Page 1
Response to Anonymous Referee #1
Major comments:
1) A new method by considering the variation in MAC is developed to obtain BC mass
size distribution and then bulk BC mass concentration from size-resolved light
absorption measurements. Size-resolved MAC calculated on the basis of core-shell
Mie model is mainly discussed, which is determined by Dp-dependent DBC and coating
thickness. However, there are many assumptions in calculation processes, e.g., same
DBC and coating thickness at each selected mobility size, a constant number fraction
of BC-containing particles, etc. Meanwhile, measurements were not described clearly.
Response: Thanks for your comments. The size resolved MAC in this study was based
on core-shell Mie model. The influence of the BC aggregates on the MAC as well as
the relative deviation between the core-shell model and BC aggregates were discussed
in section 5.1 of the revised manuscript to evaluate the effects of the morphology on
MAC. With respect to the assumptions used in this study, their uncertainties were
discussed in section 5, such as the uncertainties caused by using idealized core-shell
model (section 5.1), by using a constant BC-containing particle fraction (section 5.2)
and by variation of refractive index (section 5.3). With respect to description of
measurements, a more detailed description of our measurement was added in section 2.
2) The significance of this study should be also strengthened. In my point of view,
compared to BC mass loading, the light absorption measurements are more required
to evaluate the influences of BC particles on solar radiation. Thus, MAC is likely to
be more important for converting bulk BC mass loading, which can be directly
measured by using chemical method (e.g., Thermo Optical Reflection-EC) or laser-
induced incandescence techniques (e.g., SP2-rBC), to light absorption in climate
research. The current study is more important for obtaining BC mass size distribution
from size-resolved absorption measurement. BC mass size distribution obtained from
the DMA-AE51 measurement based on the new method is also suggested to compare
Page 2
with that obtained from the direct measurement from DMA-SP2 system, which has
used in the field campaign.
Response: Thanks and we agree with your comments. More sentences were added in
this text to stress the significance. The main goal of this study was to derive equivalent
BC mass concentration (EBC, after Petzold et al. (2013)) more precisely and obtain BC
particle mass size distribution (BCPMSD) from size-resolved absorption measurement.
MAC is an important variable that has to be discussed in the process. Derivation of the
EBC and related uncertainties were more discussed to emphasize that our goal was to
determine EBC more precisely.
3) The Mie model is likely to not suitable for the calculation of BC aggregates with
large sizes. For a small BC particle (core), the mass equivalent diameter of the
assumed BC sphere is much smaller than the wavelength (880 nm) resulting in a less
effect of morphology to absorption. In this case, the Mie model is somewhat feasible
for absorption estimation. However, for a large BC particle (core), its mass equivalent
diameter is close to the wavelength (i.e., large size parameter); thus, the absorption
is largely influenced by the morphology. Moreover, large BC particles are more likely
to exhibit loose fractal aggregates with thin coating, thus, is likely much different
from core-shell structure. MAC in this case cannot be well depicted by using Mie
model.
Response: Thank you for your comments. In section 5.1 of our revised manuscript, the
uncertainty caused by using idealized core-shell model was discussed by replacing the
BC core with cluster-like aggregates calculated with multiple sphere T-matrix (MSTM)
method. The relative deviation between MAC calculated by MSTM model and by core-
shell Mie model was investigated. The results showed that when the size of BC core
was smaller than 150 nm, the overall deviation was within 4 %, which indicated that
Mie theory was a good approximation to the BC aggregates even when BC core reached
200 nm. When BC core was larger than 200 nm, MAC calculated by MSTM model
increased with increasing thickness of shell. The deviations between MAC calculated
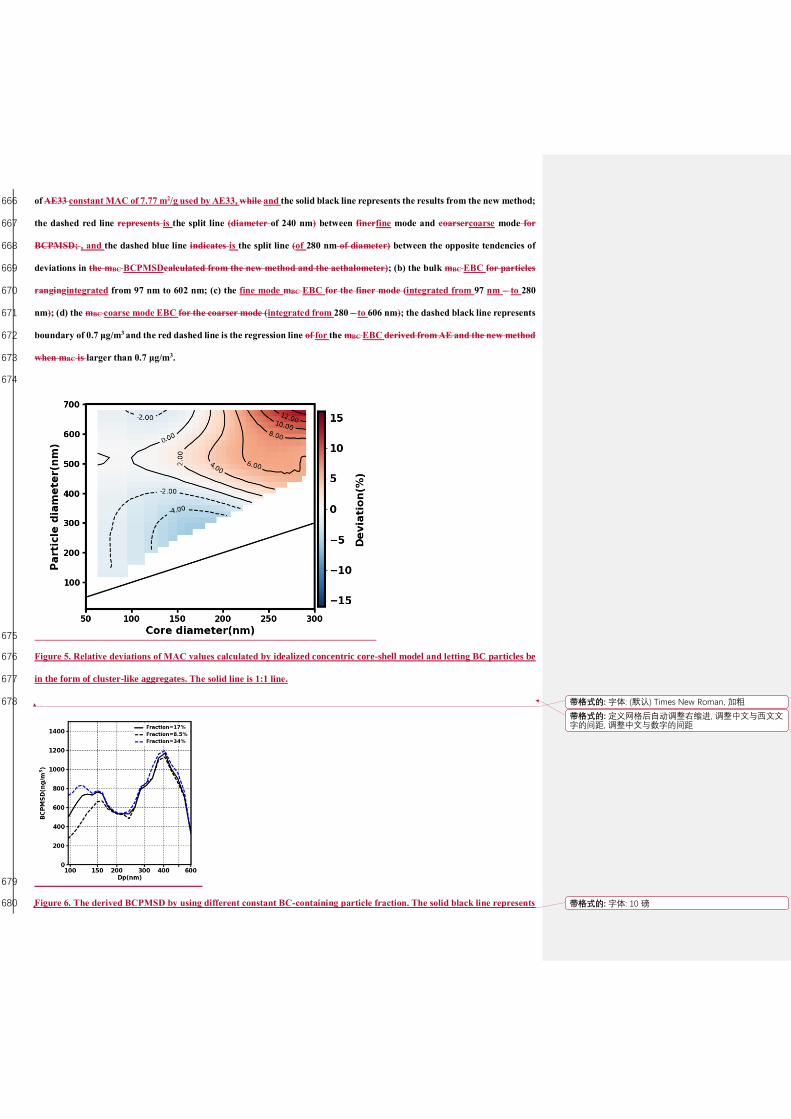
by the idealized concentric core-shell model and letting BC particles be in the form of
Page 3
cluster-like aggregates were overall within 15%.
Specific comments:
1) Wavelength should be addressed when the absolute value of MAC is mentioned.
Response: Thank you for your recommendation. Wavelength was addressed when the
absolute value of MAC was mentioned.
2) Line 13, what do the ‘different core-shell structures’ mean? Different core size and
shell thickness?
Response: Yes, ‘different core-shell structures’ meant different core sizes and shell
thicknesses in this study. ‘Different core-shell structures’ was changed into ‘different
core sizes and shell thicknesses’ in the revised manuscript to avoid ambiguity.
3) Line 57–58, Bond and Bergstrom (2006) just suggested a consistent MAC for fresh
(uncoated) BC particles.
Response: This sentence was removed in the revised manuscript.
4) Line 73, a more detailed but clear description of BCPMSD measurement should
be addressed. From my understanding, major results and discussion presented in this
study are based on the BCPMSD measurements (using DMA-AE51?) at Zhangqiu
site. DMA-SP2 measurements at Taizhou, and comparisons of AE33 with PASS-3 at
Taizhou and Beijing are mostly used to provide essential parameters (e.g., number
fraction of BC-containing particles, multi-scattering correction factor for AE33, etc.)
for the BCPMSD retrieval.
Response: Thanks for your comments. More detailed description of BCPMSD
measurement was addressed in section 2.2 in our revised manuscript.
Yes, the major results and discussion in this study were based on BCPMSD
measurements using DMA-AE51 at Zhangqiu site. The SP2 measurements at Taizhou
Page 4
as well as comparison between AE33 and PASS-3 were used to provide number fraction
of BC-containing particles as well as multi-scattering correction factor for AE33.
5) Line 112–115, the method to determine the size-resolved number fraction of BC-
containing particles should be introduced briefly. How to deal with the effect of
multicharged particles in the DMA-SP2 system? Why the number fraction of BC-
containing particles at Taizhou can be used to represent that at Zhangqiu?
Response: Thanks for your recommendation. The determination of the number fraction
of BC-containing particle was introduced briefly in the text.
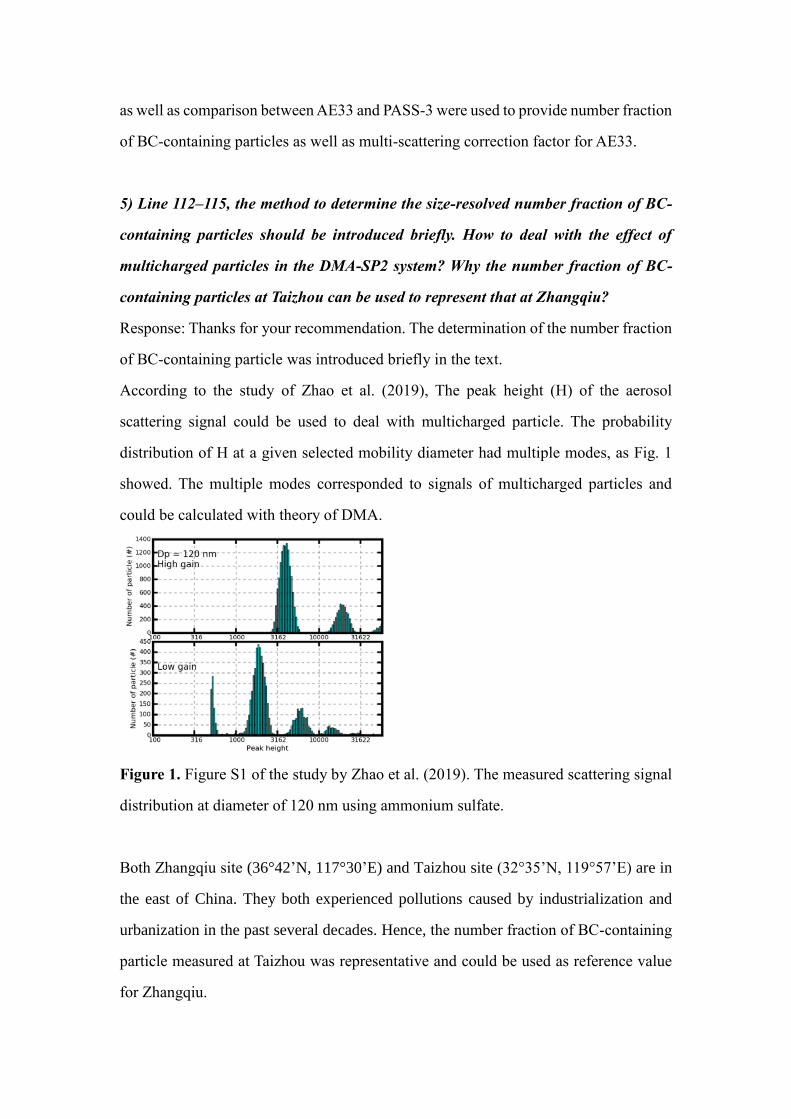
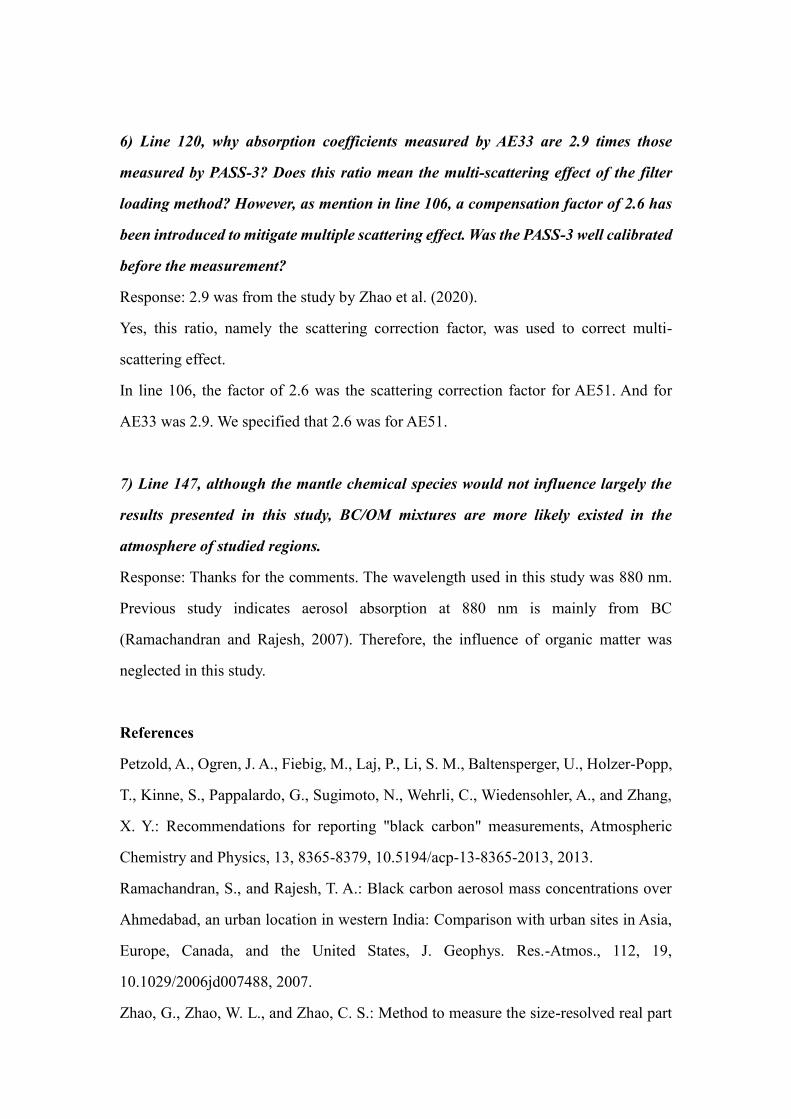
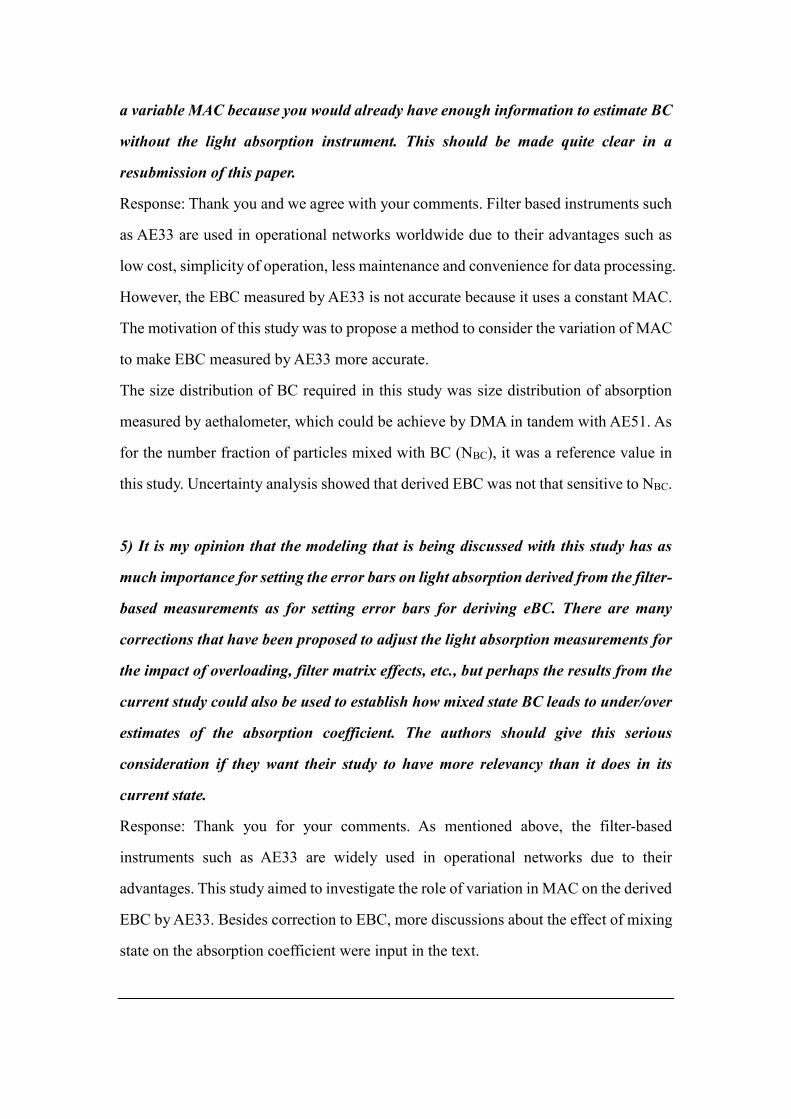
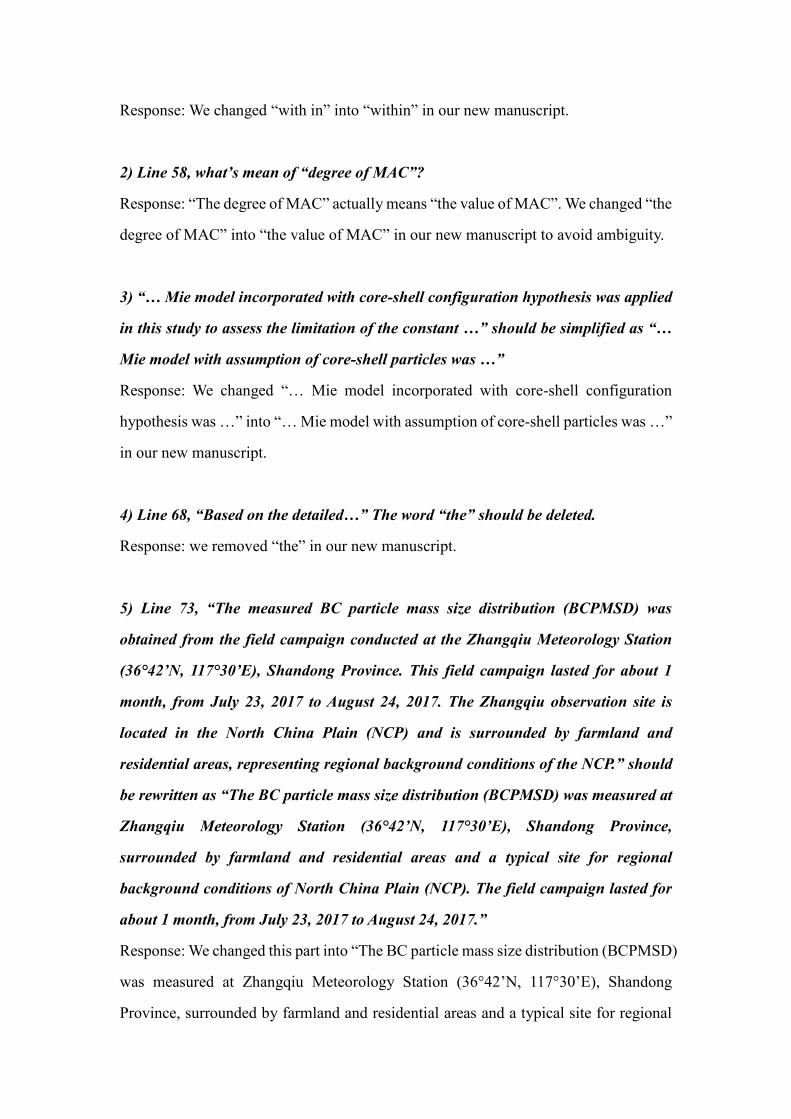
According to the study of Zhao et al. (2019), The peak height (H) of the aerosol
scattering signal could be used to deal with multicharged particle. The probability
distribution of H at a given selected mobility diameter had multiple modes, as Fig. 1
showed. The multiple modes corresponded to signals of multicharged particles and
could be calculated with theory of DMA.
Figure 1. Figure S1 of the study by Zhao et al. (2019). The measured scattering signal
distribution at diameter of 120 nm using ammonium sulfate.
Both Zhangqiu site (36°42’N, 117°30’E) and Taizhou site (32°35’N, 119°57’E) are in
the east of China. They both experienced pollutions caused by industrialization and
urbanization in the past several decades. Hence, the number fraction of BC-containing
particle measured at Taizhou was representative and could be used as reference value
for Zhangqiu.
Page 5
6) Line 120, why absorption coefficients measured by AE33 are 2.9 times those
measured by PASS-3? Does this ratio mean the multi-scattering effect of the filter
loading method? However, as mention in line 106, a compensation factor of 2.6 has
been introduced to mitigate multiple scattering effect. Was the PASS-3 well calibrated
before the measurement?
Response: 2.9 was from the study by Zhao et al. (2020).
Yes, this ratio, namely the scattering correction factor, was used to correct multi-
scattering effect.
In line 106, the factor of 2.6 was the scattering correction factor for AE51. And for
AE33 was 2.9. We specified that 2.6 was for AE51.
7) Line 147, although the mantle chemical species would not influence largely the
results presented in this study, BC/OM mixtures are more likely existed in the
atmosphere of studied regions.
Response: Thanks for the comments. The wavelength used in this study was 880 nm.
Previous study indicates aerosol absorption at 880 nm is mainly from BC
(Ramachandran and Rajesh, 2007). Therefore, the influence of organic matter was
neglected in this study.
References
Petzold, A., Ogren, J. A., Fiebig, M., Laj, P., Li, S. M., Baltensperger, U., Holzer-Popp,
T., Kinne, S., Pappalardo, G., Sugimoto, N., Wehrli, C., Wiedensohler, A., and Zhang,
X. Y.: Recommendations for reporting "black carbon" measurements, Atmospheric
Chemistry and Physics, 13, 8365-8379, 10.5194/acp-13-8365-2013, 2013.
Ramachandran, S., and Rajesh, T. A.: Black carbon aerosol mass concentrations over
Ahmedabad, an urban location in western India: Comparison with urban sites in Asia,
Europe, Canada, and the United States, J. Geophys. Res.-Atmos., 112, 19,
10.1029/2006jd007488, 2007.
Zhao, G., Zhao, W. L., and Zhao, C. S.: Method to measure the size-resolved real part
Page 6
of aerosol refractive index using differential mobility analyzer in tandem with single-
particle soot photometer, Atmospheric Measurement Techniques, 12, 3541-3550,
10.5194/amt-12-3541-2019, 2019.
Zhao, G., Yu, Y., Tian, P., Li, J., Guo, S., and Zhao, C.: Evaluation and Correction of
the Ambient Particle Spectral Light Absorption Measured Using a Filter-based
Aethalometer, Aerosol and Air Quality Research, 20, 1833-1841,
10.4209/aaqr.2019.10.0500, 2020.
Page 7
Response to Anonymous Referee #2
Major comments:
1) The authors have ignored the recommendations as proposed by Petzold et al.
(2013), recommendations that are generally accepted by the scientific community, on
how black carbon (BC) should be reported when derived from instruments that
measure light attenuation, i.e. filter based or photoacoustic sensor. BC derived from
these techniques should be reported as equivalent BC, or eBC. If or when this paper
is resubmitted, the title should reflect clearly that it is eBC that is being discussed, not
BC.
Response: Thanks for your recommendation. The term ‘black carbon’ (BC) was
changed into ‘equivalent BC’. As suggested by Petzold et al. (2013), equivalent BC
was abbreviated to “EBC” in the revised manuscript.
2) A large fraction of the introduction is devoted to the importance of BC for climate
change due to radiative forcing. What the authors fail to understand is that in the
context of their study, the corrections to the MAC that they are proposing is
completely irrelevant. Sensors that measure light absorption like the Aethalometer,
are already providing the necessary information that is relevant to climate change,
i.e. it is not the mass concentration that is important it is the optical cross section. I
will address this further below with respect to the mixing state of BC, but the primary
point is that the mass concentration of BC is not important when doing radiative
transfer calculations if you already have the primary measurements of the
coefficients of scattering and absorption. The authors also mention that BC might be
efficient CCN or IN, both true statements but again irrelevant with respect to their
study. Hence, the introduction needs to be completely rewritten to explain the real
relevance of the current study, and that is to set some error bounds on eBC derived
from Aethalometer measurements and NOT a cutting edge, new methodology that
will in any way improve the accuracy of such measurements.
Page 8
Response: Thank you for your comments. The introduction was rewritten to emphasize
the importance of MAC correction when deriving EBC from light absorption based on
filter-based instrument.
3) This study should be written up as a detailed analysis of the uncertainties in the
MAC related to the mixing state of BC, i.e. the refractive indices, real and imaginary,
the wavelength of incident light, and the relative sizes of the core and shell. Secondly,
in the introduction, it should be made quite clear how this analysis differs from the
many others that have already been published.
Response: Thank you for your comments. Detailed uncertainty analysis, including
refractive indices, was input in section 5 of the revised manuscript. The discussions
included uncertainties of MAC caused by using idealized core-shell model, using
constant BC-containing particle fraction, and variation of RI. The influence of sizes of
core and shell were discussed in the uncertainty analysis. With respect to wavelength,
EBC is derived from ab at a specific wavelength, namely 880 nm. At 880 nm, aerosol
absorption is mainly from BC (Ramachandran and Rajesh, 2007). At shorter
wavelength, absorption of organic carbon is not negligible any more, leading to
difficulty of extracting BC absorption from total absorption. Therefore, the wavelength
dependency of MAC was not discussed since the main goal of this study was to derive
EBC, and the organic component was not included in this study.
The variation of MAC due to mixing state was not considered when deriving EBC
from ab in the previous studies, difference between this study and previous studies was
input in the text. The motivation of this study was to propose a modified approach
considering variation of MAC due to mixing state.
4) The methodology that is discussed in this paper is being promoted as a way to
derive a more accurate EBC but this is misleading because in order to apply this you
need a lot of additional complementary information about the size distribution of the
BC, the fraction of particles that are mixed with BC, etc. If you had all the necessary
information to begin with, then you wouldn’t even need to try and derive EBC using
Page 9
a variable MAC because you would already have enough information to estimate BC
without the light absorption instrument. This should be made quite clear in a
resubmission of this paper.
Response: Thank you and we agree with your comments. Filter based instruments such
as AE33 are used in operational networks worldwide due to their advantages such as
low cost, simplicity of operation, less maintenance and convenience for data processing.
However, the EBC measured by AE33 is not accurate because it uses a constant MAC.
The motivation of this study was to propose a method to consider the variation of MAC
to make EBC measured by AE33 more accurate.
The size distribution of BC required in this study was size distribution of absorption
measured by aethalometer, which could be achieve by DMA in tandem with AE51. As
for the number fraction of particles mixed with BC (NBC), it was a reference value in
this study. Uncertainty analysis showed that derived EBC was not that sensitive to NBC.
5) It is my opinion that the modeling that is being discussed with this study has as
much importance for setting the error bars on light absorption derived from the filter-
based measurements as for setting error bars for deriving eBC. There are many
corrections that have been proposed to adjust the light absorption measurements for
the impact of overloading, filter matrix effects, etc., but perhaps the results from the
current study could also be used to establish how mixed state BC leads to under/over
estimates of the absorption coefficient. The authors should give this serious
consideration if they want their study to have more relevancy than it does in its
current state.
Response: Thank you for your comments. As mentioned above, the filter-based
instruments such as AE33 are widely used in operational networks due to their
advantages. This study aimed to investigate the role of variation in MAC on the derived
EBC by AE33. Besides correction to EBC, more discussions about the effect of mixing
state on the absorption coefficient were input in the text.
Page 10
Specific comments:
1) Line 1, “determination of black carbon mass concentration from aerosol light
absorption using variable mass absorption cross-section”. Here and from here on out
this is to be called “equivalent black carbon”.
Response: “Black carbon” was changed into “equivalent black carbon” in the text.
2) Line 10, “the mass absorption cross-section (MAC) is a crucial parameter for
converting light absorption coefficient (ab) to mass equivalent BC concentration
(mBC)”. Here and forward, change this into eBC.
Response: mBC was modified as EBC in the revised manuscript here and forward.
3) Line 11, “traditional filter-based instrument, such as AE33, uses a constant MAC
of 7.77 m2/g to derive mBC, which may lead to uncertainty in mBC.” Add the
wavelength that this is for.
Response: Thanks for your recommendation. wavelength of 880 nm was appended to
7.77 m2/g in the text.
4) Line 22, “because of its highly absorbing properties in the visible spectral region,
BC is considered to have a significant influence on global warming.” By definition,
“black” means all wavelengths, not just visible.
Response: “In the visible spectral region” was deleted in the revised manuscript.
5) Line25, “despite the importance of BC to climate, the global mean direct radiative
forcing of BC particles still spans over a poorly constrained range of 0.2 – 1 W/m2.”
Please clarify. I don't understand what this means.
Response: This sentence was removed from the text to avoid ambiguity.
6) Line 29, “to fully evaluate the influences of BC particles on solar radiation or
Page 11
precipitation, more precise measurements of BC mass loading in the atmosphere are
required.” This is an incorrect argument for saying that more accurate
measurements of BC are needed because instrument like the aethalometer measure
light absorption directly without the need for converting it to eBC. With respect to the
impact on clouds, what is needed is better measurements that can show just exactly
how BC does form droplets or ice. Hence, an accurate MAC is not relevant for these
impacts. The only impact that BC mass has that is important is on health or damage
to building surfaces.
Response: Thanks for your comments. This sentence was deleted in the revised
manuscript to make the content more relevant to the correction to EBC.
7) Line 31, “a variety of techniques have been developed to measure real-time BC
mass concentrations.” None of these measure BC mass concentrations.
Response: These absorption measurement techniques was removed and instruments
measuring BC mass concentration, such as SP2, OCEC, SP-AMS, was input in the text.
8) Line 37 and line 38, “it measures real-time BC concentrations by converting the
absorption coefficient (ab) into mass equivalent BC concentrations (mBC) through a
constant mass absorption cross-section (MAC), which provides the BC absorption
per unit mass.” AE33 does not measure BC concentrations and the wavelength
dependency of MAC has to be discussed at the very beginning.
Response: “BC concentrations” was changed into “BC absorption” and “880 nm” was
appended to MAC.
8) Line 53, “a wide range of MAC (2 – 25 m2/g) has been reported in previous studies.”
This range is due to wavelength dependency. What is the range for a single frequency,
especially for the one being used here?
Response: Thanks for your comments. This sentence was changed into “A wide range
of MAC has been reported in previous studies. For instance, Bond and Bergstrom (2006)
reported MAC at 550 nm varying from 1.6 m2/g. Sharma et al. (2002) reported MAC
Page 12
at 880 nm varying from 6.4 to 28.3 m2/g.” to make wavelength dependency clear.
9) Line 62 to 64, “the hypothetical BC mixing state affects the corresponding
absorption properties. It is critical to propose a method to infer mBC from light
attenuation measurements considering aerosol size and the process by which BC
aerosols mix with other aerosol components.” Is this being proposed, completely
independent of any other information about the environment?
Response: The mixing state of BC was one of the important factors that affect the
absorption properties of BC-containing particles. The size of aerosol was required to
estimate the effect of mixing state on BC absorption. It was dependent on other
information, such as refractive index (RI). The influence of RI on the uncertainty of
MAC was discussed in the later content. This sentence was removed to avoid ambiguity.
10) Line 70, “this modified method measures size-resolved mBC accurately and
improves the evaluation of BC radiative forcing.” How can a theoretical model
"measure" eBC?
Response: Thanks for your comment. “Measure” was modified into “estimate”.
11) Line 77, “the DMA (Differential Mobility Analyzer)-SP2 system measurements
to determine the number fraction of BC-containing aerosols and to compare AE33
and the three-wavelength photoacoustic soot spectrometer (PASS-3) were conducted
in Taizhou.” What wavelength of AE33 are compared?
Response: The wavelengths used for comparison between AE33 and PASS-3 were 405
nm, 532 nm and 781 nm. 405 nm, 532 nm and 781 nm are the wavelengths PASS-3
measures. The wavelengths AE33 measures are 370 nm, 470 nm, 520 nm, 590 nm, 660
nm, 880 nm and 950 nm. For AE33, 405 nm, 532 nm and 781 nm were calculated with
wavelengths pairs of (370 nm, 470 nm), (520 nm, 590 nm) and (660 nm, 880 nm)
through Ångström relationship:
Page 13
𝜎ab(𝜆1)
𝜎ab(𝜆2)= (
𝜆1𝜆2)−𝛼𝑎𝑏
,
𝜎ab(𝜆) = 𝜎ab(𝜆1) (𝜆
𝜆1)−𝛼𝑎𝑏
.
Detailed description can be found in (Zhao et al., 2020). Wavelengths (405 nm, 532 nm
and 781 nm) as well as the reference was appended to the manuscript.
12) Line 84, “Meanwhile, from March 21, 2017 to April 9, 2017 at the Peking
University site, the results from simultaneous measurements from AE51 (model 51,
microAeth, USA) and AE33 were compared.” What wavelength?
Response: The wavelength of AE51 was 880 nm. Wavelength of “880 nm” was
appended to “AE51 and AE33”.
13) Line 99, “the dry aerosol scattering coefficients at 525 nm were measured
simultaneously by an integrated nephelometer (Ecotech 100 Pty Ltd., Aurora 3000)
with a flow rate of 3 L/min.” How does this wavelength correspond to the
Aethalometer wavelengths?
Response: The dry scattering coefficient at 525 nm here was used as a proxy of
pollution level. At a specific wavelength, higher (lower) dry scattering coefficient could
indicate a relatively polluted (clean) episode. Dry scattering coefficient at 525 nm was
not used for comparison with light attenuation measured by aethalometer. “As an
indicator of pollution level” was appended to the sentence.
14) Line 105, “factor k was set as 0.004 and ATN is the measured light attenuation
when particles load on the fiber filter of AE51.” Where does this value come from?
Response: “k = 0.004” was from the work by Zhao et al. (2019). “(Zhao et al., 2019b)”
was appended to “0.004” in the manuscript.
15) Line 114 – 115, “according to the measurements from Taizhou, only 17% of the
ambient particles that contained BC averagely for bulk aerosol populations.” This is
Page 14
an incomplete sentence.
Response: this sentence was modified into “according to the measurements from
Taizhou, only 17% of the ambient particles contained BC averagely for bulk aerosol
populations.”.
16) Line 116, “we adjusted the measured wavelengths of AE33 to the measured
wavelengths of PASS-3 (405 nm, 532 nm, and 781 nm).” How the adjustment is made?
Response: 405 nm, 532 nm and 781 nm are the wavelengths PASS-3 measures. The
wavelengths AE33 measures are 370 nm, 470 nm, 520 nm, 590 nm, 660 nm, 880 nm
and 950 nm. They are not consistent. For comparison, the wavelengths of AE33 were
interpolated to the wavelengths of PASS-3 in this study. Specifically, For AE33, 405
nm, 532 nm and 781 nm were interpolated with wavelengths pairs of (370 nm, 470 nm),
(520 nm, 590 nm) and (660 nm, 880 nm) through Ångström relationship:
𝜎ab(𝜆1)
𝜎ab(𝜆2)= (
𝜆1𝜆2)−𝛼ab
,
𝜎ab(𝜆) = 𝜎ab(𝜆1) (𝜆
𝜆1)−𝛼ab
.
More detailed description could be found in (Zhao et al., 2020). The interpolation
method was added to the manuscript. “Adjusted” was changed into “interpolated”.
17) Line 182 – 183, “it should be pointed out that the retrieval algorithm of BCPMSD
is based on the assumption that BC-containing particles of a fixed diameter are all
core-shell mixed and the corresponding DBC for a specific Dparticle is same.” A major
assumption. Where is the sensitivity study that evaluates this assumption? This
uncertainty analysis belongs in the main text, not in a supplement.
Response: Thanks for your comments. The sensitivity study from the supplement was
moved to the section 5.1 in the revised manuscript.
Reference
Petzold, A., Ogren, J. A., Fiebig, M., Laj, P., Li, S. M., Baltensperger, U., Holzer-Popp,
Page 15
T., Kinne, S., Pappalardo, G., Sugimoto, N., Wehrli, C., Wiedensohler, A., and Zhang,
X. Y.: Recommendations for reporting "black carbon" measurements, Atmospheric
Chemistry and Physics, 13, 8365-8379, 10.5194/acp-13-8365-2013, 2013.
Ramachandran, S., and Rajesh, T. A.: Black carbon aerosol mass concentrations over
Ahmedabad, an urban location in western India: Comparison with urban sites in Asia,
Europe, Canada, and the United States, J. Geophys. Res.-Atmos., 112, 19,
10.1029/2006jd007488, 2007.
Zhao, G., Tao, J. C., Kuang, Y., Shen, C. Y., Yu, Y. L., and Zhao, C. S.: Role of black
carbon mass size distribution in the direct aerosol radiative forcing, Atmospheric
Chemistry and Physics, 19, 13175-13188, 10.5194/acp-19-13175-2019, 2019.
Zhao, G., Yu, Y., Tian, P., Li, J., Guo, S., and Zhao, C.: Evaluation and Correction of
the Ambient Particle Spectral Light Absorption Measured Using a Filter-based
Aethalometer, Aerosol and Air Quality Research, 20, 10.4209/aaqr.2019.10.0500, 2020.
Page 16
Response to Anonymous Referee #3
Major comments:
1) As the authors pointed, for the new BC, its shape is chain-like, not a spherical one,
so how do you know this method is applicable for the measurement. How many parts
of BC is newly generated and how many is old one is there a guess for that? Do you
have some samples measured ASAP and others saved and wait some time to let them
to be old one?
Response: Thank you very much for your comments. We discussed the uncertainties
caused by using idealized core-shell model in section 5 of our new manuscript. We
replaced the spherical BC particle with cluster-like aggregates using multiple sphere T-
matrix (MSTM) method. The results show that the deviations between the idealized
concentric core-shell model and the cluster-like aggregates are overall within 15%. For
BC core smaller than 200 nm, the deviations are within 4%. So, the method is applicable
for the measurement.
After emitted into ambient environment, a pure BC particle will soon be coated. The
absorption ability of the coated BC particle will be enhanced due to lensing effect. the
absorption coefficient (𝜎ab) of the coated BC particle will be larger that of pure BC
particle. In our method, we do not limit the BC-containing particle that it has to be core-
shell structure, it can also be a pure BC particle as long as the calculated 𝜎ab matches
measured 𝜎ab. So, we do not need to guess how many parts of BC is newly generated
and how many parts of BC is old.
Sorry, we do not have sample measured ASAP and others saved and wait some time to
let them to be old one. But according to the work of Peng et al. (2016), the aging time
scale is ~ 4 hours.
Specific comments:
1) Line 16, “with in” should be “within”.
Page 17
Response: We changed “with in” into “within” in our new manuscript.
2) Line 58, what’s mean of “degree of MAC”?
Response: “The degree of MAC” actually means “the value of MAC”. We changed “the
degree of MAC” into “the value of MAC” in our new manuscript to avoid ambiguity.
3) “… Mie model incorporated with core-shell configuration hypothesis was applied
in this study to assess the limitation of the constant …” should be simplified as “…
Mie model with assumption of core-shell particles was …”
Response: We changed “… Mie model incorporated with core-shell configuration
hypothesis was …” into “… Mie model with assumption of core-shell particles was …”
in our new manuscript.
4) Line 68, “Based on the detailed…” The word “the” should be deleted.
Response: we removed “the” in our new manuscript.
5) Line 73, “The measured BC particle mass size distribution (BCPMSD) was
obtained from the field campaign conducted at the Zhangqiu Meteorology Station
(36°42’N, 117°30’E), Shandong Province. This field campaign lasted for about 1
month, from July 23, 2017 to August 24, 2017. The Zhangqiu observation site is
located in the North China Plain (NCP) and is surrounded by farmland and
residential areas, representing regional background conditions of the NCP.” should
be rewritten as “The BC particle mass size distribution (BCPMSD) was measured at
Zhangqiu Meteorology Station (36°42’N, 117°30’E), Shandong Province,
surrounded by farmland and residential areas and a typical site for regional
background conditions of North China Plain (NCP). The field campaign lasted for
about 1 month, from July 23, 2017 to August 24, 2017.”
Response: We changed this part into “The BC particle mass size distribution (BCPMSD)
was measured at Zhangqiu Meteorology Station (36°42’N, 117°30’E), Shandong
Province, surrounded by farmland and residential areas and a typical site for regional
Page 18
background conditions of North China Plain (NCP). The field campaign lasted for about
1 month, from July 23, 2017 to August 24, 2017.” in our new manuscript.
6) Line 76, the last word “system” should be deleted.
Response: We deleted “system” in our new manuscript.
7) Line 77, “measurements to determine …” should be “is used to determine …”.
Response: We changed “measurements to determine …” into “is used to determine …”
in our new manuscript.
8) Line 78, “The suburban measurement site”, the word “measurement” should be
deleted.
Response: We deleted the “measurement” in our new manuscript.
9) Line 79, the word “the” before “Jianghuai Plain” should be deleted.
Response: We deleted “the” before “Jianghuai Plain” in our new manuscript.
10) Line 86 and 87, “All the measurements in the three sites were conducted in
containers where ambient temperature was controlled within 24 ± 2 °C with a particle
pre-impactor to remove particles larger than 10 μm from the input air stream.”
should be rewritten as “All the measurements in the three sites were conducted in
temperature (24 ± 2 °C) controlled containers, and a particle pre-impactor is used to
remove particles larger than 10 μm from the input airflow.”
Response: The sentence was changed into “All the measurements in the three sites were
conducted in temperature (24 ± 2 °C) controlled containers, and a particle pre-impactor
is used to remove particles larger than 10 μm from the input airflow.” In our new
manuscript.
11) Line 92, “developed by (Ning et al., 2013). The instrument setup was further
improved by Zhao et al. (2019b).” should be “developed by Ning et al. (2013) and
Page 19
improved by Zhao et al. (2019b)”.
Response: we changed “developed by (Ning et al., 2013). The instrument setup was
further improved by Zhao et al. (2019b)” into “developed by Ning et al. (2013) and
improved by Zhao et al. (2019b)” in our new manuscript.
12) Line 101, “that were used to represent air pollution conditions” should be deleted.
Response: “that were used to represent air pollution conditions” was deleted in our new
manuscript.
13) Line 105, the variables of k and ATN should be italic.
Response: k and ATN were changed into italic in our new manuscript.
14) Line 108, “in this study” should be deleted.
Response: “in this study” was deleted in our new manuscript.
15) Beginning of line 115, word “from” should be “at” and the same for line 117.
Response: “from” was changed into “at” in our new manuscript.
16) Line 117 and 118, “with a measurement flowrate of” should be “with flowrate
of”.
Response: “with a measurement flowrate of” was changed into “with flowrate of” in
our new manuscript.
17) Line 123, “… through a constant MAC value” should be “under assumption of
a constant MAC”.
Response: “… through a constant MAC value” was changed into “under assumption of
a constant MAC”.
18) Line 130, “an appropriate model simulation is needed for representing a single
BC particle’s optical properties.” What’s meaning of this sentence?
Page 20
Response: This sentence means that a proper model is required to simulate the optical
parameters, such as the MAC, absorption coefficient, and scattering coefficient, of BC-
containing particles to a good approximation. To avoid ambiguity, this sentence was
changed into “a proper model is required to simulate the optical properties of BC-
containing particles to a good approximation.” in our new manuscript.
19) Line 131, “There are three widely employed mixing states that are used to
represent the structure of BC-containing aerosols” should be “Three widely
employed mixing states are used to represent the structure of BC-carried aerosols”.
Response: The sentence was changed into “Three widely employed mixing states are
used to represent the structure of BC-carried aerosols.” in our new manuscript.
20) Line 133, “… chain-like aggregates composed of small spheres” should be
“chain-like aggregates of small spheres”.
Response: “chain-like aggregates composed of small spheres” was changed into “chain-
like aggregates of small spheres” in our new manuscript.
21) Line 139, “the spherical core and shell favor the Mie model” should be deleted.
Response: “the spherical core and shell favor the Mie model” was deleted in our new
manuscript.
22) Line 140, “in this study” should be deleted.
Response: “in this study” at line 140 was deleted in our new manuscript.
23) Line 143, could you use other words for the section title?
Response: The section title was changed to “Simulation of MAC for BC-containing
particle using Mie theory”.
24) Line 147, the word “frequent” should be replace by “common”.
Response: the word “frequent” was replaced by “common” in our new manuscript.
Page 21
25) Line 150, “… at the wavelength of 880 nm, calculated using the Mie theory, has
been presented” should be “… at wavelength of 880 nm are simulated with Mie
scattering method.”
Response: “… at the wavelength of 880 nm, calculated using the Mie theory, has been
presented” was changed into “… at wavelength of 880 nm are simulated with Mie
scattering method.” in our new manuscript.
26) Line 151, “reported to vary with incident light wavelength” should be “dependent
on light wavelength”.
Response: “reported to vary with incident light wavelength” was changed into
“dependent on light wavelength” in our new manuscript.
27) Line 152~153, “as BC particles can be emitted from different fuels and conditions,
RI cannot be observed directly, with both real and imaginary part of RI varying over
a significantly wide range” should be “due to different sources of BC, both the real
and imaginary part of RI varies over a significantly wide range”.
Response: “as BC particles can be emitted from different fuels and conditions, RI
cannot be observed directly, with both real and imaginary part of RI varying over a
significantly wide range” was changed into “due to different sources of BC, both the
real and imaginary part of RI varies over a significantly wide range” in our new
manuscript.
28) Line 157, “averaged values are illustrated …” Do you mean “mean values …”
Response: Yes, “averaged values” are actually “mean values”. To avoid ambiguity,
“averaged values” was changed into “mean values” in our new manuscript.
29) Please rewrite paragraph between line 168 and 173 to make it simple and clear.
Response: The paragraph between line 168 and 173 was rewritten to make it simpler
and clearer in our new manuscript.
Page 22
30) Line 174, the first sentence “The detailed iterative procedure is illustrated in Fig.
2.” Should be reposition to the end of last paragraph, and the word “detailed” should
be “deleted”.
Response: The first sentence at Line 174 was repositioned to the end of the paragraph
and the word “detailed” was deleted in our new manuscript.
31) Line 175, “represented” should be replace by “shown”.
Response: “represented” was replace by “shown” in our new manuscript.
32) Line 175, “a simplified algorithm for deriving BCPMSD was proposed by
considering Fig. 1 as a look-up table.” Should be rewritten as “a simplified algorithm
was proposed to derive BCPMSD through a pre-calculated look-up table.”
Response: “a simplified algorithm for deriving BCPMSD was proposed by considering
Fig. 1 as a look-up table.” was rewritten as “a simplified algorithm was proposed to
derive BCPMSD through a pre-calculated look-up table.” in our new manuscript.
33) Line 195 and 196, words “finer mode” and “coarser mode” should be replaced
by “fine mode” and “coarse mode”, please read through the whole draft to replace
other similar words.
Response: “finer mode” and “coarser mode” was replaced by “fine mode” and “coarse
mode” through the whole draft in our new manuscript.
34) Line 198, “The results indicate that with the boundary of 280 nm, two opposite
deviation tendencies exist.” should be replaced by “the results show that there exist
two opposite deviation trends before and after the turning point around 280nm.”
Response: “The results indicate that with the boundary of 280 nm, two opposite
deviation tendencies exist.” was replaced by “the results show that there exist two
opposite deviation trends before and after the turning point around 280nm.” in our new
manuscript.
Page 23
35) Line 247, “The variations in on …” should be “The variation of …”
Response: “The variations in on …” was changed into “The variation of …” in our new
manuscript.
36) Line 247, “all MACs in the look-up table in Fig. 1 are the mean values as the
imaginary part and real part of BC RI varied over a wide range.” What’s the meaning
of this sentence mean, please rewrite?
Response: This sentence was rewritten as “for a MAC (880 nm) point at (Dparticle, DBC)
of Fig. 1, it is actually a mean value averaged with respect to both real part of RI varied
from 1.5 to 2.0 and imaginary part of RI varied from 0.5 to 1.1.” in our new manuscript.
37) Please rewrite the whole paragraph between line 247~260 to make it clear and
simple.
Response: the whole paragraph between line 247~260 was re written in our new
manuscript to make it clear and simple.
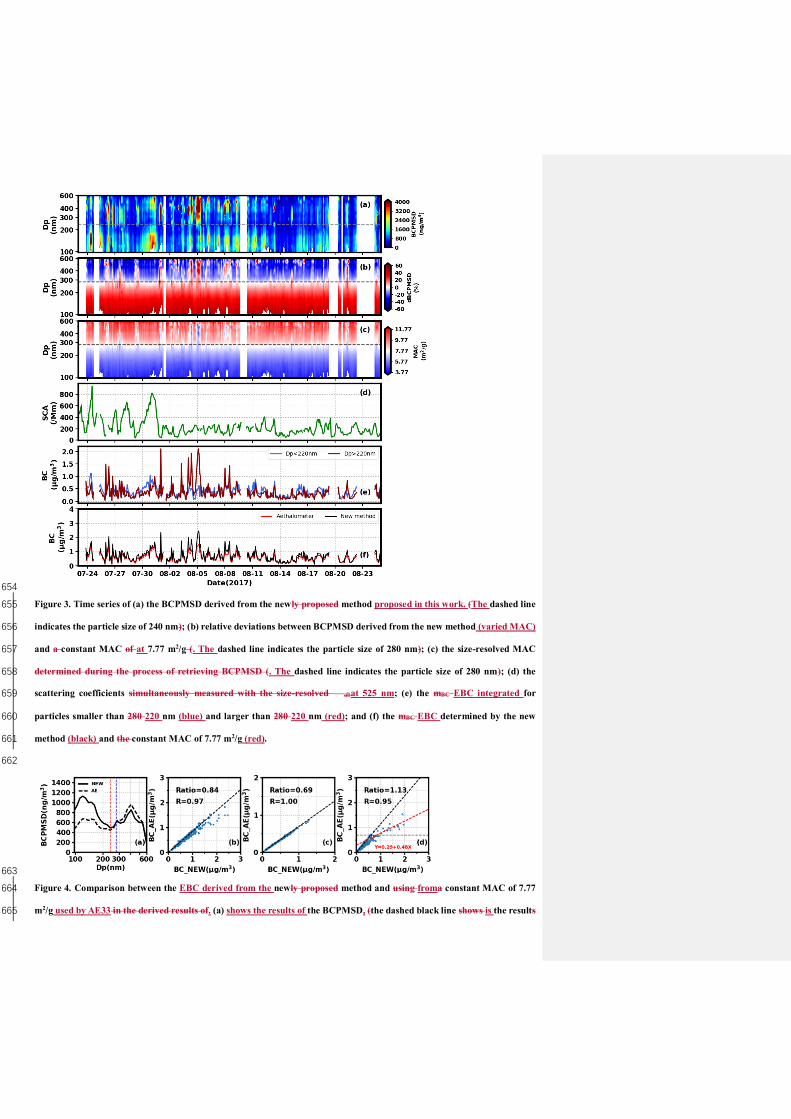
38) Line 454 to line 459, please rewrite caption for Figure 3 and make it easy to read.
The same for the caption of Figure 4.
Response: The captions for Fig. 3 and Fig. 4 were rewritten in our new manuscript to
make it easy to read.
Peng, J. F., Hu, M., Guo, S., Du, Z. F., Zheng, J., Shang, D. J., Zamora, M. L., Zeng, L. M., Shao, M.,
Wu, Y. S., Zheng, J., Wang, Y., Glen, C. R., Collins, D. R., Molina, M. J., and Zhang, R. Y.: Markedly
enhanced absorption and direct radiative forcing of black carbon under polluted urban
environments, Proceedings of the National Academy of Sciences of the United States of America,
113, 4266-4271, 10.1073/pnas.1602310113, 2016.
Page 24
Determination of equivalent black carbon mass concentration from 1
aerosol light absorption using variable mass absorption cross-section 2
Weilun Zhao1, Wangshu Tan1,2, Gang Zhao1,23, Chuanyang Shen1, Yingli Yu4,1, Chunsheng Zhao1 3
1Department of Atmospheric and Oceanic Sciences, School of Physics, Peking University, Beijing 100871, China 4
2School of Optics and Photonics, Beijing Institute of Technology, Beijing 100081, China 5
2State 3State Key Joint Laboratory of Environmental Simulation and Pollution Control, College of Environmental Sciences and 6
Engineering, Peking University, Beijing 100871, China 7
4Economics & Technology Research Institute, China National Petroleum Corporation, Beijing 100724, China 8
Correspondence to: Chunsheng Zhao ([email protected] ) 9
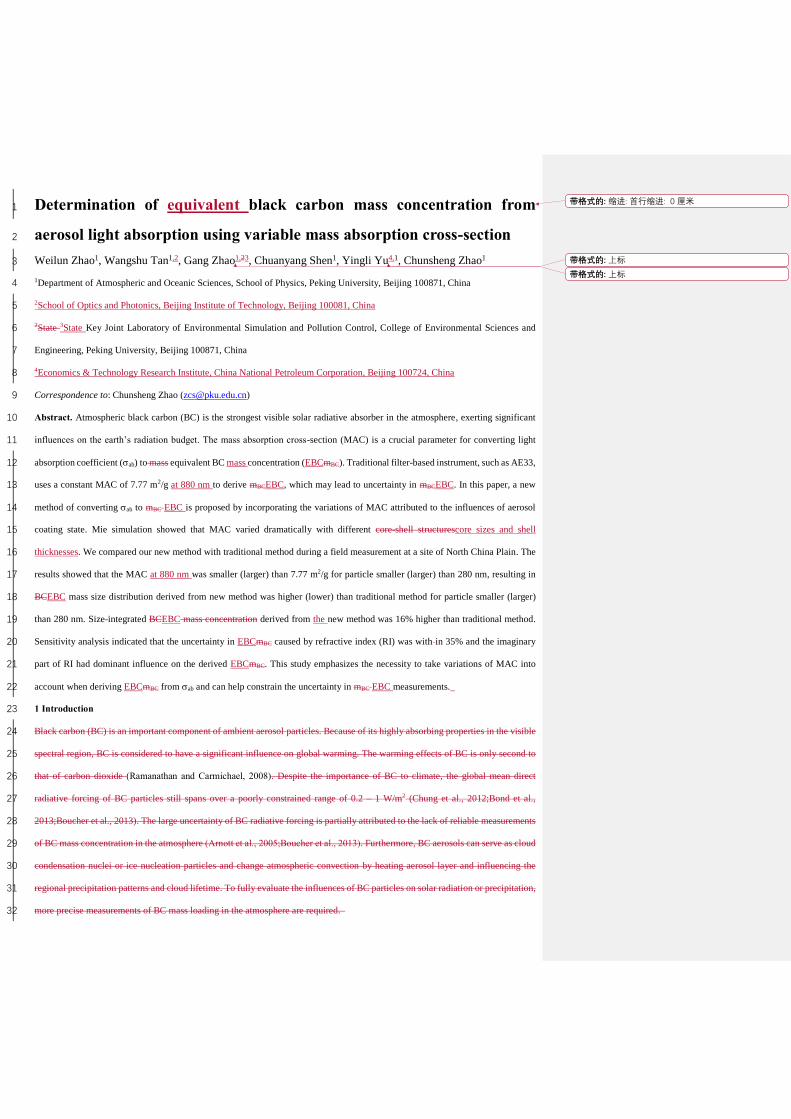
Abstract. Atmospheric black carbon (BC) is the strongest visible solar radiative absorber in the atmosphere, exerting significant 10
influences on the earth’s radiation budget. The mass absorption cross-section (MAC) is a crucial parameter for converting light 11
absorption coefficient (ab) to mass equivalent BC mass concentration (EBCmBC). Traditional filter-based instrument, such as AE33, 12
uses a constant MAC of 7.77 m2/g at 880 nm to derive mBCEBC, which may lead to uncertainty in mBCEBC. In this paper, a new 13
method of converting ab to mBC EBC is proposed by incorporating the variations of MAC attributed to the influences of aerosol 14
coating state. Mie simulation showed that MAC varied dramatically with different core-shell structurescore sizes and shell 15
thicknesses. We compared our new method with traditional method during a field measurement at a site of North China Plain. The 16
results showed that the MAC at 880 nm was smaller (larger) than 7.77 m2/g for particle smaller (larger) than 280 nm, resulting in 17
BCEBC mass size distribution derived from new method was higher (lower) than traditional method for particle smaller (larger) 18
than 280 nm. Size-integrated BCEBC mass concentration derived from the new method was 16% higher than traditional method. 19
Sensitivity analysis indicated that the uncertainty in EBCmBC caused by refractive index (RI) was with in 35% and the imaginary 20
part of RI had dominant influence on the derived EBCmBC. This study emphasizes the necessity to take variations of MAC into 21
account when deriving EBCmBC from ab and can help constrain the uncertainty in mBC EBC measurements. 22
1 Introduction 23
Black carbon (BC) is an important component of ambient aerosol particles. Because of its highly absorbing properties in the visible 24
spectral region, BC is considered to have a significant influence on global warming. The warming effects of BC is only second to 25
that of carbon dioxide (Ramanathan and Carmichael, 2008). Despite the importance of BC to climate, the global mean direct 26
radiative forcing of BC particles still spans over a poorly constrained range of 0.2 – 1 W/m2 (Chung et al., 2012;Bond et al., 27
2013;Boucher et al., 2013). The large uncertainty of BC radiative forcing is partially attributed to the lack of reliable measurements 28
of BC mass concentration in the atmosphere (Arnott et al., 2005;Boucher et al., 2013). Furthermore, BC aerosols can serve as cloud 29
condensation nuclei or ice nucleation particles and change atmospheric convection by heating aerosol layer and influencing the 30
regional precipitation patterns and cloud lifetime. To fully evaluate the influences of BC particles on solar radiation or precipitation, 31
more precise measurements of BC mass loading in the atmosphere are required. 32
带格式的: 缩进: 首行缩进: 0 厘米
带格式的: 上标
带格式的: 上标
Page 25
A variety of techniques have been developed to measure real-time BC mass concentrations. Aethalometer (Hansen et al., 1984), 33
Particle Soot Absorption Photometer (PSAP) (Bond et al., 1999), and Multiple-Angle Absorption Photometer (MAAP) (Petzold 34
and Schonlinner, 2004) are based on filter-based attenuation, while the Single Particle Soot Photometer (SP2) is a light-induced 35
incandescent instrument . Other instruments that use photo-acoustic methods such as Photoacoustic Spectrometer (PAS) (Truex and 36
Anderson, 1979) or Photo-Acoustic Soot Spectrometer (PASS) have also been introduced. The aethalometer AE33 (model 33, 37
Magee, USA), a convenient and rapid instrument, is commonly used for routine BC observations or dedicated campaigns (Castagna 38
et al., 2019;Sandradewi et al., 2008;Helin et al., 2018). It measures real-time BC concentrations by converting the absorption 39
coefficient (ab) into mass equivalent BC concentrations (mBC) through a constant mass absorption cross-section (MAC), which 40
provides the BC absorption per unit mass. 41
However, it has been reported that the MAC of BC is substantially affected by the process through which BC mixes with other 42
aerosol components (Gunter et al., 1993;Doran et al., 2007;Lack and Cappa, 2010;Peng et al., 2016). Field measurements have 43
indicated that fresh BC particles are generally subject to several coating processes while being transported in the atmosphere and 44
tend to be covered in layers of other organic or inorganic components (Shiraiwa et al., 2007;Cappa et al., 2019;Bond et al., 2006). 45
The gathered shell that builds up on the BC core, acting as a lens to focus additional incident light on the enclosed BC core, can 46
enhance BC light absorption (Fuller et al., 1999) and has significant influences on the BC radiative forcing (Jacobson, 2001). This 47
light absorption enhancement has been termed as “lensing effect” of the BC particles. 48
For typical core-coating mixed BC containing particles, this lensing effect was found to enhance BC absorption by 50-100% (Bond 49
et al., 2006). Schwarz et al. (2008) found that fresh soot particles internally mixed with sulfates and organics during transportation, 50
and the lensing effect enhanced the light absorption by a factor of 1.3-1.5. Some controlled laboratory studies also confirmed the 51
occurrence of absorption enhancement and their conclusions were consistent with the model calculation (Adler et al., 2010;Brem et 52
al., 2012;Shiraiwa et al., 2010). Meanwhile, other field studies demonstrated a wide range of this lensing effect (Cappa et al., 2019). 53
In contrast, some field observations showed a slight absorption enhancement (Cappa et al., 2012;Nakayama et al., 2014). A wide 54
range of MAC (2-25 m2/g) has been reported in previous studiesBond and Bergstrom (2006);Sharma et al. (2002) 55
Some studies suggested using site-specific MAC values for converting ab into mBC (Martins et al., 1998;Schmid et al., 2006). 56
However, field measurements indicated that MAC showed both large temporal and spatial variability (Bond and Bergstrom, 57
2006;Lack et al., 2012;Cappa et al., 2012;Ram and Sarin, 2009). Bond and Bergstrom (2006) suggested using consistent MAC and 58
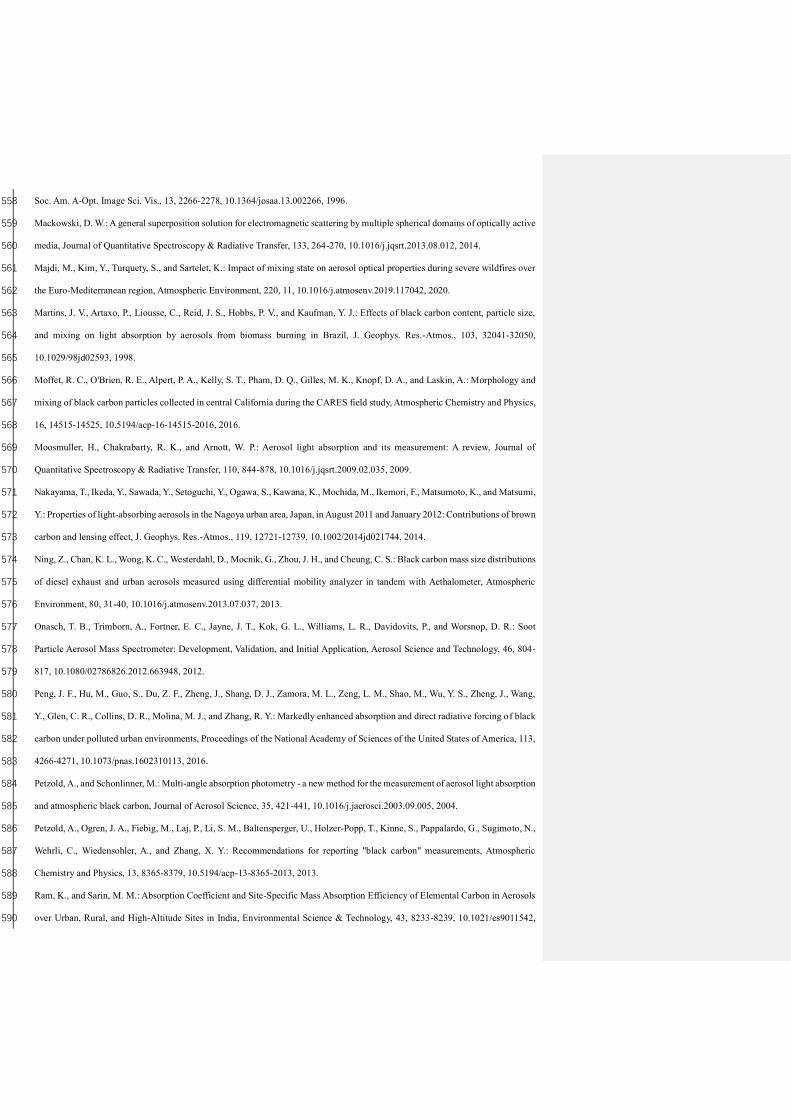
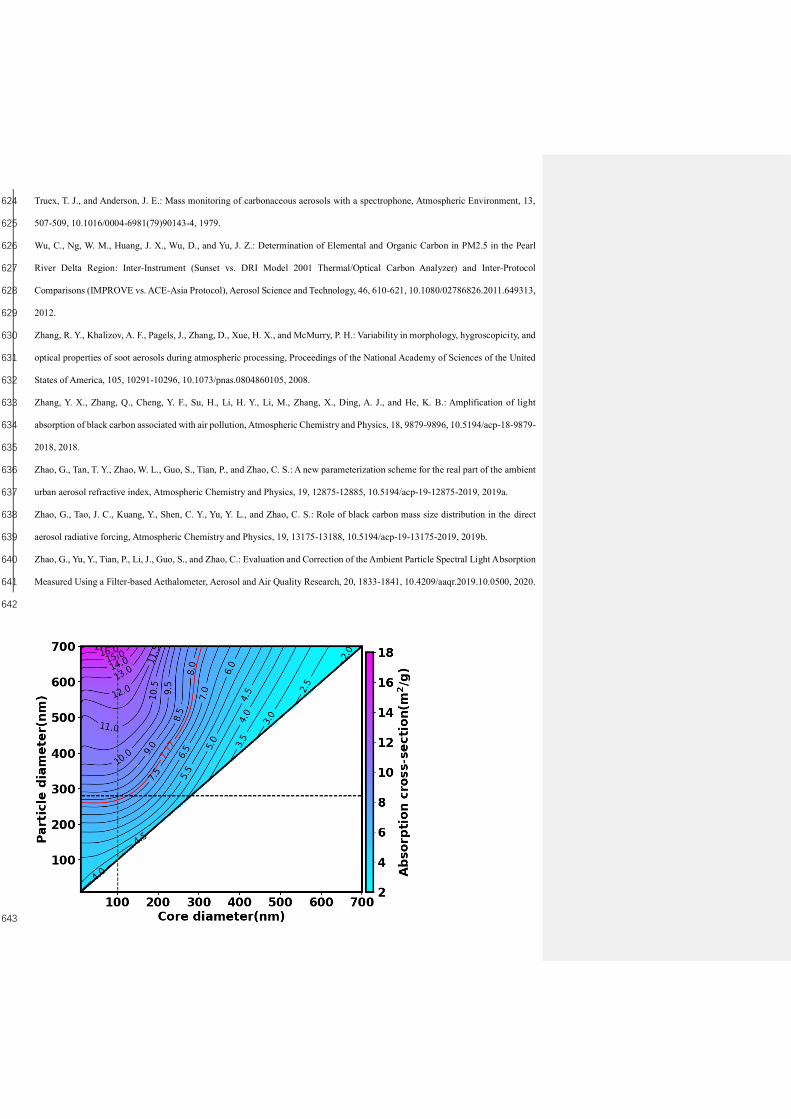
refractive index (RI) values for the BC measurements. In addition to the mixing state, the degree of MAC also relies on diameter of 59
the BC core (DBC), RI, coating thickness, and the location of the BC core (Bond and Bergstrom, 2006;Fuller et al., 1999;Lack and 60
Cappa, 2010). To better determine the current atmospheric BC mass loading, a more reliable MAC application is imperative to infer 61
BC mass from measured light attenuation. 62
The hypothetical BC mixing state affects the corresponding absorption properties. It is critical to propose a method to infer mBC 63
from light attenuation measurements considering aerosol size and the process by which BC aerosols mix with other aerosol 64
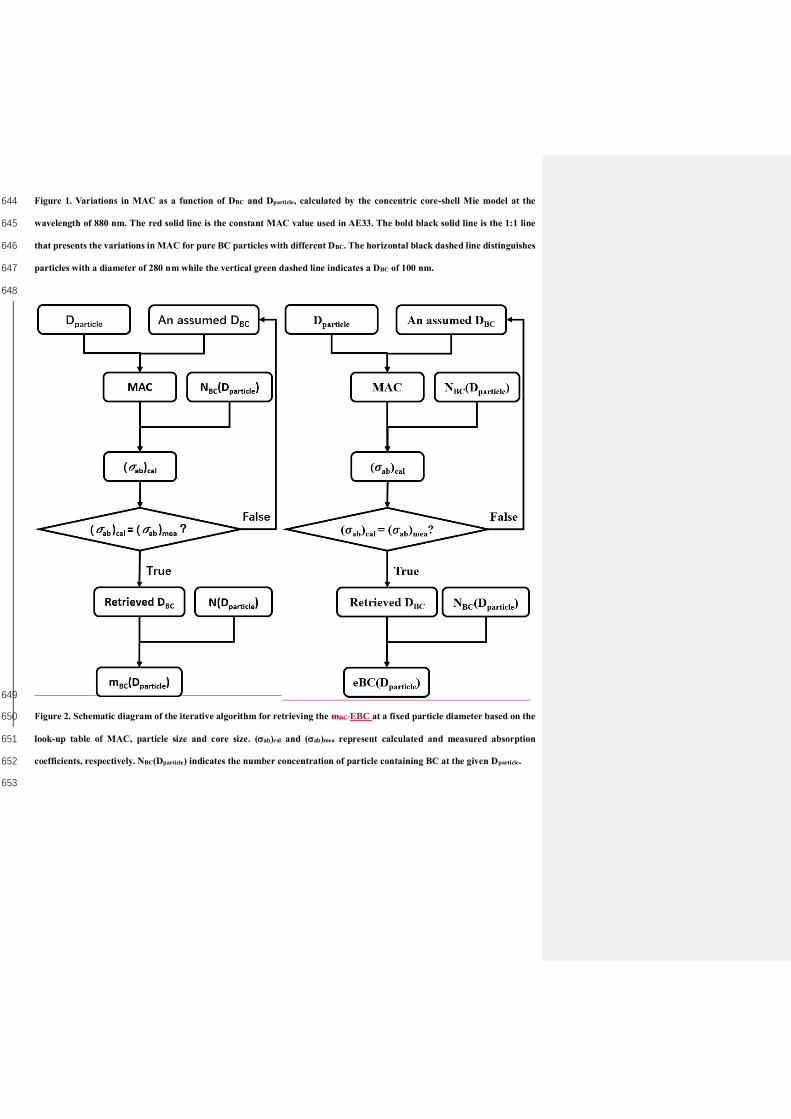
components. A simplified core-shell configuration has been introduced to illustrate the structure of BC-containing particles and 65
带格式的: 缩进: 右侧: -0 厘米, 左 -0.01 字符, 定义网格后自动调整右缩进, 调整中文与西文文字的间距, 调整中文与数字的间距
带格式的: 缩进: 左 -0.01 字符
Page 26
calculate the relevant optical properties. Several studies have demonstrated that it is appropriate to use the core-shell configuration 66
for aged aerosol (Majdi et al., 2020;Liu et al., 2019;Li et al., 2019). 67
With the objective of improving the reliability of mBC inferred from AE33, the Mie model incorporated with core-shell configuration 68
hypothesis was applied in this study to assess the limitation of the constant conversion factor used for MAC. Based on the detailed 69
analysis of the relationship among MAC, DBC, and coating thickness (Tshell), a modified approach has been proposed for filter-based 70
instruments to derive mBC from ab. This modified method measures size-resolvoled mBC accurately and improves the evaluation of 71
BC radiative forcing. 72
Black carbon (BC) is an important component of atmospheric aerosol particles. The warming effect of BC is only second to that of 73
carbon dioxide (CO2) (Ramanathan and Carmichael, 2008) because of its highly absorbing property. The environmental effect of 74
BC is nonnegligible. The absorption of BC can significantly reduce visibility (Moosmuller et al., 2009). BC are considered a major 75
factor of adverse health disease (Highwood and Kinnersley, 2006). The fractal aggregates morphology of BC provides substantial 76
surface area for deposition of cancerogenic matter. The insoluble nature and fine size of BC make it deposit in the lung for a long 77
time. Because the significant impact of BC, extensive measurement has been made to monitor atmospheric loading of BC and give 78
reference to policymaker for mitigation. 79
The BC mass concentration (mBC) is one of the important variables for BC measurement (Bond et al., 2013). Many methods have 80
been proposed to determine mBC. For instance, the single-particle soot photometer (SP2) measure refractory BC (rBC) based on 81
laser-induced incandescence (Schwarz et al., 2006). The organic carbon/elemental carbon (OCEC) analyzer determines elemental 82
carbon (EC) through heating collected sample in a subsequent helium/oxygen environment (Wu et al., 2012). Soot particle aerosol 83
mass spectrometry (SP-AMS) combines laser-induced incandescence as well as laser vaporization used in mass spectrometry 84
(Onasch et al., 2012) and also reports mBC as rBC. However, the abovementioned instruments are complicated in structure, highly 85
expensive, hard to maintain, and as a result, not widely used. 86
Filter-based instruments, such as aethalometer (Hansen et al., 1984), are commonly used for routine BC observations and dedicated 87
campaigns (Castagna et al., 2019;Sandradewi et al., 2008;Helin et al., 2018) because they are convenient and easy to maintain. 88
Aethalometer does not directly measure mBC and actually measures light absorption. Aethalometer converts absorption coefficient 89
(ab) at 880 nm to equivalent BC mass concentration (EBC) (Petzold et al., 2013) through a fixed mass absorption cross-section 90
(MAC, 7.77 m2/g at 880 nm). However, field measurements indicated that MAC showed both large temporal and spatial variability 91
(Bond and Bergstrom, 2006;Lack et al., 2012;Cappa et al., 2012). For example, Bond et al. (2006) reported MAC at 550 nm varying 92
from 1.6 to 15.9 m2/g. Sharma et al. (2002) reported MAC at 880 nm varying from 6.4 to 28.3 m2/g. It is not appropriate to use a 93
fixed MAC at when EBC is derived from ab at 880 nm. The variation of MAC has to be taken into account to reduce the uncertainty 94
in the ab-derived EBC. 95
The mixing state of BC is one of the crucial reasons leading to large variation in MAC. Field measurements have indicated that 96
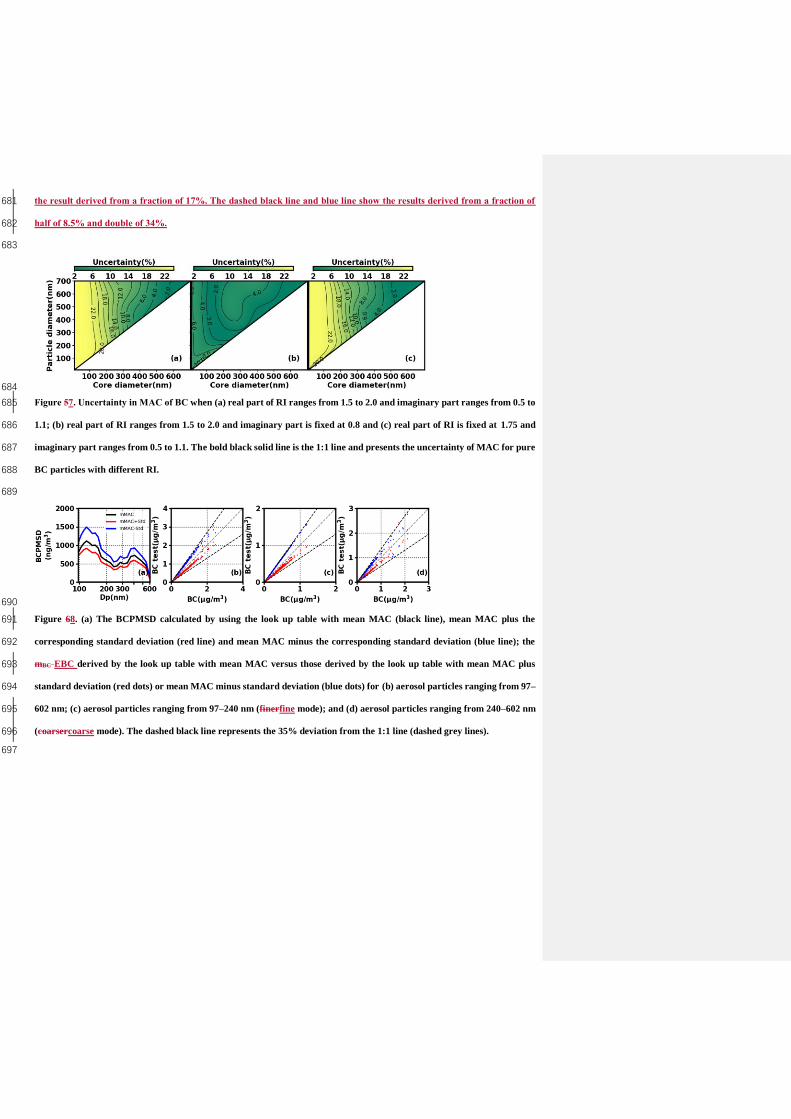
fresh BC particles are generally subject to several coating processes while being transported in the atmosphere and tend to be covered 97
in layers of other organic or inorganic components (Shiraiwa et al., 2007;Cappa et al., 2019;Bond et al., 2006). The gathered shell 98
Page 27
that builds up on the BC core, acting as a lens to focus additional incident light on the enclosed BC core, can enhance BC light 99
absorption (Fuller et al., 1999). As a result, a coated BC particle will have a bigger MAC than the original pure BC particle. This 100
light absorption enhancement is termed as “lensing effect” of the BC-containing particles. For typical core-coating mixed BC-101
containing particles, this lensing effect was found to enhance BC absorption by 50-100% (Bond et al., 2006). Schwarz et al. (2008) 102
found that fresh soot particles internally mixed with sulfates and organics during transportation, and the lensing effect enhanced the 103
light absorption by a factor of 1.3-1.5. 104
At a given wavelength, such as 880 nm, the degree of MAC relies on the size and the location of BC core, coating thickness, as well 105
as refractive index (RI) (Fuller et al., 1999;Lack and Cappa, 2010). A simplified core-shell configuration has been introduced to 106
illustrate the structure of BC-containing particles and calculate the relevant optical properties. Several studies have demonstrated 107
that it is appropriate to use the core-shell configuration for aged aerosol (Majdi et al., 2020;Liu et al., 2019;Li et al., 2019). 108
In the previous studies (Zhao et al., 2019b;Ran et al., 2016a;Ran et al., 2016b;Castagna et al., 2019), the variation of MAC due to 109
mixing state was not considered when deriving EBC from ab. With the objective of improving the reliability of ab-derived EBC, 110
the Mie model incorporated with core-shell configuration hypothesis was applied in this study to assess the limitation of fixed MAC 111
on ab-derived EBC. Based on the detailed analysis of the relationship among MAC, DBC, and coating thickness (Tshell), a modified 112
approach considering variation of MAC due to mixing state was proposed for filter-based instruments to derive EBC from ab. 113
Detailed uncertainty analysis is carried out to assess the influence of assumptions used in this study. This modified method estimates 114
size-resolvoled EBC accurately and reduces the uncertainty in ab-derived EBC with respect to mixing state. 115
2 Dataset and instrumentation 116
2.1 Measurement sites 117
The measured BC particle mass size distribution (BCPMSD)The EBC particle mass size distribution (BCPMSD) was obtained 118
obtained from the field campaign conducted at the Zhangqiu Meteorology Station (36°42’N, 117°30’E), Shandong Province, 119
surrounded by farmland and residential areas and a typical site for regional background conditions of North China Plain (NCP). 120
This The field campaign lasted for about 1 month, from July 23, 2017 to August 24, 2017. The Zhangqiu observation site is located 121
in the North China Plain (NCP) and is surrounded by farmland and residential areas, representing regional background conditions 122
of the NCP. 123
The number fraction of BC-containing aerosol (NBC) is required during conversion from absorption to EBC. NBC was not measured 124
simultaneously at Zhangqiu due to limitation in instruments. NBC is a reference value in this work and referred from measurement 125
at Taizhou (32°35’N, 119°57’E). An SP2 was used to determine NBC at Taizhou from May 24, 2018 to June 18, 2018. The suburban 126
measurement site Taizhou lies at the south end of the Jianghuai Plain in the East of China. This industrial area between the two 127
megacities of Nanjing and Shanghai has experienced severe pollution during the past thirty years. Hence, NBC measured at Taizhou 128
is representative and the campaign averaged NBC is used in this work. The measurements were conducted from May 24, 2018 to 129
June 18, 2018. The DMA (Differential Mobility Analyzer)-SP2 system measurement of the number fraction of BC-containing 130
aerosols and Besides, comparison between AE33 and the three-wavelength photoacoustic soot spectrometer (PASS-3) at 405 nm, 131
带格式的: 缩进: 左 -0.01 字符
带格式的: 字体: 加粗
带格式的: 下标
带格式的: 下标
带格式的: 下标
带格式的: 上标
带格式的: 非上标/ 下标
带格式的: 下标
带格式的: 下标
Page 28
532 nm and 781 nm (Zhao et al., 2020) was also carried out at Taizhou for scattering correction of AE33.were conducted in Taizhou 132
(119°57’ E, 32°35’ N). The suburban measurement site Taizhou lies at the south end of the Jianghuai Plain in the East of China. This 133
industrial area between the two megacities of Nanjing and Shanghai has experienced severe pollution during the past thirty years. 134
The measurements were conducted from May 24, 2018 to June 18, 2018. 135
Besides Taizhou, The the measurements for comparing AE33 and PASS-3 were comparison between AE33 and PASS-3 was also 136
conducted from March 20, 2018 to April 30, 2018 and from October 10, 2018 to October 19, 2018 in Peking University (39°59’ N, 137
116°18’ E). This site is located at the northwest of Beijing, a megacity experiencing severe and complex urban pollution. Meanwhile, 138
fFrom March 21, 2017 to April 9, 2017 at the Peking University site, the results from simultaneous measurements from simultaneous 139
measurements of aethalometer AE51 (model 51, microAeth, USA) and AE33 at 880 nm were carried out comparedto investigate 140
the consistency between AE51 and AE33. 141
2.2 Instruments 142
All the measurements in the three sites were conducted in temperature (24 ± 2 °C) controlled containers where ambient temperature 143
was controlled within 24 ± 2 °C with, and a particle pre-impactor to was used to remove particles larger than 10 μmμm from the 144
input air stream. The drying systems in the three sites were configured with a Nafion dryer to keep the relative humidity of sample 145
flow below 40%. This type of dryer performs good well in reducing aerosol losses. The transmission efficiency of the Nafion dryer 146
is up to 90% for particles smaller than 10 nm and rises up to 100% for particles larger than 30 nm (The performance details of the 147
Nafion dryer can be accessed at http://www.permapure.com). 148
During the field campaign at the Zhangqiu site, the particle number size distribution (PNSD) as well as BCPMSD were 149
simultaneously determined using the measurement system developed by Ning et al. (2013). The instrument setup was further and 150
improved by Zhao et al. (2019b). The polydisperse aerosol sample flow was first drawn into DMA (Model 3080, TSI, USA) to 151
select relatively monodispersed aerosol sub-populations with diameters ranging from 97 to 602 nm. Sheath and sample flows were 152
set as 3 and 0.5 L/min, respectively. The selected monodispersed aerosol populations were further divided into two paths. One path 153
(0.2 L/min) was drawn into AE51 for mBC EBC measurements. The other path (0.3 L/min) was analyzed using CPC (model 3772, 154
TSI, USA) for number concentration measurements. As the standard sample flow for CPC 3772 is 1 L/min, a cleaned airflow of 0.7 155
L/min was added for compensation. A BCPMSD cycle measured here required 5 min and we averaged the data with a temporal 156
resolution of 2 hours. 157
The dry aerosol scattering coefficients at 525 nm were measured simultaneously to represent air pollution condition by an integrated 158
nephelometer (Ecotech Pty Ltd., Aurora 3000) with a flow rate of 3 L/min. and The temporal resolution was of 1 min. Similar to 159
the measured BCPMSD, aerosol scattering coefficients that were used to represent air pollution conditions were also averaged with 160
a temporal resolution of 2 hours. 161
While observing BCPMSD at the Beijing site, added AE33 (3 L/min) simultaneously to measure the bulk mBC. The bulk mBC from 162
AE33 and from the integrated BCPMSD measured by AE51 were then compared. For AE51, the influence of loading effect was 163
resolved by using 𝜎ab,corrected = (1 + 𝑘 ∙ 𝐴𝑇𝑁)𝜎ab,uncorrected. 𝜎ab,corrected and 𝜎ab,uncorrected are the corrected and uncorrected 164
带格式的: 字体: 加粗
带格式的: 字体: 10 磅
Page 29
ab, respectively. Factor 𝑘 was is set as 0.004 (Zhao et al., 2019b) and 𝐴𝑇𝑁 is the measured light attenuation when by particles 165
load collected on the fiber filter of AE51. A recommended compensation of 2.6 for AE51 was is introduced here to mitigate the 166
multiple scattering problem (Zhang et al., 2018). Zhao et al. (2019b) added AE33 (3 L/min) to measure the bulk EBC simultaneously 167
while measuring BCPMSD. The bulk EBC from AE33 and the integrated EBC from BCPMSD measured by AE51 were then 168
compared. Results showed that the variation trends and magnitudes of mBC EBC measured by AE33 and AE51 were in good 169
consistence . Therefore, in this study, the BCPMSD measured by AE51 was regarded as the measurement results of AE33, and the 170
size-resolved ab were retrieved by the constant MAC value of 7.77 m2/g used in AE33. The traditional BCPMSD is retrieved from 171
AE51-measured size-resolved ab with a constant MAC value of 7.77 m2/g used for AE33. In our new method, the MAC is variable 172
as a function of BC core size (DBC) and particle diameter (Dparticle). 173
For the coupling DMA-SP2 system measurement, the dried sample flow was drawn into DMA to select particles with diameters 174
ranging from 200 to 450 nm. Then, the selected monodispersed aerosol samples were analyzed in SP2 (0.12 L/min) to identify the 175
BC containing particles and in CPC (0.28 L/min) to count the total number of particles. The size-resolved number fraction of BC-176
containing particles was then derived. As the total flowrate was 0.4 L/min from DMA, the sheath flow of DMA was 4 L/min. 177
Detailed configuration of the DMA-SP2 system has been demonstrated in a previous study . According to the measurements from 178
Taizhou, only 17% of the ambient particles that contained BC averagely for bulk aerosol populations. 179
For scattering correction, a scattering correction factor 𝐶𝑓 is required to account for the scattering effect of the filter 180
matrix: 𝜎ab,corrected = 𝜎ab,uncorrected/𝐶𝑓 . 𝐶𝑓 is determined by simultaneous measurement of 𝜎ab by PASS-3 (𝜎ab,PASS−3 ) and 181
AE33 (𝜎ab,AE33 ). 𝜎ab,PASS−3 is considered as 𝜎ab,corrected and 𝜎ab,AE33 is considered as 𝜎ab,uncorrected . The wavelengths of 182
PASS-3 and AE33 are not the same. We adjusted tThe measured wavelengths of AE33 (370 nm, 470 nm, 520 nm, 590 nm, 660 nm, 183
880 nm and 950 nm) were interpolated to the measured wavelengths of PASS-3 (405 nm, 532 nm, and 781 nm). Specifically, For 184
AE33, 405 nm, 532 nm and 781 nm are calculated at wavelengths pairs of (370 nm, 470 nm), (520 nm, 590 nm) and (660 nm, 880 185
nm) through Ångström relationship: 186
𝜎ab(𝜆1)
𝜎ab(𝜆2)= (
𝜆1
𝜆2
)−𝛼ab
. 187
More detailed information can be found in Zhao et al. (2020). Measurement results from at Taizhou and Beijing showed that all the 188
ratios of ab measured by AE33 with a measurement flowrate of 3 L/min and PASS-3 with a measurement flowrate of 1 L/min at 189
the three wavelengths varied slightly over the East and North China Plain (± 0.04), with the an average value at of 2.9. Therefore, 190
as the measurement results between AE33 and AE51 were consistent, all the size-resolved ab from AE51 adopted in this study were 191
corrected through the mean ratiowith 𝐶𝑓 = 2.9 of 2.9. 192
For the SP2 system, the aerosol samples were analyzed in SP2 (0.12 L/min) to identify the BC-containing particles and in CPC 193
(0.28 L/min) to count the total number of particles. When a BC-containing particle travels through the laser beam (1064 nm) inside 194
the SP2, it emits incandescent light. The avalanche photodetectors (APDs) around the laser beam can detect the incandescence 195
signal. Then the BC-containing particle is detected. NBC can be determined as the ratio of the number of BC-containing particle to 196
带格式的: 下标
带格式的: 下标
带格式的: 字体: 10 磅
带格式的: 字体: 10 磅
带格式的: 字体: 10 磅
带格式的: 字体: 10 磅
带格式的: 字体: 10 磅
带格式的: 字体: 10 磅
带格式的: 字体: 10 磅
带格式的: 字体: 10 磅
带格式的: 字体: 10 磅
带格式的: 字体: 10 磅
带格式的: 字体: 10 磅
带格式的: 字体: 10 磅
带格式的: 字体: 10 磅
带格式的: 字体: 10 磅
带格式的: 字体: 10 磅
带格式的: 字体: 10 磅
带格式的: 字体: 10 磅
带格式的: 下标
Page 30
that of total aerosol particle. Detailed configuration of the SP2 system has been demonstrated in a previous study (Zhao et al., 2019a). 197
According to the measurements at Taizhou, only 17% of the ambient particles contained BC averagely for bulk aerosol populations. 198
All the measurement systems at the three sites are shown in Fig. S1 in the supplement. 199
3 Method 200
For current filter-based intruments, mBCEBC are generally derived from ab under assumption ofthrough a constant MAC value. 201
However, the MAC values are enhanced by different degrees when BC particles are mixed with other weakly-absorbing materials, 202
leading to large uncertainties on BC massEBC retrieval and further evaluations of BC atmospheric optical effects. In order to gain 203
more accurate atmospheric BC mass loadingEBC, it is critical to consider the discrepancies in MAC caused by variations in the 204
coating process, BC sizes, etc. Among with the core-shell configuration hypothesis, developing the relationship between MAC, DBC, 205
and Tshell is a new approach to correlate mBC EBC with ab. 206
3.1 Core-shell geometry of aerosol particles 207
To evaluate the theoretical discrepancies in MAC values caused by the corresponding impact factors, an appropriate model 208
simulation is needed for representing a single BC particle’s optical propertiesa proper model is required to simulate the optical 209
properties of BC-containing particles to a good approximation. There are three widely employed mixing states that are used to 210
represent the structure of BC-containing aerosolsThree widely employed mixing states are used to represent the structure of BC-211
containing aerosols: internal, external, and core-shell model (Ma et al., 2011;China et al., 2015). Generally, newly-emitted BC 212
particles are chain-like aggregates composed of small spheres. During the coating process, the chain-like BC aggregates become 213
more compact as they collapse and are coated as a core by organic and inorganic materials (Bond and Bergstrom, 2006). Therefore, 214
core-shell configuration is more plausible (Jacobson, 2000). Ma et al. (2012) also indicated that the core-shell assumption can 215
provide a better performance in optical closure than the internal or external models. Furthermore, Moffet et al. (2016) studied particle 216
mixing state and morphology using scanning transmission X-ray microscopy and highlighted that core-shell structure dominated 217
the mixing state of ambient aerosol particles. As aerosols are assumed to be core-shell mixed, with a spherical BC core in the center 218
of the coating sphere, the spherical core and shell favor the Mie model. Therefore, the Mie model was used in this study to simulate 219
the optical properties of BC particles with core-shell mixing state. The consistency in observed and theoretical values obtained using 220
Mie and core-shell morphology support the suitability of this method (Cappa et al., 2012). 221
3.2 Mie modeled MAC of BC particlesSimulation of MAC for BC-containing particle using Mie theory 222
Many optical simulations for BC particles with concentric sphere geometry have been reported and the corresponding results show 223
that the absorption of a pure BC particle will be enhanced when a shell composed of non-absorbing material deposits on this pure 224
BC particle. Since we focused on the optical properties were focused on rather than chemical compositions of the mixed aerosols, 225
a simplified hypothesis of BC/sulfate mixtures, which is frequent common in the atmosphere (Khalizov et al., 2009), was introduced 226
in the algorithm for calculating mBCEBC. 227
The reason of AE33 using 880 nm to determine EBC is that aerosol absorption at 880 nm is mainly from BC (Ramachandran and 228
Rajesh, 2007). At shorter wavelength, absorption of organic carbon is not negligible any more, leading to difficulty of extracting 229
带格式的
Page 31
BC absorption from total aerosol absorption. Therefore, MAC at 880 nm is discussed in this study Since the filter-based instruments 230
(AE33) use ab at the wavelength of 880 nm to determine mBC,and the MAC distribution for a wide range of core and coating sizes 231
at the wavelength of 880 nm, calculated using the are simulated with Mie scattering theory, has been presented. The refractive index 232
(RI), reported to vary with incident light wavelengthdependent on light wavelength, is an important parameter to determine aerosol 233
optical properties. However, as BC particles can be emitted from different fuels and conditions, RI cannot be observed directly, with 234
both real and imaginary part of RI varying over a significantly wide rangedue to different sources of BC, both the real and imaginary 235
part of RI varies over a significantly wide range. Liu et al. (2018) summarized RI values for specific wavelengths and showed that 236
the real part is generally in the range of 1.5 to 2.0 while the imaginary part usually varies from 0.5 to 1.1 (Sorensen, 2001;Bond and 237
Bergstrom, 2006). Therefore, the real part and imaginary part of RI were set to change from 1.5 to 2.0 and from 0.5 to 1.1, 238
respectively, with a step increase of 0.01. Meanwhile, the RI of sulfate was set as 1.55-1.0-6 i and the density of BC was set as 1.8 239
g/cm3, similar to Bond et al. (2006). A total of 3111 values were obtained, and the averaged mean values are illustrated in Fig. 1. 240
The DBC and total aerosol particle diameter (Dparticle, DBC + Tshell) ranged from 10 to 700 nm. 241
Figure 1 presents several features of the variation pattern of MAC at 880 nm. MAC values varied significantly with DBC and the 242
thickness of non-absorbing coating, which indicated that light absorption of BC-containing particles was sensitive to the BC core 243
and the coating. When the DBC was less than 100 nm, the thickness of the coating dominated the variation of MAC values, and MAC 244
values increased with increasing Tshell. As the value Tshell increased, the lensing effect became more significant, the light absorption 245
consequently also increased with increasing Tshell.. MAC value can increase from 4 m2/g to about 17 m2/g when the total aerosol 246
size reached up to 700 nm, which indicated that light absorption can be enhanced significantly by the coating. When the DBC was 247
larger than about 100 nm, both Tshell and DBC determined MAC values and DBC played a more important role considering that the 248
majority of the contour lines tilted to the axis of particle diameter. MAC increased with increasing Tshell and decreased with the 249
increasing DBC. At this range (DBC > 100 nm), the coating still enhanced absorption. For pure BC particle, MAC decreased with 250
increasing DBC when DBC > ~ 220 nm, which indicated that the absorption of large BC particles was less than that of small BC 251
particles per unit mass. If the Dparticle or the coating (Tshell) was fixed, larger DBC generally corresponded to a smaller MAC. Not only 252
did the MAC of coated BC-containing particle vary significantly, but the variation of MAC of pure BC particle was also 253
nonnegligible. Moreover, even for pure BC particles, MAC values varied significantly with the size of BC particles. For smaller 254
pure BC particles, the MAC values increased slightly with BC size until DBC reached 220 nm. Then, MAC decreased with an increase 255
increasingin DBC. Therefore, light absorption can be significantly influenced by coating state, and the a constant MAC value of 7.77 256
m2/g used in AE33 is only appropriate for a very limited condition. 257
3.3 New method to retrieve mBCEBC by considering the variation of MAC 258
In this subsection, we introduce a new method is introduced to determine mBC EBC from the measurement of thed ab at a given 259
diameter. For At a given Dparticle (=DBC + Tshell) selected by DMA, if DBC is prescribedassumed, the corresponding Tshell is 260
determinedis fixed. Combining the simultaneously measured PNSDparticle number concentration (N(Dparticle)) by CPC downstream 261
the DMA and the prescribed percentage of particles containing BCNBC, the number of BC-containing particles (NBC(Dparticle)) is then 262
带格式的: 下标
带格式的: 下标
带格式的: 下标
带格式的: 下标
带格式的: 下标
带格式的: 非上标/ 下标
带格式的: 非上标/ 下标
带格式的: 下标
带格式的: 下标
带格式的: 下标
带格式的: 下标
Page 32
determined at Dparticle. 𝜎ab can then be calculated by Mie model with Dparticle, DBC and NBC(Dparticle).Corresponding absorption 263
properties at the Dparticle with fixed DBC and Tshell can be calculated using the Mie model. If the calculated 𝜎ab matches measured 264
𝜎ab by AE51, then the prescribed DBC is considered as diameter of BC core at Dparticle. Else, DBC is changed until calculated 𝜎ab 265
equals measured 𝜎ab. MAC can be calculated by Mie model with Dparticle, DBC and a presumed BC density. EBC at Dparticle is then 266
derived by dividing measured 𝜎ab by MAC. BCPMSD can then be derived through changing Dparticle selected by DMA.Hence, if 267
the number concentration of BC-containing particles and ab at a given Dparticle are measured, we can infer the DBC by closing the 268
measured and the calculated ab. Then, the mBC can be obtained from DBC for every Dparticle. Finally, the BCPMSD is derived. 269
The detailed iterative procedure is illustrated in Fig. 2. As the absorption properties of BC particles in different coating states have 270
been evaluated with the Mie model, as represented shown in Fig. 1, a simplified algorithm was proposed for deriving BCPMSD 271
was proposed by considering Fig. 1 as a through a pre-calculated look-up table. For every specificeach Dparticle selected by DMA, if 272
a DBC is assumed, the corresponding MAC of the particle can be derived from the look-up table. Then, the ab can be derived from 273
the MAC, the assumed BC density (1.8 g/cm3 in this study), and the number of BC-containing particlesNBC (17% of the total number 274
for every each Dparticle). We adjusted the guessed DBC until the difference between calculated and measured ab was within an 275
acceptable range (0.1%). Consequently, the DBC and thus the mBC EBC at a given Dparticle was determined. The mBC EBC at different 276
aerosol sizes were derived separately. Finally, the size-resolved mBC EBC and the bulk mBC EBC were obtained. The detailed 277
iterative procedure is illustrated in Fig. 2. 278
It should be pointed out that the retrieval algorithm of BCPMSD is based on the assumption that BC-containing particles of a fixed 279
diameter are all core-shell mixed and the corresponding DBC for a specific Dparticle is same. The uncertainties caused by idealized 280
core-shell model was discussed in section 5.1. Moreover, aA constant number percentage (17%) of BC-containing particles was 281
adopted in this study. However, the BC-containing particle fraction varied with the primary source, time, coagulation, and extent of 282
atmospheric process. The influence attributed to the constant fraction of BC-containing particles has beenwas discussed in section 283
2 of the supplement5.2. Additionally, Bond et al. (2013) summarized the density for different graphitic materials. The density values 284
are 1.8 – 2.1 g/cm3 for pure graphite, 1.8 – 1.9 g/cm3 for pressed pellets of BC, and 1.718 g/cm3 for fullerene soot. A constant density 285
(1.8 g/cm3) for BC was briefly used to calculate MAC and BC mass from the volume of particles with a diameter of DBC. Therefore, 286
the uncertainty of derived mBC EBC in this study simply depends on the ratio of 1.8 g/cm3 and the real density. Finally, the MAC 287
values in the look-up table were the averaged mean values for different RI and the corresponding effects have beenwere discussed 288
in section 5.3. 289
4 Results and discussion 290
Figure 3 provides a comprehensive overview of the variations in measured and retrieved size-resolved parameters during the 291
campaign. As evident from Fig. 3(a), for the BCPMSD derived by the new method, two modes were found, similar to the results of 292
AE33. Figure 4(a) shows the averaged BCPMSD derived from the new method and AE33 during the campaign. The finerfine mode 293
was located between 97 – 240 nm while the coarsercoarse mode was located between 240 – 602 nm. Figure 3(b) represents the 294
relative deviations between the BCPMSD derived from the new proposed method and those derived from a constant MAC value of 295
带格式的: 下标
带格式的: 下标
带格式的: 下标
带格式的: 下标
带格式的: 下标
带格式的: 非上标/ 下标
带格式的: 下标
Page 33
7.77 m2/g at 880 nm. The results show that there exist two opposite deviation trends before and after the turning point around 296
280nm.The results indicate that with the boundary of 280 nm, two opposite deviation tendencies exist. For aerosol particles larger 297
than 280 nm, the mBC EBC derived by the new method were mostly lower than those derived with the constant MAC value of 7.77 298
m2/g at 880 nm. In contrast, when aerosol particles were smaller than 280 nm, the mBC EBC from the new method were significantly 299
higher than those calculated by the constant MAC, as shown in Fig. 3(c). Figure 3(c) shows the time series of size-resolved MAC 300
during the derivation process of BCPMSD. According to Fig. 3(c), for aerosol particles smaller than 280 nm, the corresponding 301
MAC was almost lower than 7.77 m2/g at 880 nm. This is because the MAC values of particles smaller than 280 nm are mostly 302
lower than 7.77 m2/g, as represented in Fig. 1. A smaller MAC implies a weaker absorption ability, which means that the same 303
measured ab will correspond to an increased mBCEBC. Therefore, more BC mass loadingsEBC were derived from the new method. 304
For aerosol particles larger than 280 nm, in order to match the measured ab, the corresponding DBC were generally found to be in 305
those regions of look-up table where the MAC values were larger than 7.77 m2/g at 880 nm (Fig. 3(c)). Thus, the BC mass loadings 306
for particles larger than 280 nm were found to be less than those calculated with the constant MAC value of 7.77 m2/g at 880 nm. 307
From Fig. 3(c), it can be seen that MAC varied from less than 4 m2/g to larger than 10 m2/g at 880 nm, which implies a large 308
variability of the absorption ability of BC-containing particle. Therefore, if the conversion between mBC and ab is required, the 309
consideration of variation in mixing state is highly recommended. The simultaneously measured scattering coefficients at 525 nm 310
were introduced here to represent air pollution. As shown in Fig. 3(d), the observation station experienced different levels of 311
pollution. Deviations of mBC EBC derived from the newly proposed method and the constant MAC at different aerosol sizes did not 312
show dependencies on pollution conditions. 313
Figure 3(e) shows the time series of mBC EBC at finerfine and coarsercoarse modes. Compared to the results of AE33, tThe mBC 314
EBC were more concentrated in the finerfine mode as compared tothan in the coarsercoarse mode. The mBC EBC at finerfine mode 315
were found to be higher than those at the coarsercoarse mode for 73% of the experiment campaign duration. The variation trends of 316
bulk mBC EBC calculated by considering the variations of MAC and a constant MAC were similar (Fig. 3(f)). The bulk mBC EBC 317
calculated by the new method were higher than those derived by the constant MAC in 83% of the experiment campaign duration. 318
The mBC EBC calculated from the new method and AE33 for different aerosol size ranges were statistically analyzed. As shown in 319
Fig. 4, for all mBC EBC of aerosols ranging between 97 – 602 nm and 97 – 280 nm derived from new method and AE33, strong 320
linear relationships were observed with correlation coefficients of 0.99 and 1.00, respectively. The ratios between the mBC EBC 321
derived from AE33 and the new method for aerosol diameter ranges of 97 – 602 nm and 97 – 280 nm were 0.84 and 0.69, respectively, 322
indicating that the mBC EBC obtained from AE33 was 16% lower for bulk aerosol particles and 31% lower for aerosols smaller than 323
280 nm. For the diameter range of 280 – 602 nm, MAC values varied significantly and the deviations in mBC EBC derived from the 324
new method and AE33 were divided into two types with a boundary of 0.7 μg/m3. If the mBC EBC derived from AE33 was lower 325
than 0.7 μg/m3, there was a relatively consistent ratio of 1.13 between the mBC EBC from the new method and AE33, with a 326
correlation coefficient of 0.95. Therefore, BC mass loading from the AE33 algorithm was 13% higher for aerosol particles larger 327
than 280 nm and mBC EBC lower than 0.7 μg/m3. However, when the mBC EBC derived from AE33 was larger than 0.7 μg/m3, data 328
带格式的: 上标
带格式的: 上标
带格式的: 下标
Page 34
points become discrete, and the relationship between the mBC EBC derived from AE33 and the new method could be expressed 329
through an equation (y = 0.29 + 0.48x). However, these comparisons for aerosols at different size ranges were obtained based on 330
the measurements in the NCP. Additionally, the number of samples where mBC EBC of 280 – 602 nm were larger than 0.7 μg/m3 331
was too small. Further studies on BCPMSD in conjunction with the PNSD measurements at different sites need to be carried out. 332
5 Uncertainty analysis 333
5.1 The uncertainties of MAC caused by using idealized core-shell model 334
An idealized concentric core-shell model with a spherical BC core fully coated by sulfate was configured to study the MAC of BC 335
aerosols and derive the EBC in this study. However, freshly emitted BC particles were found to normally exist in the form of loose 336
cluster-like aggregates with numerous spherical primary monomers (Liu et al., 2015). Soon after, these aggregates become coated 337
with other components and collapsed to a more compact form during the coating process (Zhang et al., 2008;Peng et al., 2016). 338
Therefore, the uncertainty in the idealized core-shell configuration is discussed in this subsection. 339
5.1.1 The formation of BC aggregates with a determined morphology 340
The fractal aggregates of BC have been well described by fractal geometries through the well-known statistical scaling law 341
(Sorensen, 2001): 342
𝑁 = 𝑘𝑓 (𝑅𝑔
𝑎)
𝐷𝑓
, 343
where 𝑁 is the number of “same-sized” monomers in the cluster, 𝑎 is the monomer radius, 𝐷𝑓 and 𝑘𝑓 are known as the fractal 344
dimension and fractal prefactor respectively, determining the morphology of BC cluster. The compactness of a fractal aggregate 345
increses with increasing 𝐷𝑓 or 𝑘𝑓. 𝑅𝑔 is the gyration radius, infering the overall aggregate radius, determined by 346
R𝑔 = √1
𝑁∑ 𝑟𝑖
2
𝑁
𝑖=1
, 347
where 𝑟𝑖 represents the distance of the 𝑖-th monomer from the center of mass of BC cluster. 348
In order to generate fractal-like aggregates with given 𝑁, 𝑅𝑔, 𝑎, 𝐷𝑓 and 𝑘𝑓, the sequential algorithm proposed in Filippov et al. 349
(2000) is introduced in this study to add the primary monomers one by one. On condition that there is an aggregate including 𝑁 − 1 350
monomers, the 𝑁-th monomer is constantly placed randomly until it has at least one contact point with the previously attached 351
𝑁 − 1 monomers with no overlapping. Besides, the mass center of the next Nth monomer must obey the rule as follows: 352
(𝑟𝑁 − 𝑟𝑁−1)2 =𝑁2𝑎2
𝑁 − 1(
𝑁
𝑘𝑓)
2/𝐷𝑓
−𝑁𝑎2
𝑁 − 1− 𝑁𝑎2 (
𝑁 − 1
𝑘𝑓)
2/𝐷𝑓
, 353
where 𝑟𝑁−1 and 𝑟𝑁 are the mass center of the first 𝑁 − 1 monomers and the 𝑁-th monomer, respectively. After the fractual 354
configuration of BC aggregates, the absorption properties of BC containing particles need to be evaluate. 355
The fractal dimensions for aged BC aggregates are generally close to 3 (Kahnert et al., 2012). The aim of this study is to evaluate 356
the effects of aerosol microphysics on the absorption enhancement of fully coated BC particles, which can be regarded as the aged 357
BC aerosols. Therefore, the fractal dimension 𝐷𝑓 is set to be 2.8 and 𝑘𝑓 is generally set to be 1.2. The diameter of the primary 358
monomers is usually between 20-50 nm and the number of the primary monomers for an aggregates is between 50-300. The size of 359
带格式的: 字体: 加粗
Page 35
BC core calcuated by the new method is smaller than 300 nm most of the time during Zhangqiu campaign. The diameter of primary 360
monomers is set to be 50 nm and the number of the primary monomers for an aggregates ranges from 2 to 200, leading to the largest 361
size of volume equivalent BC core close to 300 nm. The real part of BC is generally in the range of 1.5 to 2.0 while the imaginary 362
part usually varies from 0.5 to 1.1 (Liu et al., 2018). Therefore, the mean value 1.75 for BC real part and 0.8 for BC imaginary part 363
are adopted here to calculate MAC values for BC/sulfate mixtures at the wavelength of 880 nm. 364
5.1.2 Multiple Sphere T-matrix (MSTM) method 365
As the traditional Mie model is not available for the fractal aggregates, the widely used MSTM method is employed here to quantify 366
the absorption properties of BC clusters (Mackowski and Mishchenko, 1996;Mackowski, 2014). The addition theorem of vector 367
spherical wave functions is used in MSTM method to describe the mutual interactions among the system. The T-matrix of aggregates 368
used to derive particle optical properties can be obtained from these individual monomers. MSTM method can calculate light 369
scattering and absorption properties of the randomly oriented aggregates without numerical averaging over particle orientations if 370
the position, size and refractive index of every spherical element are given. However, the MSTM method is only applicable to 371
evaluate the aggregates of spheres without overlapping and it is carried out with high computational demand. 372
The deviations showed in Fig. 5 are derived by subtracting MAC values calculated by MSTM model by those calculated by Mie 373
model. The results show that most of the MAC values calculated by assuming BC particles in the form of cluster-like aggregates 374
are smaller when the size of BC core is smaller than 150 nm and the overall deviation is within 4 %, which indicates that Mie theory 375
is a good approximation to the BC aggregates even when DBC reaches 200 nm. When BC core is larger than 200 nm, the MAC 376
values calculated by MSTM model increase with the thickness of shell and will be larger than those derived from concentric core-377
shell model. The deviations between MAC calculated by the idealized concentric core-shell model and letting BC particles be in the 378
form of cluster-like aggregates are overall within 15%. 379
5.2 The uncertainties of derived EBC caused by using a constant BC-containing particle fraction 380
Figure 6 shows the deviation of BCPMSD calculated from different NBC (8.5%, 17%, 34%). We can see that for our newly proposed 381
method, using a constant NBC does not change the size-resolved distribution mode. There is still a fine mode and coarse mode with 382
a boundary of 240 nm. Besides, the influence of using different NBC to derived EBC is very limited when particles are larger than 383
200 nm. However, the deviations between the EBC derived from different NBC are large when particles diameters are smaller than 384
200 nm. At this range, if NBC is underestimated, the EBC will be underestimated. On the contrary, the EBC is overeatimated if NBC 385
is overestimated. 386
5 5.3 The uncertainties of MAC caused by variation of RIInfluences of RI on MAC 387
As the RI of BC is still reported to vary over a wide range and the MAC used in this study was a mean value, it is critical to assess 388
the impact caused by variation in the real and imaginary parts of RI on the calculated MAC and the derived BC mass 389
concentrationsEBC. For aerosol particles with fixed given DBC and Tshell, we calculated the MAC of BC with the real part of RI 390
ranging from 1.5 to 2.0 and imaginary part ranging from 0.5 to 1.1. The step increase of both real and imaginary parts was 0.01 and 391
there were 3111 MAC values for every aerosol particle with fixed given DBC core size and Tshell. The ratio of the standard deviation 392
带格式的: 下标
带格式的: 字体: (中文) +中文正文 (等线), (中文) 中文(中国)
带格式的: 字体: 10 磅
带格式的: 字体: 10 磅
带格式的: 定义网格后自动调整右缩进, 调整中文与西文文字的间距, 调整中文与数字的间距
带格式的: 字体: (中文) 等线, 非加粗, 不检查拼写或语法
带格式的: 下标
Page 36
to the mean value for these 3111 MAC values have been presented to demonstrate the uncertainty in MAC due to the uncertainty 393
of BC RI. 394
Figure 57(a) shows the uncertainties in MAC along different values of DBC and Tshell. It shows that aerosol particles with a small 395
BC core have larger uncertainties and all the uncertainties were below 24%, implying a large variation in absorption for BC-396
containing particle with small BC core. When Dparticle was fixed, the uncertainties decreased with increasing DBC. When DBC was 397
determined, the uncertainties did not change much with Tshell., indicating the importance to quantify DBC for BC-containing particles 398
in order to reduce RI-related uncertainty in absorption. For pure BC particles, the uncertainties also decreased with increasing BC 399
particle size significantly from over 22% at 100 nm to less than 2% at 600 nm. Figure 57(b) shows the uncertainties when the 400
imaginary part was fixed at 0.8 and the real part ranged from 1.5 to 2.0 with an interval of 0.01. It can be seen that when the 401
imaginary part of RI was fixed, variations in the real part led to slight uncertainties. All the uncertainties were found to be below 402
14%. Figure 57(c) demonstrates the uncertainties when the real part was fixed at 1.75 and the imaginary part ranged from 0.5 to 1.1 403
with an interval of 0.01. Comparing Fig. 57(a) and 57(c), we can see that the patterns of MAC uncertainties were similar. Overall, 404
the uncertainties were dominated by the variations of the imaginary part and only slightly affected by variations in the real part. 405
Therefore, it is highly recommended to reduce the uncertainties in the imaginary part for a more precise absorption measurement. 406
The variations in of on mBC EBC caused by the uncertainties in RI were further evaluated. As stated in section 3.2, allfor a MAC 407
(880 nm) point at MACs (Dparticle, DBC) of Fig. 1, it is a mean value averaged with respect to both real part of RI varied from 1.5 to 408
2.0 and imaginary part of RI varied from 0.5 to 1.1. in the look-up table in Fig. 1 are the mean values as the imaginary part and real 409
part of BC RI varied over a wide range. Therefore, tThe mean MACs (880 nm) in the look-up table plus corresponding standard 410
deviation (MAC + Std) and minus corresponding standard deviation (MAC – Std) were utilized used to show the uncertainties in 411
mBC EBC caused by variation of BC RI of BC. As we can see from Fig. 68(a), irrespective of the MAC values in look-up table were 412
was MAC + Std or MAC – Std, there was no change in the mode of BCPMSD. The derived mBC EBC of all aerosols particles 413
ranging from 97 – 602 nm increased when the MAC values used in the look-up table were MAC – Std was used and decreased when 414
MAC + Std values were was used in the look-up table. Compared to the bulk mBC EBC retrieved derived through the look-up table 415
withby mean MAC, those derived through the look-up table withby MAC – Std were higher within 35% (Fig. 68(b)). The decrease 416
in the magnitude of derived mBC EBC caused by MAC + Std values was significantly less than the increase in the magnitudederived 417
EBC caused by the MAC – Std values. Similarly, fFor aerosol particles at both finerfine and coarsercoarse modesmode particles, 418
the deviations in mBC EBC caused by MAC + Std or MAC – Std were also within 35% (Fig. 6 8(c) and Fig. 6 8(d)). Meanwhile, the 419
increase in the magnitude of derived ab into mBC caused by the MAC-Std values was also significantly higher than the decrease in 420
the magnitude caused by the MAC + Std values. This sensitivity study indicated indicates that the accuracy of the retrieved derived 421
BCPMSD is sensitive to the accuracy of MAC values in the look-up table, especially when the real actual MACs are is less than the 422
mean MAC values used in the look-up table. 423
An idealized concentric core-shell model with a spherical BC core fully coated by sulfate was configured to study the MAC of BC 424
aerosols and derive the mBC. However, freshly emitted BC particles were found to normally exist in the form of loose cluster-like 425
带格式的: 下标
带格式的: 下标
带格式的: 下标
带格式的: 非上标/ 下标
Page 37
aggregates with numerous spherical primary monomers . Soon after, these aggregates become coated with other components and 426
collapsed to a more compact form during the coating process . Therefore, the uncertainty in the idealized core-shell configuration 427
is discussed in section 3 of the supplement. 428
6 Conclusions 429
There was a significant variability in the MAC values of BC with the size of BC core and the thickness of coating, which exerted a 430
significant influence on the optical method for measuring mBCderiving EBC. In this study, a new method was proposed to derive 431
mBC EBCwhile considering the lensing effect of core-shell structure and subsequently the consequent MAC variations in MACof 432
BC. 433
A look-up table describing the variations of MAC at 880 nm attributed to the coating state and size of BC core was established 434
theoretically using Mie simulation and assuming a core-shell configuration for BC-containing aerosols. The MAC at 880 nm varied 435
significantly with different sizes of core and shell from less than 2 m2/g to over 16 m2/g, indicating a large variation in absorption 436
ability for BC-containing particle. Then, the mBC EBC at different aerosol sizes were derived by finding an appropriate BC core 437
configured with a MAC value from the look-up table to close the calculated and measured ab. 438
This newly proposed method was applied to a campaign measurement in the NCP. There were two modes for BCPMSD at the 439
accumulation mode separated by 240 nm. For 73% of the cases, the mBC EBC of the finerfine mode were larger than those of the 440
coarsercoarse mode during the measurement. The mBC EBC derived by the new method were mostly lower than those derived by a 441
constant MAC of 7.77 m2/g for particles larger than 280 nm, and higher for particles smaller than 280 nm. Similarly, the bulk mBC 442
EBC accumulated from BCPMSD derived from the new method were mostly higher than those derived from a constant MAC of 443
7.77 m2/g. 444
Uncertainty analysis was carried out with respect to assumptions used in this study. The uncertainty caused by idealized core-shell 445
model was analyzed by substituting the core with cluster-like aggregates using MSTM method, and the resulting relative 446
uncertainties were within 15%. The uncertainties caused by using a constant number fraction of BC-containing particle was analyzed 447
by halving and doubling its value, and the results showed that particle larger than 200 nm was insensitive to the number fraction of 448
BC-containing particle, whereas, for particle smaller than 200 nm, the EBC would be underestimated if the BC-containing particle 449
fraction was underestimated. The uncertainty in derived mBC EBC that was caused due to the wide range of RI of the BC core was 450
also studied. The results indicated that the uncertainty of the imaginary part results in larger uncertainties to the MAC as compared 451
to with the real part. The relative uncertainty of the derived mBC EBC was within 35%. 452
This study provides a new way to derive mBC EBC from ab for the widely-used filter-based measurements. This research deepens 453
our understanding of the uncertainty in measured mBC EBC caused by the utilization of a constant MAC and illustrates the great 454
necessity to take the variation of MAC into account. The new method improves the measurements of BCPMSD and is further 455
beneficial to the evaluation of BC radiative forcingdeepens the understanding about the significant influence of mixing state on the 456
absorption of BC. 457
Data availability 458
带格式的: 上标
带格式的: 上标
Page 38
The measurement data involved in this study are available upon request to the authors. 459
Author contributions 460
CZ determined the main goal of this study. WZ and WT designed the methods. WZ carried them out and prepared the paper with 461
contributions from all co-authors. 462
Competing interests 463
The authors declare that they have no conflict of interest. 464
References 465
Adler, G., Riziq, A. A., Erlick, C., and Rudich, Y.: Effect of intrinsic organic carbon on the optical properties of fresh diesel soot, 466
Proceedings of the National Academy of Sciences of the United States of America, 107, 6699-6704, 10.1073/pnas.0903311106, 467
2010. 468
Arnott, W. P., Hamasha, K., Moosmuller, H., Sheridan, P. J., and Ogren, J. A.: Towards aerosol light-absorption measurements with 469
a 7-wavelength Aethalometer: Evaluation with a photoacoustic instrument and 3-wavelength nephelometer, Aerosol Science and 470
Technology, 39, 17-29, 10.1080/027868290901972, 2005. 471
Bond, T. C., Anderson, T. L., and Campbell, D.: Calibration and intercomparison of filter-based measurements of visible light 472
absorption by aerosols, Aerosol Science and Technology, 30, 582-600, 10.1080/027868299304435, 1999. 473
Bond, T. C., and Bergstrom, R. W.: Light absorption by carbonaceous particles: An investigative review, Aerosol Science and 474
Technology, 40, 27-67, 10.1080/02786820500421521, 2006. 475
Bond, T. C., Habib, G., and Bergstrom, R. W.: Limitations in the enhancement of visible light absorption due to mixing state, J. 476
Geophys. Res.-Atmos., 111, 13, 10.1029/2006jd007315, 2006. 477
Bond, T. C., Doherty, S. J., Fahey, D. W., Forster, P. M., Berntsen, T., DeAngelo, B. J., Flanner, M. G., Ghan, S., Karcher, B., Koch, 478
D., Kinne, S., Kondo, Y., Quinn, P. K., Sarofim, M. C., Schultz, M. G., Schulz, M., Venkataraman, C., Zhang, H., Zhang, S., Bellouin, 479
N., Guttikunda, S. K., Hopke, P. K., Jacobson, M. Z., Kaiser, J. W., Klimont, Z., Lohmann, U., Schwarz, J. P., Shindell, D., Storelvmo, 480
T., Warren, S. G., and Zender, C. S.: Bounding the role of black carbon in the climate system: A scientific assessment, J. Geophys. 481
Res.-Atmos., 118, 5380-5552, 10.1002/jgrd.50171, 2013. 482
Boucher, O., D. Randall, P. Artaxo, C. Bretherton, G. Feingold, P. Forster, V.-M. Kerminen, Y. Kondo, H. Liao, U. Lohmann, P. 483
Rasch, S.K. Satheesh, S. Sherwood, B. Stevens, and Zhang, X. Y.: Clouds and Aerosols. In: Climate Change 2013: The Physical 484
Science Basis. Contribution of Working Group I to the Fifth Assessment Report of the Intergovernmental Panel on Climate Change, 485
in, edited by: Stocker, T. F., D. Qin, G.-K. Plattner, M. Tignor, S.K. Allen, J. Boschung, A. Nauels, Y. Xia, V. Bex and P.M. Midgley, 486
Cambridge University Press, Cambridge, United Kingdom and New York, NY, USA, 571-657, 2013. 487
Brem, B. T., Gonzalez, F. C. M., Meyers, S. R., Bond, T. C., and Rood, M. J.: Laboratory-Measured Optical Properties of Inorganic 488
and Organic Aerosols at Relative Humidities up to 95%, Aerosol Science and Technology, 46, 178-190, 489
10.1080/02786826.2011.617794, 2012. 490
Cappa, C. D., Onasch, T. B., Massoli, P., Worsnop, D. R., Bates, T. S., Cross, E. S., Davidovits, P., Hakala, J., Hayden, K. L., Jobson, 491
带格式的: 字体: 10 磅
Page 39
B. T., Kolesar, K. R., Lack, D. A., Lerner, B. M., Li, S. M., Mellon, D., Nuaaman, I., Olfert, J. S., Petaja, T., Quinn, P. K., Song, C., 492
Subramanian, R., Williams, E. J., and Zaveri, R. A.: Radiative Absorption Enhancements Due to the Mixing State of Atmospheric 493
Black Carbon, Science, 337, 1078-1081, 10.1126/science.1223447, 2012. 494
Cappa, C. D., Zhang, X. L., Russell, L. M., Collier, S., Lee, A. K. Y., Chen, C. L., Betha, R., Chen, S. J., Liu, J., Price, D. J., Sanchez, 495
K. J., McMeeking, G. R., Williams, L. R., Onasch, T. B., Worsnop, D. R., Abbatt, J., and Zhang, Q.: Light absorption by ambient 496
black and brown carbon and its dependence on black carbon coating state for two California, USA, cities in winter and summer, J. 497
Geophys. Res.-Atmos., 124, 1550-1577, 10.1029/2018jd029501, 2019. 498
Castagna, J., Calvello, M., Esposito, F., and Pavese, G.: Analysis of equivalent black carbon multi-year data at an oil pre-treatment 499
plant: Integration with satellite data to identify black carbon transboundary sources, Remote Sens. Environ., 235, 10, 500
10.1016/j.rse.2019.111429, 2019. 501
China, S., Scarnato, B., Owen, R. C., Zhang, B., Ampadu, M. T., Kumar, S., Dzepina, K., Dziobak, M. P., Fialho, P., Perlinger, J. A., 502
Hueber, J., Helmig, D., Mazzoleni, L. R., and Mazzoleni, C.: Morphology and mixing state of aged soot particles at a remote marine 503
free troposphere site: Implications for optical properties, Geophys. Res. Lett., 42, 1243-1250, 10.1002/2014gl062404, 2015. 504
Chung, C. E., Ramanathan, V., and Decremer, D.: Observationally constrained estimates of carbonaceous aerosol radiative forcing, 505
Proceedings of the National Academy of Sciences of the United States of America, 109, 11624-11629, 10.1073/pnas.1203707109, 506
2012. 507
Doran, J. C., Barnard, J. C., Arnott, W. P., Cary, R., Coulter, R., Fast, J. D., Kassianov, E. I., Kleinman, L., Laulainen, N. S., Martin, 508
T., Paredes-Miranda, G., Pekour, M. S., Shaw, W. J., Smith, D. F., Springston, S. R., and Yu, X. Y.: The T1-T2 study: evolution of 509
aerosol properties downwind of Mexico City, Atmospheric Chemistry and Physics, 7, 1585-1598, 10.5194/acp-7-1585-2007, 2007. 510
Filippov, A. V., Zurita, M., and Rosner, D. E.: Fractal-like aggregates: Relation between morphology and physical properties, J. 511
Colloid Interface Sci., 229, 261-273, 10.1006/jcis.2000.7027, 2000. 512
Fuller, K. A., Malm, W. C., and Kreidenweis, S. M.: Effects of mixing on extinction by carbonaceous particles, J. Geophys. Res.-513
Atmos., 104, 15941-15954, 10.1029/1998jd100069, 1999. 514
Gunter, R. L., Hansen, A. D. A., Boatman, J. F., Bodhaine, B. A., Schnell, R. C., and Garvey, D. M.: Airborne measurement of 515
aerosol optical-properties over south-central New-Mexico, Atmospheric Environment Part a-General Topics, 27, 1363-1368, 516
10.1016/0960-1686(93)90262-w, 1993. 517
Hansen, A. D. A., Rosen, H., and Novakov, T.: The aethalometer - an instrument for the real-time measurement of optical-absorption 518
by aerosol-particles, Sci. Total Environ., 36, 191-196, 10.1016/0048-9697(84)90265-1, 1984. 519
Helin, A., Niemi, J. V., Virkkula, A., Pirjola, L., Teinila, K., Backman, J., Aurela, M., Saarikoski, S., Ronkko, T., Asmi, E., and 520
Timonen, H.: Characteristics and source apportionment of black carbon in the Helsinki metropolitan area, Finland, Atmospheric 521
Environment, 190, 87-98, 10.1016/j.atmosenv.2018.07.022, 2018. 522
Highwood, E. J., and Kinnersley, R. P.: When smoke gets in our eyes: The multiple impacts of atmospheric black carbon on climate, 523
air quality and health, Environment International, 32, 560-566, 10.1016/j.envint.2005.12.003, 2006. 524
Page 40
Jacobson, M. Z.: A physically-based treatment of elemental carbon optics: Implications for global direct forcing of aerosols, 525
Geophys. Res. Lett., 27, 217-220, 10.1029/1999gl010968, 2000. 526
Jacobson, M. Z.: Strong radiative heating due to the mixing state of black carbon in atmospheric aerosols, Nature, 409, 695-697, 527
10.1038/35055518, 2001. 528
Kahnert, M., Nousiainen, T., Lindqvist, H., and Ebert, M.: Optical properties of light absorbing carbon aggregates mixed with sulfate: 529
assessment of different model geometries for climate forcing calculations, Optics Express, 20, 17, 10.1364/oe.20.010042, 2012. 530
Khalizov, A. F., Xue, H. X., Wang, L., Zheng, J., and Zhang, R. Y.: Enhanced light absorption and scattering by carbon soot aerosol 531
internally mixed with sulfuric acid, Journal of Physical Chemistry A, 113, 1066-1074, 10.1021/jp807531n, 2009. 532
Lack, D. A., and Cappa, C. D.: Impact of brown and clear carbon on light absorption enhancement, single scatter albedo and 533
absorption wavelength dependence of black carbon, Atmospheric Chemistry and Physics, 10, 4207-4220, 10.5194/acp-10-4207-534
2010, 2010. 535
Lack, D. A., Langridge, J. M., Bahreini, R., Cappa, C. D., Middlebrook, A. M., and Schwarz, J. P.: Brown carbon and internal mixing 536
in biomass burning particles, Proceedings of the National Academy of Sciences of the United States of America, 109, 14802-14807, 537
10.1073/pnas.1206575109, 2012. 538
Li, Z. J., Tan, H. B., Zheng, J., Liu, L., Qin, Y. M., Wang, N., Li, F., Li, Y. J., Cai, M. F., Ma, Y., and Chan, C. K.: Light absorption 539
properties and potential sources of particulate brown carbon in the Pearl River Delta region of China, Atmospheric Chemistry and 540
Physics, 19, 11669-11685, 10.5194/acp-19-11669-2019, 2019. 541
Liu, C., Yin, Y., Hu, F. C., Jin, H. C., and Sorensen, C. M.: The effects of monomer size distribution on the radiative properties of 542
black carbon aggregates, Aerosol Science and Technology, 49, 928-940, 10.1080/02786826.2015.1085953, 2015. 543
Liu, C., Chung, C. E., Yin, Y., and Schnaiter, M.: The absorption Angstrom exponent of black carbon: from numerical aspects, 544
Atmospheric Chemistry and Physics, 18, 6259-6273, 10.5194/acp-18-6259-2018, 2018. 545
Liu, H., Pan, X. L., Wu, Y., Wang, D. W., Tian, Y., Liu, X. Y., Lei, L., Sun, Y. L., Fu, P. Q., and Wang, Z. F.: Effective densities of 546
soot particles and their relationships with the mixing state at an urban site in the Beijing megacity in the winter of 2018, Atmospheric 547
Chemistry and Physics, 19, 14791-14804, 10.5194/acp-19-14791-2019, 2019. 548
Ma, N., Zhao, C. S., Nowak, A., Muller, T., Pfeifer, S., Cheng, Y. F., Deng, Z. Z., Liu, P. F., Xu, W. Y., Ran, L., Yan, P., Gobel, T., 549
Hallbauer, E., Mildenberger, K., Henning, S., Yu, J., Chen, L. L., Zhou, X. J., Stratmann, F., and Wiedensohler, A.: Aerosol optical 550
properties in the North China Plain during HaChi campaign: an in-situ optical closure study, Atmospheric Chemistry and Physics, 551
11, 5959-5973, 10.5194/acp-11-5959-2011, 2011. 552
Ma, N., Zhao, C. S., Muller, T., Cheng, Y. F., Liu, P. F., Deng, Z. Z., Xu, W. Y., Ran, L., Nekat, B., van Pinxteren, D., Gnauk, T., 553
Mueller, K., Herrmann, H., Yan, P., Zhou, X. J., and Wiedensohler, A.: A new method to determine the mixing state of light absorbing 554
carbonaceous using the measured aerosol optical properties and number size distributions, Atmospheric Chemistry and Physics, 12, 555
2381-2397, 10.5194/acp-12-2381-2012, 2012. 556
Mackowski, D. W., and Mishchenko, M. I.: Calculation of the T matrix and the scattering matrix for ensembles of spheres, J. Opt. 557
Page 41
Soc. Am. A-Opt. Image Sci. Vis., 13, 2266-2278, 10.1364/josaa.13.002266, 1996. 558
Mackowski, D. W.: A general superposition solution for electromagnetic scattering by multiple spherical domains of optically active 559
media, Journal of Quantitative Spectroscopy & Radiative Transfer, 133, 264-270, 10.1016/j.jqsrt.2013.08.012, 2014. 560
Majdi, M., Kim, Y., Turquety, S., and Sartelet, K.: Impact of mixing state on aerosol optical properties during severe wildfires over 561
the Euro-Mediterranean region, Atmospheric Environment, 220, 11, 10.1016/j.atmosenv.2019.117042, 2020. 562
Martins, J. V., Artaxo, P., Liousse, C., Reid, J. S., Hobbs, P. V., and Kaufman, Y. J.: Effects of black carbon content, particle size, 563
and mixing on light absorption by aerosols from biomass burning in Brazil, J. Geophys. Res.-Atmos., 103, 32041-32050, 564
10.1029/98jd02593, 1998. 565
Moffet, R. C., O'Brien, R. E., Alpert, P. A., Kelly, S. T., Pham, D. Q., Gilles, M. K., Knopf, D. A., and Laskin, A.: Morphology and 566
mixing of black carbon particles collected in central California during the CARES field study, Atmospheric Chemistry and Physics, 567
16, 14515-14525, 10.5194/acp-16-14515-2016, 2016. 568
Moosmuller, H., Chakrabarty, R. K., and Arnott, W. P.: Aerosol light absorption and its measurement: A review, Journal of 569
Quantitative Spectroscopy & Radiative Transfer, 110, 844-878, 10.1016/j.jqsrt.2009.02.035, 2009. 570
Nakayama, T., Ikeda, Y., Sawada, Y., Setoguchi, Y., Ogawa, S., Kawana, K., Mochida, M., Ikemori, F., Matsumoto, K., and Matsumi, 571
Y.: Properties of light-absorbing aerosols in the Nagoya urban area, Japan, in August 2011 and January 2012: Contributions of brown 572
carbon and lensing effect, J. Geophys. Res.-Atmos., 119, 12721-12739, 10.1002/2014jd021744, 2014. 573
Ning, Z., Chan, K. L., Wong, K. C., Westerdahl, D., Mocnik, G., Zhou, J. H., and Cheung, C. S.: Black carbon mass size distributions 574
of diesel exhaust and urban aerosols measured using differential mobility analyzer in tandem with Aethalometer, Atmospheric 575
Environment, 80, 31-40, 10.1016/j.atmosenv.2013.07.037, 2013. 576
Onasch, T. B., Trimborn, A., Fortner, E. C., Jayne, J. T., Kok, G. L., Williams, L. R., Davidovits, P., and Worsnop, D. R.: Soot 577
Particle Aerosol Mass Spectrometer: Development, Validation, and Initial Application, Aerosol Science and Technology, 46, 804-578
817, 10.1080/02786826.2012.663948, 2012. 579
Peng, J. F., Hu, M., Guo, S., Du, Z. F., Zheng, J., Shang, D. J., Zamora, M. L., Zeng, L. M., Shao, M., Wu, Y. S., Zheng, J., Wang, 580
Y., Glen, C. R., Collins, D. R., Molina, M. J., and Zhang, R. Y.: Markedly enhanced absorption and direct radiative forcing of black 581
carbon under polluted urban environments, Proceedings of the National Academy of Sciences of the United States of America, 113, 582
4266-4271, 10.1073/pnas.1602310113, 2016. 583
Petzold, A., and Schonlinner, M.: Multi-angle absorption photometry - a new method for the measurement of aerosol light absorption 584
and atmospheric black carbon, Journal of Aerosol Science, 35, 421-441, 10.1016/j.jaerosci.2003.09.005, 2004. 585
Petzold, A., Ogren, J. A., Fiebig, M., Laj, P., Li, S. M., Baltensperger, U., Holzer-Popp, T., Kinne, S., Pappalardo, G., Sugimoto, N., 586
Wehrli, C., Wiedensohler, A., and Zhang, X. Y.: Recommendations for reporting "black carbon" measurements, Atmospheric 587
Chemistry and Physics, 13, 8365-8379, 10.5194/acp-13-8365-2013, 2013. 588
Ram, K., and Sarin, M. M.: Absorption Coefficient and Site-Specific Mass Absorption Efficiency of Elemental Carbon in Aerosols 589
over Urban, Rural, and High-Altitude Sites in India, Environmental Science & Technology, 43, 8233-8239, 10.1021/es9011542, 590
Page 42
2009. 591
Ramachandran, S., and Rajesh, T. A.: Black carbon aerosol mass concentrations over Ahmedabad, an urban location in western 592
India: Comparison with urban sites in Asia, Europe, Canada, and the United States, J. Geophys. Res.-Atmos., 112, 19, 593
10.1029/2006jd007488, 2007. 594
Ramanathan, V., and Carmichael, G.: Global and regional climate changes due to black carbon, Nature Geoscience, 1, 221-227, 595
10.1038/ngeo156, 2008. 596
Ran, L., Deng, Z. Z., Wang, P. C., and Xia, X. A.: Black carbon and wavelength-dependent aerosol absorption in the North China 597
Plain based on two-year aethalometer measurements, Atmospheric Environment, 142, 132-144, 10.1016/j.atmosenv.2016.07.014, 598
2016a. 599
Ran, L., Deng, Z. Z., Xu, X. B., Yan, P., Lin, W. L., Wang, Y., Tian, P., Wang, P. C., Pan, W. L., and Lu, D. R.: Vertical profiles of 600
black carbon measured by a micro-aethalometer in summer in the North China Plain, Atmospheric Chemistry and Physics, 16, 601
10441-10454, 10.5194/acp-16-10441-2016, 2016b. 602
Sandradewi, J., Prevot, A. S. H., Szidat, S., Perron, N., Alfarra, M. R., Lanz, V. A., Weingartner, E., and Baltensperger, U.: Using 603
aerosol light absorption measurements for the quantitative determination of wood burning and traffic emission contributions to 604
particulate matter, Environmental Science & Technology, 42, 3316-3323, 10.1021/es702253m, 2008. 605
Schmid, O., Artaxo, P., Arnott, W. P., Chand, D., Gatti, L. V., Frank, G. P., Hoffer, A., Schnaiter, M., and Andreae, M. O.: Spectral 606
light absorption by ambient aerosols influenced by biomass burning in the Amazon Basin. I: Comparison and field calibration of 607
absorption measurement techniques, Atmospheric Chemistry and Physics, 6, 3443-3462, 10.5194/acp-6-3443-2006, 2006. 608
Schwarz, J. P., Gao, R. S., Fahey, D. W., Thomson, D. S., Watts, L. A., Wilson, J. C., Reeves, J. M., Darbeheshti, M., Baumgardner, 609
D. G., Kok, G. L., Chung, S. H., Schulz, M., Hendricks, J., Lauer, A., Karcher, B., Slowik, J. G., Rosenlof, K. H., Thompson, T. L., 610
Langford, A. O., Loewenstein, M., and Aikin, K. C.: Single-particle measurements of midlatitude black carbon and light-scattering 611
aerosols from the boundary layer to the lower stratosphere, J. Geophys. Res.-Atmos., 111, 15, 10.1029/2006jd007076, 2006. 612
Schwarz, J. P., Spackman, J. R., Fahey, D. W., Gao, R. S., Lohmann, U., Stier, P., Watts, L. A., Thomson, D. S., Lack, D. A., Pfister, 613
L., Mahoney, M. J., Baumgardner, D., Wilson, J. C., and Reeves, J. M.: Coatings and their enhancement of black carbon light 614
absorption in the tropical atmosphere, J. Geophys. Res.-Atmos., 113, 10, 10.1029/2007jd009042, 2008. 615
Sharma, S., Brook, J. R., Cachier, H., Chow, J., Gaudenzi, A., and Lu, G.: Light absorption and thermal measurements of black 616
carbon in different regions of Canada, J. Geophys. Res.-Atmos., 107, 11, 10.1029/2002jd002496, 2002. 617
Shiraiwa, M., Kondo, Y., Moteki, N., Takegawa, N., Miyazaki, Y., and Blake, D. R.: Evolution of mixing state of black carbon in 618
polluted air from Tokyo, Geophys. Res. Lett., 34, 5, 10.1029/2007gl029819, 2007. 619
Shiraiwa, M., Kondo, Y., Iwamoto, T., and Kita, K.: Amplification of Light Absorption of Black Carbon by Organic Coating, Aerosol 620
Science and Technology, 44, 46-54, 10.1080/02786820903357686, 2010. 621
Sorensen, C. M.: Light scattering by fractal aggregates: A review, Aerosol Science and Technology, 35, 648-687, 622
10.1080/027868201316900007, 2001. 623
Page 43
Truex, T. J., and Anderson, J. E.: Mass monitoring of carbonaceous aerosols with a spectrophone, Atmospheric Environment, 13, 624
507-509, 10.1016/0004-6981(79)90143-4, 1979. 625
Wu, C., Ng, W. M., Huang, J. X., Wu, D., and Yu, J. Z.: Determination of Elemental and Organic Carbon in PM2.5 in the Pearl 626
River Delta Region: Inter-Instrument (Sunset vs. DRI Model 2001 Thermal/Optical Carbon Analyzer) and Inter-Protocol 627
Comparisons (IMPROVE vs. ACE-Asia Protocol), Aerosol Science and Technology, 46, 610-621, 10.1080/02786826.2011.649313, 628
2012. 629
Zhang, R. Y., Khalizov, A. F., Pagels, J., Zhang, D., Xue, H. X., and McMurry, P. H.: Variability in morphology, hygroscopicity, and 630
optical properties of soot aerosols during atmospheric processing, Proceedings of the National Academy of Sciences of the United 631
States of America, 105, 10291-10296, 10.1073/pnas.0804860105, 2008. 632
Zhang, Y. X., Zhang, Q., Cheng, Y. F., Su, H., Li, H. Y., Li, M., Zhang, X., Ding, A. J., and He, K. B.: Amplification of light 633
absorption of black carbon associated with air pollution, Atmospheric Chemistry and Physics, 18, 9879-9896, 10.5194/acp-18-9879-634
2018, 2018. 635
Zhao, G., Tan, T. Y., Zhao, W. L., Guo, S., Tian, P., and Zhao, C. S.: A new parameterization scheme for the real part of the ambient 636
urban aerosol refractive index, Atmospheric Chemistry and Physics, 19, 12875-12885, 10.5194/acp-19-12875-2019, 2019a. 637
Zhao, G., Tao, J. C., Kuang, Y., Shen, C. Y., Yu, Y. L., and Zhao, C. S.: Role of black carbon mass size distribution in the direct 638
aerosol radiative forcing, Atmospheric Chemistry and Physics, 19, 13175-13188, 10.5194/acp-19-13175-2019, 2019b. 639
Zhao, G., Yu, Y., Tian, P., Li, J., Guo, S., and Zhao, C.: Evaluation and Correction of the Ambient Particle Spectral Light Absorption 640
Measured Using a Filter-based Aethalometer, Aerosol and Air Quality Research, 20, 1833-1841, 10.4209/aaqr.2019.10.0500, 2020. 641
642
643
Page 44
Figure 1. Variations in MAC as a function of DBC and Dparticle, calculated by the concentric core-shell Mie model at the 644
wavelength of 880 nm. The red solid line is the constant MAC value used in AE33. The bold black solid line is the 1:1 line 645
that presents the variations in MAC for pure BC particles with different DBC. The horizontal black dashed line distinguishes 646
particles with a diameter of 280 nm while the vertical green dashed line indicates a DBC of 100 nm. 647
648
649
Figure 2. Schematic diagram of the iterative algorithm for retrieving the mBC EBC at a fixed particle diameter based on the 650
look-up table of MAC, particle size and core size. (ab)cal and (ab)mea represent calculated and measured absorption 651
coefficients, respectively. NBC(Dparticle) indicates the number concentration of particle containing BC at the given Dparticle. 652
653
Page 45
654
Figure 3. Time series of (a) the BCPMSD derived from the newly proposed method proposed in this work. (The dashed line 655
indicates the particle size of 240 nm); (b) relative deviations between BCPMSD derived from the new method (varied MAC) 656
and a constant MAC of at 7.77 m2/g (. The dashed line indicates the particle size of 280 nm); (c) the size-resolved MAC 657
determined during the process of retrieving BCPMSD (. The dashed line indicates the particle size of 280 nm); (d) the 658
scattering coefficients simultaneously measured with the size-resolved abat 525 nm; (e) the mBC EBC integrated for 659
particles smaller than 280 220 nm (blue) and larger than 280 220 nm (red); and (f) the mBC EBC determined by the new 660
method (black) and the constant MAC of 7.77 m2/g (red). 661
662
663
Figure 4. Comparison between the EBC derived from the newly proposed method and using froma constant MAC of 7.77 664
m2/g used by AE33 in the derived results of. (a) shows the results of the BCPMSD, (the dashed black line shows is the results 665
Page 46
of AE33 constant MAC of 7.77 m2/g used by AE33, while and the solid black line represents the results from the new method; 666
the dashed red line represents is the split line (diameter of 240 nm) between finerfine mode and coarsercoarse mode for 667
BCPMSD; , and the dashed blue line indicates is the split line (of 280 nm of diameter) between the opposite tendencies of 668
deviations in the mBC BCPMSDcalculated from the new method and the aethalometer); (b) the bulk mBC EBC for particles 669
rangingintegrated from 97 nm to 602 nm; (c) the fine mode mBC EBC for the finer mode (integrated from 97 nm – to 280 670
nm); (d) the mBC coarse mode EBC for the coarser mode (integrated from 280 – to 606 nm); the dashed black line represents 671
boundary of 0.7 μg/m3 and the red dashed line is the regression line of for the mBC EBC derived from AE and the new method 672
when mBC is larger than 0.7 μg/m3. 673
674
675
Figure 5. Relative deviations of MAC values calculated by idealized concentric core-shell model and letting BC particles be 676
in the form of cluster-like aggregates. The solid line is 1:1 line. 677
678
679
Figure 6. The derived BCPMSD by using different constant BC-containing particle fraction. The solid black line represents 680
带格式的: 字体: (默认) Times New Roman, 加粗
带格式的: 定义网格后自动调整右缩进, 调整中文与西文文字的间距, 调整中文与数字的间距
带格式的: 字体: 10 磅
Page 47
the result derived from a fraction of 17%. The dashed black line and blue line show the results derived from a fraction of 681
half of 8.5% and double of 34%. 682
683
684
Figure 57. Uncertainty in MAC of BC when (a) real part of RI ranges from 1.5 to 2.0 and imaginary part ranges from 0.5 to 685
1.1; (b) real part of RI ranges from 1.5 to 2.0 and imaginary part is fixed at 0.8 and (c) real part of RI is fixed at 1.75 and 686
imaginary part ranges from 0.5 to 1.1. The bold black solid line is the 1:1 line and presents the uncertainty of MAC for pure 687
BC particles with different RI. 688
689
690
Figure 68. (a) The BCPMSD calculated by using the look up table with mean MAC (black line), mean MAC plus the 691
corresponding standard deviation (red line) and mean MAC minus the corresponding standard deviation (blue line); the 692
mBC EBC derived by the look up table with mean MAC versus those derived by the look up table with mean MAC plus 693
standard deviation (red dots) or mean MAC minus standard deviation (blue dots) for (b) aerosol particles ranging from 97–694
602 nm; (c) aerosol particles ranging from 97–240 nm (finerfine mode); and (d) aerosol particles ranging from 240–602 nm 695
(coarsercoarse mode). The dashed black line represents the 35% deviation from the 1:1 line (dashed grey lines). 696
697