Mechanical properties of high performance fiber reinforced cementitious composites Mostafa Fakharifar a,1 , Ahmad Dalvand b , Mahdi Arezoumandi c,2 , Mohammad K. Sharbatdar b , Genda Chen d,⇑ , Ali Kheyroddin b a Department of Civil, Architectural and Environmental Engineering, Missouri University of Science and Technology, 209 Pine Building, 1304 N. Pine Street, Rolla, MO 65409, United States b Department of Civil Engineering, Semnan University, Semnan, Iran c Department of Civil, Architectural and Environmental Engineering, Missouri University of Science and Technology, 212 Butler Carlton Hall, 1401 N. Pine Street, Rolla, MO 65409, United States d Department of Civil, Architectural and Environmental Engineering, Missouri University of Science and Technology, 328 Butler Carlton Hall, 1401 N. Pine Street, Rolla, MO 65409, United States highlights Compressive and flexural strength of HPFRCC follow normal distribution. Linear relationship exists between flexural and compressive strength of HPFRCC. Increasing fiber content improves mechanical properties of HPFRCC. Increasing fiber content enhances first crack and failure strength of HPFRCC. article info Article history: Received 6 February 2014 Received in revised form 21 August 2014 Accepted 24 August 2014 Keywords: Compressive strength Flexural strength Impact resistance Statistical data analysis Probability distribution Energy absorption abstract Extensive experimental studies on High Performance Fiber Reinforced Cement Composites (HPFRCC) owing to their remarkable properties have been carried out. Statistical studies have been mainly focused on Fiber Reinforced Concrete (FRC). An extensive study, including an experimental/statistical approach addressing key mechanical properties (compressive and flexural strength) and impact resistance of such high performance composites with inclusion of different volume of fibers has been carried out on two- hundred and forty specimens in this research. Results from this study revealed that compressive and flexural strength as well as impact resistance of HPFRCC follow the normal distribution. Furthermore, statistical data analyses (both parametric and non- parametric) showed higher percentage of fibers led in greater values for mechanical properties and impact resistance of HPFRCC. Moreover, based on acquired test results, equations were developed between mechanical properties and impact resistance of HPFRCC materials. Ó 2014 Elsevier Ltd. All rights reserved. 1. Introduction High Performance Fiber Reinforced Cementitious Composites (HPFRCC) is a class of fiber cement composites with fine aggre- gates, demonstrating remarkable properties such as improved resilience and sustainability. HPFRCC materials also exhibit improved properties compared with normal concrete (NC) and/or Fiber Reinforced Concrete (FRC) in terms of higher ductility, dura- bility and energy dissipation capacity. This material can be charac- terized by a pseudo-ductile tensile strain hardening behavior with multiple cracking prior to failure [1,2]. Tensile behavior of NC, FRC and HPFRCC materials are compared in Fig. 1. This figure clearly exhibits three distinct behavior upon cracking. When concrete, mortar or FRC are subjected to tension, brittle degrading behavior at first cracking due to inability to transfer tensile stresses across the crack surface is observed. In contrary, HPFRCC materials undergo multiple cracking after first cracking, exhibiting a http://dx.doi.org/10.1016/j.conbuildmat.2014.08.068 0950-0618/Ó 2014 Elsevier Ltd. All rights reserved. ⇑ Corresponding author. Tel.: +1 573 341 4462; fax: +1 573 341 4729. E-mail addresses: [email protected](M. Fakharifar), Ahmad.dalvand@gmail. com (A. Dalvand), [email protected](M. Arezoumandi), [email protected](M.K. Sharbatdar), [email protected](G. Chen), [email protected](A. Kheyroddin). 1 Tel.: +1 573 341 6845; fax: +1 573 341 4497. 2 Tel.: +1 573 341 6372; fax: +1 573 341 4729. Construction and Building Materials 71 (2014) 510–520 Contents lists available at ScienceDirect Construction and Building Materials journal homepage: www.elsevier.com/locate/conbuildmat
Transcript
Construction and Building Materials 71 (2014) 510–520
Mostafa Fakharifar a,1, Ahmad Dalvand b, Mahdi Arezoumandi c,2, Mohammad K. Sharbatdar b,Genda Chen d,⇑, Ali Kheyroddin b
a Department of Civil, Architectural and Environmental Engineering, Missouri University of Science and Technology, 209 Pine Building, 1304 N. Pine Street, Rolla, MO 65409,United Statesb Department of Civil Engineering, Semnan University, Semnan, Iranc Department of Civil, Architectural and Environmental Engineering, Missouri University of Science and Technology, 212 Butler Carlton Hall, 1401 N. Pine Street, Rolla, MO65409, United Statesd Department of Civil, Architectural and Environmental Engineering, Missouri University of Science and Technology, 328 Butler Carlton Hall, 1401 N. Pine Street, Rolla, MO65409, United States
h i g h l i g h t s
� Compressive and flexural strength of HPFRCC follow normal distribution.� Linear relationship exists between flexural and compressive strength of HPFRCC.� Increasing fiber content improves mechanical properties of HPFRCC.� Increasing fiber content enhances first crack and failure strength of HPFRCC.
a r t i c l e i n f o
Article history:Received 6 February 2014Received in revised form 21 August 2014Accepted 24 August 2014
Keywords:Compressive strengthFlexural strengthImpact resistanceStatistical data analysisProbability distributionEnergy absorption
a b s t r a c t
Extensive experimental studies on High Performance Fiber Reinforced Cement Composites (HPFRCC)owing to their remarkable properties have been carried out. Statistical studies have been mainly focusedon Fiber Reinforced Concrete (FRC). An extensive study, including an experimental/statistical approachaddressing key mechanical properties (compressive and flexural strength) and impact resistance of suchhigh performance composites with inclusion of different volume of fibers has been carried out on two-hundred and forty specimens in this research.
Results from this study revealed that compressive and flexural strength as well as impact resistance ofHPFRCC follow the normal distribution. Furthermore, statistical data analyses (both parametric and non-parametric) showed higher percentage of fibers led in greater values for mechanical properties andimpact resistance of HPFRCC. Moreover, based on acquired test results, equations were developedbetween mechanical properties and impact resistance of HPFRCC materials.
� 2014 Elsevier Ltd. All rights reserved.
1. Introduction
High Performance Fiber Reinforced Cementitious Composites(HPFRCC) is a class of fiber cement composites with fine aggre-gates, demonstrating remarkable properties such as improved
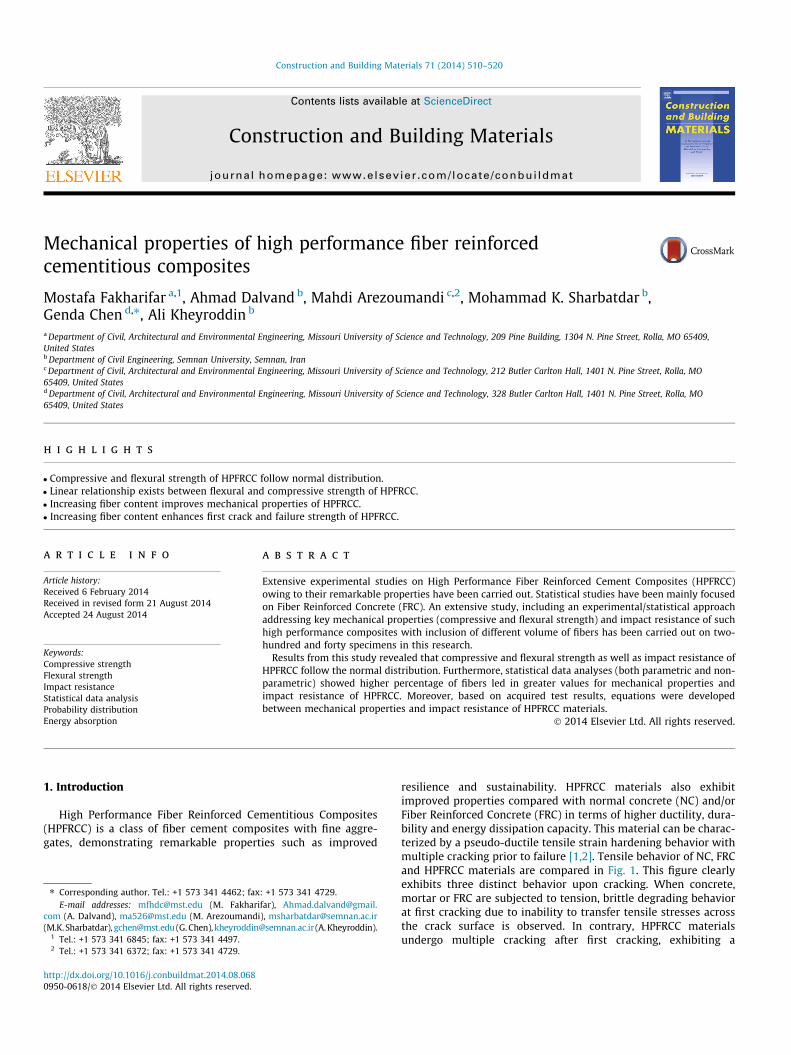
resilience and sustainability. HPFRCC materials also exhibitimproved properties compared with normal concrete (NC) and/orFiber Reinforced Concrete (FRC) in terms of higher ductility, dura-bility and energy dissipation capacity. This material can be charac-terized by a pseudo-ductile tensile strain hardening behavior withmultiple cracking prior to failure [1,2]. Tensile behavior of NC, FRCand HPFRCC materials are compared in Fig. 1. This figure clearlyexhibits three distinct behavior upon cracking. When concrete,mortar or FRC are subjected to tension, brittle degrading behaviorat first cracking due to inability to transfer tensile stresses acrossthe crack surface is observed. In contrary, HPFRCC materialsundergo multiple cracking after first cracking, exhibiting a
Fig. 1. Typical tensile stress–strain or deformation relation up to failure of: (a) normal concrete (NC); (b) Fiber Reinforced Concrete (FRC); and (c) High Performance FiberReinforced Cementitious Composites (HPFRCC), adopted from [2,10].
Table 1Typical mechanical and physical properties of ECC [8].
Compressivestrength
First cracking strength(MPa)
Ultimate tensile strength(MPa)
Flexural strength(MPa)
Young’s modulus(GPa)
Ultimate tensile strain(%)
Density(g/cm3)
20–95 3–7 4–12 10–30 18–34 1–8 0.95–2.3
M. Fakharifar et al. / Construction and Building Materials 71 (2014) 510–520 511
hardening behavior, i.e., strength increase after first cracking. Onlyfor the HPFRCC materials the post cracking strength, rpc, is higherthan the first cracking strength, rcc.
In recent years, a new class of HPFRCC materials calledengineered cementitious composites (ECC) has emerged, offeringpromising solutions for structures with longer service life featuringenhanced structural performance. Developed at the University ofMichigan, ECC exhibits a typical moderate tensile strength of 4–6 MPa and ductility of 3–5% [3]. Besides, other types of ECC mate-rials including self-consolidating ECC, early high strength ECC, lightweight ECC and green ECC were introduced and studied by variousresearchers [4–7]. Typical Mechanical and physical properties ofECC material is presented in Table 1 [8]. Polyvinyl alcohol (PVA)fibers have been widely used in development of ECC materials.However, fiber selection depends on different parametersincluding: (1) fiber properties (diameter, surface roughness and
mechanical behavior), (2) characteristics of matrix (crack resis-tance and fiber–matrix interfacial bonding strength), (3) perfor-mance objectives of ECC (desired properties, durability, andsustainability), and (4) cost considerations of ECC materials in filedapplications [9].
As set forth earlier and illustrated in Fig. 1, adding fibers intoconcrete may enhance concrete mechanical properties, includingflexural strength, fracture toughness, thermal shock strength, fati-gue strength and impact resistance [10–15]. Many studies revealedthe superior performance of HPFRCC materials based on itsobserved static mechanical properties. Little research has beenundertaken on the loading rate effect on the mechanical behaviorof HPFRCC materials. Behavior of fiber, matrix and the interfacialbond between them is dependent on loading (strain) rate [2]. Thus,impact tests are valuable tools to characterize completely thebehavior of HPFRCC materials under high strain rate loadings.
512 M. Fakharifar et al. / Construction and Building Materials 71 (2014) 510–520
Loading rate effect is significantly important on strength and duc-tility of critical regions within structures, such as beam–columnjoints and coupling beams [16,17] when subjected to earthquakeloading.
Existing statistical data analyses available in the literature aremainly focused on mechanical properties (compression and flex-ure) and impact strength of FRC materials. Implementation of areliable large set of experimental tests in addition to statistical dataanalyses would be an appropriate method to further study anddevelop the understanding of mechanical properties of these highpotential composite materials. Effect of fiber content on statisticalparameters and distribution of flexural strength, compressivestrength and impact strength of HPFRCC is vital and need to beaddressed. Energy dissipation of HPFRCC has never been statisti-cally studied previously. To the best of the author’s knowledge, athorough experimental/statistical study on impact strength,mechanical properties and energy dissipation of HPFRCC materialshas not been investigated yet. Although, HPFRCC have been studiedfor their mechanical properties, but not statistically evaluated yetbased on adequately large number of compression, flexure andimpact test specimens, including different fiber contents.
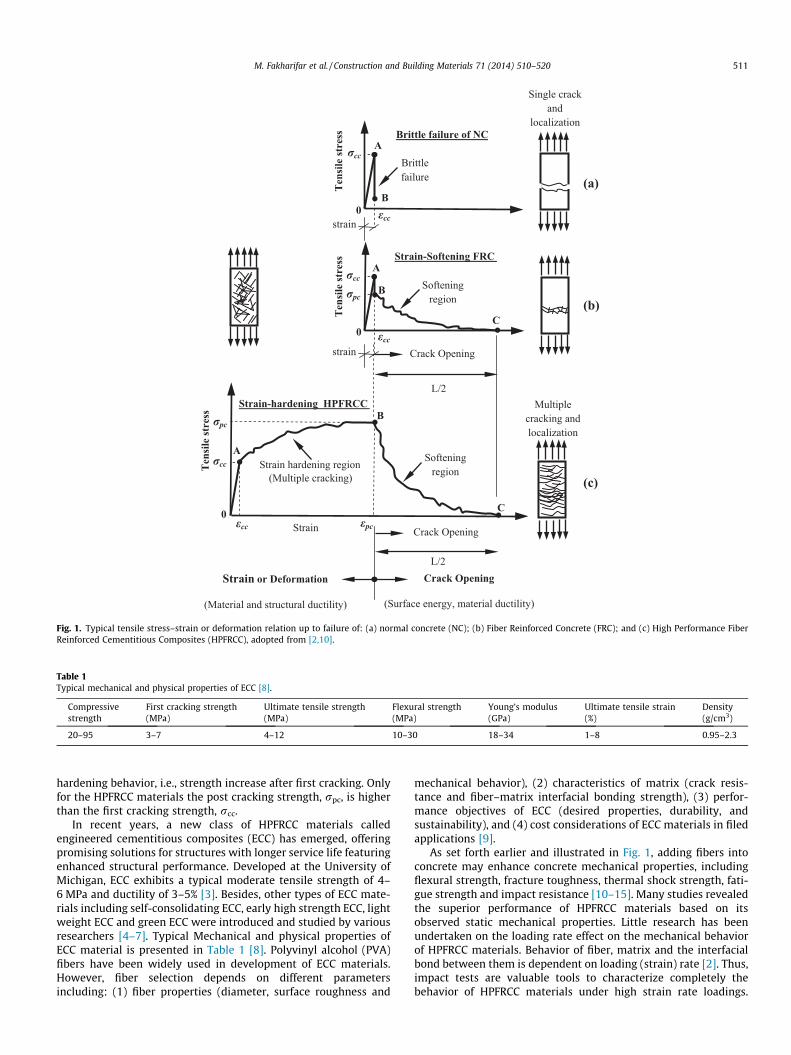
Table 2Chemical composition and physical properties ofcement.
Composition Percentage
SiO2 21.1Al2O3 4.37Fe2O3 3.88MgO 1.56
2. Research significance
Research on HPFRCC materials widely indicated their enhancedproperties featuring improved ductility, strength and durabilityunder static load condition. Impact tests characterize the perfor-mance of HPFRCC under high strain rates. Effect of fiber contenton the impact strength of HPFRCC under dynamic loading is notcompletely characterized yet. A thorough experimental/statisticalstudy would contribute to better characterization of mechanicalproperties and impact strength of HPFRCC, including different fibercontents. Thus, a relatively large test matrix was developed by theauthors to further investigate the mechanical properties andimpact strength of HPFRCC materials. Two hundred and forty spec-imens total, that is significantly larger than test matrices in similarstudies to provide a reliable baseline for statistical analyses, werecast, prepared and tested to achieve this goal.
Three volume fraction of polypropylene (PP) fiber equal to 0.5%,0.75% and 1% were considered in this study. Considering the threedifferent fiber content, total specimens in this study would be cat-egorized as: 60 specimens (100 � 100 � 100 mm) for compressivestrength (20 specimens per group), 60 specimens(60 � 80 � 320 mm) for flexural strength (20 specimens per group)and 120 specimens (150 � 64 mm) for impact resistance (40 spec-imens per group). The proposed drop-weight test according to theACI Committee 544 [18], commonly used for impact strength ofFRC, has been used for impact resistance test of HPFRCC specimensin the current study. Data obtained from such tests usually have acoefficient of variation (COV) of more than 25%. The variation inimpact strength from the drop-weight test has been reported forthe FRC materials [19–24] and not for the HPFRCC yet.
All three groups of HPFRCC specimens were cast with identicalwater–cement ratio of 0.38 with three different volume fibercontents of 0.5%, 0.75%, and 1%, which are designated as HP-0.5,HP-0.75 and HP-1, respectively. Numeric value represents thepercentage of fibers used in the corresponding group of specimens.For example, HP-0.5 represents the group of specimens with 0.5%fibers. Compressive strength tests were performed on twenty100 � 100 � 100 mm cubic specimens per group preparedaccording to BS 1881-108:1983 [25]. Flexural strength tests wereconducted on twenty 60 � 80 � 320 mm beam specimens per
group according to BS EN 12390-5:2009 [26]. Although compres-sive and flexural strength test procedures are almost fixed, a briefexplanation on drop test procedure undertaken in this research ispresented. Drop-weight tests were conducted following the ACI544 Committee’s recommendations. For each concrete mix, ten150 � 300 mm cylindrical specimens were cast. Then each cylinderwas cut into four 64 mm thick cylindrical disks using a diamondblade concrete saw. During impact tests, each cylindrical diskwas set centered on a base plate within four positioning lugs,and impacted by repeated blows. Blows were applied through a4.45 kg hammer falling continually from a 457 mm height onto asteel ball with the diameter of 63.5 mm, which was centered atthe top surface of the disk. The number of blows required to causethe first visible crack and then failure were recorded. With the aidof a magnifier equipped with built-in flashlight, the number ofblows to initiate the first visible crack on the top surface wasdefined as the first-crack strength, while the number of blows togenerate failure of the disk was identified as the failure strength.All tests were performed after curing the specimens for 28 days.
4. Materials and specimens preparation
In this experimental study, ASTM Type II Portland cement, crushed sand, and PPfibers were used in the mix. Tables 2 and 3 present the cement compositions andmechanical properties of PP fibers, respectively. A high range water reducer agentwith the commercial name of Mape110� was used to adjust the workability of theconcrete mixtures. For batching, cement was mixed with aggregates for 1 min. Then,the water and water reducer agent were added to the mix, and mixed for 6–8 min. Themixture proportions for three different mixes are provided in Table 4. Then fresh con-crete was cast into cubic form (100 � 100 � 100 mm), cylindrical form(150 � 300 mm), and prismatic form (60 � 80 � 320 mm) for compressive, impact
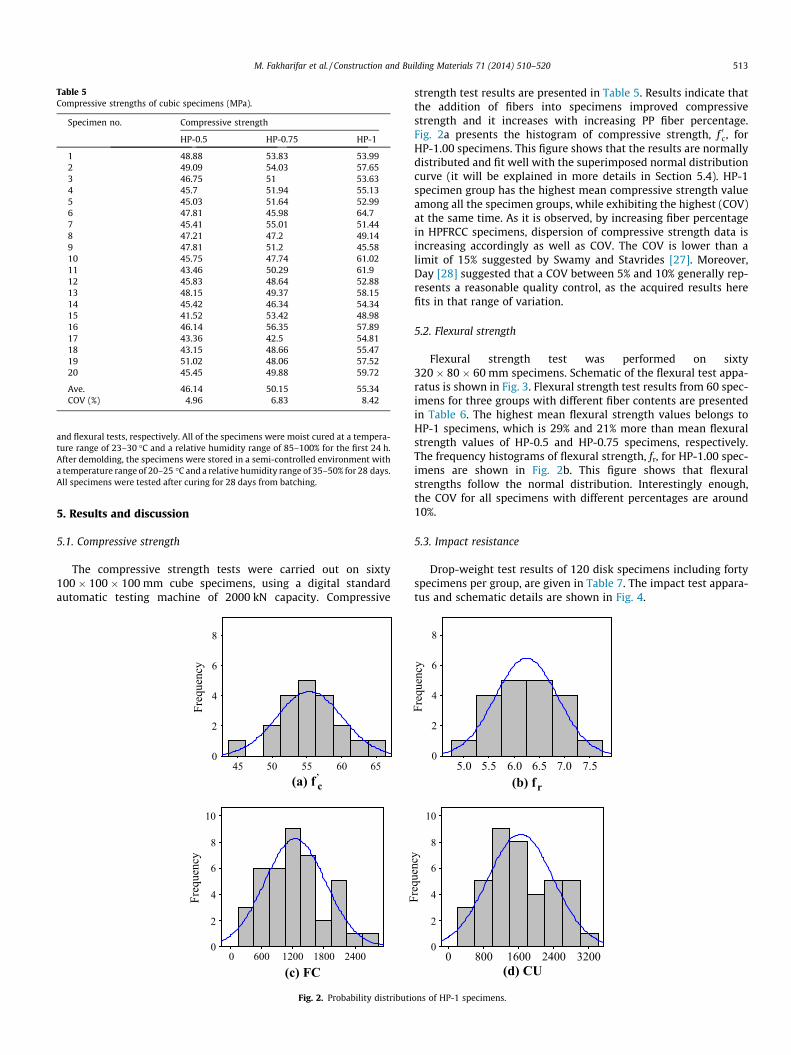
Table 5Compressive strengths of cubic specimens (MPa).
M. Fakharifar et al. / Construction and Building Materials 71 (2014) 510–520 513
and flexural tests, respectively. All of the specimens were moist cured at a tempera-ture range of 23–30 �C and a relative humidity range of 85–100% for the first 24 h.After demolding, the specimens were stored in a semi-controlled environment witha temperature range of 20–25 �C and a relative humidity range of 35–50% for 28 days.All specimens were tested after curing for 28 days from batching.
5. Results and discussion
5.1. Compressive strength
The compressive strength tests were carried out on sixty100 � 100 � 100 mm cube specimens, using a digital standardautomatic testing machine of 2000 kN capacity. Compressive
6560555045
8
6
4
2
0
Freq
uenc
y
(a) f’c
2400180012006000
10
8
6
4
2
0
Freq
uenc
y
(c) FC
Fig. 2. Probability distributi
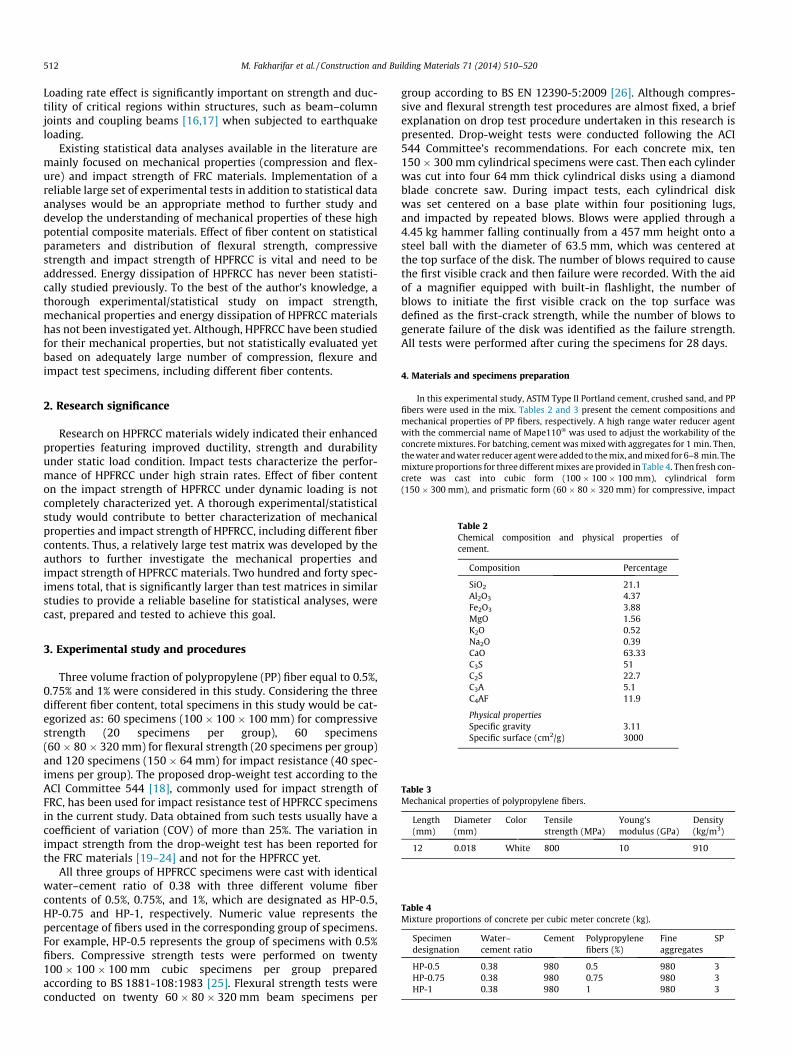
strength test results are presented in Table 5. Results indicate thatthe addition of fibers into specimens improved compressivestrength and it increases with increasing PP fiber percentage.Fig. 2a presents the histogram of compressive strength, f 0c, forHP-1.00 specimens. This figure shows that the results are normallydistributed and fit well with the superimposed normal distributioncurve (it will be explained in more details in Section 5.4). HP-1specimen group has the highest mean compressive strength valueamong all the specimen groups, while exhibiting the highest (COV)at the same time. As it is observed, by increasing fiber percentagein HPFRCC specimens, dispersion of compressive strength data isincreasing accordingly as well as COV. The COV is lower than alimit of 15% suggested by Swamy and Stavrides [27]. Moreover,Day [28] suggested that a COV between 5% and 10% generally rep-resents a reasonable quality control, as the acquired results herefits in that range of variation.
5.2. Flexural strength
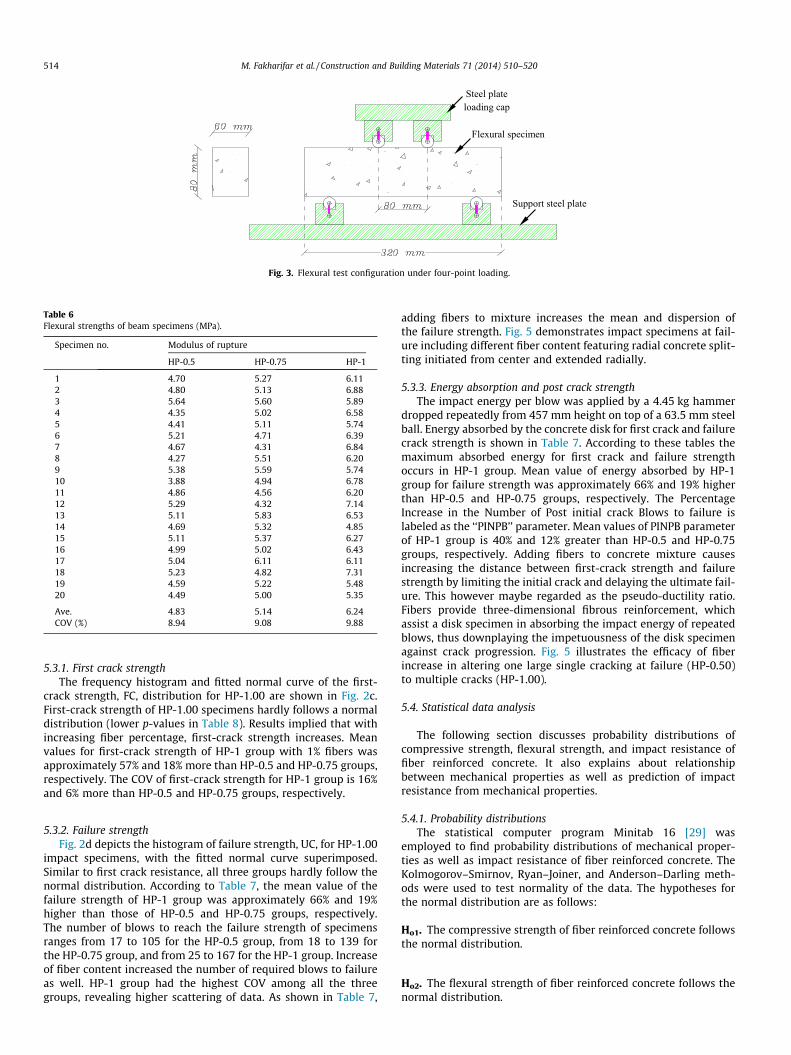
Flexural strength test was performed on sixty320 � 80 � 60 mm specimens. Schematic of the flexural test appa-ratus is shown in Fig. 3. Flexural strength test results from 60 spec-imens for three groups with different fiber contents are presentedin Table 6. The highest mean flexural strength values belongs toHP-1 specimens, which is 29% and 21% more than mean flexuralstrength values of HP-0.5 and HP-0.75 specimens, respectively.The frequency histograms of flexural strength, fr, for HP-1.00 spec-imens are shown in Fig. 2b. This figure shows that flexuralstrengths follow the normal distribution. Interestingly enough,the COV for all specimens with different percentages are around10%.
5.3. Impact resistance
Drop-weight test results of 120 disk specimens including fortyspecimens per group, are given in Table 7. The impact test appara-tus and schematic details are shown in Fig. 4.
7.57.06.56.05.55.0
8
6
4
2
0
Freq
uenc
y
(b) fr
3200240016008000
10
8
6
4
2
0
Freq
uenc
y
(d) CU
ons of HP-1 specimens.
Steel plateloading cap
Flexural specimen
Support steel plate
Fig. 3. Flexural test configuration under four-point loading.
Table 6Flexural strengths of beam specimens (MPa).
514 M. Fakharifar et al. / Construction and Building Materials 71 (2014) 510–520
5.3.1. First crack strengthThe frequency histogram and fitted normal curve of the first-
crack strength, FC, distribution for HP-1.00 are shown in Fig. 2c.First-crack strength of HP-1.00 specimens hardly follows a normaldistribution (lower p-values in Table 8). Results implied that withincreasing fiber percentage, first-crack strength increases. Meanvalues for first-crack strength of HP-1 group with 1% fibers wasapproximately 57% and 18% more than HP-0.5 and HP-0.75 groups,respectively. The COV of first-crack strength for HP-1 group is 16%and 6% more than HP-0.5 and HP-0.75 groups, respectively.
5.3.2. Failure strengthFig. 2d depicts the histogram of failure strength, UC, for HP-1.00
impact specimens, with the fitted normal curve superimposed.Similar to first crack resistance, all three groups hardly follow thenormal distribution. According to Table 7, the mean value of thefailure strength of HP-1 group was approximately 66% and 19%higher than those of HP-0.5 and HP-0.75 groups, respectively.The number of blows to reach the failure strength of specimensranges from 17 to 105 for the HP-0.5 group, from 18 to 139 forthe HP-0.75 group, and from 25 to 167 for the HP-1 group. Increaseof fiber content increased the number of required blows to failureas well. HP-1 group had the highest COV among all the threegroups, revealing higher scattering of data. As shown in Table 7,
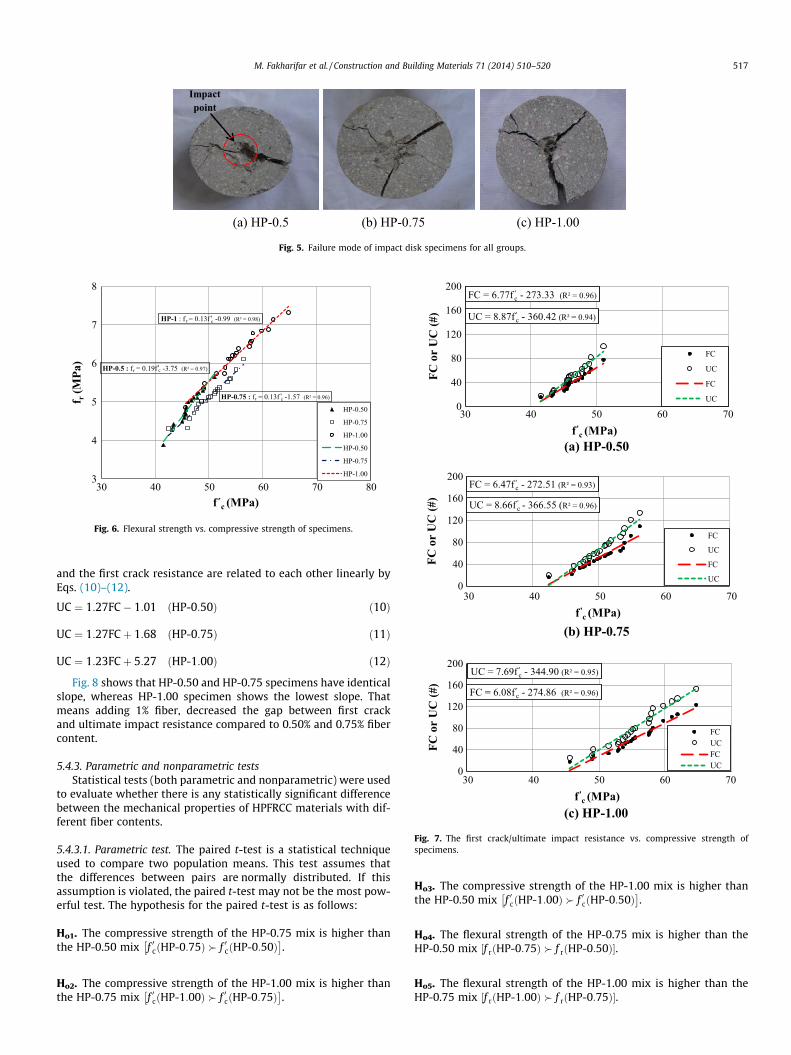
adding fibers to mixture increases the mean and dispersion ofthe failure strength. Fig. 5 demonstrates impact specimens at fail-ure including different fiber content featuring radial concrete split-ting initiated from center and extended radially.
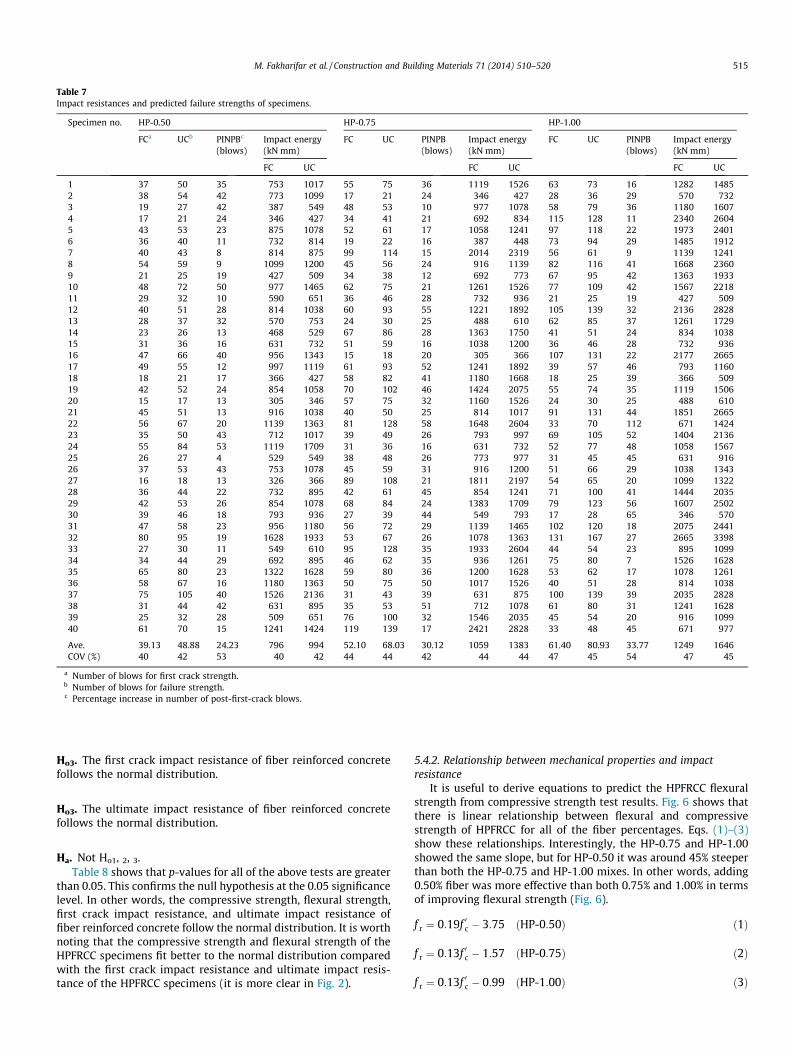
5.3.3. Energy absorption and post crack strengthThe impact energy per blow was applied by a 4.45 kg hammer
dropped repeatedly from 457 mm height on top of a 63.5 mm steelball. Energy absorbed by the concrete disk for first crack and failurecrack strength is shown in Table 7. According to these tables themaximum absorbed energy for first crack and failure strengthoccurs in HP-1 group. Mean value of energy absorbed by HP-1group for failure strength was approximately 66% and 19% higherthan HP-0.5 and HP-0.75 groups, respectively. The PercentageIncrease in the Number of Post initial crack Blows to failure islabeled as the ‘‘PINPB’’ parameter. Mean values of PINPB parameterof HP-1 group is 40% and 12% greater than HP-0.5 and HP-0.75groups, respectively. Adding fibers to concrete mixture causesincreasing the distance between first-crack strength and failurestrength by limiting the initial crack and delaying the ultimate fail-ure. This however maybe regarded as the pseudo-ductility ratio.Fibers provide three-dimensional fibrous reinforcement, whichassist a disk specimen in absorbing the impact energy of repeatedblows, thus downplaying the impetuousness of the disk specimenagainst crack progression. Fig. 5 illustrates the efficacy of fiberincrease in altering one large single cracking at failure (HP-0.50)to multiple cracks (HP-1.00).
5.4. Statistical data analysis
The following section discusses probability distributions ofcompressive strength, flexural strength, and impact resistance offiber reinforced concrete. It also explains about relationshipbetween mechanical properties as well as prediction of impactresistance from mechanical properties.
5.4.1. Probability distributionsThe statistical computer program Minitab 16 [29] was
employed to find probability distributions of mechanical proper-ties as well as impact resistance of fiber reinforced concrete. TheKolmogorov–Smirnov, Ryan–Joiner, and Anderson–Darling meth-ods were used to test normality of the data. The hypotheses forthe normal distribution are as follows:
Ho1. The compressive strength of fiber reinforced concrete followsthe normal distribution.
Ho2. The flexural strength of fiber reinforced concrete follows thenormal distribution.
Table 7Impact resistances and predicted failure strengths of specimens.
a Number of blows for first crack strength.b Number of blows for failure strength.c Percentage increase in number of post-first-crack blows.
M. Fakharifar et al. / Construction and Building Materials 71 (2014) 510–520 515
Ho3. The first crack impact resistance of fiber reinforced concretefollows the normal distribution.
Ho3. The ultimate impact resistance of fiber reinforced concretefollows the normal distribution.
Ha. Not Ho1, 2, 3.Table 8 shows that p-values for all of the above tests are greater
than 0.05. This confirms the null hypothesis at the 0.05 significancelevel. In other words, the compressive strength, flexural strength,first crack impact resistance, and ultimate impact resistance offiber reinforced concrete follow the normal distribution. It is worthnoting that the compressive strength and flexural strength of theHPFRCC specimens fit better to the normal distribution comparedwith the first crack impact resistance and ultimate impact resis-tance of the HPFRCC specimens (it is more clear in Fig. 2).
5.4.2. Relationship between mechanical properties and impactresistance
It is useful to derive equations to predict the HPFRCC flexuralstrength from compressive strength test results. Fig. 6 shows thatthere is linear relationship between flexural and compressivestrength of HPFRCC for all of the fiber percentages. Eqs. (1)–(3)show these relationships. Interestingly, the HP-0.75 and HP-1.00showed the same slope, but for HP-0.50 it was around 45% steeperthan both the HP-0.75 and HP-1.00 mixes. In other words, adding0.50% fiber was more effective than both 0.75% and 1.00% in termsof improving flexural strength (Fig. 6).
f r ¼ 0:19f 0c � 3:75 ðHP-0:50Þ ð1Þ
f r ¼ 0:13f 0c � 1:57 ðHP-0:75Þ ð2Þ
f r ¼ 0:13f 0c � 0:99 ðHP-1:00Þ ð3Þ
(a)
(b)
25 mm
5 mm
Steel ball with 63 mm diameter
Steel cap
Specimen
Steel pipe with 64 mm inside diameter
Base fixture
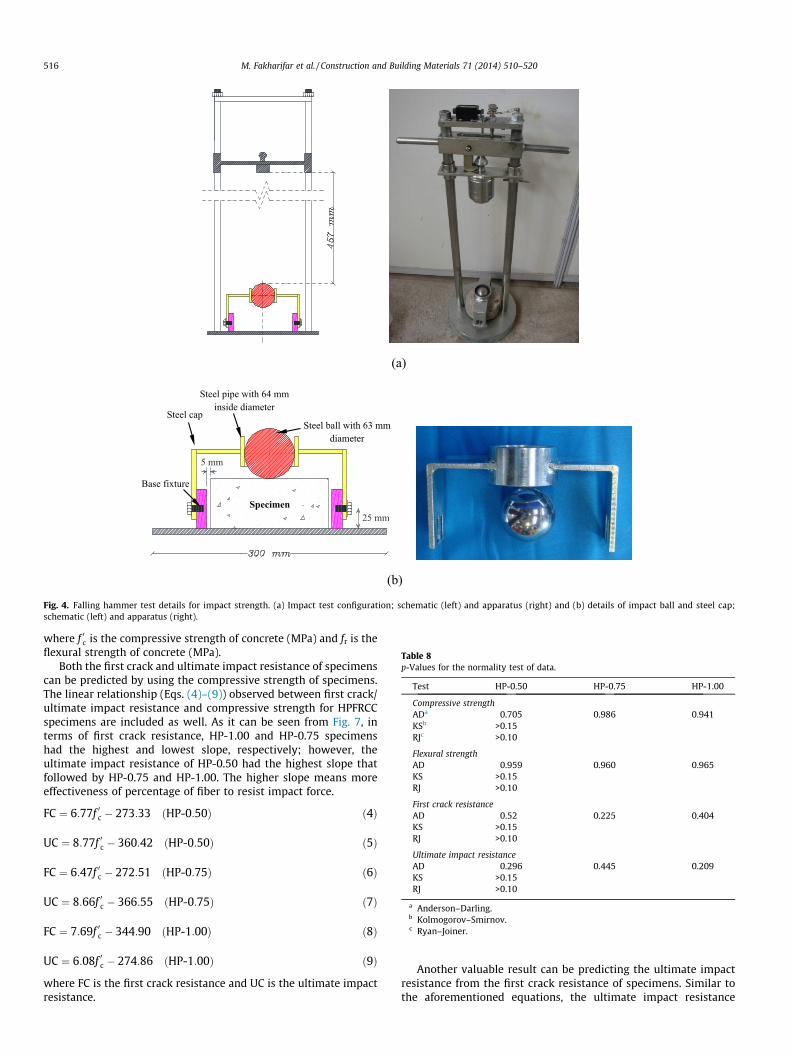
Fig. 4. Falling hammer test details for impact strength. (a) Impact test configuration; schematic (left) and apparatus (right) and (b) details of impact ball and steel cap;schematic (left) and apparatus (right).
a Anderson–Darling.b Kolmogorov–Smirnov.c Ryan–Joiner.
516 M. Fakharifar et al. / Construction and Building Materials 71 (2014) 510–520
where f 0c is the compressive strength of concrete (MPa) and fr is theflexural strength of concrete (MPa).
Both the first crack and ultimate impact resistance of specimenscan be predicted by using the compressive strength of specimens.The linear relationship (Eqs. (4)–(9)) observed between first crack/ultimate impact resistance and compressive strength for HPFRCCspecimens are included as well. As it can be seen from Fig. 7, interms of first crack resistance, HP-1.00 and HP-0.75 specimenshad the highest and lowest slope, respectively; however, theultimate impact resistance of HP-0.50 had the highest slope thatfollowed by HP-0.75 and HP-1.00. The higher slope means moreeffectiveness of percentage of fiber to resist impact force.
FC ¼ 6:77f 0c � 273:33 ðHP-0:50Þ ð4Þ
UC ¼ 8:77f 0c � 360:42 ðHP-0:50Þ ð5Þ
FC ¼ 6:47f 0c � 272:51 ðHP-0:75Þ ð6Þ
UC ¼ 8:66f 0c � 366:55 ðHP-0:75Þ ð7Þ
FC ¼ 7:69f 0c � 344:90 ðHP-1:00Þ ð8Þ
UC ¼ 6:08f 0c � 274:86 ðHP-1:00Þ ð9Þ
where FC is the first crack resistance and UC is the ultimate impactresistance.
Another valuable result can be predicting the ultimate impactresistance from the first crack resistance of specimens. Similar tothe aforementioned equations, the ultimate impact resistance
(a) HP-0.5 (b) HP-0.75 (c) HP-1.00
Impact point
Fig. 5. Failure mode of impact disk specimens for all groups.
HP-0.5 : fr = 0.19f c -3.75 (R² = 0.97)
HP-0.75 : fr = 0.13f c -1.57 (R² = 0.96)
HP-1 : f r = 0.13f c -0.99 (R² = 0.98)
3
4
5
6
7
8
30 40 50 60 70 80
f r(M
Pa)
f´c (MPa)
HP-0.50
HP-0.75
HP-1.00
HP-0.50
HP-0.75
HP-1.00
'
'
'
Fig. 6. Flexural strength vs. compressive strength of specimens.
(a) HP-0.50
(b) HP-0.75
(c) HP-1.00
FC = 6.77f 'c - 273.33 (R² = 0.96)
UC = 8.87f 'c - 360.42 (R² = 0.94)
0
40
80
120
160
200
FC o
r U
C (#
)
FC
UC
FC
UC
FC = 6.47f 'c - 272.51 (R² = 0.93)
UC = 8.66f 'c - 366.55 (R² = 0.96)
0
40
80
120
160
200
30 40 50 60 70
FC o
r U
C (#
)
f 'c (MPa)
30 40 50 60 70f'
c (MPa)
30 40 50 60 70f'
c (MPa)
FC
UC
FC
UC
FC = 6.08f 'c - 274.86 (R² = 0.96)
UC = 7.69f 'c - 344.90 (R² = 0.95)
0
40
80
120
160
200
FC o
r U
C (#
)
FCUCFCUC
Fig. 7. The first crack/ultimate impact resistance vs. compressive strength ofspecimens.
M. Fakharifar et al. / Construction and Building Materials 71 (2014) 510–520 517
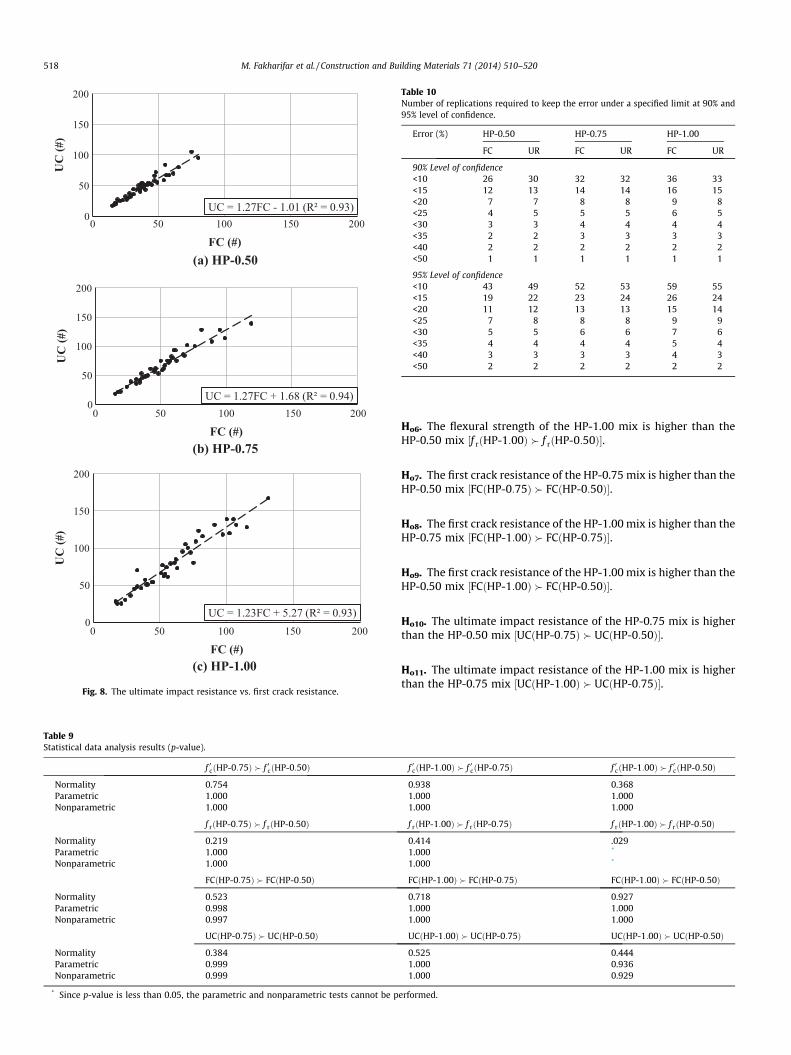
and the first crack resistance are related to each other linearly byEqs. (10)–(12).
UC ¼ 1:27FC� 1:01 ðHP-0:50Þ ð10Þ
UC ¼ 1:27FCþ 1:68 ðHP-0:75Þ ð11Þ
UC ¼ 1:23FCþ 5:27 ðHP-1:00Þ ð12Þ
Fig. 8 shows that HP-0.50 and HP-0.75 specimens have identicalslope, whereas HP-1.00 specimen shows the lowest slope. Thatmeans adding 1% fiber, decreased the gap between first crackand ultimate impact resistance compared to 0.50% and 0.75% fibercontent.
5.4.3. Parametric and nonparametric testsStatistical tests (both parametric and nonparametric) were used
to evaluate whether there is any statistically significant differencebetween the mechanical properties of HPFRCC materials with dif-ferent fiber contents.
5.4.3.1. Parametric test. The paired t-test is a statistical techniqueused to compare two population means. This test assumes thatthe differences between pairs are normally distributed. If thisassumption is violated, the paired t-test may not be the most pow-erful test. The hypothesis for the paired t-test is as follows:
Ho1. The compressive strength of the HP-0.75 mix is higher thanthe HP-0.50 mix f 0cðHP-0:75Þ � f 0cðHP-0:50Þ
� �.
Ho2. The compressive strength of the HP-1.00 mix is higher thanthe HP-0.75 mix f 0cðHP-1:00Þ � f 0cðHP-0:75Þ
� �.
Ho3. The compressive strength of the HP-1.00 mix is higher thanthe HP-0.50 mix f 0cðHP-1:00Þ � f 0cðHP-0:50Þ
� �.
Ho4. The flexural strength of the HP-0.75 mix is higher than theHP-0.50 mix f rðHP-0:75Þ � f rðHP-0:50Þ½ �.
Ho5. The flexural strength of the HP-1.00 mix is higher than theHP-0.75 mix f rðHP-1:00Þ � f rðHP-0:75Þ½ �.
(a) HP-0.50
(b) HP-0.75
(c) HP-1.00
UC = 1.27FC - 1.01 (R² = 0.93)0
50
100
150
200
UC
(#)
UC = 1.27FC + 1.68 (R² = 0.94)0
50
100
150
200
UC
(#)
UC = 1.23FC + 5.27 (R² = 0.93)0
50
100
150
200
0 50 100 150 200
UC
(#)
FC (#)
0 50 100 150 200
FC (#)
0 50 100 150 200
FC (#)
Fig. 8. The ultimate impact resistance vs. first crack resistance.
Table 9Statistical data analysis results (p-value).
M. Fakharifar et al. / Construction and Building Materials 71 (2014) 510–520 519
Ho12. The ultimate impact resistance of the HP-1.00 mix is higherthan the HP-0.50 mix UCðHP-1:00Þ � UCðHP-0:50Þ½ �.
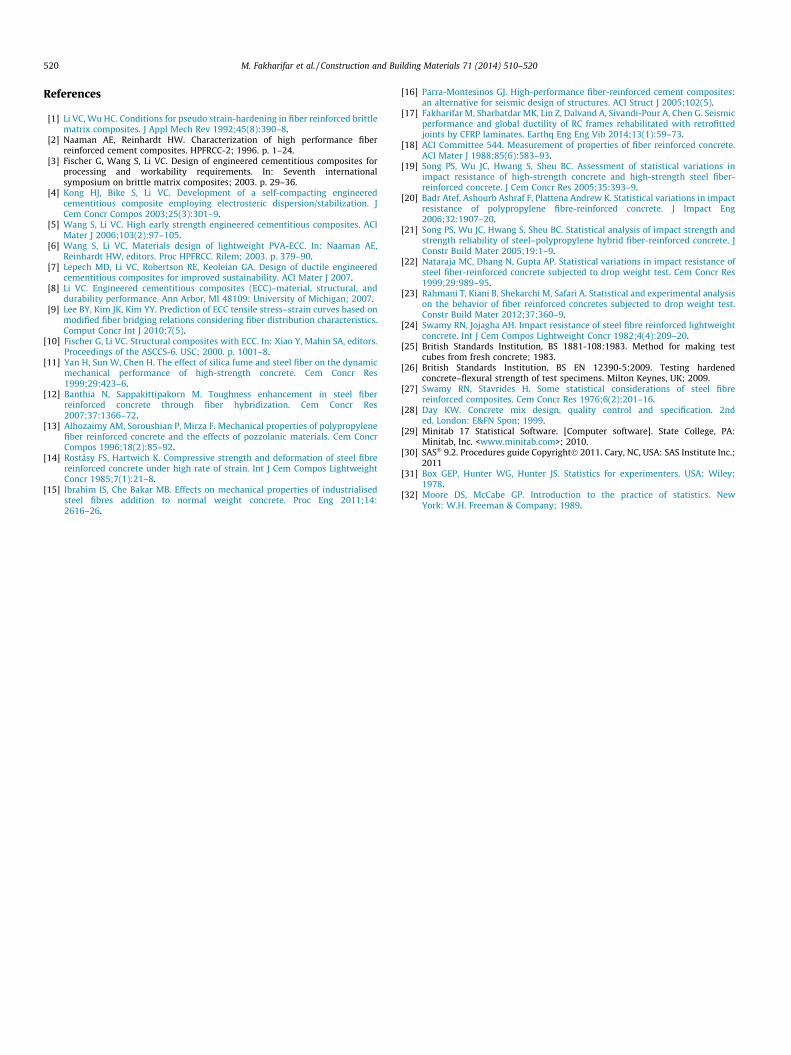
Ha. Not Ho1–12.The statistical computer program SAS 9.2 [30] was employed to
perform these statistical tests. The Anderson–Darling test showedthe data – the differences between the mechanical properties ofspecimens with different percentage of fiber – follows a normaldistribution (see Table 9). Therefore, the paired t-tests could beperformed. The result of the paired t-test presented in Table 9 thatshows the p-values were greater than 0.05 for all of the hypothe-ses. This confirms the null hypotheses at the 0.05 significance level.In other words, increasing the fiber content improved the mechan-ical properties of HPFRCC.
5.4.3.2. Nonparametric test. Unlike the parametric tests, nonpara-metric tests are referred to as distribution-free tests. These testshave the advantage of requiring no assumption of normality, andthey usually compare medians rather than means. The Wilcoxonsigned-rank test is usually identified as a nonparametric alterna-tive to the paired t-test. The hypothesis for this test is the sameas those for the paired t-test. The Wilcoxon signed rank testassumes that the distribution of the difference of pairs is symmet-rical. This assumption can be checked; if the distribution is normal,it is also symmetrical. As mentioned earlier, the data follows thenormal distribution and the Wilcoxon signed ranks test can beused. As it can be seen in Table 9, similar to the parametric studyall the p-values for the Wilcoxon signed rank were greater than0.05. Like the parametric test, the nonparametric test confirmsthe null hypotheses at the 0.05 significance level. Interestingly,the p-values for both the parametric and nonparametric tests arevery close to each other. Overall, results of the statistical data anal-yses showed that the HPFRCC mix with higher fiber content pos-sesses higher mechanical properties.
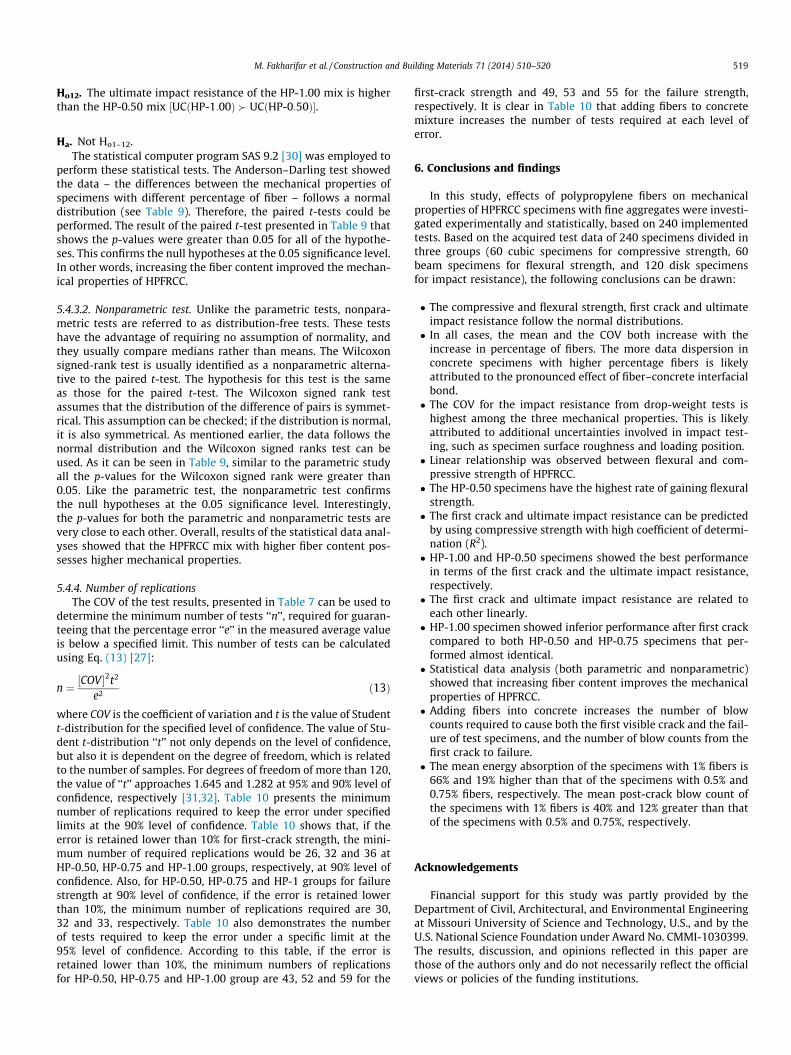
5.4.4. Number of replicationsThe COV of the test results, presented in Table 7 can be used to
determine the minimum number of tests ‘‘n’’, required for guaran-teeing that the percentage error ‘‘e’’ in the measured average valueis below a specified limit. This number of tests can be calculatedusing Eq. (13) [27]:
n ¼ ½COV �2t2
e2 ð13Þ
where COV is the coefficient of variation and t is the value of Studentt-distribution for the specified level of confidence. The value of Stu-dent t-distribution ‘‘t’’ not only depends on the level of confidence,but also it is dependent on the degree of freedom, which is relatedto the number of samples. For degrees of freedom of more than 120,the value of ‘‘t’’ approaches 1.645 and 1.282 at 95% and 90% level ofconfidence, respectively [31,32]. Table 10 presents the minimumnumber of replications required to keep the error under specifiedlimits at the 90% level of confidence. Table 10 shows that, if theerror is retained lower than 10% for first-crack strength, the mini-mum number of required replications would be 26, 32 and 36 atHP-0.50, HP-0.75 and HP-1.00 groups, respectively, at 90% level ofconfidence. Also, for HP-0.50, HP-0.75 and HP-1 groups for failurestrength at 90% level of confidence, if the error is retained lowerthan 10%, the minimum number of replications required are 30,32 and 33, respectively. Table 10 also demonstrates the numberof tests required to keep the error under a specific limit at the95% level of confidence. According to this table, if the error isretained lower than 10%, the minimum numbers of replicationsfor HP-0.50, HP-0.75 and HP-1.00 group are 43, 52 and 59 for the
first-crack strength and 49, 53 and 55 for the failure strength,respectively. It is clear in Table 10 that adding fibers to concretemixture increases the number of tests required at each level oferror.
6. Conclusions and findings
In this study, effects of polypropylene fibers on mechanicalproperties of HPFRCC specimens with fine aggregates were investi-gated experimentally and statistically, based on 240 implementedtests. Based on the acquired test data of 240 specimens divided inthree groups (60 cubic specimens for compressive strength, 60beam specimens for flexural strength, and 120 disk specimensfor impact resistance), the following conclusions can be drawn:
� The compressive and flexural strength, first crack and ultimateimpact resistance follow the normal distributions.� In all cases, the mean and the COV both increase with the
increase in percentage of fibers. The more data dispersion inconcrete specimens with higher percentage fibers is likelyattributed to the pronounced effect of fiber–concrete interfacialbond.� The COV for the impact resistance from drop-weight tests is
highest among the three mechanical properties. This is likelyattributed to additional uncertainties involved in impact test-ing, such as specimen surface roughness and loading position.� Linear relationship was observed between flexural and com-
pressive strength of HPFRCC.� The HP-0.50 specimens have the highest rate of gaining flexural
strength.� The first crack and ultimate impact resistance can be predicted
by using compressive strength with high coefficient of determi-nation (R2).� HP-1.00 and HP-0.50 specimens showed the best performance
in terms of the first crack and the ultimate impact resistance,respectively.� The first crack and ultimate impact resistance are related to
each other linearly.� HP-1.00 specimen showed inferior performance after first crack
compared to both HP-0.50 and HP-0.75 specimens that per-formed almost identical.� Statistical data analysis (both parametric and nonparametric)
showed that increasing fiber content improves the mechanicalproperties of HPFRCC.� Adding fibers into concrete increases the number of blow
counts required to cause both the first visible crack and the fail-ure of test specimens, and the number of blow counts from thefirst crack to failure.� The mean energy absorption of the specimens with 1% fibers is
66% and 19% higher than that of the specimens with 0.5% and0.75% fibers, respectively. The mean post-crack blow count ofthe specimens with 1% fibers is 40% and 12% greater than thatof the specimens with 0.5% and 0.75%, respectively.
Acknowledgements
Financial support for this study was partly provided by theDepartment of Civil, Architectural, and Environmental Engineeringat Missouri University of Science and Technology, U.S., and by theU.S. National Science Foundation under Award No. CMMI-1030399.The results, discussion, and opinions reflected in this paper arethose of the authors only and do not necessarily reflect the officialviews or policies of the funding institutions.
520 M. Fakharifar et al. / Construction and Building Materials 71 (2014) 510–520
References
[1] Li VC, Wu HC. Conditions for pseudo strain-hardening in fiber reinforced brittlematrix composites. J Appl Mech Rev 1992;45(8):390–8.
[2] Naaman AE, Reinhardt HW. Characterization of high performance fiberreinforced cement composites. HPFRCC-2; 1996. p. 1–24.
[3] Fischer G, Wang S, Li VC. Design of engineered cementitious composites forprocessing and workability requirements. In: Seventh internationalsymposium on brittle matrix composites; 2003. p. 29–36.
[4] Kong HJ, Bike S, Li VC. Development of a self-compacting engineeredcementitious composite employing electrosteric dispersion/stabilization. JCem Concr Compos 2003;25(3):301–9.
[5] Wang S, Li VC. High early strength engineered cementitious composites. ACIMater J 2006;103(2):97–105.
[6] Wang S, Li VC. Materials design of lightweight PVA-ECC. In: Naaman AE,Reinhardt HW, editors. Proc HPFRCC. Rilem; 2003. p. 379–90.
[7] Lepech MD, Li VC, Robertson RE, Keoleian GA. Design of ductile engineeredcementitious composites for improved sustainability. ACI Mater J 2007.
[8] Li VC. Engineered cementitious composites (ECC)–material, structural, anddurability performance. Ann Arbor, MI 48109: University of Michigan; 2007.
[9] Lee BY, Kim JK, Kim YY. Prediction of ECC tensile stress–strain curves based onmodified fiber bridging relations considering fiber distribution characteristics.Comput Concr Int J 2010;7(5).
[10] Fischer G, Li VC. Structural composites with ECC. In: Xiao Y, Mahin SA, editors.Proceedings of the ASCCS-6. USC; 2000. p. 1001–8.
[11] Yan H, Sun W, Chen H. The effect of silica fume and steel fiber on the dynamicmechanical performance of high-strength concrete. Cem Concr Res1999;29:423–6.
[12] Banthia N, Sappakittipakorn M. Toughness enhancement in steel fiberreinforced concrete through fiber hybridization. Cem Concr Res2007;37:1366–72.
[13] Alhozaimy AM, Soroushian P, Mirza F. Mechanical properties of polypropylenefiber reinforced concrete and the effects of pozzolanic materials. Cem ConcrCompos 1996;18(2):85–92.
[14] Rostásy FS, Hartwich K. Compressive strength and deformation of steel fibrereinforced concrete under high rate of strain. Int J Cem Compos LightweightConcr 1985;7(1):21–8.
[15] Ibrahim IS, Che Bakar MB. Effects on mechanical properties of industrialisedsteel fibres addition to normal weight concrete. Proc Eng 2011;14:2616–26.
[16] Parra-Montesinos GJ. High-performance fiber-reinforced cement composites:an alternative for seismic design of structures. ACI Struct J 2005;102(5).
[17] Fakharifar M, Sharbatdar MK, Lin Z, Dalvand A, Sivandi-Pour A, Chen G. Seismicperformance and global ductility of RC frames rehabilitated with retrofittedjoints by CFRP laminates. Earthq Eng Eng Vib 2014;13(1):59–73.
[18] ACI Committee 544. Measurement of properties of fiber reinforced concrete.ACI Mater J 1988;85(6):583–93.
[19] Song PS, Wu JC, Hwang S, Sheu BC. Assessment of statistical variations inimpact resistance of high-strength concrete and high-strength steel fiber-reinforced concrete. J Cem Concr Res 2005;35:393–9.
[20] Badr Atef, Ashourb Ashraf F, Plattena Andrew K. Statistical variations in impactresistance of polypropylene fibre-reinforced concrete. J Impact Eng2006;32:1907–20.
[21] Song PS, Wu JC, Hwang S, Sheu BC. Statistical analysis of impact strength andstrength reliability of steel–polypropylene hybrid fiber-reinforced concrete. JConstr Build Mater 2005;19:1–9.
[22] Nataraja MC, Dhang N, Gupta AP. Statistical variations in impact resistance ofsteel fiber-reinforced concrete subjected to drop weight test. Cem Concr Res1999;29:989–95.
[23] Rahmani T, Kiani B, Shekarchi M, Safari A. Statistical and experimental analysison the behavior of fiber reinforced concretes subjected to drop weight test.Constr Build Mater 2012;37:360–9.
[24] Swamy RN, Jojagha AH. Impact resistance of steel fibre reinforced lightweightconcrete. Int J Cem Compos Lightweight Concr 1982;4(4):209–20.
[25] British Standards Institution, BS 1881-108:1983. Method for making testcubes from fresh concrete; 1983.
[26] British Standards Institution, BS EN 12390-5:2009. Testing hardenedconcrete–flexural strength of test specimens. Milton Keynes, UK; 2009.
[27] Swamy RN, Stavrides H. Some statistical considerations of steel fibrereinforced composites. Cem Concr Res 1976;6(2):201–16.
[28] Day KW. Concrete mix design, quality control and specification. 2nded. London: E&FN Spon; 1999.
[29] Minitab 17 Statistical Software. [Computer software]. State College, PA:Minitab, Inc. <www.minitab.com>; 2010.
[30] SAS� 9.2. Procedures guide Copyright� 2011. Cary, NC, USA: SAS Institute Inc.;2011