Page 1
Session 1 : Landslides in HSWR and Relevant Material Properties
Part 5 : Modeling of HSWR for the Investigation of Landslides
(modeling key characteristics of HSWR controlling landslides)
Michael J. Kavvadas
National Technical University of Athens, Greece
The Mediterranean Workshop on LandslidesLANDSLIDES IN HARD SOILS AND WEAK ROCKS (HSWR)
Naples, 21-22 October 2013
Introductory Reports
Page 2
Part 5 : Modeling of HSWR for the Investigation of Landslides
Michael J. Kavvadas
National Technical University of Athens, Greece
CONTENTS
Modeling strength degradation wrt the initiation and evolution of landslides, i.e., :
• strain softening (strain-induced strength degradation)
• creep effects (time-dependent strength degradation)
The Mediterranean Workshop on LandslidesLANDSLIDES IN HARD SOILS AND WEAK ROCKS (HSWR)
Naples, 21-22 October 2013
Page 3
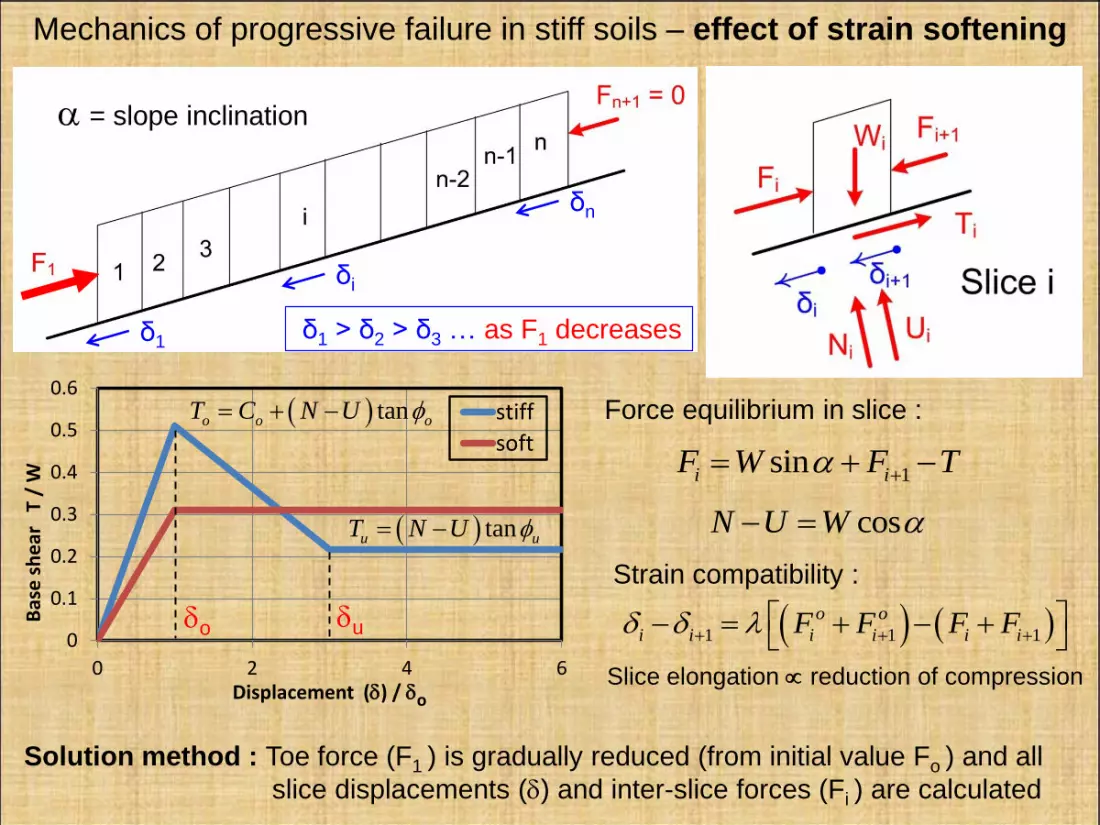
Mechanics of progressive failure in stiff soils – effect of strain softening
= slope inclination
0
0.1
0.2
0.3
0.4
0.5
0.6
0 2 4 6
Bas
e s
he
ar
T /
W
Displacement () / o
stiff
soft tano o oT C N U
tanu uT N U
o u
1sini iF W F T
Force equilibrium in slice :
cosN U W
Strain compatibility :
1 1 1
o o
i i i i i iF F F F
Slice elongation reduction of compression
Solution method : Toe force (F1 ) is gradually reduced (from initial value Fo ) and all
slice displacements () and inter-slice forces (Fi ) are calculated
δ1 > δ2 > δ3 … as F1 decreases δ1
δi
δn
Page 4
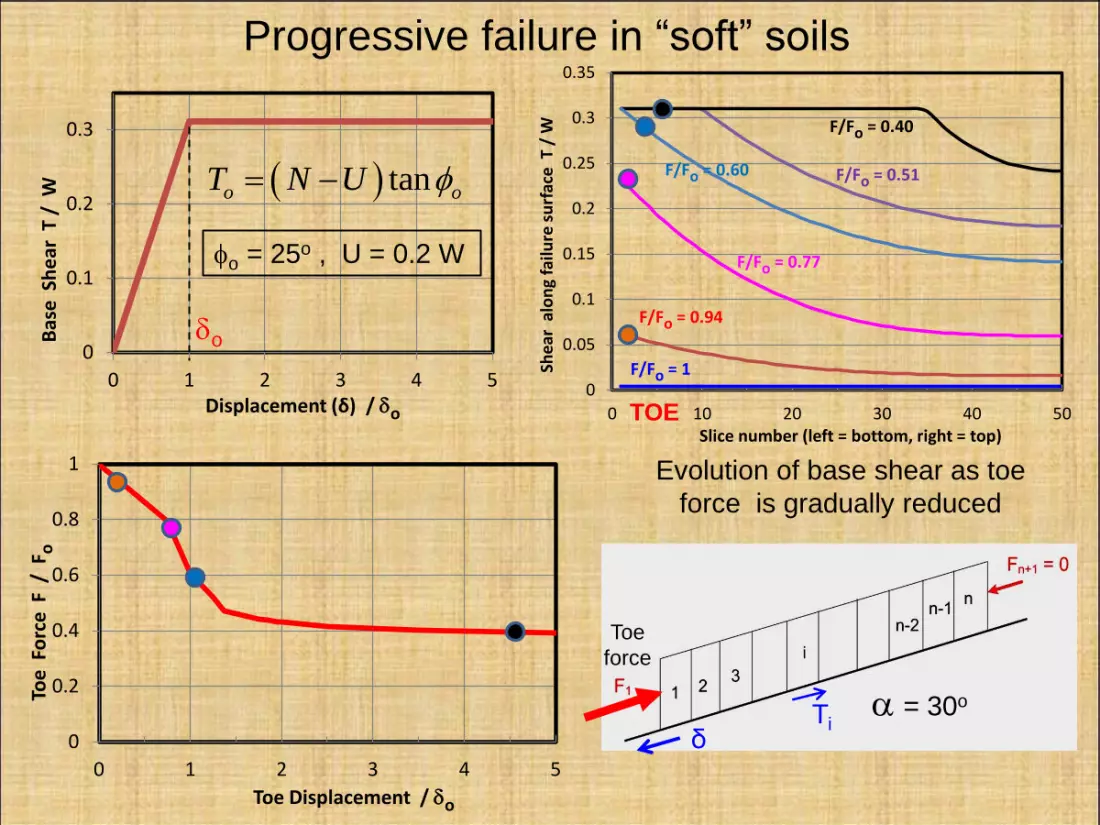
Progressive failure in “soft” soils
0
0.1
0.2
0.3
0 1 2 3 4 5
Bas
e S
he
ar T
/ W
Displacement (δ) / o
o
o = 25o , U = 0.2 W
tano oT N U
0
0.05
0.1
0.15
0.2
0.25
0.3
0.35
0 10 20 30 40 50
Shea
r a
lon
g fa
ilure
su
rfac
e T
/ W
Slice number (left = bottom, right = top)
F/Fo = 0.94
F/Fo = 0.77
F/Fo = 0.51
F/Fo = 0.40
F/Fo = 1
F/Fo = 0.60
0
0.2
0.4
0.6
0.8
1
0 1 2 3 4 5
Toe
Fo
rce
F /
Fo
Toe Displacement / o
Toe
force
= 30oTi
Evolution of base shear as toe
force is gradually reduced
δ
TOE
Page 5
0
0.1
0.2
0.3
0.4
0.5
0.6
0 1 2 3 4
Bas
e S
he
ar
T /
W
Displacement (δ) / o
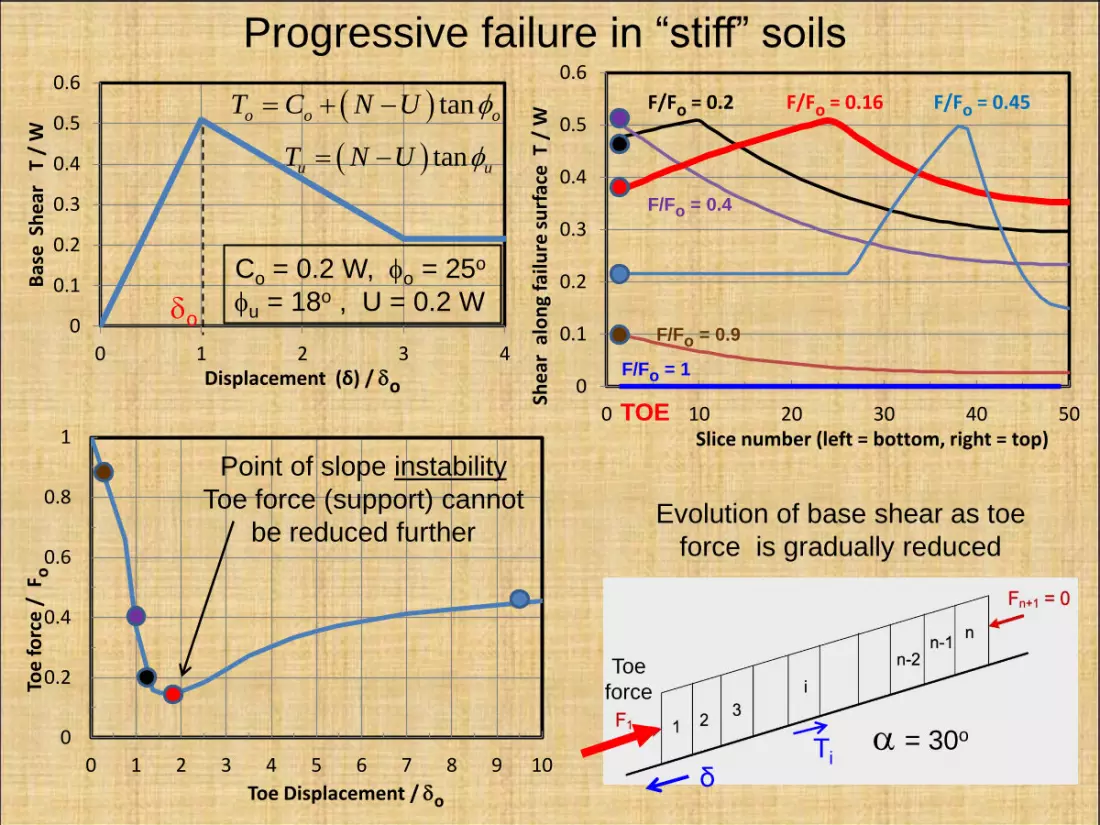
Progressive failure in “stiff” soils
o
Co = 0.2 W, o = 25o
u = 18o , U = 0.2 W
tano o oT C N U
tanu uT N U
0
0.2
0.4
0.6
0.8
1
0 1 2 3 4 5 6 7 8 9 10
Toe
fo
rce
/ F
o
Toe Displacement / o
Toe
force
= 30oTi
0
0.1
0.2
0.3
0.4
0.5
0.6
0 10 20 30 40 50
She
ar a
lon
g fa
ilure
su
rfac
e T
/ W
Slice number (left = bottom, right = top)
F/Fo = 0.9
F/Fo = 0.4
F/Fo = 0.2 F/Fo = 0.16 F/Fo = 0.45
F/Fo = 1
Point of slope instability
Toe force (support) cannot
be reduced furtherEvolution of base shear as toe
force is gradually reduced
TOE
δ
Page 6
0
0.1
0.2
0.3
0.4
0.5
0.6
0 2 4 6
Bas
e S
he
ar
T /
W
Displacement (δ) / o
0
0.2
0.4
0.6
0.8
1
0 1 2 3 4 5 6 7 8 9 10
Toe
fo
rce
F
/ F
o
Toe Displacement / o
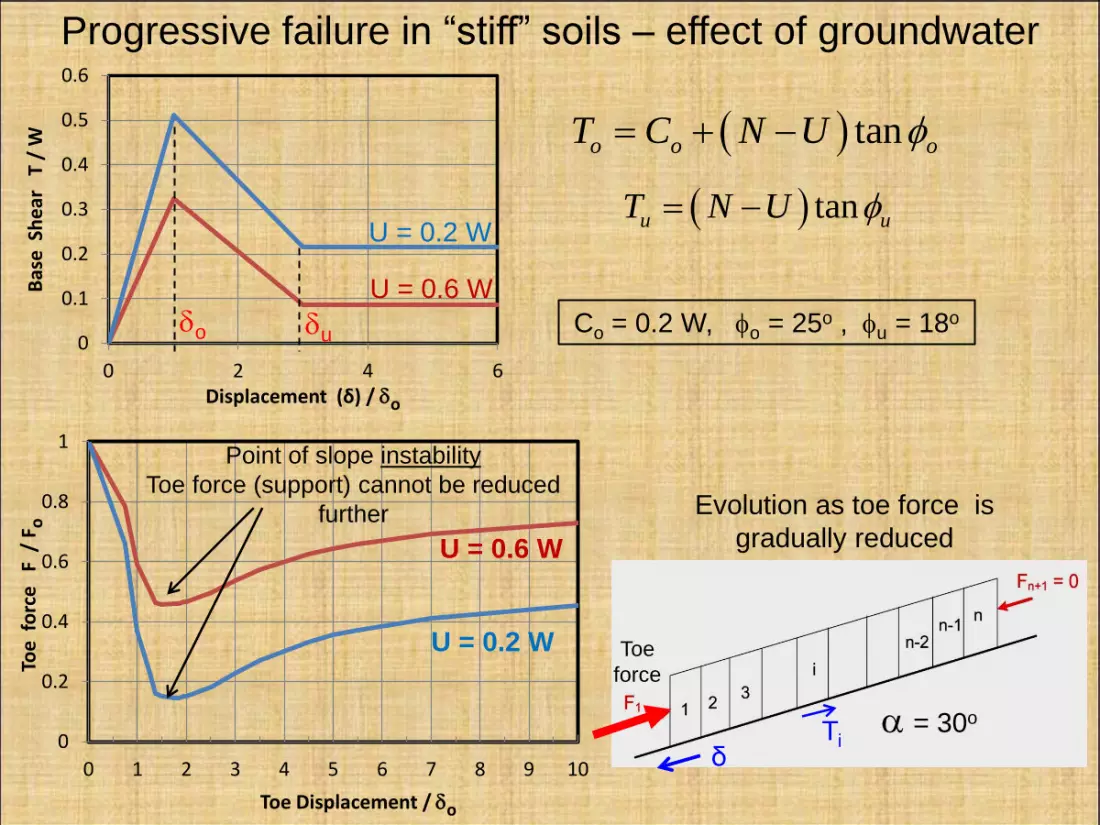
Progressive failure in “stiff” soils – effect of groundwater
o Co = 0.2 W, o = 25o , u = 18o
tano o oT C N U
tanu uT N U
Toe
force
= 30oTi
Evolution as toe force is
gradually reduced
Point of slope instability
Toe force (support) cannot be reduced
further
u
U = 0.2 W
U = 0.6 W
δ
U = 0.2 W
U = 0.6 W
Page 7
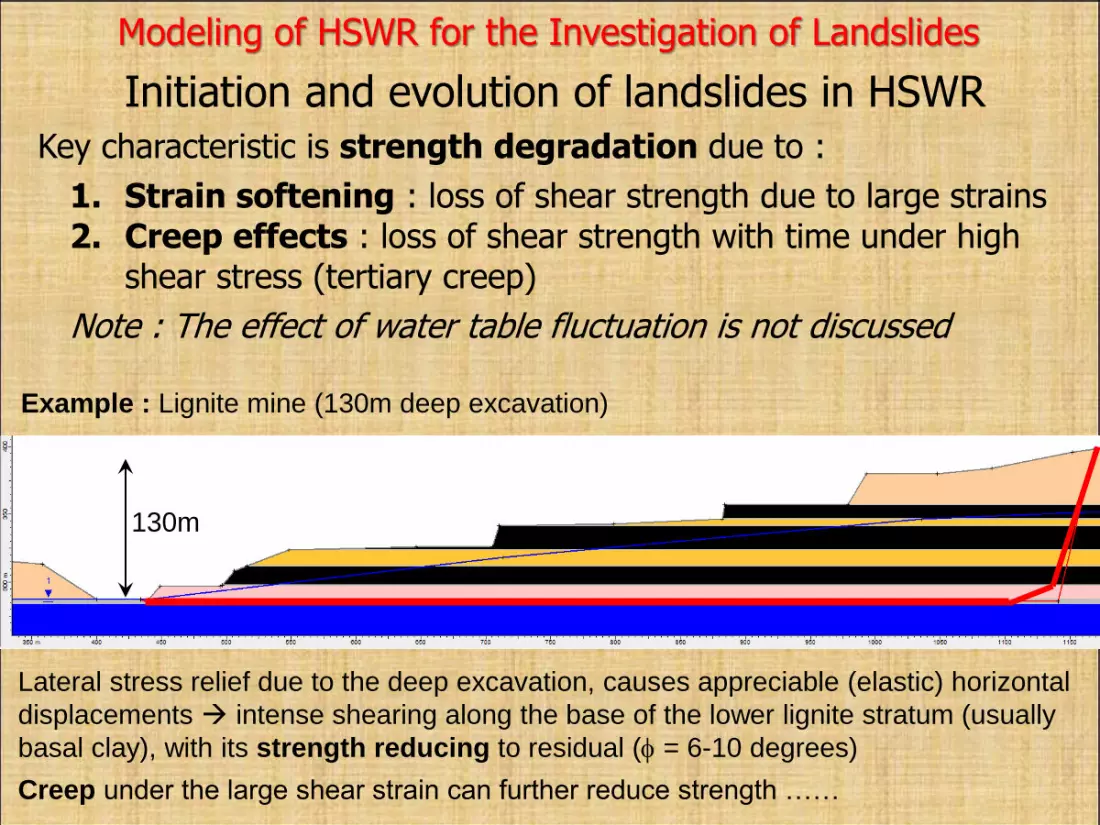
Initiation and evolution of landslides in HSWRKey characteristic is strength degradation due to :
1. Strain softening : loss of shear strength due to large strains2. Creep effects : loss of shear strength with time under high
shear stress (tertiary creep)
Note : The effect of water table fluctuation is not discussed
Modeling of HSWR for the Investigation of Landslides
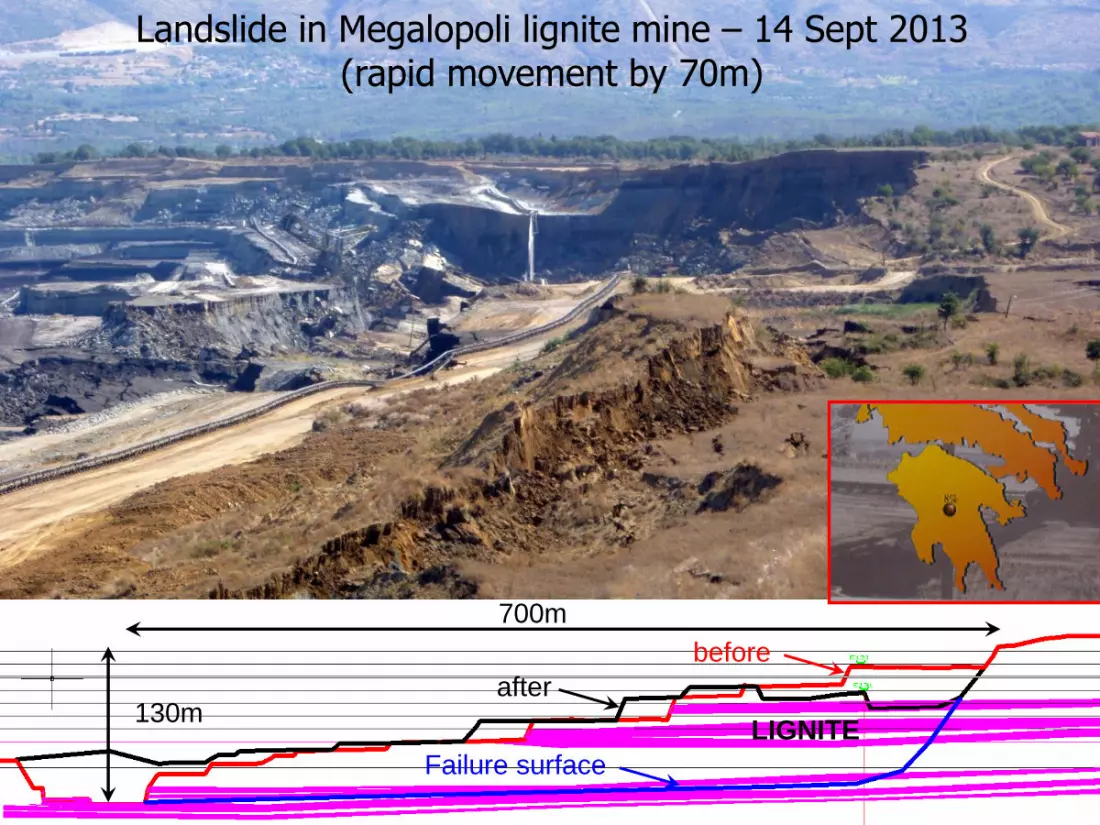
Example : Lignite mine (130m deep excavation)
Lateral stress relief due to the deep excavation, causes appreciable (elastic) horizontal
displacements intense shearing along the base of the lower lignite stratum (usually
basal clay), with its strength reducing to residual ( = 6-10 degrees)
Creep under the large shear strain can further reduce strength ……
130m
Page 8
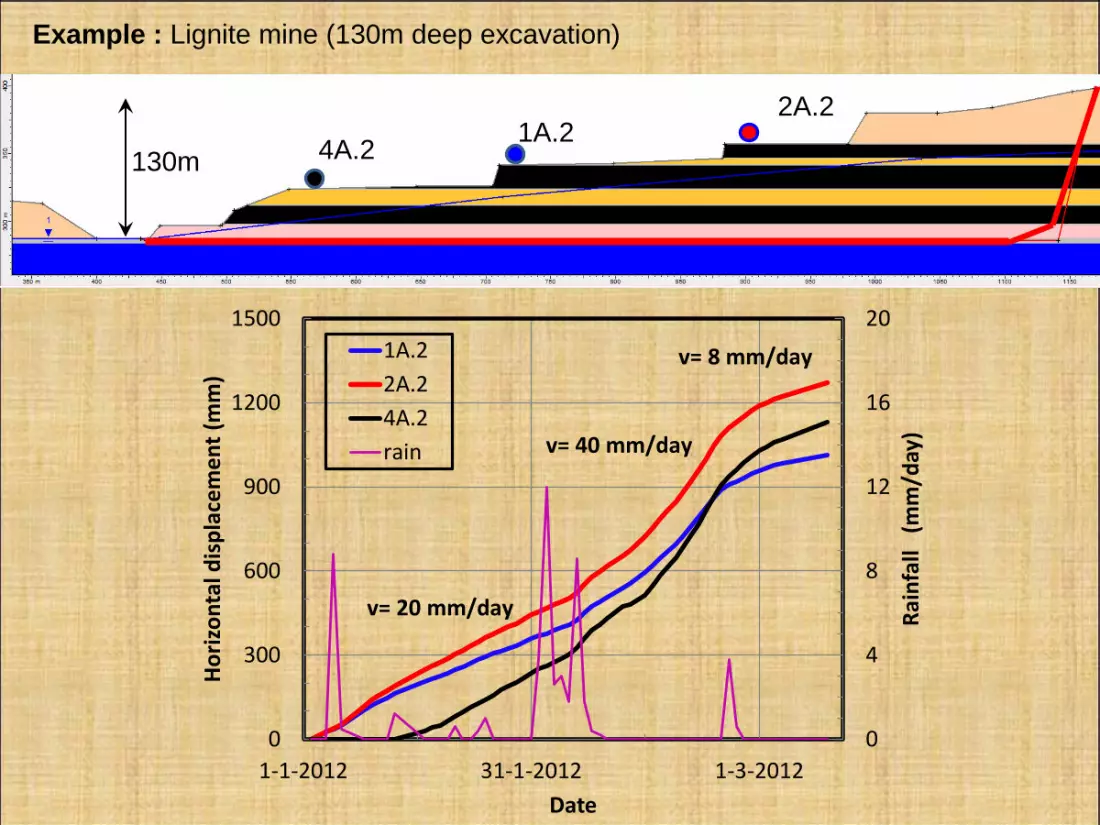
Example : Lignite mine (130m deep excavation)
130m
0
4
8
12
16
20
0
300
600
900
1200
1500
1-1-2012 31-1-2012 1-3-2012
Rai
nfa
ll (
mm
/day
)
Ho
rizo
nta
l dis
pla
cem
en
t (m
m)
Date
1A.2
2A.2
4A.2
rain
v= 20 mm/day
v= 40 mm/day
v= 8 mm/day
2A.21A.2
4A.2
Page 9
Landslide in Megalopoli lignite mine – 14 Sept 2013(rapid movement by 70m)
700m
130m
before
after
Failure surface
LIGNITE
Page 10
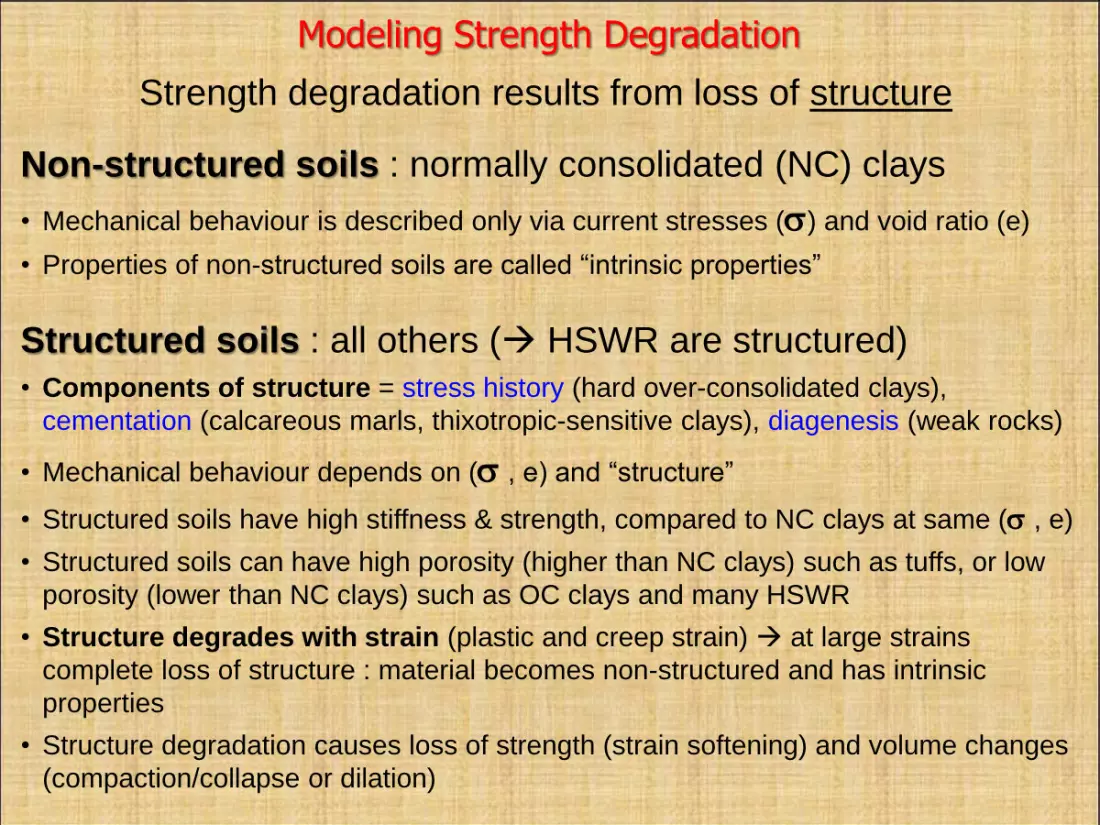
Modeling Strength Degradation
Non-structured soils : normally consolidated (NC) clays
• Mechanical behaviour is described only via current stresses () and void ratio (e)
• Properties of non-structured soils are called “intrinsic properties”
Structured soils : all others ( HSWR are structured)
• Components of structure = stress history (hard over-consolidated clays),
cementation (calcareous marls, thixotropic-sensitive clays), diagenesis (weak rocks)
• Mechanical behaviour depends on ( , e) and “structure”
• Structured soils have high stiffness & strength, compared to NC clays at same ( , e)
• Structured soils can have high porosity (higher than NC clays) such as tuffs, or low
porosity (lower than NC clays) such as OC clays and many HSWR
• Structure degrades with strain (plastic and creep strain) at large strains
complete loss of structure : material becomes non-structured and has intrinsic
properties
• Structure degradation causes loss of strength (strain softening) and volume changes
(compaction/collapse or dilation)
Strength degradation results from loss of structure
Page 11
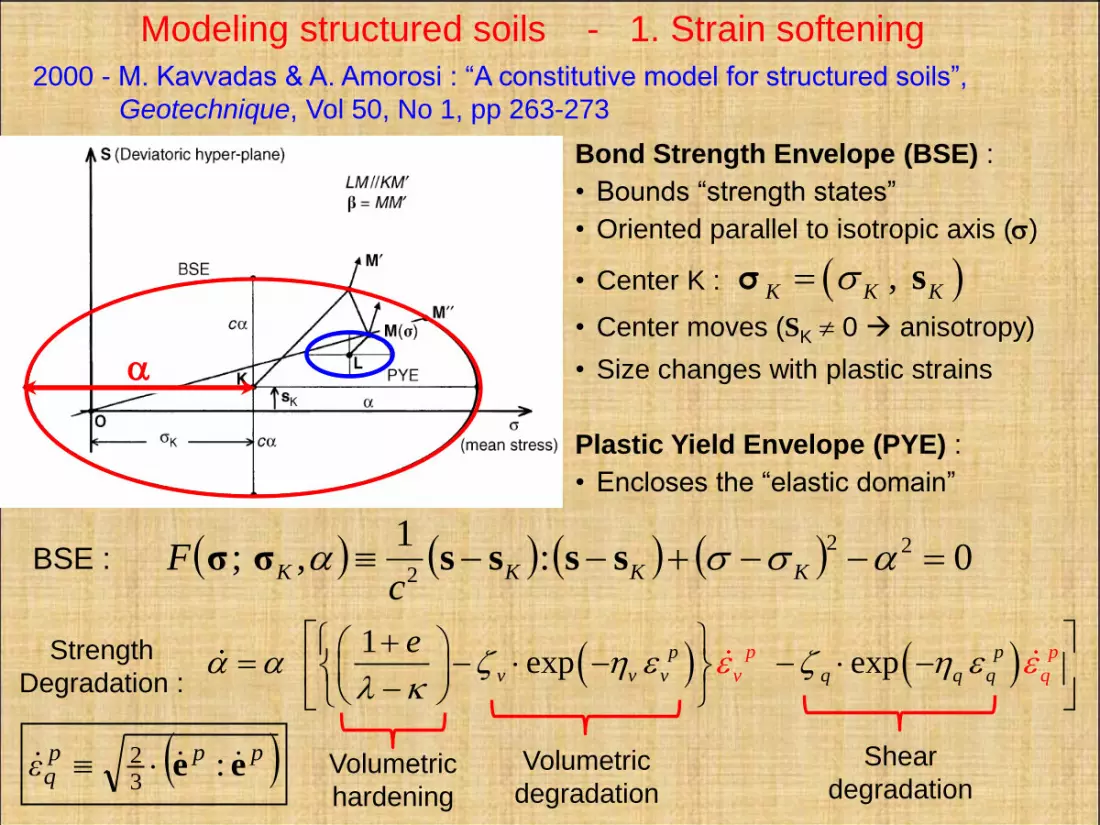
2000 - M. Kavvadas & A. Amorosi : “A constitutive model for structured soils”,
Geotechnique, Vol 50, No 1, pp 263-273
Modeling structured soils - 1. Strain softening
1
exp expp p
v v v
p
q qq
p
v q
e
0:1
,; 22
2 KKKK
cF ssssσσBSE :
Strength
Degradation :
Volumetric
degradation
Shear
degradationVolumetric
hardening
Bond Strength Envelope (BSE) :
• Bounds “strength states”
• Oriented parallel to isotropic axis ()
• Center K :
• Center moves (SK 0 anisotropy)
• Size changes with plastic strains
Plastic Yield Envelope (PYE) :
• Encloses the “elastic domain”
,K K K sσ
pppqε ee :
32
Page 12
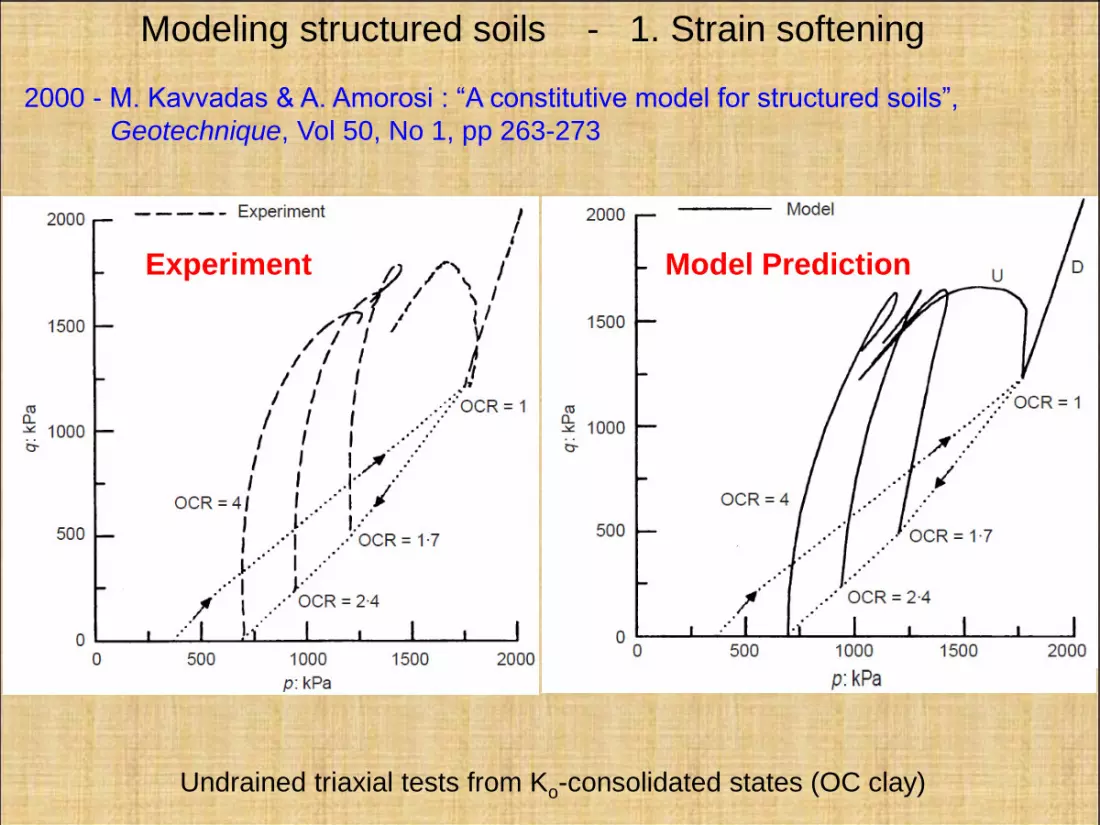
2000 - M. Kavvadas & A. Amorosi : “A constitutive model for structured soils”,
Geotechnique, Vol 50, No 1, pp 263-273
Experiment Model Prediction
Undrained triaxial tests from Ko-consolidated states (OC clay)
Modeling structured soils - 1. Strain softening
Page 13
σK
σ
s ΙSE
Κ*
α*σΚ*
σο* =σΚ* +α*=2α*
Κ
σΚ α
cα
cα
SSE
σο=σΚ+α
L
PYE
M΄
ξα ξα
L
σL
PYE
M
β
M΄΄
σK
σ
s
σ
s ΙSE
Κ*
α*σΚ*
σο* =σΚ* +α*=2α*
ΙSEΙSE
Κ*Κ*Κ*Κ*
α*σΚ* α*σΚ*
σο* =σΚ* +α*=2α*
Κ
σΚ α
cα
cα
SSE
σο=σΚ+α
ΚΚΚ
σΚ ασΚ α
cα
cα
cα
cα
SSESSE
σο=σΚ+ασο=σΚ+α
L
PYE
LL
PYEPYE
M΄M΄
ξα ξα
L
σL
PYE
ξα ξα
L
σL
PYELL
σLσL
PYEPYE
MM
ββ
M΄΄M΄΄
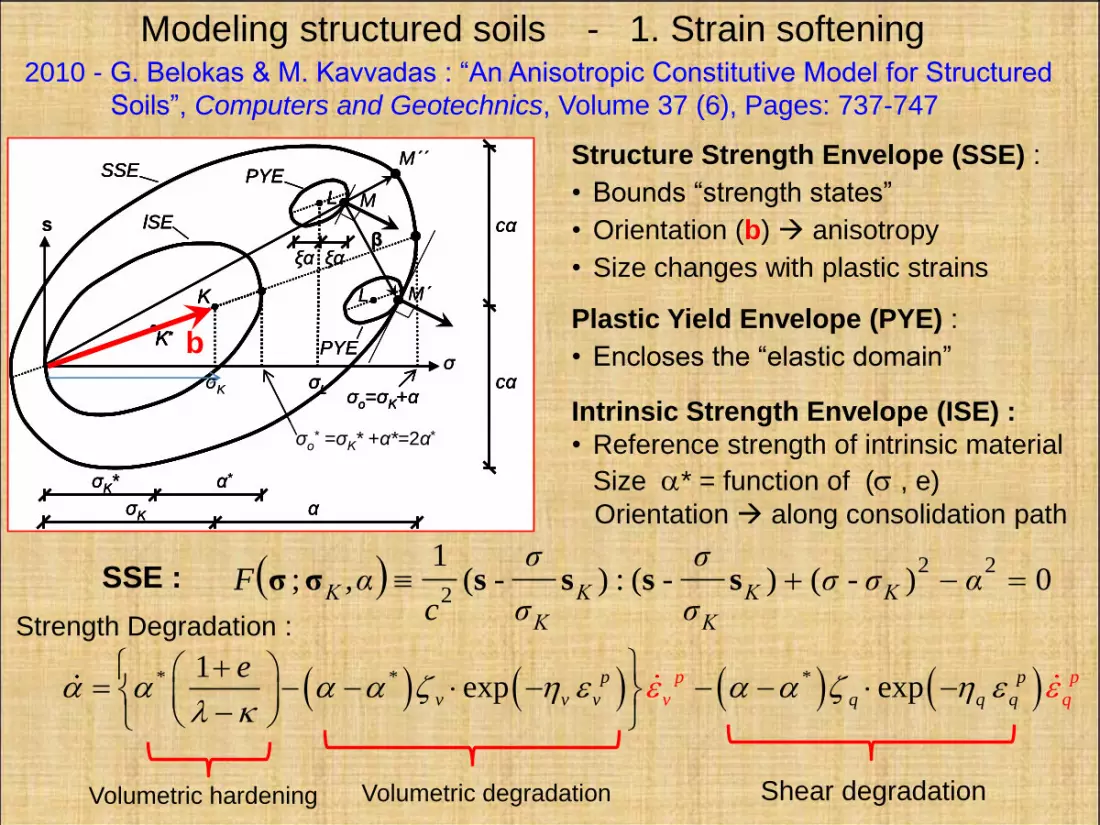
2010 - G. Belokas & M. Kavvadas : “An Anisotropic Constitutive Model for Structured
Soils”, Computers and Geotechnics, Volume 37 (6), Pages: 737-747
Structure Strength Envelope (SSE) :
• Bounds “strength states”
• Orientation (b) anisotropy
• Size changes with plastic strains
Plastic Yield Envelope (PYE) :
• Encloses the “elastic domain”
Intrinsic Strength Envelope (ISE) :
• Reference strength of intrinsic material
Size * = function of ( , e)
Orientation along consolidation path
b
0)-()-(:)-(1
; 22
2 ασσ
σ
σ
σ
σ
cα,F ΚΚ
Κ
Κ
Κ
Κ ssssσσSSE :
* * *1exp expp p
v v v q q q
p p
v q
e
Strength Degradation :
Volumetric degradation Shear degradationVolumetric hardening
Modeling structured soils - 1. Strain softening
Page 14
0
100
200
300
400
500
600
700
0 100 200 300 400 500 600 700 800
She
ar s
tre
ss -
q (
kPa)
Mean stress - p (kPa)
0
100
200
300
400
500
600
700
0.00 0.10 0.20 0.30 0.40
She
ar s
tre
ss -
q (
kPa)
Shear strain - εq
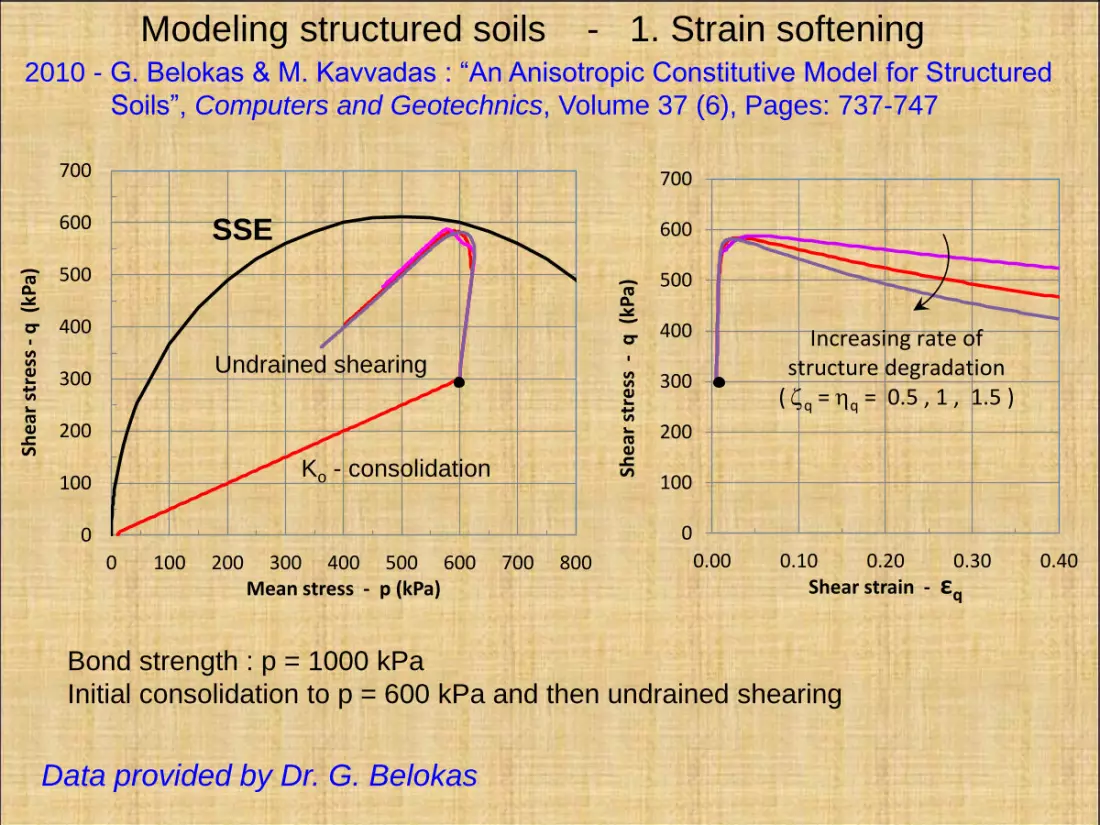
Increasing rate ofstructure degradation
( q = q = 0.5 , 1 , 1.5 )
Ko - consolidation
Undrained shearing
2010 - G. Belokas & M. Kavvadas : “An Anisotropic Constitutive Model for Structured
Soils”, Computers and Geotechnics, Volume 37 (6), Pages: 737-747
Bond strength : p = 1000 kPa
Initial consolidation to p = 600 kPa and then undrained shearing
Modeling structured soils - 1. Strain softening
SSE
Data provided by Dr. G. Belokas
Page 15
0
100
200
300
400
500
600
700
0.00 0.10 0.20 0.30 0.40
She
ar s
tre
ss -
q (
kPa)
Shear strain - εq
0
100
200
300
400
500
600
700
0 100 200 300 400 500 600 700 800
She
ar s
tre
ss -
q (
kPa)
Mean stress - p (kPa)
Ko - consolidation
Undrained shearing
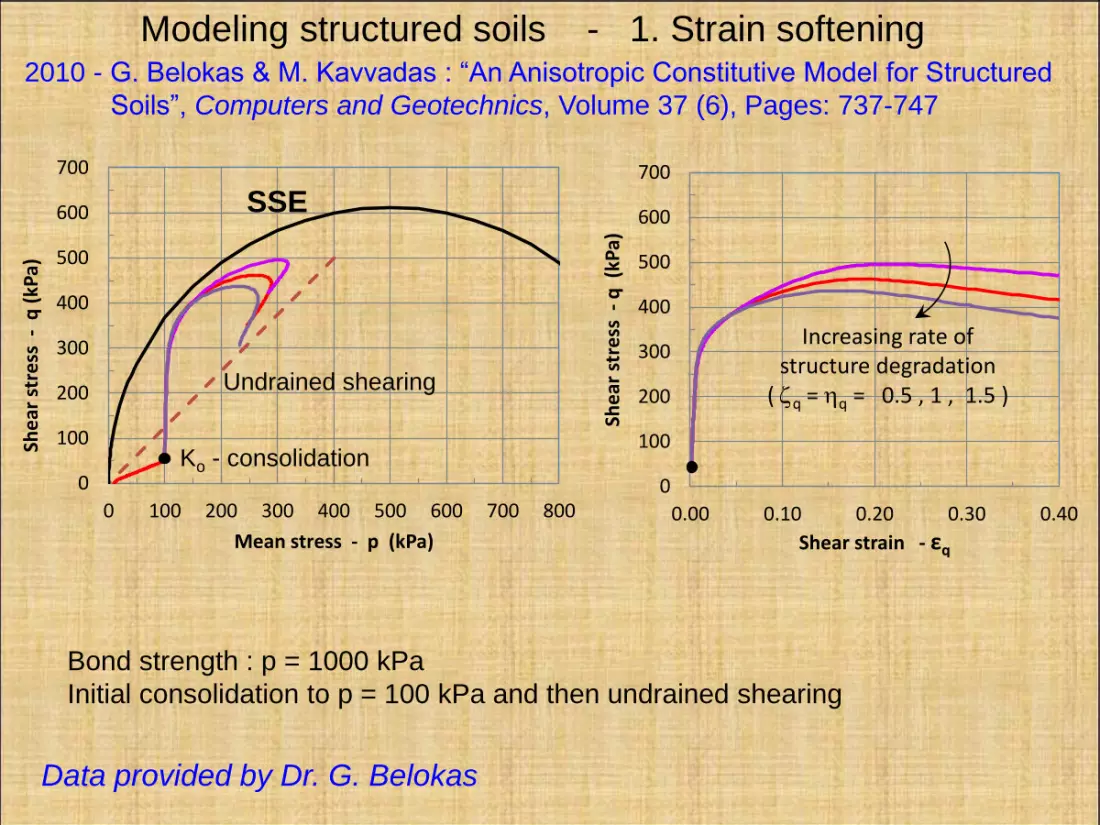
2010 - G. Belokas & M. Kavvadas : “An Anisotropic Constitutive Model for Structured
Soils”, Computers and Geotechnics, Volume 37 (6), Pages: 737-747
Increasing rate ofstructure degradation
( q = q = 0.5 , 1 , 1.5 )
Bond strength : p = 1000 kPa
Initial consolidation to p = 100 kPa and then undrained shearing
Modeling structured soils - 1. Strain softening
SSE
Data provided by Dr. G. Belokas
Page 16
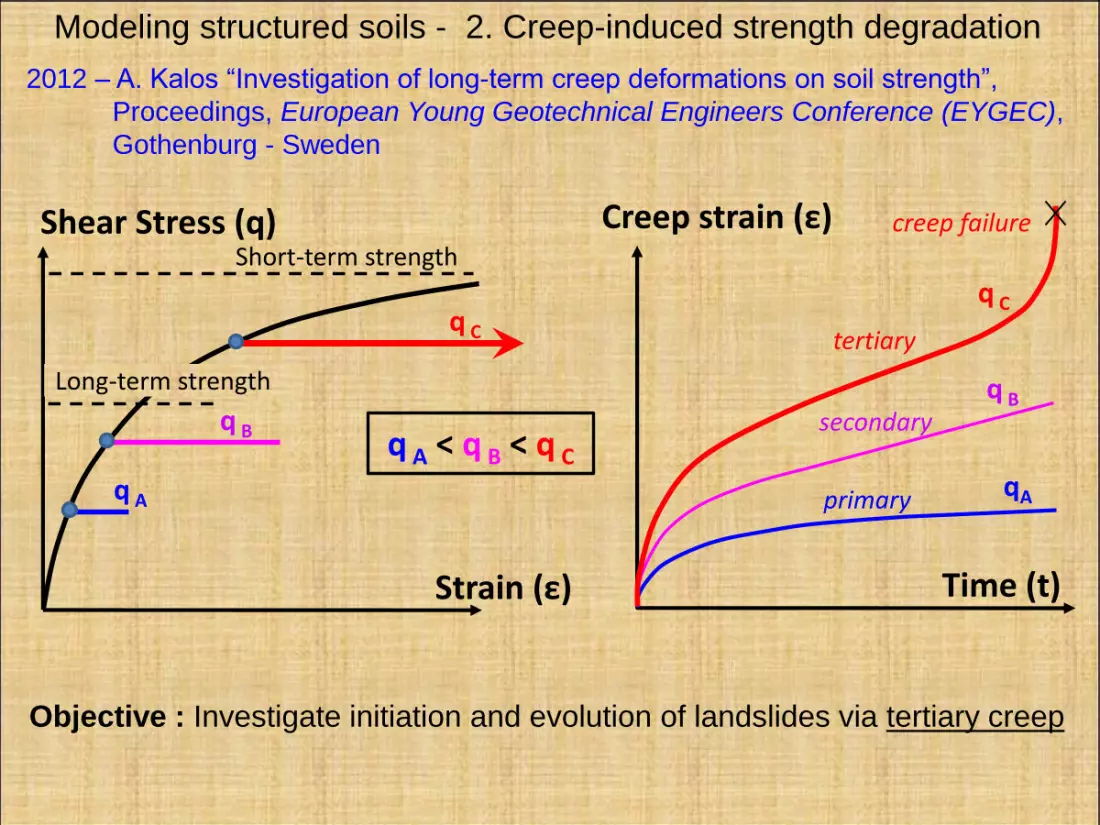
Modeling structured soils - 2. Creep-induced strength degradation
2012 – A. Kalos “Investigation of long-term creep deformations on soil strength”,
Proceedings, European Young Geotechnical Engineers Conference (EYGEC),
Gothenburg - Sweden
Time (t)
qA
Creep strain (ε)
secondary
primary
tertiary
creep failure
q B
q C
q A < q B < q C
Strain (ε)
Shear Stress (q)
q A
q B
q C
Objective : Investigate initiation and evolution of landslides via tertiary creep
Short-term strength
Long-term strength
Page 17
α*
α
σ
cα
sShort-term CSL
Short-term SSE
Long-term CSL
2 2
2
1F : σ α α
c s s
ISE
2. State leading to
long-term failure
1. State not leading
to long-term failure
Modeling structured soils - 2. Creep-induced strength degradation
* * *1exp expp p
v v v q q q
p p
v q
e
1. Strength degradation with plastic strains :
Volumetric degradation Shear degradationVolumetric hardening
Simple model with both plastic strain and creep destructuring
PYE
Initial state
t
ε
1
2
Page 18
0
500
1000
1500
0 500 1000 1500
σ1
-σ
3(k
Pa)
mean stress p (kPa)
CSLCU stress pathinitial SSEfinal SSE
0
100
200
300
400
500
600
0 0.1 0.2 0.3 0.4
σ1
-σ
3(k
Pa)
axial strain ε1
0
500
1000
1500
0 500 1000 1500 2000 2500
σ1
-σ
3(k
Pa)
mean stress p (kPa)
CSLCD stress pathinitial SSEfinal SSE
0
100
200
300
400
500
600
0 0.1 0.2 0.3 0.4
σ1
-σ
3(k
Pa)
axial strain ε1
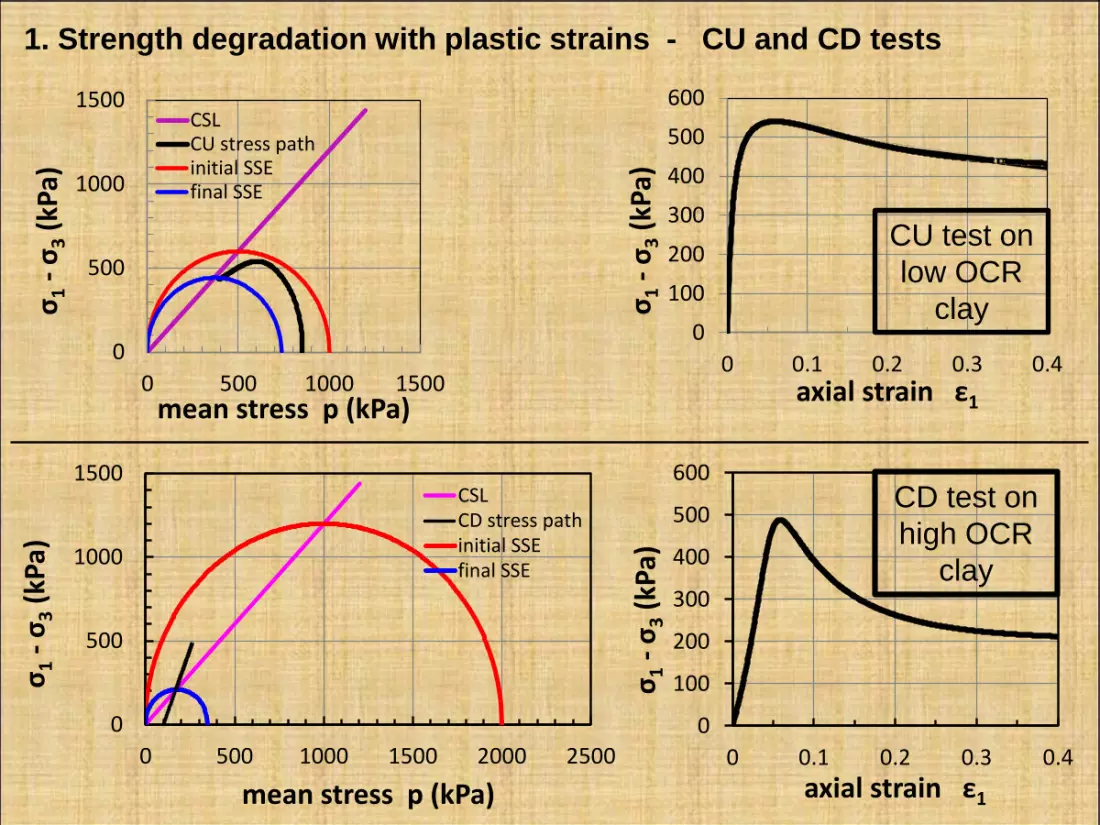
1. Strength degradation with plastic strains - CU and CD tests
CU test on
low OCR
clay
CD test on
high OCR
clay
Page 19
1
0
11
tqt
q m
mtq
ε 2A sinh a Dε
tm
ε2A sinh a D t
Shear creep strain-rate :
Singh-Mitchell type creep
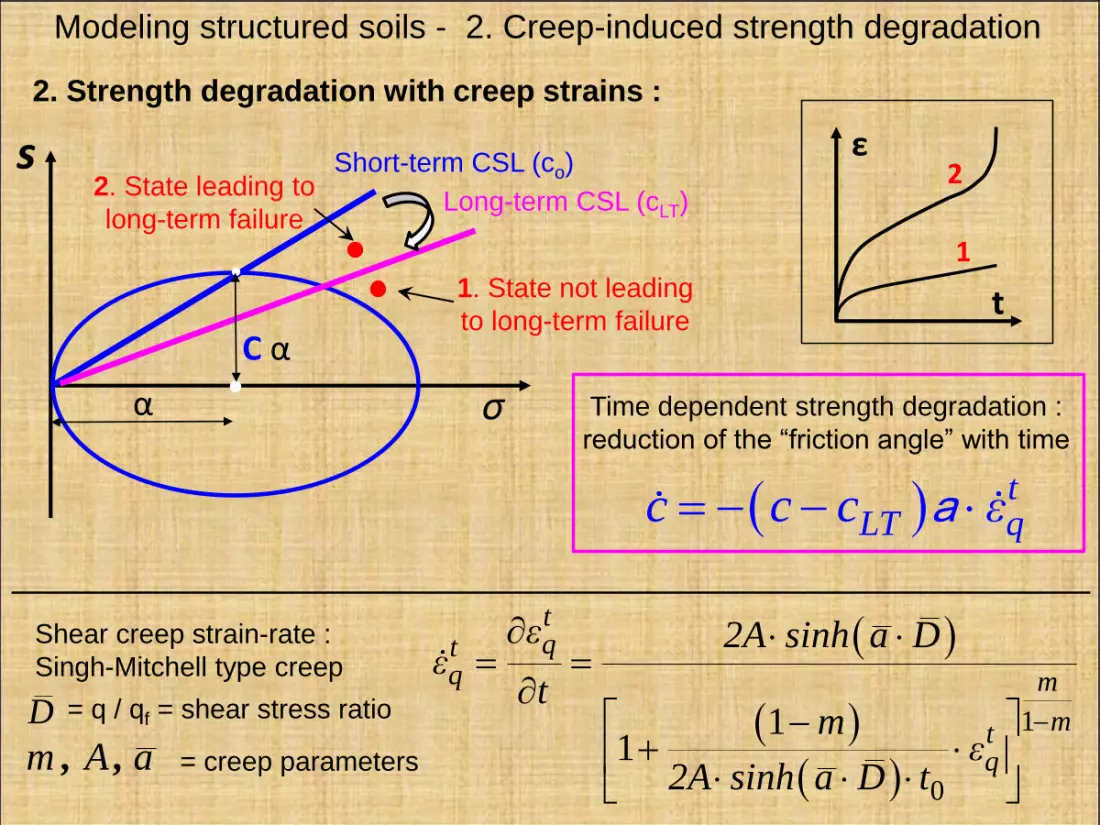
= q / qf = shear stress ratio
Modeling structured soils - 2. Creep-induced strength degradation
tLT qc c c ε a
2. Strength degradation with creep strains :
D
m A a, , = creep parameters
α σ
C α
s Short-term CSL (co)
Long-term CSL (cLT)2. State leading to
long-term failure
1. State not leading
to long-term failure
Time dependent strength degradation :
reduction of the “friction angle” with time
t
ε
1
2
Page 20
0
500
1000
1500
0 0.1 0.2 0.3 0.4
She
ar
q =
σ1
-σ
3(k
Pa)
Shear strain q
primary creep
secondary creep
tertiary creep
0.0
0.2
0.4
0.6
0 5 10 15
She
ar s
trai
n
q
time (months)
primary creep
secondary creep
tertiary creep
0
500
1000
1500
0 500 1000 1500 2000 2500
She
ar s
ress
q =
σ1
-σ
3(k
Pa)
Mean stress p (kPa)
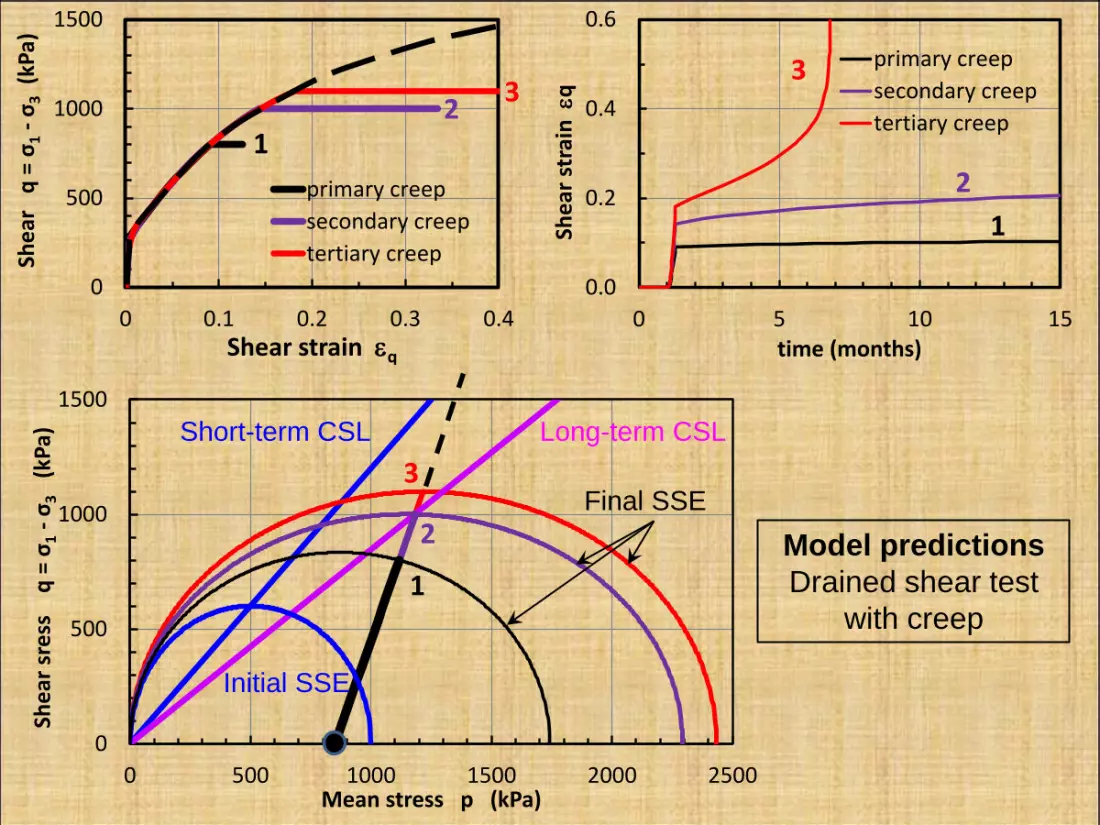
Short-term CSL Long-term CSL
Initial SSE
Final SSE
Model predictions
Drained shear test
with creep
1
3
2
1
32
1
2
3
Page 21
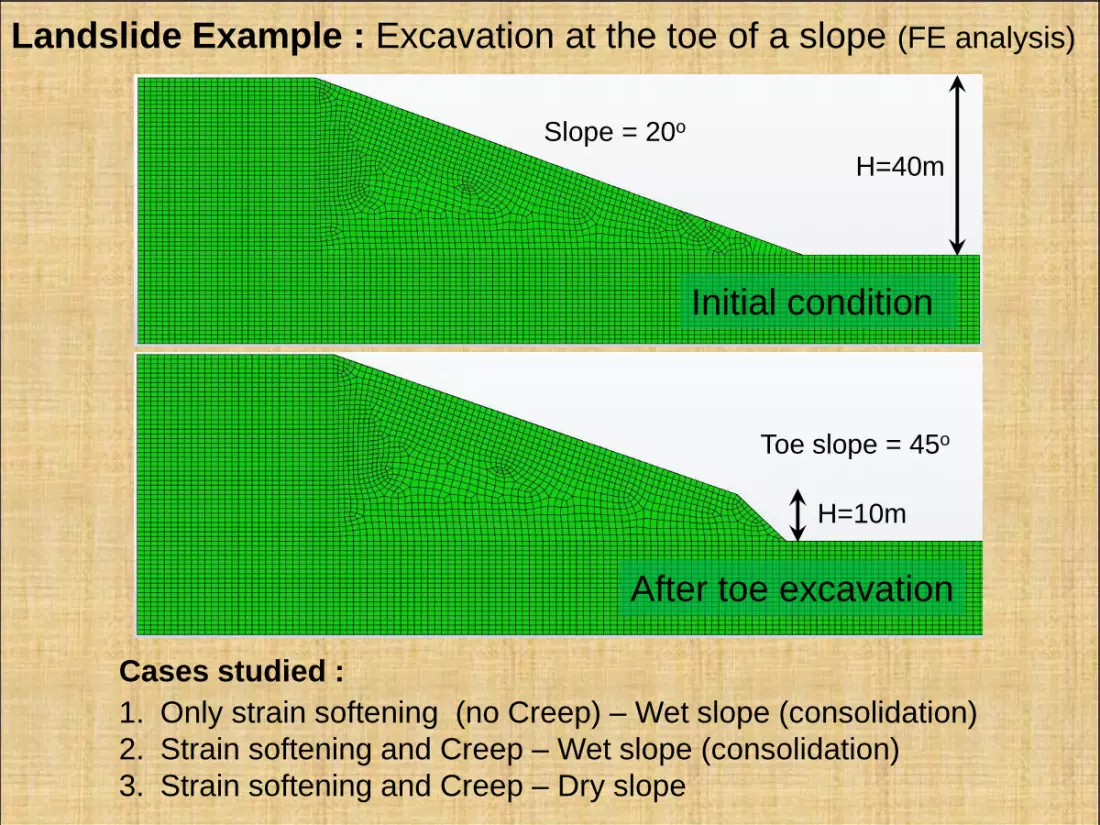
Landslide Example : Excavation at the toe of a slope (FE analysis)
H=40m
Slope = 20o
H=10m
Toe slope = 45o
Initial condition
After toe excavation
Cases studied :
1. Only strain softening (no Creep) – Wet slope (consolidation)
2. Strain softening and Creep – Wet slope (consolidation)
3. Strain softening and Creep – Dry slope
Page 22
1. Only strain softening (no Creep) – Wet slope (consolidation)
Displacements shortly after toe excavation
(undrained toe excavation)
U = 17cm
Displacements at failure
(during consolidation)
Umax > 50cm
Localised failure surface does not develop …..
U = 20cm
U = 28cm
Page 23
1. Only strain softening (no Creep) – Wet slope (consolidation)
Localised failure surface
does not develop …..
1
2
3
0.0
0.1
0.2
0.3
0.4
0.5
900 950 1000 1050
Um
agn
(m)
time (days)
1
2
3
Toe excavation
Failure
Evolution of slope displacement
during consolidation
(after toe excavation)
Page 24
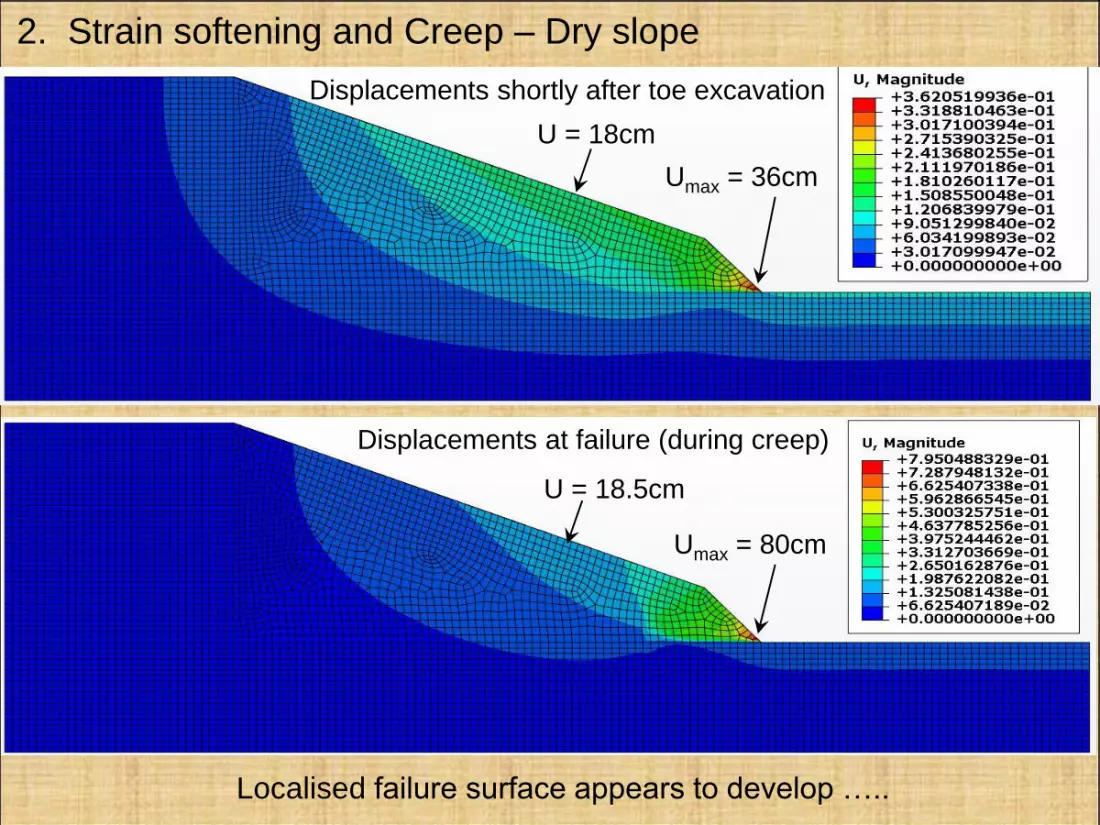
2. Strain softening and Creep – Dry slope
Displacements shortly after toe excavation
Umax = 36cm
Displacements at failure (during creep)
Umax = 80cm
Localised failure surface appears to develop …..
U = 18cm
U = 18.5cm
Page 25
Mises shear stress (q)
shortly after toe excavation
Mises shear stress (q)
at failure (during creep)
Small q on
“failure” surface
2. Strain softening and Creep – Dry slope
Localised failure surface appears to develop …
Large q on
“failure” surface
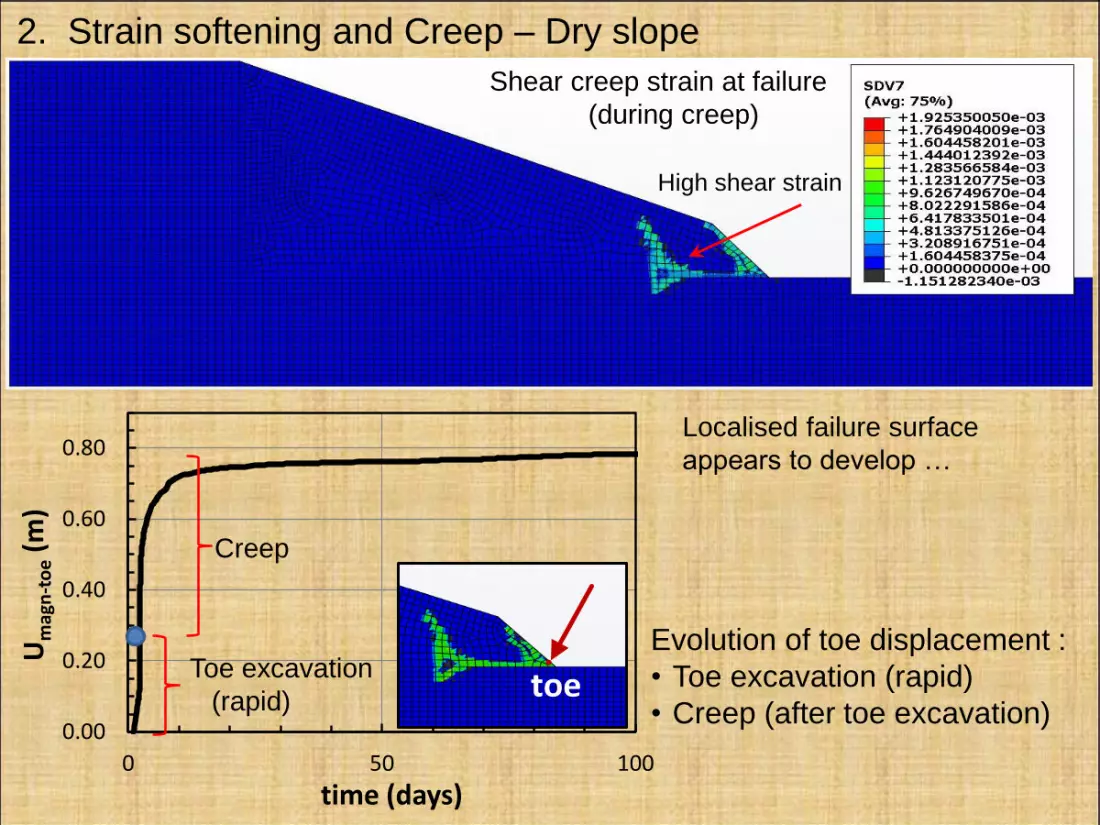
Page 26
Shear creep strain at failure
(during creep)
0.00
0.20
0.40
0.60
0.80
0 50 100
Um
agn
-to
e(m
)
time (days)
toe
Evolution of toe displacement :
• Toe excavation (rapid)
• Creep (after toe excavation)
Toe excavation
(rapid)
Creep
2. Strain softening and Creep – Dry slope
Localised failure surface
appears to develop …
High shear strain
Page 27
3
0.00
0.03
0.06
0.09
0.12
0 50 100
She
ar s
trai
n
εq
time (days)
0
100
200
300
400
500
0 100 200 300 400 500 600
She
ar s
tre
ss
q (
kPa)
Mean stress p (kPa)
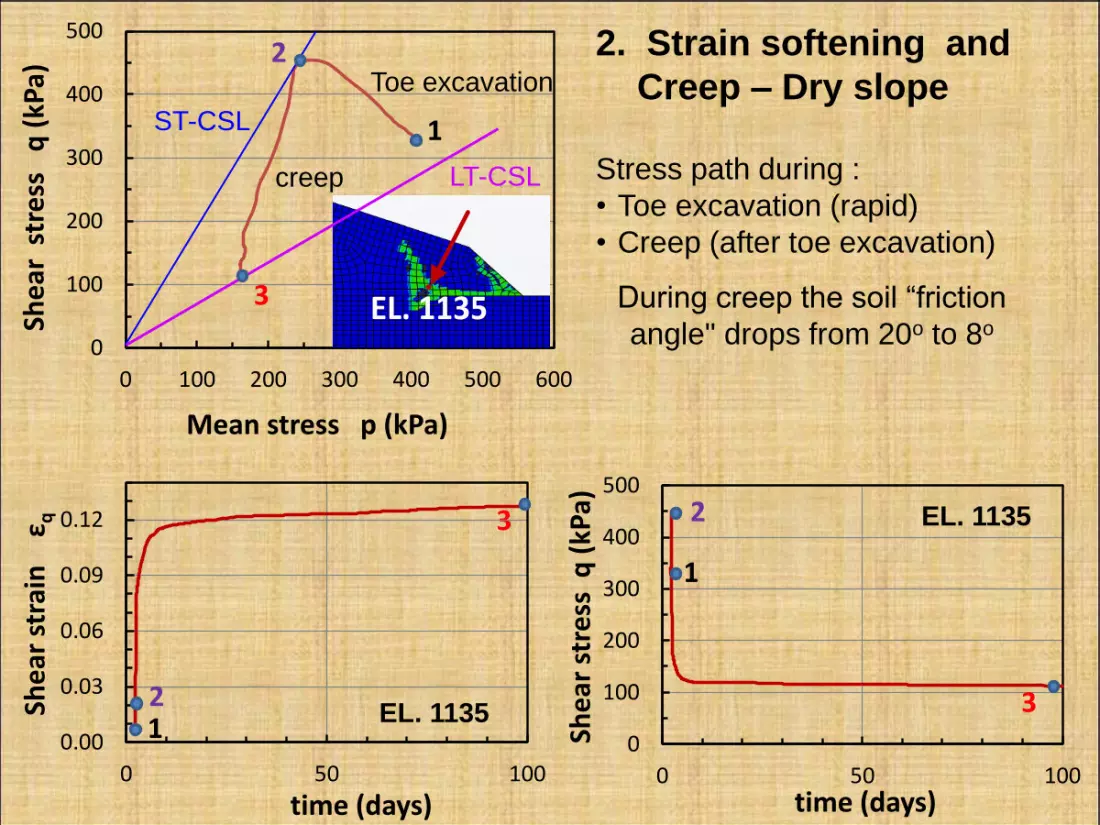
EL. 1135
Toe excavation
creep Stress path during :
• Toe excavation (rapid)
• Creep (after toe excavation)
During creep the soil “friction
angle" drops from 20o to 8o
1
2
3
12
EL. 1135
2. Strain softening and
Creep – Dry slope
0
100
200
300
400
500
0 50 100
She
ar s
tre
ss q
(kP
a)
time (days)
EL. 1135
1
3
2
ST-CSL
LT-CSL
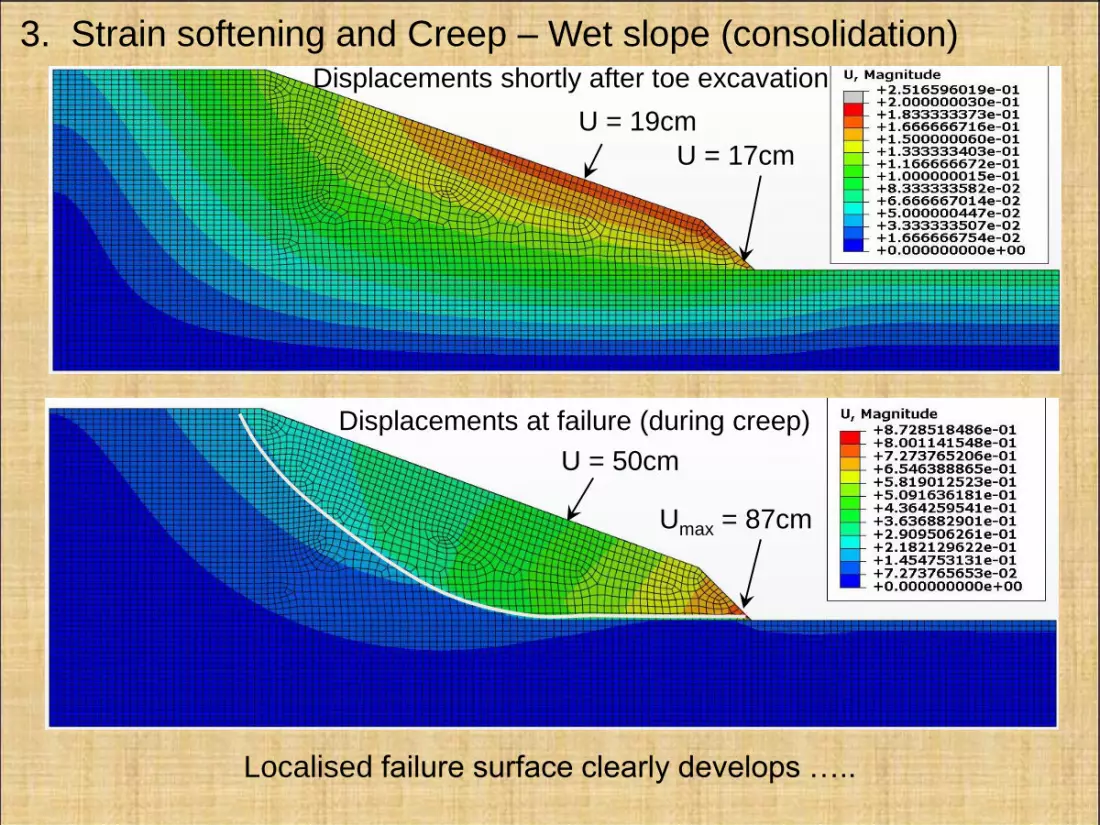
Page 28
3. Strain softening and Creep – Wet slope (consolidation)Displacements shortly after toe excavation
U = 17cm
Displacements at failure (during creep)
Umax = 87cm
Localised failure surface clearly develops …..
U = 19cm
U = 50cm
Page 29
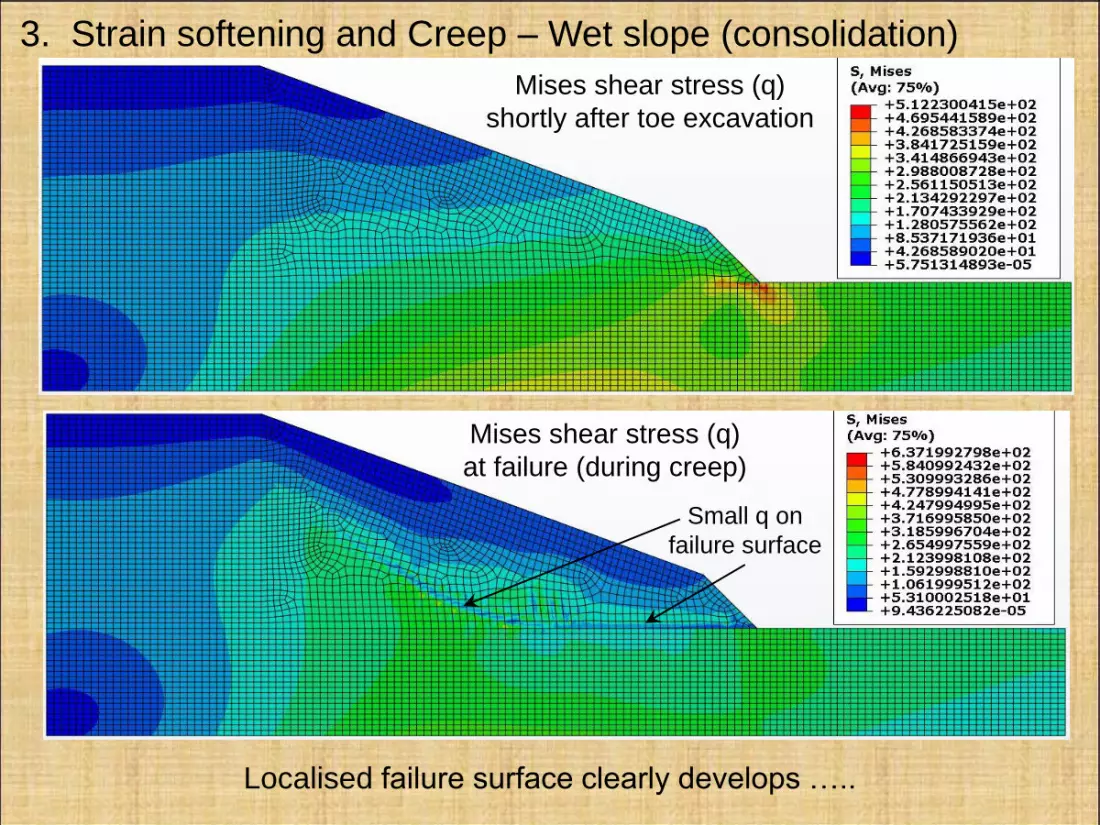
3. Strain softening and Creep – Wet slope (consolidation)
Localised failure surface clearly develops …..
Mises shear stress (q)
shortly after toe excavation
Mises shear stress (q)
at failure (during creep)
Small q on
failure surface
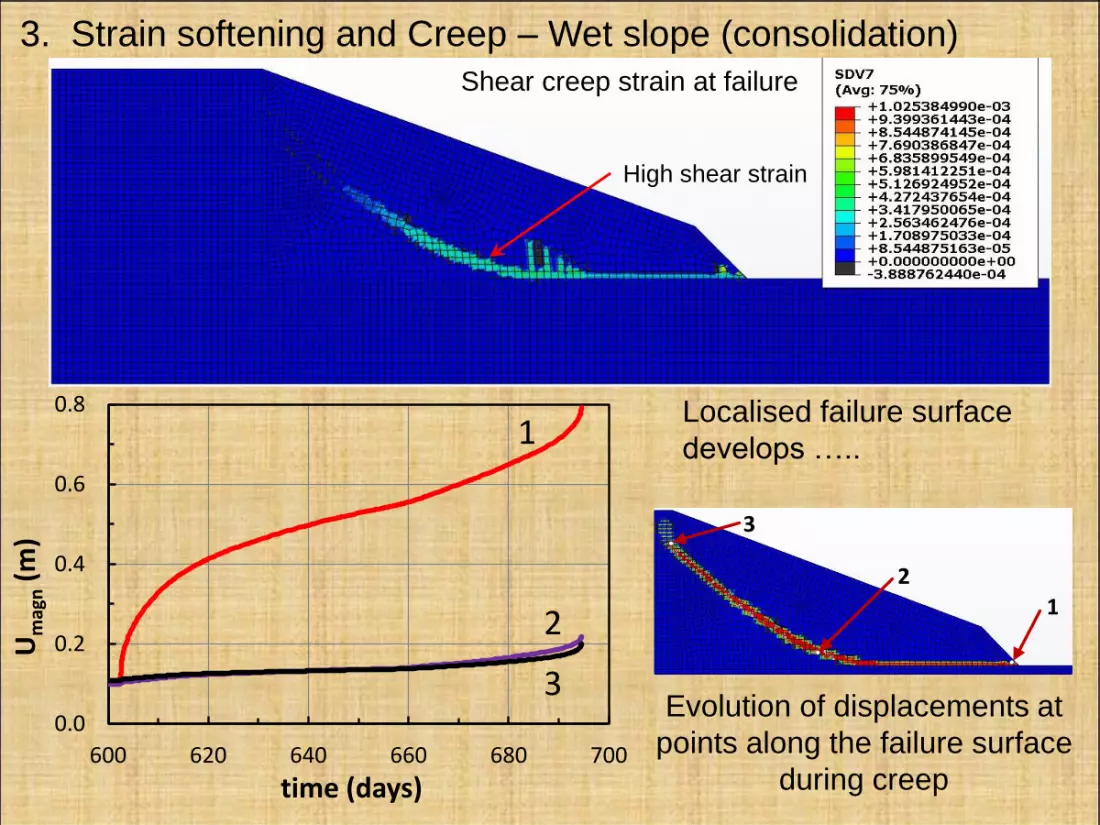
Page 30
Shear creep strain at failure
Evolution of displacements at
points along the failure surface
during creep
Localised failure surface
develops …..
High shear strain
3. Strain softening and Creep – Wet slope (consolidation)
0.0
0.2
0.4
0.6
0.8
600 620 640 660 680 700
Um
agn
(m)
time (days)
1
3
2
2
1
3
Page 31
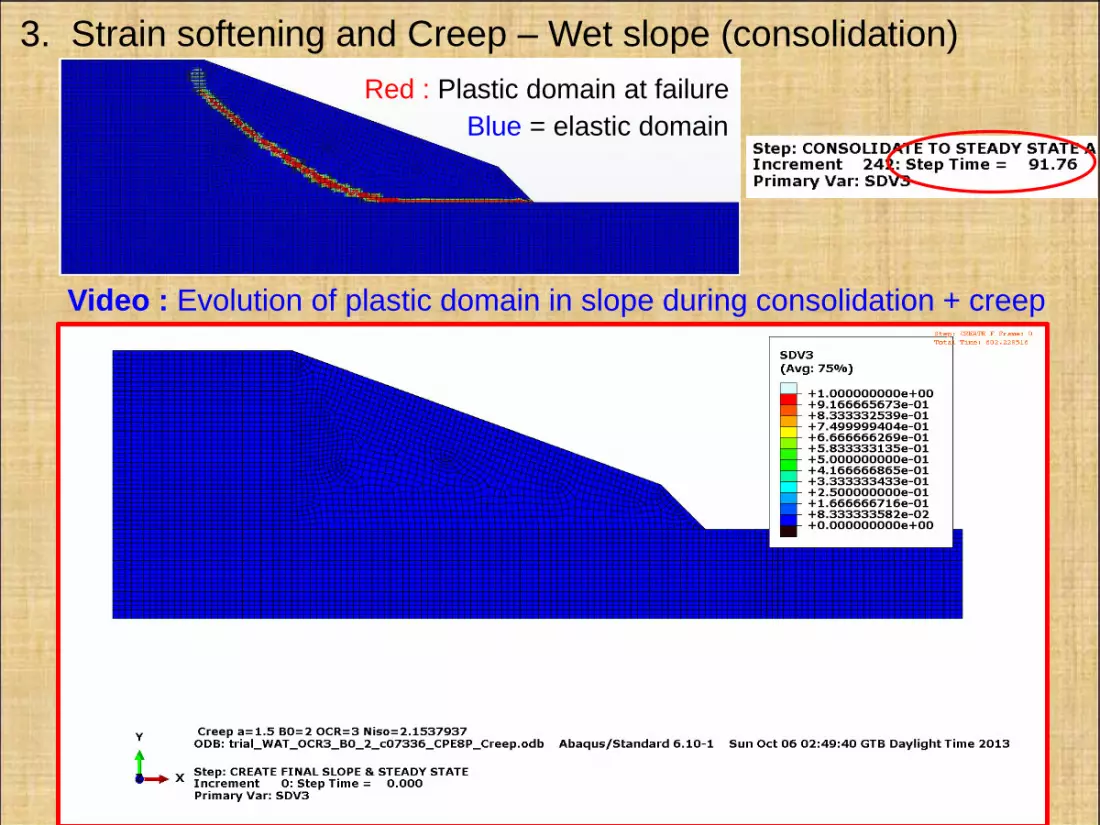
Red : Plastic domain at failure
Blue = elastic domain
3. Strain softening and Creep – Wet slope (consolidation)
Video : Evolution of plastic domain in slope during consolidation + creep
Page 32
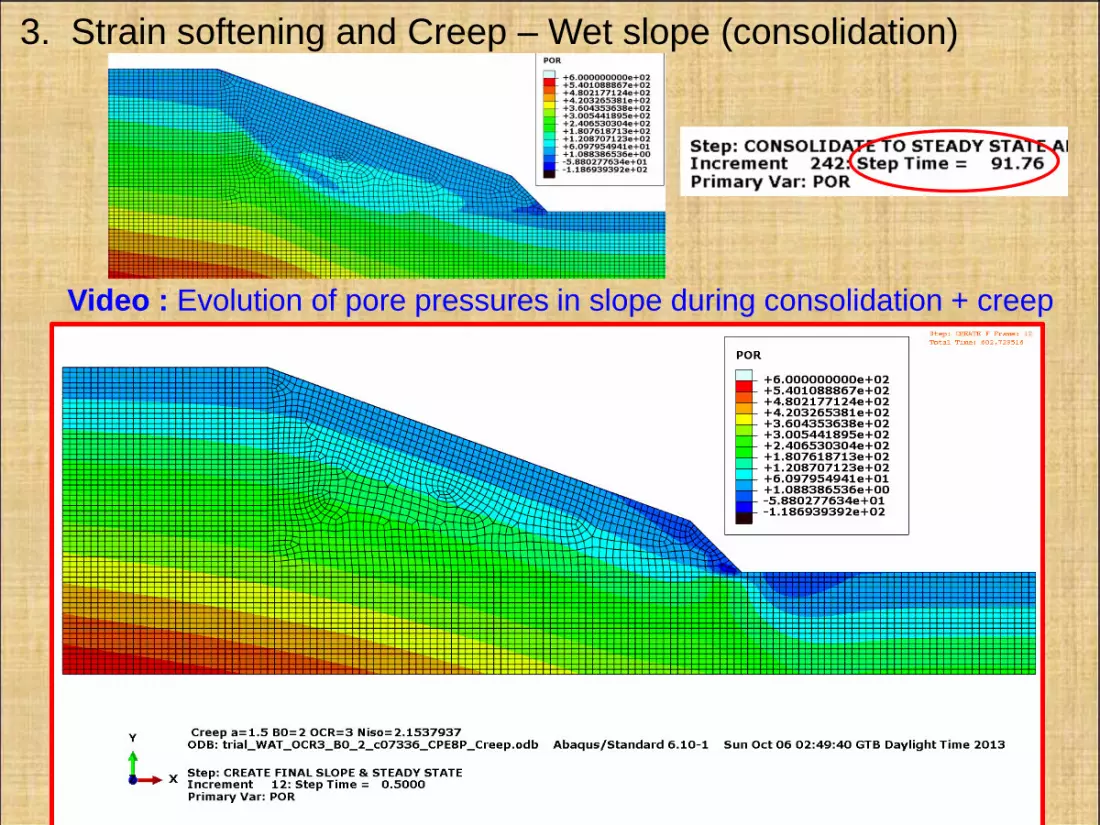
3. Strain softening and Creep – Wet slope (consolidation)
Video : Evolution of pore pressures in slope during consolidation + creep
Page 33
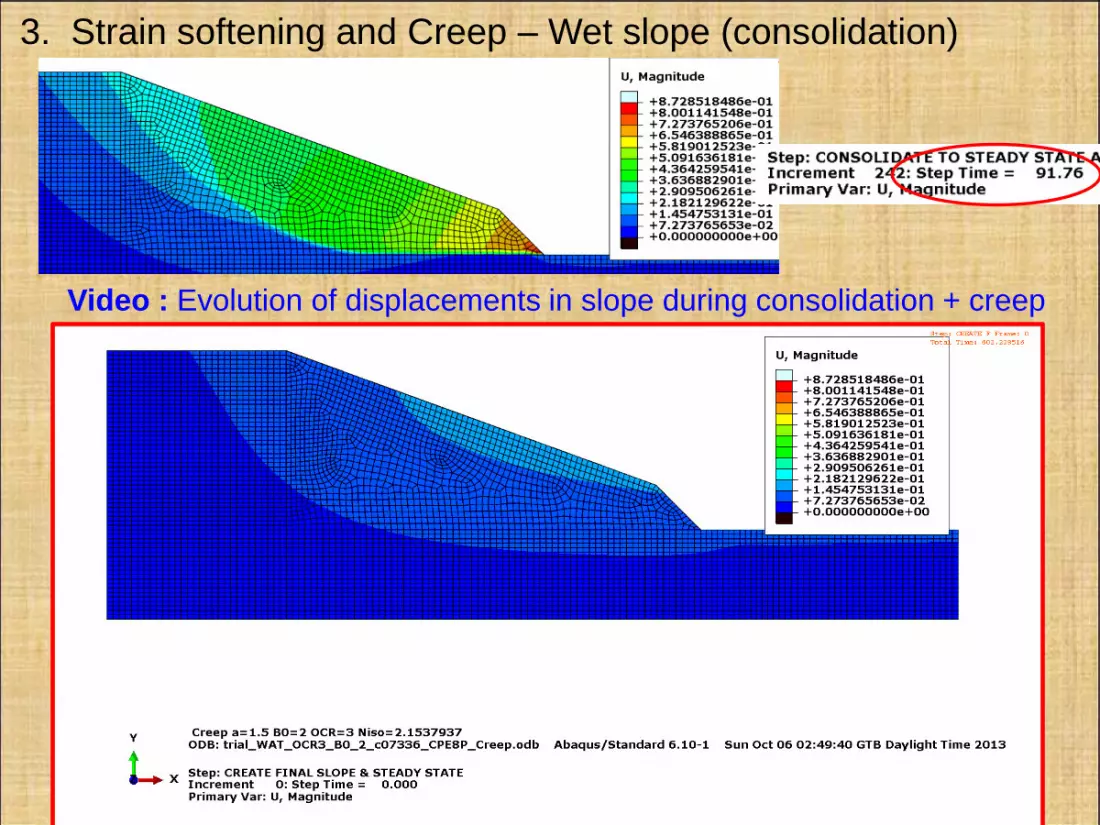
3. Strain softening and Creep – Wet slope (consolidation)
Video : Evolution of displacements in slope during consolidation + creep
Page 34
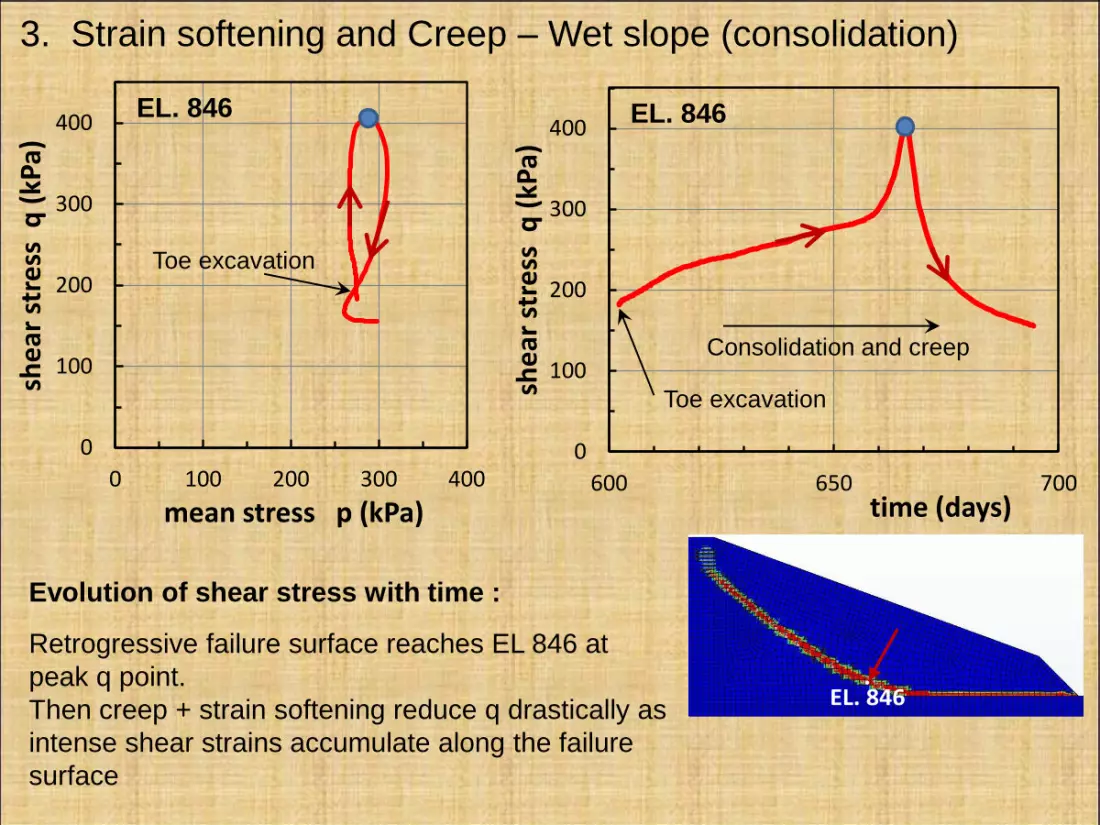
3. Strain softening and Creep – Wet slope (consolidation)
0
100
200
300
400
0 100 200 300 400
she
ar s
tre
ss q
(kP
a)
mean stress p (kPa)
EL. 846
0
100
200
300
400
600 650 700
she
ar s
tre
ss q
(kP
a)time (days)
Toe excavation
Consolidation and creep
Evolution of shear stress with time :
Retrogressive failure surface reaches EL 846 at
peak q point.
Then creep + strain softening reduce q drastically as
intense shear strains accumulate along the failure
surface
EL. 846 EL. 846
Toe excavation
Page 35
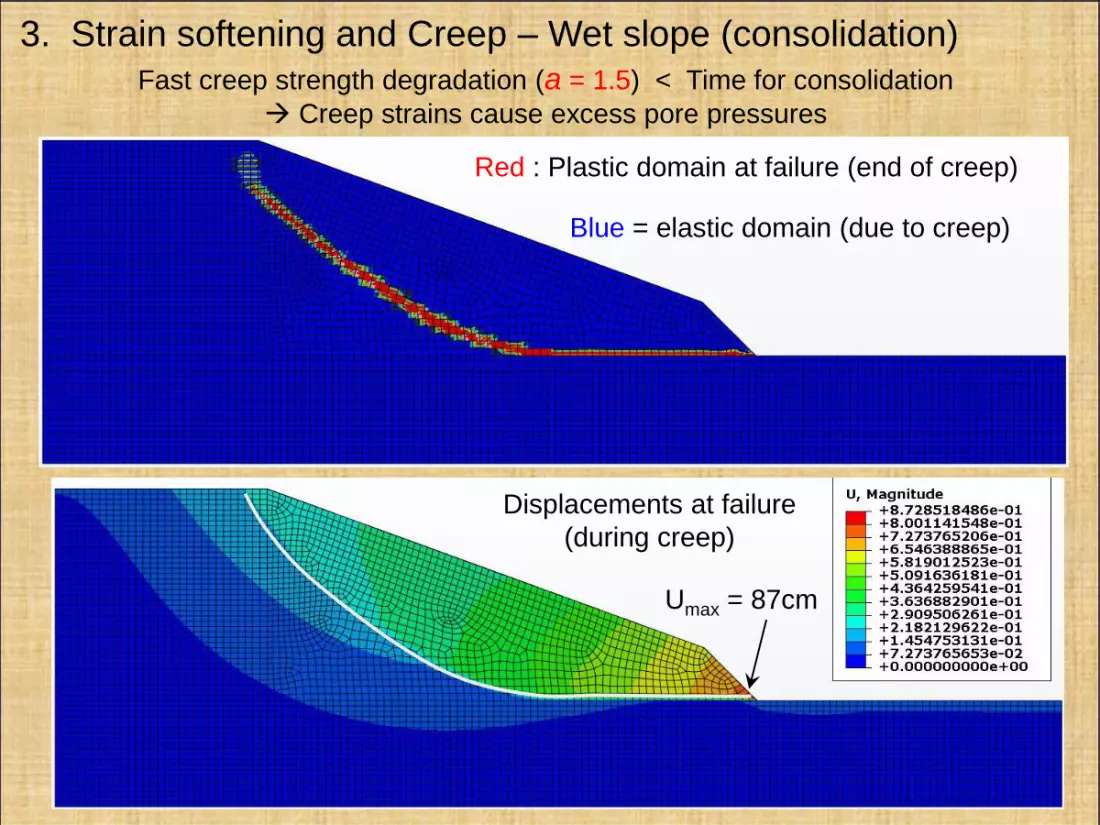
3. Strain softening and Creep – Wet slope (consolidation)
Red : Plastic domain at failure (end of creep)
Displacements at failure
(during creep)
Umax = 87cm
Fast creep strength degradation (a = 1.5) < Time for consolidation
Creep strains cause excess pore pressures
Blue = elastic domain (due to creep)
Page 36
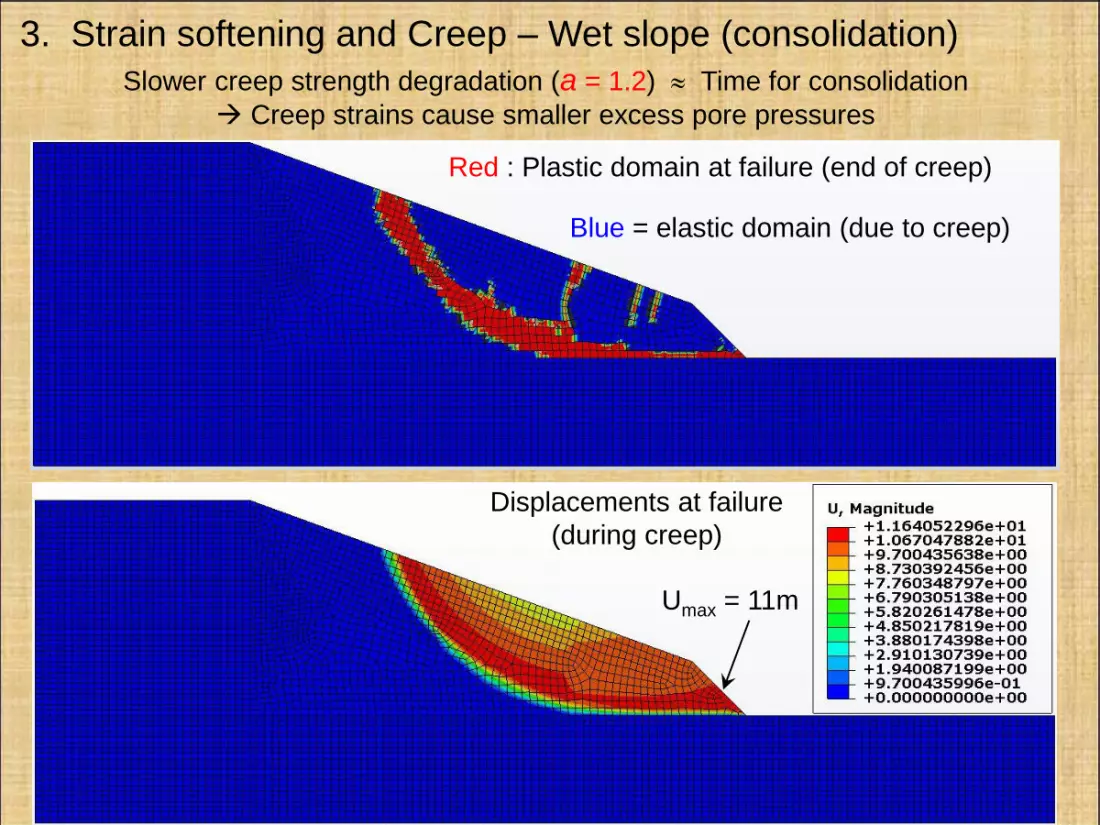
3. Strain softening and Creep – Wet slope (consolidation)
Red : Plastic domain at failure (end of creep)
Displacements at failure
(during creep)
Umax = 11m
Slower creep strength degradation (a = 1.2) Time for consolidation
Creep strains cause smaller excess pore pressures
Blue = elastic domain (due to creep)
Page 37
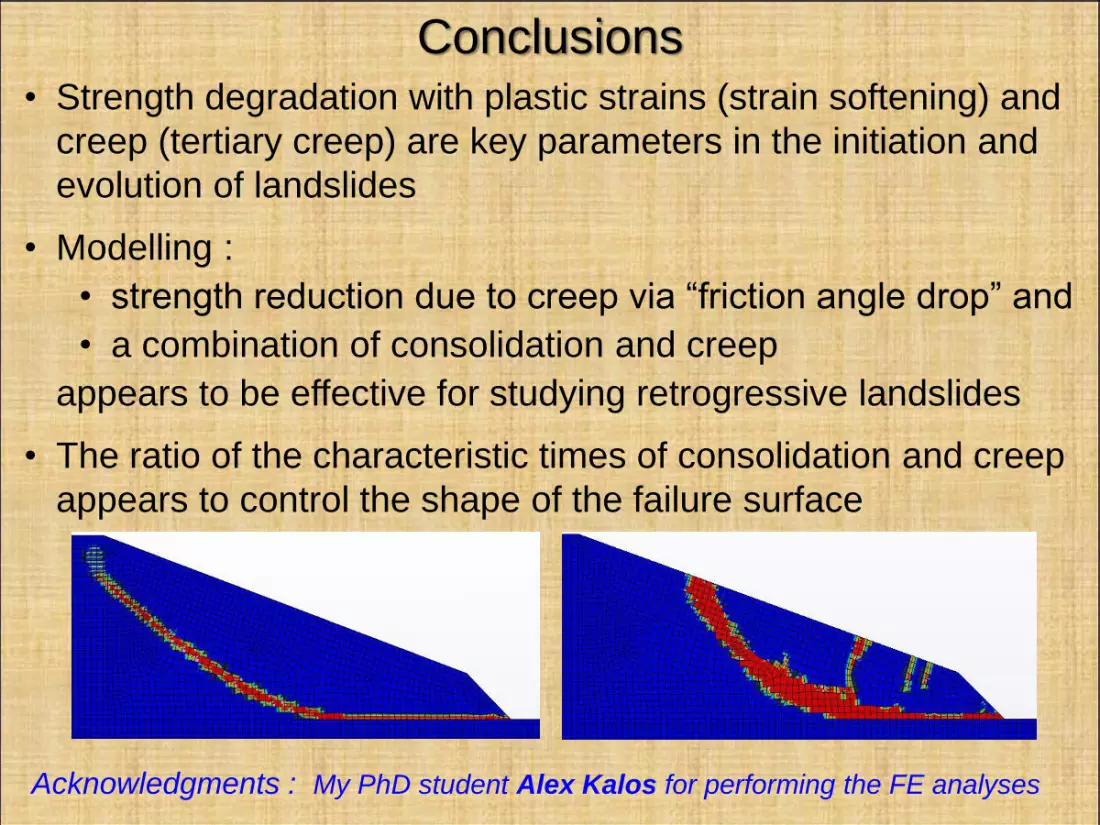
Conclusions• Strength degradation with plastic strains (strain softening) and
creep (tertiary creep) are key parameters in the initiation and
evolution of landslides
• Modelling :
• strength reduction due to creep via “friction angle drop” and
• a combination of consolidation and creep
appears to be effective for studying retrogressive landslides
• The ratio of the characteristic times of consolidation and creep
appears to control the shape of the failure surface
Acknowledgments : My PhD student Alex Kalos for performing the FE analyses