26
Merger of Equals CREATING THE PREMIER MIDWEST BANKING FRANCHISE JUNE 1, 2021
| Date post: | 10-May-2023 |
| Category: |
Documents |
| Upload: | khangminh22 |
| View: | 0 times |
| Download: | 0 times |
Merger of EqualsCREATING THE PREMIER MIDWEST BANKING FRANCHISE
JUNE 1, 2021
Disclaimer
2
Forward-Looking StatementsThis communication includes “f orward-looking statements” within the meaning of the Priv ate Securities Litigation Ref orm Act of 1995, Section 27A of the Securities Act of 1933, as amended, and Section 21E of the Securities Exchange Act of 1934, as amended, with respect to First Midwest Bancorp, Inc.’s and Old National Bancorp’s belief s, goals, intentions, and expectations regarding the proposed transaction, rev enues, earnings, loan production, asset quality , and capital lev els, among other matters; our estimates of f uture costs and benef its of the actions we may take; our assessments of probable losses on loans; our assessments of interest rate and other market risks; our ability to achiev e our f inancial and other strategic goals; the expected timing of completion of the proposed transaction; the expected cost sav ings, sy nergies and other anticipated benef its f rom the proposed transaction; and other statements that are not historical f acts.
Forward‐looking statements are ty pically identif ied by such words as “believ e,” “expect,” “anticipate,” “intend,” “outlook,” “estimate,” “f orecast,” “project,” “should,” “will,” and other similar words and expressions, and are subject to numerous assumptions, risks, and uncertainties, which change ov er time. These f orward-looking statements include, without limitation, those relating to the terms, timing and closing of the proposed transaction.
Additionally , f orward‐looking statements speak only as of the date they are made; First Midwest and Old National do not assume any duty , and do not undertake, to update such f orward‐looking statements, whether written or oral, that may be made f rom time to time, whether as a result of new inf ormation, f uture ev ents, or otherwise. Furthermore, because f orward‐looking statements are subject to assumptions and uncertainties, actual results or f uture ev ents could dif f er, possibly materially, from those indicated in such f orward-looking statements as a result of a v ariety of factors, many of which are bey ond the control of First Midwest and Old National. Such statements are based upon the current belief s and expectations of the management of First Midwest and Old National and are subject to signif icant risks and uncertainties outside of the control of the parties. Caution should be exercised against placing undue reliance on f orward-looking statements. The f actors that could cause actual results to dif f er materially include the f ollowing: the occurrence of any ev ent, change or other circumstances that could giv e rise to the right of one or both of the parties to terminate the def initiv e merger agreement between First Midwest and Old National; the outcome of any legal proceedings that may be instituted against First Midwest or Old National; the possibility that the proposed transaction will not close when expected or at all because required regulatory , shareholder or other approv als are not receiv ed or other conditions to the closing are not satisf ied on a timely basis or at all, or are obtained subject to conditions that are not anticipated (and the risk that required regulatory approv als may result in the imposition of conditions that could adv ersely af fect the combined company or the expected benef its of the proposed transaction); the ability of First Midwest and Old National to meet expectations regarding the timing, completion and accounting and tax treatments of the proposed transaction; the risk that any announcements relating to the proposed transaction could hav e adv erse ef f ects on the market price of the common stock of either or both parties to the proposed transaction; the possibility that the anticipated benef its of the proposed transaction will not be realized when expected or at all, including as a result of the impact of , or problems arising f rom, the integration of the two companies or as a result of the strength of the economy and competitiv e f actors in the areas where First Midwest and Old National do business; certain restrictions during the pendency of the proposed transaction that may impact the parties’ ability to pursue certain business opportunities or strategic transactions; the possibility that the transaction may be more expensiv e to complete than anticipated, including as a result of unexpected f actors or ev ents; div ersion of management’s attention f rom ongoing business operations and opportunities; the possibility that the parties may be unable to achiev e expected sy nergies and operating ef f iciencies in the merger within the expected timef rames or at all and to successf ully integrate First Midwest’s operations and those of Old National; such integration may be more dif f icult, time consuming or costly than expected; rev enues f ollowing the proposed transaction may be lower than expected; First Midwest’s and Old National’s success in executing their respectiv e business plans and strategies and managing the risks inv olv ed in the f oregoing; the dilution caused by Old National’s issuance of additional shares of its capital stock in connection with the proposed transaction; ef f ects of the announcement, pendency or completion of the proposed transaction on the ability of First Midwest and Old National to retain customers and retain and hire key personnel and maintain relationships with their suppliers, and on their operating results and businesses generally ; risks related to the potential impact of general economic, political and market f actors on the companies or the proposed transaction and other f actors that may af fect future results of First Midwest and Old National; uncertainty as to the extent of the duration, scope, and impacts of the COVID-19 pandemic on First Midwest, Old National and the proposed transaction; and the other f actors discussed in the “Risk Factors” and “Management’s Discussion and Analy sis of Financial Condition and Results of Operations” sections of each of First Midwest’s and Old National’s Annual Report on Form 10‐K f or the y ear ended December 31, 2020, in the “Risk Factors” and “Management’s Discussion and Analy sis of Financial Condition and Results of Operations” sections of each of First Midwest’s and Old National’s Quarterly Report on Form 10‐Q f or the quarter ended March 31, 2021, and in other reports First Midwest and Old National f ile with the U.S. Securities and Exchange Commission (the “SEC”).
Unaudited Prospective Financial InformationOld National and First Midwest do not, as a matter of course, publicly disclose f orecasts or internal projections as to their f uture f inancial perf ormance, rev enues, earnings, f inancial condition or other results, giv en, among other reasons, the inherent uncertainty of the underly ing assumptions and estimates, other than, f rom time to time, certain expected f inancial results and operational metrics f or the current y ear and certain f uture y ears in their respectiv e regular earnings press releases and other inv estor materials. Howev er, Old National and First Midwest are including in this joint inv estor presentation certain unaudited prospectiv e f inancial inf ormation that was made av ailable in the course of their mutual due diligence and utilized, at their direction, in the f airness opinions rendered by their respectiv e f inancial adv isors. Neither Old National nor First Midwest endorses the prospectiv e f inancial inf ormation as necessarily predictiv e of actual f uture results.Additional Information and Where to Find ItIn connection with the proposed transaction, Old National will f ile a registration statement on Form S-4 with the SEC. The registration statement will include a joint proxy statement of First Midwest and Old National, which also constitutes a prospectus of Old National, that will be sent to First Midwest’s and Old National’s shareholders seeking certain approv als related to the proposed transaction.
The inf ormation contained herein does not constitute an of f er to sell or a solicitation of an of f er to buy any securities or a solicitation of any v ote or approv al, nor shall there be any sale of securities in any jurisdiction in which such of f er, solicitation or sale would be unlawf ul prior to registration or qualif ication under the securities laws of any such jurisdiction. INVESTORS AND SECURITY HOLDERS OF FIRST MIDWEST AND OLD NATIONAL AND THEIR RESPECTIVE AFFILIATES ARE URGED TO READ, WHEN AVAILABLE, THE REGISTRATION STATEMENT ON FORM S-4, THE JOINT PROXY STATEMENT/PROSPECTUS TO BE INCLUDED WITHIN THE REGISTRATION STATEMENT ON FORM S-4 AND ANY OTHER RELEVANT DOCUMENTS FILED OR TO BE FILED WITH THE SEC IN CONNECTION WITH THE PROPOSED TRANSACTION, AS WELL AS ANY AMENDMENTS OR SUPPLEMENTS TO THOSE DOCUMENTS, BECAUSE THEY WILL CONTAIN IMPORTANT INFORMATION ABOUT FIRST MIDWEST, OLD NATIONAL AND THE PROPOSED TRANSACTION. Inv estors and security holders will be able to obtain a f ree copy of the registration statement, including the joint proxy statement/prospectus, as well as other relev ant documents f iled with the SEC containing inf ormation about First Midwest and Old National, without charge, at the SEC’s website (http://www.sec.gov ). Copies of documents f iled with the SEC by First Midwest will be made av ailable f ree of charge in the “Inv estor Relations” section of First Midwest’s website, https://f irstmidwest.com/, under the heading “SEC Filings.” Copies of documents f iled with the SEC by Old National will be made av ailable f ree of charge in the “Inv estor Relations” section of Old National’s website, https://www.oldnational.com/, under the heading “Financial Inf ormation.”Participants in Solicitation First Midwest, Old National, and certain of their respectiv e directors and executiv e of ficers may be deemed to be participants in the solicitation of proxies in respect of the proposed transaction under the rules of the SEC. Inf ormation regarding First Midwest’s directors and executiv e of ficers is av ailable in its def initiv e proxy statement, which was f iled with the SEC on April 13, 2021, and certain other documents f iled by First Midwest with the SEC. Inf ormation regarding Old National’s directors and executiv e of f icers is av ailable in its def initiv e proxy statement, which was f iled with the SEC on March 8, 2021, and certain other documents f iled by Old National with the SEC. Other inf ormation regarding the participants in the solicitation of proxies in respect of the proposed transaction and a description of their direct and indirect interests, by security holdings or otherwise, will be contained in the joint proxy statement/prospectus and other relev ant materials to be f iled with the SEC. Free copies of these documents, when av ailable, may be obtained as described in the preceding paragraph.
Non-GAAP Financial Measures
3
Non-GAAP Financial MeasuresIn addition to results presented in accordance with GAAP, this presentation contains certain non-GAAP financial measures. A reconcil iation of tangible book value and other ratios is included on page 25. Old National and First Midwest believe that providing certain non-GAAP financial measures provides investors with information useful in understanding performance trends and financial position. Old National and First Midwest use these measures for internal planning and forecasting purposes. Old National, First Midwest, and their respective securities analysts, investors and other interested parties, also use these measures to review peer company operating performance. Old National and First Midwest believe that this presentation and discussion, together with the accompanying reconciliations, provides an understanding of factors and trends affecting Old National’s and First Midwest’s businesses and allows investor to view performance in a manner similar to management. These non-GAAP measures should not be considered a substitute for GAAP basis measures and results, and investors are strongly encouraged to review the consolidated financial statements in their entirety and not to rely on any single financial measure. Because non-GAAP financial measures are not standardized, it may not be possible to compare these financial measures with other companies’ non-GAAP financial measures having the same or similar names.
4
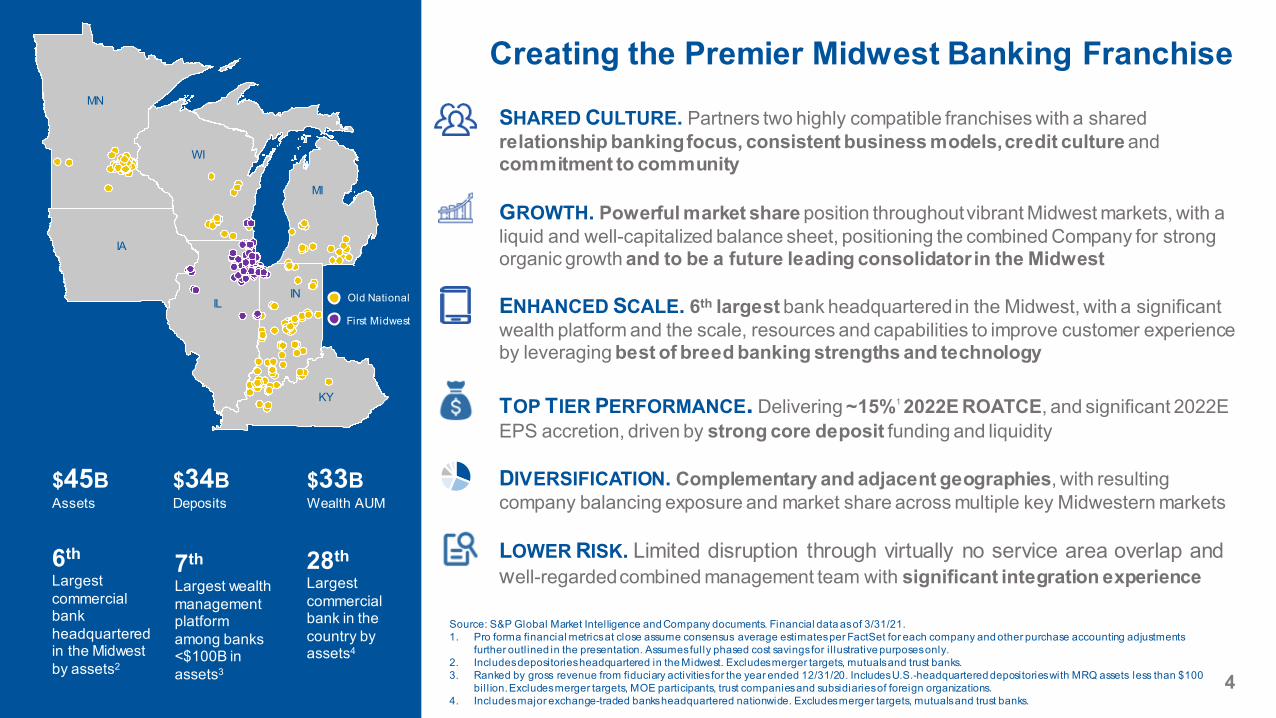
SHARED CULTURE. Partners two highly compatible franchises with a sharedrelationship banking focus, consistent business models, credit culture andcommitment to community
GROWTH. Powerful market share position throughout vibrant Midwest markets, with a liquid and well-capitalized balance sheet, positioning the combined Company for strong organic growth and to be a future leading consolidator in the Midwest
ENHANCED SCALE. 6th largest bank headquartered in the Midwest, with a significantwealth platform and the scale, resources and capabilities to improve customer experience by leveraging best of breed banking strengths and technology
TOP TIER PERFORMANCE. Delivering ~15%1 2022E ROATCE, and significant 2022E EPS accretion, driven by strong core deposit funding and liquidity
DIVERSIFICATION. Complementary and adjacent geographies, with resulting company balancing exposure and market share across multiple key Midwestern markets
LOWER RISK. Limited disruption through virtually no service area overlap and well-regarded combined management team with significant integration experience
Creating the Premier Midwest Banking Franchise
28thLargest commercial bank in the country by assets4
6thLargest commercial bank headquartered in the Midwest by assets2
Old National
First Midwest
MN
IA
WI
MI
KY
ILIN
$45BAssets
$34BDeposits
$33BWealth AUM
Source: S&P Global Market Intelligence and Company documents. Financial data as of 3/31/21. 1. Pro forma financial metrics at close assume consensus average estimates per FactSet for each company and other purchase accounting adjustments
further outlined in the presentation. Assumes fully phased cost savings for i l lustrative purposes only.2. Includes depositories headquartered in the Midwest. Excludes merger targets, mutuals and trust banks.3. Ranked by gross revenue from fiduciary activities for the year ended 12/31/20. Includes U.S.-headquartered depositories with MRQ assets less than $100
bil l ion. Excludes merger targets, MOE participants, trust companies and subsidiaries of foreign organizations.4. Includes major exchange-traded banks headquartered nationwide. Excludes merger targets, mutuals and trust banks.
7thLargest wealth management platform among banks <$100B in assets3
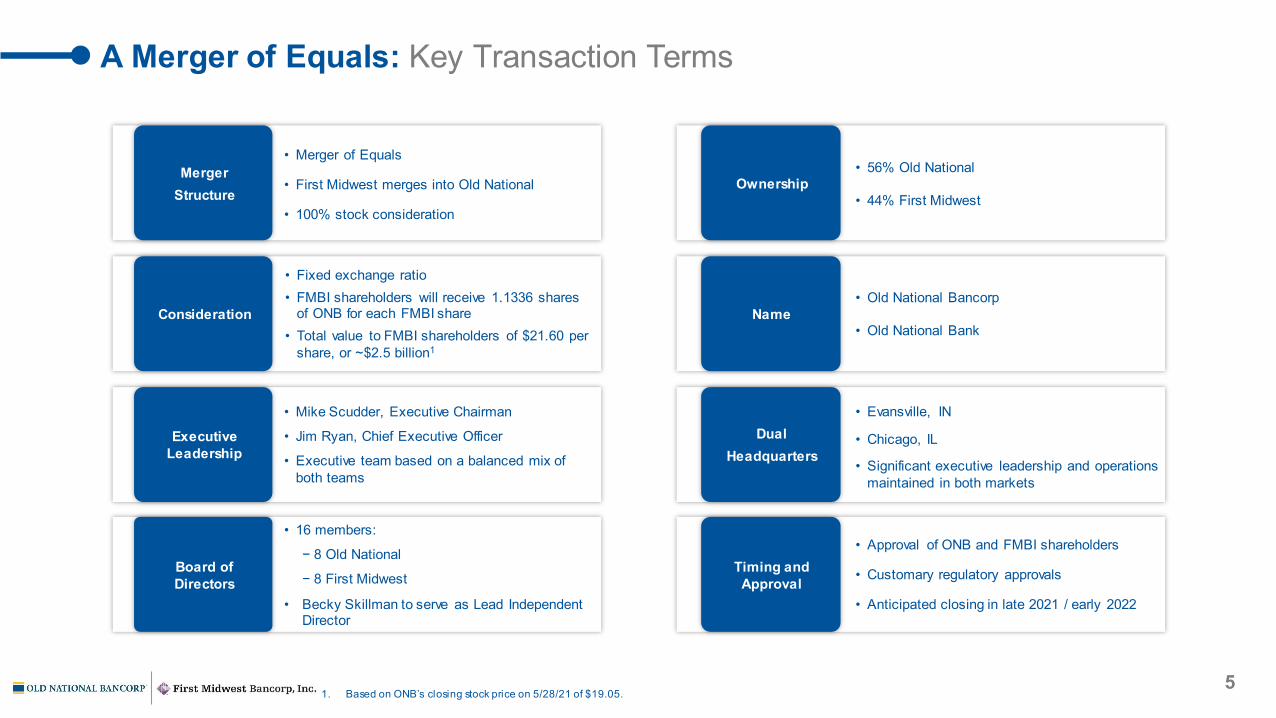
A Merger of Equals: Key Transaction Terms
• Merger of Equals
• First Midwest merges into Old National
• 100% stock consideration
• Mike Scudder, Executive Chairman
• Jim Ryan, Chief Executive Officer
• Executive team based on a balanced mix of both teams
• 16 members:
− 8 Old National
− 8 First Midwest
• Becky Skillman to serve as Lead Independent Director
• 56% Old National
• 44% First Midwest
• Evansville, IN
• Chicago, IL
• Significant executive leadership and operationsmaintained in both markets
• Approval of ONB and FMBI shareholders
• Customary regulatory approvals
• Anticipated closing in late 2021 / early 2022
• Old National Bancorp
• Old National Bank
• Fixed exchange ratio• FMBI shareholders will receive 1.1336 shares
of ONB for each FMBI share• Total value to FMBI shareholders of $21.60 per
share, or ~$2.5 billion1
MergerStructure
Ownership
Consideration Name
Executive Leadership
DualHeadquarters
Board of Directors
Timing and Approval
51. Based on ONB’s closing stock price on 5/28/21 of $19.05.
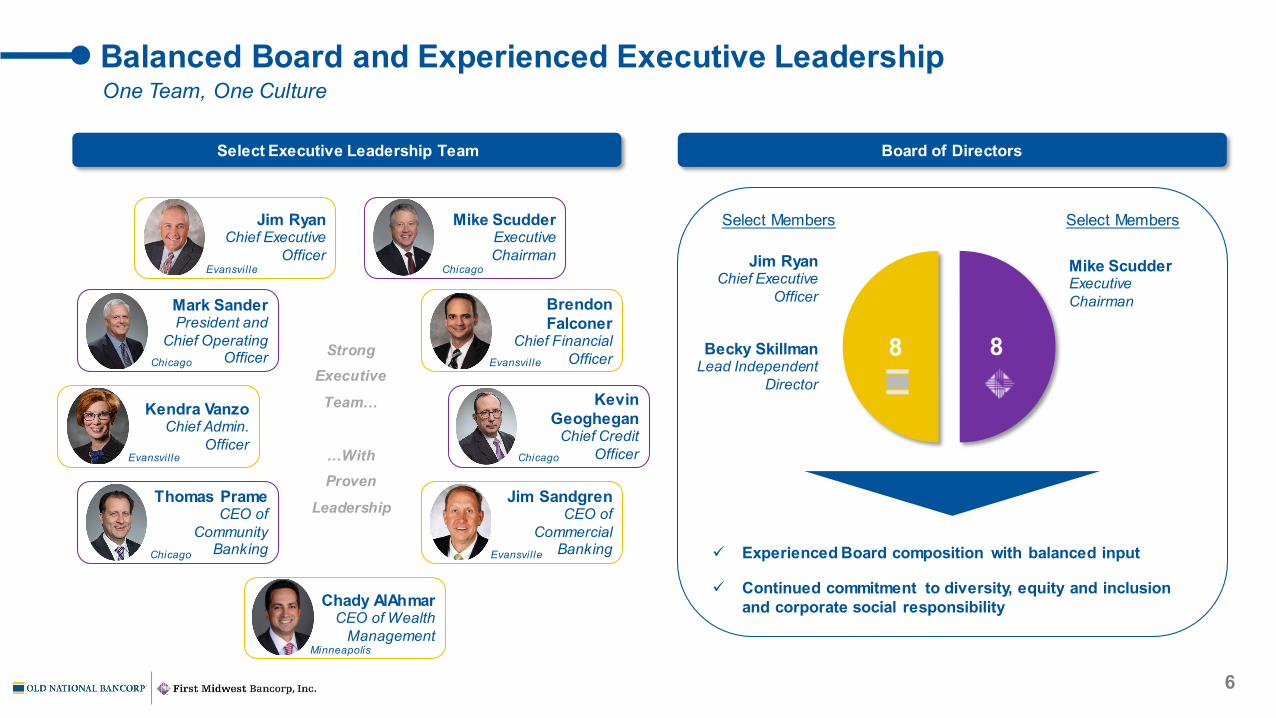
Jim RyanChief Executive
Officer
Mike ScudderExecutiveChairman
Chady AlAhmarCEO of Wealth
Management
Balanced Board and Experienced Executive Leadership
Select Executive Leadership Team Board of Directors
8 8
Select Members Select Members
Experienced Board composition with balanced input
Continued commitment to diversity, equity and inclusion and corporate social responsibility
Jim RyanChief Executive
Officer
Mike ScudderExecutiveChairman
Becky SkillmanLead Independent
Director
6
BrendonFalconer
Chief FinancialOfficer
Jim SandgrenCEO of
CommercialBanking
KevinGeoghegan
Chief CreditOfficer
Kendra VanzoChief Admin.
Officer
StrongExecutive
Team…
…With Proven
Leadership
One Team, One Culture
Mark SanderPresident and
Chief OperatingOfficer
Thomas PrameCEO of
CommunityBanking
Evansvil le
Evansvil le
Evansvil le
Evansvil le
Chicago
Chicago
Chicago
Chicago
Minneapolis
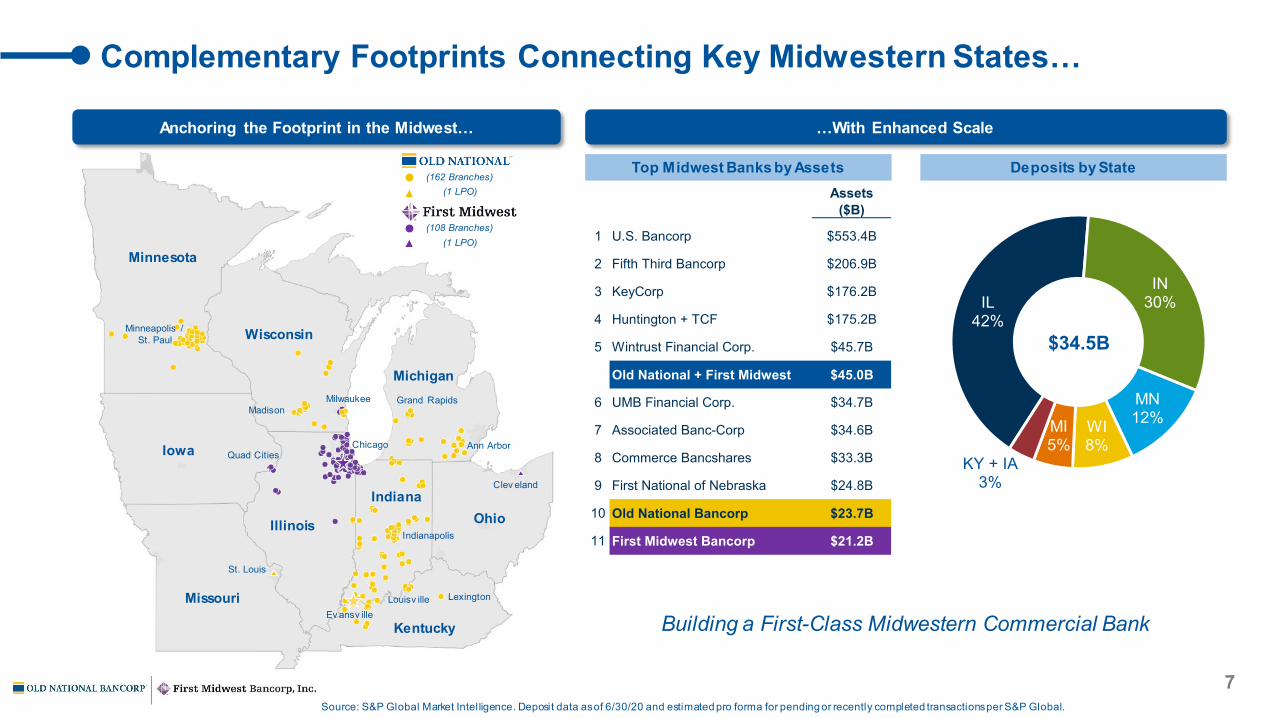
IL42%
IN30%
MN12%WI
8%MI5%
KY + IA3%
7
Complementary Footprints Connecting Key Midwestern States…
Anchoring the Footprint in the Midwest… …With Enhanced Scale
Deposits by StateTop Midwest Banks by AssetsAssets
($B)
1 U.S. Bancorp $553.4B
2 Fifth Third Bancorp $206.9B
3 KeyCorp $176.2B
4 Huntington + TCF $175.2B
5 Wintrust Financial Corp. $45.7B
Old National + First Midwest $45.0B
6 UMB Financial Corp. $34.7B
7 Associated Banc-Corp $34.6B
8 Commerce Bancshares $33.3B
9 First National of Nebraska $24.8B
10 Old National Bancorp $23.7B
11 First Midwest Bancorp $21.2B
Source: S&P Global Market Intelligence. Deposit data as of 6/30/20 and estimated pro forma for pending or recently completed transactions per S&P Global.
$34.5B
Building a First-Class Midwestern Commercial Bank
Minnesota
Iowa
Wisconsin
Illinois
Kentucky
Indiana
Michigan
Minneapolis /St. Paul
Milwaukee
Chicago
MadisonGrand Rapids
Indianapolis
Louisv illeEv ansv ille
Missouri
St. Louis
Lexington
Quad CitiesAnn Arbor
(162 Branches)
(108 Branches)
(1 LPO)
(1 LPO)
Clev eland
Ohio
8
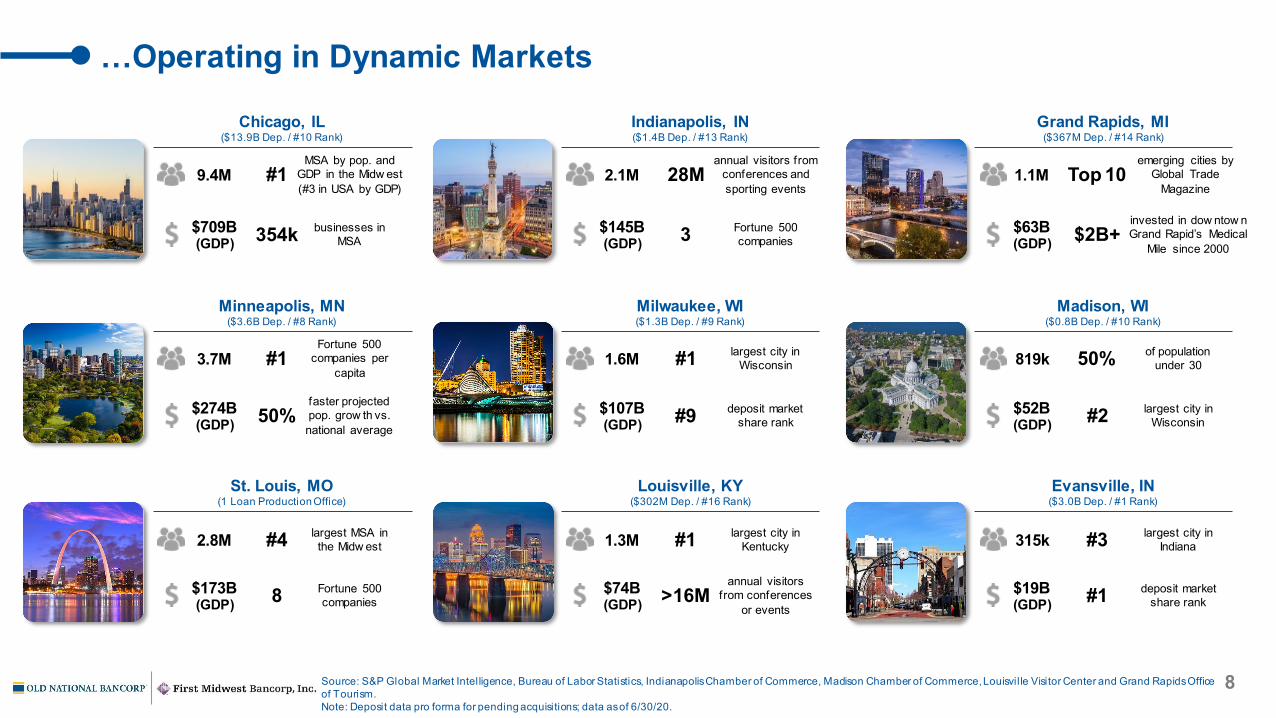
…Operating in Dynamic Markets
Source: S&P Global Market Intelligence, Bureau of Labor Statistics, Indianapolis Chamber of Commerce, Madison Chamber of Commerce, Louisvil le Visitor Center and Grand Rapids Office of Tourism.Note: Deposit data pro forma for pending acquisitions; data as of 6/30/20.
St. Louis, MO(1 Loan Production Office)
Minneapolis, MN($3.6B Dep. / #8 Rank)
3.7M
$274B(GDP)
#1
50%
Fortune 500 companies per
capita
faster projected pop. grow th vs. national average
2.8M
$173B(GDP)
#4 largest MSA in the Midw est
8 Fortune 500 companies
Chicago, IL($13.9B Dep. / #10 Rank)
9.4M
$709B(GDP)
#1
354k
MSA by pop. and GDP in the Midw est (#3 in USA by GDP)
businesses in MSA
Milwaukee, WI($1.3B Dep. / #9 Rank)
1.6M
$107B(GDP)
#1
#9
largest city in Wisconsin
deposit market share rank
Grand Rapids, MI($367M Dep. / #14 Rank)
1.1M
$63B(GDP)
Top 10emerging cities by
Global Trade Magazine
$2B+invested in dow ntow n Grand Rapid’s Medical
Mile since 2000
Madison, WI($0.8B Dep. / #10 Rank)
819k
$52B(GDP)
50% of population under 30
#2 largest city in Wisconsin
Indianapolis, IN($1.4B Dep. / #13 Rank)
2.1M
$145B(GDP)
28Mannual visitors from
conferences and sporting events
3 Fortune 500 companies
Louisville, KY($302M Dep. / #16 Rank)
1.3M
$74B(GDP)
#1 largest city in Kentucky
>16Mannual visitors
from conferences or events
Evansville, IN($3.0B Dep. / #1 Rank)
315k
$19B(GDP)
#3 largest city in Indiana
#1 deposit market share rank
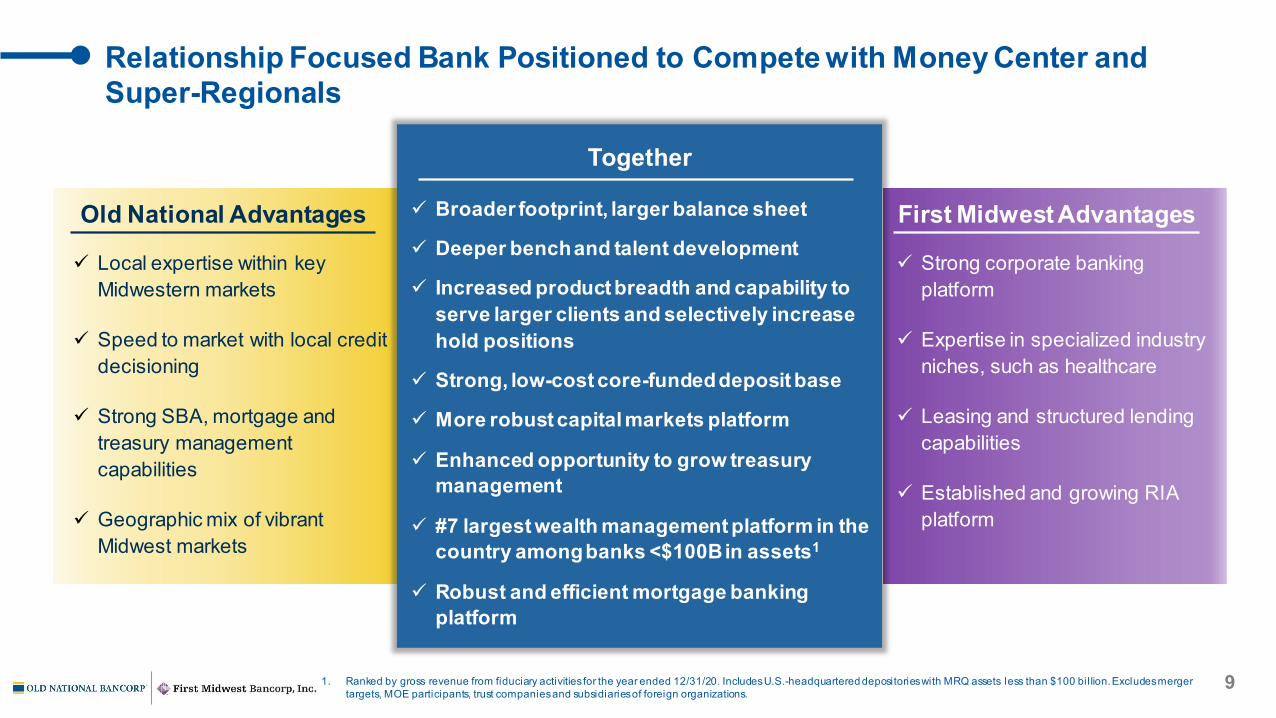
Strong corporate banking platform
Expertise in specialized industry niches, such as healthcare
Leasing and structured lending capabilities
Established and growing RIA platform
Local expertise within key Midwestern markets
Speed to market with local credit decisioning
Strong SBA, mortgage and treasury management capabilities
Geographic mix of vibrant Midwest markets
Old National Advantages
Relationship Focused Bank Positioned to Compete with Money Center and Super-Regionals
First Midwest Advantages Broader footprint, larger balance sheet
Deeper bench and talent development
Increased product breadth and capability to serve larger clients and selectively increase hold positions
Strong, low-cost core-funded deposit base
More robust capital markets platform
Enhanced opportunity to grow treasury management
#7 largest wealth management platform in the country among banks <$100B in assets1
Robust and efficient mortgage banking platform
Together
91. Ranked by gross revenue from fiduciary activities for the year ended 12/31/20. Includes U.S.-headquartered depositories with MRQ assets less than $100 bil lion. Excludes merger targets, MOE participants, trust companies and subsidiaries of foreign organizations.
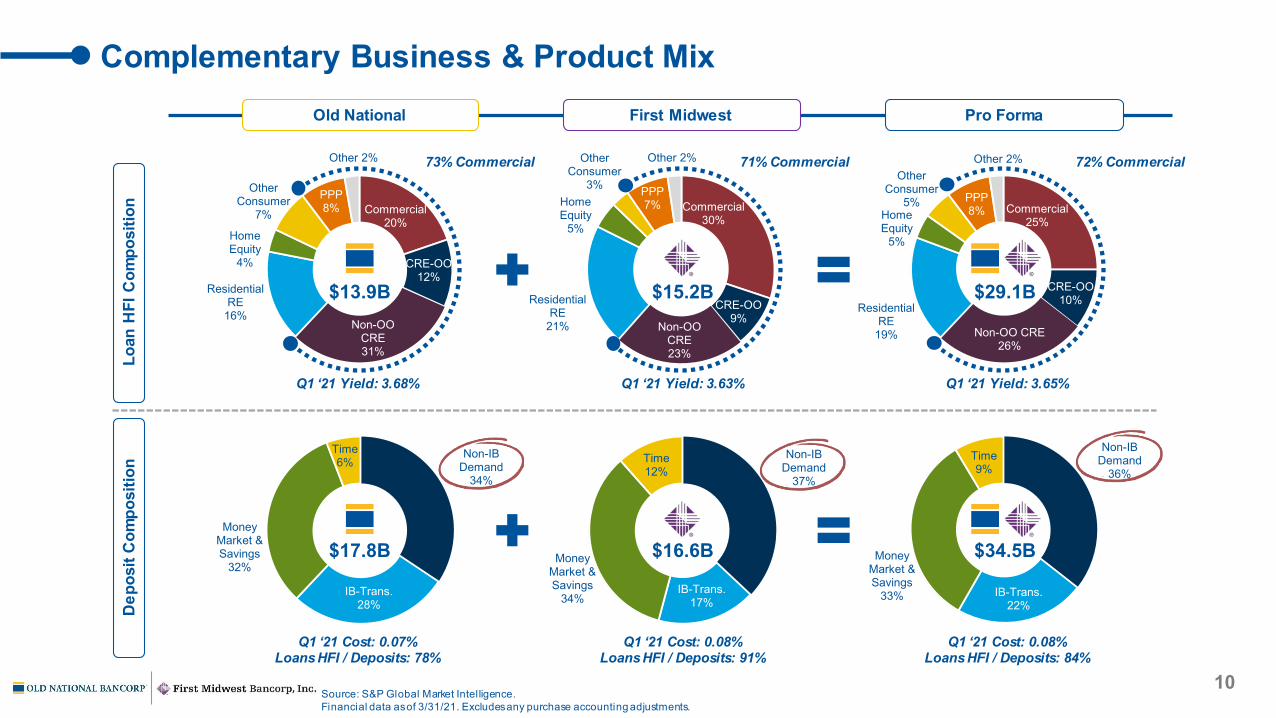
Commercial20%
CRE-OO12%
Non-OO CRE31%
Residential RE
16%
Home Equity
4%
Other Consumer
7%
PPP8%
Other 2%
Non-IB Demand
36%
IB-Trans.22%
Money Market & Savings
33%
Time9%
10
Complementary Business & Product Mix
Non-IB Demand
37%
IB-Trans.17%
Money Market & Savings
34%
Time12%
Non-IB Demand
34%
IB-Trans.28%
Money Market & Savings
32%
Time6%
$17.8B
Q1 ‘21 Cost: 0.07%Loans HFI / Deposits: 78%
Q1 ‘21 Cost: 0.08%Loans HFI / Deposits: 91%
Dep
osit
Com
posi
tion
$16.6B $34.5B
Q1 ‘21 Cost: 0.08%Loans HFI / Deposits: 84%
Source: S&P Global Market Intelligence.Financial data as of 3/31/21. Excludes any purchase accounting adjustments.
Loan
HFI
Com
posi
tion Commercial
30%
CRE-OO9%
Non-OO CRE23%
Residential RE
21%
Home Equity
5%
Other Consumer
3% PPP7%
Other 2%
Commercial25%
CRE-OO10%
Non-OO CRE26%
Residential RE
19%
Home Equity
5%
Other Consumer
5% PPP8%
Other 2%
$13.9B
Q1 ‘21 Yield: 3.68% Q1 ‘21 Yield: 3.63%
$15.2B $29.1B
Q1 ‘21 Yield: 3.65%
Old National First Midwest Pro Forma
73% Commercial 71% Commercial 72% Commercial
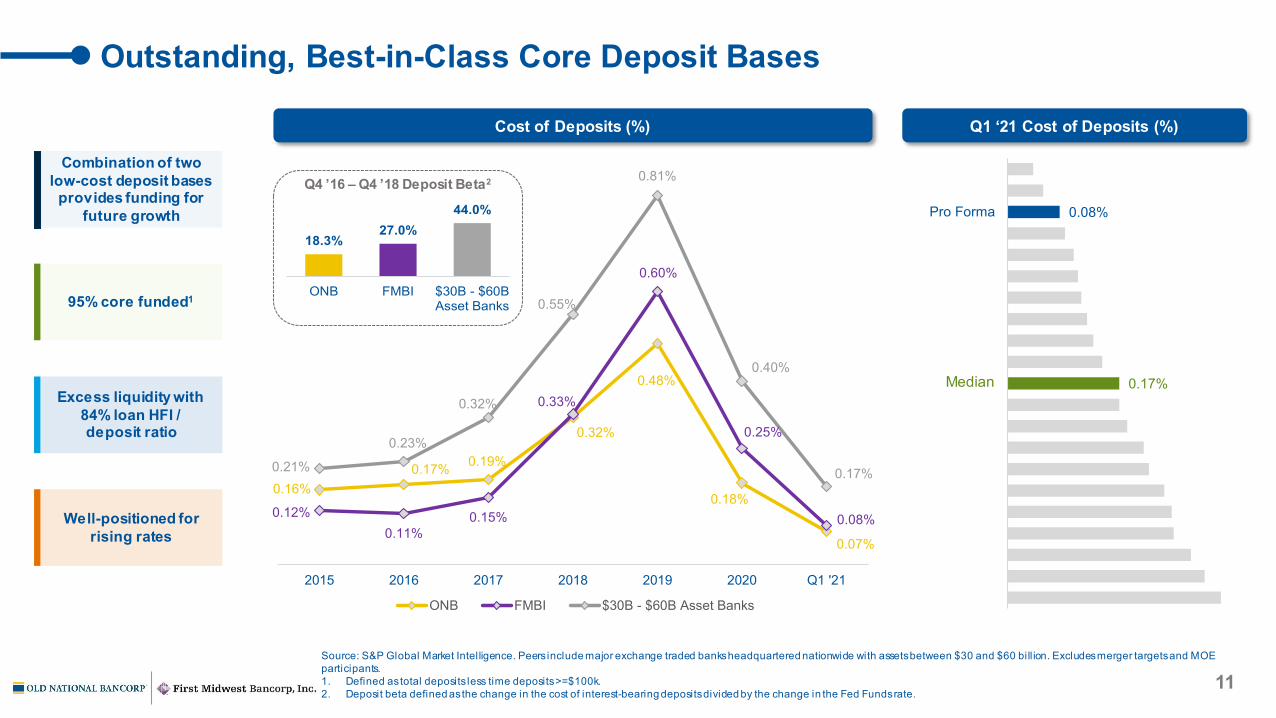
0.16%0.17% 0.19%
0.32%
0.48%
0.18%
0.07%
0.12%0.11%
0.15%
0.33%
0.60%
0.25%
0.08%
0.21%
0.23%
0.32%
0.55%
0.81%
0.40%
0.17%
2015 2016 2017 2018 2019 2020 Q1 '21
ONB FMBI $30B - $60B Asset Banks
11
Outstanding, Best-in-Class Core Deposit Bases
0.17%
0.08%Pro Forma
Median
Source: S&P Global Market Intelligence. Peers include major exchange traded banks headquartered nationwide with assets between $30 and $60 bill ion. Excludes merger targets and MOE participants.1. Defined as total deposits less time deposits >=$100k.2. Deposit beta defined as the change in the cost of interest-bearing deposits divided by the change in the Fed Funds rate.
Q4 ’16 – Q4 ’18 Deposit Beta2
18.3%27.0%
44.0%
ONB FMBI $30B - $60BAsset Banks95% core funded1
Well-positioned for rising rates
Combination of two low-cost deposit bases
provides funding for future growth
Excess liquidity with 84% loan HFI / deposit ratio
Cost of Deposits (%) Q1 ‘21 Cost of Deposits (%)
12
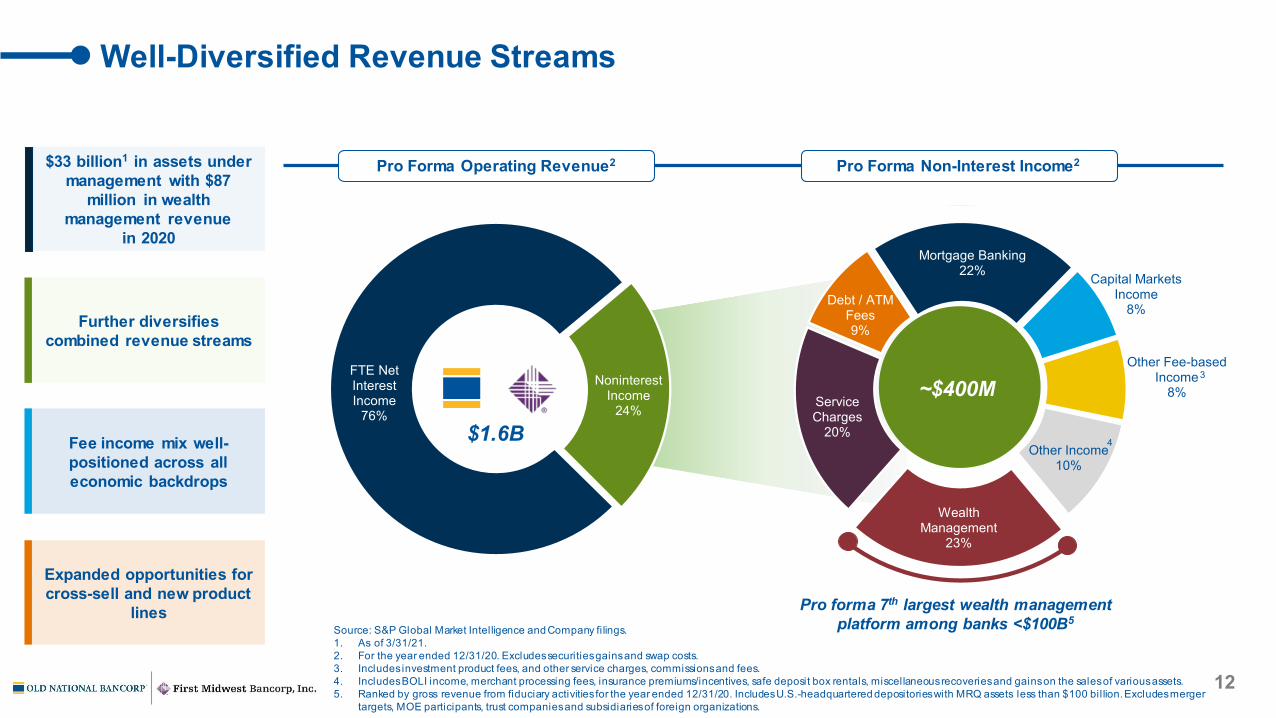
Source: S&P Global Market Intelligence and Company fi lings.1. As of 3/31/21.2. For the year ended 12/31/20. Excludes securities gains and swap costs.3. Includes investment product fees, and other service charges, commissions and fees.4. Includes BOLI income, merchant processing fees, insurance premiums/incentives, safe deposit box rentals, miscellaneous recoveries and gains on the sales of various assets.5. Ranked by gross revenue from fiduciary activities for the year ended 12/31/20. Includes U.S.-headquartered depositories with MRQ assets less than $100 bil lion. Excludes merger
targets, MOE participants, trust companies and subsidiaries of foreign organizations.
FTE Net Interest Income
76%
Noninterest Income
24%
Wealth Management
23%
Service Charges
20%
Debt / ATM Fees9%
Mortgage Banking22% Capital Markets
Income8%
Other Fee-based Income
8%
Other Income10%
$1.6B
Well-Diversified Revenue Streams
~$400M
Pro Forma Operating Revenue2 Pro Forma Non-Interest Income2
Further diversifies combined revenue streams
Expanded opportunities for cross-sell and new product
lines
$33 billion1 in assets under management with $87
million in wealth management revenue
in 2020
Fee income mix well-positioned across all economic backdrops
Pro forma 7th largest wealth management platform among banks <$100B5
3
4
Wealth Management
Insights
13
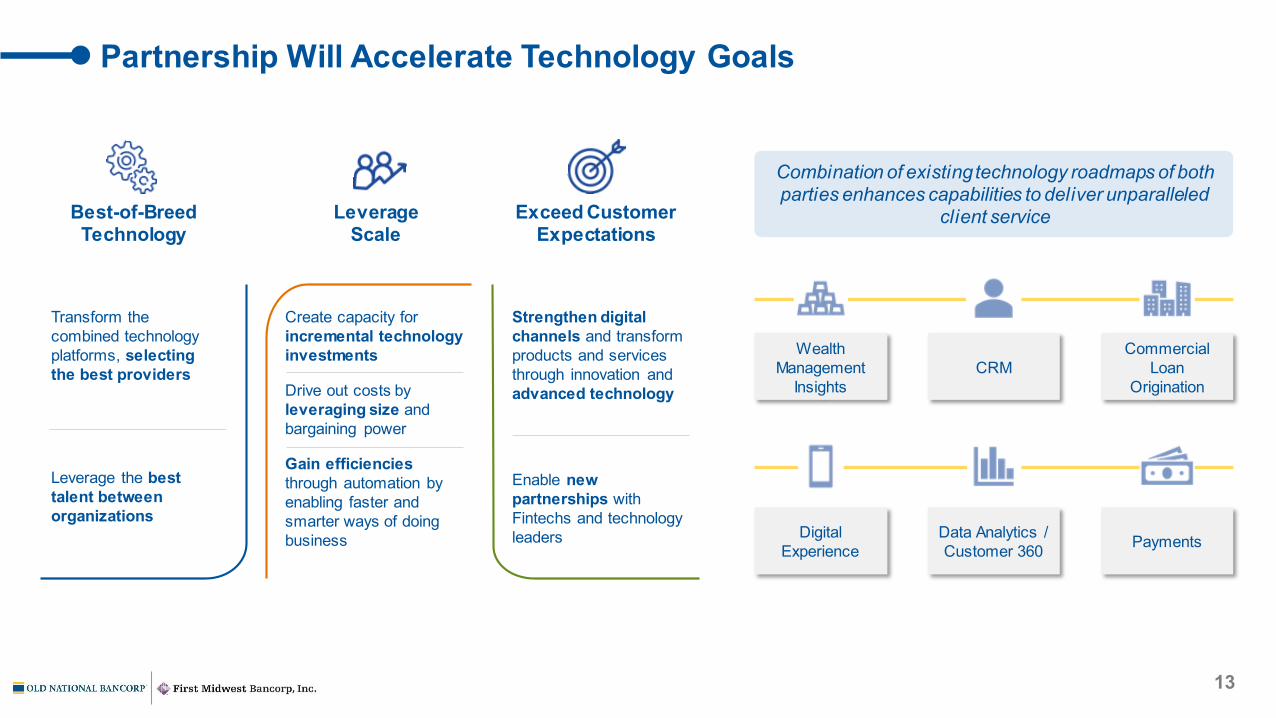
Partnership Will Accelerate Technology Goals
Best-of-Breed Technology
LeverageScale
Create capacity for incremental technology investments
Drive out costs by leveraging size and bargaining power
Gain efficienciesthrough automation by enabling faster and smarter ways of doing business
Exceed Customer Expectations
Strengthen digital channels and transform products and services through innovation and advanced technology
Enable new partnerships with Fintechs and technology leaders
Transform the combined technology platforms, selecting the best providers
Leverage the best talent between organizations
Combination of existing technology roadmaps of both parties enhances capabilities to deliver unparalleled
client service
CRMCommercial
Loan Origination
Digital Experience
Data Analytics /Customer 360 Payments
14
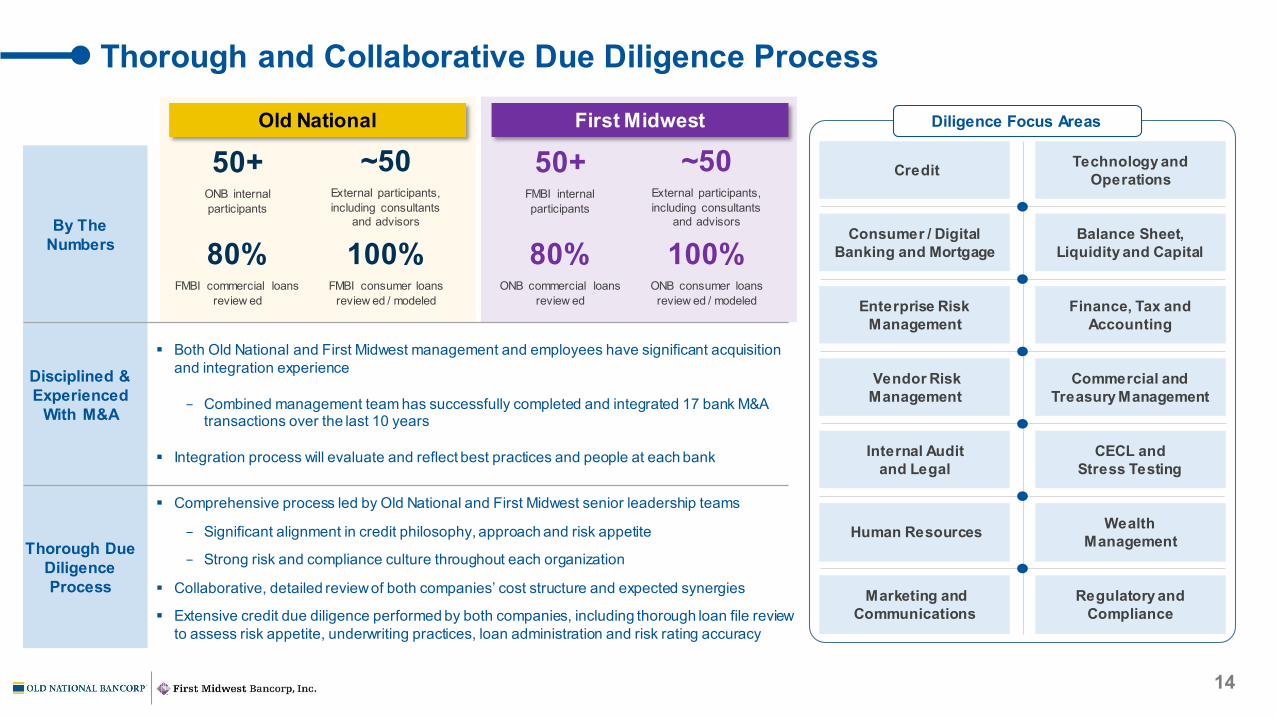
Thorough and Collaborative Due Diligence Process
By The Numbers
Disciplined & Experienced
With M&A
Thorough Due Diligence Process
Credit Technology and Operations
Consumer / Digital Banking and Mortgage
Balance Sheet, Liquidity and Capital
Enterprise Risk Management
Finance, Tax and Accounting
Vendor Risk Management
Commercial and Treasury Management
Internal Audit and Legal
CECL andStress Testing
Human Resources Wealth Management
Marketing and Communications
Regulatory and Compliance
Old National First Midwest
50+ONB internal participants
80%FMBI commercial loans
review ed
100%FMBI consumer loans
review ed / modeled
80%ONB commercial loans
review ed
100%ONB consumer loans review ed / modeled
Diligence Focus Areas
~50External participants, including consultants
and advisors
50+FMBI internal participants
~50External participants, including consultants
and advisors
Both Old National and First Midwest management and employees have significant acquisition and integration experience
− Combined management team has successfully completed and integrated 17 bank M&A transactions over the last 10 years
Integration process will evaluate and reflect best practices and people at each bank
Comprehensive process led by Old National and First Midwest senior leadership teams
− Significant alignment in credit philosophy, approach and risk appetite
− Strong risk and compliance culture throughout each organization
Collaborative, detailed review of both companies’ cost structure and expected synergies
Extensive credit due diligence performed by both companies, including thorough loan file review to assess risk appetite, underwriting practices, loan administration and risk rating accuracy
15
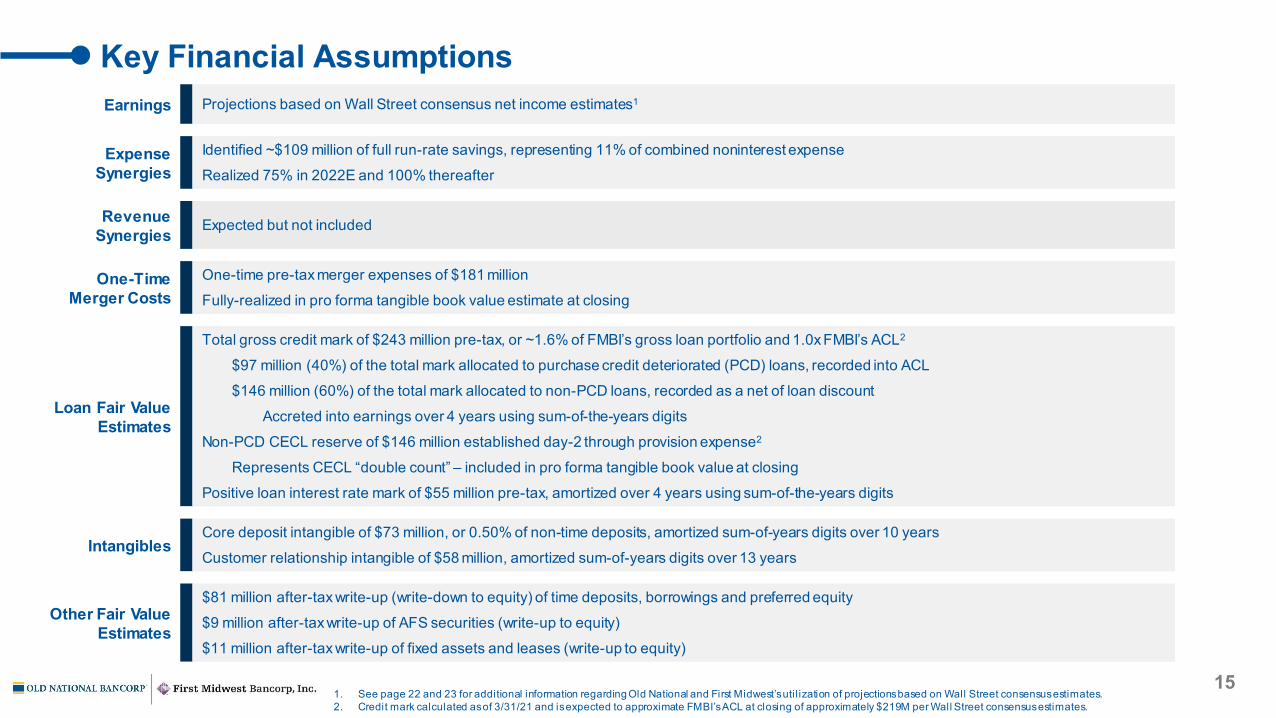
Key Financial AssumptionsEarnings Projections based on Wall Street consensus net income estimates1
ExpenseSynergies
Identified ~$109 million of full run-rate savings, representing 11% of combined noninterest expense
Realized 75% in 2022E and 100% thereafter
RevenueSynergies Expected but not included
One-Time Merger Costs
One-time pre-tax merger expenses of $181 million
Fully-realized in pro forma tangible book value estimate at closing
Loan Fair ValueEstimates
Total gross credit mark of $243 million pre-tax, or ~1.6% of FMBI’s gross loan portfolio and 1.0x FMBI’s ACL2
$97 million (40%) of the total mark allocated to purchase credit deteriorated (PCD) loans, recorded into ACL
$146 million (60%) of the total mark allocated to non-PCD loans, recorded as a net of loan discount
Accreted into earnings over 4 years using sum-of-the-years digits
Non-PCD CECL reserve of $146 million established day-2 through provision expense2
Represents CECL “double count” – included in pro forma tangible book value at closing
Positive loan interest rate mark of $55 million pre-tax, amortized over 4 years using sum-of-the-years digits
IntangiblesCore deposit intangible of $73 million, or 0.50% of non-time deposits, amortized sum-of-years digits over 10 years
Customer relationship intangible of $58 million, amortized sum-of-years digits over 13 years
Other Fair Value Estimates
$81 million after-tax write-up (write-down to equity) of time deposits, borrowings and preferred equity
$9 million after-tax write-up of AFS securities (write-up to equity)
$11 million after-tax write-up of fixed assets and leases (write-up to equity)
1. See page 22 and 23 for additional information regarding Old National and First Midwest’s uti l ization of projections based on Wall Street consensus estimates. 2. Credit mark calculated as of 3/31/21 and is expected to approximate FMBI’s ACL at closing of approximately $219M per Wall Street consensus estimates.
16
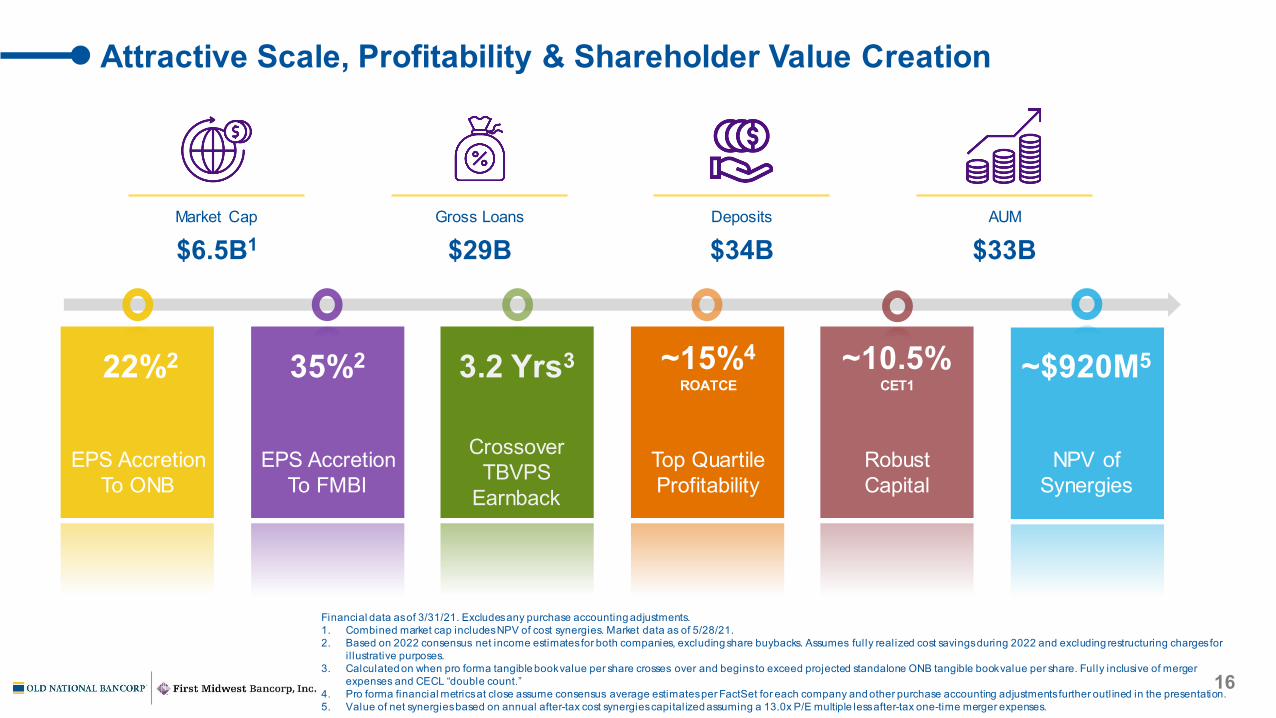
Attractive Scale, Profitability & Shareholder Value Creation
Financial data as of 3/31/21. Excludes any purchase accounting adjustments. 1. Combined market cap includes NPV of cost synergies. Market data as of 5/28/21.2. Based on 2022 consensus net income estimates for both companies, excluding share buybacks. Assumes fully realized cost savings during 2022 and excluding restructuring charges for
i l lustrative purposes.3. Calculated on when pro forma tangible book value per share crosses over and begins to exceed projected standalone ONB tangible book value per share. Fully inclusive of merger
expenses and CECL “double count.” 4. Pro forma financial metrics at close assume consensus average estimates per FactSet for each company and other purchase accounting adjustments further outlined in the presentation.5. Value of net synergies based on annual after-tax cost synergies capitalized assuming a 13.0x P/E multiple less after-tax one-time merger expenses.
EPS AccretionTo ONB
CrossoverTBVPS
Earnback
EPS AccretionTo FMBI
Top Quartile Profitability
RobustCapital
Market Cap
$6.5B1Gross Loans
$29BDeposits
$34BAUM
$33B
22%2 35%2 3.2 Yrs3 ~15%4ROATCE
~10.5%CET1
NPV ofSynergies
~$920M5
17
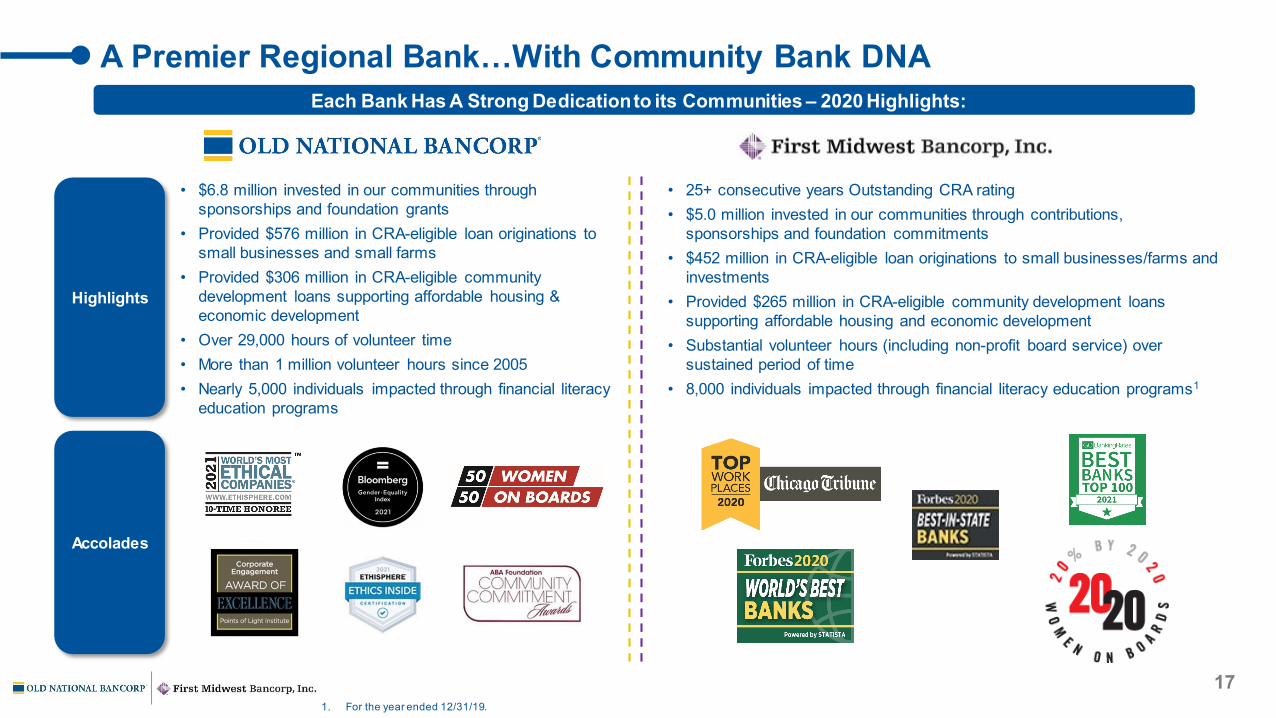
A Premier Regional Bank…With Community Bank DNA
• 25+ consecutive years Outstanding CRA rating• $5.0 million invested in our communities through contributions,
sponsorships and foundation commitments• $452 million in CRA-eligible loan originations to small businesses/farms and
investments• Provided $265 million in CRA-eligible community development loans
supporting affordable housing and economic development• Substantial volunteer hours (including non-profit board service) over
sustained period of time• 8,000 individuals impacted through financial literacy education programs1
Each Bank Has A Strong Dedication to its Communities – 2020 Highlights:
Highlights
Accolades
• $6.8 million invested in our communities through sponsorships and foundation grants
• Provided $576 million in CRA-eligible loan originations to small businesses and small farms
• Provided $306 million in CRA-eligible community development loans supporting affordable housing & economic development
• Over 29,000 hours of volunteer time• More than 1 million volunteer hours since 2005• Nearly 5,000 individuals impacted through financial literacy
education programs
1. For the year ended 12/31/19.
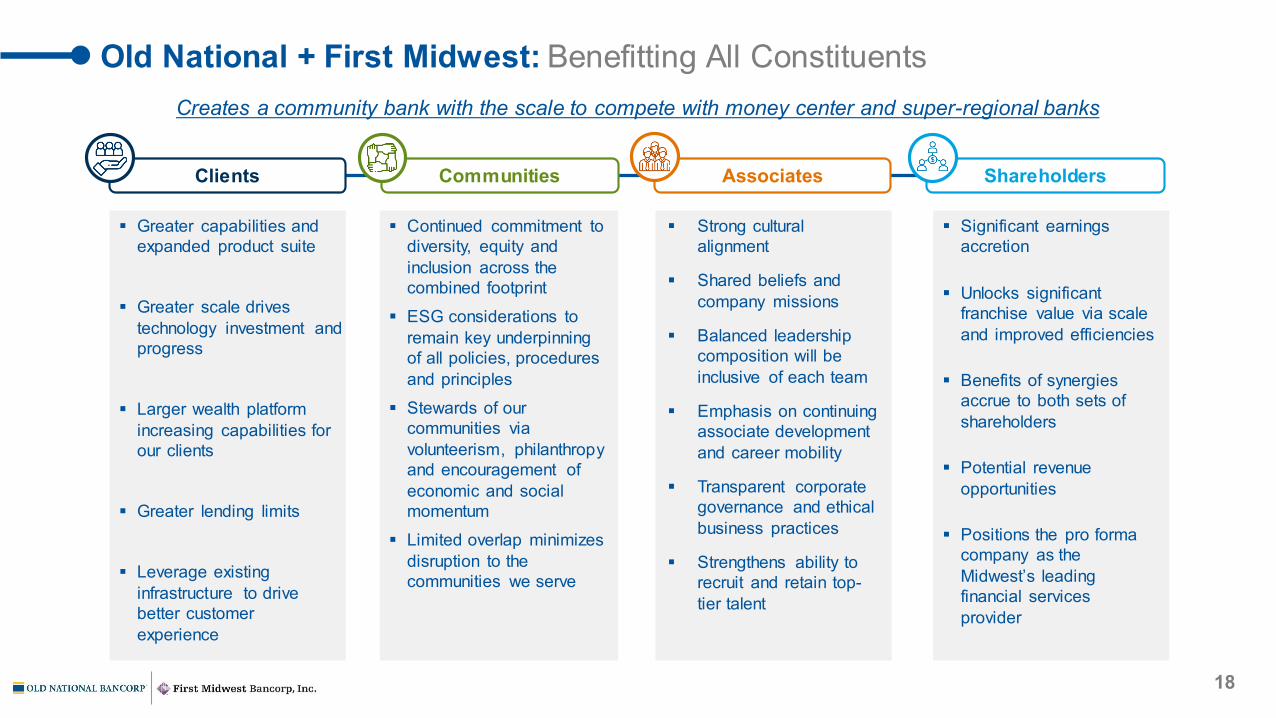
Old National + First Midwest: Benefitting All Constituents
Clients Communities Associates
Greater capabilities and expanded product suite
Greater scale drives technology investment and progress
Larger wealth platform increasing capabilities for our clients
Greater lending limits
Leverage existing infrastructure to drive better customer experience
Continued commitment to diversity, equity and inclusion across the combined footprint
ESG considerations to remain key underpinning of all policies, procedures and principles
Stewards of our communities via volunteerism, philanthropy and encouragement of economic and social momentum
Limited overlap minimizes disruption to the communities we serve
Strong cultural alignment
Shared beliefs and company missions
Balanced leadership composition will be inclusive of each team
Emphasis on continuing associate development and career mobility
Transparent corporate governance and ethical business practices
Strengthens ability to recruit and retain top-tier talent
18
Shareholders
Significant earnings accretion
Unlocks significant franchise value via scale and improved efficiencies
Benefits of synergies accrue to both sets of shareholders
Potential revenue opportunities
Positions the pro forma company as the Midwest’s leading financial services provider
Creates a community bank with the scale to compete with money center and super-regional banks

19
Appendix
20
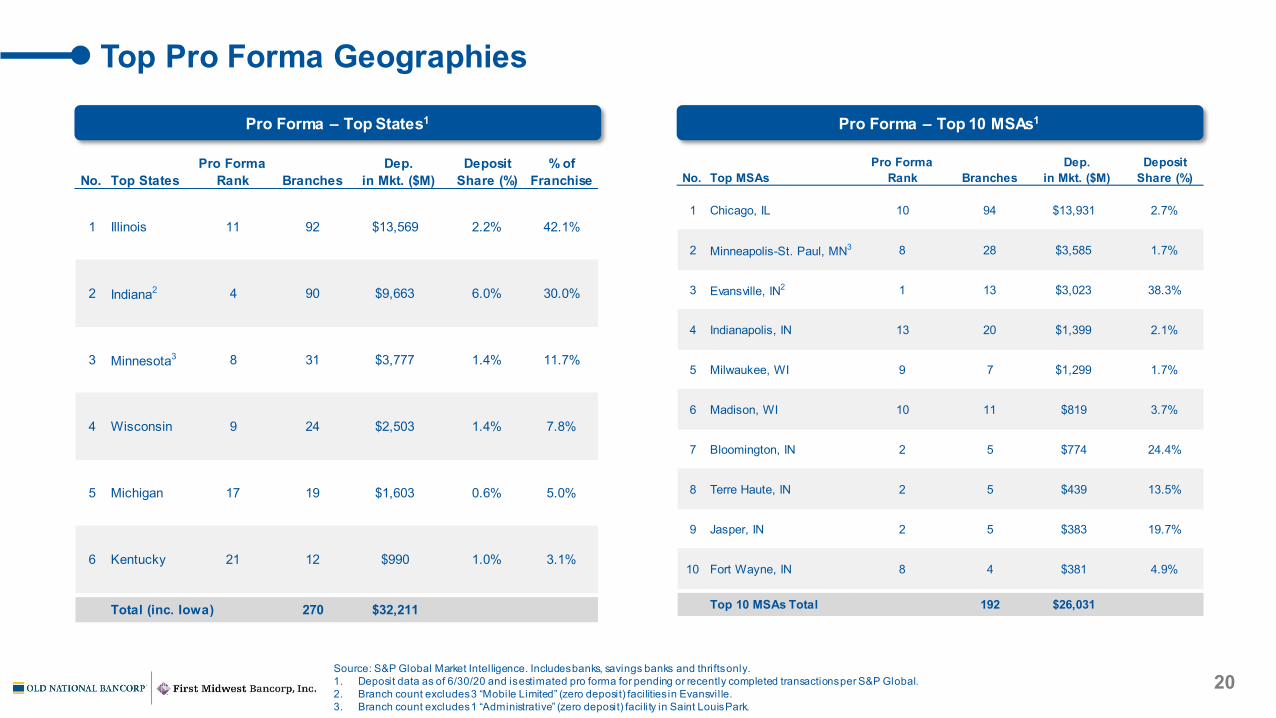
Top Pro Forma Geographies
Pro Forma – Top States1 Pro Forma – Top 10 MSAs1
No. Top StatesPro Forma
Rank BranchesDep.
in Mkt. ($M)Deposit
Share (%)% of
Franchise
1 Illinois 11 92 $13,569 2.2% 42.1%
2 Indiana2 4 90 $9,663 6.0% 30.0%
3 Minnesota3 8 31 $3,777 1.4% 11.7%
4 Wisconsin 9 24 $2,503 1.4% 7.8%
5 Michigan 17 19 $1,603 0.6% 5.0%
6 Kentucky 21 12 $990 1.0% 3.1%
Total (inc. Iowa) 270 $32,211
No. Top MSAsPro Forma
Rank BranchesDep.
in Mkt. ($M)Deposit
Share (%)
1 Chicago, IL 10 94 $13,931 2.7%
2 Minneapolis-St. Paul, MN3 8 28 $3,585 1.7%
3 Evansville, IN2 1 13 $3,023 38.3%
4 Indianapolis, IN 13 20 $1,399 2.1%
5 Milwaukee, WI 9 7 $1,299 1.7%
6 Madison, WI 10 11 $819 3.7%
7 Bloomington, IN 2 5 $774 24.4%
8 Terre Haute, IN 2 5 $439 13.5%
9 Jasper, IN 2 5 $383 19.7%
10 Fort Wayne, IN 8 4 $381 4.9%
Top 10 MSAs Total 192 $26,031
Source: S&P Global Market Intelligence. Includes banks, savings banks and thrifts only.1. Deposit data as of 6/30/20 and is estimated pro forma for pending or recently completed transactions per S&P Global.2. Branch count excludes 3 “Mobile Limited” (zero deposit) facilities in Evansvil le.3. Branch count excludes 1 “Administrative” (zero deposit) facility in Saint Louis Park.
21
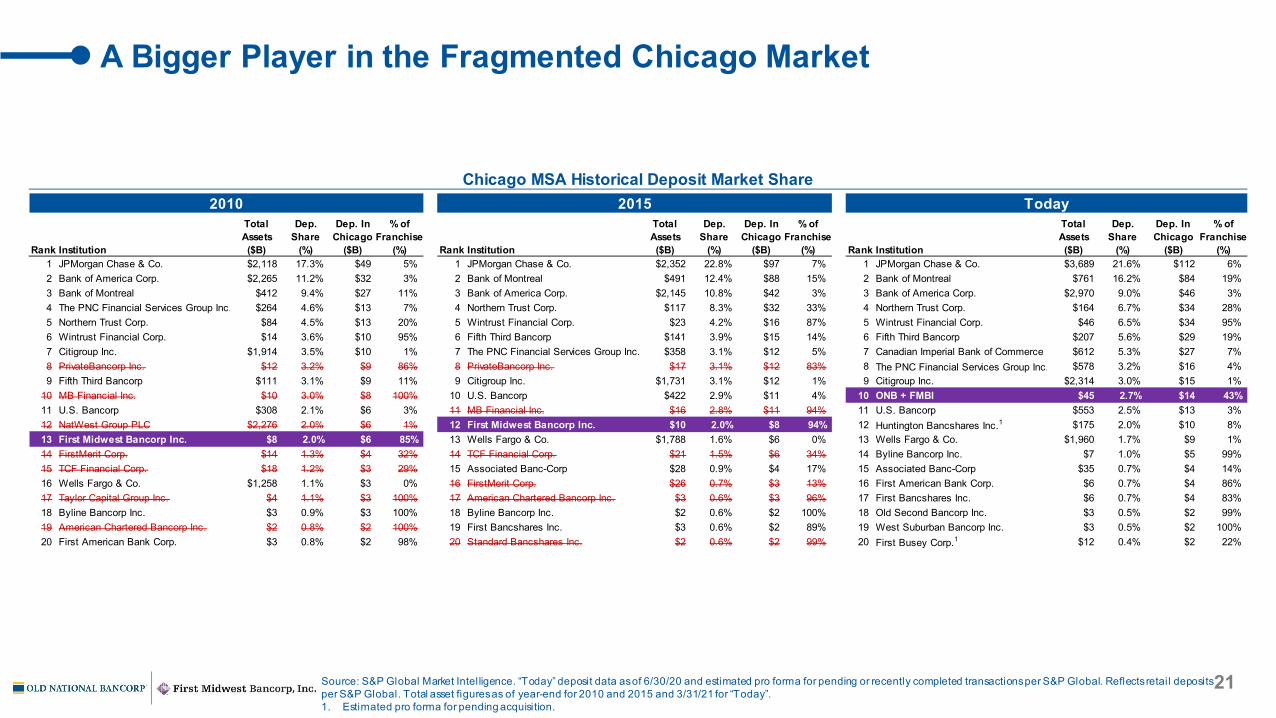
A Bigger Player in the Fragmented Chicago Market
Source: S&P Global Market Intelligence. “Today” deposit data as of 6/30/20 and estimated pro forma for pending or recently completed transactions per S&P Global. Reflects retail deposits per S&P Global. Total asset figures as of year-end for 2010 and 2015 and 3/31/21 for “Today”.1. Estimated pro forma for pending acquisition.
Chicago MSA Historical Deposit Market Share2010 2015 Today
Total Dep. Dep. In % of Total Dep. Dep. In % of Total Dep. Dep. In % ofAssets Share Chicago Franchise Assets Share Chicago Franchise Assets Share Chicago Franchise
Rank Institution ($B) (%) ($B) (%) Rank Institution ($B) (%) ($B) (%) Rank Institution ($B) (%) ($B) (%)1 JPMorgan Chase & Co. $2,118 17.3% $49 5% 1 JPMorgan Chase & Co. $2,352 22.8% $97 7% 1 JPMorgan Chase & Co. $3,689 21.6% $112 6%2 Bank of America Corp. $2,265 11.2% $32 3% 2 Bank of Montreal $491 12.4% $88 15% 2 Bank of Montreal $761 16.2% $84 19%3 Bank of Montreal $412 9.4% $27 11% 3 Bank of America Corp. $2,145 10.8% $42 3% 3 Bank of America Corp. $2,970 9.0% $46 3%4 The PNC Financial Services Group Inc. $264 4.6% $13 7% 4 Northern Trust Corp. $117 8.3% $32 33% 4 Northern Trust Corp. $164 6.7% $34 28%5 Northern Trust Corp. $84 4.5% $13 20% 5 Wintrust Financial Corp. $23 4.2% $16 87% 5 Wintrust Financial Corp. $46 6.5% $34 95%6 Wintrust Financial Corp. $14 3.6% $10 95% 6 Fifth Third Bancorp $141 3.9% $15 14% 6 Fifth Third Bancorp $207 5.6% $29 19%7 Citigroup Inc. $1,914 3.5% $10 1% 7 The PNC Financial Services Group Inc. $358 3.1% $12 5% 7 Canadian Imperial Bank of Commerce $612 5.3% $27 7%8 PrivateBancorp Inc. $12 3.2% $9 86% 8 PrivateBancorp Inc. $17 3.1% $12 83% 8 The PNC Financial Services Group Inc. $578 3.2% $16 4%9 Fifth Third Bancorp $111 3.1% $9 11% 9 Citigroup Inc. $1,731 3.1% $12 1% 9 Citigroup Inc. $2,314 3.0% $15 1%
10 MB Financial Inc. $10 3.0% $8 100% 10 U.S. Bancorp $422 2.9% $11 4% 10 ONB + FMBI $45 2.7% $14 43%11 U.S. Bancorp $308 2.1% $6 3% 11 MB Financial Inc. $16 2.8% $11 94% 11 U.S. Bancorp $553 2.5% $13 3%12 NatWest Group PLC $2,276 2.0% $6 1% 12 First Midwest Bancorp Inc. $10 2.0% $8 94% 12 Huntington Bancshares Inc.1 $175 2.0% $10 8%13 First Midwest Bancorp Inc. $8 2.0% $6 85% 13 Wells Fargo & Co. $1,788 1.6% $6 0% 13 Wells Fargo & Co. $1,960 1.7% $9 1%14 FirstMerit Corp. $14 1.3% $4 32% 14 TCF Financial Corp. $21 1.5% $6 34% 14 Byline Bancorp Inc. $7 1.0% $5 99%15 TCF Financial Corp. $18 1.2% $3 29% 15 Associated Banc-Corp $28 0.9% $4 17% 15 Associated Banc-Corp $35 0.7% $4 14%16 Wells Fargo & Co. $1,258 1.1% $3 0% 16 FirstMerit Corp. $26 0.7% $3 13% 16 First American Bank Corp. $6 0.7% $4 86%17 Taylor Capital Group Inc. $4 1.1% $3 100% 17 American Chartered Bancorp Inc. $3 0.6% $3 96% 17 First Bancshares Inc. $6 0.7% $4 83%18 Byline Bancorp Inc. $3 0.9% $3 100% 18 Byline Bancorp Inc. $2 0.6% $2 100% 18 Old Second Bancorp Inc. $3 0.5% $2 99%19 American Chartered Bancorp Inc. $2 0.8% $2 100% 19 First Bancshares Inc. $3 0.6% $2 89% 19 West Suburban Bancorp Inc. $3 0.5% $2 100%20 First American Bank Corp. $3 0.8% $2 98% 20 Standard Bancshares Inc. $2 0.6% $2 99% 20 First Busey Corp.1 $12 0.4% $2 22%
22
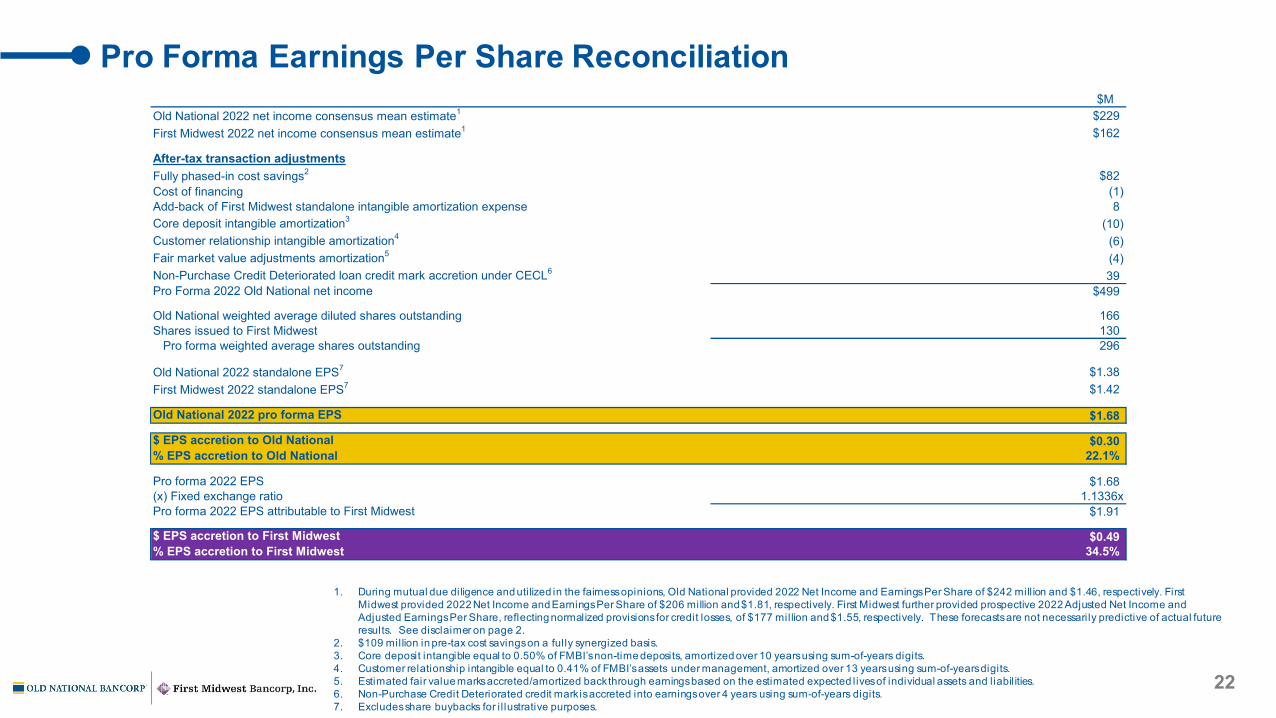
Pro Forma Earnings Per Share Reconciliation
1. During mutual due diligence and utilized in the fairness opinions, Old National provided 2022 Net Income and Earnings Per Share of $242 mill ion and $1.46, respectively. First Midwest provided 2022 Net Income and Earnings Per Share of $206 million and $1.81, respectively. First Midwest further provided prospective 2022 Adjusted Net Income and Adjusted Earnings Per Share, reflecting normalized provisions for credit losses, of $177 million and $1.55, respectively. These forecasts are not necessarily predictive of actual future results. See disclaimer on page 2.
2. $109 million in pre-tax cost savings on a fully synergized basis.3. Core deposit intangible equal to 0.50% of FMBI’s non-time deposits, amortized over 10 years using sum-of-years digits.4. Customer relationship intangible equal to 0.41% of FMBI’s assets under management, amortized over 13 years using sum-of-years digits.5. Estimated fair value marks accreted/amortized back through earnings based on the estimated expected lives of individual assets and liabil ities.6. Non-Purchase Credit Deteriorated credit mark is accreted into earnings over 4 years using sum-of-years digits.7. Excludes share buybacks for i l lustrative purposes.
$MOld National 2022 net income consensus mean estimate1 $229First Midwest 2022 net income consensus mean estimate1 $162
After-tax transaction adjustmentsFully phased-in cost savings2 $82Cost of financing (1)Add-back of First Midwest standalone intangible amortization expense 8Core deposit intangible amortization3 (10)Customer relationship intangible amortization4 (6)Fair market value adjustments amortization5 (4)Non-Purchase Credit Deteriorated loan credit mark accretion under CECL6 39Pro Forma 2022 Old National net income $499
Old National weighted average diluted shares outstanding 166Shares issued to First Midwest 130
Pro forma weighted average shares outstanding 296
Old National 2022 standalone EPS7 $1.38First Midwest 2022 standalone EPS7 $1.42
Old National 2022 pro forma EPS $1.68
$ EPS accretion to Old National $0.30% EPS accretion to Old National 22.1%
Pro forma 2022 EPS $1.68(x) Fixed exchange ratio 1.1336xPro forma 2022 EPS attributable to First Midwest $1.91
$ EPS accretion to First Midwest $0.49% EPS accretion to First Midwest 34.5%
23
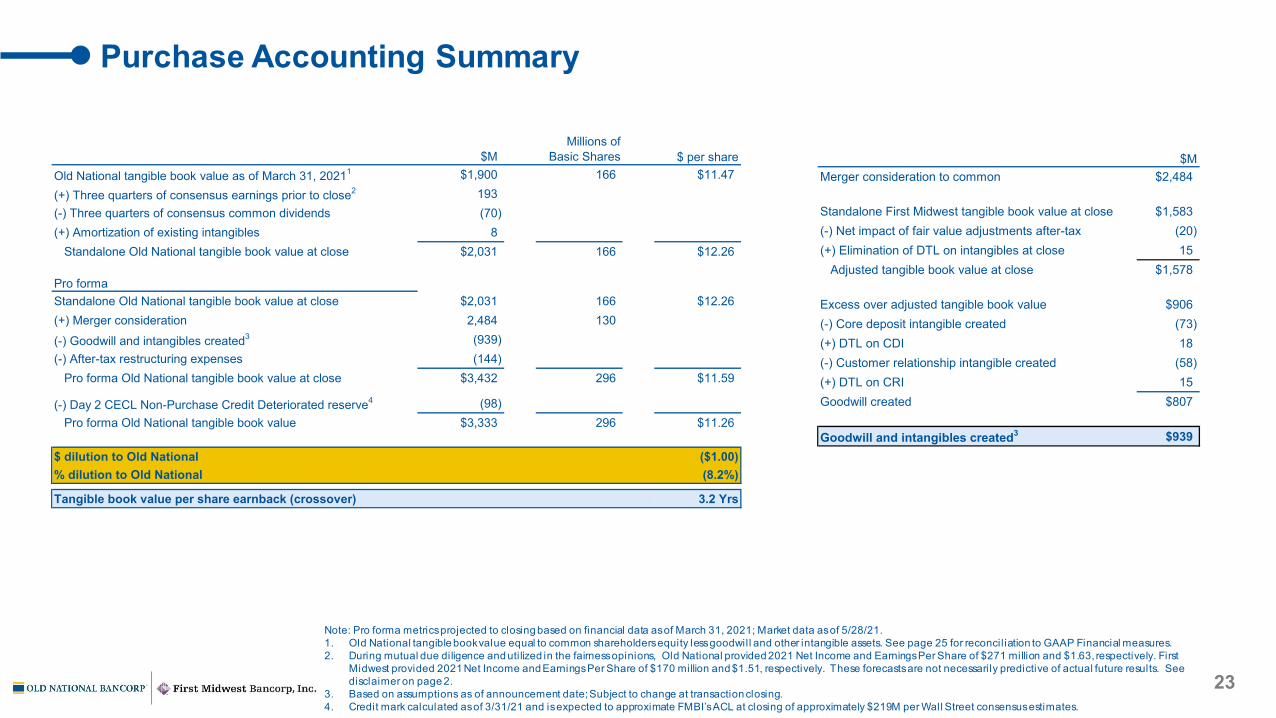
Purchase Accounting Summary
Note: Pro forma metrics projected to closing based on financial data as of March 31, 2021; Market data as of 5/28/21.1. Old National tangible book value equal to common shareholders equity less goodwill and other intangible assets. See page 25 for reconcil iation to GAAP Financial measures.2. During mutual due diligence and utilized in the fairness opinions, Old National provided 2021 Net Income and Earnings Per Share of $271 million and $1.63, respectively. First
Midwest provided 2021 Net Income and Earnings Per Share of $170 million and $1.51, respectively. These forecasts are not necessarily predictive of actual future results. See disclaimer on page 2.
3. Based on assumptions as of announcement date; Subject to change at transaction closing.4. Credit mark calculated as of 3/31/21 and is expected to approximate FMBI’s ACL at closing of approximately $219M per Wall Street consensus estimates.
$M)Millions of
Basic Shares $ per shareOld National tangible book value as of March 31, 20211 $1,900 166 $11.47(+) Three quarters of consensus earnings prior to close2 193(-) Three quarters of consensus common dividends (70)(+) Amortization of existing intangibles 8
Standalone Old National tangible book value at close $2,031 166 $12.26
Pro formaStandalone Old National tangible book value at close $2,031 166 $12.26(+) Merger consideration 2,484 130(-) Goodwill and intangibles created3 (939)(-) After-tax restructuring expenses (144)
Pro forma Old National tangible book value at close $3,432 296 $11.59
(-) Day 2 CECL Non-Purchase Credit Deteriorated reserve4 (98)Pro forma Old National tangible book value $3,333 296 $11.26
$ dilution to Old National ($1.00)% dilution to Old National (8.2%)
Tangible book value per share earnback (crossover) 3.2 Yrs
$MMerger consideration to common $2,484
Standalone First Midwest tangible book value at close $1,583(-) Net impact of fair value adjustments after-tax (20)(+) Elimination of DTL on intangibles at close 15
Adjusted tangible book value at close $1,578
Excess over adjusted tangible book value $906(-) Core deposit intangible created (73)(+) DTL on CDI 18(-) Customer relationship intangible created (58)(+) DTL on CRI 15Goodwill created $807
Goodwill and intangibles created3 $939
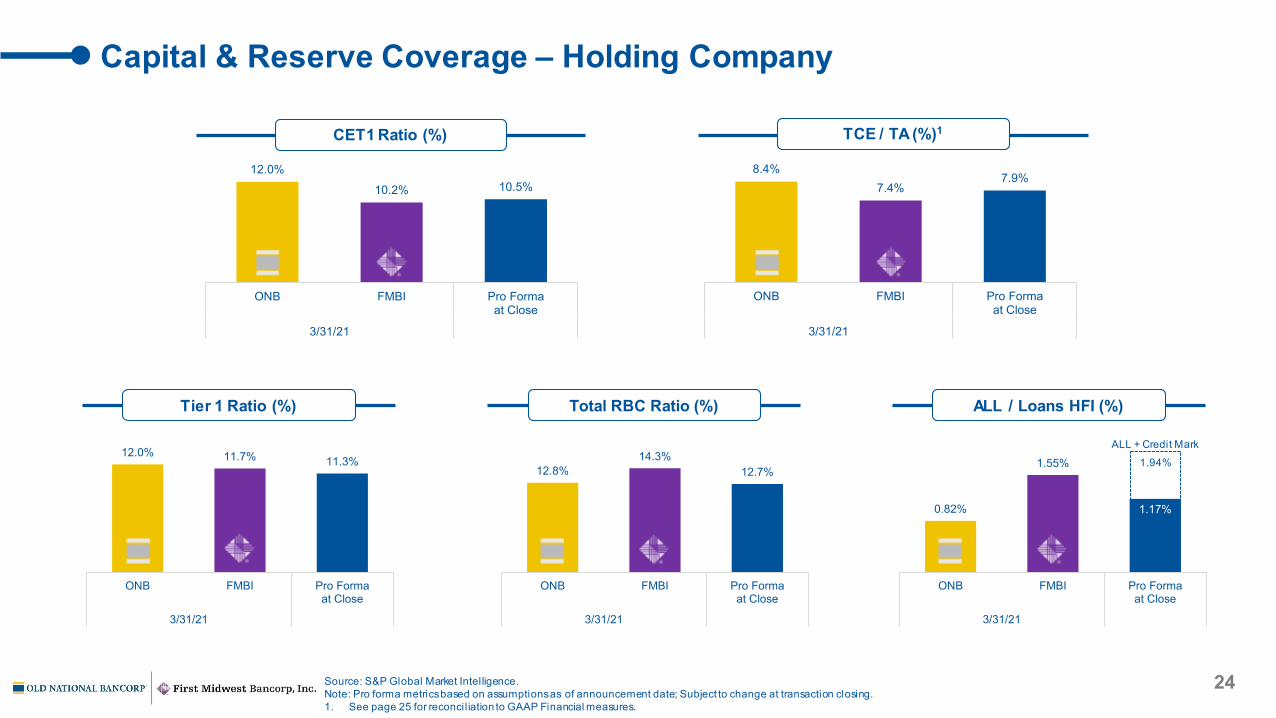
Capital & Reserve Coverage – Holding Company
Source: S&P Global Market Intelligence.Note: Pro forma metrics based on assumptions as of announcement date; Subject to change at transaction closing.1. See page 25 for reconcil iation to GAAP Financial measures.
CET1 Ratio (%) TCE / TA (%)1
Tier 1 Ratio (%) Total RBC Ratio (%) ALL / Loans HFI (%)
12.0%
10.2% 10.5%
ONB FMBI Pro Formaat Close
3/31/21
8.4%7.4%
7.9%
ONB FMBI Pro Formaat Close
3/31/21
12.0% 11.7% 11.3%
ONB FMBI Pro Formaat Close
3/31/21
12.8%14.3%
12.7%
ONB FMBI Pro Formaat Close
3/31/21
0.82%
1.55%
1.17%
ONB FMBI Pro Formaat Close
3/31/21
ALL + Credit Mark
1.94%
24
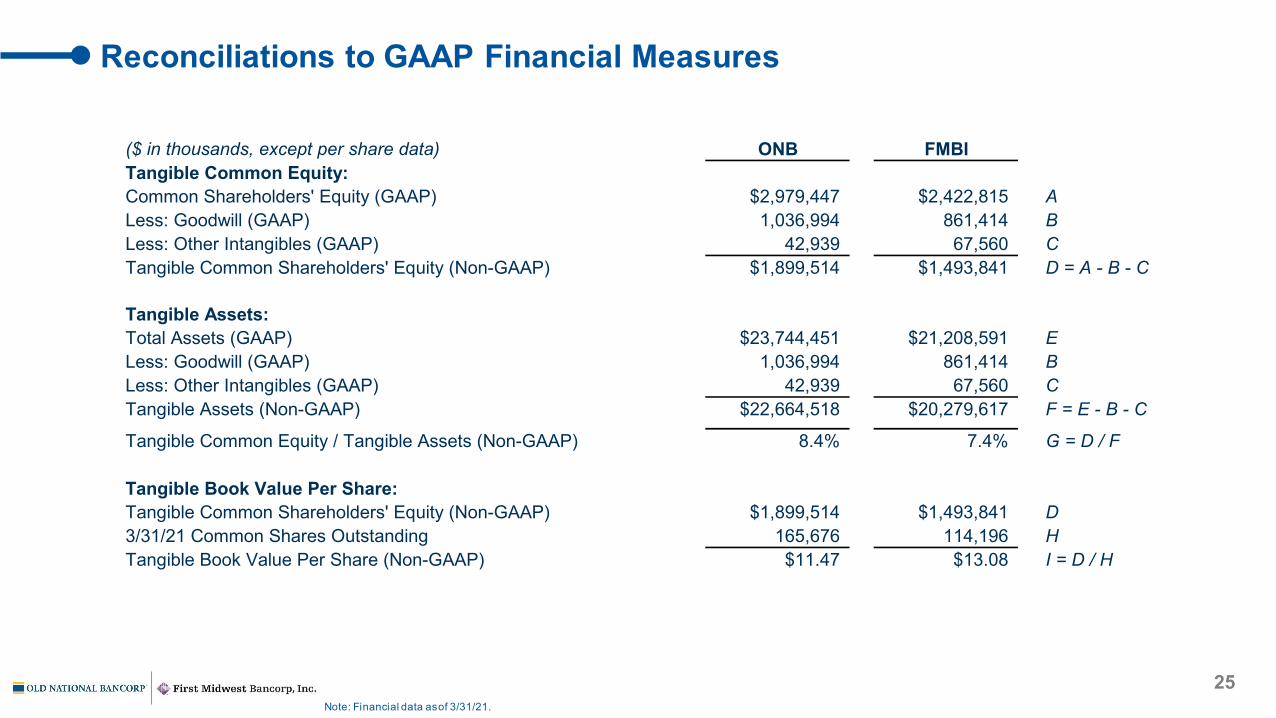
Reconciliations to GAAP Financial Measures
Note: Financial data as of 3/31/21.
25
($ in thousands, except per share data) ONB FMBITangible Common Equity:Common Shareholders' Equity (GAAP) $2,979,447 $2,422,815 ALess: Goodwill (GAAP) 1,036,994 861,414 BLess: Other Intangibles (GAAP) 42,939 67,560 CTangible Common Shareholders' Equity (Non-GAAP) $1,899,514 $1,493,841 D = A - B - C
Tangible Assets:Total Assets (GAAP) $23,744,451 $21,208,591 ELess: Goodwill (GAAP) 1,036,994 861,414 BLess: Other Intangibles (GAAP) 42,939 67,560 CTangible Assets (Non-GAAP) $22,664,518 $20,279,617 F = E - B - C
Tangible Common Equity / Tangible Assets (Non-GAAP) 8.4% 7.4% G = D / F
Tangible Book Value Per Share:Tangible Common Shareholders' Equity (Non-GAAP) $1,899,514 $1,493,841 D3/31/21 Common Shares Outstanding 165,676 114,196 HTangible Book Value Per Share (Non-GAAP) $11.47 $13.08 I = D / H