Mg/Ca paleothermometry in high salinity environments
Babette A.A. Hoogakker a,!, Gary P. Klinkhammer b, Harry Elder!eld a, Eelco J. Rohling c, Chris Hayward a,d
a Department of Earth Sciences, University of Cambridge, Downing Street, CB2 3EQ, Cambridge, UKb Oregon State University, College of Oceanic and Atmospheric Sciences, Ocean. Admin. Bldg. 104, Corvallis, Oregon, 97331, USAc National Oceanography Centre, University of Southampton, SO14 3ZH, Southampton, UKd School of Geosciences, Grant Institute of Earth Sciences, University of Edinburgh, Kings Buildings, West Mains Road, Edinburgh EH9 3JW, UK
a b s t r a c ta r t i c l e i n f o
Article history:Received 21 August 2008Received in revised form 18 May 2009Accepted 20 May 2009Available online 27 June 2009
Editor: P. DeMenocal
Keywords:Mg/Ca paleothermometryRed Seasalinityhigh Mg-calcite overgrowthsconventional ICP-AESelectron microprobe analysisscanning electron microscopy"ow-through time resolved analysisCaCO3 supersaturationGlobigerinoides ruber
Planktonic foraminiferal Mg/Ca ratios have become a fundamental temperature proxy in past climatereconstructions. However, in the highly evaporative seas of the tropics and subtropics, anomalously highplanktonic foraminiferal Mg/Ca ratios arise, possibly linked to high salinities. The extent to which salinityaffects Mg uptake into foraminiferal calcite remains disputed. Some studies suggest onlyminor salinity effects,whereas others suggest a dominant role. Here, we present new data from the highly saline (N40) Red Sea,which separate pure foraminiferal calcite from other phases. The results show that high Mg/Ca ratios (7 to13mmol/mol), found byconventional analysis of planktonic foraminifera fromaRed Sea sediment core, are notcaused by increasedMg uptake into foraminiferal calcite in a high salinity setting (e.g. beyond those predictedby culturing studies), but instead result from secondary high Mg-calcite overgrowths. The overgrowths likelyformed near the sediment–seawater interface, from CaCO3 supersaturated interstitial seawater.
To fully appreciate the complexity of climate change, a thoroughknowledge of past ocean hydrography and circulation is required.Heat exchange between the atmosphere and ocean takes place at thesea surface. Variations in this heat exchange play a crucial role inclimate change, and it is essential that we develop reliable estimatesof sea surface temperatures (SST) and salinity, which togetherdetermine ocean density (hence, circulation), as well as global icevolume/sea-level (Curry et al., 2003).
Sea water temperature reconstructions based on Mg/Ca ratiosin planktonic foraminiferal calcite in addition offer the potential forreconstructing depth-speci!c (seasonal) temperature, given that theecology of the investigated planktonic foraminiferal species is suf-!ciently constrained. A speci!c advantage of Mg/Ca for reconstruct-ing sea water temperatures is that it can be paired with !18Ocalcite
measurements on the same shells, allowing its use to derive !18Owater
(Elder!eld and Ganssen, 2000), which provides critical informationabout global ice volume and the regional hydrological budget.
Although planktonic foraminiferal Mg/Ca ratios have been widelyused as a paleotemperature proxy, it has been found that the con-ventional approach of this method, that of bulk analysis offoraminifera shells after chemical cleaning, produces anomalouslyhigh Mg/Ca ratios in strongly evaporative areas of the tropics andsubtropics (e.g. Greater and Little Bahama Bank, Eastern Mediterra-nean Sea, and Red Sea) (Rosenthal et al., 2000; Lear et al., 2002;Reuning et al., 2005; Ferguson et al., 2008).
Recently, Ferguson et al. (2008) suggested that such anomalouslyhigh values occur because salinity may exert an important controlon Mg/Ca ratios in planktonic foraminifera, with Mg/Ca ratios being15–60% higher per salinity unit increase than estimated from pub-lished calibrations of Mg/Ca increase with temperature. Such aneffect would compromise the applicability of foraminiferal Mg/Caratios as a paleo seawater temperature proxy. For example,Caribbean Last Glacial Maximum (LGM) temperatures could beoverestimated bymore than 2.5 °C (Ferguson et al., 2008). Therefore,it is essential that potential effects of salinity on Mg uptake in
Earth and Planetary Science Letters 284 (2009) 583–589
foraminifera are constrained. In this study we investigate the cause(s) for anomalously high Mg/Ca ratios (ratios beyond those pre-dicted by culturing studies) measured on downcore sediment sam-ples from the highly saline central Red Sea.
2. Materials and methods
In order to assess direct and indirect effects that salinity may haveon planktonic foraminiferal Mg uptake, we measured Mg/Ca ratiosusing a variety of techniques, on downcore sediment samples fromcentral Red Sea sediment core MD92-1017 (19°23"24qN, 38°40"84qE,570 mwater depth) (Rohling et al., 1998). At present the central RedSea is characterized by high salinities (38–40), while salinities du-ring glacial sea-level low-stands reached 50 or more (Rohling et al.,1998; Siddall et al., 2003; Boyer et al., 2006), making this an idealnatural location for this purpose.
We used several approaches to measure Mg/Ca ratios on calcite ofthe planktonic foraminifer Globigerinoides ruber, together with highmagni!cation scanning electron microprobe (SEM) imaging: (i) meanbatch Mg/Ca ratios on multiple specimens by both conventionalmethodology and "ow-through time resolved analysis, (ii) Mg/Caratios of different calcite phases by "ow-through time resolvedanalysis, and (iii) Mg/Ca distributionwithin the foraminiferal shell bySEM-led electron microprobe analysis (Brown and Elder!eld, 1996;Barker et al., 2003; Benway et al., 2003; Anand and Elder!eld, 2005)(Fig. 1). G. ruber thrives in shallow surface waters (top 50 m) and, asthis species does not deposit a calcite crust during gametogenesis, itscalcite shell should re"ect sea water chemistry of these depths (Caronet al., 1990; Reiss and Hottinger, 1984). The age model of core MD92-1017 is based on oxygen isotope stratigraphy (Hemleben et al., 1996;Rohling et al., 1998; Fenton et al., 2000), which divides !18O records instandard glacial and interglacial !18O stages (Fig. 1).
A total of 8 samples were analyzed by ICP-AES. Samples containedbetween 21 and 26 specimens of G. ruber (250–300 !m fraction) withbatch weights between 250 and 410 !g. Two intervals were selected,covering interglacial MIS 11.3 and cool substage MIS 11.2 (Fig. 1). Prior
to cleaning, samples were gently crushed between glass plates torelease contaminant material. Samples were cleaned using the tech-nique described by Barker et al. (2003), which includes clay removalthrough the minimal settling technique in UHQ water and methanol,removal of organic matter through oxidation, optical removal ofcontaminant coarse grains, and a dilute acid leach to remove adsorbedcontaminants from the test fragments. For each interval, a subset ofsamples was also cleaned using a reductive cleaning step (Yu et al.,2005, after Boyle and Keigwin, 1985). Prior to analysis with ICP-AES,samples were dissolved in 0.075 M HNO3 and centrifuged in order tosettle any remaining small silicate particles. Mg/Ca ratios weremeasured using a Vista ICP-AES, with 0.29% precision.
2.2. Flow through time resolved analysis (FT-TRA)
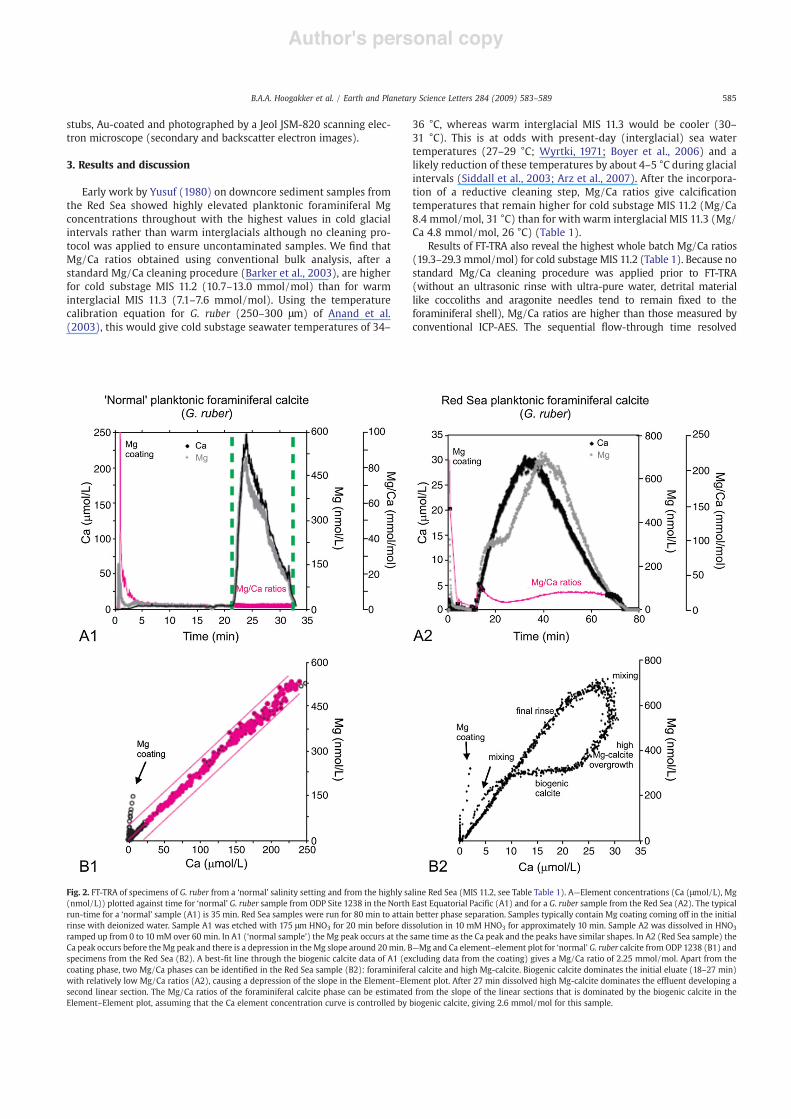
A total of 6 samples from MIS 7.2, MIS 11.2 and MIS 11.3 wereanalyzed using "ow-through time resolved analysis (FT-TRA, chro-matographic approach to cleaning and dissolving foraminiferal calciteand other types of geological materials, adaptable to a variety ofchemical methods; Haley and Klinkhammer, 2002). Samples con-tained 14 to 15 specimens of G. ruber (N250 !m fraction), with batchweights between 209 and 330 !g. A simple chemistry was applied tountreated samples, including a 15 minute rinse with deionized water,followed by dissolution with nitric acid ramped up from 0 to 10 mMover 60 minutes, ending with an additional 5 minute water rinse. FT-TRA results are portrayed as ef"uent element concentration againstrun-time (Fig. 2A) and ef"uent Element–Element concentration(Fig. 2B). Complete separation of the overgrowth and biogenic calcitewas not achieved in this study (Fig. 2A2). Mg/Ca ratios of planktonicforaminiferal calcite were estimated from the slope of the linearsegment dominated by biogenic calcite in the Element–Element plot(Fig. 2B2).
2.3. Scanning electron microscopy-led electron microprobe analysis (SEM-led EMPA)
Two samples were analyzed by SEM-led EMPA from MIS 6.4 andMIS 9.3 from the 250–300 !m size fraction. Each sample wasultrasonically rinsed with ultra-pure water, dried and then impreg-nated in epoxy resin under vacuum. Samples were polished to exposeforaminiferal test walls in cross section and then carbon coated byvacuum evaporation. SEM images were taken from the foraminiferalcross sections using both secondary and backscatter mode, and usedas a mapping tool prior to EMPA. The backscatter mode was used toidentify areas of foraminiferal calcite (light appearance on SEM imagedue to relatively high average atomic number) and impurities (greyappearance on SEM image due to lower average atomic number). ACAMECA SX100 was used for EMPA using 15 kV accelerating voltageand 10 nA beam current with beamsize of 5 !m. Spot measurementswere carried out spread across the foraminiferal chambers in order toaccommodate for heterogeneity. The following elements were mea-sured: wt.% Ca (detection limit 510 ppm), Mg (detection limit197 ppm), Fe (detection limit 510 ppm), Si (detection limit151 ppm), Al (detection limit 46 ppm), Mn (detection limit235 ppm), Sr (detection limit 209 ppm). The " X-ray lines wereused for all elements except Sr, for which the La line was analysed. Weused internal laboratory standards diopside (Ca, Si), periclase (Mg),corundum (Al), pure metals (Fe, Mn) and celestine (Sr). Data re-duction used the X-Phi method within Cameca's PeakSight software.
2.4. Scanning electron microscope (SEM) images
Inner and outer surfaces of planktonic foraminiferal specimensfrom MIS 6.4 and 9.3 were photographed using a SEM. Each samplewas gently crushed to reveal inner surfaces and then ultrasonicallyrinsed using ultra-purewater. After drying, samples were mounted on
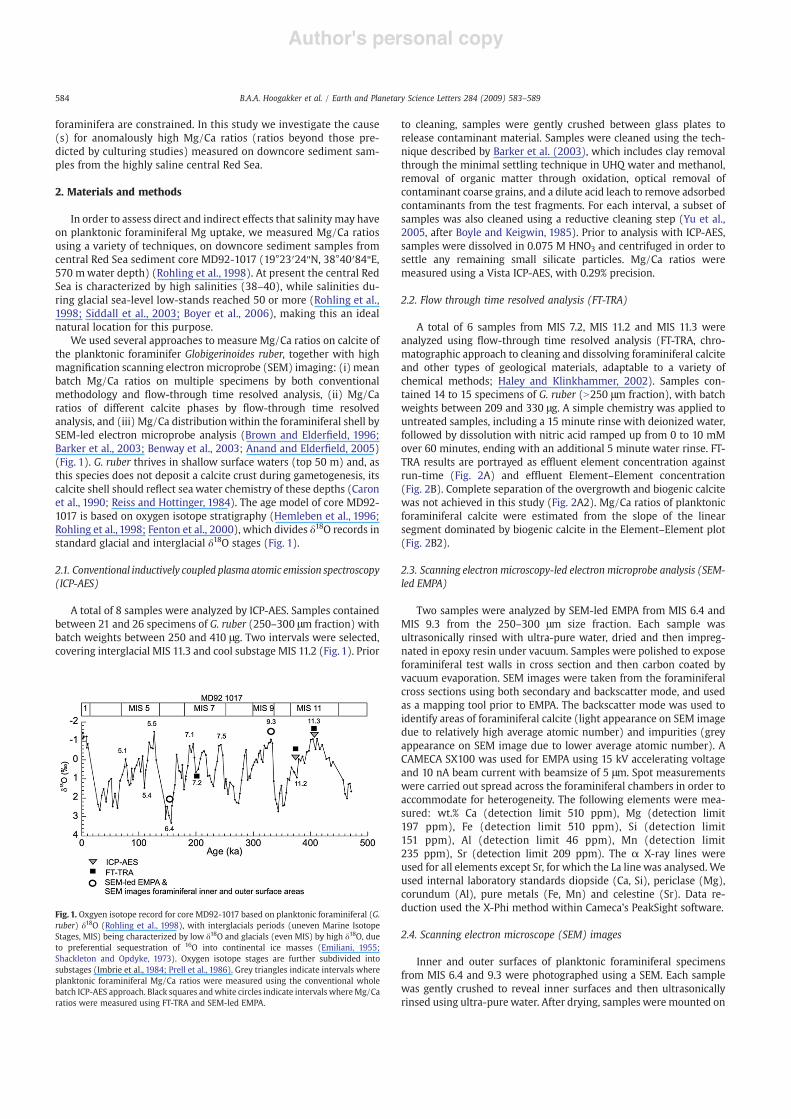
Fig. 1. Oxgyen isotope record for core MD92-1017 based on planktonic foraminiferal (G.ruber) !18O (Rohling et al., 1998), with interglacials periods (uneven Marine IsotopeStages, MIS) being characterized by low !18O and glacials (even MIS) by high !18O, dueto preferential sequestration of 16O into continental ice masses (Emiliani, 1955;Shackleton and Opdyke, 1973). Oxygen isotope stages are further subdivided intosubstages (Imbrie et al., 1984; Prell et al., 1986). Grey triangles indicate intervals whereplanktonic foraminiferal Mg/Ca ratios were measured using the conventional wholebatch ICP-AES approach. Black squares andwhite circles indicate intervals whereMg/Caratios were measured using FT-TRA and SEM-led EMPA.
584 B.A.A. Hoogakker et al. / Earth and Planetary Science Letters 284 (2009) 583–589
stubs, Au-coated and photographed by a Jeol JSM-820 scanning elec-tron microscope (secondary and backscatter electron images).
3. Results and discussion
Early work by Yusuf (1980) on downcore sediment samples fromthe Red Sea showed highly elevated planktonic foraminiferal Mgconcentrations throughout with the highest values in cold glacialintervals rather than warm interglacials although no cleaning pro-tocol was applied to ensure uncontaminated samples. We !nd thatMg/Ca ratios obtained using conventional bulk analysis, after astandard Mg/Ca cleaning procedure (Barker et al., 2003), are higherfor cold substage MIS 11.2 (10.7–13.0 mmol/mol) than for warminterglacial MIS 11.3 (7.1–7.6 mmol/mol). Using the temperaturecalibration equation for G. ruber (250–300 !m) of Anand et al.(2003), this would give cold substage seawater temperatures of 34–
36 °C, whereas warm interglacial MIS 11.3 would be cooler (30–31 °C). This is at odds with present-day (interglacial) sea watertemperatures (27–29 °C; Wyrtki, 1971; Boyer et al., 2006) and alikely reduction of these temperatures by about 4–5 °C during glacialintervals (Siddall et al., 2003; Arz et al., 2007). After the incorpora-tion of a reductive cleaning step, Mg/Ca ratios give calci!cationtemperatures that remain higher for cold substage MIS 11.2 (Mg/Ca8.4 mmol/mol, 31 °C) than for with warm interglacial MIS 11.3 (Mg/Ca 4.8 mmol/mol, 26 °C) (Table 1).
Results of FT-TRA also reveal the highest whole batch Mg/Ca ratios(19.3–29.3 mmol/mol) for cold substage MIS 11.2 (Table 1). Because nostandard Mg/Ca cleaning procedure was applied prior to FT-TRA(without an ultrasonic rinse with ultra-pure water, detrital materiallike coccoliths and aragonite needles tend to remain !xed to theforaminiferal shell), Mg/Ca ratios are higher than those measured byconventional ICP-AES. The sequential "ow-through time resolved
Fig. 2. FT-TRA of specimens of G. ruber from a ‘normal’ salinity setting and from the highly saline Red Sea (MIS 11.2, see Table Table 1). A—Element concentrations (Ca (!mol/L), Mg(nmol/L)) plotted against time for ‘normal’ G. ruber sample from ODP Site 1238 in the North East Equatorial Paci!c (A1) and for a G. ruber sample from the Red Sea (A2). The typicalrun-time for a ‘normal’ sample (A1) is 35 min. Red Sea samples were run for 80 min to attain better phase separation. Samples typically contain Mg coating coming off in the initialrinse with deionized water. Sample A1 was etched with 175 !m HNO3 for 20 min before dissolution in 10 mM HNO3 for approximately 10 min. Sample A2 was dissolved in HNO3
ramped up from 0 to 10 mM over 60 min. In A1 (‘normal sample’) the Mg peak occurs at the same time as the Ca peak and the peaks have similar shapes. In A2 (Red Sea sample) theCa peak occurs before the Mg peak and there is a depression in the Mg slope around 20min. B—Mg and Ca element–element plot for ‘normal’ G. ruber calcite from ODP 1238 (B1) andspecimens from the Red Sea (B2). A best-!t line through the biogenic calcite data of A1 (excluding data from the coating) gives a Mg/Ca ratio of 2.25 mmol/mol. Apart from thecoating phase, two Mg/Ca phases can be identi!ed in the Red Sea sample (B2): foraminiferal calcite and high Mg-calcite. Biogenic calcite dominates the initial eluate (18–27 min)with relatively low Mg/Ca ratios (A2), causing a depression of the slope in the Element–Element plot. After 27 min dissolved high Mg-calcite dominates the ef"uent developing asecond linear section. The Mg/Ca ratios of the foraminiferal calcite phase can be estimated from the slope of the linear sections that is dominated by the biogenic calcite in theElement–Element plot, assuming that the Ca element concentration curve is controlled by biogenic calcite, giving 2.6 mmol/mol for this sample.
585B.A.A. Hoogakker et al. / Earth and Planetary Science Letters 284 (2009) 583–589
diagram for MIS 11.2 clearly illustrates that the whole-sample ratios areCa-weighted averages from several Mg-calcite phases: a non-biogenicMg coating, a high-Mg-calcite phase, and biogenic calcite (Fig. 2). Using
the slope of the linear segment dominated by biogenic calcite (seeexamples in Fig. 2B) we estimate isolated foraminiferal Mg/Ca ratios of5.2–6.3mmol/mol for interglacial MIS 11.3, and 2.8 and 2.6–3.2 for cold
Table 1
A—Details of sea water temperatures and predicted Mg/Ca ratios (using calibration equation of Anand et al. (2003) for G. ruber 250–300 !m) for the present day warm interglacialsand glacials-cold substages.
Predicted Mg/Ca ratios Temperature 50–0 m Predicted Mg/Ca ratios Temperature 50–0 m5.3–6.5 mmol/mol 27–29 °C 3.2–4.4 mmol/mol 22–25 °C
Present day mean annual sea water temperatures for 50–0 mwater depths are from Boyer et al. (2006); glacial and cold substage SST from Siddall et al. (2003) and Arz et al. (2007).
B—Measured Mg/Ca ratios, using the various methods discussed in the main text, and their calculated sea water temperatures (same calibration equation as for A).
Warm interglacials Glacials—cold substages
Method Measured Mg/Ca ratios(mmol/mol)
Calibrated sea watertemperatures
Measured Mg/Ca ratios(mmol/mol)
Calibrated sea watertemperatures
Conventional ICP-AES, Barker et al. (2003) cleaning protocol 7.6 (MIS 11.3) 31 11.2 (MIS 11.2) 347.1 (MIS 11.3) 30 10.7 (MIS 11.2) 347.2 (MIS 11.3) 30 13.0 (MIS 11.2) 36
Conventional ICP-AES, Barker et al. (2003) cleaningprotocol+reductive cleaning step
4.8 (MIS 11.3) 26 8.4 (MIS 11.2) 31
FT-TRA (ICP-MS) whole batch 9.8 (MIS 11.3) 33 19.3 (MIS 7.2) 408.1 (MIS 11.3) 31 24.7 (MIS 11.2) 42
27.7 (MIS 11.2) 4329.3 (MIS 11.2) 44
FT-TRA (ICP-MS) foraminiferal calcite phase 5.2 (MIS 11.3) 27 2.8 (MIS 7.2) 206.3 (MIS 11.3) 29 2.6 (MIS 11.2) 18
3.2 (MIS 11.2) 223.2 (MIS 11.2) 22
SEM-led EMPA of foraminiferal cross sections (average) 6.4 (MIS 9.3) 29 3.4 (MIS 6.4) 23
C—Predicted Mg/Ca ratios for present-day/warm interglacials and glacials-cold substages, including a salinity effect as proposed by the culturing study of Kısakürek et al. (2008):Mg/Ca=exp((0.06!Salinity+0.08!Temperature)!2.8), and a sensitivity to temperature of 0.04 instead of 0.06. Present day mean annual salinity (50–0 m water depth) fromBoyer et al. (2006).
Predicted Mg/Ca ratios as a function of temperature and salinity(after Kısakürek et al. (2008)
Predicted Mg/Ca ratios SST, salinity Predicted Mg/Ca ratios SST, salinity5.4 mmol/mol 27 °C, 38.9 7.1 mmol/mol 22 °C, 506.4 mmol/mol 29 °C, 38.9 9.0 mmol/mol 25 °C, 50
5.3 mmol/mol 22 °C, 456.7 mmol/mol 25 °C, 453.3 mmol/mol 16 °C, 45
Sensitivity to salinity 0.04 2.5 mmol/mol 27 °C, 38.9 2.6 mmol/mol 22 °C, 502.9 mmol/mol 29 °C, 38.9 3.3 mmol/mol 25 °C, 50
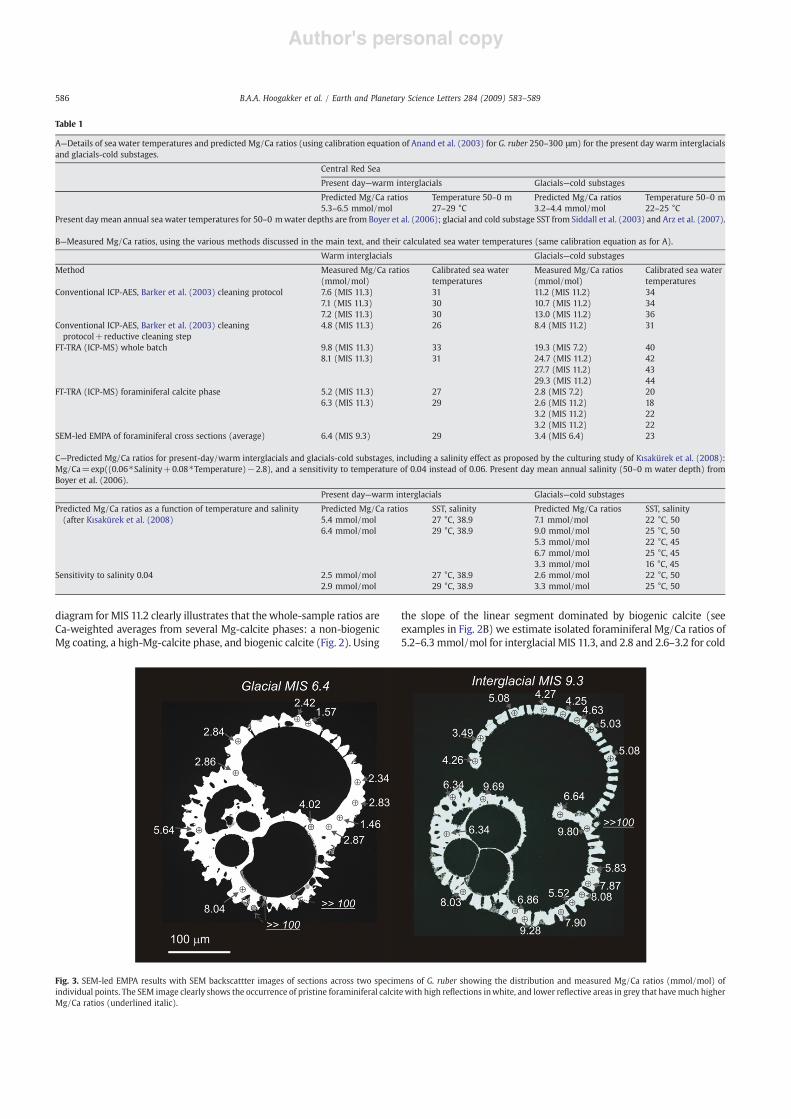
Fig. 3. SEM-led EMPA results with SEM backscattter images of sections across two specimens of G. ruber showing the distribution and measured Mg/Ca ratios (mmol/mol) ofindividual points. The SEM image clearly shows the occurrence of pristine foraminiferal calcitewith high re"ections inwhite, and lower re"ective areas in grey that havemuch higherMg/Ca ratios (underlined italic).
586 B.A.A. Hoogakker et al. / Earth and Planetary Science Letters 284 (2009) 583–589
Author's personal copy
substages MIS 7.2 and 11.2 (Table 1). Using the temperature calibrationequation of Anand et al. (2003) forG. ruber (250–300 !m) these isolatedforaminiferal Mg/Ca ratios give calci!cation temperatures of 27–29 °Cfor MIS 11.3 and 20 °C and 18–22 °C for MIS 7.2 and 11.2, which are ingood agreement with present-day (interglacial) and cold substage seawater temperatures (Table 1).
SEM-led EMPA for samples from interglacial MIS 9.3 and glacialMIS 6.4 also shows different Mg/Ca phases. High backscatter areas inSEM images of cross sections represent foraminiferal calcite and allhave Fe, Si, Al and Mn below detection limit. Low backscatter areas onthe other hand represent impure phases that contain signi!cantamounts of Fe, Si, Al and Mn. Foraminiferal Sr/Ca ratios are uniformlydistributed (this is con!rmed by the FT-TRA analysis) and average1.65 mmol/mol for both samples, con!rming no recrystallization ofthe tests after burial. The impurities show highly elevated Mg/Caratios (NN100 mmol/mol) and comprise a mixture of high-Mg-calciteand silicate minerals (Fig. 3). Average Mg/Ca ratios measured onforaminiferal calcite shell cross sections are 3.4 mmol/mol for glacialMIS 6.4, and 6.4 mmol/mol for interglacial MIS 9.3, giving calci!cationtemperatures of 23 °C for glacial MIS 6 and 29 °C for interglacial MIS 9(Table 1).
Our results show that planktonic foraminiferal Mg/Ca ratios,obtained from focussed analysis of foraminiferal calcite by FT-TRA andSEM-led EMPA, are in good agreement with present-day (interglacial)sea water temperatures (27–29 °C; Wyrtki, 1971; Boyer et al., 2006)and up to 4–5 °C reduction during glacials and cold substages (Siddallet al., 2003; Arz et al., 2007). Results from both sequential "ow-through leaching and SEM-led EMPA show that the higher than pre-dicted Mg/Ca values for interglacials (7.1 mmol/mol) and coldintervals/glacials (13.0 mmol/mol) measured by conventionalwhole batch ICP-AES are due to impure phases (i.e., not foraminiferalcalcite) (Figs. 2 and 3, Table 1). Cleaning techniques used prior toconventional whole batch analysis will remove silicate mineralimpurities, and it is therefore most likely that the high Mg/Ca ratiosresult from other impurities, in particular coatings and overgrowthsthat are resilient to the applied cleaning procedures. This is furtherdemonstrated by our FT-TRA results, with simultaneous dissolutionof the foraminiferal calcite and high Mg-calcite phases throughout theexperiment (Fig. 2). Resilience of overgrowths to routinely appliedcleaning procedures has also been demonstrated for older PlioceneCaribbean samples (Groeneveld et al., 2008).
Reductive cleaning caused similar reductions in Mg/Ca ratios forboth cold MIS 11.2 (33%) and warm interglacial MIS 11.3 (28%) anddoes not satisfactorily remove the impurities for cold substage MIS11.2 as Mg/Ca ratios are still higher than those of warm interglacialMIS 11.3 (Table 1). In a recent study, Yu et al. (2007) show that thecitrate used in the reductive cleaning step causes preferential leachingof Mg-rich parts of benthic foraminiferal shells. It is not unlikely thatthe similar reduction in planktonic foraminiferal Mg/Ca ratios of MIS11.2 and MIS 11.3 after reductive cleaning is due to partial dissolutionof Mg-rich parts of the foraminiferal shell rather than removal ofimpurities (Table 1).
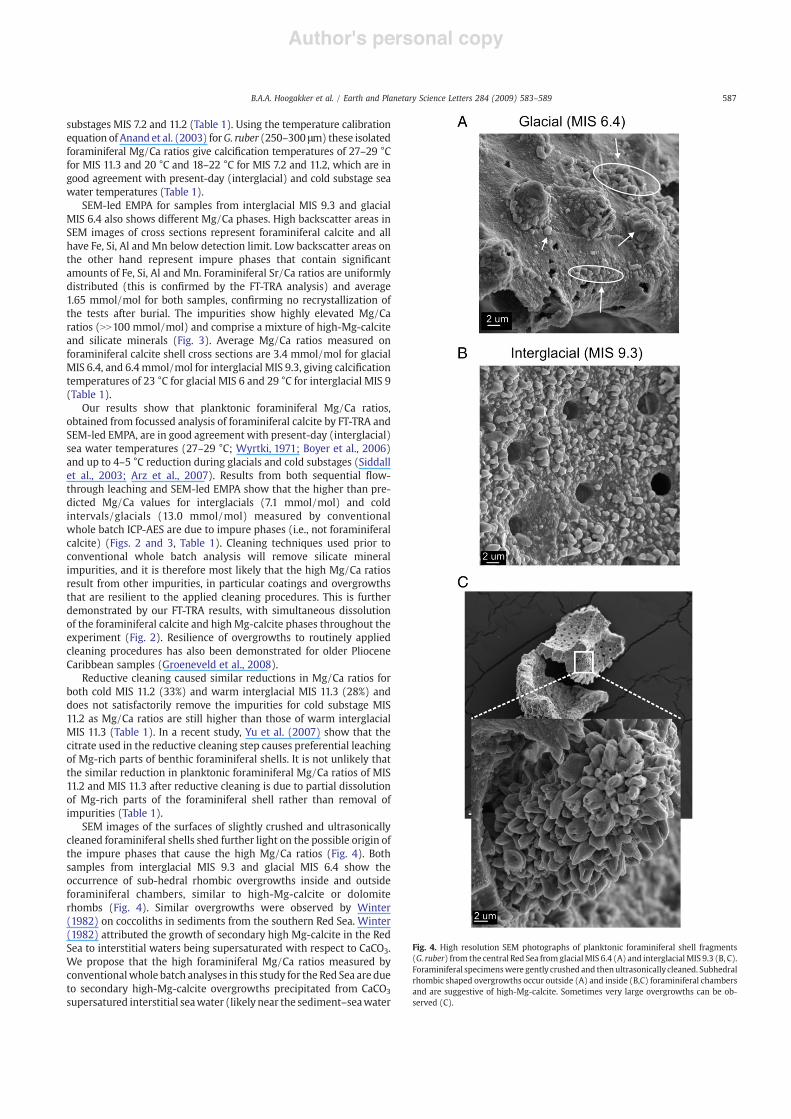
SEM images of the surfaces of slightly crushed and ultrasonicallycleaned foraminiferal shells shed further light on the possible origin ofthe impure phases that cause the high Mg/Ca ratios (Fig. 4). Bothsamples from interglacial MIS 9.3 and glacial MIS 6.4 show theoccurrence of sub-hedral rhombic overgrowths inside and outsideforaminiferal chambers, similar to high-Mg-calcite or dolomiterhombs (Fig. 4). Similar overgrowths were observed by Winter(1982) on coccoliths in sediments from the southern Red Sea. Winter(1982) attributed the growth of secondary high Mg-calcite in the RedSea to interstitial waters being supersaturated with respect to CaCO3.We propose that the high foraminiferal Mg/Ca ratios measured byconventionalwhole batch analyses in this study for the Red Sea are dueto secondary high-Mg-calcite overgrowths precipitated from CaCO3
supersatured interstitial seawater (likely near the sediment–seawater
Fig. 4. High resolution SEM photographs of planktonic foraminiferal shell fragments(G. ruber) from the central Red Sea fromglacialMIS 6.4 (A) and interglacialMIS 9.3 (B, C).Foraminiferal specimenswere gently crushed and thenultrasonically cleaned. Subhedralrhombic shaped overgrowths occur outside (A) and inside (B,C) foraminiferal chambersand are suggestive of high-Mg-calcite. Sometimes very large overgrowths can be ob-served (C).
587B.A.A. Hoogakker et al. / Earth and Planetary Science Letters 284 (2009) 583–589
interface as no increasing downcore trend is observed). A similarmechanism was proposed by Rosenthal et al. (2000) and Lear et al.(2002) to explain higher than expected Mg/Ca ratios in planktonicforaminiferal samples from the Bahamas, con!rming that this issueneeds to be considered in other areas. Ferguson et al. (2008) argue thathigh Mg-calcite overgrowths, characterizing foraminiferal samplesfrom the Mediterranean Sea, are generally removed after a reductivecleaning step.
Red Sea high Mg-calcites have MgCO3 contents of ~12–14 mol%(Milliman et al., 1969; Luz et al., 1984). With typical Red Sea over-growth Mg/Ca ratios of 136 to 163 mmol/mol, we calculate thatinterglacial samples would need to comprise 3 to 4% overgrowthmaterial, whereas glacial samples would need 2 to 3%, which is withinthe remit of observations in Fig. 4.
Ferguson et al. (2008) proposed that planktonic foraminiferalMg/Ca ratios may increase by 15 to 60% per unit increase in salinity.Using these values, planktonic foraminiferal Mg/Ca ratios shouldhave been between 5 and 26 mmol/mol during MIS 6.4 in the centralRed Sea, when salinities were 10 or more higher (Rohling et al., 1998;Siddall et al., 2003) yet SEM-led EMPA shows a ratio of only 3.4mmol/mol (Fig. 3, Table 1). Culture studies suggest a modest increase inplanktonic foraminiferal Mg/Ca per unit increase in salinity, varyingbetween 6% (Orbulina universa, G. ruber) and 8% (Globigerinoidessacculifer) (Nürnberg et al., 1996; Lea et al., 1999; Lea, 2003; Kısaküreket al., 2008). If we predict Mg/Ca ratios with a sensitivity to bothtemperature and salinity (G. ruber calibration equation of Kısaküreket al., 2008), then predicted ratios fall in the range of measured Mg/Caratios for interglacials MIS 9.3 and 11.3 (Table 1). For glacial MIS 6.4predicted Mg/Ca ratios appear too high. If we apply a smaller sen-sitivity to salinity (4% instead of 6%) measured glacial Mg/Ca ratios dofall within the predicted range (2.6–3.3 mmol/mol), but thosepredicted for interglacials MIS 9.3 and 11.3 then become to low(2.6–3.1 mmol/mol). This suggests that the sensitivity of planktonicforaminiferal Mg uptake to salinity may be more complex, decreasingwith lower temperatures.
Culturing studies suggest that salinity has some effect on Mguptake in planktonic foraminiferal calcite (Nürnberg et al., 1996; Leaet al., 1999; Kısakürek et al., 2008). Such a mechanism is not res-ponsible for the anomalously high Mg/Ca ratios (7–13 mmol/mol)obtained by conventional analysis for the central Red Sea corewe havestudied. The results presented do not support a dominant role ofsalinity on Mg uptake in planktonic foraminiferal calcite in this highsalinity environment. Our study emphasizes the key role thatcarbonate saturation state has on early diagenesis of planktonicforaminiferal calcite through the precipitation of high-Mg-calciteovergrowths. Screening for overgrowths in areas subject to high and/or varying interstitial CaCO3 saturation states, using the methodsdescribed in this study, is therefore crucial before interpreting for-aminiferal Mg/Ca ratios obtained by conventional methods.
Acknowledgements
We are grateful to Andy Buckley, Keith Grey, Angela Huckle and IanMarshall for help with sample processing and Scanning ElectronMicroscope and Electron Microprobe use. Babette Hoogakker andHarry Elder!eld acknowledge funding from the STOPFEN EuropeanNetwork research project HPRN-CT-2002-00221 and fromNERC. EelcoRohling acknowledges support from NERC projects NE/C003152/1and NE/E01531X/1. Funding to Gary Klinkhammer was provided bythe US NSF-OCE-MGG through grant OCE-0426410.
References
Anand, P., Elder!eld, H., 2005. Variability of Mg/Ca and Sr/Ca between and within theplanktonic foraminifers Globigerina bulloides and Globorotalia truncatulinoides.Geochem. Geophys. Geosys. 6. doi10.1029/2004GC000811.
Anand, P., Elder!eld, H., Conte, M.H., 2003. Calibration of Mg/Ca thermometry inplanktonic foraminifera from a sediment trap time series. Paleoceanography 18.doi10.1029/2002PA000846.
Arz, H.W., Lamy, F., Ganopolski, A., Nowaczyk, N., Pätzold, J., 2007. Dominant NorthernHemisphere climate control over millennial-scale glacial sea-level variability. Quat.Sci. Rev. 26, 312–321.
Barker, S., Greaves, M., Elder!eld, H., 2003. A study of cleaning procedures used forforaminiferalMg/Ca paleothermometry. Geochem. Geophys. Geosys. 4. doi10.1029/2003GC000559.
Boyer, T.P., Antonov, J.I., Garcia, H.E., Johnson, D.R.R., Locarnini, A., Mishonov, A.V.,Pitcher, M.T., Baranova, O.K., Smolyar, I.V., 2006. World ocean database 2005. In:Levitus, S. (Ed.), NOAA Atlas NESDIS 60. U.S. Government Printing Of!ce,Washington, D.C. 190 pp.
Boyle, E.A., Keigwin, L.D., 1985. Comparison of Atlantic and Paci!c paleochemicalrecords for the last 215,000 years: changes in deep ocean circulation and chemicalinventories. Earth Planet. Sci. Lett. 76, 135–150.
Brown, S.J., Elder!eld, H., 1996. Variations in Mg/Ca and Sr/Ca ratios of planktonicforaminifera caused by postdepositional dissolution: evidence of shallow Mg-dependent dissolution. Paleocanography 11, 543–551.
Caron, D.A., Anderson, O.R., Lindsey, J.L., Faber, W.W., Lim, E.L., 1990. Effects ofgametogenesis on test structure and dissolution of some spinose planktonicforaminifera and implications for test preservation.Mar.Micropaleontol.16, 93–116.
Curry, R., Dickons, B., Yashayaev, I., 2003. A change in the freshwater balance of theAtlantic Ocean over the past four decades. Nature 426, 826–829.
Elder!eld, H., Ganssen, G., 2000. Past temperature and !18O of surface ocean watersinferred from foraminiferal Mg/Ca ratios. Nature 405, 442–445.
Emiliani, C., 1955. Pleistocene temperatures. J. Geol. 63, 538–578.Fenton, M., Geiselhart, S., Rohling, E.J., Hemleben, C., 2000. Aplanktonic zones in the Red
Sea. Mar. Micropaleontol. 40, 277–294.Ferguson, J.E., Henderson, G.M., Kucera, M., Rickaby, R.E.M., 2008. Systematic change of
foraminiferal Mg/Ca ratios across a strong salinity gradient. Earth Planet. Sci. Lett.265, 153–166.
Groeneveld, J., Nürnberg, D., Tiedemann, R., Reichart, G.J., Steph, S., Reuning, L., Crudeli, D.,Mason, P., 2008. Foraminiferal Mg/Ca increase in the Caribbean during the Pliocene:Western Atlantic Warm Pool formation, salinity in"uence, or diagenetic overprint?Geochem. Geophys. Geosys. 9. doi10.1029/2006GC001564.
Haley, B.A., Klinkhammer, G.P., 2002. Development of a "ow-through system forcleaning and dissolving foraminiferal tests. Chem. Geol. 185, 51–69.
Hemleben, C., Meischner, D., Zahn, R., AlmogiLabin, A., Erlenkeuser, H., Hiller, B., 1996.Three hundred eighty thousand year long stable isotope and faunal records fromthe Red Sea: in"uence of global sea level change on hydrography. Paleoceanography11, 147–156.
Imbrie, J., Shackleton, N.J., Pisias, N.G., Morley, J.J., Prell, W.L., Martinson, D.G., Hays, J.D.,McIntyre, A., Mix, A.C., 1984. The orbital theory of Pleistocene climate: support froma revised chronology of the marine #18O record. In: Berger, A., Imbrie, I., Hays, J.,Kukla, G., Salzmann, B. (Eds.), Milankovich and Climate: understanding response toastronomical forcing 1. InD. Reidel Publishing Company, Dordrecht, pp. 269–305.
Kısakürek, B., Eisenhauer, A., Böhm, F., Garbe-Schönberg, D., Erez, J., 2008. Controls onshell Mg/Ca and Sr/Ca in cultured planktonic foraminiferan, Globigerinoides ruber(white). Earth Planet. Sci. Lett. 273. doi10.1016/j.epsl.2008.06.026.
Lea, D.W., 2003. Elemental and isotopic proxies of marine temperatures. In: The Oceansand Marine Geochemistry (Elder!eld, H. ed.) vol. 6 Treatise on Geochemistry (H.D.Holland H.D., K.K. Tuerekian eds.), Elsevier-Pergamon, Oxford, pp. 365–390.
Lea, D.W., Mashiotta, T.A., Spero, H.J., 1999. Controls on magnesium and strontium uptakein planktonic foraminifera determined by live culturing. Geochim. Cosmochim. Acta63, 2369–2379.
Luz, B., Heller-Kallai, L., Almogi-Labin, A.,1984. Carbonatemineralogy of Late Pleistocenesediments from the Northern Red Sea. Isr. J. Earth-Sci. 33, 157–166.
Milliman, J.D., Ross, D.A., Ku, T.L., 1969. Precipitation and lithi!cation of deep-seacarbonate in the Red Sea. J. Sediment. Petrol. 39, 724–736.
Nürnberg, D., Bijma, J., Hemleben, C., 1996. Assessing the reliability of magnesium inforaminiferal calcite as a proxy for water mass temperatures. Geochim. Cosmochim.Acta 60, 803–814.
Prell, W.L., Imbrie, J., Martinson, D.G., Morley, J.J., Pisias, N.G., Shackleton, N.J., Streeter, H.F.,1986. Graphic correlation of oxygen isotope stratigraphy: application to the lateQuaternary. Paleoceanography 1, 137–162.
Reiss, Z., Hottinger, L., 1984. The Gulf of Aqaba, Ecological Micropaleontology. In:Ecological studies, vol. 50. Springer, Berlin, p. 354.
Reuning, L., Reijmer, J.J.G., Betzler, C., Swart, P., Bauch, T., 2005. The use of palaeoceano-graphic proxies in carbonate periplatform settings—opportunities and pitfalls.Sediment. Geol. 175, 131–152.
Rohling, E.J., Fenton, M., Jorissen, F.J., Bertrand, P., Ganssen, G., Caulet, J.P., 1998.Magnitudes of sea-level lowstands of the past 500,000 years. Nature 394, 162–165.
Rosenthal, Y., Lohmann, G.P., Lohmann, K.C., Sherrell, R.M., 2000. Incorporation andpreservation of Mg in Globigerinoides sacculifer: implications for reconstructingthe temperature and O-18/O-16 of seawater. Paleoceanography 15, 135–145.
Shackleton, N.J., Opdyke, N.D., 1973. Oxygen isotope and paleomagnetic stratigraphy ofEquatorial Paci!c Core V28-238: oxygen isotope temperatures and ice volumes on a105 year and 106 year scale. Quat. Res. 3, 39–55.
Siddall,M., Rohling, E.J., Almogi-Labin, A., Hemleben, C.,Meischner, D., Schmeltzer, I., Smeed,D.A., 2003. Sea-level "uctuations during the last glacial cycle. Nature 423, 853–858.
588 B.A.A. Hoogakker et al. / Earth and Planetary Science Letters 284 (2009) 583–589