55
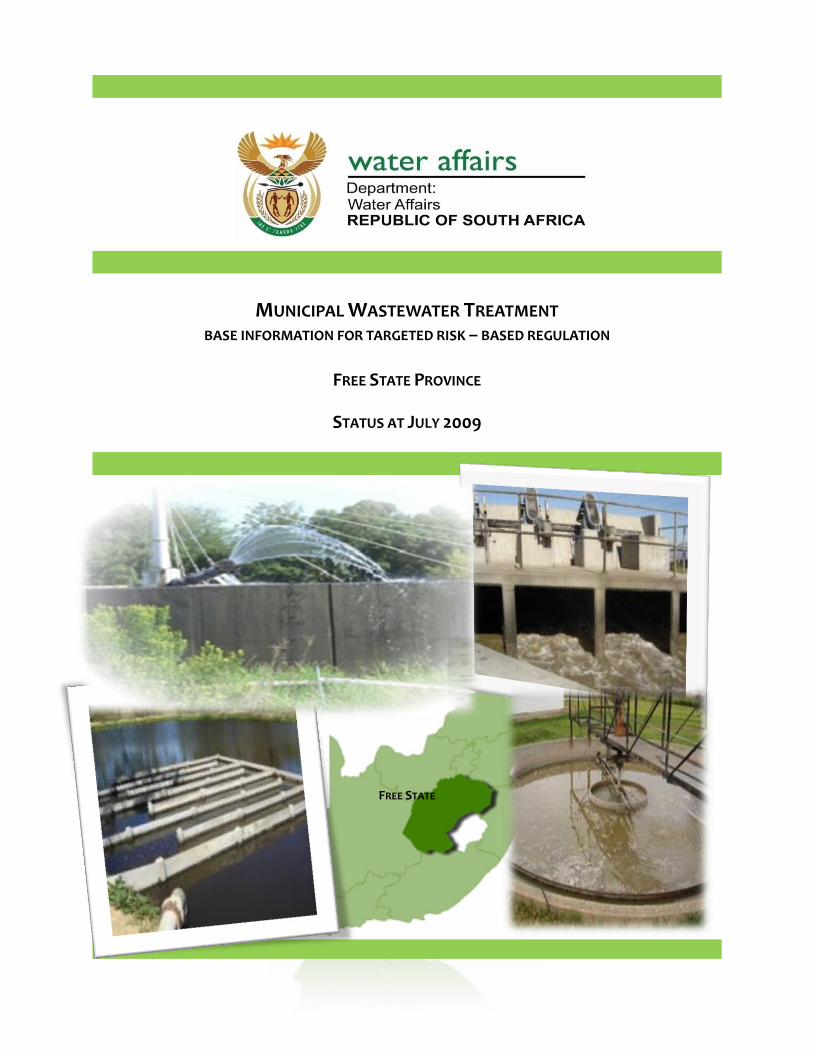
MUNICIPAL WASTEWATER TREATMENT BASE INFORMATION FOR TARGETED RISK – BASED REGULATION FREE STATE PROVINCE STATUS AT JULY 2009 FREE STATE
| Date post: | 28-Feb-2023 |
| Category: |
Documents |
| Upload: | khangminh22 |
| View: | 1 times |
| Download: | 0 times |
MUNICIPAL WASTEWATER TREATMENT BASE INFORMATION FOR TARGETED RISK – BASED REGULATION
FREE STATE PROVINCE
STATUS AT JULY 2009
FREE STATE
Page 2 of 55
INDEX
A. Context 3
B. Purpose of Report: Risk-Based Assessment 4
C. Overview of the Free State Wastewater Treatment Works 5
D. Licensing Status of Wastewater Treatment Works in the Free State 8
E. Receiving Plans Vs Design Capacity 11
F. WSA / WSP Arrangements, Technology used and Compliance Standards 17
G. Effluent Quality Non-Compliance Trends 21
H. Technical Skills Gap Analysis 30
I. Weighted Prioritisation of Potentially High Risk WWTW 42
J. Conclusions and Recommendations 47
All assessment data and information reflected in the Risk Based Assessments, its Executive Summaries and electronic data sheets are property of the Department of Water Affairs. It has been developed- and paid for under the national Wastewater Regulatory Programme 2008/09 (DWA Water Services Regulations). It is illegal to sell this material for profit. Would the material be reproduced or quoted, DWA should be acknowledged and referenced.

Page 3 of 55
Page 4 of 55
A. CONTEXT
South Africa has build a substantial wastewater management industry that comprises of approximately 9 70 treatment plants, extensive pipe networks, and pump stations, transporting and treating an average of 7 589 000 kilolitres of wastewater on a daily basis. The country runs a prominent wastewater treatment business with capital replacement value of >R 23 billion and operational expenditure of >R 3.5 b per annum. Frost and Sullivan (2006) estimate the value of the RSA water and wastewater treatment equipment market at US$ 135m, with growth at 3.8%. This revenue share was split by treatment segment as 34.5% water treatment, and 65.2% water treatment with an end producer breakdown as 44.2% municipal, 50.6% industrial and 5.2% commercial. South Africa is yet to explore and respond to the market sector that deals with reuse, reclamation and innovative technologies amidst increasing pressures on water resources (climate change, decreasing water quality, decreased dilution potential, etc). Free State owns and operations 101 small, medium, large and macro-sized wastewater treatment works (WWTW’s). For decades, South Africa has been recognised for their leading research in wastewater treatment technology, science and engineering, complimented by the development and management of sanitation infrastructure. However, a national survey on Wastewater Treatment in South Africa (DWA August 2006) reported findings indicating that a significant number of sewage treatment plants are not properly operated and maintained and discharge poor quality effluent to streams and rivers. This situation impacts directly on the downstream water users, the quality of natural waters and the cost & availability of potable water and its treatment in South Africa. At that time, Minister Hendricks expressed her concern “that a number of the wastewater treatment works have failed in recent times. DWA takes this very seriously and has initiated several actions to ensure that the sector takes suitable mitigation and preventative actions. Our primary focus is to gain a full understanding of the factors causing and affecting their recent wastewater treatment problems and to intervene appropriately so that all municipalities regain effective and sustainable services.” Recent investigations and audits quantify the status of wastewater services and compliance with the respective Water Acts and confirm that this situation must be addressed as a matter of urgency. The Minister’s message and concern regarding the state of rivers and the status of wastewater treatment in the country was carried throughout the year 2008 at a number of prominent events, including her addresses to Parliament, the National Water Summit, the WISA conference and the Municipal Indaba. She announced a number of measures, which include (but not limited to):
that initial audit is to be extended to all wastewater treatment plants
that special attention is given to the regulation of the sector which includes accountability, performance monitoring and legal intervention
continuous one-on-one intervention is taking place. The Minister of DWA stated at the launch of Masibambane III that DWA has been going through institutional restructuring for some time and that the final phase of this restructuring is being entered into. The focus of support for Masibambane III is based on the need to address challenges mentioned above; to support the institutional realignment, build efficient institutions for effective water service provision, and support sustainable water resource management via (but not limited to):
transferring department-owned water services schemes and operations to water service authorities (municipalities);
and ensuring effective service delivery by competent water services authorities and institutions.
The function of wastewater treatment lies primarily with Water Service Authorities and their Providers to operate and maintain the physical infrastructure and the chemical/biological processes. As Sector Leader, DWA has an oversight and regulatory role. DWA is intensifying its efforts to determine and improve the status of WWTW’s in South Africa. An extensive assessment and intervention plan is geared towards assisting WSA/WSP’s to improve their technically proficiency and legal compliance with effluent discharge specifications. Mobilisation of all necessary resources, funds and political commitment is required to rectify cases of non-compliances.
Page 5 of 55
At the same time, regulatory role of DWA is strengthening and ‘regulatory driven support’ is geared to address areas of non-compliance and rectifying situations of continued non-compliance via the Enforcement Protocol process. To facilitate DWA’s role as Regulator, they have brought about the National Water Services Regulation Strategy (NWSRS), which provides a clear statement of strategic intent about regulating the water and sanitation services sector in South Africa. The Strategy is based on the logic that a prioritised and strategic use of the available regulatory resources will have greater impact if these resources are concentrated and used to address areas of key risk, at the same time as building the necessary foundations for the development of more comprehensive and effective regulation over time.
High level assessment of wastewater management status in Gauteng, Western- and Free State are amongst the first to be done, in order to provide a scientific and factual basis from where DWA and municipalities can proceed to rectify, monitor and maintain wastewater services on a national scale.
B. PURPOSE OF REPORT:RISK-BASED ASSESSMENT This Executive Summary is an extract of a more comprehensive desktop assessment of all the Wastewater Treatment Works (WWTW) within the Free State. The purpose of this report is to provide a priority list of WWTW with potentially high risk profiles based on:
Status of hydraulic design capacity and actual flow received
Status of effluent quality as compared to legal discharge standards
Status of technical and health/safety skills and compliance to legal requirements
In the national survey of wastewater treatment, as reported in the WRC report: “Wastewater Treatment in South Africa: Field Evaluation of the Status and Performance of Wastewater Treatment Plants” it was recognised that the performance of a wastewater treatment plant depends on a number of diverse factors including:
The plants resources available to operate and maintain the plant
Wastewater flow and pollution load received at the plant compared to the original design flow/load
Appropriate treatment technology installed
Stakeholder expectations and requirements.
Therefore, the generic protocol for plant evaluation considers a facility within the context of the following:
Resources available to operate and maintain the plant, including the plant treatment infrastructure, staff allocation to operate and maintain the plant, financial resources to cover all plant-related expenses and information resources to assist plant management
Plant performance is based on developing an understanding of the wastewater flows and associated load treated at the plant, efficiency of individual unit treatment processes, plant effluent quality and acceptable sludge handling and disposal
Stakeholders’ needs and requirements including the plant owners and operators, the community being served and the regulatory authorities. These needs are typically evaluated in terms of compliance with licences/permits, environmental impacts and risks to neighbouring communities
This risk-based (desktop) assessment does not aim to provide an in-depth evaluation, but rather to provide high level management information and guidance to decision-makers. The Report will assist to describe and identify prioritise WWTWs in the Free State on a higher (first order) level, and may direct that more comprehensive assessments be commissioned to uncover specific details of compliance and performance, and causes underlying those. From the information that is available on from the Risk-based Assessment, the following summaries can be developed:
Page 6 of 55
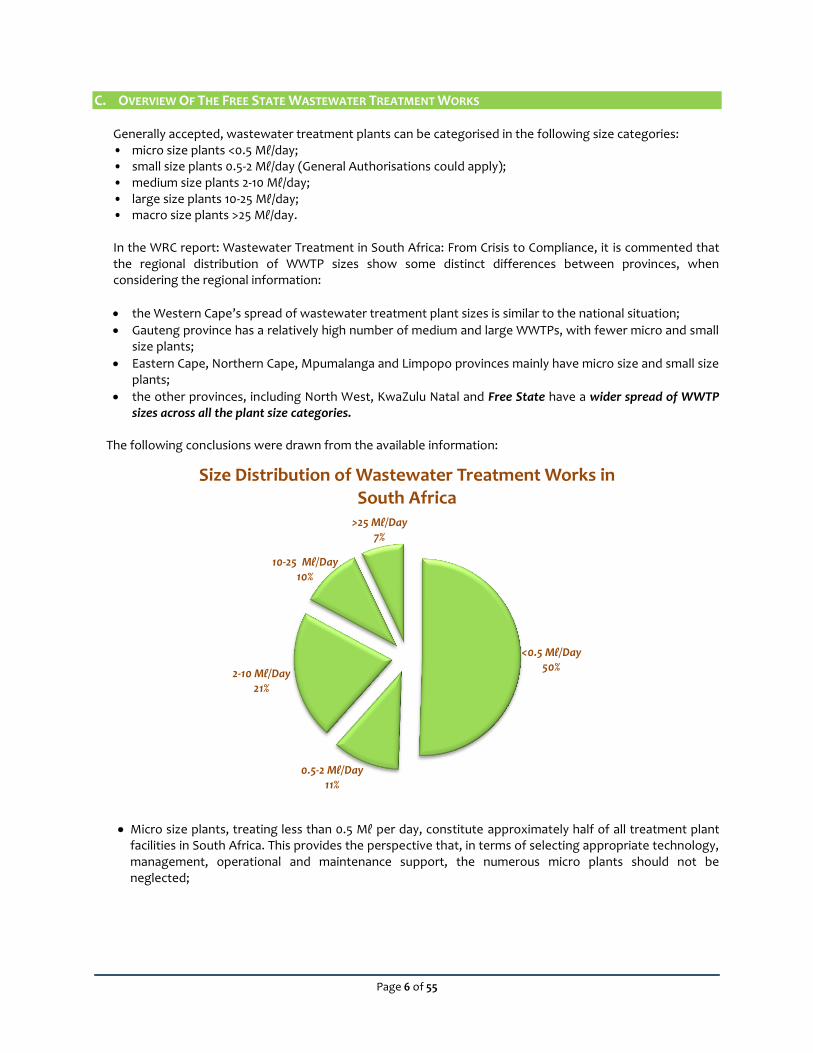
C. OVERVIEW OF THE FREE STATE WASTEWATER TREATMENT WORKS
Generally accepted, wastewater treatment plants can be categorised in the following size categories: • micro size plants <0.5 Mℓ/day; • small size plants 0.5-2 Mℓ/day (General Authorisations could apply); • medium size plants 2-10 Mℓ/day; • large size plants 10-25 Mℓ/day; • macro size plants >25 Mℓ/day. In the WRC report: Wastewater Treatment in South Africa: From Crisis to Compliance, it is commented that the regional distribution of WWTP sizes show some distinct differences between provinces, when considering the regional information:
the Western Cape’s spread of wastewater treatment plant sizes is similar to the national situation;
Gauteng province has a relatively high number of medium and large WWTPs, with fewer micro and small size plants;
Eastern Cape, Northern Cape, Mpumalanga and Limpopo provinces mainly have micro size and small size plants;
the other provinces, including North West, KwaZulu Natal and Free State have a wider spread of WWTP sizes across all the plant size categories.
The following conclusions were drawn from the available information:
Micro size plants, treating less than 0.5 Mℓ per day, constitute approximately half of all treatment plant facilities in South Africa. This provides the perspective that, in terms of selecting appropriate technology, management, operational and maintenance support, the numerous micro plants should not be neglected;
<0.5 Mℓ/Day 50%
0.5-2 Mℓ/Day 11%
2-10 Mℓ/Day 21%
10-25 Mℓ/Day 10%
>25 Mℓ/Day 7%
Size Distribution of Wastewater Treatment Works in South Africa
Page 7 of 55
Small plants in the size range of 1 – 5 Mℓ per day are also numerous and constitute as much as a quarter of all wastewater treatment plants in South Africa. This again constitutes a large number of plants which fill a specific make in terms of management, operations and maintenance;
The medium and large plants category includes the other quarter of the wastewater treatment facilities in South Africa. The medium and larger plants would typically have access to better management, operations and maintenance resources.
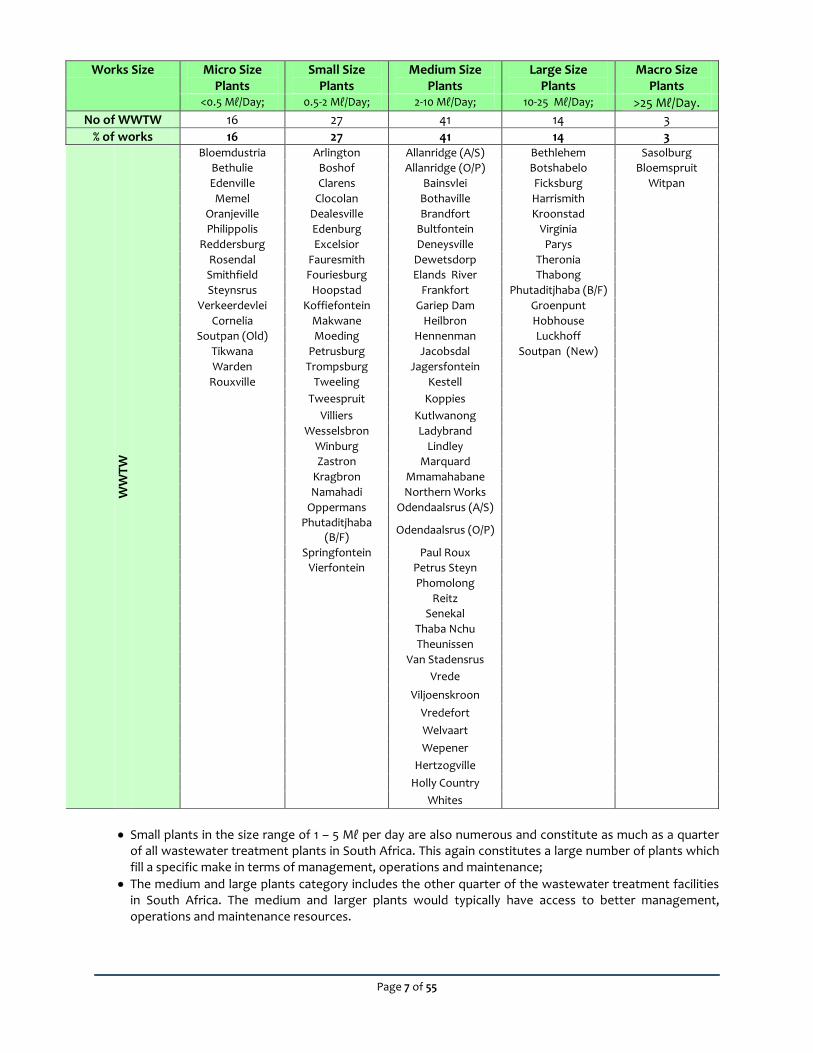
Works Size Micro Size Plants
Small Size Plants
Medium Size Plants
Large Size Plants
Macro Size Plants
<0.5 Mℓ/Day; 0.5-2 Mℓ/Day; 2-10 Mℓ/Day; 10-25 Mℓ/Day; >25 Mℓ/Day.
No of WWTW 16 27 41 14 3
% of works 16 27 41 14 3 W
WT
W
Bloemdustria Arlington Allanridge (A/S) Bethlehem Sasolburg
Bethulie Boshof Allanridge (O/P) Botshabelo Bloemspruit
Edenville Clarens Bainsvlei Ficksburg Witpan
Memel Clocolan Bothaville Harrismith
Oranjeville Dealesville Brandfort Kroonstad
Philippolis Edenburg Bultfontein Virginia
Reddersburg Excelsior Deneysville Parys
Rosendal Fauresmith Dewetsdorp Theronia
Smithfield Fouriesburg Elands River Thabong
Steynsrus Hoopstad Frankfort Phutaditjhaba (B/F)
Verkeerdevlei Koffiefontein Gariep Dam Groenpunt
Cornelia Makwane Heilbron Hobhouse
Soutpan (Old) Moeding Hennenman Luckhoff
Tikwana Petrusburg Jacobsdal Soutpan (New)
Warden Trompsburg Jagersfontein
Rouxville Tweeling Kestell
Tweespruit Koppies
Villiers Kutlwanong
Wesselsbron Ladybrand
Winburg Lindley
Zastron Marquard
Kragbron Mmamahabane
Namahadi Northern Works
Oppermans Odendaalsrus (A/S)
Phutaditjhaba
(B/F) Odendaalsrus (O/P)
Springfontein Paul Roux
Vierfontein Petrus Steyn
Phomolong
Reitz
Senekal
Thaba Nchu
Theunissen
Van Stadensrus
Vrede
Viljoenskroon
Vredefort 2 Welvaart
1.54 Northern Works Wepener Hertzogville Holly Country Whites
Page 8 of 55
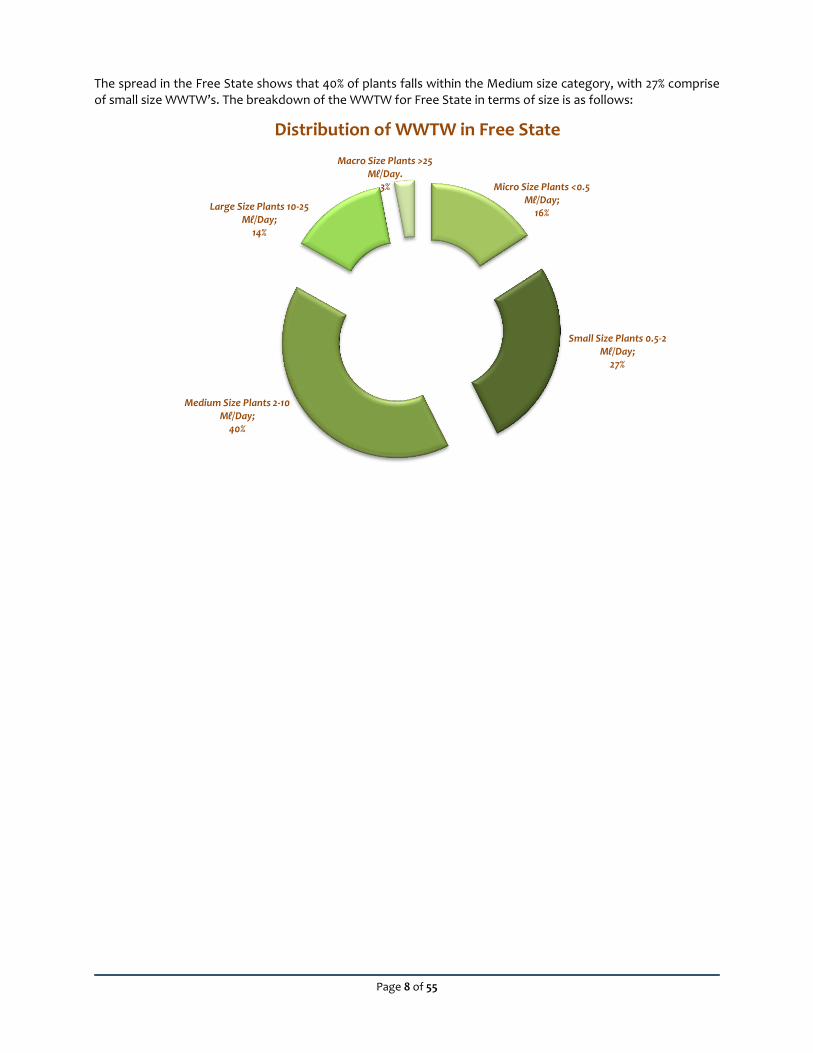
The spread in the Free State shows that 40% of plants falls within the Medium size category, with 27% comprise of small size WWTW’s. The breakdown of the WWTW for Free State in terms of size is as follows:
Micro Size Plants <0.5 Mℓ/Day;
16%
Small Size Plants 0.5-2 Mℓ/Day;
27%
Medium Size Plants 2-10 Mℓ/Day;
40%
Large Size Plants 10-25 Mℓ/Day;
14%
Macro Size Plants >25 Mℓ/Day.
3%
Distribution of WWTW in Free State
Page 9 of 55
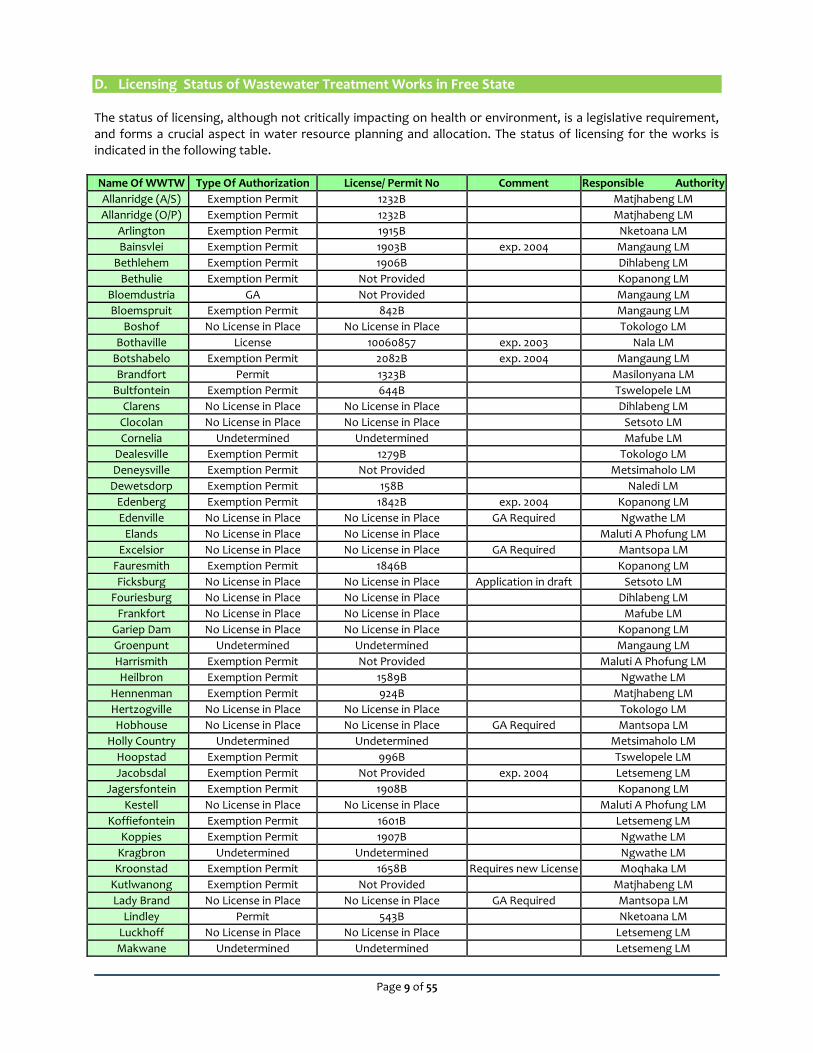
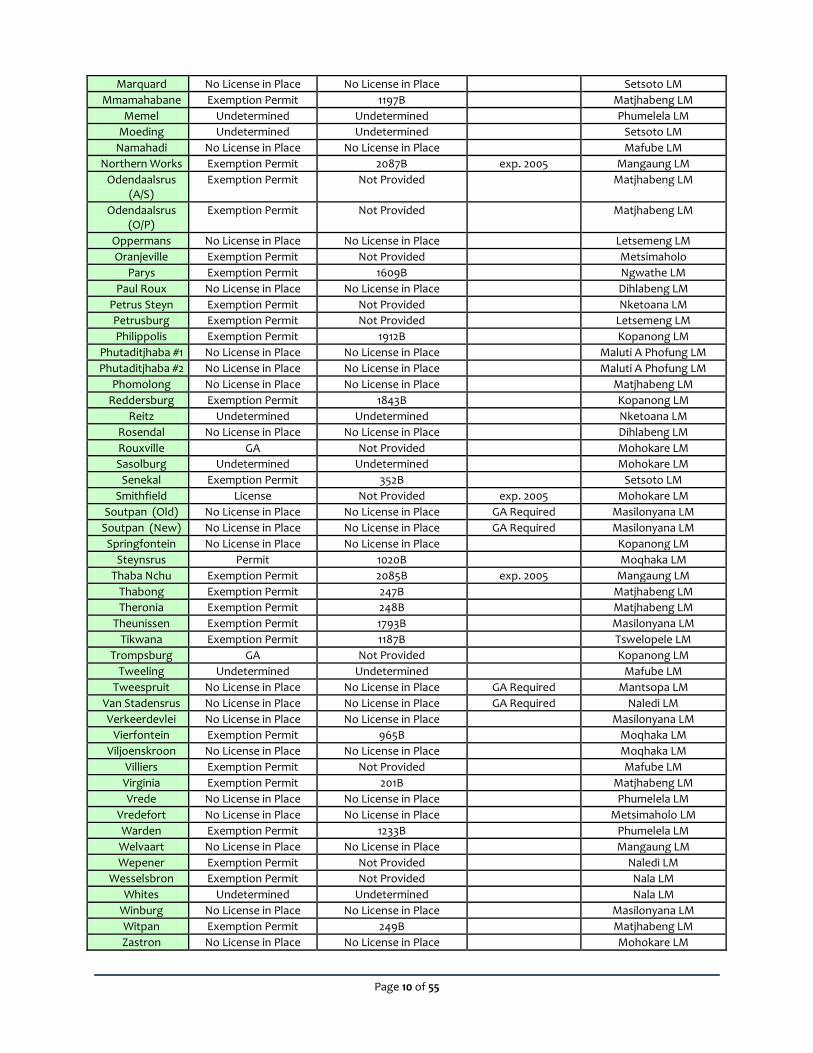
D. Licensing Status of Wastewater Treatment Works in Free State The status of licensing, although not critically impacting on health or environment, is a legislative requirement, and forms a crucial aspect in water resource planning and allocation. The status of licensing for the works is indicated in the following table. Name Of WWTW Type Of Authorization License/ Permit No Comment Responsible Authority
Allanridge (A/S) Exemption Permit 1232B Matjhabeng LM
Allanridge (O/P) Exemption Permit 1232B Matjhabeng LM
Arlington Exemption Permit 1915B Nketoana LM
Bainsvlei Exemption Permit 1903B exp. 2004 Mangaung LM
Bethlehem Exemption Permit 1906B Dihlabeng LM
Bethulie Exemption Permit Not Provided Kopanong LM
Bloemdustria GA Not Provided Mangaung LM
Bloemspruit Exemption Permit 842B Mangaung LM
Boshof No License in Place No License in Place Tokologo LM
Bothaville License 10060857 exp. 2003 Nala LM
Botshabelo Exemption Permit 2082B exp. 2004 Mangaung LM
Brandfort Permit 1323B Masilonyana LM
Bultfontein Exemption Permit 644B Tswelopele LM
Clarens No License in Place No License in Place Dihlabeng LM
Clocolan No License in Place No License in Place Setsoto LM
Cornelia Undetermined Undetermined Mafube LM
Dealesville Exemption Permit 1279B Tokologo LM
Deneysville Exemption Permit Not Provided Metsimaholo LM
Dewetsdorp Exemption Permit 158B Naledi LM
Edenberg Exemption Permit 1842B exp. 2004 Kopanong LM
Edenville No License in Place No License in Place GA Required Ngwathe LM
Elands No License in Place No License in Place Maluti A Phofung LM
Excelsior No License in Place No License in Place GA Required Mantsopa LM
Fauresmith Exemption Permit 1846B Kopanong LM
Ficksburg No License in Place No License in Place Application in draft Setsoto LM
Fouriesburg No License in Place No License in Place Dihlabeng LM
Frankfort No License in Place No License in Place Mafube LM
Gariep Dam No License in Place No License in Place Kopanong LM
Groenpunt Undetermined Undetermined Mangaung LM
Harrismith Exemption Permit Not Provided Maluti A Phofung LM
Heilbron Exemption Permit 1589B Ngwathe LM
Hennenman Exemption Permit 924B Matjhabeng LM
Hertzogville No License in Place No License in Place Tokologo LM
Hobhouse No License in Place No License in Place GA Required Mantsopa LM
Holly Country Undetermined Undetermined Metsimaholo LM
Hoopstad Exemption Permit 996B Tswelopele LM
Jacobsdal Exemption Permit Not Provided exp. 2004 Letsemeng LM
Jagersfontein Exemption Permit 1908B Kopanong LM
Kestell No License in Place No License in Place Maluti A Phofung LM
Koffiefontein Exemption Permit 1601B Letsemeng LM
Koppies Exemption Permit 1907B Ngwathe LM
Kragbron Undetermined Undetermined Ngwathe LM
Kroonstad Exemption Permit 1658B Requires new License Moqhaka LM
Kutlwanong Exemption Permit Not Provided Matjhabeng LM
Lady Brand No License in Place No License in Place GA Required Mantsopa LM
Lindley Permit 543B Nketoana LM
Luckhoff No License in Place No License in Place Letsemeng LM
Makwane Undetermined Undetermined Letsemeng LM
Page 10 of 55
Marquard No License in Place No License in Place Setsoto LM
Mmamahabane Exemption Permit 1197B Matjhabeng LM
Memel Undetermined Undetermined Phumelela LM
Moeding Undetermined Undetermined Setsoto LM
Namahadi No License in Place No License in Place Mafube LM
Northern Works Exemption Permit 2087B exp. 2005 Mangaung LM
Odendaalsrus (A/S)
Exemption Permit Not Provided Matjhabeng LM
Odendaalsrus (O/P)
Exemption Permit Not Provided Matjhabeng LM
Oppermans No License in Place No License in Place Letsemeng LM
Oranjeville Exemption Permit Not Provided Metsimaholo
Parys Exemption Permit 1609B Ngwathe LM
Paul Roux No License in Place No License in Place Dihlabeng LM
Petrus Steyn Exemption Permit Not Provided Nketoana LM
Petrusburg Exemption Permit Not Provided Letsemeng LM
Philippolis Exemption Permit 1912B Kopanong LM
Phutaditjhaba #1 No License in Place No License in Place Maluti A Phofung LM
Phutaditjhaba #2 No License in Place No License in Place Maluti A Phofung LM
Phomolong No License in Place No License in Place Matjhabeng LM
Reddersburg Exemption Permit 1843B Kopanong LM
Reitz Undetermined Undetermined Nketoana LM
Rosendal No License in Place No License in Place Dihlabeng LM
Rouxville GA Not Provided Mohokare LM
Sasolburg Undetermined Undetermined Mohokare LM
Senekal Exemption Permit 352B Setsoto LM
Smithfield License Not Provided exp. 2005 Mohokare LM
Soutpan (Old) No License in Place No License in Place GA Required Masilonyana LM
Soutpan (New) No License in Place No License in Place GA Required Masilonyana LM
Springfontein No License in Place No License in Place Kopanong LM
Steynsrus Permit 1020B Moqhaka LM
Thaba Nchu Exemption Permit 2085B exp. 2005 Mangaung LM
Thabong Exemption Permit 247B Matjhabeng LM
Theronia Exemption Permit 248B Matjhabeng LM
Theunissen Exemption Permit 1793B Masilonyana LM
Tikwana Exemption Permit 1187B Tswelopele LM
Trompsburg GA Not Provided Kopanong LM
Tweeling Undetermined Undetermined Mafube LM
Tweespruit No License in Place No License in Place GA Required Mantsopa LM
Van Stadensrus No License in Place No License in Place GA Required Naledi LM
Verkeerdevlei No License in Place No License in Place Masilonyana LM
Vierfontein Exemption Permit 965B Moqhaka LM
Viljoenskroon No License in Place No License in Place Moqhaka LM
Villiers Exemption Permit Not Provided Mafube LM
Virginia Exemption Permit 201B Matjhabeng LM
Vrede No License in Place No License in Place Phumelela LM
Vredefort No License in Place No License in Place Metsimaholo LM
Warden Exemption Permit 1233B Phumelela LM
Welvaart No License in Place No License in Place Mangaung LM
Wepener Exemption Permit Not Provided Naledi LM
Wesselsbron Exemption Permit Not Provided Nala LM
Whites Undetermined Undetermined Nala LM
Winburg No License in Place No License in Place Masilonyana LM
Witpan Exemption Permit 249B Matjhabeng LM
Zastron No License in Place No License in Place Mohokare LM
Page 11 of 55
Due to the numerous other functions that form part of the WSA / Municipalities, it is observed that in ensuring that correct licences and registration of works is applied for and concluded, this activity often receives a lower priority as compared to meeting the basic service demands, etc. It is recommended that DWA assists municipalities in verifying their registration and licenses. From past experience in this matter, it is cautioned that the support may need to be extended to support the preparation of the license by the WSA, based on the necessary license application document – especially in the cases of lower capacity WSA’s. The Risk-based Assessment also shows that information on the compliance of WWTWs, in terms of Schedule III and IV of the National Water Act and Regulation 2834 of the Water Act, is not readily available (or at the required detail) at the Works. This shows a general non-compliance trend with the requirements that allows for qualified/experienced supervisors, process controllers and maintenance staff in accordance with the works Classification.
Due to the numerous other functions that form part of the WSA, actions to ensure that licences and registration of works are often given a lower priority as compared to meeting the basic service demands, etc. It is recommended that DWA assists municipalities in verifying their registration and licenses. From past experience in this matter, it is cautioned that the support should be extended to support the preparation on behalf of the WSA, the necessary license application document.
Page 12 of 55
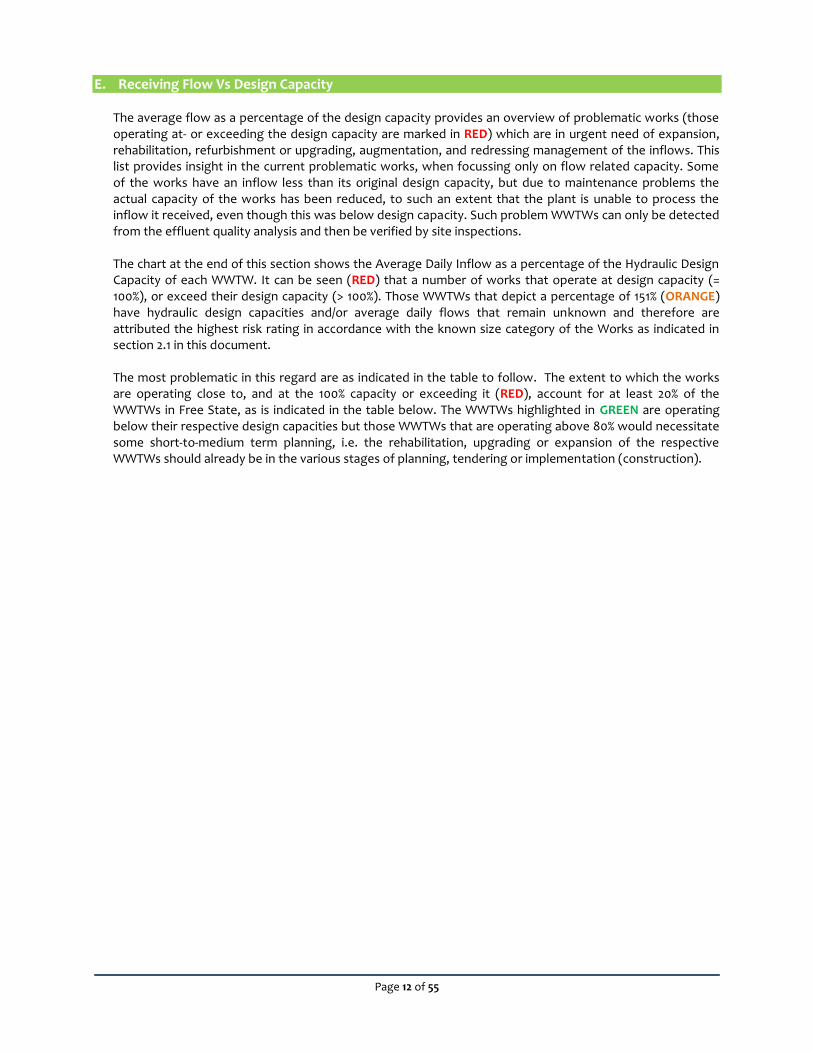
E. Receiving Flow Vs Design Capacity
The average flow as a percentage of the design capacity provides an overview of problematic works (those operating at- or exceeding the design capacity are marked in RED) which are in urgent need of expansion, rehabilitation, refurbishment or upgrading, augmentation, and redressing management of the inflows. This list provides insight in the current problematic works, when focussing only on flow related capacity. Some of the works have an inflow less than its original design capacity, but due to maintenance problems the actual capacity of the works has been reduced, to such an extent that the plant is unable to process the inflow it received, even though this was below design capacity. Such problem WWTWs can only be detected from the effluent quality analysis and then be verified by site inspections. The chart at the end of this section shows the Average Daily Inflow as a percentage of the Hydraulic Design Capacity of each WWTW. It can be seen (RED) that a number of works that operate at design capacity (= 100%), or exceed their design capacity (> 100%). Those WWTWs that depict a percentage of 151% (ORANGE) have hydraulic design capacities and/or average daily flows that remain unknown and therefore are attributed the highest risk rating in accordance with the known size category of the Works as indicated in section 2.1 in this document. The most problematic in this regard are as indicated in the table to follow. The extent to which the works are operating close to, and at the 100% capacity or exceeding it (RED), account for at least 20% of the WWTWs in Free State, as is indicated in the table below. The WWTWs highlighted in GREEN are operating below their respective design capacities but those WWTWs that are operating above 80% would necessitate some short-to-medium term planning, i.e. the rehabilitation, upgrading or expansion of the respective WWTWs should already be in the various stages of planning, tendering or implementation (construction).
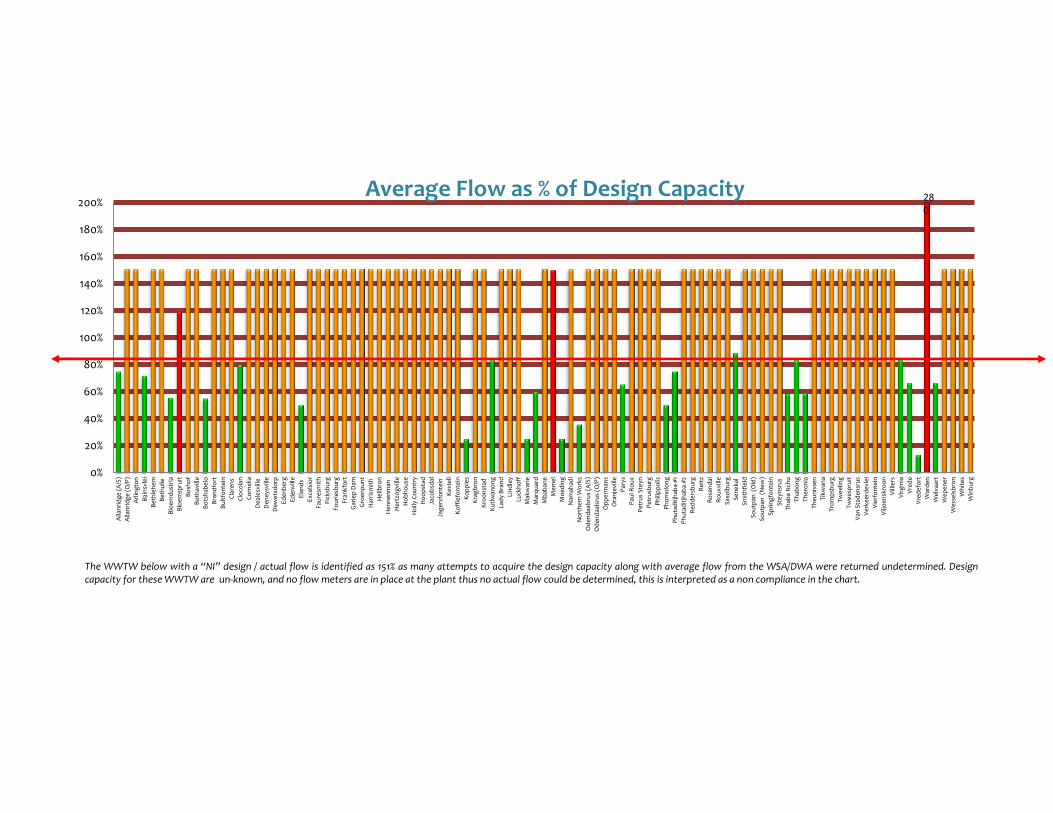
The WWTW below with a “NI” design / actual flow is identified as 151% as many attempts to acquire the design capacity along with average flow from the WSA/DWA were returned undetermined. Design capacity for these WWTW are un-known, and no flow meters are in place at the plant thus no actual flow could be determined, this is interpreted as a non compliance in the chart.
0%
20%
40%
60%
80%
100%
120%
140%
160%
180%
200%
Alla
nri
dg
e (A
/S)
Alla
nri
dg
e (
O/P
)
Arl
ing
ton
Bai
nsv
lei
Be
thle
he
m
Be
thu
lie
Blo
em
du
stri
a
Blo
em
spru
it
Bo
sho
f
Bo
thav
ille
Bo
tsh
abe
lo
Bra
nd
fort
Bu
ltfo
nte
in
Cla
ren
s
Clo
cola
n
Co
rne
lia
De
ale
svill
e
De
ney
svill
e
De
we
tsd
orp
Ed
enb
erg
Ed
en
ville
Ela
nd
s
Ex
cels
ior
Fau
resm
ith
Fick
sbu
rg
Fou
ries
bu
rg
Fra
nkf
ort
Gar
iep
Dam
Gro
enp
un
t
Har
rism
ith
He
ilbro
n
He
nn
enm
an
He
rtzo
gvi
lle
Ho
bh
ou
se
Ho
lly C
ou
ntr
y
Ho
op
stad
Jaco
bsd
al
Jag
ers
fon
tein
Ke
ste
ll
Ko
ffie
fon
tein
Ko
pp
ies
Kra
gb
ron
Kro
on
stad
Ku
tlw
ano
ng
Lad
y B
ran
d
Lin
dle
y
Luck
ho
ff
Mak
wan
e
Mar
qu
ard
Mb
aban
e
Me
me
l
Mo
ed
ing
Nam
ahad
i
No
rth
ern
Wo
rks
Od
end
aals
rus
(A/S
)
Od
end
aals
rus
(O/P
)
Op
pe
rman
s
Ora
nje
ville
Par
ys
Pau
l Ro
ux
Pe
tru
s St
eyn
Pe
tru
sbu
rg
Ph
ilip
po
lis
Ph
om
olo
ng
Ph
uta
dit
jhab
a #1
Ph
uta
dit
jhab
a #2
Re
dd
ers
bu
rg
Re
itz
Ro
sen
dal
Ro
ux
ville
Sas
olb
urg
Sen
eka
l
Sm
ith
fie
ld
Sou
tpan
(O
ld)
So
utp
an (
New
)
Sp
rin
gfo
nte
in
Ste
ynsr
us
Th
aba
Nch
u
Thab
on
g
Th
ero
nia
Theu
nis
sen
Tikw
ana
Tro
mp
sbu
rg
Twe
elin
g
Twe
esp
ruit
Van
Sta
den
sru
s
Ver
ke
erd
evl
ei
Vie
rfo
nte
in
Vilj
oen
skro
on
Vill
iers
Vir
gin
ia
Vre
de
Vre
de
fort
War
den
We
lvaa
rt
We
pe
ne
r
We
sse
lsb
ron
Wh
ites
Win
bu
rg
Hu
nd
red
s
Average Flow as % of Design Capacity 280
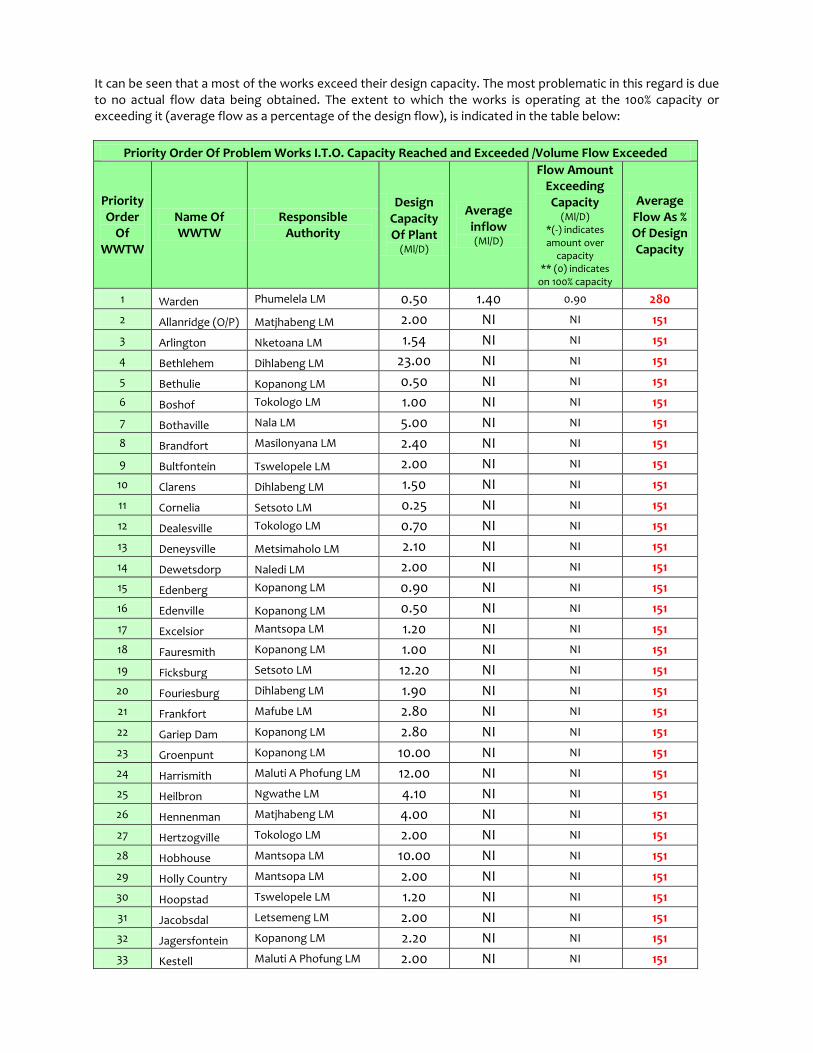
It can be seen that a most of the works exceed their design capacity. The most problematic in this regard is due to no actual flow data being obtained. The extent to which the works is operating at the 100% capacity or exceeding it (average flow as a percentage of the design flow), is indicated in the table below:
Priority Order Of Problem Works I.T.O. Capacity Reached and Exceeded /Volume Flow Exceeded
Priority Order
Of WWTW
Name Of WWTW
Responsible Authority
Design Capacity Of Plant
(Ml/D)
Average inflow (Ml/D)
Flow Amount Exceeding Capacity
(Ml/D) *(-) indicates amount over
capacity ** (0) indicates
on 100% capacity
Average Flow As % Of Design Capacity
1 Warden Phumelela LM 0.50 1.40 0.90 280
2 Allanridge (O/P) Matjhabeng LM 2.00 NI NI 151
3 Arlington Nketoana LM 1.54 NI NI 151
4 Bethlehem Dihlabeng LM 23.00 NI NI 151
5 Bethulie Kopanong LM 0.50 NI NI 151
6 Boshof Tokologo LM 1.00 NI NI 151
7 Bothaville Nala LM 5.00 NI NI 151
8 Brandfort Masilonyana LM 2.40 NI NI 151
9 Bultfontein Tswelopele LM 2.00 NI NI 151
10 Clarens Dihlabeng LM 1.50 NI NI 151
11 Cornelia Setsoto LM 0.25 NI NI 151
12 Dealesville Tokologo LM 0.70 NI NI 151
13 Deneysville Metsimaholo LM 2.10 NI NI 151
14 Dewetsdorp Naledi LM 2.00 NI NI 151
15 Edenberg Kopanong LM 0.90 NI NI 151
16 Edenville Kopanong LM 0.50 NI NI 151
17 Excelsior Mantsopa LM 1.20 NI NI 151
18 Fauresmith Kopanong LM 1.00 NI NI 151
19 Ficksburg Setsoto LM 12.20 NI NI 151
20 Fouriesburg Dihlabeng LM 1.90 NI NI 151
21 Frankfort Mafube LM 2.80 NI NI 151
22 Gariep Dam Kopanong LM 2.80 NI NI 151
23 Groenpunt Kopanong LM 10.00 NI NI 151
24 Harrismith Maluti A Phofung LM 12.00 NI NI 151
25 Heilbron Ngwathe LM 4.10 NI NI 151
26 Hennenman Matjhabeng LM 4.00 NI NI 151
27 Hertzogville Tokologo LM 2.00 NI NI 151
28 Hobhouse Mantsopa LM 10.00 NI NI 151
29 Holly Country Mantsopa LM 2.00 NI NI 151
30 Hoopstad Tswelopele LM 1.20 NI NI 151
31 Jacobsdal Letsemeng LM 2.00 NI NI 151
32 Jagersfontein Kopanong LM 2.20 NI NI 151
33 Kestell Maluti A Phofung LM 2.00 NI NI 151
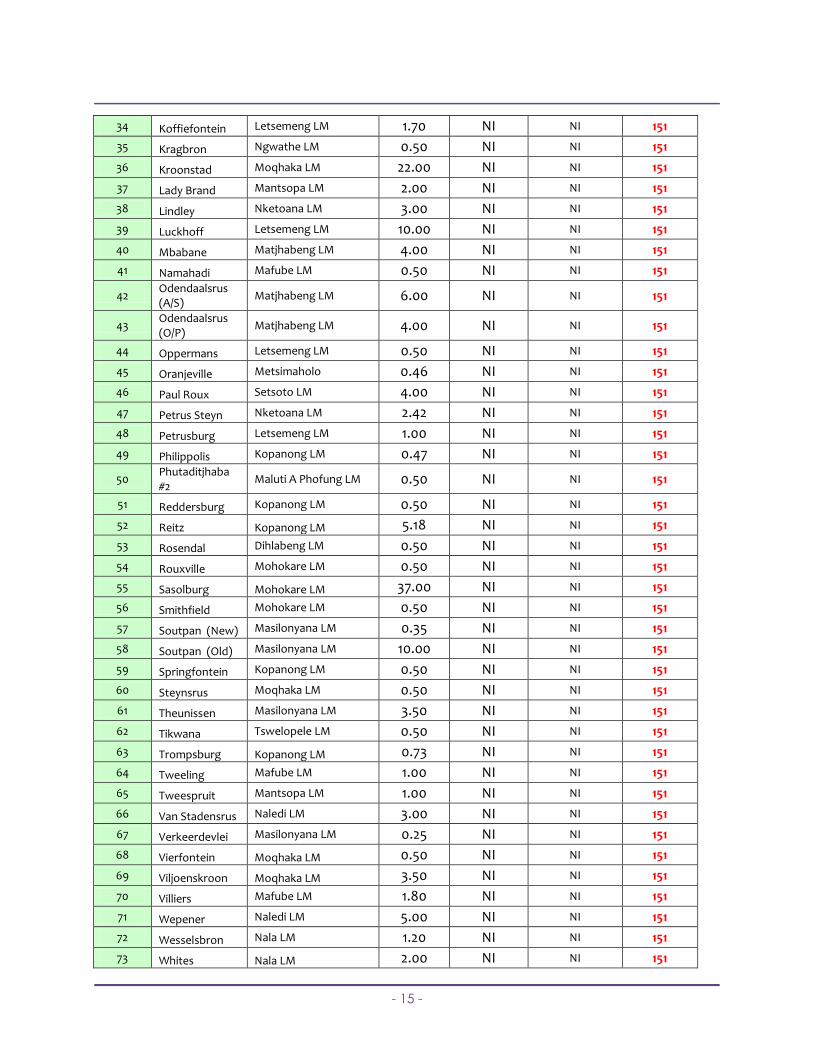
- 15 -
34 Koffiefontein Letsemeng LM 1.70 NI NI 151
35 Kragbron Ngwathe LM 0.50 NI NI 151
36 Kroonstad Moqhaka LM 22.00 NI NI 151
37 Lady Brand Mantsopa LM 2.00 NI NI 151
38 Lindley Nketoana LM 3.00 NI NI 151
39 Luckhoff Letsemeng LM 10.00 NI NI 151
40 Mbabane Matjhabeng LM 4.00 NI NI 151
41 Namahadi Mafube LM 0.50 NI NI 151
42 Odendaalsrus (A/S)
Matjhabeng LM 6.00 NI NI 151
43 Odendaalsrus (O/P)
Matjhabeng LM 4.00 NI NI 151
44 Oppermans Letsemeng LM 0.50 NI NI 151
45 Oranjeville Metsimaholo 0.46 NI NI 151
46 Paul Roux Setsoto LM 4.00 NI NI 151
47 Petrus Steyn Nketoana LM 2.42 NI NI 151
48 Petrusburg Letsemeng LM 1.00 NI NI 151
49 Philippolis Kopanong LM 0.47 NI NI 151
50 Phutaditjhaba #2
Maluti A Phofung LM 0.50 NI NI 151
51 Reddersburg Kopanong LM 0.50 NI NI 151
52 Reitz Kopanong LM 5.18 NI NI 151
53 Rosendal Dihlabeng LM 0.50 NI NI 151
54 Rouxville Mohokare LM 0.50 NI NI 151
55 Sasolburg Mohokare LM 37.00 NI NI 151
56 Smithfield Mohokare LM 0.50 NI NI 151
57 Soutpan (New) Masilonyana LM 0.35 NI NI 151
58 Soutpan (Old) Masilonyana LM 10.00 NI NI 151
59 Springfontein Kopanong LM 0.50 NI NI 151
60 Steynsrus Moqhaka LM 0.50 NI NI 151
61 Theunissen Masilonyana LM 3.50 NI NI 151
62 Tikwana Tswelopele LM 0.50 NI NI 151
63 Trompsburg Kopanong LM 0.73 NI NI 151
64 Tweeling Mafube LM 1.00 NI NI 151
65 Tweespruit Mantsopa LM 1.00 NI NI 151
66 Van Stadensrus Naledi LM 3.00 NI NI 151
67 Verkeerdevlei Masilonyana LM 0.25 NI NI 151
68 Vierfontein Moqhaka LM 0.50 NI NI 151
69 Viljoenskroon Moqhaka LM 3.50 NI NI 151
70 Villiers Mafube LM 1.80 NI NI 151
71 Wepener Naledi LM 5.00 NI NI 151
72 Wesselsbron Nala LM 1.20 NI NI 151
73 Whites Nala LM 2.00 NI NI 151
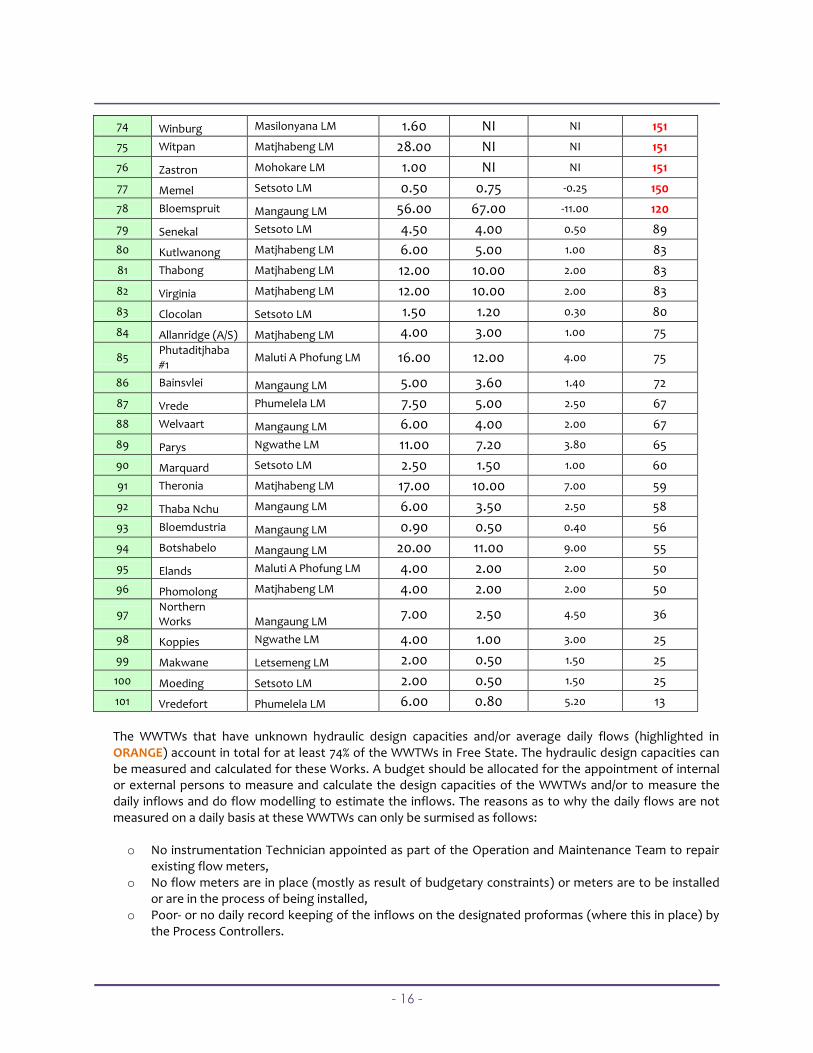
- 16 -
74 Winburg Masilonyana LM 1.60 NI NI 151
75 Witpan Matjhabeng LM 28.00 NI NI 151
76 Zastron Mohokare LM 1.00 NI NI 151
77 Memel Setsoto LM 0.50 0.75 -0.25 150
78 Bloemspruit Mangaung LM 56.00 67.00 -11.00 120
79 Senekal Setsoto LM 4.50 4.00 0.50 89
80 Kutlwanong Matjhabeng LM 6.00 5.00 1.00 83
81 Thabong Matjhabeng LM 12.00 10.00 2.00 83
82 Virginia Matjhabeng LM 12.00 10.00 2.00 83
83 Clocolan Setsoto LM 1.50 1.20 0.30 80
84 Allanridge (A/S) Matjhabeng LM 4.00 3.00 1.00 75
85 Phutaditjhaba #1
Maluti A Phofung LM 16.00 12.00 4.00 75
86 Bainsvlei Mangaung LM 5.00 3.60 1.40 72
87 Vrede Phumelela LM 7.50 5.00 2.50 67
88 Welvaart Mangaung LM 6.00 4.00 2.00 67
89 Parys Ngwathe LM 11.00 7.20 3.80 65
90 Marquard Setsoto LM 2.50 1.50 1.00 60
91 Theronia Matjhabeng LM 17.00 10.00 7.00 59
92 Thaba Nchu Mangaung LM 6.00 3.50 2.50 58
93 Bloemdustria Mangaung LM 0.90 0.50 0.40 56
94 Botshabelo Mangaung LM 20.00 11.00 9.00 55
95 Elands Maluti A Phofung LM 4.00 2.00 2.00 50
96 Phomolong Matjhabeng LM 4.00 2.00 2.00 50
97 Northern Works Mangaung LM
7.00 2.50 4.50 36
98 Koppies Ngwathe LM 4.00 1.00 3.00 25
99 Makwane Letsemeng LM 2.00 0.50 1.50 25
100 Moeding Setsoto LM 2.00 0.50 1.50 25
101 Vredefort Phumelela LM 6.00 0.80 5.20 13
The WWTWs that have unknown hydraulic design capacities and/or average daily flows (highlighted in ORANGE) account in total for at least 74% of the WWTWs in Free State. The hydraulic design capacities can be measured and calculated for these Works. A budget should be allocated for the appointment of internal or external persons to measure and calculate the design capacities of the WWTWs and/or to measure the daily inflows and do flow modelling to estimate the inflows. The reasons as to why the daily flows are not measured on a daily basis at these WWTWs can only be surmised as follows: o No instrumentation Technician appointed as part of the Operation and Maintenance Team to repair
existing flow meters, o No flow meters are in place (mostly as result of budgetary constraints) or meters are to be installed
or are in the process of being installed, o Poor- or no daily record keeping of the inflows on the designated proformas (where this in place) by
the Process Controllers.

- 17 -
78 of 101 Works (77%) in the Free State are operating at- or exceeding their design capacities - also considering that these two WSAs own and operate the first and second highest number of WWTWs in their respective areas. The other WSAs at most have either one or two of their WWTWs operating at or exceeding their design capacities. Smaller to medium sized municipalities may have some challenges in terms of management, planning and funding resources available to remedy their WWTWs compliant. Larger municipalities seems to have reasonable capable structures and resources in place to manage their WWTWs within its design capabilities, unlike the situation for smaller, and less capacitated and resourceful WSAs in the Free State.
- 18 -
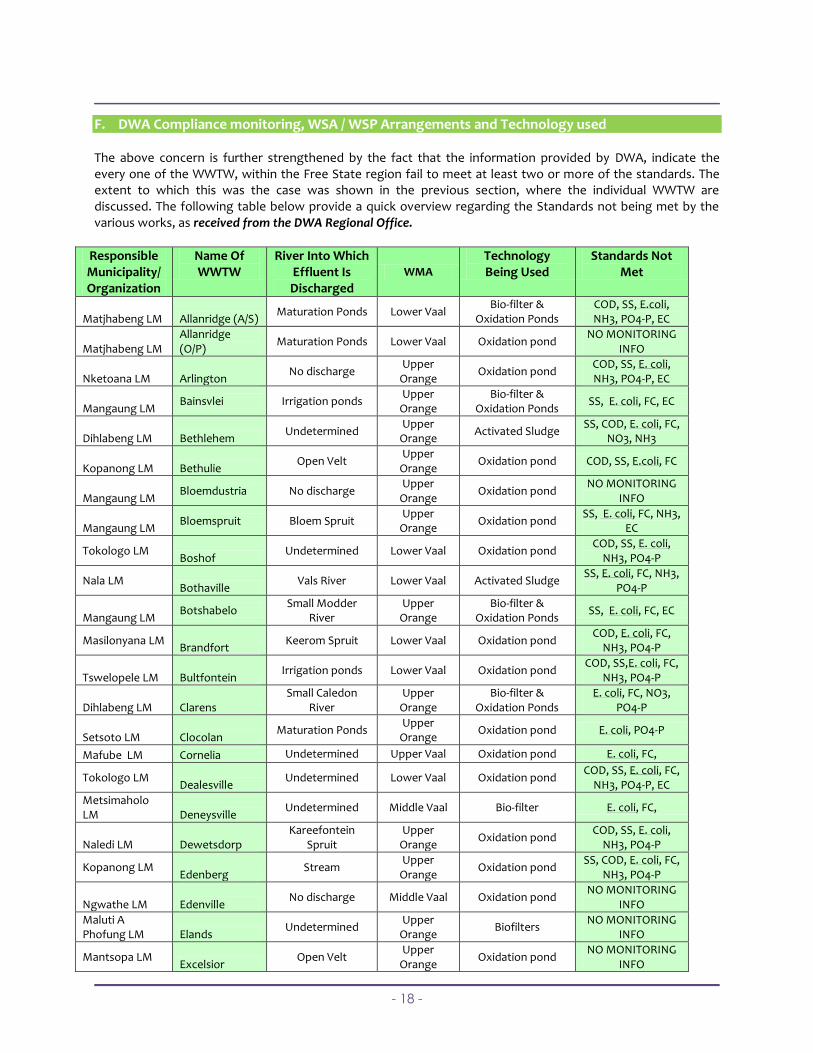
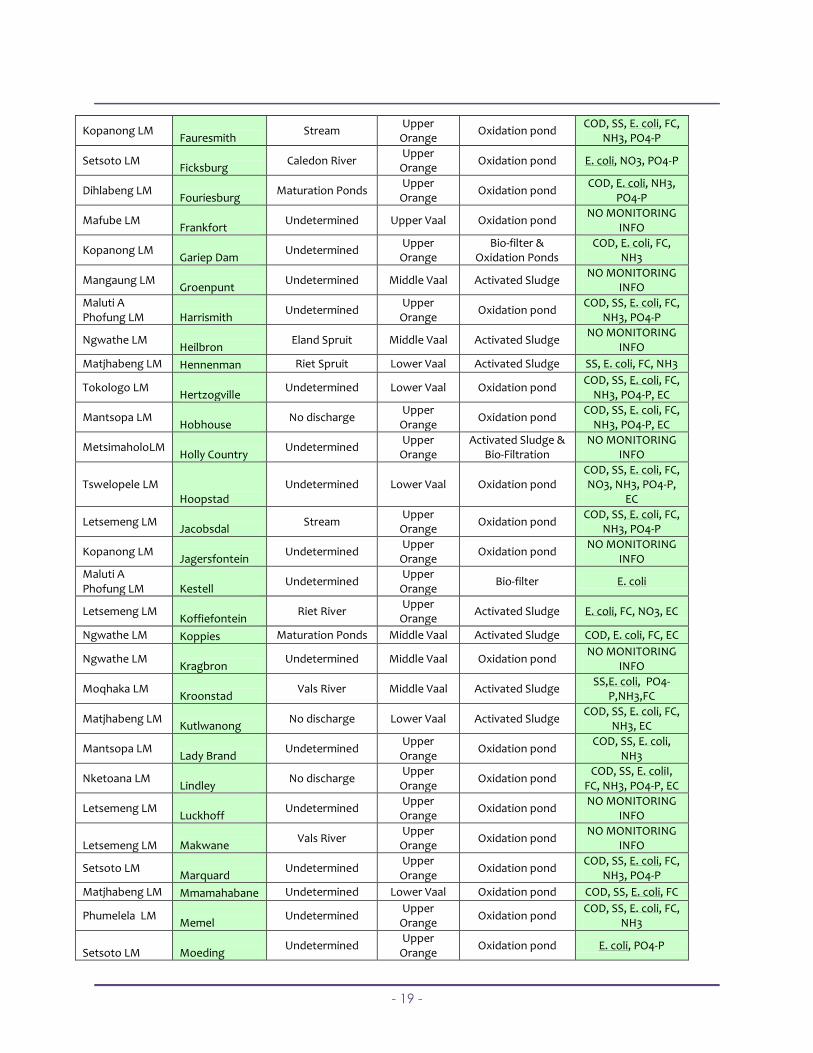
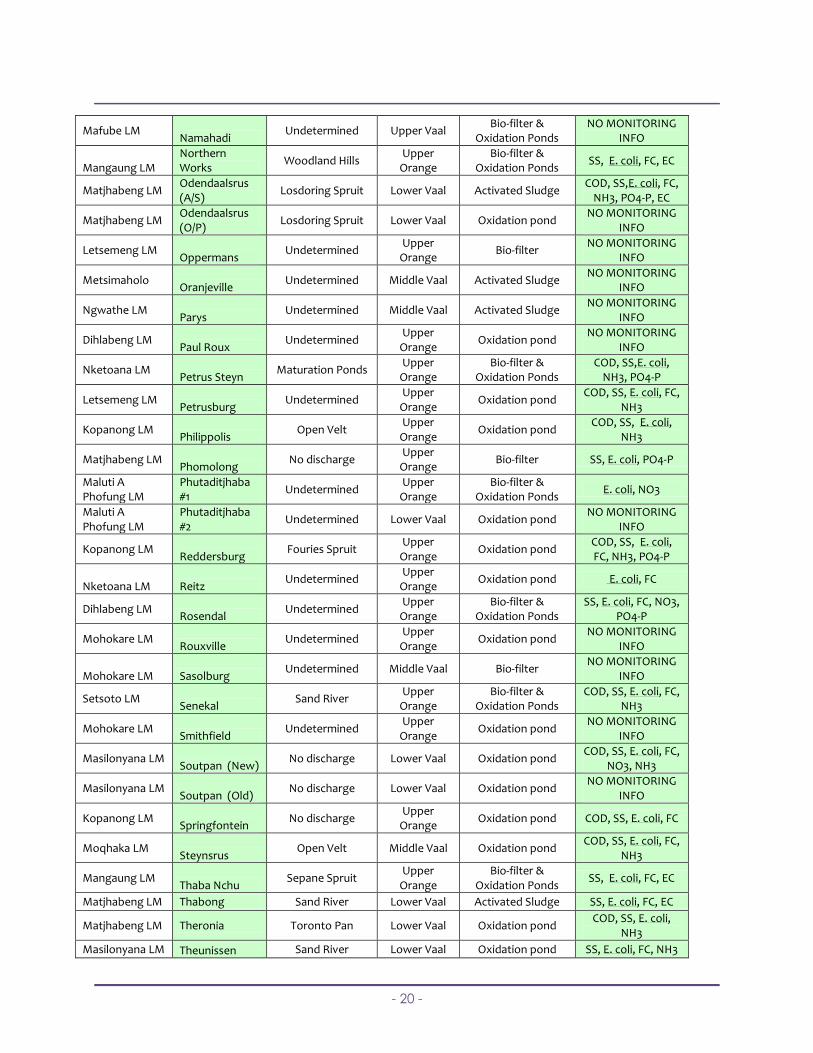
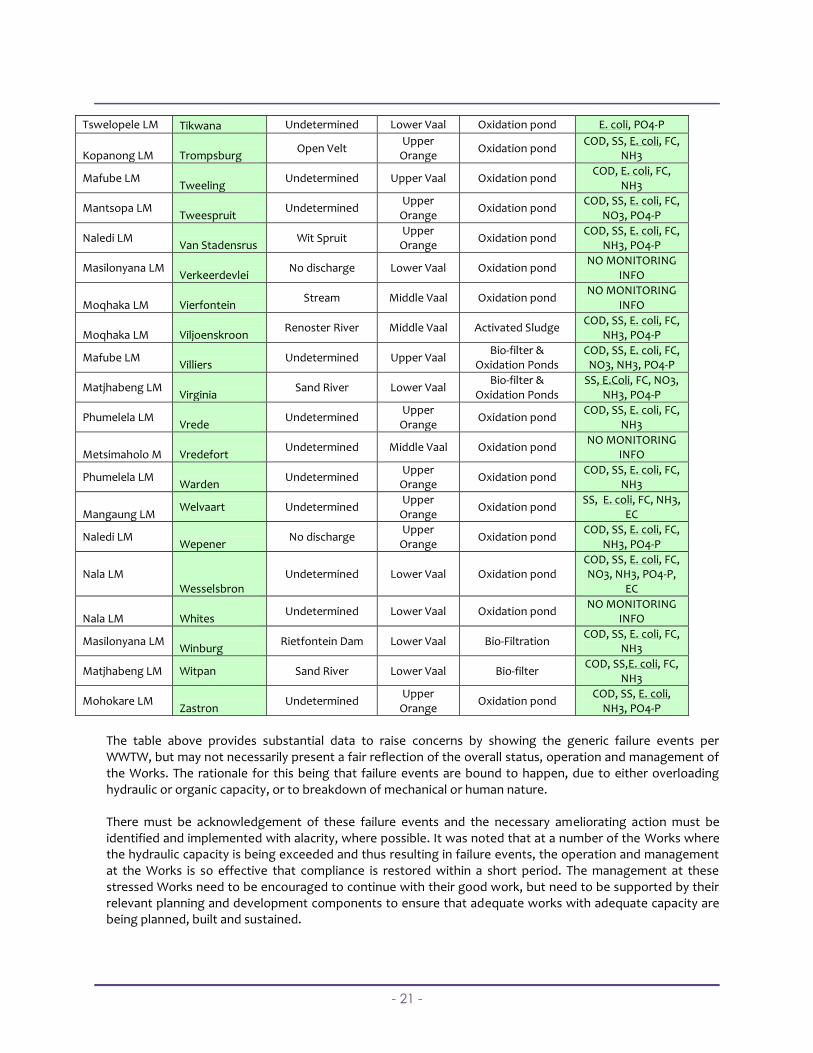
F. DWA Compliance monitoring, WSA / WSP Arrangements and Technology used
The above concern is further strengthened by the fact that the information provided by DWA, indicate the every one of the WWTW, within the Free State region fail to meet at least two or more of the standards. The extent to which this was the case was shown in the previous section, where the individual WWTW are discussed. The following table below provide a quick overview regarding the Standards not being met by the various works, as received from the DWA Regional Office.
Responsible Municipality/ Organization
Name Of WWTW
River Into Which Effluent Is Discharged
WMA
Technology Being Used
Standards Not Met
Matjhabeng LM Allanridge (A/S) Maturation Ponds Lower Vaal
Bio-filter & Oxidation Ponds
COD, SS, E.coli, NH3, PO4-P, EC
Matjhabeng LM Allanridge (O/P)
Maturation Ponds Lower Vaal Oxidation pond NO MONITORING
INFO
Nketoana LM Arlington No discharge
Upper Orange
Oxidation pond COD, SS, E. coli, NH3, PO4-P, EC
Mangaung LM Bainsvlei Irrigation ponds
Upper Orange
Bio-filter & Oxidation Ponds
SS, E. coli, FC, EC
Dihlabeng LM Bethlehem Undetermined
Upper Orange
Activated Sludge SS, COD, E. coli, FC,
NO3, NH3
Kopanong LM Bethulie Open Velt
Upper Orange
Oxidation pond COD, SS, E.coli, FC
Mangaung LM Bloemdustria No discharge
Upper Orange
Oxidation pond NO MONITORING
INFO
Mangaung LM Bloemspruit Bloem Spruit
Upper Orange
Oxidation pond SS, E. coli, FC, NH3,
EC
Tokologo LM Boshof
Undetermined Lower Vaal Oxidation pond COD, SS, E. coli,
NH3, PO4-P
Nala LM Bothaville
Vals River Lower Vaal Activated Sludge SS, E. coli, FC, NH3,
PO4-P
Mangaung LM Botshabelo
Small Modder River
Upper Orange
Bio-filter & Oxidation Ponds
SS, E. coli, FC, EC
Masilonyana LM Brandfort
Keerom Spruit Lower Vaal Oxidation pond COD, E. coli, FC,
NH3, PO4-P
Tswelopele LM Bultfontein Irrigation ponds Lower Vaal Oxidation pond
COD, SS,E. coli, FC, NH3, PO4-P
Dihlabeng LM Clarens Small Caledon
River Upper
Orange Bio-filter &
Oxidation Ponds E. coli, FC, NO3,
PO4-P
Setsoto LM Clocolan Maturation Ponds
Upper Orange
Oxidation pond E. coli, PO4-P
Mafube LM Cornelia Undetermined Upper Vaal Oxidation pond E. coli, FC,
Tokologo LM Dealesville
Undetermined Lower Vaal Oxidation pond COD, SS, E. coli, FC,
NH3, PO4-P, EC
Metsimaholo LM Deneysville
Undetermined Middle Vaal Bio-filter E. coli, FC,
Naledi LM Dewetsdorp Kareefontein
Spruit Upper
Orange Oxidation pond
COD, SS, E. coli, NH3, PO4-P
Kopanong LM Edenberg
Stream Upper
Orange Oxidation pond
SS, COD, E. coli, FC, NH3, PO4-P
Ngwathe LM Edenville No discharge Middle Vaal Oxidation pond
NO MONITORING INFO
Maluti A Phofung LM Elands
Undetermined Upper
Orange Biofilters
NO MONITORING INFO
Mantsopa LM Excelsior
Open Velt Upper
Orange Oxidation pond
NO MONITORING INFO
- 19 -
Kopanong LM Fauresmith
Stream Upper
Orange Oxidation pond
COD, SS, E. coli, FC, NH3, PO4-P
Setsoto LM Ficksburg
Caledon River Upper
Orange Oxidation pond E. coli, NO3, PO4-P
Dihlabeng LM Fouriesburg
Maturation Ponds Upper
Orange Oxidation pond
COD, E. coli, NH3, PO4-P
Mafube LM Frankfort
Undetermined Upper Vaal Oxidation pond NO MONITORING
INFO
Kopanong LM Gariep Dam
Undetermined Upper
Orange Bio-filter &
Oxidation Ponds COD, E. coli, FC,
NH3
Mangaung LM Groenpunt
Undetermined Middle Vaal Activated Sludge NO MONITORING
INFO
Maluti A Phofung LM Harrismith
Undetermined Upper
Orange Oxidation pond
COD, SS, E. coli, FC, NH3, PO4-P
Ngwathe LM Heilbron
Eland Spruit Middle Vaal Activated Sludge NO MONITORING
INFO
Matjhabeng LM Hennenman Riet Spruit Lower Vaal Activated Sludge SS, E. coli, FC, NH3
Tokologo LM Hertzogville
Undetermined Lower Vaal Oxidation pond COD, SS, E. coli, FC,
NH3, PO4-P, EC
Mantsopa LM Hobhouse
No discharge Upper
Orange Oxidation pond
COD, SS, E. coli, FC, NH3, PO4-P, EC
MetsimaholoLM Holly Country
Undetermined Upper
Orange Activated Sludge &
Bio-Filtration NO MONITORING
INFO
Tswelopele LM Hoopstad
Undetermined Lower Vaal Oxidation pond COD, SS, E. coli, FC, NO3, NH3, PO4-P,
EC
Letsemeng LM Jacobsdal
Stream Upper
Orange Oxidation pond
COD, SS, E. coli, FC, NH3, PO4-P
Kopanong LM Jagersfontein
Undetermined Upper
Orange Oxidation pond
NO MONITORING INFO
Maluti A Phofung LM Kestell
Undetermined Upper
Orange Bio-filter E. coli
Letsemeng LM Koffiefontein
Riet River Upper
Orange Activated Sludge E. coli, FC, NO3, EC
Ngwathe LM Koppies Maturation Ponds Middle Vaal Activated Sludge COD, E. coli, FC, EC
Ngwathe LM Kragbron
Undetermined Middle Vaal Oxidation pond NO MONITORING
INFO
Moqhaka LM Kroonstad
Vals River Middle Vaal Activated Sludge SS,E. coli, PO4-
P,NH3,FC
Matjhabeng LM Kutlwanong
No discharge Lower Vaal Activated Sludge COD, SS, E. coli, FC,
NH3, EC
Mantsopa LM Lady Brand
Undetermined Upper
Orange Oxidation pond
COD, SS, E. coli, NH3
Nketoana LM Lindley
No discharge Upper
Orange Oxidation pond
COD, SS, E. coliI, FC, NH3, PO4-P, EC
Letsemeng LM Luckhoff
Undetermined Upper
Orange Oxidation pond
NO MONITORING INFO
Letsemeng LM Makwane Vals River
Upper Orange
Oxidation pond NO MONITORING
INFO
Setsoto LM Marquard
Undetermined Upper
Orange Oxidation pond
COD, SS, E. coli, FC, NH3, PO4-P
Matjhabeng LM Mmamahabane Undetermined Lower Vaal Oxidation pond COD, SS, E. coli, FC
Phumelela LM Memel
Undetermined Upper
Orange Oxidation pond
COD, SS, E. coli, FC, NH3
Setsoto LM Moeding Undetermined
Upper Orange
Oxidation pond E. coli, PO4-P
- 20 -
Mafube LM Namahadi
Undetermined Upper Vaal Bio-filter &
Oxidation Ponds NO MONITORING
INFO
Mangaung LM Northern Works
Woodland Hills Upper
Orange Bio-filter &
Oxidation Ponds SS, E. coli, FC, EC
Matjhabeng LM Odendaalsrus (A/S)
Losdoring Spruit Lower Vaal Activated Sludge COD, SS,E. coli, FC,
NH3, PO4-P, EC
Matjhabeng LM Odendaalsrus (O/P)
Losdoring Spruit Lower Vaal Oxidation pond NO MONITORING
INFO
Letsemeng LM Oppermans
Undetermined Upper
Orange Bio-filter
NO MONITORING INFO
Metsimaholo Oranjeville
Undetermined Middle Vaal Activated Sludge NO MONITORING
INFO
Ngwathe LM Parys
Undetermined Middle Vaal Activated Sludge NO MONITORING
INFO
Dihlabeng LM Paul Roux
Undetermined Upper
Orange Oxidation pond
NO MONITORING INFO
Nketoana LM Petrus Steyn
Maturation Ponds Upper
Orange Bio-filter &
Oxidation Ponds COD, SS,E. coli,
NH3, PO4-P
Letsemeng LM Petrusburg
Undetermined Upper
Orange Oxidation pond
COD, SS, E. coli, FC, NH3
Kopanong LM Philippolis
Open Velt Upper
Orange Oxidation pond
COD, SS, E. coli, NH3
Matjhabeng LM Phomolong
No discharge Upper
Orange Bio-filter SS, E. coli, PO4-P
Maluti A Phofung LM
Phutaditjhaba #1
Undetermined Upper
Orange Bio-filter &
Oxidation Ponds E. coli, NO3
Maluti A Phofung LM
Phutaditjhaba #2
Undetermined Lower Vaal Oxidation pond NO MONITORING
INFO
Kopanong LM Reddersburg
Fouries Spruit Upper
Orange Oxidation pond
COD, SS, E. coli, FC, NH3, PO4-P
Nketoana LM Reitz Undetermined
Upper Orange
Oxidation pond E. coli, FC
Dihlabeng LM Rosendal
Undetermined Upper
Orange Bio-filter &
Oxidation Ponds SS, E. coli, FC, NO3,
PO4-P
Mohokare LM Rouxville
Undetermined Upper
Orange Oxidation pond
NO MONITORING INFO
Mohokare LM Sasolburg Undetermined Middle Vaal Bio-filter
NO MONITORING INFO
Setsoto LM Senekal
Sand River Upper
Orange Bio-filter &
Oxidation Ponds COD, SS, E. coli, FC,
NH3
Mohokare LM Smithfield
Undetermined Upper
Orange Oxidation pond
NO MONITORING INFO
Masilonyana LM Soutpan (New)
No discharge Lower Vaal Oxidation pond COD, SS, E. coli, FC,
NO3, NH3
Masilonyana LM Soutpan (Old)
No discharge Lower Vaal Oxidation pond NO MONITORING
INFO
Kopanong LM Springfontein
No discharge Upper
Orange Oxidation pond COD, SS, E. coli, FC
Moqhaka LM Steynsrus
Open Velt Middle Vaal Oxidation pond COD, SS, E. coli, FC,
NH3
Mangaung LM Thaba Nchu
Sepane Spruit Upper
Orange Bio-filter &
Oxidation Ponds SS, E. coli, FC, EC
Matjhabeng LM Thabong Sand River Lower Vaal Activated Sludge SS, E. coli, FC, EC
Matjhabeng LM Theronia Toronto Pan Lower Vaal Oxidation pond COD, SS, E. coli,
NH3
Masilonyana LM Theunissen Sand River Lower Vaal Oxidation pond SS, E. coli, FC, NH3
- 21 -
Tswelopele LM Tikwana Undetermined Lower Vaal Oxidation pond E. coli, PO4-P
Kopanong LM Trompsburg Open Velt
Upper Orange
Oxidation pond COD, SS, E. coli, FC,
NH3
Mafube LM Tweeling
Undetermined Upper Vaal Oxidation pond COD, E. coli, FC,
NH3
Mantsopa LM Tweespruit
Undetermined Upper
Orange Oxidation pond
COD, SS, E. coli, FC, NO3, PO4-P
Naledi LM Van Stadensrus
Wit Spruit Upper
Orange Oxidation pond
COD, SS, E. coli, FC, NH3, PO4-P
Masilonyana LM Verkeerdevlei
No discharge Lower Vaal Oxidation pond NO MONITORING
INFO
Moqhaka LM Vierfontein Stream Middle Vaal Oxidation pond
NO MONITORING INFO
Moqhaka LM Viljoenskroon Renoster River Middle Vaal Activated Sludge
COD, SS, E. coli, FC, NH3, PO4-P
Mafube LM Villiers
Undetermined Upper Vaal Bio-filter &
Oxidation Ponds COD, SS, E. coli, FC, NO3, NH3, PO4-P
Matjhabeng LM Virginia
Sand River Lower Vaal Bio-filter &
Oxidation Ponds SS, E.Coli, FC, NO3,
NH3, PO4-P
Phumelela LM Vrede
Undetermined Upper
Orange Oxidation pond
COD, SS, E. coli, FC, NH3
Metsimaholo M Vredefort Undetermined Middle Vaal Oxidation pond
NO MONITORING INFO
Phumelela LM Warden
Undetermined Upper
Orange Oxidation pond
COD, SS, E. coli, FC, NH3
Mangaung LM Welvaart Undetermined
Upper Orange
Oxidation pond SS, E. coli, FC, NH3,
EC
Naledi LM Wepener
No discharge Upper
Orange Oxidation pond
COD, SS, E. coli, FC, NH3, PO4-P
Nala LM Wesselsbron
Undetermined Lower Vaal Oxidation pond COD, SS, E. coli, FC, NO3, NH3, PO4-P,
EC
Nala LM Whites Undetermined Lower Vaal Oxidation pond
NO MONITORING INFO
Masilonyana LM Winburg
Rietfontein Dam Lower Vaal Bio-Filtration COD, SS, E. coli, FC,
NH3
Matjhabeng LM Witpan Sand River Lower Vaal Bio-filter COD, SS,E. coli, FC,
NH3
Mohokare LM Zastron
Undetermined Upper
Orange Oxidation pond
COD, SS, E. coli, NH3, PO4-P
The table above provides substantial data to raise concerns by showing the generic failure events per WWTW, but may not necessarily present a fair reflection of the overall status, operation and management of the Works. The rationale for this being that failure events are bound to happen, due to either overloading hydraulic or organic capacity, or to breakdown of mechanical or human nature. There must be acknowledgement of these failure events and the necessary ameliorating action must be identified and implemented with alacrity, where possible. It was noted that at a number of the Works where the hydraulic capacity is being exceeded and thus resulting in failure events, the operation and management at the Works is so effective that compliance is restored within a short period. The management at these stressed Works need to be encouraged to continue with their good work, but need to be supported by their relevant planning and development components to ensure that adequate works with adequate capacity are being planned, built and sustained.
- 22 -
Of greater concern is the issue of failure trends that exists where there is a consistent and regular failure, not necessarily related to the hydraulic design capacity of the Works. In most of such cases, the Plant Superintendent and Process Controllers are aware (or suspect) the failures, but they are not necessarily engaged in specific actions to rectify these within predetermined timeframes. Similarly of concern is the situation where operation of the Works, based on the effluent quality parameters, fluctuate between compliance and non-compliance, and where there does not appear to be a trend of sustainable compliance. Perhaps the greatest cause of concern is situations where no information or data is available, indicating that the WSA may not even be aware of their status and most probably are not-complying as result of their absence of plan and flow/ quality measurement. There can be a significant opportunity for improvement on the final effluent quality data by merely addressing the compliance monitoring requirements, and then to gradually progress towards the improved compliance of the final effluent.
- 23 -
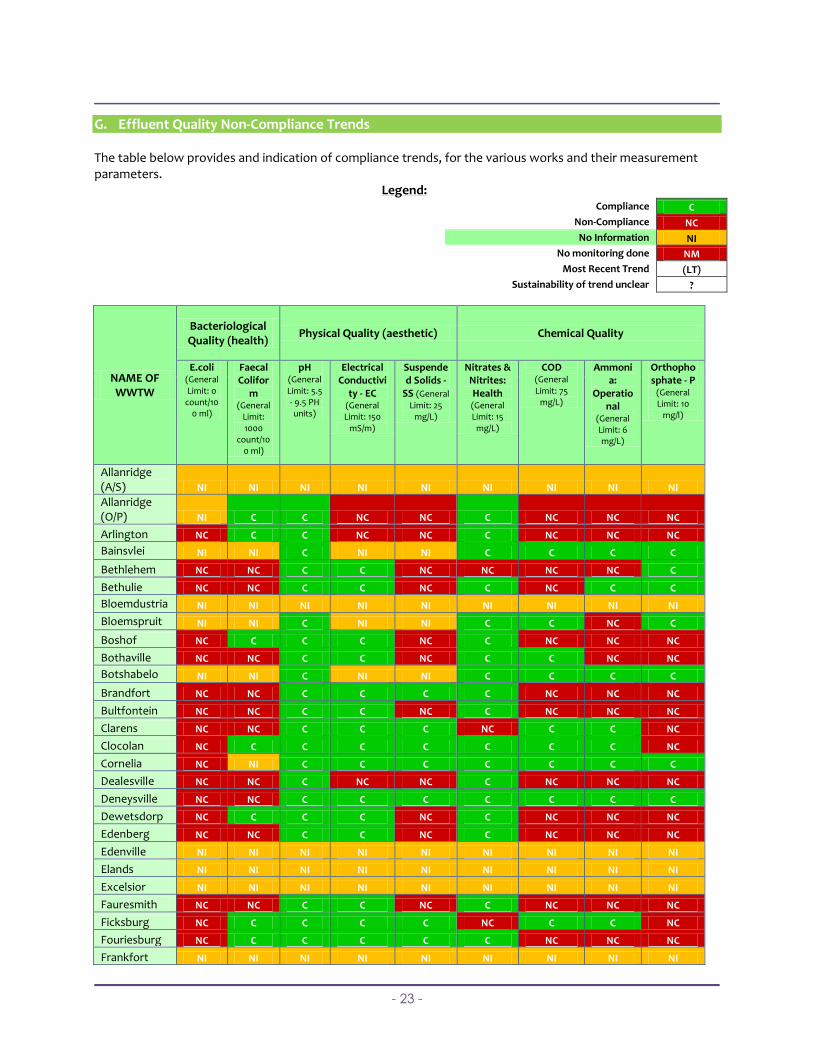
G. Effluent Quality Non-Compliance Trends The table below provides and indication of compliance trends, for the various works and their measurement parameters. Legend:
Compliance C
Non-Compliance NC
No Information NI
No monitoring done NM
Most Recent Trend (LT)
Sustainability of trend unclear ?
NAME OF WWTW
Bacteriological Quality (health)
Physical Quality (aesthetic) Chemical Quality
E.coli (General Limit: 0
count/100 ml)
Faecal Colifor
m (General
Limit: 1000
count/100 ml)
pH (General Limit: 5.5 - 9.5 PH units)
Electrical Conductivi
ty - EC (General Limit: 150
mS/m)
Suspended Solids -
SS (General
Limit: 25 mg/L)
Nitrates & Nitrites: Health (General Limit: 15
mg/L)
COD (General Limit: 75
mg/L)
Ammonia:
Operational
(General Limit: 6 mg/L)
Orthophosphate - P
(General Limit: 10
mg/l)
Allanridge (A/S) NI NI NI NI NI NI NI NI NI
Allanridge (O/P) NI C C NC NC C NC NC NC
Arlington NC C C NC NC C NC NC NC
Bainsvlei NI NI C NI NI C C C C
Bethlehem NC NC C C NC NC NC NC C
Bethulie NC NC C C NC C NC C C
Bloemdustria NI NI NI NI NI NI NI NI NI
Bloemspruit NI NI C NI NI C C NC C
Boshof NC C C C NC C NC NC NC
Bothaville NC NC C C NC C C NC NC
Botshabelo NI NI C NI NI C C C C
Brandfort NC NC C C C C NC NC NC
Bultfontein NC NC C C NC C NC NC NC
Clarens NC NC C C C NC C C NC
Clocolan NC C C C C C C C NC
Cornelia NC NI C C C C C C C
Dealesville NC NC C NC NC C NC NC NC
Deneysville NC NC C C C C C C C
Dewetsdorp NC C C C NC C NC NC NC
Edenberg NC NC C C NC C NC NC NC
Edenville NI NI NI NI NI NI NI NI NI
Elands NI NI NI NI NI NI NI NI NI
Excelsior NI NI NI NI NI NI NI NI NI
Fauresmith NC NC C C NC C NC NC NC
Ficksburg NC C C C C NC C C NC
Fouriesburg NC C C C C C NC NC NC
Frankfort NI NI NI NI NI NI NI NI NI
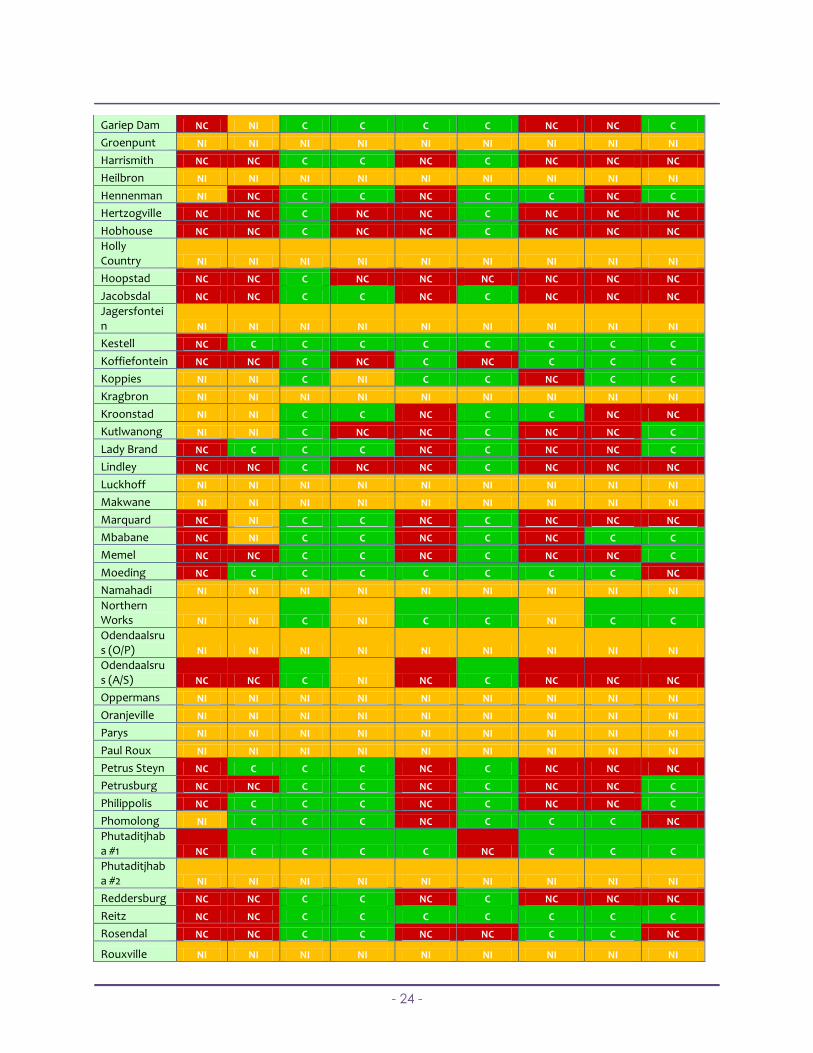
- 24 -
Gariep Dam NC NI C C C C NC NC C
Groenpunt NI NI NI NI NI NI NI NI NI
Harrismith NC NC C C NC C NC NC NC
Heilbron NI NI NI NI NI NI NI NI NI
Hennenman NI NC C C NC C C NC C
Hertzogville NC NC C NC NC C NC NC NC
Hobhouse NC NC C NC NC C NC NC NC
Holly Country NI NI NI NI NI NI NI NI NI
Hoopstad NC NC C NC NC NC NC NC NC
Jacobsdal NC NC C C NC C NC NC NC
Jagersfontein NI NI NI NI NI NI NI NI NI
Kestell NC C C C C C C C C
Koffiefontein NC NC C NC C NC C C C
Koppies NI NI C NI C C NC C C
Kragbron NI NI NI NI NI NI NI NI NI
Kroonstad NI NI C C NC C C NC NC
Kutlwanong NI NI C NC NC C NC NC C
Lady Brand NC C C C NC C NC NC C
Lindley NC NC C NC NC C NC NC NC
Luckhoff NI NI NI NI NI NI NI NI NI
Makwane NI NI NI NI NI NI NI NI NI
Marquard NC NI C C NC C NC NC NC
Mbabane NC NI C C NC C NC C C
Memel NC NC C C NC C NC NC C
Moeding NC C C C C C C C NC
Namahadi NI NI NI NI NI NI NI NI NI
Northern Works NI NI C NI C C NI C C
Odendaalsrus (O/P) NI NI NI NI NI NI NI NI NI
Odendaalsrus (A/S) NC NC C NI NC C NC NC NC
Oppermans NI NI NI NI NI NI NI NI NI
Oranjeville NI NI NI NI NI NI NI NI NI
Parys NI NI NI NI NI NI NI NI NI
Paul Roux NI NI NI NI NI NI NI NI NI
Petrus Steyn NC C C C NC C NC NC NC
Petrusburg NC NC C C NC C NC NC C
Philippolis NC C C C NC C NC NC C
Phomolong NI C C C NC C C C NC
Phutaditjhaba #1 NC C C C C NC C C C
Phutaditjhaba #2 NI NI NI NI NI NI NI NI NI
Reddersburg NC NC C C NC C NC NC NC
Reitz NC NC C C C C C C C
Rosendal NC NC C C NC NC C C NC
Rouxville NI NI NI NI NI NI NI NI NI
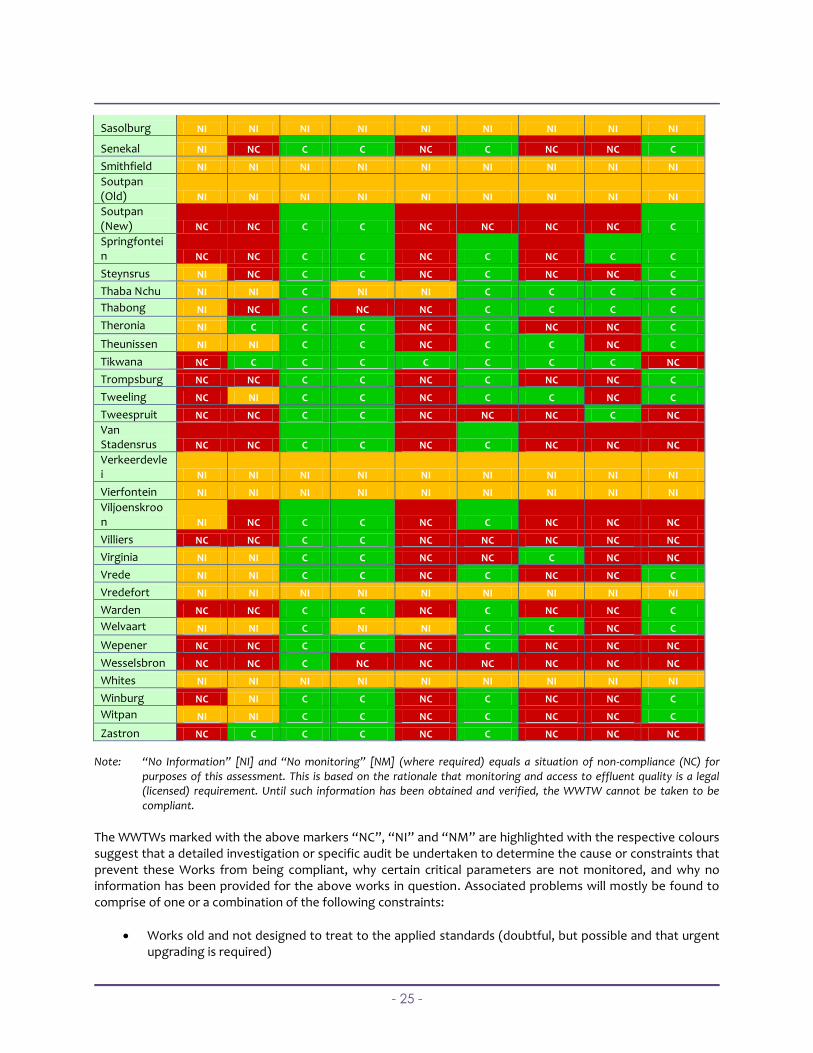
- 25 -
Sasolburg NI NI NI NI NI NI NI NI NI
Senekal NI NC C C NC C NC NC C
Smithfield NI NI NI NI NI NI NI NI NI
Soutpan (Old) NI NI NI NI NI NI NI NI NI
Soutpan (New) NC NC C C NC NC NC NC C
Springfontein NC NC C C NC C NC C C
Steynsrus NI NC C C NC C NC NC C
Thaba Nchu NI NI C NI NI C C C C
Thabong NI NC C NC NC C C C C
Theronia NI C C C NC C NC NC C
Theunissen NI NI C C NC C C NC C
Tikwana NC C C C C C C C NC
Trompsburg NC NC C C NC C NC NC C
Tweeling NC NI C C NC C C NC C
Tweespruit NC NC C C NC NC NC C NC
Van Stadensrus NC NC C C NC C NC NC NC
Verkeerdevlei NI NI NI NI NI NI NI NI NI
Vierfontein NI NI NI NI NI NI NI NI NI
Viljoenskroon NI NC C C NC C NC NC NC
Villiers NC NC C C NC NC NC NC NC
Virginia NI NI C C NC NC C NC NC
Vrede NI NI C C NC C NC NC C
Vredefort NI NI NI NI NI NI NI NI NI
Warden NC NC C C NC C NC NC C
Welvaart NI NI C NI NI C C NC C
Wepener NC NC C C NC C NC NC NC
Wesselsbron NC NC C NC NC NC NC NC NC
Whites NI NI NI NI NI NI NI NI NI
Winburg NC NI C C NC C NC NC C
Witpan NI NI C C NC C NC NC C
Zastron NC C C C NC C NC NC NC
Note: “No Information” [NI] and “No monitoring” [NM] (where required) equals a situation of non-compliance (NC) for purposes of this assessment. This is based on the rationale that monitoring and access to effluent quality is a legal (licensed) requirement. Until such information has been obtained and verified, the WWTW cannot be taken to be compliant.
The WWTWs marked with the above markers “NC”, “NI” and “NM” are highlighted with the respective colours suggest that a detailed investigation or specific audit be undertaken to determine the cause or constraints that prevent these Works from being compliant, why certain critical parameters are not monitored, and why no information has been provided for the above works in question. Associated problems will mostly be found to comprise of one or a combination of the following constraints:
Works old and not designed to treat to the applied standards (doubtful, but possible and that urgent upgrading is required)
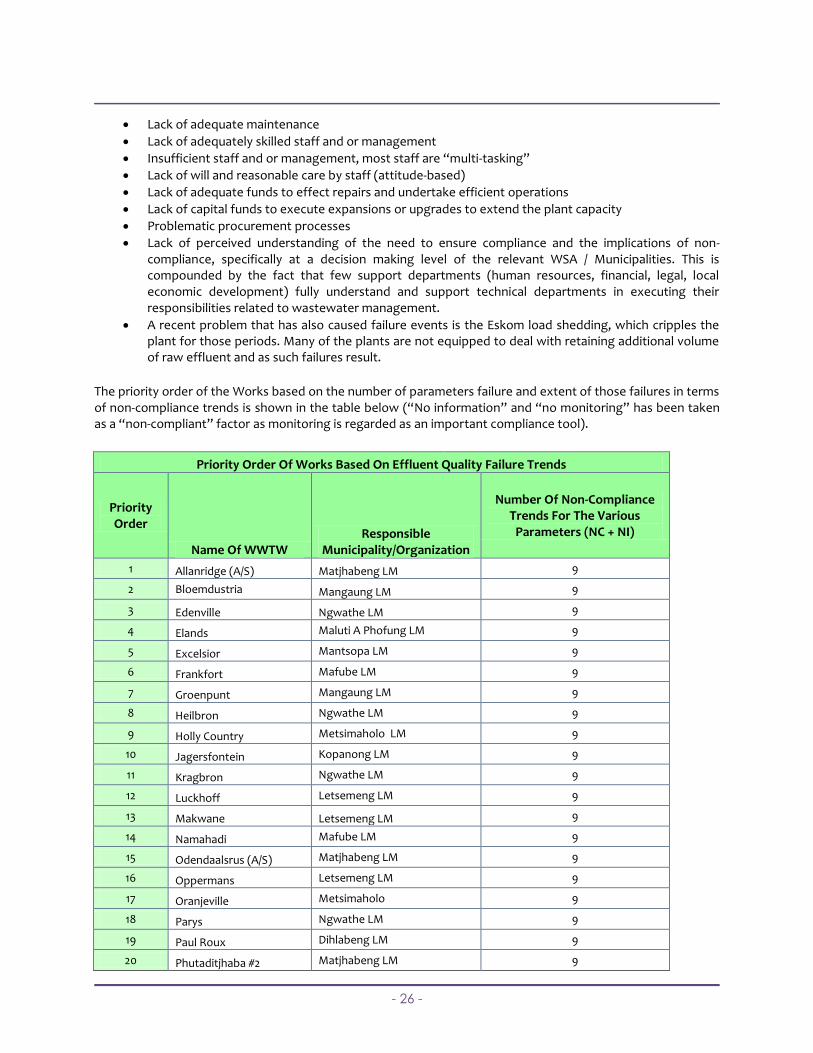
- 26 -
Lack of adequate maintenance
Lack of adequately skilled staff and or management
Insufficient staff and or management, most staff are “multi-tasking”
Lack of will and reasonable care by staff (attitude-based)
Lack of adequate funds to effect repairs and undertake efficient operations
Lack of capital funds to execute expansions or upgrades to extend the plant capacity
Problematic procurement processes
Lack of perceived understanding of the need to ensure compliance and the implications of non-compliance, specifically at a decision making level of the relevant WSA / Municipalities. This is compounded by the fact that few support departments (human resources, financial, legal, local economic development) fully understand and support technical departments in executing their responsibilities related to wastewater management.
A recent problem that has also caused failure events is the Eskom load shedding, which cripples the plant for those periods. Many of the plants are not equipped to deal with retaining additional volume of raw effluent and as such failures result.
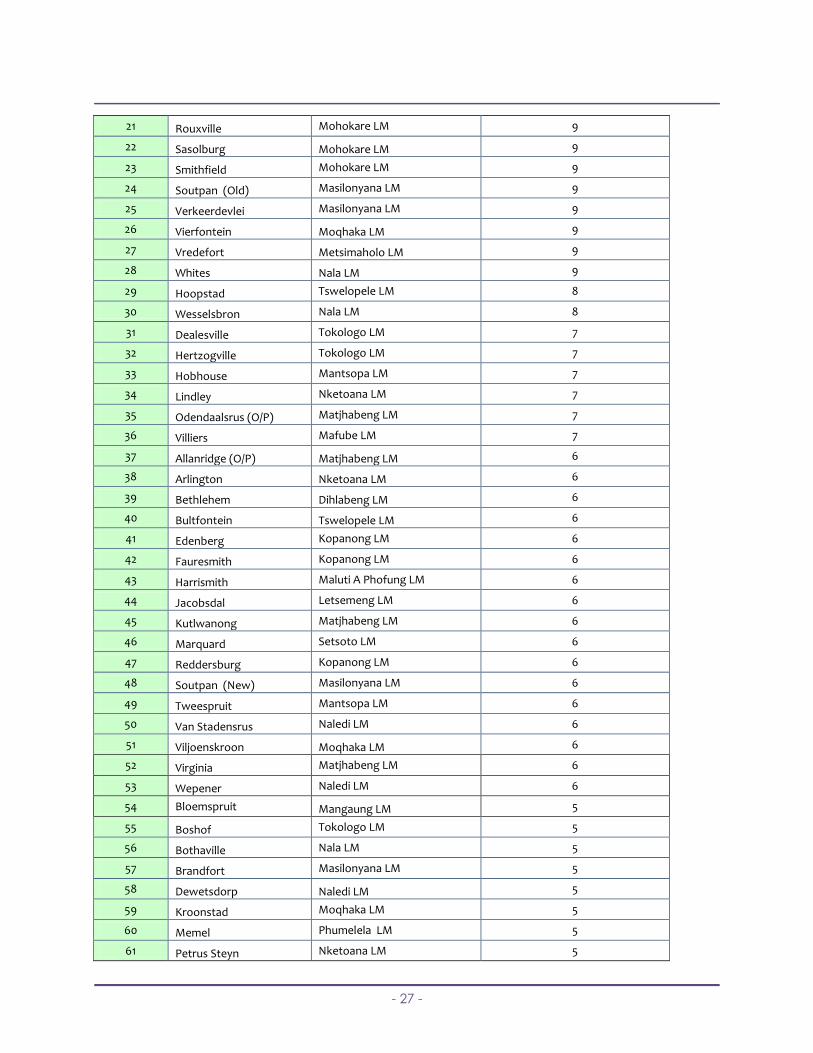
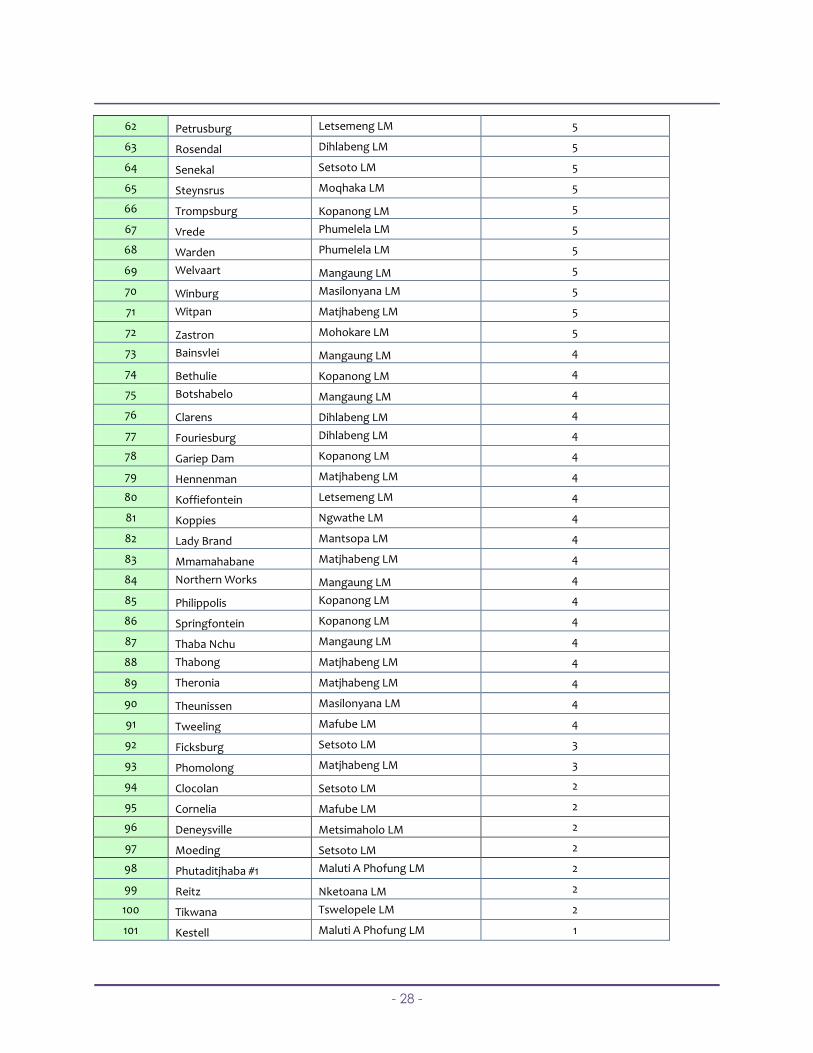
The priority order of the Works based on the number of parameters failure and extent of those failures in terms of non-compliance trends is shown in the table below (“No information” and “no monitoring” has been taken as a “non-compliant” factor as monitoring is regarded as an important compliance tool).
Priority Order Of Works Based On Effluent Quality Failure Trends
Priority Order
Name Of WWTW Responsible
Municipality/Organization
Number Of Non-Compliance Trends For The Various
Parameters (NC + NI)
1 Allanridge (A/S) Matjhabeng LM 9
2 Bloemdustria Mangaung LM 9
3 Edenville Ngwathe LM 9
4 Elands Maluti A Phofung LM 9
5 Excelsior Mantsopa LM 9
6 Frankfort Mafube LM 9
7 Groenpunt Mangaung LM 9
8 Heilbron Ngwathe LM 9
9 Holly Country Metsimaholo LM 9
10 Jagersfontein Kopanong LM 9
11 Kragbron Ngwathe LM 9
12 Luckhoff Letsemeng LM 9
13 Makwane Letsemeng LM 9
14 Namahadi Mafube LM 9
15 Odendaalsrus (A/S) Matjhabeng LM 9
16 Oppermans Letsemeng LM 9
17 Oranjeville Metsimaholo 9
18 Parys Ngwathe LM 9
19 Paul Roux Dihlabeng LM 9
20 Phutaditjhaba #2 Matjhabeng LM 9
- 27 -
21 Rouxville Mohokare LM 9
22 Sasolburg Mohokare LM 9
23 Smithfield Mohokare LM 9
24 Soutpan (Old) Masilonyana LM 9
25 Verkeerdevlei Masilonyana LM 9
26 Vierfontein Moqhaka LM 9
27 Vredefort Metsimaholo LM 9
28 Whites Nala LM 9
29 Hoopstad Tswelopele LM 8
30 Wesselsbron Nala LM 8
31 Dealesville Tokologo LM 7
32 Hertzogville Tokologo LM 7
33 Hobhouse Mantsopa LM 7
34 Lindley Nketoana LM 7
35 Odendaalsrus (O/P) Matjhabeng LM 7
36 Villiers Mafube LM 7
37 Allanridge (O/P) Matjhabeng LM 6
38 Arlington Nketoana LM 6
39 Bethlehem Dihlabeng LM 6
40 Bultfontein Tswelopele LM 6
41 Edenberg Kopanong LM 6
42 Fauresmith Kopanong LM 6
43 Harrismith Maluti A Phofung LM 6
44 Jacobsdal Letsemeng LM 6
45 Kutlwanong Matjhabeng LM 6
46 Marquard Setsoto LM 6
47 Reddersburg Kopanong LM 6
48 Soutpan (New) Masilonyana LM 6
49 Tweespruit Mantsopa LM 6
50 Van Stadensrus Naledi LM 6
51 Viljoenskroon Moqhaka LM 6
52 Virginia Matjhabeng LM 6
53 Wepener Naledi LM 6
54 Bloemspruit Mangaung LM 5
55 Boshof Tokologo LM 5
56 Bothaville Nala LM 5
57 Brandfort Masilonyana LM 5
58 Dewetsdorp Naledi LM 5
59 Kroonstad Moqhaka LM 5
60 Memel Phumelela LM 5
61 Petrus Steyn Nketoana LM 5
- 28 -
62 Petrusburg Letsemeng LM 5
63 Rosendal Dihlabeng LM 5
64 Senekal Setsoto LM 5
65 Steynsrus Moqhaka LM 5
66 Trompsburg Kopanong LM 5
67 Vrede Phumelela LM 5
68 Warden Phumelela LM 5
69 Welvaart Mangaung LM 5
70 Winburg Masilonyana LM 5
71 Witpan Matjhabeng LM 5
72 Zastron Mohokare LM 5
73 Bainsvlei Mangaung LM 4
74 Bethulie Kopanong LM 4
75 Botshabelo Mangaung LM 4
76 Clarens Dihlabeng LM 4
77 Fouriesburg Dihlabeng LM 4
78 Gariep Dam Kopanong LM 4
79 Hennenman Matjhabeng LM 4
80 Koffiefontein Letsemeng LM 4
81 Koppies Ngwathe LM 4
82 Lady Brand Mantsopa LM 4
83 Mmamahabane Matjhabeng LM 4
84 Northern Works Mangaung LM 4
85 Philippolis Kopanong LM 4
86 Springfontein Kopanong LM 4
87 Thaba Nchu Mangaung LM 4
88 Thabong Matjhabeng LM 4
89 Theronia Matjhabeng LM 4
90 Theunissen Masilonyana LM 4
91 Tweeling Mafube LM 4
92 Ficksburg Setsoto LM 3
93 Phomolong Matjhabeng LM 3
94 Clocolan Setsoto LM 2
95 Cornelia Mafube LM 2
96 Deneysville Metsimaholo LM 2
97 Moeding Setsoto LM 2
98 Phutaditjhaba #1 Maluti A Phofung LM 2
99 Reitz Nketoana LM 2
100 Tikwana Tswelopele LM 2
101 Kestell Maluti A Phofung LM 1
- 29 -
An interesting aspect to note is that the works which exceed their hydraulic capacity are not necessarily the same works that show non-compliance trends. Due to a lack of comprehensive water quality information for a number of the works, their compliance and non-compliance trends could not be determined, for this reason all “no information” parameters were put equal to NC (Non-Compliant) factors. Based on the available information, the capacity and resources of the WSA / WSP, in terms of staff skills and capacity, funds and ease of procurement of materials and equipment, play a greater role in the ability to maintain a compliance trend.
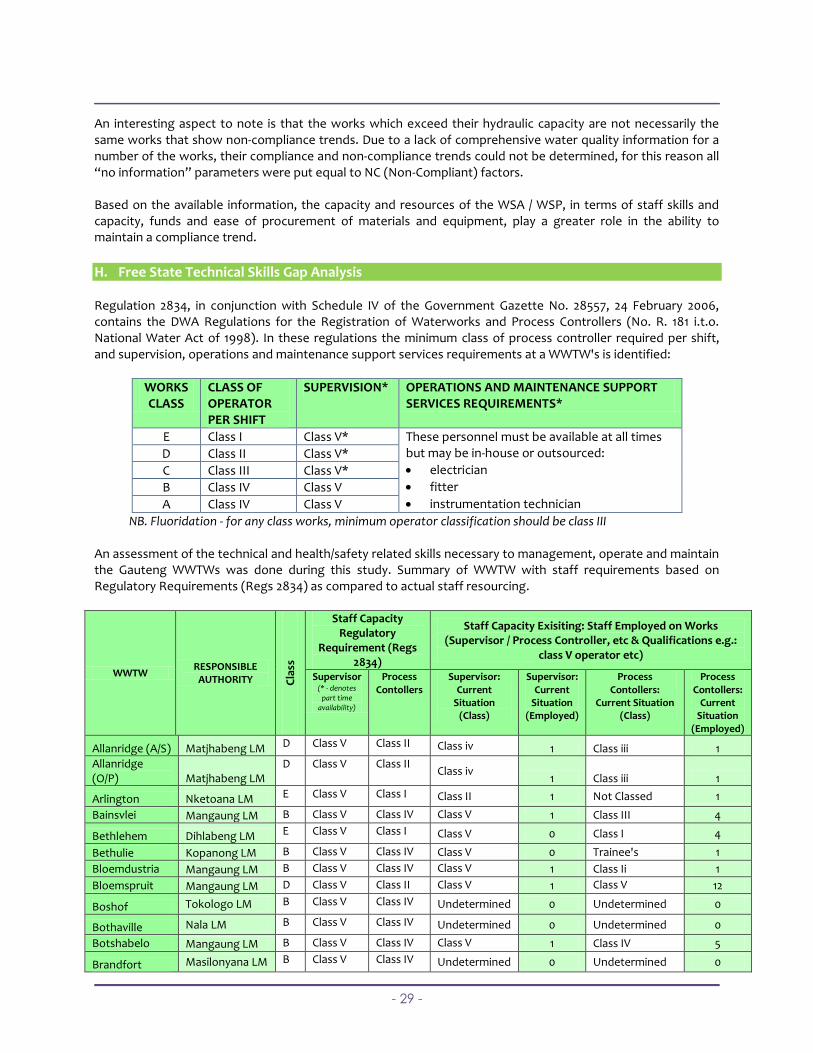
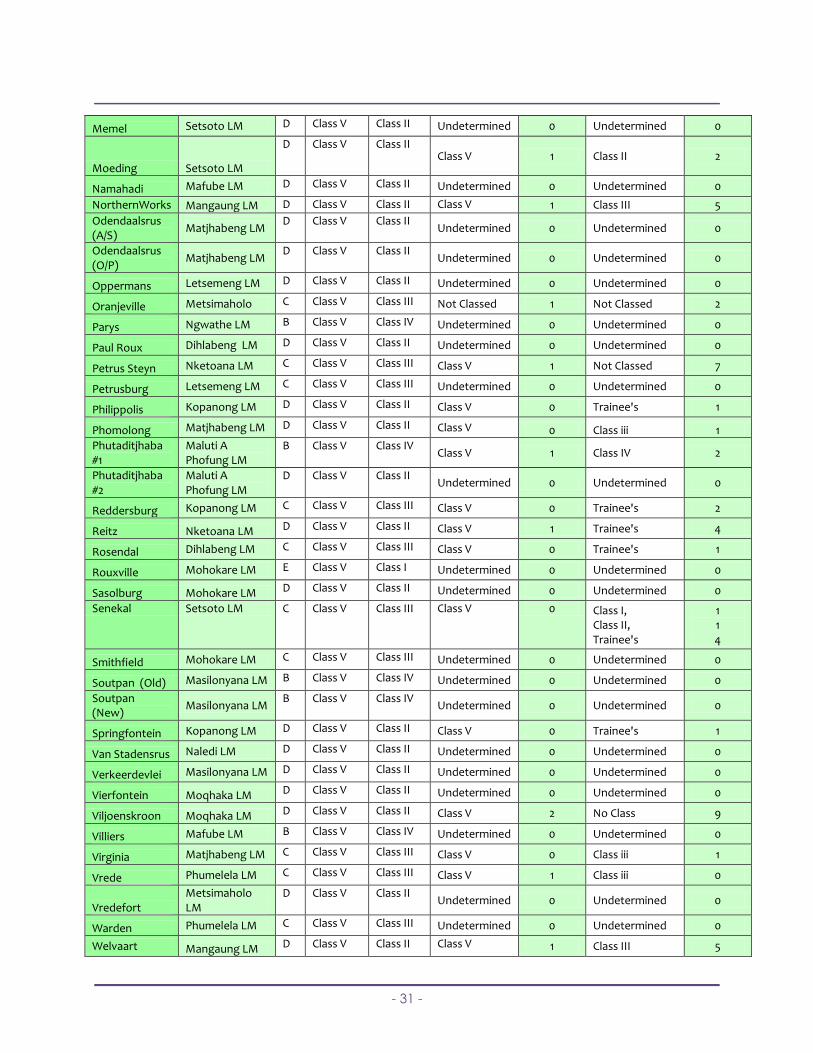
H. Free State Technical Skills Gap Analysis Regulation 2834, in conjunction with Schedule IV of the Government Gazette No. 28557, 24 February 2006, contains the DWA Regulations for the Registration of Waterworks and Process Controllers (No. R. 181 i.t.o. National Water Act of 1998). In these regulations the minimum class of process controller required per shift, and supervision, operations and maintenance support services requirements at a WWTW's is identified:
WORKS CLASS
CLASS OF OPERATOR PER SHIFT
SUPERVISION* OPERATIONS AND MAINTENANCE SUPPORT SERVICES REQUIREMENTS*
E Class I Class V* These personnel must be available at all times but may be in-house or outsourced:
electrician
fitter
instrumentation technician
D Class II Class V*
C Class III Class V*
B Class IV Class V
A Class IV Class V
NB. Fluoridation - for any class works, minimum operator classification should be class III An assessment of the technical and health/safety related skills necessary to management, operate and maintain the Gauteng WWTWs was done during this study. Summary of WWTW with staff requirements based on Regulatory Requirements (Regs 2834) as compared to actual staff resourcing.
WWTW RESPONSIBLE AUTHORITY C
lass
Staff Capacity Regulatory
Requirement (Regs 2834)
Staff Capacity Exisiting: Staff Employed on Works (Supervisor / Process Controller, etc & Qualifications e.g.:
class V operator etc)
Supervisor (* - denotes
part time availability)
Process Contollers
Supervisor: Current
Situation (Class)
Supervisor: Current
Situation (Employed)
Process Contollers:
Current Situation (Class)
Process Contollers:
Current Situation
(Employed)
Allanridge (A/S) Matjhabeng LM D Class V Class II Class iv 1 Class iii 1
Allanridge (O/P) Matjhabeng LM
D Class V Class II Class iv
1 Class iii 1
Arlington Nketoana LM E Class V Class I Class II 1 Not Classed 1
Bainsvlei Mangaung LM B Class V Class IV Class V 1 Class III 4
Bethlehem Dihlabeng LM E Class V Class I Class V 0 Class I 4
Bethulie Kopanong LM B Class V Class IV Class V 0 Trainee's 1
Bloemdustria Mangaung LM B Class V Class IV Class V 1 Class Ii 1
Bloemspruit Mangaung LM D Class V Class II Class V 1 Class V 12
Boshof Tokologo LM B Class V Class IV Undetermined 0 Undetermined 0
Bothaville Nala LM B Class V Class IV Undetermined 0 Undetermined 0
Botshabelo Mangaung LM B Class V Class IV Class V 1 Class IV 5
Brandfort Masilonyana LM B Class V Class IV Undetermined 0 Undetermined 0
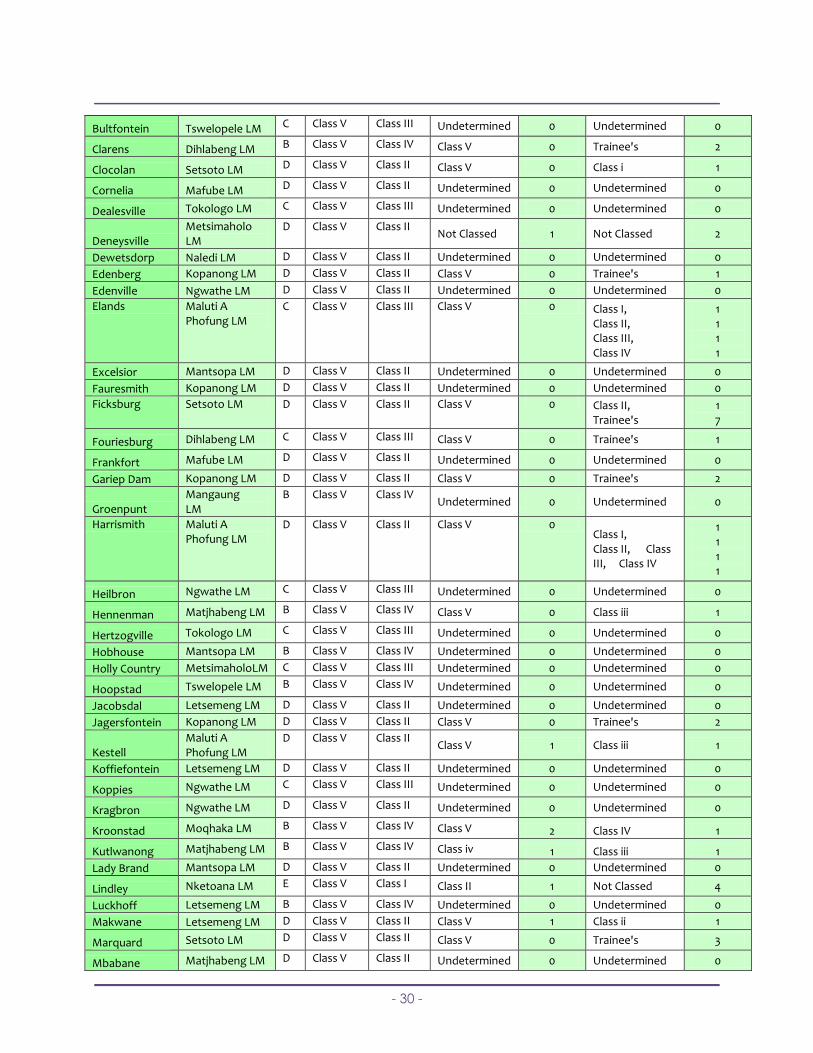
- 30 -
Bultfontein Tswelopele LM C Class V Class III Undetermined 0 Undetermined 0
Clarens Dihlabeng LM B Class V Class IV Class V 0 Trainee's 2
Clocolan Setsoto LM D Class V Class II Class V 0 Class i 1
Cornelia Mafube LM D Class V Class II Undetermined 0 Undetermined 0
Dealesville Tokologo LM C Class V Class III Undetermined 0 Undetermined 0
Deneysville Metsimaholo LM
D Class V Class II Not Classed 1 Not Classed 2
Dewetsdorp Naledi LM D Class V Class II Undetermined 0 Undetermined 0
Edenberg Kopanong LM D Class V Class II Class V 0 Trainee's 1
Edenville Ngwathe LM D Class V Class II Undetermined 0 Undetermined 0
Elands Maluti A Phofung LM
C Class V Class III Class V 0 Class I, Class II, Class III, Class IV
1 1 1 1
Excelsior Mantsopa LM D Class V Class II Undetermined 0 Undetermined 0
Fauresmith Kopanong LM D Class V Class II Undetermined 0 Undetermined 0
Ficksburg Setsoto LM D Class V Class II Class V 0 Class II, Trainee's
1 7
Fouriesburg Dihlabeng LM C Class V Class III Class V 0 Trainee's 1
Frankfort Mafube LM D Class V Class II Undetermined 0 Undetermined 0
Gariep Dam Kopanong LM D Class V Class II Class V 0 Trainee's 2
Groenpunt Mangaung LM
B Class V Class IV Undetermined 0 Undetermined 0
Harrismith Maluti A Phofung LM
D Class V Class II Class V 0 Class I, Class II, Class III, Class IV
1 1 1 1
Heilbron Ngwathe LM C Class V Class III Undetermined 0 Undetermined 0
Hennenman Matjhabeng LM B Class V Class IV Class V 0 Class iii 1
Hertzogville Tokologo LM C Class V Class III Undetermined 0 Undetermined 0
Hobhouse Mantsopa LM B Class V Class IV Undetermined 0 Undetermined 0
Holly Country MetsimaholoLM C Class V Class III Undetermined 0 Undetermined 0
Hoopstad Tswelopele LM B Class V Class IV Undetermined 0 Undetermined 0
Jacobsdal Letsemeng LM D Class V Class II Undetermined 0 Undetermined 0
Jagersfontein Kopanong LM D Class V Class II Class V 0 Trainee's 2
Kestell Maluti A Phofung LM
D Class V Class II Class V 1 Class iii 1
Koffiefontein Letsemeng LM D Class V Class II Undetermined 0 Undetermined 0
Koppies Ngwathe LM C Class V Class III Undetermined 0 Undetermined 0
Kragbron Ngwathe LM D Class V Class II Undetermined 0 Undetermined 0
Kroonstad Moqhaka LM B Class V Class IV Class V 2 Class IV 1
Kutlwanong Matjhabeng LM B Class V Class IV Class iv 1 Class iii 1
Lady Brand Mantsopa LM D Class V Class II Undetermined 0 Undetermined 0
Lindley Nketoana LM E Class V Class I Class II 1 Not Classed 4
Luckhoff Letsemeng LM B Class V Class IV Undetermined 0 Undetermined 0
Makwane Letsemeng LM D Class V Class II Class V 1 Class ii 1
Marquard Setsoto LM D Class V Class II Class V 0 Trainee's 3
Mbabane Matjhabeng LM D Class V Class II Undetermined 0 Undetermined 0
- 31 -
Memel Setsoto LM D Class V Class II Undetermined 0 Undetermined 0
Moeding Setsoto LM
D Class V Class II Class V 1 Class II 2
Namahadi Mafube LM D Class V Class II Undetermined 0 Undetermined 0
NorthernWorks Mangaung LM D Class V Class II Class V 1 Class III 5
Odendaalsrus (A/S)
Matjhabeng LM D Class V Class II
Undetermined 0 Undetermined 0
Odendaalsrus (O/P)
Matjhabeng LM D Class V Class II
Undetermined 0 Undetermined 0
Oppermans Letsemeng LM D Class V Class II Undetermined 0 Undetermined 0
Oranjeville Metsimaholo C Class V Class III Not Classed 1 Not Classed 2
Parys Ngwathe LM B Class V Class IV Undetermined 0 Undetermined 0
Paul Roux Dihlabeng LM D Class V Class II Undetermined 0 Undetermined 0
Petrus Steyn Nketoana LM C Class V Class III Class V 1 Not Classed 7
Petrusburg Letsemeng LM C Class V Class III Undetermined 0 Undetermined 0
Philippolis Kopanong LM D Class V Class II Class V 0 Trainee's 1
Phomolong Matjhabeng LM D Class V Class II Class V 0 Class iii 1
Phutaditjhaba #1
Maluti A Phofung LM
B Class V Class IV Class V 1 Class IV 2
Phutaditjhaba #2
Maluti A Phofung LM
D Class V Class II Undetermined 0 Undetermined 0
Reddersburg Kopanong LM C Class V Class III Class V 0 Trainee's 2
Reitz Nketoana LM D Class V Class II Class V 1 Trainee's 4
Rosendal Dihlabeng LM C Class V Class III Class V 0 Trainee's 1
Rouxville Mohokare LM E Class V Class I Undetermined 0 Undetermined 0
Sasolburg Mohokare LM D Class V Class II Undetermined 0 Undetermined 0
Senekal Setsoto LM C Class V Class III Class V 0 Class I, Class II, Trainee's
1 1 4
Smithfield Mohokare LM C Class V Class III Undetermined 0 Undetermined 0
Soutpan (Old) Masilonyana LM B Class V Class IV Undetermined 0 Undetermined 0
Soutpan (New)
Masilonyana LM B Class V Class IV
Undetermined 0 Undetermined 0
Springfontein Kopanong LM D Class V Class II Class V 0 Trainee's 1
Van Stadensrus Naledi LM D Class V Class II Undetermined 0 Undetermined 0
Verkeerdevlei Masilonyana LM D Class V Class II Undetermined 0 Undetermined 0
Vierfontein Moqhaka LM D Class V Class II Undetermined 0 Undetermined 0
Viljoenskroon Moqhaka LM D Class V Class II Class V 2 No Class 9
Villiers Mafube LM B Class V Class IV Undetermined 0 Undetermined 0
Virginia Matjhabeng LM C Class V Class III Class V 0 Class iii 1
Vrede Phumelela LM C Class V Class III Class V 1 Class iii 0
Vredefort Metsimaholo LM
D Class V Class II Undetermined 0 Undetermined 0
Warden Phumelela LM C Class V Class III Undetermined 0 Undetermined 0
Welvaart Mangaung LM D Class V Class II Class V 1 Class III 5
- 32 -
Wepener Naledi LM B Class V Class IV Undetermined 0 Undetermined 0
Wesselsbron Nala LM C Class V Class III Undetermined 0 Undetermined 0
Whites Nala LM C Class V Class III Undetermined 0 Undetermined 0
Winburg Masilonyana LM D Class V Class II Undetermined 0 Undetermined 0
Witpan Matjhabeng LM D Class V Class II Class V 0 Class iv 1
Zastron Mohokare LM E Class V Class I Undetermined 0 Undetermined 0
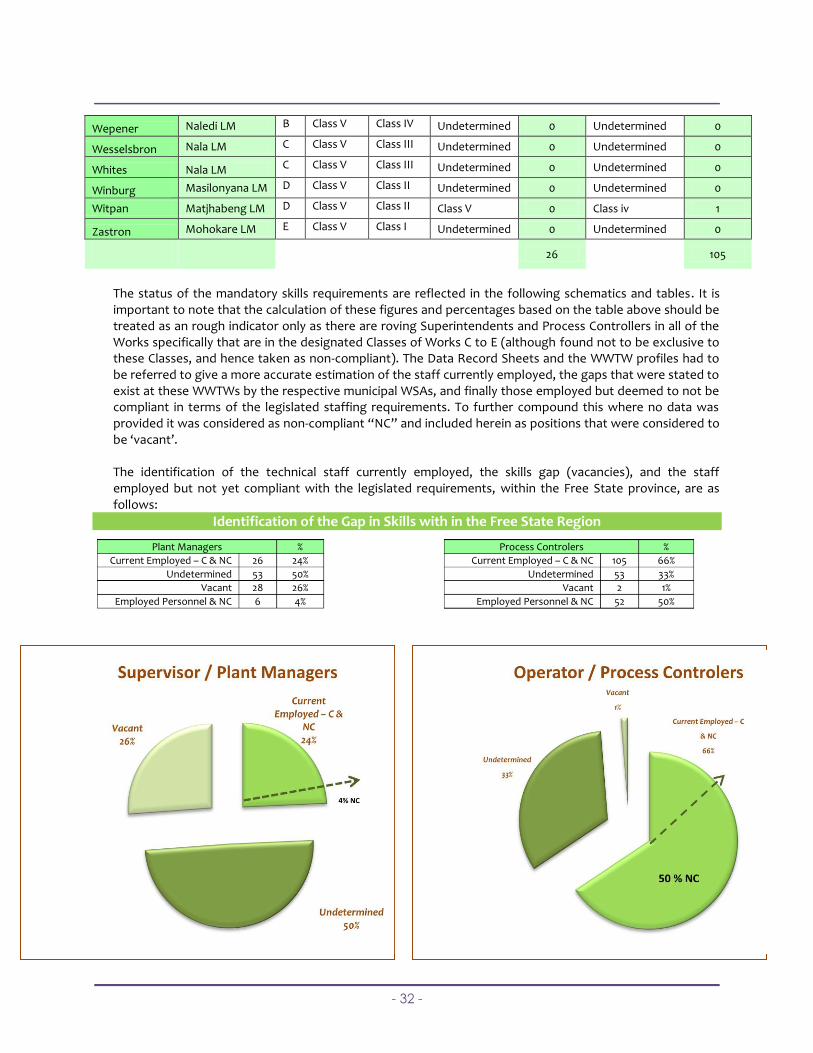
26
105
The status of the mandatory skills requirements are reflected in the following schematics and tables. It is important to note that the calculation of these figures and percentages based on the table above should be treated as an rough indicator only as there are roving Superintendents and Process Controllers in all of the Works specifically that are in the designated Classes of Works C to E (although found not to be exclusive to these Classes, and hence taken as non-compliant). The Data Record Sheets and the WWTW profiles had to be referred to give a more accurate estimation of the staff currently employed, the gaps that were stated to exist at these WWTWs by the respective municipal WSAs, and finally those employed but deemed to not be compliant in terms of the legislated staffing requirements. To further compound this where no data was provided it was considered as non-compliant “NC” and included herein as positions that were considered to be ‘vacant’. The identification of the technical staff currently employed, the skills gap (vacancies), and the staff employed but not yet compliant with the legislated requirements, within the Free State province, are as follows:
Identification of the Gap in Skills with in the Free State Region
Process Controlers %
Current Employed – C & NC 105 66%
Undetermined 53 33%
Vacant 2 1%
Employed Personnel & NC 52 50%
Plant Managers %
Current Employed – C & NC 26 24%
Undetermined 53 50%
Vacant 28 26%
Employed Personnel & NC 6 4%
- 33 -
A disturbing factor is that high percentages of personnel employed in “skilled’ positions, do not comply with the requirements for supervisory (4%) and process controllers (50%). These numbers, combined with the number of vacancies in these positions, amount to a significant number of positions that is not filled by any form of skill or by inadequate/inappropriate skill. The value of this information is that it places Free State Provincial Government in an ideal position to address this skills gap on an informed, quantified basis, and to formulate a Plan with clear targets, deliverables, timeframes, costs and methodology to address this specific gap, ideally in partnership with LGSETA and ESETA.
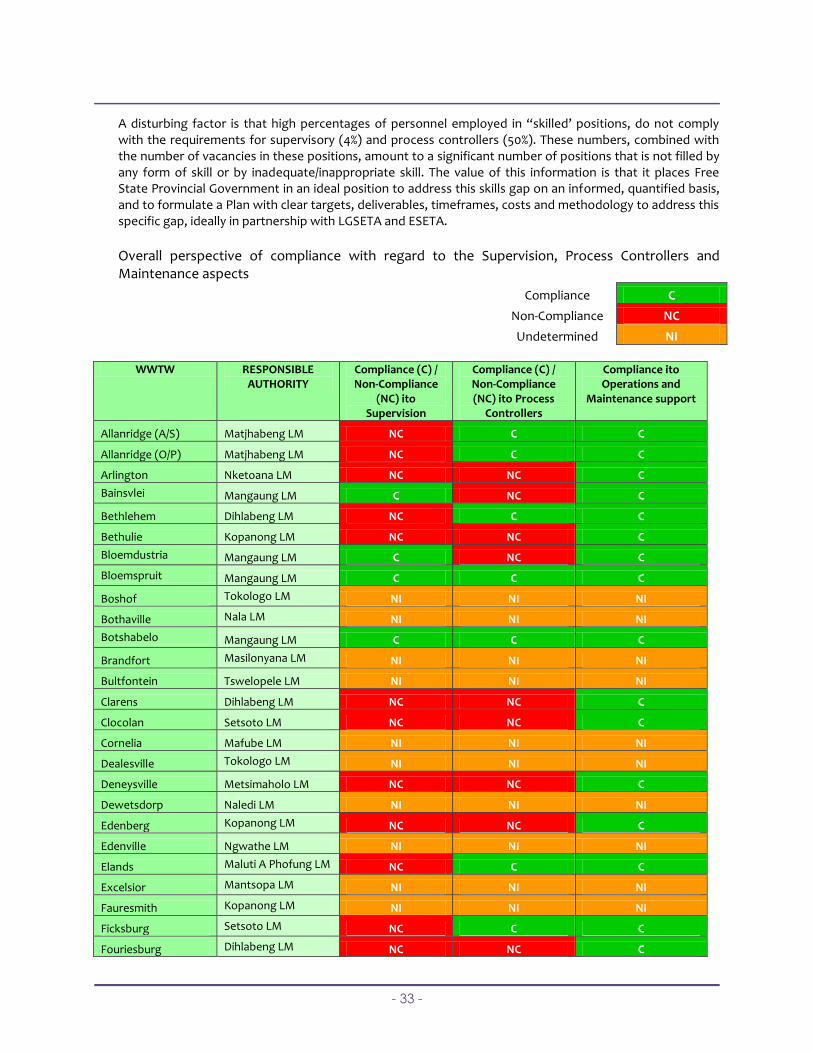
Overall perspective of compliance with regard to the Supervision, Process Controllers and Maintenance aspects
Compliance C
Non-Compliance NC
Undetermined NI
WWTW RESPONSIBLE
AUTHORITY Compliance (C) / Non-Compliance
(NC) ito Supervision
Compliance (C) / Non-Compliance (NC) ito Process
Controllers
Compliance ito Operations and
Maintenance support
Allanridge (A/S) Matjhabeng LM NC C C
Allanridge (O/P) Matjhabeng LM NC C C
Arlington Nketoana LM NC NC C
Bainsvlei Mangaung LM C NC C
Bethlehem Dihlabeng LM NC C C
Bethulie Kopanong LM NC NC C
Bloemdustria Mangaung LM C NC C
Bloemspruit Mangaung LM C C C
Boshof Tokologo LM NI NI NI
Bothaville Nala LM NI NI NI
Botshabelo Mangaung LM C C C
Brandfort Masilonyana LM NI NI NI
Bultfontein Tswelopele LM NI NI NI
Clarens Dihlabeng LM NC NC C
Clocolan Setsoto LM NC NC C
Cornelia Mafube LM NI NI NI
Dealesville Tokologo LM NI NI NI
Deneysville Metsimaholo LM NC NC C
Dewetsdorp Naledi LM NI NI NI
Edenberg Kopanong LM NC NC C
Edenville Ngwathe LM NI NI NI
Elands Maluti A Phofung LM NC C C
Excelsior Mantsopa LM NI NI NI
Fauresmith Kopanong LM NI NI NI
Ficksburg Setsoto LM NC C C
Fouriesburg Dihlabeng LM NC NC C
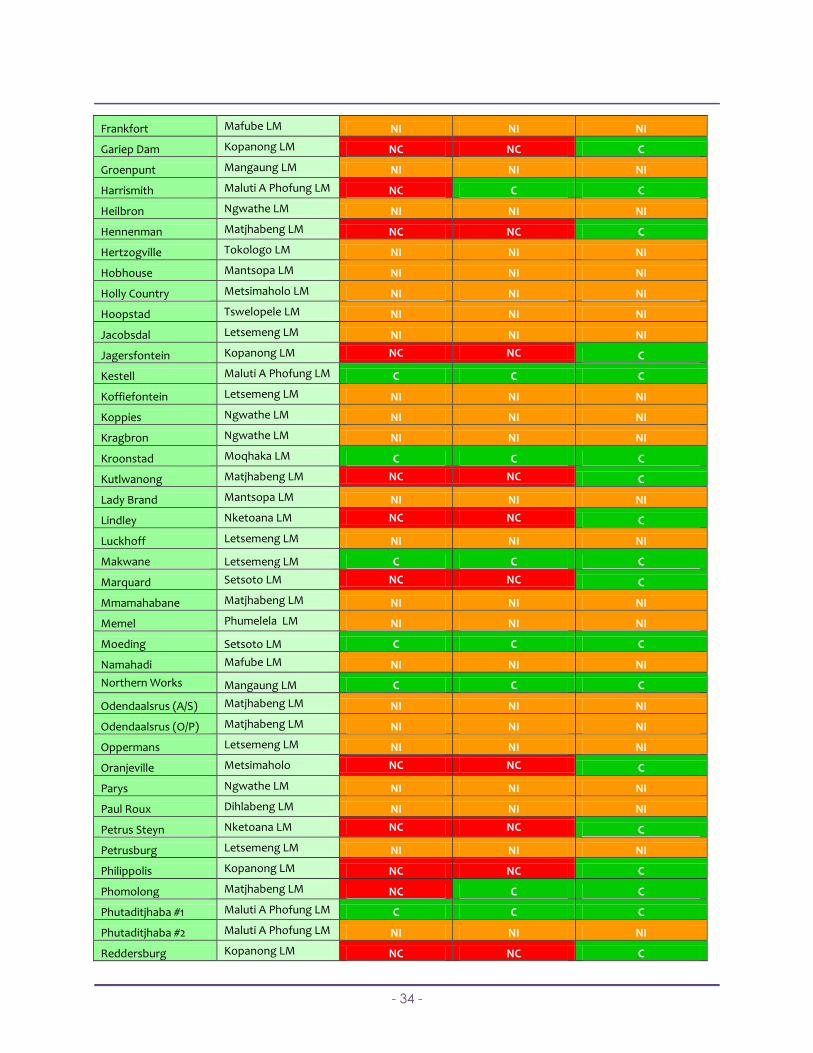
- 34 -
Frankfort Mafube LM NI NI NI
Gariep Dam Kopanong LM NC NC C
Groenpunt Mangaung LM NI NI NI
Harrismith Maluti A Phofung LM NC C C
Heilbron Ngwathe LM NI NI NI
Hennenman Matjhabeng LM NC NC C
Hertzogville Tokologo LM NI NI NI
Hobhouse Mantsopa LM NI NI NI
Holly Country Metsimaholo LM NI NI NI
Hoopstad Tswelopele LM NI NI NI
Jacobsdal Letsemeng LM NI NI NI
Jagersfontein Kopanong LM NC NC C
Kestell Maluti A Phofung LM C C C
Koffiefontein Letsemeng LM NI NI NI
Koppies Ngwathe LM NI NI NI
Kragbron Ngwathe LM NI NI NI
Kroonstad Moqhaka LM C C C
Kutlwanong Matjhabeng LM NC NC C
Lady Brand Mantsopa LM NI NI NI
Lindley Nketoana LM NC NC C
Luckhoff Letsemeng LM NI NI NI
Makwane Letsemeng LM C C C
Marquard Setsoto LM NC NC C
Mmamahabane Matjhabeng LM NI NI NI
Memel Phumelela LM NI NI NI
Moeding Setsoto LM C C C
Namahadi Mafube LM NI NI NI
Northern Works Mangaung LM C C C
Odendaalsrus (A/S) Matjhabeng LM NI NI NI
Odendaalsrus (O/P) Matjhabeng LM NI NI NI
Oppermans Letsemeng LM NI NI NI
Oranjeville Metsimaholo NC NC C
Parys Ngwathe LM NI NI NI
Paul Roux Dihlabeng LM NI NI NI
Petrus Steyn Nketoana LM NC NC C
Petrusburg Letsemeng LM NI NI NI
Philippolis Kopanong LM NC NC C
Phomolong Matjhabeng LM NC C C
Phutaditjhaba #1 Maluti A Phofung LM C C C
Phutaditjhaba #2 Maluti A Phofung LM NI NI NI
Reddersburg Kopanong LM NC NC C
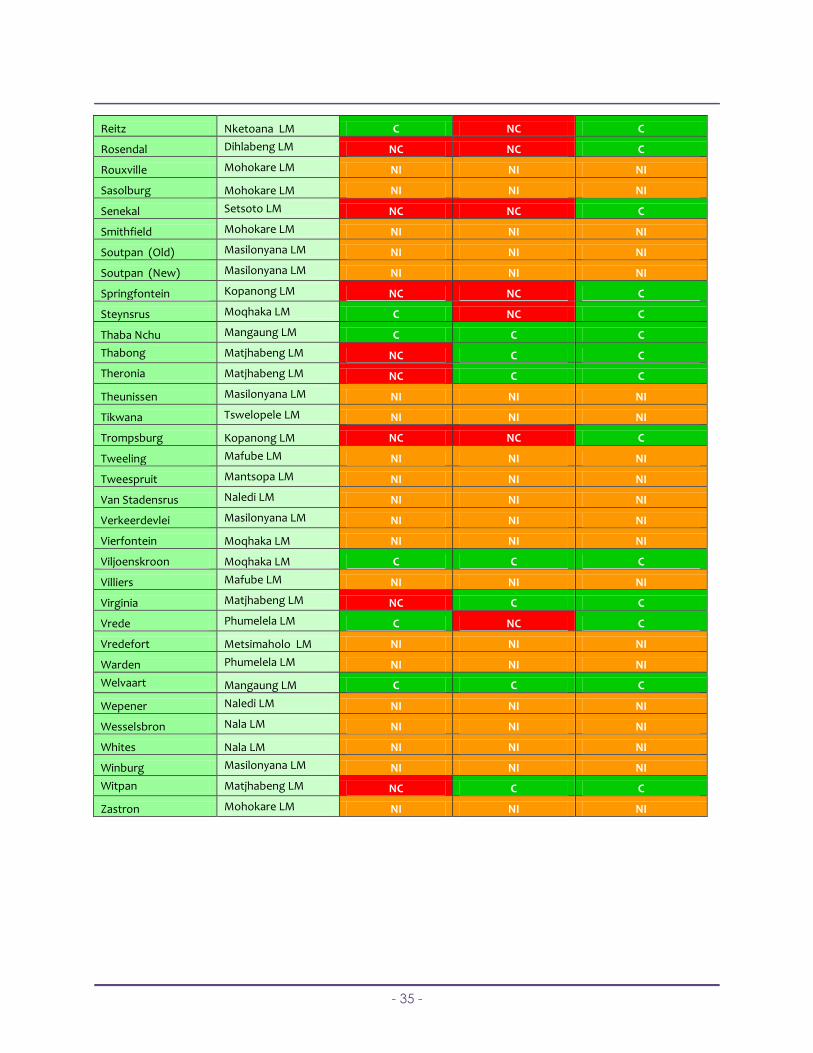
- 35 -
Reitz Nketoana LM C NC C
Rosendal Dihlabeng LM NC NC C
Rouxville Mohokare LM NI NI NI
Sasolburg Mohokare LM NI NI NI
Senekal Setsoto LM NC NC C
Smithfield Mohokare LM NI NI NI
Soutpan (Old) Masilonyana LM NI NI NI
Soutpan (New) Masilonyana LM NI NI NI
Springfontein Kopanong LM NC NC C
Steynsrus Moqhaka LM C NC C
Thaba Nchu Mangaung LM C C C
Thabong Matjhabeng LM NC C C
Theronia Matjhabeng LM NC C C
Theunissen Masilonyana LM NI NI NI
Tikwana Tswelopele LM NI NI NI
Trompsburg Kopanong LM NC NC C
Tweeling Mafube LM NI NI NI
Tweespruit Mantsopa LM NI NI NI
Van Stadensrus Naledi LM NI NI NI
Verkeerdevlei Masilonyana LM NI NI NI
Vierfontein Moqhaka LM NI NI NI
Viljoenskroon Moqhaka LM C C C
Villiers Mafube LM NI NI NI
Virginia Matjhabeng LM NC C C
Vrede Phumelela LM C NC C
Vredefort Metsimaholo LM NI NI NI
Warden Phumelela LM NI NI NI
Welvaart Mangaung LM C C C
Wepener Naledi LM NI NI NI
Wesselsbron Nala LM NI NI NI
Whites Nala LM NI NI NI
Winburg Masilonyana LM NI NI NI
Witpan Matjhabeng LM NC C C
Zastron Mohokare LM NI NI NI
- 36 -
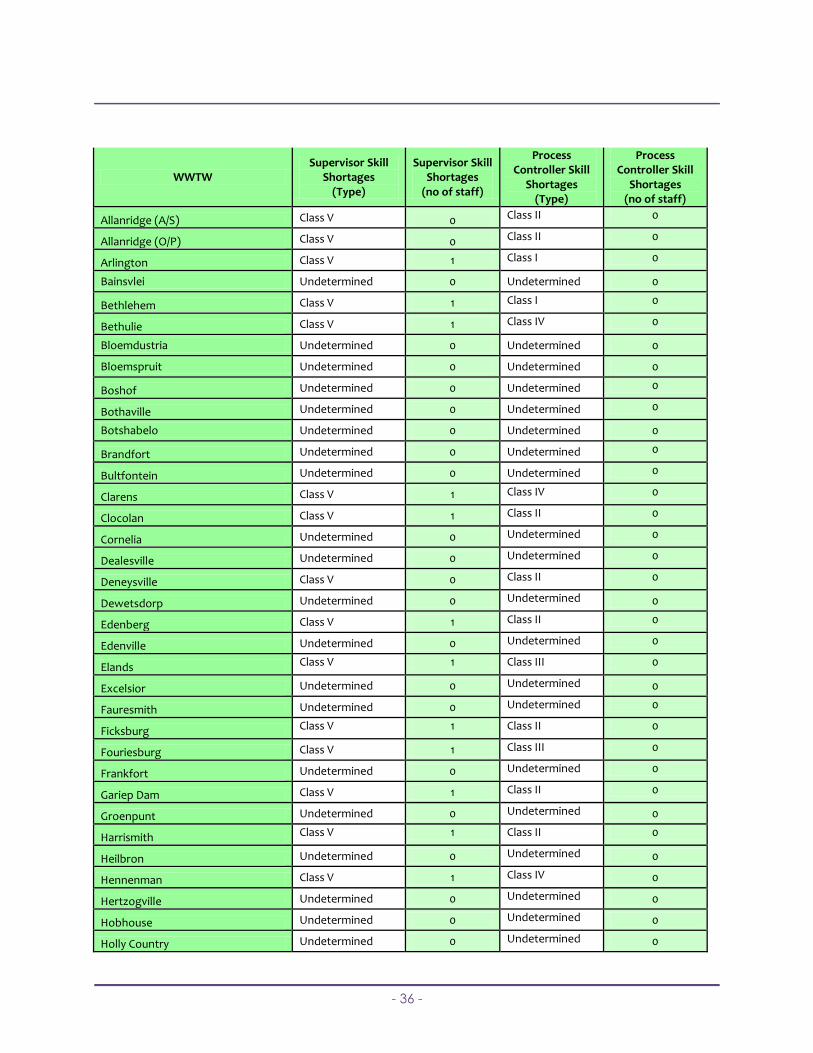
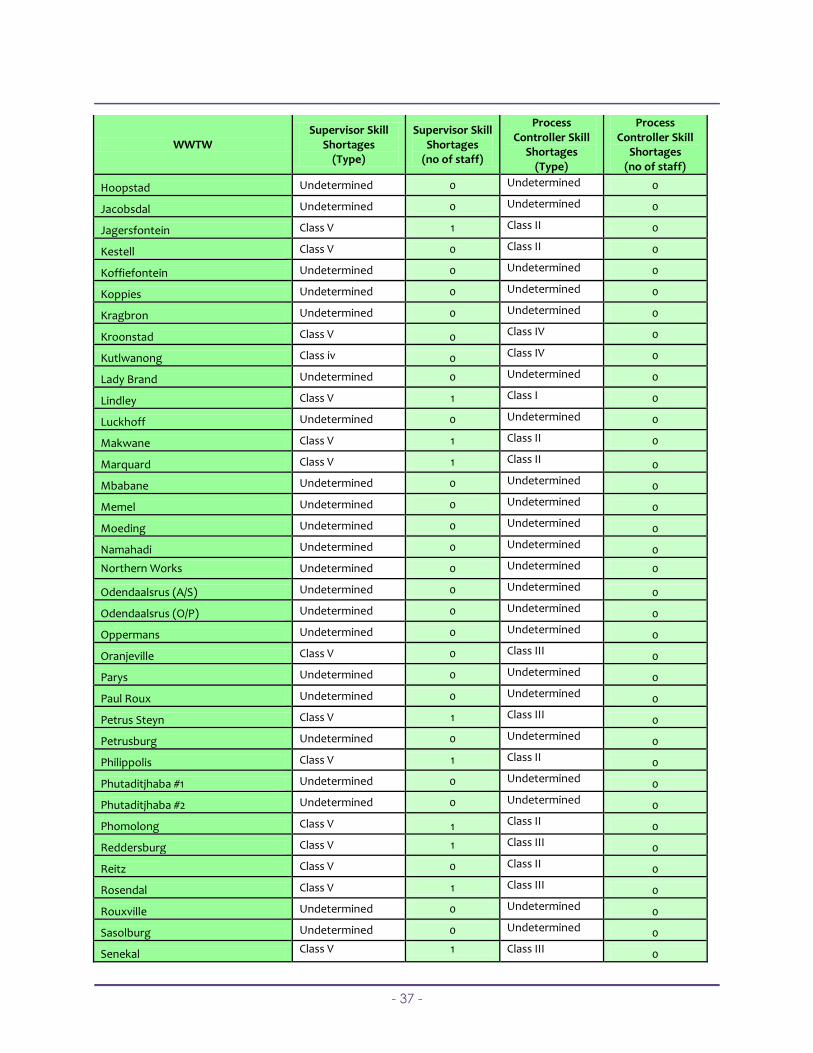
WWTW Supervisor Skill
Shortages (Type)
Supervisor Skill Shortages
(no of staff)
Process Controller Skill
Shortages (Type)
Process Controller Skill
Shortages (no of staff)
Allanridge (A/S) Class V 0 Class II 0
Allanridge (O/P) Class V 0 Class II 0
Arlington Class V 1 Class I 0
Bainsvlei Undetermined 0 Undetermined 0
Bethlehem Class V 1 Class I 0
Bethulie Class V 1 Class IV 0
Bloemdustria Undetermined 0 Undetermined 0
Bloemspruit Undetermined 0 Undetermined 0
Boshof Undetermined 0 Undetermined 0
Bothaville Undetermined 0 Undetermined 0
Botshabelo Undetermined 0 Undetermined 0
Brandfort Undetermined 0 Undetermined 0
Bultfontein Undetermined 0 Undetermined 0
Clarens Class V 1 Class IV 0
Clocolan Class V 1 Class II 0
Cornelia Undetermined 0 Undetermined 0
Dealesville Undetermined 0 Undetermined 0
Deneysville Class V 0 Class II 0
Dewetsdorp Undetermined 0 Undetermined 0
Edenberg Class V 1 Class II 0
Edenville Undetermined 0 Undetermined 0
Elands Class V 1 Class III 0
Excelsior Undetermined 0 Undetermined 0
Fauresmith Undetermined 0 Undetermined 0
Ficksburg Class V 1 Class II 0
Fouriesburg Class V 1 Class III 0
Frankfort Undetermined 0 Undetermined 0
Gariep Dam Class V 1 Class II 0
Groenpunt Undetermined 0 Undetermined 0
Harrismith Class V 1 Class II 0
Heilbron Undetermined 0 Undetermined 0
Hennenman Class V 1 Class IV 0
Hertzogville Undetermined 0 Undetermined 0
Hobhouse Undetermined 0 Undetermined 0
Holly Country Undetermined 0 Undetermined 0
- 37 -
WWTW Supervisor Skill
Shortages (Type)
Supervisor Skill Shortages
(no of staff)
Process Controller Skill
Shortages (Type)
Process Controller Skill
Shortages (no of staff)
Hoopstad Undetermined 0 Undetermined 0
Jacobsdal Undetermined 0 Undetermined 0
Jagersfontein Class V 1 Class II 0
Kestell Class V 0 Class II 0
Koffiefontein Undetermined 0 Undetermined 0
Koppies Undetermined 0 Undetermined 0
Kragbron Undetermined 0 Undetermined 0
Kroonstad Class V 0 Class IV 0
Kutlwanong Class iv 0 Class IV 0
Lady Brand Undetermined 0 Undetermined 0
Lindley Class V 1 Class I 0
Luckhoff Undetermined 0 Undetermined 0
Makwane Class V 1 Class II 0
Marquard Class V 1 Class II 0
Mbabane Undetermined 0 Undetermined 0
Memel Undetermined 0 Undetermined 0
Moeding Undetermined 0 Undetermined 0
Namahadi Undetermined 0 Undetermined 0
Northern Works Undetermined 0 Undetermined 0
Odendaalsrus (A/S) Undetermined 0 Undetermined 0
Odendaalsrus (O/P) Undetermined 0 Undetermined 0
Oppermans Undetermined 0 Undetermined 0
Oranjeville Class V 0 Class III 0
Parys Undetermined 0 Undetermined 0
Paul Roux Undetermined 0 Undetermined 0
Petrus Steyn Class V 1 Class III 0
Petrusburg Undetermined 0 Undetermined 0
Philippolis Class V 1 Class II 0
Phutaditjhaba #1 Undetermined 0 Undetermined 0
Phutaditjhaba #2 Undetermined 0 Undetermined 0
Phomolong Class V 1 Class II 0
Reddersburg Class V 1 Class III 0
Reitz Class V 0 Class II 0
Rosendal Class V 1 Class III 0
Rouxville Undetermined 0 Undetermined 0
Sasolburg Undetermined 0 Undetermined 0
Senekal Class V 1 Class III 0
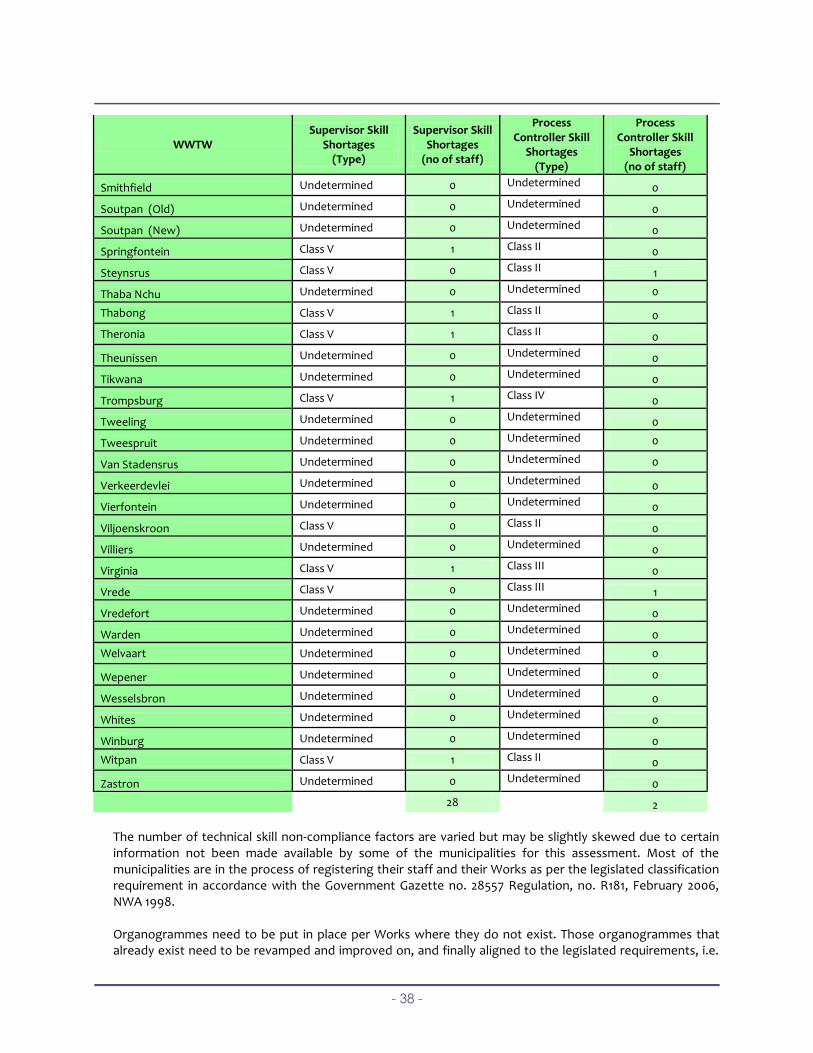
- 38 -
WWTW Supervisor Skill
Shortages (Type)
Supervisor Skill Shortages
(no of staff)
Process Controller Skill
Shortages (Type)
Process Controller Skill
Shortages (no of staff)
Smithfield Undetermined 0 Undetermined 0
Soutpan (Old) Undetermined 0 Undetermined 0
Soutpan (New) Undetermined 0 Undetermined 0
Springfontein Class V 1 Class II 0
Steynsrus Class V 0 Class II 1
Thaba Nchu Undetermined 0 Undetermined 0
Thabong Class V 1 Class II 0
Theronia Class V 1 Class II 0
Theunissen Undetermined 0 Undetermined 0
Tikwana Undetermined 0 Undetermined 0
Trompsburg Class V 1 Class IV 0
Tweeling Undetermined 0 Undetermined 0
Tweespruit Undetermined 0 Undetermined 0
Van Stadensrus Undetermined 0 Undetermined 0
Verkeerdevlei Undetermined 0 Undetermined 0
Vierfontein Undetermined 0 Undetermined 0
Viljoenskroon Class V 0 Class II 0
Villiers Undetermined 0 Undetermined 0
Virginia Class V 1 Class III 0
Vrede Class V 0 Class III 1
Vredefort Undetermined 0 Undetermined 0
Warden Undetermined 0 Undetermined 0
Welvaart Undetermined 0 Undetermined 0
Wepener Undetermined 0 Undetermined 0
Wesselsbron Undetermined 0 Undetermined 0
Whites Undetermined 0 Undetermined 0
Winburg Undetermined 0 Undetermined 0
Witpan Class V 1 Class II 0
Zastron Undetermined 0 Undetermined 0
28 2
The number of technical skill non-compliance factors are varied but may be slightly skewed due to certain information not been made available by some of the municipalities for this assessment. Most of the municipalities are in the process of registering their staff and their Works as per the legislated classification requirement in accordance with the Government Gazette no. 28557 Regulation, no. R181, February 2006, NWA 1998. Organogrammes need to be put in place per Works where they do not exist. Those organogrammes that already exist need to be revamped and improved on, and finally aligned to the legislated requirements, i.e.
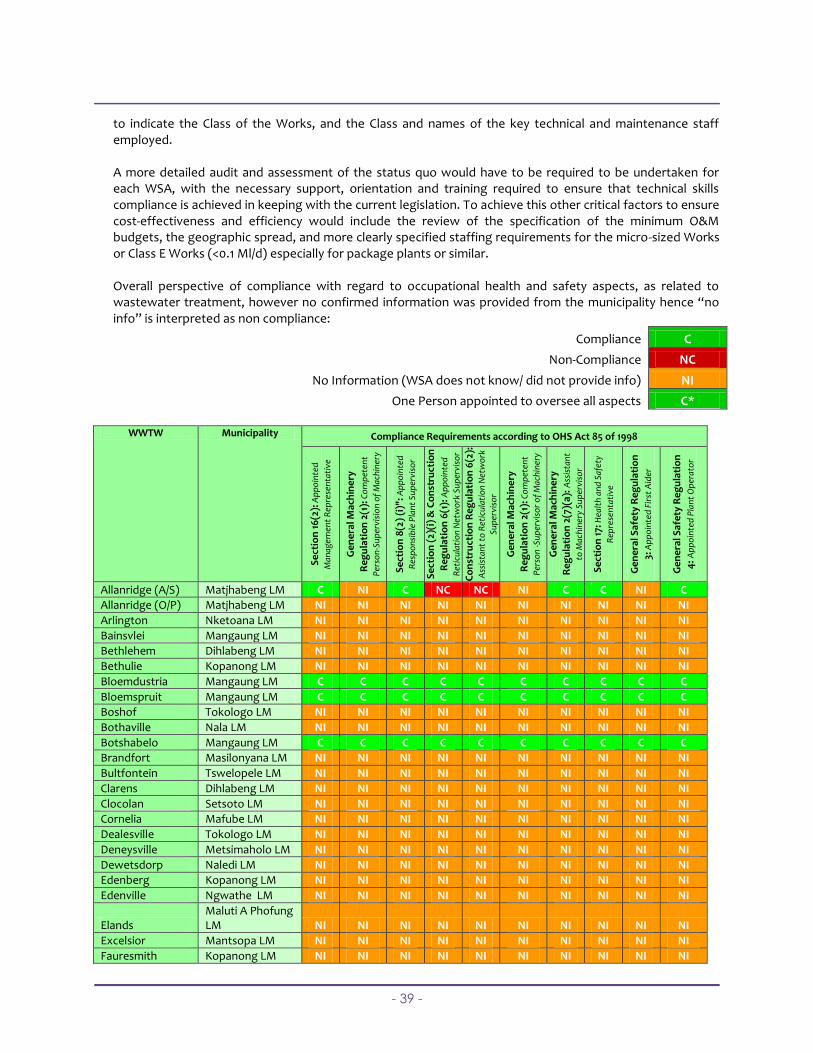
- 39 -
to indicate the Class of the Works, and the Class and names of the key technical and maintenance staff employed. A more detailed audit and assessment of the status quo would have to be required to be undertaken for each WSA, with the necessary support, orientation and training required to ensure that technical skills compliance is achieved in keeping with the current legislation. To achieve this other critical factors to ensure cost-effectiveness and efficiency would include the review of the specification of the minimum O&M budgets, the geographic spread, and more clearly specified staffing requirements for the micro-sized Works or Class E Works (<0.1 Ml/d) especially for package plants or similar.
Overall perspective of compliance with regard to occupational health and safety aspects, as related to wastewater treatment, however no confirmed information was provided from the municipality hence “no info” is interpreted as non compliance:
Compliance C
Non-Compliance NC
No Information (WSA does not know/ did not provide info) NI
One Person appointed to oversee all aspects C*
WWTW Municipality Compliance Requirements according to OHS Act 85 of 1998
Se
ctio
n 1
6(2
): A
pp
oin
ted
Man
agem
ent
Rep
rese
nta
tive
Ge
ne
ral M
ach
ine
ry
Re
gu
lati
on
2(1
): C
om
pet
ent
Per
son
-Su
per
visi
on
of
Mac
hin
ery
Se
ctio
n 8
(2)
(i)"
: Ap
po
inte
d
Res
po
nsi
ble
Pla
nt
Sup
ervi
sor
Se
ctio
n (
2)(i
) &
Co
nst
ruct
ion
Re
gu
lati
on
6(1
): A
pp
oin
ted
Ret
icu
lati
on
Net
wo
rk S
up
ervi
sor
Co
nst
ruct
ion
Re
gu
lati
on
6(2
):
Ass
ista
nt
to R
etic
ula
tio
n N
etw
ork
Sup
ervi
sor
Ge
ne
ral M
ach
ine
ry
Re
gu
lati
on
2(1
): C
om
pet
ent
Per
son
-Su
per
viso
r o
f M
ach
iner
y
Ge
ne
ral M
ach
ine
ry
Re
gu
lati
on
2(7
)(a)
: Ass
ista
nt
to M
ach
iner
y Su
per
viso
r
Se
ctio
n 1
7: H
ealt
h a
nd
Saf
ety
Rep
rese
nta
tive
Ge
ne
ral S
afe
ty R
eg
ula
tio
n
3: A
pp
oin
ted
Fir
st A
ider
Ge
ne
ral S
afe
ty R
eg
ula
tio
n
4: A
pp
oin
ted
Pla
nt
Op
erat
or
Allanridge (A/S) Matjhabeng LM C NI C NC NC NI C C NI C
Allanridge (O/P) Matjhabeng LM NI NI NI NI NI NI NI NI NI NI
Arlington Nketoana LM NI NI NI NI NI NI NI NI NI NI
Bainsvlei Mangaung LM NI NI NI NI NI NI NI NI NI NI
Bethlehem Dihlabeng LM NI NI NI NI NI NI NI NI NI NI
Bethulie Kopanong LM NI NI NI NI NI NI NI NI NI NI
Bloemdustria Mangaung LM C C C C C C C C C C
Bloemspruit Mangaung LM C C C C C C C C C C
Boshof Tokologo LM NI NI NI NI NI NI NI NI NI NI
Bothaville Nala LM NI NI NI NI NI NI NI NI NI NI
Botshabelo Mangaung LM C C C C C C C C C C
Brandfort Masilonyana LM NI NI NI NI NI NI NI NI NI NI
Bultfontein Tswelopele LM NI NI NI NI NI NI NI NI NI NI
Clarens Dihlabeng LM NI NI NI NI NI NI NI NI NI NI
Clocolan Setsoto LM NI NI NI NI NI NI NI NI NI NI
Cornelia Mafube LM NI NI NI NI NI NI NI NI NI NI
Dealesville Tokologo LM NI NI NI NI NI NI NI NI NI NI
Deneysville Metsimaholo LM NI NI NI NI NI NI NI NI NI NI
Dewetsdorp Naledi LM NI NI NI NI NI NI NI NI NI NI
Edenberg Kopanong LM NI NI NI NI NI NI NI NI NI NI
Edenville Ngwathe LM NI NI NI NI NI NI NI NI NI NI
Elands Maluti A Phofung LM NI NI NI NI NI NI NI NI NI NI
Excelsior Mantsopa LM NI NI NI NI NI NI NI NI NI NI
Fauresmith Kopanong LM NI NI NI NI NI NI NI NI NI NI
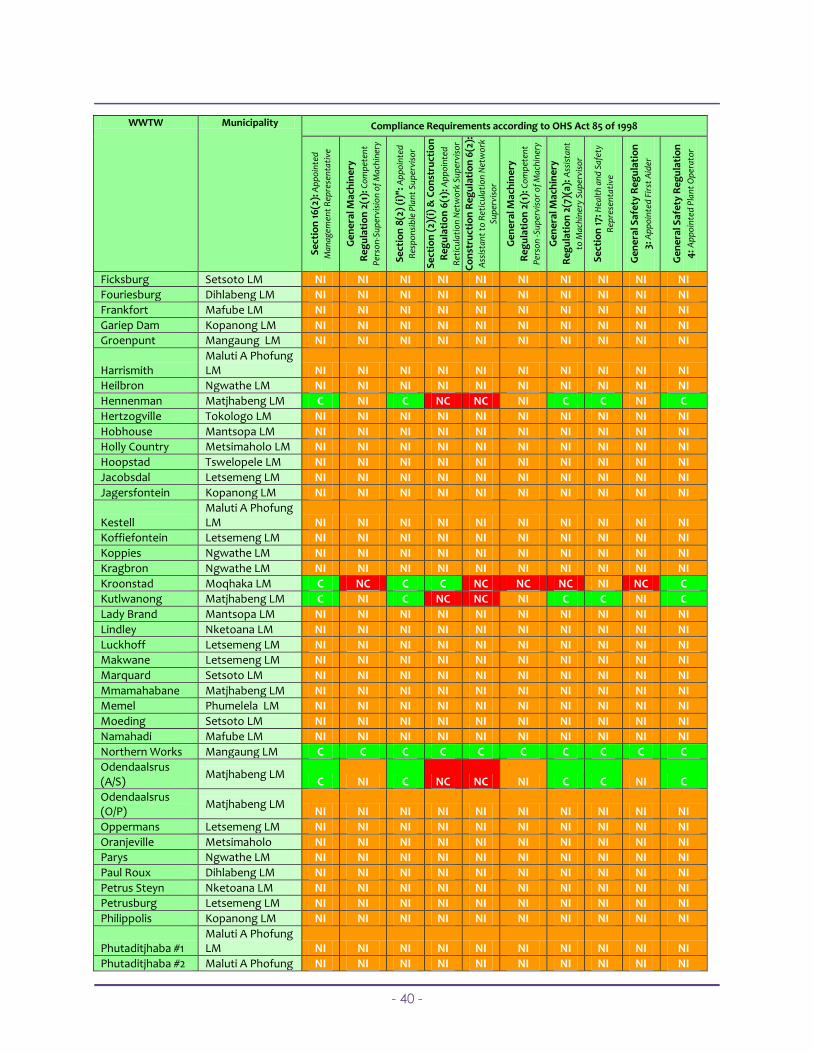
- 40 -
WWTW Municipality Compliance Requirements according to OHS Act 85 of 1998
Se
ctio
n 1
6(2
): A
pp
oin
ted
Man
agem
ent
Rep
rese
nta
tive
Ge
ne
ral M
ach
ine
ry
Re
gu
lati
on
2(1
): C
om
pet
ent
Per
son
-Su
per
visi
on
of
Mac
hin
ery
Se
ctio
n 8
(2)
(i)"
: Ap
po
inte
d
Res
po
nsi
ble
Pla
nt
Sup
ervi
sor
Se
ctio
n (
2)(i
) &
Co
nst
ruct
ion
Re
gu
lati
on
6(1
): A
pp
oin
ted
Ret
icu
lati
on
Net
wo
rk S
up
ervi
sor
Co
nst
ruct
ion
Re
gu
lati
on
6(2
):
Ass
ista
nt
to R
etic
ula
tio
n N
etw
ork
Sup
ervi
sor
Ge
ne
ral M
ach
ine
ry
Re
gu
lati
on
2(1
): C
om
pet
ent
Per
son
-Su
per
viso
r o
f M
ach
iner
y
Ge
ne
ral M
ach
ine
ry
Re
gu
lati
on
2(7
)(a)
: Ass
ista
nt
to M
ach
iner
y Su
per
viso
r
Se
ctio
n 1
7: H
ealt
h a
nd
Saf
ety
Rep
rese
nta
tive
Ge
ne
ral S
afe
ty R
eg
ula
tio
n
3: A
pp
oin
ted
Fir
st A
ider
Ge
ne
ral S
afe
ty R
eg
ula
tio
n
4: A
pp
oin
ted
Pla
nt
Op
erat
or
Ficksburg Setsoto LM NI NI NI NI NI NI NI NI NI NI
Fouriesburg Dihlabeng LM NI NI NI NI NI NI NI NI NI NI
Frankfort Mafube LM NI NI NI NI NI NI NI NI NI NI
Gariep Dam Kopanong LM NI NI NI NI NI NI NI NI NI NI
Groenpunt Mangaung LM NI NI NI NI NI NI NI NI NI NI
Harrismith Maluti A Phofung LM NI NI NI NI NI NI NI NI NI NI
Heilbron Ngwathe LM NI NI NI NI NI NI NI NI NI NI
Hennenman Matjhabeng LM C NI C NC NC NI C C NI C
Hertzogville Tokologo LM NI NI NI NI NI NI NI NI NI NI
Hobhouse Mantsopa LM NI NI NI NI NI NI NI NI NI NI
Holly Country Metsimaholo LM NI NI NI NI NI NI NI NI NI NI
Hoopstad Tswelopele LM NI NI NI NI NI NI NI NI NI NI
Jacobsdal Letsemeng LM NI NI NI NI NI NI NI NI NI NI
Jagersfontein Kopanong LM NI NI NI NI NI NI NI NI NI NI
Kestell Maluti A Phofung LM NI NI NI NI NI NI NI NI NI NI
Koffiefontein Letsemeng LM NI NI NI NI NI NI NI NI NI NI
Koppies Ngwathe LM NI NI NI NI NI NI NI NI NI NI
Kragbron Ngwathe LM NI NI NI NI NI NI NI NI NI NI
Kroonstad Moqhaka LM C NC C C NC NC NC NI NC C
Kutlwanong Matjhabeng LM C NI C NC NC NI C C NI C
Lady Brand Mantsopa LM NI NI NI NI NI NI NI NI NI NI
Lindley Nketoana LM NI NI NI NI NI NI NI NI NI NI
Luckhoff Letsemeng LM NI NI NI NI NI NI NI NI NI NI
Makwane Letsemeng LM NI NI NI NI NI NI NI NI NI NI
Marquard Setsoto LM NI NI NI NI NI NI NI NI NI NI
Mmamahabane Matjhabeng LM NI NI NI NI NI NI NI NI NI NI
Memel Phumelela LM NI NI NI NI NI NI NI NI NI NI
Moeding Setsoto LM NI NI NI NI NI NI NI NI NI NI
Namahadi Mafube LM NI NI NI NI NI NI NI NI NI NI
Northern Works Mangaung LM C C C C C C C C C C
Odendaalsrus (A/S)
Matjhabeng LM C NI C NC NC NI C C NI C
Odendaalsrus (O/P)
Matjhabeng LM NI NI NI NI NI NI NI NI NI NI
Oppermans Letsemeng LM NI NI NI NI NI NI NI NI NI NI
Oranjeville Metsimaholo NI NI NI NI NI NI NI NI NI NI
Parys Ngwathe LM NI NI NI NI NI NI NI NI NI NI
Paul Roux Dihlabeng LM NI NI NI NI NI NI NI NI NI NI
Petrus Steyn Nketoana LM NI NI NI NI NI NI NI NI NI NI
Petrusburg Letsemeng LM NI NI NI NI NI NI NI NI NI NI
Philippolis Kopanong LM NI NI NI NI NI NI NI NI NI NI
Phutaditjhaba #1 Maluti A Phofung LM NI NI NI NI NI NI NI NI NI NI
Phutaditjhaba #2 Maluti A Phofung NI NI NI NI NI NI NI NI NI NI
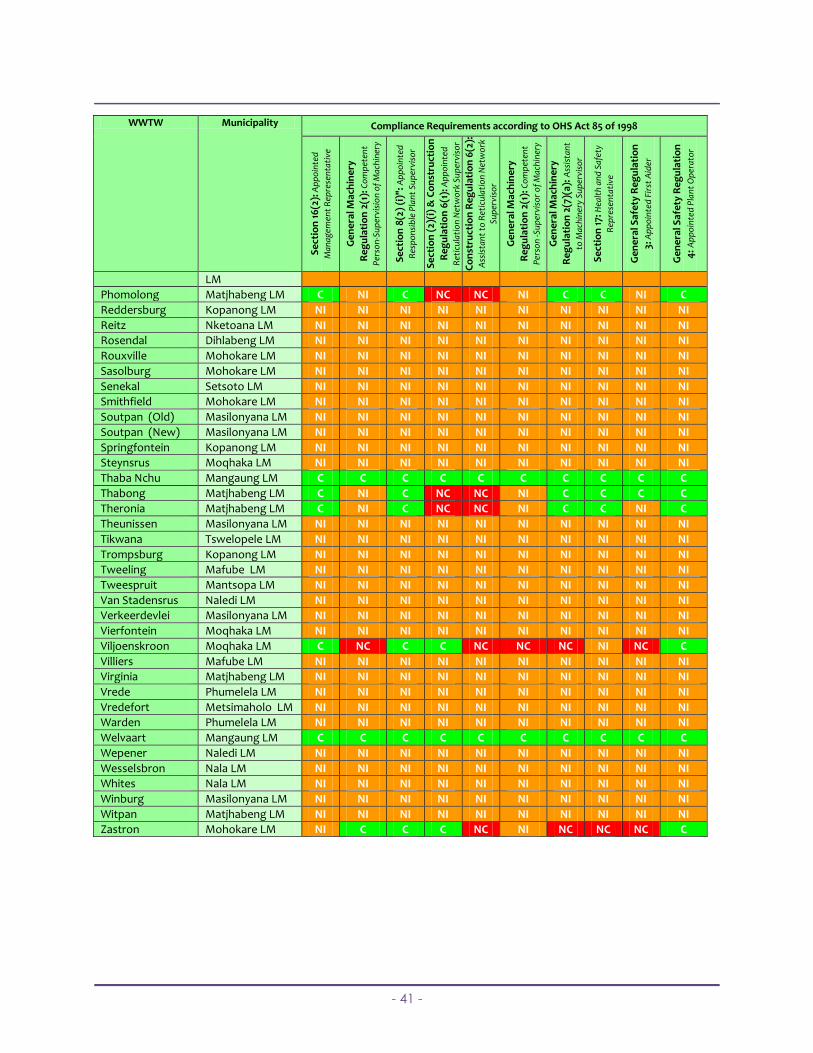
- 41 -
WWTW Municipality Compliance Requirements according to OHS Act 85 of 1998
Se
ctio
n 1
6(2
): A
pp
oin
ted
Man
agem
ent
Rep
rese
nta
tive
Ge
ne
ral M
ach
ine
ry
Re
gu
lati
on
2(1
): C
om
pet
ent
Per
son
-Su
per
visi
on
of
Mac
hin
ery
Se
ctio
n 8
(2)
(i)"
: Ap
po
inte
d
Res
po
nsi
ble
Pla
nt
Sup
ervi
sor
Se
ctio
n (
2)(i
) &
Co
nst
ruct
ion
Re
gu
lati
on
6(1
): A
pp
oin
ted
Ret
icu
lati
on
Net
wo
rk S
up
ervi
sor
Co
nst
ruct
ion
Re
gu
lati
on
6(2
):
Ass
ista
nt
to R
etic
ula
tio
n N
etw
ork
Sup
ervi
sor
Ge
ne
ral M
ach
ine
ry
Re
gu
lati
on
2(1
): C
om
pet
ent
Per
son
-Su
per
viso
r o
f M
ach
iner
y
Ge
ne
ral M
ach
ine
ry
Re
gu
lati
on
2(7
)(a)
: Ass
ista
nt
to M
ach
iner
y Su
per
viso
r
Se
ctio
n 1
7: H
ealt
h a
nd
Saf
ety
Rep
rese
nta
tive
Ge
ne
ral S
afe
ty R
eg
ula
tio
n
3: A
pp
oin
ted
Fir
st A
ider
Ge
ne
ral S
afe
ty R
eg
ula
tio
n
4: A
pp
oin
ted
Pla
nt
Op
erat
or
LM
Phomolong Matjhabeng LM C NI C NC NC NI C C NI C
Reddersburg Kopanong LM NI NI NI NI NI NI NI NI NI NI
Reitz Nketoana LM NI NI NI NI NI NI NI NI NI NI
Rosendal Dihlabeng LM NI NI NI NI NI NI NI NI NI NI
Rouxville Mohokare LM NI NI NI NI NI NI NI NI NI NI
Sasolburg Mohokare LM NI NI NI NI NI NI NI NI NI NI
Senekal Setsoto LM NI NI NI NI NI NI NI NI NI NI
Smithfield Mohokare LM NI NI NI NI NI NI NI NI NI NI
Soutpan (Old) Masilonyana LM NI NI NI NI NI NI NI NI NI NI
Soutpan (New) Masilonyana LM NI NI NI NI NI NI NI NI NI NI
Springfontein Kopanong LM NI NI NI NI NI NI NI NI NI NI
Steynsrus Moqhaka LM NI NI NI NI NI NI NI NI NI NI
Thaba Nchu Mangaung LM C C C C C C C C C C
Thabong Matjhabeng LM C NI C NC NC NI C C C C
Theronia Matjhabeng LM C NI C NC NC NI C C NI C
Theunissen Masilonyana LM NI NI NI NI NI NI NI NI NI NI
Tikwana Tswelopele LM NI NI NI NI NI NI NI NI NI NI
Trompsburg Kopanong LM NI NI NI NI NI NI NI NI NI NI
Tweeling Mafube LM NI NI NI NI NI NI NI NI NI NI
Tweespruit Mantsopa LM NI NI NI NI NI NI NI NI NI NI
Van Stadensrus Naledi LM NI NI NI NI NI NI NI NI NI NI
Verkeerdevlei Masilonyana LM NI NI NI NI NI NI NI NI NI NI
Vierfontein Moqhaka LM NI NI NI NI NI NI NI NI NI NI
Viljoenskroon Moqhaka LM C NC C C NC NC NC NI NC C
Villiers Mafube LM NI NI NI NI NI NI NI NI NI NI
Virginia Matjhabeng LM NI NI NI NI NI NI NI NI NI NI
Vrede Phumelela LM NI NI NI NI NI NI NI NI NI NI
Vredefort Metsimaholo LM NI NI NI NI NI NI NI NI NI NI
Warden Phumelela LM NI NI NI NI NI NI NI NI NI NI
Welvaart Mangaung LM C C C C C C C C C C
Wepener Naledi LM NI NI NI NI NI NI NI NI NI NI
Wesselsbron Nala LM NI NI NI NI NI NI NI NI NI NI
Whites Nala LM NI NI NI NI NI NI NI NI NI NI
Winburg Masilonyana LM NI NI NI NI NI NI NI NI NI NI
Witpan Matjhabeng LM NI NI NI NI NI NI NI NI NI NI
Zastron Mohokare LM NI C C C NC NI NC NC NC C
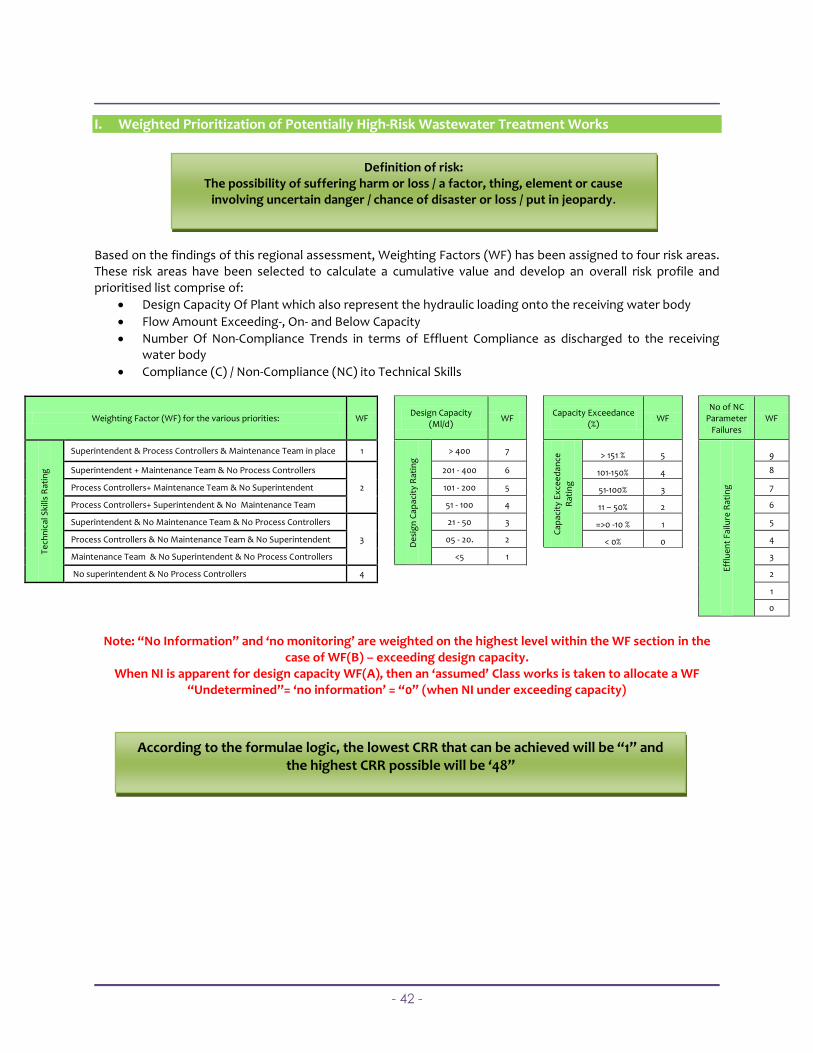
- 42 -
I. Weighted Prioritization of Potentially High-Risk Wastewater Treatment Works Based on the findings of this regional assessment, Weighting Factors (WF) has been assigned to four risk areas. These risk areas have been selected to calculate a cumulative value and develop an overall risk profile and prioritised list comprise of:
Design Capacity Of Plant which also represent the hydraulic loading onto the receiving water body
Flow Amount Exceeding-, On- and Below Capacity
Number Of Non-Compliance Trends in terms of Effluent Compliance as discharged to the receiving water body
Compliance (C) / Non-Compliance (NC) ito Technical Skills
Weighting Factor (WF) for the various priorities: WF
Design Capacity (Ml/d)
WF
Capacity Exceedance (%)
WF
No of NC Parameter
Failures WF
Te
chn
ical
Ski
lls R
atin
g
Superintendent & Process Controllers & Maintenance Team in place 1
De
sig
n C
apac
ity
Rat
ing
> 400 7
Cap
acit
y E
xce
ed
an
ce
Rat
ing
> 151 % 5
Eff
lue
nt
Failu
re R
atin
g
9
Superintendent + Maintenance Team & No Process Controllers
2
201 - 400 6 101-150% 4 8
Process Controllers+ Maintenance Team & No Superintendent 101 - 200 5 51-100% 3 7
Process Controllers+ Superintendent & No Maintenance Team 51 - 100 4 11 – 50% 2 6
Superintendent & No Maintenance Team & No Process Controllers
3
21 - 50 3 =>0 -10 % 1 5
Process Controllers & No Maintenance Team & No Superintendent 05 - 20. 2 < 0% 0 4
Maintenance Team & No Superintendent & No Process Controllers <5 1
3
No superintendent & No Process Controllers 4
2
1
0
Note: “No Information” and ‘no monitoring’ are weighted on the highest level within the WF section in the
case of WF(B) – exceeding design capacity. When NI is apparent for design capacity WF(A), then an ‘assumed’ Class works is taken to allocate a WF
“Undetermined”= ‘no information’ = “0” (when NI under exceeding capacity) According to the formulae logic, the lowest CRR that can be achieved will be “1” and
the highest CRR possible will be ‘48”
Definition of risk: The possibility of suffering harm or loss / a factor, thing, element or cause
involving uncertain danger / chance of disaster or loss / put in jeopardy.
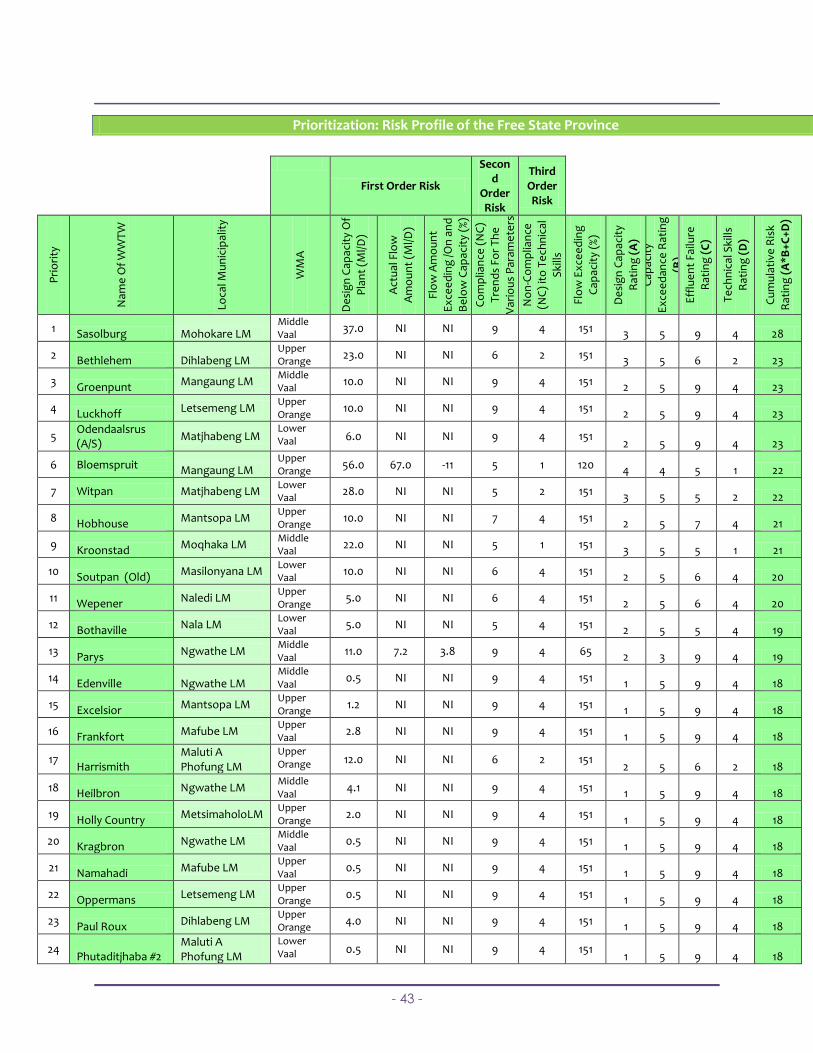
- 43 -
Prioritization: Risk Profile of the Free State Province
First Order Risk
Second
Order Risk
Third Order Risk
Pri
ori
ty
Nam
e O
f W
WT
W
Loca
l Mu
nic
ipal
ity
WM
A
De
sig
n C
apac
ity
Of
Pla
nt
(Ml/D
)
Act
ual
Flo
w
Am
ou
nt
(Ml/D
)
Flo
w A
mo
un
t
Ex
cee
din
g /O
n a
nd
Be
low
Cap
acit
y (%
) N
um
be
r O
f N
on
-
Co
mp
lian
ce (
NC
)
Tre
nd
s Fo
r T
he
Var
iou
s P
aram
ete
rs
(A)
No
n-C
om
plia
nce
(N
C)
ito
Te
chn
ical
Ski
lls
Flo
w E
xce
ed
ing
Cap
acit
y (%
)
De
sig
n C
apac
ity
Rat
ing
(A
) C
apac
ity
Ex
cee
dan
ce R
atin
g
(B)
Eff
lue
nt
Failu
re
Rat
ing
(C
)
Te
chn
ical
Ski
lls
Rat
ing
(D
)
Cu
mu
lati
ve R
isk
Rat
ing
(A
*B
+C
+D
)
1 Sasolburg Mohokare LM Middle Vaal
37.0 NI NI 9 4 151 3 5 9 4 28
2 Bethlehem Dihlabeng LM Upper Orange
23.0 NI NI 6 2 151 3 5 6 2 23
3 Groenpunt Mangaung LM Middle Vaal
10.0 NI NI 9 4 151 2 5 9 4 23
4 Luckhoff Letsemeng LM Upper Orange
10.0 NI NI 9 4 151 2 5 9 4 23
5 Odendaalsrus (A/S)
Matjhabeng LM Lower Vaal 6.0 NI NI 9 4 151
2 5 9 4 23
6 Bloemspruit Mangaung LM Upper Orange
56.0 67.0 -11 5 1 120 4 4 5 1 22
7 Witpan Matjhabeng LM Lower Vaal
28.0 NI NI 5 2 151 3 5 5 2 22
8 Hobhouse Mantsopa LM Upper Orange
10.0 NI NI 7 4 151 2 5 7 4 21
9 Kroonstad Moqhaka LM Middle Vaal
22.0 NI NI 5 1 151 3 5 5 1 21
10 Soutpan (Old) Masilonyana LM Lower Vaal
10.0 NI NI 6 4 151 2 5 6 4 20
11 Wepener Naledi LM Upper Orange
5.0 NI NI 6 4 151 2 5 6 4 20
12 Bothaville Nala LM Lower Vaal
5.0 NI NI 5 4 151 2 5 5 4 19
13 Parys Ngwathe LM Middle Vaal
11.0 7.2 3.8 9 4 65 2 3 9 4 19
14 Edenville Ngwathe LM Middle Vaal
0.5 NI NI 9 4 151 1 5 9 4 18
15 Excelsior Mantsopa LM Upper Orange
1.2 NI NI 9 4 151 1 5 9 4 18
16 Frankfort Mafube LM Upper Vaal
2.8 NI NI 9 4 151 1 5 9 4 18
17 Harrismith
Maluti A Phofung LM
Upper Orange 12.0 NI NI 6 2 151
2 5 6 2 18
18 Heilbron Ngwathe LM Middle Vaal
4.1 NI NI 9 4 151 1 5 9 4 18
19 Holly Country MetsimaholoLM Upper Orange
2.0 NI NI 9 4 151 1 5 9 4 18
20 Kragbron Ngwathe LM Middle Vaal
0.5 NI NI 9 4 151 1 5 9 4 18
21 Namahadi Mafube LM Upper Vaal
0.5 NI NI 9 4 151 1 5 9 4 18
22 Oppermans Letsemeng LM Upper Orange
0.5 NI NI 9 4 151 1 5 9 4 18
23 Paul Roux Dihlabeng LM Upper Orange
4.0 NI NI 9 4 151 1 5 9 4 18
24 Phutaditjhaba #2
Maluti A Phofung LM
Lower Vaal 0.5 NI NI 9 4 151
1 5 9 4 18
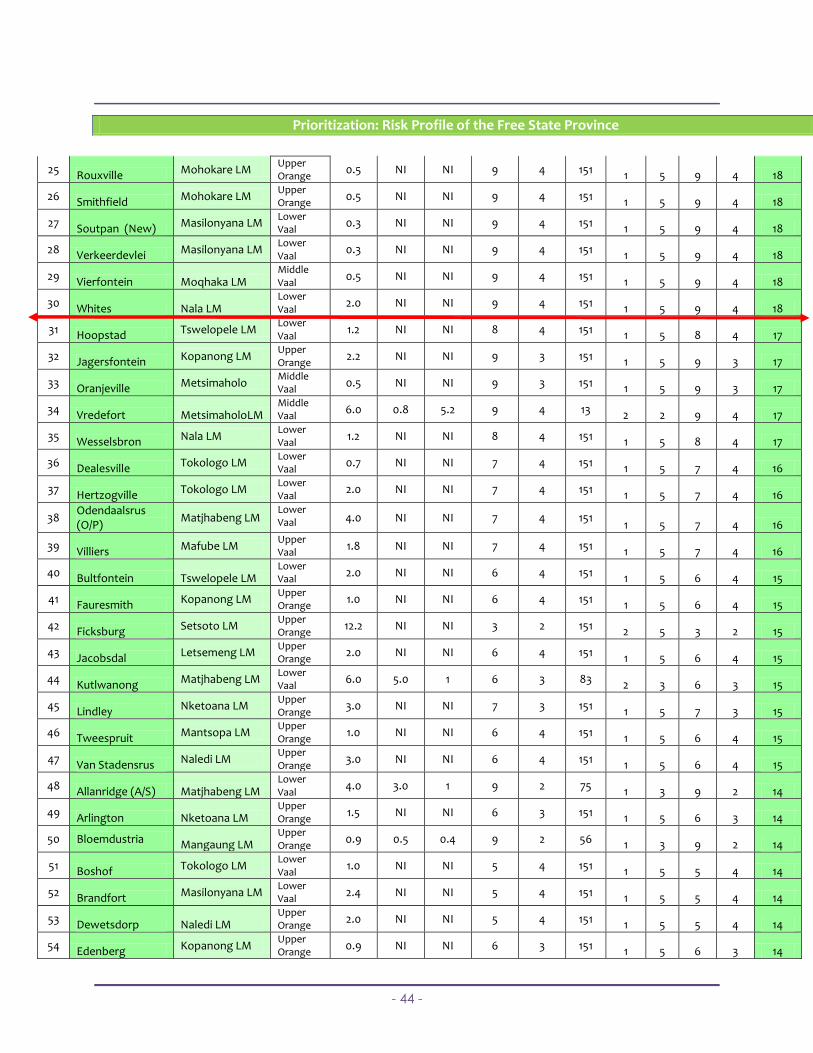
- 44 -
Prioritization: Risk Profile of the Free State Province
25 Rouxville Mohokare LM Upper Orange
0.5 NI NI 9 4 151 1 5 9 4 18
26 Smithfield Mohokare LM Upper Orange
0.5 NI NI 9 4 151 1 5 9 4 18
27 Soutpan (New) Masilonyana LM Lower Vaal
0.3 NI NI 9 4 151 1 5 9 4 18
28 Verkeerdevlei Masilonyana LM Lower Vaal
0.3 NI NI 9 4 151 1 5 9 4 18
29 Vierfontein Moqhaka LM Middle Vaal
0.5 NI NI 9 4 151 1 5 9 4 18
30 Whites Nala LM Lower Vaal
2.0 NI NI 9 4 151 1 5 9 4 18
31 Hoopstad Tswelopele LM Lower Vaal
1.2 NI NI 8 4 151 1 5 8 4 17
32 Jagersfontein Kopanong LM Upper Orange
2.2 NI NI 9 3 151 1 5 9 3 17
33 Oranjeville Metsimaholo Middle Vaal
0.5 NI NI 9 3 151 1 5 9 3 17
34 Vredefort MetsimaholoLM Middle Vaal
6.0 0.8 5.2 9 4 13 2 2 9 4 17
35 Wesselsbron Nala LM Lower Vaal
1.2 NI NI 8 4 151 1 5 8 4 17
36 Dealesville Tokologo LM Lower Vaal
0.7 NI NI 7 4 151 1 5 7 4 16
37 Hertzogville Tokologo LM Lower Vaal
2.0 NI NI 7 4 151 1 5 7 4 16
38 Odendaalsrus (O/P)
Matjhabeng LM Lower Vaal 4.0 NI NI 7 4 151
1 5 7 4 16
39 Villiers Mafube LM Upper Vaal
1.8 NI NI 7 4 151 1 5 7 4 16
40 Bultfontein Tswelopele LM Lower Vaal
2.0 NI NI 6 4 151 1 5 6 4 15
41 Fauresmith Kopanong LM Upper Orange
1.0 NI NI 6 4 151 1 5 6 4 15
42 Ficksburg Setsoto LM Upper Orange
12.2 NI NI 3 2 151 2 5 3 2 15
43 Jacobsdal Letsemeng LM Upper Orange
2.0 NI NI 6 4 151 1 5 6 4 15
44 Kutlwanong Matjhabeng LM Lower Vaal
6.0 5.0 1 6 3 83 2 3 6 3 15
45 Lindley Nketoana LM Upper Orange
3.0 NI NI 7 3 151 1 5 7 3 15
46 Tweespruit Mantsopa LM Upper Orange
1.0 NI NI 6 4 151 1 5 6 4 15
47 Van Stadensrus Naledi LM Upper Orange
3.0 NI NI 6 4 151 1 5 6 4 15
48 Allanridge (A/S) Matjhabeng LM Lower Vaal
4.0 3.0 1 9 2 75 1 3 9 2 14
49 Arlington Nketoana LM Upper Orange
1.5 NI NI 6 3 151 1 5 6 3 14
50 Bloemdustria Mangaung LM Upper Orange
0.9 0.5 0.4 9 2 56 1 3 9 2 14
51 Boshof Tokologo LM Lower Vaal
1.0 NI NI 5 4 151 1 5 5 4 14
52 Brandfort Masilonyana LM Lower Vaal
2.4 NI NI 5 4 151 1 5 5 4 14
53 Dewetsdorp Naledi LM Upper Orange
2.0 NI NI 5 4 151 1 5 5 4 14
54 Edenberg Kopanong LM Upper Orange
0.9 NI NI 6 3 151 1 5 6 3 14
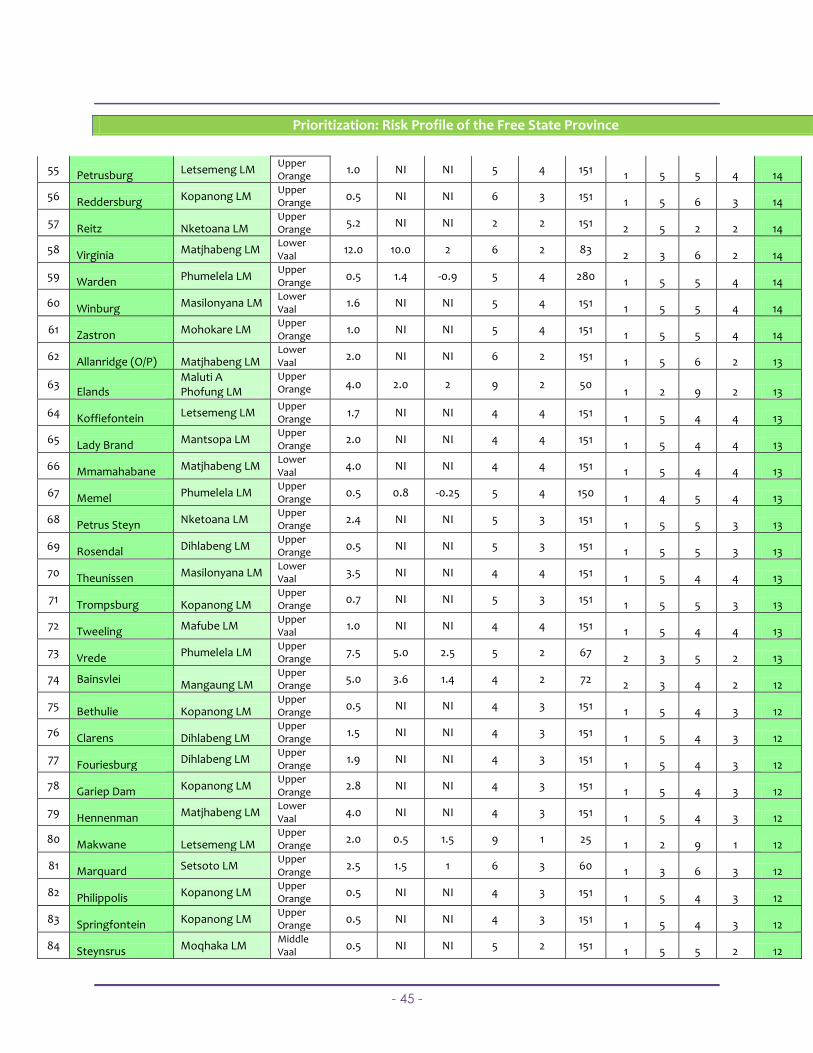
- 45 -
Prioritization: Risk Profile of the Free State Province
55 Petrusburg Letsemeng LM Upper Orange
1.0 NI NI 5 4 151 1 5 5 4 14
56 Reddersburg Kopanong LM Upper Orange
0.5 NI NI 6 3 151 1 5 6 3 14
57 Reitz Nketoana LM Upper Orange
5.2 NI NI 2 2 151 2 5 2 2 14
58 Virginia Matjhabeng LM Lower Vaal
12.0 10.0 2 6 2 83 2 3 6 2 14
59 Warden Phumelela LM Upper Orange
0.5 1.4 -0.9 5 4 280 1 5 5 4 14
60 Winburg Masilonyana LM Lower Vaal
1.6 NI NI 5 4 151 1 5 5 4 14
61 Zastron Mohokare LM Upper Orange
1.0 NI NI 5 4 151 1 5 5 4 14
62 Allanridge (O/P) Matjhabeng LM Lower Vaal
2.0 NI NI 6 2 151 1 5 6 2 13
63 Elands
Maluti A Phofung LM
Upper Orange 4.0 2.0 2 9 2 50
1 2 9 2 13
64 Koffiefontein Letsemeng LM Upper Orange
1.7 NI NI 4 4 151 1 5 4 4 13
65 Lady Brand Mantsopa LM Upper Orange
2.0 NI NI 4 4 151 1 5 4 4 13
66 Mmamahabane Matjhabeng LM Lower Vaal
4.0 NI NI 4 4 151 1 5 4 4 13
67 Memel Phumelela LM Upper Orange
0.5 0.8 -0.25 5 4 150 1 4 5 4 13
68 Petrus Steyn Nketoana LM Upper Orange
2.4 NI NI 5 3 151 1 5 5 3 13
69 Rosendal Dihlabeng LM Upper Orange
0.5 NI NI 5 3 151 1 5 5 3 13
70 Theunissen Masilonyana LM Lower Vaal
3.5 NI NI 4 4 151 1 5 4 4 13
71 Trompsburg Kopanong LM Upper Orange
0.7 NI NI 5 3 151 1 5 5 3 13
72 Tweeling Mafube LM Upper Vaal
1.0 NI NI 4 4 151 1 5 4 4 13
73 Vrede Phumelela LM Upper Orange
7.5 5.0 2.5 5 2 67 2 3 5 2 13
74 Bainsvlei Mangaung LM Upper Orange
5.0 3.6 1.4 4 2 72 2 3 4 2 12
75 Bethulie Kopanong LM Upper Orange
0.5 NI NI 4 3 151 1 5 4 3 12
76 Clarens Dihlabeng LM Upper Orange
1.5 NI NI 4 3 151 1 5 4 3 12
77 Fouriesburg Dihlabeng LM Upper Orange
1.9 NI NI 4 3 151 1 5 4 3 12
78 Gariep Dam Kopanong LM Upper Orange
2.8 NI NI 4 3 151 1 5 4 3 12
79 Hennenman Matjhabeng LM Lower Vaal
4.0 NI NI 4 3 151 1 5 4 3 12
80 Makwane Letsemeng LM Upper Orange
2.0 0.5 1.5 9 1 25 1 2 9 1 12
81 Marquard Setsoto LM Upper Orange
2.5 1.5 1 6 3 60 1 3 6 3 12
82 Philippolis Kopanong LM Upper Orange
0.5 NI NI 4 3 151 1 5 4 3 12
83 Springfontein Kopanong LM Upper Orange
0.5 NI NI 4 3 151 1 5 4 3 12
84 Steynsrus Moqhaka LM Middle Vaal
0.5 NI NI 5 2 151 1 5 5 2 12
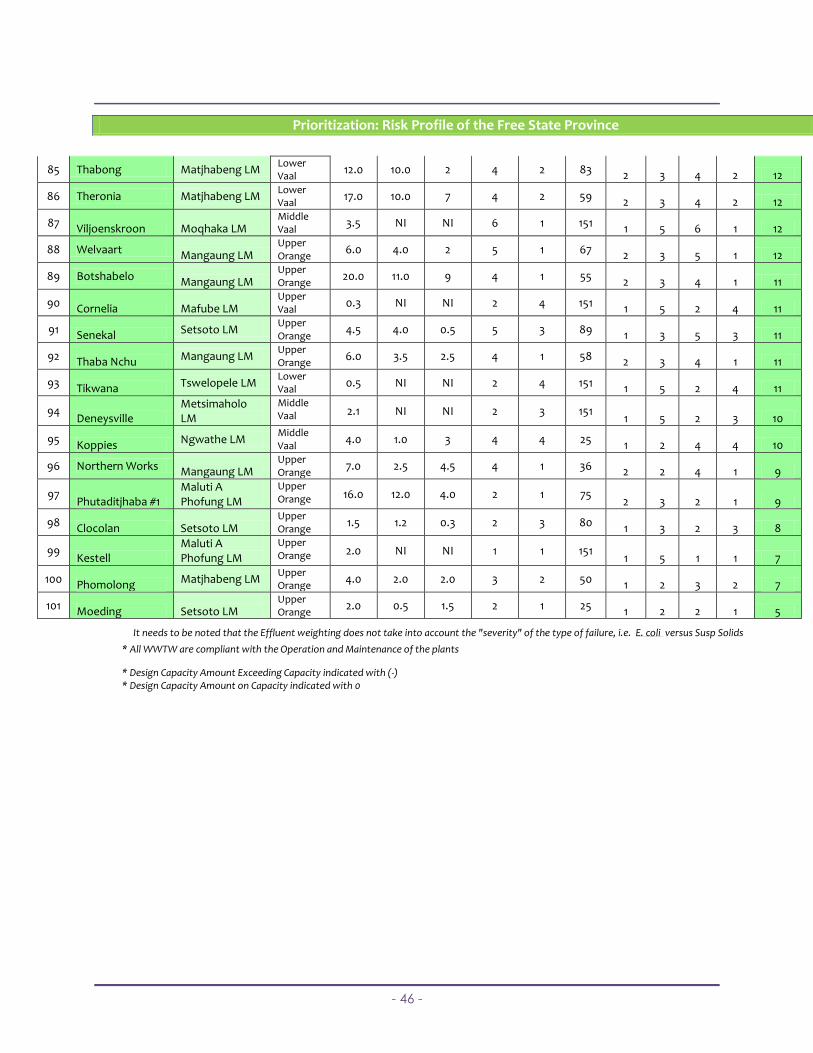
- 46 -
Prioritization: Risk Profile of the Free State Province
85 Thabong Matjhabeng LM Lower Vaal
12.0 10.0 2 4 2 83 2 3 4 2 12
86 Theronia Matjhabeng LM Lower Vaal
17.0 10.0 7 4 2 59 2 3 4 2 12
87 Viljoenskroon Moqhaka LM Middle Vaal
3.5 NI NI 6 1 151 1 5 6 1 12
88 Welvaart Mangaung LM Upper Orange
6.0 4.0 2 5 1 67 2 3 5 1 12
89 Botshabelo Mangaung LM Upper Orange
20.0 11.0 9 4 1 55 2 3 4 1 11
90 Cornelia Mafube LM Upper Vaal
0.3 NI NI 2 4 151 1 5 2 4 11
91 Senekal Setsoto LM Upper Orange
4.5 4.0 0.5 5 3 89 1 3 5 3 11
92 Thaba Nchu Mangaung LM Upper Orange
6.0 3.5 2.5 4 1 58 2 3 4 1 11
93 Tikwana Tswelopele LM Lower Vaal
0.5 NI NI 2 4 151 1 5 2 4 11
94 Deneysville
Metsimaholo LM
Middle Vaal 2.1 NI NI 2 3 151
1 5 2 3 10
95 Koppies Ngwathe LM Middle Vaal
4.0 1.0 3 4 4 25 1 2 4 4 10
96 Northern Works Mangaung LM Upper Orange
7.0 2.5 4.5 4 1 36 2 2 4 1 9
97 Phutaditjhaba #1
Maluti A Phofung LM
Upper Orange 16.0 12.0 4.0 2 1 75
2 3 2 1 9
98 Clocolan Setsoto LM Upper Orange
1.5 1.2 0.3 2 3 80 1 3 2 3 8
99 Kestell
Maluti A Phofung LM
Upper Orange 2.0 NI NI 1 1 151
1 5 1 1 7
100 Phomolong Matjhabeng LM Upper Orange
4.0 2.0 2.0 3 2 50 1 2 3 2 7
101 Moeding Setsoto LM Upper Orange
2.0 0.5 1.5 2 1 25 1 2 2 1 5
It needs to be noted that the Effluent weighting does not take into account the "severity" of the type of failure, i.e. E. coli versus Susp Solids
* All WWTW are compliant with the Operation and Maintenance of the plants
* Design Capacity Amount Exceeding Capacity indicated with (-)
* Design Capacity Amount on Capacity indicated with 0
- 47 -
J. Concluding Remarks A high number of WWTWs in the province of the Free State can be considered priority cases with regard to their cumulative risk rating (CRR) profiles, as they impact negatively on the receiving water sources and the surrounding catchments. Finding 1: A high number of Free State, Wastewater Treatment Works can be considered priority cases with specific areas requiring attention: 3 of 101 (2%) WWTW’s = Exceeding hydraulic design capacities with verified actual flow. 76 of 101 (75%) WWTW’s = No information (undetermined) as no actual flows were provided. 100 of 101 (99%) WWTW’s = Non-Compliant Trends on 2-9 effluent quality parameters (per plant)* 30 of 101 (29%) WWTW’s = Cumulative risk ratings of 18 – 28, representing the highest risk cases in the
region.
Note: Although not forming part of the CRR profile, future consideration should be given to the inclusion and
analysis of the of the operational and organic design loading at each WWTW Disinfection remains a process area with the highest evidence of non-compliance, followed closely by the
potential overloading of many of the WWTWs The monitoring of both E coli and Faecal Coli forms is not undertaken for most of the WWTWs. The
differentiation between and reasoning for the monitoring of the two parameters is not clearly understood or defined and will need clarification by DWA.
Recommendation 1:
Compile letters attached to the proposed booklet that each municipality will receive after the assessment representing their WWTWs profiles as well as on how their WWTWs compared to other WWTWs. It would be suggested to apply an ‘upscaled, risk-based’ approach or strategic intervention by targeting each WSA, OR the WSAs and the problematic WWTWs that fall within the tertiary or secondary catchments in the respective WMAs in the Free State. Ideally this would be the case for the WSAs where their collective WWTWs hold the highest impact and/or where there is already a high degree of non co-operation evident, and where the DWA Regional Office has the capacity to maximise its support and regulatory interventions.
The WSA would have to present to DWA a corrective Plan of Action, as stipulated in the Enforcement Protocol. Caution should be exercised and where possible support (and pressure) be provided before proceeding too rapidly with formal legal action, as this would discourage most municipalities to cooperate with DWA and to address the areas that leads to effluent non-compliance. Where it is deemed as necessary to follow the route of the Enforcement Protocol, a spirit of co-operative governance must be maintained during phases 1 to 6 of the Protocol application, as this will ensure that the WSA, DLG and DWA work collectively towards a compliance solution. It is required that the counterpart of DWA at Provincial Local Government and Traditional Affairs be engaged and informed of the process at the early stages of engagement with the WSA. As support is also a high priority in DWA Free State and national offices and “Sector Collaboration” serves a complimentary role to that or regulations, it is advised that the appropriate support be mobilised in order to rectify non-compliance situations. The full business process of the Protocol should only be considered when the WSA shows that no action, planning or will exists to resolve the situation. Monitoring and evaluation of the PoAs are critical in taking the Enforcement Protocol through its entire business process.
In addition, it is required to rethink on how to best apply the role of DWA as Regulator. This is a pressing matter and needs some firm resolution sooner than later. DWA Regional Offices understand the need to strengthen enforcement and compliance monitoring within the framework provided for in the 2008
- 48 -
Regulations Strategy, but the balance between regulation and support in practice need to be refined. Capacity and experience with the role of Regulator is also not fully developed at regional level, as expertise and relationships with municipalities have been developed solely in the ‘support’ context and frameworks. A paradigm shift and transformation in roles are possible, if clarity and operational capacity can be addressed.
More detailed assessments or audits may be commissioned to assess the most problematic plants and may be mobilised via DWA WSR, WSP Support and WSSCU units.
Finding 2:
Licenses, Permit and General Authorisations are in general (1) not in place, (2) expired, (3) in the process of being applied for. In some cases, applications have already been submitted to DWA, but not issued due to backlogs and internal capacity constraints to process and follow-up on the respective applications. The following scenarios may possibly explain this:
Lost in the process or having an unknown status since the transferral of the WWTWs from DWA or
Department of Public Works to the respective WSA A backlog exists in the DWA Regional Office, impacting negatively on the processing of the
applications. This has been a specific concern raised by some of the WSAs that applications have been submitted but not as of yet issued by the DWA Regional Office
Applications have been submitted to DWA, who found these to be sub-standard or lacking information and returned to the WSA/WSP with request to rectify and resubmit. In such cases, the necessary follow-up action has not been undertaken by DWA, and neither is the WSA addressing the request
License applications are not completed or submitted by the municipality due to poor knowledge regarding this legal requirement, capacity or expertise problems, inter alia.
Recommendation 2:
DWA faces potentially counter-productive actions to proceed with enforcement and regulation if the licences are not in place. WSAs are prone to use this status to ‘counter’ any regulatory action by DWA, and this may delay any productive and corrective action on WWTW level. Registration of WWTWs (Class A to E) needs to be completed as a matter of urgency. Following this or in parallel, it is required to evaluate and respond to all licence applications. A significant licensing backlog exists in the Free State and municipalities may use this situation to pardon their status of non-compliance. DWA should be aware of two aspects of this licensing process:
Regulations approach: DWA will follow the regulations route by assessing, referring back or issuing licenses, followed by rigid programmes of monitoring and evaluation
LG Support approach: However, DWA may also be required to support municipalities in cases where technical capacity does not exist to complete such licence applications
Finding 3:
Although the DWA electronic databases provide valuable data and tools to enable monitoring and reporting on the status of the WWTWs, the data integrity is still sensitive of nature, and the data received from most WSAs still need to be checked and verified. This is at this point in time unfortunately not the case for the municipalities that are supposed to submit the data on the system and reports timeously. Some municipalities had data on the eWQMS dated at 2007 only, and in some other cases the data submission lags a couple of months or more behind. The implication to the regulator may translate to DWA not being in a firm position to monitor and react promptly to situations of non-compliance. The PMRS system has significant potential to assist with the regulatory and performance requirements of wastewater services, but is still in early implementation phase.
- 49 -
Recommendation 3: The DWA electronic system/s must be used to capture wastewater data on an ongoing basis, to include both compliance monitoring by the WSA and DWA random compliance monitoring. Intelligence is required from these systems to provide early warning signs for the regional inspectors to take up non-compliance with the municipality. The establishment and commissioning a nation-wide information management system and wastewater database must also be finalised. Apart from the investigations by DWA, a comprehensive database is also being developed by DPLG, as well as the work that is being done by SALGA (transferred WWTWs), ERWAT (51 WWTWs) and GDACE (focussing development linked capacity). Coordination of these efforts is of utmost importance.
Finding 4:
Although no direct linkage could be made between final effluent non-compliance and the design capacities (hydraulic and organic load) of the WWTW, it could be still be construed as significant contributing factors (not stand alone) in the non-compliance in terms of the operations and maintenance undertaken at these WWTWs. There were WWTWs which were under hydraulic stress that performed better than plants with sufficient capacity (see the commentary of the WWTW profiles), and similarly plants that were not hydraulically stressed but with sufficient plant capacity did not comply with the legislated effluent standards. Also there were WWTWs that, although they were not hydraulically stressed, were operating in excess of their organic design load.
In sum, there are many other contributing factors that are responsible for non-compliance including: (1) the availability of information particularly plant specific operation and maintenance manuals and as-built schematics of the Works and related pertinent information like the design capacities of the WWTWs, (2) the skills and experience, correct proportioning, and ongoing training of the operational staff and maintenance team, (3) the capacity and capability, including financial and procurement constraints of the WSA and/or WSP, inter alia that exhibit the ‘Bigger Picture” in the ability of the WWTW to maintain a consistent trend of compliance. Recommendation 4: Where information is not readily available on the design capacities (hydraulic and organic), it should be communicated to WSAs that a budget allocation be set aside to have these capacities measured and calculated. This should also include the appointment (or outsourcing) of Instrumentation Technician/s, the repair of flow meters and the replacement or installation of meters at all the WWTW plants, and the necessary training provided to the Process Controllers to not only record the daily inflows but to follow incident management protocol where required. Where no flow metering has been undertaken, internal/external resources may be utilised to undertake flow modelling at these Works to establish the average daily flows and to give future projections to the WSA to inform their MTIEF planning process.
These and any other operation and maintenance deficiencies at these WWTWs must be identified and addressed via the supportive route and/or the enforcement route. The application of the new WRC guideline to train and implement a programme for DWA officials to evaluate WWTWs may provide a meaningful focus on wastewater management matters to DWA field officials. The establishment of a specific Forum for Plant Superintendents/Managers and Operators/Process Controllers per WSA or Local Municipality to engage, share and learn on issues pertaining to WWTWs may be a potential solution to the current status quo (WISA has commenced with such a Forum, as well as a Working Group has been established at the Water Quality Conference in Port Elizabeth May 2009). These initiatives need to be communicated to the WSAs, along with the Green Drop incentive. A costing framework for capital expansions is available in the 2007 revised DPLG MIG Industry Guide, but a costing guide for operations and maintenance costs need to be finalised. The latter appears to be useful and much required by the WSAs as they could use these national benchmarks to motivate their own annual O&M costs, and MTIEF planning and CAPEX budgets.
- 50 -
Finding 5:
Although funds are not the primary cause for non-compliance at these WWTWs, significant O&M backlogs are created, and this is over and above the capital funding required to meet the wastewater demand. Some Councillors are still encouraging residential and related developments in municipalities; whilst the sewer reticulation network and the bulk sanitation treatment facilities have inadequate capacity (physical, financial and human) to deal with further (increased) demands.
Recommendation 5:
Critical linkages must be made between various initiatives and priorities to address this problem from a holistic point of view. These will include giving wastewater management a prominent profile in the Councillor Development Programme. The programme should include potable water losses and storm water ingress into sewer conveyor systems, and the impact that these have on the WWTW capacity. The implementation of WC/DM in this context as part of the same cycle needs to be encouraged especially in terms of the WSDP provisions. Firm decisions by Councils (ideally in the form of Moratoriums) must be encouraged to prevent LED Portfolio decisions that allow new WWTWs to be constructed without first refurbishing or rehabilitating or upgrading the WWTWs and conveyor infrastructure. The findings of this assessment need to be communicated to National Treasury and MEC LG with specific request to address the O&M requirements of WWTWs with local government.
Finding 6:
The province of Free State is not unique with regard to the aforementioned challenges. High level 1st order assessments undertaken for Gauteng, Western Cape, Eastern Cape, KZN and North West to mention a few indicate similar trends and also require focussed interventions to rectify situations of non-compliant WWTWs. Northern Cape has already commenced to ‘operationalise’ the Enforcement Protocol by systematic site investigations to a number of WWTWs in the area, and following these up with requests for corrective Plans of Actions from the municipalities.
Recommendation 6: The approach, procedures, methodology and outcomes from implementation of the Enforcement Protocol, within the context of ‘regulatory driven support’, must be captured and documented as a ‘lesson learning’ and be used to expand the protocol to the other priority municipalities. With wastewater management and technical skills identified as one of the truly scarce skills in South Africa, and realising that addressing the skills gap with rigorous training and ongoing capacity building will require time and the resources to boot. It is therefore essential that the wastewater and water resource management sectors look at or revisit other alternative vehicles for service delivery in this discipline (as introduced in finding 7 to follow).
Finding 7: As stated in the previous finding above, wastewater management and technical skills can be regarded as a ‘scarce’ skill in South Africa. This is also evident when studying the vacancies and the skills non-compliance profiles indicated in the previous section in this assessment. Alternative vehicles of the management, operation and maintenance of WWTWs need to be considered. Findings from Frost and Sullivan (2007) “Procurement processes and outsourcing in the South African water and wastewater market” indicate that: Legislative drivers (bylaws and regulations) in the SA wastewater market are beginning to be effectively
enforced as industrial activities increase The rate of construction of municipal infrastructure far exceeds the amount of skill and labour required
to manage these assets, and municipalities will need to find alternative means of managing and maintaining their assets
Despite the need to outsource wastewater treatment functions, municipalities are faced with limited financing from the government, hence they are less involved in outsourcing activities to WSPs in the wastewater segments;
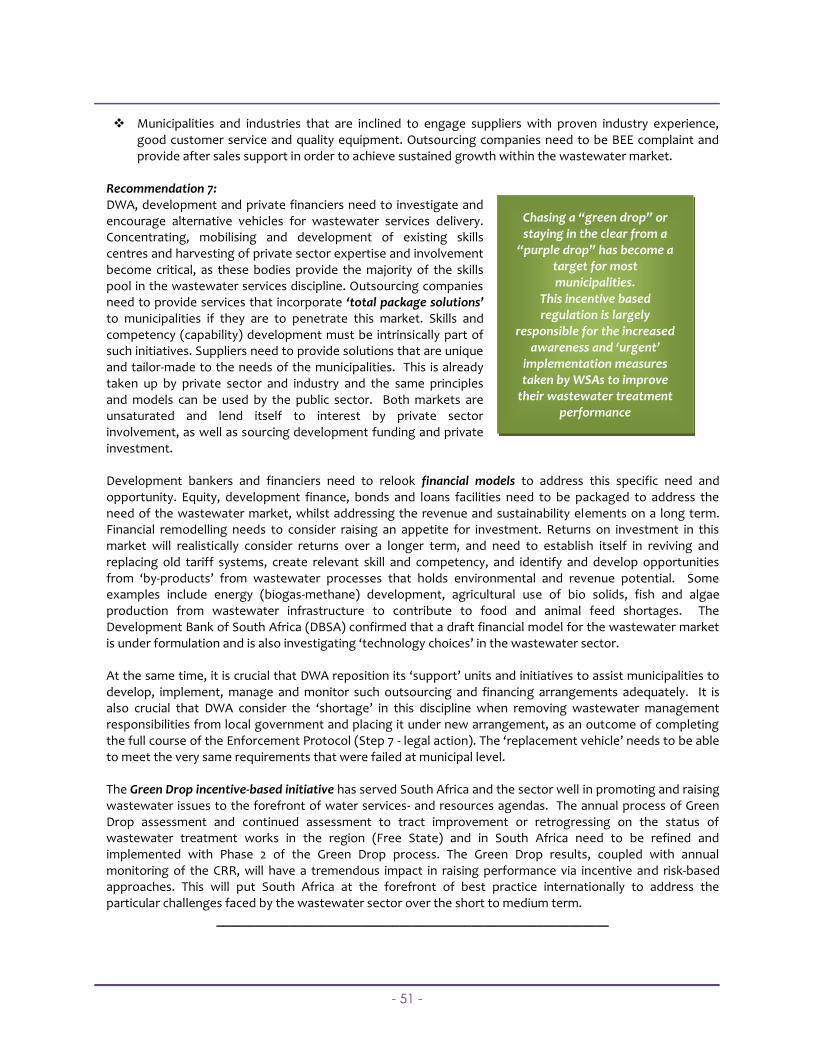
- 51 -
Municipalities and industries that are inclined to engage suppliers with proven industry experience, good customer service and quality equipment. Outsourcing companies need to be BEE complaint and provide after sales support in order to achieve sustained growth within the wastewater market.
Recommendation 7: DWA, development and private financiers need to investigate and encourage alternative vehicles for wastewater services delivery. Concentrating, mobilising and development of existing skills centres and harvesting of private sector expertise and involvement become critical, as these bodies provide the majority of the skills pool in the wastewater services discipline. Outsourcing companies need to provide services that incorporate ‘total package solutions’ to municipalities if they are to penetrate this market. Skills and competency (capability) development must be intrinsically part of such initiatives. Suppliers need to provide solutions that are unique and tailor-made to the needs of the municipalities. This is already taken up by private sector and industry and the same principles and models can be used by the public sector. Both markets are unsaturated and lend itself to interest by private sector involvement, as well as sourcing development funding and private investment.
Development bankers and financiers need to relook financial models to address this specific need and opportunity. Equity, development finance, bonds and loans facilities need to be packaged to address the need of the wastewater market, whilst addressing the revenue and sustainability elements on a long term. Financial remodelling needs to consider raising an appetite for investment. Returns on investment in this market will realistically consider returns over a longer term, and need to establish itself in reviving and replacing old tariff systems, create relevant skill and competency, and identify and develop opportunities from ‘by-products’ from wastewater processes that holds environmental and revenue potential. Some examples include energy (biogas-methane) development, agricultural use of bio solids, fish and algae production from wastewater infrastructure to contribute to food and animal feed shortages. The Development Bank of South Africa (DBSA) confirmed that a draft financial model for the wastewater market is under formulation and is also investigating ‘technology choices’ in the wastewater sector.
At the same time, it is crucial that DWA reposition its ‘support’ units and initiatives to assist municipalities to develop, implement, manage and monitor such outsourcing and financing arrangements adequately. It is also crucial that DWA consider the ‘shortage’ in this discipline when removing wastewater management responsibilities from local government and placing it under new arrangement, as an outcome of completing the full course of the Enforcement Protocol (Step 7 - legal action). The ‘replacement vehicle’ needs to be able to meet the very same requirements that were failed at municipal level. The Green Drop incentive-based initiative has served South Africa and the sector well in promoting and raising wastewater issues to the forefront of water services- and resources agendas. The annual process of Green Drop assessment and continued assessment to tract improvement or retrogressing on the status of wastewater treatment works in the region (Free State) and in South Africa need to be refined and implemented with Phase 2 of the Green Drop process. The Green Drop results, coupled with annual monitoring of the CRR, will have a tremendous impact in raising performance via incentive and risk-based approaches. This will put South Africa at the forefront of best practice internationally to address the particular challenges faced by the wastewater sector over the short to medium term.
____________________________________________________________
Chasing a “green drop” or staying in the clear from a
“purple drop” has become a target for most municipalities.
This incentive based regulation is largely
responsible for the increased awareness and ‘urgent’
implementation measures taken by WSAs to improve
their wastewater treatment performance
- 52 -
Due to the nature of the non-compliance, the following high-level priorities can be pursued. These priorities can be planned in more detail to consider and cover the findings and recommendations listed above.
Priority indicator 1: total impact based on weighted 4 risk areas
The weighted prioritisation table provides the names of the WWTWs that are regarded to have the highest impact on the receiving environment and/or the non co-operation of two of the District municipalities in this assessment. The impact is determined based on 4 different risk areas, with the final weighing factor then reflecting the load by: (1) the plant capacity, (2) design capacity exceedance, (3) effluent parameter failures, and (4) technical skills gaps. It is recommended that WWTWs in the top 30 (29% of the total WWTWs) receive priority attention, as they present the highest risk overall (CRR 18 – 28). This would narrow the initial focus to include the following LMs: Mohokare, Dihlabeng, Kopanong, Letsemeng, Matjhabeng, Mangaung, Mantsopa, Moqhaka, Masilonyana, Naledi, Nala, Ngwathe, Mafube, Maluti A Phofung, and Setsoto. Findings 1 and 6 have reference here. Priority indicator 2: exceeding design capacity
Prioritisation in terms of exceeding design capacity can also serve to inform a targeted process to address non-compliance, if such need is preferred above the Priority 1 approach of addressing the ‘total impact’. Findings 1 and 4 have reference here.
Priority indicator 3: exceeding >3 effluent quality parameters
Prioritisation in terms of the works being unable to meet three or more effluent quality determinants can also serve to inform a targeted process to address non-compliance. Findings 1 and 4 have reference here. Findings 1, 3 and 4 have reference here.
The most critical WWTWs, or the WWTWs within non co-operative municipalities, could be earmarked for more detailed assessments, which can be used at, or following the recommendations as indicated under Finding 1. The assessment should aim to take a multi-disciplinary approach by taking into consideration technical, economic, human resources, legal and environmental aspects. The site assessment should further attempt to make technical (or other) recommendations in order to address the issue of overall non-compliance. It is recommended that the current practice of site-inspections by DWA personnel continue, but that the efforts are expanded to include issues of capacity, quality, etc to ensure that the risk profile can be updated with regular intervals – using the existing processes in the regional offices.
In conclusion, the current introduction and roll-out nationally of the Blue and Green Drop initiative will continue to contribute significantly and positively in creating the awareness and the incentive to municipalities. This will act as the KEY CATALYST that would facilitate appropriate steps by the municipalities to increase the performance of their WWTWs and to remedy/rectify the current situations of non-compliance and non co-operation. Chasing a “green drop” or staying clear of a “purple drop” would become the target for most municipalities. Note to all aforementioned areas: The most critical works could be marked for detailed assessments, which can be used at- or following the recommendations under Finding 1. It is recommended that such assessments be reserved to the low capacity municipalities, as the metropolitan and larger municipalities usually have sufficient resources to conduct details assessments themselves. The assessment should aim to take a multi-disciplinary approach by taking into consideration technical, economic, human resources, legal and environmental aspects. The site assessment
- 53 -
should further attempt to make technical (or other) recommendations in order to address the issue of non-compliance.
Finally, the need to ensure that wastewater quality data is captured, monitored, acted upon and made available through the electronic Water Quality Management System is an item that needs to be pursued on an ongoing basis. A consistent and serious concern that applies to most of the works is that their Biological Quality (Health), indicated by E. coli and Faecal coliform control parameters would not appear to be consistently monitored or sampled. Escherichia coli (E.coli) are used as an indicator of faecal pollution by warm blooded animals (often interpreted as human faecal pollution). The presence of faecal pollution by warm blooded animals may indicate the presence of pathogens responsible for infectious disease such as gastroenteritis, cholera, dysentery and typhoid fever after ingestion of contaminated water. The risks of being infected correlates with the level of contamination of the water and the amount of contaminated water consumed. Higher concentrations of E.coli in water will indicate a higher risk of contracting waterborne disease, even if small amounts of water are consumed. Any bacteriological failure with regards to E. coli can therefore be considered a direct indication of risk to health. Similarly, faecal coli form bacteria are found in water wherever the water is contaminated with faecal waste of human or animal origin. Faecal coli forms are primarily used to indicate the presence of bacterial pathogens such as Salmonella spp., Shigella spp., Vibrio cholerae, Campylobacter jejuni, Campylobacter coli, Yersinia enterocolitica and pathogenic E. coli. These organisms can be transmitted via the faecal/oral route by contaminated or poorly treated water and may cause diseases such as gastroenteritis, salmonellosis, dysentery, cholera and typhoid fever. The risks of being infected correlates with the level of contamination of the water and the amount of contaminated water consumed. Higher concentrations of faecal coliforms in water will indicate a higher risk of contracting waterborne disease, even if small amounts of water are consumed. Also to note is that for any treated wastewater discharges, 0% failure with regards to specified limits for faecal coli forms is required. Any bacteriological failure with regards to faecal coli forms can therefore be considered as a direct indication of risk to health. If the percentage failure exceeds the required limits shown above, intervention is required to rectify the situation (e.g. optimise disinfection). In the light of recent Cholera outbreaks, it is thus recommended that urgent attention is given to ensuring that these parameters are being monitored regularly at the various works.
K. Reference
i. Statement to Parliament on ‘water crisis’: Speech by Mrs LB Hendricks, Minister of Water Affairs and Forestry: Parliament, Cape Town: 11 March 2008, (http://www.DWA.gov.za/minister/Default_dates06.asp?year=2008);
ii. The WRC Report on Wastewater Treatment In South Africa : “ From Crisis To Compliance: Final: Report No: 8011/8295/3/P, Submitted to: Water Research Commission and the Department of Water Affairs and Forestry by Golder Associates Africa and Zitholele Consulting, August 2006;
iii. National Water Summit: Speech by Mrs LB Hendricks, Minister of Water Affairs and Forestry: Gallagher Estate, Midrand, Gauteng : 17 March 2008: Theme: WATER SUSTAINING LIVES AND ENABLING GROWTH, (http://www.DWA.gov.za/minister/Default_dates06.asp?year=2008);
- 54 -
iv. Launch of Masibambane III: Speech by Mrs LB Hendricks, Minister of Water Affairs and Forestry: Gallagher Estate, Midrand, Gauteng: 17 March 2008: (http://www.DWA.gov.za/minister/Default_dates06.asp?year=2008);
v. Department on Water Services briefing Parliamentary Monitoring Group: Parliament of South Africa :Minutes: 10 Sept 2003, (http://www.pmg.org.za);
vi. REPORT ON: The Applicability and Economic Consideration of Various Wastewater Treatment Technologies to Effluents Arising from Waterborne Sewage Technology Evaluation Module: Revision : Draft 04: Submitted to: Water Research Commission and the Department of Water Affairs and Forestry: Golder Associates Africa and Zitholele Consulting: March 2006: 8011/7636/1/P;
vii. Wastewater Treatment in South Africa;
viii. Field Evaluation of the Status and Performance of Wastewater Treatment Plants: Final: Submitted to: Water Research Commission and The Department of Water Affairs and Forestry by Golder Associates Africa and Zitholele Consulting, August 2006;
ix. Web-based Article: Sewerage shapes up as next crisis: dated Tuesday, March 18, 2008 on InternAfrica;
x. ISSN 0378-4738 = Water SA Vol. 28 No. 4 October 2002 463 : Conference Paper: A modified method to determine biomass concentration as COD in pure cultures and in activated sludge systems: by Edgardo M Contreras, Nora C Bertola, Leda Giannuzzi and Noemi E Zaritzky, (http://www.wrc.org.za);
xi. Engineering news article: Water treatment facility upgrade meets 2010 standards: Christy van der Merwe, (http://www.engineeringnews.co.za/article.php?a_id=105503);
xii. Free State State of the Environment Report: , (www. environment.gov.za/soer/reports/freestate.html.);
xiii. Article from IMIESA: April 2004: Latest Design, (http://search.sabinet.co.za/images/ejour/imiesa/imiesa_v29_n4_a22.pdf);
xiv. Draft Regulations For The Registration Of Waterworks And Process Controllers: Government Gazette No. 28557: 24 February 2006: No. R. 181 24 February 2006: National Water Act, 1998;
xv. Government Gazette 18 May 1984 No. 9225: Regulation No. 991 18 May 1984: Requirements For The Purification Of Waste Water Or Effluent: General and Special Standards;
xvi. Act No. 108, 1997 WATER SERVICES ACT, 1997;
xvii. Free State Provincial Water Sector Plan ;
xviii. Free State State of the Environment Report;
xix. Free State Spatial Development Framework, 2007;
xx. Guidelines for Land Use Schemes, Free State Department of Local Government and Housing, March 2006;
http://www.fs.gov.za/Departments/FINANCE/economic/opportunities/opportunities.htm;
xxi. National Spatial Development Perspective, March 2003;
xxii. Reviewed Free State Growth and Development Strategy, 2007-2014;
xxiii. Thabo Mofutsanyane District Municipality Integrated Development Plan 2007/08;
xxiv. Thabo Mofutsanyane District Municipality, Spatial Development Framework, 2005/06 IDP Review Cycle;
xxv. Thabo Mofutsanyane Industrial Development Strategy, Draft Report, Urban-Econ Development Economists, 2006;
xxvi. Free State Spatial Development Framework, 2007;

- 55 -
xxvii. 2003/2006 Strategic Plan of the Department of Agriculture;
xxviii. DWA Report: Water Use Charges for Government Water Schemes and Water Resources Management Charges for the Free State Region 2004/2005;
xxix. DWA- State of the Rivers Report – Free State.
***********************************


