Nonphotosynthetic Pigments as Potential Biosignatures Edward W. Schwieterman, 1,2,3 Charles S. Cockell, 4,5 and Victoria S. Meadows 1,2,3 Abstract Previous work on possible surface reflectance biosignatures for Earth-like planets has typically focused on analogues to spectral features produced by photosynthetic organisms on Earth, such as the vegetation red edge. Although oxygenic photosynthesis, facilitated by pigments evolved to capture photons, is the dominant me- tabolism on our planet, pigmentation has evolved for multiple purposes to adapt organisms to their environ- ment. We present an interdisciplinary study of the diversity and detectability of nonphotosynthetic pigments as biosignatures, which includes a description of environments that host nonphotosynthetic biologically pigmented surfaces, and a lab-based experimental analysis of the spectral and broadband color diversity of pigmented organisms on Earth. We test the utility of broadband color to distinguish between Earth-like planets with significant coverage of nonphotosynthetic pigments and those with photosynthetic or nonbiological surfaces, using both 1-D and 3-D spectral models. We demonstrate that, given sufficient surface coverage, non- photosynthetic pigments could significantly impact the disk-averaged spectrum of a planet. However, we find that due to the possible diversity of organisms and environments, and the confounding effects of the atmo- sphere and clouds, determination of substantial coverage by biologically produced pigments would be difficult with broadband colors alone and would likely require spectrally resolved data. Key Words: Biosignatures— Exoplanets—Halophiles—Pigmentation—Reflectance spectroscopy—Spectral models. Astrobiology 15, 341–361. 1. Introduction T he search for life beyond Earth requires an under- standing of the measurable ways life can impact its en- vironment. These measurable impacts are biosignatures: ‘‘an object, substance, and/or pattern whose origin specifically requires a biological agent’’ (Des Marais et al., 2008). To be considered a useful biosignature, this evidence must be clearly discernable from the results of abiotic processes. Three main classes of remotely detectable biosignatures have been proposed. First, there are spectral absorption features produced by biosignature gases. These are gases that are produced by metabolic processes, and their production by abiotic processes, such as volcanic outgassing or photo- chemistry, can be reasonably excluded. The standard often applied is a requirement for a chemical disequilibrium that is most likely of biological origin (Lovelock, 1965; Hitchcock and Lovelock, 1967; Sagan et al., 1993). Gaseous oxygen (O 2 ) and its photochemical by-product ozone (O 3 ) are ex- amples of gaseous biosignatures that are robust to many false- positive scenarios, although recent work suggests that sig- nificant abiotic production of these gases may occur via photochemistry for stars with sufficiently high far-UV irra- diances (e.g., Domagal-Goldman et al., 2014; Tian et al., 2014) or via massive runaway-greenhouse-mediated water loss during the pre-main-sequence phase of low-mass stars (Luger and Barnes, 2015). Oxygen is considered a more ro- bust biosignature in the simultaneous presence of a reduced gas like methane (CH 4 ). For a review of potential bio- signature gases see, for example, the work of Seager et al. (2012). The second class of remotely detectable bio- signatures consists of reflectance signatures from pigmented organisms, especially land vegetation. Reflectance is the fraction of incident light that is reflected from a surface, which will vary with wavelength depending on the optical properties of the surface. The most commonly explored 1 University of Washington Astronomy Department, Seattle, Washington, USA. 2 NAI Virtual Planetary Laboratory, Seattle, Washington, USA. 3 University of Washington Astrobiology Program, Seattle, Washington, USA. 4 University of Edinburgh School of Physics and Astronomy, Edinburgh, UK. 5 UK Centre for Astrobiology, Edinburgh, UK. ª The Author(s) 2015; Published by Mary Ann Liebert, Inc. This Open Access article is distributed under the terms of the Creative Commons Attribution Noncommercial License (http://creativecommons.org/licenses/by-nc/4.0/) which permits any noncommercial use, distribution, and reproduction in any medium, provided the original author(s) and the source are credited. ASTROBIOLOGY Volume 15, Number 5, 2015 DOI: 10.1089/ast.2014.1178 341
Transcript
Nonphotosynthetic Pigments as Potential Biosignatures
Edward W. Schwieterman,1,2,3 Charles S. Cockell,4,5 and Victoria S. Meadows1,2,3
Abstract
Previous work on possible surface reflectance biosignatures for Earth-like planets has typically focused onanalogues to spectral features produced by photosynthetic organisms on Earth, such as the vegetation red edge.Although oxygenic photosynthesis, facilitated by pigments evolved to capture photons, is the dominant me-tabolism on our planet, pigmentation has evolved for multiple purposes to adapt organisms to their environ-ment. We present an interdisciplinary study of the diversity and detectability of nonphotosynthetic pigments asbiosignatures, which includes a description of environments that host nonphotosynthetic biologically pigmentedsurfaces, and a lab-based experimental analysis of the spectral and broadband color diversity of pigmentedorganisms on Earth. We test the utility of broadband color to distinguish between Earth-like planets withsignificant coverage of nonphotosynthetic pigments and those with photosynthetic or nonbiological surfaces,using both 1-D and 3-D spectral models. We demonstrate that, given sufficient surface coverage, non-photosynthetic pigments could significantly impact the disk-averaged spectrum of a planet. However, we findthat due to the possible diversity of organisms and environments, and the confounding effects of the atmo-sphere and clouds, determination of substantial coverage by biologically produced pigments would be difficultwith broadband colors alone and would likely require spectrally resolved data. Key Words: Biosignatures—Exoplanets—Halophiles—Pigmentation—Reflectance spectroscopy—Spectral models. Astrobiology 15, 341–361.
1. Introduction
The search for life beyond Earth requires an under-standing of the measurable ways life can impact its en-
vironment. These measurable impacts are biosignatures: ‘‘anobject, substance, and/or pattern whose origin specificallyrequires a biological agent’’ (Des Marais et al., 2008). To beconsidered a useful biosignature, this evidence must beclearly discernable from the results of abiotic processes.Three main classes of remotely detectable biosignatures havebeen proposed. First, there are spectral absorption featuresproduced by biosignature gases. These are gases that areproduced by metabolic processes, and their production byabiotic processes, such as volcanic outgassing or photo-chemistry, can be reasonably excluded. The standard oftenapplied is a requirement for a chemical disequilibrium that ismost likely of biological origin (Lovelock, 1965; Hitchcockand Lovelock, 1967; Sagan et al., 1993). Gaseous oxygen
(O2) and its photochemical by-product ozone (O3) are ex-amples of gaseous biosignatures that are robust to many false-positive scenarios, although recent work suggests that sig-nificant abiotic production of these gases may occur viaphotochemistry for stars with sufficiently high far-UV irra-diances (e.g., Domagal-Goldman et al., 2014; Tian et al.,2014) or via massive runaway-greenhouse-mediated waterloss during the pre-main-sequence phase of low-mass stars(Luger and Barnes, 2015). Oxygen is considered a more ro-bust biosignature in the simultaneous presence of a reducedgas like methane (CH4). For a review of potential bio-signature gases see, for example, the work of Seager et al.(2012). The second class of remotely detectable bio-signatures consists of reflectance signatures from pigmentedorganisms, especially land vegetation. Reflectance is thefraction of incident light that is reflected from a surface,which will vary with wavelength depending on the opticalproperties of the surface. The most commonly explored
1University of Washington Astronomy Department, Seattle, Washington, USA.2NAI Virtual Planetary Laboratory, Seattle, Washington, USA.3University of Washington Astrobiology Program, Seattle, Washington, USA.4University of Edinburgh School of Physics and Astronomy, Edinburgh, UK.5UK Centre for Astrobiology, Edinburgh, UK.ª The Author(s) 2015; Published by Mary Ann Liebert, Inc. This Open Access article is distributed under the terms of the Creative
Commons Attribution Noncommercial License (http://creativecommons.org/licenses/by-nc/4.0/) which permits any noncommercial use,distribution, and reproduction in any medium, provided the original author(s) and the source are credited.
ASTROBIOLOGYVolume 15, Number 5, 2015DOI: 10.1089/ast.2014.1178
341
spectral feature in this category is the vegetation red edge(VRE) of oxygenic photosynthesizers such as land-basedplants, which produces a sharp increase in reflectance fromthe visible to the near-infrared portions of the spectrum(Sagan et al., 1993; Seager et al., 2005). Finally, there aretemporal biosignatures. These are time-dependent changes inmeasurable quantities such as gas concentrations, planetaryalbedos, or broadband colors (the ratios of intensities mea-sured between two or more filter bands) that are produced as aconsequence of changes in biological activity (Meadows,2006). For example, seasonal periodicities observed in CO2
and CH4 concentrations on Earth are correlated with land-based respiration (Keeling, 1960; Rasmussen and Khalil,1981; Khalil and Rasmussen, 1983; Keeling et al., 1996), andseasonal variation in pigmentation can be observed in land-based vegetation. The focus of this paper is on reflectancebiosignatures with the acknowledgement that there may alsobe a seasonal or time-dependent component.
The most commonly considered biosignatures are prod-ucts of photosynthesis or are phenomena otherwise associ-ated with photosynthetic organisms. Photosynthesis is amethod of primary production (turning CO2 to biomass) thatuses photons from the Sun (or in general, a host star or stars)as a source of energy, and a reductant, such as H2, H2S,Fe2 + , or H2O, as a source of electrons (Hohmann-Marriottand Blankenship, 2012). Oxygenic photosynthesis, whichuses H2O as a reductant and generates O2 as a waste prod-uct, is by far the most productive metabolism by orders ofmagnitude on modern Earth (Kiang et al., 2007a). It is oftenreasoned that the organisms with the most productive me-tabolism will be the most plentiful and therefore will gen-erate the most detectable signatures, and those signatureswill be related to their primary metabolism.
However, oxygenic photosynthesis may not have alwaysdominated the detectable biosphere in the past. Geologicalevidence suggests that biofilms or microbial mats of an-oxygenic photosynthesizers may have generated the mostprevalent surface signatures of life for several hundredmillion years before the development of oxygenic photo-synthesis. This is inferred from the gap between the earlieststromatolite fossils at 3.5 Ga (Schopf, 1993) and the earliestundisputed geochemical evidence for oxygenic photosyn-thesis at 2.7 Ga (Buick, 2008).
There are currently no known remotely detectable gaseousbiosignatures strictly associated with anoxygenic photosyn-thesis, and there are also many chemosynthetic metabolismsthat do not produce waste gases in chemical disequilibriumwith their environments (Des Marais et al., 2002). In theabsence of gaseous biosignatures, surface reflectance featureswould be the only possibly detectable biosignatures. An-oxygenic photosynthesizers and chemosynthetic pigment-bearing species would have generated their own surface re-flectance biosignatures by reflecting more strongly at wave-lengths where their pigment absorption was least efficient.
Near-future spaced-based telescopes may have the ability todirectly image Earth-sized planets and search for surface re-flectance biosignatures (Des Marais et al., 2002; Cockell et al.,2009; Levine et al., 2009; Postman et al., 2010; Seager et al.,2014; Stapelfeldt et al., 2014). To support these missions, it isimportant to better understand the possible diversity of plane-tary biosignatures, including surface biosignatures. Severalauthors have investigated the effects of photosynthetic vege-
tation or microbial mats on the disk-averaged spectrum of Earthor Earth-like planets (Seager et al., 2005; Montanes-Rodriguezet al., 2006; Tinetti et al., 2006b, 2006c; Sanroma, et al., 2013),and Sanroma et al. (2014) investigated the spectrum andtemporally varying broadband colors of an Earth substantiallycovered with anoxygenic purple bacteria. Hegde and Kalte-negger (2013) explored whether broadband filter photometrycan serve as a first step to characterizing the surfaces of Earth-like exoplanets, and argued that visible spectrum broadbandcolors could be used to identify certain environments or sig-nificant coverage by specific types of extremophiles, lichens, orbacterial mats. However, this initial study did not consider theeffects on the resulting broadband colors due to reflected ra-diation transmitted through the atmosphere.
As we will argue here, nonphotosynthetic pigments couldprovide alternative biosignatures to those generated byphotosynthesis. In particular, this may be the case for highlyproductive chemosynthetic biospheres that have evolvedpigmentation to cope with extreme environments, or forphotosynthetic biospheres where the spectral reflectance isdominated by a nonphotosynthetic pigment. In support ofthis argument, we detail below a range of environments onEarth where nonphotosynthetic pigments dominate thespectral reflectance. While our focus is on applications toremotely detectable surface biosignatures on exoplanets,pigmented organisms may also be searched for in limitedenvironments within our own solar system such as in themartian subsurface or Europa’s ocean (Dalton et al., 2003).
There is empirical evidence from several environments onmodern Earth that, even in the presence of photosyntheticprimary producers, the dominant reflectance biosignature canbe from biologically produced pigments that developed toprovide functions other than light capture for photosynthesis.For example, halophilic archaea such as Halobacterium sal-inarum and bacteria such as Salinbacter ruber dominate thespectral reflectance of hypersaline lakes and saltern crystal-lizer ponds with their nonphotosynthetic pigments (DasSar-ma, 2006; Oren, 2009, 2013). The pink coloration of thenorthern portion of the Great Salt Lake, Utah, USA, is visiblein photographs from the International Space Station. OwensLake, California, USA, and the saltern crystallizer ponds ofSan Francisco, USA, are further examples of the macroscopiccoloration effect from these pigmented organisms (see Fig.1a, 1b, and 1c). Other environments where pigmented halo-philes dominate the spectral reflectance include Lake Hillierin Australia, the Sivash in Ukraine/Russia, and Lake Retba inSenegal. These halophilic organisms contain substantialamounts of carotenoids such as bacterioruberin, resulting inred, pink, or orange coloration to water above thresholdsalinities. Although the photosynthetic primary producers inhypersaline environments are often green algae like Duna-liella salina, which also contain carotenoid pigments, Orenet al. (1992) and Oren and Dubinsky (1994) found that thevisible coloration of hypersaline lakes is dominated by the(smaller but more abundant) halophilic archaea and bacteria.This is due to the even distribution of pigments in the ar-chaeal cells, which provides them with more surface area pervolume and allows them to effectively shade the more con-centrated pigments in the Dunaliella cells (Oren et al., 1992).
Another example where nonphotosynthetic pigmentsdominate the spectral reflectance comes from extremophiles(including chemotrophic thermophiles) at the edges of hot
342 SCHWIETERMAN ET AL.
springs, where temperatures can exceed the 73�C tempera-ture limit for photosynthesis (Meeks and Castenholz, 1971).Thermophiles such as Thermus aquaticus (Brock andFreeze, 1969), whose pigmentation may be an adaptation tooxidative stress, generate the inner ring of yellow seen in theGrand Prismatic Spring in Yellowstone National Park, USA(Fig. 1d). Pigmented thermophilic chemotrophs, togetherwith carotenoid-bearing cyanobacteria, form a visible colorgradient across the spring (Dartnell, 2011). ‘‘Watermelonsnow’’ is a designation given to the visible red or pinkcoloration of snow caused by the green algae Chlamydo-monas nivalis (Painter et al., 2001; Williams et al., 2003).This organism thrives in high altitudes and polar regionsduring the summer with the aid of the red carotenoid pig-ment astaxanthin, which helps protect it from UV radiationand warms the cell by absorbing more incident solar radi-ation than the surrounding snow.
Many types of vegetation alter their spectral appearance(color) seasonally, illustrating another case where non-photosynthetic pigments can dominate the visible reflec-tance spectrum. The red and orange autumn coloration ofleaves is due to carotenoid pigments that are unmasked aschlorophyll degrades, while red pigmentation is due to an-thocyanin, a pH-dependent pigment that is produced denovo in autumn foliage, perhaps to provide photoprotection(Archetti et al., 2009).
Nonphotosynthetic pigments can serve a variety offunctions, many of which help the organism adapt tostressors in the environment. These compounds can be usedfor photoprotection (Proteau et al., 1993; Williams et al.,2003; Solovchenko and Merzlyak, 2008; Archetti et al.,2009) and as quenching agents for protection against free
radicals (Saito et al., 1997). Desiccation- and ionizing-radiation-resistant organisms such as Deinococcus radio-durans and Rubrobacter radiotolerans contain carotenoidpigments that are thought to function primarily as antioxi-dants (Saito et al., 1994; Cox and Battista, 2005; Tian et al.,2008). Some pigments serve as biocontrol mechanisms toslow growth as resources are exhausted (Venil and Laksh-manaperumalsamy, 2009) or to facilitate interactions be-tween bacterial cells in colonies or aggregates through aphenomenon known as ‘‘quorum sensing’’ (McClean et al.,1997; Williams et al., 2007). Such pigments are often as-sociated with pathogenic bacteria, as invading a host ex-poses these organisms to extremes in terms of temperatureand in many cases an immune system attack (Liu and Nizet,2009). ‘‘Siderophore’’ pigments are used as Fe3 + bondingagents in iron-limited conditions (Meyer, 2000). Plants andanimals use pigments in signaling to other organisms(Chittka and Raine, 2006), as is the case for pigments usedin flowers for attracting pollinators.
In summary, the spectral properties of many biologicalpigments are decoupled from the light environment to vary-ing degrees. While some nonphotosynthetic pigments areadapted to be sensitive to small portions of the electromag-netic spectrum, such as UV-screening pigments, others arehosted by organisms in zero light conditions (Kimura et al.,2003). Organisms possessing nonphotosynthetic pigments arenot necessarily closely related genetically to photosyntheticspecies, and the phylogenetic diversity of pigment-producingspecies in general is much broader than that of photosyntheticspecies (Klassen, 2010). Table 1 shows a list of functions thatpigment molecules perform other than light harvesting andprovides specific examples of pigments that carry out thesefunctions and the organisms in which they are found. We notethat some carotenoids can have a light-harvesting function inanoxygenic phototrophs and cyanobacteria but predominantlyfunction as protectants against photooxidative stress (Cogdellet al., 2000; Glaeser and Klug, 2005; Ziegelhoffer and Do-nohue, 2009). For the purposes of this paper, we considerthese carotenoids as photoprotectants and antioxidants andthus as nonphotosynthetic pigments.
To expand the study of remotely detectable surface bio-signatures beyond those associated with photosynthesis, weexplore the nature, diversity, and detectability of non-photosynthetic pigments. Our study is broken into fourcomponents. First, we measure the reflectance spectra of adiverse collection of pigmented organisms on Earth. Theseorganisms may be considered as analogues to the possiblebiologically pigmented surfaces that may be present onother planets. Second, we generate synthetic spectra with a1-D radiative transfer model that simulates ideal caseswhere single surface types dominate planetary surfaces andare viewed through a planetary atmosphere. We comparescenarios with nonphotosynthetic pigment surfaces to thosewith other dominant surface types. We include in thesesimulations both the spectral reflectances measured in thefirst, experimental portion of the study and spectral reflec-tances of biotic and abiotic surfaces from literature. Third, wecreate a more comprehensive 3-D spectral model of an Earth-analog planet where the oceans are dominated by pigmentedhalophiles at the same densities found in high-salinity pondson Earth and include the effects of an atmosphere, clouds, anda heterogeneous surface. Finally, we examine the utility of
FIG. 1. Macroscopic surfaces where carotenoid-type pig-ments dominate the spectral reflectance. (a) The Great SaltLake, Utah, USA, seen from the International Space Station(credit: NASA). The Great Salt Lake is approximately120 km long, 45 km wide, and 4.9 m deep on average. (b)Owens Lake in California, USA (credit: NASA). OwensLake is 28 km long, 16 km wide, and 0.9 m deep on average.(c) Salt ponds in San Francisco, California, USA (credit:dro!d, Atlanta, GA). (d) The Grand Prismatic Spring inYellowstone National Park, Wyoming, USA (credit: Na-tional Park Service). The spring is 90 m long by 80 m wideand approximately 50 m deep.
NONPHOTOSYNTHETIC PIGMENTS AS POTENTIAL BIOSIGNATURES 343
broadband colors in identifying and characterizing a diversityof biological and abiotic surface types when full consider-ation of atmospheric effects is made.
2. Methods and Models
Below we will describe the methods and the models forboth the experimental and spectral modeling components ofthis study.
2.1. Choice of cultured organisms
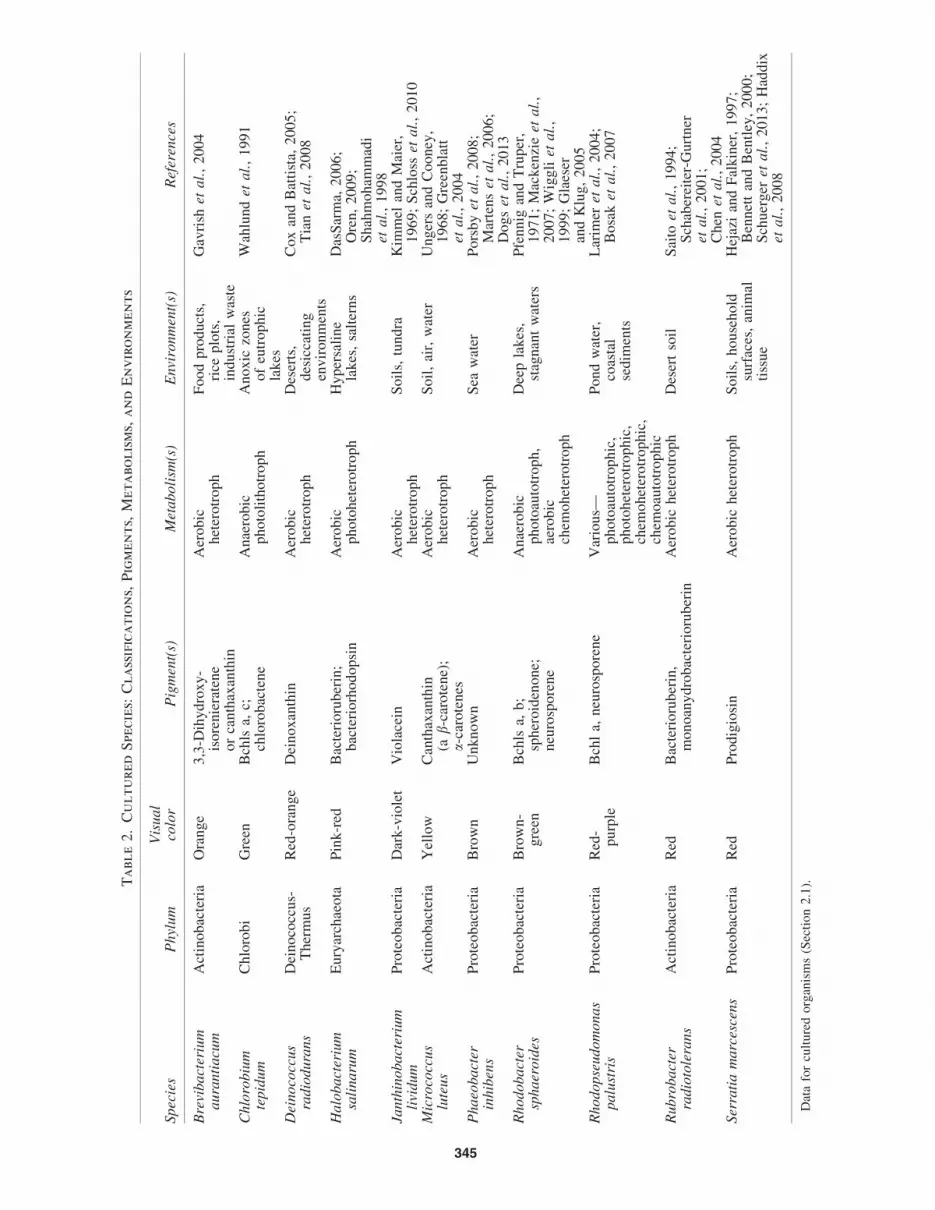
We cultured and measured the spectral characteristics of avariety of pigmented bacteria (and one archaeon) that rep-resent various colorations, metabolisms, and phylogenies.For practical reasons, we preferentially selected fast-growing,easily culturable strains. Table 2 lists the species, phylum,color, primary pigment, metabolism, and environment ofthe selected organisms. Below we briefly describe eachorganism.
Brevibacterium aurantiacum—an orange Gram-positiveactinobacterium that has been isolated from food products,rice plots, and industrial waste. The production of orangecarotenoid pigmentation is observed to be induced by blue(*400 nm) light (Gavrish et al., 2004; Takano et al., 2006).
Chlorobium tepidum—a green sulfur Gram-negativebacterium that grows photoautotrophically or photo-heterotrophically under anaerobic conditions. C. tepidum wasisolated from an acidic (pH 4.5–6.0) hot spring containing highconcentrations of sulfide (Wahlund et al., 1991). Chlorobiumspecies are often found in anoxic zones of eutrophic lakes
(Prescott et al., 2005). Molecular fossils (biomarkers) indicateChlorobium blooms were present in high numbers during theend-Permian mass extinction event (Cao et al., 2009).
Deinococcus radiodurans—a well-known polyextremophilethat stains Gram-positive (although its cell wall has Gram-negative characteristics), which can survive exposure tolarge amounts of ionizing radiation and desiccating condi-tions (Cox and Battista, 2005). The primary pigment pro-duced by D. radiodurans is the carotenoid deinoxanthin,which gives colonies a red-orange coloration.
Halobacterium salinarum—a Gram-negative halophilicarchaeon that contains the red carotenoid pigment, bacter-ioruberin, and achieves photoheterotrophy with bacterio-rhodopsin. Bacterioruberin has been shown to assist H.salinarum in resisting damage to DNA by ionizing radiationand UV light (Shahmohammadi et al., 1998). Halobacter-ium species are of interest to astrobiologists because they arepolyextremophiles and occupy a niche populated by fewother organisms (DasSarma, 2006). H. salinarum was chosenin his work to represent the pigmented halophiles that givehypersaline lakes and ponds their pink or red color.
Janthinobacterium lividum—a Gram-negative aerobicproteobacterium commonly found in soils, freshwater, andtundra. J. lividum produces the dark violet pigment violaceinand can aggregate in dense colonies or biofilms (Kimmeland Maier, 1969; Pantanella et al., 2007; Schloss et al.,2010). The pigment violacein is involved in ‘‘quorumsensing,’’ which can facilitate interactions between cells in acolony (McClean et al., 1997; Gonzalez and Keshavan,2006; Williams et al., 2007).
Micrococcus luteus—a Gram-positive, yellow-pigmentedaerobic actinobacterium. The yellow pigmentation is due to thecarotene derivative canthaxanthin (Ungers and Cooney, 1968).
Phaeobacter inhibens—a Gram-negative brown-pigmentedproteobacterium isolated from seawater. P. inhibens producesan uncharacterized brown pigment and displays antimicrobialproperties (Porsby et al., 2008; Dogs et al., 2013).
Rhodobacter sphaeroides—a Gram-negative purple non-sulfur anoxygenic photosynthetic proteobacterium. R. sphaer-oides has a diverse array of metabolic pathways, growing byaerobic or anaerobic respiration, photosynthesis or fermenta-tion (Mackenzie et al., 2007). Carotenoids produced by R.sphaeroides have been shown to reduce photooxidative stressagainst singlet oxygen (Glaeser and Klug, 2005) and are thecause of the orange-brown coloration the organism exhibits inanaerobic cultures. The R. sphaeroides strain in this study wasgrown photoheterotrophically in anaerobic conditions.
Rhodopseudomonas palustris—a Gram-negative purpleanoxygenic photosynthetic proteobacterium. Like R.sphaeroides, R. palustris is metabolically versatile, able togrow photoautotrophically, photoheterotrophically, che-moautotrophically, or chemoheterotrophically (Larimeret al., 2004). This diverse array of metabolisms allows theorganisms to survive in a variety of environments. R. pa-lustris is especially interesting as it has been shown toprecipitate calcite in solutions rich in calcium carbonate,serving as a model to illuminate how ancient anoxygenicphotosynthetic stromatolites may have been constructed(Bosak et al., 2007). The R. palustris strain in this study wasgrown photoheterotrophically in anaerobic conditions.
Rubrobacter radiotolerans—a Gram-positive red-pigmentedactinobacterium that is isolated from desert soil. R. radio-tolerans is highly radioresistant and can survive radiationdoses higher than other radioresistant bacteria includingDeinococcus radiodurans (Saito et al., 1994). R. radio-tolerans contains bacterioruberin and other pigments typi-cally found in halophilic bacteria (Saito et al., 1994).
Serratia marcescens—a common Gram-negative environ-mental proteobacterium that produces the red pigment pro-digiosin (Venil and Lakshmanaperumalsamy, 2009). S.marcescens is often found growing as a thin pink film onbathroom surfaces and has been known to cause infections
(Hejazi and Falkiner, 1997; Haddix et al., 2008). A relatedorganism, Serratia liquefaciens, which also produces prodi-giosin, has been shown to grow in an anoxic, CO2-enriched 7mbar (Mars-like) atmosphere at 0�C (Schuerger et al., 2013).
2.2. Growth and harvesting of cells
Each organism in Table 2 was acquired from DeutscheSammlung von Mikroorganismen und Zellkulturen(DSMZ1) in the form of either a live culture or a freeze-dried pellet in a vacuum-sealed glass ampoule. Standardculturing procedures were followed after assembling therecommended growth medium for each organism (see Table3). All species were grown in oxic conditions with the ex-ception of the anaerobic anoxygenic photosynthesizersChlorobium tepidum, Rhodobacter sphaeroides, and Rho-dopseudomonas palustris, which were grown anaerobicallyin light. Cells were harvested for reflectance spectra mea-surements in one of two ways:
(1) Liquid cultures were transferred to 50 mL Falcontubes and centrifuged for 10 min at 2700g to pelletizethe intact cells. The supernatant was removed andreplaced with deionized water. The tube was agitatedto rinse the cells of the growth media and thencentrifuged again for 10 min at 2700g to re-isolate thecells as a pellet. A sterilized small metal spatula wasused to transfer the cleaned cell pellet to black filterpaper in a Petri dish (black paper was chosen tominimize the scattering of light during subsequentreflectance spectra measurements).
(2) Plate-spread cultures were allowed to proliferate untila substantial percentage of the plate was covered withgrowth. A sterilized metal spatula was then used togently scrape the surface of the growth media until athick paste of cells was gathered. This was transferredto filter paper in a Petri dish.
In both (1) and (2), the sample was allowed to dry for 1 hto remove any film of water on the surface of the sample that
Table 3. Culture Information
Species DSMZ strain ID # DSMZ media # Culture typea
Data for cultured strains. Aerobic cultures were grown in the presence of oxygen, whereas anaerobic cultures were grown in airtightbottles evacuated of oxygen. Further detailed information regarding strain type and culture media can be found online at https://www.dsmz.de.
aAll cultures were grown at 25�C unless noted otherwise.
1https://www.dsmz.de
346 SCHWIETERMAN ET AL.
could cause specular reflection. The resulting cell mass wasat least 0.5 · 0.5 cm and opaque. See Fig. 2 for an example.Growth media and dead cell matter were removed becausethese factors varied from strain to strain and would com-plicate the direct comparison of one organism to another.Their removal ensured that the spectral features observed inthe subsequent reflectance spectra measurements originatedfrom the pigmented cells.
2.3. Spectral reflectance measurements
Spectral reflectance measurements were made of amonoculture of each species to determine the wavelength-dependent features of the organism’s reflectance spectrumwithout environmental effects. Specifically, we aimed toquantify the location and strength of major spectral features.We assumed the samples were sufficiently thick to be dif-fuse reflectors due to multiple scattering within the cellularlayers (see, e.g., Broschat et al., 2014). The light environ-ments are similarly diffuse above microbial mats mixedwithin a sediment matrix ( Jorgensen and Des Marais, 1988;Kuhl et al., 1997; Decho et al., 2003).
Reflectance spectra measurements were made with anOcean Optics USB2000 + UV/vis spectrometer (Ocean Op-tics grating #3) with 2048 pixel channels, a dispersion of0.32 nm per pixel, and an optical resolution of 4.12 nm. Thespectrometer was attached to a reflectance probe (OceanOptics R400-7) via a 400 lm diameter SMA 905 fiber opticcable. The reflectance probe contained one read fiber and sixilluminating fibers arranged in a circular pattern around theread fiber. An Ocean Optics HL-2000 tungsten-halogen lightsource was joined to the fiber optic cable. A similar experi-mental configuration was described by Decho et al. (2003).
The reflectance probe was secured by an adjustable clampattached to a vertical ring stand. Samples were placed on acustom holder on a level surface below the reflectanceprobe. The probe’s position was maintained 30 mm from thesurface of the sample with a 0� (perpendicular) orientation.The entire sampling apparatus was contained within a cus-tom-built dark box to exclude ambient light. This box wascoated in matte black paper to minimize scattering of lightfrom the light source.
The wavelength-dependent radiance reflectance (R(k))was calculated according to the following equation:
R(k)¼C(k)sample�C(k)dark
C(k)standard�C(k)dark
·tstandard
tsample
· k(k)WS� 1 (1)
where C(k)sample is the counts from the sample measure-ment, C(k)dark is the dark count with no illumination,C(k)standard is the counts measured from the standard, tsample
is the integration time of the sample, tstandard is the inte-gration time of the standard, and k(k)WS-1 is the wavelength-dependent calibration factor for the WS-1 diffuse reflectancestandard. The factor k(k)WS-1 varies between 0.992 and0.993 for the wavelength range measured in this work (ta-bles with the wavelength-dependent calibration factors areavailable on the Ocean Optics Web site2).
Calibrations for reflectance measurements were made asfollows. The light source was turned on several minutesbefore calibration measurements were made. The SpectralonWS-1 diffuse reflectance standard was placed in the sampleposition 30 mm below the reflectance probe. A series of100–500 calibration spectra with integration times of 1 mswere collected from the illuminated reflectance standard.These calibration spectra were averaged and stored tocomputer memory. To measure the dark current, the lightwas blocked from entering the fiber with a switch-operatedinternal shutter, and a complementary series of calibrationspectra were taken and stored to memory. New dark andreflectance calibration spectra were taken before each newsample measurement set.
Three to five spectral sets were recorded for each or-ganism sample. Each set was a series of 100–500 spectralscans encompassing the 0.4–0.85 lm wavelength range.Each scan had an integration time of 1 ms, chosen to achievemaximum signal-to-noise without saturating the detector.The series of spectral scans were then averaged to produce acomposite spectrum. This procedure was repeated 3–5 timesat different locations on the sample surface to produce aspectral set. The location of the sample under the fiber wasadjusted for each composite spectrum in the set, such thatthe sensor viewed a smooth area of the sample to minimizethe effect of surface roughness on the reflectance of theisolated cells. The final spectrum for each organism wascomputed by taking the median value at each wavelengthpoint of the averaged composite spectra in the spectral set.This setup yields spectra with high signal-to-noise for the0.4–0.85 lm spectral range. The standard deviation for anywavelength in the composite spectra was less than 5%.Although the fiber-spectrometer combination had spectralsensitivity from 0.35 to 0.85 lm, shorter wavelengths wereinaccessible because the tungsten-halogen fiber optic lightsource does not produce significant UV light.
2.4. Spectral modeling of simulated planets
In the realistic case of a disk-averaged planetary obser-vation, a pigmented surface will be viewed through an at-mosphere; therefore, a remote observation of a planetaryspectrum will include atmospheric absorption and scattering
FIG. 2. A sample of Brevibacterium aurantiacum beforemeasurement with the Ocean Optics spectrometer.
2http://www.oceanoptics.com
NONPHOTOSYNTHETIC PIGMENTS AS POTENTIAL BIOSIGNATURES 347
effects by gaseous molecules and clouds. To explore theeffects of the atmosphere on the detectability of reflectancefrom surface pigments, we use a radiative transfer model tocalculate top-of-atmosphere spectra for both abiotic andbiotic surfaces observed through an Earth-like atmosphere.We use the abiotic surfaces to compare spectra where bio-signatures are present to those cases where they are notpresent.
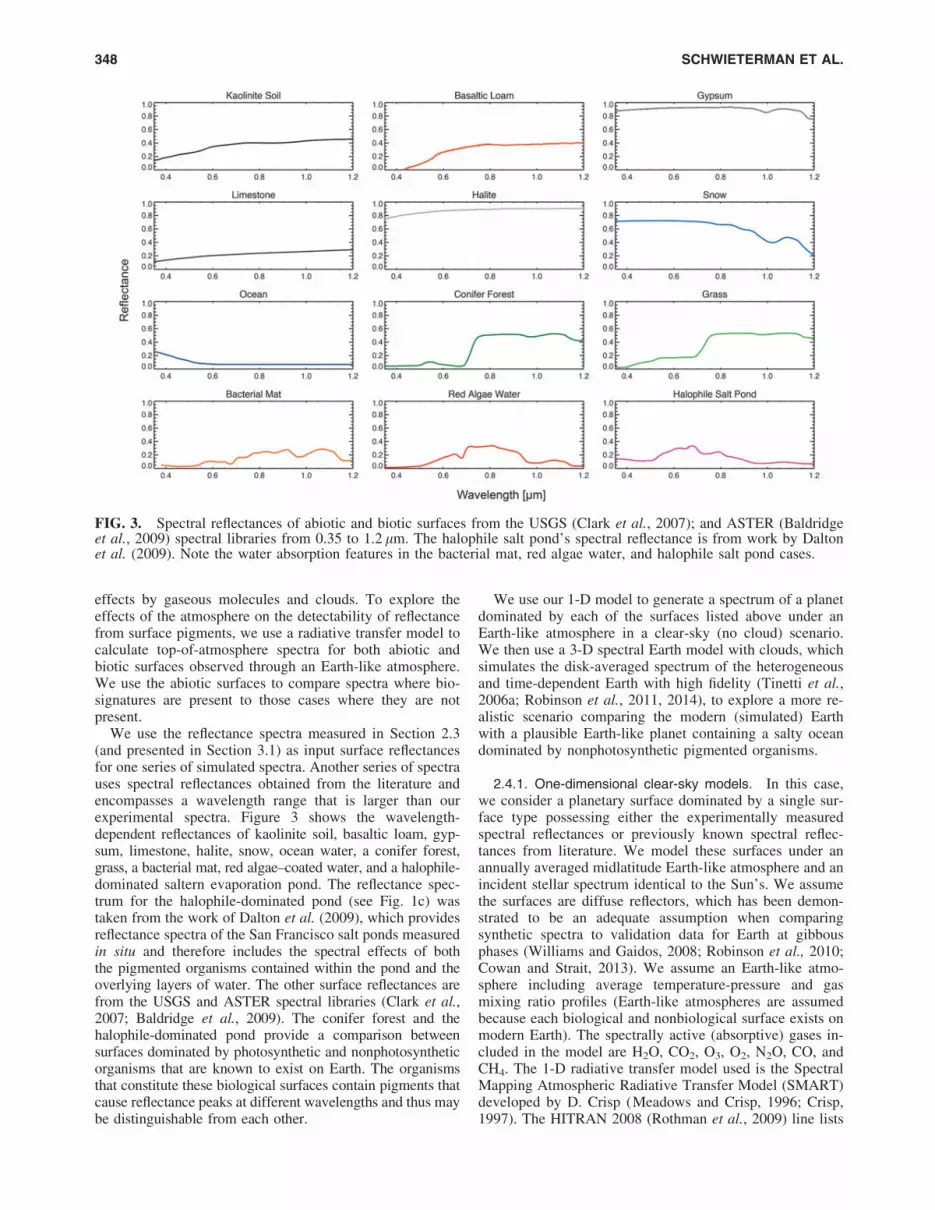
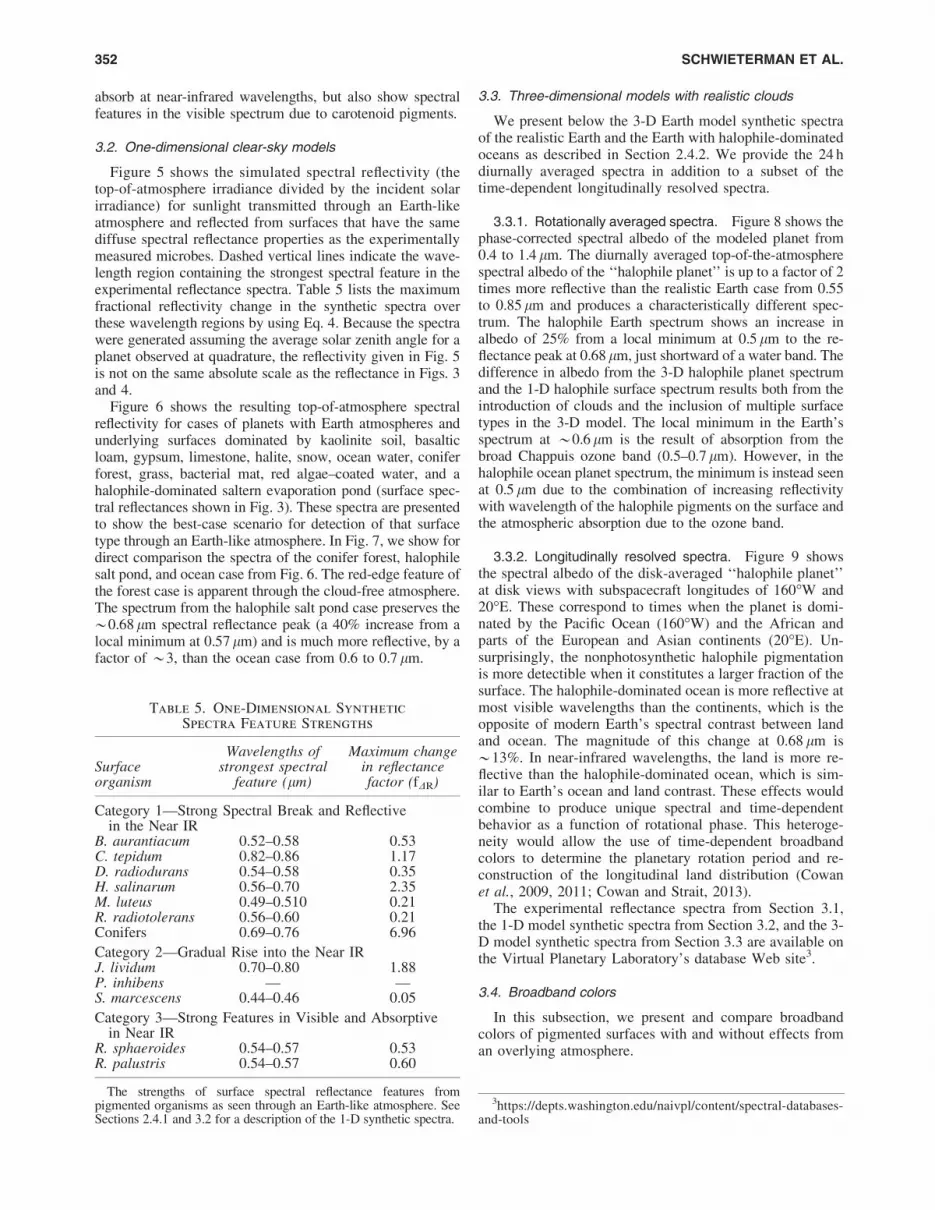
We use the reflectance spectra measured in Section 2.3(and presented in Section 3.1) as input surface reflectancesfor one series of simulated spectra. Another series of spectrauses spectral reflectances obtained from the literature andencompasses a wavelength range that is larger than ourexperimental spectra. Figure 3 shows the wavelength-dependent reflectances of kaolinite soil, basaltic loam, gyp-sum, limestone, halite, snow, ocean water, a conifer forest,grass, a bacterial mat, red algae–coated water, and a halophile-dominated saltern evaporation pond. The reflectance spec-trum for the halophile-dominated pond (see Fig. 1c) wastaken from the work of Dalton et al. (2009), which providesreflectance spectra of the San Francisco salt ponds measuredin situ and therefore includes the spectral effects of boththe pigmented organisms contained within the pond and theoverlying layers of water. The other surface reflectances arefrom the USGS and ASTER spectral libraries (Clark et al.,2007; Baldridge et al., 2009). The conifer forest and thehalophile-dominated pond provide a comparison betweensurfaces dominated by photosynthetic and nonphotosyntheticorganisms that are known to exist on Earth. The organismsthat constitute these biological surfaces contain pigments thatcause reflectance peaks at different wavelengths and thus maybe distinguishable from each other.
We use our 1-D model to generate a spectrum of a planetdominated by each of the surfaces listed above under anEarth-like atmosphere in a clear-sky (no cloud) scenario.We then use a 3-D spectral Earth model with clouds, whichsimulates the disk-averaged spectrum of the heterogeneousand time-dependent Earth with high fidelity (Tinetti et al.,2006a; Robinson et al., 2011, 2014), to explore a more re-alistic scenario comparing the modern (simulated) Earthwith a plausible Earth-like planet containing a salty oceandominated by nonphotosynthetic pigmented organisms.
2.4.1. One-dimensional clear-sky models. In this case,we consider a planetary surface dominated by a single sur-face type possessing either the experimentally measuredspectral reflectances or previously known spectral reflec-tances from literature. We model these surfaces under anannually averaged midlatitude Earth-like atmosphere and anincident stellar spectrum identical to the Sun’s. We assumethe surfaces are diffuse reflectors, which has been demon-strated to be an adequate assumption when comparingsynthetic spectra to validation data for Earth at gibbousphases (Williams and Gaidos, 2008; Robinson et al., 2010;Cowan and Strait, 2013). We assume an Earth-like atmo-sphere including average temperature-pressure and gasmixing ratio profiles (Earth-like atmospheres are assumedbecause each biological and nonbiological surface exists onmodern Earth). The spectrally active (absorptive) gases in-cluded in the model are H2O, CO2, O3, O2, N2O, CO, andCH4. The 1-D radiative transfer model used is the SpectralMapping Atmospheric Radiative Transfer Model (SMART)developed by D. Crisp (Meadows and Crisp, 1996; Crisp,1997). The HITRAN 2008 (Rothman et al., 2009) line lists
FIG. 3. Spectral reflectances of abiotic and biotic surfaces from the USGS (Clark et al., 2007); and ASTER (Baldridgeet al., 2009) spectral libraries from 0.35 to 1.2 lm. The halophile salt pond’s spectral reflectance is from work by Daltonet al. (2009). Note the water absorption features in the bacterial mat, red algae water, and halophile salt pond cases.
348 SCHWIETERMAN ET AL.
were used to calculate the absorption cross-sections for eachspectrally active gas. The resolution of the spectral grid inthe model was 1 cm - 1, which corresponds to a wavelengthresolution of Dk = 2.5 · 10 - 5 lm at k = 0.5 lm. We used asingle solar zenith angle of 60�, which approximates theillumination observed in a planetary disk average (Seguraet al., 2005), and consider cases with no cloud cover. Thismimics a clear sounding through the atmosphere and is onlyachievable for a partially cloud-covered planet when theobservation has adequate spatial resolution. Realistically,some level of cloud cover is expected, and while obtaininglongitudinally resolved observations of terrestrial exoplanetsmay be possible with adequately time-resolved photometryfrom future space-based telescopes (Cowan et al., 2009,2011; Cowan and Strait, 2013), the spatial resolution ob-tainable will span a significant fraction of the planet and sowill likely still include clouds. While this will affect abso-lute detectability of surface reflectance biosignatures, it willnot introduce spurious wavelength-dependent features in thespectrum because clouds are approximately gray (i.e., theyhave largely wavelength-independent reflectivity) in thevisible regime. The spectrum of a partially cloud-coveredplanet will be a linear combination of spectra from clearsoundings and spectra from fully and partially cloud-coveredsoundings. The effect on the planetary spectrum of spatiallyinhomogeneous clouds is more fully captured in the 3-Dmodel described below.
2.4.2. Three-dimensional spectral Earth model. To bet-ter assess the detectability of the most promising non-photosynthetic pigmented organism in a plausible context,and to compare with spatially resolved models of inhabitedEarth-like planets in the literature (e.g., Tinetti et al., 2006b;Robinson et al., 2011; Sanroma et al., 2013, 2014), weproduced more comprehensive whole-planet spectra thatcontain the confounding effects of spatially resolved cloudsand different surface types. To do this we use the VirtualPlanetary Laboratory’s 3-D spectrally resolved Earth model(described by Robinson et al., 2011). Briefly, this modelincorporates data from Earth-observing satellites, includingspatially dependent snow and cloud cover, surface temper-ature, and gas mixing ratio profiles, as input to a spatiallyand altitudinally resolved radiative transfer model of a dis-tant Earth-like planet. These properties were interpolatedfrom high-spatial-resolution onto lower-resolution maps byusing the Hierarchical Equal Area and isoLatitude Pix-elization (HEALPix) method (Gorski et al., 2004). For themodel runs presented here, the atmospheric parametersvaried spatially over 48 atmospheric pixels with 40 verticallayers, and the surface was approximated as 192 pixels. Thesurface reflectance of each surface pixel was calculated as alinear combination of five surface types (ocean, soil, snow,forest, and grassland). The modern Earth continental ar-rangement is used for the land and ocean spatial distribution.We assume the observer is viewing the disk-averaged planetfrom an approximately sub-equatorial latitude (1.6�N) and aSun-planet-observer phase angle of 57.7� over a 24 h periodfrom March 18–19. This date was chosen because the Vir-tual Planetary Laboratory’s Earth model has already beenvalidated on this date with observed near-infrared andbroadband visible spectra taken during the EPOXI missionby the Deep Impact spacecraft (Livengood et al., 2011;
Robinson et al., 2011). The disk-integrated spectrum of theplanet produced by the model was divided by a solarspectrum corrected for phase (i.e., partial illumination of theplanet) with a Lambertian phase function, to produce thewhole-disk planetary spectral albedo (hereafter referred toas the ‘‘albedo’’). It has been shown that Earth’s phasefunction only deviates significantly from a Lambertianfunction near crescent phase (phase angles near zero) whereglint (specular reflection from the ocean) and cloud forwardscattering become important (Williams and Gaidos, 2008;Robinson et al., 2010).
To explore the potential detectability of a non-photosynthetic pigment with as comprehensive a model aspossible, we used the 3-D spectral Earth model describedabove to compare the spectrum of a realistic Earth with asimilar model case in which the spectral reflectance of theoceans has been replaced by that of the halophile-dominatedsaltern pond. This environment was chosen for furthermodeling because the halophile spectrum produced a strongspectral signature that was comparable in strength to that ofphotosynthetic plants (e.g., the conifer forest), and so had ahigher probability of being detectable in the disk-average.This simulation approximates a scenario in which an Earth-like planet contains a very salty, shallow ocean populated bypigmented halophilic organisms at the same density found inthe San Francisco saltern ponds with the highest salinity(Dalton et al., 2009), but with the same cloud and snow/icecover of modern Earth. This ‘‘halophile Earth’’ case presentsa best-case end-member scenario for the surface coverage ofpigmented halophilic organisms on an Earth-like planet.
2.5. Broadband colors
Broadband colors were calculated to investigate theirusefulness in identifying exoplanet surface types via astro-nomical observations and to search for possible patternswhen comparing the colors produced by biotic or abioticsurfaces. Broadband color in this context is the difference inbrightness between two bands. In astronomical observations,this is reported as a logarithm. To compare two bands X andY, we used the equation
CXY ¼X�Y ¼ � 2:5 � log10
rX
rY
� �(2)
where rX is the reflectivity in band X and rY is the reflectivityin band Y. We define reflectivity here as the irradiance fromthe planet in a given band divided by the irradiance of theincident solar spectrum. Typically in astronomical obser-vations color is a difference in observed flux between bands,which will vary as a function of the host star’s spectrumwhen the flux from the target object is composed of reflectedlight from the star. Here, we use reflectivity only in calcu-lating broadband colors and assume that the host star’sspectrum, which will be known, has been divided out of theobserved planet flux. We first calculate broadband colors ofthe experimentally measured reflectance spectra, and thebiotic and abiotic surfaces from spectral libraries, neglectingthe effects from atmospheric absorption and scattering. Wethen calculate the colors using our simulated spectra (Sec-tion 2.4) that account for the effects of viewing a surfacethrough a planetary atmosphere. We define three bands for
NONPHOTOSYNTHETIC PIGMENTS AS POTENTIAL BIOSIGNATURES 349
our illustration: B* = Blue = 0.4–0.5 lm, V* = Visible = 0.5–0.7 lm, and I* = Infrared = 0.7–0.85 lm. These bands aremodeled after the Johnson-Cousins BVI bands but differ inthat they have perfect transmission through the entire ide-alized filter band-pass for comparison with other studies ofbroadband colors of planetary surfaces (e.g., Hegde andKaltenegger, 2013). The infrared band additionally has asmaller width and terminates at a shorter wavelength(0.85 lm vs. *0.9 lm) due to limitations on our measure-ments from the Ocean Optics spectrometer.
3. Results
3.1. Reflectance spectra measurements
The reflectance spectrum for each organism we measuredin the laboratory is shown in Fig. 4. The wavelength-de-pendent spectral reflectance of a conifer forest, obtainedfrom the ASTER spectral library (Baldridge et al., 2009), isprovided for comparison. The strength of spectral breakfeatures such as the VRE can be quantified by measuring thereflectance change between the maximum reflectance andthe nearest local minimum in reflectance, given here as
DR¼Rkmax�Rkmin
(3)
where Rkmaxis the maximum reflectance and Rkmin
is thereflectance at the nearest local minimum. Another way to
quantify the strength of the spectral feature is to calculatethe change in reflectance factor (fDR) over a wavelengthinterval:
fDR¼Rkmax
�Rkmin
Rkmin
¼ DR
Rkmin
(4)
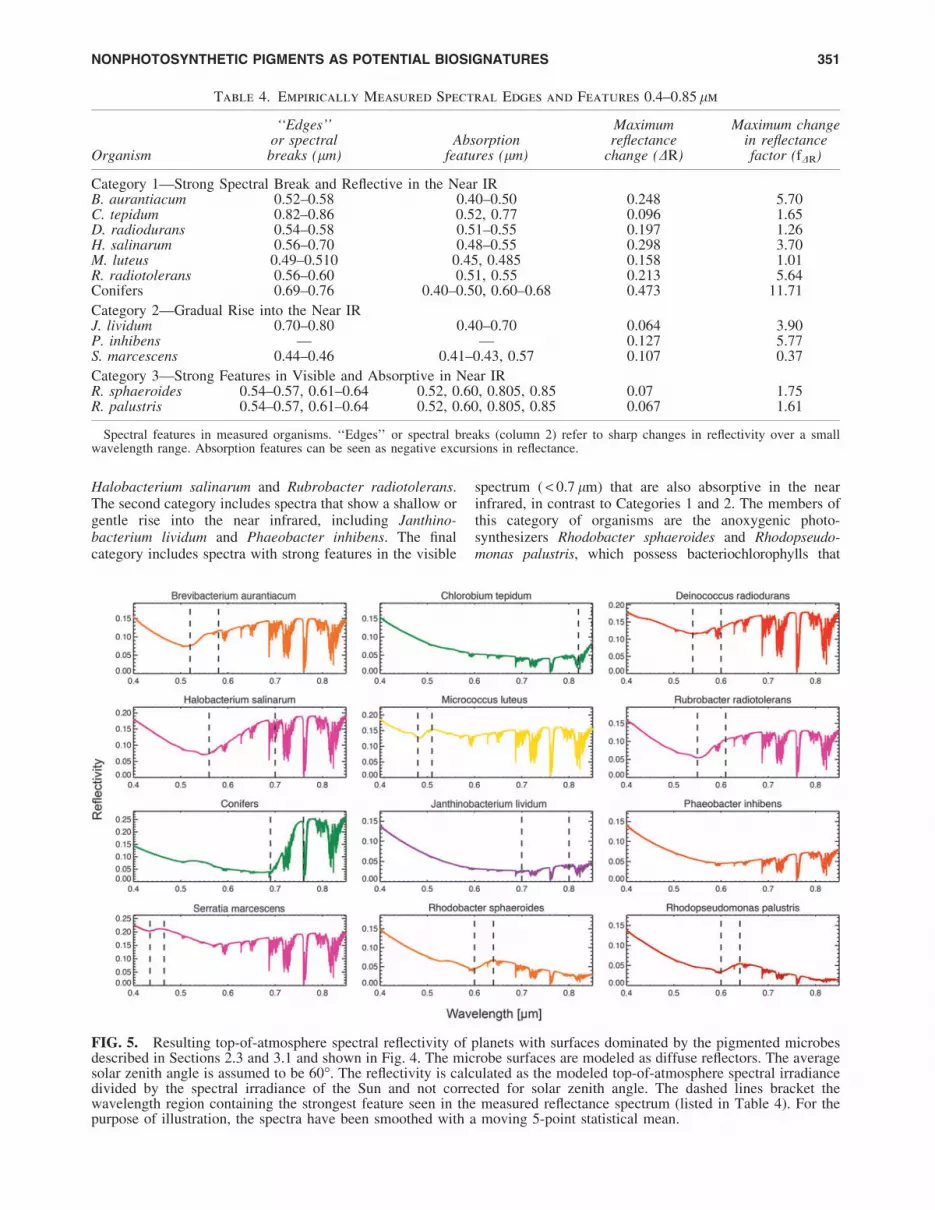
Table 4 reports the locations of notable spectral featuresin our measured reflectance spectra and the strength of thosefeatures as defined above. The strength of the red edge for aconifer forest, an increase in reflectance from 0.69 to0.77 lm of DR * 0.5 and fDR * 12, is in the upper range ofred edge strength. Other vegetation and photosynthetic or-ganisms may have substantially weaker red edges (Kianget al., 2007a). As shown in the figure and table, there is adiverse range of spectral features in the measured organ-isms, including edge features that are well within a factor of2 of the conifer forest red edge strength. Especially notableis H. salinarum, which has DR * 0.3 and fDR * 4 over awavelength interval comparable to the conifer forest rededge rise.
We split the spectra into three categories based on thestrength and location of major spectral features (alsoshown in Table 4). The first category includes spectra witha strong spectral break or reflectance increase into the redor near infrared. This category includes the red-edgeproducing conifers and the bacterioruberin-containing
FIG. 4. Spectra of all 11 pigmented microorganisms studied in this work organized and grouped into the categories givenin Table 4. The seventh panel is the reflectance spectrum of a conifer forest taken from the ASTER spectral library(Baldridge et al., 2009). Spectra were taken from 0.4 to 0.85 lm. The dashed lines bracket the wavelength region containingthe strongest spectral feature (listed in Table 4). Note that the vertical axes have different scales in order to show the spectralfeatures of all organisms.
350 SCHWIETERMAN ET AL.
Halobacterium salinarum and Rubrobacter radiotolerans.The second category includes spectra that show a shallow orgentle rise into the near infrared, including Janthino-bacterium lividum and Phaeobacter inhibens. The finalcategory includes spectra with strong features in the visible
spectrum ( < 0.7 lm) that are also absorptive in the nearinfrared, in contrast to Categories 1 and 2. The members ofthis category of organisms are the anoxygenic photo-synthesizers Rhodobacter sphaeroides and Rhodopseudo-monas palustris, which possess bacteriochlorophylls that
Table 4. Empirically Measured Spectral Edges and Features 0.4–0.85 lm
Category 2—Gradual Rise into the Near IRJ. lividum 0.70–0.80 0.40–0.70 0.064 3.90P. inhibens — — 0.127 5.77S. marcescens 0.44–0.46 0.41–0.43, 0.57 0.107 0.37
Category 3—Strong Features in Visible and Absorptive in Near IRR. sphaeroides 0.54–0.57, 0.61–0.64 0.52, 0.60, 0.805, 0.85 0.07 1.75R. palustris 0.54–0.57, 0.61–0.64 0.52, 0.60, 0.805, 0.85 0.067 1.61
Spectral features in measured organisms. ‘‘Edges’’ or spectral breaks (column 2) refer to sharp changes in reflectivity over a smallwavelength range. Absorption features can be seen as negative excursions in reflectance.
FIG. 5. Resulting top-of-atmosphere spectral reflectivity of planets with surfaces dominated by the pigmented microbesdescribed in Sections 2.3 and 3.1 and shown in Fig. 4. The microbe surfaces are modeled as diffuse reflectors. The averagesolar zenith angle is assumed to be 60�. The reflectivity is calculated as the modeled top-of-atmosphere spectral irradiancedivided by the spectral irradiance of the Sun and not corrected for solar zenith angle. The dashed lines bracket thewavelength region containing the strongest feature seen in the measured reflectance spectrum (listed in Table 4). For thepurpose of illustration, the spectra have been smoothed with a moving 5-point statistical mean.
NONPHOTOSYNTHETIC PIGMENTS AS POTENTIAL BIOSIGNATURES 351
absorb at near-infrared wavelengths, but also show spectralfeatures in the visible spectrum due to carotenoid pigments.
3.2. One-dimensional clear-sky models
Figure 5 shows the simulated spectral reflectivity (thetop-of-atmosphere irradiance divided by the incident solarirradiance) for sunlight transmitted through an Earth-likeatmosphere and reflected from surfaces that have the samediffuse spectral reflectance properties as the experimentallymeasured microbes. Dashed vertical lines indicate the wave-length region containing the strongest spectral feature in theexperimental reflectance spectra. Table 5 lists the maximumfractional reflectivity change in the synthetic spectra overthese wavelength regions by using Eq. 4. Because the spectrawere generated assuming the average solar zenith angle for aplanet observed at quadrature, the reflectivity given in Fig. 5is not on the same absolute scale as the reflectance in Figs. 3and 4.
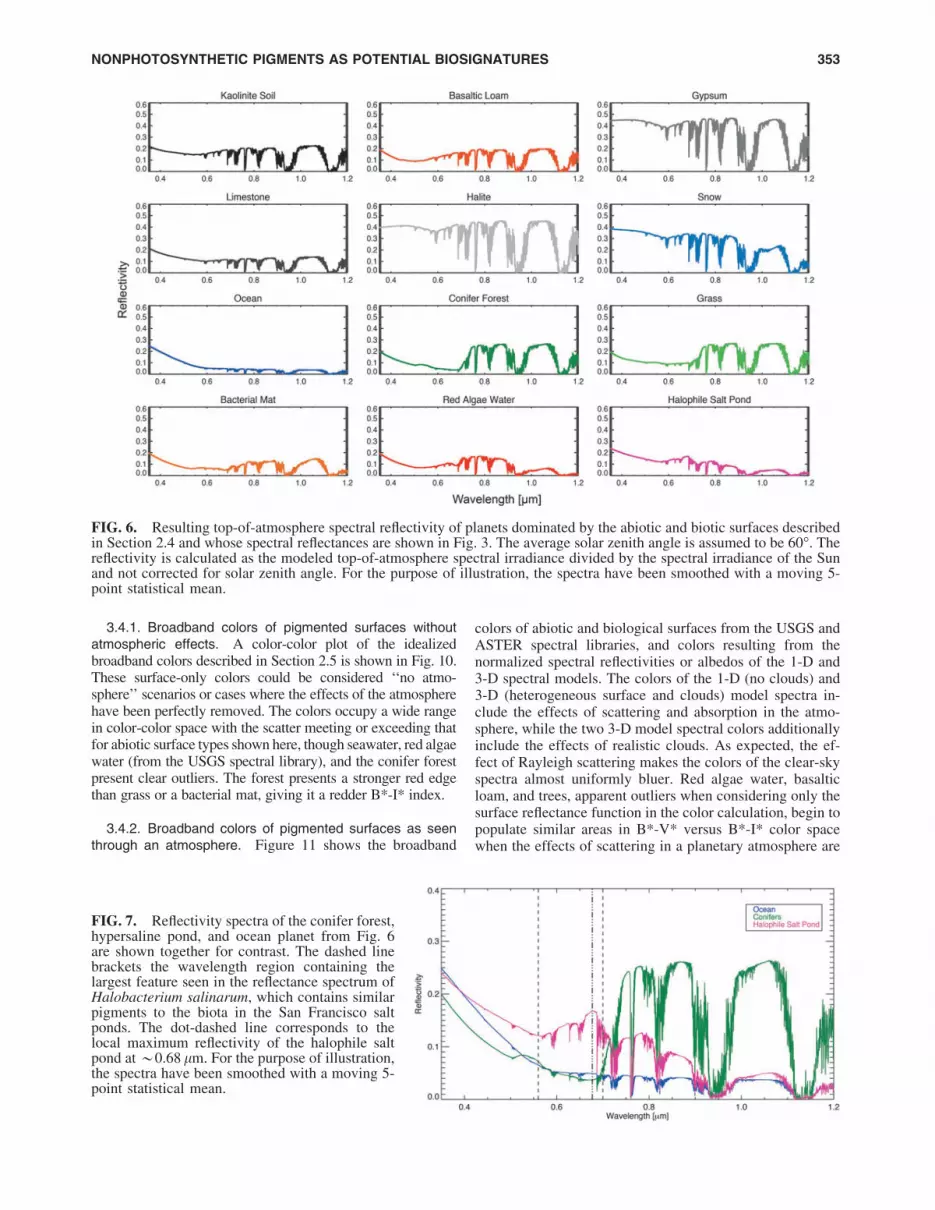
Figure 6 shows the resulting top-of-atmosphere spectralreflectivity for cases of planets with Earth atmospheres andunderlying surfaces dominated by kaolinite soil, basalticloam, gypsum, limestone, halite, snow, ocean water, coniferforest, grass, bacterial mat, red algae–coated water, and ahalophile-dominated saltern evaporation pond (surface spec-tral reflectances shown in Fig. 3). These spectra are presentedto show the best-case scenario for detection of that surfacetype through an Earth-like atmosphere. In Fig. 7, we show fordirect comparison the spectra of the conifer forest, halophilesalt pond, and ocean case from Fig. 6. The red-edge feature ofthe forest case is apparent through the cloud-free atmosphere.The spectrum from the halophile salt pond case preserves the*0.68 lm spectral reflectance peak (a 40% increase from alocal minimum at 0.57 lm) and is much more reflective, by afactor of *3, than the ocean case from 0.6 to 0.7 lm.
3.3. Three-dimensional models with realistic clouds
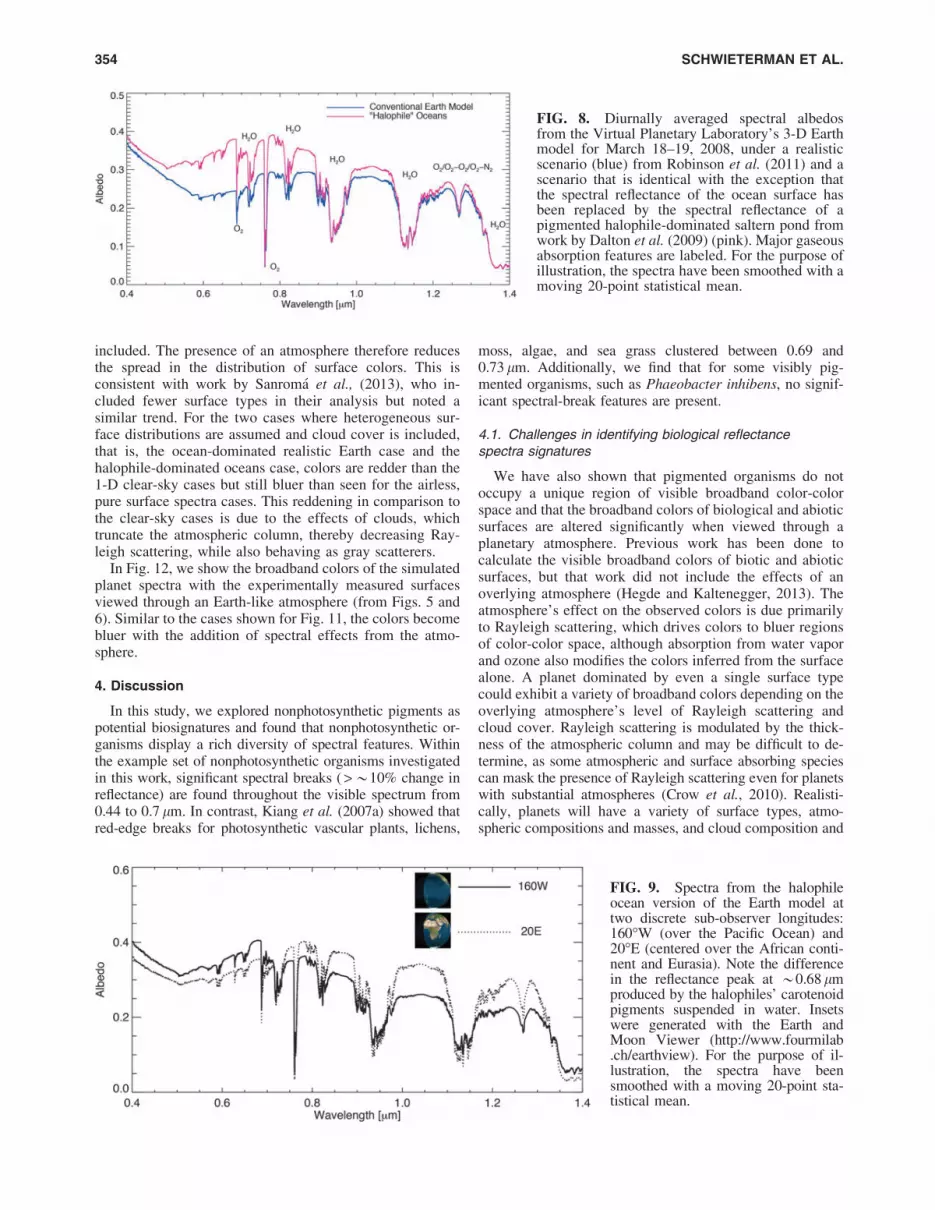
We present below the 3-D Earth model synthetic spectraof the realistic Earth and the Earth with halophile-dominatedoceans as described in Section 2.4.2. We provide the 24 hdiurnally averaged spectra in addition to a subset of thetime-dependent longitudinally resolved spectra.
3.3.1. Rotationally averaged spectra. Figure 8 shows thephase-corrected spectral albedo of the modeled planet from0.4 to 1.4 lm. The diurnally averaged top-of-the-atmospherespectral albedo of the ‘‘halophile planet’’ is up to a factor of 2times more reflective than the realistic Earth case from 0.55to 0.85 lm and produces a characteristically different spec-trum. The halophile Earth spectrum shows an increase inalbedo of 25% from a local minimum at 0.5 lm to the re-flectance peak at 0.68 lm, just shortward of a water band. Thedifference in albedo from the 3-D halophile planet spectrumand the 1-D halophile surface spectrum results both from theintroduction of clouds and the inclusion of multiple surfacetypes in the 3-D model. The local minimum in the Earth’sspectrum at *0.6 lm is the result of absorption from thebroad Chappuis ozone band (0.5–0.7 lm). However, in thehalophile ocean planet spectrum, the minimum is instead seenat 0.5 lm due to the combination of increasing reflectivitywith wavelength of the halophile pigments on the surface andthe atmospheric absorption due to the ozone band.
3.3.2. Longitudinally resolved spectra. Figure 9 showsthe spectral albedo of the disk-averaged ‘‘halophile planet’’at disk views with subspacecraft longitudes of 160�W and20�E. These correspond to times when the planet is domi-nated by the Pacific Ocean (160�W) and the African andparts of the European and Asian continents (20�E). Un-surprisingly, the nonphotosynthetic halophile pigmentationis more detectible when it constitutes a larger fraction of thesurface. The halophile-dominated ocean is more reflective atmost visible wavelengths than the continents, which is theopposite of modern Earth’s spectral contrast between landand ocean. The magnitude of this change at 0.68 lm is*13%. In near-infrared wavelengths, the land is more re-flective than the halophile-dominated ocean, which is sim-ilar to Earth’s ocean and land contrast. These effects wouldcombine to produce unique spectral and time-dependentbehavior as a function of rotational phase. This heteroge-neity would allow the use of time-dependent broadbandcolors to determine the planetary rotation period and re-construction of the longitudinal land distribution (Cowanet al., 2009, 2011; Cowan and Strait, 2013).
The experimental reflectance spectra from Section 3.1,the 1-D model synthetic spectra from Section 3.2, and the 3-D model synthetic spectra from Section 3.3 are available onthe Virtual Planetary Laboratory’s database Web site3.
3.4. Broadband colors
In this subsection, we present and compare broadbandcolors of pigmented surfaces with and without effects froman overlying atmosphere.
Table 5. One-Dimensional Synthetic
Spectra Feature Strengths
Surfaceorganism
Wavelengths ofstrongest spectral
feature (lm)
Maximum changein reflectancefactor (fDR)
Category 1—Strong Spectral Break and Reflectivein the Near IR
Category 2—Gradual Rise into the Near IRJ. lividum 0.70–0.80 1.88P. inhibens — —S. marcescens 0.44–0.46 0.05
Category 3—Strong Features in Visible and Absorptivein Near IR
R. sphaeroides 0.54–0.57 0.53R. palustris 0.54–0.57 0.60
The strengths of surface spectral reflectance features frompigmented organisms as seen through an Earth-like atmosphere. SeeSections 2.4.1 and 3.2 for a description of the 1-D synthetic spectra.
3.4.1. Broadband colors of pigmented surfaces withoutatmospheric effects. A color-color plot of the idealizedbroadband colors described in Section 2.5 is shown in Fig. 10.These surface-only colors could be considered ‘‘no atmo-sphere’’ scenarios or cases where the effects of the atmospherehave been perfectly removed. The colors occupy a wide rangein color-color space with the scatter meeting or exceeding thatfor abiotic surface types shown here, though seawater, red algaewater (from the USGS spectral library), and the conifer forestpresent clear outliers. The forest presents a stronger red edgethan grass or a bacterial mat, giving it a redder B*-I* index.
3.4.2. Broadband colors of pigmented surfaces as seenthrough an atmosphere. Figure 11 shows the broadband
colors of abiotic and biological surfaces from the USGS andASTER spectral libraries, and colors resulting from thenormalized spectral reflectivities or albedos of the 1-D and3-D spectral models. The colors of the 1-D (no clouds) and3-D (heterogeneous surface and clouds) model spectra in-clude the effects of scattering and absorption in the atmo-sphere, while the two 3-D model spectral colors additionallyinclude the effects of realistic clouds. As expected, the ef-fect of Rayleigh scattering makes the colors of the clear-skyspectra almost uniformly bluer. Red algae water, basalticloam, and trees, apparent outliers when considering only thesurface reflectance function in the color calculation, begin topopulate similar areas in B*-V* versus B*-I* color spacewhen the effects of scattering in a planetary atmosphere are
FIG. 6. Resulting top-of-atmosphere spectral reflectivity of planets dominated by the abiotic and biotic surfaces describedin Section 2.4 and whose spectral reflectances are shown in Fig. 3. The average solar zenith angle is assumed to be 60�. Thereflectivity is calculated as the modeled top-of-atmosphere spectral irradiance divided by the spectral irradiance of the Sunand not corrected for solar zenith angle. For the purpose of illustration, the spectra have been smoothed with a moving 5-point statistical mean.
FIG. 7. Reflectivity spectra of the conifer forest,hypersaline pond, and ocean planet from Fig. 6are shown together for contrast. The dashed linebrackets the wavelength region containing thelargest feature seen in the reflectance spectrum ofHalobacterium salinarum, which contains similarpigments to the biota in the San Francisco saltponds. The dot-dashed line corresponds to thelocal maximum reflectivity of the halophile saltpond at *0.68 lm. For the purpose of illustration,the spectra have been smoothed with a moving 5-point statistical mean.
NONPHOTOSYNTHETIC PIGMENTS AS POTENTIAL BIOSIGNATURES 353
included. The presence of an atmosphere therefore reducesthe spread in the distribution of surface colors. This isconsistent with work by Sanroma et al., (2013), who in-cluded fewer surface types in their analysis but noted asimilar trend. For the two cases where heterogeneous sur-face distributions are assumed and cloud cover is included,that is, the ocean-dominated realistic Earth case and thehalophile-dominated oceans case, colors are redder than the1-D clear-sky cases but still bluer than seen for the airless,pure surface spectra cases. This reddening in comparison tothe clear-sky cases is due to the effects of clouds, whichtruncate the atmospheric column, thereby decreasing Ray-leigh scattering, while also behaving as gray scatterers.
In Fig. 12, we show the broadband colors of the simulatedplanet spectra with the experimentally measured surfacesviewed through an Earth-like atmosphere (from Figs. 5 and6). Similar to the cases shown for Fig. 11, the colors becomebluer with the addition of spectral effects from the atmo-sphere.
4. Discussion
In this study, we explored nonphotosynthetic pigments aspotential biosignatures and found that nonphotosynthetic or-ganisms display a rich diversity of spectral features. Withinthe example set of nonphotosynthetic organisms investigatedin this work, significant spectral breaks ( >*10% change inreflectance) are found throughout the visible spectrum from0.44 to 0.7 lm. In contrast, Kiang et al. (2007a) showed thatred-edge breaks for photosynthetic vascular plants, lichens,
moss, algae, and sea grass clustered between 0.69 and0.73 lm. Additionally, we find that for some visibly pig-mented organisms, such as Phaeobacter inhibens, no signif-icant spectral-break features are present.
4.1. Challenges in identifying biological reflectancespectra signatures
We have also shown that pigmented organisms do notoccupy a unique region of visible broadband color-colorspace and that the broadband colors of biological and abioticsurfaces are altered significantly when viewed through aplanetary atmosphere. Previous work has been done tocalculate the visible broadband colors of biotic and abioticsurfaces, but that work did not include the effects of anoverlying atmosphere (Hegde and Kaltenegger, 2013). Theatmosphere’s effect on the observed colors is due primarilyto Rayleigh scattering, which drives colors to bluer regionsof color-color space, although absorption from water vaporand ozone also modifies the colors inferred from the surfacealone. A planet dominated by even a single surface typecould exhibit a variety of broadband colors depending on theoverlying atmosphere’s level of Rayleigh scattering andcloud cover. Rayleigh scattering is modulated by the thick-ness of the atmospheric column and may be difficult to de-termine, as some atmospheric and surface absorbing speciescan mask the presence of Rayleigh scattering even for planetswith substantial atmospheres (Crow et al., 2010). Realisti-cally, planets will have a variety of surface types, atmo-spheric compositions and masses, and cloud composition and
FIG. 8. Diurnally averaged spectral albedosfrom the Virtual Planetary Laboratory’s 3-D Earthmodel for March 18–19, 2008, under a realisticscenario (blue) from Robinson et al. (2011) and ascenario that is identical with the exception thatthe spectral reflectance of the ocean surface hasbeen replaced by the spectral reflectance of apigmented halophile-dominated saltern pond fromwork by Dalton et al. (2009) (pink). Major gaseousabsorption features are labeled. For the purpose ofillustration, the spectra have been smoothed with amoving 20-point statistical mean.
FIG. 9. Spectra from the halophileocean version of the Earth model attwo discrete sub-observer longitudes:160�W (over the Pacific Ocean) and20�E (centered over the African conti-nent and Eurasia). Note the differencein the reflectance peak at *0.68 lmproduced by the halophiles’ carotenoidpigments suspended in water. Insetswere generated with the Earth andMoon Viewer (http://www.fourmilab.ch/earthview). For the purpose of il-lustration, the spectra have beensmoothed with a moving 20-point sta-tistical mean.
354 SCHWIETERMAN ET AL.
fractional coverage. The observed colors will therefore behighly degenerate, with similar colors being produced by alarge variety of possible planetary environments.
The surface reflection signal of any possible surface biotawill also be a component of a larger, complex planetaryenvironment, which will have its own effects on the re-
flectance spectrum. This will make attributing specificspectral features to life implausible without informationabout the planetary context. If the dominant pigments for theorganisms are nonphotosynthetic, there is a large range ofpossible wavelengths where significant spectral featuresmay appear. Analogues of the VRE may be predicted based
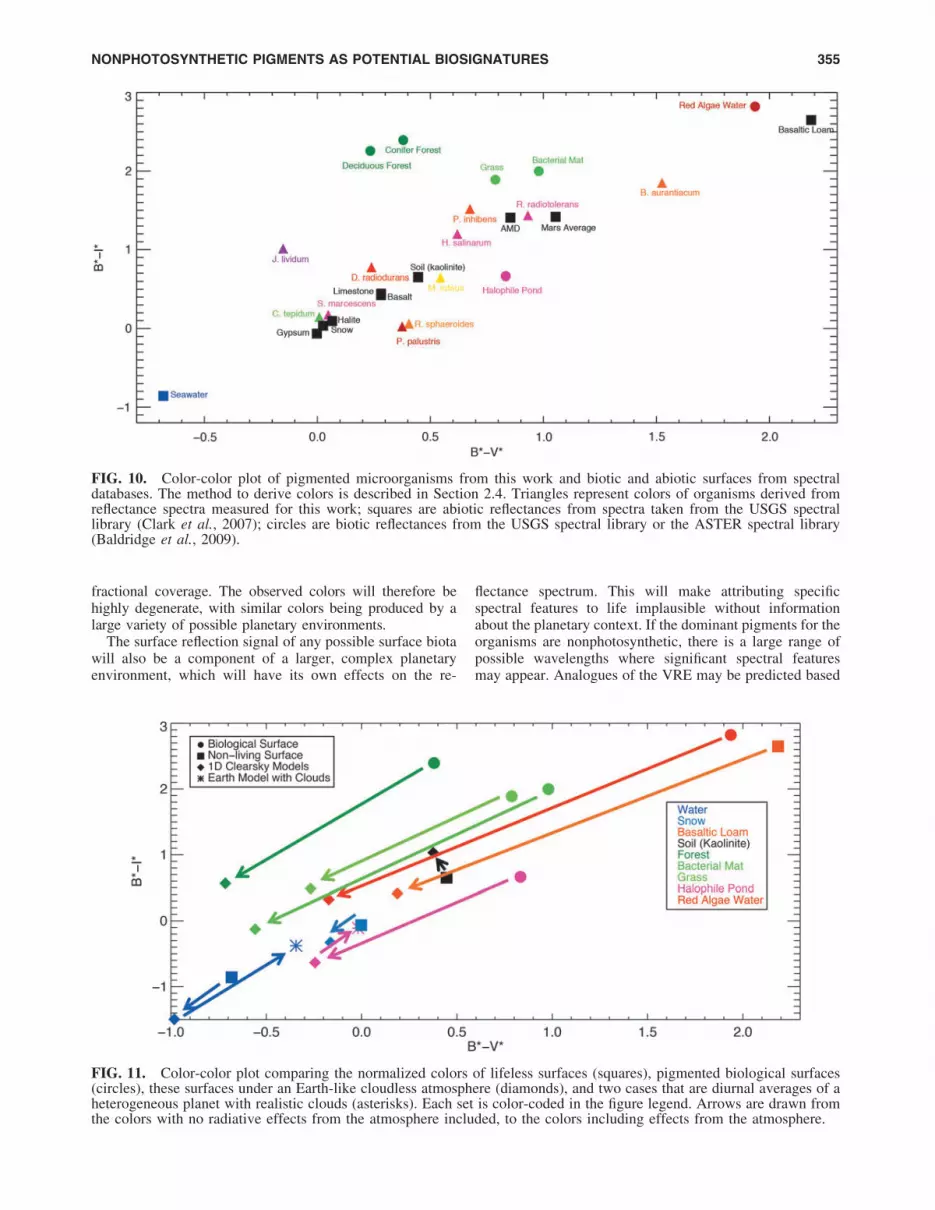
FIG. 10. Color-color plot of pigmented microorganisms from this work and biotic and abiotic surfaces from spectraldatabases. The method to derive colors is described in Section 2.4. Triangles represent colors of organisms derived fromreflectance spectra measured for this work; squares are abiotic reflectances from spectra taken from the USGS spectrallibrary (Clark et al., 2007); circles are biotic reflectances from the USGS spectral library or the ASTER spectral library(Baldridge et al., 2009).
FIG. 11. Color-color plot comparing the normalized colors of lifeless surfaces (squares), pigmented biological surfaces(circles), these surfaces under an Earth-like cloudless atmosphere (diamonds), and two cases that are diurnal averages of aheterogeneous planet with realistic clouds (asterisks). Each set is color-coded in the figure legend. Arrows are drawn fromthe colors with no radiative effects from the atmosphere included, to the colors including effects from the atmosphere.
NONPHOTOSYNTHETIC PIGMENTS AS POTENTIAL BIOSIGNATURES 355
on the wavelength for the peak photon-flux at the planetarysurface if the incident stellar spectrum and the planetaryatmospheric parameters are well known (Kiang et al.,2007a, 2007b). However, if the most widespread or de-tectable surface organisms are not photosynthetic, then thestrongest spectral breaks may not be at the predictedwavelengths. Even many anoxygenic photosynthesizers onEarth do not have spectral breaks near 0.7 lm due to bac-teriochlorophylls that absorb at longer wavelengths (Hoh-mann-Marriott and Blankenship, 2012). For this reason, anddue to possible degeneracies with other planetary properties,a few preselected narrowband filters would not be able todistinguish between the vast diversity of possible features,and the best discrimination of the source of the surface re-flectivity would likely require an evaluation of the wholevisible spectrum with spectrally resolved data.
Examination of the planetary context could also rule outsome of the false-positive possibilities for biological surfacereflectance features. For example, the minerals, such assulfur compounds, that have been posited as a possible falsepositive for the VRE (Seager et al., 2005) are much brighterat near-infrared wavelengths than water (Clark et al., 2007;Baldridge et al., 2009). Therefore, if a larger spectral rangeis accessible, it may be possible to discriminate mineralsfrom pigments suspended in water, as the latter will showmuch lower albedos at near-infrared wavelengths because ofabsorption from the overlying water.
4.2. Plausibility of widespread environmentsconducive to nonphotosynthetic life
Pigmented nonphotosynthetic organisms inhabit envi-ronments on Earth that could exist on other habitable ter-restrial planets. An example of this type of environment ishypersaline ponds, whose spectral reflectances are often
dominated by nonphotosynthetic pigmented halophiles. The‘‘halophile planet’’ modeled in this study is a best-casescenario for a planet that possesses significant coverage ofnonphotosynthetic pigments, although it is plausible thatsimilar environments may exist on terrestrial planets withthe right conditions. For example, high-salinity environ-ments may be more extensive on a planet with shalloweroceans or different weathering rates (Pierrehumbert, 2010).The high-salinity environment is hostile to many potentialgrazers, and the resulting lack of predation allows the mi-crobial inhabitants of high-salt ponds to exist at high den-sities even with low levels of primary productivity (Oren,2009). The same type of scenario is observed in high-temperature hot springs, where thermophilic bacteria cangrow into biofilms in part because they face little to nopredation. Other ‘‘extreme’’ environmental conditions, suchas an anoxic atmosphere, may also preclude macroscopicgrazers, as was the case on Earth before the origin of ani-mals *575 million years ago (Narbonne, 2005). The sup-pression of predation due to lack of oxygen could potentiallyallow for a much larger—and therefore more detectable—steady-state biomass, without requiring extremes in salinityor temperature.
4.3. Remote detectability of nonphotosyntheticlife with spectrally resolved data
In contrast to information from broadband filters, spec-trally resolved data is sensitive to reflectance features, suchas spectral breaks, that may be indicative of surface life,such as photosynthetic analogues to the VRE or the non-photosynthetic organisms included in this study. The re-flective pigments of nonphotosynthetic organisms suspendedin water may be distinguished from abiotic features by ex-amining the spectral shape of the feature and determining
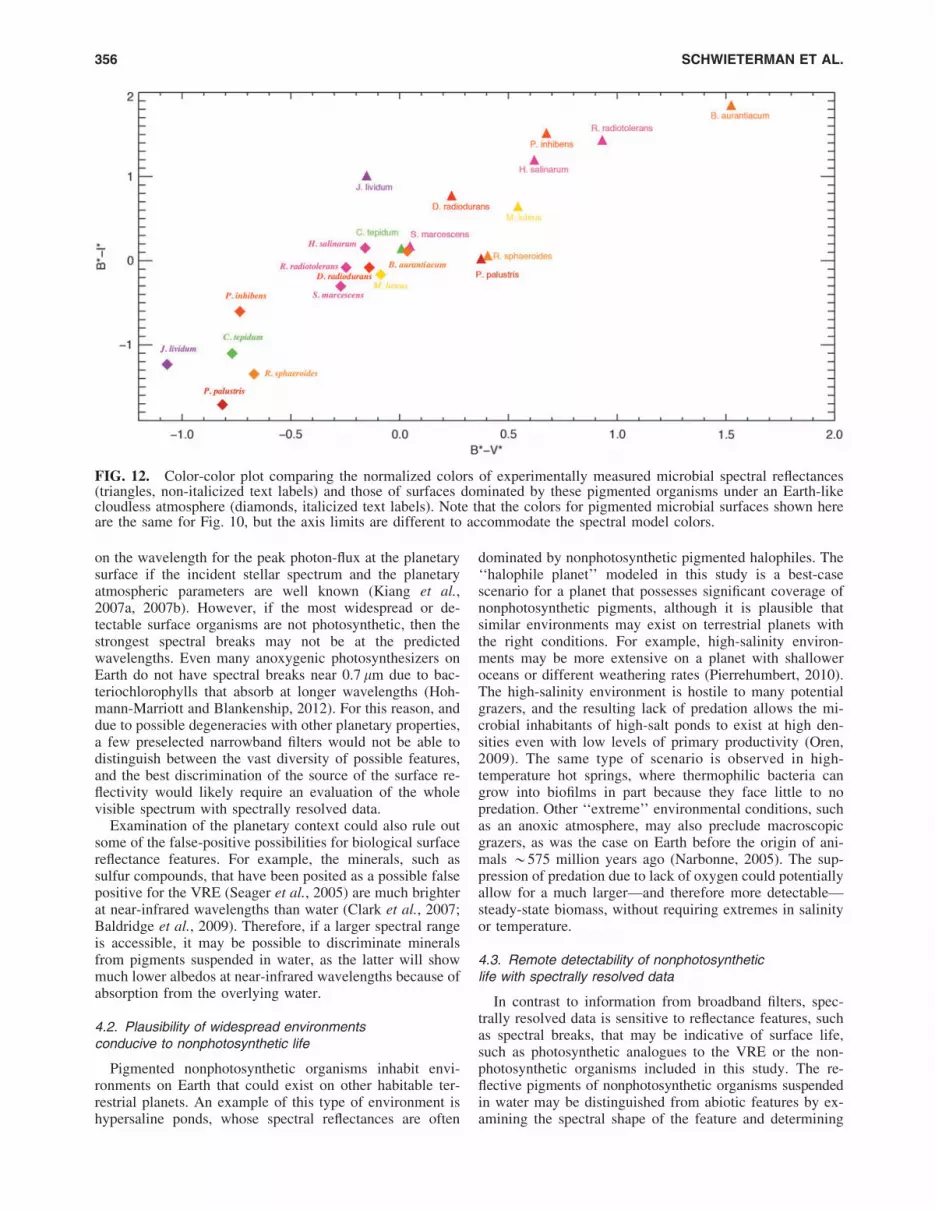
FIG. 12. Color-color plot comparing the normalized colors of experimentally measured microbial spectral reflectances(triangles, non-italicized text labels) and those of surfaces dominated by these pigmented organisms under an Earth-likecloudless atmosphere (diamonds, italicized text labels). Note that the colors for pigmented microbial surfaces shown hereare the same for Fig. 10, but the axis limits are different to accommodate the spectral model colors.
356 SCHWIETERMAN ET AL.
the environmental context from the full spectrum; for ex-ample, by detecting strong water vapor or searching forocean glint (Williams and Gaidos, 2008; Robinson et al.,2010, 2014). Glint that is spatially correlated with the ob-served pigment signature (using a mapping technique suchas that described in Cowan et al., 2009) would argue forcolocation on the planetary surface.
For an environment hosting widespread nonphotosyntheticpigmented halophilic organisms, our 3-D spectral modelpredicts a characteristic spectral feature, and a time-varyingsignal in the disk-averaged spectrum that is potentiallyseveral times larger than that posited for the VRE. The VREsignal on Earth has been quantified from Earthshine data asthe time-dependent fractional change in albedo at 0.7 lmdue to the changing proportion of vegetation in the diskview of the planet (Montanes-Rodriguez et al., 2006). TheVRE signal defined in this way is a *2% effect, thoughthis quantification is dependent on the viewing geometry ofthe planet and would have varied through geological time(Arnold et al., 2009). In contrast, a shallow ocean popu-lated by a significant density of pigmented halophiles couldproduce a maximum 13% time-variable signal at 0.68 lm,assuming the modern Earth’s continental arrangement. Thephotometric variability due to changes in the proportionalcoverage of the visible planetary disk has been consideredin other model scenarios as a method to distinguish bio-logical surfaces from abiotic ones (Sanroma et al., 2013,2014). The increasing variability with wavelength of theamplitude of the infrared albedo modeled for the ArcheanEarth with different fractional coverage of anoxygenicphotosynthetic purple bacteria (Sanroma et al., 2014) isdue to the high reflectivity of purple bacteria at near-infrared wavelengths (*1.1 lm). In contrast, the pigmentedorganisms found in the salt ponds are more reflective atvisible wavelengths, and a planet populated with themwould instead exhibit the greatest difference in spectralalbedo between ocean and land in the visible portion ofthe spectrum.
4.4. Near-future implications
Near-future space-based direct-imaging telescopes arecurrently being designed that can probe the spectral surfacereflectance of planets in the habitable zones of their stars.However, due to their relatively small apertures ( £ 1.4 m),these telescopes will not be able to observe wavelengths aslong as those of the photosynthetic red-edge feature forplanets in the habitable zones of all but the nearest stars(Seager et al., 2014; Stapelfeldt et al., 2014). This resultsfrom the relationship between telescope diameter, innerworking angle, and spectral range. Even for instrumentswith spectral ranges that extend over the entire astronomicalvisible wavelength range (0.4–1.0 lm), a significant portionof range will be excluded for many targets depending ontheir distance from Earth and consequently whether theirhabitable zones are accessible given the inner working anglerequirements for those wavelengths. In the case of longwavelength cutoffs shorter than 0.7 lm, which also excludesthe strongest O2 and CH4 spectral features, surface reflec-tance biosignatures shortward of the traditional VRE (suchas those shown in this paper) may be the only plausiblyaccessible class of biosignature.
5. Summary and Conclusions
With laboratory measurements of wavelength-dependentreflectance, we have demonstrated the diversity of spectralfeatures and broadband colors of organisms with non-photosynthetic pigments. Using radiative transfer models of1-D and 3-D, planet-wide, spatially resolved spectra, wehave shown that, given adequate surface coverage, a non-photosynthetic pigment can create a significant effect in thedisk-averaged spectrum of a terrestrial planet. We alsocalculated broadband colors for a range of pigments andother biological and abiotic surface types in the visiblewavelength range considering only their spectral reflec-tances, and for more realistic scenarios that included anoverlying atmosphere and clouds. While the resultantbroadband colors are dependent on the nature of spectralreflectance of the surface—including those of any biologi-cally produced pigments—it would not be feasible to make adefinitive determination of surface type based on thebroadband color alone. Higher-resolution spectra would befar more informative, allowing observers to search for fea-tures such as line breaks or peaks that may indicate bio-logical pigments. Highly reflective pigments suspended inwater would possess a spectral reflectance that peaks in thevisible spectrum and would exhibit glint at small phase an-gles, possibly allowing an observer to distinguish between anonphotosynthetic pigment biosignature and another reflec-tive surface. This work has shown that there is a diverse rangeof potential surface reflectance biosignatures beyond thecommonly considered photosynthetic red edge. For many ofthe planned first-generation terrestrial exoplanet direct-imagingobservations, spectral features from nonphotosynthetic pig-ments may be the only plausibly accessible biosignatures inthe visible wavelength ranges where data may be obtained.
Acknowledgments
This work was supported in part by the NASA Astro-biology Institute’s Virtual Planetary Laboratory Lead Team,funded by the National Aeronautics and Space Adminis-tration through the NASA Astrobiology Institute under so-licitation NNH12ZDA002C and Cooperative AgreementNumber NNA13AA93A. This work was also supported inpart by the UK Centre for Astrobiology.
We would like to thank Nancy Kiang and Niki Parenteaufor helpful comments and discussion. We would also like tothank the two anonymous reviewers who provided usefulcomments that allowed us to greatly improve this manuscript.
Author Disclosure Statement
No competing financial interests exist.
References
Archetti, M., Doring, T.F., Hagen, S.B., Hughes, N.M., Leather,S.R., Lee, D.W., Lev-Yadun, S., Manetas, Y., Ougham, H.J.,Schaberg, P.G., and Thomas, H. (2009) Unravelling theevolution of autumn colours: an interdisciplinary approach.Trends Ecol Evol 24:166–173.
Arnold, L., Breon, F.-M., and Brewer, S. (2009) The Earth as anextrasolar planet: the vegetation spectral signature today andduring the last Quaternary climatic extrema. InternationalJournal of Astrobiology 8:81–94.
NONPHOTOSYNTHETIC PIGMENTS AS POTENTIAL BIOSIGNATURES 357
Baldridge, A.M., Hook, S.J., Grove, C.I., and Rivera, G. (2009)The ASTER spectral library version 2.0. Remote Sens En-viron 113:711–715.
Bennett, J.W. and Bentley, R. (2000) Seeing red: the story ofprodigiosin. Adv Appl Microbiol 47:1–32.
Boichenko, V.A., Wang, J.M., Anton, J., Lanyi, J.K., andBalashov, S.P. (2006) Functions of carotenoids in xantho-rhodopsin and archaerhodopsin, from action spectra of pho-toinhibition of cell respiration. Biochim Biophys Acta 1757:1649–1656.
Bosak, T., Greene, S.E., and Newman, D.K. (2007) A likelyrole for anoxygenic photosynthetic microbes in the formationof ancient stromatolites. Geobiology 5:119–126.
Brock, T.D. and Freeze, H. (1969) Thermus aquaticus gen. n.and sp. n., a non-sporulating extreme thermophile. J Bacteriol98:289–297.
Broschat, S.L., Loge, F.J., Peppin, J.D., White, D., Call, D.R.,and Kuhn, E. (2014) Optical reflectance assay for the detec-tion of biofilm formation. J Biomed Opt 10, doi:10.1117/1.1953347.
Buick, R. (2008) When did oxygenic photosynthesis evolve?Philos Trans R Soc Lond B Biol Sci 363:2731–2743.
Cao, C., Love, G.D., Hays, L.E., Wang, W., Shen, S., andSummons, R.E. (2009) Biogeochemical evidence for euxinicoceans and ecological disturbance presaging the end-Permianmass extinction event. Earth Planet Sci Lett 281:188–201.
Chen, M.-Y., Wu, S.-H., Lin, G.-H., Lu, C.-P., Lin, Y.-T.,Chang, W.-C., and Tsay, S.-S. (2004) Rubrobacter taiwa-nensis sp. nov., a novel thermophilic, radiation-resistantspecies isolated from hot springs. Int J Syst Evol Microbiol54:1849–1855.
Chittka, L. and Raine, N.E. (2006) Recognition of flowers bypollinators. Curr Opin Plant Biol 9:428–435.
Clark, R.N., Swayze, G.A., Wise, R., Livo, E., Hoefen, T.,Kokaly, R., and Sutley, S.J. (2007) USGS Digital SpectralLibrary splib06a, Digital Data Series 231, U.S. GeologicalSurvey, Reston, VA. Available online at http://speclab.cr.usgs.gov/spectral.lib06.
Clayton, R.K. (1966) Spectroscopic analysis of bacteriochloro-phylls in vitro and in vivo. Photochem Photobiol 5:669–677.
Cockell, C.S., Leger, A., Fridlund, M., Herbst, T.M., Kalte-negger, L., Absil, O., Beichman, C., Benz, W., Blanc, M.,Brack, A., Chelli, A., Colangeli, L., Cottin, H., Coude duForesto, F., Danchi, W.C., Defrere, D., den Herder, J.-W.,Eiroa, C., Greaves, J., Henning, T., Johnston, K.J., Jones, H.,Labadie, L., Lammer, H., Launhardt, R., Lawson, P., Lay,O.P., LeDuigou, J.M., Liseau, R., Malbet, F., Martin, S.R.,Mawet, D., Mourard, D., Moutou, C., Mugnier, L.M., Olli-vier, M., Paresce, F., Quirrenbach, A., Rabbia, Y.D., Raven,J.A., Rottgering, H.J., Rouan, D., Santos, N.C., Selsis, F.,Serabyn, E., Shibai, H., Tamura, M., Thiebaut, E., Westall,F., and White, G.J. (2009) Darwin—a mission to detect andsearch for life on extrasolar planets. Astrobiology 9:1–22.
Cogdell, R.J., Howard, T.D., Bittl, R., Schlodder, E., Geisen-heimer, I., and Lubitz, W. (2000) How carotenoids protectbacterial photosynthesis. Philos Trans R Soc Lond B Biol Sci355:1345–1349.
Cowan, N.B. and Strait, T.E. (2013) Determining reflectancespectra of surfaces and clouds on exoplanets. Astrophys J765, doi:10.1088/2041-8205/765/1/L17.
Cowan, N.B., Agol, E., Meadows, V.S., Robinson, T., Liv-engood, T.A., Deming, D., Lisse, C.M., A’Hearn, M.F.,Wellnitz, D.D., Seager, S., and Charbonneau, D. (2009) Alienmaps of an ocean-bearing world. Astrophys J 700:915–923.
Cowan, N.B., Robinson, T., Livengood, T.A., Deming, D.,Agol, E., A’Hearn, M.F., Charbonneau, D., Lisse, C.M.,Meadows, V.S., Seager, S., Shields, A.L., and Wellnitz, D.D.(2011) Rotational variability of Earth’s polar regions: impli-cations for detecting snowball planets. Astrophys J 731,doi:10.1088/0004-637X/731/1/76.
Crisp, D. (1997) Absorption of sunlight by water vapor incloudy conditions: a partial explanation for the cloud ab-sorption anomaly. Geophys Res Lett 24:571–574.
Crow, C.A., McFadden, L.A., Robinson, T., Livengood, T.A.,Hewagama, T., Barry, R.K., Deming, L.D., Meadows, V., andLisse, C.M. (2010) Views from EPOXI: colors in our solarsystem as an analog for extrasolar planets. Astrophys J 729,doi:10.1088/0004-637X/729/2/130.
Dadachova, E., Bryan, R.A., Huang, X., Moadel, T., Schweit-zer, A.D., Aisen, P., Nosanchuk, J.D., and Casadevall, A.(2007) Ionizing radiation changes the electronic properties ofmelanin and enhances the growth of melanized fungi. PloSOne 2, doi:10.1371/journal.pone.0000457.
Dalton, J.B., Mogul, R., Kagawa, H.K., Chan, S.L., and Ja-mieson, C.S. (2003) Near-infrared detection of potential ev-idence for microscopic organisms on Europa. Astrobiology3:505–529.
Dalton, J.B., Palmer-Moloney, L.J., Rogoff, D., Hlavka, C., andDuncan, C. (2009) Remote monitoring of hypersaline envi-ronments in San Francisco Bay, CA, USA. Int J Remote Sens30:2933–2949.
Dartnell, L. (2011) Biological constraints on habitability. As-tronomy & Geophysics 52:25–28.
DasSarma, S. (2006) Extreme halophiles are models for astro-biology. Microbe Wash DC 1:120–126.
Des Marais, D.J., Harwit, M.O., Jucks, K.W., Kasting, J.F., Lin,D.N.C., Lunine, J.I., Schneider, J., Seager, S., Traub, W.A.,and Woolf, N.J. (2002) Remote sensing of planetary prop-erties and biosignatures on extrasolar terrestrial planets. As-trobiology 2:153–181.
Des Marais, D.J., Nuth, J.A., Allamandola, L.J., Boss, A.P.,Farmer, J.D., Hoehler, T.M., Jakosky, B.M., Meadows,V.S., Pohorille, A., Runnegar, B., and Spormann, A.M.(2008) The NASA Astrobiology Roadmap. Astrobiology 8:715–730.
Dogs, M., Voget, S., Teshima, H., Petersen, J., Davenport, K.,Dalingault, H., Chen, A., Pati, A., Ivanova, N., Goodwin,L.A., Chain, P., Detter, J.C., Standfest, S., Rohde, M., Gro-now, S., Kyrpides, N.C., Woyke, T., Simon, M., Klenk, H.,Goker, M, and Brinkoff, T. (2013) Genome sequence ofPhaeobacter inhibens type strain (T5(T)), a secondary me-tabolite producing representative of the marine Roseobacterclade, and emendation of the species description of Phaeo-bacter inhibens. Stand Genomic Sci 9:334–350.
Domagal-Goldman, S.D., Segura, A., Claire, M.W., Robinson,T.D., and Meadows, V.S. (2014) Abiotic ozone and oxygen inatmospheres similar to prebiotic Earth. Astrophys J 792,doi:10.1088/0004-637X/792/2/90.
Gavrish, E.I., Krauzova, V.I., Potekhina, N.V., Karasev, S.G.,Plotnikova, E.G., Altyntseva, O.V, Korosteleva, L.A., andEvtushenko, L.I. (2004) [Three new species of brevibacter-ia—Brevibacterium antiquum sp. nov., Brevibacterium aur-antiacum sp. nov. and Brevibacterium permense sp. nov]. InRussian. Mikrobiologiia 73:218–225.
Glaeser, J. and Klug, G. (2005) Photo-oxidative stress in Rho-dobacter sphaeroides: protective role of carotenoids andexpression of selected genes. Microbiology 151:1927–1938.
Gonzalez, J.E. and Keshavan, N.D. (2006) Messing withbacterial quorum sensing. Microbiol Mol Biol Rev 70:859–875.
Gorski, K.M., Hivon, E., Banday, A.J., Wandelt, B.D., Hansen,F.K., Reinecke, M., and Bartelman, M. (2004) HEALPix—aframework for high resolution discretization, and fast analysisof data distributed on the sphere. Astrophys J 622:759–771.
Grote, M. and O’Malley, M.A. (2011) Enlightening the lifesciences: the history of halobacterial and microbial rhodopsinresearch. FEMS Microbiol Rev 35:1082–1099.
Haddix, P.L., Jones, S., Patel, P., Burnham, S., Knights, K.,Powell, J.N., and LaForm, A. (2008) Kinetic analysis ofgrowth rate, ATP, and pigmentation suggests an energy-spilling function for the pigment prodigiosin of Serratiamarcescens. J Bacteriol 190:7453–7463.
Haddock, S.H.D., Moline, M.A., and Case, J.F. (2010) Biolu-minescence in the sea. Ann Rev Mar Sci 2:443–493.
Hegde, S. and Kaltenegger, L. (2013) Colors of extreme exo-Earth environments. Astrobiology 13:47–56.
Hejazi, A. and Falkiner, F.R. (1997) Serratia marcescens. JMed Microbiol 46:903–912.
Hitchcock, D.R. and Lovelock, J.E. (1967) Life detection byatmospheric analysis. Icarus 7:149–159.
Hohmann-Marriott, M.F. and Blankenship, R.E. (2012) Thephotosynthetic world. In Photosynthesis: Plastid Biology,Energy Conversion and Carbon Assimilation, edited by J.J.Eaton-Rye, B.C. Tripathy, and T.D. Sharkey, Springer,Dordrecht, the Netherlands, pp 3–32.
Jorgensen, B.B. and Des Marais, D.J. (1988) Optical propertiesof benthic photosynthetic communities: fiber-optic studies ofcyanobacterial mats. Limnol Oceanogr 33:99–113.
Keeling, C.D. (1960) The concentration and isotopic abundancesof carbon dioxide in the atmosphere. Tellus 12:200–203.
Keeling, C.D., Chin, J.F.S., and Whorf, T.P. (1996) Increasedactivity of northern vegetation inferred from atmosphericCO2 measurements. Nature 382:146–149.
Khalil, M.A.K. and Rasmussen, R.A. (1983) Sources, sinks, andseasonal cycles of atmospheric methane. J Geophys Res 88,doi:10.1029/JC088iC09p05131.
Kiang, N.Y., Siefert, J., Govindjee, and Blankenship, R.E.(2007a) Spectral signatures of photosynthesis. I. Review ofEarth organisms. Astrobiology 7:222–251.
Kiang, N.Y., Segura, A., Tinetti, G., Govindjee, Blankenship,R.E., Cohen, M., Siefert, J., Crisp, D., and Meadows, V.S.(2007b) Spectral signatures of photosynthesis. II. Coevolu-tion with other stars and the atmosphere on extrasolar worlds.Astrobiology 7:252–274.
Kimmel, K.E. and Maier, S. (1969) Effect of cultural conditionson the synthesis of violacein in mesophilic and psychrophilicstrains of Chromobacterium. Can J Microbiol 15:111–116.
Kimura, H., Asada, R., Masta, A., and Naganuma, T. (2003)Distribution of microorganisms in the subsurface of the
Manus Basin hydrothermal vent field in Papua New Guinea.Appl Environ Microbiol 69:644–648.
Klassen, J.L. (2010) Phylogenetic and evolutionary patternsin microbial carotenoid biosynthesis are revealed by com-parative genomics. PloS One 5, doi:10.1371/journal.pone.0011257.
Kuhl, M., Lassen, C., and Revsbech, N.P. (1997) A simple lightmeter for measurements of PAR (400 to 700 nm) with fiber-optic microprobes: application for P vs E0(PAR) measure-ments in a microbial mat. Aquat Microb Ecol 13:197–207.
Lemee, L., Peuchant, E., Clerc, M., Brunner, M., and Pfander,H. (1997) Deinoxanthin: a new carotenoid isolated fromDeinococcus radiodurans. Tetrahedron 53:919–926.
Levine, M., Lisman, D., Shaklan, S., Kasting, J., Traub, W.,Alexander, J., Angel, R., Blaurock, C., Brown, M., Brown,R., Burrows, C., Clampin, M., Cohen, E., Content, D., De-well, L., Dumont, P., Egerman, R., Ferguson, H., Ford, V.,Greene, J., Guyon, O., Hammel, H., Heap, S., Ho, T., Horner,S., Hunyadi, S., Irish, S., Jackson, C., Kasdin, J., Kissil, A.,Krim, M., Kuchner, M., Kwack, E., Lillie, C., Lin, D., Liu,A., Marchen, L., Marley, M., Meadows, V., Mosier, G.,Mouroulis, P., Noecker, M., Ohl, R., Oppenheimer, B., Pit-man, J., Ridgway, S., Sabatke, E., Seager, S., Shao, M.,Smith, A., Soummer, R., Stapelfeldt, K., Tenerell, D., Trau-ger, J., and Vanderbei, R. (2009) Terrestrial Planet FinderCoronagraph (TPF-C) flight baseline concept. arXiv:0911.3200.
Liu, G.Y. and Nizet, V. (2009) Color me bad: microbial pig-ments as virulence factors. Trends Microbiol 17:406–413.
Livengood, T.A., Deming, L.D., A’Hearn, M.F., Charbonneau,D., Hewagama, T., Lisse, C.M., McFadden, L.A., Meadows,V.S., Robinson, T.D., Seager, S., and Wellnitz, D.D. (2011)Properties of an Earth-like planet orbiting a Sun-like star:Earth observed by the EPOXI mission. Astrobiology 11:907–930.
Lovelock, J.E. (1965) A physical basis for life detection ex-periments. Nature 207:568–570.
Luger, R. and Barnes, R. (2015) Extreme water loss and abioticO2 buildup on planets throughout the habitable zones of Mdwarfs. Astrobiology 15:119–143.
Mackenzie, C., Eraso, J.M., Choudhary, M., Roh, J.H., Zeng,X., Bruscella, P., Puskas, A., and Kaplan, S. (2007) Post-genomic adventures with Rhodobacter sphaeroides. AnnuRev Microbiol 61:283–307.
Martens, T., Heidorn, T., Pukall, R., Simon, M., Tindall, B.J.,and Brinkhoff, T. (2006) Reclassification of Roseobactergallaeciensis Ruiz-Ponte et al. 1998 as Phaeobacter gallae-ciensis gen. nov., comb. nov., description of Phaeobacterinhibens sp. nov., reclassification of Ruegeria algicola (Lafayet al. 1995) Uchino et al. 1999 as Marinovum algicola gen.nov., comb. nov., and emended descriptions of the generaRoseobacter, Ruegeria and Leisingera. Int J Syst Evol Mi-crobiol 56:1293–1304.
McClean, K.H., Winson, M.K., Fish, L., Taylor, A., Chhabra,S.R., Camara, M., Daykin, M., Lamb, J.H., Swift, S., Bycroft,B.W., Stewart, G.S.A.B., and Williams, P. (1997) Quorumsensing and Chromobacterium violaceum: exploitation of
NONPHOTOSYNTHETIC PIGMENTS AS POTENTIAL BIOSIGNATURES 359
violacein production and inhibition for the detection of N-acylhomoserine lactones. Microbiology 143:3703–3711.
Meadows, V.S. (2006) Modelling the diversity of extrasolarterrestrial planets. Proceedings of the International Astro-nomical Union 1, doi:10.1017/S1743921306009033.
Meadows, V.S. and Crisp, D. (1996) Ground-based near-infra-red observations of the Venus nightside: the thermal structureand water abundance near the surface. J Geophys Res 101:4595–4622.
Meeks, J.C. and Castenholz, R.W. (1971) Growth and photo-synthesis in an extreme thermophile, Synechococcus lividus(Cyanophyta). Arch Mikrobiol 78:25–41.
Montanes-Rodriguez, P., Palle, E., Goode, P.R., and Martin-Torres, F.J. (2006) Vegetation signature in the observedglobally integrated spectrum of Earth considering simulta-neous cloud data: applications for extrasolar planets. Astro-phys J 651:544–552.
Narbonne, G.M. (2005) The Ediacara biota: Neoproterozoicorigin of animals and their ecosystems. Annu Rev EarthPlanet Sci 33:421–442.
Oren, A. (2009) Saltern evaporation ponds as model systems forthe study of primary production processes under hypersalineconditions. Aquat Microb Ecol 56:193–204.
Oren, A. (2013) Salinibacter: an extremely halophilic bacteriumwith archaeal properties. FEMS Microbiol Lett 342:1–9.
Oren, A. and Dubinsky, Z. (1994) On the red coloration ofsaltern crystallizer ponds. II. Additional evidence for thecontribution of halobacterial pigments. International Journalof Salt Lake Research 3:9–13.
Oren, A., Stambler, N., and Dubinsky, Z. (1992) On the redcoloration of saltern crystallizer ponds. International Journalof Salt Lake Research 1:77–89.
Painter, T.H., Duval, B., Thomas, W.H., Mendez, M., Heint-zelman, S., and Dozier, J. (2001) Detection and quantificationof snow algae with an airborne imaging spectrometer. ApplEnviron Microbiol 67:5267–5272.
Pantanella, F., Berlutti, F., Passariello, C., Sarli, S., Morea, C.,and Schippa, S. (2007) Violacein and biofilm production inJanthinobacterium lividum. J Appl Microbiol 102:992–999.
Pfennig, N. and Truper, H.G. (1971) Type and neotype strainsof the species of phototrophic bacteria maintained in pureculture. Int J Syst Bacteriol 21:19–24.
Pierrehumbert, R.T. (2010) Principles of Planetary Climate,Cambridge University Press, Cambridge, UK.
Porsby, C.H., Nielsen, K.F., and Gram, L. (2008) Phaeobacterand Ruegeria species of the Roseobacter clade colonize sep-arate niches in a Danish Turbot (Scophthalmus maximus)–rearing farm and antagonize Vibrio anguillarum under differentgrowth conditions. Appl Environ Microbiol 74:7356–7364.
Postman, M., Traub, W.A., Krist, J., Stapelfeldt, K., Brown, R.,Oegerle, W., Lo, A., Clampin, M., Soummer, R., Wiseman, J.,and Mountain, M. (2010) Advanced Technology Large-Aper-ture Space Telescope (ATLAST): characterizing habitableworlds. In Pathways Towards Habitable Planets: Proceedingsof a Workshop Held 14 to 18 September 2009 in Barcelona,Spain, edited by V. Coude du Foresto, D.M. Gelino, and I. Ribas,Astronomical Society of the Pacific, San Francisco, p 361.
Prescott, L., Harley, J., and Klein, D. (2005) Microbiology,McGraw Hill, New York.
Proteau, P.J., Gerwick, W.H., Garcia-Pichel, F., and Cas-tenholz, R. (1993) The structure of scytonemin, an ultraviolet
sunscreen pigment from the sheaths of cyanobacteria. Ex-perientia 49:825–829.
Rasmussen, R.A. and Khalil, M.A.K. (1981) Atmosphericmethane (CH4): trends and seasonal cycles. J Geophys Res86, doi:10.1029/JC086iC10p09826.
Robinson, T.D., Meadows, V.S., and Crisp, D. (2010) Detectingoceans on extrasolar planets using the glint effect. AstrophysJ 721:L67–L71.
Robinson, T.D., Meadows, V.S., Crisp, D., Deming, D.,A’Hearn, M.F., Charbonneau, D., Livengood, T.A., Seager,S., Barry, R.K., Hearty, T., Hewagama, T., Lisse, C.M.,McFadden, L.A., and Wellnitz, D.D. (2011) Earth as an ex-trasolar planet: Earth model validation using EPOXI Earthobservations. Astrobiology 11:393–408.
Robinson, T.D., Ennico, K., Meadows, V.S., Sparks, W., Bus-sey, D.B.J., Schwieterman, E.W., and Breiner, J. (2014)Detection of ocean glint and ozone absorption using LCROSSEarth observations. Astrophys J 787, doi:10.1088/0004-637X/787/2/171.
Rothman, L.S., Gordon, I.E., Barbe, A., Benner, D.C., Bernath,P.F., Birk, M., Boudon, V., Brown, L.R., Campargue, A.,Champion, J.-P., Chance, K., Coudert, L.H., Dana, V., Devi,V.M., Fally, S., Flaud, J.-M., Gamache, R.R., Goldman, A.,Jacquemart, D., Kleiner, I., Lacome, N., Lafferty, W.J.,Mandin, J.-Y., Massie, S.T., Mikhailenko, S.N., Miller, C.E.,Moazzen-Ahmadi, N., Naumenko, O.V., Nikitin, A.V., Or-phal, J., Perevalov, V.I., Perrin, A., Predoi-Cross, A., Rins-land, C.P., Rotger, M., Simeckova, M., Smith, M.A.H., Sung,K., Tashkun, S.A., Tennyson, J., Toth, R.A., Vandaele, A.C.,and Vander Auwera, J. (2009) The HITRAN 2008 molecularspectroscopic database. J Quant Spectrosc Radiat Transf110:533–572.
Sagan, C., Thompson, W.R., Carlson, R., Gurnett, D., and Hord,C. (1993) A search for life on Earth from the Galileospacecraft. Nature 365:715–721.
Saito, T., Terato, H., and Yamamoto, O. (1994) Pigments ofRubrobacter radiotolerans. Arch Microbiol 162:414–421.
Saito, T., Miyabe, Y., Ide, H., and Yamamoto, O. (1997) Hy-droxyl radical scavenging ability of bacterioruberin. Radia-tion Physics and Chemistry 50:267–269.
Sanroma, E., Palle, E., and Garcıa Munoz, A. (2013) On theeffects of the evolution of microbial mats and land plants onthe Earth as a planet. Photometric and spectroscopic lightcurves of paleo-Earths. Astrophys J 766, doi:10.1088/0004-637X/766/2/133.
Sanroma, E., Palle, E., Parenteau, M.N., Kiang, N.Y., Gu-tierrez-Navarro, A.M., Lopez, R., and Montanes-Rodrıguez,P. (2014) Characterizing the purple Earth: modeling theglobally integrated spectral variability of the Archean Earth.Astrophys J 780, doi:10.1088/0004-637X/780/1/52.
Schabereiter-Gurtner, C., Pinar, G., Vybiral, D., Lubitz, W., andRolleke, S. (2001) Rubrobacter-related bacteria associatedwith rosy discolouration of masonry and lime wall paintings.Arch Microbiol 176:347–354.
Schloss, P.D., Allen, H.K., Klimowicz, A.K., Mlot, C., Gross,J.A., Savengsuksa, S., McEllin, J., Clardy, J., Ruess, R.W.,and Handelsman, J. (2010) Psychrotrophic strain of Janthi-nobacterium lividum from a cold Alaskan soil producesprodigiosin. DNA Cell Biol 29:533–541.
Schopf, J.W. (1993) Microfossils of the early Archean Apex chert:new evidence of the antiquity of life. Science 260:640–646.
Schuerger, A.C., Ulrich, R., Berry, B.J., and Nicholson, W.L.(2013) Growth of Serratia liquefaciens under 7 mbar, 0�C, andCO2-enriched anoxic atmospheres. Astrobiology 13:115–131.
360 SCHWIETERMAN ET AL.
Seager, S., Turner, E.L., Schafer, J., and Ford, E.B. (2005)Vegetation’s red edge: a possible spectroscopic biosignatureof extraterrestrial plants. Astrobiology 5:372–390.
Seager, S., Schrenk, M., and Bains, W. (2012) An astrophysicalview of Earth-based metabolic biosignature gases. Astro-biology 12:61–82.
Seager, S., Cash, W.C., Kasdin, N.J., Sparks, W.B., Turnbull,M.C., Kuchner, M.J., Roberge, A., Domagal-Goldman, S.,Shaklan, S., Thomson, M., Lisman, D., Martin, S., Cady, E.,and Webb, D. (2014) Exo-S: a probe-scale space mission todirectly image and spectroscopically characterize exoplane-tary systems using a starshade and telescope system [abstract311.06]. In American Astronomical Society Meeting #224,American Astronomical Society, Washington, DC.
Segura, A., Kasting, J.F., Meadows, V., Cohen, M., Scalo, J.,Crisp, D., Butler, R.A.H., and Tinetti, G. (2005) Bio-signatures from Earth-like planets around M dwarfs. Astro-biology 5:706–725.
Shahmohammadi, H.R., Asgarani, E., Terato, H., Saito, T.,Ohyama, Y., Gekko, K., Yamamoto, O., and Ide, H. (1998)Protective roles of bacterioruberin and intracellular KCl inthe resistance of Halobacterium salinarium against DNA-damaging agents. J Radiat Res 39:251–262.
Solovchenko, A.E. and Merzlyak, M.N. (2008) Screening ofvisible and UV radiation as a photoprotective mechanism inplants. Russ J Plant Physiol 55:719–737.
Stapelfeldt, K.R., Brenner, M.P., Warfield, K., Belikov, R.,Brugarolas, P., Bryden, G., Cahoy, K.L., Chakrabarti, S.,Dekens, F., Effinger, R., Hirsch, B., Kissil, A., Krist, J.E.,Lang, J., Marley, M.S., McElwain, M.W., Meadows, V.,Nissen, J., Oseas, J., Serabyn, G., Sunada, E., Traub, W.A.,Trauger, J.T., and Unwin, S.C. (2014) Exo-C: a probe-scalespace mission to directly image and spectroscopically char-acterize exoplanetary systems using an internal coronagraph[abstract #311.07]. In American Astronomical Society Meet-ing #224, American Astronomical Society, Washington, DC.
Takano, H., Asker, D., Beppu, T., and Ueda, K. (2006) Geneticcontrol for light-induced carotenoid production in non-pho-totrophic bacteria. J Ind Microbiol Biotechnol 33:88–93.
Tanaka, Y., Sasaki, N., and Ohmiya, A. (2008) Biosynthesis ofplant pigments: anthocyanins, betalains and carotenoids.Plant J 54:733–749.
Tian, B., Sun, Z., Xu, Z., Shen, S., Wang, H., and Hua, Y.(2008) Carotenoid 3’,4’-desaturase is involved in carotenoidbiosynthesis in the radioresistant bacterium Deinococcusradiodurans. Microbiology 154:3697–3706.
Tian, F., France, K., Linsky, J.L., Mauas, P.J.D., and Vieytes,M.C. (2014) High stellar FUV/NUV ratio and oxygen con-tents in the atmospheres of potentially habitable planets.Earth Planet Sci Lett 385:22–27.
Tinetti, G., Meadows, V.S., Crisp, D., Fong, W., Fishbein, E.,Turnbull, M., and Bibring, J.-P. (2006a) Detectability ofplanetary characteristics in disk-averaged spectra. I: the Earthmodel. Astrobiology 6:34–47.
Tinetti, G., Meadows, V.S., Crisp, D., Kiang, N.Y., Kahn, B.H.,Bosc, E., Fishbein, E., Velusamy, T., and Turnbull, M.
(2006b) Detectability of planetary characteristics in disk-averaged spectra II: synthetic spectra and light-curves ofEarth. Astrobiology 6:881–900.
Tinetti, G., Rashby, S., and Yung, Y.L. (2006c) Detectability ofred-edge-shifted vegetation on terrestrial planets orbiting Mstars. Astrophys J 644:L129–L132.
Ungers, G.E. and Cooney, J.J. (1968) Isolation and character-ization of carotenoid pigments of Micrococcus roseus. JBacteriol 96:234–241.
Valadon, L.R. and Mummery, R.S. (1968) Carotenoids in floralparts of a narcissus, a daffodil and a tulip. Biochemical J106:479–484.
Venil, C. and Lakshmanaperumalsamy, P. (2009) An insightfuloverview on microbial pigment, prodigiosin. ElectronicJournal of Biology 5:49–61.
Wahlund, T.M., Woese, C.R., Castenholz, R.W., and Madigan,M.T. (1991) A thermophilic green sulfur bacterium from NewZealand hot springs, Chlorobium tepidum sp. nov. Arch Mi-crobiol 156:81–90.
Wiggli, M., Smallcombe, A., and Bachofen, R. (1999) Re-flectance spectroscopy and laser confocal microscopy as toolsin an ecophysiological study of microbial mats in an alpinebog pond. J Microbiol Methods 34:173–182.
Williams, D.M. and Gaidos, E. (2008) Detecting the glint ofstarlight on the oceans of distant planets. Icarus 195:927–937.
Williams, P., Winzer, K., Chan, W.C., and Camara, M. (2007)Look who’s talking: communication and quorum sensing inthe bacterial world. Philos Trans R Soc Lond B Biol Sci 362:1119–1134.
Williams, W.E., Gorton, H.L., and Vogelmann, T.C. (2003)Surface gas-exchange processes of snow algae. Proc NatlAcad Sci USA 100:562–566.
Ziegelhoffer, E.C. and Donohue, T.J., (2009) Bacterial re-sponses to photo-oxidative stress. Nat Rev Microbiol 7:856–863.
Address correspondence to:Edward W. Schwieterman
Box 351580University of WashingtonSeattle, WA 98115-1580