Optical Excitations and Field Enhancement in Short Graphene Nanoribbons Caterina Cocchi, *,†,‡ Deborah Prezzi, *,† Alice Ruini, †,‡ Enrico Benassi, † Marilia J. Caldas, ¶ Stefano Corni, † and Elisa Molinari †,‡ Centro S3, CNR-Istituto Nanoscienze, I-41125 Modena, Italy, Dipartimento di Fisica, Università di Modena e Reggio Emilia, I-41125 Modena, Italy, and Instituto de Física, Universidade de São Paulo, 05508-900 São Paulo, SP, Brazil E-mail: [email protected]; [email protected]* To whom correspondence should be addressed † Centro S3, CNR-Istituto Nanoscienze, I-41125 Modena, Italy ‡ Dipartimento di Fisica, Università di Modena e Reggio Emilia, I-41125 Modena, Italy ¶ Instituto de Física, Universidade de São Paulo, 05508-900 São Paulo, SP, Brazil 1 arXiv:1203.6369v1 [cond-mat.mtrl-sci] 28 Mar 2012
Transcript
Optical Excitations and Field Enhancement in Short
Graphene Nanoribbons
Caterina Cocchi,∗,†,‡ Deborah Prezzi,∗,† Alice Ruini,†,‡ Enrico Benassi,† Marilia J.
Caldas,¶ Stefano Corni,† and Elisa Molinari†,‡
Centro S3, CNR-Istituto Nanoscienze, I-41125 Modena, Italy, Dipartimento di Fisica, Università
di Modena e Reggio Emilia, I-41125 Modena, Italy, and Instituto de Física, Universidade de São
∗To whom correspondence should be addressed†Centro S3, CNR-Istituto Nanoscienze, I-41125 Modena, Italy‡Dipartimento di Fisica, Università di Modena e Reggio Emilia, I-41125 Modena, Italy¶Instituto de Física, Universidade de São Paulo, 05508-900 São Paulo, SP, Brazil
In the last few years remarkable interest has grown for nanoplasmonics and the perspectives it
offers to merge electronics and photonics at the nanoscale.1,2 A wide range of potential applica-
tions can be designed, including sensing and spectroscopic techniques,3–6 fabrication of nanoan-
tennas7–11 and light emitters,12,13 as well as beyond-THz optical devices or solar-energy con-
version systems.14–16 While great attention has been devoted to metal nanoparticles, due to the
relative ease to produce them and to their possibility to support surface modes,17–19 new materials
and metamaterials are now being explored,20,21 which, in addition to enhanced optical responses,
are able to optimize circuit integration and reduce losses. Graphene has proved to have unique
electronic and mechanical properties,22 and has been more recently investigated also for photonics
and optoelectronics.23–25 In the field of (nano)plasmonics, so far most emphasis has been devoted
to spectroscopy of plasmons in extended graphene, either doped or undoped,26–32 and to the large
lifetimes of their excitations compared to conventional metals.30,33 Some interesting predictions,
mostly based on macroscopic models, have been proposed for plasmonics in spatially-modulated
graphene of micron and sub-micron size range.32,34–38
Here we focus on graphene in a completely different regime, typical of nanoscale structures,
where an optical gap opens as a consequence of quantum confinement, and we show that field
enhancement effects can also be seen. This regime has become particularly exciting in view of the
recent production of controlled graphene wires by chemical routes.39–42 We consider the case of
self-standing elongated graphene nanoflakes (GNFs) with H-terminated edges, which we analyze
by applying a fully-microscopic quantum-chemical approach. These flakes can be thought of as fi-
nite portions of armchair-edged graphene nanoribbons (GNRs)43 [see 1(a)] of variable widths and
lengths. We focus on the optical properties, which are sensitive to the structural details of the sys-
tem, namely length and width modulation, by computing their UV-vis spectra. In the low energy
region intense and tunable peaks are recognized, characterized by a coherent coupling of transi-
tions that yield “collective” excitations with strong transition dipole. The local field enhancement
produced by these large dipole excitations is discussed for a prototypical flake of sub-nanometer
width and nanometer length.
3
Figure 1: (a) Ball-and-stick model of a prototypical elongated graphene flake, characterized bylength parameter NL = 28 (x direction) and width parameter NW = 7 (y direction). Edge atomsare passivated with H (white balls). (b) Optical spectrum (dashed line) calculated for the systemin (a): the oscillator strength (OS) of individual excitations is indicated by black bars. The mainexcitations are labeled according to their polarization with respect to the long axis of the system(x), i.e. L for longitudinal and T for transverse polarization. (c) Optical spectra of a series ofgraphene flakes of fixed width (NW = 7) and variable length, from 24 to 88 Å, labeled after theirlength parameter NL, ranging from 10 to 40. The OS is normalized with respect to the flake lengthin both (b) and (c). All spectra are obtained by introducing a Lorentzian broadening of 25 meV.
4
To investigate the nature of these optical excitations, their microscopic origin and their size-
dependent trends, we adopt the semi-empirical Hartree-Fock-based method ZINDO, which imple-
ments the configuration-interaction (CI) procedure including single excitations only (S).44 This
method is known to provide reliable results for the optical spectra of aromatic molecules45–47.48
All calculations are performed starting from optimized geometries obtained with AM1,49,50 used
also for the calculation of mean-field ground state properties.
The analysis of the optical properties is carried out for a series of prototypical short graphene
nanoribbons or graphene nanoflakes (GNFs) of fixed width (∼ 7.3 Å) and variable length (from
24 to 88 Å). Following the standard notation for armchair GNRs,43 these structures can be char-
acterized by a width parameter NW , which indicates the number of dimeric lines along the zigzag
direction (y axis). In addition, we here introduce a length parameter NL that corresponds to the
number of zigzag chains in the armchair direction (x axis), excluding the ends. As shown in the
model structure of 1(a), the flake edges are passivated with H atoms and the flake ends are shaped
to minimize the zigzag-edge contributions.51,52 The structure of a prototypical flake with NW = 7
and NL = 28 is displayed in 1(a) and its UV-vis spectrum (dashed line) is shown in 1(b), where
the oscillator strengths (OS) of the individual optical excitations are indicated by black bars. The
optical spectrum is dominated by three intense peaks: the first two, L1 and L2, correspond to ex-
citations with a large transition dipole along the x axis of the system (L stands for "longitudinally
polarized”); the third peak is found at higher energy and is dominated by the excitation T2, which
shows a transverse polarization (y direction) with respect to the long axis of the system. In addi-
tion to these, we also find a transversally polarized excitation T1 with negligible oscillator strength
below the first peak L1, and a weak longitudinally polarized excitation (LW) between L1 and L2.
1(c) displays the calculated UV-vis spectra for GNFs of the same width (NW = 7) and increasing
length, with NL ranging from 10 to 40. The main features described for the case of NL = 28 are
maintained along the flake series, except for L1 becoming the lowest-energy excitation in place of
T1 for the longest GNF (NL = 40): this is a signature of the approaching behavior of quasi-1D arm-
chair graphene nanoribbons (AGNRs).53 Moreover, as a result of confinement, we find an overall
5
red-shift of L1 and L2, with the optical gap decreasing from 3.14 to 2.48 eV. The energy difference
between these longitudinal excitations is almost unaffected upon flake length increase, ranging
from about 0.55 eV (NL = 40) to 0.60 eV (NL = 10). As expected, the energy of T1 and T2 does
not vary considerably with length, since they are polarized along the flake width, kept fixed. At
increasing length, we also notice a significant transfer of OS to the lowest energy peak L1, which
tends to saturate for the longest flake, again similarly to the behavior of infinite nanoribbons.53
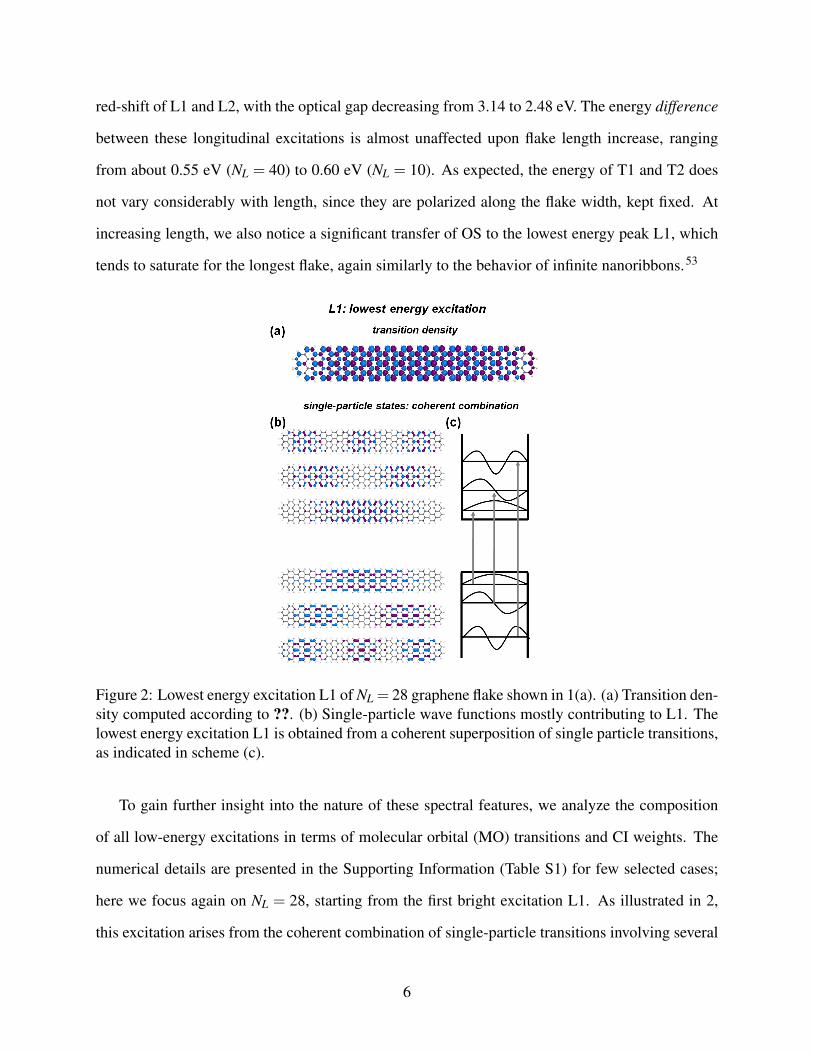
Figure 2: Lowest energy excitation L1 of NL = 28 graphene flake shown in 1(a). (a) Transition den-sity computed according to ??. (b) Single-particle wave functions mostly contributing to L1. Thelowest energy excitation L1 is obtained from a coherent superposition of single particle transitions,as indicated in scheme (c).
To gain further insight into the nature of these spectral features, we analyze the composition
of all low-energy excitations in terms of molecular orbital (MO) transitions and CI weights. The
numerical details are presented in the Supporting Information (Table S1) for few selected cases;
here we focus again on NL = 28, starting from the first bright excitation L1. As illustrated in 2,
this excitation arises from the coherent combination of single-particle transitions involving several
6
harmonics of the same states. Note that, while in shorter flakes the HOMO→ LUMO transition
contributes for most of the weight, in longer structures several higher harmonics enter the compo-
sition with comparable weights. The fact that transitions between occupied and virtual MOs with
the same envelope function modulation concur to form the excitation helps explaining the large OS
observed, as this mechanism tends to maximize the wave function overlap. The spatial extension
of the MOs increases with their energy distance from the frontier orbitals, further contributing to
the large transition dipole. This effect is made particularly evident by plotting the transition density
of the excitation, defined as:
ρ0p(rrr) = ∑ia
Cpiaφi(rrr)φ∗a (rrr), (1)
where Cpia are the CI coefficients of the p-th excited state, corresponding to single excitations from
the occupied φi to virtual φa orbitals.54 From 2(a) we notice that the density extends homoge-
neously over the entire structure with an underlying dipolar character, and is not concentrated just
to the central portion. This is evident also by inspecting the contour plot of the corresponding
electric potential, pictorially represented in 3.
Figure 3: Pictorial view of the electric potential generated by the transition density relative to theexcitations L1, L2, LW and T2 of the NL = 28 flake.
Consistently with their polarization, L1 and L2 have a large dipole oriented along x, while that
of T2 is along y. As shown for L1 in 2, also L2 and T2 arise from combinations of transitions
between states with the same envelope function modulation. On the contrary, LW is mainly com-
posed by transitions involving MOs with different number of nodes. This gives rise to a multipolar
modulation in the electric potential, as shown in 3, and leads to the weaker intensity observed for
this excitation.
7
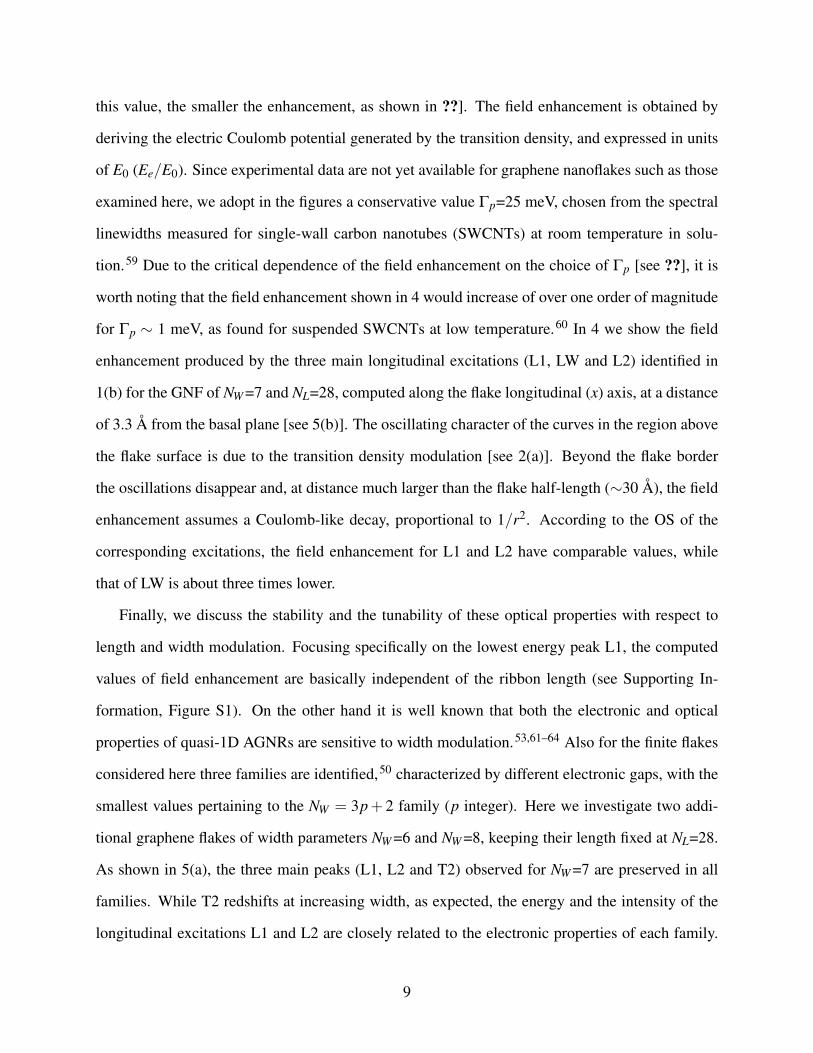
Figure 4: Field enhancement of longitudinally polarized excitations L1, L2 and LW of NW =7 andNL=28 graphene nanoflake computed along the flake axis, at 3.3 Å from its plane. Close to the flakecenter, above its surface, the field enhancement is susceptible of the transition density modulation[see 2(a)]. In the inset, pictorial sketch of the field enhancement contour plot in (x,y) and (x,z)views. Notice that the values of the field enhancement are sensitive to the choice of Γp, accordingto ??: here a conservative value Γp=25 meV is adopted.
The large dipole strength and the “beyond-single-particle” nature of L1 and L2 recall the main
features related to collective plasmonic excitations in small metal clusters, as analyzed by means
of atomistic methods.55–58 We thus calculate for our systems a quantity which is usually adopted
for the characterization of plasmonic excitations, i.e. the local enhancement of an electromagnetic
field incident on the system. To this end, we approximate the flake response function, at resonance
conditions, via the electronic density variation δρ(ω0p;rrr) induced by the periodic external electric
field EEE0exp(−iω0pt), given by:
δρ(ω0p;rrr) =−ρ0p(rrr)ihΓp
µµµ0p ·EEE0. (2)
Here µµµ0p is the transition dipole for the excitation to the in-resonance p state, and Γp is the cor-
responding decay rate, related to the intrinsic absorption bandwidth. Details on the derivation of
?? are given in the Supporting Information. The oscillating charge distribution δρ(ω0p;rrr) orig-
inates an additional electric field EEEe(rrr)exp(−iω0pt) leading to an overall enhanced electric field
(E0 +Ee) nearby the graphene flake. The transition dipole µµµ0p is a straight result from the cal-
culation, while Γp is a critical parameter in determining the maximum enhancement [the larger
8
this value, the smaller the enhancement, as shown in ??]. The field enhancement is obtained by
deriving the electric Coulomb potential generated by the transition density, and expressed in units
of E0 (Ee/E0). Since experimental data are not yet available for graphene nanoflakes such as those
examined here, we adopt in the figures a conservative value Γp=25 meV, chosen from the spectral
linewidths measured for single-wall carbon nanotubes (SWCNTs) at room temperature in solu-
tion.59 Due to the critical dependence of the field enhancement on the choice of Γp [see ??], it is
worth noting that the field enhancement shown in 4 would increase of over one order of magnitude
for Γp ∼ 1 meV, as found for suspended SWCNTs at low temperature.60 In 4 we show the field
enhancement produced by the three main longitudinal excitations (L1, LW and L2) identified in
1(b) for the GNF of NW =7 and NL=28, computed along the flake longitudinal (x) axis, at a distance
of 3.3 Å from the basal plane [see 5(b)]. The oscillating character of the curves in the region above
the flake surface is due to the transition density modulation [see 2(a)]. Beyond the flake border
the oscillations disappear and, at distance much larger than the flake half-length (∼30 Å), the field
enhancement assumes a Coulomb-like decay, proportional to 1/r2. According to the OS of the
corresponding excitations, the field enhancement for L1 and L2 have comparable values, while
that of LW is about three times lower.
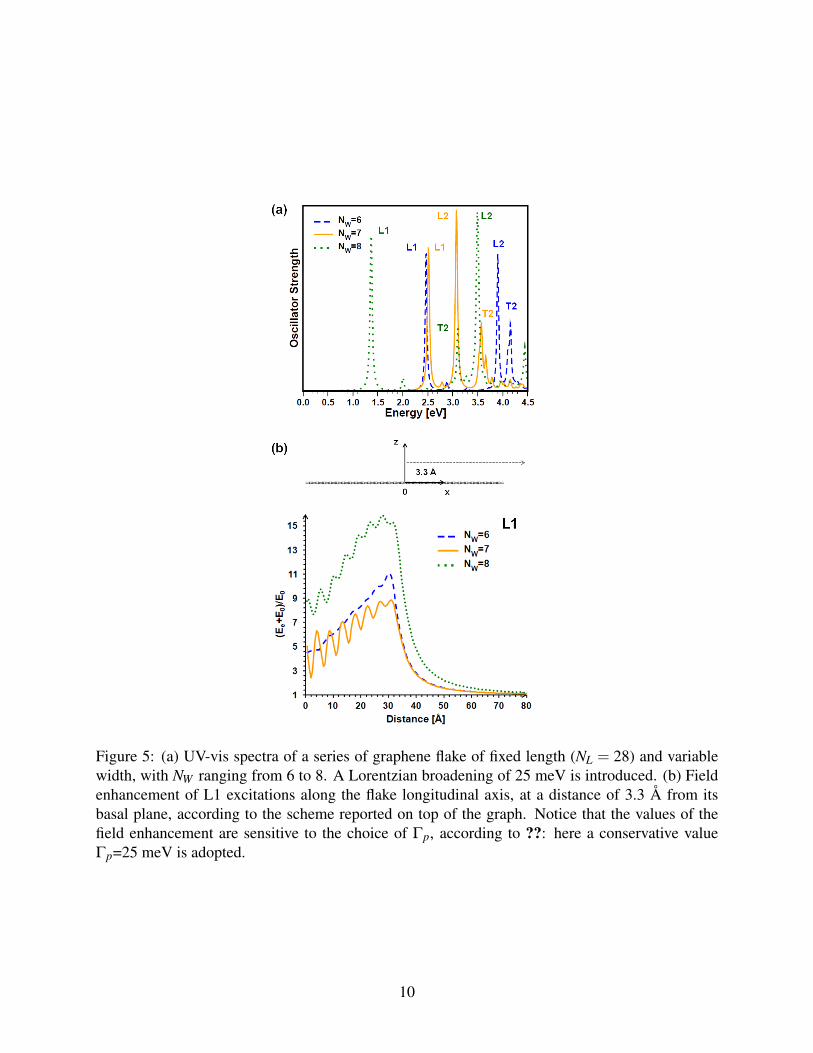
Finally, we discuss the stability and the tunability of these optical properties with respect to
length and width modulation. Focusing specifically on the lowest energy peak L1, the computed
values of field enhancement are basically independent of the ribbon length (see Supporting In-
formation, Figure S1). On the other hand it is well known that both the electronic and optical
properties of quasi-1D AGNRs are sensitive to width modulation.53,61–64 Also for the finite flakes
considered here three families are identified,50 characterized by different electronic gaps, with the
smallest values pertaining to the NW = 3p+ 2 family (p integer). Here we investigate two addi-
tional graphene flakes of width parameters NW =6 and NW =8, keeping their length fixed at NL=28.
As shown in 5(a), the three main peaks (L1, L2 and T2) observed for NW =7 are preserved in all
families. While T2 redshifts at increasing width, as expected, the energy and the intensity of the
longitudinal excitations L1 and L2 are closely related to the electronic properties of each family.
9
Figure 5: (a) UV-vis spectra of a series of graphene flake of fixed length (NL = 28) and variablewidth, with NW ranging from 6 to 8. A Lorentzian broadening of 25 meV is introduced. (b) Fieldenhancement of L1 excitations along the flake longitudinal axis, at a distance of 3.3 Å from itsbasal plane, according to the scheme reported on top of the graph. Notice that the values of thefield enhancement are sensitive to the choice of Γp, according to ??: here a conservative valueΓp=25 meV is adopted.
10
In particular the trend for the electronic gaps50 is reflected in the excitation energies of L1. The
field enhancement computed for the L1 excitation of each GNF of different width is shown in 5(b):
we find a distinctive enhancement for NW =8 compared to the other two, which already comes from
the transition dipole moments of the individual single-particle excitations.
In summary, we have analyzed the optical excitations of finite graphene nanoribbons, of sub-
nanometer width and nanometer length. At low energy the UV-vis spectra are dominated by intense
excitations with longitudinal polarization with respect to the flake long axis. These are character-
ized by a “collective” character, coming from coherent superposition of MO transitions with the
same envelope function modulation. The investigated excitations are tunable both in energy and
intensity upon appropriate length and width ribbon modulation. The field enhancement computed
for these excitations suggests the applicability of these systems as nanoantennas and in other opto-
electronic and nanoplasmonic applications.
Acknowledgement
The authors are grateful to Andrea Bertoni, Ulrich Hohenester and Massimo Rontani for stimulat-
ing and helpful discussions, and acknowledge CINECA for computational support. This work was
partly supported by the Italian Ministry of University and Research under FIRB grant ItalNanoNet,
and by Fondazione Cassa di Risparmio di Modena with project COLDandFEW. M. J. C. acknowl-
edges support from FAPESP and CNPq (Brazil).
Supporting Information Available
We include the description of the main excitations, both longitudinally and transversally polarized,
for selected graphene ribbons of variable length and width. The effects of length modulation on the
field enhancement produced by the lowest energy bright excitation are discussed, supported by a
figure showing the corresponding curves for few selected cases. Finally, the analytical expression
of the field enhancement is analytically derived from the transition density on the basis of linear
response theory. This material is available free of charge via the Internet at http://pubs.
∗To whom correspondence should be addressed†Centro S3, CNR-Istituto Nanoscienze, I-41125 Modena, Italy‡Dipartimento di Fisica, Università di Modena e Reggio Emilia, I-41125 Modena, Italy¶Instituto de Física, Universidade de São Paulo, 05508-900 São Paulo, SP, Brazil
S1
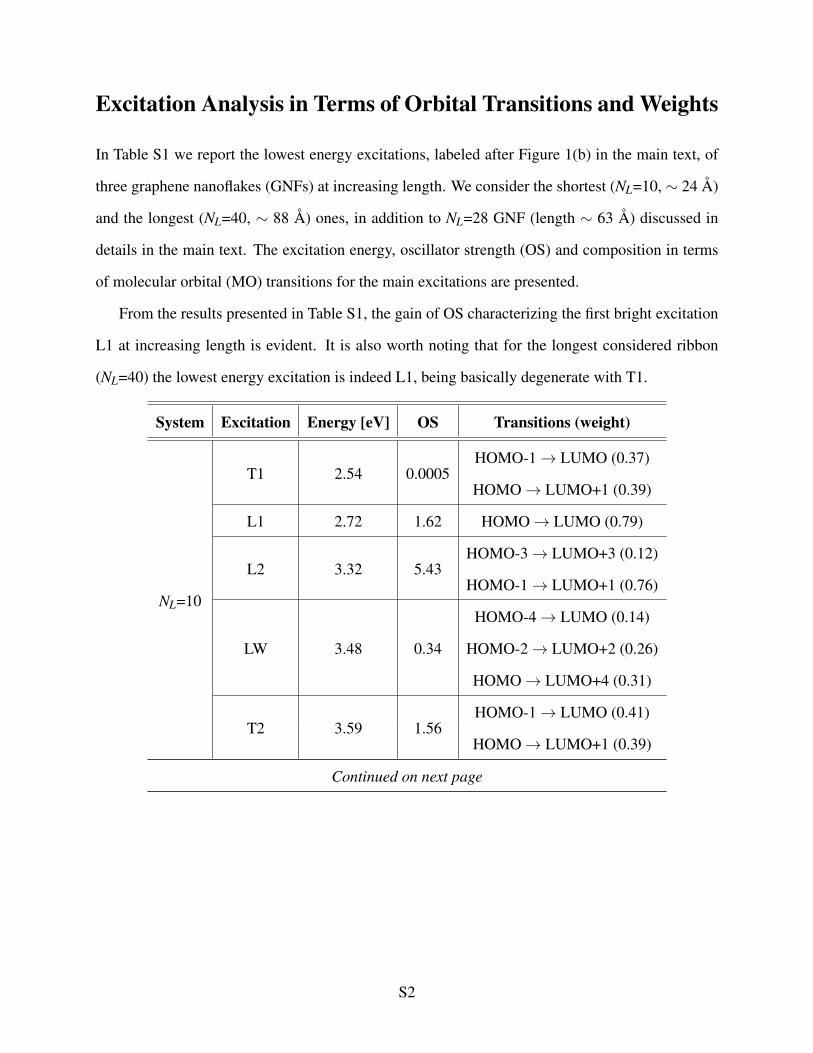
Excitation Analysis in Terms of Orbital Transitions and Weights
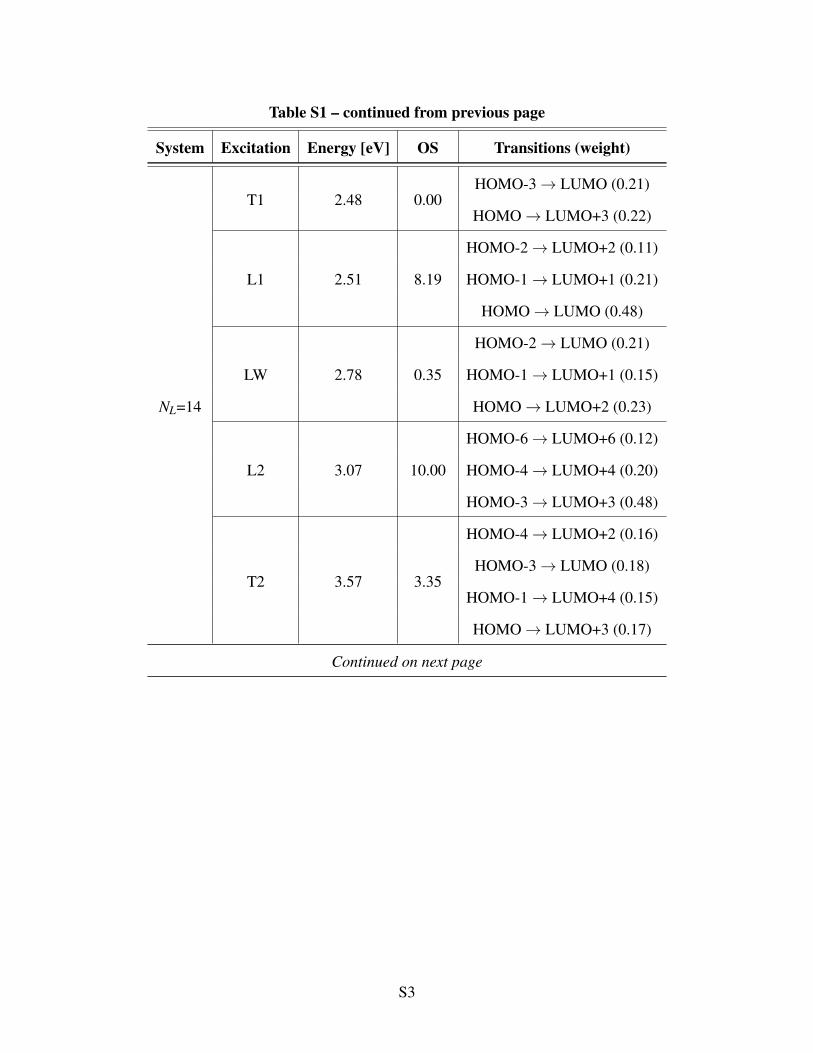
In Table S1 we report the lowest energy excitations, labeled after Figure 1(b) in the main text, of
three graphene nanoflakes (GNFs) at increasing length. We consider the shortest (NL=10, ∼ 24 Å)
and the longest (NL=40, ∼ 88 Å) ones, in addition to NL=28 GNF (length ∼ 63 Å) discussed in
details in the main text. The excitation energy, oscillator strength (OS) and composition in terms
of molecular orbital (MO) transitions for the main excitations are presented.
From the results presented in Table S1, the gain of OS characterizing the first bright excitation
L1 at increasing length is evident. It is also worth noting that for the longest considered ribbon
(NL=40) the lowest energy excitation is indeed L1, being basically degenerate with T1.
System Excitation Energy [eV] OS Transitions (weight)
NL=10
T1 2.54 0.0005HOMO-1→ LUMO (0.37)
HOMO→ LUMO+1 (0.39)
L1 2.72 1.62 HOMO→ LUMO (0.79)
L2 3.32 5.43HOMO-3→ LUMO+3 (0.12)
HOMO-1→ LUMO+1 (0.76)
LW 3.48 0.34
HOMO-4→ LUMO (0.14)
HOMO-2→ LUMO+2 (0.26)
HOMO→ LUMO+4 (0.31)
T2 3.59 1.56HOMO-1→ LUMO (0.41)
HOMO→ LUMO+1 (0.39)
Continued on next page
S2
Table S1 – continued from previous page
System Excitation Energy [eV] OS Transitions (weight)
NL=14
T1 2.48 0.00HOMO-3→ LUMO (0.21)
HOMO→ LUMO+3 (0.22)
L1 2.51 8.19
HOMO-2→ LUMO+2 (0.11)
HOMO-1→ LUMO+1 (0.21)
HOMO→ LUMO (0.48)
LW 2.78 0.35
HOMO-2→ LUMO (0.21)
HOMO-1→ LUMO+1 (0.15)
HOMO→ LUMO+2 (0.23)
L2 3.07 10.00
HOMO-6→ LUMO+6 (0.12)
HOMO-4→ LUMO+4 (0.20)
HOMO-3→ LUMO+3 (0.48)
T2 3.57 3.35
HOMO-4→ LUMO+2 (0.16)
HOMO-3→ LUMO (0.18)
HOMO-1→ LUMO+4 (0.15)
HOMO→ LUMO+3 (0.17)
Continued on next page
S3
Table S1 – continued from previous page
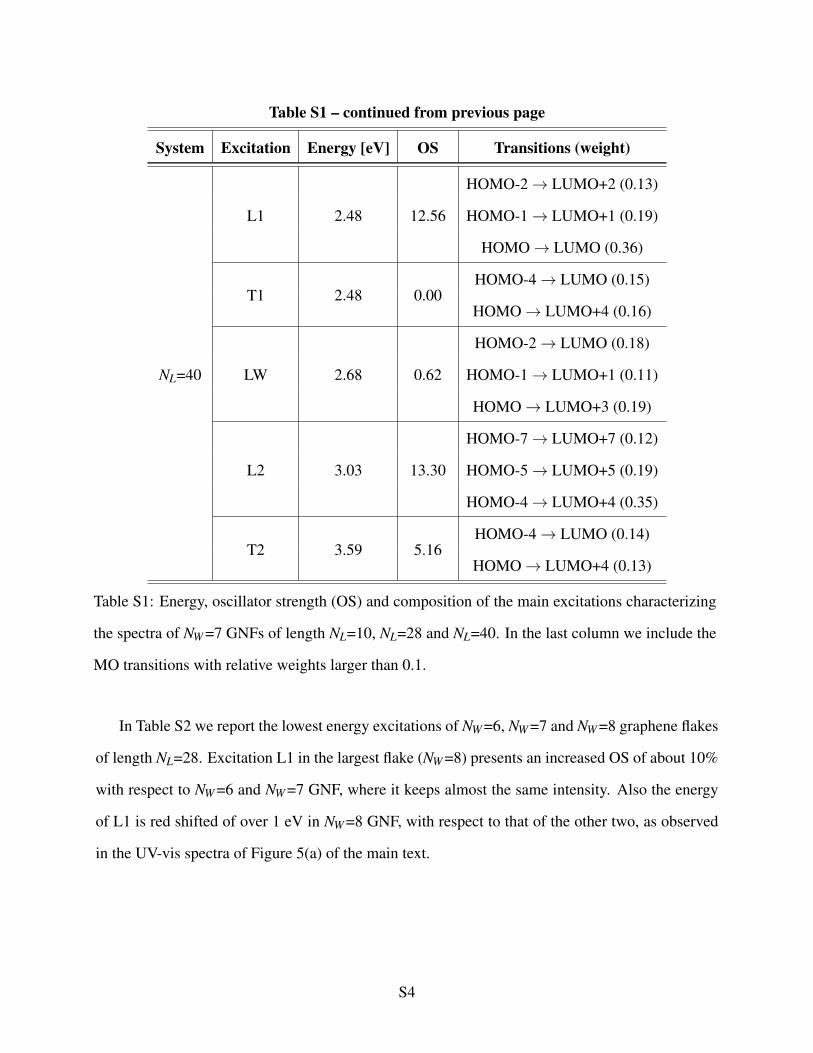
System Excitation Energy [eV] OS Transitions (weight)
NL=40
L1 2.48 12.56
HOMO-2→ LUMO+2 (0.13)
HOMO-1→ LUMO+1 (0.19)
HOMO→ LUMO (0.36)
T1 2.48 0.00HOMO-4→ LUMO (0.15)
HOMO→ LUMO+4 (0.16)
LW 2.68 0.62
HOMO-2→ LUMO (0.18)
HOMO-1→ LUMO+1 (0.11)
HOMO→ LUMO+3 (0.19)
L2 3.03 13.30
HOMO-7→ LUMO+7 (0.12)
HOMO-5→ LUMO+5 (0.19)
HOMO-4→ LUMO+4 (0.35)
T2 3.59 5.16HOMO-4→ LUMO (0.14)
HOMO→ LUMO+4 (0.13)
Table S1: Energy, oscillator strength (OS) and composition of the main excitations characterizing
the spectra of NW =7 GNFs of length NL=10, NL=28 and NL=40. In the last column we include the
MO transitions with relative weights larger than 0.1.
In Table S2 we report the lowest energy excitations of NW =6, NW =7 and NW =8 graphene flakes
of length NL=28. Excitation L1 in the largest flake (NW =8) presents an increased OS of about 10%
with respect to NW =6 and NW =7 GNF, where it keeps almost the same intensity. Also the energy
of L1 is red shifted of over 1 eV in NW =8 GNF, with respect to that of the other two, as observed
in the UV-vis spectra of Figure 5(a) of the main text.
S4
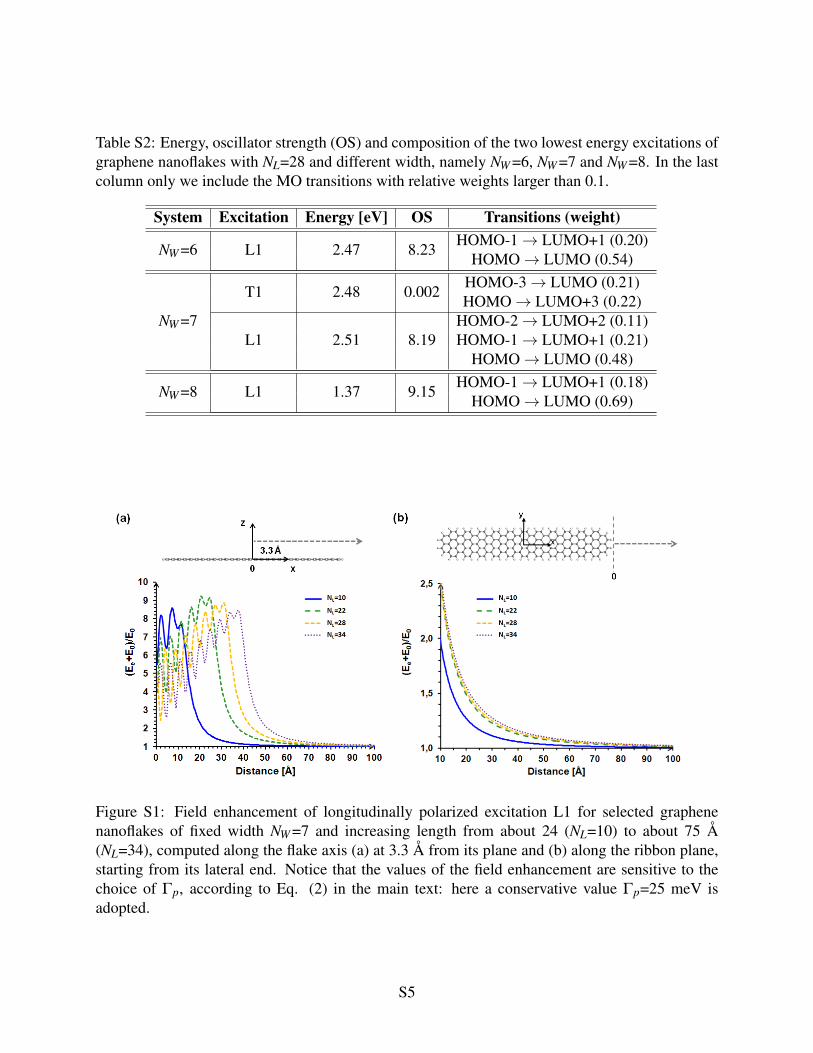
Table S2: Energy, oscillator strength (OS) and composition of the two lowest energy excitations ofgraphene nanoflakes with NL=28 and different width, namely NW =6, NW =7 and NW =8. In the lastcolumn only we include the MO transitions with relative weights larger than 0.1.
System Excitation Energy [eV] OS Transitions (weight)
Figure S1: Field enhancement of longitudinally polarized excitation L1 for selected graphenenanoflakes of fixed width NW =7 and increasing length from about 24 (NL=10) to about 75 Å(NL=34), computed along the flake axis (a) at 3.3 Å from its plane and (b) along the ribbon plane,starting from its lateral end. Notice that the values of the field enhancement are sensitive to thechoice of Γp, according to Eq. (2) in the main text: here a conservative value Γp=25 meV isadopted.
S5
Effects of Length Increase on the Field Enhancement
We report in Figure S1 the field enhancement produced by L1 excitation along the longitudinal
(x) axis of selected graphene flakes of increasing length, at different heights from the basal plane:
at 3.3 Å above the plane from the flake center [see Figure S1(a)] and along the plane from the
flake end [see Figure S1(b)]. It is worth noting that above the ribbon plane the field enhancement
is basically independent of the length, and the curves are characterized by an oscillating behavior
related to the transition density modulation. On the other hand, further from the flake lateral
border, where the dipolar character of the transition density becomes predominant [see also Figure
2(a) in the main text], the field enhancement curves follow the oscillator strength gain of L1 upon
increasing length [see Table S1 and also Figure 1(c) in the main text].
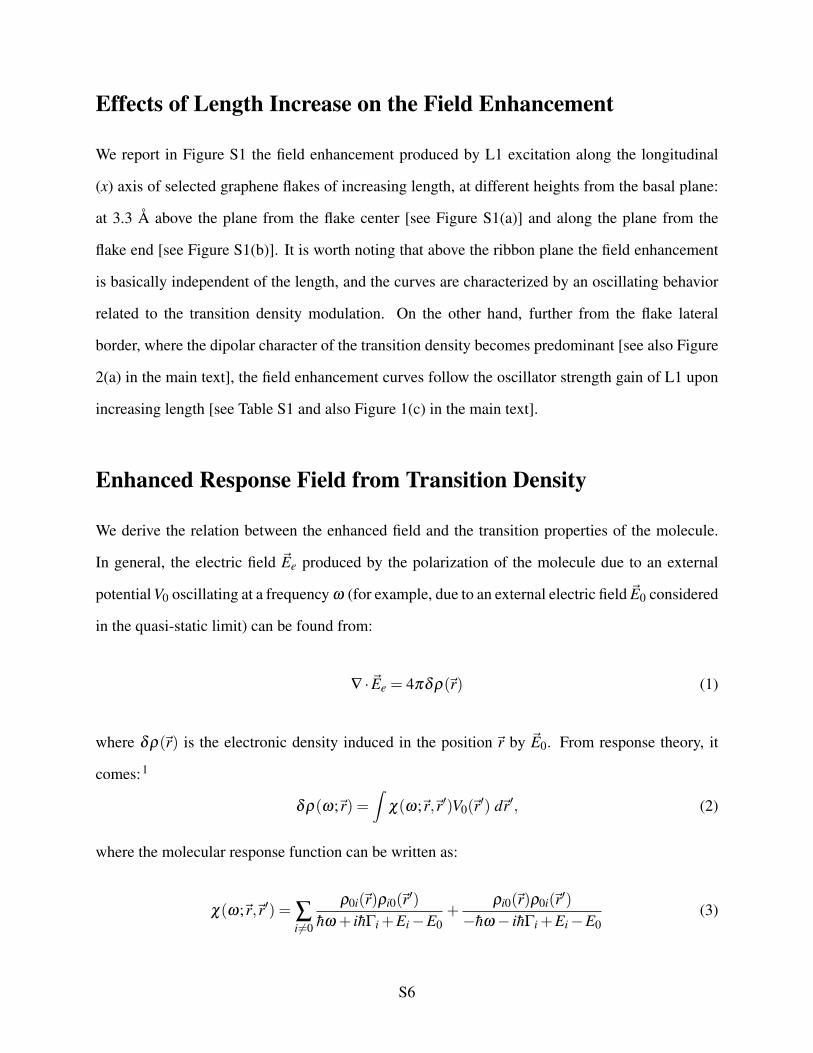
Enhanced Response Field from Transition Density
We derive the relation between the enhanced field and the transition properties of the molecule.
In general, the electric field ~Ee produced by the polarization of the molecule due to an external
potential V0 oscillating at a frequency ω (for example, due to an external electric field ~E0 considered
in the quasi-static limit) can be found from:
∇ ·~Ee = 4πδρ(~r) (1)
where δρ(~r) is the electronic density induced in the position ~r by ~E0. From response theory, it
comes:1
δρ(ω;~r) =∫
χ(ω;~r,~r′)V0(~r′) d~r′, (2)
where the molecular response function can be written as:
χ(ω;~r,~r′) = ∑i6=0
ρ0i(~r)ρi0(~r′)hω + ihΓi +Ei−E0
+ρi0(~r)ρ0i(~r′)
−hω− ihΓi +Ei−E0(3)
S6
In Eq. (3), ρ0i are the transition densities between the ground state 0 and the excited state i, and
Ei are the energies of the states. When the frequency ω is close to a molecular transition from
0 to p (i.e., ω ≈ ωp0 = (Ep−E0)/h), one denominator in Eq. (3) becomes very small, and the
corresponding term dominates the sum over i, so that:
χ(ωp0;~r,~r′)≈ ρ0p(~r)ρp0(~r′)ihΓp
. (4)
Therefore:
δρ(ω;~r) =ρ0p(~r)ihΓp
∫ρp0(~r′)V0(~r′) d~r′. (5)
If we now assume that V0(~r′) is the electrostatic potential associated with an external probing field
in the quasi static limit, then:
V0(~r′) =−~r′ ·~E0 (6)
and
δρ(ω0p;~r) =−ρ0p(~r)ihΓp
~µp0 ·~E0, (7)
where ~µp0 is the molecular transition dipole, evaluated here by the ZINDO/S method. By solving
Eq. (1) using the expression of δρ(ω;~r) in Eq. (7), the electric potential and the field ~Ee plotted in
Figure 3 and Figure 4 of the main text are finally obtained.
References
(1) Fetter, A. L.; Walecka, J. D. Quantum theory of many-particle systems; McGraw-Hill, New