Page 1
Physicochemical characteristics of Lake IRAD, an
artificial lake in Wakwa region, CameroonW.M.L. Fezeu,1,2*M.B. Ngassoum,1 E. Montarges-Pelletier,3 G. Echevarria4 and
C.M.F. Mbofung1
1National School of Agro-Industrial Sciences, Ngaoundere University, Ngaoundere, Cameroon, 2Belisle Laboratory,
100 Fisher, Mont-St-Hilaire (Quebec), Canada, 3Laboratoire Environnement et Mineralurgie, CNRS-Nancy University,
15 avenue du Charmois, 54500 Vandoeuvre les Nancy, France, and 4Laboratory of Soil and Environmental Sciences
(LSE), E.N.S.A.I.A. – INPL, Vandoeuvre-les-Nancy, France
AbstractWakwa is a region in north Cameroon characterized by intensive cattle production. This study evaluated the physico-
chemical characteristics of the waters in Lake IRAD, located near Wakwa, which is the main water source for cattle graz-
ing in this area. Water samples were collected at four sampling sites during the rainy and dry seasons (April, July,
October and February). The chemical composition of the water samples was analysed for various constituents, including
nitrate (NO3–), chloride (Cl)), phosphate (PO4
3)), bicarbonate (HCO3)), calcium (Ca), magnesium (Mg), manganese
(Mn), aluminium (Al), zinc (Zn), copper (Cu), iron (Fe), nickel (Ni), cadmium (Cd), ammonia–nitrogen (NH4–N) and
organic matter (OM). The mineral composition varied significantly (P < 0.05) with the sampling period. High concentra-
tions of zinc (0.96 mg L)1) and dissolved iron (1.23 mg L)l) were observed during the dry season. Total iron
(3.25 mg L)1), OM (15.4 mg of O2 L)1), nitrate (28.82 mg L)1) and NH4–N (1.05 mg L)1) concentrations were highest
during the rainy season. The iron, OM and NH4–N concentrations were higher than the USEPA-recommended values
(0.2 mg L)1, 4 mg of O2 L)1 and 0.5 mg L)1, respectively). The phosphate, copper, nickel and cadmium concentrations,
considered as the polluting substances, were present in negligible concentrations, being below the detection limits of the
analytical techniques used to measure them. The high iron, OM and nitrogen concentrations were attributed to water-lea-
ched soil run-off, as well as the activity of animals in the lake. Sampling sites 1 and 2, which were used mostly by cattle,
were observed to have the highest concentrations of NH4–N, compared with sites 3 and S (exit point). It will be neces-
sary to delimit cattle access points to the lake to reduce this type of contamination of drinking water.
Key wordsagricultural activities, lake, livestock husbandry, minerals.
INTRODUCTIONAlthough an important physiological requirement for all
life, including humans, water is not uniformly distributed
on our planet. Grazing cattle in most tropical countries
generally use surface water sources (e.g. rivers, lakes
and springs) to satisfy their water needs. Being a tropical
country, Cameroon has readily substantial water during
its rainy season. In contrast, during the dry season, after
the rains have ended, and rivers have dried up, water
demands increase at the same time that water sources
become rare. In the Adamawa region, a major cattle-rais-
ing area of Cameroon, the dry season is generally
marked by nomadic behaviour, during which cattle farm-
ers bring their cattle to the few water points that have
resisted to drought (Boutrais 1974).
Cattle raising is generally artisanal in the Adamawa
region, with grazers using any accessible water source to
satisfy their water needs (e.g. rivers, lakes and springs).
Although animals can tolerate poor water quality better
than humans, cattle can nevertheless be affected if the
concentrations of some specific compounds (organic or
mineral) in the water they drink are sufficiently elevated.
Although the cattle might not exhibit clinical signs of ill-
ness, growth, lactation and reproduction might be
affected (Braul & Kirychuk 2001). Thus, the mineral
*Corresponding author. Email: [email protected]
Accepted for publication 15 May 2009.
� 2009 The AuthorsDoi: 10.1111/j.1440-1770.2009.00402.x Journal compilation � 2009 Blackwell Publishing Asia Pty Ltd
Lakes & Reservoirs: Research and Management 2009 14: 259–268
Page 2
quality of water is a very important parameter for optimal
cattle raising and reproduction. Water deemed safe for
human consumption must meet specific criteria (NRC
(National Research Council) 2001), including organoleptic
properties (e.g. odour and taste), physicochemical prop-
erties (e.g. pH, total dissolved solids and hardness, total
dissolved oxygen and suspended solids) toxic compound
levels (e.g. heavy metals, organophosphates and hydro-
carbons), excess cations or anions levels (e.g. nitrates,
sodium, sulphates and iron) and bacterial levels.
To facilitate cattle grazing consistent with these crite-
ria, watering points for cattle are distributed and the
water quality is controlled. In recognition of this link
between the quality of water and its effects on cattle rear-
ing, researchers at the Wakwa Research Center, in the
Adamawa region of Cameroon, constructed an artificial
lake to satisfy cattle water needs.
For grazing lands for which the aforementioned crite-
ria are being met, the drinking points are well con-
structed and protected. Fewer precautions, however, are
taken to protect water quality in many tropical pastures.
As a result, these latter water sources are susceptible to
contamination by the cattle that drink it. This concern is
especially serious at Wakwa, in Cameroon, owing to the
interrelation of farming and cattle raising (Boutrais 1974).
As a result, the available water sources used by both
cattle breeders and farmers, as well as for human activi-
ties, could be significantly contaminated.
The artificial lake covered the water requirements of
cattle for the research centre at Wakwa 60 years ago dur-
ing the rainy season, and especially in the dry season.
With the contribution of rain water, the lake has usually
has an important surface area, becoming with time an
important drinking water source for animals in the lake
vicinity during both dry and rainy seasons. This lake is
not only a water source for cattle breeders, but also a
source of minerals for animals. At the same time, how-
ever, it also might represent a health and ⁄ or environmen-
tal danger, as it is possible to find dead fish in the lake
during the dry season, likely attributable to organic or
mineral pollution (Hubbard et al. 2004). Despite the
importance of this lake for watering livestock, no informa-
tion exists on the quality of its water, although of organic
matter (OM) contamination of these waters have been
previously demonstrated (Sangogin 1991; Mignolet et al.
1999; Smith et al. 1999).
Accordingly, the objective of this study was to deter-
mine the organic and mineral quality of the waters in the
artificial lake at the Wakwa Research Center.
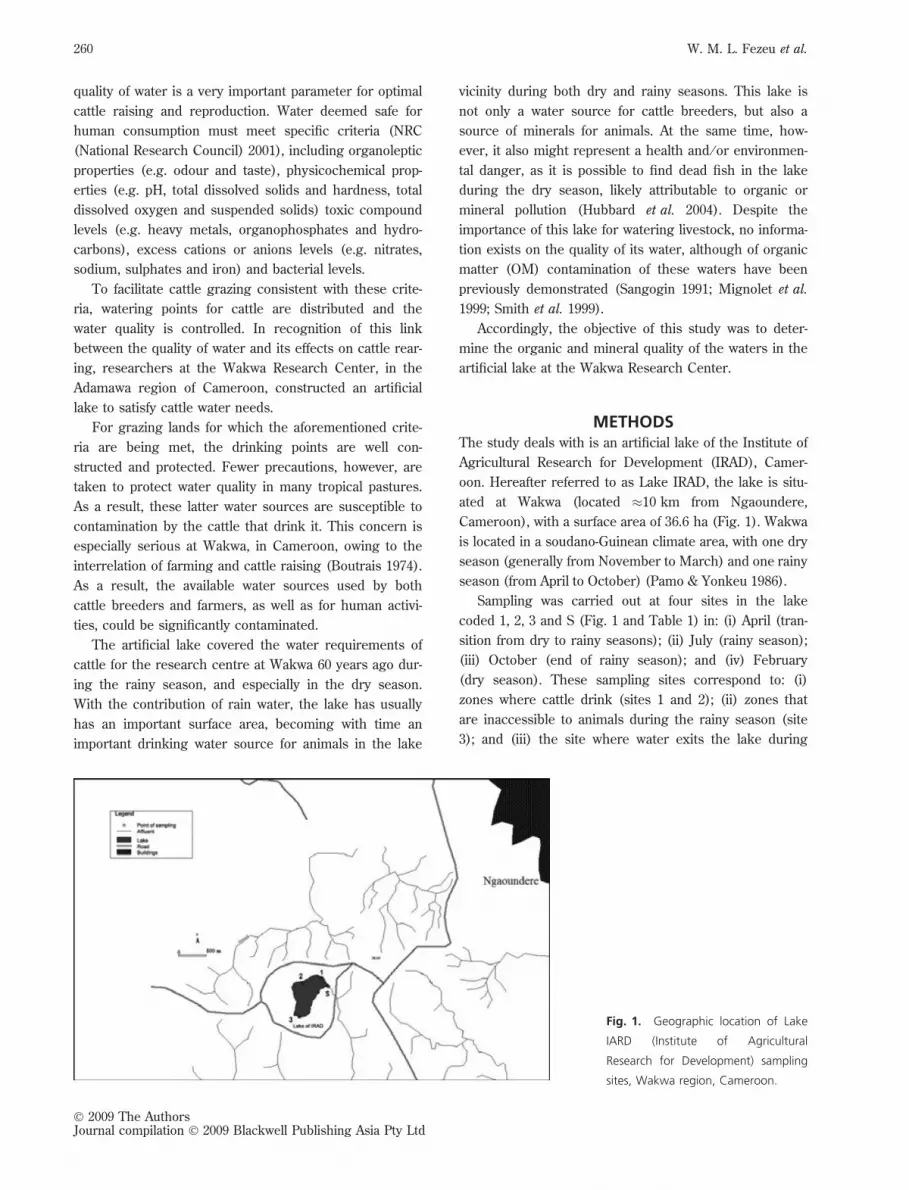
METHODSThe study deals with is an artificial lake of the Institute of
Agricultural Research for Development (IRAD), Camer-
oon. Hereafter referred to as Lake IRAD, the lake is situ-
ated at Wakwa (located �10 km from Ngaoundere,
Cameroon), with a surface area of 36.6 ha (Fig. 1). Wakwa
is located in a soudano-Guinean climate area, with one dry
season (generally from November to March) and one rainy
season (from April to October) (Pamo & Yonkeu 1986).
Sampling was carried out at four sites in the lake
coded 1, 2, 3 and S (Fig. 1 and Table 1) in: (i) April (tran-
sition from dry to rainy seasons); (ii) July (rainy season);
(iii) October (end of rainy season); and (iv) February
(dry season). These sampling sites correspond to: (i)
zones where cattle drink (sites 1 and 2); (ii) zones that
are inaccessible to animals during the rainy season (site
3); and (iii) the site where water exits the lake during
Fig. 1. Geographic location of Lake
IARD (Institute of Agricultural
Research for Development) sampling
sites, Wakwa region, Cameroon.
� 2009 The AuthorsJournal compilation � 2009 Blackwell Publishing Asia Pty Ltd
260 W. M. L. Fezeu et al.
Page 3
the rainy season (site S). Water samples were collected
in cleaned polypropylene bottles, and quickly transported
to the laboratory for chemical analyses.
The pH was measured with a portable pH meter (PIC-
COLO-ATC brand, Hanna, France), whereas the electrical
conductivity (EC; v) was measured with a TACUSSEL
CD-60 resistivimeter (Tacussel Electronique, France).
The bicarbonate, carbonate and chloride concentrations
were determined by titrimetric methods (AFNOR 1986).
The sulphate and nitrate concentrations were assayed on
the basis of the colorimetric methods described by
Rodier (1978). As also described by Rodier (1978), a
method that makes use of the oxidative properties of per-
manganate was utilized to determine the OM content in
the water samples.
The water samples were filtered through a 0.2 lm fil-
ter and analysed for dissolved iron and filtered trough
25 lm filter and digested with concentrated nitric acid
and analysed for total calcium, magnesium, sodium, iron,
aluminium, manganese and zinc concentrations, using
inductive coupled plasma atomic emission spectrometry
(ICP-AES). The copper content was assayed via atomic
absorption spectrophotometry (Varian SpectrAA-600, Var-
ian, Palo Alto, CA, USA).
All analyses were carried out in duplicate. The data
were then subjected to analysis of variance (ANOVA), as a
means of detecting the effects of period (month) and
sampling location on the physicochemical composition of
the lake water. The Duncan multiple range test (DMRT)
was used to compare individual means in the case of sig-
nificant variations. Pearson’s correlation was used to
determine the relationships between all the analysed
parameters. Statistical analyses were carried out with the
Statgraphics Plus 5.2 (ANOVA, Statpoint Technologie, Inc.,
USA) and Statistica (Pearson’s correlation, Statsft, Inc.,
USA) software. The statistical significance of the data
was defined at P < 0.05.
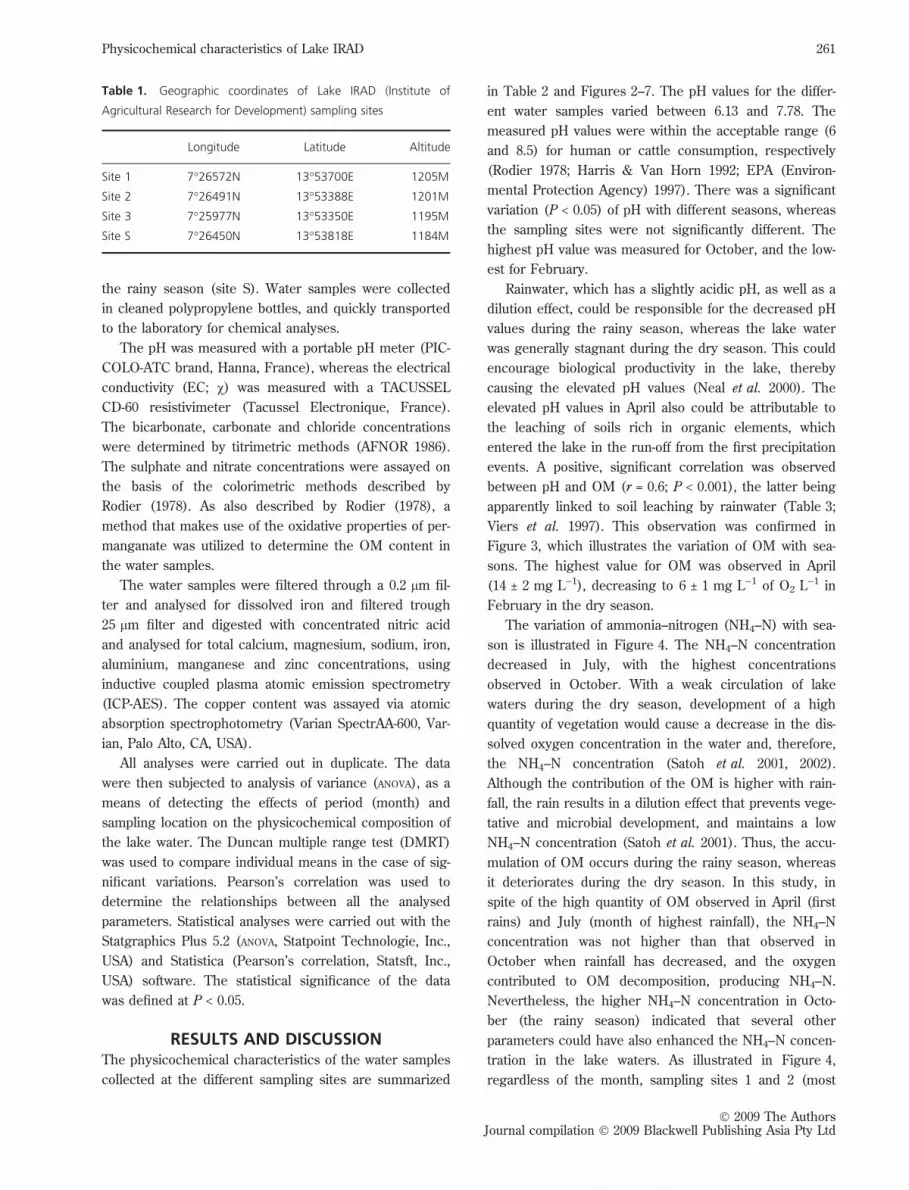
RESULTS AND DISCUSSIONThe physicochemical characteristics of the water samples
collected at the different sampling sites are summarized
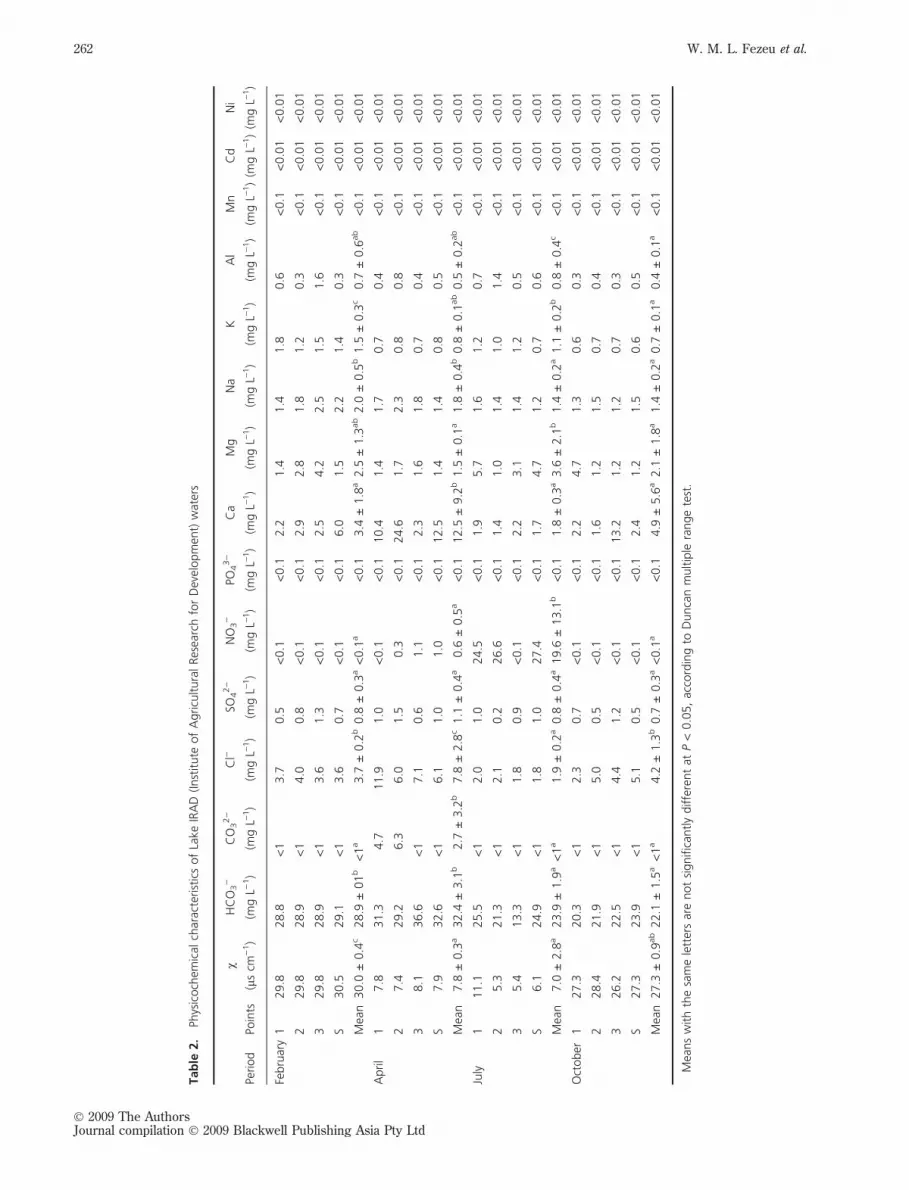
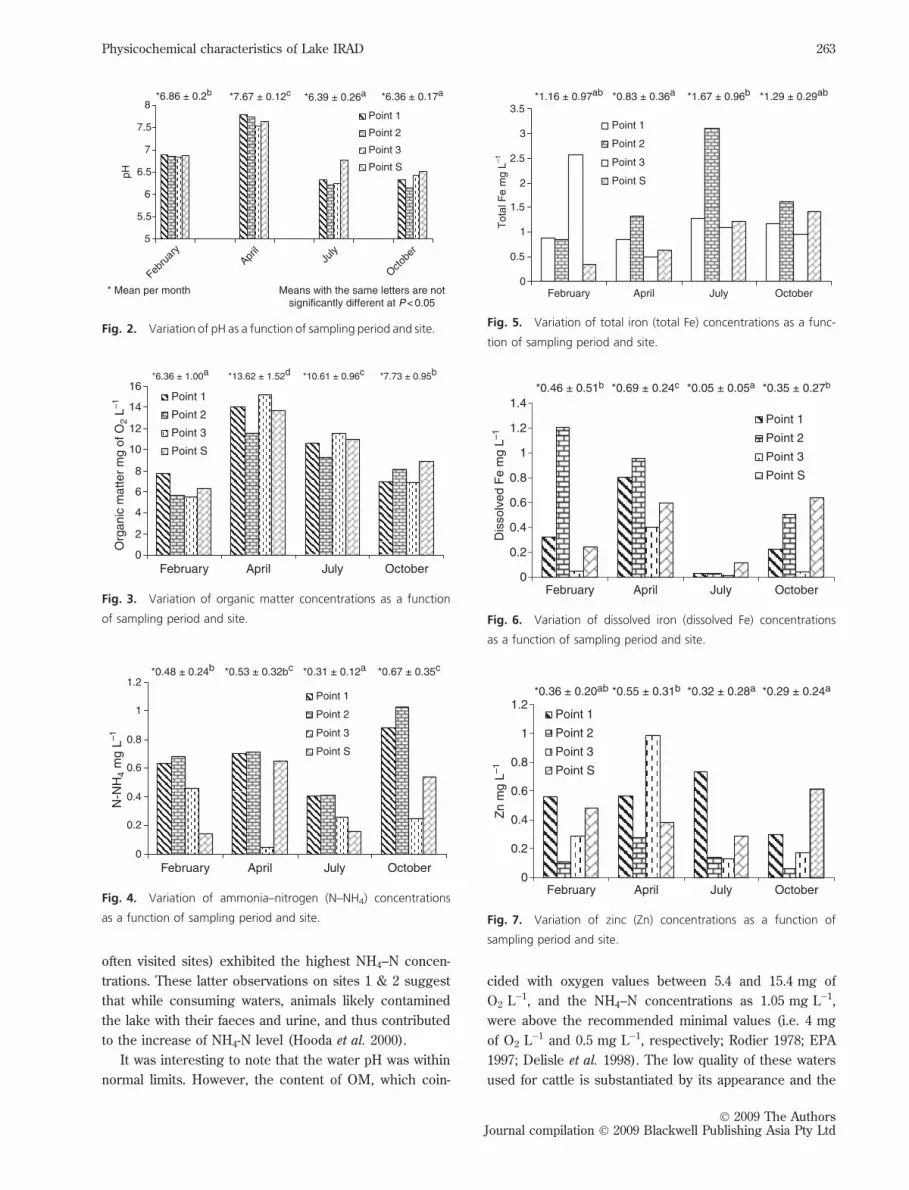
in Table 2 and Figures 2–7. The pH values for the differ-
ent water samples varied between 6.13 and 7.78. The
measured pH values were within the acceptable range (6
and 8.5) for human or cattle consumption, respectively
(Rodier 1978; Harris & Van Horn 1992; EPA (Environ-
mental Protection Agency) 1997). There was a significant
variation (P < 0.05) of pH with different seasons, whereas
the sampling sites were not significantly different. The
highest pH value was measured for October, and the low-
est for February.
Rainwater, which has a slightly acidic pH, as well as a
dilution effect, could be responsible for the decreased pH
values during the rainy season, whereas the lake water
was generally stagnant during the dry season. This could
encourage biological productivity in the lake, thereby
causing the elevated pH values (Neal et al. 2000). The
elevated pH values in April also could be attributable to
the leaching of soils rich in organic elements, which
entered the lake in the run-off from the first precipitation
events. A positive, significant correlation was observed
between pH and OM (r = 0.6; P < 0.001), the latter being
apparently linked to soil leaching by rainwater (Table 3;
Viers et al. 1997). This observation was confirmed in
Figure 3, which illustrates the variation of OM with sea-
sons. The highest value for OM was observed in April
(14 ± 2 mg L)1), decreasing to 6 ± 1 mg L)1 of O2 L)1 in
February in the dry season.
The variation of ammonia–nitrogen (NH4–N) with sea-
son is illustrated in Figure 4. The NH4–N concentration
decreased in July, with the highest concentrations
observed in October. With a weak circulation of lake
waters during the dry season, development of a high
quantity of vegetation would cause a decrease in the dis-
solved oxygen concentration in the water and, therefore,
the NH4–N concentration (Satoh et al. 2001, 2002).
Although the contribution of the OM is higher with rain-
fall, the rain results in a dilution effect that prevents vege-
tative and microbial development, and maintains a low
NH4–N concentration (Satoh et al. 2001). Thus, the accu-
mulation of OM occurs during the rainy season, whereas
it deteriorates during the dry season. In this study, in
spite of the high quantity of OM observed in April (first
rains) and July (month of highest rainfall), the NH4–N
concentration was not higher than that observed in
October when rainfall has decreased, and the oxygen
contributed to OM decomposition, producing NH4–N.
Nevertheless, the higher NH4–N concentration in Octo-
ber (the rainy season) indicated that several other
parameters could have also enhanced the NH4–N concen-
tration in the lake waters. As illustrated in Figure 4,
regardless of the month, sampling sites 1 and 2 (most
Table 1. Geographic coordinates of Lake IRAD (Institute of
Agricultural Research for Development) sampling sites
Longitude Latitude Altitude
Site 1 7�26572N 13�53700E 1205M
Site 2 7�26491N 13�53388E 1201M
Site 3 7�25977N 13�53350E 1195M
Site S 7�26450N 13�53818E 1184M
� 2009 The AuthorsJournal compilation � 2009 Blackwell Publishing Asia Pty Ltd
Physicochemical characteristics of Lake IRAD 261
Page 4
Tab
le2.
Phys
icoch
emic
alch
arac
terist
ics
of
Lake
IRA
D(In
stitute
of
Agricu
ltura
lRes
earc
hfo
rD
evel
opm
ent)
wat
ers
Period
Poin
ts
v
(ls
cm)
1)
HC
O3)
(mg
L)1)
CO
32)
(mg
L–1)
Cl)
(mg
L–1)
SO42)
(mg
L–1)
NO
3)
(mg
L–1)
PO43)
(mg
L–1)
Ca
(mg
L–1)
Mg
(mg
L–1)
Na
(mg
L–1)
K
(mg
L–1)
Al
(mg
L–1)
Mn
(mg
L–1)
Cd
(mg
L–1)
Ni
(mg
L–1)
Febru
ary
129.8
28.8
<1
3.7
0.5
<0.1
<0.1
2.2
1.4
1.4
1.8
0.6
<0.1
<0.0
1<
0.0
1
229.8
28.9
<1
4.0
0.8
<0.1
<0.1
2.9
2.8
1.8
1.2
0.3
<0.1
<0.0
1<
0.0
1
329.8
28.9
<1
3.6
1.3
<0.1
<0.1
2.5
4.2
2.5
1.5
1.6
<0.1
<0.0
1<
0.0
1
S30.5
29.1
<1
3.6
0.7
<0.1
<0.1
6.0
1.5
2.2
1.4
0.3
<0.1
<0.0
1<
0.0
1
Mea
n30.0
±0.4
c28.9
±01
b<
1a
3.7
±0.2
b0.8
±0.3
a<
0.1
a<
0.1
3.4
±1.8
a2.5
±1.3
ab
2.0
±0.5
b1.5
±0.3
c0.7
±0.6
ab
<0.1
<0.0
1<
0.0
1
April
17.8
31.3
4.7
11.9
1.0
<0.1
<0.1
10.4
1.4
1.7
0.7
0.4
<0.1
<0.0
1<
0.0
1
27.4
29.2
6.3
6.0
1.5
0.3
<0.1
24.6
1.7
2.3
0.8
0.8
<0.1
<0.0
1<
0.0
1
38.1
36.6
<1
7.1
0.6
1.1
<0.1
2.3
1.6
1.8
0.7
0.4
<0.1
<0.0
1<
0.0
1
S7.9
32.6
<1
6.1
1.0
1.0
<0.1
12.5
1.4
1.4
0.8
0.5
<0.1
<0.0
1<
0.0
1
Mea
n7.8
±0.3
a32.4
±3.1
b2.7
±3.2
b7.8
±2.8
c1.1
±0.4
a0.6
±0.5
a<
0.1
12.5
±9.2
b1.5
±0.1
a1.8
±0.4
b0.8
±0.1
ab
0.5
±0.2
ab
<0.1
<0.0
1<
0.0
1
July
111.1
25.5
<1
2.0
1.0
24.5
<0.1
1.9
5.7
1.6
1.2
0.7
<0.1
<0.0
1<
0.0
1
25.3
21.3
<1
2.1
0.2
26.6
<0.1
1.4
1.0
1.4
1.0
1.4
<0.1
<0.0
1<
0.0
1
35.4
13.3
<1
1.8
0.9
<0.1
<0.1
2.2
3.1
1.4
1.2
0.5
<0.1
<0.0
1<
0.0
1
S6.1
24.9
<1
1.8
1.0
27.4
<0.1
1.7
4.7
1.2
0.7
0.6
<0.1
<0.0
1<
0.0
1
Mea
n7.0
±2.8
a23.9
±1.9
a<
1a
1.9
±0.2
a0.8
±0.4
a19.6
±13.1
b<
0.1
1.8
±0.3
a3.6
±2.1
b1.4
±0.2
a1.1
±0.2
b0.8
±0.4
c<
0.1
<0.0
1<
0.0
1
Oct
ober
127.3
20.3
<1
2.3
0.7
<0.1
<0.1
2.2
4.7
1.3
0.6
0.3
<0.1
<0.0
1<
0.0
1
228.4
21.9
<1
5.0
0.5
<0.1
<0.1
1.6
1.2
1.5
0.7
0.4
<0.1
<0.0
1<
0.0
1
326.2
22.5
<1
4.4
1.2
<0.1
<0.1
13.2
1.2
1.2
0.7
0.3
<0.1
<0.0
1<
0.0
1
S27.3
23.9
<1
5.1
0.5
<0.1
<0.1
2.4
1.2
1.5
0.6
0.5
<0.1
<0.0
1<
0.0
1
Mea
n27.3
±0.9
ab
22.1
±1.5
a<
1a
4.2
±1.3
b0.7
±0.3
a<
0.1
a<
0.1
4.9
±5.6
a2.1
±1.8
a1.4
±0.2
a0.7
±0.1
a0.4
±0.1
a<
0.1
<0.0
1<
0.0
1
Mea
ns
with
the
sam
ele
tter
sar
enot
signifi
cantly
diffe
rent
atP
<0.0
5,
acco
rdin
gto
Dunca
nm
ultip
lera
nge
test
.
� 2009 The AuthorsJournal compilation � 2009 Blackwell Publishing Asia Pty Ltd
262 W. M. L. Fezeu et al.
Page 5
often visited sites) exhibited the highest NH4–N concen-
trations. These latter observations on sites 1 & 2 suggest
that while consuming waters, animals likely contamined
the lake with their faeces and urine, and thus contributed
to the increase of NH4-N level (Hooda et al. 2000).
It was interesting to note that the water pH was within
normal limits. However, the content of OM, which coin-
cided with oxygen values between 5.4 and 15.4 mg of
O2 L)1, and the NH4–N concentrations as 1.05 mg L)1,
were above the recommended minimal values (i.e. 4 mg
of O2 L)1 and 0.5 mg L)1, respectively; Rodier 1978; EPA
1997; Delisle et al. 1998). The low quality of these waters
used for cattle is substantiated by its appearance and the
0
0.2
0.4
0.6
0.8
1
1.2
1.4
February
Dis
solv
ed F
e m
g L–1
Point 1
Point 2
Point 3
Point S
*0.05 ± 0.05a
April July October
*0.46 ± 0.51b *0.69 ± 0.24c *0.35 ± 0.27b
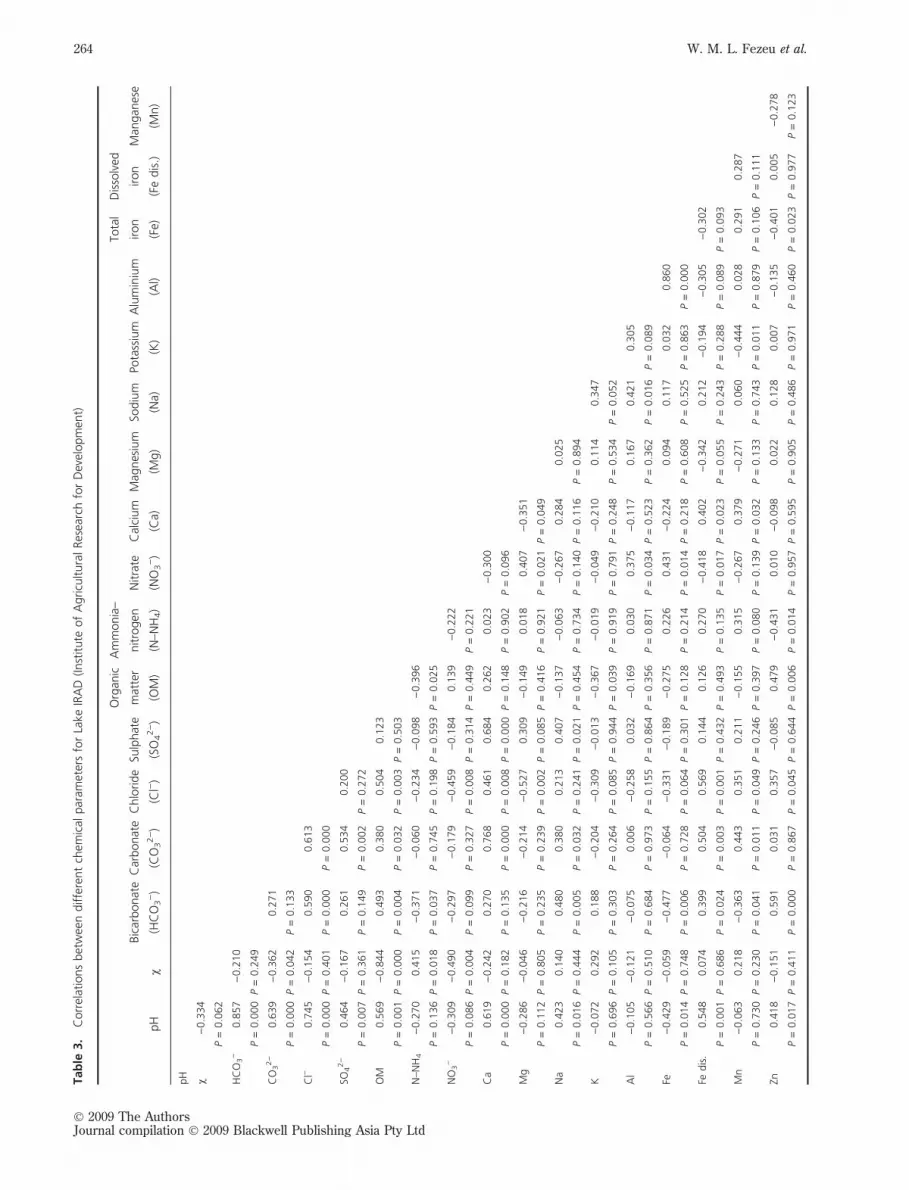
Fig. 6. Variation of dissolved iron (dissolved Fe) concentrations
as a function of sampling period and site.
0
0.2
0.4
0.6
0.8
1
1.2
February
Zn
mg
L–1
Point 1
Point 2
Point 3
Point S
*0.29 ± 0.24a*0.36 ± 0.20ab *0.55 ± 0.31b *0.32 ± 0.28a
April July October
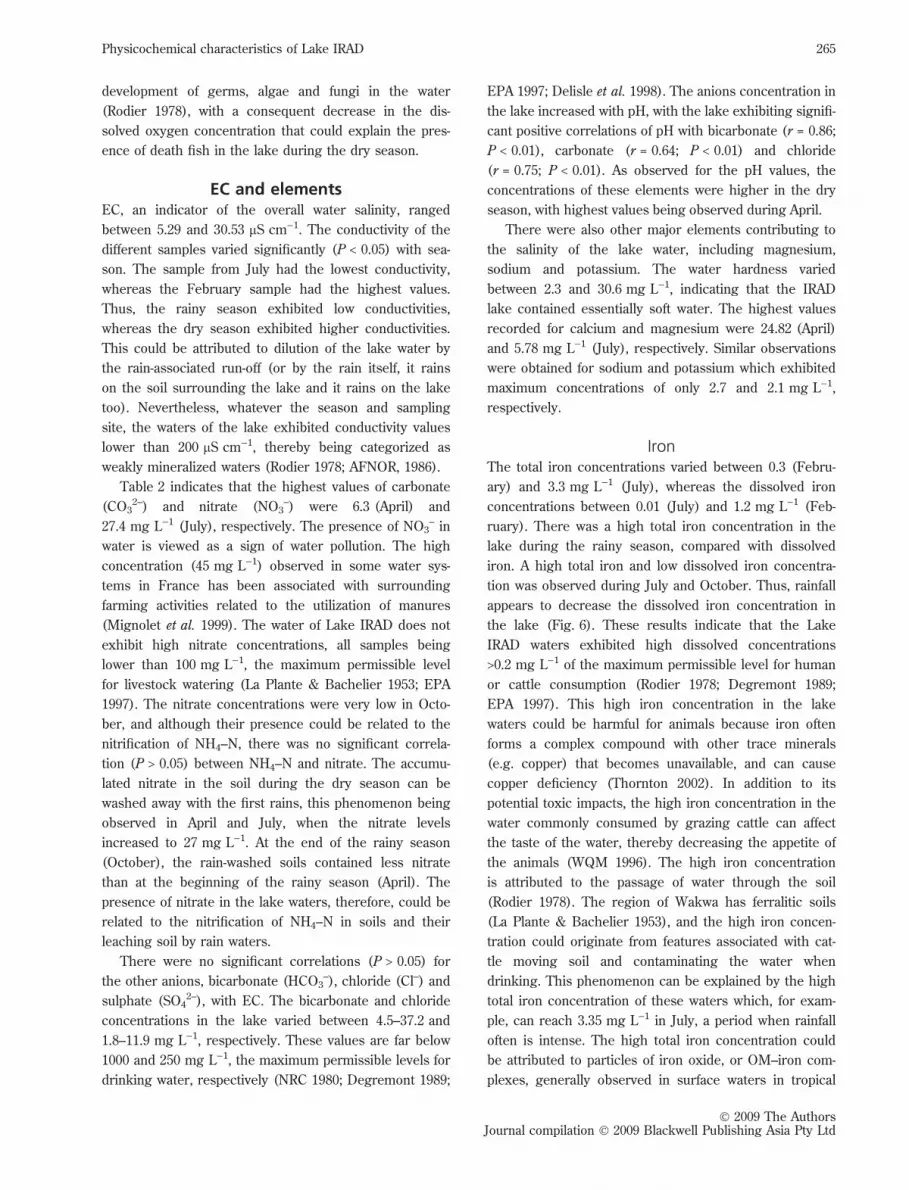
Fig. 7. Variation of zinc (Zn) concentrations as a function of
sampling period and site.
5
5.5
6
6.5
7
7.5
8
Febru
ary
April
July
Octobe
r
pHPoint 1
Point 2
Point 3
Point S
*6.86 ± 0.2b *6.39 ± 0.26a
* Mean per month
*6.36 ± 0.17a*7.67 ± 0.12c
Means with the same letters are notsignificantly different at P < 0.05
Fig. 2. Variation of pH as a function of sampling period and site.
0
0.5
1
1.5
2
2.5
3
3.5
February April July October
Tot
al F
e m
g L–1
Point 1
Point 2
Point 3
Point S
*1.16 ± 0.97ab *0.83 ± 0.36a *1.67 ± 0.96b *1.29 ± 0.29ab
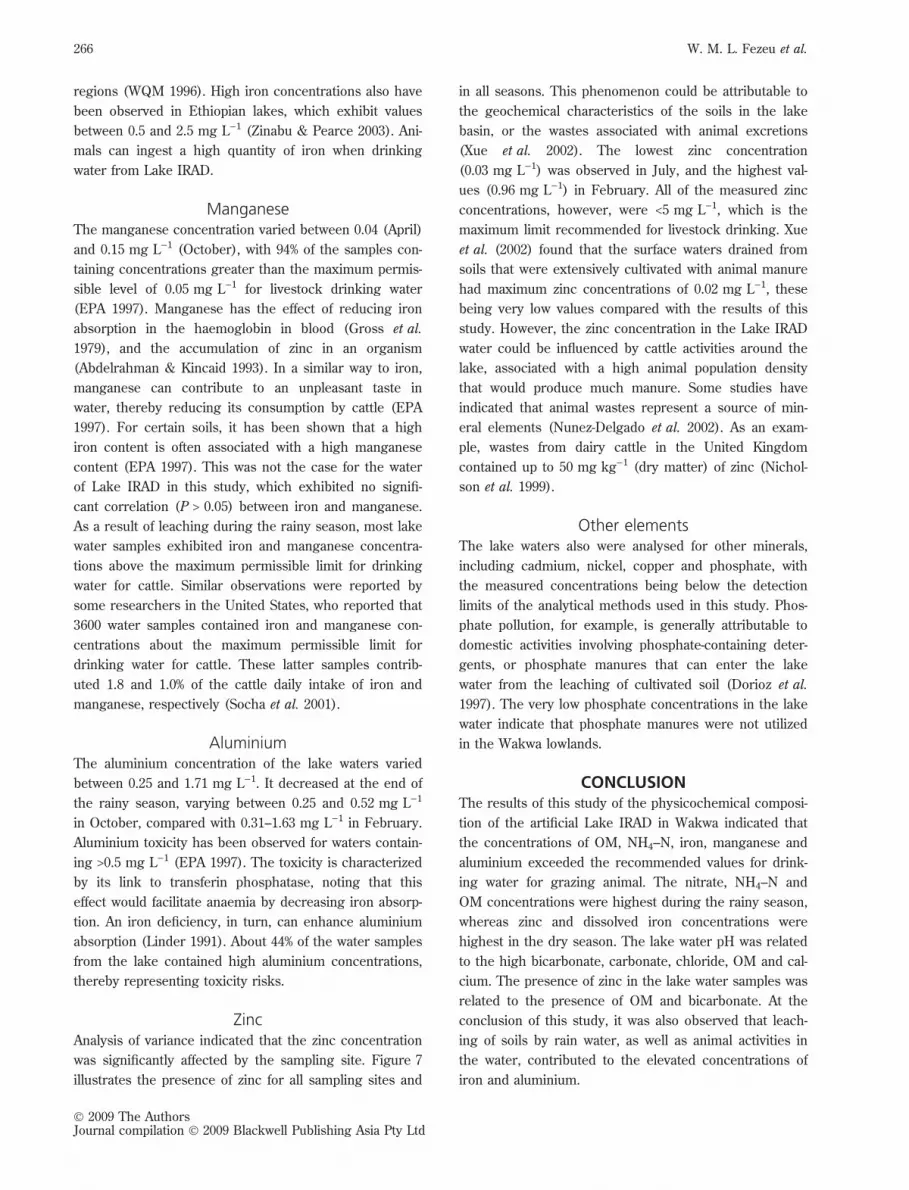
Fig. 5. Variation of total iron (total Fe) concentrations as a func-
tion of sampling period and site.
0
2
4
6
8
10
12
14
16
February April July October
Org
anic
mat
ter
mg
of O
2 L–1
Point 1
Point 2
Point 3
Point S
*6.36 ± 1.00a *13.62 ± 1.52d *7.73 ± 0.95b*10.61 ± 0.96c
Fig. 3. Variation of organic matter concentrations as a function
of sampling period and site.
0
0.2
0.4
0.6
0.8
1
1.2
February April July October
N-N
H4
mg
L–1
Point 1
Point 2
Point 3
Point S
*0.48 ± 0.24b *0.53 ± 0.32bc *0.31 ± 0.12a *0.67 ± 0.35c
Fig. 4. Variation of ammonia–nitrogen (N–NH4) concentrations
as a function of sampling period and site.
� 2009 The AuthorsJournal compilation � 2009 Blackwell Publishing Asia Pty Ltd
Physicochemical characteristics of Lake IRAD 263
Page 6
Tab
le3.
Corr
elat
ions
bet
wee
ndiffe
rent
chem
ical
par
amet
ers
for
Lake
IRA
D(In
stitute
of
Agricu
ltura
lRes
earc
hfo
rD
evel
opm
ent)
pH
v
Bic
arbonat
e
(HC
O3))
Car
bonat
e
(CO
32))
Chlo
ride
(Cl)
)
Sulp
hat
e
(SO
42))
Org
anic
mat
ter
(OM
)
Am
monia
–
nitro
gen
(N–N
H4)
Nitra
te
(NO
3))
Cal
cium
(Ca)
Mag
nes
ium
(Mg)
Sodiu
m
(Na)
Pota
ssiu
m
(K)
Alu
min
ium
(Al)
Tota
l
iron
(Fe)
Dis
solv
ed
iron
(Fe
dis
.)
Man
gan
ese
(Mn)
pH v
)0.3
34
P=
0.0
62
HC
O3)
0.8
57
)0.2
10
P=
0.0
00
P=
0.2
49
CO
32)
0.6
39
)0.3
62
0.2
71
P=
0.0
00
P=
0.0
42
P=
0.1
33
Cl)
0.7
45
)0.1
54
0.5
90
0.6
13
P=
0.0
00
P=
0.4
01
P=
0.0
00
P=
0.0
00
SO42)
0.4
64
)0.1
67
0.2
61
0.5
34
0.2
00
P=
0.0
07
P=
0.3
61
P=
0.1
49
P=
0.0
02
P=
0.2
72
OM
0.5
69
)0.8
44
0.4
93
0.3
80
0.5
04
0.1
23
P=
0.0
01
P=
0.0
00
P=
0.0
04
P=
0.0
32
P=
0.0
03
P=
0.5
03
N–N
H4
)0.2
70
0.4
15
)0.3
71
)0.0
60
)0.2
34
)0.0
98
)0.3
96
P=
0.1
36
P=
0.0
18
P=
0.0
37
P=
0.7
45
P=
0.1
98
P=
0.5
93
P=
0.0
25
NO
3)
)0.3
09
)0.4
90
)0.2
97
)0.1
79
)0.4
59
)0.1
84
0.1
39
)0.2
22
P=
0.0
86
P=
0.0
04
P=
0.0
99
P=
0.3
27
P=
0.0
08
P=
0.3
14
P=
0.4
49
P=
0.2
21
Ca
0.6
19
)0.2
42
0.2
70
0.7
68
0.4
61
0.6
84
0.2
62
0.0
23
)0.3
00
P=
0.0
00
P=
0.1
82
P=
0.1
35
P=
0.0
00
P=
0.0
08
P=
0.0
00
P=
0.1
48
P=
0.9
02
P=
0.0
96
Mg
)0.2
86
)0.0
46
)0.2
16
)0.2
14
)0.5
27
0.3
09
)0.1
49
0.0
18
0.4
07
)0.3
51
P=
0.1
12
P=
0.8
05
P=
0.2
35
P=
0.2
39
P=
0.0
02
P=
0.0
85
P=
0.4
16
P=
0.9
21
P=
0.0
21
P=
0.0
49
Na
0.4
23
0.1
40
0.4
80
0.3
80
0.2
13
0.4
07
)0.1
37
)0.0
63
)0.2
67
0.2
84
0.0
25
P=
0.0
16
P=
0.4
44
P=
0.0
05
P=
0.0
32
P=
0.2
41
P=
0.0
21
P=
0.4
54
P=
0.7
34
P=
0.1
40
P=
0.1
16
P=
0.8
94
K)
0.0
72
0.2
92
0.1
88
)0.2
04
)0.3
09
)0.0
13
)0.3
67
)0.0
19
)0.0
49
)0.2
10
0.1
14
0.3
47
P=
0.6
96
P=
0.1
05
P=
0.3
03
P=
0.2
64
P=
0.0
85
P=
0.9
44
P=
0.0
39
P=
0.9
19
P=
0.7
91
P=
0.2
48
P=
0.5
34
P=
0.0
52
Al
)0.1
05
)0.1
21
)0.0
75
0.0
06
)0.2
58
0.0
32
)0.1
69
0.0
30
0.3
75
)0.1
17
0.1
67
0.4
21
0.3
05
P=
0.5
66
P=
0.5
10
P=
0.6
84
P=
0.9
73
P=
0.1
55
P=
0.8
64
P=
0.3
56
P=
0.8
71
P=
0.0
34
P=
0.5
23
P=
0.3
62
P=
0.0
16
P=
0.0
89
Fe)
0.4
29
)0.0
59
)0.4
77
)0.0
64
)0.3
31
)0.1
89
)0.2
75
0.2
26
0.4
31
)0.2
24
0.0
94
0.1
17
0.0
32
0.8
60
P=
0.0
14
P=
0.7
48
P=
0.0
06
P=
0.7
28
P=
0.0
64
P=
0.3
01
P=
0.1
28
P=
0.2
14
P=
0.0
14
P=
0.2
18
P=
0.6
08
P=
0.5
25
P=
0.8
63
P=
0.0
00
Fedis
.0.5
48
0.0
74
0.3
99
0.5
04
0.5
69
0.1
44
0.1
26
0.2
70
)0.4
18
0.4
02
)0.3
42
0.2
12
)0.1
94
)0.3
05
)0.3
02
P=
0.0
01
P=
0.6
86
P=
0.0
24
P=
0.0
03
P=
0.0
01
P=
0.4
32
P=
0.4
93
P=
0.1
35
P=
0.0
17
P=
0.0
23
P=
0.0
55
P=
0.2
43
P=
0.2
88
P=
0.0
89
P=
0.0
93
Mn
)0.0
63
0.2
18
)0.3
63
0.4
43
0.3
51
0.2
11
)0.1
55
0.3
15
)0.2
67
0.3
79
)0.2
71
0.0
60
)0.4
44
0.0
28
0.2
91
0.2
87
P=
0.7
30
P=
0.2
30
P=
0.0
41
P=
0.0
11
P=
0.0
49
P=
0.2
46
P=
0.3
97
P=
0.0
80
P=
0.1
39
P=
0.0
32
P=
0.1
33
P=
0.7
43
P=
0.0
11
P=
0.8
79
P=
0.1
06
P=
0.1
11
Zn0.4
18
)0.1
51
0.5
91
0.0
31
0.3
57
)0.0
85
0.4
79
)0.4
31
0.0
10
)0.0
98
0.0
22
0.1
28
0.0
07
)0.1
35
)0.4
01
0.0
05
)0.2
78
P=
0.0
17
P=
0.4
11
P=
0.0
00
P=
0.8
67
P=
0.0
45
P=
0.6
44
P=
0.0
06
P=
0.0
14
P=
0.9
57
P=
0.5
95
P=
0.9
05
P=
0.4
86
P=
0.9
71
P=
0.4
60
P=
0.0
23
P=
0.9
77
P=
0.1
23
� 2009 The AuthorsJournal compilation � 2009 Blackwell Publishing Asia Pty Ltd
264 W. M. L. Fezeu et al.
Page 7
development of germs, algae and fungi in the water
(Rodier 1978), with a consequent decrease in the dis-
solved oxygen concentration that could explain the pres-
ence of death fish in the lake during the dry season.
EC and elementsEC, an indicator of the overall water salinity, ranged
between 5.29 and 30.53 lS cm)1. The conductivity of the
different samples varied significantly (P < 0.05) with sea-
son. The sample from July had the lowest conductivity,
whereas the February sample had the highest values.
Thus, the rainy season exhibited low conductivities,
whereas the dry season exhibited higher conductivities.
This could be attributed to dilution of the lake water by
the rain-associated run-off (or by the rain itself, it rains
on the soil surrounding the lake and it rains on the lake
too). Nevertheless, whatever the season and sampling
site, the waters of the lake exhibited conductivity values
lower than 200 lS cm)1, thereby being categorized as
weakly mineralized waters (Rodier 1978; AFNOR, 1986).
Table 2 indicates that the highest values of carbonate
(CO32–) and nitrate (NO3
–) were 6.3 (April) and
27.4 mg L)1 (July), respectively. The presence of NO3– in
water is viewed as a sign of water pollution. The high
concentration (45 mg L)1) observed in some water sys-
tems in France has been associated with surrounding
farming activities related to the utilization of manures
(Mignolet et al. 1999). The water of Lake IRAD does not
exhibit high nitrate concentrations, all samples being
lower than 100 mg L)1, the maximum permissible level
for livestock watering (La Plante & Bachelier 1953; EPA
1997). The nitrate concentrations were very low in Octo-
ber, and although their presence could be related to the
nitrification of NH4–N, there was no significant correla-
tion (P > 0.05) between NH4–N and nitrate. The accumu-
lated nitrate in the soil during the dry season can be
washed away with the first rains, this phenomenon being
observed in April and July, when the nitrate levels
increased to 27 mg L)1. At the end of the rainy season
(October), the rain-washed soils contained less nitrate
than at the beginning of the rainy season (April). The
presence of nitrate in the lake waters, therefore, could be
related to the nitrification of NH4–N in soils and their
leaching soil by rain waters.
There were no significant correlations (P > 0.05) for
the other anions, bicarbonate (HCO3–), chloride (Cl–) and
sulphate (SO42–), with EC. The bicarbonate and chloride
concentrations in the lake varied between 4.5–37.2 and
1.8–11.9 mg L)1, respectively. These values are far below
1000 and 250 mg L)1, the maximum permissible levels for
drinking water, respectively (NRC 1980; Degremont 1989;
EPA 1997; Delisle et al. 1998). The anions concentration in
the lake increased with pH, with the lake exhibiting signifi-
cant positive correlations of pH with bicarbonate (r = 0.86;
P < 0.01), carbonate (r = 0.64; P < 0.01) and chloride
(r = 0.75; P < 0.01). As observed for the pH values, the
concentrations of these elements were higher in the dry
season, with highest values being observed during April.
There were also other major elements contributing to
the salinity of the lake water, including magnesium,
sodium and potassium. The water hardness varied
between 2.3 and 30.6 mg L)1, indicating that the IRAD
lake contained essentially soft water. The highest values
recorded for calcium and magnesium were 24.82 (April)
and 5.78 mg L)1 (July), respectively. Similar observations
were obtained for sodium and potassium which exhibited
maximum concentrations of only 2.7 and 2.1 mg L)1,
respectively.
IronThe total iron concentrations varied between 0.3 (Febru-
ary) and 3.3 mg L)1 (July), whereas the dissolved iron
concentrations between 0.01 (July) and 1.2 mg L)1 (Feb-
ruary). There was a high total iron concentration in the
lake during the rainy season, compared with dissolved
iron. A high total iron and low dissolved iron concentra-
tion was observed during July and October. Thus, rainfall
appears to decrease the dissolved iron concentration in
the lake (Fig. 6). These results indicate that the Lake
IRAD waters exhibited high dissolved concentrations
>0.2 mg L)1 of the maximum permissible level for human
or cattle consumption (Rodier 1978; Degremont 1989;
EPA 1997). This high iron concentration in the lake
waters could be harmful for animals because iron often
forms a complex compound with other trace minerals
(e.g. copper) that becomes unavailable, and can cause
copper deficiency (Thornton 2002). In addition to its
potential toxic impacts, the high iron concentration in the
water commonly consumed by grazing cattle can affect
the taste of the water, thereby decreasing the appetite of
the animals (WQM 1996). The high iron concentration
is attributed to the passage of water through the soil
(Rodier 1978). The region of Wakwa has ferralitic soils
(La Plante & Bachelier 1953), and the high iron concen-
tration could originate from features associated with cat-
tle moving soil and contaminating the water when
drinking. This phenomenon can be explained by the high
total iron concentration of these waters which, for exam-
ple, can reach 3.35 mg L)1 in July, a period when rainfall
often is intense. The high total iron concentration could
be attributed to particles of iron oxide, or OM–iron com-
plexes, generally observed in surface waters in tropical
� 2009 The AuthorsJournal compilation � 2009 Blackwell Publishing Asia Pty Ltd
Physicochemical characteristics of Lake IRAD 265
Page 8
regions (WQM 1996). High iron concentrations also have
been observed in Ethiopian lakes, which exhibit values
between 0.5 and 2.5 mg L)1 (Zinabu & Pearce 2003). Ani-
mals can ingest a high quantity of iron when drinking
water from Lake IRAD.
ManganeseThe manganese concentration varied between 0.04 (April)
and 0.15 mg L)1 (October), with 94% of the samples con-
taining concentrations greater than the maximum permis-
sible level of 0.05 mg L)1 for livestock drinking water
(EPA 1997). Manganese has the effect of reducing iron
absorption in the haemoglobin in blood (Gross et al.
1979), and the accumulation of zinc in an organism
(Abdelrahman & Kincaid 1993). In a similar way to iron,
manganese can contribute to an unpleasant taste in
water, thereby reducing its consumption by cattle (EPA
1997). For certain soils, it has been shown that a high
iron content is often associated with a high manganese
content (EPA 1997). This was not the case for the water
of Lake IRAD in this study, which exhibited no signifi-
cant correlation (P > 0.05) between iron and manganese.
As a result of leaching during the rainy season, most lake
water samples exhibited iron and manganese concentra-
tions above the maximum permissible limit for drinking
water for cattle. Similar observations were reported by
some researchers in the United States, who reported that
3600 water samples contained iron and manganese con-
centrations about the maximum permissible limit for
drinking water for cattle. These latter samples contrib-
uted 1.8 and 1.0% of the cattle daily intake of iron and
manganese, respectively (Socha et al. 2001).
AluminiumThe aluminium concentration of the lake waters varied
between 0.25 and 1.71 mg L)1. It decreased at the end of
the rainy season, varying between 0.25 and 0.52 mg L)1
in October, compared with 0.31–1.63 mg L)1 in February.
Aluminium toxicity has been observed for waters contain-
ing >0.5 mg L)1 (EPA 1997). The toxicity is characterized
by its link to transferin phosphatase, noting that this
effect would facilitate anaemia by decreasing iron absorp-
tion. An iron deficiency, in turn, can enhance aluminium
absorption (Linder 1991). About 44% of the water samples
from the lake contained high aluminium concentrations,
thereby representing toxicity risks.
ZincAnalysis of variance indicated that the zinc concentration
was significantly affected by the sampling site. Figure 7
illustrates the presence of zinc for all sampling sites and
in all seasons. This phenomenon could be attributable to
the geochemical characteristics of the soils in the lake
basin, or the wastes associated with animal excretions
(Xue et al. 2002). The lowest zinc concentration
(0.03 mg L)1) was observed in July, and the highest val-
ues (0.96 mg L)1) in February. All of the measured zinc
concentrations, however, were <5 mg L)1, which is the
maximum limit recommended for livestock drinking. Xue
et al. (2002) found that the surface waters drained from
soils that were extensively cultivated with animal manure
had maximum zinc concentrations of 0.02 mg L)1, these
being very low values compared with the results of this
study. However, the zinc concentration in the Lake IRAD
water could be influenced by cattle activities around the
lake, associated with a high animal population density
that would produce much manure. Some studies have
indicated that animal wastes represent a source of min-
eral elements (Nunez-Delgado et al. 2002). As an exam-
ple, wastes from dairy cattle in the United Kingdom
contained up to 50 mg kg)1 (dry matter) of zinc (Nichol-
son et al. 1999).
Other elementsThe lake waters also were analysed for other minerals,
including cadmium, nickel, copper and phosphate, with
the measured concentrations being below the detection
limits of the analytical methods used in this study. Phos-
phate pollution, for example, is generally attributable to
domestic activities involving phosphate-containing deter-
gents, or phosphate manures that can enter the lake
water from the leaching of cultivated soil (Dorioz et al.
1997). The very low phosphate concentrations in the lake
water indicate that phosphate manures were not utilized
in the Wakwa lowlands.
CONCLUSIONThe results of this study of the physicochemical composi-
tion of the artificial Lake IRAD in Wakwa indicated that
the concentrations of OM, NH4–N, iron, manganese and
aluminium exceeded the recommended values for drink-
ing water for grazing animal. The nitrate, NH4–N and
OM concentrations were highest during the rainy season,
whereas zinc and dissolved iron concentrations were
highest in the dry season. The lake water pH was related
to the high bicarbonate, carbonate, chloride, OM and cal-
cium. The presence of zinc in the lake water samples was
related to the presence of OM and bicarbonate. At the
conclusion of this study, it was also observed that leach-
ing of soils by rain water, as well as animal activities in
the water, contributed to the elevated concentrations of
iron and aluminium.
� 2009 The AuthorsJournal compilation � 2009 Blackwell Publishing Asia Pty Ltd
266 W. M. L. Fezeu et al.
Page 9
The water of Lake IRAD in the Wakwa region was
found to be contaminated by cattle. Sampling sites 1 and
2, the sites most frequented by these animals, exhibited
high concentrations of NH4–N, compared with sampling
sites 3 and S, the latter being less frequented by grazing
animals. To reduce the contamination of the lake waters
associated with cattle, it will be important to develop
access zones to water for these animals.
ACKNOWLEDGEMENTSThis research was funded by the Agence Universitaire de
la Francophonie (AUF). Acknowledgments are also due
to the IRAD, Wakwa (Cameroon), for collecting the sam-
ples utilized in this study.
REFERENCESAbdelrahman M. M. & Kincaid R. L. (1993) Deposition of
copper, manganese, zinc, and selenium in bovine fetal
tissue at different stages of gestation. J. Dairy Sci. 76,
3588–93.
AFNOR (1986) Eaux Methodes d’essaie. Recueil de la
Norme Francaise, Paris.
Boutrais J. (1974). Les conditions naturelles de l’elevage
sur le Plateau de l’Adamaoua (Cameroun). Cahiers OR-
STOM, serie Sciences Humaines XI (2), 160–3.
Braul L. & Kirychuk B. (2001) Water quality and cattle.
Agriculture and Agri-Food Canada. ENH-11-2001-10,
6 p. Available from URL: http://www.kellnsolar.com/
pdfs/wqcattle.pdf
Degremont (1989) Memento technique de l’eau, Tome 1,
9eme edn. Edition du cinquantenaire, 592 p.
Delisle F., Cariepy S. & Bedard Y. (1998) Bassin versant
de la riviere Yamaka: l’activite agricole est ses effets
sur la qualite de l’eau. ministere de l’Environnement et
de la Faune et Saint-Vision 2000, Quebec, Canada.
Dorioz J. M., Trevisan D. & Vansteelant J. Y. (1997)
Transfert de phosphore des basins versants agricoles
vers les lacs: impact, ordre de grandeur, mecanisme.
In: L’eau dans l’espace rural (eds C. Riou, R. Bonho-
mme, P. Chassi, A. Neveu & F. Papy) pp. 249–64. Pro-
duction vegetale et qualite de l’eau, Institut National de
la Recherche Agricole Paris, Paris.
EPA (Environmental Protection Agency) (1997) Current
Drinking Water Standards (Human): Office of Ground
Water and Drinking Water. US Environmental Protec-
tion Agency, Washington, DC, EPA 815-k-97-002.
Gross P., Davis J. A. G., Harley R. A. & Detreville R. T.
P. (1979) Lymphatite transport of fibrous dust from the
lungs. J. Occup. Med. 15, 186–9.
Harris B. J. & Van Horn H. H. (1992) Water and its
Importance to Animals. University of Florida, IFAS
Extention CIR1017 Florida, 8 p. Available from URL:
http://edis.ifas.ufl.edu/pdffiles/ds/ds08500.pdf
Hooda P. S., Edwards A.C., Anderson H. A. & Miller A.
(2000) A review of water quality concerns in livestock
farming areas. The Science of Total Environment 250,
143–67.
Hubbard R. K., Newton G. L. & Hill G. M. (2004) Water
quality and the grazing animal. J. Anim. Sci. 82 (E.
Suppl.): E255–63.
La Plante A. & Bachelier G. (1953) Introduction a la ped-
ologie de l’Adamaoua. Etude detaillee dans la section
de Ngaoundere, Cameroun. Centre de Paris, ORSTOM,
Yaounde, Cameroun, IRCAM, N� 1237, 40 p.
Linder M. C. (1991) Nutrition and metabolism of trace
elements. In: Nutritional Biochemistry and Metabolism
with Clinical Application, 2nd edn (ed. Maria C. Linder)
pp. 215–32. New York (Elsevier).
Mignolet C., Thenard V., Benoıt M., Anfrie M.N., Foissy
D., Grosse M. & Trommenschlager J.M. (1999) Live-
stock farming systems and sustainable drinking water
production: proposition of risk indicators at different
organisational levels. Livestock Production Science 61,
307–13.
Neal C., Richard J., Williams R. J. et al. (2000) The water
quality of the River Thames at a rural site downstream
of Oxford. Sci. Total Environ. 251–252, 441–57.
Nicholson F. A., Chambers B. J., Williams J. R. & Unwin
R. J. (1999) Heavy metal contents of livestock feeds
and animal manures in England and Wales. Bioresour.
Technol. 70, 23–31.
NRC (National Research Council) (1980) Mineral Toler-
ance of Domestic Animals. National Academy Press,
Washington, DC.
NRC (National Research Council) (2001) Nutrient
Requirements of Dairy Cattle, 7th revised edn. National
Academy Press, Washington, DC.
Nunez-Delgado Avelino, Lopez-Periago Eugine & Diaz-
Fierros-Viquiera Francisco (2002) Pollution attenuation
by soils receiving cattle slurry after passage of a slurry-
like feed solution, column experiments. Bioresour.
Technol. 84, 229–36.
Pamo E. T. & Yonkeu S. (1986) Etude de l’evolution de
quelques parametres climatiques de l’environnement
pastoral de Wakwa, Adamaoua Cameroun. Re. Sci et
Tech. Ser. Sci., Zootech. 2 (3), 19–34.
Rodier J. (1978) L’analyse de l’eau, Chimie, Physicochi-
mie, Bacteriologie, Biologie, 6th edn. Dunod-Tech-
nique, Paris.
Sangogin A. Y. (1991) Ground and surface water pollution
by open refuse dump in Ibadan. Niger., Discov. Innov.
3 (1), 37–43.
� 2009 The AuthorsJournal compilation � 2009 Blackwell Publishing Asia Pty Ltd
Physicochemical characteristics of Lake IRAD 267
Page 10
Satoh Y., Sasaki M., Miyamori Y. et al. (2001) Perturba-
tion of a water column of Lake Onogawa by local heavy
rainfall. Limnology 2, 11–18.
Satoh Y., Ura H., Kimura T., Shiono M. & Seo S.-K.
(2002) Factors controlling hypolimnetic ammonia accu-
mulation in a lake. Jap. Soc. Limnol. 3, 43–6.
Smith D. C., Sacks J. & Senior E. (1999) Irrigation of soil
with synthetic landfill leachate – Speciation and
distribution of selected pollutants. Environ. Pollut.
106, 429–41.
Socha M. T., Linn J. G., Tomlinson D. J. & Johnson A. B.
(2001) Impact of variations in chemical composition of
water on potential palatability and mineral intake of
dairy cattle. J. Dairy Sci. 84(Suppl. 1), 85.
Thornton I. (2002) Geochemistry and mineral nutrition of
agricultural livestock and wildlife. Appl. Geochem. 17,
1017–28.
Viers J., Dupre¢ B., Polve¢ M., Schott J., Dandurand J.-L.
& Braun J.-J. (1997) Chemical weathering in the drain-
age basin of a tropical watershed (Nsimi-Zoetele site,
Cameroon): Comparison between organic-poor and
organic-rich waters. Chem. Geol. 140, 181–206.
WQM (Water Quality Management) (1996) South African
Water Quality Guidelines. Volume 5: Agricultural
Water Use: Livestock Watering, 2nd edn. Department
of Water Affairs and Forestry, Pretoria, South Africa.
Xue H., Nhat P. H., Gachter R. & Hooda P. S. (2002) The
transport of Cu and Zn from agricultural soils to sur-
face water in a small catchment. Adv. Environ. Res. 8,
69–76.
Zinabu G. M. & Pearce N. J. G. (2003) Concentrations of
heavy metals and related trace elements in some Ethio-
pian rift-valley lakes and their in-flows. Hydrobiologia
429, 171–8.
� 2009 The AuthorsJournal compilation � 2009 Blackwell Publishing Asia Pty Ltd
268 W. M. L. Fezeu et al.