Pre-Separation Job Durations and Unemployment Insurance Eligibility Final Report Prepared for: Human Resources Development Canada May 1998 Prepared by: Peter J. Kuhn Department of Economics McMaster University Arthur Sweetman Department of Economics University of Victoria SP-AH047E-05-98 (également disponible en français)
Transcript
Pre-Separation Job Durationsand
Unemployment InsuranceEligibility
Final Report
Prepared for:
Human Resources Development Canada
May 1998
Prepared by:
Peter J. KuhnDepartment of Economics
McMaster University
Arthur SweetmanDepartment of Economics
University of Victoria
SP-AH047E-05-98(également disponible en français)
The views expressed in this study are the personal views of the authorand not necessarily those of HRDC.
PrefaceHuman Resources Development Canada (HRDC), in its policies andprograms, is committed to assisting all Canadians in their efforts tolive contributing and rewarding lives and to promote a fair and safeworkplace, a competitive labour market with equitable access to work,and a strong learning culture.
To ensure that public money is well spent in pursuit of this mission,HRDC rigorously evaluates the extent to which its programs areachieving their objectives. To do this, the Department systematicallycollects information to evaluate the continuing rationale, net impactsand effects, and alternatives for publicly-funded activities. Suchknowledge provides a basis for measuring performance and theretrospective lessons learned for strategic policy and planning purposes.
As part of this process, the Department commissioned five formalevaluation studies on how Canadians adjusted to the 1994 UI reforms.These studies were performed by external academic subject-matterexperts. Each evaluation represents a stand alone analysis of a specifictopic.
Bob Wilson Ging WongDirector General DirectorEvaluation and Data Strategic EvaluationDevelopment and Monitoring
Table of ContentsExecutive Summary............................................................................ i
2. The Policy Changes ....................................................................3
3. Data and Methodology ............................................................. 111. Definitions............................................................................. 112. Measuring the effect of C-17 on UI eligibility .......................143. Measuring the efftect of C-17 on UI receipt ..........................16
4. Results:Effects on UI Entitlements .........................................191. Effects of Bill C-17 on UI entitlements if no behavioural
changes were possible ..........................................................192. Behavioural changes in qualifying weeks..............................283. Estimated effects on UI eligibility allowing for
behavioural responses in the weeks worked .........................42
5. Results:Effects of C-17 on UI Receipts ..................................55
Data Appendix .................................................................................77
List of Tables
Table 1 Legislated Weeks of UI Entitlement before Bill C-17 .......4
Table 2 Legislated Weeks of UI Entitlement after Bill C-17 ..........6
Table 3 Legislated Reductions in Weeks of UI EntitlementDue to Bill C-17 ...............................................................8
Table 4 Mean Weeks of UI Eligibility Per UI Claim byIndustry, Assuming No Behavioural Change ...................22
Table 5 Mean Weeks of UI Eligibility Per UI Claim by ProvinceAssuming No Behavioural Change....................................23
Table 6 Mean Weeks of UI Eligibility Per Separation by IndustryAssuming No Behavioural Change....................................25
Table 7 Mean Weeks of UI Eligibility Per Separation by ProvinceAssuming No Behavioural Change....................................26
Table 8 Distribution of Weeks of Lost EligibilityAssuming No Behavioural Change....................................27
Table 9 Distribution of Insurable Weeks in Window One -Women............................................................................30
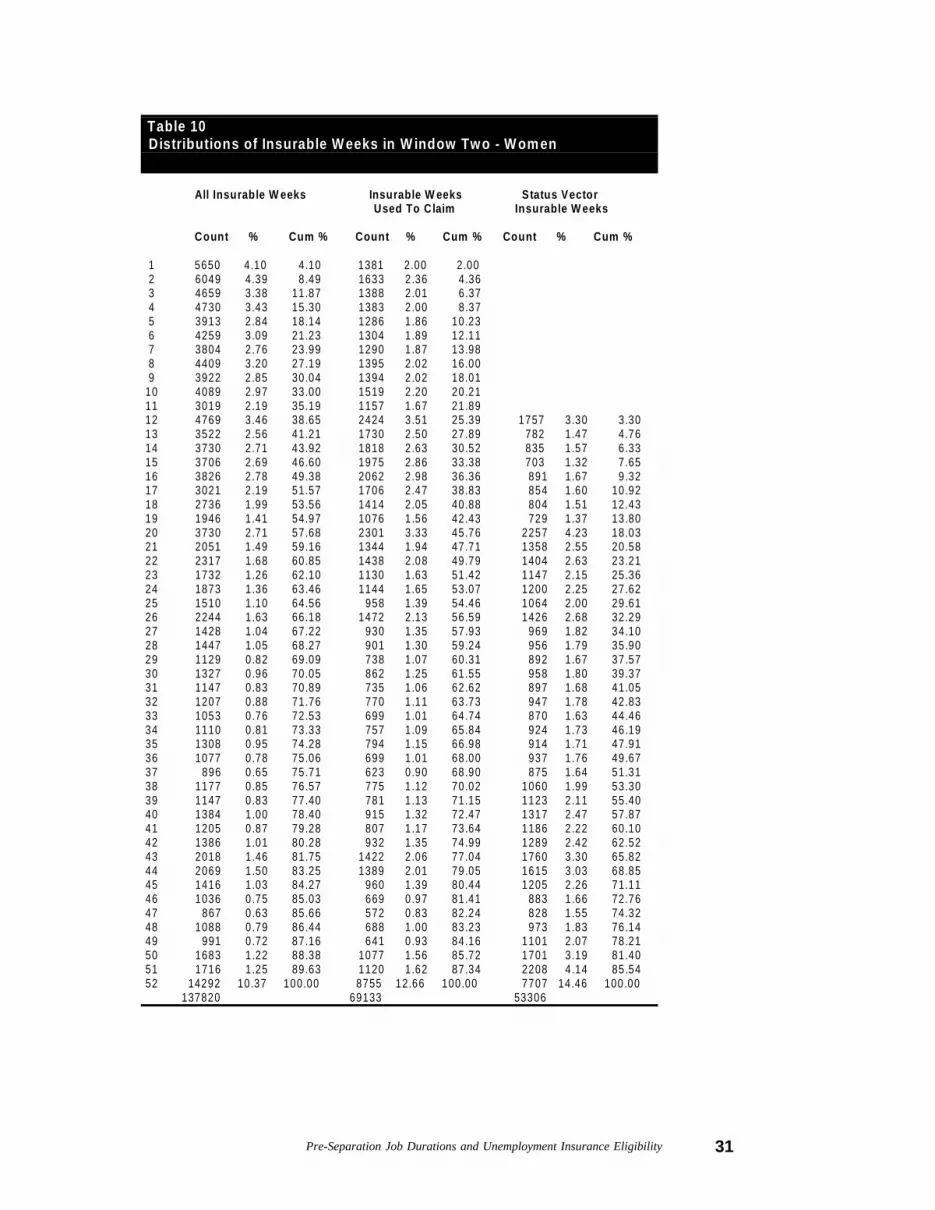
Table 10 Distribution of Insurable Weeks in Window Two -Women............................................................................31
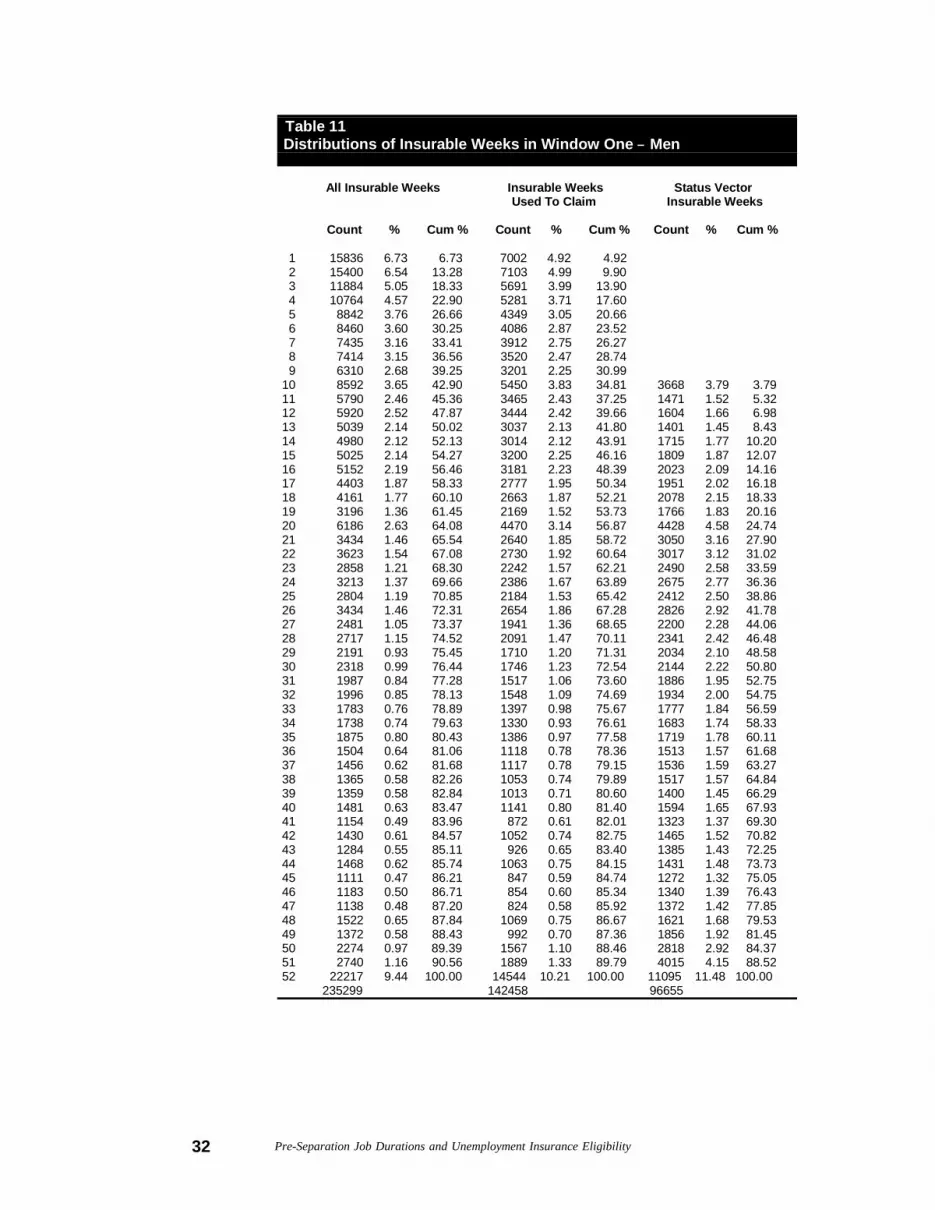
Table 11 Distribution of Insurable Weeks in Window One -Men .................................................................................32
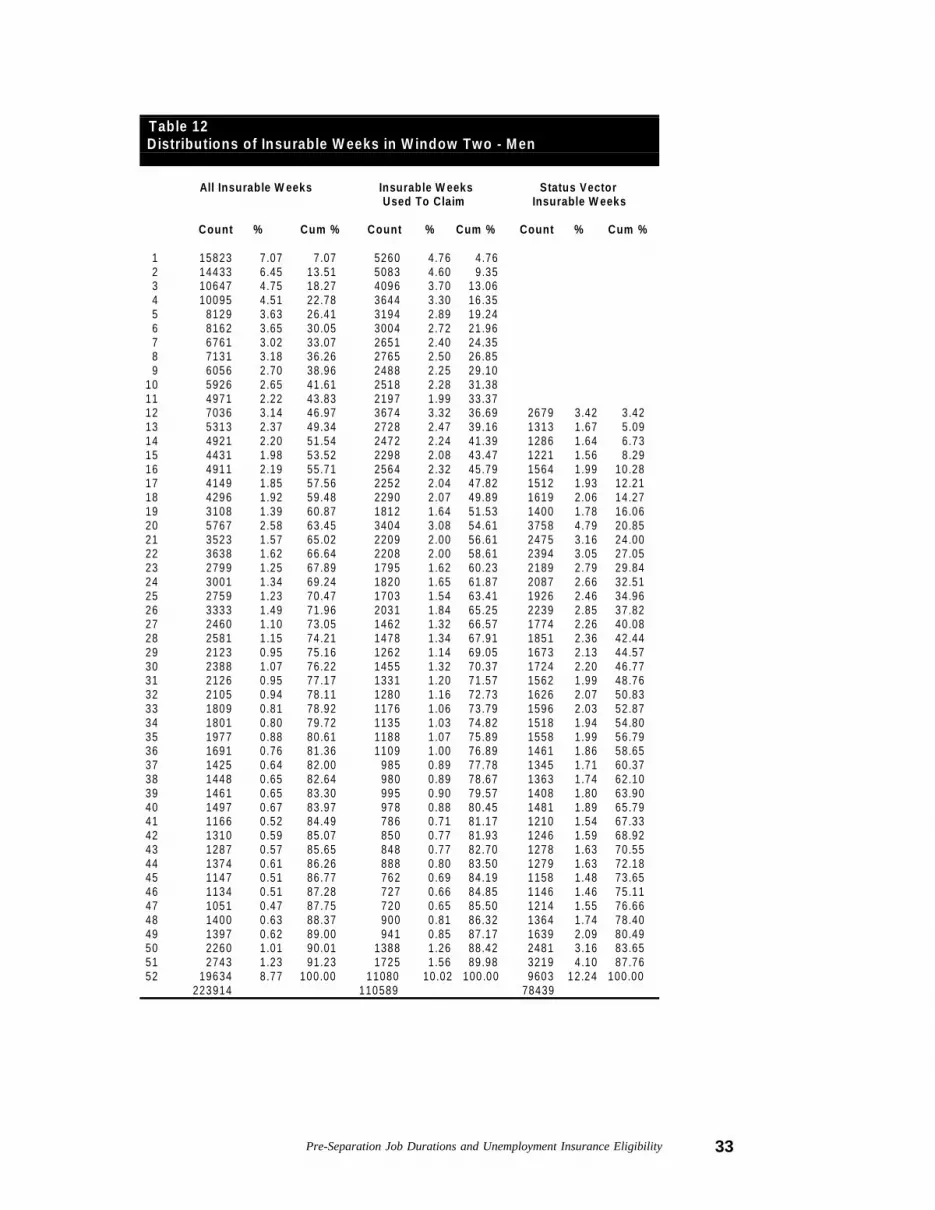
Table 12 Distribution of Insurable Weeks in Window Two -Men .................................................................................33
Table 13 Newfoundland’s Distribution of the Excess of WeeksWorked Compared to the Minimum Required By theEntrance Requirement.....................................................40
Table 14 Northern Ontario’s Distribution of the Excess of WeeksWorked Compared to the Minimum Required By theEntrance Requirement.....................................................41
Table 15 Mean Weeks of UI Eligibility Per UI Claim by IndustryAssuming a Behavioural Change in Weeks of Employment.44
Table 16 Mean Weeks of UI Eligibility Per UI Claim by ProvinceAssuming a Behavioural Change in Weeks of Employment.45
Table 17 Mean Weeks of UI Eligibility Per Separation by IndustryAssuming a Behavioural Change in Weeks of Employment.46
Table 18 Mean Weeks of UI Eligibility Per Separation by ProvinceAllowing for a Behavioural Change in the Weeks Worked .47
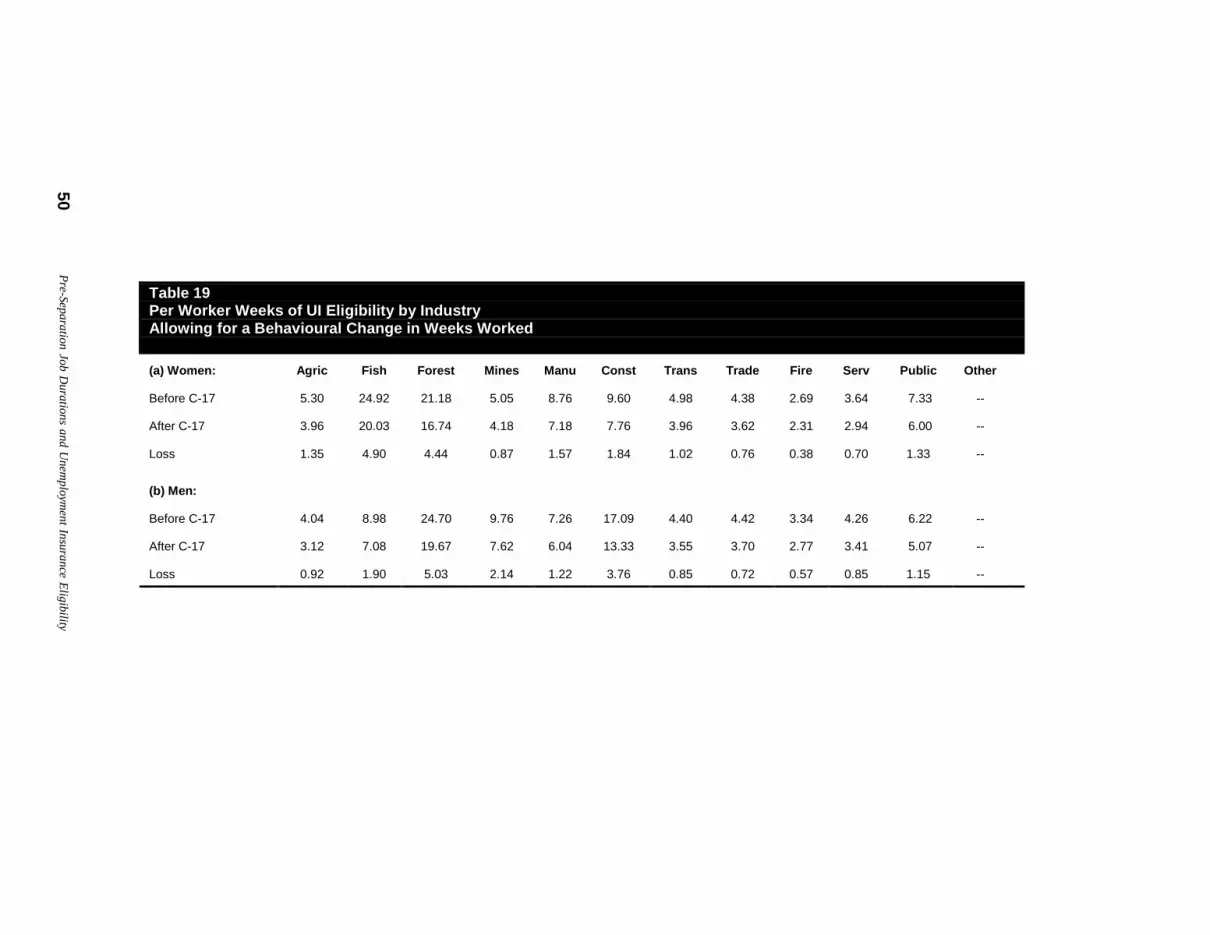
Table 19 Per Worker Weeks of UI Eligibility by IndustryAllowing for a Behavioural Change in theWeeks Worked................................................................50
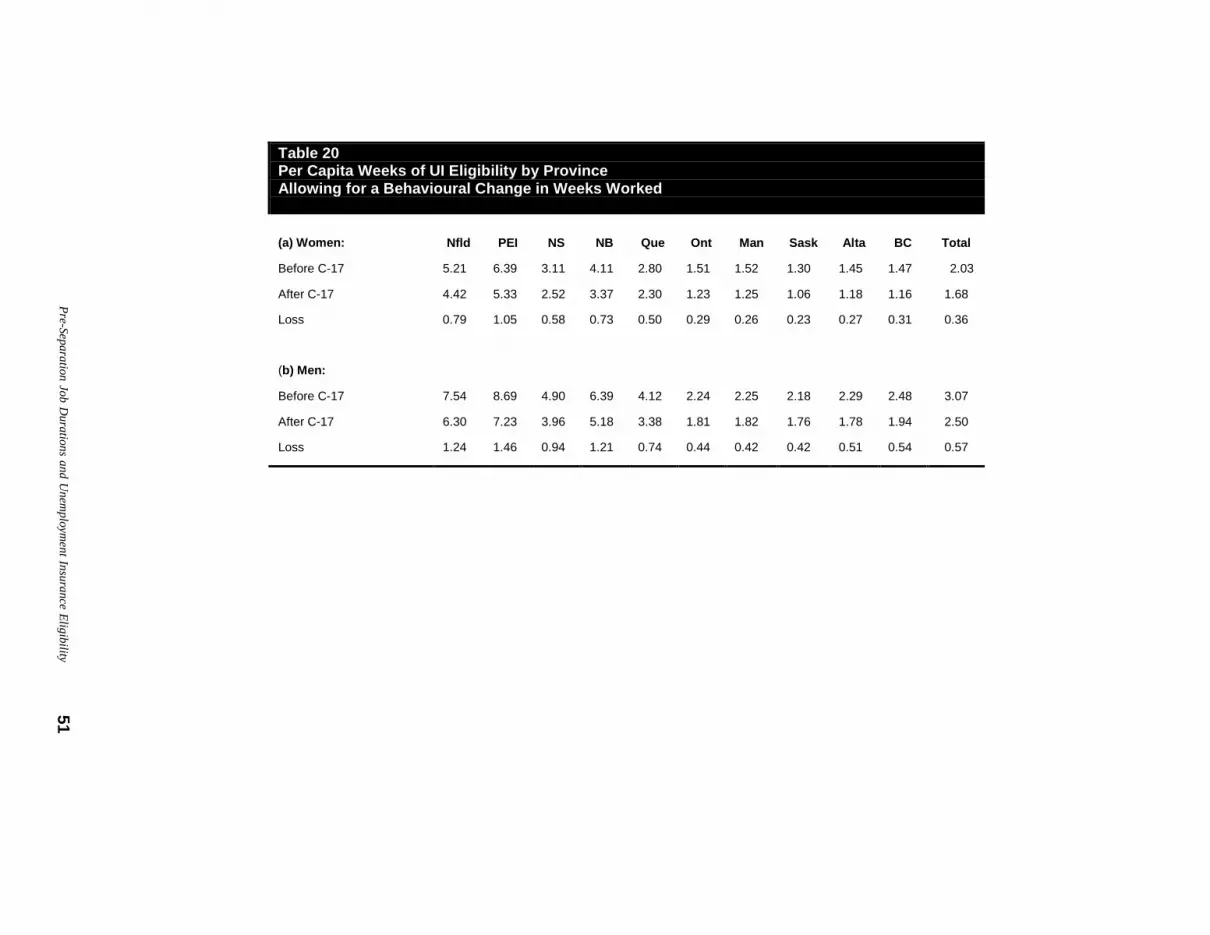
Table 20 Per Capita Weeks of UI Eligibility by ProvinceAllowing for Behavioural Change in Weeks Worked ......51
Table 21 Per Worker Weeks of UI Eligibility by Industry forAll Separations Assuming a Behavioural Response inEmployment Only.............................................................52
Table 22 Per Capita Weeks of UI Eligibility by ProvinceAll Separations Assuming a Behavioural Response inEmployment Only.............................................................53
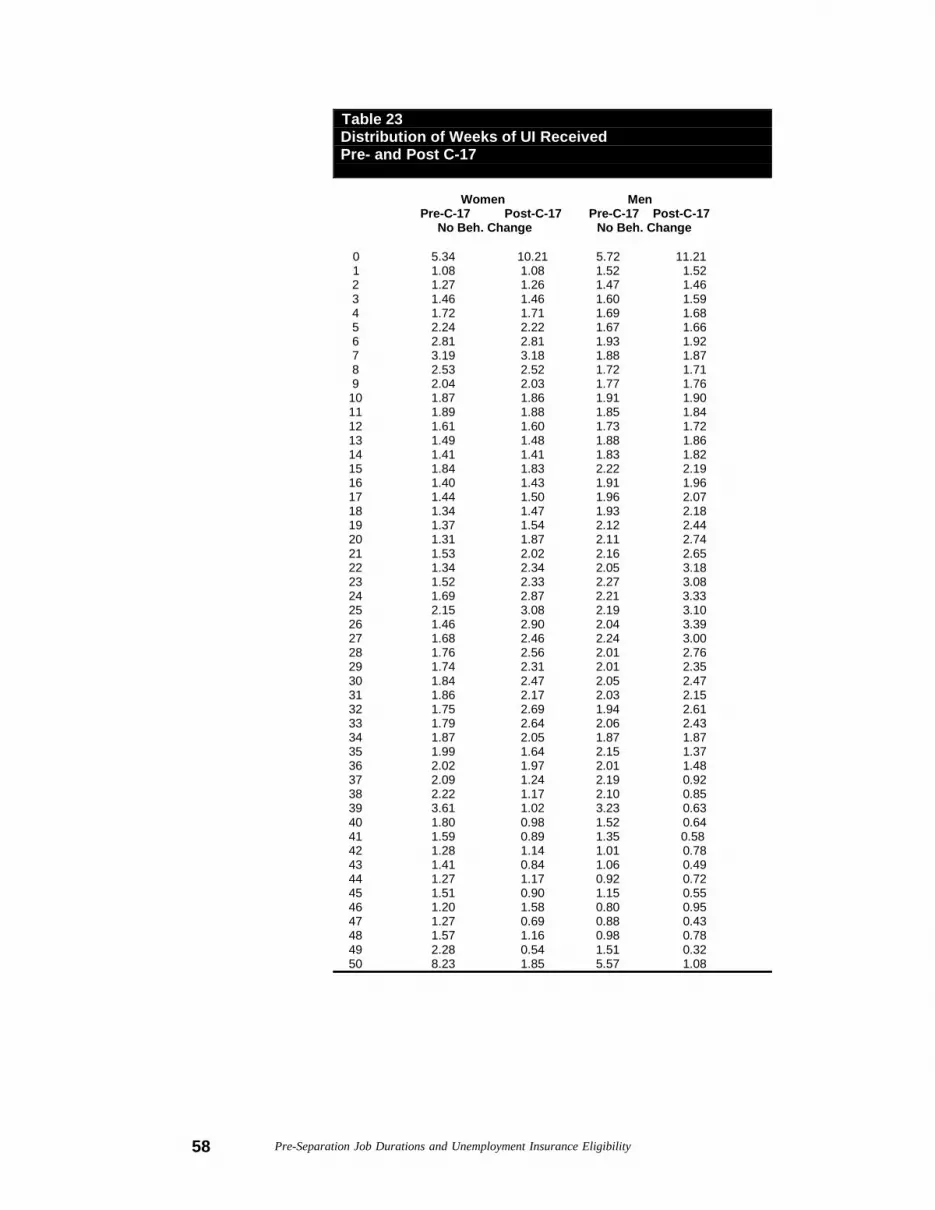
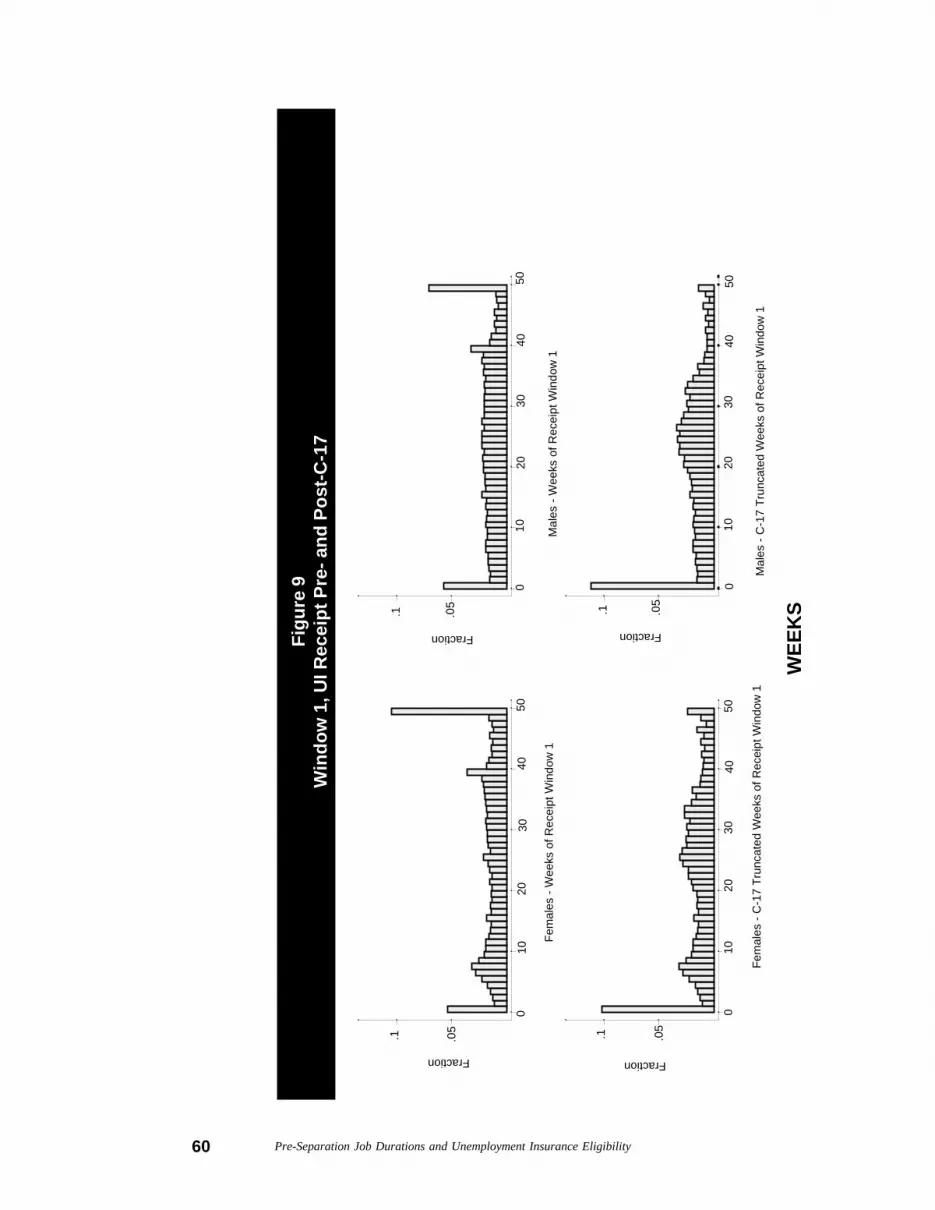
Table 23 Distribution of Weeks of UI Received, Pre-and Post C-17 .................................................................58
Table 24 Mean Weeks of UI Receipt per UI Claim by IndustryAssuming No Behavioural Change....................................61
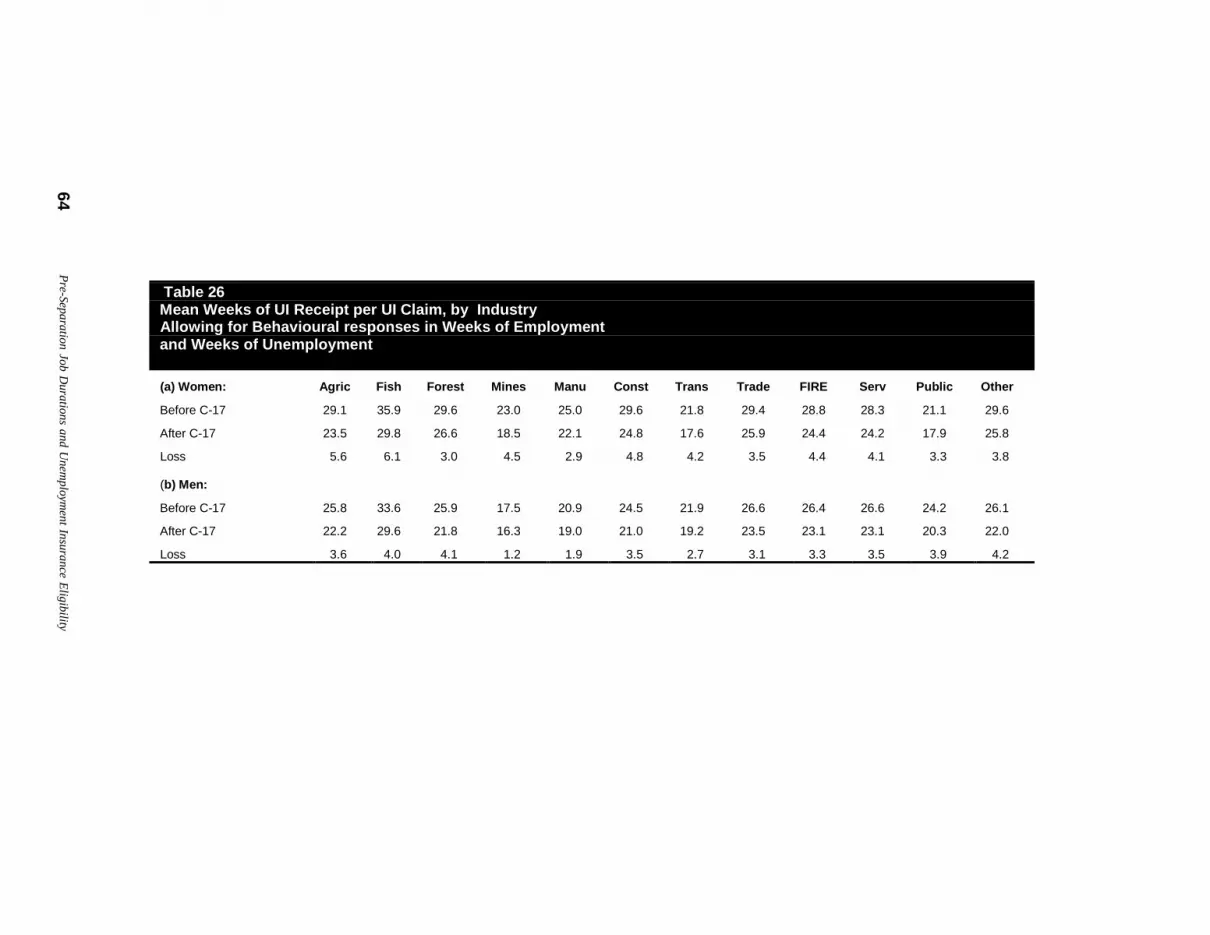
Table 25 Mean Weeks of UI Receipt Per UI Claim by IndustryAllowing For A Behavioural Response in Weeks ofEmployment.....................................................................63
Table 26 Mean Weeks of UI Receipt Per UI Claim by IndustryAllowing For Behavioural Responses in Weeks ofEmployment and Weeks of Unemployment.......................64
Table 27 Mean Weeks of UI Receipt Per UI Claim by ProvinceAssuming No Behavioural Change....................................66
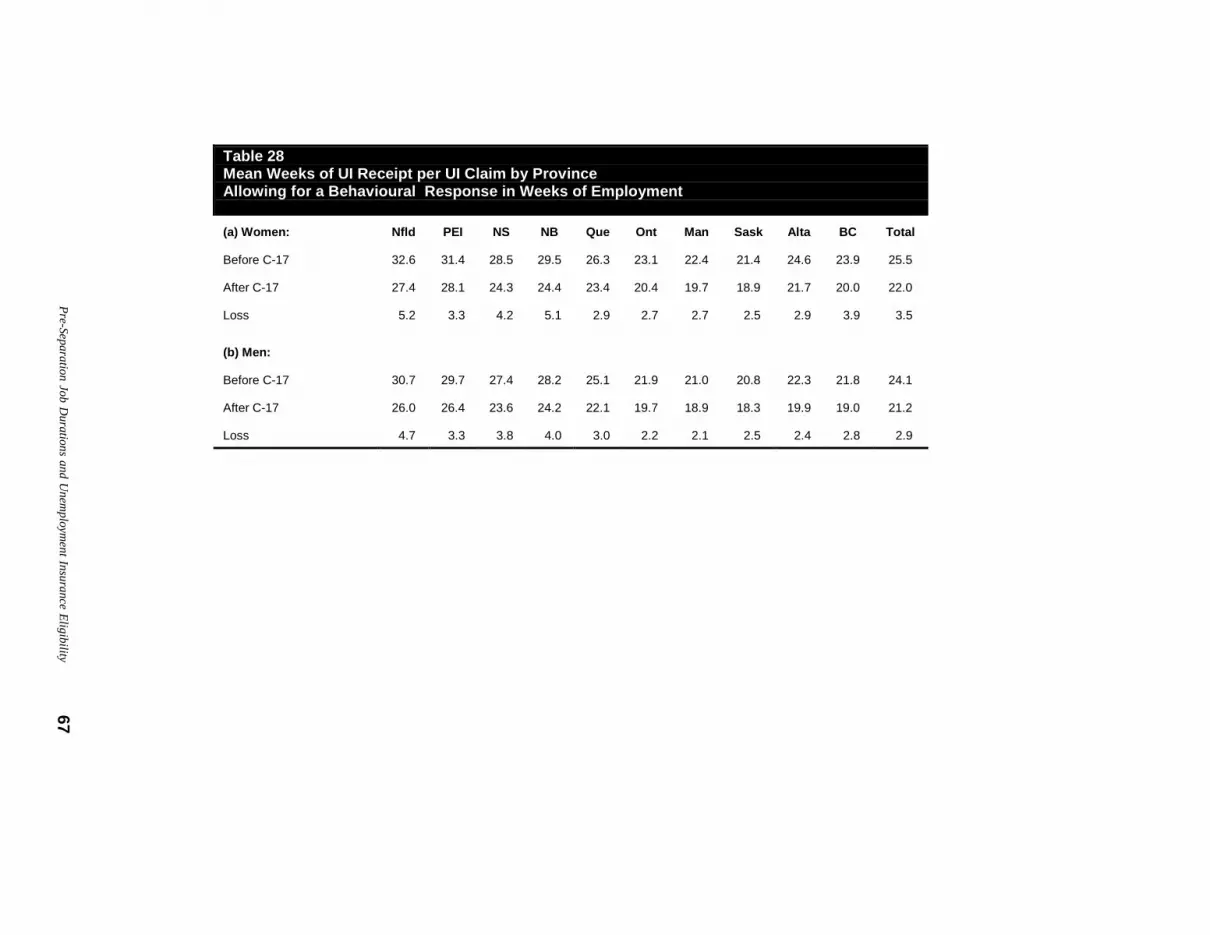
Table 28 Mean Weeks of UI Receipt Per UI Claim by ProvinceAllowing For Behavioural Response inWeeks of Employment......................................................67
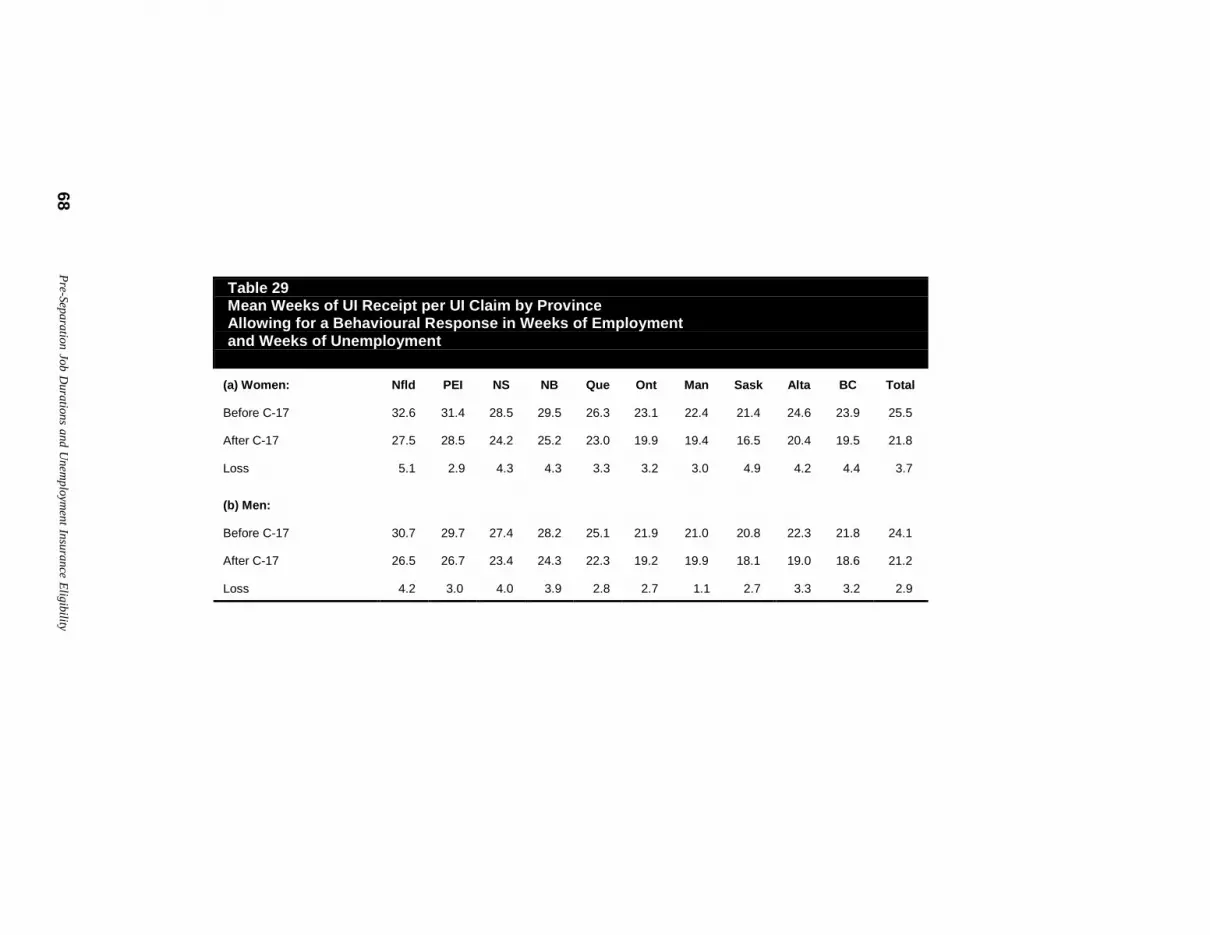
Table 29 Mean Weeks of UI Receipt Per UI Claim by ProvinceAllowing for Behavioural Response in Weeks ofEmployment and Weeks of Unemployment......................68
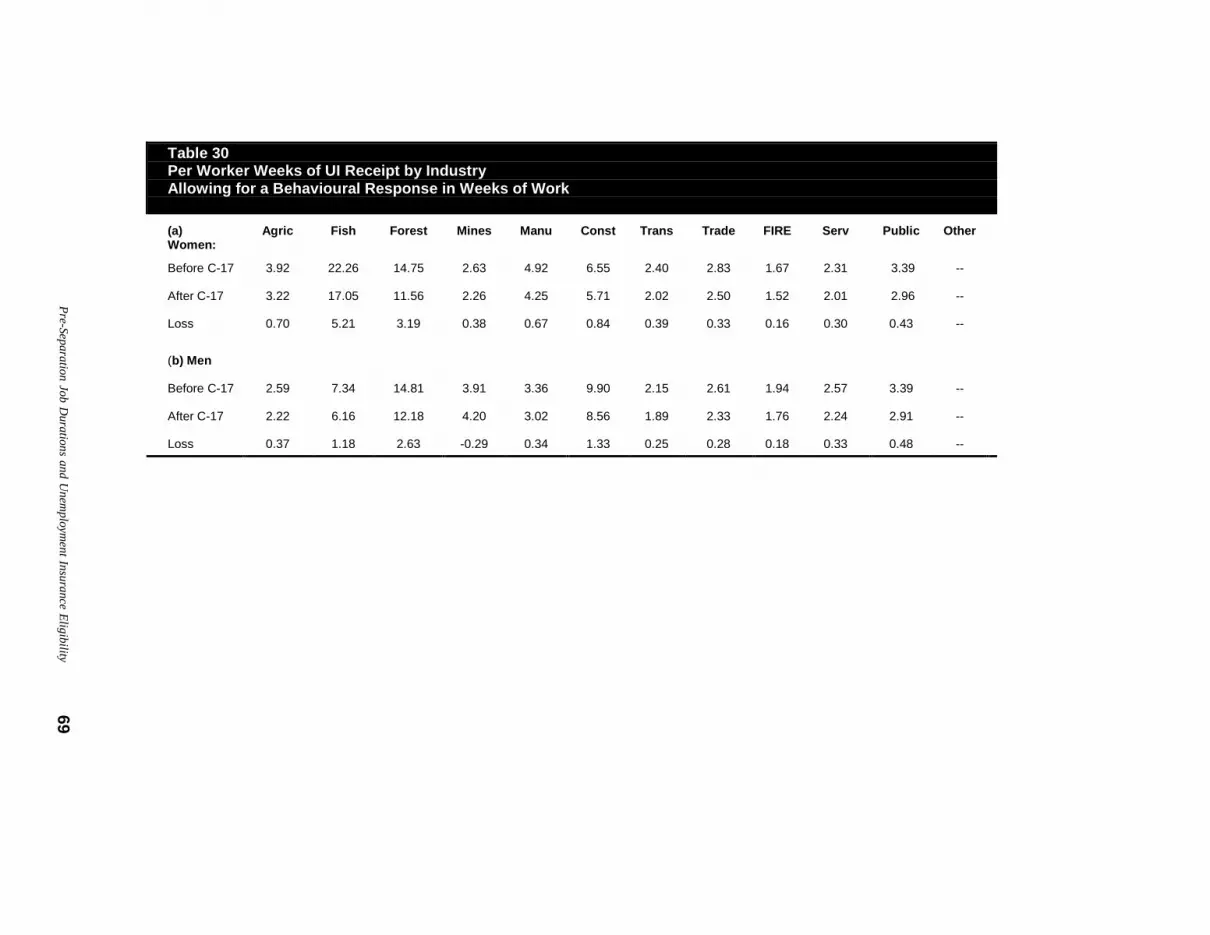
Table 30 Per Worker Weeks of UI Receipt by IndustryAllowing for Behavioural Response in Weeksof Work ...........................................................................69
Table 31 Per Capita Weeks of UI Receipt by ProvinceAssuming A Behavioural Response in Weeksof Employment................................................................71
List of Figures
Figure 1 UI Eligibility and Weeks Worked ....................................10
Figure 2 Window 1, Eligibility Pre- and Post-C-17......................21
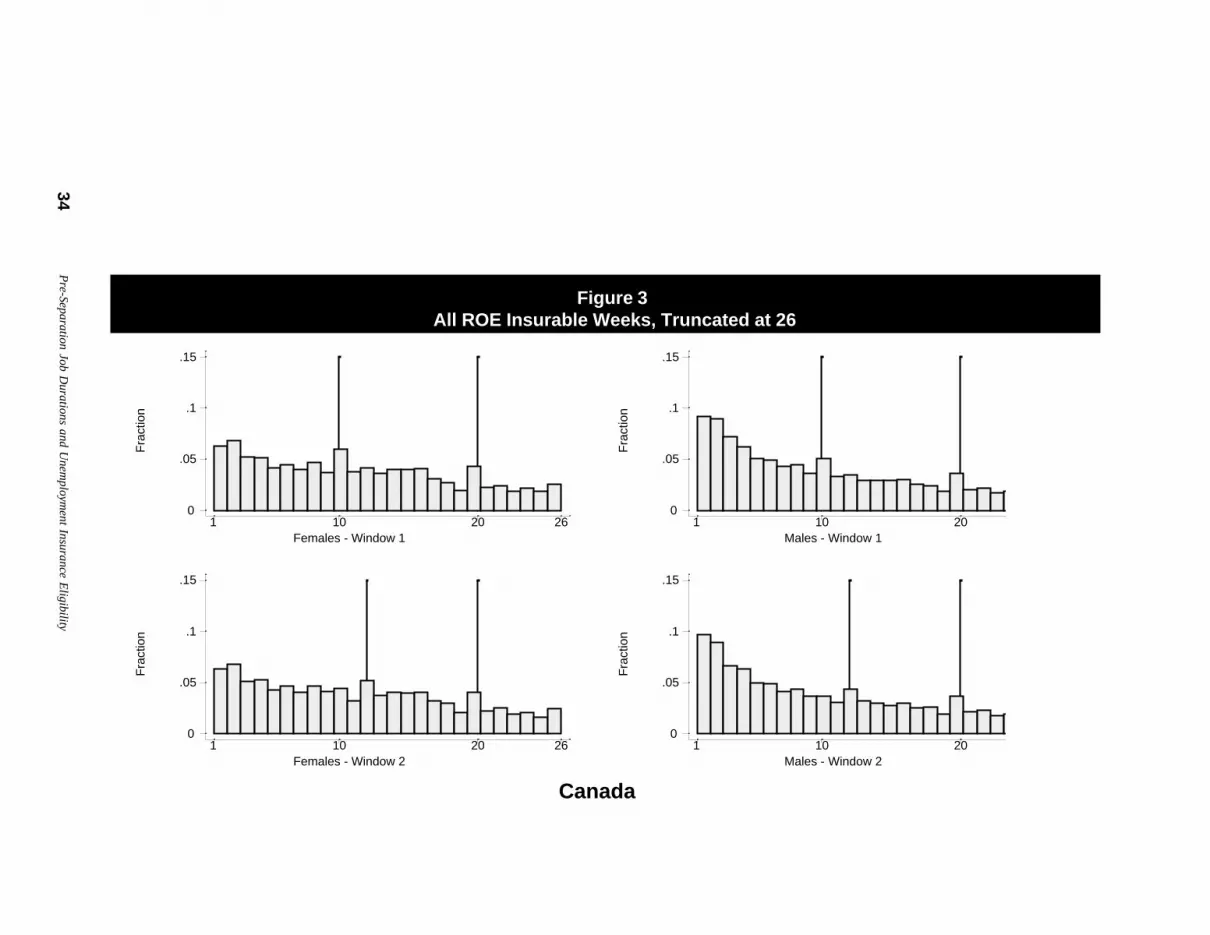
Figure 3 All ROE Insurable Weeks, Truncated at 26.....................34
Figure 4 Claimant’s SV Insurable Weeks, Truncated at 26 ............35
Figure 5 All ROE Insurable Weeks, Truncated at 26.....................37
Figure 6 Claimants’ SV Insurable Weeks, Truncated at 26............38
Figure 7 ROE Weeks Used to Claim, Truncated at 26 ...................39
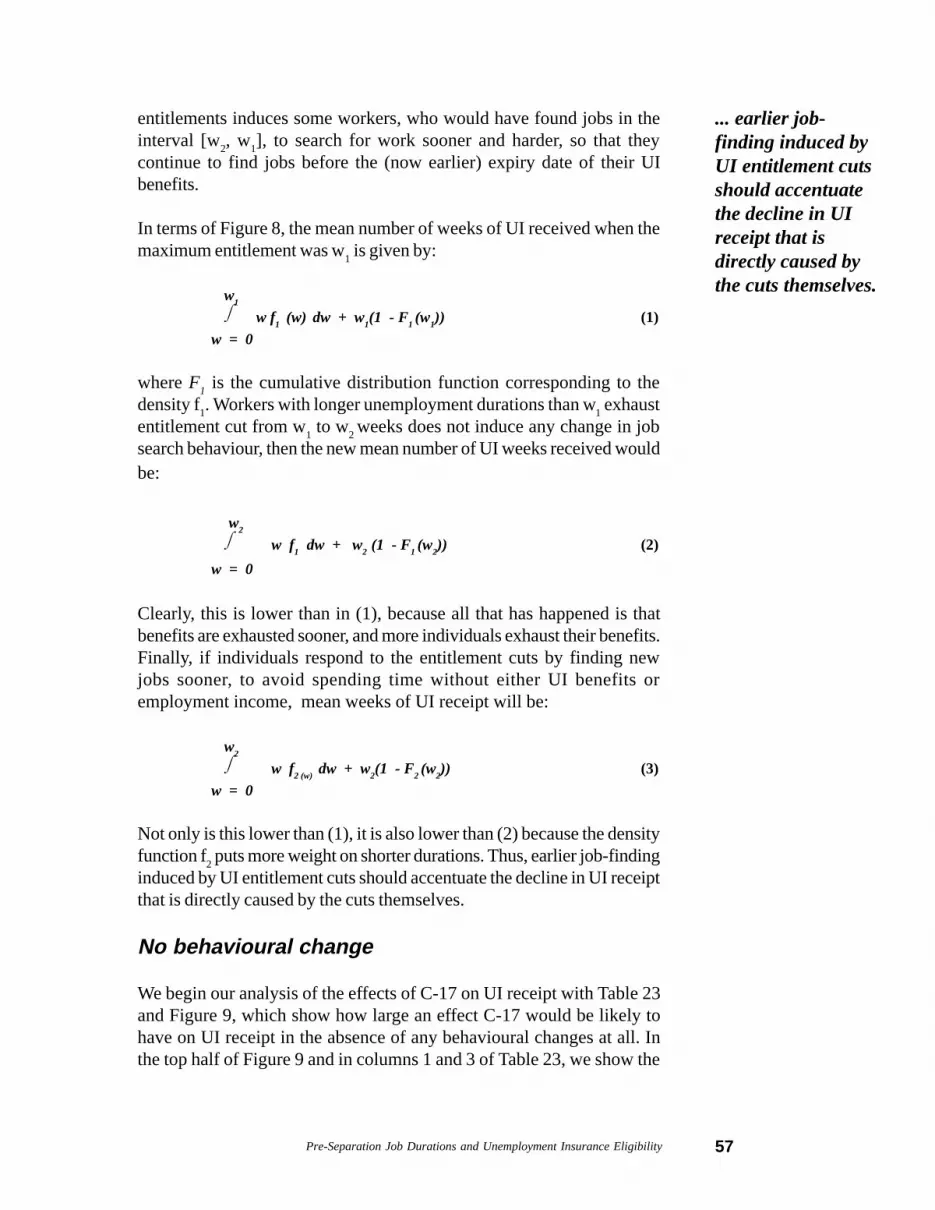
Figure 8 Hypothetical Distributions of UnemploymentSpells Under Two Different UI Benefit Entitlements...........56
Figure 9 Window 1, UI Receipt Pre- and Post-C17 ......................60
Pre-Separation Job Durations and Unemployment Insurance Eligibility i
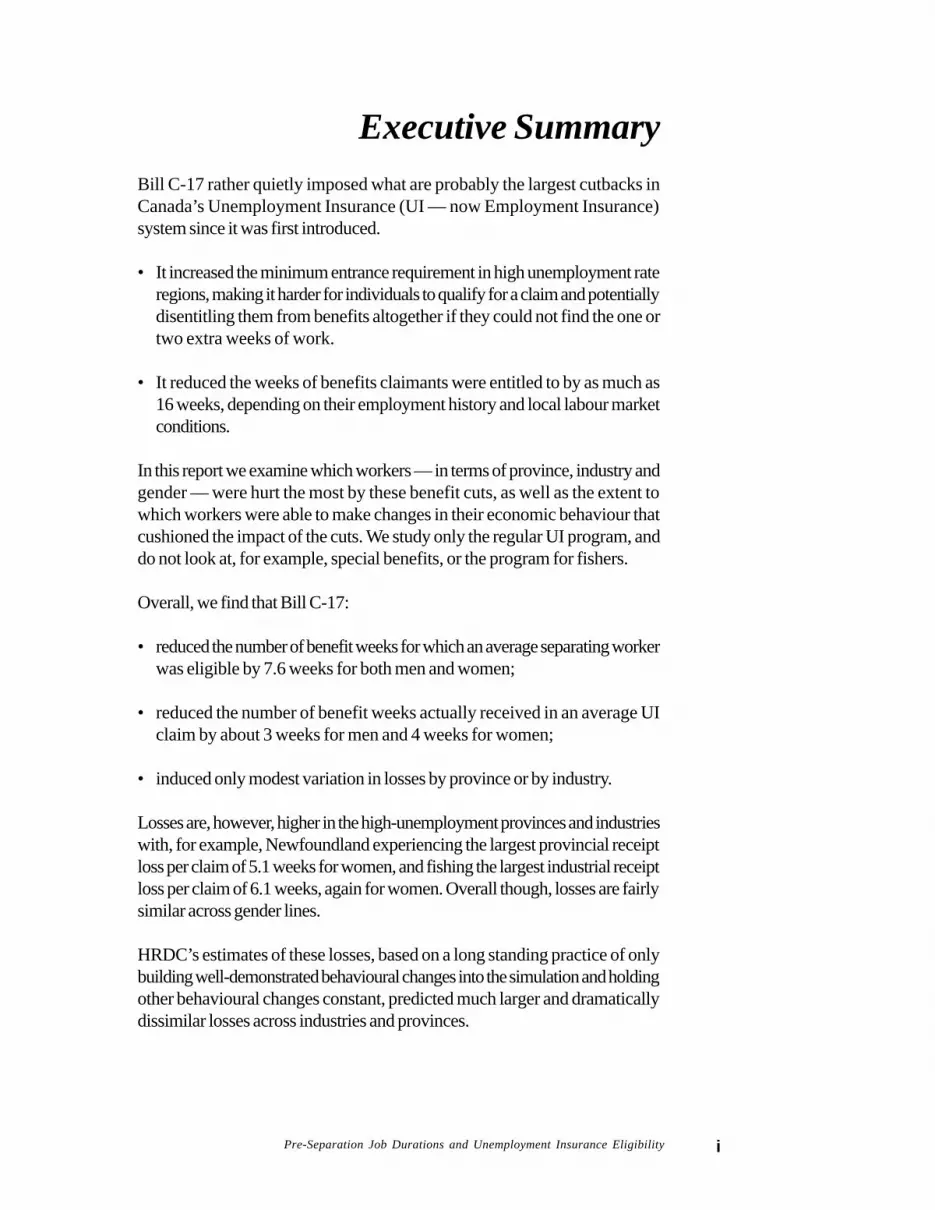
Executive SummaryBill C-17 rather quietly imposed what are probably the largest cutbacks inCanada’s Unemployment Insurance (UI — now Employment Insurance)system since it was first introduced.
• It increased the minimum entrance requirement in high unemployment rateregions, making it harder for individuals to qualify for a claim and potentiallydisentitling them from benefits altogether if they could not find the one ortwo extra weeks of work.
• It reduced the weeks of benefits claimants were entitled to by as much as16 weeks, depending on their employment history and local labour marketconditions.
In this report we examine which workers — in terms of province, industry andgender — were hurt the most by these benefit cuts, as well as the extent towhich workers were able to make changes in their economic behaviour thatcushioned the impact of the cuts. We study only the regular UI program, anddo not look at, for example, special benefits, or the program for fishers.
Overall, we find that Bill C-17:
• reduced the number of benefit weeks for which an average separating workerwas eligible by 7.6 weeks for both men and women;
• reduced the number of benefit weeks actually received in an average UIclaim by about 3 weeks for men and 4 weeks for women;
• induced only modest variation in losses by province or by industry.
Losses are, however, higher in the high-unemployment provinces and industrieswith, for example, Newfoundland experiencing the largest provincial receiptloss per claim of 5.1 weeks for women, and fishing the largest industrial receiptloss per claim of 6.1 weeks, again for women. Overall though, losses are fairlysimilar across gender lines.
HRDC’s estimates of these losses, based on a long standing practice of onlybuilding well-demonstrated behavioural changes into the simulation and holdingother behavioural changes constant, predicted much larger and dramaticallydissimilar losses across industries and provinces.
ii Pre-Separation Job Durations and Unemployment Insurance Eligibility
• A key reason why C-17-induced losses per separation do not vary moredramatically across provinces and industries concerns behavioural changesin qualifying weeks at the entrance requirement in high unemployment rateregions. Most workers concentrated in the high-unemployment provincesand industries were able to obtain the extra weeks of work required toqualify for UI benefits.
Most workers in high unemployment rate regions who would have beencompletely disentitled were they unable to obtain one or two extra weeks ofwork were, in fact, able to accumulate enough extra weeks to substantiallymitigate the effects the Bill would otherwise have had on their UI eligibility.While in some cases — notably the fishing industry — these extra weeks ofwork may have been the results of other, compensatory government programs,they play an important role in determining the ultimate industrial and regionalimpact of the UI cutbacks in Bill C-17 whatever their source. However, workerswho were not potentially totally disentitled were much less able to adjust theirweeks of work in response to Bill C-17.
• Though their losses were quite large, with 50 percent of workers losingbetween 8 and 16 weeks of benefit eligibility, those workers separatingfrom an employer but only losing UI eligibility (and not being totallydisentitled), did not obviously obtain more weeks of work in their UIqualifying period to increase their UI benefit duration.
Finally, while C-17’s impact on UI eligibility and receipt per job separationwere surprisingly equally distributed across provinces and industries, it isimportant to note that its per worker, and per capita impact was not. Thisoccurred because the probability of experiencing a job separation, and claim,varied across provinces.
• Because workers in high-unemployment provinces and industries (es-sentially the Atlantic provinces and to some extent Quebec, and theprimary industries plus construction) are much more likely to experi-ence a job separation, a randomly-selected worker in those provincesand industries could expect to lose more weeks of UI benefits than aworker elsewhere in Canada due to C-17.
For example, an average woman employed in the fishing industry (not includingself-employed fishers who are covered by a separate program) collected about22 weeks of UI benefits per year before the introduction of C-17, this fell byjust over 5 weeks, to 17, following the introduction of Bill C-17; similarly theaverage man in the fishing industry, pre-C-17, collected UI for about 7 weeksper year, this dropped to about 6 after the Bill. Forestry workers, of bothsexes, claimed over 14 weeks of UI per year prior to Bill C-17, and thisdropped by about 2 to 3 weeks following it. In stark contrast, Canada-wide
Pre-Separation Job Durations and Unemployment Insurance Eligibility iii
average weeks of UI receipt per worker fell by about one half of a week.Average annual receipt by female workers dropped from about 3 to 2.5 weeks;the drop for males was from about 3.6 to 3.1.
Comparable differences in the legislation’s impact across provinces on a percapita basis were observed. In Newfoundland the average man and womanclaimed 3.8 and 5.2 weeks of UI in the year before Bill C-17, and lost 0.61and 0.80 weeks as result of it respectively. For the country as whole though,the average per capita claim was only 1.2 weeks and 1.7 weeks for men andwomen respectively, and the losses were about 0.2 for each. Clearly, the cutshad a disproportionate impact on those provinces and industries which werethe highest users of the UI system. Though the subsidization is smaller followingBill C-17, it has not, however, by any means ended the massive cross-subsidization of provinces east of the Ottawa River, and of the agricultural,fishing, forestry, and construction industries, by the other provinces andindustries in Canada.
iv Pre-Separation Job Durations and Unemployment Insurance Eligibility
Pre-Separation Job Durations and Unemployment Insurance Eligibility 1
1. Introduction
On May 31, 1994, Parliament adopted Bill C-17, enacting a number ofchanges to the Canadian Unemployment Insurance (UI) system, effectiveon July 3, 1994. These changes, while less publicized, and less hotlycontested than those in some other recent changes to the UI system (forexample, 1993’s Bill C-113, or the system’s more recent conversion to“employment insurance”), enacted probably the most dramatic cuts inUI eligibility since the system was first introduced. In which provincesand industries were workers most affected by these cuts? Were men orwomen more affected? And to what extent were workers able to mitigatethe effects of the cuts by changing their employment and job searchbehaviour? These are the questions addressed in this report for the regularUI program.
Section 2 of the report describes the main policy changes brought aboutby Bill C-17. Section 3 describes the data and methodology we use toanalyse the effects of Bill C-17. Sections 4 and 5 present our estimates ofthe effects of C-17 on two main outcomes respectively: workers' UIentitlements (given a worker loses a job, or starts a UI claim, how manyweeks of UI benefits can he or she can count on?) and workers' actualreceipt of UI (how many weeks of benefits do workers actually draw?).Conclusions are summed up in a final section.
2 Pre-Separation Job Durations and Unemployment Insurance Eligibility
Pre-Separation Job Durations and Unemployment Insurance Eligibility 3
2. The Policy Changes
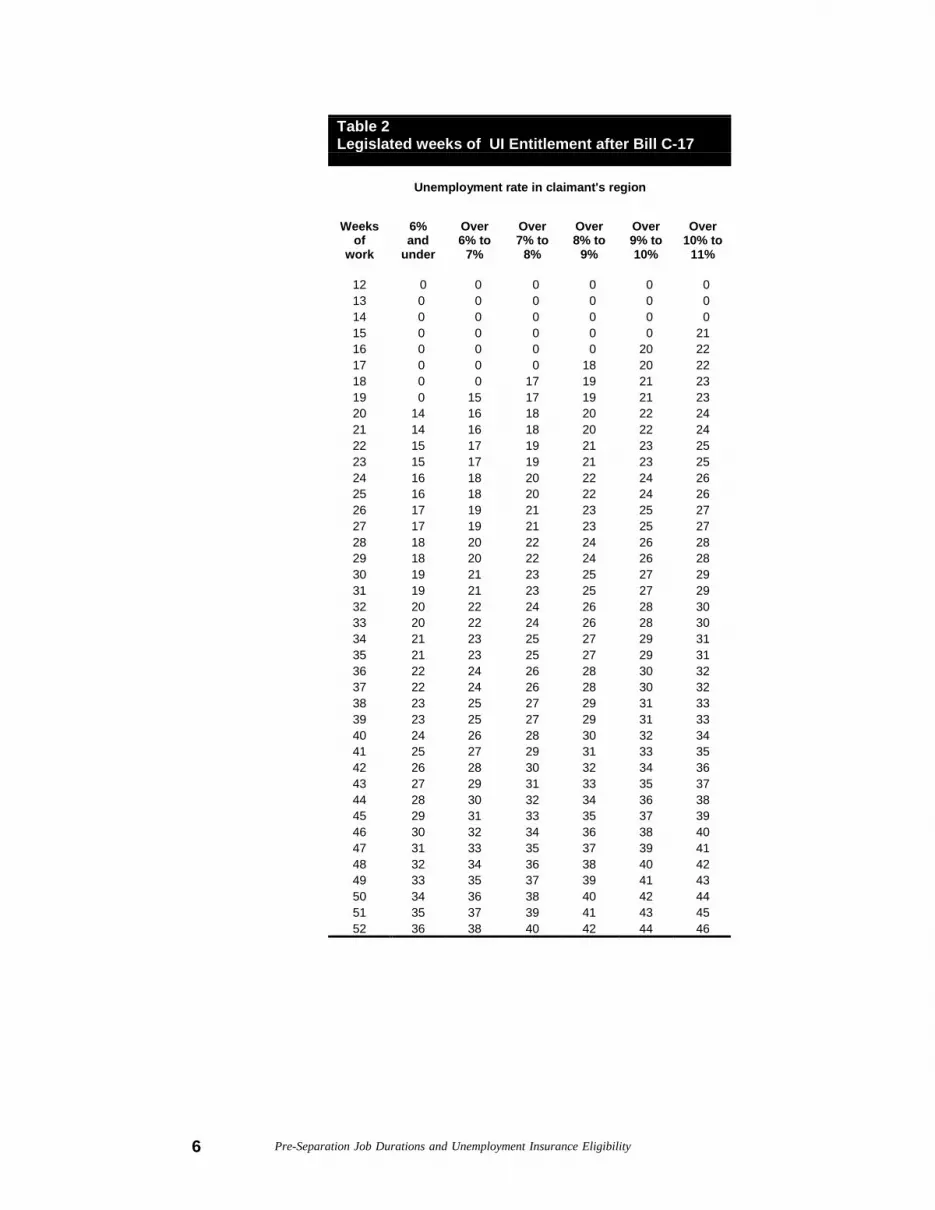
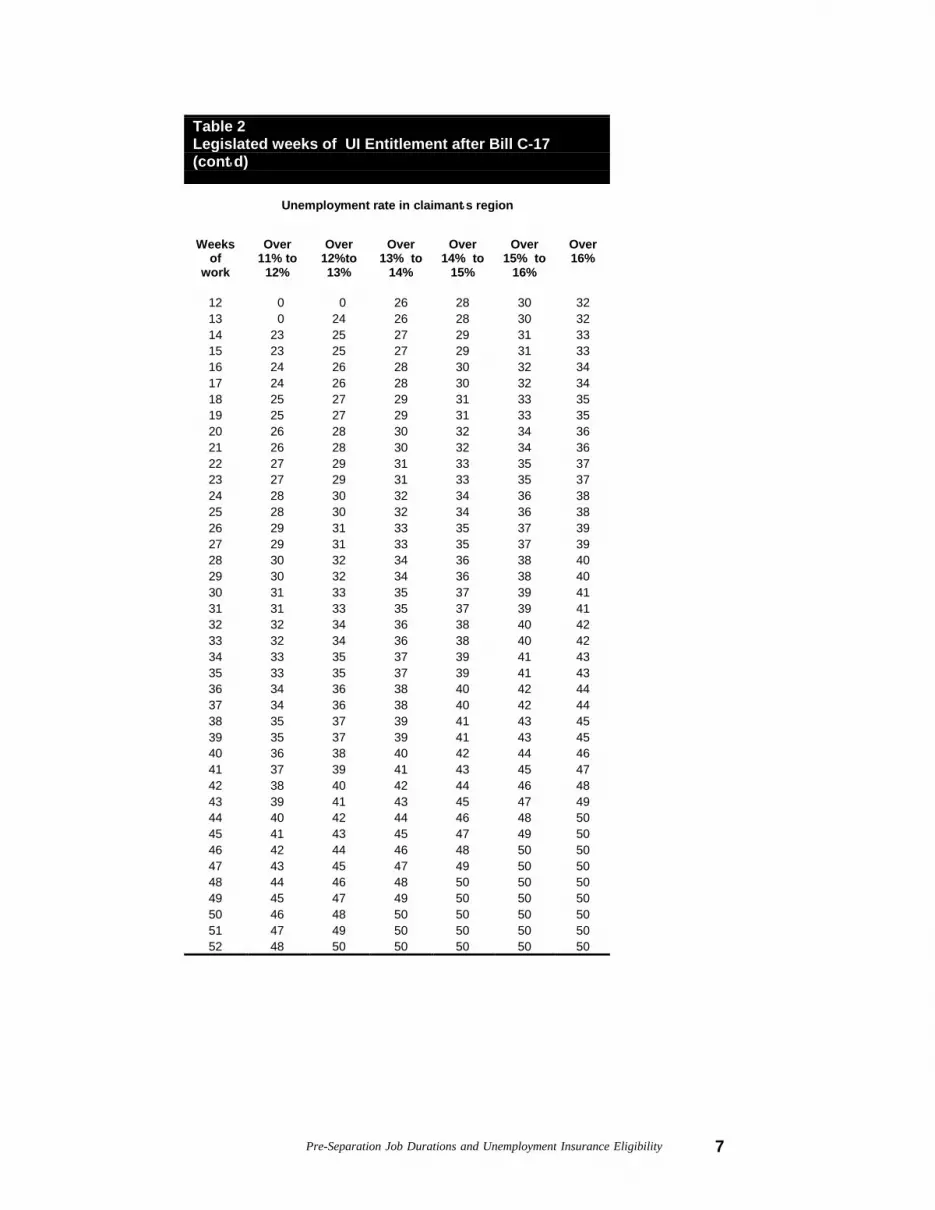
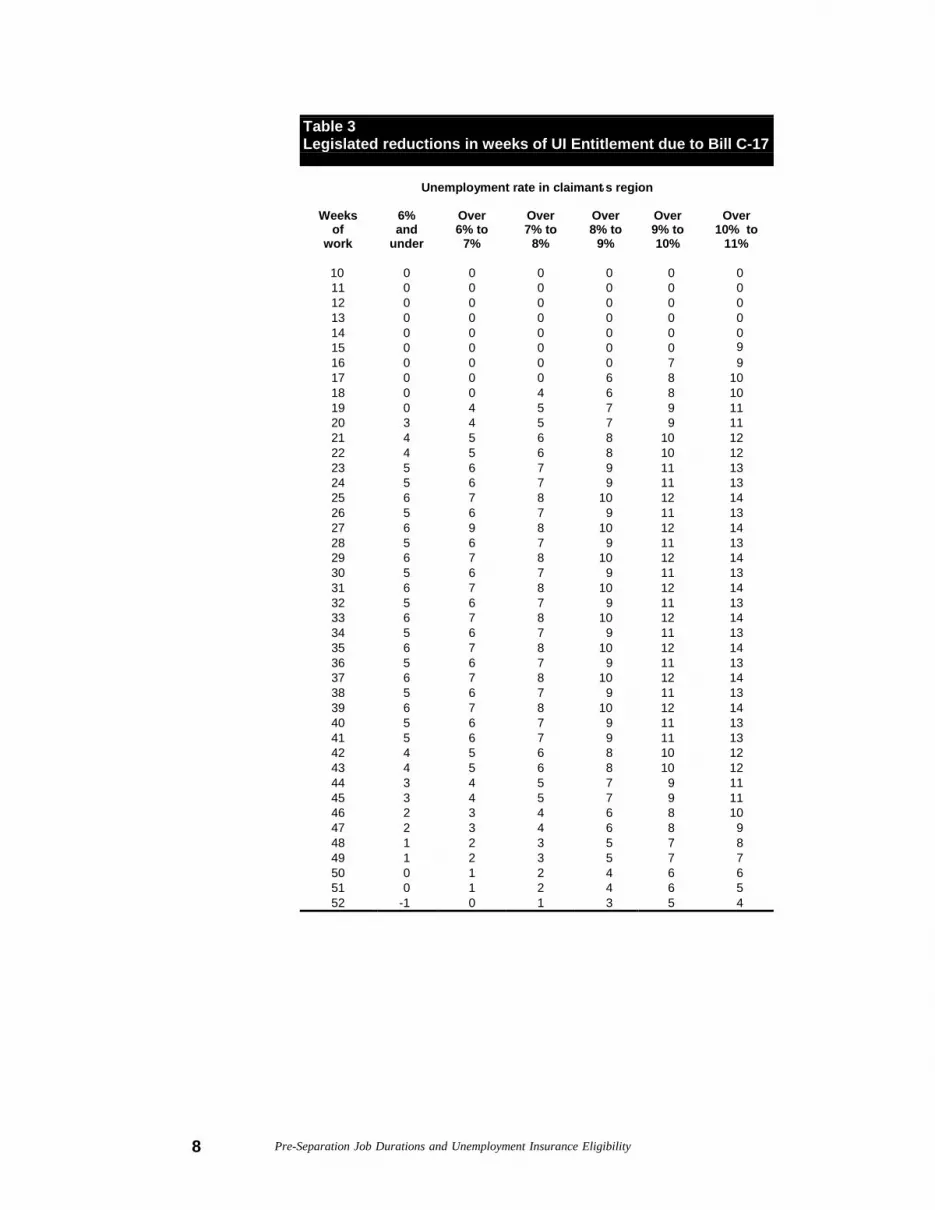
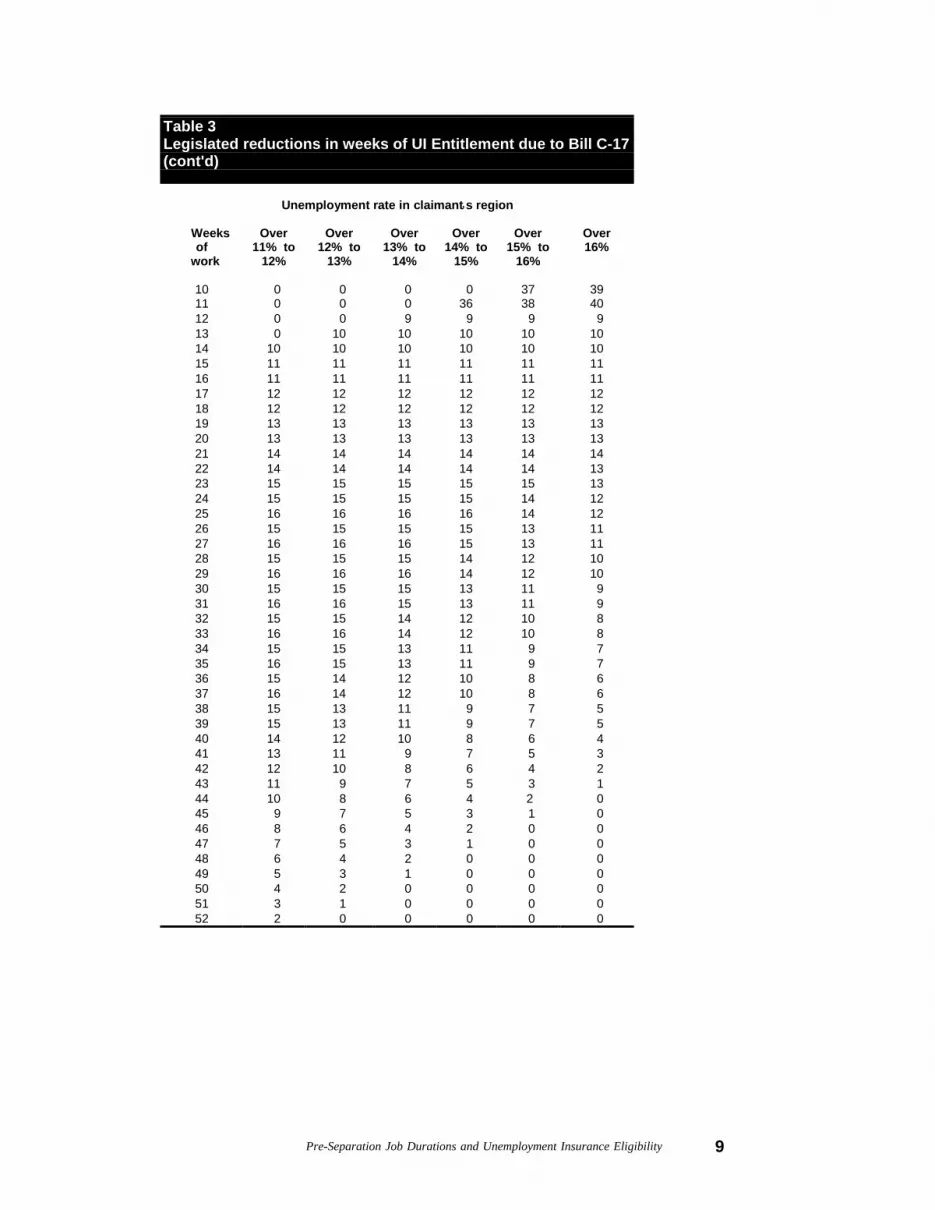
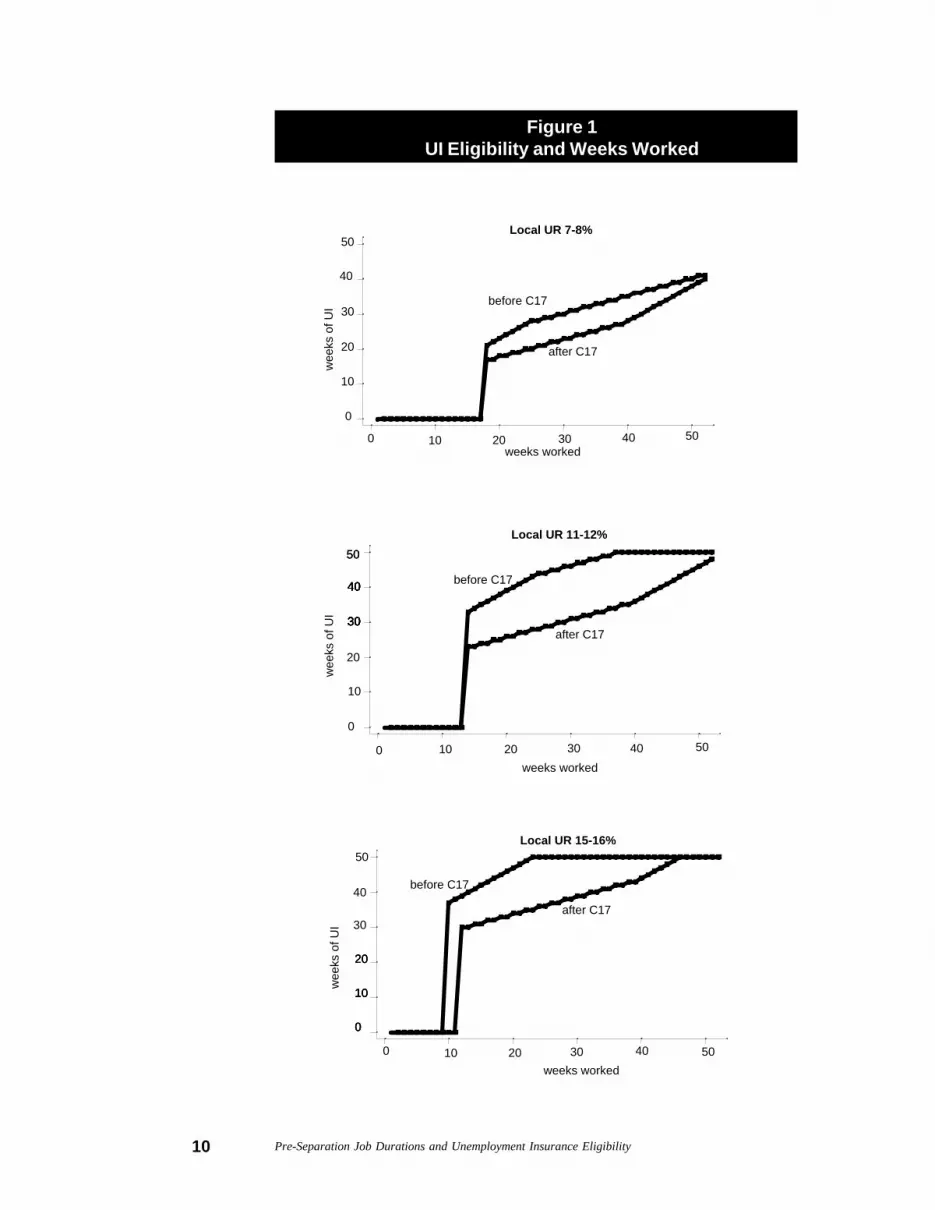
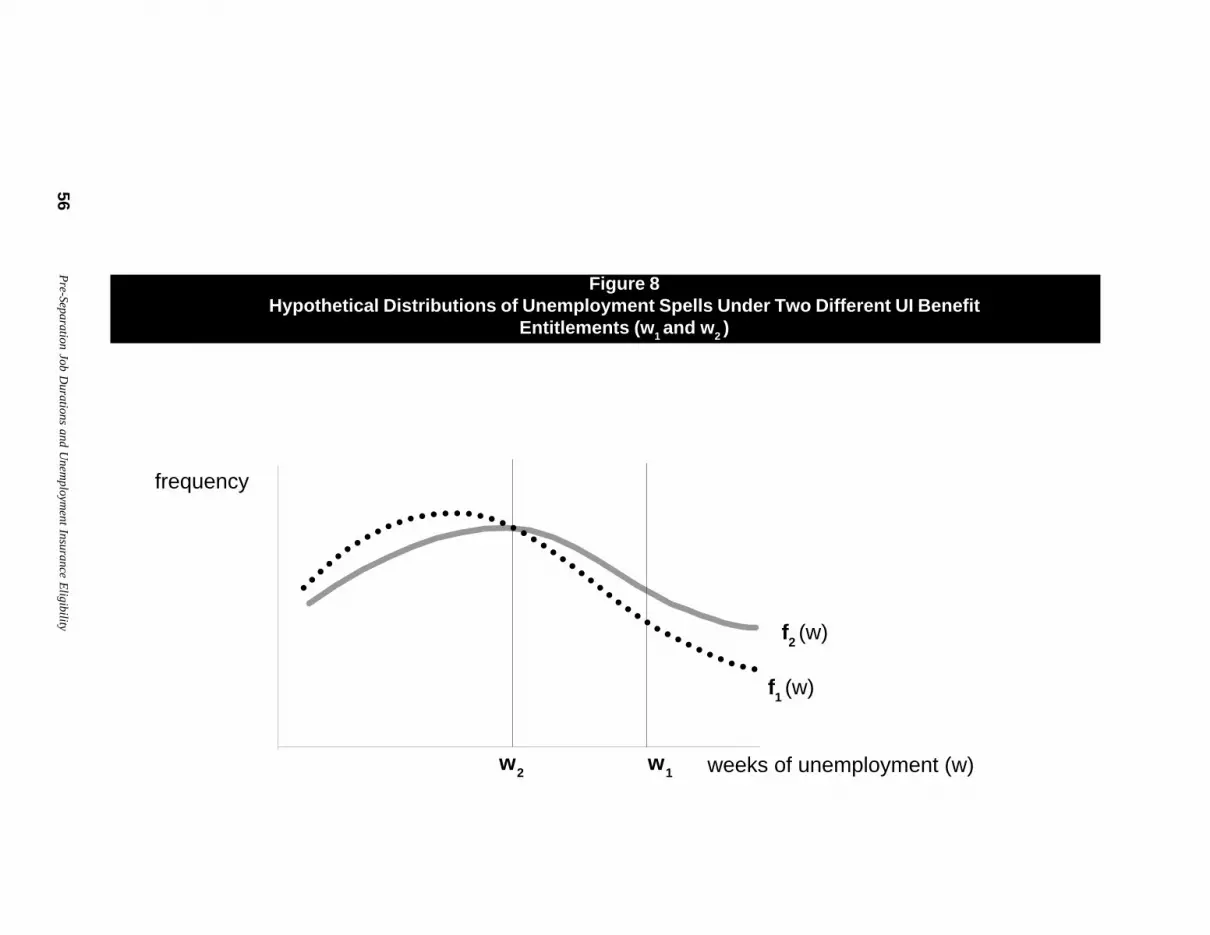
Both before and after the introduction of Bill C-17, the number of weeksof unemployment insurance benefits to which job losers were entitled inCanada were linked by legislation to two things: the number of weeksthey had worked in paid, covered employment in the 52 weeks prior tothe separation (ROE qualifying weeks), and the rate of unemployment intheir local UI region. Before the introduction of Bill C-17, one needed atleast 10 weeks of work in the last 52 to receive any UI benefits, and themaximum number of benefit weeks for which one could qualify was 50.Bill C-17 substantially changed this relation between ROE qualifyingweeks and UI benefit entitlements. The full schedules of qualifying weeksand entitlement weeks are presented in Tables 1 to 3; they are illustratedgraphically for three different local unemployment rates in Figure 1. Ascan be seen from both the Figure and Tables, Bill C-17 did two mainthings. First, in regions with high unemployment (>14 percent), itincreased the number of work weeks required to qualify for UI from 10to 12: now no one in Canada could claim UI with less than 12 weeks ofwork in the previous year. Second, in all regions, regardless of the localunemployment rate, the Bill substantially reduced the UI entitlements ofmost workers with less than a full year of work in the previous year. Thiseffect is particularly strong in regions slightly above the national averageunemployment rate (e.g. 11-14 percent), and for workers with 20 to 40qualifying weeks, as is shown in the middle panel of Figure 1 and inTable 3; the largest reduction of 16 weeks occurred for workers in thesesituations. All told, relative to the preexisting legislation at the time(defined in Bill C-113), Bill C-17 thus imposed major penalties on theUI entitlements of workers with less than average to somewhat above-average unemployment rates.
Bill C-17implemented twosignificant changesto the UI rules.First, it increasedthe minimumnumber of workweeks required toqualify for UI from10 to 12.Second, itsubstantiallyreduced the UIentitlements of mostworkers with lessthan a full year ofwork in theprevious year.
4 Pre-Separation Job Durations and Unemployment Insurance Eligibility
Table 1Legislated weeks of UI Entitlement before Bill C-17
Unemployment Rate in claimant’s region
Weeksof work
6%and
under
Over6% to
7%
Over7% to
8%
Over8% to
9%
Over9% to10%
Over10% to
11%
1011121314
00000
00000
00000
00000
00000
00000
1516171819
00000
0000
19
000
2122
00
242526
027282930
3031323334
2021222324
1718192021
2021222324
2324252627
2728293031
3132333435
3536373839
2526272829
2222232324
2525262627
2828292930
3232333334
3636373738
4040414142
3031323334
2425252626
2728282929
3031313232
3435353636
3839394040
4243434444
3536373839
2727282829
3030313132
3333343435
3737383839
4141424243
4545464647
4041424344
2930303131
3233333434
3536363737
3940404141
4344444545
4748484949
4546474849
3232333334
3535363637
3838393940
4242434344
4646474748
5050505050
505152
343535
373838
404141
444545
484949
505050
Pre-Separation Job Durations and Unemployment Insurance Eligibility 5
Table 1Legislated weeks of UI Entitlement before Bill C-17(cont =d)
Unemployment rate in claimant =s region
Weeksof work
Over11% to
12%
Over12% to
13%
Over13% to
14%
Over14% to
15%
Over15% to
16%
Over16%
1011121314
0 0 0 033
0 0 03435
0 0353637
036373839
3738394041
3940414243
1516171819
3435363738
3637383940
3839404142
4041424344
4243444546
4445464748
2021222324
3940414243
4142434445
4344454647
4546474849
4748495050
4950505050
2526272829
4444454546
4646474748
4848494950
5050505050
5050505050
5050505050
3031323334
4647474848
4849495050
5050505050
5050505050
5050505050
5050505050
3536373839
4949505050
5050505050
5050505050
5050505050
5050505050
5050505050
4041424344
5050505050
5050505050
5050505050
5050505050
5050505050
5050505050
4546474849
5050505050
5050505050
5050505050
5050505050
5050505050
5050505050
505152
505050
505050
505050
505050
505050
505050
6 Pre-Separation Job Durations and Unemployment Insurance Eligibility
Table 2Legislated weeks of UI Entitlement after Bill C-17
10 Pre-Separation Job Durations and Unemployment Insurance Eligibility
Figure 1UI Eligibility and Weeks Worked
wee
ks o
f UI
Local UR 7-8%
weeks worked
before C17
after C17
0 10 20 30 40 50
wee
ks o
f UI
Local UR 11-12%
weeks worked
before C17
after C17
0 10 20 30 40 50
0
10
20
30
40
50
wee
ks o
f UI
Local UR 15-16%
weeks worked
before C17
after C17
0 10 20 30 40 50
0
10
20
30
40
50
0
10
20
30
40
50
0
10
20
30
40
50
0
10
20
30
40
50
30
40
30
40
30
40
30
40
20
10
0
Pre-Separation Job Durations and Unemployment Insurance Eligibility 11
3. Data and Methodology
1. Definitions
Figure 1 and Table 3 clearly suggest that the effects of Bill C-17 onworkers’ UI entitlements and on their ultimate receipt of UI are likely tobe greatest in provinces and industries with high unemployment rates,and where workers’ labour market histories involve a greater amount ofpart-year work. In a sense, this should not be surprising since at least partof the intent of the legislation may have been to reduce the implicit subsidyto part-year work inherent in the UI system. To know how many weeksof UI entitlement, and/or UI benefits, workers actually lost, to know howthis varied across provinces and industries, and to know to what extentworkers were able to make behavioural changes in their work historiesto mitigate the effects of these program cuts, a more detailed methodologyand conceptual framework is needed. We outline that methodology inthis section, beginning with some definitions.
Two main outcomes: eligibility and receipt
First, as already mentioned, in this study we measure the effects of BillC-17 on two main outcomes: total weeks of UI eligibility, and total weeksof UI benefits actually received. Clearly, weeks of eligibility are of directinterest to workers when they first become unemployed: the total numberof UI benefit weeks they could count on, if needed, may be an importantdeterminant of workers’ financial security, as well as an importantdeterminant of the job search strategies they undertake. At the same time,however, most unemployed workers in Canada, at least prior to C-17,did not use up all the weeks of UI benefits to which they are entitled.Thus, especially from the point of view of the expenditures of the UIsystem, or if our interest is to measure changes in the total dollar benefitsreceived by a particular province or industry, it is also important tocalculate incidence in terms of the total number of benefit weeks actuallyreceived. We conduct both exercises in this report, devoting Section 4 toan analysis of entitlement changes, and Section 5 to an analysis of changesin actual benefit weeks received.
Two possible behavioural changes:qualifying weeks and search intensity
Second, in assessing the behavioural responses of workers (and perhapsfirms) to Bill C-17, we need to consider two possible kinds of behaviouralchange. One of these is changes in qualifying weeks of employment. If
12 Pre-Separation Job Durations and Unemployment Insurance Eligibility
workers try to compensate for reductions in UI eligibility by accumulatingextra weeks of work, we would expect qualifying weeks to increase,especially among workers who would otherwise be totally disentitledfrom UI (i.e. those with 10 or 11-week work histories). These behaviouralchanges will affect both workers’ UI eligibility and receipt, in both casesacting to mitigate the effects of the UI program cuts on the declines inthese outcome measures. A second possible response to the shorterduration of UI benefits is for workers to search harder, or begin to searchearlier, for new jobs while on a UI claim. Because this effect operates tochange the length of time one receives benefits once one has alreadybecome unemployed, it is relevant only to the actual weeks of UI receivedand not to the original entitlement. Further, to the extent that thisbehavioural change leads workers on UI to find re-employment earlierthan they otherwise would have, it will tend not to mitigate but toaccentuate the effects of the UI program cuts on UI receipt, reducing iteven more than what would be brought about by the eligibility cuts alone.
Three units of analysis:claims, separation and persons
A third and final definitional matter concerns the populations for whichour incidence calculations are made. We present results for three mainpopulations, or units of analysis: UI claims, separations, and persons.When we present incidence calculations per UI claim, we ask thefollowing question: “By how many weeks did Bill C-17 shorten theaverage UI claim?” When we present results on a per-separation basis,we ask “Given I lose my job, how many fewer weeks am I likely to beentitled to (or actually receive)?” These losses differ from per-claim lossesbecause not all workers who lose jobs either claim UI, or are eligible forUI — indeed some may be rendered ineligible by Bill C-17 itself. Finally,even though the UI system might, for example, treat all separations roughlyequally regardless of where they occur, it may be the case that workers insome provinces or industries are much more likely to experience aseparation in a given year, and thus be more likely to receive UI. Thus,especially if one is interested in calculating the effect of C-17 on thefinancial cross-subsidization that occurs across industries and provincesvia the UI system, it is also of interest to develop per capita, or per-worker measures of incidence. Our per capita estimates of, say, C-17’seffects on UI receipt ask: “How many fewer weeks of UI does the averageworker in industry X, or the average adult resident in province Y, receiveas a result of Bill C-17?”
Pre-Separation Job Durations and Unemployment Insurance Eligibility 13
Micro-accounting (nonparametric) approach
Our basic approach in this report to estimating the incidence of the cutsin Bill C-17, as well as the importance of worker’s behavioural responsesin mitigating or accentuating the effects of those cuts, might best be termeda “micro-accounting” approach, which decomposes the entire distributionof changes in observed UI entitlement and receipt before and after theintroduction of the Bill. This methodology, which is at the same timeconceptually simple and data-intensive, is based on the following: at most,there are only two kinds of behavioural changes through which thelegislated effects of C-17 (shown in Table 3) must be “filtered” todetermine the actual changes in UI benefits received by a particular sampleof people: changes in qualifying weeks of work, and changes inunemployment durations once on claim. Given this, we can use the entiredistributions of these two variables (qualifying weeks and weeks on claim)to compute counterfactual distributions of our outcome variables thatshow how much the outcome variable would have changed had therebeen no changes in “economic behaviour” at all. The discrepancybetween these changes and the actual ones can then be interpreted as acombination of behavioural changes induced by the legislation, orbehavioural changes caused by other factors that changed at the sametime as the legislation changed, such as, perhaps, macroeconomicconditions.
This micro-accounting approach has, of course, both advantages anddisadvantages over other methodologies, such as for example a regression-based one. A key advantage is the fact that we estimate, nonparametrically,the entire distribution of outcome changes, and can hold constant, againnonparametrically, the entire distribution of the two behavioural variables,rather than just means as are typically used in a regression context. Apotential disadvantage may be a difficulty, in some cases, in separatingbehavioural effects that are induced by the legislation from other changesin behaviour that would have occurred anyway, due for example toimproving macroeconomic conditions. However, given the extremenonlinearity in the nature of the C-17 legislative changes (recall Table3), the fact that macroeconomic conditions were relatively stable aroundthe time of our analysis, and the fact that the available time series fromwhich to estimate macro effects are quite short anyway, we believe quitestrongly that the micro-accounting approach used here is in fact the moreappropriate one for the question at hand.
In more detail, our analysis focuses on a comparison of the UI experiencesof a one-tenth random sample of workers experiencing a job separation,as measured by the receipt of a record of employment (ROE) form inHRDC administrative data, in one of two window periods, before and
Our basic approach... could best betermed a“micro-accounting”approach, whichdecomposes theentire distribution ofchanges in observedUI entitlement andreceipt before andafter theintroduction of theBill.
14 Pre-Separation Job Durations and Unemployment Insurance Eligibility
after the introduction of Bill C-17. Our first window period starts at thebeginning of March 1993, and extends until the end of February 1994.Because the provisions of C-17 were phased in gradually between Apriland July of 1994, our second window starts in August 1994, and continuesuntil the end of July 1995.1 In order to control for seasonal effects on allthe variables examined, which previous experience has shown can bevery strong, each calendar month appears only once in each window, thatis, each month is matched to a month in the other window. Some of thematches are from the year before, but others are from two years previous;this is unavoidable given the timing of the legislation. National averageunemployment rates in the two windows were 11.3 and 9.8 percentrespectively; thus there was a modest improvement in overall labourmarket conditions which we need to take into account in interpreting ourresults. We discuss how our micro-accounting approach is applied tothese two window periods to estimate the effects of C-17 on UI eligibility,and on UI receipt, in turn, below.
2. Measuring the effect of C-17 on UIeligibility
Conceptually, our analysis of the effects of Bill C-17 on UI eligibilityproceeds in three steps. First, we use the UI rules prevailing before theintroduction of C-17 to compute the total weeks of UI eligibility of eachof the almost 400,000 workers in our first window period (as noted earlier,this is a simple, but very nonlinear function of the worker’s number ofqualifying work weeks and the unemployment rate prevailing in his orher region). For any given population we are interested in (e.g. a particularindustry, province, or Canada as a whole), this gives us the entiredistribution of UI entitlements prevailing before Bill C-17 wasimplemented. It also gives us the initial distribution of workersacross qualifying weeks and UI regions for any group of interest.
No behavioural change
Next, we use the above distribution of workers across qualifying-weeksand regions to compute the following counterfactual distribution: Whatwould the entire distribution of weeks of UI eligibility be, if the newC-17 rules had been in place, but the distribution of workers acrossqualifying weeks and regions was the same as it was in the pre-C-17period, and if all local unemployment rates remained at their pre-C-17
1 Past experience suggests that large windows must be provided around policy changes likethose in C-17 because of, among other things, lags in filing for UI following job separationand the possibility of “backdating” claims. The administrative lag in processing records ofemployment (ROEs) must also be considered. More details about the timing and construc-tion of our sample are provided in the data appendix.
Pre-Separation Job Durations and Unemployment Insurance Eligibility 15
levels? This quantity gives us an indication of what effect C-17 wouldhave in the absence of any behavioural changes in weeks of work, dueeither to the Bill itself or to other factors like changing macroeconomicconditions.2
Behavioural change in weeks of employment
Finally, we examine the distribution of workers across qualifying weeksin our “after”-C-17 window, and compute what the distribution of UIeligibility is among these workers based on their actual work experience,under the new (C-17) rules, but holding local unemployment rates fixedat the levels that prevailed in the pre-C-17 window. This gives us ameasure of how the actual distribution of eligibility changed, holdingconstant the effect of macroeconomic conditions on UI rules, but allowingthe distribution of weeks worked to change as they actually did in responseto the legislation (and perhaps other influences that may affectthedistribution — e.g. macroeconomic conditions).
While the above procedure is conceptually quite simple, in practice ouranalysis of the effects of C-17 on UI entitlements is complicated by thefollowing issue: there is not a one-to-one mapping between jobseparations, as measured by ROE’s, and UI claims. This is not simplybecause some separations do not result in a claim, but also becauseworkers can combine work weeks from more than one separation in orderto initiate a claim for UI. As our results in this report show, this is a veryimportant feature of the Canadian UI system that has not been given itsfull due in most evaluative work on the system. For our purposes here, itraises some difficulties in calculating the number of “qualifying weeks”a separating individual actually has. In practice, we use two alternativeways to measure qualifying weeks, neither of which is perfect, but eachof which has advantages and disadvantages. They are described below.
Separation based approach(separation unit of analysis)
One way to define the number of qualifying weeks a workers has accessto is what we call a “separation-based”, or “ROE-based”, approach. Eachtime a separation occurs, we observe how many weeks of work anindividual had in that job. If those weeks are insufficient to qualify forthe maximum duration of UI benefits in the worker’s region, we thensearch through that individual’s recent employment history for otherROE’s with unused qualifying weeks. Any such weeks are added to the
2 It also nets out the effect of any interregional migration, but we do not believe this is a majorfactor in the short-run responses to C-17.
16 Pre-Separation Job Durations and Unemployment Insurance Eligibility
qualifying weeks in the current ROE to determine the worker’s full UIeligibility. A key advantage of this ROE-based approach is that it allowsus to estimate the distribution of qualifying weeks for all workersexperiencing a separation, including those who never claim UI. Adisadvantage is that it combines entitlement weeks from different jobsthe way we think would be of maximum advantage to workers, ratherthan the actual way workers choose to combine ROE’s, which could bedifferent.
Claim based approach (claim unit of analysis)
A second way to define qualifying weeks is what we call a claim-based,or SV-based, approach. For each of the separations in our data whichactually result in a UI claim, the administrative data tells us directly howmany weeks of benefits they were actually entitled to in that claim, basedon all the ROE’s they actually used to qualify for benefits (the total numberof weeks used to qualify from all ROE’s together is termed the individual’s“status-vector (SV) insured weeks”). The advantage of this is that it givesus the exact number of weeks each claimant actually qualified for, basedon all available qualifying weeks, combined the way they actually are byreal claimants and UI offices. The disadvantage of this measure is that itis not observed for non-claimants: thus if an individual did not qualifyfor UI under, say, the C-17 rules, we cannot ascertain from their SV-insured-weeks whether they had enough weeks to qualify for benefitsunder the less restrictive, pre-C-17 rules. Our ability to analyse the UIdisentitlement of workers unable to accumulate the minimum number ofweeks to qualify for UI at all is thus limited.
Because each has its advantages and disadvantages, we use both ROE-based, and SV-based, measures of qualifying weeks in our analysis below.Unless otherwise indicated, we use the ROE-based approach wheneverwe report results on a per-separation basis, and the SV-based approachwhenever we report results on a per-claim basis. To the extent that theresults are similar with both methods, our confidence in them will beincreased.
3. Measuring the effect of C-17 onUI receipt
Our analysis of C-17’s effects on UI receipt is similar in most respects toits effects on UI eligibility. As before, it is based on a micro-accountingframework that compares entire distributions of outcomes (now weeksof UI receipt) in two window periods, and develops some simplecounterfactual calculations of what the Bill’s impact would be in the
Pre-Separation Job Durations and Unemployment Insurance Eligibility 17
absence of any behavioural changes, compared to what it actually was.And again, we present results for two alternative populations (UI claimsand persons). The main difference from the previous procedure — asidefrom the outcome measure itself — is that we are now interested in theeffects of two different kinds of changes in economic behaviour —changes in job search, and weeks on claim among UI recipients as wellas changes in the distribution of weeks worked to qualify for UI. Theprocedure, therefore, now has the following four steps rather than three.
Before C-17
First, for each individual in our “before” sample, we compute their totalnumber of UI qualifying weeks, plus their actual weeks of UI claimed(which is zero if the separation did not result in a claim). For any group(e.g. province, industry or gender) of interest, this gives us the distributionof UI weeks actually received before C-17.
No behavioural change
Next, for each individual in the “before” sample who claims UI, we alsocompute a “truncated” weeks of benefit equal to the actual if the actual isless than that individual’s entitlement (given their work history and region)under the new C-17 rules, and equal to the C-17 entitlement otherwise[i.e. Truncated = min (actual claimed, post-C-17 entitlement)]. For anypopulation subgroup, this gives the entire distribution of UI weeks itwould claim under the new, C-17 rules, if individuals altered neithertheir qualifying weeks of work, nor their search behaviour while on UIclaim. Note that this assumes that all individuals who would previouslyhave claimed more weeks than their “after” entitlement exhaust their UIbenefits.
Behavioural change in qualifying weeks
Third, we use the distribution of qualifying weeks prevailing in our “after”C-17 sample, combined with the conditional mean, in the “pre” sample,of truncated weeks conditional on qualifying weeks, to compute adistribution of weeks of UI receipt. This distribution is what would occurif individuals changed their qualifying weeks (i.e. employment spells) tothe new level in response to the legislation, but conditional on qualifyingweeks, did not change their job search behaviour once on claim. It thusallows for “economic behaviour” in changing qualifying weeks but notin job search once on UI.
18 Pre-Separation Job Durations and Unemployment Insurance Eligibility
Behavioural change in qualifying weeksand search intensity
Finally, we look at the actual distribution of total weeks of UI claimed inour ‘after” sample, to get an estimate of the total effects of Bill C-17allowing for both kinds of behavioural responses to the Bill, some ofwhich we argue — based on their distribution across qualifying weekcategories — are almost certainly induced responses to the legislativechanges themselves.
Pre-Separation Job Durations and Unemployment Insurance Eligibility 19
4. Results: Effects of C-17 onUI Entitlements
In this section we estimate the effect of Bill C-17 on the number of weeksof UI benefits to which a “new” job loser, in a given province or industry,is entitled. In practice, of course, individuals do not always use all theweeks of UI to which they entitled, as they tend to find new jobs beforetheir UI eligibility expires. The effects of C-17 on the number of weeksof UI actually claimed is examined in Section 5; however it seems clearthat the number of weeks of UI workers know they can count on, giventhey experience a job loss, is an important quantity to them, and it is thisquantity we focus on in this section.3
Our analysis of the effects of Bill C-17 on workers’ UI entitlements isdivided into three subsections. The first of these presents estimates ofthe distribution of eligibility losses per separation, both overall and byprovince, industry and gender, that would be caused by Bill C-17 ifworkers and firms were unable to make any behavioural adjustments tothe Bill at all. The second presents evidence that some behaviouraladjustments in qualifying weeks were in fact made in response to theBill: as we shall see, some workers, especially in the Atlantic provinces,were able to accumulate enough extra weeks of work to avoid what wouldotherwise be quite substantial reductions in UI entitlements. The finalsection presents estimates of eligibility losses, by province, industry andgender, that take into account workers’ (and firms’) behavioural responsesto the Bill. As mentioned, at various points in the section, we shall presentour estimates of eligibility losses for three different “populations”: perUI claim, per job separation, and per person employed in a given industryor resident in a given province.
1. Effects of Bill C-17 on UI entitlements ifno behavioural changes were possible
Suppose that, after the introduction of Bill C-17, the entire distributionof ROE qualifying weeks among workers who experience a job separationremained the same in all regions of the country. Suppose also that localunemployment rates remained at exactly their pre-C-17 levels. How manyfewer weeks of UI benefits would the average worker starting a UI claim,
3 The distinction between eligibility and receipt is analogous to that between budget constraintsand consumption choices: the first summarizes the options available and the second theindividual’s choices given those options. In a some senses, the former could actually beconsidered a better indicator of the effects of the changes on individual welfare than thelatter.
20 Pre-Separation Job Durations and Unemployment Insurance Eligibility
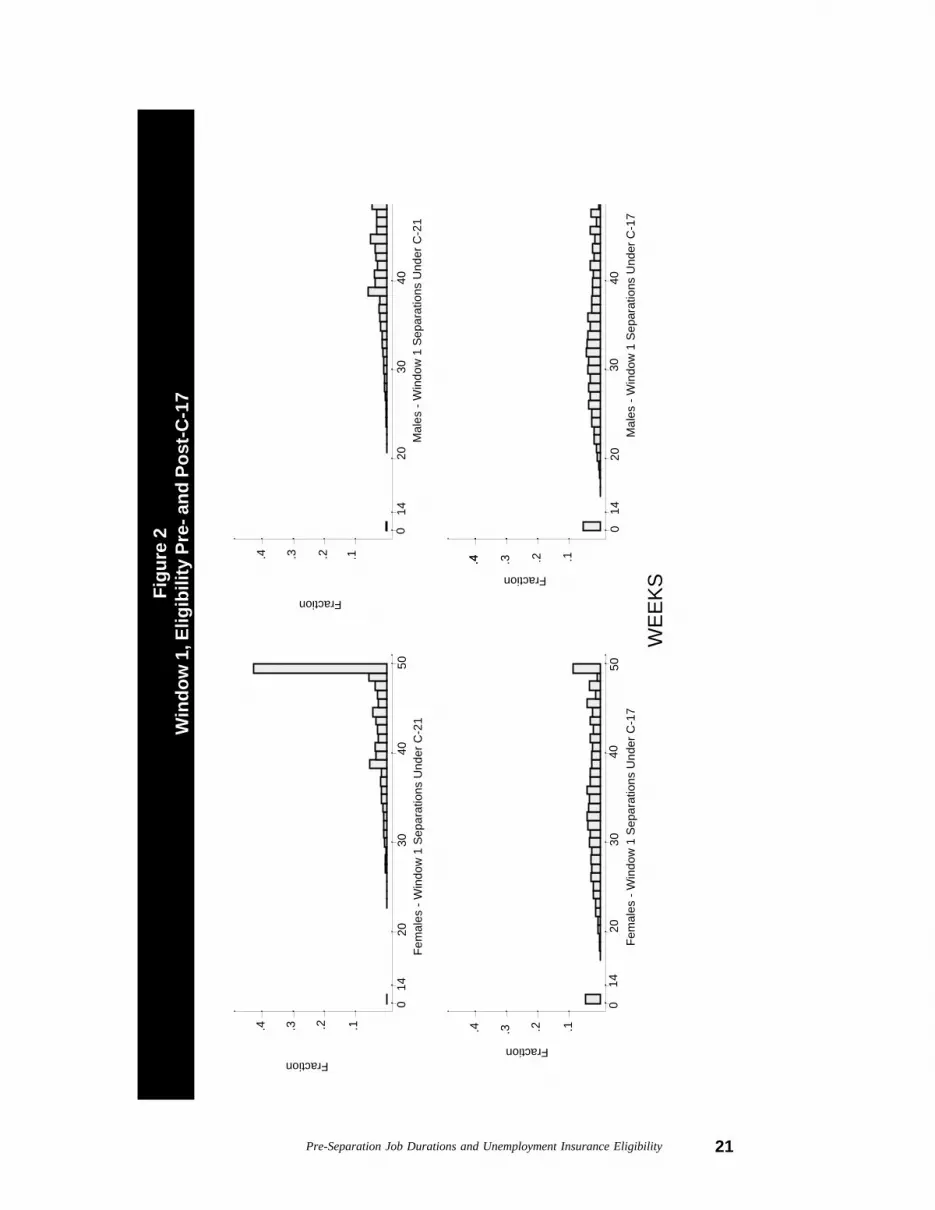
or losing a job, be entitled to? And how does this loss vary by province,industry and gender? Answers to these questions are provided in Figure2, and Tables 4-8. As outlined in the last section, all the numbers presentedthere were calculated by applying the C-17 rules to the entire distributionof qualifying weeks for each specified unit of analysis, disaggregated byprovince, industry and sex, in our “pre-C-17” window period, definedearlier.
Claim based unit of analysis
Eligibility levels and losses per UI claim are presented in Tables 4 and 5.It is worth noting that, as discussed earlier, the initial eligibility levels inthese tables are calculated from the distribution of status vector insuredweeks among all workers who claimed UI before Bill C-17, and that thelosses ask how many fewer weeks of UI this group of workers wouldreceive if C-17 had been applied to them. The numbers therefore includenot only the eligibility losses of workers with initial insured weeks of 12or more, but also the large losses due to the disentitlement of workerswith only 10 or 11 weeks of insured employment in high-unemploymentregions.
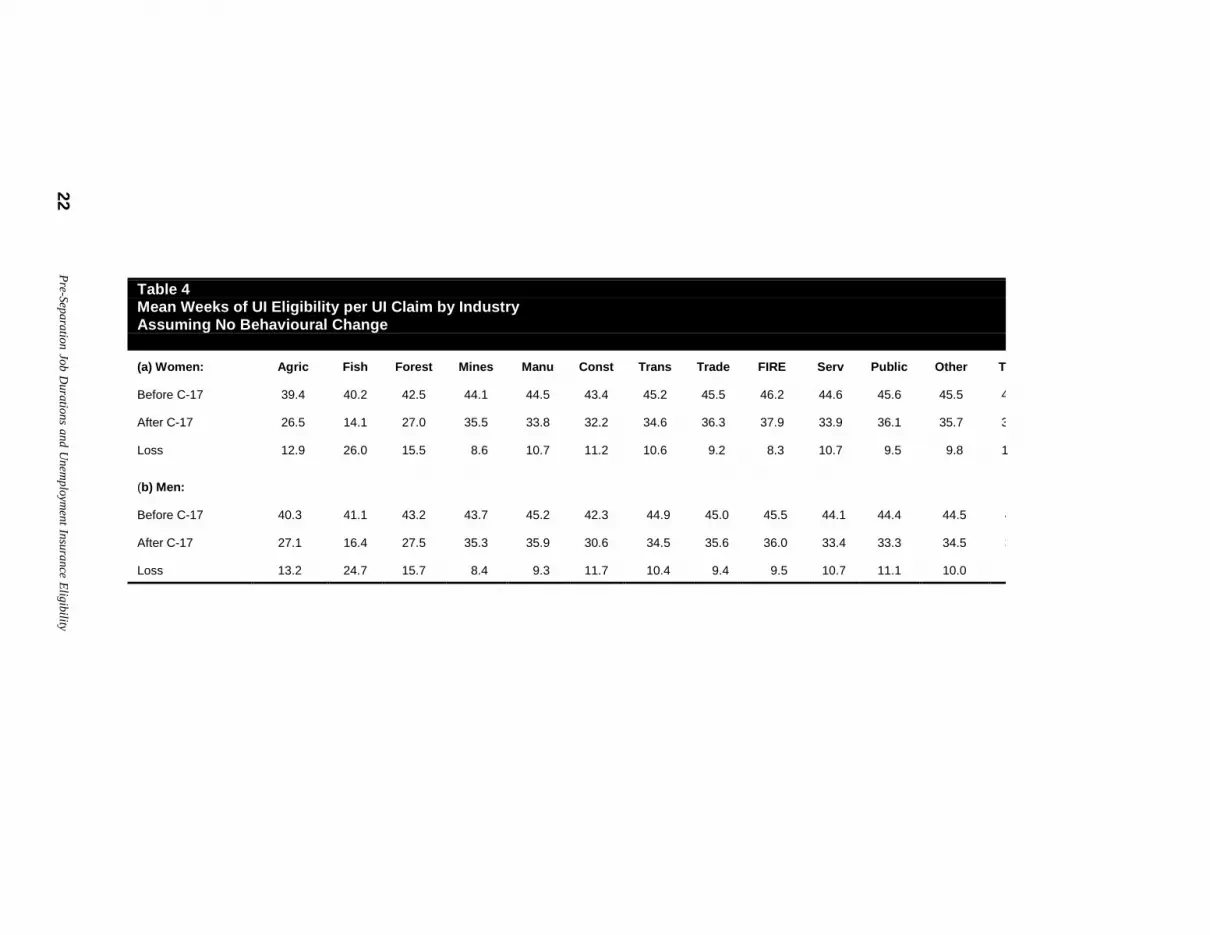
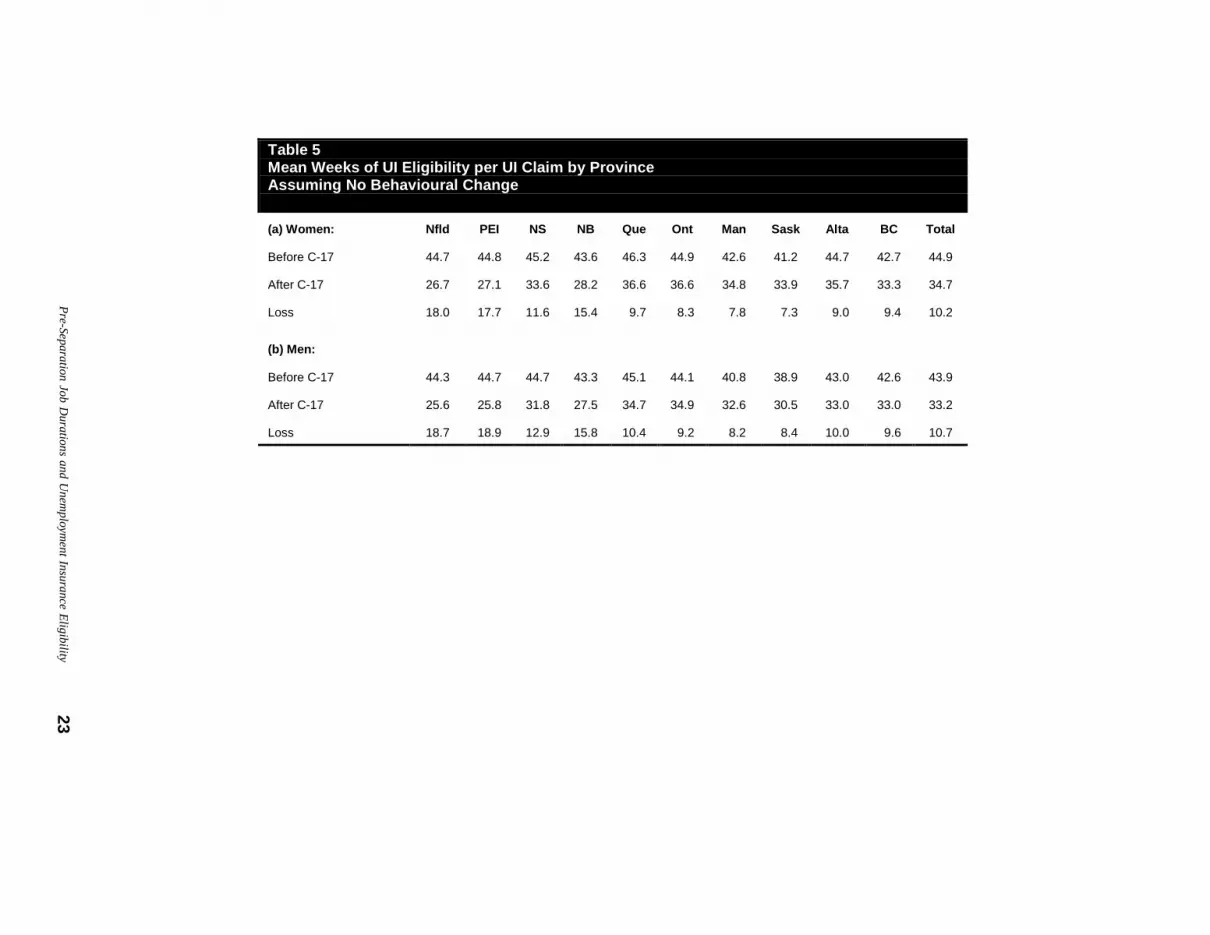
According to Tables 4 and 5, if workers were not able to make anybehavioural changes to adjust to the new Bill, the average worker startinga UI claim in Canada would be entitled to about 10 fewer weeks of benefitsas a result of Bill C-17. In both historical and percentage terms, this is avery large cut in the duration of benefits, amounting to slightly under onequarter of the initial mean entitlement of about 44 weeks. Surprisinglyperhaps, both the pre- and post-C-17 UI entitlements of men and womenare very similar; there thus appears to be very little gender differential inthe impact of the Bill on individuals’ UI entitlements. Tables 4 and 5also disaggregate these overall losses by industry and provincerespectively. In this regard both tables share an interesting feature: thereis much more variation in UI entitlements across provinces and industriesafter C-17 than before it. In fact, a reasonable summary of the two Tablescould run somewhat like this: Before C-17, a average worker initiating aUI claim was entitled to a little over 40 weeks of benefits, regardless ofwhich province he or she lived in, regardless of which industry he or sheworked for, and regardless of gender. (There is some cross-industry andcross-province variation, but only one provincial number — 38.9 forwomen in Saskatchewan,— and only one industry number — 39.4 formen in agriculture — are below 40 weeks.) After C-17 (absent behaviouraladjustment), entitlements vary much more across provinces and industries,with those provinces and industries with the least stable employmentpatterns (i.e. the highest fraction of workers with low ROE qualifyingweeks — below 12) experiencing the biggest drops.These are the provinces
... there is muchmore variation in
UI entitlementsacross provinces
and industries afterC-17 than before it.
Pre-Separation Job Durations and Unemployment Insurance Eligibility 21
Fig
ure
2W
indo
w 1
, Elig
ibili
ty P
re- a
nd P
ost-
C-1
7
WE
EK
S
Fraction
Fem
ales
- W
indo
w 1
Sep
arat
ions
Und
er C
-21
0
1420
3040
50
Fraction
Mal
es -
Win
dow
1 S
epar
atio
ns U
nder
C-2
1
014
2030
40
.1.2.3.4
Fraction
Fem
ales
- W
indo
w 1
Sep
arat
ions
Und
er C
-17
0
1420
3040
50Fraction
Mal
es -
Win
dow
1 S
epar
atio
ns U
nder
C-1
7
014
2030
40
.1
.2
.3
.4.4 .3 .2 .1
.4.4 .3
.2
.1
22P
re-S
epara
tion Jo
b D
ura
tions a
nd U
nem
plo
yment In
sura
nce
Elig
ibility
Table 4Mean Weeks of UI Eligibility per UI Claim by IndustryAssuming No Behavioural Change
(a) Women: Agric Fish Forest Mines Manu Const Trans Trade FIRE Serv Public Other T
24 Pre-Separation Job Durations and Unemployment Insurance Eligibility
of Newfoundland, PEI, New Brunswick and (to a lesser extent) NovaScotia, and the industries of fishing, forestry and agriculture.4 Workers inthe fishing industry, if not able to make behavioural changes to avoidthem — an issue we explore in the next subsection — would experienceespecially massive average losses in UI eligibility of 25 to 26 weeks dueto Bill C-17. Much of this comes from those with 10 or 11 weeks of workwho are completely disentitled.
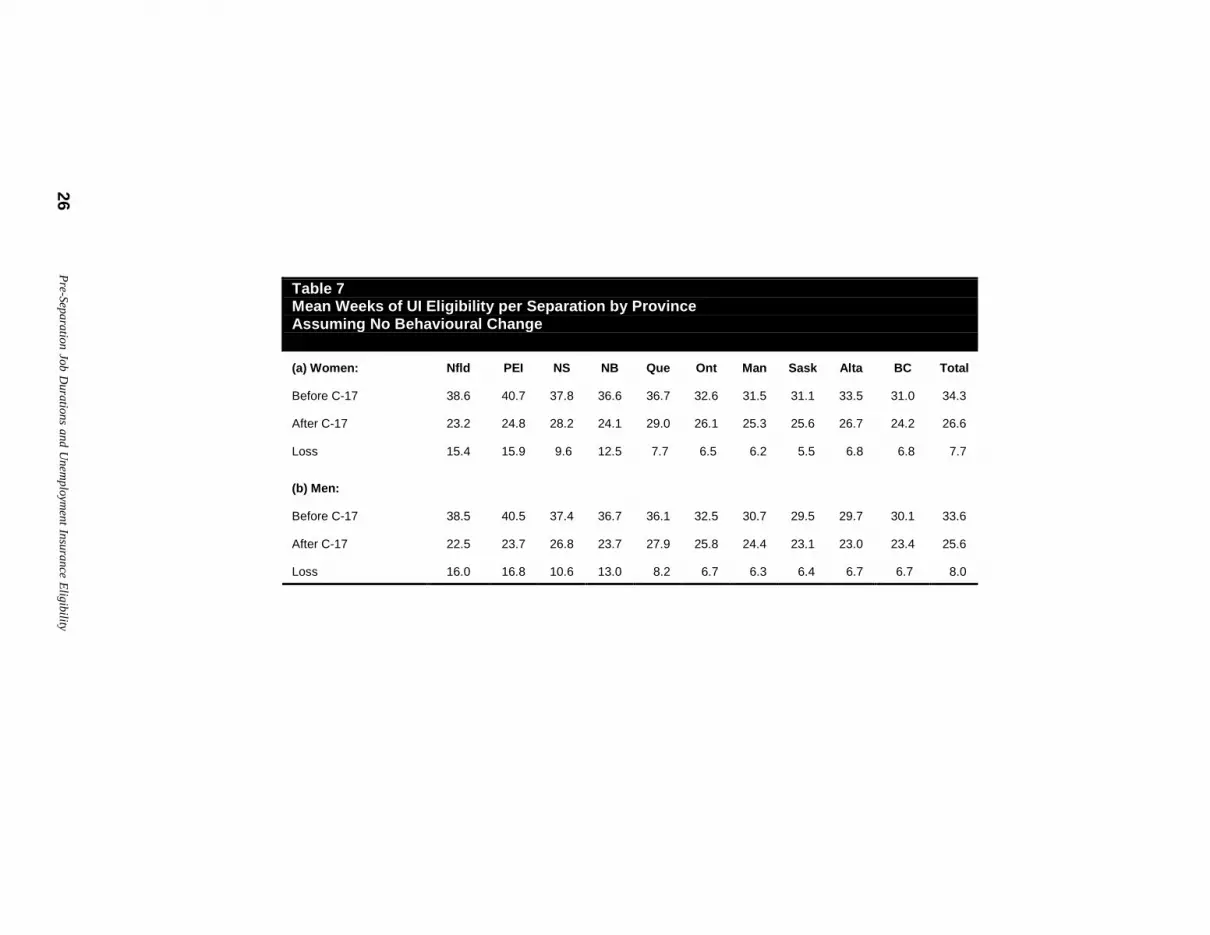
Separation based unit of analysis
Tables 6 and 7 give the distribution of mean eligibility losses per jobseparation, also by industry and province. As mentioned, in these Tableswe calculate qualifying weeks using information from individuals’ ROEforms, combining them where necessary. Since not all workersexperiencing a separation claim UI, the total entitlements per separation,both before and after the change, are lower. Largely because of this “scale”effect, the mean C-17-induced losses are lower too, at 7.7 weeks forwomen and 8.0 weeks for men. Aside from this overall difference inmagnitude, the pattern of eligibility losses across industries and provinces,absent behavioural adjustment, is the same whether these losses arecalculated on a per-claim, or a per-separation basis.
Person based unit of analysis(per worker and per capita)
A final perspective on the distribution of UI eligibility losses before anybehavioural adjustments is provided in Table 8 and Figure 2, which incontrast to the means shown in Tables 3 to 7, show the entire distributionof eligibility losses for the country as a whole (Figure 2 shows the entiredistributions of UI eligibility per separation before and after C-17; Table8 shows the entire distribution of the difference between these two, i.e.losses). Together, Table 8 and Figure 2 show that both the initial meanentitlements, and the 10 week mean drop in entitlement shown in Tables 6and 7, are means of distributions that are either highly asymmetric, orbimodal, or both.5 According to Figure 2, by far the most common UIentitlement for both men and women before the introduction of BillC-17 was the maximum one, of 50 weeks: around 40 percent of all workersstarting a UI claim could count on a full 50 weeks of benefits, if theyneeded them. After Bill C-17, this changed dramatically, with less than10 percent of all claimants qualifying for a full 50 weeks. Further, about 5percent of those who would have qualified for UI before the introduction
4 In this study, workers in the fishing industry include all individuals in the fishing industryexcept self-employed owner-operators of a fishing boat, who are covered under a separateUI program.
5 Very similar patterns are found in the distribution of losses per claim, in Tables 4 and 5.
Pre
-Separa
tion Jo
b D
ura
tions a
nd U
nem
plo
yment In
sura
nce
Elig
ibility
25
Table 6Mean Weeks of UI Eligibility per Separation by IndustryAssuming No Behavioural Change
(a) Women: Agric Fish Forest Mines Manu Const Trans Trade FIRE Serv Public Other T
28 Pre-Separation Job Durations and Unemployment Insurance Eligibility
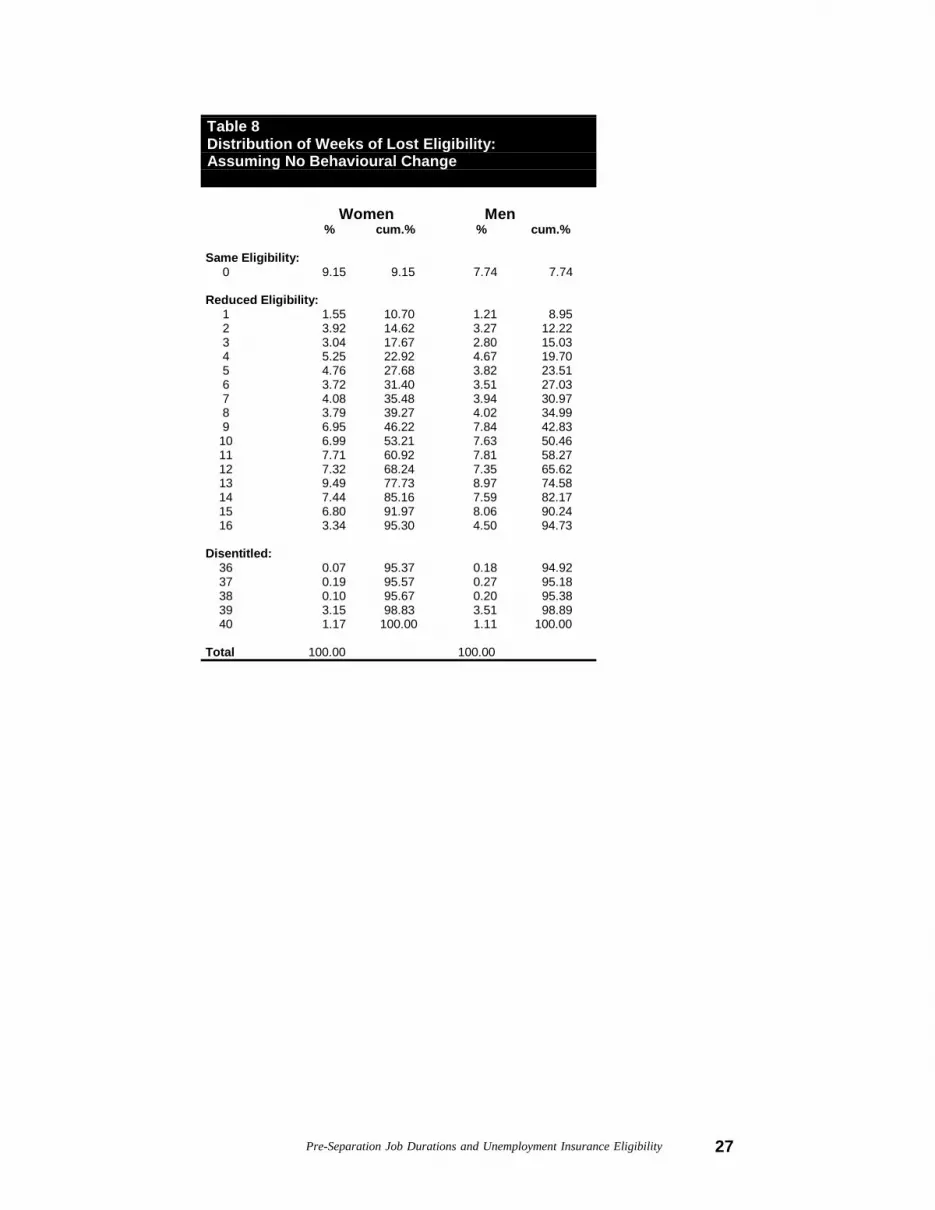
of C-17 would have insufficient weeks of work to qualify for UI at allunder C-17, thus earning an entitlement of zero weeks. This small groupof “totally disentitled” workers would experience — remember this is inthe absence of any behavioural changes — a huge loss in entitlement, asis shown in Table 8. If there were no behavioural responses to Bill C-17,Table 8 shows that only 9.1 percent of women, and 7.7 percent of menstarting UI claims would face no reduction in weeks of UI eligibility. Afurther 86.1 (95.3-9.1) percent of women and 87 percent of men wouldexperience losses of from 1 to 16 weeks, as a result of the lowerentitlements in the new law. Finally, about 5 percent of both women andmen would experience massive losses as their work history would nowbe insufficient to qualify for UI. Thus, while we focus on mean eligibilitylosses in much of this paper, especially in our summaries of whichprovinces and industries lost most, it is important to bear in mind thatthese means can come from quite bimodal distributions in which aminority of workers may experience massive losses.
In sum, our analysis of what the effects of Bill C-17 would be onindividuals’ UI entitlements, in the absence of any behavioural responsesto the Bill, shows the following. First, the mean loss in weeks of UIentitlement would be about 10 weeks per UI claim, or 8 weeks per jobseparation. Second, the distribution of these losses is bimodal, with thegreat bulk of workers experiencing losses of 1 to 16 weeks, but a smallminority —those with sufficient weeks to qualify under the old rules butinsufficient to qualify under the new— experiencing total UIdisentitlement, with losses of 36 to 40 weeks of benefits. Third, — againbefore any behavioural adjustments are made — these losses are quiteunevenly distributed across industries and provinces, with those provincesand industries where workers have the least stable employment histories(roughly the Atlantic provinces, and fishing, forestry and agriculture)experiencing the largest losses. The C-17 changes appear to have beendesigned to penalize unstable employment histories, and in this respectappear to have succeeded.
2. Behavioural changes in qualifying weeks
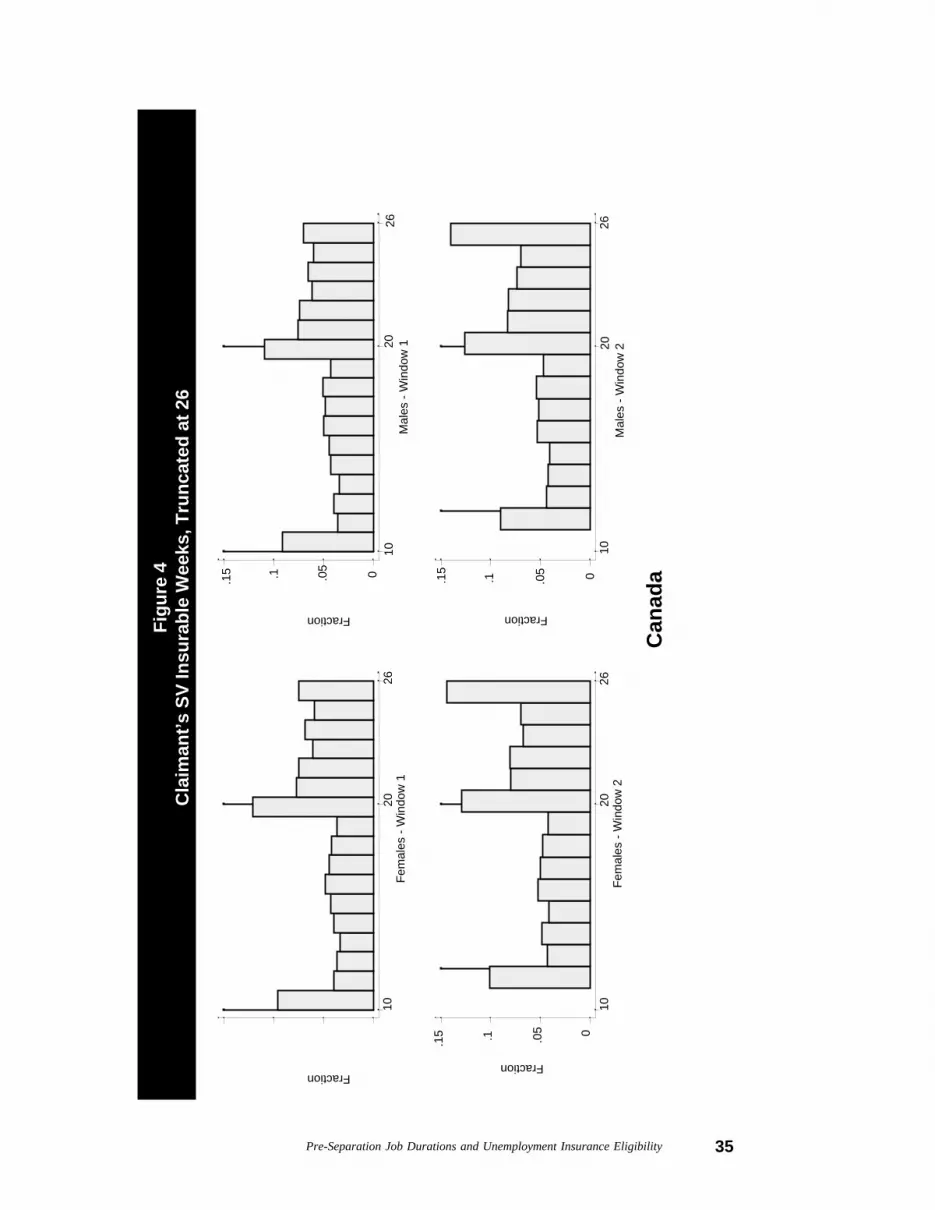
One way for workers and firms to mitigate the effect of the eligibilitycuts documented above, on both their UI eligibility and overall financialwell being, is to accumulate more qualifying weeks of work. In thissubsection we explore various pieces of evidence to see whether suchchanges did in fact occur, where they occurred, and how big they were.We begin our analysis with Tables 9 through 12 and Figures 3 and 4,which show the distribution of work weeks that can be used to qualify for
Pre-Separation Job Durations and Unemployment Insurance Eligibility 29
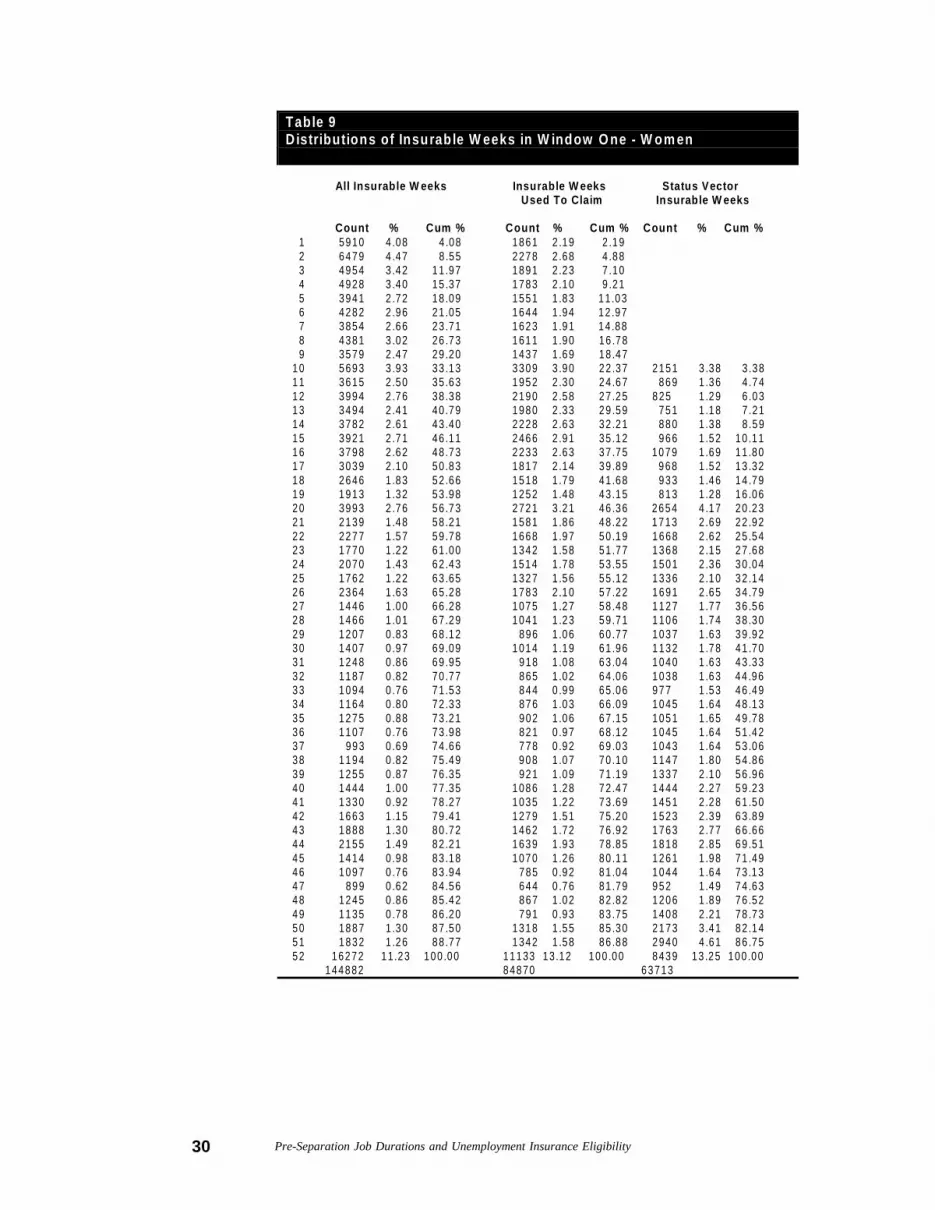
UI before and after Bill C-17. (Figures 3 and 4 simply present in graphicalform the portions of Tables 9 to 12 that apply to up to 26 weeks of work).Given the lack of a one-to one correspondence between job separationsand UI claims noted in the last section, Tables 9 to 12 present three differentestimates of the distribution of qualifying weeks. The counts of “allinsurable week” are derived from individual ROE’s, and simply reportthe total number of work weeks available from all ROE’s. “Insurableweeks used to claim” are calculated the same way, but count only thoseROE’s, not aggregating short jobs, the individual eventually used toestablish a UI claim.6 Finally, “status vector insurable weeks” are derivedfrom UI claim information, i.e. from the “status vector” file, and not fromROE’s. These count the total number of work weeks (potentially frommultiple ROE’s) used to establish each UI claim, from which theindividual’s UI entitlement in that claim is calculated. Because these arebased on claimants only, they only contain total weeks in excess of theminimum qualifying level before and after the policy change.
Tables 9 through 12, and Figures 3 and 4, show the following. First, anastonishing share (at least to us) of jobs lasting less than the minimumnumber of weeks needed to qualify for UI are eventually used, presumablyby being combined with other jobs, to qualify for UI anyway. In window1, the share of these “very short” jobs that eventually are used to qualifyfor UI is 63 percent (18.47/29.20) for women, and 79 percent (21.89/35.19) for men. Among other things, this suggests that analyses of theincentive effects of UI on employment durations that are based purely onthe duration of individual jobs, such as Christofides and McKenna (1996)and Green and Riddell (1997), may be picking up only a small fractionof those effects: having a job that lasts less than minimum qualifyingweeks does not, by any means, preclude one from qualifying for UI inCanada.
Second, in all three distributions examined, and for both women andmen, there is a clear “spike” at the minimum number of weeks needed toqualify for UI in the highest unemployment rate regions in Canada beforethe introduction of Bill C-17 (10 weeks).7 This spike is consistent withsome individuals and firms having enough control over the number ofweeks they work per year to accumulate exactly the minimum number ofwork weeks needed to establish a UI claim. Third, while it is clearlypresent, this spike at 10 weeks, which is an important number in terms of
6 Recall that ROE’s for less than the minimum qualifying weeks (10 before C-17; 12 after)can still be used to establish a UI claim if they are combined with other ROE’s in the same52-week period.
7 Of course the minimum varied across Canada according to local unemployment rates, but10 was the lowest of these minima. Results which take this into account are presented inFigures 5 to 7 and Tables 13 to 14.
... there is a clear“spike” at theminimum numberof weeks needed to qualify for UI in the highestunemployment rateregions in Canadabefore the introduction of BillC-17 (10 weeks).
30 Pre-Separation Job Durations and Unemployment Insurance Eligibility
Table 9D istributions of Insurab le W eeks in W indow O ne - W om en
All Insurable W eeks Insurable W eeks Status Vector Used To Claim Insurable W eeks
Pre-Separation Job Durations and Unemployment Insurance Eligibility 35
Can
ada
Fraction
Fem
ales
- W
indo
w 1
10
2026
Fraction
Mal
es -
Win
dow
1
1020
26
0.05
.1.15
Fraction
Fem
ales
- W
indo
w 2
10
2026
Fraction
Mal
es -
Win
dow
2
1020
26
0
.05
.1.15
.15
.1 .05 0
Fig
ure
4C
laim
ant’s
SV
Insu
rabl
e W
eeks
, Tru
ncat
ed a
t 26
Can
ada
36 Pre-Separation Job Durations and Unemployment Insurance Eligibility
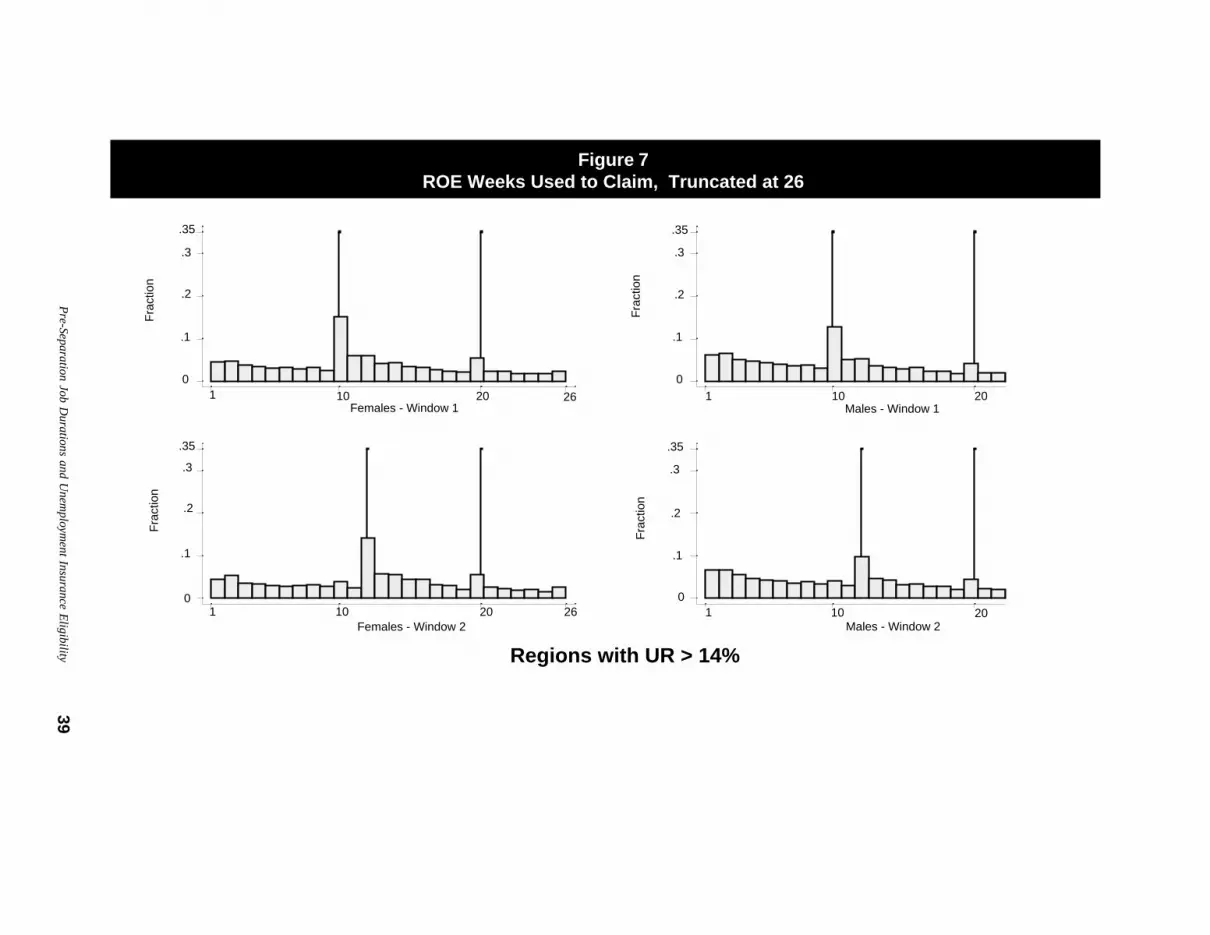
the UI system only for those Canadian workers in UI regions where thelocal (3 month moving average seasonally adjusted) unemployment rateis greater than 15 percent, does not represent a large fraction of the Canadianlabour force as a whole. Focusing for example on women’s SV insuredweeks in Table 9 (none of the other cases are very different), only 3.4percent of all UI claims nationwide are established with just the minimumnumber of weeks needed to qualify in high-unemployment regions (10weeks). Only about 14-16 per cent were established with fewer than 20SV insured weeks, which was the highest possible minimum qualifyingweeks, for regions with unemployment rates below 6 percent. (In theperiod in question the regional three month moving average seasonallyadjusted unemployment rates used to administer the UI system rangedfrom below 6 percent to over substantially 16 percent). Fourth, while thisspike is small, it does move when the UI system changes, exactly aspredicted by a simple incentive argument: after the introduction of Bill C-17, the spike is found at 12 weeks, the new qualifying minimum, ratherthan 10 as before. Both clearly show a small spike at 10 weeks before theintroduction of Bill C-17, which moves to 12 weeks after C-17.Interestingly there also appears to be a robust spike at 20 weeks, whichdoes not move when the legislation changes.
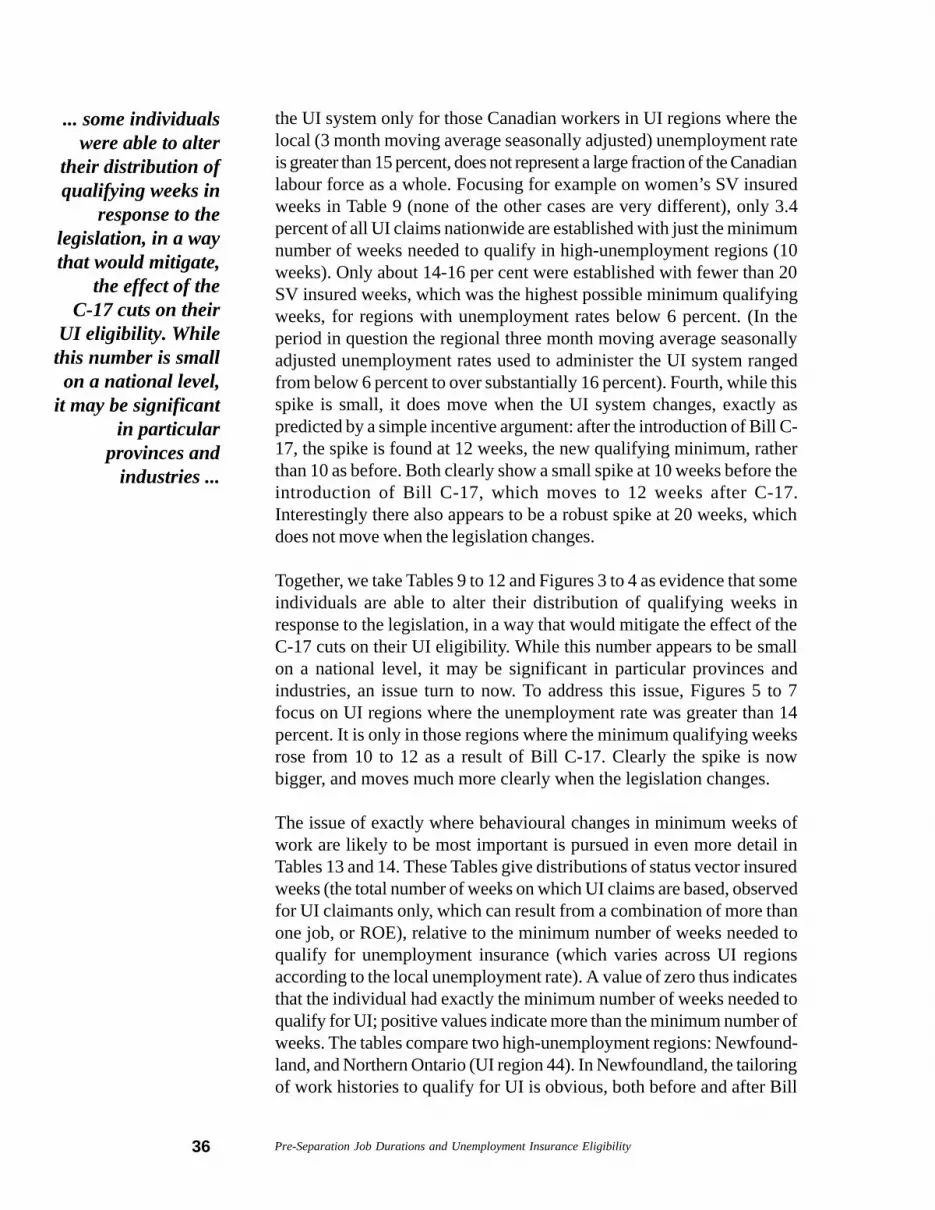
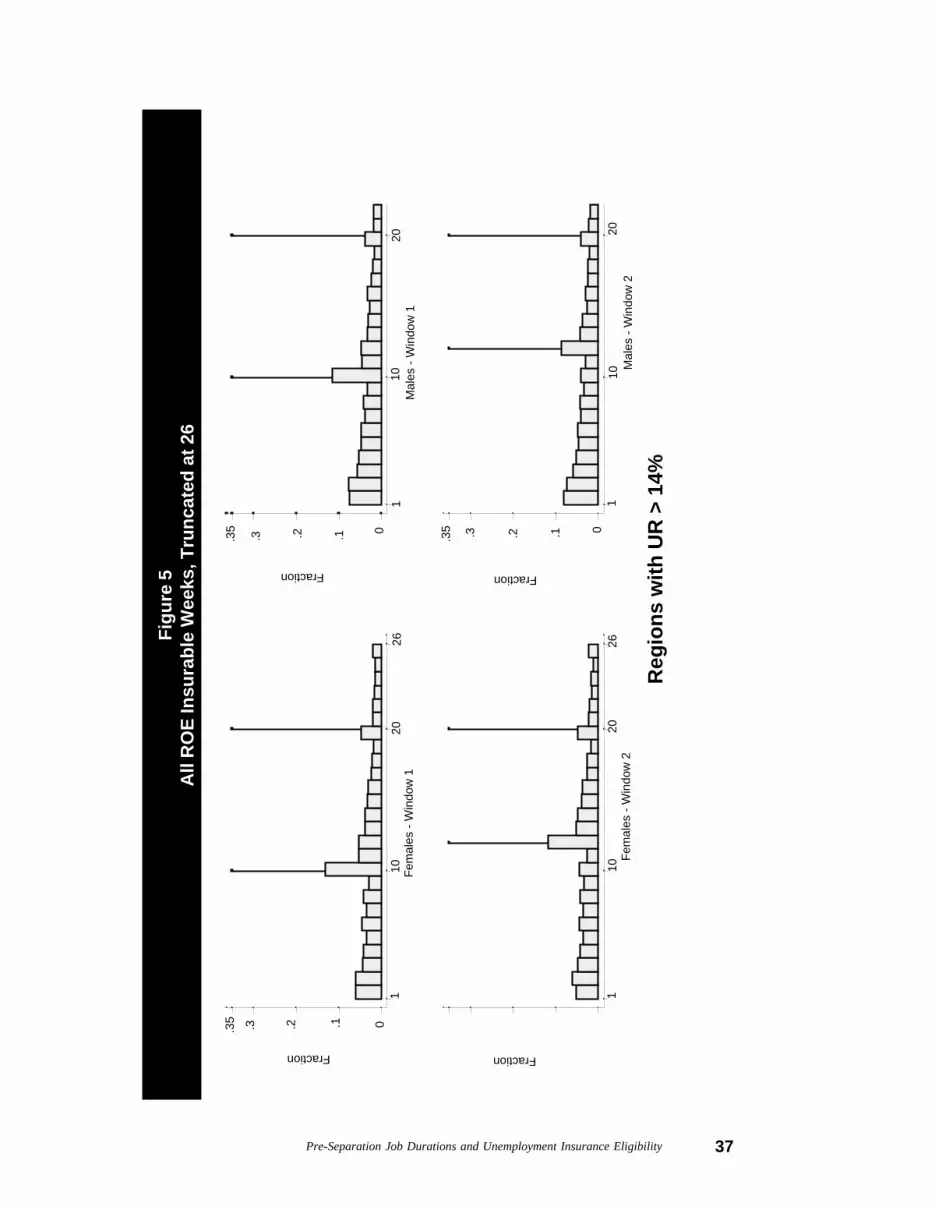
Together, we take Tables 9 to 12 and Figures 3 to 4 as evidence that someindividuals are able to alter their distribution of qualifying weeks inresponse to the legislation, in a way that would mitigate the effect of theC-17 cuts on their UI eligibility. While this number appears to be smallon a national level, it may be significant in particular provinces andindustries, an issue turn to now. To address this issue, Figures 5 to 7focus on UI regions where the unemployment rate was greater than 14percent. It is only in those regions where the minimum qualifying weeksrose from 10 to 12 as a result of Bill C-17. Clearly the spike is nowbigger, and moves much more clearly when the legislation changes.
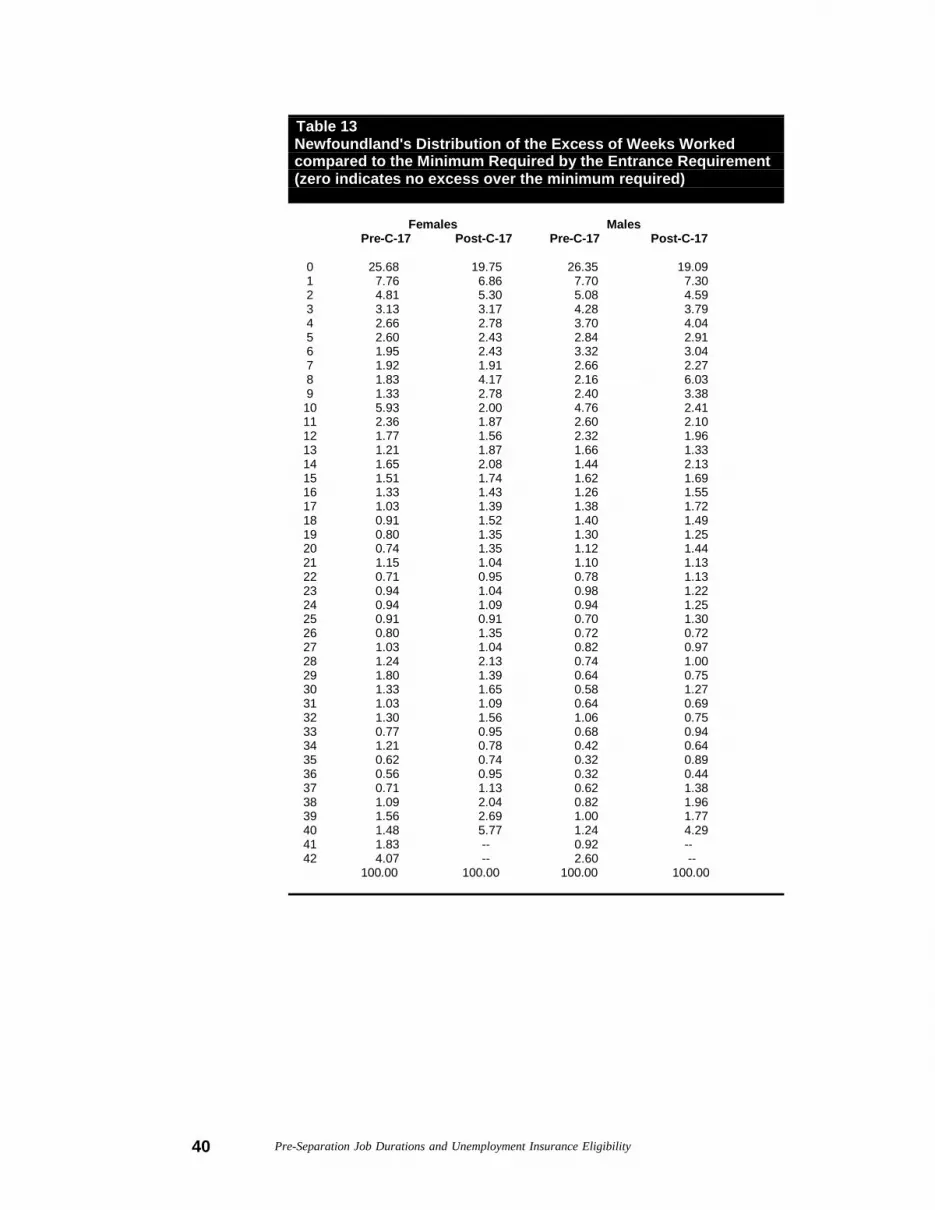
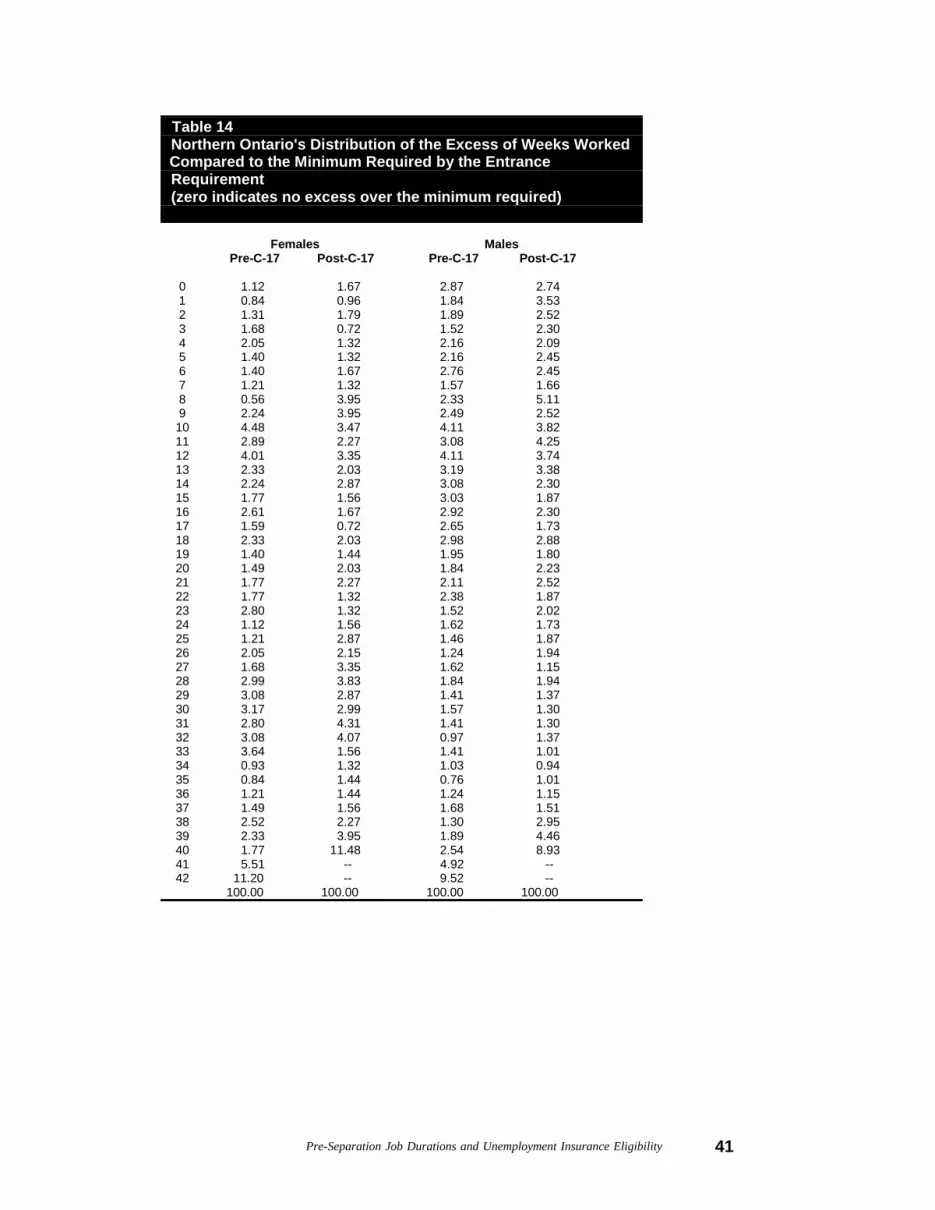
The issue of exactly where behavioural changes in minimum weeks ofwork are likely to be most important is pursued in even more detail inTables 13 and 14. These Tables give distributions of status vector insuredweeks (the total number of weeks on which UI claims are based, observedfor UI claimants only, which can result from a combination of more thanone job, or ROE), relative to the minimum number of weeks needed toqualify for unemployment insurance (which varies across UI regionsaccording to the local unemployment rate). A value of zero thus indicatesthat the individual had exactly the minimum number of weeks needed toqualify for UI; positive values indicate more than the minimum number ofweeks. The tables compare two high-unemployment regions: Newfound-land, and Northern Ontario (UI region 44). In Newfoundland, the tailoringof work histories to qualify for UI is obvious, both before and after Bill
... some individualswere able to alter
their distribution ofqualifying weeks in
response to thelegislation, in a waythat would mitigate,
the effect of theC-17 cuts on their
UI eligibility. Whilethis number is smallon a national level,
it may be significantin particular
provinces andindustries ...
Pre-Separation Job Durations and Unemployment Insurance Eligibility 37
Reg
ions
with
UR
> 1
4%
Fraction
Fem
ales
- W
indo
w 1
1
1020
26
Fraction
Mal
es -
Win
dow
1
110
200.1.2
.3.35
Fraction
Fem
ales
- W
indo
w 2
1
1020
26Fraction
Mal
es -
Win
dow
2
110
200.1.2.3.35
.35
.3
.2 .1 0
Fig
ure
5A
ll R
OE
Insu
rabl
e W
eeks
, Tru
ncat
ed a
t 26
38P
re-S
epara
tion Jo
b D
ura
tions a
nd U
nem
plo
yment In
sura
nce
Elig
ibility
Regions with UR > 14%
Fra
ctio
n
Females - Window 1 10 20 26
Fra
ctio
n
Males - Window 1 10 20
0
.1
.2
.3
.35
Fra
ctio
n
Females - Window 2 10 20 26
Fra
ctio
n
Males - Window 2 10 20
0
.1
.2
.3
.35.35
.3
.2
.1
0
0
.1
.2
.3
.35
Figure 6Claimant’s SV Insurable Weeks, Truncated at 26
Pre
-Separa
tion Jo
b D
ura
tions a
nd U
nem
plo
yment In
sura
nce
Elig
ibility
39
Regions with UR > 14%
Fra
ctio
n
Females - Window 1 1 10 20 26
Fra
ctio
n
Males - Window 1 1 10 20
0
.1
.2
.3
.35
Fra
ctio
n
Females - Window 2 1 10 20 26
Fra
ctio
nMales - Window 2
1 10 200
.1
.2
.3
.35
0
.1
.2
.3
.35
.35
.3
.2
.1
0
Figure 7ROE Weeks Used to Claim, Truncated at 26
40 Pre-Separation Job Durations and Unemployment Insurance Eligibility
Table 13 Newfoundland's Distribution of the Excess of Weeks Worked compared to the Minimum Required by the Entrance Requirement (zero indicates no excess over the minimum required)
42 Pre-Separation Job Durations and Unemployment Insurance Eligibility
C-17: Before the Bill, fully 26 percent of UI claims established inNewfoundland by both men and women were established on the basis ofthe minimum possible number of weeks of work. This fraction droppedsomewhat, to 18-19 percent after C-17, suggesting that not all of those 26percent were able to find the extra 2 weeks of work needed to qualify forUI. However, the continued existence of a spike at the new, higher levelof qualifying weeks after C-17 suggests that behavioural changes inresponse to C-17 could have substantially mitigated the effects of thisBill on workers’ UI entitlements in that province.
Table 14 presents the exact same statistics for the highest-unemploymentregion in Ontario, UI region 44. Interestingly, during the sample period,the overall unemployment rate in UI region 44 (pre-C-17 the UI regionalunemployment rate ranged from 14.3 percent to 16.4 percent; post-C-17it was between 13.3 percent to 14.6 percent, only in the last month of theperiod did the regional rate dip below 14 percent) was not that differentfrom that in Newfoundland (pre-C-17 the 3 regions unemployment rateswere between 12.7 percent to 27.5 percent; post-C-17 from 11.7 percentto 27.4 percent) in terms of the ranges used in the operation of the UIsystem. Incredibly, however, the spike seen in Newfoundland is totallyabsent.8 We conclude that, while high unemployment, and employmentin primary industries are important factors, they are not sufficient toexplain the tailoring of work histories to the UI system in the Atlanticprovinces, especially Newfoundland. Other factors, among them learningeffects and the possibility of a “culture of unemployment” must play arole as well. These factors may play an important role in modifying theincidence of Bill C-17, relative to what would occur if no behaviouralchanges were possible, an issue we turn to now.
3. Estimated effects on UI eligibilityallowing for behavioural responses inweeks worked
While legislation-induced behavioural changes in qualifying weeks maynot be of great importance on the national level, the previous subsectionshowed that they may be quite important in particular provinces andindustries, especially those which are high users of the UI system. Theability of workers to make such behavioural changes could thus haveimportant effects on the pattern of C-17-induced eligibility losses acrossprovinces and industries. To examine that possibility, in this section wepresent estimates of the incidence of Bill C-17 that incorporate themitigating effects of these behavioural changes. Tables 15 to 18 present
8 The spike is also, less surprisingly, absent for Ontario as a whole.
... while highunemployment, and
employment inprimary industries
are importantfactors, they are notsufficient to explain
the tailoring ofwork histories to
the UI system in theAtlantic provinces
... other factors,among them
learning effects andthe possibility of a
“culture ofunemployment”
must play a role aswell.
Pre-Separation Job Durations and Unemployment Insurance Eligibility 43
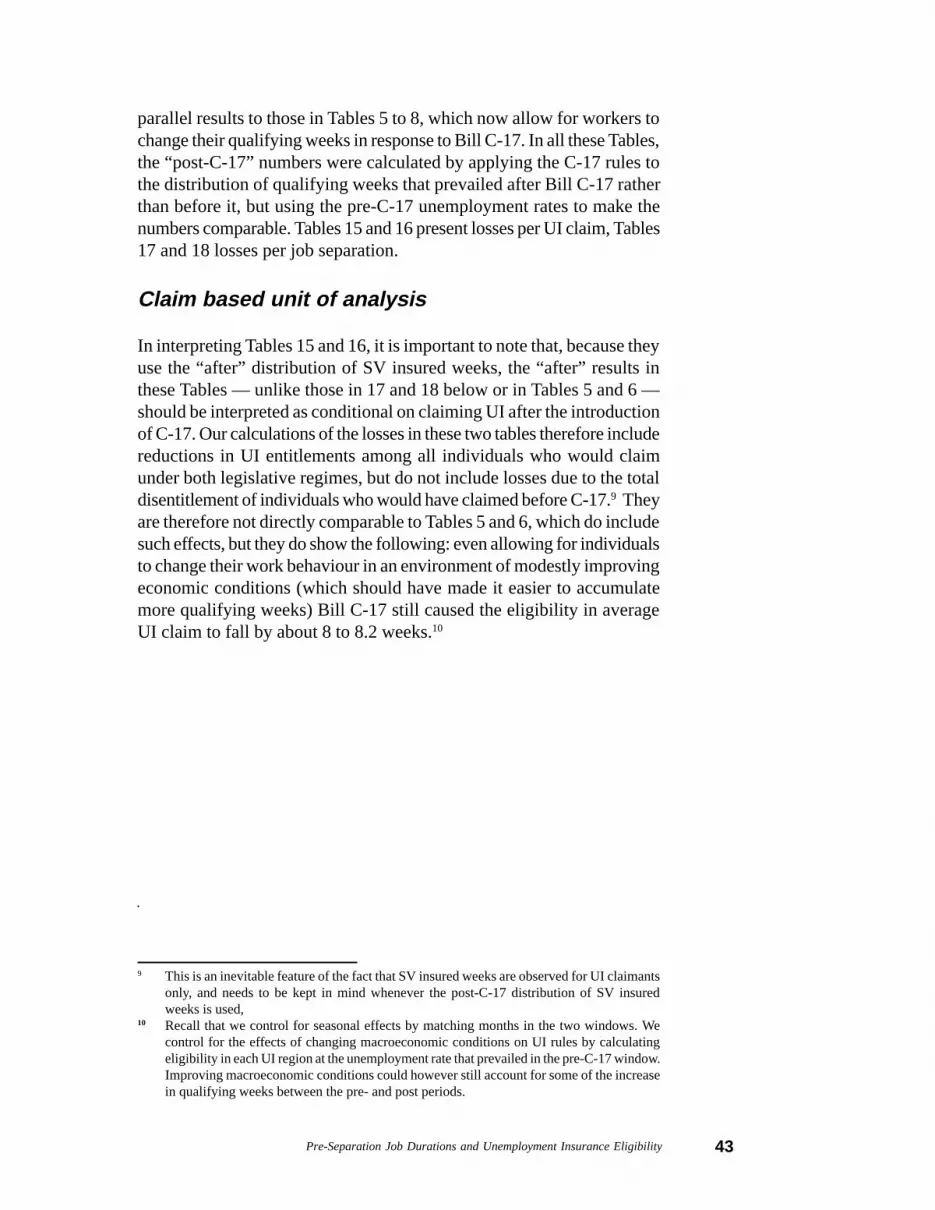
parallel results to those in Tables 5 to 8, which now allow for workers tochange their qualifying weeks in response to Bill C-17. In all these Tables,the “post-C-17” numbers were calculated by applying the C-17 rules tothe distribution of qualifying weeks that prevailed after Bill C-17 ratherthan before it, but using the pre-C-17 unemployment rates to make thenumbers comparable. Tables 15 and 16 present losses per UI claim, Tables17 and 18 losses per job separation.
Claim based unit of analysis
In interpreting Tables 15 and 16, it is important to note that, because theyuse the “after” distribution of SV insured weeks, the “after” results inthese Tables — unlike those in 17 and 18 below or in Tables 5 and 6 —should be interpreted as conditional on claiming UI after the introductionof C-17. Our calculations of the losses in these two tables therefore includereductions in UI entitlements among all individuals who would claimunder both legislative regimes, but do not include losses due to the totaldisentitlement of individuals who would have claimed before C-17.9 Theyare therefore not directly comparable to Tables 5 and 6, which do includesuch effects, but they do show the following: even allowing for individualsto change their work behaviour in an environment of modestly improvingeconomic conditions (which should have made it easier to accumulatemore qualifying weeks) Bill C-17 still caused the eligibility in averageUI claim to fall by about 8 to 8.2 weeks.10
10 Recall that we control for seasonal effects by matching months in the two windows. Wecontrol for the effects of changing macroeconomic conditions on UI rules by calculatingeligibility in each UI region at the unemployment rate that prevailed in the pre-C-17 window.Improving macroeconomic conditions could however still account for some of the increasein qualifying weeks between the pre- and post periods.
9 This is an inevitable feature of the fact that SV insured weeks are observed for UI claimantsonly, and needs to be kept in mind whenever the post-C-17 distribution of SV insuredweeks is used,
44P
re-S
epara
tion Jo
b D
ura
tions a
nd U
nem
plo
yment In
sura
nce
Elig
ibility
Table 15 Mean Weeks of UI Eligibility per UI Claim, by Industry Assuming a Behavioural Change in Weeks of Employment
(a) Women: Agric Fish Forest Mines Manu Const Trans Trade FIRE Serv Public Other
48 Pre-Separation Job Durations and Unemployment Insurance Eligibility
Tables 15 and 16 also share another interesting feature, which is thedistribution of eligibility losses across provinces and industries. UnlikeTables 5 and 6, which showed much larger eligibility losses in the Atlanticprovinces, and in the fishing, forestry and agricultural industries, the lossesare now much more evenly spread across provinces and industries. Whatthis implies is that either almost all of the excess eligibility loss in high-unemployment provinces and industries takes the form of failure toaccumulate enough weeks to qualify for UI at all (a factor which is notcaptured by Tables 15 and 16) or that workers in those provinces wereable to make behavioural adjustments in their qualifying weeks of workthat largely eliminated the disproportionate effects of Bill C-17 on theirUI eligibility. To sort out these issues, we now turn to the distribution ofeligibility losses per job separation.
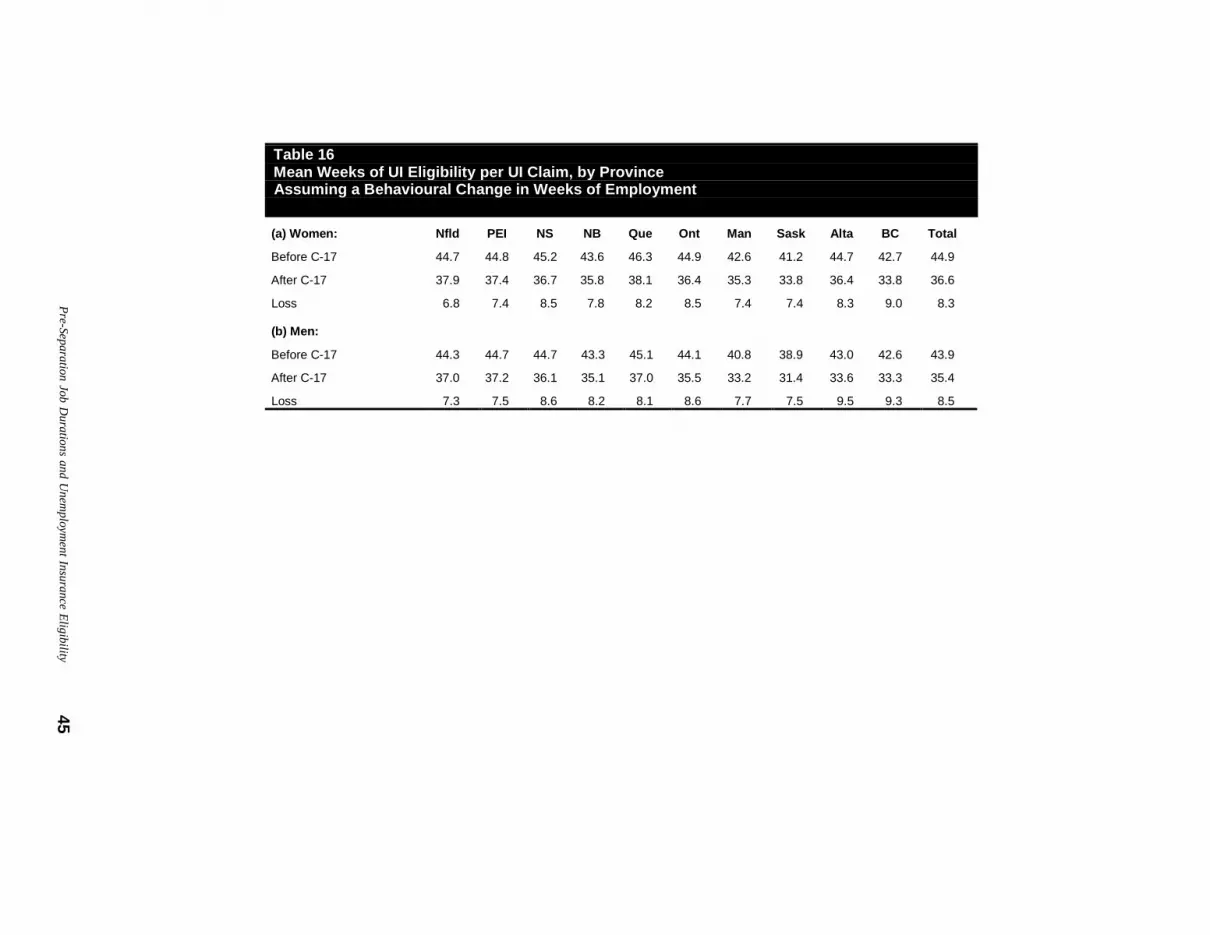
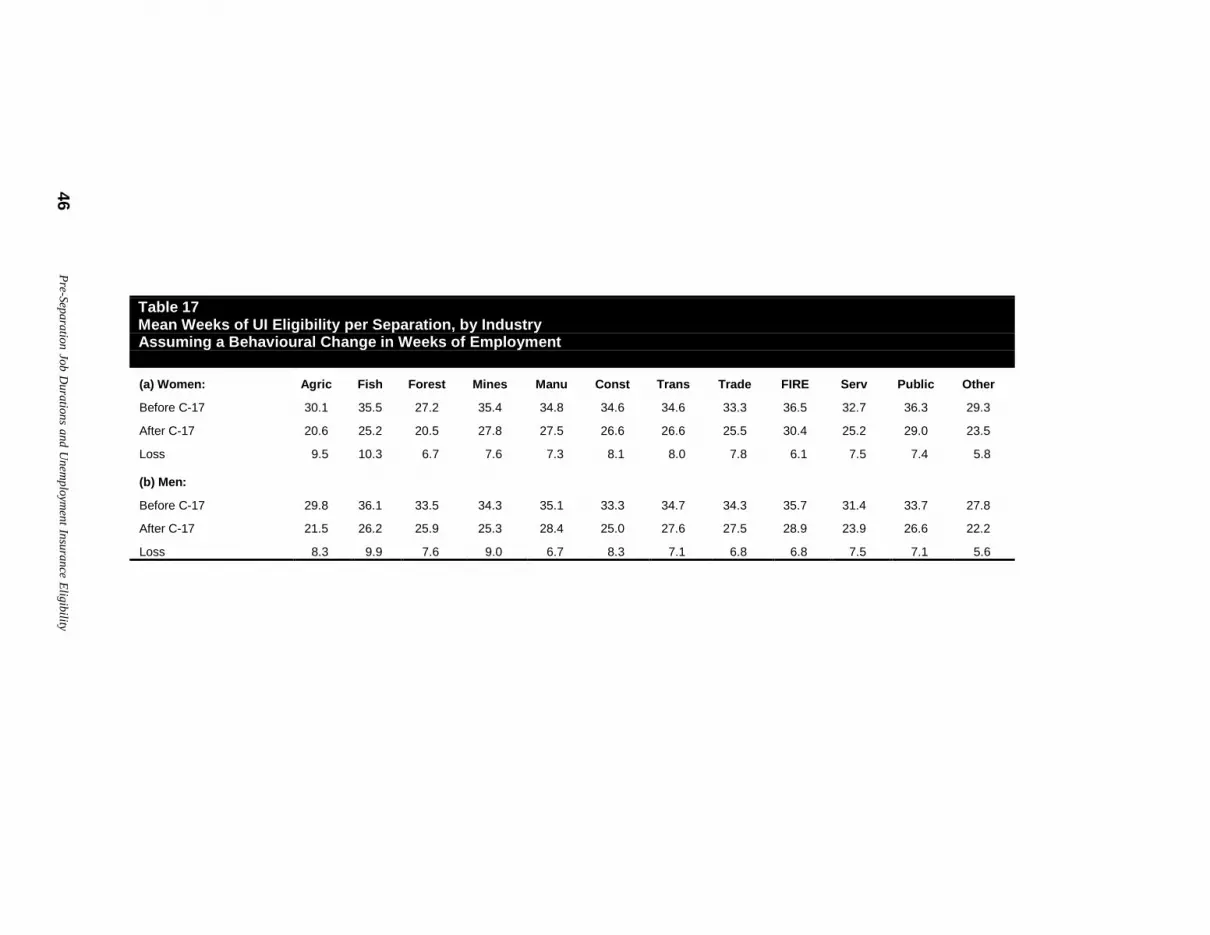
Separation based unit of analysis
Tables 17 and 18 present the same kind of results as in Tables 15 and 16,but on a per-separation basis. As in Tables 7 and 8 these were calculatedfrom the distributions of ROE weeks, rather than the distributions of statusvector insured weeks. Because they condition only on separating from ajob and not on actually claiming UI they are directly comparable to their“no behavioural change” counterparts in Tables 7 and 8, and they doincorporate eligibility losses due to a failure to qualify for any UI at all.As suggested by Tables 15 and 16 however, the losses are much moreevenly distributed across provinces and industries when behaviouralchanges are accounted for than when they are not. For example (fromTable 7), absent incentive effects on weeks of work, the average jobloser in Newfoundland would have lost almost 16 weeks of UI entitlement,more than twice the national average. Once the ability of workers to findextra weeks of work to mitigate the effects of C-17 is taken into account,their losses become essentially equal to the national average of 7.6weeks.11 While behavioural changes in weeks of work are of limitedimportance nationwide, we conclude that they can be of major importancein certain regions, and can substantially alter our estimates of who is mosthurt by the eligibility cuts in recent UI legislation. In particular, whenworkers’ and firms’ efforts to find extra weeks of work to mitigate theC-17-induced cuts are taken into account, the average entitlement loss perjob separation after C-17 is not much different in high-unemploymentprovinces and industries than other provinces and industries. This findingcoincides with the observation in the previous subsection
11 This dramatic effect on the provincial pattern of losses, of using the post-C-17 distributionof insured weeks rather than the pre-C-17 distribution, is highly unlikely to be an artifact ofchanging macroeconomic conditions between the pre- and post periods. That could only bethe case if macro conditions improved much more rapidly in the Atlantic provinces thanelsewhere, which was patently not the case.
... the losses aremuch more evenlydistributed across
provinces andindustries when
behaviouralchanges are
accounted for thanwhen they are not.
Pre-Separation Job Durations and Unemployment Insurance Eligibility 49
that behavioural changes in response to the legislation were much morepronounced in Newfoundland than in other parts of Canada.12
Person based unit of analysis(per worker or per capita)
Tables 19 through 22 present a final perspective on the provincial,industrial, and gender distribution of UI eligibility losses engendered byBill C-17, by expressing these losses in per-worker, or per-capita terms,rather than per job separation or per UI claim. Rather than asking howmuch the UI eligibility of an average job loser or UI claimant falls, thesetables ask the following question: “Given you are employed in a particularindustry, or live in a particular province, how many fewer weeks of UIare you likely to become entitled to in a given year as a result of a jobloss?” If job losses are more common in certain industries or provinces,workers in those industries or provinces are likely to be hurt more byC-17 simply because they are more likely to lose their jobs in a givenyear, even if their eligibility losses, conditional on a job loss, are nodifferent from workers elsewhere. The numbers in Tables 19 and 20 arecalculated from the “per claim” numbers in Tables 15 and 16, using theratio of claims per industry in our HRDC data to that of employment byindustry in Statistics Canada’s Labour Force Survey data for 1993, andthe ratio of claims per province to 1993 counts of population.13
Even though, from our previous results, we know that a separating workercould expect roughly the same UI eligibility in all industries beforeC-17, Table 19 clearly shows that certain industries were still much higherusers of the UI system than others because of their much higher separationrates.These high-use industries include construction, fishing and foresty.Interestingly, both before and after C-17, fishing shows extremely high UIuse for women (we conjecture many of these are fish plant workers) butnot for men, while the opposite is true for construction. Because job lossstill a relatively rare event nationwide, Table 19 also shows that theaverage employed worker lost only about a week of UI entitlement due toBill C-17. Because certain industries rely much more on layoffs and
1 3 Because the LFS definitions of public sector workers differ from those in our administrativedata, an adjustment was made using the Survey of Employment, Earnings and Hours. Thepublic sector, in this report, includes government-supplied health and education services.
... the averageemployed workerlost only about aweek of UIentitlement due toBill C-17. Becausecertain industriesrely much more onlayoffs and UIsystem, however,workers in thoseindustries lost asmuch as five timesas much, evenwhen behaviouralchanges are takeninto account.
1 2 Some of what we are labelling behavioural effects, at least in the special cases of Newfoundlandand the fishing industry, may reflect the impact of government “make-work” programs, suchas the Atlantic Groundfish Strategy (TAGS), some of which were specifically designed toprovide workers with enough employment to qualify for UI. While it is debatable whetherthese represent “genuine” employment, they certainly acted to maintain individuals’ UIentitlements relative to what they would otherwise have been.
50P
re-S
epara
tion Jo
b D
ura
tions a
nd U
nem
plo
yment In
sura
nce
Elig
ibility
Table 19Per Worker Weeks of UI Eligibility by IndustryAllowing for a Behavioural Change in Weeks Worked
(a) Women: Agric Fish Forest Mines Manu Const Trans Trade Fire Serv Public Other
54 Pre-Separation Job Durations and Unemployment Insurance Eligibility
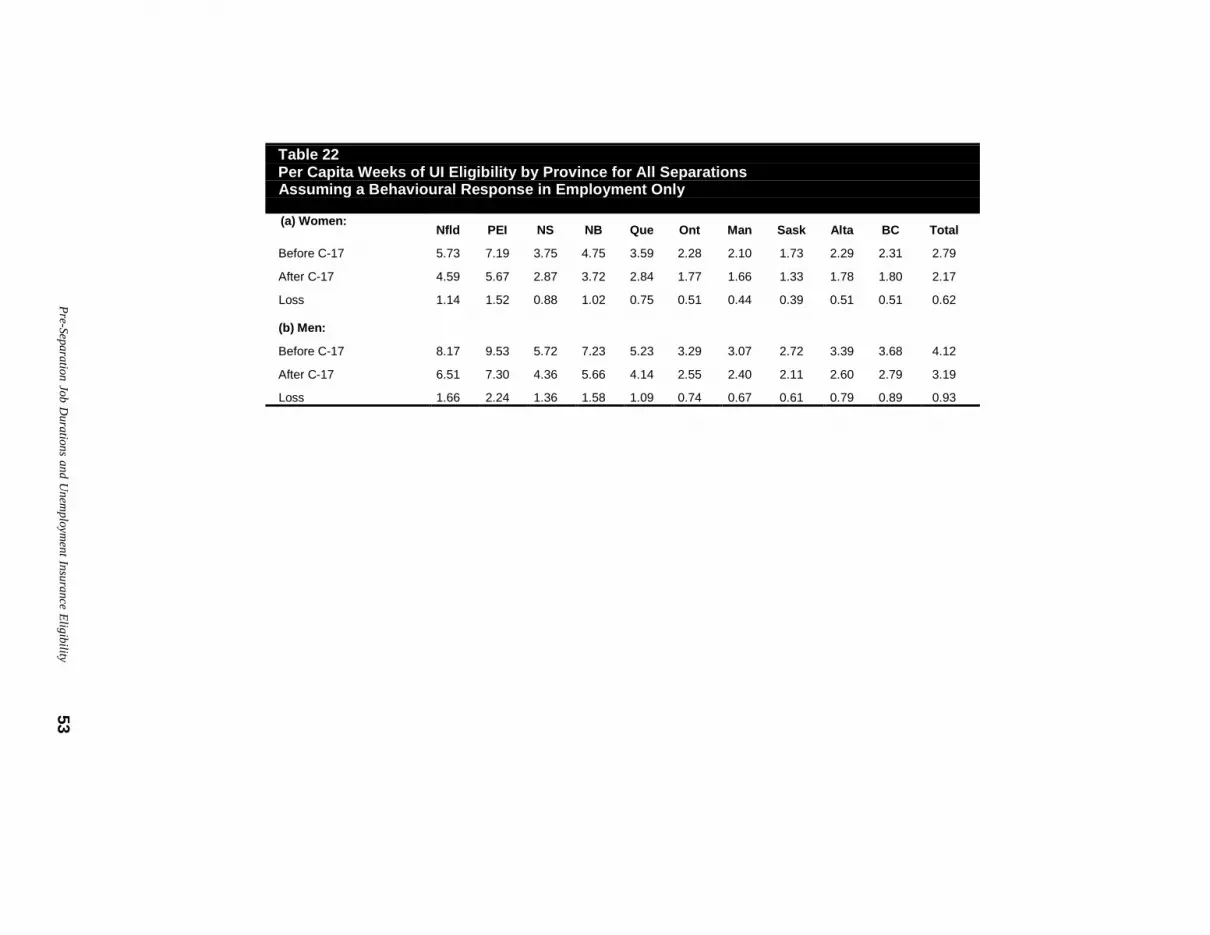
UI system, however, workers in those industries lost as much as fivetimes as much, even when behavioural changes to mitigate the effects ofC-17 are taken into account. Even after these losses, however, the fishingand forestry industries derive much greater subsidies from the UI systemthan other industries, as the eligibility losses came from a very high base.
Table 20 performs the same exercise as Table 19 except by provinces.Because the losses shown here are now per capita rather than per worker,they are even smaller. Again, since the Atlantic provinces, and to someextent Quebec are much heavier users of the UI system due to their morefrequent layoffs, they lose more than other provinces. Even after C-17,however, they benefit much more from the UI system than the rest ofCanada. Tables 21 and 22 perform the same exercise as Tables 19 and20, but on a per separation basis, rather than a per claimant one. Overall,the magnitude of the numbers are somewhat larger since, claimants beinga subset of all separations, there are more weeks of eligibility from allseparations to be averaged across each province or industry. However,apart from the difference in the level, the pattern across provinces andindustries is very similar to that for claimants.
Pre-Separation Job Durations and Unemployment Insurance Eligibility 55
5. Results: Effects of C-17on UI Receipts
In the previous section we analysed the effect of Bill C-17 on the amountof UI benefits workers know they can count on when they becomeunemployed — workers’ UI entitlements. While this is certainly a quantityof direct interest to workers, it is also the case that most workers in Canadado not exhaust their full entitlement of UI weeks. For a number of reasons,including assessing the effects of C-17 on the government’s actualexpenditures, as well as the total dollar amount of the UI subsidy goingto various provinces and industries, it is also interesting to know theeffects Bill C-17 had on the actual number of weeks of UI received byworkers. That is the goal of this section.
As we noted in Section 2, assessing the effect of C-17 on UI receipt issomewhat harder than assessing its effects on entitlements, because —in addition to the changes in qualifying weeks of unemployment analysedin the previous section — a second kind of behavioural change couldplay an important role in modifying the direct effects of the legislation.In particular, in addition to increasing the number of work weeks peopleaccumulate before they become unemployed, the UI entitlement cuts inC-17 could also affect the amount of time people remain unemployedonce they start collecting benefits. We term this latter effect an effect onunemployment durations, in contrast to the effect on employmentdurations already examined.
Theoretical considerations
Interestingly, if individuals respond to UI entitlement cuts by searchingharder, or sooner, for jobs while they are unemployed, the effect — unlikethe behavioural changes in employment durations already examined,which mitigate the effects of cuts on UI receipt — should be to accentuate,or reinforce, the direct decline in UI receipt caused by the legislativechanges in Bill C-17.14 To see this, consider the situation in Figure 8,where we show two hypothetical distributions of unemploymentdurations, f
1(w) and f
2 (w), before and after a cut in an individual’s UI
entitlement from w1 to w
2 weeks respectively. As drawn, the cut in UI
1 4 According to standard economic intuition, they should however mitigate, the Bill’s negativeeffects on workers’ utility or well being, and probably on cash income too, as they substituteemployment income for UI income. The intuition is the same as how consumers dampen theeffects of price increases on their utility by substituting away from the more expensive products.
56P
re-S
epara
tion Jo
b D
ura
tions a
nd U
nem
plo
yment In
sura
nce
Elig
ibility
Figure 8Hypothetical Distributions of Unemployment Spells Under Two Different UI Benefit
Entitlements (w 1 and w 2 )
frequency
weeks of unemployment (w)
f1 (w)
f2 (w)
w2 w1
Pre-Separation Job Durations and Unemployment Insurance Eligibility 57
entitlements induces some workers, who would have found jobs in theinterval [w
2, w
1], to search for work sooner and harder, so that they
continue to find jobs before the (now earlier) expiry date of their UIbenefits.
In terms of Figure 8, the mean number of weeks of UI received when themaximum entitlement was w
1 is given by:
w1
I w f1
(w) dw + w
1(1 - F
1 (w
1)) (1)
w = 0
where F1 is the cumulative distribution function corresponding to the
density f1. Workers with longer unemployment durations than w
1 exhaust
entitlement cut from w1 to w
2 weeks does not induce any change in job
search behaviour, then the new mean number of UI weeks received wouldbe:
w2
I w f1
dw + w2
(1 - F1 (w
2)) (2)
w = 0
Clearly, this is lower than in (1), because all that has happened is thatbenefits are exhausted sooner, and more individuals exhaust their benefits.Finally, if individuals respond to the entitlement cuts by finding newjobs sooner, to avoid spending time without either UI benefits oremployment income, mean weeks of UI receipt will be:
w2
I w f2 (w)
dw + w2(1 - F
2 (w
2)) (3)
w = 0
Not only is this lower than (1), it is also lower than (2) because the densityfunction f
2 puts more weight on shorter durations. Thus, earlier job-finding
induced by UI entitlement cuts should accentuate the decline in UI receiptthat is directly caused by the cuts themselves.
No behavioural change
We begin our analysis of the effects of C-17 on UI receipt with Table 23and Figure 9, which show how large an effect C-17 would be likely tohave on UI receipt in the absence of any behavioural changes at all. Inthe top half of Figure 9 and in columns 1 and 3 of Table 23, we show the
... earlier job-finding induced byUI entitlement cutsshould accentuatethe decline in UIreceipt that isdirectly caused bythe cuts themselves.
58 Pre-Separation Job Durations and Unemployment Insurance Eligibility
Table 23 Distribution of Weeks of UI Received Pre- and Post C-17
Women Men Pre-C-17 Post-C-17 Pre-C-17 Post-C-17 No Beh. Change No Beh. Change
Pre-Separation Job Durations and Unemployment Insurance Eligibility 59
actual distribution of weeks of UI received by all individuals who claimedUI in our first window period, before the introduction of Bill C-17.
Interestingly, a substantial fraction of both men and women — indeedover 8 percent of women — received a full 50 weeks of benefits. Asubstantial fraction also received zero weeks, which in the current contextmeans they initiated an application for benefits but either found re-employment during the two-week waiting `period, or were disqualifiedfrom benefits. In the bottom half of the Figure 9, and in columns 2 and 4 ofTable 23, we present the distribution of “truncated” weeks of UI receiptfor this same sample of individuals. “Truncated” benefit weeks, for eachindividual who claimed UI in our pre-C-17 window, are equal to actualUI benefit weeks received, if these are less than the number of weeks thatperson would be entitled to had the new, C-17 rules been in place. Ifactual (pre-C-17) weeks are greater than what the person would havereceived under the C-17 rules (given his or her local unemployment rateand employment history) then truncated weeks equal their C-17 entitlement:absent any behavioural changes, this person would exhaust their benefitsunder the new, C-17 rules and receive the maximum number of weeks ofUI for which they are now eligible.
As the bottom panels of Figure 9 show, under the C-17 rules, manyindividuals who previously would have qualified for UI benefits wouldreceive no benefits at all after C-17, because their short employmenthistories (of 10 or 11 weeks) now disqualify them from benefits. Also ofinterest, however, is the dramatic decline in the number of UI claimspredicted to last a full 50 weeks, and the increase in the fraction lasting20 to 35 weeks. It is much harder to qualify for a full 50 weeks of benefitsunder the C-17 rules than before; many individuals who would previouslyhave qualified for a full 50 weeks, absent any behavioural change, wouldnow find themselves exhausting their benefits at a lower limit. Overall,it is our impression that the C-17 system is designed, much more thanthe previous one, to “reserve” these “full year” benefits to workers withcontinuous employment histories, and this is apparent in the distributionof entitlements.
In Tables 24 we ask what would happen to mean weeks of UI actuallyreceived per claim if there were no behavioural changes at all; thus wesimply apply the C-17 rules to the distribution of ROE weeks and ofactual UI spells existing before C-17. (These are just means of thedistributions in Table 23, overall and disaggregated by industry andprovince). Clearly, compared to the reductions in UI entitlements examinedin the previous section, the mean losses shown in this Table, of a littleover 4 weeks per UI claim, are smaller, because not all individuals exhausttheir UI entitlements. Overall, however, the results show a very similar
60 Pre-Separation Job Durations and Unemployment Insurance Eligibility
Fig
ure
9W
indo
w 1
, UI R
ecei
pt P
re-
and
Pos
t-C
-17
Fraction
0
1020
3040
50
Fraction
0
1020
3040
50
.05
.1
Fraction
0
1020
3040
50
Fraction
0
1020
3040
50
.05
.1
.05
.05
.1
.1
Fem
ales
- C
-17
Tru
ncat
ed W
eeks
of R
ecei
pt W
indo
w 1
WE
EK
S
Mal
es -
C-1
7 T
runc
ated
Wee
ks o
f Rec
eipt
Win
dow
1
Mal
es -
Wee
ks o
f Rec
eipt
Win
dow
1F
emal
es -
Wee
ks o
f Rec
eipt
Win
dow
1
Pre
-Separa
tion Jo
b D
ura
tions a
nd U
nem
plo
yment In
sura
nce
Elig
ibility
61
Table 24Mean Weeks of UI Receipt per UI Claim by IndustryAssuming No Behavioural Change
(a) Women: Agric Fish Forest Mines Manu Const Trans Trade FIRE Serv Public Other Tot
62 Pre-Separation Job Durations and Unemployment Insurance Eligibility
industrial pattern to those found in UI entitlements in the previous section:massive losses are predicted in fishing, and significantly larger than averagelosses are predicted in agriculture, forestry and construction, industrieswhere unstable employment histories are common.
Allowing for behavioural changes
In Table 25 we ask what would happen to individuals’ UI receipt if, inresponse to the legislation, individuals were able to adjust their qualifyingweeks to the levels actually seen after C-17, but (conditional on qualifyingweeks) they had the same length of unemployment spells as before. Thusbehavioural change in employment durations is allowed, but not inunemployment durations. Because — like Table 15, and like Tables 26,28 and 29 which follow — these tables are per UI claim and base their“after” calculations on the post-C-17 distribution of SV insured weeks,it is important to recall that the “after” estimates in this table areconditional on claiming UI. Like Table 15, they thus do not include UIlosses due to a failure to qualify at all. In Section 3 we showed howeverthat this feature of the SV-based data does not materially alter ourestimates of the industrial or provincial pattern of C-17-induced losseswhen behavioural change in qualifying weeks is allowed. The main resultof Table 25 is that, once behavioural adjustment in weeks of work isallowed, the pattern of losses is much more evenly distributed acrossindustries than when it is not: Increases in qualifying weeks amongworkers in the high-UI-use industries (fishing, agriculture, forestry, andconstruction) played an important role in mitigating the effects of BillC-17 on the number of weeks these workers weeks received UI benefits.
Table 26 finally incorporates the “new” behavioural response that mightplay a role in worker’s UI receipt, but did not play a role in our calculationsof initial eligibility: the possibility that the shorter UI entitlements underthe new Bill may induce workers to find new jobs faster than they didbefore. It does this by using the actual post-C-17, rather than the truncatedpre-C-17, distribution of UI spells to calculate mean weeks of receipt.Concerning the national totals, the most striking thing about Table 26 isthe similarity of the numbers to those in Table 25: there is essentially noevidence that, on a national level, the eligibility cutbacks in C-17 causedany earlier job finding among UI recipients than before. Essentially, thetruncated distribution of benefit weeks describes the actual very well,implying that instead of finding new jobs earlier, people simply exhaustedtheir benefits earlier than they would have when entitlements were cut.15
15 The absence of an increase in overall mean losses in Table 26, relative to Table 25, as wouldbe predicted by relatively standard search models, is especially noteworthy because, giventhe modest improvement in macroeconomic conditions over the period, one might haveexpected unemployment durations to fall somewhat due to purely cyclical factors.
... once behaviouraladjustment in
weeks of work is allowed,the pattern of losses
is much moreevenly distributedacross industries
than whenit is not. Increases
in qualifying weeksamong workers in
the high-UI-useindustries played an
important role inmitigating the
effects of Bill C-17 on the
number of weeks these workers
weeks received UIbenefits.
.... there is essentially no
evidence that, on anational level, the
eligibility cutbacks in C-17 caused any
earlier job findingamong UIrecipients
than before.
Pre
-Separa
tion Jo
b D
ura
tions a
nd U
nem
plo
yment In
sura
nce
Elig
ibility
63
Table 25 Mean Weeks of UI Receipt per UI Claim, by Industry Allowing for a Behavioural Response in Weeks of Employment
(a) Women: Agric Fish Forest Mines Manu Const Trans Trade FIRE Serv Public Other
Pre-Separation Job Durations and Unemployment Insurance Eligibility 65
Of some interest, also, is the pattern of losses in Table 26, relative toTable 25. In the two highest-UI-use industries, forestry and fishing,allowing for behavioural change in unemployment durations furthermitigates, rather than accentuating as expected, the impact of C-17 ontheir receipt of UI. What this implies is that, at least in the period beforebenefits expiry, workers on UI in those industries actually became lesslikely to take a new job, rather than more likely. This may be becauseworkers felt a greater need to “use up” every week of UI entitlement theystill had, thus making even more “efficient” use of the system, at least interms of extracting benefit weeks from any given employment history.
Tables 27 to 29 present parallel results to those in Tables 24 to 26 forprovinces rather than industries, with very similar results. Focusing onNewfoundland as illustrative of a trend common to the Atlantic provinces,Bill C-17 reduced the number of weeks of UI actually received during anaverage UI claim by 4.2 weeks for men, and 5.1 weeks for women. Thesenumbers are each about a week higher than their respective nationalaverages, but would have been much higher had workers not made thesignificant changes in qualifying weeks of work they actually made. Asbefore, changes in job finding rates among workers on claim play anegligible role in affecting the incidence of C-17-induced cuts in UIreceipt.
Person based unit of analysis(per worker and per capita)
As in the previous section, our final perspective on the effects of C-17 onUI receipt expresses these effects in per-worker or per-capita, rather thanper UI-claim terms. Because some industries are much more prone tounstable employment histories than others, and thus are much more likelyto lead to the initiation of UI claims, this can cast quite a differentperspective on our results. Nationally, Table 30 shows that Bill C-17caused the average working woman in Canada to receive half a weekless of UI benefits per year; the cost to the average working man was .44weeks of benefits. However the average Canadian worker only received3 to 3.5 weeks of UI benefits per year to begin with, compared to anastounding 22 weeks per year received by women in the fishing industry,and almost 15 weeks per year received by men and women in forestry.Not surprisingly, because their initial reliance on the system was soextreme, workers in these industries also experienced the biggest averageannual reductions in actual weeks of UI received; in the most extremecase (women in fishing) the loss was 5 weeks. Even after thesedisproportionate losses though, workers in those industries still receivemany more weeks of UI benefits per year than workers in any otherCanadian industry.
66P
re-S
epara
tion Jo
b D
ura
tions a
nd U
nem
plo
yment In
sura
nce
Elig
ibility
Table 27Mean Weeks of UI Receipt per UI Claim by ProvinceAssuming No Behavioural Change
(a) Women: Nfld PEI NS NB Que Ont Man Sask Alta BC Total
70 Pre-Separation Job Durations and Unemployment Insurance Eligibility
Nationally, Table 31 shows that the average woman aged 15 or overliving in Canada (whether working or not) received 0.16 fewer weeks ofUI benefits as a result of Bill C-17; the average man lost 0.22 weeks ofbenefits. Unsurprisingly perhaps, the largest per capita losses occurred inNewfoundland, with a maximum of 0.80 weeks per year for maleNewfoundlanders. Even after the cuts, however, residents of the Atlanticprovinces, and to a significant extent Quebec, still receive many moreweeks of UI benefits than workers in the other provinces. While an“average” male in Ontario received one week of UI benefits per yearafter C-17, men in Quebec received twice as much — two weeks —those in Newfoundland more than four times as much, and those in PEImore than five times as much.Thus,while clearly having a disproportionateimpact on those provinces and industries which were the highest users ofthe UI system, Bill C-17 has not, by any means, ended the massive cross-subsidization of provinces east of the Ottawa River, and of the agricultural,fishing, forestry, and construction industries, by the other provinces andindustries in Canada.
Pre
-Separa
tion Jo
b D
ura
tions a
nd U
nem
plo
yment In
sura
nce
Elig
ibility
71
Table 31Per Capita Weeks of UI Receipt by ProvinceAssuming a Behavioural Response in Weeks of Employment
(a) Women: Nfld PEI NS NB Que Ont Man Sask Alta BC Total
72 Pre-Separation Job Durations and Unemployment Insurance Eligibility
Pre-Separation Job Durations and Unemployment Insurance Eligibility 73
6. SummaryBill C-17 rather quietly imposed what are probably the largest cutbacksin Canada’s Unemployment Insurance (now Employment insurance)systemsince it was first introduced, both making it harder for individualsto qualify for a claim at all, and reducing the number of weeks of benefitsclaimants were entitled to by as much as 16 weeks, depending on theiremployment history and local labour market conditions. In this reportwe examine which workers — in terms of province, industry and gender— were hurt the most by these benefit cuts, as well as the extent towhich workers were able to make changes in their economic behaviourthat cushioned the impact of those cuts.
Overall, we find that Bill C-17 reduced the number of benefit weeks forwhich a separating worker was eligible by 7.6 weeks for both men andwomen, and reduced the number of benefit weeks actually received in anaverage UI claim by about 3 weeks for men and 4 weeks for women.Interestingly, not only are these losses fairly similar across gender lines,they also exhibit only modest variation by province or by industry. Lossesare, however higher in the high-unemployment provinces and industries,with — for example — Newfoundland experiencing the largest provincialreceipt loss per claim of 5.1 weeks for women, and fishing the largestindustrial receipt loss per claim of 6.1 weeks, again for women.
A key reason why C-17-induced losses per separation do not vary moredramatically across provinces and industries concerns behaviouralchanges in qualifying weeks, concentrated in the high-unemploymentprovinces and industries. Especially in those provinces and industries,we find that workers were able to accumulate enough extra weeks ofwork to substantially mitigate the effects the Bill would otherwise havehad on their UI eligibility. While in some cases --notably the fishingindustry — these extra weeks of work may have been the results of other,compensatory government programs, they play an important role indetermining the ultimate industrial and regional impact of the UI cutbacksin Bill C-17 whatever their source.
Finally, while C-17's impact on UI eligibility and receipt per job separationwere surprisingly equally distributed across provinces and industries, itis important to note that its per worker, or per-capita impact was not.Because workers in high-unemployment provinces and industries(essentially the Atlantic provinces and to some extent Quebec, and theprimary industries plus construction) are much more likely to experiencea job separation, a randomly selected worker in those provinces and
74 Pre-Separation Job Durations and Unemployment Insurance Eligibility
industries could expect to lose many more weeks of UI benefits than aworker elsewhere in Canada due to C-17. For example, an average womenemployed in the fishing industry, and an average man employed in theforestry industry, both collected about 25 weeks of UI benefits per yearbefore the introduction of C-17, a number which fell by 5 weeks to 20after C-17. Canada-wide, average weeks of UI receipt fell by about oneweek per worker, from about 5 to 4 for women and 6 to 5 for men. Itfollows that, while clearly having a disproportionate impact on thoseprovinces and industries which were the highest users of the UI system,Bill C-17 has not, by any means, ended the massive cross-subsidizationof provinces east of the Ottawa River, and of the agricultural, fishing,forestry, and construction industries, by the other provinces and industriesin Canada.
Pre-Separation Job Durations and Unemployment Insurance Eligibility 75
References
Christofides, L., and C. McKenna, “Unemployment Insurance and JobDurations in Canada” Journal of Labor Economics 14 (April1996):286-312.
Green, David and W. Craig Riddell, “Qualifying for UnemploymentInsurance: An Empirical Analysis”, Economic Journal, forthcoming1997.
76 Pre-Separation Job Durations and Unemployment Insurance Eligibility
Pre-Separation Job Durations and Unemployment Insurance Eligibility 77
Data AppendixAs mentioned, the data used in this report come from HRDCadministrative files. To be included in our sample, a worker had toexperience a job separation in one of two window periods, March 1993-February 1994, or August 1994-July 1995. Formally, our windows inDDD weeks are: window one, 1419 to 1470; and window two, 1493 to1544. Subtract 600 from these numbers to convert them to those currentlyused in operating the UI system. In defining these samples, job separationsare dated by the last week worked. If this data is missing, then severalalternatives are employed (for example, the mid-point of the last monthis used if it is available), thus for a small number of cases the last week ismeasured with error. As is detailed in the report, we conduct analyses intwo ways: a “separation-based” approach which follows all workersexperiencing a separation and determines their subsequent UI entitlement,and a “claim-based” one which focuses on the length of claims onceestablished. Our sample is limited to workers who separated from theirlast job for reasons of “short work” and "other," and we are only lookingat regular UI claims, not special benefits.
The samples used in this final report were taken from the August 1996update of the ROE file and the June 1996 update of the SV file. Thisimplies that while we should observe almost all of the job separations inthe second window in the record of employment (ROE) file, we do notobserve all of the UI claims near the end of the second window in thestatus vector (SV) file. Further, it is clear that data on UI benefit expirationswill only be available for the first five months of the second window,thus only the first 5 months of each window are used for the claim data.
Perhaps more crucially, the UI-region of each worker must be identifiedin order to calculate that worker's eligibility. Given the data available,this is quite difficult and can only be done with error. For those whoclaim UI, the economic region can be identified, but it cannot be directlyascertained for those who do not claim. As a proxy HRDC provided uswith the UI region based on the employer's postal code. For those whoclaim UI, this can be compared with the actual region. Problems areobvious. Most employers in, for example, Newfoundland employ workerswho then claim in that province although not necessarily in the same UIregion. In contrast, however, employers with, for example, Toronto postalcodes employ workers in all of the 62 UI regions across Canada. Toillustrate, only 65 percent of the men in the window one sample who hada Toronto employer claimed UI in the Toronto region. Overall, the imputedUI-region appears to be correct about 75 percent of the time. Some of
78 Pre-Separation Job Durations and Unemployment Insurance Eligibility
this is attributable to a "head office" effect. It also results from workerswho either move to, or live, in a different region than their employer. (Itis even possible that some workers may choose their region strategically.)This is a serious limitation when dealing with the eligibility of those whodo not claim UI, which is of particular interest in determining thoseworkers who are completely disentitled from, or discouraged fromapplying for, UI by the changes associated with Bill C-17.
The classification of industries used in our analysis is that provided byHRDC on its administrative data files. It may be worth noting that thefishing industry here does not include self-employed fishermen, who arecovered by a separate UI program, nor does the agricultural industryinclude self-employed farmers, who are not covered by any UI program.(We leave the political economy of this why this is the case to others).The public sector includes education and health services that are providedby governments.