Part I Predicting, Preventing, and Remediating Reading Failures The four papers in this section explore the practical implica- tions of recent theory and research. The first two give witness to the extraordinary progress that has been made in the diagno- sis and prevention of reading difficulties even prior to formal reading instruction; the latter two lay the foundation for better remediation and teacher training. Importantly, these papers also clarify why it is that the suggestions proposed should prove valuable. Finally, perhaps because the studies are rooted in a well-articulated theoretical framework, the results obtained will both challenge and enhance our current understanding of reading acquisition. Nathlie Badian's paper is notable for its well-honed battery of preschool measures which, when administered a full six months before kindergarten, achieves an impressive 91% suc- cess rate in predicting second grade reading scores. Whereas common wisdom might lead school districts to focus on chron- ological age, socioeconomic status and/or verbal IQ, Badian's work is consistent with a number of other studies in demon- strating the superior predictive power of a small set of phono- logical, linguistic and orthographic measures. Badian's battery continues to evolve in response to both theoretical and empiri- cal considerations; in this particular stud~ it is intriguing that the greatest predictive power derives from a measure of memory for visually presented letter strings. The paper by Susan Brady and her colleagues at Haskins Laboratories demonstrates that there is much we can do even for children whose prognosis at kindergarten entry is less than optimal. For, as Badian points out in her discussion, although strong preschool skills bode well for reading success, weak scores do not lead inevitably to reading failure. Although the inner-city children studied by Brady et al. initially demonstrated little or no understanding on a wide variety of preschool mea- sures, intensive instruction focusing on the analysis of the sound structure of words yielded promising results: children
Transcript
Part I Predicting, Preventing, and
Remediating Reading Failures The four papers in this section explore the practical implica- tions of recent theory and research. The first two give witness to the extraordinary progress that has been made in the diagno- sis and prevention of reading difficulties even prior to formal reading instruction; the latter two lay the foundation for better remediation and teacher training. Importantly, these papers also clarify why it is that the suggestions proposed should prove valuable. Finally, perhaps because the studies are rooted in a well-articulated theoretical framework, the results obtained will both challenge and enhance our current understanding of reading acquisition.
Nathlie Badian's paper is notable for its well-honed battery of preschool measures which, when administered a full six months before kindergarten, achieves an impressive 91% suc- cess rate in predicting second grade reading scores. Whereas common wisdom might lead school districts to focus on chron- ological age, socioeconomic status and/or verbal IQ, Badian's work is consistent with a number of other studies in demon- strating the superior predictive power of a small set of phono- logical, linguistic and orthographic measures. Badian's battery continues to evolve in response to both theoretical and empiri- cal considerations; in this particular stud~ it is intriguing that the greatest predictive power derives from a measure of memory for visually presented letter strings.
The paper by Susan Brady and her colleagues at Haskins Laboratories demonstrates that there is much we can do even for children whose prognosis at kindergarten entry is less than optimal. For, as Badian points out in her discussion, although strong preschool skills bode well for reading success, weak scores do not lead inevitably to reading failure. Although the inner-city children studied by Brady et al. initially demonstrated little or no understanding on a wide variety of preschool mea- sures, intensive instruction focusing on the analysis of the sound structure of words yielded promising results: children
2 PART I
receiving instruction during kindergarten were more likely to be promoted directly to first grade, and-- in sharp contrast to their prognosis at kindergarten entry--were performing at grade level by the end of first grade. Although this study is on a smaller scale than other studies yielding similar results, an im- portant feature is the fact that the instruction was carried out by classroom teachers with entire unselected classes of inner- city children, raising the hope that teachers can be equipped to forestall the large incidence of reading failure that characterizes inner-city schools. A finding worthy of further inquiry con- cerns the small but significant effects of metalinguistic training on more basic linguistic function.
Stephen Truch shares with us his impressive successes in remediating already failed readers, moving us beyond the well- established research on diagnosis and prevention. Although the older reader surely poses larger and different challenges, the re- sults of Truch's intervention research suggest that the same theoretical framework and training that proved effective with pre-readers in Brady et al. is also appropriate for many school children and adults. Although the field yet requires a definitive remediation study with well-selected control subjects, Truch's study is an important step in that direction and is an important resource for anyone planning to design and /or evaluate a re- mediation program. His findings suggest there is no age barrier to effective instruction; persons of any age who lack decoding skills may benefit from thorough instruction in linguistic, and especially phonological, analysis.
In the final paper in this section, Louisa Moats makes the point that although effective reading instruction must begin with the classroom teacher, few teachers have an in-depth ap- preciation of the phonological and orthographic regularities that govern English spelling. They are often ill-equiFped to pass on the very skills that research suggests are important for reading mastery; they are apt to view the intricacies of the Eng- lish orthography (wrongly) as hopelessly unsystematic. Moats not only reminds us that an explicit awareness of phonology and orthography are not God-given talents, bestowed on us by virtue of learning to speak, she also raises the possibility that as we become highly skilled users of the orthography, we may lose access to the knowledge we did apply when we first ac- quired literacy. Despite her sobering message about our failure to train teachers adequately in language structure, the encour- aging fact was that the teachers interviewed were receptive to and enthusiastic about training of this nature.
Preschool Prediction: Orthographic and Phonological Skills, and Reading
Nathlie A. Badian
Holbrook Public Schools Holbrook, Massachusetts
The Children's Hospital Boston, Massachusetts
Harvard Medical School
Because of the research demonstrating the roles of phonological awareness, serial naming speed, and orthographic processing in reading, a test of each of these skills was added to a preschool screening battery. The main aim of the study was to determine whether these measures would contribute to the prediction of reading. The 118 subjects were first tested six months before kindergarten entry and were followed up 19 and 24 months later. Each additional screening test made a significant, independent contribution to the prediction of early first grade word reading~spelling, after the contributions of a parent rating of preschool reading ability (PRA), verbal IQ, socio-economic status (SES), and chronological age were accounted for. With letter nam- ing and PRA, the additional tests were responsible for 62 percent of the variance. The orthographic test made the largest single con- tribution (32%) to the variance in word reading~spelling.
Variables contributing significantly to the prediction of later first grade reading comprehension were (in order of proportion of the variance accounted for) letter naming, sentence memory, object naming speed, the orthographic test, and SES. The revised preschool screening battery correctly identified 91 percent of indi- vidual first grade good and poor readers. It was concluded that preschool measures of phonological awareness, serial naming speed, and orthographic processing make a strong contribution to prediction of first grade reading.
The Holbrook Screening Battery (HSB) has been adminis- tered to twenty consecutive year-groups of preschool children in a small school district to help identify children at risk for learn- ing problems before they enter kindergarten (Badian 1982; 1988a; 1988b; 1990). In a recent analysis of preschool screening instru- ments, Carran and Scott (1992) reported that the HSB (Badian 1988a) and the Satz and Friel (1974) screening battery had some of the best predictive validity indicators and risk indices of the studies they examined, but recommendations were for further studies to fine-tune the screening instruments. From time to time changes reflecting research findings have been made in the sub- test composition of the HSB to improve its predictive validity. We have continually sought to enhance its power to predict which children may develop later reading difficulties.
Subtests added to the HSB, which were not part of the bat- tery analyzed by Carran and Scott (1992), include Rapid Autom- atized Naming of Objects (RAN Objects) (Denckla and Rudel 1974), syllable tapping (adapted from Mann and Liberman 1984), and a visual-orthographic matching task created for the HSB. These subtests were added because the previous HSB (e.g., Badian 1990) did not include any measure of naming speed, phonological awareness, or orthographic processing. Earlier versions of the HSB included a verbal subtest (WPPSI Similarities) which was excluded from the updated version dis- cussed here, because of time constraints. For a previous year- group of children the inclusion of Similarities in the preschool HSB was responsible for less than one percent of the variance in grade 1 word reading or reading comprehension (Badian unpublished data).
The RAN Objects subtest was added because of the consid- erable research evidence that continuous naming speed predicts later reading (Badian 1993a; Badian et al. 1990; Blachman 1984; Felton 1992; Felton and Brown 1990; Wolf 1984, 1991) and con- sistently differentiates between normal and disabled readers
PRESCHOOL PREDICTION 5
(Badian et al. 1991; Bowers and Swanson 1991; Davis and Spring 1990; Denckla and Rudel 1976; Felton and Wood 1989; WolL Bally, and Morris 1986). In particular, a strong relationship between kindergarten symbol naming speed (i.e., letters and numbers) and later reading has been reported (Badian et al. 1990; Wolf 1984; 1991). As the HSB is administered six months before kindergarten entry to children who are at least one year younger than in the studies cited, it is not possible to administer tests of naming speed for symbols, or even colors, as at that time many children cannot name letters or numbers, and some can- not name all the common colors. RAN Objects, however, is suit- able for young children, as the stimuli are pictures of five famil- iar objects. An advantage of RAN Objects is its independence from the prereading skill of symbol naming (Wagner and Torgesen 1987). Wolf (1991), drawing on the findings of her lon- gitudinal study of children from kindergarten through fourth grade, stressed that in the early stages of reading all naming speed tasks predict all reading skills, and that for young chil- dren naming any visual stimulus under timed conditions ap- pears to be tapping subprocesses underlying reading.
The second additional measure (syllable tapping) was added to test phonological awareness. There is a massive body of research documenting the substantial and possibly causal role that phonological awareness plays in reading (Ball 1993; Wagnq~r and Torgesen 1987). In particular, tests of phoneme awareness, such as phoneme deletion (Rosner and Simon 1971) or phoneme segmentation (Liberman et al. 1974) are significantly related to reading. However, Liberman and her colleagues (1974) demon- strated that no preschool children and only 17 percent of kinder- garten children were able to segment words by phonemes, whereas 46 percent of preschoolers could segment by syllables. In a longitudinal stud~ Mann and Liberman (1984) chose sylla- ble segmentation, rather than phoneme segmentation, to test kindergarten children, because syllable segmentation is not con- founded by reading instruction, but phoneme segmentation may have a reciprocal relationship to reading. Perfetti and his col- leagues (1987), in a longitudinal study of first grade children, concluded that phonemic deletion tasks, in particular, have a truly reciprocal relationship to reading.
Because preschool children have such difficulty with pho- neme awareness tasks (Ehri 1989), a shortened version of Liberman's syllable segmentation task (tapping the number of syllables in words of one-to-three syllables) was added to the HSB, as a test of phonological awareness within the capabilities
of preschool children (Mann and Liberman 1984). Syllable tap- ping administered to kindergarten children was significantly related to first grade reading (Mann and Liberman 1984), and concurrently to reading-related measures (Blachman 1984).
Although there is a consensus that phonological processing skills are of the utmost importance in reading, there has been a growing concern that the focus on the role of phonological pro- cessing has tended to overshadow or even ignore the role of orthographic processing skills (Adams 1990; Adams and Bruck 1993; Bowers and Wolf 1993; Cunningham and Stanovich 1993; Stanovich and West 1989). According to Bowers and Wolf (1993), orthographic skills refer to the processing of letters and letter patterns into words and word parts. Adams and Bruck (1993) quote research confirming that even skilled readers visually process each individual letter of every word they read, and they point out that the execution of many tasks used to assess phono- logical processing (e.g., pseudoword reading) depends on ortho- graphic knowledge and the relationship between phonological and orthographic knowledge. Adams (1990, p. 54) believes that the ability to recognize letters, spelling patterns, and whole words effortlessly, automatically, and visually is the most critical factor beneath fluent reading. In Adam's model of reading, the orthographic, phonological, meaning, and context processors are all interconnected, but the orthographic processor is the only one to receive information directly from the printed page. The inde- pendent roles of orthographic and phonological processing in reading have been demonstrated in recent studies of children in the early school grades (Badian 1993b; Cunningham and Stan- ovich 1993). In these studies, orthographic processing ability accounted for variance in first grade word recognition even after the variance in three phonological processing measures had been partialed out (Cunningb~m and Stanovich 1993) and made sig- nificant contributions to word recognition, word attack skills, and reading comprehension in grades 1 to 3 after IQ, reading experience, phonological awareness, and letter-naming speed had been controlled (Badian 1993b).
As orthographic processing tasks (e.g., Olson et al. 1989) typically require the ability to recognize visuany real from pseu- dowords, they are beyond the capabilities of prereaders. A visu- al matching task was created for the HSB as a measure of begin- ning orthographic skills, defined as accuracy in processing writ- ten symbols and symbol sequences, independently of the ability to name or read them. The stimuli begin with single letters and progress to sequences of two to four letters or numerals.
PRESCHOOL PREDICTION 7
The main aims of the current s tudy were to determine whether adding measures of phonological awareness, naming speed, and orthographic processing to a preschool screening battery would contribute to the prediction of early reading skills, and whether each of the added variables would make an independent contribution to reading. A secondary aim was to examine the effects of differences in preschool reading ability upon first grade reading skills.
Method
Subjects The pool of subjects was all children in a small school dis-
trict born between September 1, 1985, and August 31, 1986, who entered kindergarten in September, 1991. The 153 children (74 boys, 79 girls) in this year-group were screened in early March, 1991 (age range: 54 to 66 months). At follow up in October-November and March of first grade 31 children were no longer students in the school district. One child was omitted from the study because of limited English, and three children because they were repeating kindergarten, leaving 118 children as subjects, including one with incomplete screening data.
The 118 subjects (54 boys, 64 girls) were 60.2 months of age (SD 3.7) at the time of screening, 79.3 months (SD 3.3; range 74 to 86 months) at the initial follow-up testing in early first grade, and 84.2 months (SD 3.3: range 79 to 91 months) at the later first grade testing. The majority of subjects (95%) were white and pri- marily of Irish, Italian, and English ancestry. The remaining sub- jects were black. An estimate of socio-economic status (SES) was obtained from parental occupation (father's, when both parents were present), using a 5-point rating scale: 1 = professional and technical workers (16.1%), 2 = managerial, clerical, and sales workers (29.7%), 3 = craftsmen or skilled manual workers (30.5%), 4 = service or unskilled manual workers (19.5%), 5 = laborers (4.2%). The mean SES score was 2.65 (SD 1.1).
All subjects were taught reading and written language by the Won Way method (Bradley 1977). Won Way is a multisen- sory phonetic approach, strongly influenced by the Orton- Gillingham and Spalding methods.
Screening Measures Each subject was tested individually by trained specialists.
The HSB subtests included in this study are listed below, catego- rized into Language, Pre-academic, and Visual-Motor subdivi-
sions. These subdivisions are based on a factor analysis computed from the scores of the total group.
Short-Form Verbal IQ (VIQ) Two subtests loading on the Language factor (WPPSI Information and Arithmetic, Wechsler 1963) were converted into a short-form Verbal IQ (M 100, SD 15). The validity coefficient of this WPPSI short form is .830 (Sattler 1974, p. 456). The mean short-form VIQ of the subjects was 106.3 (SD 13.1).
Language WPPSI Sentences (Wechsler 1963): The child repeats in-
creasingly longer sentences after the examiner. Scoring was as indicated in the WPPSI manual , and scaled scores were used.
Language Sample: The child tells a story about a picture. The story was scored by a trained language therapist on five attributes (vocabulary, syntax, prosody/fluency, articulation, mean length of utterance), using a 5-point scale (0 = poor; 4 = superior).
RAN Objects (Denckla and Rudel 1974): The child is timed as he/she names 50 pictures (5 objects repeated at random 10 times) on a chart. Times taken to complete the chart were converted to normalized scaled scores (M 10, SD 3), using scores of the initial 153 subjects screened with the HSB, with higher scores indicating better performance.
Pre-Academic Letters: The child names 13 upper case letters, shown one
by one on cards (B O S E R T H P I V Z M A). Shapes: The child names five geometric forms, shown on
cards (circle, cross, square, triangle, diamond). Colors: The child names eight common colors, when
shown them (red, blue, yellow, green, orange, brown, black, white).
Syllable Tapping: After eight practice items, the child taps the number of syllables in the first 10 words used by Mann and Liberman (1984): popsicle, dinner, penny, house, valentine, open, box, cook, birthday, president.
Visual Matching: After two practice items, the child points to the one of four stimuli, which matches the target item on the extreme left of each line. The 10 target stimuli are: u, d, j, ((, 38, bo, NAZ, 369, saw, drop. The response stim- uli deviate from the target items mainly in sequencing or spatial orientation (e.g., drop: droq, drop, borq, brop).
Visual-Motor Name Writing: The child writes his or her first and Jast
PRESCHOOL PREDICTION 9
names (maximum score = 6). Copy Forms: The child uses a pencil to copy the five geo-
metric forms listed above under Shapes. Each form is scored as fail (0), pass (1), or superior (2) by the same examiner (Maximum score = 10).
Draw-a-Person: The child's pencil drawing of a person is scored using the system of Koppitz (1968).
Raw scores were used for all pre-academic and visual- motor tasks.
Preschool Reading Achievement (PRA) At the time of screen- ing parents were asked, as part of a detailed questionnaire, whether their child could read: Not at all, a few words, many' words, or books. Percentages in each category were: Not at al][ (50.8%), a few words (42.4%), many words (3.4%), books (3.4%). Ratings of 1 for Not at all, to 4 for Books, were used (mean PRA: 1.6, SD 0.7).
Early Grade I Reading Measures Wechsler Individual Achievement Test (WIAT) (Psycho-
logical Corporation 1992): Basic Reading, Spelling. The Basic Reading subtest was administered individually to
each subject in early November of first grade. On the first four items the child points to the one of four words beginning or ending with the same sound as a pictured object. The next three items are word recognition (pointing to the one of four words telling the name of a picture). The remaining items are word reading. The Spelling subtest was administered to the group in late October. The first four items are dictated letters, and on the next two items the child writes the letter associated with a sound. The remaining items are dictated spelling words.
On each subtest subjects were tested until they reached the specified ceiling. The total raw score of the two WIAT subtests was used as the early first grade reading criterion. Standard scores (M 100, SD 15) were also obtained for each subtest, using fall first grade norms.
Later Grade 1 Reading Measure Stanford Achievement Test (SAT), Primary 1, Form J (Psy-
chological Corporation 1991): Reading Comprehension. Because it was not possible to test reading comprehension
in early first grade, the SAT Reading Comprehension subtest, administered by the school in late March, was used as a mea- sure of reading comprehension. All subjects, but one, were pre- sent for testing. Raw scores were used in most analyses.
Statistical Analyses There was no difference between boys and girls in early
reading/spening: F (1,116) = 0.26, p<.61, later reading compre- hension: F (1,115) = 1.99, p<.16, age: F (1,116) = 0.22, p<.64, SES" F (1,116) = 1.42, p<.24, PRA: F (1,116) = 0.00, p<.l.00, or VIQ: F (1,116) = 0.02, p<.90. Therefore, gender was not a factor in any analysis.
Correlational and Multiple Regression Analyses Simple and partial (VIQ and PRA as covariates) correlation coefficients of all preschool variables with reading were computed. To test the possibility that performance on Visual Matching is dependent on letter knowledge, partial correlations of this subtest with reading measures were obtained, with Letters partialed out.
With reading/spell ing and reading comprehension as the dependent variables, stepwise regression analyses were per- formed and also multiple regression analyses of the HSB with and without the three added subtests. Hierarchical regression analyses were then computed, with PRA, SES, VIQ, and age entered first, followed by the screening subtests. In another set of analyses the three subtests added to the HSB (RAN Objects, Visual Matching, Syllable Tapping) were entered in a fixed, rotating order, to determine the percentage of independent variance in reading contributed by each of the subtests added to the basic screening battery.
Comparison of Groups of Readers The subjects were classi- fied as poor, average, or good readers, based on their first grade WIAT reading/spelling scores. Poor readers (Group 1: n = 15) obtained a raw total reading + spelling score of <14, which was one standard deviation below the group mean, and equal to a mean standard score of 89.3 (SD 4.2, 23 ~a percentile). Raw scores for average readers (Group 2: n = 78) ranged from 14 to 29, with a mean standard score of 107.9 (SD 7.5, 70 th percentile). The good readers' (Group 3: n = 25) raw scores ranged from 30 to 71, with a mean standard score of 139.9 (SD 12.4) (99.6 percen- tile). Subjects were compared on the screening subtests using analysis of covariance (ANCOVA). The covariates were SES: F (2,115) = 10.12, p<.001 (3>2>1), PRA: F (2,115) = 11.19, p<.001 (3>2 = 1), and VIQ: F (2,115) = 15.61, p<.001 (3>2>1). The groups did not differ in age: F (1,115) = 0.06, p<.94.
Prel iminary analyses showed that subjects who as pre- schoolers could read either no words or just a few did not differ on any screening subtest, in VIQ, SES, age, or in first grade read- ing. These two groups were, therefore, combined as nonreaders, while the small number who could read many words or books
PRESCHOOL PREDICTION 111
were classified as preschool readers. Further ANCOVAs were carried out with the first grade good readers subdivided into preschool nonreaders (Group 3: n =18) and preschool readers (Group 4: n = 7). Some analyses were made with preschool read- ers omitted. All but one of the preschool readers were good readers in first grade. The first grade good readers who had been preschool nonreaders did not differ from average or poor readers in PRA, and were equal in VIQ and SES to good readers who had been preschool readers.
Discriminant Function Analysis The 117 subjects for whom there were complete data were classified as good or poor read- ers, using the WIAT reading/spel l ing cutoff score of <14 to define poor reading (102 good readers, 15 poor readers). Dis- criminant function analyses were computed, with VIQ, PRA, SES, age, and the screening subtests as variables, to determine the best combination of variables to identify individual good and poor readers. A 2 x 2 matrix was drawn up of valid and false positives and negatives, and the hit rate sensitivity, specit- ficity, and positive predictive value (PPV) were calculated (Carran and Scott 1992).
A further 2 x 2 matrix was drawn up using predetermined school system criteria for high risk. Some years ago the use of a global raw score cutoff for high risk status was abandoned. Raw scores of each group of screening subtests are converted to T-scores (mean 50, SD 10). A T-score more than one standard deviation below the mean (i.e., <40 o r <15 th percentile) on the Language or Pre-academic subtotal places a child in the risk category for reading problems. Using these criteria 22 (18.8%) of the 118 subjects were at risk for reading difficulties.
Results
The mean raw WIAT Basic Reading/Spelling score was 24.3 (SD 11.2). Using fall grade norms, based on a national stan- dardization sample, mean scores were approximately at the 77 th percentile for Basic Reading and at the 84 th percentile for Spelling. The mean SAT Reading Comprehension score was 31.0 (SD 8.1), which was approximately at the 67 th percentile. Grade equivalent scores ranged from K.1 to 7.0 for Basic Reading, from K.0 to 4.8 for Spelling, and from 1.3 to 7.4 for Reading Comprehension.
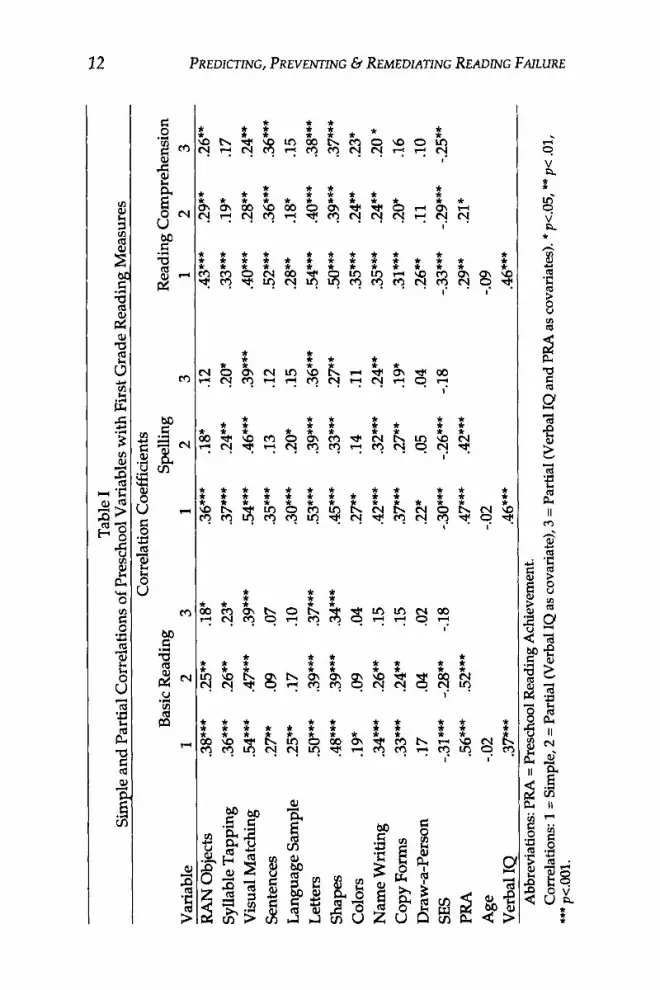
Table I shows simple and partial correlation coefficients between the preschool variables and the reading subtests, and
Var
iabl
e
Tab
le I
S
imp
le a
nd
Par
tial
Co
rrel
atio
ns
of P
resc
hool
Var
iab
les
wit
h F
irst
Gra
de
Rea
din
8 M
easu
res
Co
rrel
atio
n C
oef
fici
ents
Bas
ic R
ead
ing
S
pel
lin
g
Rea
din
g C
om
pre
hen
sio
n
1 2
3 1
2 3
1 2
3
bo
RA
N O
bjec
ts
.38*
**
.25*
* .1
8"
.36*
**
.18"
.1
2 .4
3***
.2
9**
.26*
*
Syl
labl
e T
app
ing
.3
6***
.2
6**
.23*
.3
7***
.2
4**
.20*
.3
3***
.1
9"
.17
Vis
ual
Mat
chin
g
.54*
**
.47*
**
.39*
**
.54*
**
.46*
**
.39*
**
.40*
**
.28*
* .2
4**
Sen
ten
ces
.27*
* .0
9 .0
7 .3
5***
.1
3 .1
2 .5
2***
.3
6***
.3
6***
Lan
gu
age
Sam
ple
.2
5**
.17
.10
.30*
**
.20*
.1
5 .2
8**
.18"
.1
5
Let
ters
.5
0***
.3
9***
.3
7***
.5
3***
.3
9***
.3
6***
.5
4***
.4
0***
.3
8***
Sh
apes
.4
8***
.3
9***
.3
4***
.4
5***
.3
3***
.2
7**
.50*
**
.39*
**
.37*
**
Co
lors
.1
9"
.09
.04
.27*
* .1
4 .1
1 .3
5***
.2
4**
.23*
Nam
e W
riti
ng
.3
4***
.2
6**
.15
.42*
**
.32*
**
.24*
* .3
5***
.2
4**
.20
*
Co
py
Fo
rms
.33*
**
.24*
* .1
5 .3
7***
.2
7**
.19"
.3
1"**
.2
0*
.16
Dra
w-a
-Per
son
.1
7 .0
4 .0
2 .2
2*
.05
.04
.26*
* .1
1 .1
0
SES
-.31
"**
-.28*
* -.
18
-.30*
**
-.26*
**
-.18
-.3
3***
-.2
9***
-.2
5**
PR
A
.56*
**
.52*
**
.47*
**
.42*
**
.29*
* .2
1"
Ag
e -.
02
-.02
-.
09
Ver
bal
IQ
.37*
**
.46*
**
.46*
**
Abb
revi
atio
ns:
PRA
= P
resc
hool
Rea
ding
Ach
ieve
men
t. C
orre
latio
ns:
1 =
Sim
ple,
2 =
Par
tial
(Ver
bal I
Q a
s co
vari
ate)
, 3 =
Par
tial
(V
erba
l IQ
and
PR
A a
s co
vari
ates
). *
p<.0
5, *
* p<
.01,
• *
* p<.
001.
PRESCHOOL PREDICTION 13
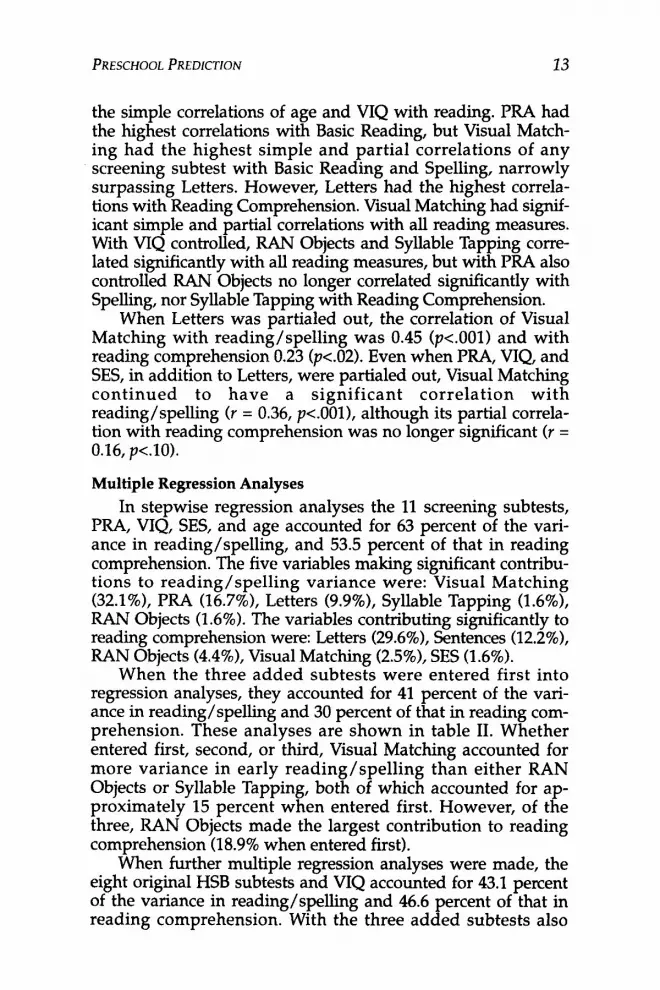
the simple correlations of age and VIQ with reading. PRA had the highest correlations with Basic Reading, but Visual Match- ing had the highest simple and partial correlations of any
screening subtest with Basic Reading and Spelling, narrowly surpassing Letters. However, Letters had the highest correla- tions with Reading Comprehension. Visual Matching had signif- icant simple and partial correlations with all reading measures. With VIQ controlled, RAN Objects and Syllable Tapping corre- lated significantly with all reading measures, but with PRA also controlled RAN Objects no longer correlated significantly with Spelling, nor Syllable Tapping with Reading Comprehension.
When Letters was partialed out, the correlation of Visual Matching with reading/spelling was 0.45 (p<.001) and with reading comprehension 0.23 (p<.02). Even when PRA, VIQ, and SES, in addition to Letters, were partialed out, Visual Matching continued to have a signif icant correlation with reading/spelling (r = 0.36, p<.001), although its partial correla- tion with reading comprehension was no longer significant (r = 0.16, p<.10).
Multiple Regression Analyses In stepwise regression analyses the 11 screening subtests,
PRA, VIQ, SES, and age accounted for 63 percent of the vari- ance in reading/spelling, and 53.5 percent of that in reading comprehension. The five variables making significant contribu- tions to reading/spel l ing variance were: Visual Matching (32.1%), PRA (16.7%), Letters (9.9%), Syllable Tapping (1.6%), RAN Objects (1.6%). The variables contributing significantly to reading comprehension were: Letters (29.6%), Sentences (12.2%), RAN Objects (4.4%), Visual Matching (2.5%), SES (1.6%).
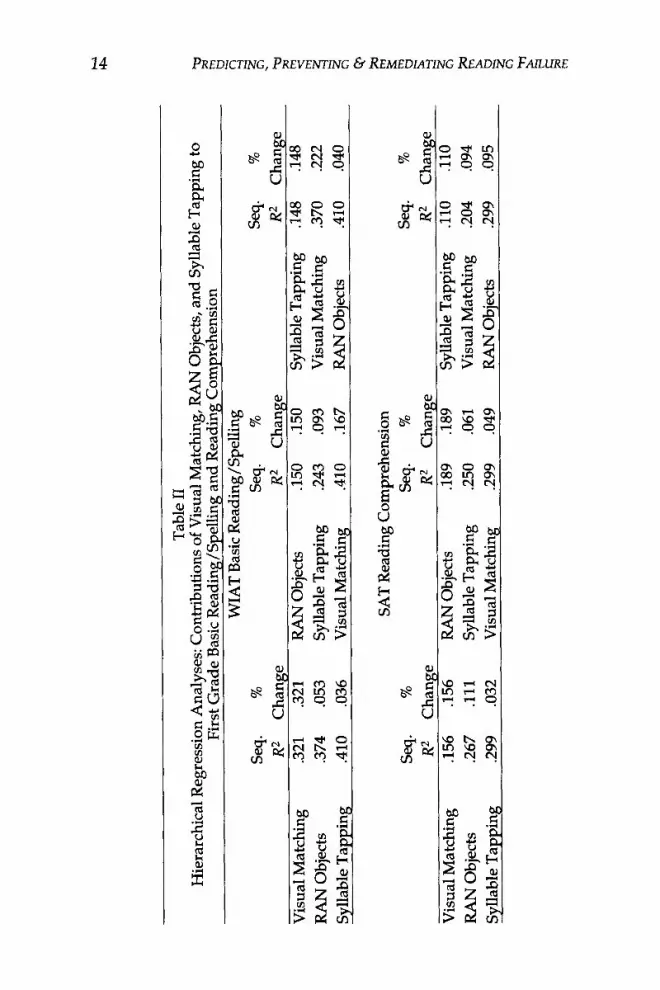
When the three added subtests were entered first into regression analyses, they accounted for 41 percent of the vari- ance in reading/spelling and 30 percent of that in reading com- prehension. These analyses are shown in table II. Whether entered first, second, or third, Visual Matching accounted for more variance in early reading/spel l ing than either RAN Objects or Syllable Tapping, both of which accounted for ap- proximately 15 percent when entered first. However, of the three, RAN Objects made the largest contribution to reading comprehension (18.9% when entered first).
When further multiple regression analyses were made, the eight original HSB subtests and VIQ accounted for 43.1 percent of the variance in reading/spelling and 46.6 percent of that in reading comprehension. With the three added subtests also
Tab
le II
H
iera
rchi
cal R
egre
ssio
n A
naly
ses:
Con
trib
utio
ns o
f Vis
ual M
atch
ing,
RA
N O
bjec
ts, a
nd S
ylla
ble
Tap
ping
to
Firs
t Gra
de B
asic
Rea
ding
/Spe
llin
g an
d R
eadi
ng C
ompr
ehen
sion
Vis
ual M
atch
ing
RA
N O
bjec
ts
Syll
able
Tap
ping
WIA
T B
asic
Rea
ding
/Spe
llin
g Se
q.
%
Seq.
%
Se
q.
%
R 2
Cha
nge
R 2
Cha
nge
R 2
Cha
nge
.321
.3
21
RA
N O
bjec
ts
.150
.1
50
Sy
llab
le T
appi
ng
.148
.1
48
.374
.0
53
Sy
llab
le T
appi
ng
.243
.0
93
V
isua
l Mat
chin
g .3
70
.222
.4
10
.03
6
Vis
ual M
atch
ing
.410
.1
67
RA
N O
bjec
ts
.410
.0
40
Vis
ual M
atch
ing
RA
N O
bjec
ts
Syll
able
Tap
ping
SAT
Rea
ding
Com
preh
ensi
on
Seq.
%
Se
q.
%
Seq.
%
R
2 C
hang
e R
2 C
hang
e R
2 C
hang
e .1
56
.156
R
AN
Obj
ects
.1
89
.18
9
Syll
able
Tap
ping
.1
10
.110
.2
67
.11
1
Syll
able
Tap
ping
.2
50
.061
V
isua
l Mat
chin
g .2
04
.094
.2
99
.03
2
Vis
ual M
atch
ing
.299
.0
49
RA
N O
bjec
ts
.299
.0
95
(-~ pr~
pr~ P~
t~
pr~
PRESCHOOL PREDICTION 15
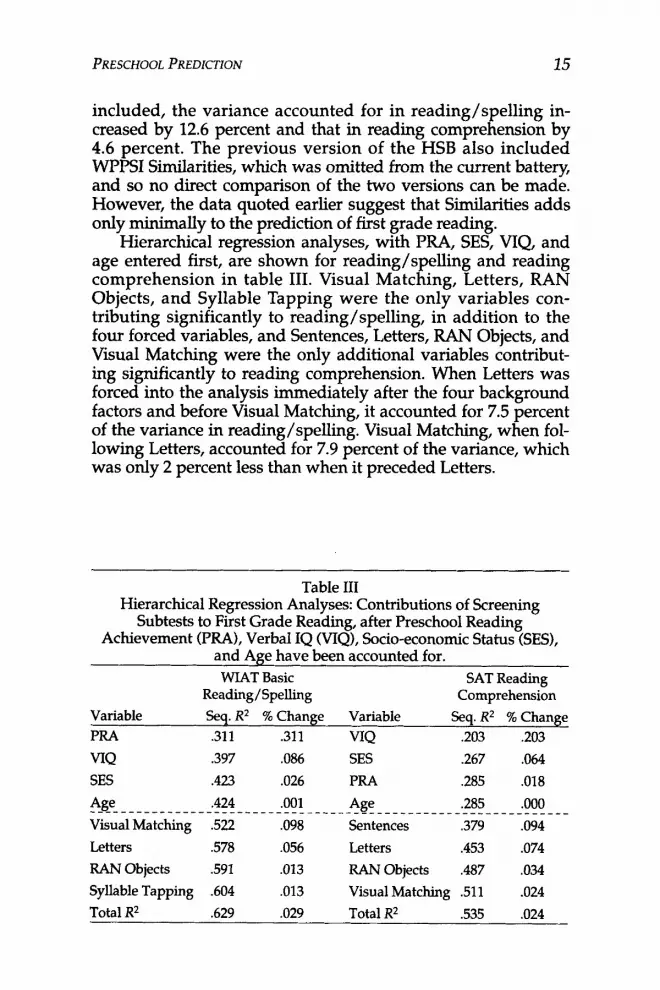
included, the variance accounted for in reading/spel l ing in- creased by 12.6 percent and that in reading comprehension by 4.6 percent. The previous version of the HSB also included WPPSI Similarities, which was omitted from the current battery, and so no direct comparison of the two versions can be made. However, the data quoted earlier suggest that Similarities adds only minimally to the prediction of first grade reading.
Hierarchical regression analyses, with PRA, SES, VIQ, and age entered first, are shown for reading/spelling and reading comprehension in table III. Visual Matching, Letters, RAN Objects, and Syllable Tapping were the only variables con- tributing significantly to reading/spelling, in addition to the four forced variables, and Sentences, Letters, RAN Objects, and Visual Matching were the only additional variables contribut- ing significantly to reading comprehension. When Letters was forced into the analysis immediately after the four background factors and before Visual Matching, it accounted for 7.5 percent of the variance in reading/spelling. Visual Matching, when fol- lowing Letters, accounted for 7.9 percent of the variance, which was only 2 percent less than when it preceded Letters.
Table III Hierarchical Regression Analyses: Contributions of Screening
Subtests to First Grade Reading, after Preschool Reading Achievement (PRA), Verbal IQ (V/Q), Socio-economic Status (SES),
and Age have been accounted for. WIAT Basic SAT Reading
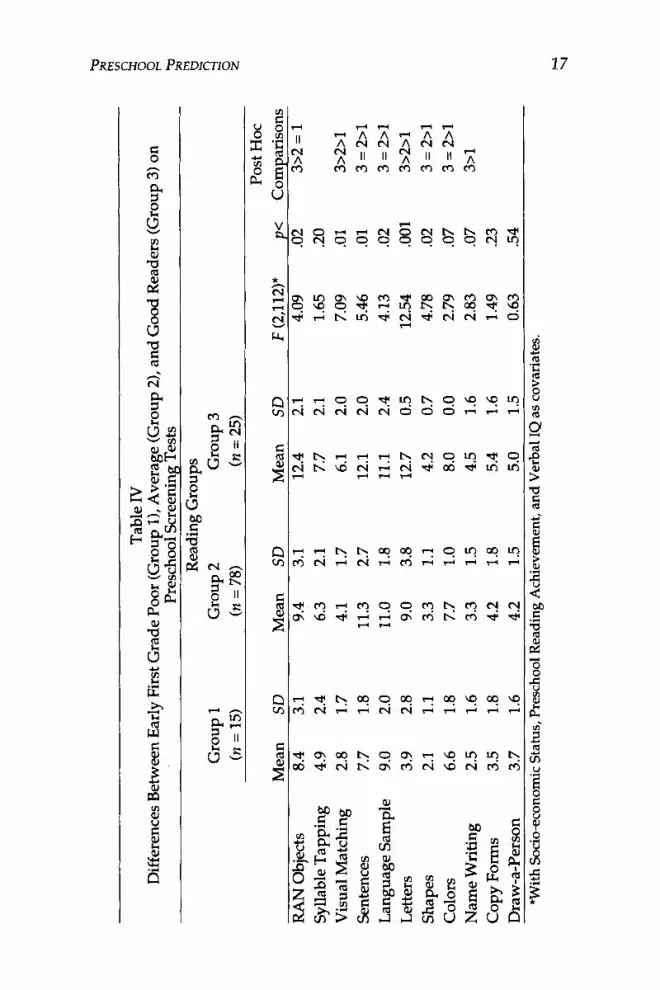
Comparison of Groups of Readers Early First Grade Good, Average, and Poor Readers The mean
scores of the three groups of readers on the screening subtests are shown in table IV, together with the significance of group differences, and post-hoc analyses (Duncan's Multiple Range Test). With SES, PRA, and VIQ statistically controlled, the groups differed significantly on Sentences, the Language Sam- ple, RAN Objects, Letters, Shapes, and Visual Matching. Differ- ences on Colors and Name Writing approached significance. Good and average readers did not differ on Sentences, the Language Sample, Shapes, or Colors, but were superior to the poor readers. Good readers were superior to both other groups, who did not differ, on RAN Objects, and all groups differed from one another on Letters and Visual Matching.
When analyses were made with good readers divided into preschool nonreaders (Group 3) and readers (Group 4), it was found that good readers differed on three screening subtests. Group 4 was superior to Group 3 (and both other groups) on Visual Matching: F (3,111) = 6.50, p<.001 (4>3, 2, 1; 3>1) and Syllable Tapping: F (3,111) = 2.15, p<.10 (4>3 = 2 = 1), but Group 3 was superior to Group 4 on Sentences: F (3,110) = 4.33, p<.01 (3>4 = 1; 2>1). In first grade Group 4 was superior to Group 3 in Basic Reading: F (3,110) = 68.93, p<.001 (4>3>2>1) and Spelling: F (3,110) = 44.72, p<.001 (4>3>2>1), but Groups 3 and 4 did not differ in Reading Comprehension: F (3,110) = 9.73, p<.001 (4 = 3>2>1). When subjects were compared on the three added subtests with Group 4 subjects omitted, Group 3 good readers (i.e., preschool nonreaders) were superior to both other groups on RAN Objects and Visual Matching, but the groups did not differ on Syllable Tapping.
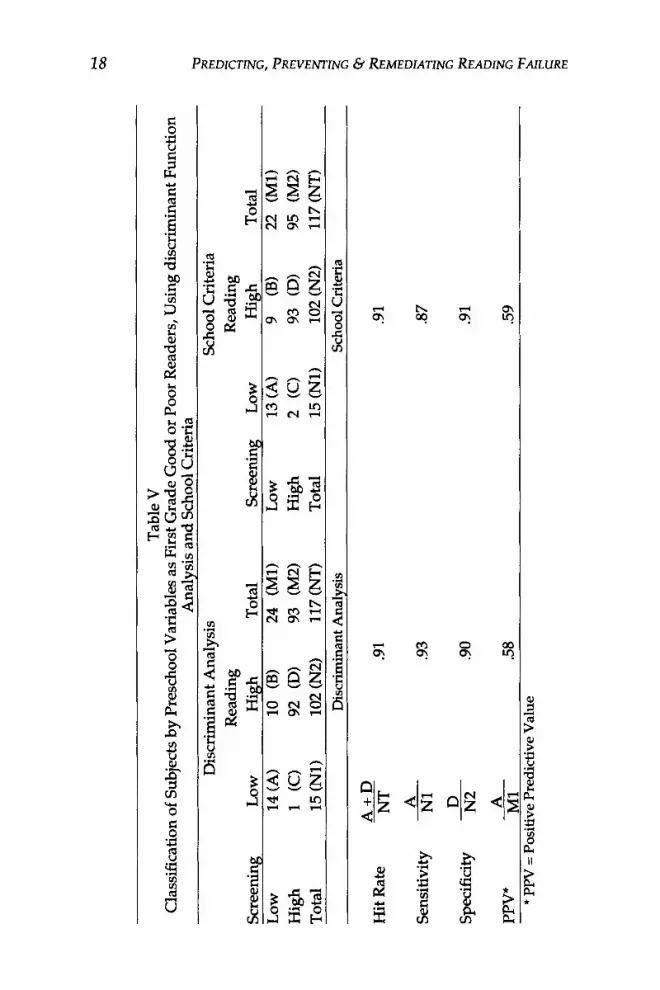
Group Classification Using Discrimination Analysis and School Criteria
Table V shows the classification of individual subjects as good or poor readers using discriminant function analysis and school criteria. A combination of Sentences, Visual Matching, and Colors gave the best results in the discriminant function analysis. These three subtests yielded a hit rate of 91 percent.
By school criteria the 22 subjects who scored below the 15th percentile on the Language or Pre-academic HSB subtotal were predetermined to be at risk for poor reading. As with the dis- criminant function analysis the hit rate was high (91%).
Table V also shows the Sensitivity, Specificity, and Positive Predictive Value (PPV) indices (Carran and Scott 1992). Ac-
03
Tab
le I
V
Dif
fere
nces
Bet
wee
n E
arly
Fir
st G
rad
e P
oo
r (G
rou
p I
), A
ver
age
(Gro
up
2),
an
d G
oo
d R
ead
ers
(Gro
up
3)
on
P
resc
hool
Scr
een
ing
Tes
ts
Rea
din
g G
rou
ps
Gro
up
I
Gro
up
2
Gro
up
3
(n =
15)
(n
= 7
8)
(n =
25)
t'-
Po
st H
oc
Mea
n
SD
Mea
n
SD
M
ean
S
D
F (
2,11
2)*
p<
Co
mp
aris
on
s R
AN
Obj
ects
8.
4 3.
1 9.
4 3.
1 12
.4
2.1
4.09
.0
2 3>
2 =
1
Syl
labl
e T
app
ing
4.
9 2.
4 6.
3 2.
1 7.
7 2.
1 1.
65
.20
Vis
ual
Mat
chin
g
2.8
1.7
4.1
1.7
6.I
2.0
7.09
.0
1 3>
2>1
Sen
tenc
es
7.7
1.8
11.3
2.
7 12
.1
2.0
5.46
.0
1 3
= 2
>1
Lan
gu
age
Sam
ple
9.
0 2.
0 11
.0
1.8
11.1
2.
4 4.
13
.02
3 =
2>
1
Let
ters
3.
9 2.
8 9.
0 3.
8 12
.7
0.5
12.5
4 .0
01
3>2>
1
Sha
pes
2.1
1.1
3.3
1.1
4.2
0.7
4.78
.0
2 3
= 2
>1
Col
ors
6.6
1.8
7.7
1.0
8.0
0.0
2.79
.0
7 3
= 2
>1
Nam
e W
riti
ng
2.
5 1.
6 3.
3 1.
5 4.
5 1.
6 2.
83
.07
3>1
Co
py
Fo
rms
3.5
1.8
4.2
1.8
5.4
1.6
1.49
.2
3
Dra
w-a
-Per
son
3.
7 1.
6 4.
2 1.
5 5.
0 1.
5 0.
63
.54
*With
Soc
io-e
cono
mic
Sta
tus,
Pre
scho
ol R
eadi
ng A
chie
vem
ent,
and
Ver
bal I
Q a
s co
vari
ates
.
NI
Tab
le V
C
lass
ific
atio
n of
Sub
ject
s b
y P
resc
hool
Var
iabl
es a
s F
irst
Gra
de
Goo
d or
Poo
r R
eade
rs, U
sing
dis
crim
inan
t Fun
ctio
n
Scr
eeni
ng
Lo
w
Hig
h
Tot
al
Ana
lysi
s an
d S
choo
l Cri
teri
a D
iscr
imin
ant A
naly
sis
Sch
ool C
rite
ria
Rea
ding
R
eadi
ng
Lo
w
His
h
Tot
al
Scr
eeni
n~
Lo
w
Hig
h
Tot
al
14(A
) 10
(B
) 24
(M
1)
Lo
w
13(A
) 9
(B)
22
(M1)
1
(C)
92
(D)
93
(M2)
H
igh
2
(C)
93
(D)
95
(M2)
15
(N
1)
102
(N2)
11
7 (N
T)
Tot
al
15 (
N1)
10
2 (N
2)
117
(NT
) D
iscr
imin
ant A
naly
sis
Scho
ol C
rite
ria
A+
D
Hit
Rat
e N
T
.91
.91
A
Sen
siti
vity
N
1 .9
3 .8
7
D
Spe
cifi
city
N
2 .9
0 .9
1
A
PPV
* M
1 .5
8 .5
9 *
PPV
= P
ositi
ve P
redi
ctiv
e V
alue
t~
v~
t~
PRESCHOOL PREDICTION 19
cording to Carran and Scott, values of .80 or higher are satisfac- tory. By each method of classification Sensitivity (probability of predicting a poor outcome or the valid positive rate) was good (.87 to .93) and so also was Specificity (probability of predicting a good outcome or valid negative rate), with values of .90 and .91. However, the PPV was low in both analyses (.58 to .59). The PPV indicates the probability that a subject who is low on the screening test will have a poor outcome. Approximately 40 per- cent of children expected to become poor readers were normal first grade readers.
Discuss ion
The main aim of this s tudy was to determine whether adding three theoretically motivated subtests to a preschool screening battery (Holbrook Screening Battery [HSB]) would contribute to the prediction of reading achievement. The addi- tions to the HSB were tests of phonological awareness (Syllable Tapping), object naming speed (RAN Objects), and orthographic processing (Visual Matching). The subjects were first tested 6 months before kindergarten entry and were followed up in first grade 19 and 24 months later.
As preschool familiarity with print may be a major determi- nant of early school reading skills (Canningham and Stanovich 1993), an estimate of each child's preschool reading achievement (PRA) was obtained from parents at the time of screening. Approximately 93 percent of the preschoolers could read either no words or only a few, and as these two groups did not differ on any screening subtest or in early first grade reading skills, they were categorized as nonreaders. The remaining subjects, who could read many words or books, were classified as pre- school readers.
There was a wide range in the reading levels of the children in first grade, with grade equivalent scores ranging from begin- ning kindergarten to grade 7 level. When groups of good, aver- age, and poor readers were compared on the screening subtests, with socio-economic status (SES), PRA, and Verbal IQ (VIQ) controlled, poor readers showed significant deficits in sentence memory, spoken language, visual matching, and naming of let- ters, colors, and shapes, compared with other readers. Both poor and average readers were inferior to good readers in object naming speed, and all three groups differed in le~er naming and visual matching. Good readers who had been preschool readers were superior to good readers who had been nonreaders
as preschoolers on visual matching and syllable tapping, but significantly lower in sentence memory. The two groups of good readers were equal in object naming speed and letter naming, and superior to average and poor readers.
The superiority of preschool readers on the orthographic task, which requires careful scanning and comparing of symbols and symbol sequences, could be the result of their reading expe- rience. However, when the preschool readers were omitted, good readers (who had been preschool nonreaders) were signifi- cantly superior to average and poor readers, suggesting that the ability to process visual symbols accurately may also facilitate reading acquisition. To investigate the possibility that Visual Matching may be just a sensitive measure of letter identification, correlations of this subtest with reading were computed with letter naming partialed out. Visual Matching continued to have significant correlations with reading skills, even with letter knowledge controlled, and its contribution to reading/spelling was reduced by only 2 percent when it followed letter naming in a hierarchical regression analysis. It is unlikely that the pre- school readers' greater skill on the phonological awareness task (syllable tapping) was a result of their reading experience, because the task is not closely related to reading. Rather, pre- school readers' skill on this simple phonological task may reflect a general phonological sensitivity which aided their reading development. The superiority of both groups of good readers in preschool naming speed provides support for the relationship of lexical retrieval speed with reading.
Results of correlational and regression analyses suggest that measures of phonological awareness, naming speed, and ortho- graphic processing in a preschool battery contribute to predic- tion of early reading skills. When entered alone into regression analyses, the three additional subtests accounted for 41 percent of the variance in early first grade reading/spelling and for 30 percent of that in later first grade reading comprehension. With Verbal IQ controlled, each of the three subtests correlated sig- nificantly with each reading measure. When all variables were entered into regression analyses, the three additional subtests, letter naming and PRA were the only variables contributing significantly to early first grade reading/spelling. Visual Match- ing made a large contribution to prediction of reading (32%), but the independent contributions of Object Naming and Syllable Tapping were very small, and less than those of PRA and letter naming. When the four background factors were entered first (PRA, VIQ, SES, age), the three additional subtests
PRESCHOOL PREDICTION 21
and letter naming were again the only screening subtests con- tributing to reading/spelling. Visual Matching and RAN Ob- jects, but not Syllable Tapping, also made significant contribu- tions to later first grade reading comprehension, following sen- tence memory and letter naming.
The finding that the orthographic matching task made such a substantial contribution to prediction of early reading/spell- ing skills is consistent with research showing the importance of orthographic knowledge in reading (Adams 1990; Adams and Bruck 1993; Bowers and Wolf 1993). It remains to be seen whether the visual matching task will continue to predict read- ing in later years. Stanovich (1992) quotes research showing a developmental trend in the nature of cognitive deficits under- lying reading failure, with visual deficits characterizing reading failure only in the earliest stages. Although, as in this study, orthographic and phonological processing skills are indepen- dent components of the variance in reading (Cunningham and Stanovich 1993), their interactive roles have been stressed (Adams 1990; Adams and Bruck 1993; Berninger 1990; Bowers and Wolf 1993; Cunningharn and Stanovich 1993).
Stanovich (1992) ranks phonological awareness measures on a continuum from deep to shallow sensitivity, while Ball (1993) classifies them as emerging, simple, or complex. Accord- ing to these classification systems, Syllable Tapping, which involves large-sized word units, is a relatively shallow or sim- ple measure of phonological awareness. Although complex measures, such as phoneme deletion tasks, generally have higher correlations with reading, there is evidence that the rela- tionship may be reciprocal, rather than causal (Perfetti et al. 1987). It was not possible to administer tasks of phoneme awareness to preschool children (Ehri 1989; Liberman et al. 1974.). However, phonological awareness tasks involving rhyme have been administered to children as young as three years of age and have been found to predict emerging reading skills 15 months later (MacLean, Bryant, and Bradley 1987). It is possible that alternative tasks of phonological awareness may have been stronger predictors of reading, than the one used in this study.
The young age of the subjects at initial testing also deter- mined the type of naming speed task. There is evidence that kindergarten symbol naming speed is a strong predictor of later reading, but the relationship between object naming speed and reading has tended to be weaker, although usually significant (Badian et al. 1990; Felton 1992; Wolf, Bally, and Morris 1986). However, Wagner and Torgesen (1987), in their review of pho-
nological recoding in lexical access (naming speed) suggested that Wolf's (1984) finding that naming speed for objects reliably predicted later reading was of greater interest than her finding of larger correlations between naming speed for letters and later reading. Letter naming speed and reading may be corre- lated because of other properties they have in common. In this study object naming speed, like Syllable Tapping, accounted for a small, but significant, independent percentage of the variance in beginning first grade word reading/spelling. Its correlation with reading comprehension was somewhat higher than that with word reading. Wolf (1991) theorized that the stronger rela- tionship of object naming to reading comprehension is due to object naming's greater requirement for semantic processing. The reasons for the relationship of naming speed with reading have been debated. According to Wolf (1991) serial naming and text reading both demand lexical access and retrieval within a context of rapid scanning, sequencing, and processing of visu- ally presented material, and a precise timing mechanism, un- derlying both language and motor domains, may be implicated in naming speed. It has been pointed out that serial naming tasks also measure articulation rate and a variety of other read- ing-related processes, including orthographic processing (Torgesen et al. 1990).
An important goal of longitudinal predictive studies should be to identify as accurately as possible the individual children at risk for reading difficulties, on the assumption that early identification, followed by intervention, will prevent or allevi- ate learning problems. In this study it was possible to classify 91 percent of the preschool subjects as good or poor readers, using either a combination of three screening variables (sen- tence memory, visual matching, color naming) or predeter- mined school criteria. The valid positive rate (sensitivity) was high, as was the valid negative rate (specificity). However, the PPV index, or probability of predicting that a subject low on the screening will have a poor outcome, was low. In these respects the results are similar to those obtained in an earlier version of the HSB (Badian 1988a) analyzed by Carran and Scott (1992), but sensitivity, and even the PPV index, are much higher in this study than on another earlier version of the HSB (Badian 1988b).
To conclude, this study suggests that tests of phonological awareness, serial naming speed, and orthographic processing in a preschool battery make a strong contribution to the prediction of first grade reading skills. Together with letter naming and a
PRESCHOOL PREDICTION 23
rating of preschool reading ability these tests accounted for 60 percent of the variance in word reading/spelling, with the orthographic task responsible for more than half of it. Future follow ups will show whether these tasks continue to predict later reading. From the study of this year-group of children pre- dictions of good and poor reading can be generated for future samples. It should be stressed, however, that the preschool screening battery, and the orthographic task in particular, was more effective in predicting which children would succeed in first grade reading, than who would fail. This means that chil- dren who score low on a preschool battery are not necessarily doomed to failure. Effective teaching methods undoubtedly play a strong role in unexpected success, increasing the false positive rate. All subjects of this study were fortunate in that they were taught reading, spelling, and writing by an excellent, structured, multisensory phonetic approach (Bradley 1977).
References
Adams, M. J. 1990. Beginning to Read: Thinking and Learning about Print. Cambridge, MA: MIT Press.
Adams, M. J., and Bruck, M. 1993. Word recognition: The interface of educational poli- cies and scientific research. Reading and Writing: An Interdisciplinary Journal 5:113-39.
Badian, N. A. 1993a. Predicting reading progress in children receiving special help. Annals of Dyslexia 43:90-109.
Badian, N. A. 1993b. Phonemic awareness, naming, visual symbol processing, and reading. Reading and Writing: An Interdisciplinary Journal 5:87-100.
Badian, N. A. 1990. Background factors and preschool test scores as predictors of read- ing: A nine-year longitudinal study. Reading and Writing: An Interdisciplinary Journal 2:11-30.
Badian, N. A. 1988a. The prediction of good and poor reading before kindergarten entry: A nine-year follow-up. Journal of Learning Disabilities 21:98-103.
Badian, N. A. 1988b. Predicting dyslexia in a preschool population. In R. L. and M. W. Masland (eds.). Preschool Prevention of Reading Failure, Parkton, MD: York Press.
Badian, N. A. 1982. The prediction of good and poor reading before kindergarten entry: A 4-year follow-up. Journal of Special Education 16:309-18.
Badian, N. A., Duffy, F. H., Als, H., and McAnulty, G. B. 1991. Linguistic profiles of dyslexics and good readers. Annals of Dyslexia 41:221--45.
Badian, N. A., McAnulty, G. B., Duffy, F. H., and Als, H. 1990. Prediction of dyslexia in kindergarten boys. Annals of Dyslexia 40:152-69.
Ball, E. W. 1993. Phonological awareness: What's important and to whom? Reading and Writing: An Interdisciplinary Journal 5:141-59.
Berninger, V. W. 1990. Multiple orthographic codes: Key to alternative instructional methodologies for developing orthographic-phonological connections underly- ing word identification. School Psychology Review 19:518--33.
Blachman, B. 1984. Relationship of rapid naming ability and language analysis skills to kindergarten and first grade reading achievement. Journal of Educational Psychology 76:610--22.
Bowers, P. G., and Swanson, L. B. 1991. Naming speed deficits in reading disability: Multiple measures of a singular process. Journal of Experimental Child Psychology 51:195-219.
Bowers, P. G., and Wolf, M. 1993. Theoretical links among naming speed, precise tim- ing mechanisms and orthographic skill in dyslexia. Reading and Writing: An Interdisciplinary Journal 5:69-85.
Bradley, R. F. 1977. Won Way: An Approach to Reading and Language Arts. Wenham, MA: Bradley Enterprises.
Carran, D. T., and Scott, K. G. 1992. Risk assessment in preschool children: Research implications for the early detection of educational handicaps. Topics in Early Childhood Special Education 12:196-211.
Cunningham, A. E., and Stanovich, K. E. 1993. Children's literacy environments and early word recognition skills. Reading and Writing: An Interdisciplinary Journal 5:193-204.
Davis, J. M., and Spring, C. 1990. The Digit Naming Speed Test: Its power and incre- mental validity in identifying children with specific reading disabilities. Psychology in the Schools 27:15-22.
Denckla, M. B., and Rudel, R. 1976. Rapid automatized naming (R.A.N.): Dyslexia dif- ferentiated from other learning disabilities. Neuropsychologia 14:471-79.
Denckla, M. B., and Rudel, R. 1974. Rapid "automatized" naming of pictured objects, colors, letters and numbers by normal children. Cortex 10: 186-202.
Ehri, L. C. 1989. The development of spelling knowledge and its role in reading acquisi- tion and reading disability. Journal of Learning Disabilities 22:356-65.
Felton, R. H. 1992. Early identification of children at risk for reading disabilities. Topics in Early Childhood Special Education 12:212-29.
Felton, R. H., and Brown, I. S. 1990. Phonological processes as predictors of specific reading skills in children at risk for reading failure. Reading and Writing: An Interdisciplinary Journal 2:39-59.
Felton, R. H., and Wood, F. B. 1989. Cognitive deficits in reading disability and atten- tion deficit disorder. Journal of Learning Disabilities 22:3-13, 22.
Koppitz, E. M. 1968. Psychological Evaluation of Children's Human Figure Drawings. New York: Grune and Stratton.
Liberman, I. Y, Shankweiler, D., Fischer, F. W., and Carter, B. 1974. Explicit syllable and phoneme segmentation in the young child. Journal of Experimental Child Psychology 18:201-12.
Maclean, M., Bryant, P., and Bradley, L. 1987. Rhyming, nursery rhymes, and reading in early childhood. Merrill-Palmer Quarterly 33:255-81.
Mann, V. A., and Liberman, I. Y., 1984. Phonological awareness and verbal short-term memory. Journal of Learning Disabilities 17:592-99.
Olson, R., Wise, B., Conners, F., Rack, J., and Fulker, D. 1989. Specific deficits in compo- nent reading and language skills: Genetic and environmental influences. Journal of Learning Disabilities 22:339--48.
Perfetti, C. A., Beck, I., Bell, L., and Hughes, C. 1987. Phonemic knowledge and learn- ing to read are reciprocal: A longitudinal study of first grade children. Merrill- Palmer Quarterly 33:283-319.
Rosner, J., and Simon, D. 1971. The Auditory Analysis Test: An initial report. Journal of Learning Disabilities 4:384-92.
Sattler, J. M. 1974. An Assessment of Children's Intelligence. Philadelphia: Saunders. Satz, P., and Friel, J. 1974. Some predictive antecedents of specific reading disability: A
preliminary two-year follow-up. Journal of Learning Disabilities 7:48-55. Stanovich, K. E. 1992. Speculations on the causes and consequences of individual differ-
ences in early reading acquisition. In R. B. Gough, L. C. Ehri, and R. Treiman (eds.). Reading Acquisition. Hillsdale, NJ: Lawrence Erlbaum Associates.
PRESCHOOL PREDICTION 25
Stanovich, K. E., and West, R. F. 1989. Exposure to print and orthographic processing. Reading Research Quarterly 24"402-33.
Torgesen, J. K., Wagner, R. K., Simmons, K., and Laughon, P. 1990. Identifying phono- logical coding problems in disabled readers: Naming, counting, or span mea- sures? Learning Disability Quarterly 13:236--43.
Wagner, R. K., and Torgesen, J. K. 1987. The nature of phonological processing and its causal role in the acquisition of reading skills. Psychological Bulletin 101:192-212.
Wechsler, D. 1963. Wechsler Preschool and Primary Scale of Intelligence. New York: Psychological Corporation.
Wolf, M. 1991. Naming speed and reading: The contribution of the cognitive neuro- sciences. Reading Research Quarterly 26:123-41.
Wolf, M. 1984. Naming, reading, and the dyslexias: A longitudinal overview. Annals of Dyslexia 34:87-115.
Wolf, M., Bally, H., and Morris, R. 1986. Automaticity, retrieval processes, and reading: A longitudinal study in average and impaired readers. Child Development 57:988-1000.