217
An umbrella trust governed by the laws of Ireland. Principal Global Investors Funds Annual Report and Audited Financial Statements For the year ended 30 September 2018
| Date post: | 07-May-2023 |
| Category: |
Documents |
| Upload: | khangminh22 |
| View: | 3 times |
| Download: | 0 times |
An umbrella trust governed by the laws of Ireland.
Principal Global Investors Funds Annual Report and Audited Financial Statements
For the year ended 30 September 2018
PRINCIPAL GLOBAL INVESTORS FUNDS
ANNUAL REPORT AND AUDITED FINANCIAL STATEMENTS FOR THE YEAR ENDED 30 SEPTEMBER 2018
CONTENTS
General Information 4 - 12 Investment Adviser s Report 13 - 20
21 - 24 Depositary 25
26 Statement of Depositary 26
Portfolio of Investments: Global Equity F 27 - 28 Asian Equity F 29 - 30 European Equity F 31 - 33
33 - 35 35 - 36
Preferred Securities Fund 37 - 44 45 - 46
High Yield F 47 - 53 Global Property Securities F 54 - 56 Post Global Limited Term High Yield F 57 - 60 Origin Global Emerging Markets F 61 - 62 Origin Global Smaller Companies F 63 - 66
67 68 - 73
74 - 77 Statement of Financial Position as at 30 September 2018 78 - 83 Statement of Financial Position as at 30 September 2017 84 - 89 Statement of Comprehensive Income for the year ended 30 September 2018 90 - 92 Statement of Comprehensive Income for the year ended 30 September 2017 93 - 95 Statement of Movement in Net Assets Attributable to Redeemable Participating Unitholders for the year ended 30 September 2018 96 - 98 Statement of Movement in Net Assets Attributable to Redeemable Participating Unitholders for the year ended 30 September 2017 99 - 101 Notes to the Annual Report and Financial Statements 102 - 177
Supplementary Information (Unaudited): Fund Performance & Leverage 178 - 188 Total Expense Ratios 189 - 190 UCITS V Remuneration Policy 191
PRINCIPAL GLOBAL INVESTORS FUNDS
ANNUAL REPORT AND AUDITED FINANCIAL STATEMENTS FOR THE YEAR ENDED 30 SEPTEMBER 2018
CONTENTS (continued)
Statement of Material Portfolio Changes (Unaudited): Global Equity F 192 Asian Equity F 193 European Equity F 194 Emerging Markets Equity F 195 Japanese Equity Fund 196 Preferred Securities Fund 197 U.S. Equity F 198 High Yield F 199 Global Property Securities F 200 Post Global Limited Term High Yield F 201 Global Time Diversified Absolute Return Fund 202 Global Small Cap Equity F 203 Origin Global Emerging Markets F 204 Origin Global Smaller Companies F 205 Claritas Latin American Equity F 206 Finisterre Emerging Market Debt Fund 207
208 209
210 211
Finisterre Unconstrained Emerging Markets Fixed Income Fund 212 Securities Financing Transaction Regulation (Unaudited) 213 Directory 214 - 215 Information for Investors in Switzerland 215 Enquiries 216
PRINCIPAL GLOBAL INVESTORS FUNDS
4
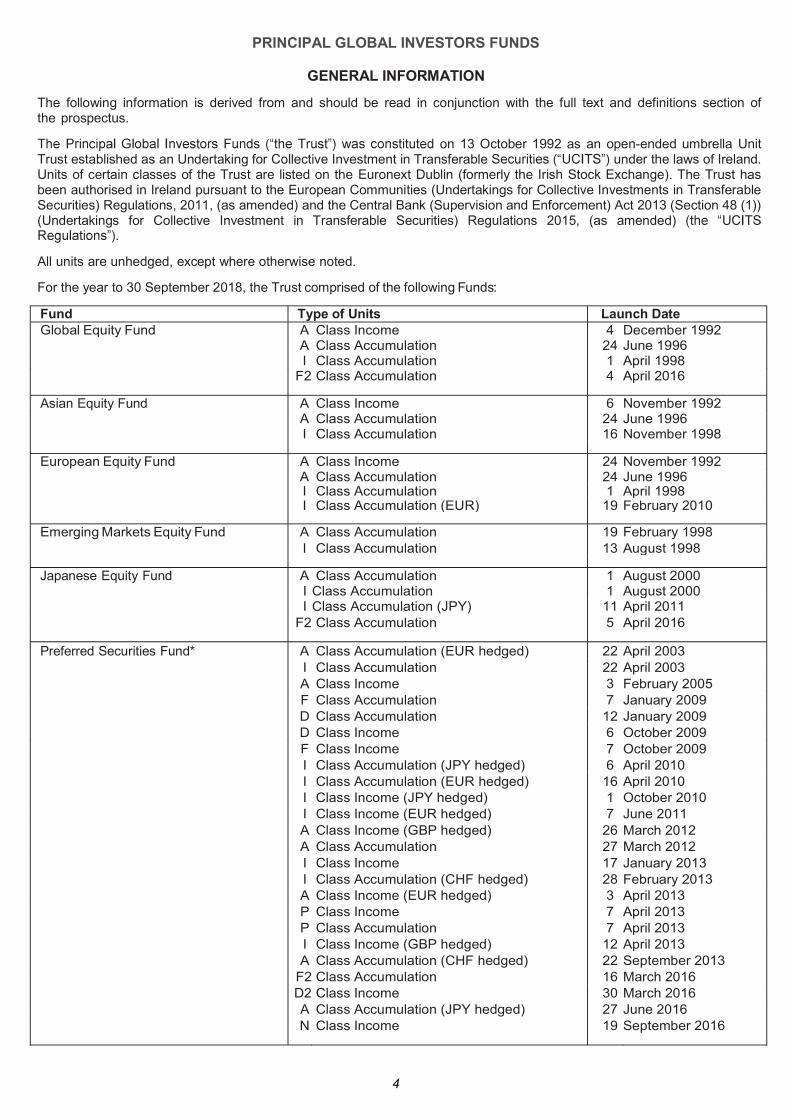
GENERAL INFORMATION
The following information is derived from and should be read in conjunction with the full text and definitions section of the prospectus.
on 13 October 1992 as an open-ended umbrella Unit Trust established as an Undertaking for Collective Investment in Transferable S under the laws of Ireland. Units of certain classes of the Trust are listed on the Euronext Dublin (formerly the Irish Stock Exchange). The Trust has been authorised in Ireland pursuant to the European Communities (Undertakings for Collective Investments in Transferable Securities) Regulations, 2011, (as amended) and the Central Bank (Supervision and Enforcement) Act 2013 (Section 48 (1)) (Undertakings for Collective Investment in Transferable Securities) Regulations 2015, (as amended)
All units are unhedged, except where otherwise noted.
For the year to 30 September 2018, the Trust comprised of the following Funds:
Fund Type of Units Launch Date Global Equity Fund A Class Income 4 December 1992 A Class Accumulation 24 June 1996 I Class Accumulation 1 April 1998 F2 Class Accumulation 4 April 2016
Asian Equity Fund A Class Income 6 November 1992 A Class Accumulation 24 June 1996 I Class Accumulation 16 November 1998
European Equity Fund A Class Income 24 November 1992 A Class Accumulation 24 June 1996 I Class Accumulation 1 April 1998 I Class Accumulation (EUR) 19 February 2010
Emerging Markets Equity Fund A Class Accumulation 19 February 1998 I Class Accumulation 13 August 1998
Japanese Equity Fund A Class Accumulation 1 August 2000 I Class Accumulation 1 August 2000 I Class Accumulation (JPY) 11 April 2011 F2 Class Accumulation 5 April 2016
Preferred Securities Fund* A Class Accumulation (EUR hedged) 22 April 2003 I Class Accumulation 22 April 2003 A Class Income 3 February 2005 F Class Accumulation 7 January 2009 D Class Accumulation 12 January 2009 D Class Income 6 October 2009 F Class Income 7 October 2009 I Class Accumulation (JPY hedged) 6 April 2010 I Class Accumulation (EUR hedged) 16 April 2010 I Class Income (JPY hedged) 1 October 2010 I Class Income (EUR hedged) 7 June 2011 A Class Income (GBP hedged) 26 March 2012 A Class Accumulation 27 March 2012 I Class Income 17 January 2013 I Class Accumulation (CHF hedged) 28 February 2013 A Class Income (EUR hedged) 3 April 2013 P Class Income 7 April 2013 P Class Accumulation 7 April 2013 I Class Income (GBP hedged) 12 April 2013 A Class Accumulation (CHF hedged) 22 September 2013 F2 Class Accumulation 16 March 2016 D2 Class Income 30 March 2016 A Class Accumulation (JPY hedged) 27 June 2016 N Class Income 19 September 2016
PRINCIPAL GLOBAL INVESTORS FUNDS
5
GENERAL INFORMATION (continued)
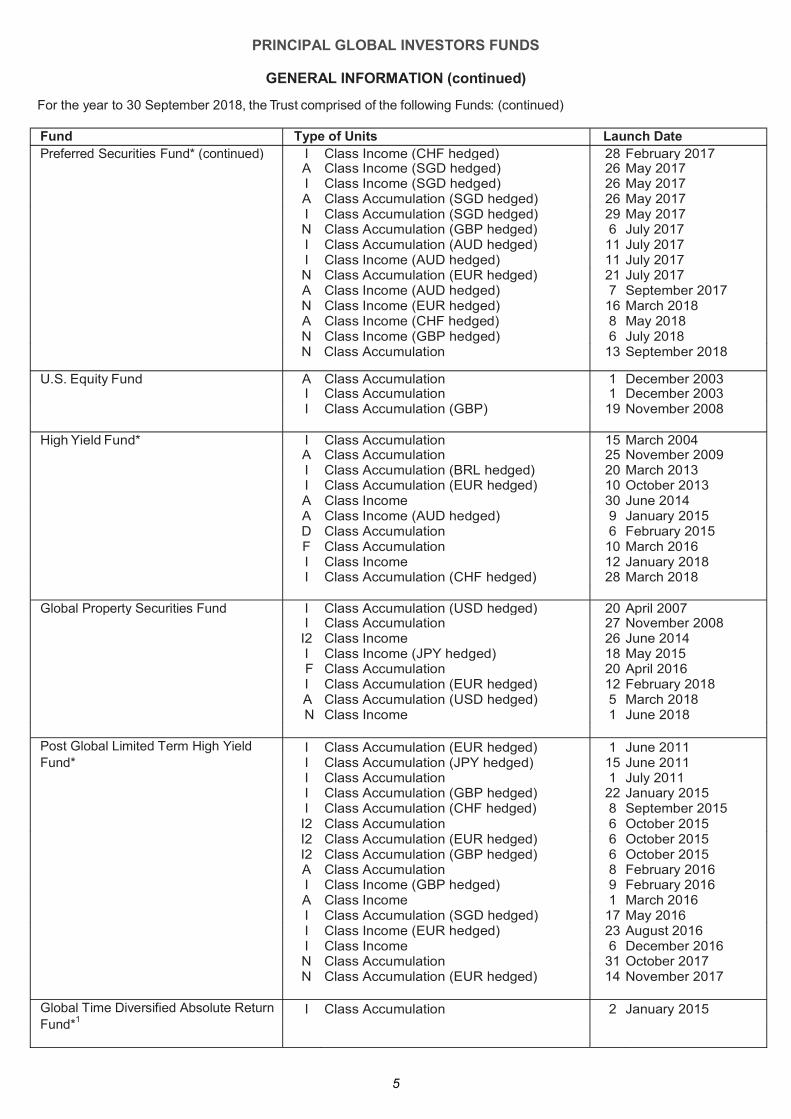
For the year to 30 September 2018, the Trust comprised of the following Funds: (continued)
Fund Type of Units Launch Date Preferred Securities Fund* (continued) I Class Income (CHF hedged) 28 February 2017 A Class Income (SGD hedged) 26 May 2017 I Class Income (SGD hedged) 26 May 2017 A Class Accumulation (SGD hedged) 26 May 2017 I Class Accumulation (SGD hedged) 29 May 2017 N Class Accumulation (GBP hedged) 6 July 2017 I Class Accumulation (AUD hedged) 11 July 2017 I Class Income (AUD hedged) 11 July 2017 N Class Accumulation (EUR hedged) 21 July 2017 A Class Income (AUD hedged) 7 September 2017 N Class Income (EUR hedged) 16 March 2018 A Class Income (CHF hedged) 8 May 2018 N Class Income (GBP hedged) 6 July 2018
N Class Accumulation 13 September 2018
U.S. Equity Fund A Class Accumulation 1 December 2003 I Class Accumulation 1 December 2003 I Class Accumulation (GBP) 19 November 2008 High Yield Fund* I Class Accumulation 15 March 2004 A Class Accumulation 25 November 2009 I Class Accumulation (BRL hedged) 20 March 2013 I Class Accumulation (EUR hedged) 10 October 2013 A Class Income 30 June 2014 A Class Income (AUD hedged) 9 January 2015 D Class Accumulation 6 February 2015 F Class Accumulation 10 March 2016 I Class Income 12 January 2018 I Class Accumulation (CHF hedged) 28 March 2018 Global Property Securities Fund I Class Accumulation (USD hedged) 20 April 2007 I Class Accumulation 27 November 2008 I2 Class Income 26 June 2014 I Class Income (JPY hedged) 18 May 2015 F Class Accumulation 20 April 2016 I Class Accumulation (EUR hedged) 12 February 2018 A Class Accumulation (USD hedged) 5 March 2018 N Class Income 1 June 2018 Post Global Limited Term High Yield I Class Accumulation (EUR hedged) 1 June 2011 Fund* I Class Accumulation (JPY hedged) 15 June 2011 I Class Accumulation 1 July 2011 I Class Accumulation (GBP hedged) 22 January 2015 I Class Accumulation (CHF hedged) 8 September 2015 I2 Class Accumulation 6 October 2015 I2 Class Accumulation (EUR hedged) 6 October 2015 I2 Class Accumulation (GBP hedged) 6 October 2015 A Class Accumulation 8 February 2016 I Class Income (GBP hedged) 9 February 2016 A Class Income 1 March 2016 I Class Accumulation (SGD hedged) 17 May 2016 I Class Income (EUR hedged) 23 August 2016 I Class Income 6 December 2016 N Class Accumulation 31 October 2017 N Class Accumulation (EUR hedged) 14 November 2017 Global Time Diversified Absolute Return I Class Accumulation 2 January 2015 Fund*1
PRINCIPAL GLOBAL INVESTORS FUNDS
6
GENERAL INFORMATION (continued)
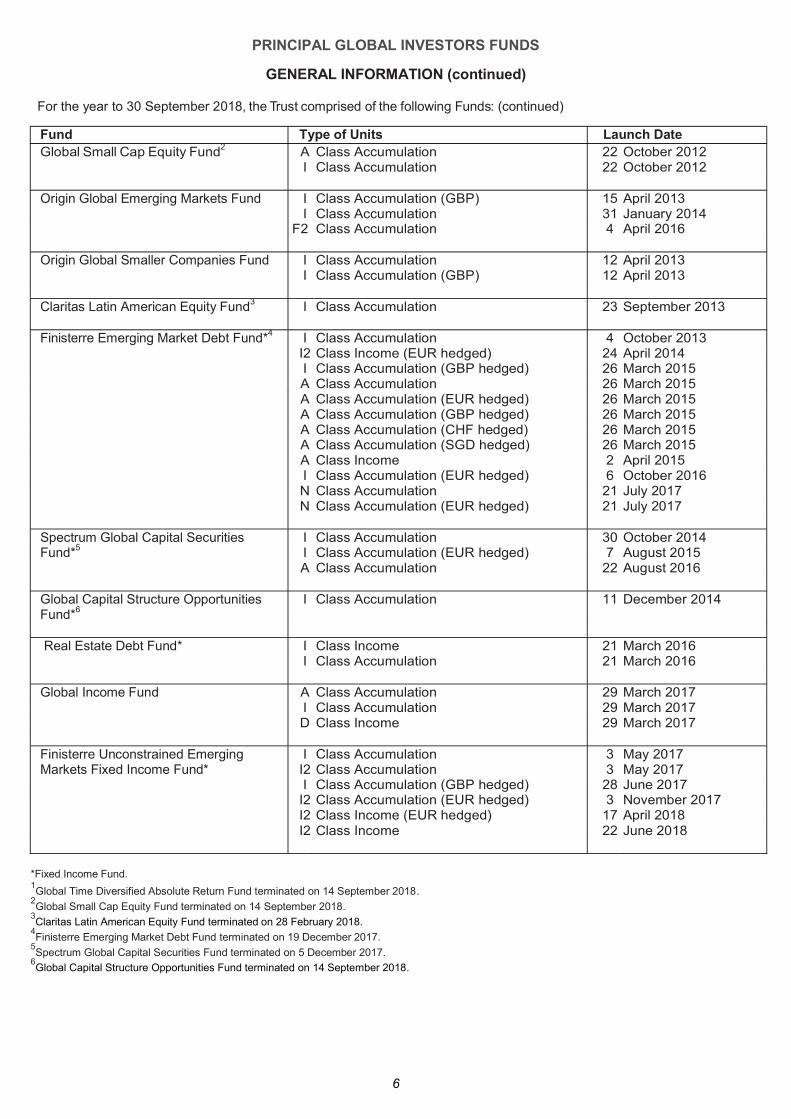
For the year to 30 September 2018, the Trust comprised of the following Funds: (continued)
Fund Type of Units Launch Date Global Small Cap Equity Fund2 A Class Accumulation 22 October 2012 I Class Accumulation 22 October 2012 Origin Global Emerging Markets Fund I Class Accumulation (GBP) 15 April 2013 I Class Accumulation 31 January 2014 F2 Class Accumulation 4 April 2016 Origin Global Smaller Companies Fund I Class Accumulation 12 April 2013 I Class Accumulation (GBP) 12 April 2013 Claritas Latin American Equity Fund3 I Class Accumulation 23 September 2013 Finisterre Emerging Market Debt Fund*4 I Class Accumulation 4 October 2013 I2 Class Income (EUR hedged) 24 April 2014 I Class Accumulation (GBP hedged) 26 March 2015 A Class Accumulation 26 March 2015 A Class Accumulation (EUR hedged) 26 March 2015 A Class Accumulation (GBP hedged) 26 March 2015 A Class Accumulation (CHF hedged) 26 March 2015 A Class Accumulation (SGD hedged) 26 March 2015 A Class Income 2 April 2015 I Class Accumulation (EUR hedged) 6 October 2016 N Class Accumulation 21 July 2017 N Class Accumulation (EUR hedged) 21 July 2017 Spectrum Global Capital Securities I Class Accumulation 30 October 2014 Fund*5 I Class Accumulation (EUR hedged) 7 August 2015 A Class Accumulation 22 August 2016 Global Capital Structure Opportunities I Class Accumulation 11 December 2014 Fund*6 Real Estate Debt Fund* I Class Income 21 March 2016 I Class Accumulation 21 March 2016 Global Income Fund A Class Accumulation 29 March 2017 I Class Accumulation 29 March 2017 D Class Income 29 March 2017 Finisterre Unconstrained Emerging I Class Accumulation 3 May 2017 Markets Fixed Income Fund* I2 Class Accumulation 3 May 2017 I Class Accumulation (GBP hedged) 28 June 2017 I2 Class Accumulation (EUR hedged) 3 November 2017 I2 Class Income (EUR hedged) 17 April 2018 I2 Class Income 22 June 2018
*Fixed Income Fund. 1Global Time Diversified Absolute Return Fund terminated on 14 September 2018.
2Global Small Cap Equity Fund terminated on 14 September 2018.
3Claritas Latin American Equity Fund terminated on 28 February 2018.
4Finisterre Emerging Market Debt Fund terminated on 19 December 2017.
5Spectrum Global Capital Securities Fund terminated on 5 December 2017.
6Global Capital Structure Opportunities Fund terminated on 14 September 2018.
PRINCIPAL GLOBAL INVESTORS FUNDS
7
GENERAL INFORMATION (continued)
and the Board of Directors of the Manager , add additional Funds.
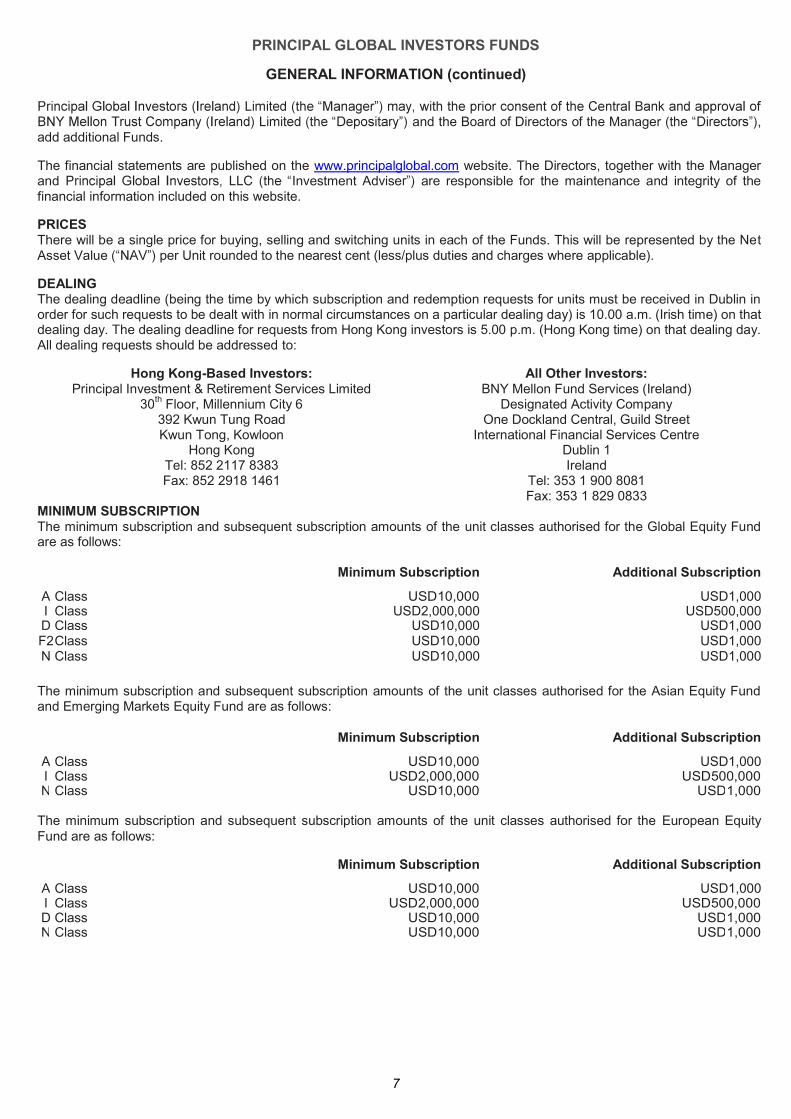
The financial statements are published on the www.principalglobal.com website. The Directors, together with the Manager and Investment Advise are responsible for the maintenance and integrity of the financial information included on this website.
PRICES There will be a single price for buying, selling and switching units in each of the Funds. This will be represented by the Net Asset Value per Unit rounded to the nearest cent (less/plus duties and charges where applicable).
DEALING The dealing deadline (being the time by which subscription and redemption requests for units must be received in Dublin in order for such requests to be dealt with in normal circumstances on a particular dealing day) is 10.00 a.m. (Irish time) on that dealing day. The dealing deadline for requests from Hong Kong investors is 5.00 p.m. (Hong Kong time) on that dealing day. All dealing requests should be addressed to:
Hong Kong-Based Investors: All Other Investors: Principal Investment & Retirement Services Limited BNY Mellon Fund Services (Ireland)
30th Floor, Millennium City 6 Designated Activity Company 392 Kwun Tung Road One Dockland Central, Guild Street Kwun Tong, Kowloon International Financial Services Centre
Hong Kong Dublin 1 Tel: 852 2117 8383 Ireland Fax: 852 2918 1461 Tel: 353 1 900 8081
Fax: 353 1 829 0833 MINIMUM SUBSCRIPTION The minimum subscription and subsequent subscription amounts of the unit classes authorised for the Global Equity Fund are as follows: Minimum Subscription Additional Subscription
A Class USD10,000 USD1,000 I Class USD2,000,000 USD500,000 D Class USD10,000 USD1,000 F2 Class USD10,000 USD1,000 N Class USD10,000 USD1,000
The minimum subscription and subsequent subscription amounts of the unit classes authorised for the Asian Equity Fund and Emerging Markets Equity Fund are as follows:
Minimum Subscription Additional Subscription
A Class USD10,000 USD1,000 I Class USD2,000,000 USD500,000 N Class USD10,000 USD1,000
The minimum subscription and subsequent subscription amounts of the unit classes authorised for the European Equity Fund are as follows:
Minimum Subscription Additional Subscription
A Class USD10,000 USD1,000 I Class USD2,000,000 USD500,000 D Class USD10,000 USD1,000 N Class USD10,000 USD1,000
PRINCIPAL GLOBAL INVESTORS FUNDS
8
GENERAL INFORMATION (continued)
MINIMUM SUBSCRIPTION (continued)
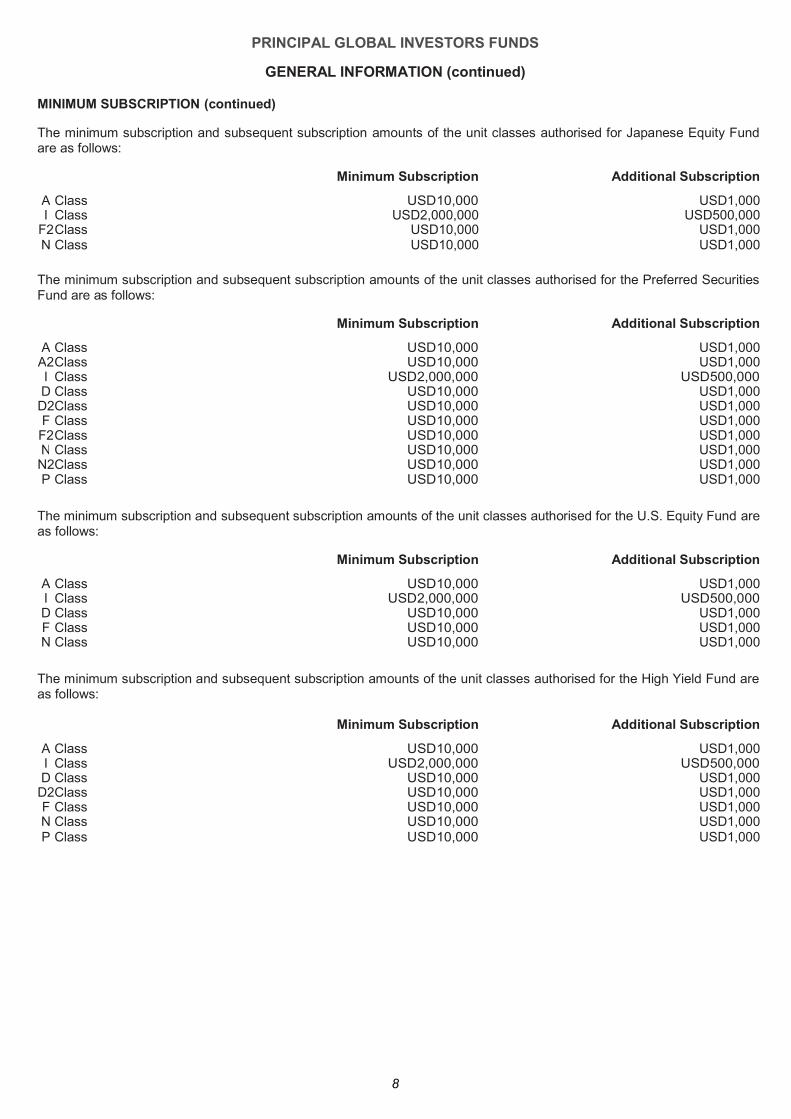
The minimum subscription and subsequent subscription amounts of the unit classes authorised for Japanese Equity Fund are as follows:
Minimum Subscription Additional Subscription
A Class USD10,000 USD1,000 I Class USD2,000,000 USD500,000
F2 Class USD10,000 USD1,000 N Class USD10,000 USD1,000
The minimum subscription and subsequent subscription amounts of the unit classes authorised for the Preferred Securities Fund are as follows:
Minimum Subscription Additional Subscription
A Class USD10,000 USD1,000 A2 Class USD10,000 USD1,000 I Class USD2,000,000 USD500,000 D Class USD10,000 USD1,000 D2 Class USD10,000 USD1,000 F Class USD10,000 USD1,000 F2 Class USD10,000 USD1,000 N Class USD10,000 USD1,000 N2 Class USD10,000 USD1,000 P Class USD10,000 USD1,000
The minimum subscription and subsequent subscription amounts of the unit classes authorised for the U.S. Equity Fund are as follows:
Minimum Subscription Additional Subscription
A Class USD10,000 USD1,000 I Class USD2,000,000 USD500,000 D Class USD10,000 USD1,000 F Class USD10,000 USD1,000 N Class USD10,000 USD1,000
The minimum subscription and subsequent subscription amounts of the unit classes authorised for the High Yield Fund are as follows: Minimum Subscription Additional Subscription
A Class USD10,000 USD1,000 I Class USD2,000,000 USD500,000 D Class USD10,000 USD1,000 D2 Class USD10,000 USD1,000 F Class USD10,000 USD1,000 N Class USD10,000 USD1,000 P Class USD10,000 USD1,000
PRINCIPAL GLOBAL INVESTORS FUNDS
9
GENERAL INFORMATION (continued)
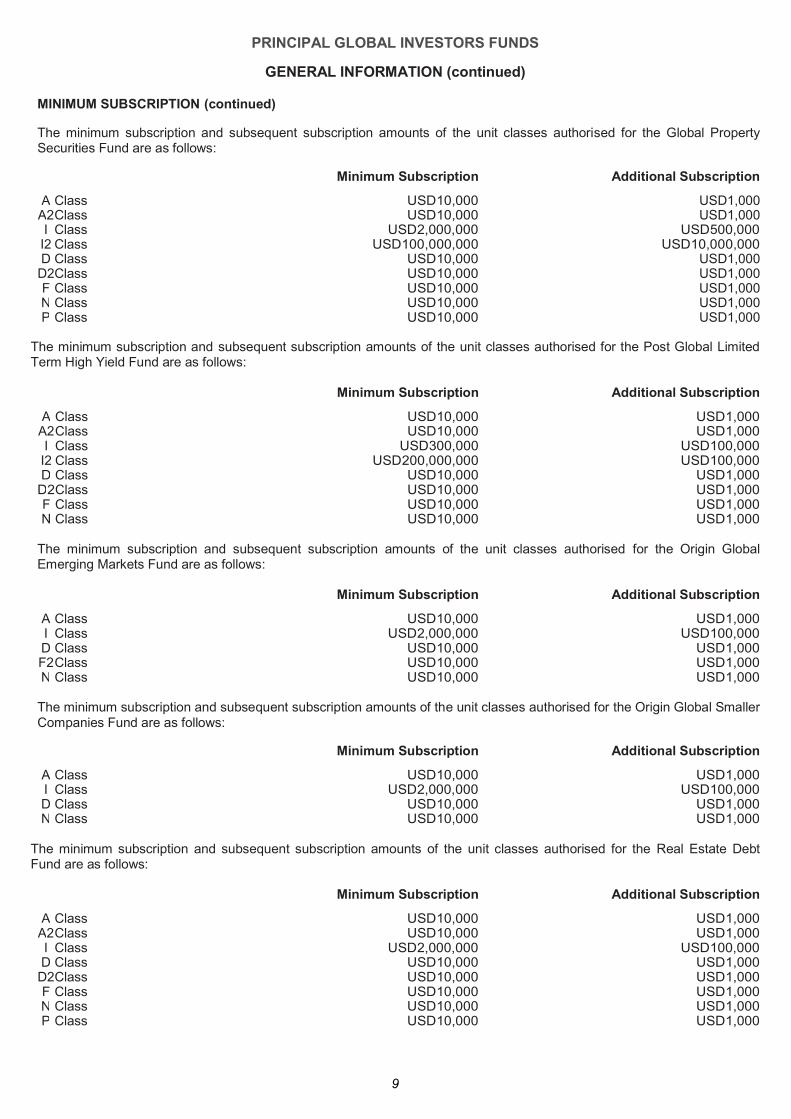
MINIMUM SUBSCRIPTION (continued)
The minimum subscription and subsequent subscription amounts of the unit classes authorised for the Global Property Securities Fund are as follows:
Minimum Subscription Additional Subscription
A Class USD10,000 USD1,000 A2 Class USD10,000 USD1,000 I Class USD2,000,000 USD500,000 I2 Class USD100,000,000 USD10,000,000 D Class USD10,000 USD1,000 D2 Class USD10,000 USD1,000 F Class USD10,000 USD1,000 N Class USD10,000 USD1,000 P Class USD10,000 USD1,000
The minimum subscription and subsequent subscription amounts of the unit classes authorised for the Post Global Limited Term High Yield Fund are as follows:
Minimum Subscription Additional Subscription
A Class USD10,000 USD1,000 A2 Class USD10,000 USD1,000 I Class USD300,000 USD100,000
I2 Class USD200,000,000 USD100,000 D Class USD10,000 USD1,000
D2 Class USD10,000 USD1,000 F Class USD10,000 USD1,000 N Class USD10,000 USD1,000
The minimum subscription and subsequent subscription amounts of the unit classes authorised for the Origin Global Emerging Markets Fund are as follows:
Minimum Subscription Additional Subscription
A Class USD10,000 USD1,000 I Class USD2,000,000 USD100,000 D Class USD10,000 USD1,000 F2 Class USD10,000 USD1,000 N Class USD10,000 USD1,000
The minimum subscription and subsequent subscription amounts of the unit classes authorised for the Origin Global Smaller Companies Fund are as follows:
Minimum Subscription Additional Subscription
A Class USD10,000 USD1,000 I Class USD2,000,000 USD100,000 D Class USD10,000 USD1,000 N Class USD10,000 USD1,000
The minimum subscription and subsequent subscription amounts of the unit classes authorised for the Real Estate Debt Fund are as follows:
Minimum Subscription Additional Subscription
A Class USD10,000 USD1,000 A2 Class USD10,000 USD1,000 I Class USD2,000,000 USD100,000 D Class USD10,000 USD1,000 D2 Class USD10,000 USD1,000 F Class USD10,000 USD1,000 N Class USD10,000 USD1,000 P Class USD10,000 USD1,000
PRINCIPAL GLOBAL INVESTORS FUNDS
10
GENERAL INFORMATION (continued)
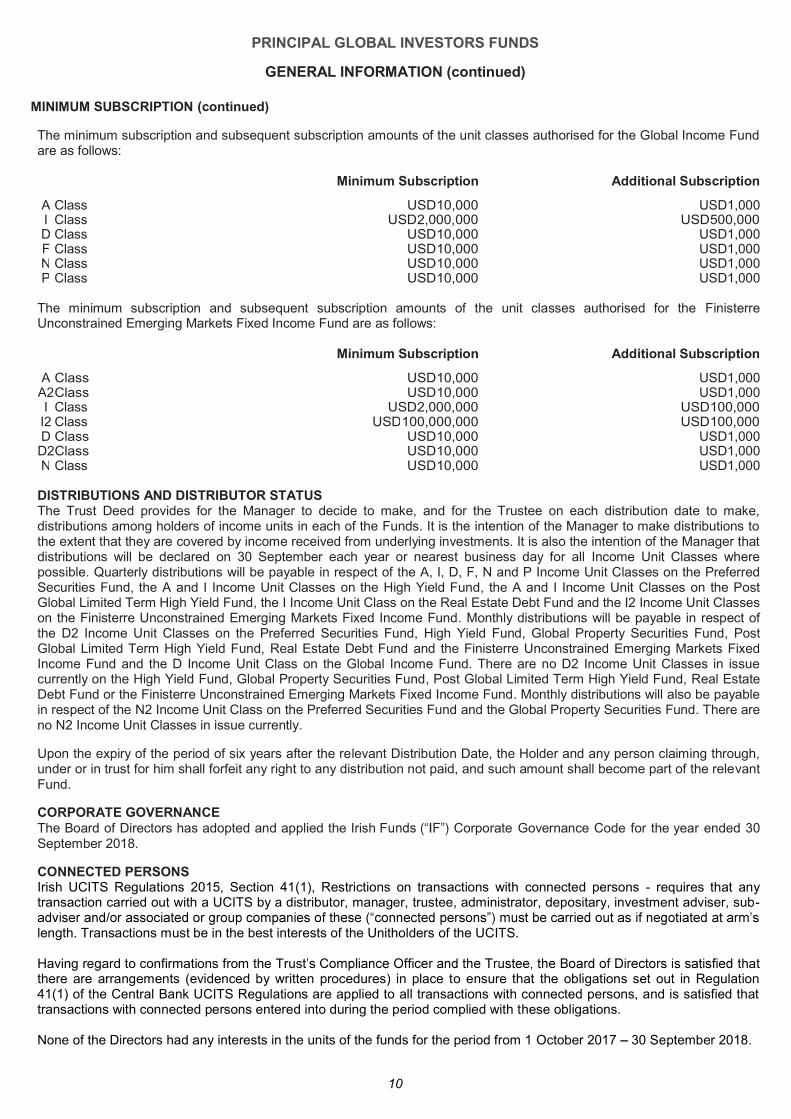
MINIMUM SUBSCRIPTION (continued)
The minimum subscription and subsequent subscription amounts of the unit classes authorised for the Global Income Fund are as follows: Minimum Subscription Additional Subscription
A Class USD10,000 USD1,000 I Class USD2,000,000 USD500,000 D Class USD10,000 USD1,000 F Class USD10,000 USD1,000 N Class USD10,000 USD1,000 P Class USD10,000 USD1,000
The minimum subscription and subsequent subscription amounts of the unit classes authorised for the Finisterre Unconstrained Emerging Markets Fixed Income Fund are as follows: Minimum Subscription Additional Subscription
A Class USD10,000 USD1,000 A2 Class USD10,000 USD1,000 I Class USD2,000,000 USD100,000 I2 Class USD100,000,000 USD100,000 D Class USD10,000 USD1,000 D2 Class USD10,000 USD1,000 N Class USD10,000 USD1,000
DISTRIBUTIONS AND DISTRIBUTOR STATUS The Trust Deed provides for the Manager to decide to make, and for the Trustee on each distribution date to make, distributions among holders of income units in each of the Funds. It is the intention of the Manager to make distributions to the extent that they are covered by income received from underlying investments. It is also the intention of the Manager that distributions will be declared on 30 September each year or nearest business day for all Income Unit Classes where possible. Quarterly distributions will be payable in respect of the A, I, D, F, N and P Income Unit Classes on the Preferred Securities Fund, the A and I Income Unit Classes on the High Yield Fund, the A and I Income Unit Classes on the Post Global Limited Term High Yield Fund, the I Income Unit Class on the Real Estate Debt Fund and the I2 Income Unit Classes on the Finisterre Unconstrained Emerging Markets Fixed Income Fund. Monthly distributions will be payable in respect of the D2 Income Unit Classes on the Preferred Securities Fund, High Yield Fund, Global Property Securities Fund, Post Global Limited Term High Yield Fund, Real Estate Debt Fund and the Finisterre Unconstrained Emerging Markets Fixed Income Fund and the D Income Unit Class on the Global Income Fund. There are no D2 Income Unit Classes in issue currently on the High Yield Fund, Global Property Securities Fund, Post Global Limited Term High Yield Fund, Real Estate Debt Fund or the Finisterre Unconstrained Emerging Markets Fixed Income Fund. Monthly distributions will also be payable in respect of the N2 Income Unit Class on the Preferred Securities Fund and the Global Property Securities Fund. There are no N2 Income Unit Classes in issue currently.
Upon the expiry of the period of six years after the relevant Distribution Date, the Holder and any person claiming through, under or in trust for him shall forfeit any right to any distribution not paid, and such amount shall become part of the relevant Fund.
CORPORATE GOVERNANCE The Board of Directors has adopted and applied the Irish F Corporate Governance Code for the year ended 30 September 2018.
CONNECTED PERSONS Irish UCITS Regulations 2015, Section 41(1), Restrictions on transactions with connected persons - requires that any transaction carried out with a UCITS by a distributor, manager, trustee, administrator, depositary, investment adviser, sub-
length. Transactions must be in the best interests of the Unitholders of the UCITS. Having regard to confirmations from the Trust that there are arrangements (evidenced by written procedures) in place to ensure that the obligations set out in Regulation 41(1) of the Central Bank UCITS Regulations are applied to all transactions with connected persons, and is satisfied that transactions with connected persons entered into during the period complied with these obligations. None of the Directors had any interests in the units of the funds for the period from 1 October 2017 30 September 2018.
PRINCIPAL GLOBAL INVESTORS FUNDS
11
GENERAL INFORMATION (continued)
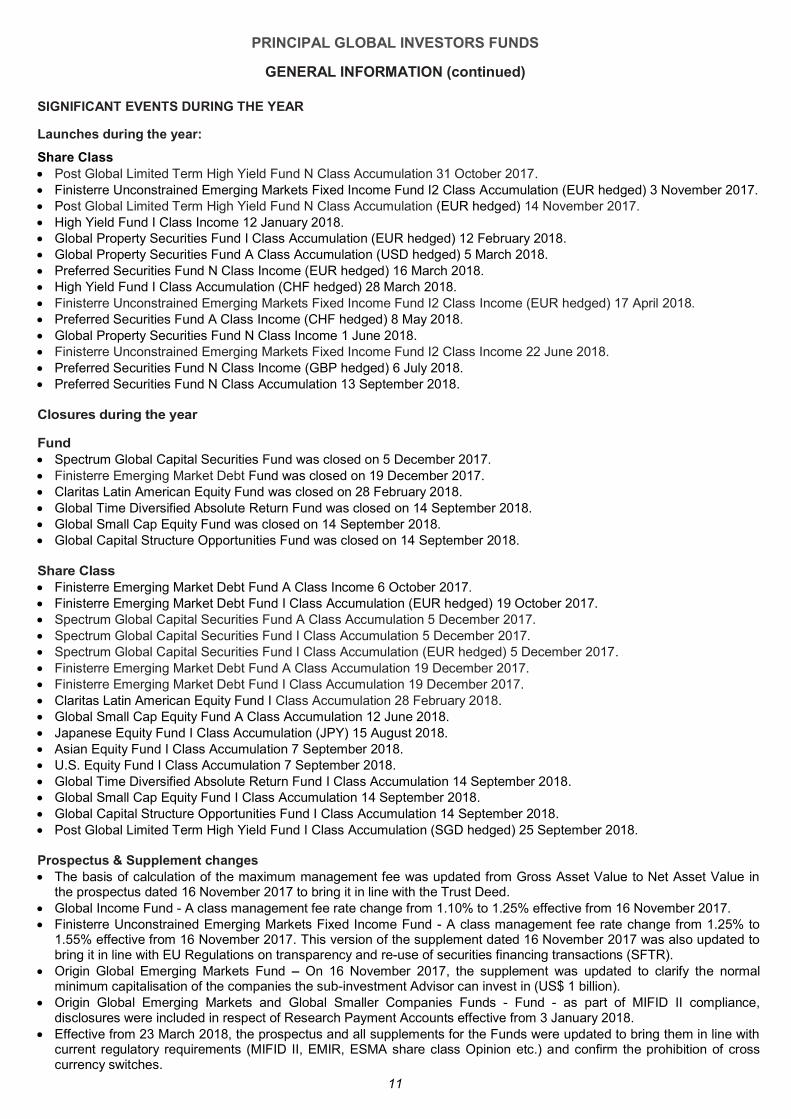
SIGNIFICANT EVENTS DURING THE YEAR Launches during the year:
Share Class Post Global Limited Term High Yield Fund N Class Accumulation 31 October 2017. Finisterre Unconstrained Emerging Markets Fixed Income Fund I2 Class Accumulation (EUR hedged) 3 November 2017. Post Global Limited Term High Yield Fund N Class Accumulation (EUR hedged) 14 November 2017. High Yield Fund I Class Income 12 January 2018. Global Property Securities Fund I Class Accumulation (EUR hedged) 12 February 2018. Global Property Securities Fund A Class Accumulation (USD hedged) 5 March 2018. Preferred Securities Fund N Class Income (EUR hedged) 16 March 2018. High Yield Fund I Class Accumulation (CHF hedged) 28 March 2018. Finisterre Unconstrained Emerging Markets Fixed Income Fund I2 Class Income (EUR hedged) 17 April 2018. Preferred Securities Fund A Class Income (CHF hedged) 8 May 2018. Global Property Securities Fund N Class Income 1 June 2018. Finisterre Unconstrained Emerging Markets Fixed Income Fund I2 Class Income 22 June 2018. Preferred Securities Fund N Class Income (GBP hedged) 6 July 2018. Preferred Securities Fund N Class Accumulation 13 September 2018.
Closures during the year
Fund Spectrum Global Capital Securities Fund was closed on 5 December 2017. Finisterre Emerging Market Debt Fund was closed on 19 December 2017. Claritas Latin American Equity Fund was closed on 28 February 2018. Global Time Diversified Absolute Return Fund was closed on 14 September 2018. Global Small Cap Equity Fund was closed on 14 September 2018. Global Capital Structure Opportunities Fund was closed on 14 September 2018.
Share Class Finisterre Emerging Market Debt Fund A Class Income 6 October 2017. Finisterre Emerging Market Debt Fund I Class Accumulation (EUR hedged) 19 October 2017. Spectrum Global Capital Securities Fund A Class Accumulation 5 December 2017. Spectrum Global Capital Securities Fund I Class Accumulation 5 December 2017. Spectrum Global Capital Securities Fund I Class Accumulation (EUR hedged) 5 December 2017. Finisterre Emerging Market Debt Fund A Class Accumulation 19 December 2017. Finisterre Emerging Market Debt Fund I Class Accumulation 19 December 2017. Claritas Latin American Equity Fund I Class Accumulation 28 February 2018. Global Small Cap Equity Fund A Class Accumulation 12 June 2018. Japanese Equity Fund I Class Accumulation (JPY) 15 August 2018. Asian Equity Fund I Class Accumulation 7 September 2018. U.S. Equity Fund I Class Accumulation 7 September 2018. Global Time Diversified Absolute Return Fund I Class Accumulation 14 September 2018. Global Small Cap Equity Fund I Class Accumulation 14 September 2018. Global Capital Structure Opportunities Fund I Class Accumulation 14 September 2018. Post Global Limited Term High Yield Fund I Class Accumulation (SGD hedged) 25 September 2018.
Prospectus & Supplement changes The basis of calculation of the maximum management fee was updated from Gross Asset Value to Net Asset Value in
the prospectus dated 16 November 2017 to bring it in line with the Trust Deed. Global Income Fund - A class management fee rate change from 1.10% to 1.25% effective from 16 November 2017. Finisterre Unconstrained Emerging Markets Fixed Income Fund - A class management fee rate change from 1.25% to
1.55% effective from 16 November 2017. This version of the supplement dated 16 November 2017 was also updated to bring it in line with EU Regulations on transparency and re-use of securities financing transactions (SFTR).
Origin Global Emerging Markets Fund On 16 November 2017, the supplement was updated to clarify the normal minimum capitalisation of the companies the sub-investment Advisor can invest in (US$ 1 billion).
Origin Global Emerging Markets and Global Smaller Companies Funds - Fund - as part of MIFID II compliance, disclosures were included in respect of Research Payment Accounts effective from 3 January 2018.
Effective from 23 March 2018, the prospectus and all supplements for the Funds were updated to bring them in line with current regulatory requirements (MIFID II, EMIR, ESMA share class Opinion etc.) and confirm the prohibition of cross currency switches.
PRINCIPAL GLOBAL INVESTORS FUNDS
12
GENERAL INFORMATION (continued)
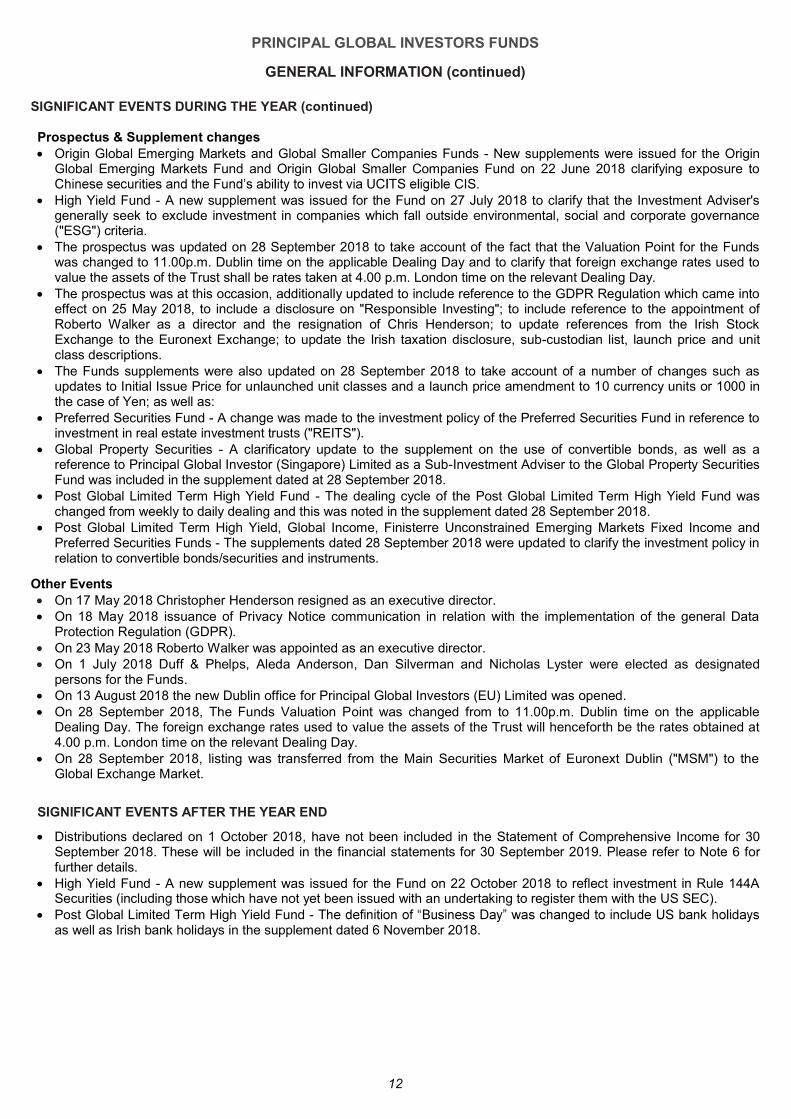
SIGNIFICANT EVENTS DURING THE YEAR (continued) Prospectus & Supplement changes Origin Global Emerging Markets and Global Smaller Companies Funds - New supplements were issued for the Origin
Global Emerging Markets Fund and Origin Global Smaller Companies Fund on 22 June 2018 clarifying exposure to CIS.
High Yield Fund - A new supplement was issued for the Fund on 27 July 2018 to clarify that the Investment Adviser's generally seek to exclude investment in companies which fall outside environmental, social and corporate governance ("ESG") criteria.
The prospectus was updated on 28 September 2018 to take account of the fact that the Valuation Point for the Funds was changed to 11.00p.m. Dublin time on the applicable Dealing Day and to clarify that foreign exchange rates used to value the assets of the Trust shall be rates taken at 4.00 p.m. London time on the relevant Dealing Day.
The prospectus was at this occasion, additionally updated to include reference to the GDPR Regulation which came into effect on 25 May 2018, to include a disclosure on "Responsible Investing"; to include reference to the appointment of Roberto Walker as a director and the resignation of Chris Henderson; to update references from the Irish Stock Exchange to the Euronext Exchange; to update the Irish taxation disclosure, sub-custodian list, launch price and unit class descriptions.
The Funds supplements were also updated on 28 September 2018 to take account of a number of changes such as updates to Initial Issue Price for unlaunched unit classes and a launch price amendment to 10 currency units or 1000 in the case of Yen; as well as:
Preferred Securities Fund - A change was made to the investment policy of the Preferred Securities Fund in reference to investment in real estate investment trusts ("REITS").
Global Property Securities - A clarificatory update to the supplement on the use of convertible bonds, as well as a reference to Principal Global Investor (Singapore) Limited as a Sub-Investment Adviser to the Global Property Securities Fund was included in the supplement dated at 28 September 2018.
Post Global Limited Term High Yield Fund - The dealing cycle of the Post Global Limited Term High Yield Fund was changed from weekly to daily dealing and this was noted in the supplement dated 28 September 2018.
Post Global Limited Term High Yield, Global Income, Finisterre Unconstrained Emerging Markets Fixed Income and Preferred Securities Funds - The supplements dated 28 September 2018 were updated to clarify the investment policy in relation to convertible bonds/securities and instruments.
Other Events On 17 May 2018 Christopher Henderson resigned as an executive director. On 18 May 2018 issuance of Privacy Notice communication in relation with the implementation of the general Data
Protection Regulation (GDPR). On 23 May 2018 Roberto Walker was appointed as an executive director. On 1 July 2018 Duff & Phelps, Aleda Anderson, Dan Silverman and Nicholas Lyster were elected as designated
persons for the Funds. On 13 August 2018 the new Dublin office for Principal Global Investors (EU) Limited was opened. On 28 September 2018, The Funds Valuation Point was changed from to 11.00p.m. Dublin time on the applicable
Dealing Day. The foreign exchange rates used to value the assets of the Trust will henceforth be the rates obtained at 4.00 p.m. London time on the relevant Dealing Day.
On 28 September 2018, listing was transferred from the Main Securities Market of Euronext Dublin ("MSM") to the Global Exchange Market.
SIGNIFICANT EVENTS AFTER THE YEAR END
Distributions declared on 1 October 2018, have not been included in the Statement of Comprehensive Income for 30 September 2018. These will be included in the financial statements for 30 September 2019. Please refer to Note 6 for further details.
High Yield Fund - A new supplement was issued for the Fund on 22 October 2018 to reflect investment in Rule 144A Securities (including those which have not yet been issued with an undertaking to register them with the US SEC).
Post Global Limited Term High Yield Fund - as well as Irish bank holidays in the supplement dated 6 November 2018.
PRINCIPAL GLOBAL INVESTORS FUNDS
for the year ended 30 September 2018
13
Global Equity Fund
For the twelve-month period ending 30 September 2018, the Global Equity Fund reported net performance of 8.4%.
The portfolio benefitted from stock selection within the industrials sector, led by Norfolk Southern, Boeing and Waste Management. Conversely, staple holdings of Philip Morris, Ambev and WH Group offset the outperformance.
Developed markets maintained their dominance as the United States extended its strong returns while emerging markets slumped further. Earnings resilience was the catalyst to higher equity returns outweighing geopolitical risks and trade disputes though the emerging markets group but was unable to stave off currency pressures as well as slowing growth in China.
The US dollar appreciated against most global currency baskets. Central banks continued with their tightening of monetary policies with some advancing further on the initiative. Rate hikes were more prevalent amongst emerging central banks as they were forced to take further action to address persistent currency weakness.
Style leadership remained strongly biased toward growth over value.
Divergence has been a prominent theme in 2018 as returns by style, market cap, country and sector have varied widely despite low aggregate market volatility. The expectation is for this to continue amid global trade tensions and currency pressures slowing growth in China. Further contention is stemming from an economic growth backdrop that is showing signs of fatigue as many leading economic indicators moderate from recent highs despite remaining at expansionary levels.
As noted previously, a major area of investor concern as we move through the year is the escalating trade tensions and tit-for-tat tariffs between the United States and some of its larger counterparts.
We continue to prefer companies with favourable earnings trends and other aspects of improving business fundamentals, rising investor expectations and attractive relative valuations. Stock selection remains our focus, as always.
Asian Equity Fund
For the twelve-month period ending 30 September 2018, the Asian Equity Fund reported net performance of -3.34%.
Overweight positions to CNOOC, PTT Public and DBS Group Holdings, contributed significantly to the strategy, returning +59.7%, +39.8% and +32.2%, respectively. Significant detractors from the portfolio include overweight positions to LARGAN Precision, SK Hynix and LG Electronics. The three detractors from performance returned -31.4%, -24.5% and -38.0%, respectively.
The Asia Pacific region slightly outperformed while stock selection in Asia drove overall losses during the period. Within Asia, positive stock selection in China, Thailand and no exposure to the Philippines, were drivers of outperformance, but these gains were offset by losses in South Korea, India and Taiwan. In the Pacific region, stock selection in Singapore was a notable contributor and Hong Kong underperformed.
Despite the performance headwinds, we are sticking to our stock selection and portfolio construction process. We have shifted the portfolio to be more defensive and reduced our exposure to growth stocks, lowering the overall beta. In Korea, we remain cautious on the overall outlook as domestic drivers to the economy are looking weak, with government policies failing to lift demand while employment growth has slowed sharply. We aggressively reduced our exposure to India to be more neutral to the market and more tilted towards weaker currency beneficiaries. Amid the trade war rhetoric and possible economic slowdown, we maintain our underweight position in China and shifted the portfolio towards more defensive and balanced exposure.
European Equity Fund
For the twelve-month period ending 30 September 2018, the European Equity Fund reported net performance of 2.87%.
The top 3 contributors were Ubisoft, Wirecard and Kering, rising 58.0%, 107.9% and 49.0%, respectively. The top 3 detractors were Total, Vestas Wind Systems and SAP- these returned +7.9%, -30.9% and -4.1%, respectively.
PRINCIPAL GLOBAL INVESTORS FUNDS
for the year ended 30 September 2018 (continued)
14
European Equity Fund (continued)
The Fund saw its strongest positive attribution during the year under review from the financial sector, where our defensive stance was beneficial. Stock selection in France and Spain was particularly strong. We saw especially strong attribution from French online games manufacturer Ubisoft during the year after it rose 58%, from German payment processor Wirecard which more than doubled from the levels at which we first bought into it earlier in the year and from French luxury goods manufacturer Kering which rose 49%.
We saw slight negative attribution from stock selection in the healthcare sector. Denmark and the Netherlands though were positive in most sectors and markets. Our exposure to French energy group Total, Danish wine turbine manufacturer Vestas and German technology group SAP was negative during the year.
Divergence has been a prominent theme in 2018 as style, market cap, country and sector returns have all moved in discordant fashion. The expectation is for this to continue amid global trade tensions, currency pressures and a slowing China. However, corporate fundamentals remain solid in European equity markets.
Markets will continue to face some risk of correction due to de-risking and rebalancing pressures by pension funds and sovereign institutions. Other key risks, as always, include geopolitical uncertainty and potential policy missteps, whether monetary, fiscal and/or regulatory in nature. As we have noted repeatedly in recent years, in a market environment underpinned by aggressive governmental policy, even subtle changes in policy expectations can have swift implications for markets and investor sentiment.
We continue to prefer companies with favourable earnings trends and other aspects of improving business fundamentals, rising investor expectations and attractive relative valuations. Stock selection remains our focus, as always.
Emerging Markets Equity Fund
For the twelve-month period ending 30 September 2018, the Emerging Markets Equity Fund reported net performance of -5.06%.
The top performing contributors during the period were Lukoil, Yageo Corporation, CNOOC, Vale and Walmex, these stocks were up 51.1%, 62.3%, 59.7%, 55.2% and 36.3%, respectively. The top detractors during the period were Yes Bank, LG Electronics, X5, Standard Bank and Qualicorp, with declines of 52.4%, 41.4%, 32.6%, 30.2% and 39.8%, respectively.
Our strategy underperformed over the last twelve months with gains in Latin America and losses in Europe, the Middle East EMEA and Asia. The Asia region was particularly hard for our process due to a sharp collapse in multiples
which drove overall losses during the period. From a country perspective, Mexico, Taiwan and Turkey were the top relative performers while South Korea, India and China were the top detractors. From a sector perspective, energy was the top relative performer while consumer discretionary was the top detractor.
Despite the performance headwinds, we are sticking to our stock selection and portfolio construction process. We have shifted the portfolio to be more defensive and reduced our exposure to growth stocks, lowering the overall beta. In Korea, we remain cautious on the overall outlook as domestic drivers to the economy are looking weak, with government policies failing to lift demand while employment growth has slowed sharply. We aggressively reduced our exposure to India to be more neutral to the market and more tilted towards weaker currency beneficiaries. Amid the trade war rhetoric and possible economic slowdown, we maintain our underweight position in China and shifted the portfolio towards more defensive and balanced exposure. We have a slight overweight to the Latin America region, where our main exposure is in Brazil and Mexico. In Brazil, we have adopted a barbell positioning with an overweight in materials (exporters) and financials (high domestic beta), while being slightly overweight overall.
Japanese Equity Fund
For the twelve-month period ending 30 September 2018, the Japanese Equity Fund reported net performance of 3.88%.
The portfolio underperformed the MSCI Japan Index during the period. Stock selection in the real estate and industrials sectors were most effective. However, stock selection in the healthcare and information technology sectors were less effective.
The portfolio underperformed the twelve-month period on the back of negative stock selection. Our investment process and portfolio style characteristics faced significant headwinds during the period in Japan.
PRINCIPAL GLOBAL INVESTORS FUNDS
for the year ended 30 September 2018 (continued)
15
Japanese Equity Fund (continued)
An overweight position in Sumitomo Dainippon Pharma contributed strongly to performance in the period as the stock was up 80.73% in USD terms. An overweight position in Takeda Pharmaceuticals had a negative impact on the portfolio in the period as the security was down 20.40% in USD included KDDI Corp, Mitsubishi Corp, Fuji Oil, Itochu Corp and Hitachi.
Divergence has been a prominent theme in 2018 as returns by style, market cap; country and sector have varied widely despite low aggregate market volatility. The expectation is for this to continue amid global trade tensions, currency pressures slowing growth in China. Further contention is stemming from an economic growth backdrop that is showing signs of fatigue as many leading economic indicators moderate from recent highs despite remaining at expansionary levels.
The portfolio continues to overweight stocks with improving business fundamentals, rising investor expectations and attractive relative valuations. Our portfolio construction strategies minimize market, sector and industry exposures, relative to the index, in order to isolate superior stock selection as the primary source of outperformance.
Preferred Securities Fund
For the twelve-month period ending 30 September 2018, the Preferred Securities reported net performance of -0.50%. The portfolio benefitted from its 10% allocation to floating rate securities in a period of rising rates. Extended insurance and
US Bank Trust Preferred floaters also performed strongly. The past twelve months for the fund has been a difficult period for performance in a rising interest rate environment. Spreads on preferreds had tightened leading into the period given the implications for growth and fiscal stimulus under the Republican administration. After making tights in early 2018, preferreds sold off as longer-term rates rose given robust economic data, wage inflation and increased deficit spending. Spreads widened given the overbought nature of the market
headlines in Italy and the Turkish currency crisis.
Across the board, Junior subordinated spreads are better than they were at the start the year and income opportunities are as good as they have been in over five years. The lines of least resistance appear pointed toward higher nominal (and real)
r. We have a favourable credit view for global financials and of beneficial structures (i.e., income features) that can uniquely support total returns over the prospective performance of ordinary corporate bonds. Relative value choices are fluid. Generally, we like the overall nominal yields of the junior subordinated sector and wider than average spreads for the cycle. CoCos appear cheap to institutional preferred securities. Technical influences appear to be weighing on the USD$25 par sector as it appears increasingly vulnerable to tax-loss appetites as we progress through this last quarter of the year.
U.S. Equity Fund
For the twelve-month period ending 30 September 2018, the U.S. Equity Fund reported net performance of 18.42%.
The portfolio underperformed the S&P 500 Index during the period. Stock selection in the industrials and information technology sectors was the most effective, whereas stock selection in the consumer discretionary and utilities sectors was less effective.
The portfolio underperformed during the twelve-month period. Our overweight positions in Boeing Company and Valero Energy Corporation and an underweight position in General Electric Company contributed positively to performance. Our overweight positions in CVS Health Corporation, Lazard Ltd and Intel Corporation detracted from performance.
go & Company and Exxon Mobil Corporation.
Our portfolio is comprised of companies we believe offer superior fundamental change relative to their peers, rising investor expectations and attractive relative valuations. High Yield Fund
For the twelve-month period ending 30 September 2018, the High Yield Fund reported net performance of 1.89%.
PRINCIPAL GLOBAL INVESTORS FUNDS
for the year ended 30 September 2018 (continued)
16
High Yield Fund (continued)
Security selection contributed to the outperformance, specifically the strong performance of California Resources, Academy Sports, AVAYA Inc, Emerald Performance and Catlin Insurance. However, this was somewhat offset by the weak performance of Seadrill Partners, Invesco and Dish.
Despite concerns around rising rates, emerging market stress, an escalating trade war, Italian sovereign risk, Brexit, equity valuations and heightened volatility, high yield spreads have remained mostly range-bound in the last twelve-months. This resilience can be attributed to the strong fundamental environment, the strength of the U.S. economy and positive supply/demand dynamics. Notably, the Fed is gradually removing accommodation through balance sheet reduction and rate hikes, and although the European Central Bank ( ECB ) and Bank of Japan ( BoJ ) continue to expand their balance sheets, the ECB has indicated that it will stop its government and corporate bond asset purchase program at the end of 2018.
High yield fundamentals remain strong and spreads have been resilient despite macro concerns around emerging markets, trade wars, Fed hiking and Italy. The 2.0% before reaching 1.9% in August 2019. High yield should continue to perform well with a constructive fundamental backdrop helping cushion any pressure seen from rising rates. We continue to see the best value in single B-rated names,
Our current top industry recommendations are insurance, energy, communications and finance companies.
Global Property Securities Fund
For the twelve-month period ending 30 September 2018, the Global Property Securities Fund reported net performance of 6.83%.
The Fund benefited from good selection among U.S. net lease owners, U.S. data centres and U.S. office names. In
to industrial was a positive. Negative stock selection decisions include holdings of Japanese developers and U.S. hotels.
generally delivered good results. The returns of REITs were negatively impacted by the rise in long term bond yields throughout most of the period until the latter half where risk appetite waned on rising trade tensions and signs of deceleration in economic growth for China. This defensive market sentiment caused some investors to favour the REIT sector. Merger and acquisition activity in REIT sector also helped drive returns higher for REITs. All three regions of the world saw positive returns for REITs.
Despite healthy macro real estate conditions, rapidly changing sentiment has led to a choppy return profile for real estate stocks thus far in 2018. Property stocks have generally outperformed on defensive moves in the market in reaction to global growth or trade concerns or when interest rates have moved lower. Conversely, REITs have lagged the broader markets when investors have exhibited more optimism for growth prospects or when interest rates have moved higher, as investors have had greater preference for more offensive positioning or see higher rates as a headwind to property pricing levels.
Overall, we are constructive on global property stocks and welcome the recent increase in volatility to more normal levels, as we believe volatility creates dislocations that our bottom-up stock selection has a proven ability to exploit. We are confident our disciplined approach of bottom-up stock selection will allow us to identify attractive investments amidst this elevated macroeconomic uncertainty and benefit patient investors over the medium-to-longer term.
Post Global Limited Term High Yield Fund
For the twelve-month period ending 30 September 2018, the Post Global Limited Term High Yield Fund reported net performance of 1.73%.
While rising interest rates were a headwind for fixed income markets, the fund generated steady income returns from high quality businesses in more stable, defensive sectors, including healthcare, technology/software, cable/satellite and telecommunications. The portfolio continued to remain underweight in commodity related credits and other riskier sectors like retail.
PRINCIPAL GLOBAL INVESTORS FUNDS
for the year ended 30 September 2018 (continued)
17
Post Global Limited Term High Yield Fund (continued)
As interest rates rose sharply over the last 12 months (with the yield on the 2-year U.S. Treasury increasing from 1.48% to 2.82%), prices were lower across fixed income markets. However, the fund was able to offset the impact of interest rate increases through solid income generation, in addition to price upside in select situations where bonds were redeemed early at a premium. Importantly, when the high yield market saw sharp weakness during the first quarter of 2018, downside protection was strong. Credit quality remained good, as the fund continued to be positioned defensively in high quality businesses.
reflect our cautious views on risk asset valuations and concerns around interest rates. However, yields have improved
30 September 2018. In addition, fundamentals continue to be good for most U.S. high yield credits, as corporate profits have been strong and U.S. GDP growth is expected to remain robust. We continue to focus on the belief that short duration corporate credit remains attractive on both an absolute and relative basis (with relatively low levels of credit, market and duration risk) provided we keep our focus on investing in high quality businesses with strong downside protection.
Global Time Diversified Absolute Return Fund (Terminated 14 September 2018)
For the period from 1 October 2017 to 14 September 2018, the Global Time Diversified Absolute Return Fund reported net performance of -0.65%. The Fund finished the 2018 year-to-date period well. The key contributors were the USD Reserve currency theme, ahead of the USD sell-off in September, and the Anglo basket theme: both of which were long USD. The Strategic Currency Programme component, meanwhile, lagged its discretionary side. New themes introduced over the period included a Trump-led trade war position and a theme based on our belief that sensitivity to inflation surprises will likely increase amid less spare capacity and greater policy trade-offs. Both these new themes have been broadly flat since their introduction. The Strategic Currency Programme ( SCP ) investment strategy is long term in nature, with positions set just once per calendar year. The weights over the financial year were long AUD, USD and NZD versus EUR, CHF and SEK on a Forward Valuation bias; long JPY, EUR and GBP versus CHF, NOK and AUD on a PPP consideration; and long GBP versus EUR on valuation considerations. The fund closed on the 14 September 2018.
Global Small Cap Equity Fund (Terminated 14 September 2018)
For the period from 1 October 2017 to 14 September 2018, the Global Small Cap Equity Fund reported net performance of 7.92%.
Strong stock selection in the United States and Norway drove outperformance during the period while Japan and the United Kingdom were key detractors. The energy and information technology sectors were the biggest contributors to returns while the healthcare and financials sectors were the biggest detractors.
The portfolio outperformed its index for the twelve-month period ending 14 September 2018, on the back of positive stock selection. The period provided a positive environment for our stock selection approach. Companies with strong fundamental change profiles and attractive relative valuation tended to outperform across most sectors and regions, with Japan being a notable exception.
The United States contributed strongly to relative portfolio performance during the period as consumer discretionary and information technology stocks performed well. Japan and the United Kingdom were the biggest detractors. Within emerging markets, China was the most notable contributor.
The fund closed on 14 September 2018.
Origin Global Emerging Markets Fund
For the twelve-month period ending 30 September 2018, the Origin Global Emerging Markets Fund reported net performance of -4.58%.
Stock selection was negative over the period. At a sector level financials and materials were the biggest contributors, but names in information technology proved a significant enough drag to offset those winners.
PRINCIPAL GLOBAL INVESTORS FUNDS
for the year ended 30 September 2018 (continued)
18
Origin Global Emerging Markets Fund (continued)
The period can be divided into two distinct periods: the final quarter of 2017 and then the first three quarters of 2018. 2017 presented an orderly market environment, albeit one with exceptionally low volatility, but with clear leadership and directionality, the obverse is true of 2018. The year thus far has been characterised by heightened volatility that in turn has driven a period of irrational as we would view it - market behaviour, with the market actively rejecting our target characteristics.
At Origin, we do not attempt to forecast the future, preferring instead to follow the evidence. The shape of the portfolio has changed somewhat over the past 12 months, and certainly during 2018. At a sector level, this has meant a reduction in exposure to financials and consumer discretionary names as we have increased holdings in the materials sector.
India.
Whatever the future holds, you can be certain that we will continue to build portfolios of companies that exhibit those characteristics we favour. As soon as the market returns to rewarding those companies that best embody the balance of those characteristics then the strategy remains positioned to perform well.
Origin Global Smaller Companies Fund
For the twelve-month period ending 30 September 2018, the Origin Global Small Companies Fund reported net performance of 3.17%.
Stock selection was negative over the period. At a sector level, consumer staples and materials were the standout performers; however this was more than offset by the drag from information technology names.
The period can be divided into two distinct periods: the final quarter of 2017 and then the first three quarters of 2018. 2017 presented an orderly market environment, albeit one with exceptionally low volatility, but with clear leadership and directionality, the obverse is true of 2018. The year thus far has been characterised by heightened volatility that in turn has driven a period of irrational as we would view it - market behaviour, with the market actively rejecting our target characteristics.
At Origin, we do not attempt to forecast the future, preferring instead to follow the evidence. There has been a distinct and meaningful change in the shape of the portfolio during 2018. The shape of the portfolio has adjusted to reflect the changing evidence geographically, with a reduction in emerging market holdings predominantly in favour of U.S. names. At a sector level the changes have been less pronounced, nevertheless, we have seen a move away from information technology and consumer discretionary names in favour of virtually all other sectors.
Whatever the future holds, you can be certain that we will continue to build portfolios of companies that exhibit those characteristics we favour. As soon as the market returns to rewarding those companies that best embody the balance of those characteristics then the strategy remains positioned to perform well.
Claritas Latin American Equity Fund (Terminated 28 February 2018)
For the five months to close of the Fund on 28 February 2018, the Claritas Latin American Equity Fund reported net performance of 9.32%. Stock picking was entirely responsible for the alpha of the fund. The positive highlights during the period were the
and Vale in Brazil were the main detractors of the portfolio. The past five months were marked by an increase in market volatility, initially due to higher interest rates in the United States and subsequently due to technical factors. Despite that, equity markets continued to post positive performance, as economic growth remains solid, inflation is still tamed and earnings are surprising in the upside. Latin American equities (+5.20%) performed relatively in line with developed markets (+5.90%), but underperformed emerging markets (+10.5%). This underperformance was mainly caused by disappointments with the agenda reform in Brazil and political fears in
PRINCIPAL GLOBAL INVESTORS FUNDS
for the year ended 30 September 2018 (continued)
19
Finisterre Emerging Market Debt Fund (Terminated 19 December 2017) The Finisterre Emerging Market Debt Fund terminated on 19 December 2017. No Investment Adviser report has been prepared as the Fund was not in operation for a significant period after the year end.
Spectrum Global Capital Securities Fund (Terminated 5 December 2017)
The Spectrum Global Capital Securities Fund terminated on 5 December 2017. No Investment Adviser report has been prepared as the Fund was not in operation for a significant period after the year end.
Global Capital Structure Opportunities Fund (Terminated 14 September 2018)
For the period from 1 October 2017 to 14 September 2018, the Global Capital Structure Opportunities Fund reported net performance of -2.11%.
Positive performers during the last year within the fund included Chubb, Andeavor Logistics, Morgan Stanley, Barclays and Bank of America. Negative contributors during the last year within the fund included Intesa, Westpac, UniCredit, BBVA and UBS.
Risk assets rallied into the close of 2017 on the combination of better than expected corporate earnings, rebounding economic data and a lack of inflation globally. The positive momentum carried into 2018, but by February, the fear of monetary tightening led to a sell-off in Treasury yields, higher volatility, and wider credit spreads. Further weight on the market as the year progressed included political turmoil, escalating trade wars and the Italian political crisis. The Fed raised rates three times during 2018 through its September meeting, with an expectation that they will raise once more in 2018.
Risk markets remain in a transition phase from the days of historic monetary accommodation to an environment of less accommodation and gradual rate increases by the Fed. However, valuations remain supported by global economic strength and continued foreign central bank accommodation. We have a favourable view on banks and financials. U.S. Money Centres' capital metrics are beginning to level off and potentially could be calibrated down on the new regulatory
addition, higher market volatility could result in higher capital markets-related revenues. In Yankee banks, improvements in capital and asset quality continue but trade tensions and increasing political uncertainty and noise may limit spread performance.
The Fund closed on the 14 September 2018.
Real Estate Debt Fund
For the twelve-month period ending 30 September 2018, the Real Estate Debt Fund reported net performance of 2.80%.
Over the year, the fund benefitted from positive security selection which contributed to over 400 basis points of gross excess return compared to the Bloomberg Barclays CMBS Investment Grade Index. Holdings of BBB- rated bonds contributed most to overall portfolio performance, driven by an attractive yield profile and spread tightening in the sector.
The Real Estate Debt Fund invests primarily in US commercial mortgage-backed securities ( CMBS ) with an objective of providing attractive long-term risk-adjusted returns. The Sub-Investment Adviser has constructed a diversified portfolio with exposure to a wide range of vintage and credit segments, which to date has carried a higher yield profile compared to the Bloomberg Barclays CMBS Investment Grade Index. Demand for alternative sources of yield has benefitted the portfolio as investors have shown interest in the asset class. Meanwhile, the significant increase in the 10-year U.S. Treasury rate experienced over the past year detracted from total return from a mark-to-market perspective.
CMBS represents a fixed-income investment in an underlying pool of first mortgages secured by commercial real estate properties located throughout the United States. The health of the commercial real estate market is directly influenced by the health of the economy, and more specifically, the U.S. job market which has added over 2.5 million jobs over the past year. Improving economic growth in the United States, generally balanced real estate supply/demand fundamentals and property-level income growth may benefit the credit performance of the portfolio. Conversely, heightened geopolitical risk, an emergence of growth concerns, rising rates (especially in longer maturities) and/or weak market technicals could negatively impact the portfolio. Given stable real estate fundamentals, the yield enhancement offered by CMBS appears attractive, especially in lower rated segments. Additionally, CMBS presents an opportunity to diversify broader fixed income portfolios via an alternative credit exposure, as especially important factor to consider as the current economic cycle extends.
PRINCIPAL GLOBAL INVESTORS FUNDS
for the year ended 30 September 2018 (continued)
20
Global Income Fund
For the twelve-month period ending 30 September 2018, the Global Income Fund reported net performance of 0.94%.
d s
allocation to the global emerging market (fixed income and equities) sector detracted.
The global high yield bond market posted a slightly positive return, while global high dividend equity markets posted mid-single digit positive returns during the period, in the risk-on market environment. Global growth, fundamentals and earnings provided support, while geopolitical tensions, political turmoil and emerging market concerns dominated headlines. In addition, the interest rate environment remained subdued as rates stayed relatively low versus historical averages across the globe. The United States continued to work towards normalised monetary policy with incremental tightening as did the Bank of England and some emerging market countries, while Europe continued to support economic growth through accommodative policies.
With our expectations for equities to outperform fixed income, the fund has a corresponding overweight to equities and an ctors, the fund is tactically underweight the
global emerging markets sector and slightly overweight the global industrials & services sector. While emerging market securities provide diversification with more rapid growth trajectories at times, the systemic risk in the space is a concern. For the global industrials & services sector, we have a preference for equity securities. Within this space, the slow, later stage economic growth acceleration bodes well for these cyclically-oriented securities. In the global real estate &
lobal finance sector, the confluence of the spectre of rising rates and delayed regulatory implementation has resulted in a positive re-rating of financial assets.
Finisterre Unconstrained Emerging Markets Fixed Income Fund
For the twelve-month period ending 30 September 2018, the Finisterre Unconstrained Emerging Markets Fixed Income reported net performance of 0.91%.
A relative value credit curve flattener in Bahrain (long 10Y bond vs long 5Y CDS duration neutral) was the second largest positive contributor to portfolio performance, as we correctly anticipated a potential sovereign stress episode - the country was losing reserves amid a global USD funding crunch. Egyptian positions in the EGP local T-Bills market were a significant provider of steady income to the portfolio. The country continued to deliver on its steady fiscal adjustment under International Moneexports and lower imports. Nigeria was a positive contributor to the portfolio, equally related to a long local currency T-Bill position and active trading on the mid to long end part of the hard currency bond curve. Nigeria continues to benefit from steady oil inflows and positive current account to fund its financing needs.
Despite strong oil prices and one of the most credible fiscal and monetary policy mix, Russian assets were held back by geopolitical tensions and the risk of further U.S. sanctions. Long positions in local and external sovereign bonds were negative contributors as a result. Although we benefitted in the first quarter from our long CDS positions in Argentina in the run-up to the IMF program, we registered a negative performance in August from our long positions in Argentina 2048 bonds, as the currency depreciated and risk appetite deteriorated strongly. Sri Lanka was a moderate net detractor to the portfolio over the past year as our long mid-duration positions in sovereign USD bonds suffered in early 2018 from political uncertainty and the overhang of potential new bond issuance amidst fiscal slippage.
Principal Global Investors, LLC 31 October 2018
PRINCIPAL GLOBAL INVESTORS FUNDS
26
Manager The Manager of the Trust is required by the UCITS Regulations to prepare financial statements for each accounting period which gives a true and fair view of the financial position of the Trust at the end of that period, the results of its operations and the movement in net assets for the period then ended. In preparing these financial statements the Manager is required to: select suitable accounting policies and then apply them consistently;
make judgments and estimates that are prudent and reasonable; and
prepare the financial statements on the going concern basis unless it is inappropriate to presume that the Trust will
continue in operation.
ensure that any transaction carried out with a UCITS by a management company or Depositary to the UCITS, the delegates or sub-delegates of the management company or Depositary, and any associate or group of such a management company, Depositary, delegate or sub- at
The Manager is responsible for keeping proper books of account which disclose with reasonable accuracy at any time the financial position of the Trust and for ensuring that the financial statements are prepared in accordance with accounting standards generally accepted in Ireland and for ensuring that they comply with the provisions of the Trust Deed, the UCITS Regulations and the Hong Kong Securities and Futures Commission's Code on Unit Trusts and Mutual Funds. The Manager is also responsible with respect to its duties under the UCITS Regulations to take reasonable steps for the prevention and detection of fraud and other irregularities. Principal Global Investors (Ireland) Limited
STATEMENT OF DEPOSITARY RESPONSIBILITIES Depositary The Depositary is required by the UCITS Regulations, to: maintain the assets of a Unit Trust in safekeeping;
report to the Unitholders for each accounting period on the conduct of the Manager in the management of a Unit Trust. BNY Mellon Trust Company (Ireland) Limited
PRINCIPAL GLOBAL INVESTORS FUNDS
PORTFOLIO OF INVESTMENTS AS AT 30 SEPTEMBER 2018
27
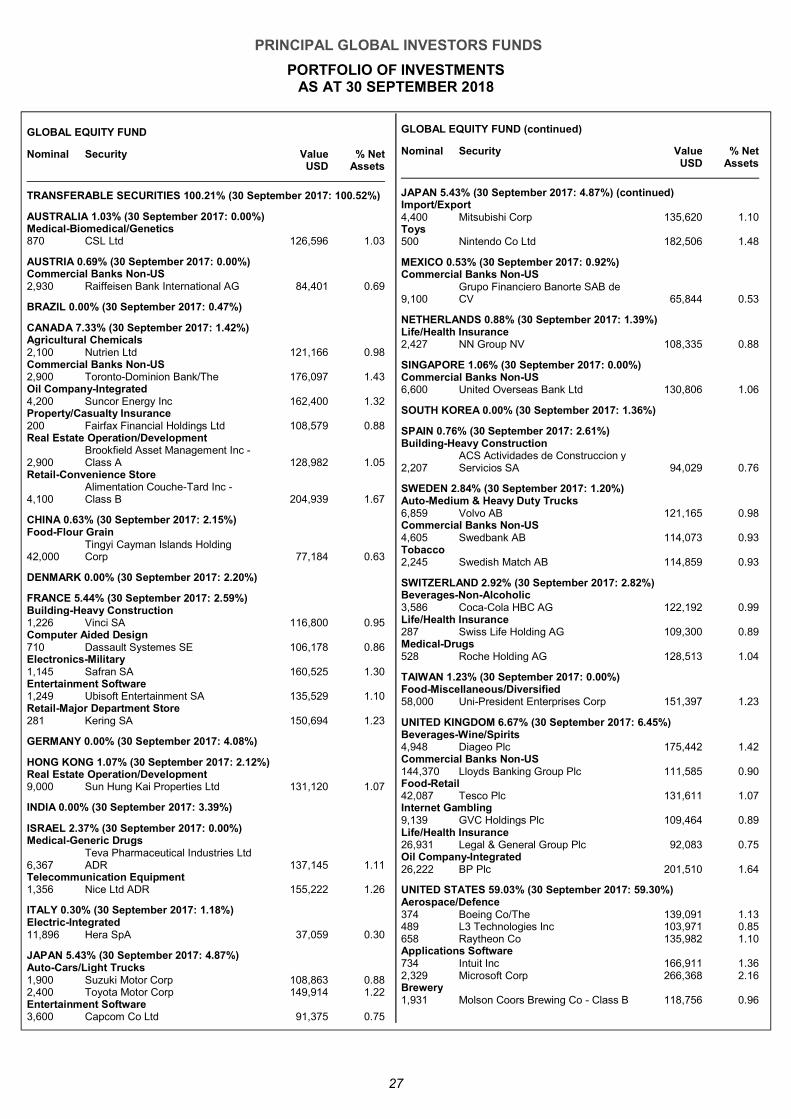
GLOBAL EQUITY FUND
Nominal Security Value USD
% Net Assets
TRANSFERABLE SECURITIES 100.21% (30 September 2017: 100.52%)
AUSTRALIA 1.03% (30 September 2017: 0.00%) Medical-Biomedical/Genetics 870 CSL Ltd 126,596 1.03
AUSTRIA 0.69% (30 September 2017: 0.00%) Commercial Banks Non-US 2,930 Raiffeisen Bank International AG 84,401 0.69
BRAZIL 0.00% (30 September 2017: 0.47%)
CANADA 7.33% (30 September 2017: 1.42%) Agricultural Chemicals 2,100 Nutrien Ltd 121,166 0.98 Commercial Banks Non-US 2,900 Toronto-Dominion Bank/The 176,097 1.43 Oil Company-Integrated 4,200 Suncor Energy Inc 162,400 1.32 Property/Casualty Insurance 200 Fairfax Financial Holdings Ltd 108,579 0.88 Real Estate Operation/Development
2,900 Brookfield Asset Management Inc - Class A 128,982 1.05
Retail-Convenience Store
4,100 Alimentation Couche-Tard Inc - Class B 204,939 1.67
CHINA 0.63% (30 September 2017: 2.15%) Food-Flour Grain
42,000 Tingyi Cayman Islands Holding Corp 77,184 0.63
DENMARK 0.00% (30 September 2017: 2.20%)
FRANCE 5.44% (30 September 2017: 2.59%) Building-Heavy Construction 1,226 Vinci SA 116,800 0.95 Computer Aided Design 710 Dassault Systemes SE 106,178 0.86 Electronics-Military 1,145 Safran SA 160,525 1.30 Entertainment Software 1,249 Ubisoft Entertainment SA 135,529 1.10 Retail-Major Department Store 281 Kering SA 150,694 1.23
GERMANY 0.00% (30 September 2017: 4.08%)
HONG KONG 1.07% (30 September 2017: 2.12%) Real Estate Operation/Development 9,000 Sun Hung Kai Properties Ltd 131,120 1.07
INDIA 0.00% (30 September 2017: 3.39%)
ISRAEL 2.37% (30 September 2017: 0.00%) Medical-Generic Drugs
6,367 Teva Pharmaceutical Industries Ltd ADR 137,145 1.11
Telecommunication Equipment 1,356 Nice Ltd ADR 155,222 1.26
ITALY 0.30% (30 September 2017: 1.18%) Electric-Integrated 11,896 Hera SpA 37,059 0.30
JAPAN 5.43% (30 September 2017: 4.87%) Auto-Cars/Light Trucks 1,900 Suzuki Motor Corp 108,863 0.88 2,400 Toyota Motor Corp 149,914 1.22 Entertainment Software 3,600 Capcom Co Ltd 91,375 0.75
GLOBAL EQUITY FUND (continued)
Nominal Security ValueUSD
% Net Assets
JAPAN 5.43% (30 September 2017: 4.87%) (continued) Import/Export 4,400 Mitsubishi Corp 135,620 1.10 Toys 500 Nintendo Co Ltd 182,506 1.48
MEXICO 0.53% (30 September 2017: 0.92%) Commercial Banks Non-US
9,100 Grupo Financiero Banorte SAB de CV 65,844 0.53
NETHERLANDS 0.88% (30 September 2017: 1.39%) Life/Health Insurance 2,427 NN Group NV 108,335 0.88
SINGAPORE 1.06% (30 September 2017: 0.00%) Commercial Banks Non-US 6,600 United Overseas Bank Ltd 130,806 1.06
SOUTH KOREA 0.00% (30 September 2017: 1.36%)
SPAIN 0.76% (30 September 2017: 2.61%) Building-Heavy Construction
2,207 ACS Actividades de Construccion y Servicios SA 94,029 0.76
SWEDEN 2.84% (30 September 2017: 1.20%) Auto-Medium & Heavy Duty Trucks 6,859 Volvo AB 121,165 0.98 Commercial Banks Non-US 4,605 Swedbank AB 114,073 0.93 Tobacco 2,245 Swedish Match AB 114,859 0.93
SWITZERLAND 2.92% (30 September 2017: 2.82%) Beverages-Non-Alcoholic 3,586 Coca-Cola HBC AG 122,192 0.99 Life/Health Insurance 287 Swiss Life Holding AG 109,300 0.89 Medical-Drugs 528 Roche Holding AG 128,513 1.04
TAIWAN 1.23% (30 September 2017: 0.00%) Food-Miscellaneous/Diversified 58,000 Uni-President Enterprises Corp 151,397 1.23
UNITED KINGDOM 6.67% (30 September 2017: 6.45%) Beverages-Wine/Spirits 4,948 Diageo Plc 175,442 1.42 Commercial Banks Non-US 144,370 Lloyds Banking Group Plc 111,585 0.90 Food-Retail 42,087 Tesco Plc 131,611 1.07 Internet Gambling 9,139 GVC Holdings Plc 109,464 0.89 Life/Health Insurance 26,931 Legal & General Group Plc 92,083 0.75 Oil Company-Integrated 26,222 BP Plc 201,510 1.64
UNITED STATES 59.03% (30 September 2017: 59.30%) Aerospace/Defence 374 Boeing Co/The 139,091 1.13 489 L3 Technologies Inc 103,971 0.85 658 Raytheon Co 135,982 1.10 Applications Software 734 Intuit Inc 166,911 1.36 2,329 Microsoft Corp 266,368 2.16 Brewery 1,931 Molson Coors Brewing Co - Class B 118,756 0.96
PRINCIPAL GLOBAL INVESTORS FUNDS
PORTFOLIO OF INVESTMENTS AS AT 30 SEPTEMBER 2018 (continued)
28
GLOBAL EQUITY FUND (continued)
Nominal Security Value USD
% Net Assets
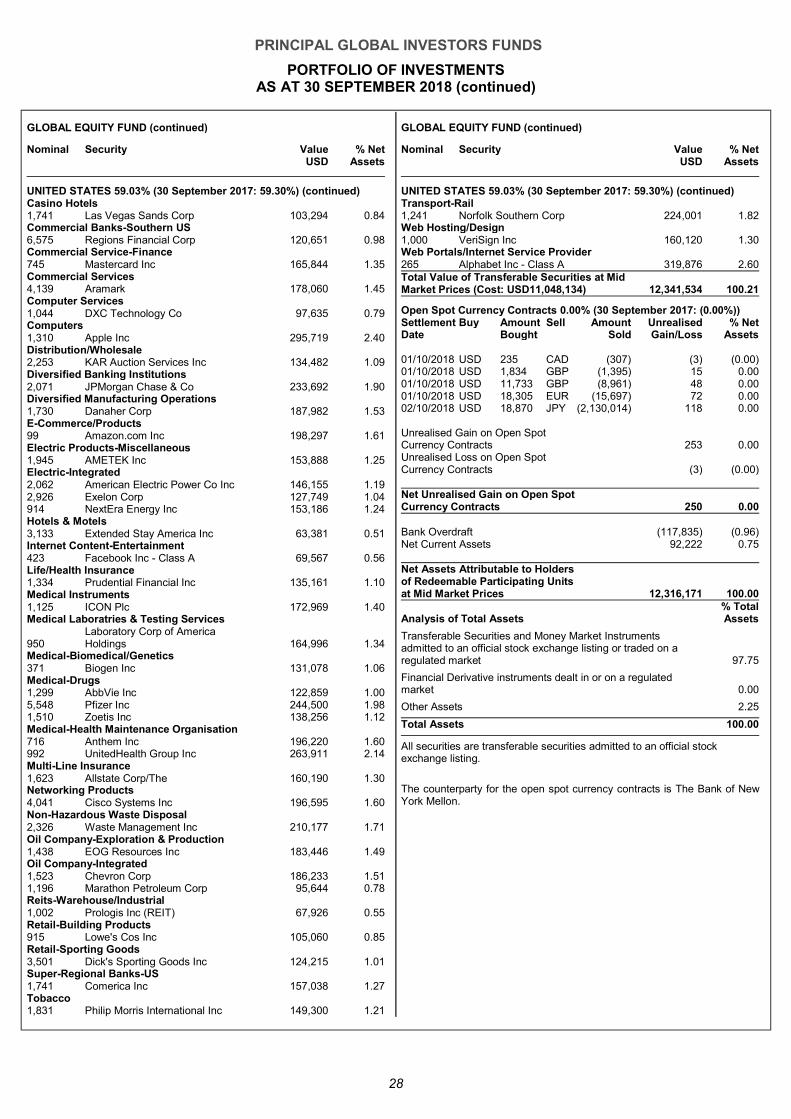
UNITED STATES 59.03% (30 September 2017: 59.30%) (continued) Casino Hotels 1,741 Las Vegas Sands Corp 103,294 0.84 Commercial Banks-Southern US 6,575 Regions Financial Corp 120,651 0.98 Commercial Service-Finance 745 Mastercard Inc 165,844 1.35 Commercial Services 4,139 Aramark 178,060 1.45 Computer Services 1,044 DXC Technology Co 97,635 0.79 Computers 1,310 Apple Inc 295,719 2.40 Distribution/Wholesale 2,253 KAR Auction Services Inc 134,482 1.09 Diversified Banking Institutions 2,071 JPMorgan Chase & Co 233,692 1.90 Diversified Manufacturing Operations 1,730 Danaher Corp 187,982 1.53 E-Commerce/Products 99 Amazon.com Inc 198,297 1.61 Electric Products-Miscellaneous 1,945 AMETEK Inc 153,888 1.25 Electric-Integrated 2,062 American Electric Power Co Inc 146,155 1.19 2,926 Exelon Corp 127,749 1.04 914 NextEra Energy Inc 153,186 1.24 Hotels & Motels 3,133 Extended Stay America Inc 63,381 0.51 Internet Content-Entertainment 423 Facebook Inc - Class A 69,567 0.56 Life/Health Insurance 1,334 Prudential Financial Inc 135,161 1.10 Medical Instruments 1,125 ICON Plc 172,969 1.40 Medical Laboratries & Testing Services
950 Laboratory Corp of America Holdings 164,996 1.34
Medical-Biomedical/Genetics 371 Biogen Inc 131,078 1.06 Medical-Drugs 1,299 AbbVie Inc 122,859 1.00 5,548 Pfizer Inc 244,500 1.98 1,510 Zoetis Inc 138,256 1.12 Medical-Health Maintenance Organisation 716 Anthem Inc 196,220 1.60 992 UnitedHealth Group Inc 263,911 2.14 Multi-Line Insurance 1,623 Allstate Corp/The 160,190 1.30 Networking Products 4,041 Cisco Systems Inc 196,595 1.60 Non-Hazardous Waste Disposal 2,326 Waste Management Inc 210,177 1.71 Oil Company-Exploration & Production 1,438 EOG Resources Inc 183,446 1.49 Oil Company-Integrated 1,523 Chevron Corp 186,233 1.51 1,196 Marathon Petroleum Corp 95,644 0.78 Reits-Warehouse/Industrial 1,002 Prologis Inc (REIT) 67,926 0.55 Retail-Building Products 915 Lowe's Cos Inc 105,060 0.85 Retail-Sporting Goods 3,501 Dick's Sporting Goods Inc 124,215 1.01 Super-Regional Banks-US 1,741 Comerica Inc 157,038 1.27 Tobacco 1,831 Philip Morris International Inc 149,300 1.21
GLOBAL EQUITY FUND (continued)
Nominal Security ValueUSD
% Net Assets
UNITED STATES 59.03% (30 September 2017: 59.30%) (continued) Transport-Rail 1,241 Norfolk Southern Corp 224,001 1.82 Web Hosting/Design 1,000 VeriSign Inc 160,120 1.30 Web Portals/Internet Service Provider 265 Alphabet Inc - Class A 319,876 2.60 Total Value of Transferable Securities at Mid Market Prices (Cost: USD11,048,134) 12,341,534 100.21
Open Spot Currency Contracts 0.00% (30 September 2017: (0.00%)) Settlement Buy Amount Sell Amount Unrealised % Net Date Bought Sold Gain/Loss Assets 01/10/2018 USD 235 CAD (307) (3) (0.00) 01/10/2018 USD 1,834 GBP (1,395) 15 0.00 01/10/2018 USD 11,733 GBP (8,961) 48 0.00 01/10/2018 USD 18,305 EUR (15,697) 72 0.00 02/10/2018 USD 18,870 JPY (2,130,014) 118 0.00 Unrealised Gain on Open Spot Currency Contracts 253 0.00 Unrealised Loss on Open Spot Currency Contracts (3) (0.00) Net Unrealised Gain on Open Spot Currency Contracts 250 0 .00
Bank Overdraft (117,835) (0.96) Net Current Assets 92,222 0.75 Net Assets Attributable to Holders of Redeemable Participating Units at Mid Market Prices 12,316,171 100.00
Analysis of Total Assets % Total Assets
Transferable Securities and Money Market Instruments admitted to an official stock exchange listing or traded on a regulated market 97.75
Financial Derivative instruments dealt in or on a regulated market 0.00
Other Assets 2.25
Total Assets 100.00
All securities are transferable securities admitted to an official stock exchange listing.
The counterparty for the open spot currency contracts is The Bank of New York Mellon.
PRINCIPAL GLOBAL INVESTORS FUNDS
PORTFOLIO OF INVESTMENTS AS AT 30 SEPTEMBER 2018 (continued)
29
ASIAN EQUITY FUND
Nominal Security Value USD
% Net Assets
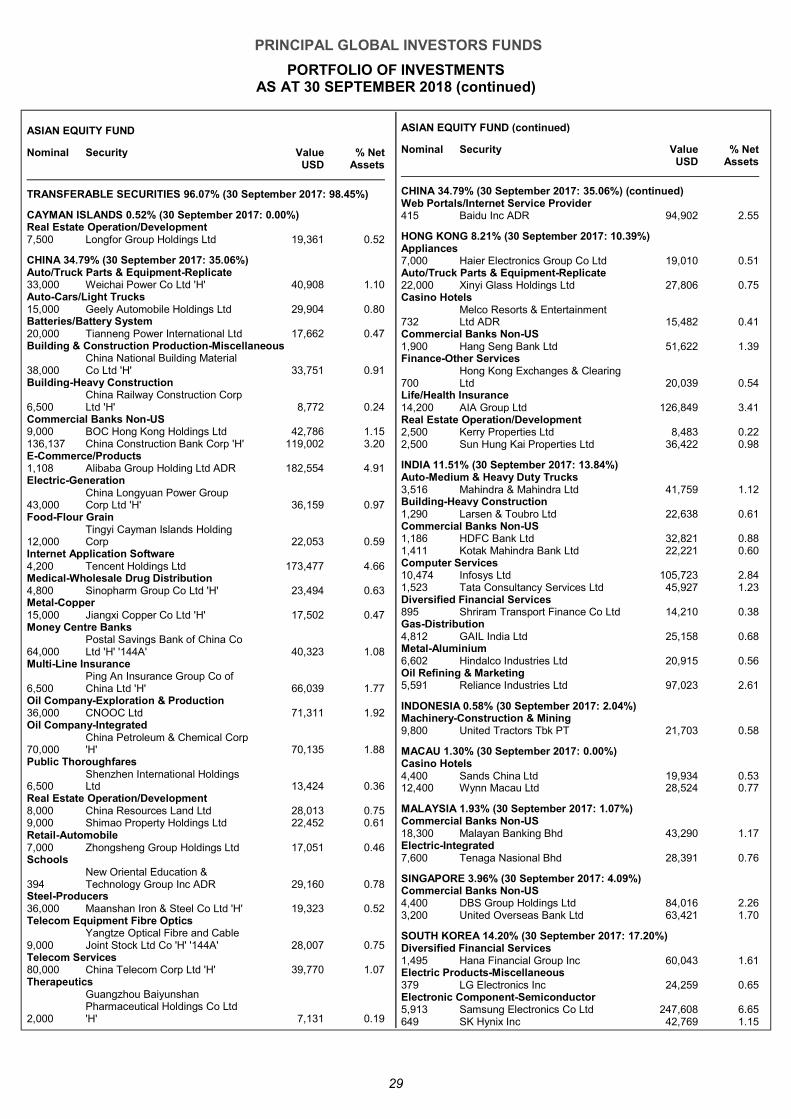
TRANSFERABLE SECURITIES 96.07% (30 September 2017: 98.45%)
CAYMAN ISLANDS 0.52% (30 September 2017: 0.00%) Real Estate Operation/Development 7,500 Longfor Group Holdings Ltd 19,361 0.52
CHINA 34.79% (30 September 2017: 35.06%) Auto/Truck Parts & Equipment-Replicate 33,000 Weichai Power Co Ltd 'H' 40,908 1.10 Auto-Cars/Light Trucks 15,000 Geely Automobile Holdings Ltd 29,904 0.80 Batteries/Battery System 20,000 Tianneng Power International Ltd 17,662 0.47 Building & Construction Production-Miscellaneous
38,000 China National Building Material Co Ltd 'H' 33,751 0.91
Building-Heavy Construction
6,500 China Railway Construction Corp Ltd 'H' 8,772 0.24
Commercial Banks Non-US 9,000 BOC Hong Kong Holdings Ltd 42,786 1.15 136,137 China Construction Bank Corp 'H' 119,002 3.20 E-Commerce/Products 1,108 Alibaba Group Holding Ltd ADR 182,554 4.91 Electric-Generation
43,000 China Longyuan Power Group Corp Ltd 'H' 36,159 0.97
Food-Flour Grain
12,000 Tingyi Cayman Islands Holding Corp 22,053 0.59
Internet Application Software 4,200 Tencent Holdings Ltd 173,477 4.66 Medical-Wholesale Drug Distribution 4,800 Sinopharm Group Co Ltd 'H' 23,494 0.63 Metal-Copper 15,000 Jiangxi Copper Co Ltd 'H' 17,502 0.47 Money Centre Banks
64,000 Postal Savings Bank of China Co Ltd 'H' '144A' 40,323 1.08
Multi-Line Insurance
6,500 Ping An Insurance Group Co of China Ltd 'H' 66,039 1.77
Oil Company-Exploration & Production 36,000 CNOOC Ltd 71,311 1.92 Oil Company-Integrated
70,000 China Petroleum & Chemical Corp 'H' 70,135 1.88
Public Thoroughfares
6,500 Shenzhen International Holdings Ltd 13,424 0.36
Real Estate Operation/Development 8,000 China Resources Land Ltd 28,013 0.75 9,000 Shimao Property Holdings Ltd 22,452 0.61 Retail-Automobile 7,000 Zhongsheng Group Holdings Ltd 17,051 0.46 Schools
394 New Oriental Education & Technology Group Inc ADR 29,160 0.78
Steel-Producers 36,000 Maanshan Iron & Steel Co Ltd 'H' 19,323 0.52 Telecom Equipment Fibre Optics
9,000 Yangtze Optical Fibre and Cable Joint Stock Ltd Co 'H' '144A' 28,007 0.75
Telecom Services 80,000 China Telecom Corp Ltd 'H' 39,770 1.07 Therapeutics
2,000
Guangzhou Baiyunshan Pharmaceutical Holdings Co Ltd 'H' 7,131 0.19
ASIAN EQUITY FUND (continued)
Nominal Security Value USD
% Net Assets
CHINA 34.79% (30 September 2017: 35.06%) (continued) Web Portals/Internet Service Provider 415 Baidu Inc ADR 94,902 2.55
HONG KONG 8.21% (30 September 2017: 10.39%) Appliances 7,000 Haier Electronics Group Co Ltd 19,010 0.51 Auto/Truck Parts & Equipment-Replicate 22,000 Xinyi Glass Holdings Ltd 27,806 0.75 Casino Hotels
732 Melco Resorts & Entertainment Ltd ADR 15,482 0.41
Commercial Banks Non-US 1,900 Hang Seng Bank Ltd 51,622 1.39 Finance-Other Services
700 Hong Kong Exchanges & Clearing Ltd 20,039 0.54
Life/Health Insurance 14,200 AIA Group Ltd 126,849 3.41 Real Estate Operation/Development 2,500 Kerry Properties Ltd 8,483 0.22 2,500 Sun Hung Kai Properties Ltd 36,422 0.98
INDIA 11.51% (30 September 2017: 13.84%) Auto-Medium & Heavy Duty Trucks 3,516 Mahindra & Mahindra Ltd 41,759 1.12 Building-Heavy Construction 1,290 Larsen & Toubro Ltd 22,638 0.61 Commercial Banks Non-US 1,186 HDFC Bank Ltd 32,821 0.88 1,411 Kotak Mahindra Bank Ltd 22,221 0.60 Computer Services 10,474 Infosys Ltd 105,723 2.84 1,523 Tata Consultancy Services Ltd 45,927 1.23Diversified Financial Services 895 Shriram Transport Finance Co Ltd 14,210 0.38 Gas-Distribution 4,812 GAIL India Ltd 25,158 0.68 Metal-Aluminium 6,602 Hindalco Industries Ltd 20,915 0.56 Oil Refining & Marketing 5,591 Reliance Industries Ltd 97,023 2.61
INDONESIA 0.58% (30 September 2017: 2.04%) Machinery-Construction & Mining 9,800 United Tractors Tbk PT 21,703 0.58
MACAU 1.30% (30 September 2017: 0.00%) Casino Hotels 4,400 Sands China Ltd 19,934 0.53 12,400 Wynn Macau Ltd 28,524 0.77
MALAYSIA 1.93% (30 September 2017: 1.07%) Commercial Banks Non-US 18,300 Malayan Banking Bhd 43,290 1.17 Electric-Integrated 7,600 Tenaga Nasional Bhd 28,391 0.76
SINGAPORE 3.96% (30 September 2017: 4.09%) Commercial Banks Non-US 4,400 DBS Group Holdings Ltd 84,016 2.26 3,200 United Overseas Bank Ltd 63,421 1.70
SOUTH KOREA 14.20% (30 September 2017: 17.20%) Diversified Financial Services 1,495 Hana Financial Group Inc 60,043 1.61 Electric Products-Miscellaneous 379 LG Electronics Inc 24,259 0.65 Electronic Component-Semiconductor 5,913 Samsung Electronics Co Ltd 247,608 6.65 649 SK Hynix Inc 42,769 1.15
PRINCIPAL GLOBAL INVESTORS FUNDS
PORTFOLIO OF INVESTMENTS AS AT 30 SEPTEMBER 2018 (continued)
30
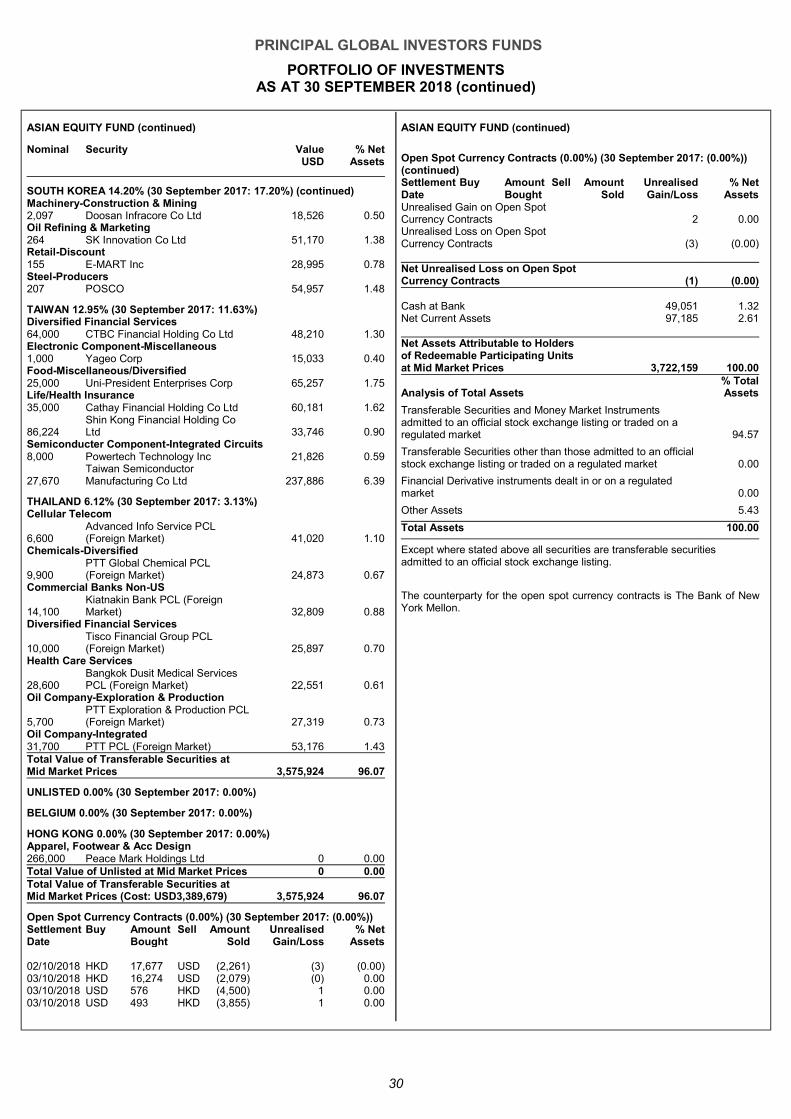
ASIAN EQUITY FUND (continued)
Nominal Security Value USD
% Net Assets
SOUTH KOREA 14.20% (30 September 2017: 17.20%) (continued) Machinery-Construction & Mining 2,097 Doosan Infracore Co Ltd 18,526 0.50 Oil Refining & Marketing 264 SK Innovation Co Ltd 51,170 1.38 Retail-Discount 155 E-MART Inc 28,995 0.78 Steel-Producers 207 POSCO 54,957 1.48
TAIWAN 12.95% (30 September 2017: 11.63%) Diversified Financial Services 64,000 CTBC Financial Holding Co Ltd 48,210 1.30 Electronic Component-Miscellaneous 1,000 Yageo Corp 15,033 0.40 Food-Miscellaneous/Diversified 25,000 Uni-President Enterprises Corp 65,257 1.75 Life/Health Insurance 35,000 Cathay Financial Holding Co Ltd 60,181 1.62
86,224 Shin Kong Financial Holding Co Ltd 33,746 0.90
Semiconducter Component-Integrated Circuits 8,000 Powertech Technology Inc 21,826 0.59
27,670 Taiwan Semiconductor Manufacturing Co Ltd 237,886 6.39
THAILAND 6.12% (30 September 2017: 3.13%) Cellular Telecom
6,600 Advanced Info Service PCL (Foreign Market) 41,020 1.10
Chemicals-Diversified
9,900 PTT Global Chemical PCL (Foreign Market) 24,873 0.67
Commercial Banks Non-US
14,100 Kiatnakin Bank PCL (Foreign Market) 32,809 0.88
Diversified Financial Services
10,000 Tisco Financial Group PCL (Foreign Market) 25,897 0.70
Health Care Services
28,600 Bangkok Dusit Medical Services PCL (Foreign Market) 22,551 0.61
Oil Company-Exploration & Production
5,700 PTT Exploration & Production PCL (Foreign Market) 27,319 0.73
Oil Company-Integrated 31,700 PTT PCL (Foreign Market) 53,176 1.43 Total Value of Transferable Securities at Mid Market Prices 3,575,924 96.07
UNLISTED 0.00% (30 September 2017: 0.00%)
BELGIUM 0.00% (30 September 2017: 0.00%)
HONG KONG 0.00% (30 September 2017: 0.00%) Apparel, Footwear & Acc Design 266,000 Peace Mark Holdings Ltd 0 0.00 Total Value of Unlisted at Mid Market Prices 0 0.00 Total Value of Transferable Securities at Mid Market Prices (Cost: USD3,389,679) 3,575,924 96.07
Open Spot Currency Contracts (0.00%) (30 September 2017: (0.00%)) Settlement Buy Amount Sell Amount Unrealised % Net Date Bought Sold Gain/Loss Assets 02/10/2018 HKD 17,677 USD (2,261) (3) (0.00) 03/10/2018 HKD 16,274 USD (2,079) (0) 0.00 03/10/2018 USD 576 HKD (4,500) 1 0.00 03/10/2018 USD 493 HKD (3,855) 1 0.00
ASIAN EQUITY FUND (continued)
Open Spot Currency Contracts (0.00%) (30 September 2017: (0.00%)) (continued) Settlement Buy Amount Sell Amount Unrealised % Net Date Bought Sold Gain/Loss Assets Unrealised Gain on Open Spot Currency Contracts 2 0.00 Unrealised Loss on Open Spot Currency Contracts (3) (0.00) Net Unrealised Loss on Open Spot Currency Contracts (1) (0 .00)
Cash at Bank 49,051 1.32 Net Current Assets 97,185 2.61 Net Assets Attributable to Holders of Redeemable Participating Units at Mid Market Prices 3,722,159 100.00
Analysis of Total Assets % Total Assets
Transferable Securities and Money Market Instruments admitted to an official stock exchange listing or traded on a regulated market 94.57
Transferable Securities other than those admitted to an official stock exchange listing or traded on a regulated market 0.00
Financial Derivative instruments dealt in or on a regulated market 0.00
Other Assets 5.43
Total Assets 100.00
Except where stated above all securities are transferable securities admitted to an official stock exchange listing.
The counterparty for the open spot currency contracts is The Bank of New York Mellon.
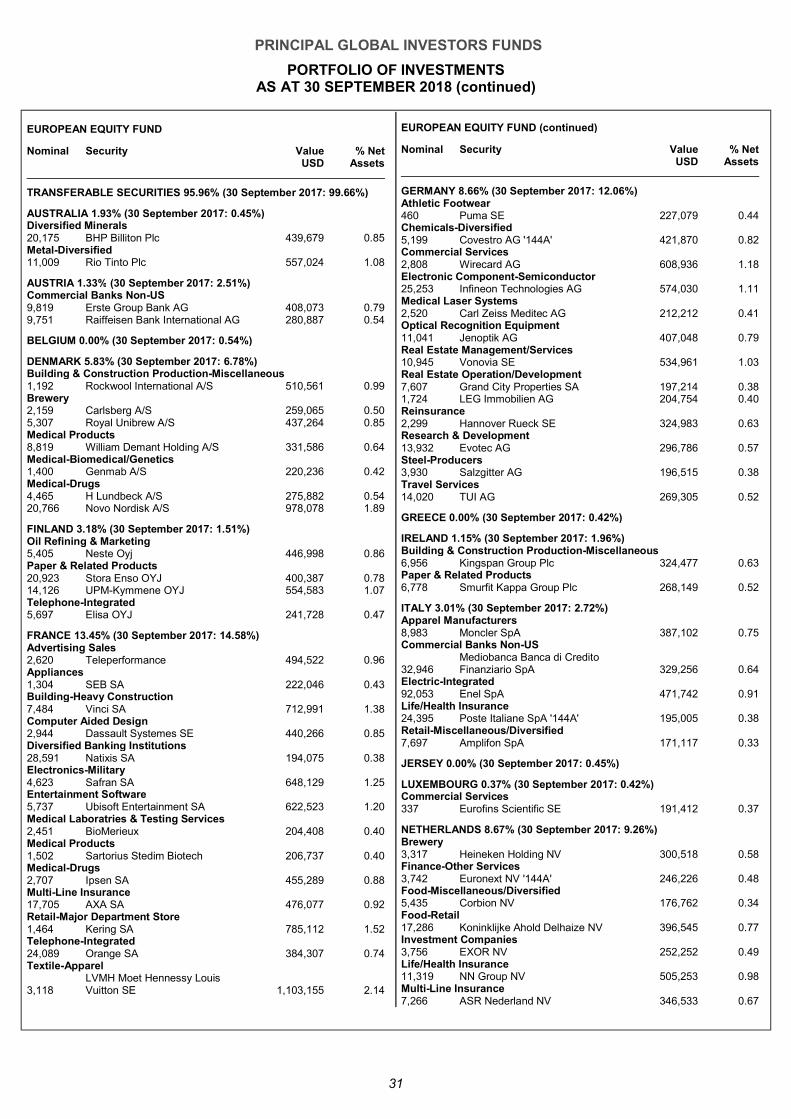
PRINCIPAL GLOBAL INVESTORS FUNDS
PORTFOLIO OF INVESTMENTS AS AT 30 SEPTEMBER 2018 (continued)
31
EUROPEAN EQUITY FUND
Nominal Security Value USD
% Net Assets
TRANSFERABLE SECURITIES 95.96% (30 September 2017: 99.66%)
AUSTRALIA 1.93% (30 September 2017: 0.45%) Diversified Minerals 20,175 BHP Billiton Plc 439,679 0.85 Metal-Diversified 11,009 Rio Tinto Plc 557,024 1.08
AUSTRIA 1.33% (30 September 2017: 2.51%) Commercial Banks Non-US 9,819 Erste Group Bank AG 408,073 0.79 9,751 Raiffeisen Bank International AG 280,887 0.54
BELGIUM 0.00% (30 September 2017: 0.54%)
DENMARK 5.83% (30 September 2017: 6.78%) Building & Construction Production-Miscellaneous 1,192 Rockwool International A/S 510,561 0.99 Brewery 2,159 Carlsberg A/S 259,065 0.50 5,307 Royal Unibrew A/S 437,264 0.85 Medical Products 8,819 William Demant Holding A/S 331,586 0.64 Medical-Biomedical/Genetics 1,400 Genmab A/S 220,236 0.42 Medical-Drugs 4,465 H Lundbeck A/S 275,882 0.54 20,766 Novo Nordisk A/S 978,078 1.89
FINLAND 3.18% (30 September 2017: 1.51%) Oil Refining & Marketing 5,405 Neste Oyj 446,998 0.86 Paper & Related Products 20,923 Stora Enso OYJ 400,387 0.78 14,126 UPM-Kymmene OYJ 554,583 1.07 Telephone-Integrated 5,697 Elisa OYJ 241,728 0.47
FRANCE 13.45% (30 September 2017: 14.58%) Advertising Sales 2,620 Teleperformance 494,522 0.96 Appliances 1,304 SEB SA 222,046 0.43 Building-Heavy Construction 7,484 Vinci SA 712,991 1.38 Computer Aided Design 2,944 Dassault Systemes SE 440,266 0.85 Diversified Banking Institutions 28,591 Natixis SA 194,075 0.38 Electronics-Military 4,623 Safran SA 648,129 1.25 Entertainment Software 5,737 Ubisoft Entertainment SA 622,523 1.20 Medical Laboratries & Testing Services 2,451 BioMerieux 204,408 0.40 Medical Products 1,502 Sartorius Stedim Biotech 206,737 0.40 Medical-Drugs 2,707 Ipsen SA 455,289 0.88 Multi-Line Insurance 17,705 AXA SA 476,077 0.92 Retail-Major Department Store 1,464 Kering SA 785,112 1.52 Telephone-Integrated 24,089 Orange SA 384,307 0.74 Textile-Apparel
3,118 LVMH Moet Hennessy Louis Vuitton SE 1,103,155 2.14
EUROPEAN EQUITY FUND (continued)
Nominal Security Value USD
% Net Assets
GERMANY 8.66% (30 September 2017: 12.06%) Athletic Footwear 460 Puma SE 227,079 0.44 Chemicals-Diversified 5,199 Covestro AG '144A' 421,870 0.82 Commercial Services 2,808 Wirecard AG 608,936 1.18 Electronic Component-Semiconductor 25,253 Infineon Technologies AG 574,030 1.11 Medical Laser Systems 2,520 Carl Zeiss Meditec AG 212,212 0.41 Optical Recognition Equipment 11,041 Jenoptik AG 407,048 0.79 Real Estate Management/Services 10,945 Vonovia SE 534,961 1.03 Real Estate Operation/Development 7,607 Grand City Properties SA 197,214 0.38 1,724 LEG Immobilien AG 204,754 0.40 Reinsurance 2,299 Hannover Rueck SE 324,983 0.63 Research & Development 13,932 Evotec AG 296,786 0.57 Steel-Producers 3,930 Salzgitter AG 196,515 0.38 Travel Services 14,020 TUI AG 269,305 0.52
GREECE 0.00% (30 September 2017: 0.42%)
IRELAND 1.15% (30 September 2017: 1.96%) Building & Construction Production-Miscellaneous 6,956 Kingspan Group Plc 324,477 0.63 Paper & Related Products 6,778 Smurfit Kappa Group Plc 268,149 0.52
ITALY 3.01% (30 September 2017: 2.72%) Apparel Manufacturers 8,983 Moncler SpA 387,102 0.75 Commercial Banks Non-US
32,946 Mediobanca Banca di Credito Finanziario SpA 329,256 0.64
Electric-Integrated 92,053 Enel SpA 471,742 0.91 Life/Health Insurance 24,395 Poste Italiane SpA '144A' 195,005 0.38 Retail-Miscellaneous/Diversified 7,697 Amplifon SpA 171,117 0.33
JERSEY 0.00% (30 September 2017: 0.45%)
LUXEMBOURG 0.37% (30 September 2017: 0.42%) Commercial Services 337 Eurofins Scientific SE 191,412 0.37
NETHERLANDS 8.67% (30 September 2017: 9.26%) Brewery 3,317 Heineken Holding NV 300,518 0.58 Finance-Other Services 3,742 Euronext NV '144A' 246,226 0.48 Food-Miscellaneous/Diversified 5,435 Corbion NV 176,762 0.34 Food-Retail 17,286 Koninklijke Ahold Delhaize NV 396,545 0.77 Investment Companies 3,756 EXOR NV 252,252 0.49 Life/Health Insurance 11,319 NN Group NV 505,253 0.98 Multi-Line Insurance 7,266 ASR Nederland NV 346,533 0.67
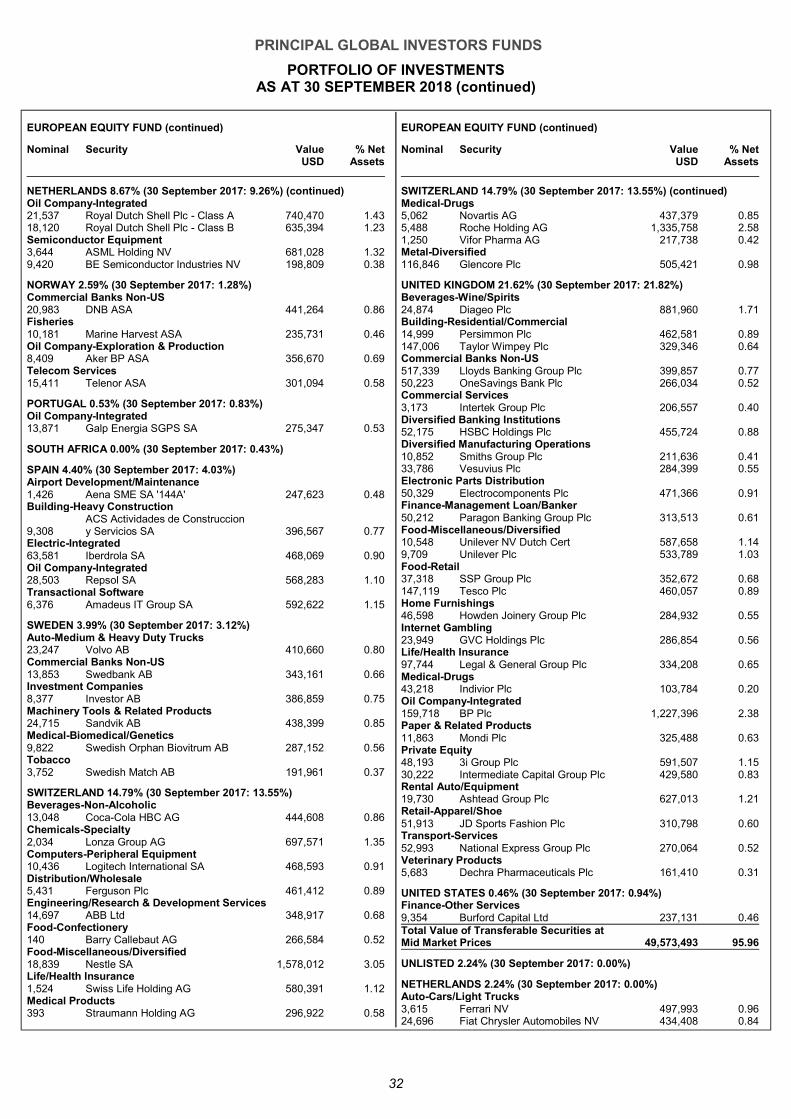
PRINCIPAL GLOBAL INVESTORS FUNDS
PORTFOLIO OF INVESTMENTS AS AT 30 SEPTEMBER 2018 (continued)
32
EUROPEAN EQUITY FUND (continued)
Nominal Security Value USD
% Net Assets
NETHERLANDS 8.67% (30 September 2017: 9.26%) (continued) Oil Company-Integrated 21,537 Royal Dutch Shell Plc - Class A 740,470 1.43 18,120 Royal Dutch Shell Plc - Class B 635,394 1.23 Semiconductor Equipment 3,644 ASML Holding NV 681,028 1.32 9,420 BE Semiconductor Industries NV 198,809 0.38
NORWAY 2.59% (30 September 2017: 1.28%) Commercial Banks Non-US 20,983 DNB ASA 441,264 0.86 Fisheries 10,181 Marine Harvest ASA 235,731 0.46 Oil Company-Exploration & Production 8,409 Aker BP ASA 356,670 0.69 Telecom Services 15,411 Telenor ASA 301,094 0.58
PORTUGAL 0.53% (30 September 2017: 0.83%) Oil Company-Integrated 13,871 Galp Energia SGPS SA 275,347 0.53
SOUTH AFRICA 0.00% (30 September 2017: 0.43%)
SPAIN 4.40% (30 September 2017: 4.03%) Airport Development/Maintenance 1,426 Aena SME SA '144A' 247,623 0.48 Building-Heavy Construction
9,308 ACS Actividades de Construccion y Servicios SA 396,567 0.77
Electric-Integrated 63,581 Iberdrola SA 468,069 0.90 Oil Company-Integrated 28,503 Repsol SA 568,283 1.10 Transactional Software 6,376 Amadeus IT Group SA 592,622 1.15
SWEDEN 3.99% (30 September 2017: 3.12%) Auto-Medium & Heavy Duty Trucks 23,247 Volvo AB 410,660 0.80 Commercial Banks Non-US 13,853 Swedbank AB 343,161 0.66 Investment Companies 8,377 Investor AB 386,859 0.75 Machinery Tools & Related Products 24,715 Sandvik AB 438,399 0.85 Medical-Biomedical/Genetics 9,822 Swedish Orphan Biovitrum AB 287,152 0.56 Tobacco 3,752 Swedish Match AB 191,961 0.37
SWITZERLAND 14.79% (30 September 2017: 13.55%) Beverages-Non-Alcoholic 13,048 Coca-Cola HBC AG 444,608 0.86 Chemicals-Specialty 2,034 Lonza Group AG 697,571 1.35 Computers-Peripheral Equipment 10,436 Logitech International SA 468,593 0.91 Distribution/Wholesale 5,431 Ferguson Plc 461,412 0.89 Engineering/Research & Development Services 14,697 ABB Ltd 348,917 0.68 Food-Confectionery 140 Barry Callebaut AG 266,584 0.52 Food-Miscellaneous/Diversified 18,839 Nestle SA 1,578,012 3.05 Life/Health Insurance 1,524 Swiss Life Holding AG 580,391 1.12 Medical Products 393 Straumann Holding AG 296,922 0.58
EUROPEAN EQUITY FUND (continued)
Nominal Security Value USD
% Net Assets
SWITZERLAND 14.79% (30 September 2017: 13.55%) (continued) Medical-Drugs 5,062 Novartis AG 437,379 0.85 5,488 Roche Holding AG 1,335,758 2.58 1,250 Vifor Pharma AG 217,738 0.42 Metal-Diversified 116,846 Glencore Plc 505,421 0.98
UNITED KINGDOM 21.62% (30 September 2017: 21.82%) Beverages-Wine/Spirits 24,874 Diageo Plc 881,960 1.71 Building-Residential/Commercial 14,999 Persimmon Plc 462,581 0.89 147,006 Taylor Wimpey Plc 329,346 0.64 Commercial Banks Non-US 517,339 Lloyds Banking Group Plc 399,857 0.77 50,223 OneSavings Bank Plc 266,034 0.52 Commercial Services 3,173 Intertek Group Plc 206,557 0.40 Diversified Banking Institutions 52,175 HSBC Holdings Plc 455,724 0.88 Diversified Manufacturing Operations 10,852 Smiths Group Plc 211,636 0.41 33,786 Vesuvius Plc 284,399 0.55 Electronic Parts Distribution 50,329 Electrocomponents Plc 471,366 0.91 Finance-Management Loan/Banker 50,212 Paragon Banking Group Plc 313,513 0.61 Food-Miscellaneous/Diversified 10,548 Unilever NV Dutch Cert 587,658 1.14 9,709 Unilever Plc 533,789 1.03 Food-Retail 37,318 SSP Group Plc 352,672 0.68 147,119 Tesco Plc 460,057 0.89 Home Furnishings 46,598 Howden Joinery Group Plc 284,932 0.55 Internet Gambling 23,949 GVC Holdings Plc 286,854 0.56 Life/Health Insurance 97,744 Legal & General Group Plc 334,208 0.65 Medical-Drugs 43,218 Indivior Plc 103,784 0.20 Oil Company-Integrated 159,718 BP Plc 1,227,396 2.38 Paper & Related Products 11,863 Mondi Plc 325,488 0.63 Private Equity 48,193 3i Group Plc 591,507 1.15 30,222 Intermediate Capital Group Plc 429,580 0.83 Rental Auto/Equipment 19,730 Ashtead Group Plc 627,013 1.21 Retail-Apparel/Shoe 51,913 JD Sports Fashion Plc 310,798 0.60 Transport-Services 52,993 National Express Group Plc 270,064 0.52 Veterinary Products 5,683 Dechra Pharmaceuticals Plc 161,410 0.31
UNITED STATES 0.46% (30 September 2017: 0.94%) Finance-Other Services 9,354 Burford Capital Ltd 237,131 0.46 Total Value of Transferable Securities at Mid Market Prices 49,573,493 95.96
UNLISTED 2.24% (30 September 2017: 0.00%)
NETHERLANDS 2.24% (30 September 2017: 0.00%) Auto-Cars/Light Trucks 3,615 Ferrari NV 497,993 0.96 24,696 Fiat Chrysler Automobiles NV 434,408 0.84
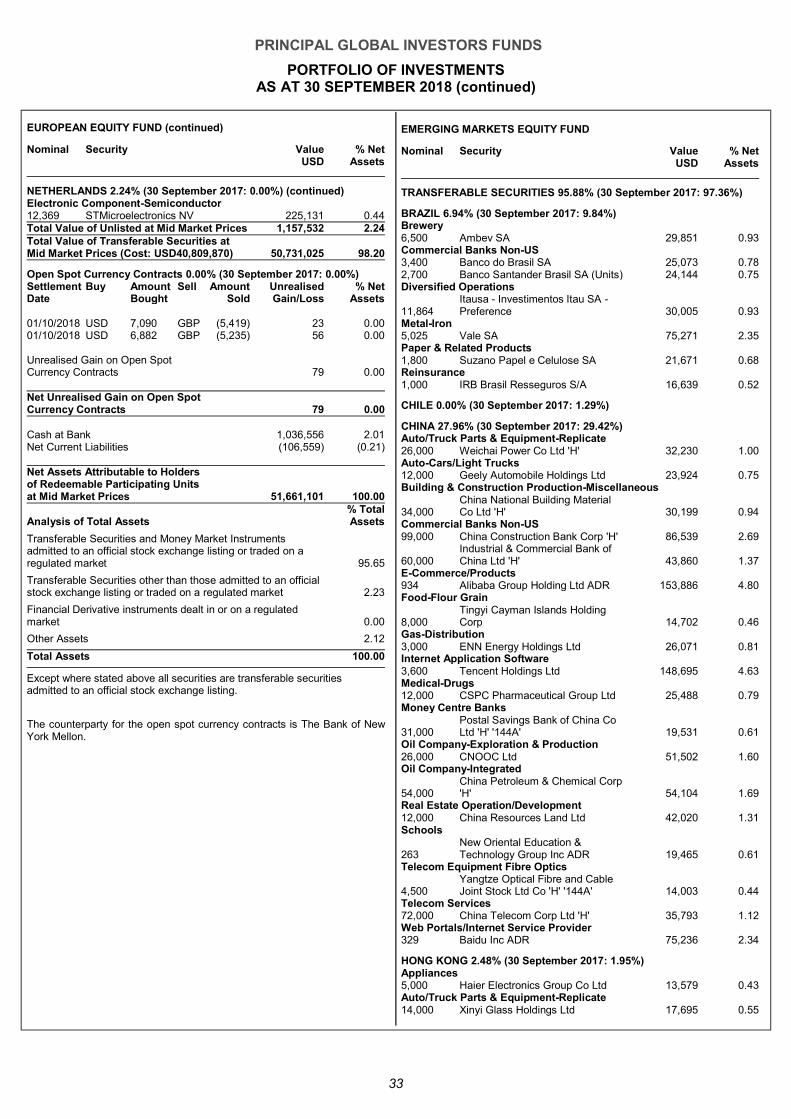
PRINCIPAL GLOBAL INVESTORS FUNDS
PORTFOLIO OF INVESTMENTS AS AT 30 SEPTEMBER 2018 (continued)
33
EUROPEAN EQUITY FUND (continued)
Nominal Security Value USD
% Net Assets
NETHERLANDS 2.24% (30 September 2017: 0.00%) (continued) Electronic Component-Semiconductor 12,369 STMicroelectronics NV 225,131 0.44 Total Value of Unlisted at Mid Market Prices 1,157,532 2.24 Total Value of Transferable Securities at Mid Market Prices (Cost: USD40,809,870) 50,731,025 98.20
Open Spot Currency Contracts 0.00% (30 September 2017: 0.00%) Settlement Buy Amount Sell Amount Unrealised % Net Date Bought Sold Gain/Loss Assets 01/10/2018 USD 7,090 GBP (5,419) 23 0.00 01/10/2018 USD 6,882 GBP (5,235) 56 0.00 Unrealised Gain on Open Spot Currency Contracts 79 0.00 Net Unrealised Gain on Open Spot Currency Contracts 79 0 .00
Cash at Bank 1,036,556 2.01 Net Current Liabilities (106,559) (0.21) Net Assets Attributable to Holders of Redeemable Participating Units at Mid Market Prices 51,661,101 100.00
Analysis of Total Assets% Total Assets
Transferable Securities and Money Market Instruments admitted to an official stock exchange listing or traded on a regulated market 95.65
Transferable Securities other than those admitted to an official stock exchange listing or traded on a regulated market 2.23
Financial Derivative instruments dealt in or on a regulated market 0.00
Other Assets 2.12
Total Assets 100.00
Except where stated above all securities are transferable securities admitted to an official stock exchange listing.
The counterparty for the open spot currency contracts is The Bank of New York Mellon.
EMERGING MARKETS EQUITY FUND
Nominal Security Value USD
% Net Assets
TRANSFERABLE SECURITIES 95.88% (30 September 2017: 97.36%)
BRAZIL 6.94% (30 September 2017: 9.84%) Brewery 6,500 Ambev SA 29,851 0.93 Commercial Banks Non-US 3,400 Banco do Brasil SA 25,073 0.78 2,700 Banco Santander Brasil SA (Units) 24,144 0.75 Diversified Operations
11,864 Itausa - Investimentos Itau SA - Preference 30,005 0.93
Metal-Iron 5,025 Vale SA 75,271 2.35 Paper & Related Products 1,800 Suzano Papel e Celulose SA 21,671 0.68 Reinsurance 1,000 IRB Brasil Resseguros S/A 16,639 0.52
CHILE 0.00% (30 September 2017: 1.29%)
CHINA 27.96% (30 September 2017: 29.42%) Auto/Truck Parts & Equipment-Replicate 26,000 Weichai Power Co Ltd 'H' 32,230 1.00 Auto-Cars/Light Trucks 12,000 Geely Automobile Holdings Ltd 23,924 0.75 Building & Construction Production-Miscellaneous
34,000 China National Building Material Co Ltd 'H' 30,199 0.94
Commercial Banks Non-US 99,000 China Construction Bank Corp 'H' 86,539 2.69
60,000 Industrial & Commercial Bank of China Ltd 'H' 43,860 1.37
E-Commerce/Products 934 Alibaba Group Holding Ltd ADR 153,886 4.80 Food-Flour Grain
8,000 Tingyi Cayman Islands Holding Corp 14,702 0.46
Gas-Distribution 3,000 ENN Energy Holdings Ltd 26,071 0.81 Internet Application Software 3,600 Tencent Holdings Ltd 148,695 4.63 Medical-Drugs 12,000 CSPC Pharmaceutical Group Ltd 25,488 0.79 Money Centre Banks
31,000 Postal Savings Bank of China Co Ltd 'H' '144A' 19,531 0.61
Oil Company-Exploration & Production 26,000 CNOOC Ltd 51,502 1.60 Oil Company-Integrated
54,000 China Petroleum & Chemical Corp 'H' 54,104 1.69
Real Estate Operation/Development 12,000 China Resources Land Ltd 42,020 1.31 Schools
263 New Oriental Education & Technology Group Inc ADR 19,465 0.61
Telecom Equipment Fibre Optics
4,500 Yangtze Optical Fibre and Cable Joint Stock Ltd Co 'H' '144A' 14,003 0.44
Telecom Services 72,000 China Telecom Corp Ltd 'H' 35,793 1.12 Web Portals/Internet Service Provider 329 Baidu Inc ADR 75,236 2.34
HONG KONG 2.48% (30 September 2017: 1.95%) Appliances 5,000 Haier Electronics Group Co Ltd 13,579 0.43 Auto/Truck Parts & Equipment-Replicate 14,000 Xinyi Glass Holdings Ltd 17,695 0.55
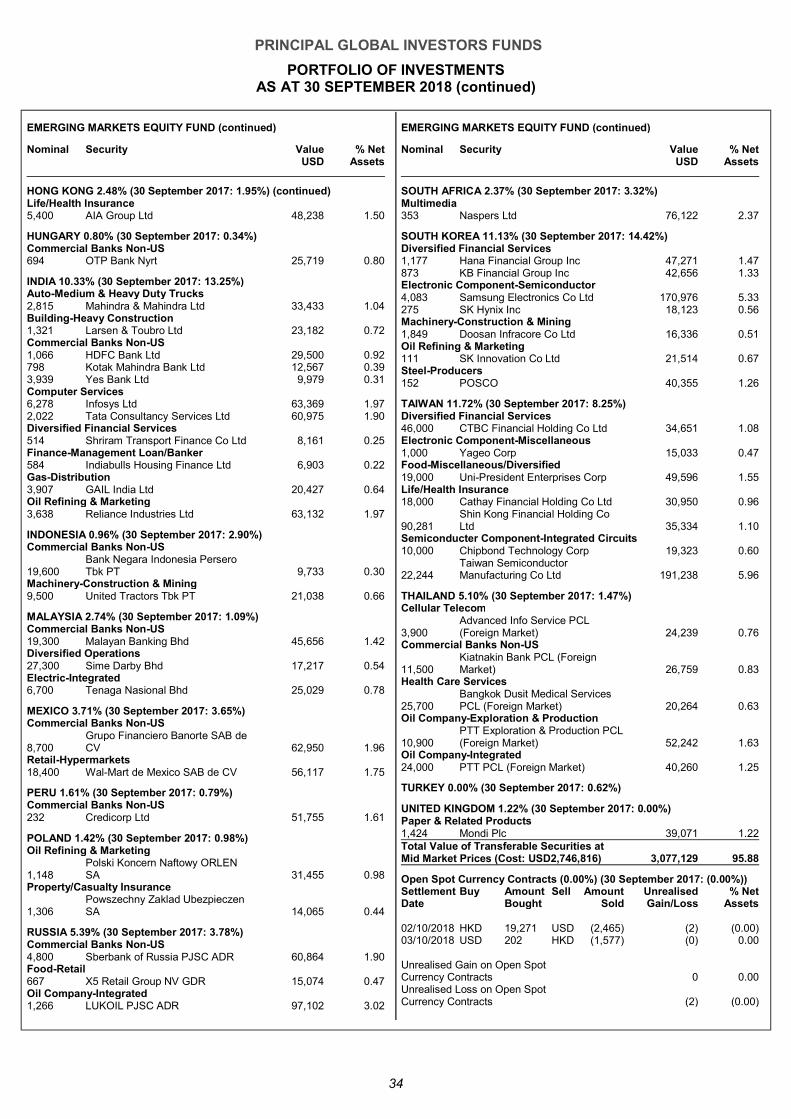
PRINCIPAL GLOBAL INVESTORS FUNDS
PORTFOLIO OF INVESTMENTS AS AT 30 SEPTEMBER 2018 (continued)
34
EMERGING MARKETS EQUITY FUND (continued)
Nominal Security Value USD
% Net Assets
HONG KONG 2.48% (30 September 2017: 1.95%) (continued) Life/Health Insurance 5,400 AIA Group Ltd 48,238 1.50
HUNGARY 0.80% (30 September 2017: 0.34%) Commercial Banks Non-US 694 OTP Bank Nyrt 25,719 0.80
INDIA 10.33% (30 September 2017: 13.25%) Auto-Medium & Heavy Duty Trucks 2,815 Mahindra & Mahindra Ltd 33,433 1.04 Building-Heavy Construction 1,321 Larsen & Toubro Ltd 23,182 0.72 Commercial Banks Non-US 1,066 HDFC Bank Ltd 29,500 0.92 798 Kotak Mahindra Bank Ltd 12,567 0.39 3,939 Yes Bank Ltd 9,979 0.31 Computer Services 6,278 Infosys Ltd 63,369 1.97 2,022 Tata Consultancy Services Ltd 60,975 1.90 Diversified Financial Services 514 Shriram Transport Finance Co Ltd 8,161 0.25 Finance-Management Loan/Banker 584 Indiabulls Housing Finance Ltd 6,903 0.22 Gas-Distribution 3,907 GAIL India Ltd 20,427 0.64 Oil Refining & Marketing 3,638 Reliance Industries Ltd 63,132 1.97
INDONESIA 0.96% (30 September 2017: 2.90%) Commercial Banks Non-US
19,600 Bank Negara Indonesia Persero Tbk PT 9,733 0.30
Machinery-Construction & Mining 9,500 United Tractors Tbk PT 21,038 0.66
MALAYSIA 2.74% (30 September 2017: 1.09%) Commercial Banks Non-US 19,300 Malayan Banking Bhd 45,656 1.42 Diversified Operations 27,300 Sime Darby Bhd 17,217 0.54 Electric-Integrated 6,700 Tenaga Nasional Bhd 25,029 0.78
MEXICO 3.71% (30 September 2017: 3.65%) Commercial Banks Non-US
8,700 Grupo Financiero Banorte SAB de CV 62,950 1.96
Retail-Hypermarkets 18,400 Wal-Mart de Mexico SAB de CV 56,117 1.75
PERU 1.61% (30 September 2017: 0.79%) Commercial Banks Non-US 232 Credicorp Ltd 51,755 1.61
POLAND 1.42% (30 September 2017: 0.98%) Oil Refining & Marketing
1,148 Polski Koncern Naftowy ORLEN SA 31,455 0.98
Property/Casualty Insurance
1,306 Powszechny Zaklad Ubezpieczen SA 14,065 0.44
RUSSIA 5.39% (30 September 2017: 3.78%) Commercial Banks Non-US 4,800 Sberbank of Russia PJSC ADR 60,864 1.90 Food-Retail 667 X5 Retail Group NV GDR 15,074 0.47 Oil Company-Integrated 1,266 LUKOIL PJSC ADR 97,102 3.02
EMERGING MARKETS EQUITY FUND (continued)
Nominal Security Value USD
% Net Assets
SOUTH AFRICA 2.37% (30 September 2017: 3.32%) Multimedia 353 Naspers Ltd 76,122 2.37
SOUTH KOREA 11.13% (30 September 2017: 14.42%) Diversified Financial Services 1,177 Hana Financial Group Inc 47,271 1.47 873 KB Financial Group Inc 42,656 1.33 Electronic Component-Semiconductor 4,083 Samsung Electronics Co Ltd 170,976 5.33 275 SK Hynix Inc 18,123 0.56 Machinery-Construction & Mining 1,849 Doosan Infracore Co Ltd 16,336 0.51 Oil Refining & Marketing 111 SK Innovation Co Ltd 21,514 0.67 Steel-Producers 152 POSCO 40,355 1.26
TAIWAN 11.72% (30 September 2017: 8.25%) Diversified Financial Services 46,000 CTBC Financial Holding Co Ltd 34,651 1.08 Electronic Component-Miscellaneous 1,000 Yageo Corp 15,033 0.47 Food-Miscellaneous/Diversified 19,000 Uni-President Enterprises Corp 49,596 1.55 Life/Health Insurance 18,000 Cathay Financial Holding Co Ltd 30,950 0.96
90,281 Shin Kong Financial Holding Co Ltd 35,334 1.10
Semiconducter Component-Integrated Circuits 10,000 Chipbond Technology Corp 19,323 0.60
22,244 Taiwan Semiconductor Manufacturing Co Ltd 191,238 5.96
THAILAND 5.10% (30 September 2017: 1.47%) Cellular Telecom
3,900 Advanced Info Service PCL (Foreign Market) 24,239 0.76
Commercial Banks Non-US
11,500 Kiatnakin Bank PCL (Foreign Market) 26,759 0.83
Health Care Services
25,700 Bangkok Dusit Medical Services PCL (Foreign Market) 20,264 0.63
Oil Company-Exploration & Production
10,900 PTT Exploration & Production PCL (Foreign Market) 52,242 1.63
Oil Company-Integrated 24,000 PTT PCL (Foreign Market) 40,260 1.25
TURKEY 0.00% (30 September 2017: 0.62%)
UNITED KINGDOM 1.22% (30 September 2017: 0.00%) Paper & Related Products 1,424 Mondi Plc 39,071 1.22 Total Value of Transferable Securities at Mid Market Prices (Cost: USD2,746,816) 3,077,129 95.88
Open Spot Currency Contracts (0.00%) (30 September 2017: (0.00%)) Settlement Buy Amount Sell Amount Unrealised % Net Date Bought Sold Gain/Loss Assets 02/10/2018 HKD 19,271 USD (2,465) (2) (0.00) 03/10/2018 USD 202 HKD (1,577) (0) 0.00 Unrealised Gain on Open Spot Currency Contracts 0 0.00 Unrealised Loss on Open Spot Currency Contracts (2) (0.00)
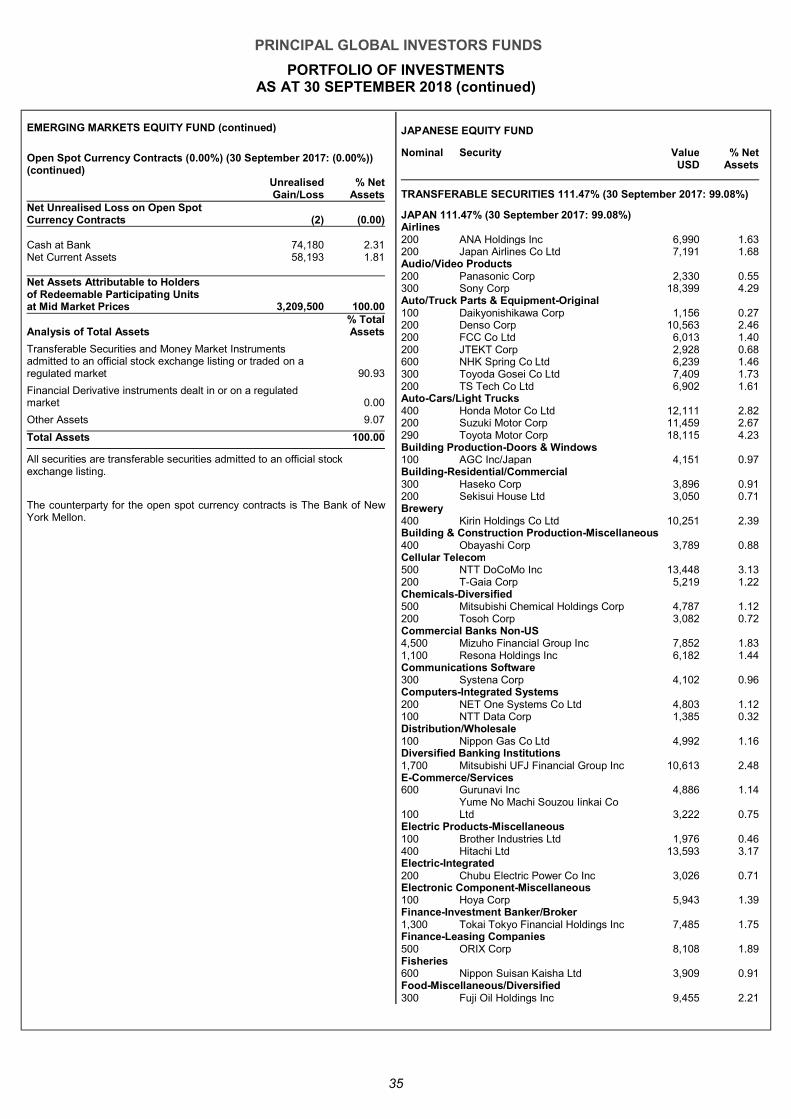
PRINCIPAL GLOBAL INVESTORS FUNDS
PORTFOLIO OF INVESTMENTS AS AT 30 SEPTEMBER 2018 (continued)
35
EMERGING MARKETS EQUITY FUND (continued)
Open Spot Currency Contracts (0.00%) (30 September 2017: (0.00%)) (continued) Unrealised % Net Gain/Loss Assets Net Unrealised Loss on Open Spot Currency Contracts (2) (0 .00)
Cash at Bank 74,180 2.31 Net Current Assets 58,193 1.81 Net Assets Attributable to Holders of Redeemable Participating Units at Mid Market Prices 3,209,500 100.00
Analysis of Total Assets % Total Assets
Transferable Securities and Money Market Instruments admitted to an official stock exchange listing or traded on a regulated market 90.93
Financial Derivative instruments dealt in or on a regulated market 0.00
Other Assets 9.07
Total Assets 100.00
All securities are transferable securities admitted to an official stock exchange listing.
The counterparty for the open spot currency contracts is The Bank of New York Mellon.
JAPANESE EQUITY FUND
Nominal Security Value USD
% Net Assets
TRANSFERABLE SECURITIES 111.47% (30 September 2017: 99.08%)
JAPAN 111.47% (30 September 2017: 99.08%) Airlines 200 ANA Holdings Inc 6,990 1.63 200 Japan Airlines Co Ltd 7,191 1.68 Audio/Video Products 200 Panasonic Corp 2,330 0.55 300 Sony Corp 18,399 4.29 Auto/Truck Parts & Equipment-Original 100 Daikyonishikawa Corp 1,156 0.27 200 Denso Corp 10,563 2.46 200 FCC Co Ltd 6,013 1.40 200 JTEKT Corp 2,928 0.68 600 NHK Spring Co Ltd 6,239 1.46 300 Toyoda Gosei Co Ltd 7,409 1.73 200 TS Tech Co Ltd 6,902 1.61 Auto-Cars/Light Trucks 400 Honda Motor Co Ltd 12,111 2.82 200 Suzuki Motor Corp 11,459 2.67 290 Toyota Motor Corp 18,115 4.23 Building Production-Doors & Windows 100 AGC Inc/Japan 4,151 0.97 Building-Residential/Commercial 300 Haseko Corp 3,896 0.91 200 Sekisui House Ltd 3,050 0.71 Brewery 400 Kirin Holdings Co Ltd 10,251 2.39 Building & Construction Production-Miscellaneous 400 Obayashi Corp 3,789 0.88 Cellular Telecom 500 NTT DoCoMo Inc 13,448 3.13 200 T-Gaia Corp 5,219 1.22 Chemicals-Diversified 500 Mitsubishi Chemical Holdings Corp 4,787 1.12 200 Tosoh Corp 3,082 0.72 Commercial Banks Non-US 4,500 Mizuho Financial Group Inc 7,852 1.83 1,100 Resona Holdings Inc 6,182 1.44 Communications Software 300 Systena Corp 4,102 0.96 Computers-Integrated Systems 200 NET One Systems Co Ltd 4,803 1.12 100 NTT Data Corp 1,385 0.32 Distribution/Wholesale 100 Nippon Gas Co Ltd 4,992 1.16 Diversified Banking Institutions 1,700 Mitsubishi UFJ Financial Group Inc 10,613 2.48 E-Commerce/Services 600 Gurunavi Inc 4,886 1.14
100 Yume No Machi Souzou Iinkai Co Ltd 3,222 0.75
Electric Products-Miscellaneous 100 Brother Industries Ltd 1,976 0.46 400 Hitachi Ltd 13,593 3.17 Electric-Integrated 200 Chubu Electric Power Co Inc 3,026 0.71 Electronic Component-Miscellaneous 100 Hoya Corp 5,943 1.39 Finance-Investment Banker/Broker 1,300 Tokai Tokyo Financial Holdings Inc 7,485 1.75 Finance-Leasing Companies 500 ORIX Corp 8,108 1.89 Fisheries 600 Nippon Suisan Kaisha Ltd 3,909 0.91 Food-Miscellaneous/Diversified 300 Fuji Oil Holdings Inc 9,455 2.21
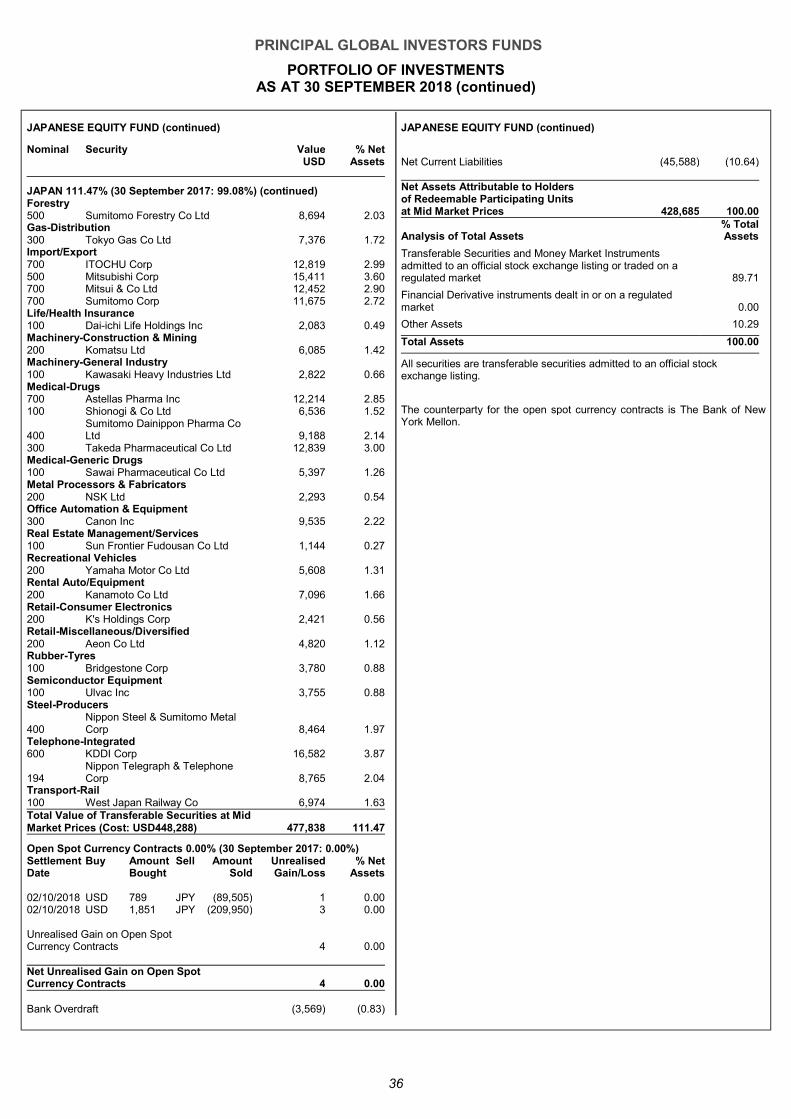
PRINCIPAL GLOBAL INVESTORS FUNDS
PORTFOLIO OF INVESTMENTS AS AT 30 SEPTEMBER 2018 (continued)
36
JAPANESE EQUITY FUND (continued)
Nominal Security Value USD
% Net Assets
JAPAN 111.47% (30 September 2017: 99.08%) (continued) Forestry 500 Sumitomo Forestry Co Ltd 8,694 2.03 Gas-Distribution 300 Tokyo Gas Co Ltd 7,376 1.72 Import/Export 700 ITOCHU Corp 12,819 2.99 500 Mitsubishi Corp 15,411 3.60 700 Mitsui & Co Ltd 12,452 2.90 700 Sumitomo Corp 11,675 2.72 Life/Health Insurance 100 Dai-ichi Life Holdings Inc 2,083 0.49 Machinery-Construction & Mining 200 Komatsu Ltd 6,085 1.42 Machinery-General Industry 100 Kawasaki Heavy Industries Ltd 2,822 0.66 Medical-Drugs 700 Astellas Pharma Inc 12,214 2.85 100 Shionogi & Co Ltd 6,536 1.52
400 Sumitomo Dainippon Pharma Co Ltd 9,188 2.14
300 Takeda Pharmaceutical Co Ltd 12,839 3.00 Medical-Generic Drugs 100 Sawai Pharmaceutical Co Ltd 5,397 1.26 Metal Processors & Fabricators 200 NSK Ltd 2,293 0.54 Office Automation & Equipment 300 Canon Inc 9,535 2.22 Real Estate Management/Services 100 Sun Frontier Fudousan Co Ltd 1,144 0.27 Recreational Vehicles 200 Yamaha Motor Co Ltd 5,608 1.31 Rental Auto/Equipment 200 Kanamoto Co Ltd 7,096 1.66 Retail-Consumer Electronics 200 K's Holdings Corp 2,421 0.56 Retail-Miscellaneous/Diversified 200 Aeon Co Ltd 4,820 1.12 Rubber-Tyres 100 Bridgestone Corp 3,780 0.88 Semiconductor Equipment 100 Ulvac Inc 3,755 0.88 Steel-Producers
400 Nippon Steel & Sumitomo Metal Corp 8,464 1.97
Telephone-Integrated 600 KDDI Corp 16,582 3.87
194 Nippon Telegraph & Telephone Corp 8,765 2.04
Transport-Rail 100 West Japan Railway Co 6,974 1.63 Total Value of Transferable Securities at Mid Market Prices (Cost: USD448,288) 477,838 111.47
Open Spot Currency Contracts 0.00% (30 September 2017: 0.00%) Settlement Buy Amount Sell Amount Unrealised % Net Date Bought Sold Gain/Loss Assets 02/10/2018 USD 789 JPY (89,505) 1 0.00 02/10/2018 USD 1,851 JPY (209,950) 3 0.00 Unrealised Gain on Open Spot Currency Contracts 4 0.00 Net Unrealised Gain on Open Spot Currency Contracts 4 0 .00
Bank Overdraft (3,569) (0.83)
JAPANESE EQUITY FUND (continued)
Net Current Liabilities (45,588) (10.64) Net Assets Attributable to Holders of Redeemable Participating Units at Mid Market Prices 428,685 100.00
Analysis of Total Assets % Total Assets
Transferable Securities and Money Market Instruments admitted to an official stock exchange listing or traded on a regulated market 89.71
Financial Derivative instruments dealt in or on a regulated market 0.00
Other Assets 10.29
Total Assets 100.00
All securities are transferable securities admitted to an official stock exchange listing.
The counterparty for the open spot currency contracts is The Bank of New York Mellon.
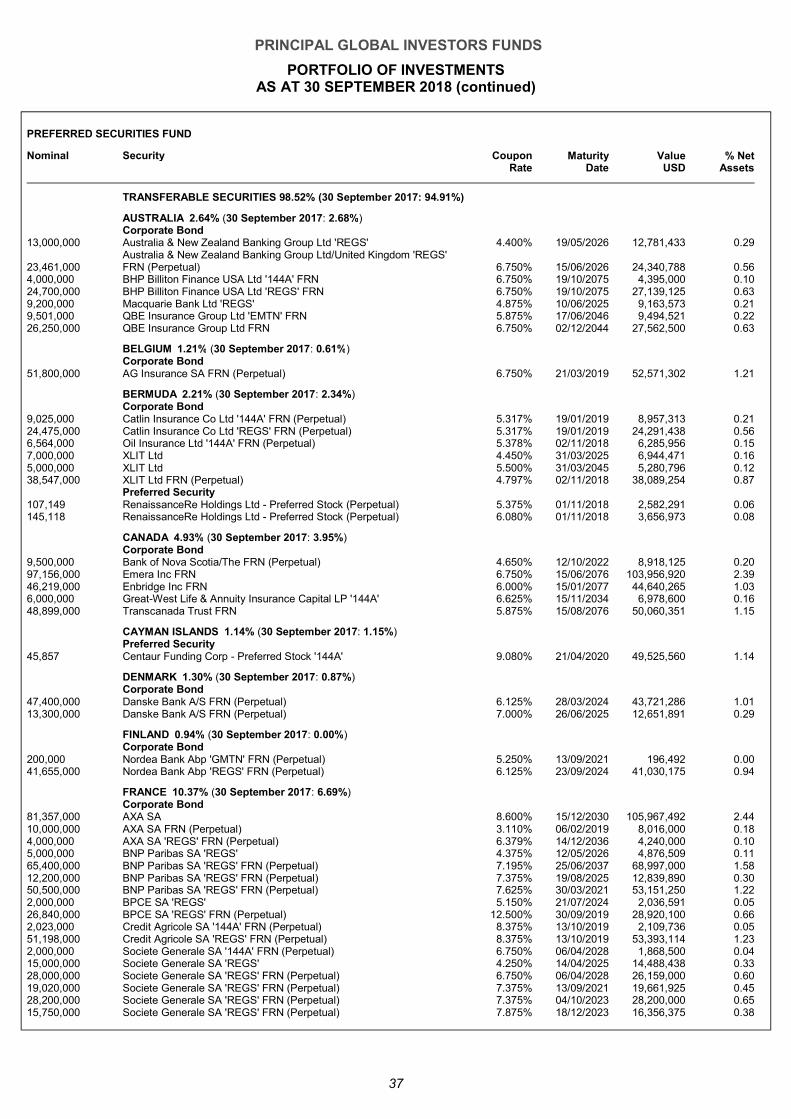
PRINCIPAL GLOBAL INVESTORS FUNDS
PORTFOLIO OF INVESTMENTS AS AT 30 SEPTEMBER 2018 (continued)
37
PREFERRED SECURITIES FUND
Nominal Security Coupon Rate
Maturity Date
Value USD
% Net Assets
TRANSFERABLE SECURITIES 98.52% (30 September 2017: 94.91%)
AUSTRALIA 2.64% (30 September 2017: 2.68%) Corporate Bond
13,000,000 Australia & New Zealand Banking Group Ltd 'REGS' 4.400% 19/05/2026 12,781,433 0.29
23,461,000 Australia & New Zealand Banking Group Ltd/United Kingdom 'REGS' FRN (Perpetual) 6.750% 15/06/2026 24,340,788 0.56
4,000,000 BHP Billiton Finance USA Ltd '144A' FRN 6.750% 19/10/2075 4,395,000 0.10 24,700,000 BHP Billiton Finance USA Ltd 'REGS' FRN 6.750% 19/10/2075 27,139,125 0.63 9,200,000 Macquarie Bank Ltd 'REGS' 4.875% 10/06/2025 9,163,573 0.21 9,501,000 QBE Insurance Group Ltd 'EMTN' FRN 5.875% 17/06/2046 9,494,521 0.22 26,250,000 QBE Insurance Group Ltd FRN 6.750% 02/12/2044 27,562,500 0.63
BELGIUM 1.21% (30 September 2017: 0.61%) Corporate Bond
51,800,000 AG Insurance SA FRN (Perpetual) 6.750% 21/03/2019 52,571,302 1.21
BERMUDA 2.21% (30 September 2017: 2.34%) Corporate Bond
9,025,000 Catlin Insurance Co Ltd '144A' FRN (Perpetual) 5.317% 19/01/2019 8,957,313 0.21 24,475,000 Catlin Insurance Co Ltd 'REGS' FRN (Perpetual) 5.317% 19/01/2019 24,291,438 0.56 6,564,000 Oil Insurance Ltd '144A' FRN (Perpetual) 5.378% 02/11/2018 6,285,956 0.15 7,000,000 XLIT Ltd 4.450% 31/03/2025 6,944,471 0.16 5,000,000 XLIT Ltd 5.500% 31/03/2045 5,280,796 0.12 38,547,000 XLIT Ltd FRN (Perpetual) 4.797% 02/11/2018 38,089,254 0.87
Preferred Security 107,149 RenaissanceRe Holdings Ltd - Preferred Stock (Perpetual) 5.375% 01/11/2018 2,582,291 0.06 145,118 RenaissanceRe Holdings Ltd - Preferred Stock (Perpetual) 6.080% 01/11/2018 3,656,973 0.08
CANADA 4.93% (30 September 2017: 3.95%) Corporate Bond
9,500,000 Bank of Nova Scotia/The FRN (Perpetual) 4.650% 12/10/2022 8,918,125 0.20 97,156,000 Emera Inc FRN 6.750% 15/06/2076 103,956,920 2.39 46,219,000 Enbridge Inc FRN 6.000% 15/01/2077 44,640,265 1.03 6,000,000 Great-West Life & Annuity Insurance Capital LP '144A' 6.625% 15/11/2034 6,978,600 0.16 48,899,000 Transcanada Trust FRN 5.875% 15/08/2076 50,060,351 1.15
CAYMAN ISLANDS 1.14% (30 September 2017: 1.15%) Preferred Security
45,857 Centaur Funding Corp - Preferred Stock '144A' 9.080% 21/04/2020 49,525,560 1.14
DENMARK 1.30% (30 September 2017: 0.87%) Corporate Bond
47,400,000 Danske Bank A/S FRN (Perpetual) 6.125% 28/03/2024 43,721,286 1.01 13,300,000 Danske Bank A/S FRN (Perpetual) 7.000% 26/06/2025 12,651,891 0.29
FINLAND 0.94% (30 September 2017: 0.00%) Corporate Bond
200,000 Nordea Bank Abp 'GMTN' FRN (Perpetual) 5.250% 13/09/2021 196,492 0.00 41,655,000 Nordea Bank Abp 'REGS' FRN (Perpetual) 6.125% 23/09/2024 41,030,175 0.94
FRANCE 10.37% (30 September 2017: 6.69%) Corporate Bond
81,357,000 AXA SA 8.600% 15/12/2030 105,967,492 2.44 10,000,000 AXA SA FRN (Perpetual) 3.110% 06/02/2019 8,016,000 0.18 4,000,000 AXA SA 'REGS' FRN (Perpetual) 6.379% 14/12/2036 4,240,000 0.10 5,000,000 BNP Paribas SA 'REGS' 4.375% 12/05/2026 4,876,509 0.11 65,400,000 BNP Paribas SA 'REGS' FRN (Perpetual) 7.195% 25/06/2037 68,997,000 1.58 12,200,000 BNP Paribas SA 'REGS' FRN (Perpetual) 7.375% 19/08/2025 12,839,890 0.30 50,500,000 BNP Paribas SA 'REGS' FRN (Perpetual) 7.625% 30/03/2021 53,151,250 1.22 2,000,000 BPCE SA 'REGS' 5.150% 21/07/2024 2,036,591 0.05 26,840,000 BPCE SA 'REGS' FRN (Perpetual) 12.500% 30/09/2019 28,920,100 0.66 2,023,000 Credit Agricole SA '144A' FRN (Perpetual) 8.375% 13/10/2019 2,109,736 0.05 51,198,000 Credit Agricole SA 'REGS' FRN (Perpetual) 8.375% 13/10/2019 53,393,114 1.23 2,000,000 Societe Generale SA '144A' FRN (Perpetual) 6.750% 06/04/2028 1,868,500 0.04 15,000,000 Societe Generale SA 'REGS' 4.250% 14/04/2025 14,488,438 0.33 28,000,000 Societe Generale SA 'REGS' FRN (Perpetual) 6.750% 06/04/2028 26,159,000 0.60 19,020,000 Societe Generale SA 'REGS' FRN (Perpetual) 7.375% 13/09/2021 19,661,925 0.45 28,200,000 Societe Generale SA 'REGS' FRN (Perpetual) 7.375% 04/10/2023 28,200,000 0.65 15,750,000 Societe Generale SA 'REGS' FRN (Perpetual) 7.875% 18/12/2023 16,356,375 0.38
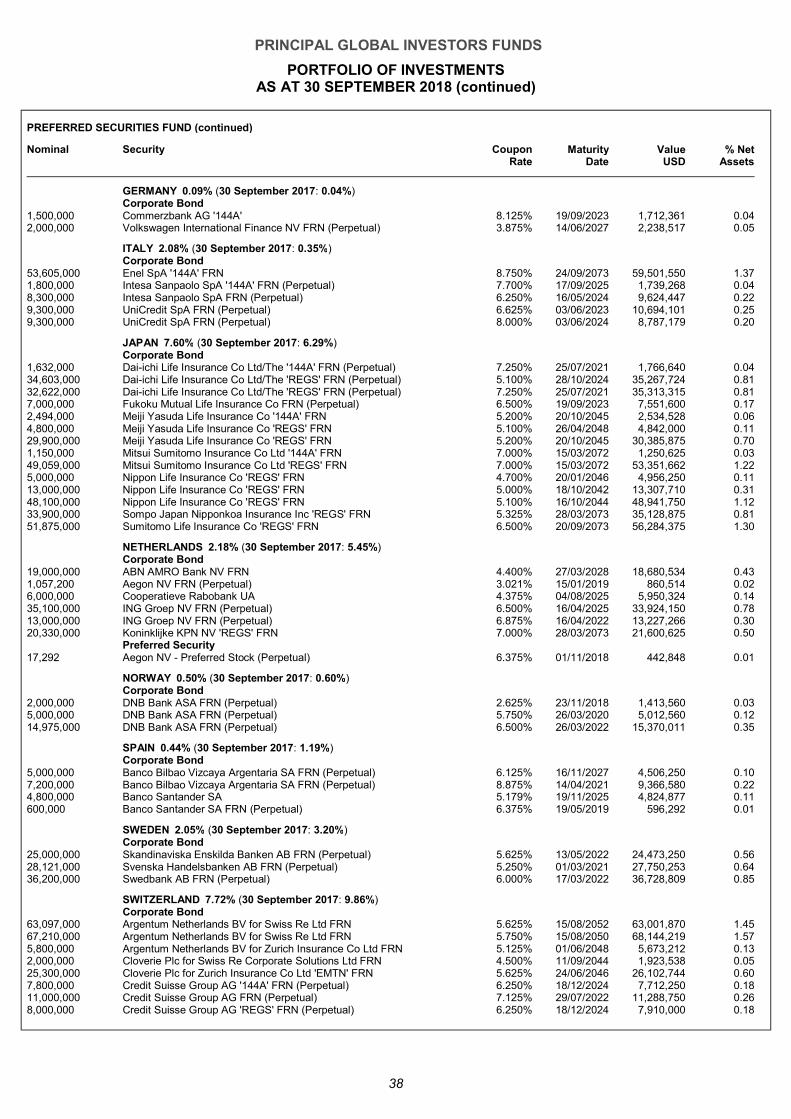
PRINCIPAL GLOBAL INVESTORS FUNDS
PORTFOLIO OF INVESTMENTS AS AT 30 SEPTEMBER 2018 (continued)
38
PREFERRED SECURITIES FUND (continued)
Nominal Security Coupon Rate
Maturity Date
Value USD
% Net Assets
GERMANY 0.09% (30 September 2017: 0.04%) Corporate Bond
1,500,000 Commerzbank AG '144A' 8.125% 19/09/2023 1,712,361 0.04 2,000,000 Volkswagen International Finance NV FRN (Perpetual) 3.875% 14/06/2027 2,238,517 0.05
ITALY 2.08% (30 September 2017: 0.35%) Corporate Bond
53,605,000 Enel SpA '144A' FRN 8.750% 24/09/2073 59,501,550 1.37 1,800,000 Intesa Sanpaolo SpA '144A' FRN (Perpetual) 7.700% 17/09/2025 1,739,268 0.04 8,300,000 Intesa Sanpaolo SpA FRN (Perpetual) 6.250% 16/05/2024 9,624,447 0.22 9,300,000 UniCredit SpA FRN (Perpetual) 6.625% 03/06/2023 10,694,101 0.25 9,300,000 UniCredit SpA FRN (Perpetual) 8.000% 03/06/2024 8,787,179 0.20
JAPAN 7.60% (30 September 2017: 6.29%) Corporate Bond
1,632,000 Dai-ichi Life Insurance Co Ltd/The '144A' FRN (Perpetual) 7.250% 25/07/2021 1,766,640 0.04 34,603,000 Dai-ichi Life Insurance Co Ltd/The 'REGS' FRN (Perpetual) 5.100% 28/10/2024 35,267,724 0.81 32,622,000 Dai-ichi Life Insurance Co Ltd/The 'REGS' FRN (Perpetual) 7.250% 25/07/2021 35,313,315 0.81 7,000,000 Fukoku Mutual Life Insurance Co FRN (Perpetual) 6.500% 19/09/2023 7,551,600 0.17 2,494,000 Meiji Yasuda Life Insurance Co '144A' FRN 5.200% 20/10/2045 2,534,528 0.06 4,800,000 Meiji Yasuda Life Insurance Co 'REGS' FRN 5.100% 26/04/2048 4,842,000 0.11 29,900,000 Meiji Yasuda Life Insurance Co 'REGS' FRN 5.200% 20/10/2045 30,385,875 0.70 1,150,000 Mitsui Sumitomo Insurance Co Ltd '144A' FRN 7.000% 15/03/2072 1,250,625 0.03 49,059,000 Mitsui Sumitomo Insurance Co Ltd 'REGS' FRN 7.000% 15/03/2072 53,351,662 1.22 5,000,000 Nippon Life Insurance Co 'REGS' FRN 4.700% 20/01/2046 4,956,250 0.11 13,000,000 Nippon Life Insurance Co 'REGS' FRN 5.000% 18/10/2042 13,307,710 0.31 48,100,000 Nippon Life Insurance Co 'REGS' FRN 5.100% 16/10/2044 48,941,750 1.12 33,900,000 Sompo Japan Nipponkoa Insurance Inc 'REGS' FRN 5.325% 28/03/2073 35,128,875 0.81 51,875,000 Sumitomo Life Insurance Co 'REGS' FRN 6.500% 20/09/2073 56,284,375 1.30
NETHERLANDS 2.18% (30 September 2017: 5.45%) Corporate Bond
19,000,000 ABN AMRO Bank NV FRN 4.400% 27/03/2028 18,680,534 0.43 1,057,200 Aegon NV FRN (Perpetual) 3.021% 15/01/2019 860,514 0.02 6,000,000 Cooperatieve Rabobank UA 4.375% 04/08/2025 5,950,324 0.14 35,100,000 ING Groep NV FRN (Perpetual) 6.500% 16/04/2025 33,924,150 0.78 13,000,000 ING Groep NV FRN (Perpetual) 6.875% 16/04/2022 13,227,266 0.30 20,330,000 Koninklijke KPN NV 'REGS' FRN 7.000% 28/03/2073 21,600,625 0.50
Preferred Security 17,292 Aegon NV - Preferred Stock (Perpetual) 6.375% 01/11/2018 442,848 0.01
NORWAY 0.50% (30 September 2017: 0.60%) Corporate Bond
2,000,000 DNB Bank ASA FRN (Perpetual) 2.625% 23/11/2018 1,413,560 0.03 5,000,000 DNB Bank ASA FRN (Perpetual) 5.750% 26/03/2020 5,012,560 0.12 14,975,000 DNB Bank ASA FRN (Perpetual) 6.500% 26/03/2022 15,370,011 0.35
SPAIN 0.44% (30 September 2017: 1.19%) Corporate Bond
5,000,000 Banco Bilbao Vizcaya Argentaria SA FRN (Perpetual) 6.125% 16/11/2027 4,506,250 0.10 7,200,000 Banco Bilbao Vizcaya Argentaria SA FRN (Perpetual) 8.875% 14/04/2021 9,366,580 0.22 4,800,000 Banco Santander SA 5.179% 19/11/2025 4,824,877 0.11 600,000 Banco Santander SA FRN (Perpetual) 6.375% 19/05/2019 596,292 0.01
SWEDEN 2.05% (30 September 2017: 3.20%) Corporate Bond
25,000,000 Skandinaviska Enskilda Banken AB FRN (Perpetual) 5.625% 13/05/2022 24,473,250 0.56 28,121,000 Svenska Handelsbanken AB FRN (Perpetual) 5.250% 01/03/2021 27,750,253 0.64 36,200,000 Swedbank AB FRN (Perpetual) 6.000% 17/03/2022 36,728,809 0.85
SWITZERLAND 7.72% (30 September 2017: 9.86%) Corporate Bond
63,097,000 Argentum Netherlands BV for Swiss Re Ltd FRN 5.625% 15/08/2052 63,001,870 1.45 67,210,000 Argentum Netherlands BV for Swiss Re Ltd FRN 5.750% 15/08/2050 68,144,219 1.57 5,800,000 Argentum Netherlands BV for Zurich Insurance Co Ltd FRN 5.125% 01/06/2048 5,673,212 0.13 2,000,000 Cloverie Plc for Swiss Re Corporate Solutions Ltd FRN 4.500% 11/09/2044 1,923,538 0.05 25,300,000 Cloverie Plc for Zurich Insurance Co Ltd 'EMTN' FRN 5.625% 24/06/2046 26,102,744 0.60 7,800,000 Credit Suisse Group AG '144A' FRN (Perpetual) 6.250% 18/12/2024 7,712,250 0.18 11,000,000 Credit Suisse Group AG FRN (Perpetual) 7.125% 29/07/2022 11,288,750 0.26 8,000,000 Credit Suisse Group AG 'REGS' FRN (Perpetual) 6.250% 18/12/2024 7,910,000 0.18
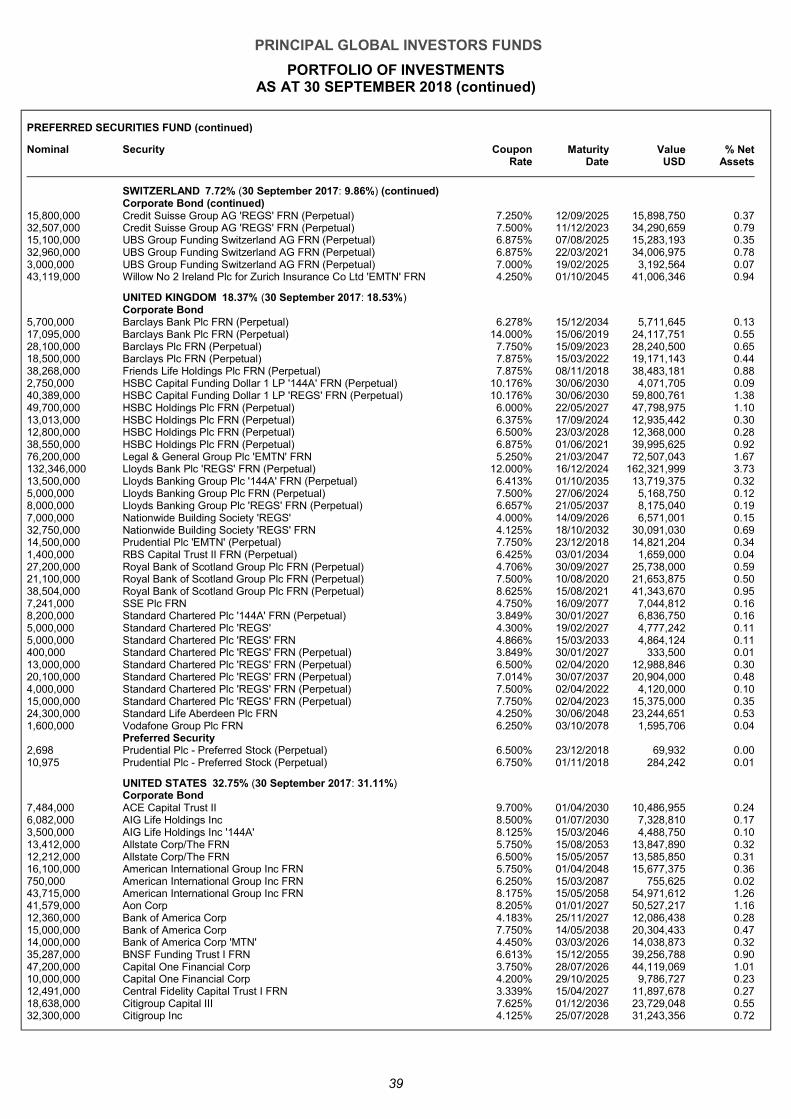
PRINCIPAL GLOBAL INVESTORS FUNDS
PORTFOLIO OF INVESTMENTS AS AT 30 SEPTEMBER 2018 (continued)
39
PREFERRED SECURITIES FUND (continued)
Nominal Security Coupon Rate
Maturity Date
Value USD
% Net Assets
SWITZERLAND 7.72% (30 September 2017: 9.86%) (continued) Corporate Bond (continued)
15,800,000 Credit Suisse Group AG 'REGS' FRN (Perpetual) 7.250% 12/09/2025 15,898,750 0.37 32,507,000 Credit Suisse Group AG 'REGS' FRN (Perpetual) 7.500% 11/12/2023 34,290,659 0.79 15,100,000 UBS Group Funding Switzerland AG FRN (Perpetual) 6.875% 07/08/2025 15,283,193 0.35 32,960,000 UBS Group Funding Switzerland AG FRN (Perpetual) 6.875% 22/03/2021 34,006,975 0.78 3,000,000 UBS Group Funding Switzerland AG FRN (Perpetual) 7.000% 19/02/2025 3,192,564 0.07 43,119,000 Willow No 2 Ireland Plc for Zurich Insurance Co Ltd 'EMTN' FRN 4.250% 01/10/2045 41,006,346 0.94
UNITED KINGDOM 18.37% (30 September 2017: 18.53%) Corporate Bond
5,700,000 Barclays Bank Plc FRN (Perpetual) 6.278% 15/12/2034 5,711,645 0.13 17,095,000 Barclays Bank Plc FRN (Perpetual) 14.000% 15/06/2019 24,117,751 0.55 28,100,000 Barclays Plc FRN (Perpetual) 7.750% 15/09/2023 28,240,500 0.65 18,500,000 Barclays Plc FRN (Perpetual) 7.875% 15/03/2022 19,171,143 0.44 38,268,000 Friends Life Holdings Plc FRN (Perpetual) 7.875% 08/11/2018 38,483,181 0.88 2,750,000 HSBC Capital Funding Dollar 1 LP '144A' FRN (Perpetual) 10.176% 30/06/2030 4,071,705 0.09 40,389,000 HSBC Capital Funding Dollar 1 LP 'REGS' FRN (Perpetual) 10.176% 30/06/2030 59,800,761 1.38 49,700,000 HSBC Holdings Plc FRN (Perpetual) 6.000% 22/05/2027 47,798,975 1.10 13,013,000 HSBC Holdings Plc FRN (Perpetual) 6.375% 17/09/2024 12,935,442 0.30 12,800,000 HSBC Holdings Plc FRN (Perpetual) 6.500% 23/03/2028 12,368,000 0.28 38,550,000 HSBC Holdings Plc FRN (Perpetual) 6.875% 01/06/2021 39,995,625 0.92 76,200,000 Legal & General Group Plc 'EMTN' FRN 5.250% 21/03/2047 72,507,043 1.67 132,346,000 Lloyds Bank Plc 'REGS' FRN (Perpetual) 12.000% 16/12/2024 162,321,999 3.73 13,500,000 Lloyds Banking Group Plc '144A' FRN (Perpetual) 6.413% 01/10/2035 13,719,375 0.32 5,000,000 Lloyds Banking Group Plc FRN (Perpetual) 7.500% 27/06/2024 5,168,750 0.12 8,000,000 Lloyds Banking Group Plc 'REGS' FRN (Perpetual) 6.657% 21/05/2037 8,175,040 0.19 7,000,000 Nationwide Building Society 'REGS' 4.000% 14/09/2026 6,571,001 0.15 32,750,000 Nationwide Building Society 'REGS' FRN 4.125% 18/10/2032 30,091,030 0.69 14,500,000 Prudential Plc 'EMTN' (Perpetual) 7.750% 23/12/2018 14,821,204 0.34 1,400,000 RBS Capital Trust II FRN (Perpetual) 6.425% 03/01/2034 1,659,000 0.04 27,200,000 Royal Bank of Scotland Group Plc FRN (Perpetual) 4.706% 30/09/2027 25,738,000 0.59 21,100,000 Royal Bank of Scotland Group Plc FRN (Perpetual) 7.500% 10/08/2020 21,653,875 0.50 38,504,000 Royal Bank of Scotland Group Plc FRN (Perpetual) 8.625% 15/08/2021 41,343,670 0.95 7,241,000 SSE Plc FRN 4.750% 16/09/2077 7,044,812 0.16 8,200,000 Standard Chartered Plc '144A' FRN (Perpetual) 3.849% 30/01/2027 6,836,750 0.16 5,000,000 Standard Chartered Plc 'REGS' 4.300% 19/02/2027 4,777,242 0.11 5,000,000 Standard Chartered Plc 'REGS' FRN 4.866% 15/03/2033 4,864,124 0.11 400,000 Standard Chartered Plc 'REGS' FRN (Perpetual) 3.849% 30/01/2027 333,500 0.01 13,000,000 Standard Chartered Plc 'REGS' FRN (Perpetual) 6.500% 02/04/2020 12,988,846 0.30 20,100,000 Standard Chartered Plc 'REGS' FRN (Perpetual) 7.014% 30/07/2037 20,904,000 0.48 4,000,000 Standard Chartered Plc 'REGS' FRN (Perpetual) 7.500% 02/04/2022 4,120,000 0.10 15,000,000 Standard Chartered Plc 'REGS' FRN (Perpetual) 7.750% 02/04/2023 15,375,000 0.35 24,300,000 Standard Life Aberdeen Plc FRN 4.250% 30/06/2048 23,244,651 0.53 1,600,000 Vodafone Group Plc FRN 6.250% 03/10/2078 1,595,706 0.04
Preferred Security 2,698 Prudential Plc - Preferred Stock (Perpetual) 6.500% 23/12/2018 69,932 0.00 10,975 Prudential Plc - Preferred Stock (Perpetual) 6.750% 01/11/2018 284,242 0.01
UNITED STATES 32.75% (30 September 2017: 31.11%) Corporate Bond
7,484,000 ACE Capital Trust II 9.700% 01/04/2030 10,486,955 0.24 6,082,000 AIG Life Holdings Inc 8.500% 01/07/2030 7,328,810 0.17 3,500,000 AIG Life Holdings Inc '144A' 8.125% 15/03/2046 4,488,750 0.10 13,412,000 Allstate Corp/The FRN 5.750% 15/08/2053 13,847,890 0.32 12,212,000 Allstate Corp/The FRN 6.500% 15/05/2057 13,585,850 0.31 16,100,000 American International Group Inc FRN 5.750% 01/04/2048 15,677,375 0.36 750,000 American International Group Inc FRN 6.250% 15/03/2087 755,625 0.02 43,715,000 American International Group Inc FRN 8.175% 15/05/2058 54,971,612 1.26 41,579,000 Aon Corp 8.205% 01/01/2027 50,527,217 1.16 12,360,000 Bank of America Corp 4.183% 25/11/2027 12,086,438 0.28 15,000,000 Bank of America Corp 7.750% 14/05/2038 20,304,433 0.47 14,000,000 Bank of America Corp 'MTN' 4.450% 03/03/2026 14,038,873 0.32 35,287,000 BNSF Funding Trust I FRN 6.613% 15/12/2055 39,256,788 0.90 47,200,000 Capital One Financial Corp 3.750% 28/07/2026 44,119,069 1.01 10,000,000 Capital One Financial Corp 4.200% 29/10/2025 9,786,727 0.23 12,491,000 Central Fidelity Capital Trust I FRN 3.339% 15/04/2027 11,897,678 0.27 18,638,000 Citigroup Capital III 7.625% 01/12/2036 23,729,048 0.55 32,300,000 Citigroup Inc 4.125% 25/07/2028 31,243,356 0.72
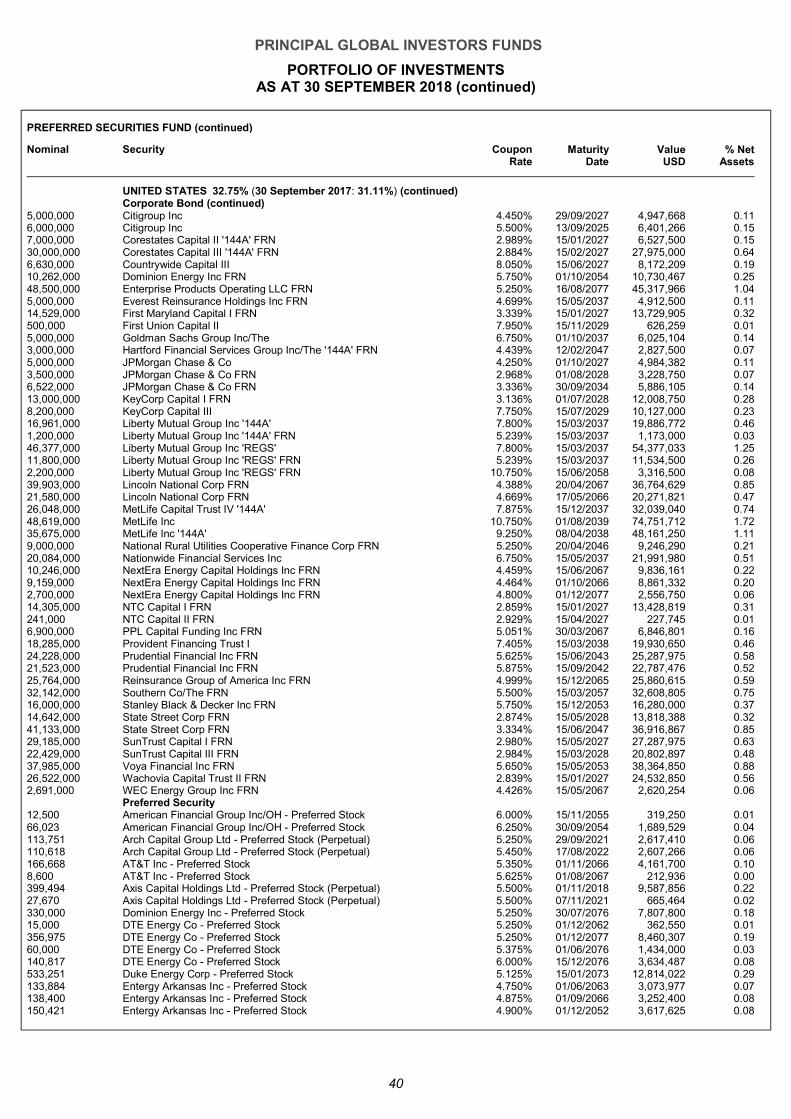
PRINCIPAL GLOBAL INVESTORS FUNDS
PORTFOLIO OF INVESTMENTS AS AT 30 SEPTEMBER 2018 (continued)
40
PREFERRED SECURITIES FUND (continued)
Nominal Security Coupon Rate
Maturity Date
Value USD
% Net Assets
UNITED STATES 32.75% (30 September 2017: 31.11%) (continued) Corporate Bond (continued)
5,000,000 Citigroup Inc 4.450% 29/09/2027 4,947,668 0.11 6,000,000 Citigroup Inc 5.500% 13/09/2025 6,401,266 0.15 7,000,000 Corestates Capital II '144A' FRN 2.989% 15/01/2027 6,527,500 0.15 30,000,000 Corestates Capital III '144A' FRN 2.884% 15/02/2027 27,975,000 0.64 6,630,000 Countrywide Capital III 8.050% 15/06/2027 8,172,209 0.19 10,262,000 Dominion Energy Inc FRN 5.750% 01/10/2054 10,730,467 0.25 48,500,000 Enterprise Products Operating LLC FRN 5.250% 16/08/2077 45,317,966 1.04 5,000,000 Everest Reinsurance Holdings Inc FRN 4.699% 15/05/2037 4,912,500 0.11 14,529,000 First Maryland Capital I FRN 3.339% 15/01/2027 13,729,905 0.32 500,000 First Union Capital II 7.950% 15/11/2029 626,259 0.01 5,000,000 Goldman Sachs Group Inc/The 6.750% 01/10/2037 6,025,104 0.14 3,000,000 Hartford Financial Services Group Inc/The '144A' FRN 4.439% 12/02/2047 2,827,500 0.07 5,000,000 JPMorgan Chase & Co 4.250% 01/10/2027 4,984,382 0.11 3,500,000 JPMorgan Chase & Co FRN 2.968% 01/08/2028 3,228,750 0.07 6,522,000 JPMorgan Chase & Co FRN 3.336% 30/09/2034 5,886,105 0.14 13,000,000 KeyCorp Capital I FRN 3.136% 01/07/2028 12,008,750 0.28 8,200,000 KeyCorp Capital III 7.750% 15/07/2029 10,127,000 0.23 16,961,000 Liberty Mutual Group Inc '144A' 7.800% 15/03/2037 19,886,772 0.46 1,200,000 Liberty Mutual Group Inc '144A' FRN 5.239% 15/03/2037 1,173,000 0.03 46,377,000 Liberty Mutual Group Inc 'REGS' 7.800% 15/03/2037 54,377,033 1.25 11,800,000 Liberty Mutual Group Inc 'REGS' FRN 5.239% 15/03/2037 11,534,500 0.26 2,200,000 Liberty Mutual Group Inc 'REGS' FRN 10.750% 15/06/2058 3,316,500 0.08 39,903,000 Lincoln National Corp FRN 4.388% 20/04/2067 36,764,629 0.85 21,580,000 Lincoln National Corp FRN 4.669% 17/05/2066 20,271,821 0.47 26,048,000 MetLife Capital Trust IV '144A' 7.875% 15/12/2037 32,039,040 0.74 48,619,000 MetLife Inc 10.750% 01/08/2039 74,751,712 1.7235,675,000 MetLife Inc '144A' 9.250% 08/04/2038 48,161,250 1.11 9,000,000 National Rural Utilities Cooperative Finance Corp FRN 5.250% 20/04/2046 9,246,290 0.21 20,084,000 Nationwide Financial Services Inc 6.750% 15/05/2037 21,991,980 0.51 10,246,000 NextEra Energy Capital Holdings Inc FRN 4.459% 15/06/2067 9,836,161 0.22 9,159,000 NextEra Energy Capital Holdings Inc FRN 4.464% 01/10/2066 8,861,332 0.20 2,700,000 NextEra Energy Capital Holdings Inc FRN 4.800% 01/12/2077 2,556,750 0.06 14,305,000 NTC Capital I FRN 2.859% 15/01/2027 13,428,819 0.31 241,000 NTC Capital II FRN 2.929% 15/04/2027 227,745 0.01 6,900,000 PPL Capital Funding Inc FRN 5.051% 30/03/2067 6,846,801 0.16 18,285,000 Provident Financing Trust I 7.405% 15/03/2038 19,930,650 0.46 24,228,000 Prudential Financial Inc FRN 5.625% 15/06/2043 25,287,975 0.58 21,523,000 Prudential Financial Inc FRN 5.875% 15/09/2042 22,787,476 0.52 25,764,000 Reinsurance Group of America Inc FRN 4.999% 15/12/2065 25,860,615 0.59 32,142,000 Southern Co/The FRN 5.500% 15/03/2057 32,608,805 0.75 16,000,000 Stanley Black & Decker Inc FRN 5.750% 15/12/2053 16,280,000 0.37 14,642,000 State Street Corp FRN 2.874% 15/05/2028 13,818,388 0.32 41,133,000 State Street Corp FRN 3.334% 15/06/2047 36,916,867 0.85 29,185,000 SunTrust Capital I FRN 2.980% 15/05/2027 27,287,975 0.63 22,429,000 SunTrust Capital III FRN 2.984% 15/03/2028 20,802,897 0.48 37,985,000 Voya Financial Inc FRN 5.650% 15/05/2053 38,364,850 0.88 26,522,000 Wachovia Capital Trust II FRN 2.839% 15/01/2027 24,532,850 0.56 2,691,000 WEC Energy Group Inc FRN 4.426% 15/05/2067 2,620,254 0.06
Preferred Security 12,500 American Financial Group Inc/OH - Preferred Stock 6.000% 15/11/2055 319,250 0.01 66,023 American Financial Group Inc/OH - Preferred Stock 6.250% 30/09/2054 1,689,529 0.04 113,751 Arch Capital Group Ltd - Preferred Stock (Perpetual) 5.250% 29/09/2021 2,617,410 0.06 110,618 Arch Capital Group Ltd - Preferred Stock (Perpetual) 5.450% 17/08/2022 2,607,266 0.06 166,668 AT&T Inc - Preferred Stock 5.350% 01/11/2066 4,161,700 0.10 8,600 AT&T Inc - Preferred Stock 5.625% 01/08/2067 212,936 0.00 399,494 Axis Capital Holdings Ltd - Preferred Stock (Perpetual) 5.500% 01/11/2018 9,587,856 0.22 27,670 Axis Capital Holdings Ltd - Preferred Stock (Perpetual) 5.500% 07/11/2021 665,464 0.02 330,000 Dominion Energy Inc - Preferred Stock 5.250% 30/07/2076 7,807,800 0.18 15,000 DTE Energy Co - Preferred Stock 5.250% 01/12/2062 362,550 0.01 356,975 DTE Energy Co - Preferred Stock 5.250% 01/12/2077 8,460,307 0.19 60,000 DTE Energy Co - Preferred Stock 5.375% 01/06/2076 1,434,000 0.03 140,817 DTE Energy Co - Preferred Stock 6.000% 15/12/2076 3,634,487 0.08 533,251 Duke Energy Corp - Preferred Stock 5.125% 15/01/2073 12,814,022 0.29 133,884 Entergy Arkansas Inc - Preferred Stock 4.750% 01/06/2063 3,073,977 0.07 138,400 Entergy Arkansas Inc - Preferred Stock 4.875% 01/09/2066 3,252,400 0.08 150,421 Entergy Arkansas Inc - Preferred Stock 4.900% 01/12/2052 3,617,625 0.08
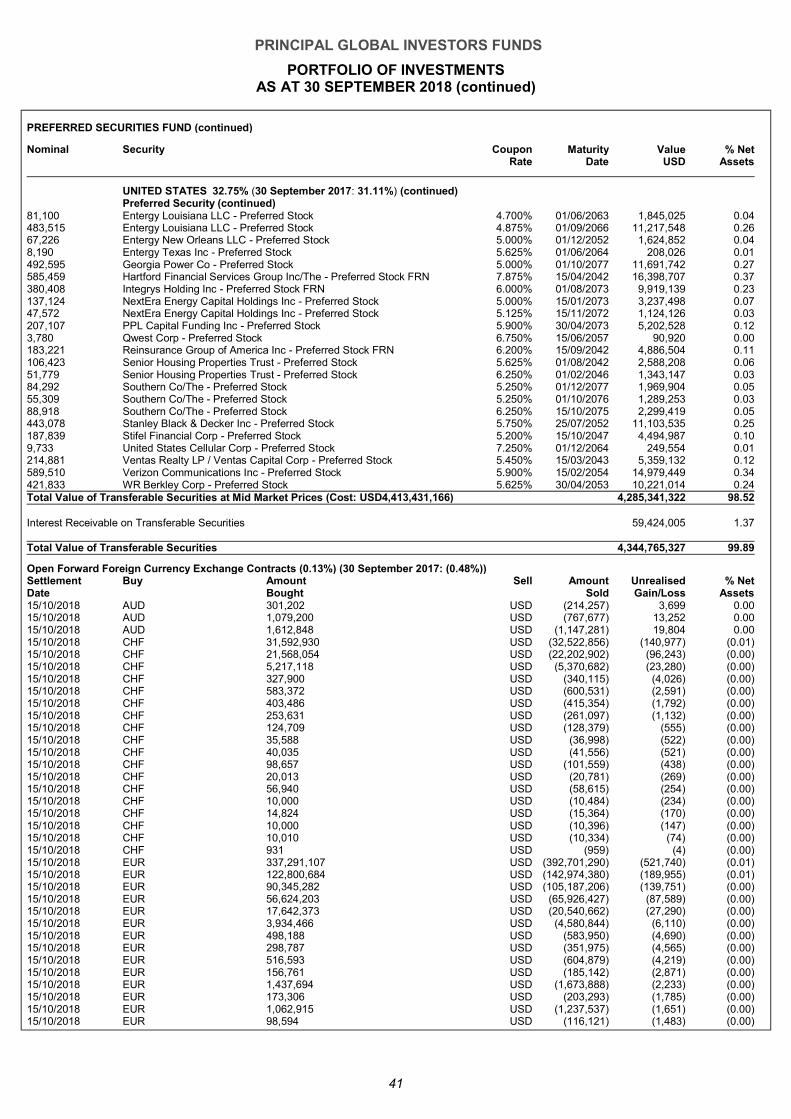
PRINCIPAL GLOBAL INVESTORS FUNDS
PORTFOLIO OF INVESTMENTS AS AT 30 SEPTEMBER 2018 (continued)
41
PREFERRED SECURITIES FUND (continued)
Nominal Security Coupon Rate
Maturity Date
Value USD
% Net Assets
UNITED STATES 32.75% (30 September 2017: 31.11%) (continued) Preferred Security (continued)
81,100 Entergy Louisiana LLC - Preferred Stock 4.700% 01/06/2063 1,845,025 0.04 483,515 Entergy Louisiana LLC - Preferred Stock 4.875% 01/09/2066 11,217,548 0.26 67,226 Entergy New Orleans LLC - Preferred Stock 5.000% 01/12/2052 1,624,852 0.04 8,190 Entergy Texas Inc - Preferred Stock 5.625% 01/06/2064 208,026 0.01 492,595 Georgia Power Co - Preferred Stock 5.000% 01/10/2077 11,691,742 0.27 585,459 Hartford Financial Services Group Inc/The - Preferred Stock FRN 7.875% 15/04/2042 16,398,707 0.37 380,408 Integrys Holding Inc - Preferred Stock FRN 6.000% 01/08/2073 9,919,139 0.23 137,124 NextEra Energy Capital Holdings Inc - Preferred Stock 5.000% 15/01/2073 3,237,498 0.07 47,572 NextEra Energy Capital Holdings Inc - Preferred Stock 5.125% 15/11/2072 1,124,126 0.03 207,107 PPL Capital Funding Inc - Preferred Stock 5.900% 30/04/2073 5,202,528 0.12 3,780 Qwest Corp - Preferred Stock 6.750% 15/06/2057 90,920 0.00 183,221 Reinsurance Group of America Inc - Preferred Stock FRN 6.200% 15/09/2042 4,886,504 0.11 106,423 Senior Housing Properties Trust - Preferred Stock 5.625% 01/08/2042 2,588,208 0.06 51,779 Senior Housing Properties Trust - Preferred Stock 6.250% 01/02/2046 1,343,147 0.03 84,292 Southern Co/The - Preferred Stock 5.250% 01/12/2077 1,969,904 0.05 55,309 Southern Co/The - Preferred Stock 5.250% 01/10/2076 1,289,253 0.03 88,918 Southern Co/The - Preferred Stock 6.250% 15/10/2075 2,299,419 0.05 443,078 Stanley Black & Decker Inc - Preferred Stock 5.750% 25/07/2052 11,103,535 0.25 187,839 Stifel Financial Corp - Preferred Stock 5.200% 15/10/2047 4,494,987 0.10 9,733 United States Cellular Corp - Preferred Stock 7.250% 01/12/2064 249,554 0.01 214,881 Ventas Realty LP / Ventas Capital Corp - Preferred Stock 5.450% 15/03/2043 5,359,132 0.12 589,510 Verizon Communications Inc - Preferred Stock 5.900% 15/02/2054 14,979,449 0.34 421,833 WR Berkley Corp - Preferred Stock 5.625% 30/04/2053 10,221,014 0.24 Total Value of Transferable Securities at Mid Market Prices (Cost: USD4,413,431,166) 4,285,341,322 98.52 Interest Receivable on Transferable Securities 59,424,005 1.37 Total Value of Transferable Securities 4,344,765,327 99.89
Open Forward Foreign Currency Exchange Contracts (0.13%) (30 September 2017: (0.48%)) Settlement Date
Buy Amount Bought
Sell Amount Sold
Unrealised Gain/Loss
% Net Assets
15/10/2018 AUD 301,202 USD (214,257) 3,699 0 .00
15/10/2018 AUD 1,079,200 USD (767,677) 13,252 0 .00
15/10/2018 AUD 1,612,848 USD (1,147,281) 19,804 0 .00
15/10/2018 CHF 31,592,930 USD (32,522,856) (140,977) (0 .01)
15/10/2018 CHF 21,568,054 USD (22,202,902) (96,243) (0 .00)
15/10/2018 CHF 5,217,118 USD (5,370,682) (23,280) (0 .00)
15/10/2018 CHF 327,900 USD (340,115) (4,026) (0 .00)
15/10/2018 CHF 583,372 USD (600,531) (2,591) (0 .00)
15/10/2018 CHF 403,486 USD (415,354) (1,792) (0 .00)
15/10/2018 CHF 253,631 USD (261,097) (1,132) (0 .00)
15/10/2018 CHF 124,709 USD (128,379) (555) (0 .00)
15/10/2018 CHF 35,588 USD (36,998) (522) (0 .00)
15/10/2018 CHF 40,035 USD (41,556) (521) (0 .00)
15/10/2018 CHF 98,657 USD (101,559) (438) (0 .00)
15/10/2018 CHF 20,013 USD (20,781) (269) (0 .00)
15/10/2018 CHF 56,940 USD (58,615) (254) (0 .00)
15/10/2018 CHF 10,000 USD (10,484) (234) (0 .00)
15/10/2018 CHF 14,824 USD (15,364) (170) (0 .00)
15/10/2018 CHF 10,000 USD (10,396) (147) (0 .00)
15/10/2018 CHF 10,010 USD (10,334) (74) (0 .00)
15/10/2018 CHF 931 USD (959) (4) (0 .00)
15/10/2018 EUR 337,291,107 USD (392,701,290) (521,740) (0 .01)
15/10/2018 EUR 122,800,684 USD (142,974,380) (189,955) (0 .01)
15/10/2018 EUR 90,345,282 USD (105,187,206) (139,751) (0 .00)
15/10/2018 EUR 56,624,203 USD (65,926,427) (87,589) (0 .00)
15/10/2018 EUR 17,642,373 USD (20,540,662) (27,290) (0 .00)
15/10/2018 EUR 3,934,466 USD (4,580,844) (6,110) (0 .00)
15/10/2018 EUR 498,188 USD (583,950) (4,690) (0 .00)
15/10/2018 EUR 298,787 USD (351,975) (4,565) (0 .00)
15/10/2018 EUR 516,593 USD (604,879) (4,219) (0 .00)
15/10/2018 EUR 156,761 USD (185,142) (2,871) (0 .00)
15/10/2018 EUR 1,437,694 USD (1,673,888) (2,233) (0 .00)
15/10/2018 EUR 173,306 USD (203,293) (1,785) (0 .00)
15/10/2018 EUR 1,062,915 USD (1,237,537) (1,651) (0 .00)
15/10/2018 EUR 98,594 USD (116,121) (1,483) (0 .00)
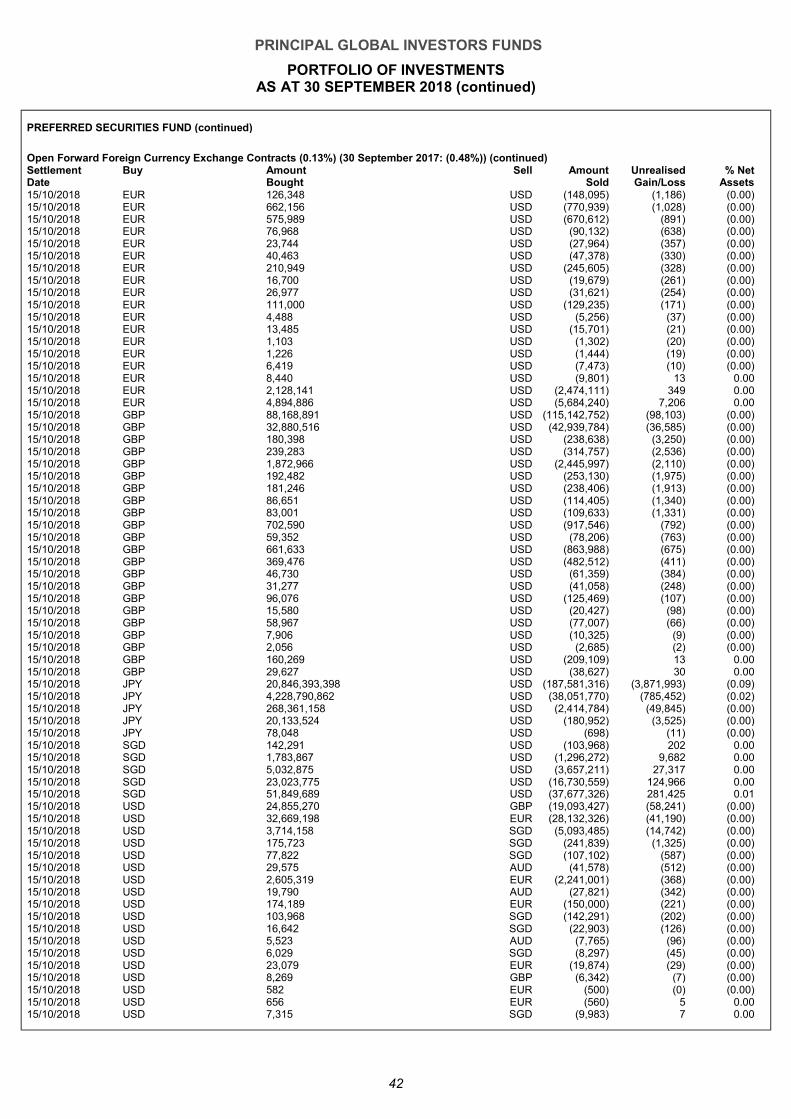
PRINCIPAL GLOBAL INVESTORS FUNDS
PORTFOLIO OF INVESTMENTS AS AT 30 SEPTEMBER 2018 (continued)
42
PREFERRED SECURITIES FUND (continued)
Open Forward Foreign Currency Exchange Contracts (0.13%) (30 September 2017: (0.48%)) (continued) Settlement Date
Buy Amount Bought
Sell Amount Sold
Unrealised Gain/Loss
% Net Assets
15/10/2018 EUR 126,348 USD (148,095) (1,186) (0 .00)
15/10/2018 EUR 662,156 USD (770,939) (1,028) (0 .00)
15/10/2018 EUR 575,989 USD (670,612) (891) (0 .00)
15/10/2018 EUR 76,968 USD (90,132) (638) (0 .00)
15/10/2018 EUR 23,744 USD (27,964) (357) (0 .00)
15/10/2018 EUR 40,463 USD (47,378) (330) (0 .00)
15/10/2018 EUR 210,949 USD (245,605) (328) (0 .00)
15/10/2018 EUR 16,700 USD (19,679) (261) (0 .00)
15/10/2018 EUR 26,977 USD (31,621) (254) (0 .00)
15/10/2018 EUR 111,000 USD (129,235) (171) (0 .00)
15/10/2018 EUR 4,488 USD (5,256) (37) (0 .00)
15/10/2018 EUR 13,485 USD (15,701) (21) (0 .00)
15/10/2018 EUR 1,103 USD (1,302) (20) (0 .00)
15/10/2018 EUR 1,226 USD (1,444) (19) (0 .00)
15/10/2018 EUR 6,419 USD (7,473) (10) (0 .00)
15/10/2018 EUR 8,440 USD (9,801) 13 0 .00
15/10/2018 EUR 2,128,141 USD (2,474,111) 349 0 .00
15/10/2018 EUR 4,894,886 USD (5,684,240) 7,206 0 .00
15/10/2018 GBP 88,168,891 USD (115,142,752) (98,103) (0 .00)
15/10/2018 GBP 32,880,516 USD (42,939,784) (36,585) (0 .00)
15/10/2018 GBP 180,398 USD (238,638) (3,250) (0 .00)
15/10/2018 GBP 239,283 USD (314,757) (2,536) (0 .00)
15/10/2018 GBP 1,872,966 USD (2,445,997) (2,110) (0 .00)
15/10/2018 GBP 192,482 USD (253,130) (1,975) (0 .00)
15/10/2018 GBP 181,246 USD (238,406) (1,913) (0 .00)
15/10/2018 GBP 86,651 USD (114,405) (1,340) (0 .00)
15/10/2018 GBP 83,001 USD (109,633) (1,331) (0 .00)
15/10/2018 GBP 702,590 USD (917,546) (792) (0 .00)
15/10/2018 GBP 59,352 USD (78,206) (763) (0 .00)
15/10/2018 GBP 661,633 USD (863,988) (675) (0 .00)
15/10/2018 GBP 369,476 USD (482,512) (411) (0 .00)
15/10/2018 GBP 46,730 USD (61,359) (384) (0 .00)
15/10/2018 GBP 31,277 USD (41,058) (248) (0 .00)
15/10/2018 GBP 96,076 USD (125,469) (107) (0 .00)
15/10/2018 GBP 15,580 USD (20,427) (98) (0 .00)
15/10/2018 GBP 58,967 USD (77,007) (66) (0 .00)
15/10/2018 GBP 7,906 USD (10,325) (9) (0 .00)
15/10/2018 GBP 2,056 USD (2,685) (2) (0 .00)
15/10/2018 GBP 160,269 USD (209,109) 13 0 .00
15/10/2018 GBP 29,627 USD (38,627) 30 0 .00
15/10/2018 JPY 20,846,393,398 USD (187,581,316) (3,871,993) (0 .09)
15/10/2018 JPY 4,228,790,862 USD (38,051,770) (785,452) (0 .02)
15/10/2018 JPY 268,361,158 USD (2,414,784) (49,845) (0 .00)
15/10/2018 JPY 20,133,524 USD (180,952) (3,525) (0 .00)
15/10/2018 JPY 78,048 USD (698) (11) (0 .00)
15/10/2018 SGD 142,291 USD (103,968) 202 0 .00
15/10/2018 SGD 1,783,867 USD (1,296,272) 9,682 0 .00
15/10/2018 SGD 5,032,875 USD (3,657,211) 27,317 0 .00
15/10/2018 SGD 23,023,775 USD (16,730,559) 124,966 0 .00
15/10/2018 SGD 51,849,689 USD (37,677,326) 281,425 0 .01
15/10/2018 USD 24,855,270 GBP (19,093,427) (58,241) (0 .00)
15/10/2018 USD 32,669,198 EUR (28,132,326) (41,190) (0 .00)
15/10/2018 USD 3,714,158 SGD (5,093,485) (14,742) (0 .00)
15/10/2018 USD 175,723 SGD (241,839) (1,325) (0 .00)
15/10/2018 USD 77,822 SGD (107,102) (587) (0 .00)
15/10/2018 USD 29,575 AUD (41,578) (512) (0 .00)
15/10/2018 USD 2,605,319 EUR (2,241,001) (368) (0 .00)
15/10/2018 USD 19,790 AUD (27,821) (342) (0 .00)
15/10/2018 USD 174,189 EUR (150,000) (221) (0 .00)
15/10/2018 USD 103,968 SGD (142,291) (202) (0 .00)
15/10/2018 USD 16,642 SGD (22,903) (126) (0 .00)
15/10/2018 USD 5,523 AUD (7,765) (96) (0 .00)
15/10/2018 USD 6,029 SGD (8,297) (45) (0 .00)
15/10/2018 USD 23,079 EUR (19,874) (29) (0 .00)
15/10/2018 USD 8,269 GBP (6,342) (7) (0 .00)
15/10/2018 USD 582 EUR (500) (0) (0 .00)
15/10/2018 USD 656 EUR (560) 5 0 .00
15/10/2018 USD 7,315 SGD (9,983) 7 0 .00
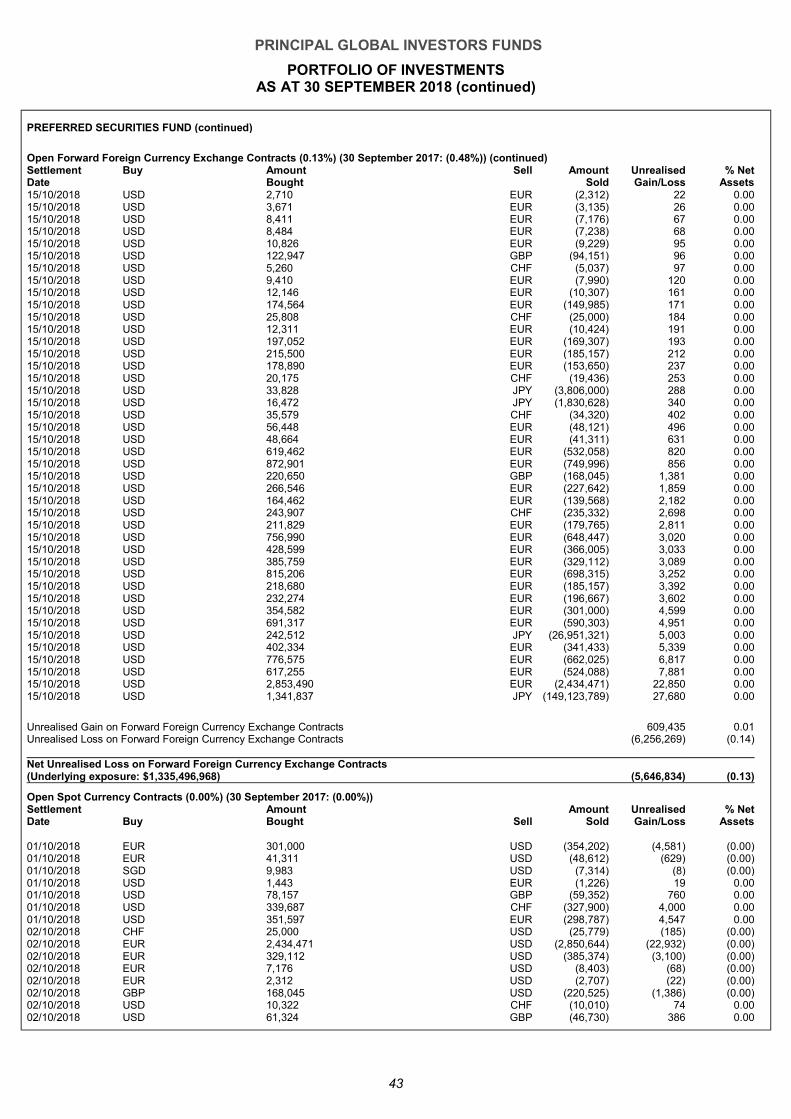
PRINCIPAL GLOBAL INVESTORS FUNDS
PORTFOLIO OF INVESTMENTS AS AT 30 SEPTEMBER 2018 (continued)
43
PREFERRED SECURITIES FUND (continued)
Open Forward Foreign Currency Exchange Contracts (0.13%) (30 September 2017: (0.48%)) (continued) Settlement Date
Buy Amount Bought
Sell Amount Sold
Unrealised Gain/Loss
% Net Assets
15/10/2018 USD 2,710 EUR (2,312) 22 0 .00
15/10/2018 USD 3,671 EUR (3,135) 26 0 .00
15/10/2018 USD 8,411 EUR (7,176) 67 0 .00
15/10/2018 USD 8,484 EUR (7,238) 68 0 .00
15/10/2018 USD 10,826 EUR (9,229) 95 0 .00
15/10/2018 USD 122,947 GBP (94,151) 96 0 .00
15/10/2018 USD 5,260 CHF (5,037) 97 0 .00
15/10/2018 USD 9,410 EUR (7,990) 120 0 .00
15/10/2018 USD 12,146 EUR (10,307) 161 0 .00
15/10/2018 USD 174,564 EUR (149,985) 171 0 .00
15/10/2018 USD 25,808 CHF (25,000) 184 0 .00
15/10/2018 USD 12,311 EUR (10,424) 191 0 .00
15/10/2018 USD 197,052 EUR (169,307) 193 0 .00
15/10/2018 USD 215,500 EUR (185,157) 212 0 .00
15/10/2018 USD 178,890 EUR (153,650) 237 0 .00
15/10/2018 USD 20,175 CHF (19,436) 253 0 .00
15/10/2018 USD 33,828 JPY (3,806,000) 288 0 .00
15/10/2018 USD 16,472 JPY (1,830,628) 340 0 .00
15/10/2018 USD 35,579 CHF (34,320) 402 0 .00
15/10/2018 USD 56,448 EUR (48,121) 496 0 .00
15/10/2018 USD 48,664 EUR (41,311) 631 0 .00
15/10/2018 USD 619,462 EUR (532,058) 820 0 .00
15/10/2018 USD 872,901 EUR (749,996) 856 0 .00
15/10/2018 USD 220,650 GBP (168,045) 1,381 0 .00
15/10/2018 USD 266,546 EUR (227,642) 1,859 0 .00
15/10/2018 USD 164,462 EUR (139,568) 2,182 0 .00
15/10/2018 USD 243,907 CHF (235,332) 2,698 0 .00
15/10/2018 USD 211,829 EUR (179,765) 2,811 0 .00
15/10/2018 USD 756,990 EUR (648,447) 3,020 0 .00
15/10/2018 USD 428,599 EUR (366,005) 3,033 0 .00
15/10/2018 USD 385,759 EUR (329,112) 3,089 0 .00
15/10/2018 USD 815,206 EUR (698,315) 3,252 0 .00
15/10/2018 USD 218,680 EUR (185,157) 3,392 0 .00
15/10/2018 USD 232,274 EUR (196,667) 3,602 0 .00
15/10/2018 USD 354,582 EUR (301,000) 4,599 0 .00
15/10/2018 USD 691,317 EUR (590,303) 4,951 0 .00
15/10/2018 USD 242,512 JPY (26,951,321) 5,003 0 .00
15/10/2018 USD 402,334 EUR (341,433) 5,339 0 .00
15/10/2018 USD 776,575 EUR (662,025) 6,817 0 .00
15/10/2018 USD 617,255 EUR (524,088) 7,881 0 .00
15/10/2018 USD 2,853,490 EUR (2,434,471) 22,850 0 .00
15/10/2018 USD 1,341,837 JPY (149,123,789) 27,680 0 .00
Unrealised Gain on Forward Foreign Currency Exchange Contracts 609,435 0 .01
Unrealised Loss on Forward Foreign Currency Exchange Contracts (6,256,269) (0 .14)
Net Unrealised Loss on Forward Foreign Currency Exchange Contracts (Underlying exposure: $1,335,496,968) (5,646,834) (0 .13)
Open Spot Currency Contracts (0.00%) (30 September 2017: (0.00%)) Settlement Date Buy
Amount Bought Sell
Amount Sold
Unrealised Gain/Loss
% Net Assets
01/10/2018 EUR 301,000 USD (354,202) (4,581) (0.00) 01/10/2018 EUR 41,311 USD (48,612) (629) (0.00) 01/10/2018 SGD 9,983 USD (7,314) (8) (0.00) 01/10/2018 USD 1,443 EUR (1,226) 19 0.00 01/10/2018 USD 78,157 GBP (59,352) 760 0.00 01/10/2018 USD 339,687 CHF (327,900) 4,000 0.00 01/10/2018 USD 351,597 EUR (298,787) 4,547 0.00 02/10/2018 CHF 25,000 USD (25,779) (185) (0.00) 02/10/2018 EUR 2,434,471 USD (2,850,644) (22,932) (0.00) 02/10/2018 EUR 329,112 USD (385,374) (3,100) (0.00) 02/10/2018 EUR 7,176 USD (8,403) (68) (0.00) 02/10/2018 EUR 2,312 USD (2,707) (22) (0.00) 02/10/2018 GBP 168,045 USD (220,525) (1,386) (0.00) 02/10/2018 USD 10,322 CHF (10,010) 74 0.00 02/10/2018 USD 61,324 GBP (46,730) 386 0.00
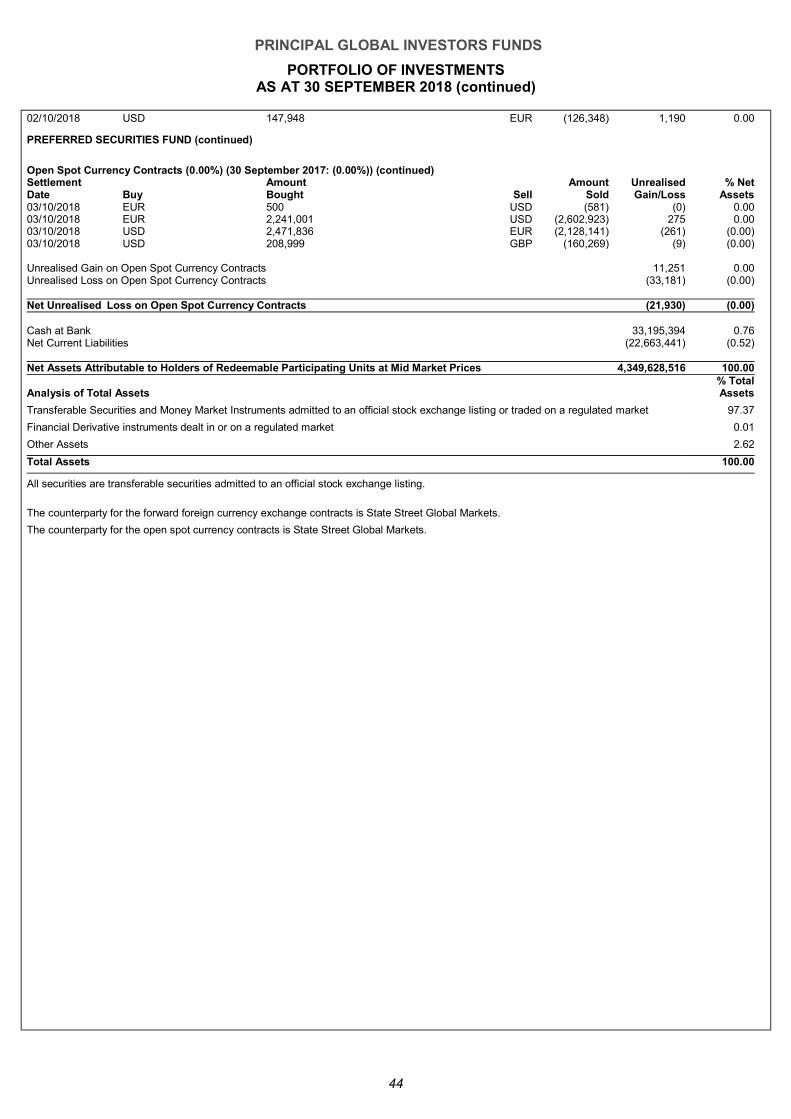
PRINCIPAL GLOBAL INVESTORS FUNDS
PORTFOLIO OF INVESTMENTS AS AT 30 SEPTEMBER 2018 (continued)
44
02/10/2018 USD 147,948 EUR (126,348) 1,190 0.00
PREFERRED SECURITIES FUND (continued)
Open Spot Currency Contracts (0.00%) (30 September 2017: (0.00%)) (continued) Settlement Date Buy
Amount Bought Sell
Amount Sold
Unrealised Gain/Loss
% Net Assets
03/10/2018 EUR 500 USD (581) (0) 0.00 03/10/2018 EUR 2,241,001 USD (2,602,923) 275 0.00 03/10/2018 USD 2,471,836 EUR (2,128,141) (261) (0.00) 03/10/2018 USD 208,999 GBP (160,269) (9) (0.00) Unrealised Gain on Open Spot Currency Contracts 11,251 0.00 Unrealised Loss on Open Spot Currency Contracts (33,181) (0.00) Net Unrealised Loss on Open Spot Currency Contracts (21,930) (0 .00)
Cash at Bank 33,195,394 0.76 Net Current Liabilities (22,663,441) (0.52) Net Assets Attributable to Holders of Redeemable Participating Units at Mid Market Prices 4,349,628,516 100.00
Analysis of Total Assets % Total Assets
Transferable Securities and Money Market Instruments admitted to an official stock exchange listing or traded on a regulated market 97.37
Financial Derivative instruments dealt in or on a regulated market 0.01
Other Assets 2.62
Total Assets 100.00
All securities are transferable securities admitted to an official stock exchange listing.
The counterparty for the forward foreign currency exchange contracts is State Street Global Markets.
The counterparty for the open spot currency contracts is State Street Global Markets.
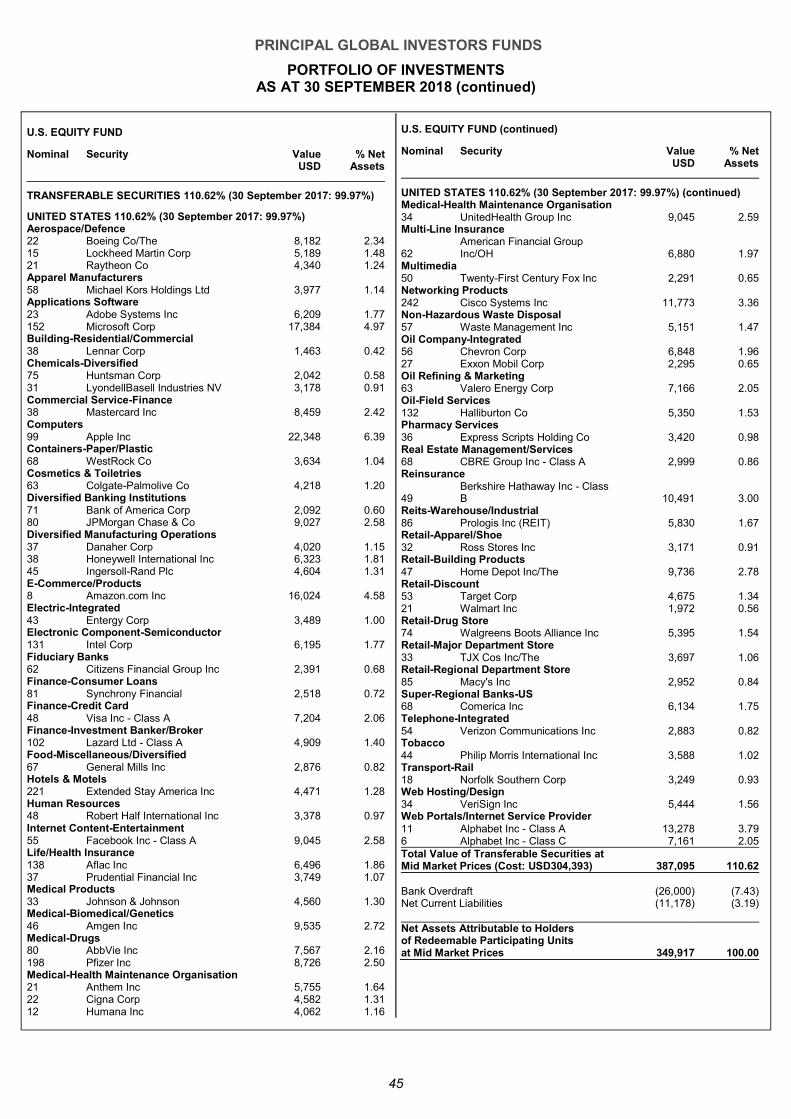
PRINCIPAL GLOBAL INVESTORS FUNDS
PORTFOLIO OF INVESTMENTS AS AT 30 SEPTEMBER 2018 (continued)
45
U.S. EQUITY FUND
Nominal Security Value USD
% Net Assets
TRANSFERABLE SECURITIES 110.62% (30 September 2017: 99.97%)
UNITED STATES 110.62% (30 September 2017: 99.97%) Aerospace/Defence 22 Boeing Co/The 8,182 2.34 15 Lockheed Martin Corp 5,189 1.48 21 Raytheon Co 4,340 1.24 Apparel Manufacturers 58 Michael Kors Holdings Ltd 3,977 1.14 Applications Software 23 Adobe Systems Inc 6,209 1.77 152 Microsoft Corp 17,384 4.97 Building-Residential/Commercial 38 Lennar Corp 1,463 0.42 Chemicals-Diversified 75 Huntsman Corp 2,042 0.58 31 LyondellBasell Industries NV 3,178 0.91 Commercial Service-Finance 38 Mastercard Inc 8,459 2.42 Computers 99 Apple Inc 22,348 6.39 Containers-Paper/Plastic 68 WestRock Co 3,634 1.04 Cosmetics & Toiletries 63 Colgate-Palmolive Co 4,218 1.20 Diversified Banking Institutions 71 Bank of America Corp 2,092 0.60 80 JPMorgan Chase & Co 9,027 2.58 Diversified Manufacturing Operations 37 Danaher Corp 4,020 1.15 38 Honeywell International Inc 6,323 1.81 45 Ingersoll-Rand Plc 4,604 1.31 E-Commerce/Products 8 Amazon.com Inc 16,024 4.58 Electric-Integrated 43 Entergy Corp 3,489 1.00 Electronic Component-Semiconductor 131 Intel Corp 6,195 1.77 Fiduciary Banks 62 Citizens Financial Group Inc 2,391 0.68 Finance-Consumer Loans 81 Synchrony Financial 2,518 0.72 Finance-Credit Card 48 Visa Inc - Class A 7,204 2.06 Finance-Investment Banker/Broker 102 Lazard Ltd - Class A 4,909 1.40 Food-Miscellaneous/Diversified 67 General Mills Inc 2,876 0.82 Hotels & Motels 221 Extended Stay America Inc 4,471 1.28 Human Resources 48 Robert Half International Inc 3,378 0.97 Internet Content-Entertainment 55 Facebook Inc - Class A 9,045 2.58 Life/Health Insurance 138 Aflac Inc 6,496 1.86 37 Prudential Financial Inc 3,749 1.07 Medical Products 33 Johnson & Johnson 4,560 1.30 Medical-Biomedical/Genetics 46 Amgen Inc 9,535 2.72 Medical-Drugs 80 AbbVie Inc 7,567 2.16 198 Pfizer Inc 8,726 2.50 Medical-Health Maintenance Organisation 21 Anthem Inc 5,755 1.64 22 Cigna Corp 4,582 1.31 12 Humana Inc 4,062 1.16
U.S. EQUITY FUND (continued)
Nominal Security Value USD
% Net Assets
UNITED STATES 110.62% (30 September 2017: 99.97%) (continued) Medical-Health Maintenance Organisation 34 UnitedHealth Group Inc 9,045 2.59 Multi-Line Insurance
62 American Financial Group Inc/OH 6,880 1.97
Multimedia 50 Twenty-First Century Fox Inc 2,291 0.65 Networking Products 242 Cisco Systems Inc 11,773 3.36 Non-Hazardous Waste Disposal 57 Waste Management Inc 5,151 1.47 Oil Company-Integrated 56 Chevron Corp 6,848 1.96 27 Exxon Mobil Corp 2,295 0.65 Oil Refining & Marketing 63 Valero Energy Corp 7,166 2.05 Oil-Field Services 132 Halliburton Co 5,350 1.53 Pharmacy Services 36 Express Scripts Holding Co 3,420 0.98 Real Estate Management/Services 68 CBRE Group Inc - Class A 2,999 0.86 Reinsurance
49 Berkshire Hathaway Inc - Class B 10,491 3.00
Reits-Warehouse/Industrial 86 Prologis Inc (REIT) 5,830 1.67 Retail-Apparel/Shoe 32 Ross Stores Inc 3,171 0.91 Retail-Building Products 47 Home Depot Inc/The 9,736 2.78 Retail-Discount 53 Target Corp 4,675 1.34 21 Walmart Inc 1,972 0.56 Retail-Drug Store 74 Walgreens Boots Alliance Inc 5,395 1.54 Retail-Major Department Store 33 TJX Cos Inc/The 3,697 1.06 Retail-Regional Department Store 85 Macy's Inc 2,952 0.84 Super-Regional Banks-US 68 Comerica Inc 6,134 1.75 Telephone-Integrated 54 Verizon Communications Inc 2,883 0.82 Tobacco 44 Philip Morris International Inc 3,588 1.02 Transport-Rail 18 Norfolk Southern Corp 3,249 0.93 Web Hosting/Design 34 VeriSign Inc 5,444 1.56 Web Portals/Internet Service Provider 11 Alphabet Inc - Class A 13,278 3.79 6 Alphabet Inc - Class C 7,161 2.05 Total Value of Transferable Securities at Mid Market Prices (Cost: USD304,393) 387,095 110.62 Bank Overdraft (26,000) (7.43) Net Current Liabilities (11,178) (3.19) Net Assets Attributable to Holders of Redeemable Participating Units at Mid Market Prices 349,917 100.00
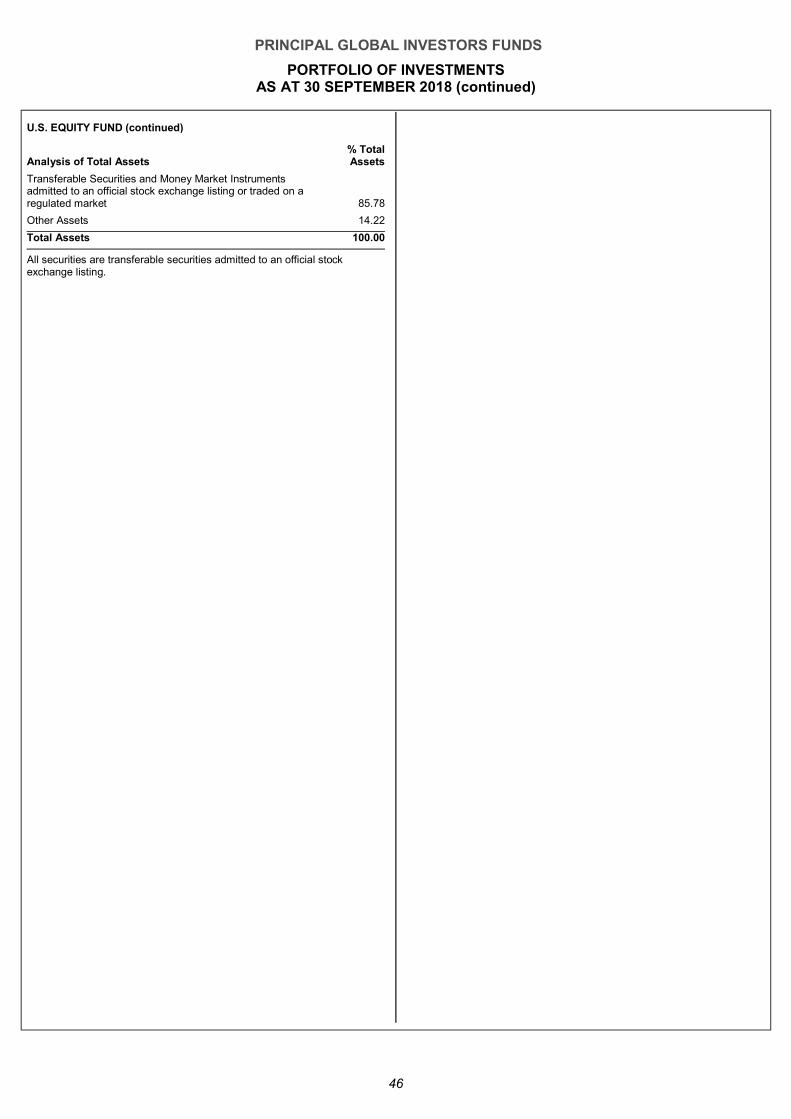
PRINCIPAL GLOBAL INVESTORS FUNDS
PORTFOLIO OF INVESTMENTS AS AT 30 SEPTEMBER 2018 (continued)
46
U.S. EQUITY FUND (continued)
Analysis of Total Assets % Total Assets
Transferable Securities and Money Market Instruments admitted to an official stock exchange listing or traded on a regulated market 85.78
Other Assets 14.22
Total Assets 100.00
All securities are transferable securities admitted to an official stock exchange listing.
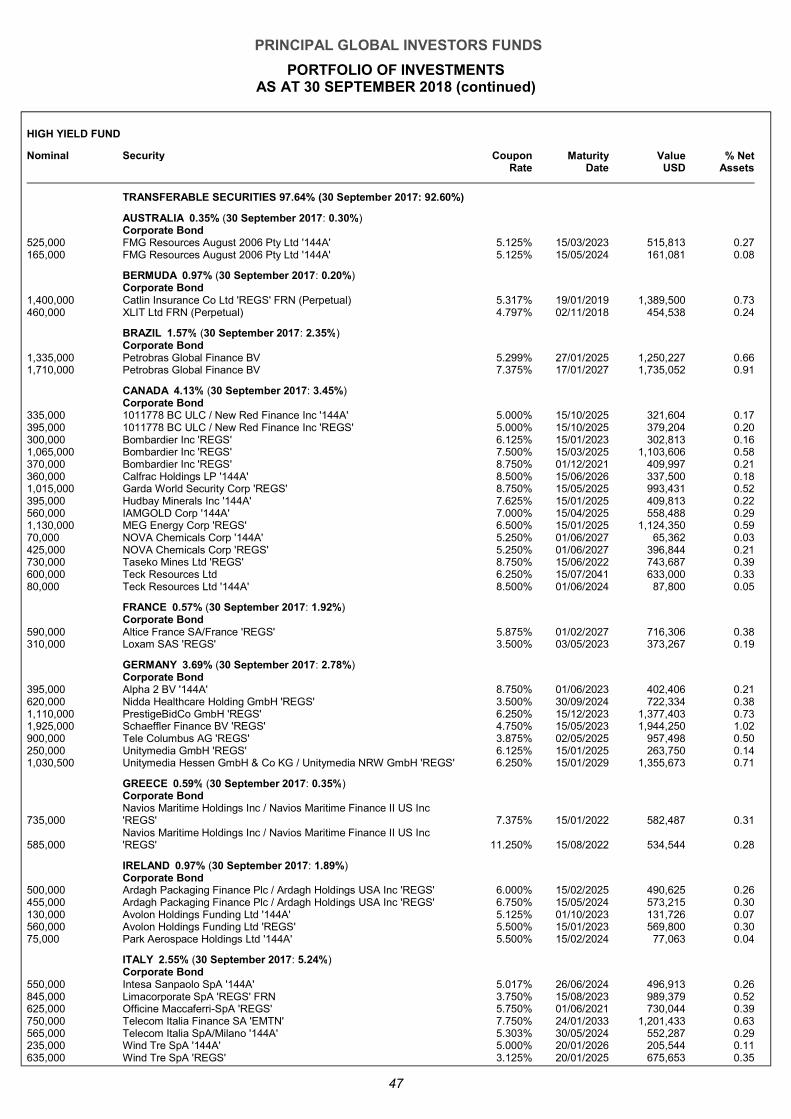
PRINCIPAL GLOBAL INVESTORS FUNDS
PORTFOLIO OF INVESTMENTS AS AT 30 SEPTEMBER 2018 (continued)
47
HIGH YIELD FUND
Nominal Security Coupon Rate
Maturity Date
Value USD
% Net Assets
TRANSFERABLE SECURITIES 97.64% (30 September 2017: 92.60%)
AUSTRALIA 0.35% (30 September 2017: 0.30%) Corporate Bond
525,000 FMG Resources August 2006 Pty Ltd '144A' 5.125% 15/03/2023 515,813 0.27 165,000 FMG Resources August 2006 Pty Ltd '144A' 5.125% 15/05/2024 161,081 0.08
BERMUDA 0.97% (30 September 2017: 0.20%) Corporate Bond
1,400,000 Catlin Insurance Co Ltd 'REGS' FRN (Perpetual) 5.317% 19/01/2019 1,389,500 0.73 460,000 XLIT Ltd FRN (Perpetual) 4.797% 02/11/2018 454,538 0.24
BRAZIL 1.57% (30 September 2017: 2.35%) Corporate Bond
1,335,000 Petrobras Global Finance BV 5.299% 27/01/2025 1,250,227 0.66 1,710,000 Petrobras Global Finance BV 7.375% 17/01/2027 1,735,052 0.91
CANADA 4.13% (30 September 2017: 3.45%) Corporate Bond
335,000 1011778 BC ULC / New Red Finance Inc '144A' 5.000% 15/10/2025 321,604 0.17 395,000 1011778 BC ULC / New Red Finance Inc 'REGS' 5.000% 15/10/2025 379,204 0.20 300,000 Bombardier Inc 'REGS' 6.125% 15/01/2023 302,813 0.16 1,065,000 Bombardier Inc 'REGS' 7.500% 15/03/2025 1,103,606 0.58 370,000 Bombardier Inc 'REGS' 8.750% 01/12/2021 409,997 0.21 360,000 Calfrac Holdings LP '144A' 8.500% 15/06/2026 337,500 0.18 1,015,000 Garda World Security Corp 'REGS' 8.750% 15/05/2025 993,431 0.52 395,000 Hudbay Minerals Inc '144A' 7.625% 15/01/2025 409,813 0.22 560,000 IAMGOLD Corp '144A' 7.000% 15/04/2025 558,488 0.29 1,130,000 MEG Energy Corp 'REGS' 6.500% 15/01/2025 1,124,350 0.59 70,000 NOVA Chemicals Corp '144A' 5.250% 01/06/2027 65,362 0.03 425,000 NOVA Chemicals Corp 'REGS' 5.250% 01/06/2027 396,844 0.21 730,000 Taseko Mines Ltd 'REGS' 8.750% 15/06/2022 743,687 0.39 600,000 Teck Resources Ltd 6.250% 15/07/2041 633,000 0.33 80,000 Teck Resources Ltd '144A' 8.500% 01/06/2024 87,800 0.05
FRANCE 0.57% (30 September 2017: 1.92%) Corporate Bond
590,000 Altice France SA/France 'REGS' 5.875% 01/02/2027 716,306 0.38 310,000 Loxam SAS 'REGS' 3.500% 03/05/2023 373,267 0.19
GERMANY 3.69% (30 September 2017: 2.78%) Corporate Bond
395,000 Alpha 2 BV '144A' 8.750% 01/06/2023 402,406 0.21 620,000 Nidda Healthcare Holding GmbH 'REGS' 3.500% 30/09/2024 722,334 0.38 1,110,000 PrestigeBidCo GmbH 'REGS' 6.250% 15/12/2023 1,377,403 0.73 1,925,000 Schaeffler Finance BV 'REGS' 4.750% 15/05/2023 1,944,250 1.02 900,000 Tele Columbus AG 'REGS' 3.875% 02/05/2025 957,498 0.50 250,000 Unitymedia GmbH 'REGS' 6.125% 15/01/2025 263,750 0.14 1,030,500 Unitymedia Hessen GmbH & Co KG / Unitymedia NRW GmbH 'REGS' 6.250% 15/01/2029 1,355,673 0.71
GREECE 0.59% (30 September 2017: 0.35%) Corporate Bond
735,000 Navios Maritime Holdings Inc / Navios Maritime Finance II US Inc 'REGS' 7.375% 15/01/2022 582,487 0.31
585,000 Navios Maritime Holdings Inc / Navios Maritime Finance II US Inc 'REGS' 11.250% 15/08/2022 534,544 0.28
IRELAND 0.97% (30 September 2017: 1.89%) Corporate Bond
500,000 Ardagh Packaging Finance Plc / Ardagh Holdings USA Inc 'REGS' 6.000% 15/02/2025 490,625 0.26 455,000 Ardagh Packaging Finance Plc / Ardagh Holdings USA Inc 'REGS' 6.750% 15/05/2024 573,215 0.30 130,000 Avolon Holdings Funding Ltd '144A' 5.125% 01/10/2023 131,726 0.07 560,000 Avolon Holdings Funding Ltd 'REGS' 5.500% 15/01/2023 569,800 0.30 75,000 Park Aerospace Holdings Ltd '144A' 5.500% 15/02/2024 77,063 0.04
ITALY 2.55% (30 September 2017: 5.24%) Corporate Bond
550,000 Intesa Sanpaolo SpA '144A' 5.017% 26/06/2024 496,913 0.26 845,000 Limacorporate SpA 'REGS' FRN 3.750% 15/08/2023 989,379 0.52 625,000 Officine Maccaferri-SpA 'REGS' 5.750% 01/06/2021 730,044 0.39 750,000 Telecom Italia Finance SA 'EMTN' 7.750% 24/01/2033 1,201,433 0.63 565,000 Telecom Italia SpA/Milano '144A' 5.303% 30/05/2024 552,287 0.29 235,000 Wind Tre SpA '144A' 5.000% 20/01/2026 205,544 0.11 635,000 Wind Tre SpA 'REGS' 3.125% 20/01/2025 675,653 0.35
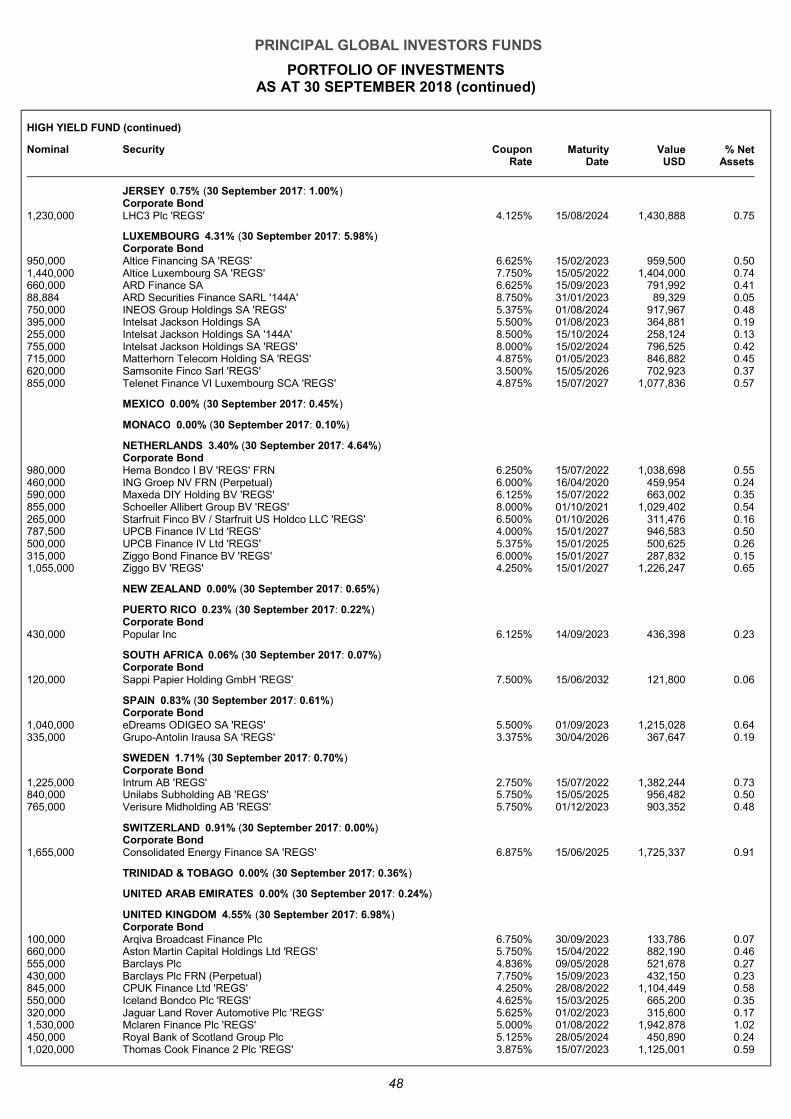
PRINCIPAL GLOBAL INVESTORS FUNDS
PORTFOLIO OF INVESTMENTS AS AT 30 SEPTEMBER 2018 (continued)
48
HIGH YIELD FUND (continued)
Nominal Security Coupon Rate
Maturity Date
Value USD
% Net Assets
JERSEY 0.75% (30 September 2017: 1.00%) Corporate Bond
1,230,000 LHC3 Plc 'REGS' 4.125% 15/08/2024 1,430,888 0.75
LUXEMBOURG 4.31% (30 September 2017: 5.98%) Corporate Bond
950,000 Altice Financing SA 'REGS' 6.625% 15/02/2023 959,500 0.50 1,440,000 Altice Luxembourg SA 'REGS' 7.750% 15/05/2022 1,404,000 0.74 660,000 ARD Finance SA 6.625% 15/09/2023 791,992 0.41 88,884 ARD Securities Finance SARL '144A' 8.750% 31/01/2023 89,329 0.05 750,000 INEOS Group Holdings SA 'REGS' 5.375% 01/08/2024 917,967 0.48 395,000 Intelsat Jackson Holdings SA 5.500% 01/08/2023 364,881 0.19 255,000 Intelsat Jackson Holdings SA '144A' 8.500% 15/10/2024 258,124 0.13 755,000 Intelsat Jackson Holdings SA 'REGS' 8.000% 15/02/2024 796,525 0.42 715,000 Matterhorn Telecom Holding SA 'REGS' 4.875% 01/05/2023 846,882 0.45 620,000 Samsonite Finco Sarl 'REGS' 3.500% 15/05/2026 702,923 0.37 855,000 Telenet Finance VI Luxembourg SCA 'REGS' 4.875% 15/07/2027 1,077,836 0.57
MEXICO 0.00% (30 September 2017: 0.45%)
MONACO 0.00% (30 September 2017: 0.10%)
NETHERLANDS 3.40% (30 September 2017: 4.64%) Corporate Bond
980,000 Hema Bondco I BV 'REGS' FRN 6.250% 15/07/2022 1,038,698 0.55 460,000 ING Groep NV FRN (Perpetual) 6.000% 16/04/2020 459,954 0.24 590,000 Maxeda DIY Holding BV 'REGS' 6.125% 15/07/2022 663,002 0.35 855,000 Schoeller Allibert Group BV 'REGS' 8.000% 01/10/2021 1,029,402 0.54 265,000 Starfruit Finco BV / Starfruit US Holdco LLC 'REGS' 6.500% 01/10/2026 311,476 0.16 787,500 UPCB Finance IV Ltd 'REGS' 4.000% 15/01/2027 946,583 0.50 500,000 UPCB Finance IV Ltd 'REGS' 5.375% 15/01/2025 500,625 0.26 315,000 Ziggo Bond Finance BV 'REGS' 6.000% 15/01/2027 287,832 0.15 1,055,000 Ziggo BV 'REGS' 4.250% 15/01/2027 1,226,247 0.65
NEW ZEALAND 0.00% (30 September 2017: 0.65%)
PUERTO RICO 0.23% (30 September 2017: 0.22%) Corporate Bond
430,000 Popular Inc 6.125% 14/09/2023 436,398 0.23
SOUTH AFRICA 0.06% (30 September 2017: 0.07%) Corporate Bond
120,000 Sappi Papier Holding GmbH 'REGS' 7.500% 15/06/2032 121,800 0.06
SPAIN 0.83% (30 September 2017: 0.61%) Corporate Bond
1,040,000 eDreams ODIGEO SA 'REGS' 5.500% 01/09/2023 1,215,028 0.64 335,000 Grupo-Antolin Irausa SA 'REGS' 3.375% 30/04/2026 367,647 0.19
SWEDEN 1.71% (30 September 2017: 0.70%) Corporate Bond
1,225,000 Intrum AB 'REGS' 2.750% 15/07/2022 1,382,244 0.73 840,000 Unilabs Subholding AB 'REGS' 5.750% 15/05/2025 956,482 0.50 765,000 Verisure Midholding AB 'REGS' 5.750% 01/12/2023 903,352 0.48
SWITZERLAND 0.91% (30 September 2017: 0.00%) Corporate Bond
1,655,000 Consolidated Energy Finance SA 'REGS' 6.875% 15/06/2025 1,725,337 0.91
TRINIDAD & TOBAGO 0.00% (30 September 2017: 0.36%)
UNITED ARAB EMIRATES 0.00% (30 September 2017: 0.24%)
UNITED KINGDOM 4.55% (30 September 2017: 6.98%) Corporate Bond
100,000 Arqiva Broadcast Finance Plc 6.750% 30/09/2023 133,786 0.07 660,000 Aston Martin Capital Holdings Ltd 'REGS' 5.750% 15/04/2022 882,190 0.46 555,000 Barclays Plc 4.836% 09/05/2028 521,678 0.27 430,000 Barclays Plc FRN (Perpetual) 7.750% 15/09/2023 432,150 0.23 845,000 CPUK Finance Ltd 'REGS' 4.250% 28/08/2022 1,104,449 0.58 550,000 Iceland Bondco Plc 'REGS' 4.625% 15/03/2025 665,200 0.35 320,000 Jaguar Land Rover Automotive Plc 'REGS' 5.625% 01/02/2023 315,600 0.17 1,530,000 Mclaren Finance Plc 'REGS' 5.000% 01/08/2022 1,942,878 1.02 450,000 Royal Bank of Scotland Group Plc 5.125% 28/05/2024 450,890 0.24 1,020,000 Thomas Cook Finance 2 Plc 'REGS' 3.875% 15/07/2023 1,125,001 0.59
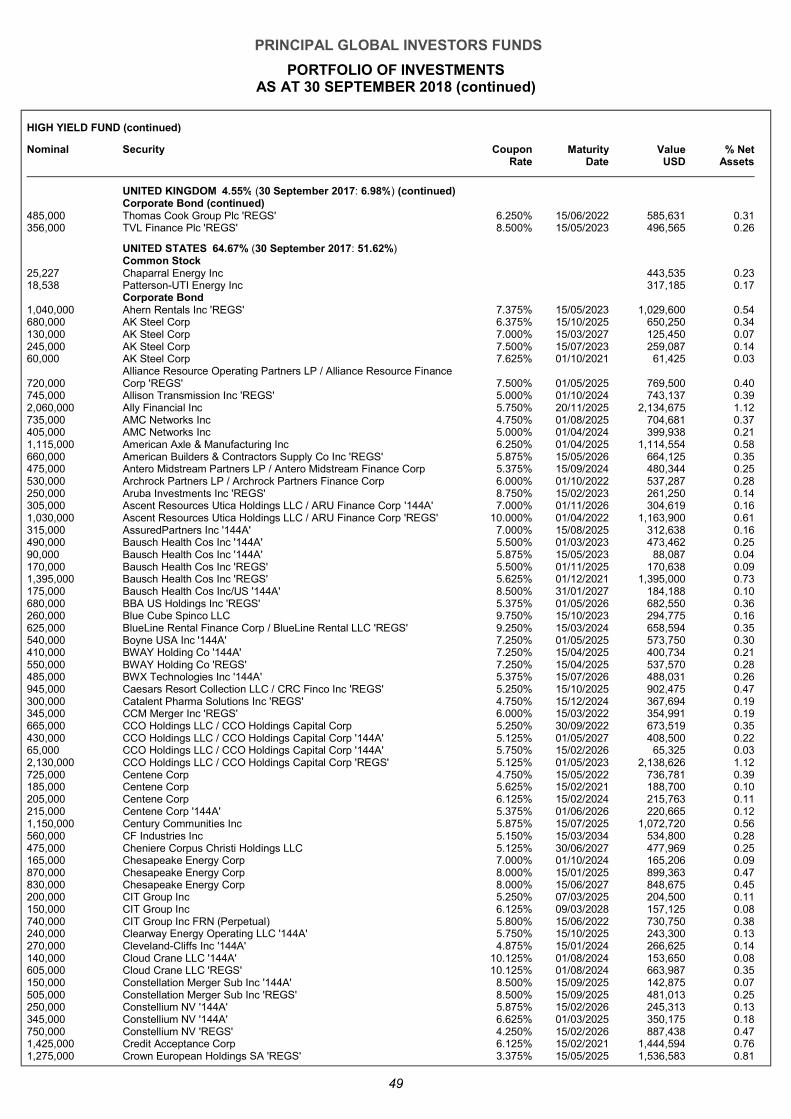
PRINCIPAL GLOBAL INVESTORS FUNDS
PORTFOLIO OF INVESTMENTS AS AT 30 SEPTEMBER 2018 (continued)
49
HIGH YIELD FUND (continued)
Nominal Security Coupon Rate
Maturity Date
Value USD
% Net Assets
UNITED KINGDOM 4.55% (30 September 2017: 6.98%) (continued) Corporate Bond (continued)
485,000 Thomas Cook Group Plc 'REGS' 6.250% 15/06/2022 585,631 0.31 356,000 TVL Finance Plc 'REGS' 8.500% 15/05/2023 496,565 0.26
UNITED STATES 64.67% (30 September 2017: 51.62%) Common Stock
25,227 Chaparral Energy Inc 443,535 0.23 18,538 Patterson-UTI Energy Inc 317,185 0.17
Corporate Bond 1,040,000 Ahern Rentals Inc 'REGS' 7.375% 15/05/2023 1,029,600 0.54 680,000 AK Steel Corp 6.375% 15/10/2025 650,250 0.34 130,000 AK Steel Corp 7.000% 15/03/2027 125,450 0.07 245,000 AK Steel Corp 7.500% 15/07/2023 259,087 0.14 60,000 AK Steel Corp 7.625% 01/10/2021 61,425 0.03
720,000 Alliance Resource Operating Partners LP / Alliance Resource Finance Corp 'REGS' 7.500% 01/05/2025 769,500 0.40
745,000 Allison Transmission Inc 'REGS' 5.000% 01/10/2024 743,137 0.39 2,060,000 Ally Financial Inc 5.750% 20/11/2025 2,134,675 1.12 735,000 AMC Networks Inc 4.750% 01/08/2025 704,681 0.37 405,000 AMC Networks Inc 5.000% 01/04/2024 399,938 0.21 1,115,000 American Axle & Manufacturing Inc 6.250% 01/04/2025 1,114,554 0.58 660,000 American Builders & Contractors Supply Co Inc 'REGS' 5.875% 15/05/2026 664,125 0.35 475,000 Antero Midstream Partners LP / Antero Midstream Finance Corp 5.375% 15/09/2024 480,344 0.25 530,000 Archrock Partners LP / Archrock Partners Finance Corp 6.000% 01/10/2022 537,287 0.28 250,000 Aruba Investments Inc 'REGS' 8.750% 15/02/2023 261,250 0.14 305,000 Ascent Resources Utica Holdings LLC / ARU Finance Corp '144A' 7.000% 01/11/2026 304,619 0.16 1,030,000 Ascent Resources Utica Holdings LLC / ARU Finance Corp 'REGS' 10.000% 01/04/2022 1,163,900 0.61 315,000 AssuredPartners Inc '144A' 7.000% 15/08/2025 312,638 0.16 490,000 Bausch Health Cos Inc '144A' 5.500% 01/03/2023 473,462 0.25 90,000 Bausch Health Cos Inc '144A' 5.875% 15/05/2023 88,087 0.04 170,000 Bausch Health Cos Inc 'REGS' 5.500% 01/11/2025 170,638 0.09 1,395,000 Bausch Health Cos Inc 'REGS' 5.625% 01/12/2021 1,395,000 0.73 175,000 Bausch Health Cos Inc/US '144A' 8.500% 31/01/2027 184,188 0.10 680,000 BBA US Holdings Inc 'REGS' 5.375% 01/05/2026 682,550 0.36 260,000 Blue Cube Spinco LLC 9.750% 15/10/2023 294,775 0.16 625,000 BlueLine Rental Finance Corp / BlueLine Rental LLC 'REGS' 9.250% 15/03/2024 658,594 0.35 540,000 Boyne USA Inc '144A' 7.250% 01/05/2025 573,750 0.30 410,000 BWAY Holding Co '144A' 7.250% 15/04/2025 400,734 0.21 550,000 BWAY Holding Co 'REGS' 7.250% 15/04/2025 537,570 0.28 485,000 BWX Technologies Inc '144A' 5.375% 15/07/2026 488,031 0.26 945,000 Caesars Resort Collection LLC / CRC Finco Inc 'REGS' 5.250% 15/10/2025 902,475 0.47 300,000 Catalent Pharma Solutions Inc 'REGS' 4.750% 15/12/2024 367,694 0.19 345,000 CCM Merger Inc 'REGS' 6.000% 15/03/2022 354,991 0.19 665,000 CCO Holdings LLC / CCO Holdings Capital Corp 5.250% 30/09/2022 673,519 0.35 430,000 CCO Holdings LLC / CCO Holdings Capital Corp '144A' 5.125% 01/05/2027 408,500 0.22 65,000 CCO Holdings LLC / CCO Holdings Capital Corp '144A' 5.750% 15/02/2026 65,325 0.03 2,130,000 CCO Holdings LLC / CCO Holdings Capital Corp 'REGS' 5.125% 01/05/2023 2,138,626 1.12 725,000 Centene Corp 4.750% 15/05/2022 736,781 0.39 185,000 Centene Corp 5.625% 15/02/2021 188,700 0.10 205,000 Centene Corp 6.125% 15/02/2024 215,763 0.11 215,000 Centene Corp '144A' 5.375% 01/06/2026 220,665 0.12 1,150,000 Century Communities Inc 5.875% 15/07/2025 1,072,720 0.56 560,000 CF Industries Inc 5.150% 15/03/2034 534,800 0.28 475,000 Cheniere Corpus Christi Holdings LLC 5.125% 30/06/2027 477,969 0.25 165,000 Chesapeake Energy Corp 7.000% 01/10/2024 165,206 0.09 870,000 Chesapeake Energy Corp 8.000% 15/01/2025 899,363 0.47 830,000 Chesapeake Energy Corp 8.000% 15/06/2027 848,675 0.45 200,000 CIT Group Inc 5.250% 07/03/2025 204,500 0.11 150,000 CIT Group Inc 6.125% 09/03/2028 157,125 0.08 740,000 CIT Group Inc FRN (Perpetual) 5.800% 15/06/2022 730,750 0.38 240,000 Clearway Energy Operating LLC '144A' 5.750% 15/10/2025 243,300 0.13 270,000 Cleveland-Cliffs Inc '144A' 4.875% 15/01/2024 266,625 0.14 140,000 Cloud Crane LLC '144A' 10.125% 01/08/2024 153,650 0.08 605,000 Cloud Crane LLC 'REGS' 10.125% 01/08/2024 663,987 0.35 150,000 Constellation Merger Sub Inc '144A' 8.500% 15/09/2025 142,875 0.07 505,000 Constellation Merger Sub Inc 'REGS' 8.500% 15/09/2025 481,013 0.25 250,000 Constellium NV '144A' 5.875% 15/02/2026 245,313 0.13 345,000 Constellium NV '144A' 6.625% 01/03/2025 350,175 0.18 750,000 Constellium NV 'REGS' 4.250% 15/02/2026 887,438 0.47 1,425,000 Credit Acceptance Corp 6.125% 15/02/2021 1,444,594 0.76 1,275,000 Crown European Holdings SA 'REGS' 3.375% 15/05/2025 1,536,583 0.81
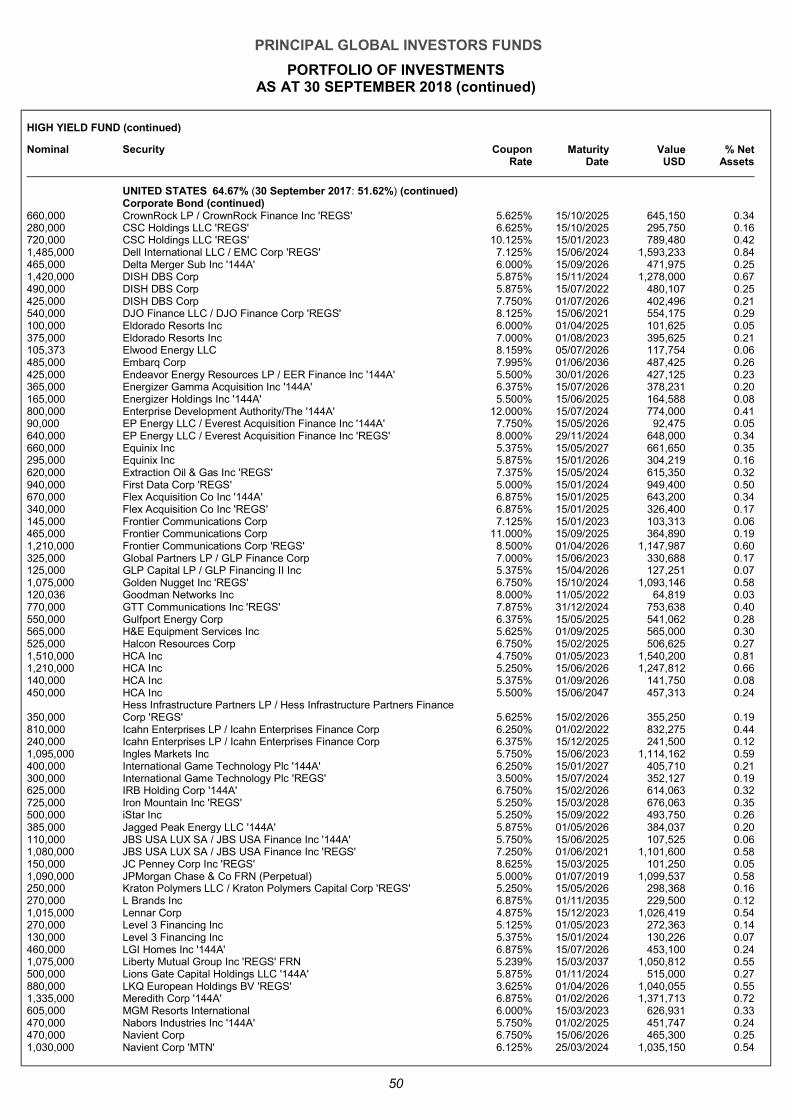
PRINCIPAL GLOBAL INVESTORS FUNDS
PORTFOLIO OF INVESTMENTS AS AT 30 SEPTEMBER 2018 (continued)
50
HIGH YIELD FUND (continued)
Nominal Security Coupon Rate
Maturity Date
Value USD
% Net Assets
UNITED STATES 64.67% (30 September 2017: 51.62%) (continued) Corporate Bond (continued)
660,000 CrownRock LP / CrownRock Finance Inc 'REGS' 5.625% 15/10/2025 645,150 0.34 280,000 CSC Holdings LLC 'REGS' 6.625% 15/10/2025 295,750 0.16 720,000 CSC Holdings LLC 'REGS' 10.125% 15/01/2023 789,480 0.42 1,485,000 Dell International LLC / EMC Corp 'REGS' 7.125% 15/06/2024 1,593,233 0.84 465,000 Delta Merger Sub Inc '144A' 6.000% 15/09/2026 471,975 0.25 1,420,000 DISH DBS Corp 5.875% 15/11/2024 1,278,000 0.67 490,000 DISH DBS Corp 5.875% 15/07/2022 480,107 0.25 425,000 DISH DBS Corp 7.750% 01/07/2026 402,496 0.21 540,000 DJO Finance LLC / DJO Finance Corp 'REGS' 8.125% 15/06/2021 554,175 0.29 100,000 Eldorado Resorts Inc 6.000% 01/04/2025 101,625 0.05 375,000 Eldorado Resorts Inc 7.000% 01/08/2023 395,625 0.21 105,373 Elwood Energy LLC 8.159% 05/07/2026 117,754 0.06 485,000 Embarq Corp 7.995% 01/06/2036 487,425 0.26 425,000 Endeavor Energy Resources LP / EER Finance Inc '144A' 5.500% 30/01/2026 427,125 0.23 365,000 Energizer Gamma Acquisition Inc '144A' 6.375% 15/07/2026 378,231 0.20 165,000 Energizer Holdings Inc '144A' 5.500% 15/06/2025 164,588 0.08 800,000 Enterprise Development Authority/The '144A' 12.000% 15/07/2024 774,000 0.41 90,000 EP Energy LLC / Everest Acquisition Finance Inc '144A' 7.750% 15/05/2026 92,475 0.05 640,000 EP Energy LLC / Everest Acquisition Finance Inc 'REGS' 8.000% 29/11/2024 648,000 0.34 660,000 Equinix Inc 5.375% 15/05/2027 661,650 0.35 295,000 Equinix Inc 5.875% 15/01/2026 304,219 0.16 620,000 Extraction Oil & Gas Inc 'REGS' 7.375% 15/05/2024 615,350 0.32 940,000 First Data Corp 'REGS' 5.000% 15/01/2024 949,400 0.50 670,000 Flex Acquisition Co Inc '144A' 6.875% 15/01/2025 643,200 0.34 340,000 Flex Acquisition Co Inc 'REGS' 6.875% 15/01/2025 326,400 0.17 145,000 Frontier Communications Corp 7.125% 15/01/2023 103,313 0.06465,000 Frontier Communications Corp 11.000% 15/09/2025 364,890 0.19 1,210,000 Frontier Communications Corp 'REGS' 8.500% 01/04/2026 1,147,987 0.60 325,000 Global Partners LP / GLP Finance Corp 7.000% 15/06/2023 330,688 0.17 125,000 GLP Capital LP / GLP Financing II Inc 5.375% 15/04/2026 127,251 0.07 1,075,000 Golden Nugget Inc 'REGS' 6.750% 15/10/2024 1,093,146 0.58 120,036 Goodman Networks Inc 8.000% 11/05/2022 64,819 0.03 770,000 GTT Communications Inc 'REGS' 7.875% 31/12/2024 753,638 0.40 550,000 Gulfport Energy Corp 6.375% 15/05/2025 541,062 0.28 565,000 H&E Equipment Services Inc 5.625% 01/09/2025 565,000 0.30 525,000 Halcon Resources Corp 6.750% 15/02/2025 506,625 0.27 1,510,000 HCA Inc 4.750% 01/05/2023 1,540,200 0.81 1,210,000 HCA Inc 5.250% 15/06/2026 1,247,812 0.66 140,000 HCA Inc 5.375% 01/09/2026 141,750 0.08 450,000 HCA Inc 5.500% 15/06/2047 457,313 0.24
350,000 Hess Infrastructure Partners LP / Hess Infrastructure Partners Finance Corp 'REGS' 5.625% 15/02/2026 355,250 0.19
810,000 Icahn Enterprises LP / Icahn Enterprises Finance Corp 6.250% 01/02/2022 832,275 0.44 240,000 Icahn Enterprises LP / Icahn Enterprises Finance Corp 6.375% 15/12/2025 241,500 0.12 1,095,000 Ingles Markets Inc 5.750% 15/06/2023 1,114,162 0.59 400,000 International Game Technology Plc '144A' 6.250% 15/01/2027 405,710 0.21 300,000 International Game Technology Plc 'REGS' 3.500% 15/07/2024 352,127 0.19 625,000 IRB Holding Corp '144A' 6.750% 15/02/2026 614,063 0.32 725,000 Iron Mountain Inc 'REGS' 5.250% 15/03/2028 676,063 0.35 500,000 iStar Inc 5.250% 15/09/2022 493,750 0.26 385,000 Jagged Peak Energy LLC '144A' 5.875% 01/05/2026 384,037 0.20 110,000 JBS USA LUX SA / JBS USA Finance Inc '144A' 5.750% 15/06/2025 107,525 0.06 1,080,000 JBS USA LUX SA / JBS USA Finance Inc 'REGS' 7.250% 01/06/2021 1,101,600 0.58 150,000 JC Penney Corp Inc 'REGS' 8.625% 15/03/2025 101,250 0.05 1,090,000 JPMorgan Chase & Co FRN (Perpetual) 5.000% 01/07/2019 1,099,537 0.58 250,000 Kraton Polymers LLC / Kraton Polymers Capital Corp 'REGS' 5.250% 15/05/2026 298,368 0.16 270,000 L Brands Inc 6.875% 01/11/2035 229,500 0.12 1,015,000 Lennar Corp 4.875% 15/12/2023 1,026,419 0.54 270,000 Level 3 Financing Inc 5.125% 01/05/2023 272,363 0.14 130,000 Level 3 Financing Inc 5.375% 15/01/2024 130,226 0.07 460,000 LGI Homes Inc '144A' 6.875% 15/07/2026 453,100 0.24 1,075,000 Liberty Mutual Group Inc 'REGS' FRN 5.239% 15/03/2037 1,050,812 0.55 500,000 Lions Gate Capital Holdings LLC '144A' 5.875% 01/11/2024 515,000 0.27 880,000 LKQ European Holdings BV 'REGS' 3.625% 01/04/2026 1,040,055 0.55 1,335,000 Meredith Corp '144A' 6.875% 01/02/2026 1,371,713 0.72 605,000 MGM Resorts International 6.000% 15/03/2023 626,931 0.33 470,000 Nabors Industries Inc '144A' 5.750% 01/02/2025 451,747 0.24 470,000 Navient Corp 6.750% 15/06/2026 465,300 0.25 1,030,000 Navient Corp 'MTN' 6.125% 25/03/2024 1,035,150 0.54
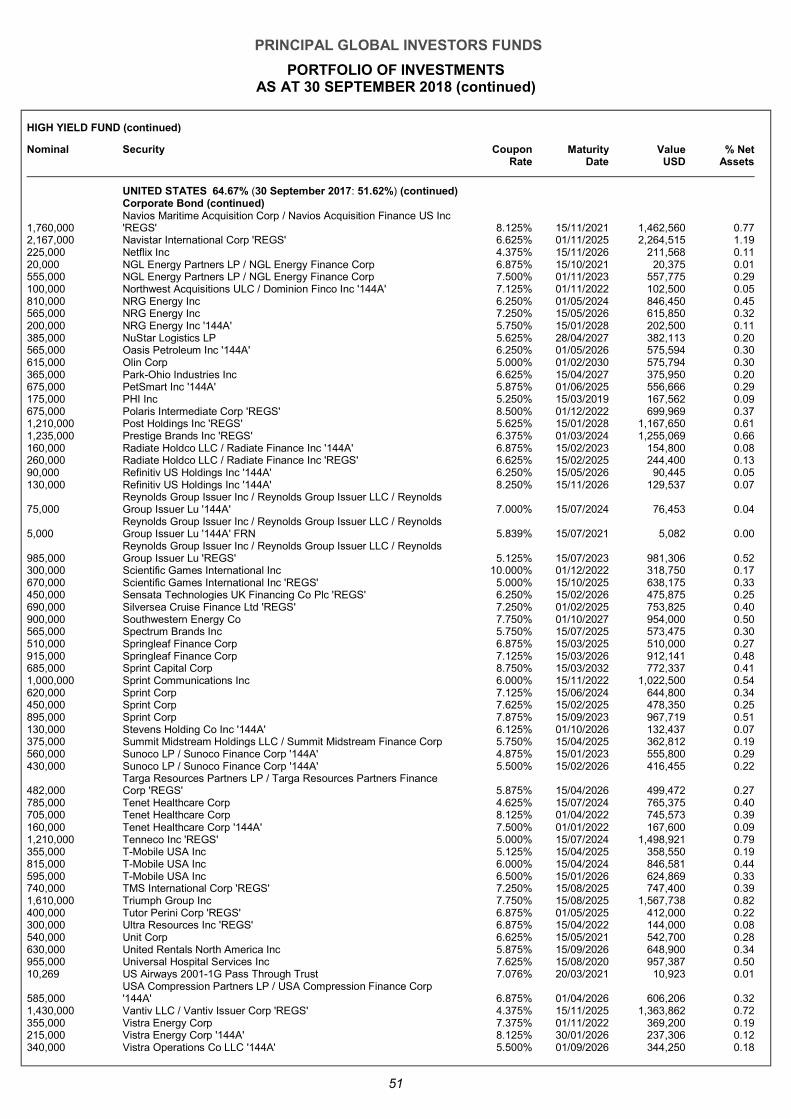
PRINCIPAL GLOBAL INVESTORS FUNDS
PORTFOLIO OF INVESTMENTS AS AT 30 SEPTEMBER 2018 (continued)
51
HIGH YIELD FUND (continued)
Nominal Security Coupon Rate
Maturity Date
Value USD
% Net Assets
UNITED STATES 64.67% (30 September 2017: 51.62%) (continued) Corporate Bond (continued)
1,760,000 Navios Maritime Acquisition Corp / Navios Acquisition Finance US Inc 'REGS' 8.125% 15/11/2021 1,462,560 0.77
2,167,000 Navistar International Corp 'REGS' 6.625% 01/11/2025 2,264,515 1.19 225,000 Netflix Inc 4.375% 15/11/2026 211,568 0.11 20,000 NGL Energy Partners LP / NGL Energy Finance Corp 6.875% 15/10/2021 20,375 0.01 555,000 NGL Energy Partners LP / NGL Energy Finance Corp 7.500% 01/11/2023 557,775 0.29 100,000 Northwest Acquisitions ULC / Dominion Finco Inc '144A' 7.125% 01/11/2022 102,500 0.05 810,000 NRG Energy Inc 6.250% 01/05/2024 846,450 0.45 565,000 NRG Energy Inc 7.250% 15/05/2026 615,850 0.32 200,000 NRG Energy Inc '144A' 5.750% 15/01/2028 202,500 0.11 385,000 NuStar Logistics LP 5.625% 28/04/2027 382,113 0.20 565,000 Oasis Petroleum Inc '144A' 6.250% 01/05/2026 575,594 0.30 615,000 Olin Corp 5.000% 01/02/2030 575,794 0.30 365,000 Park-Ohio Industries Inc 6.625% 15/04/2027 375,950 0.20 675,000 PetSmart Inc '144A' 5.875% 01/06/2025 556,666 0.29 175,000 PHI Inc 5.250% 15/03/2019 167,562 0.09 675,000 Polaris Intermediate Corp 'REGS' 8.500% 01/12/2022 699,969 0.37 1,210,000 Post Holdings Inc 'REGS' 5.625% 15/01/2028 1,167,650 0.61 1,235,000 Prestige Brands Inc 'REGS' 6.375% 01/03/2024 1,255,069 0.66 160,000 Radiate Holdco LLC / Radiate Finance Inc '144A' 6.875% 15/02/2023 154,800 0.08 260,000 Radiate Holdco LLC / Radiate Finance Inc 'REGS' 6.625% 15/02/2025 244,400 0.13 90,000 Refinitiv US Holdings Inc '144A' 6.250% 15/05/2026 90,445 0.05 130,000 Refinitiv US Holdings Inc '144A' 8.250% 15/11/2026 129,537 0.07
75,000 Reynolds Group Issuer Inc / Reynolds Group Issuer LLC / Reynolds Group Issuer Lu '144A' 7.000% 15/07/2024 76,453 0.04
5,000 Reynolds Group Issuer Inc / Reynolds Group Issuer LLC / Reynolds Group Issuer Lu '144A' FRN 5.839% 15/07/2021 5,082 0.00
985,000 Reynolds Group Issuer Inc / Reynolds Group Issuer LLC / Reynolds Group Issuer Lu 'REGS' 5.125% 15/07/2023 981,306 0.52
300,000 Scientific Games International Inc 10.000% 01/12/2022 318,750 0.17 670,000 Scientific Games International Inc 'REGS' 5.000% 15/10/2025 638,175 0.33 450,000 Sensata Technologies UK Financing Co Plc 'REGS' 6.250% 15/02/2026 475,875 0.25 690,000 Silversea Cruise Finance Ltd 'REGS' 7.250% 01/02/2025 753,825 0.40 900,000 Southwestern Energy Co 7.750% 01/10/2027 954,000 0.50 565,000 Spectrum Brands Inc 5.750% 15/07/2025 573,475 0.30 510,000 Springleaf Finance Corp 6.875% 15/03/2025 510,000 0.27 915,000 Springleaf Finance Corp 7.125% 15/03/2026 912,141 0.48 685,000 Sprint Capital Corp 8.750% 15/03/2032 772,337 0.41 1,000,000 Sprint Communications Inc 6.000% 15/11/2022 1,022,500 0.54 620,000 Sprint Corp 7.125% 15/06/2024 644,800 0.34 450,000 Sprint Corp 7.625% 15/02/2025 478,350 0.25 895,000 Sprint Corp 7.875% 15/09/2023 967,719 0.51 130,000 Stevens Holding Co Inc '144A' 6.125% 01/10/2026 132,437 0.07 375,000 Summit Midstream Holdings LLC / Summit Midstream Finance Corp 5.750% 15/04/2025 362,812 0.19 560,000 Sunoco LP / Sunoco Finance Corp '144A' 4.875% 15/01/2023 555,800 0.29 430,000 Sunoco LP / Sunoco Finance Corp '144A' 5.500% 15/02/2026 416,455 0.22
482,000 Targa Resources Partners LP / Targa Resources Partners Finance Corp 'REGS' 5.875% 15/04/2026 499,472 0.27
785,000 Tenet Healthcare Corp 4.625% 15/07/2024 765,375 0.40 705,000 Tenet Healthcare Corp 8.125% 01/04/2022 745,573 0.39 160,000 Tenet Healthcare Corp '144A' 7.500% 01/01/2022 167,600 0.09 1,210,000 Tenneco Inc 'REGS' 5.000% 15/07/2024 1,498,921 0.79 355,000 T-Mobile USA Inc 5.125% 15/04/2025 358,550 0.19 815,000 T-Mobile USA Inc 6.000% 15/04/2024 846,581 0.44 595,000 T-Mobile USA Inc 6.500% 15/01/2026 624,869 0.33 740,000 TMS International Corp 'REGS' 7.250% 15/08/2025 747,400 0.39 1,610,000 Triumph Group Inc 7.750% 15/08/2025 1,567,738 0.82 400,000 Tutor Perini Corp 'REGS' 6.875% 01/05/2025 412,000 0.22 300,000 Ultra Resources Inc 'REGS' 6.875% 15/04/2022 144,000 0.08 540,000 Unit Corp 6.625% 15/05/2021 542,700 0.28 630,000 United Rentals North America Inc 5.875% 15/09/2026 648,900 0.34 955,000 Universal Hospital Services Inc 7.625% 15/08/2020 957,387 0.50 10,269 US Airways 2001-1G Pass Through Trust 7.076% 20/03/2021 10,923 0.01
585,000 USA Compression Partners LP / USA Compression Finance Corp '144A' 6.875% 01/04/2026 606,206 0.32
1,430,000 Vantiv LLC / Vantiv Issuer Corp 'REGS' 4.375% 15/11/2025 1,363,862 0.72 355,000 Vistra Energy Corp 7.375% 01/11/2022 369,200 0.19 215,000 Vistra Energy Corp '144A' 8.125% 30/01/2026 237,306 0.12 340,000 Vistra Operations Co LLC '144A' 5.500% 01/09/2026 344,250 0.18
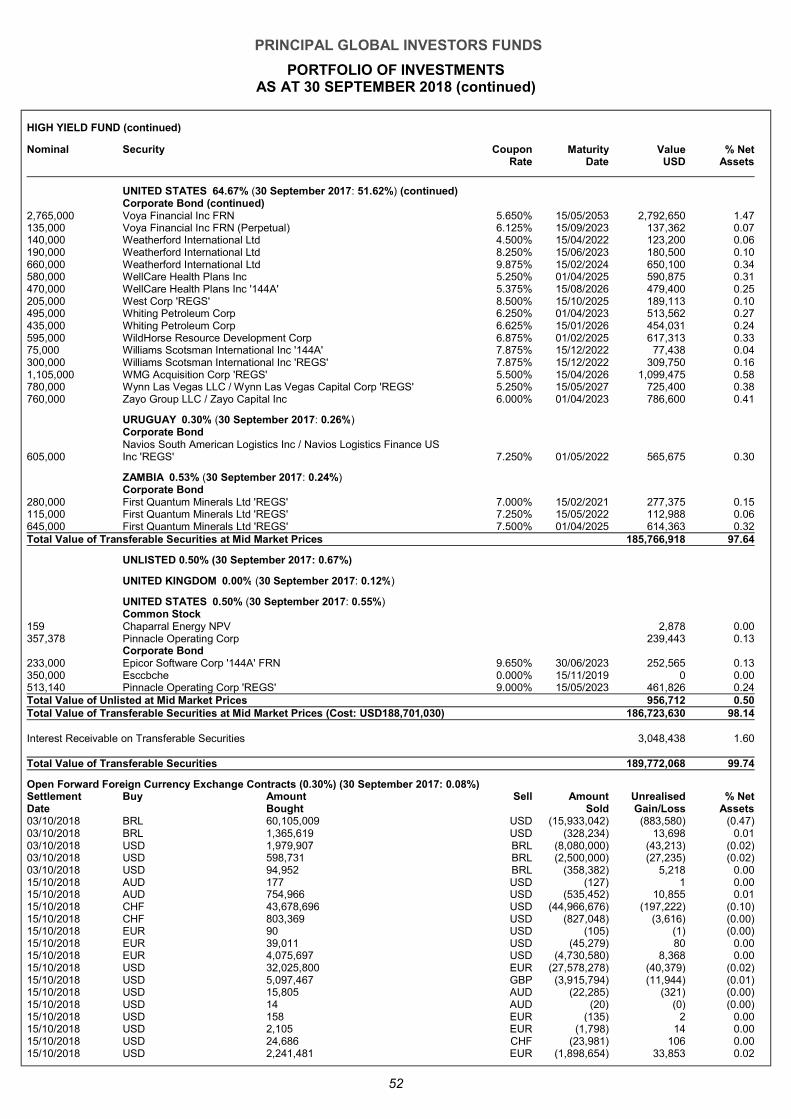
PRINCIPAL GLOBAL INVESTORS FUNDS
PORTFOLIO OF INVESTMENTS AS AT 30 SEPTEMBER 2018 (continued)
52
HIGH YIELD FUND (continued)
Nominal Security Coupon Rate
Maturity Date
Value USD
% Net Assets
UNITED STATES 64.67% (30 September 2017: 51.62%) (continued) Corporate Bond (continued)
2,765,000 Voya Financial Inc FRN 5.650% 15/05/2053 2,792,650 1.47 135,000 Voya Financial Inc FRN (Perpetual) 6.125% 15/09/2023 137,362 0.07 140,000 Weatherford International Ltd 4.500% 15/04/2022 123,200 0.06 190,000 Weatherford International Ltd 8.250% 15/06/2023 180,500 0.10 660,000 Weatherford International Ltd 9.875% 15/02/2024 650,100 0.34 580,000 WellCare Health Plans Inc 5.250% 01/04/2025 590,875 0.31 470,000 WellCare Health Plans Inc '144A' 5.375% 15/08/2026 479,400 0.25 205,000 West Corp 'REGS' 8.500% 15/10/2025 189,113 0.10 495,000 Whiting Petroleum Corp 6.250% 01/04/2023 513,562 0.27 435,000 Whiting Petroleum Corp 6.625% 15/01/2026 454,031 0.24 595,000 WildHorse Resource Development Corp 6.875% 01/02/2025 617,313 0.33 75,000 Williams Scotsman International Inc '144A' 7.875% 15/12/2022 77,438 0.04 300,000 Williams Scotsman International Inc 'REGS' 7.875% 15/12/2022 309,750 0.16 1,105,000 WMG Acquisition Corp 'REGS' 5.500% 15/04/2026 1,099,475 0.58 780,000 Wynn Las Vegas LLC / Wynn Las Vegas Capital Corp 'REGS' 5.250% 15/05/2027 725,400 0.38 760,000 Zayo Group LLC / Zayo Capital Inc 6.000% 01/04/2023 786,600 0.41
URUGUAY 0.30% (30 September 2017: 0.26%) Corporate Bond
605,000 Navios South American Logistics Inc / Navios Logistics Finance US Inc 'REGS' 7.250% 01/05/2022 565,675 0.30
ZAMBIA 0.53% (30 September 2017: 0.24%) Corporate Bond
280,000 First Quantum Minerals Ltd 'REGS' 7.000% 15/02/2021 277,375 0.15 115,000 First Quantum Minerals Ltd 'REGS' 7.250% 15/05/2022 112,988 0.06 645,000 First Quantum Minerals Ltd 'REGS' 7.500% 01/04/2025 614,363 0.32 Total Value of Transferable Securities at Mid Market Prices 185,766,918 97.64
UNLISTED 0.50% (30 September 2017: 0.67%)
UNITED KINGDOM 0.00% (30 September 2017: 0.12%)
UNITED STATES 0.50% (30 September 2017: 0.55%) Common Stock
159 Chaparral Energy NPV 2,878 0.00 357,378 Pinnacle Operating Corp 239,443 0.13
Corporate Bond 233,000 Epicor Software Corp '144A' FRN 9.650% 30/06/2023 252,565 0.13 350,000 Esccbche 0.000% 15/11/2019 0 0.00 513,140 Pinnacle Operating Corp 'REGS' 9.000% 15/05/2023 461,826 0.24 Total Value of Unlisted at Mid Market Prices 956,712 0.50 Total Value of Transferable Securities at Mid Market Prices (Cost: USD188,701,030) 186,723,630 98.14 Interest Receivable on Transferable Securities 3,048,438 1.60 Total Value of Transferable Securities 189,772,068 99.74
Open Forward Foreign Currency Exchange Contracts (0.30%) (30 September 2017: 0.08%) Settlement Date
Buy Amount Bought
Sell Amount Sold
Unrealised Gain/Loss
% Net Assets
03/10/2018 BRL 60,105,009 USD (15,933,042) (883,580) (0 .47)
03/10/2018 BRL 1,365,619 USD (328,234) 13,698 0 .01
03/10/2018 USD 1,979,907 BRL (8,080,000) (43,213) (0 .02)
03/10/2018 USD 598,731 BRL (2,500,000) (27,235) (0 .02)
03/10/2018 USD 94,952 BRL (358,382) 5,218 0 .00
15/10/2018 AUD 177 USD (127) 1 0 .00
15/10/2018 AUD 754,966 USD (535,452) 10,855 0 .01
15/10/2018 CHF 43,678,696 USD (44,966,676) (197,222) (0 .10)
15/10/2018 CHF 803,369 USD (827,048) (3,616) (0 .00)
15/10/2018 EUR 90 USD (105) (1) (0 .00)
15/10/2018 EUR 39,011 USD (45,279) 80 0 .00
15/10/2018 EUR 4,075,697 USD (4,730,580) 8,368 0 .00
15/10/2018 USD 32,025,800 EUR (27,578,278) (40,379) (0 .02)
15/10/2018 USD 5,097,467 GBP (3,915,794) (11,944) (0 .01)
15/10/2018 USD 15,805 AUD (22,285) (321) (0 .00)
15/10/2018 USD 14 AUD (20) (0) (0 .00)
15/10/2018 USD 158 EUR (135) 2 0 .00
15/10/2018 USD 2,105 EUR (1,798) 14 0 .00
15/10/2018 USD 24,686 CHF (23,981) 106 0 .00
15/10/2018 USD 2,241,481 EUR (1,898,654) 33,853 0 .02
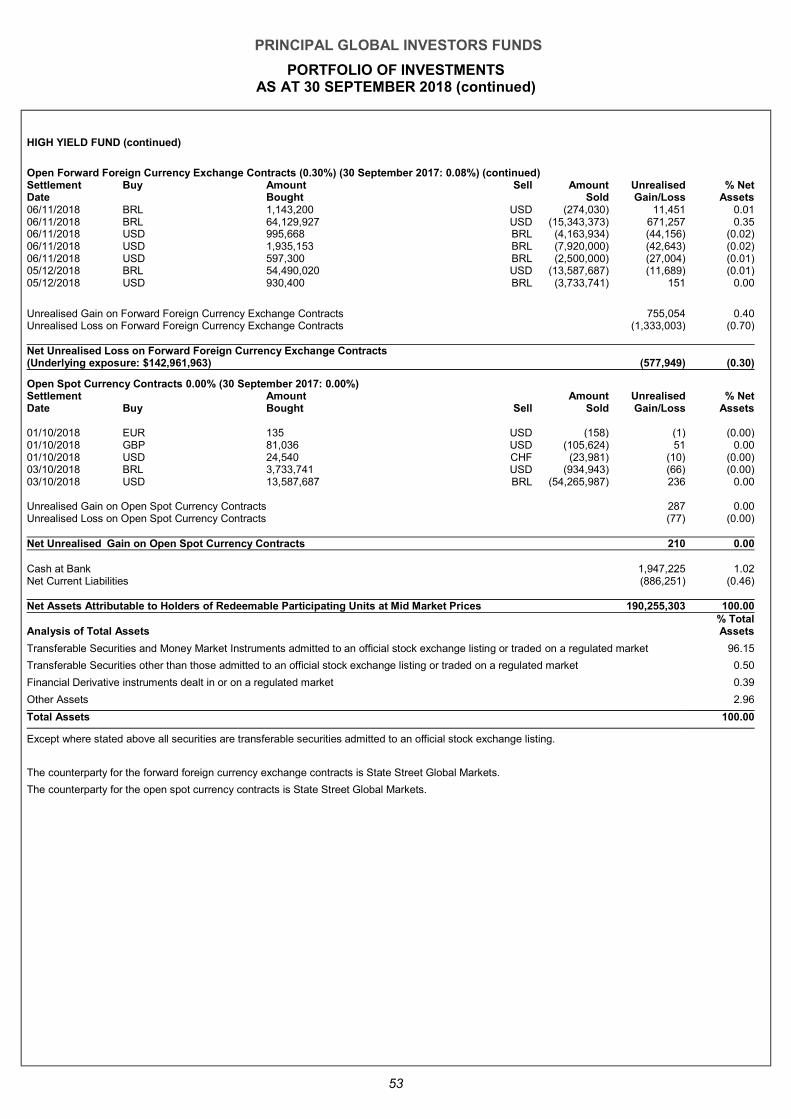
PRINCIPAL GLOBAL INVESTORS FUNDS
PORTFOLIO OF INVESTMENTS AS AT 30 SEPTEMBER 2018 (continued)
53
HIGH YIELD FUND (continued)
Open Forward Foreign Currency Exchange Contracts (0.30%) (30 September 2017: 0.08%) (continued) Settlement Date
Buy Amount Bought
Sell Amount Sold
Unrealised Gain/Loss
% Net Assets
06/11/2018 BRL 1,143,200 USD (274,030) 11,451 0 .01
06/11/2018 BRL 64,129,927 USD (15,343,373) 671,257 0 .35
06/11/2018 USD 995,668 BRL (4,163,934) (44,156) (0 .02)
06/11/2018 USD 1,935,153 BRL (7,920,000) (42,643) (0 .02)
06/11/2018 USD 597,300 BRL (2,500,000) (27,004) (0 .01)
05/12/2018 BRL 54,490,020 USD (13,587,687) (11,689) (0 .01)
05/12/2018 USD 930,400 BRL (3,733,741) 151 0 .00
Unrealised Gain on Forward Foreign Currency Exchange Contracts 755,054 0 .40
Unrealised Loss on Forward Foreign Currency Exchange Contracts (1,333,003) (0 .70)
Net Unrealised Loss on Forward Foreign Currency Exchange Contracts (Underlying exposure: $142,961,963) (577,949) (0 .30)
Open Spot Currency Contracts 0.00% (30 September 2017: 0.00%) Settlement Date Buy
Amount Bought Sell
Amount Sold
Unrealised Gain/Loss
% Net Assets
01/10/2018 EUR 135 USD (158) (1) (0.00) 01/10/2018 GBP 81,036 USD (105,624) 51 0.00 01/10/2018 USD 24,540 CHF (23,981) (10) (0.00) 03/10/2018 BRL 3,733,741 USD (934,943) (66) (0.00) 03/10/2018 USD 13,587,687 BRL (54,265,987) 236 0.00 Unrealised Gain on Open Spot Currency Contracts 287 0.00 Unrealised Loss on Open Spot Currency Contracts (77) (0.00) Net Unrealised Gain on Open Spot Currency Contracts 210 0 .00
Cash at Bank 1,947,225 1.02 Net Current Liabilities (886,251) (0.46) Net Assets Attributable to Holders of Redeemable Participating Units at Mid Market Prices 190,255,303 100.00
Analysis of Total Assets % Total Assets
Transferable Securities and Money Market Instruments admitted to an official stock exchange listing or traded on a regulated market 96.15
Transferable Securities other than those admitted to an official stock exchange listing or traded on a regulated market 0.50
Financial Derivative instruments dealt in or on a regulated market 0.39
Other Assets 2.96
Total Assets 100.00
Except where stated above all securities are transferable securities admitted to an official stock exchange listing.
The counterparty for the forward foreign currency exchange contracts is State Street Global Markets.
The counterparty for the open spot currency contracts is State Street Global Markets.
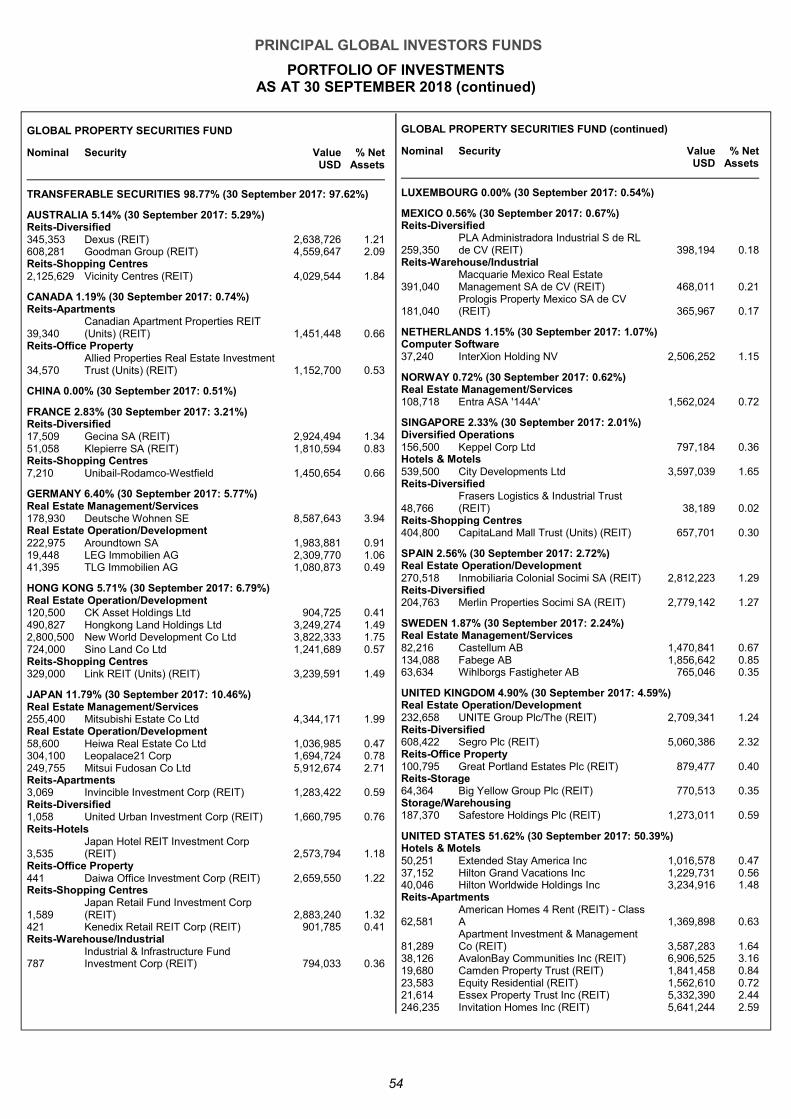
PRINCIPAL GLOBAL INVESTORS FUNDS
PORTFOLIO OF INVESTMENTS AS AT 30 SEPTEMBER 2018 (continued)
54
GLOBAL PROPERTY SECURITIES FUND
Nominal Security Value USD
% Net Assets
TRANSFERABLE SECURITIES 98.77% (30 September 2017: 97.62%)
AUSTRALIA 5.14% (30 September 2017: 5.29%) Reits-Diversified 345,353 Dexus (REIT) 2,638,726 1.21 608,281 Goodman Group (REIT) 4,559,647 2.09 Reits-Shopping Centres 2,125,629 Vicinity Centres (REIT) 4,029,544 1.84
CANADA 1.19% (30 September 2017: 0.74%) Reits-Apartments
39,340 Canadian Apartment Properties REIT (Units) (REIT) 1,451,448 0.66
Reits-Office Property
34,570 Allied Properties Real Estate Investment Trust (Units) (REIT) 1,152,700 0.53
CHINA 0.00% (30 September 2017: 0.51%)
FRANCE 2.83% (30 September 2017: 3.21%) Reits-Diversified 17,509 Gecina SA (REIT) 2,924,494 1.34 51,058 Klepierre SA (REIT) 1,810,594 0.83 Reits-Shopping Centres 7,210 Unibail-Rodamco-Westfield 1,450,654 0.66
GERMANY 6.40% (30 September 2017: 5.77%) Real Estate Management/Services 178,930 Deutsche Wohnen SE 8,587,643 3.94 Real Estate Operation/Development 222,975 Aroundtown SA 1,983,881 0.91 19,448 LEG Immobilien AG 2,309,770 1.06 41,395 TLG Immobilien AG 1,080,873 0.49
HONG KONG 5.71% (30 September 2017: 6.79%) Real Estate Operation/Development 120,500 CK Asset Holdings Ltd 904,725 0.41 490,827 Hongkong Land Holdings Ltd 3,249,274 1.49 2,800,500 New World Development Co Ltd 3,822,333 1.75 724,000 Sino Land Co Ltd 1,241,689 0.57 Reits-Shopping Centres 329,000 Link REIT (Units) (REIT) 3,239,591 1.49
JAPAN 11.79% (30 September 2017: 10.46%) Real Estate Management/Services 255,400 Mitsubishi Estate Co Ltd 4,344,171 1.99 Real Estate Operation/Development 58,600 Heiwa Real Estate Co Ltd 1,036,985 0.47 304,100 Leopalace21 Corp 1,694,724 0.78 249,755 Mitsui Fudosan Co Ltd 5,912,674 2.71 Reits-Apartments 3,069 Invincible Investment Corp (REIT) 1,283,422 0.59 Reits-Diversified 1,058 United Urban Investment Corp (REIT) 1,660,795 0.76 Reits-Hotels
3,535 Japan Hotel REIT Investment Corp (REIT) 2,573,794 1.18
Reits-Office Property 441 Daiwa Office Investment Corp (REIT) 2,659,550 1.22 Reits-Shopping Centres
1,589 Japan Retail Fund Investment Corp (REIT) 2,883,240 1.32
421 Kenedix Retail REIT Corp (REIT) 901,785 0.41 Reits-Warehouse/Industrial
787 Industrial & Infrastructure Fund Investment Corp (REIT) 794,033 0.36
GLOBAL PROPERTY SECURITIES FUND (continued)
Nominal Security Value USD
% Net Assets
LUXEMBOURG 0.00% (30 September 2017: 0.54%)
MEXICO 0.56% (30 September 2017: 0.67%) Reits-Diversified
259,350 PLA Administradora Industrial S de RL de CV (REIT) 398,194 0.18
Reits-Warehouse/Industrial
391,040 Macquarie Mexico Real Estate Management SA de CV (REIT) 468,011 0.21
181,040 Prologis Property Mexico SA de CV (REIT) 365,967 0.17
NETHERLANDS 1.15% (30 September 2017: 1.07%) Computer Software 37,240 InterXion Holding NV 2,506,252 1.15
NORWAY 0.72% (30 September 2017: 0.62%) Real Estate Management/Services 108,718 Entra ASA '144A' 1,562,024 0.72
SINGAPORE 2.33% (30 September 2017: 2.01%) Diversified Operations 156,500 Keppel Corp Ltd 797,184 0.36 Hotels & Motels 539,500 City Developments Ltd 3,597,039 1.65 Reits-Diversified
48,766 Frasers Logistics & Industrial Trust (REIT) 38,189 0.02
Reits-Shopping Centres 404,800 CapitaLand Mall Trust (Units) (REIT) 657,701 0.30
SPAIN 2.56% (30 September 2017: 2.72%) Real Estate Operation/Development 270,518 Inmobiliaria Colonial Socimi SA (REIT) 2,812,223 1.29 Reits-Diversified 204,763 Merlin Properties Socimi SA (REIT) 2,779,142 1.27
SWEDEN 1.87% (30 September 2017: 2.24%) Real Estate Management/Services 82,216 Castellum AB 1,470,841 0.67 134,088 Fabege AB 1,856,642 0.85 63,634 Wihlborgs Fastigheter AB 765,046 0.35
UNITED KINGDOM 4.90% (30 September 2017: 4.59%) Real Estate Operation/Development 232,658 UNITE Group Plc/The (REIT) 2,709,341 1.24 Reits-Diversified 608,422 Segro Plc (REIT) 5,060,386 2.32 Reits-Office Property 100,795 Great Portland Estates Plc (REIT) 879,477 0.40 Reits-Storage 64,364 Big Yellow Group Plc (REIT) 770,513 0.35 Storage/Warehousing 187,370 Safestore Holdings Plc (REIT) 1,273,011 0.59
UNITED STATES 51.62% (30 September 2017: 50.39%) Hotels & Motels 50,251 Extended Stay America Inc 1,016,578 0.47 37,152 Hilton Grand Vacations Inc 1,229,731 0.56 40,046 Hilton Worldwide Holdings Inc 3,234,916 1.48 Reits-Apartments
62,581 American Homes 4 Rent (REIT) - Class A 1,369,898 0.63
81,289 Apartment Investment & Management Co (REIT) 3,587,283 1.64
38,126 AvalonBay Communities Inc (REIT) 6,906,525 3.16 19,680 Camden Property Trust (REIT) 1,841,458 0.84 23,583 Equity Residential (REIT) 1,562,610 0.72 21,614 Essex Property Trust Inc (REIT) 5,332,390 2.44 246,235 Invitation Homes Inc (REIT) 5,641,244 2.59
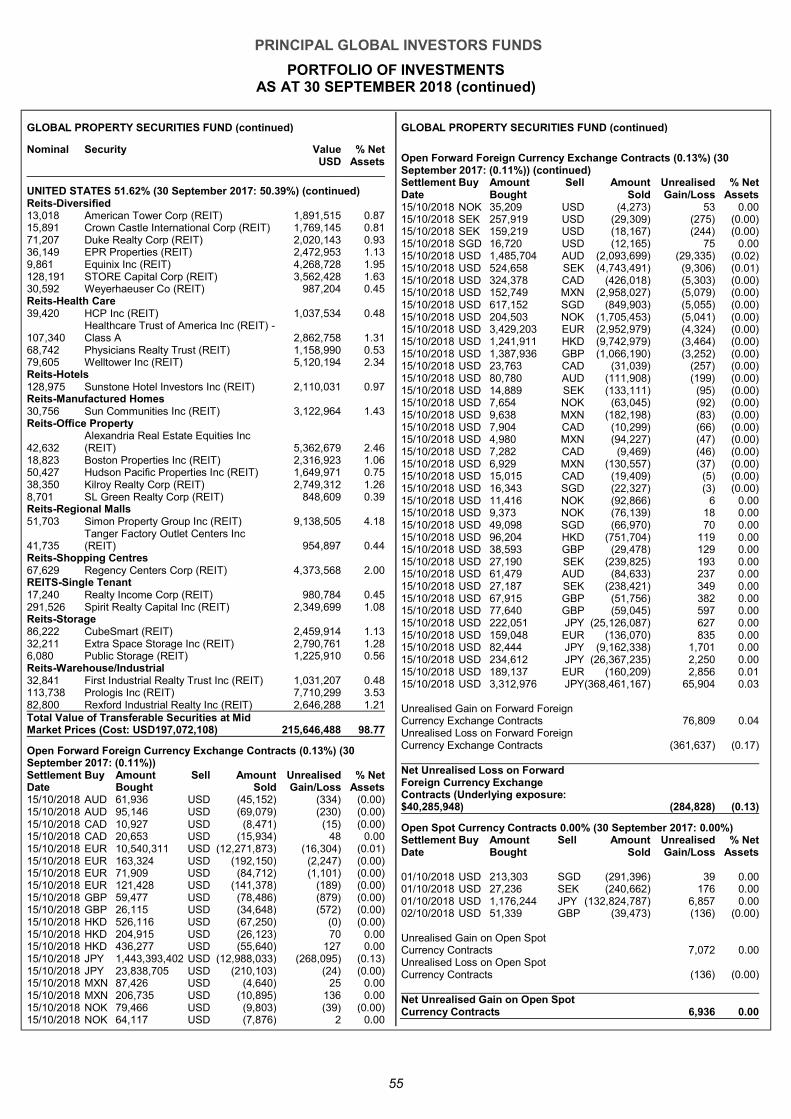
PRINCIPAL GLOBAL INVESTORS FUNDS
PORTFOLIO OF INVESTMENTS AS AT 30 SEPTEMBER 2018 (continued)
55
GLOBAL PROPERTY SECURITIES FUND (continued)
Nominal Security Value USD
% Net Assets
UNITED STATES 51.62% (30 September 2017: 50.39%) (continued) Reits-Diversified 13,018 American Tower Corp (REIT) 1,891,515 0.87 15,891 Crown Castle International Corp (REIT) 1,769,145 0.81 71,207 Duke Realty Corp (REIT) 2,020,143 0.93 36,149 EPR Properties (REIT) 2,472,953 1.13 9,861 Equinix Inc (REIT) 4,268,728 1.95 128,191 STORE Capital Corp (REIT) 3,562,428 1.63 30,592 Weyerhaeuser Co (REIT) 987,204 0.45 Reits-Health Care 39,420 HCP Inc (REIT) 1,037,534 0.48
107,340 Healthcare Trust of America Inc (REIT) - Class A 2,862,758 1.31
68,742 Physicians Realty Trust (REIT) 1,158,990 0.53 79,605 Welltower Inc (REIT) 5,120,194 2.34 Reits-Hotels 128,975 Sunstone Hotel Investors Inc (REIT) 2,110,031 0.97 Reits-Manufactured Homes 30,756 Sun Communities Inc (REIT) 3,122,964 1.43 Reits-Office Property
42,632 Alexandria Real Estate Equities Inc (REIT) 5,362,679 2.46
18,823 Boston Properties Inc (REIT) 2,316,923 1.06 50,427 Hudson Pacific Properties Inc (REIT) 1,649,971 0.75 38,350 Kilroy Realty Corp (REIT) 2,749,312 1.26 8,701 SL Green Realty Corp (REIT) 848,609 0.39 Reits-Regional Malls 51,703 Simon Property Group Inc (REIT) 9,138,505 4.18
41,735 Tanger Factory Outlet Centers Inc (REIT) 954,897 0.44
Reits-Shopping Centres 67,629 Regency Centers Corp (REIT) 4,373,568 2.00 REITS-Single Tenant 17,240 Realty Income Corp (REIT) 980,784 0.45 291,526 Spirit Realty Capital Inc (REIT) 2,349,699 1.08 Reits-Storage 86,222 CubeSmart (REIT) 2,459,914 1.13 32,211 Extra Space Storage Inc (REIT) 2,790,761 1.28 6,080 Public Storage (REIT) 1,225,910 0.56 Reits-Warehouse/Industrial 32,841 First Industrial Realty Trust Inc (REIT) 1,031,207 0.48 113,738 Prologis Inc (REIT) 7,710,299 3.53 82,800 Rexford Industrial Realty Inc (REIT) 2,646,288 1.21 Total Value of Transferable Securities at Mid Market Prices (Cost: USD197,072,108) 215,646,488 98.77
Open Forward Foreign Currency Exchange Contracts (0.13%) (30 September 2017: (0.11%)) Settlement Buy Amount Sell Amount Unrealised % Net Date Bought Sold Gain/Loss Assets 15/10/2018 AUD 61,936 USD (45,152) (334) (0 .00)
15/10/2018 AUD 95,146 USD (69,079) (230) (0 .00)
15/10/2018 CAD 10,927 USD (8,471) (15) (0 .00)
15/10/2018 CAD 20,653 USD (15,934) 48 0 .00
15/10/2018 EUR 10,540,311 USD (12,271,873) (16,304) (0 .01)
15/10/2018 EUR 163,324 USD (192,150) (2,247) (0 .00)
15/10/2018 EUR 71,909 USD (84,712) (1,101) (0 .00)
15/10/2018 EUR 121,428 USD (141,378) (189) (0 .00)
15/10/2018 GBP 59,477 USD (78,486) (879) (0 .00)
15/10/2018 GBP 26,115 USD (34,648) (572) (0 .00)
15/10/2018 HKD 526,116 USD (67,250) (0) (0 .00)
15/10/2018 HKD 204,915 USD (26,123) 70 0 .00
15/10/2018 HKD 436,277 USD (55,640) 127 0 .00
15/10/2018 JPY 1,443,393,402 USD (12,988,033) (268,095) (0 .13)
15/10/2018 JPY 23,838,705 USD (210,103) (24) (0 .00)
15/10/2018 MXN 87,426 USD (4,640) 25 0 .00
15/10/2018 MXN 206,735 USD (10,895) 136 0 .00
15/10/2018 NOK 79,466 USD (9,803) (39) (0 .00)
15/10/2018 NOK 64,117 USD (7,876) 2 0 .00
GLOBAL PROPERTY SECURITIES FUND (continued)
Open Forward Foreign Currency Exchange Contracts (0.13%) (30 September 2017: (0.11%)) (continued) Settlement Buy Amount Sell Amount Unrealised % Net Date Bought Sold Gain/Loss Assets 15/10/2018 NOK 35,209 USD (4,273) 53 0 .00
15/10/2018 SEK 257,919 USD (29,309) (275) (0 .00)
15/10/2018 SEK 159,219 USD (18,167) (244) (0 .00)
15/10/2018 SGD 16,720 USD (12,165) 75 0 .00
15/10/2018 USD 1,485,704 AUD (2,093,699) (29,335) (0 .02)
15/10/2018 USD 524,658 SEK (4,743,491) (9,306) (0 .01)
15/10/2018 USD 324,378 CAD (426,018) (5,303) (0 .00)
15/10/2018 USD 152,749 MXN (2,958,027) (5,079) (0 .00)
15/10/2018 USD 617,152 SGD (849,903) (5,055) (0 .00)
15/10/2018 USD 204,503 NOK (1,705,453) (5,041) (0 .00)
15/10/2018 USD 3,429,203 EUR (2,952,979) (4,324) (0 .00)
15/10/2018 USD 1,241,911 HKD (9,742,979) (3,464) (0 .00)
15/10/2018 USD 1,387,936 GBP (1,066,190) (3,252) (0 .00)
15/10/2018 USD 23,763 CAD (31,039) (257) (0 .00)
15/10/2018 USD 80,780 AUD (111,908) (199) (0 .00)
15/10/2018 USD 14,889 SEK (133,111) (95) (0 .00)
15/10/2018 USD 7,654 NOK (63,045) (92) (0 .00)
15/10/2018 USD 9,638 MXN (182,198) (83) (0 .00)
15/10/2018 USD 7,904 CAD (10,299) (66) (0 .00)
15/10/2018 USD 4,980 MXN (94,227) (47) (0 .00)
15/10/2018 USD 7,282 CAD (9,469) (46) (0 .00)
15/10/2018 USD 6,929 MXN (130,557) (37) (0 .00)
15/10/2018 USD 15,015 CAD (19,409) (5) (0 .00)
15/10/2018 USD 16,343 SGD (22,327) (3) (0 .00)
15/10/2018 USD 11,416 NOK (92,866) 6 0 .00
15/10/2018 USD 9,373 NOK (76,139) 18 0 .00
15/10/2018 USD 49,098 SGD (66,970) 70 0 .00
15/10/2018 USD 96,204 HKD (751,704) 119 0 .00
15/10/2018 USD 38,593 GBP (29,478) 129 0 .00
15/10/2018 USD 27,190 SEK (239,825) 193 0 .00
15/10/2018 USD 61,479 AUD (84,633) 237 0 .00
15/10/2018 USD 27,187 SEK (238,421) 349 0 .00
15/10/2018 USD 67,915 GBP (51,756) 382 0 .00
15/10/2018 USD 77,640 GBP (59,045) 597 0 .00
15/10/2018 USD 222,051 JPY (25,126,087) 627 0 .00
15/10/2018 USD 159,048 EUR (136,070) 835 0 .00
15/10/2018 USD 82,444 JPY (9,162,338) 1,701 0 .00
15/10/2018 USD 234,612 JPY (26,367,235) 2,250 0 .00
15/10/2018 USD 189,137 EUR (160,209) 2,856 0 .01
15/10/2018 USD 3,312,976 JPY (368,461,167) 65,904 0 .03
Unrealised Gain on Forward Foreign Currency Exchange Contracts 76,809 0.04 Unrealised Loss on Forward Foreign Currency Exchange Contracts (361,637) (0.17) Net Unrealised Loss on Forward Foreign Currency Exchange Contracts (Underlying exposure: $40,285,948) (284,828) (0.13)
Open Spot Currency Contracts 0.00% (30 September 2017: 0.00%) Settlement Buy Amount Sell Amount Unrealised % Net Date Bought Sold Gain/Loss Assets 01/10/2018 USD 213,303 SGD (291,396) 39 0.00 01/10/2018 USD 27,236 SEK (240,662) 176 0.00 01/10/2018 USD 1,176,244 JPY (132,824,787) 6,857 0.00 02/10/2018 USD 51,339 GBP (39,473) (136) (0.00) Unrealised Gain on Open Spot Currency Contracts 7,072 0.00 Unrealised Loss on Open Spot Currency Contracts (136) (0.00) Net Unrealised Gain on Open Spot Currency Contracts 6,936 0 .00
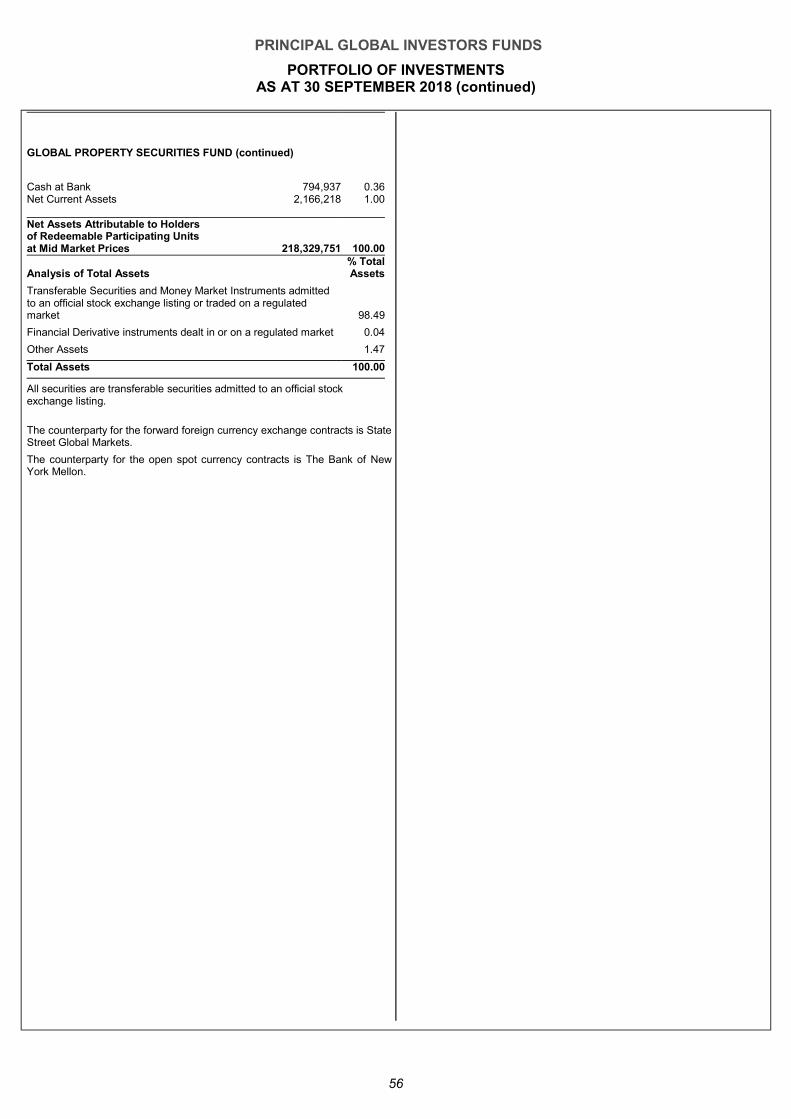
PRINCIPAL GLOBAL INVESTORS FUNDS
PORTFOLIO OF INVESTMENTS AS AT 30 SEPTEMBER 2018 (continued)
56
GLOBAL PROPERTY SECURITIES FUND (continued)
Cash at Bank 794,937 0.36 Net Current Assets 2,166,218 1.00 Net Assets Attributable to Holders of Redeemable Participating Units at Mid Market Prices 218,329,751 100.00
Analysis of Total Assets % Total Assets
Transferable Securities and Money Market Instruments admitted to an official stock exchange listing or traded on a regulated market 98.49
Financial Derivative instruments dealt in or on a regulated market 0.04
Other Assets 1.47
Total Assets 100.00
All securities are transferable securities admitted to an official stock exchange listing.
The counterparty for the forward foreign currency exchange contracts is State Street Global Markets.
The counterparty for the open spot currency contracts is The Bank of New York Mellon.
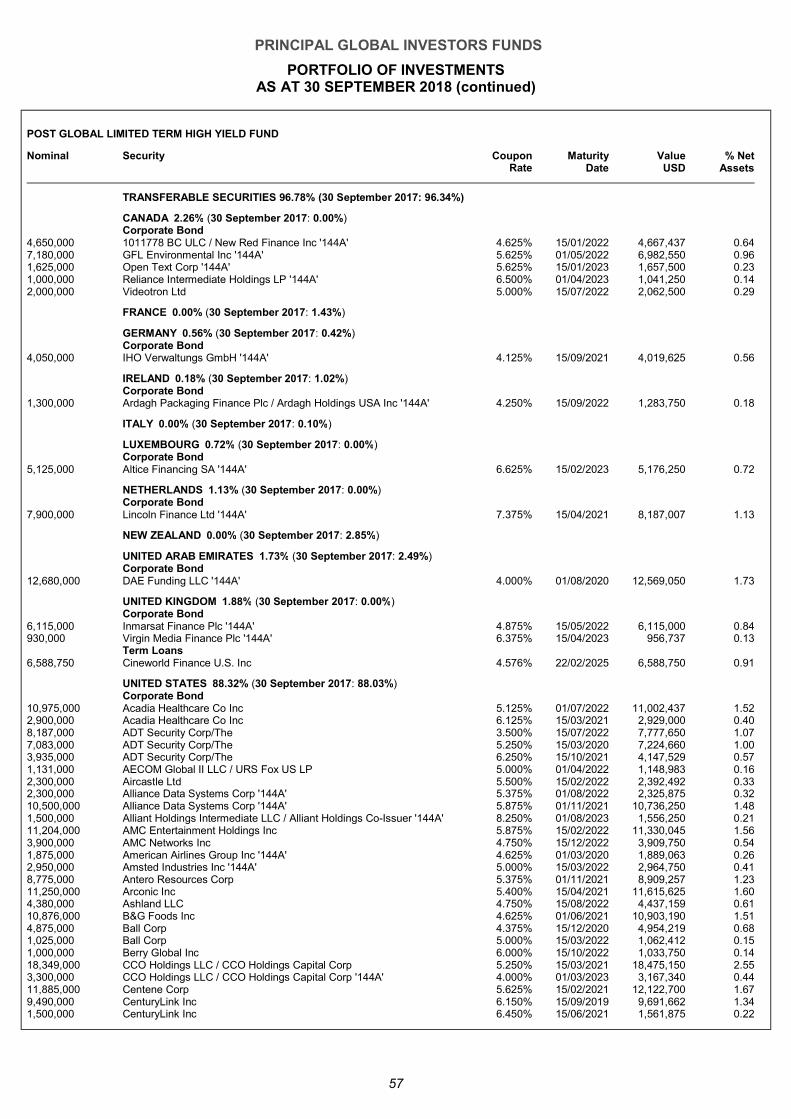
PRINCIPAL GLOBAL INVESTORS FUNDS
PORTFOLIO OF INVESTMENTS AS AT 30 SEPTEMBER 2018 (continued)
57
POST GLOBAL LIMITED TERM HIGH YIELD FUND
Nominal Security Coupon Rate
Maturity Date
Value USD
% Net Assets
TRANSFERABLE SECURITIES 96.78% (30 September 2017: 96.34%)
CANADA 2.26% (30 September 2017: 0.00%) Corporate Bond
4,650,000 1011778 BC ULC / New Red Finance Inc '144A' 4.625% 15/01/2022 4,667,437 0.64 7,180,000 GFL Environmental Inc '144A' 5.625% 01/05/2022 6,982,550 0.96 1,625,000 Open Text Corp '144A' 5.625% 15/01/2023 1,657,500 0.23 1,000,000 Reliance Intermediate Holdings LP '144A' 6.500% 01/04/2023 1,041,250 0.14 2,000,000 Videotron Ltd 5.000% 15/07/2022 2,062,500 0.29
FRANCE 0.00% (30 September 2017: 1.43%)
GERMANY 0.56% (30 September 2017: 0.42%) Corporate Bond
4,050,000 IHO Verwaltungs GmbH '144A' 4.125% 15/09/2021 4,019,625 0.56
IRELAND 0.18% (30 September 2017: 1.02%) Corporate Bond
1,300,000 Ardagh Packaging Finance Plc / Ardagh Holdings USA Inc '144A' 4.250% 15/09/2022 1,283,750 0.18
ITALY 0.00% (30 September 2017: 0.10%)
LUXEMBOURG 0.72% (30 September 2017: 0.00%) Corporate Bond
5,125,000 Altice Financing SA '144A' 6.625% 15/02/2023 5,176,250 0.72
NETHERLANDS 1.13% (30 September 2017: 0.00%) Corporate Bond
7,900,000 Lincoln Finance Ltd '144A' 7.375% 15/04/2021 8,187,007 1.13
NEW ZEALAND 0.00% (30 September 2017: 2.85%)
UNITED ARAB EMIRATES 1.73% (30 September 2017: 2.49%) Corporate Bond
12,680,000 DAE Funding LLC '144A' 4.000% 01/08/2020 12,569,050 1.73
UNITED KINGDOM 1.88% (30 September 2017: 0.00%) Corporate Bond
6,115,000 Inmarsat Finance Plc '144A' 4.875% 15/05/2022 6,115,000 0.84 930,000 Virgin Media Finance Plc '144A' 6.375% 15/04/2023 956,737 0.13
Term Loans 6,588,750 Cineworld Finance U.S. Inc 4.576% 22/02/2025 6,588,750 0.91
UNITED STATES 88.32% (30 September 2017: 88.03%) Corporate Bond
10,975,000 Acadia Healthcare Co Inc 5.125% 01/07/2022 11,002,437 1.52 2,900,000 Acadia Healthcare Co Inc 6.125% 15/03/2021 2,929,000 0.40 8,187,000 ADT Security Corp/The 3.500% 15/07/2022 7,777,650 1.07 7,083,000 ADT Security Corp/The 5.250% 15/03/2020 7,224,660 1.00 3,935,000 ADT Security Corp/The 6.250% 15/10/2021 4,147,529 0.57 1,131,000 AECOM Global II LLC / URS Fox US LP 5.000% 01/04/2022 1,148,983 0.16 2,300,000 Aircastle Ltd 5.500% 15/02/2022 2,392,492 0.33 2,300,000 Alliance Data Systems Corp '144A' 5.375% 01/08/2022 2,325,875 0.32 10,500,000 Alliance Data Systems Corp '144A' 5.875% 01/11/2021 10,736,250 1.48 1,500,000 Alliant Holdings Intermediate LLC / Alliant Holdings Co-Issuer '144A' 8.250% 01/08/2023 1,556,250 0.21 11,204,000 AMC Entertainment Holdings Inc 5.875% 15/02/2022 11,330,045 1.56 3,900,000 AMC Networks Inc 4.750% 15/12/2022 3,909,750 0.54 1,875,000 American Airlines Group Inc '144A' 4.625% 01/03/2020 1,889,063 0.26 2,950,000 Amsted Industries Inc '144A' 5.000% 15/03/2022 2,964,750 0.41 8,775,000 Antero Resources Corp 5.375% 01/11/2021 8,909,257 1.23 11,250,000 Arconic Inc 5.400% 15/04/2021 11,615,625 1.60 4,380,000 Ashland LLC 4.750% 15/08/2022 4,437,159 0.61 10,876,000 B&G Foods Inc 4.625% 01/06/2021 10,903,190 1.51 4,875,000 Ball Corp 4.375% 15/12/2020 4,954,219 0.68 1,025,000 Ball Corp 5.000% 15/03/2022 1,062,412 0.15 1,000,000 Berry Global Inc 6.000% 15/10/2022 1,033,750 0.14 18,349,000 CCO Holdings LLC / CCO Holdings Capital Corp 5.250% 15/03/2021 18,475,150 2.55 3,300,000 CCO Holdings LLC / CCO Holdings Capital Corp '144A' 4.000% 01/03/2023 3,167,340 0.44 11,885,000 Centene Corp 5.625% 15/02/2021 12,122,700 1.67 9,490,000 CenturyLink Inc 6.150% 15/09/2019 9,691,662 1.34 1,500,000 CenturyLink Inc 6.450% 15/06/2021 1,561,875 0.22
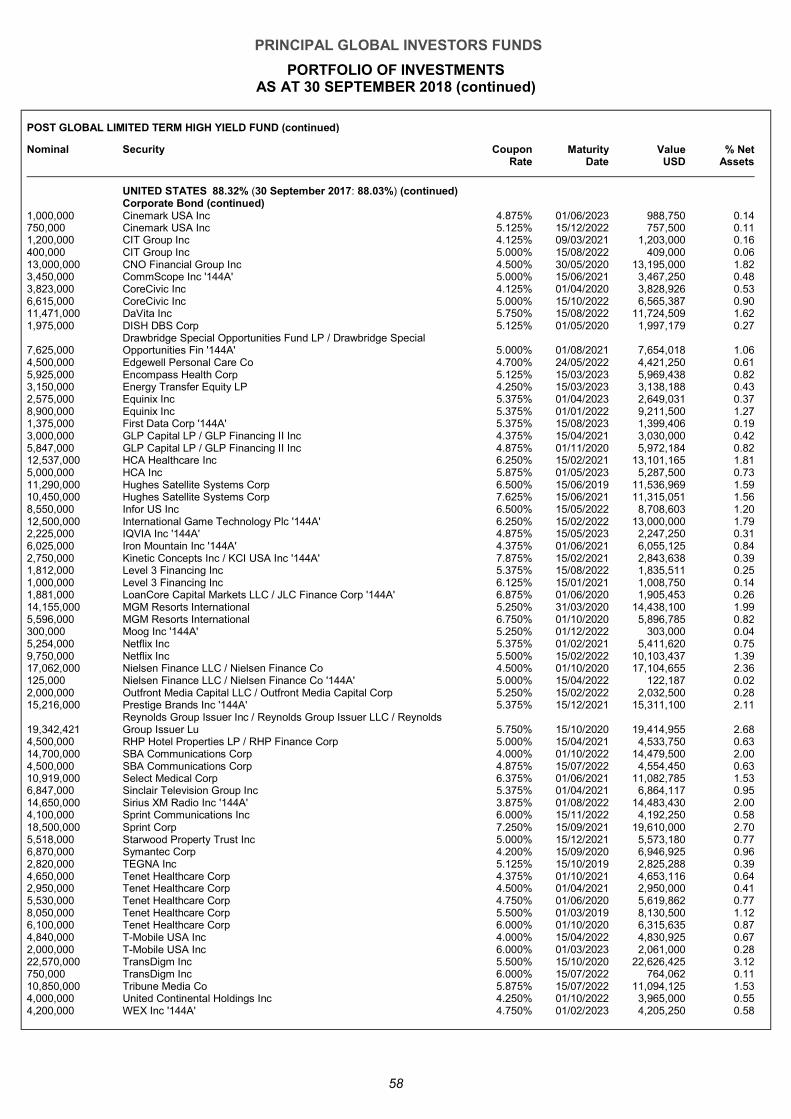
PRINCIPAL GLOBAL INVESTORS FUNDS
PORTFOLIO OF INVESTMENTS AS AT 30 SEPTEMBER 2018 (continued)
58
POST GLOBAL LIMITED TERM HIGH YIELD FUND (continued)
Nominal Security Coupon Rate
Maturity Date
Value USD
% Net Assets
UNITED STATES 88.32% (30 September 2017: 88.03%) (continued) Corporate Bond (continued)
1,000,000 Cinemark USA Inc 4.875% 01/06/2023 988,750 0.14 750,000 Cinemark USA Inc 5.125% 15/12/2022 757,500 0.11 1,200,000 CIT Group Inc 4.125% 09/03/2021 1,203,000 0.16 400,000 CIT Group Inc 5.000% 15/08/2022 409,000 0.06 13,000,000 CNO Financial Group Inc 4.500% 30/05/2020 13,195,000 1.82 3,450,000 CommScope Inc '144A' 5.000% 15/06/2021 3,467,250 0.48 3,823,000 CoreCivic Inc 4.125% 01/04/2020 3,828,926 0.53 6,615,000 CoreCivic Inc 5.000% 15/10/2022 6,565,387 0.90 11,471,000 DaVita Inc 5.750% 15/08/2022 11,724,509 1.62 1,975,000 DISH DBS Corp 5.125% 01/05/2020 1,997,179 0.27
7,625,000 Drawbridge Special Opportunities Fund LP / Drawbridge Special Opportunities Fin '144A' 5.000% 01/08/2021 7,654,018 1.06
4,500,000 Edgewell Personal Care Co 4.700% 24/05/2022 4,421,250 0.61 5,925,000 Encompass Health Corp 5.125% 15/03/2023 5,969,438 0.82 3,150,000 Energy Transfer Equity LP 4.250% 15/03/2023 3,138,188 0.43 2,575,000 Equinix Inc 5.375% 01/04/2023 2,649,031 0.37 8,900,000 Equinix Inc 5.375% 01/01/2022 9,211,500 1.27 1,375,000 First Data Corp '144A' 5.375% 15/08/2023 1,399,406 0.19 3,000,000 GLP Capital LP / GLP Financing II Inc 4.375% 15/04/2021 3,030,000 0.42 5,847,000 GLP Capital LP / GLP Financing II Inc 4.875% 01/11/2020 5,972,184 0.82 12,537,000 HCA Healthcare Inc 6.250% 15/02/2021 13,101,165 1.81 5,000,000 HCA Inc 5.875% 01/05/2023 5,287,500 0.73 11,290,000 Hughes Satellite Systems Corp 6.500% 15/06/2019 11,536,969 1.59 10,450,000 Hughes Satellite Systems Corp 7.625% 15/06/2021 11,315,051 1.56 8,550,000 Infor US Inc 6.500% 15/05/2022 8,708,603 1.20 12,500,000 International Game Technology Plc '144A' 6.250% 15/02/2022 13,000,000 1.792,225,000 IQVIA Inc '144A' 4.875% 15/05/2023 2,247,250 0.31 6,025,000 Iron Mountain Inc '144A' 4.375% 01/06/2021 6,055,125 0.84 2,750,000 Kinetic Concepts Inc / KCI USA Inc '144A' 7.875% 15/02/2021 2,843,638 0.39 1,812,000 Level 3 Financing Inc 5.375% 15/08/2022 1,835,511 0.25 1,000,000 Level 3 Financing Inc 6.125% 15/01/2021 1,008,750 0.14 1,881,000 LoanCore Capital Markets LLC / JLC Finance Corp '144A' 6.875% 01/06/2020 1,905,453 0.26 14,155,000 MGM Resorts International 5.250% 31/03/2020 14,438,100 1.99 5,596,000 MGM Resorts International 6.750% 01/10/2020 5,896,785 0.82 300,000 Moog Inc '144A' 5.250% 01/12/2022 303,000 0.04 5,254,000 Netflix Inc 5.375% 01/02/2021 5,411,620 0.75 9,750,000 Netflix Inc 5.500% 15/02/2022 10,103,437 1.39 17,062,000 Nielsen Finance LLC / Nielsen Finance Co 4.500% 01/10/2020 17,104,655 2.36 125,000 Nielsen Finance LLC / Nielsen Finance Co '144A' 5.000% 15/04/2022 122,187 0.02 2,000,000 Outfront Media Capital LLC / Outfront Media Capital Corp 5.250% 15/02/2022 2,032,500 0.28 15,216,000 Prestige Brands Inc '144A' 5.375% 15/12/2021 15,311,100 2.11
19,342,421 Reynolds Group Issuer Inc / Reynolds Group Issuer LLC / Reynolds Group Issuer Lu 5.750% 15/10/2020 19,414,955 2.68
4,500,000 RHP Hotel Properties LP / RHP Finance Corp 5.000% 15/04/2021 4,533,750 0.63 14,700,000 SBA Communications Corp 4.000% 01/10/2022 14,479,500 2.00 4,500,000 SBA Communications Corp 4.875% 15/07/2022 4,554,450 0.63 10,919,000 Select Medical Corp 6.375% 01/06/2021 11,082,785 1.53 6,847,000 Sinclair Television Group Inc 5.375% 01/04/2021 6,864,117 0.95 14,650,000 Sirius XM Radio Inc '144A' 3.875% 01/08/2022 14,483,430 2.00 4,100,000 Sprint Communications Inc 6.000% 15/11/2022 4,192,250 0.58 18,500,000 Sprint Corp 7.250% 15/09/2021 19,610,000 2.70 5,518,000 Starwood Property Trust Inc 5.000% 15/12/2021 5,573,180 0.77 6,870,000 Symantec Corp 4.200% 15/09/2020 6,946,925 0.96 2,820,000 TEGNA Inc 5.125% 15/10/2019 2,825,288 0.39 4,650,000 Tenet Healthcare Corp 4.375% 01/10/2021 4,653,116 0.64 2,950,000 Tenet Healthcare Corp 4.500% 01/04/2021 2,950,000 0.41 5,530,000 Tenet Healthcare Corp 4.750% 01/06/2020 5,619,862 0.77 8,050,000 Tenet Healthcare Corp 5.500% 01/03/2019 8,130,500 1.12 6,100,000 Tenet Healthcare Corp 6.000% 01/10/2020 6,315,635 0.87 4,840,000 T-Mobile USA Inc 4.000% 15/04/2022 4,830,925 0.67 2,000,000 T-Mobile USA Inc 6.000% 01/03/2023 2,061,000 0.28 22,570,000 TransDigm Inc 5.500% 15/10/2020 22,626,425 3.12 750,000 TransDigm Inc 6.000% 15/07/2022 764,062 0.11 10,850,000 Tribune Media Co 5.875% 15/07/2022 11,094,125 1.53 4,000,000 United Continental Holdings Inc 4.250% 01/10/2022 3,965,000 0.55 4,200,000 WEX Inc '144A' 4.750% 01/02/2023 4,205,250 0.58
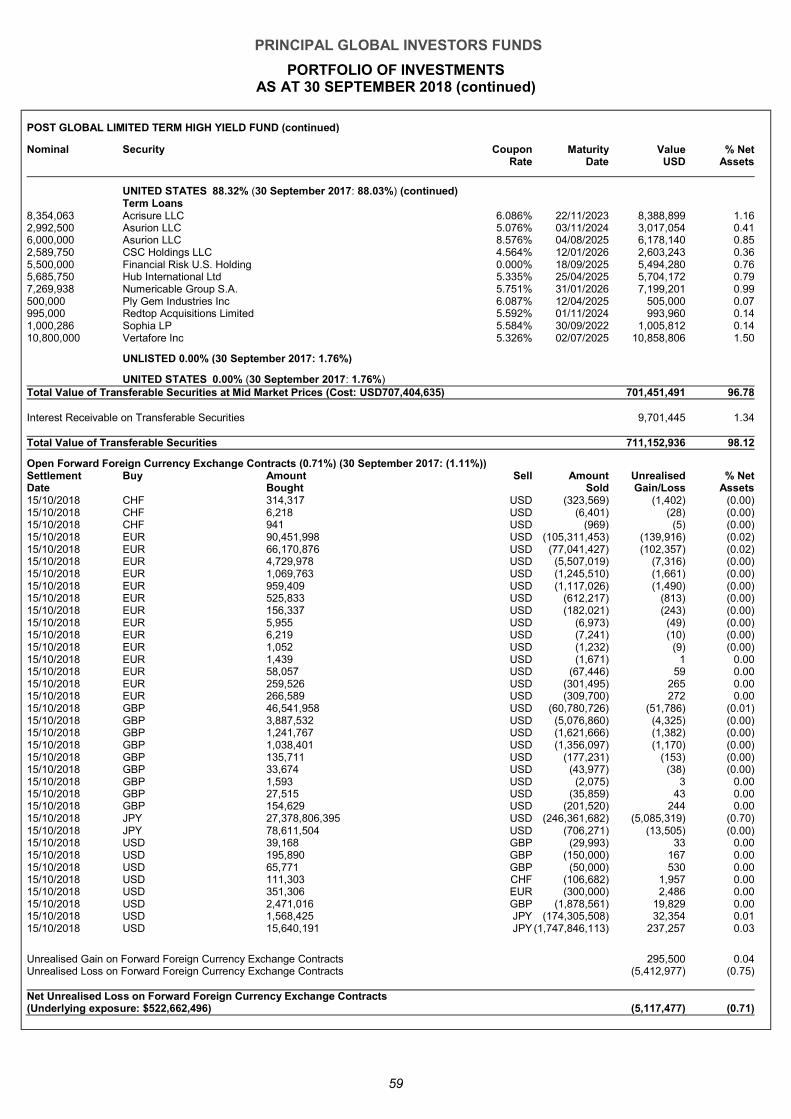
PRINCIPAL GLOBAL INVESTORS FUNDS
PORTFOLIO OF INVESTMENTS AS AT 30 SEPTEMBER 2018 (continued)
59
POST GLOBAL LIMITED TERM HIGH YIELD FUND (continued)
Nominal Security Coupon Rate
Maturity Date
Value USD
% Net Assets
UNITED STATES 88.32% (30 September 2017: 88.03%) (continued) Term Loans
8,354,063 Acrisure LLC 6.086% 22/11/2023 8,388,899 1.16 2,992,500 Asurion LLC 5.076% 03/11/2024 3,017,054 0.41 6,000,000 Asurion LLC 8.576% 04/08/2025 6,178,140 0.85 2,589,750 CSC Holdings LLC 4.564% 12/01/2026 2,603,243 0.36 5,500,000 Financial Risk U.S. Holding 0.000% 18/09/2025 5,494,280 0.76 5,685,750 Hub International Ltd 5.335% 25/04/2025 5,704,172 0.79 7,269,938 Numericable Group S.A. 5.751% 31/01/2026 7,199,201 0.99 500,000 Ply Gem Industries Inc 6.087% 12/04/2025 505,000 0.07 995,000 Redtop Acquisitions Limited 5.592% 01/11/2024 993,960 0.14 1,000,286 Sophia LP 5.584% 30/09/2022 1,005,812 0.14 10,800,000 Vertafore Inc 5.326% 02/07/2025 10,858,806 1.50
UNLISTED 0.00% (30 September 2017: 1.76%)
UNITED STATES 0.00% (30 September 2017: 1.76%) Total Value of Transferable Securities at Mid Market Prices (Cost: USD707,404,635) 701,451,491 96.78 Interest Receivable on Transferable Securities 9,701,445 1.34 Total Value of Transferable Securities 711,152,936 98.12
Open Forward Foreign Currency Exchange Contracts (0.71%) (30 September 2017: (1.11%)) Settlement Date
Buy Amount Bought
Sell Amount Sold
Unrealised Gain/Loss
% Net Assets
15/10/2018 CHF 314,317 USD (323,569) (1,402) (0 .00)
15/10/2018 CHF 6,218 USD (6,401) (28) (0 .00)
15/10/2018 CHF 941 USD (969) (5) (0 .00)
15/10/2018 EUR 90,451,998 USD (105,311,453) (139,916) (0 .02)
15/10/2018 EUR 66,170,876 USD (77,041,427) (102,357) (0 .02)
15/10/2018 EUR 4,729,978 USD (5,507,019) (7,316) (0 .00)
15/10/2018 EUR 1,069,763 USD (1,245,510) (1,661) (0 .00)
15/10/2018 EUR 959,409 USD (1,117,026) (1,490) (0 .00)
15/10/2018 EUR 525,833 USD (612,217) (813) (0 .00)
15/10/2018 EUR 156,337 USD (182,021) (243) (0 .00)
15/10/2018 EUR 5,955 USD (6,973) (49) (0 .00)
15/10/2018 EUR 6,219 USD (7,241) (10) (0 .00)
15/10/2018 EUR 1,052 USD (1,232) (9) (0 .00)
15/10/2018 EUR 1,439 USD (1,671) 1 0 .00
15/10/2018 EUR 58,057 USD (67,446) 59 0 .00
15/10/2018 EUR 259,526 USD (301,495) 265 0 .00
15/10/2018 EUR 266,589 USD (309,700) 272 0 .00
15/10/2018 GBP 46,541,958 USD (60,780,726) (51,786) (0 .01)
15/10/2018 GBP 3,887,532 USD (5,076,860) (4,325) (0 .00)
15/10/2018 GBP 1,241,767 USD (1,621,666) (1,382) (0 .00)
15/10/2018 GBP 1,038,401 USD (1,356,097) (1,170) (0 .00)
15/10/2018 GBP 135,711 USD (177,231) (153) (0 .00)
15/10/2018 GBP 33,674 USD (43,977) (38) (0 .00)
15/10/2018 GBP 1,593 USD (2,075) 3 0 .00
15/10/2018 GBP 27,515 USD (35,859) 43 0 .00
15/10/2018 GBP 154,629 USD (201,520) 244 0 .00
15/10/2018 JPY 27,378,806,395 USD (246,361,682) (5,085,319) (0 .70)
15/10/2018 JPY 78,611,504 USD (706,271) (13,505) (0 .00)
15/10/2018 USD 39,168 GBP (29,993) 33 0 .00
15/10/2018 USD 195,890 GBP (150,000) 167 0 .00
15/10/2018 USD 65,771 GBP (50,000) 530 0 .00
15/10/2018 USD 111,303 CHF (106,682) 1,957 0 .00
15/10/2018 USD 351,306 EUR (300,000) 2,486 0 .00
15/10/2018 USD 2,471,016 GBP (1,878,561) 19,829 0 .00
15/10/2018 USD 1,568,425 JPY (174,305,508) 32,354 0 .01
15/10/2018 USD 15,640,191 JPY (1,747,846,113) 237,257 0 .03
Unrealised Gain on Forward Foreign Currency Exchange Contracts 295,500 0 .04
Unrealised Loss on Forward Foreign Currency Exchange Contracts (5,412,977) (0 .75)
Net Unrealised Loss on Forward Foreign Currency Exchange Contracts (Underlying exposure: $522,662,496) (5,117,477) (0 .71)
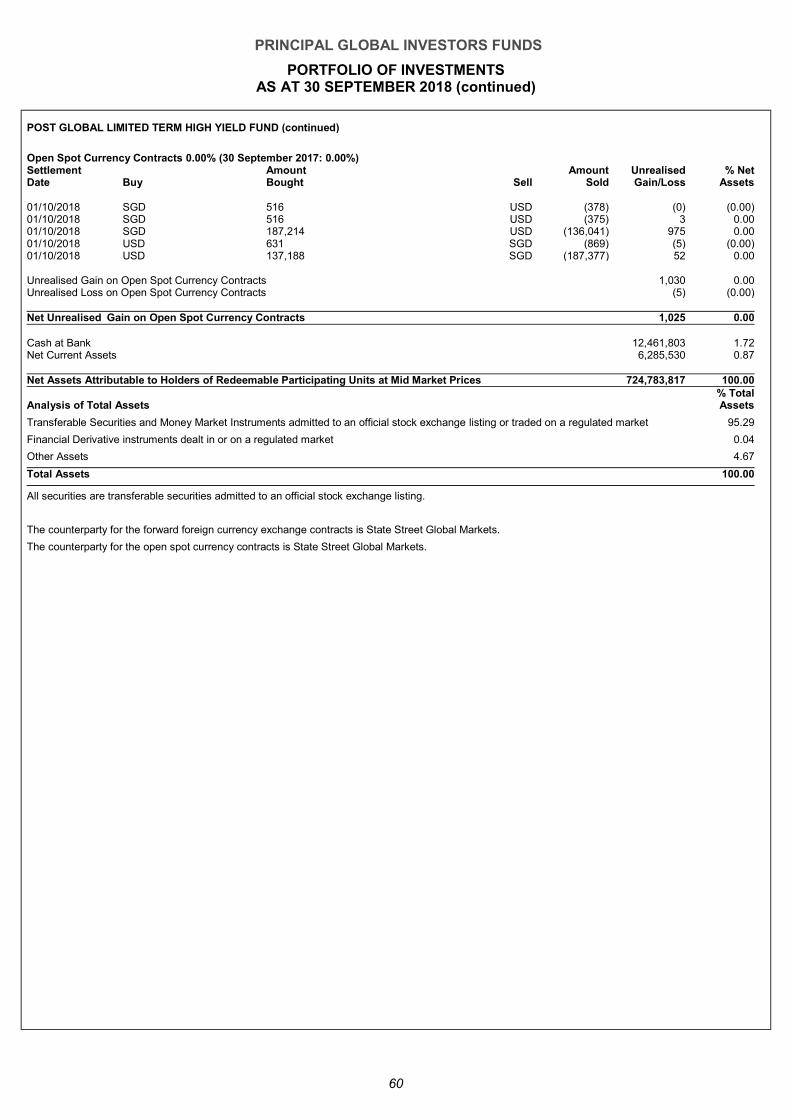
PRINCIPAL GLOBAL INVESTORS FUNDS
PORTFOLIO OF INVESTMENTS AS AT 30 SEPTEMBER 2018 (continued)
60
POST GLOBAL LIMITED TERM HIGH YIELD FUND (continued)
Open Spot Currency Contracts 0.00% (30 September 2017: 0.00%) Settlement Date Buy
Amount Bought Sell
Amount Sold
Unrealised Gain/Loss
% Net Assets
01/10/2018 SGD 516 USD (378) (0) (0.00) 01/10/2018 SGD 516 USD (375) 3 0.00 01/10/2018 SGD 187,214 USD (136,041) 975 0.00 01/10/2018 USD 631 SGD (869) (5) (0.00) 01/10/2018 USD 137,188 SGD (187,377) 52 0.00 Unrealised Gain on Open Spot Currency Contracts 1,030 0.00 Unrealised Loss on Open Spot Currency Contracts (5) (0.00) Net Unrealised Gain on Open Spot Currency Contracts 1,025 0 .00
Cash at Bank 12,461,803 1.72 Net Current Assets 6,285,530 0.87 Net Assets Attributable to Holders of Redeemable Participating Units at Mid Market Prices 724,783,817 100.00
Analysis of Total Assets % Total Assets
Transferable Securities and Money Market Instruments admitted to an official stock exchange listing or traded on a regulated market 95.29
Financial Derivative instruments dealt in or on a regulated market 0.04
Other Assets 4.67
Total Assets 100.00
All securities are transferable securities admitted to an official stock exchange listing.
The counterparty for the forward foreign currency exchange contracts is State Street Global Markets.
The counterparty for the open spot currency contracts is State Street Global Markets.
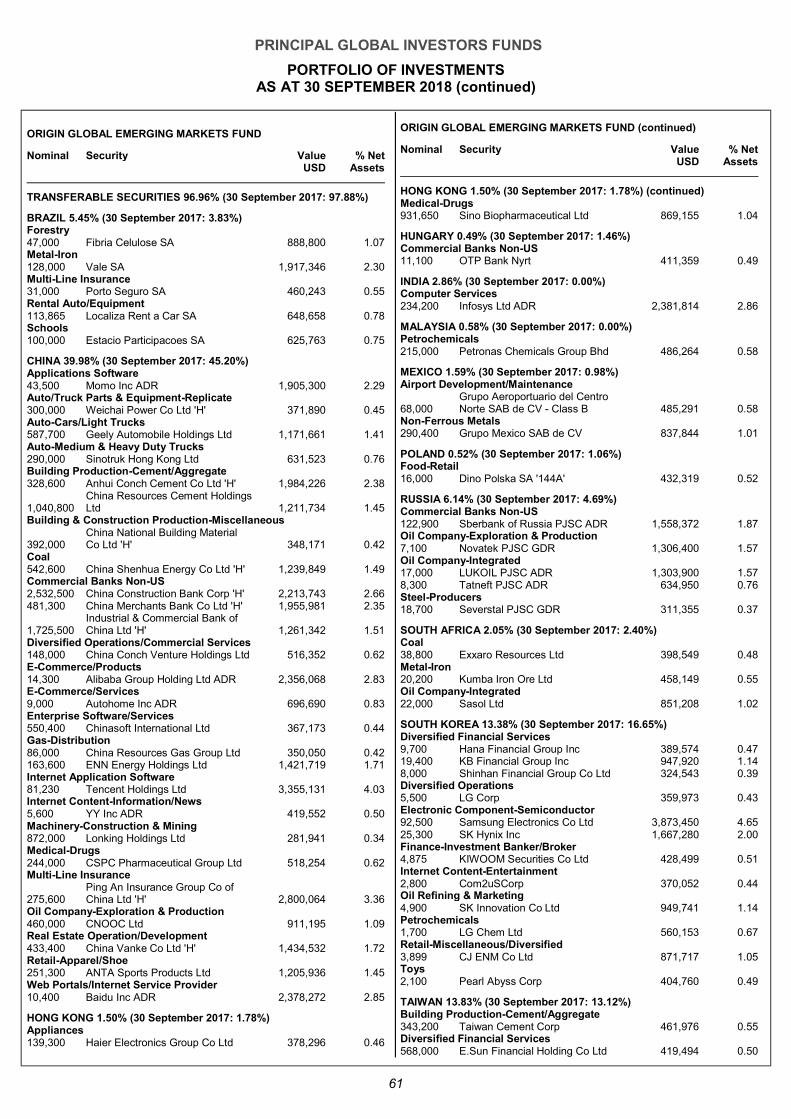
PRINCIPAL GLOBAL INVESTORS FUNDS
PORTFOLIO OF INVESTMENTS AS AT 30 SEPTEMBER 2018 (continued)
61
ORIGIN GLOBAL EMERGING MARKETS FUND
Nominal Security Value USD
% Net Assets
TRANSFERABLE SECURITIES 96.96% (30 September 2017: 97.88%)
BRAZIL 5.45% (30 September 2017: 3.83%) Forestry 47,000 Fibria Celulose SA 888,800 1.07 Metal-Iron 128,000 Vale SA 1,917,346 2.30 Multi-Line Insurance 31,000 Porto Seguro SA 460,243 0.55 Rental Auto/Equipment 113,865 Localiza Rent a Car SA 648,658 0.78 Schools 100,000 Estacio Participacoes SA 625,763 0.75
CHINA 39.98% (30 September 2017: 45.20%) Applications Software 43,500 Momo Inc ADR 1,905,300 2.29 Auto/Truck Parts & Equipment-Replicate 300,000 Weichai Power Co Ltd 'H' 371,890 0.45 Auto-Cars/Light Trucks 587,700 Geely Automobile Holdings Ltd 1,171,661 1.41 Auto-Medium & Heavy Duty Trucks 290,000 Sinotruk Hong Kong Ltd 631,523 0.76 Building Production-Cement/Aggregate 328,600 Anhui Conch Cement Co Ltd 'H' 1,984,226 2.38
1,040,800 China Resources Cement Holdings Ltd 1,211,734 1.45
Building & Construction Production-Miscellaneous
392,000 China National Building Material Co Ltd 'H' 348,171 0.42
Coal 542,600 China Shenhua Energy Co Ltd 'H' 1,239,849 1.49 Commercial Banks Non-US 2,532,500 China Construction Bank Corp 'H' 2,213,743 2.66 481,300 China Merchants Bank Co Ltd 'H' 1,955,981 2.35
1,725,500 Industrial & Commercial Bank of China Ltd 'H' 1,261,342 1.51
Diversified Operations/Commercial Services 148,000 China Conch Venture Holdings Ltd 516,352 0.62 E-Commerce/Products 14,300 Alibaba Group Holding Ltd ADR 2,356,068 2.83 E-Commerce/Services 9,000 Autohome Inc ADR 696,690 0.83 Enterprise Software/Services 550,400 Chinasoft International Ltd 367,173 0.44 Gas-Distribution 86,000 China Resources Gas Group Ltd 350,050 0.42 163,600 ENN Energy Holdings Ltd 1,421,719 1.71 Internet Application Software 81,230 Tencent Holdings Ltd 3,355,131 4.03 Internet Content-Information/News 5,600 YY Inc ADR 419,552 0.50 Machinery-Construction & Mining 872,000 Lonking Holdings Ltd 281,941 0.34 Medical-Drugs 244,000 CSPC Pharmaceutical Group Ltd 518,254 0.62 Multi-Line Insurance
275,600 Ping An Insurance Group Co of China Ltd 'H' 2,800,064 3.36
Oil Company-Exploration & Production 460,000 CNOOC Ltd 911,195 1.09 Real Estate Operation/Development 433,400 China Vanke Co Ltd 'H' 1,434,532 1.72 Retail-Apparel/Shoe 251,300 ANTA Sports Products Ltd 1,205,936 1.45 Web Portals/Internet Service Provider 10,400 Baidu Inc ADR 2,378,272 2.85
HONG KONG 1.50% (30 September 2017: 1.78%) Appliances 139,300 Haier Electronics Group Co Ltd 378,296 0.46
ORIGIN GLOBAL EMERGING MARKETS FUND (continued)
Nominal Security Value USD
% Net Assets
HONG KONG 1.50% (30 September 2017: 1.78%) (continued) Medical-Drugs 931,650 Sino Biopharmaceutical Ltd 869,155 1.04
HUNGARY 0.49% (30 September 2017: 1.46%) Commercial Banks Non-US 11,100 OTP Bank Nyrt 411,359 0.49
INDIA 2.86% (30 September 2017: 0.00%) Computer Services 234,200 Infosys Ltd ADR 2,381,814 2.86
MALAYSIA 0.58% (30 September 2017: 0.00%) Petrochemicals 215,000 Petronas Chemicals Group Bhd 486,264 0.58
MEXICO 1.59% (30 September 2017: 0.98%) Airport Development/Maintenance
68,000 Grupo Aeroportuario del Centro Norte SAB de CV - Class B 485,291 0.58
Non-Ferrous Metals 290,400 Grupo Mexico SAB de CV 837,844 1.01
POLAND 0.52% (30 September 2017: 1.06%) Food-Retail 16,000 Dino Polska SA '144A' 432,319 0.52
RUSSIA 6.14% (30 September 2017: 4.69%) Commercial Banks Non-US 122,900 Sberbank of Russia PJSC ADR 1,558,372 1.87 Oil Company-Exploration & Production 7,100 Novatek PJSC GDR 1,306,400 1.57 Oil Company-Integrated 17,000 LUKOIL PJSC ADR 1,303,900 1.57 8,300 Tatneft PJSC ADR 634,950 0.76 Steel-Producers 18,700 Severstal PJSC GDR 311,355 0.37
SOUTH AFRICA 2.05% (30 September 2017: 2.40%) Coal 38,800 Exxaro Resources Ltd 398,549 0.48 Metal-Iron 20,200 Kumba Iron Ore Ltd 458,149 0.55 Oil Company-Integrated 22,000 Sasol Ltd 851,208 1.02
SOUTH KOREA 13.38% (30 September 2017: 16.65%) Diversified Financial Services 9,700 Hana Financial Group Inc 389,574 0.47 19,400 KB Financial Group Inc 947,920 1.14 8,000 Shinhan Financial Group Co Ltd 324,543 0.39 Diversified Operations 5,500 LG Corp 359,973 0.43 Electronic Component-Semiconductor 92,500 Samsung Electronics Co Ltd 3,873,450 4.65 25,300 SK Hynix Inc 1,667,280 2.00 Finance-Investment Banker/Broker 4,875 KIWOOM Securities Co Ltd 428,499 0.51 Internet Content-Entertainment 2,800 Com2uSCorp 370,052 0.44 Oil Refining & Marketing 4,900 SK Innovation Co Ltd 949,741 1.14 Petrochemicals 1,700 LG Chem Ltd 560,153 0.67 Retail-Miscellaneous/Diversified 3,899 CJ ENM Co Ltd 871,717 1.05 Toys 2,100 Pearl Abyss Corp 404,760 0.49
TAIWAN 13.83% (30 September 2017: 13.12%) Building Production-Cement/Aggregate 343,200 Taiwan Cement Corp 461,976 0.55 Diversified Financial Services 568,000 E.Sun Financial Holding Co Ltd 419,494 0.50
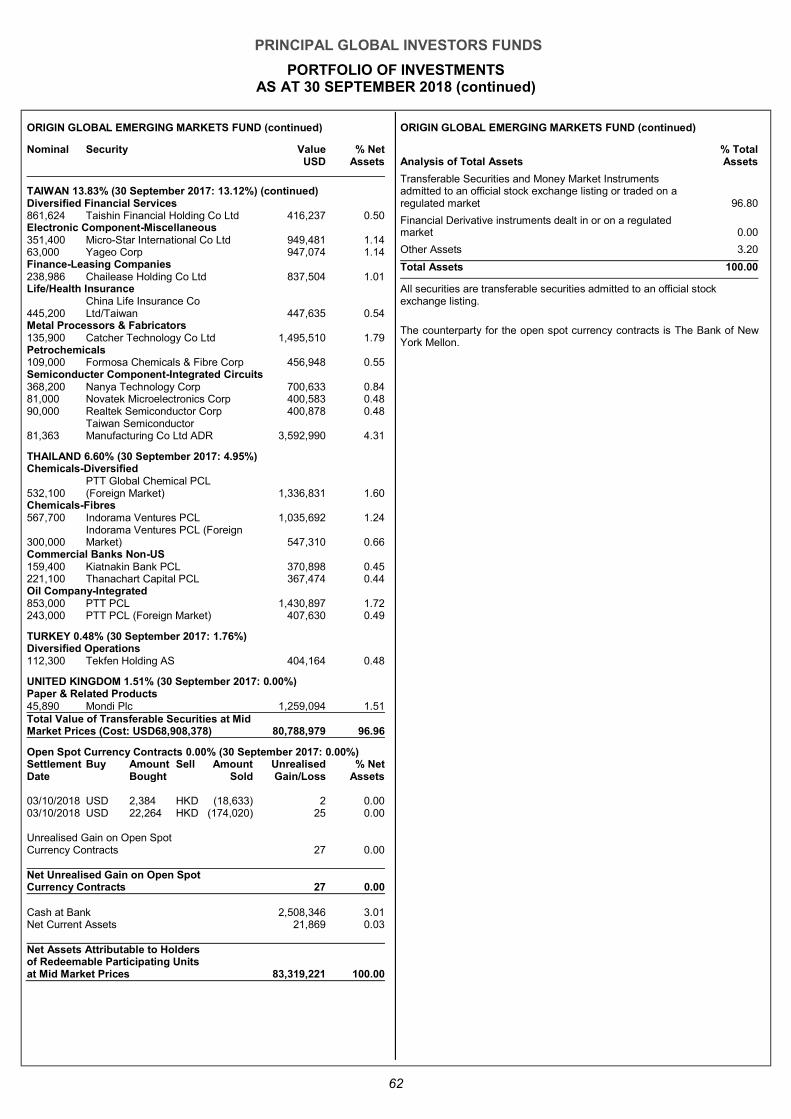
PRINCIPAL GLOBAL INVESTORS FUNDS
PORTFOLIO OF INVESTMENTS AS AT 30 SEPTEMBER 2018 (continued)
62
ORIGIN GLOBAL EMERGING MARKETS FUND (continued)
Nominal Security Value USD
% Net Assets
TAIWAN 13.83% (30 September 2017: 13.12%) (continued) Diversified Financial Services 861,624 Taishin Financial Holding Co Ltd 416,237 0.50 Electronic Component-Miscellaneous 351,400 Micro-Star International Co Ltd 949,481 1.14 63,000 Yageo Corp 947,074 1.14 Finance-Leasing Companies 238,986 Chailease Holding Co Ltd 837,504 1.01 Life/Health Insurance
445,200 China Life Insurance Co Ltd/Taiwan 447,635 0.54
Metal Processors & Fabricators 135,900 Catcher Technology Co Ltd 1,495,510 1.79 Petrochemicals 109,000 Formosa Chemicals & Fibre Corp 456,948 0.55 Semiconducter Component-Integrated Circuits 368,200 Nanya Technology Corp 700,633 0.84 81,000 Novatek Microelectronics Corp 400,583 0.48 90,000 Realtek Semiconductor Corp 400,878 0.48
81,363 Taiwan Semiconductor Manufacturing Co Ltd ADR 3,592,990 4.31
THAILAND 6.60% (30 September 2017: 4.95%) Chemicals-Diversified
532,100 PTT Global Chemical PCL (Foreign Market) 1,336,831 1.60
Chemicals-Fibres 567,700 Indorama Ventures PCL 1,035,692 1.24
300,000 Indorama Ventures PCL (Foreign Market) 547,310 0.66
Commercial Banks Non-US 159,400 Kiatnakin Bank PCL 370,898 0.45 221,100 Thanachart Capital PCL 367,474 0.44 Oil Company-Integrated 853,000 PTT PCL 1,430,897 1.72 243,000 PTT PCL (Foreign Market) 407,630 0.49
TURKEY 0.48% (30 September 2017: 1.76%) Diversified Operations 112,300 Tekfen Holding AS 404,164 0.48
UNITED KINGDOM 1.51% (30 September 2017: 0.00%) Paper & Related Products 45,890 Mondi Plc 1,259,094 1.51 Total Value of Transferable Securities at Mid Market Prices (Cost: USD68,908,378) 80,788,979 96.96
Open Spot Currency Contracts 0.00% (30 September 2017: 0.00%) Settlement Buy Amount Sell Amount Unrealised % Net Date Bought Sold Gain/Loss Assets 03/10/2018 USD 2,384 HKD (18,633) 2 0.00 03/10/2018 USD 22,264 HKD (174,020) 25 0.00 Unrealised Gain on Open Spot Currency Contracts 27 0.00 Net Unrealised Gain on Open Spot Currency Contracts 27 0 .00
Cash at Bank 2,508,346 3.01 Net Current Assets 21,869 0.03 Net Assets Attributable to Holders of Redeemable Participating Units at Mid Market Prices 83,319,221 100.00
ORIGIN GLOBAL EMERGING MARKETS FUND (continued)
Analysis of Total Assets % Total Assets
Transferable Securities and Money Market Instruments admitted to an official stock exchange listing or traded on a regulated market 96.80
Financial Derivative instruments dealt in or on a regulated market 0.00
Other Assets 3.20
Total Assets 100.00
All securities are transferable securities admitted to an official stock exchange listing.
The counterparty for the open spot currency contracts is The Bank of New York Mellon.
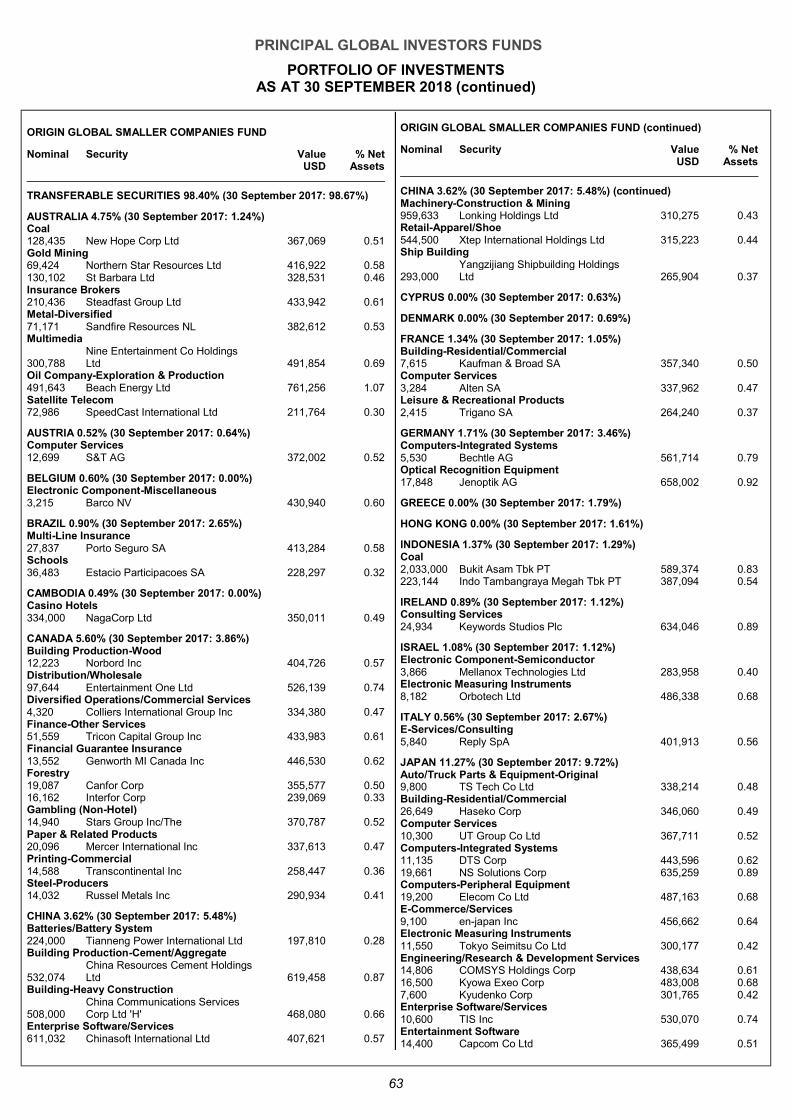
PRINCIPAL GLOBAL INVESTORS FUNDS
PORTFOLIO OF INVESTMENTS AS AT 30 SEPTEMBER 2018 (continued)
63
ORIGIN GLOBAL SMALLER COMPANIES FUND
Nominal Security Value USD
% Net Assets
TRANSFERABLE SECURITIES 98.40% (30 September 2017: 98.67%)
AUSTRALIA 4.75% (30 September 2017: 1.24%) Coal 128,435 New Hope Corp Ltd 367,069 0.51 Gold Mining 69,424 Northern Star Resources Ltd 416,922 0.58 130,102 St Barbara Ltd 328,531 0.46 Insurance Brokers 210,436 Steadfast Group Ltd 433,942 0.61 Metal-Diversified 71,171 Sandfire Resources NL 382,612 0.53 Multimedia
300,788 Nine Entertainment Co Holdings Ltd 491,854 0.69
Oil Company-Exploration & Production 491,643 Beach Energy Ltd 761,256 1.07 Satellite Telecom 72,986 SpeedCast International Ltd 211,764 0.30
AUSTRIA 0.52% (30 September 2017: 0.64%) Computer Services 12,699 S&T AG 372,002 0.52
BELGIUM 0.60% (30 September 2017: 0.00%) Electronic Component-Miscellaneous 3,215 Barco NV 430,940 0.60
BRAZIL 0.90% (30 September 2017: 2.65%) Multi-Line Insurance 27,837 Porto Seguro SA 413,284 0.58 Schools 36,483 Estacio Participacoes SA 228,297 0.32
CAMBODIA 0.49% (30 September 2017: 0.00%) Casino Hotels 334,000 NagaCorp Ltd 350,011 0.49
CANADA 5.60% (30 September 2017: 3.86%) Building Production-Wood 12,223 Norbord Inc 404,726 0.57 Distribution/Wholesale 97,644 Entertainment One Ltd 526,139 0.74 Diversified Operations/Commercial Services 4,320 Colliers International Group Inc 334,380 0.47 Finance-Other Services 51,559 Tricon Capital Group Inc 433,983 0.61 Financial Guarantee Insurance 13,552 Genworth MI Canada Inc 446,530 0.62 Forestry 19,087 Canfor Corp 355,577 0.50 16,162 Interfor Corp 239,069 0.33 Gambling (Non-Hotel) 14,940 Stars Group Inc/The 370,787 0.52 Paper & Related Products 20,096 Mercer International Inc 337,613 0.47 Printing-Commercial 14,588 Transcontinental Inc 258,447 0.36 Steel-Producers 14,032 Russel Metals Inc 290,934 0.41
CHINA 3.62% (30 September 2017: 5.48%) Batteries/Battery System 224,000 Tianneng Power International Ltd 197,810 0.28 Building Production-Cement/Aggregate
532,074 China Resources Cement Holdings Ltd 619,458 0.87
Building-Heavy Construction
508,000 China Communications Services Corp Ltd 'H' 468,080 0.66
Enterprise Software/Services 611,032 Chinasoft International Ltd 407,621 0.57
ORIGIN GLOBAL SMALLER COMPANIES FUND (continued)
Nominal Security Value USD
% Net Assets
CHINA 3.62% (30 September 2017: 5.48%) (continued) Machinery-Construction & Mining 959,633 Lonking Holdings Ltd 310,275 0.43 Retail-Apparel/Shoe 544,500 Xtep International Holdings Ltd 315,223 0.44 Ship Building
293,000 Yangzijiang Shipbuilding Holdings Ltd 265,904 0.37
CYPRUS 0.00% (30 September 2017: 0.63%)
DENMARK 0.00% (30 September 2017: 0.69%)
FRANCE 1.34% (30 September 2017: 1.05%) Building-Residential/Commercial 7,615 Kaufman & Broad SA 357,340 0.50 Computer Services 3,284 Alten SA 337,962 0.47 Leisure & Recreational Products 2,415 Trigano SA 264,240 0.37
GERMANY 1.71% (30 September 2017: 3.46%) Computers-Integrated Systems 5,530 Bechtle AG 561,714 0.79 Optical Recognition Equipment 17,848 Jenoptik AG 658,002 0.92
GREECE 0.00% (30 September 2017: 1.79%)
HONG KONG 0.00% (30 September 2017: 1.61%)
INDONESIA 1.37% (30 September 2017: 1.29%) Coal 2,033,000 Bukit Asam Tbk PT 589,374 0.83 223,144 Indo Tambangraya Megah Tbk PT 387,094 0.54
IRELAND 0.89% (30 September 2017: 1.12%) Consulting Services 24,934 Keywords Studios Plc 634,046 0.89
ISRAEL 1.08% (30 September 2017: 1.12%) Electronic Component-Semiconductor 3,866 Mellanox Technologies Ltd 283,958 0.40 Electronic Measuring Instruments 8,182 Orbotech Ltd 486,338 0.68
ITALY 0.56% (30 September 2017: 2.67%) E-Services/Consulting 5,840 Reply SpA 401,913 0.56
JAPAN 11.27% (30 September 2017: 9.72%) Auto/Truck Parts & Equipment-Original 9,800 TS Tech Co Ltd 338,214 0.48 Building-Residential/Commercial 26,649 Haseko Corp 346,060 0.49 Computer Services 10,300 UT Group Co Ltd 367,711 0.52 Computers-Integrated Systems 11,135 DTS Corp 443,596 0.62 19,661 NS Solutions Corp 635,259 0.89 Computers-Peripheral Equipment 19,200 Elecom Co Ltd 487,163 0.68 E-Commerce/Services 9,100 en-japan Inc 456,662 0.64 Electronic Measuring Instruments 11,550 Tokyo Seimitsu Co Ltd 300,177 0.42 Engineering/Research & Development Services 14,806 COMSYS Holdings Corp 438,634 0.61 16,500 Kyowa Exeo Corp 483,008 0.68 7,600 Kyudenko Corp 301,765 0.42 Enterprise Software/Services 10,600 TIS Inc 530,070 0.74 Entertainment Software 14,400 Capcom Co Ltd 365,499 0.51
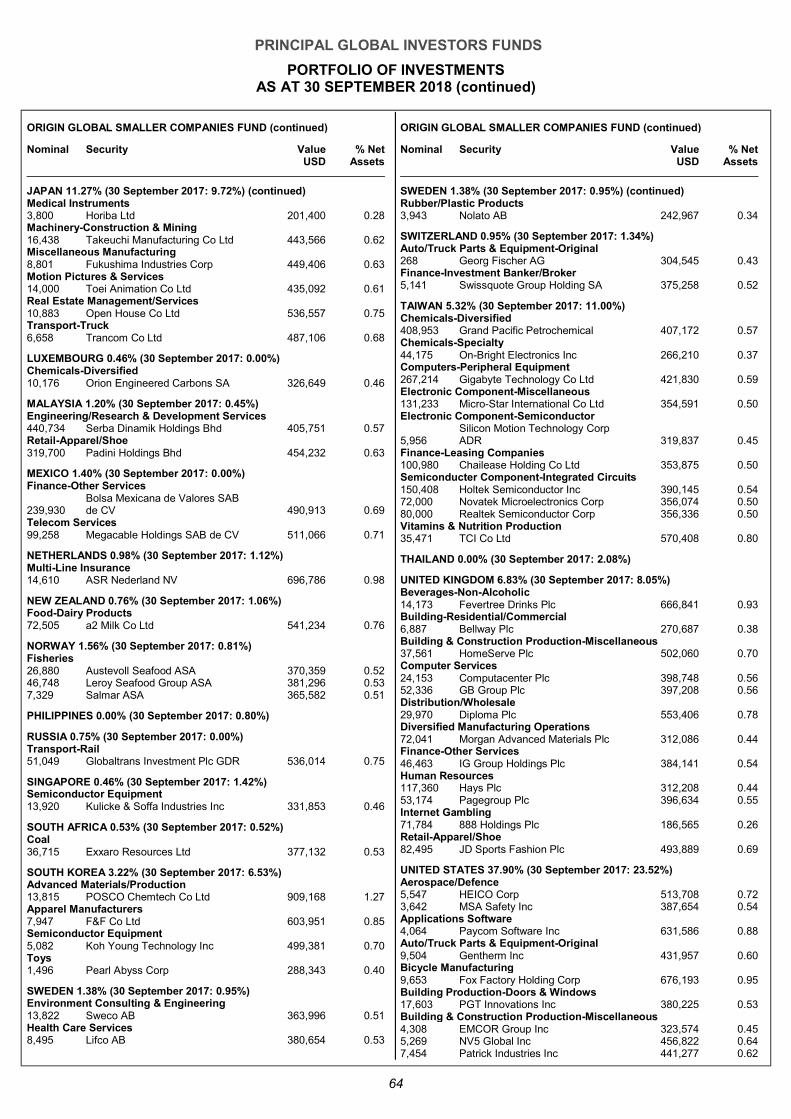
PRINCIPAL GLOBAL INVESTORS FUNDS
PORTFOLIO OF INVESTMENTS AS AT 30 SEPTEMBER 2018 (continued)
64
ORIGIN GLOBAL SMALLER COMPANIES FUND (continued)
Nominal Security Value USD
% Net Assets
JAPAN 11.27% (30 September 2017: 9.72%) (continued) Medical Instruments 3,800 Horiba Ltd 201,400 0.28 Machinery-Construction & Mining 16,438 Takeuchi Manufacturing Co Ltd 443,566 0.62 Miscellaneous Manufacturing 8,801 Fukushima Industries Corp 449,406 0.63 Motion Pictures & Services 14,000 Toei Animation Co Ltd 435,092 0.61 Real Estate Management/Services 10,883 Open House Co Ltd 536,557 0.75 Transport-Truck 6,658 Trancom Co Ltd 487,106 0.68
LUXEMBOURG 0.46% (30 September 2017: 0.00%) Chemicals-Diversified 10,176 Orion Engineered Carbons SA 326,649 0.46
MALAYSIA 1.20% (30 September 2017: 0.45%) Engineering/Research & Development Services 440,734 Serba Dinamik Holdings Bhd 405,751 0.57 Retail-Apparel/Shoe 319,700 Padini Holdings Bhd 454,232 0.63
MEXICO 1.40% (30 September 2017: 0.00%) Finance-Other Services
239,930 Bolsa Mexicana de Valores SAB de CV 490,913 0.69
Telecom Services 99,258 Megacable Holdings SAB de CV 511,066 0.71
NETHERLANDS 0.98% (30 September 2017: 1.12%) Multi-Line Insurance 14,610 ASR Nederland NV 696,786 0.98
NEW ZEALAND 0.76% (30 September 2017: 1.06%) Food-Dairy Products 72,505 a2 Milk Co Ltd 541,234 0.76
NORWAY 1.56% (30 September 2017: 0.81%) Fisheries 26,880 Austevoll Seafood ASA 370,359 0.52 46,748 Leroy Seafood Group ASA 381,296 0.53 7,329 Salmar ASA 365,582 0.51
PHILIPPINES 0.00% (30 September 2017: 0.80%)
RUSSIA 0.75% (30 September 2017: 0.00%) Transport-Rail 51,049 Globaltrans Investment Plc GDR 536,014 0.75
SINGAPORE 0.46% (30 September 2017: 1.42%) Semiconductor Equipment 13,920 Kulicke & Soffa Industries Inc 331,853 0.46
SOUTH AFRICA 0.53% (30 September 2017: 0.52%) Coal 36,715 Exxaro Resources Ltd 377,132 0.53
SOUTH KOREA 3.22% (30 September 2017: 6.53%) Advanced Materials/Production 13,815 POSCO Chemtech Co Ltd 909,168 1.27 Apparel Manufacturers 7,947 F&F Co Ltd 603,951 0.85 Semiconductor Equipment 5,082 Koh Young Technology Inc 499,381 0.70 Toys 1,496 Pearl Abyss Corp 288,343 0.40
SWEDEN 1.38% (30 September 2017: 0.95%) Environment Consulting & Engineering 13,822 Sweco AB 363,996 0.51 Health Care Services 8,495 Lifco AB 380,654 0.53
ORIGIN GLOBAL SMALLER COMPANIES FUND (continued)
Nominal Security Value USD
% Net Assets
SWEDEN 1.38% (30 September 2017: 0.95%) (continued) Rubber/Plastic Products 3,943 Nolato AB 242,967 0.34
SWITZERLAND 0.95% (30 September 2017: 1.34%) Auto/Truck Parts & Equipment-Original 268 Georg Fischer AG 304,545 0.43 Finance-Investment Banker/Broker 5,141 Swissquote Group Holding SA 375,258 0.52
TAIWAN 5.32% (30 September 2017: 11.00%) Chemicals-Diversified 408,953 Grand Pacific Petrochemical 407,172 0.57 Chemicals-Specialty 44,175 On-Bright Electronics Inc 266,210 0.37 Computers-Peripheral Equipment 267,214 Gigabyte Technology Co Ltd 421,830 0.59 Electronic Component-Miscellaneous 131,233 Micro-Star International Co Ltd 354,591 0.50 Electronic Component-Semiconductor
5,956 Silicon Motion Technology Corp ADR 319,837 0.45
Finance-Leasing Companies 100,980 Chailease Holding Co Ltd 353,875 0.50 Semiconducter Component-Integrated Circuits 150,408 Holtek Semiconductor Inc 390,145 0.54 72,000 Novatek Microelectronics Corp 356,074 0.50 80,000 Realtek Semiconductor Corp 356,336 0.50 Vitamins & Nutrition Production 35,471 TCI Co Ltd 570,408 0.80
THAILAND 0.00% (30 September 2017: 2.08%)
UNITED KINGDOM 6.83% (30 September 2017: 8.05%) Beverages-Non-Alcoholic 14,173 Fevertree Drinks Plc 666,841 0.93 Building-Residential/Commercial 6,887 Bellway Plc 270,687 0.38 Building & Construction Production-Miscellaneous 37,561 HomeServe Plc 502,060 0.70 Computer Services 24,153 Computacenter Plc 398,748 0.56 52,336 GB Group Plc 397,208 0.56 Distribution/Wholesale 29,970 Diploma Plc 553,406 0.78 Diversified Manufacturing Operations 72,041 Morgan Advanced Materials Plc 312,086 0.44 Finance-Other Services 46,463 IG Group Holdings Plc 384,141 0.54 Human Resources 117,360 Hays Plc 312,208 0.44 53,174 Pagegroup Plc 396,634 0.55 Internet Gambling 71,784 888 Holdings Plc 186,565 0.26 Retail-Apparel/Shoe 82,495 JD Sports Fashion Plc 493,889 0.69
UNITED STATES 37.90% (30 September 2017: 23.52%) Aerospace/Defence 5,547 HEICO Corp 513,708 0.72 3,642 MSA Safety Inc 387,654 0.54 Applications Software 4,064 Paycom Software Inc 631,586 0.88 Auto/Truck Parts & Equipment-Original 9,504 Gentherm Inc 431,957 0.60 Bicycle Manufacturing 9,653 Fox Factory Holding Corp 676,193 0.95 Building Production-Doors & Windows 17,603 PGT Innovations Inc 380,225 0.53 Building & Construction Production-Miscellaneous 4,308 EMCOR Group Inc 323,574 0.45 5,269 NV5 Global Inc 456,822 0.64 7,454 Patrick Industries Inc 441,277 0.62
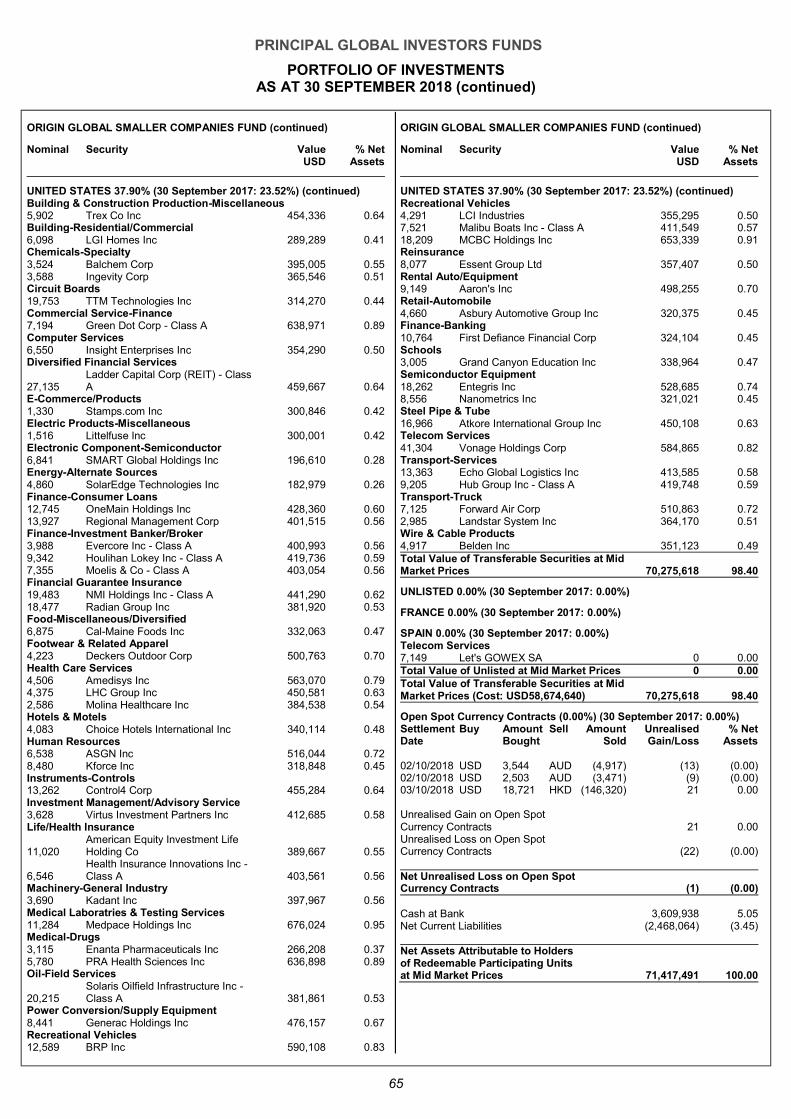
PRINCIPAL GLOBAL INVESTORS FUNDS
PORTFOLIO OF INVESTMENTS AS AT 30 SEPTEMBER 2018 (continued)
65
ORIGIN GLOBAL SMALLER COMPANIES FUND (continued)
Nominal Security Value USD
% Net Assets
UNITED STATES 37.90% (30 September 2017: 23.52%) (continued) Building & Construction Production-Miscellaneous 5,902 Trex Co Inc 454,336 0.64 Building-Residential/Commercial 6,098 LGI Homes Inc 289,289 0.41 Chemicals-Specialty 3,524 Balchem Corp 395,005 0.55 3,588 Ingevity Corp 365,546 0.51 Circuit Boards 19,753 TTM Technologies Inc 314,270 0.44 Commercial Service-Finance 7,194 Green Dot Corp - Class A 638,971 0.89 Computer Services 6,550 Insight Enterprises Inc 354,290 0.50 Diversified Financial Services
27,135 Ladder Capital Corp (REIT) - Class A 459,667 0.64
E-Commerce/Products 1,330 Stamps.com Inc 300,846 0.42 Electric Products-Miscellaneous 1,516 Littelfuse Inc 300,001 0.42 Electronic Component-Semiconductor 6,841 SMART Global Holdings Inc 196,610 0.28 Energy-Alternate Sources 4,860 SolarEdge Technologies Inc 182,979 0.26 Finance-Consumer Loans 12,745 OneMain Holdings Inc 428,360 0.60 13,927 Regional Management Corp 401,515 0.56 Finance-Investment Banker/Broker 3,988 Evercore Inc - Class A 400,993 0.56 9,342 Houlihan Lokey Inc - Class A 419,736 0.59 7,355 Moelis & Co - Class A 403,054 0.56 Financial Guarantee Insurance 19,483 NMI Holdings Inc - Class A 441,290 0.62 18,477 Radian Group Inc 381,920 0.53 Food-Miscellaneous/Diversified 6,875 Cal-Maine Foods Inc 332,063 0.47 Footwear & Related Apparel 4,223 Deckers Outdoor Corp 500,763 0.70 Health Care Services 4,506 Amedisys Inc 563,070 0.79 4,375 LHC Group Inc 450,581 0.63 2,586 Molina Healthcare Inc 384,538 0.54 Hotels & Motels 4,083 Choice Hotels International Inc 340,114 0.48 Human Resources 6,538 ASGN Inc 516,044 0.72 8,480 Kforce Inc 318,848 0.45 Instruments-Controls 13,262 Control4 Corp 455,284 0.64 Investment Management/Advisory Service 3,628 Virtus Investment Partners Inc 412,685 0.58 Life/Health Insurance
11,020 American Equity Investment Life Holding Co 389,667 0.55
6,546 Health Insurance Innovations Inc - Class A 403,561 0.56
Machinery-General Industry 3,690 Kadant Inc 397,967 0.56 Medical Laboratries & Testing Services 11,284 Medpace Holdings Inc 676,024 0.95 Medical-Drugs 3,115 Enanta Pharmaceuticals Inc 266,208 0.37 5,780 PRA Health Sciences Inc 636,898 0.89 Oil-Field Services
20,215 Solaris Oilfield Infrastructure Inc - Class A 381,861 0.53
Power Conversion/Supply Equipment 8,441 Generac Holdings Inc 476,157 0.67 Recreational Vehicles 12,589 BRP Inc 590,108 0.83
ORIGIN GLOBAL SMALLER COMPANIES FUND (continued)
Nominal Security Value USD
% Net Assets
UNITED STATES 37.90% (30 September 2017: 23.52%) (continued) Recreational Vehicles 4,291 LCI Industries 355,295 0.50 7,521 Malibu Boats Inc - Class A 411,549 0.57 18,209 MCBC Holdings Inc 653,339 0.91 Reinsurance 8,077 Essent Group Ltd 357,407 0.50 Rental Auto/Equipment 9,149 Aaron's Inc 498,255 0.70 Retail-Automobile 4,660 Asbury Automotive Group Inc 320,375 0.45 Finance-Banking 10,764 First Defiance Financial Corp 324,104 0.45 Schools 3,005 Grand Canyon Education Inc 338,964 0.47 Semiconductor Equipment 18,262 Entegris Inc 528,685 0.74 8,556 Nanometrics Inc 321,021 0.45 Steel Pipe & Tube 16,966 Atkore International Group Inc 450,108 0.63 Telecom Services 41,304 Vonage Holdings Corp 584,865 0.82 Transport-Services 13,363 Echo Global Logistics Inc 413,585 0.58 9,205 Hub Group Inc - Class A 419,748 0.59 Transport-Truck 7,125 Forward Air Corp 510,863 0.72 2,985 Landstar System Inc 364,170 0.51 Wire & Cable Products 4,917 Belden Inc 351,123 0.49 Total Value of Transferable Securities at Mid Market Prices 70,275,618 98.40
UNLISTED 0.00% (30 September 2017: 0.00%)
FRANCE 0.00% (30 September 2017: 0.00%)
SPAIN 0.00% (30 September 2017: 0.00%) Telecom Services 7,149 Let's GOWEX SA 0 0.00 Total Value of Unlisted at Mid Market Prices 0 0.00 Total Value of Transferable Securities at Mid Market Prices (Cost: USD58,674,640) 70,275,618 98.40
Open Spot Currency Contracts (0.00%) (30 September 2017: 0.00%) Settlement Buy Amount Sell Amount Unrealised % Net Date Bought Sold Gain/Loss Assets 02/10/2018 USD 3,544 AUD (4,917) (13) (0.00) 02/10/2018 USD 2,503 AUD (3,471) (9) (0.00) 03/10/2018 USD 18,721 HKD (146,320) 21 0.00 Unrealised Gain on Open Spot Currency Contracts 21 0.00 Unrealised Loss on Open Spot Currency Contracts (22) (0.00) Net Unrealised Loss on Open Spot Currency Contracts (1) (0 .00)
Cash at Bank 3,609,938 5.05 Net Current Liabilities (2,468,064) (3.45) Net Assets Attributable to Holders of Redeemable Participating Units at Mid Market Prices 71,417,491 100.00
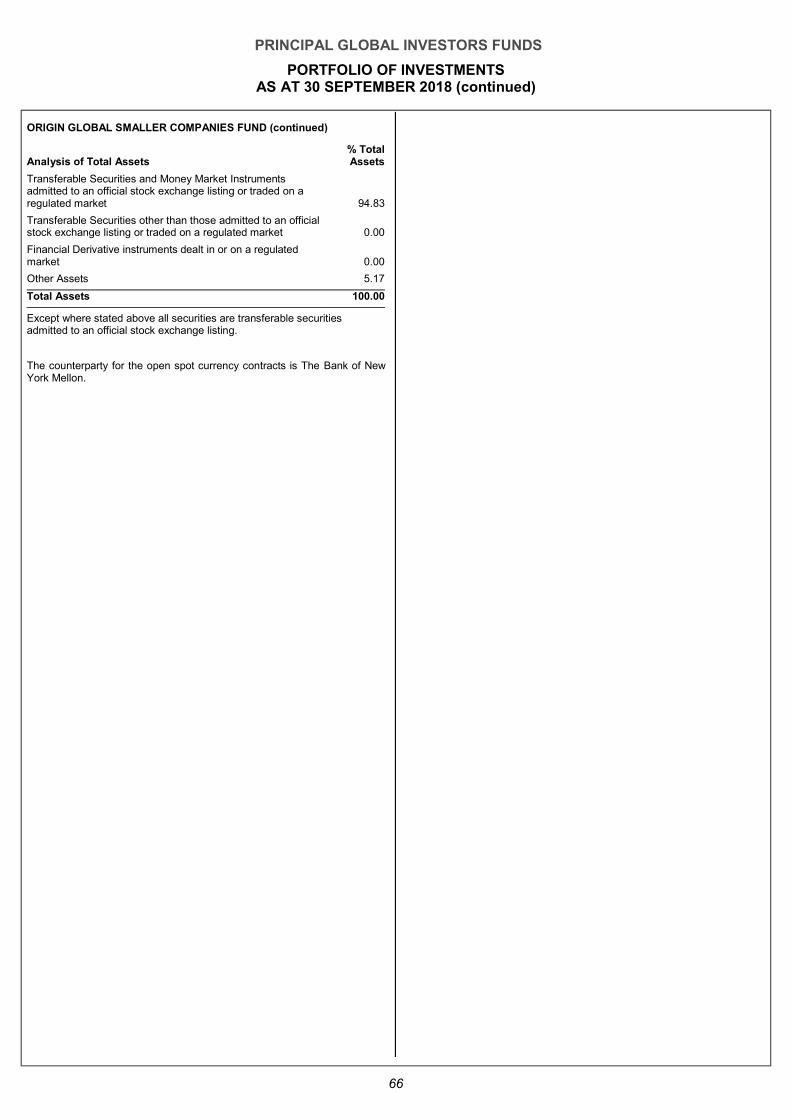
PRINCIPAL GLOBAL INVESTORS FUNDS
PORTFOLIO OF INVESTMENTS AS AT 30 SEPTEMBER 2018 (continued)
66
ORIGIN GLOBAL SMALLER COMPANIES FUND (continued)
Analysis of Total Assets % Total Assets
Transferable Securities and Money Market Instruments admitted to an official stock exchange listing or traded on a regulated market 94.83
Transferable Securities other than those admitted to an official stock exchange listing or traded on a regulated market 0.00
Financial Derivative instruments dealt in or on a regulated market 0.00
Other Assets 5.17
Total Assets 100.00
Except where stated above all securities are transferable securities admitted to an official stock exchange listing.
The counterparty for the open spot currency contracts is The Bank of New York Mellon.
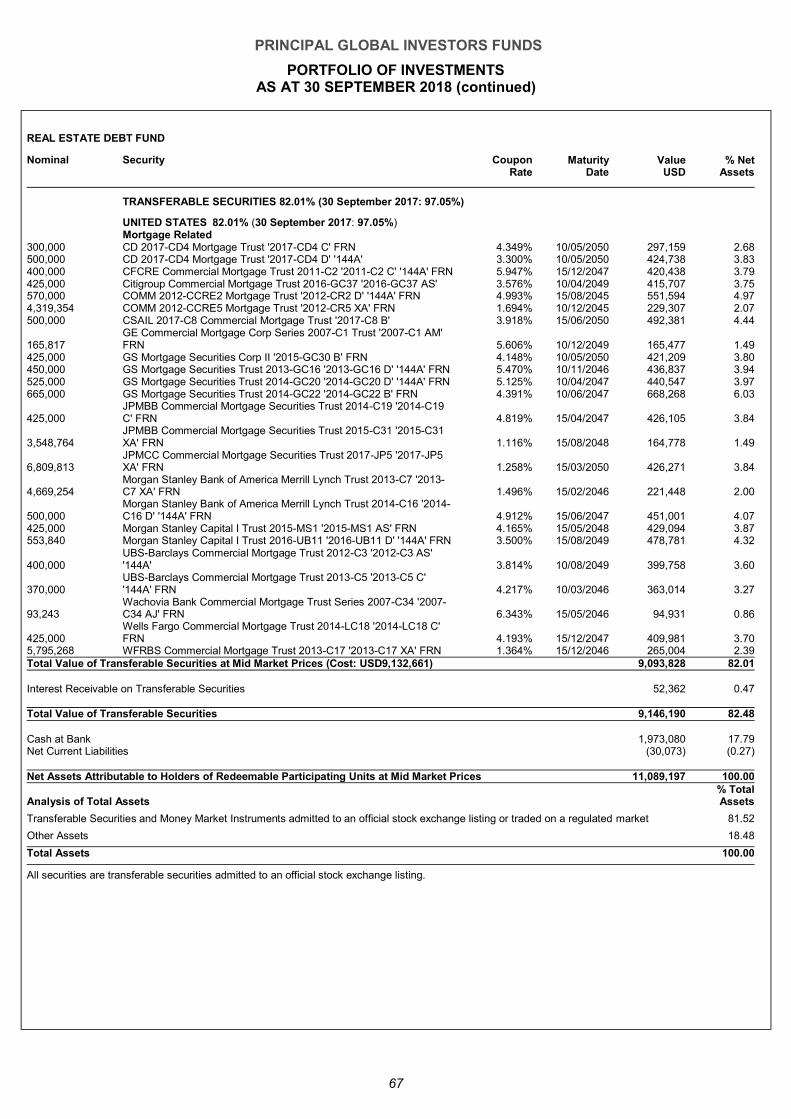
PRINCIPAL GLOBAL INVESTORS FUNDS
PORTFOLIO OF INVESTMENTS AS AT 30 SEPTEMBER 2018 (continued)
67
REAL ESTATE DEBT FUND
Nominal Security Coupon Rate
Maturity Date
Value USD
% Net Assets
TRANSFERABLE SECURITIES 82.01% (30 September 2017: 97.05%)
UNITED STATES 82.01% (30 September 2017: 97.05%) Mortgage Related
300,000 CD 2017-CD4 Mortgage Trust '2017-CD4 C' FRN 4.349% 10/05/2050 297,159 2.68 500,000 CD 2017-CD4 Mortgage Trust '2017-CD4 D' '144A' 3.300% 10/05/2050 424,738 3.83 400,000 CFCRE Commercial Mortgage Trust 2011-C2 '2011-C2 C' '144A' FRN 5.947% 15/12/2047 420,438 3.79 425,000 Citigroup Commercial Mortgage Trust 2016-GC37 '2016-GC37 AS' 3.576% 10/04/2049 415,707 3.75 570,000 COMM 2012-CCRE2 Mortgage Trust '2012-CR2 D' '144A' FRN 4.993% 15/08/2045 551,594 4.97 4,319,354 COMM 2012-CCRE5 Mortgage Trust '2012-CR5 XA' FRN 1.694% 10/12/2045 229,307 2.07 500,000 CSAIL 2017-C8 Commercial Mortgage Trust '2017-C8 B' 3.918% 15/06/2050 492,381 4.44
165,817 GE Commercial Mortgage Corp Series 2007-C1 Trust '2007-C1 AM' FRN 5.606% 10/12/2049 165,477 1.49
425,000 GS Mortgage Securities Corp II '2015-GC30 B' FRN 4.148% 10/05/2050 421,209 3.80 450,000 GS Mortgage Securities Trust 2013-GC16 '2013-GC16 D' '144A' FRN 5.470% 10/11/2046 436,837 3.94 525,000 GS Mortgage Securities Trust 2014-GC20 '2014-GC20 D' '144A' FRN 5.125% 10/04/2047 440,547 3.97 665,000 GS Mortgage Securities Trust 2014-GC22 '2014-GC22 B' FRN 4.391% 10/06/2047 668,268 6.03
425,000 JPMBB Commercial Mortgage Securities Trust 2014-C19 '2014-C19 C' FRN 4.819% 15/04/2047 426,105 3.84
3,548,764 JPMBB Commercial Mortgage Securities Trust 2015-C31 '2015-C31 XA' FRN 1.116% 15/08/2048 164,778 1.49
6,809,813 JPMCC Commercial Mortgage Securities Trust 2017-JP5 '2017-JP5 XA' FRN 1.258% 15/03/2050 426,271 3.84
4,669,254 Morgan Stanley Bank of America Merrill Lynch Trust 2013-C7 '2013-C7 XA' FRN 1.496% 15/02/2046 221,448 2.00
500,000 Morgan Stanley Bank of America Merrill Lynch Trust 2014-C16 '2014-C16 D' '144A' FRN 4.912% 15/06/2047 451,001 4.07
425,000 Morgan Stanley Capital I Trust 2015-MS1 '2015-MS1 AS' FRN 4.165% 15/05/2048 429,094 3.87 553,840 Morgan Stanley Capital I Trust 2016-UB11 '2016-UB11 D' '144A' FRN 3.500% 15/08/2049 478,781 4.32
400,000 UBS-Barclays Commercial Mortgage Trust 2012-C3 '2012-C3 AS' '144A' 3.814% 10/08/2049 399,758 3.60
370,000 UBS-Barclays Commercial Mortgage Trust 2013-C5 '2013-C5 C' '144A' FRN 4.217% 10/03/2046 363,014 3.27
93,243 Wachovia Bank Commercial Mortgage Trust Series 2007-C34 '2007-C34 AJ' FRN 6.343% 15/05/2046 94,931 0.86
425,000 Wells Fargo Commercial Mortgage Trust 2014-LC18 '2014-LC18 C' FRN 4.193% 15/12/2047 409,981 3.70
5,795,268 WFRBS Commercial Mortgage Trust 2013-C17 '2013-C17 XA' FRN 1.364% 15/12/2046 265,004 2.39 Total Value of Transferable Securities at Mid Market Prices (Cost: USD9,132,661) 9,093,828 82.01 Interest Receivable on Transferable Securities 52,362 0.47 Total Value of Transferable Securities 9,146,190 82.48 Cash at Bank 1,973,080 17.79 Net Current Liabilities (30,073) (0.27) Net Assets Attributable to Holders of Redeemable Participating Units at Mid Market Prices 11,089,197 100.00
Analysis of Total Assets % Total Assets
Transferable Securities and Money Market Instruments admitted to an official stock exchange listing or traded on a regulated market 81.52
Other Assets 18.48
Total Assets 100.00
All securities are transferable securities admitted to an official stock exchange listing.
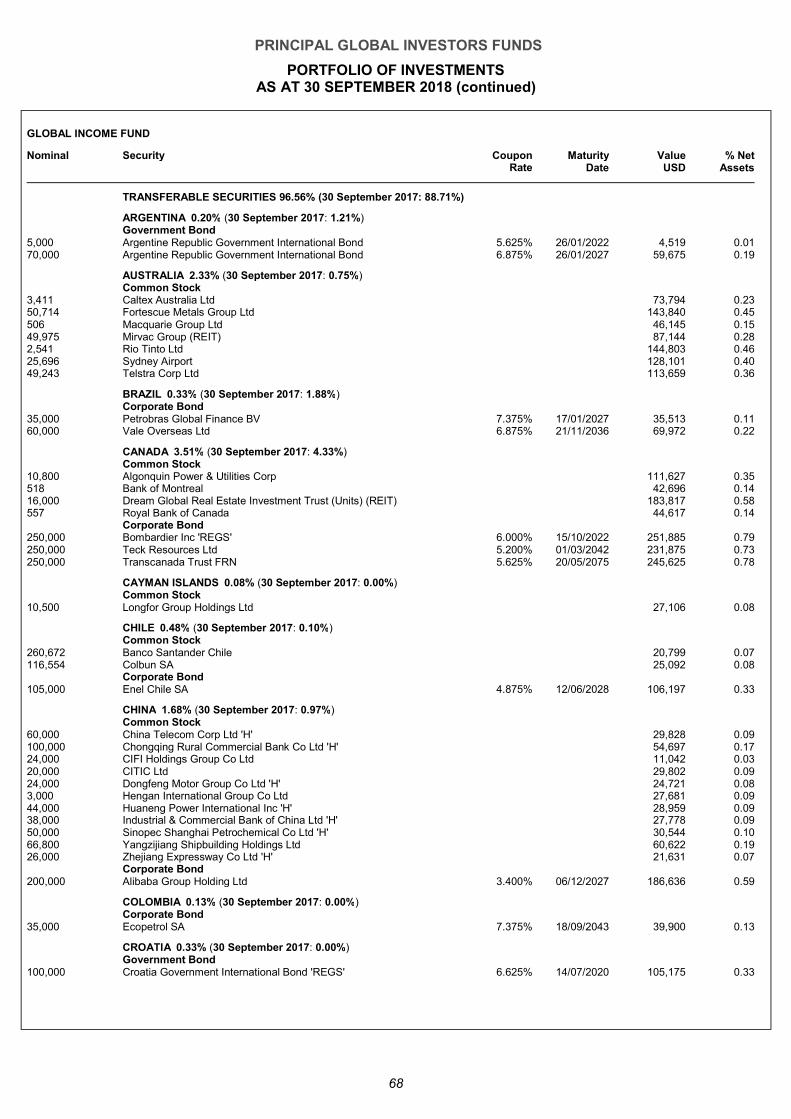
PRINCIPAL GLOBAL INVESTORS FUNDS
PORTFOLIO OF INVESTMENTS AS AT 30 SEPTEMBER 2018 (continued)
68
GLOBAL INCOME FUND
Nominal Security Coupon Rate
Maturity Date
Value USD
% Net Assets
TRANSFERABLE SECURITIES 96.56% (30 September 2017: 88.71%)
ARGENTINA 0.20% (30 September 2017: 1.21%) Government Bond
5,000 Argentine Republic Government International Bond 5.625% 26/01/2022 4,519 0.01 70,000 Argentine Republic Government International Bond 6.875% 26/01/2027 59,675 0.19
AUSTRALIA 2.33% (30 September 2017: 0.75%) Common Stock
3,411 Caltex Australia Ltd 73,794 0.23 50,714 Fortescue Metals Group Ltd 143,840 0.45 506 Macquarie Group Ltd 46,145 0.15 49,975 Mirvac Group (REIT) 87,144 0.28 2,541 Rio Tinto Ltd 144,803 0.46 25,696 Sydney Airport 128,101 0.40 49,243 Telstra Corp Ltd 113,659 0.36
BRAZIL 0.33% (30 September 2017: 1.88%) Corporate Bond
35,000 Petrobras Global Finance BV 7.375% 17/01/2027 35,513 0.11 60,000 Vale Overseas Ltd 6.875% 21/11/2036 69,972 0.22
CANADA 3.51% (30 September 2017: 4.33%) Common Stock
10,800 Algonquin Power & Utilities Corp 111,627 0.35 518 Bank of Montreal 42,696 0.14 16,000 Dream Global Real Estate Investment Trust (Units) (REIT) 183,817 0.58 557 Royal Bank of Canada 44,617 0.14
Corporate Bond 250,000 Bombardier Inc 'REGS' 6.000% 15/10/2022 251,885 0.79 250,000 Teck Resources Ltd 5.200% 01/03/2042 231,875 0.73 250,000 Transcanada Trust FRN 5.625% 20/05/2075 245,625 0.78
CAYMAN ISLANDS 0.08% (30 September 2017: 0.00%) Common Stock
10,500 Longfor Group Holdings Ltd 27,106 0.08
CHILE 0.48% (30 September 2017: 0.10%) Common Stock
260,672 Banco Santander Chile 20,799 0.07 116,554 Colbun SA 25,092 0.08
Corporate Bond 105,000 Enel Chile SA 4.875% 12/06/2028 106,197 0.33
CHINA 1.68% (30 September 2017: 0.97%) Common Stock
60,000 China Telecom Corp Ltd 'H' 29,828 0.09 100,000 Chongqing Rural Commercial Bank Co Ltd 'H' 54,697 0.17 24,000 CIFI Holdings Group Co Ltd 11,042 0.03 20,000 CITIC Ltd 29,802 0.09 24,000 Dongfeng Motor Group Co Ltd 'H' 24,721 0.08 3,000 Hengan International Group Co Ltd 27,681 0.09 44,000 Huaneng Power International Inc 'H' 28,959 0.09 38,000 Industrial & Commercial Bank of China Ltd 'H' 27,778 0.09 50,000 Sinopec Shanghai Petrochemical Co Ltd 'H' 30,544 0.10 66,800 Yangzijiang Shipbuilding Holdings Ltd 60,622 0.19 26,000 Zhejiang Expressway Co Ltd 'H' 21,631 0.07
Corporate Bond 200,000 Alibaba Group Holding Ltd 3.400% 06/12/2027 186,636 0.59
COLOMBIA 0.13% (30 September 2017: 0.00%) Corporate Bond
35,000 Ecopetrol SA 7.375% 18/09/2043 39,900 0.13
CROATIA 0.33% (30 September 2017: 0.00%) Government Bond
100,000 Croatia Government International Bond 'REGS' 6.625% 14/07/2020 105,175 0.33
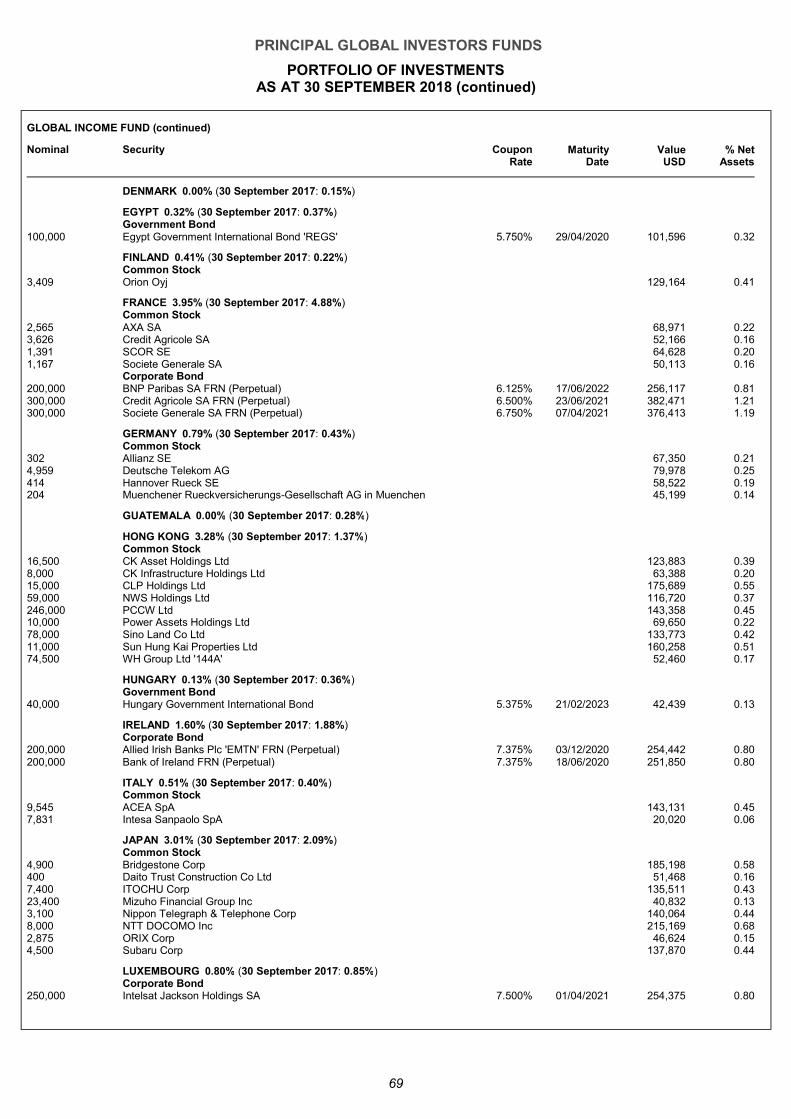
PRINCIPAL GLOBAL INVESTORS FUNDS
PORTFOLIO OF INVESTMENTS AS AT 30 SEPTEMBER 2018 (continued)
69
GLOBAL INCOME FUND (continued)
Nominal Security Coupon Rate
Maturity Date
Value USD
% Net Assets
DENMARK 0.00% (30 September 2017: 0.15%)
EGYPT 0.32% (30 September 2017: 0.37%) Government Bond
100,000 Egypt Government International Bond 'REGS' 5.750% 29/04/2020 101,596 0.32
FINLAND 0.41% (30 September 2017: 0.22%) Common Stock
3,409 Orion Oyj 129,164 0.41
FRANCE 3.95% (30 September 2017: 4.88%) Common Stock
2,565 AXA SA 68,971 0.22 3,626 Credit Agricole SA 52,166 0.16 1,391 SCOR SE 64,628 0.20 1,167 Societe Generale SA 50,113 0.16
Corporate Bond 200,000 BNP Paribas SA FRN (Perpetual) 6.125% 17/06/2022 256,117 0.81 300,000 Credit Agricole SA FRN (Perpetual) 6.500% 23/06/2021 382,471 1.21 300,000 Societe Generale SA FRN (Perpetual) 6.750% 07/04/2021 376,413 1.19
GERMANY 0.79% (30 September 2017: 0.43%) Common Stock
302 Allianz SE 67,350 0.21 4,959 Deutsche Telekom AG 79,978 0.25 414 Hannover Rueck SE 58,522 0.19 204 Muenchener Rueckversicherungs-Gesellschaft AG in Muenchen 45,199 0.14
GUATEMALA 0.00% (30 September 2017: 0.28%)
HONG KONG 3.28% (30 September 2017: 1.37%) Common Stock
16,500 CK Asset Holdings Ltd 123,883 0.39 8,000 CK Infrastructure Holdings Ltd 63,388 0.20 15,000 CLP Holdings Ltd 175,689 0.55 59,000 NWS Holdings Ltd 116,720 0.37 246,000 PCCW Ltd 143,358 0.45 10,000 Power Assets Holdings Ltd 69,650 0.22 78,000 Sino Land Co Ltd 133,773 0.42 11,000 Sun Hung Kai Properties Ltd 160,258 0.51 74,500 WH Group Ltd '144A' 52,460 0.17
HUNGARY 0.13% (30 September 2017: 0.36%) Government Bond
40,000 Hungary Government International Bond 5.375% 21/02/2023 42,439 0.13
IRELAND 1.60% (30 September 2017: 1.88%) Corporate Bond
200,000 Allied Irish Banks Plc 'EMTN' FRN (Perpetual) 7.375% 03/12/2020 254,442 0.80 200,000 Bank of Ireland FRN (Perpetual) 7.375% 18/06/2020 251,850 0.80
ITALY 0.51% (30 September 2017: 0.40%) Common Stock
9,545 ACEA SpA 143,131 0.45 7,831 Intesa Sanpaolo SpA 20,020 0.06
JAPAN 3.01% (30 September 2017: 2.09%) Common Stock
4,900 Bridgestone Corp 185,198 0.58 400 Daito Trust Construction Co Ltd 51,468 0.16 7,400 ITOCHU Corp 135,511 0.43 23,400 Mizuho Financial Group Inc 40,832 0.13 3,100 Nippon Telegraph & Telephone Corp 140,064 0.44 8,000 NTT DOCOMO Inc 215,169 0.68 2,875 ORIX Corp 46,624 0.15 4,500 Subaru Corp 137,870 0.44
LUXEMBOURG 0.80% (30 September 2017: 0.85%) Corporate Bond
250,000 Intelsat Jackson Holdings SA 7.500% 01/04/2021 254,375 0.80
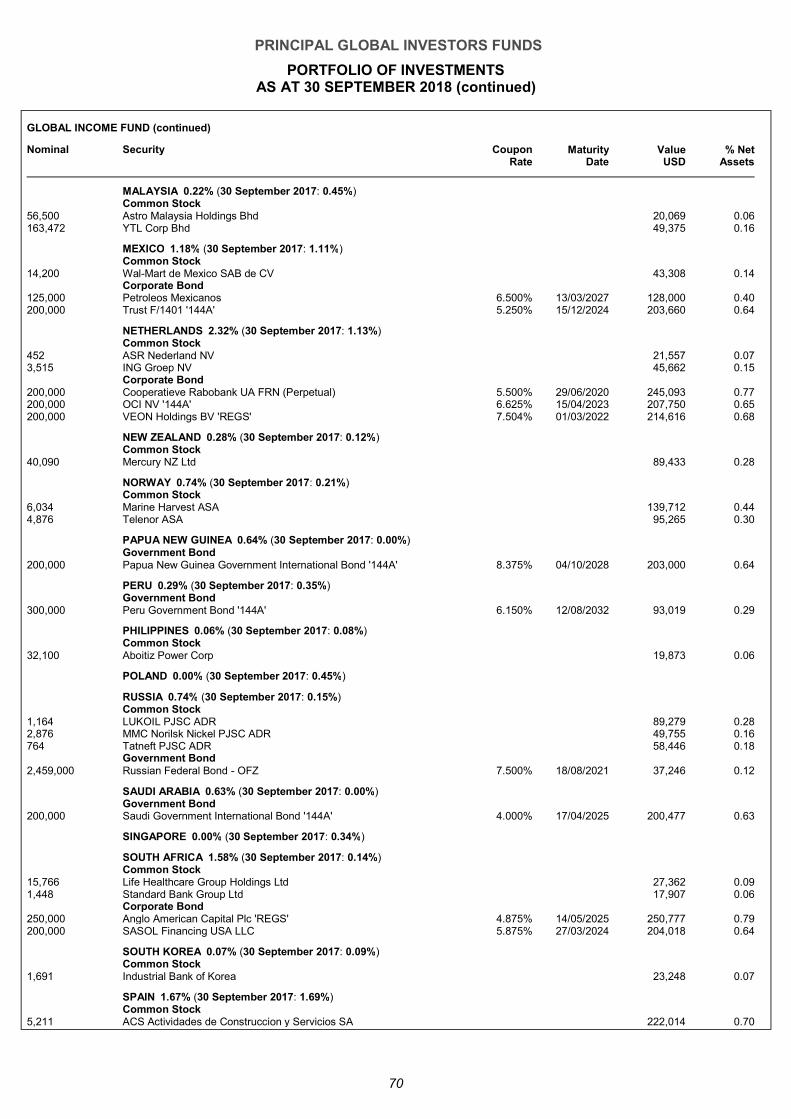
PRINCIPAL GLOBAL INVESTORS FUNDS
PORTFOLIO OF INVESTMENTS AS AT 30 SEPTEMBER 2018 (continued)
70
GLOBAL INCOME FUND (continued)
Nominal Security Coupon Rate
Maturity Date
Value USD
% Net Assets
MALAYSIA 0.22% (30 September 2017: 0.45%) Common Stock
56,500 Astro Malaysia Holdings Bhd 20,069 0.06 163,472 YTL Corp Bhd 49,375 0.16
MEXICO 1.18% (30 September 2017: 1.11%) Common Stock
14,200 Wal-Mart de Mexico SAB de CV 43,308 0.14 Corporate Bond
125,000 Petroleos Mexicanos 6.500% 13/03/2027 128,000 0.40 200,000 Trust F/1401 '144A' 5.250% 15/12/2024 203,660 0.64
NETHERLANDS 2.32% (30 September 2017: 1.13%) Common Stock
452 ASR Nederland NV 21,557 0.07 3,515 ING Groep NV 45,662 0.15
Corporate Bond 200,000 Cooperatieve Rabobank UA FRN (Perpetual) 5.500% 29/06/2020 245,093 0.77 200,000 OCI NV '144A' 6.625% 15/04/2023 207,750 0.65 200,000 VEON Holdings BV 'REGS' 7.504% 01/03/2022 214,616 0.68
NEW ZEALAND 0.28% (30 September 2017: 0.12%) Common Stock
40,090 Mercury NZ Ltd 89,433 0.28
NORWAY 0.74% (30 September 2017: 0.21%) Common Stock
6,034 Marine Harvest ASA 139,712 0.44 4,876 Telenor ASA 95,265 0.30
PAPUA NEW GUINEA 0.64% (30 September 2017: 0.00%) Government Bond
200,000 Papua New Guinea Government International Bond '144A' 8.375% 04/10/2028 203,000 0.64
PERU 0.29% (30 September 2017: 0.35%) Government Bond
300,000 Peru Government Bond '144A' 6.150% 12/08/2032 93,019 0.29
PHILIPPINES 0.06% (30 September 2017: 0.08%) Common Stock
32,100 Aboitiz Power Corp 19,873 0.06
POLAND 0.00% (30 September 2017: 0.45%)
RUSSIA 0.74% (30 September 2017: 0.15%) Common Stock
1,164 LUKOIL PJSC ADR 89,279 0.28 2,876 MMC Norilsk Nickel PJSC ADR 49,755 0.16 764 Tatneft PJSC ADR 58,446 0.18
Government Bond 2,459,000 Russian Federal Bond - OFZ 7.500% 18/08/2021 37,246 0.12
SAUDI ARABIA 0.63% (30 September 2017: 0.00%) Government Bond
200,000 Saudi Government International Bond '144A' 4.000% 17/04/2025 200,477 0.63
SINGAPORE 0.00% (30 September 2017: 0.34%)
SOUTH AFRICA 1.58% (30 September 2017: 0.14%) Common Stock
15,766 Life Healthcare Group Holdings Ltd 27,362 0.09 1,448 Standard Bank Group Ltd 17,907 0.06
Corporate Bond 250,000 Anglo American Capital Plc 'REGS' 4.875% 14/05/2025 250,777 0.79 200,000 SASOL Financing USA LLC 5.875% 27/03/2024 204,018 0.64
SOUTH KOREA 0.07% (30 September 2017: 0.09%) Common Stock
1,691 Industrial Bank of Korea 23,248 0.07
SPAIN 1.67% (30 September 2017: 1.69%) Common Stock
5,211 ACS Actividades de Construccion y Servicios SA 222,014 0.70
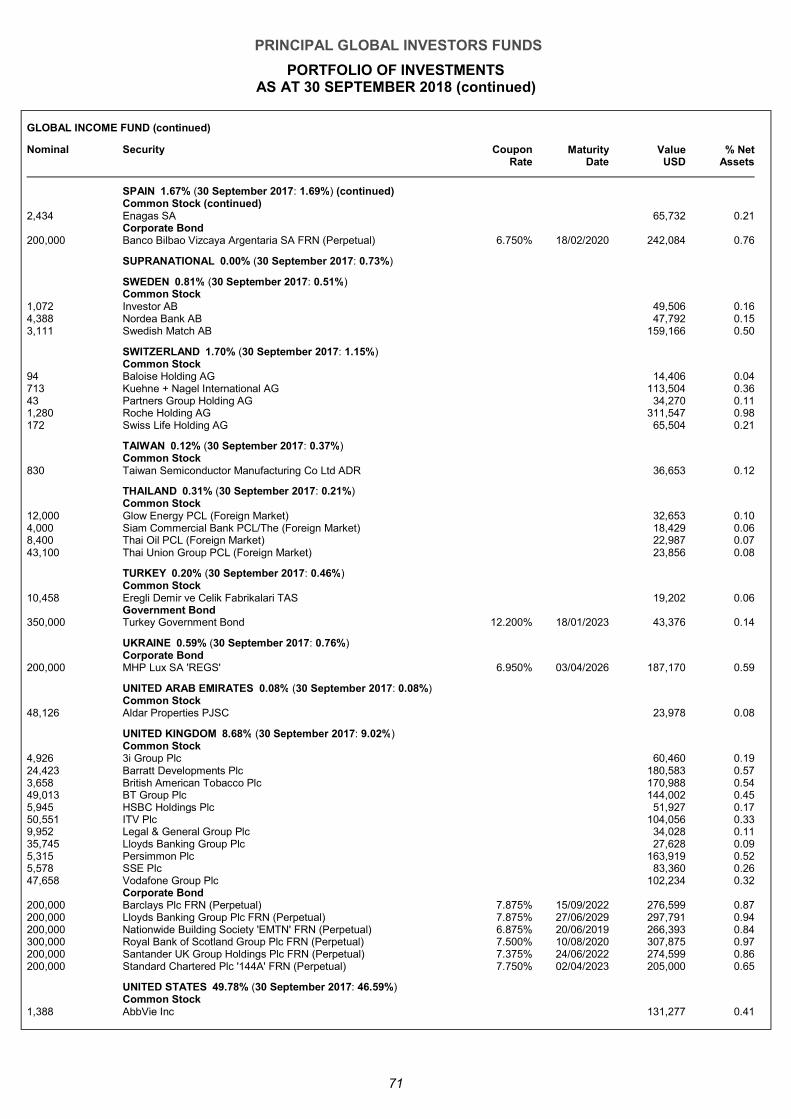
PRINCIPAL GLOBAL INVESTORS FUNDS
PORTFOLIO OF INVESTMENTS AS AT 30 SEPTEMBER 2018 (continued)
71
GLOBAL INCOME FUND (continued)
Nominal Security Coupon Rate
Maturity Date
Value USD
% Net Assets
SPAIN 1.67% (30 September 2017: 1.69%) (continued) Common Stock (continued)
2,434 Enagas SA 65,732 0.21 Corporate Bond
200,000 Banco Bilbao Vizcaya Argentaria SA FRN (Perpetual) 6.750% 18/02/2020 242,084 0.76
SUPRANATIONAL 0.00% (30 September 2017: 0.73%)
SWEDEN 0.81% (30 September 2017: 0.51%) Common Stock
1,072 Investor AB 49,506 0.16 4,388 Nordea Bank AB 47,792 0.15 3,111 Swedish Match AB 159,166 0.50
SWITZERLAND 1.70% (30 September 2017: 1.15%) Common Stock
94 Baloise Holding AG 14,406 0.04 713 Kuehne + Nagel International AG 113,504 0.36 43 Partners Group Holding AG 34,270 0.11 1,280 Roche Holding AG 311,547 0.98 172 Swiss Life Holding AG 65,504 0.21
TAIWAN 0.12% (30 September 2017: 0.37%) Common Stock
830 Taiwan Semiconductor Manufacturing Co Ltd ADR 36,653 0.12
THAILAND 0.31% (30 September 2017: 0.21%) Common Stock
12,000 Glow Energy PCL (Foreign Market) 32,653 0.10 4,000 Siam Commercial Bank PCL/The (Foreign Market) 18,429 0.06 8,400 Thai Oil PCL (Foreign Market) 22,987 0.07 43,100 Thai Union Group PCL (Foreign Market) 23,856 0.08
TURKEY 0.20% (30 September 2017: 0.46%) Common Stock
10,458 Eregli Demir ve Celik Fabrikalari TAS 19,202 0.06 Government Bond
350,000 Turkey Government Bond 12.200% 18/01/2023 43,376 0.14
UKRAINE 0.59% (30 September 2017: 0.76%) Corporate Bond
200,000 MHP Lux SA 'REGS' 6.950% 03/04/2026 187,170 0.59
UNITED ARAB EMIRATES 0.08% (30 September 2017: 0.08%) Common Stock
48,126 Aldar Properties PJSC 23,978 0.08
UNITED KINGDOM 8.68% (30 September 2017: 9.02%) Common Stock
4,926 3i Group Plc 60,460 0.19 24,423 Barratt Developments Plc 180,583 0.57 3,658 British American Tobacco Plc 170,988 0.54 49,013 BT Group Plc 144,002 0.45 5,945 HSBC Holdings Plc 51,927 0.17 50,551 ITV Plc 104,056 0.33 9,952 Legal & General Group Plc 34,028 0.11 35,745 Lloyds Banking Group Plc 27,628 0.09 5,315 Persimmon Plc 163,919 0.52 5,578 SSE Plc 83,360 0.26 47,658 Vodafone Group Plc 102,234 0.32
Corporate Bond 200,000 Barclays Plc FRN (Perpetual) 7.875% 15/09/2022 276,599 0.87 200,000 Lloyds Banking Group Plc FRN (Perpetual) 7.875% 27/06/2029 297,791 0.94 200,000 Nationwide Building Society 'EMTN' FRN (Perpetual) 6.875% 20/06/2019 266,393 0.84 300,000 Royal Bank of Scotland Group Plc FRN (Perpetual) 7.500% 10/08/2020 307,875 0.97 200,000 Santander UK Group Holdings Plc FRN (Perpetual) 7.375% 24/06/2022 274,599 0.86 200,000 Standard Chartered Plc '144A' FRN (Perpetual) 7.750% 02/04/2023 205,000 0.65
UNITED STATES 49.78% (30 September 2017: 46.59%) Common Stock
1,388 AbbVie Inc 131,277 0.41
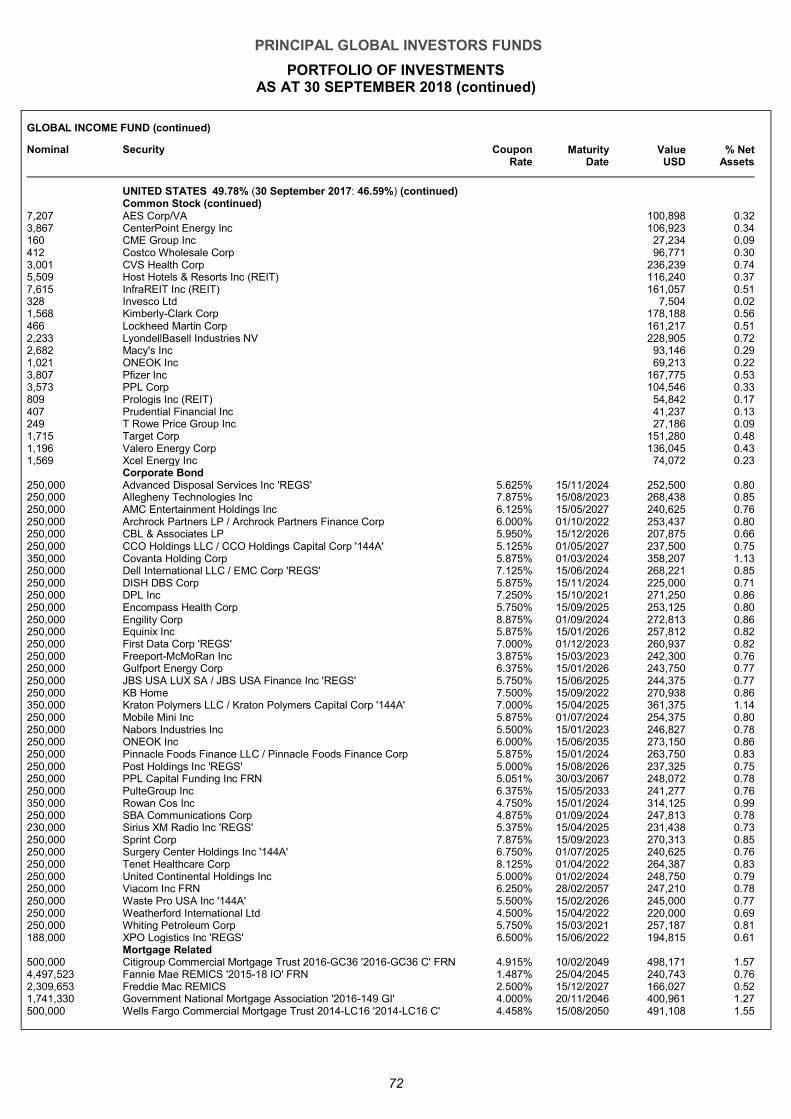
PRINCIPAL GLOBAL INVESTORS FUNDS
PORTFOLIO OF INVESTMENTS AS AT 30 SEPTEMBER 2018 (continued)
72
GLOBAL INCOME FUND (continued)
Nominal Security Coupon Rate
Maturity Date
Value USD
% Net Assets
UNITED STATES 49.78% (30 September 2017: 46.59%) (continued) Common Stock (continued)
7,207 AES Corp/VA 100,898 0.32 3,867 CenterPoint Energy Inc 106,923 0.34 160 CME Group Inc 27,234 0.09 412 Costco Wholesale Corp 96,771 0.30 3,001 CVS Health Corp 236,239 0.74 5,509 Host Hotels & Resorts Inc (REIT) 116,240 0.37 7,615 InfraREIT Inc (REIT) 161,057 0.51 328 Invesco Ltd 7,504 0.02 1,568 Kimberly-Clark Corp 178,188 0.56 466 Lockheed Martin Corp 161,217 0.51 2,233 LyondellBasell Industries NV 228,905 0.72 2,682 Macy's Inc 93,146 0.29 1,021 ONEOK Inc 69,213 0.22 3,807 Pfizer Inc 167,775 0.53 3,573 PPL Corp 104,546 0.33 809 Prologis Inc (REIT) 54,842 0.17 407 Prudential Financial Inc 41,237 0.13 249 T Rowe Price Group Inc 27,186 0.09 1,715 Target Corp 151,280 0.48 1,196 Valero Energy Corp 136,045 0.43 1,569 Xcel Energy Inc 74,072 0.23
Corporate Bond 250,000 Advanced Disposal Services Inc 'REGS' 5.625% 15/11/2024 252,500 0.80 250,000 Allegheny Technologies Inc 7.875% 15/08/2023 268,438 0.85 250,000 AMC Entertainment Holdings Inc 6.125% 15/05/2027 240,625 0.76 250,000 Archrock Partners LP / Archrock Partners Finance Corp 6.000% 01/10/2022 253,437 0.80 250,000 CBL & Associates LP 5.950% 15/12/2026 207,875 0.66 250,000 CCO Holdings LLC / CCO Holdings Capital Corp '144A' 5.125% 01/05/2027 237,500 0.75 350,000 Covanta Holding Corp 5.875% 01/03/2024 358,207 1.13 250,000 Dell International LLC / EMC Corp 'REGS' 7.125% 15/06/2024 268,221 0.85 250,000 DISH DBS Corp 5.875% 15/11/2024 225,000 0.71 250,000 DPL Inc 7.250% 15/10/2021 271,250 0.86 250,000 Encompass Health Corp 5.750% 15/09/2025 253,125 0.80 250,000 Engility Corp 8.875% 01/09/2024 272,813 0.86 250,000 Equinix Inc 5.875% 15/01/2026 257,812 0.82 250,000 First Data Corp 'REGS' 7.000% 01/12/2023 260,937 0.82 250,000 Freeport-McMoRan Inc 3.875% 15/03/2023 242,300 0.76 250,000 Gulfport Energy Corp 6.375% 15/01/2026 243,750 0.77 250,000 JBS USA LUX SA / JBS USA Finance Inc 'REGS' 5.750% 15/06/2025 244,375 0.77 250,000 KB Home 7.500% 15/09/2022 270,938 0.86 350,000 Kraton Polymers LLC / Kraton Polymers Capital Corp '144A' 7.000% 15/04/2025 361,375 1.14 250,000 Mobile Mini Inc 5.875% 01/07/2024 254,375 0.80 250,000 Nabors Industries Inc 5.500% 15/01/2023 246,827 0.78 250,000 ONEOK Inc 6.000% 15/06/2035 273,150 0.86 250,000 Pinnacle Foods Finance LLC / Pinnacle Foods Finance Corp 5.875% 15/01/2024 263,750 0.83 250,000 Post Holdings Inc 'REGS' 5.000% 15/08/2026 237,325 0.75 250,000 PPL Capital Funding Inc FRN 5.051% 30/03/2067 248,072 0.78 250,000 PulteGroup Inc 6.375% 15/05/2033 241,277 0.76 350,000 Rowan Cos Inc 4.750% 15/01/2024 314,125 0.99 250,000 SBA Communications Corp 4.875% 01/09/2024 247,813 0.78 230,000 Sirius XM Radio Inc 'REGS' 5.375% 15/04/2025 231,438 0.73 250,000 Sprint Corp 7.875% 15/09/2023 270,313 0.85 250,000 Surgery Center Holdings Inc '144A' 6.750% 01/07/2025 240,625 0.76 250,000 Tenet Healthcare Corp 8.125% 01/04/2022 264,387 0.83 250,000 United Continental Holdings Inc 5.000% 01/02/2024 248,750 0.79 250,000 Viacom Inc FRN 6.250% 28/02/2057 247,210 0.78 250,000 Waste Pro USA Inc '144A' 5.500% 15/02/2026 245,000 0.77 250,000 Weatherford International Ltd 4.500% 15/04/2022 220,000 0.69 250,000 Whiting Petroleum Corp 5.750% 15/03/2021 257,187 0.81 188,000 XPO Logistics Inc 'REGS' 6.500% 15/06/2022 194,815 0.61
Mortgage Related 500,000 Citigroup Commercial Mortgage Trust 2016-GC36 '2016-GC36 C' FRN 4.915% 10/02/2049 498,171 1.57 4,497,523 Fannie Mae REMICS '2015-18 IO' FRN 1.487% 25/04/2045 240,743 0.76 2,309,653 Freddie Mac REMICS 2.500% 15/12/2027 166,027 0.52 1,741,330 Government National Mortgage Association '2016-149 GI' 4.000% 20/11/2046 400,961 1.27 500,000 Wells Fargo Commercial Mortgage Trust 2014-LC16 '2014-LC16 C' 4.458% 15/08/2050 491,108 1.55
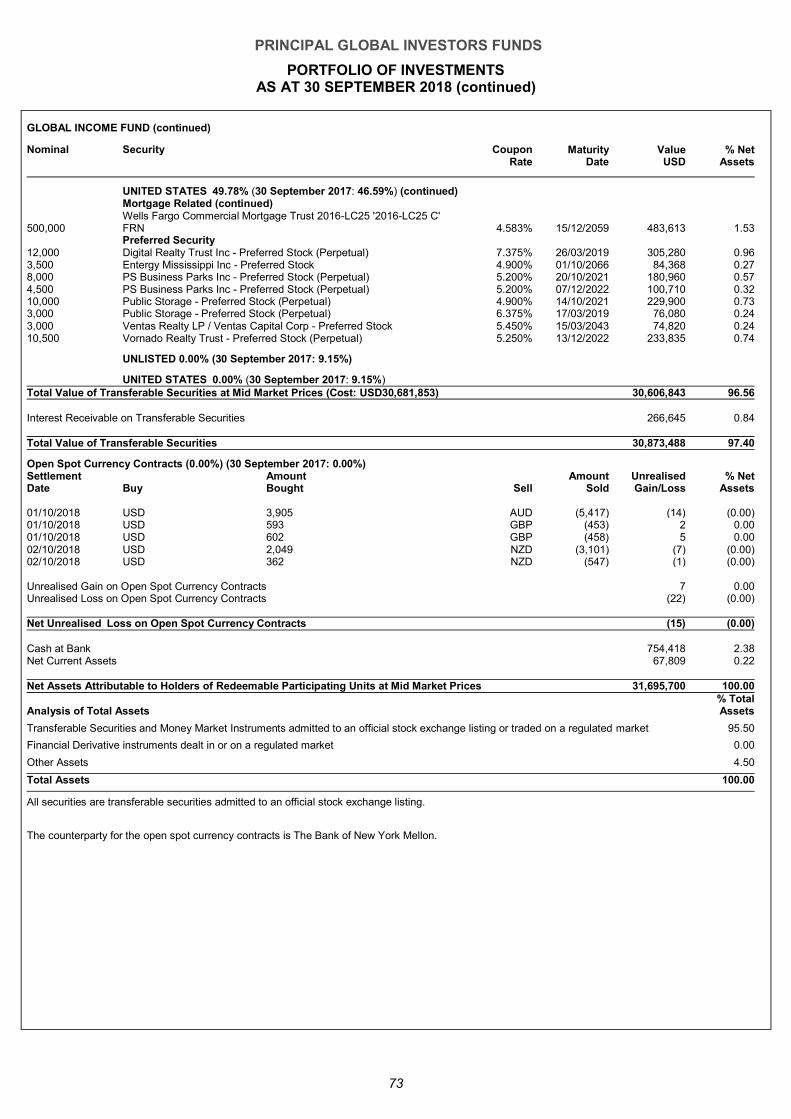
PRINCIPAL GLOBAL INVESTORS FUNDS
PORTFOLIO OF INVESTMENTS AS AT 30 SEPTEMBER 2018 (continued)
73
GLOBAL INCOME FUND (continued)
Nominal Security Coupon Rate
Maturity Date
Value USD
% Net Assets
UNITED STATES 49.78% (30 September 2017: 46.59%) (continued) Mortgage Related (continued)
500,000 Wells Fargo Commercial Mortgage Trust 2016-LC25 '2016-LC25 C' FRN 4.583% 15/12/2059 483,613 1.53
Preferred Security 12,000 Digital Realty Trust Inc - Preferred Stock (Perpetual) 7.375% 26/03/2019 305,280 0.96 3,500 Entergy Mississippi Inc - Preferred Stock 4.900% 01/10/2066 84,368 0.27 8,000 PS Business Parks Inc - Preferred Stock (Perpetual) 5.200% 20/10/2021 180,960 0.57 4,500 PS Business Parks Inc - Preferred Stock (Perpetual) 5.200% 07/12/2022 100,710 0.32 10,000 Public Storage - Preferred Stock (Perpetual) 4.900% 14/10/2021 229,900 0.73 3,000 Public Storage - Preferred Stock (Perpetual) 6.375% 17/03/2019 76,080 0.24 3,000 Ventas Realty LP / Ventas Capital Corp - Preferred Stock 5.450% 15/03/2043 74,820 0.24 10,500 Vornado Realty Trust - Preferred Stock (Perpetual) 5.250% 13/12/2022 233,835 0.74
UNLISTED 0.00% (30 September 2017: 9.15%)
UNITED STATES 0.00% (30 September 2017: 9.15%) Total Value of Transferable Securities at Mid Market Prices (Cost: USD30,681,853) 30,606,843 96.56 Interest Receivable on Transferable Securities 266,645 0.84 Total Value of Transferable Securities 30,873,488 97.40
Open Spot Currency Contracts (0.00%) (30 September 2017: 0.00%) Settlement Date Buy
Amount Bought Sell
Amount Sold
Unrealised Gain/Loss
% Net Assets
01/10/2018 USD 3,905 AUD (5,417) (14) (0.00) 01/10/2018 USD 593 GBP (453) 2 0.00 01/10/2018 USD 602 GBP (458) 5 0.00 02/10/2018 USD 2,049 NZD (3,101) (7) (0.00) 02/10/2018 USD 362 NZD (547) (1) (0.00) Unrealised Gain on Open Spot Currency Contracts 7 0.00 Unrealised Loss on Open Spot Currency Contracts (22) (0.00) Net Unrealised Loss on Open Spot Currency Contracts (15) (0 .00)
Cash at Bank 754,418 2.38 Net Current Assets 67,809 0.22 Net Assets Attributable to Holders of Redeemable Participating Units at Mid Market Prices 31,695,700 100.00
Analysis of Total Assets % Total Assets
Transferable Securities and Money Market Instruments admitted to an official stock exchange listing or traded on a regulated market 95.50
Financial Derivative instruments dealt in or on a regulated market 0.00
Other Assets 4.50
Total Assets 100.00
All securities are transferable securities admitted to an official stock exchange listing.
The counterparty for the open spot currency contracts is The Bank of New York Mellon.
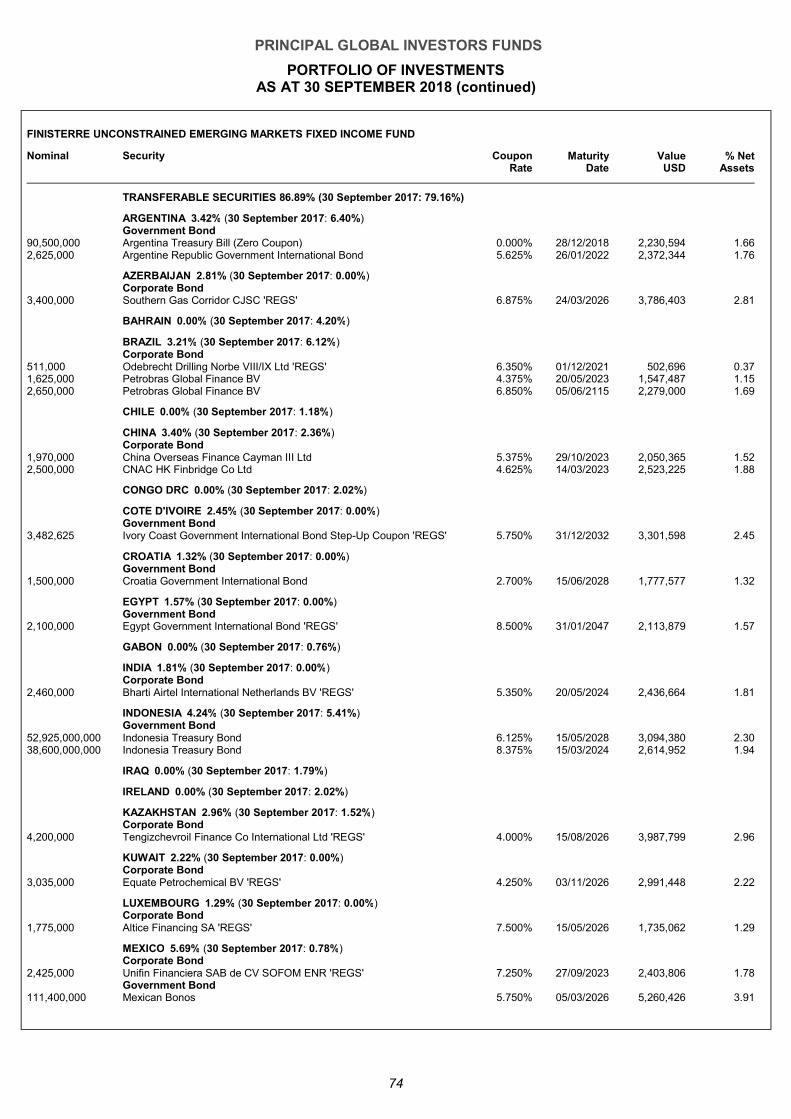
PRINCIPAL GLOBAL INVESTORS FUNDS
PORTFOLIO OF INVESTMENTS AS AT 30 SEPTEMBER 2018 (continued)
74
FINISTERRE UNCONSTRAINED EMERGING MARKETS FIXED INCOME FUND
Nominal Security Coupon Rate
Maturity Date
Value USD
% Net Assets
TRANSFERABLE SECURITIES 86.89% (30 September 2017: 79.16%)
ARGENTINA 3.42% (30 September 2017: 6.40%) Government Bond
90,500,000 Argentina Treasury Bill (Zero Coupon) 0.000% 28/12/2018 2,230,594 1.66 2,625,000 Argentine Republic Government International Bond 5.625% 26/01/2022 2,372,344 1.76
AZERBAIJAN 2.81% (30 September 2017: 0.00%) Corporate Bond
3,400,000 Southern Gas Corridor CJSC 'REGS' 6.875% 24/03/2026 3,786,403 2.81
BAHRAIN 0.00% (30 September 2017: 4.20%)
BRAZIL 3.21% (30 September 2017: 6.12%) Corporate Bond
511,000 Odebrecht Drilling Norbe VIII/IX Ltd 'REGS' 6.350% 01/12/2021 502,696 0.37 1,625,000 Petrobras Global Finance BV 4.375% 20/05/2023 1,547,487 1.15 2,650,000 Petrobras Global Finance BV 6.850% 05/06/2115 2,279,000 1.69
CHILE 0.00% (30 September 2017: 1.18%)
CHINA 3.40% (30 September 2017: 2.36%) Corporate Bond
1,970,000 China Overseas Finance Cayman III Ltd 5.375% 29/10/2023 2,050,365 1.52 2,500,000 CNAC HK Finbridge Co Ltd 4.625% 14/03/2023 2,523,225 1.88
CONGO DRC 0.00% (30 September 2017: 2.02%)
COTE D'IVOIRE 2.45% (30 September 2017: 0.00%) Government Bond
3,482,625 Ivory Coast Government International Bond Step-Up Coupon 'REGS' 5.750% 31/12/2032 3,301,598 2.45
CROATIA 1.32% (30 September 2017: 0.00%) Government Bond
1,500,000 Croatia Government International Bond 2.700% 15/06/2028 1,777,577 1.32
EGYPT 1.57% (30 September 2017: 0.00%) Government Bond
2,100,000 Egypt Government International Bond 'REGS' 8.500% 31/01/2047 2,113,879 1.57
GABON 0.00% (30 September 2017: 0.76%)
INDIA 1.81% (30 September 2017: 0.00%) Corporate Bond
2,460,000 Bharti Airtel International Netherlands BV 'REGS' 5.350% 20/05/2024 2,436,664 1.81
INDONESIA 4.24% (30 September 2017: 5.41%) Government Bond
52,925,000,000 Indonesia Treasury Bond 6.125% 15/05/2028 3,094,380 2.30 38,600,000,000 Indonesia Treasury Bond 8.375% 15/03/2024 2,614,952 1.94
IRAQ 0.00% (30 September 2017: 1.79%)
IRELAND 0.00% (30 September 2017: 2.02%)
KAZAKHSTAN 2.96% (30 September 2017: 1.52%) Corporate Bond
4,200,000 Tengizchevroil Finance Co International Ltd 'REGS' 4.000% 15/08/2026 3,987,799 2.96
KUWAIT 2.22% (30 September 2017: 0.00%) Corporate Bond
3,035,000 Equate Petrochemical BV 'REGS' 4.250% 03/11/2026 2,991,448 2.22
LUXEMBOURG 1.29% (30 September 2017: 0.00%) Corporate Bond
1,775,000 Altice Financing SA 'REGS' 7.500% 15/05/2026 1,735,062 1.29
MEXICO 5.69% (30 September 2017: 0.78%) Corporate Bond
2,425,000 Unifin Financiera SAB de CV SOFOM ENR 'REGS' 7.250% 27/09/2023 2,403,806 1.78 Government Bond
111,400,000 Mexican Bonos 5.750% 05/03/2026 5,260,426 3.91
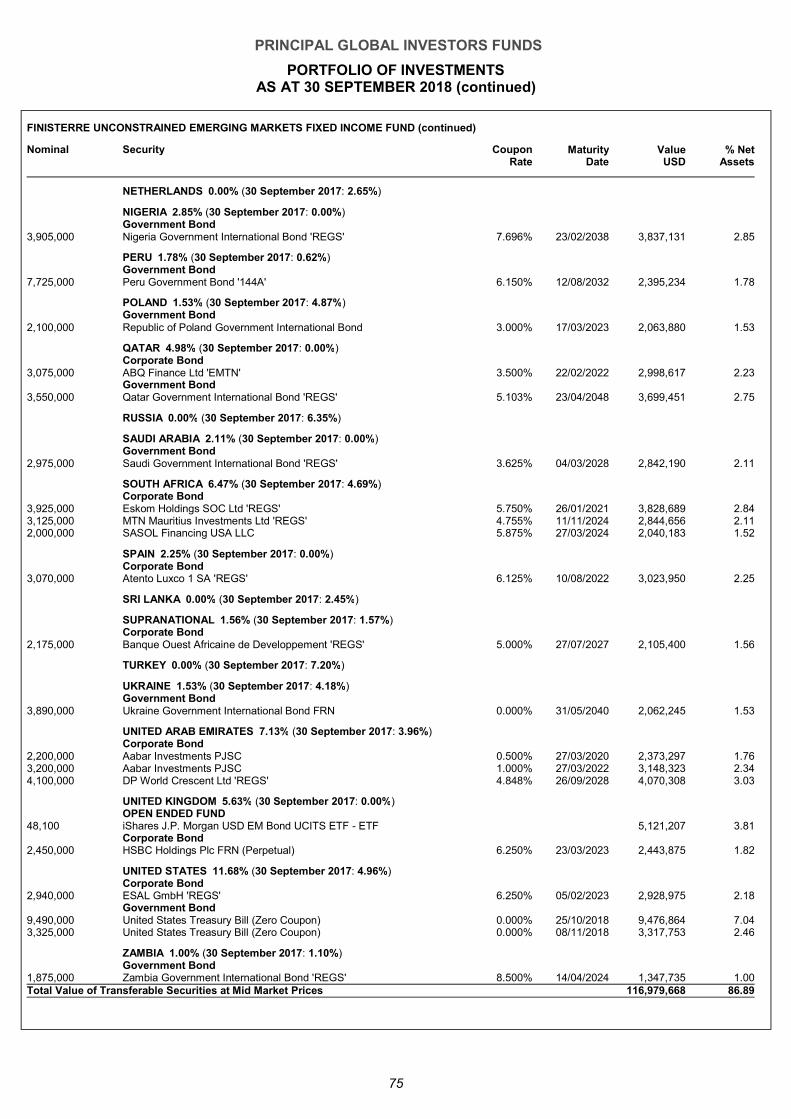
PRINCIPAL GLOBAL INVESTORS FUNDS
PORTFOLIO OF INVESTMENTS AS AT 30 SEPTEMBER 2018 (continued)
75
FINISTERRE UNCONSTRAINED EMERGING MARKETS FIXED INCOME FUND (continued)
Nominal Security Coupon Rate
Maturity Date
Value USD
% Net Assets
NETHERLANDS 0.00% (30 September 2017: 2.65%)
NIGERIA 2.85% (30 September 2017: 0.00%) Government Bond
3,905,000 Nigeria Government International Bond 'REGS' 7.696% 23/02/2038 3,837,131 2.85
PERU 1.78% (30 September 2017: 0.62%) Government Bond
7,725,000 Peru Government Bond '144A' 6.150% 12/08/2032 2,395,234 1.78
POLAND 1.53% (30 September 2017: 4.87%) Government Bond
2,100,000 Republic of Poland Government International Bond 3.000% 17/03/2023 2,063,880 1.53
QATAR 4.98% (30 September 2017: 0.00%) Corporate Bond
3,075,000 ABQ Finance Ltd 'EMTN' 3.500% 22/02/2022 2,998,617 2.23 Government Bond
3,550,000 Qatar Government International Bond 'REGS' 5.103% 23/04/2048 3,699,451 2.75
RUSSIA 0.00% (30 September 2017: 6.35%)
SAUDI ARABIA 2.11% (30 September 2017: 0.00%) Government Bond
2,975,000 Saudi Government International Bond 'REGS' 3.625% 04/03/2028 2,842,190 2.11
SOUTH AFRICA 6.47% (30 September 2017: 4.69%) Corporate Bond
3,925,000 Eskom Holdings SOC Ltd 'REGS' 5.750% 26/01/2021 3,828,689 2.84 3,125,000 MTN Mauritius Investments Ltd 'REGS' 4.755% 11/11/2024 2,844,656 2.11 2,000,000 SASOL Financing USA LLC 5.875% 27/03/2024 2,040,183 1.52
SPAIN 2.25% (30 September 2017: 0.00%) Corporate Bond
3,070,000 Atento Luxco 1 SA 'REGS' 6.125% 10/08/2022 3,023,950 2.25
SRI LANKA 0.00% (30 September 2017: 2.45%)
SUPRANATIONAL 1.56% (30 September 2017: 1.57%) Corporate Bond
2,175,000 Banque Ouest Africaine de Developpement 'REGS' 5.000% 27/07/2027 2,105,400 1.56
TURKEY 0.00% (30 September 2017: 7.20%)
UKRAINE 1.53% (30 September 2017: 4.18%) Government Bond
3,890,000 Ukraine Government International Bond FRN 0.000% 31/05/2040 2,062,245 1.53
UNITED ARAB EMIRATES 7.13% (30 September 2017: 3.96%) Corporate Bond
2,200,000 Aabar Investments PJSC 0.500% 27/03/2020 2,373,297 1.76 3,200,000 Aabar Investments PJSC 1.000% 27/03/2022 3,148,323 2.34 4,100,000 DP World Crescent Ltd 'REGS' 4.848% 26/09/2028 4,070,308 3.03
UNITED KINGDOM 5.63% (30 September 2017: 0.00%) OPEN ENDED FUND
48,100 iShares J.P. Morgan USD EM Bond UCITS ETF - ETF 5,121,207 3.81 Corporate Bond
2,450,000 HSBC Holdings Plc FRN (Perpetual) 6.250% 23/03/2023 2,443,875 1.82
UNITED STATES 11.68% (30 September 2017: 4.96%) Corporate Bond
2,940,000 ESAL GmbH 'REGS' 6.250% 05/02/2023 2,928,975 2.18 Government Bond
9,490,000 United States Treasury Bill (Zero Coupon) 0.000% 25/10/2018 9,476,864 7.04 3,325,000 United States Treasury Bill (Zero Coupon) 0.000% 08/11/2018 3,317,753 2.46
ZAMBIA 1.00% (30 September 2017: 1.10%) Government Bond
1,875,000 Zambia Government International Bond 'REGS' 8.500% 14/04/2024 1,347,735 1.00 Total Value of Transferable Securities at Mid Market Prices 116,979,668 86.89
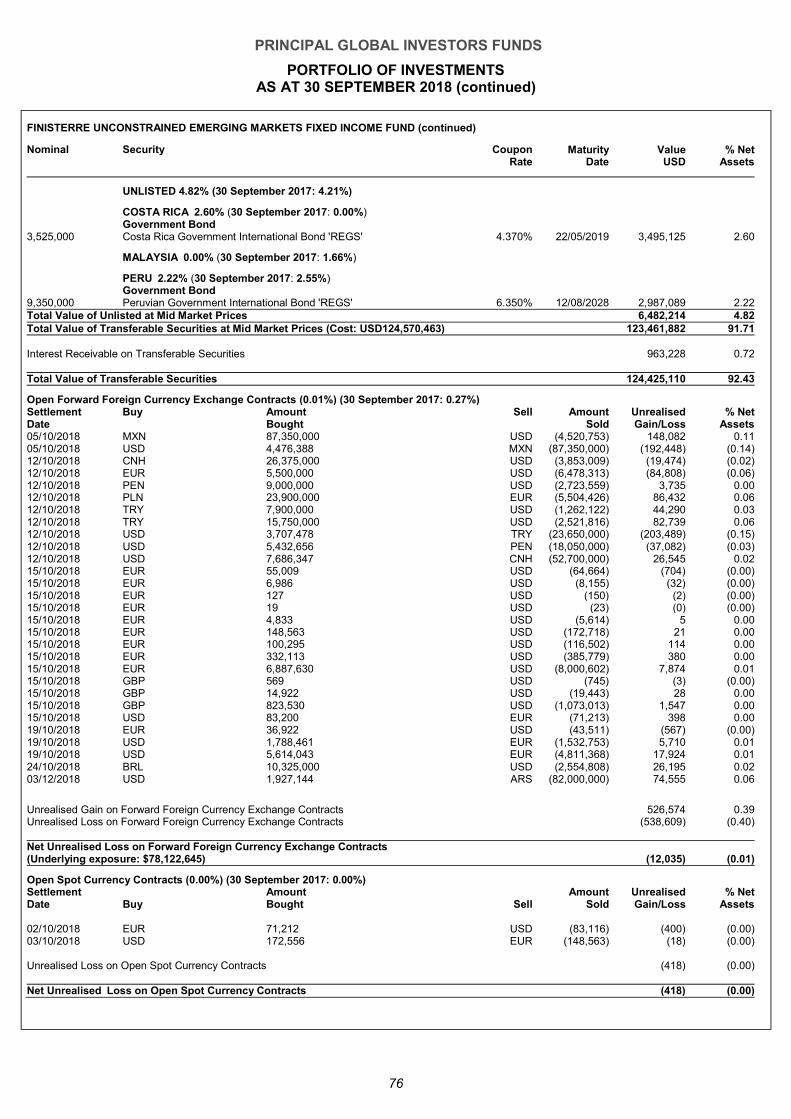
PRINCIPAL GLOBAL INVESTORS FUNDS
PORTFOLIO OF INVESTMENTS AS AT 30 SEPTEMBER 2018 (continued)
76
FINISTERRE UNCONSTRAINED EMERGING MARKETS FIXED INCOME FUND (continued)
Nominal Security Coupon Rate
Maturity Date
Value USD
% Net Assets
UNLISTED 4.82% (30 September 2017: 4.21%)
COSTA RICA 2.60% (30 September 2017: 0.00%) Government Bond
3,525,000 Costa Rica Government International Bond 'REGS' 4.370% 22/05/2019 3,495,125 2.60
MALAYSIA 0.00% (30 September 2017: 1.66%)
PERU 2.22% (30 September 2017: 2.55%) Government Bond
9,350,000 Peruvian Government International Bond 'REGS' 6.350% 12/08/2028 2,987,089 2.22 Total Value of Unlisted at Mid Market Prices 6,482,214 4.82 Total Value of Transferable Securities at Mid Market Prices (Cost: USD124,570,463) 123,461,882 91.71 Interest Receivable on Transferable Securities 963,228 0.72 Total Value of Transferable Securities 124,425,110 92.43
Open Forward Foreign Currency Exchange Contracts (0.01%) (30 September 2017: 0.27%) Settlement Date
Buy Amount Bought
Sell Amount Sold
Unrealised Gain/Loss
% Net Assets
05/10/2018 MXN 87,350,000 USD (4,520,753) 148,082 0 .11
05/10/2018 USD 4,476,388 MXN (87,350,000) (192,448) (0 .14)
12/10/2018 CNH 26,375,000 USD (3,853,009) (19,474) (0 .02)
12/10/2018 EUR 5,500,000 USD (6,478,313) (84,808) (0 .06)
12/10/2018 PEN 9,000,000 USD (2,723,559) 3,735 0 .00
12/10/2018 PLN 23,900,000 EUR (5,504,426) 86,432 0 .06
12/10/2018 TRY 7,900,000 USD (1,262,122) 44,290 0 .03
12/10/2018 TRY 15,750,000 USD (2,521,816) 82,739 0 .06
12/10/2018 USD 3,707,478 TRY (23,650,000) (203,489) (0 .15)
12/10/2018 USD 5,432,656 PEN (18,050,000) (37,082) (0 .03)
12/10/2018 USD 7,686,347 CNH (52,700,000) 26,545 0 .02
15/10/2018 EUR 55,009 USD (64,664) (704) (0 .00)
15/10/2018 EUR 6,986 USD (8,155) (32) (0 .00)
15/10/2018 EUR 127 USD (150) (2) (0 .00)
15/10/2018 EUR 19 USD (23) (0) (0 .00)
15/10/2018 EUR 4,833 USD (5,614) 5 0 .00
15/10/2018 EUR 148,563 USD (172,718) 21 0 .00
15/10/2018 EUR 100,295 USD (116,502) 114 0 .00
15/10/2018 EUR 332,113 USD (385,779) 380 0 .00
15/10/2018 EUR 6,887,630 USD (8,000,602) 7,874 0 .01
15/10/2018 GBP 569 USD (745) (3) (0 .00)
15/10/2018 GBP 14,922 USD (19,443) 28 0 .00
15/10/2018 GBP 823,530 USD (1,073,013) 1,547 0 .00
15/10/2018 USD 83,200 EUR (71,213) 398 0 .00
19/10/2018 EUR 36,922 USD (43,511) (567) (0 .00)
19/10/2018 USD 1,788,461 EUR (1,532,753) 5,710 0 .01
19/10/2018 USD 5,614,043 EUR (4,811,368) 17,924 0 .01
24/10/2018 BRL 10,325,000 USD (2,554,808) 26,195 0 .02
03/12/2018 USD 1,927,144 ARS (82,000,000) 74,555 0 .06
Unrealised Gain on Forward Foreign Currency Exchange Contracts 526,574 0 .39
Unrealised Loss on Forward Foreign Currency Exchange Contracts (538,609) (0 .40)
Net Unrealised Loss on Forward Foreign Currency Exchange Contracts (Underlying exposure: $78,122,645) (12,035) (0 .01)
Open Spot Currency Contracts (0.00%) (30 September 2017: 0.00%) Settlement Date Buy
Amount Bought Sell
Amount Sold
Unrealised Gain/Loss
% Net Assets
02/10/2018 EUR 71,212 USD (83,116) (400) (0.00) 03/10/2018 USD 172,556 EUR (148,563) (18) (0.00) Unrealised Loss on Open Spot Currency Contracts (418) (0.00) Net Unrealised Loss on Open Spot Currency Contracts (418) (0 .00)
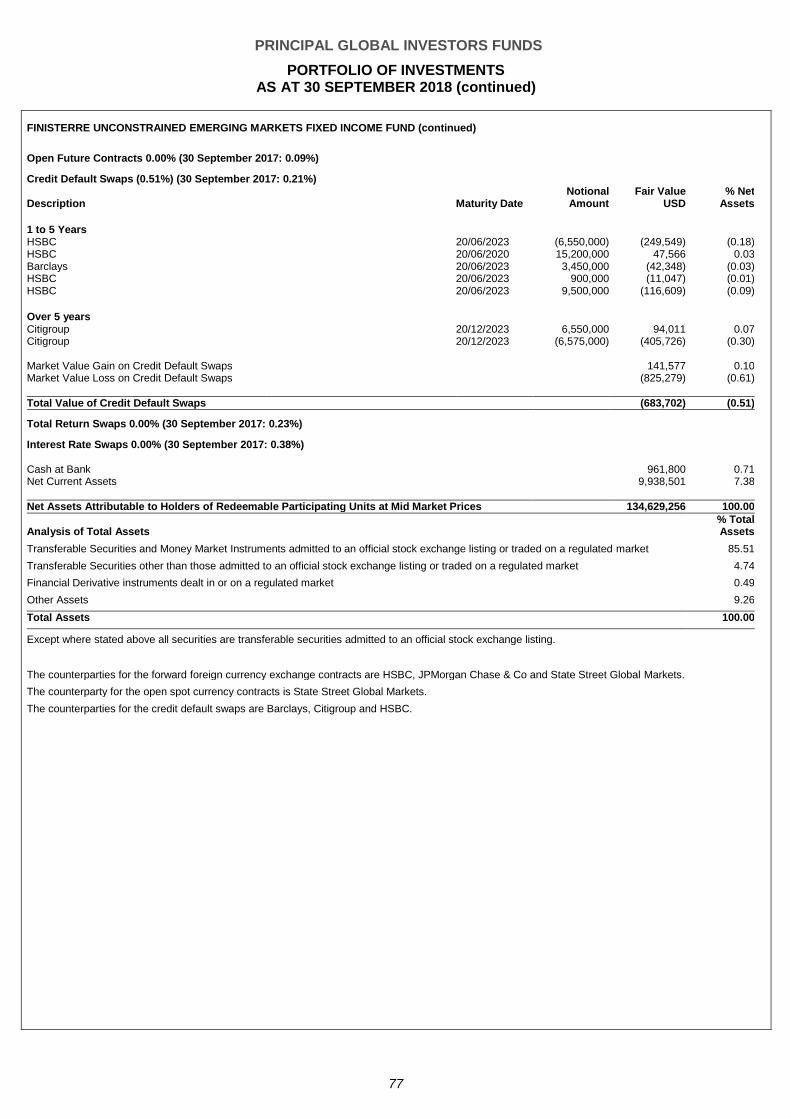
PRINCIPAL GLOBAL INVESTORS FUNDS
PORTFOLIO OF INVESTMENTS AS AT 30 SEPTEMBER 2018 (continued)
77
FINISTERRE UNCONSTRAINED EMERGING MARKETS FIXED INCOME FUND (continued)
Open Future Contracts 0.00% (30 September 2017: 0.09%)
Credit Default Swaps (0.51%) (30 September 2017: 0.21%)
Description Maturity Date Notional Amount
Fair Value USD
% Net Assets
1 to 5 Years HSBC 20/06/2023 (6,550,000) (249,549) (0.18) HSBC 20/06/2020 15,200,000 47,566 0.03 Barclays 20/06/2023 3,450,000 (42,348) (0.03) HSBC 20/06/2023 900,000 (11,047) (0.01) HSBC 20/06/2023 9,500,000 (116,609) (0.09)
Over 5 years Citigroup 20/12/2023 6,550,000 94,011 0.07 Citigroup 20/12/2023 (6,575,000) (405,726) (0.30)
Market Value Gain on Credit Default Swaps 141,577 0.10 Market Value Loss on Credit Default Swaps (825,279) (0.61)
Total Value of Credit Default Swaps (683,702) (0.51)
Total Return Swaps 0.00% (30 September 2017: 0.23%)
Interest Rate Swaps 0.00% (30 September 2017: 0.38%)
Cash at Bank 961,800 0.71 Net Current Assets 9,938,501 7.38
Net Assets Attributable to Holders of Redeemable Participating Units at Mid Market Prices 134,629,256 100.00
Analysis of Total Assets % Total Assets
Transferable Securities and Money Market Instruments admitted to an official stock exchange listing or traded on a regulated market 85.51
Transferable Securities other than those admitted to an official stock exchange listing or traded on a regulated market 4.74
Financial Derivative instruments dealt in or on a regulated market 0.49
Other Assets 9.26
Total Assets 100.00
Except where stated above all securities are transferable securities admitted to an official stock exchange listing.
The counterparties for the forward foreign currency exchange contracts are HSBC, JPMorgan Chase & Co and State Street Global Markets.
The counterparty for the open spot currency contracts is State Street Global Markets.
The counterparties for the credit default swaps are Barclays, Citigroup and HSBC.
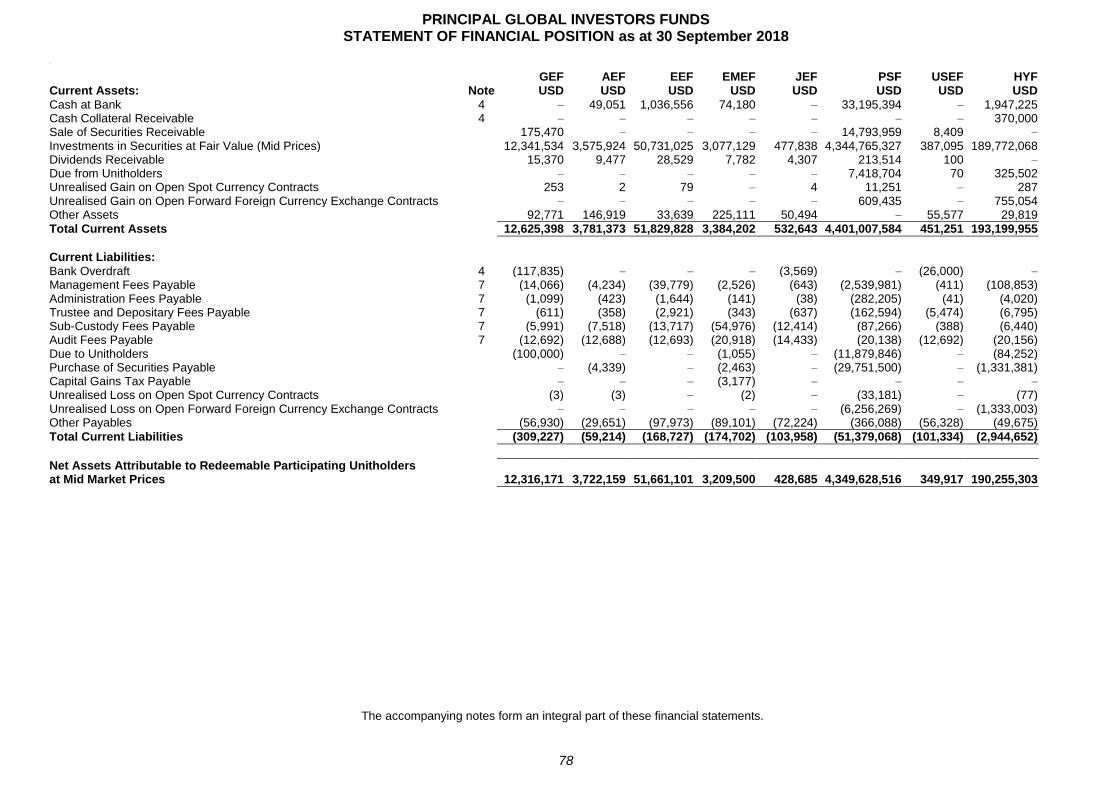
PRINCIPAL GLOBAL INVESTORS FUNDS STATEMENT OF FINANCIAL POSITION as at 30 September 2018
78
kin
GEF AEF EEF EMEF JEF PSF USEF HYF Current Assets: Note USD USD USD USD USD USD USD USD
Cash at Bank 4 – 49,051 1,036,556 74,180 – 33,195,394 – 1,947,225 Cash Collateral Receivable 4 – – – – – – – 370,000 Sale of Securities Receivable 175,470 – – – – 14,793,959 8,409 –
Investments in Securities at Fair Value (Mid Prices) 12,341,534 3,575,924 50,731,025 3,077,129 477,838 4,344,765,327 387,095 189,772,068 Dividends Receivable 15,370 9,477 28,529 7,782 4,307 213,514 100 –
Due from Unitholders – – – – – 7,418,704 70 325,502 Unrealised Gain on Open Spot Currency Contracts 253 2 79 – 4 11,251 – 287 Unrealised Gain on Open Forward Foreign Currency Exchange Contracts – – – – – 609,435 – 755,054 Other Assets 92,771 146,919 33,639 225,111 50,494 – 55,577 29,819
Total Current Assets 12,625,398 3,781,373 51,829,828 3,384,202 532,643 4,401,007,584 451,251 193,199,955
Current Liabilities: Bank Overdraft 4 (117,835) – – – (3,569) – (26,000) –
Management Fees Payable 7 (14,066) (4,234) (39,779) (2,526) (643) (2,539,981) (411) (108,853) Administration Fees Payable 7 (1,099) (423) (1,644) (141) (38) (282,205) (41) (4,020) Trustee and Depositary Fees Payable 7 (611) (358) (2,921) (343) (637) (162,594) (5,474) (6,795) Sub-Custody Fees Payable 7 (5,991) (7,518) (13,717) (54,976) (12,414) (87,266) (388) (6,440) Audit Fees Payable 7 (12,692) (12,688) (12,693) (20,918) (14,433) (20,138) (12,692) (20,156) Due to Unitholders (100,000) – – (1,055) – (11,879,846) – (84,252) Purchase of Securities Payable – (4,339) – (2,463) – (29,751,500) – (1,331,381) Capital Gains Tax Payable – – – (3,177) – – – –
Unrealised Loss on Open Spot Currency Contracts (3) (3) – (2) – (33,181) – (77) Unrealised Loss on Open Forward Foreign Currency Exchange Contracts – – – – – (6,256,269) – (1,333,003) Other Payables (56,930) (29,651) (97,973) (89,101) (72,224) (366,088) (56,328) (49,675)
Total Current Liabilities (309,227) (59,214) (168,727) (174,702) (103,958) (51,379,068) (101,334) (2,944,652)
Net Assets Attributable to Redeemable Participating Unitholders at Mid Market Prices 12,316,171 3,722,159 51,661,101 3,209,500 428,685 4,349,628,516 349,917 190,255,303
The accompanying notes form an integral part of these financial statements.
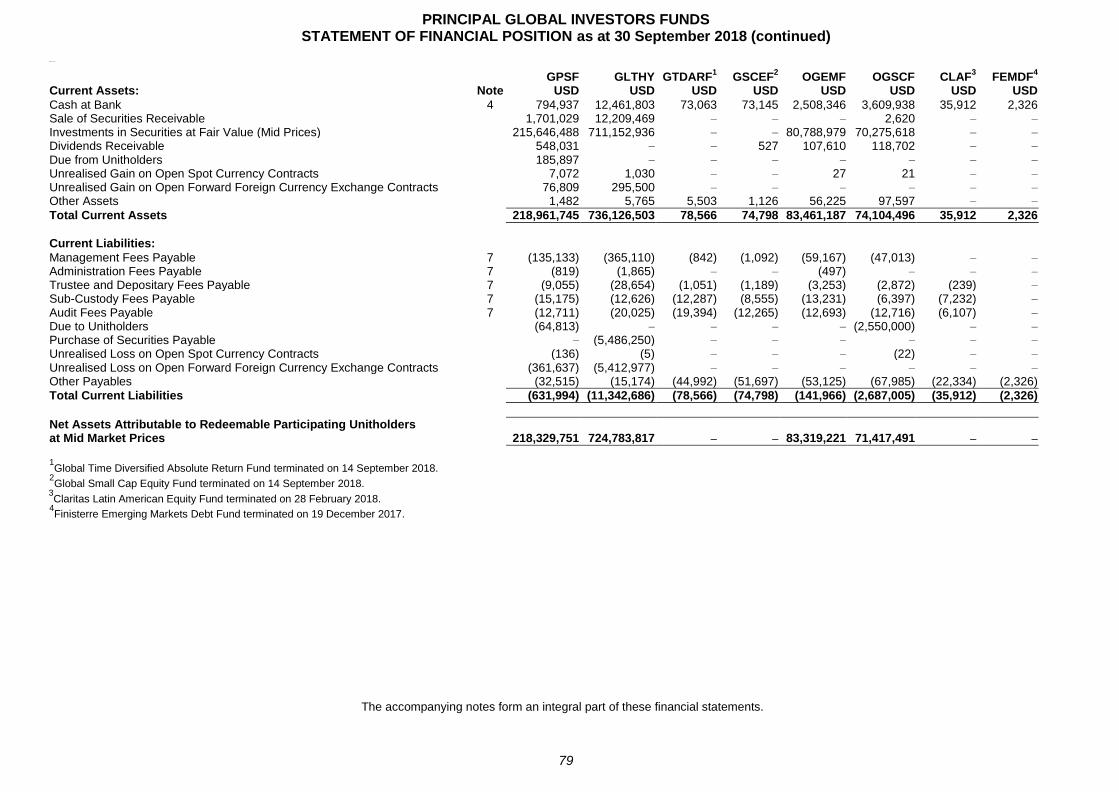
PRINCIPAL GLOBAL INVESTORS FUNDS STATEMENT OF FINANCIAL POSITION as at 30 September 2018 (continued)
79
Ddirtion an
GPSF GLTHY GTDARF1 GSCEF
2 OGEMF OGSCF CLAF
3 FEMDF
4
Current Assets: Note USD USD USD USD USD USD USD USD
Cash at Bank 4 794,937 12,461,803 73,063 73,145 2,508,346 3,609,938 35,912 2,326 Sale of Securities Receivable 1,701,029 12,209,469 – – – 2,620 – –
Investments in Securities at Fair Value (Mid Prices) 215,646,488 711,152,936 – – 80,788,979 70,275,618 – –
Dividends Receivable 548,031 – – 527 107,610 118,702 – –
Due from Unitholders 185,897 – – – – – – –
Unrealised Gain on Open Spot Currency Contracts 7,072 1,030 – – 27 21 – –
Unrealised Gain on Open Forward Foreign Currency Exchange Contracts 76,809 295,500 – – – – – –
Other Assets 1,482 5,765 5,503 1,126 56,225 97,597 – –
Total Current Assets 218,961,745 736,126,503 78,566 74,798 83,461,187 74,104,496 35,912 2,326
Current Liabilities: Management Fees Payable 7 (135,133) (365,110) (842) (1,092) (59,167) (47,013) – –
Administration Fees Payable 7 (819) (1,865) – – (497) – – –
Trustee and Depositary Fees Payable 7 (9,055) (28,654) (1,051) (1,189) (3,253) (2,872) (239) –
Sub-Custody Fees Payable 7 (15,175) (12,626) (12,287) (8,555) (13,231) (6,397) (7,232) –
Audit Fees Payable 7 (12,711) (20,025) (19,394) (12,265) (12,693) (12,716) (6,107) –
Due to Unitholders (64,813) – – – – (2,550,000) – –
Purchase of Securities Payable – (5,486,250) – – – – – –
Unrealised Loss on Open Spot Currency Contracts (136) (5) – – – (22) – –
Unrealised Loss on Open Forward Foreign Currency Exchange Contracts (361,637) (5,412,977) – – – – – –
Other Payables (32,515) (15,174) (44,992) (51,697) (53,125) (67,985) (22,334) (2,326)
Total Current Liabilities (631,994) (11,342,686) (78,566) (74,798) (141,966) (2,687,005) (35,912) (2,326)
Net Assets Attributable to Redeemable Participating Unitholders at Mid Market Prices 218,329,751 724,783,817 – – 83,319,221 71,417,491 – –
1Global Time Diversified Absolute Return Fund terminated on 14 September 2018.
2Global Small Cap Equity Fund terminated on 14 September 2018.
3Claritas Latin American Equity Fund terminated on 28 February 2018.
4Finisterre Emerging Markets Debt Fund terminated on 19 December 2017.
The accompanying notes form an integral part of these financial statements.
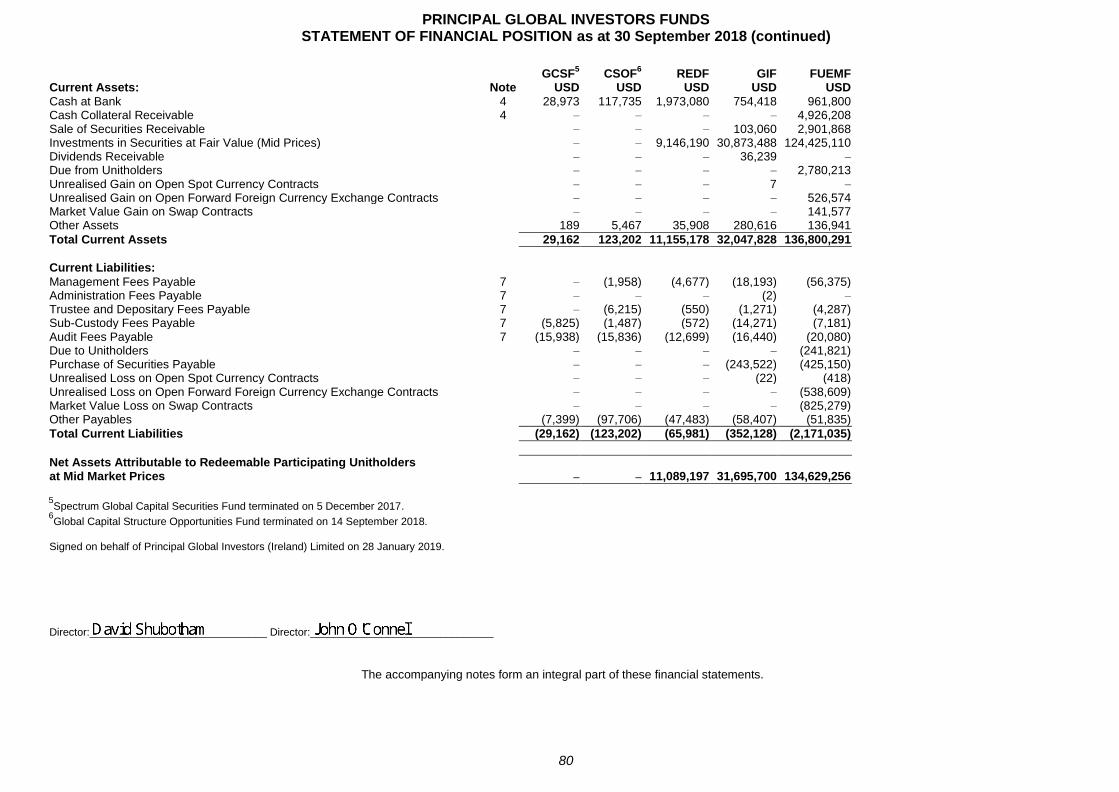
PRINCIPAL GLOBAL INVESTORS FUNDS STATEMENT OF FINANCIAL POSITION as at 30 September 2018 (continued)
80
GCSF5 CSOF
6 REDF GIF FUEMF
Current Assets: Note USD USD USD USD USD
Cash at Bank 4 28,973 117,735 1,973,080 754,418 961,800 Cash Collateral Receivable 4 – – – – 4,926,208 Sale of Securities Receivable – – – 103,060 2,901,868 Investments in Securities at Fair Value (Mid Prices) – – 9,146,190 30,873,488 124,425,110 Dividends Receivable – – – 36,239 –
Due from Unitholders – – – – 2,780,213 Unrealised Gain on Open Spot Currency Contracts – – – 7 –
Unrealised Gain on Open Forward Foreign Currency Exchange Contracts – – – – 526,574 Market Value Gain on Swap Contracts – – – – 141,577 Other Assets 189 5,467 35,908 280,616 136,941
Total Current Assets 29,162 123,202 11,155,178 32,047,828 136,800,291
Current Liabilities: Management Fees Payable 7 – (1,958) (4,677) (18,193) (56,375) Administration Fees Payable 7 – – – (2) –
Trustee and Depositary Fees Payable 7 – (6,215) (550) (1,271) (4,287) Sub-Custody Fees Payable 7 (5,825) (1,487) (572) (14,271) (7,181) Audit Fees Payable 7 (15,938) (15,836) (12,699) (16,440) (20,080) Due to Unitholders – – – – (241,821) Purchase of Securities Payable – – – (243,522) (425,150) Unrealised Loss on Open Spot Currency Contracts – – – (22) (418) Unrealised Loss on Open Forward Foreign Currency Exchange Contracts – – – – (538,609) Market Value Loss on Swap Contracts – – – – (825,279) Other Payables (7,399) (97,706) (47,483) (58,407) (51,835)
Total Current Liabilities (29,162) (123,202) (65,981) (352,128) (2,171,035)
Net Assets Attributable to Redeemable Participating Unitholders at Mid Market Prices – – 11,089,197 31,695,700 134,629,256
5Spectrum Global Capital Securities Fund terminated on 5 December 2017.
6Global Capital Structure Opportunities Fund terminated on 14 September 2018.
Signed on behalf of Principal Global Investors (Ireland) Limited on 28 January 2019. Director:______________________________ Director:_______________________________
The accompanying notes form an integral part of these financial statements.
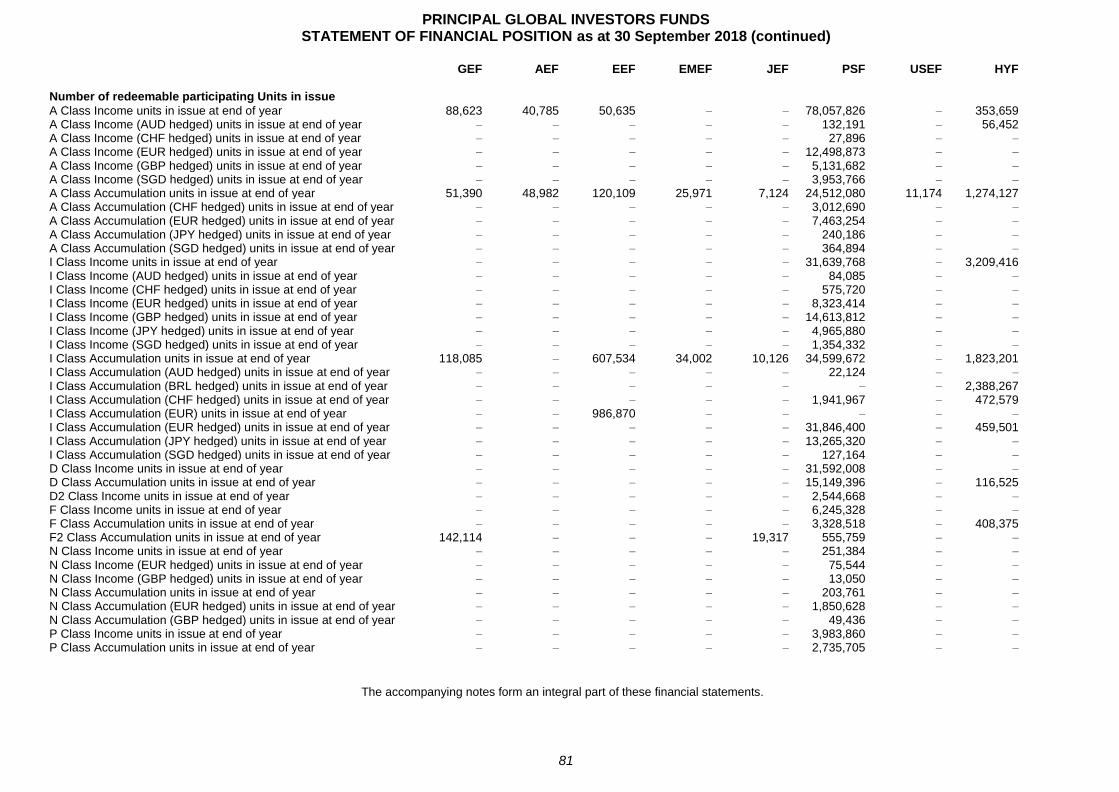
PRINCIPAL GLOBAL INVESTORS FUNDS STATEMENT OF FINANCIAL POSITION as at 30 September 2018 (continued)
81
GEF AEF EEF EMEF JEF PSF USEF HYF
Number of redeemable participating Units in issue A Class Income units in issue at end of year 88,623 40,785 50,635 – – 78,057,826 – 353,659 A Class Income (AUD hedged) units in issue at end of year – – – – – 132,191 – 56,452 A Class Income (CHF hedged) units in issue at end of year – – – – – 27,896 – –
A Class Income (EUR hedged) units in issue at end of year – – – – – 12,498,873 – –
A Class Income (GBP hedged) units in issue at end of year – – – – – 5,131,682 – –
A Class Income (SGD hedged) units in issue at end of year – – – – – 3,953,766 – –
A Class Accumulation units in issue at end of year 51,390 48,982 120,109 25,971 7,124 24,512,080 11,174 1,274,127 A Class Accumulation (CHF hedged) units in issue at end of year – – – – – 3,012,690 – –
A Class Accumulation (EUR hedged) units in issue at end of year – – – – – 7,463,254 – –
A Class Accumulation (JPY hedged) units in issue at end of year – – – – – 240,186 – –
A Class Accumulation (SGD hedged) units in issue at end of year – – – – – 364,894 – –
I Class Income units in issue at end of year – – – – – 31,639,768 – 3,209,416 I Class Income (AUD hedged) units in issue at end of year – – – – – 84,085 – –
I Class Income (CHF hedged) units in issue at end of year – – – – – 575,720 – –
I Class Income (EUR hedged) units in issue at end of year – – – – – 8,323,414 – –
I Class Income (GBP hedged) units in issue at end of year – – – – – 14,613,812 – –
I Class Income (JPY hedged) units in issue at end of year – – – – – 4,965,880 – –
I Class Income (SGD hedged) units in issue at end of year – – – – – 1,354,332 – –
I Class Accumulation units in issue at end of year 118,085 – 607,534 34,002 10,126 34,599,672 – 1,823,201 I Class Accumulation (AUD hedged) units in issue at end of year – – – – – 22,124 – –
I Class Accumulation (BRL hedged) units in issue at end of year – – – – – – – 2,388,267 I Class Accumulation (CHF hedged) units in issue at end of year – – – – – 1,941,967 – 472,579 I Class Accumulation (EUR) units in issue at end of year – – 986,870 – – – – –
I Class Accumulation (EUR hedged) units in issue at end of year – – – – – 31,846,400 – 459,501 I Class Accumulation (JPY hedged) units in issue at end of year – – – – – 13,265,320 – –
I Class Accumulation (SGD hedged) units in issue at end of year – – – – – 127,164 – –
D Class Income units in issue at end of year – – – – – 31,592,008 – –
D Class Accumulation units in issue at end of year – – – – – 15,149,396 – 116,525 D2 Class Income units in issue at end of year – – – – – 2,544,668 – –
F Class Income units in issue at end of year – – – – – 6,245,328 – –
F Class Accumulation units in issue at end of year – – – – – 3,328,518 – 408,375 F2 Class Accumulation units in issue at end of year 142,114 – – – 19,317 555,759 – –
N Class Income units in issue at end of year – – – – – 251,384 – –
N Class Income (EUR hedged) units in issue at end of year – – – – – 75,544 – –
N Class Income (GBP hedged) units in issue at end of year – – – – – 13,050 – –
N Class Accumulation units in issue at end of year – – – – – 203,761 – –
N Class Accumulation (EUR hedged) units in issue at end of year – – – – – 1,850,628 – –
N Class Accumulation (GBP hedged) units in issue at end of year – – – – – 49,436 – –
P Class Income units in issue at end of year – – – – – 3,983,860 – –
P Class Accumulation units in issue at end of year – – – – – 2,735,705 – –
The accompanying notes form an integral part of these financial statements.
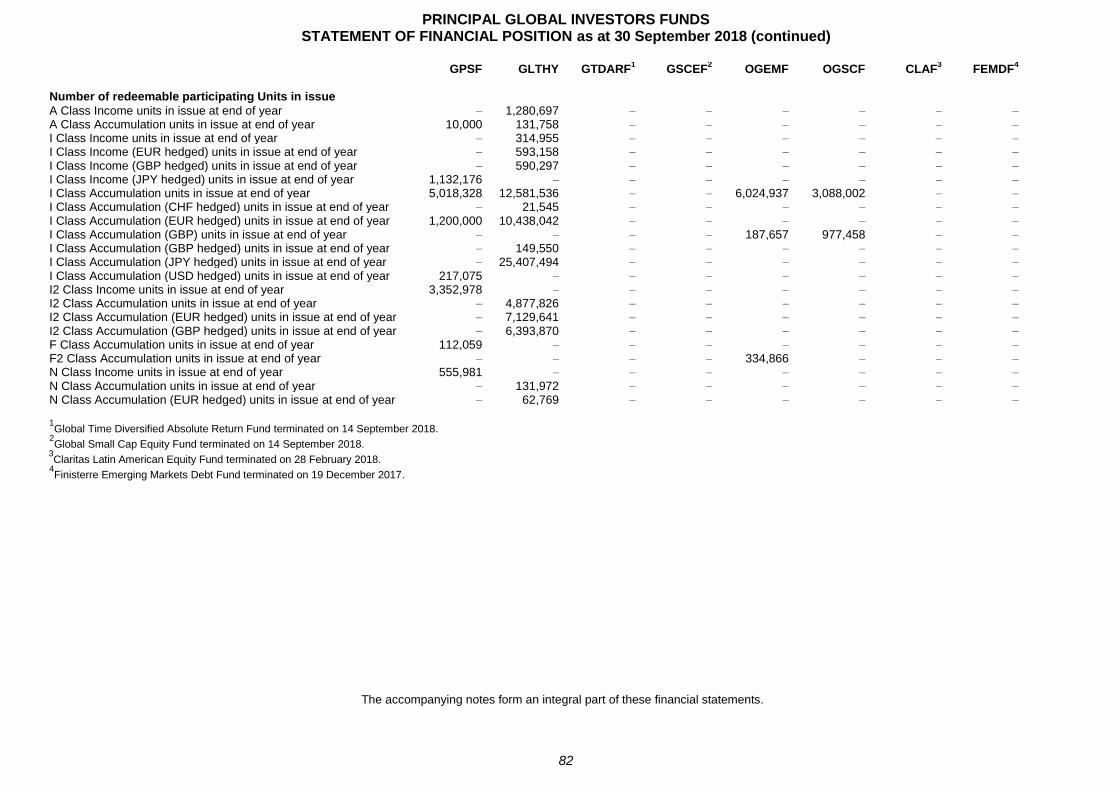
PRINCIPAL GLOBAL INVESTORS FUNDS STATEMENT OF FINANCIAL POSITION as at 30 September 2018 (continued)
82
GPSF GLTHY GTDARF1 GSCEF
2 OGEMF OGSCF CLAF
3 FEMDF
4
Number of redeemable participating Units in issue A Class Income units in issue at end of year – 1,280,697 – – – – – –
A Class Accumulation units in issue at end of year 10,000 131,758 – – – – – –
I Class Income units in issue at end of year – 314,955 – – – – – –
I Class Income (EUR hedged) units in issue at end of year – 593,158 – – – – – –
I Class Income (GBP hedged) units in issue at end of year – 590,297 – – – – – –
I Class Income (JPY hedged) units in issue at end of year 1,132,176 – – – – – – –
I Class Accumulation units in issue at end of year 5,018,328 12,581,536 – – 6,024,937 3,088,002 – –
I Class Accumulation (CHF hedged) units in issue at end of year – 21,545 – – – – – –
I Class Accumulation (EUR hedged) units in issue at end of year 1,200,000 10,438,042 – – – – – –
I Class Accumulation (GBP) units in issue at end of year – – – – 187,657 977,458 – –
I Class Accumulation (GBP hedged) units in issue at end of year – 149,550 – – – – – –
I Class Accumulation (JPY hedged) units in issue at end of year – 25,407,494 – – – – – –
I Class Accumulation (USD hedged) units in issue at end of year 217,075 – – – – – – –
I2 Class Income units in issue at end of year 3,352,978 – – – – – – –
I2 Class Accumulation units in issue at end of year – 4,877,826 – – – – – –
I2 Class Accumulation (EUR hedged) units in issue at end of year – 7,129,641 – – – – – –
I2 Class Accumulation (GBP hedged) units in issue at end of year – 6,393,870 – – – – – –
F Class Accumulation units in issue at end of year 112,059 – – – – – – –
F2 Class Accumulation units in issue at end of year – – – – 334,866 – – –
N Class Income units in issue at end of year 555,981 – – – – – – –
N Class Accumulation units in issue at end of year – 131,972 – – – – – –
N Class Accumulation (EUR hedged) units in issue at end of year – 62,769 – – – – – –
1Global Time Diversified Absolute Return Fund terminated on 14 September 2018.
2Global Small Cap Equity Fund terminated on 14 September 2018.
3Claritas Latin American Equity Fund terminated on 28 February 2018.
4Finisterre Emerging Markets Debt Fund terminated on 19 December 2017.
The accompanying notes form an integral part of these financial statements.
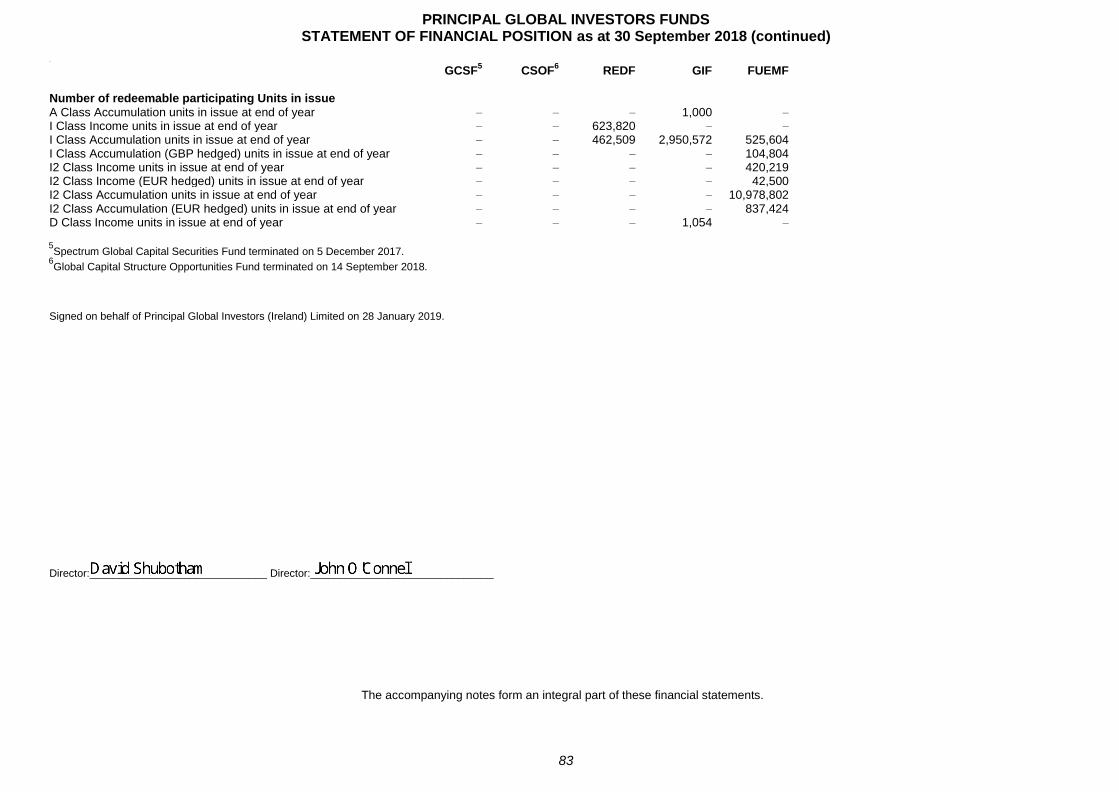
PRINCIPAL GLOBAL INVESTORS FUNDS STATEMENT OF FINANCIAL POSITION as at 30 September 2018 (continued)
83
ba
GCSF5 CSOF
6 REDF GIF FUEMF
Number of redeemable participating Units in issue A Class Accumulation units in issue at end of year – – – 1,000 –
I Class Income units in issue at end of year – – 623,820 – –
I Class Accumulation units in issue at end of year – – 462,509 2,950,572 525,604 I Class Accumulation (GBP hedged) units in issue at end of year – – – – 104,804 I2 Class Income units in issue at end of year – – – – 420,219 I2 Class Income (EUR hedged) units in issue at end of year – – – – 42,500 I2 Class Accumulation units in issue at end of year – – – – 10,978,802 I2 Class Accumulation (EUR hedged) units in issue at end of year – – – – 837,424 D Class Income units in issue at end of year – – – 1,054 –
5Spectrum Global Capital Securities Fund terminated on 5 December 2017.
6Global Capital Structure Opportunities Fund terminated on 14 September 2018.
Signed on behalf of Principal Global Investors (Ireland) Limited on 28 January 2019. Director:______________________________ Director:_______________________________
The accompanying notes form an integral part of these financial statements.
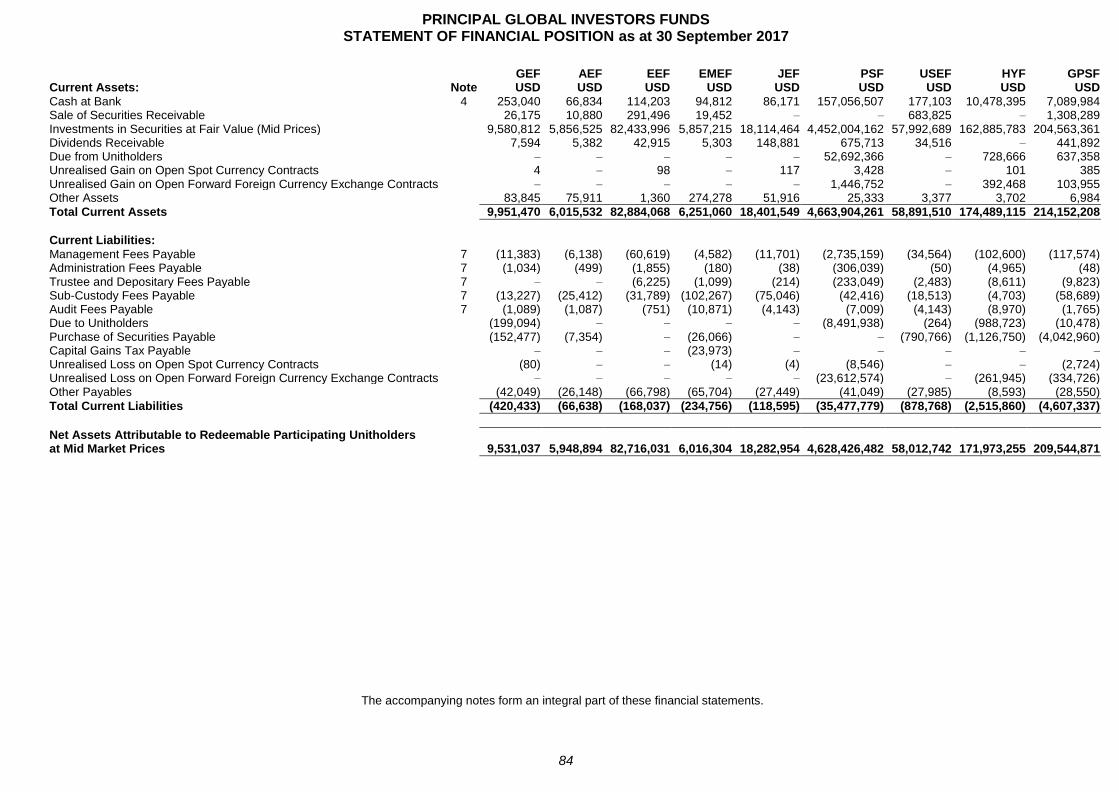
PRINCIPAL GLOBAL INVESTORS FUNDS STATEMENT OF FINANCIAL POSITION as at 30 September 2017
84
GEF AEF EEF EMEF JEF PSF USEF HYF GPSF Current Assets: Note USD USD USD USD USD USD USD USD USD
Cash at Bank 4 253,040 66,834 114,203 94,812 86,171 157,056,507 177,103 10,478,395 7,089,984 Sale of Securities Receivable 26,175 10,880 291,496 19,452 – – 683,825 – 1,308,289 Investments in Securities at Fair Value (Mid Prices) 9,580,812 5,856,525 82,433,996 5,857,215 18,114,464 4,452,004,162 57,992,689 162,885,783 204,563,361 Dividends Receivable 7,594 5,382 42,915 5,303 148,881 675,713 34,516 – 441,892 Due from Unitholders – – – – – 52,692,366 – 728,666 637,358 Unrealised Gain on Open Spot Currency Contracts 4 – 98 – 117 3,428 – 101 385 Unrealised Gain on Open Forward Foreign Currency Exchange Contracts – – – – – 1,446,752 – 392,468 103,955 Other Assets 83,845 75,911 1,360 274,278 51,916 25,333 3,377 3,702 6,984
Total Current Assets 9,951,470 6,015,532 82,884,068 6,251,060 18,401,549 4,663,904,261 58,891,510 174,489,115 214,152,208
Current Liabilities: Management Fees Payable 7 (11,383) (6,138) (60,619) (4,582) (11,701) (2,735,159) (34,564) (102,600) (117,574) Administration Fees Payable 7 (1,034) (499) (1,855) (180) (38) (306,039) (50) (4,965) (48) Trustee and Depositary Fees Payable 7 – – (6,225) (1,099) (214) (233,049) (2,483) (8,611) (9,823) Sub-Custody Fees Payable 7 (13,227) (25,412) (31,789) (102,267) (75,046) (42,416) (18,513) (4,703) (58,689) Audit Fees Payable 7 (1,089) (1,087) (751) (10,871) (4,143) (7,009) (4,143) (8,970) (1,765) Due to Unitholders (199,094) – – – – (8,491,938) (264) (988,723) (10,478) Purchase of Securities Payable (152,477) (7,354) – (26,066) – – (790,766) (1,126,750) (4,042,960) Capital Gains Tax Payable – – – (23,973) – – – – –
Unrealised Loss on Open Spot Currency Contracts (80) – – (14) (4) (8,546) – – (2,724) Unrealised Loss on Open Forward Foreign Currency Exchange Contracts – – – – – (23,612,574) – (261,945) (334,726) Other Payables (42,049) (26,148) (66,798) (65,704) (27,449) (41,049) (27,985) (8,593) (28,550)
Total Current Liabilities (420,433) (66,638) (168,037) (234,756) (118,595) (35,477,779) (878,768) (2,515,860) (4,607,337)
Net Assets Attributable to Redeemable Participating Unitholders at Mid Market Prices 9,531,037 5,948,894 82,716,031 6,016,304 18,282,954 4,628,426,482 58,012,742 171,973,255 209,544,871
The accompanying notes form an integral part of these financial statements.
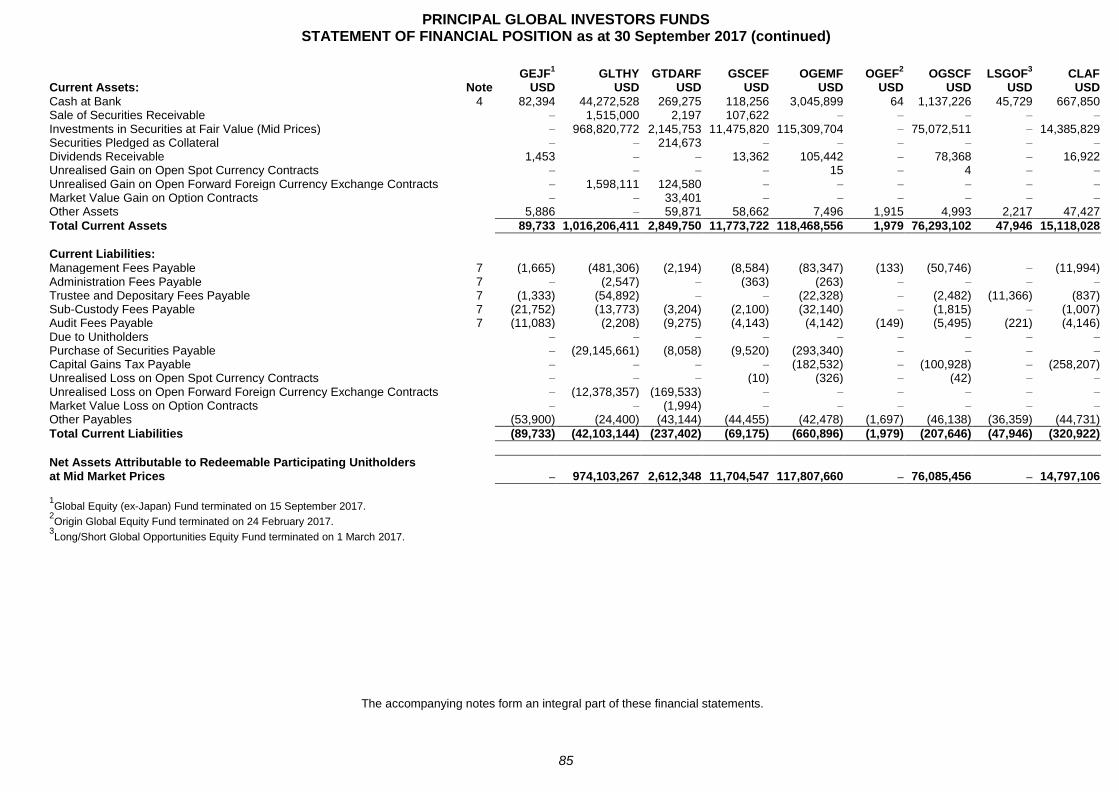
PRINCIPAL GLOBAL INVESTORS FUNDS STATEMENT OF FINANCIAL POSITION as at 30 September 2017 (continued)
85
GEJF1 GLTHY GTDARF GSCEF OGEMF OGEF
2 OGSCF LSGOF
3 CLAF
Current Assets: Note USD USD USD USD USD USD USD USD USD
Cash at Bank 4 82,394 44,272,528 269,275 118,256 3,045,899 64 1,137,226 45,729 667,850 Sale of Securities Receivable – 1,515,000 2,197 107,622 – – – – –
Investments in Securities at Fair Value (Mid Prices) – 968,820,772 2,145,753 11,475,820 115,309,704 – 75,072,511 – 14,385,829 Securities Pledged as Collateral – – 214,673 – – – – – –
Dividends Receivable 1,453 – – 13,362 105,442 – 78,368 – 16,922 Unrealised Gain on Open Spot Currency Contracts – – – – 15 – 4 – –
Unrealised Gain on Open Forward Foreign Currency Exchange Contracts – 1,598,111 124,580 – – – – – –
Market Value Gain on Option Contracts – – 33,401 – – – – – –
Other Assets 5,886 – 59,871 58,662 7,496 1,915 4,993 2,217 47,427
Total Current Assets 89,733 1,016,206,411 2,849,750 11,773,722 118,468,556 1,979 76,293,102 47,946 15,118,028
Current Liabilities: Management Fees Payable 7 (1,665) (481,306) (2,194) (8,584) (83,347) (133) (50,746) – (11,994) Administration Fees Payable 7 – (2,547) – (363) (263) – – – –
Trustee and Depositary Fees Payable 7 (1,333) (54,892) – – (22,328) – (2,482) (11,366) (837) Sub-Custody Fees Payable 7 (21,752) (13,773) (3,204) (2,100) (32,140) – (1,815) – (1,007) Audit Fees Payable 7 (11,083) (2,208) (9,275) (4,143) (4,142) (149) (5,495) (221) (4,146) Due to Unitholders – – – – – – – – –
Purchase of Securities Payable – (29,145,661) (8,058) (9,520) (293,340) – – – –
Capital Gains Tax Payable – – – – (182,532) – (100,928) – (258,207) Unrealised Loss on Open Spot Currency Contracts – – – (10) (326) – (42) – –
Unrealised Loss on Open Forward Foreign Currency Exchange Contracts – (12,378,357) (169,533) – – – – – –
Market Value Loss on Option Contracts – – (1,994) – – – – – –
Other Payables (53,900) (24,400) (43,144) (44,455) (42,478) (1,697) (46,138) (36,359) (44,731)
Total Current Liabilities (89,733) (42,103,144) (237,402) (69,175) (660,896) (1,979) (207,646) (47,946) (320,922)
Net Assets Attributable to Redeemable Participating Unitholders at Mid Market Prices – 974,103,267 2,612,348 11,704,547 117,807,660 – 76,085,456 – 14,797,106
1Global Equity (ex-Japan) Fund terminated on 15 September 2017.
2Origin Global Equity Fund terminated on 24 February 2017.
3Long/Short Global Opportunities Equity Fund terminated on 1 March 2017.
The accompanying notes form an integral part of these financial statements.
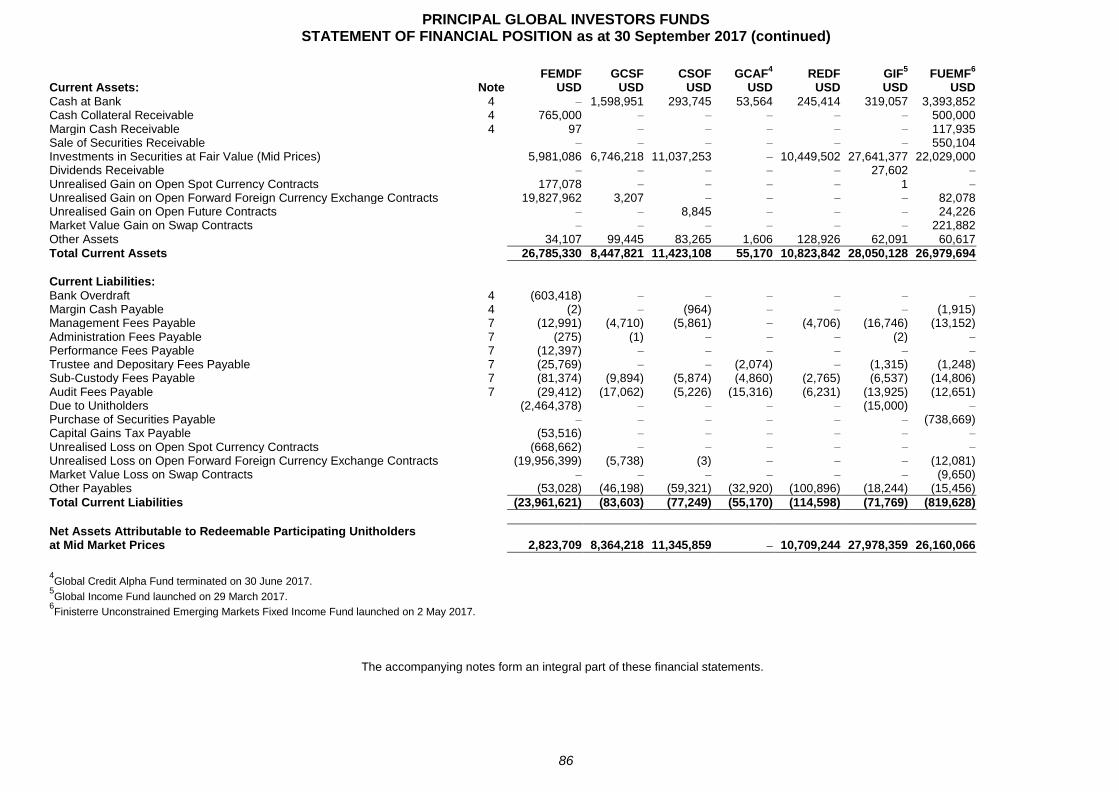
PRINCIPAL GLOBAL INVESTORS FUNDS STATEMENT OF FINANCIAL POSITION as at 30 September 2017 (continued)
86
FEMDF GCSF CSOF GCAF4 REDF GIF
5 FUEMF
6
Current Assets: Note USD USD USD USD USD USD USD
Cash at Bank 4 – 1,598,951 293,745 53,564 245,414 319,057 3,393,852 Cash Collateral Receivable 4 765,000 – – – – – 500,000 Margin Cash Receivable 4 97 – – – – – 117,935 Sale of Securities Receivable – – – – – – 550,104 Investments in Securities at Fair Value (Mid Prices) 5,981,086 6,746,218 11,037,253 – 10,449,502 27,641,377 22,029,000 Dividends Receivable – – – – – 27,602 –
Unrealised Gain on Open Spot Currency Contracts 177,078 – – – – 1 –
Unrealised Gain on Open Forward Foreign Currency Exchange Contracts 19,827,962 3,207 – – – – 82,078 Unrealised Gain on Open Future Contracts – – 8,845 – – – 24,226 Market Value Gain on Swap Contracts – – – – – – 221,882 Other Assets 34,107 99,445 83,265 1,606 128,926 62,091 60,617
Total Current Assets 26,785,330 8,447,821 11,423,108 55,170 10,823,842 28,050,128 26,979,694
Current Liabilities: Bank Overdraft 4 (603,418) – – – – – –
Margin Cash Payable 4 (2) – (964) – – – (1,915) Management Fees Payable 7 (12,991) (4,710) (5,861) – (4,706) (16,746) (13,152) Administration Fees Payable 7 (275) (1) – – – (2) –
Performance Fees Payable 7 (12,397) – – – – – –
Trustee and Depositary Fees Payable 7 (25,769) – – (2,074) – (1,315) (1,248) Sub-Custody Fees Payable 7 (81,374) (9,894) (5,874) (4,860) (2,765) (6,537) (14,806) Audit Fees Payable 7 (29,412) (17,062) (5,226) (15,316) (6,231) (13,925) (12,651) Due to Unitholders (2,464,378) – – – – (15,000) –
Purchase of Securities Payable – – – – – – (738,669) Capital Gains Tax Payable (53,516) – – – – – –
Unrealised Loss on Open Spot Currency Contracts (668,662) – – – – – –
Unrealised Loss on Open Forward Foreign Currency Exchange Contracts (19,956,399) (5,738) (3) – – – (12,081) Market Value Loss on Swap Contracts – – – – – – (9,650) Other Payables (53,028) (46,198) (59,321) (32,920) (100,896) (18,244) (15,456)
Total Current Liabilities (23,961,621) (83,603) (77,249) (55,170) (114,598) (71,769) (819,628)
Net Assets Attributable to Redeemable Participating Unitholders at Mid Market Prices 2,823,709 8,364,218 11,345,859 – 10,709,244 27,978,359 26,160,066
4Global Credit Alpha Fund terminated on 30 June 2017.
5Global Income Fund launched on 29 March 2017.
6Finisterre Unconstrained Emerging Markets Fixed Income Fund launched on 2 May 2017.
The accompanying notes form an integral part of these financial statements.
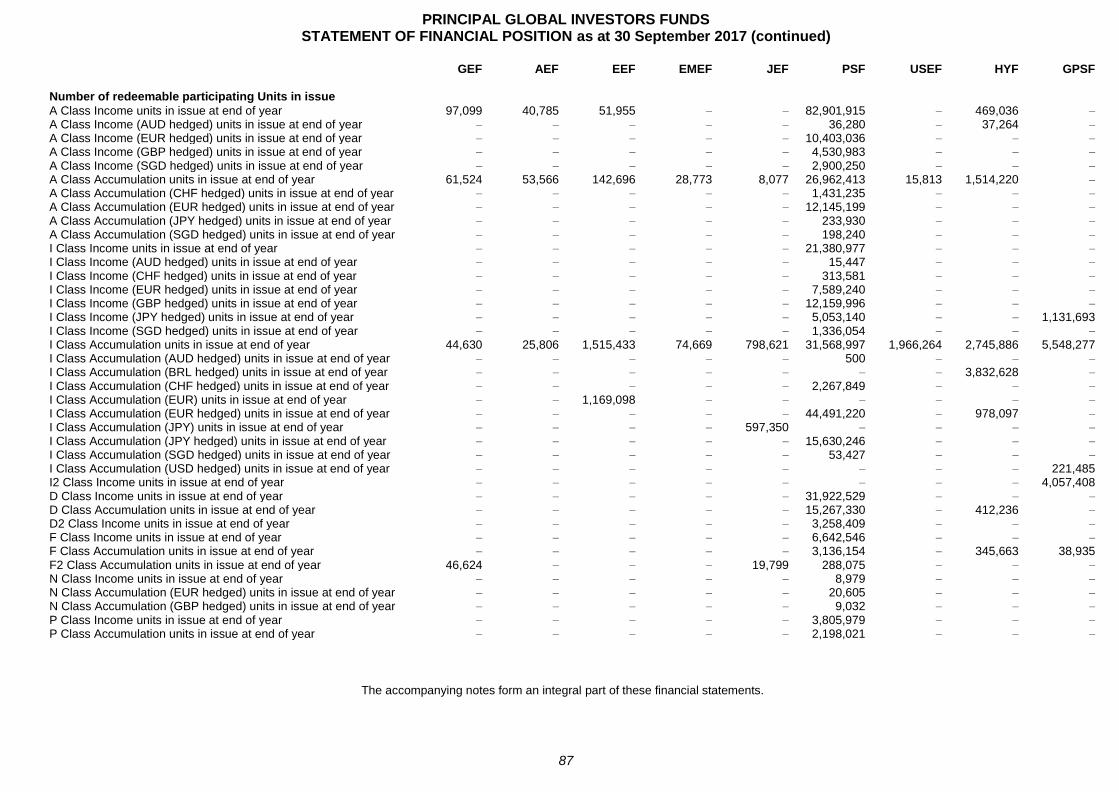
PRINCIPAL GLOBAL INVESTORS FUNDS STATEMENT OF FINANCIAL POSITION as at 30 September 2017 (continued)
87
GEF AEF EEF EMEF JEF PSF USEF HYF GPSF
Number of redeemable participating Units in issue A Class Income units in issue at end of year 97,099 40,785 51,955 – – 82,901,915 – 469,036 –
A Class Income (AUD hedged) units in issue at end of year – – – – – 36,280 – 37,264 –
A Class Income (EUR hedged) units in issue at end of year – – – – – 10,403,036 – – –
A Class Income (GBP hedged) units in issue at end of year – – – – – 4,530,983 – – –
A Class Income (SGD hedged) units in issue at end of year – – – – – 2,900,250 – – –
A Class Accumulation units in issue at end of year 61,524 53,566 142,696 28,773 8,077 26,962,413 15,813 1,514,220 –
A Class Accumulation (CHF hedged) units in issue at end of year – – – – – 1,431,235 – – –
A Class Accumulation (EUR hedged) units in issue at end of year – – – – – 12,145,199 – – –
A Class Accumulation (JPY hedged) units in issue at end of year – – – – – 233,930 – – –
A Class Accumulation (SGD hedged) units in issue at end of year – – – – – 198,240 – – –
I Class Income units in issue at end of year – – – – – 21,380,977 – – –
I Class Income (AUD hedged) units in issue at end of year – – – – – 15,447 – – –
I Class Income (CHF hedged) units in issue at end of year – – – – – 313,581 – – –
I Class Income (EUR hedged) units in issue at end of year – – – – – 7,589,240 – – –
I Class Income (GBP hedged) units in issue at end of year – – – – – 12,159,996 – – –
I Class Income (JPY hedged) units in issue at end of year – – – – – 5,053,140 – – 1,131,693 I Class Income (SGD hedged) units in issue at end of year – – – – – 1,336,054 – – –
I Class Accumulation units in issue at end of year 44,630 25,806 1,515,433 74,669 798,621 31,568,997 1,966,264 2,745,886 5,548,277 I Class Accumulation (AUD hedged) units in issue at end of year – – – – – 500 – – –
I Class Accumulation (BRL hedged) units in issue at end of year – – – – – – – 3,832,628 –
I Class Accumulation (CHF hedged) units in issue at end of year – – – – – 2,267,849 – – –
I Class Accumulation (EUR) units in issue at end of year – – 1,169,098 – – – – – –
I Class Accumulation (EUR hedged) units in issue at end of year – – – – – 44,491,220 – 978,097 –
I Class Accumulation (JPY) units in issue at end of year – – – – 597,350 – – – –
I Class Accumulation (JPY hedged) units in issue at end of year – – – – – 15,630,246 – – –
I Class Accumulation (SGD hedged) units in issue at end of year – – – – – 53,427 – – –
I Class Accumulation (USD hedged) units in issue at end of year – – – – – – – – 221,485 I2 Class Income units in issue at end of year – – – – – – – – 4,057,408 D Class Income units in issue at end of year – – – – – 31,922,529 – – –
D Class Accumulation units in issue at end of year – – – – – 15,267,330 – 412,236 –
D2 Class Income units in issue at end of year – – – – – 3,258,409 – – –
F Class Income units in issue at end of year – – – – – 6,642,546 – – –
F Class Accumulation units in issue at end of year – – – – – 3,136,154 – 345,663 38,935 F2 Class Accumulation units in issue at end of year 46,624 – – – 19,799 288,075 – – –
N Class Income units in issue at end of year – – – – – 8,979 – – –
N Class Accumulation (EUR hedged) units in issue at end of year – – – – – 20,605 – – –
N Class Accumulation (GBP hedged) units in issue at end of year – – – – – 9,032 – – –
P Class Income units in issue at end of year – – – – – 3,805,979 – – –
P Class Accumulation units in issue at end of year – – – – – 2,198,021 – – –
The accompanying notes form an integral part of these financial statements.
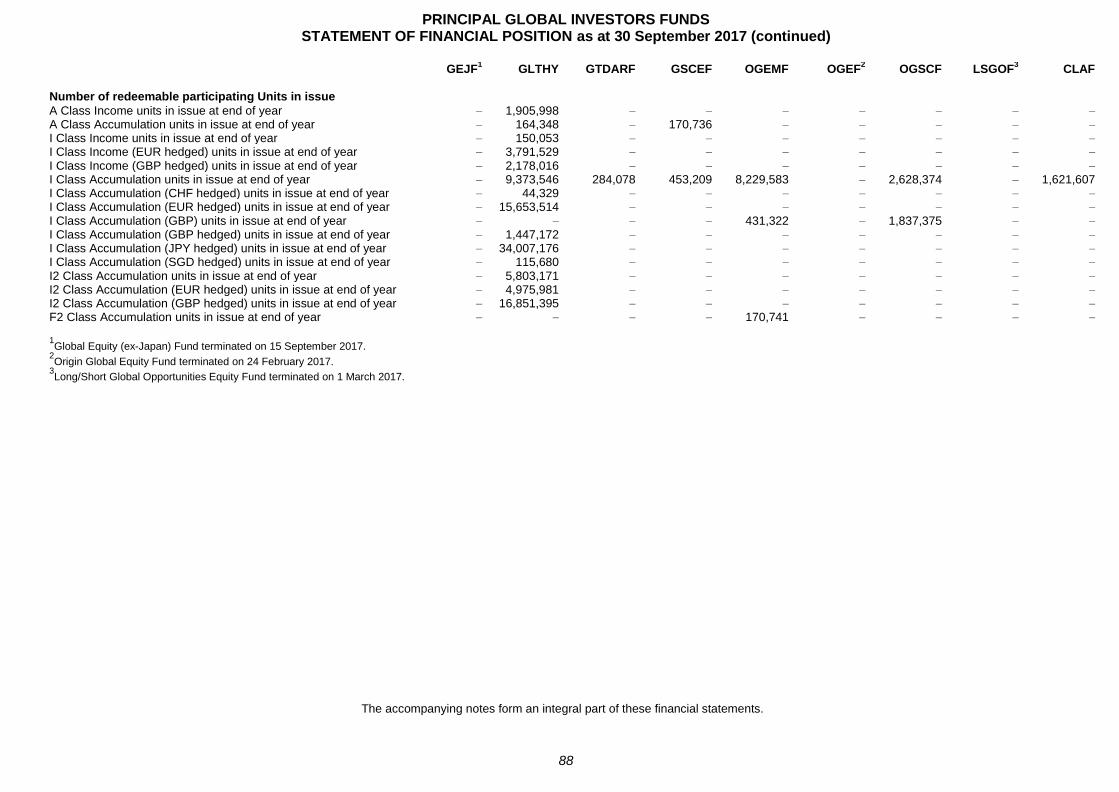
PRINCIPAL GLOBAL INVESTORS FUNDS STATEMENT OF FINANCIAL POSITION as at 30 September 2017 (continued)
88
GEJF1 GLTHY GTDARF GSCEF OGEMF OGEF
2 OGSCF LSGOF
3 CLAF
Number of redeemable participating Units in issue A Class Income units in issue at end of year – 1,905,998 – – – – – – –
A Class Accumulation units in issue at end of year – 164,348 – 170,736 – – – – –
I Class Income units in issue at end of year – 150,053 – – – – – – –
I Class Income (EUR hedged) units in issue at end of year – 3,791,529 – – – – – – –
I Class Income (GBP hedged) units in issue at end of year – 2,178,016 – – – – – – –
I Class Accumulation units in issue at end of year – 9,373,546 284,078 453,209 8,229,583 – 2,628,374 – 1,621,607 I Class Accumulation (CHF hedged) units in issue at end of year – 44,329 – – – – – – –
I Class Accumulation (EUR hedged) units in issue at end of year – 15,653,514 – – – – – – –
I Class Accumulation (GBP) units in issue at end of year – – – – 431,322 – 1,837,375 – –
I Class Accumulation (GBP hedged) units in issue at end of year – 1,447,172 – – – – – – –
I Class Accumulation (JPY hedged) units in issue at end of year – 34,007,176 – – – – – – –
I Class Accumulation (SGD hedged) units in issue at end of year – 115,680 – – – – – – –
I2 Class Accumulation units in issue at end of year – 5,803,171 – – – – – – –
I2 Class Accumulation (EUR hedged) units in issue at end of year – 4,975,981 – – – – – – –
I2 Class Accumulation (GBP hedged) units in issue at end of year – 16,851,395 – – – – – – –
F2 Class Accumulation units in issue at end of year – – – – 170,741 – – – –
1Global Equity (ex-Japan) Fund terminated on 15 September 2017.
2Origin Global Equity Fund terminated on 24 February 2017.
3Long/Short Global Opportunities Equity Fund terminated on 1 March 2017.
The accompanying notes form an integral part of these financial statements.
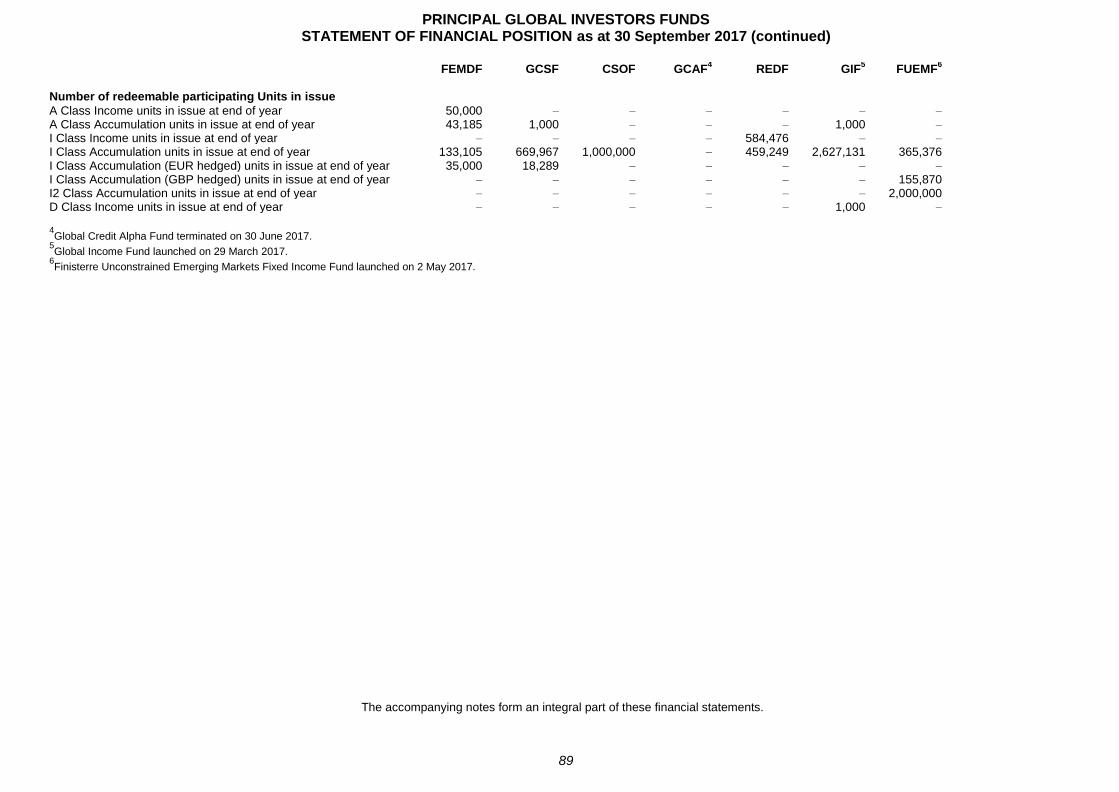
PRINCIPAL GLOBAL INVESTORS FUNDS STATEMENT OF FINANCIAL POSITION as at 30 September 2017 (continued)
89
FEMDF GCSF CSOF GCAF4 REDF GIF
5 FUEMF
6
Number of redeemable participating Units in issue A Class Income units in issue at end of year 50,000 – – – – – –
A Class Accumulation units in issue at end of year 43,185 1,000 – – – 1,000 –
I Class Income units in issue at end of year – – – – 584,476 – –
I Class Accumulation units in issue at end of year 133,105 669,967 1,000,000 – 459,249 2,627,131 365,376 I Class Accumulation (EUR hedged) units in issue at end of year 35,000 18,289 – – – – –
I Class Accumulation (GBP hedged) units in issue at end of year – – – – – – 155,870 I2 Class Accumulation units in issue at end of year – – – – – – 2,000,000 D Class Income units in issue at end of year – – – – – 1,000 –
4Global Credit Alpha Fund terminated on 30 June 2017.
5Global Income Fund launched on 29 March 2017.
6Finisterre Unconstrained Emerging Markets Fixed Income Fund launched on 2 May 2017.
The accompanying notes form an integral part of these financial statements.
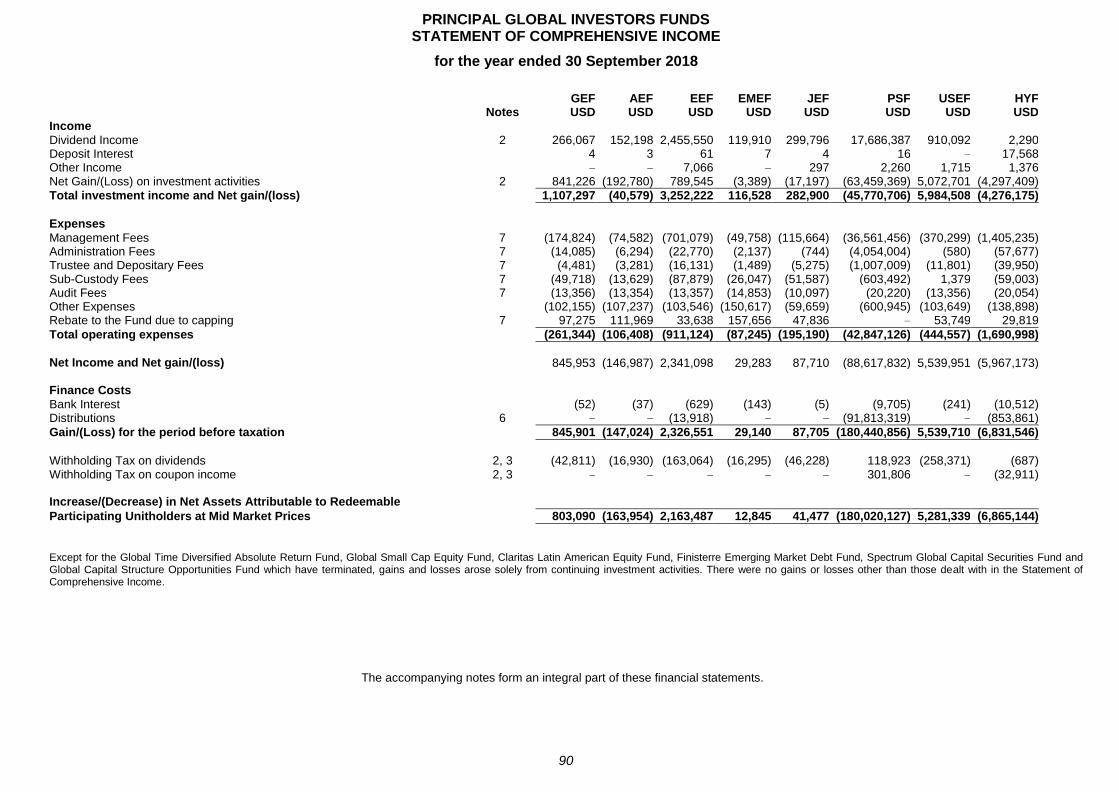
PRINCIPAL GLOBAL INVESTORS FUNDS STATEMENT OF COMPREHENSIVE INCOME
for the year ended 30 September 2018
90
GEF AEF EEF EMEF JEF PSF USEF HYF Notes USD USD USD USD USD USD USD USD Income 0 Dividend Income 2 266,067 152,198 2,455,550 119,910 299,796 17,686,387 910,092 2,290 Deposit Interest 0 4 3 61 7 4 16 – 17,568 Other Income 0 – – 7,066 – 297 2,260 1,715 1,376 Net Gain/(Loss) on investment activities 2 841,226 (192,780) 789,545 (3,389) (17,197) (63,459,369) 5,072,701 (4,297,409)
Total investment income and Net gain/(loss) 0 1,107,297 (40,579) 3,252,222 116,528 282,900 (45,770,706) 5,984,508 (4,276,175)
0 Expenses 0 Management Fees 7 (174,824) (74,582) (701,079) (49,758) (115,664) (36,561,456) (370,299) (1,405,235) Administration Fees 7 (14,085) (6,294) (22,770) (2,137) (744) (4,054,004) (580) (57,677) Trustee and Depositary Fees 7 (4,481) (3,281) (16,131) (1,489) (5,275) (1,007,009) (11,801) (39,950) Sub-Custody Fees 7 (49,718) (13,629) (87,879) (26,047) (51,587) (603,492) 1,379 (59,003) Audit Fees 7 (13,356) (13,354) (13,357) (14,853) (10,097) (20,220) (13,356) (20,054) Other Expenses 0 (102,155) (107,237) (103,546) (150,617) (59,659) (600,945) (103,649) (138,898) Rebate to the Fund due to capping 7 97,275 111,969 33,638 157,656 47,836 – 53,749 29,819
Total operating expenses 0 (261,344) (106,408) (911,124) (87,245) (195,190) (42,847,126) (444,557) (1,690,998)
0 Net Income and Net gain/(loss) 0 845,953 (146,987) 2,341,098 29,283 87,710 (88,617,832) 5,539,951 (5,967,173) 0 Finance Costs Bank Interest 0 (52) (37) (629) (143) (5) (9,705) (241) (10,512) Distributions 6 – – (13,918) – – (91,813,319) – (853,861)
Gain/(Loss) for the period before taxation 0 845,901 (147,024) 2,326,551 29,140 87,705 (180,440,856) 5,539,710 (6,831,546)
0 Withholding Tax on dividends 2, 3 (42,811) (16,930) (163,064) (16,295) (46,228) 118,923 (258,371) (687) Withholding Tax on coupon income 2, 3 – – – – – 301,806 – (32,911) 0 Increase/(Decrease) in Net Assets Attributable to Redeemable
Participating Unitholders at Mid Market Prices 0 803,090 (163,954) 2,163,487 12,845 41,477 (180,020,127) 5,281,339 (6,865,144)
0
Except for the Global Time Diversified Absolute Return Fund, Global Small Cap Equity Fund, Claritas Latin American Equity Fund, Finisterre Emerging Market Debt Fund, Spectrum Global Capital Securities Fund and Global Capital Structure Opportunities Fund which have terminated, gains and losses arose solely from continuing investment activities. There were no gains or losses other than those dealt with in the Statement of Comprehensive Income.
The accompanying notes form an integral part of these financial statements.
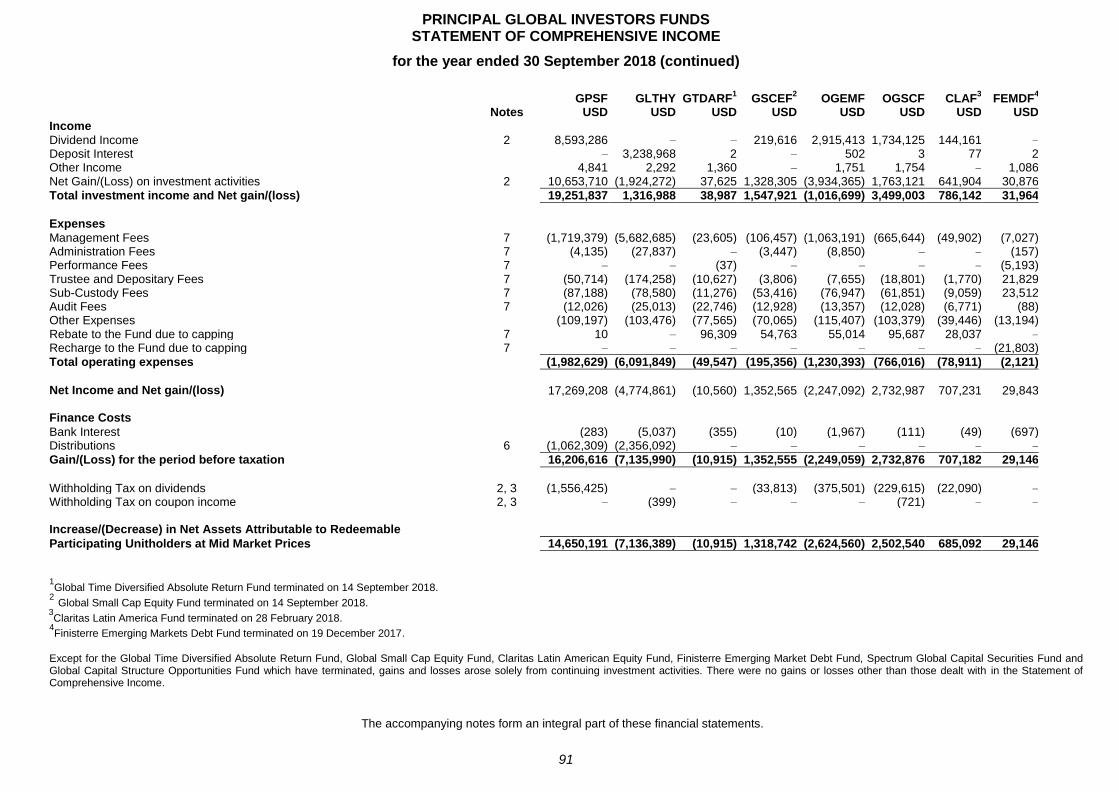
PRINCIPAL GLOBAL INVESTORS FUNDS STATEMENT OF COMPREHENSIVE INCOME
for the year ended 30 September 2018 (continued)
91
GPSF GLTHY GTDARF1 GSCEF
2 OGEMF OGSCF CLAF
3 FEMDF
4
Notes USD USD USD USD USD USD USD USD Income 0 Dividend Income 2 8,593,286 – – 219,616 2,915,413 1,734,125 144,161 –
Deposit Interest 0 – 3,238,968 2 – 502 3 77 2 Other Income 0 4,841 2,292 1,360 – 1,751 1,754 – 1,086 Net Gain/(Loss) on investment activities 2 10,653,710 (1,924,272) 37,625 1,328,305 (3,934,365) 1,763,121 641,904 30,876
Total investment income and Net gain/(loss) 0 19,251,837 1,316,988 38,987 1,547,921 (1,016,699) 3,499,003 786,142 31,964
0 Expenses 0 Management Fees 7 (1,719,379) (5,682,685) (23,605) (106,457) (1,063,191) (665,644) (49,902) (7,027) Administration Fees 7 (4,135) (27,837) – (3,447) (8,850) – – (157) Performance Fees 7 – – (37) – – – – (5,193) Trustee and Depositary Fees 7 (50,714) (174,258) (10,627) (3,806) (7,655) (18,801) (1,770) 21,829 Sub-Custody Fees 7 (87,188) (78,580) (11,276) (53,416) (76,947) (61,851) (9,059) 23,512 Audit Fees 7 (12,026) (25,013) (22,746) (12,928) (13,357) (12,028) (6,771) (88) Other Expenses 0 (109,197) (103,476) (77,565) (70,065) (115,407) (103,379) (39,446) (13,194) Rebate to the Fund due to capping 7 10 – 96,309 54,763 55,014 95,687 28,037 –
Recharge to the Fund due to capping 7 – – – – – – – (21,803)
Total operating expenses 0 (1,982,629) (6,091,849) (49,547) (195,356) (1,230,393) (766,016) (78,911) (2,121)
0 Net Income and Net gain/(loss) 0 17,269,208 (4,774,861) (10,560) 1,352,565 (2,247,092) 2,732,987 707,231 29,843 0 Finance Costs Bank Interest 0 (283) (5,037) (355) (10) (1,967) (111) (49) (697) Distributions 6 (1,062,309) (2,356,092) – – – – – –
Gain/(Loss) for the period before taxation 0 16,206,616 (7,135,990) (10,915) 1,352,555 (2,249,059) 2,732,876 707,182 29,146
0 Withholding Tax on dividends 2, 3 (1,556,425) – – (33,813) (375,501) (229,615) (22,090) –
Withholding Tax on coupon income 2, 3 – (399) – – – (721) – –
0 Increase/(Decrease) in Net Assets Attributable to Redeemable
Participating Unitholders at Mid Market Prices 0 14,650,191 (7,136,389) (10,915) 1,318,742 (2,624,560) 2,502,540 685,092 29,146
0
1Global Time Diversified Absolute Return Fund terminated on 14 September 2018.
2 Global Small Cap Equity Fund terminated on 14 September 2018. 3Claritas Latin America Fund terminated on 28 February 2018.
4Finisterre Emerging Markets Debt Fund terminated on 19 December 2017.
Except for the Global Time Diversified Absolute Return Fund, Global Small Cap Equity Fund, Claritas Latin American Equity Fund, Finisterre Emerging Market Debt Fund, Spectrum Global Capital Securities Fund and Global Capital Structure Opportunities Fund which have terminated, gains and losses arose solely from continuing investment activities. There were no gains or losses other than those dealt with in the Statement of Comprehensive Income.
The accompanying notes form an integral part of these financial statements.
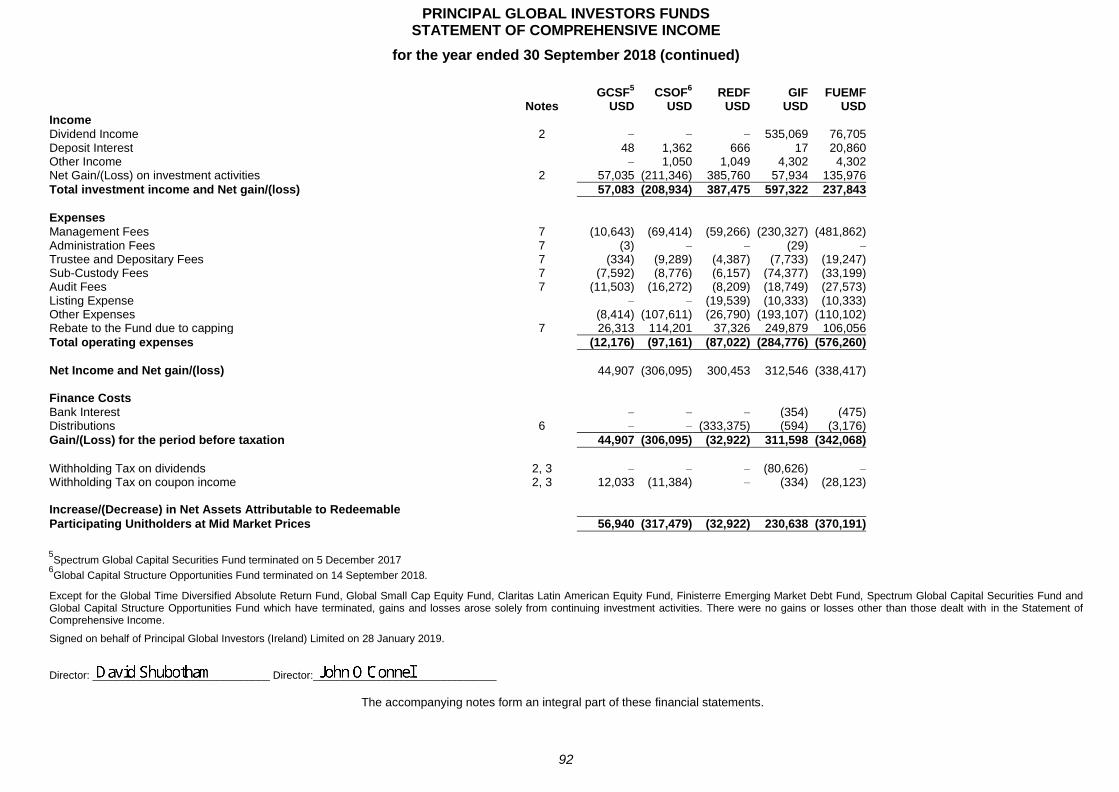
PRINCIPAL GLOBAL INVESTORS FUNDS STATEMENT OF COMPREHENSIVE INCOME
for the year ended 30 September 2018 (continued)
92
GCSF5 CSOF
6 REDF GIF FUEMF
Notes USD USD USD USD USD Income 0 Dividend Income 2 – – – 535,069 76,705 Deposit Interest 0 48 1,362 666 17 20,860 Other Income 0 – 1,050 1,049 4,302 4,302 Net Gain/(Loss) on investment activities 2 57,035 (211,346) 385,760 57,934 135,976
Total investment income and Net gain/(loss) 0 57,083 (208,934) 387,475 597,322 237,843
0 Expenses 0 Management Fees 7 (10,643) (69,414) (59,266) (230,327) (481,862) Administration Fees 7 (3) – – (29) –
Trustee and Depositary Fees 7 (334) (9,289) (4,387) (7,733) (19,247) Sub-Custody Fees 7 (7,592) (8,776) (6,157) (74,377) (33,199) Audit Fees 7 (11,503) (16,272) (8,209) (18,749) (27,573) Listing Expense 0 – – (19,539) (10,333) (10,333) Other Expenses 0 (8,414) (107,611) (26,790) (193,107) (110,102) Rebate to the Fund due to capping 7 26,313 114,201 37,326 249,879 106,056
Total operating expenses 0 (12,176) (97,161) (87,022) (284,776) (576,260)
0 Net Income and Net gain/(loss) 0 44,907 (306,095) 300,453 312,546 (338,417) 0 Finance Costs Bank Interest 0 – – – (354) (475) Distributions 6 – – (333,375) (594) (3,176)
Gain/(Loss) for the period before taxation 0 44,907 (306,095) (32,922) 311,598 (342,068)
0 Withholding Tax on dividends 2, 3 – – – (80,626) –
Withholding Tax on coupon income 2, 3 12,033 (11,384) – (334) (28,123) 0 Increase/(Decrease) in Net Assets Attributable to Redeemable
Participating Unitholders at Mid Market Prices 0 56,940 (317,479) (32,922) 230,638 (370,191)
0
5Spectrum Global Capital Securities Fund terminated on 5 December 2017
6Global Capital Structure Opportunities Fund terminated on 14 September 2018.
Except for the Global Time Diversified Absolute Return Fund, Global Small Cap Equity Fund, Claritas Latin American Equity Fund, Finisterre Emerging Market Debt Fund, Spectrum Global Capital Securities Fund and Global Capital Structure Opportunities Fund which have terminated, gains and losses arose solely from continuing investment activities. There were no gains or losses other than those dealt with in the Statement of Comprehensive Income.
Signed on behalf of Principal Global Investors (Ireland) Limited on 28 January 2019. Director: ______________________________ Director:_______________________________
The accompanying notes form an integral part of these financial statements.
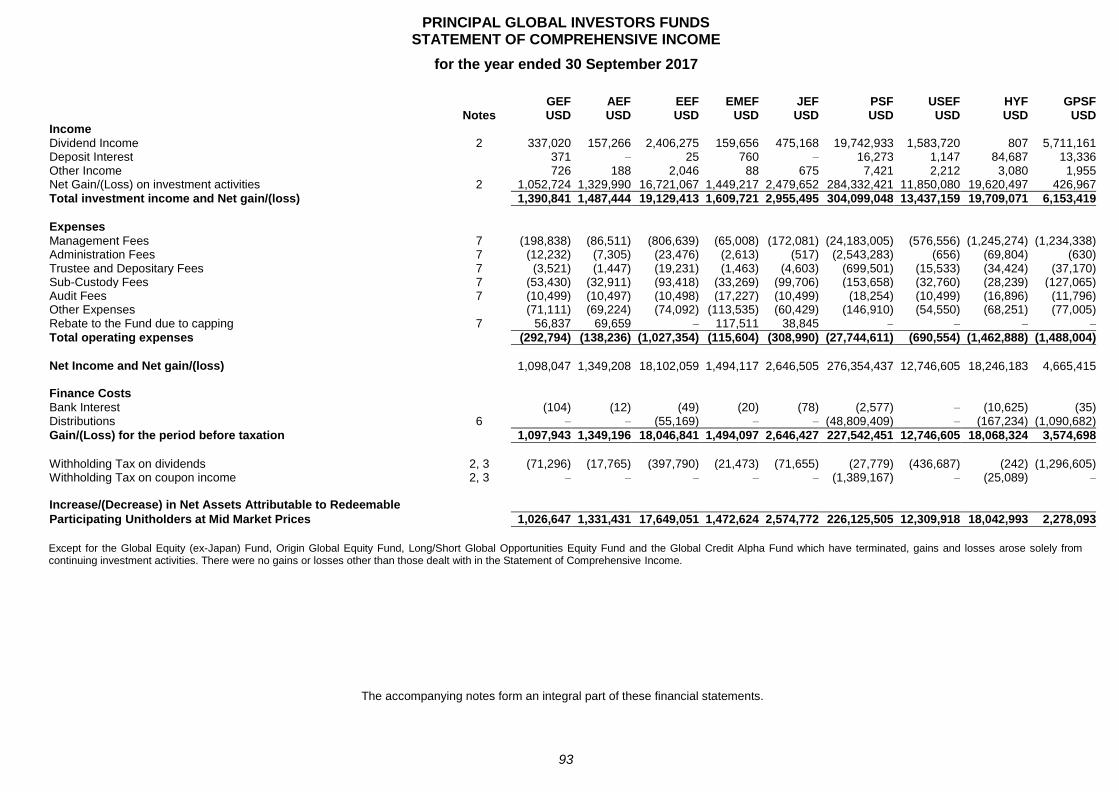
PRINCIPAL GLOBAL INVESTORS FUNDS STATEMENT OF COMPREHENSIVE INCOME
for the year ended 30 September 2017
93
GEF AEF EEF EMEF JEF PSF USEF HYF GPSF Notes USD USD USD USD USD USD USD USD USD Income 0 Dividend Income 2 337,020 157,266 2,406,275 159,656 475,168 19,742,933 1,583,720 807 5,711,161 Deposit Interest 0 371 – 25 760 – 16,273 1,147 84,687 13,336 Other Income 0 726 188 2,046 88 675 7,421 2,212 3,080 1,955 Net Gain/(Loss) on investment activities 2 1,052,724 1,329,990 16,721,067 1,449,217 2,479,652 284,332,421 11,850,080 19,620,497 426,967
Total investment income and Net gain/(loss) 0 1,390,841 1,487,444 19,129,413 1,609,721 2,955,495 304,099,048 13,437,159 19,709,071 6,153,419
0 Expenses 0 Management Fees 7 (198,838) (86,511) (806,639) (65,008) (172,081) (24,183,005) (576,556) (1,245,274) (1,234,338) Administration Fees 7 (12,232) (7,305) (23,476) (2,613) (517) (2,543,283) (656) (69,804) (630) Trustee and Depositary Fees 7 (3,521) (1,447) (19,231) (1,463) (4,603) (699,501) (15,533) (34,424) (37,170) Sub-Custody Fees 7 (53,430) (32,911) (93,418) (33,269) (99,706) (153,658) (32,760) (28,239) (127,065) Audit Fees 7 (10,499) (10,497) (10,498) (17,227) (10,499) (18,254) (10,499) (16,896) (11,796) Other Expenses 0 (71,111) (69,224) (74,092) (113,535) (60,429) (146,910) (54,550) (68,251) (77,005) Rebate to the Fund due to capping 7 56,837 69,659 – 117,511 38,845 – – – –
Total operating expenses 0 (292,794) (138,236) (1,027,354) (115,604) (308,990) (27,744,611) (690,554) (1,462,888) (1,488,004)
0 Net Income and Net gain/(loss) 0 1,098,047 1,349,208 18,102,059 1,494,117 2,646,505 276,354,437 12,746,605 18,246,183 4,665,415 0 Finance Costs Bank Interest 0 (104) (12) (49) (20) (78) (2,577) – (10,625) (35) Distributions 6 – – (55,169) – – (48,809,409) – (167,234) (1,090,682)
Gain/(Loss) for the period before taxation 0 1,097,943 1,349,196 18,046,841 1,494,097 2,646,427 227,542,451 12,746,605 18,068,324 3,574,698
0 Withholding Tax on dividends 2, 3 (71,296) (17,765) (397,790) (21,473) (71,655) (27,779) (436,687) (242) (1,296,605) Withholding Tax on coupon income 2, 3 – – – – – (1,389,167) – (25,089) –
0 Increase/(Decrease) in Net Assets Attributable to Redeemable
Participating Unitholders at Mid Market Prices 0 1,026,647 1,331,431 17,649,051 1,472,624 2,574,772 226,125,505 12,309,918 18,042,993 2,278,093
0
Except for the Global Equity (ex-Japan) Fund, Origin Global Equity Fund, Long/Short Global Opportunities Equity Fund and the Global Credit Alpha Fund which have terminated, gains and losses arose solely from continuing investment activities. There were no gains or losses other than those dealt with in the Statement of Comprehensive Income.
The accompanying notes form an integral part of these financial statements.
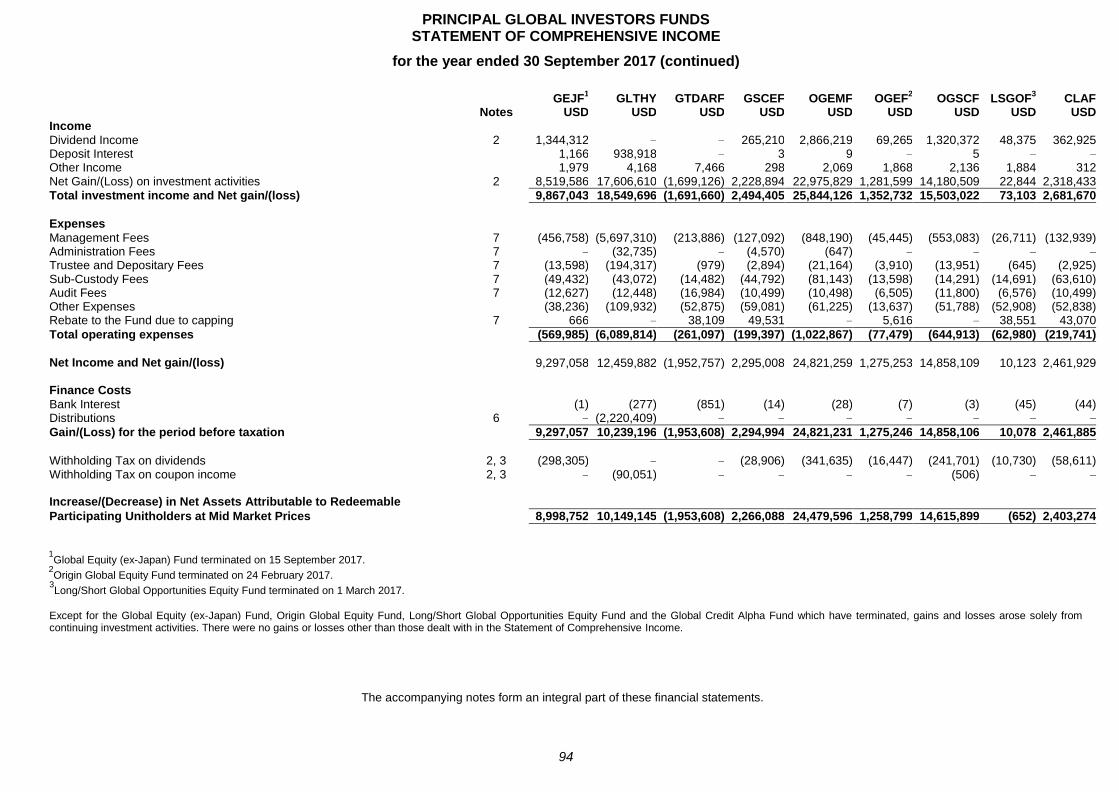
PRINCIPAL GLOBAL INVESTORS FUNDS STATEMENT OF COMPREHENSIVE INCOME
for the year ended 30 September 2017 (continued)
94
GEJF1 GLTHY GTDARF GSCEF OGEMF OGEF
2 OGSCF LSGOF
3 CLAF
Notes USD USD USD USD USD USD USD USD USD Income 0 Dividend Income 2 1,344,312 – – 265,210 2,866,219 69,265 1,320,372 48,375 362,925 Deposit Interest 0 1,166 938,918 – 3 9 – 5 – –
Other Income 0 1,979 4,168 7,466 298 2,069 1,868 2,136 1,884 312 Net Gain/(Loss) on investment activities 2 8,519,586 17,606,610 (1,699,126) 2,228,894 22,975,829 1,281,599 14,180,509 22,844 2,318,433
Total investment income and Net gain/(loss) 0 9,867,043 18,549,696 (1,691,660) 2,494,405 25,844,126 1,352,732 15,503,022 73,103 2,681,670
0 Expenses 0 Management Fees 7 (456,758) (5,697,310) (213,886) (127,092) (848,190) (45,445) (553,083) (26,711) (132,939) Administration Fees 7 – (32,735) – (4,570) (647) – – – –
Trustee and Depositary Fees 7 (13,598) (194,317) (979) (2,894) (21,164) (3,910) (13,951) (645) (2,925) Sub-Custody Fees 7 (49,432) (43,072) (14,482) (44,792) (81,143) (13,598) (14,291) (14,691) (63,610) Audit Fees 7 (12,627) (12,448) (16,984) (10,499) (10,498) (6,505) (11,800) (6,576) (10,499) Other Expenses 0 (38,236) (109,932) (52,875) (59,081) (61,225) (13,637) (51,788) (52,908) (52,838) Rebate to the Fund due to capping 7 666 – 38,109 49,531 – 5,616 – 38,551 43,070
Total operating expenses 0 (569,985) (6,089,814) (261,097) (199,397) (1,022,867) (77,479) (644,913) (62,980) (219,741)
0 Net Income and Net gain/(loss) 0 9,297,058 12,459,882 (1,952,757) 2,295,008 24,821,259 1,275,253 14,858,109 10,123 2,461,929 0 Finance Costs Bank Interest 0 (1) (277) (851) (14) (28) (7) (3) (45) (44) Distributions 6 – (2,220,409) – – – – – – –
Gain/(Loss) for the period before taxation 0 9,297,057 10,239,196 (1,953,608) 2,294,994 24,821,231 1,275,246 14,858,106 10,078 2,461,885
0 Withholding Tax on dividends 2, 3 (298,305) – – (28,906) (341,635) (16,447) (241,701) (10,730) (58,611) Withholding Tax on coupon income 2, 3 – (90,051) – – – – (506) – –
0 Increase/(Decrease) in Net Assets Attributable to Redeemable
Participating Unitholders at Mid Market Prices 0 8,998,752 10,149,145 (1,953,608) 2,266,088 24,479,596 1,258,799 14,615,899 (652) 2,403,274
0
1Global Equity (ex-Japan) Fund terminated on 15 September 2017.
2Origin Global Equity Fund terminated on 24 February 2017.
3Long/Short Global Opportunities Equity Fund terminated on 1 March 2017.
Except for the Global Equity (ex-Japan) Fund, Origin Global Equity Fund, Long/Short Global Opportunities Equity Fund and the Global Credit Alpha Fund which have terminated, gains and losses arose solely from continuing investment activities. There were no gains or losses other than those dealt with in the Statement of Comprehensive Income.
The accompanying notes form an integral part of these financial statements.
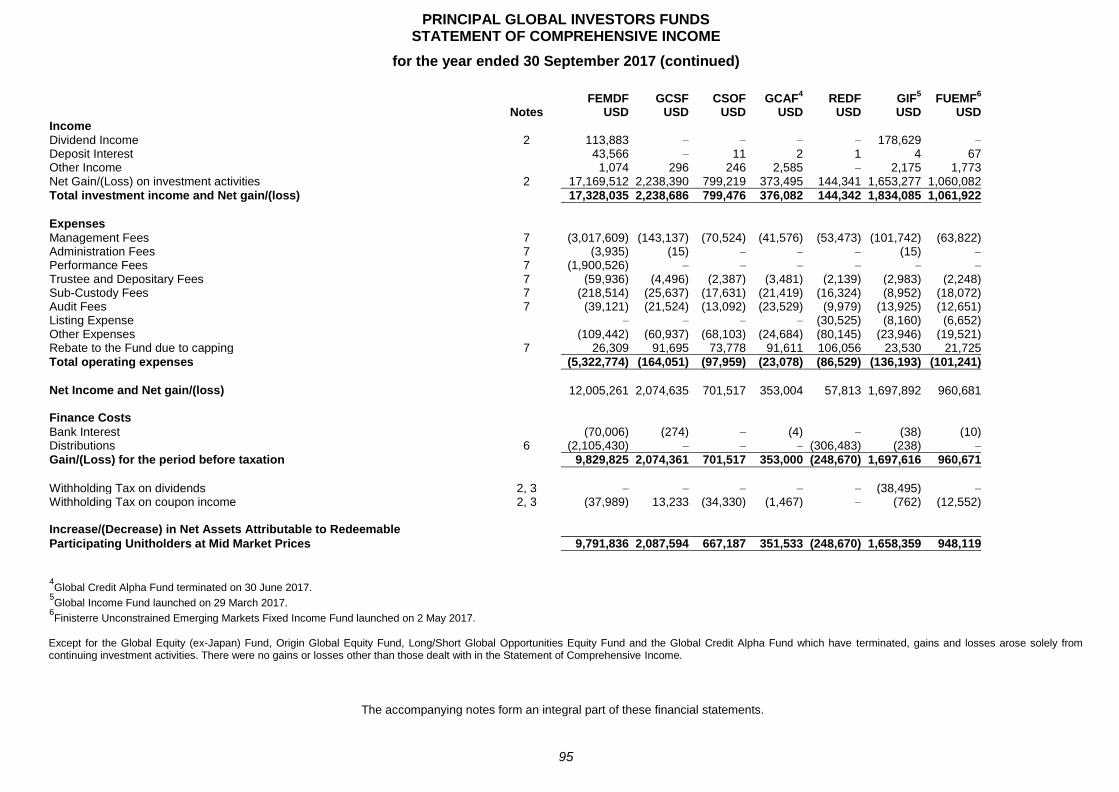
PRINCIPAL GLOBAL INVESTORS FUNDS STATEMENT OF COMPREHENSIVE INCOME
for the year ended 30 September 2017 (continued)
95
FEMDF GCSF CSOF GCAF4 REDF GIF
5 FUEMF
6
Notes USD USD USD USD USD USD USD Income 0 Dividend Income 2 113,883 – – – – 178,629 –
Deposit Interest 0 43,566 – 11 2 1 4 67 Other Income 0 1,074 296 246 2,585 – 2,175 1,773 Net Gain/(Loss) on investment activities 2 17,169,512 2,238,390 799,219 373,495 144,341 1,653,277 1,060,082
Total investment income and Net gain/(loss) 0 17,328,035 2,238,686 799,476 376,082 144,342 1,834,085 1,061,922
0 Expenses 0 Management Fees 7 (3,017,609) (143,137) (70,524) (41,576) (53,473) (101,742) (63,822) Administration Fees 7 (3,935) (15) – – – (15) –
Performance Fees 7 (1,900,526) – – – – – –
Trustee and Depositary Fees 7 (59,936) (4,496) (2,387) (3,481) (2,139) (2,983) (2,248) Sub-Custody Fees 7 (218,514) (25,637) (17,631) (21,419) (16,324) (8,952) (18,072) Audit Fees 7 (39,121) (21,524) (13,092) (23,529) (9,979) (13,925) (12,651) Listing Expense 0 – – – – (30,525) (8,160) (6,652) Other Expenses 0 (109,442) (60,937) (68,103) (24,684) (80,145) (23,946) (19,521) Rebate to the Fund due to capping 7 26,309 91,695 73,778 91,611 106,056 23,530 21,725
Total operating expenses 0 (5,322,774) (164,051) (97,959) (23,078) (86,529) (136,193) (101,241)
0 Net Income and Net gain/(loss) 0 12,005,261 2,074,635 701,517 353,004 57,813 1,697,892 960,681 0 Finance Costs Bank Interest 0 (70,006) (274) – (4) – (38) (10) Distributions 6 (2,105,430) – – – (306,483) (238) –
Gain/(Loss) for the period before taxation 0 9,829,825 2,074,361 701,517 353,000 (248,670) 1,697,616 960,671
0 Withholding Tax on dividends 2, 3 – – – – – (38,495) –
Withholding Tax on coupon income 2, 3 (37,989) 13,233 (34,330) (1,467) – (762) (12,552) 0 Increase/(Decrease) in Net Assets Attributable to Redeemable
Participating Unitholders at Mid Market Prices 0 9,791,836 2,087,594 667,187 351,533 (248,670) 1,658,359 948,119
0
4Global Credit Alpha Fund terminated on 30 June 2017.
5Global Income Fund launched on 29 March 2017.
6Finisterre Unconstrained Emerging Markets Fixed Income Fund launched on 2 May 2017.
Except for the Global Equity (ex-Japan) Fund, Origin Global Equity Fund, Long/Short Global Opportunities Equity Fund and the Global Credit Alpha Fund which have terminated, gains and losses arose solely from continuing investment activities. There were no gains or losses other than those dealt with in the Statement of Comprehensive Income.
The accompanying notes form an integral part of these financial statements.
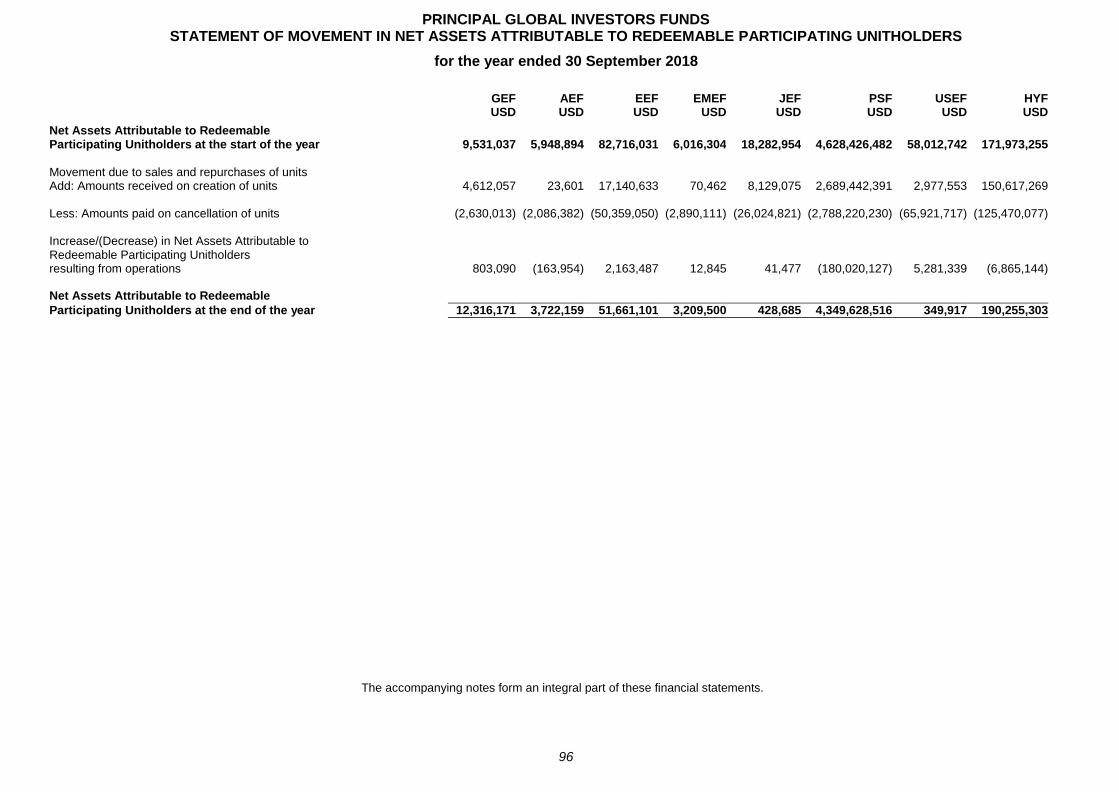
PRINCIPAL GLOBAL INVESTORS FUNDS STATEMENT OF MOVEMENT IN NET ASSETS ATTRIBUTABLE TO REDEEMABLE PARTICIPATING UNITHOLDERS
for the year ended 30 September 2018
96
GEF AEF EEF EMEF JEF PSF USEF HYF
USD USD USD USD USD USD USD USD
Net Assets Attributable to Redeemable Participating Unitholders at the start of the year 9,531,037 5,948,894 82,716,031 6,016,304 18,282,954 4,628,426,482 58,012,742 171,973,255
Movement due to sales and repurchases of units Add: Amounts received on creation of units 4,612,057 23,601 17,140,633 70,462 8,129,075 2,689,442,391 2,977,553 150,617,269 Less: Amounts paid on cancellation of units (2,630,013) (2,086,382) (50,359,050) (2,890,111) (26,024,821) (2,788,220,230) (65,921,717) (125,470,077) Increase/(Decrease) in Net Assets Attributable to Redeemable Participating Unitholders resulting from operations 803,090 (163,954) 2,163,487 12,845 41,477 (180,020,127) 5,281,339 (6,865,144) Net Assets Attributable to Redeemable 0
Participating Unitholders at the end of the year 0 12,316,171 3,722,159 51,661,101 3,209,500 428,685 4,349,628,516 349,917 190,255,303
The accompanying notes form an integral part of these financial statements.
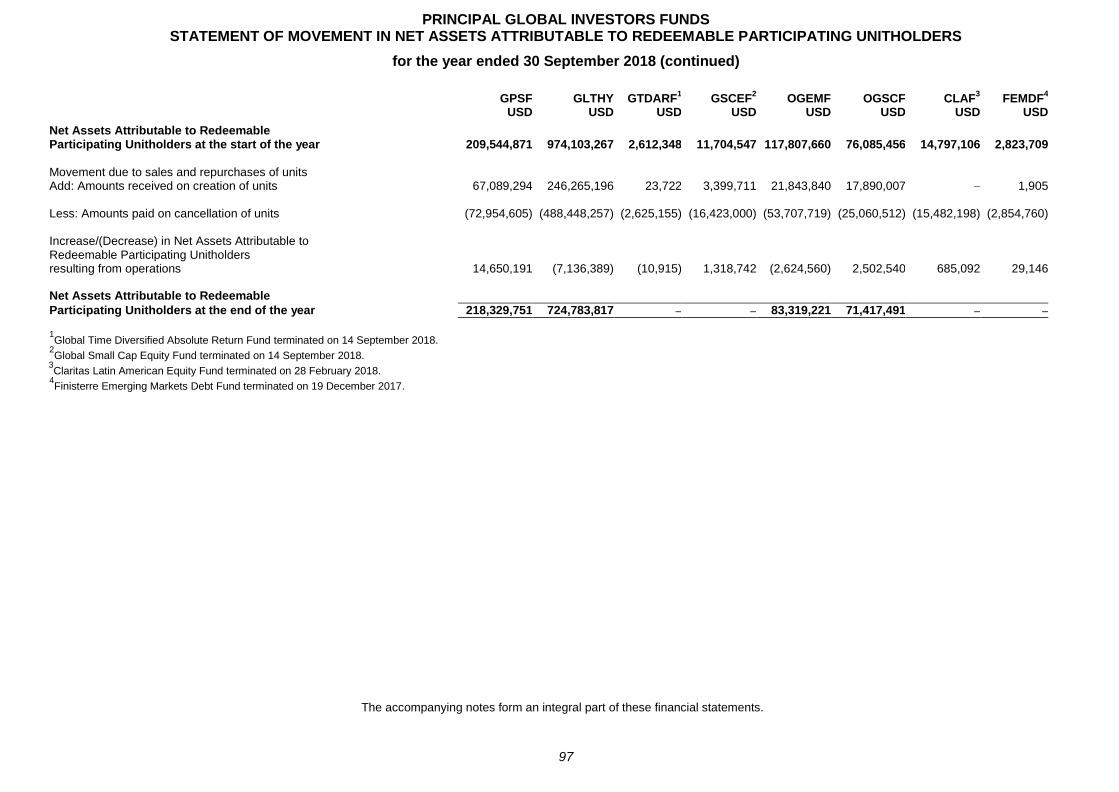
PRINCIPAL GLOBAL INVESTORS FUNDS STATEMENT OF MOVEMENT IN NET ASSETS ATTRIBUTABLE TO REDEEMABLE PARTICIPATING UNITHOLDERS
for the year ended 30 September 2018 (continued)
97
GPSF GLTHY GTDARF1 GSCEF
2 OGEMF OGSCF CLAF
3 FEMDF
4
USD USD USD USD USD USD USD USD
Net Assets Attributable to Redeemable Participating Unitholders at the start of the year 209,544,871 974,103,267 2,612,348 11,704,547 117,807,660 76,085,456 14,797,106 2,823,709
Movement due to sales and repurchases of units Add: Amounts received on creation of units 67,089,294 246,265,196 23,722 3,399,711 21,843,840 17,890,007 – 1,905 Less: Amounts paid on cancellation of units (72,954,605) (488,448,257) (2,625,155) (16,423,000) (53,707,719) (25,060,512) (15,482,198) (2,854,760) Increase/(Decrease) in Net Assets Attributable to Redeemable Participating Unitholders resulting from operations 14,650,191 (7,136,389) (10,915) 1,318,742 (2,624,560) 2,502,540 685,092 29,146 Net Assets Attributable to Redeemable 0
Participating Unitholders at the end of the year 0 218,329,751 724,783,817 – – 83,319,221 71,417,491 – –
1Global Time Diversified Absolute Return Fund terminated on 14 September 2018.
2Global Small Cap Equity Fund terminated on 14 September 2018.
3Claritas Latin American Equity Fund terminated on 28 February 2018.
4Finisterre Emerging Markets Debt Fund terminated on 19 December 2017.
The accompanying notes form an integral part of these financial statements.
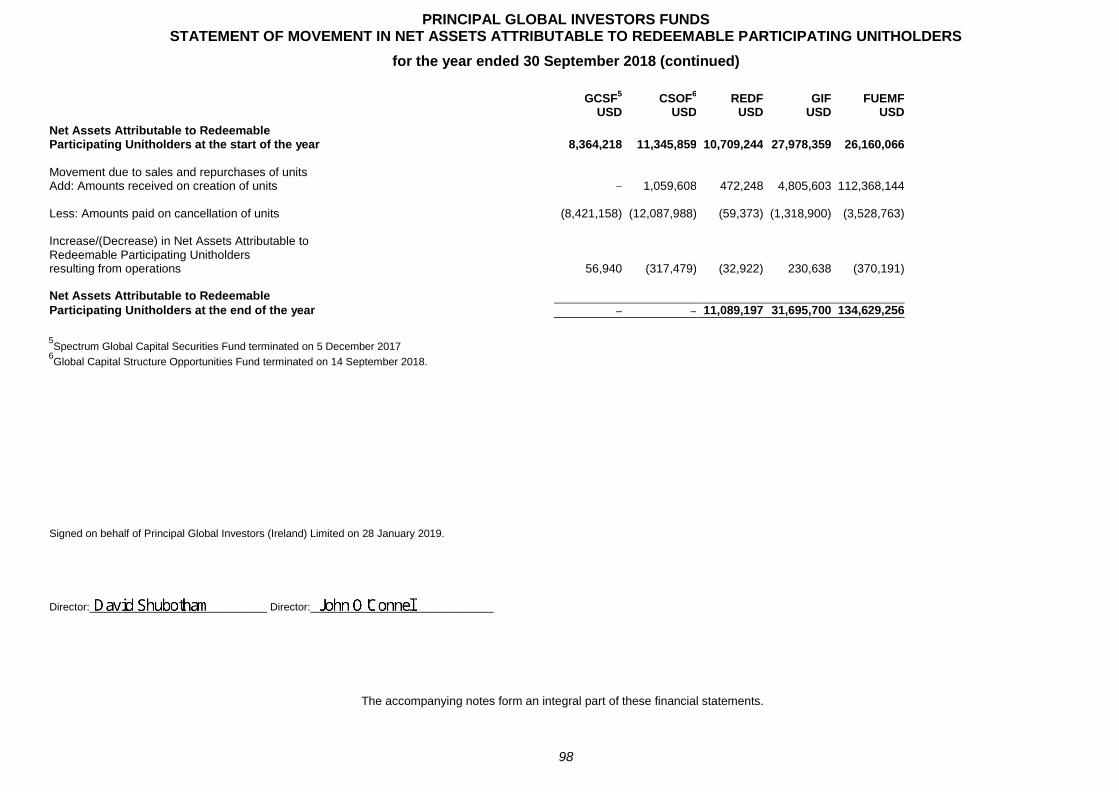
PRINCIPAL GLOBAL INVESTORS FUNDS STATEMENT OF MOVEMENT IN NET ASSETS ATTRIBUTABLE TO REDEEMABLE PARTICIPATING UNITHOLDERS
for the year ended 30 September 2018 (continued)
98
GCSF5 CSOF
6 REDF GIF FUEMF
USD USD USD USD USD
Net Assets Attributable to Redeemable Participating Unitholders at the start of the year 8,364,218 11,345,859 10,709,244 27,978,359 26,160,066
Movement due to sales and repurchases of units Add: Amounts received on creation of units – 1,059,608 472,248 4,805,603 112,368,144 Less: Amounts paid on cancellation of units (8,421,158) (12,087,988) (59,373) (1,318,900) (3,528,763) Increase/(Decrease) in Net Assets Attributable to Redeemable Participating Unitholders resulting from operations 56,940 (317,479) (32,922) 230,638 (370,191) Net Assets Attributable to Redeemable 0
Participating Unitholders at the end of the year 0 – – 11,089,197 31,695,700 134,629,256
5Spectrum Global Capital Securities Fund terminated on 5 December 2017
6Global Capital Structure Opportunities Fund terminated on 14 September 2018.
Signed on behalf of Principal Global Investors (Ireland) Limited on 28 January 2019. Director:______________________________ Director:_______________________________
The accompanying notes form an integral part of these financial statements.
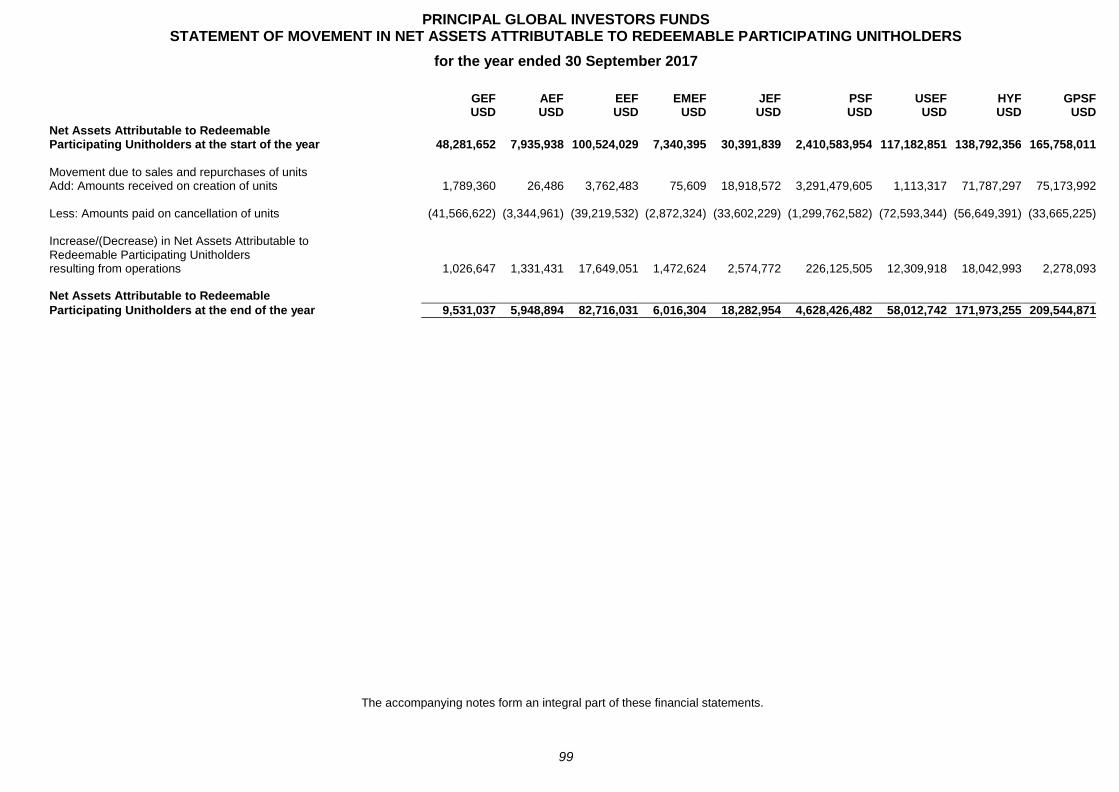
PRINCIPAL GLOBAL INVESTORS FUNDS STATEMENT OF MOVEMENT IN NET ASSETS ATTRIBUTABLE TO REDEEMABLE PARTICIPATING UNITHOLDERS
for the year ended 30 September 2017
99
GEF AEF EEF EMEF JEF PSF USEF HYF GPSF
USD USD USD USD USD USD USD USD USD
Net Assets Attributable to Redeemable Participating Unitholders at the start of the year 48,281,652 7,935,938 100,524,029 7,340,395 30,391,839 2,410,583,954 117,182,851 138,792,356 165,758,011
Movement due to sales and repurchases of units Add: Amounts received on creation of units 1,789,360 26,486 3,762,483 75,609 18,918,572 3,291,479,605 1,113,317 71,787,297 75,173,992 Less: Amounts paid on cancellation of units (41,566,622) (3,344,961) (39,219,532) (2,872,324) (33,602,229) (1,299,762,582) (72,593,344) (56,649,391) (33,665,225) Increase/(Decrease) in Net Assets Attributable to Redeemable Participating Unitholders resulting from operations 1,026,647 1,331,431 17,649,051 1,472,624 2,574,772 226,125,505 12,309,918 18,042,993 2,278,093 Net Assets Attributable to Redeemable 0
Participating Unitholders at the end of the year 0 9,531,037 5,948,894 82,716,031 6,016,304 18,282,954 4,628,426,482 58,012,742 171,973,255 209,544,871
The accompanying notes form an integral part of these financial statements.
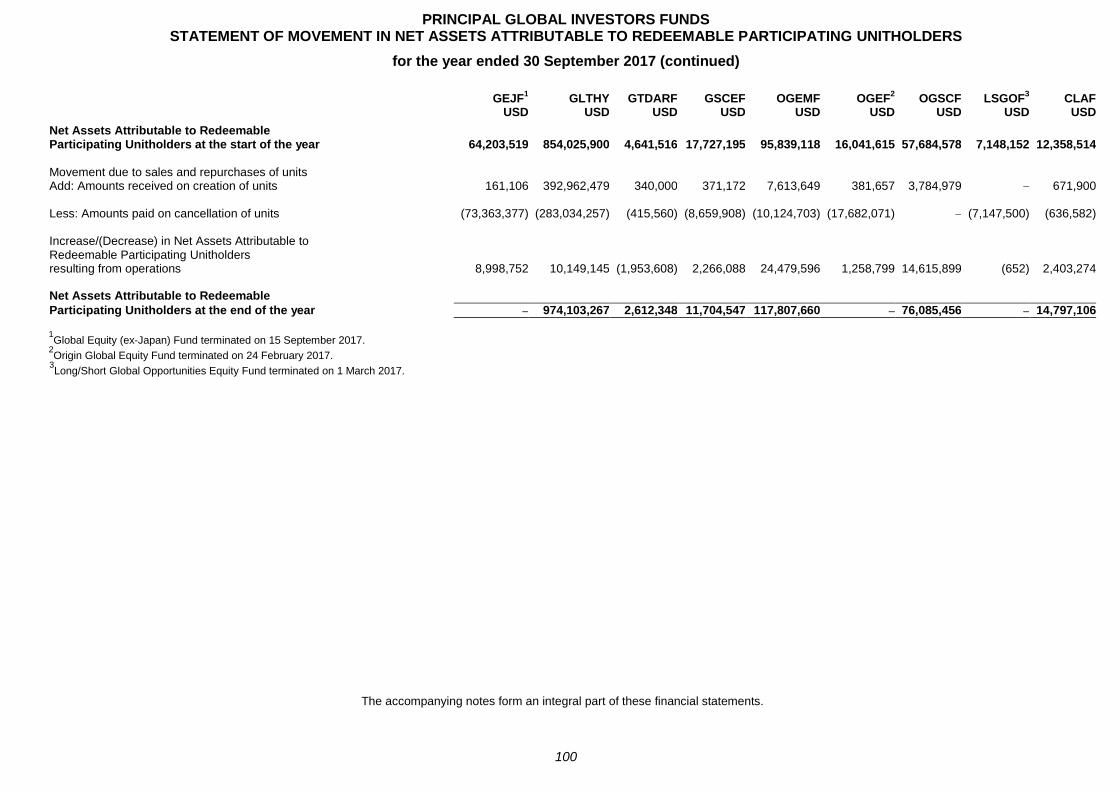
PRINCIPAL GLOBAL INVESTORS FUNDS STATEMENT OF MOVEMENT IN NET ASSETS ATTRIBUTABLE TO REDEEMABLE PARTICIPATING UNITHOLDERS
for the year ended 30 September 2017 (continued)
100
GEJF1 GLTHY GTDARF GSCEF OGEMF OGEF
2 OGSCF LSGOF
3 CLAF
USD USD USD USD USD USD USD USD USD
Net Assets Attributable to Redeemable Participating Unitholders at the start of the year 64,203,519 854,025,900 4,641,516 17,727,195 95,839,118 16,041,615 57,684,578 7,148,152 12,358,514
Movement due to sales and repurchases of units Add: Amounts received on creation of units 161,106 392,962,479 340,000 371,172 7,613,649 381,657 3,784,979 – 671,900 Less: Amounts paid on cancellation of units (73,363,377) (283,034,257) (415,560) (8,659,908) (10,124,703) (17,682,071) – (7,147,500) (636,582) Increase/(Decrease) in Net Assets Attributable to Redeemable Participating Unitholders resulting from operations 8,998,752 10,149,145 (1,953,608) 2,266,088 24,479,596 1,258,799 14,615,899 (652) 2,403,274 Net Assets Attributable to Redeemable 0
Participating Unitholders at the end of the year 0 – 974,103,267 2,612,348 11,704,547 117,807,660 – 76,085,456 – 14,797,106
1Global Equity (ex-Japan) Fund terminated on 15 September 2017.
2Origin Global Equity Fund terminated on 24 February 2017.
3Long/Short Global Opportunities Equity Fund terminated on 1 March 2017.
The accompanying notes form an integral part of these financial statements.
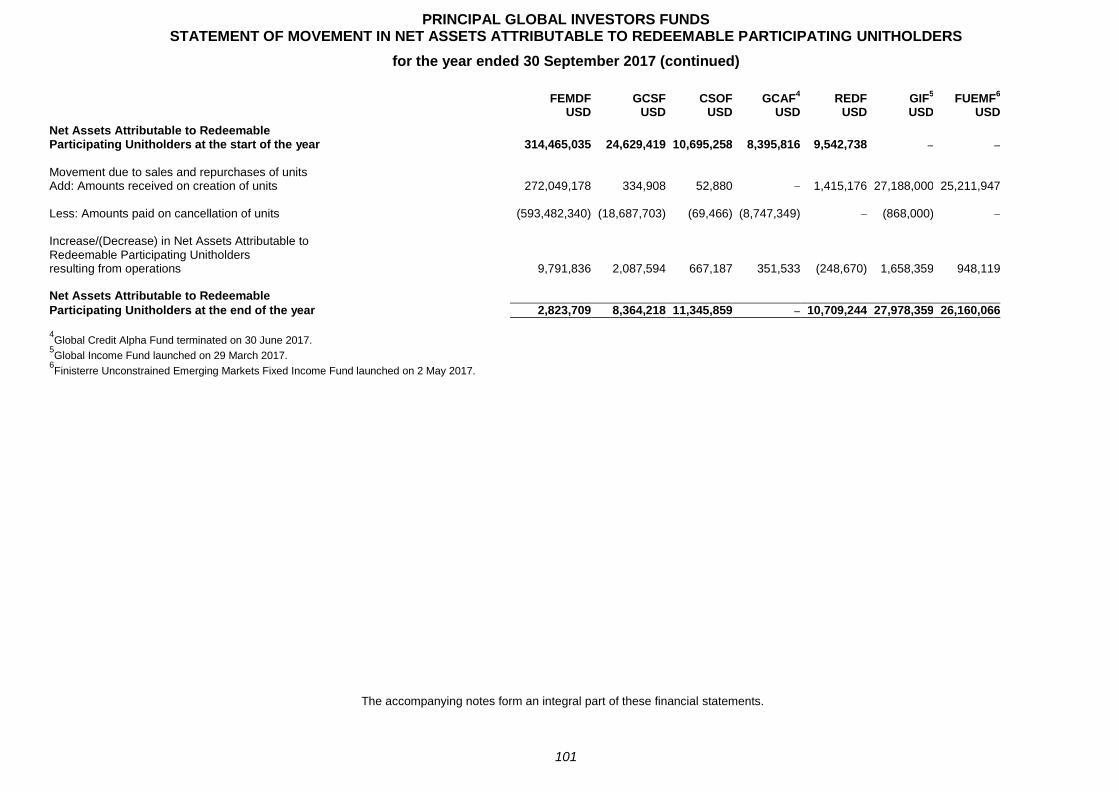
PRINCIPAL GLOBAL INVESTORS FUNDS STATEMENT OF MOVEMENT IN NET ASSETS ATTRIBUTABLE TO REDEEMABLE PARTICIPATING UNITHOLDERS
for the year ended 30 September 2017 (continued)
101
FEMDF GCSF CSOF GCAF4 REDF GIF
5 FUEMF
6
USD USD USD USD USD USD USD
Net Assets Attributable to Redeemable Participating Unitholders at the start of the year 314,465,035 24,629,419 10,695,258 8,395,816 9,542,738 – – Movement due to sales and repurchases of units Add: Amounts received on creation of units 272,049,178 334,908 52,880 – 1,415,176 27,188,000 25,211,947 Less: Amounts paid on cancellation of units (593,482,340) (18,687,703) (69,466) (8,747,349) – (868,000) –
Increase/(Decrease) in Net Assets Attributable to Redeemable Participating Unitholders resulting from operations 9,791,836 2,087,594 667,187 351,533 (248,670) 1,658,359 948,119 Net Assets Attributable to Redeemable 0
Participating Unitholders at the end of the year 0 2,823,709 8,364,218 11,345,859 – 10,709,244 27,978,359 26,160,066
4Global Credit Alpha Fund terminated on 30 June 2017.
5Global Income Fund launched on 29 March 2017.
6Finisterre Unconstrained Emerging Markets Fixed Income Fund launched on 2 May 2017.
The accompanying notes form an integral part of these financial statements.
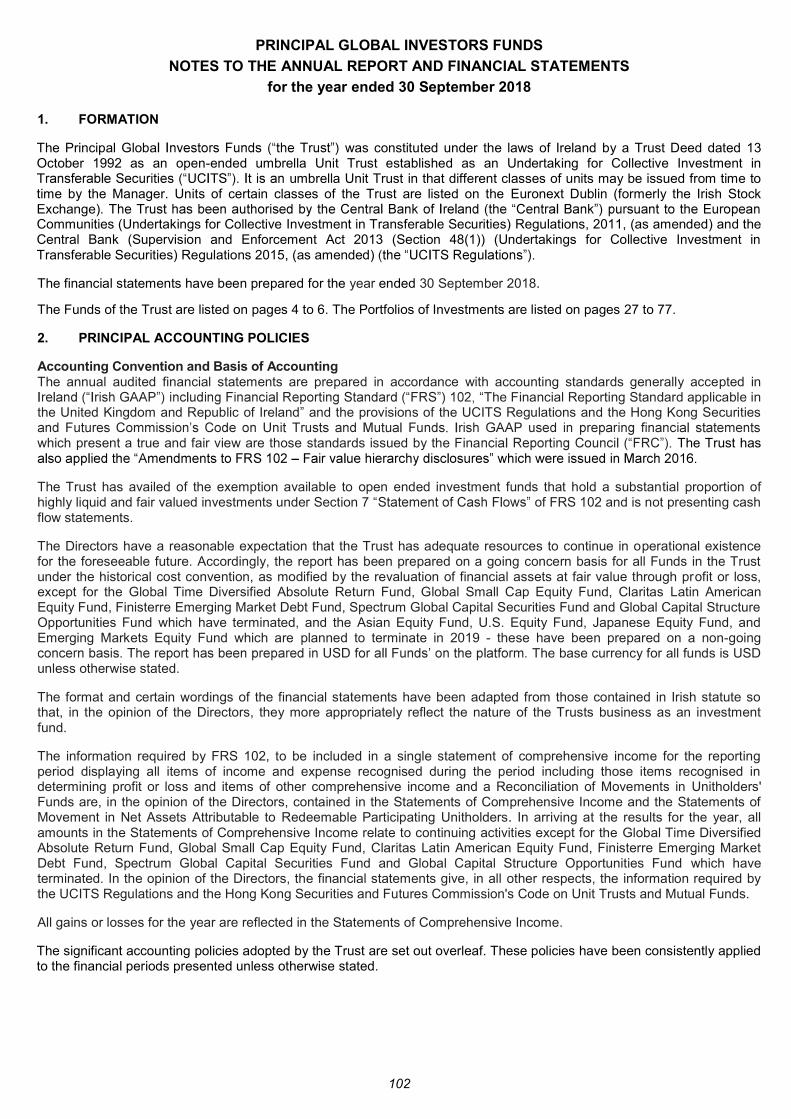
PRINCIPAL GLOBAL INVESTORS FUNDS
NOTES TO THE ANNUAL REPORT AND FINANCIAL STATEMENTS
for the year ended 30 September 2018
102
1. FORMATION
The Principal Globa was constituted under the laws of Ireland by a Trust Deed dated 13 October 1992 as an open-ended umbrella Unit Trust established as an Undertaking for Collective Investment in
umbrella Unit Trust in that different classes of units may be issued from time to time by the Manager. Units of certain classes of the Trust are listed on the Euronext Dublin (formerly the Irish Stock Exchange)Communities (Undertakings for Collective Investment in Transferable Securities) Regulations, 2011, (as amended) and the Central Bank (Supervision and Enforcement Act 2013 (Section 48(1)) (Undertakings for Collective Investment in Transferable Securities) Regulations 2015, (as amended)
The financial statements have been prepared for the year ended 30 September 2018.
The Funds of the Trust are listed on pages 4 to 6. The Portfolios of Investments are listed on pages 27 to 77.
2. PRINCIPAL ACCOUNTING POLICIES
Accounting Convention and Basis of Accounting The annual audited financial statements are prepared in accordance with accounting standards generally accepted in
The Financial Reporting Standard applicable in the United Kingdom and Republic of Ireland and the provisions of the UCITS Regulations and the Hong Kong Securities
which present a true and fair view are those standards issued by the Fina The Trust has
The Trust has availed of the exemption available to open ended investment funds that hold a substantial proportion of highly liquid and fair valued investments under Section 7 of FRS 102 and is not presenting cash flow statements.
The Directors have a reasonable expectation that the Trust has adequate resources to continue in operational existence for the foreseeable future. Accordingly, the report has been prepared on a going concern basis for all Funds in the Trust under the historical cost convention, as modified by the revaluation of financial assets at fair value through profit or loss, except for the Global Time Diversified Absolute Return Fund, Global Small Cap Equity Fund, Claritas Latin American Equity Fund, Finisterre Emerging Market Debt Fund, Spectrum Global Capital Securities Fund and Global Capital Structure Opportunities Fund which have terminated, and the Asian Equity Fund, U.S. Equity Fund, Japanese Equity Fund, and Emerging Markets Equity Fund which are planned to terminate in 2019 - these have been prepared on a non-going
The base currency for all funds is USD unless otherwise stated.
The format and certain wordings of the financial statements have been adapted from those contained in Irish statute so that, in the opinion of the Directors, they more appropriately reflect the nature of the Trusts business as an investment fund.
The information required by FRS 102, to be included in a single statement of comprehensive income for the reporting period displaying all items of income and expense recognised during the period including those items recognised in determining profit or loss and items of other comprehensive income and a Reconciliation of Movements in Unitholders' Funds are, in the opinion of the Directors, contained in the Statements of Comprehensive Income and the Statements of Movement in Net Assets Attributable to Redeemable Participating Unitholders. In arriving at the results for the year, all amounts in the Statements of Comprehensive Income relate to continuing activities except for the Global Time Diversified Absolute Return Fund, Global Small Cap Equity Fund, Claritas Latin American Equity Fund, Finisterre Emerging Market Debt Fund, Spectrum Global Capital Securities Fund and Global Capital Structure Opportunities Fund which have terminated. In the opinion of the Directors, the financial statements give, in all other respects, the information required by the UCITS Regulations and the Hong Kong Securities and Futures Commission's Code on Unit Trusts and Mutual Funds.
All gains or losses for the year are reflected in the Statements of Comprehensive Income.
The significant accounting policies adopted by the Trust are set out overleaf. These policies have been consistently applied to the financial periods presented unless otherwise stated.
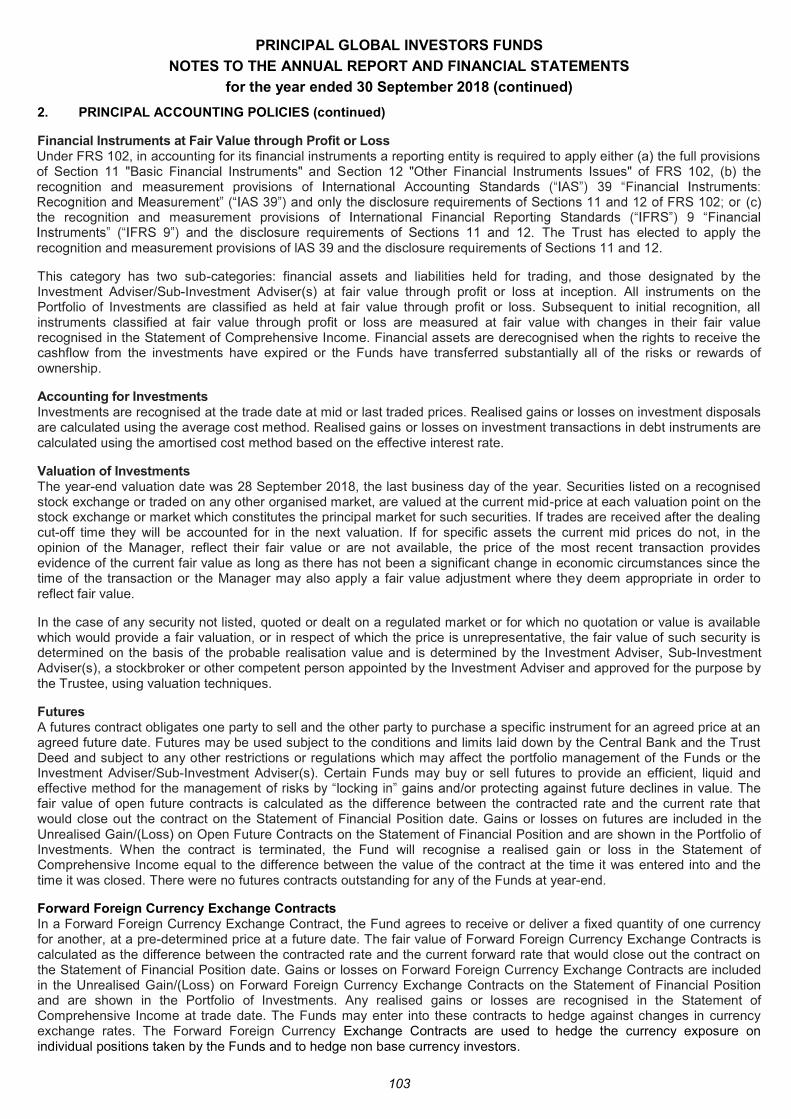
PRINCIPAL GLOBAL INVESTORS FUNDS
NOTES TO THE ANNUAL REPORT AND FINANCIAL STATEMENTS
for the year ended 30 September 2018 (continued)
103
2. PRINCIPAL ACCOUNTING POLICIES (continued)
Financial Instruments at Fair Value through Profit or Loss Under FRS 102, in accounting for its financial instruments a reporting entity is required to apply either (a) the full provisions of Section 11 "Basic Financial Instruments" and Section 12 "Other Financial Instruments Issues" of FRS 102, (b) the recognition and measurement provisions of
(c) the recognition and measurement provisions
The Trust has elected to apply the recognition and measurement provisions of lAS 39 and the disclosure requirements of Sections 11 and 12.
This category has two sub-categories: financial assets and liabilities held for trading, and those designated by the Investment Adviser/Sub-Investment Adviser(s) at fair value through profit or loss at inception. All instruments on the Portfolio of Investments are classified as held at fair value through profit or loss. Subsequent to initial recognition, all instruments classified at fair value through profit or loss are measured at fair value with changes in their fair value recognised in the Statement of Comprehensive Income. Financial assets are derecognised when the rights to receive the cashflow from the investments have expired or the Funds have transferred substantially all of the risks or rewards of ownership.
Accounting for Investments Investments are recognised at the trade date at mid or last traded prices. Realised gains or losses on investment disposals are calculated using the average cost method. Realised gains or losses on investment transactions in debt instruments are calculated using the amortised cost method based on the effective interest rate.
Valuation of Investments The year-end valuation date was 28 September 2018, the last business day of the year. Securities listed on a recognised stock exchange or traded on any other organised market, are valued at the current mid-price at each valuation point on the stock exchange or market which constitutes the principal market for such securities. If trades are received after the dealing cut-off time they will be accounted for in the next valuation. If for specific assets the current mid prices do not, in the opinion of the Manager, reflect their fair value or are not available, the price of the most recent transaction provides evidence of the current fair value as long as there has not been a significant change in economic circumstances since the time of the transaction or the Manager may also apply a fair value adjustment where they deem appropriate in order to reflect fair value.
In the case of any security not listed, quoted or dealt on a regulated market or for which no quotation or value is available which would provide a fair valuation, or in respect of which the price is unrepresentative, the fair value of such security is determined on the basis of the probable realisation value and is determined by the Investment Adviser, Sub-Investment Adviser(s), a stockbroker or other competent person appointed by the Investment Adviser and approved for the purpose by the Trustee, using valuation techniques.
Futures A futures contract obligates one party to sell and the other party to purchase a specific instrument for an agreed price at an agreed future date. Futures may be used subject to the conditions and limits laid down by the Central Bank and the Trust Deed and subject to any other restrictions or regulations which may affect the portfolio management of the Funds or the Investment Adviser/Sub-Investment Adviser(s). Certain Funds may buy or sell futures to provide an efficient, liquid and effective method for the management fair value of open future contracts is calculated as the difference between the contracted rate and the current rate that would close out the contract on the Statement of Financial Position date. Gains or losses on futures are included in the Unrealised Gain/(Loss) on Open Future Contracts on the Statement of Financial Position and are shown in the Portfolio of Investments. When the contract is terminated, the Fund will recognise a realised gain or loss in the Statement of Comprehensive Income equal to the difference between the value of the contract at the time it was entered into and the time it was closed. There were no futures contracts outstanding for any of the Funds at year-end.
Forward Foreign Currency Exchange Contracts In a Forward Foreign Currency Exchange Contract, the Fund agrees to receive or deliver a fixed quantity of one currency for another, at a pre-determined price at a future date. The fair value of Forward Foreign Currency Exchange Contracts is calculated as the difference between the contracted rate and the current forward rate that would close out the contract on the Statement of Financial Position date. Gains or losses on Forward Foreign Currency Exchange Contracts are included in the Unrealised Gain/(Loss) on Forward Foreign Currency Exchange Contracts on the Statement of Financial Position and are shown in the Portfolio of Investments. Any realised gains or losses are recognised in the Statement of Comprehensive Income at trade date. The Funds may enter into these contracts to hedge against changes in currency exchange rates. The Forward Foreign Currency Exchange Contracts are used to hedge the currency exposure on individual positions taken by the Funds and to hedge non base currency investors.
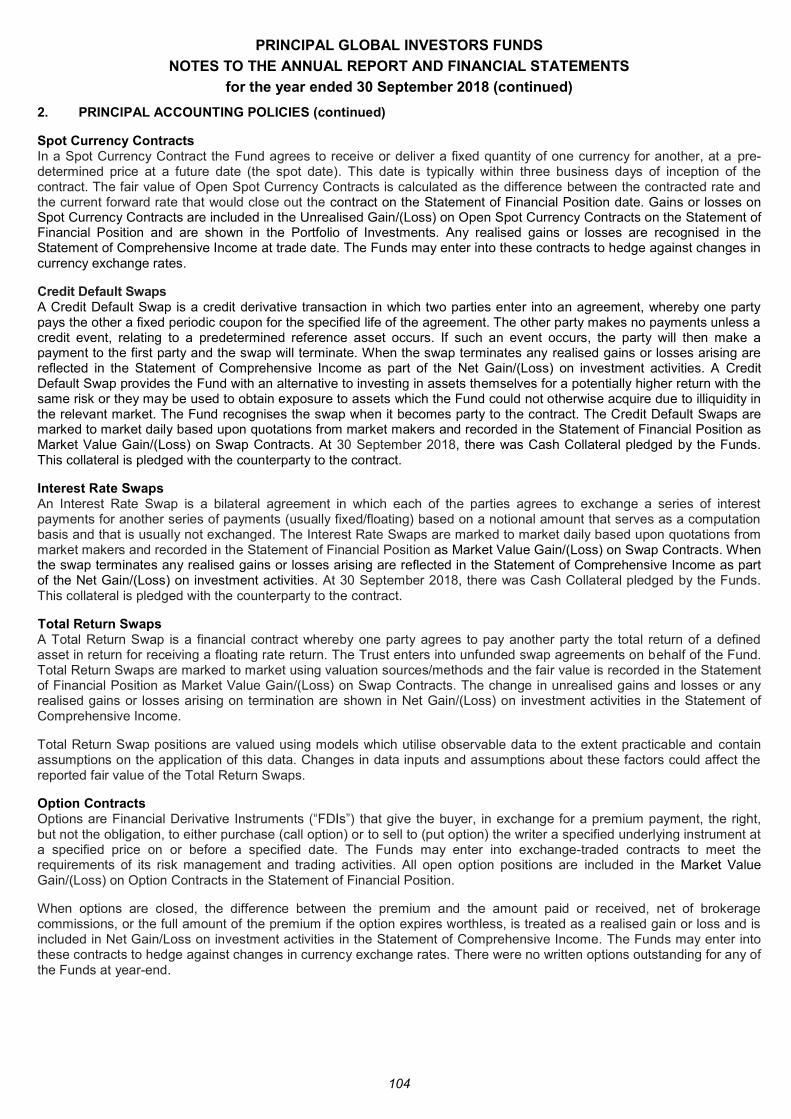
PRINCIPAL GLOBAL INVESTORS FUNDS
NOTES TO THE ANNUAL REPORT AND FINANCIAL STATEMENTS
for the year ended 30 September 2018 (continued)
104
2. PRINCIPAL ACCOUNTING POLICIES (continued)
Spot Currency Contracts In a Spot Currency Contract the Fund agrees to receive or deliver a fixed quantity of one currency for another, at a pre-determined price at a future date (the spot date). This date is typically within three business days of inception of the contract. The fair value of Open Spot Currency Contracts is calculated as the difference between the contracted rate and the current forward rate that would close out the contract on the Statement of Financial Position date. Gains or losses on Spot Currency Contracts are included in the Unrealised Gain/(Loss) on Open Spot Currency Contracts on the Statement of Financial Position and are shown in the Portfolio of Investments. Any realised gains or losses are recognised in the Statement of Comprehensive Income at trade date. The Funds may enter into these contracts to hedge against changes in currency exchange rates.
Credit Default Swaps A Credit Default Swap is a credit derivative transaction in which two parties enter into an agreement, whereby one party pays the other a fixed periodic coupon for the specified life of the agreement. The other party makes no payments unless a credit event, relating to a predetermined reference asset occurs. If such an event occurs, the party will then make a payment to the first party and the swap will terminate. When the swap terminates any realised gains or losses arising are reflected in the Statement of Comprehensive Income as part of the Net Gain/(Loss) on investment activities. A Credit Default Swap provides the Fund with an alternative to investing in assets themselves for a potentially higher return with the same risk or they may be used to obtain exposure to assets which the Fund could not otherwise acquire due to illiquidity in the relevant market. The Fund recognises the swap when it becomes party to the contract. The Credit Default Swaps are marked to market daily based upon quotations from market makers and recorded in the Statement of Financial Position as Market Value Gain/(Loss) on Swap Contracts. At 30 September 2018, there was Cash Collateral pledged by the Funds. This collateral is pledged with the counterparty to the contract.
Interest Rate Swaps An Interest Rate Swap is a bilateral agreement in which each of the parties agrees to exchange a series of interest payments for another series of payments (usually fixed/floating) based on a notional amount that serves as a computation basis and that is usually not exchanged. The Interest Rate Swaps are marked to market daily based upon quotations from market makers and recorded in the Statement of Financial Position as Market Value Gain/(Loss) on Swap Contracts. When the swap terminates any realised gains or losses arising are reflected in the Statement of Comprehensive Income as part of the Net Gain/(Loss) on investment activities. At 30 September 2018, there was Cash Collateral pledged by the Funds. This collateral is pledged with the counterparty to the contract.
Total Return Swaps A Total Return Swap is a financial contract whereby one party agrees to pay another party the total return of a defined asset in return for receiving a floating rate return. The Trust enters into unfunded swap agreements on behalf of the Fund. Total Return Swaps are marked to market using valuation sources/methods and the fair value is recorded in the Statement of Financial Position as Market Value Gain/(Loss) on Swap Contracts. The change in unrealised gains and losses or any realised gains or losses arising on termination are shown in Net Gain/(Loss) on investment activities in the Statement of Comprehensive Income.
Total Return Swap positions are valued using models which utilise observable data to the extent practicable and contain assumptions on the application of this data. Changes in data inputs and assumptions about these factors could affect the reported fair value of the Total Return Swaps.
Option Contracts Options are Financial Derivative Instruments that give the buyer, in exchange for a premium payment, the right, but not the obligation, to either purchase (call option) or to sell to (put option) the writer a specified underlying instrument at a specified price on or before a specified date. The Funds may enter into exchange-traded contracts to meet the requirements of its risk management and trading activities. All open option positions are included in the Market Value Gain/(Loss) on Option Contracts in the Statement of Financial Position.
When options are closed, the difference between the premium and the amount paid or received, net of brokerage commissions, or the full amount of the premium if the option expires worthless, is treated as a realised gain or loss and is included in Net Gain/Loss on investment activities in the Statement of Comprehensive Income. The Funds may enter into these contracts to hedge against changes in currency exchange rates. There were no written options outstanding for any of the Funds at year-end.
PRINCIPAL GLOBAL INVESTORS FUNDS
NOTES TO THE ANNUAL REPORT AND FINANCIAL STATEMENTS
for the year ended 30 September 2018 (continued)
105
2. PRINCIPAL ACCOUNTING POLICIES (continued)
Foreign Currency Transactions In accordance with Sstatements are measured using the currency of the primary economic environment in which it operates (functional
nctional currency is attributable to the functional currency being: a) the major
functional currency assessment was completed at a Fund level. respective functional currencies when assessed under FRS 102. The functional currency of each Fund of the Trust is USD.
For each Fund: (i) Currency gains or losses can arise where there is a difference between the amounts of foreign dividends and
interest received or paid. These gains or losses are included where appropriate in the dividend and interest income figure in the individual Comprehensive Income;
(ii) Currency gains or losses realised on securities purchases and sales transactions are included in Net Gain/(Loss) on investment activities in the individual Statement of Comprehensive Income;
(iii) Unrealised currency gains or losses on securities held at year end are included in Net Gain/(Loss) on investment activities in the individual Statement of Comprehensive Income; and
(iv) translated at the rate of exchange ruling at the close of business on the Statement of Financial Position date and exchange differences are included in Net Gain/(Lof Comprehensive Income.
Income from Investments Dividends are credited to the Statement of Comprehensive Income on the dates on which the relevant securities are listed
- -recoverable withholding taxes, which are disclosed separately in the Statement of Comprehensive Income, and net of any tax credits. Realised gains or losses on investment transactions in debt instruments are calculated using the amortised cost method based on the effective interest rate.
Net Gain/(Loss) on Investment Activities In respect of each instrument type classified as Financial Instruments at Fair Value through Profit or Loss, the movement in unrealised gains/(losses) since the prior period end and realised gains/(losses) are included in Net Gain/(Loss) on investment activities in the Statement of Comprehensive Income. Interest earned on fixed income securities such as bonds is included here also.
Expenses Operating expenses inclusive of Performance Fees are recognised on an accruals basis in the Statement of Comprehensive Income.
Formation Costs Formation costs are written off over a five year period commencing from the year in which they are incurred.
Anti-Dilution Levy The Manager may exercise its discretion to apply an anti-dilution levy in relation to subscriptions and redemptions of units. The levy is a charge for transaction costs that may be deducted from the NAV per Unit of the relevant class to reflect the costs of acquiring or disposing of underlying assets to fund subscriptions or redemptions from the Fund, respectively. The levy is intended to be used to ensure that all investors in the Trust are treated equitably by allocating transaction costs to the investors whose transactions give rise to those costs. For the year ended 30 September 2018 there were anti-dilution levies charged on the following funds: Asian Equity Fund $4,652, European Equity Fund $27,108, Japanese Equity Fund $1,797,704, Preferred Securities Fund $4, US Equity Fund $2,781, High Yield Fund $54,276, Global Small Cap Equity Fund $23,011, Origin Global Emerging Markets Fund $139,059, Claritas Latin American Equity Fund $27,573, Finisterre Unconstrained Emerging Markets Fixed Income Fund $192,645.There was no anti-dilution levy charged during the year ended 30 September 2017.
Cash at Bank Cash is valued at amortised cost, which approximates fair value. Cash is held with the Bank of New York Mellon Trust Company (Ireland) Limited.
PRINCIPAL GLOBAL INVESTORS FUNDS
NOTES TO THE ANNUAL REPORT AND FINANCIAL STATEMENTS
for the year ended 30 September 2018 (continued)
106
2. PRINCIPAL ACCOUNTING POLICIES (continued)
Cash Collateral & Pledged Collateral Cash Collateral provided by the Fund is identified in the Statement of Financial Position as Cash Collateral and is not included as a component of Cash at Bank. For collateral other than cash, if the party to whom the collateral is provided has the right by contract or custom to sell or re-pledge the collateral, the Fund classifies that asset in its Statement of Financial Position separately from Other Assets and identifies the asset as pledged collateral. Where the party to whom the collateral is provided does not have the right to sell or re-pledge; a disclosure of the collateral provided is made in the notes to the financial statements.
Margin Cash Receivable/Payable Cash Collateral Receivable/Payable to the Trust in relation to the open Futures Contracts and open Swap Contracts is identified in the Statement of Financial Position as Margin Cash Receivable/Payable and is not included as a component of Cash at Bank. There is no Margin Cash Receivable/Payable at 30 September 2018. Margin Cash Receivable/Payable at 30 September 2017 is detailed as part of Note 4.
Distributions The A Income Unit Classes from the Asian Equity Fund and European Equity Fund will declare and pay annual distributions to Unitholders.
The Preferred Securities Fund will declare and pay quarterly distributions to Unitholders holding the A, I, D, F, N and P Income Unit Classes.
The High Yield Fund will declare and pay quarterly distributions to Unitholders holding the A and I Income Unit Class.
The Post Global Limited Term High Yield Fund will declare and pay quarterly distributions to Unitholders holding the A Income Unit Class and I Income Unit Class.
The I, I2 and N Income Unit Classes from the Global Property Securities Fund and the I2 Income Unit Class from the Finisterre Unconstrained Emerging Markets Fixed Income Fund will also declare and pay annual distributions to Unitholders.
The Real Estate Debt Fund will declare and pay quarterly distribution to Unitholders holding the I Income Unit Class.
The Global Income Fund will declare and pay monthly distributions to Unitholders holding the D Income Unit Class.
The Finisterre Unconstrained Emerging Markets Fixed Income Fund will declare and pay quarterly distributions to Unitholders holding the I2 Income Unit Class.
The D2 and N2 Income Unit Classes from the Preferred Securities Fund and Global Property Securities Fund will declare and pay monthly distributions to Unitholders. There are no D2 Income Unit Classes in issue currently on the High Yield Fund, Post Global Limited Term High Yield Fund, Real Estate Debt Fund or the Finisterre Unconstrained Emerging Markets Fixed Income Fund. There are no N2 Income Unit Classes in issue currently on the Preferred Securities Fund or the Global Property Securities Fund.
Upon the expiry of the period of six years after the relevant Distribution Date, the Holder and any person claiming through, under or in trust for him shall forfeit any right to any distribution not paid, and such amount shall become part of the relevant Fund.
Distributions are recorded by each Fund on ex-dividend date in the Statement of Comprehensive Income once approved by the Board.
Offsetting Financial assets and liabilities are offset and the net amount reported in the Statement of Financial Position when there is a legally enforceable right to set-off the recognised amounts and there is an intention to settle on a net basis, or minimise the assets and settle the liability simultaneously.
Participating Units All participating units issued by the Funds provide the investors the right to acquire redemptions for cash at the value proportionate to the investor s share in the Fund s net assets at the redemption date. Such instruments give rise to a financial liability for the present value of the redemption amount. In accordance with the issued prospectus the Funds are contractually obliged to redeem units at the traded NAV per unit which is calculated at each valuation point.
PRINCIPAL GLOBAL INVESTORS FUNDS
NOTES TO THE ANNUAL REPORT AND FINANCIAL STATEMENTS
for the year ended 30 September 2018 (continued)
107
3. TAXATION
Under current law and practice the Trust qualifies as an investment undertaking as defined in Section 739B of the Taxes Consolidation Act, 1997, as amended. On that basis, it is not chargeable to Irish tax on its income or gains.
However, Irish tax may arise on the happening of a chargeable event . A chargeable event includes any distribution payments to Unitholders, any encashment, redemption, cancellation, repurchase or transfer of units and any deemed disposals of units as described below for Irish tax purposes arising as a result of holding units in the Trust for a period of eight years or more. Where a chargeable event occurs, the Trust is required to account for the Irish tax thereon.
No Irish tax will arise on the Trust in respect of chargeable events in respect of: (i) a Unitholder who is neither Irish resident nor ordinarily resident in Ireland for tax purposes, at the time of the
chargeable event, provided appropriate valid declarations in accordance with the provisions of the Taxes Consolidation Act, 1997, as amended, are held by the Trust or the Trust has been authorised by the Irish Revenue to make gross payments in the absence of appropriate declarations; and
(ii) certain exempted Irish tax resident Unitholders who have provided the Trust with the necessary signed statutory declarations.
Dividends, interest and capital gains (if any) received on investments made by the Trust may be subject to taxes imposed by the country from which the investment income/gains are received and such taxes may not be recoverable by the Trust or its Unitholders. Redeeming Units When a redemption request has been submitted by a Unitholder who is or is deemed to be an Irish resident, or is acting on behalf of an Irish resident, the Manager shall deduct from the redemption proceeds an amount which is equal to the tax payable by the Unit Trust to the Revenue Commissioners in Ireland in respect of the relevant transaction.
PRINCIPAL GLOBAL INVESTORS FUNDS
NOTES TO THE ANNUAL REPORT AND FINANCIAL STATEMENTS
for the year ended 30 September 2018 (continued)
108
4. CASH AND BANK BALANCES
At 30 September 2018 GEF USD
AEF USD
EEF USD
EMEF USD
JEF USD
PSF USD
USEF USD
HYF USD
GPSF USD
GLTHY USD
GTDARF1 USD
Cash at Bank 49,051 1,036,556 74,180 33,195,394 1,947,225 794,937 12,461,803 73,063 Cash Collateral Receivable 370,000 Bank Overdraft (117,835) (3,569) (26,000) (117,835) 49,051 1,036,556 74,180 (3,569) 33,195,394 (26,000) 2,317,225 794,937 12,461,803 73,063
At 30 September 2018 GSCEF2 USD
OGEMF USD
OGSCF USD
CLAF3 USD
FEMDF4 USD
GCSF5 USD
CSOF6 USD
REDF USD
GIF USD
FUEMF USD
Cash at Bank 73,145 2,508,346 3,609,938 35,912 2,326 28,973 117,735 1,973,080 754,418 961,800 Cash Collateral Receivable 4,926,208 73,145 2,508,346 3,609,938 35,912 2,326 28,973 117,735 1,973,080 754,418 5,888,008
1Global Time Diversified Absolute Return Fund terminated on 14 September 2018.
2Global Small Cap Equity Fund terminated on 14 September 2018.
3Claritas Latin America Fund terminated on 28 February 2018.
4Finisterre Emerging Markets Debt Fund terminated on 19 December 2017.
5Spectrum Global Capital Securities Fund terminated on 5 December 2017.
6Global Capital Structure Opportunities Fund terminated on 14 September 2018.
All Cash at Bank balances are held with BNY Mellon Trust Company (Ireland) Limited. Cash Collateral receivable/payable is held with the following counterparties: Barclays, Citigroup, HSBC, JP Morgan Chase & Co. and State Street Global Markets.
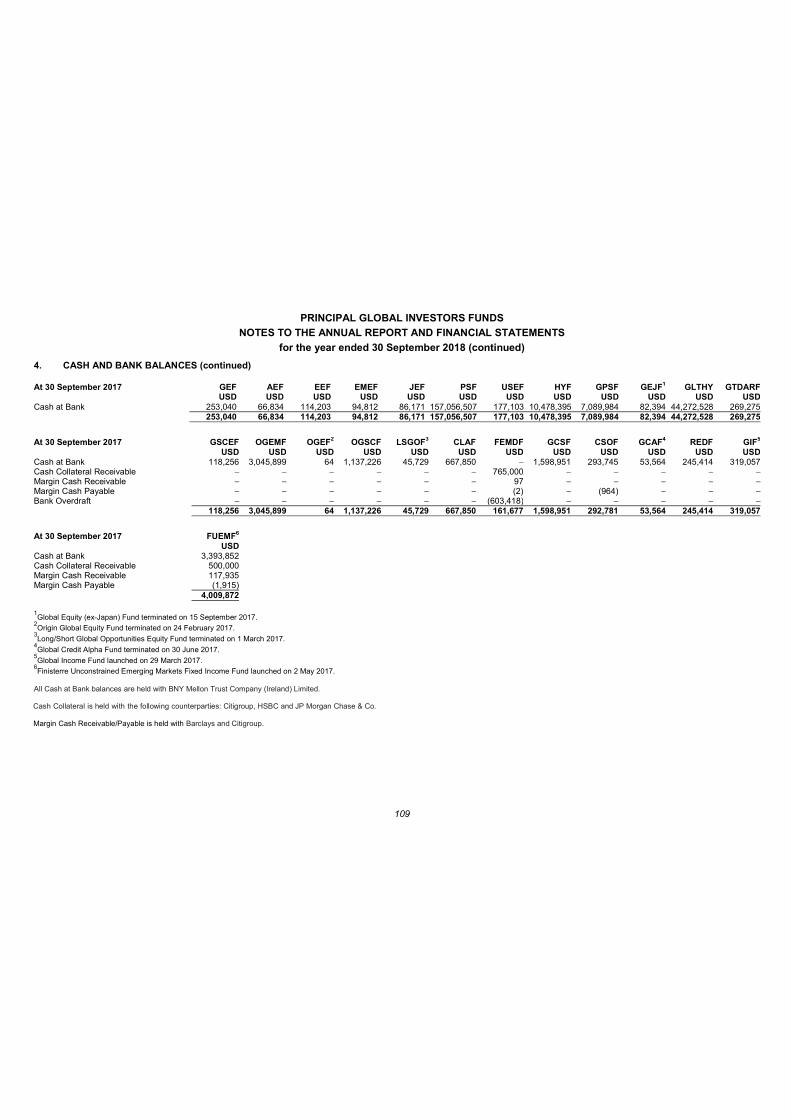
PRINCIPAL GLOBAL INVESTORS FUNDS
NOTES TO THE ANNUAL REPORT AND FINANCIAL STATEMENTS
for the year ended 30 September 2018 (continued)
109
4. CASH AND BANK BALANCES (continued)
At 30 September 2017 GEF USD
AEF USD
EEF USD
EMEF USD
JEF USD
PSF USD
USEF USD
HYF USD
GPSF USD
GEJF1 USD
GLTHY USD
GTDARF USD
Cash at Bank 253,040 66,834 114,203 94,812 86,171 157,056,507 177,103 10,478,395 7,089,984 82,394 44,272,528 269,275 253,040 66,834 114,203 94,812 86,171 157,056,507 177,103 10,478,395 7,089,984 82,394 44,272,528 269,275
At 30 September 2017 GSCEF
USD OGEMF
USD OGEF2
USD OGSCF
USD LSGOF3
USD CLAF
USD FEMDF
USD GCSF
USD CSOF
USD GCAF4
USD REDF
USD GIF5 USD
Cash at Bank 118,256 3,045,899 64 1,137,226 45,729 667,850 1,598,951 293,745 53,564 245,414 319,057 Cash Collateral Receivable 765,000 Margin Cash Receivable 97 Margin Cash Payable (2) (964) Bank Overdraft (603,418) 118,256 3,045,899 64 1,137,226 45,729 667,850 161,677 1,598,951 292,781 53,564 245,414 319,057
At 30 September 2017 FUEMF6
USD Cash at Bank 3,393,852 Cash Collateral Receivable 500,000 Margin Cash Receivable 117,935 Margin Cash Payable (1,915) 4,009,872
1Global Equity (ex-Japan) Fund terminated on 15 September 2017.
2Origin Global Equity Fund terminated on 24 February 2017.
3Long/Short Global Opportunities Equity Fund terminated on 1 March 2017.
4Global Credit Alpha Fund terminated on 30 June 2017.
5Global Income Fund launched on 29 March 2017.
6Finisterre Unconstrained Emerging Markets Fixed Income Fund launched on 2 May 2017.
All Cash at Bank balances are held with BNY Mellon Trust Company (Ireland) Limited. Cash Collateral is held with the following counterparties: Citigroup, HSBC and JP Morgan Chase & Co. Margin Cash Receivable/Payable is held with Barclays and Citigroup.
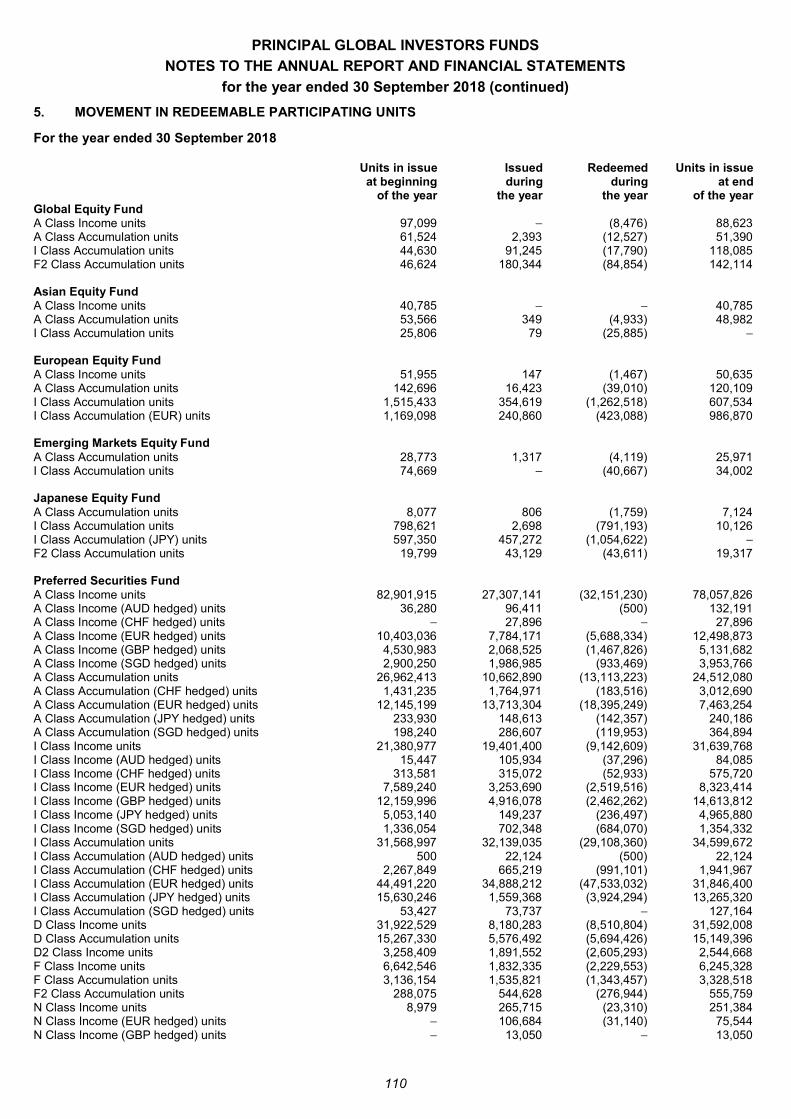
PRINCIPAL GLOBAL INVESTORS FUNDS
NOTES TO THE ANNUAL REPORT AND FINANCIAL STATEMENTS
for the year ended 30 September 2018 (continued)
110
5. MOVEMENT IN REDEEMABLE PARTICIPATING UNITS
For the year ended 30 September 2018
Units in issue at beginning
of the year
Issued during
the year
Redeemed during
the year
Units in issue at end
of the year Global Equity Fund A Class Income units 97,099 (8,476) 88,623 A Class Accumulation units 61,524 2,393 (12,527) 51,390 I Class Accumulation units 44,630 91,245 (17,790) 118,085 F2 Class Accumulation units 46,624 180,344 (84,854) 142,114 Asian Equity Fund A Class Income units 40,785 40,785 A Class Accumulation units 53,566 349 (4,933) 48,982 I Class Accumulation units 25,806 79 (25,885) European Equity Fund A Class Income units 51,955 147 (1,467) 50,635 A Class Accumulation units 142,696 16,423 (39,010) 120,109 I Class Accumulation units 1,515,433 354,619 (1,262,518) 607,534 I Class Accumulation (EUR) units 1,169,098 240,860 (423,088) 986,870 Emerging Markets Equity Fund A Class Accumulation units 28,773 1,317 (4,119) 25,971 I Class Accumulation units 74,669 (40,667) 34,002 Japanese Equity Fund A Class Accumulation units 8,077 806 (1,759) 7,124 I Class Accumulation units 798,621 2,698 (791,193) 10,126 I Class Accumulation (JPY) units 597,350 457,272 (1,054,622) F2 Class Accumulation units 19,799 43,129 (43,611) 19,317 Preferred Securities Fund A Class Income units 82,901,915 27,307,141 (32,151,230) 78,057,826 A Class Income (AUD hedged) units 36,280 96,411 (500) 132,191 A Class Income (CHF hedged) units 27,896 27,896 A Class Income (EUR hedged) units 10,403,036 7,784,171 (5,688,334) 12,498,873 A Class Income (GBP hedged) units 4,530,983 2,068,525 (1,467,826) 5,131,682 A Class Income (SGD hedged) units 2,900,250 1,986,985 (933,469) 3,953,766 A Class Accumulation units 26,962,413 10,662,890 (13,113,223) 24,512,080 A Class Accumulation (CHF hedged) units 1,431,235 1,764,971 (183,516) 3,012,690 A Class Accumulation (EUR hedged) units 12,145,199 13,713,304 (18,395,249) 7,463,254 A Class Accumulation (JPY hedged) units 233,930 148,613 (142,357) 240,186 A Class Accumulation (SGD hedged) units 198,240 286,607 (119,953) 364,894 I Class Income units 21,380,977 19,401,400 (9,142,609) 31,639,768 I Class Income (AUD hedged) units 15,447 105,934 (37,296) 84,085 I Class Income (CHF hedged) units 313,581 315,072 (52,933) 575,720 I Class Income (EUR hedged) units 7,589,240 3,253,690 (2,519,516) 8,323,414 I Class Income (GBP hedged) units 12,159,996 4,916,078 (2,462,262) 14,613,812 I Class Income (JPY hedged) units 5,053,140 149,237 (236,497) 4,965,880 I Class Income (SGD hedged) units 1,336,054 702,348 (684,070) 1,354,332 I Class Accumulation units 31,568,997 32,139,035 (29,108,360) 34,599,672 I Class Accumulation (AUD hedged) units 500 22,124 (500) 22,124 I Class Accumulation (CHF hedged) units 2,267,849 665,219 (991,101) 1,941,967 I Class Accumulation (EUR hedged) units 44,491,220 34,888,212 (47,533,032) 31,846,400 I Class Accumulation (JPY hedged) units 15,630,246 1,559,368 (3,924,294) 13,265,320 I Class Accumulation (SGD hedged) units 53,427 73,737 127,164 D Class Income units 31,922,529 8,180,283 (8,510,804) 31,592,008 D Class Accumulation units 15,267,330 5,576,492 (5,694,426) 15,149,396 D2 Class Income units 3,258,409 1,891,552 (2,605,293) 2,544,668 F Class Income units 6,642,546 1,832,335 (2,229,553) 6,245,328 F Class Accumulation units 3,136,154 1,535,821 (1,343,457) 3,328,518 F2 Class Accumulation units 288,075 544,628 (276,944) 555,759 N Class Income units 8,979 265,715 (23,310) 251,384 N Class Income (EUR hedged) units 106,684 (31,140) 75,544 N Class Income (GBP hedged) units 13,050 13,050
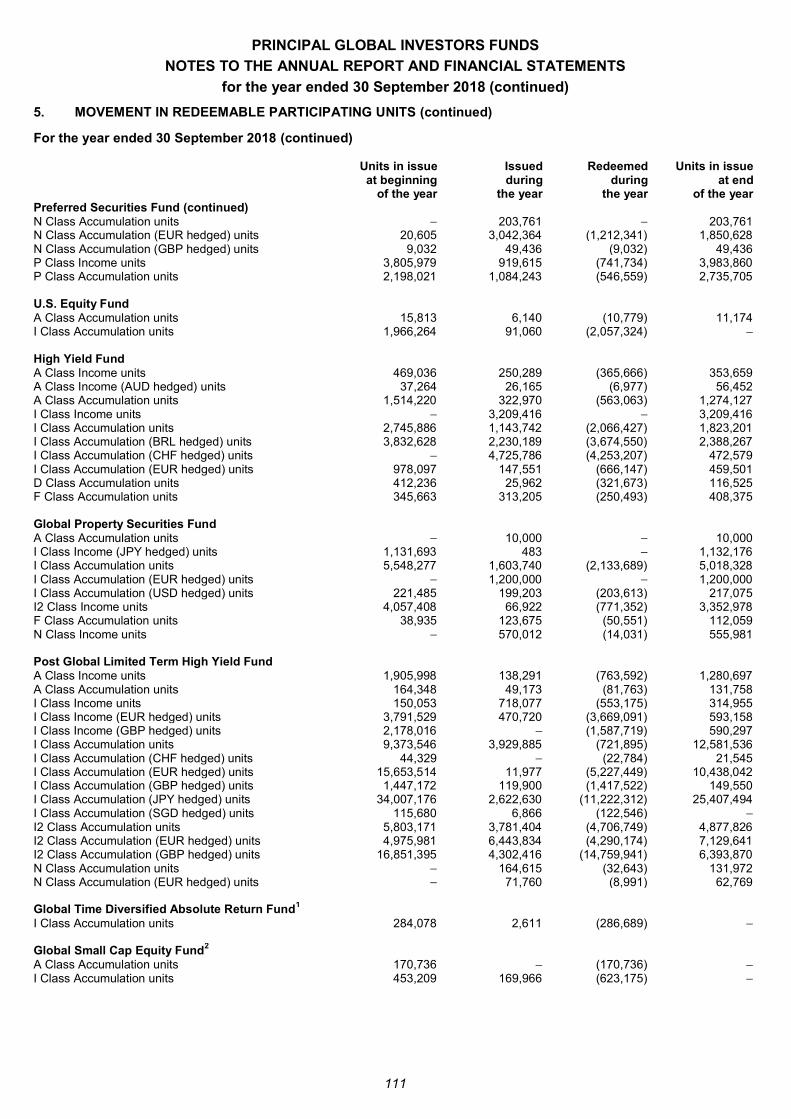
PRINCIPAL GLOBAL INVESTORS FUNDS
NOTES TO THE ANNUAL REPORT AND FINANCIAL STATEMENTS
for the year ended 30 September 2018 (continued)
111
5. MOVEMENT IN REDEEMABLE PARTICIPATING UNITS (continued)
For the year ended 30 September 2018 (continued)
Units in issue at beginning
of the year
Issued during
the year
Redeemed during
the year
Units in issue at end
of the year Preferred Securities Fund (continued) N Class Accumulation units 203,761 203,761 N Class Accumulation (EUR hedged) units 20,605 3,042,364 (1,212,341) 1,850,628 N Class Accumulation (GBP hedged) units 9,032 49,436 (9,032) 49,436 P Class Income units 3,805,979 919,615 (741,734) 3,983,860 P Class Accumulation units 2,198,021 1,084,243 (546,559) 2,735,705 U.S. Equity Fund A Class Accumulation units 15,813 6,140 (10,779) 11,174 I Class Accumulation units 1,966,264 91,060 (2,057,324) High Yield Fund A Class Income units 469,036 250,289 (365,666) 353,659 A Class Income (AUD hedged) units 37,264 26,165 (6,977) 56,452 A Class Accumulation units 1,514,220 322,970 (563,063) 1,274,127 I Class Income units 3,209,416 3,209,416 I Class Accumulation units 2,745,886 1,143,742 (2,066,427) 1,823,201 I Class Accumulation (BRL hedged) units 3,832,628 2,230,189 (3,674,550) 2,388,267 I Class Accumulation (CHF hedged) units 4,725,786 (4,253,207) 472,579 I Class Accumulation (EUR hedged) units 978,097 147,551 (666,147) 459,501 D Class Accumulation units 412,236 25,962 (321,673) 116,525 F Class Accumulation units 345,663 313,205 (250,493) 408,375 Global Property Securities Fund A Class Accumulation units 10,000 10,000 I Class Income (JPY hedged) units 1,131,693 483 1,132,176 I Class Accumulation units 5,548,277 1,603,740 (2,133,689) 5,018,328 I Class Accumulation (EUR hedged) units 1,200,000 1,200,000 I Class Accumulation (USD hedged) units 221,485 199,203 (203,613) 217,075 I2 Class Income units 4,057,408 66,922 (771,352) 3,352,978 F Class Accumulation units 38,935 123,675 (50,551) 112,059 N Class Income units 570,012 (14,031) 555,981 Post Global Limited Term High Yield Fund A Class Income units 1,905,998 138,291 (763,592) 1,280,697 A Class Accumulation units 164,348 49,173 (81,763) 131,758 I Class Income units 150,053 718,077 (553,175) 314,955 I Class Income (EUR hedged) units 3,791,529 470,720 (3,669,091) 593,158 I Class Income (GBP hedged) units 2,178,016 (1,587,719) 590,297 I Class Accumulation units 9,373,546 3,929,885 (721,895) 12,581,536 I Class Accumulation (CHF hedged) units 44,329 (22,784) 21,545 I Class Accumulation (EUR hedged) units 15,653,514 11,977 (5,227,449) 10,438,042 I Class Accumulation (GBP hedged) units 1,447,172 119,900 (1,417,522) 149,550 I Class Accumulation (JPY hedged) units 34,007,176 2,622,630 (11,222,312) 25,407,494 I Class Accumulation (SGD hedged) units 115,680 6,866 (122,546) I2 Class Accumulation units 5,803,171 3,781,404 (4,706,749) 4,877,826 I2 Class Accumulation (EUR hedged) units 4,975,981 6,443,834 (4,290,174) 7,129,641 I2 Class Accumulation (GBP hedged) units 16,851,395 4,302,416 (14,759,941) 6,393,870 N Class Accumulation units 164,615 (32,643) 131,972 N Class Accumulation (EUR hedged) units 71,760 (8,991) 62,769 Global Time Diversified Absolute Return Fund1 I Class Accumulation units 284,078 2,611 (286,689) Global Small Cap Equity Fund2 A Class Accumulation units 170,736 (170,736) I Class Accumulation units 453,209 169,966 (623,175)
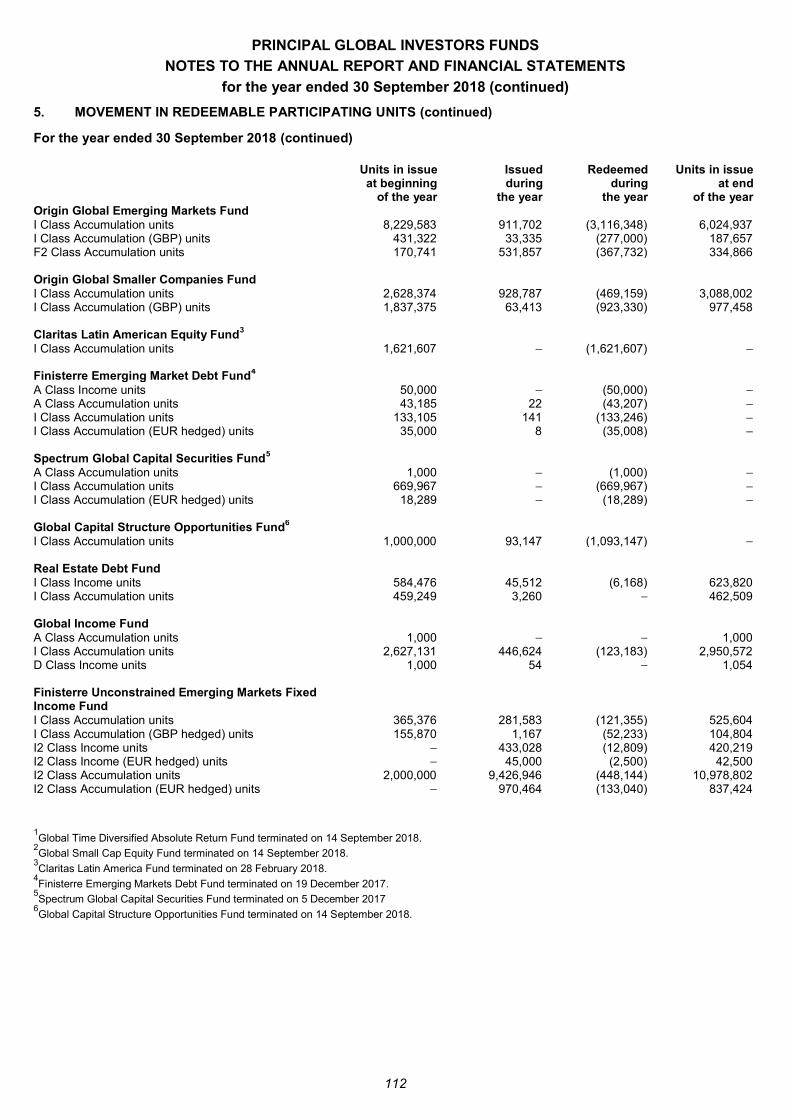
PRINCIPAL GLOBAL INVESTORS FUNDS
NOTES TO THE ANNUAL REPORT AND FINANCIAL STATEMENTS
for the year ended 30 September 2018 (continued)
112
5. MOVEMENT IN REDEEMABLE PARTICIPATING UNITS (continued)
For the year ended 30 September 2018 (continued)
Units in issue at beginning
of the year
Issued during
the year
Redeemed during
the year
Units in issue at end
of the year Origin Global Emerging Markets Fund I Class Accumulation units 8,229,583 911,702 (3,116,348) 6,024,937 I Class Accumulation (GBP) units 431,322 33,335 (277,000) 187,657 F2 Class Accumulation units 170,741 531,857 (367,732) 334,866 Origin Global Smaller Companies Fund I Class Accumulation units 2,628,374 928,787 (469,159) 3,088,002 I Class Accumulation (GBP) units 1,837,375 63,413 (923,330) 977,458 Claritas Latin American Equity Fund3 I Class Accumulation units 1,621,607 (1,621,607) Finisterre Emerging Market Debt Fund4 A Class Income units 50,000 (50,000) A Class Accumulation units 43,185 22 (43,207) I Class Accumulation units 133,105 141 (133,246) I Class Accumulation (EUR hedged) units 35,000 8 (35,008) Spectrum Global Capital Securities Fund5 A Class Accumulation units 1,000 (1,000) I Class Accumulation units 669,967 (669,967) I Class Accumulation (EUR hedged) units 18,289 (18,289) Global Capital Structure Opportunities Fund6 I Class Accumulation units 1,000,000 93,147 (1,093,147) Real Estate Debt Fund I Class Income units 584,476 45,512 (6,168) 623,820 I Class Accumulation units 459,249 3,260 462,509 Global Income Fund A Class Accumulation units 1,000 1,000 I Class Accumulation units 2,627,131 446,624 (123,183) 2,950,572 D Class Income units 1,000 54 1,054 Finisterre Unconstrained Emerging Markets Fixed Income Fund I Class Accumulation units 365,376 281,583 (121,355) 525,604 I Class Accumulation (GBP hedged) units 155,870 1,167 (52,233) 104,804 I2 Class Income units 433,028 (12,809) 420,219 I2 Class Income (EUR hedged) units 45,000 (2,500) 42,500 I2 Class Accumulation units 2,000,000 9,426,946 (448,144) 10,978,802 I2 Class Accumulation (EUR hedged) units 970,464 (133,040) 837,424
1Global Time Diversified Absolute Return Fund terminated on 14 September 2018.
2Global Small Cap Equity Fund terminated on 14 September 2018.
3Claritas Latin America Fund terminated on 28 February 2018.
4Finisterre Emerging Markets Debt Fund terminated on 19 December 2017.
5Spectrum Global Capital Securities Fund terminated on 5 December 2017
6Global Capital Structure Opportunities Fund terminated on 14 September 2018.
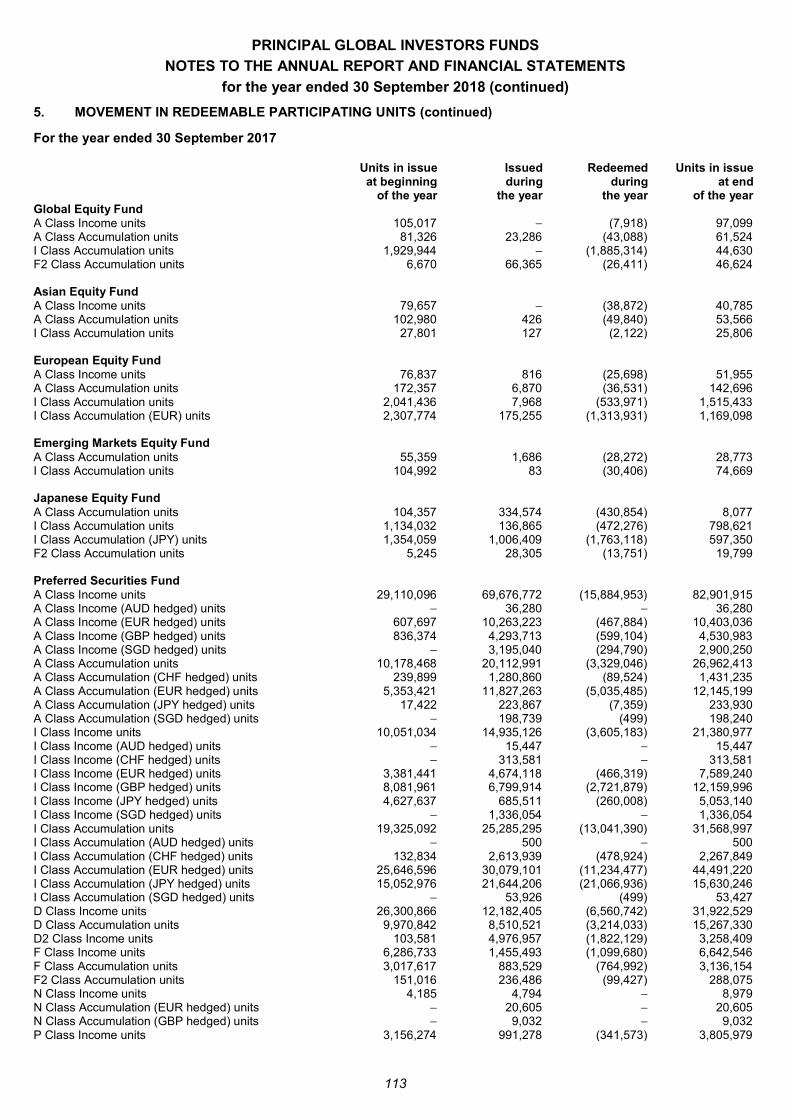
PRINCIPAL GLOBAL INVESTORS FUNDS
NOTES TO THE ANNUAL REPORT AND FINANCIAL STATEMENTS
for the year ended 30 September 2018 (continued)
113
5. MOVEMENT IN REDEEMABLE PARTICIPATING UNITS (continued)
For the year ended 30 September 2017
Units in issue at beginning
of the year
Issued during
the year
Redeemed during
the year
Units in issue at end
of the year Global Equity Fund A Class Income units 105,017 (7,918) 97,099 A Class Accumulation units 81,326 23,286 (43,088) 61,524 I Class Accumulation units 1,929,944 (1,885,314) 44,630 F2 Class Accumulation units 6,670 66,365 (26,411) 46,624 Asian Equity Fund A Class Income units 79,657 (38,872) 40,785 A Class Accumulation units 102,980 426 (49,840) 53,566 I Class Accumulation units 27,801 127 (2,122) 25,806 European Equity Fund A Class Income units 76,837 816 (25,698) 51,955 A Class Accumulation units 172,357 6,870 (36,531) 142,696 I Class Accumulation units 2,041,436 7,968 (533,971) 1,515,433 I Class Accumulation (EUR) units 2,307,774 175,255 (1,313,931) 1,169,098 Emerging Markets Equity Fund A Class Accumulation units 55,359 1,686 (28,272) 28,773 I Class Accumulation units 104,992 83 (30,406) 74,669 Japanese Equity Fund A Class Accumulation units 104,357 334,574 (430,854) 8,077 I Class Accumulation units 1,134,032 136,865 (472,276) 798,621 I Class Accumulation (JPY) units 1,354,059 1,006,409 (1,763,118) 597,350 F2 Class Accumulation units 5,245 28,305 (13,751) 19,799 Preferred Securities Fund A Class Income units 29,110,096 69,676,772 (15,884,953) 82,901,915 A Class Income (AUD hedged) units 36,280 36,280 A Class Income (EUR hedged) units 607,697 10,263,223 (467,884) 10,403,036 A Class Income (GBP hedged) units 836,374 4,293,713 (599,104) 4,530,983 A Class Income (SGD hedged) units 3,195,040 (294,790) 2,900,250 A Class Accumulation units 10,178,468 20,112,991 (3,329,046) 26,962,413 A Class Accumulation (CHF hedged) units 239,899 1,280,860 (89,524) 1,431,235 A Class Accumulation (EUR hedged) units 5,353,421 11,827,263 (5,035,485) 12,145,199 A Class Accumulation (JPY hedged) units 17,422 223,867 (7,359) 233,930 A Class Accumulation (SGD hedged) units 198,739 (499) 198,240 I Class Income units 10,051,034 14,935,126 (3,605,183) 21,380,977 I Class Income (AUD hedged) units 15,447 15,447 I Class Income (CHF hedged) units 313,581 313,581 I Class Income (EUR hedged) units 3,381,441 4,674,118 (466,319) 7,589,240 I Class Income (GBP hedged) units 8,081,961 6,799,914 (2,721,879) 12,159,996 I Class Income (JPY hedged) units 4,627,637 685,511 (260,008) 5,053,140 I Class Income (SGD hedged) units 1,336,054 1,336,054 I Class Accumulation units 19,325,092 25,285,295 (13,041,390) 31,568,997 I Class Accumulation (AUD hedged) units 500 500 I Class Accumulation (CHF hedged) units 132,834 2,613,939 (478,924) 2,267,849 I Class Accumulation (EUR hedged) units 25,646,596 30,079,101 (11,234,477) 44,491,220 I Class Accumulation (JPY hedged) units 15,052,976 21,644,206 (21,066,936) 15,630,246 I Class Accumulation (SGD hedged) units 53,926 (499) 53,427 D Class Income units 26,300,866 12,182,405 (6,560,742) 31,922,529 D Class Accumulation units 9,970,842 8,510,521 (3,214,033) 15,267,330 D2 Class Income units 103,581 4,976,957 (1,822,129) 3,258,409 F Class Income units 6,286,733 1,455,493 (1,099,680) 6,642,546 F Class Accumulation units 3,017,617 883,529 (764,992) 3,136,154 F2 Class Accumulation units 151,016 236,486 (99,427) 288,075 N Class Income units 4,185 4,794 8,979 N Class Accumulation (EUR hedged) units 20,605 20,605 N Class Accumulation (GBP hedged) units 9,032 9,032 P Class Income units 3,156,274 991,278 (341,573) 3,805,979
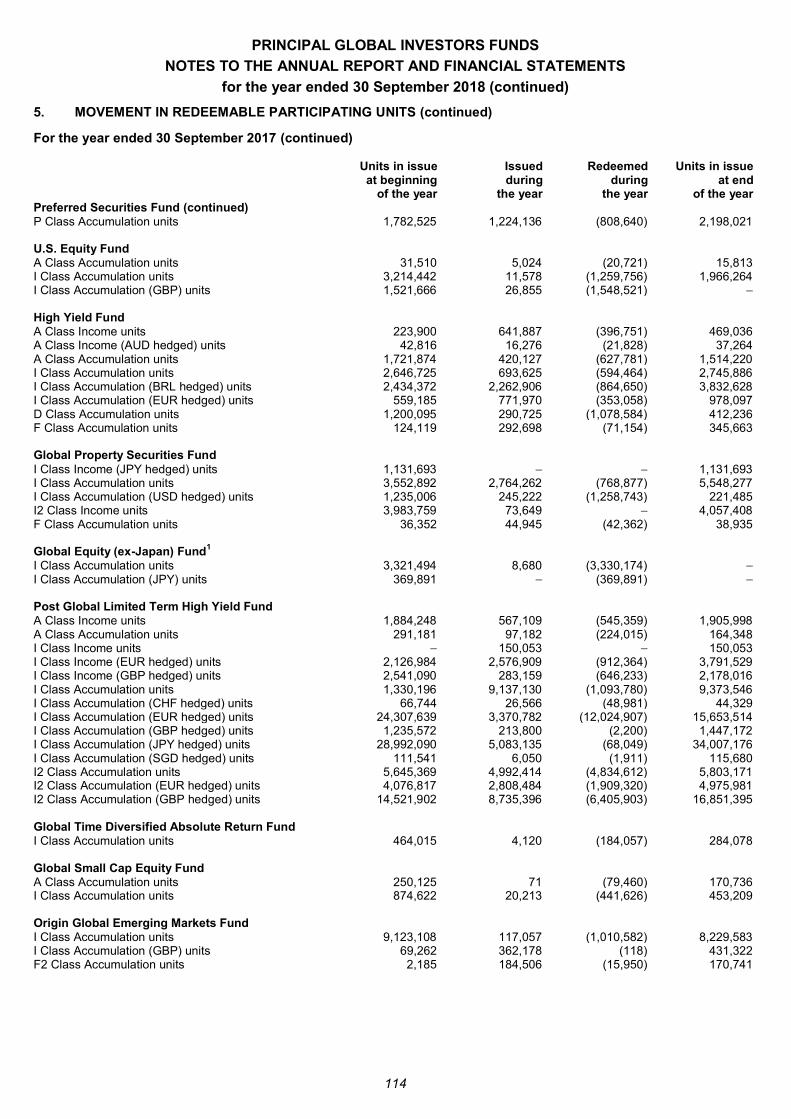
PRINCIPAL GLOBAL INVESTORS FUNDS
NOTES TO THE ANNUAL REPORT AND FINANCIAL STATEMENTS
for the year ended 30 September 2018 (continued)
114
5. MOVEMENT IN REDEEMABLE PARTICIPATING UNITS (continued)
For the year ended 30 September 2017 (continued)
Units in issue at beginning
of the year
Issued during
the year
Redeemed during
the year
Units in issue at end
of the year Preferred Securities Fund (continued) P Class Accumulation units 1,782,525 1,224,136 (808,640) 2,198,021 U.S. Equity Fund A Class Accumulation units 31,510 5,024 (20,721) 15,813 I Class Accumulation units 3,214,442 11,578 (1,259,756) 1,966,264 I Class Accumulation (GBP) units 1,521,666 26,855 (1,548,521) High Yield Fund A Class Income units 223,900 641,887 (396,751) 469,036 A Class Income (AUD hedged) units 42,816 16,276 (21,828) 37,264 A Class Accumulation units 1,721,874 420,127 (627,781) 1,514,220 I Class Accumulation units 2,646,725 693,625 (594,464) 2,745,886 I Class Accumulation (BRL hedged) units 2,434,372 2,262,906 (864,650) 3,832,628 I Class Accumulation (EUR hedged) units 559,185 771,970 (353,058) 978,097 D Class Accumulation units 1,200,095 290,725 (1,078,584) 412,236 F Class Accumulation units 124,119 292,698 (71,154) 345,663 Global Property Securities Fund I Class Income (JPY hedged) units 1,131,693 1,131,693 I Class Accumulation units 3,552,892 2,764,262 (768,877) 5,548,277 I Class Accumulation (USD hedged) units 1,235,006 245,222 (1,258,743) 221,485 I2 Class Income units 3,983,759 73,649 4,057,408 F Class Accumulation units 36,352 44,945 (42,362) 38,935 Global Equity (ex-Japan) Fund1 I Class Accumulation units 3,321,494 8,680 (3,330,174) I Class Accumulation (JPY) units 369,891 (369,891) Post Global Limited Term High Yield Fund A Class Income units 1,884,248 567,109 (545,359) 1,905,998 A Class Accumulation units 291,181 97,182 (224,015) 164,348 I Class Income units 150,053 150,053 I Class Income (EUR hedged) units 2,126,984 2,576,909 (912,364) 3,791,529 I Class Income (GBP hedged) units 2,541,090 283,159 (646,233) 2,178,016 I Class Accumulation units 1,330,196 9,137,130 (1,093,780) 9,373,546 I Class Accumulation (CHF hedged) units 66,744 26,566 (48,981) 44,329 I Class Accumulation (EUR hedged) units 24,307,639 3,370,782 (12,024,907) 15,653,514 I Class Accumulation (GBP hedged) units 1,235,572 213,800 (2,200) 1,447,172 I Class Accumulation (JPY hedged) units 28,992,090 5,083,135 (68,049) 34,007,176 I Class Accumulation (SGD hedged) units 111,541 6,050 (1,911) 115,680 I2 Class Accumulation units 5,645,369 4,992,414 (4,834,612) 5,803,171 I2 Class Accumulation (EUR hedged) units 4,076,817 2,808,484 (1,909,320) 4,975,981 I2 Class Accumulation (GBP hedged) units 14,521,902 8,735,396 (6,405,903) 16,851,395 Global Time Diversified Absolute Return Fund I Class Accumulation units 464,015 4,120 (184,057) 284,078 Global Small Cap Equity Fund A Class Accumulation units 250,125 71 (79,460) 170,736 I Class Accumulation units 874,622 20,213 (441,626) 453,209 Origin Global Emerging Markets Fund I Class Accumulation units 9,123,108 117,057 (1,010,582) 8,229,583 I Class Accumulation (GBP) units 69,262 362,178 (118) 431,322 F2 Class Accumulation units 2,185 184,506 (15,950) 170,741
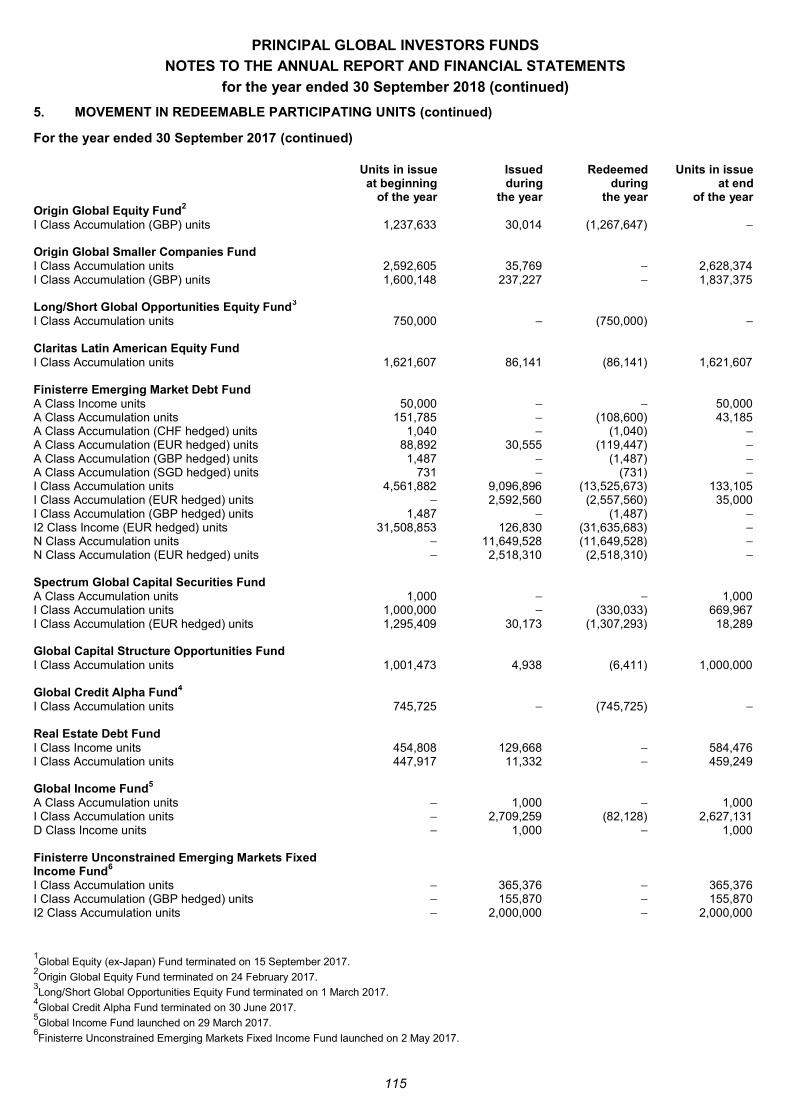
PRINCIPAL GLOBAL INVESTORS FUNDS
NOTES TO THE ANNUAL REPORT AND FINANCIAL STATEMENTS
for the year ended 30 September 2018 (continued)
115
5. MOVEMENT IN REDEEMABLE PARTICIPATING UNITS (continued)
For the year ended 30 September 2017 (continued)
Units in issue at beginning
of the year
Issued during
the year
Redeemed during
the year
Units in issue at end
of the year Origin Global Equity Fund2 I Class Accumulation (GBP) units 1,237,633 30,014 (1,267,647) Origin Global Smaller Companies Fund I Class Accumulation units 2,592,605 35,769 2,628,374 I Class Accumulation (GBP) units 1,600,148 237,227 1,837,375 Long/Short Global Opportunities Equity Fund3 I Class Accumulation units 750,000 (750,000) Claritas Latin American Equity Fund I Class Accumulation units 1,621,607 86,141 (86,141) 1,621,607 Finisterre Emerging Market Debt Fund A Class Income units 50,000 50,000 A Class Accumulation units 151,785 (108,600) 43,185 A Class Accumulation (CHF hedged) units 1,040 (1,040) A Class Accumulation (EUR hedged) units 88,892 30,555 (119,447) A Class Accumulation (GBP hedged) units 1,487 (1,487) A Class Accumulation (SGD hedged) units 731 (731) I Class Accumulation units 4,561,882 9,096,896 (13,525,673) 133,105 I Class Accumulation (EUR hedged) units 2,592,560 (2,557,560) 35,000 I Class Accumulation (GBP hedged) units 1,487 (1,487) I2 Class Income (EUR hedged) units 31,508,853 126,830 (31,635,683) N Class Accumulation units 11,649,528 (11,649,528) N Class Accumulation (EUR hedged) units 2,518,310 (2,518,310) Spectrum Global Capital Securities Fund A Class Accumulation units 1,000 1,000 I Class Accumulation units 1,000,000 (330,033) 669,967 I Class Accumulation (EUR hedged) units 1,295,409 30,173 (1,307,293) 18,289 Global Capital Structure Opportunities Fund I Class Accumulation units 1,001,473 4,938 (6,411) 1,000,000 Global Credit Alpha Fund4 I Class Accumulation units 745,725 (745,725) Real Estate Debt Fund I Class Income units 454,808 129,668 584,476 I Class Accumulation units 447,917 11,332 459,249 Global Income Fund5 A Class Accumulation units 1,000 1,000 I Class Accumulation units 2,709,259 (82,128) 2,627,131 D Class Income units 1,000 1,000 Finisterre Unconstrained Emerging Markets Fixed Income Fund6 I Class Accumulation units 365,376 365,376 I Class Accumulation (GBP hedged) units 155,870 155,870 I2 Class Accumulation units 2,000,000 2,000,000
1Global Equity (ex-Japan) Fund terminated on 15 September 2017.
2Origin Global Equity Fund terminated on 24 February 2017.
3Long/Short Global Opportunities Equity Fund terminated on 1 March 2017.
4Global Credit Alpha Fund terminated on 30 June 2017.
5Global Income Fund launched on 29 March 2017.
6Finisterre Unconstrained Emerging Markets Fixed Income Fund launched on 2 May 2017.
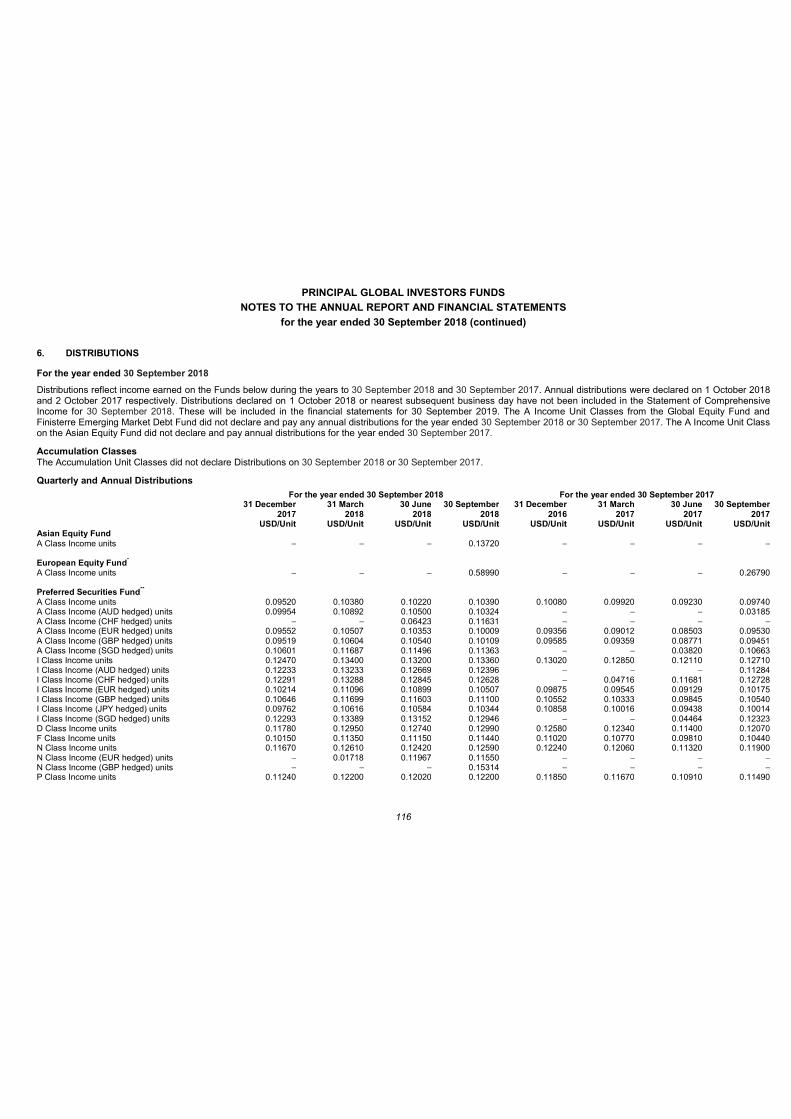
PRINCIPAL GLOBAL INVESTORS FUNDS
NOTES TO THE ANNUAL REPORT AND FINANCIAL STATEMENTS
for the year ended 30 September 2018 (continued)
116
6. DISTRIBUTIONS
For the year ended 30 September 2018
Distributions reflect income earned on the Funds below during the years to 30 September 2018 and 30 September 2017. Annual distributions were declared on 1 October 2018 and 2 October 2017 respectively. Distributions declared on 1 October 2018 or nearest subsequent business day have not been included in the Statement of Comprehensive Income for 30 September 2018. These will be included in the financial statements for 30 September 2019. The A Income Unit Classes from the Global Equity Fund and Finisterre Emerging Market Debt Fund did not declare and pay any annual distributions for the year ended 30 September 2018 or 30 September 2017. The A Income Unit Class on the Asian Equity Fund did not declare and pay annual distributions for the year ended 30 September 2017.
Accumulation Classes The Accumulation Unit Classes did not declare Distributions on 30 September 2018 or 30 September 2017.
Quarterly and Annual Distributions
For the year ended 30 September 2018 For the year ended 30 September 2017
31 December 2017
USD/Unit
31 March 2018
USD/Unit
30 June 2018
USD/Unit
30 September 2018
USD/Unit
31 December 2016
USD/Unit
31 March 2017
USD/Unit
30 June 2017
USD/Unit
30 September 2017
USD/Unit Asian Equity Fund A Class Income units 0.13720 European Equity Fund* A Class Income units 0.58990 0.26790 Preferred Securities Fund** A Class Income units 0.09520 0.10380 0.10220 0.10390 0.10080 0.09920 0.09230 0.09740 A Class Income (AUD hedged) units 0.09954 0.10892 0.10500 0.10324 0.03185 A Class Income (CHF hedged) units 0.06423 0.11631 A Class Income (EUR hedged) units 0.09552 0.10507 0.10353 0.10009 0.09356 0.09012 0.08503 0.09530 A Class Income (GBP hedged) units 0.09519 0.10604 0.10540 0.10109 0.09585 0.09359 0.08771 0.09451 A Class Income (SGD hedged) units 0.10601 0.11687 0.11496 0.11363 0.03820 0.10663 I Class Income units 0.12470 0.13400 0.13200 0.13360 0.13020 0.12850 0.12110 0.12710 I Class Income (AUD hedged) units 0.12233 0.13233 0.12669 0.12396 0.11284 I Class Income (CHF hedged) units 0.12291 0.13288 0.12845 0.12628 0.04716 0.11681 0.12728 I Class Income (EUR hedged) units 0.10214 0.11096 0.10899 0.10507 0.09875 0.09545 0.09129 0.10175 I Class Income (GBP hedged) units 0.10646 0.11699 0.11603 0.11100 0.10552 0.10333 0.09845 0.10540 I Class Income (JPY hedged) units 0.09762 0.10616 0.10584 0.10344 0.10858 0.10016 0.09438 0.10014 I Class Income (SGD hedged) units 0.12293 0.13389 0.13152 0.12946 0.04464 0.12323 D Class Income units 0.11780 0.12950 0.12740 0.12990 0.12580 0.12340 0.11400 0.12070 F Class Income units 0.10150 0.11350 0.11150 0.11440 0.11020 0.10770 0.09810 0.10440 N Class Income units 0.11670 0.12610 0.12420 0.12590 0.12240 0.12060 0.11320 0.11900 N Class Income (EUR hedged) units 0.01718 0.11967 0.11550 N Class Income (GBP hedged) units 0.15314 P Class Income units 0.11240 0.12200 0.12020 0.12200 0.11850 0.11670 0.10910 0.11490
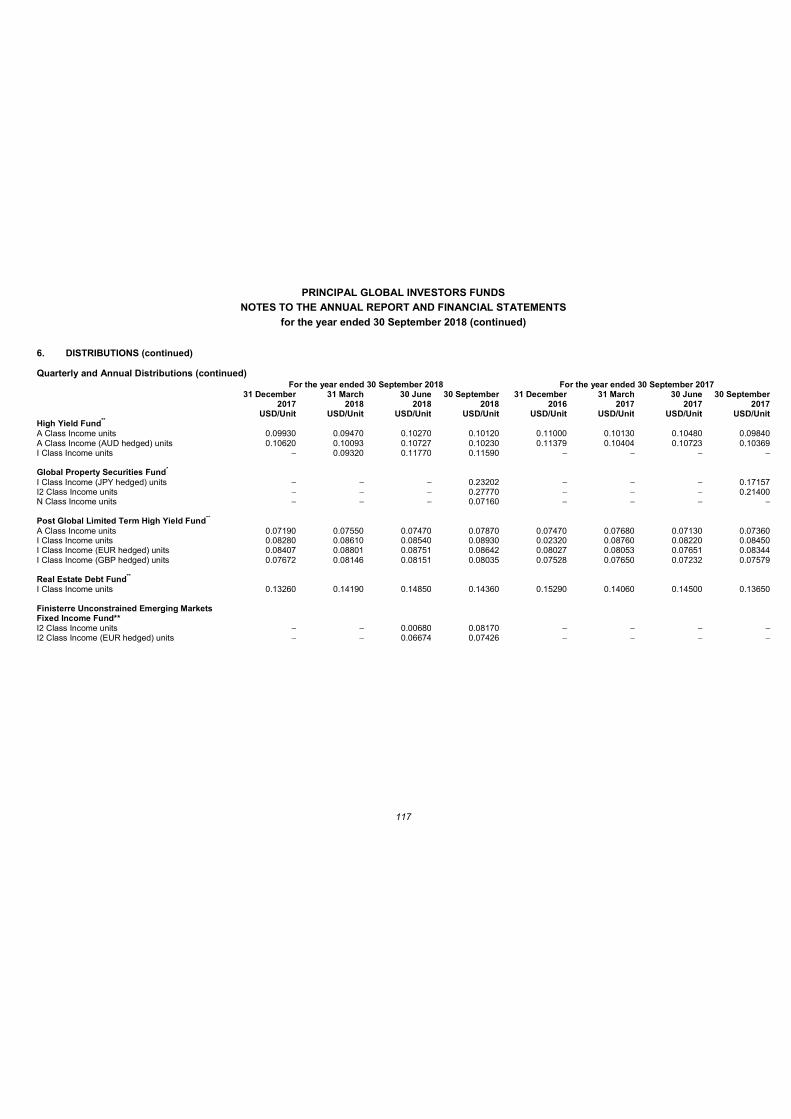
PRINCIPAL GLOBAL INVESTORS FUNDS
NOTES TO THE ANNUAL REPORT AND FINANCIAL STATEMENTS
for the year ended 30 September 2018 (continued)
117
6. DISTRIBUTIONS (continued)
Quarterly and Annual Distributions (continued) For the year ended 30 September 2018 For the year ended 30 September 2017
31 December 2017
USD/Unit
31 March 2018
USD/Unit
30 June 2018
USD/Unit
30 September 2018
USD/Unit
31 December 2016
USD/Unit
31 March 2017
USD/Unit
30 June 2017
USD/Unit
30 September 2017
USD/Unit High Yield Fund** A Class Income units 0.09930 0.09470 0.10270 0.10120 0.11000 0.10130 0.10480 0.09840 A Class Income (AUD hedged) units 0.10620 0.10093 0.10727 0.10230 0.11379 0.10404 0.10723 0.10369 I Class Income units 0.09320 0.11770 0.11590 Global Property Securities Fund* I Class Income (JPY hedged) units 0.23202 0.17157 I2 Class Income units 0.27770 0.21400 N Class Income units 0.07160 Post Global Limited Term High Yield Fund** A Class Income units 0.07190 0.07550 0.07470 0.07870 0.07470 0.07680 0.07130 0.07360 I Class Income units 0.08280 0.08610 0.08540 0.08930 0.02320 0.08760 0.08220 0.08450 I Class Income (EUR hedged) units 0.08407 0.08801 0.08751 0.08642 0.08027 0.08053 0.07651 0.08344 I Class Income (GBP hedged) units 0.07672 0.08146 0.08151 0.08035 0.07528 0.07650 0.07232 0.07579 Real Estate Debt Fund** I Class Income units 0.13260 0.14190 0.14850 0.14360 0.15290 0.14060 0.14500 0.13650 Finisterre Unconstrained Emerging Markets Fixed Income Fund** I2 Class Income units 0.00680 0.08170 I2 Class Income (EUR hedged) units 0.06674 0.07426
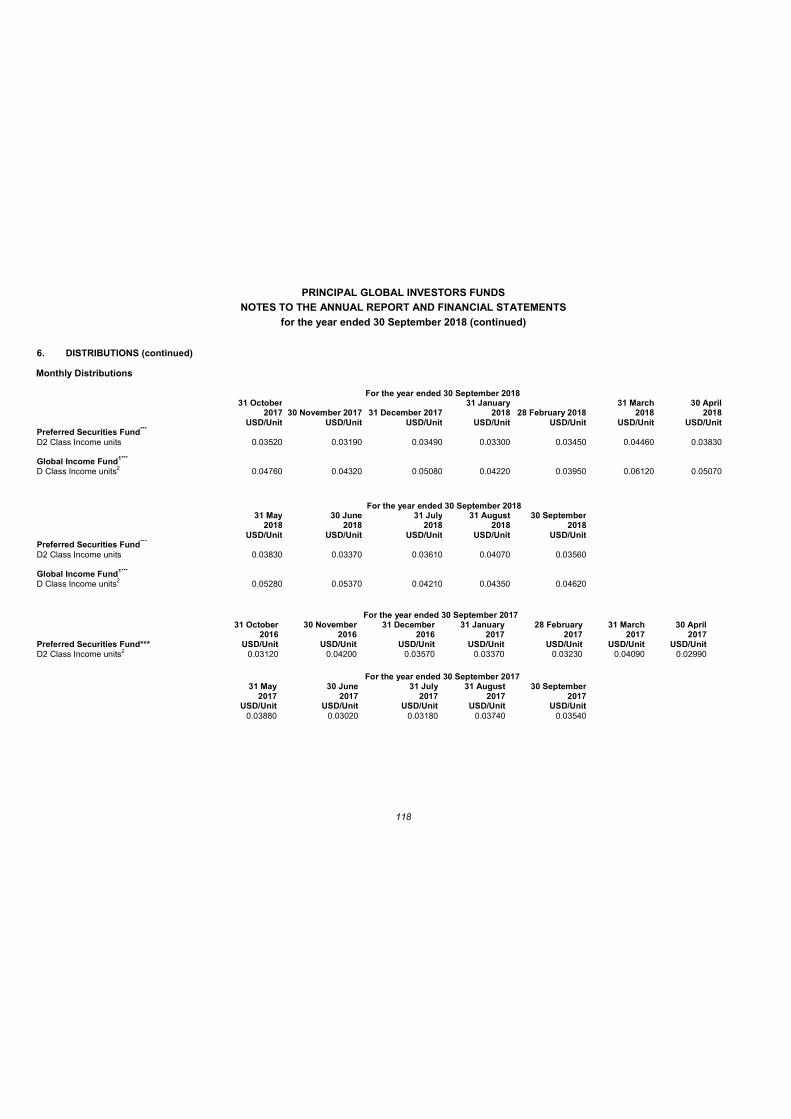
PRINCIPAL GLOBAL INVESTORS FUNDS
NOTES TO THE ANNUAL REPORT AND FINANCIAL STATEMENTS
for the year ended 30 September 2018 (continued)
118
6. DISTRIBUTIONS (continued)
Monthly Distributions
For the year ended 30 September 2018
31 October 2017
USD/Unit 30 November 2017
USD/Unit 31 December 2017
USD/Unit
31 January 2018
USD/Unit 28 February 2018
USD/Unit
31 March 2018
USD/Unit
30 April 2018
USD/Unit Preferred Securities Fund*** D2 Class Income units 0.03520 0.03190 0.03490 0.03300 0.03450 0.04460 0.03830 Global Income Fund1*** D Class Income units2 0.04760 0.04320 0.05080 0.04220 0.03950 0.06120 0.05070
For the year ended 30 September 2018
31 May 2018
USD/Unit
30 June 2018
USD/Unit
31 July 2018
USD/Unit
31 August 2018
USD/Unit
30 September 2018
USD/Unit Preferred Securities Fund*** D2 Class Income units 0.03830 0.03370 0.03610 0.04070 0.03560 Global Income Fund1*** D Class Income units2 0.05280 0.05370 0.04210 0.04350 0.04620
For the year ended 30 September 2017 31 October 30 November 31 December 31 January 28 February 31 March 30 April
Preferred Securities Fund*** 2016
USD/Unit 2016
USD/Unit 2016
USD/Unit 2017
USD/Unit 2017
USD/Unit 2017
USD/Unit 2017
USD/Unit D2 Class Income units2 0.03120 0.04200 0.03570 0.03370 0.03230 0.04090 0.02990
For the year ended 30 September 2017 31 May 30 June 31 July 31 August 30 September
2017
USD/Unit 2017
USD/Unit 2017
USD/Unit 2017
USD/Unit 2017
USD/Unit 0.03880 0.03020 0.03180 0.03740 0.03540
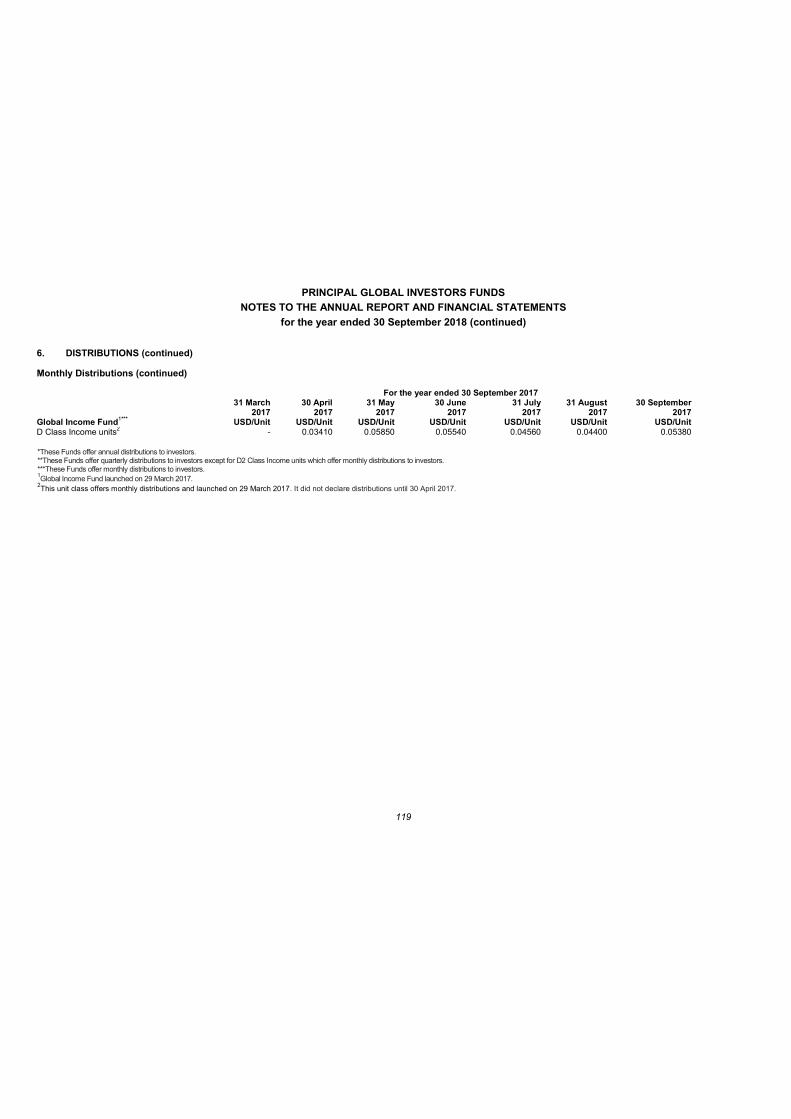
PRINCIPAL GLOBAL INVESTORS FUNDS
NOTES TO THE ANNUAL REPORT AND FINANCIAL STATEMENTS
for the year ended 30 September 2018 (continued)
119
6. DISTRIBUTIONS (continued)
Monthly Distributions (continued)
For the year ended 30 September 2017 31 March 30 April 31 May 30 June 31 July 31 August 30 September
Global Income Fund1*** 2017
USD/Unit 2017
USD/Unit 2017
USD/Unit 2017
USD/Unit 2017
USD/Unit 2017
USD/Unit 2017
USD/Unit D Class Income units2 - 0.03410 0.05850 0.05540 0.04560 0.04400 0.05380 *These Funds offer annual distributions to investors. **These Funds offer quarterly distributions to investors except for D2 Class Income units which offer monthly distributions to investors. ***These Funds offer monthly distributions to investors. 1Global Income Fund launched on 29 March 2017. 2This unit class offers monthly distributions and launched on 29 March 2017. It did not declare distributions until 30 April 2017.
PRINCIPAL GLOBAL INVESTORS FUNDS
NOTES TO THE ANNUAL REPORT AND FINANCIAL STATEMENTS
for the year ended 30 September 2018 (continued)
120
7. SIGNIFICANT CONTRACTS AND TRANSACTIONS WITH RELATED PARTIES
Management Fee Pursuant to the Trust Deed dated 13 Manager to the Trust and is responsible for its management and administration. For services rendered, the Trust will pay to the Manager an annual fee, accrued daily in the unit price and payable monthly in arrears. The Management Fee is currently calculated as a percentage of the NAV of each Fund and is accrued every Business Day. These related party transactions have been entered into in the ordinary course of business. The Management Fee expense is shown in the Statement of Comprehensive Income and the accrued amount is shown in the Statement of Financial Position. Management Fee rates for each unit class are listed in the supplement for each Fund. These are available from the www.principalglobal.com website.
Management Fee Rebate I Class Investors in certain Funds in agreement with the Investment Adviser/Sub-Investment Adviser(s), are entitled to a reduction in their effective annual Management Fee. This fee reduction is effected by way of a Management Fee Rebate, paid as cash and/or additional units purchased on the investors behalf by the Manager of the Fund. The effective Management Fees paid/accrued by these investors are disclosed in the Statement of Comprehensive Income and Statement of Financial Position. Those Funds to which the rebate applies, the ranges and the amount of the rebate applicable to those ranges are disclosed in the supplements for each Fund.
Expense Cap The Manager, at its discretion, may absorb (directly by waiving a portion of its fees or by reimbursement to the account of each Fund), certain additional fees, costs or expenses for each Fund that may arise in respect of the management and operation of the Trust attributable to each Fund. This Expense Cap fee is shown as Rebate/Recharge to the Fund due to capping in the Statement of Comprehensive Income and the accrual/prepaid amount is shown as part of Other Assets or Other Payables in the Statement of Financial Position.
Administration Fee In addition to the Management Fee, the Trust Deed permits the Manager to charge an Administration Fee of up to 0.15% per annum of the value of the units in the Funds for administering the Trust. Currently the Manager only charges this fee on the NAV of the Funds attributable to A, A2, D, D2, F, F2, N and P Class units. This fee is calculated as a percentage of the NAV of each Fund attributable to A, A2, D, D2, F, F2, N and P units and is accrued every Business Day. The total accrued amount is paid monthly in arrears. All fees and expenses payable to the Administrator in respect of the administration services it provides to the Manager will be met by the Manager. Administration Fee expense is shown in the Statement of Comprehensive Income and the accrued amount is shown in the Statement of Financial Position.
Trustee and Depositary fee The Manager appointed BNY Mellon Trust Company (Ireland) Limited to act as the Trustee to the Trust. The principal activity of the Trustee is to act as the Depositary and Trustee of the assets of collective investment schemes ( CISs ). The Trustee may retain for its own use out of each Fund a fee of up to 0.022% per annum of the NAV of the units calculated on each Business Day during the month, accrued and deducted from the Fund the following month - subject to a minimum fee of US$15,000 per annum which may be waived. The fee currently charged by the Trustee per Fund is disclosed in the relevant supplement for each Fund. The Trustee Fee expense is shown in the Statement of Comprehensive Income and the accrued amount is shown in the Statement of Financial Position.
Directors Remuneration Wright and Mr. Jim Firn are independent non-executive Directors
of the Manager and have no executive function with the Investment Adviser or its related party companies. The Manager pays each independent non-executi ,000 for their services rendered to the Trust. Mr. Christopher Henderson (resigned 17 May 2018), Mr. Mike Beer, Mr. Greg Thornton and Mr. Roberto Walker (appointed 23 May 2018) are related parties to the Investment Adviser and receive no compensation from the Trust.
Sub-Custody Fee Sub-Custodians will be paid a fee at normal commercial rates and such fee shall be paid out of the Fund. The level of Sub-Custodian Fees and expenses will vary depending on the investment profile of the Fund including, in particular, the nature of the securities markets in which the Fund invests, the size of the Fund and the amount of trading in the assets of the Fund. Such fees will be charged at normal commercial rates and will only be reimbursed from a Fund where they are less than 0.50% per annum of the NAV of the Fund. The Manager will pay any fees that exceed this level. Sub-Custody Fee expense is shown in the Statement of Comprehensive Income and the accrued amount is shown in the Statement of Financial Position.
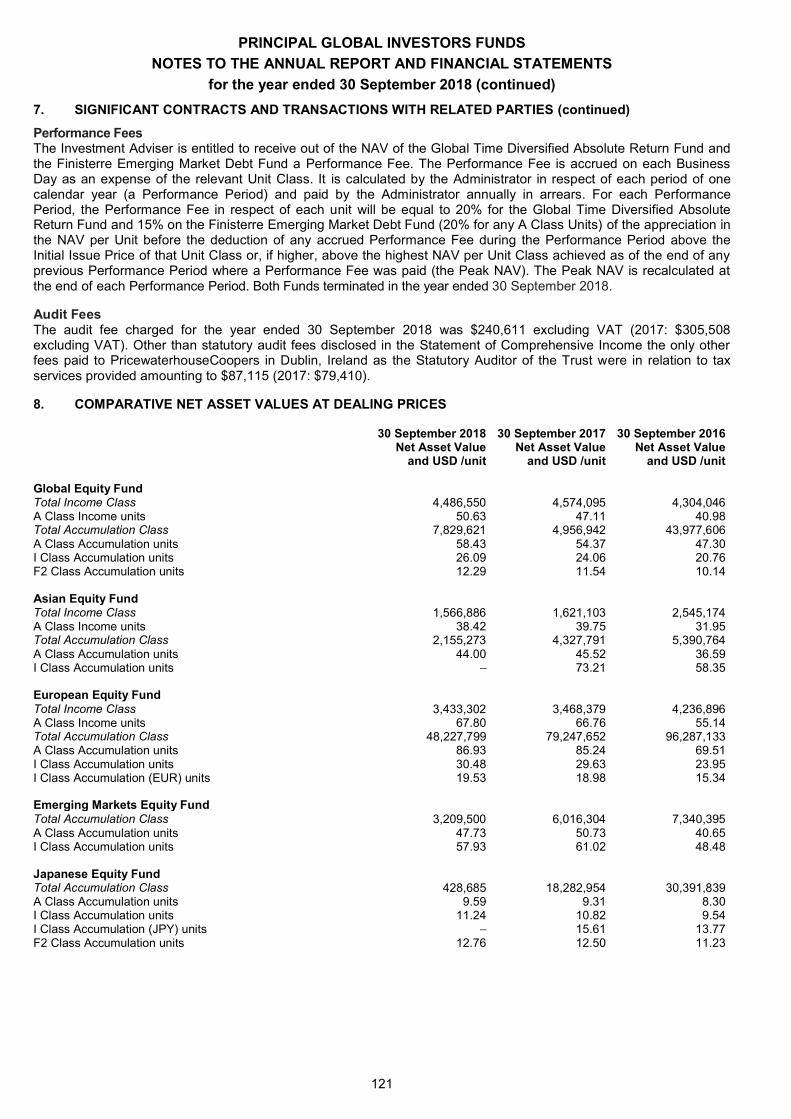
PRINCIPAL GLOBAL INVESTORS FUNDS
NOTES TO THE ANNUAL REPORT AND FINANCIAL STATEMENTS
for the year ended 30 September 2018 (continued)
121
7. SIGNIFICANT CONTRACTS AND TRANSACTIONS WITH RELATED PARTIES (continued)
Performance Fees The Investment Adviser is entitled to receive out of the NAV of the Global Time Diversified Absolute Return Fund and the Finisterre Emerging Market Debt Fund a Performance Fee. The Performance Fee is accrued on each Business Day as an expense of the relevant Unit Class. It is calculated by the Administrator in respect of each period of one calendar year (a Performance Period) and paid by the Administrator annually in arrears. For each Performance Period, the Performance Fee in respect of each unit will be equal to 20% for the Global Time Diversified Absolute Return Fund and 15% on the Finisterre Emerging Market Debt Fund (20% for any A Class Units) of the appreciation in the NAV per Unit before the deduction of any accrued Performance Fee during the Performance Period above the Initial Issue Price of that Unit Class or, if higher, above the highest NAV per Unit Class achieved as of the end of any previous Performance Period where a Performance Fee was paid (the Peak NAV). The Peak NAV is recalculated at the end of each Performance Period. Both Funds terminated in the year ended 30 September 2018.
Audit Fees The audit fee charged for the year ended 30 September 2018 was $240,611 excluding VAT (2017: $305,508 excluding VAT). Other than statutory audit fees disclosed in the Statement of Comprehensive Income the only other fees paid to PricewaterhouseCoopers in Dublin, Ireland as the Statutory Auditor of the Trust were in relation to tax services provided amounting to $87,115 (2017: $79,410).
8. COMPARATIVE NET ASSET VALUES AT DEALING PRICES
30 September 2018 Net Asset Value
and USD /unit
30 September 2017 Net Asset Value
and USD /unit
30 September 2016 Net Asset Value
and USD /unit Global Equity Fund Total Income Class 4,486,550 4,574,095 4,304,046 A Class Income units 50.63 47.11 40.98 Total Accumulation Class 7,829,621 4,956,942 43,977,606 A Class Accumulation units 58.43 54.37 47.30 I Class Accumulation units 26.09 24.06 20.76 F2 Class Accumulation units 12.29 11.54 10.14 Asian Equity Fund Total Income Class 1,566,886 1,621,103 2,545,174 A Class Income units 38.42 39.75 31.95 Total Accumulation Class 2,155,273 4,327,791 5,390,764 A Class Accumulation units 44.00 45.52 36.59 I Class Accumulation units 73.21 58.35 European Equity Fund Total Income Class 3,433,302 3,468,379 4,236,896 A Class Income units 67.80 66.76 55.14 Total Accumulation Class 48,227,799 79,247,652 96,287,133 A Class Accumulation units 86.93 85.24 69.51 I Class Accumulation units 30.48 29.63 23.95 I Class Accumulation (EUR) units 19.53 18.98 15.34 Emerging Markets Equity Fund Total Accumulation Class 3,209,500 6,016,304 7,340,395 A Class Accumulation units 47.73 50.73 40.65 I Class Accumulation units 57.93 61.02 48.48 Japanese Equity Fund Total Accumulation Class 428,685 18,282,954 30,391,839 A Class Accumulation units 9.59 9.31 8.30 I Class Accumulation units 11.24 10.82 9.54 I Class Accumulation (JPY) units 15.61 13.77 F2 Class Accumulation units 12.76 12.50 11.23
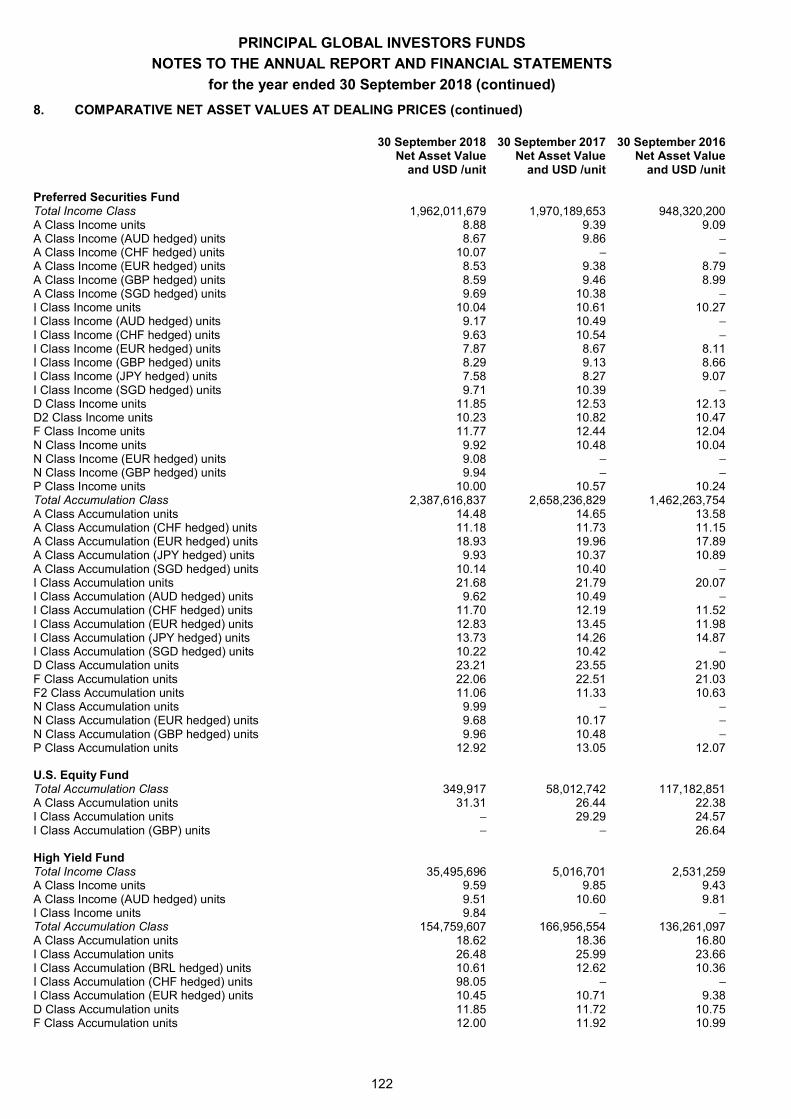
PRINCIPAL GLOBAL INVESTORS FUNDS
NOTES TO THE ANNUAL REPORT AND FINANCIAL STATEMENTS
for the year ended 30 September 2018 (continued)
122
8. COMPARATIVE NET ASSET VALUES AT DEALING PRICES (continued)
30 September 2018 Net Asset Value
and USD /unit
30 September 2017 Net Asset Value
and USD /unit
30 September 2016 Net Asset Value
and USD /unit Preferred Securities Fund Total Income Class 1,962,011,679 1,970,189,653 948,320,200 A Class Income units 8.88 9.39 9.09 A Class Income (AUD hedged) units 8.67 9.86 A Class Income (CHF hedged) units 10.07 A Class Income (EUR hedged) units 8.53 9.38 8.79 A Class Income (GBP hedged) units 8.59 9.46 8.99 A Class Income (SGD hedged) units 9.69 10.38 I Class Income units 10.04 10.61 10.27 I Class Income (AUD hedged) units 9.17 10.49 I Class Income (CHF hedged) units 9.63 10.54 I Class Income (EUR hedged) units 7.87 8.67 8.11 I Class Income (GBP hedged) units 8.29 9.13 8.66 I Class Income (JPY hedged) units 7.58 8.27 9.07 I Class Income (SGD hedged) units 9.71 10.39 D Class Income units 11.85 12.53 12.13 D2 Class Income units 10.23 10.82 10.47 F Class Income units 11.77 12.44 12.04 N Class Income units 9.92 10.48 10.04 N Class Income (EUR hedged) units 9.08 N Class Income (GBP hedged) units 9.94 P Class Income units 10.00 10.57 10.24 Total Accumulation Class 2,387,616,837 2,658,236,829 1,462,263,754 A Class Accumulation units 14.48 14.65 13.58 A Class Accumulation (CHF hedged) units 11.18 11.73 11.15 A Class Accumulation (EUR hedged) units 18.93 19.96 17.89 A Class Accumulation (JPY hedged) units 9.93 10.37 10.89 A Class Accumulation (SGD hedged) units 10.14 10.40 I Class Accumulation units 21.68 21.79 20.07 I Class Accumulation (AUD hedged) units 9.62 10.49 I Class Accumulation (CHF hedged) units 11.70 12.19 11.52 I Class Accumulation (EUR hedged) units 12.83 13.45 11.98 I Class Accumulation (JPY hedged) units 13.73 14.26 14.87 I Class Accumulation (SGD hedged) units 10.22 10.42 D Class Accumulation units 23.21 23.55 21.90 F Class Accumulation units 22.06 22.51 21.03 F2 Class Accumulation units 11.06 11.33 10.63 N Class Accumulation units 9.99 N Class Accumulation (EUR hedged) units 9.68 10.17 N Class Accumulation (GBP hedged) units 9.96 10.48 P Class Accumulation units 12.92 13.05 12.07 U.S. Equity Fund Total Accumulation Class 349,917 58,012,742 117,182,851 A Class Accumulation units 31.31 26.44 22.38 I Class Accumulation units 29.29 24.57 I Class Accumulation (GBP) units 26.64 High Yield Fund Total Income Class 35,495,696 5,016,701 2,531,259 A Class Income units 9.59 9.85 9.43 A Class Income (AUD hedged) units 9.51 10.60 9.81 I Class Income units 9.84 Total Accumulation Class 154,759,607 166,956,554 136,261,097 A Class Accumulation units 18.62 18.36 16.80 I Class Accumulation units 26.48 25.99 23.66 I Class Accumulation (BRL hedged) units 10.61 12.62 10.36 I Class Accumulation (CHF hedged) units 98.05 I Class Accumulation (EUR hedged) units 10.45 10.71 9.38 D Class Accumulation units 11.85 11.72 10.75 F Class Accumulation units 12.00 11.92 10.99
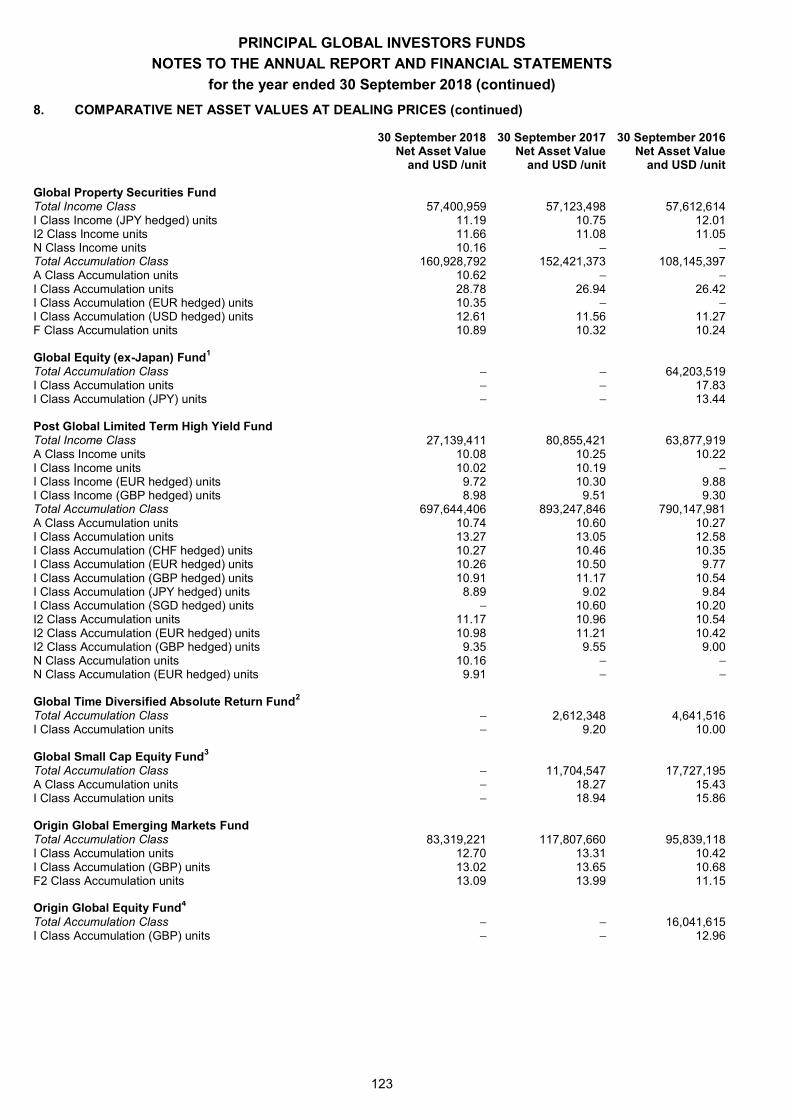
PRINCIPAL GLOBAL INVESTORS FUNDS
NOTES TO THE ANNUAL REPORT AND FINANCIAL STATEMENTS
for the year ended 30 September 2018 (continued)
123
8. COMPARATIVE NET ASSET VALUES AT DEALING PRICES (continued)
30 September 2018 Net Asset Value
and USD /unit
30 September 2017 Net Asset Value
and USD /unit
30 September 2016 Net Asset Value
and USD /unit Global Property Securities Fund Total Income Class 57,400,959 57,123,498 57,612,614 I Class Income (JPY hedged) units 11.19 10.75 12.01 I2 Class Income units 11.66 11.08 11.05 N Class Income units 10.16 Total Accumulation Class 160,928,792 152,421,373 108,145,397 A Class Accumulation units 10.62 I Class Accumulation units 28.78 26.94 26.42 I Class Accumulation (EUR hedged) units 10.35 I Class Accumulation (USD hedged) units 12.61 11.56 11.27 F Class Accumulation units 10.89 10.32 10.24 Global Equity (ex-Japan) Fund1 Total Accumulation Class 64,203,519 I Class Accumulation units 17.83 I Class Accumulation (JPY) units 13.44 Post Global Limited Term High Yield Fund Total Income Class 27,139,411 80,855,421 63,877,919 A Class Income units 10.08 10.25 10.22 I Class Income units 10.02 10.19 I Class Income (EUR hedged) units 9.72 10.30 9.88 I Class Income (GBP hedged) units 8.98 9.51 9.30 Total Accumulation Class 697,644,406 893,247,846 790,147,981 A Class Accumulation units 10.74 10.60 10.27 I Class Accumulation units 13.27 13.05 12.58 I Class Accumulation (CHF hedged) units 10.27 10.46 10.35 I Class Accumulation (EUR hedged) units 10.26 10.50 9.77 I Class Accumulation (GBP hedged) units 10.91 11.17 10.54 I Class Accumulation (JPY hedged) units 8.89 9.02 9.84 I Class Accumulation (SGD hedged) units 10.60 10.20 I2 Class Accumulation units 11.17 10.96 10.54 I2 Class Accumulation (EUR hedged) units 10.98 11.21 10.42 I2 Class Accumulation (GBP hedged) units 9.35 9.55 9.00 N Class Accumulation units 10.16 N Class Accumulation (EUR hedged) units 9.91 Global Time Diversified Absolute Return Fund2 Total Accumulation Class 2,612,348 4,641,516 I Class Accumulation units 9.20 10.00 Global Small Cap Equity Fund3 Total Accumulation Class 11,704,547 17,727,195 A Class Accumulation units 18.27 15.43 I Class Accumulation units 18.94 15.86 Origin Global Emerging Markets Fund Total Accumulation Class 83,319,221 117,807,660 95,839,118 I Class Accumulation units 12.70 13.31 10.42 I Class Accumulation (GBP) units 13.02 13.65 10.68 F2 Class Accumulation units 13.09 13.99 11.15 Origin Global Equity Fund4 Total Accumulation Class 16,041,615 I Class Accumulation (GBP) units 12.96
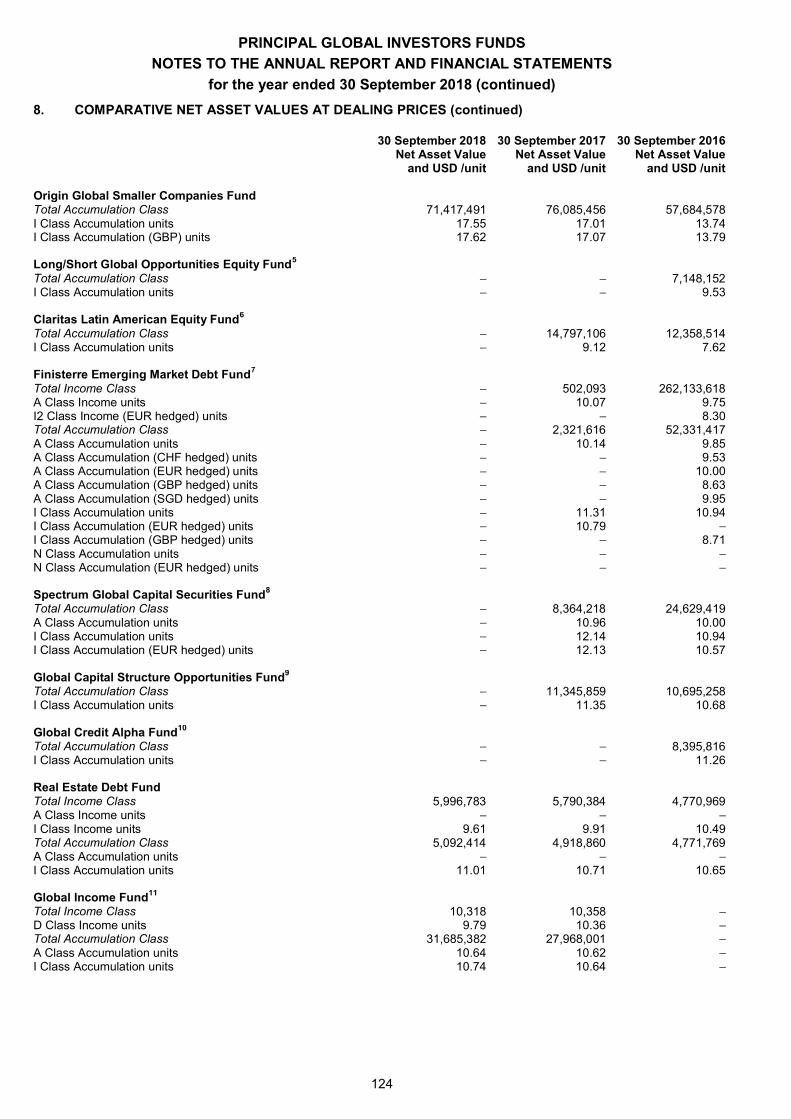
PRINCIPAL GLOBAL INVESTORS FUNDS
NOTES TO THE ANNUAL REPORT AND FINANCIAL STATEMENTS
for the year ended 30 September 2018 (continued)
124
8. COMPARATIVE NET ASSET VALUES AT DEALING PRICES (continued)
30 September 2018 Net Asset Value
and USD /unit
30 September 2017 Net Asset Value
and USD /unit
30 September 2016 Net Asset Value
and USD /unit Origin Global Smaller Companies Fund Total Accumulation Class 71,417,491 76,085,456 57,684,578 I Class Accumulation units 17.55 17.01 13.74 I Class Accumulation (GBP) units 17.62 17.07 13.79 Long/Short Global Opportunities Equity Fund5 Total Accumulation Class 7,148,152 I Class Accumulation units 9.53 Claritas Latin American Equity Fund6 Total Accumulation Class 14,797,106 12,358,514 I Class Accumulation units 9.12 7.62 Finisterre Emerging Market Debt Fund7 Total Income Class 502,093 262,133,618 A Class Income units 10.07 9.75 I2 Class Income (EUR hedged) units 8.30 Total Accumulation Class 2,321,616 52,331,417 A Class Accumulation units 10.14 9.85 A Class Accumulation (CHF hedged) units 9.53 A Class Accumulation (EUR hedged) units 10.00 A Class Accumulation (GBP hedged) units 8.63 A Class Accumulation (SGD hedged) units 9.95 I Class Accumulation units 11.31 10.94 I Class Accumulation (EUR hedged) units 10.79 I Class Accumulation (GBP hedged) units 8.71 N Class Accumulation units N Class Accumulation (EUR hedged) units Spectrum Global Capital Securities Fund8 Total Accumulation Class 8,364,218 24,629,419 A Class Accumulation units 10.96 10.00 I Class Accumulation units 12.14 10.94 I Class Accumulation (EUR hedged) units 12.13 10.57 Global Capital Structure Opportunities Fund9 Total Accumulation Class 11,345,859 10,695,258 I Class Accumulation units 11.35 10.68 Global Credit Alpha Fund10 Total Accumulation Class 8,395,816 I Class Accumulation units 11.26 Real Estate Debt Fund Total Income Class 5,996,783 5,790,384 4,770,969 A Class Income units I Class Income units 9.61 9.91 10.49 Total Accumulation Class 5,092,414 4,918,860 4,771,769 A Class Accumulation units I Class Accumulation units 11.01 10.71 10.65 Global Income Fund11 Total Income Class 10,318 10,358 D Class Income units 9.79 10.36 Total Accumulation Class 31,685,382 27,968,001 A Class Accumulation units 10.64 10.62 I Class Accumulation units 10.74 10.64
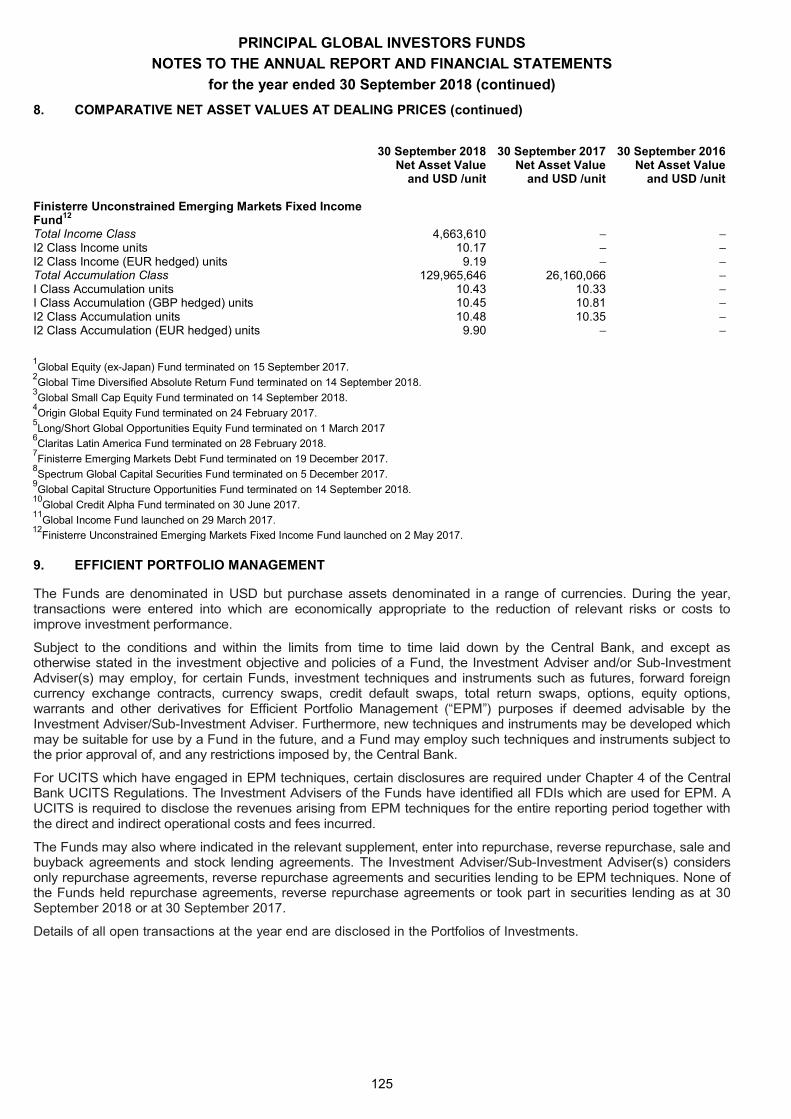
PRINCIPAL GLOBAL INVESTORS FUNDS
NOTES TO THE ANNUAL REPORT AND FINANCIAL STATEMENTS
for the year ended 30 September 2018 (continued)
125
8. COMPARATIVE NET ASSET VALUES AT DEALING PRICES (continued)
30 September 2018 Net Asset Value
and USD /unit
30 September 2017 Net Asset Value
and USD /unit
30 September 2016 Net Asset Value
and USD /unit Finisterre Unconstrained Emerging Markets Fixed Income Fund12 Total Income Class 4,663,610 I2 Class Income units 10.17 I2 Class Income (EUR hedged) units 9.19 Total Accumulation Class 129,965,646 26,160,066 I Class Accumulation units 10.43 10.33 I Class Accumulation (GBP hedged) units 10.45 10.81 I2 Class Accumulation units 10.48 10.35 I2 Class Accumulation (EUR hedged) units 9.90
1Global Equity (ex-Japan) Fund terminated on 15 September 2017.
2Global Time Diversified Absolute Return Fund terminated on 14 September 2018.
3Global Small Cap Equity Fund terminated on 14 September 2018.
4Origin Global Equity Fund terminated on 24 February 2017.
5Long/Short Global Opportunities Equity Fund terminated on 1 March 2017
6Claritas Latin America Fund terminated on 28 February 2018.
7Finisterre Emerging Markets Debt Fund terminated on 19 December 2017.
8Spectrum Global Capital Securities Fund terminated on 5 December 2017.
9Global Capital Structure Opportunities Fund terminated on 14 September 2018.
10Global Credit Alpha Fund terminated on 30 June 2017.
11Global Income Fund launched on 29 March 2017.
12Finisterre Unconstrained Emerging Markets Fixed Income Fund launched on 2 May 2017.
9. EFFICIENT PORTFOLIO MANAGEMENT
The Funds are denominated in USD but purchase assets denominated in a range of currencies. During the year, transactions were entered into which are economically appropriate to the reduction of relevant risks or costs to improve investment performance.
Subject to the conditions and within the limits from time to time laid down by the Central Bank, and except as otherwise stated in the investment objective and policies of a Fund, the Investment Adviser and/or Sub-Investment Adviser(s) may employ, for certain Funds, investment techniques and instruments such as futures, forward foreign currency exchange contracts, currency swaps, credit default swaps, total return swaps, options, equity options, warrants and other derivatives for Efficient Portfolio Management purposes if deemed advisable by the Investment Adviser/Sub-Investment Adviser. Furthermore, new techniques and instruments may be developed which may be suitable for use by a Fund in the future, and a Fund may employ such techniques and instruments subject to the prior approval of, and any restrictions imposed by, the Central Bank.
For UCITS which have engaged in EPM techniques, certain disclosures are required under Chapter 4 of the Central Bank UCITS Regulations. The Investment Advisers of the Funds have identified all FDIs which are used for EPM. A UCITS is required to disclose the revenues arising from EPM techniques for the entire reporting period together with the direct and indirect operational costs and fees incurred.
The Funds may also where indicated in the relevant supplement, enter into repurchase, reverse repurchase, sale and buyback agreements and stock lending agreements. The Investment Adviser/Sub-Investment Adviser(s) considers only repurchase agreements, reverse repurchase agreements and securities lending to be EPM techniques. None of the Funds held repurchase agreements, reverse repurchase agreements or took part in securities lending as at 30 September 2018 or at 30 September 2017.
Details of all open transactions at the year end are disclosed in the Portfolios of Investments.
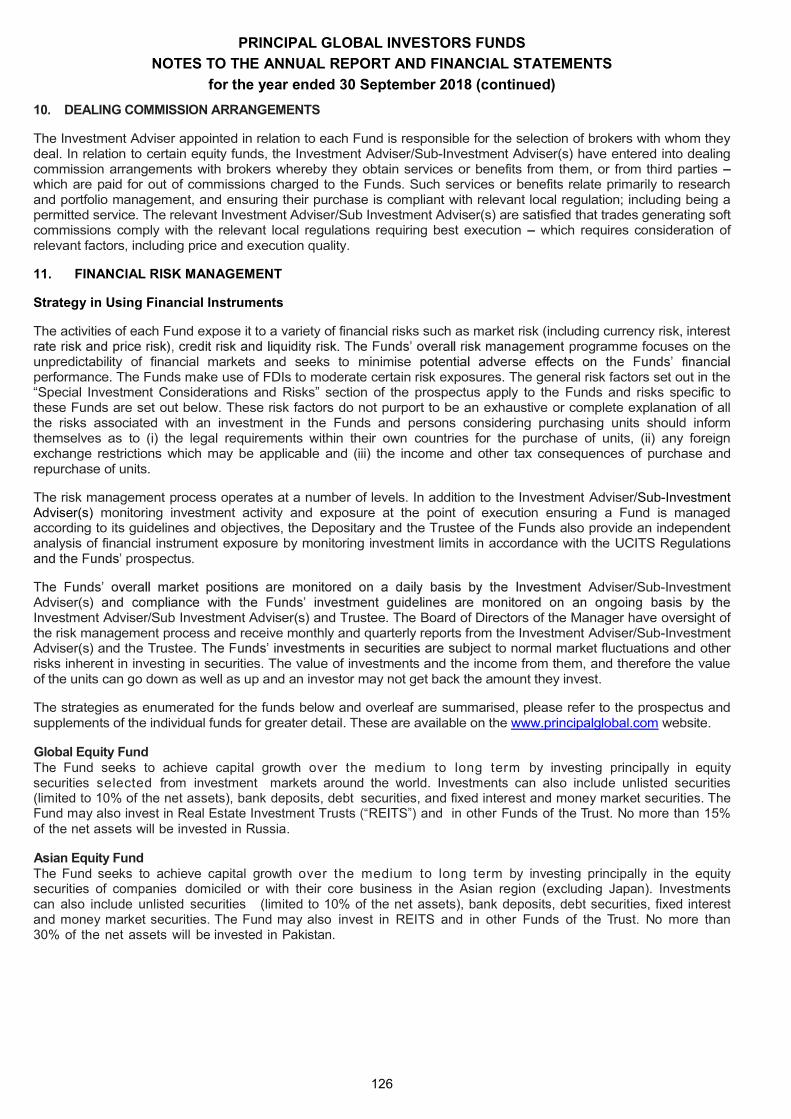
PRINCIPAL GLOBAL INVESTORS FUNDS
NOTES TO THE ANNUAL REPORT AND FINANCIAL STATEMENTS
for the year ended 30 September 2018 (continued)
126
10. DEALING COMMISSION ARRANGEMENTS
The Investment Adviser appointed in relation to each Fund is responsible for the selection of brokers with whom they deal. In relation to certain equity funds, the Investment Adviser/Sub-Investment Adviser(s) have entered into dealing commission arrangements with brokers whereby they obtain services or benefits from them, or from third parties which are paid for out of commissions charged to the Funds. Such services or benefits relate primarily to research and portfolio management, and ensuring their purchase is compliant with relevant local regulation; including being a permitted service. The relevant Investment Adviser/Sub Investment Adviser(s) are satisfied that trades generating soft commissions comply with the relevant local regulations requiring best execution which requires consideration of relevant factors, including price and execution quality.
11. FINANCIAL RISK MANAGEMENT
Strategy in Using Financial Instruments
The activities of each Fund expose it to a variety of financial risks such as market risk (including currency risk, interest programme focuses on the
unpredictability of financial markets and seeks to minimise performance. The Funds make use of FDIs to moderate certain risk exposures. The general risk factors set out in the Special Investment Considerations and Risks section of the prospectus apply to the Funds and risks specific to
these Funds are set out below. These risk factors do not purport to be an exhaustive or complete explanation of all the risks associated with an investment in the Funds and persons considering purchasing units should inform themselves as to (i) the legal requirements within their own countries for the purchase of units, (ii) any foreign exchange restrictions which may be applicable and (iii) the income and other tax consequences of purchase and repurchase of units.
The risk management process operates at a number of levels. In addition to the Investment Adviser/Sub-Investment Adviser(s) monitoring investment activity and exposure at the point of execution ensuring a Fund is managed according to its guidelines and objectives, the Depositary and the Trustee of the Funds also provide an independent analysis of financial instrument exposure by monitoring investment limits in accordance with the UCITS Regulations
prospectus.
Adviser/Sub-Investment Adviser(s) Investment Adviser/Sub Investment Adviser(s) and Trustee. The Board of Directors of the Manager have oversight of the risk management process and receive monthly and quarterly reports from the Investment Adviser/Sub-Investment Adviser(s) and the Trustee. ect to normal market fluctuations and other risks inherent in investing in securities. The value of investments and the income from them, and therefore the value of the units can go down as well as up and an investor may not get back the amount they invest.
The strategies as enumerated for the funds below and overleaf are summarised, please refer to the prospectus and supplements of the individual funds for greater detail. These are available on the www.principalglobal.com website.
Global Equity Fund The Fund seeks to achieve capital growth over the medium to long term by investing principally in equity securities selected from investment markets around the world. Investments can also include unlisted securities (limited to 10% of the net assets), bank deposits, debt securities, and fixed interest and money market securities. The Fund may also invest in Real Estate Investment Trusts and in other Funds of the Trust. No more than 15% of the net assets will be invested in Russia.
Asian Equity Fund The Fund seeks to achieve capital growth over the medium to long term by investing principally in the equity securities of companies domiciled or with their core business in the Asian region (excluding Japan). Investments can also include unlisted securities (limited to 10% of the net assets), bank deposits, debt securities, fixed interest and money market securities. The Fund may also invest in REITS and in other Funds of the Trust. No more than 30% of the net assets will be invested in Pakistan.
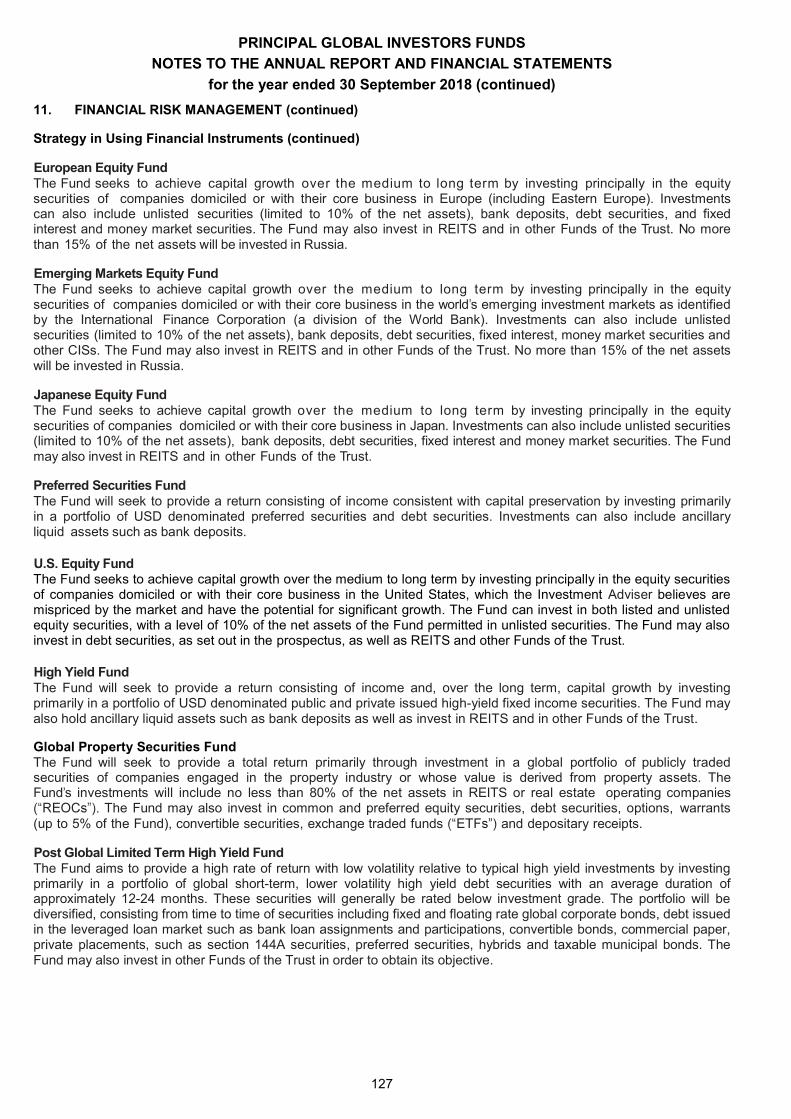
PRINCIPAL GLOBAL INVESTORS FUNDS
NOTES TO THE ANNUAL REPORT AND FINANCIAL STATEMENTS
for the year ended 30 September 2018 (continued)
127
11. FINANCIAL RISK MANAGEMENT (continued)
Strategy in Using Financial Instruments (continued)
European Equity Fund The Fund seeks to achieve capital growth over the medium to long term by investing principally in the equity securities of companies domiciled or with their core business in Europe (including Eastern Europe). Investments can also include unlisted securities (limited to 10% of the net assets), bank deposits, debt securities, and fixed interest and money market securities. The Fund may also invest in REITS and in other Funds of the Trust. No more than 15% of the net assets will be invested in Russia.
Emerging Markets Equity Fund The Fund seeks to achieve capital growth over the medium to long term by investing principally in the equity securities of companies domiciled or with their core business in the world s emerging investment markets as identified by the International Finance Corporation (a division of the World Bank). Investments can also include unlisted securities (limited to 10% of the net assets), bank deposits, debt securities, fixed interest, money market securities and other CISs. The Fund may also invest in REITS and in other Funds of the Trust. No more than 15% of the net assets will be invested in Russia.
Japanese Equity Fund The Fund seeks to achieve capital growth over the medium to long term by investing principally in the equity securities of companies domiciled or with their core business in Japan. Investments can also include unlisted securities (limited to 10% of the net assets), bank deposits, debt securities, fixed interest and money market securities. The Fund may also invest in REITS and in other Funds of the Trust.
Preferred Securities Fund The Fund will seek to provide a return consisting of income consistent with capital preservation by investing primarily in a portfolio of USD denominated preferred securities and debt securities. Investments can also include ancillary liquid assets such as bank deposits.
U.S. Equity Fund The Fund seeks to achieve capital growth over the medium to long term by investing principally in the equity securities of companies domiciled or with their core business in the United States, which the Investment Adviser believes are mispriced by the market and have the potential for significant growth. The Fund can invest in both listed and unlisted equity securities, with a level of 10% of the net assets of the Fund permitted in unlisted securities. The Fund may also invest in debt securities, as set out in the prospectus, as well as REITS and other Funds of the Trust.
High Yield Fund The Fund will seek to provide a return consisting of income and, over the long term, capital growth by investing primarily in a portfolio of USD denominated public and private issued high-yield fixed income securities. The Fund may also hold ancillary liquid assets such as bank deposits as well as invest in REITS and in other Funds of the Trust.
Global Property Securities Fund The Fund will seek to provide a total return primarily through investment in a global portfolio of publicly traded securities of companies engaged in the property industry or whose value is derived from property assets. The Fund s investments will include no less than 80% of the net assets in REITS or real estate operating companies
The Fund may also invest in common and preferred equity securities, debt securities, options, warrants (up to 5% of the Fund), convertible securities, exchange traded funds and depositary receipts.
Post Global Limited Term High Yield Fund The Fund aims to provide a high rate of return with low volatility relative to typical high yield investments by investing primarily in a portfolio of global short-term, lower volatility high yield debt securities with an average duration of approximately 12-24 months. These securities will generally be rated below investment grade. The portfolio will be diversified, consisting from time to time of securities including fixed and floating rate global corporate bonds, debt issued in the leveraged loan market such as bank loan assignments and participations, convertible bonds, commercial paper, private placements, such as section 144A securities, preferred securities, hybrids and taxable municipal bonds. The Fund may also invest in other Funds of the Trust in order to obtain its objective.
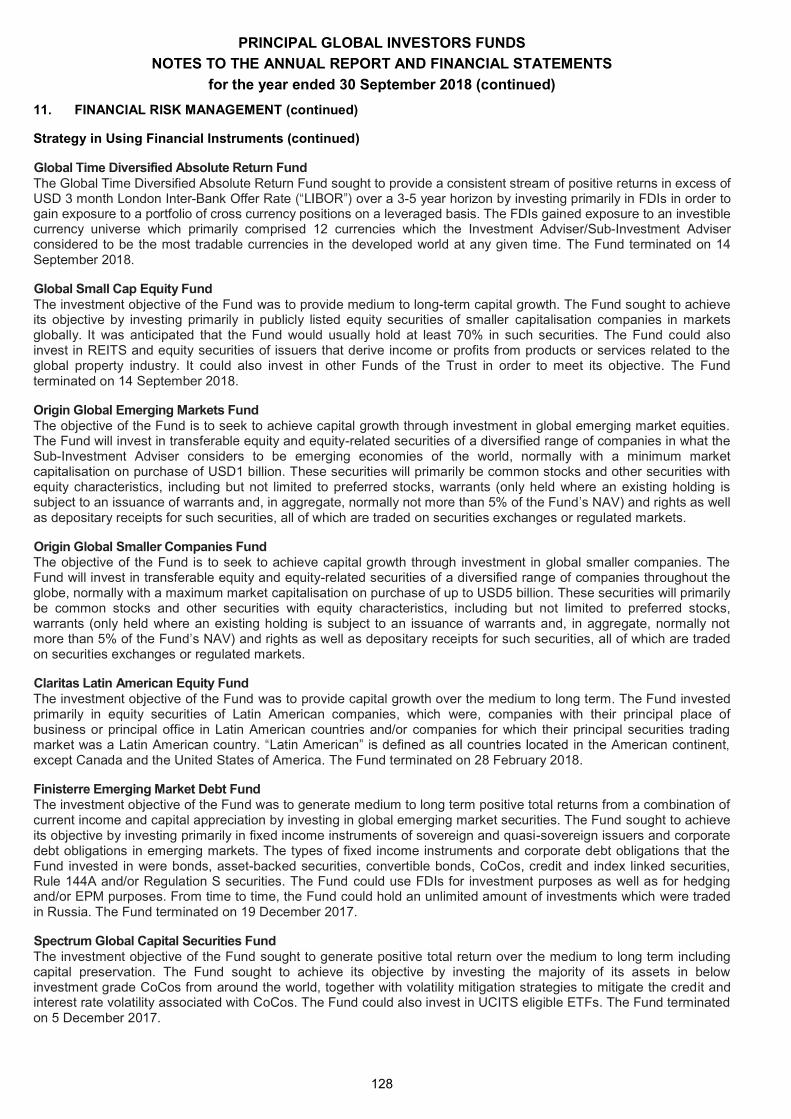
PRINCIPAL GLOBAL INVESTORS FUNDS
NOTES TO THE ANNUAL REPORT AND FINANCIAL STATEMENTS
for the year ended 30 September 2018 (continued)
128
11. FINANCIAL RISK MANAGEMENT (continued)
Strategy in Using Financial Instruments (continued)
Global Time Diversified Absolute Return Fund The Global Time Diversified Absolute Return Fund sought to provide a consistent stream of positive returns in excess of USD 3 month London Inter-Bank Offer Rate over a 3-5 year horizon by investing primarily in FDIs in order to gain exposure to a portfolio of cross currency positions on a leveraged basis. The FDIs gained exposure to an investible currency universe which primarily comprised 12 currencies which the Investment Adviser/Sub-Investment Adviser considered to be the most tradable currencies in the developed world at any given time. The Fund terminated on 14 September 2018.
Global Small Cap Equity Fund The investment objective of the Fund was to provide medium to long-term capital growth. The Fund sought to achieve its objective by investing primarily in publicly listed equity securities of smaller capitalisation companies in markets globally. It was anticipated that the Fund would usually hold at least 70% in such securities. The Fund could also invest in REITS and equity securities of issuers that derive income or profits from products or services related to the global property industry. It could also invest in other Funds of the Trust in order to meet its objective. The Fund terminated on 14 September 2018.
Origin Global Emerging Markets Fund The objective of the Fund is to seek to achieve capital growth through investment in global emerging market equities. The Fund will invest in transferable equity and equity-related securities of a diversified range of companies in what the Sub-Investment Adviser considers to be emerging economies of the world, normally with a minimum market capitalisation on purchase of USD1 billion. These securities will primarily be common stocks and other securities with equity characteristics, including but not limited to preferred stocks, warrants (only held where an existing holding is subject to an issuance of warrants and, in aggregate, normally not more than 5% of the Fund s NAV) and rights as well as depositary receipts for such securities, all of which are traded on securities exchanges or regulated markets.
Origin Global Smaller Companies Fund The objective of the Fund is to seek to achieve capital growth through investment in global smaller companies. The Fund will invest in transferable equity and equity-related securities of a diversified range of companies throughout the globe, normally with a maximum market capitalisation on purchase of up to USD5 billion. These securities will primarily be common stocks and other securities with equity characteristics, including but not limited to preferred stocks, warrants (only held where an existing holding is subject to an issuance of warrants and, in aggregate, normally not more than 5% of the Fund s NAV) and rights as well as depositary receipts for such securities, all of which are traded on securities exchanges or regulated markets.
Claritas Latin American Equity Fund The investment objective of the Fund was to provide capital growth over the medium to long term. The Fund invested primarily in equity securities of Latin American companies, which were, companies with their principal place of business or principal office in Latin American countries and/or companies for which their principal securities trading market was a Latin Ameriexcept Canada and the United States of America. The Fund terminated on 28 February 2018.
Finisterre Emerging Market Debt Fund The investment objective of the Fund was to generate medium to long term positive total returns from a combination of current income and capital appreciation by investing in global emerging market securities. The Fund sought to achieve its objective by investing primarily in fixed income instruments of sovereign and quasi-sovereign issuers and corporate debt obligations in emerging markets. The types of fixed income instruments and corporate debt obligations that the Fund invested in were bonds, asset-backed securities, convertible bonds, CoCos, credit and index linked securities, Rule 144A and/or Regulation S securities. The Fund could use FDIs for investment purposes as well as for hedging and/or EPM purposes. From time to time, the Fund could hold an unlimited amount of investments which were traded in Russia. The Fund terminated on 19 December 2017.
Spectrum Global Capital Securities Fund The investment objective of the Fund sought to generate positive total return over the medium to long term including capital preservation. The Fund sought to achieve its objective by investing the majority of its assets in below investment grade CoCos from around the world, together with volatility mitigation strategies to mitigate the credit and interest rate volatility associated with CoCos. The Fund could also invest in UCITS eligible ETFs. The Fund terminated on 5 December 2017.
PRINCIPAL GLOBAL INVESTORS FUNDS
NOTES TO THE ANNUAL REPORT AND FINANCIAL STATEMENTS
for the year ended 30 September 2018 (continued)
129
11. FINANCIAL RISK MANAGEMENT (continued)
Strategy in Using Financial Instruments (continued)
Global Capital Structure Opportunities Fund The Fund sought to provide high single digit returns over any given market cycle while minimising drawdown risk. The Fund sought to achieve its objective primarily by investing across the capital structure of companies around the world which, together with investment in FDI s, sought to minimise certain risks associated with such investments. In certain market conditions the Fund could also invest in government debt. The Fund could also invest in UCITS eligible CISs and ETFs. The Fund terminated on 14 September 2018.
Real Estate Debt Fund The objective of the Fund is to provide attractive long term risk adjusted returns. The Fund seeks to achieve the investment objective by investing the majority of its assets in a diversified portfolio of U.S. commercial mortgage-
on commercial real estate properties located across the U.S. While the Fund will primarily invest in CMBS, it may also invest in unsecured bonds issued by companies primarily engaged in a real estate or real estate related business. The CMBS and unsecured bonds may include Rule 144A purposes and the Fund may also hold ancillary liquid assets such as bank deposits and U.S. Treasury Securities.
Global Income Fund The investment objective of the Fund is to provide high current income, with reasonable long-term capital appreciation. The Fund seeks to achieve the investment objective by investing the majority of its assets in income-producing equity, debt and hybrid securities. Hybrid securities are securities with features of both debt and equity securities. The Fund will consistently employ a global asset allocation investment process, which is based upon fundamental research driven, long-term focused security selection. The types of debt securities the Fund may invest in include, but are not limited to, corporate, sovereign and quasi-sovereign bonds, commercial and residential mortgage backed securities and other asset backed securities. Investment in commercial and residential mortgage backed securities and other
may invest in are preferred stock and convertible securities, including CoCo securities. The Fund may also invest in UCITS or CISs, the constituents of which would typically include the instruments described above.
Finisterre Unconstrained Emerging Markets Fixed Income Fund The investment objective of the Fund is to seek to generate total returns through income and capital appreciation, while limiting volatility and potential capital losses. The Fund seeks to achieve its objective by actively investing in a diversified range of fixed-income and FDI, a majority (not less than 51%) issued by or referencing emerging markets. These include corporate, sovereign and quasi-sovereign entities. The Fund seeks to extract value from investments in both investment grade and high yield fixed income instruments, and can include both stressed and distressed securities. A proportion of the net assets of the Fund may be invested in UCITS eligible CISs, including exchange traded funds and the Fund may hold equities as a result of the conversion of a convertible bond or as the result of a debt restructuring.
Market Price Risk
All securities and investments present a risk of loss of capital. The Investment Adviser/Sub-Investment Adviser(s) moderates this risk through diversification and careful selection of securities and other financial instruments within the limits defined in the prospectus.
Except for derivatives, the maximum risk resulting from financial instruments is determined by the fair value of the financial instruments. Possible losses from written options can be unlimited and losses on forwards and futures can result from the movement in currency exchange rates in the time between the forward trade date and the settlement date depending on the volatility of the currencies.
The maximum risk of the Interest Rate Swaps, Credit Default Swaps, Cross Currency Swaps and Total Return Swaps daily basis by the
-Investment Adviser(s).
The Investment Adviser/Sub-Investment Adviser(s) reviews the portfolio characteristics of each Fund in its entirety. This review may include as appropriate a review of country allocations, country weights, capitalization, distribution, industry sector weights, price/book levels, currency exposure, portfolio maturity, portfolio duration, sector exposure, quality exposure and other key risk measures.
PRINCIPAL GLOBAL INVESTORS FUNDS
NOTES TO THE ANNUAL REPORT AND FINANCIAL STATEMENTS
for the year ended 30 September 2018 (continued)
130
11. FINANCIAL RISK MANAGEMENT (continued)
Market Price Risk (continued)
The Funds may employ investment techniques and FDIs for EPM and/or investment purposes within the limits set out in the prospectus as described in the sections rations and
currency exchange contracts, repurchase contracts, reverse repurchase agreements, sale and buyback agreements, stock lending agreements, credit default swaps, interest rate swaps and other over the counter derivative instruments which may be used subject to the conditions and limits laid down by the Central Bank and the Trust Deed and subject to any other restrictions or regulations which may affect the portfolio management of the Funds.
Sensitivity Analysis Sensitivity analysis is an indication based on historical data showing the impact of a 5% movement in the Benchmark on the NAV of the Funds at the Statement of Financial Position date.
Limitations of Sensitivity Analysis: Some limitations of sensitivity analysis are;
the models are based on historical data and cannot take account of the fact that future market price movements, correlations between markets and levels of market liquidity in conditions of market stress may bear no relation to historical patterns;
the market price risk information is a relative estimate of risk rather than a precise and accurate number; the market price information represents a hypothetical outcome and is not intended to be predictive; and
future market conditions could vary significantly from those experienced in the past.
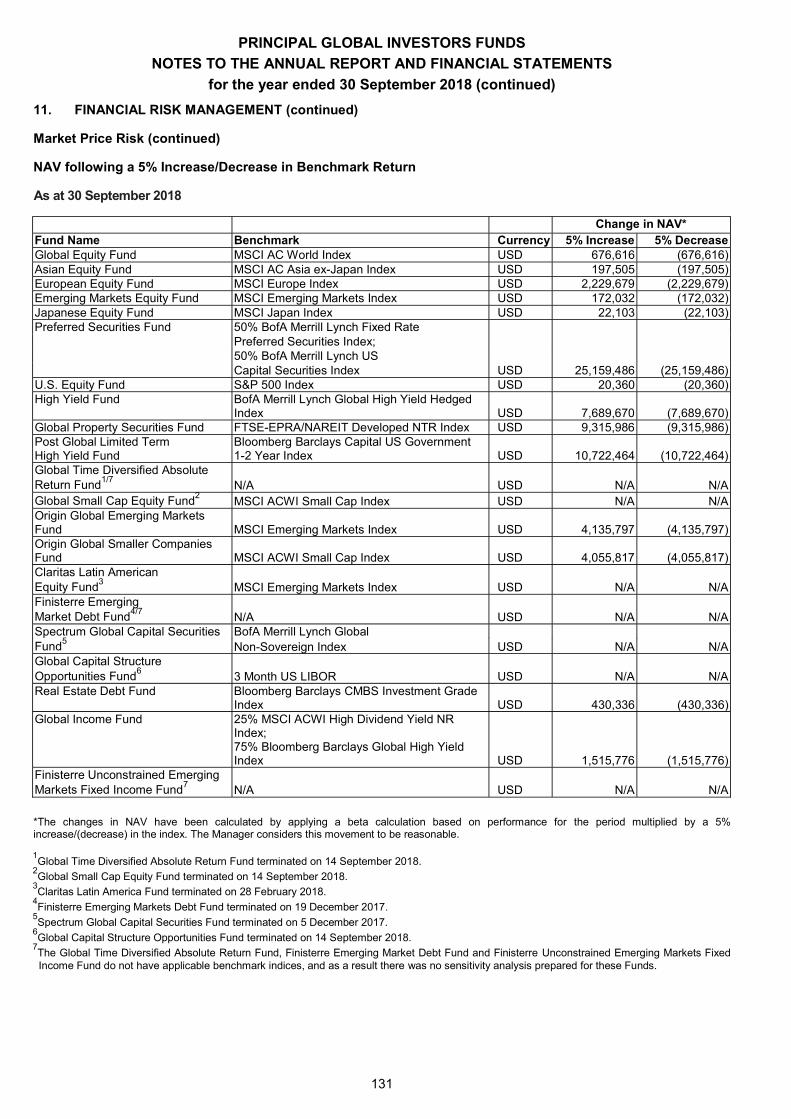
PRINCIPAL GLOBAL INVESTORS FUNDS
NOTES TO THE ANNUAL REPORT AND FINANCIAL STATEMENTS
for the year ended 30 September 2018 (continued)
131
11. FINANCIAL RISK MANAGEMENT (continued)
Market Price Risk (continued)
NAV following a 5% Increase/Decrease in Benchmark Return
As at 30 September 2018
Change in NAV* Fund Name Benchmark Currency 5% Increase 5% Decrease Global Equity Fund MSCI AC World Index USD 676,616 (676,616) Asian Equity Fund MSCI AC Asia ex-Japan Index USD 197,505 (197,505) European Equity Fund MSCI Europe Index USD 2,229,679 (2,229,679) Emerging Markets Equity Fund MSCI Emerging Markets Index USD 172,032 (172,032) Japanese Equity Fund MSCI Japan Index USD 22,103 (22,103) Preferred Securities Fund 50% BofA Merrill Lynch Fixed Rate
USD
Preferred Securities Index; 50% BofA Merrill Lynch US Capital Securities Index 25,159,486 (25,159,486)
U.S. Equity Fund S&P 500 Index USD 20,360 (20,360) High Yield Fund BofA Merrill Lynch Global High Yield Hedged
Index USD 7,689,670 (7,689,670) Global Property Securities Fund FTSE-EPRA/NAREIT Developed NTR Index USD 9,315,986 (9,315,986) Post Global Limited Term Bloomberg Barclays Capital US Government High Yield Fund 1-2 Year Index USD 10,722,464 (10,722,464) Global Time Diversified Absolute Return Fund
1/7 N/A USD N/A N/A
Global Small Cap Equity Fund2 MSCI ACWI Small Cap Index USD N/A N/A
Origin Global Emerging Markets Fund MSCI Emerging Markets Index USD 4,135,797 (4,135,797) Origin Global Smaller Companies Fund MSCI ACWI Small Cap Index USD 4,055,817 (4,055,817) Claritas Latin American Equity Fund
3MSCI Emerging Markets Index USD N/A N/A
Finisterre Emerging Market Debt Fund
4/7 N/A USD N/A N/A
Spectrum Global Capital Securities Fund
5
BofA Merrill Lynch Global USD
Non-Sovereign Index N/A N/A
Global Capital Structure Opportunities Fund
6 3 Month US LIBOR USD N/A N/A
Real Estate Debt Fund Bloomberg Barclays CMBS Investment Grade Index USD 430,336 (430,336)
Global Income Fund 25% MSCI ACWI High Dividend Yield NR Index; 75% Bloomberg Barclays Global High Yield Index USD 1,515,776 (1,515,776)
Finisterre Unconstrained Emerging Markets Fixed Income Fund7 N/A USD N/A N/A
*The changes in NAV have been calculated by applying a beta calculation based on performance for the period multiplied by a 5% increase/(decrease) in the index. The Manager considers this movement to be reasonable. 1Global Time Diversified Absolute Return Fund terminated on 14 September 2018.
2Global Small Cap Equity Fund terminated on 14 September 2018.
3Claritas Latin America Fund terminated on 28 February 2018.
4Finisterre Emerging Markets Debt Fund terminated on 19 December 2017.
5Spectrum Global Capital Securities Fund terminated on 5 December 2017.
6Global Capital Structure Opportunities Fund terminated on 14 September 2018.
7The Global Time Diversified Absolute Return Fund, Finisterre Emerging Market Debt Fund and Finisterre Unconstrained Emerging Markets Fixed Income Fund do not have applicable benchmark indices, and as a result there was no sensitivity analysis prepared for these Funds.
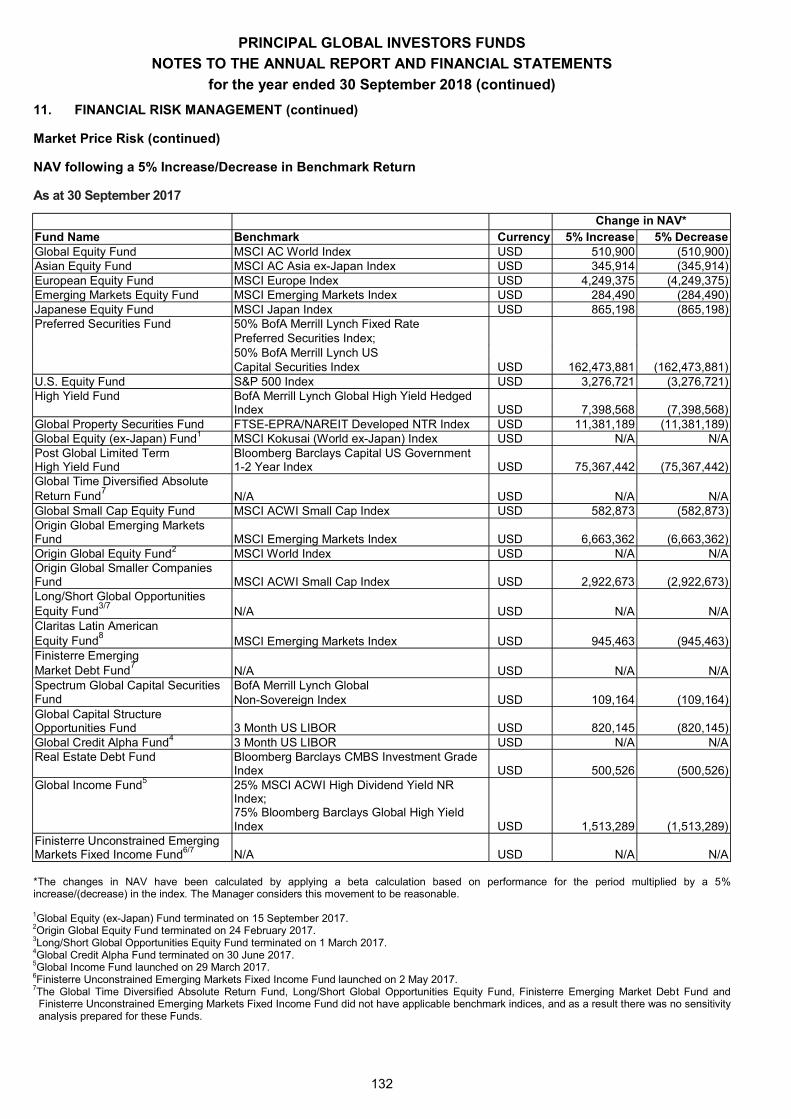
PRINCIPAL GLOBAL INVESTORS FUNDS
NOTES TO THE ANNUAL REPORT AND FINANCIAL STATEMENTS
for the year ended 30 September 2018 (continued)
132
11. FINANCIAL RISK MANAGEMENT (continued)
Market Price Risk (continued)
NAV following a 5% Increase/Decrease in Benchmark Return
As at 30 September 2017
Change in NAV* Fund Name Benchmark Currency 5% Increase 5% Decrease Global Equity Fund MSCI AC World Index USD 510,900 (510,900) Asian Equity Fund MSCI AC Asia ex-Japan Index USD 345,914 (345,914) European Equity Fund MSCI Europe Index USD 4,249,375 (4,249,375) Emerging Markets Equity Fund MSCI Emerging Markets Index USD 284,490 (284,490) Japanese Equity Fund MSCI Japan Index USD 865,198 (865,198) Preferred Securities Fund 50% BofA Merrill Lynch Fixed Rate
USD
Preferred Securities Index; 50% BofA Merrill Lynch US Capital Securities Index 162,473,881 (162,473,881)
U.S. Equity Fund S&P 500 Index USD 3,276,721 (3,276,721) High Yield Fund BofA Merrill Lynch Global High Yield Hedged
Index USD 7,398,568 (7,398,568) Global Property Securities Fund FTSE-EPRA/NAREIT Developed NTR Index USD 11,381,189 (11,381,189) Global Equity (ex-Japan) Fund1 MSCI Kokusai (World ex-Japan) Index USD N/A N/A Post Global Limited Term Bloomberg Barclays Capital US Government High Yield Fund 1-2 Year Index USD 75,367,442 (75,367,442) Global Time Diversified Absolute Return Fund
7 N/A USD N/A N/A
Global Small Cap Equity Fund MSCI ACWI Small Cap Index USD 582,873 (582,873) Origin Global Emerging Markets Fund MSCI Emerging Markets Index USD 6,663,362 (6,663,362) Origin Global Equity Fund2 MSCI World Index USD N/A N/A Origin Global Smaller Companies Fund MSCI ACWI Small Cap Index USD 2,922,673 (2,922,673) Long/Short Global Opportunities Equity Fund
3/7 N/A USD N/A N/A
Claritas Latin American Equity Fund
8 MSCI Emerging Markets Index USD 945,463 (945,463)
Finisterre Emerging Market Debt Fund
7 N/A USD N/A N/A
Spectrum Global Capital Securities Fund
BofA Merrill Lynch Global USD
Non-Sovereign Index 109,164 (109,164)
Global Capital Structure Opportunities Fund 3 Month US LIBOR USD 820,145 (820,145) Global Credit Alpha Fund4 3 Month US LIBOR USD N/A N/A Real Estate Debt Fund Bloomberg Barclays CMBS Investment Grade
Index USD 500,526 (500,526) Global Income Fund5 25% MSCI ACWI High Dividend Yield NR
Index; 75% Bloomberg Barclays Global High Yield Index USD 1,513,289 (1,513,289)
Finisterre Unconstrained Emerging Markets Fixed Income Fund6/7 N/A USD N/A N/A *The changes in NAV have been calculated by applying a beta calculation based on performance for the period multiplied by a 5% increase/(decrease) in the index. The Manager considers this movement to be reasonable. 1Global Equity (ex-Japan) Fund terminated on 15 September 2017. 2Origin Global Equity Fund terminated on 24 February 2017. 3Long/Short Global Opportunities Equity Fund terminated on 1 March 2017. 4Global Credit Alpha Fund terminated on 30 June 2017. 5Global Income Fund launched on 29 March 2017. 6Finisterre Unconstrained Emerging Markets Fixed Income Fund launched on 2 May 2017. 7The Global Time Diversified Absolute Return Fund, Long/Short Global Opportunities Equity Fund, Finisterre Emerging Market Debt Fund and Finisterre Unconstrained Emerging Markets Fixed Income Fund did not have applicable benchmark indices, and as a result there was no sensitivity analysis prepared for these Funds.
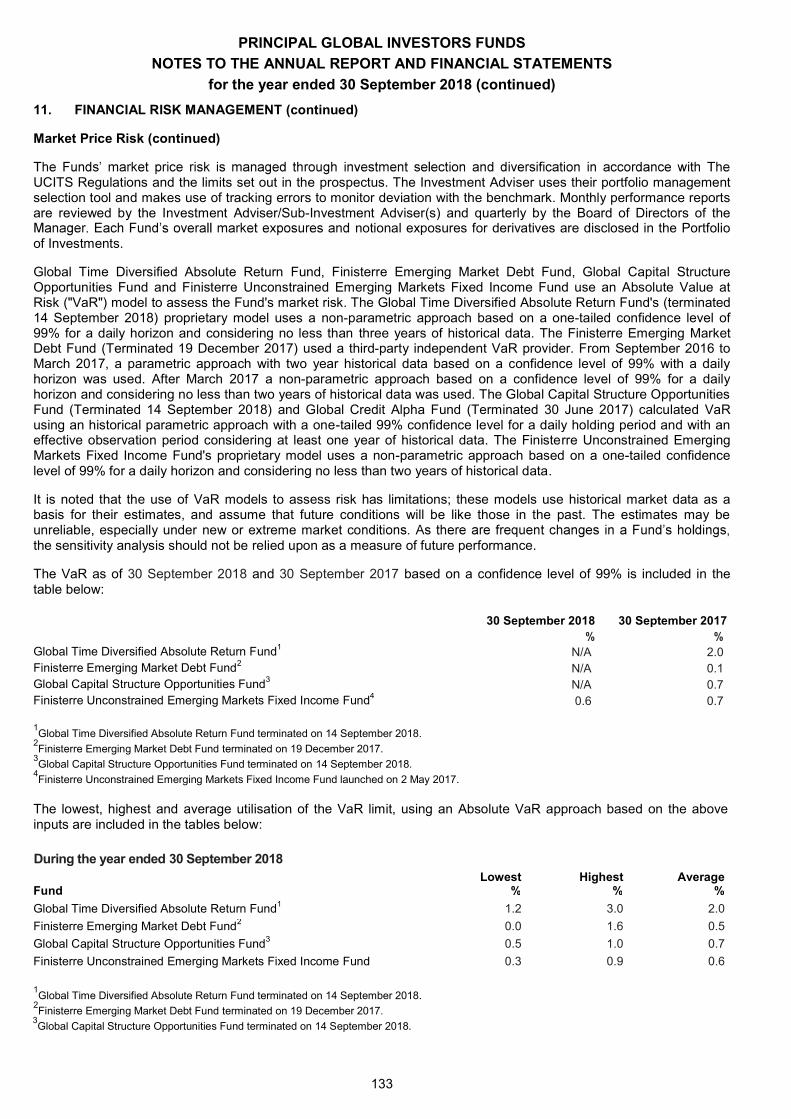
PRINCIPAL GLOBAL INVESTORS FUNDS
NOTES TO THE ANNUAL REPORT AND FINANCIAL STATEMENTS
for the year ended 30 September 2018 (continued)
133
11. FINANCIAL RISK MANAGEMENT (continued)
Market Price Risk (continued)
UCITS Regulations and the limits set out in the prospectus. The Investment Adviser uses their portfolio management selection tool and makes use of tracking errors to monitor deviation with the benchmark. Monthly performance reports are reviewed by the Investment Adviser/Sub-Investment Adviser(s) and quarterly by the Board of Directors of the
notional exposures for derivatives are disclosed in the Portfolio of Investments.
Global Time Diversified Absolute Return Fund, Finisterre Emerging Market Debt Fund, Global Capital Structure Opportunities Fund and Finisterre Unconstrained Emerging Markets Fixed Income Fund use an Absolute Value at Risk ("VaR") model to assess the Fund's market risk. The Global Time Diversified Absolute Return Fund's (terminated 14 September 2018) proprietary model uses a non-parametric approach based on a one-tailed confidence level of 99% for a daily horizon and considering no less than three years of historical data. The Finisterre Emerging Market Debt Fund (Terminated 19 December 2017) used a third-party independent VaR provider. From September 2016 to March 2017, a parametric approach with two year historical data based on a confidence level of 99% with a daily horizon was used. After March 2017 a non-parametric approach based on a confidence level of 99% for a daily horizon and considering no less than two years of historical data was used. The Global Capital Structure Opportunities Fund (Terminated 14 September 2018) and Global Credit Alpha Fund (Terminated 30 June 2017) calculated VaR using an historical parametric approach with a one-tailed 99% confidence level for a daily holding period and with an effective observation period considering at least one year of historical data. The Finisterre Unconstrained Emerging Markets Fixed Income Fund's proprietary model uses a non-parametric approach based on a one-tailed confidence level of 99% for a daily horizon and considering no less than two years of historical data.
It is noted that the use of VaR models to assess risk has limitations; these models use historical market data as a basis for their estimates, and assume that future conditions will be like those in the past. The estimates may be unreliable, especially under new or extreme market cothe sensitivity analysis should not be relied upon as a measure of future performance.
The VaR as of 30 September 2018 and 30 September 2017 based on a confidence level of 99% is included in the table below:
30 September 2018 30 September 2017 % % Global Time Diversified Absolute Return Fund1 N/A 2.0 Finisterre Emerging Market Debt Fund2 N/A 0.1 Global Capital Structure Opportunities Fund3 N/A 0.7 Finisterre Unconstrained Emerging Markets Fixed Income Fund4 0.6 0.7
1Global Time Diversified Absolute Return Fund terminated on 14 September 2018.
2Finisterre Emerging Market Debt Fund terminated on 19 December 2017.
3Global Capital Structure Opportunities Fund terminated on 14 September 2018.
4Finisterre Unconstrained Emerging Markets Fixed Income Fund launched on 2 May 2017.
The lowest, highest and average utilisation of the VaR limit, using an Absolute VaR approach based on the above inputs are included in the tables below:
During the year ended 30 September 2018 Lowest Highest Average
Fund % % %
Global Time Diversified Absolute Return Fund1 1.2 3.0 2.0 Finisterre Emerging Market Debt Fund2 0.0 1.6 0.5 Global Capital Structure Opportunities Fund3 0.5 1.0 0.7 Finisterre Unconstrained Emerging Markets Fixed Income Fund 0.3 0.9 0.6 1Global Time Diversified Absolute Return Fund terminated on 14 September 2018.
2Finisterre Emerging Market Debt Fund terminated on 19 December 2017.
3Global Capital Structure Opportunities Fund terminated on 14 September 2018.
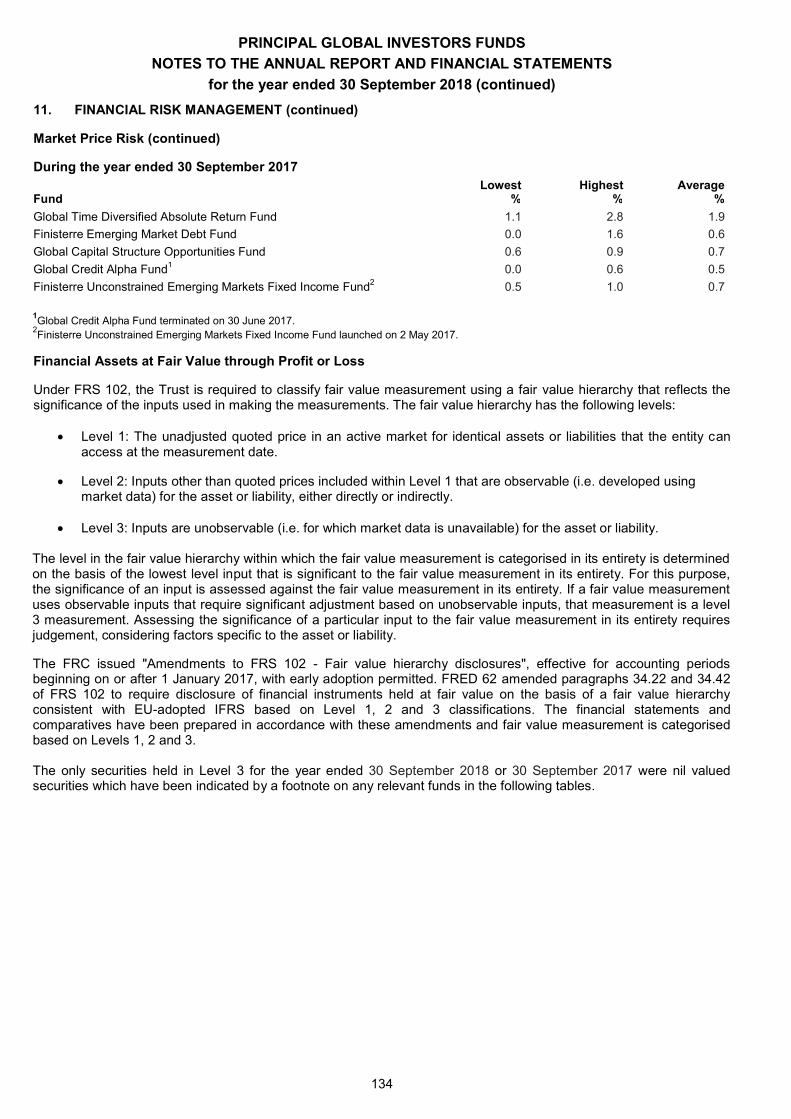
PRINCIPAL GLOBAL INVESTORS FUNDS
NOTES TO THE ANNUAL REPORT AND FINANCIAL STATEMENTS
for the year ended 30 September 2018 (continued)
134
11. FINANCIAL RISK MANAGEMENT (continued)
Market Price Risk (continued)
During the year ended 30 September 2017 Lowest Highest Average
Fund % % %
Global Time Diversified Absolute Return Fund 1.1 2.8 1.9 Finisterre Emerging Market Debt Fund 0.0 1.6 0.6 Global Capital Structure Opportunities Fund 0.6 0.9 0.7 Global Credit Alpha Fund1 0.0 0.6 0.5 Finisterre Unconstrained Emerging Markets Fixed Income Fund2 0.5 1.0 0.7
1Global Credit Alpha Fund terminated on 30 June 2017.
2Finisterre Unconstrained Emerging Markets Fixed Income Fund launched on 2 May 2017.
Financial Assets at Fair Value through Profit or Loss
Under FRS 102, the Trust is required to classify fair value measurement using a fair value hierarchy that reflects the significance of the inputs used in making the measurements. The fair value hierarchy has the following levels:
Level 1: The unadjusted quoted price in an active market for identical assets or liabilities that the entity can access at the measurement date.
Level 2: Inputs other than quoted prices included within Level 1 that are observable (i.e. developed using market data) for the asset or liability, either directly or indirectly.
Level 3: Inputs are unobservable (i.e. for which market data is unavailable) for the asset or liability.
The level in the fair value hierarchy within which the fair value measurement is categorised in its entirety is determined on the basis of the lowest level input that is significant to the fair value measurement in its entirety. For this purpose, the significance of an input is assessed against the fair value measurement in its entirety. If a fair value measurement uses observable inputs that require significant adjustment based on unobservable inputs, that measurement is a level 3 measurement. Assessing the significance of a particular input to the fair value measurement in its entirety requires judgement, considering factors specific to the asset or liability.
The FRC issued "Amendments to FRS 102 - Fair value hierarchy disclosures", effective for accounting periods beginning on or after 1 January 2017, with early adoption permitted. FRED 62 amended paragraphs 34.22 and 34.42 of FRS 102 to require disclosure of financial instruments held at fair value on the basis of a fair value hierarchy consistent with EU-adopted IFRS based on Level 1, 2 and 3 classifications. The financial statements and comparatives have been prepared in accordance with these amendments and fair value measurement is categorised based on Levels 1, 2 and 3. The only securities held in Level 3 for the year ended 30 September 2018 or 30 September 2017 were nil valued securities which have been indicated by a footnote on any relevant funds in the following tables.
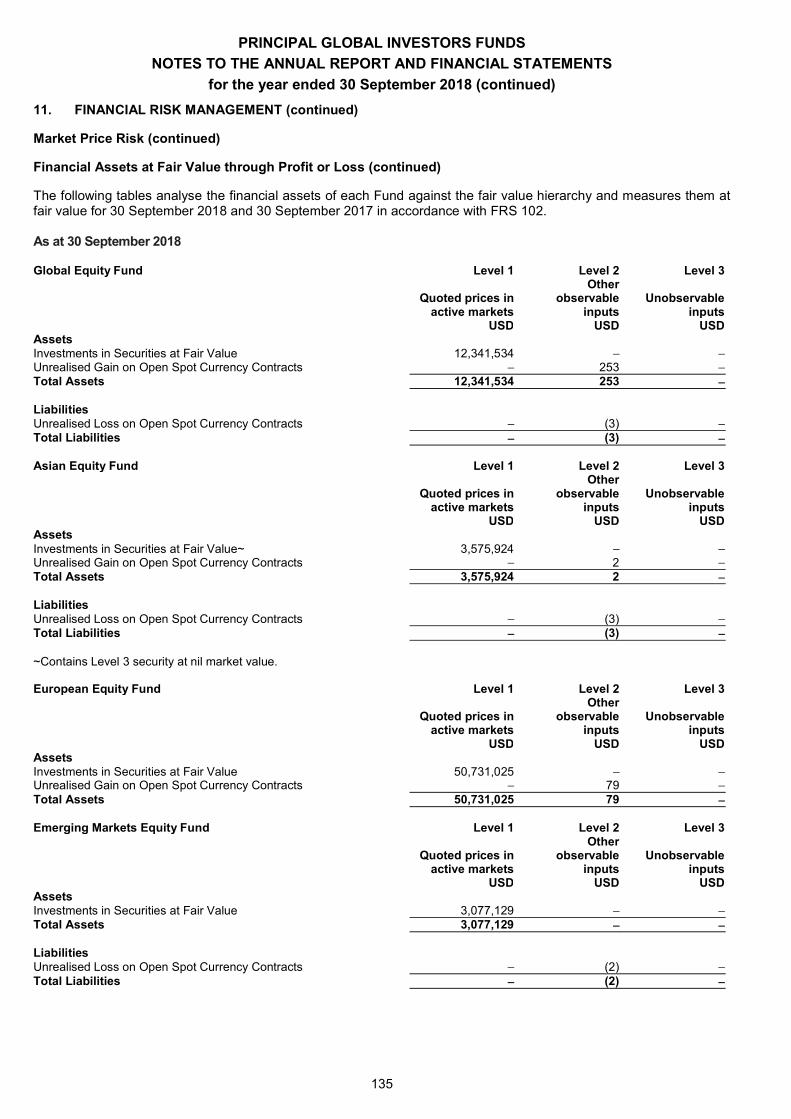
PRINCIPAL GLOBAL INVESTORS FUNDS
NOTES TO THE ANNUAL REPORT AND FINANCIAL STATEMENTS
for the year ended 30 September 2018 (continued)
135
11. FINANCIAL RISK MANAGEMENT (continued)
Market Price Risk (continued)
Financial Assets at Fair Value through Profit or Loss (continued)
The following tables analyse the financial assets of each Fund against the fair value hierarchy and measures them at fair value for 30 September 2018 and 30 September 2017 in accordance with FRS 102.
As at 30 September 2018
Global Equity Fund Level 1 Level 2 Level 3
Quoted prices in Other
observable Unobservable active markets inputs inputs USD USD USD Assets Investments in Securities at Fair Value 12,341,534 Unrealised Gain on Open Spot Currency Contracts 253 Total Assets 12,341,534 253 Liabilities Unrealised Loss on Open Spot Currency Contracts (3) Total Liabilities (3) Asian Equity Fund Level 1 Level 2 Level 3
Quoted prices in Other
observable Unobservable active markets inputs inputs USD USD USD Assets Investments in Securities at Fair Value~ 3,575,924 Unrealised Gain on Open Spot Currency Contracts 2 Total Assets 3,575,924 2 Liabilities Unrealised Loss on Open Spot Currency Contracts (3) Total Liabilities (3) ~Contains Level 3 security at nil market value. European Equity Fund Level 1 Level 2 Level 3
Quoted prices in Other
observable Unobservable active markets inputs inputs USD USD USD Assets Investments in Securities at Fair Value 50,731,025 Unrealised Gain on Open Spot Currency Contracts 79 Total Assets 50,731,025 79 Emerging Markets Equity Fund Level 1 Level 2 Level 3
Quoted prices in Other
observable Unobservable active markets inputs inputs USD USD USD Assets Investments in Securities at Fair Value 3,077,129 Total Assets 3,077,129 Liabilities Unrealised Loss on Open Spot Currency Contracts (2) Total Liabilities (2)
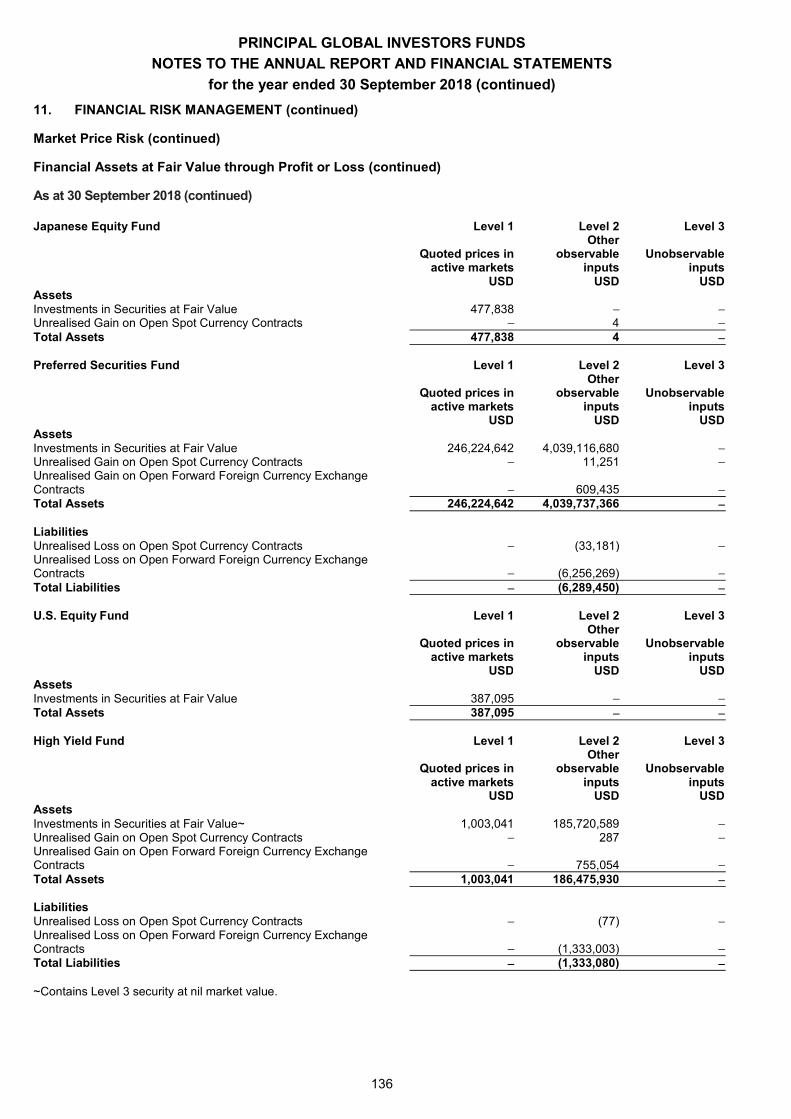
PRINCIPAL GLOBAL INVESTORS FUNDS
NOTES TO THE ANNUAL REPORT AND FINANCIAL STATEMENTS
for the year ended 30 September 2018 (continued)
136
11. FINANCIAL RISK MANAGEMENT (continued)
Market Price Risk (continued)
Financial Assets at Fair Value through Profit or Loss (continued)
As at 30 September 2018 (continued)
Japanese Equity Fund Level 1 Level 2 Level 3
Quoted prices in Other
observable Unobservable active markets inputs inputs USD USD USD Assets Investments in Securities at Fair Value 477,838 Unrealised Gain on Open Spot Currency Contracts 4 Total Assets 477,838 4 Preferred Securities Fund Level 1 Level 2 Level 3
Quoted prices in Other
observable Unobservable active markets inputs inputs USD USD USD Assets Investments in Securities at Fair Value 246,224,642 4,039,116,680 Unrealised Gain on Open Spot Currency Contracts 11,251 Unrealised Gain on Open Forward Foreign Currency Exchange Contracts 609,435 Total Assets 246,224,642 4,039,737,366 Liabilities Unrealised Loss on Open Spot Currency Contracts (33,181) Unrealised Loss on Open Forward Foreign Currency Exchange Contracts (6,256,269) Total Liabilities (6,289,450) U.S. Equity Fund Level 1 Level 2 Level 3
Quoted prices in Other
observable Unobservable active markets inputs inputs USD USD USD Assets Investments in Securities at Fair Value 387,095 Total Assets 387,095 High Yield Fund Level 1 Level 2 Level 3
Quoted prices in Other
observable Unobservable active markets inputs inputs USD USD USD Assets Investments in Securities at Fair Value~ 1,003,041 185,720,589 Unrealised Gain on Open Spot Currency Contracts 287 Unrealised Gain on Open Forward Foreign Currency Exchange Contracts 755,054 Total Assets 1,003,041 186,475,930 Liabilities Unrealised Loss on Open Spot Currency Contracts (77) Unrealised Loss on Open Forward Foreign Currency Exchange Contracts (1,333,003) Total Liabilities (1,333,080) ~Contains Level 3 security at nil market value.
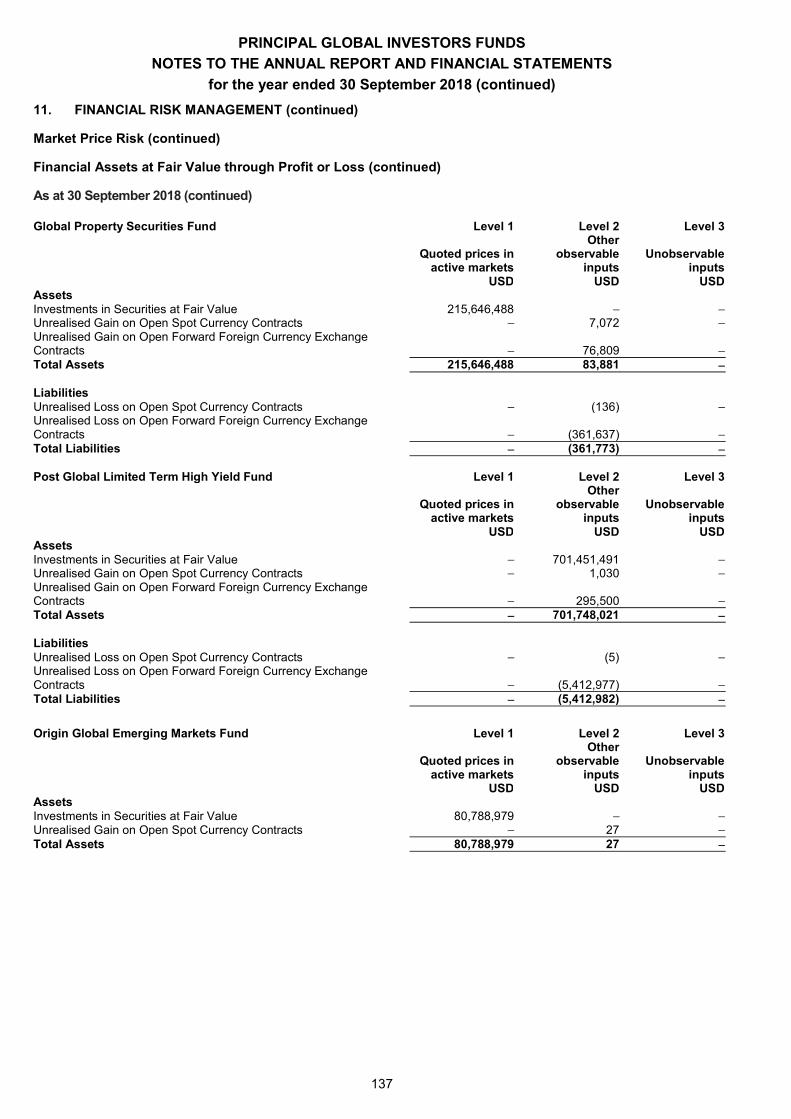
PRINCIPAL GLOBAL INVESTORS FUNDS
NOTES TO THE ANNUAL REPORT AND FINANCIAL STATEMENTS
for the year ended 30 September 2018 (continued)
137
11. FINANCIAL RISK MANAGEMENT (continued)
Market Price Risk (continued)
Financial Assets at Fair Value through Profit or Loss (continued)
As at 30 September 2018 (continued)
Global Property Securities Fund Level 1 Level 2 Level 3
Quoted prices in Other
observable Unobservable active markets inputs inputs USD USD USD Assets Investments in Securities at Fair Value 215,646,488 Unrealised Gain on Open Spot Currency Contracts 7,072 Unrealised Gain on Open Forward Foreign Currency Exchange Contracts 76,809 Total Assets 215,646,488 83,881 Liabilities Unrealised Loss on Open Spot Currency Contracts (136) Unrealised Loss on Open Forward Foreign Currency Exchange Contracts (361,637) Total Liabilities (361,773) Post Global Limited Term High Yield Fund Level 1 Level 2 Level 3
Quoted prices in Other
observable Unobservable active markets inputs inputs USD USD USD Assets Investments in Securities at Fair Value 701,451,491 Unrealised Gain on Open Spot Currency Contracts 1,030 Unrealised Gain on Open Forward Foreign Currency Exchange Contracts 295,500 Total Assets 701,748,021 Liabilities Unrealised Loss on Open Spot Currency Contracts (5) Unrealised Loss on Open Forward Foreign Currency Exchange Contracts (5,412,977) Total Liabilities (5,412,982)
Origin Global Emerging Markets Fund Level 1 Level 2 Level 3
Quoted prices in Other
observable Unobservable active markets inputs inputs USD USD USD Assets Investments in Securities at Fair Value 80,788,979 Unrealised Gain on Open Spot Currency Contracts 27 Total Assets 80,788,979 27
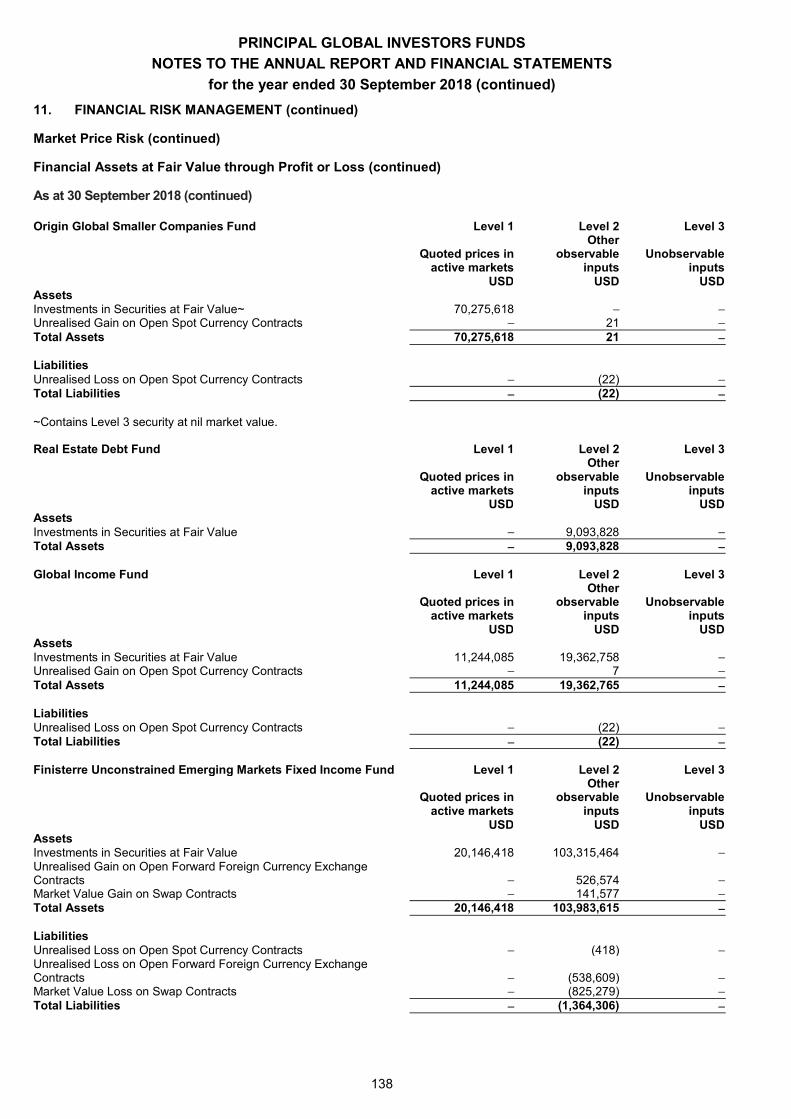
PRINCIPAL GLOBAL INVESTORS FUNDS
NOTES TO THE ANNUAL REPORT AND FINANCIAL STATEMENTS
for the year ended 30 September 2018 (continued)
138
11. FINANCIAL RISK MANAGEMENT (continued)
Market Price Risk (continued)
Financial Assets at Fair Value through Profit or Loss (continued)
As at 30 September 2018 (continued)
Origin Global Smaller Companies Fund Level 1 Level 2 Level 3
Quoted prices in Other
observable Unobservable active markets inputs inputs USD USD USD Assets Investments in Securities at Fair Value~ 70,275,618 Unrealised Gain on Open Spot Currency Contracts 21 Total Assets 70,275,618 21 Liabilities Unrealised Loss on Open Spot Currency Contracts (22) Total Liabilities (22) ~Contains Level 3 security at nil market value. Real Estate Debt Fund Level 1 Level 2 Level 3
Quoted prices in Other
observable Unobservable active markets inputs inputs USD USD USD Assets Investments in Securities at Fair Value 9,093,828 Total Assets 9,093,828 Global Income Fund Level 1 Level 2 Level 3
Quoted prices in Other
observable Unobservable active markets inputs inputs USD USD USD Assets Investments in Securities at Fair Value 11,244,085 19,362,758 Unrealised Gain on Open Spot Currency Contracts 7 Total Assets 11,244,085 19,362,765 Liabilities Unrealised Loss on Open Spot Currency Contracts (22) Total Liabilities (22) Finisterre Unconstrained Emerging Markets Fixed Income Fund Level 1 Level 2 Level 3
Quoted prices in Other
observable Unobservable active markets inputs inputs USD USD USD Assets Investments in Securities at Fair Value 20,146,418 103,315,464 Unrealised Gain on Open Forward Foreign Currency Exchange Contracts 526,574 Market Value Gain on Swap Contracts 141,577 Total Assets 20,146,418 103,983,615 Liabilities Unrealised Loss on Open Spot Currency Contracts (418) Unrealised Loss on Open Forward Foreign Currency Exchange Contracts (538,609) Market Value Loss on Swap Contracts (825,279) Total Liabilities (1,364,306)
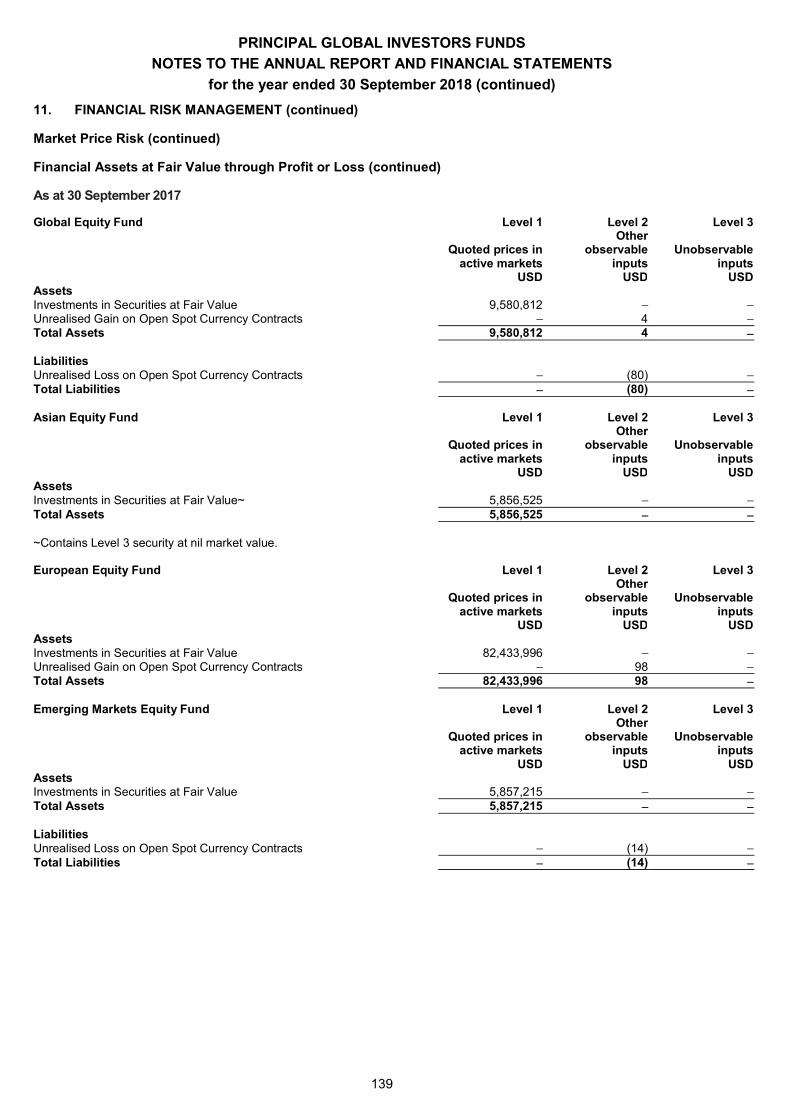
PRINCIPAL GLOBAL INVESTORS FUNDS
NOTES TO THE ANNUAL REPORT AND FINANCIAL STATEMENTS
for the year ended 30 September 2018 (continued)
139
11. FINANCIAL RISK MANAGEMENT (continued)
Market Price Risk (continued)
Financial Assets at Fair Value through Profit or Loss (continued)
As at 30 September 2017
Global Equity Fund Level 1 Level 2 Level 3
Quoted prices in Other
observable Unobservable active markets inputs inputs USD USD USD Assets Investments in Securities at Fair Value 9,580,812 Unrealised Gain on Open Spot Currency Contracts 4 Total Assets 9,580,812 4 Liabilities Unrealised Loss on Open Spot Currency Contracts (80) Total Liabilities (80) Asian Equity Fund Level 1 Level 2 Level 3
Quoted prices in Other
observable Unobservable active markets inputs inputs USD USD USD Assets Investments in Securities at Fair Value~ 5,856,525 Total Assets 5,856,525 ~Contains Level 3 security at nil market value. European Equity Fund Level 1 Level 2 Level 3
Quoted prices in Other
observable Unobservable active markets inputs inputs USD USD USD Assets Investments in Securities at Fair Value 82,433,996 Unrealised Gain on Open Spot Currency Contracts 98 Total Assets 82,433,996 98 Emerging Markets Equity Fund Level 1 Level 2 Level 3
Quoted prices in Other
observable Unobservable active markets inputs inputs USD USD USD Assets Investments in Securities at Fair Value 5,857,215 Total Assets 5,857,215 Liabilities Unrealised Loss on Open Spot Currency Contracts (14) Total Liabilities (14)
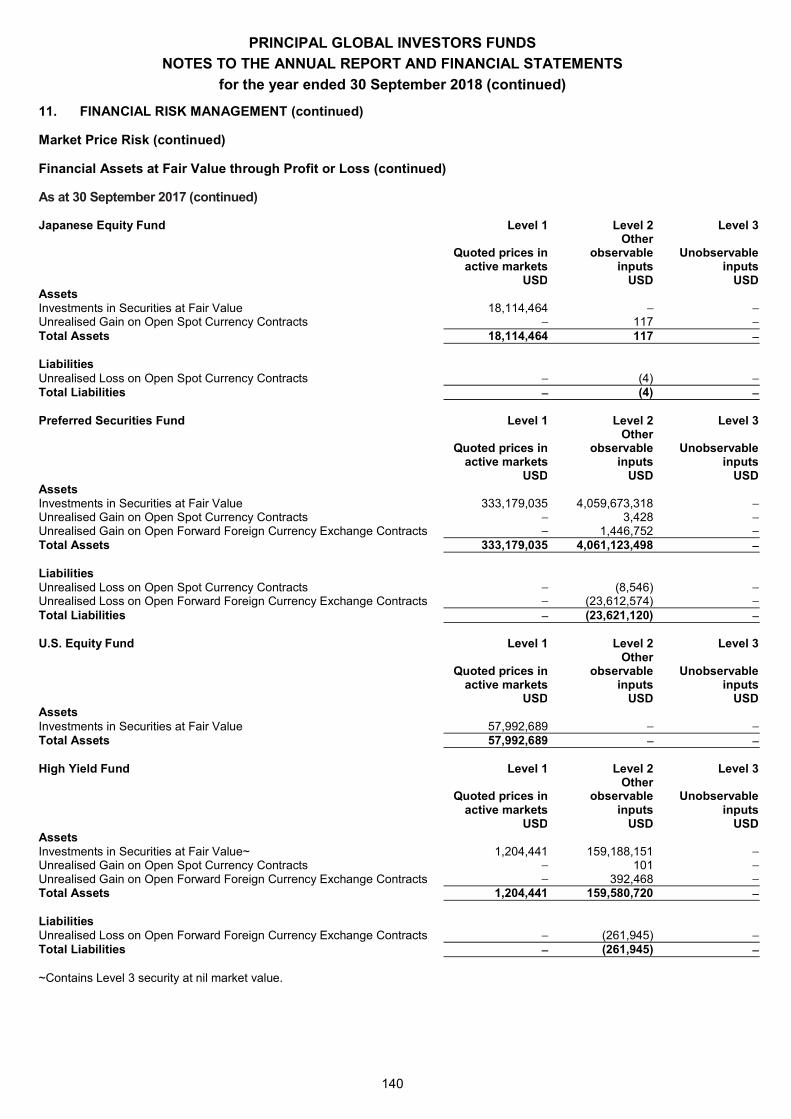
PRINCIPAL GLOBAL INVESTORS FUNDS
NOTES TO THE ANNUAL REPORT AND FINANCIAL STATEMENTS
for the year ended 30 September 2018 (continued)
140
11. FINANCIAL RISK MANAGEMENT (continued)
Market Price Risk (continued)
Financial Assets at Fair Value through Profit or Loss (continued)
As at 30 September 2017 (continued)
Japanese Equity Fund Level 1 Level 2 Level 3
Quoted prices in Other
observable Unobservable active markets inputs inputs USD USD USD Assets Investments in Securities at Fair Value 18,114,464 Unrealised Gain on Open Spot Currency Contracts 117 Total Assets 18,114,464 117 Liabilities Unrealised Loss on Open Spot Currency Contracts (4) Total Liabilities (4) Preferred Securities Fund Level 1 Level 2 Level 3
Quoted prices in Other
observable Unobservable active markets inputs inputs USD USD USD Assets Investments in Securities at Fair Value 333,179,035 4,059,673,318 Unrealised Gain on Open Spot Currency Contracts 3,428 Unrealised Gain on Open Forward Foreign Currency Exchange Contracts 1,446,752 Total Assets 333,179,035 4,061,123,498 Liabilities Unrealised Loss on Open Spot Currency Contracts (8,546) Unrealised Loss on Open Forward Foreign Currency Exchange Contracts (23,612,574) Total Liabilities (23,621,120) U.S. Equity Fund Level 1 Level 2 Level 3
Quoted prices in Other
observable Unobservable active markets inputs inputs USD USD USD Assets Investments in Securities at Fair Value 57,992,689 Total Assets 57,992,689 High Yield Fund Level 1 Level 2 Level 3
Quoted prices in Other
observable Unobservable active markets inputs inputs USD USD USD Assets Investments in Securities at Fair Value~ 1,204,441 159,188,151 Unrealised Gain on Open Spot Currency Contracts 101 Unrealised Gain on Open Forward Foreign Currency Exchange Contracts 392,468 Total Assets 1,204,441 159,580,720 Liabilities Unrealised Loss on Open Forward Foreign Currency Exchange Contracts (261,945) Total Liabilities (261,945) ~Contains Level 3 security at nil market value.
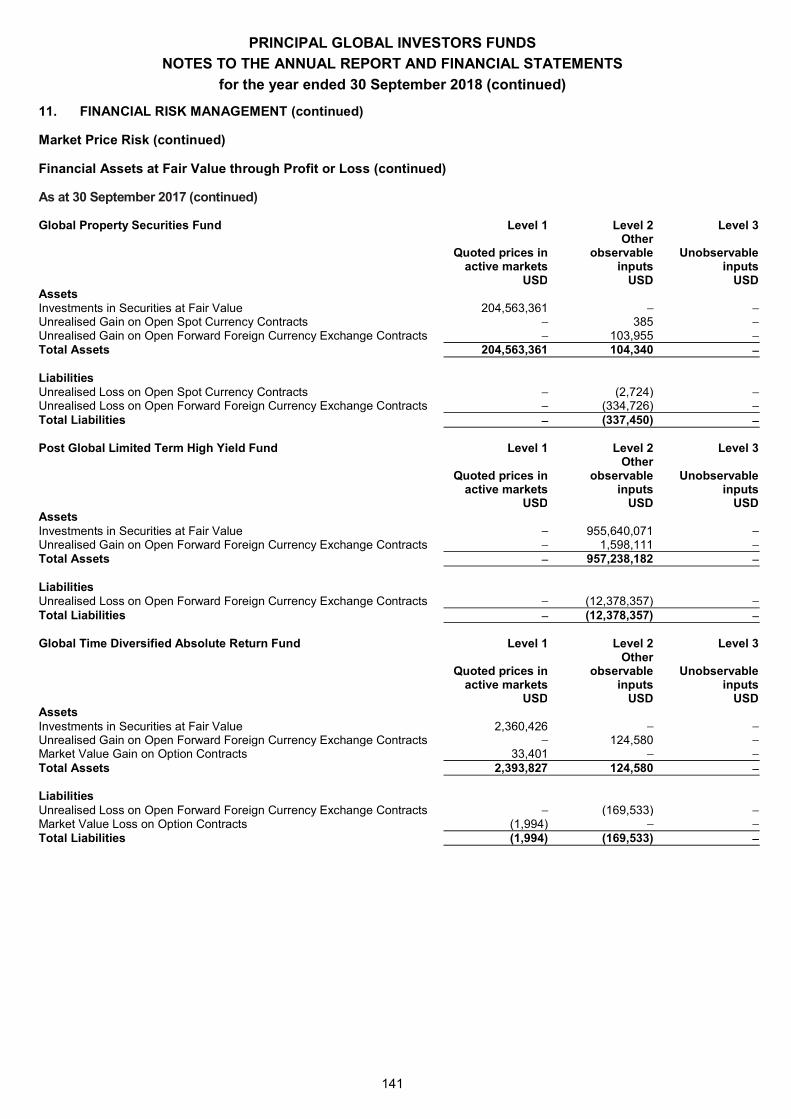
PRINCIPAL GLOBAL INVESTORS FUNDS
NOTES TO THE ANNUAL REPORT AND FINANCIAL STATEMENTS
for the year ended 30 September 2018 (continued)
141
11. FINANCIAL RISK MANAGEMENT (continued)
Market Price Risk (continued)
Financial Assets at Fair Value through Profit or Loss (continued)
As at 30 September 2017 (continued)
Global Property Securities Fund Level 1 Level 2 Level 3
Quoted prices in Other
observable Unobservable active markets inputs inputs USD USD USD Assets Investments in Securities at Fair Value 204,563,361 Unrealised Gain on Open Spot Currency Contracts 385 Unrealised Gain on Open Forward Foreign Currency Exchange Contracts 103,955 Total Assets 204,563,361 104,340 Liabilities Unrealised Loss on Open Spot Currency Contracts (2,724) Unrealised Loss on Open Forward Foreign Currency Exchange Contracts (334,726) Total Liabilities (337,450) Post Global Limited Term High Yield Fund Level 1 Level 2 Level 3
Quoted prices in Other
observable Unobservable active markets inputs inputs USD USD USD Assets Investments in Securities at Fair Value 955,640,071 Unrealised Gain on Open Forward Foreign Currency Exchange Contracts 1,598,111 Total Assets 957,238,182 Liabilities Unrealised Loss on Open Forward Foreign Currency Exchange Contracts (12,378,357) Total Liabilities (12,378,357) Global Time Diversified Absolute Return Fund Level 1 Level 2 Level 3
Quoted prices in Other
observable Unobservable active markets inputs inputs USD USD USD Assets Investments in Securities at Fair Value 2,360,426 Unrealised Gain on Open Forward Foreign Currency Exchange Contracts 124,580 Market Value Gain on Option Contracts 33,401 Total Assets 2,393,827 124,580 Liabilities Unrealised Loss on Open Forward Foreign Currency Exchange Contracts (169,533) Market Value Loss on Option Contracts (1,994) Total Liabilities (1,994) (169,533)
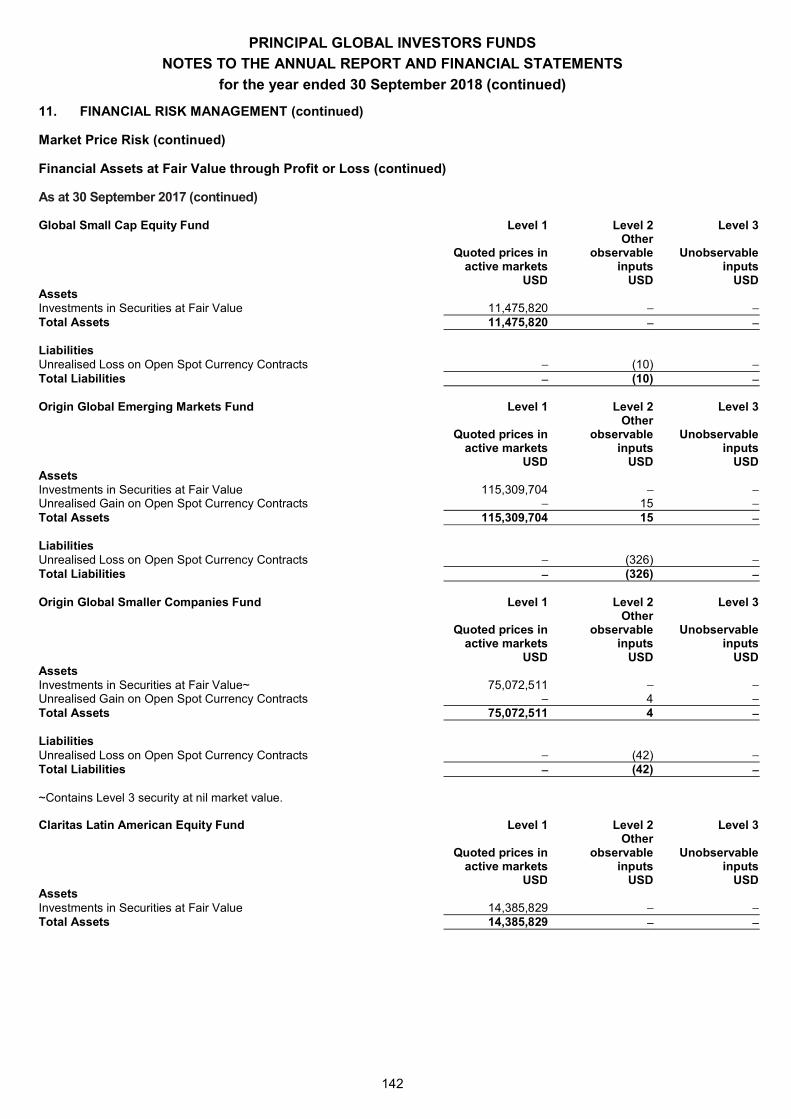
PRINCIPAL GLOBAL INVESTORS FUNDS
NOTES TO THE ANNUAL REPORT AND FINANCIAL STATEMENTS
for the year ended 30 September 2018 (continued)
142
11. FINANCIAL RISK MANAGEMENT (continued)
Market Price Risk (continued)
Financial Assets at Fair Value through Profit or Loss (continued)
As at 30 September 2017 (continued)
Global Small Cap Equity Fund Level 1 Level 2 Level 3
Quoted prices in Other
observable Unobservable active markets inputs inputs USD USD USD Assets Investments in Securities at Fair Value 11,475,820 Total Assets 11,475,820 Liabilities Unrealised Loss on Open Spot Currency Contracts (10) Total Liabilities (10) Origin Global Emerging Markets Fund Level 1 Level 2 Level 3
Quoted prices in Other
observable Unobservable active markets inputs inputs USD USD USD Assets Investments in Securities at Fair Value 115,309,704 Unrealised Gain on Open Spot Currency Contracts 15 Total Assets 115,309,704 15 Liabilities Unrealised Loss on Open Spot Currency Contracts (326) Total Liabilities (326) Origin Global Smaller Companies Fund Level 1 Level 2 Level 3
Quoted prices in Other
observable Unobservable active markets inputs inputs USD USD USD Assets Investments in Securities at Fair Value~ 75,072,511 Unrealised Gain on Open Spot Currency Contracts 4 Total Assets 75,072,511 4 Liabilities Unrealised Loss on Open Spot Currency Contracts (42) Total Liabilities (42) ~Contains Level 3 security at nil market value. Claritas Latin American Equity Fund Level 1 Level 2 Level 3
Quoted prices in Other
observable Unobservable active markets inputs inputs USD USD USD Assets Investments in Securities at Fair Value 14,385,829 Total Assets 14,385,829
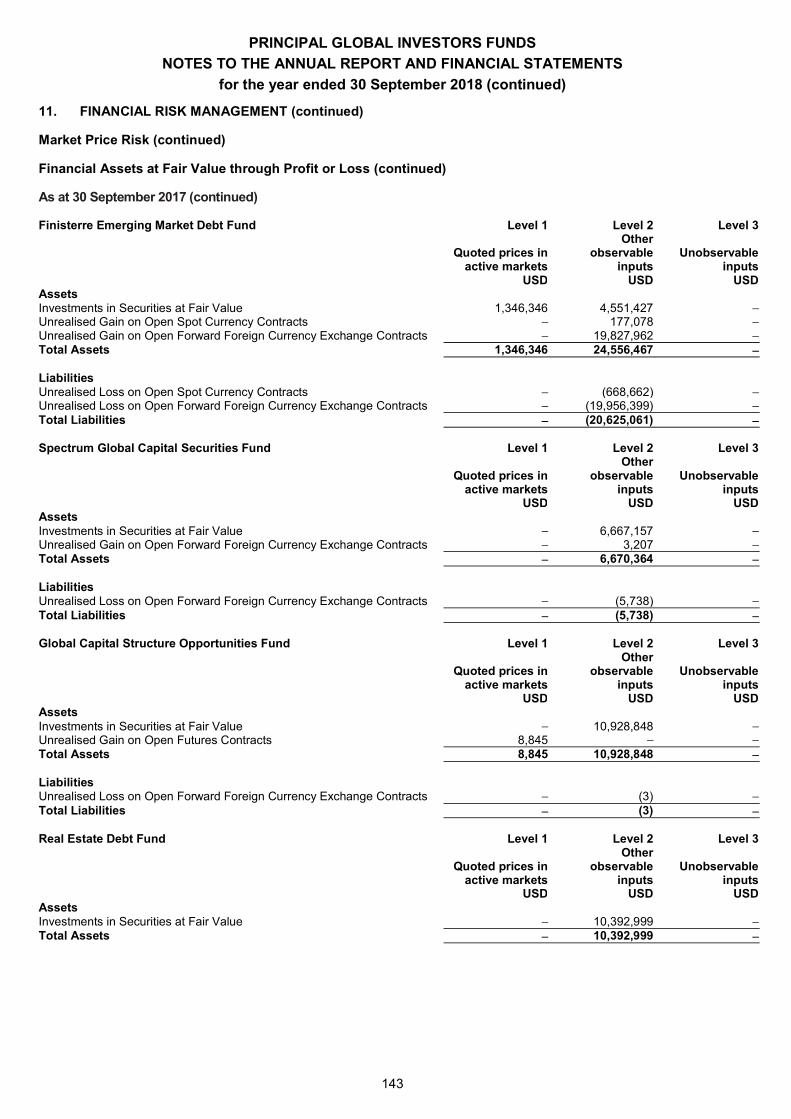
PRINCIPAL GLOBAL INVESTORS FUNDS
NOTES TO THE ANNUAL REPORT AND FINANCIAL STATEMENTS
for the year ended 30 September 2018 (continued)
143
11. FINANCIAL RISK MANAGEMENT (continued)
Market Price Risk (continued)
Financial Assets at Fair Value through Profit or Loss (continued)
As at 30 September 2017 (continued)
Finisterre Emerging Market Debt Fund Level 1 Level 2 Level 3
Quoted prices in Other
observable Unobservable active markets inputs inputs USD USD USD Assets Investments in Securities at Fair Value 1,346,346 4,551,427 Unrealised Gain on Open Spot Currency Contracts 177,078 Unrealised Gain on Open Forward Foreign Currency Exchange Contracts 19,827,962 Total Assets 1,346,346 24,556,467 Liabilities Unrealised Loss on Open Spot Currency Contracts (668,662) Unrealised Loss on Open Forward Foreign Currency Exchange Contracts (19,956,399) Total Liabilities (20,625,061) Spectrum Global Capital Securities Fund Level 1 Level 2 Level 3
Quoted prices in Other
observable Unobservable active markets inputs inputs USD USD USD Assets Investments in Securities at Fair Value 6,667,157 Unrealised Gain on Open Forward Foreign Currency Exchange Contracts 3,207 Total Assets 6,670,364 Liabilities Unrealised Loss on Open Forward Foreign Currency Exchange Contracts (5,738) Total Liabilities (5,738) Global Capital Structure Opportunities Fund Level 1 Level 2 Level 3
Quoted prices in Other
observable Unobservable active markets inputs inputs USD USD USD Assets Investments in Securities at Fair Value 10,928,848 Unrealised Gain on Open Futures Contracts 8,845 Total Assets 8,845 10,928,848 Liabilities Unrealised Loss on Open Forward Foreign Currency Exchange Contracts (3) Total Liabilities (3) Real Estate Debt Fund Level 1 Level 2 Level 3
Quoted prices in Other
observable Unobservable active markets inputs inputs USD USD USD Assets Investments in Securities at Fair Value 10,392,999 Total Assets 10,392,999
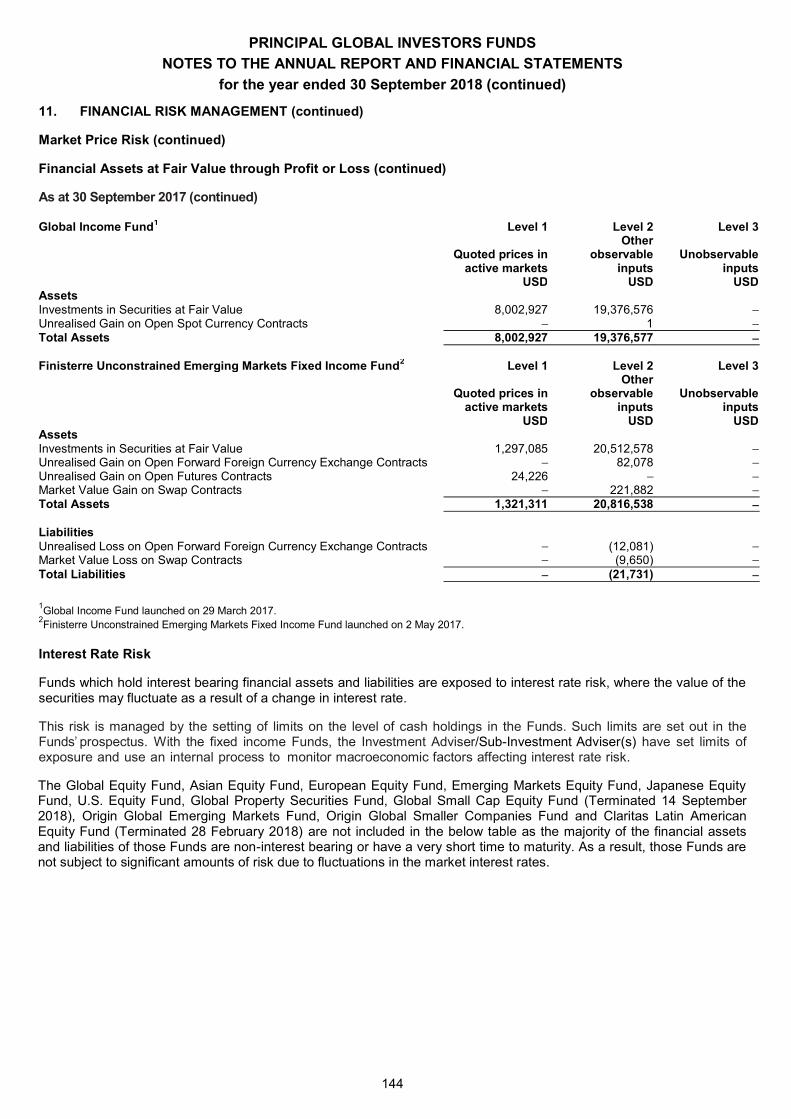
PRINCIPAL GLOBAL INVESTORS FUNDS
NOTES TO THE ANNUAL REPORT AND FINANCIAL STATEMENTS
for the year ended 30 September 2018 (continued)
144
11. FINANCIAL RISK MANAGEMENT (continued)
Market Price Risk (continued)
Financial Assets at Fair Value through Profit or Loss (continued)
As at 30 September 2017 (continued)
Global Income Fund1 Level 1 Level 2 Level 3
Quoted prices in Other
observable Unobservable active markets inputs inputs USD USD USD Assets Investments in Securities at Fair Value 8,002,927 19,376,576 Unrealised Gain on Open Spot Currency Contracts 1 Total Assets 8,002,927 19,376,577 Finisterre Unconstrained Emerging Markets Fixed Income Fund2 Level 1 Level 2 Level 3
Quoted prices in Other
observable Unobservable active markets inputs inputs USD USD USD Assets Investments in Securities at Fair Value 1,297,085 20,512,578 Unrealised Gain on Open Forward Foreign Currency Exchange Contracts 82,078 Unrealised Gain on Open Futures Contracts 24,226 Market Value Gain on Swap Contracts 221,882 Total Assets 1,321,311 20,816,538 Liabilities Unrealised Loss on Open Forward Foreign Currency Exchange Contracts (12,081) Market Value Loss on Swap Contracts (9,650) Total Liabilities (21,731)
1Global Income Fund launched on 29 March 2017.
2Finisterre Unconstrained Emerging Markets Fixed Income Fund launched on 2 May 2017.
Interest Rate Risk
Funds which hold interest bearing financial assets and liabilities are exposed to interest rate risk, where the value of the securities may fluctuate as a result of a change in interest rate.
This risk is managed by the setting of limits on the level of cash holdings in the Funds. Such limits are set out in the Funds prospectus. With the fixed income Funds, the Investment Adviser/Sub-Investment Adviser(s) have set limits of exposure and use an internal process to monitor macroeconomic factors affecting interest rate risk.
The Global Equity Fund, Asian Equity Fund, European Equity Fund, Emerging Markets Equity Fund, Japanese Equity Fund, U.S. Equity Fund, Global Property Securities Fund, Global Small Cap Equity Fund (Terminated 14 September 2018), Origin Global Emerging Markets Fund, Origin Global Smaller Companies Fund and Claritas Latin American Equity Fund (Terminated 28 February 2018) are not included in the below table as the majority of the financial assets and liabilities of those Funds are non-interest bearing or have a very short time to maturity. As a result, those Funds are not subject to significant amounts of risk due to fluctuations in the market interest rates.
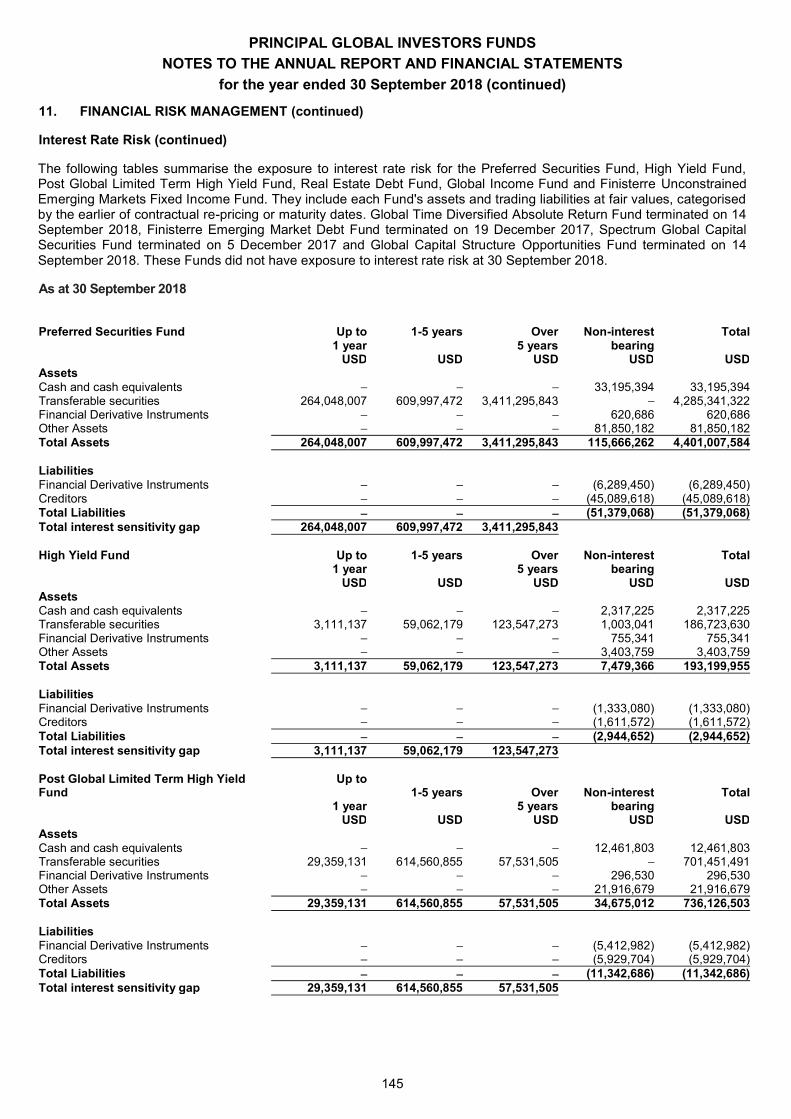
PRINCIPAL GLOBAL INVESTORS FUNDS
NOTES TO THE ANNUAL REPORT AND FINANCIAL STATEMENTS
for the year ended 30 September 2018 (continued)
145
11. FINANCIAL RISK MANAGEMENT (continued)
Interest Rate Risk (continued)
The following tables summarise the exposure to interest rate risk for the Preferred Securities Fund, High Yield Fund, Post Global Limited Term High Yield Fund, Real Estate Debt Fund, Global Income Fund and Finisterre Unconstrained Emerging Markets Fixed Income Fund. They include each Fund's assets and trading liabilities at fair values, categorised by the earlier of contractual re-pricing or maturity dates. Global Time Diversified Absolute Return Fund terminated on 14 September 2018, Finisterre Emerging Market Debt Fund terminated on 19 December 2017, Spectrum Global Capital Securities Fund terminated on 5 December 2017 and Global Capital Structure Opportunities Fund terminated on 14 September 2018. These Funds did not have exposure to interest rate risk at 30 September 2018.
As at 30 September 2018
Preferred Securities Fund Up to 1-5 years Over Non-interest Total 1 year 5 years bearing USD USD USD USD USD Assets Cash and cash equivalents 33,195,394 33,195,394 Transferable securities 264,048,007 609,997,472 3,411,295,843 4,285,341,322 Financial Derivative Instruments 620,686 620,686 Other Assets 81,850,182 81,850,182 Total Assets 264,048,007 609,997,472 3,411,295,843 115,666,262 4,401,007,584 Liabilities Financial Derivative Instruments (6,289,450) (6,289,450) Creditors (45,089,618) (45,089,618) Total Liabilities (51,379,068) (51,379,068) Total interest sensitivity gap 264,048,007 609,997,472 3,411,295,843 High Yield Fund Up to 1-5 years Over Non-interest Total 1 year 5 years bearing USD USD USD USD USD Assets Cash and cash equivalents 2,317,225 2,317,225 Transferable securities 3,111,137 59,062,179 123,547,273 1,003,041 186,723,630 Financial Derivative Instruments 755,341 755,341 Other Assets 3,403,759 3,403,759 Total Assets 3,111,137 59,062,179 123,547,273 7,479,366 193,199,955 Liabilities Financial Derivative Instruments (1,333,080) (1,333,080) Creditors (1,611,572) (1,611,572) Total Liabilities (2,944,652) (2,944,652) Total interest sensitivity gap 3,111,137 59,062,179 123,547,273 Post Global Limited Term High Yield Fund
Up to 1-5 years Over Non-interest Total
1 year 5 years bearing USD USD USD USD USD Assets Cash and cash equivalents 12,461,803 12,461,803 Transferable securities 29,359,131 614,560,855 57,531,505 701,451,491 Financial Derivative Instruments 296,530 296,530 Other Assets 21,916,679 21,916,679 Total Assets 29,359,131 614,560,855 57,531,505 34,675,012 736,126,503 Liabilities Financial Derivative Instruments (5,412,982) (5,412,982) Creditors (5,929,704) (5,929,704) Total Liabilities (11,342,686) (11,342,686) Total interest sensitivity gap 29,359,131 614,560,855 57,531,505
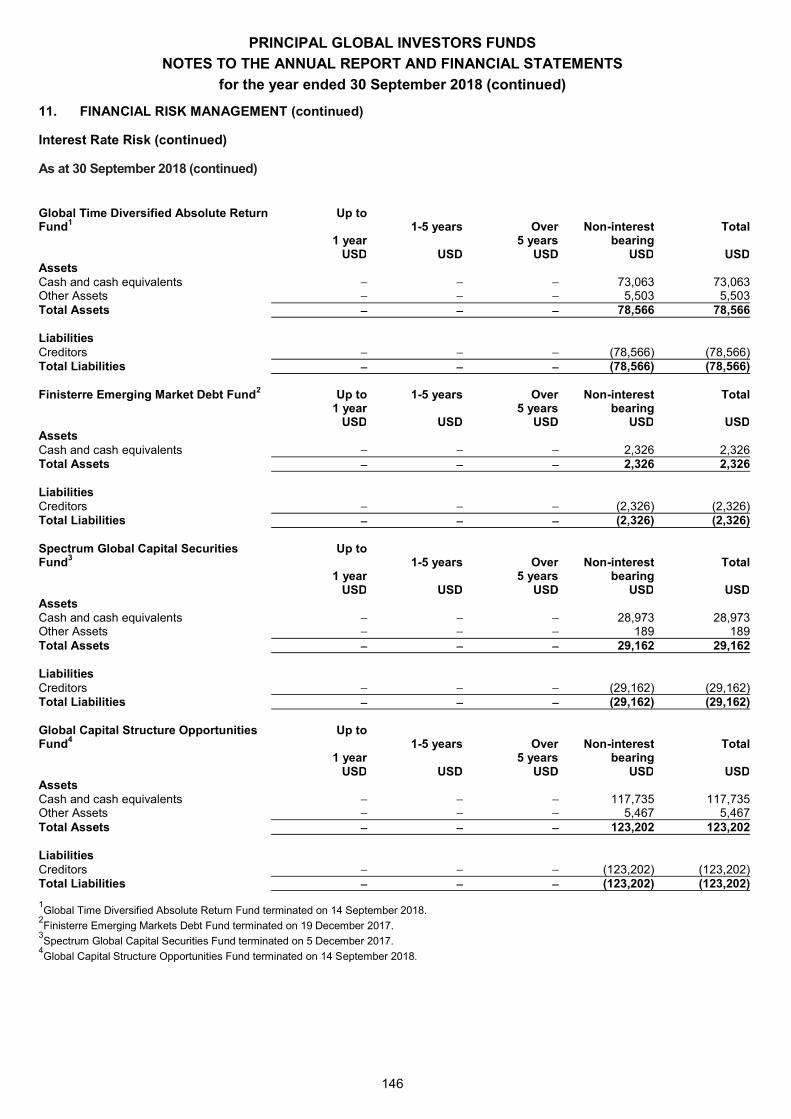
PRINCIPAL GLOBAL INVESTORS FUNDS
NOTES TO THE ANNUAL REPORT AND FINANCIAL STATEMENTS
for the year ended 30 September 2018 (continued)
146
11. FINANCIAL RISK MANAGEMENT (continued)
Interest Rate Risk (continued)
As at 30 September 2018 (continued)
Global Time Diversified Absolute Return Fund1
Up to 1-5 years Over Non-interest Total
1 year 5 years bearing USD USD USD USD USD Assets Cash and cash equivalents 73,063 73,063 Other Assets 5,503 5,503 Total Assets 78,566 78,566 Liabilities Creditors (78,566) (78,566) Total Liabilities (78,566) (78,566) Finisterre Emerging Market Debt Fund2 Up to 1-5 years Over Non-interest Total 1 year 5 years bearing USD USD USD USD USD Assets Cash and cash equivalents 2,326 2,326 Total Assets 2,326 2,326 Liabilities Creditors (2,326) (2,326) Total Liabilities (2,326) (2,326) Spectrum Global Capital Securities Fund3
Up to 1-5 years Over Non-interest Total
1 year 5 years bearing USD USD USD USD USD Assets Cash and cash equivalents 28,973 28,973 Other Assets 189 189 Total Assets 29,162 29,162 Liabilities Creditors (29,162) (29,162) Total Liabilities (29,162) (29,162) Global Capital Structure Opportunities Fund4
Up to 1-5 years Over Non-interest Total
1 year 5 years bearing USD USD USD USD USD Assets Cash and cash equivalents 117,735 117,735 Other Assets 5,467 5,467 Total Assets 123,202 123,202 Liabilities Creditors (123,202) (123,202) Total Liabilities (123,202) (123,202)
1Global Time Diversified Absolute Return Fund terminated on 14 September 2018.
2Finisterre Emerging Markets Debt Fund terminated on 19 December 2017.
3Spectrum Global Capital Securities Fund terminated on 5 December 2017.
4Global Capital Structure Opportunities Fund terminated on 14 September 2018.
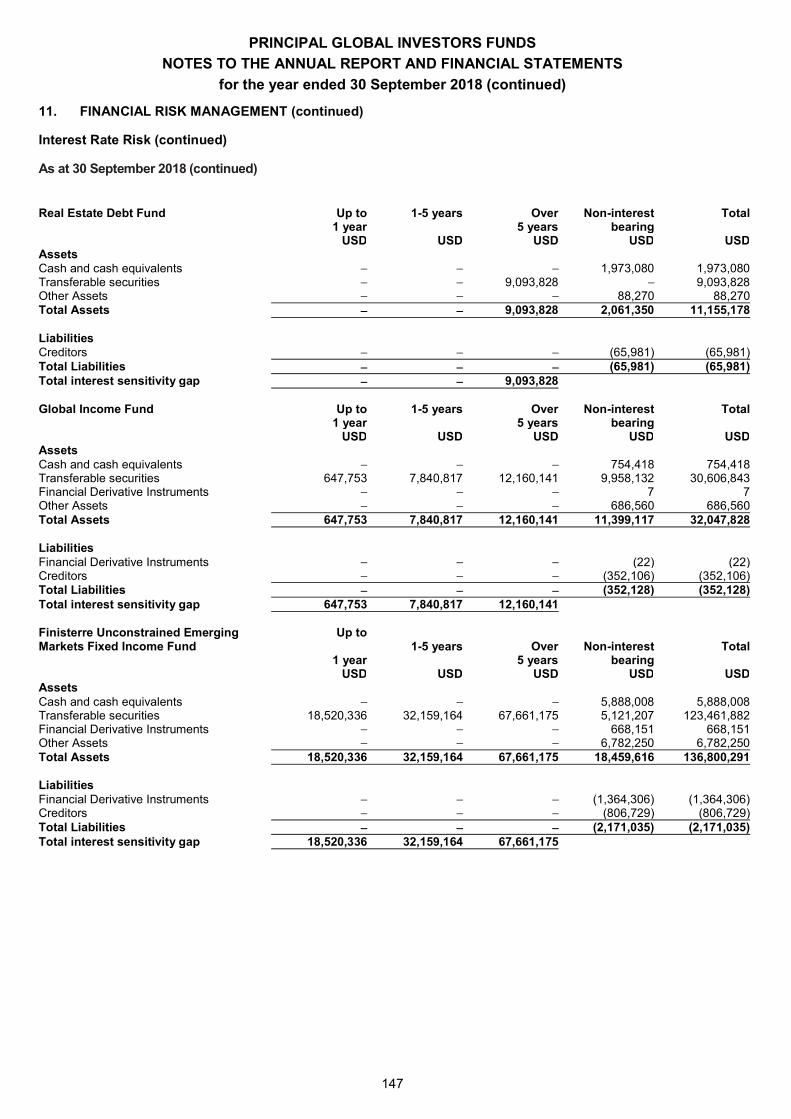
PRINCIPAL GLOBAL INVESTORS FUNDS
NOTES TO THE ANNUAL REPORT AND FINANCIAL STATEMENTS
for the year ended 30 September 2018 (continued)
147
11. FINANCIAL RISK MANAGEMENT (continued)
Interest Rate Risk (continued)
As at 30 September 2018 (continued)
Real Estate Debt Fund Up to 1-5 years Over Non-interest Total 1 year 5 years bearing USD USD USD USD USD Assets Cash and cash equivalents 1,973,080 1,973,080 Transferable securities 9,093,828 9,093,828 Other Assets 88,270 88,270 Total Assets 9,093,828 2,061,350 11,155,178 Liabilities Creditors (65,981) (65,981) Total Liabilities (65,981) (65,981) Total interest sensitivity gap 9,093,828 Global Income Fund Up to 1-5 years Over Non-interest Total 1 year 5 years bearing USD USD USD USD USD Assets Cash and cash equivalents 754,418 754,418 Transferable securities 647,753 7,840,817 12,160,141 9,958,132 30,606,843 Financial Derivative Instruments 7 7 Other Assets 686,560 686,560 Total Assets 647,753 7,840,817 12,160,141 11,399,117 32,047,828 Liabilities Financial Derivative Instruments (22) (22) Creditors (352,106) (352,106) Total Liabilities (352,128) (352,128) Total interest sensitivity gap 647,753 7,840,817 12,160,141 Finisterre Unconstrained Emerging Markets Fixed Income Fund
Up to 1-5 years Over Non-interest Total
1 year 5 years bearing USD USD USD USD USD Assets Cash and cash equivalents 5,888,008 5,888,008 Transferable securities 18,520,336 32,159,164 67,661,175 5,121,207 123,461,882 Financial Derivative Instruments 668,151 668,151 Other Assets 6,782,250 6,782,250 Total Assets 18,520,336 32,159,164 67,661,175 18,459,616 136,800,291 Liabilities Financial Derivative Instruments (1,364,306) (1,364,306) Creditors (806,729) (806,729) Total Liabilities (2,171,035) (2,171,035) Total interest sensitivity gap 18,520,336 32,159,164 67,661,175
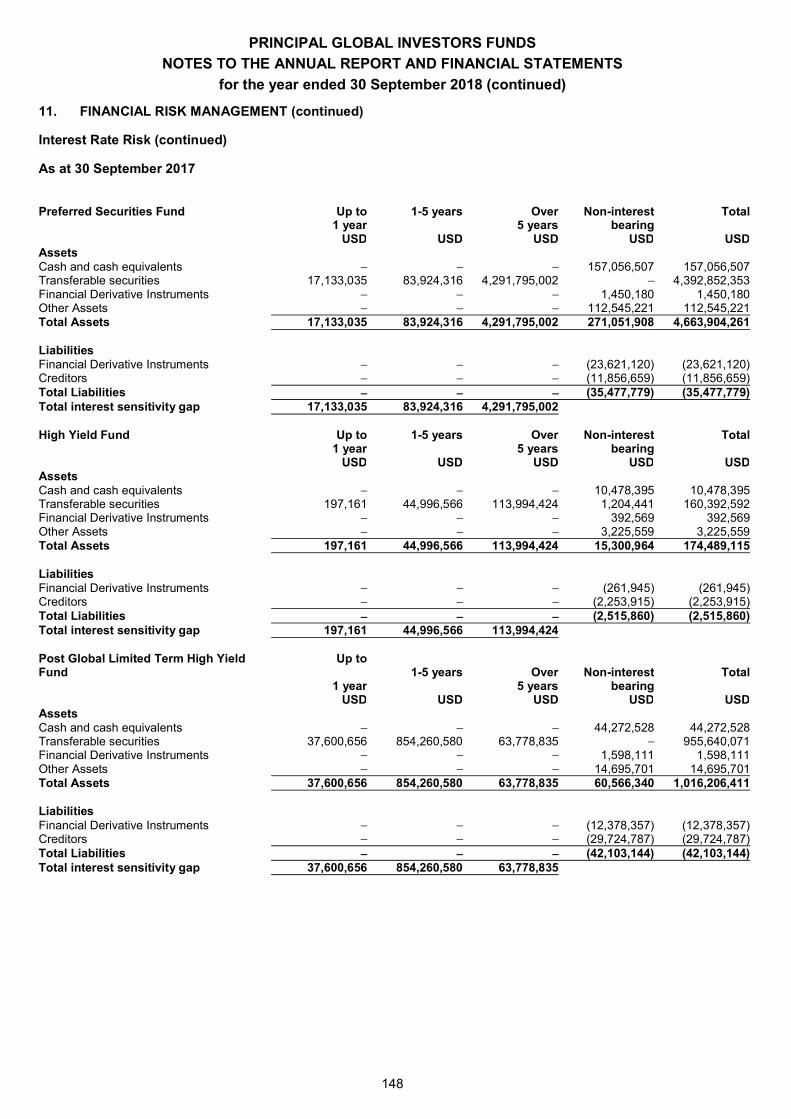
PRINCIPAL GLOBAL INVESTORS FUNDS
NOTES TO THE ANNUAL REPORT AND FINANCIAL STATEMENTS
for the year ended 30 September 2018 (continued)
148
11. FINANCIAL RISK MANAGEMENT (continued)
Interest Rate Risk (continued)
As at 30 September 2017
Preferred Securities Fund Up to 1-5 years Over Non-interest Total 1 year 5 years bearing USD USD USD USD USD Assets Cash and cash equivalents 157,056,507 157,056,507 Transferable securities 17,133,035 83,924,316 4,291,795,002 4,392,852,353 Financial Derivative Instruments 1,450,180 1,450,180 Other Assets 112,545,221 112,545,221 Total Assets 17,133,035 83,924,316 4,291,795,002 271,051,908 4,663,904,261 Liabilities Financial Derivative Instruments (23,621,120) (23,621,120) Creditors (11,856,659) (11,856,659) Total Liabilities (35,477,779) (35,477,779) Total interest sensitivity gap 17,133,035 83,924,316 4,291,795,002 High Yield Fund Up to 1-5 years Over Non-interest Total 1 year 5 years bearing USD USD USD USD USD Assets Cash and cash equivalents 10,478,395 10,478,395 Transferable securities 197,161 44,996,566 113,994,424 1,204,441 160,392,592 Financial Derivative Instruments 392,569 392,569 Other Assets 3,225,559 3,225,559 Total Assets 197,161 44,996,566 113,994,424 15,300,964 174,489,115 Liabilities Financial Derivative Instruments (261,945) (261,945) Creditors (2,253,915) (2,253,915) Total Liabilities (2,515,860) (2,515,860) Total interest sensitivity gap 197,161 44,996,566 113,994,424 Post Global Limited Term High Yield Fund
Up to 1-5 years Over Non-interest Total
1 year 5 years bearing USD USD USD USD USD Assets Cash and cash equivalents 44,272,528 44,272,528 Transferable securities 37,600,656 854,260,580 63,778,835 955,640,071 Financial Derivative Instruments 1,598,111 1,598,111 Other Assets 14,695,701 14,695,701 Total Assets 37,600,656 854,260,580 63,778,835 60,566,340 1,016,206,411 Liabilities Financial Derivative Instruments (12,378,357) (12,378,357) Creditors (29,724,787) (29,724,787) Total Liabilities (42,103,144) (42,103,144) Total interest sensitivity gap 37,600,656 854,260,580 63,778,835
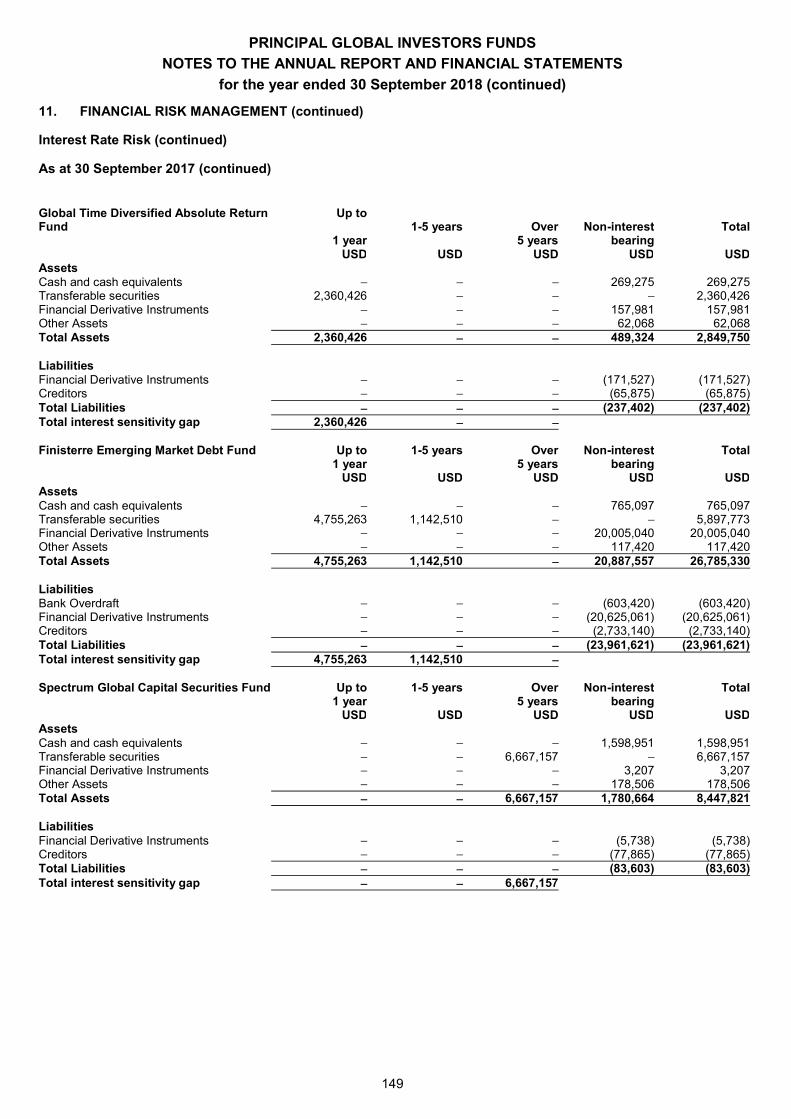
PRINCIPAL GLOBAL INVESTORS FUNDS
NOTES TO THE ANNUAL REPORT AND FINANCIAL STATEMENTS
for the year ended 30 September 2018 (continued)
149
11. FINANCIAL RISK MANAGEMENT (continued)
Interest Rate Risk (continued)
As at 30 September 2017 (continued)
Global Time Diversified Absolute Return Fund
Up to 1-5 years Over Non-interest Total
1 year 5 years bearing USD USD USD USD USD Assets Cash and cash equivalents 269,275 269,275 Transferable securities 2,360,426 2,360,426 Financial Derivative Instruments 157,981 157,981 Other Assets 62,068 62,068 Total Assets 2,360,426 489,324 2,849,750 Liabilities Financial Derivative Instruments (171,527) (171,527) Creditors (65,875) (65,875) Total Liabilities (237,402) (237,402) Total interest sensitivity gap 2,360,426 Finisterre Emerging Market Debt Fund Up to 1-5 years Over Non-interest Total 1 year 5 years bearing USD USD USD USD USD Assets Cash and cash equivalents 765,097 765,097 Transferable securities 4,755,263 1,142,510 5,897,773 Financial Derivative Instruments 20,005,040 20,005,040 Other Assets 117,420 117,420 Total Assets 4,755,263 1,142,510 20,887,557 26,785,330 Liabilities Bank Overdraft (603,420) (603,420) Financial Derivative Instruments (20,625,061) (20,625,061) Creditors (2,733,140) (2,733,140) Total Liabilities (23,961,621) (23,961,621) Total interest sensitivity gap 4,755,263 1,142,510 Spectrum Global Capital Securities Fund Up to 1-5 years Over Non-interest Total 1 year 5 years bearing USD USD USD USD USD Assets Cash and cash equivalents 1,598,951 1,598,951 Transferable securities 6,667,157 6,667,157 Financial Derivative Instruments 3,207 3,207 Other Assets 178,506 178,506 Total Assets 6,667,157 1,780,664 8,447,821 Liabilities Financial Derivative Instruments (5,738) (5,738) Creditors (77,865) (77,865) Total Liabilities (83,603) (83,603) Total interest sensitivity gap 6,667,157
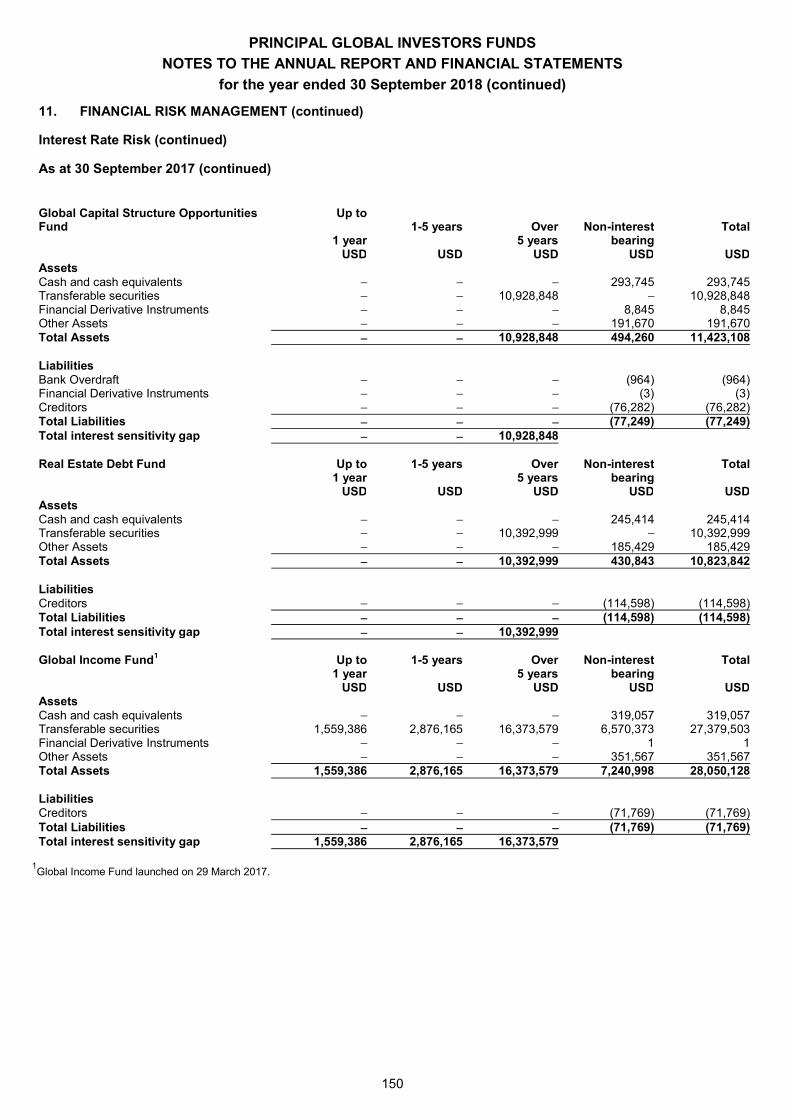
PRINCIPAL GLOBAL INVESTORS FUNDS
NOTES TO THE ANNUAL REPORT AND FINANCIAL STATEMENTS
for the year ended 30 September 2018 (continued)
150
11. FINANCIAL RISK MANAGEMENT (continued)
Interest Rate Risk (continued)
As at 30 September 2017 (continued)
Global Capital Structure Opportunities Fund
Up to 1-5 years Over Non-interest Total
1 year 5 years bearing USD USD USD USD USD Assets Cash and cash equivalents 293,745 293,745 Transferable securities 10,928,848 10,928,848 Financial Derivative Instruments 8,845 8,845 Other Assets 191,670 191,670 Total Assets 10,928,848 494,260 11,423,108 Liabilities Bank Overdraft (964) (964) Financial Derivative Instruments (3) (3) Creditors (76,282) (76,282) Total Liabilities (77,249) (77,249) Total interest sensitivity gap 10,928,848 Real Estate Debt Fund Up to 1-5 years Over Non-interest Total 1 year 5 years bearing USD USD USD USD USD Assets Cash and cash equivalents 245,414 245,414 Transferable securities 10,392,999 10,392,999 Other Assets 185,429 185,429 Total Assets 10,392,999 430,843 10,823,842 Liabilities Creditors (114,598) (114,598) Total Liabilities (114,598) (114,598) Total interest sensitivity gap 10,392,999 Global Income Fund1 Up to 1-5 years Over Non-interest Total 1 year 5 years bearing USD USD USD USD USD Assets Cash and cash equivalents 319,057 319,057 Transferable securities 1,559,386 2,876,165 16,373,579 6,570,373 27,379,503 Financial Derivative Instruments 1 1 Other Assets 351,567 351,567 Total Assets 1,559,386 2,876,165 16,373,579 7,240,998 28,050,128 Liabilities Creditors (71,769) (71,769) Total Liabilities (71,769) (71,769) Total interest sensitivity gap 1,559,386 2,876,165 16,373,579
1Global Income Fund launched on 29 March 2017.
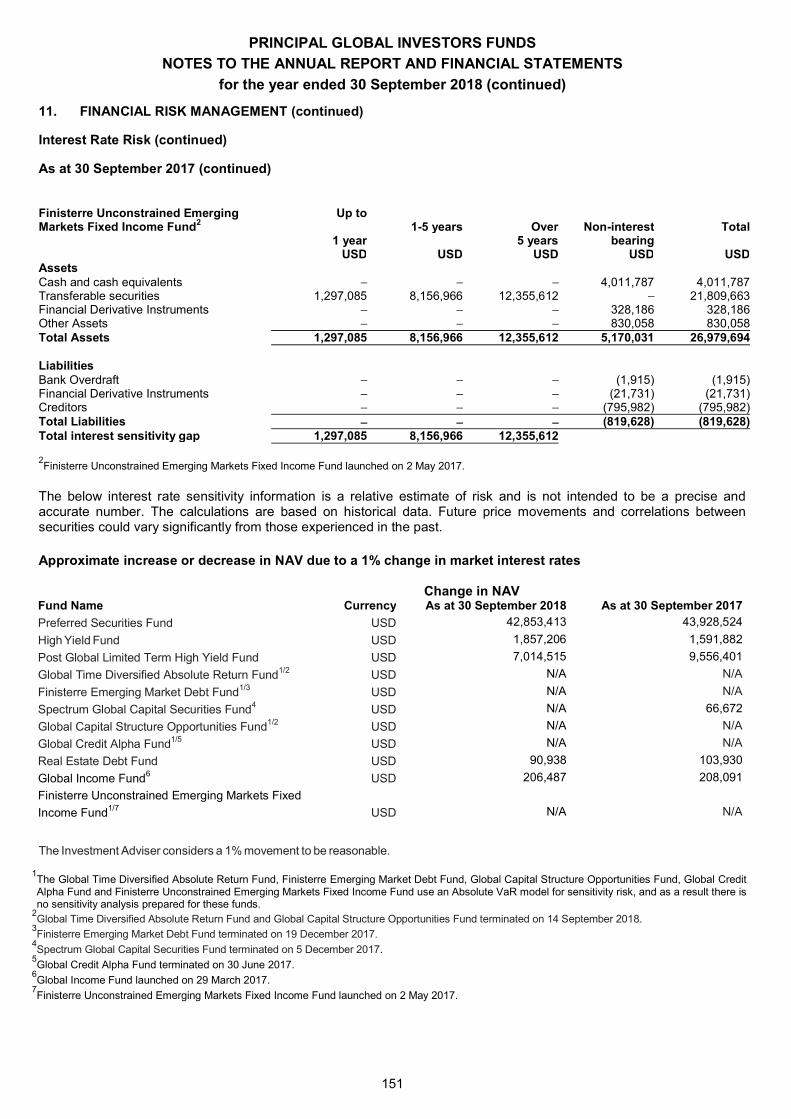
PRINCIPAL GLOBAL INVESTORS FUNDS
NOTES TO THE ANNUAL REPORT AND FINANCIAL STATEMENTS
for the year ended 30 September 2018 (continued)
151
11. FINANCIAL RISK MANAGEMENT (continued)
Interest Rate Risk (continued)
As at 30 September 2017 (continued)
Finisterre Unconstrained Emerging Markets Fixed Income Fund2
Up to 1-5 years Over Non-interest Total
1 year 5 years bearing USD USD USD USD USD Assets Cash and cash equivalents 4,011,787 4,011,787 Transferable securities 1,297,085 8,156,966 12,355,612 21,809,663 Financial Derivative Instruments 328,186 328,186 Other Assets 830,058 830,058 Total Assets 1,297,085 8,156,966 12,355,612 5,170,031 26,979,694 Liabilities Bank Overdraft (1,915) (1,915) Financial Derivative Instruments (21,731) (21,731) Creditors (795,982) (795,982) Total Liabilities (819,628) (819,628) Total interest sensitivity gap 1,297,085 8,156,966 12,355,612
2Finisterre Unconstrained Emerging Markets Fixed Income Fund launched on 2 May 2017.
The below interest rate sensitivity information is a relative estimate of risk and is not intended to be a precise and accurate number. The calculations are based on historical data. Future price movements and correlations between securities could vary significantly from those experienced in the past. Approximate increase or decrease in NAV due to a 1% change in market interest rates
Change in NAV
Fund Name Currency As at 30 September 2018 As at 30 September 2017
Preferred Securities Fund USD 42,853,413 43,928,524 High Yield Fund USD 1,857,206 1,591,882 Post Global Limited Term High Yield Fund USD 7,014,515 9,556,401 Global Time Diversified Absolute Return Fund1/2 USD N/A N/A Finisterre Emerging Market Debt Fund1/3 USD N/A N/A Spectrum Global Capital Securities Fund4 USD N/A 66,672 Global Capital Structure Opportunities Fund1/2 USD N/A N/A Global Credit Alpha Fund1/5 USD N/A N/A Real Estate Debt Fund USD 90,938 103,930 Global Income Fund6 USD 206,487 208,091 Finisterre Unconstrained Emerging Markets Fixed Income Fund1/7 USD N/A N/A
The Investment Adviser considers a 1% movement to be reasonable.
1The Global Time Diversified Absolute Return Fund, Finisterre Emerging Market Debt Fund, Global Capital Structure Opportunities Fund, Global Credit Alpha Fund and Finisterre Unconstrained Emerging Markets Fixed Income Fund use an Absolute VaR model for sensitivity risk, and as a result there is no sensitivity analysis prepared for these funds.
2Global Time Diversified Absolute Return Fund and Global Capital Structure Opportunities Fund terminated on 14 September 2018.
3Finisterre Emerging Market Debt Fund terminated on 19 December 2017.
4Spectrum Global Capital Securities Fund terminated on 5 December 2017.
5Global Credit Alpha Fund terminated on 30 June 2017.
6Global Income Fund launched on 29 March 2017.
7Finisterre Unconstrained Emerging Markets Fixed Income Fund launched on 2 May 2017.
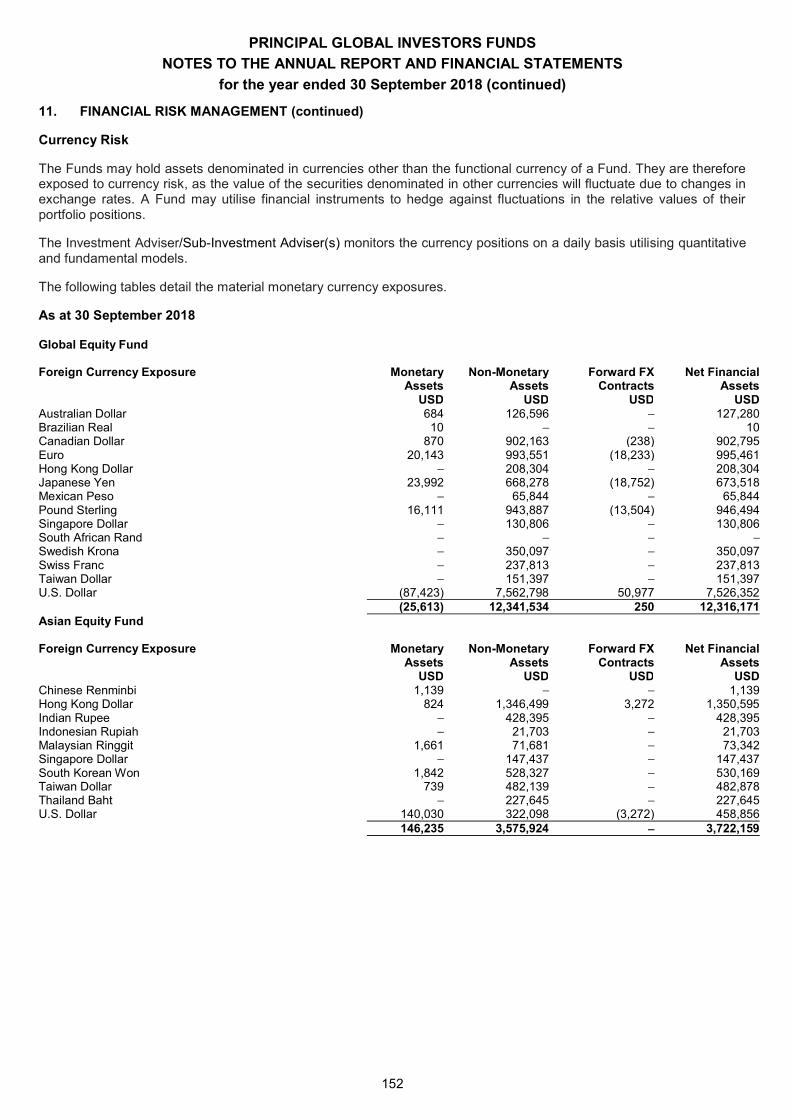
PRINCIPAL GLOBAL INVESTORS FUNDS
NOTES TO THE ANNUAL REPORT AND FINANCIAL STATEMENTS
for the year ended 30 September 2018 (continued)
152
11. FINANCIAL RISK MANAGEMENT (continued)
Currency Risk
The Funds may hold assets denominated in currencies other than the functional currency of a Fund. They are therefore exposed to currency risk, as the value of the securities denominated in other currencies will fluctuate due to changes in exchange rates. A Fund may utilise financial instruments to hedge against fluctuations in the relative values of their portfolio positions.
The Investment Adviser/Sub-Investment Adviser(s) monitors the currency positions on a daily basis utilising quantitative and fundamental models.
The following tables detail the material monetary currency exposures.
As at 30 September 2018
Global Equity Fund Foreign Currency Exposure Monetary Non-Monetary Forward FX Net Financial Assets Assets Contracts Assets USD USD USD USD Australian Dollar 684 126,596 127,280 Brazilian Real 10 10 Canadian Dollar 870 902,163 (238) 902,795 Euro 20,143 993,551 (18,233) 995,461 Hong Kong Dollar 208,304 208,304 Japanese Yen 23,992 668,278 (18,752) 673,518 Mexican Peso 65,844 65,844 Pound Sterling 16,111 943,887 (13,504) 946,494 Singapore Dollar 130,806 130,806 South African Rand Swedish Krona 350,097 350,097 Swiss Franc 237,813 237,813 Taiwan Dollar 151,397 151,397 U.S. Dollar (87,423) 7,562,798 50,977 7,526,352 (25,613) 12,341,534 250 12,316,171 Asian Equity Fund Foreign Currency Exposure Monetary Non-Monetary Forward FX Net Financial Assets Assets Contracts Assets USD USD USD USD Chinese Renminbi 1,139 1,139 Hong Kong Dollar 824 1,346,499 3,272 1,350,595 Indian Rupee 428,395 428,395 Indonesian Rupiah 21,703 21,703 Malaysian Ringgit 1,661 71,681 73,342 Singapore Dollar 147,437 147,437 South Korean Won 1,842 528,327 530,169 Taiwan Dollar 739 482,139 482,878 Thailand Baht 227,645 227,645 U.S. Dollar 140,030 322,098 (3,272) 458,856 146,235 3,575,924 3,722,159
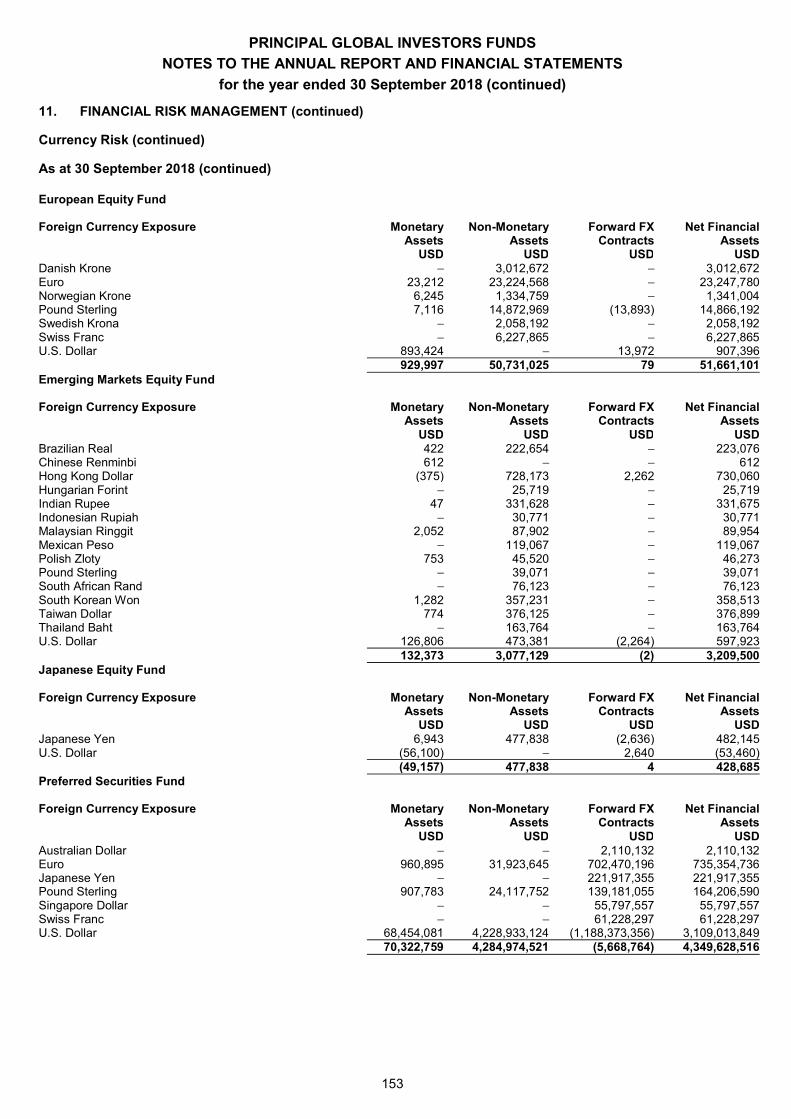
PRINCIPAL GLOBAL INVESTORS FUNDS
NOTES TO THE ANNUAL REPORT AND FINANCIAL STATEMENTS
for the year ended 30 September 2018 (continued)
153
11. FINANCIAL RISK MANAGEMENT (continued)
Currency Risk (continued)
As at 30 September 2018 (continued)
European Equity Fund Foreign Currency Exposure Monetary Non-Monetary Forward FX Net Financial Assets Assets Contracts Assets USD USD USD USD Danish Krone 3,012,672 3,012,672 Euro 23,212 23,224,568 23,247,780 Norwegian Krone 6,245 1,334,759 1,341,004 Pound Sterling 7,116 14,872,969 (13,893) 14,866,192 Swedish Krona 2,058,192 2,058,192 Swiss Franc 6,227,865 6,227,865 U.S. Dollar 893,424 13,972 907,396 929,997 50,731,025 79 51,661,101 Emerging Markets Equity Fund Foreign Currency Exposure Monetary Non-Monetary Forward FX Net Financial Assets Assets Contracts Assets USD USD USD USD Brazilian Real 422 222,654 223,076 Chinese Renminbi 612 612 Hong Kong Dollar (375) 728,173 2,262 730,060 Hungarian Forint 25,719 25,719 Indian Rupee 47 331,628 331,675 Indonesian Rupiah 30,771 30,771 Malaysian Ringgit 2,052 87,902 89,954 Mexican Peso 119,067 119,067 Polish Zloty 753 45,520 46,273 Pound Sterling 39,071 39,071 South African Rand 76,123 76,123 South Korean Won 1,282 357,231 358,513 Taiwan Dollar 774 376,125 376,899 Thailand Baht 163,764 163,764 U.S. Dollar 126,806 473,381 (2,264) 597,923 132,373 3,077,129 (2) 3,209,500 Japanese Equity Fund Foreign Currency Exposure Monetary Non-Monetary Forward FX Net Financial Assets Assets Contracts Assets USD USD USD USD Japanese Yen 6,943 477,838 (2,636) 482,145 U.S. Dollar (56,100) 2,640 (53,460) (49,157) 477,838 4 428,685 Preferred Securities Fund Foreign Currency Exposure Monetary Non-Monetary Forward FX Net Financial Assets Assets Contracts Assets USD USD USD USD Australian Dollar 2,110,132 2,110,132 Euro 960,895 31,923,645 702,470,196 735,354,736 Japanese Yen 221,917,355 221,917,355 Pound Sterling 907,783 24,117,752 139,181,055 164,206,590 Singapore Dollar 55,797,557 55,797,557 Swiss Franc 61,228,297 61,228,297 U.S. Dollar 68,454,081 4,228,933,124 (1,188,373,356) 3,109,013,849 70,322,759 4,284,974,521 (5,668,764) 4,349,628,516
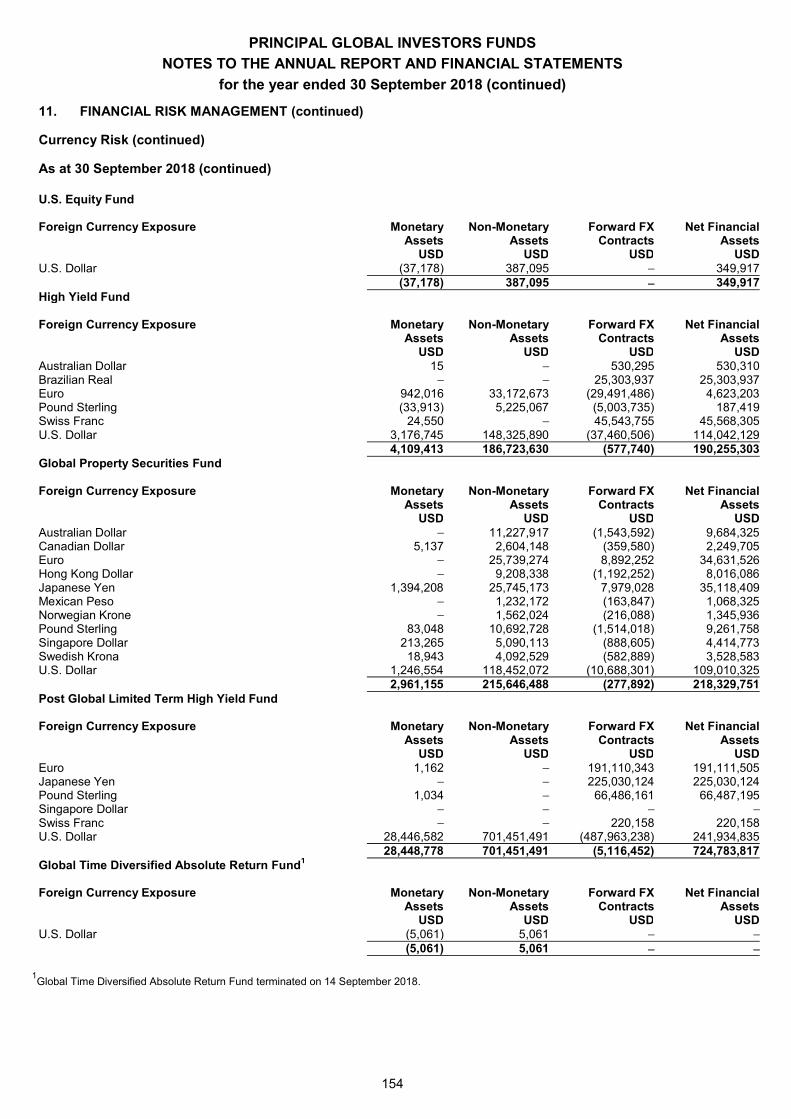
PRINCIPAL GLOBAL INVESTORS FUNDS
NOTES TO THE ANNUAL REPORT AND FINANCIAL STATEMENTS
for the year ended 30 September 2018 (continued)
154
11. FINANCIAL RISK MANAGEMENT (continued)
Currency Risk (continued)
As at 30 September 2018 (continued)
U.S. Equity Fund Foreign Currency Exposure Monetary Non-Monetary Forward FX Net Financial Assets Assets Contracts Assets USD USD USD USD U.S. Dollar (37,178) 387,095 349,917 (37,178) 387,095 349,917 High Yield Fund Foreign Currency Exposure Monetary Non-Monetary Forward FX Net Financial Assets Assets Contracts Assets USD USD USD USD Australian Dollar 15 530,295 530,310 Brazilian Real 25,303,937 25,303,937 Euro 942,016 33,172,673 (29,491,486) 4,623,203 Pound Sterling (33,913) 5,225,067 (5,003,735) 187,419 Swiss Franc 24,550 45,543,755 45,568,305 U.S. Dollar 3,176,745 148,325,890 (37,460,506) 114,042,129 4,109,413 186,723,630 (577,740) 190,255,303 Global Property Securities Fund Foreign Currency Exposure Monetary Non-Monetary Forward FX Net Financial Assets Assets Contracts Assets USD USD USD USD Australian Dollar 11,227,917 (1,543,592) 9,684,325 Canadian Dollar 5,137 2,604,148 (359,580) 2,249,705 Euro 25,739,274 8,892,252 34,631,526 Hong Kong Dollar 9,208,338 (1,192,252) 8,016,086 Japanese Yen 1,394,208 25,745,173 7,979,028 35,118,409 Mexican Peso 1,232,172 (163,847) 1,068,325 Norwegian Krone 1,562,024 (216,088) 1,345,936 Pound Sterling 83,048 10,692,728 (1,514,018) 9,261,758 Singapore Dollar 213,265 5,090,113 (888,605) 4,414,773 Swedish Krona 18,943 4,092,529 (582,889) 3,528,583 U.S. Dollar 1,246,554 118,452,072 (10,688,301) 109,010,325 2,961,155 215,646,488 (277,892) 218,329,751 Post Global Limited Term High Yield Fund Foreign Currency Exposure Monetary Non-Monetary Forward FX Net Financial Assets Assets Contracts Assets USD USD USD USD Euro 1,162 191,110,343 191,111,505 Japanese Yen 225,030,124 225,030,124 Pound Sterling 1,034 66,486,161 66,487,195 Singapore Dollar Swiss Franc 220,158 220,158 U.S. Dollar 28,446,582 701,451,491 (487,963,238) 241,934,835 28,448,778 701,451,491 (5,116,452) 724,783,817 Global Time Diversified Absolute Return Fund1 Foreign Currency Exposure Monetary Non-Monetary Forward FX Net Financial Assets Assets Contracts Assets USD USD USD USD U.S. Dollar (5,061) 5,061 (5,061) 5,061
1Global Time Diversified Absolute Return Fund terminated on 14 September 2018.
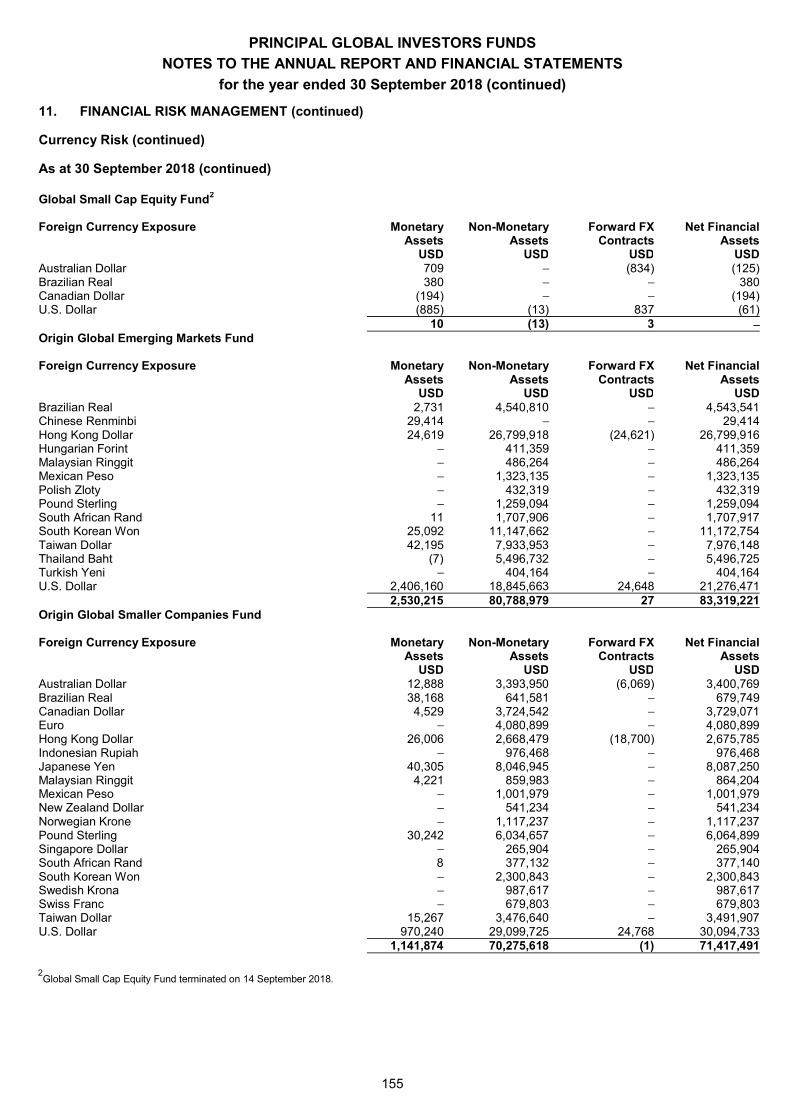
PRINCIPAL GLOBAL INVESTORS FUNDS
NOTES TO THE ANNUAL REPORT AND FINANCIAL STATEMENTS
for the year ended 30 September 2018 (continued)
155
11. FINANCIAL RISK MANAGEMENT (continued)
Currency Risk (continued)
As at 30 September 2018 (continued)
Global Small Cap Equity Fund2 Foreign Currency Exposure Monetary Non-Monetary Forward FX Net Financial Assets Assets Contracts Assets USD USD USD USD Australian Dollar 709 (834) (125) Brazilian Real 380 380 Canadian Dollar (194) (194) U.S. Dollar (885) (13) 837 (61) 10 (13) 3 Origin Global Emerging Markets Fund Foreign Currency Exposure Monetary Non-Monetary Forward FX Net Financial Assets Assets Contracts Assets USD USD USD USD Brazilian Real 2,731 4,540,810 4,543,541 Chinese Renminbi 29,414 29,414 Hong Kong Dollar 24,619 26,799,918 (24,621) 26,799,916 Hungarian Forint 411,359 411,359 Malaysian Ringgit 486,264 486,264 Mexican Peso 1,323,135 1,323,135 Polish Zloty 432,319 432,319 Pound Sterling 1,259,094 1,259,094 South African Rand 11 1,707,906 1,707,917 South Korean Won 25,092 11,147,662 11,172,754 Taiwan Dollar 42,195 7,933,953 7,976,148 Thailand Baht (7) 5,496,732 5,496,725 Turkish Yeni 404,164 404,164 U.S. Dollar 2,406,160 18,845,663 24,648 21,276,471 2,530,215 80,788,979 27 83,319,221 Origin Global Smaller Companies Fund Foreign Currency Exposure Monetary Non-Monetary Forward FX Net Financial Assets Assets Contracts Assets USD USD USD USD Australian Dollar 12,888 3,393,950 (6,069) 3,400,769 Brazilian Real 38,168 641,581 679,749 Canadian Dollar 4,529 3,724,542 3,729,071 Euro 4,080,899 4,080,899 Hong Kong Dollar 26,006 2,668,479 (18,700) 2,675,785 Indonesian Rupiah 976,468 976,468 Japanese Yen 40,305 8,046,945 8,087,250 Malaysian Ringgit 4,221 859,983 864,204 Mexican Peso 1,001,979 1,001,979 New Zealand Dollar 541,234 541,234 Norwegian Krone 1,117,237 1,117,237 Pound Sterling 30,242 6,034,657 6,064,899 Singapore Dollar 265,904 265,904 South African Rand 8 377,132 377,140 South Korean Won 2,300,843 2,300,843 Swedish Krona 987,617 987,617 Swiss Franc 679,803 679,803 Taiwan Dollar 15,267 3,476,640 3,491,907 U.S. Dollar 970,240 29,099,725 24,768 30,094,733 1,141,874 70,275,618 (1) 71,417,491
2Global Small Cap Equity Fund terminated on 14 September 2018.
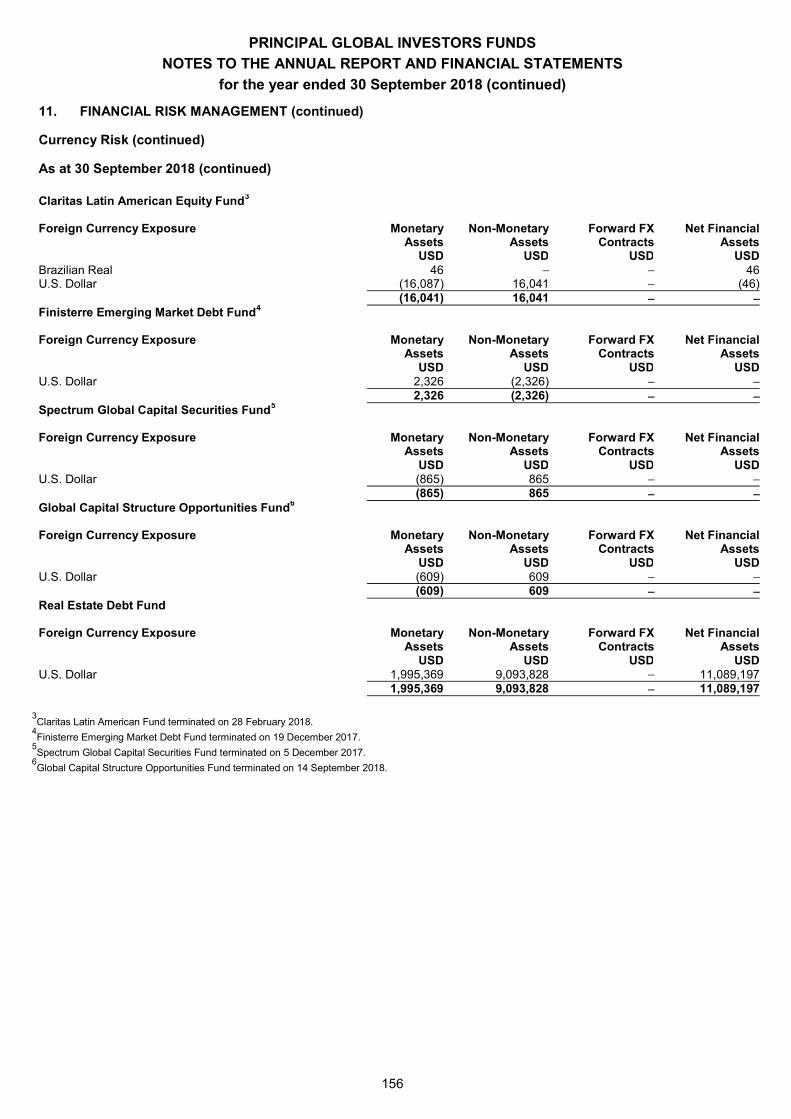
PRINCIPAL GLOBAL INVESTORS FUNDS
NOTES TO THE ANNUAL REPORT AND FINANCIAL STATEMENTS
for the year ended 30 September 2018 (continued)
156
11. FINANCIAL RISK MANAGEMENT (continued)
Currency Risk (continued)
As at 30 September 2018 (continued)
Claritas Latin American Equity Fund3 Foreign Currency Exposure Monetary Non-Monetary Forward FX Net Financial Assets Assets Contracts Assets USD USD USD USD Brazilian Real 46 46 U.S. Dollar (16,087) 16,041 (46) (16,041) 16,041 Finisterre Emerging Market Debt Fund4 Foreign Currency Exposure Monetary Non-Monetary Forward FX Net Financial Assets Assets Contracts Assets USD USD USD USD U.S. Dollar 2,326 (2,326) 2,326 (2,326) Spectrum Global Capital Securities Fund5 Foreign Currency Exposure Monetary Non-Monetary Forward FX Net Financial Assets Assets Contracts Assets USD USD USD USD U.S. Dollar (865) 865 (865) 865 Global Capital Structure Opportunities Fund6 Foreign Currency Exposure Monetary Non-Monetary Forward FX Net Financial Assets Assets Contracts Assets USD USD USD USD U.S. Dollar (609) 609 (609) 609 Real Estate Debt Fund Foreign Currency Exposure Monetary Non-Monetary Forward FX Net Financial Assets Assets Contracts Assets USD USD USD USD U.S. Dollar 1,995,369 9,093,828 11,089,197 1,995,369 9,093,828 11,089,197
3Claritas Latin American Fund terminated on 28 February 2018.
4Finisterre Emerging Market Debt Fund terminated on 19 December 2017.
5Spectrum Global Capital Securities Fund terminated on 5 December 2017.
6Global Capital Structure Opportunities Fund terminated on 14 September 2018.
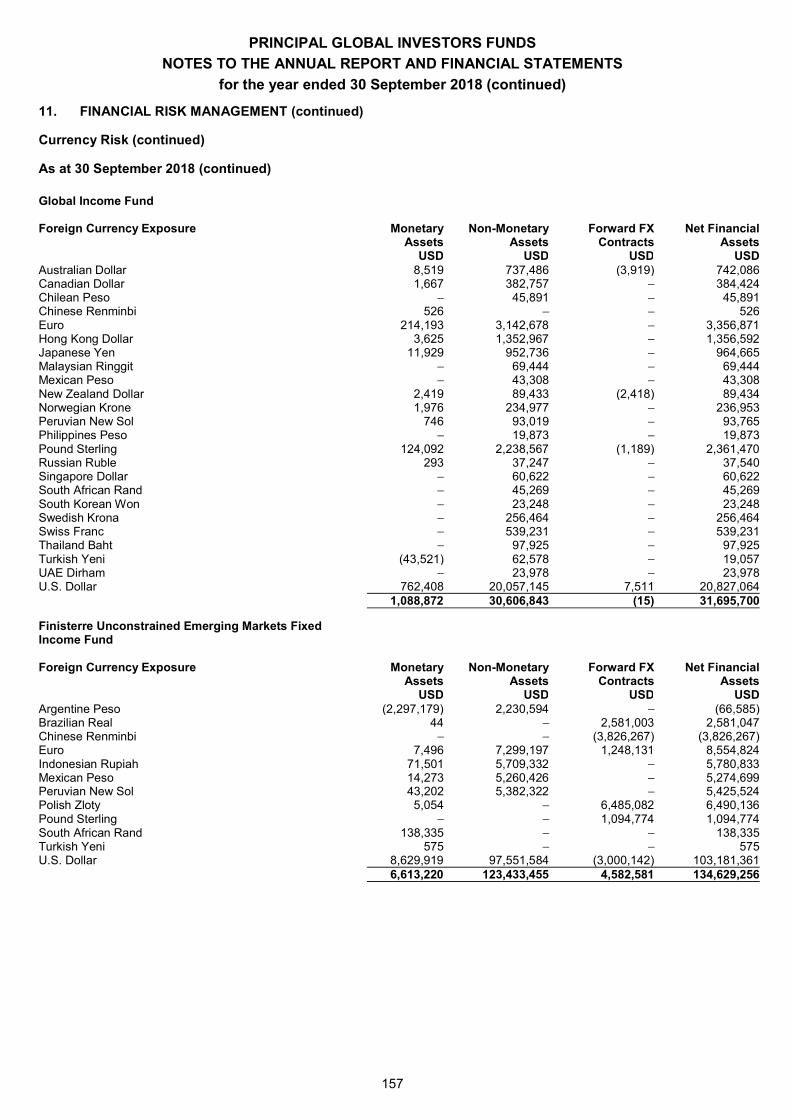
PRINCIPAL GLOBAL INVESTORS FUNDS
NOTES TO THE ANNUAL REPORT AND FINANCIAL STATEMENTS
for the year ended 30 September 2018 (continued)
157
11. FINANCIAL RISK MANAGEMENT (continued)
Currency Risk (continued)
As at 30 September 2018 (continued)
Global Income Fund Foreign Currency Exposure Monetary Non-Monetary Forward FX Net Financial Assets Assets Contracts Assets USD USD USD USD Australian Dollar 8,519 737,486 (3,919) 742,086 Canadian Dollar 1,667 382,757 384,424 Chilean Peso 45,891 45,891 Chinese Renminbi 526 526 Euro 214,193 3,142,678 3,356,871 Hong Kong Dollar 3,625 1,352,967 1,356,592 Japanese Yen 11,929 952,736 964,665 Malaysian Ringgit 69,444 69,444 Mexican Peso 43,308 43,308 New Zealand Dollar 2,419 89,433 (2,418) 89,434 Norwegian Krone 1,976 234,977 236,953 Peruvian New Sol 746 93,019 93,765 Philippines Peso 19,873 19,873 Pound Sterling 124,092 2,238,567 (1,189) 2,361,470 Russian Ruble 293 37,247 37,540 Singapore Dollar 60,622 60,622 South African Rand 45,269 45,269 South Korean Won 23,248 23,248 Swedish Krona 256,464 256,464 Swiss Franc 539,231 539,231 Thailand Baht 97,925 97,925 Turkish Yeni (43,521) 62,578 19,057 UAE Dirham 23,978 23,978 U.S. Dollar 762,408 20,057,145 7,511 20,827,064 1,088,872 30,606,843 (15) 31,695,700
Finisterre Unconstrained Emerging Markets Fixed Income Fund Foreign Currency Exposure Monetary Non-Monetary Forward FX Net Financial Assets Assets Contracts Assets USD USD USD USD Argentine Peso (2,297,179) 2,230,594 (66,585) Brazilian Real 44 2,581,003 2,581,047 Chinese Renminbi (3,826,267) (3,826,267) Euro 7,496 7,299,197 1,248,131 8,554,824 Indonesian Rupiah 71,501 5,709,332 5,780,833 Mexican Peso 14,273 5,260,426 5,274,699 Peruvian New Sol 43,202 5,382,322 5,425,524 Polish Zloty 5,054 6,485,082 6,490,136 Pound Sterling 1,094,774 1,094,774 South African Rand 138,335 138,335 Turkish Yeni 575 575 U.S. Dollar 8,629,919 97,551,584 (3,000,142) 103,181,361 6,613,220 123,433,455 4,582,581 134,629,256
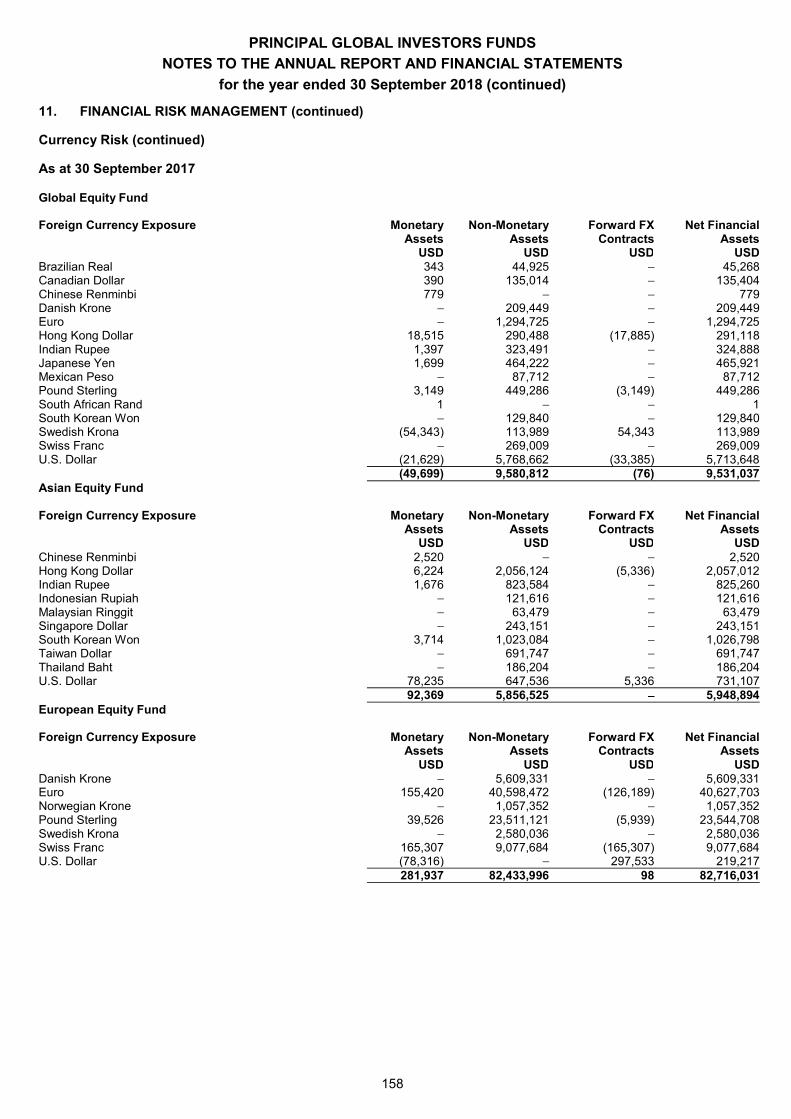
PRINCIPAL GLOBAL INVESTORS FUNDS
NOTES TO THE ANNUAL REPORT AND FINANCIAL STATEMENTS
for the year ended 30 September 2018 (continued)
158
11. FINANCIAL RISK MANAGEMENT (continued)
Currency Risk (continued)
As at 30 September 2017
Global Equity Fund Foreign Currency Exposure Monetary Non-Monetary Forward FX Net Financial Assets Assets Contracts Assets USD USD USD USD Brazilian Real 343 44,925 45,268 Canadian Dollar 390 135,014 135,404 Chinese Renminbi 779 779 Danish Krone 209,449 209,449 Euro 1,294,725 1,294,725 Hong Kong Dollar 18,515 290,488 (17,885) 291,118 Indian Rupee 1,397 323,491 324,888 Japanese Yen 1,699 464,222 465,921 Mexican Peso 87,712 87,712 Pound Sterling 3,149 449,286 (3,149) 449,286 South African Rand 1 1 South Korean Won 129,840 129,840 Swedish Krona (54,343) 113,989 54,343 113,989 Swiss Franc 269,009 269,009 U.S. Dollar (21,629) 5,768,662 (33,385) 5,713,648 (49,699) 9,580,812 (76) 9,531,037 Asian Equity Fund Foreign Currency Exposure Monetary Non-Monetary Forward FX Net Financial Assets Assets Contracts Assets USD USD USD USD Chinese Renminbi 2,520 2,520 Hong Kong Dollar 6,224 2,056,124 (5,336) 2,057,012 Indian Rupee 1,676 823,584 825,260 Indonesian Rupiah 121,616 121,616 Malaysian Ringgit 63,479 63,479 Singapore Dollar 243,151 243,151 South Korean Won 3,714 1,023,084 1,026,798 Taiwan Dollar 691,747 691,747 Thailand Baht 186,204 186,204 U.S. Dollar 78,235 647,536 5,336 731,107 92,369 5,856,525 5,948,894 European Equity Fund Foreign Currency Exposure Monetary Non-Monetary Forward FX Net Financial Assets Assets Contracts Assets USD USD USD USD Danish Krone 5,609,331 5,609,331 Euro 155,420 40,598,472 (126,189) 40,627,703 Norwegian Krone 1,057,352 1,057,352 Pound Sterling 39,526 23,511,121 (5,939) 23,544,708 Swedish Krona 2,580,036 2,580,036 Swiss Franc 165,307 9,077,684 (165,307) 9,077,684 U.S. Dollar (78,316) 297,533 219,217 281,937 82,433,996 98 82,716,031
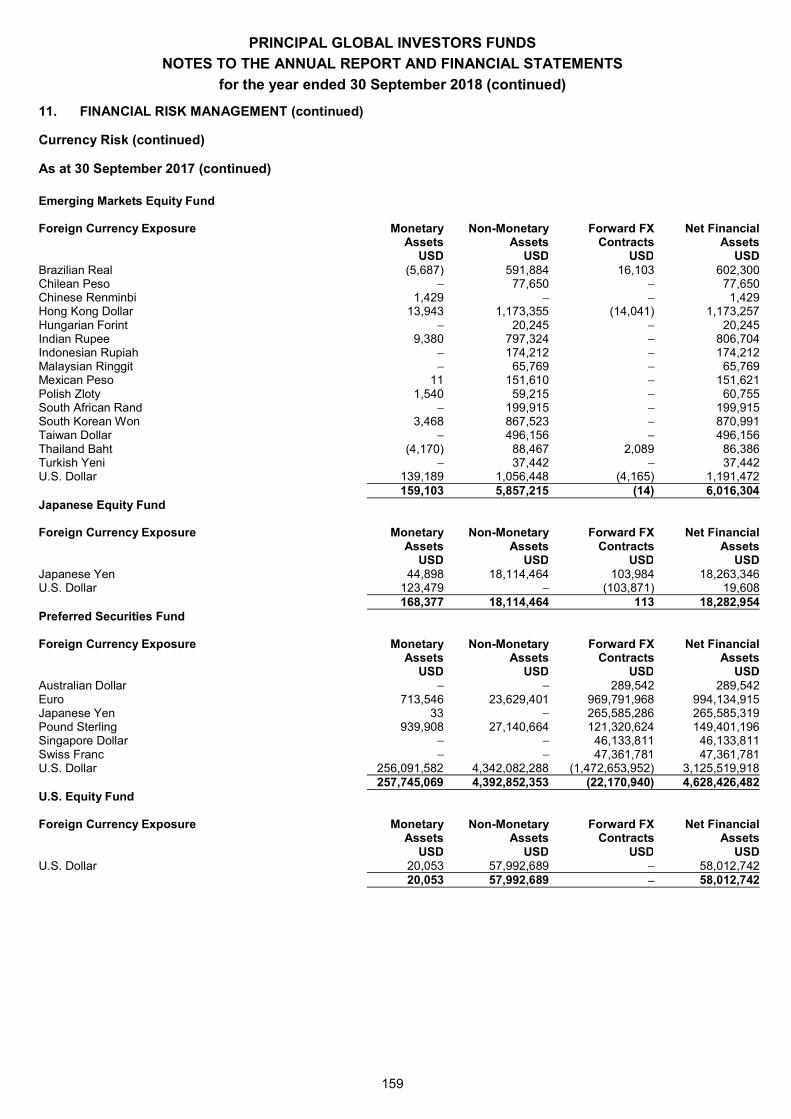
PRINCIPAL GLOBAL INVESTORS FUNDS
NOTES TO THE ANNUAL REPORT AND FINANCIAL STATEMENTS
for the year ended 30 September 2018 (continued)
159
11. FINANCIAL RISK MANAGEMENT (continued)
Currency Risk (continued)
As at 30 September 2017 (continued)
Emerging Markets Equity Fund Foreign Currency Exposure Monetary Non-Monetary Forward FX Net Financial Assets Assets Contracts Assets USD USD USD USD Brazilian Real (5,687) 591,884 16,103 602,300 Chilean Peso 77,650 77,650 Chinese Renminbi 1,429 1,429 Hong Kong Dollar 13,943 1,173,355 (14,041) 1,173,257 Hungarian Forint 20,245 20,245 Indian Rupee 9,380 797,324 806,704 Indonesian Rupiah 174,212 174,212 Malaysian Ringgit 65,769 65,769 Mexican Peso 11 151,610 151,621 Polish Zloty 1,540 59,215 60,755 South African Rand 199,915 199,915 South Korean Won 3,468 867,523 870,991 Taiwan Dollar 496,156 496,156 Thailand Baht (4,170) 88,467 2,089 86,386 Turkish Yeni 37,442 37,442 U.S. Dollar 139,189 1,056,448 (4,165) 1,191,472 159,103 5,857,215 (14) 6,016,304 Japanese Equity Fund Foreign Currency Exposure Monetary Non-Monetary Forward FX Net Financial Assets Assets Contracts Assets USD USD USD USD Japanese Yen 44,898 18,114,464 103,984 18,263,346 U.S. Dollar 123,479 (103,871) 19,608 168,377 18,114,464 113 18,282,954 Preferred Securities Fund Foreign Currency Exposure Monetary Non-Monetary Forward FX Net Financial Assets Assets Contracts Assets USD USD USD USD Australian Dollar 289,542 289,542 Euro 713,546 23,629,401 969,791,968 994,134,915 Japanese Yen 33 265,585,286 265,585,319 Pound Sterling 939,908 27,140,664 121,320,624 149,401,196 Singapore Dollar 46,133,811 46,133,811 Swiss Franc 47,361,781 47,361,781 U.S. Dollar 256,091,582 4,342,082,288 (1,472,653,952) 3,125,519,918 257,745,069 4,392,852,353 (22,170,940) 4,628,426,482 U.S. Equity Fund Foreign Currency Exposure Monetary Non-Monetary Forward FX Net Financial Assets Assets Contracts Assets USD USD USD USD U.S. Dollar 20,053 57,992,689 58,012,742 20,053 57,992,689 58,012,742
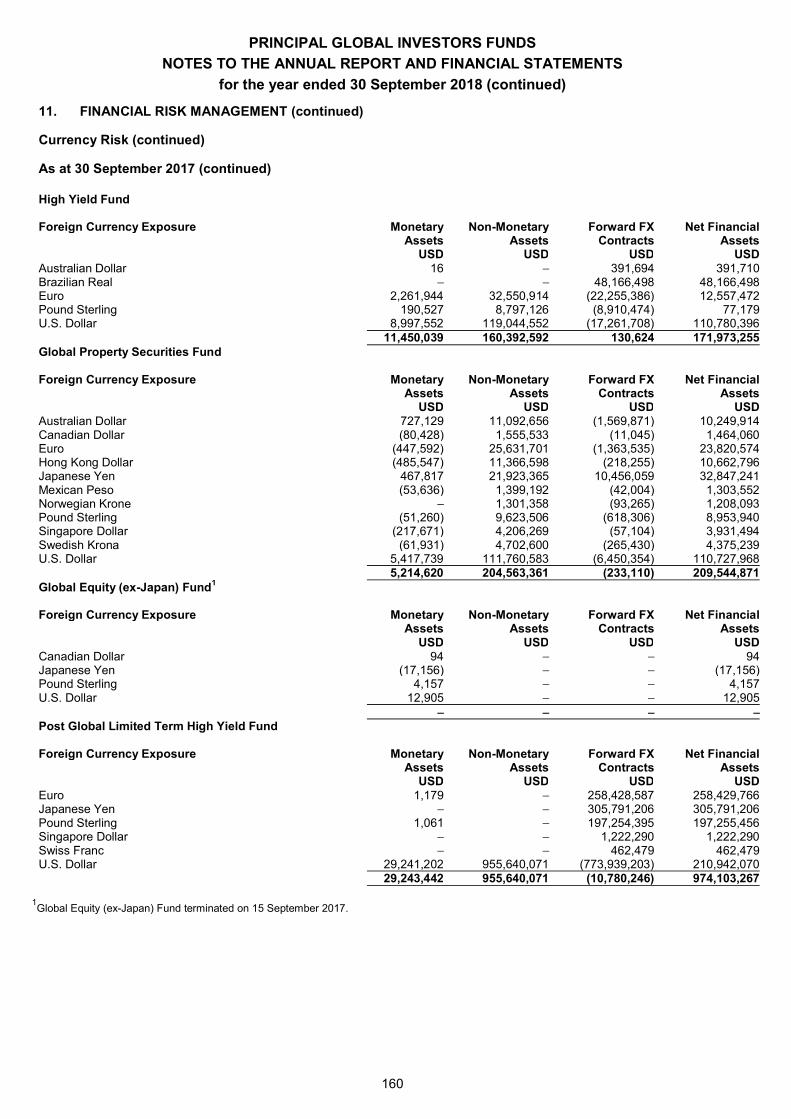
PRINCIPAL GLOBAL INVESTORS FUNDS
NOTES TO THE ANNUAL REPORT AND FINANCIAL STATEMENTS
for the year ended 30 September 2018 (continued)
160
11. FINANCIAL RISK MANAGEMENT (continued)
Currency Risk (continued)
As at 30 September 2017 (continued)
High Yield Fund Foreign Currency Exposure Monetary Non-Monetary Forward FX Net Financial Assets Assets Contracts Assets USD USD USD USD Australian Dollar 16 391,694 391,710 Brazilian Real 48,166,498 48,166,498 Euro 2,261,944 32,550,914 (22,255,386) 12,557,472 Pound Sterling 190,527 8,797,126 (8,910,474) 77,179 U.S. Dollar 8,997,552 119,044,552 (17,261,708) 110,780,396 11,450,039 160,392,592 130,624 171,973,255 Global Property Securities Fund Foreign Currency Exposure Monetary Non-Monetary Forward FX Net Financial Assets Assets Contracts Assets USD USD USD USD Australian Dollar 727,129 11,092,656 (1,569,871) 10,249,914 Canadian Dollar (80,428) 1,555,533 (11,045) 1,464,060 Euro (447,592) 25,631,701 (1,363,535) 23,820,574 Hong Kong Dollar (485,547) 11,366,598 (218,255) 10,662,796 Japanese Yen 467,817 21,923,365 10,456,059 32,847,241 Mexican Peso (53,636) 1,399,192 (42,004) 1,303,552 Norwegian Krone 1,301,358 (93,265) 1,208,093 Pound Sterling (51,260) 9,623,506 (618,306) 8,953,940 Singapore Dollar (217,671) 4,206,269 (57,104) 3,931,494 Swedish Krona (61,931) 4,702,600 (265,430) 4,375,239 U.S. Dollar 5,417,739 111,760,583 (6,450,354) 110,727,968 5,214,620 204,563,361 (233,110) 209,544,871 Global Equity (ex-Japan) Fund1 Foreign Currency Exposure Monetary Non-Monetary Forward FX Net Financial Assets Assets Contracts Assets USD USD USD USD Canadian Dollar 94 94 Japanese Yen (17,156) (17,156) Pound Sterling 4,157 4,157 U.S. Dollar 12,905 12,905 Post Global Limited Term High Yield Fund Foreign Currency Exposure Monetary Non-Monetary Forward FX Net Financial Assets Assets Contracts Assets USD USD USD USD Euro 1,179 258,428,587 258,429,766 Japanese Yen 305,791,206 305,791,206 Pound Sterling 1,061 197,254,395 197,255,456 Singapore Dollar 1,222,290 1,222,290 Swiss Franc 462,479 462,479 U.S. Dollar 29,241,202 955,640,071 (773,939,203) 210,942,070 29,243,442 955,640,071 (10,780,246) 974,103,267
1Global Equity (ex-Japan) Fund terminated on 15 September 2017.
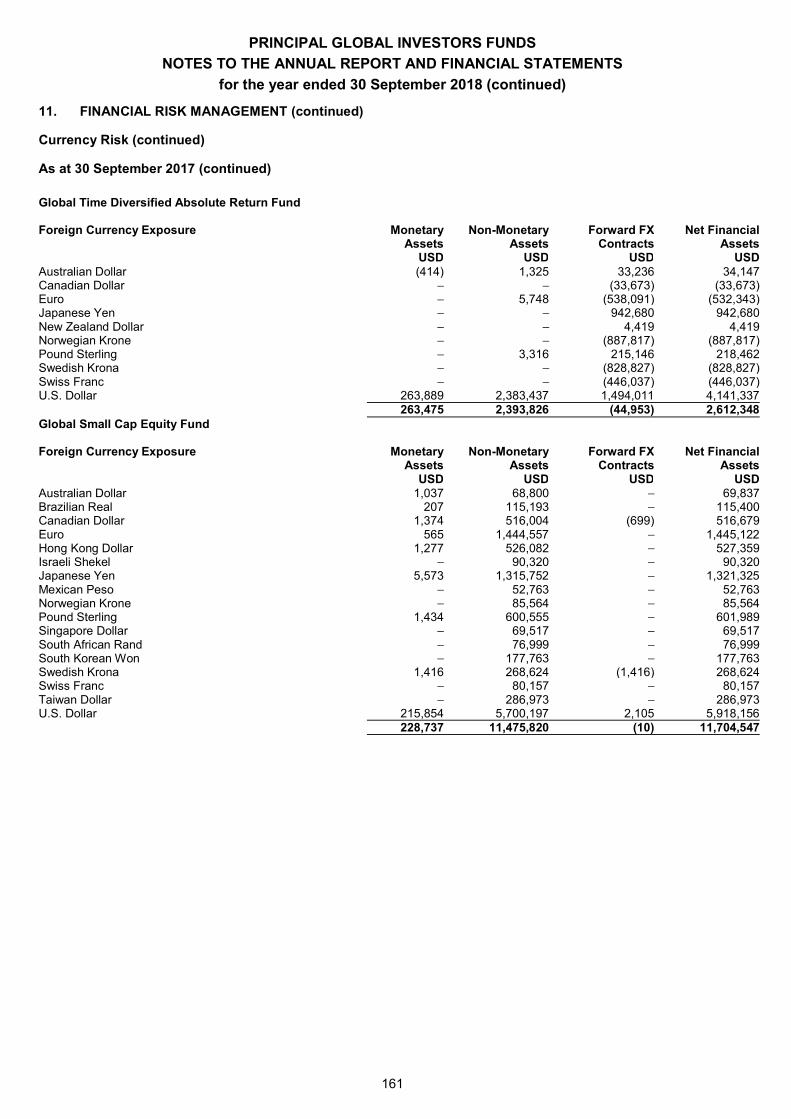
PRINCIPAL GLOBAL INVESTORS FUNDS
NOTES TO THE ANNUAL REPORT AND FINANCIAL STATEMENTS
for the year ended 30 September 2018 (continued)
161
11. FINANCIAL RISK MANAGEMENT (continued)
Currency Risk (continued)
As at 30 September 2017 (continued)
Global Time Diversified Absolute Return Fund Foreign Currency Exposure Monetary Non-Monetary Forward FX Net Financial Assets Assets Contracts Assets USD USD USD USD Australian Dollar (414) 1,325 33,236 34,147 Canadian Dollar (33,673) (33,673) Euro 5,748 (538,091) (532,343) Japanese Yen 942,680 942,680 New Zealand Dollar 4,419 4,419 Norwegian Krone (887,817) (887,817) Pound Sterling 3,316 215,146 218,462 Swedish Krona (828,827) (828,827) Swiss Franc (446,037) (446,037) U.S. Dollar 263,889 2,383,437 1,494,011 4,141,337 263,475 2,393,826 (44,953) 2,612,348 Global Small Cap Equity Fund Foreign Currency Exposure Monetary Non-Monetary Forward FX Net Financial Assets Assets Contracts Assets USD USD USD USD Australian Dollar 1,037 68,800 69,837 Brazilian Real 207 115,193 115,400 Canadian Dollar 1,374 516,004 (699) 516,679 Euro 565 1,444,557 1,445,122 Hong Kong Dollar 1,277 526,082 527,359 Israeli Shekel 90,320 90,320 Japanese Yen 5,573 1,315,752 1,321,325 Mexican Peso 52,763 52,763 Norwegian Krone 85,564 85,564 Pound Sterling 1,434 600,555 601,989 Singapore Dollar 69,517 69,517 South African Rand 76,999 76,999 South Korean Won 177,763 177,763 Swedish Krona 1,416 268,624 (1,416) 268,624 Swiss Franc 80,157 80,157 Taiwan Dollar 286,973 286,973 U.S. Dollar 215,854 5,700,197 2,105 5,918,156 228,737 11,475,820 (10) 11,704,547
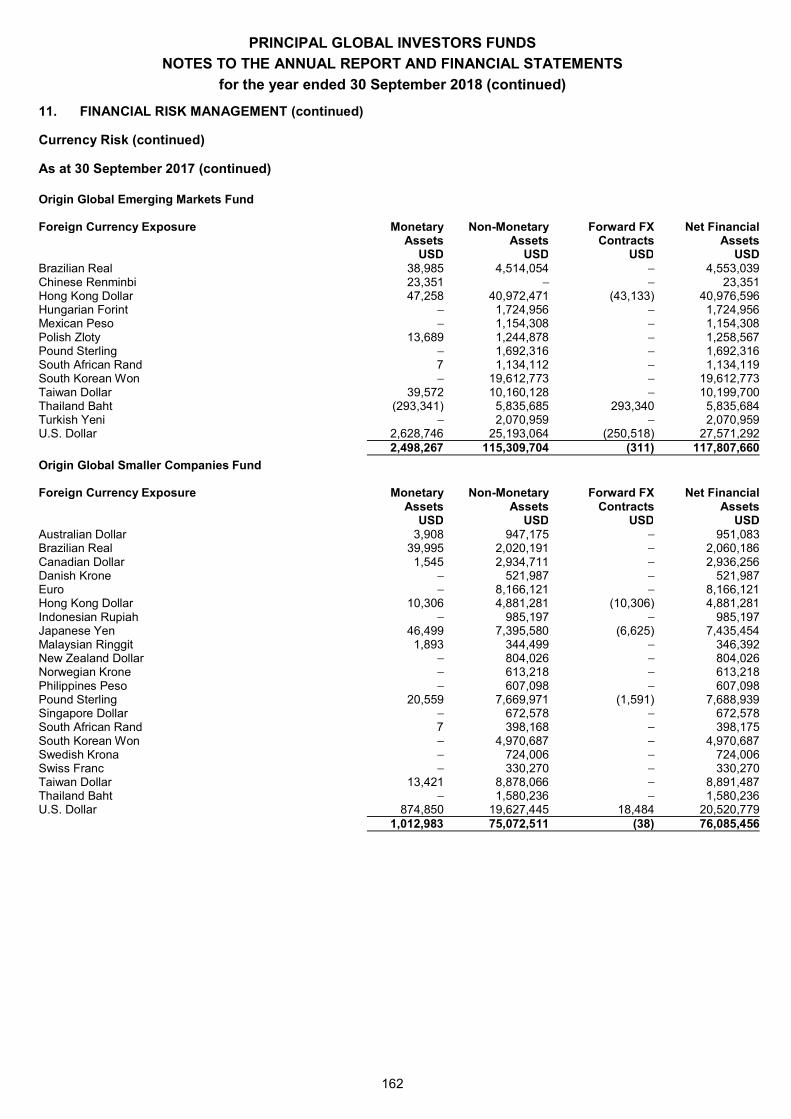
PRINCIPAL GLOBAL INVESTORS FUNDS
NOTES TO THE ANNUAL REPORT AND FINANCIAL STATEMENTS
for the year ended 30 September 2018 (continued)
162
11. FINANCIAL RISK MANAGEMENT (continued)
Currency Risk (continued)
As at 30 September 2017 (continued)
Origin Global Emerging Markets Fund Foreign Currency Exposure Monetary Non-Monetary Forward FX Net Financial Assets Assets Contracts Assets USD USD USD USD Brazilian Real 38,985 4,514,054 4,553,039 Chinese Renminbi 23,351 23,351 Hong Kong Dollar 47,258 40,972,471 (43,133) 40,976,596 Hungarian Forint 1,724,956 1,724,956 Mexican Peso 1,154,308 1,154,308 Polish Zloty 13,689 1,244,878 1,258,567 Pound Sterling 1,692,316 1,692,316 South African Rand 7 1,134,112 1,134,119 South Korean Won 19,612,773 19,612,773 Taiwan Dollar 39,572 10,160,128 10,199,700 Thailand Baht (293,341) 5,835,685 293,340 5,835,684 Turkish Yeni 2,070,959 2,070,959 U.S. Dollar 2,628,746 25,193,064 (250,518) 27,571,292 2,498,267 115,309,704 (311) 117,807,660
Origin Global Smaller Companies Fund Foreign Currency Exposure Monetary Non-Monetary Forward FX Net Financial Assets Assets Contracts Assets USD USD USD USD Australian Dollar 3,908 947,175 951,083 Brazilian Real 39,995 2,020,191 2,060,186 Canadian Dollar 1,545 2,934,711 2,936,256 Danish Krone 521,987 521,987 Euro 8,166,121 8,166,121 Hong Kong Dollar 10,306 4,881,281 (10,306) 4,881,281 Indonesian Rupiah 985,197 985,197 Japanese Yen 46,499 7,395,580 (6,625) 7,435,454 Malaysian Ringgit 1,893 344,499 346,392 New Zealand Dollar 804,026 804,026 Norwegian Krone 613,218 613,218 Philippines Peso 607,098 607,098 Pound Sterling 20,559 7,669,971 (1,591) 7,688,939 Singapore Dollar 672,578 672,578 South African Rand 7 398,168 398,175 South Korean Won 4,970,687 4,970,687 Swedish Krona 724,006 724,006 Swiss Franc 330,270 330,270 Taiwan Dollar 13,421 8,878,066 8,891,487 Thailand Baht 1,580,236 1,580,236 U.S. Dollar 874,850 19,627,445 18,484 20,520,779 1,012,983 75,072,511 (38) 76,085,456
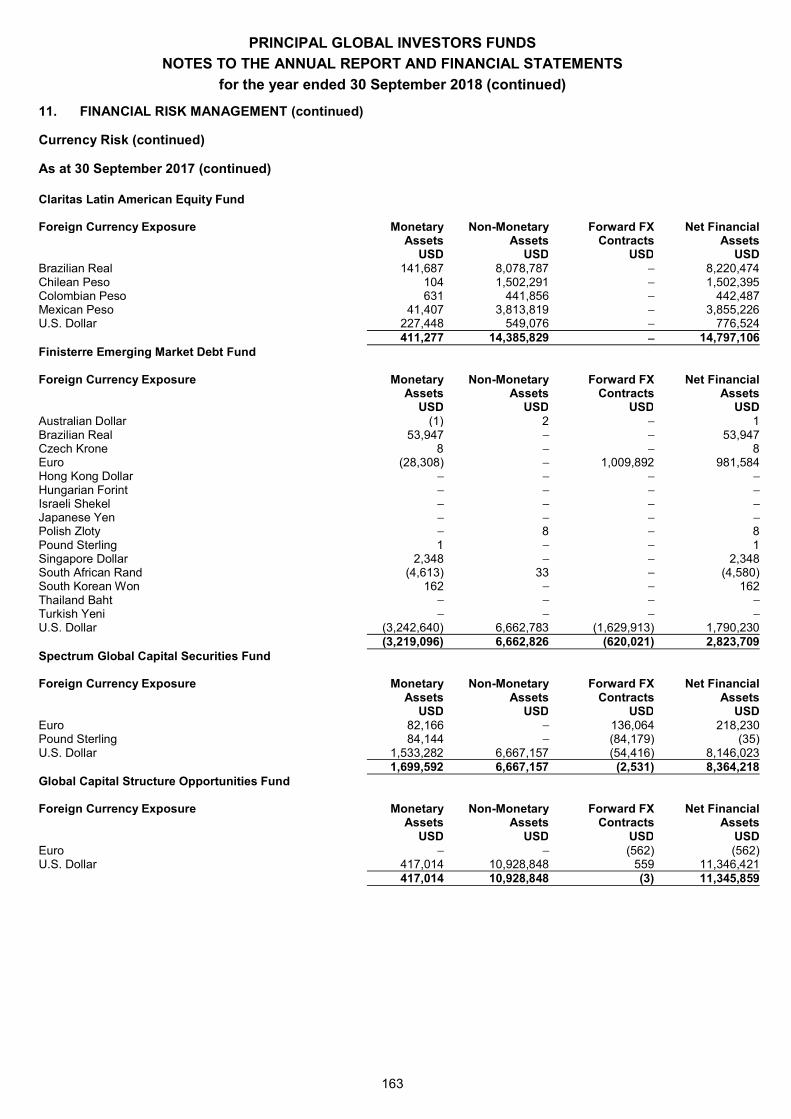
PRINCIPAL GLOBAL INVESTORS FUNDS
NOTES TO THE ANNUAL REPORT AND FINANCIAL STATEMENTS
for the year ended 30 September 2018 (continued)
163
11. FINANCIAL RISK MANAGEMENT (continued)
Currency Risk (continued)
As at 30 September 2017 (continued)
Claritas Latin American Equity Fund Foreign Currency Exposure Monetary Non-Monetary Forward FX Net Financial Assets Assets Contracts Assets USD USD USD USD Brazilian Real 141,687 8,078,787 8,220,474 Chilean Peso 104 1,502,291 1,502,395 Colombian Peso 631 441,856 442,487 Mexican Peso 41,407 3,813,819 3,855,226 U.S. Dollar 227,448 549,076 776,524 411,277 14,385,829 14,797,106 Finisterre Emerging Market Debt Fund Foreign Currency Exposure Monetary Non-Monetary Forward FX Net Financial Assets Assets Contracts Assets USD USD USD USD Australian Dollar (1) 2 1 Brazilian Real 53,947 53,947 Czech Krone 8 8 Euro (28,308) 1,009,892 981,584 Hong Kong Dollar Hungarian Forint Israeli Shekel Japanese Yen Polish Zloty 8 8 Pound Sterling 1 1 Singapore Dollar 2,348 2,348 South African Rand (4,613) 33 (4,580) South Korean Won 162 162 Thailand Baht Turkish Yeni U.S. Dollar (3,242,640) 6,662,783 (1,629,913) 1,790,230 (3,219,096) 6,662,826 (620,021) 2,823,709 Spectrum Global Capital Securities Fund Foreign Currency Exposure Monetary Non-Monetary Forward FX Net Financial Assets Assets Contracts Assets USD USD USD USD Euro 82,166 136,064 218,230 Pound Sterling 84,144 (84,179) (35) U.S. Dollar 1,533,282 6,667,157 (54,416) 8,146,023 1,699,592 6,667,157 (2,531) 8,364,218 Global Capital Structure Opportunities Fund Foreign Currency Exposure Monetary Non-Monetary Forward FX Net Financial Assets Assets Contracts Assets USD USD USD USD Euro (562) (562) U.S. Dollar 417,014 10,928,848 559 11,346,421 417,014 10,928,848 (3) 11,345,859
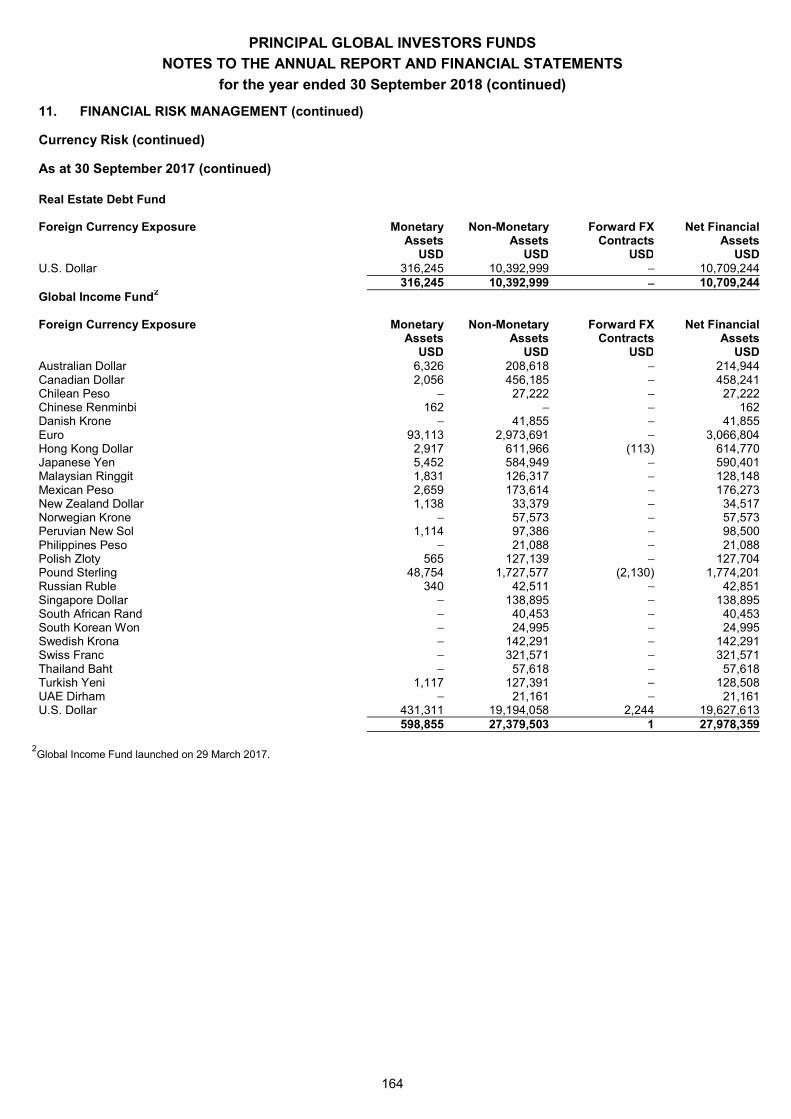
PRINCIPAL GLOBAL INVESTORS FUNDS
NOTES TO THE ANNUAL REPORT AND FINANCIAL STATEMENTS
for the year ended 30 September 2018 (continued)
164
11. FINANCIAL RISK MANAGEMENT (continued)
Currency Risk (continued)
As at 30 September 2017 (continued)
Real Estate Debt Fund Foreign Currency Exposure Monetary Non-Monetary Forward FX Net Financial Assets Assets Contracts Assets USD USD USD USD U.S. Dollar 316,245 10,392,999 10,709,244 316,245 10,392,999 10,709,244 Global Income Fund2 Foreign Currency Exposure Monetary Non-Monetary Forward FX Net Financial Assets Assets Contracts Assets USD USD USD USD Australian Dollar 6,326 208,618 214,944 Canadian Dollar 2,056 456,185 458,241 Chilean Peso 27,222 27,222 Chinese Renminbi 162 162 Danish Krone 41,855 41,855 Euro 93,113 2,973,691 3,066,804 Hong Kong Dollar 2,917 611,966 (113) 614,770 Japanese Yen 5,452 584,949 590,401 Malaysian Ringgit 1,831 126,317 128,148 Mexican Peso 2,659 173,614 176,273 New Zealand Dollar 1,138 33,379 34,517 Norwegian Krone 57,573 57,573 Peruvian New Sol 1,114 97,386 98,500 Philippines Peso 21,088 21,088 Polish Zloty 565 127,139 127,704 Pound Sterling 48,754 1,727,577 (2,130) 1,774,201 Russian Ruble 340 42,511 42,851 Singapore Dollar 138,895 138,895 South African Rand 40,453 40,453 South Korean Won 24,995 24,995 Swedish Krona 142,291 142,291 Swiss Franc 321,571 321,571 Thailand Baht 57,618 57,618 Turkish Yeni 1,117 127,391 128,508 UAE Dirham 21,161 21,161 U.S. Dollar 431,311 19,194,058 2,244 19,627,613 598,855 27,379,503 1 27,978,359
2Global Income Fund launched on 29 March 2017.
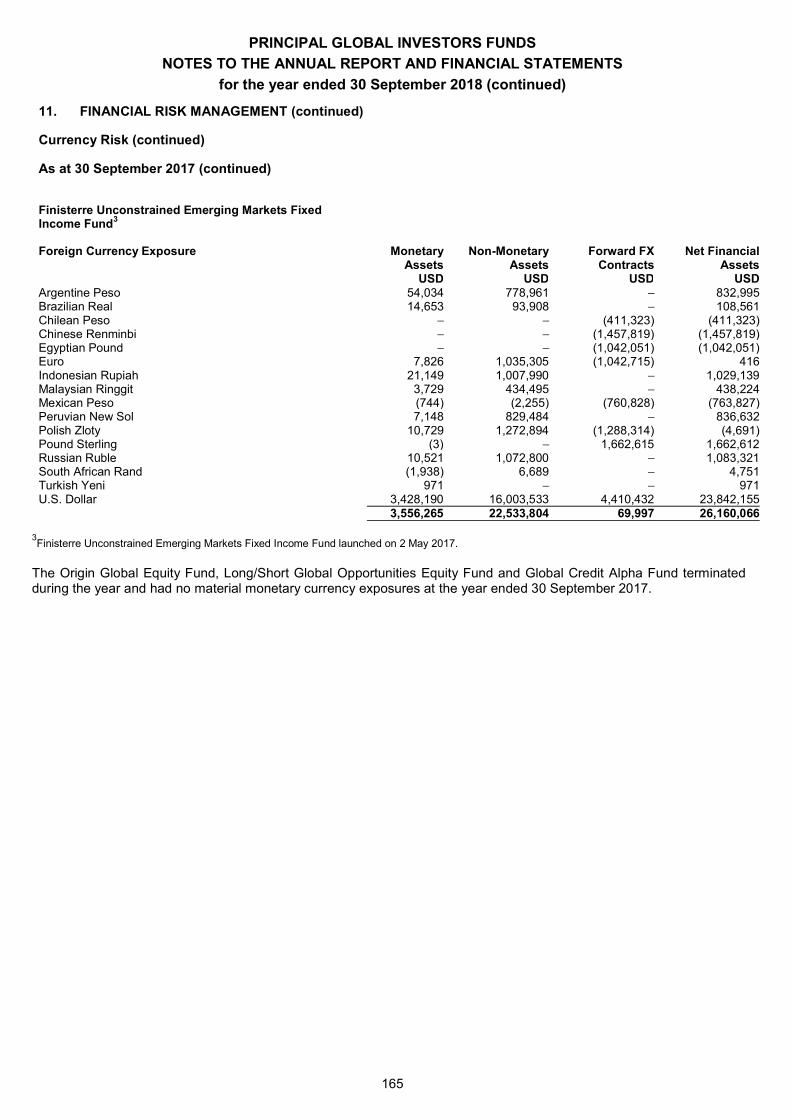
PRINCIPAL GLOBAL INVESTORS FUNDS
NOTES TO THE ANNUAL REPORT AND FINANCIAL STATEMENTS
for the year ended 30 September 2018 (continued)
165
11. FINANCIAL RISK MANAGEMENT (continued)
Currency Risk (continued)
As at 30 September 2017 (continued)
Finisterre Unconstrained Emerging Markets Fixed Income Fund3 Foreign Currency Exposure Monetary Non-Monetary Forward FX Net Financial Assets Assets Contracts Assets USD USD USD USD Argentine Peso 54,034 778,961 832,995 Brazilian Real 14,653 93,908 108,561 Chilean Peso (411,323) (411,323) Chinese Renminbi (1,457,819) (1,457,819) Egyptian Pound (1,042,051) (1,042,051) Euro 7,826 1,035,305 (1,042,715) 416 Indonesian Rupiah 21,149 1,007,990 1,029,139 Malaysian Ringgit 3,729 434,495 438,224 Mexican Peso (744) (2,255) (760,828) (763,827) Peruvian New Sol 7,148 829,484 836,632 Polish Zloty 10,729 1,272,894 (1,288,314) (4,691) Pound Sterling (3) 1,662,615 1,662,612 Russian Ruble 10,521 1,072,800 1,083,321 South African Rand (1,938) 6,689 4,751 Turkish Yeni 971 971 U.S. Dollar 3,428,190 16,003,533 4,410,432 23,842,155 3,556,265 22,533,804 69,997 26,160,066
3Finisterre Unconstrained Emerging Markets Fixed Income Fund launched on 2 May 2017.
The Origin Global Equity Fund, Long/Short Global Opportunities Equity Fund and Global Credit Alpha Fund terminated during the year and had no material monetary currency exposures at the year ended 30 September 2017.
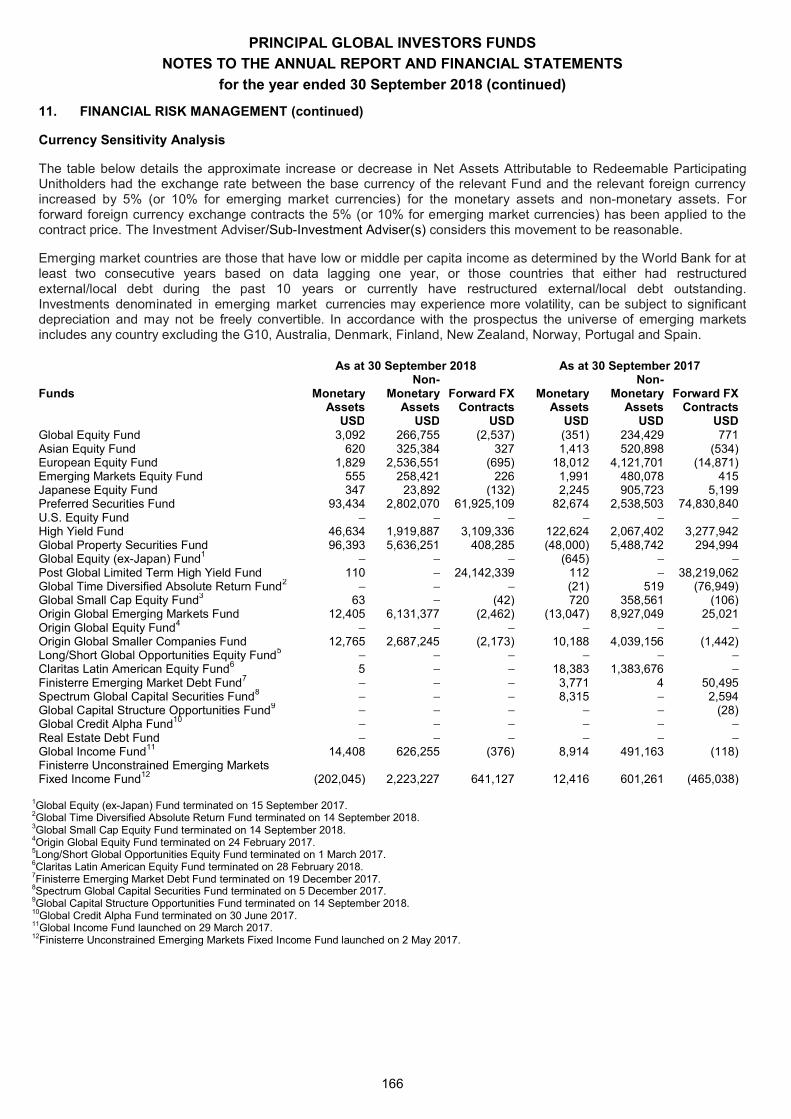
PRINCIPAL GLOBAL INVESTORS FUNDS
NOTES TO THE ANNUAL REPORT AND FINANCIAL STATEMENTS
for the year ended 30 September 2018 (continued)
166
11. FINANCIAL RISK MANAGEMENT (continued)
Currency Sensitivity Analysis
The table below details the approximate increase or decrease in Net Assets Attributable to Redeemable Participating Unitholders had the exchange rate between the base currency of the relevant Fund and the relevant foreign currency increased by 5% (or 10% for emerging market currencies) for the monetary assets and non-monetary assets. For forward foreign currency exchange contracts the 5% (or 10% for emerging market currencies) has been applied to the contract price. The Investment Adviser/Sub-Investment Adviser(s) considers this movement to be reasonable.
Emerging market countries are those that have low or middle per capita income as determined by the World Bank for at least two consecutive years based on data lagging one year, or those countries that either had restructured external/local debt during the past 10 years or currently have restructured external/local debt outstanding. Investments denominated in emerging market currencies may experience more volatility, can be subject to significant depreciation and may not be freely convertible. In accordance with the prospectus the universe of emerging markets includes any country excluding the G10, Australia, Denmark, Finland, New Zealand, Norway, Portugal and Spain. As at 30 September 2018 As at 30 September 2017
Funds Monetary Non-
Monetary Forward FX Monetary Non-
Monetary Forward FX Assets Assets Contracts Assets Assets Contracts USD USD USD USD USD USD Global Equity Fund 3,092 266,755 (2,537) (351) 234,429 771 Asian Equity Fund 620 325,384 327 1,413 520,898 (534) European Equity Fund 1,829 2,536,551 (695) 18,012 4,121,701 (14,871) Emerging Markets Equity Fund 555 258,421 226 1,991 480,078 415 Japanese Equity Fund 347 23,892 (132) 2,245 905,723 5,199 Preferred Securities Fund 93,434 2,802,070 61,925,109 82,674 2,538,503 74,830,840 U.S. Equity Fund High Yield Fund 46,634 1,919,887 3,109,336 122,624 2,067,402 3,277,942 Global Property Securities Fund 96,393 5,636,251 408,285 (48,000) 5,488,742 294,994 Global Equity (ex-Japan) Fund1 (645) Post Global Limited Term High Yield Fund 110 24,142,339 112 38,219,062 Global Time Diversified Absolute Return Fund2 (21) 519 (76,949) Global Small Cap Equity Fund3 63 (42) 720 358,561 (106) Origin Global Emerging Markets Fund 12,405 6,131,377 (2,462) (13,047) 8,927,049 25,021 Origin Global Equity Fund4 Origin Global Smaller Companies Fund 12,765 2,687,245 (2,173) 10,188 4,039,156 (1,442) Long/Short Global Opportunities Equity Fund5 Claritas Latin American Equity Fund6 5 18,383 1,383,676 Finisterre Emerging Market Debt Fund7 3,771 4 50,495 Spectrum Global Capital Securities Fund8 8,315 2,594 Global Capital Structure Opportunities Fund9 (28) Global Credit Alpha Fund10 Real Estate Debt Fund Global Income Fund11 14,408 626,255 (376) 8,914 491,163 (118) Finisterre Unconstrained Emerging Markets Fixed Income Fund12 (202,045) 2,223,227 641,127 12,416 601,261 (465,038)
1Global Equity (ex-Japan) Fund terminated on 15 September 2017. 2Global Time Diversified Absolute Return Fund terminated on 14 September 2018. 3Global Small Cap Equity Fund terminated on 14 September 2018. 4Origin Global Equity Fund terminated on 24 February 2017. 5Long/Short Global Opportunities Equity Fund terminated on 1 March 2017. 6Claritas Latin American Equity Fund terminated on 28 February 2018. 7Finisterre Emerging Market Debt Fund terminated on 19 December 2017. 8Spectrum Global Capital Securities Fund terminated on 5 December 2017. 9Global Capital Structure Opportunities Fund terminated on 14 September 2018. 10Global Credit Alpha Fund terminated on 30 June 2017. 11Global Income Fund launched on 29 March 2017. 12Finisterre Unconstrained Emerging Markets Fixed Income Fund launched on 2 May 2017.
PRINCIPAL GLOBAL INVESTORS FUNDS
NOTES TO THE ANNUAL REPORT AND FINANCIAL STATEMENTS
for the year ended 30 September 2018 (continued)
167
11. FINANCIAL RISK MANAGEMENT (continued)
Depositary Risk
The Depositary is the Bank of New York Mellon Trust Company (Ireland) Limited ( the Depositary Substantially all of the Cash at Bank and investments in debt securities of the Trust are held by the Depositary. The Trust is exposed to credit risk through the use of the Depositary for their cash and investments. Bankruptcy or insolvency of the Depositary may cause the rights with respect to its cash and investments in debt securities held by the Depositary to be delayed or limited. The maximum exposure to this risk at 30 September 2018 and 30 September 2017 is the amount of Cash at Bank disclosed in Note 4 and the investments in securities, liquidity instruments and forward foreign currency exchange contracts disclosed in the relevant Funds Portfolio of Investments.
To mitigate the risks the Trust is exposed to from the use of the Depositary, the Manager employs appropriate procedures to ensure that the counterparties are reputable institutions and that the credit risk is acceptable to the Trust. The Trust only transacts with that are regulated entities subject to prudential supervision, or with high credit-ratings assigned by international credit-rating agencie -cash assets are maintained by the Depositary in segregated accounts. Thus in the event of insolvency or bankruptcy of the Depositary -cash assets are segregated and protected and this further reduces counterparty risk. The Trust will, however, be exposed to the credit risk of the Depositary or counterparty/Sub-Custodian used by the Depositary, in relation to the Trust's Cash at Bank held by the Depositary. In the event of the insolvency or bankruptcy of the Depositary, the Trust will be treated as a general creditor of the Depositary in relation to cash holdings of the Trust. To mitigate these risks the Investment Adviser ensures that the Trust transacts only with that are regulated entities subject to prudential supervision or with high credit-ratings assigned by international credit-rating agencies.
Credit Risk
The Funds will be exposed to credit risk, which is the risk that a counterparty or issuer will be unable to pay amounts in full when due. Impairment provisions are provided for losses that have been incurred by the Statement of Financial Position date, if any. The carrying amount of financial assets best represents its maximum exposure to credit risk at the reporting date.
the Cash at Bank balances held at the Depositary prospectus lists various investment restrictions with regard to issuer and counterparty concentration limits.
All transactions in listed securities are settled/paid for upon delivery using approved brokers. The risk of default is considered minimal, as delivery of securities sold is only made once the broker has received payment. Payment is made on a purchase once the securities have been received by the broker. The trade will fail if either party fails to meet their obligation.
Interest Rate Swaps may be traded bilaterally between a Fund and a counterparty or centrally cleared through a central counterparty clearing house ("CCP"). The Funds that engage in swaps trading bilaterally restrict their exposure to credit losses on the trading of derivative instruments held by entering into master netting arrangements with counterparties. Netting arrangements do not result in an offset of Statement of Financial Position assets and liabilities, as transactions are usually disclosed on a gross basis and settled on a net basis. However, the credit risk associated with favourable contracts is reduced by a netting arrangement to the extent that if an event of default occurs, all amounts with the counterparty are terminated and settled on a net basis. The Funds that engage in swaps trading through a CCP restrict their exposure to credit losses on the trading of derivative instruments held by entering into master netting arrangements with the CCP. The were no CCPs at 30 September 2018.
The Investment Adviser/Sub-Investment Adviser(s) may utilise over-the-counter and exchange traded derivatives. Derivatives traded on exchanges will usually be supported by daily margin calls and therefore not carry the same degree of counterparty risk.
The Investment Adviser/Sub-Investment Adviser(s) may also use Futures and Options as part of its investment strategy. to use these strategies may be limited by market conditions, regulatory requirements and tax
considerations.
As part of its investing in derivatives the Funds may pledge or receive collateral. This collateral can be pledged or received either in the form of cash and cash equivalents or securities. There is a risk that the value of such collateral may fall below the value of the underlying derivatives. In addition, as the Funds may invest in Cash Collateral received, subject to conditions, the Funds may be exposed to the risk associated with such investments, such as failure or default of the issuer of the relevant security.
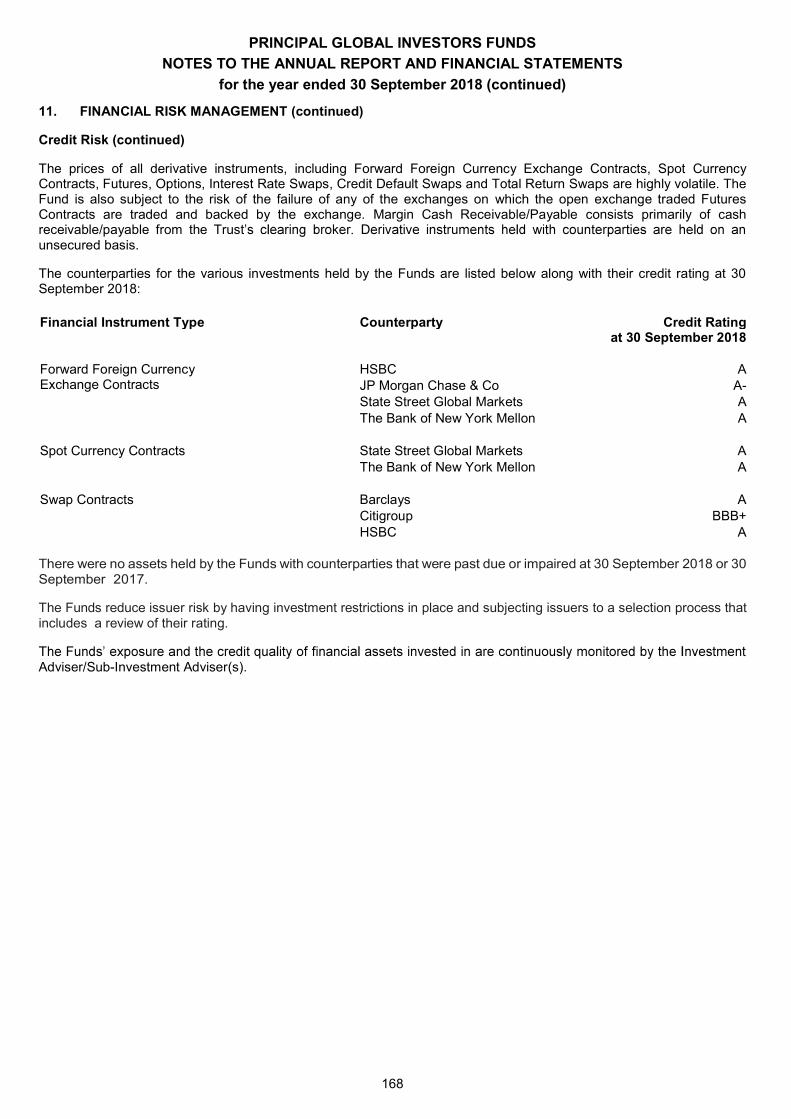
PRINCIPAL GLOBAL INVESTORS FUNDS
NOTES TO THE ANNUAL REPORT AND FINANCIAL STATEMENTS
for the year ended 30 September 2018 (continued)
168
11. FINANCIAL RISK MANAGEMENT (continued)
Credit Risk (continued)
The prices of all derivative instruments, including Forward Foreign Currency Exchange Contracts, Spot Currency Contracts, Futures, Options, Interest Rate Swaps, Credit Default Swaps and Total Return Swaps are highly volatile. The Fund is also subject to the risk of the failure of any of the exchanges on which the open exchange traded Futures Contracts are traded and backed by the exchange. Margin Cash Receivable/Payable consists primarily of cash receivable/payable from the Trustunsecured basis.
The counterparties for the various investments held by the Funds are listed below along with their credit rating at 30 September 2018: Financial Instrument Type Counterparty Credit Rating
at 30 September 2018
Forward Foreign Currency Exchange Contracts
HSBC A JP Morgan Chase & Co A- State Street Global Markets A The Bank of New York Mellon A
Spot Currency Contracts State Street Global Markets A
The Bank of New York Mellon A
Swap Contracts Barclays A Citigroup BBB+ HSBC A
There were no assets held by the Funds with counterparties that were past due or impaired at 30 September 2018 or 30 September 2017.
The Funds reduce issuer risk by having investment restrictions in place and subjecting issuers to a selection process that includes a review of their rating.
Adviser/Sub-Investment Adviser(s).
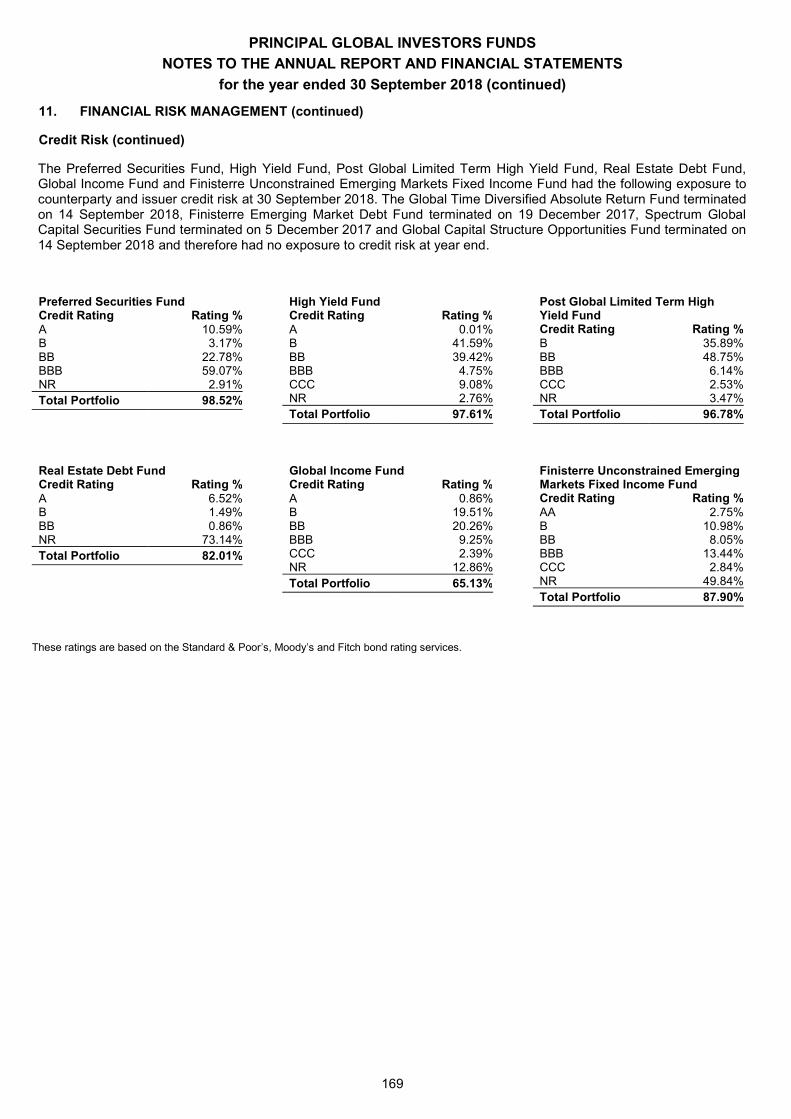
PRINCIPAL GLOBAL INVESTORS FUNDS
NOTES TO THE ANNUAL REPORT AND FINANCIAL STATEMENTS
for the year ended 30 September 2018 (continued)
169
11. FINANCIAL RISK MANAGEMENT (continued)
Credit Risk (continued)
The Preferred Securities Fund, High Yield Fund, Post Global Limited Term High Yield Fund, Real Estate Debt Fund, Global Income Fund and Finisterre Unconstrained Emerging Markets Fixed Income Fund had the following exposure to counterparty and issuer credit risk at 30 September 2018. The Global Time Diversified Absolute Return Fund terminated on 14 September 2018, Finisterre Emerging Market Debt Fund terminated on 19 December 2017, Spectrum Global Capital Securities Fund terminated on 5 December 2017 and Global Capital Structure Opportunities Fund terminated on 14 September 2018 and therefore had no exposure to credit risk at year end.
Preferred Securities Fund Credit Rating Rating % A 10.59% B 3.17% BB 22.78% BBB 59.07% NR 2.91% Total Portfolio 98.52%
High Yield Fund Credit Rating Rating % A 0.01% B 41.59% BB 39.42% BBB 4.75% CCC 9.08% NR 2.76% Total Portfolio 97.61%
Post Global Limited Term High Yield Fund Credit Rating Rating % B 35.89% BB 48.75% BBB 6.14% CCC 2.53% NR 3.47% Total Portfolio 96.78%
Real Estate Debt Fund Credit Rating Rating % A 6.52% B 1.49% BB 0.86% NR 73.14% Total Portfolio 82.01%
Global Income Fund Credit Rating Rating % A 0.86% B 19.51% BB 20.26% BBB 9.25% CCC 2.39% NR 12.86% Total Portfolio 65.13%
Finisterre Unconstrained Emerging Markets Fixed Income Fund Credit Rating Rating % AA 2.75% B 10.98% BB 8.05% BBB 13.44% CCC 2.84% NR 49.84% Total Portfolio 87.90%
These ratings are based on the Standard & Poor s, Moody s and Fitch bond rating services.
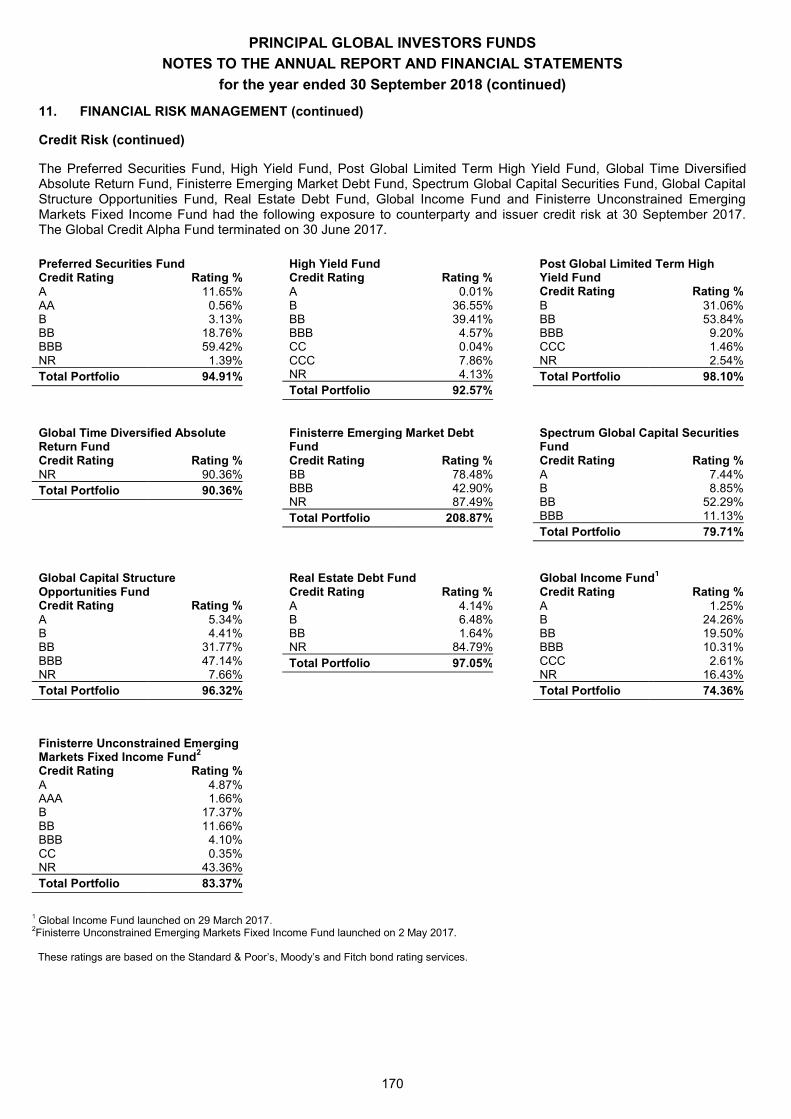
PRINCIPAL GLOBAL INVESTORS FUNDS
NOTES TO THE ANNUAL REPORT AND FINANCIAL STATEMENTS
for the year ended 30 September 2018 (continued)
170
11. FINANCIAL RISK MANAGEMENT (continued)
Credit Risk (continued)
The Preferred Securities Fund, High Yield Fund, Post Global Limited Term High Yield Fund, Global Time Diversified Absolute Return Fund, Finisterre Emerging Market Debt Fund, Spectrum Global Capital Securities Fund, Global Capital Structure Opportunities Fund, Real Estate Debt Fund, Global Income Fund and Finisterre Unconstrained Emerging Markets Fixed Income Fund had the following exposure to counterparty and issuer credit risk at 30 September 2017. The Global Credit Alpha Fund terminated on 30 June 2017. Preferred Securities Fund Credit Rating Rating % A 11.65% AA 0.56% B 3.13% BB 18.76% BBB 59.42% NR 1.39% Total Portfolio 94.91%
High Yield Fund Credit Rating Rating % A 0.01% B 36.55% BB 39.41% BBB 4.57% CC 0.04% CCC 7.86% NR 4.13% Total Portfolio 92.57%
Post Global Limited Term High Yield Fund Credit Rating Rating % B 31.06% BB 53.84% BBB 9.20% CCC 1.46% NR 2.54% Total Portfolio 98.10%
Global Time Diversified Absolute Return Fund Credit Rating Rating % NR 90.36% Total Portfolio 90.36%
Finisterre Emerging Market Debt Fund Credit Rating Rating % BB 78.48% BBB 42.90% NR 87.49% Total Portfolio 208.87%
Spectrum Global Capital Securities Fund Credit Rating Rating % A 7.44% B 8.85% BB 52.29% BBB 11.13% Total Portfolio 79.71%
Global Capital Structure Opportunities Fund Credit Rating Rating % A 5.34% B 4.41% BB 31.77% BBB 47.14% NR 7.66% Total Portfolio 96.32%
Real Estate Debt Fund Credit Rating Rating % A 4.14% B 6.48% BB 1.64% NR 84.79% Total Portfolio 97.05%
Global Income Fund1 Credit Rating Rating % A 1.25% B 24.26% BB 19.50% BBB 10.31% CCC 2.61% NR 16.43% Total Portfolio 74.36%
Finisterre Unconstrained Emerging Markets Fixed Income Fund2 Credit Rating Rating % A 4.87% AAA 1.66% B 17.37% BB 11.66% BBB 4.10% CC 0.35% NR 43.36% Total Portfolio 83.37%
1 Global Income Fund launched on 29 March 2017. 2Finisterre Unconstrained Emerging Markets Fixed Income Fund launched on 2 May 2017.
These ratings are based on the Standard & Poor s, Moody s and Fitch bond rating services.
PRINCIPAL GLOBAL INVESTORS FUNDS
NOTES TO THE ANNUAL REPORT AND FINANCIAL STATEMENTS
for the year ended 30 September 2018 (continued)
171
11. FINANCIAL RISK MANAGEMENT (continued)
Liquidity Risk
Liquidity risk is the risk that the Funds will experience difficulty in either realising assets or otherwise raising sufficient funds to satisfy commitments associated with financial instruments. This arises when trading volume, lack of a market
The Funds, with the exception of the Post Global Limited Term High Yield Fund which is exposed to bi-monthly cash redemptions and the Finisterre Emerging Market Debt Fund (terminated 5 December 2017) and the Global Time Diversified Absolute Return Fund (terminated 14 September 2018) which are exposed to weekly redemptions, are exposed to daily cash redemptions by Unitholders. Therefore, the Funds invest the majority of their assets in investments that are traded in an active market and can be readily disposed of; only a limited proportion of the assets are invested in assets not actively traded on a stock exchange. In addition, the Funds may restrict redemptions and have the ability to borrow in the short term to ensure settlement.
The Investment Adviser/Sub-Investment Adviser(s) monitors the
As at 30 September 2018 and 30 September 2017due or settled within 1 month of the Statement of Financial Position date with the exception of the following;
Audit Fees Payable which will be due or settled within 3 months to 1 year of the Statement of Financial Position date. These fees payable are detailed on each September 2018 and as at 30 September 2017.
Derivatives contracts held by some of the Funds where the maturity dates are detailed in the Portfolios of Investments.
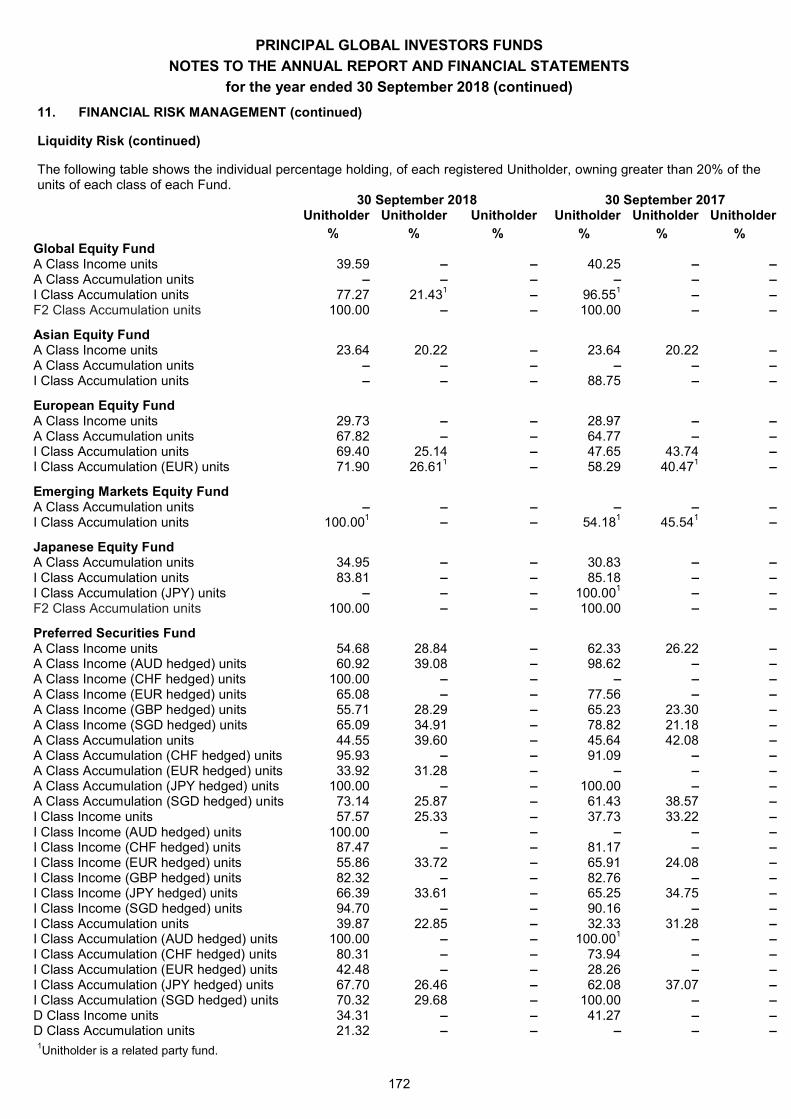
PRINCIPAL GLOBAL INVESTORS FUNDS
NOTES TO THE ANNUAL REPORT AND FINANCIAL STATEMENTS
for the year ended 30 September 2018 (continued)
172
11. FINANCIAL RISK MANAGEMENT (continued)
Liquidity Risk (continued)
The following table shows the individual percentage holding, of each registered Unitholder, owning greater than 20% of the units of each class of each Fund.
30 September 2018 30 September 2017 Unitholder Unitholder Unitholder Unitholder Unitholder Unitholder % % % % % %
Global Equity Fund A Class Income units 39.59 40.25 A Class Accumulation units I Class Accumulation units 77.27 21.431 96.551 F2 Class Accumulation units 100.00 100.00
Asian Equity Fund A Class Income units 23.64 20.22 23.64 20.22 A Class Accumulation units I Class Accumulation units 88.75
European Equity Fund A Class Income units 29.73 28.97 A Class Accumulation units 67.82 64.77 I Class Accumulation units 69.40 25.14 47.65 43.74 I Class Accumulation (EUR) units 71.90 26.611 58.29 40.471
Emerging Markets Equity Fund A Class Accumulation units I Class Accumulation units 100.001 54.181 45.541
Japanese Equity Fund A Class Accumulation units 34.95 30.83 I Class Accumulation units 83.81 85.18 I Class Accumulation (JPY) units 100.001 F2 Class Accumulation units 100.00 100.00
Preferred Securities Fund A Class Income units 54.68 28.84 62.33 26.22 A Class Income (AUD hedged) units 60.92 39.08 98.62 A Class Income (CHF hedged) units 100.00 A Class Income (EUR hedged) units 65.08 77.56 A Class Income (GBP hedged) units 55.71 28.29 65.23 23.30 A Class Income (SGD hedged) units 65.09 34.91 78.82 21.18 A Class Accumulation units 44.55 39.60 45.64 42.08 A Class Accumulation (CHF hedged) units 95.93 91.09 A Class Accumulation (EUR hedged) units 33.92 31.28 A Class Accumulation (JPY hedged) units 100.00 100.00 A Class Accumulation (SGD hedged) units 73.14 25.87 61.43 38.57 I Class Income units 57.57 25.33 37.73 33.22 I Class Income (AUD hedged) units 100.00 I Class Income (CHF hedged) units 87.47 81.17 I Class Income (EUR hedged) units 55.86 33.72 65.91 24.08 I Class Income (GBP hedged) units 82.32 82.76 I Class Income (JPY hedged) units 66.39 33.61 65.25 34.75 I Class Income (SGD hedged) units 94.70 90.16 I Class Accumulation units 39.87 22.85 32.33 31.28 I Class Accumulation (AUD hedged) units 100.00 100.001 I Class Accumulation (CHF hedged) units 80.31 73.94 I Class Accumulation (EUR hedged) units 42.48 28.26 I Class Accumulation (JPY hedged) units 67.70 26.46 62.08 37.07 I Class Accumulation (SGD hedged) units 70.32 29.68 100.00 D Class Income units 34.31 41.27 D Class Accumulation units 21.32 1Unitholder is a related party fund.
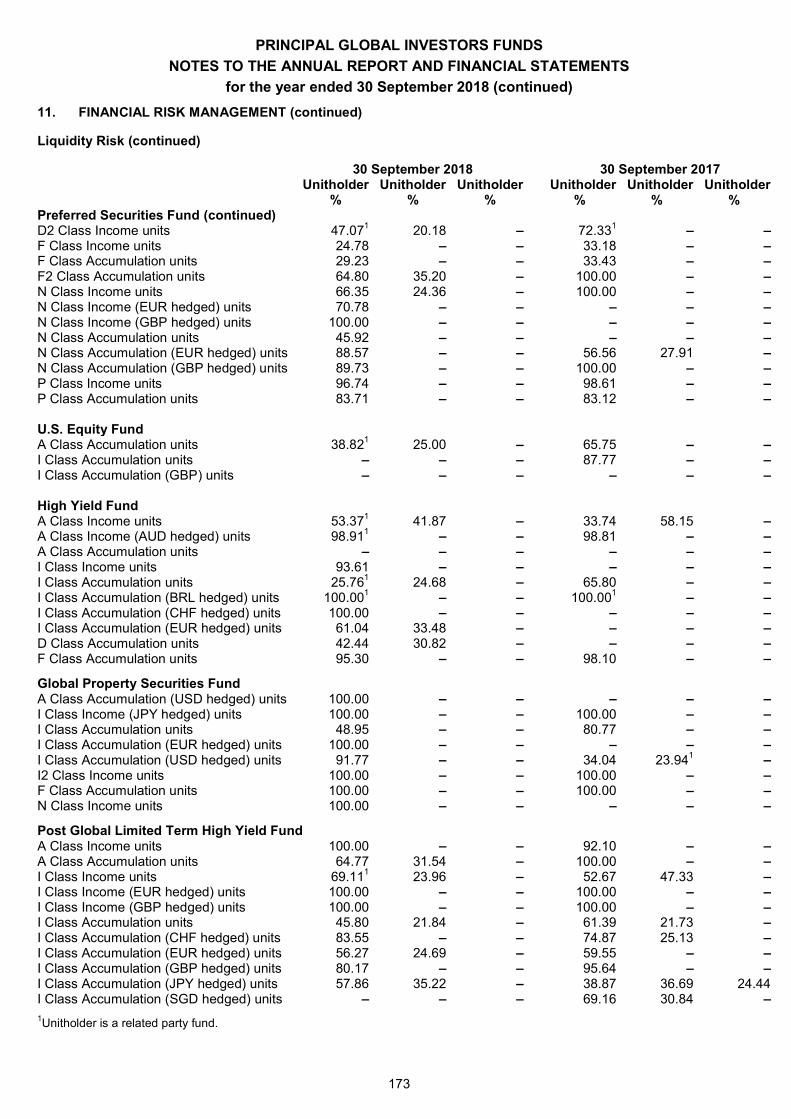
PRINCIPAL GLOBAL INVESTORS FUNDS
NOTES TO THE ANNUAL REPORT AND FINANCIAL STATEMENTS
for the year ended 30 September 2018 (continued)
173
11. FINANCIAL RISK MANAGEMENT (continued)
Liquidity Risk (continued)
30 September 2018 30 September 2017 Unitholder Unitholder Unitholder Unitholder Unitholder Unitholder % % % % % %
Preferred Securities Fund (continued) D2 Class Income units 47.071 20.18 72.331 F Class Income units 24.78 33.18 F Class Accumulation units 29.23 33.43 F2 Class Accumulation units 64.80 35.20 100.00 N Class Income units 66.35 24.36 100.00 N Class Income (EUR hedged) units 70.78 N Class Income (GBP hedged) units 100.00 N Class Accumulation units 45.92 N Class Accumulation (EUR hedged) units 88.57 56.56 27.91 N Class Accumulation (GBP hedged) units 89.73 100.00 P Class Income units 96.74 98.61 P Class Accumulation units 83.71 83.12 U.S. Equity Fund A Class Accumulation units 38.821 25.00 65.75 I Class Accumulation units 87.77 I Class Accumulation (GBP) units High Yield Fund A Class Income units 53.371 41.87 33.74 58.15 A Class Income (AUD hedged) units 98.911 98.81 A Class Accumulation units I Class Income units 93.61 I Class Accumulation units 25.761 24.68 65.80 I Class Accumulation (BRL hedged) units 100.001 100.001 I Class Accumulation (CHF hedged) units 100.00 I Class Accumulation (EUR hedged) units 61.04 33.48 D Class Accumulation units 42.44 30.82 F Class Accumulation units 95.30 98.10
Global Property Securities Fund A Class Accumulation (USD hedged) units 100.00 I Class Income (JPY hedged) units 100.00 100.00 I Class Accumulation units 48.95 80.77 I Class Accumulation (EUR hedged) units 100.00 I Class Accumulation (USD hedged) units 91.77 34.04 23.941 I2 Class Income units 100.00 100.00 F Class Accumulation units 100.00 100.00 N Class Income units 100.00
Post Global Limited Term High Yield Fund A Class Income units 100.00 92.10 A Class Accumulation units 64.77 31.54 100.00 I Class Income units 69.111 23.96 52.67 47.33 I Class Income (EUR hedged) units 100.00 100.00 I Class Income (GBP hedged) units 100.00 100.00 I Class Accumulation units 45.80 21.84 61.39 21.73 I Class Accumulation (CHF hedged) units 83.55 74.87 25.13 I Class Accumulation (EUR hedged) units 56.27 24.69 59.55 I Class Accumulation (GBP hedged) units 80.17 95.64 I Class Accumulation (JPY hedged) units 57.86 35.22 38.87 36.69 24.44 I Class Accumulation (SGD hedged) units 69.16 30.84 1Unitholder is a related party fund.
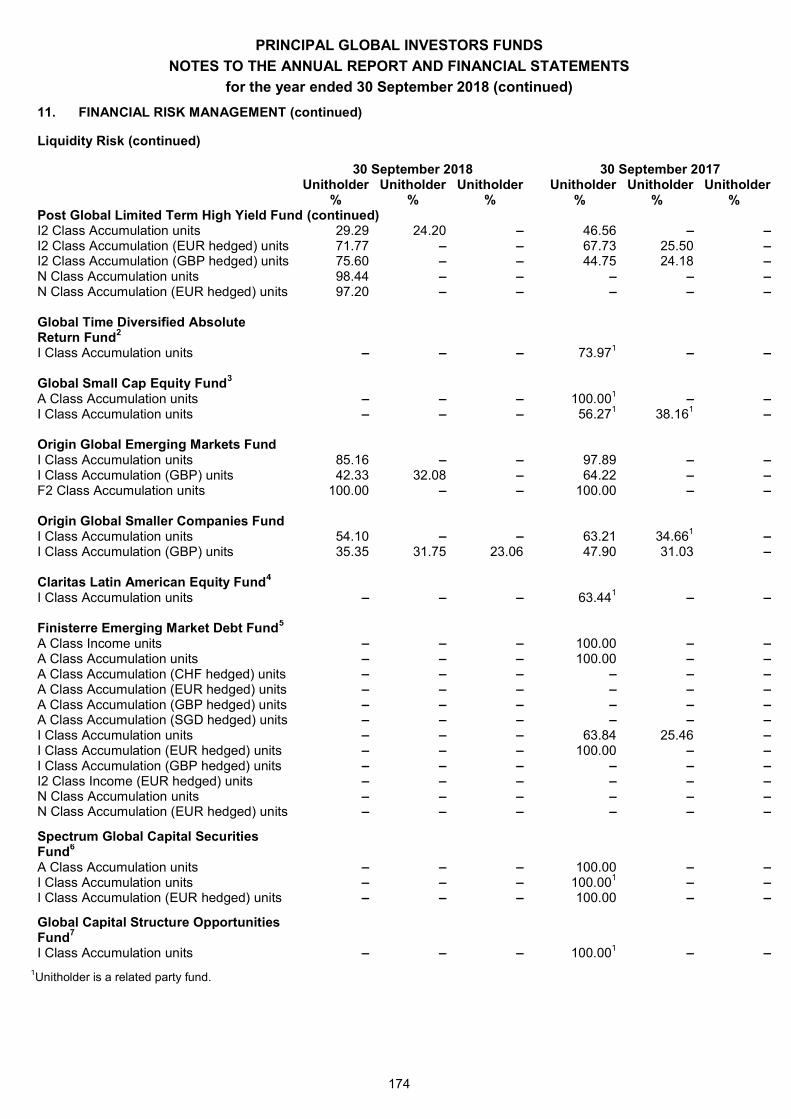
PRINCIPAL GLOBAL INVESTORS FUNDS
NOTES TO THE ANNUAL REPORT AND FINANCIAL STATEMENTS
for the year ended 30 September 2018 (continued)
174
11. FINANCIAL RISK MANAGEMENT (continued)
Liquidity Risk (continued)
30 September 2018 30 September 2017 Unitholder Unitholder Unitholder Unitholder Unitholder Unitholder % % % % % %
Post Global Limited Term High Yield Fund (continued) I2 Class Accumulation units 29.29 24.20 46.56 I2 Class Accumulation (EUR hedged) units 71.77 67.73 25.50 I2 Class Accumulation (GBP hedged) units 75.60 44.75 24.18 N Class Accumulation units 98.44 N Class Accumulation (EUR hedged) units 97.20 Global Time Diversified Absolute Return Fund2 I Class Accumulation units 73.971 Global Small Cap Equity Fund3 A Class Accumulation units 100.001 I Class Accumulation units 56.271 38.161 Origin Global Emerging Markets Fund I Class Accumulation units 85.16 97.89 I Class Accumulation (GBP) units 42.33 32.08 64.22 F2 Class Accumulation units 100.00 100.00 Origin Global Smaller Companies Fund I Class Accumulation units 54.10 63.21 34.661 I Class Accumulation (GBP) units 35.35 31.75 23.06 47.90 31.03
Claritas Latin American Equity Fund4 I Class Accumulation units 63.441
Finisterre Emerging Market Debt Fund5 A Class Income units 100.00 A Class Accumulation units 100.00 A Class Accumulation (CHF hedged) units A Class Accumulation (EUR hedged) units A Class Accumulation (GBP hedged) units A Class Accumulation (SGD hedged) units I Class Accumulation units 63.84 25.46 I Class Accumulation (EUR hedged) units 100.00 I Class Accumulation (GBP hedged) units I2 Class Income (EUR hedged) units N Class Accumulation units N Class Accumulation (EUR hedged) units
Spectrum Global Capital Securities Fund6 A Class Accumulation units 100.00 I Class Accumulation units 100.001 I Class Accumulation (EUR hedged) units 100.00
Global Capital Structure Opportunities Fund7
I Class Accumulation units 100.001 1Unitholder is a related party fund.
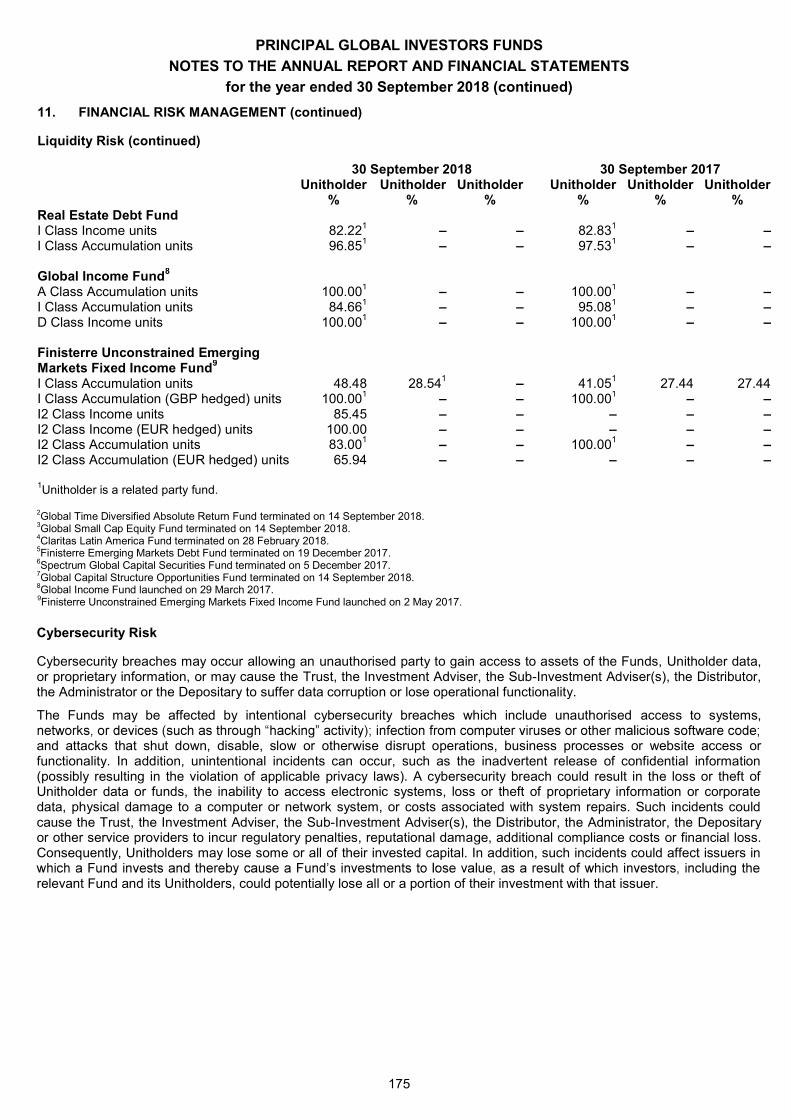
PRINCIPAL GLOBAL INVESTORS FUNDS
NOTES TO THE ANNUAL REPORT AND FINANCIAL STATEMENTS
for the year ended 30 September 2018 (continued)
175
11. FINANCIAL RISK MANAGEMENT (continued)
Liquidity Risk (continued)
30 September 2018 30 September 2017 Unitholder Unitholder Unitholder Unitholder Unitholder Unitholder % % % % % % Real Estate Debt Fund I Class Income units 82.221 82.831 I Class Accumulation units 96.851 97.531 Global Income Fund8 A Class Accumulation units 100.001 100.001 I Class Accumulation units 84.661 95.081 D Class Income units 100.001 100.001 Finisterre Unconstrained Emerging Markets Fixed Income Fund9 I Class Accumulation units 48.48 28.541 41.051 27.44 27.44 I Class Accumulation (GBP hedged) units 100.001 100.001 I2 Class Income units 85.45 I2 Class Income (EUR hedged) units 100.00 I2 Class Accumulation units 83.001 100.001 I2 Class Accumulation (EUR hedged) units 65.94 1Unitholder is a related party fund. 2Global Time Diversified Absolute Return Fund terminated on 14 September 2018. 3Global Small Cap Equity Fund terminated on 14 September 2018. 4Claritas Latin America Fund terminated on 28 February 2018. 5Finisterre Emerging Markets Debt Fund terminated on 19 December 2017. 6Spectrum Global Capital Securities Fund terminated on 5 December 2017. 7Global Capital Structure Opportunities Fund terminated on 14 September 2018. 8Global Income Fund launched on 29 March 2017. 9Finisterre Unconstrained Emerging Markets Fixed Income Fund launched on 2 May 2017. Cybersecurity Risk
Cybersecurity breaches may occur allowing an unauthorised party to gain access to assets of the Funds, Unitholder data, or proprietary information, or may cause the Trust, the Investment Adviser, the Sub-Investment Adviser(s), the Distributor, the Administrator or the Depositary to suffer data corruption or lose operational functionality.
The Funds may be affected by intentional cybersecurity breaches which include unauthorised access to systems,
and attacks that shut down, disable, slow or otherwise disrupt operations, business processes or website access or functionality. In addition, unintentional incidents can occur, such as the inadvertent release of confidential information (possibly resulting in the violation of applicable privacy laws). A cybersecurity breach could result in the loss or theft of Unitholder data or funds, the inability to access electronic systems, loss or theft of proprietary information or corporate data, physical damage to a computer or network system, or costs associated with system repairs. Such incidents could cause the Trust, the Investment Adviser, the Sub-Investment Adviser(s), the Distributor, the Administrator, the Depositary or other service providers to incur regulatory penalties, reputational damage, additional compliance costs or financial loss. Consequently, Unitholders may lose some or all of their invested capital. In addition, such incidents could affect issuers in
relevant Fund and its Unitholders, could potentially lose all or a portion of their investment with that issuer.
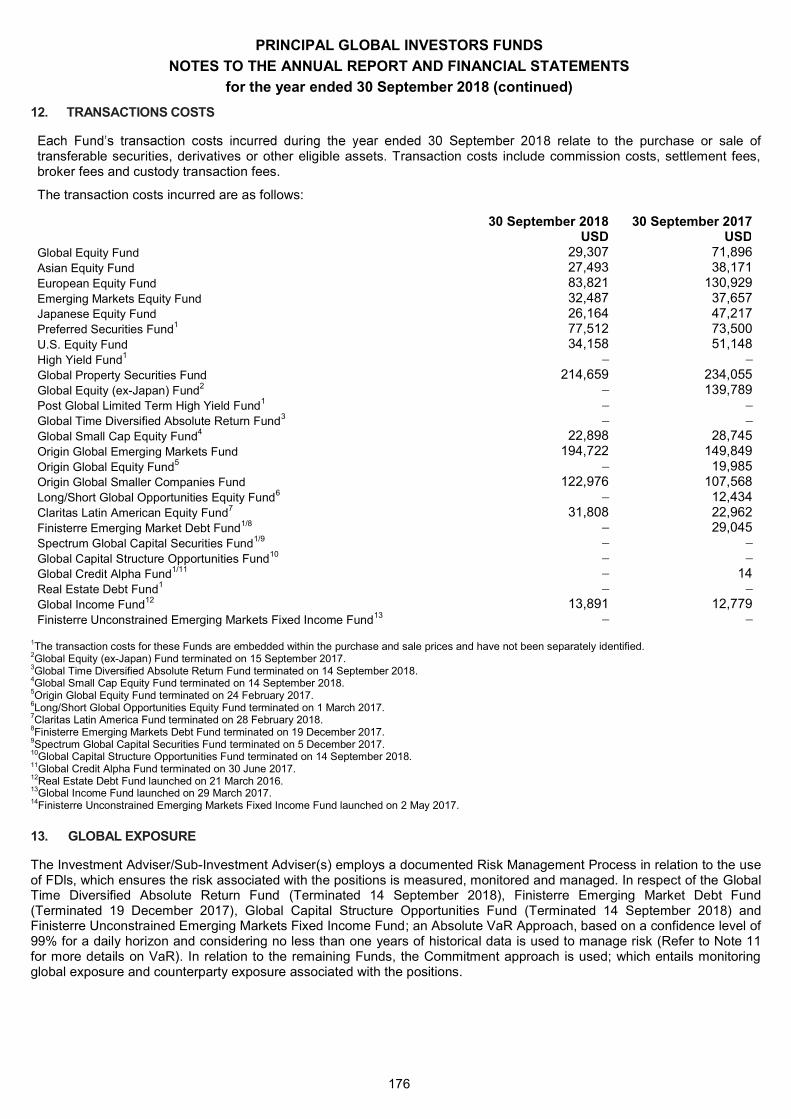
PRINCIPAL GLOBAL INVESTORS FUNDS
NOTES TO THE ANNUAL REPORT AND FINANCIAL STATEMENTS
for the year ended 30 September 2018 (continued)
176
12. TRANSACTIONS COSTS
8 relate to the purchase or sale of transferable securities, derivatives or other eligible assets. Transaction costs include commission costs, settlement fees, broker fees and custody transaction fees.
The transaction costs incurred are as follows:
30 September 2018 30 September 2017 USD USD Global Equity Fund 29,307 71,896 Asian Equity Fund 27,493 38,171 European Equity Fund 83,821 130,929 Emerging Markets Equity Fund 32,487 37,657 Japanese Equity Fund 26,164 47,217 Preferred Securities Fund1 77,512 73,500 U.S. Equity Fund 34,158 51,148 High Yield Fund1 Global Property Securities Fund 214,659 234,055 Global Equity (ex-Japan) Fund2 139,789 Post Global Limited Term High Yield Fund1 Global Time Diversified Absolute Return Fund3 Global Small Cap Equity Fund4 22,898 28,745 Origin Global Emerging Markets Fund 194,722 149,849 Origin Global Equity Fund5 19,985 Origin Global Smaller Companies Fund 122,976 107,568 Long/Short Global Opportunities Equity Fund6 12,434 Claritas Latin American Equity Fund7 31,808 22,962 Finisterre Emerging Market Debt Fund1/8 29,045 Spectrum Global Capital Securities Fund1/9 Global Capital Structure Opportunities Fund10 Global Credit Alpha Fund1/11 14 Real Estate Debt Fund1 Global Income Fund12 13,891 12,779 Finisterre Unconstrained Emerging Markets Fixed Income Fund13
1The transaction costs for these Funds are embedded within the purchase and sale prices and have not been separately identified. 2Global Equity (ex-Japan) Fund terminated on 15 September 2017. 3Global Time Diversified Absolute Return Fund terminated on 14 September 2018. 4Global Small Cap Equity Fund terminated on 14 September 2018. 5Origin Global Equity Fund terminated on 24 February 2017. 6Long/Short Global Opportunities Equity Fund terminated on 1 March 2017. 7Claritas Latin America Fund terminated on 28 February 2018. 8Finisterre Emerging Markets Debt Fund terminated on 19 December 2017. 9Spectrum Global Capital Securities Fund terminated on 5 December 2017. 10Global Capital Structure Opportunities Fund terminated on 14 September 2018. 11Global Credit Alpha Fund terminated on 30 June 2017. 12Real Estate Debt Fund launched on 21 March 2016. 13Global Income Fund launched on 29 March 2017. 14Finisterre Unconstrained Emerging Markets Fixed Income Fund launched on 2 May 2017.
13. GLOBAL EXPOSURE
The Investment Adviser/Sub-Investment Adviser(s) employs a documented Risk Management Process in relation to the use of FDls, which ensures the risk associated with the positions is measured, monitored and managed. In respect of the Global Time Diversified Absolute Return Fund (Terminated 14 September 2018), Finisterre Emerging Market Debt Fund (Terminated 19 December 2017), Global Capital Structure Opportunities Fund (Terminated 14 September 2018) and Finisterre Unconstrained Emerging Markets Fixed Income Fund; an Absolute VaR Approach, based on a confidence level of 99% for a daily horizon and considering no less than one years of historical data is used to manage risk (Refer to Note 11 for more details on VaR). In relation to the remaining Funds, the Commitment approach is used; which entails monitoring global exposure and counterparty exposure associated with the positions.
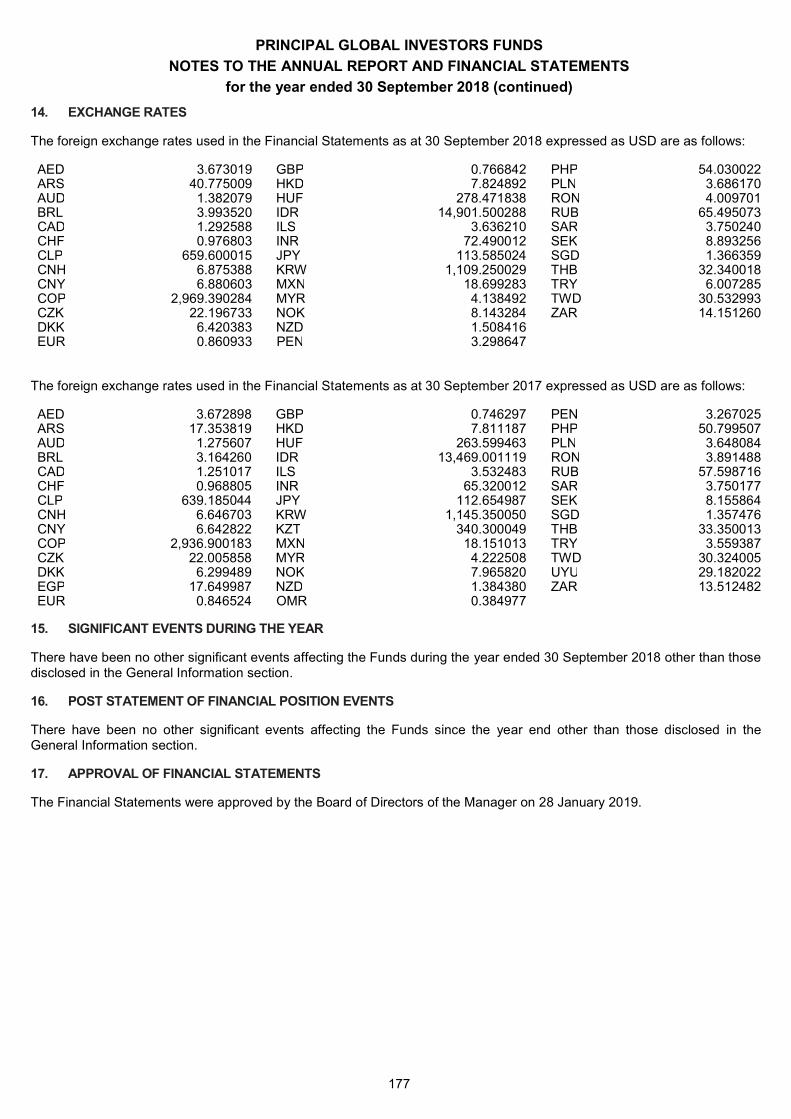
PRINCIPAL GLOBAL INVESTORS FUNDS
NOTES TO THE ANNUAL REPORT AND FINANCIAL STATEMENTS
for the year ended 30 September 2018 (continued)
177
14. EXCHANGE RATES
The foreign exchange rates used in the Financial Statements as at 30 September 2018 expressed as USD are as follows:
AED 3.673019 GBP 0.766842 PHP 54.030022 ARS 40.775009 HKD 7.824892 PLN 3.686170 AUD 1.382079 HUF 278.471838 RON 4.009701 BRL 3.993520 IDR 14,901.500288 RUB 65.495073 CAD 1.292588 ILS 3.636210 SAR 3.750240 CHF 0.976803 INR 72.490012 SEK 8.893256 CLP 659.600015 JPY 113.585024 SGD 1.366359 CNH 6.875388 KRW 1,109.250029 THB 32.340018 CNY 6.880603 MXN 18.699283 TRY 6.007285 COP 2,969.390284 MYR 4.138492 TWD 30.532993 CZK 22.196733 NOK 8.143284 ZAR 14.151260 DKK 6.420383 NZD 1.508416 EUR 0.860933 PEN 3.298647
The foreign exchange rates used in the Financial Statements as at 30 September 2017 expressed as USD are as follows:
AED 3.672898 GBP 0.746297 PEN 3.267025 ARS 17.353819 HKD 7.811187 PHP 50.799507 AUD 1.275607 HUF 263.599463 PLN 3.648084 BRL 3.164260 IDR 13,469.001119 RON 3.891488 CAD 1.251017 ILS 3.532483 RUB 57.598716 CHF 0.968805 INR 65.320012 SAR 3.750177 CLP 639.185044 JPY 112.654987 SEK 8.155864 CNH 6.646703 KRW 1,145.350050 SGD 1.357476 CNY 6.642822 KZT 340.300049 THB 33.350013 COP 2,936.900183 MXN 18.151013 TRY 3.559387 CZK 22.005858 MYR 4.222508 TWD 30.324005 DKK 6.299489 NOK 7.965820 UYU 29.182022 EGP 17.649987 NZD 1.384380 ZAR 13.512482EUR 0.846524 OMR 0.384977
15. SIGNIFICANT EVENTS DURING THE YEAR
There have been no other significant events affecting the Funds during the year ended 30 September 2018 other than those disclosed in the General Information section.
16. POST STATEMENT OF FINANCIAL POSITION EVENTS
There have been no other significant events affecting the Funds since the year end other than those disclosed in the General Information section.
17. APPROVAL OF FINANCIAL STATEMENTS
The Financial Statements were approved by the Board of Directors of the Manager on 28 January 2019.
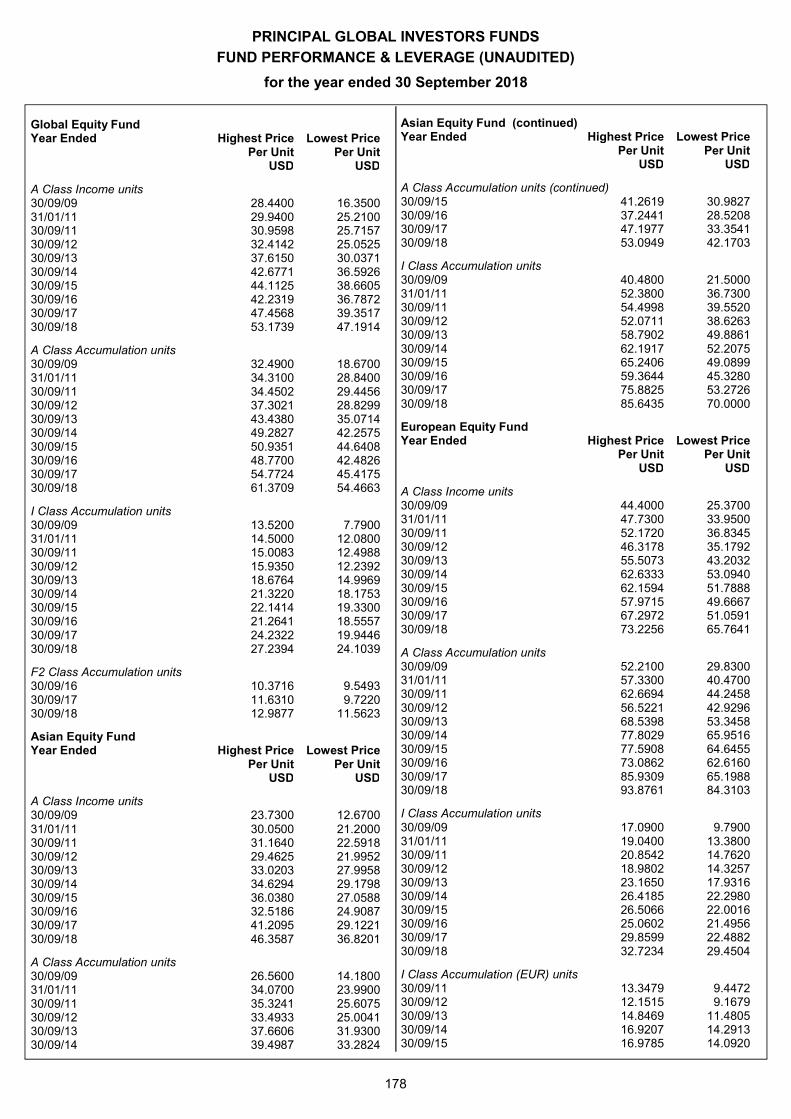
PRINCIPAL GLOBAL INVESTORS FUNDS
FUND PERFORMANCE & LEVERAGE (UNAUDITED)
for the year ended 30 September 2018
178
Global Equity Fund Year Ended Highest Price Lowest Price Per Unit Per Unit USD USD
A Class Income units 30/09/09 28.4400 16.3500 31/01/11 29.9400 25.2100 30/09/11 30.9598 25.7157 30/09/12 32.4142 25.0525 30/09/13 37.6150 30.0371 30/09/14 42.6771 36.5926 30/09/15 44.1125 38.6605 30/09/16 42.2319 36.7872 30/09/17 47.4568 39.3517 30/09/18 53.1739 47.1914
A Class Accumulation units 30/09/09 32.4900 18.6700 31/01/11 34.3100 28.8400 30/09/11 34.4502 29.4456 30/09/12 37.3021 28.8299 30/09/13 43.4380 35.0714 30/09/14 49.2827 42.2575 30/09/15 50.9351 44.6408 30/09/16 48.7700 42.4826 30/09/17 54.7724 45.4175 30/09/18 61.3709 54.4663
I Class Accumulation units 30/09/09 13.5200 7.7900 31/01/11 14.5000 12.0800 30/09/11 15.0083 12.4988 30/09/12 15.9350 12.2392 30/09/13 18.6764 14.9969 30/09/14 21.3220 18.1753 30/09/15 22.1414 19.3300 30/09/16 21.2641 18.5557 30/09/17 24.2322 19.9446 30/09/18 27.2394 24.1039
F2 Class Accumulation units 30/09/16 10.3716 9.5493 30/09/17 11.6310 9.7220 30/09/18 12.9877 11.5623
Asian Equity Fund Year Ended Highest Price Lowest Price Per Unit Per Unit USD USD
A Class Income units 30/09/09 23.7300 12.6700 31/01/11 30.0500 21.2000 30/09/11 31.1640 22.5918 30/09/12 29.4625 21.9952 30/09/13 33.0203 27.9958 30/09/14 34.6294 29.1798 30/09/15 36.0380 27.0588 30/09/16 32.5186 24.9087 30/09/17 41.2095 29.1221 30/09/18 46.3587 36.8201
A Class Accumulation units 30/09/09 26.5600 14.1800 31/01/11 34.0700 23.9900 30/09/11 35.3241 25.6075 30/09/12 33.4933 25.0041 30/09/13 37.6606 31.9300 30/09/14 39.4987 33.2824
Asian Equity Fund (continued) Year Ended Highest Price Lowest Price Per Unit Per Unit USD USD
A Class Accumulation units (continued) 30/09/15 41.2619 30.9827 30/09/16 37.2441 28.5208 30/09/17 47.1977 33.3541 30/09/18 53.0949 42.1703
I Class Accumulation units 30/09/09 40.4800 21.5000 31/01/11 52.3800 36.7300 30/09/11 54.4998 39.5520 30/09/12 52.0711 38.6263 30/09/13 58.7902 49.8861 30/09/14 62.1917 52.2075 30/09/15 65.2406 49.0899 30/09/16 59.3644 45.3280 30/09/17 75.8825 53.2726 30/09/18 85.6435 70.0000
European Equity Fund Year Ended Highest Price Lowest Price Per Unit Per Unit USD USD
A Class Income units 30/09/09 44.4000 25.3700 31/01/11 47.7300 33.9500 30/09/11 52.1720 36.8345 30/09/12 46.3178 35.1792 30/09/13 55.5073 43.2032 30/09/14 62.6333 53.0940 30/09/15 62.1594 51.7888 30/09/16 57.9715 49.6667 30/09/17 67.2972 51.0591 30/09/18 73.2256 65.7641
A Class Accumulation units 30/09/09 52.2100 29.8300 31/01/11 57.3300 40.4700 30/09/11 62.6694 44.2458 30/09/12 56.5221 42.9296 30/09/13 68.5398 53.3458 30/09/14 77.8029 65.9516 30/09/15 77.5908 64.6455 30/09/16 73.0862 62.6160 30/09/17 85.9309 65.1988 30/09/18 93.8761 84.3103
I Class Accumulation units 30/09/09 17.0900 9.7900 31/01/11 19.0400 13.3800 30/09/11 20.8542 14.7620 30/09/12 18.9802 14.3257 30/09/13 23.1650 17.9316 30/09/14 26.4185 22.2980 30/09/15 26.5066 22.0016 30/09/16 25.0602 21.4956 30/09/17 29.8599 22.4882 30/09/18 32.7234 29.4504
I Class Accumulation (EUR) units 30/09/11 13.3479 9.4472 30/09/12 12.1515 9.1679 30/09/13 14.8469 11.4805 30/09/14 16.9207 14.2913 30/09/15 16.9785 14.0920
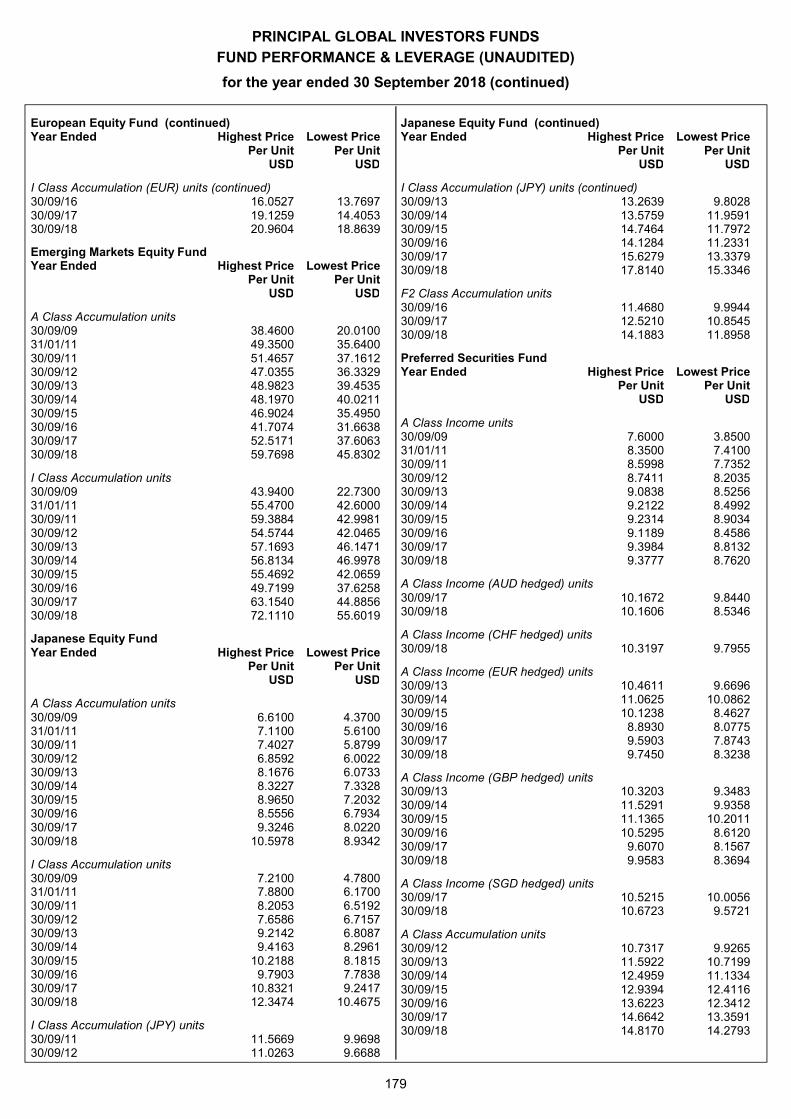
PRINCIPAL GLOBAL INVESTORS FUNDS
FUND PERFORMANCE & LEVERAGE (UNAUDITED)
for the year ended 30 September 2018 (continued)
179
European Equity Fund (continued) Year Ended Highest Price Lowest Price Per Unit Per Unit USD USD
I Class Accumulation (EUR) units (continued) 30/09/16 16.0527 13.7697 30/09/17 19.1259 14.4053 30/09/18 20.9604 18.8639
Emerging Markets Equity Fund Year Ended Highest Price Lowest Price Per Unit Per Unit USD USD
A Class Accumulation units 30/09/09 38.4600 20.0100 31/01/11 49.3500 35.6400 30/09/11 51.4657 37.1612 30/09/12 47.0355 36.3329 30/09/13 48.9823 39.4535 30/09/14 48.1970 40.0211 30/09/15 46.9024 35.4950 30/09/16 41.7074 31.6638 30/09/17 52.5171 37.6063 30/09/18 59.7698 45.8302
I Class Accumulation units 30/09/09 43.9400 22.7300 31/01/11 55.4700 42.6000 30/09/11 59.3884 42.9981 30/09/12 54.5744 42.0465 30/09/13 57.1693 46.1471 30/09/14 56.8134 46.9978 30/09/15 55.4692 42.0659 30/09/16 49.7199 37.6258 30/09/17 63.1540 44.8856 30/09/18 72.1110 55.6019
Japanese Equity Fund Year Ended Highest Price Lowest Price Per Unit Per Unit USD USD
A Class Accumulation units 30/09/09 6.6100 4.3700 31/01/11 7.1100 5.6100 30/09/11 7.4027 5.8799 30/09/12 6.8592 6.0022 30/09/13 8.1676 6.0733 30/09/14 8.3227 7.3328 30/09/15 8.9650 7.2032 30/09/16 8.5556 6.7934 30/09/17 9.3246 8.0220 30/09/18 10.5978 8.9342
I Class Accumulation units 30/09/09 7.2100 4.7800 31/01/11 7.8800 6.1700 30/09/11 8.2053 6.5192 30/09/12 7.6586 6.7157 30/09/13 9.2142 6.8087 30/09/14 9.4163 8.2961 30/09/15 10.2188 8.1815 30/09/16 9.7903 7.7838 30/09/17 10.8321 9.2417 30/09/18 12.3474 10.4675
I Class Accumulation (JPY) units 30/09/11 11.5669 9.9698 30/09/12 11.0263 9.6688
Japanese Equity Fund (continued) Year Ended Highest Price Lowest Price Per Unit Per Unit USD USD
I Class Accumulation (JPY) units (continued) 30/09/13 13.2639 9.8028 30/09/14 13.5759 11.9591 30/09/15 14.7464 11.7972 30/09/16 14.1284 11.2331 30/09/17 15.6279 13.3379 30/09/18 17.8140 15.3346
F2 Class Accumulation units 30/09/16 11.4680 9.9944 30/09/17 12.5210 10.8545 30/09/18 14.1883 11.8958
Preferred Securities Fund Year Ended Highest Price Lowest Price Per Unit Per Unit USD USD
A Class Income units 30/09/09 7.6000 3.8500 31/01/11 8.3500 7.4100 30/09/11 8.5998 7.7352 30/09/12 8.7411 8.2035 30/09/13 9.0838 8.5256 30/09/14 9.2122 8.4992 30/09/15 9.2314 8.9034 30/09/16 9.1189 8.4586 30/09/17 9.3984 8.8132 30/09/18 9.3777 8.7620
A Class Income (AUD hedged) units 30/09/17 10.1672 9.8440 30/09/18 10.1606 8.5346
A Class Income (CHF hedged) units 30/09/18 10.3197 9.7955
A Class Income (EUR hedged) units 30/09/13 10.4611 9.6696 30/09/14 11.0625 10.0862 30/09/15 10.1238 8.4627 30/09/16 8.8930 8.0775 30/09/17 9.5903 7.8743 30/09/18 9.7450 8.3238
A Class Income (GBP hedged) units 30/09/13 10.3203 9.3483 30/09/14 11.5291 9.9358 30/09/15 11.1365 10.2011 30/09/16 10.5295 8.6120 30/09/17 9.6070 8.1567 30/09/18 9.9583 8.3694
A Class Income (SGD hedged) units 30/09/17 10.5215 10.0056 30/09/18 10.6723 9.5721
A Class Accumulation units 30/09/12 10.7317 9.9265 30/09/13 11.5922 10.7199 30/09/14 12.4959 11.1334 30/09/15 12.9394 12.4116 30/09/16 13.6223 12.3412 30/09/17 14.6642 13.3591 30/09/18 14.8170 14.2793
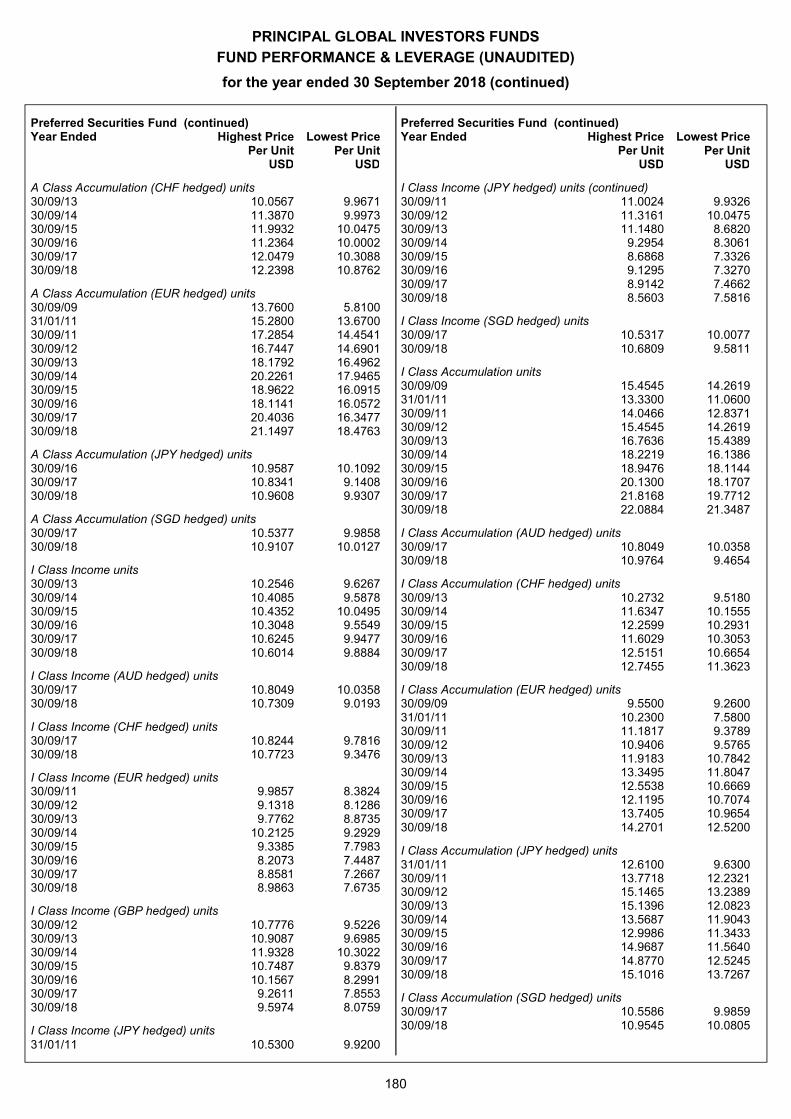
PRINCIPAL GLOBAL INVESTORS FUNDS
FUND PERFORMANCE & LEVERAGE (UNAUDITED)
for the year ended 30 September 2018 (continued)
180
Preferred Securities Fund (continued) Year Ended Highest Price Lowest Price Per Unit Per Unit USD USD
A Class Accumulation (CHF hedged) units 30/09/13 10.0567 9.9671 30/09/14 11.3870 9.9973 30/09/15 11.9932 10.0475 30/09/16 11.2364 10.0002 30/09/17 12.0479 10.3088 30/09/18 12.2398 10.8762
A Class Accumulation (EUR hedged) units 30/09/09 13.7600 5.8100 31/01/11 15.2800 13.6700 30/09/11 17.2854 14.4541 30/09/12 16.7447 14.6901 30/09/13 18.1792 16.4962 30/09/14 20.2261 17.9465 30/09/15 18.9622 16.0915 30/09/16 18.1141 16.0572 30/09/17 20.4036 16.3477 30/09/18 21.1497 18.4763
A Class Accumulation (JPY hedged) units 30/09/16 10.9587 10.1092 30/09/17 10.8341 9.1408 30/09/18 10.9608 9.9307
A Class Accumulation (SGD hedged) units 30/09/17 10.5377 9.9858 30/09/18 10.9107 10.0127
I Class Income units 30/09/13 10.2546 9.6267 30/09/14 10.4085 9.5878 30/09/15 10.4352 10.0495 30/09/16 10.3048 9.5549 30/09/17 10.6245 9.9477 30/09/18 10.6014 9.8884
I Class Income (AUD hedged) units 30/09/17 10.8049 10.0358 30/09/18 10.7309 9.0193
I Class Income (CHF hedged) units 30/09/17 10.8244 9.7816 30/09/18 10.7723 9.3476
I Class Income (EUR hedged) units 30/09/11 9.9857 8.3824 30/09/12 9.1318 8.1286 30/09/13 9.7762 8.8735 30/09/14 10.2125 9.2929 30/09/15 9.3385 7.7983 30/09/16 8.2073 7.4487 30/09/17 8.8581 7.2667 30/09/18 8.9863 7.6735
I Class Income (GBP hedged) units 30/09/12 10.7776 9.5226 30/09/13 10.9087 9.6985 30/09/14 11.9328 10.3022 30/09/15 10.7487 9.8379 30/09/16 10.1567 8.2991 30/09/17 9.2611 7.8553 30/09/18 9.5974 8.0759
I Class Income (JPY hedged) units 31/01/11 10.5300 9.9200
Preferred Securities Fund (continued) Year Ended Highest Price Lowest Price Per Unit Per Unit USD USD
I Class Income (JPY hedged) units (continued) 30/09/11 11.0024 9.9326 30/09/12 11.3161 10.0475 30/09/13 11.1480 8.6820 30/09/14 9.2954 8.3061 30/09/15 8.6868 7.3326 30/09/16 9.1295 7.3270 30/09/17 8.9142 7.4662 30/09/18 8.5603 7.5816
I Class Income (SGD hedged) units 30/09/17 10.5317 10.0077 30/09/18 10.6809 9.5811
I Class Accumulation units 30/09/09 15.4545 14.2619 31/01/11 13.3300 11.0600 30/09/11 14.0466 12.8371 30/09/12 15.4545 14.2619 30/09/13 16.7636 15.4389 30/09/14 18.2219 16.1386 30/09/15 18.9476 18.1144 30/09/16 20.1300 18.1707 30/09/17 21.8168 19.7712 30/09/18 22.0884 21.3487
I Class Accumulation (AUD hedged) units 30/09/17 10.8049 10.0358 30/09/18 10.9764 9.4654
I Class Accumulation (CHF hedged) units 30/09/13 10.2732 9.5180 30/09/14 11.6347 10.1555 30/09/15 12.2599 10.2931 30/09/16 11.6029 10.3053 30/09/17 12.5151 10.6654 30/09/18 12.7455 11.3623
I Class Accumulation (EUR hedged) units 30/09/09 9.5500 9.2600 31/01/11 10.2300 7.5800 30/09/11 11.1817 9.3789 30/09/12 10.9406 9.5765 30/09/13 11.9183 10.7842 30/09/14 13.3495 11.8047 30/09/15 12.5538 10.6669 30/09/16 12.1195 10.7074 30/09/17 13.7405 10.9654 30/09/18 14.2701 12.5200
I Class Accumulation (JPY hedged) units 31/01/11 12.6100 9.6300 30/09/11 13.7718 12.2321 30/09/12 15.1465 13.2389 30/09/13 15.1396 12.0823 30/09/14 13.5687 11.9043 30/09/15 12.9986 11.3433 30/09/16 14.9687 11.5640 30/09/17 14.8770 12.5245 30/09/18 15.1016 13.7267
I Class Accumulation (SGD hedged) units 30/09/17 10.5586 9.9859 30/09/18 10.9545 10.0805
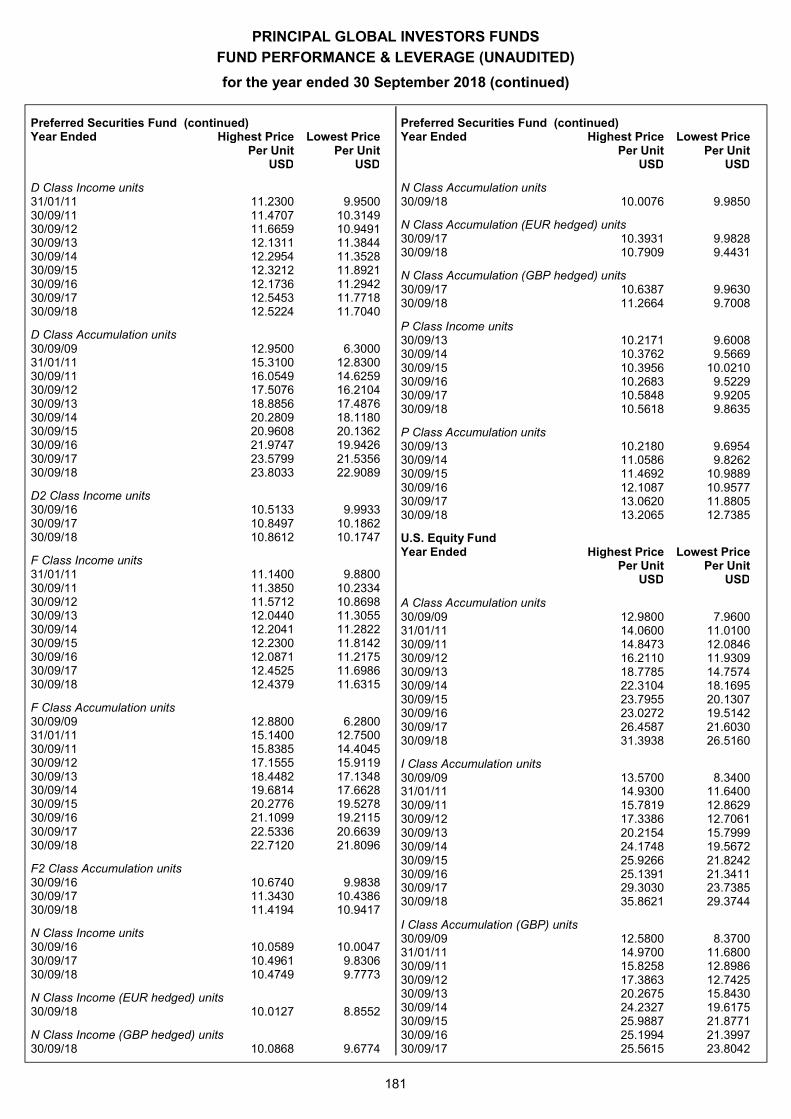
PRINCIPAL GLOBAL INVESTORS FUNDS
FUND PERFORMANCE & LEVERAGE (UNAUDITED)
for the year ended 30 September 2018 (continued)
181
Preferred Securities Fund (continued) Year Ended Highest Price Lowest Price Per Unit Per Unit USD USD
D Class Income units 31/01/11 11.2300 9.9500 30/09/11 11.4707 10.3149 30/09/12 11.6659 10.9491 30/09/13 12.1311 11.3844 30/09/14 12.2954 11.3528 30/09/15 12.3212 11.8921 30/09/16 12.1736 11.2942 30/09/17 12.5453 11.7718 30/09/18 12.5224 11.7040
D Class Accumulation units 30/09/09 12.9500 6.3000 31/01/11 15.3100 12.8300 30/09/11 16.0549 14.6259 30/09/12 17.5076 16.2104 30/09/13 18.8856 17.4876 30/09/14 20.2809 18.1180 30/09/15 20.9608 20.1362 30/09/16 21.9747 19.9426 30/09/17 23.5799 21.5356 30/09/18 23.8033 22.9089
D2 Class Income units 30/09/16 10.5133 9.9933 30/09/17 10.8497 10.1862 30/09/18 10.8612 10.1747
F Class Income units 31/01/11 11.1400 9.8800 30/09/11 11.3850 10.2334 30/09/12 11.5712 10.8698 30/09/13 12.0440 11.3055 30/09/14 12.2041 11.2822 30/09/15 12.2300 11.8142 30/09/16 12.0871 11.2175 30/09/17 12.4525 11.6986 30/09/18 12.4379 11.6315
F Class Accumulation units 30/09/09 12.8800 6.2800 31/01/11 15.1400 12.7500 30/09/11 15.8385 14.4045 30/09/12 17.1555 15.9119 30/09/13 18.4482 17.1348 30/09/14 19.6814 17.6628 30/09/15 20.2776 19.5278 30/09/16 21.1099 19.2115 30/09/17 22.5336 20.6639 30/09/18 22.7120 21.8096
F2 Class Accumulation units 30/09/16 10.6740 9.9838 30/09/17 11.3430 10.4386 30/09/18 11.4194 10.9417
N Class Income units 30/09/16 10.0589 10.0047 30/09/17 10.4961 9.8306 30/09/18 10.4749 9.7773
N Class Income (EUR hedged) units 30/09/18 10.0127 8.8552
N Class Income (GBP hedged) units 30/09/18 10.0868 9.6774
Preferred Securities Fund (continued) Year Ended Highest Price Lowest Price Per Unit Per Unit USD USD
N Class Accumulation units 30/09/18 10.0076 9.9850
N Class Accumulation (EUR hedged) units 30/09/17 10.3931 9.9828 30/09/18 10.7909 9.4431
N Class Accumulation (GBP hedged) units 30/09/17 10.6387 9.9630 30/09/18 11.2664 9.7008
P Class Income units 30/09/13 10.2171 9.6008 30/09/14 10.3762 9.5669 30/09/15 10.3956 10.0210 30/09/16 10.2683 9.5229 30/09/17 10.5848 9.9205 30/09/18 10.5618 9.8635
P Class Accumulation units 30/09/13 10.2180 9.6954 30/09/14 11.0586 9.8262 30/09/15 11.4692 10.9889 30/09/16 12.1087 10.9577 30/09/17 13.0620 11.8805 30/09/18 13.2065 12.7385
U.S. Equity Fund Year Ended Highest Price Lowest Price Per Unit Per Unit USD USD
A Class Accumulation units 30/09/09 12.9800 7.9600 31/01/11 14.0600 11.0100 30/09/11 14.8473 12.0846 30/09/12 16.2110 11.9309 30/09/13 18.7785 14.7574 30/09/14 22.3104 18.1695 30/09/15 23.7955 20.1307 30/09/16 23.0272 19.5142 30/09/17 26.4587 21.6030 30/09/18 31.3938 26.5160
I Class Accumulation units 30/09/09 13.5700 8.3400 31/01/11 14.9300 11.6400 30/09/11 15.7819 12.8629 30/09/12 17.3386 12.7061 30/09/13 20.2154 15.7999 30/09/14 24.1748 19.5672 30/09/15 25.9266 21.8242 30/09/16 25.1391 21.3411 30/09/17 29.3030 23.7385 30/09/18 35.8621 29.3744
I Class Accumulation (GBP) units 30/09/09 12.5800 8.3700 31/01/11 14.9700 11.6800 30/09/11 15.8258 12.8986 30/09/12 17.3863 12.7425 30/09/13 20.2675 15.8430 30/09/14 24.2327 19.6175 30/09/15 25.9887 21.8771 30/09/16 25.1994 21.3997 30/09/17 25.5615 23.8042
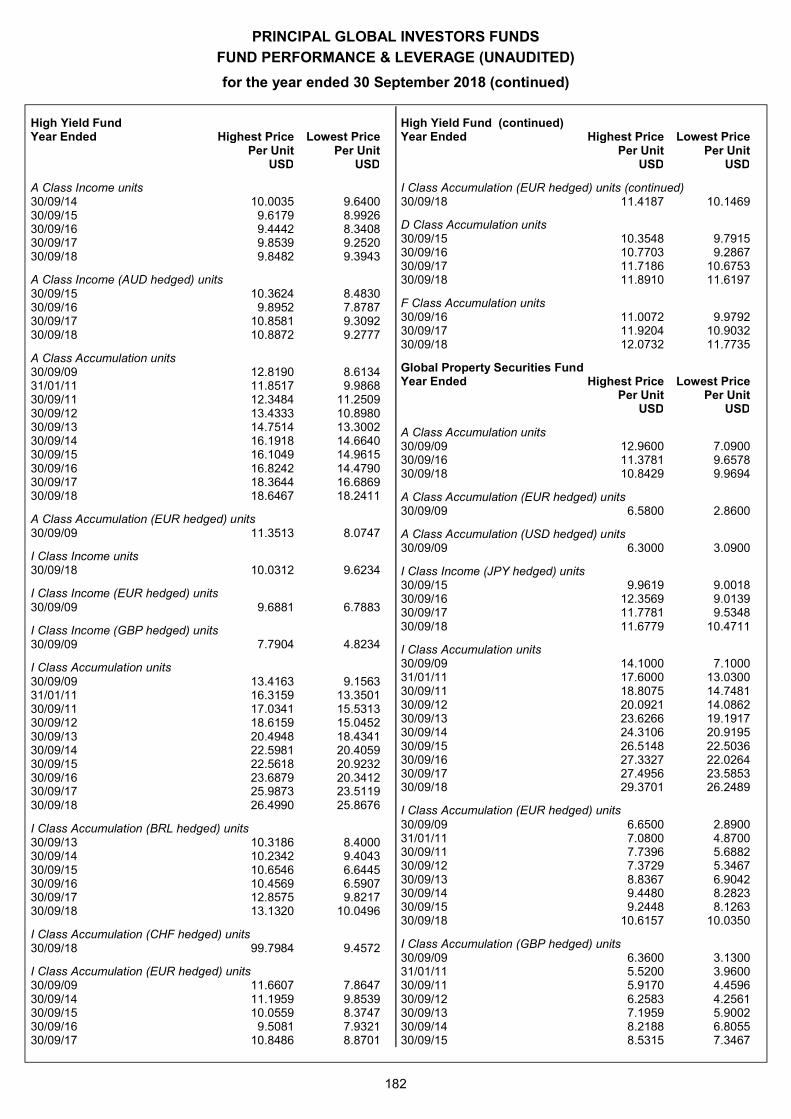
PRINCIPAL GLOBAL INVESTORS FUNDS
FUND PERFORMANCE & LEVERAGE (UNAUDITED)
for the year ended 30 September 2018 (continued)
182
High Yield Fund Year Ended Highest Price Lowest Price Per Unit Per Unit USD USD
A Class Income units 30/09/14 10.0035 9.6400 30/09/15 9.6179 8.9926 30/09/16 9.4442 8.3408 30/09/17 9.8539 9.2520 30/09/18 9.8482 9.3943
A Class Income (AUD hedged) units 30/09/15 10.3624 8.4830 30/09/16 9.8952 7.8787 30/09/17 10.8581 9.3092 30/09/18 10.8872 9.2777
A Class Accumulation units 30/09/09 12.8190 8.6134 31/01/11 11.8517 9.9868 30/09/11 12.3484 11.2509 30/09/12 13.4333 10.8980 30/09/13 14.7514 13.3002 30/09/14 16.1918 14.6640 30/09/15 16.1049 14.9615 30/09/16 16.8242 14.4790 30/09/17 18.3644 16.6869 30/09/18 18.6467 18.2411
A Class Accumulation (EUR hedged) units 30/09/09 11.3513 8.0747
I Class Income units 30/09/18 10.0312 9.6234
I Class Income (EUR hedged) units 30/09/09 9.6881 6.7883
I Class Income (GBP hedged) units 30/09/09 7.7904 4.8234
I Class Accumulation units 30/09/09 13.4163 9.1563 31/01/11 16.3159 13.3501 30/09/11 17.0341 15.5313 30/09/12 18.6159 15.0452 30/09/13 20.4948 18.4341 30/09/14 22.5981 20.4059 30/09/15 22.5618 20.9232 30/09/16 23.6879 20.3412 30/09/17 25.9873 23.5119 30/09/18 26.4990 25.8676
I Class Accumulation (BRL hedged) units 30/09/13 10.3186 8.4000 30/09/14 10.2342 9.4043 30/09/15 10.6546 6.6445 30/09/16 10.4569 6.5907 30/09/17 12.8575 9.8217 30/09/18 13.1320 10.0496
I Class Accumulation (CHF hedged) units 30/09/18 99.7984 9.4572
I Class Accumulation (EUR hedged) units 30/09/09 11.6607 7.8647 30/09/14 11.1959 9.8539 30/09/15 10.0559 8.3747 30/09/16 9.5081 7.9321 30/09/17 10.8486 8.8701
High Yield Fund (continued) Year Ended Highest Price Lowest Price Per Unit Per Unit USD USD
I Class Accumulation (EUR hedged) units (continued) 30/09/18 11.4187 10.1469
D Class Accumulation units 30/09/15 10.3548 9.7915 30/09/16 10.7703 9.2867 30/09/17 11.7186 10.6753 30/09/18 11.8910 11.6197
F Class Accumulation units 30/09/16 11.0072 9.9792 30/09/17 11.9204 10.9032 30/09/18 12.0732 11.7735
Global Property Securities Fund Year Ended Highest Price Lowest Price Per Unit Per Unit USD USD
A Class Accumulation units 30/09/09 12.9600 7.0900 30/09/16 11.3781 9.6578 30/09/18 10.8429 9.9694
A Class Accumulation (EUR hedged) units 30/09/09 6.5800 2.8600
A Class Accumulation (USD hedged) units 30/09/09 6.3000 3.0900
I Class Income (JPY hedged) units 30/09/15 9.9619 9.0018 30/09/16 12.3569 9.0139 30/09/17 11.7781 9.5348 30/09/18 11.6779 10.4711
I Class Accumulation units 30/09/09 14.1000 7.1000 31/01/11 17.6000 13.0300 30/09/11 18.8075 14.7481 30/09/12 20.0921 14.0862 30/09/13 23.6266 19.1917 30/09/14 24.3106 20.9195 30/09/15 26.5148 22.5036 30/09/16 27.3327 22.0264 30/09/17 27.4956 23.5853 30/09/18 29.3701 26.2489
I Class Accumulation (EUR hedged) units 30/09/09 6.6500 2.8900 31/01/11 7.0800 4.8700 30/09/11 7.7396 5.6882 30/09/12 7.3729 5.3467 30/09/13 8.8367 6.9042 30/09/14 9.4480 8.2823 30/09/15 9.2448 8.1263 30/09/18 10.6157 10.0350
I Class Accumulation (GBP hedged) units 30/09/09 6.3600 3.1300 31/01/11 5.5200 3.9600 30/09/11 5.9170 4.4596 30/09/12 6.2583 4.2561 30/09/13 7.1959 5.9002 30/09/14 8.2188 6.8055 30/09/15 8.5315 7.3467
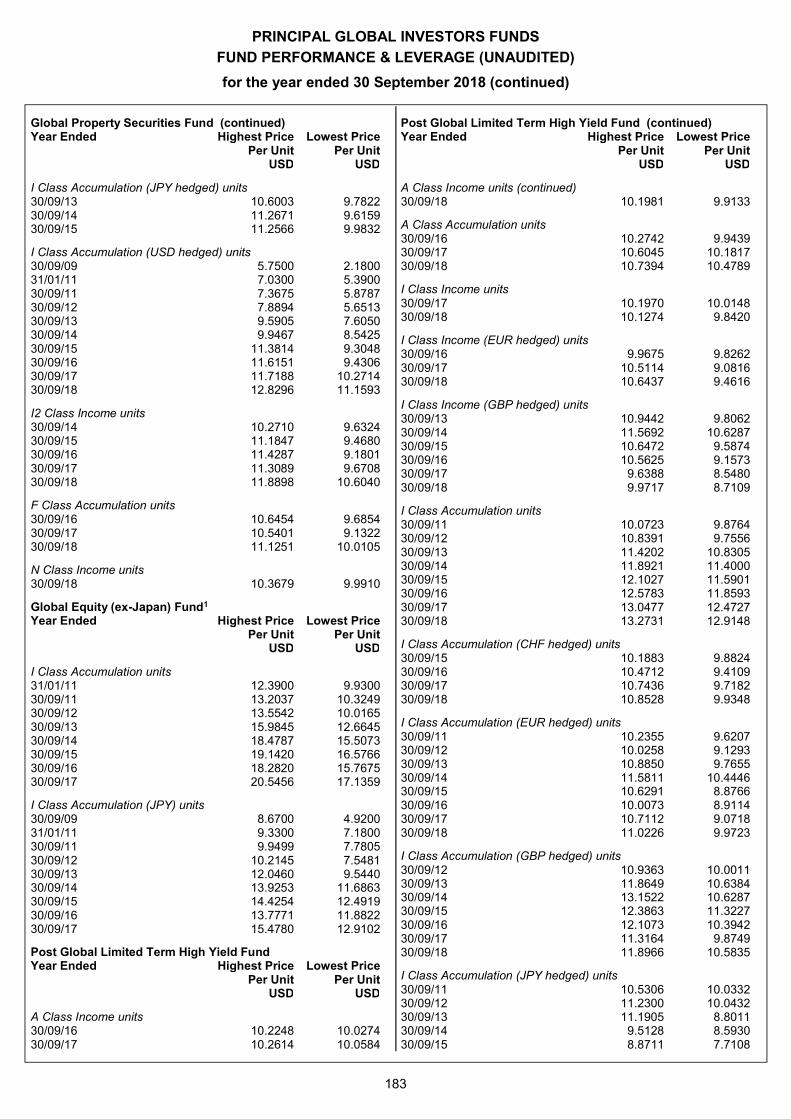
PRINCIPAL GLOBAL INVESTORS FUNDS
FUND PERFORMANCE & LEVERAGE (UNAUDITED)
for the year ended 30 September 2018 (continued)
183
Global Property Securities Fund (continued) Year Ended Highest Price Lowest Price Per Unit Per Unit USD USD
I Class Accumulation (JPY hedged) units 30/09/13 10.6003 9.7822 30/09/14 11.2671 9.6159 30/09/15 11.2566 9.9832
I Class Accumulation (USD hedged) units 30/09/09 5.7500 2.1800 31/01/11 7.0300 5.3900 30/09/11 7.3675 5.8787 30/09/12 7.8894 5.6513 30/09/13 9.5905 7.6050 30/09/14 9.9467 8.5425 30/09/15 11.3814 9.3048 30/09/16 11.6151 9.4306 30/09/17 11.7188 10.2714 30/09/18 12.8296 11.1593
I2 Class Income units 30/09/14 10.2710 9.6324 30/09/15 11.1847 9.4680 30/09/16 11.4287 9.1801 30/09/17 11.3089 9.6708 30/09/18 11.8898 10.6040
F Class Accumulation units 30/09/16 10.6454 9.6854 30/09/17 10.5401 9.1322 30/09/18 11.1251 10.0105
N Class Income units 30/09/18 10.3679 9.9910
Global Equity (ex-Japan) Fund1 Year Ended Highest Price Lowest Price Per Unit Per Unit USD USD
I Class Accumulation units 31/01/11 12.3900 9.9300 30/09/11 13.2037 10.3249 30/09/12 13.5542 10.0165 30/09/13 15.9845 12.6645 30/09/14 18.4787 15.5073 30/09/15 19.1420 16.5766 30/09/16 18.2820 15.7675 30/09/17 20.5456 17.1359
I Class Accumulation (JPY) units 30/09/09 8.6700 4.9200 31/01/11 9.3300 7.1800 30/09/11 9.9499 7.7805 30/09/12 10.2145 7.5481 30/09/13 12.0460 9.5440 30/09/14 13.9253 11.6863 30/09/15 14.4254 12.4919 30/09/16 13.7771 11.8822 30/09/17 15.4780 12.9102
Post Global Limited Term High Yield Fund Year Ended Highest Price Lowest Price Per Unit Per Unit USD USD
A Class Income units 30/09/16 10.2248 10.0274 30/09/17 10.2614 10.0584
Post Global Limited Term High Yield Fund (continued) Year Ended Highest Price Lowest Price Per Unit Per Unit USD USD
A Class Income units (continued) 30/09/18 10.1981 9.9133
A Class Accumulation units 30/09/16 10.2742 9.9439 30/09/17 10.6045 10.1817 30/09/18 10.7394 10.4789
I Class Income units 30/09/17 10.1970 10.0148 30/09/18 10.1274 9.8420
I Class Income (EUR hedged) units 30/09/16 9.9675 9.8262 30/09/17 10.5114 9.0816 30/09/18 10.6437 9.4616
I Class Income (GBP hedged) units 30/09/13 10.9442 9.8062 30/09/14 11.5692 10.6287 30/09/15 10.6472 9.5874 30/09/16 10.5625 9.1573 30/09/17 9.6388 8.5480 30/09/18 9.9717 8.7109
I Class Accumulation units 30/09/11 10.0723 9.8764 30/09/12 10.8391 9.7556 30/09/13 11.4202 10.8305 30/09/14 11.8921 11.4000 30/09/15 12.1027 11.5901 30/09/16 12.5783 11.8593 30/09/17 13.0477 12.4727 30/09/18 13.2731 12.9148
I Class Accumulation (CHF hedged) units 30/09/15 10.1883 9.8824 30/09/16 10.4712 9.4109 30/09/17 10.7436 9.7182 30/09/18 10.8528 9.9348
I Class Accumulation (EUR hedged) units 30/09/11 10.2355 9.6207 30/09/12 10.0258 9.1293 30/09/13 10.8850 9.7655 30/09/14 11.5811 10.4446 30/09/15 10.6291 8.8766 30/09/16 10.0073 8.9114 30/09/17 10.7112 9.0718 30/09/18 11.0226 9.9723
I Class Accumulation (GBP hedged) units 30/09/12 10.9363 10.0011 30/09/13 11.8649 10.6384 30/09/14 13.1522 10.6287 30/09/15 12.3863 11.3227 30/09/16 12.1073 10.3942 30/09/17 11.3164 9.8749 30/09/18 11.8966 10.5835
I Class Accumulation (JPY hedged) units 30/09/11 10.5306 10.0332 30/09/12 11.2300 10.0432 30/09/13 11.1905 8.8011 30/09/14 9.5128 8.5930 30/09/15 8.8711 7.7108
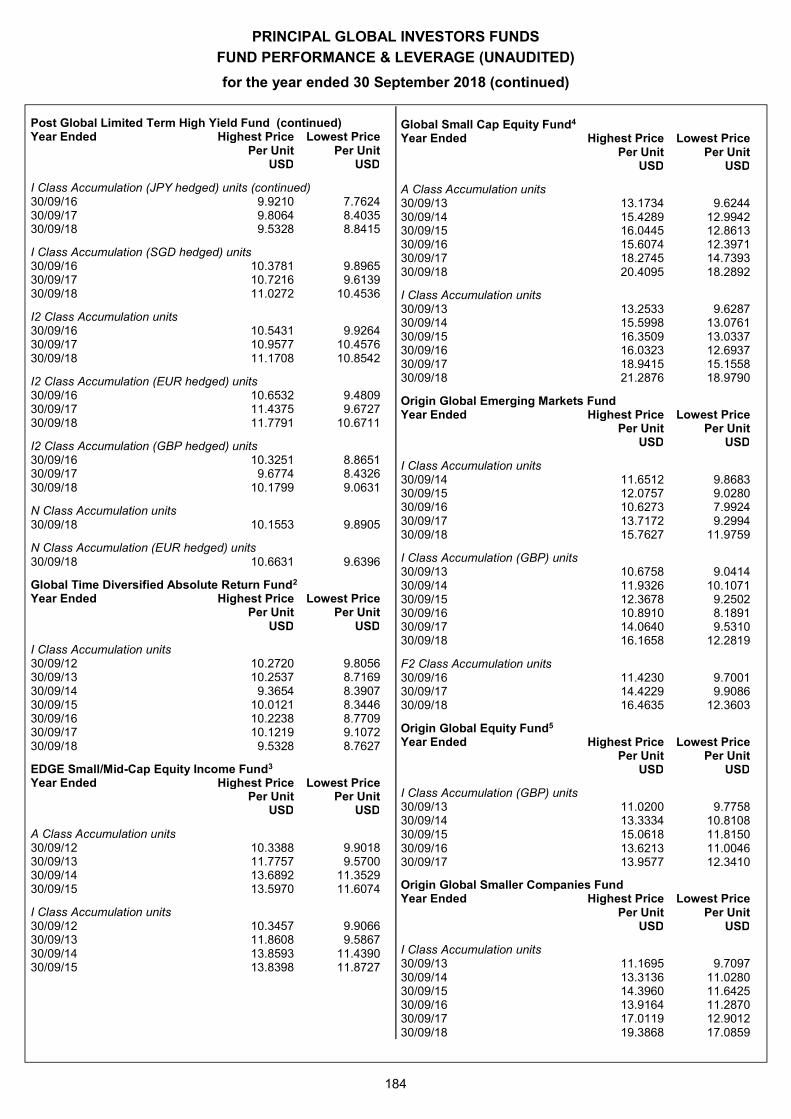
PRINCIPAL GLOBAL INVESTORS FUNDS
FUND PERFORMANCE & LEVERAGE (UNAUDITED)
for the year ended 30 September 2018 (continued)
184
Post Global Limited Term High Yield Fund (continued) Year Ended Highest Price Lowest Price Per Unit Per Unit USD USD
I Class Accumulation (JPY hedged) units (continued) 30/09/16 9.9210 7.7624 30/09/17 9.8064 8.4035 30/09/18 9.5328 8.8415
I Class Accumulation (SGD hedged) units 30/09/16 10.3781 9.8965 30/09/17 10.7216 9.6139 30/09/18 11.0272 10.4536
I2 Class Accumulation units 30/09/16 10.5431 9.9264 30/09/17 10.9577 10.4576 30/09/18 11.1708 10.8542
I2 Class Accumulation (EUR hedged) units 30/09/16 10.6532 9.4809 30/09/17 11.4375 9.6727 30/09/18 11.7791 10.6711
I2 Class Accumulation (GBP hedged) units 30/09/16 10.3251 8.8651 30/09/17 9.6774 8.4326 30/09/18 10.1799 9.0631
N Class Accumulation units 30/09/18 10.1553 9.8905
N Class Accumulation (EUR hedged) units 30/09/18 10.6631 9.6396
Global Time Diversified Absolute Return Fund2 Year Ended Highest Price Lowest Price Per Unit Per Unit USD USD
I Class Accumulation units 30/09/12 10.2720 9.8056 30/09/13 10.2537 8.7169 30/09/14 9.3654 8.3907 30/09/15 10.0121 8.3446 30/09/16 10.2238 8.7709 30/09/17 10.1219 9.1072 30/09/18 9.5328 8.7627
EDGE Small/Mid-Cap Equity Income Fund3 Year Ended Highest Price Lowest Price Per Unit Per Unit USD USD
A Class Accumulation units 30/09/12 10.3388 9.9018 30/09/13 11.7757 9.5700 30/09/14 13.6892 11.3529 30/09/15 13.5970 11.6074
I Class Accumulation units 30/09/12 10.3457 9.9066 30/09/13 11.8608 9.5867 30/09/14 13.8593 11.4390 30/09/15 13.8398 11.8727
Global Small Cap Equity Fund4 Year Ended Highest Price Lowest Price Per Unit Per Unit USD USD
A Class Accumulation units 30/09/13 13.1734 9.6244 30/09/14 15.4289 12.9942 30/09/15 16.0445 12.8613 30/09/16 15.6074 12.3971 30/09/17 18.2745 14.7393 30/09/18 20.4095 18.2892
I Class Accumulation units 30/09/13 13.2533 9.6287 30/09/14 15.5998 13.0761 30/09/15 16.3509 13.0337 30/09/16 16.0323 12.6937 30/09/17 18.9415 15.1558 30/09/18 21.2876 18.9790
Origin Global Emerging Markets Fund Year Ended Highest Price Lowest Price Per Unit Per Unit USD USD
I Class Accumulation units 30/09/14 11.6512 9.8683 30/09/15 12.0757 9.0280 30/09/16 10.6273 7.9924 30/09/17 13.7172 9.2994 30/09/18 15.7627 11.9759
I Class Accumulation (GBP) units 30/09/13 10.6758 9.0414 30/09/14 11.9326 10.1071 30/09/15 12.3678 9.2502 30/09/16 10.8910 8.1891 30/09/17 14.0640 9.5310 30/09/18 16.1658 12.2819
F2 Class Accumulation units 30/09/16 11.4230 9.7001 30/09/17 14.4229 9.9086 30/09/18 16.4635 12.3603
Origin Global Equity Fund5 Year Ended Highest Price Lowest Price Per Unit Per Unit USD USD
I Class Accumulation (GBP) units 30/09/13 11.0200 9.7758 30/09/14 13.3334 10.8108 30/09/15 15.0618 11.8150 30/09/16 13.6213 11.0046 30/09/17 13.9577 12.3410
Origin Global Smaller Companies Fund Year Ended Highest Price Lowest Price Per Unit Per Unit USD USD
I Class Accumulation units 30/09/13 11.1695 9.7097 30/09/14 13.3136 11.0280 30/09/15 14.3960 11.6425 30/09/16 13.9164 11.2870 30/09/17 17.0119 12.9012 30/09/18 19.3868 17.0859
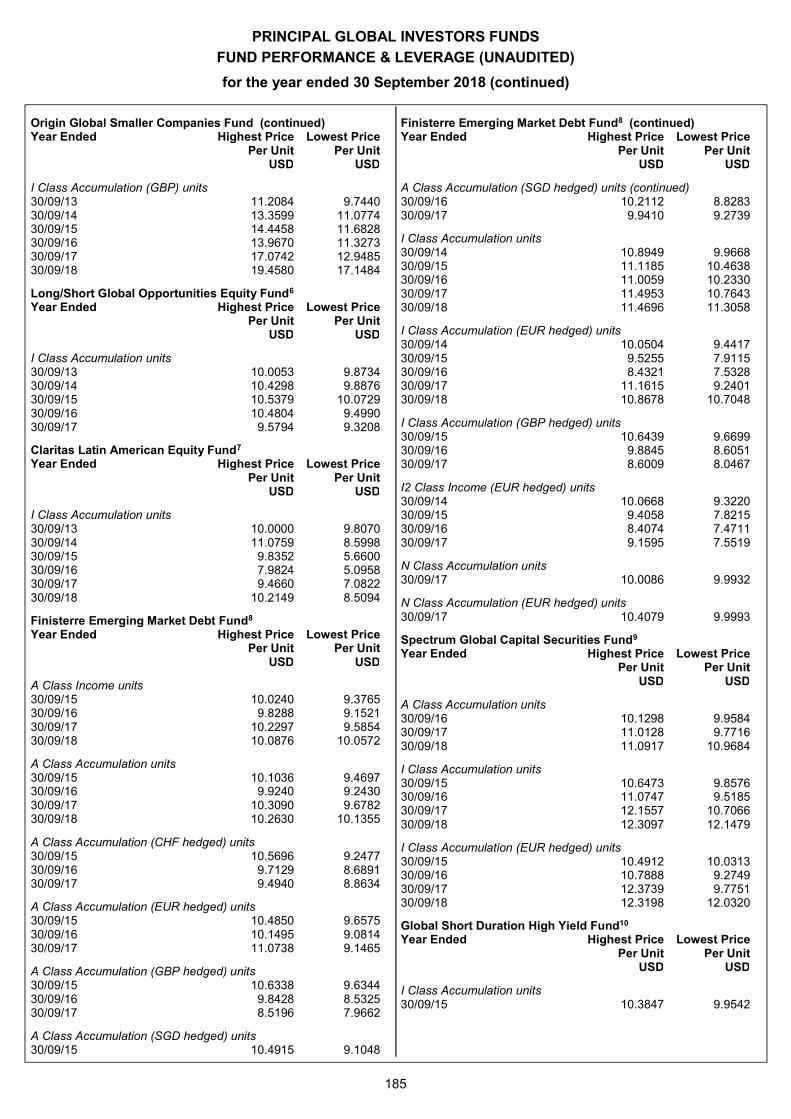
PRINCIPAL GLOBAL INVESTORS FUNDS
FUND PERFORMANCE & LEVERAGE (UNAUDITED)
for the year ended 30 September 2018 (continued)
185
Origin Global Smaller Companies Fund (continued) Year Ended Highest Price Lowest Price Per Unit Per Unit USD USD
I Class Accumulation (GBP) units 30/09/13 11.2084 9.7440 30/09/14 13.3599 11.0774 30/09/15 14.4458 11.6828 30/09/16 13.9670 11.3273 30/09/17 17.0742 12.9485 30/09/18 19.4580 17.1484
Long/Short Global Opportunities Equity Fund6 Year Ended Highest Price Lowest Price Per Unit Per Unit USD USD
I Class Accumulation units 30/09/13 10.0053 9.8734 30/09/14 10.4298 9.8876 30/09/15 10.5379 10.0729 30/09/16 10.4804 9.4990 30/09/17 9.5794 9.3208
Claritas Latin American Equity Fund7 Year Ended Highest Price Lowest Price Per Unit Per Unit USD USD
I Class Accumulation units 30/09/13 10.0000 9.8070 30/09/14 11.0759 8.5998 30/09/15 9.8352 5.6600 30/09/16 7.9824 5.0958 30/09/17 9.4660 7.0822 30/09/18 10.2149 8.5094
Finisterre Emerging Market Debt Fund8 Year Ended Highest Price Lowest Price Per Unit Per Unit USD USD
A Class Income units 30/09/15 10.0240 9.3765 30/09/16 9.8288 9.1521 30/09/17 10.2297 9.5854 30/09/18 10.0876 10.0572
A Class Accumulation units 30/09/15 10.1036 9.4697 30/09/16 9.9240 9.2430 30/09/17 10.3090 9.6782 30/09/18 10.2630 10.1355
A Class Accumulation (CHF hedged) units 30/09/15 10.5696 9.2477 30/09/16 9.7129 8.6891 30/09/17 9.4940 8.8634
A Class Accumulation (EUR hedged) units 30/09/15 10.4850 9.6575 30/09/16 10.1495 9.0814 30/09/17 11.0738 9.1465
A Class Accumulation (GBP hedged) units 30/09/15 10.6338 9.6344 30/09/16 9.8428 8.5325 30/09/17 8.5196 7.9662
A Class Accumulation (SGD hedged) units 30/09/15 10.4915 9.1048
Finisterre Emerging Market Debt Fund8 (continued) Year Ended Highest Price Lowest Price Per Unit Per Unit USD USD
A Class Accumulation (SGD hedged) units (continued) 30/09/16 10.2112 8.8283 30/09/17 9.9410 9.2739
I Class Accumulation units 30/09/14 10.8949 9.9668 30/09/15 11.1185 10.4638 30/09/16 11.0059 10.2330 30/09/17 11.4953 10.7643 30/09/18 11.4696 11.3058
I Class Accumulation (EUR hedged) units 30/09/14 10.0504 9.4417 30/09/15 9.5255 7.9115 30/09/16 8.4321 7.5328 30/09/17 11.1615 9.2401 30/09/18 10.8678 10.7048
I Class Accumulation (GBP hedged) units 30/09/15 10.6439 9.6699 30/09/16 9.8845 8.6051 30/09/17 8.6009 8.0467
I2 Class Income (EUR hedged) units 30/09/14 10.0668 9.3220 30/09/15 9.4058 7.8215 30/09/16 8.4074 7.4711 30/09/17 9.1595 7.5519
N Class Accumulation units 30/09/17 10.0086 9.9932
N Class Accumulation (EUR hedged) units 30/09/17 10.4079 9.9993
Spectrum Global Capital Securities Fund9 Year Ended Highest Price Lowest Price Per Unit Per Unit USD USD
A Class Accumulation units 30/09/16 10.1298 9.9584 30/09/17 11.0128 9.7716 30/09/18 11.0917 10.9684
I Class Accumulation units 30/09/15 10.6473 9.8576 30/09/16 11.0747 9.5185 30/09/17 12.1557 10.7066 30/09/18 12.3097 12.1479
I Class Accumulation (EUR hedged) units 30/09/15 10.4912 10.0313 30/09/16 10.7888 9.2749 30/09/17 12.3739 9.7751 30/09/18 12.3198 12.0320
Global Short Duration High Yield Fund10 Year Ended Highest Price Lowest Price Per Unit Per Unit USD USD
I Class Accumulation units 30/09/15 10.3847 9.9542
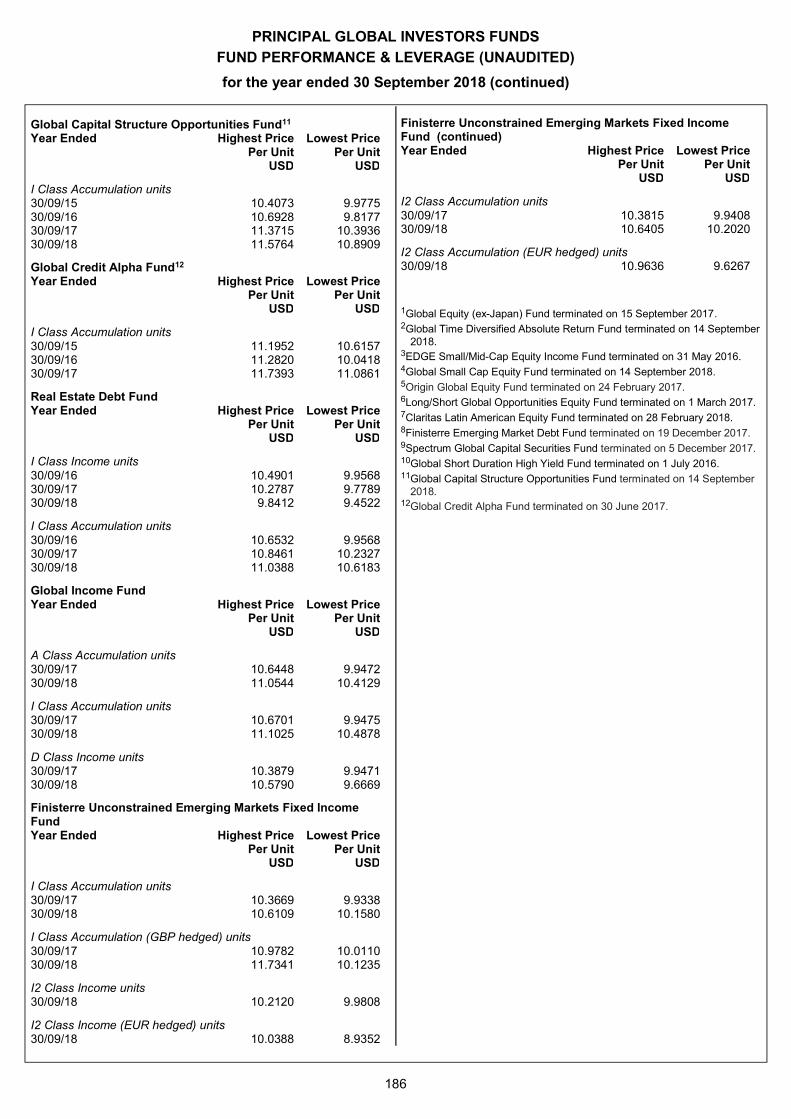
PRINCIPAL GLOBAL INVESTORS FUNDS
FUND PERFORMANCE & LEVERAGE (UNAUDITED)
for the year ended 30 September 2018 (continued)
186
Global Capital Structure Opportunities Fund11 Year Ended Highest Price Lowest Price Per Unit Per Unit USD USD
I Class Accumulation units 30/09/15 10.4073 9.9775 30/09/16 10.6928 9.8177 30/09/17 11.3715 10.3936 30/09/18 11.5764 10.8909
Global Credit Alpha Fund12 Year Ended Highest Price Lowest Price Per Unit Per Unit USD USD
I Class Accumulation units 30/09/15 11.1952 10.6157 30/09/16 11.2820 10.0418 30/09/17 11.7393 11.0861
Real Estate Debt Fund Year Ended Highest Price Lowest Price Per Unit Per Unit USD USD
I Class Income units 30/09/16 10.4901 9.9568 30/09/17 10.2787 9.7789 30/09/18 9.8412 9.4522
I Class Accumulation units 30/09/16 10.6532 9.9568 30/09/17 10.8461 10.2327 30/09/18 11.0388 10.6183
Global Income Fund Year Ended Highest Price Lowest Price Per Unit Per Unit USD USD
A Class Accumulation units 30/09/17 10.6448 9.9472 30/09/18 11.0544 10.4129
I Class Accumulation units 30/09/17 10.6701 9.9475 30/09/18 11.1025 10.4878
D Class Income units 30/09/17 10.3879 9.9471 30/09/18 10.5790 9.6669
Finisterre Unconstrained Emerging Markets Fixed Income Fund Year Ended Highest Price Lowest Price Per Unit Per Unit USD USD
I Class Accumulation units 30/09/17 10.3669 9.9338 30/09/18 10.6109 10.1580
I Class Accumulation (GBP hedged) units 30/09/17 10.9782 10.0110 30/09/18 11.7341 10.1235
I2 Class Income units 30/09/18 10.2120 9.9808
I2 Class Income (EUR hedged) units 30/09/18 10.0388 8.9352
Finisterre Unconstrained Emerging Markets Fixed Income Fund (continued) Year Ended Highest Price Lowest Price Per Unit Per Unit USD USD
I2 Class Accumulation units 30/09/17 10.3815 9.9408 30/09/18 10.6405 10.2020
I2 Class Accumulation (EUR hedged) units 30/09/18 10.9636 9.6267
1Global Equity (ex-Japan) Fund terminated on 15 September 2017. 2Global Time Diversified Absolute Return Fund terminated on 14 September
2018. 3EDGE Small/Mid-Cap Equity Income Fund terminated on 31 May 2016. 4Global Small Cap Equity Fund terminated on 14 September 2018. 5Origin Global Equity Fund terminated on 24 February 2017. 6Long/Short Global Opportunities Equity Fund terminated on 1 March 2017. 7Claritas Latin American Equity Fund terminated on 28 February 2018. 8Finisterre Emerging Market Debt Fund terminated on 19 December 2017. 9Spectrum Global Capital Securities Fund terminated on 5 December 2017. 10Global Short Duration High Yield Fund terminated on 1 July 2016. 11Global Capital Structure Opportunities Fund terminated on 14 September
2018. 12Global Credit Alpha Fund terminated on 30 June 2017.
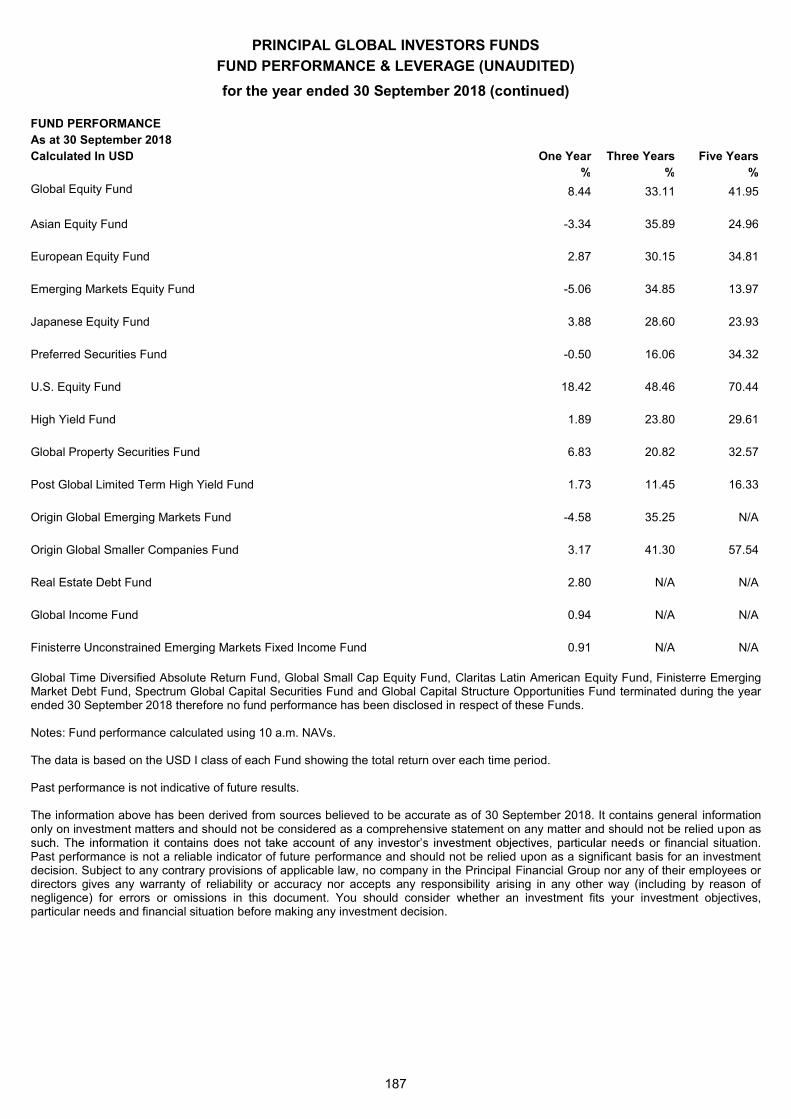
PRINCIPAL GLOBAL INVESTORS FUNDS
FUND PERFORMANCE & LEVERAGE (UNAUDITED)
for the year ended 30 September 2018 (continued)
187
FUND PERFORMANCE As at 30 September 2018 Calculated In USD One Year Three Years Five Years % % % Global Equity Fund 8.44 33.11 41.95 Asian Equity Fund -3.34 35.89 24.96 European Equity Fund 2.87 30.15 34.81 Emerging Markets Equity Fund -5.06 34.85 13.97 Japanese Equity Fund 3.88 28.60 23.93 Preferred Securities Fund -0.50 16.06 34.32 U.S. Equity Fund 18.42 48.46 70.44 High Yield Fund 1.89 23.80 29.61 Global Property Securities Fund 6.83 20.82 32.57 Post Global Limited Term High Yield Fund 1.73 11.45 16.33 Origin Global Emerging Markets Fund -4.58 35.25 N/A Origin Global Smaller Companies Fund 3.17 41.30 57.54 Real Estate Debt Fund 2.80 N/A N/A Global Income Fund 0.94 N/A N/A Finisterre Unconstrained Emerging Markets Fixed Income Fund 0.91 N/A N/A Global Time Diversified Absolute Return Fund, Global Small Cap Equity Fund, Claritas Latin American Equity Fund, Finisterre Emerging Market Debt Fund, Spectrum Global Capital Securities Fund and Global Capital Structure Opportunities Fund terminated during the year ended 30 September 2018 therefore no fund performance has been disclosed in respect of these Funds. Notes: Fund performance calculated using 10 a.m. NAVs. The data is based on the USD I class of each Fund showing the total return over each time period. Past performance is not indicative of future results. The information above has been derived from sources believed to be accurate as of 30 September 2018. It contains general information only on investment matters and should not be considered as a comprehensive statement on any matter and should not be relied upon as
s or financial situation. Past performance is not a reliable indicator of future performance and should not be relied upon as a significant basis for an investment decision. Subject to any contrary provisions of applicable law, no company in the Principal Financial Group nor any of their employees or directors gives any warranty of reliability or accuracy nor accepts any responsibility arising in any other way (including by reason of negligence) for errors or omissions in this document. You should consider whether an investment fits your investment objectives, particular needs and financial situation before making any investment decision.
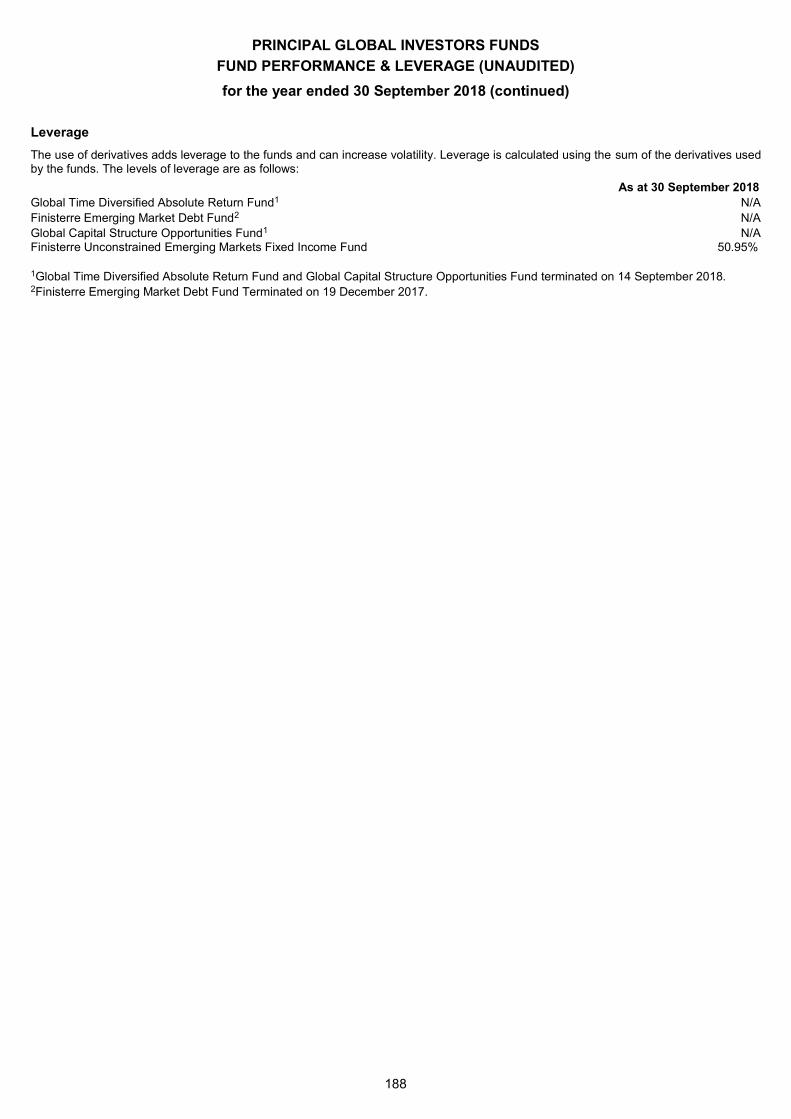
PRINCIPAL GLOBAL INVESTORS FUNDS
FUND PERFORMANCE & LEVERAGE (UNAUDITED)
for the year ended 30 September 2018 (continued)
188
Leverage
The use of derivatives adds leverage to the funds and can increase volatility. Leverage is calculated using the sum of the derivatives used by the funds. The levels of leverage are as follows:
As at 30 September 2018 Global Time Diversified Absolute Return Fund1 N/A Finisterre Emerging Market Debt Fund2 N/A Global Capital Structure Opportunities Fund1 N/A Finisterre Unconstrained Emerging Markets Fixed Income Fund 50.95% 1Global Time Diversified Absolute Return Fund and Global Capital Structure Opportunities Fund terminated on 14 September 2018. 2Finisterre Emerging Market Debt Fund Terminated on 19 December 2017.
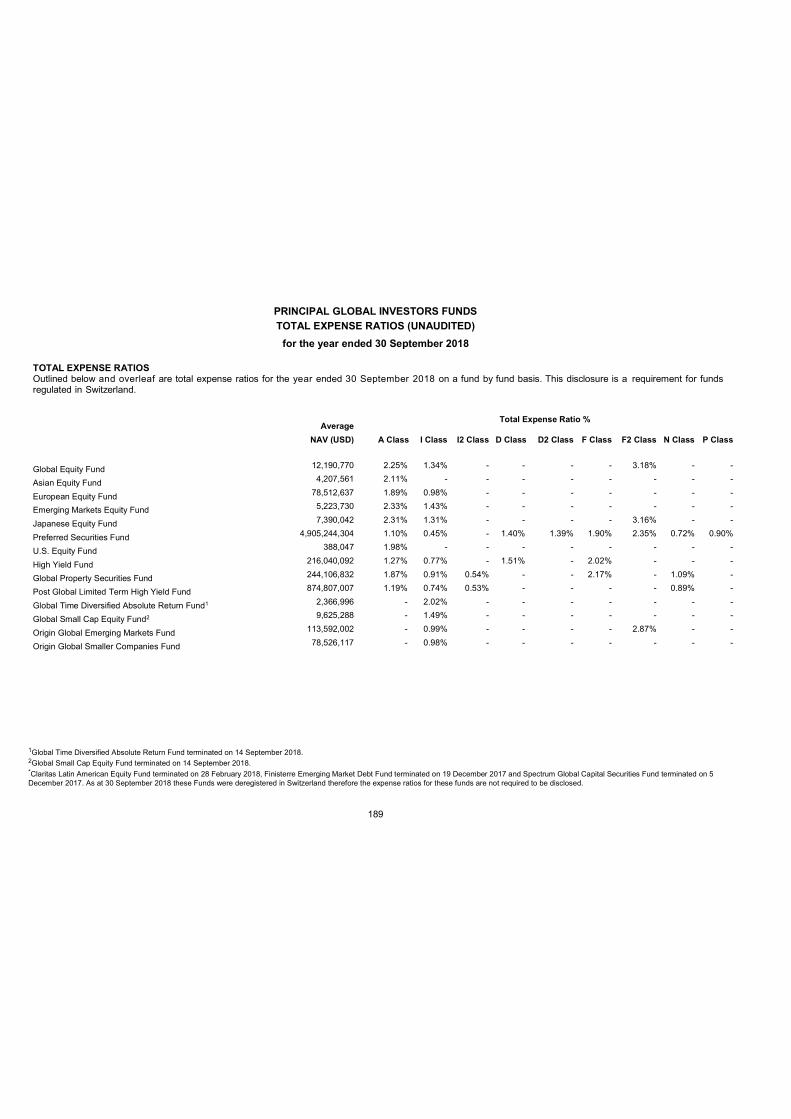
PRINCIPAL GLOBAL INVESTORS FUNDS
TOTAL EXPENSE RATIOS (UNAUDITED)
for the year ended 30 September 2018
189
TOTAL EXPENSE RATIOS Outlined below and overleaf are total expense ratios for the year ended 30 September 2018 on a fund by fund basis. This disclosure is a requirement for funds regulated in Switzerland.
Total Expense Ratio % Average
NAV (USD) A Class I Class I2 Class D Class D2 Class F Class F2 Class N Class P Class
Global Equity Fund 12,190,770 2.25% 1.34% - - - - 3.18% - -
Asian Equity Fund 4,207,561 2.11% - - - - - - - -
European Equity Fund 78,512,637 1.89% 0.98% - - - - - - -
Emerging Markets Equity Fund 5,223,730 2.33% 1.43% - - - - - - -
Japanese Equity Fund 7,390,042 2.31% 1.31% - - - - 3.16% - -
Preferred Securities Fund 4,905,244,304 1.10% 0.45% - 1.40% 1.39% 1.90% 2.35% 0.72% 0.90%
U.S. Equity Fund 388,047 1.98% - - - - - - - -
High Yield Fund 216,040,092 1.27% 0.77% - 1.51% - 2.02% - - -
Global Property Securities Fund 244,106,832 1.87% 0.91% 0.54% - - 2.17% - 1.09% -
Post Global Limited Term High Yield Fund 874,807,007 1.19% 0.74% 0.53% - - - - 0.89% -
Global Time Diversified Absolute Return Fund1 2,366,996 - 2.02% - - - - - - -
Global Small Cap Equity Fund2 9,625,288 - 1.49% - - - - - - -
Origin Global Emerging Markets Fund 113,592,002 - 0.99% - - - - 2.87% - -
Origin Global Smaller Companies Fund 78,526,117 - 0.98% - - - - - - -
1Global Time Diversified Absolute Return Fund terminated on 14 September 2018. 2Global Small Cap Equity Fund terminated on 14 September 2018. *Claritas Latin American Equity Fund terminated on 28 February 2018, Finisterre Emerging Market Debt Fund terminated on 19 December 2017 and Spectrum Global Capital Securities Fund terminated on 5 December 2017. As at 30 September 2018 these Funds were deregistered in Switzerland therefore the expense ratios for these funds are not required to be disclosed.
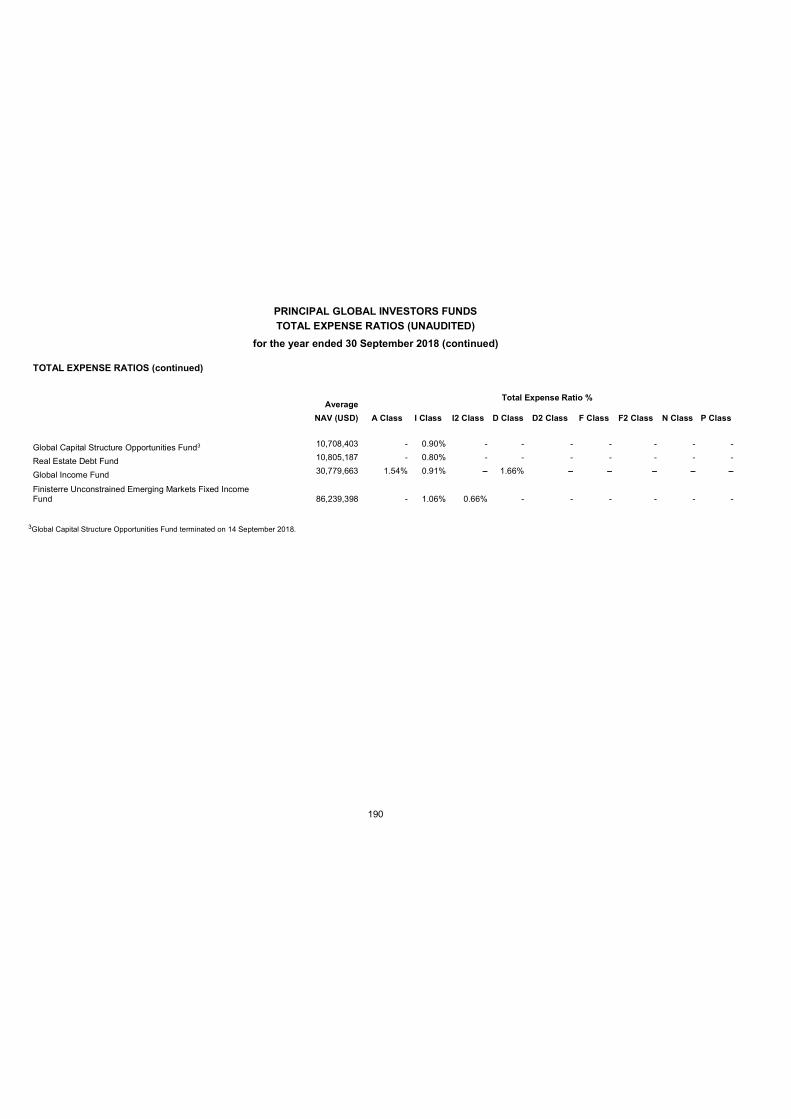
PRINCIPAL GLOBAL INVESTORS FUNDS
TOTAL EXPENSE RATIOS (UNAUDITED)
for the year ended 30 September 2018 (continued)
190
TOTAL EXPENSE RATIOS (continued)
Total Expense Ratio %
Average
NAV (USD) A Class I Class I2 Class D Class D2 Class F Class F2 Class N Class P Class
Global Capital Structure Opportunities Fund3 10,708,403 - 0.90% - - - - - - -
Real Estate Debt Fund 10,805,187 - 0.80% - - - - - - -
Global Income Fund 30,779,663 1.54% 0.91% 1.66%
Finisterre Unconstrained Emerging Markets Fixed Income Fund 86,239,398 - 1.06% 0.66% - - - - - -
3Global Capital Structure Opportunities Fund terminated on 14 September 2018.
PRINCIPAL GLOBAL INVESTORS FUNDS
UCITS V Remuneration Policy (UNAUDITED)
for the year ended 30 September 2018
191
UCITS V Remuneration Policy (Unaudited) Regulation 89(3A) of the UCITS Regulations: UCITS V Remuneration Requirements; Regulation 89(3A) of the UCITS Regulations (as introduced pursuant to the UCITS V Regulations on 21 March 2016) requires that the annual report of Principal Global Investors Funds (the ) contains certain disclosures on remuneration paid remuneration policy made during the year. In this regard, the following points are to be noted:
The Manager has prepared a remuneration policy outlining how it adheres to the remuneration requirements set out in the UCITS Regulations. This policy was adopted with effect from 18 March 2016.
An annual review was undertaken of the remuneration policy during the financial year and no material changes
were made to the remuneration policy.
The Manager has no employees or staff that it employs and pays directly. The Manager has a Board of Directors, three of whom are employees of the Principal Group and receive no remuneration from the Manager. The remaining four directors, each of whom is independent, receive a fixed fee only (for the year ended 30 September 2018;
100,000 in aggregate) and do not receive variable remuneration. These fees are set at a level that reflects the
scope and complexity of its activities. The Manager delegates certain portfolio management activities for the Trust to Principal Global Investors LLC, (the
) and to Principal Global Investors (Europe) Limited, Principal Global Investors (Australia) Limited, Spectrum Asset Management, Principal Real Estate Investors LLC, Principal Global Investors (Japan) Limited, Principal Global Investors (Singapore) Limited, Post Advisory Group LLC, Origin Asset Management LLP, Claritas Administraceo De Recursos Ltda, Finisterre Malta Limited and Finisterre Capital LLP, (the - ) The Delegate has calculated that, in aggregate, it pays its relevant staff** the following in relation to the functions it performs in respect of the Trust:
An aggregate amount of $4,571,045, including an amount of $8,282 corresponding with received performance fees. This amount is applied across 73 members of staff at the Delegate and is apportioned as approximately $658,662 in aggregate fixed remuneration and $3,912,384 in aggregate variable remuneration. In accordance with applicable European regulation and guidance, these figures are calculated on the basis of fee income received by the Delegate in relation to the Trust and how this correlates with the relevant staff's remuneration. Further, these figures relate only to the proportion of the relevant staff's remuneration that is estimated to be attributed, on a pro rata basis, to the functions such staff perform for the Delegate in relation to the Trust.
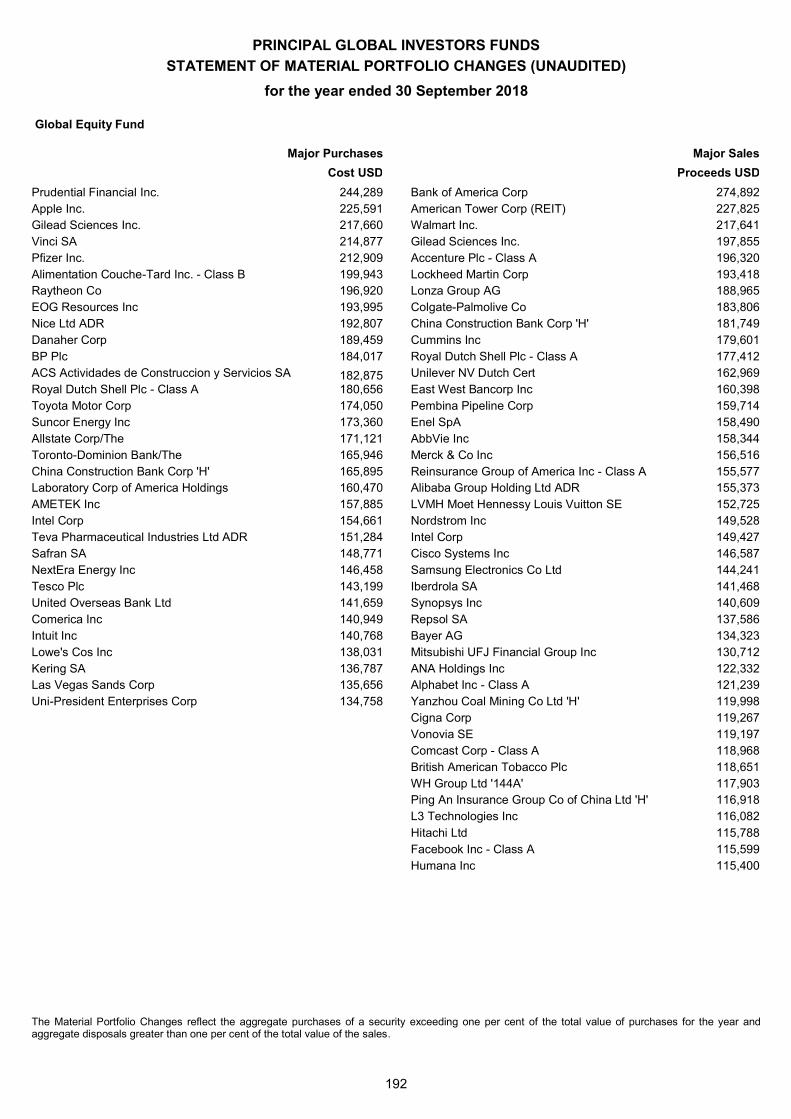
PRINCIPAL GLOBAL INVESTORS FUNDS
STATEMENT OF MATERIAL PORTFOLIO CHANGES (UNAUDITED)
for the year ended 30 September 2018
192
Global Equity Fund
Major Purchases Major Sales
Cost USD Proceeds USD
Prudential Financial Inc. 244,289 Bank of America Corp 274,892 Apple Inc. 225,591 American Tower Corp (REIT) 227,825 Gilead Sciences Inc. 217,660 Walmart Inc. 217,641 Vinci SA 214,877 Gilead Sciences Inc. 197,855 Pfizer Inc. 212,909 Accenture Plc - Class A 196,320 Alimentation Couche-Tard Inc. - Class B 199,943 Lockheed Martin Corp 193,418 Raytheon Co 196,920 Lonza Group AG 188,965 EOG Resources Inc 193,995 Colgate-Palmolive Co 183,806 Nice Ltd ADR 192,807 China Construction Bank Corp 'H' 181,749 Danaher Corp 189,459 Cummins Inc 179,601 BP Plc 184,017 Royal Dutch Shell Plc - Class A 177,412 ACS Actividades de Construccion y Servicios SA 182,875 Unilever NV Dutch Cert 162,969 Royal Dutch Shell Plc - Class A 180,656 East West Bancorp Inc 160,398 Toyota Motor Corp 174,050 Pembina Pipeline Corp 159,714 Suncor Energy Inc 173,360 Enel SpA 158,490 Allstate Corp/The 171,121 AbbVie Inc 158,344 Toronto-Dominion Bank/The 165,946 Merck & Co Inc 156,516 China Construction Bank Corp 'H' 165,895 Reinsurance Group of America Inc - Class A 155,577 Laboratory Corp of America Holdings 160,470 Alibaba Group Holding Ltd ADR 155,373 AMETEK Inc 157,885 LVMH Moet Hennessy Louis Vuitton SE 152,725 Intel Corp 154,661 Nordstrom Inc 149,528 Teva Pharmaceutical Industries Ltd ADR 151,284 Intel Corp 149,427 Safran SA 148,771 Cisco Systems Inc 146,587 NextEra Energy Inc 146,458 Samsung Electronics Co Ltd 144,241 Tesco Plc 143,199 Iberdrola SA 141,468 United Overseas Bank Ltd 141,659 Synopsys Inc 140,609 Comerica Inc 140,949 Repsol SA 137,586 Intuit Inc 140,768 Bayer AG 134,323 Lowe's Cos Inc 138,031 Mitsubishi UFJ Financial Group Inc 130,712 Kering SA 136,787 ANA Holdings Inc 122,332 Las Vegas Sands Corp 135,656 Alphabet Inc - Class A 121,239 Uni-President Enterprises Corp 134,758 Yanzhou Coal Mining Co Ltd 'H' 119,998
Cigna Corp 119,267
Vonovia SE 119,197
Comcast Corp - Class A 118,968
British American Tobacco Plc 118,651
WH Group Ltd '144A' 117,903
Ping An Insurance Group Co of China Ltd 'H' 116,918
L3 Technologies Inc 116,082
Hitachi Ltd 115,788
Facebook Inc - Class A 115,599
Humana Inc 115,400
The Material Portfolio Changes reflect the aggregate purchases of a security exceeding one per cent of the total value of purchases for the year and aggregate disposals greater than one per cent of the total value of the sales.
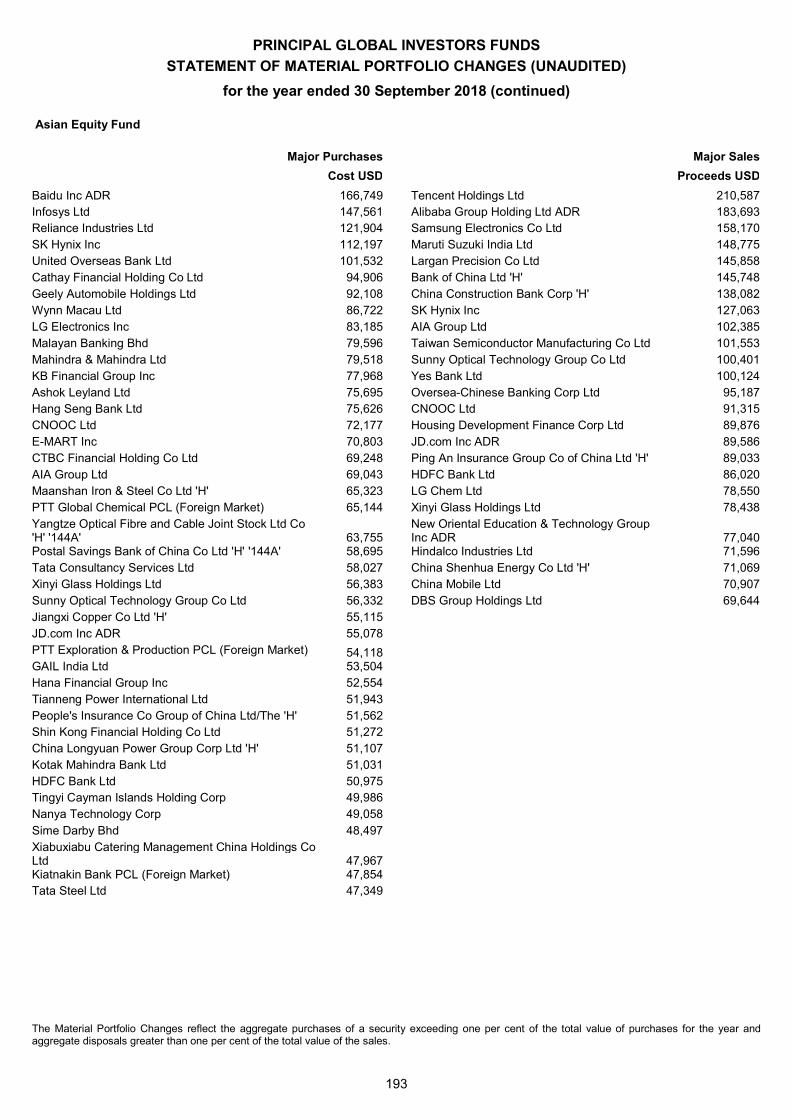
PRINCIPAL GLOBAL INVESTORS FUNDS
STATEMENT OF MATERIAL PORTFOLIO CHANGES (UNAUDITED)
for the year ended 30 September 2018 (continued)
193
Asian Equity Fund
Major Purchases Major Sales
Cost USD Proceeds USD
Baidu Inc ADR 166,749 Tencent Holdings Ltd 210,587 Infosys Ltd 147,561 Alibaba Group Holding Ltd ADR 183,693 Reliance Industries Ltd 121,904 Samsung Electronics Co Ltd 158,170 SK Hynix Inc 112,197 Maruti Suzuki India Ltd 148,775 United Overseas Bank Ltd 101,532 Largan Precision Co Ltd 145,858 Cathay Financial Holding Co Ltd 94,906 Bank of China Ltd 'H' 145,748 Geely Automobile Holdings Ltd 92,108 China Construction Bank Corp 'H' 138,082 Wynn Macau Ltd 86,722 SK Hynix Inc 127,063 LG Electronics Inc 83,185 AIA Group Ltd 102,385 Malayan Banking Bhd 79,596 Taiwan Semiconductor Manufacturing Co Ltd 101,553 Mahindra & Mahindra Ltd 79,518 Sunny Optical Technology Group Co Ltd 100,401 KB Financial Group Inc 77,968 Yes Bank Ltd 100,124 Ashok Leyland Ltd 75,695 Oversea-Chinese Banking Corp Ltd 95,187 Hang Seng Bank Ltd 75,626 CNOOC Ltd 91,315 CNOOC Ltd 72,177 Housing Development Finance Corp Ltd 89,876 E-MART Inc 70,803 JD.com Inc ADR 89,586 CTBC Financial Holding Co Ltd 69,248 Ping An Insurance Group Co of China Ltd 'H' 89,033 AIA Group Ltd 69,043 HDFC Bank Ltd 86,020 Maanshan Iron & Steel Co Ltd 'H' 65,323 LG Chem Ltd 78,550 PTT Global Chemical PCL (Foreign Market) 65,144 Xinyi Glass Holdings Ltd 78,438 Yangtze Optical Fibre and Cable Joint Stock Ltd Co 'H' '144A' 63,755
New Oriental Education & Technology Group Inc ADR 77,040
Postal Savings Bank of China Co Ltd 'H' '144A' 58,695 Hindalco Industries Ltd 71,596 Tata Consultancy Services Ltd 58,027 China Shenhua Energy Co Ltd 'H' 71,069 Xinyi Glass Holdings Ltd 56,383 China Mobile Ltd 70,907 Sunny Optical Technology Group Co Ltd 56,332 DBS Group Holdings Ltd 69,644 Jiangxi Copper Co Ltd 'H' 55,115 JD.com Inc ADR 55,078 PTT Exploration & Production PCL (Foreign Market) 54,118 GAIL India Ltd 53,504 Hana Financial Group Inc 52,554 Tianneng Power International Ltd 51,943 People's Insurance Co Group of China Ltd/The 'H' 51,562 Shin Kong Financial Holding Co Ltd 51,272 China Longyuan Power Group Corp Ltd 'H' 51,107 Kotak Mahindra Bank Ltd 51,031 HDFC Bank Ltd 50,975 Tingyi Cayman Islands Holding Corp 49,986 Nanya Technology Corp 49,058 Sime Darby Bhd 48,497 Xiabuxiabu Catering Management China Holdings Co Ltd 47,967 Kiatnakin Bank PCL (Foreign Market) 47,854 Tata Steel Ltd 47,349 The Material Portfolio Changes reflect the aggregate purchases of a security exceeding one per cent of the total value of purchases for the year and aggregate disposals greater than one per cent of the total value of the sales.
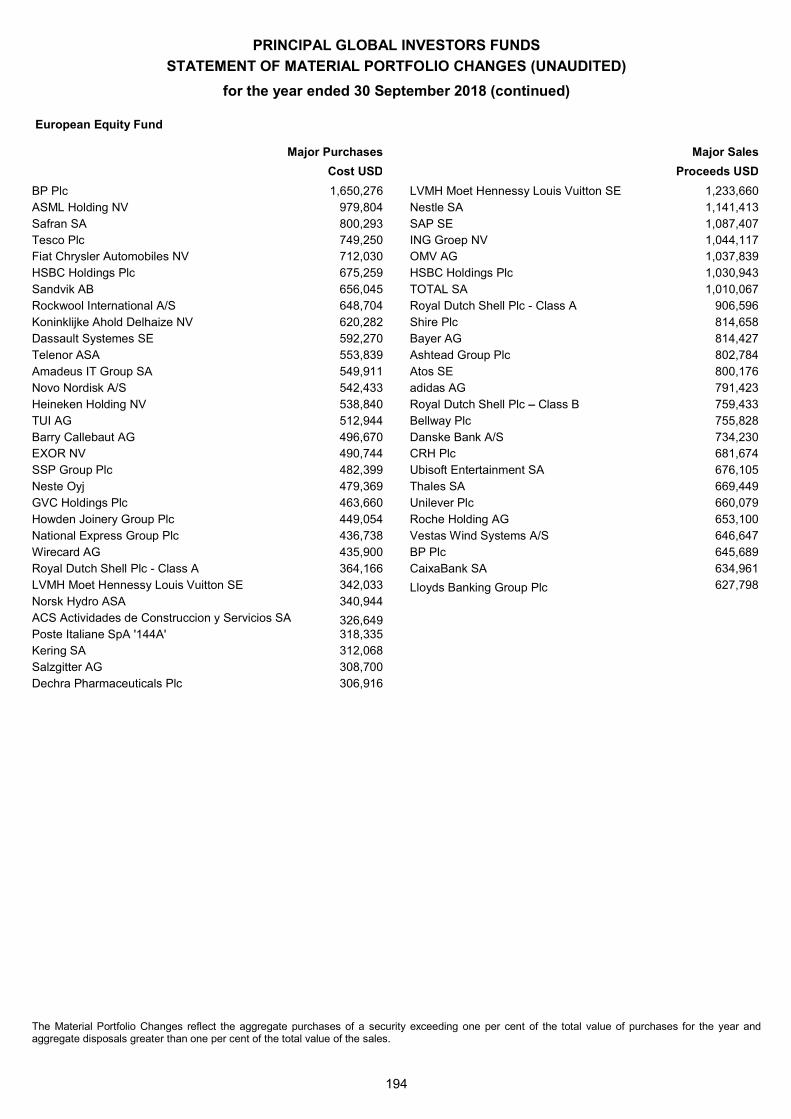
PRINCIPAL GLOBAL INVESTORS FUNDS
STATEMENT OF MATERIAL PORTFOLIO CHANGES (UNAUDITED)
for the year ended 30 September 2018 (continued)
194
European Equity Fund
Major Purchases Major Sales
Cost USD Proceeds USD
BP Plc 1,650,276 LVMH Moet Hennessy Louis Vuitton SE 1,233,660 ASML Holding NV 979,804 Nestle SA 1,141,413 Safran SA 800,293 SAP SE 1,087,407 Tesco Plc 749,250 ING Groep NV 1,044,117 Fiat Chrysler Automobiles NV 712,030 OMV AG 1,037,839 HSBC Holdings Plc 675,259 HSBC Holdings Plc 1,030,943 Sandvik AB 656,045 TOTAL SA 1,010,067 Rockwool International A/S 648,704 Royal Dutch Shell Plc - Class A 906,596 Koninklijke Ahold Delhaize NV 620,282 Shire Plc 814,658 Dassault Systemes SE 592,270 Bayer AG 814,427 Telenor ASA 553,839 Ashtead Group Plc 802,784 Amadeus IT Group SA 549,911 Atos SE 800,176 Novo Nordisk A/S 542,433 adidas AG 791,423 Heineken Holding NV 538,840 Royal Dutch Shell Plc Class B 759,433 TUI AG 512,944 Bellway Plc 755,828 Barry Callebaut AG 496,670 Danske Bank A/S 734,230 EXOR NV 490,744 CRH Plc 681,674 SSP Group Plc 482,399 Ubisoft Entertainment SA 676,105 Neste Oyj 479,369 Thales SA 669,449 GVC Holdings Plc 463,660 Unilever Plc 660,079 Howden Joinery Group Plc 449,054 Roche Holding AG 653,100 National Express Group Plc 436,738 Vestas Wind Systems A/S 646,647 Wirecard AG 435,900 BP Plc 645,689 Royal Dutch Shell Plc - Class A 364,166 CaixaBank SA 634,961 LVMH Moet Hennessy Louis Vuitton SE 342,033 Lloyds Banking Group Plc 627,798 Norsk Hydro ASA 340,944 ACS Actividades de Construccion y Servicios SA 326,649 Poste Italiane SpA '144A' 318,335 Kering SA 312,068 Salzgitter AG 308,700 Dechra Pharmaceuticals Plc 306,916
The Material Portfolio Changes reflect the aggregate purchases of a security exceeding one per cent of the total value of purchases for the year and aggregate disposals greater than one per cent of the total value of the sales.
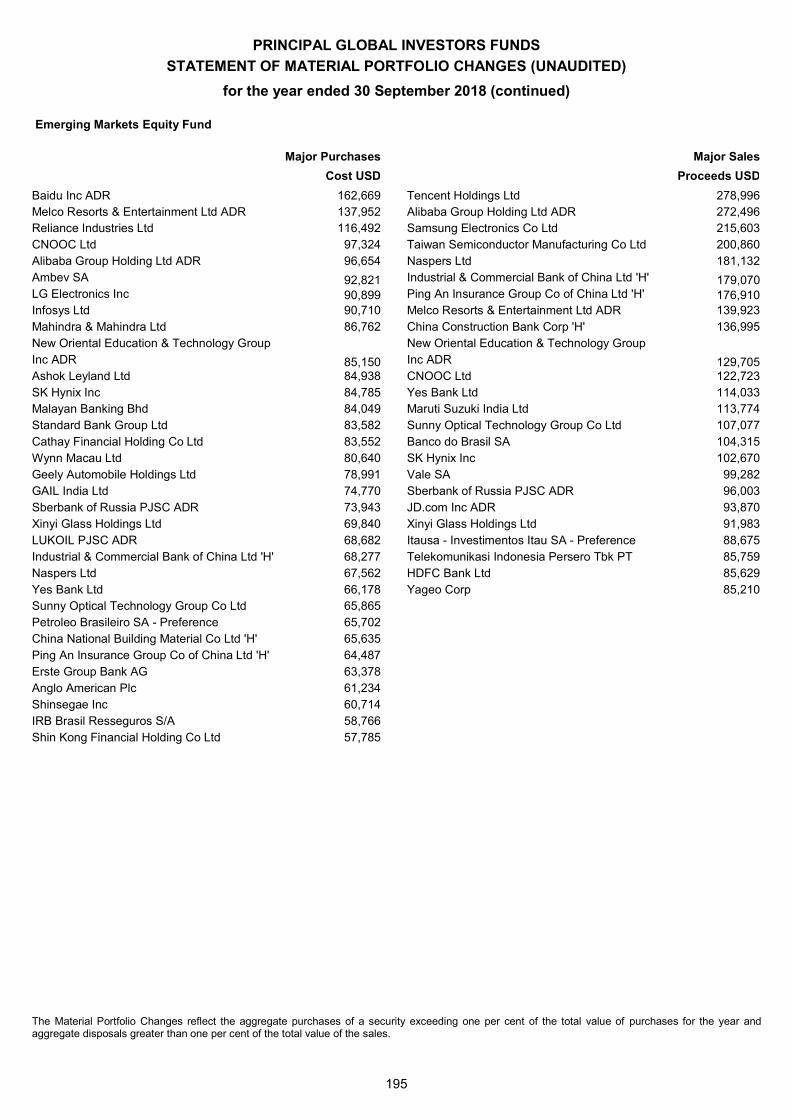
PRINCIPAL GLOBAL INVESTORS FUNDS
STATEMENT OF MATERIAL PORTFOLIO CHANGES (UNAUDITED)
for the year ended 30 September 2018 (continued)
195
Emerging Markets Equity Fund
Major Purchases Major Sales
Cost USD Proceeds USD
Baidu Inc ADR 162,669 Tencent Holdings Ltd 278,996 Melco Resorts & Entertainment Ltd ADR 137,952 Alibaba Group Holding Ltd ADR 272,496 Reliance Industries Ltd 116,492 Samsung Electronics Co Ltd 215,603 CNOOC Ltd 97,324 Taiwan Semiconductor Manufacturing Co Ltd 200,860 Alibaba Group Holding Ltd ADR 96,654 Naspers Ltd 181,132 Ambev SA 92,821 Industrial & Commercial Bank of China Ltd 'H' 179,070 LG Electronics Inc 90,899 Ping An Insurance Group Co of China Ltd 'H' 176,910 Infosys Ltd 90,710 Melco Resorts & Entertainment Ltd ADR 139,923 Mahindra & Mahindra Ltd 86,762 China Construction Bank Corp 'H' 136,995 New Oriental Education & Technology Group New Oriental Education & Technology Group Inc ADR 85,150 Inc ADR 129,705 Ashok Leyland Ltd 84,938 CNOOC Ltd 122,723 SK Hynix Inc 84,785 Yes Bank Ltd 114,033 Malayan Banking Bhd 84,049 Maruti Suzuki India Ltd 113,774 Standard Bank Group Ltd 83,582 Sunny Optical Technology Group Co Ltd 107,077 Cathay Financial Holding Co Ltd 83,552 Banco do Brasil SA 104,315 Wynn Macau Ltd 80,640 SK Hynix Inc 102,670 Geely Automobile Holdings Ltd 78,991 Vale SA 99,282 GAIL India Ltd 74,770 Sberbank of Russia PJSC ADR 96,003 Sberbank of Russia PJSC ADR 73,943 JD.com Inc ADR 93,870 Xinyi Glass Holdings Ltd 69,840 Xinyi Glass Holdings Ltd 91,983 LUKOIL PJSC ADR 68,682 Itausa - Investimentos Itau SA - Preference 88,675 Industrial & Commercial Bank of China Ltd 'H' 68,277 Telekomunikasi Indonesia Persero Tbk PT 85,759 Naspers Ltd 67,562 HDFC Bank Ltd 85,629 Yes Bank Ltd 66,178 Yageo Corp 85,210 Sunny Optical Technology Group Co Ltd 65,865 Petroleo Brasileiro SA - Preference 65,702 China National Building Material Co Ltd 'H' 65,635 Ping An Insurance Group Co of China Ltd 'H' 64,487 Erste Group Bank AG 63,378 Anglo American Plc 61,234 Shinsegae Inc 60,714 IRB Brasil Resseguros S/A 58,766 Shin Kong Financial Holding Co Ltd 57,785 The Material Portfolio Changes reflect the aggregate purchases of a security exceeding one per cent of the total value of purchases for the year and aggregate disposals greater than one per cent of the total value of the sales.
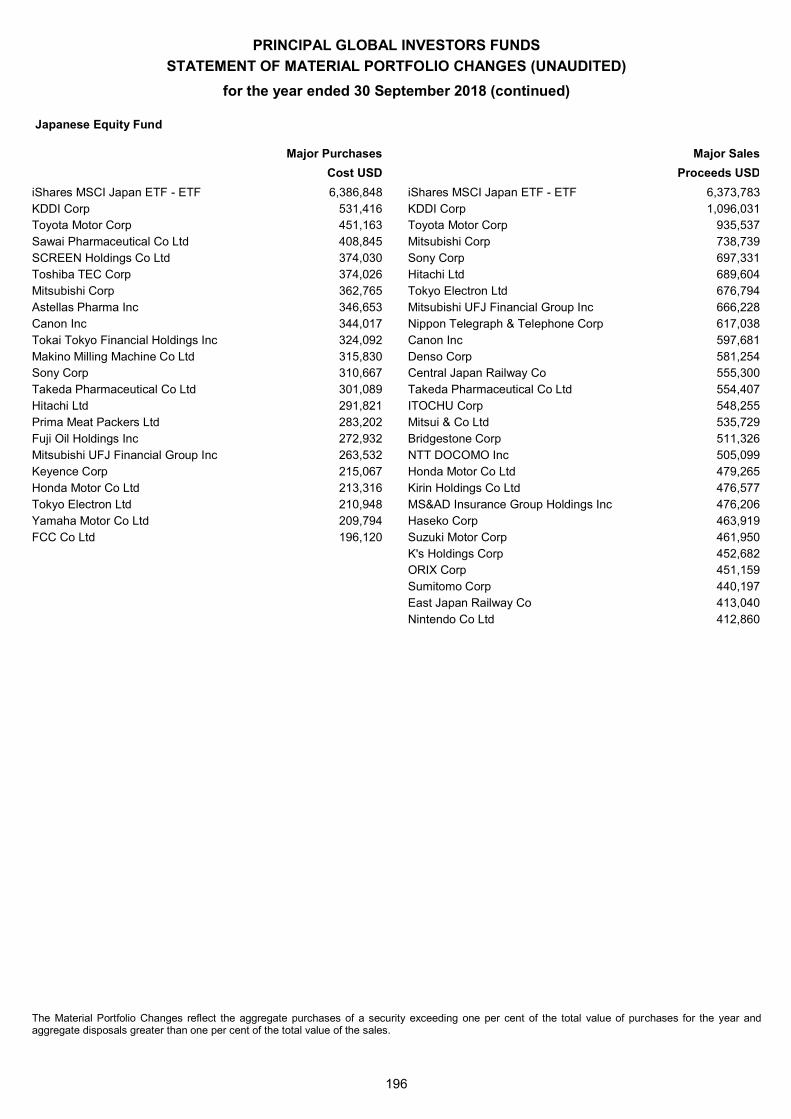
PRINCIPAL GLOBAL INVESTORS FUNDS
STATEMENT OF MATERIAL PORTFOLIO CHANGES (UNAUDITED)
for the year ended 30 September 2018 (continued)
196
Japanese Equity Fund
Major Purchases Major Sales
Cost USD Proceeds USD
iShares MSCI Japan ETF - ETF 6,386,848 iShares MSCI Japan ETF - ETF 6,373,783 KDDI Corp 531,416 KDDI Corp 1,096,031 Toyota Motor Corp 451,163 Toyota Motor Corp 935,537 Sawai Pharmaceutical Co Ltd 408,845 Mitsubishi Corp 738,739 SCREEN Holdings Co Ltd 374,030 Sony Corp 697,331 Toshiba TEC Corp 374,026 Hitachi Ltd 689,604 Mitsubishi Corp 362,765 Tokyo Electron Ltd 676,794 Astellas Pharma Inc 346,653 Mitsubishi UFJ Financial Group Inc 666,228 Canon Inc 344,017 Nippon Telegraph & Telephone Corp 617,038 Tokai Tokyo Financial Holdings Inc 324,092 Canon Inc 597,681 Makino Milling Machine Co Ltd 315,830 Denso Corp 581,254 Sony Corp 310,667 Central Japan Railway Co 555,300 Takeda Pharmaceutical Co Ltd 301,089 Takeda Pharmaceutical Co Ltd 554,407 Hitachi Ltd 291,821 ITOCHU Corp 548,255 Prima Meat Packers Ltd 283,202 Mitsui & Co Ltd 535,729 Fuji Oil Holdings Inc 272,932 Bridgestone Corp 511,326 Mitsubishi UFJ Financial Group Inc 263,532 NTT DOCOMO Inc 505,099 Keyence Corp 215,067 Honda Motor Co Ltd 479,265 Honda Motor Co Ltd 213,316 Kirin Holdings Co Ltd 476,577 Tokyo Electron Ltd 210,948 MS&AD Insurance Group Holdings Inc 476,206 Yamaha Motor Co Ltd 209,794 Haseko Corp 463,919 FCC Co Ltd 196,120 Suzuki Motor Corp 461,950
K's Holdings Corp 452,682
ORIX Corp 451,159
Sumitomo Corp 440,197
East Japan Railway Co 413,040
Nintendo Co Ltd 412,860
The Material Portfolio Changes reflect the aggregate purchases of a security exceeding one per cent of the total value of purchases for the year and aggregate disposals greater than one per cent of the total value of the sales.
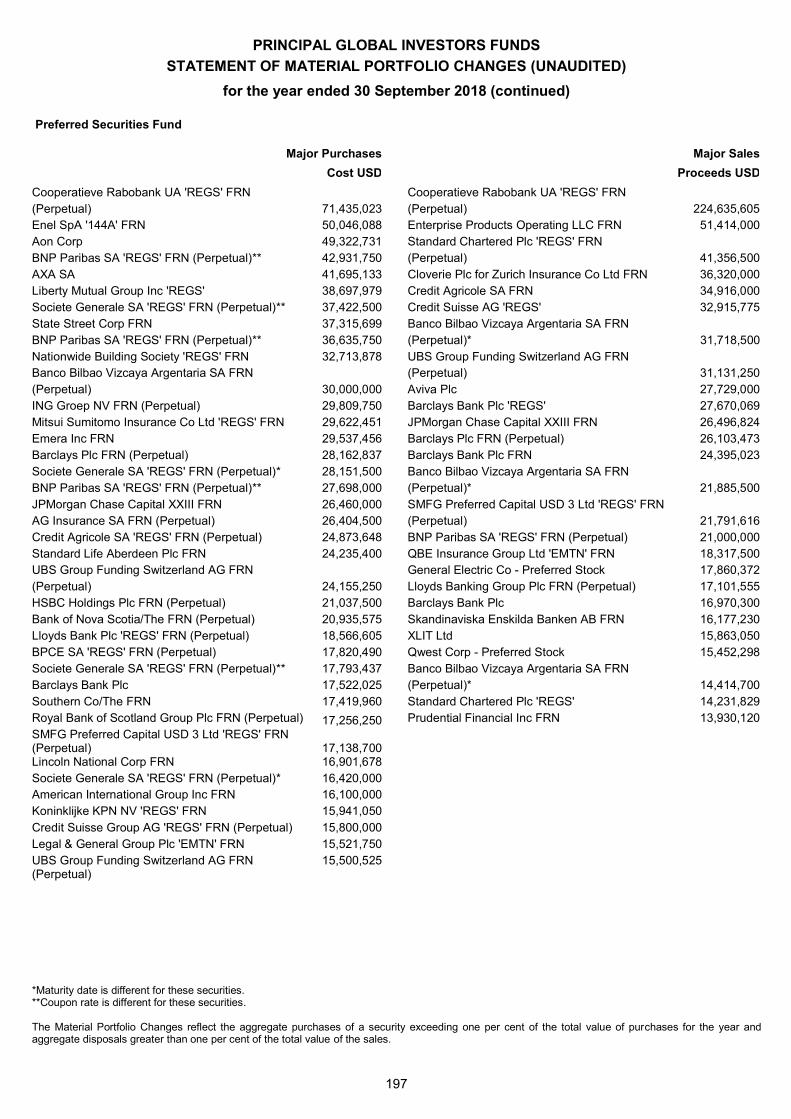
PRINCIPAL GLOBAL INVESTORS FUNDS
STATEMENT OF MATERIAL PORTFOLIO CHANGES (UNAUDITED)
for the year ended 30 September 2018 (continued)
197
Preferred Securities Fund
Major Purchases Major Sales
Cost USD Proceeds USD
Cooperatieve Rabobank UA 'REGS' FRN Cooperatieve Rabobank UA 'REGS' FRN (Perpetual) 71,435,023 (Perpetual) 224,635,605 Enel SpA '144A' FRN 50,046,088 Enterprise Products Operating LLC FRN 51,414,000 Aon Corp 49,322,731 Standard Chartered Plc 'REGS' FRN BNP Paribas SA 'REGS' FRN (Perpetual)** 42,931,750 (Perpetual) 41,356,500 AXA SA 41,695,133 Cloverie Plc for Zurich Insurance Co Ltd FRN 36,320,000 Liberty Mutual Group Inc 'REGS' 38,697,979 Credit Agricole SA FRN 34,916,000 Societe Generale SA 'REGS' FRN (Perpetual)** 37,422,500 Credit Suisse AG 'REGS' 32,915,775 State Street Corp FRN 37,315,699 Banco Bilbao Vizcaya Argentaria SA FRN BNP Paribas SA 'REGS' FRN (Perpetual)** 36,635,750 (Perpetual)* 31,718,500 Nationwide Building Society 'REGS' FRN 32,713,878 UBS Group Funding Switzerland AG FRN Banco Bilbao Vizcaya Argentaria SA FRN (Perpetual) 31,131,250 (Perpetual) 30,000,000 Aviva Plc 27,729,000 ING Groep NV FRN (Perpetual) 29,809,750 Barclays Bank Plc 'REGS' 27,670,069 Mitsui Sumitomo Insurance Co Ltd 'REGS' FRN 29,622,451 JPMorgan Chase Capital XXIII FRN 26,496,824 Emera Inc FRN 29,537,456 Barclays Plc FRN (Perpetual) 26,103,473 Barclays Plc FRN (Perpetual) 28,162,837 Barclays Bank Plc FRN 24,395,023 Societe Generale SA 'REGS' FRN (Perpetual)* 28,151,500 Banco Bilbao Vizcaya Argentaria SA FRN BNP Paribas SA 'REGS' FRN (Perpetual)** 27,698,000 (Perpetual)* 21,885,500 JPMorgan Chase Capital XXIII FRN 26,460,000 SMFG Preferred Capital USD 3 Ltd 'REGS' FRN AG Insurance SA FRN (Perpetual) 26,404,500 (Perpetual) 21,791,616 Credit Agricole SA 'REGS' FRN (Perpetual) 24,873,648 BNP Paribas SA 'REGS' FRN (Perpetual) 21,000,000 Standard Life Aberdeen Plc FRN 24,235,400 QBE Insurance Group Ltd 'EMTN' FRN 18,317,500 UBS Group Funding Switzerland AG FRN General Electric Co - Preferred Stock 17,860,372 (Perpetual) 24,155,250 Lloyds Banking Group Plc FRN (Perpetual) 17,101,555 HSBC Holdings Plc FRN (Perpetual) 21,037,500 Barclays Bank Plc 16,970,300 Bank of Nova Scotia/The FRN (Perpetual) 20,935,575 Skandinaviska Enskilda Banken AB FRN 16,177,230 Lloyds Bank Plc 'REGS' FRN (Perpetual) 18,566,605 XLIT Ltd 15,863,050 BPCE SA 'REGS' FRN (Perpetual) 17,820,490 Qwest Corp - Preferred Stock 15,452,298 Societe Generale SA 'REGS' FRN (Perpetual)** 17,793,437 Banco Bilbao Vizcaya Argentaria SA FRN Barclays Bank Plc 17,522,025 (Perpetual)* 14,414,700 Southern Co/The FRN 17,419,960 Standard Chartered Plc 'REGS' 14,231,829 Royal Bank of Scotland Group Plc FRN (Perpetual) 17,256,250 Prudential Financial Inc FRN 13,930,120 SMFG Preferred Capital USD 3 Ltd 'REGS' FRN (Perpetual) 17,138,700 Lincoln National Corp FRN 16,901,678 Societe Generale SA 'REGS' FRN (Perpetual)* 16,420,000 American International Group Inc FRN 16,100,000 Koninklijke KPN NV 'REGS' FRN 15,941,050 Credit Suisse Group AG 'REGS' FRN (Perpetual) 15,800,000 Legal & General Group Plc 'EMTN' FRN 15,521,750 UBS Group Funding Switzerland AG FRN (Perpetual)
15,500,525
*Maturity date is different for these securities. **Coupon rate is different for these securities. The Material Portfolio Changes reflect the aggregate purchases of a security exceeding one per cent of the total value of purchases for the year and aggregate disposals greater than one per cent of the total value of the sales.
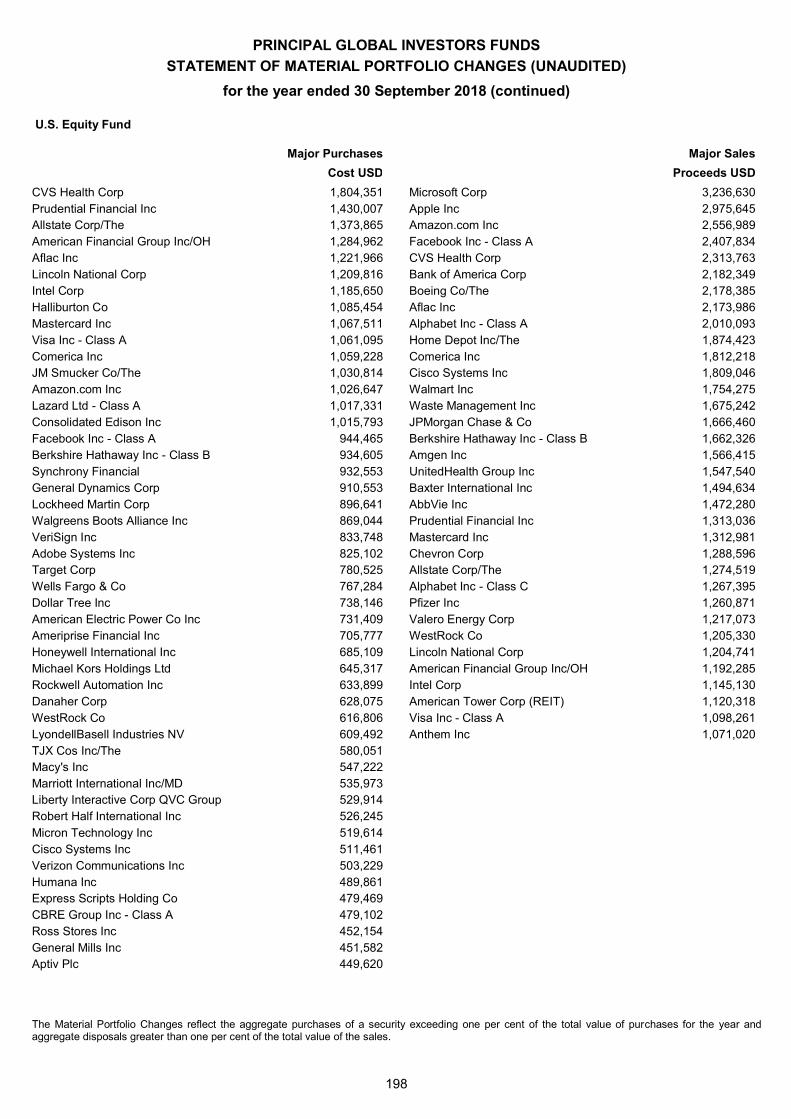
PRINCIPAL GLOBAL INVESTORS FUNDS
STATEMENT OF MATERIAL PORTFOLIO CHANGES (UNAUDITED)
for the year ended 30 September 2018 (continued)
198
U.S. Equity Fund
Major Purchases Major Sales
Cost USD Proceeds USD
CVS Health Corp 1,804,351 Microsoft Corp 3,236,630 Prudential Financial Inc 1,430,007 Apple Inc 2,975,645 Allstate Corp/The 1,373,865 Amazon.com Inc 2,556,989 American Financial Group Inc/OH 1,284,962 Facebook Inc - Class A 2,407,834 Aflac Inc 1,221,966 CVS Health Corp 2,313,763 Lincoln National Corp 1,209,816 Bank of America Corp 2,182,349 Intel Corp 1,185,650 Boeing Co/The 2,178,385 Halliburton Co 1,085,454 Aflac Inc 2,173,986 Mastercard Inc 1,067,511 Alphabet Inc - Class A 2,010,093 Visa Inc - Class A 1,061,095 Home Depot Inc/The 1,874,423 Comerica Inc 1,059,228 Comerica Inc 1,812,218 JM Smucker Co/The 1,030,814 Cisco Systems Inc 1,809,046 Amazon.com Inc 1,026,647 Walmart Inc 1,754,275 Lazard Ltd - Class A 1,017,331 Waste Management Inc 1,675,242 Consolidated Edison Inc 1,015,793 JPMorgan Chase & Co 1,666,460 Facebook Inc - Class A 944,465 Berkshire Hathaway Inc - Class B 1,662,326 Berkshire Hathaway Inc - Class B 934,605 Amgen Inc 1,566,415 Synchrony Financial 932,553 UnitedHealth Group Inc 1,547,540 General Dynamics Corp 910,553 Baxter International Inc 1,494,634 Lockheed Martin Corp 896,641 AbbVie Inc 1,472,280 Walgreens Boots Alliance Inc 869,044 Prudential Financial Inc 1,313,036 VeriSign Inc 833,748 Mastercard Inc 1,312,981 Adobe Systems Inc 825,102 Chevron Corp 1,288,596 Target Corp 780,525 Allstate Corp/The 1,274,519 Wells Fargo & Co 767,284 Alphabet Inc - Class C 1,267,395 Dollar Tree Inc 738,146 Pfizer Inc 1,260,871 American Electric Power Co Inc 731,409 Valero Energy Corp 1,217,073 Ameriprise Financial Inc 705,777 WestRock Co 1,205,330 Honeywell International Inc 685,109 Lincoln National Corp 1,204,741 Michael Kors Holdings Ltd 645,317 American Financial Group Inc/OH 1,192,285 Rockwell Automation Inc 633,899 Intel Corp 1,145,130 Danaher Corp 628,075 American Tower Corp (REIT) 1,120,318 WestRock Co 616,806 Visa Inc - Class A 1,098,261 LyondellBasell Industries NV 609,492 Anthem Inc 1,071,020 TJX Cos Inc/The 580,051 Macy's Inc 547,222 Marriott International Inc/MD 535,973 Liberty Interactive Corp QVC Group 529,914 Robert Half International Inc 526,245 Micron Technology Inc 519,614 Cisco Systems Inc 511,461 Verizon Communications Inc 503,229 Humana Inc 489,861 Express Scripts Holding Co 479,469 CBRE Group Inc - Class A 479,102 Ross Stores Inc 452,154 General Mills Inc 451,582 Aptiv Plc 449,620
The Material Portfolio Changes reflect the aggregate purchases of a security exceeding one per cent of the total value of purchases for the year and aggregate disposals greater than one per cent of the total value of the sales.
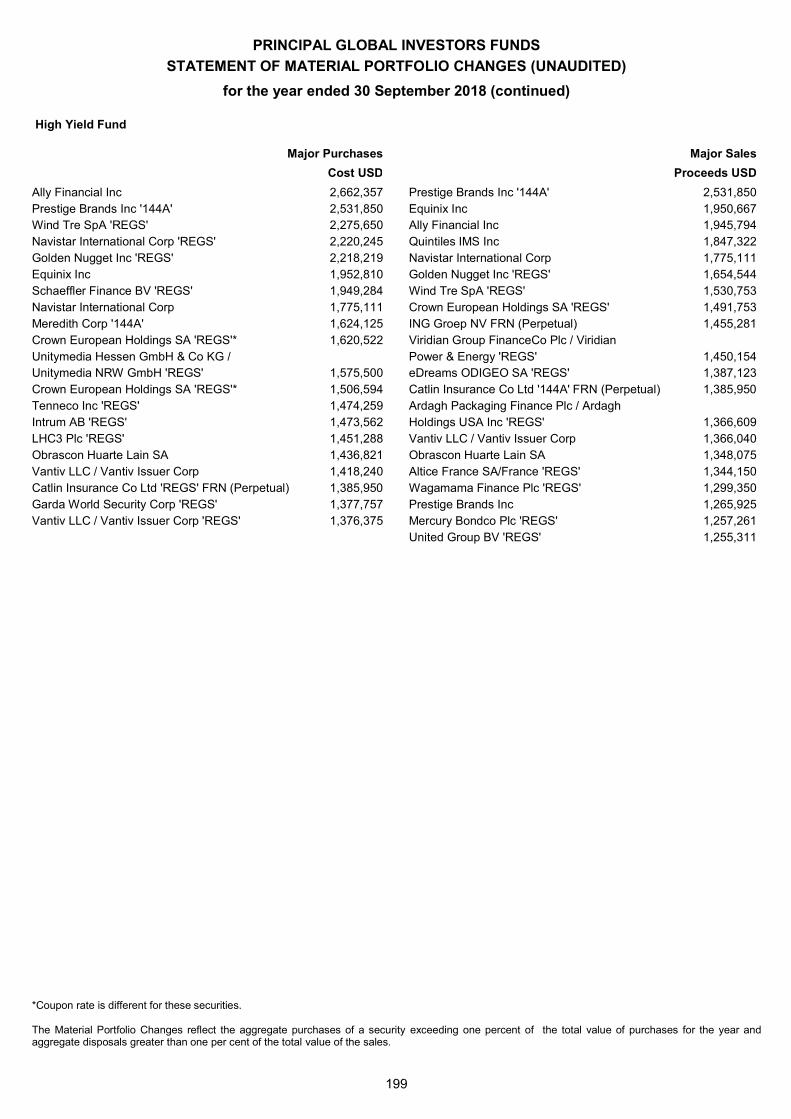
PRINCIPAL GLOBAL INVESTORS FUNDS
STATEMENT OF MATERIAL PORTFOLIO CHANGES (UNAUDITED)
for the year ended 30 September 2018 (continued)
199
High Yield Fund
Major Purchases Major Sales
Cost USD Proceeds USD
Ally Financial Inc 2,662,357 Prestige Brands Inc '144A' 2,531,850 Prestige Brands Inc '144A' 2,531,850 Equinix Inc 1,950,667 Wind Tre SpA 'REGS' 2,275,650 Ally Financial Inc 1,945,794 Navistar International Corp 'REGS' 2,220,245 Quintiles IMS Inc 1,847,322 Golden Nugget Inc 'REGS' 2,218,219 Navistar International Corp 1,775,111 Equinix Inc 1,952,810 Golden Nugget Inc 'REGS' 1,654,544 Schaeffler Finance BV 'REGS' 1,949,284 Wind Tre SpA 'REGS' 1,530,753 Navistar International Corp 1,775,111 Crown European Holdings SA 'REGS' 1,491,753 Meredith Corp '144A' 1,624,125 ING Groep NV FRN (Perpetual) 1,455,281 Crown European Holdings SA 'REGS'* 1,620,522 Viridian Group FinanceCo Plc / Viridian Unitymedia Hessen GmbH & Co KG / Power & Energy 'REGS' 1,450,154 Unitymedia NRW GmbH 'REGS' 1,575,500 eDreams ODIGEO SA 'REGS' 1,387,123 Crown European Holdings SA 'REGS'* 1,506,594 Catlin Insurance Co Ltd '144A' FRN (Perpetual) 1,385,950 Tenneco Inc 'REGS' 1,474,259 Ardagh Packaging Finance Plc / Ardagh Intrum AB 'REGS' 1,473,562 Holdings USA Inc 'REGS' 1,366,609 LHC3 Plc 'REGS' 1,451,288 Vantiv LLC / Vantiv Issuer Corp 1,366,040 Obrascon Huarte Lain SA 1,436,821 Obrascon Huarte Lain SA 1,348,075 Vantiv LLC / Vantiv Issuer Corp 1,418,240 Altice France SA/France 'REGS' 1,344,150 Catlin Insurance Co Ltd 'REGS' FRN (Perpetual) 1,385,950 Wagamama Finance Plc 'REGS' 1,299,350 Garda World Security Corp 'REGS' 1,377,757 Prestige Brands Inc 1,265,925 Vantiv LLC / Vantiv Issuer Corp 'REGS' 1,376,375 Mercury Bondco Plc 'REGS' 1,257,261 United Group BV 'REGS' 1,255,311
*Coupon rate is different for these securities. The Material Portfolio Changes reflect the aggregate purchases of a security exceeding one percent of the total value of purchases for the year and aggregate disposals greater than one per cent of the total value of the sales.
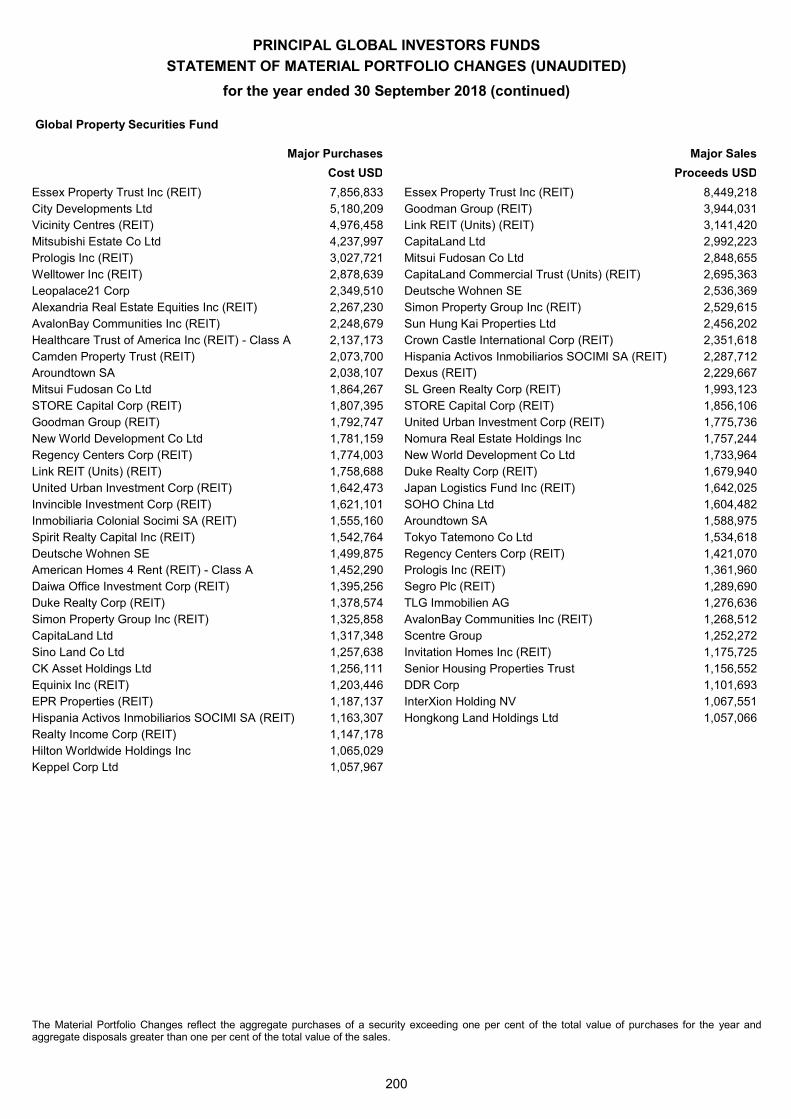
PRINCIPAL GLOBAL INVESTORS FUNDS
STATEMENT OF MATERIAL PORTFOLIO CHANGES (UNAUDITED)
for the year ended 30 September 2018 (continued)
200
Global Property Securities Fund
Major Purchases Major Sales
Cost USD Proceeds USD
Essex Property Trust Inc (REIT) 7,856,833 Essex Property Trust Inc (REIT) 8,449,218 City Developments Ltd 5,180,209 Goodman Group (REIT) 3,944,031 Vicinity Centres (REIT) 4,976,458 Link REIT (Units) (REIT) 3,141,420 Mitsubishi Estate Co Ltd 4,237,997 CapitaLand Ltd 2,992,223 Prologis Inc (REIT) 3,027,721 Mitsui Fudosan Co Ltd 2,848,655 Welltower Inc (REIT) 2,878,639 CapitaLand Commercial Trust (Units) (REIT) 2,695,363 Leopalace21 Corp 2,349,510 Deutsche Wohnen SE 2,536,369 Alexandria Real Estate Equities Inc (REIT) 2,267,230 Simon Property Group Inc (REIT) 2,529,615 AvalonBay Communities Inc (REIT) 2,248,679 Sun Hung Kai Properties Ltd 2,456,202 Healthcare Trust of America Inc (REIT) - Class A 2,137,173 Crown Castle International Corp (REIT) 2,351,618 Camden Property Trust (REIT) 2,073,700 Hispania Activos Inmobiliarios SOCIMI SA (REIT) 2,287,712 Aroundtown SA 2,038,107 Dexus (REIT) 2,229,667 Mitsui Fudosan Co Ltd 1,864,267 SL Green Realty Corp (REIT) 1,993,123 STORE Capital Corp (REIT) 1,807,395 STORE Capital Corp (REIT) 1,856,106 Goodman Group (REIT) 1,792,747 United Urban Investment Corp (REIT) 1,775,736 New World Development Co Ltd 1,781,159 Nomura Real Estate Holdings Inc 1,757,244 Regency Centers Corp (REIT) 1,774,003 New World Development Co Ltd 1,733,964 Link REIT (Units) (REIT) 1,758,688 Duke Realty Corp (REIT) 1,679,940 United Urban Investment Corp (REIT) 1,642,473 Japan Logistics Fund Inc (REIT) 1,642,025 Invincible Investment Corp (REIT) 1,621,101 SOHO China Ltd 1,604,482 Inmobiliaria Colonial Socimi SA (REIT) 1,555,160 Aroundtown SA 1,588,975 Spirit Realty Capital Inc (REIT) 1,542,764 Tokyo Tatemono Co Ltd 1,534,618 Deutsche Wohnen SE 1,499,875 Regency Centers Corp (REIT) 1,421,070 American Homes 4 Rent (REIT) - Class A 1,452,290 Prologis Inc (REIT) 1,361,960 Daiwa Office Investment Corp (REIT) 1,395,256 Segro Plc (REIT) 1,289,690 Duke Realty Corp (REIT) 1,378,574 TLG Immobilien AG 1,276,636 Simon Property Group Inc (REIT) 1,325,858 AvalonBay Communities Inc (REIT) 1,268,512 CapitaLand Ltd 1,317,348 Scentre Group 1,252,272 Sino Land Co Ltd 1,257,638 Invitation Homes Inc (REIT) 1,175,725 CK Asset Holdings Ltd 1,256,111 Senior Housing Properties Trust 1,156,552 Equinix Inc (REIT) 1,203,446 DDR Corp 1,101,693 EPR Properties (REIT) 1,187,137 InterXion Holding NV 1,067,551 Hispania Activos Inmobiliarios SOCIMI SA (REIT) 1,163,307 Hongkong Land Holdings Ltd 1,057,066 Realty Income Corp (REIT) 1,147,178 Hilton Worldwide Holdings Inc 1,065,029 Keppel Corp Ltd 1,057,967
The Material Portfolio Changes reflect the aggregate purchases of a security exceeding one per cent of the total value of purchases for the year and aggregate disposals greater than one per cent of the total value of the sales.
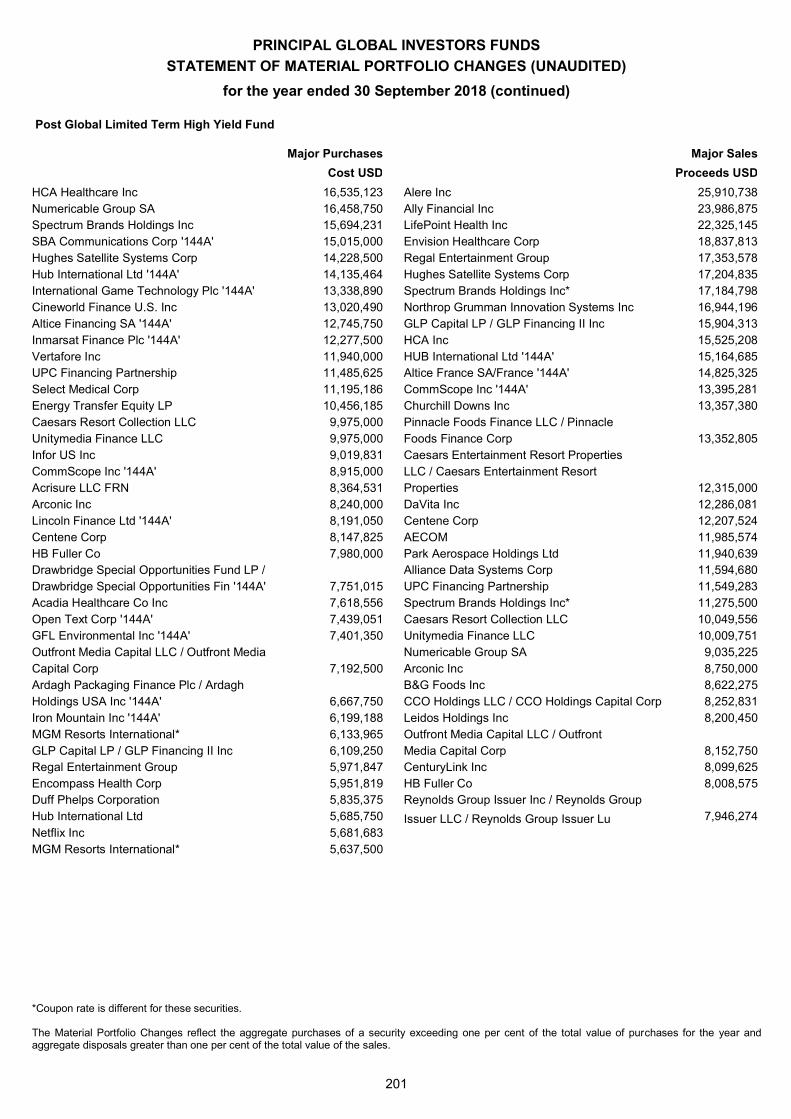
PRINCIPAL GLOBAL INVESTORS FUNDS
STATEMENT OF MATERIAL PORTFOLIO CHANGES (UNAUDITED)
for the year ended 30 September 2018 (continued)
201
Post Global Limited Term High Yield Fund
Major Purchases Major Sales
Cost USD Proceeds USD
HCA Healthcare Inc 16,535,123 Alere Inc 25,910,738 Numericable Group SA 16,458,750 Ally Financial Inc 23,986,875 Spectrum Brands Holdings Inc 15,694,231 LifePoint Health Inc 22,325,145 SBA Communications Corp '144A' 15,015,000 Envision Healthcare Corp 18,837,813 Hughes Satellite Systems Corp 14,228,500 Regal Entertainment Group 17,353,578 Hub International Ltd '144A' 14,135,464 Hughes Satellite Systems Corp 17,204,835 International Game Technology Plc '144A' 13,338,890 Spectrum Brands Holdings Inc* 17,184,798 Cineworld Finance U.S. Inc 13,020,490 Northrop Grumman Innovation Systems Inc 16,944,196 Altice Financing SA '144A' 12,745,750 GLP Capital LP / GLP Financing II Inc 15,904,313 Inmarsat Finance Plc '144A' 12,277,500 HCA Inc 15,525,208 Vertafore Inc 11,940,000 HUB International Ltd '144A' 15,164,685 UPC Financing Partnership 11,485,625 Altice France SA/France '144A' 14,825,325 Select Medical Corp 11,195,186 CommScope Inc '144A' 13,395,281 Energy Transfer Equity LP 10,456,185 Churchill Downs Inc 13,357,380 Caesars Resort Collection LLC 9,975,000 Pinnacle Foods Finance LLC / Pinnacle Unitymedia Finance LLC 9,975,000 Foods Finance Corp 13,352,805 Infor US Inc 9,019,831 Caesars Entertainment Resort Properties CommScope Inc '144A' 8,915,000 LLC / Caesars Entertainment Resort Acrisure LLC FRN 8,364,531 Properties 12,315,000 Arconic Inc 8,240,000 DaVita Inc 12,286,081 Lincoln Finance Ltd '144A' 8,191,050 Centene Corp 12,207,524 Centene Corp 8,147,825 AECOM 11,985,574 HB Fuller Co 7,980,000 Park Aerospace Holdings Ltd 11,940,639 Drawbridge Special Opportunities Fund LP / Alliance Data Systems Corp 11,594,680 Drawbridge Special Opportunities Fin '144A' 7,751,015 UPC Financing Partnership 11,549,283 Acadia Healthcare Co Inc 7,618,556 Spectrum Brands Holdings Inc* 11,275,500 Open Text Corp '144A' 7,439,051 Caesars Resort Collection LLC 10,049,556 GFL Environmental Inc '144A' 7,401,350 Unitymedia Finance LLC 10,009,751 Outfront Media Capital LLC / Outfront Media Numericable Group SA 9,035,225 Capital Corp 7,192,500 Arconic Inc 8,750,000 Ardagh Packaging Finance Plc / Ardagh B&G Foods Inc 8,622,275 Holdings USA Inc '144A' 6,667,750 CCO Holdings LLC / CCO Holdings Capital Corp 8,252,831 Iron Mountain Inc '144A' 6,199,188 Leidos Holdings Inc 8,200,450 MGM Resorts International* 6,133,965 Outfront Media Capital LLC / Outfront GLP Capital LP / GLP Financing II Inc 6,109,250 Media Capital Corp 8,152,750 Regal Entertainment Group 5,971,847 CenturyLink Inc 8,099,625 Encompass Health Corp 5,951,819 HB Fuller Co 8,008,575 Duff Phelps Corporation 5,835,375 Reynolds Group Issuer Inc / Reynolds Group Hub International Ltd 5,685,750 Issuer LLC / Reynolds Group Issuer Lu 7,946,274 Netflix Inc 5,681,683 MGM Resorts International* 5,637,500
*Coupon rate is different for these securities. The Material Portfolio Changes reflect the aggregate purchases of a security exceeding one per cent of the total value of purchases for the year and aggregate disposals greater than one per cent of the total value of the sales.
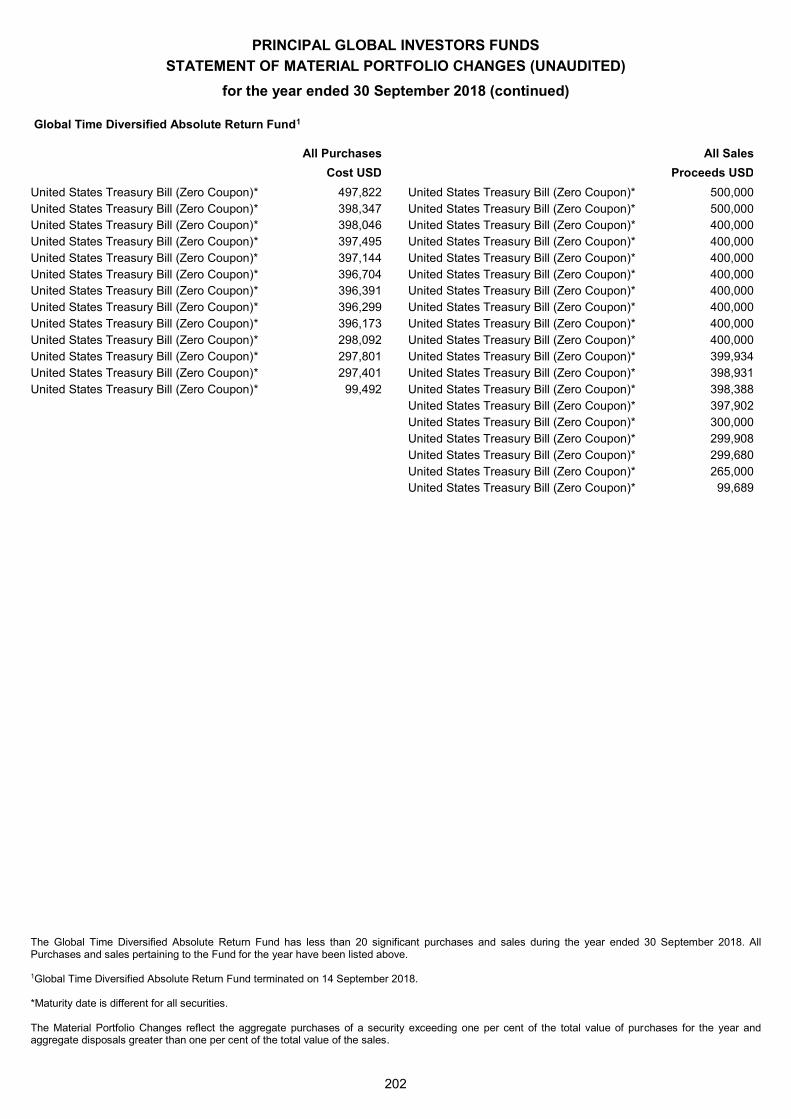
PRINCIPAL GLOBAL INVESTORS FUNDS
STATEMENT OF MATERIAL PORTFOLIO CHANGES (UNAUDITED)
for the year ended 30 September 2018 (continued)
202
Global Time Diversified Absolute Return Fund1
All Purchases All Sales
Cost USD Proceeds USD
United States Treasury Bill (Zero Coupon)* 497,822 United States Treasury Bill (Zero Coupon)* 500,000 United States Treasury Bill (Zero Coupon)* 398,347 United States Treasury Bill (Zero Coupon)* 500,000 United States Treasury Bill (Zero Coupon)* 398,046 United States Treasury Bill (Zero Coupon)* 400,000 United States Treasury Bill (Zero Coupon)* 397,495 United States Treasury Bill (Zero Coupon)* 400,000 United States Treasury Bill (Zero Coupon)* 397,144 United States Treasury Bill (Zero Coupon)* 400,000 United States Treasury Bill (Zero Coupon)* 396,704 United States Treasury Bill (Zero Coupon)* 400,000 United States Treasury Bill (Zero Coupon)* 396,391 United States Treasury Bill (Zero Coupon)* 400,000 United States Treasury Bill (Zero Coupon)* 396,299 United States Treasury Bill (Zero Coupon)* 400,000 United States Treasury Bill (Zero Coupon)* 396,173 United States Treasury Bill (Zero Coupon)* 400,000 United States Treasury Bill (Zero Coupon)* 298,092 United States Treasury Bill (Zero Coupon)* 400,000 United States Treasury Bill (Zero Coupon)* 297,801 United States Treasury Bill (Zero Coupon)* 399,934 United States Treasury Bill (Zero Coupon)* 297,401 United States Treasury Bill (Zero Coupon)* 398,931 United States Treasury Bill (Zero Coupon)* 99,492 United States Treasury Bill (Zero Coupon)* 398,388
United States Treasury Bill (Zero Coupon)* 397,902
United States Treasury Bill (Zero Coupon)* 300,000
United States Treasury Bill (Zero Coupon)* 299,908
United States Treasury Bill (Zero Coupon)* 299,680
United States Treasury Bill (Zero Coupon)* 265,000
United States Treasury Bill (Zero Coupon)* 99,689
The Global Time Diversified Absolute Return Fund has less than 20 significant purchases and sales during the year ended 30 September 2018. All Purchases and sales pertaining to the Fund for the year have been listed above.
1Global Time Diversified Absolute Return Fund terminated on 14 September 2018. *Maturity date is different for all securities. The Material Portfolio Changes reflect the aggregate purchases of a security exceeding one per cent of the total value of purchases for the year and aggregate disposals greater than one per cent of the total value of the sales.
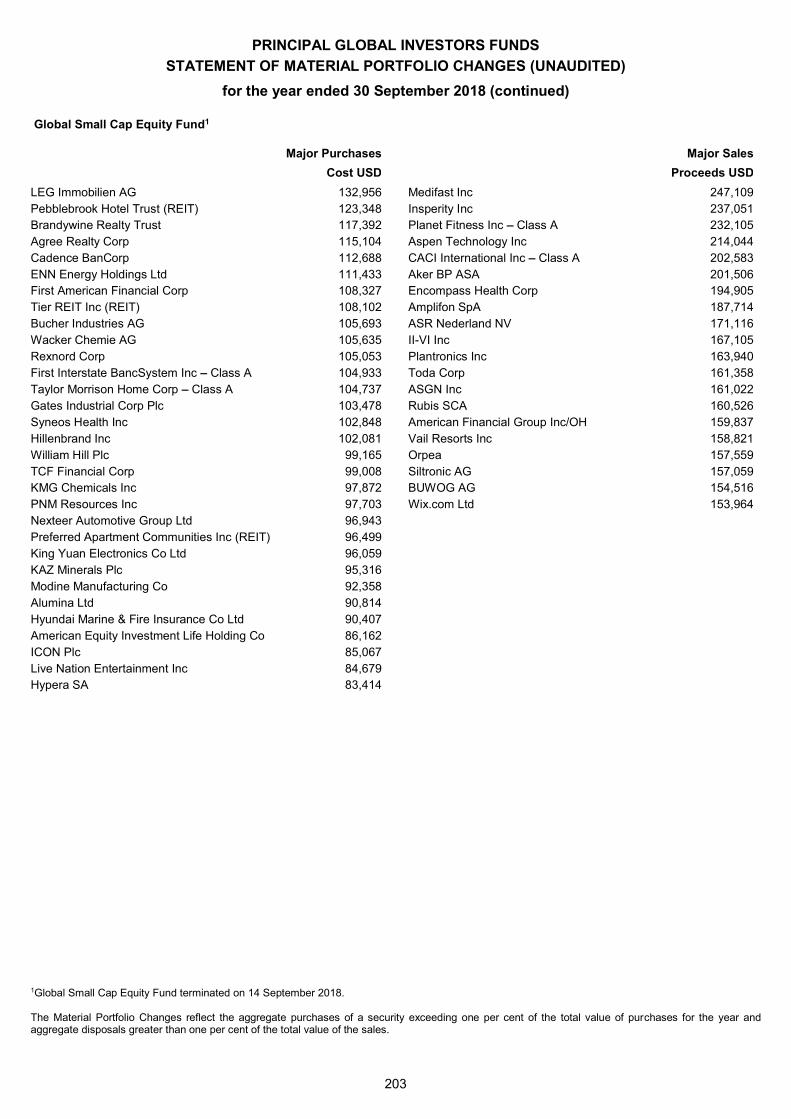
PRINCIPAL GLOBAL INVESTORS FUNDS
STATEMENT OF MATERIAL PORTFOLIO CHANGES (UNAUDITED)
for the year ended 30 September 2018 (continued)
203
Global Small Cap Equity Fund1
Major Purchases Major Sales
Cost USD Proceeds USD
LEG Immobilien AG 132,956 Medifast Inc 247,109 Pebblebrook Hotel Trust (REIT) 123,348 Insperity Inc 237,051 Brandywine Realty Trust 117,392 Planet Fitness Inc Class A 232,105 Agree Realty Corp 115,104 Aspen Technology Inc 214,044 Cadence BanCorp 112,688 CACI International Inc Class A 202,583 ENN Energy Holdings Ltd 111,433 Aker BP ASA 201,506 First American Financial Corp 108,327 Encompass Health Corp 194,905 Tier REIT Inc (REIT) 108,102 Amplifon SpA 187,714 Bucher Industries AG 105,693 ASR Nederland NV 171,116 Wacker Chemie AG 105,635 II-VI Inc 167,105 Rexnord Corp 105,053 Plantronics Inc 163,940 First Interstate BancSystem Inc Class A 104,933 Toda Corp 161,358 Taylor Morrison Home Corp Class A 104,737 ASGN Inc 161,022 Gates Industrial Corp Plc 103,478 Rubis SCA 160,526 Syneos Health Inc 102,848 American Financial Group Inc/OH 159,837 Hillenbrand Inc 102,081 Vail Resorts Inc 158,821 William Hill Plc 99,165 Orpea 157,559 TCF Financial Corp 99,008 Siltronic AG 157,059 KMG Chemicals Inc 97,872 BUWOG AG 154,516 PNM Resources Inc 97,703 Wix.com Ltd 153,964 Nexteer Automotive Group Ltd 96,943 Preferred Apartment Communities Inc (REIT) 96,499 King Yuan Electronics Co Ltd 96,059 KAZ Minerals Plc 95,316 Modine Manufacturing Co 92,358 Alumina Ltd 90,814 Hyundai Marine & Fire Insurance Co Ltd 90,407 American Equity Investment Life Holding Co 86,162 ICON Plc 85,067 Live Nation Entertainment Inc 84,679 Hypera SA 83,414
1Global Small Cap Equity Fund terminated on 14 September 2018. The Material Portfolio Changes reflect the aggregate purchases of a security exceeding one per cent of the total value of purchases for the year and aggregate disposals greater than one per cent of the total value of the sales.
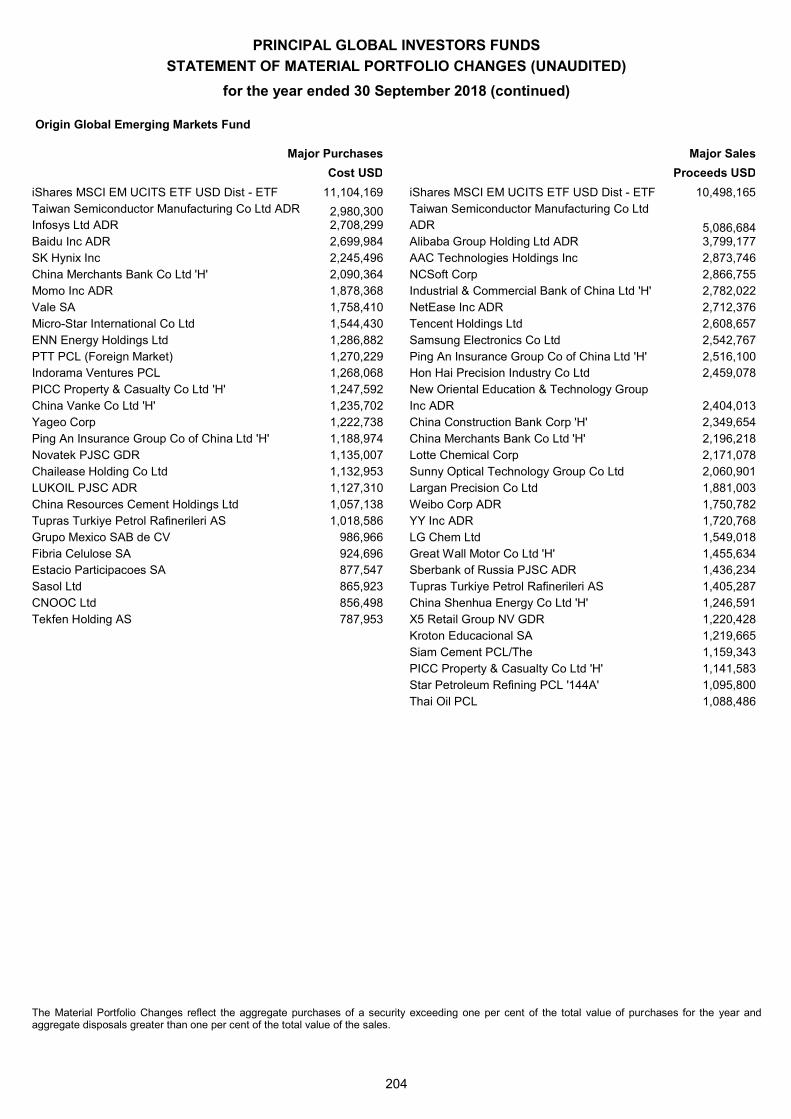
PRINCIPAL GLOBAL INVESTORS FUNDS
STATEMENT OF MATERIAL PORTFOLIO CHANGES (UNAUDITED)
for the year ended 30 September 2018 (continued)
204
Origin Global Emerging Markets Fund
Major Purchases Major Sales
Cost USD Proceeds USD
iShares MSCI EM UCITS ETF USD Dist - ETF 11,104,169 iShares MSCI EM UCITS ETF USD Dist - ETF 10,498,165 Taiwan Semiconductor Manufacturing Co Ltd ADR 2,980,300 Taiwan Semiconductor Manufacturing Co Ltd Infosys Ltd ADR 2,708,299 ADR 5,086,684 Baidu Inc ADR 2,699,984 Alibaba Group Holding Ltd ADR 3,799,177 SK Hynix Inc 2,245,496 AAC Technologies Holdings Inc 2,873,746 China Merchants Bank Co Ltd 'H' 2,090,364 NCSoft Corp 2,866,755 Momo Inc ADR 1,878,368 Industrial & Commercial Bank of China Ltd 'H' 2,782,022 Vale SA 1,758,410 NetEase Inc ADR 2,712,376 Micro-Star International Co Ltd 1,544,430 Tencent Holdings Ltd 2,608,657 ENN Energy Holdings Ltd 1,286,882 Samsung Electronics Co Ltd 2,542,767 PTT PCL (Foreign Market) 1,270,229 Ping An Insurance Group Co of China Ltd 'H' 2,516,100 Indorama Ventures PCL 1,268,068 Hon Hai Precision Industry Co Ltd 2,459,078 PICC Property & Casualty Co Ltd 'H' 1,247,592 New Oriental Education & Technology Group China Vanke Co Ltd 'H' 1,235,702 Inc ADR 2,404,013 Yageo Corp 1,222,738 China Construction Bank Corp 'H' 2,349,654 Ping An Insurance Group Co of China Ltd 'H' 1,188,974 China Merchants Bank Co Ltd 'H' 2,196,218 Novatek PJSC GDR 1,135,007 Lotte Chemical Corp 2,171,078 Chailease Holding Co Ltd 1,132,953 Sunny Optical Technology Group Co Ltd 2,060,901 LUKOIL PJSC ADR 1,127,310 Largan Precision Co Ltd 1,881,003 China Resources Cement Holdings Ltd 1,057,138 Weibo Corp ADR 1,750,782 Tupras Turkiye Petrol Rafinerileri AS 1,018,586 YY Inc ADR 1,720,768 Grupo Mexico SAB de CV 986,966 LG Chem Ltd 1,549,018 Fibria Celulose SA 924,696 Great Wall Motor Co Ltd 'H' 1,455,634 Estacio Participacoes SA 877,547 Sberbank of Russia PJSC ADR 1,436,234 Sasol Ltd 865,923 Tupras Turkiye Petrol Rafinerileri AS 1,405,287 CNOOC Ltd 856,498 China Shenhua Energy Co Ltd 'H' 1,246,591 Tekfen Holding AS 787,953 X5 Retail Group NV GDR 1,220,428
Kroton Educacional SA 1,219,665
Siam Cement PCL/The 1,159,343
PICC Property & Casualty Co Ltd 'H' 1,141,583
Star Petroleum Refining PCL '144A' 1,095,800
Thai Oil PCL 1,088,486
The Material Portfolio Changes reflect the aggregate purchases of a security exceeding one per cent of the total value of purchases for the year and aggregate disposals greater than one per cent of the total value of the sales.
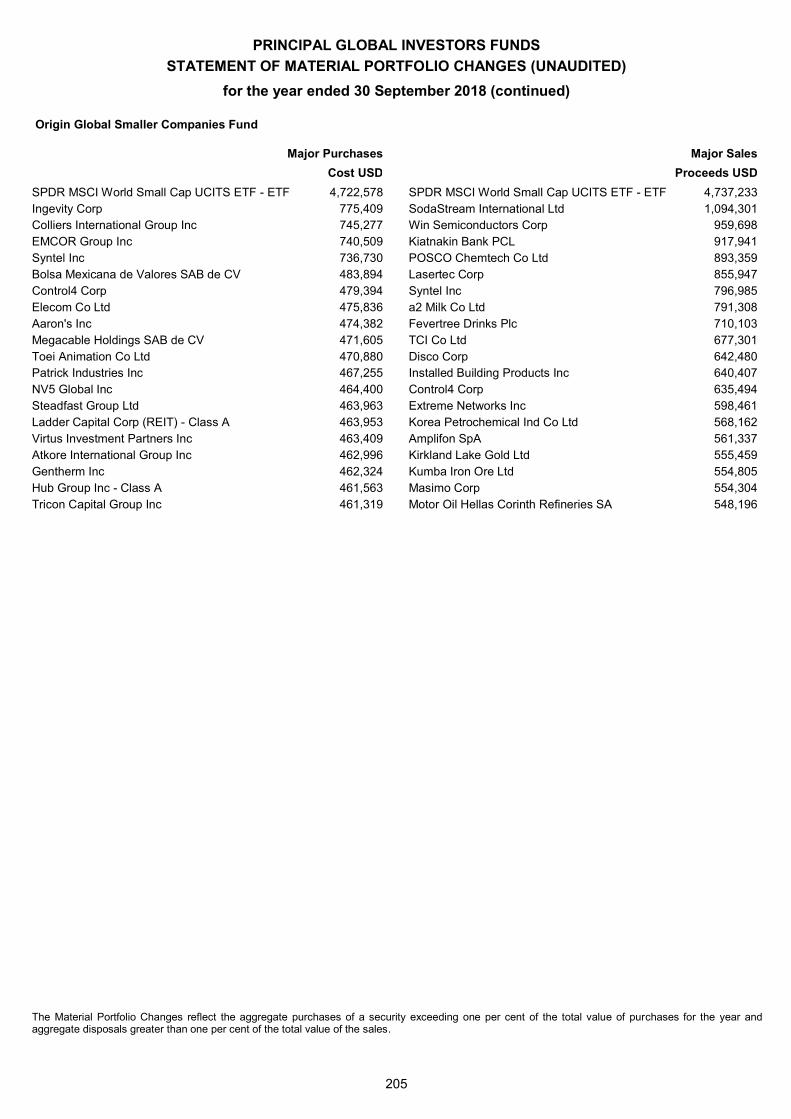
PRINCIPAL GLOBAL INVESTORS FUNDS
STATEMENT OF MATERIAL PORTFOLIO CHANGES (UNAUDITED)
for the year ended 30 September 2018 (continued)
205
Origin Global Smaller Companies Fund
Major Purchases Major Sales
Cost USD Proceeds USD
SPDR MSCI World Small Cap UCITS ETF - ETF 4,722,578 SPDR MSCI World Small Cap UCITS ETF - ETF 4,737,233 Ingevity Corp 775,409 SodaStream International Ltd 1,094,301 Colliers International Group Inc 745,277 Win Semiconductors Corp 959,698 EMCOR Group Inc 740,509 Kiatnakin Bank PCL 917,941 Syntel Inc 736,730 POSCO Chemtech Co Ltd 893,359 Bolsa Mexicana de Valores SAB de CV 483,894 Lasertec Corp 855,947 Control4 Corp 479,394 Syntel Inc 796,985 Elecom Co Ltd 475,836 a2 Milk Co Ltd 791,308 Aaron's Inc 474,382 Fevertree Drinks Plc 710,103 Megacable Holdings SAB de CV 471,605 TCI Co Ltd 677,301 Toei Animation Co Ltd 470,880 Disco Corp 642,480 Patrick Industries Inc 467,255 Installed Building Products Inc 640,407 NV5 Global Inc 464,400 Control4 Corp 635,494 Steadfast Group Ltd 463,963 Extreme Networks Inc 598,461 Ladder Capital Corp (REIT) - Class A 463,953 Korea Petrochemical Ind Co Ltd 568,162 Virtus Investment Partners Inc 463,409 Amplifon SpA 561,337 Atkore International Group Inc 462,996 Kirkland Lake Gold Ltd 555,459 Gentherm Inc 462,324 Kumba Iron Ore Ltd 554,805 Hub Group Inc - Class A 461,563 Masimo Corp 554,304 Tricon Capital Group Inc 461,319 Motor Oil Hellas Corinth Refineries SA 548,196
The Material Portfolio Changes reflect the aggregate purchases of a security exceeding one per cent of the total value of purchases for the year and aggregate disposals greater than one per cent of the total value of the sales.
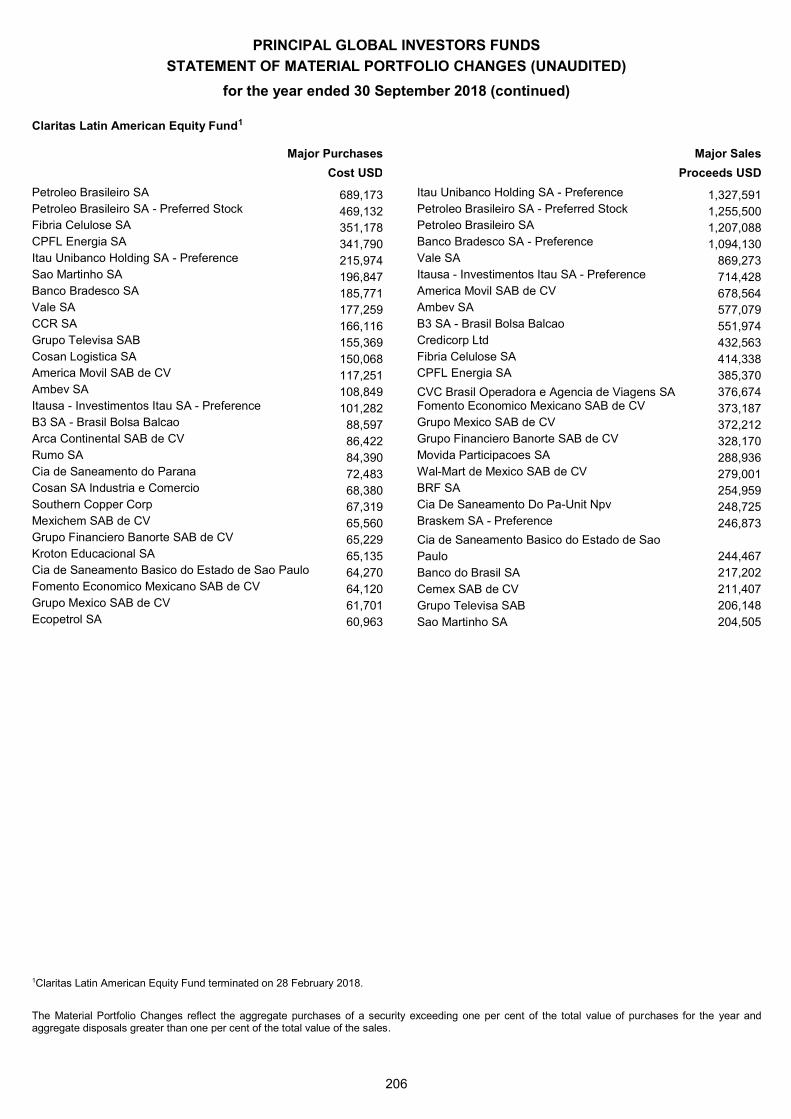
PRINCIPAL GLOBAL INVESTORS FUNDS
STATEMENT OF MATERIAL PORTFOLIO CHANGES (UNAUDITED)
for the year ended 30 September 2018 (continued)
206
Claritas Latin American Equity Fund1
Major Purchases Major Sales
Cost USD Proceeds USD
Petroleo Brasileiro SA 689,173 Itau Unibanco Holding SA - Preference 1,327,591 Petroleo Brasileiro SA - Preferred Stock 469,132 Petroleo Brasileiro SA - Preferred Stock 1,255,500 Fibria Celulose SA 351,178 Petroleo Brasileiro SA 1,207,088 CPFL Energia SA 341,790 Banco Bradesco SA - Preference 1,094,130 Itau Unibanco Holding SA - Preference 215,974 Vale SA 869,273 Sao Martinho SA 196,847 Itausa - Investimentos Itau SA - Preference 714,428 Banco Bradesco SA 185,771 America Movil SAB de CV 678,564 Vale SA 177,259 Ambev SA 577,079 CCR SA 166,116 B3 SA - Brasil Bolsa Balcao 551,974 Grupo Televisa SAB 155,369 Credicorp Ltd 432,563 Cosan Logistica SA 150,068 Fibria Celulose SA 414,338 America Movil SAB de CV 117,251 CPFL Energia SA 385,370 Ambev SA 108,849 CVC Brasil Operadora e Agencia de Viagens SA 376,674 Itausa - Investimentos Itau SA - Preference 101,282 Fomento Economico Mexicano SAB de CV 373,187 B3 SA - Brasil Bolsa Balcao 88,597 Grupo Mexico SAB de CV 372,212 Arca Continental SAB de CV 86,422 Grupo Financiero Banorte SAB de CV 328,170 Rumo SA 84,390 Movida Participacoes SA 288,936 Cia de Saneamento do Parana 72,483 Wal-Mart de Mexico SAB de CV 279,001 Cosan SA Industria e Comercio 68,380 BRF SA 254,959 Southern Copper Corp 67,319 Cia De Saneamento Do Pa-Unit Npv 248,725 Mexichem SAB de CV 65,560 Braskem SA - Preference 246,873 Grupo Financiero Banorte SAB de CV 65,229 Cia de Saneamento Basico do Estado de Sao Kroton Educacional SA 65,135 Paulo 244,467 Cia de Saneamento Basico do Estado de Sao Paulo 64,270 Banco do Brasil SA 217,202 Fomento Economico Mexicano SAB de CV 64,120 Cemex SAB de CV 211,407 Grupo Mexico SAB de CV 61,701 Grupo Televisa SAB 206,148 Ecopetrol SA 60,963 Sao Martinho SA 204,505
1Claritas Latin American Equity Fund terminated on 28 February 2018.
The Material Portfolio Changes reflect the aggregate purchases of a security exceeding one per cent of the total value of purchases for the year and aggregate disposals greater than one per cent of the total value of the sales.
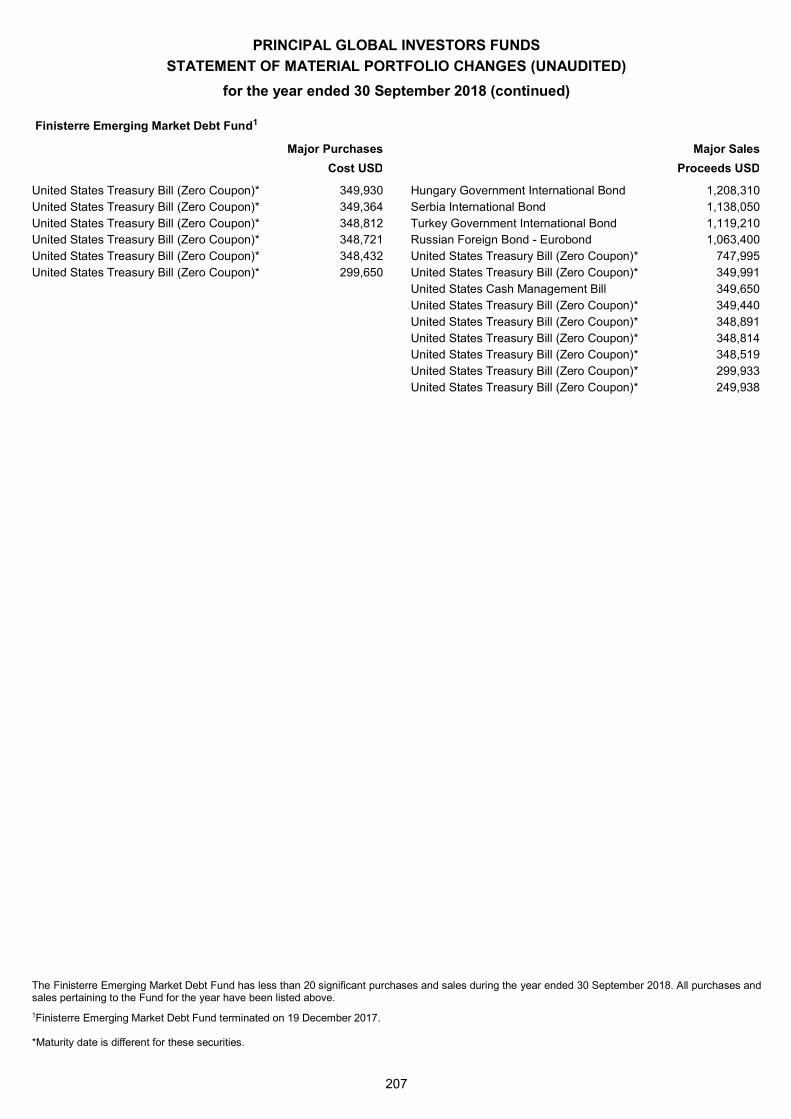
PRINCIPAL GLOBAL INVESTORS FUNDS
STATEMENT OF MATERIAL PORTFOLIO CHANGES (UNAUDITED)
for the year ended 30 September 2018 (continued)
207
Finisterre Emerging Market Debt Fund1
Major Purchases Major Sales
Cost USD Proceeds USD
United States Treasury Bill (Zero Coupon)* 349,930 Hungary Government International Bond 1,208,310 United States Treasury Bill (Zero Coupon)* 349,364 Serbia International Bond 1,138,050 United States Treasury Bill (Zero Coupon)* 348,812 Turkey Government International Bond 1,119,210 United States Treasury Bill (Zero Coupon)* 348,721 Russian Foreign Bond - Eurobond 1,063,400 United States Treasury Bill (Zero Coupon)* 348,432 United States Treasury Bill (Zero Coupon)* 747,995 United States Treasury Bill (Zero Coupon)* 299,650 United States Treasury Bill (Zero Coupon)* 349,991 United States Cash Management Bill 349,650 United States Treasury Bill (Zero Coupon)* 349,440 United States Treasury Bill (Zero Coupon)* 348,891 United States Treasury Bill (Zero Coupon)* 348,814 United States Treasury Bill (Zero Coupon)* 348,519 United States Treasury Bill (Zero Coupon)* 299,933 United States Treasury Bill (Zero Coupon)* 249,938
The Finisterre Emerging Market Debt Fund has less than 20 significant purchases and sales during the year ended 30 September 2018. All purchases and sales pertaining to the Fund for the year have been listed above.
1Finisterre Emerging Market Debt Fund terminated on 19 December 2017. *Maturity date is different for these securities.
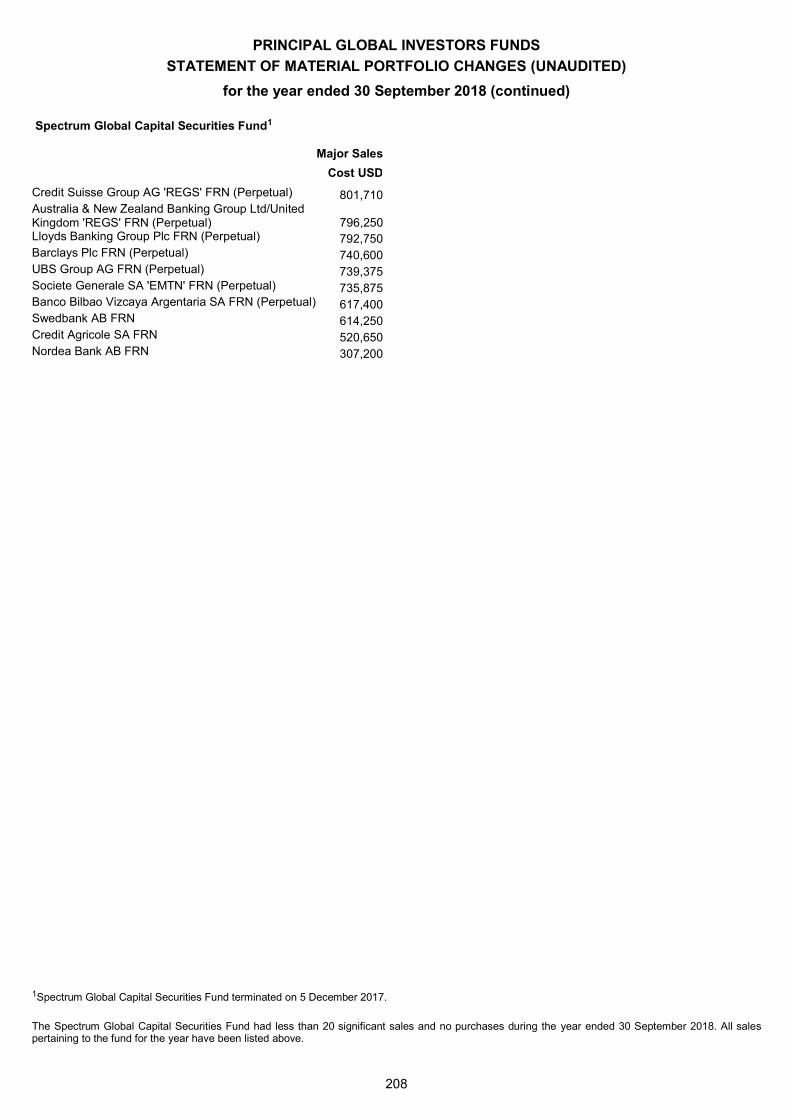
PRINCIPAL GLOBAL INVESTORS FUNDS
STATEMENT OF MATERIAL PORTFOLIO CHANGES (UNAUDITED)
for the year ended 30 September 2018 (continued)
208
Spectrum Global Capital Securities Fund1
Major Sales
Cost USD
Credit Suisse Group AG 'REGS' FRN (Perpetual) 801,710 Australia & New Zealand Banking Group Ltd/United Kingdom 'REGS' FRN (Perpetual) 796,250 Lloyds Banking Group Plc FRN (Perpetual) 792,750 Barclays Plc FRN (Perpetual) 740,600 UBS Group AG FRN (Perpetual) 739,375 Societe Generale SA 'EMTN' FRN (Perpetual) 735,875 Banco Bilbao Vizcaya Argentaria SA FRN (Perpetual) 617,400 Swedbank AB FRN 614,250 Credit Agricole SA FRN 520,650 Nordea Bank AB FRN 307,200 1Spectrum Global Capital Securities Fund terminated on 5 December 2017.
The Spectrum Global Capital Securities Fund had less than 20 significant sales and no purchases during the year ended 30 September 2018. All sales pertaining to the fund for the year have been listed above.
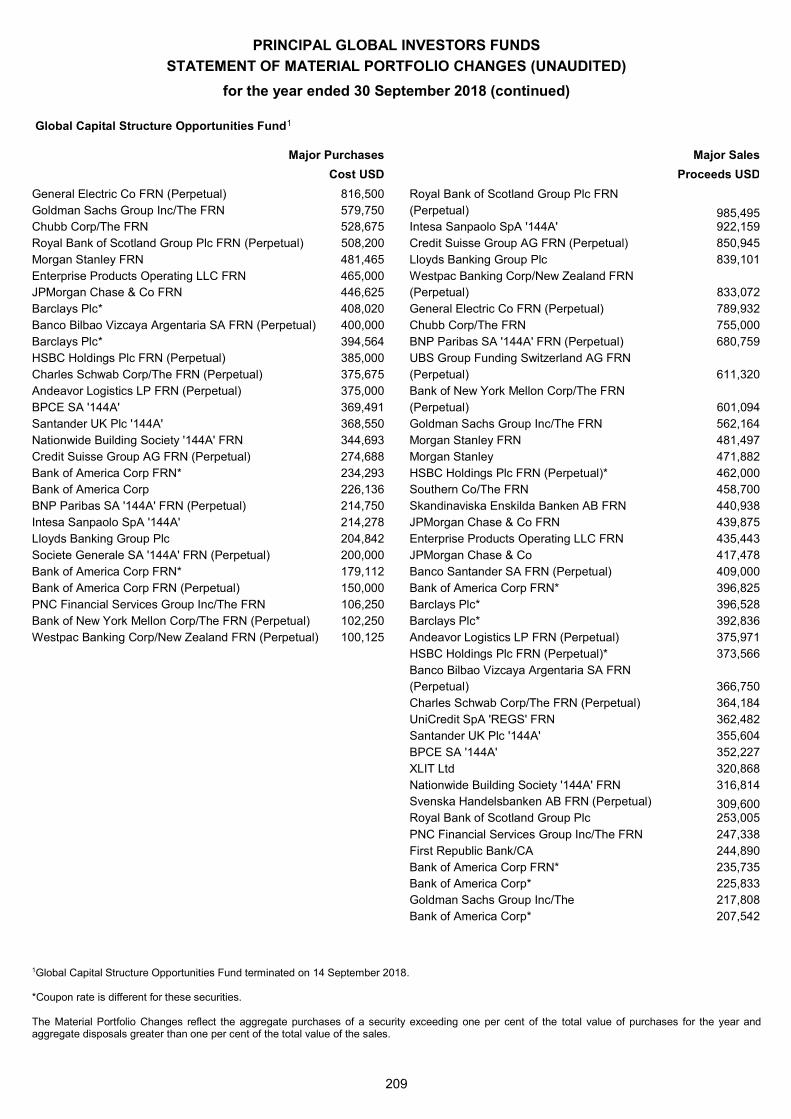
PRINCIPAL GLOBAL INVESTORS FUNDS
STATEMENT OF MATERIAL PORTFOLIO CHANGES (UNAUDITED)
for the year ended 30 September 2018 (continued)
209
Global Capital Structure Opportunities Fund1
Major Purchases Major Sales
Cost USD Proceeds USD
General Electric Co FRN (Perpetual) 816,500 Royal Bank of Scotland Group Plc FRN Goldman Sachs Group Inc/The FRN 579,750 (Perpetual) 985,495 Chubb Corp/The FRN 528,675 Intesa Sanpaolo SpA '144A' 922,159 Royal Bank of Scotland Group Plc FRN (Perpetual) 508,200 Credit Suisse Group AG FRN (Perpetual) 850,945 Morgan Stanley FRN 481,465 Lloyds Banking Group Plc 839,101 Enterprise Products Operating LLC FRN 465,000 Westpac Banking Corp/New Zealand FRN JPMorgan Chase & Co FRN 446,625 (Perpetual) 833,072 Barclays Plc* 408,020 General Electric Co FRN (Perpetual) 789,932 Banco Bilbao Vizcaya Argentaria SA FRN (Perpetual) 400,000 Chubb Corp/The FRN 755,000 Barclays Plc* 394,564 BNP Paribas SA '144A' FRN (Perpetual) 680,759 HSBC Holdings Plc FRN (Perpetual) 385,000 UBS Group Funding Switzerland AG FRN Charles Schwab Corp/The FRN (Perpetual) 375,675 (Perpetual) 611,320 Andeavor Logistics LP FRN (Perpetual) 375,000 Bank of New York Mellon Corp/The FRN BPCE SA '144A' 369,491 (Perpetual) 601,094 Santander UK Plc '144A' 368,550 Goldman Sachs Group Inc/The FRN 562,164 Nationwide Building Society '144A' FRN 344,693 Morgan Stanley FRN 481,497 Credit Suisse Group AG FRN (Perpetual) 274,688 Morgan Stanley 471,882 Bank of America Corp FRN* 234,293 HSBC Holdings Plc FRN (Perpetual)* 462,000 Bank of America Corp 226,136 Southern Co/The FRN 458,700 BNP Paribas SA '144A' FRN (Perpetual) 214,750 Skandinaviska Enskilda Banken AB FRN 440,938 Intesa Sanpaolo SpA '144A' 214,278 JPMorgan Chase & Co FRN 439,875 Lloyds Banking Group Plc 204,842 Enterprise Products Operating LLC FRN 435,443 Societe Generale SA '144A' FRN (Perpetual) 200,000 JPMorgan Chase & Co 417,478 Bank of America Corp FRN* 179,112 Banco Santander SA FRN (Perpetual) 409,000 Bank of America Corp FRN (Perpetual) 150,000 Bank of America Corp FRN* 396,825 PNC Financial Services Group Inc/The FRN 106,250 Barclays Plc* 396,528 Bank of New York Mellon Corp/The FRN (Perpetual) 102,250 Barclays Plc* 392,836 Westpac Banking Corp/New Zealand FRN (Perpetual) 100,125 Andeavor Logistics LP FRN (Perpetual) 375,971 HSBC Holdings Plc FRN (Perpetual)* 373,566 Banco Bilbao Vizcaya Argentaria SA FRN
(Perpetual) 366,750
Charles Schwab Corp/The FRN (Perpetual) 364,184
UniCredit SpA 'REGS' FRN 362,482
Santander UK Plc '144A' 355,604
BPCE SA '144A' 352,227
XLIT Ltd 320,868
Nationwide Building Society '144A' FRN 316,814
Svenska Handelsbanken AB FRN (Perpetual) 309,600 Royal Bank of Scotland Group Plc 253,005
PNC Financial Services Group Inc/The FRN 247,338
First Republic Bank/CA 244,890
Bank of America Corp FRN* 235,735
Bank of America Corp* 225,833
Goldman Sachs Group Inc/The 217,808
Bank of America Corp* 207,542
1Global Capital Structure Opportunities Fund terminated on 14 September 2018. *Coupon rate is different for these securities. The Material Portfolio Changes reflect the aggregate purchases of a security exceeding one per cent of the total value of purchases for the year and aggregate disposals greater than one per cent of the total value of the sales.
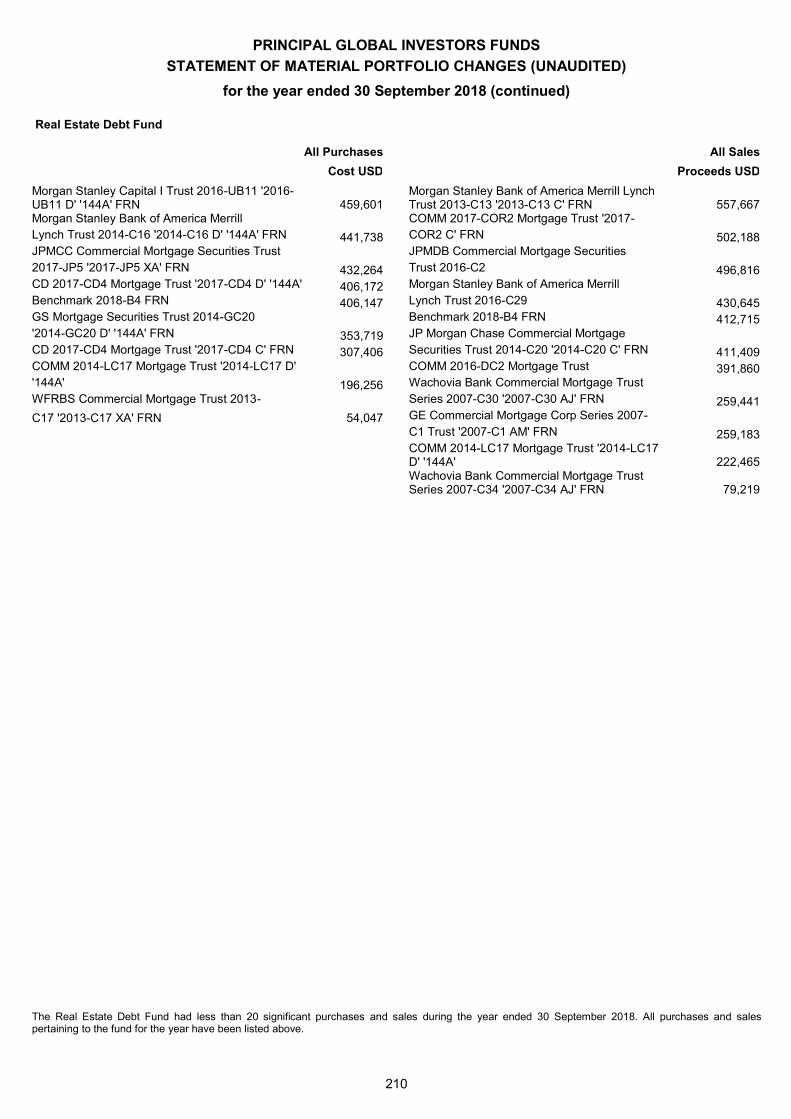
PRINCIPAL GLOBAL INVESTORS FUNDS
STATEMENT OF MATERIAL PORTFOLIO CHANGES (UNAUDITED)
for the year ended 30 September 2018 (continued)
210
Real Estate Debt Fund
All Purchases All Sales
Cost USD Proceeds USD
Morgan Stanley Capital I Trust 2016-UB11 '2016-UB11 D' '144A' FRN 459,601
Morgan Stanley Bank of America Merrill Lynch Trust 2013-C13 '2013-C13 C' FRN 557,667
Morgan Stanley Bank of America Merrill COMM 2017-COR2 Mortgage Trust '2017- Lynch Trust 2014-C16 '2014-C16 D' '144A' FRN 441,738 COR2 C' FRN 502,188 JPMCC Commercial Mortgage Securities Trust JPMDB Commercial Mortgage Securities 2017-JP5 '2017-JP5 XA' FRN 432,264 Trust 2016-C2 496,816 CD 2017-CD4 Mortgage Trust '2017-CD4 D' '144A' 406,172 Morgan Stanley Bank of America Merrill Benchmark 2018-B4 FRN 406,147 Lynch Trust 2016-C29 430,645 GS Mortgage Securities Trust 2014-GC20 Benchmark 2018-B4 FRN 412,715 '2014-GC20 D' '144A' FRN 353,719 JP Morgan Chase Commercial Mortgage CD 2017-CD4 Mortgage Trust '2017-CD4 C' FRN 307,406 Securities Trust 2014-C20 '2014-C20 C' FRN 411,409 COMM 2014-LC17 Mortgage Trust '2014-LC17 D' COMM 2016-DC2 Mortgage Trust 391,860 '144A' 196,256 Wachovia Bank Commercial Mortgage Trust WFRBS Commercial Mortgage Trust 2013- Series 2007-C30 '2007-C30 AJ' FRN 259,441 C17 '2013-C17 XA' FRN 54,047 GE Commercial Mortgage Corp Series 2007- C1 Trust '2007-C1 AM' FRN 259,183
COMM 2014-LC17 Mortgage Trust '2014-LC17 D' '144A' 222,465
Wachovia Bank Commercial Mortgage Trust Series 2007-C34 '2007-C34 AJ' FRN 79,219
The Real Estate Debt Fund had less than 20 significant purchases and sales during the year ended 30 September 2018. All purchases and sales pertaining to the fund for the year have been listed above.
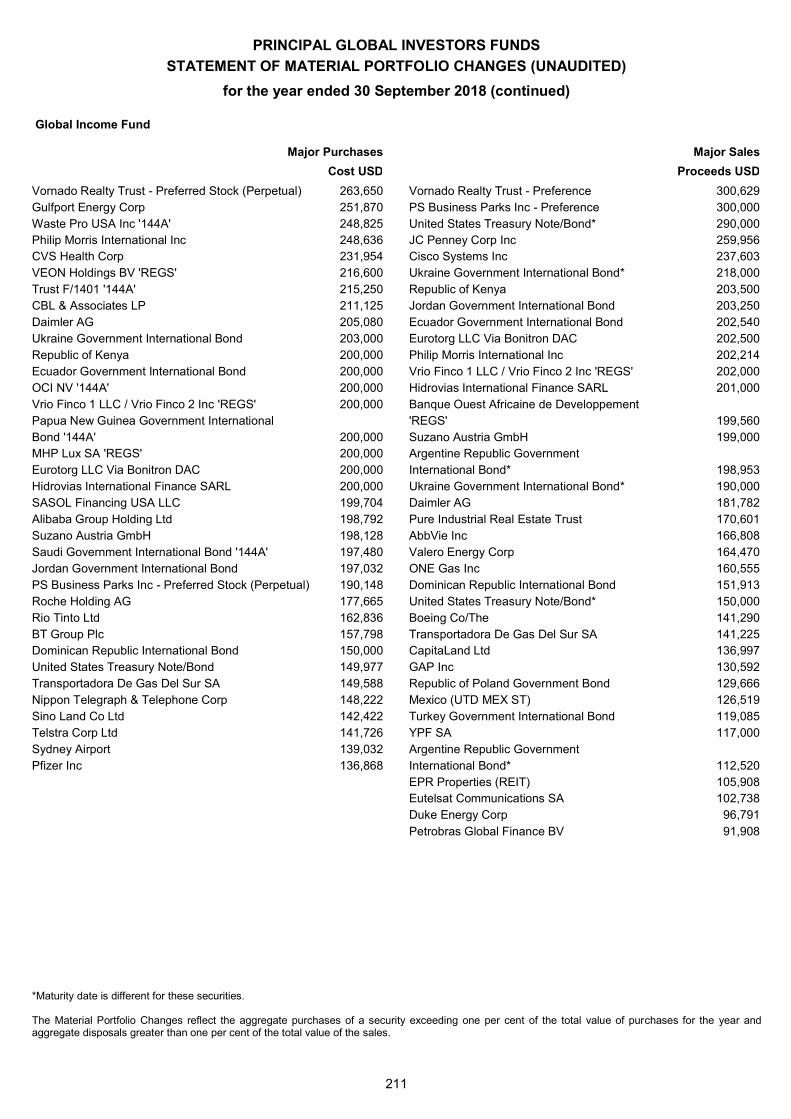
PRINCIPAL GLOBAL INVESTORS FUNDS
STATEMENT OF MATERIAL PORTFOLIO CHANGES (UNAUDITED)
for the year ended 30 September 2018 (continued)
211
Global Income Fund
Major Purchases Major Sales
Cost USD Proceeds USD
Vornado Realty Trust - Preferred Stock (Perpetual) 263,650 Vornado Realty Trust - Preference 300,629 Gulfport Energy Corp 251,870 PS Business Parks Inc - Preference 300,000 Waste Pro USA Inc '144A' 248,825 United States Treasury Note/Bond* 290,000 Philip Morris International Inc 248,636 JC Penney Corp Inc 259,956 CVS Health Corp 231,954 Cisco Systems Inc 237,603 VEON Holdings BV 'REGS' 216,600 Ukraine Government International Bond* 218,000 Trust F/1401 '144A' 215,250 Republic of Kenya 203,500 CBL & Associates LP 211,125 Jordan Government International Bond 203,250 Daimler AG 205,080 Ecuador Government International Bond 202,540 Ukraine Government International Bond 203,000 Eurotorg LLC Via Bonitron DAC 202,500 Republic of Kenya 200,000 Philip Morris International Inc 202,214 Ecuador Government International Bond 200,000 Vrio Finco 1 LLC / Vrio Finco 2 Inc 'REGS' 202,000 OCI NV '144A' 200,000 Hidrovias International Finance SARL 201,000 Vrio Finco 1 LLC / Vrio Finco 2 Inc 'REGS' 200,000 Banque Ouest Africaine de Developpement Papua New Guinea Government International 'REGS' 199,560 Bond '144A' 200,000 Suzano Austria GmbH 199,000 MHP Lux SA 'REGS' 200,000 Argentine Republic Government Eurotorg LLC Via Bonitron DAC 200,000 International Bond* 198,953 Hidrovias International Finance SARL 200,000 Ukraine Government International Bond* 190,000 SASOL Financing USA LLC 199,704 Daimler AG 181,782 Alibaba Group Holding Ltd 198,792 Pure Industrial Real Estate Trust 170,601 Suzano Austria GmbH 198,128 AbbVie Inc 166,808 Saudi Government International Bond '144A' 197,480 Valero Energy Corp 164,470 Jordan Government International Bond 197,032 ONE Gas Inc 160,555 PS Business Parks Inc - Preferred Stock (Perpetual) 190,148 Dominican Republic International Bond 151,913 Roche Holding AG 177,665 United States Treasury Note/Bond* 150,000 Rio Tinto Ltd 162,836 Boeing Co/The 141,290 BT Group Plc 157,798 Transportadora De Gas Del Sur SA 141,225 Dominican Republic International Bond 150,000 CapitaLand Ltd 136,997 United States Treasury Note/Bond 149,977 GAP Inc 130,592 Transportadora De Gas Del Sur SA 149,588 Republic of Poland Government Bond 129,666 Nippon Telegraph & Telephone Corp 148,222 Mexico (UTD MEX ST) 126,519 Sino Land Co Ltd 142,422 Turkey Government International Bond 119,085 Telstra Corp Ltd 141,726 YPF SA 117,000 Sydney Airport 139,032 Argentine Republic Government Pfizer Inc 136,868 International Bond* 112,520 EPR Properties (REIT) 105,908 Eutelsat Communications SA 102,738
Duke Energy Corp 96,791
Petrobras Global Finance BV 91,908
*Maturity date is different for these securities. The Material Portfolio Changes reflect the aggregate purchases of a security exceeding one per cent of the total value of purchases for the year and aggregate disposals greater than one per cent of the total value of the sales.
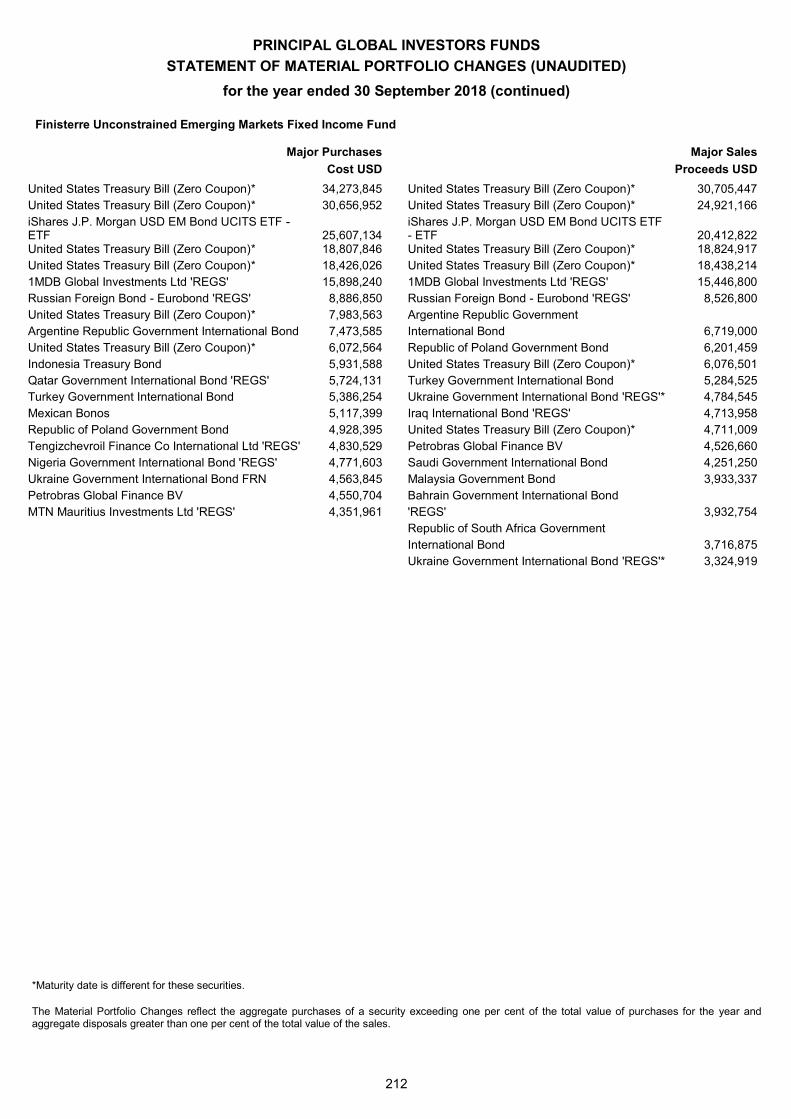
PRINCIPAL GLOBAL INVESTORS FUNDS
STATEMENT OF MATERIAL PORTFOLIO CHANGES (UNAUDITED)
for the year ended 30 September 2018 (continued)
212
Finisterre Unconstrained Emerging Markets Fixed Income Fund
Major Purchases Major Sales
Cost USD Proceeds USD
United States Treasury Bill (Zero Coupon)* 34,273,845 United States Treasury Bill (Zero Coupon)* 30,705,447 United States Treasury Bill (Zero Coupon)* 30,656,952 United States Treasury Bill (Zero Coupon)* 24,921,166 iShares J.P. Morgan USD EM Bond UCITS ETF - ETF 25,607,134
iShares J.P. Morgan USD EM Bond UCITS ETF - ETF 20,412,822
United States Treasury Bill (Zero Coupon)* 18,807,846 United States Treasury Bill (Zero Coupon)* 18,824,917 United States Treasury Bill (Zero Coupon)* 18,426,026 United States Treasury Bill (Zero Coupon)* 18,438,214 1MDB Global Investments Ltd 'REGS' 15,898,240 1MDB Global Investments Ltd 'REGS' 15,446,800 Russian Foreign Bond - Eurobond 'REGS' 8,886,850 Russian Foreign Bond - Eurobond 'REGS' 8,526,800 United States Treasury Bill (Zero Coupon)* 7,983,563 Argentine Republic Government Argentine Republic Government International Bond 7,473,585 International Bond 6,719,000 United States Treasury Bill (Zero Coupon)* 6,072,564 Republic of Poland Government Bond 6,201,459 Indonesia Treasury Bond 5,931,588 United States Treasury Bill (Zero Coupon)* 6,076,501 Qatar Government International Bond 'REGS' 5,724,131 Turkey Government International Bond 5,284,525 Turkey Government International Bond 5,386,254 Ukraine Government International Bond 'REGS'* 4,784,545 Mexican Bonos 5,117,399 Iraq International Bond 'REGS' 4,713,958 Republic of Poland Government Bond 4,928,395 United States Treasury Bill (Zero Coupon)* 4,711,009 Tengizchevroil Finance Co International Ltd 'REGS' 4,830,529 Petrobras Global Finance BV 4,526,660 Nigeria Government International Bond 'REGS' 4,771,603 Saudi Government International Bond 4,251,250 Ukraine Government International Bond FRN 4,563,845 Malaysia Government Bond 3,933,337 Petrobras Global Finance BV 4,550,704 Bahrain Government International Bond MTN Mauritius Investments Ltd 'REGS' 4,351,961 'REGS' 3,932,754 Republic of South Africa Government International Bond 3,716,875
Ukraine Government International Bond 'REGS'* 3,324,919
*Maturity date is different for these securities. The Material Portfolio Changes reflect the aggregate purchases of a security exceeding one per cent of the total value of purchases for the year and aggregate disposals greater than one per cent of the total value of the sales.

PRINCIPAL GLOBAL INVESTORS FUNDS
Securities Financing Transactions Regulation (UNAUDITED)
for the year ended 30 September 2018
213
There are no securities financing transactions that require disclosure as at 30 September 2018 in accordance with the Securities Financing Regulation (Regulation (EU) 2015/2365).
PRINCIPAL GLOBAL INVESTORS FUNDS
DIRECTORY
214
Manager Principal Global Investors (Ireland) Limited Registered Office: 32 Molesworth Street Dublin 2 Ireland
Investment Adviser Principal Global Investors, LLC 801 Grand Avenue Des Moines Iowa 50392 United States of America
Sub-Investment Advisers Principal Global Investors (Europe) Limited Global Equity Fund, Asian Equity Fund, European Equity Fund, Emerging Markets Equity Fund, Global Property Securities Fund, Global Time Diversified Absolute Return Fund (until 14 September 2018) 1 Wood Street London EC2V 7JB United Kingdom
Principal Global Investors (Australia) Limited Global Property Securities Fund Level 43 AMP Centre 50 Bridge Street GPO Box 4169 Sydney NSW 2000 Australia
Spectrum Asset Management, Inc Preferred Securities Fund, Spectrum Global Capital Securities Fund (until 5 December 2017), Global Income Fund 2 High Ridge Park #2 Stamford CT 06905 United States of America
Principal Real Estate Investors, LLC Global Property Securities Fund, Real Estate Debt Fund 801 Grand Avenue Des Moines Iowa 50392 United States of America
Principal Global Investors (Japan) Limited Japanese Equity Fund Imperial Tower 18th Floor 1-1-1 Uchisaiwai-cho Chiyoda-ku Tokyo 100-0011 Japan
Principal Global Investors (Singapore) Limited (from 5 September 2018) Global Property Securities Fund 1 Raffles Quay 19-04 North Tower Singapore 048583 Singapore
Post Advisory Group, LLC Post Global Limited Term High Yield Fund 2049 Century Park East Suite 3050 Los Angeles CA 90067 United States of America
* Denotes independent non-executive directors
Origin Asset Management LLP Origin Global Emerging Markets Fund, Origin Global Smaller Companies Fund One Carey Lane London EC2V 8AE United Kingdom Claritas Administraceo De Recursos Ltda (until 28 February 2018) Claritas Latin American Equity Fund Avenida Brigadeiro Faria Lima 4221 - - Itaim Bibi CEP 04538- - SP Brasil Finisterre Malta Limited Finisterre Emerging Market Debt Fund (until 19 December 2017), Finisterre Unconstrained Emerging Markets Fixed Income Fund Level 5, Marina Business Centre Abate Rigord Street Ta' Xbiex XBX 1127 Malta
Finisterre Capital LLP Finisterre Emerging Market Debt Fund (until 19 December 2017), Finisterre Unconstrained Emerging Markets Fixed Income Fund 10 New Burlington Street London W1S 3BE United Kingdom
Board of Directors of the Manager Bronwyn Wright* (Irish) Christopher Henderson (American) (resigned 17 May 2018) David Shubotham* (Irish) Jim Firn* (American & British)
(Irish) Mike Beer (Chairman) (American) Greg Thornton (British) Roberto Walker (Chilean) (Appointed 23 May 2018) Administrator BNY Mellon Fund Services (Ireland) Designated Activity Company One Dockland Central Guild Street International Financial Services Centre Dublin 1 Ireland
Depositary BNY Mellon Trust Company (Ireland) Limited One Dockland Central Guild Street International Financial Services Centre Dublin 1 Ireland
Independent Auditor PricewaterhouseCoopers Chartered Accountants and Registered Auditors One Spencer Dock North Wall Quay Dublin 1 Ireland
215
PRINCIPAL GLOBAL INVESTORS FUNDS
DIRECTORY (continued)
The prospectus, the Trust Deed, the annual and semi-annual reports may be obtained free of charge during normal business hours from the following national representatives:
Legal Advisers to the Manager as to Irish Law Maples and Calder
Dublin 2 Ireland Company Secretary MFD Secretaries Limited 32 Molesworth Street Dublin 2 Ireland Sponsoring Broker Maples and Calder 75 St Stephen's Green Dublin 2 Ireland France Representative
29 Boulevard Hausmann 75009 Paris France
United Kingdom Representative Principal Global Investors (Europe) Limited 1 Wood Street London EC2V 7JB United Kingdom
Germany Representative ODDO BHF Bank Aktiengesellschaft Bockenheimer Landstrasse 10 60323 Frankfurt am Main Germany
Spain Representative
28002 Madrid Spain
Belgium Representative BNP Paribas Securities Services Brussels Branch Rue de Loxum 25 1000 Brussels Belgium
Switzerland Representative ACOLIN Fund Services AG Stadelhoferstrasse 18 CH-8001 Z rich Switzerland Hong Kong Representative Principal Investment & Retirement Services Limited 30th Floor Millenium City 6 392 Kwun Tong Road Kwun Tong Kowloon Hong Kong
Sweden Representative SEB Merchant Banking
atan 8 SE - 111 47 Stockholm Sweden Austria Representative Erste Bank der oesterreichischen Sparkassen AG (Erste Bank Oesterreich) Am Graben 21 A-1010 Wien Austria Luxembourg Representative CACEIS Bank Luxembourg
L-2520 Luxembourg Luxembourg Denmark Representative SEB Denmark Bernstorffsgade 50 Copenhagen V1577 Denmark
Information for investors in Switzerland Principal Global Investors Funds are investment funds set up under the laws of the Republic of Ireland. The Swiss Representative is ACOLIN Fund Services AG, Stadelhoferstrasse 18, CH-8001
17 1204 Representative and Paying Agent are Stadelhoferstrasse 18, CH-8001, Z rich, Switzerland. Communications to the Swiss Representative are to be made to the Zurich branch. Payments to the Swiss Paying Agent are also to be addressed to the
prospectus, the annual and semi-annual reports as well as a list of purchases and sales made on behalf of Principal Global Investors Funds can be obtained free of charge at the Zurich branch of the Representative and Paying Agent during ordinary business hours.
PRINCIPAL GLOBAL INVESTORS FUNDS
ENQUIRIES
216
Requests for subscriptions, conversion or redemption of Units, dealing and administration enquiries:-
Hong Kong-based Investors Hong Kong Representative Principal Investment & Retirement Services Limited 30th Floor Millenium City 6 392 Kwun Tong Road Kwun Tong Kowloon Hong Kong Tel: 852 2117 8383 (General enquiries) Fax: 852 2918 1461 (Dealing) Email: [email protected]
All Investors (except Hong Kong-based investors) The Administrator BNY Mellon Fund Services (Ireland) Designated Activity Company One Dockland Central Guild Street International Financial Services Centre Dublin 1 Ireland Tel: 353 1 900 8081 Fax: 353 1 829 0833
Sales and other enquiries
Hong Kong-based Investors Hong Kong Representative Principal Investment & Retirement Services Limited 30th Floor Millenium City 6 392 Kwun Tong Road Kwun Tong Kowloon Hong Kong Tel: 852 2117 8383 (General enquiries) Fax: 852 2918 1461 (Dealing) Email: [email protected]
European-based Investors European Representative Principal Global Investors (Europe) Limited 1 Wood Street London EC2V 7JB United Kingdom Tel: 44 20 7710 0220 (London) Tel: 49 89 2421 8155 (Munich) Tel: 31 20 700 5522 (Amsterdam) Email: [email protected]
Middle-East and Africa Investors Principal Global Investors LLC Office 109 Level 1 Gate Village 7 Dubai International Financial Centre P.O. Box 482006 Dubai United Arab Emirates Tel: 971 4346 4555
Singaporean Investors Principal Global Investors (Singapore) Limited One Raffles Quay No. 19 - 01 North Tower Singapore 048583 Tel: 65 6332 0683
Internet Further information about the Unit Trust and about Principal Global Investors can be found on the following website: www.principalglobal.com

Principalglobal.com/funds


