188
Joint Lead Managers Prospectus regarding listing on NASDAQ OMX Stockholm
| Date post: | 29-Mar-2023 |
| Category: |
Documents |
| Upload: | khangminh22 |
| View: | 0 times |
| Download: | 0 times |
Joint Lead Managers
Prospectus regarding listing onNASDAQ OMX Stockholm
Important InformatIon
INfOrMAtION tO INveStOrSIn this prospectus (the “Prospectus”), “Cavotec”, the “Company” or the “Group”, depending on the context, refer to Cavotec SA (a Swiss li-mited company), company registration no. CH-501.3.015.724-3, the group for which Cavotec SA is the parent company or a subsidiary of Cavotec SA. The “Managers” refer to Handelsbanken Capital Markets, a business area of Svenska Handelsbanken AB (publ) (“Handelsban-ken Capital Markets”) and SEB Enskilda, a business area of Skandi-naviska Enskilda Banken AB (publ) (“SEB Enskilda”), respectively. The Managers have no financial or other interests in the transaction, apart from a fee, fixed in advance, for services provided in relation to the transaction.
The Swedish version of this Prospectus has been approved and regi-stered by the Swedish Financial Supervisory Authority in accordance with the provisions of Chapter 2, sections 25 and 26 of the Swedish Financial Instruments Trading Act (1991:980). The approval and regi-stration of the Swedish Prospectus does not imply that the Swedish Financial Supervisory Authority guarantees that the factual information provided in this Prospectus is accurate or complete. Please note that, in accordance with an exemption granted by the Swedish Financial Su-pervisory Authority, Cavotec will publish continuous and price sensitive information in English only and no Swedish translations will be available.
The Prospectus may not be distributed in any country in which the distribution requires additional prospectuses, registration or other me-asures than what is required by Swedish law, or otherwise violates the regulations in such country.
The shares have not been registered and will not be registered in ac-cordance with the United States Securities Act of 1933 (the “Securities Act”) or any provincial law in Canada and may not be offered or sold, directly or indirectly, within the United States or Canada or to persons who are domiciled there other than in such cases as do not require registration in accordance with the Securities Act or any provincial law in Canada.
The figures presented in this Prospectus have been rounded off in cer-tain cases, as a consequence of which the tables will not always tally correctly. Unless otherwise stated, all financial figures are stated in Euro (“EUR”). Financial information in this Prospectus has not been audited and/or reviewed by the auditors unless explicitly stated.
This Prospectus is governed by Swedish law. The courts of Sweden have exclusive jurisdiction to settle any conflict or dispute arising out of or in connection with this Prospectus. In case of any inconsistency between the Swedish and English version of the Prospectus, the En-glish version shall prevail.
Financial information in the Prospectus that is not derived from the audi-ted financial statements for 2008, 2009 or 2010 nor from the reviewed interim report for the period 1 January–30 June 2011 originates from Cavotec’s internal accounting and reporting system. This data has not been audited or reviewed by Cavotec’s auditors.
fOrwArD-lOOkINg INfOrMAtIONThis Prospectus may include forward-looking information. Such infor-mation is not a guarantee of future conditions and is subject to una-voidable risks and uncertainties. Forward-looking information may be distinguished by the fact that it does not exclusively refer to historic or current factual circumstances or that it contains such words as “may”, “should”, “expected”, “believed”, “estimated”, “planned”, “being pre-pared”, “is estimated”, “plans to”, “forecast”, “attempts” or “could” or negations of such terms and other variations thereof or comparative terms. This forward-looking information reflects the current expectation of Cavotec’s Board of Directors and executive management based on
the information available to them and is based on a number of as-sumptions that are subject to elements of risks and uncertainty that may be beyond the control of the Board of Directors and the executi-ve management. Actual results can deviate considerably from what is expressed or implied in this forward-looking information. All forward-looking information is based exclusively on the conditions prevailing when it was provided and Cavotec and its Board have no obligation (and explicitly refute any such obligation) to update or change such forward-looking information, either as a result of new information, new conditions or other factors. All forward-looking information that can be attributed to Cavotec or persons who act on its behalf are subject to the reservation in this section or referred to in this section.
INDuStry AND MArket DAtAThis Prospectus contains information from third parties in the form of industry and market data as well as statistics and calculations derived from industry reports and studies, market research reports, publicly available information and commercial publications.
Certain market share information and other statements in this Prospec-tus regarding the industries in which Cavotec operates and its position relative to its competitors are not based on published statistical data or information obtained from independent third parties. Rather, such information and statements reflect the Company’s best estimates ba-sed upon information obtained from trade and business organisations and associations and other contacts within the industries in which it competes, as well as information published by its competitors. The Company believes that such data are useful in helping investors under-stand the industries in which Cavotec operates and its position within the industries. However, the Company does not have access to the facts and assumptions underlying the numerical data, market data and other information extracted from publicly available sources and has not independently verified market data provided by third parties or indust-ry or general publications. In addition, while the Company believes its internal research to be reliable, such research has not been verified by any independent sources and the Company cannot guarantee its accuracy. Readers should note that macroeconomic forecasts and sentiments change. Cavotec has strived to use the latest available in-formation from relevant sources. However, there are often long periods of time between publications of data which could negatively influence the relevance.
Neither the Company, nor the Managers, assumes any responsibility for the correctness of any market share or industry data included in this Prospectus. The Company confirms that the information provided by third parties has been accurately reproduced. So far as the Company is aware and has been able to ascertain from information published by such third parties, no facts have been omitted which would render the reproduced information inaccurate or misleading.
DOCuMeNtS INCOrPOrAteD tHrOugH refereNCeThe following documents shall be incorporated and constitute a part of the prospectus:1. Page 18–47 of Cavotec MSL’s annual report for 2008, including the
auditor’s report2. Page 18–46 of Cavotec MSL’s annual report for 2009, including the
auditor’s reportCavotec MSL’s annual reports for 2008 and 2009 which have been in-corporated in the Prospectus through reference have been audited by PricewaterhouseCoopers. The 2008 and 2009 auditor’s reports have been included in the annual reports for the respective years. The rele-vant auditors’ reports contained no observations.
The incorporated documents are available throughout the entire pe-riod of validity of the Prospectus from Cavotec on its website at www.cavotec.com.
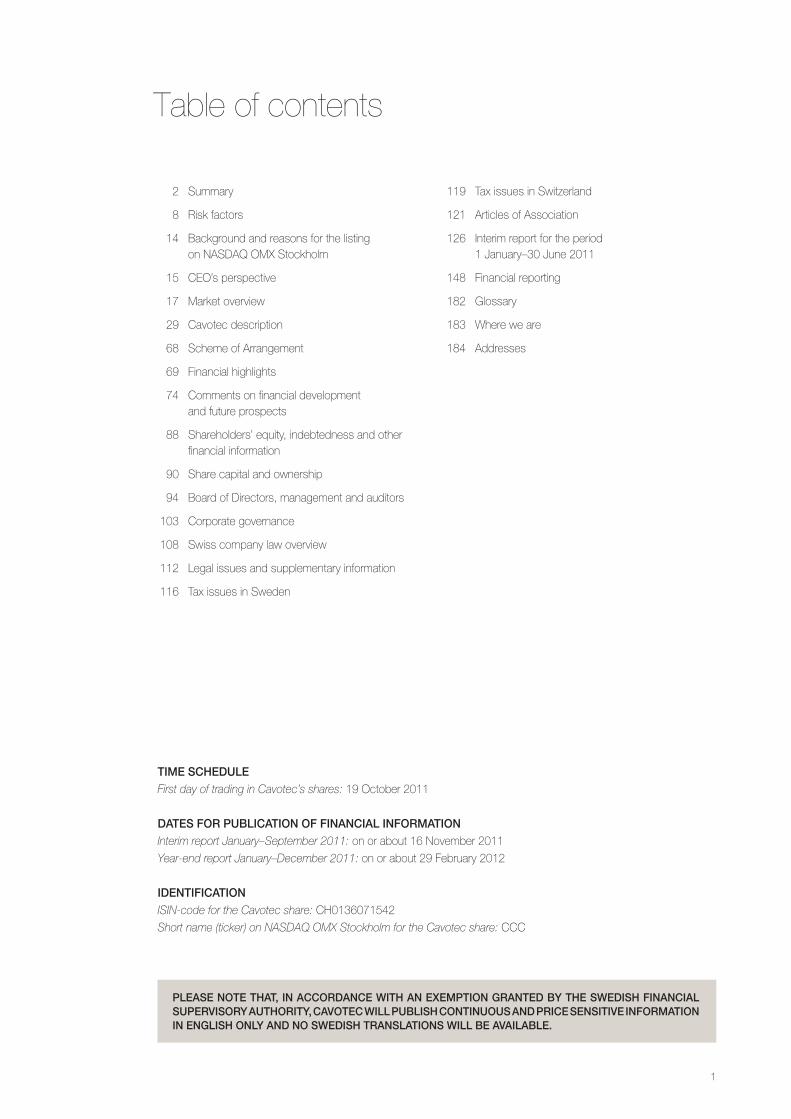
tIme ScheduleFirst day of trading in Cavotec’s shares: 19 October 2011
dateS for puBlIcatIon of fInancIal InformatIonInterim report January–September 2011: on or about 16 November 2011
Year-end report January–December 2011: on or about 29 February 2012
IdentIfIcatIonISIN-code for the Cavotec share: CH0136071542
Short name (ticker) on NASDAQ OMX Stockholm for the Cavotec share: CCC
2 Summary
8 Risk factors
14 Background and reasons for the listing on NASDAQ OMX Stockholm
15 CEO’s perspective
17 Market overview
29 Cavotec description
68 Scheme of Arrangement
69 Financial highlights
74 Comments on financial development and future prospects
88 Shareholders’ equity, indebtedness and other financial information
90 Share capital and ownership
94 Board of Directors, management and auditors
103 Corporate governance
108 Swiss company law overview
112 Legal issues and supplementary information
116 Tax issues in Sweden
119 Tax issues in Switzerland
121 Articles of Association
126 Interim report for the period 1 January–30 June 2011
148 Financial reporting
182 Glossary
183 Where we are
184 Addresses
Table of contents
pleaSe note that, In accordance wIth an exemptIon granted By the SwedISh fInancIal SupervISory authorIty, cavotec wIll puBlISh contInuouS and prIce SenSItIve InformatIon In englISh only and no SwedISh tranSlatIonS wIll Be avaIlaBle.
1
SummaryThis summary shall be viewed as an introduction to the Prospectus. Each decision to invest in the Cavotec share shall
be based on an assessment of the Prospectus as a whole. Investors who bring action in court with respect to the
information in the Prospectus may be forced to bear the costs for translation of the Prospectus. A person may be made
responsible for the information included or lacking in the summary, or its translation, only if the summary or translation is
misleading or incorrect in relation to the other portions of the Prospectus.
Background and reaSonS In BrIefCavotec is a global engineering group, supplying innovative and environmentally friendly systems to the ports and
maritime, airports, mining and tunnelling and general industry sectors. Cavotec has an ambitious plan regarding both
organic and acquisition driven growth. The Cavotec Group has been listed on the NZX since January 2007 when
Cavotec Group Holdings NV and Mooring Systems Limited, which was listed on the NZX, merged their business
interests through a reverse acquisition in a share for share transaction creating Cavotec MSL Holdings Ltd. Liquidity on
the NZX has been low in recent years and overall trading volumes have fallen which has underlined the necessity of
seeking alternative listings of the Cavotec share.
Cavotec considers a listing on NASDAQ OMX Stockholm as an important step to provide additional ways of maximising
shareholder value. The Board of Directors believes that NASDAQ OMX Stockholm has a strong investor base that can
support capital raisings for value-accretive acquisitions in line with the Company’s growth policy and acquisition strategy,
and that by choosing Stockholm as the listing location the transparency of the Company’s business will increase since
many similar companies, as well as some important Cavotec customers, are listed in Stockholm.
BrIef cavotec deScrIptIonCavotec is a global engineering group that enables industries worldwide to improve productivity, safety and sustainability.
Cavotec delivers power transmission, distribution and control technologies that form the link between fixed installations,
in for example airports, ports and mines, and mobile equipment such as aircraft, ships, mining equipment and cranes.
The Group designs and manufactures systems within the following four Market Units:
•Ports & Maritime manufactures innovative power and control systems, including MoorMaster™ automated mooring
units, Alternative Maritime Power (AMP) systems, motorised cable reels and marine slipring systems. These
technologies enable the ports and maritime industry to operate safely, sustainably and more productively. Customers
are primarily global OEMs and major port authorities, shipping companies and general contractors.
•Airports develops advanced ground support equipment (GSE), including fuel, water and power supply pit systems,
PCAir systems, tunnel systems, aircraft connectors and caddies that help airlines and airports to reduce tarmac
congestion, improve efficiency and reduce environmental impact. Customers are primarily public and private airports
and airport authorities, aircraft manufacturers and general contractors.
•Mining & Tunnelling specialises in cables, cable reels and power connectors, reducing customers’ reliance on diesel
driven machinery and making the mining and tunnelling industry more sustainable and more efficient. Customers are
primarily global OEMs and mining companies.
•General Industry provides a diverse range of products, including spring driven reels, slipring columns, power
connectors, radio remote controls, cables, cable ladders and cable chains. The customer base is highly diversified
with companies in various industries, including many international OEMs.
2
All engineering and most manufacturing of Cavotec’s products and systems take place at nine specialised engineering
Centres of Excellence in Germany (three), Sweden, Norway, Italy, the United States (two) and New Zealand. Many of
Cavotec’s customers purchase from various places around the world, with the Group following its customers as they
expand globally. Cavotec is strongly positioned to provide a local customer oriented approach with the support of a
worldwide network.
BuSIneSS concept, goalS and StrategIeSBusiness conceptCavotec’s business concept is to design, engineer and sell innovative products and systems that enable industries to
improve efficiency, profitability, productivity and environmental sustainability.
By bringing together a local approach and a global vision Cavotec is committed to build long-term partnerships with
customers aimed at introducing a best practice approach and competency throughout Cavotec’s fields of activity.
goalsFinancial goals•Annual revenues of EUR 0.5 billion including acquisitions over the next business cycle
•Organic revenue growth at a CAGR of 10 per cent over the next business cycle
•EBIT margin to increase to 12 per cent over the coming years
•A debt/equity ratio of at most 0.75
Dividend policyCavotec’s goal is to distribute dividends of approximately 25 per cent of the Group’s net profit after tax. Account should
however be taken of Cavotec’s financial position, cash flow and future prospects.
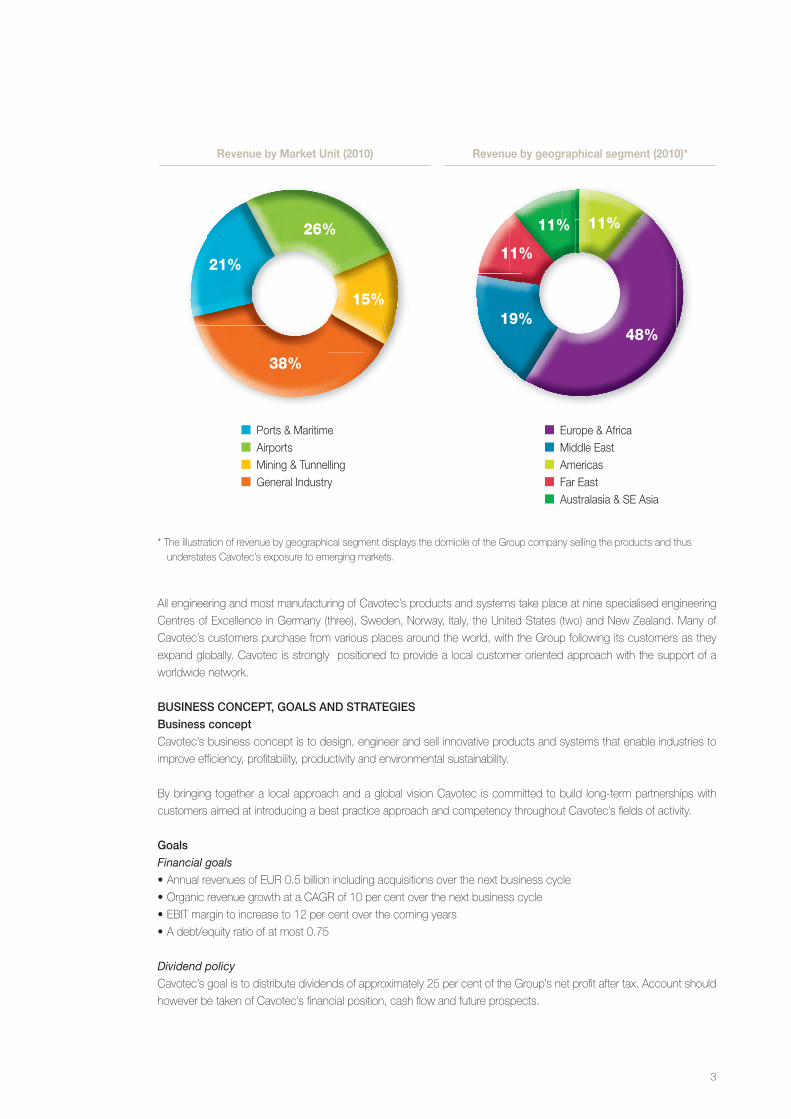
Ports & Maritime Airports Mining & Tunnelling General Industry
21%
26%
15%
38%
Revenue by Market Unit (2010) Revenue by geographical segment (2010)*
Europe & Africa Middle East Americas Far East Australasia & SE Asia
48%
11%11%
11%
19%
* The illustration of revenue by geographical segment displays the domicile of the Group company selling the products and thus understates Cavotec’s exposure to emerging markets.
3
Strategies•unrivaled customer service and engineering excellence. Many of the Company’s customers depend on
Cavotec’s products as critical elements in their operations.
•attract and retain highly skilled and talented staff is crucial for Cavotec to maintain the highest quality and
engineering content throughout the Company’s operations.
•organic growth through the Company’s investments in its innovative product portfolio and through increased
importance of systems delivery and project management.
•complementary acquisitions within Cavotec’s business areas in cases where Cavotec’s management believes the
target is a leading player in its niche, normally well structured, profitable, reputable and of manageable size.
•continued international expansion, both organically and through acquisitions. Cavotec is active in growing regions
such as China, Brazil, India, Russia and South East Asia.
Strengths and competitive advantagesMarket positioning •Presence in growth sectors: Cavotec has a significant presence in the airports, ports and maritime, and mining
industries.
•Global niche market positions: Cavotec has established positions in various industrial niches. Cavotec furthermore has
the ability to serve customers worldwide.
Proven business model •Track record of strong and profitable growth: Cavotec has displayed strong growth, both organic and acquisition
driven. Cavotec has emphasised the importance of growing profitably.
•Well-invested with operational leverage: Cavotec has invested in manufacturing capacity and a global network of sales
companies. As sales grow Cavotec expects to lift its operating margins due to this scalability.
•Proven mission critical products and systems: Cavotec is focused on high quality products with an increasingly high
engineering content. Most of Cavotec’s products are considered key components in equipment produced by OEM
customers or by end customers. In addition, the Group continues to build its role as a systems integrator.
•Diversified blue chip customer base: Cavotec has strong relationships with blue chip customers all over the world. In
total, Cavotec has approximately 7,000 active customers, giving Cavotec a diversified profile.
•Experienced managers: Cavotec’s management has extensive experience of the Group and the industries of Cavotec.
Potential for long-term growth•Presence in emerging markets: The Group is active in, and targets, emerging markets such as China and South East
Asia, India, Russia and Brazil.
•Capacity for growth through mergers and acquisitions: Cavotec has significant experience of company acquisitions.
During its history the Group has acquired 18 companies. Cavotec strives to acquire locally leading companies and
make them global through Cavotec’s global sales network.
•Innovative proprietary technology: Cavotec has invested in innovative proprietary technology which management
expects to drive growth in the coming years.
market overvIewCavotec is active in a number of different markets in which it has established strong and often global niche positions in
diverse segments. Cavotec’s operations can broadly be divided between the ports and maritime, airports, mining and
tunnelling, and general industry sectors.
One common denominator for all of Cavotec’s market segments is that they are affected by the general health of the
global economy. Following a substantial negative shift in 2009, global GDP has rebounded and positive growth is
expected in the coming years.(1)
(1) National Institute of Economic Research (NIER) (SE) as of August 2011 (based on data from Eurostat, OECD, IMF and national sources).
4
ports and maritime Cavotec’s management believes that growing consumer demand, in developing and mature economies, increased
containerisation of commodities and related increases in global and regional trade and shipping activities is driving
increased construction, investment and renovation of ports and port equipment.
airportsCavotec’s management believes that the development of commercial air traffic and the number of potential or ongoing
airport construction and refurbishment projects are indicators of market growth and development for Cavotec’s market
niches. Global air transport has risen over time as have passenger numbers.
mining and tunnelling Cavotec’s management believes that the main demand driver for this market segment is the level of capital expenditure
in the mining and tunnelling industry. The global mining and tunnelling industry is currently growing with rising demand
in emerging markets and elsewhere. This is also underpinned by a rise in commodity prices, and a need for greater
automation and stricter safety standards.
general industryThe main drivers of demand for the diverse general industry markets are GDP growth and industrial production. With
GDP growth rebounding in 2010, the same is true for industrial production which experienced a significant recovery
from the lows seen in 2009.
rISk factorSInvestment in Cavotec shares is associated with a number of risks. Numerous factors affect or may affect Cavotec’s
operations, both directly and indirectly. Apart from the following overview, an investor should also consider the section
“Risk factors” and other information in this Prospectus.
market and business-related risks•Marketconditions;marketconditionsandthestateoftheglobaleconomyasawholemayhaveanimpactonCavotec’s
operations.
•Politicalrisk;attimesCavotecundertakesprojectsincountrieswherethepoliticalsituationhasbeen,orcouldbecome,
unstable.
•Expansionandacquisitions;geographicalexpansionandacquisitionscouldaffectCavotec’sbusiness.
•Competition;CavotecoperatesinacompetitiveenvironmentandiftheCompanyfailstokeepupwithcompetitorsthis
could adversely affect the Group.
•Productandprojectliability,warrantiesandrecalls;Cavotecisexposedtoproductliabilityandwarrantiesifitsproducts
cause injury to persons or damage property.
•Damage to property; production stoppages and damage to property could have a negative effect onCavotec’s
business and profits.
•Keyemployees;anumberofkeyemployeesareimportantforthecontinuedsuccessofCavotec.
•Suppliers;Cavotecdependsoncontinuingandsatisfactoryco-operationwithitssuppliers.
•Customers;Cavotecmaybenegativelyaffectedbytheactionsanddevelopmentofitscustomers.
•Reputationrisk;theriskoflossofreputationmayaffectCavotec’sbusiness.
5
legal risks•Statutoryrequirementsandotherregulations;Cavotecoperatesinanumberof jurisdictionsandissubjectto local
laws, rules and regulations applying within each of these jurisdictions and to international rules and regulations.
•Intellectual property rights; Cavotec possesses and makes use of a number of patents, trademarks and other
intellectual property rights in its operations.
•Environmentally related risks;Cavotec is exposed to environmentally related risks in connectionwith for example
permits.
•Taxrelatedrisks;Cavotecisexposedtotax-relatedrisksassociatedwithchangesintheinterpretationoflegislationin
the jurisdictions where it operates.
•Disputes;Groupcompaniesmayfromtimetotimebecomeinvolvedindisputesrelatedtoforexampleproductand
project liability.
•Increased trade protectionism: Cavotec is exposed to risks with regards to increased trade protectionism as a
significant share of the Group’s sales are international.
financial risks•CavotecisexposedtocurrencyrisksastheGroupoperateswithdifferentcurrencies.
•Cavotecisexposedtointerestraterisksduetochangesinmarketrates.
•Cavotecisexposedtocreditrisksversusforexamplebanksandcustomers.
•Cavotec isexposedto liquidityandcapital risks regarding forexample theGroup’sability tocoveroperatingcash
needs and raise funds.
•Cavotecisexposedtorisksassociatedwithgoodwillimpairment.
risks associated with the shares•FuturesalesofsharesbymajorshareholdersalongwithnewissuesmayaffectthepriceoftheCavotecshare.
•ThemarketpriceoftheCavotecsharemayfluctuate.
•Cavotec’sabilitytodistributedividendsdependsonanumberoffactors,suchasfutureprofitsandfinancialposition.
otherCavotec’s Board of Directors consists of Stefan Widegren (Chairman), Fabio Cannavale, Leena Essén, Nicola Gerber,
ChristerGranskog,LakshmiC.Khanna,ErikLautmann,JoePopeandOttonelPopesco(GroupCEO).
Cavotec’sGroupKeyManagementconsistsofOttonelPopesco(GroupCEO)andDiegoFiorentini(GroupCFO).
The Cavotec Executive Management Committee, (EMC), is nominated by the CEO and currently consists of twelve
members. The EMC advises on and supports the implementation of global strategies as defined by the CEO in specific
areas. The EMC is made up of members from the Group’s most experienced and knowledgeable management team.
This includes top corporate staff, several Regional Managers and several Group Market Unit Managers. For further
informationon themembersof theBoardofDirectors, theGroupKeyManagementand theEMC,pleasesee the
section “Board of Directors, management and auditors”.
TheauditorofCavotecSAisPricewaterhouseCoopersSA.DanielKettereristheauditorincharge.
Members of the Board of Directors and senior management, and their families own approximately 56 per cent of the
shares of the Company.
Cavotec SA’s headquarter is located on via Serafino Balestra 27, CH-6900 Lugano, Switzerland, and its telephone
number is +41 91 911 4010.
Handelsbanken Capital Markets and SEB Enskilda are Joint Lead Managers as well as financial advisors to Cavotec in
connection with the listing.
6
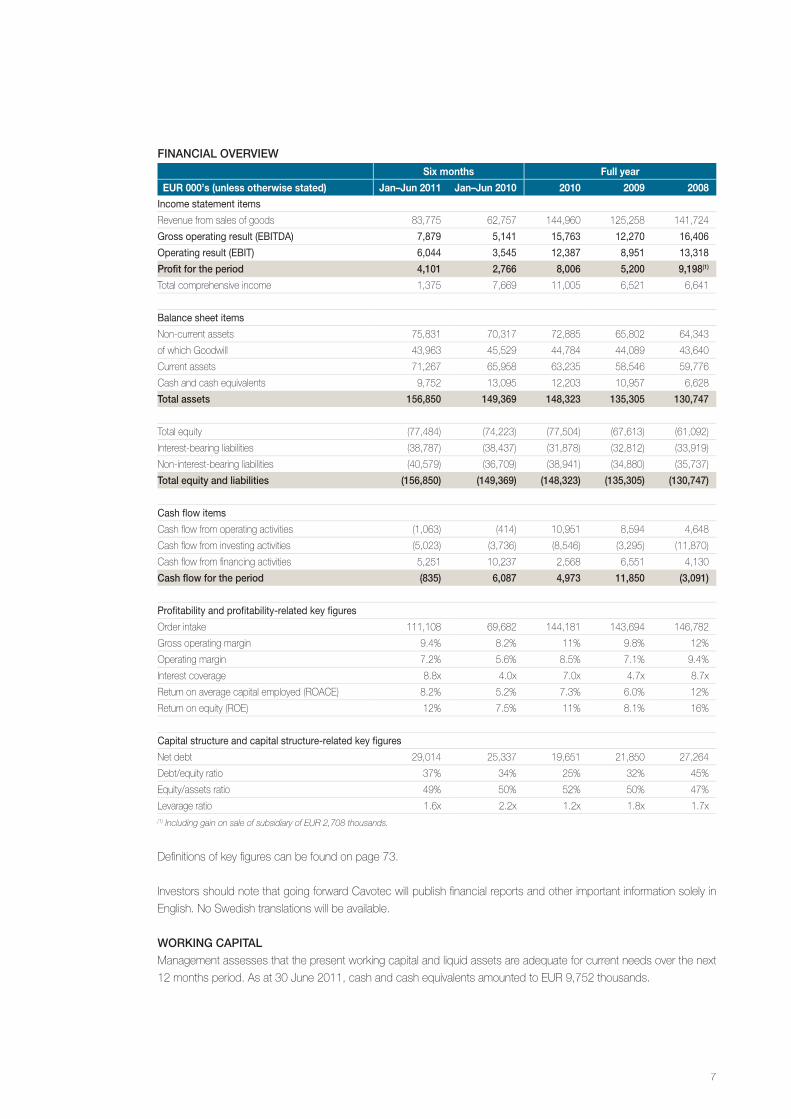
fInancIal overvIewSix months Full year
EUR 000’s (unless otherwise stated) Jan–Jun 2011 Jan–Jun 2010 2010 2009 2008
Income statement items
Revenue from sales of goods 83,775 62,757 144,960 125,258 141,724
gross operating result (eBItDA) 7,879 5,141 15,763 12,270 16,406
Operating result (eBIt) 6,044 3,545 12,387 8,951 13,318
profit for the period 4,101 2,766 8,006 5,200 9,198(1)
Total comprehensive income 1,375 7,669 11,005 6,521 6,641
Balance sheet items
Non-current assets 75,831 70,317 72,885 65,802 64,343
of which Goodwill 43,963 45,529 44,784 44,089 43,640
Current assets 71,267 65,958 63,235 58,546 59,776
Cash and cash equivalents 9,752 13,095 12,203 10,957 6,628
total assets 156,850 149,369 148,323 135,305 130,747
Total equity (77,484) (74,223) (77,504) (67,613) (61,092)
Interest-bearing liabilities (38,787) (38,437) (31,878) (32,812) (33,919)
Non-interest-bearing liabilities (40,579) (36,709) (38,941) (34,880) (35,737)
total equity and liabilities (156,850) (149,369) (148,323) (135,305) (130,747)
Cash flow items
Cash flow from operating activities (1,063) (414) 10,951 8,594 4,648
Cash flow from investing activities (5,023) (3,736) (8,546) (3,295) (11,870)
Cash flow from financing activities 5,251 10,237 2,568 6,551 4,130
cash flow for the period (835) 6,087 4,973 11,850 (3,091)
Profitability and profitability-related key figures
Order intake 111,108 69,682 144,181 143,694 146,782
Gross operating margin 9.4% 8.2% 11% 9.8% 12%
Operating margin 7.2% 5.6% 8.5% 7.1% 9.4%
Interest coverage 8.8x 4.0x 7.0x 4.7x 8.7x
Return on average capital employed (ROACE) 8.2% 5.2% 7.3% 6.0% 12%
Return on equity (ROE) 12% 7.5% 11% 8.1% 16%
Capital structure and capital structure-related key figures
Net debt 29,014 25,337 19,651 21,850 27,264
Debt/equity ratio 37% 34% 25% 32% 45%
Equity/assets ratio 49% 50% 52% 50% 47%
Levarage ratio 1.6x 2.2x 1.2x 1.8x 1.7x(1) Including gain on sale of subsidiary of EUR 2,708 thousands.
Definitions of key figures can be found on page 73.
Investors should note that going forward Cavotec will publish financial reports and other important information solely in
English. No Swedish translations will be available.
workIng capItalManagement assesses that the present working capital and liquid assets are adequate for current needs over the next
12 months period. As at 30 June 2011, cash and cash equivalents amounted to EUR 9,752 thousands.
7
Risk factorsInvestment in Cavotec shares is associated with a number of risks. Numerous factors affect or may affect Cavotec’s
operations, both directly and indirectly. Risk factors and major circumstances deemed to be of importance for Cavotec’s
business and future development are described below in no particular order of priority and without claim to be exhaustive.
Other risks as yet unknown to the Company, or which the Company at present deems to be insignificant, may in the
future have a pronounced adverse affect on Cavotec’s business, financial position or profits. Such risk factors may
also cause a considerable decline in the price of Cavotec’s shares and investors could lose part or the whole of their
investment. Apart from this section, an investor should also consider the other information in this Prospectus.
This Prospectus contains statements about the future which may be affected by future events, risks and uncertainties.
The Company’s actual results may be considerably different to the expected results in statements about the future due
to many factors, among them, but not limited to, the risks described below and elsewhere in this Prospectus.
market and BuSIneSS related rISkSmarket conditionsFactors relating to the global economy and the market, such as corporate investments, public investments,
globalisation in the international trade, availability of financing, inflation, deflation, interest rate levels, exchange rates,
taxes, unemployment and general economic growth affect Cavotec’s business and the economic climate in which the
Company operates. Further, conditions in the global capital market may affect Cavotec. Demand for Cavotec’s products
and systems is affected by the willingness of companies and countries to invest and therefore also by the availability
of financing, since only a small part of the Group’s revenue from sales of goods are recurring sales. The stresses and
strains which the global capital markets were exposed to in the second half of 2008 and in 2009 affected companies in
the industry and, contributed to lower investment levels and decreased availability of financing and thus, had an impact
on Cavotec’s profitability. The above factors may adversely affect Cavotec’s business, financial position and profits in
the future.
political riskCavotec is active in a number of countries where the political situation has been, or could become, unstable. Cavotec
has so far not experienced any material adverse effects from such developments, but such developments could
negatively affect Cavotec’s business, financial position and profits in the future.
expansion and acquisitionsIn the past, Cavotec has expanded geographically and with new products to strengthen its position and competitiveness.
Possible future changes such as the startup, and also the closure, of production facilities may involve difficulties with the
Group’s staff, suppliers and customers and can lead to difficulties in adapting the operations to the new circumstances
or lead to a production stoppage. Thus, there is no guarantee that geographical expansion or other changes in Cavotec’s
geographical presence or structure will succeed, and these factors may have an adverse impact on Cavotec’s business,
financial position and profits in the future.
There are always risks related to business acquisitions which are different from the risks that the Company faces in its day-
to-day operations. In addition to company-specific risks, acquisitions imply risks that customers, suppliers or key personnel
choose to end their relationships with the acquired company or other companies within the Group. There are also risks
related to the integration of acquired businesses, meaning that for example synergies cannot be achieved as planned. In
relation to some acquisitions there are also risks that required regulatory approvals are not obtained. Should one or more
of these risks materialise, it may have an adverse impact on Cavotec’s business, financial position and profits in the future.
competitionCavotec is of the opinion that its success depends in part on the Company’s ability to develop new and innovative
products and to continuously develop existing products further. If Cavotec fails to keep up with its customers’ specific
needs and expectations by lagging product and/or technical development or if the Company is unable to meet relevant
productivity, price and/or quality requirements, the Company carries the risk of losing contracts and/or market shares
to competitors. Loss of contracts and/or market shares may have an adverse impact on Cavotec’s business, financial
position and profits in the future.
8
Although the Company considers the markets in which it operates as fragmented, should other quality suppliers be
more successful in developing their products or sell their products for lower prices than Cavotec, the Company may
lose business and/or market shares. Moreover, the Company’s customers may develop products and solutions on their
own that wholly or partially replace the need for Cavotec’s products.
Competition may also increase in some or all of Cavotec’s markets as a result of legislative, regulatory, technological
or other factors. Increased competition could cause the Company to lose business or compel it to price products and
services on less advantageous terms, or otherwise have an adverse impact on Cavotec’s business, financial position
and profits in the future.
Cavotec’s products are often customised to the specific needs of the customer. It is therefore possible for Cavotec
to be competitive despite the relatively small volumes of each individual product. However, if the level of product
standardisation in industries where Cavotec is active should increase, Cavotec could face competition from companies
which can take advantage of greater scale in production and this could have an adverse impact on Cavotec’s business,
financial position and profits in the future.
product and project liability, warranties and recallsCavotec is exposed to product liability and warranties if its products cause injury to persons or damage to property. The
Company is further exposed to project liability in connection with its operations within project management. Cavotec
assesses that the risks are the greatest in the Airports Market Unit due to the substantial damages suppliers can be
forced to bear even for errors that could be considered incidental. It cannot be excluded that product and project liability,
warranties and recalls may have an adverse impact on Cavotec’s business, financial position and profits in the future.
damage to propertyDirect damage to Cavotec’s property from for example natural disaster may cause an operation stoppage, which can
make it impossible or difficult to comply with obligations to customers. In turn, said events and the risk of said events,
may cause customers to switch to another supplier. It cannot be excluded that direct damage to Cavotec’s property may
have an adverse impact on Cavotec’s business, financial position and profits in the future.
Cavotec’s customers and the customers’ other suppliers are affected by the same risk, which could have an effect on
Cavotec, as customers may face production halts as a result of damage or insufficient supply of components from other
suppliers. It cannot be excluded that damage to property for Cavotec’s customers and other important suppliers to its
customers, may have an adverse impact on Cavotec’s business, financial position and profits in the future.
key employeesThe Group’s success depends largely on the continued ability to identify, hire and retain qualified and experienced
executives, local managers, engineers and other key employees. The Group’s ability to hire and retain qualified personnel
depends on a number of factors, some of which are beyond Cavotec’s control, including the competitive environment
on the local employment markets in which the Group operates. The loss of an executive, a local manager, an engineer
or another key employee due to, for example, such employee leaving to work for a competitor or retiring, may result
in a loss of important know-how and may significantly delay or prevent the achievement of development objectives or
the implementation of the Group’s business strategy. If the Group is unable to hire or retain qualified and experienced
executives, local managers, engineers and other key employees, this could have an adverse effect on the Group’s
business, financial position and profits in the future.
Suppliers Although Cavotec is of the opinion that it does not depend on any one specific supplier, the Company depends on
continuing and satisfactory co-operation with its suppliers. To be able to assemble, sell and supply products Cavotec
depends on external suppliers complying with agreed requirements relating for example to quantities, quality and delivery
times. Incorrect, late or failed deliveries from its suppliers may lead to Cavotec’s deliveries also being delayed or having to
be interrupted, being defective or incorrect, circumstances which can result in reduced sales and increased costs. Should
the co-operation with the suppliers be obstructed or discontinued, Cavotec would also need to replace them with new
suppliers, which may have an adverse impact on the Company’s business, financial position and profits in the future.
9
For Cavotec, as for other players in its markets, it is in very specific occasions, such as with the sale of cables, partly possible
to pass on increased commodity prices to its customers to offset the increased costs. However, a decline in commodity
supplies or drastically increased prices of these commodities could influence Cavotec’s options for manufacturing and
supplying products. Cavotec is also partly dependent on the availability of and the price of certain intermediate goods which
it purchases from external suppliers and refines and then sells to its customers. Adverse developments relating to supplies
may have a negative impact on Cavotec’s business, financial position and profits in the future.
customersCavotec depends on its customers and the Company may be adversely affected if any of its major customers should
be declared bankrupt or should be at risk of bankruptcy, or become the subject of similar action, if it postpones a
major contract or if Cavotec’s relations with its major customers are impaired. If Cavotec’s customers fail to meet their
obligations, drastically reduce their operations, completely close their businesses or change supplier it may have an
adverse impact on Cavotec’s business, financial position and profits in the future.
reputation riskFor Cavotec’s customers the quality and reliability of Cavotec’s products are often critical and thus their confidence
in Cavotec and Cavotec’s products is highly important. Therefore, the risk of loss of reputation as a result of negative
publicity regarding the Company’s business (whether true or false) may, in rare cases, result in loss of customers and
reduced revenues and thus negatively affect Cavotec’s business, financial position and profits in the future.
legal rISkS Statutory requirements and other regulationsCavotec operates in a number of jurisdictions and is subject to local laws, rules and regulations applying within each
of these jurisdictions and to international rules and regulations. Changes in regulatory frameworks, customs and excise
regulations and other events, price and currency controls and other public guidelines in the countries where Cavotec
operates may adversely affect its business, financial position and profits in the future.
In the future, Cavotec may become established in markets and countries where it has not previously operated. New
establishment, in particular in developing countries, may involve unforeseen costs, for example due to delays in obtaining
business-related permits, which may have an adverse impact on Cavotec’s business, financial position and profits in the future.
Intellectual property rightsCavotec possesses a number of patents, trademarks and other intellectual property rights. Cavotec may develop its
own and joint products and technologies, which it occasionally patents. However, there is no guarantee that Cavotec
will be granted patents or that the Group will be able to defend patents, trademarks and other intellectual property rights
granted or that submitted applications will be granted. Nor can it be guaranteed that Cavotec will not be regarded as
infringing intellectual property rights held by external parties. Should Cavotec fail to protect and retain its intellectual
property rights or should it be regarded as infringing intellectual property rights, this may have an adverse impact on
Cavotec’s business, financial position and profits in the future.
environmentally related risksCavotec’s operations are subject to permit and registration obligations in a number of jurisdictions. All of the Group’s
operations are either subject to permit obligations or are regulated by each country’s environmental legislation. Cavotec
assesses that all subsidiaries have the required permits and agreements and comply with specific safety, reporting
and inspection requirements. However, should Cavotec be deemed by the relevant authorities not to comply with the
requirements it may have an adverse impact on Cavotec’s business, financial position and profits in the future.
Changes in law or statutory regulations involving more stringent requirements or changed conditions concerning health,
safety and the environment or moves toward the stricter application by authorities of laws and regulations may require
additional investment and result in increased costs and other measures for the companies of the Group which are
subject to such regulation. Should Cavotec fail to deal with such changes in a cost-effective way, this may have an
adverse impact on Cavotec’s business, financial position and profits in the future.
10
Even though the Company is not aware of any instances of contamination, there is no guarantee that the Company’s
current and previous activities have not caused contamination to land where the Company has at some time operated.
Possible contamination resulting from the Company’s operations may oblige the Company to perform restoration work
which may have an adverse impact on Cavotec’s business, financial position and profits in the future.
tax related risksCavotec manages its operations through companies in a number of countries. The business, including transactions
between Group companies, is operated according to Cavotec’s understanding or interpretation of current tax laws,
tax treaties and other tax law stipulations and in accordance with Cavotec’s understanding and interpretation of
the requirements of the tax authorities concerned. However, it cannot be ruled out that Cavotec’s understanding or
interpretation of the above mentioned laws, treaties and other regulations is not correct in every aspect. Nor can it
be ruled out that the tax authorities of the countries concerned will make assessments and take decisions which
deviate from Cavotec’s understanding or interpretation of the abovementioned laws, treaties and other regulations.
Cavotec’s tax position both for previous years and the present year may change as a result of the decisions of the
tax authorities concerned or as a result of changed laws, treaties and other regulations. Such decisions or changes,
possibly retroactive, may have an adverse impact on Cavotec’s business, financial position and profits in the future.
disputesGroup companies may become involved in disputes within the framework of their normal business activities and, like other
players in Cavotec’s markets, risk being subject to claims in lawsuits concerning agreements, product and project liability,
alleged faults in supplies of goods and services, environmental issues and intellectual property rights. Disputes and claims of this
kind can be time consuming, disrupt normal operations, involve significant financial resources and result in considerable costs.
Moreover, it can be difficult to predict the outcome of complex disputes. Finally, the risk and complexity is further magnified by
Cavotec’s international character with operations in many different jurisdictions. Should the Group become involved in disputes
as described it may have an adverse impact on Cavotec’s business, financial position and profits in the future.
Increased trade protectionismCavotec is a global company and much of the Group’s sales are international to customers in other countries, either
directly to the customers or indirectly through Cavotec’s own sales companies. Therefore, if restrictions on international
trade are increased, through for example decreases in quota levels, increased tariffs or other measures, it could have an
adverse impact on Cavotec’s business, financial position and profits in the future.
fInancIal rISkS currency risksCurrency risks are the result of purchases and sales of goods and services in other currencies besides the respective
subsidiary’s local currency (transaction risk) and of the translation of the balance sheets in foreign currencies into the
EUR currency (translation risk).
An area of transaction risk arises from the fact that the Group’s major manufacturing units, except for the operations
of Cavotec Dabico, Cavotec Micro-control and Cavotec INET,(1) are located in EUR currency based jurisdictions while
significant sales are made in territories where the US dollar has historically had a significant influence. This means that a
strong EUR is generally negative for Cavotec. Thus, currency risks, i.e. exchange rate changes, may have an adverse
impact on Cavotec’s business, financial position and profits in the future.
In connection with translation of the Group’s net investments in foreign subsidiaries into EUR, there is a risk that changes
in exchange rates will affect the Group’s consolidated balance sheet. As the majority of Cavotec’s borrowing is in EUR
and a large part of the net investments are denominated in other currencies, primarily USD, the Group’s comprehensive
income is affected by exchange differences. This means that a strong EUR is generally negative for Cavotec.
(1) Cavotec acquired INET, a US operation with domestic and international operations, sales and field support offices, on 16 August 2011. In 2010 the acquired operations had sales of approximately EUR 16 million
11
Interest rate risksInterest rate risk relates to the risk of the value of financial instruments fluctuating due to changes in market rates.
As at 31 December 2010, Cavotec’s net debt amounted to EUR 19,651 thousands. The impact of a 1 per cent
increase/decrease in interest rates would in 2010 have resulted in a decrease/increase on profit for the year of EUR 208
thousands. The interest rate risk may lead to changes in fair values and cash flows and may have an adverse impact on
Cavotec’s business, financial position and profits in the future.
credit risksCredit risk arises from cash and cash equivalents and transactions with banks, as well as credit exposures to customers,
including outstanding receivables and committed transactions. It cannot be excluded that these risks may lead to credit
losses for Cavotec if for example a customer to Cavotec is not able to meet its obligations. Credit risks may have an
adverse impact on Cavotec’s business, financial position and profits in the future.
liquidity and capital risksThe Company is subject to the risk of not being able to adequately cover the operating cash needs of the business in
the short and medium term. Although Cavotec assesses that its access to liquid funds is good, it cannot be excluded
that it may suffer liquidity problems which can have an adverse impact on Cavotec’s business, financial position and
profits in the future.
The Group’s loans are subject to certain restrictive covenants, including, but not limited to, additional borrowing, certain
financial ratios, limitations on acquisitions and disposals of assets. If the financial covenants are not met and their breach
is not remedied during a certain period or the lenders do not waive the covenants, there may be grounds for termination
under the conditions of the credit facility.
Cavotec’s capacity to pay its debts, otherwise comply with its obligations and comply with the terms and conditions of
the credit agreement and its capacity to refinance its loans and make payments according to its undertakings depend,
among other things, on Cavotec’s future results. Some aspects of the Company’s future results depend on economic,
financial, competitive and other factors beyond the Company’s control.
If Cavotec is not able to raise funds, in time, at all, or at acceptable conditions, or if the Company fails to meet its
obligations under the Company’s credit agreement or breaches the financial loan terms it may have an adverse affect
on Cavotec’s business, financial position and profits, and on Cavotec’s ability to obtain additional financing should this
be needed.
Please refer to the section “Legal issues and supplementary information” for more information concerning the Group’s
financial arrangements.
goodwillA substantial share of Cavotec’s assets consists of goodwill. As at 30 June 2011 the Group’s goodwill amounted to
EUR 43,963 thousands. The Group’s total equity amounted to EUR 77,484 thousands. If the Group would be required
to write down the whole goodwill amount, which is regarded as unlikely by Cavotec, the equity/assets ratio of the Group
would decrease to approximately 30 per cent from 49 per cent, as at 30 June 2011. Goodwill is tested annually during
the third quarter to identify any necessary impairment requirements. Tests are continually conducted of carrying amounts
to ensure that these do not exceed their assessed value in use. In the financial statements for 2010, no impairment
of goodwill was identified or recorded. In the event that future tests in respect of sustained decreases in the value of
goodwill should lead to impairment, this may have an adverse impact on Cavotec’s business, financial position and
profits in the future.
12

rISkS aSSocIated wIth the ShareSfuture sales of shares by major shareholders and new issuesSales of large quantities of the Company’s shares, irrespective of whether this involves the sale of existing shares or
shares acquired through new issues could have an adverse impact on the current market price of the shares.
the market price of the cavotec shareThere are no guarantees that an active market for trading in the shares of Cavotec will evolve or, if one should emerge,
that it will remain after the listing is completed. The liquidity and market price after listing may be affected by major
fluctuations as a reaction to many factors, including fluctuations in actual and forecasted profits, or that analysts’ profit
expectations are not met, changes in trading volumes of Cavotec’s shares, changed macroeconomic conditions, the
actions of competitors and suppliers, changed market valuations of similar companies, changed investor or analyst
opinions of Cavotec or the sector, changes in the regulatory environment in which Cavotec operates and other factors
mentioned in this section, as well as equity market fluctuations and general macroeconomic conditions which may have
an adverse impact on the share price and liquidity, irrespective of Cavotec’s actual results or the conditions in its markets.
cavotec’s ability to distribute dividendsThe holders of shares in Cavotec are entitled to dividends decided after the shares have been listed on NASDAQ
OMX Stockholm. Moreover, holders must be registered as owners of such shares on the record date decided by the
shareholders’ meeting or the Board of Directors for such dividends. The size of any future dividends depends on the
Company’s future profits, financial position, cash flow, working capital needs and other factors.
13
Background and reasons for the listing on NASDAQ OMX StockholmCavotec is a global engineering group, supplying innovative and environmentally friendly systems to the ports and maritime,
airports, mining and tunnelling and general industry sectors. Cavotec has an ambitious plan regarding both organic and
acquisition driven growth. So far during its history the Cavotec Group has acquired 18 companies. Cavotec foresees a
continued strong growth in its product and system solution sales and has identified a number of potentially interesting and
strategic acquisition targets. As an international group with value-adding acquisitions as an integral part of its growth strategy it
is vital for Cavotec to have access to capital.
The Cavotec Group has been listed on the NZX since January 2007 when Cavotec Group Holdings NV and Mooring Systems
Limited, which was listed on the NZX, merged their business interests through a reverse acquisition in a share for share
transaction creating Cavotec MSL Holdings Ltd (“Cavotec MSL”). Liquidity on the NZX has been low in recent years and
overall trading volumes have fallen which has underlined the necessity of seeking alternative listings of the Cavotec share.
Furthermore, the NZX is remotely located from Cavotec’s main markets and it is associated with additional costs to have the
parent company’s domicile in New Zealand, far away from Cavotec’s main business operations.
Cavotec considers a listing on NASDAQ OMX Stockholm as an important step to provide additional ways of maximising
shareholder value. In evaluating alternative listings to NZX it has been deemed important to consider Cavotec’s geographical
footprint where the majority of sales are in Europe and where the importance of Asia and the Americas is increasing. Further,
Cavotec is of the opinion that by choosing Stockholm as the listing location, the transparency of the Company’s business will
increase since many similar companies are listed in Stockholm as well as some important customers of Cavotec. The Board
of Directors also believes that NASDAQ OMX Stockholm has a strong investor base that can support capital raisings for
value-accretive acquisitions and that a listing on NASDAQ OMX Stockholm in itself will make the Cavotec share an attractive
consideration in future acquisitions, which was demonstrated through the recent acquisition of INET. Finally, it can also be said
that Cavotec in many ways has a Swedish origin since a large part of the shares are held by Swedes and the Group was
started from a Swedish base and thereafter expanded internationally. The listing on NASDAQ OMX Stockholm is taking place
after the delisting from NZX.
Therefore, at the Annual General Meeting of shareholders held on 28 April 2011, the shareholders of Cavotec MSL voted
in favour of a plan to, through a so called Scheme of Arrangement, move the domicile of Cavotec to Switzerland, closer to
the main markets of the Cavotec Group, with a new parent company, Cavotec SA. The Board of Directors of Cavotec SA
has subsequent to the AGM decision applied for and received approval for listing of Cavotec SA’s shares on NASDAQ OMX
Stockholm.
Cavotec’s Board of Directors is responsible for the content of this Prospectus. The Board of Directors hereby provides an
assurance that all reasonable care has been taken to ensure that the information contained in this Prospectus is, as far as the
Board of Directors knows, true and that nothing has been omitted that could affect its meaning.
Lugano, 14 October 2011
cavotec SaThe Board of Directors
14
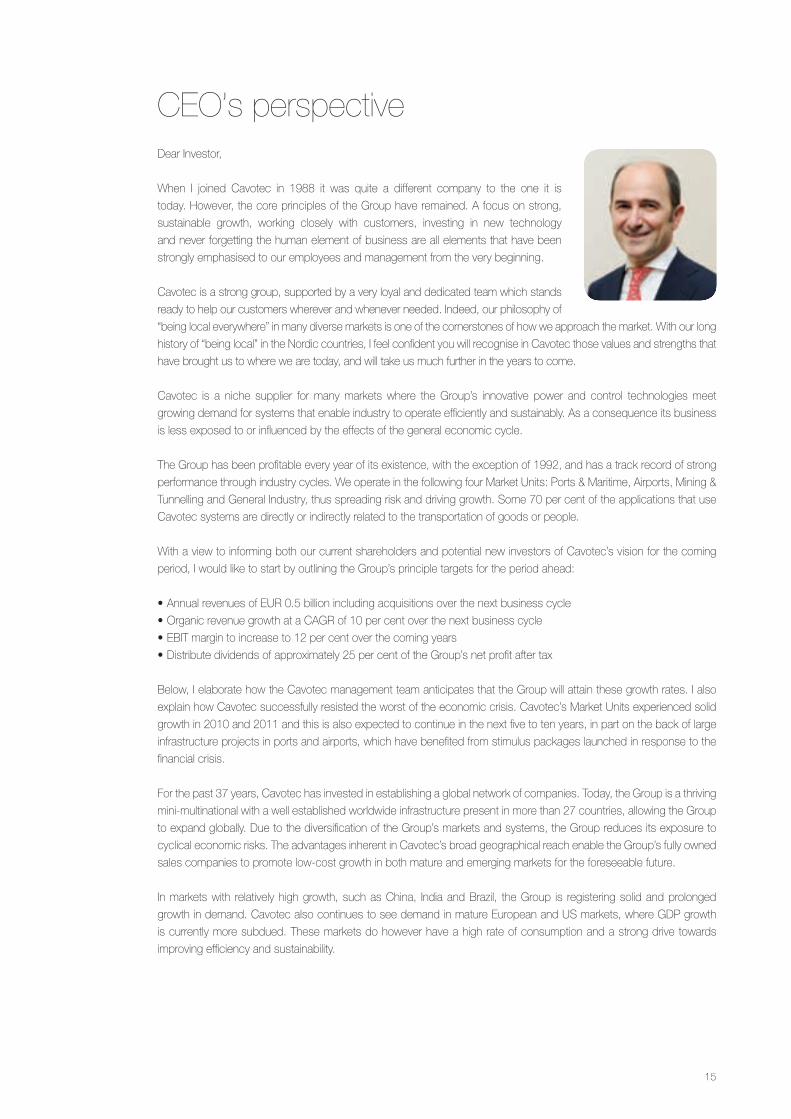
CEO’s perspectiveDear Investor,
When I joined Cavotec in 1988 it was quite a different company to the one it is
today. However, the core principles of the Group have remained. A focus on strong,
sustainable growth, working closely with customers, investing in new technology
and never forgetting the human element of business are all elements that have been
strongly emphasised to our employees and management from the very beginning.
Cavotec is a strong group, supported by a very loyal and dedicated team which stands
ready to help our customers wherever and whenever needed. Indeed, our philosophy of
“being local everywhere” in many diverse markets is one of the cornerstones of how we approach the market. With our long
history of “being local” in the Nordic countries, I feel confident you will recognise in Cavotec those values and strengths that
have brought us to where we are today, and will take us much further in the years to come.
Cavotec is a niche supplier for many markets where the Group’s innovative power and control technologies meet
growing demand for systems that enable industry to operate efficiently and sustainably. As a consequence its business
is less exposed to or influenced by the effects of the general economic cycle.
The Group has been profitable every year of its existence, with the exception of 1992, and has a track record of strong
performance through industry cycles. We operate in the following four Market Units: Ports & Maritime, Airports, Mining &
Tunnelling and General Industry, thus spreading risk and driving growth. Some 70 per cent of the applications that use
Cavotec systems are directly or indirectly related to the transportation of goods or people.
With a view to informing both our current shareholders and potential new investors of Cavotec’s vision for the coming
period, I would like to start by outlining the Group’s principle targets for the period ahead:
•Annual revenues of EUR 0.5 billion including acquisitions over the next business cycle
•Organic revenue growth at a CAGR of 10 per cent over the next business cycle
•EBIT margin to increase to 12 per cent over the coming years
•Distribute dividends of approximately 25 per cent of the Group’s net profit after tax
Below, I elaborate how the Cavotec management team anticipates that the Group will attain these growth rates. I also
explain how Cavotec successfully resisted the worst of the economic crisis. Cavotec’s Market Units experienced solid
growth in 2010 and 2011 and this is also expected to continue in the next five to ten years, in part on the back of large
infrastructure projects in ports and airports, which have benefited from stimulus packages launched in response to the
financial crisis.
For the past 37 years, Cavotec has invested in establishing a global network of companies. Today, the Group is a thriving
mini-multinational with a well established worldwide infrastructure present in more than 27 countries, allowing the Group
to expand globally. Due to the diversification of the Group’s markets and systems, the Group reduces its exposure to
cyclical economic risks. The advantages inherent in Cavotec’s broad geographical reach enable the Group’s fully owned
sales companies to promote low-cost growth in both mature and emerging markets for the foreseeable future.
In markets with relatively high growth, such as China, India and Brazil, the Group is registering solid and prolonged
growth in demand. Cavotec also continues to see demand in mature European and US markets, where GDP growth
is currently more subdued. These markets do however have a high rate of consumption and a strong drive towards
improving efficiency and sustainability.
15
TheGroupfirstinvestedinlocalcompaniesintheFarEast(HongKong,ChinaandSingapore),inthelate1980s.This
has given Cavotec a substantial advantage in these markets where the Group is now considered a niche leader. This
isillustratedbythelong-standingrelationshipswithcompaniessuchasPSA(1989),HKT(1994)andZPMC(1996)(1)
which, thanks to Cavotec’s local presence, continued technological developments and broad experience in the market
continue to flourish today. Furthermore, customers increasingly see Cavotec as a complete systems integrator, rather
than a supplier of individual components.
Cavotec supplies systems directly for cranes and ships in the ports and maritime industry, including cable reels, a unique
system for automated mooring, and shore power supply systems. Global container traffic increased nearly 15 per cent
in 2010, and growth has been projected to amount to between 8 and 9 per cent over the next few years.(2)
In the airports industry, where Cavotec manufactures ground support equipment including air conditioning, power
and other utilities, albeit moderate compared to 2010 which was exceptionally strong, the International Air Transport
Association (IATA) and Goldman Sachs forecast continued growth for the aviation industry following the severe downturn
in 2008 and 2009, primarily in China and the Middle East where new hubs will increasingly compete with existing
European ones.(3)
One of the most significant recent developments for the Airports Market Unit was the acquisition of INET in the US. On 15
August, the Cavotec Board of Directors unanimously approved the acquisition of INET, a well established manufacturer
of ground support equipment in the airports sector. The acquisition is an asset deal with the consideration including
the issue of 7.7 million shares at NZD 3.30 per share and an earn-out upon fulfillment of certain terms and conditions.
For mining and tunnelling, the Group supplies systems indirectly for rigs and loaders for the mining, extraction, excavation,
drilling and transportation sectors worldwide. In the past 20 years, annual global transportation growth has doubled twice
as fast as world GDP, and the forecast for the coming years continues to be positive. According to the World Bank,(4)
globalgrowth isprojectedtocontinue from2011through2013;andglobalgrowthequals tradeandtransportation.
Cavotec is therefore likely to see continued market demand across its Market Units.
Cavotec has established long-standing relationships with major industrial groups such as ABB, Aker, Atlas Copco, Cargotec,
Konecranes,PalfingerandSandvik.TheGroupsuppliesthesecompanies,oftenundermulti-year,worldwidecontractsfor
dedicated product supply and support. Such arrangements account for between 10 and 15 per cent of Cavotec’s turnover.
In July 2011, Cavotec reported its largest order book on record. Management sees this result as evidence of the
strong standing Cavotec, and its products, has across its markets, and an indicator of the Group’s potential to realise
substantial future growth. Given Cavotec’s solid performance to date, coupled with the opportunities afforded by listing
on NASDAQ OMX Stockholm, the Group believes it is ideally posed to attain the goal of EUR 0.5 billion in annual
revenues over the next business cycle, including acquisitions.
Against this background, I am confident of a bright future for Cavotec as a company listed on NASDAQ OMX Stockholm.
Ottonel PopescoChief Executive Officer
(1)PSA–PortofSingapore,HKT–HongKongTerminals,ZPMC–ShanghaiZhenhuaPortMachinery(2) Drewry Supply Chain Advisors, Multimodal, 2011(3) Goldman Sachs – Chinese Aviation Outlook (15 November 2010),
IATA Financial Forecast (September 2011)(4) The World Bank
16
Market overviewThe information about market growth and market size and Cavotec’s market position compared to its competitors
as specified in this Prospectus is Cavotec’s overall assessment based on both internal and external sources. In the
Prospectus, Cavotec has endeavoured to accurately reproduce information from these sources, although it has not itself
verified the information from these sources. To the best of Cavotec’s knowledge and evaluation abilities, no significant
facts have been omitted which would make the information incorrect or misleading.
Readers should note that macroeconomic forecasts and sentiments change. Cavotec has strived to use the latest
available information from relevant sources. However, there are often long periods of time between publications of data
which could negatively influence the relevance.
cavotec’S market unItSCavotec is active in a number of different markets in which it has established strong and often global niche positions.
Cavotec’s operations can broadly be divided between the ports and maritime, airports, mining and tunnelling, and
general industry sectors. There are significant differences both between as well as within each market segment. Below
is an overview of important characteristics and trends of, as well as Cavotec’s position in, each market segment.
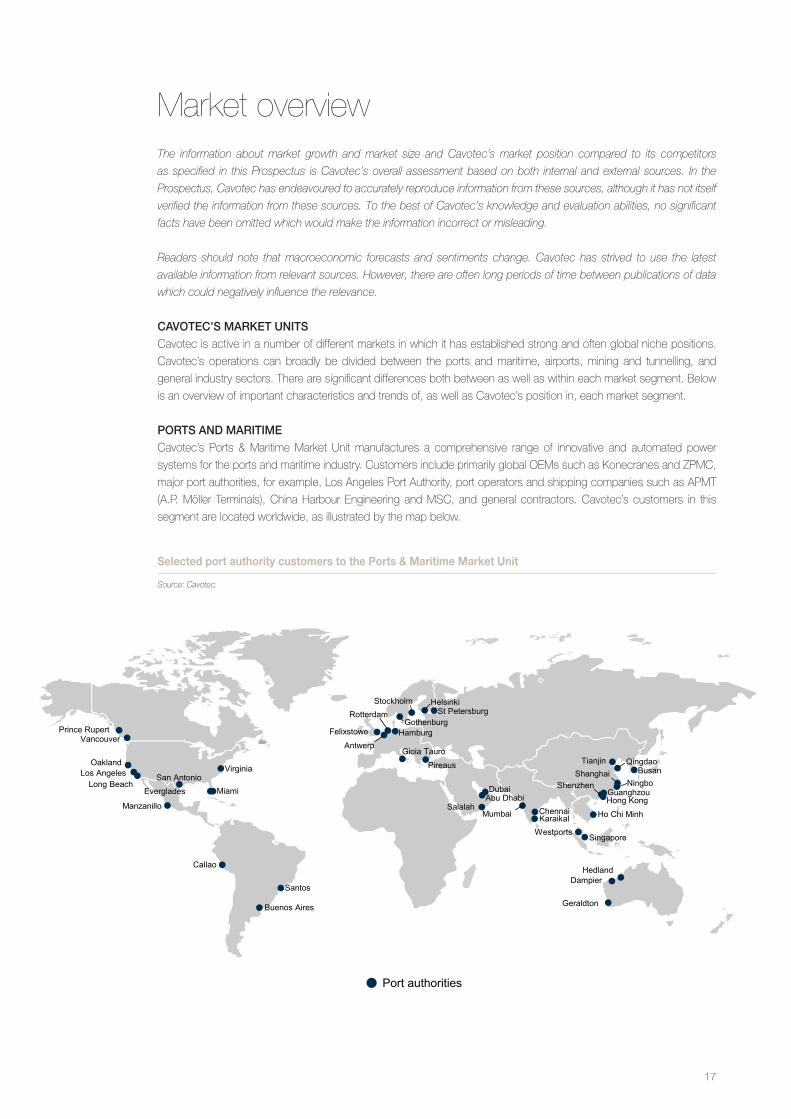
portS and marItIme Cavotec’s Ports & Maritime Market Unit manufactures a comprehensive range of innovative and automated power
systemsfortheportsandmaritimeindustry.CustomersincludeprimarilyglobalOEMssuchasKonecranesandZPMC,
major port authorities, for example, Los Angeles Port Authority, port operators and shipping companies such as APMT
(A.P. Möller Terminals), China Harbour Engineering and MSC, and general contractors. Cavotec’s customers in this
segment are located worldwide, as illustrated by the map below.
Selected port authority customers to the Ports & Maritime Market Unit
Source: Cavotec
Long Beach Miami
Los Angeles
Salalah
Port authorities
Pireaus
Geraldton
Hedland Dampier
Ho Chi Minh
Oakland
Prince Rupert
Karaikal Westports
Abu Dhabi
Shanghai
Gioia Tauro
Rotterdam
Buenos Aires
Callao
Antwerp
Busan
Chennai
Dubai Everglades
Felixstowe Gothenburg
Guanghzou
Hamburg
Helsinki
Hong Kong Manzanillo
Mumbai
Ningbo
Qingdao
Santos
Singapore
Shenzhen
St Petersburg Stockholm
Tianjin
Vancouver
Virginia San Antonio
17
Sector reviewThe niches that Cavotec operates in are specialised and therefore no official statistics for the size or growth of these
markets exist. However, Cavotec’s management believes that, partly based on data from Drewry Consultants,(1) growing
consumer demand in developing and mature countries and global economic growth, increased containerisation of
commodities and related increases in trade and shipping activity (both global and regional, especially intra-Asia) is driving
increased construction, investments and renovation of ports and port equipment. Such investments are considered
the main drivers of demand for the ports and maritime industry. It should be noted that the prevailing uncertainty on the
financial markets could lead to customers delaying investment decisions as they did in 2008. Furthermore, as ships are
growing in number and size and demand to upgrade existing capacity is increasing, management expects investments
in automation, efficiency and sustainable solutions to grow accordingly.
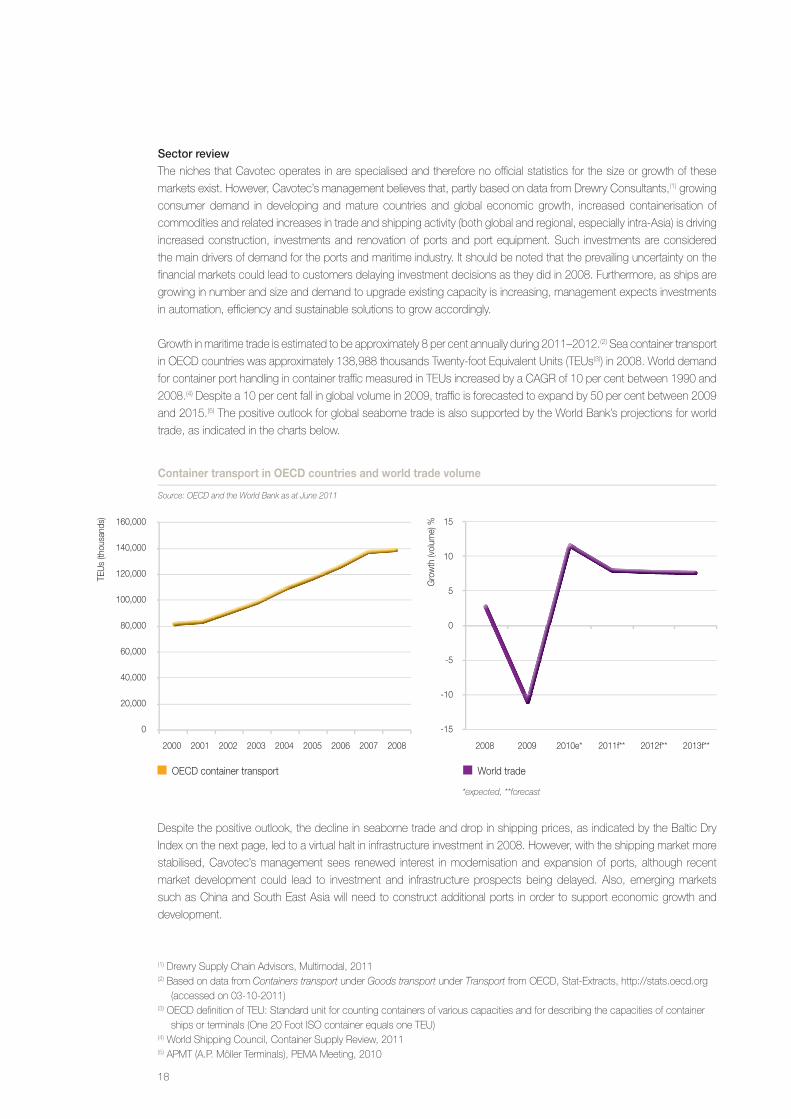
Growth in maritime trade is estimated to be approximately 8 per cent annually during 2011–2012.(2) Sea container transport
in OECD countries was approximately 138,988 thousands Twenty-foot Equivalent Units (TEUs(3)) in 2008. World demand
for container port handling in container traffic measured in TEUs increased by a CAGR of 10 per cent between 1990 and
2008.(4) Despite a 10 per cent fall in global volume in 2009, traffic is forecasted to expand by 50 per cent between 2009
and 2015.(5) The positive outlook for global seaborne trade is also supported by the World Bank’s projections for world
trade, as indicated in the charts below.
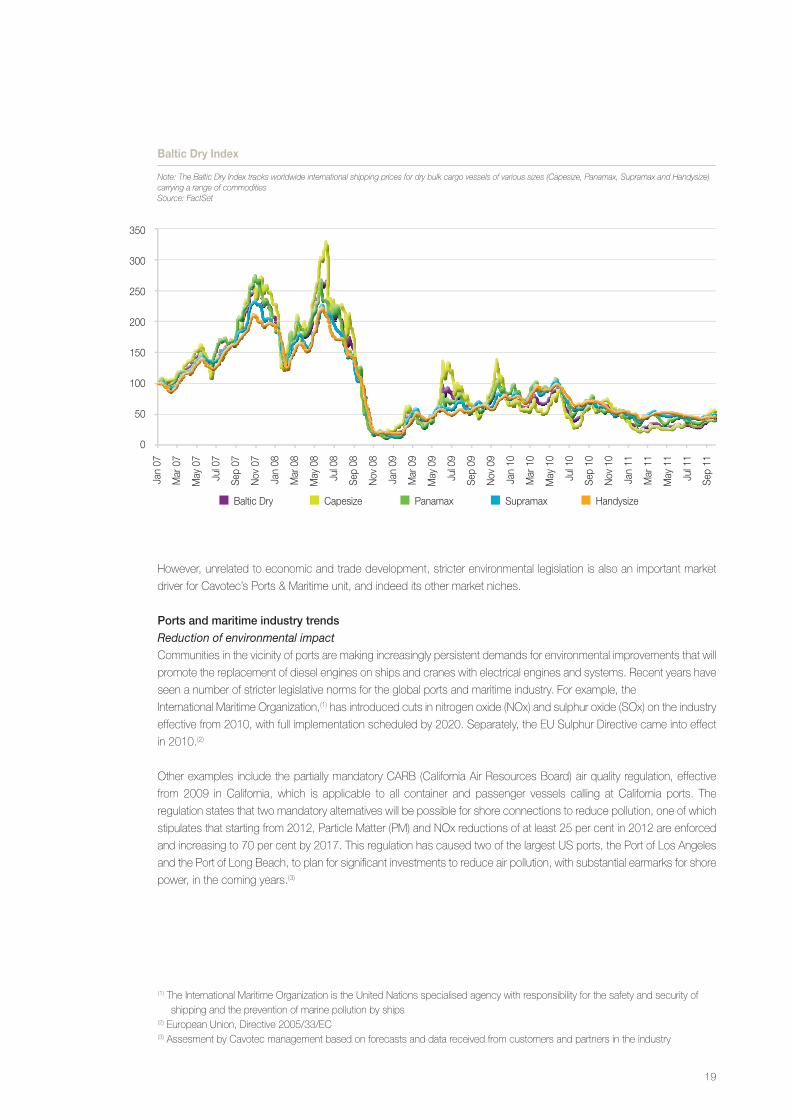
Despite the positive outlook, the decline in seaborne trade and drop in shipping prices, as indicated by the Baltic Dry
Index on the next page, led to a virtual halt in infrastructure investment in 2008. However, with the shipping market more
stabilised, Cavotec’s management sees renewed interest in modernisation and expansion of ports, although recent
market development could lead to investment and infrastructure prospects being delayed. Also, emerging markets
such as China and South East Asia will need to construct additional ports in order to support economic growth and
development.
Container transport in OECD countries and world trade volume
Source: OECD and the World Bank as at June 2011
(1) Drewry Supply Chain Advisors, Multimodal, 2011(2) Based on data from Containers transport under Goods transport under Transport from OECD, Stat-Extracts, http://stats.oecd.org
(accessed on 03-10-2011)(3) OECD definition of TEU: Standard unit for counting containers of various capacities and for describing the capacities of container
ships or terminals (One 20 Foot ISO container equals one TEU)(4) World Shipping Council, Container Supply Review, 2011(5) APMT (A.P. Möller Terminals), PEMA Meeting, 2010
*expected, **forecast
TEU
s (th
ousa
nds)
Gro
wth
(vol
ume)
%160,000
140,000
120,000
100,000
80,000
60,000
40,000
20,000
0
15
10
5
0
-5
-10
-15
OECD container transport World trade
2000 2001 2002 2003 2004 2005 2006 2007 2008 2008 2009 2010e* 2011f** 2012f** 2013f**
18
However, unrelated to economic and trade development, stricter environmental legislation is also an important market
driver for Cavotec’s Ports & Maritime unit, and indeed its other market niches.
ports and maritime industry trendsReduction of environmental impactCommunities in the vicinity of ports are making increasingly persistent demands for environmental improvements that will
promote the replacement of diesel engines on ships and cranes with electrical engines and systems. Recent years have
seen a number of stricter legislative norms for the global ports and maritime industry. For example, the
International Maritime Organization,(1) has introduced cuts in nitrogen oxide (NOx) and sulphur oxide (SOx) on the industry
effective from 2010, with full implementation scheduled by 2020. Separately, the EU Sulphur Directive came into effect
in 2010.(2)
Other examples include the partially mandatory CARB (California Air Resources Board) air quality regulation, effective
from 2009 in California, which is applicable to all container and passenger vessels calling at California ports. The
regulation states that two mandatory alternatives will be possible for shore connections to reduce pollution, one of which
stipulates that starting from 2012, Particle Matter (PM) and NOx reductions of at least 25 per cent in 2012 are enforced
and increasing to 70 per cent by 2017. This regulation has caused two of the largest US ports, the Port of Los Angeles
and the Port of Long Beach, to plan for significant investments to reduce air pollution, with substantial earmarks for shore
power, in the coming years.(3)
Baltic Dry Index
Note: The Baltic Dry Index tracks worldwide international shipping prices for dry bulk cargo vessels of various sizes (Capesize, Panamax, Supramax and Handysize) carrying a range of commoditiesSource: FactSet
(1) The International Maritime Organization is the United Nations specialised agency with responsibility for the safety and security of shipping and the prevention of marine pollution by ships
(2) European Union, Directive 2005/33/EC(3) Assesment by Cavotec management based on forecasts and data received from customers and partners in the industry
Baltic Dry Capesize Panamax Supramax Handysize
350
300
250
200
150
100
50
0
Jan
07
Mar
07
May
07
Jul 0
7
Sep
07
Nov
07
Jan
08
Mar
08
May
08
Jul 0
8
Sep
08
Nov
08
Jan
09
Mar
09
May
09
Jul 0
9
Sep
09
Nov
09
Jan
10
Mar
10
May
10
Jul 1
0
Sep
10
Nov
10
Jan
11
Mar
11
May
11
Jul 1
1
Sep
11
19
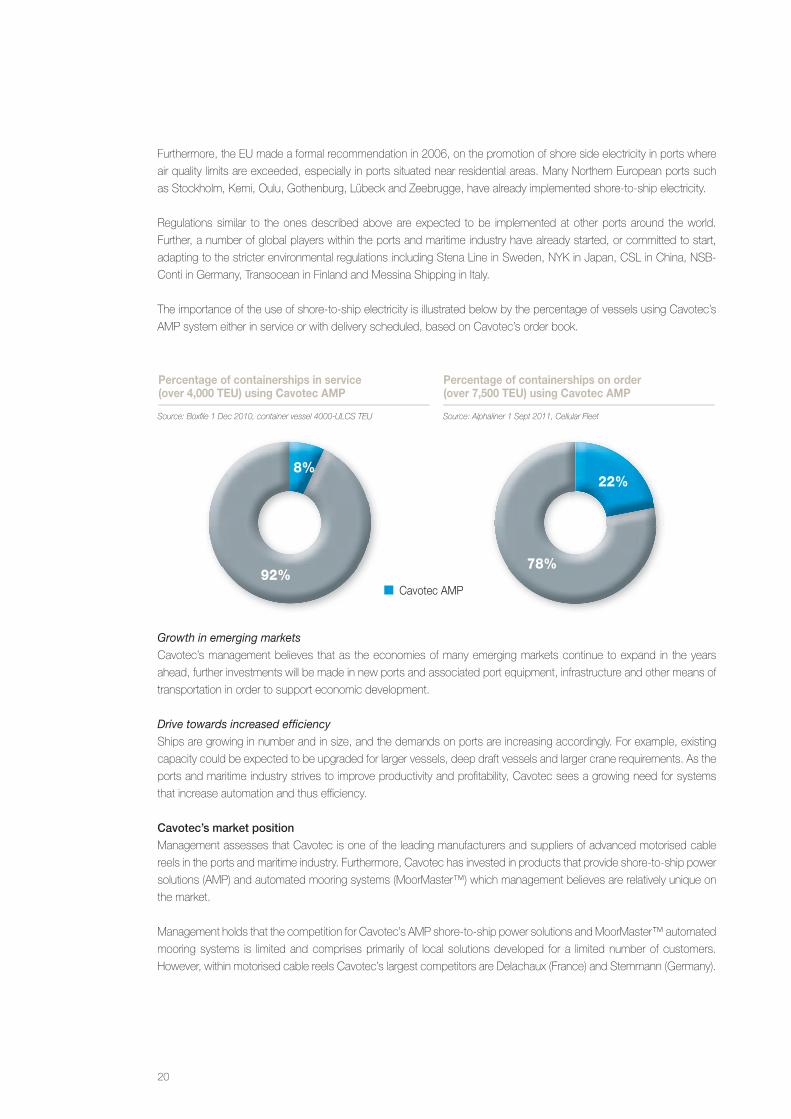
Furthermore, the EU made a formal recommendation in 2006, on the promotion of shore side electricity in ports where
air quality limits are exceeded, especially in ports situated near residential areas. Many Northern European ports such
asStockholm,Kemi,Oulu,Gothenburg,LübeckandZeebrugge,havealreadyimplementedshore-to-shipelectricity.
Regulations similar to the ones described above are expected to be implemented at other ports around the world.
Further, a number of global players within the ports and maritime industry have already started, or committed to start,
adaptingtothestricterenvironmentalregulationsincludingStenaLineinSweden,NYKinJapan,CSLinChina,NSB-
Conti in Germany, Transocean in Finland and Messina Shipping in Italy.
The importance of the use of shore-to-ship electricity is illustrated below by the percentage of vessels using Cavotec’s
AMP system either in service or with delivery scheduled, based on Cavotec’s order book.
Growth in emerging marketsCavotec’s management believes that as the economies of many emerging markets continue to expand in the years
ahead, further investments will be made in new ports and associated port equipment, infrastructure and other means of
transportation in order to support economic development.
Drive towards increased efficiencyShips are growing in number and in size, and the demands on ports are increasing accordingly. For example, existing
capacity could be expected to be upgraded for larger vessels, deep draft vessels and larger crane requirements. As the
ports and maritime industry strives to improve productivity and profitability, Cavotec sees a growing need for systems
that increase automation and thus efficiency.
cavotec’s market positionManagement assesses that Cavotec is one of the leading manufacturers and suppliers of advanced motorised cable
reels in the ports and maritime industry. Furthermore, Cavotec has invested in products that provide shore-to-ship power
solutions (AMP) and automated mooring systems (MoorMaster™) which management believes are relatively unique on
the market.
Management holds that the competition for Cavotec’s AMP shore-to-ship power solutions and MoorMaster™ automated
mooring systems is limited and comprises primarily of local solutions developed for a limited number of customers.
However, within motorised cable reels Cavotec’s largest competitors are Delachaux (France) and Stemmann (Germany).
Cavotec AMP
Percentage of containerships in service (over 4,000 TEU) using Cavotec AMP
Percentage of containerships on order (over 7,500 TEU) using Cavotec AMP
8%
92%78%
22%
Source: Boxfile 1 Dec 2010, container vessel 4000-ULCS TEU Source: Alphaliner 1 Sept 2011, Cellular Fleet
20
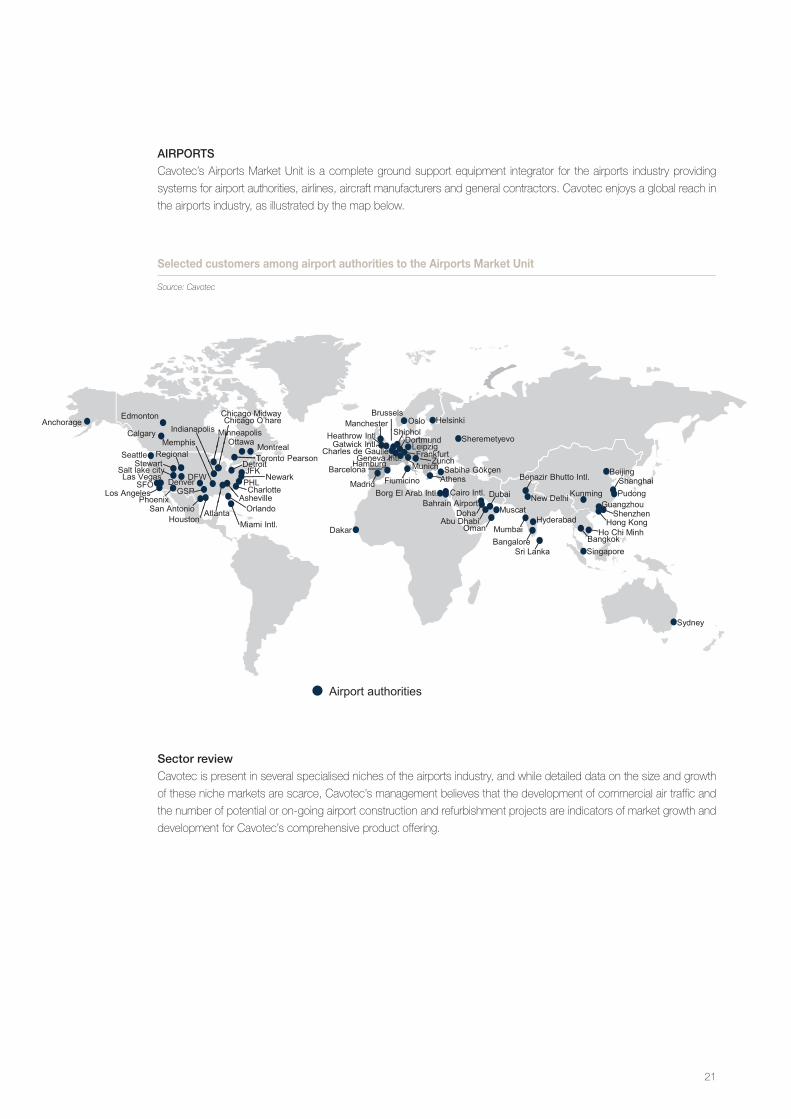
aIrportSCavotec’s Airports Market Unit is a complete ground support equipment integrator for the airports industry providing
systems for airport authorities, airlines, aircraft manufacturers and general contractors. Cavotec enjoys a global reach in
the airports industry, as illustrated by the map below.
Sector review Cavotec is present in several specialised niches of the airports industry, and while detailed data on the size and growth
of these niche markets are scarce, Cavotec’s management believes that the development of commercial air traffic and
the number of potential or on-going airport construction and refurbishment projects are indicators of market growth and
development for Cavotec’s comprehensive product offering.
Selected customers among airport authorities to the Airports Market Unit
Source: Cavotec
Newark
Airport authorities
SFO
Orlando
Anchorage
Bahrain Airport Dubai
Frankfurt Gatwick Intl.
Heathrow Intl.
Munich
New Delhi
Oslo
Shanghai
Chicago Midway
Borg El Arab Intl.
Mumbai
Salt lake city Toronto Pearson
Sri Lanka
Regional
Bangkok
Cairo Intl.
San Antonio
Indianapolis
JFK
GSP
DFW
Miami Intl. Ho Chi Minh
Los Angeles PHL
Abu Dhabi Muscat
Benazir Bhutto Intl.
Shiphol
Geneva Intl. Sabiha Gökçen
Charles de Gaulle Memphis
Kunming
Athens
Bangalore
Beijing Barcelona
Dakar
Dortmund
Fiumicino
Helsinki
Hyderabad
Leipzig
Madrid
Manchester
Doha
Oman
Pudong
Singapore
Guangzhou
Hong Kong Shenzhen
Sheremetyevo
Sydney
Charlotte
Chicago O’hare
Denver
Detroit
Houston
Las Vegas
Minneapolis
Phoenix
Stewart Seattle
Asheville
Atlanta
Calgary
Montreal Ottawa
Edmonton Brussels
Zurich Hamburg
21
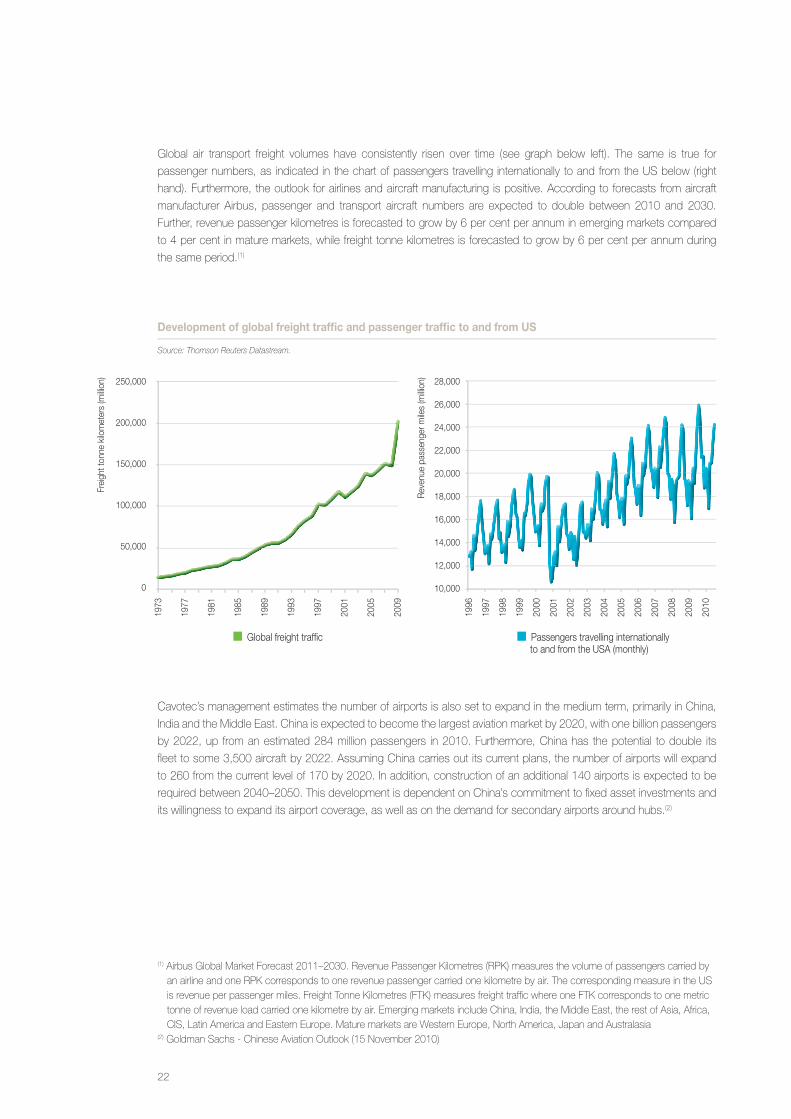
Global air transport freight volumes have consistently risen over time (see graph below left). The same is true for
passenger numbers, as indicated in the chart of passengers travelling internationally to and from the US below (right
hand). Furthermore, the outlook for airlines and aircraft manufacturing is positive. According to forecasts from aircraft
manufacturer Airbus, passenger and transport aircraft numbers are expected to double between 2010 and 2030.
Further, revenue passenger kilometres is forecasted to grow by 6 per cent per annum in emerging markets compared
to 4 per cent in mature markets, while freight tonne kilometres is forecasted to grow by 6 per cent per annum during
the same period.(1)
(1)AirbusGlobalMarketForecast2011–2030.RevenuePassengerKilometres(RPK)measuresthevolumeofpassengerscarriedbyanairlineandoneRPKcorrespondstoonerevenuepassengercarriedonekilometrebyair.ThecorrespondingmeasureintheUSisrevenueperpassengermiles.FreightTonneKilometres(FTK)measuresfreighttrafficwhereoneFTKcorrespondstoonemetrictonne of revenue load carried one kilometre by air. Emerging markets include China, India, the Middle East, the rest of Asia, Africa, CIS, Latin America and Eastern Europe. Mature markets are Western Europe, North America, Japan and Australasia
(2) Goldman Sachs - Chinese Aviation Outlook (15 November 2010)
Cavotec’s management estimates the number of airports is also set to expand in the medium term, primarily in China,
India and the Middle East. China is expected to become the largest aviation market by 2020, with one billion passengers
by 2022, up from an estimated 284 million passengers in 2010. Furthermore, China has the potential to double its
fleet to some 3,500 aircraft by 2022. Assuming China carries out its current plans, the number of airports will expand
to 260 from the current level of 170 by 2020. In addition, construction of an additional 140 airports is expected to be
required between 2040–2050. This development is dependent on China’s commitment to fixed asset investments and
its willingness to expand its airport coverage, as well as on the demand for secondary airports around hubs.(2)
Development of global freight traffic and passenger traffic to and from US
Source: Thomson Reuters Datastream.
Frei
ght t
onne
kilo
met
ers
(milli
on)
Rev
enue
pas
seng
er m
iles
(milli
on)250,000
200,000
150,000
100,000
50,000
0
28,000
26,000
24,000
22,000
20,000
18,000
16,000
14,000
12,000
10,000
1973
1977
1981
1985
1989
1993
1997
2001
2005
2009
1996
1997
1998
1999
2000
2001
2002
2003
2004
2005
2006
2007
2008
2009
2010
Global freight traffic Passengers travelling internationally to and from the USA (monthly)
22
Passengers travelling internationally to and from the USA (monthly)
airports industry trendsGrowth in emerging markets and the Middle EastCavotec expects improving economic conditions in emerging markets, as well as in the Middle East, to exert a positive
influence on the activity level in the airports industry as new airports are being built in these markets.
Environmental pressureConcern about the environment are becoming increasingly important in the airports and airline sectors. According to
IATA, airlines are aiming for at least an additional 25 per cent improvement in fuel efficiency and CO2 emissions by 2020,
through technological and operational enhancements.
Replacement of old aircraft in mature marketsThe construction of new and larger aircraft types, such as the new Airbus A380, requires changes and reconstruction
of existing airports. In the years ahead, Cavotec therefore expects that many airports in mature markets will seek to
upgrade existing facilities.
Greater and continued market liberalisationLiberalisation and privatisation of airports, airlines and air traffic control systems have led to fierce competition in many
parts of the world. Group management expects this trend to continue in the coming years. In fact, regulatory changes
are crucial to air travel expansion. According to Boeing,(1) liberalisation is the primary driver enabling value creation in the
global air transport network, as liberalisation typically gives rise to a sharp rise in traffic demand.
Continued growth of low-cost airlinesAs many markets are liberalising, low-cost airlines are encouraged to enter new markets and expand services in existing
markets. Low fares and new routes from these players have the potential to continue stimulating demand in the industry.(2)
Drive towards reducing time parked at the gateAs aircraft do not generate revenues and take up space while parked at the gate, operators are keen to reduce these
inefficiencies. Thus the trend is to take steps to improve throughput and operational efficiency by reducing the amount
of time aircraft parked at the gate.
cavotec’s market position Management assesses that Cavotec is one of the leading manufacturers and suppliers in its niches for the airports
industry, with a particularly strong position in Europe, Middle East and emerging markets. Cavotec is active on major
airport construction and refurbishment projects worldwide. As Cavotec is well established in emerging markets and the
Middle East and has invested in a strong and broad product range, comprising both standard and premium products,
Group management expects to gain market share and achieve structural growth. Cavotec also stands to gain from
increasing emphasis on stricter environmental requirements.
Within pre-conditioned air systems, management assesses that Cavotec’s largest competitors are the traditional PCA
systems (Trielectron, Ciat), while currently no competition exists for the Group’s sub-freeze technologies. There are no
large competitors for Cavotec’s in-ground power and fuel solutions.
(1) Boeing Current Market Outlook 2011–2030(2) Boeing Current Market Outlook 2011–2030
23
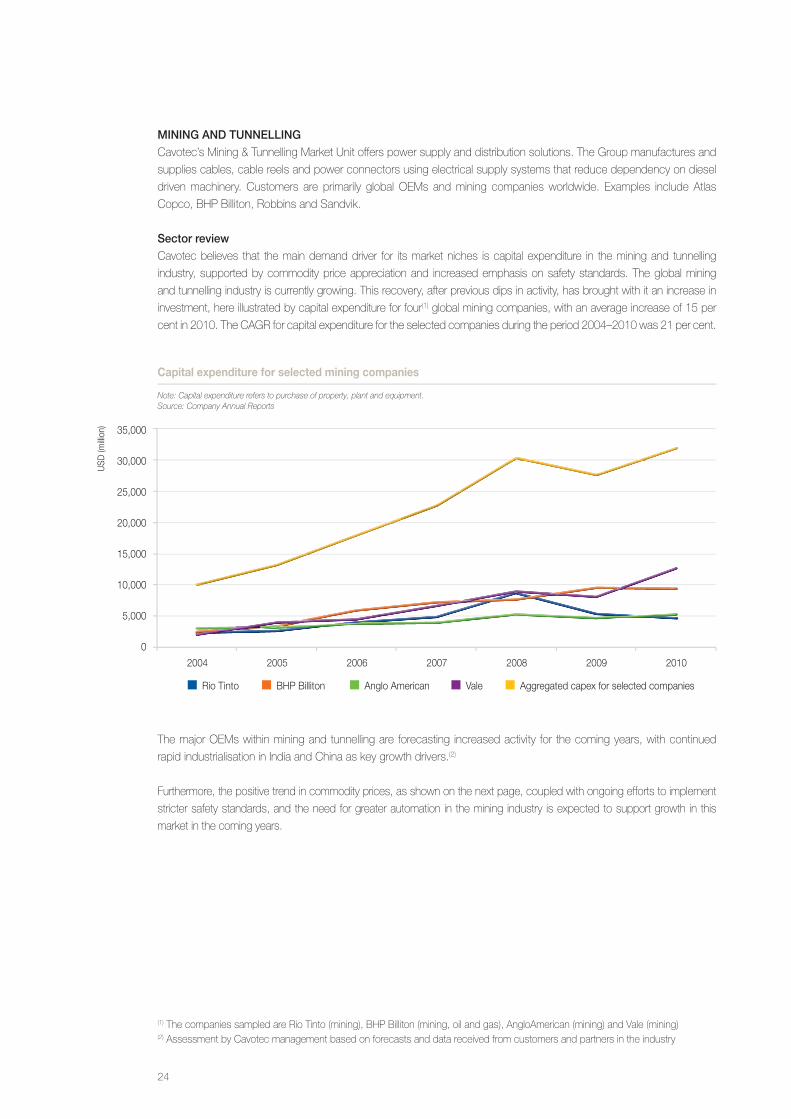
mInIng and tunnellIngCavotec’s Mining & Tunnelling Market Unit offers power supply and distribution solutions. The Group manufactures and
supplies cables, cable reels and power connectors using electrical supply systems that reduce dependency on diesel
driven machinery. Customers are primarily global OEMs and mining companies worldwide. Examples include Atlas
Copco, BHP Billiton, Robbins and Sandvik.
Sector review Cavotec believes that the main demand driver for its market niches is capital expenditure in the mining and tunnelling
industry, supported by commodity price appreciation and increased emphasis on safety standards. The global mining
and tunnelling industry is currently growing. This recovery, after previous dips in activity, has brought with it an increase in
investment, here illustrated by capital expenditure for four(1) global mining companies, with an average increase of 15 per
cent in 2010. The CAGR for capital expenditure for the selected companies during the period 2004–2010 was 21 per cent.
(1) The companies sampled are Rio Tinto (mining), BHP Billiton (mining, oil and gas), AngloAmerican (mining) and Vale (mining)(2) Assessment by Cavotec management based on forecasts and data received from customers and partners in the industry
Capital expenditure for selected mining companies
Note: Capital expenditure refers to purchase of property, plant and equipment. Source: Company Annual Reports
2004 2005 2006 2007 2008 2009 2010
Rio Tinto BHP Billiton Anglo American Vale Aggregated capex for selected companies
35,000
30,000
25,000
20,000
15,000
10,000
5,000
0
USD
(milli
on)
The major OEMs within mining and tunnelling are forecasting increased activity for the coming years, with continued
rapid industrialisation in India and China as key growth drivers.(2)
Furthermore, the positive trend in commodity prices, as shown on the next page, coupled with ongoing efforts to implement
stricter safety standards, and the need for greater automation in the mining industry is expected to support growth in this
market in the coming years.
24
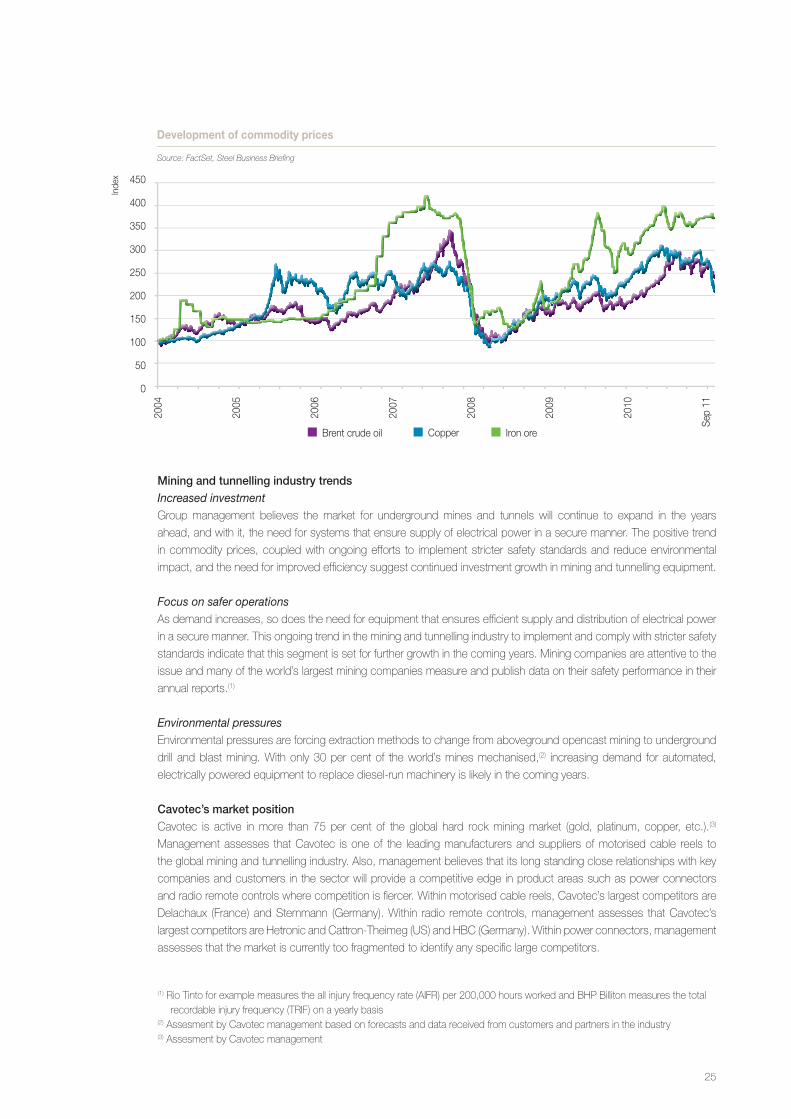
(1) Rio Tinto for example measures the all injury frequency rate (AIFR) per 200,000 hours worked and BHP Billiton measures the total recordable injury frequency (TRIF) on a yearly basis
(2) Assesment by Cavotec management based on forecasts and data received from customers and partners in the industry(3) Assesment by Cavotec management
mining and tunnelling industry trendsIncreased investmentGroup management believes the market for underground mines and tunnels will continue to expand in the years
ahead, and with it, the need for systems that ensure supply of electrical power in a secure manner. The positive trend
in commodity prices, coupled with ongoing efforts to implement stricter safety standards and reduce environmental
impact, and the need for improved efficiency suggest continued investment growth in mining and tunnelling equipment.
Focus on safer operationsAs demand increases, so does the need for equipment that ensures efficient supply and distribution of electrical power
in a secure manner. This ongoing trend in the mining and tunnelling industry to implement and comply with stricter safety
standards indicate that this segment is set for further growth in the coming years. Mining companies are attentive to the
issue and many of the world’s largest mining companies measure and publish data on their safety performance in their
annual reports.(1)
Environmental pressuresEnvironmental pressures are forcing extraction methods to change from aboveground opencast mining to underground
drill and blast mining. With only 30 per cent of the world’s mines mechanised,(2) increasing demand for automated,
electrically powered equipment to replace diesel-run machinery is likely in the coming years.
cavotec’s market positionCavotec is active in more than 75 per cent of the global hard rock mining market (gold, platinum, copper, etc.).(3)
Management assesses that Cavotec is one of the leading manufacturers and suppliers of motorised cable reels to
the global mining and tunnelling industry. Also, management believes that its long standing close relationships with key
companies and customers in the sector will provide a competitive edge in product areas such as power connectors
and radio remote controls where competition is fiercer. Within motorised cable reels, Cavotec’s largest competitors are
Delachaux (France) and Stemmann (Germany). Within radio remote controls, management assesses that Cavotec’s
largest competitors are Hetronic and Cattron-Theimeg (US) and HBC (Germany). Within power connectors, management
assesses that the market is currently too fragmented to identify any specific large competitors.
Development of commodity prices
Source: FactSet, Steel Business Briefing
Brent crude oil Copper Iron ore
450
400
350
300
250
200
150
100
50
0
Inde
x
2004
2005
2006
2007
2008
2009
2010
Sep
11
25
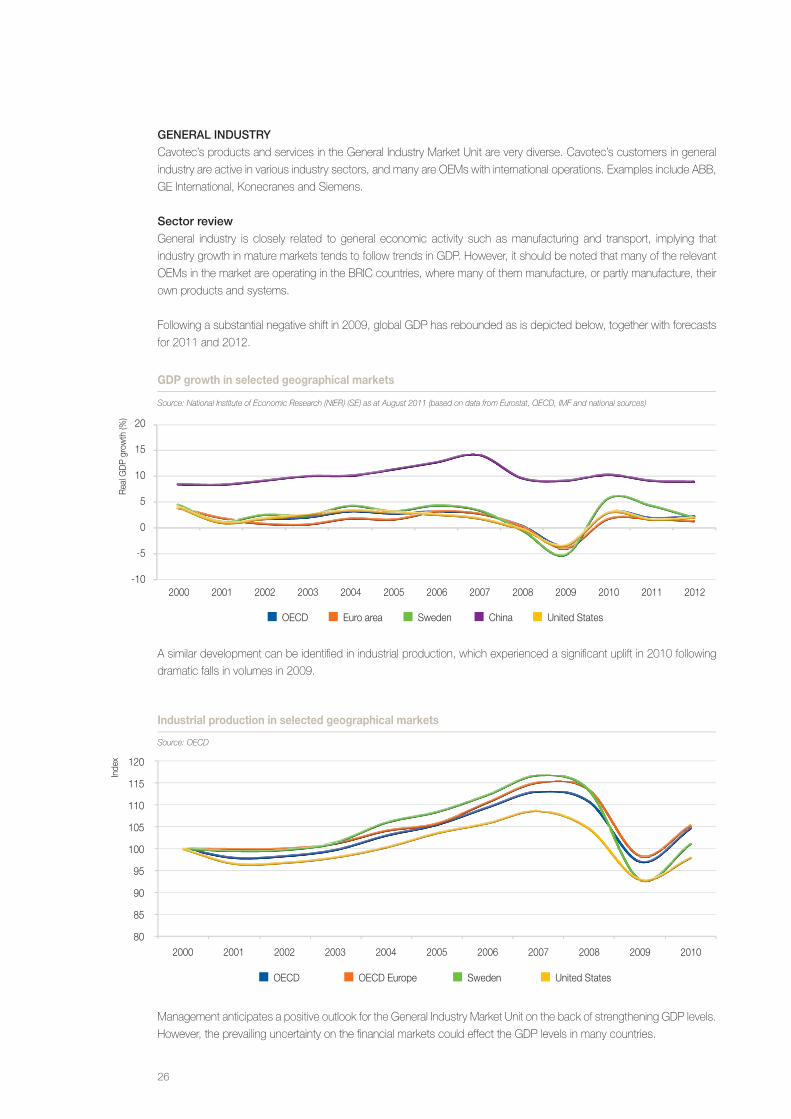
general InduStryCavotec’s products and services in the General Industry Market Unit are very diverse. Cavotec’s customers in general
industry are active in various industry sectors, and many are OEMs with international operations. Examples include ABB,
GEInternational,KonecranesandSiemens.
Sector reviewGeneral industry is closely related to general economic activity such as manufacturing and transport, implying that
industry growth in mature markets tends to follow trends in GDP. However, it should be noted that many of the relevant
OEMs in the market are operating in the BRIC countries, where many of them manufacture, or partly manufacture, their
own products and systems.
Following a substantial negative shift in 2009, global GDP has rebounded as is depicted below, together with forecasts
for 2011 and 2012.
A similar development can be identified in industrial production, which experienced a significant uplift in 2010 following
dramatic falls in volumes in 2009.
Management anticipates a positive outlook for the General Industry Market Unit on the back of strengthening GDP levels.
However, the prevailing uncertainty on the financial markets could effect the GDP levels in many countries.
Industrial production in selected geographical markets
Source: OECD
2000 2001 2002 2003 2004 2005 2006 2007 2008 2009 2010
OECD OECD Europe Sweden United States
120
115
110
105
100
95
90
85
80
Inde
x
GDP growth in selected geographical markets
Source: National Institute of Economic Research (NIER) (SE) as at August 2011 (based on data from Eurostat, OECD, IMF and national sources)
2000 2001 2002 2003 2004 2005 2006 2007 2008 2009 2010 2011 2012
OECD Euro area Sweden China United States
20
15
10
5
0
-5
-10
Rea
l GD
P gr
owth
(%)
26

general industry trendsTighter safety requirementsAs demand in the general industry market increases, so does the need for machinery and equipment that ensure safe
and efficient manufacturing processes. Many OEMs have implemented strict safety standards, often following guidelines
or requirements issued by international agencies such as the International Organization for Standardization (ISO), and
management expects this trend to continue.
Sustainable and environmentally friendly efficiency gainsThe general industry faces constant pressure to improve operational efficiency, while at the same time, OEMs are
increasingly required to minimise the environmental impact from their manufacturing processes. For example, many of
Cavotec’s OEM customers strive to reduce CO2 emissions and have implemented systems for measuring environmental
performance.
cavotec’s market positionIt is the opinion of management that Cavotec is one of the leading manufacturers of certain niche applications in the
general industry sector. Cavotec also supplies products in segments where competition is more intense, such as slipring
columns, power connectors and radio remote controls. Cavotec has a global presence, primarily competing with locally-
based competitors in the respective geographical regions, but also with global manufacturing conglomerates. Group
management expects that Cavotec’s overall market position will strengthen in the coming years as the Company’s
products are specifically designed to meet more exacting safety and environmental requirements.
The markets for products such as slipring columns are highly fragmented. Within radio remote controls, it is management’s
judgement that Cavotec’s largest competitors are Hetronic and Cattron-Theimeg (US) and HBC (Germany). Within
power connectors, management assesses that the market is too fragmented to identify the largest competitors.
28
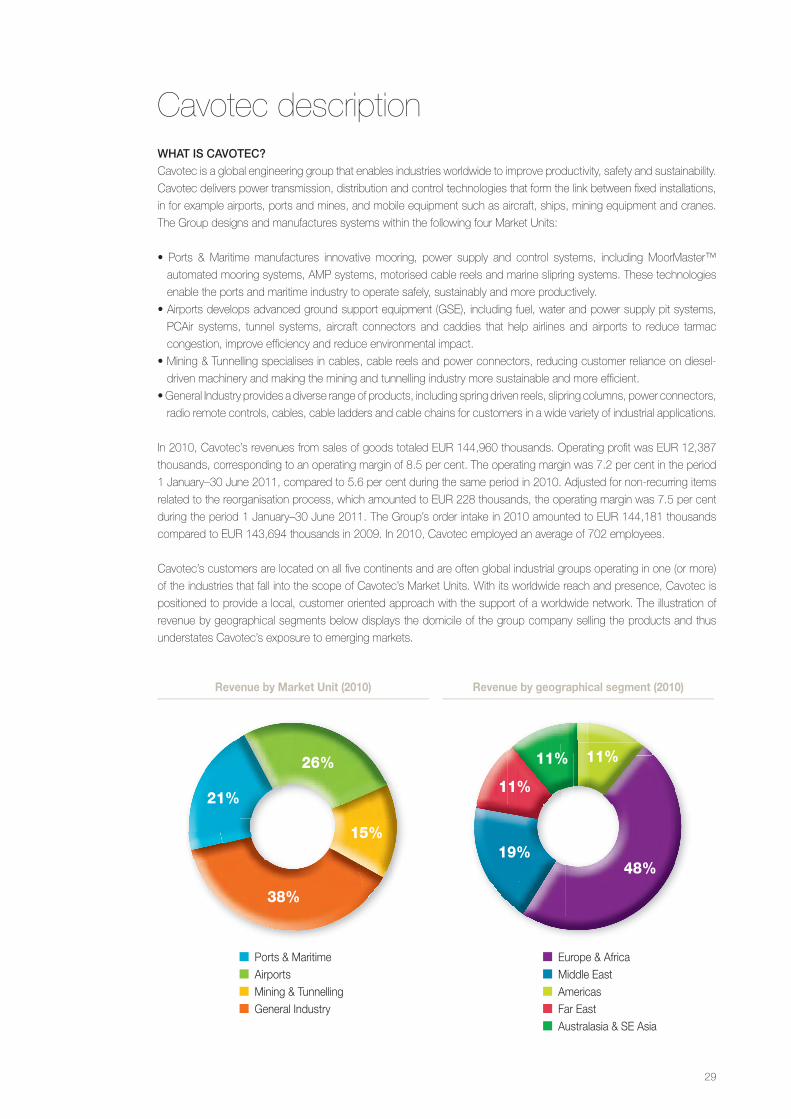
what IS cavotec?Cavotec is a global engineering group that enables industries worldwide to improve productivity, safety and sustainability.
Cavotec delivers power transmission, distribution and control technologies that form the link between fixed installations,
in for example airports, ports and mines, and mobile equipment such as aircraft, ships, mining equipment and cranes.
The Group designs and manufactures systems within the following four Market Units:
• Ports &Maritimemanufactures innovative mooring, power supply and control systems, includingMoorMaster™
automated mooring systems, AMP systems, motorised cable reels and marine slipring systems. These technologies
enable the ports and maritime industry to operate safely, sustainably and more productively.
•Airportsdevelopsadvancedgroundsupportequipment(GSE),includingfuel,waterandpowersupplypitsystems,
PCAir systems, tunnel systems, aircraft connectors and caddies that help airlines and airports to reduce tarmac
congestion, improve efficiency and reduce environmental impact.
•Mining&Tunnellingspecialisesincables,cablereelsandpowerconnectors,reducingcustomerrelianceondiesel-
driven machinery and making the mining and tunnelling industry more sustainable and more efficient.
•GeneralIndustryprovidesadiverserangeofproducts,includingspringdrivenreels,slipringcolumns,powerconnectors,
radio remote controls, cables, cable ladders and cable chains for customers in a wide variety of industrial applications.
In 2010, Cavotec’s revenues from sales of goods totaled EUR 144,960 thousands. Operating profit was EUR 12,387
thousands, corresponding to an operating margin of 8.5 per cent. The operating margin was 7.2 per cent in the period
1 January–30 June 2011, compared to 5.6 per cent during the same period in 2010. Adjusted for non-recurring items
related to the reorganisation process, which amounted to EUR 228 thousands, the operating margin was 7.5 per cent
during the period 1 January–30 June 2011. The Group’s order intake in 2010 amounted to EUR 144,181 thousands
compared to EUR 143,694 thousands in 2009. In 2010, Cavotec employed an average of 702 employees.
Cavotec’s customers are located on all five continents and are often global industrial groups operating in one (or more)
of the industries that fall into the scope of Cavotec’s Market Units. With its worldwide reach and presence, Cavotec is
positioned to provide a local, customer oriented approach with the support of a worldwide network. The illustration of
revenue by geographical segments below displays the domicile of the group company selling the products and thus
understates Cavotec’s exposure to emerging markets.
Cavotec description
Ports & Maritime Airports Mining & Tunnelling General Industry
21%
26%
15%
38%
Revenue by Market Unit (2010) Revenue by geographical segment (2010)
Europe & Africa Middle East Americas Far East Australasia & SE Asia
48%
11%11%
11%
19%
29
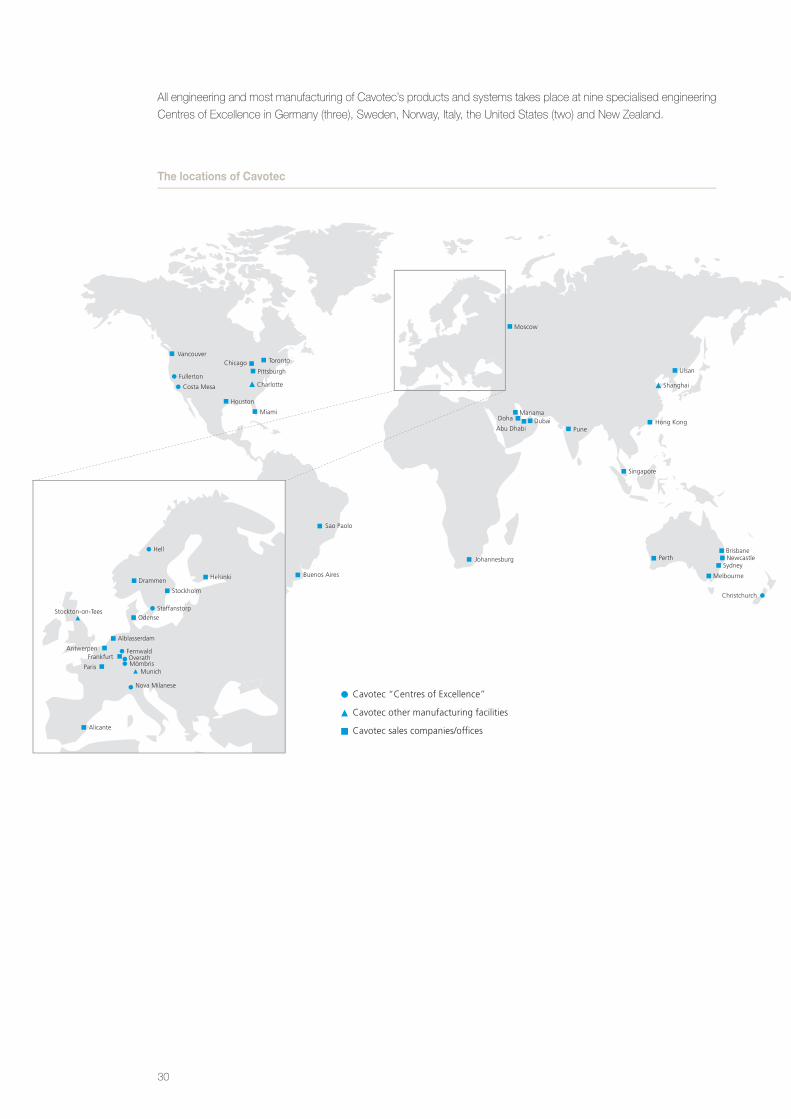
The locations of Cavotec
Buenos Aires
Sao Paolo
Johannesburg
Moscow
ManamaDoha
Abu DhabiDubai
Pune
Singapore
NewcastleSydney
Melbourne
BrisbanePerth
Christchurch
Hong Kong
Shanghai
Ulsan
Charlotte
Miami
Costa Mesa
Houston
PittsburghChicago
Vancouver
Fullerton
Helsinki
Odense
Alblasserdam
AntwerpenFrankfurt
Paris
Stockholm
Drammen
Hell
Nova Milanese
Alicante
Staffanstorp
Mömbris
Fernwald
Munich
Overath
Stockton-on-Tees
Toronto
Cavotec “Centres of Excellence”
Cavotec other manufacturing facilities
Cavotec sales companies/offices
All engineering and most manufacturing of Cavotec’s products and systems takes place at nine specialised engineering
Centres of Excellence in Germany (three), Sweden, Norway, Italy, the United States (two) and New Zealand.
30
BuSIneSS concept, goalS and StrategIeSBusiness conceptCavotec’s business concept is to design, engineer and sell innovative products and systems that enable industries to improve efficiency, profitability, productivity and environmental sustainability. By bringing together a local approach and a global vision Cavotec is committed to build long-term partnerships with customers aimed at introducing a best practice approach and competency throughout Cavotec’s fields of activity.
goalsFinancial goals•Annual revenues of EUR 0.5 billion including acquisitions over the next business cycle•Organic revenue growth at a CAGR of 10 per cent over the next business cycle•EBIT margin to increase to 12 per cent over the coming years•A debt/equity ratio of at most 0.75
Dividend policyCavotec’s goal is to distribute dividends of approximately 25 per cent of the Group’s net profit after tax. Account should however be taken of Cavotec’s financial position, cash flow and future prospects.
StrategiesUnrivaled customer service and engineering excellenceThe main focus in Cavotec’s operations is high quality service and engineering. The operations of Cavotec’s customers are dependent on Cavotec’s products fulfilling highly stringent quality demands. Furthermore, Cavotec’s pricing capacity is determined by the high engineering content of the Group’s products. Thus, quality and engineering are Cavotec’s primary competitive advantages.
Attract and retain highly skilled and talented staffIn order to continue to expand and maintain quality and engineering content, Cavotec strives to attract and retain highly skilled and talented staff. To achieve this, Cavotec aims to offer a positive and rewarding work environment for its employees. Cavotec’s approximately 800 members of staff (following the INET acquisition) are drawn from more than 40 countries and from a wide variety of backgrounds. Cavotec retains a friendly, professional working atmosphere where fresh thinking and a willingness to explore new approaches are keenly encouraged. An open working environment, that fosters the free exchange of ideas and mutual respect between individuals, underpins the Group’s unique capabilities as a global engineering group.
Organic growth through innovative products, systems delivery and project managementCavotec is targeting strong organic growth going forward. To this end, the Group has for decades invested in innovative products including MoorMaster™ automated mooring systems, AMP systems for ships, PCAir systems (sub-freezing cooling of aircraft) and marine slipring systems for Azipod, that are expected to achieve structural, above market, growth. In addition, as part of Cavotec’s growth strategy the Group aims to increase the importance of systems delivery and project management, where Cavotec acts as a systems integrator. A core strength of the Group is the ability to combine innovative thinking and extensive engineering experience with a strong sense of service and support to the customer. This combination, together with Cavotec’s extensive local presence has established the Group as an important industry partner.
Complementary acquisitionsCavotec’s management has identified some 10 to 15 possible future acquisition targets in Cavotec’s business areas. All of these companies are, Cavotec’s management believes, leading players in their niches, normally well structured, profitable, reputable and of manageable size. Furthermore, given the Group’s sound financial position, Cavotec’s management believes that the Group has capacity for acquisitions.
Continued international expansionCavotec aims to continue its successful international expansion, both organically and through acquisitions. The Group is active in, and targets, regions where Cavotec believes growth will be strong. Cavotec’s global reach provides a compelling argument for customers worldwide to use Cavotec’s products. The Group’s portfolio of references gives Cavotec credibility all over the world.
Strengths and competitive advantagesMarket positioningPresence in growth sectorsCavotec has a significant presence in the airports, ports and maritime, and mining industries. These are, management believes, industries with potential for growth in coming years.
31
Global niche market positionsCavotec has established positions in various industrial niches within the airports, mining and tunnelling, ports and maritime, and general industry markets. Furthermore, the Group has a global presence through its own subsidiaries which enables it to serve customers worldwide.
Proven business modelTrack record of strong and profitable growthCavotec has displayed strong growth, both organic and acquisition-driven. Moreover, Cavotec has always emphasised the importance of growing profitably over the long-term.
Well-invested with operational leverageCavotec has over the years made investments in manufacturing capacity and a global network of wholly owned sales companies. As sales grow over the coming years Cavotec expects, in line with the Group’s financial goal, to lift its operating margins due to this scalability – Cavotec has the capability to increase sales through its network with modest (or with lower) cost increases.
Proven mission critical products and system integrationSince its foundation, Cavotec has focused on providing high quality products with an increasingly high engineering content. Cavotec’s consistent approach has won the Group a solid reputation that Cavotec strives to maintain and capitalise on. Most of Cavotec’s products are considered key components in equipment produced by OEM customers or by end customers. Cavotec’s products make up a relatively small portion of the total cost of the final product or system, while the income lost from disruptions could be significant for end customers and thus Cavotec has strong negotiating and pricing powers and is shielded from cost cutting initiatives. In addition to the above, the Group continues to build its role as a systems integrator and has demonstrated capacity to manage projects valued above EUR 30 million.
Diversified blue chip customer baseCavotec has established strong relationships with blue chip customers all over the world, including customers with presence in emerging markets. Cavotec currently has approximately 7,000 active customers in a wide range of industries. Management believes that this gives the Group a diversified profile that strongly reduces the operational risk.
Experienced managersCavotec’s management has extensive experience of the Group and the industries of Cavotec. Group CEO, Ottonel Popesco, has worked for Cavotec since 1988. Members of the Executive Management Committee(1) are senior executive officers who have been active in Cavotec for a significant number of years.
Potential for long-term growthEmerging market presenceCavotecaimstocontinueitssuccessful internationalexpansion;andtheGroupisactivein,andtargets,emergingmarketssuch as China and South East Asia, India, Russia and Brazil.
Capacity for growth through mergers and acquisitions Cavotec has significant experience of company acquisitions, and has routines and a team in place to handle both acquisitions and the subsequent integration. During its history the Group has acquired 18 companies. Cavotec strives to acquire locally, leading companies and make them global by selling their products through Cavotec’s global sales network.
Innovative proprietary technologyCavotec has consistently invested in innovative proprietary technology, such as MoorMaster™, AMP shore-to-ship technology and PCAir systems, which management expects to drive growth in the coming years. The increased interest for these products globally is to a large extent, management believes, independent of the prevailing economic environment. Demand is instead more driven by an increasing focus on environmental concerns and improved efficiency. These innovations currently contribute approximately 15 per cent of Group revenues.(2)
(1) Please refer to the page 106 for a description of the Executive Management Committee(2) The products MoorMaster™, AMP shore-to-ship technology, PCAir systems and Marine Slipring Systems for Azipod are considered innovations in the calculations above.
32
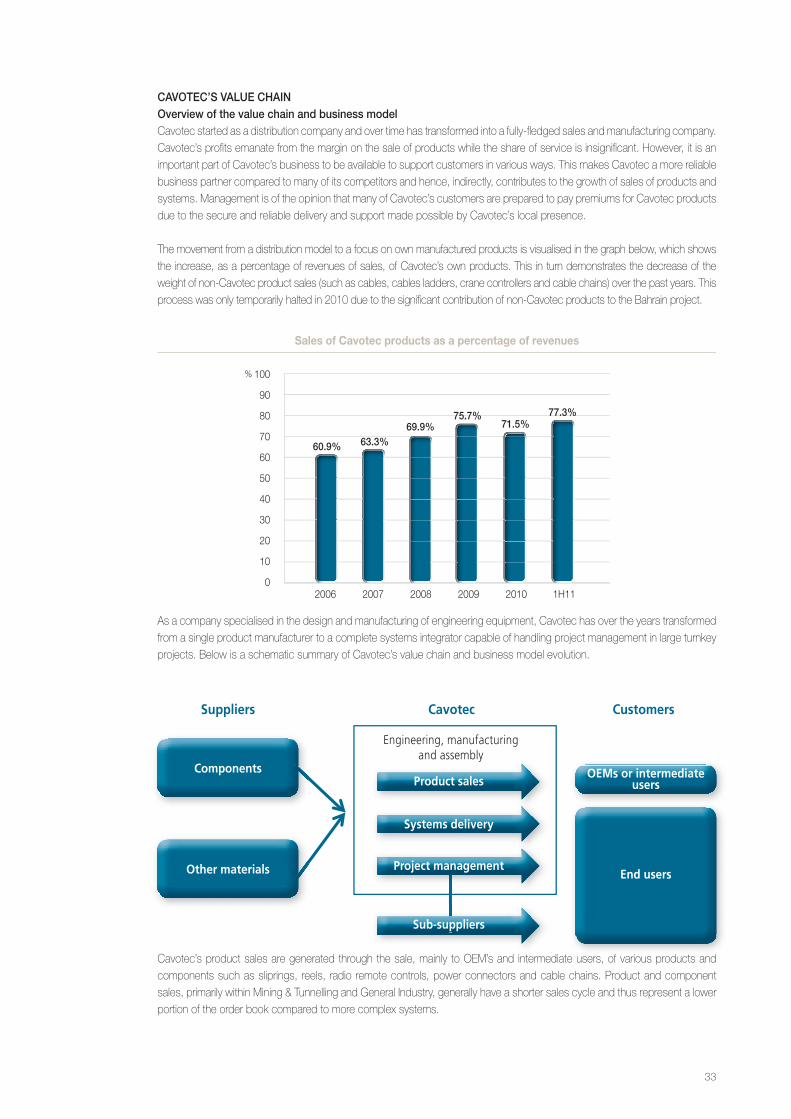
cavotec’S value chaIn overview of the value chain and business modelCavotec started as a distribution company and over time has transformed into a fully-fledged sales and manufacturing company. Cavotec’s profits emanate from the margin on the sale of products while the share of service is insignificant. However, it is an important part of Cavotec’s business to be available to support customers in various ways. This makes Cavotec a more reliable business partner compared to many of its competitors and hence, indirectly, contributes to the growth of sales of products and systems. Management is of the opinion that many of Cavotec’s customers are prepared to pay premiums for Cavotec products due to the secure and reliable delivery and support made possible by Cavotec’s local presence.
The movement from a distribution model to a focus on own manufactured products is visualised in the graph below, which shows the increase, as a percentage of revenues of sales, of Cavotec’s own products. This in turn demonstrates the decrease of the weight of non-Cavotec product sales (such as cables, cables ladders, crane controllers and cable chains) over the past years. This process was only temporarily halted in 2010 due to the significant contribution of non-Cavotec products to the Bahrain project.
As a company specialised in the design and manufacturing of engineering equipment, Cavotec has over the years transformed from a single product manufacturer to a complete systems integrator capable of handling project management in large turnkey projects. Below is a schematic summary of Cavotec’s value chain and business model evolution.
Cavotec’s product sales are generated through the sale, mainly to OEM’s and intermediate users, of various products and components such as sliprings, reels, radio remote controls, power connectors and cable chains. Product and component sales, primarily within Mining & Tunnelling and General Industry, generally have a shorter sales cycle and thus represent a lower portion of the order book compared to more complex systems.
Components
Suppliers Cavotec
Engineering, manufacturing and assembly
Customers
Other materials End users
OEMs or intermediateusersProduct sales
Systems delivery
Project management
Sub-suppliers
Sales of Cavotec products as a percentage of revenues
%
2006 2007 2008 2009 2010 1H11
60.9% 63.3%69.9%
75.7%71.5%
77.3%
100
90
80
70
60
50
40
30
20
10
0
33
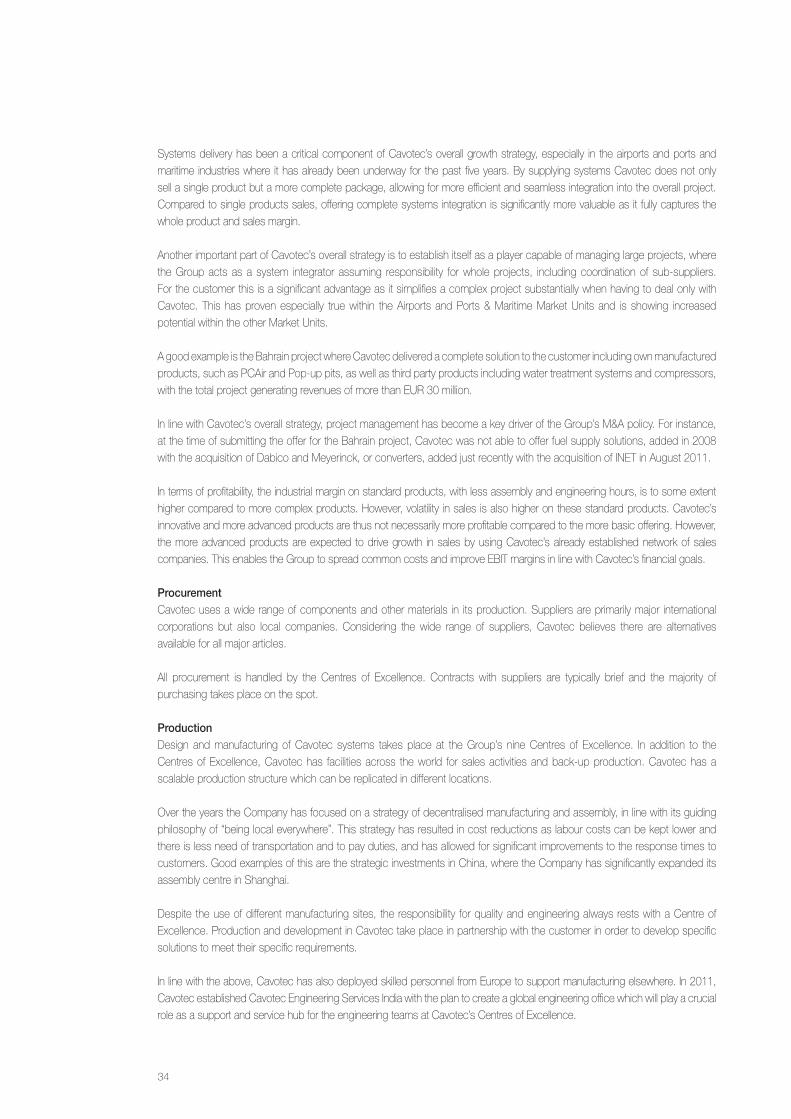
Systems delivery has been a critical component of Cavotec’s overall growth strategy, especially in the airports and ports and maritime industries where it has already been underway for the past five years. By supplying systems Cavotec does not only sell a single product but a more complete package, allowing for more efficient and seamless integration into the overall project. Compared to single products sales, offering complete systems integration is significantly more valuable as it fully captures the whole product and sales margin.
Another important part of Cavotec’s overall strategy is to establish itself as a player capable of managing large projects, where the Group acts as a system integrator assuming responsibility for whole projects, including coordination of sub-suppliers. For the customer this is a significant advantage as it simplifies a complex project substantially when having to deal only with Cavotec. This has proven especially true within the Airports and Ports & Maritime Market Units and is showing increased potential within the other Market Units.
A good example is the Bahrain project where Cavotec delivered a complete solution to the customer including own manufactured products, such as PCAir and Pop-up pits, as well as third party products including water treatment systems and compressors, with the total project generating revenues of more than EUR 30 million.
In line with Cavotec’s overall strategy, project management has become a key driver of the Group’s M&A policy. For instance, at the time of submitting the offer for the Bahrain project, Cavotec was not able to offer fuel supply solutions, added in 2008 with the acquisition of Dabico and Meyerinck, or converters, added just recently with the acquisition of INET in August 2011.
In terms of profitability, the industrial margin on standard products, with less assembly and engineering hours, is to some extent higher compared to more complex products. However, volatility in sales is also higher on these standard products. Cavotec’s innovative and more advanced products are thus not necessarily more profitable compared to the more basic offering. However, the more advanced products are expected to drive growth in sales by using Cavotec’s already established network of sales companies. This enables the Group to spread common costs and improve EBIT margins in line with Cavotec’s financial goals.
procurementCavotec uses a wide range of components and other materials in its production. Suppliers are primarily major international corporations but also local companies. Considering the wide range of suppliers, Cavotec believes there are alternatives available for all major articles.
All procurement is handled by the Centres of Excellence. Contracts with suppliers are typically brief and the majority of purchasing takes place on the spot.
productionDesign and manufacturing of Cavotec systems takes place at the Group’s nine Centres of Excellence. In addition to the Centres of Excellence, Cavotec has facilities across the world for sales activities and back-up production. Cavotec has a scalable production structure which can be replicated in different locations.
Over the years the Company has focused on a strategy of decentralised manufacturing and assembly, in line with its guiding philosophy of “being local everywhere”. This strategy has resulted in cost reductions as labour costs can be kept lower and there is less need of transportation and to pay duties, and has allowed for significant improvements to the response times to customers. Good examples of this are the strategic investments in China, where the Company has significantly expanded its assembly centre in Shanghai. Despite the use of different manufacturing sites, the responsibility for quality and engineering always rests with a Centre of Excellence. Production and development in Cavotec take place in partnership with the customer in order to develop specific solutions to meet their specific requirements.
In line with the above, Cavotec has also deployed skilled personnel from Europe to support manufacturing elsewhere. In 2011, Cavotec established Cavotec Engineering Services India with the plan to create a global engineering office which will play a crucial role as a support and service hub for the engineering teams at Cavotec’s Centres of Excellence.
34

Location: Costa Mesa, CA, USAEstablished: 1966Size: 4,500 sqm
Cavotec Dabico has led the market for in-ground fuel systems for aircraft for more than four decades. Cavotec’s experience extends back to when the first airport hydrant fuelling systems were designed and installed. Customising products to meet the demands of customers is a specialty of the Group.
cavotec dabico
Location: Mömbris, GermanyEstablished: 1968Size: 5,000 sqm
Cavotec Fladung has been a pioneer of airport ground support equipment specialising in in-ground utility systems – including Cavotec’s pre-conditioned air system – mobile caddies, aircraft cables, connectors and tow bars and cable coilers.
cavotec fladung
Location: Fullerton, CA, USAEstablished: 1967Size: 6,500 sqm
Cavotec INET is engaged in the Civil and Military Airports Ground Support Equipment sector, servicing aircraft as an engineering and manufacturing company of power conversion 50/60Hz to 400Hz systems, static transfer switches, Uninterruptible Power Systems (UPS), specialised Group Power Units (GPU) and Pre-conditioned Air Systems. Cavotec INET is also the beneficiary of several certifications as preferred contractor for federal and various local governments in the USA.
cavotecInet
Location: Staffanstorp, SwedenEstablished: 1991Size: 2,000 sqm
Cavotec Connectors’ electrical power, power supply, power cable and rotating power connector are used in many different industrial applications. They can be found in ports and terminals, mining and tunnelling, railways, steel and aluminium plants, mobile generator sets, offshore and other mobile industrial machinery.
cavotec connectors
Location: Overath, GermanyEstablished: 1991Size: 7,000 sqm
Cavotec Alfo specialises in the design and manufacturing of spring reels and slipring columns, used in many different industry sectors. Cavotec’s spring driven cable reels meet all applicable IEC international standards and comply with the latest EU-requirements (CE-marking). Cavotec is acknowledged across the industry for its attention to detail and innovations.
cavotec alfo
cavotec’s centres of excellence
35

Location: Fernwald, GermanyEstablished: 1968Size: 3,000 sqm
Cavotec Meyerinck, based in Germany, supplies a wide range of fuelling systems, fluid and surge control, and loading terminal products for the aviation sector. In addition, Cavotec manufactures similar solutions for the petrochemical and food beverage industries.
cavotec meyerinck
Location: Hell, NorwayEstablished: 1985Size: 3,000 sqm
Cavotec Micro-control supplies a comprehensive range of radio remote control systems (RRCs) designed for a vast range of applications in the offshore, mining, and maritime sectors, as well as general and process industries around the world.
cavotec micro-control
Location: Nova Milanese, ItalyEstablished: 1963Size: 8,000 sqm
Cavotec Specimas is a well-established developer of motorised cable reel technology for the ports and maritime, mining and tunnelling and general industry sectors. Cavotec’s engineers design and manufacture the Group’s AMP systems, motorised cable reels, patented Panzerbelt cable protection system, power cables and electric marine propulsion sliprings.
cavotec Specimas
Location: Christchurch, New ZealandEstablished: 1999Size: 500 sqm
Based in Christchurch, New Zealand, the Cavotec MoorMaster technical team consists of experienced maritime personnel, naval architects and mechanical and electrical engineers who design and develop Cavotec’s vacuum-based, automated mooring system, MoorMaster™.
cavotec moormaster
36
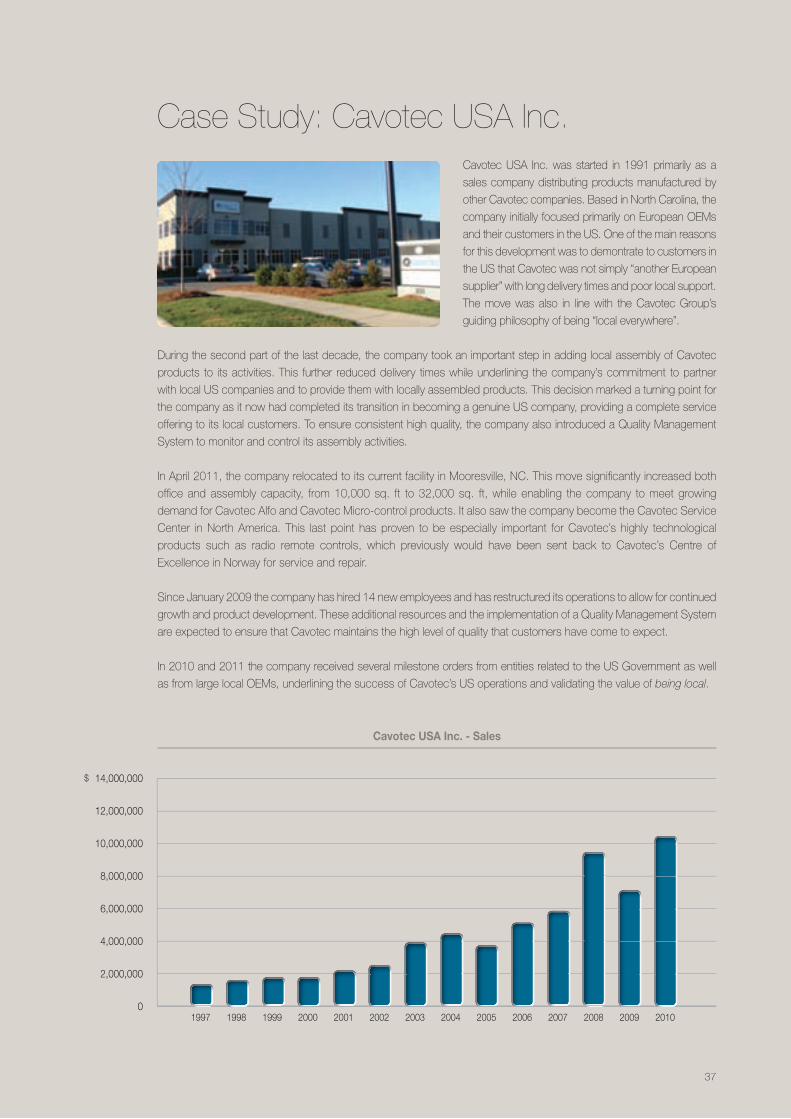
Cavotec USA Inc. was started in 1991 primarily as a
sales company distributing products manufactured by
other Cavotec companies. Based in North Carolina, the
company initially focused primarily on European OEMs
and their customers in the US. One of the main reasons
for this development was to demontrate to customers in
the US that Cavotec was not simply “another European
supplier” with long delivery times and poor local support.
The move was also in line with the Cavotec Group’s
guiding philosophy of being “local everywhere”.
During the second part of the last decade, the company took an important step in adding local assembly of Cavotec
products to its activities. This further reduced delivery times while underlining the company’s commitment to partner
with local US companies and to provide them with locally assembled products. This decision marked a turning point for
the company as it now had completed its transition in becoming a genuine US company, providing a complete service
offering to its local customers. To ensure consistent high quality, the company also introduced a Quality Management
System to monitor and control its assembly activities.
In April 2011, the company relocated to its current facility in Mooresville, NC. This move significantly increased both
office and assembly capacity, from 10,000 sq. ft to 32,000 sq. ft, while enabling the company to meet growing
demand for Cavotec Alfo and Cavotec Micro-control products. It also saw the company become the Cavotec Service
Center in North America. This last point has proven to be especially important for Cavotec’s highly technological
products such as radio remote controls, which previously would have been sent back to Cavotec’s Centre of
Excellence in Norway for service and repair.
Since January 2009 the company has hired 14 new employees and has restructured its operations to allow for continued
growth and product development. These additional resources and the implementation of a Quality Management System
are expected to ensure that Cavotec maintains the high level of quality that customers have come to expect.
In 2010 and 2011 the company received several milestone orders from entities related to the US Government as well
as from large local OEMs, underlining the success of Cavotec’s US operations and validating the value of being local.
Case Study: Cavotec USA Inc.
Cavotec USA Inc. - Sales
$
1997 1998 1999 2000 2001 2002 2003 2004 2005 2006 2007 2008 2009 2010
14,000,000
12,000,000
10,000,000
8,000,000
6,000,000
4,000,000
2,000,000
0
37
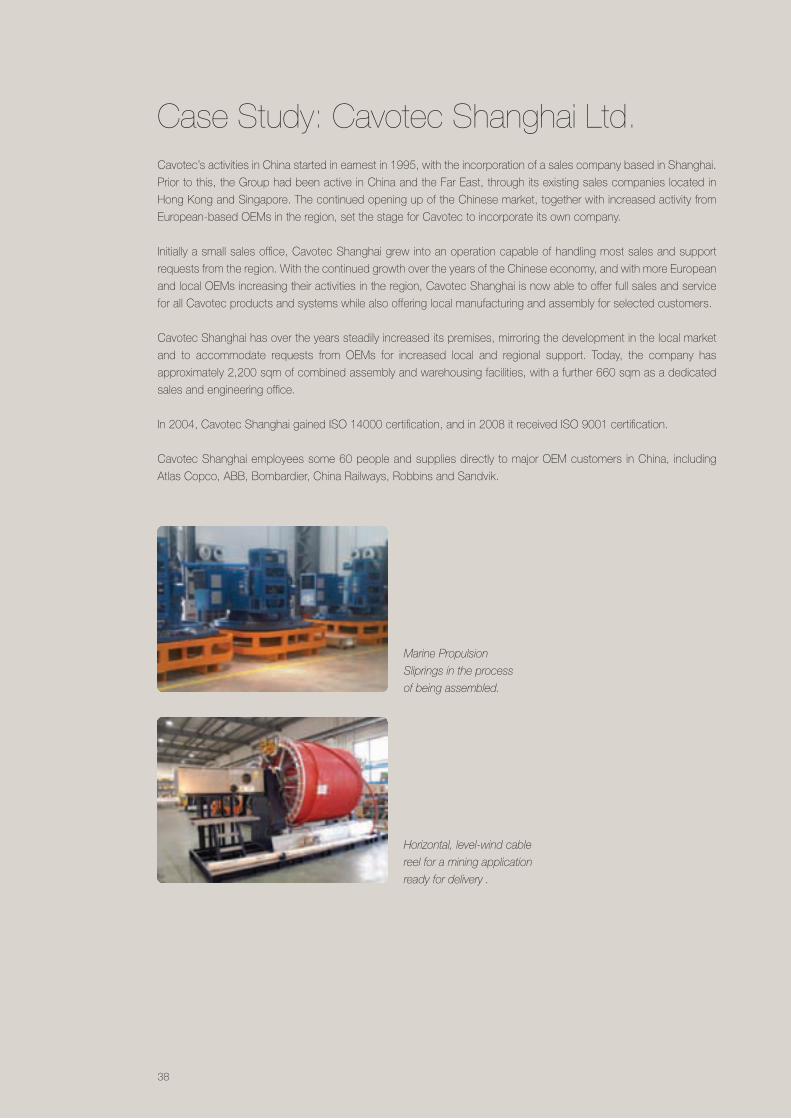
Cavotec’s activities in China started in earnest in 1995, with the incorporation of a sales company based in Shanghai.
Prior to this, the Group had been active in China and the Far East, through its existing sales companies located in
HongKongandSingapore.ThecontinuedopeningupoftheChinesemarket,togetherwithincreasedactivityfrom
European-based OEMs in the region, set the stage for Cavotec to incorporate its own company.
Initially a small sales office, Cavotec Shanghai grew into an operation capable of handling most sales and support
requests from the region. With the continued growth over the years of the Chinese economy, and with more European
and local OEMs increasing their activities in the region, Cavotec Shanghai is now able to offer full sales and service
for all Cavotec products and systems while also offering local manufacturing and assembly for selected customers.
Cavotec Shanghai has over the years steadily increased its premises, mirroring the development in the local market
and to accommodate requests from OEMs for increased local and regional support. Today, the company has
approximately 2,200 sqm of combined assembly and warehousing facilities, with a further 660 sqm as a dedicated
sales and engineering office.
In 2004, Cavotec Shanghai gained ISO 14000 certification, and in 2008 it received ISO 9001 certification.
Cavotec Shanghai employees some 60 people and supplies directly to major OEM customers in China, including
Atlas Copco, ABB, Bombardier, China Railways, Robbins and Sandvik.
Case Study: Cavotec Shanghai Ltd.
Marine Propulsion
Sliprings in the process
of being assembled.
Horizontal, level-wind cable
reel for a mining application
ready for delivery .
38
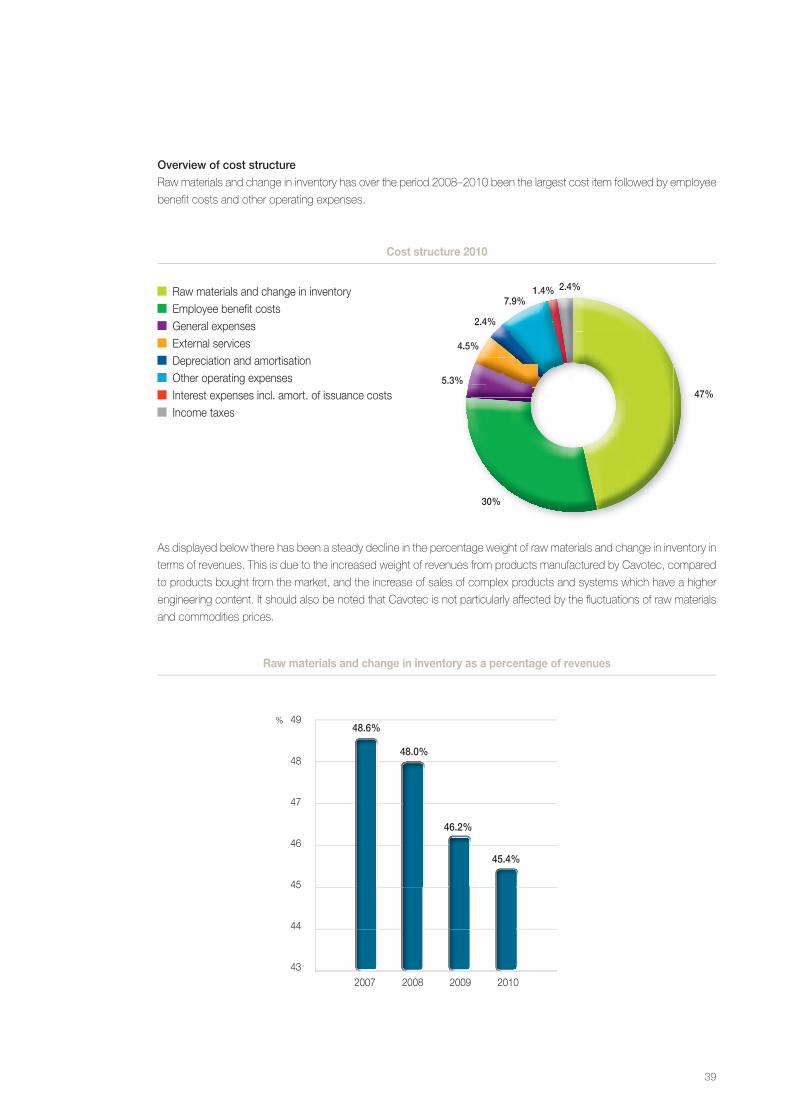
Raw materials and change in inventory Employee benefit costs General expenses External services Depreciation and amortisation Other operating expenses Interest expenses incl. amort. of issuance costs Income taxes
5.3%
4.5%
2.4%
7.9%1.4% 2.4%
47%
30%
Cost structure 2010
Raw materials and change in inventory as a percentage of revenues
%
2007 2008 2009 2010
48.6%
48.0%
46.2%
45.4%
49
48
47
46
45
44
43
As displayed below there has been a steady decline in the percentage weight of raw materials and change in inventory in
terms of revenues. This is due to the increased weight of revenues from products manufactured by Cavotec, compared
to products bought from the market, and the increase of sales of complex products and systems which have a higher
engineering content. It should also be noted that Cavotec is not particularly affected by the fluctuations of raw materials
and commodities prices.
overview of cost structureRaw materials and change in inventory has over the period 2008–2010 been the largest cost item followed by employee
benefit costs and other operating expenses.
39
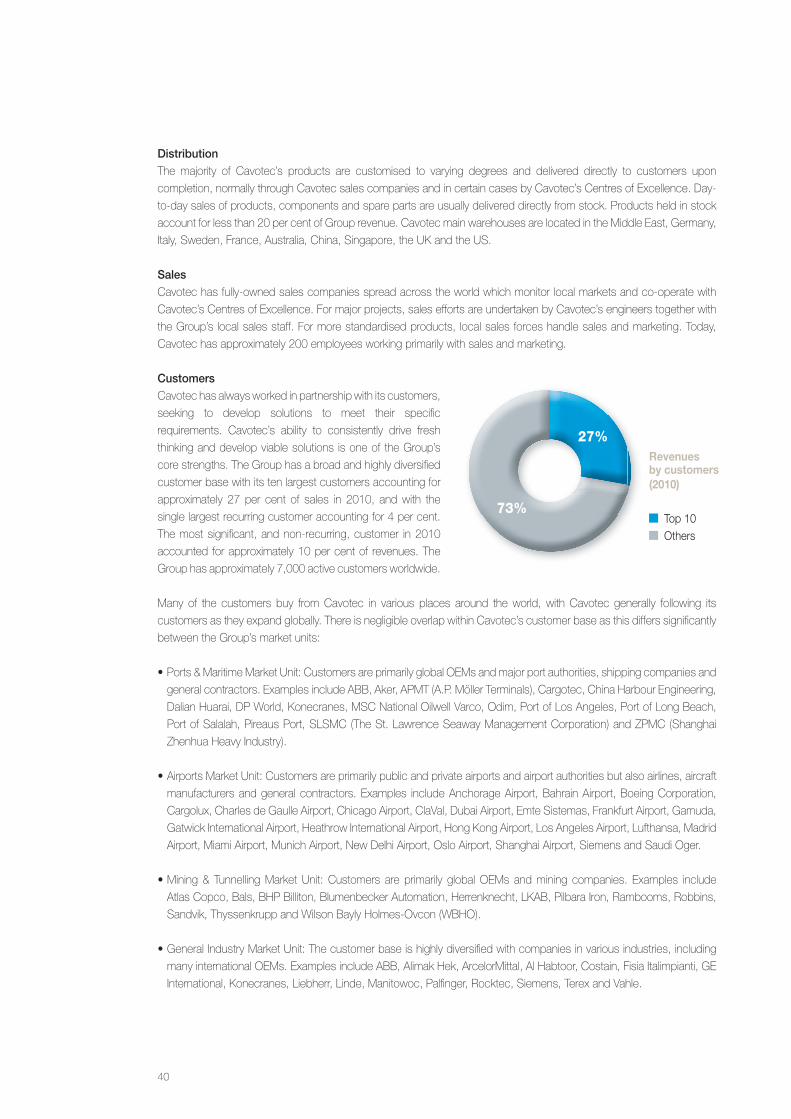
Revenues by customers (2010)
Top 10 Others
73%
27%
distributionThe majority of Cavotec’s products are customised to varying degrees and delivered directly to customers upon
completion, normally through Cavotec sales companies and in certain cases by Cavotec’s Centres of Excellence. Day-
to-day sales of products, components and spare parts are usually delivered directly from stock. Products held in stock
account for less than 20 per cent of Group revenue. Cavotec main warehouses are located in the Middle East, Germany,
Italy,Sweden,France,Australia,China,Singapore,theUKandtheUS.
SalesCavotec has fully-owned sales companies spread across the world which monitor local markets and co-operate with
Cavotec’s Centres of Excellence. For major projects, sales efforts are undertaken by Cavotec’s engineers together with
the Group’s local sales staff. For more standardised products, local sales forces handle sales and marketing. Today,
Cavotec has approximately 200 employees working primarily with sales and marketing.
customersCavotec has always worked in partnership with its customers,
seeking to develop solutions to meet their specific
requirements. Cavotec’s ability to consistently drive fresh
thinking and develop viable solutions is one of the Group’s
core strengths. The Group has a broad and highly diversified
customer base with its ten largest customers accounting for
approximately 27 per cent of sales in 2010, and with the
single largest recurring customer accounting for 4 per cent.
The most significant, and non-recurring, customer in 2010
accounted for approximately 10 per cent of revenues. The
Group has approximately 7,000 active customers worldwide.
Many of the customers buy from Cavotec in various places around the world, with Cavotec generally following its
customers as they expand globally. There is negligible overlap within Cavotec’s customer base as this differs significantly
between the Group’s market units:
•Ports & Maritime Market Unit: Customers are primarily global OEMs and major port authorities, shipping companies and
general contractors. Examples include ABB, Aker, APMT (A.P. Möller Terminals), Cargotec, China Harbour Engineering,
DalianHuarai,DPWorld,Konecranes,MSCNationalOilwellVarco,Odim,PortofLosAngeles,PortofLongBeach,
Port of Salalah, Pireaus Port, SLSMC (The St. Lawrence Seaway Management Corporation) and ZPMC (Shanghai
Zhenhua Heavy Industry).
•Airports Market Unit: Customers are primarily public and private airports and airport authorities but also airlines, aircraft
manufacturers and general contractors. Examples include Anchorage Airport, Bahrain Airport, Boeing Corporation,
Cargolux, Charles de Gaulle Airport, Chicago Airport, ClaVal, Dubai Airport, Emte Sistemas, Frankfurt Airport, Gamuda,
GatwickInternationalAirport,HeathrowInternationalAirport,HongKongAirport,LosAngelesAirport,Lufthansa,Madrid
Airport, Miami Airport, Munich Airport, New Delhi Airport, Oslo Airport, Shanghai Airport, Siemens and Saudi Oger.
•Mining & Tunnelling Market Unit: Customers are primarily global OEMs and mining companies. Examples include
AtlasCopco,Bals,BHPBilliton,BlumenbeckerAutomation,Herrenknecht,LKAB,PilbaraIron,Rambooms,Robbins,
Sandvik, Thyssenkrupp and Wilson Bayly Holmes-Ovcon (WBHO).
•General Industry Market Unit: The customer base is highly diversified with companies in various industries, including
many international OEMs. Examples include ABB, Alimak Hek, ArcelorMittal, Al Habtoor, Costain, Fisia Italimpianti, GE
International,Konecranes,Liebherr,Linde,Manitowoc,Palfinger,Rocktec,Siemens,TerexandVahle.
40
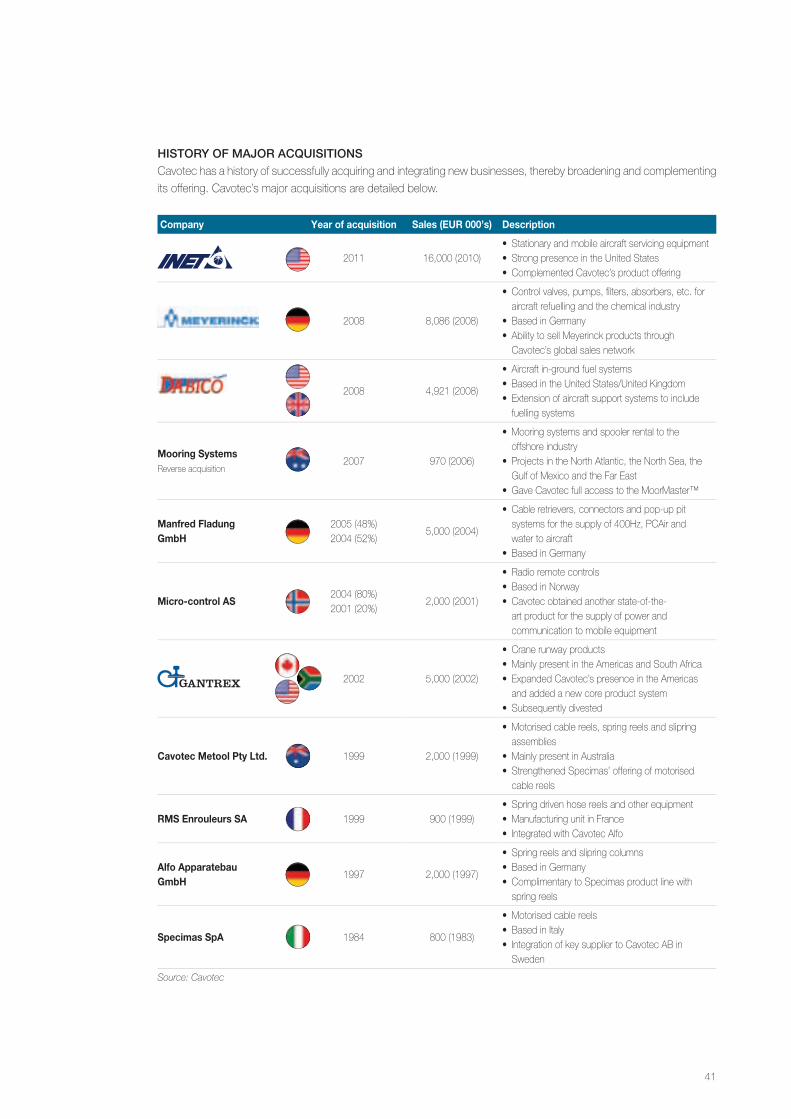
hIStory of major acQuISItIonSCavotec has a history of successfully acquiring and integrating new businesses, thereby broadening and complementing
its offering. Cavotec’s major acquisitions are detailed below.
Company Year of acquisition Sales (EUR 000’s) Description
2011 16,000 (2010)• Stationary and mobile aircraft servicing equipment• Strong presence in the United States• Complemented Cavotec’s product offering
2008 8,086 (2008)
• Control valves, pumps, filters, absorbers, etc. for aircraft refuelling and the chemical industry
• Based in Germany• Ability to sell Meyerinck products through
Cavotec’s global sales network
2008 4,921 (2008)
• Aircraft in-ground fuel systems• BasedintheUnitedStates/UnitedKingdom• Extension of aircraft support systems to include
fuelling systems
Mooring SystemsReverse acquisition
2007 970 (2006)
• Mooring systems and spooler rental to the offshore industry
• Projects in the North Atlantic, the North Sea, the Gulf of Mexico and the Far East
• Gave Cavotec full access to the MoorMaster™
Manfred Fladung GmbH
2005 (48%)2004 (52%)
5,000 (2004)
• Cable retrievers, connectors and pop-up pit systems for the supply of 400Hz, PCAir and water to aircraft
• Based in Germany
Micro-control AS2004 (80%)2001 (20%)
2,000 (2001)
• Radio remote controls• Based in Norway• Cavotec obtained another state-of-the-
art product for the supply of power and communication to mobile equipment
2002 5,000 (2002)
• Crane runway products• Mainly present in the Americas and South Africa• Expanded Cavotec’s presence in the Americas
and added a new core product system• Subsequently divested
Cavotec Metool Pty Ltd. 1999 2,000 (1999)
• Motorised cable reels, spring reels and slipring assemblies
• Mainly present in Australia• Strengthened Specimas’ offering of motorised
cable reels
RMS Enrouleurs SA 1999 900 (1999)• Spring driven hose reels and other equipment• Manufacturing unit in France• Integrated with Cavotec Alfo
Alfo Apparatebau GmbH
1997 2,000 (1997)
• Spring reels and slipring columns• Based in Germany• Complimentary to Specimas product line with
spring reels
Specimas SpA 1984 800 (1983)
• Motorised cable reels• Based in Italy• Integration of key supplier to Cavotec AB in
Sweden
Source: Cavotec
41
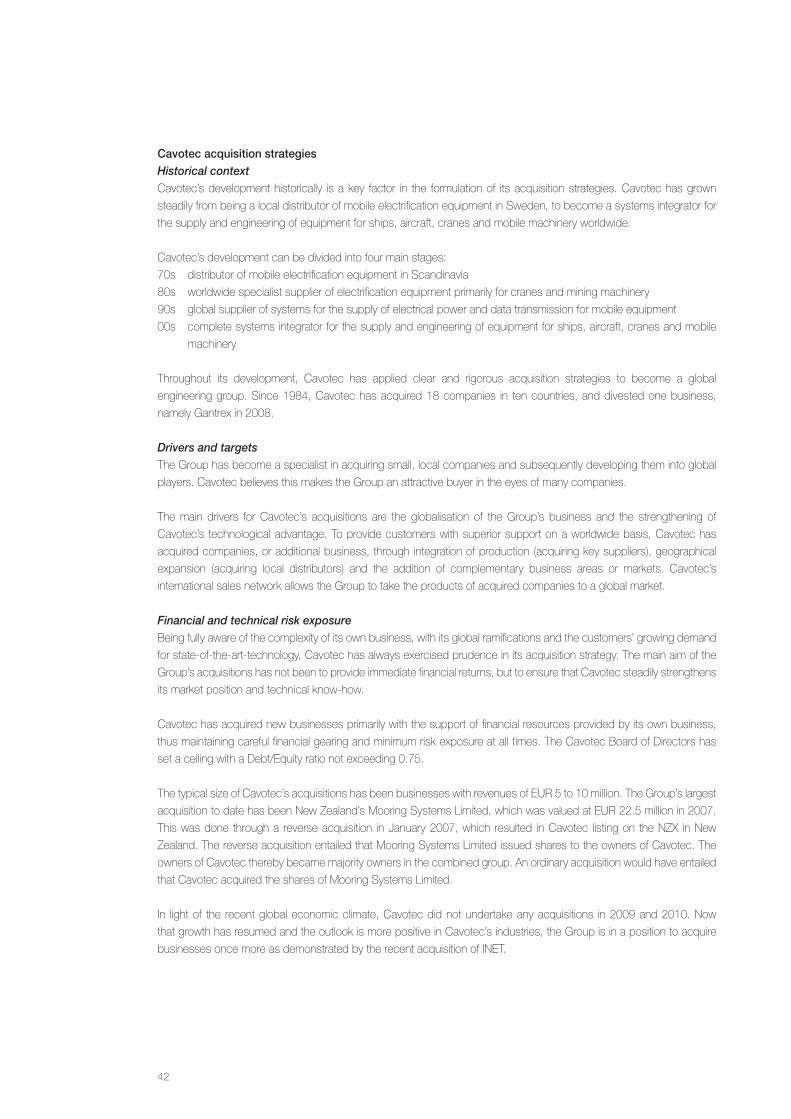
cavotec acquisition strategiesHistorical contextCavotec’s development historically is a key factor in the formulation of its acquisition strategies. Cavotec has grown
steadily from being a local distributor of mobile electrification equipment in Sweden, to become a systems integrator for
the supply and engineering of equipment for ships, aircraft, cranes and mobile machinery worldwide.
Cavotec’s development can be divided into four main stages:
70s distributor of mobile electrification equipment in Scandinavia
80s worldwide specialist supplier of electrification equipment primarily for cranes and mining machinery
90s global supplier of systems for the supply of electrical power and data transmission for mobile equipment
00s complete systems integrator for the supply and engineering of equipment for ships, aircraft, cranes and mobile
machinery
Throughout its development, Cavotec has applied clear and rigorous acquisition strategies to become a global
engineering group. Since 1984, Cavotec has acquired 18 companies in ten countries, and divested one business,
namely Gantrex in 2008.
Drivers and targetsThe Group has become a specialist in acquiring small, local companies and subsequently developing them into global
players. Cavotec believes this makes the Group an attractive buyer in the eyes of many companies.
The main drivers for Cavotec’s acquisitions are the globalisation of the Group’s business and the strengthening of
Cavotec’s technological advantage. To provide customers with superior support on a worldwide basis, Cavotec has
acquired companies, or additional business, through integration of production (acquiring key suppliers), geographical
expansion (acquiring local distributors) and the addition of complementary business areas or markets. Cavotec’s
international sales network allows the Group to take the products of acquired companies to a global market.
Financial and technical risk exposureBeing fully aware of the complexity of its own business, with its global ramifications and the customers’ growing demand
for state-of-the-art-technology, Cavotec has always exercised prudence in its acquisition strategy. The main aim of the
Group’s acquisitions has not been to provide immediate financial returns, but to ensure that Cavotec steadily strengthens
its market position and technical know-how.
Cavotec has acquired new businesses primarily with the support of financial resources provided by its own business,
thus maintaining careful financial gearing and minimum risk exposure at all times. The Cavotec Board of Directors has
set a ceiling with a Debt/Equity ratio not exceeding 0.75.
The typical size of Cavotec’s acquisitions has been businesses with revenues of EUR 5 to 10 million. The Group’s largest
acquisition to date has been New Zealand’s Mooring Systems Limited, which was valued at EUR 22.5 million in 2007.
This was done through a reverse acquisition in January 2007, which resulted in Cavotec listing on the NZX in New
Zealand. The reverse acquisition entailed that Mooring Systems Limited issued shares to the owners of Cavotec. The
owners of Cavotec thereby became majority owners in the combined group. An ordinary acquisition would have entailed
that Cavotec acquired the shares of Mooring Systems Limited.
In light of the recent global economic climate, Cavotec did not undertake any acquisitions in 2009 and 2010. Now
that growth has resumed and the outlook is more positive in Cavotec’s industries, the Group is in a position to acquire
businesses once more as demonstrated by the recent acquisition of INET.
42

Integration of newly acquired companiesCavotec has developed in the past decade an experienced and dedicated integration team consisting of officers from
accounting, IT, logistics and HR. The team is well supported by other experts involved in marketing, engineering and
production. All Cavotec companies use the same IT-systems for communication, reporting and engineering standards,
worldwide. It is therefore of vital importance that new acquisitions are timely and correctly integrated into the Group.
Based on the experience of some 18 acquisitions these integration activities have become a common part of Cavotec’s
operations.
Future targetsCavotec’s pool of possible acquisition targets has grown steadily. These are mainly small and medium-sized
companies, and tend to be niche suppliers with strong reputations in Cavotec’s business areas or related sectors.
Currently, Cavotec is aware of some 10 to 15 companies that are deemed to be a good fit for the Cavotec business
model, of which two to three are being actively pursued. These potential acquisitions are profitable companies, of
manageable size and with similar margins to Cavotec. If a major acquisition was to present itself, Cavotec would
consider various financing options, including raising new capital.
43
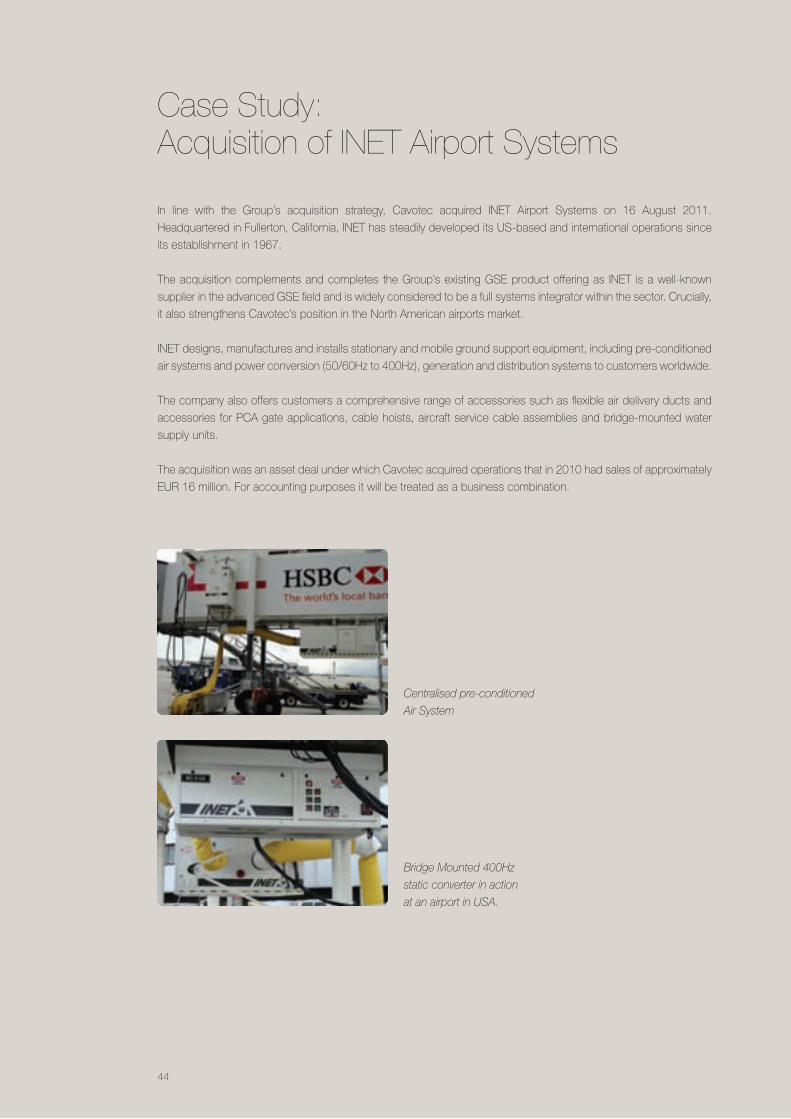
In line with the Group’s acquisition strategy, Cavotec acquired INET Airport Systems on 16 August 2011.
Headquartered in Fullerton, California, INET has steadily developed its US-based and international operations since
its establishment in 1967.
The acquisition complements and completes the Group’s existing GSE product offering as INET is a well-known
supplier in the advanced GSE field and is widely considered to be a full systems integrator within the sector. Crucially,
it also strengthens Cavotec’s position in the North American airports market.
INET designs, manufactures and installs stationary and mobile ground support equipment, including pre-conditioned
air systems and power conversion (50/60Hz to 400Hz), generation and distribution systems to customers worldwide.
The company also offers customers a comprehensive range of accessories such as flexible air delivery ducts and
accessories for PCA gate applications, cable hoists, aircraft service cable assemblies and bridge-mounted water
supply units.
The acquisition was an asset deal under which Cavotec acquired operations that in 2010 had sales of approximately
EUR 16 million. For accounting purposes it will be treated as a business combination.
Case Study: Acquisition of INET Airport Systems
Bridge Mounted 400Hz
static converter in action
at an airport in USA.
Centralised pre-conditioned
Air System
44
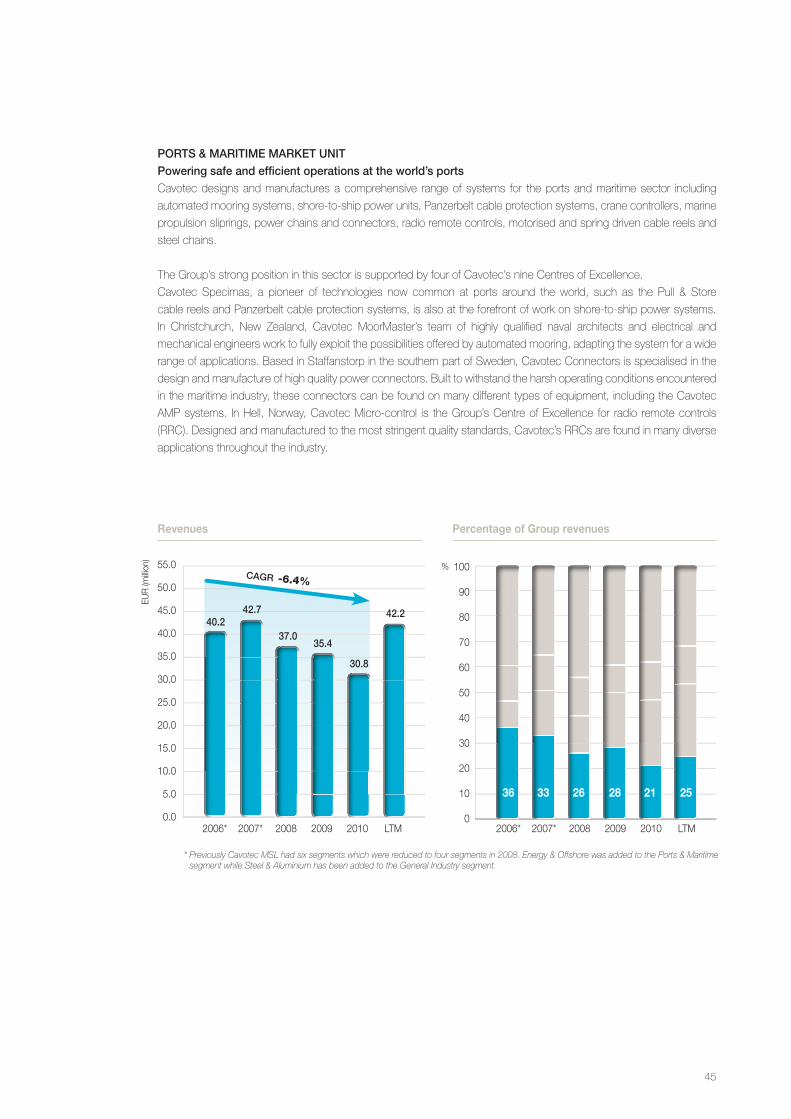
portS & marItIme market unItpowering safe and efficient operations at the world’s portsCavotec designs and manufactures a comprehensive range of systems for the ports and maritime sector including
automated mooring systems, shore-to-ship power units, Panzerbelt cable protection systems, crane controllers, marine
propulsion sliprings, power chains and connectors, radio remote controls, motorised and spring driven cable reels and
steel chains.
The Group’s strong position in this sector is supported by four of Cavotec’s nine Centres of Excellence.
Cavotec Specimas, a pioneer of technologies now common at ports around the world, such as the Pull & Store
cable reels and Panzerbelt cable protection systems, is also at the forefront of work on shore-to-ship power systems.
In Christchurch, New Zealand, Cavotec MoorMaster’s team of highly qualified naval architects and electrical and
mechanical engineers work to fully exploit the possibilities offered by automated mooring, adapting the system for a wide
range of applications. Based in Staffanstorp in the southern part of Sweden, Cavotec Connectors is specialised in the
design and manufacture of high quality power connectors. Built to withstand the harsh operating conditions encountered
in the maritime industry, these connectors can be found on many different types of equipment, including the Cavotec
AMP systems. In Hell, Norway, Cavotec Micro-control is the Group’s Centre of Excellence for radio remote controls
(RRC). Designed and manufactured to the most stringent quality standards, Cavotec’s RRCs are found in many diverse
applications throughout the industry.
Revenues Percentage of Group revenues
100
90
80
70
60
50
40
30
20
10
0
55.0
50.0
45.0
40.0
35.0
30.0
25.0
20.0
15.0
10.0
5.0
0.0
EUR
(milli
on)
%
2006* 2007* 2008 2009 2010 LTM 2006* 2007* 2008 2009 2010 LTM
40.242.7
37.035.4
30.8
42.2
cagr -6.4%
* Previously Cavotec MSL had six segments which were reduced to four segments in 2008. Energy & Offshore was added to the Ports & Maritime segment while Steel & Aluminium has been added to the General Industry segment.
21 25 28263336
45
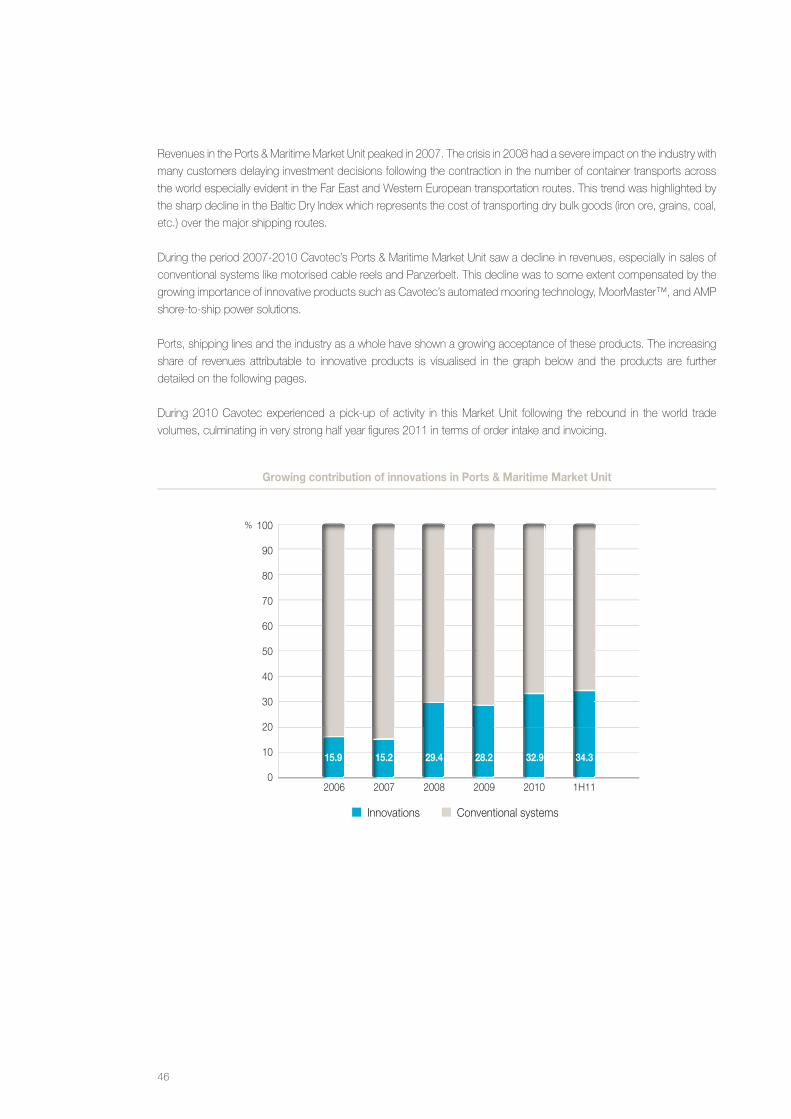
Revenues in the Ports & Maritime Market Unit peaked in 2007. The crisis in 2008 had a severe impact on the industry with
many customers delaying investment decisions following the contraction in the number of container transports across
the world especially evident in the Far East and Western European transportation routes. This trend was highlighted by
the sharp decline in the Baltic Dry Index which represents the cost of transporting dry bulk goods (iron ore, grains, coal,
etc.) over the major shipping routes.
During the period 2007-2010 Cavotec’s Ports & Maritime Market Unit saw a decline in revenues, especially in sales of
conventional systems like motorised cable reels and Panzerbelt. This decline was to some extent compensated by the
growing importance of innovative products such as Cavotec’s automated mooring technology, MoorMaster™, and AMP
shore-to-ship power solutions.
Ports, shipping lines and the industry as a whole have shown a growing acceptance of these products. The increasing
share of revenues attributable to innovative products is visualised in the graph below and the products are further
detailed on the following pages.
During 2010 Cavotec experienced a pick-up of activity in this Market Unit following the rebound in the world trade
volumes, culminating in very strong half year figures 2011 in terms of order intake and invoicing.
Growing contribution of innovations in Ports & Maritime Market Unit
100
90
80
70
60
50
40
30
20
10
0
%
2006 2007 2008 2009 2010 1H11
15.9 15.2 29.4 28.2 32.9 34.3
Innovations Conventional systems
46
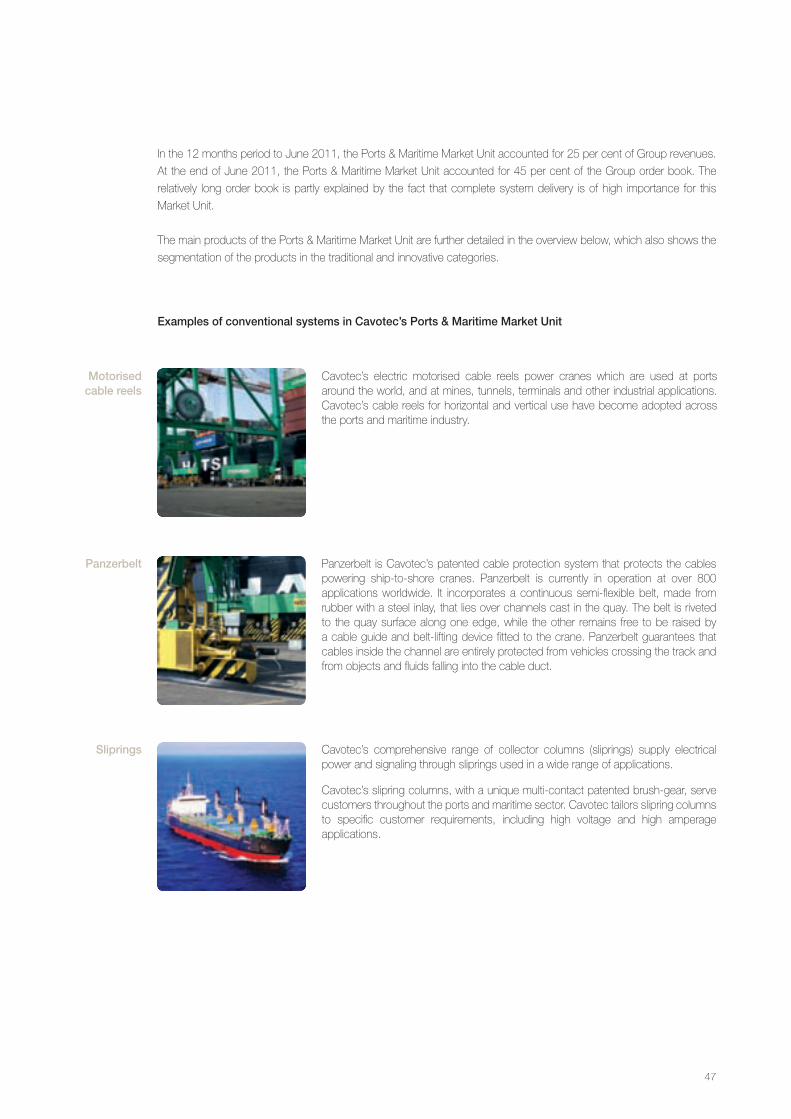
In the 12 months period to June 2011, the Ports & Maritime Market Unit accounted for 25 per cent of Group revenues.
At the end of June 2011, the Ports & Maritime Market Unit accounted for 45 per cent of the Group order book. The
relatively long order book is partly explained by the fact that complete system delivery is of high importance for this
Market Unit.
The main products of the Ports & Maritime Market Unit are further detailed in the overview below, which also shows the
segmentation of the products in the traditional and innovative categories.
examples of conventional systems in cavotec’s ports & maritime market unit
Panzerbelt is Cavotec’s patented cable protection system that protects the cables powering ship-to-shore cranes. Panzerbelt is currently in operation at over 800 applications worldwide. It incorporates a continuous semi-flexible belt, made from rubber with a steel inlay, that lies over channels cast in the quay. The belt is riveted to the quay surface along one edge, while the other remains free to be raised by a cable guide and belt-lifting device fitted to the crane. Panzerbelt guarantees that cables inside the channel are entirely protected from vehicles crossing the track and from objects and fluids falling into the cable duct.
Cavotec’s comprehensive range of collector columns (sliprings) supply electrical power and signaling through sliprings used in a wide range of applications.
Cavotec’s slipring columns, with a unique multi-contact patented brush-gear, serve customers throughout the ports and maritime sector. Cavotec tailors slipring columns to specific customer requirements, including high voltage and high amperage applications.
panzerbelt
Sliprings
Cavotec’s electric motorised cable reels power cranes which are used at ports around the world, and at mines, tunnels, terminals and other industrial applications. Cavotec’s cable reels for horizontal and vertical use have become adopted across the ports and maritime industry.
motorised cable reels
47
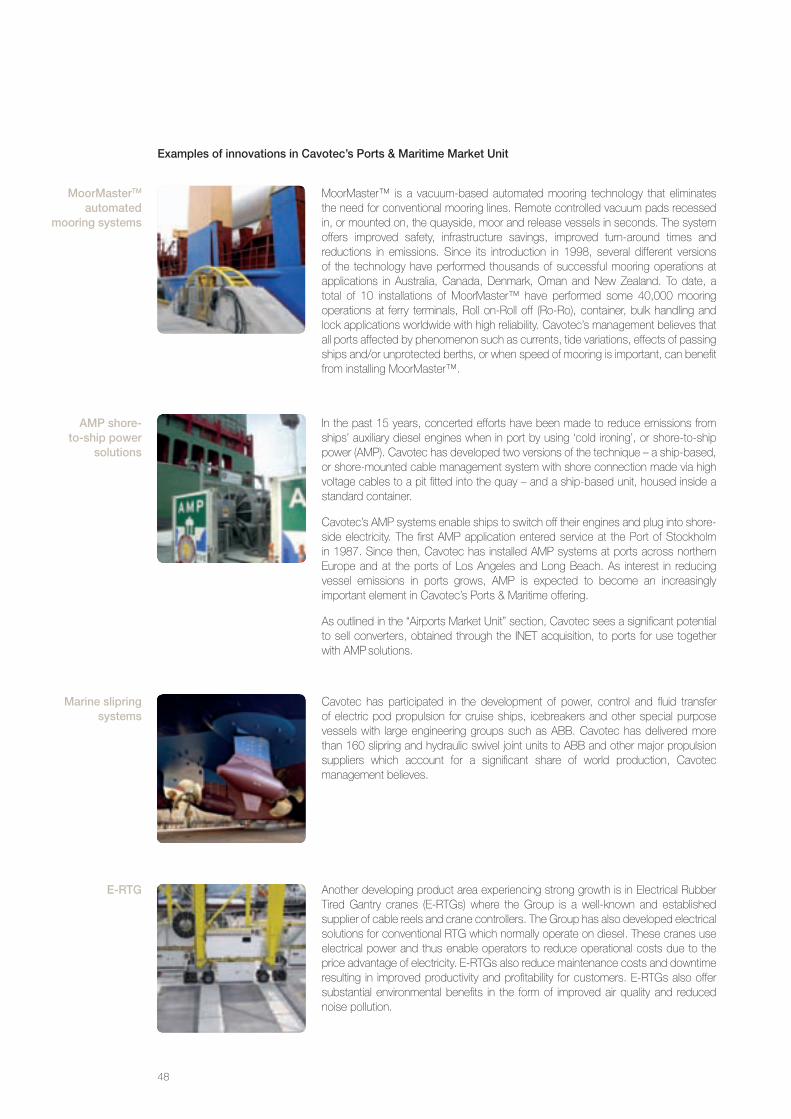
Another developing product area experiencing strong growth is in Electrical Rubber Tired Gantry cranes (E-RTGs) where the Group is a well-known and established supplier of cable reels and crane controllers. The Group has also developed electrical solutions for conventional RTG which normally operate on diesel. These cranes use electrical power and thus enable operators to reduce operational costs due to the price advantage of electricity. E-RTGs also reduce maintenance costs and downtime resulting in improved productivity and profitability for customers. E-RTGs also offer substantial environmental benefits in the form of improved air quality and reduced noise pollution.
e-rtg
In the past 15 years, concerted efforts have been made to reduce emissions from ships’ auxiliary diesel engines when in port by using ‘cold ironing’, or shore-to-ship power (AMP). Cavotec has developed two versions of the technique – a ship-based, or shore-mounted cable management system with shore connection made via high voltage cables to a pit fitted into the quay – and a ship-based unit, housed inside a standard container.
Cavotec’s AMP systems enable ships to switch off their engines and plug into shore-side electricity. The first AMP application entered service at the Port of Stockholm in 1987. Since then, Cavotec has installed AMP systems at ports across northern Europe and at the ports of Los Angeles and Long Beach. As interest in reducing vessel emissions in ports grows, AMP is expected to become an increasingly important element in Cavotec’s Ports & Maritime offering.
As outlined in the “Airports Market Unit” section, Cavotec sees a significant potential to sell converters, obtained through the INET acquisition, to ports for use together with AMP solutions.
amp shore-to-ship power
solutions
MoorMaster™ is a vacuum-based automated mooring technology that eliminates the need for conventional mooring lines. Remote controlled vacuum pads recessed in, or mounted on, the quayside, moor and release vessels in seconds. The system offers improved safety, infrastructure savings, improved turn-around times and reductions in emissions. Since its introduction in 1998, several different versions of the technology have performed thousands of successful mooring operations at applications in Australia, Canada, Denmark, Oman and New Zealand. To date, a total of 10 installations of MoorMaster™ have performed some 40,000 mooring operations at ferry terminals, Roll on-Roll off (Ro-Ro), container, bulk handling and lock applications worldwide with high reliability. Cavotec’s management believes that all ports affected by phenomenon such as currents, tide variations, effects of passing ships and/or unprotected berths, or when speed of mooring is important, can benefit from installing MoorMaster™.
moormastertm automated
mooring systems
Cavotec has participated in the development of power, control and fluid transfer of electric pod propulsion for cruise ships, icebreakers and other special purpose vessels with large engineering groups such as ABB. Cavotec has delivered more than 160 slipring and hydraulic swivel joint units to ABB and other major propulsion suppliers which account for a significant share of world production, Cavotec management believes.
marine slipring systems
examples of innovations in cavotec’s ports & maritime market unit
48
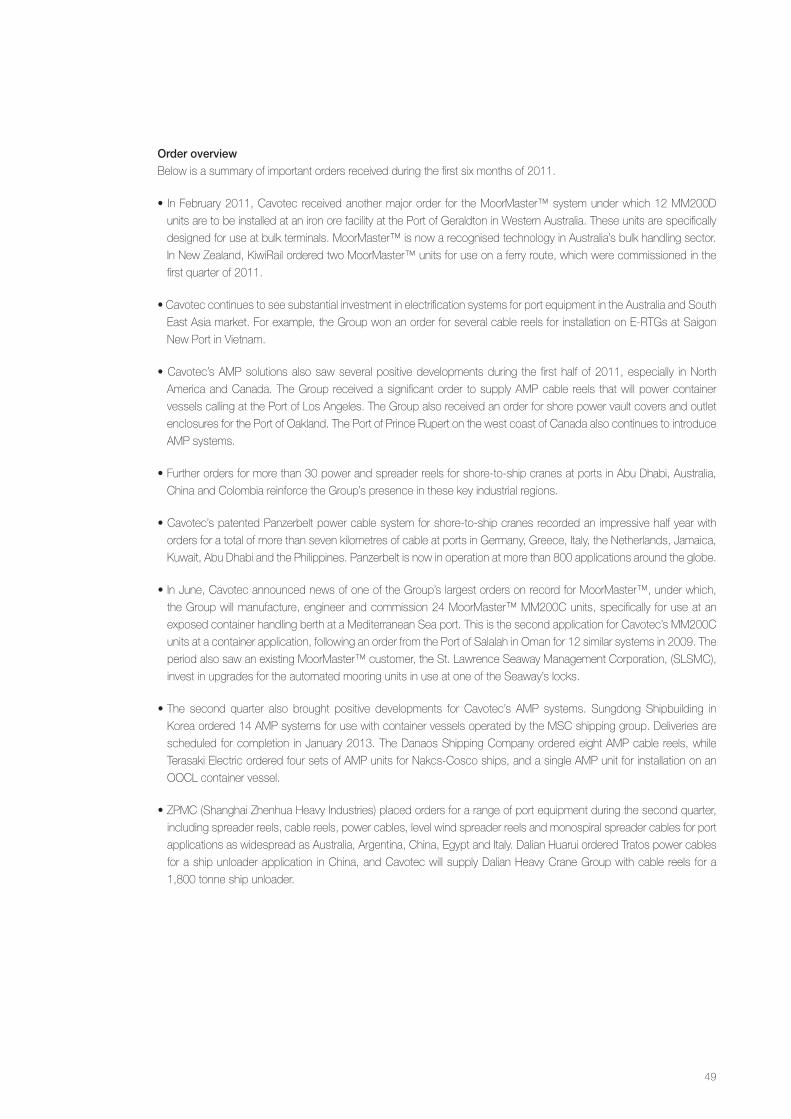
order overviewBelow is a summary of important orders received during the first six months of 2011.
• InFebruary2011,Cavotec receivedanothermajororder for theMoorMaster™systemunderwhich12MM200D
units are to be installed at an iron ore facility at the Port of Geraldton in Western Australia. These units are specifically
designed for use at bulk terminals. MoorMaster™ is now a recognised technology in Australia’s bulk handling sector.
InNewZealand,KiwiRailorderedtwoMoorMaster™unitsforuseonaferryroute,whichwerecommissionedinthe
first quarter of 2011.
•CavoteccontinuestoseesubstantialinvestmentinelectrificationsystemsforportequipmentintheAustraliaandSouth
East Asia market. For example, the Group won an order for several cable reels for installation on E-RTGs at Saigon
New Port in Vietnam.
•Cavotec’sAMPsolutionsalsosawseveralpositivedevelopmentsduring thefirsthalfof2011,especially inNorth
America and Canada. The Group received a significant order to supply AMP cable reels that will power container
vessels calling at the Port of Los Angeles. The Group also received an order for shore power vault covers and outlet
enclosures for the Port of Oakland. The Port of Prince Rupert on the west coast of Canada also continues to introduce
AMP systems.
•Furtherordersformorethan30powerandspreaderreelsforshore-to-shipcranesatportsinAbuDhabi,Australia,
China and Colombia reinforce the Group’s presence in these key industrial regions.
•Cavotec’spatentedPanzerbeltpowercablesystemforshore-to-shipcranesrecordedanimpressivehalfyearwith
orders for a total of more than seven kilometres of cable at ports in Germany, Greece, Italy, the Netherlands, Jamaica,
Kuwait,AbuDhabiandthePhilippines.Panzerbeltisnowinoperationatmorethan800applicationsaroundtheglobe.
•InJune,CavotecannouncednewsofoneoftheGroup’slargestordersonrecordforMoorMaster™,underwhich,
the Group will manufacture, engineer and commission 24 MoorMaster™ MM200C units, specifically for use at an
exposed container handling berth at a Mediterranean Sea port. This is the second application for Cavotec’s MM200C
units at a container application, following an order from the Port of Salalah in Oman for 12 similar systems in 2009. The
period also saw an existing MoorMaster™ customer, the St. Lawrence Seaway Management Corporation, (SLSMC),
invest in upgrades for the automated mooring units in use at one of the Seaway’s locks.
•The second quarter also brought positive developments for Cavotec’s AMP systems. Sungdong Shipbuilding in
Koreaordered14AMPsystemsforusewithcontainervesselsoperatedbytheMSCshippinggroup.Deliveriesare
scheduled for completion in January 2013. The Danaos Shipping Company ordered eight AMP cable reels, while
Terasaki Electric ordered four sets of AMP units for Nakcs-Cosco ships, and a single AMP unit for installation on an
OOCL container vessel.
•ZPMC(ShanghaiZhenhuaHeavyIndustries)placedordersforarangeofportequipmentduringthesecondquarter,
including spreader reels, cable reels, power cables, level wind spreader reels and monospiral spreader cables for port
applications as widespread as Australia, Argentina, China, Egypt and Italy. Dalian Huarui ordered Tratos power cables
for a ship unloader application in China, and Cavotec will supply Dalian Heavy Crane Group with cable reels for a
1,800 tonne ship unloader.
49
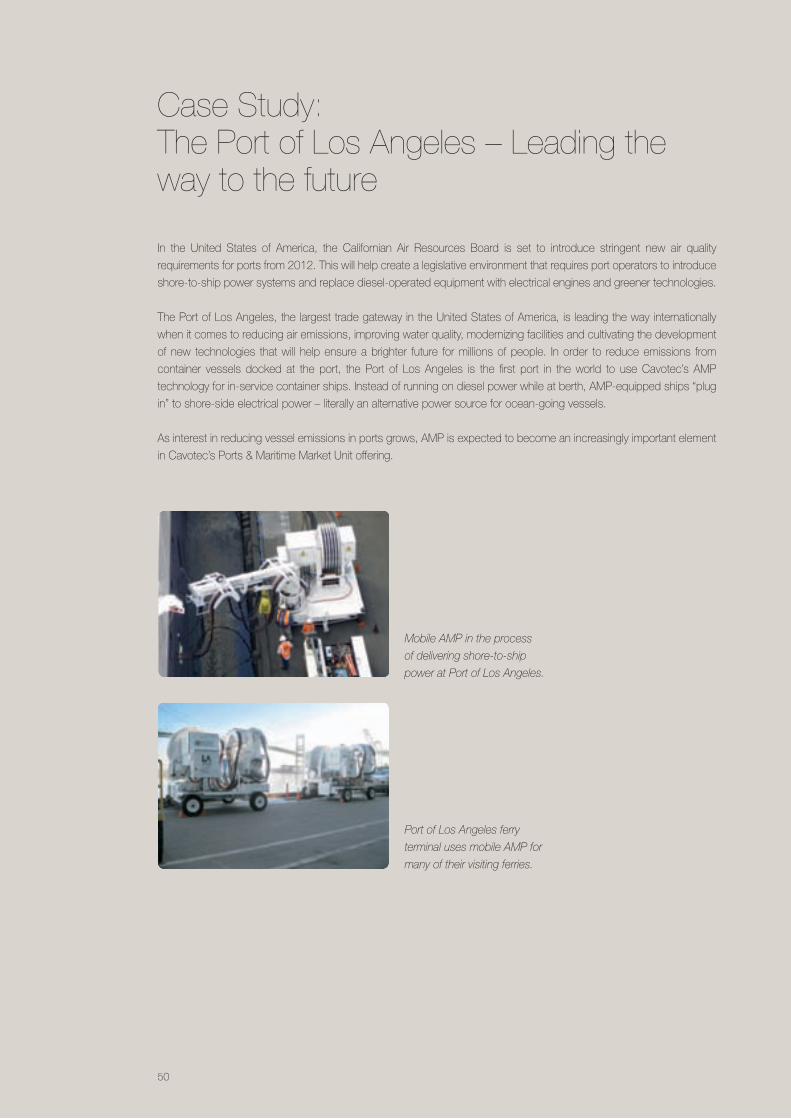
In the United States of America, the Californian Air Resources Board is set to introduce stringent new air quality
requirements for ports from 2012. This will help create a legislative environment that requires port operators to introduce
shore-to-ship power systems and replace diesel-operated equipment with electrical engines and greener technologies.
The Port of Los Angeles, the largest trade gateway in the United States of America, is leading the way internationally
when it comes to reducing air emissions, improving water quality, modernizing facilities and cultivating the development
of new technologies that will help ensure a brighter future for millions of people. In order to reduce emissions from
container vessels docked at the port, the Port of Los Angeles is the first port in the world to use Cavotec’s AMP
technology for in-service container ships. Instead of running on diesel power while at berth, AMP-equipped ships “plug
in” to shore-side electrical power – literally an alternative power source for ocean-going vessels.
As interest in reducing vessel emissions in ports grows, AMP is expected to become an increasingly important element
in Cavotec’s Ports & Maritime Market Unit offering.
Case Study: The Port of Los Angeles – Leading the way to the future
Port of Los Angeles ferry
terminal uses mobile AMP for
many of their visiting ferries.
Mobile AMP in the process
of delivering shore-to-ship
power at Port of Los Angeles.
50
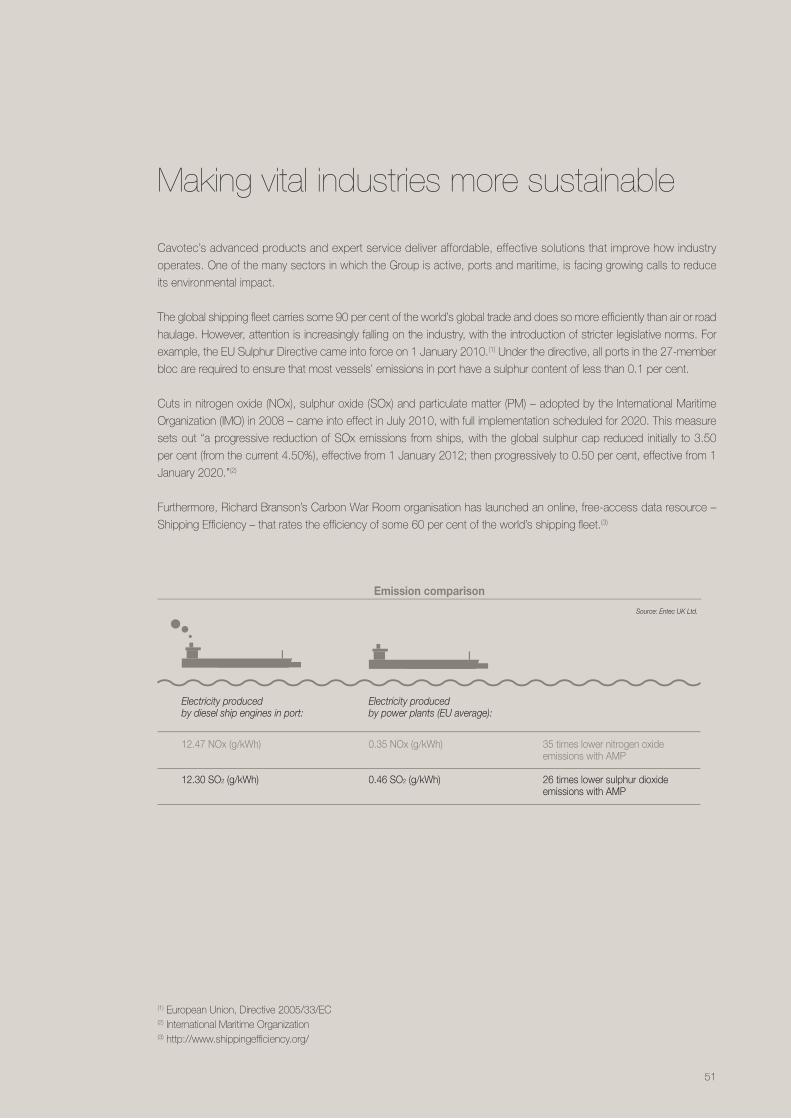
Making vital industries more sustainable
Cavotec’s advanced products and expert service deliver affordable, effective solutions that improve how industry
operates. One of the many sectors in which the Group is active, ports and maritime, is facing growing calls to reduce
its environmental impact.
The global shipping fleet carries some 90 per cent of the world’s global trade and does so more efficiently than air or road
haulage. However, attention is increasingly falling on the industry, with the introduction of stricter legislative norms. For
example, the EU Sulphur Directive came into force on 1 January 2010.(1) Under the directive, all ports in the 27-member
bloc are required to ensure that most vessels’ emissions in port have a sulphur content of less than 0.1 per cent.
Cuts in nitrogen oxide (NOx), sulphur oxide (SOx) and particulate matter (PM) – adopted by the International Maritime
Organization (IMO) in 2008 – came into effect in July 2010, with full implementation scheduled for 2020. This measure
sets out “a progressive reduction of SOx emissions from ships, with the global sulphur cap reduced initially to 3.50
percent(fromthecurrent4.50%),effectivefrom1January2012;thenprogressivelyto0.50percent,effectivefrom1
January 2020.”(2)
Furthermore, Richard Branson’s Carbon War Room organisation has launched an online, free-access data resource –
Shipping Efficiency – that rates the efficiency of some 60 per cent of the world’s shipping fleet.(3)
Electricity produced by diesel ship engines in port:
Source: Entec UK Ltd.
Electricity produced by power plants (EU average):
12.47 NOx (g/kWh)
12.30 SO2 (g/kWh)
0.35 NOx (g/kWh)
0.46 SO2 (g/kWh)
35 times lower nitrogen oxide emissions with AMP
26 times lower sulphur dioxide emissions with AMP
Emission comparison
(1) European Union, Directive 2005/33/EC(2) International Maritime Organization(3) http://www.shippingefficiency.org/
51
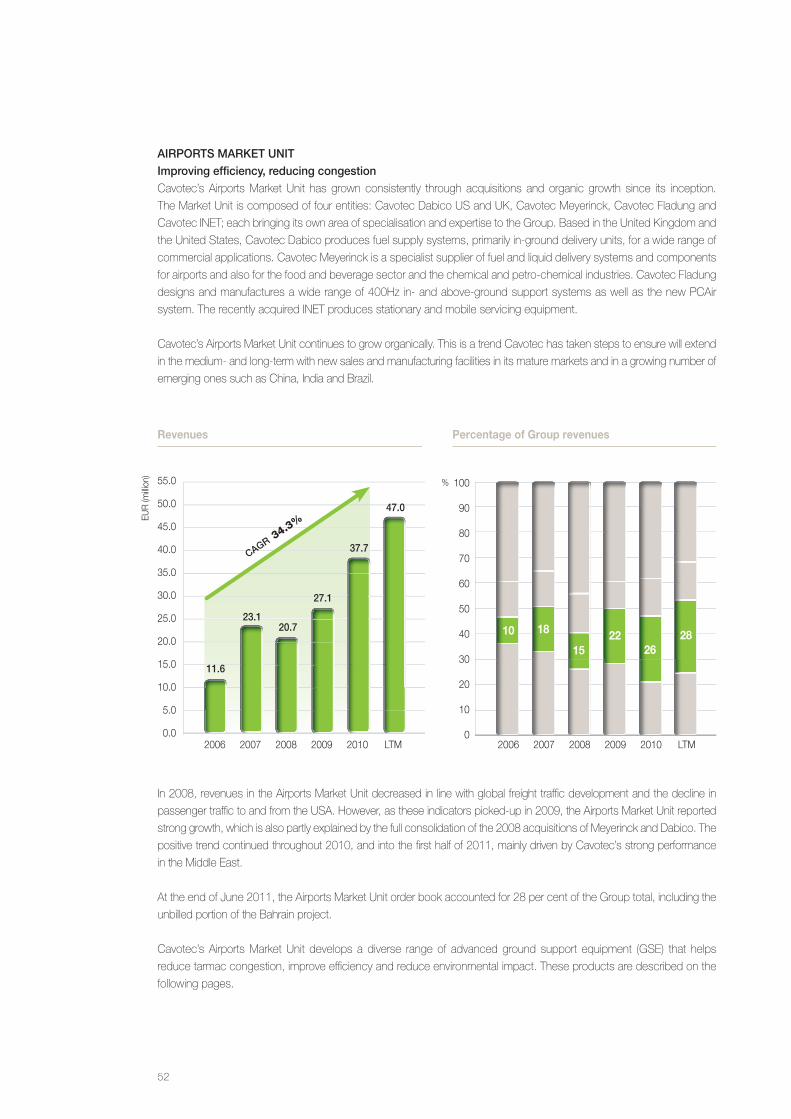
aIrportS market unItImproving efficiency, reducing congestionCavotec’s Airports Market Unit has grown consistently through acquisitions and organic growth since its inception.
TheMarketUnitiscomposedoffourentities:CavotecDabicoUSandUK,CavotecMeyerinck,CavotecFladungand
CavotecINET;eachbringingitsownareaofspecialisationandexpertisetotheGroup.BasedintheUnitedKingdomand
the United States, Cavotec Dabico produces fuel supply systems, primarily in-ground delivery units, for a wide range of
commercial applications. Cavotec Meyerinck is a specialist supplier of fuel and liquid delivery systems and components
for airports and also for the food and beverage sector and the chemical and petro-chemical industries. Cavotec Fladung
designs and manufactures a wide range of 400Hz in- and above-ground support systems as well as the new PCAir
system. The recently acquired INET produces stationary and mobile servicing equipment.
Cavotec’s Airports Market Unit continues to grow organically. This is a trend Cavotec has taken steps to ensure will extend
in the medium- and long-term with new sales and manufacturing facilities in its mature markets and in a growing number of
emerging ones such as China, India and Brazil.
In 2008, revenues in the Airports Market Unit decreased in line with global freight traffic development and the decline in
passenger traffic to and from the USA. However, as these indicators picked-up in 2009, the Airports Market Unit reported
strong growth, which is also partly explained by the full consolidation of the 2008 acquisitions of Meyerinck and Dabico. The
positive trend continued throughout 2010, and into the first half of 2011, mainly driven by Cavotec’s strong performance
in the Middle East.
At the end of June 2011, the Airports Market Unit order book accounted for 28 per cent of the Group total, including the
unbilled portion of the Bahrain project.
Cavotec’s Airports Market Unit develops a diverse range of advanced ground support equipment (GSE) that helps
reduce tarmac congestion, improve efficiency and reduce environmental impact. These products are described on the
following pages.
Revenues Percentage of Group revenues
100
90
80
70
60
50
40
30
20
10
0
55.0
50.0
45.0
40.0
35.0
30.0
25.0
20.0
15.0
10.0
5.0
0.0
EUR
(milli
on)
%
2006 2007 2008 2009 2010 LTM 2006 2007 2008 2009 2010 LTM
11.6
23.120.7
27.1
37.7
47.0
cagr 34.3
%
26 28 22
15
1810
52
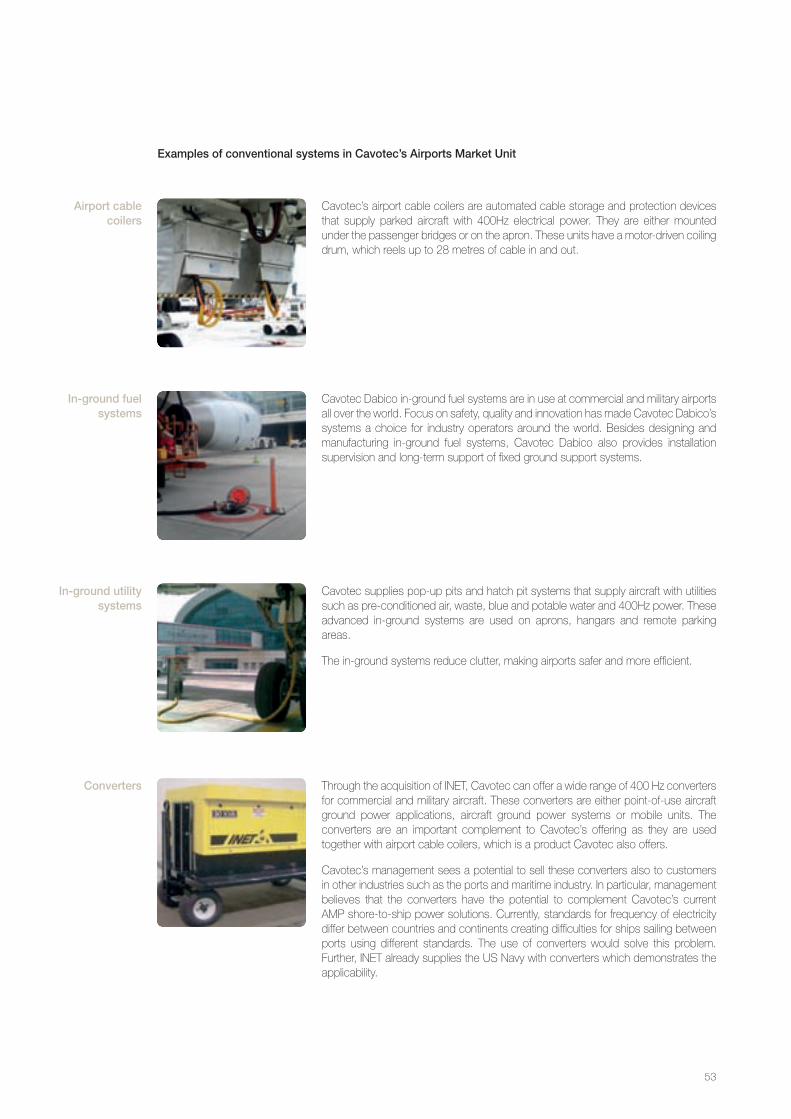
Cavotec supplies pop-up pits and hatch pit systems that supply aircraft with utilities such as pre-conditioned air, waste, blue and potable water and 400Hz power. These advanced in-ground systems are used on aprons, hangars and remote parking areas.
The in-ground systems reduce clutter, making airports safer and more efficient.
In-ground utility systems
Through the acquisition of INET, Cavotec can offer a wide range of 400 Hz converters for commercial and military aircraft. These converters are either point-of-use aircraft ground power applications, aircraft ground power systems or mobile units. The converters are an important complement to Cavotec’s offering as they are used together with airport cable coilers, which is a product Cavotec also offers.
Cavotec’s management sees a potential to sell these converters also to customers in other industries such as the ports and maritime industry. In particular, management believes that the converters have the potential to complement Cavotec’s current AMP shore-to-ship power solutions. Currently, standards for frequency of electricity differ between countries and continents creating difficulties for ships sailing between ports using different standards. The use of converters would solve this problem. Further, INET already supplies the US Navy with converters which demonstrates the applicability.
converters
Cavotec’s airport cable coilers are automated cable storage and protection devices that supply parked aircraft with 400Hz electrical power. They are either mounted under the passenger bridges or on the apron. These units have a motor-driven coiling drum, which reels up to 28 metres of cable in and out.
airport cable coilers
Cavotec Dabico in-ground fuel systems are in use at commercial and military airports all over the world. Focus on safety, quality and innovation has made Cavotec Dabico’s systems a choice for industry operators around the world. Besides designing and manufacturing in-ground fuel systems, Cavotec Dabico also provides installation supervision and long-term support of fixed ground support systems.
In-ground fuel systems
examples of conventional systems in cavotec’s airports market unit
53

The acquisition of INET strengthened and expanded Cavotec’s offering of PCA systems to the airports industry. The Cavotec INET offering includes point-of-use air conditioners, bridge, apron or hangar-mounted air handlers as well as mobile air conditioner units, all which are used mainly for commercial aircraft. Cavotec’s management believes that these PCA systems have the potential to use the same twin screw compressor/expander technology as Cavotec’s other PCAir systems.
conventional pca systems
Cavotec caddies are mobile units designed to supply aircraft with 400Hz power, water and pre-conditioned air. There are three different versions: one that is operated manually; one that is motor-driven; and one that features an integrated 400Hzfrequency converter enabling it to connect directly to 50Hz ground power.
mobile caddies
Cavotec Meyerinck fuelling arms are hose-free pantographs that eliminate the need for dispensers or tanker trucks. Cavotec’s stainless steel fuelling arms serve more than 2,000 applications around the globe. Cavotec also produces a comprehensive range of fuelling equipment such as flow meters, filters and hydrant couplers.
aviation fuelling arms
The Cavotec PCAir system is a fixed or mobile, battery-driven unit for the supply of dry pre-conditioned air. The pre-conditioned air is generated by the air cycle unit based on twin screw compressor/expander technology. It is a completely new patented concept using dry compressed air as the medium and power to supply pre-conditioned air to aircraft.
The new Cavotec PCAir system uses an improved and efficient technology, offering an environmentally friendly solution that generates sub-zero temperatures even in extreme climates.
pcair systems
examples of innovations in cavotec’s airports market unit
54
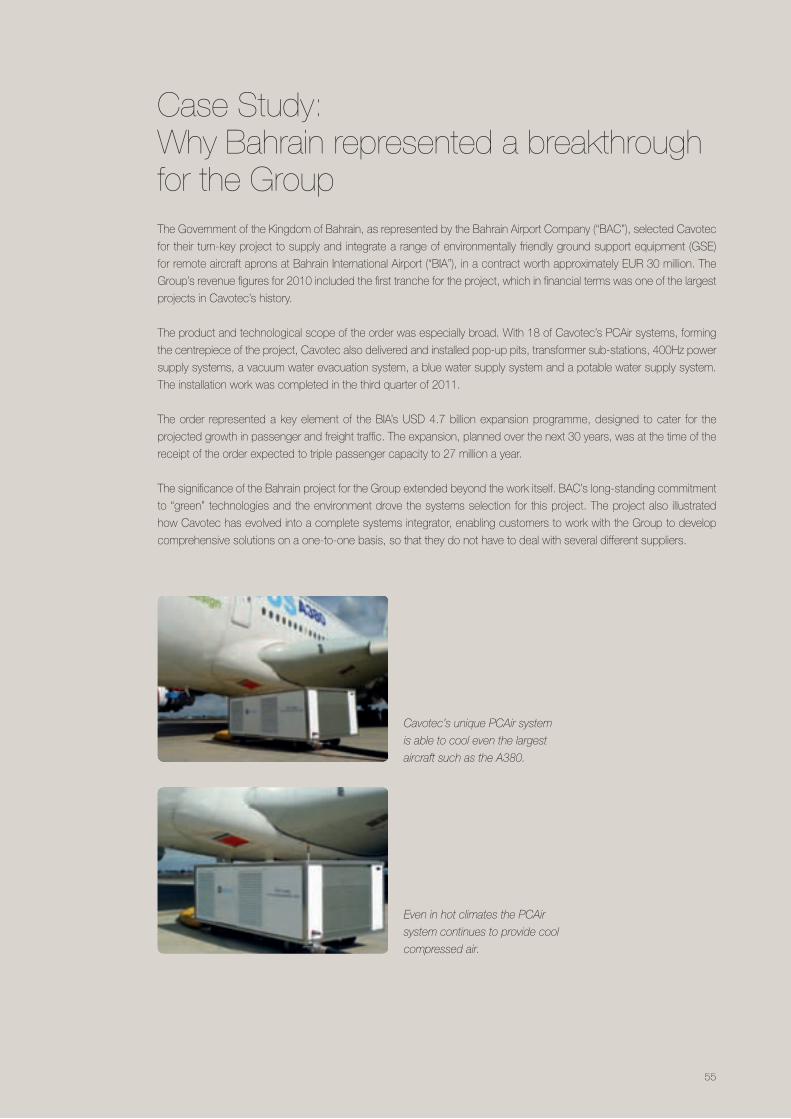
TheGovernmentoftheKingdomofBahrain,asrepresentedbytheBahrainAirportCompany(“BAC”),selectedCavotec
for their turn-key project to supply and integrate a range of environmentally friendly ground support equipment (GSE)
for remote aircraft aprons at Bahrain International Airport (“BIA”), in a contract worth approximately EUR 30 million. The
Group’s revenue figures for 2010 included the first tranche for the project, which in financial terms was one of the largest
projects in Cavotec’s history.
The product and technological scope of the order was especially broad. With 18 of Cavotec’s PCAir systems, forming
the centrepiece of the project, Cavotec also delivered and installed pop-up pits, transformer sub-stations, 400Hz power
supply systems, a vacuum water evacuation system, a blue water supply system and a potable water supply system.
The installation work was completed in the third quarter of 2011.
The order represented a key element of the BIA’s USD 4.7 billion expansion programme, designed to cater for the
projected growth in passenger and freight traffic. The expansion, planned over the next 30 years, was at the time of the
receipt of the order expected to triple passenger capacity to 27 million a year.
The significance of the Bahrain project for the Group extended beyond the work itself. BAC’s long-standing commitment
to “green” technologies and the environment drove the systems selection for this project. The project also illustrated
how Cavotec has evolved into a complete systems integrator, enabling customers to work with the Group to develop
comprehensive solutions on a one-to-one basis, so that they do not have to deal with several different suppliers.
Case Study: Why Bahrain represented a breakthrough for the Group
Even in hot climates the PCAir
system continues to provide cool
compressed air.
Cavotec’s unique PCAir system
is able to cool even the largest
aircraft such as the A380.
55
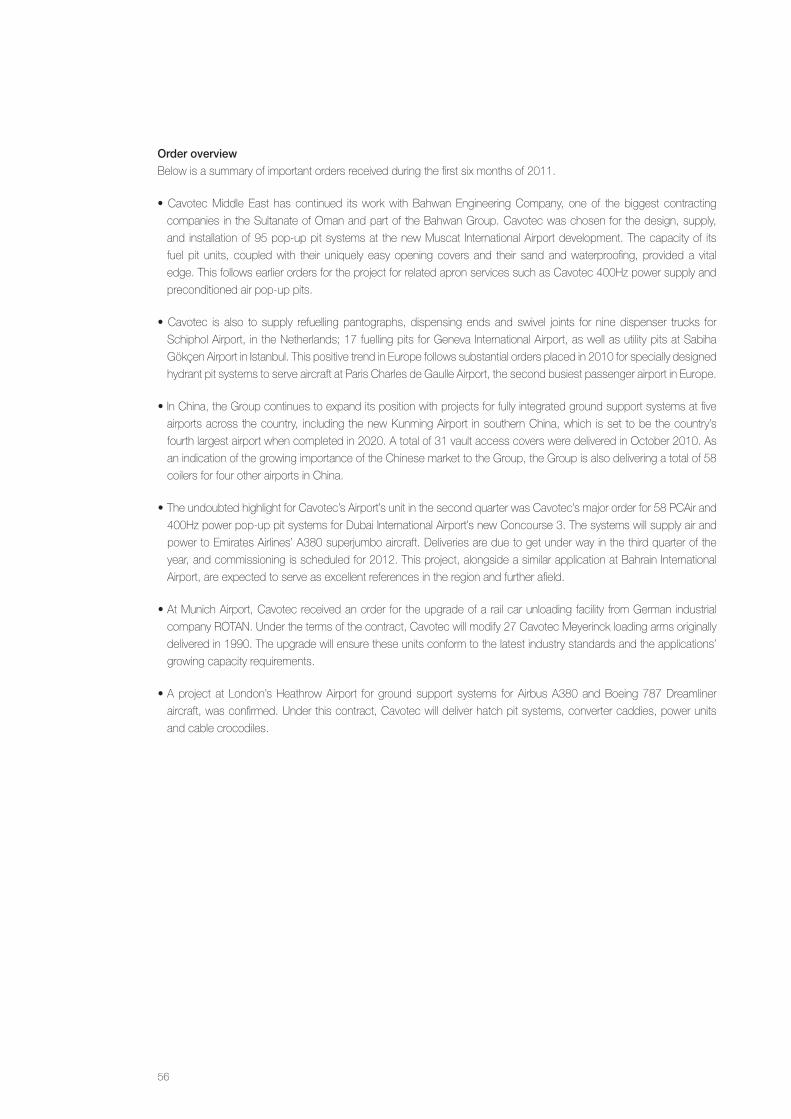
order overviewBelow is a summary of important orders received during the first six months of 2011.
•CavotecMiddleEast has continued itsworkwithBahwanEngineeringCompany, oneof thebiggest contracting
companies in the Sultanate of Oman and part of the Bahwan Group. Cavotec was chosen for the design, supply,
and installation of 95 pop-up pit systems at the new Muscat International Airport development. The capacity of its
fuel pit units, coupled with their uniquely easy opening covers and their sand and waterproofing, provided a vital
edge. This follows earlier orders for the project for related apron services such as Cavotec 400Hz power supply and
preconditioned air pop-up pits.
•Cavotec is also to supply refuellingpantographs,dispensingendsandswivel joints for ninedispenser trucks for
SchipholAirport, intheNetherlands;17fuellingpitsforGenevaInternationalAirport,aswellasutilitypitsatSabiha
Gökçen Airport in Istanbul. This positive trend in Europe follows substantial orders placed in 2010 for specially designed
hydrant pit systems to serve aircraft at Paris Charles de Gaulle Airport, the second busiest passenger airport in Europe.
•InChina,theGroupcontinuestoexpanditspositionwithprojectsforfullyintegratedgroundsupportsystemsatfive
airportsacrossthecountry, includingthenewKunmingAirport insouthernChina,which isset tobethecountry’s
fourth largest airport when completed in 2020. A total of 31 vault access covers were delivered in October 2010. As
an indication of the growing importance of the Chinese market to the Group, the Group is also delivering a total of 58
coilers for four other airports in China.
•TheundoubtedhighlightforCavotec’sAirport’sunitinthesecondquarterwasCavotec’smajororderfor58PCAirand
400Hz power pop-up pit systems for Dubai International Airport’s new Concourse 3. The systems will supply air and
power to Emirates Airlines’ A380 superjumbo aircraft. Deliveries are due to get under way in the third quarter of the
year, and commissioning is scheduled for 2012. This project, alongside a similar application at Bahrain International
Airport, are expected to serve as excellent references in the region and further afield.
•AtMunichAirport,CavotecreceivedanorderfortheupgradeofarailcarunloadingfacilityfromGermanindustrial
company ROTAN. Under the terms of the contract, Cavotec will modify 27 Cavotec Meyerinck loading arms originally
delivered in 1990. The upgrade will ensure these units conform to the latest industry standards and the applications’
growing capacity requirements.
•Aproject at London’sHeathrowAirport for groundsupport systems forAirbusA380andBoeing787Dreamliner
aircraft, was confirmed. Under this contract, Cavotec will deliver hatch pit systems, converter caddies, power units
and cable crocodiles.
56
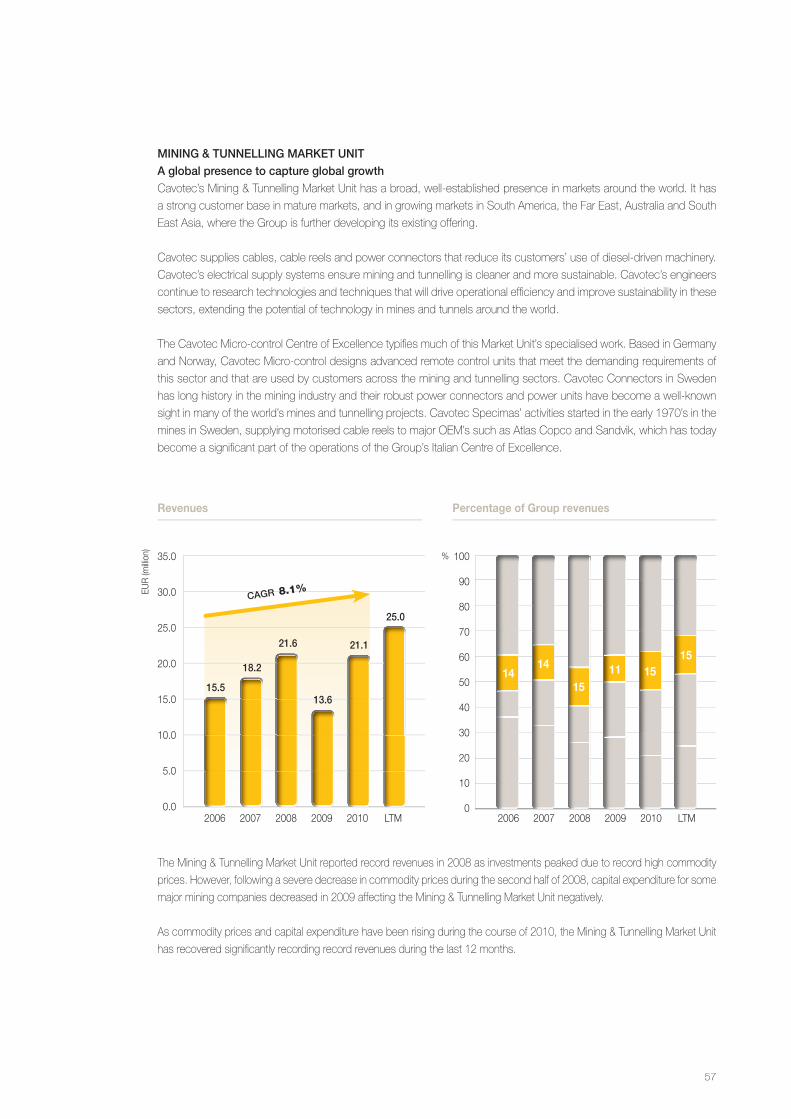
mInIng & tunnellIng market unIta global presence to capture global growthCavotec’s Mining & Tunnelling Market Unit has a broad, well-established presence in markets around the world. It has
a strong customer base in mature markets, and in growing markets in South America, the Far East, Australia and South
East Asia, where the Group is further developing its existing offering.
Cavotec supplies cables, cable reels and power connectors that reduce its customers’ use of diesel-driven machinery.
Cavotec’s electrical supply systems ensure mining and tunnelling is cleaner and more sustainable. Cavotec’s engineers
continue to research technologies and techniques that will drive operational efficiency and improve sustainability in these
sectors, extending the potential of technology in mines and tunnels around the world.
The Cavotec Micro-control Centre of Excellence typifies much of this Market Unit’s specialised work. Based in Germany
and Norway, Cavotec Micro-control designs advanced remote control units that meet the demanding requirements of
this sector and that are used by customers across the mining and tunnelling sectors. Cavotec Connectors in Sweden
has long history in the mining industry and their robust power connectors and power units have become a well-known
sight in many of the world’s mines and tunnelling projects. Cavotec Specimas’ activities started in the early 1970’s in the
mines in Sweden, supplying motorised cable reels to major OEM’s such as Atlas Copco and Sandvik, which has today
become a significant part of the operations of the Group’s Italian Centre of Excellence.
The Mining & Tunnelling Market Unit reported record revenues in 2008 as investments peaked due to record high commodity
prices. However, following a severe decrease in commodity prices during the second half of 2008, capital expenditure for some
major mining companies decreased in 2009 affecting the Mining & Tunnelling Market Unit negatively.
As commodity prices and capital expenditure have been rising during the course of 2010, the Mining & Tunnelling Market Unit
has recovered significantly recording record revenues during the last 12 months.
35.0
30.0
25.0
20.0
15.0
10.0
5.0
0.0
Revenues Percentage of Group revenues
100
90
80
70
60
50
40
30
20
10
0
EUR
(milli
on)
%
2006 2007 2008 2009 2010 LTM 2006 2007 2008 2009 2010 LTM
15.5
18.2
21.6
13.6
21.1
25.0
cagr 8.1%
15 15
1115
1414
57
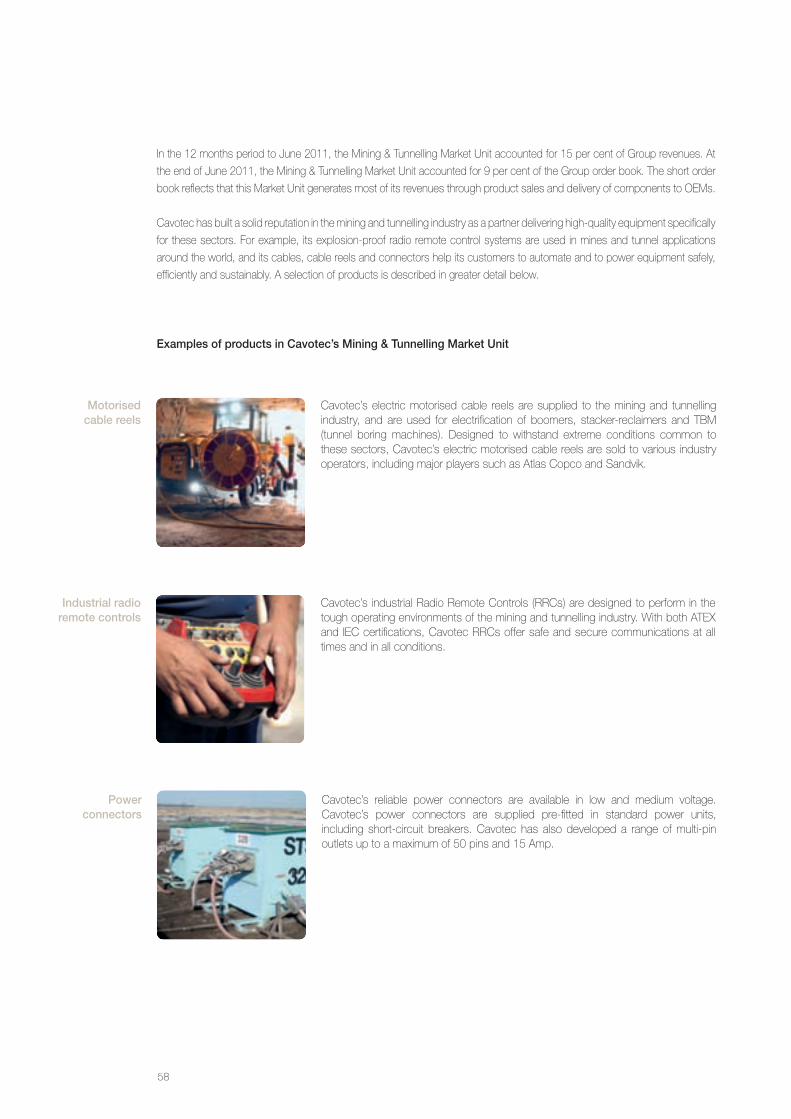
In the 12 months period to June 2011, the Mining & Tunnelling Market Unit accounted for 15 per cent of Group revenues. At
the end of June 2011, the Mining & Tunnelling Market Unit accounted for 9 per cent of the Group order book. The short order
book reflects that this Market Unit generates most of its revenues through product sales and delivery of components to OEMs.
Cavotec has built a solid reputation in the mining and tunnelling industry as a partner delivering high-quality equipment specifically
for these sectors. For example, its explosion-proof radio remote control systems are used in mines and tunnel applications
around the world, and its cables, cable reels and connectors help its customers to automate and to power equipment safely,
efficiently and sustainably. A selection of products is described in greater detail below.
examples of products in cavotec’s mining & tunnelling market unit
Cavotec’s electric motorised cable reels are supplied to the mining and tunnelling industry, and are used for electrification of boomers, stacker-reclaimers and TBM (tunnel boring machines). Designed to withstand extreme conditions common to these sectors, Cavotec’s electric motorised cable reels are sold to various industry operators, including major players such as Atlas Copco and Sandvik.
Cavotec’s industrial Radio Remote Controls (RRCs) are designed to perform in the tough operating environments of the mining and tunnelling industry. With both ATEX and IEC certifications, Cavotec RRCs offer safe and secure communications at all times and in all conditions.
Cavotec’s reliable power connectors are available in low and medium voltage. Cavotec’s power connectors are supplied pre-fitted in standard power units, including short-circuit breakers. Cavotec has also developed a range of multi-pin outlets up to a maximum of 50 pins and 15 Amp.
motorised cable reels
Industrial radio remote controls
power connectors
58
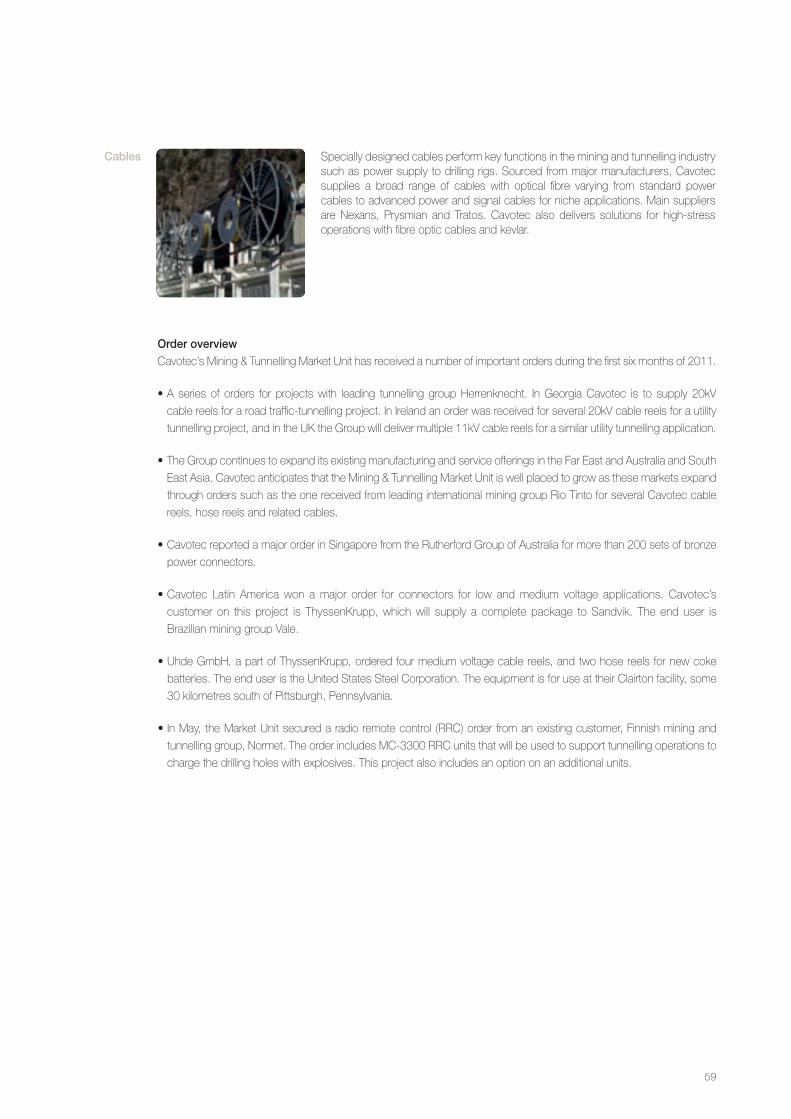
order overviewCavotec’s Mining & Tunnelling Market Unit has received a number of important orders during the first six months of 2011.
•Aseriesof orders forprojectswith leading tunnellinggroupHerrenknecht. InGeorgiaCavotec is to supply20kV
cable reels for a road traffic-tunnelling project. In Ireland an order was received for several 20kV cable reels for a utility
tunnellingproject,andintheUKtheGroupwilldelivermultiple11kVcablereelsforasimilarutilitytunnellingapplication.
•TheGroupcontinuestoexpanditsexistingmanufacturingandserviceofferingsintheFarEastandAustraliaandSouth
East Asia. Cavotec anticipates that the Mining & Tunnelling Market Unit is well placed to grow as these markets expand
through orders such as the one received from leading international mining group Rio Tinto for several Cavotec cable
reels, hose reels and related cables.
•CavotecreportedamajororderinSingaporefromtheRutherfordGroupofAustraliaformorethan200setsofbronze
power connectors.
•Cavotec Latin Americawon amajor order for connectors for low andmedium voltage applications. Cavotec’s
customer on this project is ThyssenKrupp,whichwill supply a completepackage toSandvik. Theenduser is
Brazilian mining group Vale.
•UhdeGmbH,apartofThyssenKrupp,orderedfourmediumvoltagecablereels,andtwohosereelsfornewcoke
batteries. The end user is the United States Steel Corporation. The equipment is for use at their Clairton facility, some
30 kilometres south of Pittsburgh, Pennsylvania.
•InMay,theMarketUnitsecuredaradioremotecontrol(RRC)orderfromanexistingcustomer,Finnishminingand
tunnelling group, Normet. The order includes MC-3300 RRC units that will be used to support tunnelling operations to
charge the drilling holes with explosives. This project also includes an option on an additional units.
Specially designed cables perform key functions in the mining and tunnelling industry such as power supply to drilling rigs. Sourced from major manufacturers, Cavotec supplies a broad range of cables with optical fibre varying from standard power cables to advanced power and signal cables for niche applications. Main suppliers are Nexans, Prysmian and Tratos. Cavotec also delivers solutions for high-stress operations with fibre optic cables and kevlar.
cables
59
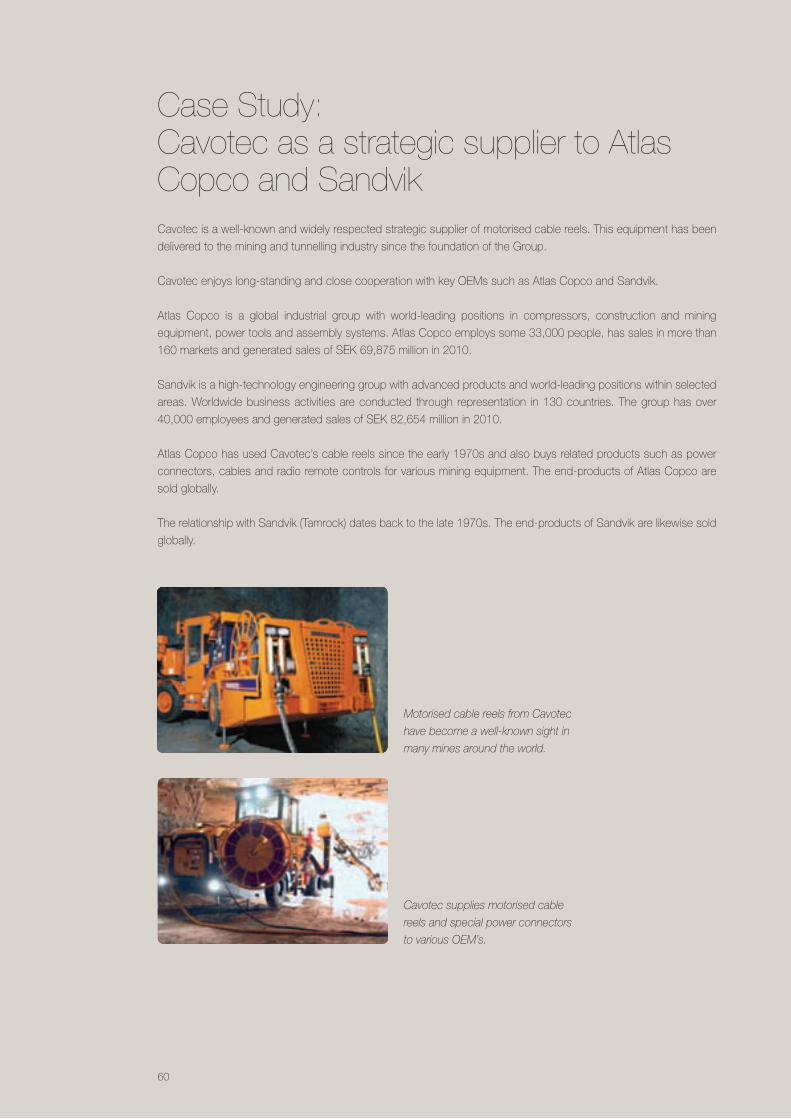
Cavotec is a well-known and widely respected strategic supplier of motorised cable reels. This equipment has been
delivered to the mining and tunnelling industry since the foundation of the Group.
Cavotec enjoys long-standing and close cooperation with key OEMs such as Atlas Copco and Sandvik.
Atlas Copco is a global industrial group with world-leading positions in compressors, construction and mining
equipment, power tools and assembly systems. Atlas Copco employs some 33,000 people, has sales in more than
160marketsandgeneratedsalesofSEK69,875millionin2010.
Sandvik is a high-technology engineering group with advanced products and world-leading positions within selected
areas. Worldwide business activities are conducted through representation in 130 countries. The group has over
40,000employeesandgeneratedsalesofSEK82,654millionin2010.
Atlas Copco has used Cavotec’s cable reels since the early 1970s and also buys related products such as power
connectors, cables and radio remote controls for various mining equipment. The end-products of Atlas Copco are
sold globally.
The relationship with Sandvik (Tamrock) dates back to the late 1970s. The end-products of Sandvik are likewise sold
globally.
Case Study: Cavotec as a strategic supplier to Atlas Copco and Sandvik
Cavotec supplies motorised cable
reels and special power connectors
to various OEM’s.
Motorised cable reels from Cavotec
have become a well-known sight in
many mines around the world.
60
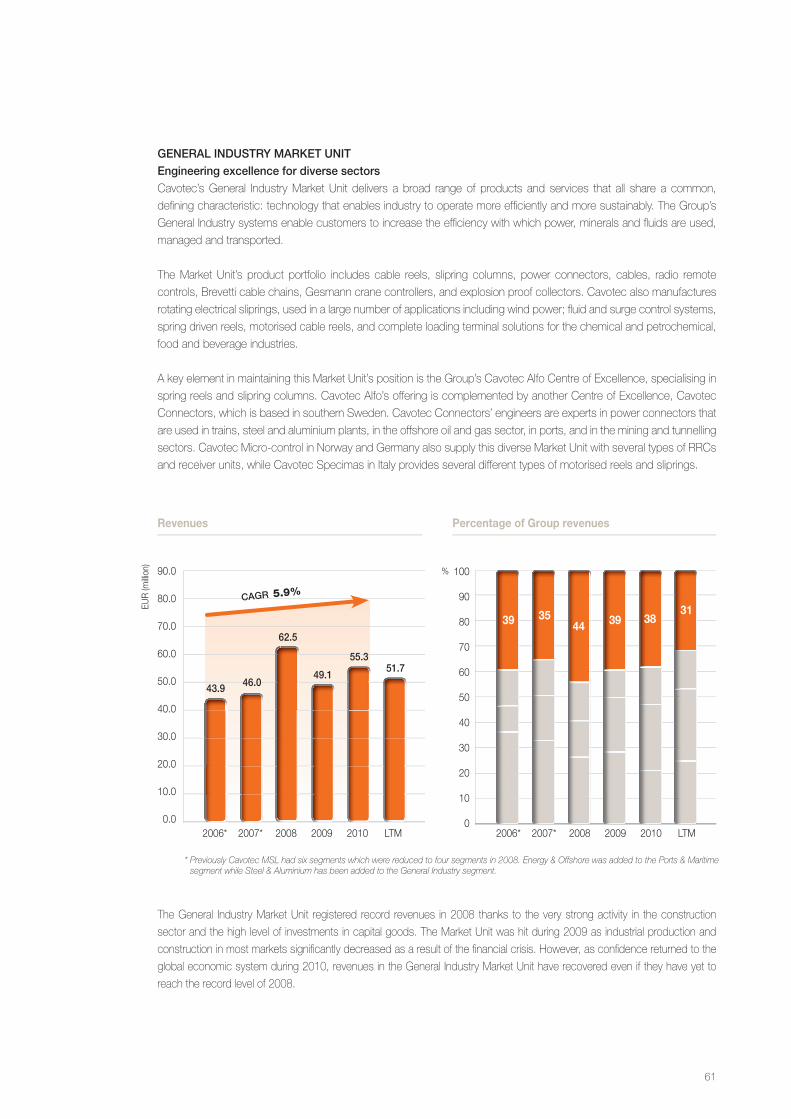
general InduStry market unItengineering excellence for diverse sectorsCavotec’s General Industry Market Unit delivers a broad range of products and services that all share a common,
defining characteristic: technology that enables industry to operate more efficiently and more sustainably. The Group’s
General Industry systems enable customers to increase the efficiency with which power, minerals and fluids are used,
managed and transported.
The Market Unit’s product portfolio includes cable reels, slipring columns, power connectors, cables, radio remote
controls, Brevetti cable chains, Gesmann crane controllers, and explosion proof collectors. Cavotec also manufactures
rotatingelectricalsliprings,usedinalargenumberofapplicationsincludingwindpower;fluidandsurgecontrolsystems,
spring driven reels, motorised cable reels, and complete loading terminal solutions for the chemical and petrochemical,
food and beverage industries.
A key element in maintaining this Market Unit’s position is the Group’s Cavotec Alfo Centre of Excellence, specialising in
spring reels and slipring columns. Cavotec Alfo’s offering is complemented by another Centre of Excellence, Cavotec
Connectors, which is based in southern Sweden. Cavotec Connectors’ engineers are experts in power connectors that
are used in trains, steel and aluminium plants, in the offshore oil and gas sector, in ports, and in the mining and tunnelling
sectors. Cavotec Micro-control in Norway and Germany also supply this diverse Market Unit with several types of RRCs
and receiver units, while Cavotec Specimas in Italy provides several different types of motorised reels and sliprings.
The General Industry Market Unit registered record revenues in 2008 thanks to the very strong activity in the construction
sector and the high level of investments in capital goods. The Market Unit was hit during 2009 as industrial production and
construction in most markets significantly decreased as a result of the financial crisis. However, as confidence returned to the
global economic system during 2010, revenues in the General Industry Market Unit have recovered even if they have yet to
reach the record level of 2008.
Revenues Percentage of Group revenues
100
90
80
70
60
50
40
30
20
10
0
90.0
80.0
70.0
60.0
50.0
40.0
30.0
20.0
10.0
0.0
EUR
(milli
on)
%
43.9 46.0
62.5
49.1
55.3
* Previously Cavotec MSL had six segments which were reduced to four segments in 2008. Energy & Offshore was added to the Ports & Maritime segment while Steel & Aluminium has been added to the General Industry segment.
2006* 2007* 2008 2009 2010 LTM
51.7
cagr 5.9%
2006* 2007* 2008 2009 2010 LTM
3831
39443539
61
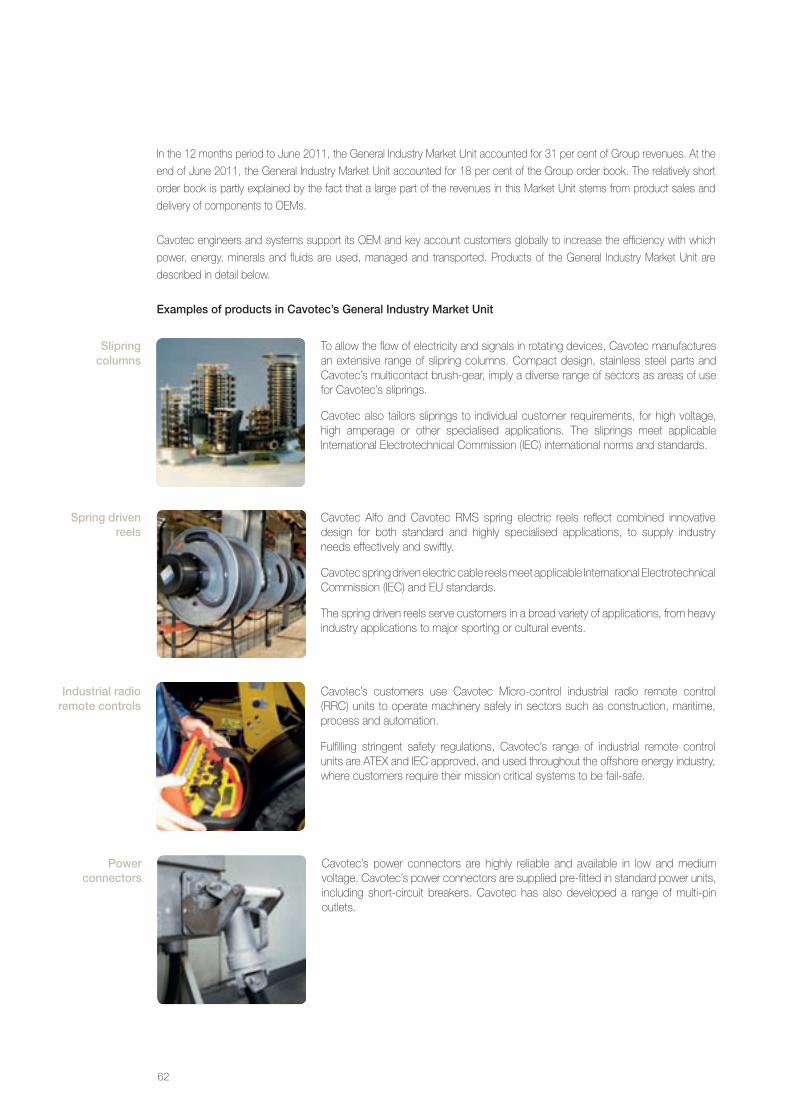
In the 12 months period to June 2011, the General Industry Market Unit accounted for 31 per cent of Group revenues. At the
end of June 2011, the General Industry Market Unit accounted for 18 per cent of the Group order book. The relatively short
order book is partly explained by the fact that a large part of the revenues in this Market Unit stems from product sales and
delivery of components to OEMs.
Cavotec engineers and systems support its OEM and key account customers globally to increase the efficiency with which
power, energy, minerals and fluids are used, managed and transported. Products of the General Industry Market Unit are
described in detail below.
examples of products in cavotec’s general Industry market unit
Cavotec Alfo and Cavotec RMS spring electric reels reflect combined innovative design for both standard and highly specialised applications, to supply industry needs effectively and swiftly.
Cavotec spring driven electric cable reels meet applicable International Electrotechnical Commission (IEC) and EU standards.
The spring driven reels serve customers in a broad variety of applications, from heavy industry applications to major sporting or cultural events.
To allow the flow of electricity and signals in rotating devices, Cavotec manufactures an extensive range of slipring columns. Compact design, stainless steel parts and Cavotec’s multicontact brush-gear, imply a diverse range of sectors as areas of use for Cavotec’s sliprings.
Cavotec also tailors sliprings to individual customer requirements, for high voltage, high amperage or other specialised applications. The sliprings meet applicable International Electrotechnical Commission (IEC) international norms and standards.
Slipring columns
Spring driven reels
Cavotec’s customers use Cavotec Micro-control industrial radio remote control (RRC) units to operate machinery safely in sectors such as construction, maritime, process and automation.
Fulfilling stringent safety regulations, Cavotec’s range of industrial remote control units are ATEX and IEC approved, and used throughout the offshore energy industry, where customers require their mission critical systems to be fail-safe.
Industrial radio remote controls
Cavotec’s power connectors are highly reliable and available in low and medium voltage. Cavotec’s power connectors are supplied pre-fitted in standard power units, including short-circuit breakers. Cavotec has also developed a range of multi-pin outlets.
power connectors
62
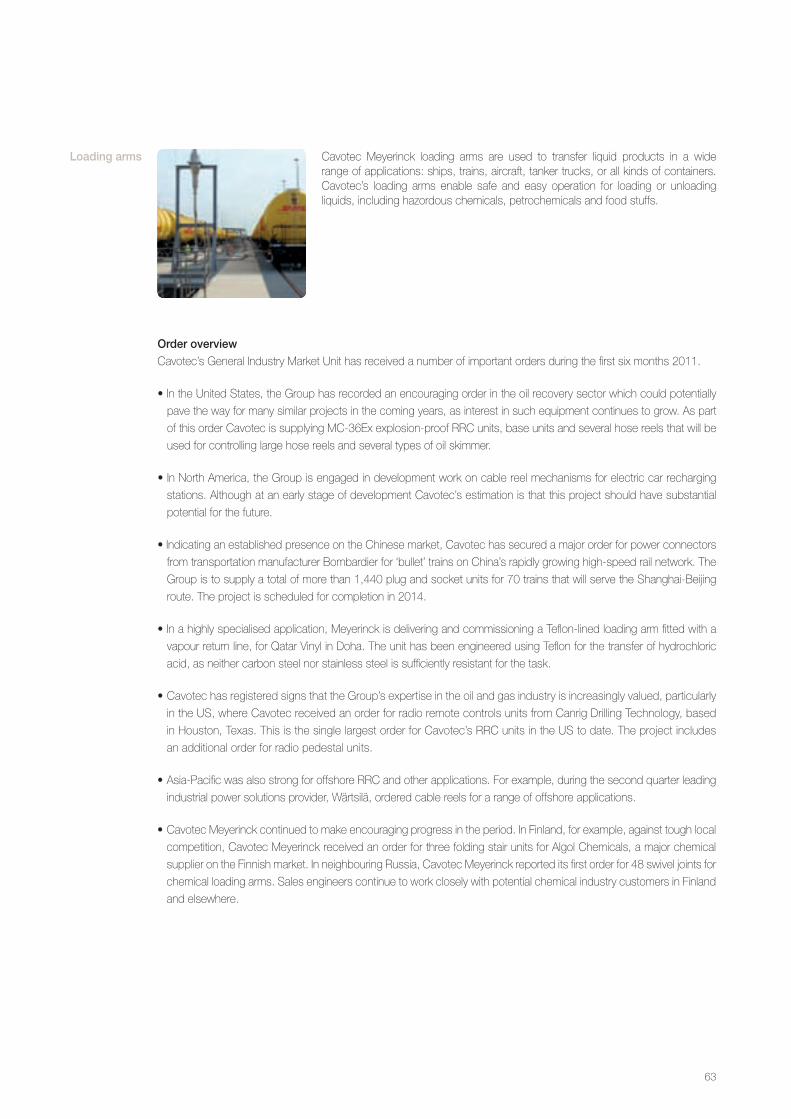
order overviewCavotec’s General Industry Market Unit has received a number of important orders during the first six months 2011.
•IntheUnitedStates,theGrouphasrecordedanencouragingorderintheoilrecoverysectorwhichcouldpotentially
pave the way for many similar projects in the coming years, as interest in such equipment continues to grow. As part
of this order Cavotec is supplying MC-36Ex explosion-proof RRC units, base units and several hose reels that will be
used for controlling large hose reels and several types of oil skimmer.
•InNorthAmerica,theGroupisengagedindevelopmentworkoncablereelmechanismsforelectriccarrecharging
stations. Although at an early stage of development Cavotec’s estimation is that this project should have substantial
potential for the future.
•IndicatinganestablishedpresenceontheChinesemarket,Cavotechassecuredamajororderforpowerconnectors
from transportation manufacturer Bombardier for ‘bullet’ trains on China’s rapidly growing high-speed rail network. The
Group is to supply a total of more than 1,440 plug and socket units for 70 trains that will serve the Shanghai-Beijing
route. The project is scheduled for completion in 2014.
•Inahighlyspecialisedapplication,MeyerinckisdeliveringandcommissioningaTeflon-linedloadingarmfittedwitha
vapour return line, for Qatar Vinyl in Doha. The unit has been engineered using Teflon for the transfer of hydrochloric
acid, as neither carbon steel nor stainless steel is sufficiently resistant for the task.
•CavotechasregisteredsignsthattheGroup’sexpertiseintheoilandgasindustryisincreasinglyvalued,particularly
in the US, where Cavotec received an order for radio remote controls units from Canrig Drilling Technology, based
in Houston, Texas. This is the single largest order for Cavotec’s RRC units in the US to date. The project includes
an additional order for radio pedestal units.
•Asia-PacificwasalsostrongforoffshoreRRCandotherapplications.Forexample,duringthesecondquarterleading
industrial power solutions provider, Wärtsilä, ordered cable reels for a range of offshore applications.
•CavotecMeyerinckcontinuedtomakeencouragingprogressintheperiod.InFinland,forexample,againsttoughlocal
competition, Cavotec Meyerinck received an order for three folding stair units for Algol Chemicals, a major chemical
supplier on the Finnish market. In neighbouring Russia, Cavotec Meyerinck reported its first order for 48 swivel joints for
chemical loading arms. Sales engineers continue to work closely with potential chemical industry customers in Finland
and elsewhere.
Cavotec Meyerinck loading arms are used to transfer liquid products in a wide range of applications: ships, trains, aircraft, tanker trucks, or all kinds of containers. Cavotec’s loading arms enable safe and easy operation for loading or unloading liquids, including hazordous chemicals, petrochemicals and food stuffs.
loading arms
63
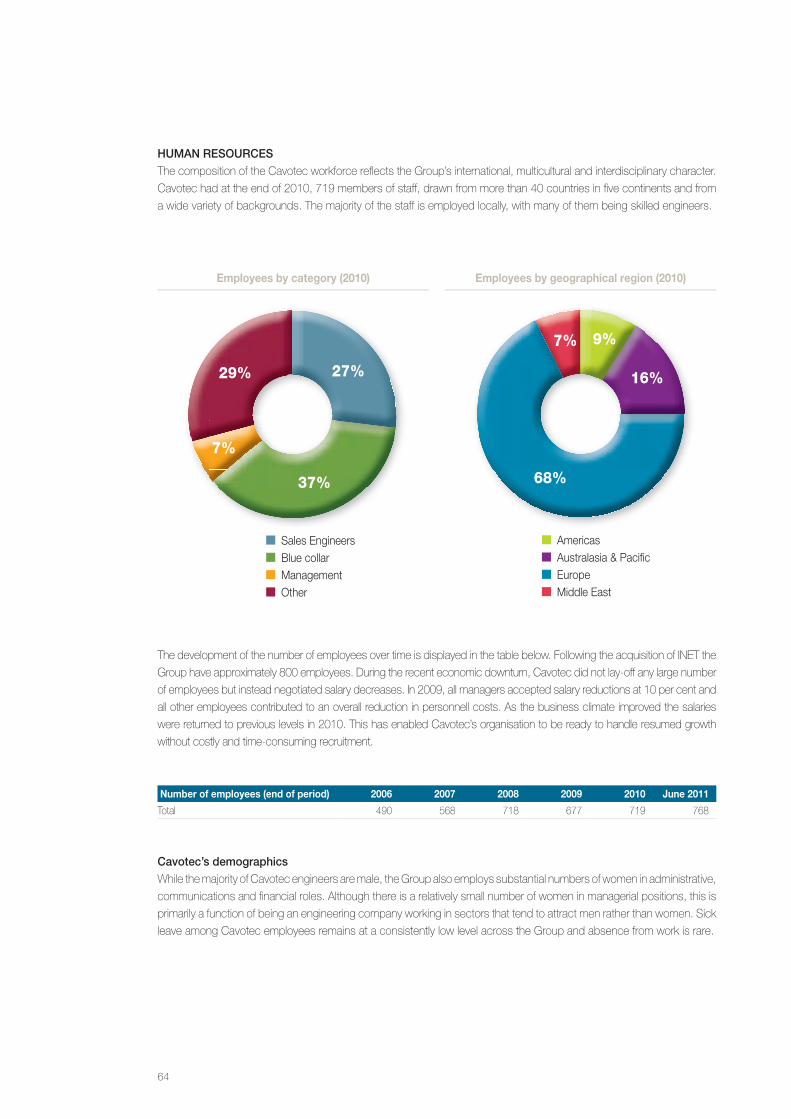
human reSourceSThe composition of the Cavotec workforce reflects the Group’s international, multicultural and interdisciplinary character.
Cavotec had at the end of 2010, 719 members of staff, drawn from more than 40 countries in five continents and from
a wide variety of backgrounds. The majority of the staff is employed locally, with many of them being skilled engineers.
The development of the number of employees over time is displayed in the table below. Following the acquisition of INET the
Group have approximately 800 employees. During the recent economic downturn, Cavotec did not lay-off any large number
of employees but instead negotiated salary decreases. In 2009, all managers accepted salary reductions at 10 per cent and
all other employees contributed to an overall reduction in personnell costs. As the business climate improved the salaries
were returned to previous levels in 2010. This has enabled Cavotec’s organisation to be ready to handle resumed growth
without costly and time-consuming recruitment.
Number of employees (end of period) 2006 2007 2008 2009 2010 June 2011
Total 490 568 718 677 719 768
cavotec’s demographicsWhile the majority of Cavotec engineers are male, the Group also employs substantial numbers of women in administrative,
communications and financial roles. Although there is a relatively small number of women in managerial positions, this is
primarily a function of being an engineering company working in sectors that tend to attract men rather than women. Sick
leave among Cavotec employees remains at a consistently low level across the Group and absence from work is rare.
Sales Engineers Blue collar Management Other
Employees by category (2010) Employees by geographical region (2010)
Americas Australasia & Pacific Europe Middle East
27%
37%
7%
29%
68%
16%
9%7%
64
mutual respect in an international teamAs a relatively small organisation spread across the world it is important for Cavotec to have a common and strong
company culture to align the goals of Cavotec and all the employees in different countries, and to create one Cavotec.
Each Cavotec employee brings to the Group a diverse range of skill sets and individual characteristics that are valued
and recognised by fellow colleagues as well as partners and customers. Cavotec is a flat organisation, where all are
respected and encouraged to contribute to its success.
In order to attract and retain highly skilled and talented people throughout the organisation, Cavotec offers a positive
and rewarding work environment for its employees. Cavotec is flexible and dynamic, yet never abandons responsibilities
and commitments. An open working environment, that fosters free exchange of ideas and mutual respect between
individuals, underpins Cavotec as a global engineering group.
local presenceIn most cases the staff is employed locally. This enables Cavotec to build long-term relationships with customers,
suppliers, authorities and professional bodies.
The local strength enables Cavotec to work closely with its customers, gain better understanding of their requirements
and solve challenges they face more effectively. For its partners and suppliers, the local presence and familiarity with
localmarketsmakeCavotecavaluableand intrinsicallycompetentbusinesspartner.Knowledgeof local realitieson
global issues makes the Group relevant for formulating regulatory norms and technical standards.
As Cavotec is a multinational group it is important for Cavotec’s employees to work with exemplary ethical standards and
an open mind. To ensure their conduct is of the highest calibre at all times, Cavotec employees are issued with a Code
of Conduct that provides detailed guidelines on ethical standards and cultural differences.
organISatIon and controlTheCEOtogetherwiththeChiefFinancialOfficerformstheGroupKeyManagement.
Cavotec is organised according to territory with seven Regional Managers reporting to the CEO. All Regional Managers
are responsible for the operating result and net profit in their region and are supported by the Managing Directors of the
legal entities operating in the relevant region.
Market Unit Managers are responsible for co-ordinating activities in the four Market Units across the Group and the
different regions. However, this is only a co-ordinating role as the decision making responsibility rests with the CEO and
the Regional Managers.
The Group also has a number of corporate functions including Finance & Accounting, Administration, Information
Technology, Investor Relations & PR, Strategic Corporate Projects, Sales & Marketing, Technical R&D, Patents &
Trademarks, Business Development and Treasury. The Group also has an independent Internal Audit function reporting
directly to the Chairman of the Company.
In addition, the CEO is supported by the Executive Management Committee.
For additional information, including information on the function of the Executive Management Committee, please refer
to the sections “Corporate governance” and “Board of Directors, management and auditors”
65
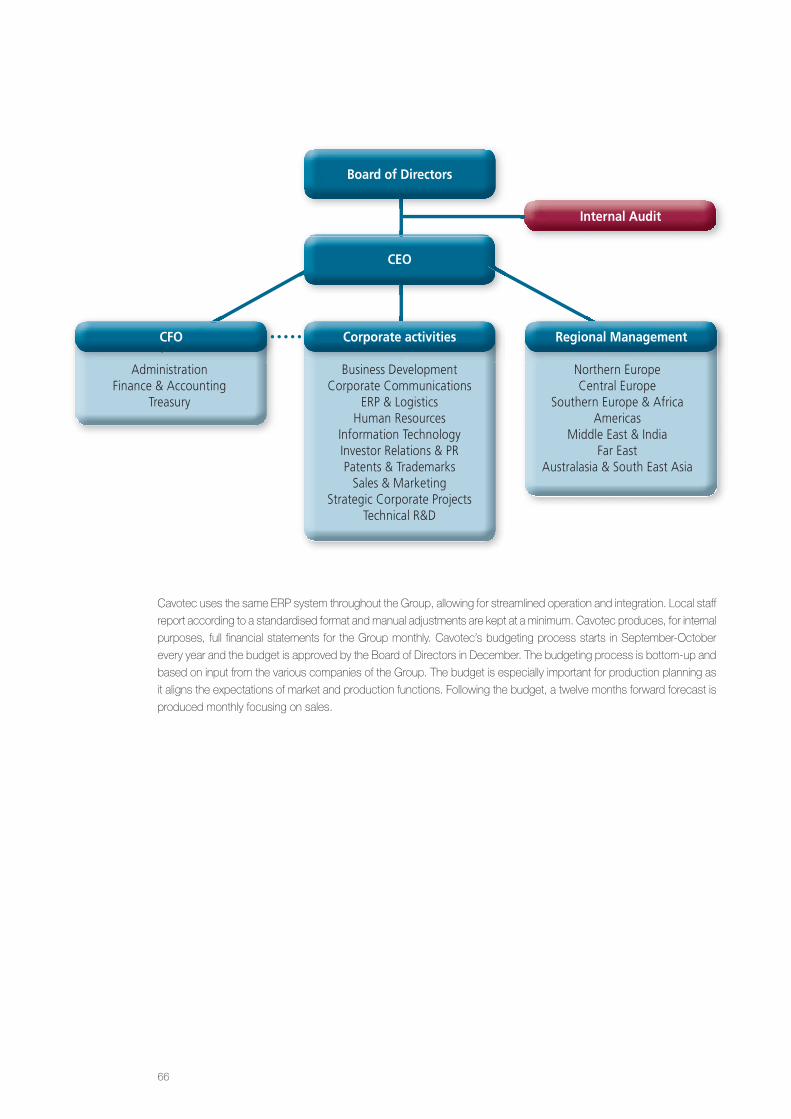
Cavotec uses the same ERP system throughout the Group, allowing for streamlined operation and integration. Local staff
report according to a standardised format and manual adjustments are kept at a minimum. Cavotec produces, for internal
purposes, full financial statements for the Group monthly. Cavotec’s budgeting process starts in September-October
every year and the budget is approved by the Board of Directors in December. The budgeting process is bottom-up and
based on input from the various companies of the Group. The budget is especially important for production planning as
it aligns the expectations of market and production functions. Following the budget, a twelve months forward forecast is
produced monthly focusing on sales.
Board of Directors
CEO
Corporate activities Regional ManagementCFO
Northern EuropeCentral Europe
Southern Europe & AfricaAmericas
Middle East & IndiaFar East
Australasia & South East Asia
Business DevelopmentCorporate Communications
ERP & LogisticsHuman Resources
Information TechnologyInvestor Relations & PRPatents & Trademarks
Sales & MarketingStrategic Corporate Projects
Technical R&D
AdministrationFinance & Accounting
Treasury
Internal Audit
66
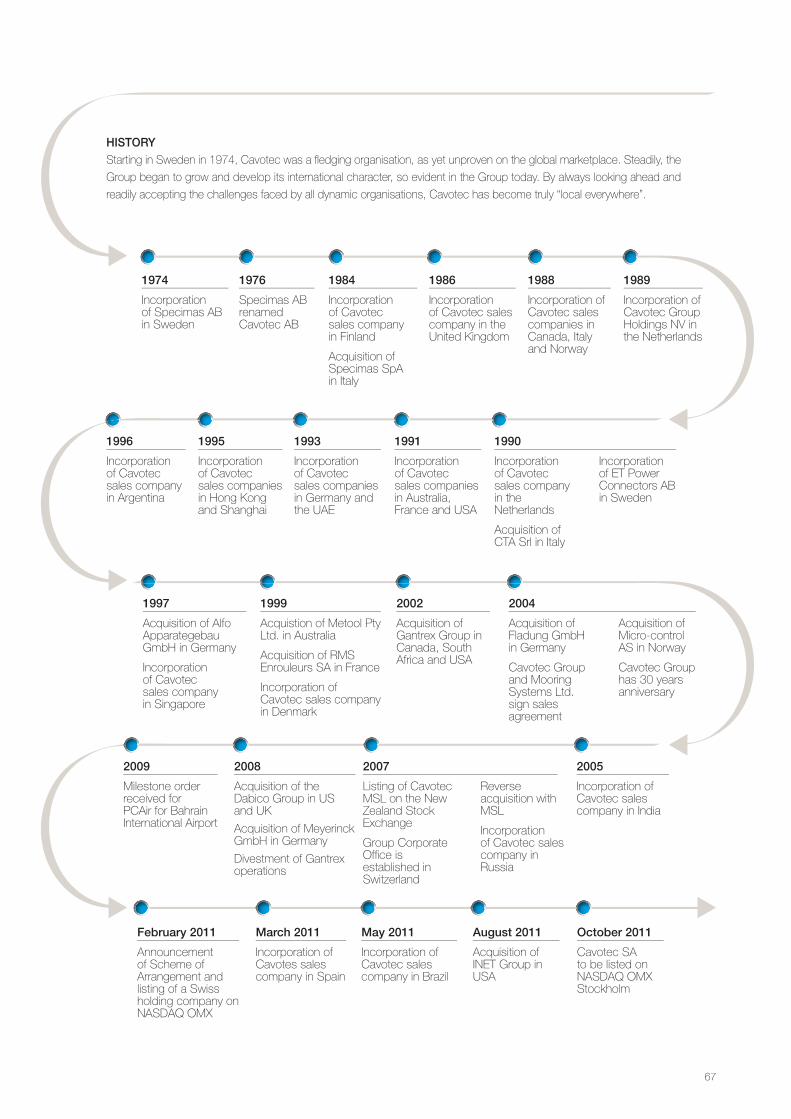
hIStoryStarting in Sweden in 1974, Cavotec was a fledging organisation, as yet unproven on the global marketplace. Steadily, the
Group began to grow and develop its international character, so evident in the Group today. By always looking ahead and
readily accepting the challenges faced by all dynamic organisations, Cavotec has become truly “local everywhere”.
1974
Incorporation of Specimas AB in Sweden
1976
Specimas AB renamed Cavotec AB
1984
Incorporation of Cavotec sales company in Finland
Acquisition of Specimas SpA in Italy
1986
Incorporation of Cavotec sales company in the UnitedKingdom
1988
Incorporation of Cavotec sales companies in Canada, Italy and Norway
1989
Incorporation of Cavotec Group Holdings NV in the Netherlands
1990
Incorporation of Cavotec sales company in the Netherlands
Acquisition of CTA Srl in Italy
Incorporation of ET Power Connectors AB in Sweden
2007
Listing of Cavotec MSL on the New Zealand Stock Exchange
Group Corporate Office is established in Switzerland
Reverse acquisition with MSL
Incorporation of Cavotec sales company in Russia
1991
Incorporation of Cavotec sales companies in Australia, France and USA
1993
Incorporation of Cavotec sales companies in Germany and the UAE
1995
Incorporation of Cavotec sales companies inHongKongand Shanghai
1996
Incorporation of Cavotec sales company in Argentina
1997
Acquisition of Alfo Apparategebau GmbH in Germany
Incorporation of Cavotec sales company in Singapore
1999
Acquistion of Metool Pty Ltd. in Australia
Acquisition of RMS Enrouleurs SA in France
Incorporation of Cavotec sales company in Denmark
2002
Acquisition of Gantrex Group in Canada, South Africa and USA
2004
Acquisition of Fladung GmbH in Germany
Cavotec Group and Mooring Systems Ltd. sign sales agreement
Acquisition of Micro-control AS in Norway
Cavotec Group has 30 years anniversary
2005
Incorporation of Cavotec sales company in India
2008
Acquisition of the Dabico Group in US andUK
Acquisition of Meyerinck GmbH in Germany
Divestment of Gantrex operations
2009
Milestone order received for PCAir for Bahrain International Airport
february 2011
Announcement of Scheme of Arrangement and listing of a Swiss holding company on NASDAQ OMX
march 2011
Incorporation of Cavotes sales company in Spain
may 2011
Incorporation of Cavotec sales company in Brazil
august 2011
Acquisition of INET Group in USA
october 2011
Cavotec SA to be listed on NASDAQ OMX Stockholm
67
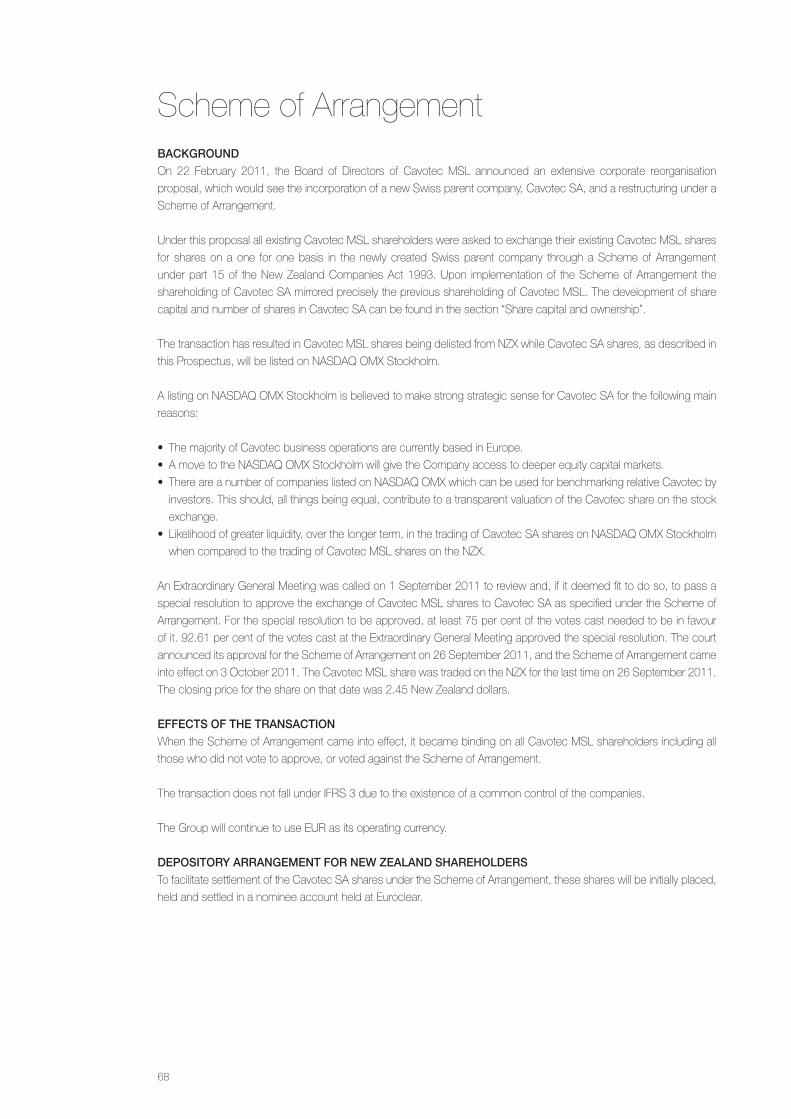
Scheme of ArrangementBackgroundOn 22 February 2011, the Board of Directors of Cavotec MSL announced an extensive corporate reorganisation
proposal, which would see the incorporation of a new Swiss parent company, Cavotec SA, and a restructuring under a
Scheme of Arrangement.
Under this proposal all existing Cavotec MSL shareholders were asked to exchange their existing Cavotec MSL shares
for shares on a one for one basis in the newly created Swiss parent company through a Scheme of Arrangement
under part 15 of the New Zealand Companies Act 1993. Upon implementation of the Scheme of Arrangement the
shareholding of Cavotec SA mirrored precisely the previous shareholding of Cavotec MSL. The development of share
capital and number of shares in Cavotec SA can be found in the section “Share capital and ownership”.
The transaction has resulted in Cavotec MSL shares being delisted from NZX while Cavotec SA shares, as described in
this Prospectus, will be listed on NASDAQ OMX Stockholm.
A listing on NASDAQ OMX Stockholm is believed to make strong strategic sense for Cavotec SA for the following main
reasons:
• The majority of Cavotec business operations are currently based in Europe.
• A move to the NASDAQ OMX Stockholm will give the Company access to deeper equity capital markets.
• There are a number of companies listed on NASDAQ OMX which can be used for benchmarking relative Cavotec by
investors. This should, all things being equal, contribute to a transparent valuation of the Cavotec share on the stock
exchange.
• Likelihood of greater liquidity, over the longer term, in the trading of Cavotec SA shares on NASDAQ OMX Stockholm
when compared to the trading of Cavotec MSL shares on the NZX.
An Extraordinary General Meeting was called on 1 September 2011 to review and, if it deemed fit to do so, to pass a
special resolution to approve the exchange of Cavotec MSL shares to Cavotec SA as specified under the Scheme of
Arrangement. For the special resolution to be approved, at least 75 per cent of the votes cast needed to be in favour
of it. 92.61 per cent of the votes cast at the Extraordinary General Meeting approved the special resolution. The court
announced its approval for the Scheme of Arrangement on 26 September 2011, and the Scheme of Arrangement came
into effect on 3 October 2011. The Cavotec MSL share was traded on the NZX for the last time on 26 September 2011.
The closing price for the share on that date was 2.45 New Zealand dollars.
effectS of the tranSactIonWhen the Scheme of Arrangement came into effect, it became binding on all Cavotec MSL shareholders including all
those who did not vote to approve, or voted against the Scheme of Arrangement.
The transaction does not fall under IFRS 3 due to the existence of a common control of the companies.
The Group will continue to use EUR as its operating currency.
depoSItory arrangement for new Zealand ShareholderSTo facilitate settlement of the Cavotec SA shares under the Scheme of Arrangement, these shares will be initially placed,
held and settled in a nominee account held at Euroclear.
68
Financial highlightsThe following section describes Cavotec’s financial information as at and for the years ended 31 December 2010, 2009
and 2008 and as at and for the six months ended 30 June 2011 and 2010, presented to facilitate comparability over the
periods. Cavotec’s financial statements for these periods have been prepared in accordance with International Financial
Reporting Standards (IFRS) and are in compliance with the New Zealand Equivalents to International Financial Reporting
Standards (NZ IFRS). There will be no change in the accounting principles applied by Cavotec as a consequence of the
change of the parent company (the Scheme of Arrangement).
Cavotec prepares its financial statements according to IFRS. There is a time lag between the issue of an International
Financial Reporting Standard and the adoption of such a standard in the European Union. Cavotec’s management
believes that if the Group’s financial statements were instead prepared according to IFRS as adopted by the EU, these
time lags would have no material impact on its financial information.
Investors should note that going forward Cavotec will publish financial reports and other important information solely in
English. No Swedish translations will be available.
This section should be read together with the section ”Comments on financial development and future prospects”, the
Group’s consolidated accounts for the 2010, 2009 and 2008 financial years and the interim report for the six months
ended 30 June 2011. For full information about the Group’s profits and financial position please refer to the sections
entitled ”Financial reporting”, Cavotec’s Annual Reports 2009 and 2008 and the section “Interim report for the period 1
January–30 June 2011”. The financial statements for 2008 and 2009 included in the Annual Reports for these years are
incorporated in the Prospectus through reference. All reports can be found on Cavotec’s website www.cavotec.com.
The reports can also be ordered from Cavotec on email [email protected] or by telephone +41 91 911 40 10.
Cavotec’s financial statements in the section entitled ”Financial reporting” and in the Annual Reports 2009 and 2008 have
been audited, and the financial statements in the section “Interim report for the period 1 January–30 June 2011” have
been reviewed, by PricewaterhouseCoopers under the PWC Engagement Partner Robert Harris. The auditor’s reports
have been included in the Annual Report for the respective years as well as the interim report. The auditor’s reports
comply with the standard format and contain no remarks. Besides auditing and reviewing the financial statements,
Cavotec’s auditors have not audited or reviewed any other information in this Prospectus.
The amounts specified in the sections entitled ”Financial highlights” and ”Comments on financial development and future
prospects” have been rounded to thousands of Euro, while calculations were made with a larger number of decimal
places. Percentages below ten and ratios are quoted to one decimal place and per share data to three decimal places,
meaning that these numbers also have been rounded. Rounding may result in certain summations not appearing to
add up.
The historical financial information provided in the Prospectus refers to the financial statements prepared by Cavotec MSL.
The new parent company, Cavotec SA (which is planned to be listed on NASDAQ OMX Stockholm), was incorporated
on 14 June 2011 and therefore has no relevant operational or financial history. Cavotec SA became the parent of
the Group after the completion of the Scheme of Arrangement on 3 October 2011. The Scheme of Arrangement is
described in greater detail on page 68 in the section “Scheme of Arrangement”. However, in summary the Scheme of
Arrangement entailed that the shareholders in Cavotec MSL received one share in Cavotec SA in exchange for every
share held in Cavotec MSL. The transaction does not fall under IFRS 3 due to the existence of a common control of the
companies. As a consequence, it has been deemed relevant to present the financial information prepared by Cavotec
MSL to describe the financial development of the Cavotec Group.
69
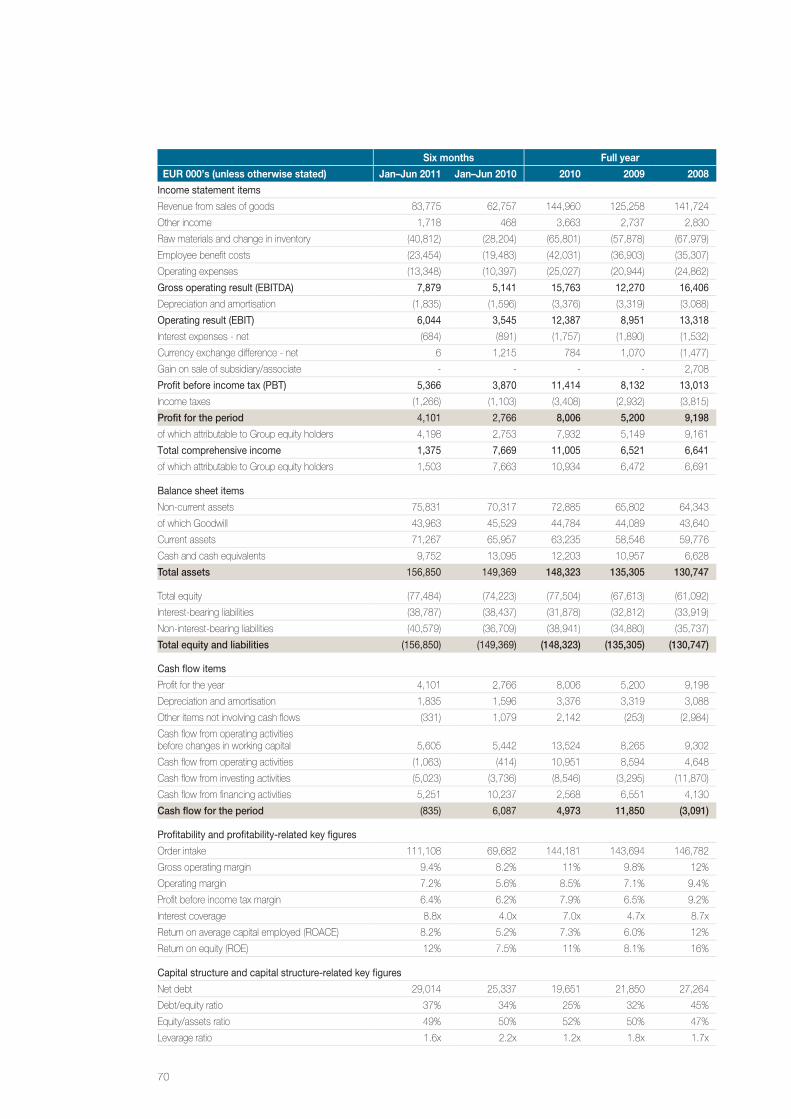
Six months Full year
EUR 000’s (unless otherwise stated) Jan–Jun 2011 Jan–Jun 2010 2010 2009 2008
Income statement items
Revenue from sales of goods 83,775 62,757 144,960 125,258 141,724
Other income 1,718 468 3,663 2,737 2,830
Raw materials and change in inventory (40,812) (28,204) (65,801) (57,878) (67,979)
Employee benefit costs (23,454) (19,483) (42,031) (36,903) (35,307)
Operating expenses (13,348) (10,397) (25,027) (20,944) (24,862)
gross operating result (eBItDA) 7,879 5,141 15,763 12,270 16,406
Depreciation and amortisation (1,835) (1,596) (3,376) (3,319) (3,088)
Operating result (eBIt) 6,044 3,545 12,387 8,951 13,318
Interest expenses - net (684) (891) (1,757) (1,890) (1,532)
Currency exchange difference - net 6 1,215 784 1,070 (1,477)
Gain on sale of subsidiary/associate - - - - 2,708
Profit before income tax (PBt) 5,366 3,870 11,414 8,132 13,013
Income taxes (1,266) (1,103) (3,408) (2,932) (3,815)
profit for the period 4,101 2,766 8,006 5,200 9,198
of which attributable to Group equity holders 4,198 2,753 7,932 5,149 9,161
total comprehensive income 1,375 7,669 11,005 6,521 6,641
of which attributable to Group equity holders 1,503 7,663 10,934 6,472 6,691
Balance sheet items
Non-current assets 75,831 70,317 72,885 65,802 64,343
of which Goodwill 43,963 45,529 44,784 44,089 43,640
Current assets 71,267 65,957 63,235 58,546 59,776
Cash and cash equivalents 9,752 13,095 12,203 10,957 6,628
total assets 156,850 149,369 148,323 135,305 130,747
Total equity (77,484) (74,223) (77,504) (67,613) (61,092)
Interest-bearing liabilities (38,787) (38,437) (31,878) (32,812) (33,919)
Non-interest-bearing liabilities (40,579) (36,709) (38,941) (34,880) (35,737)
total equity and liabilities (156,850) (149,369) (148,323) (135,305) (130,747)
Cash flow items
Profit for the year 4,101 2,766 8,006 5,200 9,198
Depreciation and amortisation 1,835 1,596 3,376 3,319 3,088
Other items not involving cash flows (331) 1,079 2,142 (253) (2,984)
Cash flow from operating activities before changes in working capital
5,605 5,442 13,524 8,265 9,302
Cash flow from operating activities (1,063) (414) 10,951 8,594 4,648
Cash flow from investing activities (5,023) (3,736) (8,546) (3,295) (11,870)
Cash flow from financing activities 5,251 10,237 2,568 6,551 4,130
cash flow for the period (835) 6,087 4,973 11,850 (3,091)
Profitability and profitability-related key figures
Order intake 111,108 69,682 144,181 143,694 146,782
Gross operating margin 9.4% 8.2% 11% 9.8% 12%
Operating margin 7.2% 5.6% 8.5% 7.1% 9.4%
Profit before income tax margin 6.4% 6.2% 7.9% 6.5% 9.2%
Interest coverage 8.8x 4.0x 7.0x 4.7x 8.7x
Return on average capital employed (ROACE) 8.2% 5.2% 7.3% 6.0% 12%
Return on equity (ROE) 12% 7.5% 11% 8.1% 16%
Capital structure and capital structure-related key figures
Net debt 29,014 25,337 19,651 21,850 27,264
Debt/equity ratio 37% 34% 25% 32% 45%
Equity/assets ratio 49% 50% 52% 50% 47%
Levarage ratio 1.6x 2.2x 1.2x 1.8x 1.7x
70
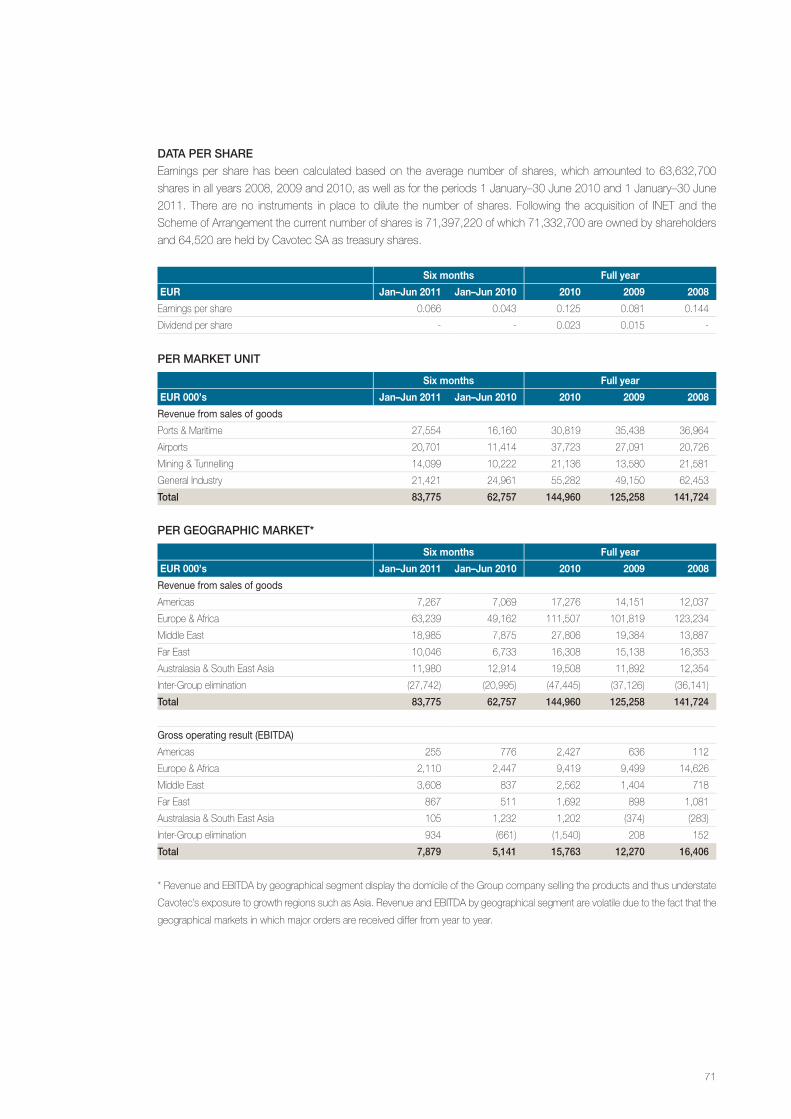
data per ShareEarnings per share has been calculated based on the average number of shares, which amounted to 63,632,700
shares in all years 2008, 2009 and 2010, as well as for the periods 1 January–30 June 2010 and 1 January–30 June
2011. There are no instruments in place to dilute the number of shares. Following the acquisition of INET and the
Scheme of Arrangement the current number of shares is 71,397,220 of which 71,332,700 are owned by shareholders
and 64,520 are held by Cavotec SA as treasury shares.
Six months Full year
EUR Jan–Jun 2011 Jan–Jun 2010 2010 2009 2008
Earnings per share 0.066 0.043 0.125 0.081 0.144
Dividend per share - - 0.023 0.015 -
per market unIt
Six months Full year
EUR 000’s Jan–Jun 2011 Jan–Jun 2010 2010 2009 2008
revenue from sales of goods
Ports & Maritime 27,554 16,160 30,819 35,438 36,964
Airports 20,701 11,414 37,723 27,091 20,726
Mining & Tunnelling 14,099 10,222 21,136 13,580 21,581
General Industry 21,421 24,961 55,282 49,150 62,453
total 83,775 62,757 144,960 125,258 141,724
per geographIc market*
Six months Full year
EUR 000’s Jan–Jun 2011 Jan–Jun 2010 2010 2009 2008
revenue from sales of goods
Americas 7,267 7,069 17,276 14,151 12,037
Europe & Africa 63,239 49,162 111,507 101,819 123,234
Middle East 18,985 7,875 27,806 19,384 13,887
Far East 10,046 6,733 16,308 15,138 16,353
Australasia & South East Asia 11,980 12,914 19,508 11,892 12,354
Inter-Group elimination (27,742) (20,995) (47,445) (37,126) (36,141)
total 83,775 62,757 144,960 125,258 141,724
gross operating result (eBItDA)
Americas 255 776 2,427 636 112
Europe & Africa 2,110 2,447 9,419 9,499 14,626
Middle East 3,608 837 2,562 1,404 718
Far East 867 511 1,692 898 1,081
Australasia & South East Asia 105 1,232 1,202 (374) (283)
Inter-Group elimination 934 (661) (1,540) 208 152
total 7,879 5,141 15,763 12,270 16,406
* Revenue and EBITDA by geographical segment display the domicile of the Group company selling the products and thus understate
Cavotec’s exposure to growth regions such as Asia. Revenue and EBITDA by geographical segment are volatile due to the fact that the
geographical markets in which major orders are received differ from year to year.
71
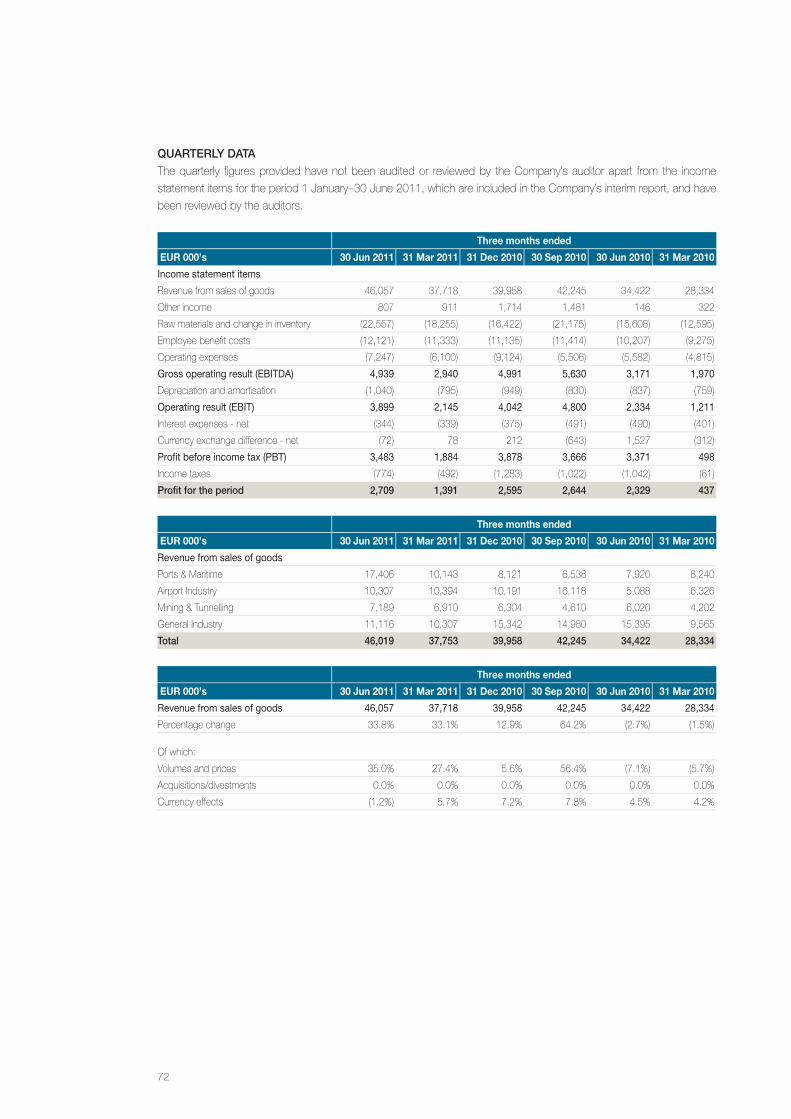
Quarterly dataThe quarterly figures provided have not been audited or reviewed by the Company’s auditor apart from the income
statement items for the period 1 January–30 June 2011, which are included in the Company’s interim report, and have
been reviewed by the auditors.
Three months ended
EUR 000’s 30 Jun 2011 31 Mar 2011 31 Dec 2010 30 Sep 2010 30 Jun 2010 31 Mar 2010
Income statement items
Revenue from sales of goods 46,057 37,718 39,958 42,245 34,422 28,334
Other income 807 911 1,714 1,481 146 322
Raw materials and change in inventory (22,557) (18,255) (16,422) (21,175) (15,608) (12,595)
Employee benefit costs (12,121) (11,333) (11,135) (11,414) (10,207) (9,275)
Operating expenses (7,247) (6,100) (9,124) (5,506) (5,582) (4,815)
gross operating result (eBItDA) 4,939 2,940 4,991 5,630 3,171 1,970
Depreciation and amortisation (1,040) (795) (949) (830) (837) (759)
Operating result (eBIt) 3,899 2,145 4,042 4,800 2,334 1,211
Interest expenses - net (344) (339) (375) (491) (490) (401)
Currency exchange difference - net (72) 78 212 (643) 1,527 (312)
Profit before income tax (PBt) 3,483 1,884 3,878 3,666 3,371 498
Income taxes (774) (492) (1,283) (1,022) (1,042) (61)
profit for the period 2,709 1,391 2,595 2,644 2,329 437
Three months ended
EUR 000’s 30 Jun 2011 31 Mar 2011 31 Dec 2010 30 Sep 2010 30 Jun 2010 31 Mar 2010
revenue from sales of goods
Ports & Maritime 17,406 10,143 8,121 6,538 7,920 8,240
Airport Industry 10,307 10,394 10,191 16,118 5,088 6,326
Mining & Tunnelling 7,189 6,910 6,304 4,610 6,020 4,202
General Industry 11,116 10,307 15,342 14,980 15,395 9,565
total 46,019 37,753 39,958 42,245 34,422 28,334
Three months ended
EUR 000’s 30 Jun 2011 31 Mar 2011 31 Dec 2010 30 Sep 2010 30 Jun 2010 31 Mar 2010
revenue from sales of goods 46,057 37,718 39,958 42,245 34,422 28,334
Percentage change 33.8% 33.1% 12.9% 64.2% (2.7%) (1.5%)
Of which:
Volumes and prices 35.0% 27.4% 5.6% 56.4% (7.1%) (5.7%)
Acquisitions/divestments 0.0% 0.0% 0.0% 0.0% 0.0% 0.0%
Currency effects (1.2%) 5.7% 7.2% 7.8% 4.5% 4.2%
72
defInItIonSaverage capital employed Total assets minus current liabilities calculated on their average of quarterly values.
debt/equity ratioNet debt as a percentage of total equity.
dividend per share (dpS)Dividend for the period divided by the total number of shares outstanding.
earnings per shareProfit/loss attributable to equity holders of the Group divided by the average number of shares for the period.
equity/assets ratioTotal equity as a percentage of total assets.
gross operating margin Operating result before depreciation and amortisation as a percentage of the period’s revenue from sales of goods.
Interest coverageOperating result divided by net interest expenses.
leverage ratioNet debt divided by operating result before depreciation and amortisation.
net debtBorrowings plus other financial liabilities, less cash and cash equivalents and current financial investments.
operating margin Operating result after depreciation and amortisation as a percentage of the period’s revenue from sales of goods.
order intakeValue of orders received during the period.
profit before income tax marginProfit/loss before income tax as a percentage of the period’s revenue from sales of goods.
return on average capital employed (roace)Net operating profit after tax (rolling 12 months) divided by average capital employed.
return on equity (roe)Net profit after tax (rolling 12 months) divided by total equity less minority interests calculated on the average of quarterly
values.
total equityShareholders’ equity including minority interests.
73
Comments on financial development and future prospectsThese comments on financial development are intended to facilitate understanding and the assessment of trends and
changes in the Group’s profits and financial position. Historical results do not necessarily give an accurate indication of
future results. The commentary below should be read together with the Group’s consolidated accounts for the 2010,
2009 and 2008 financial years and the interim report for the six months ended 30 June 2011 and associated notes, all
which have been prepared in accordance with International Financial Reporting Standards (IFRS) and are in compliance
with the New Zealand Equivalents to International Financial Reporting Standards (NZ IFRS). For full information about the
Group’s profits and financial position please refer to the section entitled “Financial reporting”, to the financial statements
contained in the annual reports for 2009 and 2008 which are incorporated in this Prospectus by reference, and to the
section “Interim report for the period 1 January–30 June 2011”.
This section contains statements about the future which depend on future events, risks and uncertainties, including
those described in the section entitled ”Risk factors”. The Group’s actual results may be considerably different to the
results expressed or suggested in statements about the future due to many different factors, among them but not limited
to the risks described below and elsewhere in this Prospectus.
The amounts specified in the sections entitled ”Financial highlights” and ”Comments on financial development and future
prospects” have been rounded to thousands of Euro, while calculations were made with a larger number of decimal
places. Percentages below ten and ratios are quoted to one decimal place and per share data to three decimal places,
meaning that these numbers also have been rounded. Rounding may result in certain summations not appearing to
add up.
Segment reportIngIn its accounting, Cavotec’s primary segments are geographical regions since the Group is managed on a geographical
basis. Resources for production are shared among the different Market Units within each geographical region. However,
the comments on financial development in this section focus on Cavotec’s Market Units (Ports & Maritime, Airports,
Mining & Tunnelling and General Industry) as this segmentation further explains the underlying drivers of the business
and facilitates a deeper understanding of the Group’s operations.
Important factorS whIch affect cavotec’S reSultSCavotec deems the following factors to be those which have the greatest impact on the Group’s results.
Business climate and investment cycle in the ports and maritime industryThe Group’s revenue from sales of goods within the ports and maritime industry as a percentage of the Group’s total
revenues amounted to 21 per cent in 2010. Today, Cavotec’s largest markets are Australia, Europe, Far East and North
America. Management anticipates that the global ports and maritime industry will need to make substantial investment
in automation and environmentally conscious technologies in the short and medium terms, which will affect the defining
elements of Cavotec’s products and expertise. Stricter environmental controls, coupled with growing demands for
improved operational efficiency is likely to create a basis for the growth within this industry in the coming years. The ports
and maritime industry is already seeing a strong recovery in investment levels, especially in emerging markets, following
a severe contraction in 2008 and 2009.
74
Business climate and investment cycle in the airports industryThe Group’s revenue from sales of goods within the airports industry as a percentage of the Group’s total revenues
amounted to 26 per cent in 2010. Today, Cavotec’s largest markets are China, Middle East, Europe and North America.
With positive economic growth, management expects continued growth for this industry in the years ahead, especially in
emerging markets such as China, India and Brazil, and across the Middle East, the Far East and South East Asia. There
are also environmental trends supporting growth.
Business climate and investment cycle in the mining and tunnelling industryThe Group’s revenue from sales of goods within the mining and tunnelling industry as a percentage of the Group’s
total revenues amounted to 15 per cent in 2010. Today, Cavotec’s largest markets are Australia and Europe. However,
many of Cavotec’s customers export their products, in which Cavotec’s equipment is installed, to other markets outside
Europe. The extraction of metals and minerals such as coal, copper and zinc are vital to modern society and economic
development. Demand for these resources remains strong today, as it has done for hundreds of years. Economic
growth supports the extraction of minerals and infrastructure improvements. Management expects that the emerging
markets, where Cavotec also has a large presence, will continue to grow in the years ahead. Similarly, most of the
mature markets are expected to continue their growth, albeit at a slower pace.
Business climate and investment cycle in the general industryThe Group’s revenue from sales of goods within the general industry as a percentage of the Group’s total revenues
amounted to 38 per cent in 2010. Today, Cavotec’s largest markets are Europe, Middle East and North America.
Cavotec has a varied portfolio of systems and products that are critical to key elements of economic activity such as
manufacturing and transport. Thus, due to Cavotec’s diverse and global product offering within the general industry, the
Group’s performance within this industry is tracking the development in the world economy. Despite the current economic
uncertainty, management expects a positive outlook for the general industry in the coming years. As requirements
regarding safety, efficiency and sustainability are tightened, Cavotec is likely to see increasingly larger and geographically
broader markets for its automation and power supply technologies.
explanatIon of ItemS whIch affect profItSrevenue from sales of goods Cavotec’s consolidated revenue from sales of goods consists of revenue from the various products of the Ports &
Maritime Market Units, Airports, Mining & Tunnelling and General Industry.
other incomeOther income consists of carriage, insurance and freight, commissions and royalties and other miscellaneous income.
raw materials and change in inventoryCavotec’s largest cost item is raw materials and change in inventory. This item comprises the cost of a number of raw
materials and intermediate goods that are used for the manufacturing of Cavotec’s various products.
employee benefit costsThe employee benefit costs mainly comprise the cost of salaries, wages and social security contributions.
operating expensesOperating expenses consists of items such as transportation expenses, external services, travelling expenses, general
expenses, rent and leasing, credit losses and warranty costs.
75
depreciation and amortisationDepreciation of tangible fixed assets comprises depreciation of industrial buildings, building improvements and other
constructions in leasehold properties, plant and machinery, laboratory equipment and miscellaneous tools, furniture and
office machines, motor vehicles and computer hardware and software.
Depreciation of tangible fixed assets and non-current assets is calculated using a straight line method so as to expense
the cost of the assets over their useful lives. Industrial buildings are depreciated with 4 per cent per year, building
improvements and other constructions in leasehold properties with 20 per cent per year, plant and machinery with 10
to 20 per cent per year, laboratory equipment and miscellaneous tools with 20 per cent per year, furniture and office
machines with 20 per cent per year, motor vehicles with 20 per cent per year and computer hardware and software with
33 per cent per year.
Intangible assets, excluding goodwill, are also amortised on a straight line basis. Capitalised development costs are
amortised over its useful life, which varies between three to five years, while patents are amortised over the period over
which they are valid (not exceeding 20 years) or their estimated useful life if shorter. In accordance with IFRS, goodwill is
not depreciated, but is tested for possible impairment annually.
Interest expenses-netInterest expenses-net consist of interest income, interest expenses and amortisation of issuance costs.
Income taxes This item refers to current tax costs including changes in deferred taxes. Cavotec’s tax costs are affected by corporate
tax rates in a number of countries and the mix between low tax and high tax countries
76
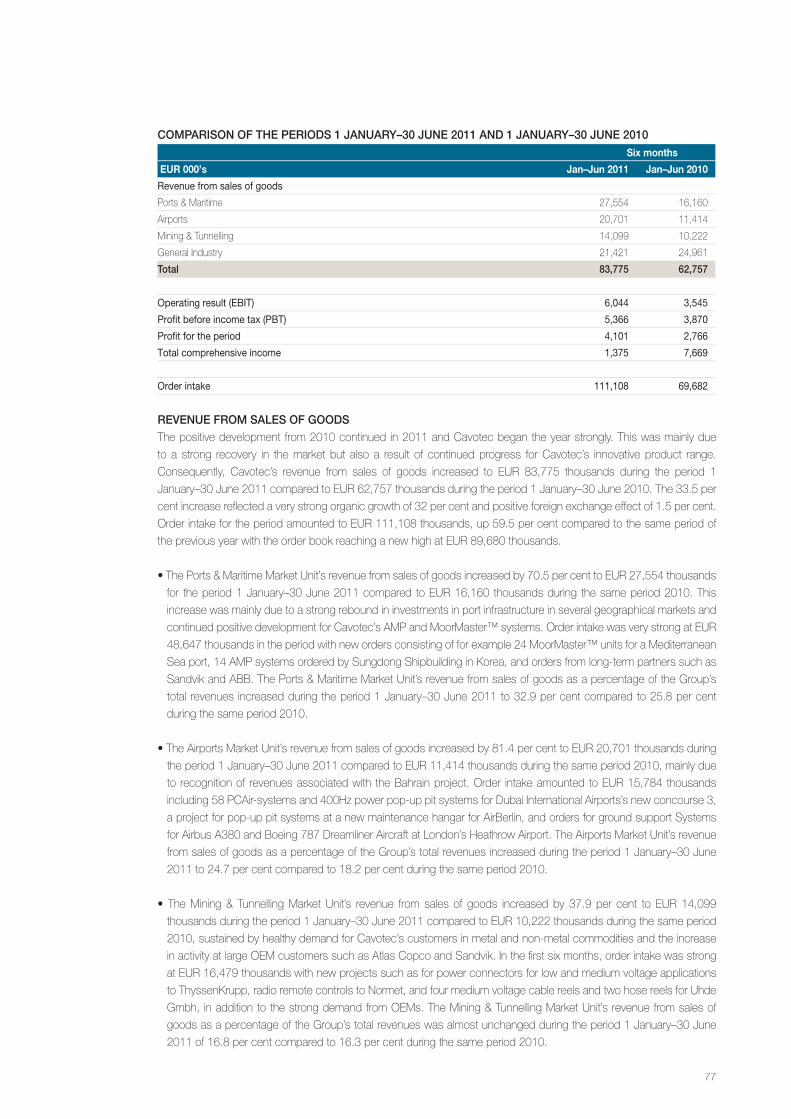
comparISon of the perIodS 1 january–30 june 2011 and 1 january–30 june 2010Six months
EUR 000’s Jan–Jun 2011 Jan–Jun 2010
revenue from sales of goods
Ports & Maritime 27,554 16,160
Airports 20,701 11,414
Mining & Tunnelling 14,099 10,222
General Industry 21,421 24,961
total 83,775 62,757
Operating result (eBIt) 6,044 3,545
Profit before income tax (PBt) 5,366 3,870
Profit for the period 4,101 2,766
total comprehensive income 1,375 7,669
Order intake 111,108 69,682
revenue from SaleS of goodS The positive development from 2010 continued in 2011 and Cavotec began the year strongly. This was mainly due
to a strong recovery in the market but also a result of continued progress for Cavotec’s innovative product range.
Consequently, Cavotec’s revenue from sales of goods increased to EUR 83,775 thousands during the period 1
January–30 June 2011 compared to EUR 62,757 thousands during the period 1 January–30 June 2010. The 33.5 per
cent increase reflected a very strong organic growth of 32 per cent and positive foreign exchange effect of 1.5 per cent.
Order intake for the period amounted to EUR 111,108 thousands, up 59.5 per cent compared to the same period of
the previous year with the order book reaching a new high at EUR 89,680 thousands.
•ThePorts&MaritimeMarketUnit’srevenuefromsalesofgoodsincreasedby70.5percenttoEUR27,554thousands
for the period 1 January–30 June 2011 compared to EUR 16,160 thousands during the same period 2010. This
increase was mainly due to a strong rebound in investments in port infrastructure in several geographical markets and
continued positive development for Cavotec’s AMP and MoorMaster™ systems. Order intake was very strong at EUR
48,647 thousands in the period with new orders consisting of for example 24 MoorMaster™ units for a Mediterranean
Seaport,14AMPsystemsorderedbySungdongShipbuildinginKorea,andordersfromlong-termpartnerssuchas
Sandvik and ABB. The Ports & Maritime Market Unit’s revenue from sales of goods as a percentage of the Group’s
total revenues increased during the period 1 January–30 June 2011 to 32.9 per cent compared to 25.8 per cent
during the same period 2010.
•TheAirportsMarketUnit’srevenuefromsalesofgoodsincreasedby81.4percenttoEUR20,701thousandsduring
the period 1 January–30 June 2011 compared to EUR 11,414 thousands during the same period 2010, mainly due
to recognition of revenues associated with the Bahrain project. Order intake amounted to EUR 15,784 thousands
including 58 PCAir-systems and 400Hz power pop-up pit systems for Dubai International Airports’s new concourse 3,
a project for pop-up pit systems at a new maintenance hangar for AirBerlin, and orders for ground support Systems
for Airbus A380 and Boeing 787 Dreamliner Aircraft at London’s Heathrow Airport. The Airports Market Unit’s revenue
from sales of goods as a percentage of the Group’s total revenues increased during the period 1 January–30 June
2011 to 24.7 per cent compared to 18.2 per cent during the same period 2010.
• TheMining& TunnellingMarketUnit’s revenue from sales of goods increasedby 37.9 per cent to EUR14,099
thousands during the period 1 January–30 June 2011 compared to EUR 10,222 thousands during the same period
2010, sustained by healthy demand for Cavotec’s customers in metal and non-metal commodities and the increase
in activity at large OEM customers such as Atlas Copco and Sandvik. In the first six months, order intake was strong
at EUR 16,479 thousands with new projects such as for power connectors for low and medium voltage applications
toThyssenKrupp,radioremotecontrolstoNormet,andfourmediumvoltagecablereelsandtwohosereelsforUhde
Gmbh, in addition to the strong demand from OEMs. The Mining & Tunnelling Market Unit’s revenue from sales of
goods as a percentage of the Group’s total revenues was almost unchanged during the period 1 January–30 June
2011 of 16.8 per cent compared to 16.3 per cent during the same period 2010.
77
•TheGeneralIndustryMarketUnit’srevenuefromsalesofgoodsdecreasedby14.2percenttoEUR21,421thousands
during the period 1 January–30 June 2011 compared to EUR 24,960 thousands during the same period 2010, mainly
due to a generally softer market development second quarter in 2011. On the other hand, order intake was healthy
at EUR 30,361 thousands with the positive momentum continuing in July. The General Industry Market Unit’s revenue
from sales of goods as a percentage of the Group’s total revenues decreased during the period 1 January–30 June
2011 to 25.6 per cent compared to 39.8 per cent during the same period 2010.
operating resultCavotec’s operating result during the period 1 January–30 June 2011 amounted to EUR 6,044 thousands compared
to a result of EUR 3,545 thousands during the same period 2010. The Group’s operating margin during the period 1
January–30 June 2011 was 7.2 per cent compared to 5.6 per cent during the same period in 2010. Adjusted for non-
recurring items relating to the reorganisation process which amounted to EUR 228 thousands the operating margin was
7.5 per cent for the first six months of 2011. The increase in operating margin was due to the increase in sales of goods
and other income and the development of costs. The Group’s cost of raw materials and change in inventory during the
period 1 January–30 June 2011 amounted to EUR 40,812 thousands compared to EUR 28,204 thousands during
the same period in 2010 with the increase principally stemming from the increase in activity. The cost of raw materials
and change in inventory as a proportion of revenue from sales of goods amounted to 48.7 per cent during the period 1
January–30 June 2011 compared to 44.9 per cent during the same period in 2010.
The Group’s employee benefit costs during the period 1 January–30 June 2011 amounted to EUR 23,454 thousands
compared to EUR 19,483 thousands during the same period in 2010. This was a direct consequence of the increase in
the number of employees to 768 at the end of the period, compared to 689 at 30 June 2010. The substantial increase
in employees is related primarily to the higher sales and activity level and the continuous expansion. However, the
employee benefit costs as a proportion of revenue from sales of goods amounted to 28.0 per cent during the period
1 January–30 June 2011 compared to 31.0 per cent during the same period in 2010. During the period 1 January–30
June 2011, operating expenses grew in line with the increase of activity and declined as a proportion of revenue from sales
of goods to 15.9 per cent from 16.6 per cent during the same period 2010.
Depreciation and amortisation amounted to EUR 1,835 thousands during the period 1 January–30 June 2011 compared
to EUR 1,596 thousands during the same period 2010. Depreciation and amortisation as a proportion of revenue from
sales of goods amounted to 2.2 per cent during the period 1 January–30 June 2011 and to 2.5 per cent during the same
period in 2010. Other income amounted to EUR 1,718 thousands during the period 1 January–30 June 2011 compared
to EUR 468 thousands during the same period 2010. The increase principally stemmed from the higher activity level.
profit before income taxDuring the period 1 January–30 June 2011, profit before income tax increased to EUR 5,366 thousands compared to
a profit of EUR 3,870 thousands during the same period. Interest expenses – net were EUR -684 thousands during the
period 1 January–30 June 2011 compared to EUR -891 thousands during the same period 2010, with the decrease
explained by lower effective interest rate. The currency exchange difference – net was positive in the period 1 January–30
June 2011 with EUR 6 thousands, compared to a positive effect in the same period 2010 of EUR 1,215 thousands.
profit for the periodProfit for the period 1 January–30 June 2011 increased to EUR 4,101 thousands compared to a profit of EUR 2,766
thousands during the same period 2010. Income taxes for the period 1 January–30 June 2011 amounted to EUR 1,266
thousands compared to EUR 1,103 thousands during the same period in 2010. The increase in income taxes was
mainly due to a higher taxable income compensated to some extent by a lower average tax rate.
total comprehensive income During the period 1 January–30 June 2011, total comprehensive income decreased significantly to EUR 1,375
thousands compared to EUR 7,669 thousands during the same period in 2010. The increase in profit for the period
was offset by exchange differences on translation of foreign operations. Such translations had a negative impact of EUR
2,725 thousands during the period 1 January–30 June 2011, while the impact during the same period in 2010 was
positive with EUR 4,920 thousands. The main reason behind the negative impact in the period 1 January–30 June 2011
was the appreciation of EUR versus primarily US dollar block currencies.
78
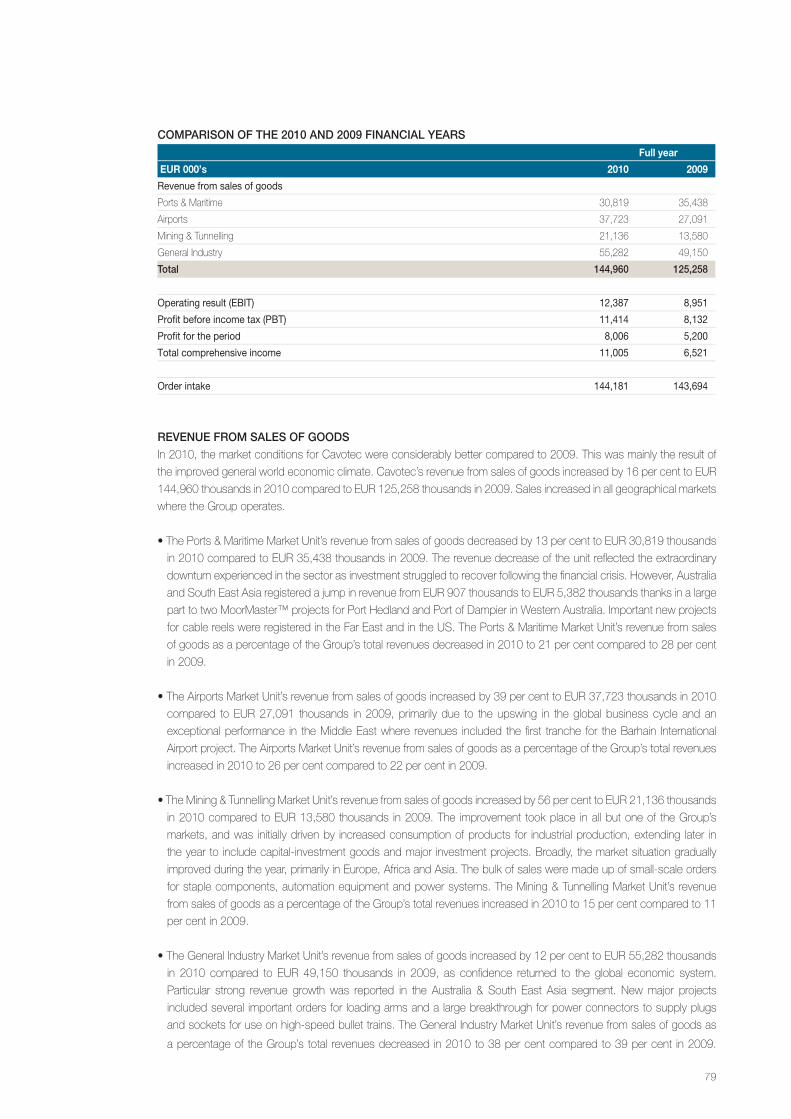
comparISon of the 2010 and 2009 fInancIal yearSFull year
EUR 000’s 2010 2009
revenue from sales of goods
Ports & Maritime 30,819 35,438
Airports 37,723 27,091
Mining & Tunnelling 21,136 13,580
General Industry 55,282 49,150
total 144,960 125,258
Operating result (eBIt) 12,387 8,951
Profit before income tax (PBt) 11,414 8,132
Profit for the period 8,006 5,200
total comprehensive income 11,005 6,521
Order intake 144,181 143,694
revenue from SaleS of goodSIn 2010, the market conditions for Cavotec were considerably better compared to 2009. This was mainly the result of
the improved general world economic climate. Cavotec’s revenue from sales of goods increased by 16 per cent to EUR
144,960 thousands in 2010 compared to EUR 125,258 thousands in 2009. Sales increased in all geographical markets
where the Group operates.
•ThePorts&MaritimeMarketUnit’srevenuefromsalesofgoodsdecreasedby13percenttoEUR30,819thousands
in 2010 compared to EUR 35,438 thousands in 2009. The revenue decrease of the unit reflected the extraordinary
downturn experienced in the sector as investment struggled to recover following the financial crisis. However, Australia
and South East Asia registered a jump in revenue from EUR 907 thousands to EUR 5,382 thousands thanks in a large
part to two MoorMaster™ projects for Port Hedland and Port of Dampier in Western Australia. Important new projects
for cable reels were registered in the Far East and in the US. The Ports & Maritime Market Unit’s revenue from sales
of goods as a percentage of the Group’s total revenues decreased in 2010 to 21 per cent compared to 28 per cent
in 2009.
•TheAirportsMarketUnit’srevenuefromsalesofgoodsincreasedby39percenttoEUR37,723thousandsin2010
compared to EUR 27,091 thousands in 2009, primarily due to the upswing in the global business cycle and an
exceptional performance in the Middle East where revenues included the first tranche for the Barhain International
Airport project. The Airports Market Unit’s revenue from sales of goods as a percentage of the Group’s total revenues
increased in 2010 to 26 per cent compared to 22 per cent in 2009.
•TheMining&TunnellingMarketUnit’srevenuefromsalesofgoodsincreasedby56percenttoEUR21,136thousands
in 2010 compared to EUR 13,580 thousands in 2009. The improvement took place in all but one of the Group’s
markets, and was initially driven by increased consumption of products for industrial production, extending later in
the year to include capital-investment goods and major investment projects. Broadly, the market situation gradually
improved during the year, primarily in Europe, Africa and Asia. The bulk of sales were made up of small-scale orders
for staple components, automation equipment and power systems. The Mining & Tunnelling Market Unit’s revenue
from sales of goods as a percentage of the Group’s total revenues increased in 2010 to 15 per cent compared to 11
per cent in 2009.
•TheGeneralIndustryMarketUnit’srevenuefromsalesofgoodsincreasedby12percenttoEUR55,282thousands
in 2010 compared to EUR 49,150 thousands in 2009, as confidence returned to the global economic system.
Particular strong revenue growth was reported in the Australia & South East Asia segment. New major projects
included several important orders for loading arms and a large breakthrough for power connectors to supply plugs
and sockets for use on high-speed bullet trains. The General Industry Market Unit’s revenue from sales of goods as
a percentage of the Group’s total revenues decreased in 2010 to 38 per cent compared to 39 per cent in 2009.
79
The Group’s order intake in 2010 amounted to EUR 144,181 thousands compared to EUR 143,694 thousands in 2009.
The order intake figures for 2009 were impacted to a certain extent due to the registering of one of the Group’s largest
orders ever from Bahrain International Airport. However in 2010, Cavotec did win a substantial number of smaller projects,
which was a positive development for the Group’s customer diversification and risk management.
operating resultCavotec’s operating result in 2010 amounted to EUR 12,387 thousands compared to a result of EUR 8,951 thousands
in 2009. The Group’s operating margin in 2010 was 8.5 per cent compared to 7.1 per cent in 2009. The improved
operating margin was due to growth in sales of goods and other income and the development of costs.
The Group’s cost of raw materials and change in inventory in 2010 amounted to EUR 65,801 thousands compared to
EUR 57,878 thousands in 2009. The difference stemmed from higher production volumes due to the increase in sales.
Indeed, the cost of raw materials and change in inventory as a proportion of revenue from sales of goods marginally
decreased to 45 per cent in 2010 compared to 46 per cent in 2009.
The Group’s employee benefit costs in 2010 amounted to EUR 42,031 thousands compared to EUR 36,903 thousands
in 2009. The increase principally stemmed from the growth in the number of office workers (an increase of 42 employees
compared to 2009) and the reinstatement of salaries following the lifting of the contingency plan put in force in 2009. The
employee benefit costs as a proportion of revenue from sales of goods amounted to 29 per cent in both 2010 and 2009.
The Group’s operating expenses in 2010 amounted to EUR 25,027 thousands compared to EUR 20,944 thousands
in 2009. Operating expenses as a proportion of revenue from sales of goods amounted to 17 per cent in 2010 and to
17 per cent in 2009. A large portion of the overall increase in operating expenses was related to the on-going project in
Bahrain and the overall higher activity level.
Depreciation and amortisation amounted to EUR 3,376 thousands in 2010 compared to EUR 3,319 thousands in 2009.
Depreciation and amortisation as a proportion of revenue from sales of goods amounted to 2.3 per cent in 2010 and to
2.6 per cent in 2009. Other income amounted to EUR 3,663 thousands in 2010 compared to EUR 2,737 thousands in
2009. The increase principally stemmed from the increased volume of business in the year, the partial recovery of credit
provisionsmadein2009andthecapitalgainsrealisedonthesaleoftheformerCavotecUKbuilding.
profit before income taxIn 2010, profit before income tax increased to EUR 11,414 thousands compared to a profit of EUR 8,132 thousands in
2009, primarily as a result of a higher operating result in 2010. Following the renegotiation of the Group indebtedness,
interest cost declined and although changes in interest income were negative, interest expenses – net declined to EUR
-1,757 thousands in 2010 compared to EUR -1,890 thousands in 2009. The currency exchange difference – net was
positive in 2010 with EUR 784 thousands, compared to a positive effect in 2009 of EUR 1,070 thousands.
profit for the periodProfit for the year in 2010 increased to EUR 8,006 thousands compared to a profit of EUR 5,200 thousands in 2009.
Income taxes for the year amounted to EUR 3,408 thousands in 2010 compared to EUR 2,932 thousands in 2009,
primarily as a result of higher taxable profits.
total comprehensive incomeIn 2010, total comprehensive income increased to EUR 11,005 thousands compared to EUR 6,521 thousands in
2009. The increase in total comprehensive income was explained by the increase in profit for the period and a positive
effect of EUR 3,456 thousands from exchange differences on translation of foreign operations. In 2009 the positive
effect of exchange differences was EUR 873 thousands. The main reason behind the positive impact in 2010 was the
depreciation of EUR versus most major currencies. In both years there were also minor effects from fair value adjustment
to available for sale financial assets.
80
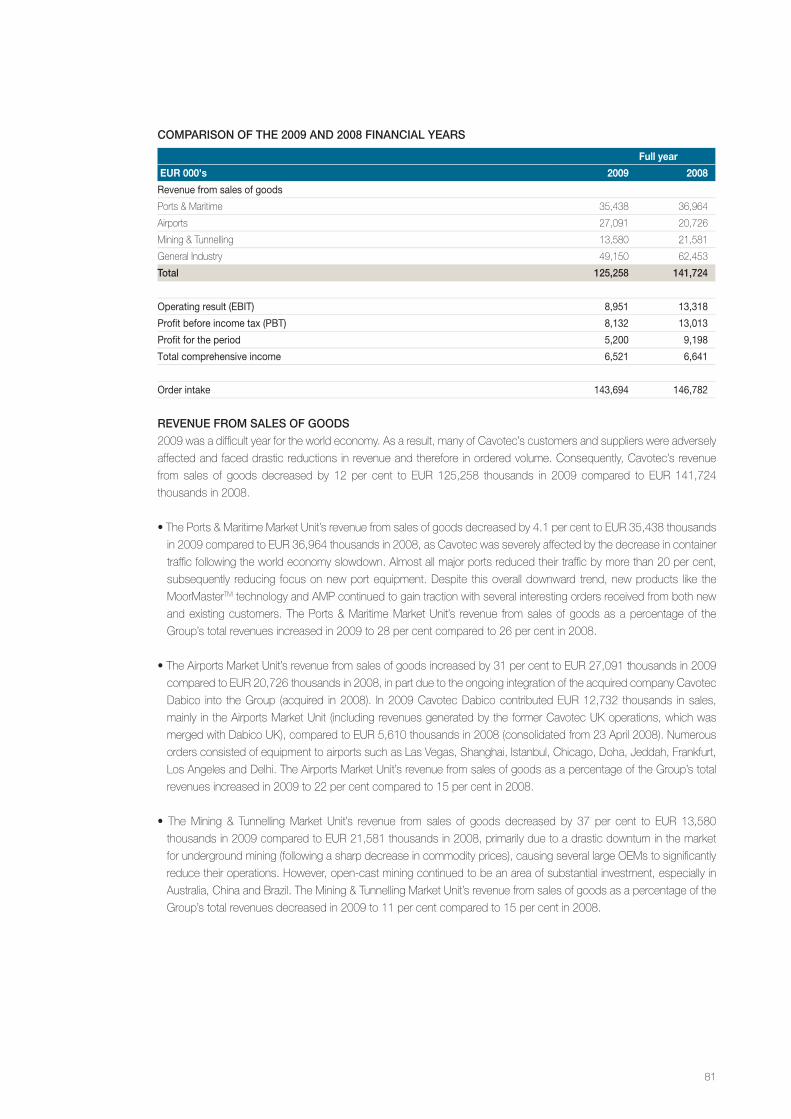
comparISon of the 2009 and 2008 fInancIal yearS
Full year
EUR 000’s 2009 2008
revenue from sales of goods
Ports & Maritime 35,438 36,964
Airports 27,091 20,726
Mining & Tunnelling 13,580 21,581
General Industry 49,150 62,453
total 125,258 141,724
Operating result (eBIt) 8,951 13,318
Profit before income tax (PBt) 8,132 13,013
Profit for the period 5,200 9,198
total comprehensive income 6,521 6,641
Order intake 143,694 146,782
revenue from SaleS of goodS 2009 was a difficult year for the world economy. As a result, many of Cavotec’s customers and suppliers were adversely
affected and faced drastic reductions in revenue and therefore in ordered volume. Consequently, Cavotec’s revenue
from sales of goods decreased by 12 per cent to EUR 125,258 thousands in 2009 compared to EUR 141,724
thousands in 2008.
•ThePorts&MaritimeMarketUnit’srevenuefromsalesofgoodsdecreasedby4.1percenttoEUR35,438thousands
in 2009 compared to EUR 36,964 thousands in 2008, as Cavotec was severely affected by the decrease in container
traffic following the world economy slowdown. Almost all major ports reduced their traffic by more than 20 per cent,
subsequently reducing focus on new port equipment. Despite this overall downward trend, new products like the
MoorMasterTM technology and AMP continued to gain traction with several interesting orders received from both new
and existing customers. The Ports & Maritime Market Unit’s revenue from sales of goods as a percentage of the
Group’s total revenues increased in 2009 to 28 per cent compared to 26 per cent in 2008.
•TheAirportsMarketUnit’srevenuefromsalesofgoodsincreasedby31percenttoEUR27,091thousandsin2009
compared to EUR 20,726 thousands in 2008, in part due to the ongoing integration of the acquired company Cavotec
Dabico into the Group (acquired in 2008). In 2009 Cavotec Dabico contributed EUR 12,732 thousands in sales,
mainly intheAirportsMarketUnit (includingrevenuesgeneratedbytheformerCavotecUKoperations,whichwas
mergedwithDabicoUK),comparedtoEUR5,610thousandsin2008(consolidatedfrom23April2008).Numerous
orders consisted of equipment to airports such as Las Vegas, Shanghai, Istanbul, Chicago, Doha, Jeddah, Frankfurt,
Los Angeles and Delhi. The Airports Market Unit’s revenue from sales of goods as a percentage of the Group’s total
revenues increased in 2009 to 22 per cent compared to 15 per cent in 2008.
• TheMining & TunnellingMarket Unit’s revenue from sales of goods decreased by 37 per cent to EUR 13,580
thousands in 2009 compared to EUR 21,581 thousands in 2008, primarily due to a drastic downturn in the market
for underground mining (following a sharp decrease in commodity prices), causing several large OEMs to significantly
reduce their operations. However, open-cast mining continued to be an area of substantial investment, especially in
Australia, China and Brazil. The Mining & Tunnelling Market Unit’s revenue from sales of goods as a percentage of the
Group’s total revenues decreased in 2009 to 11 per cent compared to 15 per cent in 2008.
81
•TheGeneralIndustryMarketUnit’srevenuefromsalesofgoodsdecreasedby21percenttoEUR49,150thousands
in 2009 compared to EUR 62,453 thousands in 2008, as a consequence of the general world economic slowdown
in particular for the construction industry. The decrease in sales was also partly due to the divestment of Gantrex at
the beginning of 2008. In 2007 Gantrex contributed revenue of approximately EUR 6,411 thousands while in 2008,
due to ongoing product sales, Gantrex’s products accounted for EUR 2,098 thousands. The General Industry Market
Unit’s revenue from sales of goods as a percentage of the Group’s total revenues decreased in 2009 to 39 per cent
compared to 44 per cent in 2008.
In 2009, Cavotec’s order intake decreased by 2.1 per cent to EUR 143,694 thousands compared to EUR 146,782
thousands in 2008.
operating resultCavotec’s operating result in 2009 amounted to EUR 8,951 thousands compared to a result of EUR 13,318 thousands in
2008. The Group’s operating margin in 2009 was 7.1 per cent compared to 9.4 per cent in 2008. The decrease in operating
margin was due to the decline in sales of goods and the development of costs and other income.
The Group’s cost of raw materials and change in inventory in 2009 amounted to EUR 57,878 thousands compared to
EUR 67,979 thousands in 2008. The decrease principally stemmed from lower production volumes due to the decline
in sales. The cost of raw materials and change in inventory as a proportion of revenue from sales of goods marginally
decreased to 46 per cent in 2009 compared to 48 per cent in 2008.
The Group’s employee benefit costs in 2009 amounted to EUR 36,903 thousands compared to EUR 35,307 thousands
in 2008. The difference principally stemmed from the increase in the average number of employees from 640 to 681, with
a portion of the increase counteracted by the contingency measures, including a 10 per cent reduction in management
salaries, introduced as a response to the financial crisis. The employee benefit costs as a proportion of revenue from
sales of goods amounted to 29 per cent in 2009 compared to 25 per cent in 2008.
The Group’s operating expenses in 2009 amounted to EUR 20,944 thousands compared to EUR 24,862 thousands
in 2008. Operating expenses as a proportion of revenue from sales of goods amounted to 16.7 per cent in 2009 and
to 17.5 per cent in 2008. A large portion of the overall decrease in operating expenses is related to cost reductions
initiated due to the decrease in sales, including lower costs for marketing, communication and PR, and other external
consultants.
Depreciation and amortisation amounted to EUR 3,319 thousands in 2009 compared to EUR 3,088 thousands in 2008.
Depreciation and amortisation as a proportion of revenue from sales of goods amounted to 2.6 per cent in 2009 and
to 2.2 per cent in 2008.
Other income amounted to EUR 2,737 thousands in 2009 compared to EUR 2,830 thousands in 2008.
profit before income taxIn 2009, profit before income tax decreased to EUR 8,132 thousands compared to a profit of EUR 13,013 thousands in
2008, primarily as a result of a lower operating result in 2009 and due to a gain on the sale of a subsidiary/associate of
EUR 2,708 thousands in 2008. In 2009 interest expenses – net increased to EUR -1,890 thousands compared to EUR
-1,536 thousands in 2008. Already in 2008 Cavotec saw increased interest expense from acquisition-related debt and
measures taken by the Company to ensure Cavotec uninterrupted access to its credit facilities worldwide. The currency
exchange difference – net was positive in 2009 with EUR 1,070 thousands, compared to a negative effect in 2008 of
EUR -1,477 thousands.
82
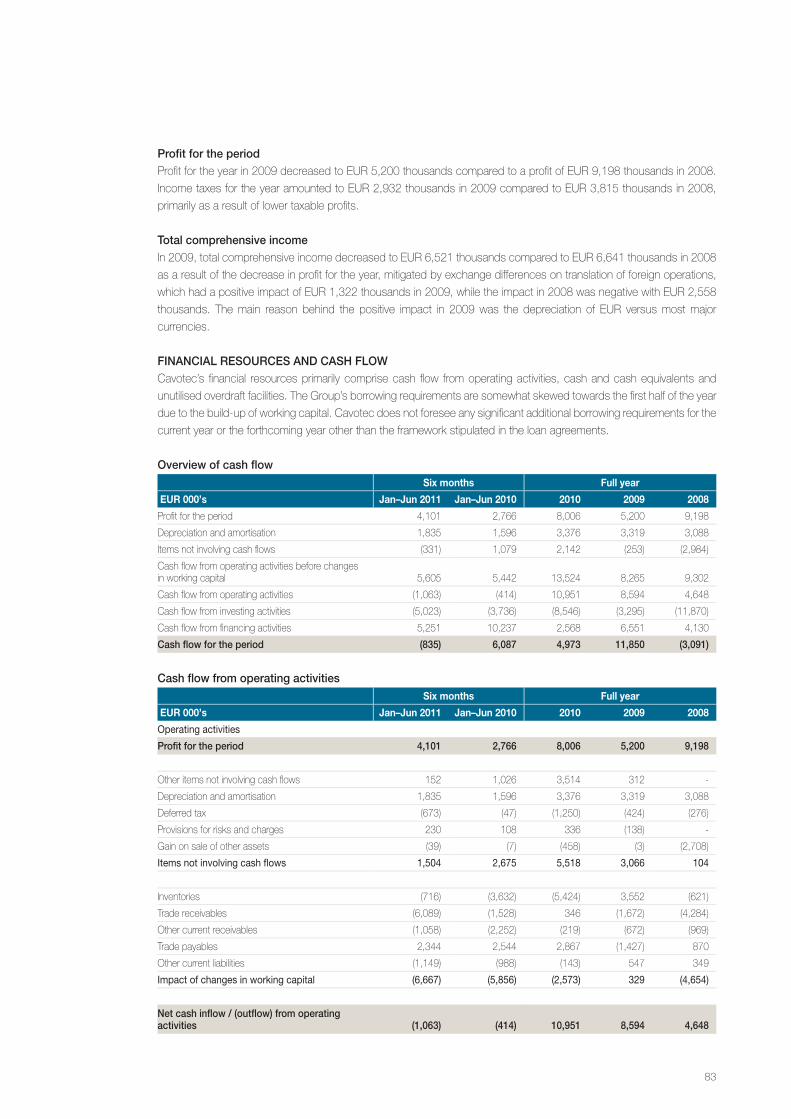
profit for the periodProfit for the year in 2009 decreased to EUR 5,200 thousands compared to a profit of EUR 9,198 thousands in 2008.
Income taxes for the year amounted to EUR 2,932 thousands in 2009 compared to EUR 3,815 thousands in 2008,
primarily as a result of lower taxable profits.
total comprehensive incomeIn 2009, total comprehensive income decreased to EUR 6,521 thousands compared to EUR 6,641 thousands in 2008
as a result of the decrease in profit for the year, mitigated by exchange differences on translation of foreign operations,
which had a positive impact of EUR 1,322 thousands in 2009, while the impact in 2008 was negative with EUR 2,558
thousands. The main reason behind the positive impact in 2009 was the depreciation of EUR versus most major
currencies.
fInancIal reSourceS and caSh flowCavotec’s financial resources primarily comprise cash flow from operating activities, cash and cash equivalents and
unutilised overdraft facilities. The Group’s borrowing requirements are somewhat skewed towards the first half of the year
due to the build-up of working capital. Cavotec does not foresee any significant additional borrowing requirements for the
current year or the forthcoming year other than the framework stipulated in the loan agreements.
overview of cash flowSix months Full year
EUR 000’s Jan–Jun 2011 Jan–Jun 2010 2010 2009 2008
Profit for the period 4,101 2,766 8,006 5,200 9,198
Depreciation and amortisation 1,835 1,596 3,376 3,319 3,088
Items not involving cash flows (331) 1,079 2,142 (253) (2,984)
Cash flow from operating activities before changes in working capital
5,605
5,442 13,524 8,265 9,302
Cash flow from operating activities (1,063) (414) 10,951 8,594 4,648
Cash flow from investing activities (5,023) (3,736) (8,546) (3,295) (11,870)
Cash flow from financing activities 5,251 10,237 2,568 6,551 4,130
cash flow for the period (835) 6,087 4,973 11,850 (3,091)
cash flow from operating activitiesSix months Full year
EUR 000’s Jan–Jun 2011 Jan–Jun 2010 2010 2009 2008
Operating activities
profit for the period 4,101 2,766 8,006 5,200 9,198
Other items not involving cash flows 152 1,026 3,514 312 -
Depreciation and amortisation 1,835 1,596 3,376 3,319 3,088
Deferred tax (673) (47) (1,250) (424) (276)
Provisions for risks and charges 230 108 336 (138) -
Gain on sale of other assets (39) (7) (458) (3) (2,708)
Items not involving cash flows 1,504 2,675 5,518 3,066 104
Inventories (716) (3,632) (5,424) 3,552 (621)
Trade receivables (6,089) (1,528) 346 (1,672) (4,284)
Other current receivables (1,058) (2,252) (219) (672) (969)
Trade payables 2,344 2,544 2,867 (1,427) 870
Other current liabilities (1,149) (988) (143) 547 349
Impact of changes in working capital (6,667) (5,856) (2,573) 329 (4,654)
net cash inflow / (outflow) from operating activities (1,063) (414) 10,951 8,594 4,648
83
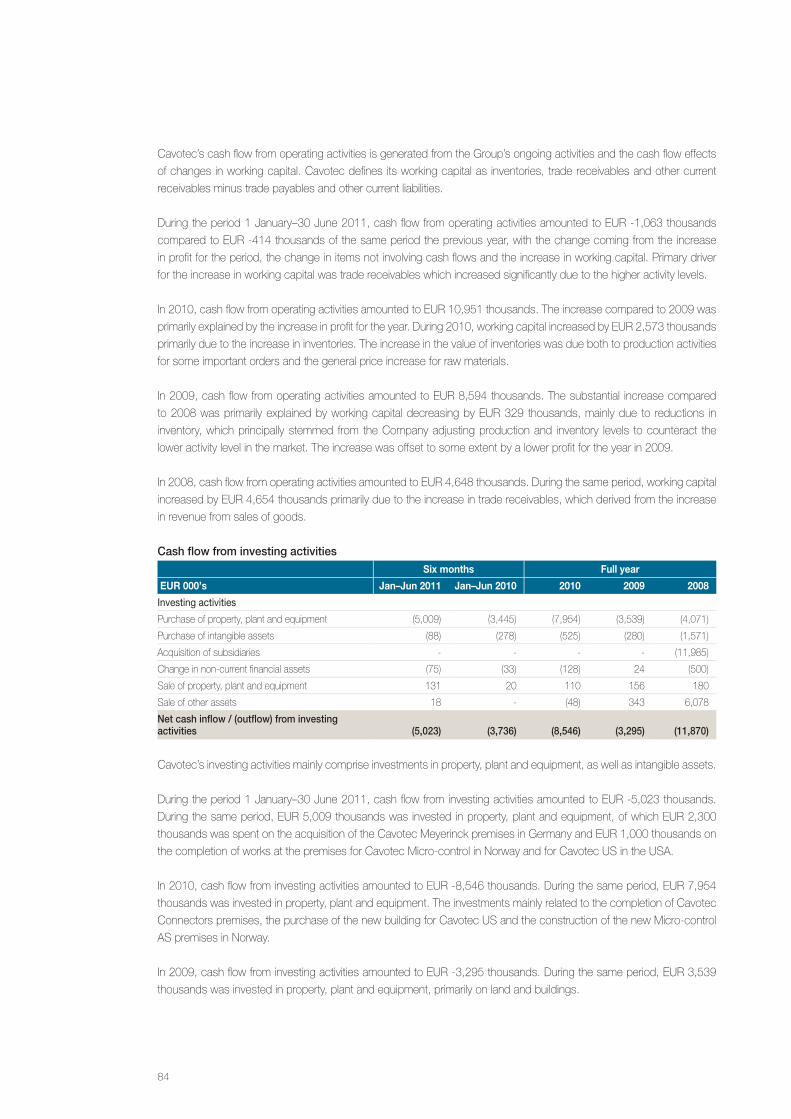
Cavotec’s cash flow from operating activities is generated from the Group’s ongoing activities and the cash flow effects
of changes in working capital. Cavotec defines its working capital as inventories, trade receivables and other current
receivables minus trade payables and other current liabilities.
During the period 1 January–30 June 2011, cash flow from operating activities amounted to EUR -1,063 thousands
compared to EUR -414 thousands of the same period the previous year, with the change coming from the increase
in profit for the period, the change in items not involving cash flows and the increase in working capital. Primary driver
for the increase in working capital was trade receivables which increased significantly due to the higher activity levels.
In 2010, cash flow from operating activities amounted to EUR 10,951 thousands. The increase compared to 2009 was
primarily explained by the increase in profit for the year. During 2010, working capital increased by EUR 2,573 thousands
primarily due to the increase in inventories. The increase in the value of inventories was due both to production activities
for some important orders and the general price increase for raw materials.
In 2009, cash flow from operating activities amounted to EUR 8,594 thousands. The substantial increase compared
to 2008 was primarily explained by working capital decreasing by EUR 329 thousands, mainly due to reductions in
inventory, which principally stemmed from the Company adjusting production and inventory levels to counteract the
lower activity level in the market. The increase was offset to some extent by a lower profit for the year in 2009.
In 2008, cash flow from operating activities amounted to EUR 4,648 thousands. During the same period, working capital
increased by EUR 4,654 thousands primarily due to the increase in trade receivables, which derived from the increase
in revenue from sales of goods.
cash flow from investing activitiesSix months Full year
EUR 000’s Jan–Jun 2011 Jan–Jun 2010 2010 2009 2008
Investing activities
Purchase of property, plant and equipment (5,009) (3,445) (7,954) (3,539) (4,071)
Purchase of intangible assets (88) (278) (525) (280) (1,571)
Acquisition of subsidiaries - - - - (11,985)
Change in non-current financial assets (75) (33) (128) 24 (500)
Sale of property, plant and equipment 131 20 110 156 180
Sale of other assets 18 - (48) 343 6,078
net cash inflow / (outflow) from investing activities (5,023)
(3,736) (8,546) (3,295) (11,870)
Cavotec’s investing activities mainly comprise investments in property, plant and equipment, as well as intangible assets.
During the period 1 January–30 June 2011, cash flow from investing activities amounted to EUR -5,023 thousands.
During the same period, EUR 5,009 thousands was invested in property, plant and equipment, of which EUR 2,300
thousands was spent on the acquisition of the Cavotec Meyerinck premises in Germany and EUR 1,000 thousands on
the completion of works at the premises for Cavotec Micro-control in Norway and for Cavotec US in the USA.
In 2010, cash flow from investing activities amounted to EUR -8,546 thousands. During the same period, EUR 7,954
thousands was invested in property, plant and equipment. The investments mainly related to the completion of Cavotec
Connectors premises, the purchase of the new building for Cavotec US and the construction of the new Micro-control
AS premises in Norway.
In 2009, cash flow from investing activities amounted to EUR -3,295 thousands. During the same period, EUR 3,539
thousands was invested in property, plant and equipment, primarily on land and buildings.
84
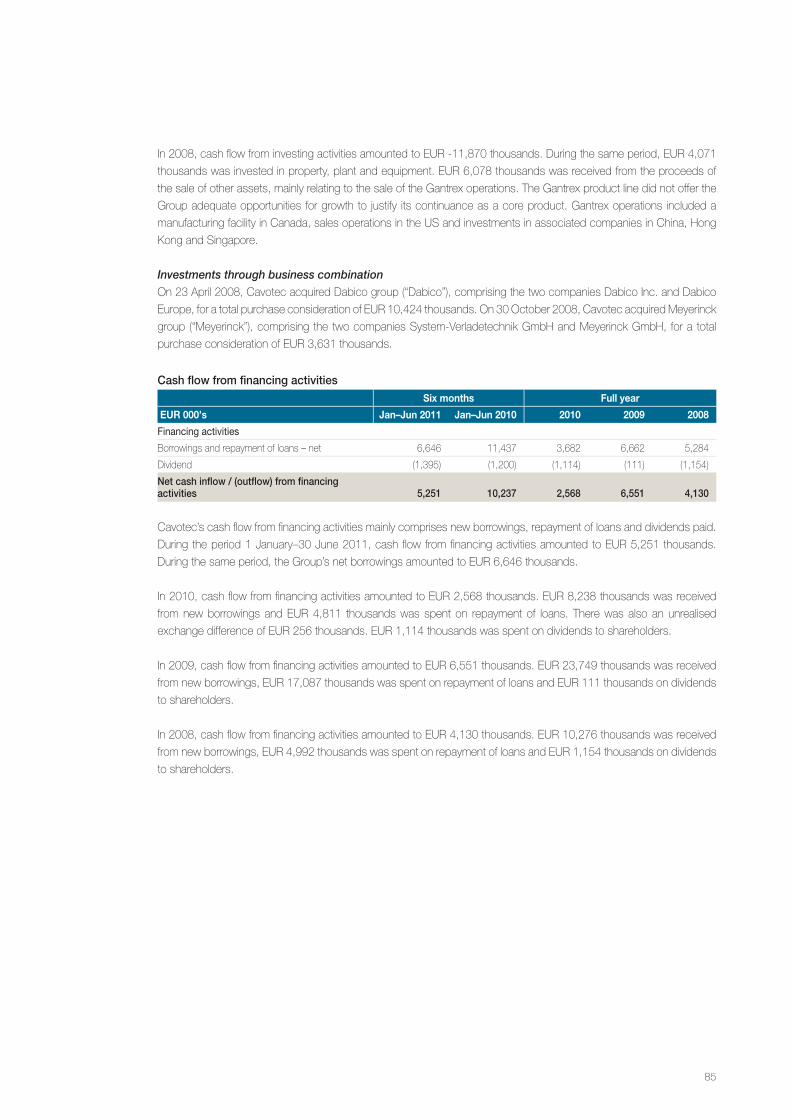
In 2008, cash flow from investing activities amounted to EUR -11,870 thousands. During the same period, EUR 4,071
thousands was invested in property, plant and equipment. EUR 6,078 thousands was received from the proceeds of
the sale of other assets, mainly relating to the sale of the Gantrex operations. The Gantrex product line did not offer the
Group adequate opportunities for growth to justify its continuance as a core product. Gantrex operations included a
manufacturing facility in Canada, sales operations in the US and investments in associated companies in China, Hong
KongandSingapore.
Investments through business combination On 23 April 2008, Cavotec acquired Dabico group (“Dabico”), comprising the two companies Dabico Inc. and Dabico
Europe, for a total purchase consideration of EUR 10,424 thousands. On 30 October 2008, Cavotec acquired Meyerinck
group (“Meyerinck”), comprising the two companies System-Verladetechnik GmbH and Meyerinck GmbH, for a total
purchase consideration of EUR 3,631 thousands.
cash flow from financing activities Six months Full year
EUR 000’s Jan–Jun 2011 Jan–Jun 2010 2010 2009 2008
financing activities
Borrowings and repayment of loans – net 6,646 11,437 3,682 6,662 5,284
Dividend (1,395) (1,200) (1,114) (111) (1,154)
net cash inflow / (outflow) from financing activities 5,251 10,237 2,568 6,551
4,130
Cavotec’s cash flow from financing activities mainly comprises new borrowings, repayment of loans and dividends paid.
During the period 1 January–30 June 2011, cash flow from financing activities amounted to EUR 5,251 thousands.
During the same period, the Group’s net borrowings amounted to EUR 6,646 thousands.
In 2010, cash flow from financing activities amounted to EUR 2,568 thousands. EUR 8,238 thousands was received
from new borrowings and EUR 4,811 thousands was spent on repayment of loans. There was also an unrealised
exchange difference of EUR 256 thousands. EUR 1,114 thousands was spent on dividends to shareholders.
In 2009, cash flow from financing activities amounted to EUR 6,551 thousands. EUR 23,749 thousands was received
from new borrowings, EUR 17,087 thousands was spent on repayment of loans and EUR 111 thousands on dividends
to shareholders.
In 2008, cash flow from financing activities amounted to EUR 4,130 thousands. EUR 10,276 thousands was received
from new borrowings, EUR 4,992 thousands was spent on repayment of loans and EUR 1,154 thousands on dividends
to shareholders.
85
InveStmentScurrent investmentsApproximately one third of the Group’s current investments stem from maintenance and purchase of production
equipment, which is primarily financed through external borrowed funds. Cavotec’s major investments over the first half
2011 consisted of the acquisition of the Cavotec Meyerinck premises and the completion of works started in 2010 on
the premises of Cavotec Micro-control in Norway and of Cavotec US in the USA. These investments were financed
primarily through external borrowed funds.
future investmentsManagement assesses that future investment needs for property, plant and equipment related to maintenance will be in
line with historical levels, while there will be additional investments related to expansion due to the increased production
levels. These investments will be financed through a mix of operational cash flow and external funds. Cavotec has
entered into an agreement to acquire new premises for Cavotec Fladung in Germany. The purchase is expected to be
completed in March 2012 and will be financed through external funds.
tangIBle non-current aSSetSAs at 31 December 2010 the net book value of Cavotec’s tangible non-current assets amounted to EUR 20,260
thousands, of which financial leasing amounted to EUR 468 thousands relating to machinery and equipment. The
tangible non-current assets consisted of land and buildings amounting to EUR 15,719 thousands, plant and equipment
amounting to EUR 3,768 thousands and fixtures and fittings amounting to EUR 772 thousands. As at 31 December
2010 Cavotec’s land and buildings were burdened by mortgages or similar items amounting to EUR 3,740 thousands.
The net book value of the tangible fixed assets as at 30 June 2011 increased to EUR 23,517 thousands. The Group
decides on a case by case basis whether to rent or own its premises.
For further information about tangible non-current assets, please see note 14 on page 168 of this Prospectus.
IntangIBle non-current aSSetSAs at 31 December 2010, the net book value of Cavotec’s intangible non-current assets amounted to EUR 50,739
thousands and consisted of research and development for EUR 1,625 thousands, patents and trademarks for EUR
4,330 thousands and goodwill for EUR 44,784 thousands. During the period between 2008 and 2010, and during the
period 1 January–30 June 2011, the Group did not complete any company acquisitions and performed no impairments
of goodwill. The changes to the value of goodwill during the period refer to changes in currency exchange rates. In 2008
Cavotec acquired Dabico and Meyerinck. Purchase of goodwill in 2008 amounted to EUR 11,985 thousands. The net
book value of the intangible fixed assets as at 30 June 2011 decreased to EUR 49,461 thousands.
For further information about intangible non-current assets, please see note 15 on page 169 of this Prospectus.
SenSItIvIty analySISImportant factors affecting the Group’s profits are described below. Assessment is based on values at the end of the
year and are made based on all other factors remaining unchanged.
Transaction exposure:
•At31December2010,hadtheEURweakened/strengthenedby10percentagainstforeigncurrenciestowhichthe
Group is exposed, with all other variables held constant, profit for the year and the resulting effect on equity would
have been EUR 298 thousands higher/lower (2009: EUR 29 thousands). This is mainly as a result of foreign exchange
gains/losses on translation of financial assets and liabilities denominated in currencies other than the EUR and in
respect of operations in non-EUR jurisdictions for financial assets and liabilities not in their local currency.
Translation exposure:
•At31December2010,hadtheEURweakened/strengthenedby10percentagainstallforeigncurrenciestowhich
the Group is exposed, with all other variables held constant, Cavotec estimates that total comprehensive income for
the period would have been approximately EUR 4,000 thousands higher/lower.
86
Interest rate exposure:
•Theimpactofa1percentincrease/decreaseininterestrateswouldin2010haveresultedinadecrease/increaseon
profit for the year of EUR 208 thousands (2009: EUR 178 thousands). Trade payables, trade receivables and other
financial instruments do not present a material exposure to interest rate volatility.
development SInce the laSt reportIng perIod A summary of Cavotec’s performance in the first six months of the current financial year can be found in Cavotec’s
interim report for the period 1 January–30 June 2011 (see the section “Interim report for the period 1 January–30 June
2011”), in addition to this section.
On 5 August 2011, Cavotec announced the successful renegotiation of the EUR 50 Million Term Loan and Revolving
Credit Facilities. On 16 August 2011, Cavotec announced the acquisition of INET, a manufacturer of ground support
equipment (GSE) in the airports sector.
The positive momentum in sales and order intake already noted in Cavotec’s performance throughout the period 1
January–30 June 2011 continued in July, August and September.
Apart from the above, there have been no further important changes in Cavotec’s financial position or market position
since the last reporting period.
future proSpectSIn the future, Cavotec does not intend to give the market economic and/or financial forecasts for its progress.
The Group’s goals and long-term strategies may be found in the section entitled ”Cavotec description”.
87
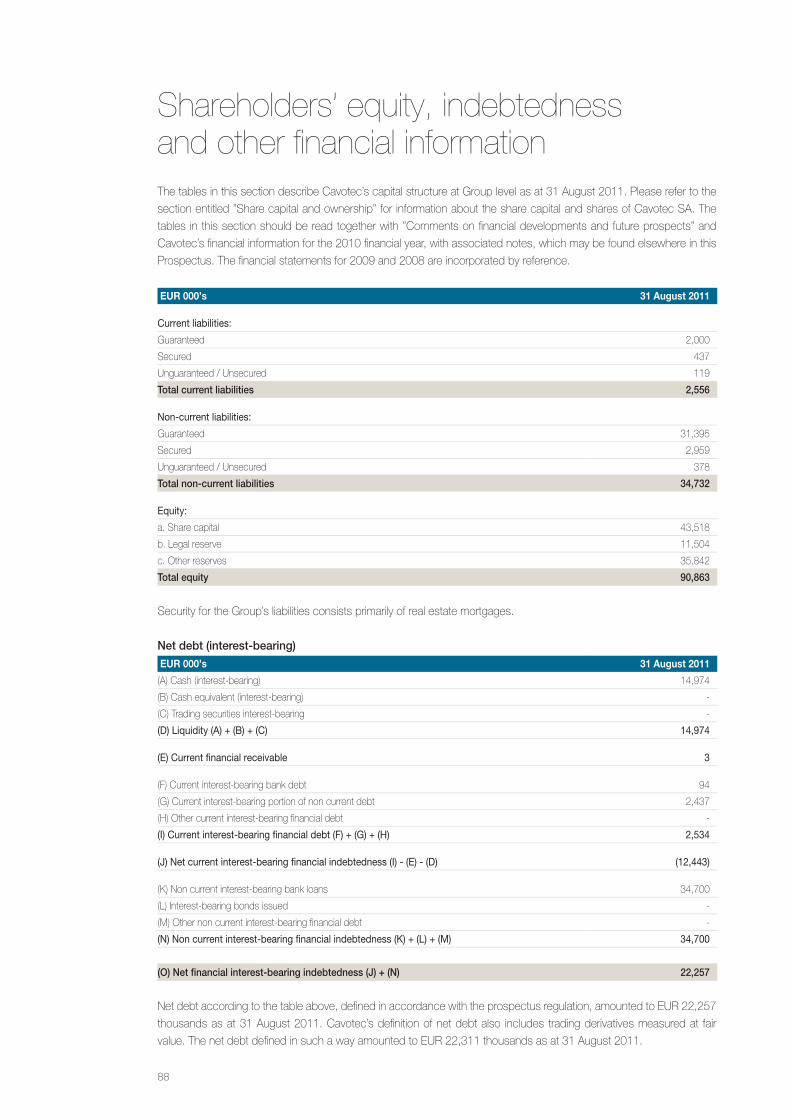
Shareholders’ equity, indebtedness and other financial informationThe tables in this section describe Cavotec’s capital structure at Group level as at 31 August 2011. Please refer to the
section entitled ”Share capital and ownership” for information about the share capital and shares of Cavotec SA. The
tables in this section should be read together with ”Comments on financial developments and future prospects” and
Cavotec’s financial information for the 2010 financial year, with associated notes, which may be found elsewhere in this
Prospectus. The financial statements for 2009 and 2008 are incorporated by reference.
EUR 000’s 31 August 2011
Current liabilities:
Guaranteed 2,000
Secured 437
Unguaranteed / Unsecured 119
total current liabilities 2,556
Non-current liabilities:
Guaranteed 31,395
Secured 2,959
Unguaranteed / Unsecured 378
total non-current liabilities 34,732
equity:
a. Share capital 43,518
b. Legal reserve 11,504
c. Other reserves 35,842
total equity 90,863
Security for the Group’s liabilities consists primarily of real estate mortgages.
net debt (interest-bearing)
EUR 000’s 31 August 2011
(A) Cash (interest-bearing) 14,974
(B) Cash equivalent (interest-bearing) -
(C) Trading securities interest-bearing -
(D) liquidity (A) + (B) + (C) 14,974
(e) Current financial receivable 3
(F) Current interest-bearing bank debt 94
(G) Current interest-bearing portion of non current debt 2,437
(H) Other current interest-bearing financial debt -
(I) Current interest-bearing financial debt (f) + (g) + (H) 2,534
(J) Net current interest-bearing financial indebtedness (I) - (e) - (D) (12,443)
(K)Noncurrentinterest-bearingbankloans 34,700
(L) Interest-bearing bonds issued -
(M) Other non current interest-bearing financial debt -
(N) Non current interest-bearing financial indebtedness (k) + (l) + (M) 34,700
(o) net financial interest-bearing indebtedness (j) + (n) 22,257
Net debt according to the table above, defined in accordance with the prospectus regulation, amounted to EUR 22,257
thousands as at 31 August 2011. Cavotec’s definition of net debt also includes trading derivatives measured at fair
value. The net debt defined in such a way amounted to EUR 22,311 thousands as at 31 August 2011.
88
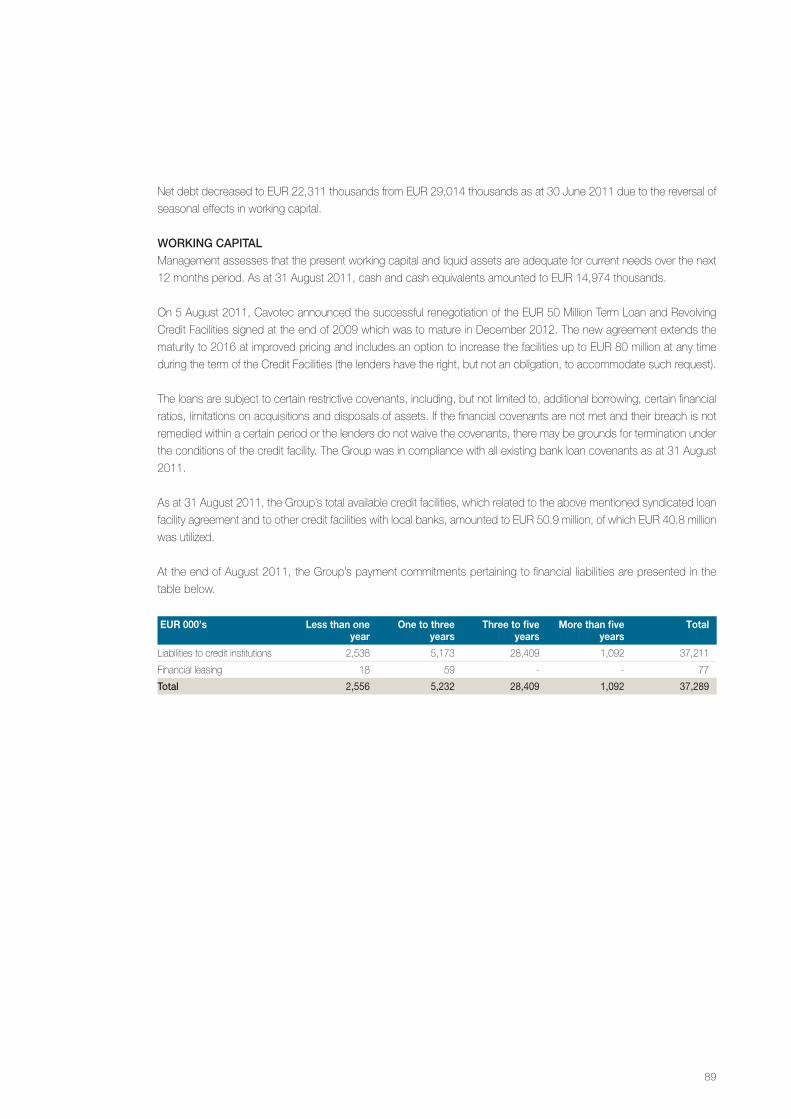
Net debt decreased to EUR 22,311 thousands from EUR 29,014 thousands as at 30 June 2011 due to the reversal of
seasonal effects in working capital.
workIng capItalManagement assesses that the present working capital and liquid assets are adequate for current needs over the next
12 months period. As at 31 August 2011, cash and cash equivalents amounted to EUR 14,974 thousands.
On 5 August 2011, Cavotec announced the successful renegotiation of the EUR 50 Million Term Loan and Revolving
Credit Facilities signed at the end of 2009 which was to mature in December 2012. The new agreement extends the
maturity to 2016 at improved pricing and includes an option to increase the facilities up to EUR 80 million at any time
during the term of the Credit Facilities (the lenders have the right, but not an obligation, to accommodate such request).
The loans are subject to certain restrictive covenants, including, but not limited to, additional borrowing, certain financial
ratios, limitations on acquisitions and disposals of assets. If the financial covenants are not met and their breach is not
remedied within a certain period or the lenders do not waive the covenants, there may be grounds for termination under
the conditions of the credit facility. The Group was in compliance with all existing bank loan covenants as at 31 August
2011.
As at 31 August 2011, the Group’s total available credit facilities, which related to the above mentioned syndicated loan
facility agreement and to other credit facilities with local banks, amounted to EUR 50.9 million, of which EUR 40.8 million
was utilized.
At the end of August 2011, the Group’s payment commitments pertaining to financial liabilities are presented in the
table below.
EUR 000’s Less than one year
One to three years
Three to five years
More than five years
Total
Liabilities to credit institutions 2,538 5,173 28,409 1,092 37,211
Financial leasing 18 59 - - 77
total 2,556 5,232 28,409 1,092 37,289
89
general
Cavotec SA was established in Lugano, Switzerland on 14 June 2011 with an initial share capital of CHF 100,000
fully paid up and divided into 100,000 registered shares. The shares’ quota (par) value was CHF 1.00. The
Company’s shares have been issued in accordance with Swiss law and the shareholders’ rights may only be
altered or modified in accordance with the Swiss Code of Obligations. Each share is entitled to one vote and
carries equal rights on the Company’s assets upon liquidation and distribution of profits. All 100,000 shares
were subscribed for and paid up in cash by Cavotec MSL. Prior to the Scheme of Arrangement, Cavotec SA’s
outstanding shares were consolidated into 64,520 shares and the shares’ quota (par) value was increased to CHF
1.55. The consolidation process induced a share capital increase of CHF 6.00.
As at the date of this Prospectus, Cavotec SA’s share capital amounts to CHF 110,665,691 fully paid up and
divided into 71,397,220 shares of which 64,520 are owned by Cavotec SA with a total nominal value of CHF
100,006 and a book value of CHF 100,006. These shares are kept as treasury shares with the associate rights
suspended.
No participation certificate (“Genusscheine”) has been issued so far. The Articles of Association do not contain
any specific provision with regard to any authorised or contingent capital increase.
The Company’s shares are registered with Euroclear Sweden AB (Box 7822, 103 97 Stockholm, Sweden), which
is the central securities depository and clearing organisation for the shares in accordance with the Swedish
Financial Instruments Accounts Act (1998:1479). The ISIN-code for Cavotec’s shares is CH0136071542.
The shares are not subject to any mandatory take over bid, squeeze-out or sell-out process. No public takeover
bid relating to the Company’s shares has occurred since the Company was established.
certaIn rIghtS aSSocIated wIth the ShareSThe shares carry the right to payment of dividend, for the first time on the record date for distribution which falls
immediately after implementation of the listing. Each shareholder is entitled to a pro rata share of the disposable
profit to the extent that the distribution of such profit to the shareholders is allowable under law and the Articles
of Association. All shares give equal rights to dividends and the Company’s assets and possible surpluses in
the event of liquidation. Decisions about the appropriation of profits are taken at shareholders’ meetings. All
shareholders on the record date adopted by the shareholders’ meeting shall be entitled to dividends. Payments
will be managed by Euroclear Sweden for shareholders that are registered through a securities register held by
Euroclear Sweden and by SIX SIS AG. Dividends are normally distributed to shareholders as a cash sum per share
through Euroclear Sweden or SIX SIS AG, but may also be paid out in kind and not in cash. Dividends are subject
to 5-year prescription rules. Upon prescription, the dividend falls to the Company. Dividends are not cumulative.
There are no restrictions on the right to dividends for shareholders domiciled outside Switzerland. Please refer
to the section “Swiss company law overview” for more information about the rights associated with the shares.
Share capital and ownership
90
development of the Share capItalThe table below sets forth the changes in the share capital of Cavotec SA since the incorporation of the Company.
It also sets out the development of the share capital in Cavotec MSL Holdings Ltd.
cavotec mSl holdings ltd.
Description Date Shares Share capital (NZD)
Reverse acquisition with Cavotec Group 5 January 2007 63,632,700 199,889,947
Acquisition of INET 17 August 2011 71,332,700 225,299,947
cavotec Sa
Description Date Shares Share capital (CHF)
Incorporation 14 June 2011 100,000 100,000
Consolidation of shares - step 1 29 September 2011 100,006 100,006
Consolidation of shares - step 2 4 October 2011 64,520 100,006
Scheme of Arrangement 4 October 2011 71,397,220 110,665,691
Listing on NASDAQ OMX Stockholm 19 October 2011 71,397,220 110,665,691
The capital increase implemented in order to comply with and execute the Scheme of Arrangement occurred by
way of contribution in kind. Cavotec SA, as of Contribution Agreement dated 3 October 2011, assumed from the
shareholders in Cavotec MSL, the option right in 71,332,700 registered shares of Cavotec MoorMaster, for a total
amount of CHF 112,705,666, accepted by the Company for this amount. This capital increase was registered
with the relevant Swiss authority on 4 October 2011. CHF 110,565,685 have been imputed on the share capital,
whereas CHF 2,139,981 as agio, for an equivalent to the contributor of 71,332,700 fully paid up registered shares with a
nominal value of CHF 1.55 each of the Company.
dIlutIon In termS of ShareholdIngCavotec has as at the date of this Prospectus no outstanding convertible debentures, warrants or other financial
instruments, which would if they were exercised imply a dilutive effect for the shareholders of the Company.
ownerShIp Structure prIor to the offerIng The number of shareholders in Cavotec MSL was, as at 29 September 2011, approximately 1,000. This was the
record date for the Scheme of Arrangement (which is further explained in the section “Scheme of Arrangement”).
Following completion of the Scheme of Arrangement on 3 October 2011 the shareholder structure in Cavotec SA
was the same as it was in Cavotec MSL. The table on page 93 sets forth the major shareholders in the Company
as at this date as well as the ownership of the Board of Directors and senior management.
ShareholderS’ agreementSTo the knowledge of the Board of Directors in Cavotec, there are no shareholders’ agreements or similar
arrangements between the shareholders of Cavotec, aiming at creating a common influence over the Company,
or that may result in a change of control of the Company.
reStrIctIonS on the dISpoSal of holdIngS of the company’S ShareSThe shares in Cavotec are not subject to any transfer restrictions.
91
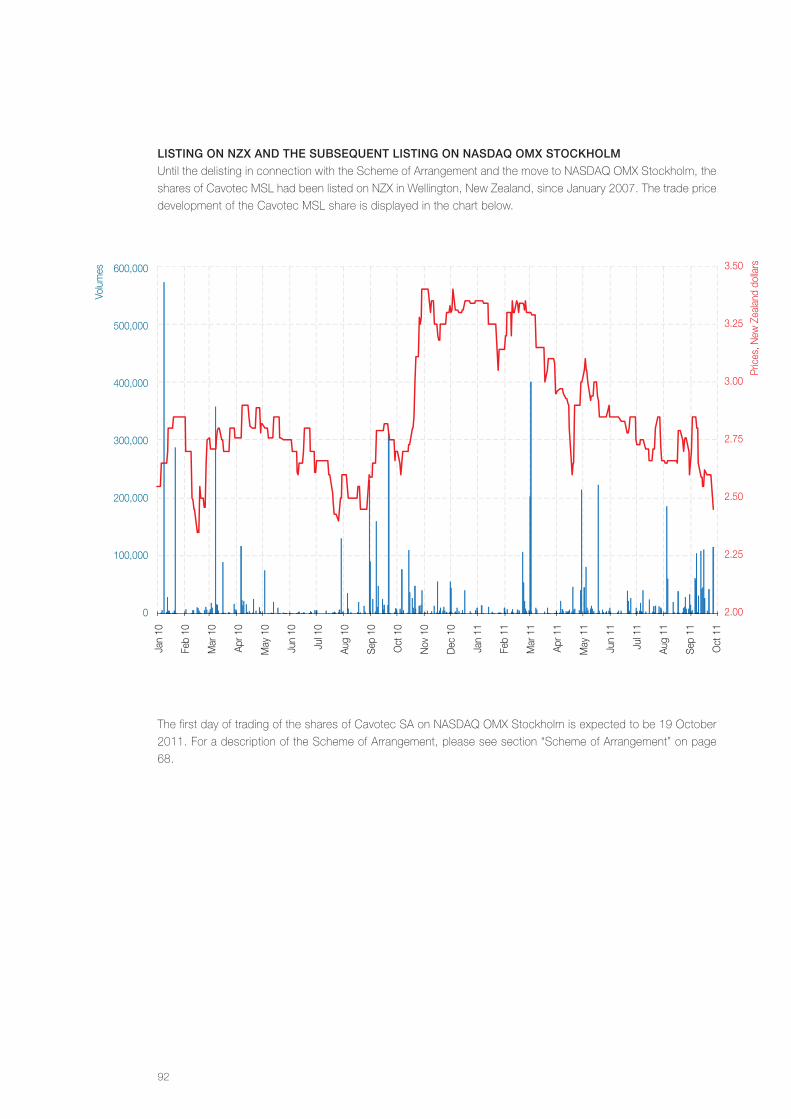
lIStIng on nZx and the SuBSeQuent lIStIng on naSdaQ omx StockholmUntil the delisting in connection with the Scheme of Arrangement and the move to NASDAQ OMX Stockholm, the
shares of Cavotec MSL had been listed on NZX in Wellington, New Zealand, since January 2007. The trade price
development of the Cavotec MSL share is displayed in the chart below.
The first day of trading of the shares of Cavotec SA on NASDAQ OMX Stockholm is expected to be 19 October
2011. For a description of the Scheme of Arrangement, please see section “Scheme of Arrangement” on page
68.
600,000
500,000
400,000
300,000
200,000
100,000
0
Volu
mes 3.50
3.25
3.00
2.75
2.50
2.25
2.00
Pric
es, N
ew Z
eala
nd d
olla
rs
Jan
10
Feb
10
Mar
10
Apr 1
0
May
10
Jun
10
Jul 1
0
Aug
10
Sep
10
Oct
10
Nov
10
Dec
10
Jan
11
Feb
11
Mar
11
Apr 1
1
May
11
Jun
11
Jul 1
1
Aug
11
Sep
11
Oct
11
92
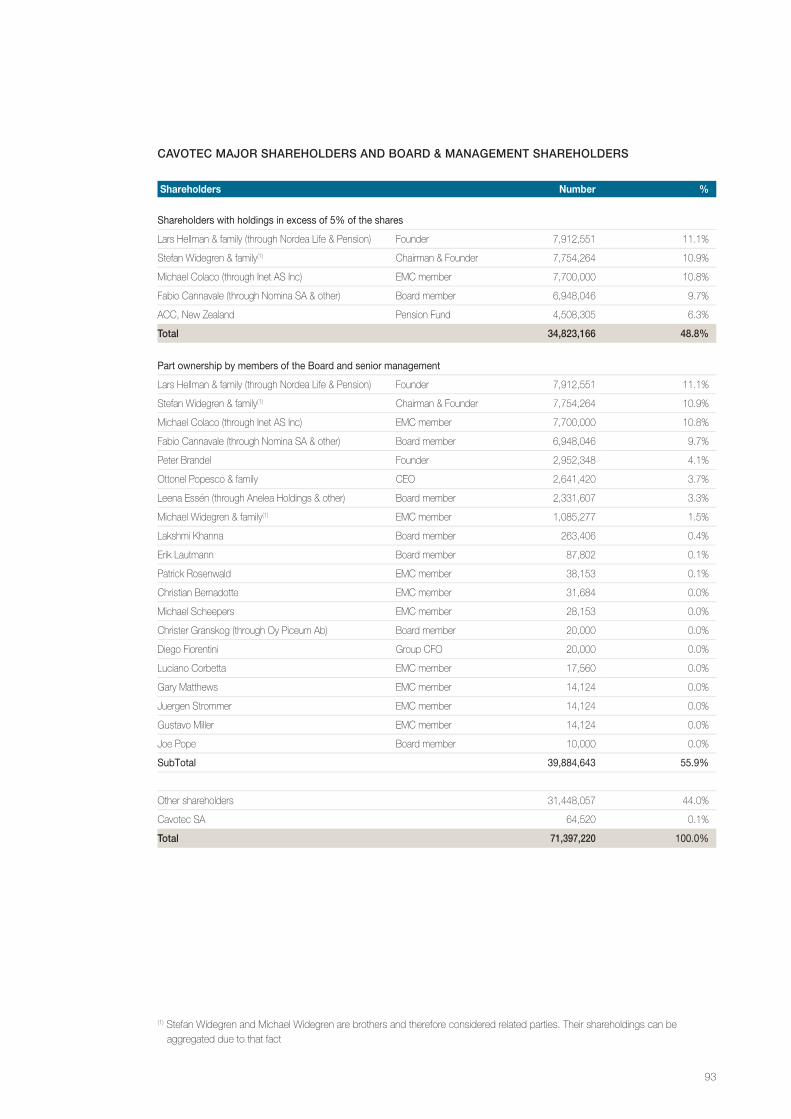
(1) Stefan Widegren and Michael Widegren are brothers and therefore considered related parties. Their shareholdings can be aggregated due to that fact
cavotec major ShareholderS and Board & management ShareholderS
Shareholders Number %
Shareholders with holdings in excess of 5% of the shares
Lars Hellman & family (through Nordea Life & Pension) Founder 7,912,551 11.1%
Stefan Widegren & family(1) Chairman & Founder 7,754,264 10.9%
Michael Colaco (through Inet AS Inc) EMC member 7,700,000 10.8%
Fabio Cannavale (through Nomina SA & other) Board member 6,948,046 9.7%
ACC, New Zealand Pension Fund 4,508,305 6.3%
total 34,823,166 48.8%
Part ownership by members of the Board and senior management
Lars Hellman & family (through Nordea Life & Pension) Founder 7,912,551 11.1%
Stefan Widegren & family(1) Chairman & Founder 7,754,264 10.9%
Michael Colaco (through Inet AS Inc) EMC member 7,700,000 10.8%
Fabio Cannavale (through Nomina SA & other) Board member 6,948,046 9.7%
Peter Brandel Founder 2,952,348 4.1%
Ottonel Popesco & family CEO 2,641,420 3.7%
Leena Essén (through Anelea Holdings & other) Board member 2,331,607 3.3%
Michael Widegren & family(1) EMC member 1,085,277 1.5%
LakshmiKhanna Board member 263,406 0.4%
Erik Lautmann Board member 87,802 0.1%
Patrick Rosenwald EMC member 38,153 0.1%
Christian Bernadotte EMC member 31,684 0.0%
Michael Scheepers EMC member 28,153 0.0%
Christer Granskog (through Oy Piceum Ab) Board member 20,000 0.0%
Diego Fiorentini Group CFO 20,000 0.0%
Luciano Corbetta EMC member 17,560 0.0%
Gary Matthews EMC member 14,124 0.0%
Juergen Strommer EMC member 14,124 0.0%
Gustavo Miller EMC member 14,124 0.0%
Joe Pope Board member 10,000 0.0%
Subtotal 39,884,643 55.9%
Other shareholders 31,448,057 44.0%
Cavotec SA 64,520 0.1%
total 71,397,220 100.0%
93
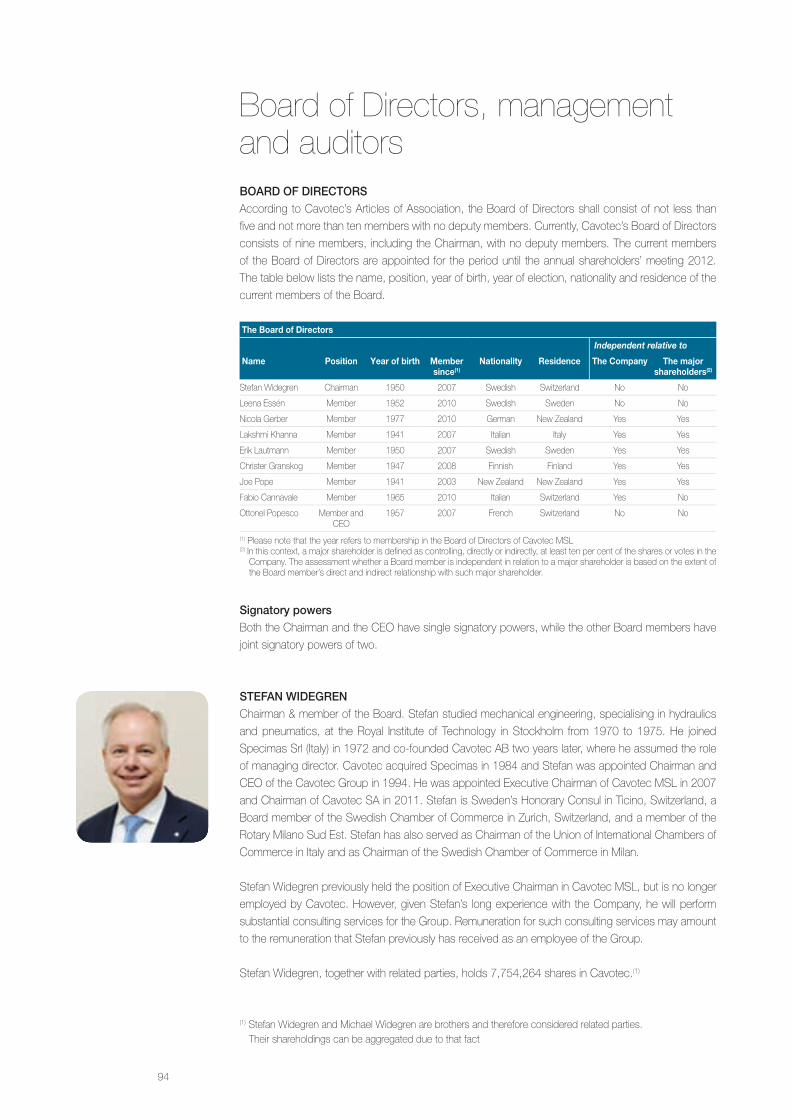
Board of Directors, management and auditorsBoard of dIrectorSAccording to Cavotec’s Articles of Association, the Board of Directors shall consist of not less than
five and not more than ten members with no deputy members. Currently, Cavotec’s Board of Directors
consists of nine members, including the Chairman, with no deputy members. The current members
of the Board of Directors are appointed for the period until the annual shareholders’ meeting 2012.
The table below lists the name, position, year of birth, year of election, nationality and residence of the
current members of the Board.
The Board of Directors
Independent relative to
Name Position Year of birth Member since(1)
Nationality Residence The Company The major shareholders(2)
Stefan Widegren Chairman 1950 2007 Swedish Switzerland No No
Leena Essén Member 1952 2010 Swedish Sweden No No
Nicola Gerber Member 1977 2010 German New Zealand Yes Yes
LakshmiKhanna Member 1941 2007 Italian Italy Yes Yes
Erik Lautmann Member 1950 2007 Swedish Sweden Yes Yes
Christer Granskog Member 1947 2008 Finnish Finland Yes Yes
Joe Pope Member 1941 2003 New Zealand New Zealand Yes Yes
Fabio Cannavale Member 1965 2010 Italian Switzerland Yes No
Ottonel Popesco Member and CEO
1957 2007 French Switzerland No No
(1) Please note that the year refers to membership in the Board of Directors of Cavotec MSL(2) In this context, a major shareholder is defined as controlling, directly or indirectly, at least ten per cent of the shares or votes in the
Company. The assessment whether a Board member is independent in relation to a major shareholder is based on the extent of the Board member’s direct and indirect relationship with such major shareholder.
Signatory powersBoth the Chairman and the CEO have single signatory powers, while the other Board members have
joint signatory powers of two.
Stefan wIdegrenChairman & member of the Board. Stefan studied mechanical engineering, specialising in hydraulics
and pneumatics, at the Royal Institute of Technology in Stockholm from 1970 to 1975. He joined
Specimas Srl (Italy) in 1972 and co-founded Cavotec AB two years later, where he assumed the role
of managing director. Cavotec acquired Specimas in 1984 and Stefan was appointed Chairman and
CEO of the Cavotec Group in 1994. He was appointed Executive Chairman of Cavotec MSL in 2007
and Chairman of Cavotec SA in 2011. Stefan is Sweden’s Honorary Consul in Ticino, Switzerland, a
Board member of the Swedish Chamber of Commerce in Zurich, Switzerland, and a member of the
Rotary Milano Sud Est. Stefan has also served as Chairman of the Union of International Chambers of
Commerce in Italy and as Chairman of the Swedish Chamber of Commerce in Milan.
Stefan Widegren previously held the position of Executive Chairman in Cavotec MSL, but is no longer
employed by Cavotec. However, given Stefan’s long experience with the Company, he will perform
substantial consulting services for the Group. Remuneration for such consulting services may amount
to the remuneration that Stefan previously has received as an employee of the Group.
Stefan Widegren, together with related parties, holds 7,754,264 shares in Cavotec.(1)
(1) Stefan Widegren and Michael Widegren are brothers and therefore considered related parties. Their shareholdings can be aggregated due to that fact
94

leena eSSénMember of the Board. Leena holds a BSc in Economics and Business from the Stockholm School
of Economics. Following her studies and prior to joining Cavotec in 1990, Leena worked as CFO
for several Swedish companies, most notably Gylling AB and PA Consulting Group. She has been
Cavotec’s group financial controller for nearly 20 years, overseeing the implementation of new financial
reporting systems and creating a transparent and accurate financial structure for the Group.
In the past five years, Leena has been, but is no longer, a member of the Board of Directors of
Rationell Parkerings Service AB. Leena was previously controller and a part of the management team
of Cavotec MSL. Leena is still employed by the Cavotec Group but in a non-executive position.
Leena Essén holds 588,686 shares in Cavotec personally, 1,565,821 shares through Anelea Holdings
Ltd. (of which Leena holds 10 per cent of the shares) and 177,100 shares through Anelea Sverige AB
(a wholly owned subsidiary of Anelea Holdings Ltd.).
nIcola gerBerMember of the Board. Nicola holds a BA (Hons) in Business Management from University of
Westminster. She is a sales and business developer as well as a marketing and product manager
in the IT sector, and she currently works for Cisco Systems Ltd. Nicola has specialised in business
development across European markets, and since 2008 across Asia Pacific markets based in New
Zealand.
Nicola Gerber does not hold any shares or warrants in Cavotec.
lakShmI khanna Member of the Board. Lakshmi holds a BA in Mathematics from Punjab University, he is qualified
as a chartered accountant in the United Kingdom, a fellowmember of the Institute of Chartered
Accountants in England and Wales, a member of the Non Executive Directors Special Interest Group
of the Institute of Chartered Accountants in England and Wales, a member of the Valuations Special
Interest Group of the Institute, a member of the Financial Reporting Faculty of the Institute and an
associate member of the Institute of Chartered Accountants of India. Lakshmi has had a career with
PricewaterhouseCoopers in Italy, stretching from 1966 to his retirement as a Partner in 2001. He has
been responsible for client services for the Italian operations of multinational entities including United
Technologies, General Foods, Trust House Forte and IBM amongst others. Lakshmi has also been
Chairman of PriceWaterhouse Management Consultants in Italy, President of the Rotary Club of Milan,
President of the World Community Service Commission of Rotary (Lombardy) and Advisor to the Joint
Task Force Confederation of Italian Industry and the Confederation of Indian Industry. He is a member
of the Supervisory Board of Progetti Industriali SpA.
Lakshmi also renders consulting services to companies on a selective basis. These services cover
areas such as strategy, finance, accounting, financial reporting and therewith related services. Lakshmi
also conducts limited consulting services for the Group.
Inthepastfiveyears,LakshmiKhannahasbeen,butisnolonger,DeputyChairmanandcompany
director of Dell’Orto India Private Ltd., company director and independent consultant of Para SpA &
International Spinning India Private Ltd. and an independent consultant of Dell’Orto SpA.
LakshmiKhannaholds263,406sharesinCavotec.
95

erIk lautmannMember of the Board. Erik holds a BSc from the Stockholm School of Economics. Erik´s professional
career included serving as group managing director of Jetpak Group AB (2002-2011), managing
director of Alfaskop AB (2000-2001), Regional Director DHL Nordic countries (1991-2000) and
managing director of Catella AB (1987-1991). Erik is chairman of PAXXO AB, Board member of Jetpak
Group AB and Swedish Entrepreneurship Forum. Erik is a fellow of the Royal Swedish Academy of
Engineering Sciences (IVA), chairman of the Board of IVA’s Business Executives Council and member
of IVA’s Board. Erik conducts limited consultancy services for the Group.
Erik Lautmann holds 87,802 shares in Cavotec.
chrISter granSkogMember of the Board. Christer holds an MSc in Industrial Management and Information Systems from
HelsinkiUniversityofTechnology.Christer isformerpresidentandCEOofKalmar Industries(1998–
2007). He has also worked as senior executive vice president of Partek Corporation and president of
Partek Cargotek AB (1997–1998), president and CEO of Sisu Corporation (1994–1997) and president
and CEO of Valmet Automation Oy (1990–1994). He currently serves as Chairman and CEO of Oy
Piceum Ab, of Patria Oyj and Lännen Tractors Oy while also serving as Deputy Chairman of VR Group
Oy. He is also a member of the Board of Directors of Actiw Oy and Sarlin Oy, a senior industrial adviser
for EQT Partners and a member of the Academy of Technical Sciences in Finland.
In the past five years, Christer Granskog has been, but is no longer, Deputy Chairman of the Board of
DirectorsofRautaruukkiOyiandamemberoftheBoardofDirectorsofKalmarIndustriesAB.
Christer Granskog holds 20,000 shares in Cavotec (through his wholly-owned holding company oy
Piceum ab).
joe popeMember of the Board. Joe has been Chief Executive and Director of several major organisations, including
12 years as CEO of ENZA and ten years on the Board at TradeNZ, culminating in his appointment as
Chairman. Currently, he is Chairman of Maxi Buoys Ltd., Revera Ltd. and Team Talk Ltd. as well as a
Trustee of Jayar Trust. He is also an Accredited Fellow of the Institute of Directors. Joe’s contribution to
business creation in New Zealand was recognised by the Governor General in the Queen’s Birthday
Honours list of 2006, when he was appointed an Officer of the New Zealand Order of Merit.
In the past five years, Joe Pope has been, but is no longer, a member of the Board of Directors of
Martinborough Vineyard Estates Ltd., Lambton Harbour Management and Chairman of the Board of
Directors of Dow Group Ltd., Horticultural and Food Research Institute of New Zealand Ltd., Wellington
Rugby Football Union Ltd. and Maxibouys Ltd. and Deputy Chairman of the Board of Directors of New
Zealand Symphony Orchestra Ltd.
Joe Pope holds 10,000 shares in Cavotec.
faBIo cannavaleMember of the Board. Fabio holds a MSc in Engineering from Politechnic University and an MBA from
INSEAD.HehasservedasastrategyconsultantatMcKinsey&CoandATKearney.Heispresident
of Bravofly and Vulcano Srl and a member of the Board of Directors of Mont SpA, Pies SpA, Iris Srl,
Nomina SA, Consortium Real Estate BV and Roam SpA.
In the past five years, Fabio Cannavale has been, but is no longer a Board member of Nordwall SpA.
Fabio Cannavale holds 6,948,046 shares in Cavotec (through Nomina SA, in which Fabio, together
with related parties, hold 100 per cent of the shares).
96
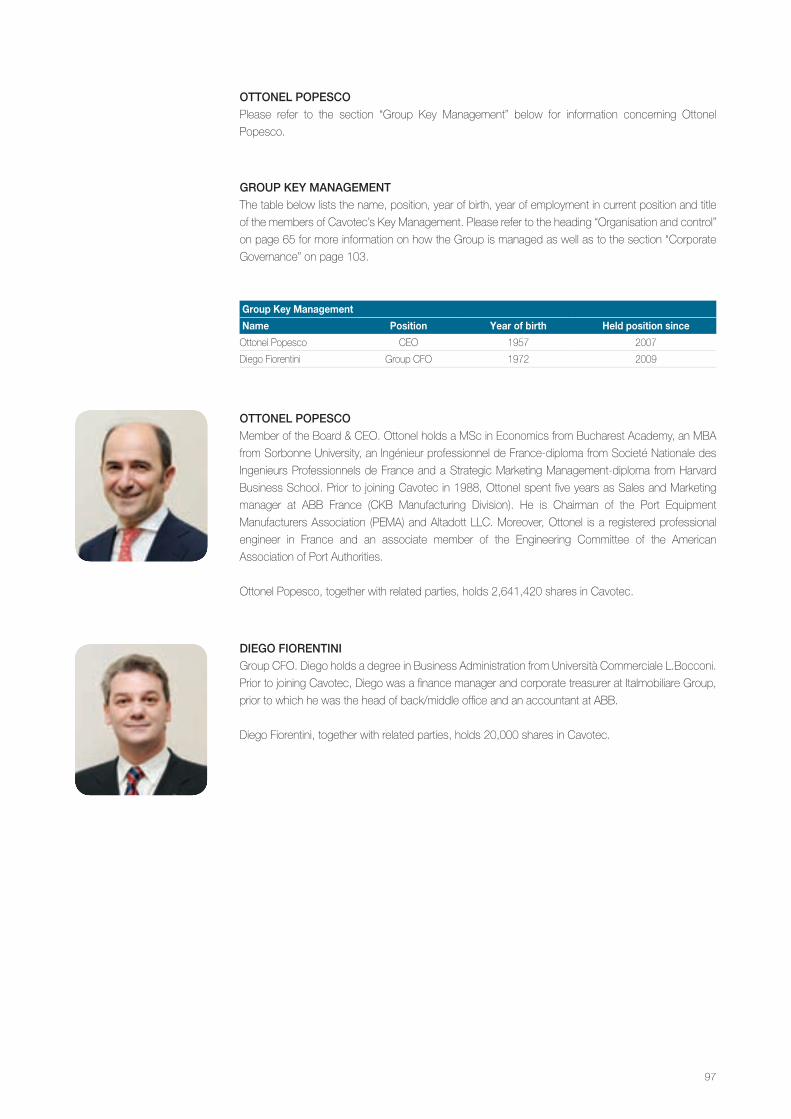
ottonel popeScoPlease refer to the section “Group Key Management” below for information concerning Ottonel
Popesco.
ottonel popeScoMember of the Board & CEO. Ottonel holds a MSc in Economics from Bucharest Academy, an MBA
from Sorbonne University, an Ingénieur professionnel de France-diploma from Societé Nationale des
Ingenieurs Professionnels de France and a Strategic Marketing Management-diploma from Harvard
Business School. Prior to joining Cavotec in 1988, Ottonel spent five years as Sales and Marketing
manager at ABB France (CKB Manufacturing Division). He is Chairman of the Port Equipment
Manufacturers Association (PEMA) and Altadott LLC. Moreover, Ottonel is a registered professional
engineer in France and an associate member of the Engineering Committee of the American
Association of Port Authorities.
Ottonel Popesco, together with related parties, holds 2,641,420 shares in Cavotec.
group key management The table below lists the name, position, year of birth, year of employment in current position and title
ofthemembersofCavotec’sKeyManagement.Pleaserefertotheheading“Organisationandcontrol”
on page 65 for more information on how the Group is managed as well as to the section “Corporate
Governance” on page 103.
Group Key Management
Name Position Year of birth Held position since
Ottonel Popesco CEO 1957 2007
Diego Fiorentini Group CFO 1972 2009
dIego fIorentInI Group CFO. Diego holds a degree in Business Administration from Università Commerciale L.Bocconi.
Prior to joining Cavotec, Diego was a finance manager and corporate treasurer at Italmobiliare Group,
prior to which he was the head of back/middle office and an accountant at ABB.
Diego Fiorentini, together with related parties, holds 20,000 shares in Cavotec.
97
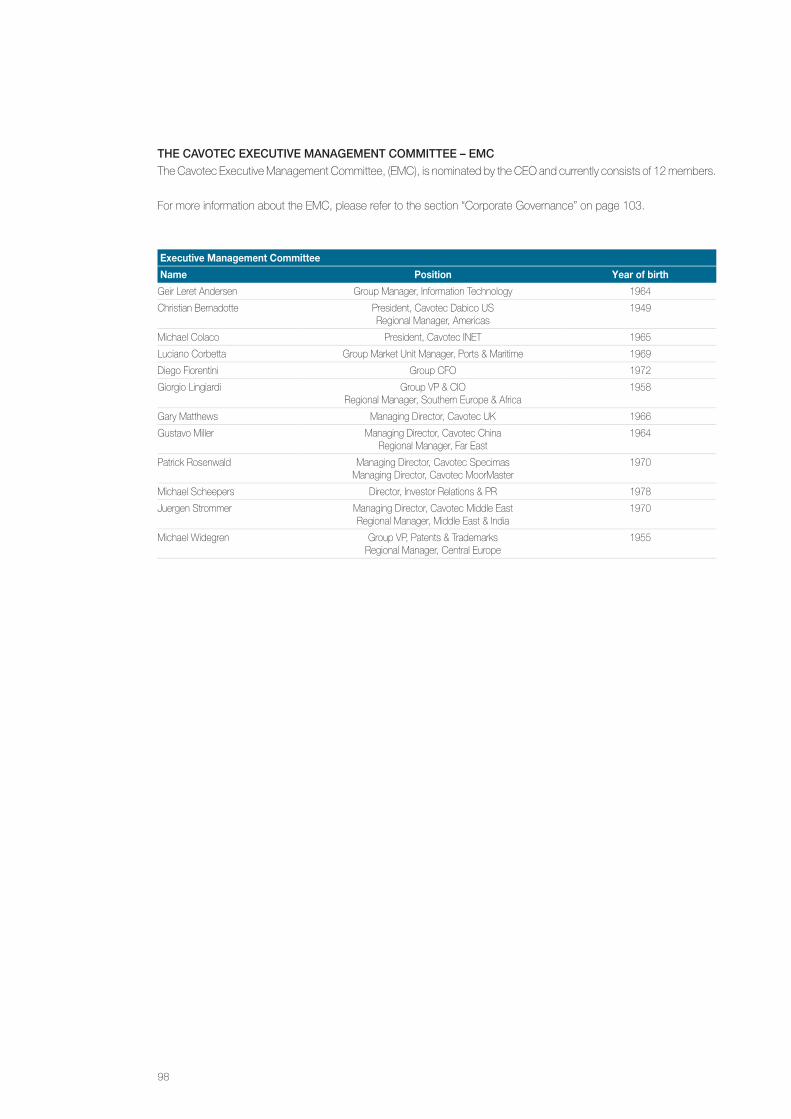
the cavotec executIve management commIttee – emcThe Cavotec Executive Management Committee, (EMC), is nominated by the CEO and currently consists of 12 members.
For more information about the EMC, please refer to the section “Corporate Governance” on page 103.
Executive Management Committee
Name Position Year of birth
Geir Leret Andersen Group Manager, Information Technology 1964
Christian Bernadotte President, Cavotec Dabico USRegional Manager, Americas
1949
Michael Colaco President, Cavotec INET 1965
Luciano Corbetta Group Market Unit Manager, Ports & Maritime 1969
Diego Fiorentini Group CFO 1972
Giorgio Lingiardi Group VP & CIO Regional Manager, Southern Europe & Africa
1958
Gary Matthews ManagingDirector,CavotecUK 1966
Gustavo Miller Managing Director, Cavotec ChinaRegional Manager, Far East
1964
Patrick Rosenwald Managing Director, Cavotec SpecimasManaging Director, Cavotec MoorMaster
1970
Michael Scheepers Director, Investor Relations & PR 1978
Juergen Strommer Managing Director, Cavotec Middle EastRegional Manager, Middle East & India
1970
Michael Widegren Group VP, Patents & TrademarksRegional Manager, Central Europe
1955
98

geIr leret anderSen Group Manager, Information Technology. Geir holds a degree in Electronics/Computer Science from
KongsbergTekniskeFagskole.
Currently, he is a member of the Board of Directors of Mariell Mote AS and Norwegian Automobile-
SportFederation,KartingComissionandManagingDirectorandownerofMBAndersenRacing.
Geir Leret Andersen does not hold any shares or warrants in Cavotec.
chrIStIan BernadottePresident, Cavotec Dabico US & Regional Manager, Americas. Christian holds a BSc in Electrical
Engineering and an MBA. He is a member of the Board of Directors of Aria Analytics and Swedish-
American Chamber of Commerce.
Christian Bernadotte holds 31,684 shares in Cavotec.
mIchael colacoPresident, Cavotec INET. Michael holds a Bachelor of Engineering degree from Concordia University,
Montreal, Canada and a Master’s degree in Business Administration from Pepperdine University,
California, USA. He has served as facilities & systems manager at Air Canada Facilities, Engineering
& Technical Services (1987-1990) and engineering & facilities services manager at Lester B. Pearson
Int. Airport (1990-1994).
Michael Colaco holds 7,700,000 shares in Cavotec.
lucIano corBettaGroup Market Unit Manager, Ports & Maritime. Luciano holds a degree in Mechanical Engineering at
Politecnico di Milano. He has served as Mechanical Engineer at TTR Srl and as Export Sales Manager
at Brevetti Stendalto SpA.
Luciano Corbetta holds 17,560 shares in Cavotec.
99
patrIck roSenwald Managing Director, Cavotec Specimas SpA & Managing Director, Cavotec MoorMaster Ltd. Patrick
holds a BSc in Engineering (Mechanical) and a Graduate Diploma in Business from Curtin University,
Western Australia.
Patrick Rosenwald holds 38,153 shares in Cavotec.
gIorgIo lIngIardIGroup VP & CIO and Regional Manager, Southern Europe & Africa. Giorgio holds a MSc in Mechanical
Engineering from University of Genoa Italy.
Giorgio Lingiardi does not hold any shares or warrants in Cavotec.
gary matthewSManagingDirector,CavotecUK.Gary holds aHNC inMechanical Engineering and anMBA from
University of Teesside. He has served as a Managing Director in Dabico Europe.
Gary Matthews holds 14,124 shares in Cavotec.
guStavo mIllerManaging Director, Cavotec China & Regional Manager, Far East. Gustavo is a Mechanical Engineer
from Catholic University of Cordoba, Argentina. He has served as a Managing Director at Impsa
Malaysia and as a General Manager Tower Cranes Division at Lindores Group (Australia).
Gustavo Miller holds 14,124 shares in Cavotec.
100
mIchael ScheeperSDirector, Investor Relations & PR. Michael studied Corporate Communications & Public Relations
at FONTYS University for Applied Sciences in the Netherlands. After his studies he joined Cavotec
in 2002, where he has since held several positions, including Communication Manager and Group
Manager, Corporate Communications. He is a member of the Investor Relations Society in the United
Kingdom,andamemberoftheEuropeanAssociationofCommunicationDirectors.
Michael Scheepers holds 28,153 shares in Cavotec.
juergen StrommerManaging Director, Cavotec Middle East FZE & Regional Manager, Middle East & India. Juergen holds
adegree inMechanicalEngineering fromMayEythTH,Kirchheim/Teckandadegree inBusiness
Management from GARP Stuttgart. He has served as General Manager at Al Futtaim Engineering.
Juergen Strommer holds 14,124 shares in Cavotec.
mIchael wIdegrenRegional Manager, Central Europe & Group VP, Patents & Trademarks. Michael has studied engineering,
specialisinginindustrialeconomics(INDEK),attheRoyalInstituteofTechnologyinStockholmbetween
1977 and 1982. He started his employment at Cavotec in 1985 and has had since then different
positions and assignments for the Company working in Sweden, Canada, Germany and Switzerland.
Michael Widegren, together with related parties, holds 1,085,277 shares in Cavotec.(1)
(1) Stefan Widegren and Michael Widegren are brothers and therefore considered related parties. Their shareholdings can be aggregated due to that fact
101
other InformatIon regardIng the memBerS of the Board of dIrectorS and management Apart from Stefan Widegren’s wife Lotten Widegren working through Cavotec International Ltd. as Group Cashpool
Manager and his two brothers Thomas Widegren and Michael Widegren working as responsible for the Airports Market
Unit, and as Group VP, Patents & Trademarks and Regional Manager Central Europe, respectively none of the above
members of the Board of Directors or management has a family relationship with any other member of the Board of
Directors or management. Moreover, Dominique Popesco (wife to the Chief Executive Officer) is employed part time
as assistant in HR and Daniela Pani (wife to EMC-member Giorgio Lingiardi) works as purchasing manager in Cavotec
Specimas. Several of the members of the Board of Directors or Management have financial interests in the Company
through their, and their related parties’, current holdings of shares and their remuneration from the Company. The Group
further rents Michael Widegrens apartment in Germany. Apart from what is set forth above, there are no conflicts of
interest between the members of the Board of Directors or management and Cavotec.
Apart from Stefan Widegren who was Chairman of Cavotec AxRail GmbH, which entered into voluntary liquidation in
2007 and what is set forth above, none of the members of the Board of Directors or management have during the last
five years been involved in any bankruptcies, receiverships or liquidations in a capacity as member or deputy member
of the Board of Directors of a company or as member of the management of a company. None of the above members
of the Board of Directors or management has been convicted of fraudulent conduct or been subject to any public
incrimination or sanctions by statutory or regulatory authorities and none of the members of the Board of Directors or
management has been disqualified by a court from acting as a member of administrative, management or supervisory
bodies of a company or from acting in the management or otherwise from conducting the affairs of a company during
the last five years.
None of the members of the Board of Directors are entitled to any benefits when they retire from the Board. For
information on management’s right to severance pay if their position with the Company is terminated, please see the
section Corporate Governance.
The office address of the members of the Board and the management is c/o Cavotec SA, via Serafino Balestra 27, 6900
Lugano, Switzerland.
audItorThe auditor of the Company is PricewaterhouseCoopers SA (via della Posta 7, 6900 Lugano, Switzerland), whom was
appointedon14June2011.DanielKettereristheauditorincharge.DanielKettererisamemberofTreuhand-Kammer
- Swiss Institute of Certified Accountants and Tax Consultants.
The auditor of Cavotec MSL Holdings Ltd. is PricewaterhouseCoopers (119 Armagh Street, Christchurch 8011, New
Zealand), whom was appointed at the annual shareholders’ meeting on 27 April 2007. Robert Harris is the PWC
Engagement Partner. Robert Harris is a member of the Institute of Chartered Accountants of New Zealand and the
Institute of Chartered Accountants of England and Wales.
102
Since Cavotec is a Swiss Company to be listed on NASDAQ OMX Stockholm, the corporate governance of Cavotec is
based on Swiss and Swedish rules and regulations, such as the Swiss Code of Obligations (the “CO”) and the Swedish
Code of Corporate Governance (Sw. Svensk kod för bolagsstyrning) (the “Code”).
the SwedISh code of corporate governanceThe Code applies to all Swedish companies with shares listed on a regulated market in Sweden and shall be fully applied
at the first annual shareholders’ meeting held during the year following market listing. The Company, although being a
Swiss company, has decided to apply the Code, but need not obey all rules in the Code but has options for selecting
alternative solutions which it may deem to better suit to its circumstances provided that any non-compliances and the
alternative solution are described and the reasons explained in the corporate governance report.
The Company will apply the Code from the time the shares are listed on NASDAQ OMX Stockholm. However, since it
is a Swiss company subject to Swiss rules and regulations there will be some deviations from the Code. Deviations that
the Company is already aware of will as far as possible be explained in this Prospectus or otherwise in the Company’s
corporate governance report which will be drawn up for the first time for the 2011 financial year.
ShareholderS’ meetIngSgeneralThe shareholders’ rights to resolve on company matters are exercised at the shareholders’ meeting. An ordinary
shareholders’ meeting is to be held yearly within six months following the close of the business year. It is called by the
Board of Directors or, if necessary, by the auditors. Extraordinary shareholders’ meetings may be called by the Board of
Directors, the liquidators or the auditors as often as necessary to safeguard the interests of the Company. Shareholders’
meetings are held at the domicile of the Company or at such other place as the Board of Directors shall determine.
Since the Company is listed in Stockholm, the Board of Director’s has the ambition to as far as possible and as long
as in compliance with Swiss rules and regulations and if no public deed issue by a Swiss notary is needed, to hold
shareholders’ meetings in Sweden. The shareholders’ meetings, deviating from the Code, will be held in English and
information and material will be available in English only. This is in accordance with an exemption granted by the Swedish
Financial Supervisory Authority. The minutes from shareholders’ meetings will be published on the Company’s website.
right to attend shareholders’ meetingsAll shareholders who are registered directly in one of Euroclear Sweden’s share registers three weekdays prior to the
shareholders’ meeting and who notify the Company of their intention to attend the shareholders’ meeting at the latest
by the date specified in the convening letter shall be entitled to attend the shareholders’ meeting and vote according
to the number of shares they hold. Shareholders may attend shareholders’ meetings in person or through a proxy.
Shareholders may usually register for shareholders’ meetings in several different ways, which are described in the
meeting convening letter.
notice of shareholders’ meetings and shareholder initiativesNotice of a shareholders’ meeting is given by means of a publication in the Swiss Commercial Gazette or by letter to the
shareholders of record as well as through a press release. Between the day of the publication or the mailing of the notice
and the day of the meeting there must be a time period of not less than 20 calendar days. The notice of the shareholders’
meeting must indicate the agenda and the motions. The notice will also be published on the Company’s website.
Stating the purpose of the meeting and the agenda to be submitted, one or more shareholders representing at least ten
per cent of the share capital may request the Board of Directors, in writing to call an extraordinary shareholders’ meeting.
In such case, the Board of Directors must call a shareholders’ meeting within two weeks.
Corporate governance
103
the Board of dIrectorSThe composition of the Board of Directors is set out in Section “Board of Directors, management and auditors” and the
members of the Board are elected for the period until the end of the next annual shareholders’ meeting. The Board of
Directors constitutes itself, but the Chairman of the Board of Directors is elected by the shareholders’ meeting as set
out in the Articles of Association. The members of the Nomination Committee, the Remuneration Committee and the
Audit Committee, as well as the respective Chairmen, are elected from and by the Board members, as further described
below in relation to the description of each committee. The Board of Directors has a Company Secretary that has the
duties and competencies set out by Swiss law. Furthermore, the Secretary assists the Board, the Chairman and the
Committees, to co-ordinate and fulfill their duties and assignments in accordance with the Board of Directors Internal
Regulations (comparable to rules of procedures and adopted by the Board of Directors).
The Board of Directors is entrusted with the ultimate management of the Company, as well as with the supervision and
control of the management. The Board of Directors is the ultimate executive body of the Company and shall determine
the principles of the business strategy and policies. The Board of Directors shall exercise its function as required by
law, the Articles of Association and the Board of Directors’ Internal Regulations. The Board shall be authorised to pass
resolutions on all matters that are not reserved to the general meeting of shareholders or to other executive bodies by
applicable law, the Articles of Association or the Internal Regulations.
By Swiss law, the Board of Directors has the following non-transferable and inalienable duties:
a)ThedeterminationofthestrategyoftheCompanyandtheGroupandtheissuanceofthenecessarydirectives;
b)Theestablishmentofaframeworkoftheorganisation;
c)Thebasicstructuringoftheaccountingsystem,ofasystemofinternalfinancialcontrols,andofthefinancialplanning;
d) The approval of the appointment (and suspension) of the officers entrusted with the management of the Company or
withitsrepresentation;
e) The supervision of management, in particular in relation to compliance with the law, the Articles and corporate
regulations,chartersanddirectives;
f) Decisions on the business report consisting of the annual financial statements, the annual report, and consolidated
financialstatementsincludinginterimpublishedreportsanddeterminationoftheaccountingstandard;
g)ThepreparationofthegeneralmeetingofshareholdersoftheCompanyandtheimplementationofitsresolutions;
h) Notification to the judge in case of a capital loss (“Unterbilanz”) of the Company and in case of over indebtedness
(“Überschuldung”;art.725-725aCO).
By Swiss law, the Board of Directors also has the following non transferable competencies: Decisions in connection
with capital increases pursuant to art. 651a, 652g, 653g CO (acknowledgement of capital increase) and art. 651 IV CO
(increaseofsharecapitalinthecaseofauthorisedcapital);decisionspursuanttoart.634aICO(sharesnotfullypaidin)
and resolutions pursuant to the Swiss Merger Act.
The Board of Directors of Cavotec MSL held six Board meetings in 2010. As per the date of this Prospectus five Board
meetings in Cavotec MSL and four Board meetings in Cavotec SA have been held in 2011.
Board commItteeSThe Board of Directors currently has three Board committees, the Nomination Committee, the Audit Committee and the
Remuneration Committee and the composition and tasks of the Committees are regulated in the Board of Directors’
Internal Regulations. Below is a brief description of the Committees as per the current Internal Regulations (which are
continuously reviewed and if deemed appropriate by the Board of Directors amended).
104
nomination committeeThe Nomination Committee shall be a committee established by the Board of Directors of the Company. This is in
line with Swiss law but will constitute a deviation from the Code that prescribes that the Nomination Committee shall
be determined by the shareholders. To follow the rules that apply to Swiss companies the Board of Directors has
decided that Nomination Committee shall be established by the Board of Directors. The composition of the Nomination
Committee shall however be in line with the Code.
The Nomination Committee shall ensure that the Company has a formal and transparent method for the nomination
and appointment of Board members. The objectives of the Nomination Committee are to regularly review and, when
appropriate, recommend changes to the composition of the Board of Directors to ensure that the Company has, and
maintains, the right composition of Board members to effectively govern and provide guidance to business, and identify
and recommend to the Board of Directors individuals for nomination as members of the Board and its Committees
(taking into account such factors as it deems appropriate, including experience, qualifications, judgement and the ability
to work with other Board members).
The current members of the Nomination Committee in Cavotec SA are Jack Groesbeek, Lars Hellman and Stefan
Widegren. The Nomination Committee of Cavotec MSL met three times in 2010 and have met one time in 2011. At the
date of this Prospectus the Nomination Committee of Cavotec SA has not had any meetings.
audit committeeThe objective of the Audit Committee is to assist the Board of Directors in discharging its responsibilities relative to
financial reporting and regulatory compliance. Members of the Audit Committee shall comprise members of the Board
appointed by the Board and in accordance with the Code. The members of the Audit Committee shall be not less than
three, all of whom shall be Board members with a majority to be independent Board members. One member must have
a financial or accounting background.
ThecurrentmembersoftheAuditCommitteeinCavotecSAareLakshmiKhanna,LeenaEssén,ChristerGranskogand
Joe Pope. Currently all the members are financially experienced and have relevant finance and/or auditing experience.
Oneofthem,namelyLakshmiKhanna,isaCharteredAccountantwhileJoePopeisanaccreditedFellowoftheInstitute
of Directors. The Audit Committee of Cavotec MSL met five times in 2010 and have met three times in 2011. At the date
of this Prospectus the Audit Committee of Cavotec SA has not had any meetings.
remuneration committeeThe purpose of the Remuneration Committee is to regularly review, and recommend changes to Board members’
remuneration to ensure that it is at an appropriate level, and effectively managed, to best advance the business
objectives of Cavotec and assist the Board of Directors in the establishment of remuneration policies and practices for,
and in discharging the Board of Directors responsibilities relative to remuneration setting and review of, the Company’s
CEO, other senior executives, and Board members. The compensation plans should reflect market conditions in the
various countries where Cavotec is operating. During 2010, the Remuneration Committee of Cavotec MSL has carried
out, with the support of the consulting firm MERCER, a complete position analysis of senior managers and linked the
outcome to compensation database statistics for all markets.
Thecurrentmembersof theRemunerationCommittee inCavotecSAareChristerGranskog,LakshmiKhanna,Erik
Lautmann and Joe Pope. The Remuneration Committee of Cavotec MSL met three times in 2010 and have met one
time in 2011. At the date of this Prospectus the Remuneration Committee of Cavotec SA has not had any meetings.
105
group key managementThecompositionoftheGroupKeyManagementissetoutinthesection“BoardofDirectors,managementandauditors”.
Cavotec’s operational structure is reasonably flat in order to ensure that the Group’s operations and decision-making
processes are efficient and responsive. Strategic, Group-related operations are the responsibility of the CEO and CFO
with the support of the Regional Managers and the Managing Directors. All material decisions within the day-to-day
operations of the Company are taken by the CEO and CFO.
Due to the inherent international character of the Group, the Managing Directors of local Cavotec companies – who
are close to their customers, suppliers and staff in their respective time zones, cultural environment and geographical
area – take day-to-day operational decisions. Managing Directors report to Regional Managers, who in turn report to
the CEO. Besides a few exceptions, both Regional Managers and Managing Directors live in the same country and
region as they operate in. Often the Regional Manager is also a Managing Director of a major company within his or her
region. The Chairman, the CEO and CFO are all working out of Cavotec’s corporate office in Switzerland. Cavotec has
also located to the corporate office its functions for Administration, Business Development, Corporate Communications,
ERP & Logistics, Finance & Accounting, Human Resources, Information Technology, Investor Relations & PR, Patents &
Trademarks, Sales & Marketing, Strategic Corporate Projects, Technical R&D, Treasury and other special advisory roles.
the cavotec executive management committee – emcThe EMC is nominated by the CEO and currently consists of twelve members.
The EMC is made up of members from the Group’s most experienced and knowledgeable management team. This
includes top corporate staff, several Regional Managers and several Group Market Unit Managers.
The EMC advises on and supports the implementation of global strategies as defined by the CEO in specific areas.
It advises the CEO on strategic management decisions and helps to implement such decisions according to each
member’s specific responsibilities or as directed by the CEO. The EMC also assists the CEO with the evaluation and
implementation of company acquisitions.
The EMC discusses and defines strategies, policies, acquisitions, overall developments and administrative improvements.
TheGroupKeyManagementimplementsrecommendationsmadebytheEMC.TheCEOpresentsthemoststrategic
recommendations to the Board of Directors for their consideration and decision. The CEO is responsible for the day-to-
day running of the Group.
Once a Board decision is taken, the EMC assists the CEO to implement the same. EMC members also support the
integration teams set up to oversee all new acquisitions.
remuneratIon and IncentIve planSThe remuneration to the members of the Board of Directors in Cavotec SA, is, in deviation from the Code, resolved by
the Board of Directors as set out in the Articles of Association, please see further in the Section “Articles of Association”.
In addition, Board members may receive remuneration for consultancy services provided to the Company. None of the
members of the Board of Directors are entitled to any benefits when resigning from the Board, in their capacity as Board
members. However, Board members may be entitled to benefits according to employment or consultancy agreements
that will continue even if the Board member would resign as Board member.
In 2010, a total remuneration to the Board members in Cavotec MSL was paid in aggregate of EUR 2,205,571, whereof
EUR 685,118 was allocated to the Chairman of the Board of Directors and EUR 1,520,453 in total, was allocated to the
106
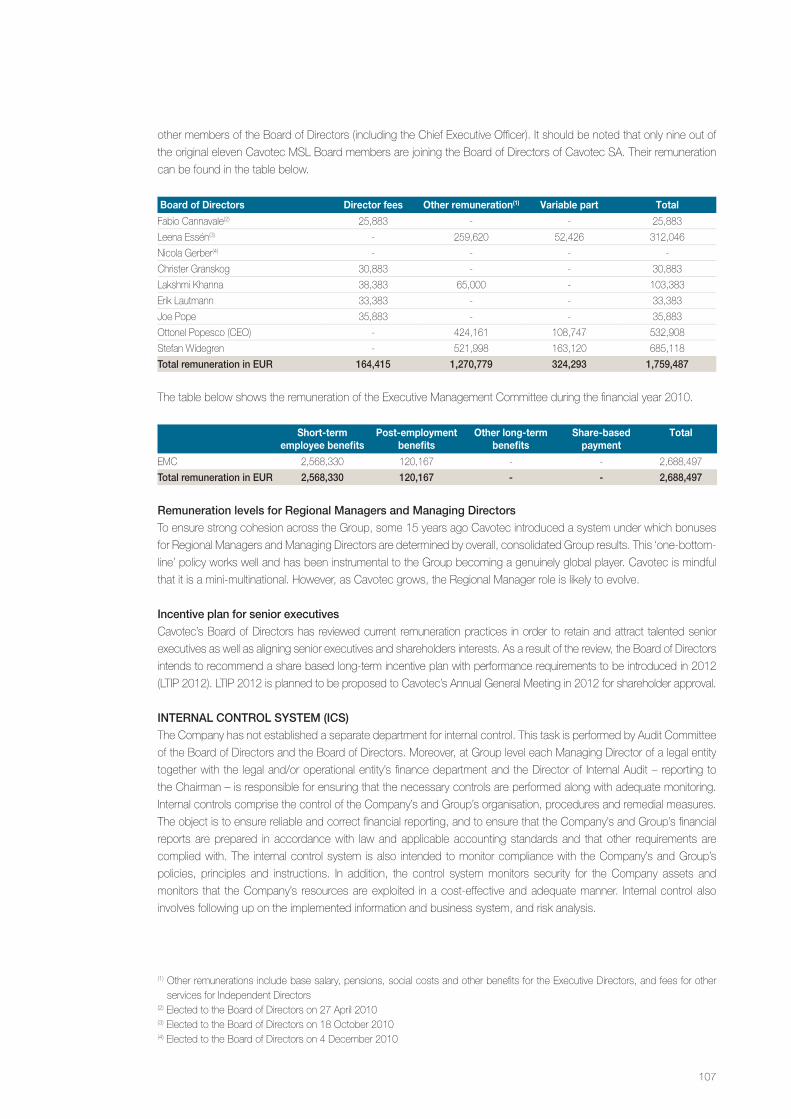
other members of the Board of Directors (including the Chief Executive Officer). It should be noted that only nine out of
the original eleven Cavotec MSL Board members are joining the Board of Directors of Cavotec SA. Their remuneration
can be found in the table below.
Board of Directors Director fees Other remuneration(1) Variable part Total
Fabio Cannavale(2) 25,883 - - 25,883
Leena Essén(3) - 259,620 52,426 312,046
Nicola Gerber(4) - - - -
Christer Granskog 30,883 - - 30,883
LakshmiKhanna 38,383 65,000 - 103,383
Erik Lautmann 33,383 - - 33,383
Joe Pope 35,883 - - 35,883
Ottonel Popesco (CEO) - 424,161 108,747 532,908
Stefan Widegren - 521,998 163,120 685,118
total remuneration in eur 164,415 1,270,779 324,293 1,759,487
The table below shows the remuneration of the Executive Management Committee during the financial year 2010.
Short-term employee benefits
Post-employment benefits
Other long-term benefits
Share-based payment
Total
EMC 2,568,330 120,167 - - 2,688,497
total remuneration in eur 2,568,330 120,167 - - 2,688,497
remuneration levels for regional managers and managing directorsTo ensure strong cohesion across the Group, some 15 years ago Cavotec introduced a system under which bonuses
for Regional Managers and Managing Directors are determined by overall, consolidated Group results. This ‘one-bottom-
line’ policy works well and has been instrumental to the Group becoming a genuinely global player. Cavotec is mindful
that it is a mini-multinational. However, as Cavotec grows, the Regional Manager role is likely to evolve.
Incentive plan for senior executivesCavotec’s Board of Directors has reviewed current remuneration practices in order to retain and attract talented senior
executives as well as aligning senior executives and shareholders interests. As a result of the review, the Board of Directors
intends to recommend a share based long-term incentive plan with performance requirements to be introduced in 2012
(LTIP 2012). LTIP 2012 is planned to be proposed to Cavotec’s Annual General Meeting in 2012 for shareholder approval.
Internal control SyStem (IcS)The Company has not established a separate department for internal control. This task is performed by Audit Committee
of the Board of Directors and the Board of Directors. Moreover, at Group level each Managing Director of a legal entity
together with the legal and/or operational entity’s finance department and the Director of Internal Audit – reporting to
the Chairman – is responsible for ensuring that the necessary controls are performed along with adequate monitoring.
Internal controls comprise the control of the Company’s and Group’s organisation, procedures and remedial measures.
The object is to ensure reliable and correct financial reporting, and to ensure that the Company’s and Group’s financial
reports are prepared in accordance with law and applicable accounting standards and that other requirements are
complied with. The internal control system is also intended to monitor compliance with the Company’s and Group’s
policies, principles and instructions. In addition, the control system monitors security for the Company assets and
monitors that the Company’s resources are exploited in a cost-effective and adequate manner. Internal control also
involves following up on the implemented information and business system, and risk analysis.
(1) Other remunerations include base salary, pensions, social costs and other benefits for the Executive Directors, and fees for other services for Independent Directors
(2) Elected to the Board of Directors on 27 April 2010 (3) Elected to the Board of Directors on 18 October 2010(4) Elected to the Board of Directors on 4 December 2010
107
The purpose of this section is solely to set out the main legal general principles governing (i) the organisation of a Swiss
stock company (in Italian: società anonima, abbreviated “SA”), (ii) its corporate governance as well as (iii) certain specific
issues concerning the right of the shareholders, pursuant to articles 620 et seq. of the Swiss Code of Obligations. This
note refers exclusively to Swiss corporate law as set forth in the Swiss Code of Obligations. It is furthermore not intended
to be exhaustive and the rules and provisions covered herein are subject to constant changes. Thus, no reliance should
be placed on any information or views contained in this note without obtaining specific professional advice.
organISatIon of a company lImIted By ShareS (SocIetÁ anonIma, “Sa”) The SA has its own legal personality separate from its members, its own name and a fixed nominal capital divided into
shares.Theshareholders’personalliabilityislimitedtothefullpaymentofthenominalvalueoftheirshares;thereisno
further liability of the shareholders for obligations of the SA, nor do they have any legal obligation to provide additional
capital to the SA at a later stage.
the share capitalThe minimum amount of the share capital is CHF 100,000. The share capital can subsequently be increased at any time
by way of a shareholders’ resolution and a board resolution amending the Articles of Association.
According to Swiss law, three ways to increase the share capital of a corporation are available: the ordinary share capital
increase, the increase out of authorised share capital and the increase out of conditional share capital.
The ordinary increase of the share capital must be resolved according to art. 650 CO by the general meeting of
shareholders and it must be carried out by the Board of Directors within three months.
By way of an increase out of authorised share capital, the shareholders’ meeting may authorise with a 2/3 majority (and
representing the absolute majority of the votes) the Board of Directors to increase the share capital within a period of two
years in an amount not exceeding half of the existing share capital.
The conditional share capital, resolved by the general meeting of shareholders, may be used by the Board of Directors in
connection with the issuance of convertible bonds, notes, warrants or similar debt instruments, as well as for employee
participation plans.
the internal organisationThe corporate bodies of a SA are the general meeting of shareholders, the Board of Directors and the auditors.
The Articles of Association may authorise the Board of Directors to delegate the management of all or part of the
company’s business to individual members or third parties in accordance with its organisational regulations. Where
management of the company’s business has not been delegated, it is the responsibility of all the members of the Board
of Directors. The law provides a list of non-transferable duties.
the general meeting of shareholdersThe general meeting of shareholders is the supreme governing body of the SA and is usually summoned by the Board
of Directors.
Shareholders’meetingsofanSAmustbeheldatleastonceayear;inparticular,themeetingthatapprovesthecompany’s
annual financial statements and the allocation of profits - the annual ordinary general meeting of shareholders - must take
place no later than six months after the close of the financial year (which may or may not correspond to the calendar
year). The following items must be included in the agenda of the annual ordinary general meeting of shareholders (i) the
approval of the annual report, the annual financial statements of the company and the consolidated financial statements
(if such statements are required by law) for the corresponding financial year, (ii) the granting of discharge to the members
of the Board of Directors, (iii) election of the members of the Board of Directors and (iv) election of the auditors. In
addition, extraordinary general meetings of shareholders may also be convened in specific cases.
Swiss company law overview
108
According to Swiss corporate law, the general meeting is convened by the Board of Directors or, where necessary, by
the external auditors. The liquidators and the representatives of bond creditors also have the right to convene general
meetings. A general meeting may also be convened by one or more shareholders together representing at least 10 per
cent of the share capital. Shareholders together representing shares with a nominal value of CHF 1 million may demand
that an item be placed on the agenda. Meetings are convened and items placed on the agenda by written request,
including details of agenda items and motions.
The notice convening the meeting must include the agenda items and the motions of the Board of Directors and the
shareholders who have requested that a general meeting shall be summoned or that an item shall be placed on the
agenda.Noresolutionsmaybemadeonmotionsrelatingtoagendaitemsthatwerenotdulynotified;exceptionstothis
are motions to convene an extraordinary general meeting or to carry out a special audit and to appoint an auditor at the
request of a shareholder. No advance notice is required to propose motions on duly notified agenda items and to debate
items without passing resolutions.
The owners or representatives of all the company’s shares may, if no objection is raised, hold a general meeting without
complying with the formal requirements for convening meetings. This meeting may discuss and pass binding resolutions on
all matters within the remit of the general meeting, provided that the owners or representatives of all the shares are present.
Unless mandatory statutory provisions or the Articles of Association provide otherwise, the shareholders’ meeting
passes its resolutions and performs elections with the absolute majority of the votes represented at the meeting without
regard to the number of shareholders present and shares represented in such meeting. The chairman of the meeting
decides on the voting procedure.
the Board of directorsStructure of the Board of DirectorsThe Board of Directors may consist of one or several members. Board members may be either employees of the company
(in this case employment law would be applicable) or stand — as a rule — in a mandate relationship with the company.
The Board of Directors organises itself (i.e. determines its chairman, deputy chairman and its secretary, as well as the
further functions, if any, of its members). The Board members and the signatories as well as their corresponding signing
powers must be entered in the commercial register.
At least one Board member or signatory of the SA with single signature right (or two with joint signature right) must be
resident in Switzerland, irrespective of his or her nationality.
Board meetingsIn principle, the Board of Directors must meet and deliberate. Board meetings should take place as often as the business
requires. A Board member may not be represented at a meeting by a proxy but must attend personally. Swiss law does
not provide for deputy Board members.
That said, resolutions may be taken by so-called circular letters, which typically take the form of a written proposal by the
chairman of the Board of Directors, which is adopted provided that the applicable majority requirement is met and that
no Board member requires a meeting.
Deliberations and resolutions shall be evidenced in minutes, which shall be signed by the meeting chairman and the
secretary and, in the case of a circular board resolution, by all Board members.
109
Duties of the Board of DirectorsThe business activities of an SA are managed by or under direction of its Board of Directors. The Board is responsible
for the execution of the decisions of the shareholders’ meeting, for keeping the corporate books and minutes, and, in
general, for the sound management of the company’s affairs.
Certain duties of the Board of Directors are inalienable and may not be delegated to other bodies of the company, nor
may they be transferred or made subject to approval of the shareholders’ meeting. However, the Board of Directors
is permitted to delegate specific powers and duties, in particular day-to-day business operations, to one or more
Board members or to an executive management. Such delegation must be based on special internal regulations that
may only be enacted if the Articles of Association empower the Board of Directors to do so. The internal regulations
contain provisions governing the executive bodies, the delegation of powers and duties, the supervision and control, the
meetings and decision making process of the corporate bodies and the reporting system.
The managers and other executive employees may be Swiss or foreign nationals and may or may not reside in
Switzerland. Foreign nationals employed to work in Switzerland do, however, need a special work permit.
Liability of the Board and management membersMembers of the Board as well as third parties entrusted with management responsibilities must carry out their duties
with due care and must duly safeguard the interests of the company. The Board members are liable for mismanagement
of the SA. If the day-to-day management of the company has been delegated, the liability of the Board members is
reduced to the proper choice, supervision and instruction of the management.
the auditorsThe statutory auditors may be individuals or companies. The SA has to keep proper books, records and accounts and
prepare a business report each year including formal financial statements consisting of a balance sheet, a profit and
loss statement and an attachment (notes). These statements must be audited by the auditors, whose formal report is
submitted to the annual general meeting of shareholders for approval. At least one of the auditors needs to be domiciled
or at least have a branch office in Switzerland.
Swiss companies are obliged to keep proper accounting records available for presentation in Switzerland. Formal
financial statements must be prepared (at least) annually, approved by the statutory auditors, adopted at the annual
shareholders’ meeting, and eventually filed with the tax authorities together with the tax return. No filing with any publicly
accessible registry is necessary, however.
Public companies must submit their annual financial statements to the auditors for an ordinary examination.
financial yearThe financial year shall be determined by the Board of Directors. At the end of each financial year, the business report,
consisting of the annual accounts, the annual report and as the case may be, the consolidated accounts, is to be
prepared pursuant to the statutory provisions.
Selected issues concerning shareholders’ rightsShareholders’ meetingsAs a protection for minority shareholders, the Board of Directors is further required to convene an extraordinary
shareholders’ meeting if so resolved by the shareholders’ meeting or requested by shareholders holding, in aggregate,
at least 10 per cent of the nominal share capital of the company. Moreover, shareholders holding shares of an aggregate
nominal value of CHF 1 million have the right to request that a specific proposal be discussed and voted upon at the
next shareholders’ meeting.
110
Information right of shareholders / special auditAn independent investigation covering specific matters may be required by minority shareholders holding 10 per cent of
the share capital or CHF 2 million worth of shares (calculated by the nominal value). The minority shareholders shall make it
plausible that the activities performed by the bodies of the company or the company itself cause such shareholders damage.
In addition to ordering an investigation, every shareholder, irrespective of its shareholding, may request information
at the shareholders’ meeting from the Board of Directors under the condition that the information is needed to make
use of the voting rights. The company’s bodies shall deny access to the information if it contains business secrets.
Releasing a piece of information protected by the confidentiality could expose the Board of Directors to liability claims by
shareholders or creditors of the company as well as penal sanctions.
Pre-emptive rightsUnder Swiss law, any share issue, whether for cash or non-cash consideration, is subject to the prior approval of the
shareholders at a shareholders’ meeting. Shareholders have a pre-emptive right to subscribe for shares, option bonds,
convertible bonds, or similar debt instruments with option rights in proportion to the nominal amount of shares held. A
resolution adopted at a shareholders’ meeting by a supermajority of at least two thirds of the shares and the absolute
majority of the nominal share capital represented at such meeting may limit or suspend pre-emptive rights under certain
special circumstances. In particular, such limitation of the pre-emptive right of subscription of the shareholders must be
grounded on compelling reasons, such as the acquisition of a company or a merger, must safeguard the principle of equal
treatment of the shareholders and cannot be used to intentionally modify the shareholding structure in the company.
Conflicts of interestThe Swiss Code of Obligations requires directors and senior management to safeguard the interests of the company,
and, in this connection, also imposes a duty of loyalty and duty of care on the company’s directors and officers. The
directors and officers are personally liable against the company for breaches of these duties.
Right to challenge shareholders’ resolutions in courtAny shareholder may take legal action against the company to challenge resolutions of the shareholders’ meeting
violating the law or the Articles of Association. In particular, resolutions are challengeable, which:
• withdraw or limit shareholders’ rights thereby violating the law or the Articles of Association (for example violation of the
proceduralrulesregardingsummoningofashareholders’meeting);
• withdraw or limit shareholders’ rights without proper reason (for example a unnecessary capital increase to dilute the
minorityshareholders’participation);
• discriminate against or disadvantage shareholders in a manner not justified by the company purpose (for example the
attributionofpreemptiverightsonlytoshareholdersworkingactivelyinthecompany);and
• withdraw the profit orientation of the company without the consent of all shareholders.
The right to challenge shareholders resolutions lapses if a suit is not filed within two months after the respective
shareholders’ meeting.
Claim for invalidation of shareholders’ resolutionsAny shareholder may cause the judge to declare null and void shareholders’ resolutions, which, in particular:
• withdraw or limit the shareholders’ rights to participate in the shareholders’ meeting, the minimum voting right, the right
tosueandotherrightsgrantedbymandatoryprovisionsoflaw;
•limittheshareholders’rightstocontrolbeyondtheextentprovidedbylaw;and
• disregard the fundamental structures of the company or violate the provisions for the protection of the capital.
Such a suit can be filed at any time.
111
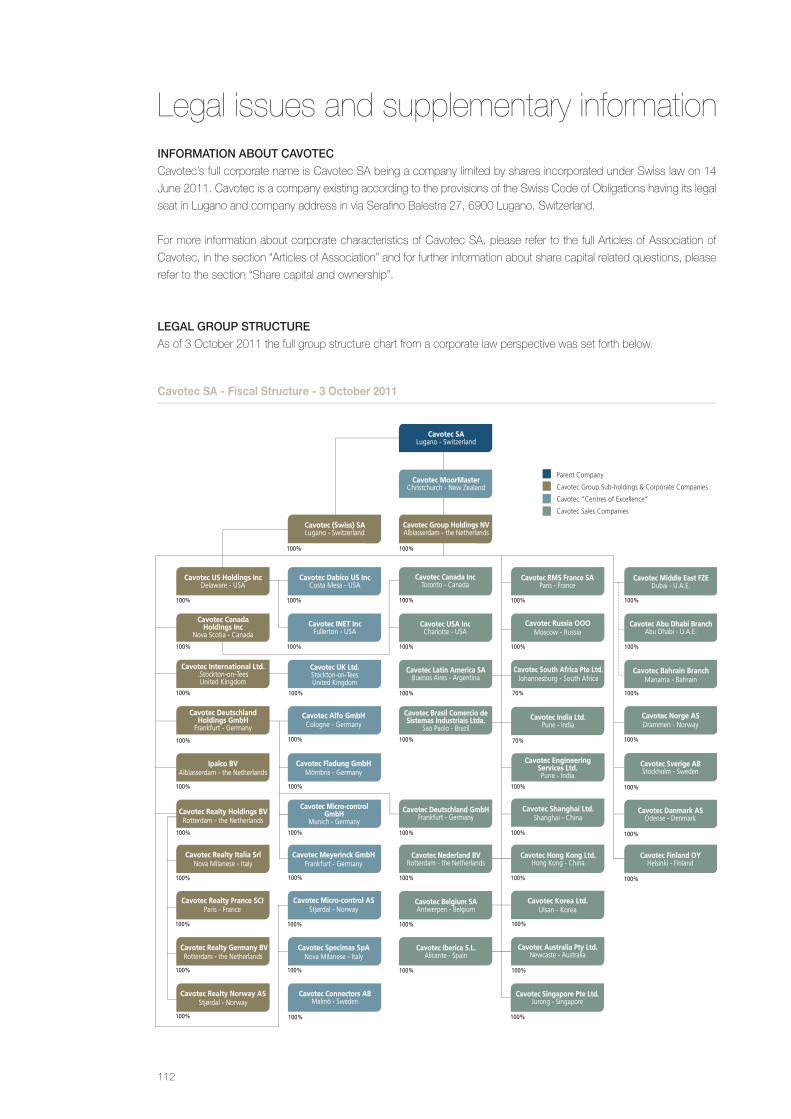
Legal issues and supplementary informationInformatIon aBout cavotecCavotec’s full corporate name is Cavotec SA being a company limited by shares incorporated under Swiss law on 14
June 2011. Cavotec is a company existing according to the provisions of the Swiss Code of Obligations having its legal
seat in Lugano and company address in via Serafino Balestra 27, 6900 Lugano, Switzerland.
For more information about corporate characteristics of Cavotec SA, please refer to the full Articles of Association of
Cavotec, in the section “Articles of Association” and for further information about share capital related questions, please
refer to the section “Share capital and ownership”.
legal group StructureAs of 3 October 2011 the full group structure chart from a corporate law perspective was set forth below.
Cavotec DeutschlandHoldings GmbH
Frankfurt - Germany
Cavotec International Ltd..Stockton-on-TeesUnited Kingdom
Cavotec Canada Holdings Inc
Nova Scotia - Canada
Cavotec US Holdings IncDelaware - USA
Cavotec Dabico US IncCosta Mesa - USA
Cavotec (Swiss) SALugano - Switzerland
Cavotec MoorMasterChristchurch - New Zealand
Cavotec SALugano - Switzerland
Cavotec Group Holdings NVAlblasserdam - the Netherlands
Cavotec Canada IncToronto - Canada
Cavotec USA IncCharlotte - USA
Cavotec UK Ltd.Stockton-on-TeesUnited Kingdom
Cavotec Deutschland GmbHFrankfurt - Germany
Cavotec Micro-controlGmbH
Munich - Germany
Cavotec Connectors ABMalmö - Sweden
Cavotec Hong Kong Ltd.Hong Kong - China
Cavotec Shanghai Ltd.Shanghai - China
Cavotec India Ltd.Pune - India
Cavotec RMS France SAParis - France
Cavotec Korea Ltd.Ulsan - Korea
100%
Cavotec Australia Pty Ltd.Newcaste - Australia
100%
Cavotec Middle East FZEDubai - U.A.E.
Cavotec Abu Dhabi BranchAbu Dhabi - U.A.E.
Cavotec Bahrain BranchManama - Bahrain
100%
100%
100%
100%
100%
100%
100%
100%
100%
100%
Cavotec Latin America SABuenos Aires - Argentina
100%
Cavotec Brasil Comercio de Sistemas Industriais Ltda.
Sao Paolo - Brazil
100%
Cavotec Nederland BVRotterdam - the Netherlands
100%
Cavotec Belgium SAAntwerpen - Belgium
100%
Cavotec Iberica S.L.Alicante - Spain
100%
100%
100%
100%
100%
Cavotec INET IncFullerton - USA
100%
100%
100%
100%
100%
100%
100%
100%
100%
100%
100%
100%
100%
100%
100%
100%
100%
70%
70%
100%
100%
Cavotec Singapore Pte Ltd.Jurong - Singapore
Cavotec Sverige ABStockholm - Sweden
100%
100%
Cavotec Danmark ASOdense - Denmark
100%
Cavotec Finland OYHelsinki - Finland
100%
100%
Cavotec Norge ASDrammen - Norway
Cavotec Russia OOOMoscow - Russia
Cavotec South Africa Pte Ltd.Johannesburg - South Africa
Cavotec Engineering Services Ltd.Pune - India
Cavotec Specimas SpANova Milanese - Italy
Cavotec Micro-control ASStjørdal - Norway
Cavotec Alfo GmbHCologne - Germany
Cavotec Fladung GmbHMömbris - Germany
Cavotec Meyerinck GmbHFrankfurt - Germany
Cavotec Realty Norway ASStjørdal - Norway
Cavotec Realty Italia SrlNova Milanese - Italy
Cavotec Realty Germany BVRotterdam - the Netherlands
Cavotec Realty France SCIParis - France
Cavotec Realty Holdings BVRotterdam - the Netherlands
Ipalco BVAlblasserdam - the Netherlands
Parent Company
Cavotec Group Sub-holdings & Corporate Companies
Cavotec “Centres of Excellence”
Cavotec Sales Companies
Cavotec SA - Fiscal Structure - 3 October 2011
112
lIStIngThe Board of Directors of Cavotec has applied for admission to trading of the Company’s shares on NASDAQ OMX
Stockholm. It is estimated that trading will start on or around 19 October 2011.
Shareholder’S regISter and Shareholder loanSThe Company shall maintain a shareholders’ register in which the full name, address and nationality (in case of legal
entities, the company name and registered office) of the holders and usufructuaries of registered shares are recorded.
Upon application with the Company, acquirers of registered shares shall be recorded in the shareholders’ register as
shareholders with the right to vote, provided they explicitly declare to have acquired the registered shares that are to be
registered in their own name and for their own account.
Any shareholder may at any time request a confirmation of the number of his registered shares, which is to be
issued by the Company. However, shareholders are not entitled to request the printing and delivery of certificates for
registered shares. The rights of shareholders whose shares are registered in a securities register in accordance with
the Swedish Financial Instruments Accounts Act (1998:1479), in particular, all shares held through Euroclear Sweden,
shall be determined in accordance with Swedish law and registered in a securities register pursuant to Swedish law.
Shareholders that are registered through a securities register held by Euroclear Sweden can exercise their rights only in
accordance with Swedish law. The Company shall be entitled to request, from time to time, from Euroclear Sweden a
list of all shareholders of record in connection with the organisation of shareholders meetings.
As at the date of this Prospectus, there were no shareholder loans in place.
corporate actIonS prIor to the tranSactIonNo dividend has been distributed so far in Cavotec SA.
Prior to the listing of the Company’s shares on NASDAQ OMX Stockholm, a number of corporate actions have been
completed, including the main actions in relation to the Scheme of Arrangement as set out in the section “Scheme of
Arrangement”.
employeeSAt 30 June 2011, the Group employed 768 full time employees. Save for what is set forth below, Cavotec applies
customary employment agreements.
MembersoftheGroupKeyManagementandtheEMCareentitledtoseverancepay,whichgenerallyamountstobetween
12 and 36 months if the agreement is terminated by the Group due to reasons caused by the employee (misconduct etc.).
materIal agreementSfinancial arrangementsCavotec Group Holdings N.V. and Cavotec, as borrowers, certain other members of the Group, as guarantors, and SEB
AG, Frankfurt am Main and Banca IMI SpA, as among other things mandated lead arrangers and issuing banks, have
entered into a facilities agreement dated 5 August 2011 (the “Facilities Agreement”) pursuant to which the lenders agree
to make available a term loan in the aggregate amount of EUR 10,000,000 (“Facility A”) and a multicurrency revolving
loan facility in the amount of EUR 40,000,000 (“Facility B”). Cavotec may request to increase Facility B by a maximum
principal amount of EUR 30,000,000 and the lenders have a right, but not an obligation, to accommodate such request.
Facility A shall be repaid in an amount of EUR 2,000,000 on 30 June of each year, with a balance of any outstanding
Facility A loan to be repaid on 5 August 2016. Facility B, being a revolving loan facility, may be drawn and repaid on the
last day of each interest period whereas the aggregate principal amount of all outstanding utilisations there under shall
be repaid no later than on 5 August 2016.
113
The Facilities Agreement contains certain restrictions relating to, inter alia, disposals, change of business, mergers
and acquisitions, financial indebtedness, payments (including dividends) and certain loans and guarantees and is
further subject to customary events of default, such as, non-payment, breach of financial covenants, breach of general
undertakings, misrepresentations, insolvency and cross-default.
customer agreementsCustomer agreements are generally concluded on an order-by-order basis, rather than as continuing agreements.
However, there are a few exceptions where framework agreements have been entered into with different Group
companies, generally on a limited term. These framework agreements set forth basic terms that shall apply during the
contract term.
There are no customer agreements that would be critical to lose, as none of them represents more than three per cent
of the revenues.
Supplier agreementsThere are no supplier agreements that would be critical to lose.
real estate and lease agreementsThe Group owns no material real estate and no lease agreements that would be critical to lose.
Intellectual property rIghtSThe Group’s strategy is to apply for patent protection when possible. External patent consultants are engaged to monitor
the Group’s intellectual property rights. The Group’s patent portfolio consists of 20 patent families. The Board of Directors
deem the patents relating to MoorMaster™ mooring systems to be the most important for the Group. These patents
consist of nine patent families which are further described in the following. The patent family “Vessel mooring method and
related means” is in the application face in Panama and under the Patent Corporation Treaty. The patent family “Mooring
robot array control system and method therefore” is registered in New Zeeland with expiry date in December 2027 and
is in the application face under the Patent Corporation Treaty. Two patent families described as “Automated docking
and mooring system” are registered in Panama with expiry date in October 2028 and are also in the application face in
various countries. The patent family “Laser scanning for mooring robot” is registered as a European patent with expiry
date in June 2025 and in various countries with expiry dates from June 2024–June 2025 and is also in the application
face in various countries. The patent family “Mooring system with active control” is registered as a European patent with
expiry date in July 2023 and in various countries with expiry dates in July 2023 and is also in the application face in
various countries. The patent family “Mooring robot” is registered in various countries with expiry dates from April 2021–
April 2022 and is in the application face as a European patent. The patent family “Seal for suction cup and method for
accommodating large movements in a mooring system” is registered as a European patent with expiry date in February
2021 and in various countries with expiry dates from February 2020–February 2021 and is also in the application face
in various countries. The patent family “Mooring device” is registered as a European patent with expiry date in February
2021 and in various countries with expiry dates from February 2020–February 2021.
TheGroupholdsregistrationsforthefollowingtrademarks(invariouscountries);PANZERBELT,SPECIMAS,CAVOFLEX,
CAVOTEC, Cavotec as a spiral logotype, POWER CHAIN, E3, MEYERINCK, PANTOGRAPH, CAVOTEC CADDY,
MOORMASTER, GANTRA & DESIGN and PULL AND STORE. The trademark MOORMASTER is registered as a
CommunityTrademarkandinNewZeeland,Australia,theUS,Japan,Canada,Singapore,HongKongandNorway.
114
InSuranceThe Company has insurance polices with international reputable insurance companies, policies which include property
damage, business interruption, third party and product liability (including aviation), directors and officers’ liability, transport,
legal protection, professional indemnity insurance and accident insurance for employees.
The Board of Directors considers the Company’s insurances to be in line with those of other companies in the same
industry and that they are sufficient for the risks normally connected with its operations. However, there can be no
assurance that the Company will not incur losses that are not covered by its insurances.
legal proceedIngSCavotec is currently not involved in any legal or arbitrational proceedings that could have a significant effect on Cavotec’s
financial position or profitability. Nor has Cavotec been involved in any such proceedings during the last 12 months.
regulatory matterS and envIronmentalThe Board of Directors assesses that all Group companies have the required permits and agreements and, in all material
respects, comply with specified safety, reporting and inspection requirements in the environmental area.
related party tranSactIonSLakshmiKhannaandErikLautmannprovideconsultancyservicestotheGroup.Theseservicesincludegeneralbusiness
strategy, India operations and general guidance on financial reporting. The total fees payable for such services rendered
amountedtoapproximatelyEUR65,000in2010forLakshmiKhanna.Nofeesforconsultancyserviceswerepaidto
Erik Lautmann for 2010. Further information about related party transactions can be found in note 27 in Cavotec MSL’s
Annual Report for 2010. In the Board of Directors’ of Cavotec’s opinion, all above mentioned transactions are concluded
on arm’s length terms.
tranSactIon coStSAll Cavotec’s costs associated with the Scheme of Arrangement in New Zealand and Switzerland, and the listing
procedure on NASDAQ OMX Stockholm, including payment to the advisors and other estimated transaction costs are
estimated to amount to a total of EUR 2.5 million.
documentatIon made avaIlaBle for InSpectIonCavotec’s Articles of Association, and Cavotec MSL’s annual report documentation for the years of 2008–2010, including
auditor’s reports are available for inspection during office hours at Cavotec’s head office at via Serafino Balestra 27 CH-
6900 Lugano, Switzerland. These documents are available in electronic form on Cavotec’s website at www.cavotec.com.
115
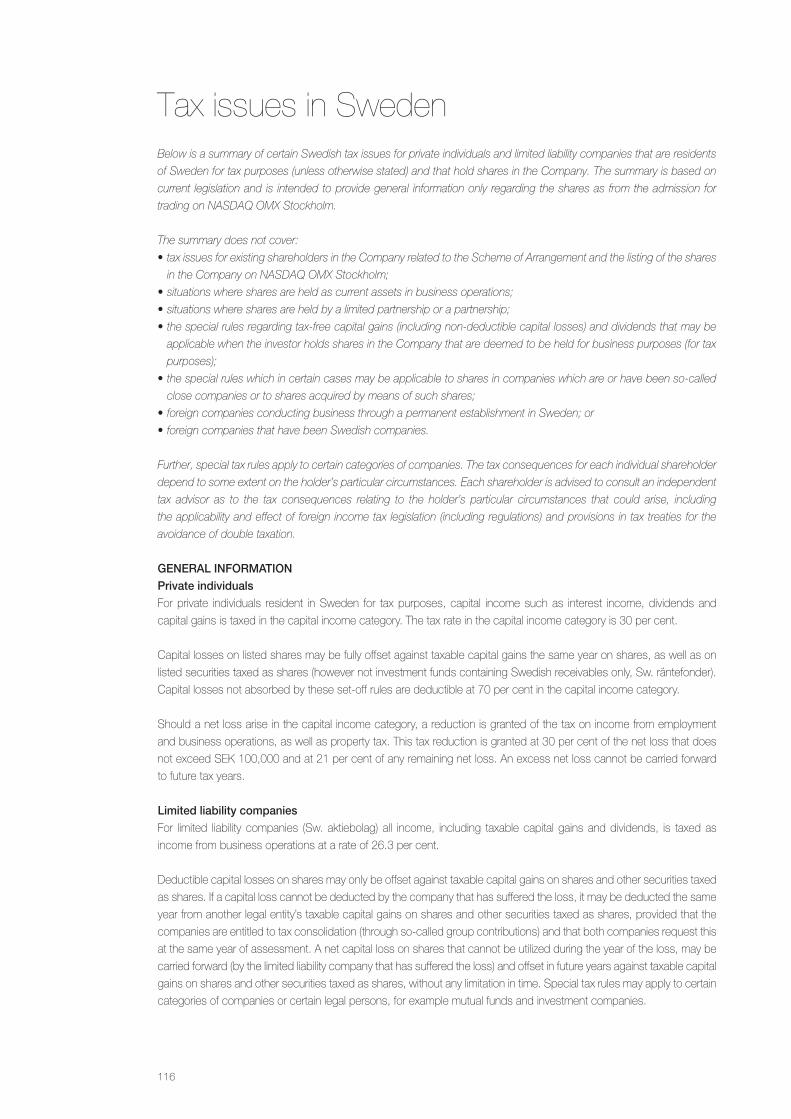
Tax issues in SwedenBelow is a summary of certain Swedish tax issues for private individuals and limited liability companies that are residents
of Sweden for tax purposes (unless otherwise stated) and that hold shares in the Company. The summary is based on
current legislation and is intended to provide general information only regarding the shares as from the admission for
trading on NASDAQ OMX Stockholm.
The summary does not cover:
•taxissuesforexistingshareholdersintheCompanyrelatedtotheSchemeofArrangementandthelistingoftheshares
in the Company on NASDAQ OMX Stockholm;
•situationswheresharesareheldascurrentassetsinbusinessoperations;
•situationswheresharesareheldbyalimitedpartnershiporapartnership;
•thespecialrulesregardingtax-freecapitalgains(includingnon-deductiblecapitallosses)anddividendsthatmaybe
applicable when the investor holds shares in the Company that are deemed to be held for business purposes (for tax
purposes);
•thespecialruleswhichincertaincasesmaybeapplicabletosharesincompanieswhichareorhavebeenso-called
close companies or to shares acquired by means of such shares;
•foreigncompaniesconductingbusinessthroughapermanentestablishmentinSweden;or
•foreigncompaniesthathavebeenSwedishcompanies.
Further, special tax rules apply to certain categories of companies. The tax consequences for each individual shareholder
depend to some extent on the holder’s particular circumstances. Each shareholder is advised to consult an independent
tax advisor as to the tax consequences relating to the holder’s particular circumstances that could arise, including
the applicability and effect of foreign income tax legislation (including regulations) and provisions in tax treaties for the
avoidance of double taxation.
general InformatIonprivate individualsFor private individuals resident in Sweden for tax purposes, capital income such as interest income, dividends and
capital gains is taxed in the capital income category. The tax rate in the capital income category is 30 per cent.
Capital losses on listed shares may be fully offset against taxable capital gains the same year on shares, as well as on
listed securities taxed as shares (however not investment funds containing Swedish receivables only, Sw. räntefonder).
Capital losses not absorbed by these set-off rules are deductible at 70 per cent in the capital income category.
Should a net loss arise in the capital income category, a reduction is granted of the tax on income from employment
and business operations, as well as property tax. This tax reduction is granted at 30 per cent of the net loss that does
notexceedSEK100,000andat21percentofanyremainingnetloss.Anexcessnetlosscannotbecarriedforward
to future tax years.
limited liability companiesFor limited liability companies (Sw. aktiebolag) all income, including taxable capital gains and dividends, is taxed as
income from business operations at a rate of 26.3 per cent.
Deductible capital losses on shares may only be offset against taxable capital gains on shares and other securities taxed
as shares. If a capital loss cannot be deducted by the company that has suffered the loss, it may be deducted the same
year from another legal entity’s taxable capital gains on shares and other securities taxed as shares, provided that the
companies are entitled to tax consolidation (through so-called group contributions) and that both companies request this
at the same year of assessment. A net capital loss on shares that cannot be utilized during the year of the loss, may be
carried forward (by the limited liability company that has suffered the loss) and offset in future years against taxable capital
gains on shares and other securities taxed as shares, without any limitation in time. Special tax rules may apply to certain
categories of companies or certain legal persons, for example mutual funds and investment companies.
116
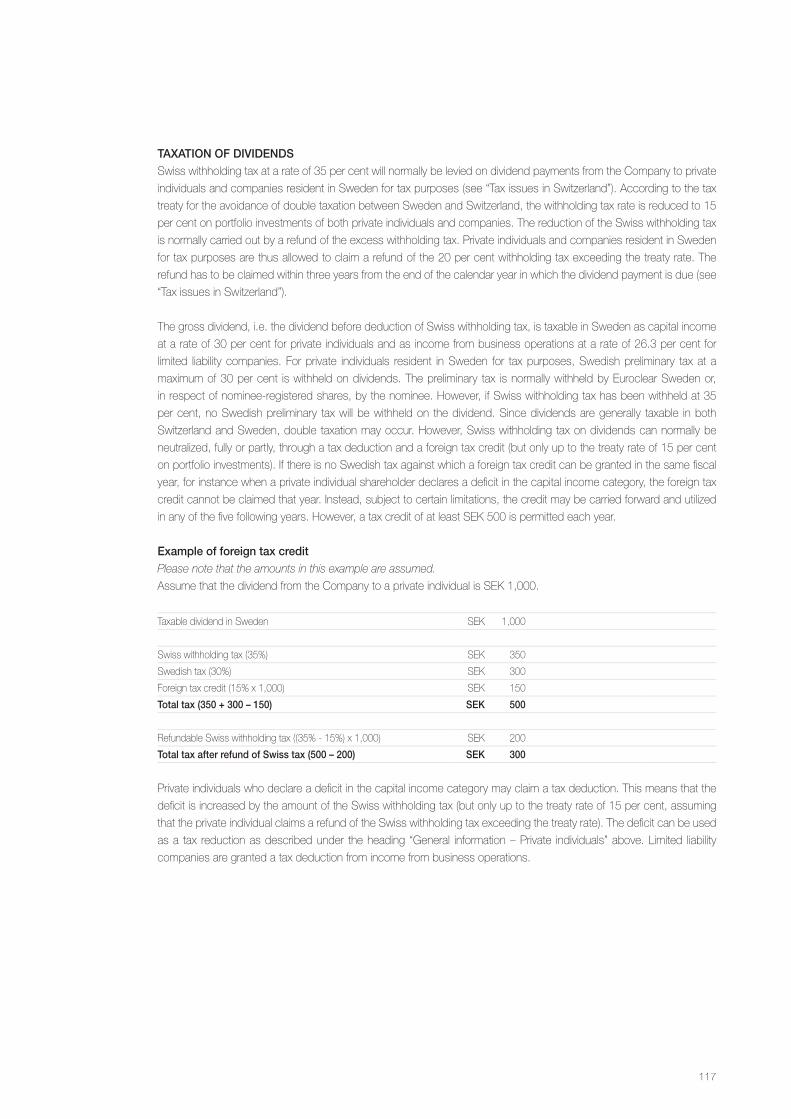
taxatIon of dIvIdendSSwiss withholding tax at a rate of 35 per cent will normally be levied on dividend payments from the Company to private
individuals and companies resident in Sweden for tax purposes (see “Tax issues in Switzerland”). According to the tax
treaty for the avoidance of double taxation between Sweden and Switzerland, the withholding tax rate is reduced to 15
per cent on portfolio investments of both private individuals and companies. The reduction of the Swiss withholding tax
is normally carried out by a refund of the excess withholding tax. Private individuals and companies resident in Sweden
for tax purposes are thus allowed to claim a refund of the 20 per cent withholding tax exceeding the treaty rate. The
refund has to be claimed within three years from the end of the calendar year in which the dividend payment is due (see
“Tax issues in Switzerland”).
The gross dividend, i.e. the dividend before deduction of Swiss withholding tax, is taxable in Sweden as capital income
at a rate of 30 per cent for private individuals and as income from business operations at a rate of 26.3 per cent for
limited liability companies. For private individuals resident in Sweden for tax purposes, Swedish preliminary tax at a
maximum of 30 per cent is withheld on dividends. The preliminary tax is normally withheld by Euroclear Sweden or,
in respect of nominee-registered shares, by the nominee. However, if Swiss withholding tax has been withheld at 35
per cent, no Swedish preliminary tax will be withheld on the dividend. Since dividends are generally taxable in both
Switzerland and Sweden, double taxation may occur. However, Swiss withholding tax on dividends can normally be
neutralized, fully or partly, through a tax deduction and a foreign tax credit (but only up to the treaty rate of 15 per cent
on portfolio investments). If there is no Swedish tax against which a foreign tax credit can be granted in the same fiscal
year, for instance when a private individual shareholder declares a deficit in the capital income category, the foreign tax
credit cannot be claimed that year. Instead, subject to certain limitations, the credit may be carried forward and utilized
inanyofthefivefollowingyears.However,ataxcreditofatleastSEK500ispermittedeachyear.
example of foreign tax creditPlease note that the amounts in this example are assumed.
AssumethatthedividendfromtheCompanytoaprivateindividualisSEK1,000.
Taxable dividend in Sweden SEK 1,000
Swiss withholding tax (35%) SEK 350
Swedish tax (30%) SEK 300
Foreign tax credit (15% x 1,000) SEK 150
total tax (350 + 300 – 150) Sek 500
Refundable Swiss withholding tax ((35% - 15%) x 1,000) SEK 200
total tax after refund of Swiss tax (500 – 200) Sek 300
Private individuals who declare a deficit in the capital income category may claim a tax deduction. This means that the
deficit is increased by the amount of the Swiss withholding tax (but only up to the treaty rate of 15 per cent, assuming
that the private individual claims a refund of the Swiss withholding tax exceeding the treaty rate). The deficit can be used
as a tax reduction as described under the heading “General information – Private individuals” above. Limited liability
companies are granted a tax deduction from income from business operations.
117
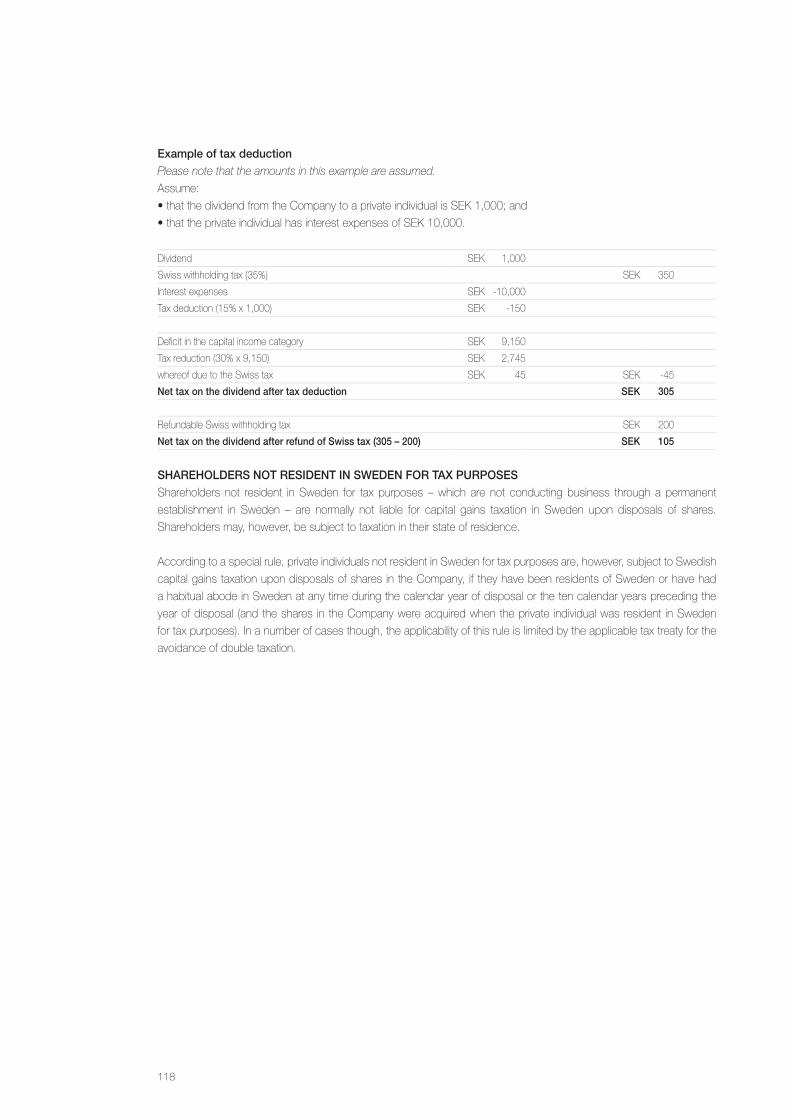
example of tax deductionPlease note that the amounts in this example are assumed.
Assume:
•thatthedividendfromtheCompanytoaprivateindividualisSEK1,000;and
•thattheprivateindividualhasinterestexpensesofSEK10,000.
Dividend SEK 1,000
Swiss withholding tax (35%) SEK 350
Interest expenses SEK -10,000
Tax deduction (15% x 1,000) SEK -150
Deficit in the capital income category SEK 9,150
Tax reduction (30% x 9,150) SEK 2,745
whereof due to the Swiss tax SEK 45 SEK -45
net tax on the dividend after tax deduction Sek 305
Refundable Swiss withholding tax SEK 200
net tax on the dividend after refund of Swiss tax (305 – 200) Sek 105
ShareholderS not reSIdent In Sweden for tax purpoSeSShareholders not resident in Sweden for tax purposes – which are not conducting business through a permanent
establishment in Sweden – are normally not liable for capital gains taxation in Sweden upon disposals of shares.
Shareholders may, however, be subject to taxation in their state of residence.
According to a special rule, private individuals not resident in Sweden for tax purposes are, however, subject to Swedish
capital gains taxation upon disposals of shares in the Company, if they have been residents of Sweden or have had
a habitual abode in Sweden at any time during the calendar year of disposal or the ten calendar years preceding the
year of disposal (and the shares in the Company were acquired when the private individual was resident in Sweden
for tax purposes). In a number of cases though, the applicability of this rule is limited by the applicable tax treaty for the
avoidance of double taxation.
118
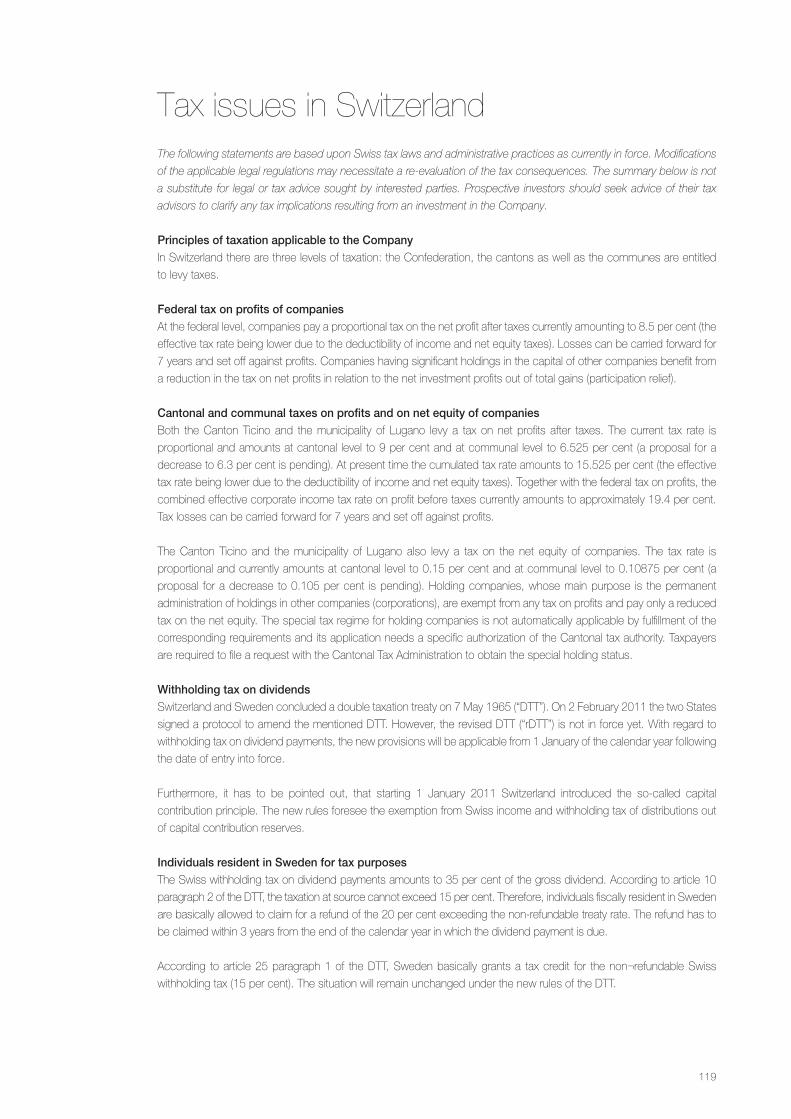
Tax issues in SwitzerlandThe following statements are based upon Swiss tax laws and administrative practices as currently in force. Modifications
of the applicable legal regulations may necessitate a re-evaluation of the tax consequences. The summary below is not
a substitute for legal or tax advice sought by interested parties. Prospective investors should seek advice of their tax
advisors to clarify any tax implications resulting from an investment in the Company.
principles of taxation applicable to the companyIn Switzerland there are three levels of taxation: the Confederation, the cantons as well as the communes are entitled
to levy taxes.
federal tax on profits of companiesAt the federal level, companies pay a proportional tax on the net profit after taxes currently amounting to 8.5 per cent (the
effective tax rate being lower due to the deductibility of income and net equity taxes). Losses can be carried forward for
7 years and set off against profits. Companies having significant holdings in the capital of other companies benefit from
a reduction in the tax on net profits in relation to the net investment profits out of total gains (participation relief).
cantonal and communal taxes on profits and on net equity of companiesBoth the Canton Ticino and the municipality of Lugano levy a tax on net profits after taxes. The current tax rate is
proportional and amounts at cantonal level to 9 per cent and at communal level to 6.525 per cent (a proposal for a
decrease to 6.3 per cent is pending). At present time the cumulated tax rate amounts to 15.525 per cent (the effective
tax rate being lower due to the deductibility of income and net equity taxes). Together with the federal tax on profits, the
combined effective corporate income tax rate on profit before taxes currently amounts to approximately 19.4 per cent.
Tax losses can be carried forward for 7 years and set off against profits.
The Canton Ticino and the municipality of Lugano also levy a tax on the net equity of companies. The tax rate is
proportional and currently amounts at cantonal level to 0.15 per cent and at communal level to 0.10875 per cent (a
proposal for a decrease to 0.105 per cent is pending). Holding companies, whose main purpose is the permanent
administration of holdings in other companies (corporations), are exempt from any tax on profits and pay only a reduced
tax on the net equity. The special tax regime for holding companies is not automatically applicable by fulfillment of the
corresponding requirements and its application needs a specific authorization of the Cantonal tax authority. Taxpayers
are required to file a request with the Cantonal Tax Administration to obtain the special holding status.
withholding tax on dividendsSwitzerland and Sweden concluded a double taxation treaty on 7 May 1965 (“DTT”). On 2 February 2011 the two States
signed a protocol to amend the mentioned DTT. However, the revised DTT (“rDTT”) is not in force yet. With regard to
withholding tax on dividend payments, the new provisions will be applicable from 1 January of the calendar year following
the date of entry into force.
Furthermore, it has to be pointed out, that starting 1 January 2011 Switzerland introduced the so-called capital
contribution principle. The new rules foresee the exemption from Swiss income and withholding tax of distributions out
of capital contribution reserves.
Individuals resident in Sweden for tax purposesThe Swiss withholding tax on dividend payments amounts to 35 per cent of the gross dividend. According to article 10
paragraph 2 of the DTT, the taxation at source cannot exceed 15 per cent. Therefore, individuals fiscally resident in Sweden
are basically allowed to claim for a refund of the 20 per cent exceeding the non-refundable treaty rate. The refund has to
be claimed within 3 years from the end of the calendar year in which the dividend payment is due.
According to article 25 paragraph 1 of the DTT, Sweden basically grants a tax credit for the non¬refundable Swiss
withholding tax (15 per cent). The situation will remain unchanged under the new rules of the DTT.
119
companies resident in Sweden for tax purposesThe withholding tax treatment applicable to companies (corporations) differs from the one applicable to individuals as
follows:
According to article 10 paragraph 2 of the DTT, dividend payments are exempted from taxation at source if the beneficiary
is a company (but not a partnership) directly holding a participation of at least 25 per cent in the capital of the company
paying the dividend.
This exemption will be further extended by the rDTT, according to which the zero-rate will be applicable if the beneficiary
of the dividend is
• a company (but not a partnership) directly or indirectly holding at least 10 per cent of the voting rights or of the capital
ofthecompanypayingthedividend;or
• a pension fund (if certain conditions are met).
Additionally, Sweden being a member state of the EU, an exemption from Swiss withholding tax could also apply based
on the Savings Tax Agreement concluded between Switzerland and the EU, according to which dividends paid by
subsidiary companies to parent companies shall not be subject to taxation in the source State where:
• the parent company has a direct minimum holding of 25 per cent of the capital of such a subsidiary for at least two
years;and
• one company is resident for tax purposes in a Member State and the other company is resident for tax purposes in
Switzerland;and
•underanydoubletaxagreementswithanythirdStatesneithercompanyisresidentfortaxpurposesinthatthirdState;
and
• both companies are subject to corporation tax without being exempted and both adopt the form of a limited company
(corporation, no partnership).
How the (partial) relief from Swiss withholding tax has to be claimed may vary. As a general rule, the beneficiary of the
dividend has firstly to pay the full amount of withholding tax and then to apply for a refund: the Swiss company retains
the withholding tax at the full rate (35 per cent). It rests with the Swedish shareholder to ask for reimbursement of any
tax amount exceeding the non-refundable treaty rate. However, in the following cases the refundable withholding tax is
not levied (so-called reporting procedure), upon application by the taxpayers and to be approved by the Swiss Federal
Tax Administration prior to distribution:
• the beneficiary of the dividend holds a substantial participation (based on the DTT 25 per cent, to be reduced to 10
percentaftertheentryintoforceoftheDTT)intheSwisscompanypayingthedividend;and
• the exemption provided by the Savings Tax Agreement applies.
According to article 25 paragraph 1 of the DTT, Sweden basically grants a tax credit for any non-refundable Swiss
withholding tax.
Shareholders not resident in Sweden for tax purposesDividends paid by the Swiss company to shareholders with fiscal residence outside Sweden are taxed at source with
withholding tax at 35 per cent. However, Switzerland has a very large network of double taxation treaties, allowing to
reduce or even eliminate the taxation at source as well as to avoid double taxation with regard to any non recoverable
source tax.
120
Articles of Association of Cavotec SA (Cavotec Ltd) - domiciled in Lugano, Switzerland
I. company name, domIcIle, purpoSe and duratIon of the company
art. 1 - company name and registered officeUnder the company name of
cavotec Sa(cavotec ltd)a corporation exists according to the provisions of the Swiss Code of Obligations (CO) having its seat in Lugano,
Switzerland.
art. 2 - purposeThe purpose of the Company is to acquire, manage, sell participations in companies of any kind in Switzerland and
abroad, in the industrial, commercial, financial and service sectors.
The Company belongs to the Cavotec group, which focus its activities in sales and marketing, engineering, design,
production and service of its customers, providing power, communication and other support services to mobile
equipment such, as airplanes, ships, cranes, mining machinery and other mobile vehicles.
The Company is empowered to open and maintain branch offices and subsidiaries in Switzerland and abroad, to
represent third parties, to engage in business and to enter into agreements which are appropriate to promote the
purpose of the Company. The Company may grant direct or indirect financing to its direct or indirect subsidiaries and
other group companies and provide guarantees or sureties of any kind for liabilities of such entities, including through
rights of lien on or fiduciary transfers of assets of the Company or through guarantees of any kind, even if these
guarantees or sureties are granted without remuneration or compensation. The company can purchase, manage and
sell real estate.
art. 3 - durationThe duration of the Company is unlimited.
II. Share capItal
art. 4 - Share capitalThe Company’s share capital is CHF 110’665’691.00. It is divided into 71’397’220 registered shares of CHF 1.55 par
value each. The share capital is fully paid up.
art. 4bis - contribution in kindThe Company, as of Contribution Agreement dated 3 October 2011, assumes from the holders of ordinary shares
of the company Cavotec MSL Holdings Limited, Christchurch, New Zealand at the close of trading of shares at the
New Zealand stock exchange on 26 September 2011, represented by Stefan Widegren under the authority of the
shareholders’ resolutions of Cavotec MSL Holdings Limited, the option right in 71’332’700 registered shares of Cavotec
MoorMaster, Christchurch, New Zealand, for a total amount of CHF 112’705’666.00, accepted by the Company for
this amount. CHF 110’565’685.00 are imputed on the nominal share capital, whereas CHF 2’139’981.00 as share
premium, for an equivalent to the contributor of 71’332’700 fully paid up registered shares of Cavotec SA with a nominal
value of CHF 1.55 each.
III. Share regISter
art. 5 - Share registerThe Company shall maintain a share register in which the full name, address and nationality (in case of legal entities, the
company name and registered office) of the holders and usufructuaries of registered shares are recorded.
121
Upon application with the Company, acquirers of registered shares will be recorded in the share register as shareholders
with the right to vote, provided they explicitly declare to have acquired the registered shares that are to be registered in
their own name and for their own account.
Notwithstanding paras. 1-2 of this article, the Company’s shares may be registered in a securities register in accordance
with the Swedish Financial Instruments Accounts Act (1998:1479).
Iv. no prIntIng of ShareS
art. 6 - no printing of SharesAny shareholder registered in the share register held by the Company may at any time request a confirmation of the number
of his registered shares, which is to be issued by the company. Shareholders are not entitled, however, to request the
printing and delivery of certificates for registered shares.
The rights of shareholders whose shares are registered in a securities register in accordance with the Swedish Financial
Instruments Accounts Act (1998:1479) shall be determined in accordance with Swedish law.
Registered shares held as intermediated securities can be transferred in accordance with the Swiss Federal Act on
Intermediated Securities. Shares that are registered in a securities register in accordance with the Swedish Financial
Instruments Accounts Act (1998:1479) shall be transferred in accordance with such Act.
Registered shares that are not held as intermediated securities and the rights resulting there from may be transferred only
by assignment. In order to be valid, such assignment requires notification to the company.
Registered shares can only be pledged in accordance with the Swiss Federal Act on Intermediated Securities. A security
interest in any such intermediated securities also cannot be granted by way of assignment. Uncertificated registered shares
registered in a securities register in accordance with the Swedish Financial Instruments Accounts Act (1998:1479), may be
pledged in accordance with Swedish law.
v. organISatIon of the company
a. Shareholders’ meeting
art. 7 - annual and extraordinary Shareholders’ meetingsAn ordinary shareholders’ meeting is to be held yearly within six months following the close of the business year. It is
called by the board of directors or, if necessary, by the auditors.
Extraordinary shareholders’ meetings may be called by the board of directors, the liquidators or the auditors as often as
necessary to safeguard the interests of the Company.
Stating the purpose of the meeting and the agenda to be submitted, one or more shareholders representing at least ten
per cent of the share capital may request the board of directors, in writing to call an extraordinary shareholders’ meeting.
In such case, the board of directors must call a shareholders’ meeting within two weeks.
Shareholders’ meetings are held at the domicile of the Company or at such other place as the board of directors shall
determine.
As long as the shares are listed on a Swedish stock exchange, the Company shall comply with the relevant rules and
regulations that are applied in that country with regard to the subject of this article.
122
art. 8 - conveningNotice of a shareholders’ meeting is given by means of a single publication in the Swiss Commercial Gazette or by letter
to the shareholders of record. Between the day of the publication or the mailing of the notice and the day of the meeting
there must be a time period of not less than 20 calendar days. The notice of the shareholders’ meeting must indicate
the agenda and the motions.
As long as the shares are listed on a Swedish stock exchange, the notice of a shareholders’ meeting shall also be kept
available on the company’s website. At the time of the notice, the Company may publish in Svenska Dagbladet an
announcement with information that the notice has been issued.
art. 9 - voting rights and proxiesIn a shareholders’ meeting each share entitles its owner to one vote. Art. 693 Para. 3 and Art. 704 Para. 1 CO remain
reserved.
By means of a written proxy, each shareholder may have his shares represented in a shareholders’ meeting by a third
person who need not himself be a shareholder.
art. 10 - resolutions and electionsUnless mandatory statutory provisions or the articles of association provide otherwise, the shareholders’ meeting passes
its resolutions and performs elections with the absolute majority of the votes represented at the meeting without regard
to the number of shareholders present and shares represented in such meeting.
The chairman of the meeting decides on the voting procedure.
art. 11 - chairman, Secretary, ScrutinisersShareholders’ meetings are presided over by the chairman of the board of directors or, in his absence, by a chairman
of the day to be elected by the shareholder’ meeting. The chairman appoints a secretary and some scrutinisers neither
of whom need be shareholders.
art. 12 - powersThe general shareholders’ meeting has the following exclusive competences:
1. Amendmentstothearticlesofassociation;
2. Approvaloftheannualreportand,asthecasemaybe,oftheconsolidatedstatementsofaccounts;
3. Approval of the annual financial statement as well as resolutions on the use of the balance sheet profits, in particular,
thedeclarationofdividendsandofprofitsharingbydirectorssubjecttoArt.671andArt.677CO;
4. Dischargeofthemembersoftheboardofdirectors;
5. Electionoftheboardmembers;
6. Electionoftheauditors;
7. Resolutions on all other matters which, under the articles of association or according to the law, are in the exclusive
competence of the shareholders’ meeting or which have been submitted to the meeting for its decision by the board
of directors.
B. Board of directors
art. 13 - organisation, term of office and remunerationThe board of directors shall be composed of a minimum of five and a maximum of ten members.
The directors are elected each year to hold office until the following annual shareholders’ meeting and may be re-elected.
The board of directors shall constitute itself autonomously. The Chairman of the board is nominated by the shareholders
meeting.
123
The members of the board of directors shall be entitled to the reimbursement of all expenses incurred in the interests of
the Company, as well as remuneration for their services that is appropriate in view of their functions and responsibilities.
The amount of the remuneration shall be fixed by the board of directors or a committee of the board of directors.
In case of a deadlock, the Chairman has a casting vote.
art. 14 - convening and resolutionsThe chairman of the board of directors calls the meetings and presides over the debates. Each director is entitled to
re-quest the calling of a meeting by giving written notice to the chairman. The board of directors sets out the particular
rules on passing resolutions in the organisational regulations.
art. 15 - duties and powersThe board of directors governs the Company. It decides on all corporate matters not reserved by law or the articles of
association for the shareholders’ meeting or another governing body.
The board of directors has the following non-assignable and non-withdrawal duties:
1. TheultimatemanagementoftheCompanyandtheissuanceofthenecessarydirectives;
2. Theestablishmentoftheorganisation;
3. Thestructuringoftheaccountingsystemandofthefinancialcontrolsand,ifnecessary,ofthefinancialplanning;
4. Theappointmentandremovalofthepersonsentrustedwiththemanagementandtherepresentation;
5. The ultimate supervision of the per-sons entrusted with the management, in particular, in view of compliance with the
law,thearticlesofassociation,regulationsanddirectives;
6. The preparation of the business report as well as the preparation of the general meeting of shareholders and the
implementingofitsresolutions;
7. Thenotificationofthejudgeincaseofoverindebtedness;
8. All further duties conferred to the board of directors by mandatory law.
The board of directors regulates the signatory powers, inclusive that of its own members. The board of directors may
entrust the preparation and the execution of its decisions or the supervision of certain transactions to committees or to
particular members. It is empowered to assign the management of the Company in whole or in part to one or several of
its members or to third persons. For this purpose, the board of directors will issue organizational regulations.
c. Statutory and group auditors
art. 16 - term of office, authority and dutiesAn auditing company subject to governmental supervision as required by law is to be appointed as auditors.
The general shareholders’ meeting shall elect the auditors for a term of one year. The rights and duties of the auditors
are determined by the provisions of the law.
The auditors must be independent according to Art. 728 CO.
124
vI. Business year, Business report, notices, liquidation
art. 17 - Business yearThe business year is to be determined by the board of directors.
At the end of each business year, the business report, consisting of the annual accounts, the annual report and as the
case may be, the consolidated accounts, is to be prepared pursuant to the statutory provisions (Art. 662 et seq. CO).
art. 18 - availability for InspectionThe business report and the report of the auditors must be available for inspection to the shareholders at the domicile
of the Company at least twenty days preceding the ordinary shareholders’ meeting. The Company must send a copy of
these reports without delay to any shareholder upon request.
As long as the shares are listed on a Swedish stock exchange, the Company shall abide by the disclosure rules and
regulations of such stock exchanges.
art. 19 - notices and publicationsNotices of the Company shall be made by letter or by publication in the Swiss Commercial Gazette (Foglio ufficiale
svizzero di commercio).
The publication organ of the Company is the Swiss Commercial Gazette (Foglio ufficiale svizzero di commercio).
As long as the shares are listed on a Swedish stock exchange, the Company shall abide by the disclosure rules and
regulations of such stock exchange.
art. 20 - dissolution and liquidationIn case of Company’s dissolution, the liquidation will be carried out by the board of directors then in office, unless the
shareholders’ meeting decides otherwise.
The liquidators have unencumbered power and authority to liquidate all corporate assets and wind up the Company.
vII. various
art. 21 - prevailing versionThe following articles of association are provided in English and Italian version. The Italian version shall prevail.
Lugano, 3 October 2011
125
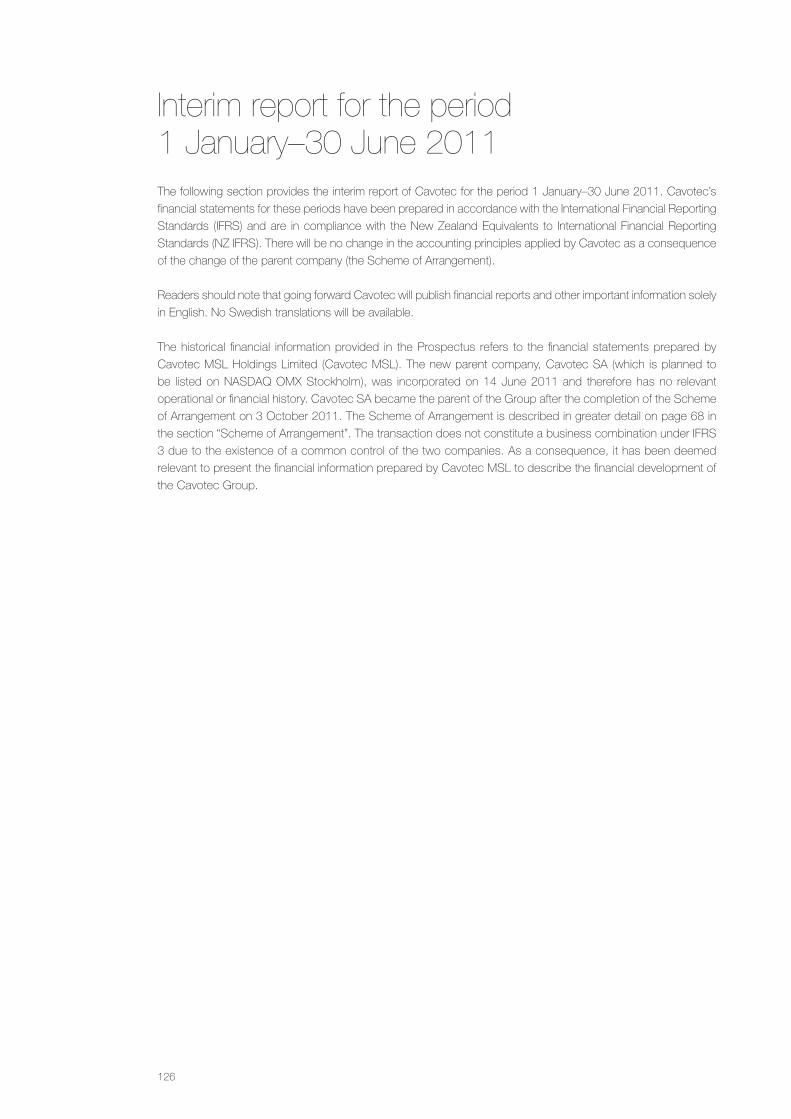
The following section provides the interim report of Cavotec for the period 1 January–30 June 2011. Cavotec’s
financial statements for these periods have been prepared in accordance with the International Financial Reporting
Standards (IFRS) and are in compliance with the New Zealand Equivalents to International Financial Reporting
Standards (NZ IFRS). There will be no change in the accounting principles applied by Cavotec as a consequence
of the change of the parent company (the Scheme of Arrangement).
Readers should note that going forward Cavotec will publish financial reports and other important information solely
in English. No Swedish translations will be available.
The historical financial information provided in the Prospectus refers to the financial statements prepared by
Cavotec MSL Holdings Limited (Cavotec MSL). The new parent company, Cavotec SA (which is planned to
be listed on NASDAQ OMX Stockholm), was incorporated on 14 June 2011 and therefore has no relevant
operational or financial history. Cavotec SA became the parent of the Group after the completion of the Scheme
of Arrangement on 3 October 2011. The Scheme of Arrangement is described in greater detail on page 68 in
the section “Scheme of Arrangement”. The transaction does not constitute a business combination under IFRS
3 due to the existence of a common control of the two companies. As a consequence, it has been deemed
relevant to present the financial information prepared by Cavotec MSL to describe the financial development of
the Cavotec Group.
Interim report for the period 1 January–30 June 2011
126
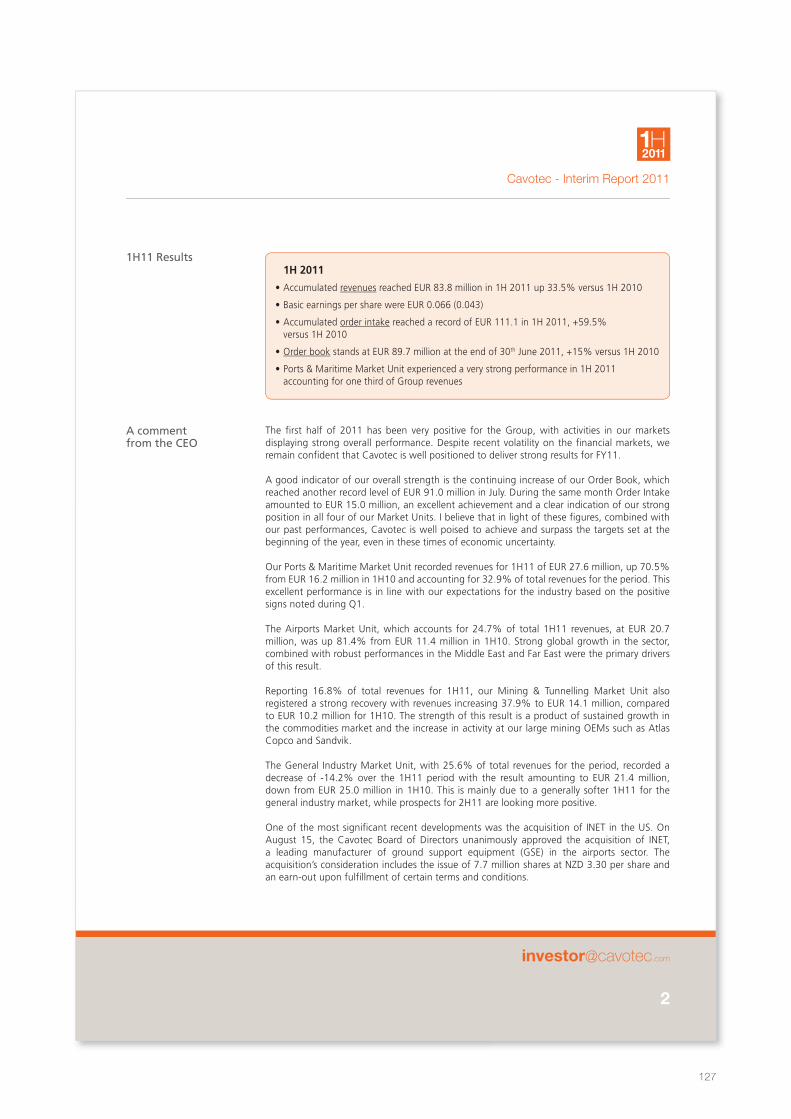
Cavotec - Interim Report 2011
2
1H2011
The first half of 2011 has been very positive for the Group, with activities in our markets displaying strong overall performance. Despite recent volatility on the financial markets, we remain confident that Cavotec is well positioned to deliver strong results for FY11.
A good indicator of our overall strength is the continuing increase of our Order Book, which reached another record level of EUR 91.0 million in July. During the same month Order Intake amounted to EUR 15.0 million, an excellent achievement and a clear indication of our strong position in all four of our Market Units. I believe that in light of these figures, combined with our past performances, Cavotec is well poised to achieve and surpass the targets set at the beginning of the year, even in these times of economic uncertainty.
Our Ports & Maritime Market Unit recorded revenues for 1H11 of EUR 27.6 million, up 70.5% from EUR 16.2 million in 1H10 and accounting for 32.9% of total revenues for the period. This excellent performance is in line with our expectations for the industry based on the positive signs noted during Q1.
The Airports Market Unit, which accounts for 24.7% of total 1H11 revenues, at EUR 20.7 million, was up 81.4% from EUR 11.4 million in 1H10. Strong global growth in the sector, combined with robust performances in the Middle East and Far East were the primary drivers of this result.
Reporting 16.8% of total revenues for 1H11, our Mining & Tunnelling Market Unit also registered a strong recovery with revenues increasing 37.9% to EUR 14.1 million, compared to EUR 10.2 million for 1H10. The strength of this result is a product of sustained growth in the commodities market and the increase in activity at our large mining OEMs such as Atlas Copco and Sandvik.
The General Industry Market Unit, with 25.6% of total revenues for the period, recorded a decrease of -14.2% over the 1H11 period with the result amounting to EUR 21.4 million, down from EUR 25.0 million in 1H10. This is mainly due to a generally softer 1H11 for the general industry market, while prospects for 2H11 are looking more positive.
One of the most significant recent developments was the acquisition of INET in the US. On August 15, the Cavotec Board of Directors unanimously approved the acquisition of INET, a leading manufacturer of ground support equipment (GSE) in the airports sector. The acquisition’s consideration includes the issue of 7.7 million shares at NZD 3.30 per share and an earn-out upon fulfillment of certain terms and conditions.
A comment from the CEO
1H11 Results1H 2011
•Accumulated revenues reached EUR 83.8 million in 1H 2011 up 33.5% versus 1H 2010
• Basic earnings per share were EUR 0.066 (0.043)
•Accumulated order intake reached a record of EUR 111.1 in 1H 2011, +59.5% versus 1H 2010
•Order book stands at EUR 89.7 million at the end of 30th June 2011, +15% versus 1H 2010
•Ports & Maritime Market Unit experienced a very strong performance in 1H 2011 accounting for one third of Group revenues
127
Cavotec - Interim Report 2011
3
1H2011
Established in 1967 and with revenues on yearly basis well over USD 25 million, INET is headquartered in Fullerton, California. The principal activities of the company are the design, manufacturing, installation and support of stationary and mobile aircraft servicing equipment. Via their domestic and international sales and field support offices, INET supplies 50/60 -400 Hz power conversion, preconditioned air systems, and power generation for the global aviation industry.
The acquisition of INET marks an important step for our Airports Market Unit and the Group as a whole. Thanks to their already strong position in the USA we will be well positioned to focus on further improving our service and support to customers while simultaneously adding INET systems to our existing product offering in both the Airports and Ports & Maritime Market Units.
Another milestone for the Group was made in August 2011 as we filed our Information Memorandum and Notice of Meeting, inviting our shareholders to attend the Special Meeting to be held in Christchurch on 1 September and to vote on the reorganization, which will culminate in the re-listing on Sweden’s NASDAQ OMX stock exchange.
EARNINGS AND PROFITABILITYOperating result amounted to EUR 6.0 million thanks to an increase of 33.5% in the revenues, which more than compensated the increase of employee benefit costs and operating expenses. Net financial items were EUR -0.7 million (vs. EUR 0.3 million in 1H10) with the decrease coming from less favourable exchange rate differences partially compensated by the lower effective interest rate. Profit before tax amounted to EUR 5.4 million (vs. EUR 3.9 million in 1H10) while profit for the period reached EUR 4.1 million (vs. EUR 2.8 million in 1H10).
OPERATING CASHFLOW AND INVESTMENTSOperating cash flow was negative in 1H11 at EUR 1.1 million (vs. EUR -0.4 million in 1H10) reflecting higher seasonality and the increase in working capital due to the higher level of activity. Investment in property, plant and equipment was EUR 3.3 million.
NET FINANCIAL POSITIONThe Group’s net financial position increased to EUR 29.0 million compared to the same period of the previous year (vs. EUR 25.3 million in 1H10). The 12 months rolling leverage ratio (Net Financial Position/EBITDA) decreased from 2.15 to 1.57 while the debt/equity ratio slightly worsened from 34% to 37%.
EMPLOYEESIn 1H11 many new faces joined the Group from all around the world, underlining not only our operational strength but also our diverse backgrounds. On June 30, 2011, the number of employees was 768, the total workforce increased by 79 since June 30, 2010 and with 49 since December 31, 2010.
There are many opportunities in the market for Cavotec to continue growing despite the ongoing global economic unrest. I am convinced that we have the right people, the right systems and the right mentality to make 2011 an outstanding success for the Group.
Ottonel PopescoChief Executive Officer
128
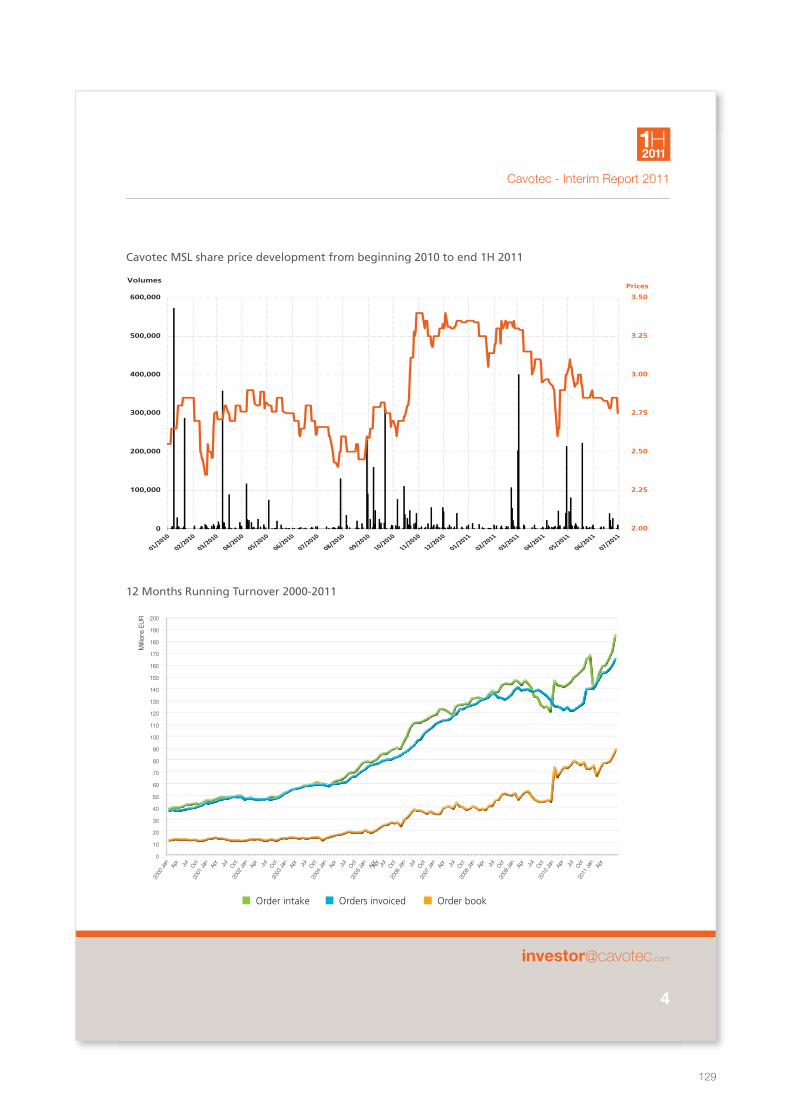
Cavotec - Interim Report 2011
4
1H2011
200
190
180
170
160
150
140
130
120
110
100
90
80
70
60
50
40
30
20
10
0
2000
Jan Ap
rJu
lOct
2001
Jan Ap
rJu
lOct
2002
Jan Ap
rJu
lOct
2003
Jan Ap
rJu
lOct
2004
Jan
2005
Jan Ap
rJu
lOct
2006
JanAp
r
Jul
OctApr
Jul
Oct
2007
Jan Ap
rJu
lOct
2008
Jan Ap
rJu
lOct
2009
Jan Ap
rJu
lOct
2010
Jan Ap
rJu
lOct
2011
Jan Ap
r
Milli
ons
EUR
Order intake Orders invoiced Order book
Volumes
600,000
500,000
0
100,000
200,000
400,000
Prices
3.50
3.25
3.00
2.75
2.50
2.25
2.00
300,000
Cavotec MSL share price development from beginning 2010 to end 1H 2011
12 Months Running Turnover 2000-2011
129
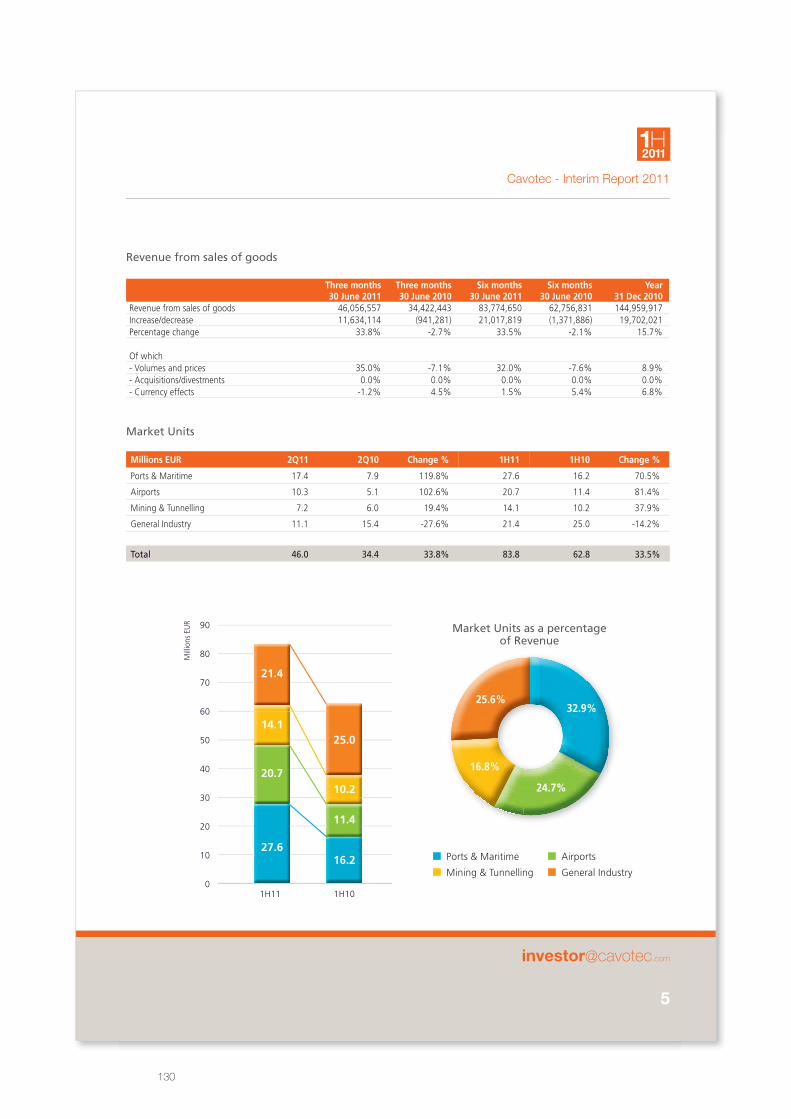
Cavotec - Interim Report 2011
5
1H2011
Ports & Maritime Airports
Mining & Tunnelling General Industry
90
80
70
60
50
40
30
20
10
0
Mill
ions
EU
R
1H11 1H10
16.2
11.4
10.2
25.0
Market Units
Millions EUR 2Q11 2Q10 Change % 1H11 1H10 Change %
Ports & Maritime 17.4 7.9 119.8% 27.6 16.2 70.5%
Airports 10.3 5.1 102.6% 20.7 11.4 81.4%
Mining & Tunnelling 7.2 6.0 19.4% 14.1 10.2 37.9%
General Industry 11.1 15.4 -27.6% 21.4 25.0 -14.2%
Total 46.0 34.4 33.8% 83.8 62.8 33.5%
Revenue from sales of goods
Three months30 June 2011
Three months30 June 2010
Six months30 June 2011
Six months30 June 2010
Year31 Dec 2010
Revenue from sales of goods 46,056,557 34,422,443 83,774,650 62,756,831 144,959,917 Increase/decrease 11,634,114 (941,281) 21,017,819 (1,371,886) 19,702,021 Percentage change 33.8% -2.7% 33.5% -2.1% 15.7%
Of which- Volumes and prices 35.0% -7.1% 32.0% -7.6% 8.9%- Acquisitions/divestments 0.0% 0.0% 0.0% 0.0% 0.0%- Currency effects -1.2% 4.5% 1.5% 5.4% 6.8%
27.6
20.7
14.1
21.4
32.9%
24.7%
16.8%
25.6%
Market Units as a percentageof Revenue
130
Cavotec - Interim Report 2011
6
1H2011
Our Ports & Maritime Market Unit benefited from a continued resurgence in investment in port infrastructure in several markets throughout the period, with a resulting flurry of orders that extended gains made in Q1. In particular, our automated mooring technology, MoorMaster™, continued its recent strong showing, with one of the largest orders to date for the system.
In June, we announced news of one of our largest orders on record for MoorMaster™; Cavotec will manufacture, engineer and commission 24 MoorMaster™ MM200C units, specifically for use at an exposed container handling berth at a Mediterranean Sea port. This is the second application for our MM200C units at a container application, following an order from the Port of Salalah in Oman for 12 similar systems in 2009. The period also saw an existing MoorMaster™ customer, the St. Lawrence Seaway Management Corporation, (SLSMC); invest in upgrades for the automated mooring units in use at one of the Seaway’s locks.
The upgrades will enhance the units’ hydraulic motion dampening systems, enabling them to absorb more energy and thus hold vessels in position more effectively. The improvements will also limit the amount of splash water that enters the units’ connectors and cables. Delivery is due at the start of September to ensure a minimum of three months testing before entering into service in December. The St Lawrence is the world’s first inland waterway to consider replacing mooring ropes with MoorMaster™. We continue to work with potential customers on adapting MoorMaster™ for applications where safety is an especially critical issue, such as at LNG berths.
Q2 also brought positive developments for our AMP systems. Sungdong Shipbuilding in Korea ordered 14 AMP systems for use with container vessels operated by the MSC shipping group. Deliveries are scheduled for completion in January 2013. The Danaos Shipping Company ordered eight AMP cable reels, while Terasaki Electric ordered four sets of AMP units for Nakcs-Cosco ships, and a single AMP unit for installation on an OOCL container vessel.
Also in the Far East, Costamare Shipping ordered AMP systems and related cables for three new vessels, while Singapore-based Darby-Draycort-Dover Park Shipping ordered a further six units. We also continued to conduct testing and installation work on several AMP projects in Canada and the US.
We experienced strong demand throughout the period from our long-term partners such as Sandvik Materials Handling, for whom we are supplying Cavotec Specimas cable reels for tripper cars that will load coal on to vessels at the Port of Beira in Mozambique. Another of our major industrial partners, ABB, ordered an Azipod slip ring ship propulsion system.
ZPMC (Shanghai Zhenhua Heavy Industries) placed orders for a range of port equipment during Q2, including spreader reels, cable reels, power cables, level wind spreader reels and monospiral spreader cables for port applications as widespread as Australia, Argentina, China, Egypt and Italy. Dalian Huarui ordered Tratos power cables for a ship unloader application in China, and we are to supply Dalian Heavy Crane Group with cable reels for a 1,800 tonne ship unloader.
In April, we received an order for four sets of motorised cable reels and motorised hose reels and related cables and hoses from port equipment manufacturer, Felguera Gruas for stacker reclaimer machines that will be used at a coal handling berth at Krishnapatnam Port on the south east coast of India.
Ports & Maritime
131
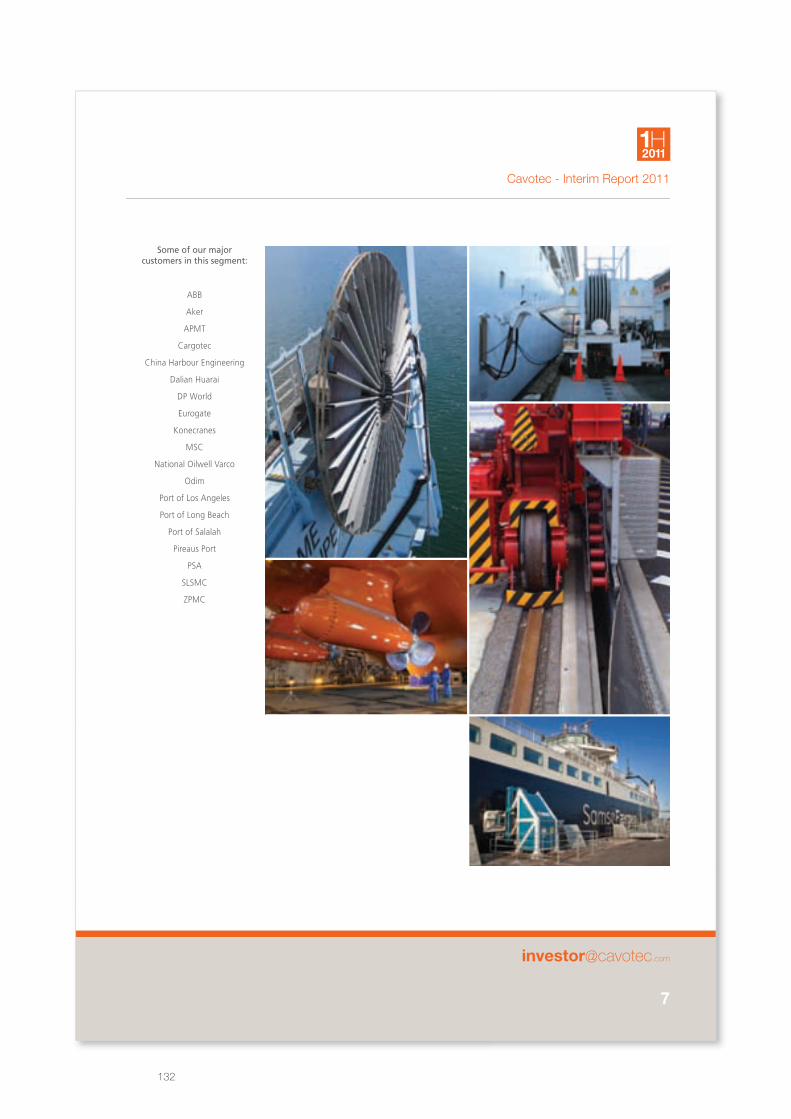
Cavotec - Interim Report 2011
7
1H2011
Some of our major customers in this segment:
ABB
Aker
APMT
Cargotec
China Harbour Engineering
Dalian Huarai
DP World
Eurogate
Konecranes
MSC
National Oilwell Varco
Odim
Port of Los Angeles
Port of Long Beach
Port of Salalah
Pireaus Port
PSA
SLSMC
ZPMC
132
Cavotec - Interim Report 2011
8
1H2011
Our Airports Market Unit continued to grow strongly in the period, with projects registered for new equipment and upgrades of existing facilities worldwide. Once again, the Middle East was especially strong, where, among other orders, we were awarded a major project for our pre-conditioned air and electrical supply pit systems at Dubai International Airport.
Our expertise in fuelling systems also continued to deliver results in the period, a trend we anticipate will continue going forward. Aircraft manufacturers’ and industry bodies’ positive forecasts on growth and investment in the sector, especially in emerging markets, suggest that Cavotec Airport’s unit will have opportunities to extend its recent strong performance in the months and years ahead.
The undoubted highlight for Cavotec’s Airport’s unit in the period was our major order for 58 PCAir and 400Hz power pop-up pit systems for Dubai International Airport’s new Concourse 3. The systems will supply air and power to Emirates Airlines’ A380 superjumbo aircraft. Deliveries are due to get under way in the third quarter of the year, and commissioning is scheduled for 2012. This project, alongside a similar application at Bahrain International Airport, will serve as excellent references in the region and further afield.
Our fuelling systems continued to register success throughout Q2. Cavotec Middle East received several orders for ‘Six-swivel’ bottom-loading arms for fuel trucks. Cavotec fuelling systems are now in use at applications across the Middle Eastern region.
Our mature markets also continued to report pleasing progress throughout Q2. One particular highlight for the period was a project for pop up pit systems at a new maintenance hangar for budget airline AirBerlin, at Berlin’s new Brandenburg International Airport, due to open in June 2012. We also received a substantial order for pop-up pit systems from German industrial conglomerate, Siemens, for an apron extension project at Leipzig Halle Airport. Cavotec engineers will support the customer with installation, start-up and commissioning. Delivery is scheduled for September.
At Munich Airport, we received an order for the upgrade of a rail car unloading facility from German industrial company ROTAN. Under the terms of the contract, Cavotec will modify 27 Cavotec Meyerinck loading arms originally delivered in 1990. The upgrade will ensure these units conform to the latest industry standards and the applications’ growing capacity requirements.
In an example of how our engineering expertise builds our position in the market, ThyssenKrupp ordered cable coil systems for Lanzarote Airport. These units offer specialised functions such as temperature sensors. And in Portugal, we registered further success with our aviation fuelling systems.
A project at London’s Heathrow Airport, to which we referred in our Q1 report, for ground support systems for Airbus A380 and Boeing 787 Dreamliner aircraft, was confirmed during the period. Under this contract, Cavotec will deliver hatch pit systems, converter caddies, power units and cable crocodiles.
Airports
133
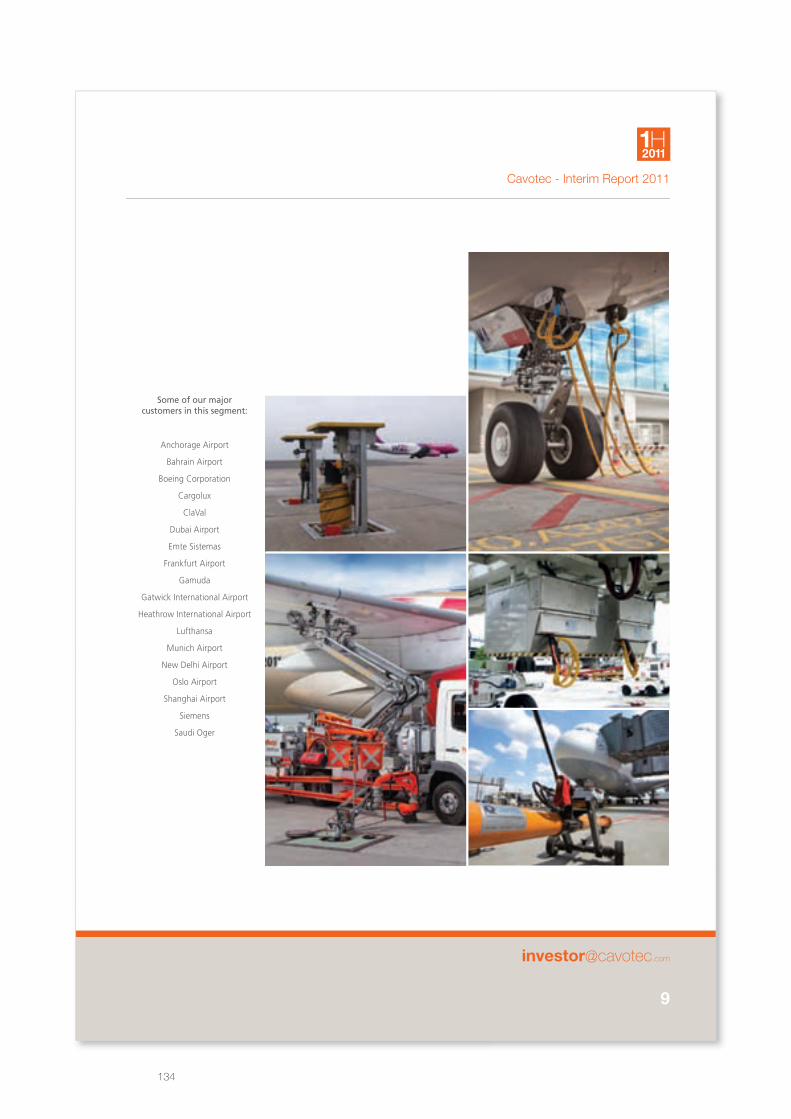
Cavotec - Interim Report 2011
9
1H2011
Some of our major customers in this segment:
Anchorage Airport
Bahrain Airport
Boeing Corporation
Cargolux
ClaVal
Dubai Airport
Emte Sistemas
Frankfurt Airport
Gamuda
Gatwick International Airport
Heathrow International Airport
Lufthansa
Munich Airport
New Delhi Airport
Oslo Airport
Shanghai Airport
Siemens
Saudi Oger
134
Cavotec - Interim Report 2011
10
1H2011
Cavotec’s Mining & Tunnelling Market Unit continued to register strong growth in Q2, with demand increasing in all markets. With the economic outlook remaining robust in emerging markets, we are seeing sustained call for our automation and power supply systems that enable operators to limit environmental impact and improve productivity. In an indication of the overall buoyancy of the segment, our long-term preferred relationships with OEMs were especially strong in the period, with customers such as Sandvik and Atlas Copco returning to 2008 production levels.
In an indication of our growing presence in Africa, we won an order to supply Pinch Bubenzer rail clamps for stacker reclaimer machines for use at a platinum mine in the Northern Cape, South Africa. Elsewhere, we were awarded an order for several hundred power connector outlet boxes for a Kazakhstan-based mining company. Cavotec Singapore also reported several orders for power cables to support mining applications.
Cavotec Latin America won a major order for connectors for low and medium voltage applications. Our customer on this project is ThyssenKrupp, which will supply a complete package to Sandvik. The end user is Brazilian mining group Vale.
Beyond the scale of the order itself, this project represents a potential breakthrough for Cavotec, as Vale is considering phasing out the use of vast mining trucks in favour of large mobile conveyor belts – a move that would potentially provide a substantial surge in demand for Cavotec systems and expertise in the sector. Vale currently uses mining trucks at the majority of its mines.
Uhde GmbH, a part of ThyssenKrupp, ordered four medium voltage cable reels, and two hose reels for new coke batteries. The end user is the United States Steel Corporation. The equipment is for use at their Clairton facility, some 30 kilometres south of Pittsburgh, Pennsylvania.
Another German industrial company, FAM GmbH, ordered several types of medium voltage cable reels – each with the capacity to reel 900m of cable – for multiple conveyer bridges, hopper cars, and stackers, for use at an AGL Angren coal mine in Uzbekistan.
In May, our tunnelling unit secured a radio remote control (RRC) order from an existing customer, Finnish mining and tunnelling group, Normet. The order includes MC-3300 RRC units that will be used to support tunnelling operations to charge the drilling holes with explosives. This project also includes an option on an additional seven units.
The bulk of demand in this segment, by its very nature is for a large number of smaller orders, rather than a small number of large orders. We registered a substantial jump in demand from our key OEM partners, primarily with orders for cable reels, cables and plugs. These key accounts have returned to demand levels last seen in 2008, prior to the downturn, and many of them are forecasting increasing needs in the coming year.
Mining & Tunnelling
135
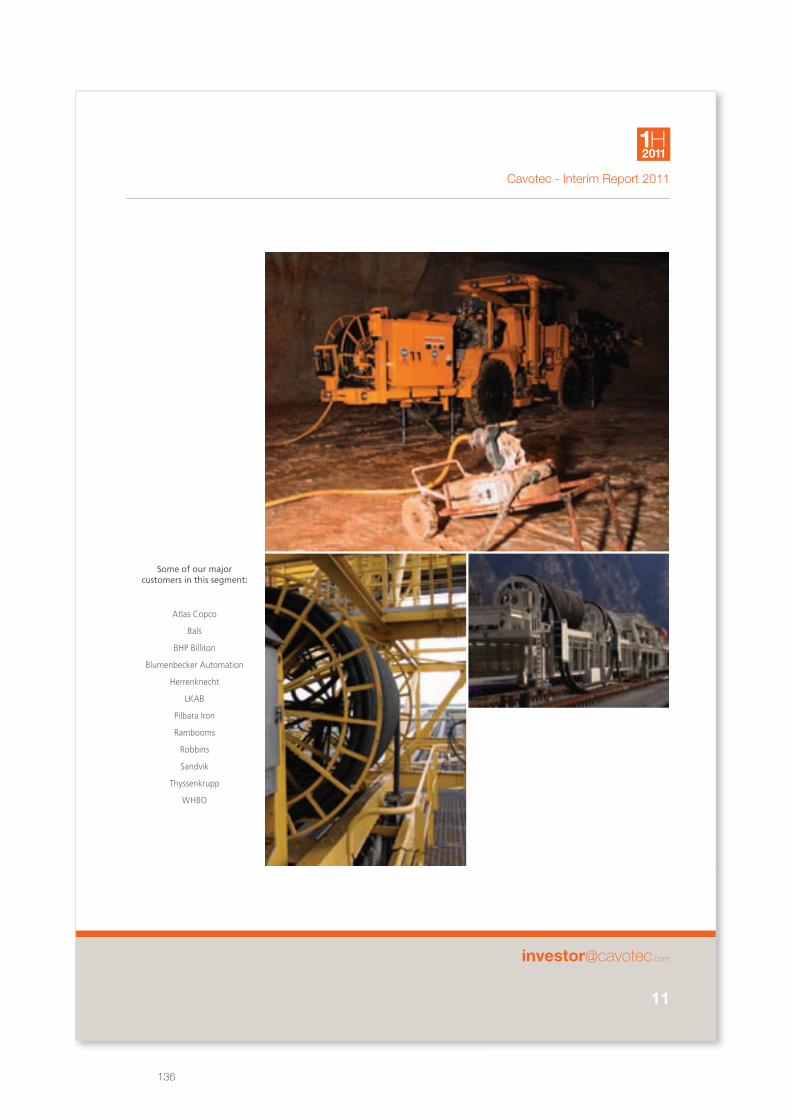
Cavotec - Interim Report 2011
11
1H2011
Some of our major customers in this segment:
Atlas Copco
Bals
BHP Billiton
Blumenbecker Automation
Herrenknecht
LKAB
Pilbara Iron
Rambooms
Robbins
Sandvik
Thyssenkrupp
WHBO
136
Cavotec - Interim Report 2011
12
1H2011
After a soft start of the year our most varied market unit, General Industry, recorded a healthy increase in demand for the Q2 period, with growth in both emerging and mature markets. The geographical and product diversity of this segment, which frequently see our expertise applied in critical, niche applications suggests that this segment will continue to mark gains for the remainder of 2011.
We saw clear signs that our expertise in the oil and gas industry is increasingly valued, particularly in the US, where we received an order for radio remote controls units from Canrig Drilling Technology, based in Houston, Texas. This is the single largest order for our RRC units in the US to date. The project includes an additional order for radio pedestal units.
This order is particularly significant because it is our first major order in the US oil and gas segment following the establishment of our office in Houston, specifically to focus on this growing market. Given the strong demand in this sector in the US, and our niche product profile and expertise, we have focused resources in the US, where we continue to successfully partner with OEMs to meet their growing needs. One element of this strategy is our recent expansion of equipment assembly at our Mooresville facility in North Carolina.
Also in the US, we continued with development work on cable reel mechanisms for electric car recharging stations; a project that we believe offers great potential in the future.
Asia-Pacific was also strong for offshore RRC and other applications. For example, during Q2 leading industrial power solutions provider, Wärtsilä, ordered cable reels for a range of offshore applications.
Our Cavotec Meyerinck unit continued to make encouraging progress in the period. In Finland, for example, against tough local competition, we received an order for three folding stair units for Algol Chemicals, a major chemical supplier on the Finnish market. In neighbouring Russia, Cavotec Meyerinck reported its first order for 48 swivel joints for chemical loading arms. Our sales engineers continue to work closely with potential chemical industry clients in Finland and elsewhere.
In France, a traditionally tough market for Meyerinck, fuel systems producer, XL Techniques ordered one loading arm and two floating suction arms marking a milestone. We are also supplying a specially designed drinking water-loading arm to fluids distribution and management systems manufacturer, ERLA Technologies.
General Industry
137
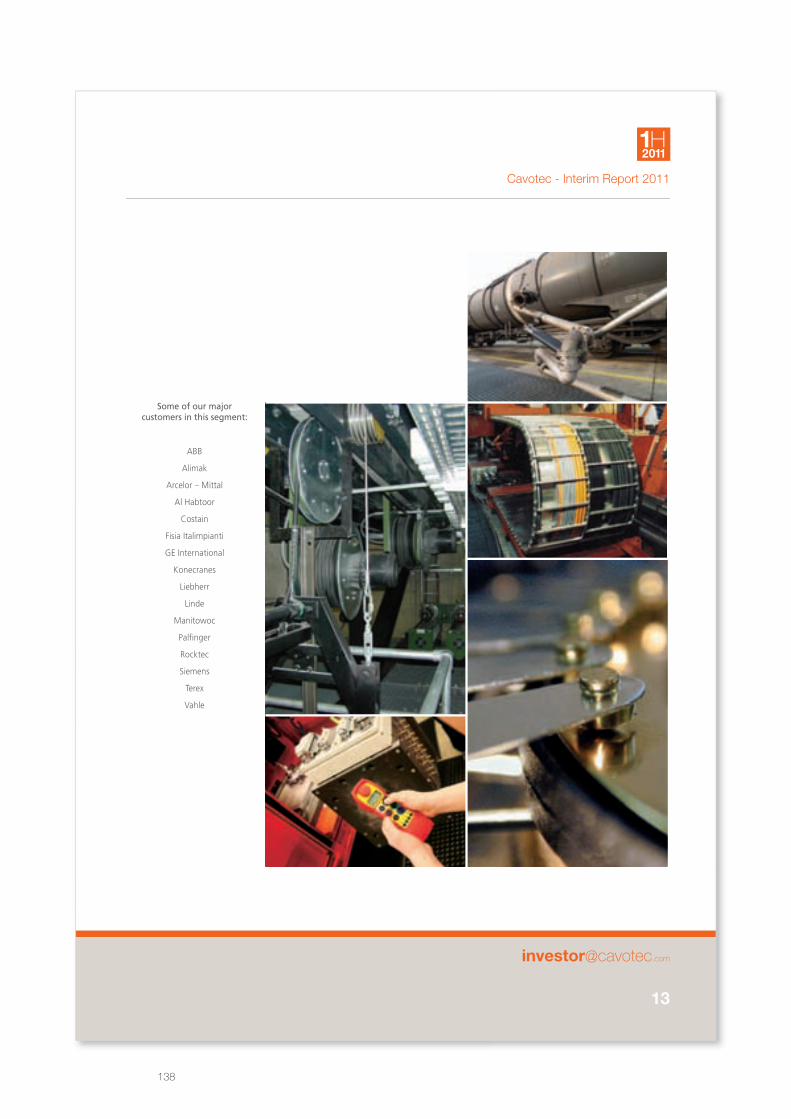
Cavotec - Interim Report 2011
13
1H2011
Some of our major customers in this segment:
ABB
Alimak
Arcelor – Mittal
Al Habtoor
Costain
Fisia Italimpianti
GE International
Konecranes
Liebherr
Linde
Manitowoc
Palfinger
Rocktec
Siemens
Terex
Vahle
138
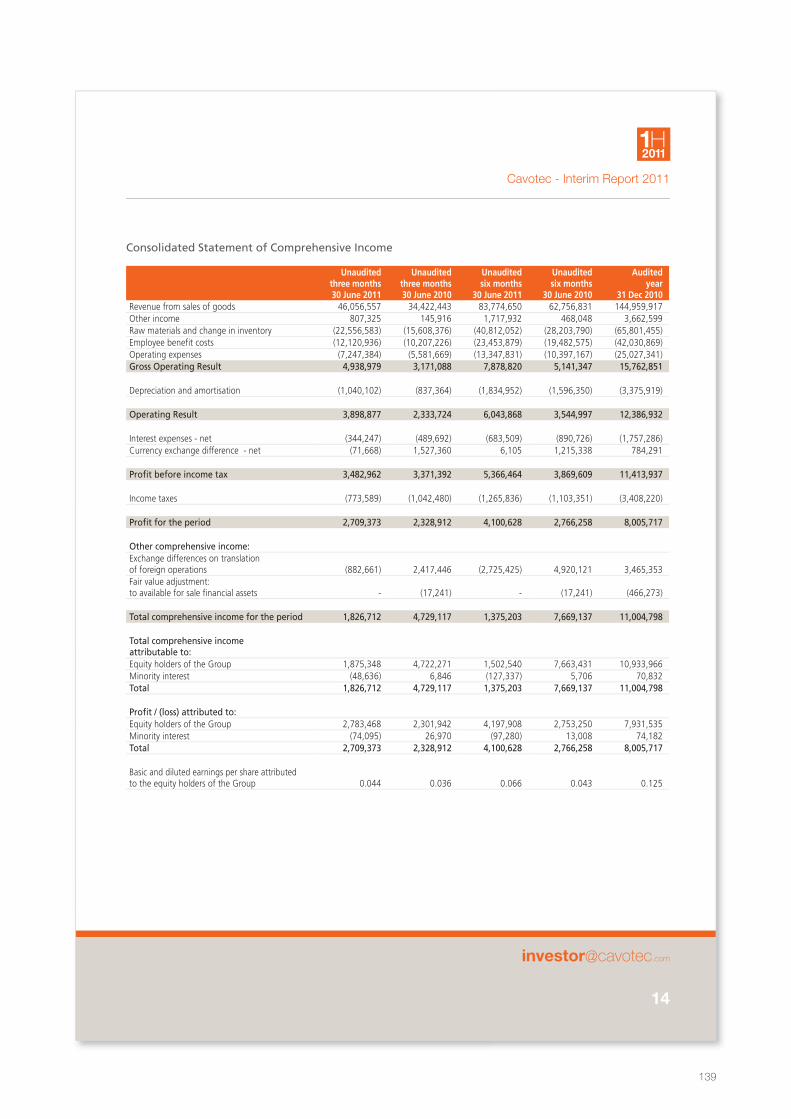
Cavotec - Interim Report 2011
14
1H2011
Consolidated Statement of Comprehensive Income
Unauditedthree months30 June 2011
Unauditedthree months30 June 2010
Unaudited six months
30 June 2011
Unaudited six months
30 June 2010
Auditedyear
31 Dec 2010Revenue from sales of goods 46,056,557 34,422,443 83,774,650 62,756,831 144,959,917 Other income 807,325 145,916 1,717,932 468,048 3,662,599 Raw materials and change in inventory (22,556,583) (15,608,376) (40,812,052) (28,203,790) (65,801,455)Employee benefit costs (12,120,936) (10,207,226) (23,453,879) (19,482,575) (42,030,869)Operating expenses (7,247,384) (5,581,669) (13,347,831) (10,397,167) (25,027,341)Gross Operating Result 4,938,979 3,171,088 7,878,820 5,141,347 15,762,851
Depreciation and amortisation (1,040,102) (837,364) (1,834,952) (1,596,350) (3,375,919) Operating Result 3,898,877 2,333,724 6,043,868 3,544,997 12,386,932
Interest expenses - net (344,247) (489,692) (683,509) (890,726) (1,757,286)Currency exchange difference - net (71,668) 1,527,360 6,105 1,215,338 784,291
Profit before income tax 3,482,962 3,371,392 5,366,464 3,869,609 11,413,937
Income taxes (773,589) (1,042,480) (1,265,836) (1,103,351) (3,408,220)
Profit for the period 2,709,373 2,328,912 4,100,628 2,766,258 8,005,717
Other comprehensive income:Exchange differences on translationof foreign operations (882,661) 2,417,446 (2,725,425) 4,920,121 3,465,353 Fair value adjustment:to available for sale financial assets - (17,241) - (17,241) (466,273)
Total comprehensive income for the period 1,826,712 4,729,117 1,375,203 7,669,137 11,004,798
Total comprehensive income attributable to:Equity holders of the Group 1,875,348 4,722,271 1,502,540 7,663,431 10,933,966 Minority interest (48,636) 6,846 (127,337) 5,706 70,832 Total 1,826,712 4,729,117 1,375,203 7,669,137 11,004,798
Profit / (loss) attributed to:Equity holders of the Group 2,783,468 2,301,942 4,197,908 2,753,250 7,931,535 Minority interest (74,095) 26,970 (97,280) 13,008 74,182 Total 2,709,373 2,328,912 4,100,628 2,766,258 8,005,717
Basic and diluted earnings per share attributedto the equity holders of the Group 0.044 0.036 0.066 0.043 0.125
139
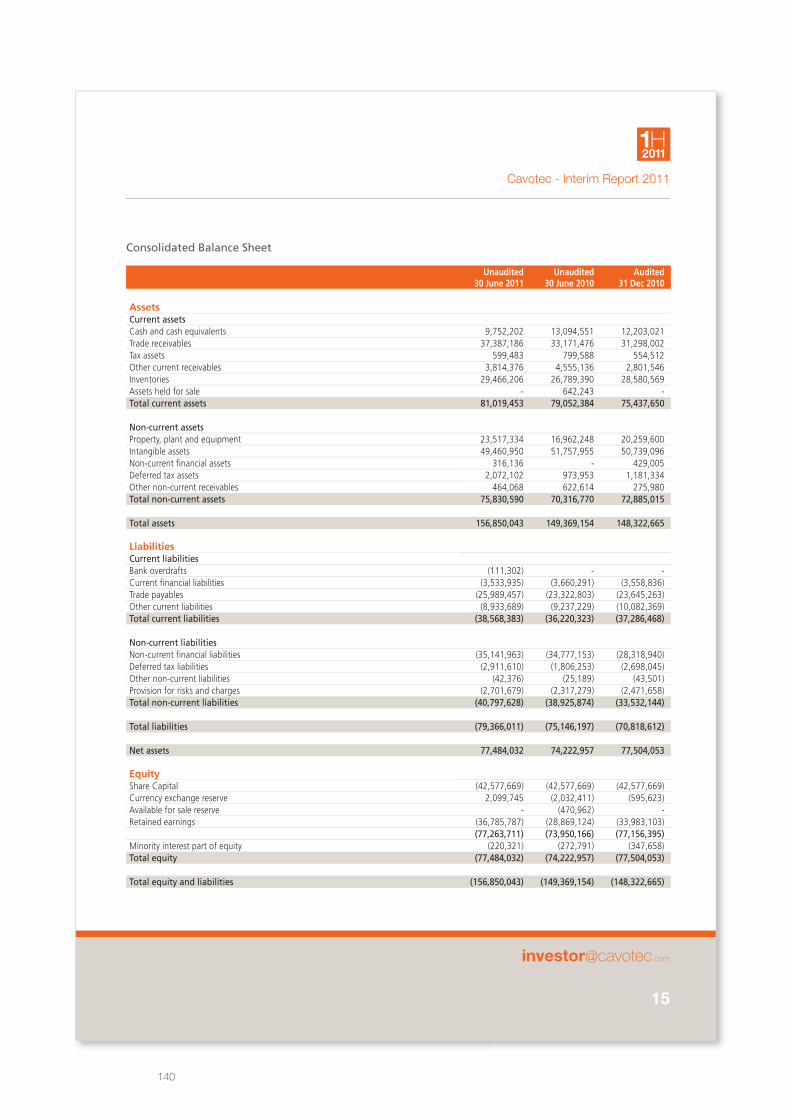
Cavotec - Interim Report 2011
15
1H2011
Consolidated Balance Sheet
Unaudited30 June 2011
Unaudited30 June 2010
Audited31 Dec 2010
AssetsCurrent assetsCash and cash equivalents 9,752,202 13,094,551 12,203,021 Trade receivables 37,387,186 33,171,476 31,298,002 Tax assets 599,483 799,588 554,512 Other current receivables 3,814,376 4,555,136 2,801,546 Inventories 29,466,206 26,789,390 28,580,569 Assets held for sale - 642,243 -Total current assets 81,019,453 79,052,384 75,437,650
Non-current assetsProperty, plant and equipment 23,517,334 16,962,248 20,259,600 Intangible assets 49,460,950 51,757,955 50,739,096 Non-current financial assets 316,136 - 429,005 Deferred tax assets 2,072,102 973,953 1,181,334 Other non-current receivables 464,068 622,614 275,980 Total non-current assets 75,830,590 70,316,770 72,885,015
Total assets 156,850,043 149,369,154 148,322,665
LiabilitiesCurrent liabilitiesBank overdrafts (111,302) - - Current financial liabilities (3,533,935) (3,660,291) (3,558,836)Trade payables (25,989,457) (23,322,803) (23,645,263)Other current liabilities (8,933,689) (9,237,229) (10,082,369)Total current liabilities (38,568,383) (36,220,323) (37,286,468)
Non-current liabilitiesNon-current financial liabilities (35,141,963) (34,777,153) (28,318,940)Deferred tax liabilities (2,911,610) (1,806,253) (2,698,045)Other non-current liabilities (42,376) (25,189) (43,501)Provision for risks and charges (2,701,679) (2,317,279) (2,471,658)Total non-current liabilities (40,797,628) (38,925,874) (33,532,144)
Total liabilities (79,366,011) (75,146,197) (70,818,612)
Net assets 77,484,032 74,222,957 77,504,053
EquityShare Capital (42,577,669) (42,577,669) (42,577,669)Currency exchange reserve 2,099,745 (2,032,411) (595,623)Available for sale reserve - (470,962) - Retained earnings (36,785,787) (28,869,124) (33,983,103)
(77,263,711) (73,950,166) (77,156,395)Minority interest part of equity (220,321) (272,791) (347,658)Total equity (77,484,032) (74,222,957) (77,504,053)
Total equity and liabilities (156,850,043) (149,369,154) (148,322,665)
140
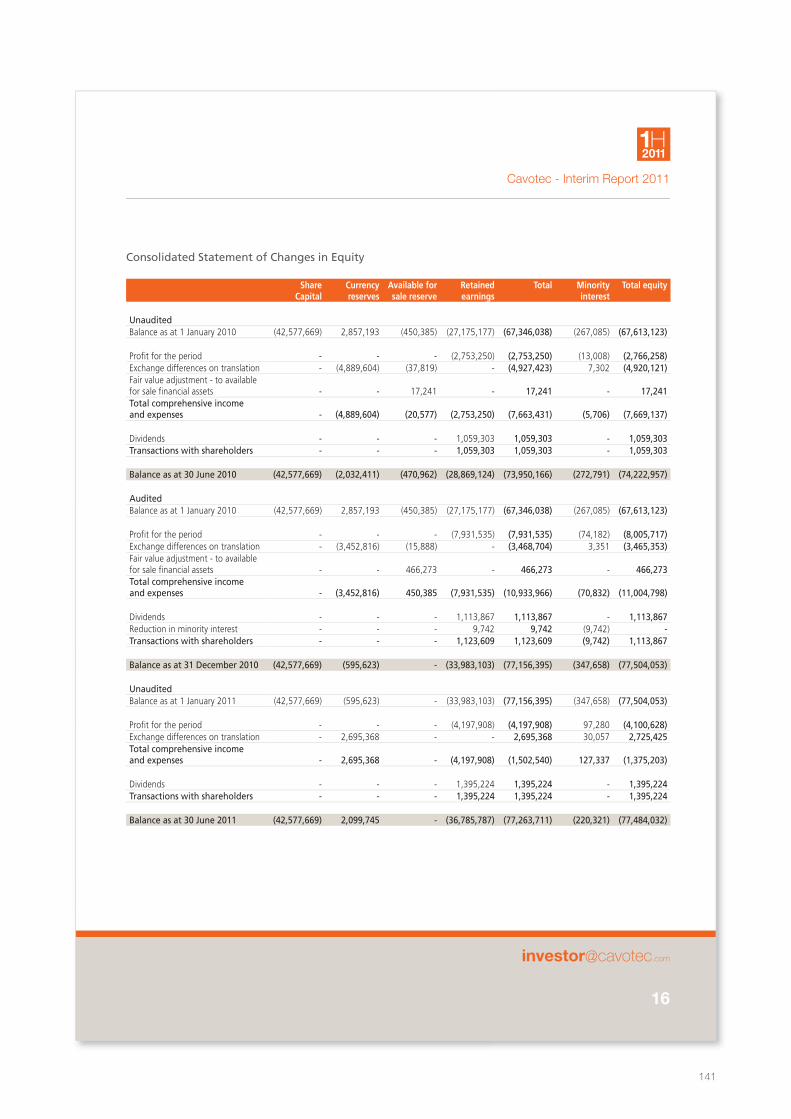
Cavotec - Interim Report 2011
16
1H2011
Consolidated Statement of Changes in Equity
Share Capital
Currency reserves
Available for sale reserve
Retained earnings
Total Minority interest
Total equity
UnauditedBalance as at 1 January 2010 (42,577,669) 2,857,193 (450,385) (27,175,177) (67,346,038) (267,085) (67,613,123)
Profit for the period - - - (2,753,250) (2,753,250) (13,008) (2,766,258)Exchange differences on translation - (4,889,604) (37,819) - (4,927,423) 7,302 (4,920,121)Fair value adjustment - to available for sale financial assets - - 17,241 - 17,241 - 17,241 Total comprehensive income and expenses -
(4,889,604) (20,577) (2,753,250) (7,663,431) (5,706) (7,669,137)
Dividends - - - 1,059,303 1,059,303 - 1,059,303 Transactions with shareholders - - - 1,059,303 1,059,303 - 1,059,303
Balance as at 30 June 2010 (42,577,669) (2,032,411) (470,962) (28,869,124) (73,950,166) (272,791) (74,222,957)
AuditedBalance as at 1 January 2010 (42,577,669) 2,857,193 (450,385) (27,175,177) (67,346,038) (267,085) (67,613,123)
Profit for the period - - - (7,931,535) (7,931,535) (74,182) (8,005,717)Exchange differences on translation - (3,452,816) (15,888) - (3,468,704) 3,351 (3,465,353)Fair value adjustment - to available for sale financial assets - - 466,273 - 466,273 - 466,273 Total comprehensive income and expenses - (3,452,816) 450,385 (7,931,535) (10,933,966) (70,832) (11,004,798)
Dividends - - - 1,113,867 1,113,867 - 1,113,867 Reduction in minority interest - - - 9,742 9,742 (9,742) - Transactions with shareholders - - - 1,123,609 1,123,609 (9,742) 1,113,867
Balance as at 31 December 2010 (42,577,669) (595,623) - (33,983,103) (77,156,395) (347,658) (77,504,053)
UnauditedBalance as at 1 January 2011 (42,577,669) (595,623) - (33,983,103) (77,156,395) (347,658) (77,504,053)
Profit for the period - - - (4,197,908) (4,197,908) 97,280 (4,100,628)Exchange differences on translation - 2,695,368 - - 2,695,368 30,057 2,725,425 Total comprehensive income and expenses - 2,695,368 - (4,197,908) (1,502,540)
127,337 (1,375,203)
Dividends - - - 1,395,224 1,395,224 - 1,395,224 Transactions with shareholders - - - 1,395,224 1,395,224 - 1,395,224
Balance as at 30 June 2011 (42,577,669) 2,099,745 - (36,785,787) (77,263,711) (220,321) (77,484,032)
141
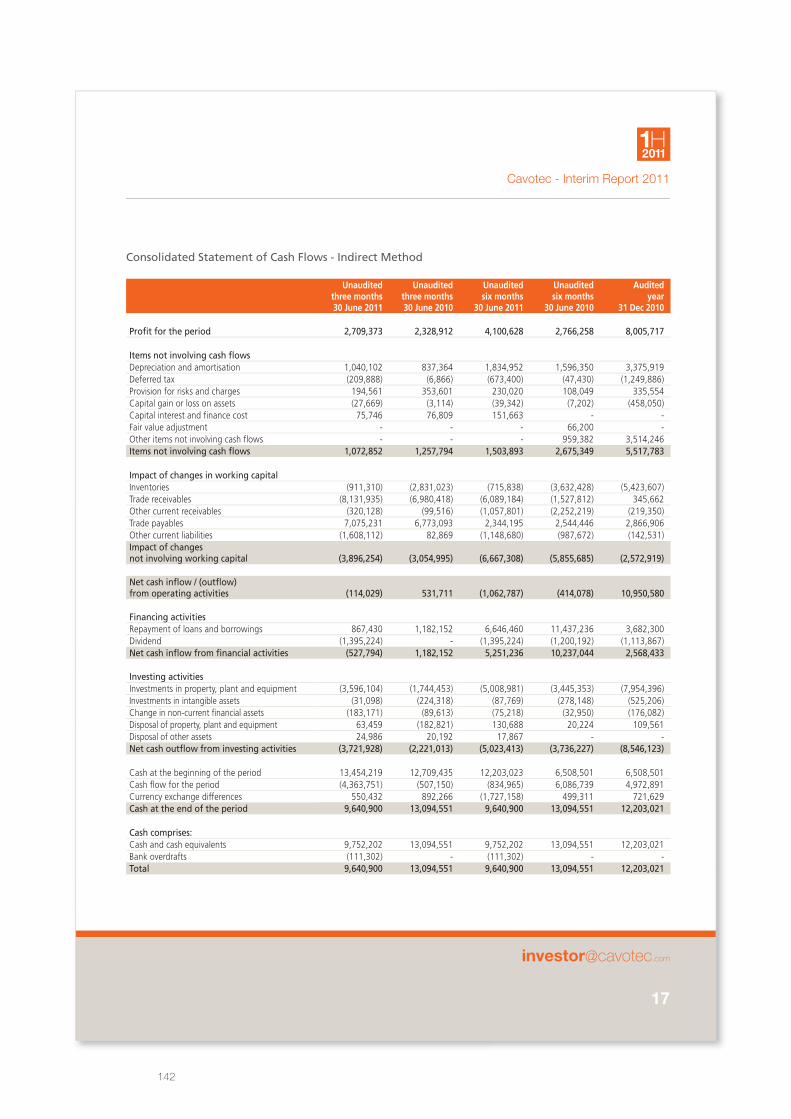
Cavotec - Interim Report 2011
17
1H2011
Consolidated Statement of Cash Flows - Indirect Method
Unauditedthree months30 June 2011
Unauditedthree months30 June 2010
Unauditedsix months
30 June 2011
Unauditedsix months
30 June 2010
Auditedyear
31 Dec 2010
Profit for the period 2,709,373 2,328,912 4,100,628 2,766,258 8,005,717
Items not involving cash flowsDepreciation and amortisation 1,040,102 837,364 1,834,952 1,596,350 3,375,919 Deferred tax (209,888) (6,866) (673,400) (47,430) (1,249,886)Provision for risks and charges 194,561 353,601 230,020 108,049 335,554 Capital gain or loss on assets (27,669) (3,114) (39,342) (7,202) (458,050)Capital interest and finance cost 75,746 76,809 151,663 - - Fair value adjustment - - - 66,200 - Other items not involving cash flows - - - 959,382 3,514,246 Items not involving cash flows 1,072,852 1,257,794 1,503,893 2,675,349 5,517,783
Impact of changes in working capitalInventories (911,310) (2,831,023) (715,838) (3,632,428) (5,423,607)Trade receivables (8,131,935) (6,980,418) (6,089,184) (1,527,812) 345,662 Other current receivables (320,128) (99,516) (1,057,801) (2,252,219) (219,350)Trade payables 7,075,231 6,773,093 2,344,195 2,544,446 2,866,906 Other current liabilities (1,608,112) 82,869 (1,148,680) (987,672) (142,531)Impact of changes not involving working capital (3,896,254) (3,054,995) (6,667,308) (5,855,685) (2,572,919)
Net cash inflow / (outflow) from operating activities (114,029) 531,711 (1,062,787) (414,078)
10,950,580
Financing activities Repayment of loans and borrowings 867,430 1,182,152 6,646,460 11,437,236 3,682,300 Dividend (1,395,224) - (1,395,224) (1,200,192) (1,113,867)Net cash inflow from financial activities (527,794) 1,182,152 5,251,236 10,237,044 2,568,433
Investing activitiesInvestments in property, plant and equipment (3,596,104) (1,744,453) (5,008,981) (3,445,353) (7,954,396)Investments in intangible assets (31,098) (224,318) (87,769) (278,148) (525,206)Change in non-current financial assets (183,171) (89,613) (75,218) (32,950) (176,082)Disposal of property, plant and equipment 63,459 (182,821) 130,688 20,224 109,561 Disposal of other assets 24,986 20,192 17,867 - - Net cash outflow from investing activities (3,721,928) (2,221,013) (5,023,413) (3,736,227) (8,546,123)
Cash at the beginning of the period 13,454,219 12,709,435 12,203,023 6,508,501 6,508,501 Cash flow for the period (4,363,751) (507,150) (834,965) 6,086,739 4,972,891 Currency exchange differences 550,432 892,266 (1,727,158) 499,311 721,629 Cash at the end of the period 9,640,900 13,094,551 9,640,900 13,094,551 12,203,021
Cash comprises:Cash and cash equivalents 9,752,202 13,094,551 9,752,202 13,094,551 12,203,021 Bank overdrafts (111,302) - (111,302) - -Total 9,640,900 13,094,551 9,640,900 13,094,551 12,203,021
142
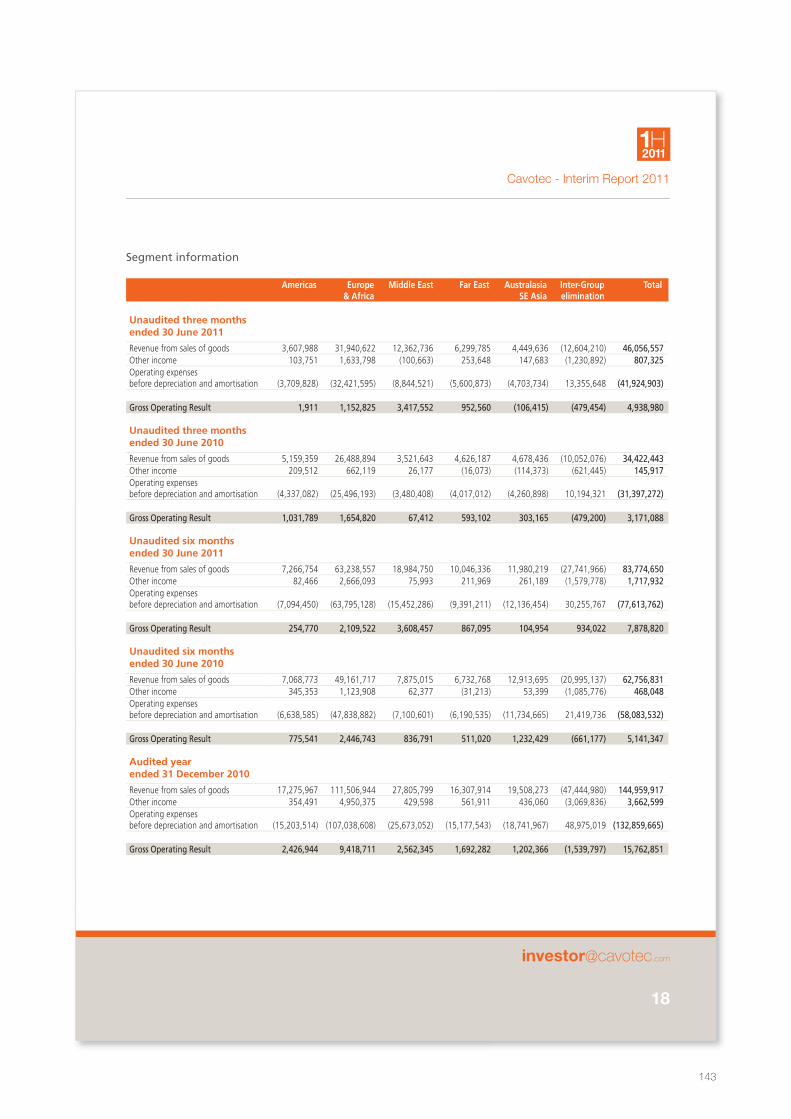
Cavotec - Interim Report 2011
18
1H2011
Segment information
Americas Europe& Africa
Middle East Far East AustralasiaSE Asia
Inter-Groupelimination
Total
Unaudited three months ended 30 June 2011
Revenue from sales of goods 3,607,988 31,940,622 12,362,736 6,299,785 4,449,636 (12,604,210) 46,056,557 Other income 103,751 1,633,798 (100,663) 253,648 147,683 (1,230,892) 807,325 Operating expenses before depreciation and amortisation
(3,709,828) (32,421,595)
(8,844,521) (5,600,873) (4,703,734) 13,355,648 (41,924,903)
Gross Operating Result 1,911 1,152,825 3,417,552 952,560 (106,415) (479,454) 4,938,980
Unaudited three months ended 30 June 2010
Revenue from sales of goods 5,159,359 26,488,894 3,521,643 4,626,187 4,678,436 (10,052,076) 34,422,443 Other income 209,512 662,119 26,177 (16,073) (114,373) (621,445) 145,917 Operating expenses before depreciation and amortisation
(4,337,082) (25,496,193) (3,480,408) (4,017,012) (4,260,898) 10,194,321 (31,397,272)
Gross Operating Result 1,031,789 1,654,820 67,412 593,102 303,165 (479,200) 3,171,088
Unaudited six months ended 30 June 2011
Revenue from sales of goods 7,266,754 63,238,557 18,984,750 10,046,336 11,980,219 (27,741,966) 83,774,650 Other income 82,466 2,666,093 75,993 211,969 261,189 (1,579,778) 1,717,932 Operating expenses before depreciation and amortisation (7,094,450)
(63,795,128)
(15,452,286) (9,391,211) (12,136,454) 30,255,767
(77,613,762)
Gross Operating Result 254,770 2,109,522 3,608,457 867,095 104,954 934,022 7,878,820
Unaudited six months ended 30 June 2010
Revenue from sales of goods 7,068,773 49,161,717 7,875,015 6,732,768 12,913,695 (20,995,137) 62,756,831 Other income 345,353 1,123,908 62,377 (31,213) 53,399 (1,085,776) 468,048 Operating expenses before depreciation and amortisation (6,638,585) (47,838,882) (7,100,601) (6,190,535) (11,734,665) 21,419,736 (58,083,532)
Gross Operating Result 775,541 2,446,743 836,791 511,020 1,232,429 (661,177) 5,141,347
Audited year ended 31 December 2010
Revenue from sales of goods 17,275,967 111,506,944 27,805,799 16,307,914 19,508,273 (47,444,980) 144,959,917 Other income 354,491 4,950,375 429,598 561,911 436,060 (3,069,836) 3,662,599 Operating expenses before depreciation and amortisation
(15,203,514)
(107,038,608) (25,673,052) (15,177,543) (18,741,967) 48,975,019
(132,859,665)
Gross Operating Result 2,426,944 9,418,711 2,562,345 1,692,282 1,202,366 (1,539,797) 15,762,851
143
Cavotec - Interim Report 2011
19
1H2011
Cavotec MSL Holdings Limited (the ‘Company’) and its subsidiaries (together ‘the Group’) designs and manufactures a wide range of innovative mobile power supply solutions. The Group has 8 Centres of Excellence located in Germany, Italy, New Zealand, Norway, Sweden and the United States of America. Sales and distribution is achieved through 29 sales companies and branch offices and a network of distributor partners spread throughout the world. The Company is a limited liability Company incorporated and domiciled in New Zealand. The Company is listed on the New Zealand stock exchange.
These Financial Statements have been approved for issue by the Board of Directors on 22 August 2011.
These general purpose consolidated financial statements for the six months ended 30 June 2011 have been prepared in accordance with IAS 34, Interim Financial Reporting. These consolidated interim financial statements do not include all the notes of the type normally included in an annual financial report. Accordingly, this report should be read in conjunction with the audited financial statements of Cavotec MSL Holdings Limited for the year ended 31 December 2010 which have been prepared in accordance with the International Financial Reporting Standards (IFRS) and the New Zealand equivalents to International Financial Reporting Standards (NZ IFRS).
All significant accounting policies have been applied on a basis consistent with those used in the audited financial statements of Cavotec MSL Holdings Limited for the year ended 31 December 2010.
General information
Basis of preparation of financial statements
Property, Plant and Equipment at June 30, 2011 amounted to EUR 23.5 million (EUR 20.3 million as of 31 December 2010) with the increase mainly related to the acquisition of the Cavotec Meyerink premises in Germany for EUR 2.3 million, and to the completion of works on the premises for Cavotec Micro control in Norway and for Cavotec US in the USA for EUR 1 million.
No acquisitions and divestments were performed during the first six months of the year.
There have been no relevant changes to the assets and liabilities for segment information as shown in the Annual Report for 2010.
On the 5 August Cavotec announced the successful renegotiation of the EUR 50 Million Term Loan and Revolving Credit Facilities signed at the end of 2009 and maturing in December 2012. The new agreement extends the maturity to 2016 at improved pricing and includes an option to increase the facilities up to EUR 80 million at any time during the term of the Credit Facilities.
On 16 August 2011 Cavotec announced the acquisition of INET as described in further detail on page 2 and 3.
Investments
Company acquisitions and divestments
Segment information
Subsequent events
Ottonel PopescoChief Executive Officer
Stefan WidegrenExecutive Chairman
On behalf of the Board22 August 2011
There have been no changes to what was stated by Cavotec in its Annual Report for 2010 under Risk management (pages 139-142).
Noteworthy risks and uncertainties
144
Cavotec - Interim Report 2011
20
1H2011
PricewaterhouseCoopers, 5 Sir Gil Simpson Drive, Burnside, Christchurch 8053,T: +64 (3) 374 3000; F: +64 (3
Independent Accountants’ ReportTo the shareholders of Cavotec MSL
Report on the Interim Financial StatementsWe have reviewed the interim financial statements (“financial statements”) of
pages 14 to 19, which comprise the balance sheet as at 3
statement of changes in equity and
information for the Group.
Directors’ Responsibility fo
The Company’s Directors are responsible for the preparation and presentation of the financial statements that
present fairly the financial position of the Group
for the period ended on that date.
Accountants’ Responsibility
We are responsible for reviewing the financial statements presented by the Directors in order to report to you
whether, in our opinion and on the basis of the procedures performed by us, an
that would indicate that the financial statements do not present fairly the matters to which they relate.
A review is limited primarily to enquiries of company personnel and analytical review procedures applied to
financial data and thus provides less assurance than an audit. We have not performed an audit on the financial
statements and, accordingly, we do not express an audit opinion.
We have reviewed the financial statements of the Group
International Standard on Review Engagement
auditor of the entity).
We have no relationship with, or interests in
accountants conducting this review, auditors,
These matters have not impaired our independence as accountants of the Group.
Opinion
Based on our review, nothing has come to our attentio
which have been prepared in accordance with International Accounting Standard 34 and New Zealand Equivalent
to International Accounting Standard 34: Interim Financial Reporting do not present fairly
of the Group as at 3o June 2011
Restriction on Distribution or UseThis report is made solely to the Company’s shareholders, as a body. Our review work
we might state to the Company’s shareholders those matters which we are required to state to them in an
accountant’s report and for no other purpose. To the fullest extent permitted by law, we do not accept or assume
responsibility to anyone other than the Company and the Company’s shareholders as a body, for our review
procedures, for this report, or for the opinions we have formed.
Chartered Accountants
22 August 2011
5 Sir Gil Simpson Drive, Burnside, Christchurch 8053, New Zealand74 3000; F: +64 (3) 374 3001; www.pwc.com/nz
Independent Accountants’ ReportCavotec MSL Holdings Limited
Report on the Interim Financial StatementsWe have reviewed the interim financial statements (“financial statements”) of Cavotec MSL Holdings Limited on
which comprise the balance sheet as at 30 June 2011, the statement of comprehensive income
statement of changes in equity and statement of cash flows for the period then ended, and other explanatory
Directors’ Responsibility for the Interim Financial Statements
The Company’s Directors are responsible for the preparation and presentation of the financial statements that
present fairly the financial position of the Group as at 30 June 2011 and its financial performance and cash fl
for the period ended on that date.
Accountants’ Responsibility
We are responsible for reviewing the financial statements presented by the Directors in order to report to you
whether, in our opinion and on the basis of the procedures performed by us, anything has come to our attention
that would indicate that the financial statements do not present fairly the matters to which they relate.
A review is limited primarily to enquiries of company personnel and analytical review procedures applied to
data and thus provides less assurance than an audit. We have not performed an audit on the financial
statements and, accordingly, we do not express an audit opinion.
We have reviewed the financial statements of the Group for the period ended 30 June
Review Engagements 2410 (Review of interim financial information by an independent
We have no relationship with, or interests in Cavotec MSL Holdings Limited other than in our capacitie
accountants conducting this review, auditors, tax advisors, and providers of other assurance related services
These matters have not impaired our independence as accountants of the Group.
Based on our review, nothing has come to our attention that causes us to believe that the financial statements
which have been prepared in accordance with International Accounting Standard 34 and New Zealand Equivalent
to International Accounting Standard 34: Interim Financial Reporting do not present fairly
2011 and its financial performance and cash flows for the period ended on that date.
Restriction on Distribution or UseThis report is made solely to the Company’s shareholders, as a body. Our review work
we might state to the Company’s shareholders those matters which we are required to state to them in an
accountant’s report and for no other purpose. To the fullest extent permitted by law, we do not accept or assume
lity to anyone other than the Company and the Company’s shareholders as a body, for our review
procedures, for this report, or for the opinions we have formed.
New Zealand
Cavotec MSL Holdings Limited on
statement of comprehensive income,
for the period then ended, and other explanatory
The Company’s Directors are responsible for the preparation and presentation of the financial statements that
and its financial performance and cash flows
We are responsible for reviewing the financial statements presented by the Directors in order to report to you
ything has come to our attention
that would indicate that the financial statements do not present fairly the matters to which they relate.
A review is limited primarily to enquiries of company personnel and analytical review procedures applied to
data and thus provides less assurance than an audit. We have not performed an audit on the financial
June 2011 in accordance with
s 2410 (Review of interim financial information by an independent
other than in our capacities as
providers of other assurance related services.
n that causes us to believe that the financial statements
which have been prepared in accordance with International Accounting Standard 34 and New Zealand Equivalent
to International Accounting Standard 34: Interim Financial Reporting do not present fairly the financial position
and its financial performance and cash flows for the period ended on that date.
This report is made solely to the Company’s shareholders, as a body. Our review work has been undertaken so that
we might state to the Company’s shareholders those matters which we are required to state to them in an
accountant’s report and for no other purpose. To the fullest extent permitted by law, we do not accept or assume
lity to anyone other than the Company and the Company’s shareholders as a body, for our review
Christchurch
145
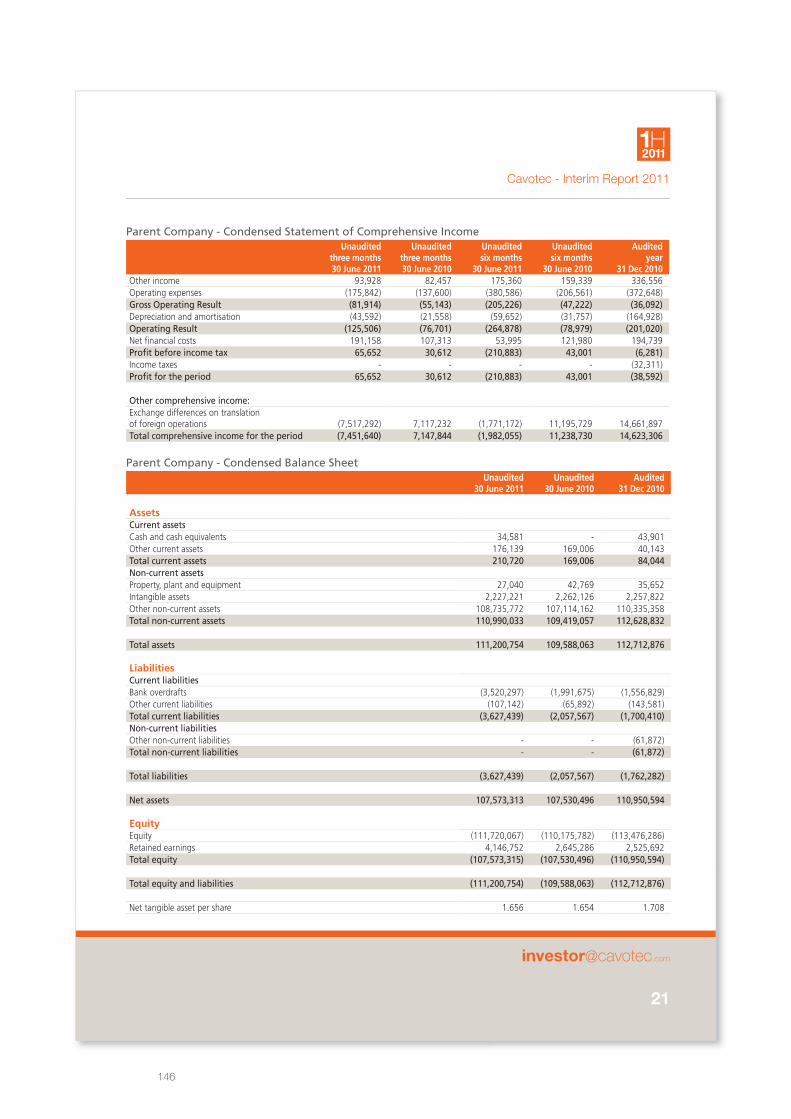
Cavotec - Interim Report 2011
21
1H2011
Parent Company - Condensed Balance Sheet Unaudited
30 June 2011Unaudited
30 June 2010Audited
31 Dec 2010
AssetsCurrent assetsCash and cash equivalents 34,581 - 43,901 Other current assets 176,139 169,006 40,143 Total current assets 210,720 169,006 84,044 Non-current assetsProperty, plant and equipment 27,040 42,769 35,652 Intangible assets 2,227,221 2,262,126 2,257,822 Other non-current assets 108,735,772 107,114,162 110,335,358 Total non-current assets 110,990,033 109,419,057 112,628,832
Total assets 111,200,754 109,588,063 112,712,876
LiabilitiesCurrent liabilitiesBank overdrafts (3,520,297) (1,991,675) (1,556,829)Other current liabilities (107,142) (65,892) (143,581)Total current liabilities (3,627,439) (2,057,567) (1,700,410)Non-current liabilitiesOther non-current liabilities - - (61,872)Total non-current liabilities - - (61,872)
Total liabilities (3,627,439) (2,057,567) (1,762,282)
Net assets 107,573,313 107,530,496 110,950,594
EquityEquity (111,720,067) (110,175,782) (113,476,286)Retained earnings 4,146,752 2,645,286 2,525,692 Total equity (107,573,315) (107,530,496) (110,950,594)
Total equity and liabilities (111,200,754) (109,588,063) (112,712,876)
Net tangible asset per share 1.656 1.654 1.708
Parent Company - Condensed Statement of Comprehensive IncomeUnaudited
three months30 June 2011
Unauditedthree months30 June 2010
Unauditedsix months
30 June 2011
Unauditedsix months
30 June 2010
Auditedyear
31 Dec 2010Other income 93,928 82,457 175,360 159,339 336,556 Operating expenses (175,842) (137,600) (380,586) (206,561) (372,648)Gross Operating Result (81,914) (55,143) (205,226) (47,222) (36,092)Depreciation and amortisation (43,592) (21,558) (59,652) (31,757) (164,928)Operating Result (125,506) (76,701) (264,878) (78,979) (201,020)Net financial costs 191,158 107,313 53,995 121,980 194,739 Profit before income tax 65,652 30,612 (210,883) 43,001 (6,281)Income taxes - - - - (32,311)Profit for the period 65,652 30,612 (210,883) 43,001 (38,592)
Other comprehensive income:Exchange differences on translationof foreign operations (7,517,292) 7,117,232
(1,771,172) 11,195,729
14,661,897
Total comprehensive income for the period (7,451,640) 7,147,844 (1,982,055) 11,238,730 14,623,306
PricewaterhouseCoopers, 5 Sir Gil Simpson Drive, Burnside, Christchurch 8053,T: +64 (3) 374 3000; F: +64 (3
Independent Accountants’ ReportTo the shareholders of Cavotec MSL
Report on the Interim Financial StatementsWe have reviewed the interim financial statements (“financial statements”) of
pages 14 to 19, which comprise the balance sheet as at 3
statement of changes in equity and
information for the Group.
Directors’ Responsibility fo
The Company’s Directors are responsible for the preparation and presentation of the financial statements that
present fairly the financial position of the Group
for the period ended on that date.
Accountants’ Responsibility
We are responsible for reviewing the financial statements presented by the Directors in order to report to you
whether, in our opinion and on the basis of the procedures performed by us, an
that would indicate that the financial statements do not present fairly the matters to which they relate.
A review is limited primarily to enquiries of company personnel and analytical review procedures applied to
financial data and thus provides less assurance than an audit. We have not performed an audit on the financial
statements and, accordingly, we do not express an audit opinion.
We have reviewed the financial statements of the Group
International Standard on Review Engagement
auditor of the entity).
We have no relationship with, or interests in
accountants conducting this review, auditors,
These matters have not impaired our independence as accountants of the Group.
Opinion
Based on our review, nothing has come to our attentio
which have been prepared in accordance with International Accounting Standard 34 and New Zealand Equivalent
to International Accounting Standard 34: Interim Financial Reporting do not present fairly
of the Group as at 3o June 2011
Restriction on Distribution or UseThis report is made solely to the Company’s shareholders, as a body. Our review work
we might state to the Company’s shareholders those matters which we are required to state to them in an
accountant’s report and for no other purpose. To the fullest extent permitted by law, we do not accept or assume
responsibility to anyone other than the Company and the Company’s shareholders as a body, for our review
procedures, for this report, or for the opinions we have formed.
Chartered Accountants
22 August 2011
5 Sir Gil Simpson Drive, Burnside, Christchurch 8053, New Zealand74 3000; F: +64 (3) 374 3001; www.pwc.com/nz
Independent Accountants’ ReportCavotec MSL Holdings Limited
Report on the Interim Financial StatementsWe have reviewed the interim financial statements (“financial statements”) of Cavotec MSL Holdings Limited on
which comprise the balance sheet as at 30 June 2011, the statement of comprehensive income
statement of changes in equity and statement of cash flows for the period then ended, and other explanatory
Directors’ Responsibility for the Interim Financial Statements
The Company’s Directors are responsible for the preparation and presentation of the financial statements that
present fairly the financial position of the Group as at 30 June 2011 and its financial performance and cash fl
for the period ended on that date.
Accountants’ Responsibility
We are responsible for reviewing the financial statements presented by the Directors in order to report to you
whether, in our opinion and on the basis of the procedures performed by us, anything has come to our attention
that would indicate that the financial statements do not present fairly the matters to which they relate.
A review is limited primarily to enquiries of company personnel and analytical review procedures applied to
data and thus provides less assurance than an audit. We have not performed an audit on the financial
statements and, accordingly, we do not express an audit opinion.
We have reviewed the financial statements of the Group for the period ended 30 June
Review Engagements 2410 (Review of interim financial information by an independent
We have no relationship with, or interests in Cavotec MSL Holdings Limited other than in our capacitie
accountants conducting this review, auditors, tax advisors, and providers of other assurance related services
These matters have not impaired our independence as accountants of the Group.
Based on our review, nothing has come to our attention that causes us to believe that the financial statements
which have been prepared in accordance with International Accounting Standard 34 and New Zealand Equivalent
to International Accounting Standard 34: Interim Financial Reporting do not present fairly
2011 and its financial performance and cash flows for the period ended on that date.
Restriction on Distribution or UseThis report is made solely to the Company’s shareholders, as a body. Our review work
we might state to the Company’s shareholders those matters which we are required to state to them in an
accountant’s report and for no other purpose. To the fullest extent permitted by law, we do not accept or assume
lity to anyone other than the Company and the Company’s shareholders as a body, for our review
procedures, for this report, or for the opinions we have formed.
New Zealand
Cavotec MSL Holdings Limited on
statement of comprehensive income,
for the period then ended, and other explanatory
The Company’s Directors are responsible for the preparation and presentation of the financial statements that
and its financial performance and cash flows
We are responsible for reviewing the financial statements presented by the Directors in order to report to you
ything has come to our attention
that would indicate that the financial statements do not present fairly the matters to which they relate.
A review is limited primarily to enquiries of company personnel and analytical review procedures applied to
data and thus provides less assurance than an audit. We have not performed an audit on the financial
June 2011 in accordance with
s 2410 (Review of interim financial information by an independent
other than in our capacities as
providers of other assurance related services.
n that causes us to believe that the financial statements
which have been prepared in accordance with International Accounting Standard 34 and New Zealand Equivalent
to International Accounting Standard 34: Interim Financial Reporting do not present fairly the financial position
and its financial performance and cash flows for the period ended on that date.
This report is made solely to the Company’s shareholders, as a body. Our review work has been undertaken so that
we might state to the Company’s shareholders those matters which we are required to state to them in an
accountant’s report and for no other purpose. To the fullest extent permitted by law, we do not accept or assume
lity to anyone other than the Company and the Company’s shareholders as a body, for our review
Christchurch
146
Cavotec - Interim Report 2011
22
1H2011
It is the responsibility of Cavotec Group Management to disclose any and all information that might impact the Cavotec share price to the market in a timely manner. Group Management is ultimately responsible for determining whether information will impact the Cavotec share.
Reporting date for 3Q11 Quarterly Report:the 3Q11 Quarterly Report will be published on 9 November 2011.
Reporting dates 2011
Some statements in this report are forward-looking, and the actual outcome could be materially different. In addition to the factors explicitly discussed, other factors could have a material effect on the actual outcome. Such factors include, but are not limited to, general business conditions, fluctuations in exchange rates and interest rates, political developments, the impact of competing products and their pricing, product development, commercialisation and technological difficulties, interruptions in supply, and major customer credit losses.
For more information please contact:
Michael ScheepersDirector, Investor Relations & PRTelephone: +41 91 911 40 10Mobile: +41 79 502 40 10Email: [email protected]
Forward-looking statements
Analysts & Media
147
The following section contains the financial statements, including notes, for the Cavotec MSL Holdings Limited
group (“Cavotec MSL”) for the financial year 2010 and is an excerpt from the annual report 2010. The financial
statements for 2008 and 2009 are incorporated in the Prospectus through reference. All reports can be found on
Cavotec’s website www.cavotec.com. The reports can also be ordered from Cavotec on email investor@cavotec.
com or by calling +41 91 911 40 10.
The Cavotec MSL group has during the relevant period been the operational group. For the newly created entity,
Cavotec SA (which is planned to be listed on NASDAQ OMX Stockholm), there is no relevant operational or financial
history. Cavotec SA was incorporated on 14 June 2011. Through a Scheme of Arrangement the operations of the
Cavotec MSL group have been transferred to the Cavotec SA group. The Scheme of Arrangement is described
in greater detail on page 68 in the section “Scheme of Arrangement”. The transaction does not constitute a
business combination under IFRS 3 due to the existence of a common controlling of the two companies. As
a consequence, it has been deemed relevant to present the financial information prepared by Cavotec MSL to
describe the financial development of the Cavotec Group.
Cavotec’s financial statements for the period 2008–2010 have been prepared in accordance with the International
Financial Reporting Standards (IFRS) and are in compliance with the New Zealand Equivalents to International
Financial Reporting Standards (NZ IFRS). There will be no change in the accounting principles applied by Cavotec
as a consequence of the change of the parent company (the Scheme of Arrangement).
Readers should note that going forward Cavotec will publish financial reports and other important information solely
in English. No Swedish translations will be available.
Financial reporting
148
The Board of Directors of Cavotec MSL Holdings Ltd. is pleased to present the Consolidated Financial Statements for 2010.
Stefan WidegrenExecutive Chairman
Ottonel PopescoChief Executive Officer
This report is dated 21 February 2011 and is signed on behalf of the Board of Cavotec MSL Holdings Limited by
Please note that all reported amounts in this report are in Euro.
149
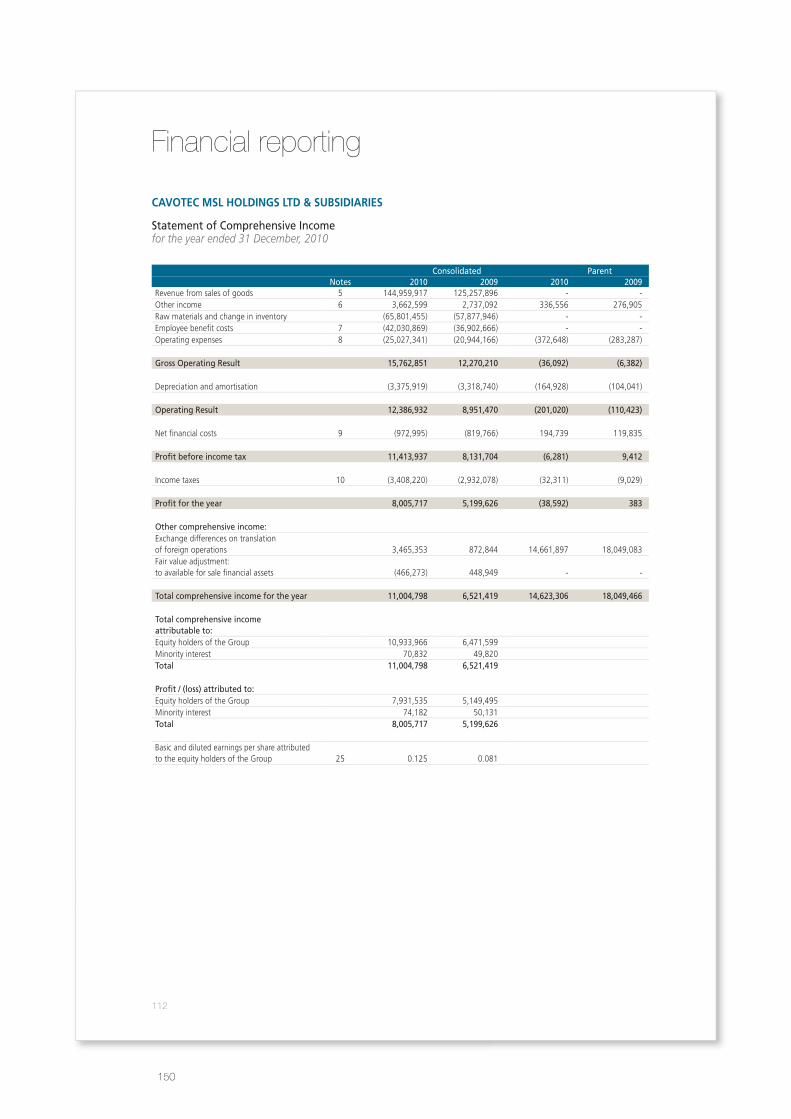
Financial reporting
Consolidated ParentNotes 2010 2009 2010 2009
Revenue from sales of goods 5 144,959,917 125,257,896 - -Other income 6 3,662,599 2,737,092 336,556 276,905 Raw materials and change in inventory (65,801,455) (57,877,946) - -Employee benefit costs 7 (42,030,869) (36,902,666) - -Operating expenses 8 (25,027,341) (20,944,166) (372,648) (283,287)
Gross Operating Result 15,762,851 12,270,210 (36,092) (6,382)
Depreciation and amortisation (3,375,919) (3,318,740) (164,928) (104,041) Operating Result 12,386,932 8,951,470 (201,020) (110,423)
Net financial costs 9 (972,995) (819,766) 194,739 119,835
Profit before income tax 11,413,937 8,131,704 (6,281) 9,412
Income taxes 10 (3,408,220) (2,932,078) (32,311) (9,029)
Profit for the year 8,005,717 5,199,626 (38,592) 383
Other comprehensive income:Exchange differences on translationof foreign operations
3,465,353
872,844 14,661,897 18,049,083
Fair value adjustment:to available for sale financial assets (466,273) 448,949 - -
Total comprehensive income for the year 11,004,798 6,521,419 14,623,306 18,049,466
Total comprehensive income attributable to:Equity holders of the Group 10,933,966 6,471,599 Minority interest 70,832 49,820 Total 11,004,798 6,521,419
Profit / (loss) attributed to:Equity holders of the Group 7,931,535 5,149,495 Minority interest 74,182 50,131 Total 8,005,717 5,199,626
Basic and diluted earnings per share attributedto the equity holders of the Group 25 0.125 0.081
CavoteC MSL HoLdingS Ltd & SubSidiarieS
Statement of Comprehensive Incomefor the year ended 31 December, 2010
112
150
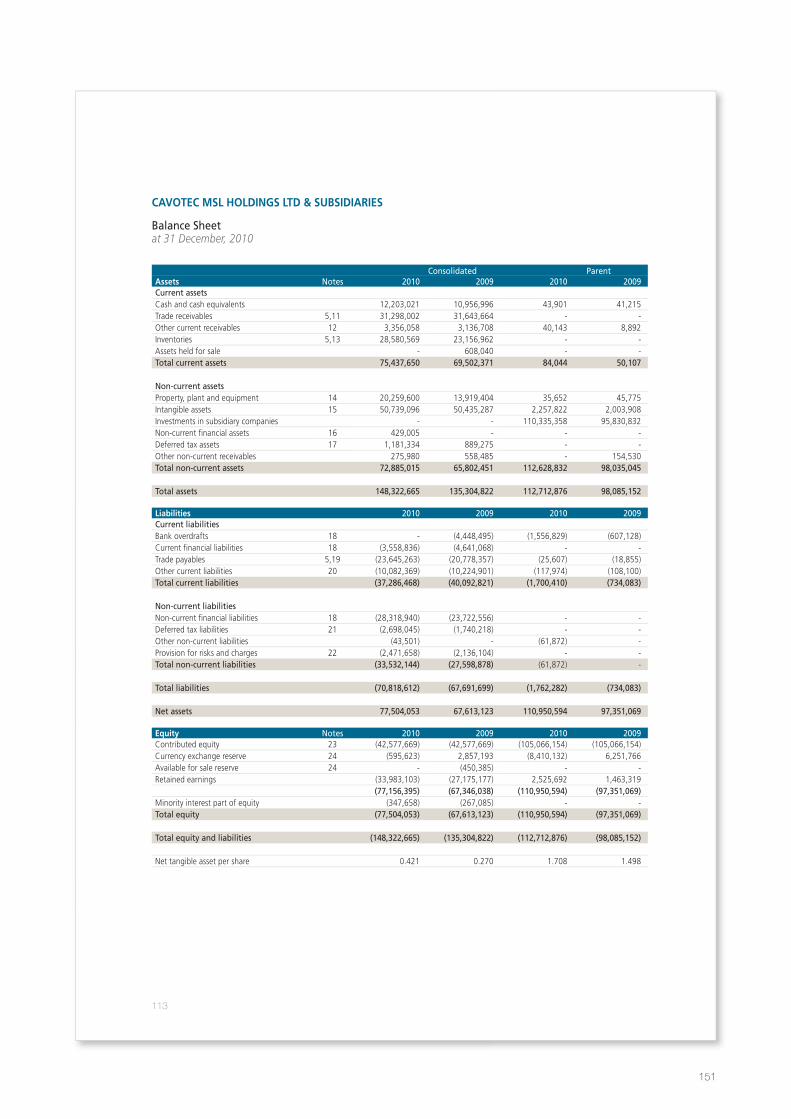
CavoteC MSL HoLdingS Ltd & SubSidiarieS
Balance Sheetat 31 December, 2010
Consolidated Parentassets Notes 2010 2009 2010 2009Current assetsCash and cash equivalents 12,203,021 10,956,996 43,901 41,215 Trade receivables 5,11 31,298,002 31,643,664 - -Other current receivables 12 3,356,058 3,136,708 40,143 8,892 Inventories 5,13 28,580,569 23,156,962 - -Assets held for sale - 608,040 - -Total current assets 75,437,650 69,502,371 84,044 50,107
Non-current assetsProperty, plant and equipment 14 20,259,600 13,919,404 35,652 45,775 Intangible assets 15 50,739,096 50,435,287 2,257,822 2,003,908 Investments in subsidiary companies - - 110,335,358 95,830,832 Non-current financial assets 16 429,005 - - -Deferred tax assets 17 1,181,334 889,275 - -Other non-current receivables 275,980 558,485 - 154,530 Total non-current assets 72,885,015 65,802,451 112,628,832 98,035,045
Total assets 148,322,665 135,304,822 112,712,876 98,085,152
Liabilities 2010 2009 2010 2009Current liabilitiesBank overdrafts 18 - (4,448,495) (1,556,829) (607,128)Current financial liabilities 18 (3,558,836) (4,641,068) - -Trade payables 5,19 (23,645,263) (20,778,357) (25,607) (18,855)Other current liabilities 20 (10,082,369) (10,224,901) (117,974) (108,100)Total current liabilities (37,286,468) (40,092,821) (1,700,410) (734,083)
Non-current liabilitiesNon-current financial liabilities 18 (28,318,940) (23,722,556) - -Deferred tax liabilities 21 (2,698,045) (1,740,218) - -Other non-current liabilities (43,501) - (61,872) -Provision for risks and charges 22 (2,471,658) (2,136,104) - -Total non-current liabilities (33,532,144) (27,598,878) (61,872) -
Total liabilities (70,818,612) (67,691,699) (1,762,282) (734,083)
Net assets 77,504,053 67,613,123 110,950,594 97,351,069
equity Notes 2010 2009 2010 2009Contributed equity 23 (42,577,669) (42,577,669) (105,066,154) (105,066,154)Currency exchange reserve 24 (595,623) 2,857,193 (8,410,132) 6,251,766 Available for sale reserve 24 - (450,385) - -Retained earnings (33,983,103) (27,175,177) 2,525,692 1,463,319
(77,156,395) (67,346,038) (110,950,594) (97,351,069)Minority interest part of equity (347,658) (267,085) - -Total equity (77,504,053) (67,613,123) (110,950,594) (97,351,069)
Total equity and liabilities (148,322,665) (135,304,822) (112,712,876) (98,085,152)
Net tangible asset per share 0.421 0.270 1.708 1.498
113
151
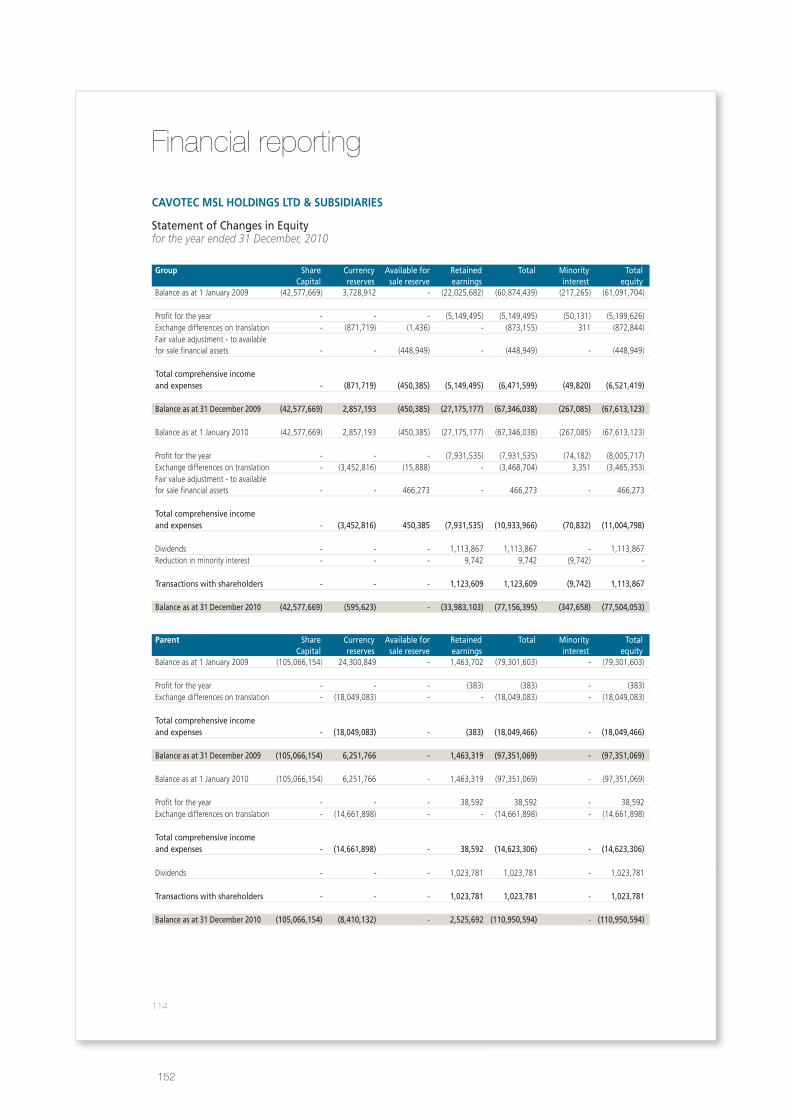
Financial reporting
CavoteC MSL HoLdingS Ltd & SubSidiarieS
Statement of Changes in Equityfor the year ended 31 December, 2010
group Share Capital
Currencyreserves
Available for sale reserve
Retainedearnings
Total Minority interest
Totalequity
Balance as at 1 January 2009 (42,577,669) 3,728,912 - (22,025,682) (60,874,439) (217,265) (61,091,704)
Profit for the year - - - (5,149,495) (5,149,495) (50,131) (5,199,626)Exchange differences on translation - (871,719) (1,436) - (873,155) 311 (872,844)Fair value adjustment - to available for sale financial assets - - (448,949) - (448,949) - (448,949)
Total comprehensive income and expenses - (871,719) (450,385) (5,149,495) (6,471,599) (49,820) (6,521,419)
Balance as at 31 December 2009 (42,577,669) 2,857,193 (450,385) (27,175,177) (67,346,038) (267,085) (67,613,123)
Balance as at 1 January 2010 (42,577,669) 2,857,193 (450,385) (27,175,177) (67,346,038) (267,085) (67,613,123)
Profit for the year - - - (7,931,535) (7,931,535) (74,182) (8,005,717)Exchange differences on translation - (3,452,816) (15,888) - (3,468,704) 3,351 (3,465,353)Fair value adjustment - to available for sale financial assets - - 466,273 - 466,273 - 466,273
Total comprehensive income and expenses - (3,452,816) 450,385 (7,931,535) (10,933,966) (70,832) (11,004,798)
Dividends - - - 1,113,867 1,113,867 - 1,113,867 Reduction in minority interest - - - 9,742 9,742 (9,742) -
Transactions with shareholders - - - 1,123,609 1,123,609 (9,742) 1,113,867
Balance as at 31 December 2010 (42,577,669) (595,623) - (33,983,103) (77,156,395) (347,658) (77,504,053)
Parent Share Capital
Currencyreserves
Available for sale reserve
Retainedearnings
Total Minority interest
Totalequity
Balance as at 1 January 2009 (105,066,154) 24,300,849 - 1,463,702 (79,301,603) - (79,301,603)
Profit for the year - - - (383) (383) - (383)Exchange differences on translation - (18,049,083) - - (18,049,083) - (18,049,083)
Total comprehensive income and expenses - (18,049,083) - (383) (18,049,466) - (18,049,466)
Balance as at 31 December 2009 (105,066,154) 6,251,766 - 1,463,319 (97,351,069) - (97,351,069)
Balance as at 1 January 2010 (105,066,154) 6,251,766 - 1,463,319 (97,351,069) - (97,351,069)
Profit for the year - - - 38,592 38,592 - 38,592 Exchange differences on translation - (14,661,898) - - (14,661,898) - (14,661,898)
Total comprehensive income and expenses - (14,661,898) - 38,592 (14,623,306) - (14,623,306)
Dividends - - - 1,023,781 1,023,781 - 1,023,781
Transactions with shareholders - - - 1,023,781 1,023,781 - 1,023,781
Balance as at 31 December 2010 (105,066,154) (8,410,132) - 2,525,692 (110,950,594) - (110,950,594)
114
152
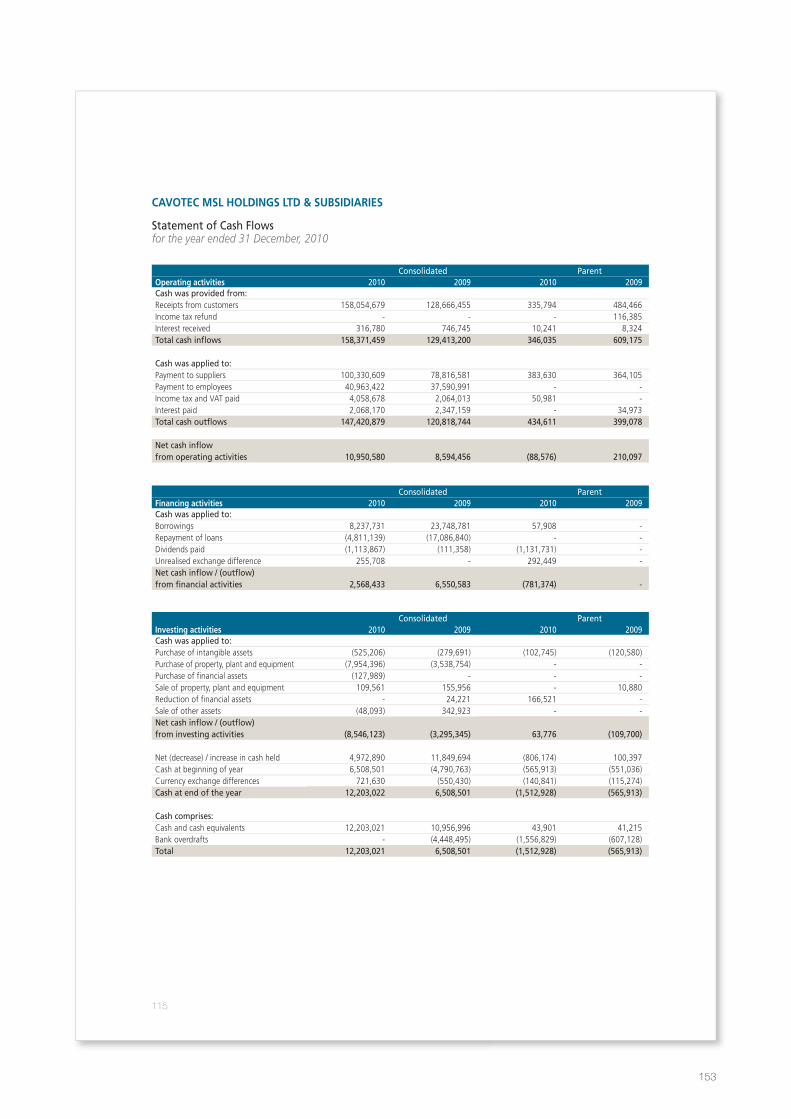
CavoteC MSL HoLdingS Ltd & SubSidiarieS
Statement of Cash Flowsfor the year ended 31 December, 2010
Consolidated Parentoperating activities 2010 2009 2010 2009Cash was provided from:Receipts from customers 158,054,679 128,666,455 335,794 484,466 Income tax refund - - - 116,385 Interest received 316,780 746,745 10,241 8,324 Total cash inflows 158,371,459 129,413,200 346,035 609,175
Cash was applied to:Payment to suppliers 100,330,609 78,816,581 383,630 364,105 Payment to employees 40,963,422 37,590,991 - - Income tax and VAT paid 4,058,678 2,064,013 50,981 - Interest paid 2,068,170 2,347,159 - 34,973 Total cash outflows 147,420,879 120,818,744 434,611 399,078
Net cash inflowfrom operating activities 10,950,580 8,594,456 (88,576) 210,097
Consolidated ParentFinancing activities 2010 2009 2010 2009Cash was applied to:Borrowings 8,237,731 23,748,781 57,908 -Repayment of loans (4,811,139) (17,086,840) - -Dividends paid (1,113,867) (111,358) (1,131,731) -Unrealised exchange difference 255,708 - 292,449 -Net cash inflow / (outflow) from financial activities 2,568,433 6,550,583 (781,374) -
Consolidated Parentinvesting activities 2010 2009 2010 2009Cash was applied to:Purchase of intangible assets (525,206) (279,691) (102,745) (120,580)Purchase of property, plant and equipment (7,954,396) (3,538,754) - - Purchase of financial assets (127,989) - - -Sale of property, plant and equipment 109,561 155,956 - 10,880 Reduction of financial assets - 24,221 166,521 - Sale of other assets (48,093) 342,923 - - Net cash inflow / (outflow) from investing activities (8,546,123) (3,295,345) 63,776 (109,700)
Net (decrease) / increase in cash held 4,972,890 11,849,694 (806,174) 100,397 Cash at beginning of year 6,508,501 (4,790,763) (565,913) (551,036)Currency exchange differences 721,630 (550,430) (140,841) (115,274)Cash at end of the year 12,203,022 6,508,501 (1,512,928) (565,913)
Cash comprises:Cash and cash equivalents 12,203,021 10,956,996 43,901 41,215 Bank overdrafts - (4,448,495) (1,556,829) (607,128)Total 12,203,021 6,508,501 (1,512,928) (565,913)
115
153
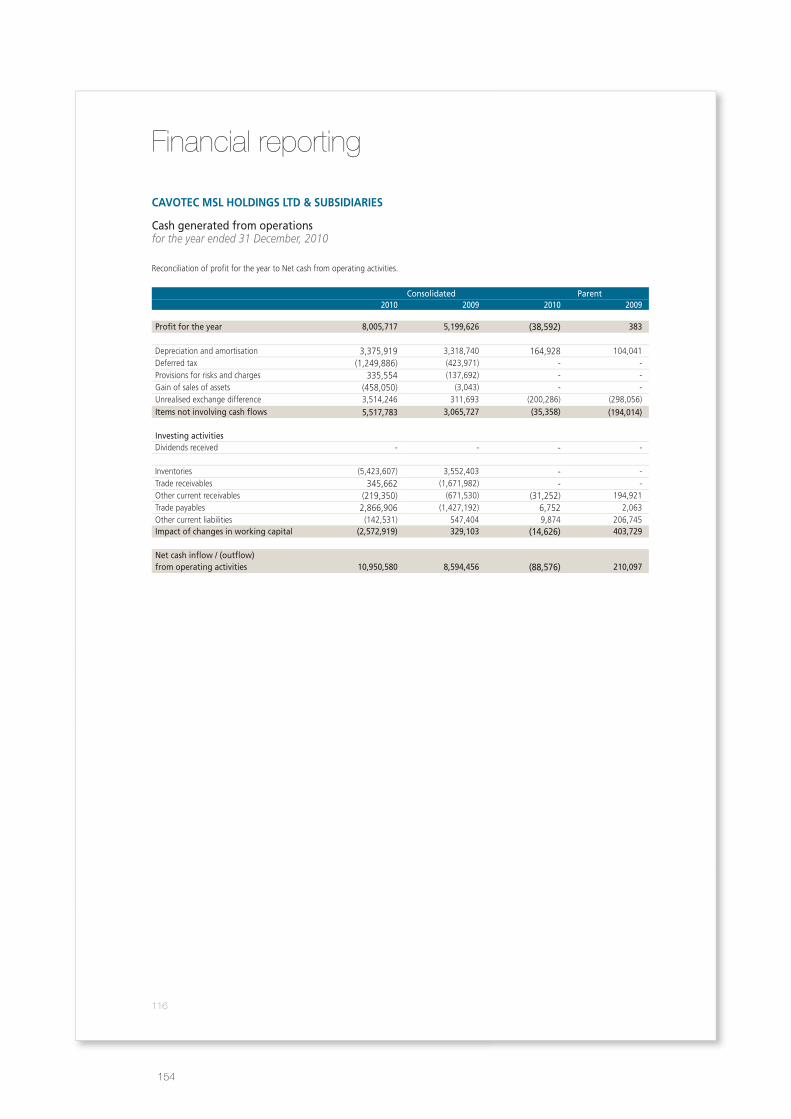
CavoteC MSL HoLdingS Ltd & SubSidiarieS
Cash generated from operationsfor the year ended 31 December, 2010
Reconciliation of profit for the year to Net cash from operating activities.
Consolidated Parent 2010 2009 2010 2009
Profit for the year 8,005,717 5,199,626 (38,592) 383
Depreciation and amortisation 3,375,919 3,318,740 164,928 104,041 Deferred tax (1,249,886) (423,971) - -Provisions for risks and charges 335,554 (137,692) - -Gain of sales of assets (458,050) (3,043) - -Unrealised exchange difference 3,514,246 311,693 (200,286) (298,056)Items not involving cash flows 5,517,783 3,065,727 (35,358) (194,014)
Investing activitiesDividends received - - - -
Inventories (5,423,607) 3,552,403 - - Trade receivables 345,662 (1,671,982) - - Other current receivables (219,350) (671,530) (31,252) 194,921 Trade payables 2,866,906 (1,427,192) 6,752 2,063 Other current liabilities (142,531) 547,404 9,874 206,745 Impact of changes in working capital (2,572,919) 329,103 (14,626) 403,729
Net cash inflow / (outflow)from operating activities 10,950,580 8,594,456 (88,576) 210,097
Financial reporting
116
154
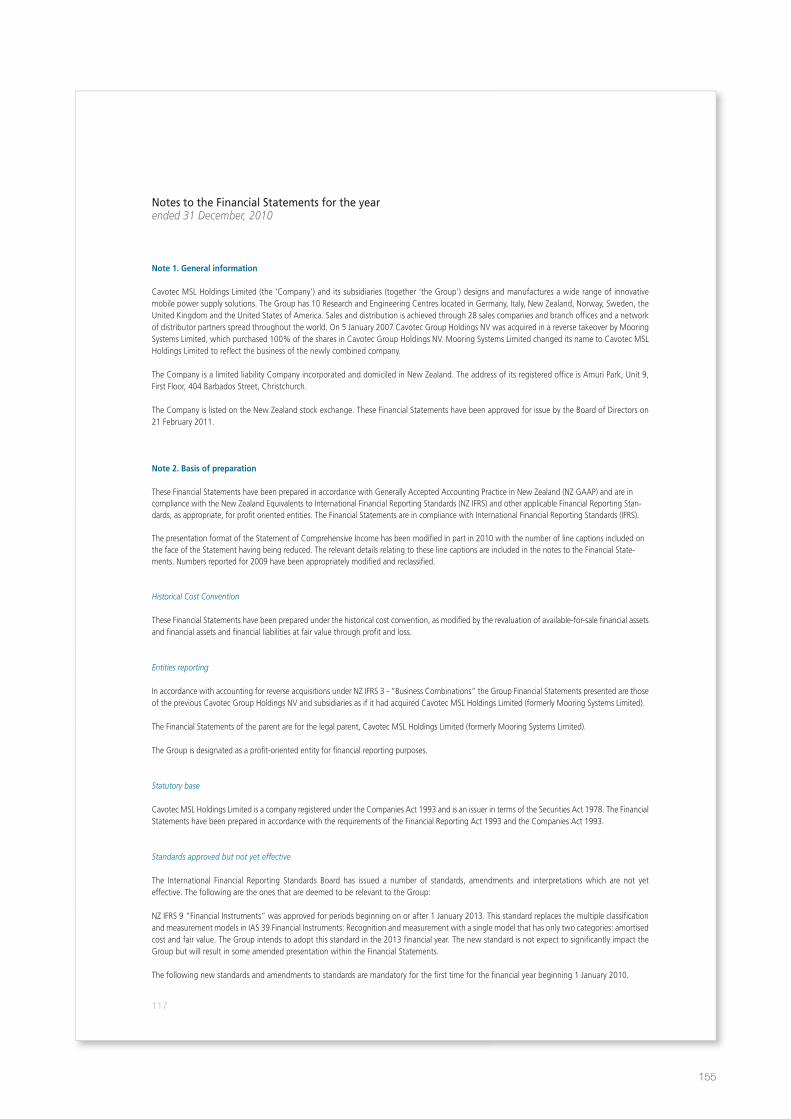
note 1. general information
Cavotec MSL Holdings Limited (the ‘Company’) and its subsidiaries (together ‘the Group’) designs and manufactures a wide range of innovative mobile power supply solutions. The Group has 10 Research and Engineering Centres located in Germany, Italy, New Zealand, Norway, Sweden, the United Kingdom and the United States of America. Sales and distribution is achieved through 28 sales companies and branch offices and a network of distributor partners spread throughout the world. On 5 January 2007 Cavotec Group Holdings NV was acquired in a reverse takeover by Mooring Systems Limited, which purchased 100% of the shares in Cavotec Group Holdings NV. Mooring Systems Limited changed its name to Cavotec MSL Holdings Limited to reflect the business of the newly combined company.
The Company is a limited liability Company incorporated and domiciled in New Zealand. The address of its registered office is Amuri Park, Unit 9, First Floor, 404 Barbados Street, Christchurch.
The Company is listed on the New Zealand stock exchange. These Financial Statements have been approved for issue by the Board of Directors on 21 February 2011.
note 2. basis of preparation
These Financial Statements have been prepared in accordance with Generally Accepted Accounting Practice in New Zealand (NZ GAAP) and are in compliance with the New Zealand Equivalents to International Financial Reporting Standards (NZ IFRS) and other applicable Financial Reporting Stan-dards, as appropriate, for profit oriented entities. The Financial Statements are in compliance with International Financial Reporting Standards (IFRS).
The presentation format of the Statement of Comprehensive Income has been modified in part in 2010 with the number of line captions included on the face of the Statement having being reduced. The relevant details relating to these line captions are included in the notes to the Financial State-ments. Numbers reported for 2009 have been appropriately modified and reclassified.
Historical Cost Convention
These Financial Statements have been prepared under the historical cost convention, as modified by the revaluation of available-for-sale financial assets and financial assets and financial liabilities at fair value through profit and loss.
Entities reporting
In accordance with accounting for reverse acquisitions under NZ IFRS 3 - “Business Combinations” the Group Financial Statements presented are those of the previous Cavotec Group Holdings NV and subsidiaries as if it had acquired Cavotec MSL Holdings Limited (formerly Mooring Systems Limited).
The Financial Statements of the parent are for the legal parent, Cavotec MSL Holdings Limited (formerly Mooring Systems Limited).
The Group is designated as a profit-oriented entity for financial reporting purposes.
Statutory base
Cavotec MSL Holdings Limited is a company registered under the Companies Act 1993 and is an issuer in terms of the Securities Act 1978. The Financial Statements have been prepared in accordance with the requirements of the Financial Reporting Act 1993 and the Companies Act 1993.
Standards approved but not yet effective
The International Financial Reporting Standards Board has issued a number of standards, amendments and interpretations which are not yet effective. The following are the ones that are deemed to be relevant to the Group:
NZ IFRS 9 “Financial Instruments” was approved for periods beginning on or after 1 January 2013. This standard replaces the multiple classification and measurement models in IAS 39 Financial Instruments: Recognition and measurement with a single model that has only two categories: amortised cost and fair value. The Group intends to adopt this standard in the 2013 financial year. The new standard is not expect to significantly impact the Group but will result in some amended presentation within the Financial Statements.
The following new standards and amendments to standards are mandatory for the first time for the financial year beginning 1 January 2010.
Notes to the Financial Statements for the yearended 31 December, 2010
117
155
Notes to the Financial Statements for the yearended 31 December, 2010
Financial reporting
NZ IFRS 3: Business combinations
The standard revises the nature of costs that can be capitalized in a business combination. The standard was adopted in the current year. However since there were no significant acquisitions or disposed activities in the current year it has had no impact on the Financial Statements.
NZ IAS 27 (revised): Consolidated and Separate Financial Statements
The revision requires that changes in ownership interest of a subsidiary be accounted for as an equity transaction. The only change in ownership interest in the current year was the increase in the shareholding of Cavotec Korea from 80% to 100%, which has been included within transactions with shareholders.
Critical accounting estimates
The preparation of the Financial Statements in conformity with NZ IFRS requires the use of certain critical accounting estimates. It also requires the management to exercise its judgement in the process of applying the Group’s accounting policies. The areas involving a higher degree of judgement or complexity, or areas where assumptions and estimates are significant to the Financial Statements, are disclosed in note 4.
note 3. Summary of significant accounting policies
The principal accounting policies adopted in the preparation of the Financial Statements are set out below. These policies have been consistently applied to all the periods presented, namely, 31 December 2010 and 2009.
Foreign currency translation
(i) Functional and presentation currency
Items included in the Financial Statements are measured using the currency of the primary economic environment in which the related entity operates (‘the functional currency’). The Financial Statements are presented in Euros, which is the Group and Company’s presentation currency.
(ii) Transactions and balances
Foreign currency transactions are translated into the functional currency using the exchange rates prevailing at the dates of the transactions. Foreign exchange gains and losses resulting from the settlement of such transactions and from the translation at year end exchange rates of monetary assets and liabilities denominated in foreign currencies are recognised in the Statement of Comprehensive Income, except when deferred in equity as qualifying cash flow hedges and qualifying net investment hedges.
(iii) Foreign operations
The results and financial position of foreign operations (none of which has the currency of a hyperinflationary economy) that have a functional currency different from the presentation currency are translated into the presentation currency as follows:
• assets and liabilities for each Balance Sheet presented are translated at the closing rate at the date of that Balance Sheet;• income and expenses for each Statement of Comprehensive Income are translated at average exchange rates; and• all resulting exchange differences are recognised as a separate component of equity.
Exchange differences arising from the translation of any net investment in foreign operations, and of borrowings are taken to shareholders’ equity. When a foreign operation is sold or any borrowings forming part of the net investment are repaid, a proportionate share of such exchange differences are recognised in the Statement of Comprehensive Income, as part of the gain or loss on sale where applicable.
118
156
Goodwill and fair value adjustments arising on the acquisition of a foreign operation are treated as assets and liabilities of the foreign operation and translated at the closing rate.
Consolidation
(i) Subsidiaries
Subsidiaries are all entities over which the Group has the power to govern the financial and operating policies generally accompanying a shareholding of more than one half of the voting rights. Subsidiaries are consolidated from the date on which control is transferred to the Group. They are de-consolidated from the date that control ceases.
The Group uses the acquisition method to account for business combinations. The consideration transferred for the acquisition of a subsidiary is the fair value of the assets transferred, the liabilities incurred and the equity interests issued by the Group. The consideration transferred includes the fair value of any asset or liability resulting from a contingent consideration arrangement. Acquisition-related costs are expensed. Identifiable assets acquired and liabilities and contingent liabilities assumed in a business combination are measured initially at their fair values at the acquisition date.
Investments in subsidiaries are accounted for at cost less impairment. Cost is adjusted to reflect changes in consideration arising from contingent consideration amendments. Cost also includes direct attributable costs of investment.
The excess of the cost of acquisition over the fair value of the Group’s share of the identifiable net assets acquired is recorded as goodwill. If the cost of acquisition is less than the fair value of the net assets of the subsidiary acquired, the difference is recognised directly in the Statement of Comprehensive Income.
Inter-company transactions, balances and unrealised gains on transactions between group companies are eliminated. Unrealised losses are also eliminated but are considered an impairment indicator of the asset transferred.
(ii) Transactions and minority interests
The Group treats transaction with non-controlling interests as transactions with equity owners of the Group. For purchases from non-controlling interests, the difference between any consideration paid and the relevant share acquired of the carrying value of net assets of the subsidiary is recorded in equity. Gains or losses on disposals to non-controlling interests are also recorded in equity.
(iii) Associates
Associates are all entities over which the Group has significant influence but not control, generally accompanying a shareholding of between 20% and 50% of the voting rights. Investments in associates are accounted for using the equity method of accounting and are initially recognised at cost. The Group’s investment in associates includes goodwill identified on acquisition, net of any accumulated impairment loss.
The Group’s share of its associates’ post-acquisition profits or losses is recognised in the profit and loss, and its share of post-acquisition movements in other comprehensive income are recognised in other comprehensive income. The cumulative post-acquisition movements are adjusted against the carrying amount of the investment. When the Group’s share of losses in an associate equals or exceeds its interest in the associates, including any other unsecured receivables, the Group does not recognise further losses, unless it has incurred obligations or made payments on behalf of the associate.
Unrealised gains on transactions between the Group and its associates are eliminated to the extent of the Group’s interest in the associates. Unrealised losses are also eliminated unless the transaction provides evidence of an impairment of the asset transferred. Accounting policies of associates have been changed where necessary to ensure consistency with the policies by the Group.
119
157
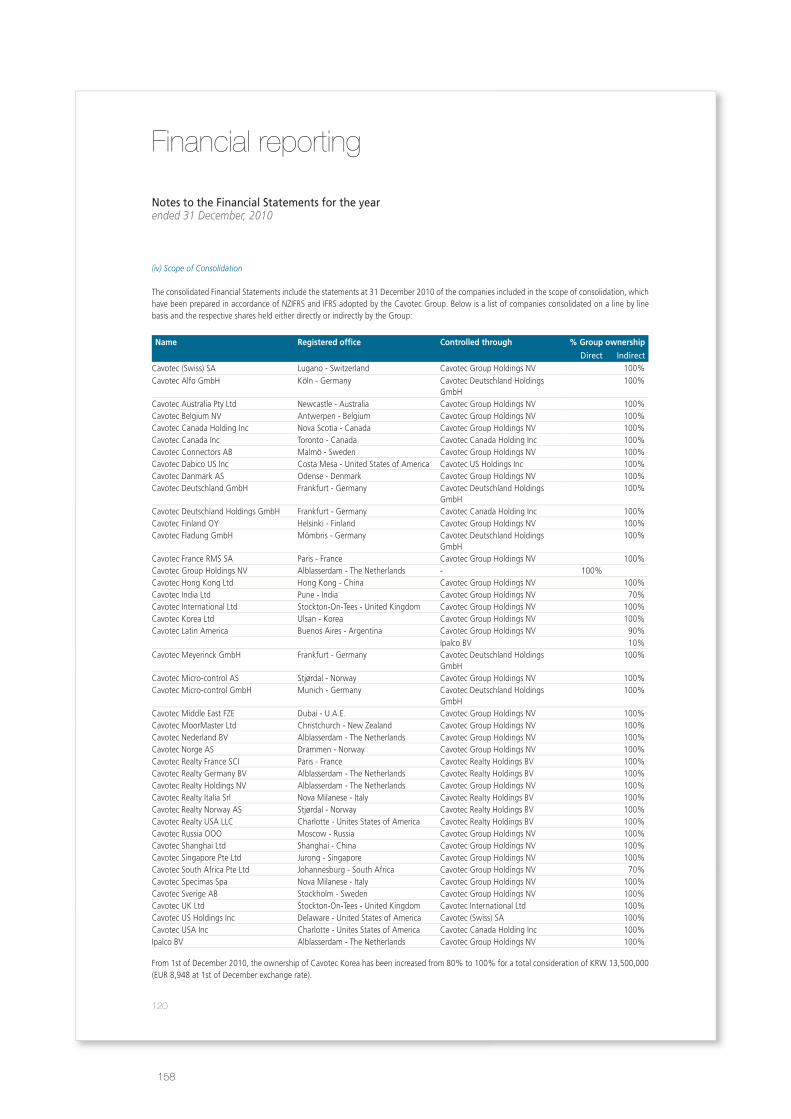
Notes to the Financial Statements for the yearended 31 December, 2010
Financial reporting
(iv) Scope of Consolidation
The consolidated Financial Statements include the statements at 31 December 2010 of the companies included in the scope of consolidation, which have been prepared in accordance of NZIFRS and IFRS adopted by the Cavotec Group. Below is a list of companies consolidated on a line by line basis and the respective shares held either directly or indirectly by the Group:
name registered office Controlled through % group ownership
Direct IndirectCavotec (Swiss) SA Lugano - Switzerland Cavotec Group Holdings NV 100%Cavotec Alfo GmbH Köln - Germany Cavotec Deutschland Holdings
GmbH100%
Cavotec Australia Pty Ltd Newcastle - Australia Cavotec Group Holdings NV 100%Cavotec Belgium NV Antwerpen - Belgium Cavotec Group Holdings NV 100%Cavotec Canada Holding Inc Nova Scotia - Canada Cavotec Group Holdings NV 100%Cavotec Canada Inc Toronto - Canada Cavotec Canada Holding Inc 100%Cavotec Connectors AB Malmö - Sweden Cavotec Group Holdings NV 100%Cavotec Dabico US Inc Costa Mesa - United States of America Cavotec US Holdings Inc 100%Cavotec Danmark AS Odense - Denmark Cavotec Group Holdings NV 100%Cavotec Deutschland GmbH Frankfurt - Germany Cavotec Deutschland Holdings
GmbH100%
Cavotec Deutschland Holdings GmbH Frankfurt - Germany Cavotec Canada Holding Inc 100%Cavotec Finland OY Helsinki - Finland Cavotec Group Holdings NV 100%Cavotec Fladung GmbH Mömbris - Germany Cavotec Deutschland Holdings
GmbH100%
Cavotec France RMS SA Paris - France Cavotec Group Holdings NV 100%Cavotec Group Holdings NV Alblasserdam - The Netherlands - 100%Cavotec Hong Kong Ltd Hong Kong - China Cavotec Group Holdings NV 100%Cavotec India Ltd Pune - India Cavotec Group Holdings NV 70%Cavotec International Ltd Stockton-On-Tees - United Kingdom Cavotec Group Holdings NV 100%Cavotec Korea Ltd Ulsan - Korea Cavotec Group Holdings NV 100%Cavotec Latin America Buenos Aires - Argentina Cavotec Group Holdings NV 90%
Ipalco BV 10%Cavotec Meyerinck GmbH Frankfurt - Germany Cavotec Deutschland Holdings
GmbH100%
Cavotec Micro-control AS Stjørdal - Norway Cavotec Group Holdings NV 100%Cavotec Micro-control GmbH Munich - Germany Cavotec Deutschland Holdings
GmbH100%
Cavotec Middle East FZE Dubai - U.A.E. Cavotec Group Holdings NV 100%Cavotec MoorMaster Ltd Christchurch - New Zealand Cavotec Group Holdings NV 100%Cavotec Nederland BV Alblasserdam - The Netherlands Cavotec Group Holdings NV 100%Cavotec Norge AS Drammen - Norway Cavotec Group Holdings NV 100%Cavotec Realty France SCI Paris - France Cavotec Realty Holdings BV 100%Cavotec Realty Germany BV Alblasserdam - The Netherlands Cavotec Realty Holdings BV 100%Cavotec Realty Holdings NV Alblasserdam - The Netherlands Cavotec Group Holdings NV 100%Cavotec Realty Italia Srl Nova Milanese - Italy Cavotec Realty Holdings BV 100%Cavotec Realty Norway AS Stjørdal - Norway Cavotec Realty Holdings BV 100%Cavotec Realty USA LLC Charlotte - Unites States of America Cavotec Realty Holdings BV 100%Cavotec Russia OOO Moscow - Russia Cavotec Group Holdings NV 100%Cavotec Shanghai Ltd Shanghai - China Cavotec Group Holdings NV 100%Cavotec Singapore Pte Ltd Jurong - Singapore Cavotec Group Holdings NV 100%Cavotec South Africa Pte Ltd Johannesburg - South Africa Cavotec Group Holdings NV 70%Cavotec Specimas Spa Nova Milanese - Italy Cavotec Group Holdings NV 100%Cavotec Sverige AB Stockholm - Sweden Cavotec Group Holdings NV 100%Cavotec UK Ltd Stockton-On-Tees - United Kingdom Cavotec International Ltd 100%Cavotec US Holdings Inc Delaware - United States of America Cavotec (Swiss) SA 100%Cavotec USA Inc Charlotte - Unites States of America Cavotec Canada Holding Inc 100%Ipalco BV Alblasserdam - The Netherlands Cavotec Group Holdings NV 100%
From 1st of December 2010, the ownership of Cavotec Korea has been increased from 80% to 100% for a total consideration of KRW 13,500,000 (EUR 8,948 at 1st of December exchange rate).
120
158
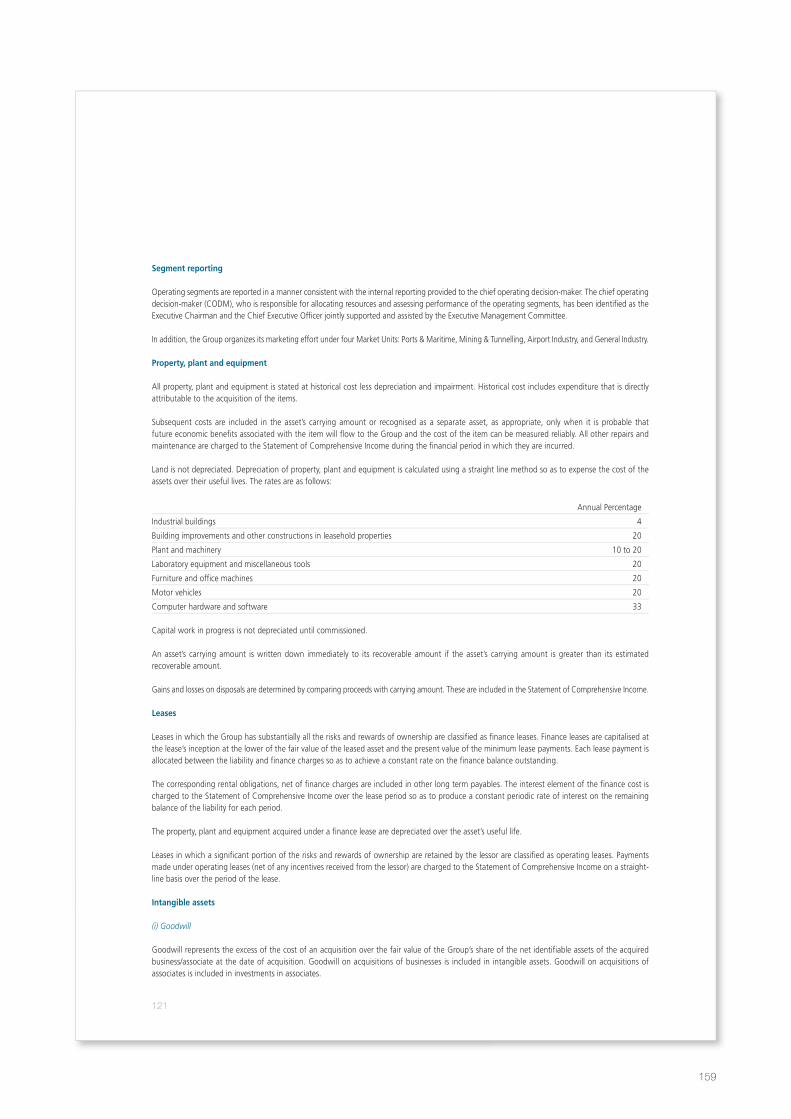
Segment reporting
Operating segments are reported in a manner consistent with the internal reporting provided to the chief operating decision-maker. The chief operating decision-maker (CODM), who is responsible for allocating resources and assessing performance of the operating segments, has been identified as the Executive Chairman and the Chief Executive Officer jointly supported and assisted by the Executive Management Committee.
In addition, the Group organizes its marketing effort under four Market Units: Ports & Maritime, Mining & Tunnelling, Airport Industry, and General Industry.
Property, plant and equipment
All property, plant and equipment is stated at historical cost less depreciation and impairment. Historical cost includes expenditure that is directly attributable to the acquisition of the items.
Subsequent costs are included in the asset’s carrying amount or recognised as a separate asset, as appropriate, only when it is probable that future economic benefits associated with the item will flow to the Group and the cost of the item can be measured reliably. All other repairs and maintenance are charged to the Statement of Comprehensive Income during the financial period in which they are incurred.
Land is not depreciated. Depreciation of property, plant and equipment is calculated using a straight line method so as to expense the cost of the assets over their useful lives. The rates are as follows:
Annual Percentage
Industrial buildings 4
Building improvements and other constructions in leasehold properties 20
Plant and machinery 10 to 20
Laboratory equipment and miscellaneous tools 20
Furniture and office machines 20
Motor vehicles 20
Computer hardware and software 33
Capital work in progress is not depreciated until commissioned.
An asset’s carrying amount is written down immediately to its recoverable amount if the asset’s carrying amount is greater than its estimated recoverable amount.
Gains and losses on disposals are determined by comparing proceeds with carrying amount. These are included in the Statement of Comprehensive Income.
Leases
Leases in which the Group has substantially all the risks and rewards of ownership are classified as finance leases. Finance leases are capitalised at the lease’s inception at the lower of the fair value of the leased asset and the present value of the minimum lease payments. Each lease payment is allocated between the liability and finance charges so as to achieve a constant rate on the finance balance outstanding.
The corresponding rental obligations, net of finance charges are included in other long term payables. The interest element of the finance cost is charged to the Statement of Comprehensive Income over the lease period so as to produce a constant periodic rate of interest on the remaining balance of the liability for each period.
The property, plant and equipment acquired under a finance lease are depreciated over the asset’s useful life.
Leases in which a significant portion of the risks and rewards of ownership are retained by the lessor are classified as operating leases. Payments made under operating leases (net of any incentives received from the lessor) are charged to the Statement of Comprehensive Income on a straight-line basis over the period of the lease.
intangible assets
(i) Goodwill
Goodwill represents the excess of the cost of an acquisition over the fair value of the Group’s share of the net identifiable assets of the acquired business/associate at the date of acquisition. Goodwill on acquisitions of businesses is included in intangible assets. Goodwill on acquisitions of associates is included in investments in associates.
121
159
Notes to the Financial Statements for the yearended 31 December, 2010
Financial reporting
Goodwill is not amortised. Instead, goodwill is tested for impairment annually, or more frequently if events or changes in circumstances indicate that it might be impaired, and is carried at cost less accumulated impairment losses. Gains and losses on the disposal of an entity include the carrying amount of goodwill relating to the entity sold.
Goodwill is allocated to cash generating units (“CGU”) for the purpose of impairment testing. Each of those cash generating units represents the Group’s investment in each Market Unit. Reductions in the value of goodwill are recognised if the recoverable amount of goodwill is less than its carrying amount
(ii) Research and development
Research expenditure is recognised as an expense as incurred. Costs incurred on development projects (relating to the design and testing of new or improved products) are recognised as intangible assets when it is probable that the project will be a success considering its commercial and technical feasibility and its costs can be measured reliably. The expenditure capitalised comprises all directly attributable costs, including costs of materials, services, direct labour and an appropriate proportion of overheads. Other development expenditures that do not meet these criteria are recognised as an expense as incurred. Development costs previously recognised as an expense are not recognised as an asset in a subsequent period. Capitalised development costs are recorded as intangible assets at cost and amortised from the point at which the asset is ready for use on a straight line basis over its useful life, which varies from 3 to 5 years.
(iii) Patents
Patents acquired in a business combination are recognised at fair value at acquisition date. Patents are amortised on a straight line basis over the period over which they are valid (not exceeding 20 years) or their estimated useful life if shorter.
impairment of non-financial assets
Assets are reviewed for impairment whenever events or changes in circumstances indicate that the carrying amount may not be recoverable. Intangible assets that have an indefinite useful life including goodwill, are not subject to amortisation and are tested annually for impairment irrespective of whether any circumstances identifying a possible impairment have been identified. An impairment loss is recognised for the amount by which the asset’s carrying amount exceeds its recoverable amount. The recoverable amount is the higher of an asset’s fair value less costs to sell and value in use. For the purposes of assessing impairment, assets are grouped at the lowest levels for which there are separately identifiable cash flows (cash generating units).
inventories
Inventories are stated at the lower of cost and net realisable value. Cost is determined using the FIFO (first –in , first – out) method. The cost of finished goods and work in progress comprises design costs, raw materials, direct labour, other direct costs and related production overheads which are attributed based on normal operating capacity. Net realisable value is the estimated selling price in the ordinary course of business less the estimated costs of completion and the estimated variable costs necessary to make the sale.
Financial instruments
Recognition and derecognition
Financial assets and liabilities are recognized when the Group becomes a party to the contractual provisions of the instrument. Purchases and sales of financial assets are accounted for at trade date, which is the day when the Group contractually commits to acquire or dispose of the assets. Trade receivables are recognized on issuance of invoices. Liabilities are recognized when the other party has performed and there is a contractual obligation to pay.
Derecognition (fully or partially) of a financial asset occurs when the rights to receive cash flows from the financial instruments expire or are transferred and substantially all of the risks and rewards of ownership have been removed from the Group. The Group derecognizes (fully or partially) a financial liability when the obligation specified in the contract is discharged or otherwise expires.
A financial asset and a financial liability is offset and the net amount presented in the Balance Sheet when, and only when, there is a legally enforceable right to set off the recognized amounts and there is an intention to either settle on a net basis, or to realize the asset and settle the liability simultaneously.
Measurement and classification
Financial instruments are, at initial recognition, measured at fair value with addition or deduction of transaction costs in the case of a financial asset or a financial liability not measured at fair value through profit and loss. Financial instruments, upon initial recognition, are classified in accordance with the categories in IAS 39 based on the purpose of the acquisition of the instrument. The financial instruments are classified as follows:
122
160
•Financial instrumentsaredesignatedatfairvaluethroughprofitandloss iftheGroupmanagessuchinvestmentsandmakespurchaseandsaledecisions based on their fair value. They are included in “Current or non-current financial assets”. Financial instruments at fair value through profit and loss are measured at fair value and changes therein are recognized in profit and loss.
•Loansandreceivablesarenon-derivativefinancialassetswithfixedordeterminablepaymentsthatarenotquotedinanactivemarket.Theyarisewhen the Group provides money, goods or services directly to a debtor with no intention of selling the receivable. Loans and receivables are included in “trade receivables”, “other current & non-current receivables”, and “current or non-current financial receivables” in the Balance Sheet. Trade receivables are recognised initially at fair value and subsequently measured at amortised cost, less provision for doubtful debts. Collectability of trade receivables is reviewed on an on-going basis. Debts which are known to be uncollectible are written off. A provision for doubtful debts is established when there is objective evidence that the Company may not be able to collect all amounts due according to the original terms of receivables, and on a prudent basis, on past due accounts. The amount of the provision is the difference between the asset’s carrying amount and realisable value. The amount of the provision is recognised in the Statement of Comprehensive Income. The fair value of loans and receivables is the same as the carrying amount since they are not discounted given the short expected time to payment.
•Held-to-maturity investmentsarenon-derivativefinancialassetswithfixedordeterminablepaymentsandfixedmaturitythattheGrouphasthepositive intention and ability to hold to maturity. Held to maturity investments are subsequently measured at amortized cost using the effective interest rate method, less any impairment losses.
•Available-for-salefinancialassetsarethosenon-derivativefinancialassetsthataredesignatedasavailableforsale.Subsequenttoinitialrecognition,they are measured at fair value and changes therein are recognized in other comprehensive income except for impairment losses which are recognized in profit and loss. When an investment is derecognized, the cumulative gain or loss in other comprehensive income is transferred to profit and loss.
•Derivativeinstrumentsaremeasuredatfairvalue.Forderivativeswhicharenotpartofhedgeaccounting(classifiedasfinancialassetsorliabilitiesheld for trading), changes in fair value are reported as operating or financial income or expense based on the purpose of the use of the derivatives and whether the instruments relate to operational or financial items. Fair value changes on derivatives are recognized in profit and loss unless the derivatives are designated as hedging instruments in cash flow or net investment hedges (see section below about hedge accounting).
impairment of financial assets
Financial assets, except for such assets classified at fair value through profit and loss, are assessed at each reporting date to determine whether there is any objective evidence that they are impaired. A financial asset is considered to be impaired if objective evidence indicates that one or more events have had a negative effect on the estimated future cash flows of that asset. An impairment loss in respect of a financial asset measured at amortized cost is calculated as the difference between its carrying amount and the present value of the estimated future cash flows discounted at the original effective interest rate. An impairment loss in respect of an available-for-sale financial asset is calculated by reference to its current fair value. If the reasons for write-down should cease to exist, the value of the asset is restored up to the value it would have if no impairment had been recognised.
Hedge accounting
In order to qualify for hedge accounting according to IAS 39, the hedging relationship must be designated, the hedge expected to be highly effective and the hedge relationship documented. The Group assesses, evaluates and documents effectiveness both at hedge inception and on an on-going basis. The method of recognizing a gain or loss resulting from hedging instruments is dependent on the type of hedge relationship, i.e. which type of risk exposure that is secured by the hedging instrument.
Changes in the fair value of derivatives that are designated and qualify as fair value hedges are recorded in profit and loss, together with any changes in the fair value of the hedged asset or liability that are attributable to the hedged risk. These changes in the fair value of the hedged asset or liability are recognized in profit and loss to offset the effect of gain or loss on the hedging instrument. Based on decisions taken in the Financial Risk Management Committee, transaction exposure can be hedged using various derivative instruments. The overriding objective is to attain cash flow or fair value hedge accounting in the consolidated Financial Statements.
Changes in the fair value of the derivative hedging instrument designated as a cash flow hedge are recognized in other comprehensive income to the extent that the hedge is effective and the accumulated changes in fair value are recognized as a separate component in equity. To the extent that the hedge is ineffective, changes in fair value are recognized in profit and loss. If the hedging instrument no longer meets the criteria for hedge accounting, expires or is sold, terminated or exercised, then hedge accounting is discontinued prospectively. The cumulative gain or loss previously recognized in equity via other comprehensive income remains there until the forecast transaction occurs. When the hedged item is a non-financial asset, the amount recognized in equity via other comprehensive income is transferred to the carrying amount of the asset when it is recognized. In other cases, the amount recognized in equity via other comprehensive income is transferred to profit and loss in the same period that the hedged item affects profit and loss.
Gain or loss on the hedging instrument relating to the effective portion of the hedge is recognized in other comprehensive income. Gain or loss relating to the ineffective portion is recognized immediately in profit and loss. Gains and losses accumulated in other comprehensive income are included in profit and loss on disposal of foreign operations.
123
161
Notes to the Financial Statements for the yearended 31 December, 2010
Financial reporting
Cash and cash equivalents
Cash and cash equivalents includes cash on hand, deposits held at call with financial institutions and other short term, highly liquid investments with original maturities of three months or less that are readily convertible to known amounts of cash and which are subject to an insignificant risk of changes in value, and bank overdrafts.
borrowings
Borrowings are initially recognised at fair value, net of transaction costs incurred. Borrowings are subsequently measured at amortised cost. Any difference between the proceeds (net of transaction costs) and the redemption amount is recognised in the Statement of Comprehensive Income over the period of the borrowings using the effective interest method.
Fees paid on the establishment of an undrawn loan facility, are recognised as prepayments and amortised on a straight line basis over the term of the facility. Borrowings are classified as current liabilities unless the Group has an unconditional right to defer settlement of liabilities for at least 12 months after the Balance Sheet date.
borrowing costs
Borrowing costs incurred for the construction of any qualifying asset are capitalised during the period of time that is required to complete and prepare the asset for its intended use or sale. Other borrowing costs are expensed.
Provisions
Provisions for deferred compensation and warranty are recognised when the Group has a present, legal or constructive obligation as a result of past events; it is more likely than not that an outflow of resources will be required to settle the obligation; and the amount has been reliably estimated. Provisions are not recognised for future operating losses.
Where there are a number of similar obligations the likelihood that an outflow will be required in settlement is determined by considering the class of obligations as a whole.
A provision is recognised even if the likelihood of an outflow with respect to any one item included in the same class of obligation may be small. Provisions are measured at the present value of the expenditures expected to be required to settle the obligation.
Share capital
Ordinary shares are classified as equity.
Incremental costs directly attributable to the issue of new shares are shown in equity as a deduction, net of tax, from the proceeds.
revenue recognition
Revenue comprises the fair value of the consideration received or receivable for the sale of goods and services, excluding value added taxes, goods and service tax (GST), rebates and discounts. Revenue is recognised as follows:
(i) Sales of goods
Sales of goods are recognised when the entity has shipped a product to the customer.
(ii) Sales of services
Sales of services are recognised in the accounting period in which the services are rendered, by reference to completion of the specific transaction assessed on the basis of the actual service provided as a proportion of the total services to be provided.
(iii) Long term contracts
Contract revenues and related costs from contracts involving complete project solutions achieved through system integration are recognized on the percentage of completion method when the outcome of the contract can be mesured reliably. Completion is generally measured by reference to the cost incurred to date as a percentage of the estimated total project costs. The milestone output method is applied when the nature of the individual projects indicates that a milestone method is the most applicable measure of progress.
124
162
Billings that exceed revenues recognized under percentage of completion are recorded as advances from customers. Revenues recognized under percentage of completion method that exceed billings are booked as unbilled receivables.
Recognized revenues and profits are subject to revisions during the project life span in the event that the assumptions regarding the overall project outcome are revised. The cumulative impact of a revision in estimates is recorded in the period when such revisions become known and measurable. Losses on projects are recognized immediately when known and measurable.
Claims for extra work or change in scope of work may be included in contract revenues when collection is highly probable.
value added tax (vat) and goods and Services tax (gSt)
The Statement of Comprehensive Income has been prepared so that all components are stated exclusive of VAT or GST. All items in the Balance Sheet are also stated net of VAT or GST, with the exception of receivables and payables, which include VAT or GST invoiced.
employee benefits
Liabilities for wages and salaries, including non-monetary benefits, annual leave and accumulating sick leave expected to be settled within 12 months of the reporting date are recognised in other payables in respect of employees’ services up to the reporting date and are measured at the amounts expected to be paid when the liabilities are settled.
dividends
Provision is made for the amount of any dividend declared on or before the end of the financial year but not distributed at balance sheet date. Dividend distribution to the Company’s shareholders is recognised as a liability in the Company’s Financial Statements in the period in which the dividends are approved by the Company’s Board of Directors.
income tax
The income tax expense for the period is the tax payable on the current years taxable income based on the national income tax rate for each jurisdiction adjusted by changes in deferred tax assets and liabilities attributable to temporary differences between the tax bases of assets and liabilities and their carrying amounts in the Financial Statements, and to unused tax losses.
Deferred tax assets and liabilities are recognised for temporary differences at the tax rates expected to apply when the assets are recovered or liabilities are settled, based on those tax rates which are enacted or substantively enacted for each jurisdiction. The relevant tax rates are applied to the cumulative amounts of deductible and taxable temporary differences to measure the deferred tax asset or liability. An exception is made for certain temporary differences arising from the initial recognition of an asset or a liability. No deferred tax asset or liability is recognised in relation to these temporary differences if they arose in a transaction, other than a business combination, that at the time of the transaction did not affect either accounting profit or taxable profit and loss.
Deferred tax assets are recognised for deductible temporary differences and unused tax losses only if it is probable that future taxable amounts will be available to utilise those temporary differences and losses.
Deferred tax liabilities and assets are not recognised for temporary differences between the carrying amount and tax bases of investments in subsidiaries and associates where the Company is able to control the timing of the reversal of the temporary differences and it is probable that the differences will not reverse in the foreseeable future.
Deferred tax assets and liabilities are offset when there is a legally enforceable right to offset current tax assets and liabilities and when the deferred tax balances relate to the same taxation authority. Current tax assets and tax liabilities are offset where the entity has a legally enforceable right to offset and intends either to settle on a net basis, or to realise the asset and settle the liability simultaneously.
Current and deferred tax balances attributable to amounts recognised directly in equity are also recognised directly in equity.
Changes in accounting policies
There have been no material changes in accounting policies during the period other than the initial applications of IFRS3 revised and IAS27 revised. The Company and Group have not adopted early any New Zealand Equivalents to International Financial Reporting Standards.
125
163
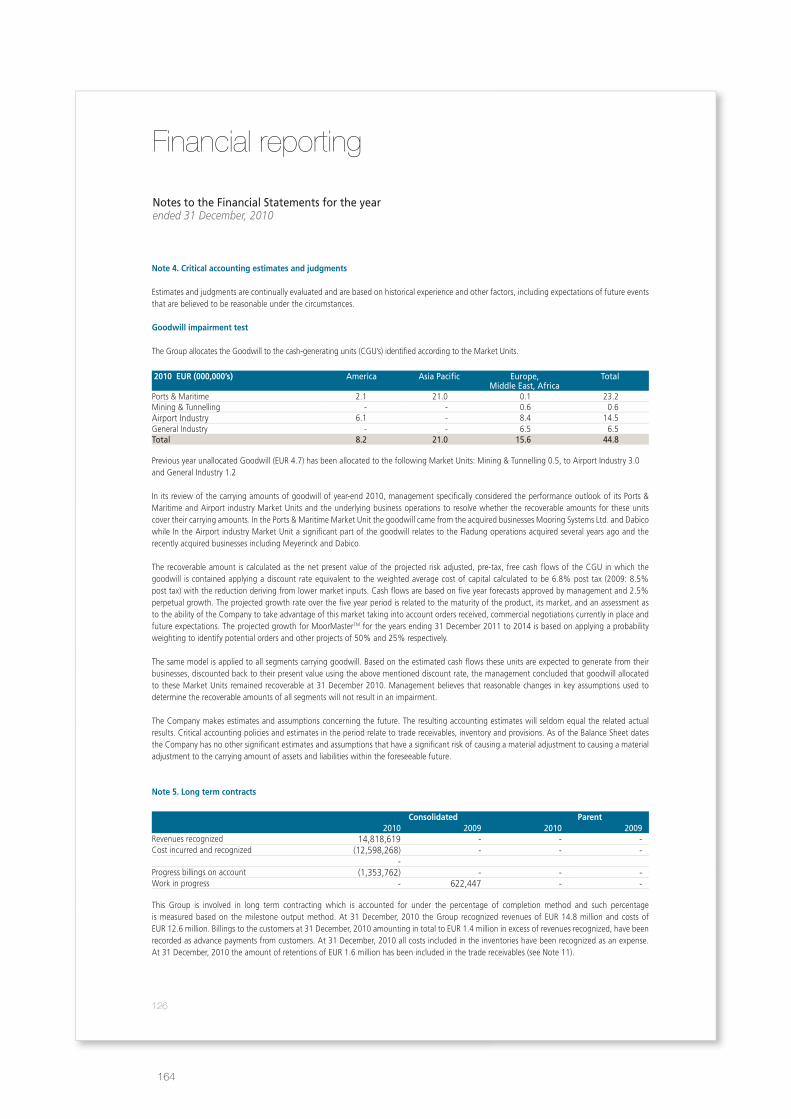
Financial reporting
Notes to the Financial Statements for the yearended 31 December, 2010
note 4. Critical accounting estimates and judgments
Estimates and judgments are continually evaluated and are based on historical experience and other factors, including expectations of future events that are believed to be reasonable under the circumstances.
goodwill impairment test
The Group allocates the Goodwill to the cash-generating units (CGU’s) identified according to the Market Units.
2010 eur (000,000’s) America Asia Pacific Europe, Middle East, Africa
Total
Ports & Maritime 2.1 21.0 0.1 23.2Mining & Tunnelling - - 0.6 0.6Airport Industry 6.1 - 8.4 14.5General Industry - - 6.5 6.5Total 8.2 21.0 15.6 44.8
Previous year unallocated Goodwill (EUR 4.7) has been allocated to the following Market Units: Mining & Tunnelling 0.5, to Airport Industry 3.0 and General Industry 1.2
In its review of the carrying amounts of goodwill of year-end 2010, management specifically considered the performance outlook of its Ports & Maritime and Airport industry Market Units and the underlying business operations to resolve whether the recoverable amounts for these units cover their carrying amounts. In the Ports & Maritime Market Unit the goodwill came from the acquired businesses Mooring Systems Ltd. and Dabico while In the Airport industry Market Unit a significant part of the goodwill relates to the Fladung operations acquired several years ago and the recently acquired businesses including Meyerinck and Dabico.
The recoverable amount is calculated as the net present value of the projected risk adjusted, pre-tax, free cash flows of the CGU in which the goodwill is contained applying a discount rate equivalent to the weighted average cost of capital calculated to be 6.8% post tax (2009: 8.5% post tax) with the reduction deriving from lower market inputs. Cash flows are based on five year forecasts approved by management and 2.5% perpetual growth. The projected growth rate over the five year period is related to the maturity of the product, its market, and an assessment as to the ability of the Company to take advantage of this market taking into account orders received, commercial negotiations currently in place and future expectations. The projected growth for MoorMasterTM for the years ending 31 December 2011 to 2014 is based on applying a probability weighting to identify potential orders and other projects of 50% and 25% respectively.
The same model is applied to all segments carrying goodwill. Based on the estimated cash flows these units are expected to generate from their businesses, discounted back to their present value using the above mentioned discount rate, the management concluded that goodwill allocated to these Market Units remained recoverable at 31 December 2010. Management believes that reasonable changes in key assumptions used to determine the recoverable amounts of all segments will not result in an impairment.
The Company makes estimates and assumptions concerning the future. The resulting accounting estimates will seldom equal the related actual results. Critical accounting policies and estimates in the period relate to trade receivables, inventory and provisions. As of the Balance Sheet dates the Company has no other significant estimates and assumptions that have a significant risk of causing a material adjustment to causing a material adjustment to the carrying amount of assets and liabilities within the foreseeable future.
note 5. Long term contracts
Consolidated Parent 2010 2009 2010 2009Revenues recognized 14,818,619 - - -Cost incurred and recognized (12,598,268) - - -
-Progress billings on account (1,353,762) - - -Work in progress - 622,447 - -
This Group is involved in long term contracting which is accounted for under the percentage of completion method and such percentage is measured based on the milestone output method. At 31 December, 2010 the Group recognized revenues of EUR 14.8 million and costs of EUR 12.6 million. Billings to the customers at 31 December, 2010 amounting in total to EUR 1.4 million in excess of revenues recognized, have been recorded as advance payments from customers. At 31 December, 2010 all costs included in the inventories have been recognized as an expense. At 31 December, 2010 the amount of retentions of EUR 1.6 million has been included in the trade receivables (see Note 11).
126
164
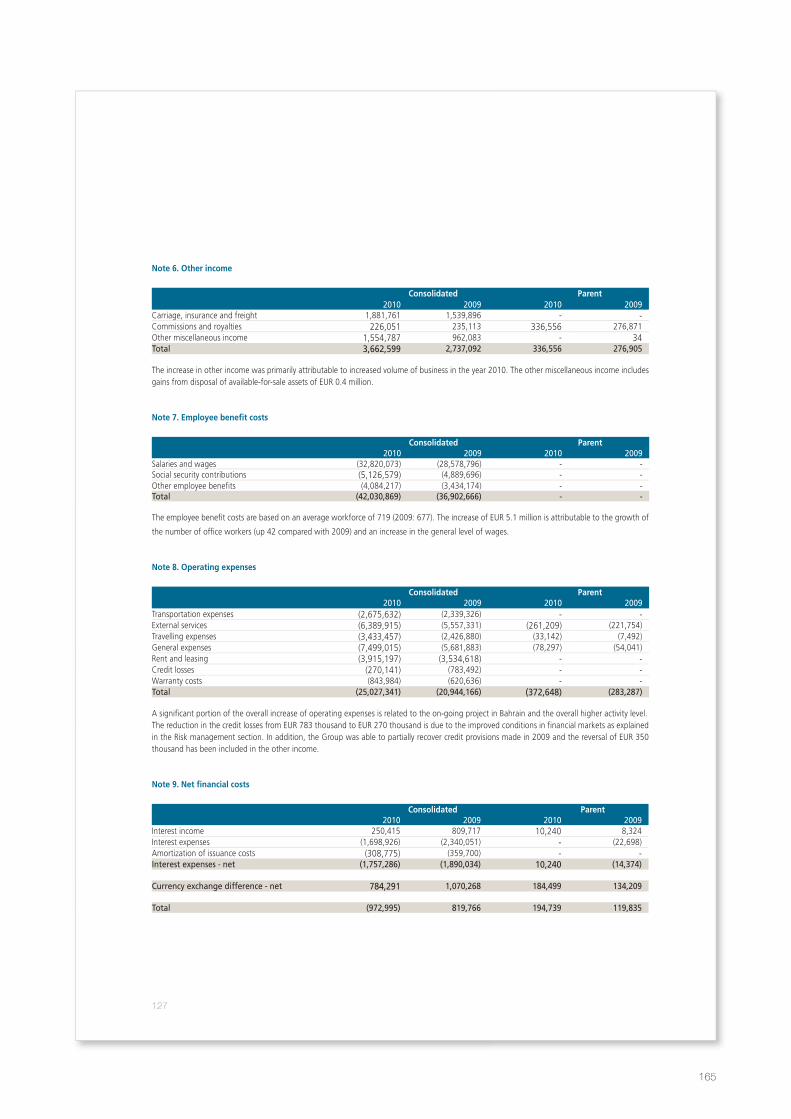
note 6. other income
Consolidated Parent 2010 2009 2010 2009Carriage, insurance and freight 1,881,761 1,539,896 - -Commissions and royalties 226,051 235,113 336,556 276,871 Other miscellaneous income 1,554,787 962,083 - 34 Total 3,662,599 2,737,092 336,556 276,905
The increase in other income was primarily attributable to increased volume of business in the year 2010. The other miscellaneous income includes gains from disposal of available-for-sale assets of EUR 0.4 million.
note 7. employee benefit costs
Consolidated Parent 2010 2009 2010 2009Salaries and wages (32,820,073) (28,578,796) - - Social security contributions (5,126,579) (4,889,696) - - Other employee benefits (4,084,217) (3,434,174) - - Total (42,030,869) (36,902,666) - -
The employee benefit costs are based on an average workforce of 719 (2009: 677). The increase of EUR 5.1 million is attributable to the growth of
the number of office workers (up 42 compared with 2009) and an increase in the general level of wages.
note 8. operating expenses
Consolidated Parent 2010 2009 2010 2009Transportation expenses (2,675,632) (2,339,326) - -External services (6,389,915) (5,557,331) (261,209) (221,754)Travelling expenses (3,433,457) (2,426,880) (33,142) (7,492)General expenses (7,499,015) (5,681,883) (78,297) (54,041)Rent and leasing (3,915,197) (3,534,618) - -Credit losses (270,141) (783,492) - -Warranty costs (843,984) (620,636) - -Total (25,027,341) (20,944,166) (372,648) (283,287)
A significant portion of the overall increase of operating expenses is related to the on-going project in Bahrain and the overall higher activity level. The reduction in the credit losses from EUR 783 thousand to EUR 270 thousand is due to the improved conditions in financial markets as explained in the Risk management section. In addition, the Group was able to partially recover credit provisions made in 2009 and the reversal of EUR 350 thousand has been included in the other income.
note 9. net financial costs
Consolidated Parent 2010 2009 2010 2009Interest income 250,415 809,717 10,240 8,324 Interest expenses (1,698,926) (2,340,051) - (22,698)Amortization of issuance costs (308,775) (359,700) - -Interest expenses - net (1,757,286) (1,890,034) 10,240 (14,374)
Currency exchange difference - net 784,291 1,070,268 184,499 134,209
Total (972,995) 819,766 194,739 119,835
127
165
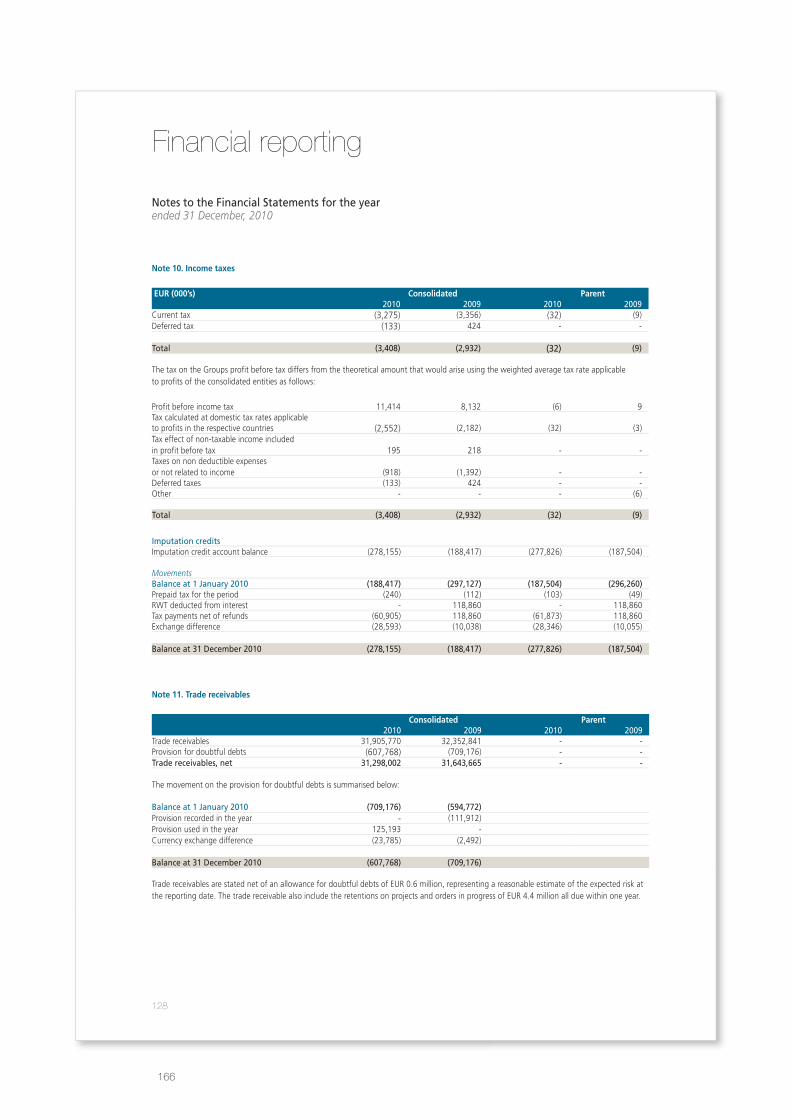
Notes to the Financial Statements for the yearended 31 December, 2010
note 10. income taxes
eur (000’s) Consolidated Parent 2010 2009 2010 2009Current tax (3,275) (3,356) (32) (9)Deferred tax (133) 424 - -
Total (3,408) (2,932) (32) (9)
The tax on the Groups profit before tax differs from the theoretical amount that would arise using the weighted average tax rate applicable to profits of the consolidated entities as follows:
Profit before income tax 11,414 8,132 (6) 9Tax calculated at domestic tax rates applicableto profits in the respective countries (2,552) (2,182) (32) (3)Tax effect of non-taxable income includedin profit before tax 195 218 - -Taxes on non deductible expenses or not related to income
(918) (1,392) - -
Deferred taxes (133) 424 - -Other - - - (6)
Total (3,408) (2,932) (32) (9)
Imputation creditsImputation credit account balance (278,155) (188,417) (277,826) (187,504)
MovementsBalance at 1 January 2010 (188,417) (297,127) (187,504) (296,260)Prepaid tax for the period (240) (112) (103) (49)RWT deducted from interest - 118,860 - 118,860 Tax payments net of refunds (60,905) 118,860 (61,873) 118,860 Exchange difference (28,593) (10,038) (28,346) (10,055)
Balance at 31 December 2010 (278,155) (188,417) (277,826) (187,504)
note 11. trade receivables
Consolidated Parent 2010 2009 2010 2009Trade receivables 31,905,770 32,352,841 - -Provision for doubtful debts (607,768) (709,176) - -Trade receivables, net 31,298,002 31,643,665 - -
The movement on the provision for doubtful debts is summarised below:
Balance at 1 January 2010 (709,176) (594,772)Provision recorded in the year - (111,912)Provision used in the year 125,193 -Currency exchange difference (23,785) (2,492)
Balance at 31 December 2010 (607,768) (709,176)
Trade receivables are stated net of an allowance for doubtful debts of EUR 0.6 million, representing a reasonable estimate of the expected risk at the reporting date. The trade receivable also include the retentions on projects and orders in progress of EUR 4.4 million all due within one year.
Financial reporting
128
166
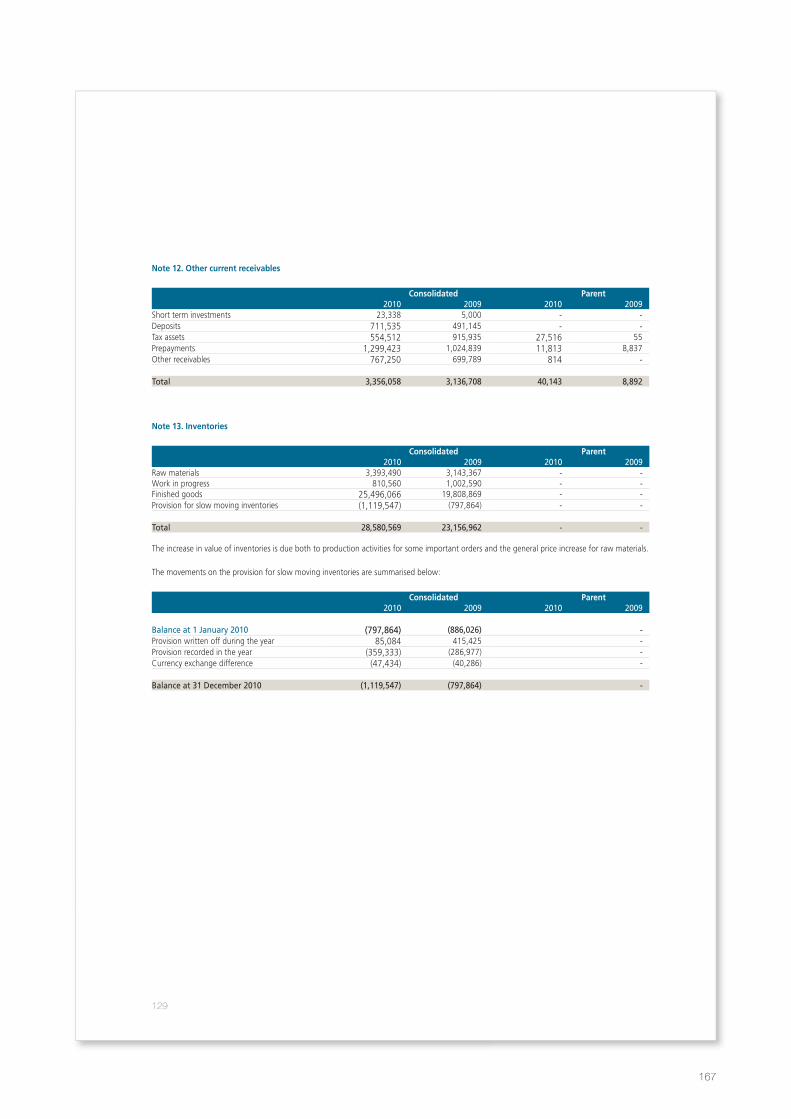
note 12. other current receivables
Consolidated Parent 2010 2009 2010 2009Short term investments 23,338 5,000 - -Deposits 711,535 491,145 - -Tax assets 554,512 915,935 27,516 55 Prepayments 1,299,423 1,024,839 11,813 8,837 Other receivables 767,250 699,789 814 -
Total 3,356,058 3,136,708 40,143 8,892
note 13. inventories
Consolidated Parent 2010 2009 2010 2009Raw materials 3,393,490 3,143,367 - - Work in progress 810,560 1,002,590 - - Finished goods 25,496,066 19,808,869 - -Provision for slow moving inventories (1,119,547) (797,864) - -
Total 28,580,569 23,156,962 - -
The increase in value of inventories is due both to production activities for some important orders and the general price increase for raw materials.
The movements on the provision for slow moving inventories are summarised below:
Consolidated Parent 2010 2009 2010 2009
Balance at 1 January 2010 (797,864) (886,026) -Provision written off during the year 85,084 415,425 -Provision recorded in the year (359,333) (286,977) -Currency exchange difference (47,434) (40,286) -
Balance at 31 December 2010 (1,119,547) (797,864) -
129
167
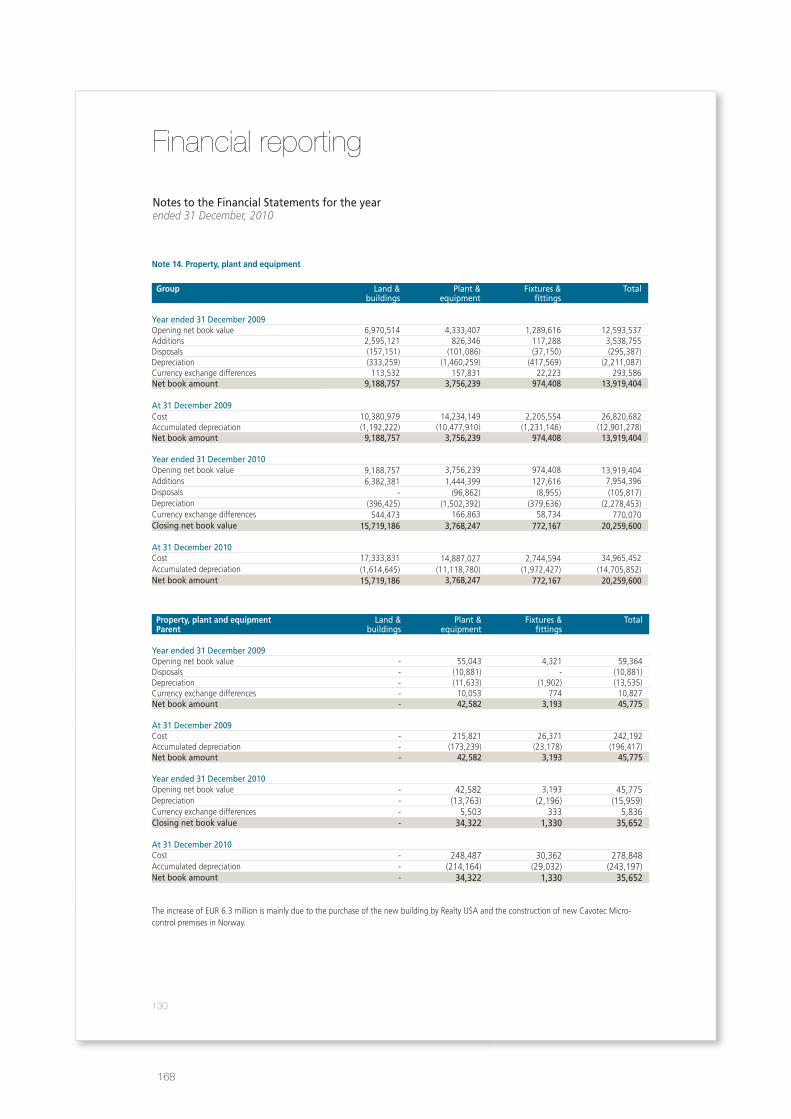
Financial reporting
Notes to the Financial Statements for the yearended 31 December, 2010
note 14. Property, plant and equipment
group Land &buildings
Plant & equipment
Fixtures &fittings
Total
Year ended 31 December 2009 Opening net book value 6,970,514 4,333,407 1,289,616 12,593,537 Additions 2,595,121 826,346 117,288 3,538,755 Disposals (157,151) (101,086) (37,150) (295,387)Depreciation (333,259) (1,460,259) (417,569) (2,211,087)Currency exchange differences 113,532 157,831 22,223 293,586 Net book amount 9,188,757 3,756,239 974,408 13,919,404
At 31 December 2009Cost 10,380,979 14,234,149 2,205,554 26,820,682 Accumulated depreciation (1,192,222) (10,477,910) (1,231,146) (12,901,278)Net book amount 9,188,757 3,756,239 974,408 13,919,404
Year ended 31 December 2010Opening net book value 9,188,757 3,756,239 974,408 13,919,404 Additions 6,382,381 1,444,399 127,616 7,954,396 Disposals - (96,862) (8,955) (105,817)Depreciation (396,425) (1,502,392) (379,636) (2,278,453)Currency exchange differences 544,473 166,863 58,734 770,070 Closing net book value 15,719,186 3,768,247 772,167 20,259,600
At 31 December 2010 Cost 17,333,831 14,887,027 2,744,594 34,965,452 Accumulated depreciation (1,614,645) (11,118,780) (1,972,427) (14,705,852)Net book amount 15,719,186 3,768,247 772,167 20,259,600
Property, plant and equipment Parent
Land &buildings
Plant & equipment
Fixtures &fittings
Total
Year ended 31 December 2009 Opening net book value - 55,043 4,321 59,364 Disposals - (10,881) - (10,881)Depreciation - (11,633) (1,902) (13,535)Currency exchange differences - 10,053 774 10,827 Net book amount - 42,582 3,193 45,775
At 31 December 2009Cost - 215,821 26,371 242,192 Accumulated depreciation - (173,239) (23,178) (196,417)Net book amount - 42,582 3,193 45,775
Year ended 31 December 2010Opening net book value - 42,582 3,193 45,775 Depreciation - (13,763) (2,196) (15,959)Currency exchange differences - 5,503 333 5,836 Closing net book value - 34,322 1,330 35,652
At 31 December 2010 Cost - 248,487 30,362 278,848 Accumulated depreciation - (214,164) (29,032) (243,197)Net book amount - 34,322 1,330 35,652
The increase of EUR 6.3 million is mainly due to the purchase of the new building by Realty USA and the construction of new Cavotec Micro-control premises in Norway.
130
168
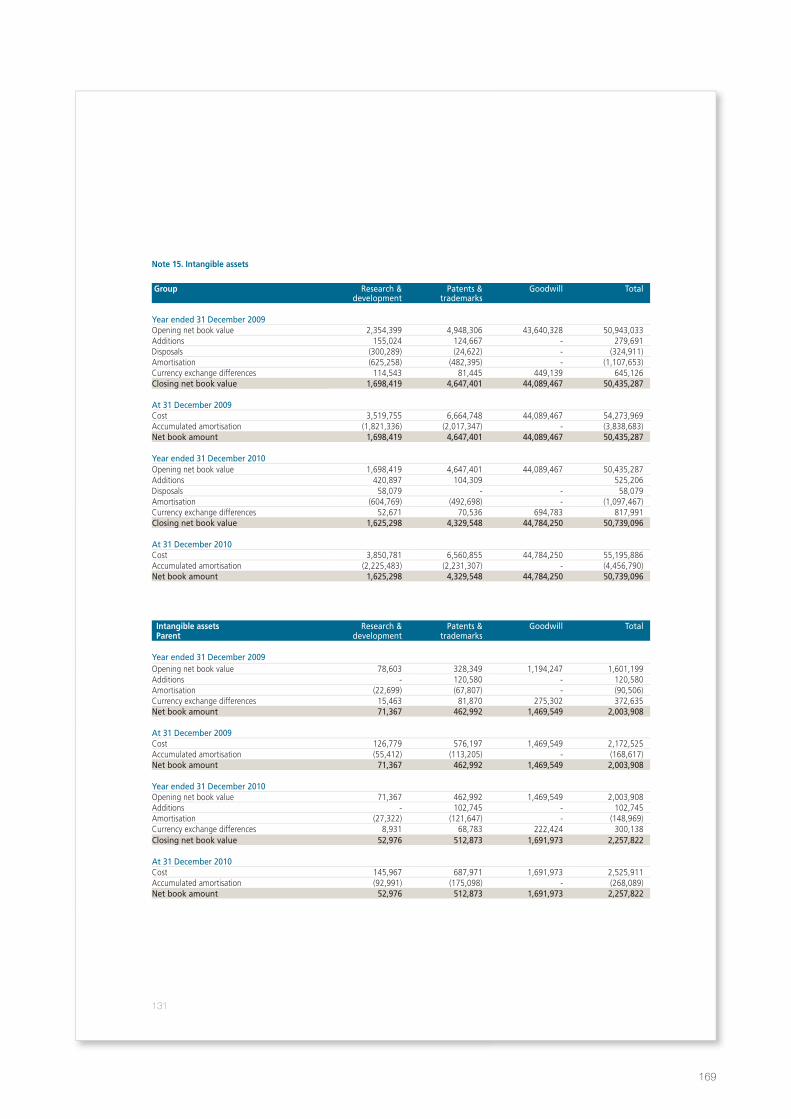
note 15. intangible assets
group Research &development
Patents & trademarks
Goodwill Total
Year ended 31 December 2009 Opening net book value 2,354,399 4,948,306 43,640,328 50,943,033 Additions 155,024 124,667 - 279,691 Disposals (300,289) (24,622) - (324,911)Amortisation (625,258) (482,395) - (1,107,653)Currency exchange differences 114,543 81,445 449,139 645,126 Closing net book value 1,698,419 4,647,401 44,089,467 50,435,287
At 31 December 2009 Cost 3,519,755 6,664,748 44,089,467 54,273,969 Accumulated amortisation (1,821,336) (2,017,347) - (3,838,683)Net book amount 1,698,419 4,647,401 44,089,467 50,435,287
Year ended 31 December 2010Opening net book value 1,698,419 4,647,401 44,089,467 50,435,287 Additions 420,897 104,309 525,206 Disposals 58,079 - - 58,079 Amortisation (604,769) (492,698) - (1,097,467)Currency exchange differences 52,671 70,536 694,783 817,991 Closing net book value 1,625,298 4,329,548 44,784,250 50,739,096
At 31 December 2010Cost 3,850,781 6,560,855 44,784,250 55,195,886 Accumulated amortisation (2,225,483) (2,231,307) - (4,456,790)Net book amount 1,625,298 4,329,548 44,784,250 50,739,096
intangible assets Research & Patents & Goodwill Total Parent development trademarks
Year ended 31 December 2009 Opening net book value 78,603 328,349 1,194,247 1,601,199 Additions - 120,580 - 120,580 Amortisation (22,699) (67,807) - (90,506)Currency exchange differences 15,463 81,870 275,302 372,635 Net book amount 71,367 462,992 1,469,549 2,003,908
At 31 December 2009 Cost 126,779 576,197 1,469,549 2,172,525 Accumulated amortisation (55,412) (113,205) - (168,617)Net book amount 71,367 462,992 1,469,549 2,003,908
Year ended 31 December 2010Opening net book value 71,367 462,992 1,469,549 2,003,908 Additions - 102,745 - 102,745 Amortisation (27,322) (121,647) - (148,969)Currency exchange differences 8,931 68,783 222,424 300,138 Closing net book value 52,976 512,873 1,691,973 2,257,822
At 31 December 2010Cost 145,967 687,971 1,691,973 2,525,911 Accumulated amortisation (92,991) (175,098) - (268,089)Net book amount 52,976 512,873 1,691,973 2,257,822
131
169
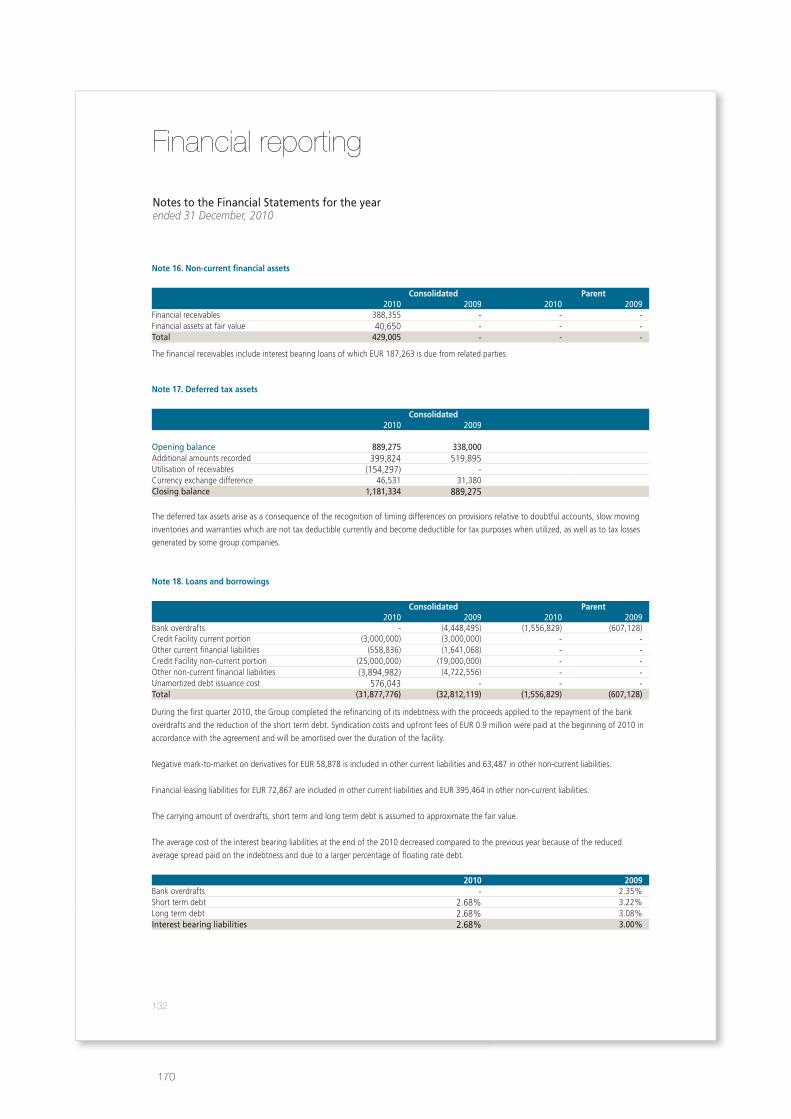
Financial reporting
Notes to the Financial Statements for the yearended 31 December, 2010
note 16. non-current financial assets
Consolidated Parent 2010 2009 2010 2009Financial receivables 388,355 - - -Financial assets at fair value 40,650 - - -Total 429,005 - - -
The financial receivables include interest bearing loans of which EUR 187,263 is due from related parties.
note 17. deferred tax assets
Consolidated 2010 2009
Opening balance 889,275 338,000 Additional amounts recorded 399,824 519,895 Utilisation of receivables (154,297) -Currency exchange difference 46,531 31,380 Closing balance 1,181,334 889,275
The deferred tax assets arise as a consequence of the recognition of timing differences on provisions relative to doubtful accounts, slow moving
inventories and warranties which are not tax deductible currently and become deductible for tax purposes when utilized, as well as to tax losses
generated by some group companies.
note 18. Loans and borrowings
Consolidated Parent 2010 2009 2010 2009Bank overdrafts - (4,448,495) (1,556,829) (607,128)Credit Facility current portion (3,000,000) (3,000,000) - -Other current financial liabilities (558,836) (1,641,068) - -Credit Facility non-current portion (25,000,000) (19,000,000) - -Other non-current financial liabilities (3,894,982) (4,722,556) - -Unamortized debt issuance cost 576,043 - - -Total (31,877,776) (32,812,119) (1,556,829) (607,128)
During the first quarter 2010, the Group completed the refinancing of its indebtness with the proceeds applied to the repayment of the bank
overdrafts and the reduction of the short term debt. Syndication costs and upfront fees of EUR 0.9 million were paid at the beginning of 2010 in
accordance with the agreement and will be amortised over the duration of the facility.
Negative mark-to-market on derivatives for EUR 58,878 is included in other current liabilities and 63,487 in other non-current liabilities.
Financial leasing liabilities for EUR 72,867 are included in other current liabilities and EUR 395,464 in other non-current liabilities.
The carrying amount of overdrafts, short term and long term debt is assumed to approximate the fair value.
The average cost of the interest bearing liabilities at the end of the 2010 decreased compared to the previous year because of the reduced
average spread paid on the indebtness and due to a larger percentage of floating rate debt.
2010 2009Bank overdrafts - 2.35%Short term debt 2.68% 3.22%Long term debt 2.68% 3.08%Interest bearing liabilities 2.68% 3.00%
132
170
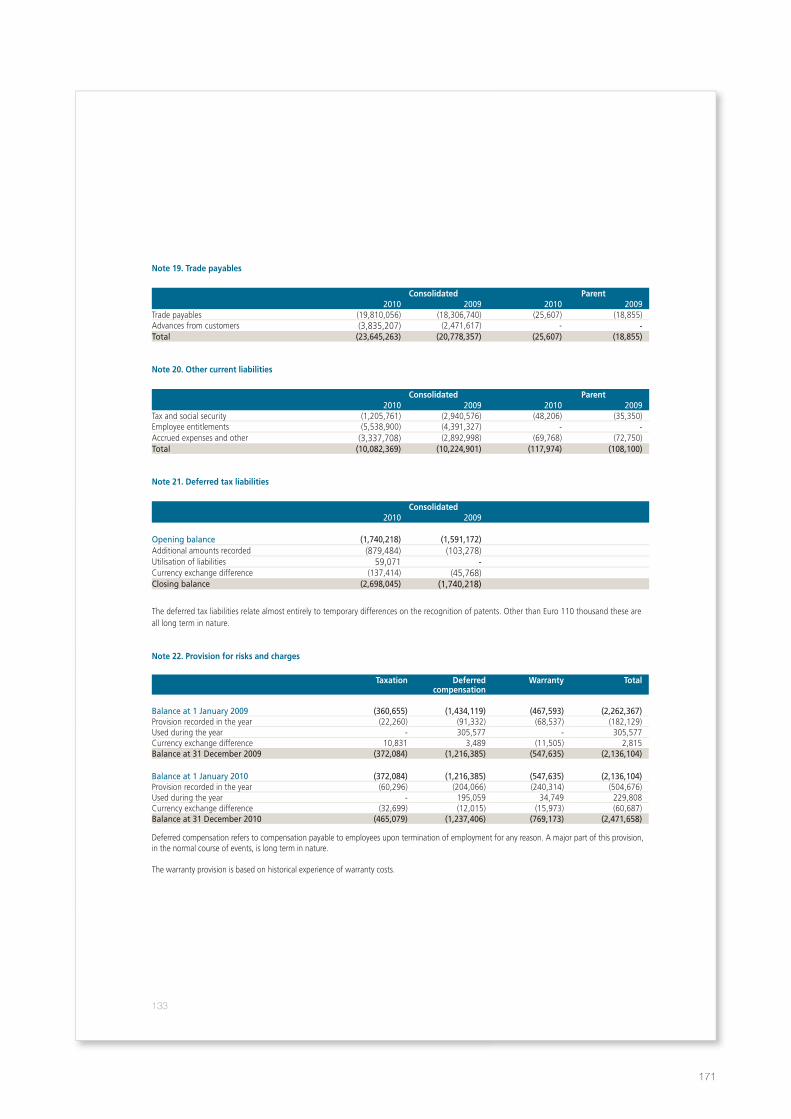
note 19. trade payables
Consolidated Parent 2010 2009 2010 2009Trade payables (19,810,056) (18,306,740) (25,607) (18,855)Advances from customers (3,835,207) (2,471,617) - -Total (23,645,263) (20,778,357) (25,607) (18,855)
note 20. other current liabilities
Consolidated Parent 2010 2009 2010 2009Tax and social security (1,205,761) (2,940,576) (48,206) (35,350)Employee entitlements (5,538,900) (4,391,327) - -Accrued expenses and other (3,337,708) (2,892,998) (69,768) (72,750)Total (10,082,369) (10,224,901) (117,974) (108,100)
note 21. deferred tax liabilities
Consolidated 2010 2009
Opening balance (1,740,218) (1,591,172)Additional amounts recorded (879,484) (103,278)Utilisation of liabilities 59,071 -Currency exchange difference (137,414) (45,768)Closing balance (2,698,045) (1,740,218)
The deferred tax liabilities relate almost entirely to temporary differences on the recognition of patents. Other than Euro 110 thousand these are all long term in nature.
note 22. Provision for risks and charges
taxation deferred compensation
Warranty total
Balance at 1 January 2009 (360,655) (1,434,119) (467,593) (2,262,367)Provision recorded in the year (22,260) (91,332) (68,537) (182,129)Used during the year - 305,577 - 305,577 Currency exchange difference 10,831 3,489 (11,505) 2,815 Balance at 31 December 2009 (372,084) (1,216,385) (547,635) (2,136,104)
Balance at 1 January 2010 (372,084) (1,216,385) (547,635) (2,136,104)Provision recorded in the year (60,296) (204,066) (240,314) (504,676)Used during the year - 195,059 34,749 229,808 Currency exchange difference (32,699) (12,015) (15,973) (60,687)Balance at 31 December 2010 (465,079) (1,237,406) (769,173) (2,471,658)
Deferred compensation refers to compensation payable to employees upon termination of employment for any reason. A major part of this provision, in the normal course of events, is long term in nature.
The warranty provision is based on historical experience of warranty costs.
133
171
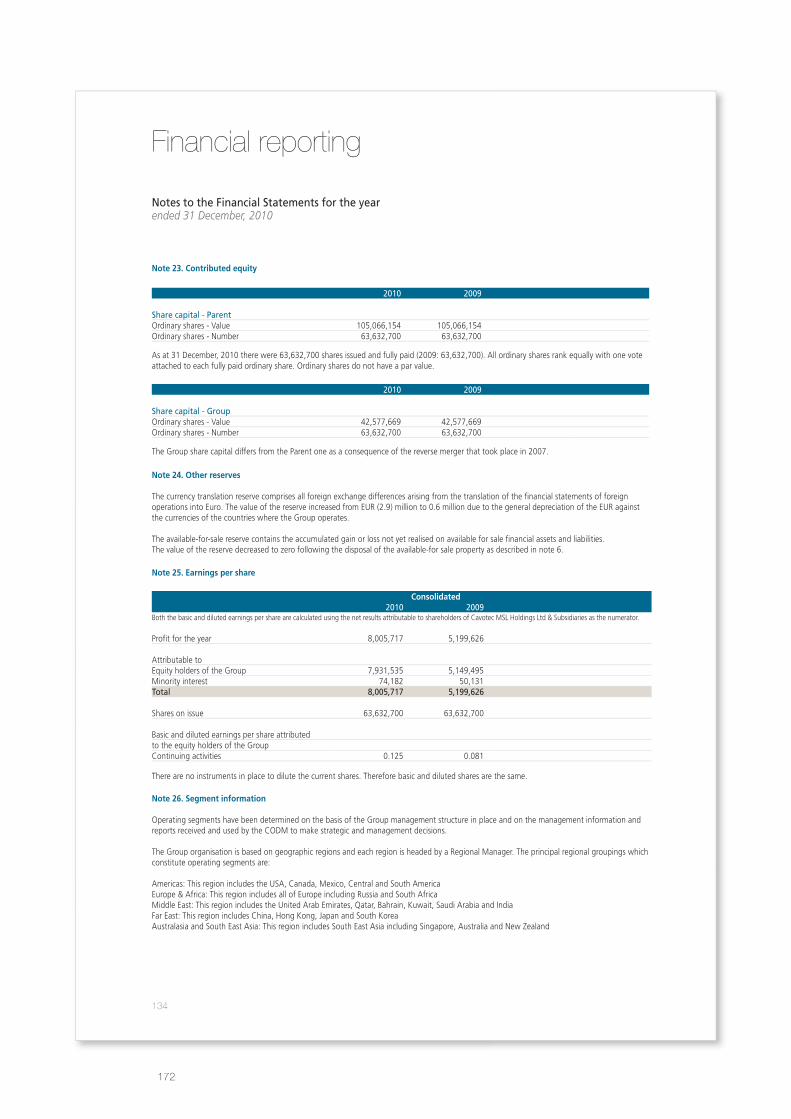
Financial reporting
Notes to the Financial Statements for the yearended 31 December, 2010
note 23. Contributed equity
2010 2009
Share capital - ParentOrdinary shares - Value 105,066,154 105,066,154 Ordinary shares - Number 63,632,700 63,632,700
As at 31 December, 2010 there were 63,632,700 shares issued and fully paid (2009: 63,632,700). All ordinary shares rank equally with one vote attached to each fully paid ordinary share. Ordinary shares do not have a par value.
2010 2009
Share capital - GroupOrdinary shares - Value 42,577,669 42,577,669 Ordinary shares - Number 63,632,700 63,632,700
The Group share capital differs from the Parent one as a consequence of the reverse merger that took place in 2007.
note 24. other reserves
The currency translation reserve comprises all foreign exchange differences arising from the translation of the financial statements of foreign operations into Euro. The value of the reserve increased from EUR (2.9) million to 0.6 million due to the general depreciation of the EUR against the currencies of the countries where the Group operates.
The available-for-sale reserve contains the accumulated gain or loss not yet realised on available for sale financial assets and liabilities.The value of the reserve decreased to zero following the disposal of the available-for sale property as described in note 6.
note 25. earnings per share
Consolidated 2010 2009Both the basic and diluted earnings per share are calculated using the net results attributable to shareholders of Cavotec MSL Holdings Ltd & Subsidiaries as the numerator.
Profit for the year 8,005,717 5,199,626
Attributable toEquity holders of the Group 7,931,535 5,149,495 Minority interest 74,182 50,131 Total 8,005,717 5,199,626
Shares on issue 63,632,700 63,632,700
Basic and diluted earnings per share attributedto the equity holders of the GroupContinuing activities 0.125 0.081
There are no instruments in place to dilute the current shares. Therefore basic and diluted shares are the same.
note 26. Segment information
Operating segments have been determined on the basis of the Group management structure in place and on the management information and reports received and used by the CODM to make strategic and management decisions.
The Group organisation is based on geographic regions and each region is headed by a Regional Manager. The principal regional groupings which constitute operating segments are:
Americas: This region includes the USA, Canada, Mexico, Central and South America Europe & Africa: This region includes all of Europe including Russia and South AfricaMiddle East: This region includes the United Arab Emirates, Qatar, Bahrain, Kuwait, Saudi Arabia and IndiaFar East: This region includes China, Hong Kong, Japan and South KoreaAustralasia and South East Asia: This region includes South East Asia including Singapore, Australia and New Zealand
134
172
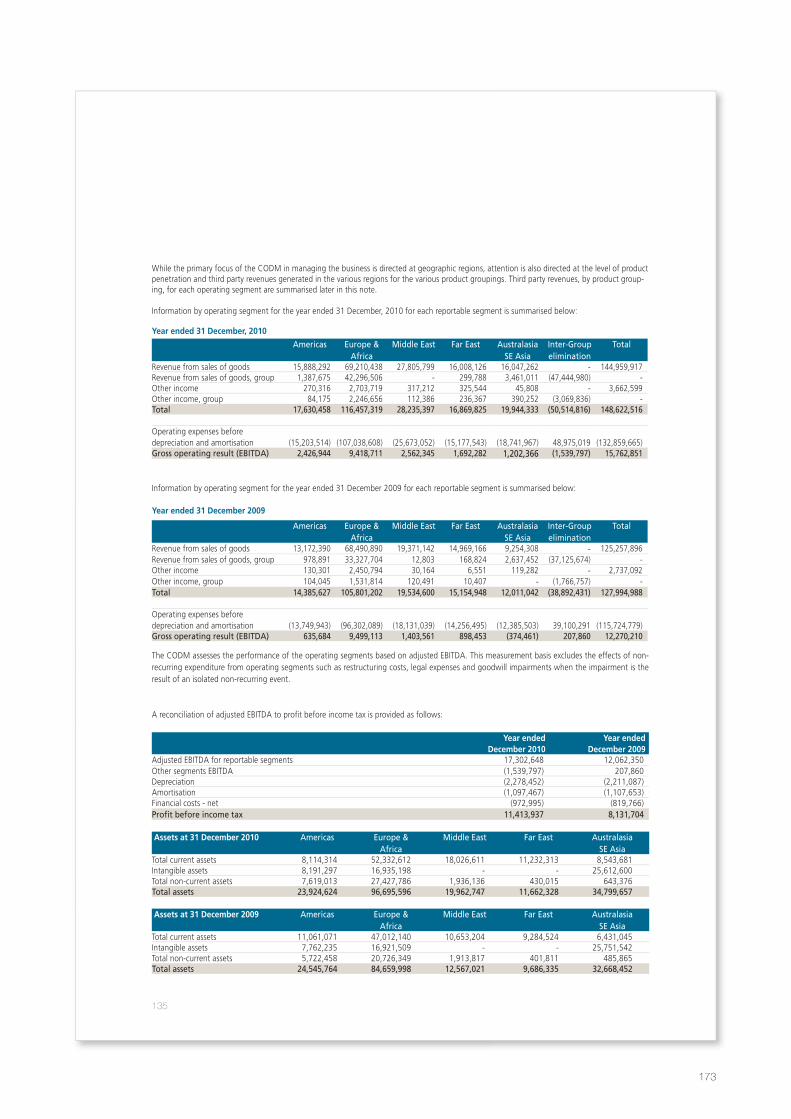
While the primary focus of the CODM in managing the business is directed at geographic regions, attention is also directed at the level of product penetration and third party revenues generated in the various regions for the various product groupings. Third party revenues, by product group-ing, for each operating segment are summarised later in this note.
Information by operating segment for the year ended 31 December, 2010 for each reportable segment is summarised below:
Year ended 31 december, 2010
Americas Europe &Africa
Middle East Far East AustralasiaSE Asia
Inter-Groupelimination
Total
Revenue from sales of goods 15,888,292 69,210,438 27,805,799 16,008,126 16,047,262 - 144,959,917 Revenue from sales of goods, group 1,387,675 42,296,506 - 299,788 3,461,011 (47,444,980) - Other income 270,316 2,703,719 317,212 325,544 45,808 - 3,662,599 Other income, group 84,175 2,246,656 112,386 236,367 390,252 (3,069,836) -Total 17,630,458 116,457,319 28,235,397 16,869,825 19,944,333 (50,514,816) 148,622,516
Operating expenses before depreciation and amortisation (15,203,514)
(107,038,608)
(25,673,052) (15,177,543) (18,741,967) 48,975,019
(132,859,665)
Gross operating result (EBITDA) 2,426,944 9,418,711 2,562,345 1,692,282 1,202,366 (1,539,797) 15,762,851
Information by operating segment for the year ended 31 December 2009 for each reportable segment is summarised below:
Year ended 31 december 2009
Americas Europe &Africa
Middle East Far East AustralasiaSE Asia
Inter-Groupelimination
Total
Revenue from sales of goods 13,172,390 68,490,890 19,371,142 14,969,166 9,254,308 - 125,257,896 Revenue from sales of goods, group 978,891 33,327,704 12,803 168,824 2,637,452 (37,125,674) - Other income 130,301 2,450,794 30,164 6,551 119,282 - 2,737,092 Other income, group 104,045 1,531,814 120,491 10,407 - (1,766,757) -Total 14,385,627 105,801,202 19,534,600 15,154,948 12,011,042 (38,892,431) 127,994,988
Operating expenses before depreciation and amortisation
(13,749,943)
(96,302,089) (18,131,039)
(14,256,495) (12,385,503)
39,100,291
(115,724,779)
Gross operating result (EBITDA) 635,684 9,499,113 1,403,561 898,453 (374,461) 207,860 12,270,210
The CODM assesses the performance of the operating segments based on adjusted EBITDA. This measurement basis excludes the effects of non-recurring expenditure from operating segments such as restructuring costs, legal expenses and goodwill impairments when the impairment is the result of an isolated non-recurring event.
A reconciliation of adjusted EBITDA to profit before income tax is provided as follows:
Year endeddecember 2010
Year endeddecember 2009
Adjusted EBITDA for reportable segments 17,302,648 12,062,350 Other segments EBITDA (1,539,797) 207,860 Depreciation (2,278,452) (2,211,087)Amortisation (1,097,467) (1,107,653)Financial costs - net (972,995) (819,766)Profit before income tax 11,413,937 8,131,704
assets at 31 december 2010 Americas Europe &Africa
Middle East Far East AustralasiaSE Asia
Total current assets 8,114,314 52,332,612 18,026,611 11,232,313 8,543,681 Intangible assets 8,191,297 16,935,198 - - 25,612,600 Total non-current assets 7,619,013 27,427,786 1,936,136 430,015 643,376 Total assets 23,924,624 96,695,596 19,962,747 11,662,328 34,799,657
assets at 31 december 2009 Americas Europe &Africa
Middle East Far East AustralasiaSE Asia
Total current assets 11,061,071 47,012,140 10,653,204 9,284,524 6,431,045 Intangible assets 7,762,235 16,921,509 - - 25,751,542 Total non-current assets 5,722,458 20,726,349 1,913,817 401,811 485,865 Total assets 24,545,764 84,659,998 12,567,021 9,686,335 32,668,452
135
173
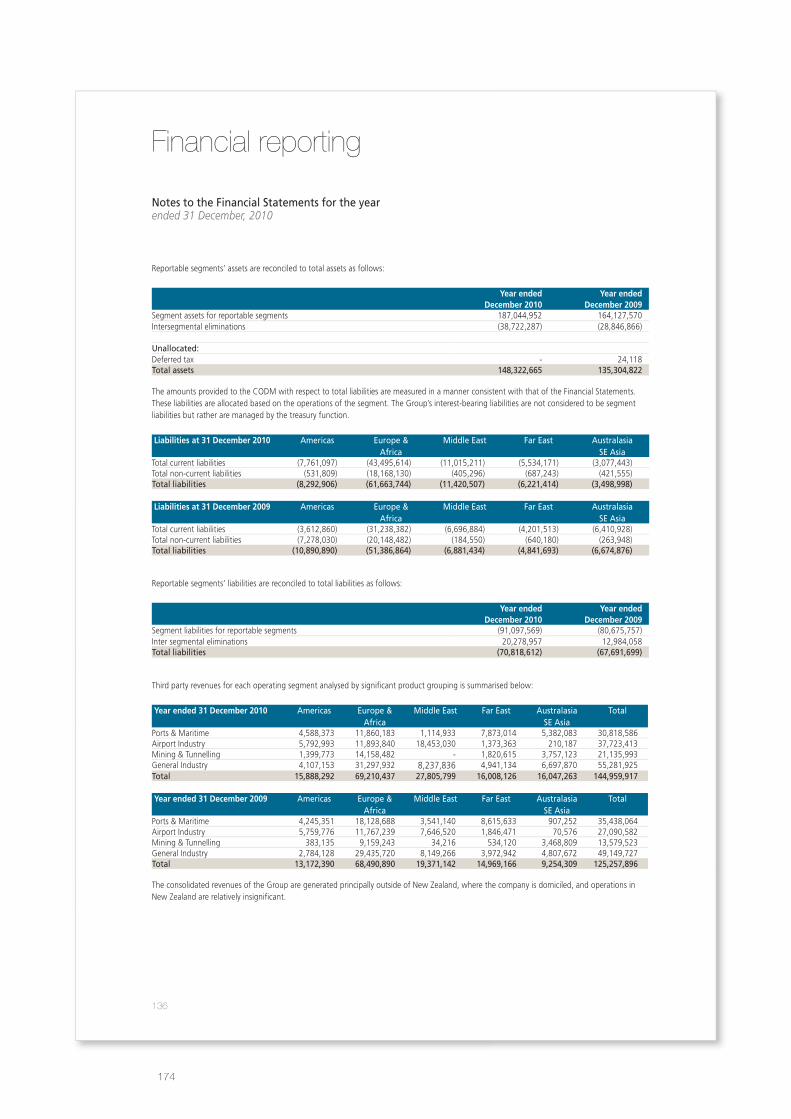
Financial reporting
Notes to the Financial Statements for the yearended 31 December, 2010
Reportable segments’ assets are reconciled to total assets as follows:
Year endeddecember 2010
Year endeddecember 2009
Segment assets for reportable segments 187,044,952 164,127,570 Intersegmental eliminations (38,722,287) (28,846,866)
Unallocated:Deferred tax - 24,118 Total assets 148,322,665 135,304,822
The amounts provided to the CODM with respect to total liabilities are measured in a manner consistent with that of the Financial Statements.These liabilities are allocated based on the operations of the segment. The Group’s interest-bearing liabilities are not considered to be segment liabilities but rather are managed by the treasury function.
Liabilities at 31 december 2010 Americas Europe &Africa
Middle East Far East AustralasiaSE Asia
Total current liabilities (7,761,097) (43,495,614) (11,015,211) (5,534,171) (3,077,443)Total non-current liabilities (531,809) (18,168,130) (405,296) (687,243) (421,555)Total liabilities (8,292,906) (61,663,744) (11,420,507) (6,221,414) (3,498,998)
Liabilities at 31 december 2009 Americas Europe &Africa
Middle East Far East AustralasiaSE Asia
Total current liabilities (3,612,860) (31,238,382) (6,696,884) (4,201,513) (6,410,928)Total non-current liabilities (7,278,030) (20,148,482) (184,550) (640,180) (263,948)Total liabilities (10,890,890) (51,386,864) (6,881,434) (4,841,693) (6,674,876)
Reportable segments’ liabilities are reconciled to total liabilities as follows:
Year endeddecember 2010
Year endeddecember 2009
Segment liabilities for reportable segments (91,097,569) (80,675,757)Inter segmental eliminations 20,278,957 12,984,058 Total liabilities (70,818,612) (67,691,699)
Third party revenues for each operating segment analysed by significant product grouping is summarised below:
Year ended 31 december 2010 Americas Europe &Africa
Middle East Far East AustralasiaSE Asia
Total
Ports & Maritime 4,588,373 11,860,183 1,114,933 7,873,014 5,382,083 30,818,586 Airport Industry 5,792,993 11,893,840 18,453,030 1,373,363 210,187 37,723,413 Mining & Tunnelling 1,399,773 14,158,482 - 1,820,615 3,757,123 21,135,993 General Industry 4,107,153 31,297,932 8,237,836 4,941,134 6,697,870 55,281,925 Total 15,888,292 69,210,437 27,805,799 16,008,126 16,047,263 144,959,917
Year ended 31 december 2009 Americas Europe &Africa
Middle East Far East AustralasiaSE Asia
Total
Ports & Maritime 4,245,351 18,128,688 3,541,140 8,615,633 907,252 35,438,064 Airport Industry 5,759,776 11,767,239 7,646,520 1,846,471 70,576 27,090,582 Mining & Tunnelling 383,135 9,159,243 34,216 534,120 3,468,809 13,579,523 General Industry 2,784,128 29,435,720 8,149,266 3,972,942 4,807,672 49,149,727 Total 13,172,390 68,490,890 19,371,142 14,969,166 9,254,309 125,257,896
The consolidated revenues of the Group are generated principally outside of New Zealand, where the company is domiciled, and operations in New Zealand are relatively insignificant.
136
174
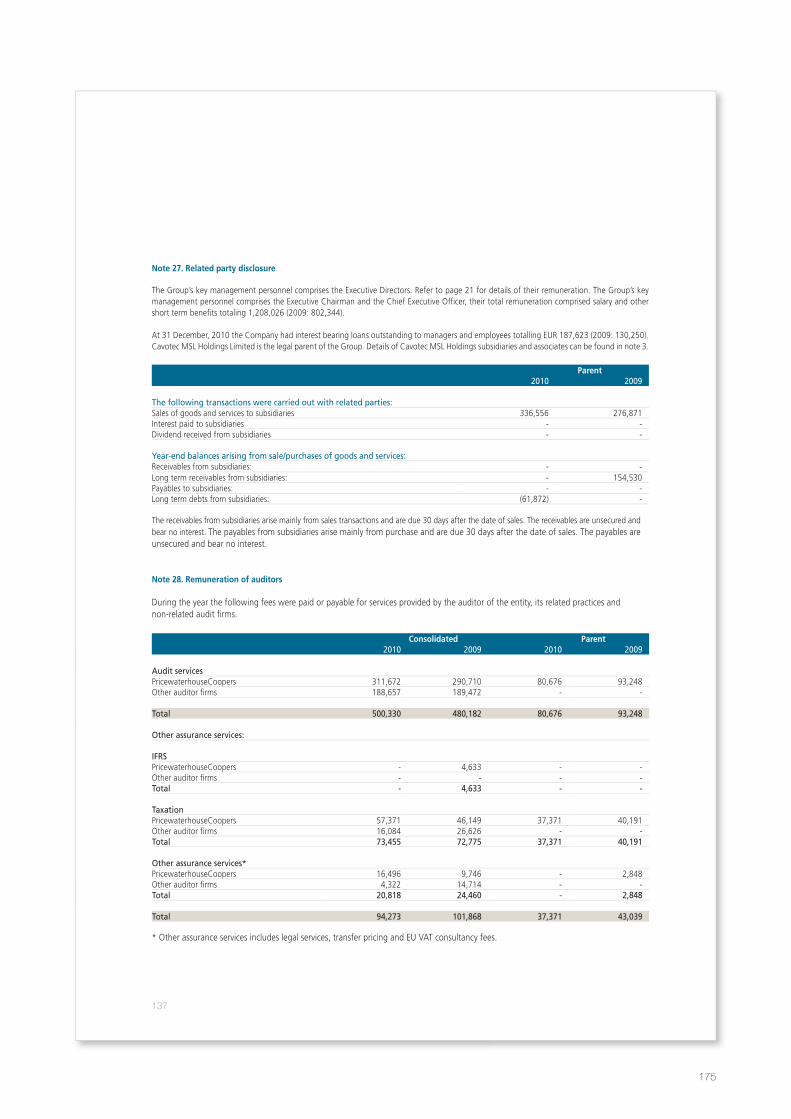
note 27. related party disclosure
The Group’s key management personnel comprises the Executive Directors. Refer to page 21 for details of their remuneration. The Group’s key management personnel comprises the Executive Chairman and the Chief Executive Officer, their total remuneration comprised salary and other short term benefits totaling 1,208,026 (2009: 802,344).
At 31 December, 2010 the Company had interest bearing loans outstanding to managers and employees totalling EUR 187,623 (2009: 130,250). Cavotec MSL Holdings Limited is the legal parent of the Group. Details of Cavotec MSL Holdings subsidiaries and associates can be found in note 3.
Parent 2010 2009
The following transactions were carried out with related parties:Sales of goods and services to subsidiaries 336,556 276,871 Interest paid to subsidiaries - -Dividend received from subsidiaries - -
Year-end balances arising from sale/purchases of goods and services:Receivables from subsidiaries: - -Long term receivables from subsidiaries: - 154,530 Payables to subsidiaries: - -Long term debts from subsidiaries: (61,872) -
The receivables from subsidiaries arise mainly from sales transactions and are due 30 days after the date of sales. The receivables are unsecured and bear no interest. The payables from subsidiaries arise mainly from purchase and are due 30 days after the date of sales. The payables are unsecured and bear no interest.
note 28. remuneration of auditors
During the year the following fees were paid or payable for services provided by the auditor of the entity, its related practices and non-related audit firms.
Consolidated Parent 2010 2009 2010 2009
Audit servicesPricewaterhouseCoopers 311,672 290,710 80,676 93,248 Other auditor firms 188,657 189,472 - -
Total 500,330 480,182 80,676 93,248
Other assurance services:
IFRSPricewaterhouseCoopers - 4,633 - -Other auditor firms - - - -Total - 4,633 - -
TaxationPricewaterhouseCoopers 57,371 46,149 37,371 40,191Other auditor firms 16,084 26,626 - -Total 73,455 72,775 37,371 40,191
Other assurance services*PricewaterhouseCoopers 16,496 9,746 - 2,848Other auditor firms 4,322 14,714 - -Total 20,818 24,460 - 2,848
Total 94,273 101,868 37,371 43,039
* Other assurance services includes legal services, transfer pricing and EU VAT consultancy fees.
137
175
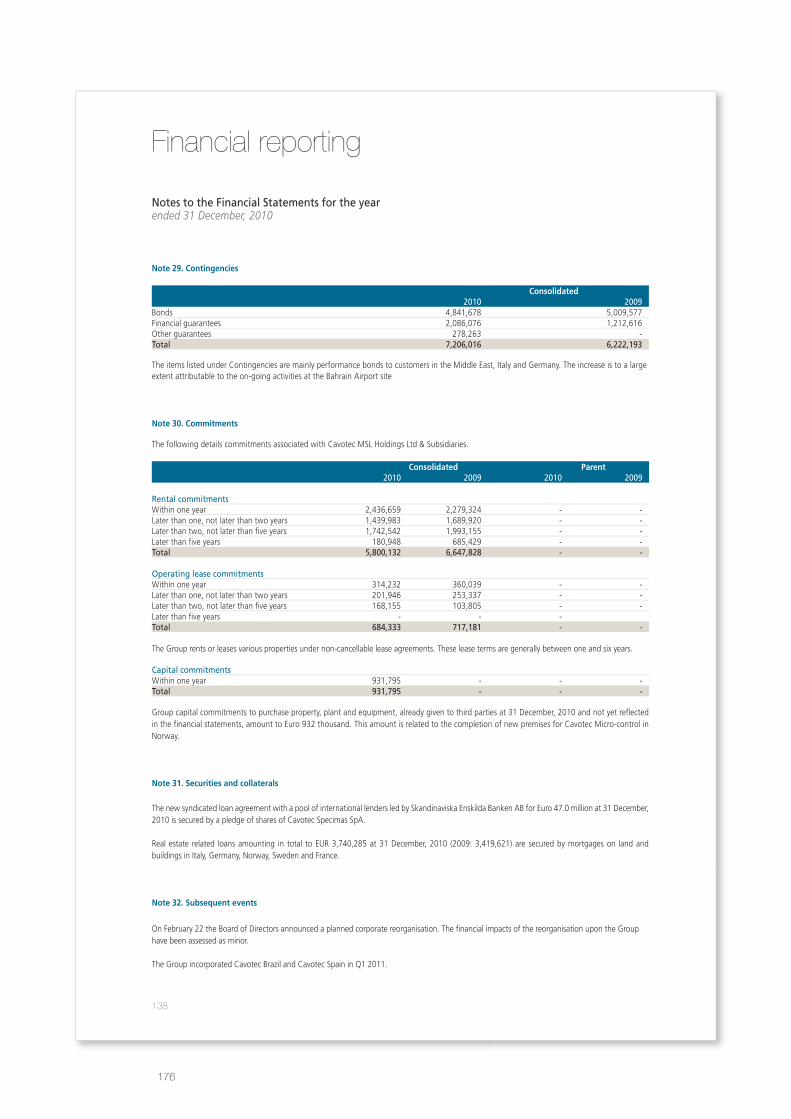
Financial reporting
Notes to the Financial Statements for the yearended 31 December, 2010
note 29. Contingencies
Consolidated 2010 2009Bonds 4,841,678 5,009,577 Financial guarantees 2,086,076 1,212,616 Other guarantees 278,263 - Total 7,206,016 6,222,193
The items listed under Contingencies are mainly performance bonds to customers in the Middle East, Italy and Germany. The increase is to a large extent attributable to the on-going activities at the Bahrain Airport site
note 30. Commitments
The following details commitments associated with Cavotec MSL Holdings Ltd & Subsidiaries.
Consolidated Parent 2010 2009 2010 2009
Rental commitmentsWithin one year 2,436,659 2,279,324 - -Later than one, not later than two years 1,439,983 1,689,920 - -Later than two, not later than five years 1,742,542 1,993,155 - -Later than five years 180,948 685,429 - -Total 5,800,132 6,647,828 - -
Operating lease commitmentsWithin one year 314,232 360,039 - -Later than one, not later than two years 201,946 253,337 - -Later than two, not later than five years 168,155 103,805 - -Later than five years - - - Total 684,333 717,181 - -
The Group rents or leases various properties under non-cancellable lease agreements. These lease terms are generally between one and six years.
Capital commitmentsWithin one year 931,795 - - -Total 931,795 - - -
Group capital commitments to purchase property, plant and equipment, already given to third parties at 31 December, 2010 and not yet reflected in the financial statements, amount to Euro 932 thousand. This amount is related to the completion of new premises for Cavotec Micro-control in Norway.
note 31. Securities and collaterals
The new syndicated loan agreement with a pool of international lenders led by Skandinaviska Enskilda Banken AB for Euro 47.0 million at 31 December, 2010 is secured by a pledge of shares of Cavotec Specimas SpA.
Real estate related loans amounting in total to EUR 3,740,285 at 31 December, 2010 (2009: 3,419,621) are secured by mortgages on land and buildings in Italy, Germany, Norway, Sweden and France.
note 32. Subsequent events
On February 22 the Board of Directors announced a planned corporate reorganisation. The financial impacts of the reorganisation upon the Group have been assessed as minor.
The Group incorporated Cavotec Brazil and Cavotec Spain in Q1 2011.
138
176
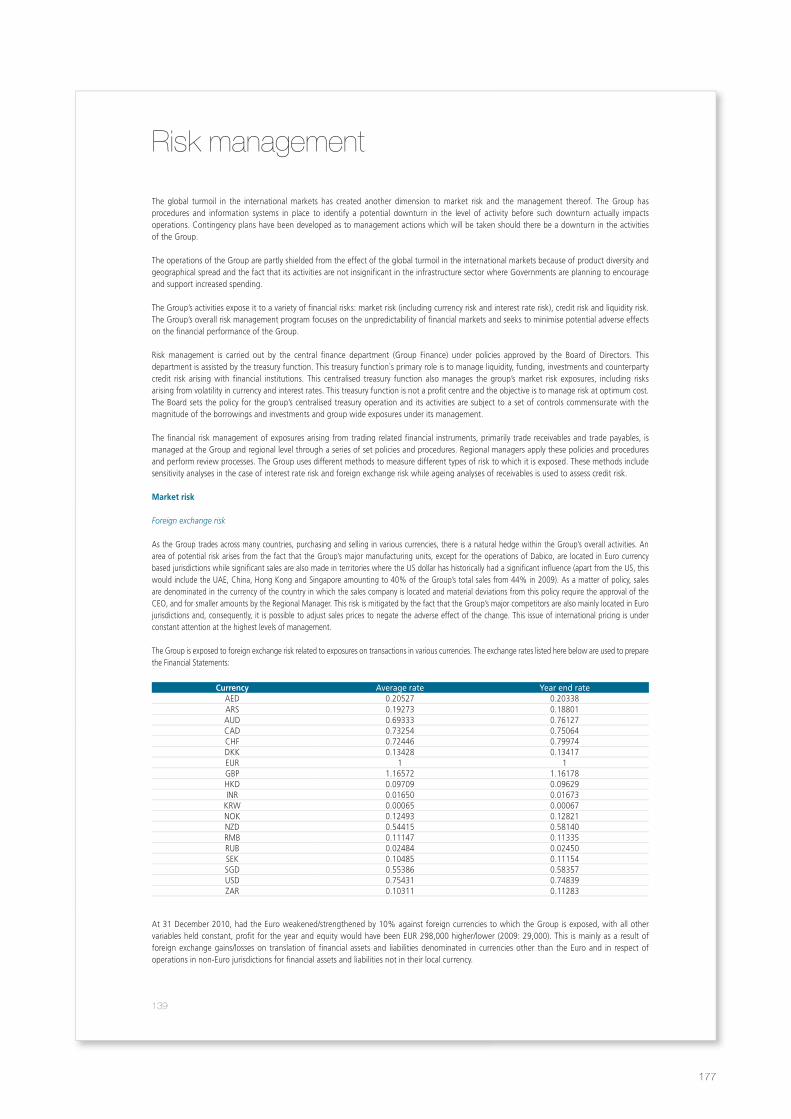
Risk management
The global turmoil in the international markets has created another dimension to market risk and the management thereof. The Group has procedures and information systems in place to identify a potential downturn in the level of activity before such downturn actually impacts operations. Contingency plans have been developed as to management actions which will be taken should there be a downturn in the activities of the Group.
The operations of the Group are partly shielded from the effect of the global turmoil in the international markets because of product diversity and geographical spread and the fact that its activities are not insignificant in the infrastructure sector where Governments are planning to encourage and support increased spending.
The Group’s activities expose it to a variety of financial risks: market risk (including currency risk and interest rate risk), credit risk and liquidity risk. The Group’s overall risk management program focuses on the unpredictability of financial markets and seeks to minimise potential adverse effects on the financial performance of the Group.
Risk management is carried out by the central finance department (Group Finance) under policies approved by the Board of Directors. This department is assisted by the treasury function. This treasury function`s primary role is to manage liquidity, funding, investments and counterparty credit risk arising with financial institutions. This centralised treasury function also manages the group’s market risk exposures, including risks arising from volatility in currency and interest rates. This treasury function is not a profit centre and the objective is to manage risk at optimum cost. The Board sets the policy for the group’s centralised treasury operation and its activities are subject to a set of controls commensurate with the magnitude of the borrowings and investments and group wide exposures under its management.
The financial risk management of exposures arising from trading related financial instruments, primarily trade receivables and trade payables, is managed at the Group and regional level through a series of set policies and procedures. Regional managers apply these policies and procedures and perform review processes. The Group uses different methods to measure different types of risk to which it is exposed. These methods include sensitivity analyses in the case of interest rate risk and foreign exchange risk while ageing analyses of receivables is used to assess credit risk.
Market risk
Foreign exchange risk
As the Group trades across many countries, purchasing and selling in various currencies, there is a natural hedge within the Group’s overall activities. An area of potential risk arises from the fact that the Group’s major manufacturing units, except for the operations of Dabico, are located in Euro currency based jurisdictions while significant sales are also made in territories where the US dollar has historically had a significant influence (apart from the US, this would include the UAE, China, Hong Kong and Singapore amounting to 40% of the Group’s total sales from 44% in 2009). As a matter of policy, sales are denominated in the currency of the country in which the sales company is located and material deviations from this policy require the approval of the CEO, and for smaller amounts by the Regional Manager. This risk is mitigated by the fact that the Group’s major competitors are also mainly located in Euro jurisdictions and, consequently, it is possible to adjust sales prices to negate the adverse effect of the change. This issue of international pricing is under constant attention at the highest levels of management.
The Group is exposed to foreign exchange risk related to exposures on transactions in various currencies. The exchange rates listed here below are used to prepare the Financial Statements:
Currency Average rate Year end rateAED 0.20527 0.20338ARS 0.19273 0.18801AUD 0.69333 0.76127CAD 0.73254 0.75064CHF 0.72446 0.79974DKK 0.13428 0.13417EUR 1 1GBP 1.16572 1.16178HKD 0.09709 0.09629INR 0.01650 0.01673
KRW 0.00065 0.00067NOK 0.12493 0.12821NZD 0.54415 0.58140RMB 0.11147 0.11335RUB 0.02484 0.02450SEK 0.10485 0.11154SGD 0.55386 0.58357USD 0.75431 0.74839ZAR 0.10311 0.11283
At 31 December 2010, had the Euro weakened/strengthened by 10% against foreign currencies to which the Group is exposed, with all other variables held constant, profit for the year and equity would have been EUR 298,000 higher/lower (2009: 29,000). This is mainly as a result of foreign exchange gains/losses on translation of financial assets and liabilities denominated in currencies other than the Euro and in respect of operations in non-Euro jurisdictions for financial assets and liabilities not in their local currency.
139
177
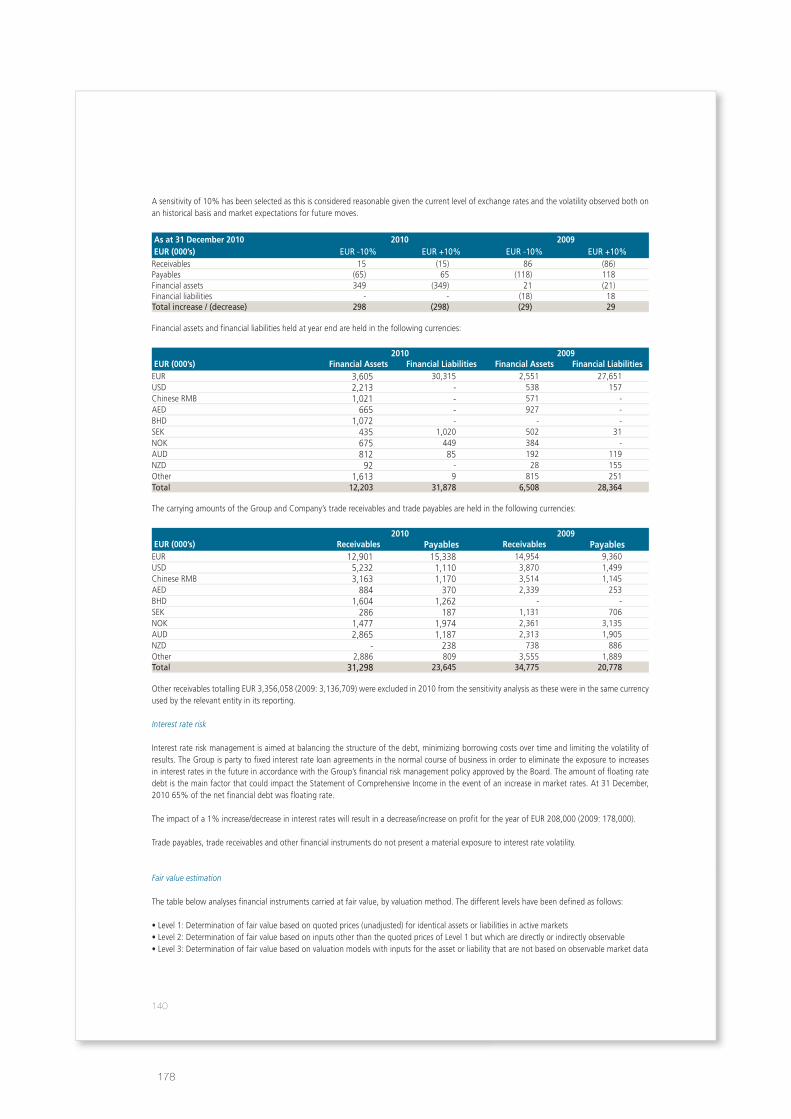
A sensitivity of 10% has been selected as this is considered reasonable given the current level of exchange rates and the volatility observed both on an historical basis and market expectations for future moves.
as at 31 december 2010 2010 2009 eur (000’s) EUR -10% EUR +10% EUR -10% EUR +10% Receivables 15 (15) 86 (86)Payables (65) 65 (118) 118Financial assets 349 (349) 21 (21)Financial liabilities - - (18) 18Total increase / (decrease) 298 (298) (29) 29
Financial assets and financial liabilities held at year end are held in the following currencies:
2010 2009 eur (000’s) Financial assets Financial Liabilities Financial assets Financial LiabilitiesEUR 3,605 30,315 2,551 27,651USD 2,213 - 538 157Chinese RMB 1,021 - 571 -AED 665 - 927 -BHD 1,072 - - -SEK 435 1,020 502 31NOK 675 449 384 -AUD 812 85 192 119NZD 92 - 28 155Other 1,613 9 815 251Total 12,203 31,878 6,508 28,364
The carrying amounts of the Group and Company’s trade receivables and trade payables are held in the following currencies:
2010 2009 eur (000’s) receivables Payables receivables PayablesEUR 12,901 15,338 14,954 9,360USD 5,232 1,110 3,870 1,499Chinese RMB 3,163 1,170 3,514 1,145AED 884 370 2,339 253BHD 1,604 1,262 - -SEK 286 187 1,131 706NOK 1,477 1,974 2,361 3,135AUD 2,865 1,187 2,313 1,905NZD - 238 738 886Other 2,886 809 3,555 1,889Total 31,298 23,645 34,775 20,778
Other receivables totalling EUR 3,356,058 (2009: 3,136,709) were excluded in 2010 from the sensitivity analysis as these were in the same currency used by the relevant entity in its reporting.
Interest rate risk
Interest rate risk management is aimed at balancing the structure of the debt, minimizing borrowing costs over time and limiting the volatility of results. The Group is party to fixed interest rate loan agreements in the normal course of business in order to eliminate the exposure to increases in interest rates in the future in accordance with the Group’s financial risk management policy approved by the Board. The amount of floating rate debt is the main factor that could impact the Statement of Comprehensive Income in the event of an increase in market rates. At 31 December, 2010 65% of the net financial debt was floating rate.
The impact of a 1% increase/decrease in interest rates will result in a decrease/increase on profit for the year of EUR 208,000 (2009: 178,000).
Trade payables, trade receivables and other financial instruments do not present a material exposure to interest rate volatility.
Fair value estimation
The table below analyses financial instruments carried at fair value, by valuation method. The different levels have been defined as follows:
•Level1:Determinationoffairvaluebasedonquotedprices(unadjusted)foridenticalassetsorliabilitiesinactivemarkets•Level2:DeterminationoffairvaluebasedoninputsotherthanthequotedpricesofLevel1butwhicharedirectlyorindirectlyobservable•Level3:Determinationoffairvaluebasedonvaluationmodelswithinputsfortheassetorliabilitythatarenotbasedonobservablemarketdata
140
178
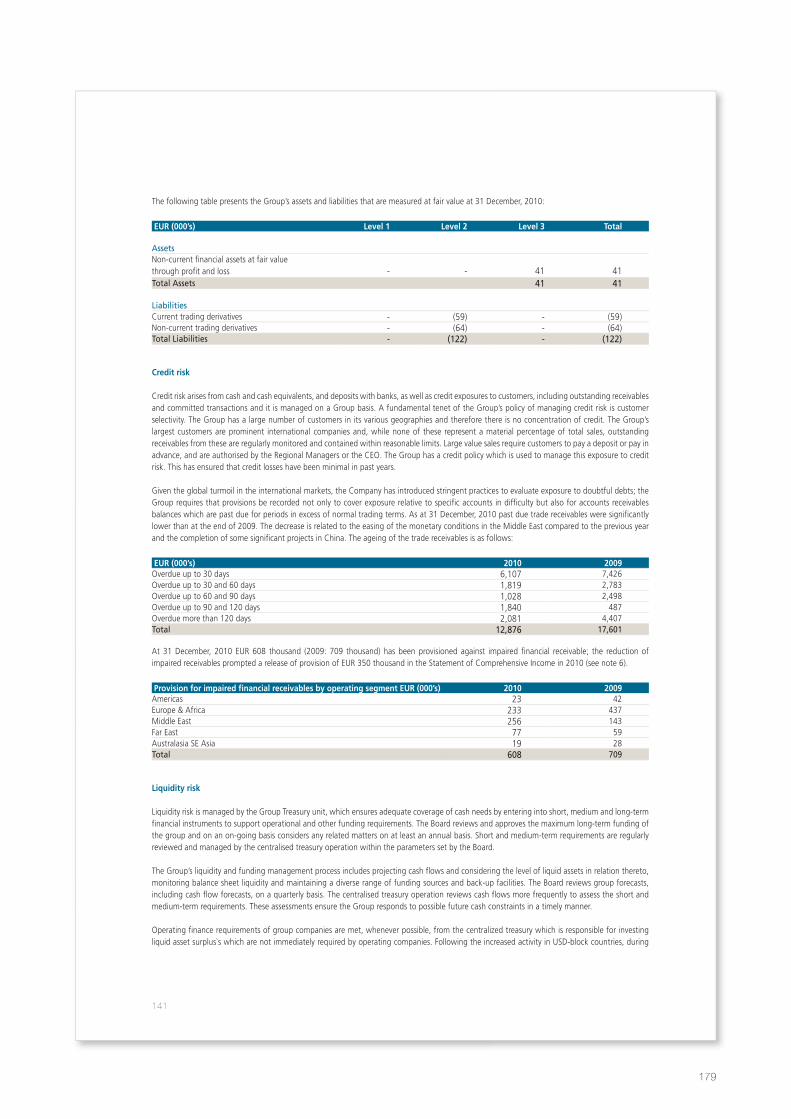
The following table presents the Group’s assets and liabilities that are measured at fair value at 31 December, 2010:
eur (000’s) Level 1 Level 2 Level 3 total
AssetsNon-current financial assets at fair value through profit and loss - - 41 41Total Assets 41 41
LiabilitiesCurrent trading derivatives - (59) - (59)Non-current trading derivatives - (64) - (64)Total Liabilities - (122) - (122)
Credit risk
Credit risk arises from cash and cash equivalents, and deposits with banks, as well as credit exposures to customers, including outstanding receivables and committed transactions and it is managed on a Group basis. A fundamental tenet of the Group’s policy of managing credit risk is customer selectivity. The Group has a large number of customers in its various geographies and therefore there is no concentration of credit. The Group’s largest customers are prominent international companies and, while none of these represent a material percentage of total sales, outstanding receivables from these are regularly monitored and contained within reasonable limits. Large value sales require customers to pay a deposit or pay in advance, and are authorised by the Regional Managers or the CEO. The Group has a credit policy which is used to manage this exposure to credit risk. This has ensured that credit losses have been minimal in past years.
Given the global turmoil in the international markets, the Company has introduced stringent practices to evaluate exposure to doubtful debts; the Group requires that provisions be recorded not only to cover exposure relative to specific accounts in difficulty but also for accounts receivables balances which are past due for periods in excess of normal trading terms. As at 31 December, 2010 past due trade receivables were significantly lower than at the end of 2009. The decrease is related to the easing of the monetary conditions in the Middle East compared to the previous year and the completion of some significant projects in China. The ageing of the trade receivables is as follows:
eur (000’s) 2010 2009Overdue up to 30 days 6,107 7,426Overdue up to 30 and 60 days 1,819 2,783Overdue up to 60 and 90 days 1,028 2,498Overdue up to 90 and 120 days 1,840 487Overdue more than 120 days 2,081 4,407Total 12,876 17,601
At 31 December, 2010 EUR 608 thousand (2009: 709 thousand) has been provisioned against impaired financial receivable; the reduction of impaired receivables prompted a release of provision of EUR 350 thousand in the Statement of Comprehensive Income in 2010 (see note 6).
Provision for impaired financial receivables by operating segment eur (000’s) 2010 2009Americas 23 42Europe & Africa 233 437Middle East 256 143Far East 77 59Australasia SE Asia 19 28Total 608 709
Liquidity risk
Liquidity risk is managed by the Group Treasury unit, which ensures adequate coverage of cash needs by entering into short, medium and long-term financial instruments to support operational and other funding requirements. The Board reviews and approves the maximum long-term funding of the group and on an on-going basis considers any related matters on at least an annual basis. Short and medium-term requirements are regularly reviewed and managed by the centralised treasury operation within the parameters set by the Board.
The Group’s liquidity and funding management process includes projecting cash flows and considering the level of liquid assets in relation thereto, monitoring balance sheet liquidity and maintaining a diverse range of funding sources and back-up facilities. The Board reviews group forecasts, including cash flow forecasts, on a quarterly basis. The centralised treasury operation reviews cash flows more frequently to assess the short and medium-term requirements. These assessments ensure the Group responds to possible future cash constraints in a timely manner.
Operating finance requirements of group companies are met, whenever possible, from the centralized treasury which is responsible for investing liquid asset surplus`s which are not immediately required by operating companies. Following the increased activity in USD-block countries, during
141
179
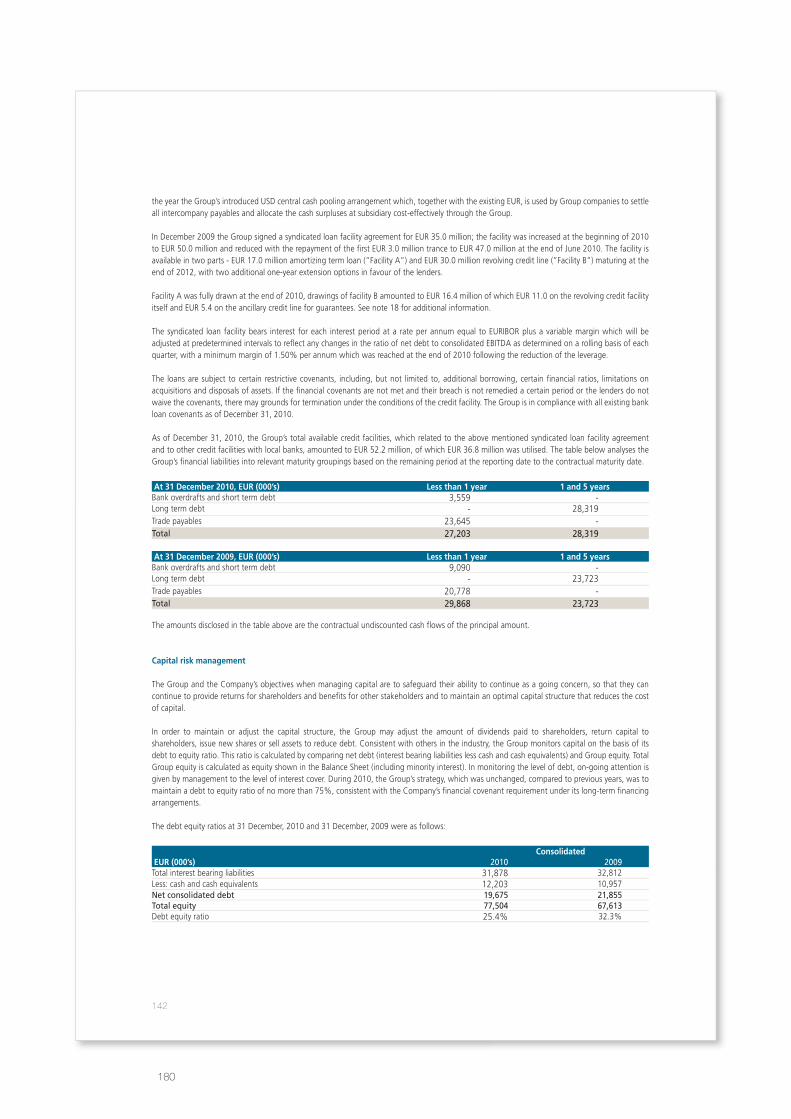
the year the Group’s introduced USD central cash pooling arrangement which, together with the existing EUR, is used by Group companies to settle all intercompany payables and allocate the cash surpluses at subsidiary cost-effectively through the Group.
In December 2009 the Group signed a syndicated loan facility agreement for EUR 35.0 million; the facility was increased at the beginning of 2010 to EUR 50.0 million and reduced with the repayment of the first EUR 3.0 million trance to EUR 47.0 million at the end of June 2010. The facility is available in two parts - EUR 17.0 million amortizing term loan (”Facility A”) and EUR 30.0 million revolving credit line (”Facility B”) maturing at the end of 2012, with two additional one-year extension options in favour of the lenders.
Facility A was fully drawn at the end of 2010, drawings of facility B amounted to EUR 16.4 million of which EUR 11.0 on the revolving credit facility itself and EUR 5.4 on the ancillary credit line for guarantees. See note 18 for additional information.
The syndicated loan facility bears interest for each interest period at a rate per annum equal to EURIBOR plus a variable margin which will be adjusted at predetermined intervals to reflect any changes in the ratio of net debt to consolidated EBITDA as determined on a rolling basis of each quarter, with a minimum margin of 1.50% per annum which was reached at the end of 2010 following the reduction of the leverage.
The loans are subject to certain restrictive covenants, including, but not limited to, additional borrowing, certain financial ratios, limitations on acquisitions and disposals of assets. If the financial covenants are not met and their breach is not remedied a certain period or the lenders do not waive the covenants, there may grounds for termination under the conditions of the credit facility. The Group is in compliance with all existing bank loan covenants as of December 31, 2010.
As of December 31, 2010, the Group’s total available credit facilities, which related to the above mentioned syndicated loan facility agreement and to other credit facilities with local banks, amounted to EUR 52.2 million, of which EUR 36.8 million was utilised. The table below analyses the Group’s financial liabilities into relevant maturity groupings based on the remaining period at the reporting date to the contractual maturity date.
at 31 december 2010, eur (000’s) Less than 1 year 1 and 5 yearsBank overdrafts and short term debt 3,559 -Long term debt - 28,319Trade payables 23,645 -Total 27,203 28,319
at 31 december 2009, eur (000’s) Less than 1 year 1 and 5 yearsBank overdrafts and short term debt 9,090 -Long term debt - 23,723Trade payables 20,778 -Total 29,868 23,723
The amounts disclosed in the table above are the contractual undiscounted cash flows of the principal amount.
Capital risk management
The Group and the Company’s objectives when managing capital are to safeguard their ability to continue as a going concern, so that they can continue to provide returns for shareholders and benefits for other stakeholders and to maintain an optimal capital structure that reduces the cost of capital.
In order to maintain or adjust the capital structure, the Group may adjust the amount of dividends paid to shareholders, return capital to shareholders, issue new shares or sell assets to reduce debt. Consistent with others in the industry, the Group monitors capital on the basis of its debt to equity ratio. This ratio is calculated by comparing net debt (interest bearing liabilities less cash and cash equivalents) and Group equity. Total Group equity is calculated as equity shown in the Balance Sheet (including minority interest). In monitoring the level of debt, on-going attention is given by management to the level of interest cover. During 2010, the Group’s strategy, which was unchanged, compared to previous years, was to maintain a debt to equity ratio of no more than 75%, consistent with the Company’s financial covenant requirement under its long-term financing arrangements.
The debt equity ratios at 31 December, 2010 and 31 December, 2009 were as follows:
Consolidated eur (000’s) 2010 2009Total interest bearing liabilities 31,878 32,812Less: cash and cash equivalents 12,203 10,957Net consolidated debt 19,675 21,855Total equity 77,504 67,613Debt equity ratio 25.4% 32.3%
142
180
PricewaterhouseCoopers, 119 Armagh Street,T: +64 (3)374 3000, F: +64 (3) 374 3001, www.pwc.com/nz
Independent Auditors’ Reportto the shareholders of Cavotec MSL Holdings
Report on the Financial Statements
We have audited the financial statements ofthe balance sheets as at 31 Decemberequity and statement of cash flowsother explanatory information for both the Company and the Group.entities it controlled at 31 December
Directors’ Responsibility for theThe Directors are responsible foraccepted accounting practice in New Zealand and that give a true and fair view of the matters to which they relateand for such internal control as the Directors determinestatements that are free from material misstatement, whether due to fraud or error.
Auditors’ ResponsibilityOur responsibility is to express an opinion on taudit in accordance with International Standards on Auditing (NewAuditing. These standards require that we comply withaudit to obtain reasonable assurance about whether the financial
An audit involves performing procedures to obtain audit evidence about the amounts andfinancial statements. The procedures selected depend on therisks of material misstatement of theassessments, the auditor considersthat give a true and fair view of the matters to which they relate in order to design audit procedures that areappropriate in the circumstances, but not for the purpose of expressientity’s internal control. An audit also includes evaluating the appropriateness of accounting policies used and thereasonableness of accounting estimates, as well as evaluating the overall presentation of the fi
We believe that the audit evidence we have obtained is sufficient and appropriate to provide a basis for our auditopinion.
We have no relationship with, or interests in,in our capacities as auditors, tax advisors and providers of other assurance related services. These matters havenot impaired our independence as auditor of the Company and Group.
OpinionIn our opinion, the financial statements on pages(i) comply with generally accepted accounting practice in New Zealand;(ii) comply with International Financial Reporting Standards; and(iii) give a true and fair view of the financial position of
and their financial performance and cash flows
Report on Other Legal and Regulatory RequirementsWe also report in accordance with Sections 16(1)(d) and 16(1)(e) of the Financial Reporting Act 1993to our audit of the financial statements for the year ended(i) we have obtained all the information and explanations that we have required; and(ii) in our opinion, proper accounting records have been kept by
examination of those records.
Restriction on Distribution orThis report is made solely to the Company’s shareholders, as a body, in accordance with Section 205(1) of theCompanies Act 1993. Our audit work has been undertakenthose matters which we are required to state to them in an auditors’ report and for no other purpose. To the fullestextent permitted by law, we do not accept or assume responsibility to anyone other thCompany’s shareholders as a body, for our audit work, for this report, or for the opinions we have formed.
21 February 2011
Chartered Accountants
PricewaterhouseCoopers, 119 Armagh Street, PO Box 13244, Christchurch 8011, New ZealandT: +64 (3)374 3000, F: +64 (3) 374 3001, www.pwc.com/nz
Auditors’ ReportCavotec MSL Holdings Limited
Report on the Financial Statements
We have audited the financial statements of Cavotec MSL Holdings Limited on pagesDecember 2010 the statements of comprehensive income
statement of cash flows for the year then ended, and a summary of significantother explanatory information for both the Company and the Group. The Group comprises the Company and the
December 2010 or from time to time during the financial year.
ponsibility for the Financial Statementsirectors are responsible for the preparation of these financial statements in accordance with generally
accepted accounting practice in New Zealand and that give a true and fair view of the matters to which they relatech internal control as the Directors determine is necessary to enable the preparation of financial
statements that are free from material misstatement, whether due to fraud or error.
Our responsibility is to express an opinion on these financial statements based on ouraudit in accordance with International Standards on Auditing (New Zealand) and International Standards on
se standards require that we comply with relevant ethical requirementsaudit to obtain reasonable assurance about whether the financial statements are free from material misstatement.
An audit involves performing procedures to obtain audit evidence about the amounts andatements. The procedures selected depend on the auditor’s judgement, including the assessment of the
risks of material misstatement of the financial statements, whether due to fraud or error. In making those riskassessments, the auditor considers the internal controls relevant to the entity’s preparation of financial statementsthat give a true and fair view of the matters to which they relate in order to design audit procedures that areappropriate in the circumstances, but not for the purpose of expressing an opinion on the effectiveness of theentity’s internal control. An audit also includes evaluating the appropriateness of accounting policies used and thereasonableness of accounting estimates, as well as evaluating the overall presentation of the fi
We believe that the audit evidence we have obtained is sufficient and appropriate to provide a basis for our audit
We have no relationship with, or interests in, Cavotec MSL Holdings Limited or any of its subsidiaries other than, tax advisors and providers of other assurance related services. These matters have
not impaired our independence as auditor of the Company and Group.
opinion, the financial statements on pages 112 to 142:comply with generally accepted accounting practice in New Zealand;comply with International Financial Reporting Standards; andgive a true and fair view of the financial position of the Company and the Group as at
financial performance and cash flows for the year then ended.
Report on Other Legal and Regulatory RequirementsWe also report in accordance with Sections 16(1)(d) and 16(1)(e) of the Financial Reporting Act 1993to our audit of the financial statements for the year ended 31 December 2010:
we have obtained all the information and explanations that we have required; andproper accounting records have been kept by the Company as far as appears from an
examination of those records.
Restriction on Distribution or UseThis report is made solely to the Company’s shareholders, as a body, in accordance with Section 205(1) of theCompanies Act 1993. Our audit work has been undertaken so that we might state to the Company’s shareholdersthose matters which we are required to state to them in an auditors’ report and for no other purpose. To the fullestextent permitted by law, we do not accept or assume responsibility to anyone other thCompany’s shareholders as a body, for our audit work, for this report, or for the opinions we have formed.
PO Box 13244, Christchurch 8011, New Zealand
on pages 112 to 142 which comprisetements of comprehensive income, and statements of changes in
for the year then ended, and a summary of significant accounting policies andThe Group comprises the Company and the
or from time to time during the financial year.
financial statements in accordance with generallyaccepted accounting practice in New Zealand and that give a true and fair view of the matters to which they relate
is necessary to enable the preparation of financialstatements that are free from material misstatement, whether due to fraud or error.
hese financial statements based on our audit. We conducted ourand International Standards on
ethical requirements and plan and perform thestatements are free from material misstatement.
An audit involves performing procedures to obtain audit evidence about the amounts and disclosures in theauditor’s judgement, including the assessment of the
financial statements, whether due to fraud or error. In making those riskrelevant to the entity’s preparation of financial statements
that give a true and fair view of the matters to which they relate in order to design audit procedures that areng an opinion on the effectiveness of the
entity’s internal control. An audit also includes evaluating the appropriateness of accounting policies used and thereasonableness of accounting estimates, as well as evaluating the overall presentation of the financial statements.
We believe that the audit evidence we have obtained is sufficient and appropriate to provide a basis for our audit
Holdings Limited or any of its subsidiaries other than, tax advisors and providers of other assurance related services. These matters have
roup as at 31 December 2010,
We also report in accordance with Sections 16(1)(d) and 16(1)(e) of the Financial Reporting Act 1993. In relation
we have obtained all the information and explanations that we have required; andas far as appears from an
This report is made solely to the Company’s shareholders, as a body, in accordance with Section 205(1) of theso that we might state to the Company’s shareholders
those matters which we are required to state to them in an auditors’ report and for no other purpose. To the fullestextent permitted by law, we do not accept or assume responsibility to anyone other than the Company and theCompany’s shareholders as a body, for our audit work, for this report, or for the opinions we have formed.
Christchurch
143
181
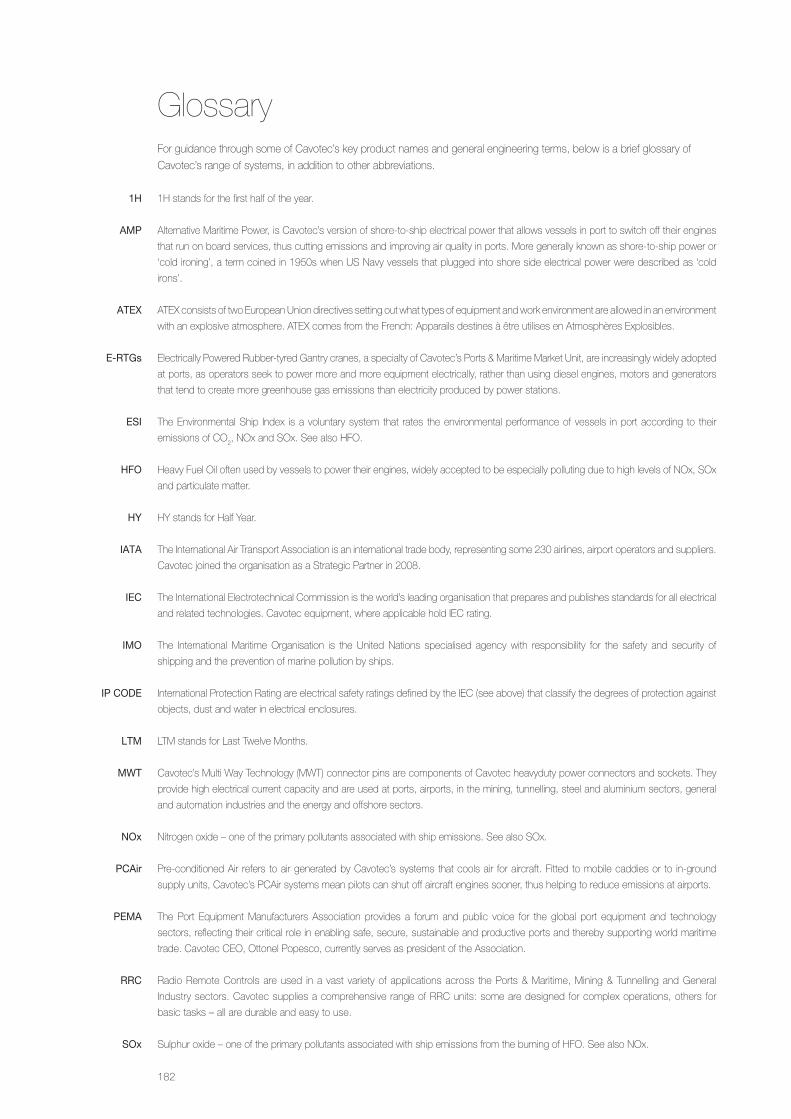
For guidance through some of Cavotec’s key product names and general engineering terms, below is a brief glossary of
Cavotec’s range of systems, in addition to other abbreviations.
Glossary
1H stands for the first half of the year.
Alternative Maritime Power, is Cavotec’s version of shore-to-ship electrical power that allows vessels in port to switch off their engines
that run on board services, thus cutting emissions and improving air quality in ports. More generally known as shore-to-ship power or
‘cold ironing’, a term coined in 1950s when US Navy vessels that plugged into shore side electrical power were described as ‘cold
irons’.
ATEX consists of two European Union directives setting out what types of equipment and work environment are allowed in an environment
with an explosive atmosphere. ATEX comes from the French: Apparails destines à être utilises en Atmosphères Explosibles.
Electrically Powered Rubber-tyred Gantry cranes, a specialty of Cavotec’s Ports & Maritime Market Unit, are increasingly widely adopted
at ports, as operators seek to power more and more equipment electrically, rather than using diesel engines, motors and generators
that tend to create more greenhouse gas emissions than electricity produced by power stations.
The Environmental Ship Index is a voluntary system that rates the environmental performance of vessels in port according to their
emissions of CO2, NOx and SOx. See also HFO.
Heavy Fuel Oil often used by vessels to power their engines, widely accepted to be especially polluting due to high levels of NOx, SOx
and particulate matter.
HY stands for Half Year.
The International Air Transport Association is an international trade body, representing some 230 airlines, airport operators and suppliers.
Cavotec joined the organisation as a Strategic Partner in 2008.
The International Electrotechnical Commission is the world’s leading organisation that prepares and publishes standards for all electrical
and related technologies. Cavotec equipment, where applicable hold IEC rating.
The International Maritime Organisation is the United Nations specialised agency with responsibility for the safety and security of
shipping and the prevention of marine pollution by ships.
International Protection Rating are electrical safety ratings defined by the IEC (see above) that classify the degrees of protection against
objects, dust and water in electrical enclosures.
LTM stands for Last Twelve Months.
Cavotec’s Multi Way Technology (MWT) connector pins are components of Cavotec heavyduty power connectors and sockets. They
provide high electrical current capacity and are used at ports, airports, in the mining, tunnelling, steel and aluminium sectors, general
and automation industries and the energy and offshore sectors.
Nitrogen oxide – one of the primary pollutants associated with ship emissions. See also SOx.
Pre-conditioned Air refers to air generated by Cavotec’s systems that cools air for aircraft. Fitted to mobile caddies or to in-ground
supply units, Cavotec’s PCAir systems mean pilots can shut off aircraft engines sooner, thus helping to reduce emissions at airports.
The Port Equipment Manufacturers Association provides a forum and public voice for the global port equipment and technology
sectors, reflecting their critical role in enabling safe, secure, sustainable and productive ports and thereby supporting world maritime
trade. Cavotec CEO, Ottonel Popesco, currently serves as president of the Association.
Radio Remote Controls are used in a vast variety of applications across the Ports & Maritime, Mining & Tunnelling and General
Industry sectors. Cavotec supplies a comprehensive range of RRC units: some are designed for complex operations, others for
basic tasks – all are durable and easy to use.
Sulphur oxide – one of the primary pollutants associated with ship emissions from the burning of HFO. See also NOx.
1H
AMP
AteX
e-rtgs
eSI
HfO
Hy
IAtA
IeC
IMO
IP CODe
ltM
Mwt
NOx
PCAir
PeMA
rrC
SOx
182
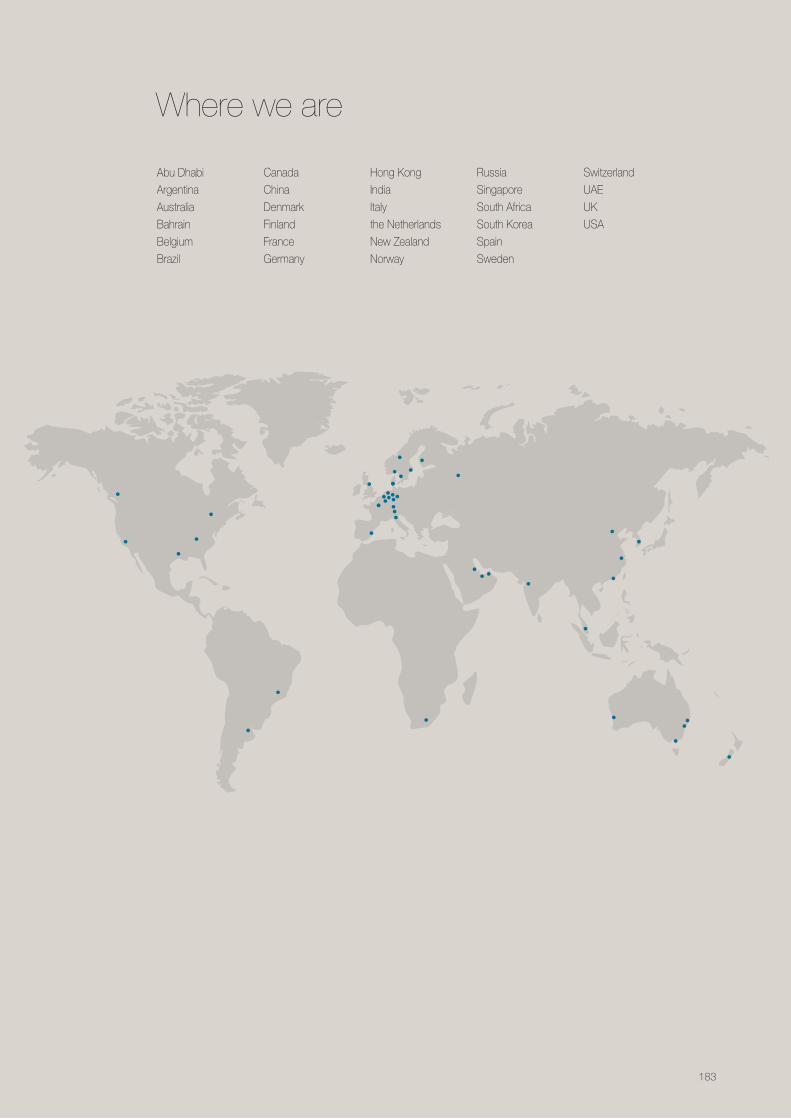
Where we are
Abu Dhabi
Argentina
Australia
Bahrain
Belgium
Brazil
Canada
China
Denmark
Finland
France
Germany
HongKong
India
Italy
the Netherlands
New Zealand
Norway
Russia
Singapore
South Africa
SouthKorea
Spain
Sweden
Switzerland
UAE
UK
USA
183

Head Office
Cavotec SAVia Serafino Balestra 27CH-6900 Lugano, SwitzerlandTelephone: +41 91 911 40 10Fax: +41 91 922 54 00www.cavotec.com
Financial advisors
Handelsbanken Capital MarketsVisiting address:Blasieholmstorg 11-12Mailing address:SE-106 70 Stockholm, SwedenTelephone: +46 8 701 10 00
SEB EnskildaVisiting address:Kungsträdgårdsgatan 8Mailing address:SE-106 40 Stockholm, SwedenTelephone: +46 8 52 22 9500
Legal advisors
Advokatfirman Vinge KBVisiting address:Smålandsgatan 20Mailing address:Box 1703SE-111 87 Stockholm, SwedenTelephone: +46 8 614 30 00
Bär & Karrer SABrandschenkestrasse 90CH-8027 Zurich, Switzerland
Account operator
Euroclear Sweden ABBox 7822SE-103 97 Stockholm


ww
w.c
avot
ec.c
om


