40
PROTECTING WHAT YOU CAN’T SEE Eliminating Security Blind Spots in an Age of Technological Change 2019–2020 // Global Application & Network Security Report
| Date post: | 21-Mar-2023 |
| Category: |
Documents |
| Upload: | khangminh22 |
| View: | 0 times |
| Download: | 0 times |
PROTECTING WHAT YOU CAN’T SEEEliminating Security Blind Spots in an Age of Technological Change
2019–2020 // Global Application & Network Security Report

2019–2020 // Global Application & Network Security Report 3
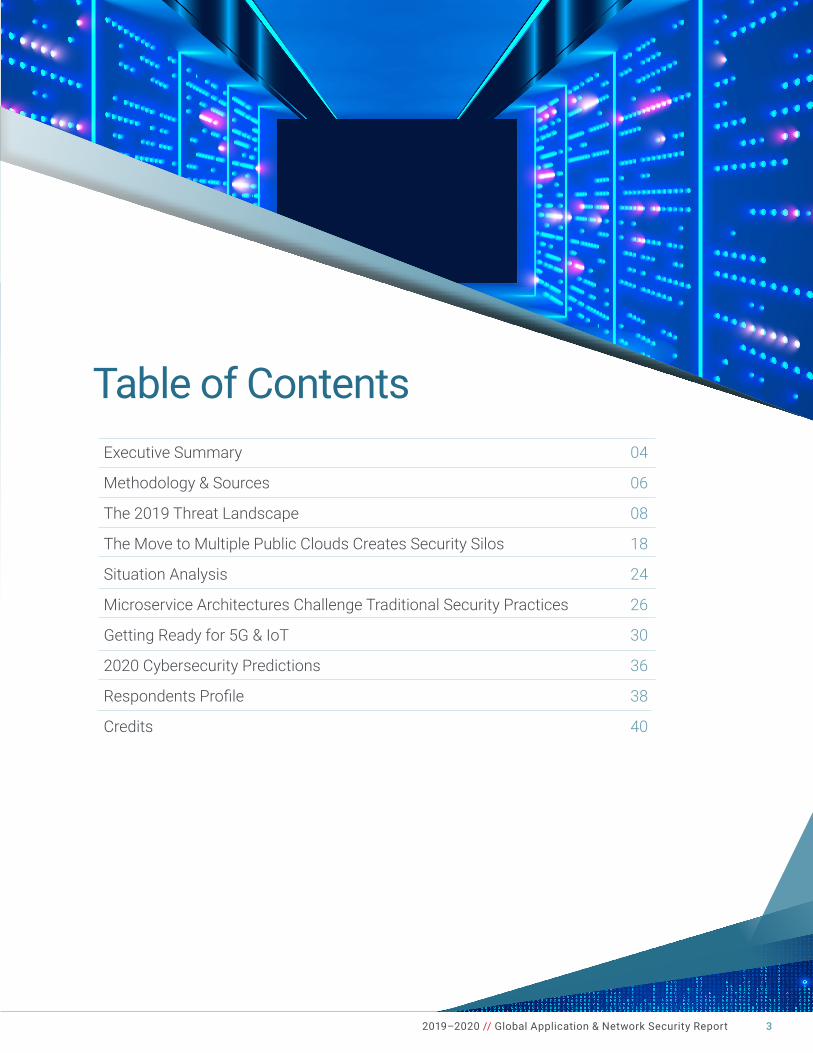
Executive Summary 04
Methodology & Sources 06
The 2019 Threat Landscape 08
The Move to Multiple Public Clouds Creates Security Silos 18
Situation Analysis 24
Microservice Architectures Challenge Traditional Security Practices 26
Getting Ready for 5G & IoT 30
2020 Cybersecurity Predictions 36
RespondentsProfile 38
Credits 40
Table of Contents
For many corporations, the security risks of moving forward quickly with new information technologies are worth the rewards of improved customer experiences. Security is not an afterthought, but it also shouldn’t stand in the way of progress.
The professionals charged with protecting their organizations’ digital assets felt the pressure to keep up with the speed of business. They also discovered that moving fast introduces challenges and uncertainties about where attacks/vulnerabilities are hiding in networks and applications. Limited visibility across their entire network ecosystems proved to be an issue. How do you protect what you can’t see?
To provide insight into the complex challenges faced by organizations as they seek to balance business agility and security requirements, Radware produces an annual Global Application & Network Security Report. This ninth annual version of the report combines Radware’s organic research, real attack data and analyses of developing trends and technologieswiththefindingsfromaglobalindustrysurvey.
In 2019, the quickest path to productivity was via migration to the public cloud. In fact, more than 75% of organizations have done so. In addition, companies continue to adopt new technologies that allow them to improve upon continuous development and deployment, such as the rapid adoption of microservices. Enterprises and service providers also kept an eye on how emerging 5G network technologies and internet of things(IoT)devicesmightfitintotheiroperationalstrategies.
These environments greatly expand the attack surface and introduce new vulnerabilities to exploit. Security teams were hampered by a lack of visibility into attack vectors in siloed public cloud environments and microservice architectures. Hackers,includingthoseaffiliatedwithgovernments, were only too happy to respond with new tactics that take advantage of blind spots.
Executive Summary
The need for speed is at the heart of decisions that organizations need to make about how to implement digital transformation strategies. By fostering faster time to market for revenue-generating services and applications, companies know that they can gain competitive advantages. But at what cost to network and application security?
2019–2020 // Global Application & Network Security Report4
EXECUTIVE SUMMARY
KEY FINDINGS
Ð Only 6% claimed not to have experienced an attack.
Ð Nation-state attacks were an issue as respondents indicated a substantial increase in the percentage of cyberattacks attributed to cyberwar, up from 19% in 2018 to 27% in 2019.
Ð Only 10% of respondents felt that their data is more secure in a publiccloudenvironment.But30%feltthatthebenefitsofthecloud,such as agility and lower costs, outweigh the security risks.
Ð Web and application intrusions (27%) were seen as the biggest threat to their companies’ cloud environments, similar to the percentage in previous years’ surveys.
Ð Companies with revenues of more than 1 billion USD/EUR/GBP reported an average cost of 1.7 million USD/EUR/GBP per cyberattack. Companies with revenues lower than 1 billion USD/EUR/GBP estimated the cost of a cyberattack at 480,000 USD/EUR/GBP.
ADDITIONAL FINDINGS
Ð Visibilitywasidentifiedasagrowingissueby46%ofrespondentswho said that they don’t know if they have experienced SSL- or TLS-basedattacksonencryptedtraffic.Threeoffiveindicatedthatmorethanhalfoftheirtrafficisencrypted—withtheaverageat62%.
Ð About one-third of respondents experienced a distributed denial-of- service (DDoS) attack in the past year. Of those who were attacked, 91% experienced application-layer attacks, primarily domain name system (DNS) or HTTP/HTTPS Flood attacks.
Ð Almost three-quarters of respondents used a public cloud environment,whiletwooffiveusedmultiplepubliccloud environments. Large and worldwide companies were most likely to use three or more public cloud environments.
Ð The majority of respondents indicated that they are not prepared to safeguard 5G network rollouts in their countries. Companies in Asia-Pacific(APAC)andEurope/MiddleEast/Africa(EMEA)weremore likely to say that they are at least somewhat prepared compared to organizations in Latin America. Service provider/telecom companies were more likely than any other vertical to say that they are prepared to handle 5G rollouts (58% vs. 16%–34%), although 13% said that they won’t address 5G before 2022.
Ð Thebiggestconcernthatrespondentsidentifiediftheirorganizationswere faced with cyberattacks is data leakage/information loss (30%), consistent with rankings from the three previous years’ surveys.
Ð Seven of 10 organizations that suffered a cyberattack in the past year had a malware/bot attack, two-thirds had an attack related to phishing or fraud, and half experienced DDoS or web application attacks.
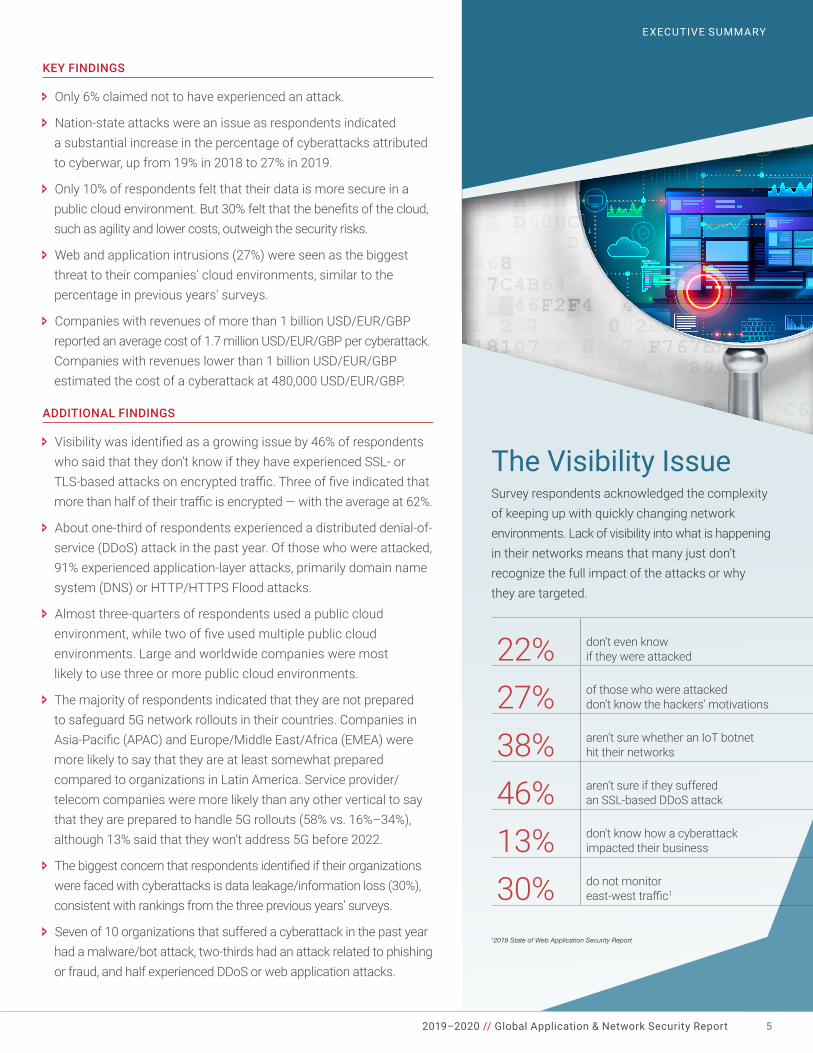
The Visibility IssueSurvey respondents acknowledged the complexity of keeping up with quickly changing network environments. Lack of visibility into what is happening in their networks means that many just don’t recognize the full impact of the attacks or why they are targeted.
12019 State of Web Application Security Report
22% don’t even know if they were attacked
27% of those who were attacked don’t know the hackers’ motivations
38% aren’t sure whether an IoT botnet hit their networks
46% aren’t sure if they suffered an SSL-based DDoS attack
13% don’t know how a cyberattack impacted their business
30% do not monitor east-westtraffic1
2019–2020 // Global Application & Network Security Report 5
EXECUTIVE SUMMARY
Methodology & SourcesGlobal Industry SurveyThe quantitative data source is a cross-industry survey conducted by Radware. This year’s survey included 561 individual respondents who represented a wide variety of organizations around the world. The study was built on prior years’ research collecting vendor-neutral information about issues that organizations faced in preparation and combat of cyberattacks.
The 2019–2020 Global Application & Network Security Report combines statistical research and frontline experience to identify cybersecurity trends that are important to organizations as they determine long-term growth strategies.
METHODOLOGY & SOURCES
2019–2020 // Global Application & Network Security Report6
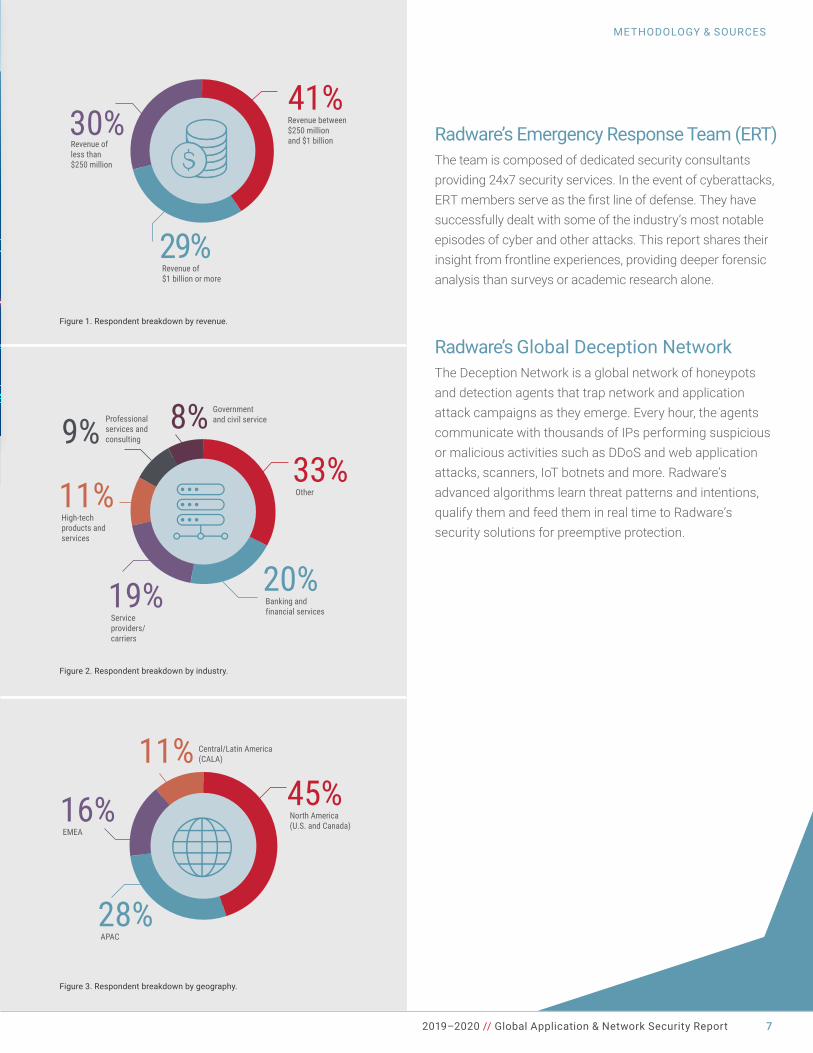
Figure 1. Respondent breakdown by revenue.
30%Revenue of less than $250 million
41%Revenue between$250 million and $1 billion
20%Banking and financial services
45%North America (U.S. and Canada)
19%Service providers/carriers
28%APAC
11%High-tech products and services
16%EMEA
9% Professional services and consulting
8% Government and civil service 11% Central/Latin America
(CALA)
33%Other
29%Revenue of $1 billion or more
Figure 3. Respondent breakdown by geography.
30%Revenue of less than $250 million
41%Revenue between$250 million and $1 billion
20%Banking and financial services
45%North America (U.S. and Canada)
19%Service providers/carriers
28%APAC
11%High-tech products and services
16%EMEA
9% Professional services and consulting
8% Government and civil service 11% Central/Latin America
(CALA)
33%Other
29%Revenue of $1 billion or more
Figure 2. Respondent breakdown by industry.
30%Revenue of less than $250 million
41%Revenue between$250 million and $1 billion
20%Banking and financial services
45%North America (U.S. and Canada)
19%Service providers/carriers
28%APAC
11%High-tech products and services
16%EMEA
9% Professional services and consulting
8% Government and civil service 11% Central/Latin America
(CALA)
33%Other
29%Revenue of $1 billion or more
2019–2020 // Global Application & Network Security Report 7
METHODOLOGY & SOURCES
Radware’s Emergency Response Team (ERT)The team is composed of dedicated security consultants providing 24x7 security services. In the event of cyberattacks, ERTmembersserveasthefirstlineofdefense.Theyhavesuccessfully dealt with some of the industry’s most notable episodes of cyber and other attacks. This report shares their insight from frontline experiences, providing deeper forensic analysis than surveys or academic research alone.
Radware’s Global Deception NetworkThe Deception Network is a global network of honeypots and detection agents that trap network and application attack campaigns as they emerge. Every hour, the agents communicate with thousands of IPs performing suspicious or malicious activities such as DDoS and web application attacks, scanners, IoT botnets and more. Radware’s advanced algorithms learn threat patterns and intentions, qualify them and feed them in real time to Radware’s security solutions for preemptive protection.
The 2019 Threat LandscapeRadware’s 2019 Global Industry SurveyRadware’s global industry survey revealed what businesses were up against as they fought to take advantage of digital transformation strategies while securing their networks and applications.
Respondentssharedasenseofconfidencewhendealingwith known threat vectors. But as businesses transition to public cloud environments, microservice architectures and 5G networks, security professionals do not have the visibility and, in some cases, the right solutions. Support is needed to protect their enterprises with assurance across several domains.
In 2019, the threat landscape showed signs of where cyberattackers will focus their efforts goingforward.Hackersfiguredouthowtotakeadvantage of blind spots in public clouds and private networks to launch headline-grabbing cyberattacks. Notable incidents reveal that data is vulnerable in the gaps between enterprises and public cloud providers. Other attacks reveal the limitations of humans who can unknowingly fall prey to traps and trigger widespread damage.
2019–2020 // Global Application & Network Security Report8
THE 2019 THREAT LANDSCAPE
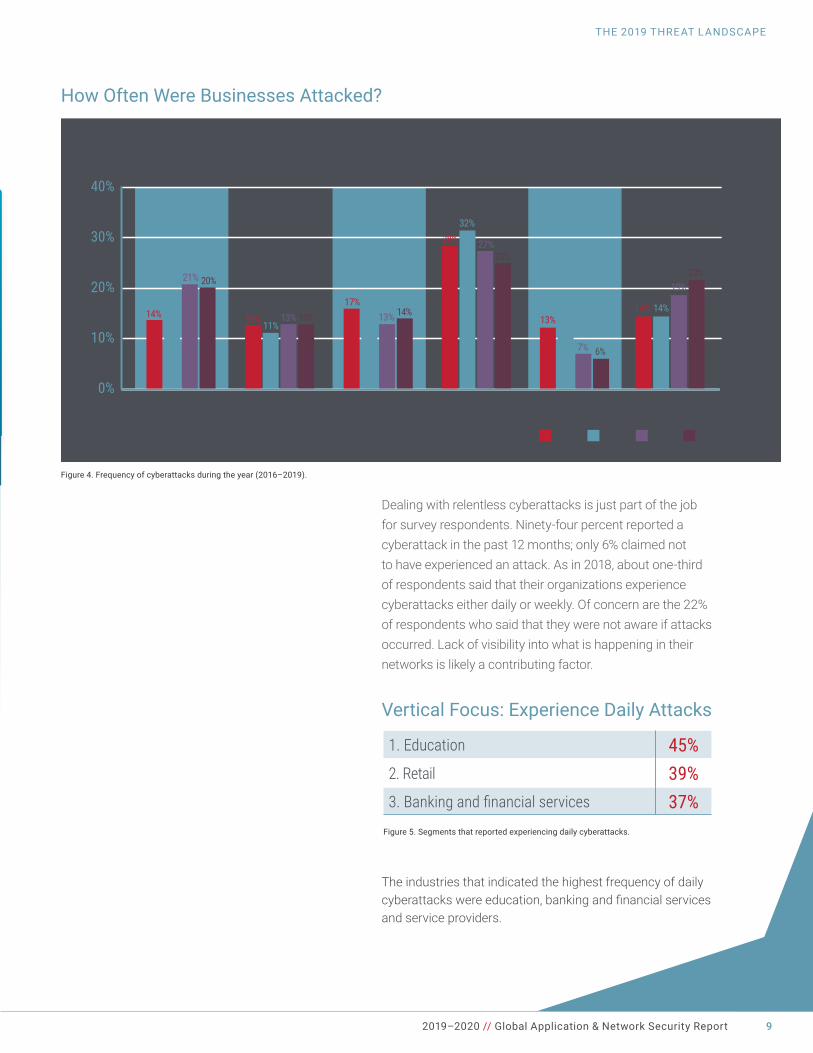
Figure 4. Frequency of cyberattacks during the year (2016–2019).
Dealing with relentless cyberattacks is just part of the job for survey respondents. Ninety-four percent reported a cyberattack in the past 12 months; only 6% claimed not to have experienced an attack. As in 2018, about one-third of respondents said that their organizations experience cyberattacks either daily or weekly. Of concern are the 22% of respondents who said that they were not aware if attacks occurred. Lack of visibility into what is happening in their networks is likely a contributing factor.
The industries that indicated the highest frequency of daily cyberattackswereeducation,bankingandfinancialservicesand service providers.
How Often Were Businesses Attacked?
Vertical Focus: Experience Daily Attacks
1. Education 45%2. Retail 39%3. Banking and financial services 37%
Figure 5. Segments that reported experiencing daily cyberattacks.
2019–2020 // Global Application & Network Security Report 9
THE 2019 THREAT LANDSCAPE
0%
10%
20%
30%
40%
Daily
2016 2017 2018 2019
Weekly Monthly Once ortwice a year
Never Unknown
14% 14%
19%
14% 13%
21% 20%
13% 11%13% 13% 13% 14%
7% 6%
22%
17% 16%13% 14%
28%32%
27%25%
2019–2020 // Global Application & Network Security Report10
THE 2019 THREAT LANDSCAPE
2https://www.newsbtc.com/2019/10/30/johannesburg-city-infrastructure-locked-down-due-to-bitcoin-ransom/3https://www.scmagazine.com/home/security-news/ransomware/arizona-beverages-ransomware-attack-exacerbated-by-unpatched-servers- poorly-configured-back-up-system/
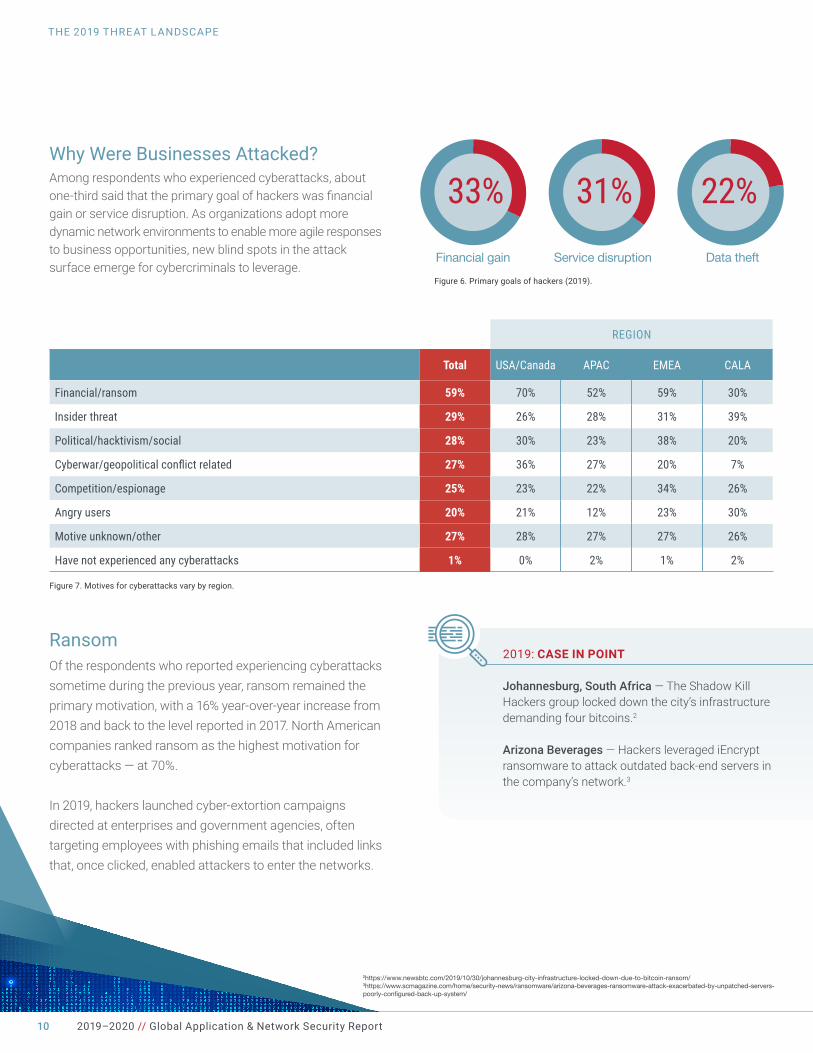
Figure 6. Primary goals of hackers (2019).
RansomOf the respondents who reported experiencing cyberattacks sometime during the previous year, ransom remained the primary motivation, with a 16% year-over-year increase from 2018 and back to the level reported in 2017. North American companies ranked ransom as the highest motivation for cyberattacks—at70%.
In 2019, hackers launched cyber-extortion campaigns directed at enterprises and government agencies, often targeting employees with phishing emails that included links that, once clicked, enabled attackers to enter the networks.
Why Were Businesses Attacked?Among respondents who experienced cyberattacks, about one-thirdsaidthattheprimarygoalofhackerswasfinancialgain or service disruption. As organizations adopt more dynamic network environments to enable more agile responses to business opportunities, new blind spots in the attack surface emerge for cybercriminals to leverage.
2019: CASE IN POINT
Johannesburg, South Africa —TheShadowKillHackers group locked down the city’s infrastructure demanding four bitcoins.2
Arizona Beverages —HackersleveragediEncryptransomware to attack outdated back-end servers in the company’s network.3
REGION
Total USA/Canada APAC EMEA CALA
Financial/ransom 59% 70% 52% 59% 30%
Insider threat 29% 26% 28% 31% 39%
Political/hacktivism/social 28% 30% 23% 38% 20%
Cyberwar/geopolitical conflict related 27% 36% 27% 20% 7%
Competition/espionage 25% 23% 22% 34% 26%
Angry users 20% 21% 12% 23% 30%
Motive unknown/other 27% 28% 27% 27% 26%
Have not experienced any cyberattacks 1% 0% 2% 1% 2%
Figure 7. Motives for cyberattacks vary by region.
31% 22%33%Financial gain Service disruption Data theft
2019–2020 // Global Application & Network Security Report 11
THE 2019 THREAT LANDSCAPE
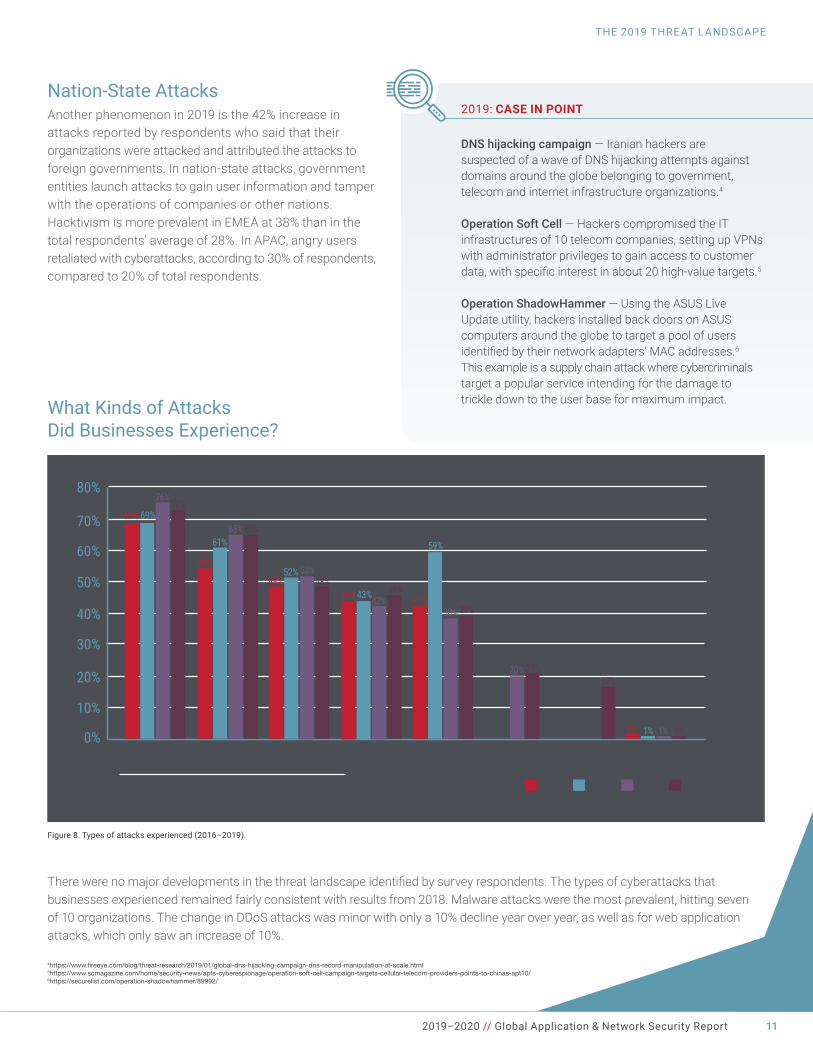
Figure 8. Types of attacks experienced (2016–2019).
Nation-State Attacks Another phenomenon in 2019 is the 42% increase in attacks reported by respondents who said that their organizations were attacked and attributed the attacks to foreign governments. In nation-state attacks, government entities launch attacks to gain user information and tamper with the operations of companies or other nations. Hacktivism is more prevalent in EMEA at 38% than in the total respondents’ average of 28%. In APAC, angry users retaliated with cyberattacks, according to 30% of respondents, compared to 20% of total respondents.
Therewerenomajordevelopmentsinthethreatlandscapeidentifiedbysurveyrespondents.Thetypesofcyberattacksthat businesses experienced remained fairly consistent with results from 2018. Malware attacks were the most prevalent, hitting seven of 10 organizations. The change in DDoS attacks was minor with only a 10% decline year over year, as well as for web application attacks, which only saw an increase of 10%.
What Kinds of Attacks Did Businesses Experience?
2019: CASE IN POINT
DNS hijacking campaign —Iranianhackersare suspected of a wave of DNS hijacking attempts against domains around the globe belonging to government, telecom and internet infrastructure organizations.4
Operation Soft Cell —HackerscompromisedtheIT infrastructures of 10 telecom companies, setting up VPNs with administrator privileges to gain access to customer data,withspecificinterestinabout20high-valuetargets.5
Operation ShadowHammer —UsingtheASUSLive Update utility, hackers installed back doors on ASUS computers around the globe to target a pool of users identifiedbytheirnetworkadapters’MACaddresses.6 This example is a supply chain attack where cybercriminals target a popular service intending for the damage to trickle down to the user base for maximum impact.
4https://www.fireeye.com/blog/threat-research/2019/01/global-dns-hijacking-campaign-dns-record-manipulation-at-scale.html5https://www.scmagazine.com/home/security-news/apts-cyberespionage/operation-soft-cell-campaign-targets-cellular-telecom-providers-points-to-chinas-apt10/6https://securelist.com/operation-shadowhammer/89992/
Figure 6. Primary goals of hackers (2019).
0%
10%
20%
30%
40%
70%
50%
60%
80%
Malwareand bots
2016 2017 2018 2019
Sociallyengineered
threats(phishing, fraud)
DDoS Web applicationattacks
Ransomthreats
Cryptominers API abuse None ofthe above
69%
54%
43% 42%
48%
69%
61%
43%
59%
20%
52%
76%
65%
42%38%
21%
53%
72%
65%
46%
17%
39%
48%
2% 1% 1% 1%
Of those who experienced attacks against a DNS server, halfexperiencedaBruteForceattack,andanothertwo-fifthsindicatedabasicqueryflood.BruteForceattacksaremorecommon in North America and CALA than in the APAC region.Cachepoisoningattacksincreasedsignificantlyforthe second year in a row (to 45%, up from 31% in 2018).
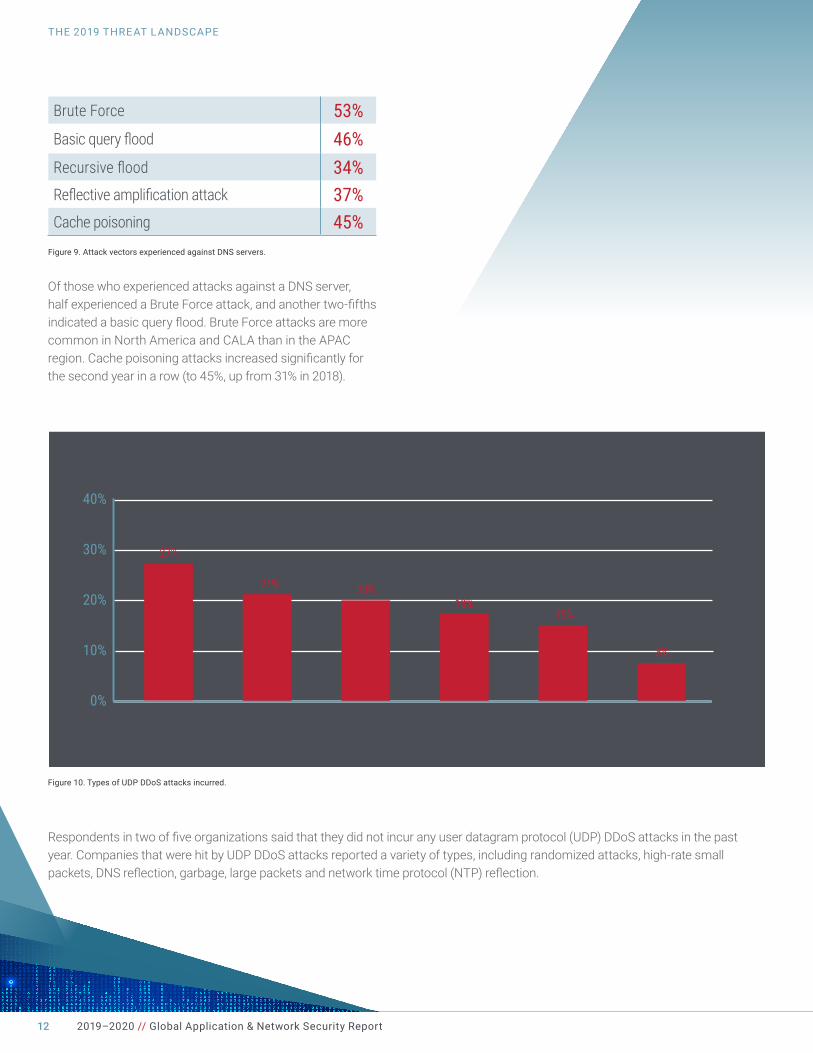
Respondentsintwooffiveorganizationssaidthattheydidnotincuranyuserdatagramprotocol(UDP)DDoSattacksinthepastyear. Companies that were hit by UDP DDoS attacks reported a variety of types, including randomized attacks, high-rate small packets,DNSreflection,garbage,largepacketsandnetworktimeprotocol(NTP)reflection.
Figure 10. Types of UDP DDoS attacks incurred.
Brute Force 53%Basic query flood 46%Recursive flood 34%Reflective amplification attack 37%Cache poisoning 45%
Figure 9. Attack vectors experienced against DNS servers.
0%
10%
20%
30%
40%
Randomizedattack
High-rate smallpackets
DNS reflection Garbage Large packets NTP reflection
27%
8%
15%18%
20%21%
2019–2020 // Global Application & Network Security Report12
THE 2019 THREAT LANDSCAPE
Focus on DDoS AttacksIn general, cyberattacks did not differ greatly based on industry, except for DDoS attacks that were most common to service provider/telecom companies at 64% compared to 48% for all respondents.
KeycharacteristicsofDDoSattacksinthisyear’sreportinclude:
Ð 10% of DDoS attacks were above 10Gbps
Ð The average packets-per-second (PPS) rate declined
Ð 42% lasted less than one hour
Ð Burst attacks were shorter and lasted only a few minutes
Three of four DDoS attacks impacted respondents’ infrastructure with partial service degradation or a complete outage. Advances in DDoS protection technologies have proved effective against simplenetworkfloods.Overtime,DDoSattackshavemoved to the application layer. Nearly all (91%) of the respondents who incurred a DDoS attack indicated that the application layer was the preferred vector.
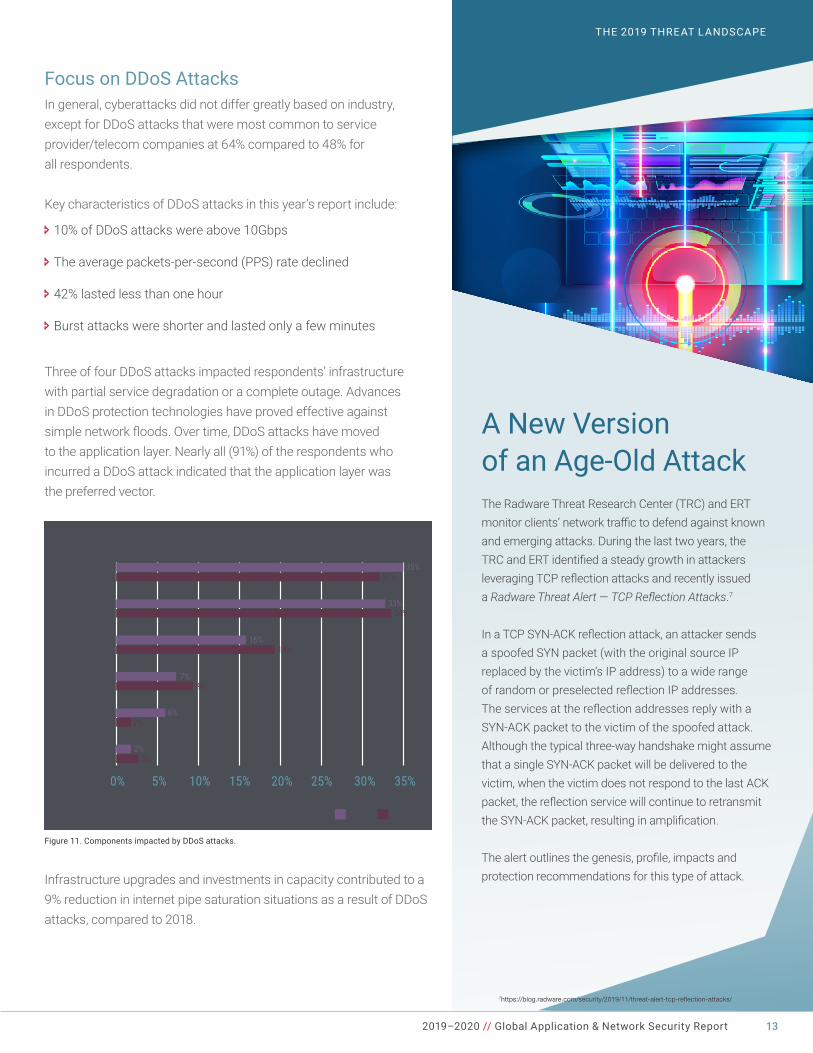
Figure 11. Components impacted by DDoS attacks.
Infrastructure upgrades and investments in capacity contributed to a 9% reduction in internet pipe saturation situations as a result of DDoS attacks, compared to 2018.
A New Version of an Age-Old AttackThe Radware Threat Research Center (TRC) and ERT monitorclients’networktraffictodefendagainstknownand emerging attacks. During the last two years, the TRCandERTidentifiedasteadygrowthinattackersleveragingTCPreflectionattacksandrecentlyissued a Radware Threat Alert—TCP Reflection Attacks.7
InaTCPSYN-ACKreflectionattack,anattackersends a spoofed SYN packet (with the original source IP replaced by the victim’s IP address) to a wide range ofrandomorpreselectedreflectionIPaddresses. TheservicesatthereflectionaddressesreplywithaSYN-ACKpackettothevictimofthespoofedattack.Although the typical three-way handshake might assume thatasingleSYN-ACKpacketwillbedeliveredtothevictim,whenthevictimdoesnotrespondtothelastACKpacket,thereflectionservicewillcontinuetoretransmittheSYN-ACKpacket,resultinginamplification.
Thealertoutlinesthegenesis,profile,impactsand protection recommendations for this type of attack.
7https://blog.radware.com/security/2019/11/threat-alert-tcp-reflection-attacks/
0% 5% 10% 15% 20% 25% 30% 35% 40% 45% 50%
Internet pipesaturation
Server
Firewall
IPS/IDS
Load balancer(ADC)
SQL server
35%32%
33%34%
6%2%
2%3%
7%9%
16%19%
2018 2019
2019–2020 // Global Application & Network Security Report 13
THE 2019 THREAT LANDSCAPE
2019–2020 // Global Application & Network Security Report14
THE 2019 THREAT LANDSCAPE
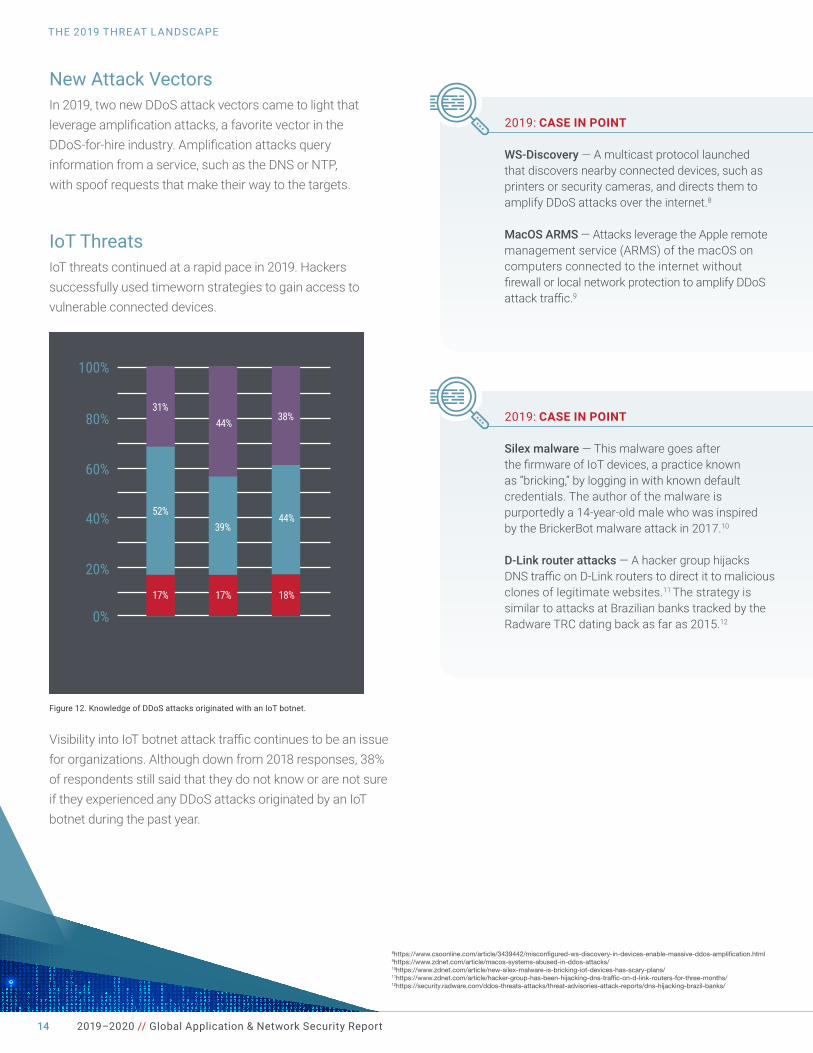
New Attack VectorsIn 2019, two new DDoS attack vectors came to light that leverageamplificationattacks,afavoritevectorinthe DDoS-for-hireindustry.Amplificationattacksquery information from a service, such as the DNS or NTP, with spoof requests that make their way to the targets.
IoT ThreatsIoT threats continued at a rapid pace in 2019. Hackers successfully used timeworn strategies to gain access to vulnerable connected devices.
VisibilityintoIoTbotnetattacktrafficcontinuestobeanissuefor organizations. Although down from 2018 responses, 38% of respondents still said that they do not know or are not sure if they experienced any DDoS attacks originated by an IoT botnet during the past year.
Figure 12. Knowledge of DDoS attacks originated with an IoT botnet.
8https://www.csoonline.com/article/3439442/misconfigured-ws-discovery-in-devices-enable-massive-ddos-amplification.html9https://www.zdnet.com/article/macos-systems-abused-in-ddos-attacks/10https://www.zdnet.com/article/new-silex-malware-is-bricking-iot-devices-has-scary-plans/11https://www.zdnet.com/article/hacker-group-has-been-hijacking-dns-traffic-on-d-link-routers-for-three-months/12https://security.radware.com/ddos-threats-attacks/threat-advisories-attack-reports/dns-hijacking-brazil-banks/
2019: CASE IN POINT
WS-Discovery —Amulticastprotocollaunchedthat discovers nearby connected devices, such as printers or security cameras, and directs them to amplify DDoS attacks over the internet.8
MacOS ARMS—AttacksleveragetheAppleremotemanagement service (ARMS) of the macOS on computers connected to the internet without firewallorlocalnetworkprotectiontoamplifyDDoSattacktraffic.9
2019: CASE IN POINT
Silex malware—Thismalwaregoesafter thefirmwareofIoTdevices,apracticeknown as “bricking,” by logging in with known default credentials. The author of the malware is purportedly a 14-year-old male who was inspired by the BrickerBot malware attack in 2017.10
D-Link router attacks—AhackergrouphijacksDNStrafficonD-Linkrouterstodirectittomaliciousclones of legitimate websites.11 The strategy is similar to attacks at Brazilian banks tracked by the Radware TRC dating back as far as 2015.12
Don’t know/not sure No Yes
2017 2018 20190%
20%
40%
60%
80%
100%
31%44% 38%
52%39%
44%
17% 17% 18%
2019–2020 // Global Application & Network Security Report 15
THE 2019 THREAT LANDSCAPE
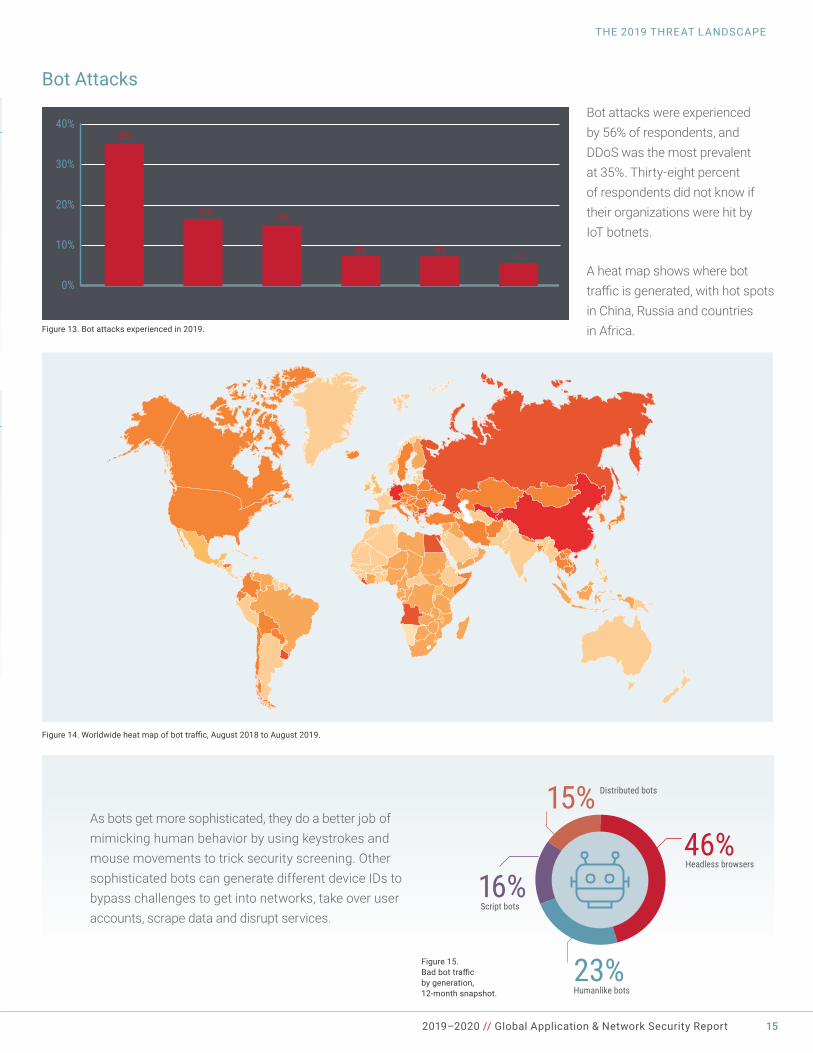
Bot Attacks
Figure 13. Bot attacks experienced in 2019.
Figure 14. Worldwide heat map of bot traffic, August 2018 to August 2019.
Figure 15. Bad bot traffic by generation, 12-month snapshot.
A heat map shows where bot trafficisgenerated,withhotspotsin China, Russia and countries in Africa.
Bot attacks were experienced by 56% of respondents, and DDoS was the most prevalent at 35%. Thirty-eight percent of respondents did not know if their organizations were hit by IoT botnets.
As bots get more sophisticated, they do a better job of mimicking human behavior by using keystrokes and mouse movements to trick security screening. Other sophisticated bots can generate different device IDs to bypass challenges to get into networks, take over user accounts, scrape data and disrupt services.
0%
10%
20%
30%
40%
DDoS Web scraping Account takeover/credential theft
Payment data abuse
Skewed marketing analytics
Denial of inventory
35%
7%8%8%
17%18%
23%Humanlike bots
16%Script bots
Headless browsers
15% Distributed bots
46%
2019–2020 // Global Application & Network Security Report16
THE 2019 THREAT LANDSCAPE
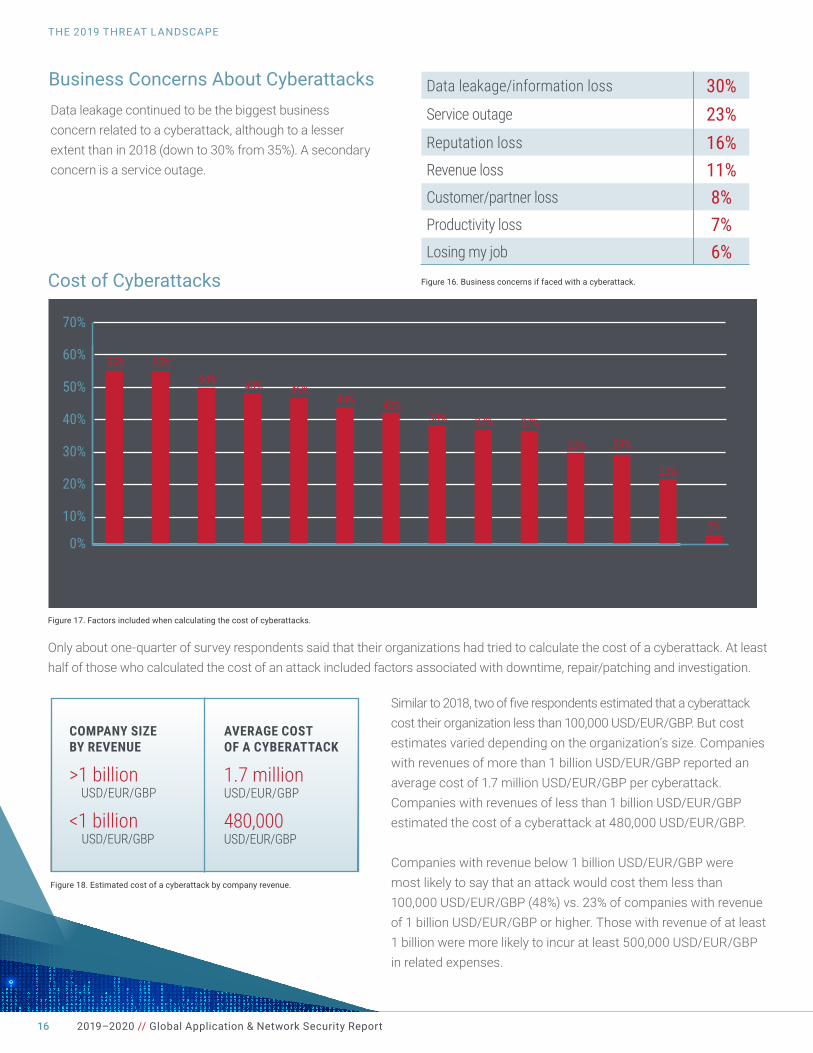
Business Concerns About Cyberattacks
Cost of Cyberattacks
Figure 17. Factors included when calculating the cost of cyberattacks.
Data leakage continued to be the biggest business concern related to a cyberattack, although to a lesser extent than in 2018 (down to 30% from 35%). A secondary concern is a service outage.
Similarto2018,twooffiverespondentsestimatedthatacyberattack cost their organization less than 100,000 USD/EUR/GBP. But cost estimates varied depending on the organization’s size. Companies with revenues of more than 1 billion USD/EUR/GBP reported an average cost of 1.7 million USD/EUR/GBP per cyberattack. Companies with revenues of less than 1 billion USD/EUR/GBP estimated the cost of a cyberattack at 480,000 USD/EUR/GBP.
Companies with revenue below 1 billion USD/EUR/GBP were most likely to say that an attack would cost them less than 100,000 USD/EUR/GBP (48%) vs. 23% of companies with revenue of 1 billion USD/EUR/GBP or higher. Those with revenue of at least 1 billion were more likely to incur at least 500,000 USD/EUR/GBP in related expenses.
Data leakage/information loss 30%Service outage 23%Reputation loss 16%Revenue loss 11%Customer/partner loss 8%Productivity loss 7%Losing my job 6%
Figure 16. Business concerns if faced with a cyberattack.
Only about one-quarter of survey respondents said that their organizations had tried to calculate the cost of a cyberattack. At least half of those who calculated the cost of an attack included factors associated with downtime, repair/patching and investigation.
Figure 18. Estimated cost of a cyberattack by company revenue.
COMPANY SIZE BY REVENUE
>1 billion USD/EUR/GBP
<1 billion USD/EUR/GBP
AVERAGE COST OF A CYBERATTACK
1.7 million USD/EUR/GBP
480,000 USD/EUR/GBP
0%
10%
30%
20%
40%
60%
50%
70%
80%
Downtime
Repair/patch cost
Cost of invest.
Imp. of new tech.
Customer notification
Third-party remediation
Resources/staffing
Gov’t. & regulatory fines
Customer remediation
Public relations
Mktg./awareness
Legal fees
Customer churn
Other
55% 55%50% 48% 46%
43% 42%38% 37% 37%
30% 29%
22%
2%
2019–2020 // Global Application & Network Security Report 17
THE 2019 THREAT LANDSCAPE
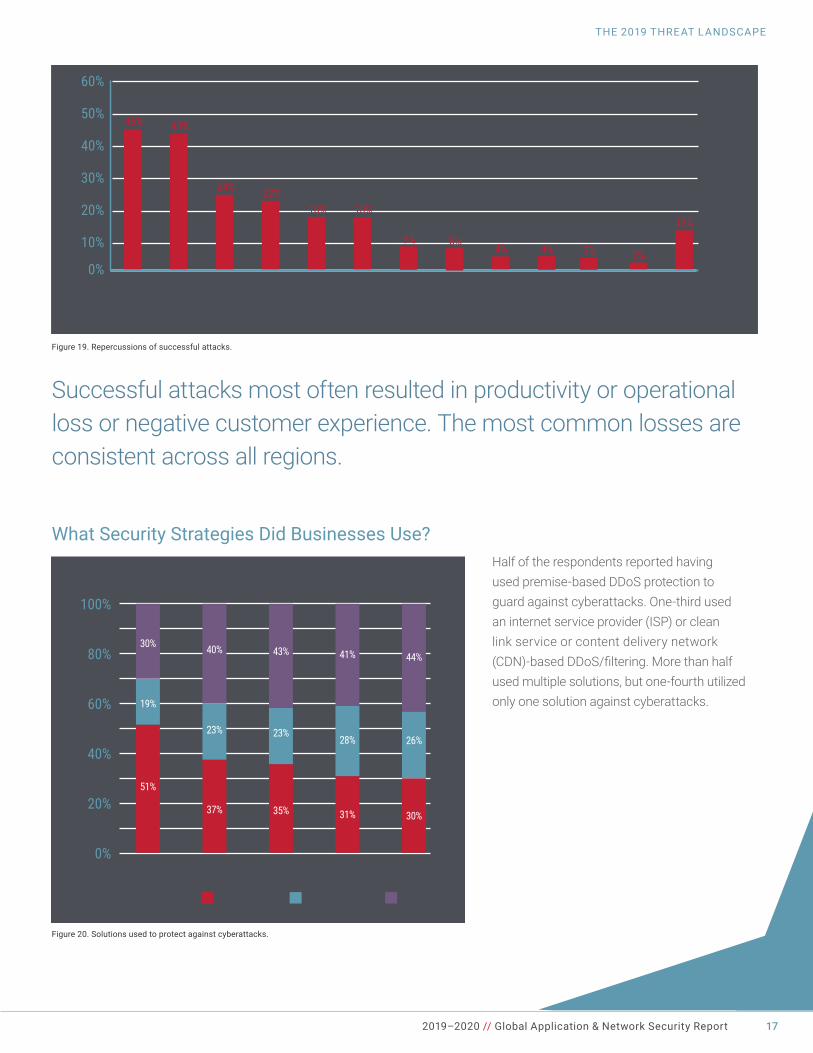
Figure 19. Repercussions of successful attacks.
Figure 20. Solutions used to protect against cyberattacks.
Successful attacks most often resulted in productivity or operational loss or negative customer experience. The most common losses are consistent across all regions.
Half of the respondents reported having used premise-based DDoS protection to guard against cyberattacks. One-third used an internet service provider (ISP) or clean link service or content delivery network (CDN)-basedDDoS/filtering.Morethanhalfused multiple solutions, but one-fourth utilized only one solution against cyberattacks.
What Security Strategies Did Businesses Use?
0%
10%
30%
20%
40%
60%
50%
Prod./oper. loss
Neg. cust.exp.
Brand reputation loss
Revenue loss
Customer loss
Unexp. budget inc.
Legalaction
Intellectual property loss
Drop in share price value
Term. of CISO or CSO
Term. of C-suite leadership
(CEO or exec) Other
None/don’t know
45% 43%
24% 22%18% 18%
9%4% 3%4% 2%
13%8%
0%
20%
40%
60%
80%
100%
51%
19%
30%
37%
23%
40%
35%
23%
43%
31%
28%
41%
30%
26%
44%
Premise-based DDoS
protection
ISP or clean link
service
CDN-basedDDoS/filtering
On-demand cloud-based
service
Always-on cloud-based
service
Currently using Planning to add Neither
The Move to Multiple Public Clouds Creates Security Silos
Organizations look to public cloud service providers for network infrastructures that enable more agile responses to customer needs and deliver high availability and network performance while reducing operational costs.
Although security professionals have better visibility into what is happening on their networks when computing resources are managedon-premise,thebenefitsofapubliccloud environment are compelling. As expected, enterprises continued to transition more applications and data to public cloud environments in 2019.
18 2019–2020 // Global Application & Network Security Report18
THE MOVE TO MULTIPLE PUBLIC CLOUDS CREATES SECURITY SILOS
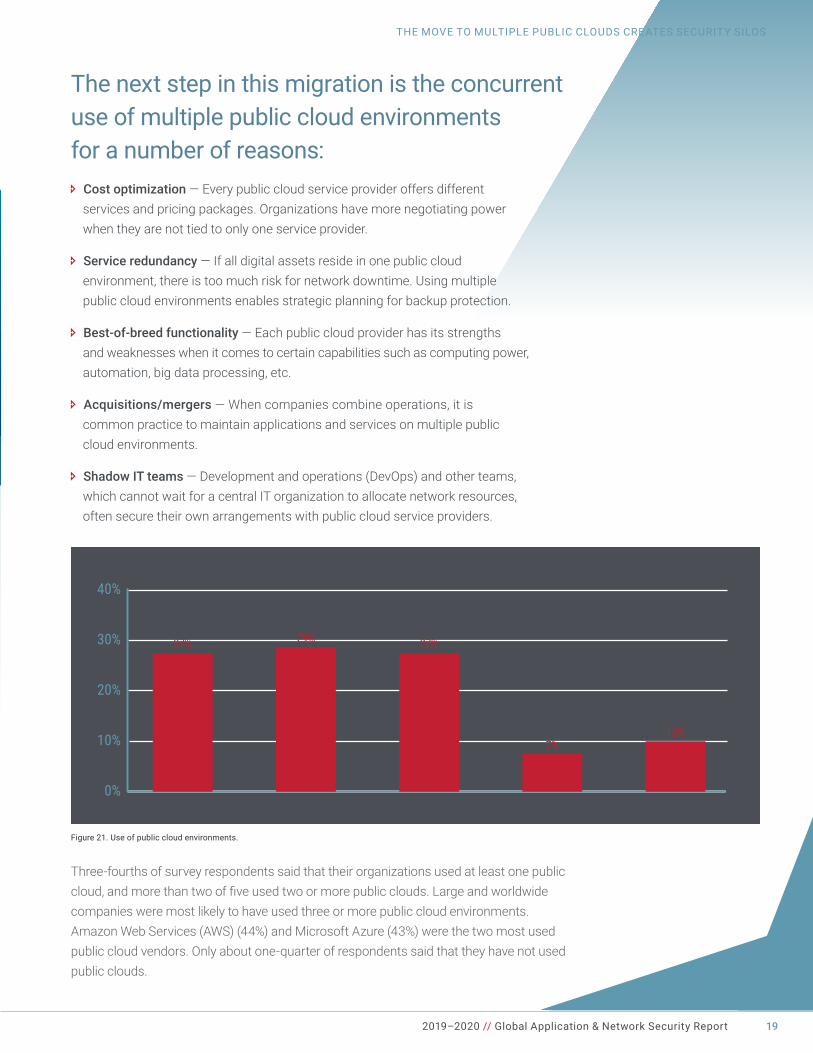
Three-fourths of survey respondents said that their organizations used at least one public cloud,andmorethantwooffiveusedtwoormorepublicclouds.Largeandworldwidecompanies were most likely to have used three or more public cloud environments. Amazon Web Services (AWS) (44%) and Microsoft Azure (43%) were the two most used public cloud vendors. Only about one-quarter of respondents said that they have not used public clouds.
Ð Cost optimization—Everypubliccloudserviceprovideroffersdifferent services and pricing packages. Organizations have more negotiating power when they are not tied to only one service provider.
Ð Service redundancy—Ifalldigitalassetsresideinonepubliccloud environment, there is too much risk for network downtime. Using multiple public cloud environments enables strategic planning for backup protection.
Ð Best-of-breed functionality—Eachpubliccloudproviderhasitsstrengths and weaknesses when it comes to certain capabilities such as computing power, automation, big data processing, etc.
Ð Acquisitions/mergers—Whencompaniescombineoperations,itis common practice to maintain applications and services on multiple public cloud environments.
Ð Shadow IT teams—Developmentandoperations(DevOps)andotherteams,which cannot wait for a central IT organization to allocate network resources, often secure their own arrangements with public cloud service providers.
Figure 21. Use of public cloud environments.
0%
10%
20%
30%
40%
None One Two Three Four or more
27% 27%
10%7%
29%
2019–2020 // Global Application & Network Security Report 19
THE MOVE TO MULTIPLE PUBLIC CLOUDS CREATES SECURITY SILOS
The next step in this migration is the concurrent use of multiple public cloud environments for a number of reasons:
2019–2020 // Global Application & Network Security Report20
THE MOVE TO MULTIPLE PUBLIC CLOUDS CREATES SECURITY SILOS
Balancing Business ChallengesThe strategic use of multiple public cloud environments introduces new business challenges. Although organizations are better able to respond rapidly to market opportunities, the decentralized nature of this model adds complexity to how applications and computing resources are secured.
Organizations—whetherviachiefinformationsecurityofficers(CISOs)orothersecurityteams—needtostayabreast of the technological and environmental changes in their public clouds. There is a need for visibility across all the different platforms from one holistic solution that enables
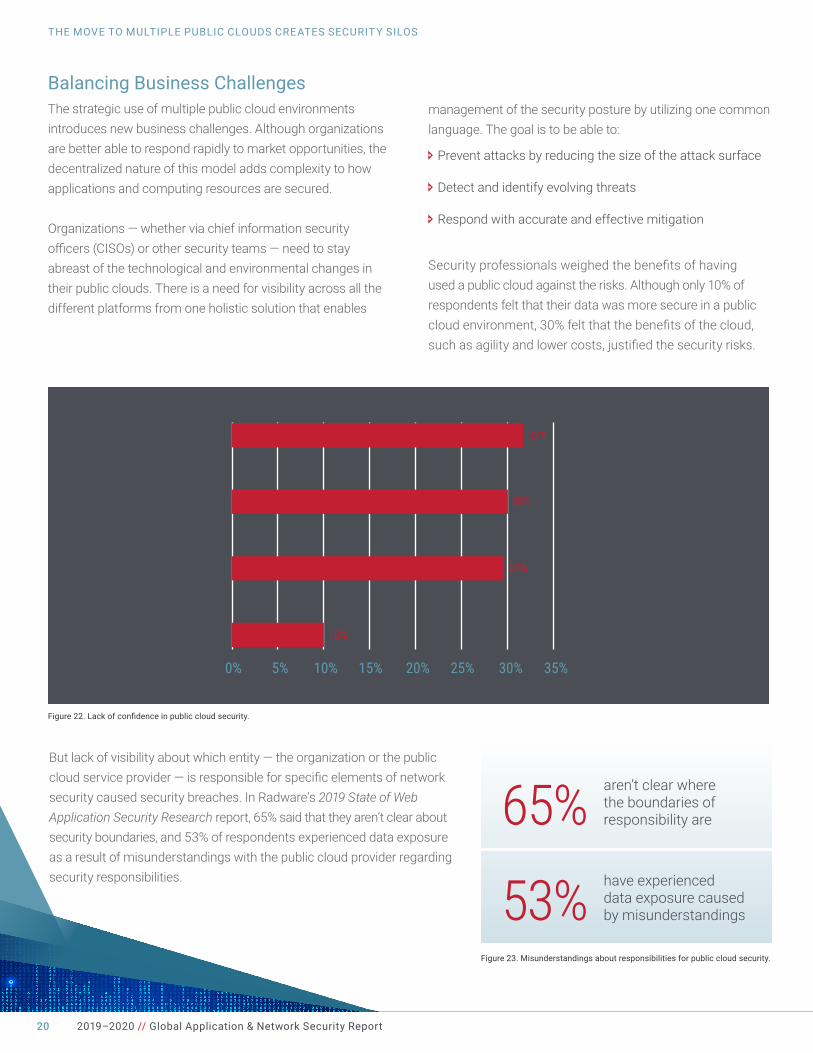
Figure 22. Lack of confidence in public cloud security.
Figure 23. Misunderstandings about responsibilities for public cloud security.
Butlackofvisibilityaboutwhichentity—theorganizationorthepubliccloudserviceprovider—isresponsibleforspecificelementsofnetworksecurity caused security breaches. In Radware’s 2019 State of Web Application Security Research report, 65% said that they aren’t clear about security boundaries, and 53% of respondents experienced data exposure as a result of misunderstandings with the public cloud provider regarding security responsibilities.
management of the security posture by utilizing one common language.Thegoalistobeableto:
Ð Prevent attacks by reducing the size of the attack surface
Ð Detect and identify evolving threats
Ð Respond with accurate and effective mitigation
Securityprofessionalsweighedthebenefitsofhaving used a public cloud against the risks. Although only 10% of respondents felt that their data was more secure in a public cloudenvironment,30%feltthatthebenefitsofthecloud,suchasagilityandlowercosts,justifiedthesecurityrisks.
32%
30%
29%
10%
0% 5% 10% 15% 20% 25% 30% 35%
My data is equally secure in eithera data center or the public cloud
My data is less secure in thepublic cloud, but other
benefits of the cloud outweigh thesecurity risks (agility, cost, etc.)
My data is less securein the public cloud
My data is more securein the public cloud
65%
53%
aren’t clear wherethe boundaries of responsibility are
have experienced data exposure caused by misunderstandings
2019–2020 // Global Application & Network Security Report 21
THE MOVE TO MULTIPLE PUBLIC CLOUDS CREATES SECURITY SILOS
In the public cloud environment, web and application intrusion (27%) was seen as the biggest threat to their companies’ cloud environments, similar to previous years’ surveys.
The Need to Rethink Security StrategiesOften when organizations migrate from on-premise to public cloud environments, security teams want to continue to use the same approach for protecting applications and data. But use of a public cloud, especially multiple public clouds, introduces new attack vectors that require better visibility into what is happening across the entire ecosystem. Security tools offered by public cloud vendors are often a popular choice to fillthegapfollowingmigration.
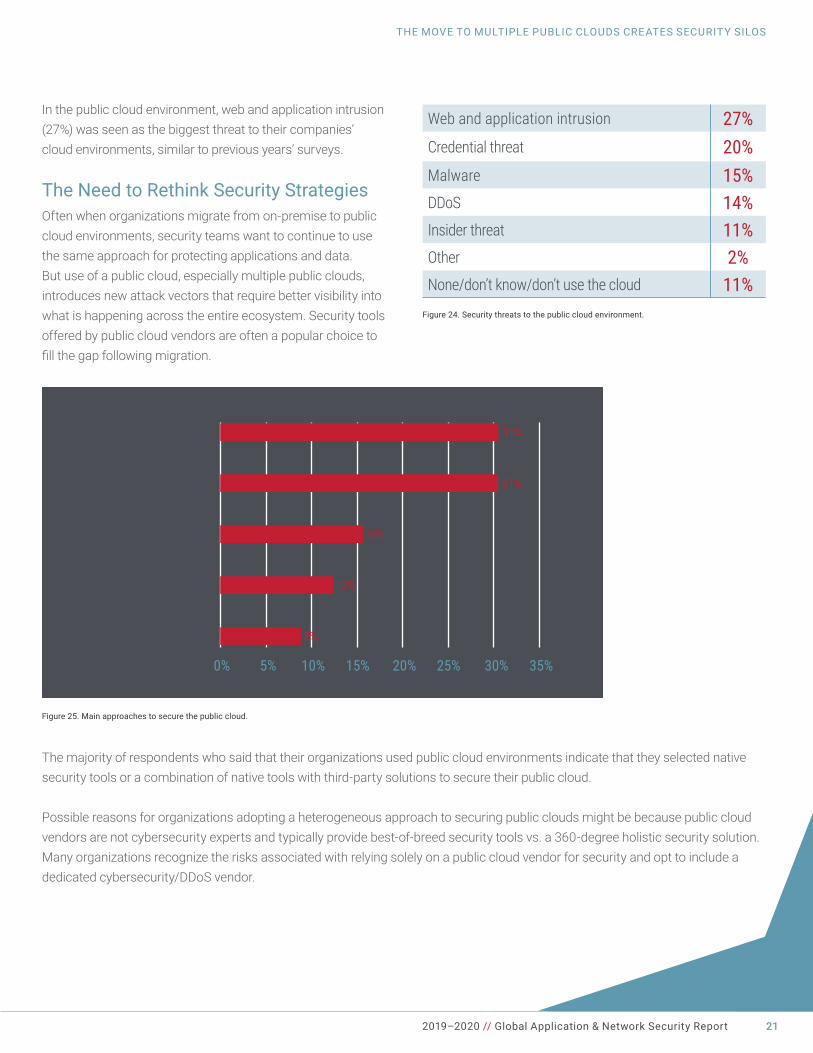
Figure 25. Main approaches to secure the public cloud.
31%
31%
16%
12%
8%
0% 5% 10% 15% 20% 25% 30% 35%
Use the native security toolsof the public cloud vendors
Combine native toolswith third-party solutions
Use the same tools as for our physical data center security
Use a dedicated cloud securitysolution from a third party
Don’t have a security solution for the public cloud
The majority of respondents who said that their organizations used public cloud environments indicate that they selected native security tools or a combination of native tools with third-party solutions to secure their public cloud.
Possible reasons for organizations adopting a heterogeneous approach to securing public clouds might be because public cloud vendors are not cybersecurity experts and typically provide best-of-breed security tools vs. a 360-degree holistic security solution. Many organizations recognize the risks associated with relying solely on a public cloud vendor for security and opt to include a dedicated cybersecurity/DDoS vendor.
Web and application intrusion 27%Credential threat 20%Malware 15%DDoS 14%Insider threat 11%Other 2%None/don’t know/don’t use the cloud 11%
Figure 24. Security threats to the public cloud environment.
2019–2020 // Global Application & Network Security Report22
Keeping Permissions TightThreats have evolved dramatically over the past few years, and hackers have devised methods to leverage cloud technologies. When data and applications are hosted in the cloud, the number of entry points to the network increases dramatically. Controlling who has permission to access network elements and data is very important.
Organizationsneedtofindtherightbalancebetweentooexcessive and restrictive permission policies. Excessive permissions leave environments open to malicious activity. Permissions that are too restrictive block DevOps teams from being able to do their jobs.
Twenty percent of survey respondents ranked credential threats as the biggest threat to their company’s cloud environment, slightly behind web and application intrusion.
Diffusion of Staff ResponsibilitiesPart of the problem is that IT administrators are generally no longer part of a centralized team controlling and administering the entire computing environment. As the role of DevOps grows, DevOps teams are spread across development Scrum teams, small groups with members representing the different functions needed to accomplish the goals at hand. No one entity controls the granting of permissions, but developers, DevOps, compliance and others should only receive the permissions they need.
Aggressive governance policies might harden organizations’ environments but could limit the ability of development teams to react quickly to update applications or access data as needed to address changing business requirements.
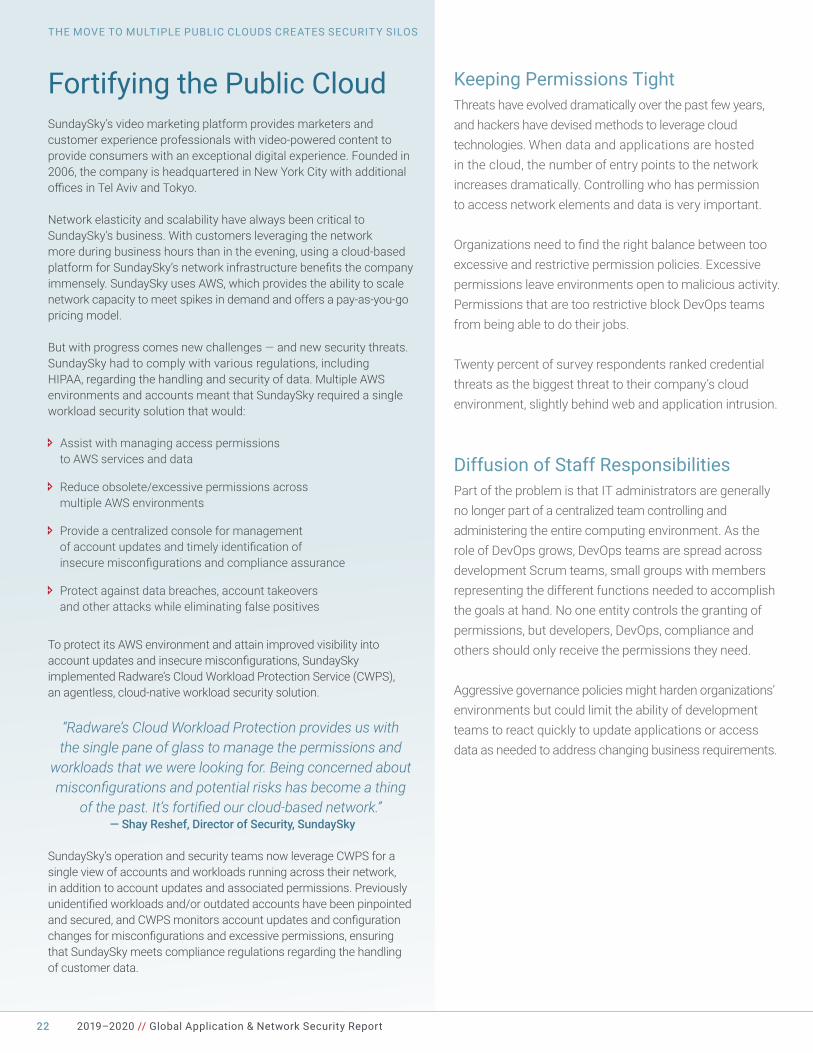
Fortifying the Public CloudSundaySky’s video marketing platform provides marketers and customer experience professionals with video-powered content to provide consumers with an exceptional digital experience. Founded in 2006, the company is headquartered in New York City with additional officesinTelAvivandTokyo.
Network elasticity and scalability have always been critical to SundaySky’s business. With customers leveraging the network more during business hours than in the evening, using a cloud-based platformforSundaySky’snetworkinfrastructurebenefitsthecompanyimmensely. SundaySky uses AWS, which provides the ability to scale network capacity to meet spikes in demand and offers a pay-as-you-go pricing model.
Butwithprogresscomesnewchallenges—andnewsecuritythreats.SundaySky had to comply with various regulations, including HIPAA, regarding the handling and security of data. Multiple AWS environments and accounts meant that SundaySky required a single workloadsecuritysolutionthatwould:
Ð Assist with managing access permissions to AWS services and data
Ð Reduce obsolete/excessive permissions across multiple AWS environments
Ð Provide a centralized console for management ofaccountupdatesandtimelyidentificationof insecuremisconfigurationsandcomplianceassurance
Ð Protect against data breaches, account takeovers and other attacks while eliminating false positives
To protect its AWS environment and attain improved visibility into accountupdatesandinsecuremisconfigurations,SundaySky implemented Radware’s Cloud Workload Protection Service (CWPS), an agentless, cloud-native workload security solution.
“Radware’s Cloud Workload Protection provides us with the single pane of glass to manage the permissions and
workloads that we were looking for. Being concerned about misconfigurations and potential risks has become a thing
of the past. It’s fortified our cloud-based network.” — Shay Reshef, Director of Security, SundaySky
SundaySky’s operation and security teams now leverage CWPS for a single view of accounts and workloads running across their network, in addition to account updates and associated permissions. Previously unidentifiedworkloadsand/oroutdatedaccountshavebeenpinpointedandsecured,andCWPSmonitorsaccountupdatesandconfigurationchangesformisconfigurationsandexcessivepermissions,ensuringthat SundaySky meets compliance regulations regarding the handling of customer data.
THE MOVE TO MULTIPLE PUBLIC CLOUDS CREATES SECURITY SILOS
2019–2020 // Global Application & Network Security Report 23
THE MOVE TO MULTIPLE PUBLIC CLOUDS CREATES SECURITY SILOS
Skills Shortage Affects Security TacticsCompetitionforqualifiedemployeesishigh,asaresalaries.Constantturnovermakesitdifficulttomaintainqualifiedknowledge transfer. Cybersecurity Ventures predicts that 3.5 million cybersecurity jobs around the globe will go unfilledby2021.13 CISO respondents to the Radware global surveyindicatedthattheystruggletofindandhireskilled IT security staff.
The role of the CISO is also evolving. As different security and developer roles in organizations gain prominence, such as DevOps, management of relationships with public cloud vendors might not reside directly with the CISO. It is quite possible that multiple groups have relationships with each public cloud vendor. This arrangement can add complexity andpotentiallyconflictwithdepartmentsandworkinggroupsregarding how security policies should be applied.
Threat propagation in public cloud environments and theshortageofqualifiedsecurityprofessionalsnecessitate the need for greater automation in security solutions. In the Radware global survey, CISOs indicated that there was a greater reliance on automation to detect and mitigate threats.
Strategies to Secure Multiple Public Cloud EnvironmentsApplying security protocols that were successful for on-premise environments will not work as applications and data migrate to public cloud environments. Security teams need to adopt new strategies to harden security across theirentirepubliccloudecosystemby:
Ð Adopting third-party security solutions The public cloud service providers’ core competencies are not network security. Rather, network protection is generally a proprietary add-on to their service offerings that operate in a silo. Instead, select a security solution from a vendor with proven expertise and thought leadership. Choose a holistic approach that can protect multiple public cloud environments with consistent implementation and maintenance of security protocols while automating prevention, detection and response.
Ð Engaging a fully managed security service To overcome staff and skills shortages, take advantage of an outside team focused on securing your public cloud network security environments.
Ð Centralizing management of network security With a security solution in place that provides visibility and control of security policies across all virtual public clouds and clouds, it is possible to achieve tighter regulation of user credentials and permissions from a centralized dashboard.
13https://cybersecurityventures.com/jobs/
2019–2020 // Global Application & Network Security Report24
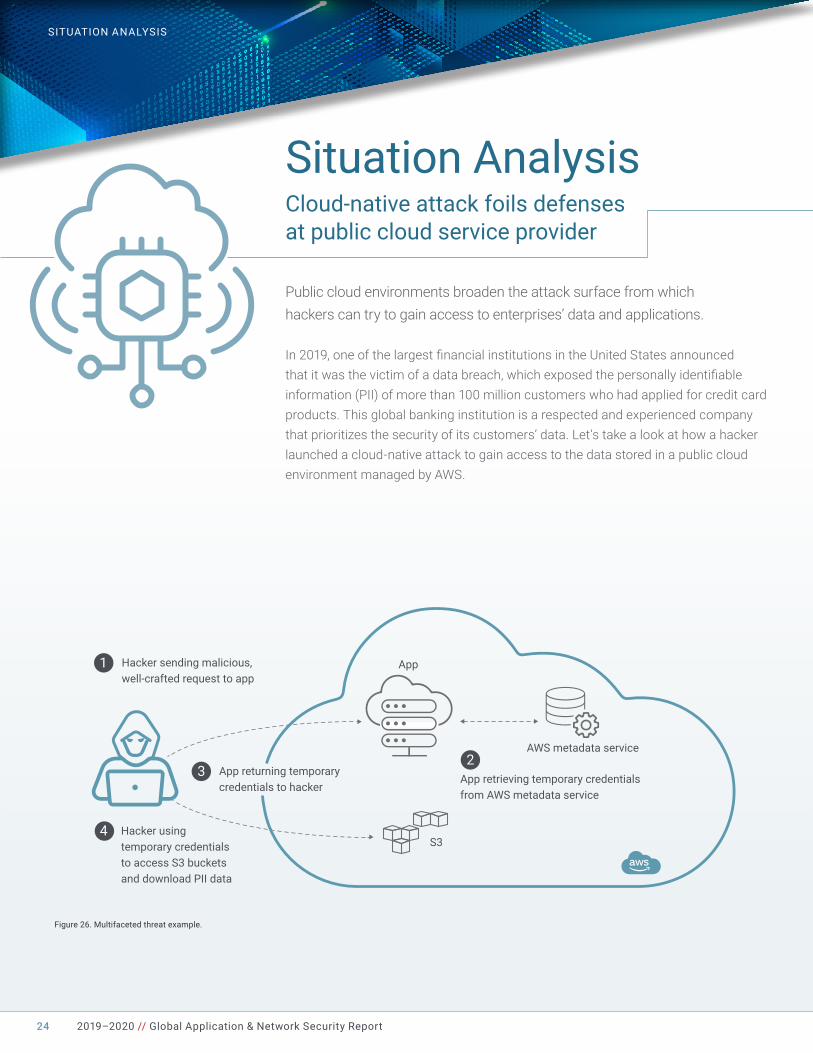
Figure 26. Multifaceted threat example.
AWS metadata service
App retrieving temporary credentialsfrom AWS metadata service
AppHacker sending malicious,well-crafted request to app
S3
1
23 App returning temporary
credentials to hacker
4 Hacker usingtemporary credentialsto access S3 bucketsand download PII data
Cloud-native attack foils defenses at public cloud service provider
Public cloud environments broaden the attack surface from which hackers can try to gain access to enterprises’ data and applications.
In2019,oneofthelargestfinancialinstitutionsintheUnitedStatesannounced thatitwasthevictimofadatabreach,whichexposedthepersonallyidentifiableinformation (PII) of more than 100 million customers who had applied for credit card products. This global banking institution is a respected and experienced company that prioritizes the security of its customers’ data. Let’s take a look at how a hacker launched a cloud-native attack to gain access to the data stored in a public cloud environment managed by AWS.
Situation Analysis
SITUATION ANALYSIS
2019–2020 // Global Application & Network Security Report 25
Moving ForwardThe global industry survey results shine a mirror on industry trends regarding the impact of cyberattacks on organizations. As security professionals evaluate strategies to support their companies’ digital transformation goals, the need to gain visibility into changing network environments is heightened.
Althoughconfidenceintheirabilitytohandleknownattackvendorsslightly improved, the increase in “don’t know” responses as to whether their organizations have been attacked is troubling. Is the rapid pace at which organizations are embracing digital
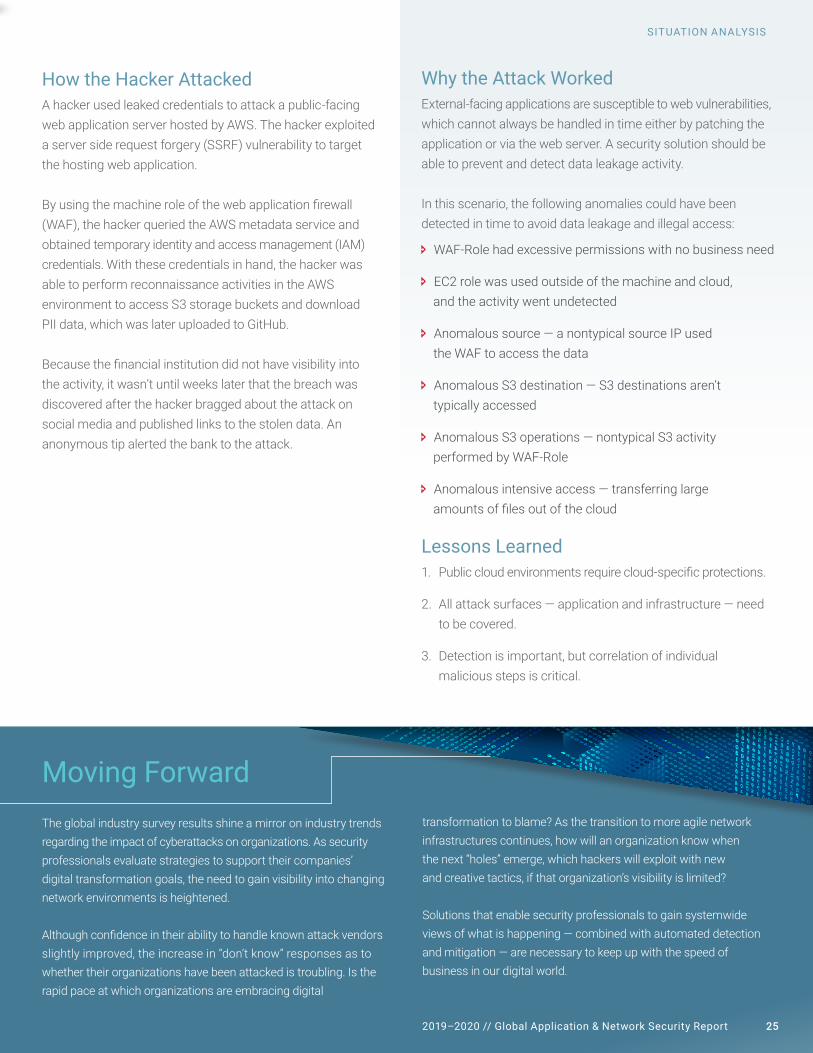
A hacker used leaked credentials to attack a public-facing web application server hosted by AWS. The hacker exploited a server side request forgery (SSRF) vulnerability to target the hosting web application.
Byusingthemachineroleofthewebapplicationfirewall(WAF), the hacker queried the AWS metadata service and obtained temporary identity and access management (IAM) credentials. With these credentials in hand, the hacker was able to perform reconnaissance activities in the AWS environment to access S3 storage buckets and download PII data, which was later uploaded to GitHub.
Becausethefinancialinstitutiondidnothavevisibilityinto the activity, it wasn’t until weeks later that the breach was discovered after the hacker bragged about the attack on social media and published links to the stolen data. An anonymous tip alerted the bank to the attack.
SITUATION ANALYSIS
Why the Attack WorkedExternal-facing applications are susceptible to web vulnerabilities, which cannot always be handled in time either by patching the application or via the web server. A security solution should be able to prevent and detect data leakage activity.
In this scenario, the following anomalies could have been detectedintimetoavoiddataleakageandillegalaccess:
Ð WAF-Role had excessive permissions with no business need
Ð EC2 role was used outside of the machine and cloud, and the activity went undetected
Ð Anomaloussource—anontypicalsourceIPused the WAF to access the data
Ð AnomalousS3destination—S3destinationsaren’t typically accessed
Ð AnomalousS3operations—nontypicalS3activity performed by WAF-Role
Ð Anomalousintensiveaccess—transferringlarge amountsoffilesoutofthecloud
Lessons Learned1. Publiccloudenvironmentsrequirecloud-specificprotections.
2. Allattacksurfaces—applicationandinfrastructure—needto be covered.
3. Detection is important, but correlation of individual malicious steps is critical.
transformation to blame? As the transition to more agile network infrastructures continues, how will an organization know when the next “holes” emerge, which hackers will exploit with new and creative tactics, if that organization’s visibility is limited?
Solutions that enable security professionals to gain systemwide viewsofwhatishappening—combinedwithautomateddetectionandmitigation—arenecessarytokeepupwiththespeedof business in our digital world.
Situation Analysis
How the Hacker Attacked
Microservice Architectures Challenge Traditional Security Practices
The cycle of planned update release schedules is outmoded and impractical. Instead, businesses have embracedagileworkflowstobeabletofixbugs, incorporate feedback from customers and implement new features on a daily or even hourly basis.
Enterprises are also making fundamental changes in their choice of environments where applications are developed and hosted. They are moving away from monolithic applications housed on-premise to microservice architectures hosted in public clouds. This shift is in response to the need for ecosystems thatareflexibleandscalableenoughtosupportrapidlychanging business requirements. How can security practices keep up?
How fast is fast enough? When it comes to creating and maintaining great customer experiences, organizations don’t have time to wait for traditional security reviews before rollingoutorenhancingapplications.Thefirstpriority is that applications meet customer needs. Application security is critical, but for businesses to maintain competitive advantages, it can’t stand in the way of progress.
2019–2020 // Global Application & Network Security Report26
MICROSERVICE ARCHITECTURES CHALLENGE TRADITIONAL SECURITY PRACTICES
The Conflicting Concepts of Agility and SecurityWhen speed of delivery is the aim of continuous application deployment models, the demands of traditional security processes can be roadblocks. IT security teams see themselves as gatekeepers, implementing rigorous processes to reduce the risk of application attacks. Mistakes are not good for job security,buttheinvestmentinrequirementsrefining,prototypetesting,trafficinspectionandpolicyreviewstakesprecioustime.
Application DevOps teams have emerged as the designers and overseers of the agile network ecosystems that enable the automated continuous delivery processes. But these teamshavedifferentprioritiesthatconflictwithconventional,deliberative security practices. Their charge is to quickly deliver applications that support business needs. Building in time for exhaustive security reviews just isn’t possible. As a result,traditionalITteamsmayfindthemselvesuninvitedfrom the process.
Distributed Architectures Introduce New Security ChallengesTo accelerate development and better utilize resources and budgets, DevOps teams are breaking computing infrastructures down into containers and applications down to microservices running in these containers. This approach provides the flexibility,scalabilityandefficienciesthattheyseekbyemployinga variety of off-the-shelf tools for automation, independent development processes of each microservice, etc.
Microservice architectures encourage the use of application programming interfaces (APIs), a set of tools and protocols used to develop application software, for different use cases. The most common API formats in modern architectures are REST/JSON. In the microservice architecture, the operational communication between the different tools used in the application development and delivery environment is done via APIs. This interface is a predefinedrequest–responsemessagesystemthatexposesreliable content and operation negotiation.
Publicly available APIs are commonly being used for machine-to-machine communication, mobile apps and IoT devices, and others allow sharing of content and data openly between communities and applications. DevOps environments with the ever-increasing demand for continuous delivery require complete process automation utilizing APIs across theboard:
Ð Service provisioning and management
Ð Platform management apps
Ð Continuous delivery process automation
API vulnerabilities are hard to detect and do not stand out. Traditional application security assessment tools do not work well with APIs or are simply irrelevant in this case. When planning for API security infrastructure, authentication and authorization must be taken into account, yet these are often not addressed properly.
All the different types of injection, authentication, access control,encryption,configurationandotherissuescanexist in APIs just like in a traditional application.
According to Radware’s 2019 web application security study, 81% of respondents reported hacking attempts targeting APIs.
2019–2020 // Global Application & Network Security Report 27
MICROSERVICE ARCHITECTURES CHALLENGE TRADITIONAL SECURITY PRACTICES
2019–2020 // Global Application & Network Security Report28
MICROSERVICE ARCHITECTURES CHALLENGE TRADITIONAL SECURITY PRACTICES
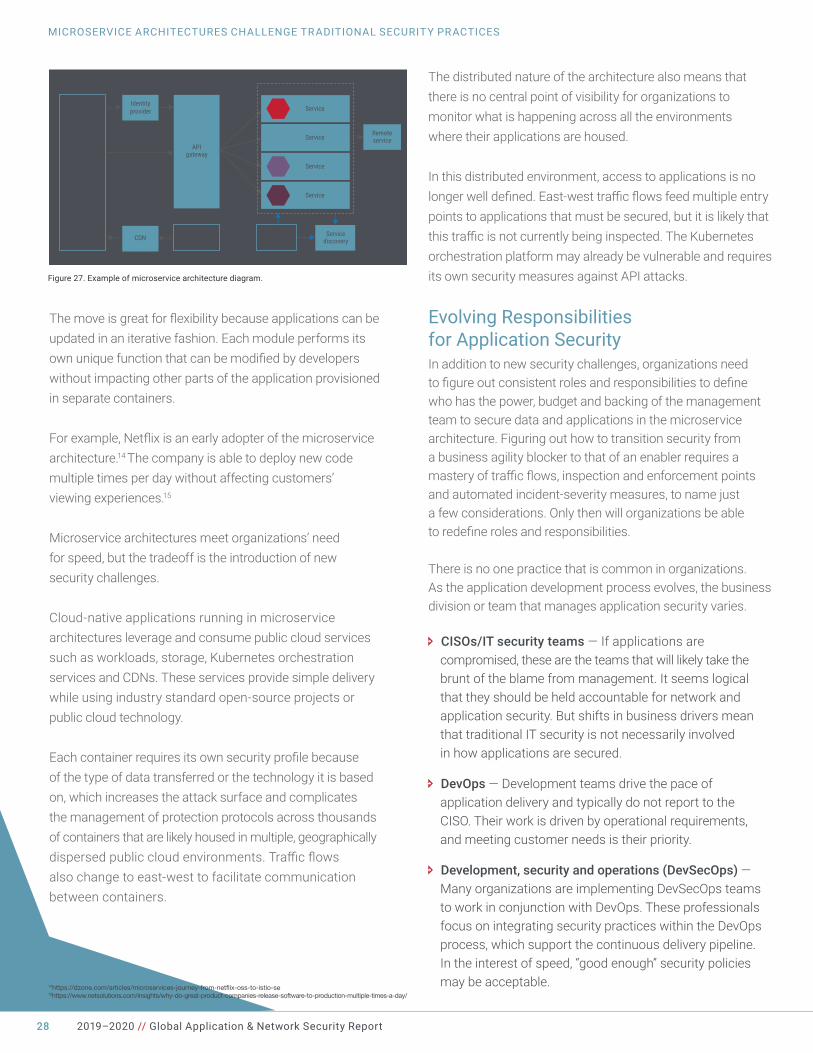
Figure 27. Example of microservice architecture diagram.
Themoveisgreatforflexibilitybecauseapplicationscanbeupdated in an iterative fashion. Each module performs its ownuniquefunctionthatcanbemodifiedbydeveloperswithout impacting other parts of the application provisioned in separate containers.
Forexample,Netflixisanearlyadopterofthemicroservicearchitecture.14 The company is able to deploy new code multiple times per day without affecting customers’ viewing experiences.15
Microservice architectures meet organizations’ need for speed, but the tradeoff is the introduction of new security challenges.
Cloud-native applications running in microservice architectures leverage and consume public cloud services suchasworkloads,storage,Kubernetesorchestrationservices and CDNs. These services provide simple delivery while using industry standard open-source projects or public cloud technology.
Eachcontainerrequiresitsownsecurityprofilebecause of the type of data transferred or the technology it is based on, which increases the attack surface and complicates the management of protection protocols across thousands of containers that are likely housed in multiple, geographically dispersedpubliccloudenvironments.Trafficflows also change to east-west to facilitate communication between containers.
The distributed nature of the architecture also means that there is no central point of visibility for organizations to monitor what is happening across all the environments where their applications are housed.
In this distributed environment, access to applications is no longerwelldefined.East-westtrafficflowsfeedmultipleentrypoints to applications that must be secured, but it is likely that thistrafficisnotcurrentlybeinginspected.TheKubernetesorchestration platform may already be vulnerable and requires its own security measures against API attacks.
Evolving Responsibilities for Application SecurityIn addition to new security challenges, organizations need tofigureoutconsistentrolesandresponsibilitiestodefinewho has the power, budget and backing of the management team to secure data and applications in the microservice architecture. Figuring out how to transition security from a business agility blocker to that of an enabler requires a masteryoftrafficflows,inspectionandenforcementpointsand automated incident-severity measures, to name just a few considerations. Only then will organizations be able toredefinerolesandresponsibilities.
There is no one practice that is common in organizations. As the application development process evolves, the business division or team that manages application security varies.
Ð CISOs/IT security teams—Ifapplicationsare compromised, these are the teams that will likely take the brunt of the blame from management. It seems logical that they should be held accountable for network and application security. But shifts in business drivers mean that traditional IT security is not necessarily involved in how applications are secured.
Ð DevOps—Developmentteamsdrivethepaceof application delivery and typically do not report to the CISO. Their work is driven by operational requirements, and meeting customer needs is their priority.
Ð Development, security and operations (DevSecOps)—Many organizations are implementing DevSecOps teams to work in conjunction with DevOps. These professionals focus on integrating security practices within the DevOps process, which support the continuous delivery pipeline. In the interest of speed, “good enough” security policies may be acceptable.14https://dzone.com/articles/microservices-journey-from-netflix-oss-to-istio-se
15https://www.netsolutions.com/insights/why-do-great-product-companies-release-software-to-production-multiple-times-a-day/
Service
Service
Microservices
APIgateway
Client
Identityprovider
CDN Static content Servicediscovery
Remoteservice
Management
Service
Service
2019–2020 // Global Application & Network Security Report 29
MICROSERVICE ARCHITECTURES CHALLENGE TRADITIONAL SECURITY PRACTICES
In Radware’s 2019 State of Application Security Research report, organizations indicated an adjustment of roles and responsibilities to cope with both the agility and security requirements of the microservice architecture. However, definingandrefiningprocessesandpracticesarefarfromoptimized, which is good news only for hackers.
The positive sentiment about the security of microservice andserverlessenvironmentsbytheirnature—especiallyforDevOps—leadstoan“afterthefact”approach,allowingforunmonitoredeast-westtraffic,redundantdistributionofSSLcertificatesandconventionalsecuritysolutionsthatfallbehind the velocity of changes that applications undergo.
Security Professionals Feel the HeatRespondents to the Radware global survey generally understand that the move to public cloud environments brings added security concerns. Only one of 10 feels that the data is more secure in the public cloud environment. Two of fiverespondentssaidthattheyusemultiplecloudenvironments.Forty-two percent indicated that they feel somewhat prepared to safeguard data and applications running in the public cloud. Yet 59% also said that their data is less secure in the public cloud(with30%willingtotaketheriskbecauseotherbenefits,such as agility, outweigh the security issues).
Gaining Visibility Going ForwardExpect the move to public cloud environments and the use of distributed architectures to continue for the development and hosting of applications. What can security professionals do now to both align their function with business priorities and ensure that data and applications are secure in the microservice architecture?
1. Adopt a risk management mindset that prioritizes business drivers to shape security mitigation policies. A “security at all costs” approach is likely to generate an unacceptable level of false positives and erroneously impact customers’ experiences with the applications. Security should follow the same development timeline as product development.
2. Establish clarity about roles for application security. Clear accountability empowers the right teams to take responsibility for decisions about the acceptable level of risk and strategies to protect applications.
3. Focus on implementing a security solution that provides one consistent point of visibility across all network environments, both public and private. Reliance on solutions offered by public cloud vendors leaves blind spots in the security posture, which attackers can exploit.
4. Selectasecuritysolutionthatfitstheecosystemalready in place without requiring adjustments, such as chang-inghowtrafficisrouted,thesubmissionofSSLcertifi-cates or the alteration of IP addresses.
5. Take advantage of the open-source nature of cloud- native applications to aggregate telemetry information abouttrafficvolumes,consumptionofapplications, performance issues, geographic distribution of users and the nature of data being processed. Use the information to analyze behavior to get better visibility about what is happening across all platforms.
6. Secure the channels through which the applications are being delivered. That means protecting APIs and web and mobile services from attack vectors such as protocol manipulation, data manipulation in servers, and session and credential attacks.
7. Deliver a security posture that is scalable and elastic to adapt to changing business needs. Automate the monitoring and mitigation of attacks everywhere in the ecosystem to support the continuous deployment process for applications.
Balancing Business Needs and Security DemandsWhen applications are the heart of a business, reacting quickly to market opportunities and maintaining the right security posture become a balancing act. Microservice architectures are desirable because they enable more agile continuous deployment models. At the same time, they introduce new security challenges.
Securitysolutions,whichflexiblyadapttotheirorganizations’need for speed in the continuous delivery of applications, are required.
2019–2020 // Global Application & Network Security Report30
Getting Ready for 5G & IoTThe commercial rollouts of 5G networks beginning in 2020 set up a tale of two prospects, a story full of twists and turns that would surely delight Charles Dickens.
1. The promise of blazing fast data speeds and lower latency services on mobile networks that enable large-scale deployment of IoT devices
2. The certainty of new attack vectors launched through the vastly expanded number of access points in 5G networks’ distributed architecture
5G technology forever changes expectations for the mobile networkexperience.Alltrafficisinthecloud,andcomputingelements and services are closer to the edge of the network, which improves performance and makes it easier for service providers to scale services. The 5G infrastructure is ideal for the deployment of IoT devices because it can handle massive amounts of data with very low latency from mobile connections.
It was the best of times, it was the worst of times, it was the age of 5G networks, it was the beginning of a new threat landscape the likes of which have never been faced before.
GETTING READY FOR 5G & IOT
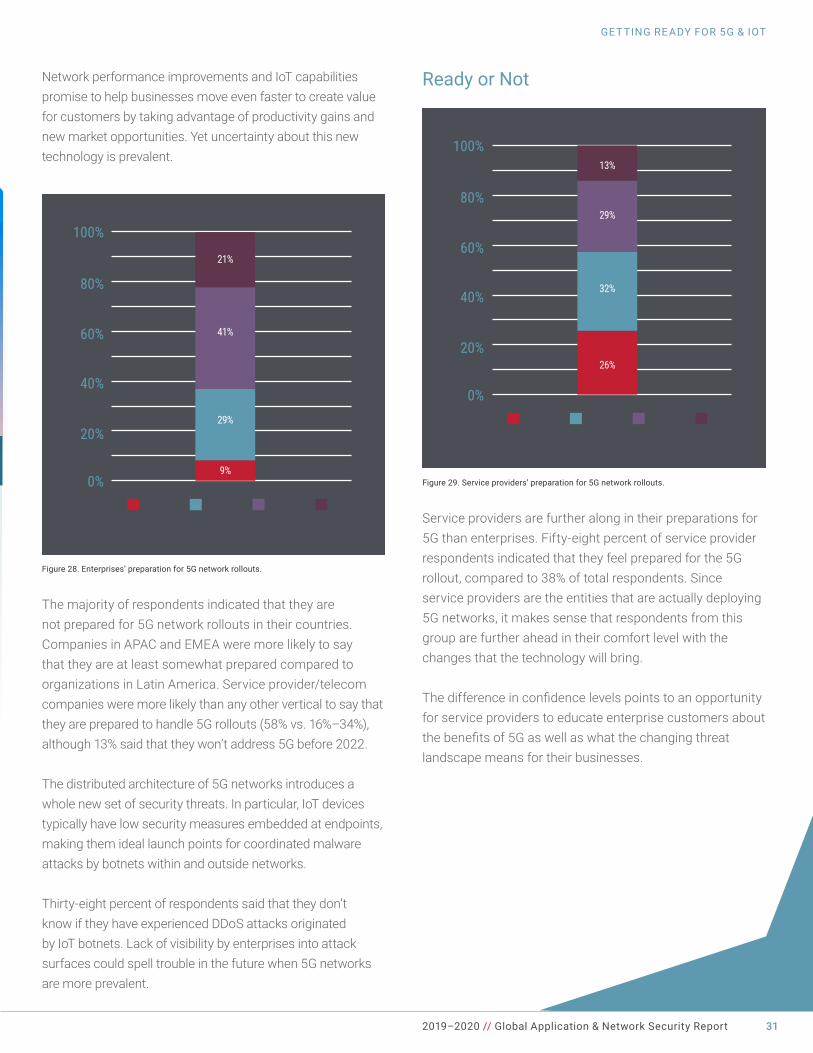
The majority of respondents indicated that they are not prepared for 5G network rollouts in their countries. Companies in APAC and EMEA were more likely to say that they are at least somewhat prepared compared to organizations in Latin America. Service provider/telecom companies were more likely than any other vertical to say that they are prepared to handle 5G rollouts (58% vs. 16%–34%), although 13% said that they won’t address 5G before 2022.
The distributed architecture of 5G networks introduces a whole new set of security threats. In particular, IoT devices typically have low security measures embedded at endpoints, making them ideal launch points for coordinated malware attacks by botnets within and outside networks.
Thirty-eight percent of respondents said that they don’t know if they have experienced DDoS attacks originated by IoT botnets. Lack of visibility by enterprises into attack surfaces could spell trouble in the future when 5G networks are more prevalent.
Figure 28. Enterprises’ preparation for 5G network rollouts.
2019–2020 // Global Application & Network Security Report 31
GETTING READY FOR 5G & IOT
0%
20%
40%
60%
80%
100%
21%
41%
29%
9%
2019
Yes, well prepared
Yes, somewhatprepared
No, not prepared
No, won’t address before 2022
Network performance improvements and IoT capabilities promise to help businesses move even faster to create value for customers by taking advantage of productivity gains and new market opportunities. Yet uncertainty about this new technology is prevalent.
Service providers are further along in their preparations for 5G than enterprises. Fifty-eight percent of service provider respondents indicated that they feel prepared for the 5G rollout, compared to 38% of total respondents. Since service providers are the entities that are actually deploying 5G networks, it makes sense that respondents from this group are further ahead in their comfort level with the changes that the technology will bring.
Thedifferenceinconfidencelevelspointstoanopportunityfor service providers to educate enterprise customers about thebenefitsof5Gaswellaswhatthechangingthreatlandscape means for their businesses.
Figure 29. Service providers’ preparation for 5G network rollouts.
0%
20%
40%
60%
80%
100%13%
29%
32%
26%
2019
Yes, well prepared
Yes, somewhatprepared
No, not prepared
No, won’t address before 2022
Ready or Not
2019–2020 // Global Application & Network Security Report32
GETTING READY FOR 5G & IOT
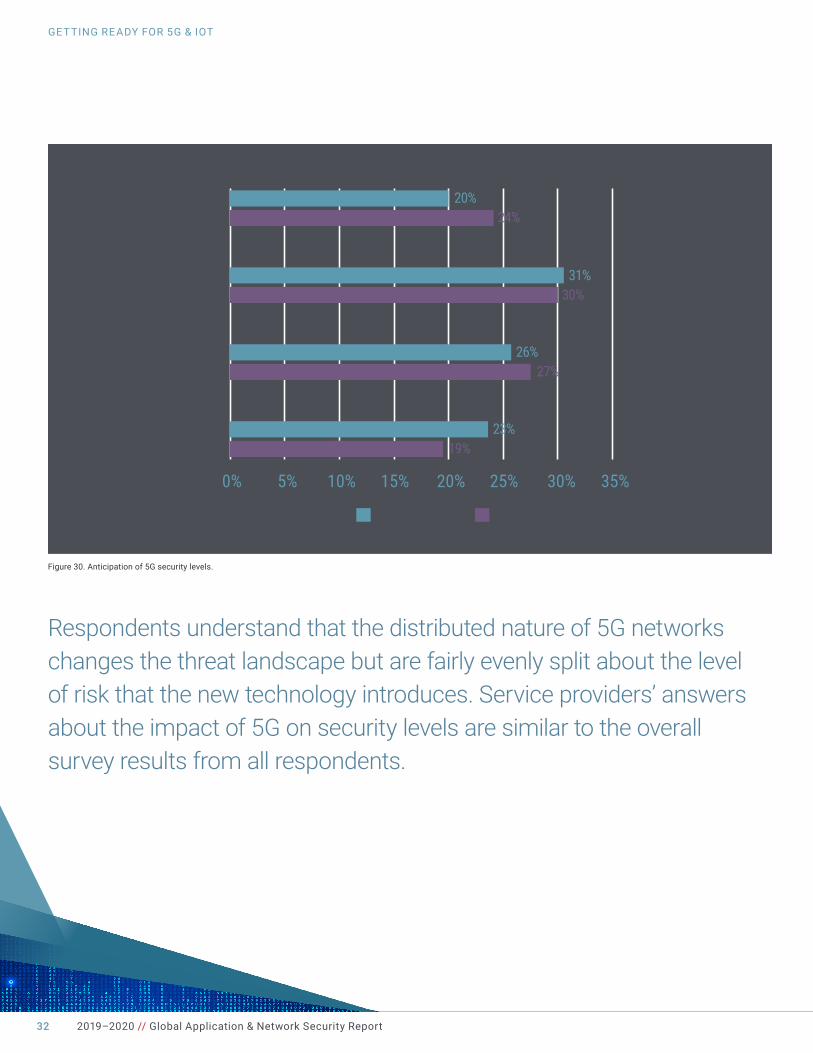
Figure 30. Anticipation of 5G security levels.
Respondents understand that the distributed nature of 5G networks changes the threat landscape but are fairly evenly split about the level of risk that the new technology introduces. Service providers’ answers about the impact of 5G on security levels are similar to the overall survey results from all respondents.
20%24%
31%30%
26%27%
23%19%8%
0% 5% 10% 15% 20% 25% 30% 35%
Better information security by nature
About the same level as today
A much greater risk exposure
Not sure
All respondents Service provider respondents
2019–2020 // Global Application & Network Security Report 33
GETTING READY FOR 5G & IOT
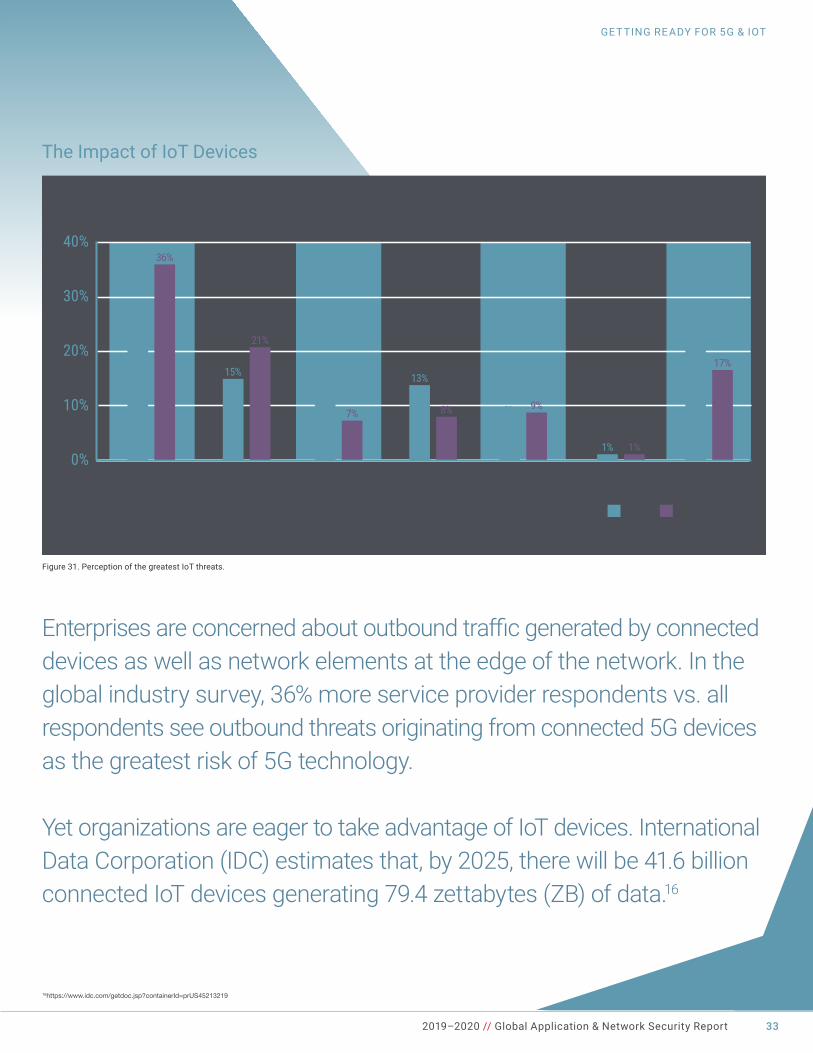
Figure 31. Perception of the greatest IoT threats.
The Impact of IoT Devices
Enterprisesareconcernedaboutoutboundtrafficgeneratedbyconnecteddevices as well as network elements at the edge of the network. In the global industry survey, 36% more service provider respondents vs. all respondents see outbound threats originating from connected 5G devices as the greatest risk of 5G technology.
Yet organizations are eager to take advantage of IoT devices. International Data Corporation (IDC) estimates that, by 2025, there will be 41.6 billion connected IoT devices generating 79.4 zettabytes (ZB) of data.16
16https://www.idc.com/getdoc.jsp?containerId=prUS45213219
0%
10%
20%
30%
40%
Volumetric DoS attacks on edge
and far edge/MEC infrastructures
Attacks on the carrier workload in the public cloud or
through the public cloud
Other
Total Service providers
Outbound threats originating from connected 5G devices, including botnet risks andnarrowband-IoT anomalies
26%
36%
15%
21%
Threats from actors on the
internet targeting the core infrastructure
14%
7%
13%
8%
DoS attacks on core service APIs and
network signaling
8% 9%
1% 1%
Unsure
24%
17%
2019–2020 // Global Application & Network Security Report34
GETTING READY FOR 5G & IOT
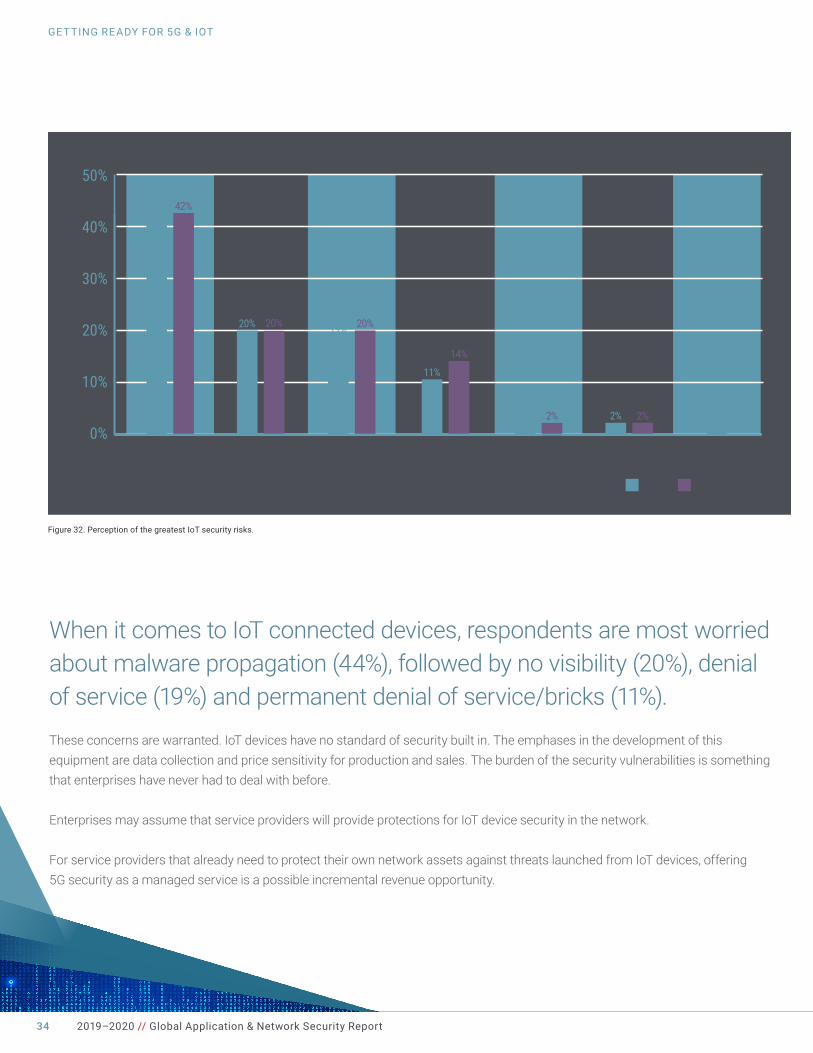
When it comes to IoT connected devices, respondents are most worried about malware propagation (44%), followed by no visibility (20%), denial of service (19%) and permanent denial of service/bricks (11%).
These concerns are warranted. IoT devices have no standard of security built in. The emphases in the development of this equipment are data collection and price sensitivity for production and sales. The burden of the security vulnerabilities is something that enterprises have never had to deal with before.
Enterprises may assume that service providers will provide protections for IoT device security in the network.
For service providers that already need to protect their own network assets against threats launched from IoT devices, offering 5G security as a managed service is a possible incremental revenue opportunity.
Figure 32. Perception of the greatest IoT security risks.
0%
10%
20%
30%
40%
50%
Malware propagation
No visibility Permanent denial of service/bricks
Other I think they are safe
Not sure
Total Service providers
44%42%
20% 20%
Denial of service
19% 20%
11%
14%
3% 2% 2% 2% 1%
2019–2020 // Global Application & Network Security Report 35
GETTING READY FOR 5G & IOT
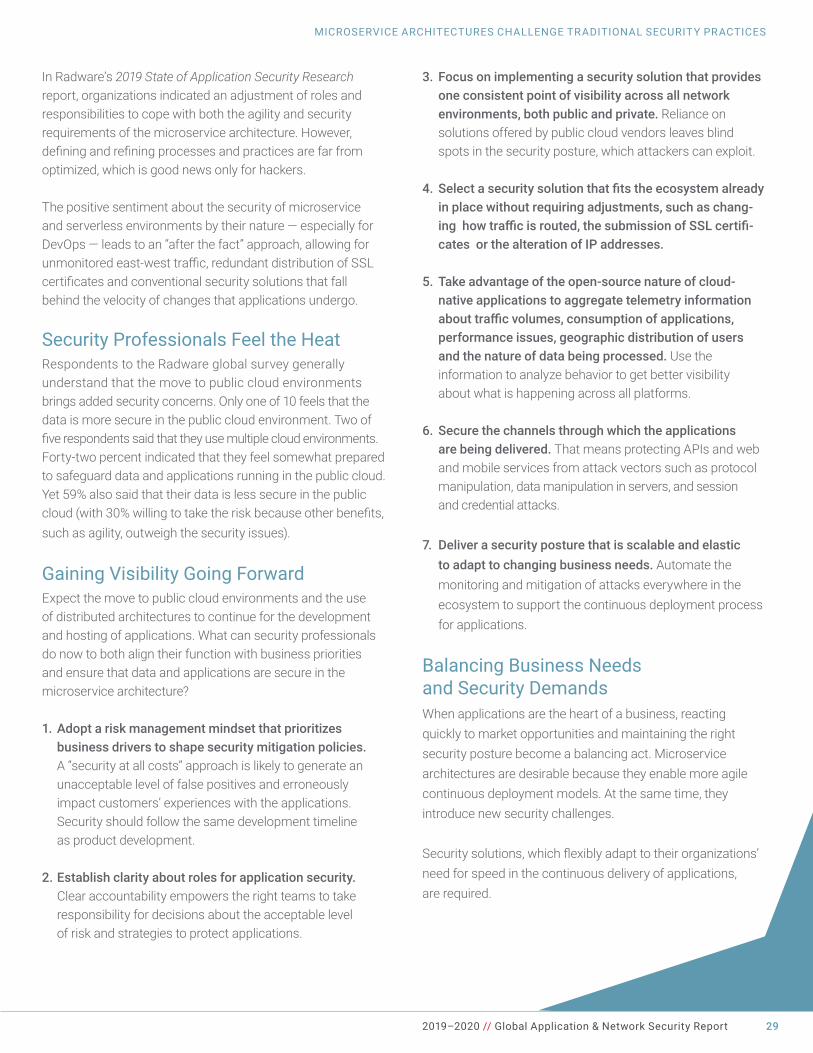
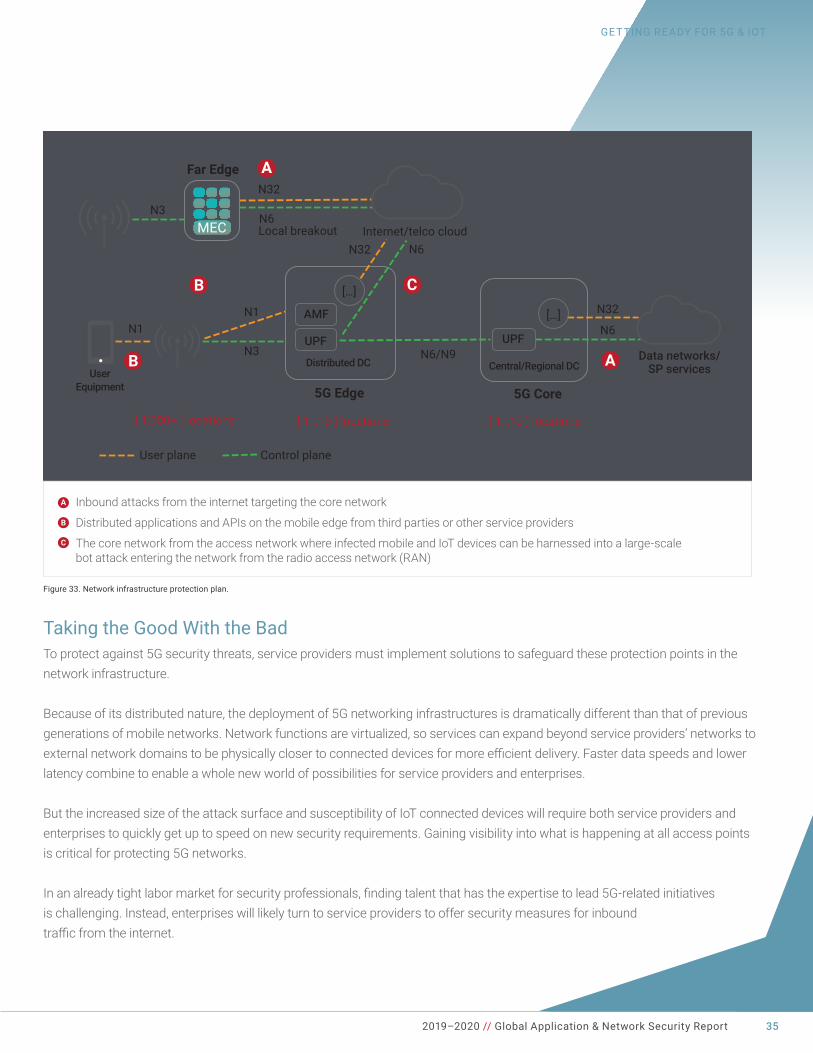
Taking the Good With the BadTo protect against 5G security threats, service providers must implement solutions to safeguard these protection points in the network infrastructure.
Because of its distributed nature, the deployment of 5G networking infrastructures is dramatically different than that of previous generations of mobile networks. Network functions are virtualized, so services can expand beyond service providers’ networks to externalnetworkdomainstobephysicallyclosertoconnecteddevicesformoreefficientdelivery.Fasterdataspeedsandlowerlatency combine to enable a whole new world of possibilities for service providers and enterprises.
But the increased size of the attack surface and susceptibility of IoT connected devices will require both service providers and enterprises to quickly get up to speed on new security requirements. Gaining visibility into what is happening at all access points is critical for protecting 5G networks.
Inanalreadytightlabormarketforsecurityprofessionals,findingtalentthathastheexpertisetolead5G-relatedinitiatives is challenging. Instead, enterprises will likely turn to service providers to offer security measures for inbound trafficfromtheinternet.
Figure 33. Network infrastructure protection plan.
Inbound attacks from the internet targeting the core network
Distributed applications and APIs on the mobile edge from third parties or other service providers
The core network from the access network where infected mobile and IoT devices can be harnessed into a large-scale bot attack entering the network from the radio access network (RAN)
5G Core
UPF
Central/Regional DC
[ 1…10 ] locations
[…]
Client
Identityprovider
CDN
Far Edge
5G Edge
AMF
UPF
Distributed DC Data networks/SP services
N3
N32
[ 1,000+ ] locations
User plane Control plane
[ 1…10 ] locations
N32
N32
N6
N6/N9
N6
[…]
N6N1
N1
N3
Local breakout Internet/telco cloudMEC
A
B C
ABUser
Equipment
A
B
C
2020 Cybersecurity PredictionsOrganizations are eager to accelerate the pace of digital transformation as a means to boost their abilities to adapt to rapidly evolving market opportunities. Every step forward seems to add to the complexity of securing networks, data and applications.
Radware network security experts predict what to expect in 2020.
2019–2020 // Global Application & Network Security Report36
2020 CYBERSECURIT Y PREDICTIONS
1.THREAT LANDSCAPE: The Resurgence of Amplification Attack Vectors As cyberdefenses improve, attackers respond in kind. We have reached a point where volumetric attacks are required to critically impact most targets. In 2020, expect to see cybercriminalsrefinetactics,techniquesandprocedures(TTPs)togenerateamplificationeffectsthatresultin volumetric attacks.
2. MASSIVE SOPHISTICATED BOTNETS ARE COMING TO THWART ELECTIONS AND E-COMMERCE:With APIs becoming the main information corridor between applications, threat actors will use bots to target APIs. Bots will get smarter and be able to sense mitigation techniques automatically and then shift techniques between attack vectors. The rapid proliferation of IoT devices will continue to fuel the formation of massive botnets, which are often used by malicious groups such as nation-states (for example, in social networks for espionage and propaganda) and organizedcrime(theft/financialgain).Furthermore,threatactors will have greater access to these tools as they become less expensive and more commonly available.
3. PUBLIC CLOUD: Multicloud Strategies Grow Even as Threats IncreaseEnterprises will continue to move their applications to the public cloud but do not want to be locked in with one vendor. Instead, they will use multiple cloud service providers to negotiate better fee structures and reduce the risk of service outages affecting business operations. This strategy exponentially increases the size of the attack surfaces in which hackers can search for vulnerabilities, knowing that organizations are challenged to maintain consistent security across multiple public cloud environments. We expect news of major application breaches to make headlines in 2020,butthebenefitsofthisapproachoutweightherisks and will not slow adoption of the public cloud.
4. APPLICATION SECURITY: Microservices and Speed of Business Reduce Visibility Into the Attack LandscapeAs more organizations employ microservices for application development and hosting, new vulnerabilities and threats will emerge. Because applications are disaggregated across adistributedarchitecture,protectingeast-westtrafficflowsinside the network will become a larger concern than defending north-southtrafficflowsfromexternalentities.In2020,weexpectarashofhacksonapplicationsviaeast-westflows,attacksonAPIsandtestingofvulnerabilitiesinKubernetes.The priority for continuous deployment of applications will continue to take precedence over traditional IT security protocols in the interest of faster time to market. DevSecOps willtakeahigherprofileasthefunctionresponsibleforsuccessful attacks and data breaches as both its authority and budget for application security increase. New privacy legislation will also reduce visibility into data transactions.
5. 5G ROLLOUTS: Progress Showcases IoT Device VulnerabilitiesCommercialrolloutsof5Gnetworksin2020willfinally enable the organizations to take advantage of IoT devices that leverage the network performance improvements and lower latency of the new technology. Expect to see a successful takedownofahigh-profilenetworkandapplicationswith an attack launched through IoT devices connected to a 5G network.
6. AUTOMATION: Fighting Fire With FireArtificialintelligence(AI)andmachinelearningarereaching a tipping point where we will see these technologies underpinning many other technologies and solutions that automate some business operations. Hackers will continue to look for ways to poison the decision-making algorithms that guide AI and machine learning to create new attack surfaces. From a security perspective, we expect machine learning to move beyondidentificationofnewthreateningbehaviorstotheautomated tuning of security policies to reduce human errors and enable organizations to redeploy security engineers from production networks to DevSecOps. Enterprises will also seek one holistic view of their security posture across multicloud environments.
2019–2020 // Global Application & Network Security Report 37
2020 CYBERSECURIT Y PREDICTIONS
2019–2020 // Global Application & Network Security Report38
RESPONDENTS PROFILE
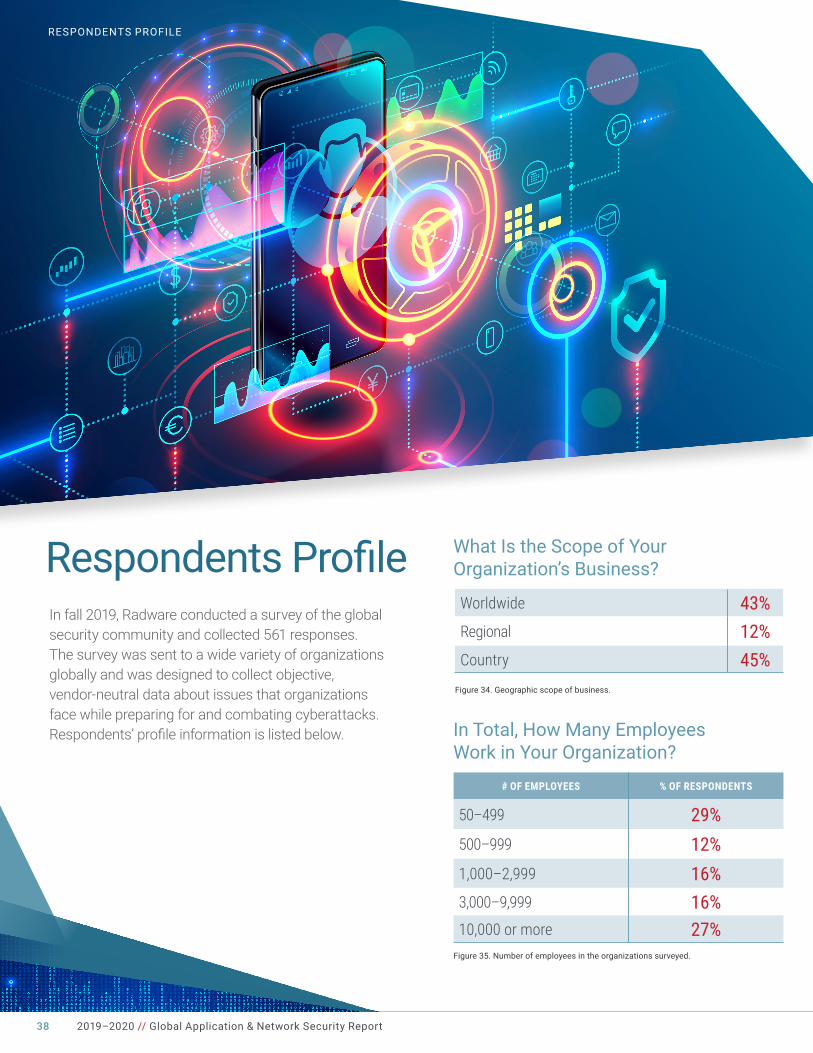
What Is the Scope of Your Organization’s Business?
Worldwide 43%Regional 12%Country 45%
Figure 34. Geographic scope of business.
In Total, How Many Employees Work in Your Organization?
# OF EMPLOYEES % OF RESPONDENTS
50–499 29%500–999 12%1,000–2,999 16%3,000–9,999 16%10,000 or more 27%
Figure 35. Number of employees in the organizations surveyed.
Respondents ProfileIn fall 2019, Radware conducted a survey of the global security community and collected 561 responses. The survey was sent to a wide variety of organizations globally and was designed to collect objective, vendor-neutral data about issues that organizations face while preparing for and combating cyberattacks. Respondents’profileinformationislistedbelow.
2019–2020 // Global Application & Network Security Report 39
RESPONDENTS PROFILE
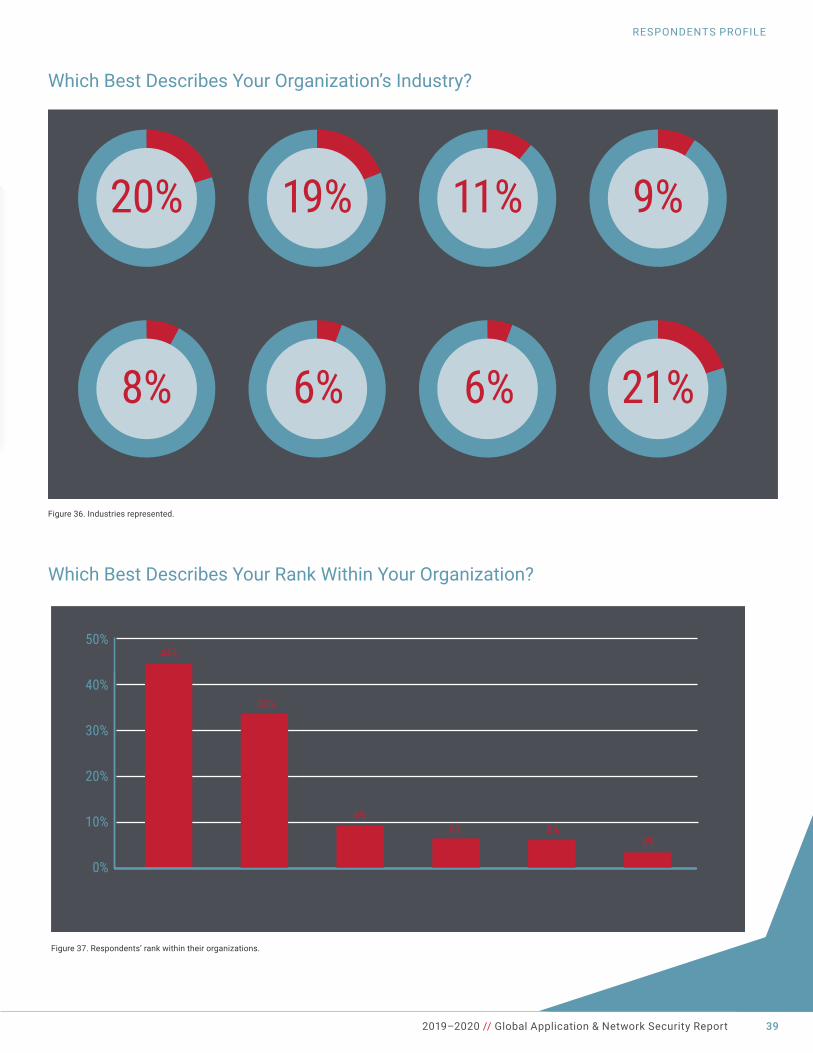
Figure 36. Industries represented.
Which Best Describes Your Organization’s Industry?
Government Healthcare Manufacturing Other
Banking/financial services
Service provider/carrier
High tech products & services
Professional services & consulting
20%
21%
19% 11% 9%
8% 6% 6%
Figure 37. Respondents’ rank within their organizations.
Which Best Describes Your Rank Within Your Organization?
0%
10%
20%
30%
40%
50%
Manager/team leader
Individual contributor
Director VP/AVP/SVP/EVP CEO/CIO/CTO CISO
44%
3%6%6%
9%
33%
Credits
CONTRIBUTORS
Michael GroskopVP, Portfolio ManagementRadware Nissim ParienteVP, Security AnalyticsRadware Louis ScialabbaDirector, Carrier Solutions MarketingRadware Eyal AraziManager, Security Product MarketingRadware Daniel SmithSecurity ResearcherRadware
PROJECT MANAGEMENT
Carolyn MuzykaDirector, Marketing CommunicationsRadware Laura Ann TillotsonManager, Marketing CommunicationsRadware
Colin BeastyManager, Global Strategic MarketingRadware
EDITORSDeborah SzajngartenDirector, Public RelationsRadware Ben ZilbermanManager, Security Product MarketingRadware EXECUTIVE SPONSORSMichael O’MalleyVP, Corporate and Strategic MarketingRadware Shira SagivHead of Portfolio MarketingRadware
Radware encourages you to join our community and follow us on: Radware Blog, LinkedIn, Facebook, Twitter, YouTube, Radware Connect app for iPhone® and our security center DDoSWarriors.com that provides a comprehensive analysis on DDoS attack tools, trends and threats.
© 2020 Radware Ltd. All rights reserved. The Radware products and solutions mentioned in this report are protected by trademarks, patents and pending patent applications of Radware in the U.S. and other countries. For more details, please see: https://www.radware.com/LegalNotice/. All other trademarks and names are property of their respective owners.
Radware® (NASDAQ: RDWR) is a global leader of cybersecurity and application delivery solutions for physical, cloud and software-defined data centers. Its award-winning solutions portfolio secures the digital experience by providing infrastructure, application and corporate IT protection and availability services to enterprises globally. Radware’s solutions empower more than 12,500 enterprise and carrier customers worldwide to adapt quickly to market challenges, maintain business continuity and achieve maximum productivity while keeping costs down. For more information, please visit www.radware.com.


