Relation of Flavor Development in Cheddar Cheese to Chemical Changes in the Fat of the Cheese J. A. OHREN 1 and S. L. "rUCKEY Department of Food Science, University of Illinois, Urbana 61801 Abstract Typical Cheddar cheese flavor was found to be related to a balance of free fatty acids and acetate. Experimental lots of cheese, which had the finest flavor and high- est score, had a concentration of free fatty acids plus acetate of 12 to 28 tLmoles per gram of cheese solids after 180 days of aging or a ratio of free fatty acids to acetic acid between 0.55 to 1.0. Gas-liquid chromatography analysis showed that iden- tical fatty acids were liberated in each lot of cheese. All even-numbered carbon fatty acids from C4 to Cls were found in each lot from the first day of manufacture. Cheese criticized as having rancid, fruity, and fermented flavors had two to three times the concentration of Clo, C12, and C14 fatty acids as did cheese of fine flavor. Cheese made from skimmilk did not ac- quire either Cheddar flavor or body char- acteristics during ripening of six or 12 months. Only Cheddar cheese containing 50% fat or more in the dry matter devel- oped a typical flavor, whereas cheese with less than 50% fat did not. As fat in the cheese decreased, the concentration of fatty acids decreased, but the acetate increased so the ratio between free fatty acids/ace- tate became undesirable. Typical flavor developed in cheese made either from raw or from pasteurized whole milk, provided the bacterial count of the milk was not abnormally high or low. Greater concen- tration of free fatty acids developed dur- ing ripening in cheese made from pasteur- ized milk, when the total plate count was high in the raw milk, > lO,O00,O00/milli- liter, than in cheese made from raw milk with a low bacterial count, 1,000 to 5,000 /milliliter. The flavor of cheese is a result of a blend of decomposition and hydrolytic products formed Received for publication August 9, 1968. 1Submitted to the Graduate College to par- tially fulfill the requirements for the degree of Doctor of Philosophy in Dairy Technology. This investigation was supported in part by Public Health Service Grant 8 TIES 25-03. 598 from milk components. Milk proteins and lac- tose are the sources of numerous flavor pre- cursors for Cheddar cheese, but milk fat is per- haps the more important source because cheese made from skimmilk does not develop a typical Cheddar flavor (9, 10, 14, 19). Hydrolysis of fat occurs in cheese made from both raw and pasteurized milk, but the extent of lipolysis tends to be greater in cheese made from raw milk. Nevertheless, a typical Ched- dar flavor does not develop when fa~ hydrolysis is either low (8) or excessive (5). However, the flavor of Cheddar cheese is more complex than the flavor of fatty acids of milk fat, even though lipolysis is one of the essential reac- tions occurring during ripening (7, 9, 10, 13, 17). Cheddar flavor is associated with the fat, but appears to be composed of numerous com- pounds which must be in balance for the flavor to be considered typical. Kristoffersen (7) has shown that when fatty acids and hydrogen sulfide are in proper ratio a desirable Cheddar flavor results, but if either fatty acids or hydro- gen sulfide is too high or low a less desirable flavor is produced. It will be shown that a somewhat similar relation was found to exist between fatty acids and acetate, although Kris- tofferen (7) did not find this to be true. Never- theless, Patton (14) found acetate and volatile acid concentration to be important factors in contributing to Cheddar flavor. Objectives of our investigation were to evalu- ate the relative importance of several factors affecting chemical changes in the fat of cheese and their effect on the development of the typical flavor. The following factors were studied relative to desirable flavor development in Cheddar cheese : 1. Concentration of free fatty acids and acetic acid in the cheese during ripening. 2. Amount of fat in the milk. 3. Microbial quality of the milk. 4. Reduction in number of bacteria in milk by heat and by hydrogen peroxide. Answers to these questions were desired. 1. Is there a specific concentration of free fatty acids plus acetate which is optimum for a typical flavor~ 2. Can concentrations of specific fatty acids
Transcript
Relation of Flavor Development in Cheddar Cheese to Chemical Changes in the Fat of the Cheese
J. A. OHREN 1 and S. L. "rUCKEY Department of Food Science, University of Illinois, Urbana 61801
Abstract
Typical Cheddar cheese flavor was found to be related to a balance of free fa t ty acids and acetate. Experimental lots of cheese, which had the finest flavor and high- est score, had a concentration of free fa t ty acids plus acetate of 12 to 28 tLmoles per gram of cheese solids af ter 180 days of aging or a ratio of free fa t ty acids to acetic acid between 0.55 to 1.0. Gas-liquid chromatography analysis showed that iden- tical fa t ty acids were liberated in each lot of cheese. All even-numbered carbon fa t ty acids from C4 to Cls were found in each lot from the first day of manufacture. Cheese criticized as having rancid, fruity, and fermented flavors had two to three times the concentration of Clo, C12, and C14 fa t ty acids as did cheese of fine flavor.
Cheese made from skimmilk did not ac- quire either Cheddar flavor or body char- acteristics during ripening of six or 12 months. Only Cheddar cheese containing 50% fa t or more in the dry matter devel- oped a typical flavor, whereas cheese with less than 50% fa t did not. As fa t in the cheese decreased, the concentration of fa t ty acids decreased, but the acetate increased so the ratio between free fa t ty acids/ace- tate became undesirable. Typical flavor developed in cheese made either from raw or from pasteurized whole milk, provided the bacterial count of the milk was not abnormally high or low. Greater concen- tration of free fa t ty acids developed dur- ing ripening in cheese made from pasteur- ized milk, when the total plate count was high in the raw milk, > lO,O00,O00/milli- liter, than in cheese made from raw milk with a low bacterial count, 1,000 to 5,000 /milliliter.
The flavor of cheese is a result of a blend of decomposition and hydrolytic products formed
Received for publication August 9, 1968. 1Submitted to the Graduate College to par-
tially fulfill the requirements for the degree of Doctor of Philosophy in Dairy Technology. This investigation was supported in part by Public Health Service Grant 8 T I E S 25-03.
598
from milk components. Milk proteins and lac- tose are the sources of numerous flavor pre- cursors for Cheddar cheese, but milk fa t is per- haps the more important source because cheese made from skimmilk does not develop a typical Cheddar flavor (9, 10, 14, 19).
Hydrolysis of fa t occurs in cheese made from both raw and pasteurized milk, but the extent of lipolysis tends to be greater in cheese made from raw milk. Nevertheless, a typical Ched- dar flavor does not develop when fa~ hydrolysis is either low (8) or excessive (5). However, the flavor of Cheddar cheese is more complex than the flavor of fa t ty acids of milk fat, even though lipolysis is one of the essential reac- tions occurring during ripening (7, 9, 10, 13, 17). Cheddar flavor is associated with the fat, but appears to be composed of numerous com- pounds which must be in balance for the flavor to be considered typical. Kristoffersen (7) has shown that when fa t ty acids and hydrogen sulfide are in proper ratio a desirable Cheddar flavor results, but if either fa t ty acids or hydro- gen sulfide is too high or low a less desirable flavor is produced. I t will be shown that a somewhat similar relation was found to exist between fa t ty acids and acetate, although Kris- tofferen (7) did not find this to be true. Never- theless, Patton (14) found acetate and volatile acid concentration to be important factors in contributing to Cheddar flavor.
Objectives of our investigation were to evalu- ate the relative importance of several factors affecting chemical changes in the fa t of cheese and their effect on the development of the typical flavor.
The following factors were studied relative to desirable flavor development in Cheddar cheese :
1. Concentration of free fa t ty acids and acetic acid in the cheese during ripening.
2. Amount of fa t in the milk. 3. Microbial quality of the milk. 4. Reduction in number of bacteria in milk
by heat and by hydrogen peroxide.
Answers to these questions were desired.
1. Is there a specific concentration of free fat ty acids plus acetate which is optimum for a typical flavor~
2. Can concentrations of specific fa t ty acids
CHEDDAR CHEESE F L A V O R 599
be correlated with desirable and also un- desirable flavors ?
3. Is level of milk fat in the cheese an im- portant factor in the development of Cheddar flavor?
4. Is bacterial population of the raw milk related to flavor of the cheese?
Experimental Procedures
'/'he measurement of' chemical changes in the fat was limited to those determined by silieic acid column chromatography or by gas-liquid chromatography (GLC). Organoleptie evalua- tion of the cheese was made by qualified judges, so as to correlate chemical changes in the fat with development of flavor.
The total free fatty acids were determined by extracting the fatty acids and glycerides from 10 g cheese using the method of Harper et ah (4) except that thynml blue instead of phenol red was used as the indicator' in the KOH titration of free fatty acids with 0.01 h- methanolic.
The rapid silicic acid method of ~fcCarthy and Duthie (11) was used to separate the fatty acids front the lipids of the cheese sample as follows :
1. Evaporate the solvent from the Harper extraction with a Rinco rotary vacuum evaporator with the flask in a water bath controlled at 45 C.
2. Acidify the residue with 20% H2S04 to thymol blue end point to release the fatty acids.
3. Transfer sample quantitatively with 20 ml anhydrous ethyl ether to McCarthy-Duthie column.
4. Remove gly(,erides from the column by extraction with several small portions of anhydrous ethyl ether until a total volume shows absence of glyeerides by thin-layer chromatography.
5. Remove fatty acids from column by adding 50 ml 2~ formic acid in anhydrous ethyl ether followed by adding 100 nd anhydrous ethyl ether to wash column. Collect total eluant in a flask containing 10 ml of 10% methanolic K 0 H to prevent loss of vola- tile acids.
Methyl esters of the free fatty acids extracted from the McCarthy-Duthie column were pre- pared as follows:
After evaporation of the ethyl ether solvent, the residue was acidified with 50% methanolic HC1 to thynml blue end point. The sample was then dried by adding 5 g of anhydrous sodium sulfate followed by filtering, and collecting the
filtrate in a 100-nil round-bottomed flask. After washing the residue on the filter with 10 ml absolute methanol, the entire filtrate was acidi- fied with 0.2 ml concentrated I{2SO 4. The acid serves as the catalyst in the methylation reaction, which occurs during' refluxing of the mixture for 30 rain in a water bath controlled at 80 C.
After cooling and neutralizing to thymol blue end point with 10% aqueous KOH, the methyl esters were properly extracted with pentane and dried with anhydrous sodium sul- fate. After several extractions and complete drying the pentane was slowly evaporated in a water bath at 40 C. The residue was then used for analysis by gas-liquid chromatography (GLC).
The following' procedure was used for separa- tion and identification of the fatty acids as methyl esters using GLC.
An Aerograph Model A-90-P gas-liquid chromatographic apparatus equipped with a thermal detector was used for chromatogTaphie analysis. A Minneapolis-Honeywell recorder Model 143X58 Electronic equipped with a Model 201 Disc integrator was used.
The samples: of methyl esters were injected into the GLC apparatus with a Hanfilton mi- crosyringe. Analytical conditions were as fol- lows: injector, colunm, detector, and collector temperatures were 255, 157, 240, and 197 C, respectively. Detector amperage was 200 ma. Flow rate of helium by soap bubble apparatus, was 44 ml per minute. Size of column was 6.35 mm by 1.52 m long and of stainless steel. The column material was 20% diethylenegly- col succinate on acid-washed Chromosorb W 60/80 mesh.
The area under the peak of a given sub- stance divided by the total area under all peaks in the ehr0matogram, nmltiplied by 100, is equal to the per cent area, that is,
Per cent A = (A/A + B-b C) X 100
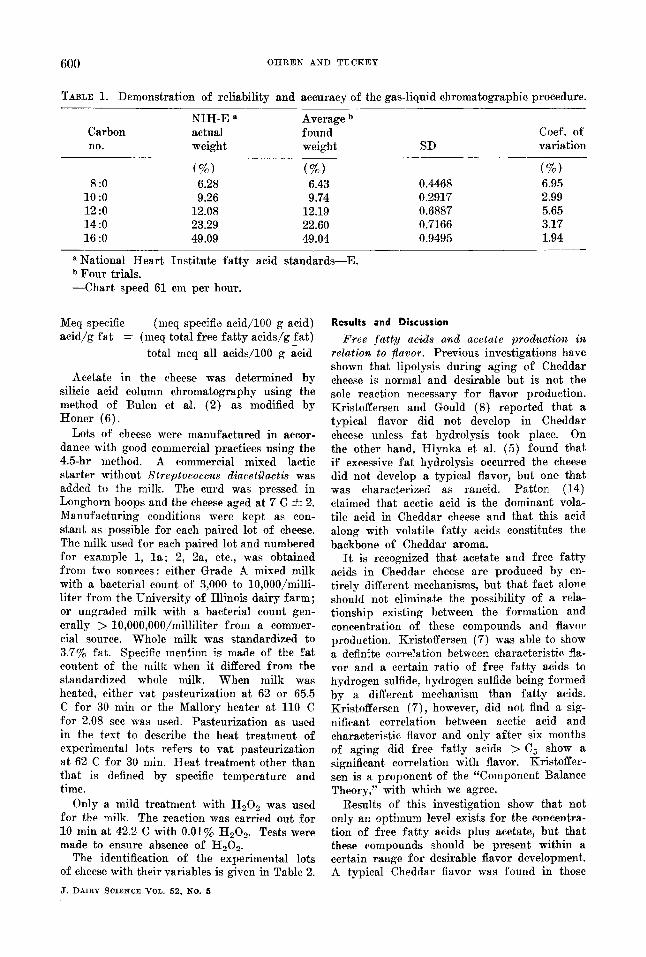
Nogare and Juvet (12) have reported that the resulting percentage can be recorded as weight per cent when a thermal conductivity detector is used. Results in Table 1 demonstrate the reliability and accuracy of the GLC procedure, using National Heart Institute Fat ty Acid Standard Mixture E as a standard.
The quantitative estimation of individual fatty acids expressed as milliequivalent (meq) of free fatty acids was determined as follows:
Meq specific % area specific acid acid/100 g a d d = from GLC X 1,000
tool w specific acid
5. DAIRY SCIENCE VOL. 52, NO. 5
600 OHI~EN AND TUCKEY
TABLE 1. Demonstration of reliability and accuracy of the gas-liquid chromatographic procedure.
NIH-E a Average b Carbon actual found Coef. of no. weight weight SD variation
a National Heart Institute fatty acid standards--E. b Four trials. - -Char t speed 61 cm per hour.
Meq specific (meq specific acid/100 g acid) acid/g fat = (meq total free fatty acids/g fat)
total meq all acids/100 g acid
Acetate in the cheese was determined by silieic acid column chromatography using the method of Bulen et al. (2) as modified by Honer (6).
Lots of cheese were manufactured in accor- dance with good commercial practices using the 4.5-hr method. A commercial mixed lactic starter without Streptococcus diacet~7a~tis was added to the milk. The curd was pressed in Longhorn hoops and the cheese aged at 7 C ~ 2. Manufacturing conditions were kept as con- stant as possible for each paired lot of cheese. The milk used for each paired lot and numbered for example 1, ]a ; 2, 2a, etc., was obtained from two sources: either Grade A mixed milk with a bacterial count of 3,000 to 10,000/milli- liter from the University of Illinois dairy farm; or ungraded milk with a bacterial count gen- erally > 10,000,000/milliliter from a commer- cial source. Whole milk was standardized to 3.7% fat. Specific mention is made of the fat content of the milk when it differed from the standardized whole milk. When milk was heated, either vat pasteurization at 62 or 65.5 C for 30 rain or the Mallory heater at 110 C for 2.08 sec was used. Pasteurization as used in the text to describe the heat treatment of experimental lots refers to vat pasteurization at 62 C for 30 rain. Heat treatment other than that is defined by specific temperature and time.
Only a mild treatment with t I20 ~ was used for the milk. The reaction was carried out for 10 min at 42.2 C with 0.01% H20 ~. Tests were made to ensure absence of H202.
The identification of the experimental lots of cheese with their variables is given in Table 2.
~. DAIRY SCIEIqCE ~OL. 52, NO.
Results and Discussion
Free fatty acids and acetate production i~ relation to flavor. Previous investigations have shown that lipolysis during aging of Cheddar cheese is normal and desirable but is not the sole reaction necessary for flavor production. Kristoffersen and Gould (8) reported that a typical flavor did not develop in Cheddar cheese unless fat hydrolysis took place. On the other hand, l:[lynka et al. (5) found that if excessive fat hydrolysis occurred the cheese did not develop a typical flavor, but one that was characterized as rancid. Patton (I4) claimed that acetic acid is the dominant vola- tile acid in Cheddar cheese and that this acid along with volatile fatty acids constitutes the backbone of Cheddar aroma.
I t is recognized that acetate and free fatty acids in Cheddar cheese are produced by en- tirely different mechanisms, but that fact alone should not eliminate the possibility of a rela- tionship existing between the formation and concentration of these compounds and flavor production. Kristoffersen (7) was able to show a definite correlation between characteristic fla- vor and a certain ratio of free fatty acids to hydrogen sulfide, hydrogen sulfide being formed by a different mechanism than fatty acids. Kristoffersen (7), however, did not find a sig- nificant correlation between acetic acid and characteristic flavor and only after six months of aging did free fatty acids > C5 show a significant correlation with flavor. Krlstoffer- sen is a proponent of the "Component Balance Theory," with which we agree.
Results of this investigation show that not only an optimum level exists for the concentra- tion of free fatty acids plus acetate, but that these compounds should be present within a certain range for desirable flavor development. A typical Cheddar flavor was found in those
CHEDDAR CHEESE FLAVOR 601
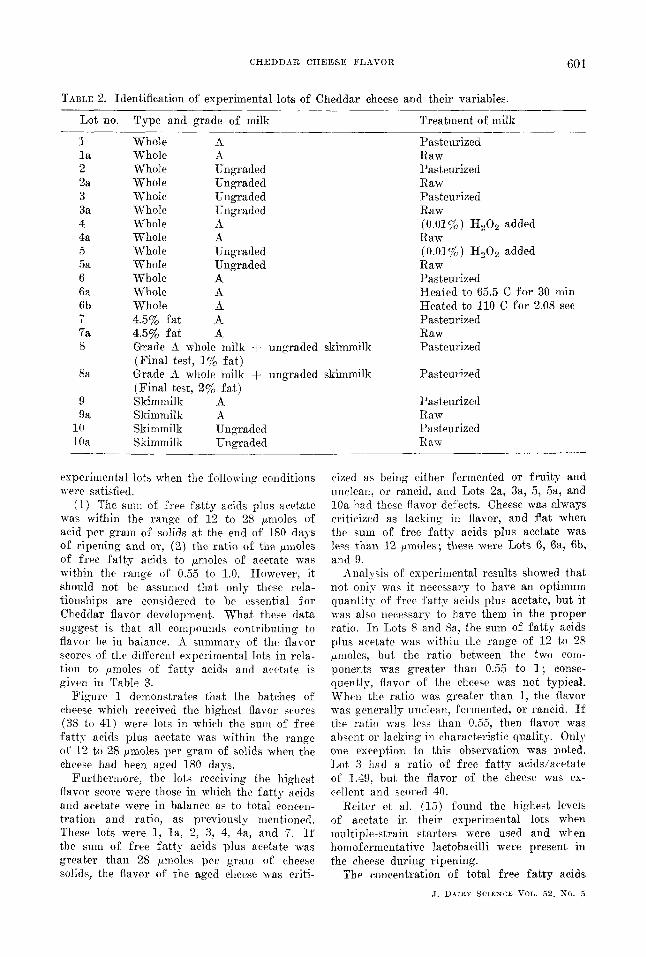
TABLE 2. Identification of experimental lots of Cheddar cheese and their variables.
Lot no. Type and grade of milk Treatment of milk
1 Whole A Pastearized l a Whole A Raw 2 Whole Ungraded Pasteurized 2a Whole Ungraded Raw 3 Whole Ungraded Pasteurized 3a Whole Ungraded Raw 4 Whole A (0.01%) t t20 ~ added 4a Whole A Raw 5 Whole Ungraded (0.01%) H 202 added 5a Whole Ungraded Raw 6 Whole A Pasteurized 6a Whole A Heated to 65.5 C for 30 nfin 6b Whole A Heated to 110 C for 2.08 see 7 4.5% fat A Pasteurized 7a 4.5% fat A Raw 8 Grade A whole milk + ungraded skimrailk Pasteurized
(Final test, 1% fat) Grade A whole milk -J- ungraded skimmilk (Final test, 2% fat.) Skimmilk A Skimmilk A Skimmilk Ungraded Skimnfilk Ungraded
8a Pasteurized
9 Pasteurized 9a Raw
10 Pasteurized 10a Raw
experimental lots when the following conditions were satisfied.
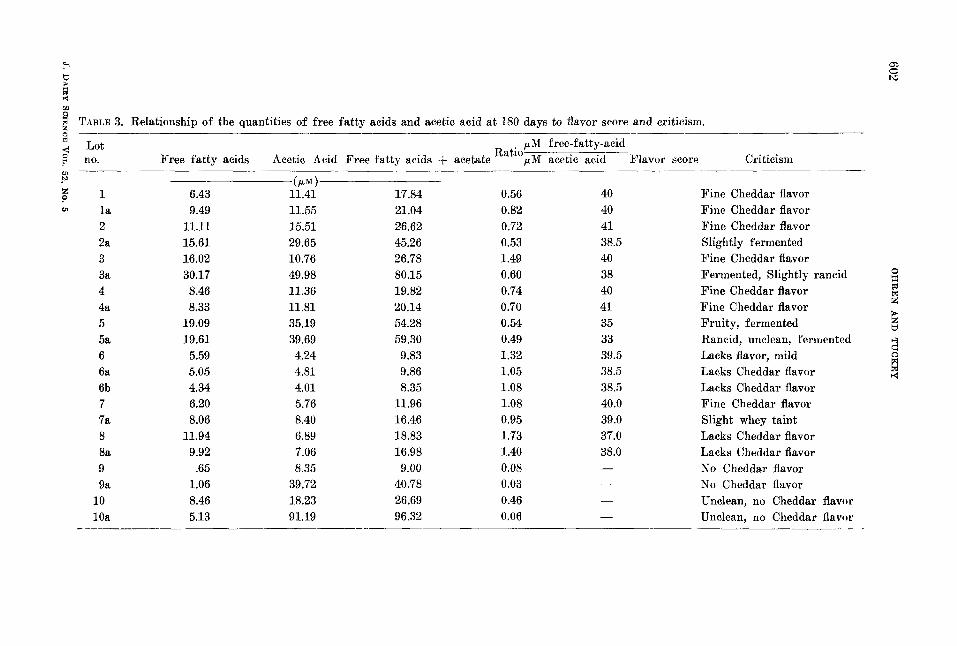
(1) The sum of free fs.tty acids plus acetate was within the range of 12 to 28 /~moles of acid per gram of solids at the end of 180 days of ripening and or, (2) the ratio of the /xmoles of free fatty acids to /xmoles of acetate was within the range of 0.55 to 1.0. However, it should not be assumed that only these rela- tionships are considered to be essential for Cheddar flavor development. What these data suggest is that all compounds contributing to flavor be in balance. A summary of the flavor scores of the different experimental lots in rela- tion to umoles of fatty acids and acetate is given in Table 3.
Figure 1 demonstrates that the batches of cheese which received the highest flavor scores (38 to 41) were lots in which the sum of free fatty acids plus acetate was within the range of 12 to 28 ~moles per gram of solids when the cheese had been aged 180 days.
Furthermore, the lots receiving' the highest flavor score were those in which the fatty acids and acetate were in balance as to total concen- tration and ratio, as previously mentioned. These lots were 1, la, 2, 3, 4, 4a, and 7. I f the stun of free fatty acids plus acetate was greater than 28 tmmles per gram of cheese solids, the flavor of the aged cheese was criti-
eized as being either fermented or fruity and unclean, or rancid, and Lots 2a, 3a, 5, 5a, and 10a had these flavor defects. Cheese was always criticized as lacking in flavor, and flat when the sum of free fatty acids plus acetate was less than 12 ~moles; these were Lots 6, 6a, 6b, and 9.
Analysis of experimental results showed that not only was it necessary to have an optimum quantity of free fatty acids plus. acetate, but it was also necessary to have them in the proper ratio. In Lots 8 and 8a, the sum of fatty acids plus acetate was within the range of 12 to 28 tmloles, but the ratio between the two com- ponents was greater than 0.55 to 1; conse- quently, flavor of the cheese was not typical When the ratio was greater than 1, the flavor was generally unclean, fermented, or rancid. I f the ratio was less than 0.55, then flavor was absent or lacking in characteristic quality. Only one exception to this observation was noted. Lot 3 had a ratio of free fatty acids/acetate of 1.49, but the flavor of the cheese was ex- cellent and scored 40.
Reiter et ah (15) found the highest levels of acetate in their experimental lots when multiple-strain starters were used and when homofermentative lactobacilli were present in the cheese during ripening.
The concentration of total free fatty acids
J . DAIRY SCIENCE VOL. 52. NO. 5
TABLE 3. Relationship of the quantities o£ free fatty acids and acetic acid at 180 days to flavor score and criticism. 5~
I I I I I I l 1 I I I I 30 31 52 33 34 35 56 37 3B 39 40 4l
SCORE OF CHEESE
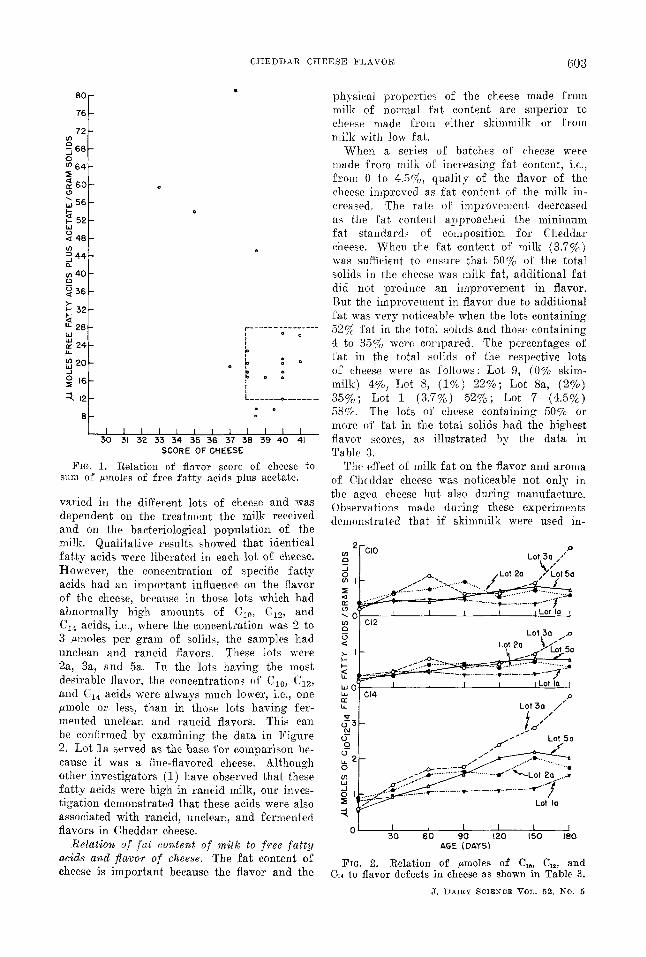
J~'m. 1. Relation of flavor score of cheese to sum of ~moles of free fatty acids plus acetate.
varied in the different lots of cheese and was dependent on the treatment the milk received and on the bacteriological population of the milk. Qualitative results showed that identical fat ty acids were liberated in each lot of cheese. However, the concentration of specific fatty acids had an important influence on the flavor of the cheese, because in those lots which had abnormally high amounts of CI~, Clu, and C14 acids, i .e, where the concentration was 2 to 3 ~moles per gram of solids, the samples had unclean and rancid flavors. These lots were 2a, 3a, and 5a. In the lots having the most desh~able flavor, the concentrations of C10, C12, and C14 acids were always much lower, i.e., one #zmole or less, than in those lots having fer- mented unclean and rancid flavors. This can be confirmed by examining the data in Figure 2. Lot l a served as the base for comparison be- cause it was a fine-flavored cheese. Although other investigators (1) have observed that these fat ty acids were high in rancid milk, our inves- tigation demonstrated that these acids were also associated -with rancid, unclean, and fermented flavors in Cheddar cheese.
Relation of fat content of milk to free fatty acids and flavor of cheese. The fa t ecintent of cheese is important because the flavor and the
physical properties of the cheese made from milk of normal fat content are superior to cheese made from either skimmilk or from milk with low fat.
When K series of batches of cheese were made from milk of increasing fat content, i.e., from 0 to 4.5%, quality of the flavor of the cheese improved as fat content of the milk in- creased. The rate of improvement decreased as the fat content approached the mininmm fat standards of composition for Cheddar
. cheese. When the fat content of milk (3.7%) was sufficient to ensure that 50% of the total solids in the cheese was milk fat, additional fat did not produce an improvement in flavor. But the improvement in flavor due to additional fat was very noticeable when the lots containing
. . . . . . . . . . . . . . . 52% fat in the total solids and those containing I 4 to 35% were eonipared. The percentages of " fat in the total solids of the respective lots F ° "* of cheese were as follows: Lot 9, (0% skim- I milk) 4%~ Lot 8, (1%) 22%; Lot 8a, (2%) L . . . . . . . . . . . . . 35%; Lot 1 (3.7%) 52%; Lot 7 (4.5%)
: ° 58%. The lots of cheese containing 50% or more of fat in the total solids had the highest flavor scores, as illustrated by the data in Table 3.
The effect of milk fat on the flavor and aroma of Cheddar cheese was noticeable not only in the aged cheese but also during manufacture, Observations made during these experiments demonstrated that if skimmilk were used in-
2
co I
n~ q
>. 1
<
LUO
"ClO 0 Lot 30 f i t
.o~ /Lot 2a / Lot 50 <--"7~..."-.'--- ............. I
Fro. 2. Relation of mnoles of C~, C~, and C~4 to flavor defects in cheese as shown in TaMe 3.
J . D A I R Y S C I E N C E V O L . 5 2 , NO,. 5
604 O H R E N A N D T U C K E ¥
stead of whole milk, the aroma and flavor compounds uniquely characteristic of Cheddar cheese were not produced at the time of milling and salting the curd, as is normally observed for whole milk cheese.
Milk fat also has a marked effect on the physical properties of the cheese curd. Cheese with less than the normal amount of fat was less pliable than that with the normal fat con- tent. The cheese curd made from skimmilk was exceedingly tough and rubbery and remained in that condition throughout ripening.
Undoubtedly, the analytical tests made on the experimental lots of choose in which the anmunt of fat was a variable, did not measure all the unique compounds (7, 9) which char- acterize the difference in flavor of whole milk cheese compared with that made from skim- milk. However, if the quantity of free fatty acids plus acetate and the ratio of fatty acids to acetate are related to flavor, then at least a partial explanation is provided for the differ- ence between lots with different fat contents.
Examination of the data in Figure 3 shows
4C
38
3E
34
32
3 0
2c w
ttJ
~2a 8
14
g~ 6
: : t4
ga
/ /
/ /
/ /
/ ) l l a
• . / i
1 ,=8
, / ~.-" ....,,s~
"'~" .......... / ~ _..~....I~ 9
7
I I I I I I 0 30 60 90 120 is0 180
AGE OF CHEESE IN DAYS
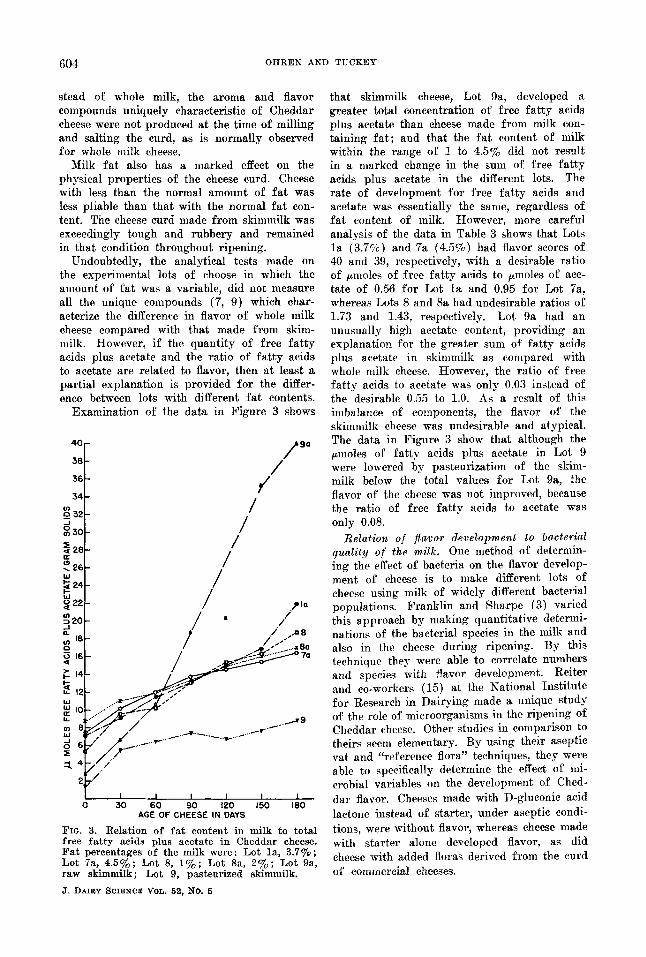
Fro. 3. Relation of fat content in milk to total free fatty acids plus acetate in Cheddar cheese. Fat percentages of the milk were: Lot la, 3.7%; Lot 7a, 4.5%; Lot 8, 1%; Lot 8a, 2%; Lot 9a, raw skimmilk; Lot 9, pasteurized skimmilk.
J . DAIRY SCIENCE VOL. 52, NO. 5
that skimmilk cheese, Lot 9a, developed a greater total concentration of free fatty acids plus acetate than cheese made from milk con- taining fat ; and that the fat content of milk within the range of 1 to 4.5% did not result in a marked change in the sum of free fatty acids plus acetate in the different lots. The rate of development for free fatty acids and acetate was essentially the same, regardless of fat content of milk. However, more careful analysis of the data in Table 3 shows that Lots l a (3.7%) and 7a (4.5%) had flavor scores of 40 and 39, respectively, with a desirable ratio of t~moles of free fatty acids to ttmoles of ace- tare of 0.56 for Lot l a and 0.95 for Lot 7a, whereas Lots 8 and 8a had undesirable ratios of 1.73 and 1.43, respectively. Lot 9a had an unusually high acetate content, providing an explanation for the greater sum of fatty acids plus acetate in skimmilk as compared with whole milk cheese. However, the ratio of free fatty acids to acetate was only 0.03 instead of the desirable 0.55 to 1.0. As a result of this imbalance of components, the flavor of the skiinmilk cheese was undesirable and atypical. The data in Figure 3 show that although the /xmoles of fatty acids plus acetate in Lot 9 were lowered by pasteurization of the skim- milk below the total values for Lot 9a, the flavor of the cheese was not improved, because the ratio of free fatty acids to acetate was only 0.08.
Relation of flavor development to bacterial quality of the milk. One method of determin- ing the effect of bacteria on the flavor develop- ment of cheese is to make different lots of cheese using milk of widely different bacterial populations. Franklin and Sharpe (3) varied this approach by making quantitative determi- nations of the bacterial species in the milk and also in the cheese during ripening. By this technique they were able to correlate numbers and species with flavor development. Reiter and co-workers (15) at the National Institute for Research in Dairying made a unique study of the role of microorganisms in the ripening of Cheddar cheese. Other studies in comparison to theirs seem elementary. By using their aseptic vat and "reference flora" techniques, they were able to specifically determine the effect of mi- crobial variables on the development of Ched- dar flavor. Cheeses made with D-gluconic acid lactone instead of starter, under aseptic condi- tions, were without flavor, whereas cheese made with starter alone developed flavor, as did cheese with added floras derived from the curd of commercial cheeses.
CHEDDAR CHEESE FLAVOR 605
When experimental lots of cheese were made for our investigation, from raw milk having a total plate count varying front 3.2 X 10 ~ to 1.0 X 10~/miltiliter, the best-flavored cheese was made from milk having a plate count be- tween 1.0 X l0 s to 2.0 X 10⁴/milliliter. Frank- lin and Sharpe (3) reported their best-flavored cheese was made from milk having comparable plate counts.
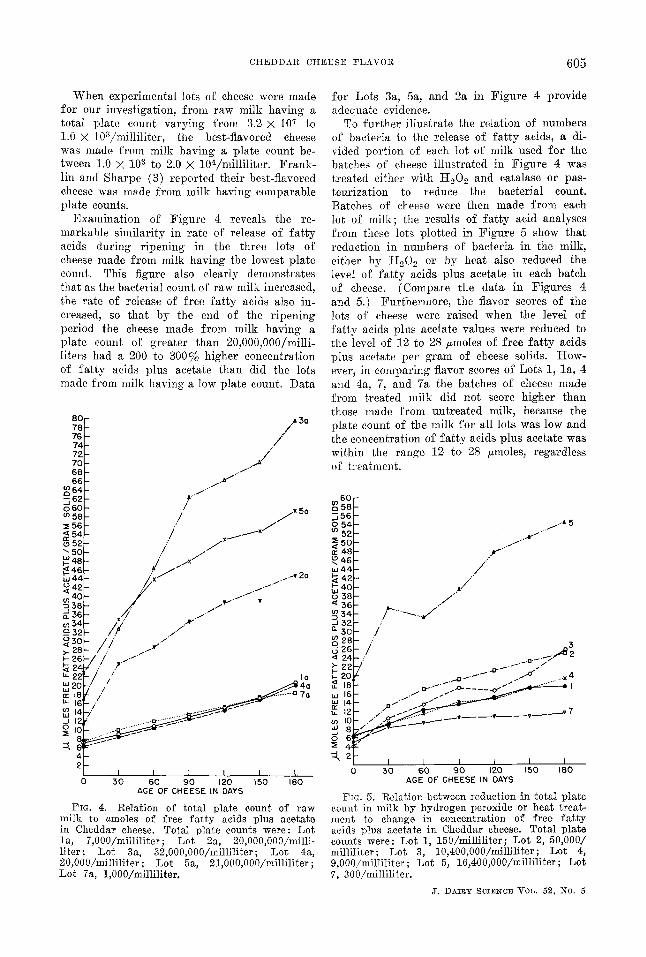
Examination of Figure 4 reveals the re- markable similarity in rate of release of fatty acids during ripening in the three lots of cheese made from milk having the lowest plate count. This figure also clearly demonstrates that as the bacterial count of raw milk increased, the rate of release of free fatty acids also in- creased, so that by the end of the ripening period the cheese made from milk having a plate count of greater than 20,000,000/milli- liters had a 200 to 300% higher concentration of fatty acids plus acetate than did the lots made from milk having a low plate count. Data
FIG. 4. ]~elation of total plate count of raw milk to ~moles of f r ee fatty acids plus acetate in Cheddar cheese. Total plate counts were: Lot la, 7,000/millillter; Lot 2a, 20,000,000/milli- llter; Lot 3a, 32,000,000/milliliter; Lot 4a, 20,000/milliliter; Lot 5a, 21,000,000/milliliter; Lot 7a, 1,000/milliliter.
for Lots 3a, 5a~ and 2a in Figure 4 provide adequate evidence.
To further illustrate the relation of numbers of bacteria to the release of fatty acids, a di- vided portion of each lot of milk used for the batches of cheese illustrated in Figure 4 was treated either with I t20 # and catalase or pas- teurization to reduce the bacterial count. Batches of cheese were then made from each lot of milk; the results of fatty acid analyses from these lots plotted in Figure 5 show that reduction in numbers of bacteria in the milk, either by H202 or by heat also reduced the level of fatty acids plus acetate in each batch of cheese. (Compare the data in Figures 4 and 5.) Furthermore, the flavor scores of the lots of cheese were raised when the level of fatty acids plus acetate values were reduced to the level of 12 to 28 tmmles of free fatty acids plus acetate per gram of cheese solids. IKow- ever, in comparing flavor scores of Lots 1, la, 4 and 4a, 7, and 7a the batches of cheese made from treated milk did not score higher than those made from untreated milk, because the plate count of the milk for all lots was low and the concentration of fatty acids plus acetate was within the range 12 to. 28 t~moles, regardless of treatment.
~ " ~ v 7 ~ 2 2 L - - - ~ . . . . . . . . . I i / ' -
e, } 41
I I I 1 i 1 O 5 0 6 0 9 0 120 I 5 0 180
AGE OF CHEESE IN DAYS
FIG. 5. ~elation between reduction in total plate count in milk by hydrogen peroxide or heat treat- ment to change in concentration of free fatty acids plus acetate in Cheddar cheese. Total plate counts were: Lot 1, 150/n'dlki]iter; Lot 2, 50,000/ milliliter; Lot 3, ]0,40O,O00/millk]iter; Lot 4, 9,000/milliliter; Lot 5, 16,400,000/milliliter; Lo~ 7. 300/milliliter.
:E ~.~ ~. o 3o so 90 ms ,~o ms 101 AGE OF CHEESE IN DAYS ~ 9
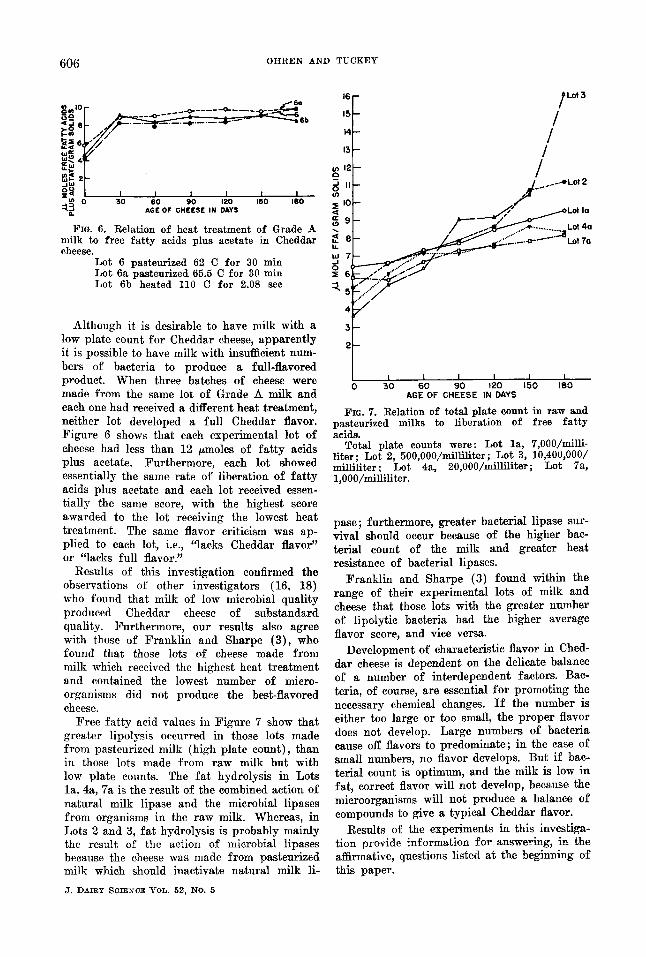
Fro . 6. R e l a t i o n o f hea t t r e a t m e n t o f Grade A milk to free fatty acids plus acetate in Cheddar ~ S cheese, t, ,., 7 Lot 6 pasteurized 62 C for 30 min -J
o Lot 6a pasteurized 65.5 C for 30 min Lot 6b heated 110 C for 2.08 sec :~
Although it is desirable to have milk with a low plate count for Cheddar cheese, apparently it is possible to have milk with insufficient num- bers of bacteria to produce a full-flavored product. When three batches of cheese were made from the same lot of Grade A milk and each one had received a different heat treatment, neither lot developed a full Cheddar flavor. Figure 6 shows that each experimental lot of cheese had less than 12 /~moles of fatty acids plus acetate. Furthermore, each lot showed essentially the same rate of liberation of fatty acids plus acetate and each lot received essen- tially the same score, with the highest score awarded to the lot receiving the lowest heat treatment. The same flavor criticism was ap- plied to each lot, i.e., "lacks Cheddar flavor" or "lacks full flavor."
Results of this investigation confirmed the observations of other investigators (16, 18) who found that milk of low microbial quality produced Cheddar cheese of substandard quality. Furthermore, our results also agree with those of Franklin and Sharpe (3), who found that those lots of cheese made from milk which received the highest heat treatment and contained the lowest number of micro- organisms did not produce the best-flavored cheese.
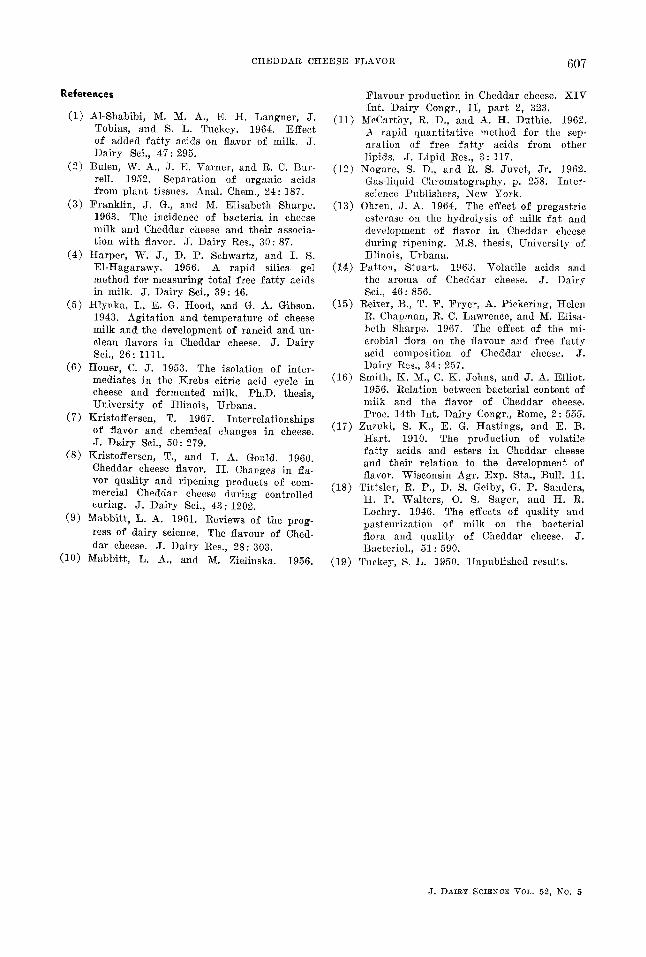
Free fat ty acid values in Figure 7 show that greater lipolysis occurred in those lots made from pasteurized milk (high plate count), than in those lots made from raw milk but with low plate counts. The fat hydrolysis in Lots la, 4a, 7a is the result of the combined action of natural milk lipase and the microbial lipases from organisms in the raw milk. Whereas, in Lots 2 and 3, fat hydrolysis is probably mainly the result of the action of microbial lipases because the cheese was made from pasteurized milk which should inactivate natural milk li-
Fro. 7. Relation of total plate count in raw and pasteurized milks to liberation of free fatty acids.
Total plate counts were: Lot la, 7,000/milli- liter; Lot 2, 500,000/milliliter; Lot 3, 10,400,000/ milliliter ; Lot 4a, 20,000/milliliter; Lot 7a, 1,000/milliliter.
pase; furthermore, greater bacterial lipase sur- vival should occur because of the higher bac- terial count of the milk and greater heat resistance of bacterial lipases.
Franklin and Sharpe (3) found within the range of their experimental lots of milk and cheese that those lots with the greater number of lipolytic bacteria had the higher average flavor score, and vice versa.
Development of characteristic flavor in Ched- dar cheese is dependent on the delicate balance of a number of interdependent factors. Bac- teria, of course, are essential for promoting the necessary chemical changes. I f the number is either too large or too small, the proper flavor does not develop. Large numbers of bacteria cause off flavors to predominate; in the case of small numbers, no flavor develops. But if bac- terial count is optimum, and the milk is low in fat, correct flavor will not develop, because the microorganisms will not produce a balance of compounds to give a typical Cheddar flavor.
Results of the experiments in this investiga- tion provide information for answering, in the affirmative, questions listed at the beginning of this paper.
J. DAIRY SCIENCE VOL. 52, NO. 5
CHEDDAR CHEESE FLAVOR 607
References
(1) A1-Shabibi, M. M. A., E. It. Langner, J. Tobias, and S. L. Tuckey. 1964. Effect of added fa t ty acids on flavor of milk. J. Dairy Sci., 47: 295.
(2) Bulen, W. A., J. E. Varner, and 1~. C. Bur- rell. 1952. Separation of organic acids from plant tissues. Anal. Chem., 24: 187.
(3) Franklin, J. G., and M. Elisabeth Sharpe. 1963. The incidence of bacteria in cheese milk and Cheddar cheese and their associa- tion with flavor. J. Dairy l~es., 30: 87.
(4) Harper, W. J., D. P. Schwartz, and I. S. E1-Hagarawy. 1956. A rapid silica gel method for measuring total free fa t ty acids in milk. J. Dairy Sci., 39: 46.
(5) Hlyllka, I., E. G. Hood, and G. A. Gibson. 1943. Agitat ion and temperature of cheese milk and the development of rancid and un- clean flavors in Cheddar cheese. J. Dairy Sci., 26 : 1111.
(6) Honer, C. J. 1953. The isolation of inter- mediates in the Krebs citric acid cycle in cheese and fermented milk. Ph.D. thesis, University of Illinois, Urbana.
(7) Kristoffersen, T. 1967. Interrelat ionships of flavor and chemical changes in cheese. J. Dairy Sci., 50: 279.
(8) Kristoffersen, T., and L A. Gould. 1960. Cheddar cheese flavor. II . Changes in fla- vor quality and ripening products of com- mercial Cheddar cheese during controlled curing. J. Dairy Sci., 43: 1202.
(9) Mabbitt , L. A. 1961. Reviews of the prog- ress of dairy science. The ttavour of Ched- dar cheese. J. Dairy Res., 28: 303.
(10) Mabbitt , L. A., and M. Zie]inska. 1956.
Flavour production in Cheddar cheese. XIV Int . Dairy Congr., I I , pa r t 2, 323.
(11) McCarthy, R. D., and A. H. Duthie. 1962. A rapid quantitat ive method for the sep- aration of free fa t ty acids from other lipids. J. Lipid Res., 3: 117.
(12) Nogare, S. D., and R. S. Juvet, Jr . 1962. Gas-liquid Chromatography. p. 258. Inter- science Publishers, New York.
(13) Ohren, J. A. ]964. The effect of pregastrie esterase on the hydrolysis of nlilk fa t and development of flavor in Cheddar cheese during ripening. M.S. thes~s, University of Illinois, Urbana.
(14) Patton, Stuart. 1963. Volatile acids and the aroma of Cheddar cheese. 3. Dairy Sci., 46: 856.
(15) Rciter, B., T. F. Fryer, A. l~iekering, Helen R. Chapman, R. C. Lawrence, and M. Elisa- beth Sharpe. 1967. The effect of the mi- crobial flora on the flavour and free fa t ty acid composition of Cheddar cheese. J. Dairy Res., 34: 257.
(16) Smith, K. M., C. K. Johns, and J. A. Elliot. 1956. l~elation between bacterial content of milk and the flavor of Cheddar cheese. Prec. 14th Int . Dairy Congr., Rome, 2: 555.
(17) Zuzuki, S. K., E. G. Hastings, and E. B. Hart. 1910. The production of volatile fa t ty acids and esters ia Cheddar cheese aaad their relation to the development, of flavor. Wisconsin Agr. Exp. Sta., Bull. 11.
(18) Tittsler, R. P., D. S. Geiby, G. P. Sanders, H. P. Walters, O. S. Sager, and H. R. Lochry. 1946. The effects of quality and pasteurization of milk on the bacterial flora and quality of Cheddar cheese. J . Bacteriol., 51: 590.