Representing key phytoplankton functional groups in ocean carbon cycle models: Coccolithophorids M. De ´bora Iglesias-Rodrı ´guez, 1,2 Christopher W. Brown, 3 Scott C. Doney, 4 Joan Kleypas, 4 Dorota Kolber, 1 Zbigniew Kolber, 1 Paul K. Hayes, 5 and Paul G. Falkowski 1,6 Received 26 June 2001; revised 8 January 2002; accepted 16 July 2002; published 26 November 2002. [1] Carbonates are the largest reservoirs of carbon on Earth. From mid-Mesozoic time, the biologically catalyzed precipitation of calcium carbonates by pelagic phytoplankton has been primarily due to the production of calcite by coccolithophorids. In this paper we address the physical and chemical processes that select for coccolithophorid blooms detected in Sea-viewing Wide Field-of-view Sensor (SeaWiFS) ocean color imagery. Our primary goal is to develop both diagnostic and prognostic models that represent the spatial and temporal dynamics of coccolithophorid blooms in order to improve our knowledge of the role of these organisms in mediating fluxes of carbon between the ocean, the atmosphere, and the lithosphere. On the basis of monthly composite images of classified coccolithophorid blooms and global climatological maps of physical variables and nutrient fields, we developed a probability density function that accounts for the physical chemical variables that predict the spatiotemporal distribution of coccolithophorids in the world oceans. Our analysis revealed that areas with sea surface temperatures (SST) between 3° and 15°C, a critical irradiance between 25 and 150 mmol quanta m 2 s 1 , and decreasing nitrate concentrations (DN/Dt < 0) are selective for upper ocean large-scale coccolithophorid blooms. While these conditions favor both Northern and Southern Hemisphere blooms of the most abundant coccolithophorid in the modern oceans, Emiliania huxleyi, the Northern and Southern Hemisphere populations of this organism are genetically distinct. Applying amplified fragment length polymorphism as a marker of genetic diversity, we identified two major taxonomic clades of E. huxleyi; one is associated with the Northern Hemisphere blooms, while the other is found in the Southern Hemisphere. We suggest a rule of ‘‘universal distribution and local selection’’: that is, coccolithophorids can be considered cosmopolitan taxa, but their genetic plasticity provides physiological accommodation to local environmental selection pressure. Sea surface temperature, critical irradiance, and DN/Dt were predicted for the years 2060–2070 using the NCAR Community Climate System Model to generate future monthly probability distributions of coccolithophorids based upon the relationships observed between the environmental variables and coccolithophorid blooms in modern oceans. Our projected probability distribution analysis suggests that in the North Atlantic, the largest habitat for coccolithophorids on Earth, the areal extent of blooms will decrease by up to 50% by the middle of this century. We discuss how the magnitude of carbon fluxes may be affected by the evolutionary success of coccolithophorids in future climate scenarios. INDEX TERMS: 1615 Global Change: Biogeochemical processes (4805); 4594 Oceanography: Physical: Instruments and techniques; 4842 Oceanography: Biological and Chemical: Modeling; 4855 Oceanography: Biological and Chemical: Plankton Citation: Iglesias-Rodrı ´guez, M. D., C. W. Brown, S. C. Doney, J. Kleypas, D. Kolber, Z. Kolber, P. K. Hayes, and P. G. Falkowski, Representing key phytoplankton functional groups in ocean carbon cycle models: Coccolithophorids, Global Biogeochem. Cycles, 16(4), 1100, doi:10.1029/2001GB001454, 2002. 3 Office of Research and Applications, National Oceanographic and Atmospheric Administration, Camp Springs, Maryland, USA. 4 National Center for Atmospheric Research, Climate and Global Dynamics, Boulder, Colorado, USA. 5 School of Biological Sciences, University of Bristol, Bristol, England. 6 Also at Department of Geology and Institute of Marine and Coastal Sciences, Rutgers University, New Brunswick, New Jersey, USA. GLOBAL BIOGEOCHEMICAL CYCLES, VOL. 16, NO. 4, 1100, doi:10.1029/2001GB001454, 2002 1 Environmental Biophysics and Molecular Ecology Program, Institute of Marine and Coastal Sciences, Rutgers University, New Brunswick, New Jersey, USA. 2 Also at School of Biological Sciences, University of Bristol, Bristol, England, UK. Copyright 2002 by the American Geophysical Union. 0886-6236/02/2001GB001454$12.00 47 - 1
Transcript
Representing key phytoplankton functional groups in ocean carbon
cycle models: Coccolithophorids
M. Debora Iglesias-Rodrıguez,1,2 Christopher W. Brown,3 Scott C. Doney,4 Joan Kleypas,4
Dorota Kolber,1 Zbigniew Kolber,1 Paul K. Hayes,5 and Paul G. Falkowski1,6
Received 26 June 2001; revised 8 January 2002; accepted 16 July 2002; published 26 November 2002.
[1] Carbonates are the largest reservoirs of carbon on Earth. From mid-Mesozoic time,the biologically catalyzed precipitation of calcium carbonates by pelagic phytoplanktonhas been primarily due to the production of calcite by coccolithophorids. In this paper weaddress the physical and chemical processes that select for coccolithophorid bloomsdetected in Sea-viewing Wide Field-of-view Sensor (SeaWiFS) ocean color imagery. Ourprimary goal is to develop both diagnostic and prognostic models that represent thespatial and temporal dynamics of coccolithophorid blooms in order to improve ourknowledge of the role of these organisms in mediating fluxes of carbon between theocean, the atmosphere, and the lithosphere. On the basis of monthly composite images ofclassified coccolithophorid blooms and global climatological maps of physical variablesand nutrient fields, we developed a probability density function that accounts for thephysical chemical variables that predict the spatiotemporal distribution ofcoccolithophorids in the world oceans. Our analysis revealed that areas with sea surfacetemperatures (SST) between 3� and 15�C, a critical irradiance between 25 and 150 mmolquanta m�2 s�1, and decreasing nitrate concentrations (DN/Dt < 0) are selective forupper ocean large-scale coccolithophorid blooms. While these conditions favor bothNorthern and Southern Hemisphere blooms of the most abundant coccolithophorid in themodern oceans, Emiliania huxleyi, the Northern and Southern Hemisphere populationsof this organism are genetically distinct. Applying amplified fragment lengthpolymorphism as a marker of genetic diversity, we identified two major taxonomic cladesof E. huxleyi; one is associated with the Northern Hemisphere blooms, while the otheris found in the Southern Hemisphere. We suggest a rule of ‘‘universal distribution andlocal selection’’: that is, coccolithophorids can be considered cosmopolitan taxa, but theirgenetic plasticity provides physiological accommodation to local environmental selectionpressure. Sea surface temperature, critical irradiance, and DN/Dt were predicted for theyears 2060–2070 using the NCAR Community Climate System Model to generate futuremonthly probability distributions of coccolithophorids based upon the relationshipsobserved between the environmental variables and coccolithophorid blooms in modernoceans. Our projected probability distribution analysis suggests that in the North Atlantic,the largest habitat for coccolithophorids on Earth, the areal extent of blooms will decreaseby up to 50% by the middle of this century. We discuss how the magnitude of carbonfluxes may be affected by the evolutionary success of coccolithophorids in future climatescenarios. INDEX TERMS: 1615 Global Change: Biogeochemical processes (4805); 4594
Oceanography: Physical: Instruments and techniques; 4842 Oceanography: Biological and Chemical:
Modeling; 4855 Oceanography: Biological and Chemical: Plankton
Citation: Iglesias-Rodrıguez, M. D., C. W. Brown, S. C. Doney, J. Kleypas, D. Kolber, Z. Kolber, P. K. Hayes, and P. G.
Falkowski, Representing key phytoplankton functional groups in ocean carbon cycle models: Coccolithophorids, Global Biogeochem.
3Office of Research and Applications, National Oceanographic andAtmospheric Administration, Camp Springs, Maryland, USA.
4National Center for Atmospheric Research, Climate and GlobalDynamics, Boulder, Colorado, USA.
5School of Biological Sciences, University of Bristol, Bristol, England.6Also at Department of Geology and Institute of Marine and Coastal
Sciences, Rutgers University, New Brunswick, New Jersey, USA.
GLOBAL BIOGEOCHEMICAL CYCLES, VOL. 16, NO. 4, 1100, doi:10.1029/2001GB001454, 2002
1Environmental Biophysics and Molecular Ecology Program, Instituteof Marine and Coastal Sciences, Rutgers University, New Brunswick, NewJersey, USA.
2Also at School of Biological Sciences, University of Bristol, Bristol,England, UK.
Copyright 2002 by the American Geophysical Union.0886-6236/02/2001GB001454$12.00
47 - 1
1. Introduction
[2] Phytoplankton comprise at least eight phylogeneticdivisions or phyla, represented by approximately 20,000extant species [Falkowski and Raven, 1997]. In the ocean,these organisms are central to biogeochemical and ecolog-ical ‘‘services’’; that is, they function to link metabolicsequences and properties to form a continuous, self-perpet-uating network of elemental fluxes. The biologically medi-ated fluxes of elements between the upper ocean and theocean interior are critically dependent upon key groups ofphytoplankton. For example, autotrophic carbon fixationconverts gaseous CO2 to a wide variety of organic carbonmolecules, virtually all of which are solid or dissolvedsolids at physiological temperatures (‘‘Fixation’’ is a termthat means to make nonvolatile, as in conversion of a gas toanother phase state). Respiration accomplishes the reverse.Nitrogen fixation converts gaseous N2 to ammonium andthence to organic molecules, while denitrification accom-plishes the reverse. Calcification converts dissolved inor-ganic carbon and Ca to solid-phase calcite and aragonite,whereas silicification converts soluble silicic acid to solidhydrated amorphous opal. Each of these biologically cata-lyzed processes is dependent upon specific metabolicsequences (i.e., gene families encoding suites of enzymes)that evolved over hundreds of millions of years of Earth’shistory, and have, over corresponding periods, led to themassive accumulation of calcite, opal, and organic matter inthe lithosphere. Presumably because of parallel evolution aswell as lateral gene transfer, these metabolic sequences havefrequently coevolved in several groups of organisms that,more often than not, are not otherwise closely related from aphylogenetic standpoint [Falkowski and Raven, 1997]. Onthe basis of their biogeochemical metabolism, these homol-ogous sets of organisms can be clustered into ‘‘functionalgroups’’ or ‘‘biogeochemical guilds’’; i.e., organisms thatare related through common biogeochemical processesrather than phylogenetic affiliation. Here we focus onelucidating the basic physical and chemical processes thatselect for surface calcifying, bloom-forming phytoplank-tonic organisms in the world oceans.[3] Coccolithophorids comprise a family of calcite-pro-
ducing Prymnesiophytes that evolved in the mid-Triassicperiod [Lipps, 1993]. They rose to taxonomic prominence asthe primary calcifying organisms following the nannoconid‘‘crisis’’ at the Cenomanian/Turonian boundary, 93 Mabefore present. The accumulation of calcite plates fromrelict coccolithophorid blooms in the Cretaceous andthroughout the Cenozoic represents a significant componentof deep-sea oozes and chalks in the open ocean, contributingup to 80% of the total precipitated CaCO3 [Fabry, 1989].There are approximately 200 extant species of coccolitho-phorids [Jordan and Green, 1994], but only two species,Emiliania huxleyi and Gephyrocapsa oceanica, are knownto form seasonal blooms in the present geological period. Ofthese two bloom-forming species, the more important in thecontemporary oceans is Emiliania huxleyi. This speciesforms seasonal blooms that can occupy over 100,000 km2
of ocean surface [Brown and Yoder, 1994], and as such,represents a significant source of biogenically producedcalcite in the global oceans [Westbroek et al., 1989].
[4] As the major calcifiers in the open ocean, coccolitho-phorids alter the equilibrium of the inorganic carbon systemand alkalinity of seawater [Denman and Pena, 1999]. Ontimescales shorter than millennia, calcification,
Ca2þ þ 2HCO�3 , CaCO3 þ H2Oþ CO2;
leads to a disequilibrium in the carbonate system andpotentiates an outgassing of CO2 to the atmosphere. Thesystem is brought back to steady state by adjustments in thelysocline depth and CaCO3 sediment burial (103–104
years). On longer timescales (106 years), rock weatheringrestores Ca2+ (i.e., alkalinity) to the ocean. As the residencetime of Ca2+ is >106 years, short-term changes in the flux ofCaCO3 can have significant impacts on the global carboncycle [Quay, 1992; Heimann and Maier-Reimer, 1996; Joosand Bruno, 1998].[5] The introduction of ocean color observing satellites in
the 1980s facilitated the observations of coccolithophoridblooms from space [Holligan et al., 1983; Brown and Yoder,1994]. These observations were extended by SeaWiFS andMODIS to provide global, synoptic images of the blooms ofcalcifying organisms [Brown, 1999]. Corresponding satel-lite data sets, in situ climatology, and model fields are alsoavailable for key physical, chemical, and biological varia-bles, such as sea surface temperature, solar irradiance, seaheight anomalies, surface nutrients, and upper ocean chlor-ophyll concentrations. The global distribution of thesephysical variables provides a means to explore the extentto which coccolithophorid blooms detected in satelliteimagery, predominantly composed of E. huxleyi, can bestatistically associated with specific environmental domains.From such analyses, it may be possible to develop a‘‘pseudo-niche’’ analysis (by ‘‘pseudo-niche,’’ we mean thatthe parameter space we use to define the taxa is based onempirical observations, and, while the parameter may becorrelated with the true ecological niche, it is not necessarilya causation of blooms), which uses a suite of criticalparameters to define environmental features that select forcoccolithophorid blooms. Given one or more sets of pre-ferred parameter spaces, it may be further possible tohindcast and forecast these coccolithophorid blooms in theworld oceans. In this paper, our primary goal is to elucidatethe parameter space(s) that selects for coccolithophoridblooms on a global scale.[6] In understanding the factors that result in a bloom of a
specific group of organisms, we make the parsimoniousassumption that in any given parcel of water in the oceanthere is a finite probability of encountering any species ofphytoplankton, but that the relative abundance of an indi-vidual species is determined by local environmental factorsthat select for that organism based on its optimal growthpotential. This assumption, which we call the ‘‘universaldistribution, local selection’’ hypothesis, negates stochasticprocesses as a causal selective agent. On the basis of thisassumption, we present the first description of satellite-detected coccolithophorid populations on a global scaleand produce a predictive model of coccolithophorid distri-bution based upon a conditional probability function usingthree predictable physical/chemical parameters. We examinechanges in the spatial and temporal statistical distribution of
47 - 2 IGLESIAS-RODRIGUEZ ET AL.: COCCOLITHOPHORIDS IN OCEAN CARBON CYCLE MODELS
these coccolithophorid blooms in relation to changes in thechemical and physical dynamics of the ocean with the aim ofproviding the basis to develop a model that representscoccolithophorids in global biogeochemical cycles and usethis information to predict the distribution of coccolitho-phore blooms in the coming decades.
2. Materials and Methods
2.1. Satellite Data and Methods
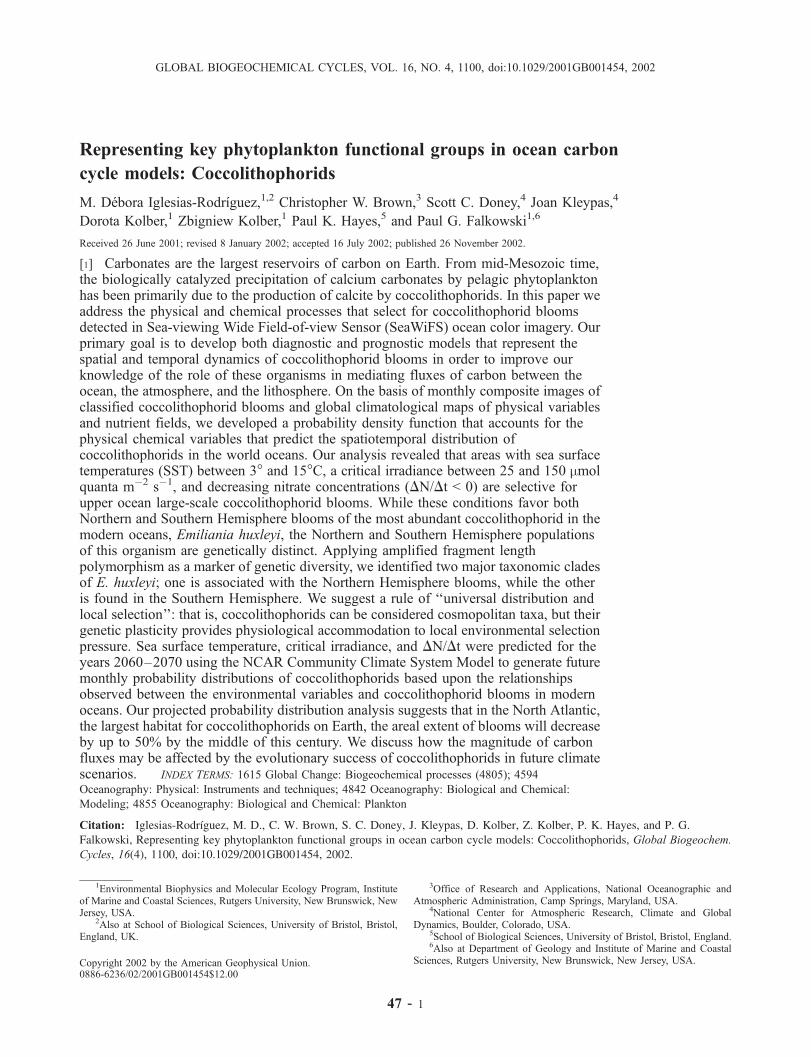
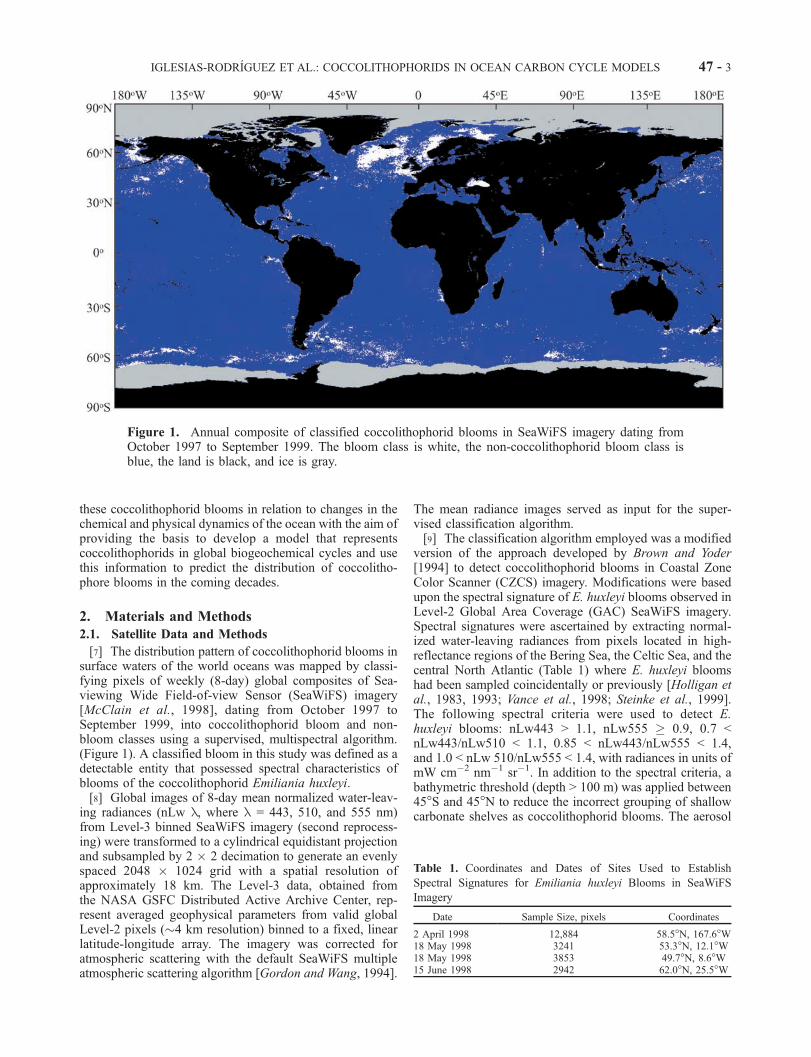
[7] The distribution pattern of coccolithophorid blooms insurface waters of the world oceans was mapped by classi-fying pixels of weekly (8-day) global composites of Sea-viewing Wide Field-of-view Sensor (SeaWiFS) imagery[McClain et al., 1998], dating from October 1997 toSeptember 1999, into coccolithophorid bloom and non-bloom classes using a supervised, multispectral algorithm.(Figure 1). A classified bloom in this study was defined as adetectable entity that possessed spectral characteristics ofblooms of the coccolithophorid Emiliania huxleyi.[8] Global images of 8-day mean normalized water-leav-
ing radiances (nLw l, where l = 443, 510, and 555 nm)from Level-3 binned SeaWiFS imagery (second reprocess-ing) were transformed to a cylindrical equidistant projectionand subsampled by 2 � 2 decimation to generate an evenlyspaced 2048 � 1024 grid with a spatial resolution ofapproximately 18 km. The Level-3 data, obtained fromthe NASA GSFC Distributed Active Archive Center, rep-resent averaged geophysical parameters from valid globalLevel-2 pixels (�4 km resolution) binned to a fixed, linearlatitude-longitude array. The imagery was corrected foratmospheric scattering with the default SeaWiFS multipleatmospheric scattering algorithm [Gordon and Wang, 1994].
The mean radiance images served as input for the super-vised classification algorithm.[9] The classification algorithm employed was a modified
version of the approach developed by Brown and Yoder[1994] to detect coccolithophorid blooms in Coastal ZoneColor Scanner (CZCS) imagery. Modifications were basedupon the spectral signature of E. huxleyi blooms observed inLevel-2 Global Area Coverage (GAC) SeaWiFS imagery.Spectral signatures were ascertained by extracting normal-ized water-leaving radiances from pixels located in high-reflectance regions of the Bering Sea, the Celtic Sea, and thecentral North Atlantic (Table 1) where E. huxleyi bloomshad been sampled coincidentally or previously [Holligan etal., 1983, 1993; Vance et al., 1998; Steinke et al., 1999].The following spectral criteria were used to detect E.huxleyi blooms: nLw443 > 1.1, nLw555 � 0.9, 0.7 <nLw443/nLw510 < 1.1, 0.85 < nLw443/nLw555 < 1.4,and 1.0 < nLw 510/nLw555 < 1.4, with radiances in units ofmW cm�2 nm�1 sr�1. In addition to the spectral criteria, abathymetric threshold (depth > 100 m) was applied between45�S and 45�N to reduce the incorrect grouping of shallowcarbonate shelves as coccolithophorid blooms. The aerosol
Figure 1. Annual composite of classified coccolithophorid blooms in SeaWiFS imagery dating fromOctober 1997 to September 1999. The bloom class is white, the non-coccolithophorid bloom class isblue, the land is black, and ice is gray.
Table 1. Coordinates and Dates of Sites Used to Establish
Spectral Signatures for Emiliania huxleyi Blooms in SeaWiFS
Imagery
Date Sample Size, pixels Coordinates
2 April 1998 12,884 58.5�N, 167.6�W18 May 1998 3241 53.3�N, 12.1�W18 May 1998 3853 49.7�N, 8.6�W15 June 1998 2942 62.0�N, 25.5�W
IGLESIAS-RODRIGUEZ ET AL.: COCCOLITHOPHORIDS IN OCEAN CARBON CYCLE MODELS 47 - 3
radiance criteria (La 670 < 1.10 mW cm�2 nm�1 sr�1) usedby Brown and Yoder [1994] was not implemented.[10] Global monthly data for all variables were arranged
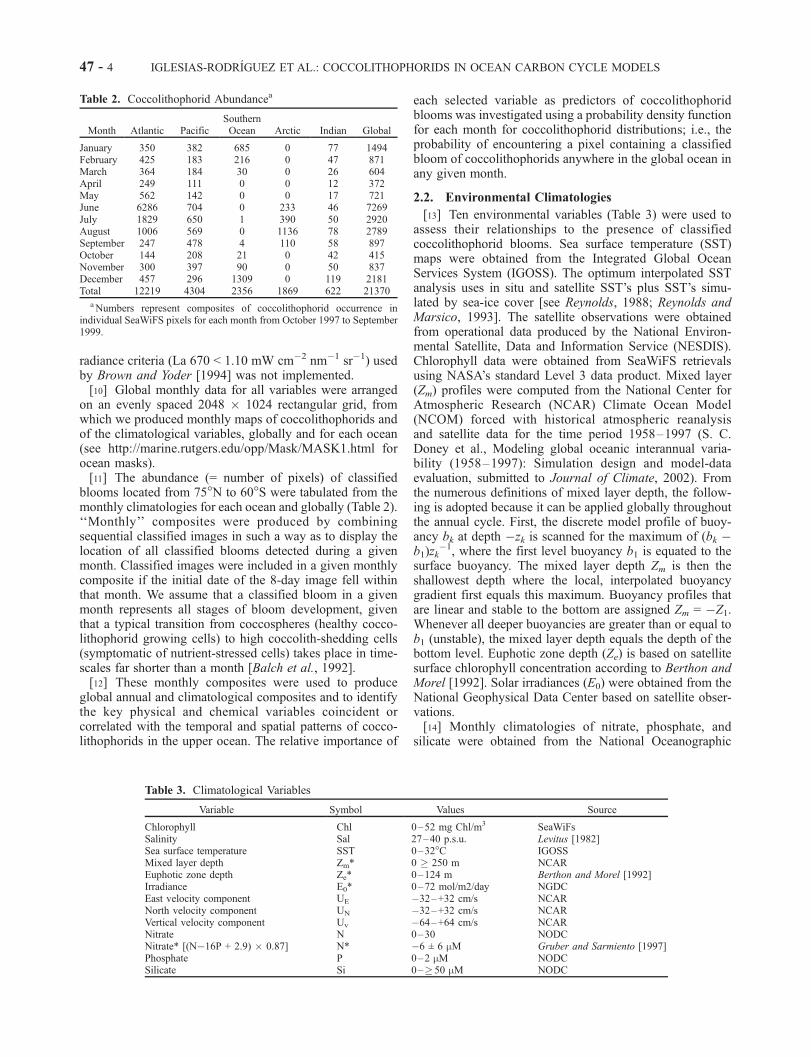
on an evenly spaced 2048 � 1024 rectangular grid, fromwhich we produced monthly maps of coccolithophorids andof the climatological variables, globally and for each ocean(see http://marine.rutgers.edu/opp/Mask/MASK1.html forocean masks).[11] The abundance (= number of pixels) of classified
blooms located from 75�N to 60�S were tabulated from themonthly climatologies for each ocean and globally (Table 2).‘‘Monthly’’ composites were produced by combiningsequential classified images in such a way as to display thelocation of all classified blooms detected during a givenmonth. Classified images were included in a given monthlycomposite if the initial date of the 8-day image fell withinthat month. We assume that a classified bloom in a givenmonth represents all stages of bloom development, giventhat a typical transition from coccospheres (healthy cocco-lithophorid growing cells) to high coccolith-shedding cells(symptomatic of nutrient-stressed cells) takes place in time-scales far shorter than a month [Balch et al., 1992].[12] These monthly composites were used to produce
global annual and climatological composites and to identifythe key physical and chemical variables coincident orcorrelated with the temporal and spatial patterns of cocco-lithophorids in the upper ocean. The relative importance of
each selected variable as predictors of coccolithophoridblooms was investigated using a probability density functionfor each month for coccolithophorid distributions; i.e., theprobability of encountering a pixel containing a classifiedbloom of coccolithophorids anywhere in the global ocean inany given month.
2.2. Environmental Climatologies
[13] Ten environmental variables (Table 3) were used toassess their relationships to the presence of classifiedcoccolithophorid blooms. Sea surface temperature (SST)maps were obtained from the Integrated Global OceanServices System (IGOSS). The optimum interpolated SSTanalysis uses in situ and satellite SST’s plus SST’s simu-lated by sea-ice cover [see Reynolds, 1988; Reynolds andMarsico, 1993]. The satellite observations were obtainedfrom operational data produced by the National Environ-mental Satellite, Data and Information Service (NESDIS).Chlorophyll data were obtained from SeaWiFS retrievalsusing NASA’s standard Level 3 data product. Mixed layer(Zm) profiles were computed from the National Center forAtmospheric Research (NCAR) Climate Ocean Model(NCOM) forced with historical atmospheric reanalysisand satellite data for the time period 1958–1997 (S. C.Doney et al., Modeling global oceanic interannual varia-bility (1958–1997): Simulation design and model-dataevaluation, submitted to Journal of Climate, 2002). Fromthe numerous definitions of mixed layer depth, the follow-ing is adopted because it can be applied globally throughoutthe annual cycle. First, the discrete model profile of buoy-ancy bk at depth �zk is scanned for the maximum of (bk �b1)zk
�1, where the first level buoyancy b1 is equated to thesurface buoyancy. The mixed layer depth Zm is then theshallowest depth where the local, interpolated buoyancygradient first equals this maximum. Buoyancy profiles thatare linear and stable to the bottom are assigned Zm = �Z1.Whenever all deeper buoyancies are greater than or equal tob1 (unstable), the mixed layer depth equals the depth of thebottom level. Euphotic zone depth (Ze) is based on satellitesurface chlorophyll concentration according to Berthon andMorel [1992]. Solar irradiances (E0) were obtained from theNational Geophysical Data Center based on satellite obser-vations.[14] Monthly climatologies of nitrate, phosphate, and
silicate were obtained from the National Oceanographic
Table 2. Coccolithophorid Abundancea
Month Atlantic PacificSouthernOcean Arctic Indian Global
aNumbers represent composites of coccolithophorid occurrence inindividual SeaWiFS pixels for each month from October 1997 to September1999.
Table 3. Climatological Variables
Variable Symbol Values Source
Chlorophyll Chl 0–52 mg Chl/m3 SeaWiFsSalinity Sal 27–40 p.s.u. Levitus [1982]Sea surface temperature SST 0–32�C IGOSSMixed layer depth Zm* 0 � 250 m NCAREuphotic zone depth Ze* 0–124 m Berthon and Morel [1992]Irradiance E0* 0–72 mol/m2/day NGDCEast velocity component UE �32–+32 cm/s NCARNorth velocity component UN �32–+32 cm/s NCARVertical velocity component Uv �64–+64 cm/s NCARNitrate N 0–30 NODCNitrate* [(N�16P + 2.9) � 0.87] N* �6 ± 6 mM Gruber and Sarmiento [1997]Phosphate P 0–2 mM NODCSilicate Si 0–� 50 mM NODC
47 - 4 IGLESIAS-RODRIGUEZ ET AL.: COCCOLITHOPHORIDS IN OCEAN CARBON CYCLE MODELS
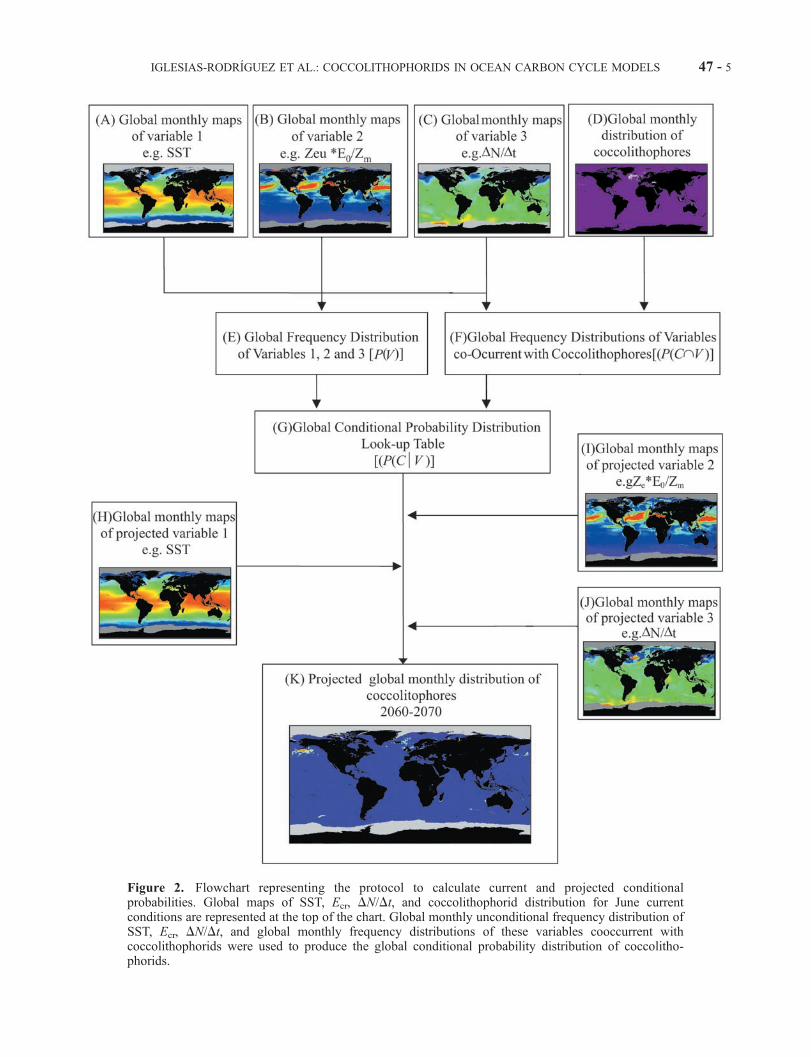
Figure 2. Flowchart representing the protocol to calculate current and projected conditionalprobabilities. Global maps of SST, Ecr, DN/Dt, and coccolithophorid distribution for June currentconditions are represented at the top of the chart. Global monthly unconditional frequency distribution ofSST, Ecr, DN/Dt, and global monthly frequency distributions of these variables cooccurrent withcoccolithophorids were used to produce the global conditional probability distribution of coccolitho-phorids.
IGLESIAS-RODRIGUEZ ET AL.: COCCOLITHOPHORIDS IN OCEAN CARBON CYCLE MODELS 47 - 5
Data Center (NODC) World Ocean Atlas 1998 data set[Conkright et al., 1998]. We vertically interpolated the datato the mixed layer using the appropriate NODC standardlevels (0, 10, 20, 30, 50, 75, 100, 125, 150, 200, 250, 300,400, and 500 m). A horizontal interpolation was carried outaccording to Najjar and Keeling [1997] and distance-weighted averaging with a 1000-km Cressman functionwas used to smooth the monthly binned fields.
2.3. Probability Analysis
[15] We generated monthly maps of coccolithophoridclimatologies, i.e., pixel abundance for the combined1997–1998 and 1998–1999 years (Table 2), and for themonthly climatological physical and chemical variablesinvestigated (Table 3). We excluded the Mediterranean/Black Sea region as it is almost entirely represented bythe Black Sea bloom. This region has a unique hydrologyand has recently been subjected to anthropogenic impact[see Mihnea, 1997]; therefore it likely is not representativeof open ocean coccolithophorid blooms.[16] To analyze which of the environmental variables
discriminate for coccolithophorids, we calculated condi-tional probability distributions, P(C|V ), that coccolithophor-ids are present under a given set of conditions, V. To producethe probability distributions, we employed the numericalprotocol as described in Figure 2. Using global monthlymaps of coccolithophorids, and three selected variables:SST, the ratio (Zeu � E0/Zm), or critical irradiance parameter(Ecr), and monthly variations in nitrate (DN/Dt), we calcu-lated the 3-D frequency distributions of the variables co-occurrent with coccolithophorids, P(C\V ) and normalizedthem with their unconditional 3-D frequency distributionsP(V ) to generate a conditional frequency distribution P(C|V )(Figure 2). Only data points with >10 occurrences in theP(C\V ) histogram were used in this calculation.[17] Future probability frequency distributions were gen-
erated as described in Figure 2. Using the look-up table thatdescribes P(C|V ), we projected these probabilities to futureclimate scenarios (2060–2070) using the same three phys-ical variables (SST, Ecr, and DN/Dt) predicted for 2060–2070 from the NCAR Community Climate System Model(CCSM), a coupled ocean-atmosphere-land-sea-ice model[Boville and Gent, 1998; Blackmon et al., 2001]. The futurescenario was forced with atmospheric greenhouse gases andaerosols following the Intergovernmental Panel on ClimateChange (IPCC) SRES A1 emissions scenario. The CCSMmodel run for this scenario and the control simulation areavailable electronically (labeled b030.02, b030.03, andb030.04; see http://www.cgd.ucar.edu/csm/experiments/ fordetails). To account for interannual variability, we haveproduced monthly climatologies based on temperature,mixed layer depth, upwelling velocity, irradiance and otherproperties for the period 2060–2070. This climatology, anda similar one constructed for the control simulation, wereused to drive an off-line, global marine ecosystem model[Moore et al., 2001a, 2001b], quantifying the response ofbiological variables (chlorophyll, nutrients, primary produc-tion) to the change in physics. Note that this approach doesnot capture the effect of long-term trends in upper thermo-cline nutrient fields.
2.4. Amplified Fragment LengthPolymorphism Analysis
[18] We used the Amplified Fragment Length Polymor-phism (AFLP) approach to analyze genetic variability of E.huxleyi populations obtained from various regions in theglobal ocean. This approach is based upon the selectiveamplification of a subset of genomic restriction fragmentsusing the polymerase chain reaction (PCR) [Vos et al.,1995]. DNA from selected Emiliania huxleyi strains (seeTable 4) was digested completely with EcoRI and MseI.Double stranded, oligonucleotide adapters were ligated tothe ends of the DNA fragments to generate template DNAfor amplification. The adapters and the adjacent restrictionenzyme recognition sites served as primer binding sites forsubsequent amplification of the restriction fragments. Selec-tive nucleotides extending into the restriction fragment wereadded to the 3’-end of the PCR primers (either G or GA)such that only a subset of the fragments were amplified, i.e.,only those fragments in which the nucleotides flanking therestriction site match the selected nucleotides. The sizedistribution of the amplified fragments was analyzed bydenaturing polyacrylamide gel electrophoresis and auto-radiography (the EcoRI-selective amplification primerswere labeled at their 50-ends with 33P).
3. Results
3.1. Coccolithophorid Distribution
[19] Satellite retrievals from SeaWiFS between September1997 and January 2000 revealed a typical, annual repeatingpattern of coccolithophorid blooms in subpolar latitudesduring the summer months, with the largest expanse in theNorth Atlantic (Figure 1). Three major seasonal coccolitho-phorid blooms were observed during the Northern andSouthern Hemisphere summers between October 1997 andSeptember 1999. These blooms were found in the NorthAtlantic, the North Pacific (see Figure 3a), and the SouthernOcean (see Figure 3a). In the North Atlantic, three majorreflectance areas were identified: one south of Iceland,following the Irminger Current; one west of the UnitedKingdom shelf waters, following the North Atlantic drift,and one west of Norway, following the Norwegian Current.Additionally, smaller-scale coccolithophorid upper oceanblooms were observed in the subpolar North Atlantic, offthe coasts of Florida, south of the United Kingdom, and inthe Gulf of Mexico (Figure 1). In the subpolar NorthPacific, during the spring of the 1997 El Nino year, insteadof the usual dominance of diatoms, a coccolithophorid
Table 4. Emiliania huxleyi Global Clonal Isolates
Clone Date of Isolation Location
B92/11 30 April 1992 North AtlanticB92/12 30 April 1992 North AtlanticB92/27 01 May 1992 North AtlanticB92/28 01 May 1992 North AtlanticB92/78 07 May 1992 North AtlanticB92/131 14 May 1992 North AtlanticB92/43 02 May 1992 North AtlanticSA April 1992 Durban, South AfricaNZ 1992 Big Glory Bay, New Zealand
47 - 6 IGLESIAS-RODRIGUEZ ET AL.: COCCOLITHOPHORIDS IN OCEAN CARBON CYCLE MODELS
bloom was observed in a large portion of the Bering Sea.SeaWiFS true color images and climatology of classifiedcoccolithophorid bloom observations showed similar coc-colithophorid distributions during the spring and summer of1998 and 1999.[20] In the Southern Ocean, we observed large aggrega-
tions of coccolithophorid blooms forming a belt north of the
Antarctic Polar Front (APF) in the Pacific and Atlanticsectors, following the Antarctic Circumpolar Current (Fig-ure 1). It appears to have initiated in the Pacific sector andsubsequently moved eastward, with the highest pixel den-sity in the Atlantic and Pacific sectors, north of the APF.Though smaller in areal extent, blooms were also seasonallyfound in waters off Chile, in the confluence of the Brazil/
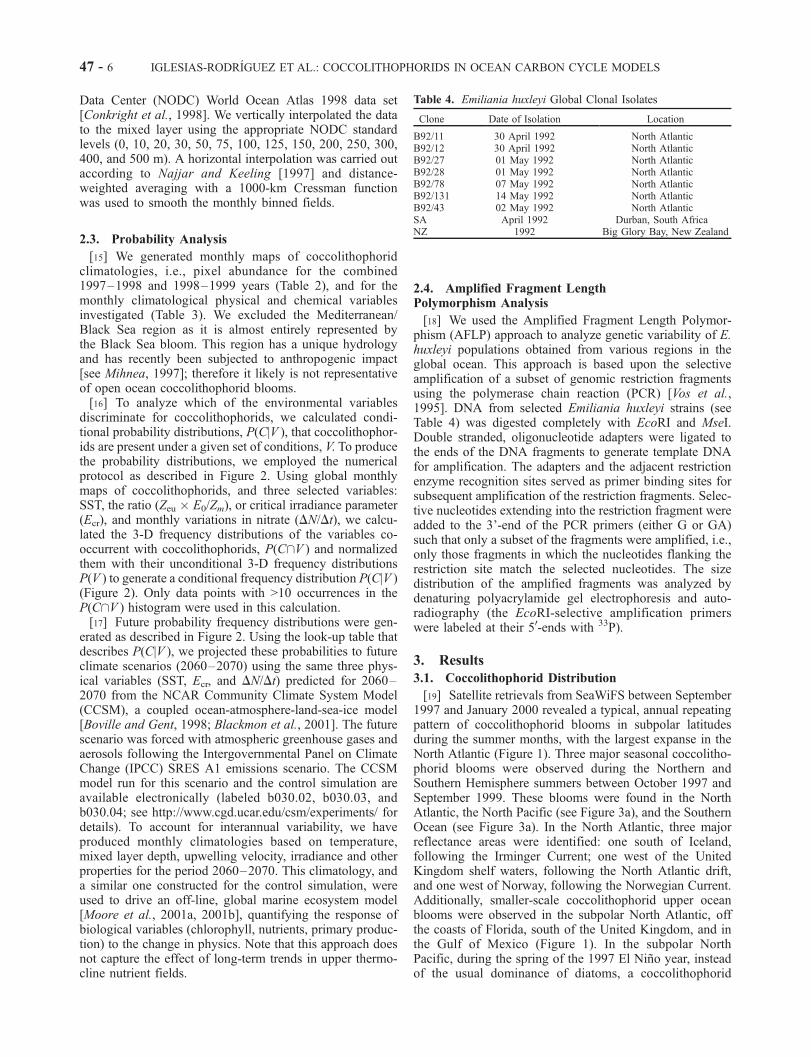
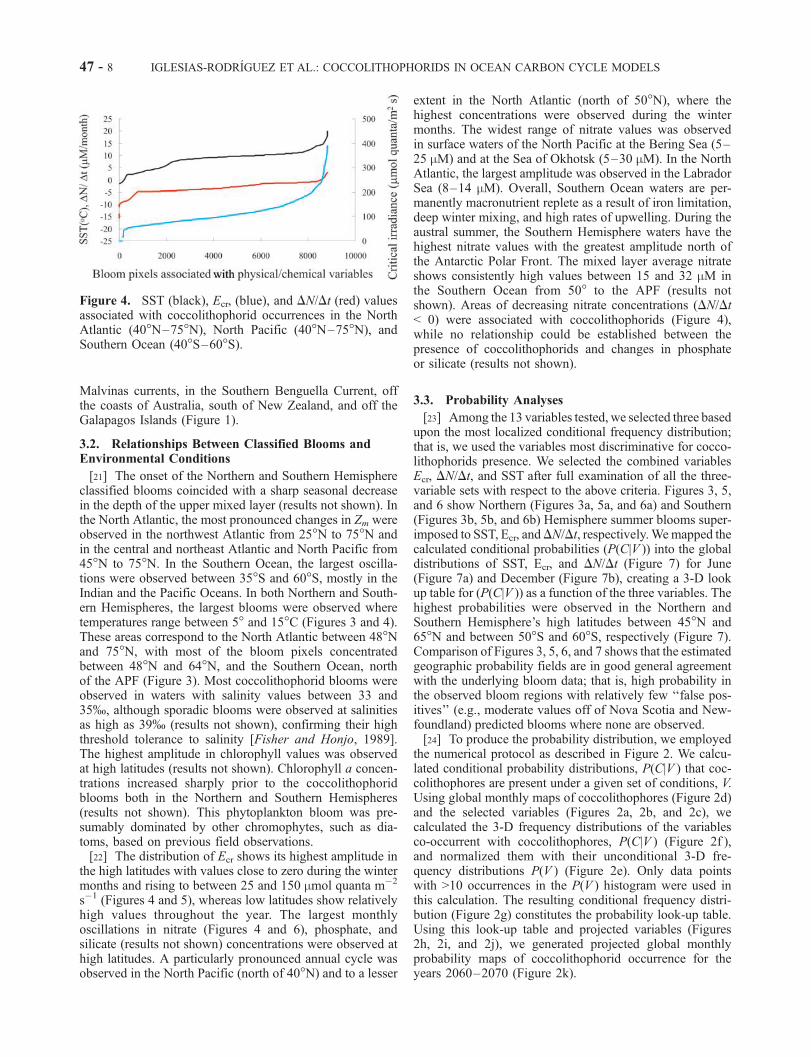
Figure 3. Coccolithophorid climatologies superimposed onto SST climatologies for (a) June and (b)December. Color bars represent SST (�C).
IGLESIAS-RODRIGUEZ ET AL.: COCCOLITHOPHORIDS IN OCEAN CARBON CYCLE MODELS 47 - 7
Malvinas currents, in the Southern Benguella Current, offthe coasts of Australia, south of New Zealand, and off theGalapagos Islands (Figure 1).
3.2. Relationships Between Classified Blooms andEnvironmental Conditions
[21] The onset of the Northern and Southern Hemisphereclassified blooms coincided with a sharp seasonal decreasein the depth of the upper mixed layer (results not shown). Inthe North Atlantic, the most pronounced changes in Zm wereobserved in the northwest Atlantic from 25�N to 75�N andin the central and northeast Atlantic and North Pacific from45�N to 75�N. In the Southern Ocean, the largest oscilla-tions were observed between 35�S and 60�S, mostly in theIndian and the Pacific Oceans. In both Northern and South-ern Hemispheres, the largest blooms were observed wheretemperatures range between 5� and 15�C (Figures 3 and 4).These areas correspond to the North Atlantic between 48�Nand 75�N, with most of the bloom pixels concentratedbetween 48�N and 64�N, and the Southern Ocean, northof the APF (Figure 3). Most coccolithophorid blooms wereobserved in waters with salinity values between 33 and35%, although sporadic blooms were observed at salinitiesas high as 39% (results not shown), confirming their highthreshold tolerance to salinity [Fisher and Honjo, 1989].The highest amplitude in chlorophyll values was observedat high latitudes (results not shown). Chlorophyll a concen-trations increased sharply prior to the coccolithophoridblooms both in the Northern and Southern Hemispheres(results not shown). This phytoplankton bloom was pre-sumably dominated by other chromophytes, such as dia-toms, based on previous field observations.[22] The distribution of Ecr shows its highest amplitude in
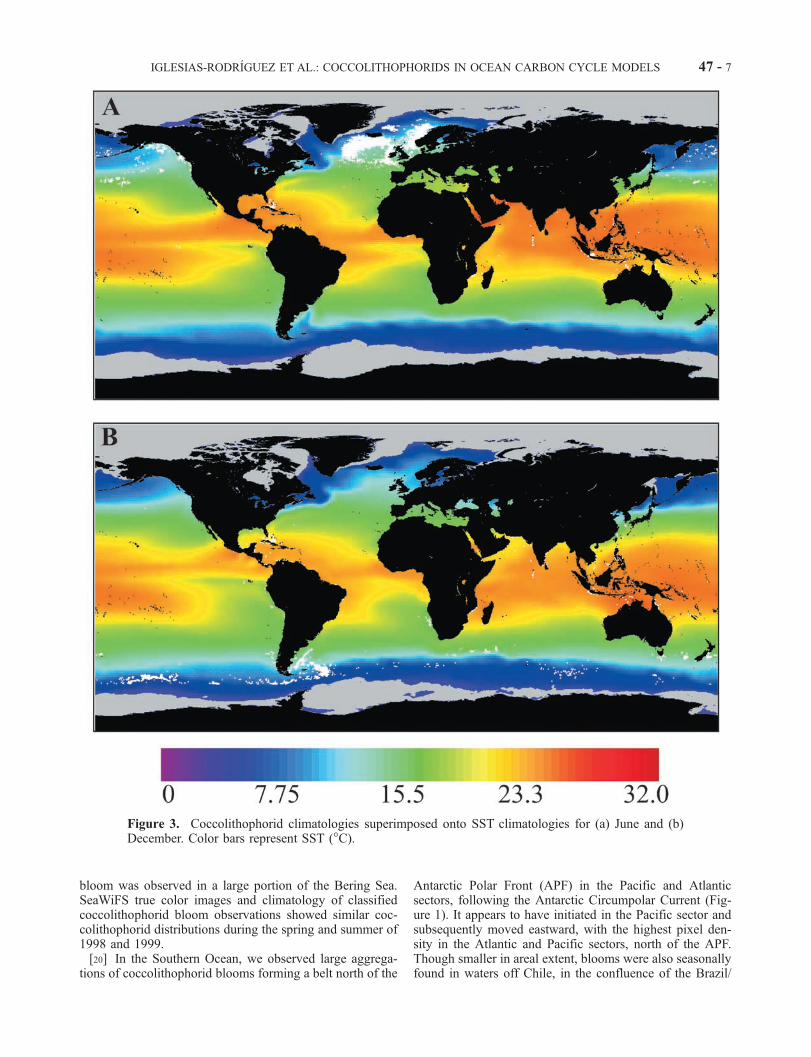
the high latitudes with values close to zero during the wintermonths and rising to between 25 and 150 mmol quanta m�2
s�1 (Figures 4 and 5), whereas low latitudes show relativelyhigh values throughout the year. The largest monthlyoscillations in nitrate (Figures 4 and 6), phosphate, andsilicate (results not shown) concentrations were observed athigh latitudes. A particularly pronounced annual cycle wasobserved in the North Pacific (north of 40�N) and to a lesser
extent in the North Atlantic (north of 50�N), where thehighest concentrations were observed during the wintermonths. The widest range of nitrate values was observedin surface waters of the North Pacific at the Bering Sea (5–25 mM) and at the Sea of Okhotsk (5–30 mM). In the NorthAtlantic, the largest amplitude was observed in the LabradorSea (8–14 mM). Overall, Southern Ocean waters are per-manently macronutrient replete as a result of iron limitation,deep winter mixing, and high rates of upwelling. During theaustral summer, the Southern Hemisphere waters have thehighest nitrate values with the greatest amplitude north ofthe Antarctic Polar Front. The mixed layer average nitrateshows consistently high values between 15 and 32 mM inthe Southern Ocean from 50� to the APF (results notshown). Areas of decreasing nitrate concentrations (DN/Dt< 0) were associated with coccolithophorids (Figure 4),while no relationship could be established between thepresence of coccolithophorids and changes in phosphateor silicate (results not shown).
3.3. Probability Analyses
[23] Among the 13 variables tested, we selected three basedupon the most localized conditional frequency distribution;that is, we used the variables most discriminative for cocco-lithophorids presence. We selected the combined variablesEcr, DN/Dt, and SST after full examination of all the three-variable sets with respect to the above criteria. Figures 3, 5,and 6 show Northern (Figures 3a, 5a, and 6a) and Southern(Figures 3b, 5b, and 6b) Hemisphere summer blooms super-imposed to SST, Ecr, andDN/Dt, respectively.Wemapped thecalculated conditional probabilities (P(C|V )) into the globaldistributions of SST, Ecr, and DN/Dt (Figure 7) for June(Figure 7a) and December (Figure 7b), creating a 3-D lookup table for (P(C|V )) as a function of the three variables. Thehighest probabilities were observed in the Northern andSouthern Hemisphere’s high latitudes between 45�N and65�N and between 50�S and 60�S, respectively (Figure 7).Comparison of Figures 3, 5, 6, and 7 shows that the estimatedgeographic probability fields are in good general agreementwith the underlying bloom data; that is, high probability inthe observed bloom regions with relatively few ‘‘false pos-itives’’ (e.g., moderate values off of Nova Scotia and New-foundland) predicted blooms where none are observed.[24] To produce the probability distribution, we employed
the numerical protocol as described in Figure 2. We calcu-lated conditional probability distributions, P(C|V ) that coc-colithophores are present under a given set of conditions, V.Using global monthly maps of coccolithophores (Figure 2d)and the selected variables (Figures 2a, 2b, and 2c), wecalculated the 3-D frequency distributions of the variablesco-occurrent with coccolithophores, P(C|V ) (Figure 2f ),and normalized them with their unconditional 3-D fre-quency distributions P(V ) (Figure 2e). Only data pointswith >10 occurrences in the P(V ) histogram were used inthis calculation. The resulting conditional frequency distri-bution (Figure 2g) constitutes the probability look-up table.Using this look-up table and projected variables (Figures2h, 2i, and 2j), we generated projected global monthlyprobability maps of coccolithophorid occurrence for theyears 2060–2070 (Figure 2k).
Figure 4. SST (black), Ecr, (blue), and DN/Dt (red) valuesassociated with coccolithophorid occurrences in the NorthAtlantic (40�N–75�N), North Pacific (40�N–75�N), andSouthern Ocean (40�S–60�S).
47 - 8 IGLESIAS-RODRIGUEZ ET AL.: COCCOLITHOPHORIDS IN OCEAN CARBON CYCLE MODELS
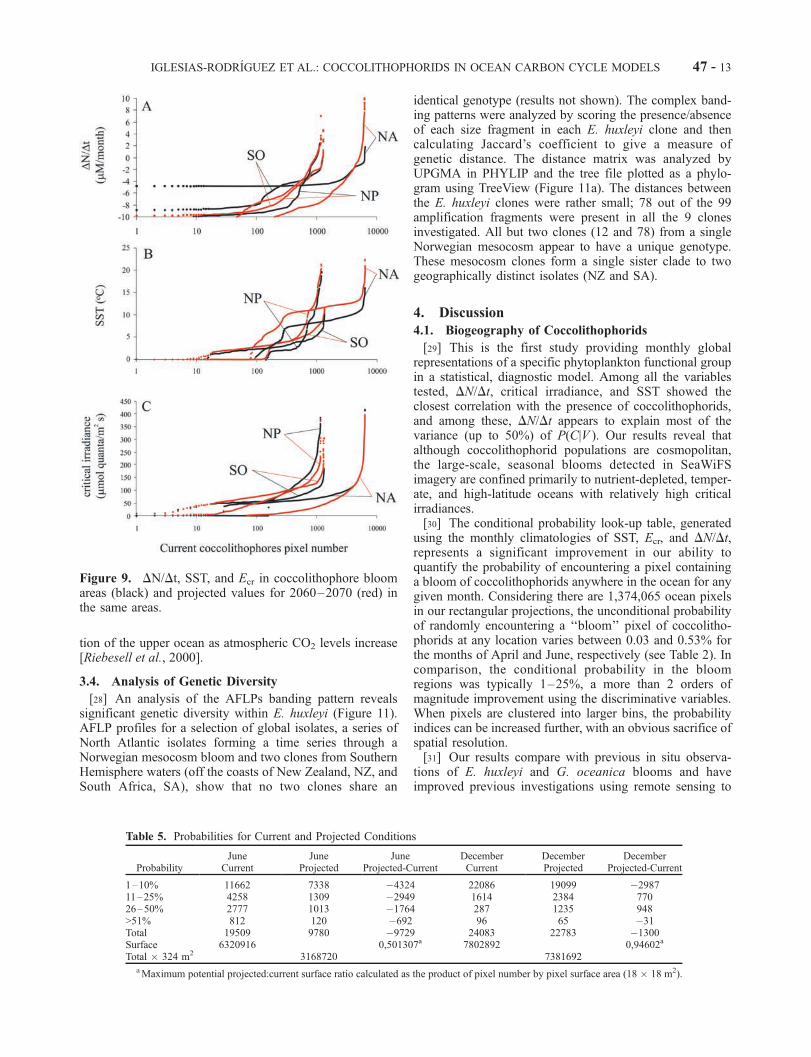
[25] To analyze the future trends in coccolithophoridpopulations in the world’s ocean, we compared the presentprobability distribution of coccolithophores (Figure 7) withthe projection for June and December of 2060–2070 (Fig-
ures 8 and 9). The projected warming in SST from the future(2060–2070) minus control scenario is largest in the sub-polar North Atlantic, followed by the subpolar North Pacificand then the Southern Ocean (Figure 9). Complex patterns of
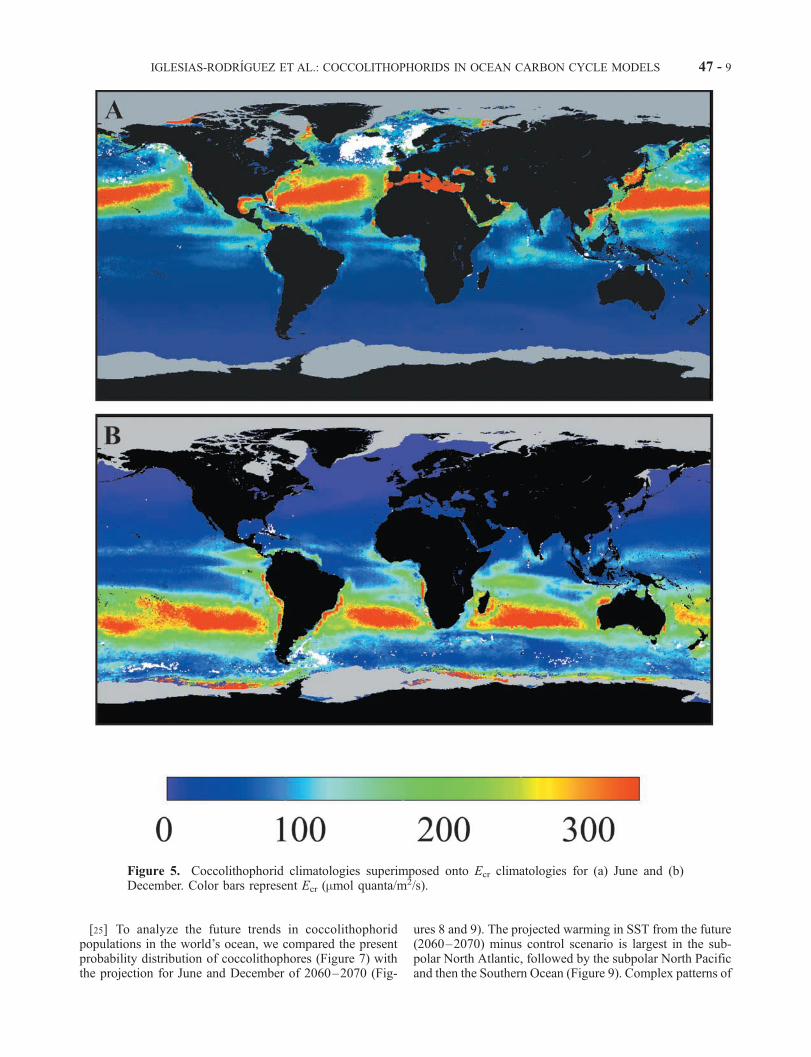
Figure 5. Coccolithophorid climatologies superimposed onto Ecr climatologies for (a) June and (b)December. Color bars represent Ecr (mmol quanta/m2/s).
IGLESIAS-RODRIGUEZ ET AL.: COCCOLITHOPHORIDS IN OCEAN CARBON CYCLE MODELS 47 - 9
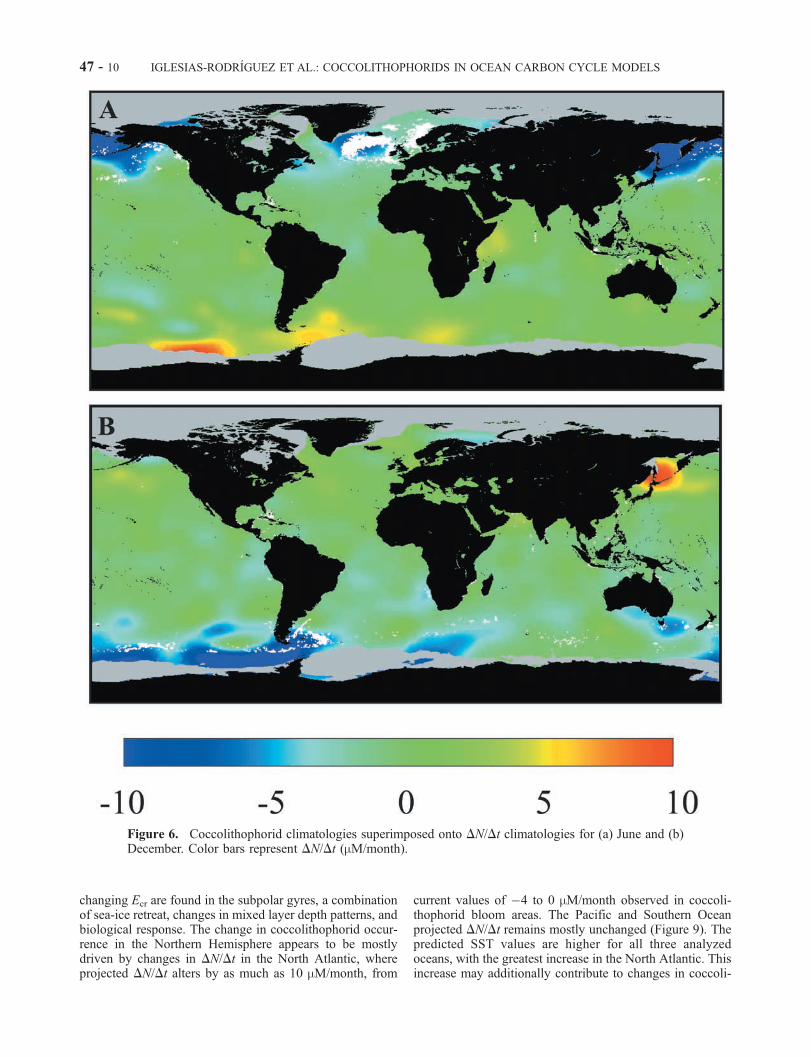
changing Ecr are found in the subpolar gyres, a combinationof sea-ice retreat, changes in mixed layer depth patterns, andbiological response. The change in coccolithophorid occur-rence in the Northern Hemisphere appears to be mostlydriven by changes in DN/Dt in the North Atlantic, whereprojected DN/Dt alters by as much as 10 mM/month, from
current values of �4 to 0 mM/month observed in coccoli-thophorid bloom areas. The Pacific and Southern Oceanprojected DN/Dt remains mostly unchanged (Figure 9). Thepredicted SST values are higher for all three analyzedoceans, with the greatest increase in the North Atlantic. Thisincrease may additionally contribute to changes in coccoli-
Figure 6. Coccolithophorid climatologies superimposed onto DN/Dt climatologies for (a) June and (b)December. Color bars represent DN/Dt (mM/month).
47 - 10 IGLESIAS-RODRIGUEZ ET AL.: COCCOLITHOPHORIDS IN OCEAN CARBON CYCLE MODELS
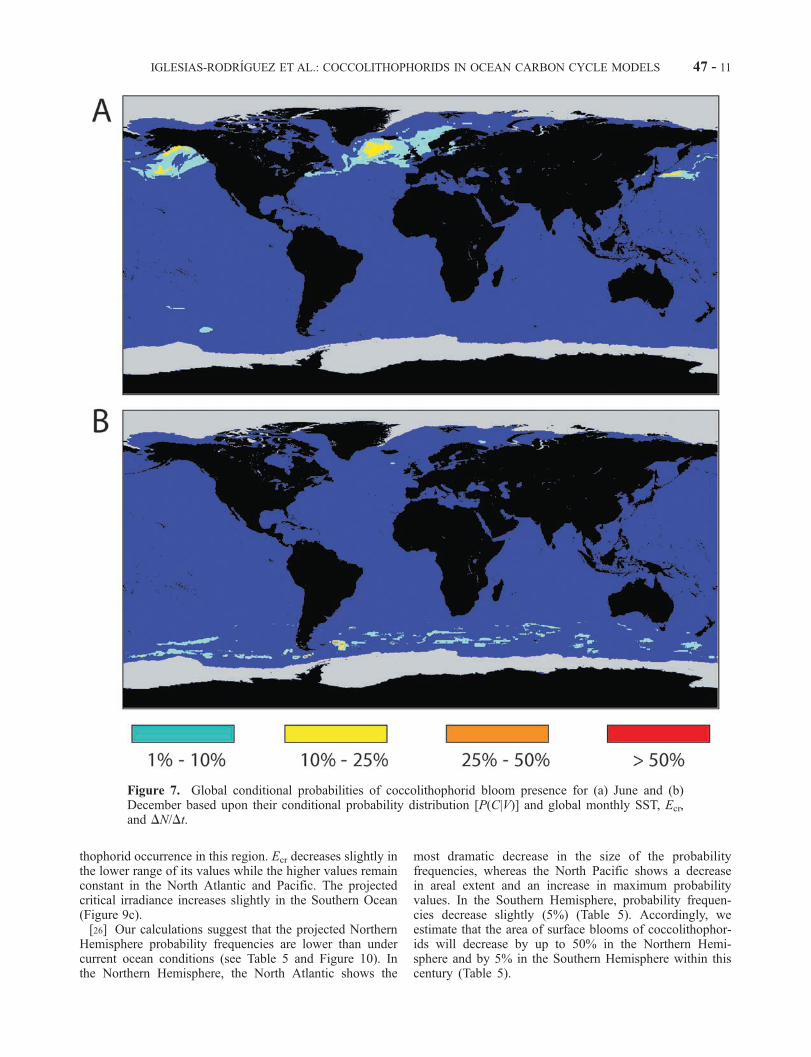
thophorid occurrence in this region. Ecr decreases slightly inthe lower range of its values while the higher values remainconstant in the North Atlantic and Pacific. The projectedcritical irradiance increases slightly in the Southern Ocean(Figure 9c).[26] Our calculations suggest that the projected Northern
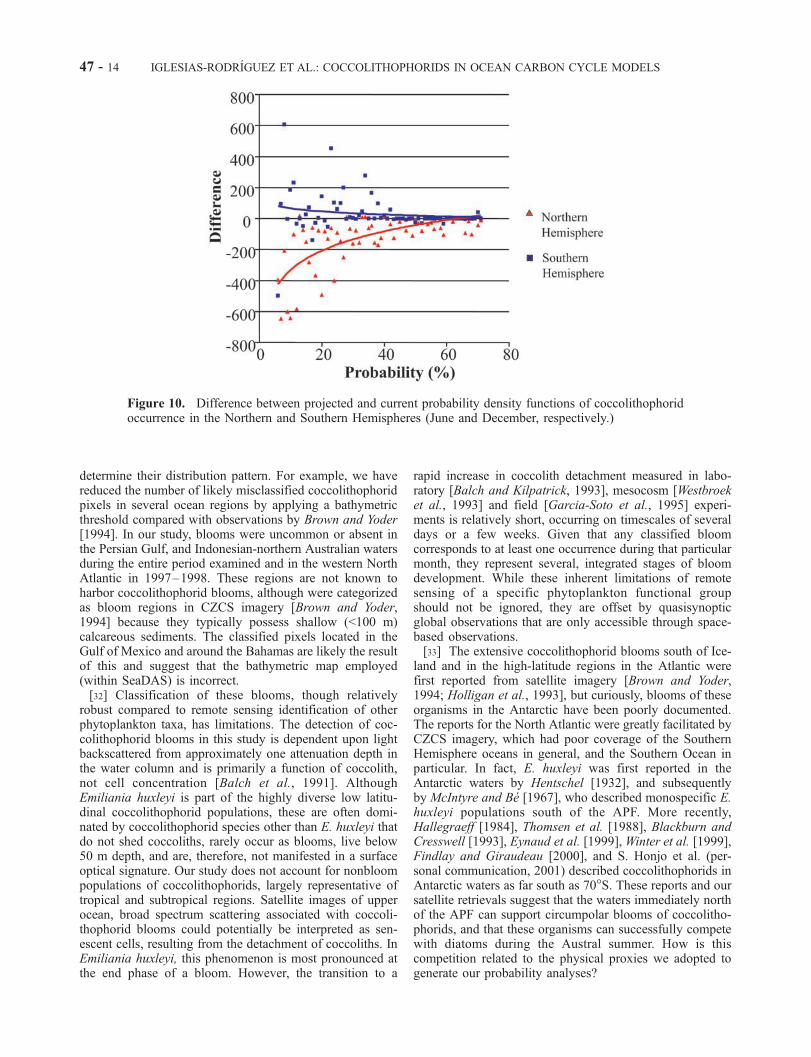
Hemisphere probability frequencies are lower than undercurrent ocean conditions (see Table 5 and Figure 10). Inthe Northern Hemisphere, the North Atlantic shows the
most dramatic decrease in the size of the probabilityfrequencies, whereas the North Pacific shows a decreasein areal extent and an increase in maximum probabilityvalues. In the Southern Hemisphere, probability frequen-cies decrease slightly (5%) (Table 5). Accordingly, weestimate that the area of surface blooms of coccolithophor-ids will decrease by up to 50% in the Northern Hemi-sphere and by 5% in the Southern Hemisphere within thiscentury (Table 5).
Figure 7. Global conditional probabilities of coccolithophorid bloom presence for (a) June and (b)December based upon their conditional probability distribution [P(C|V)] and global monthly SST, Ecr,and DN/Dt.
IGLESIAS-RODRIGUEZ ET AL.: COCCOLITHOPHORIDS IN OCEAN CARBON CYCLE MODELS 47 - 11
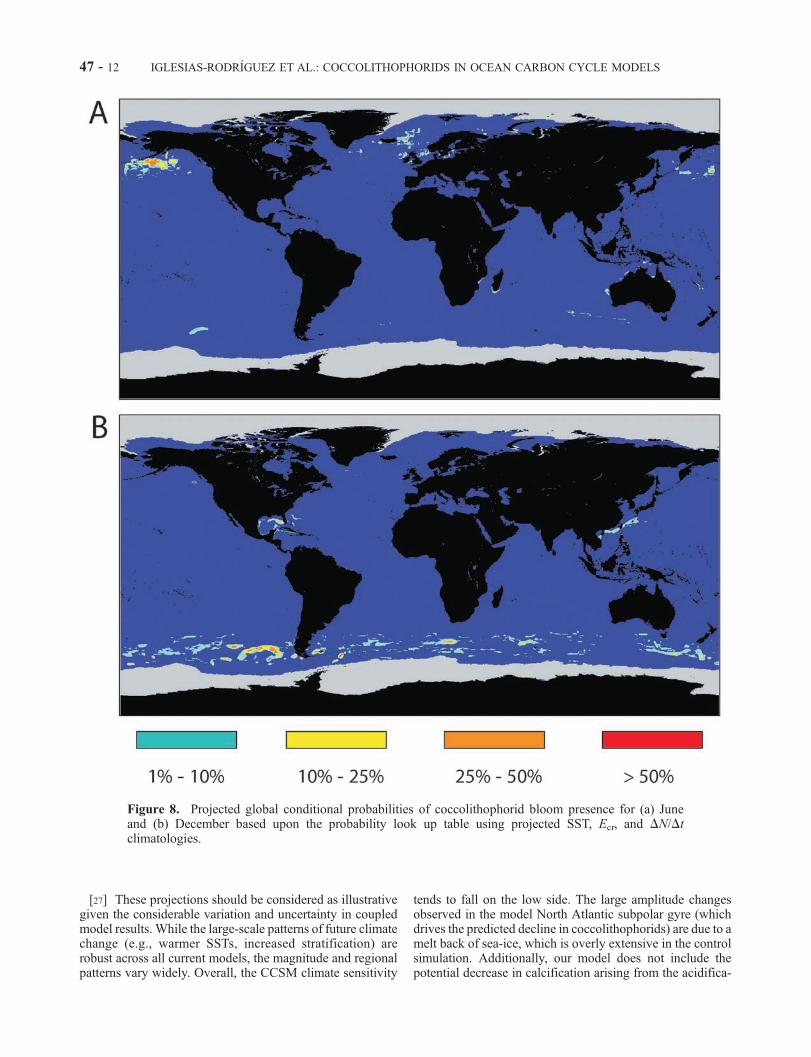
[27] These projections should be considered as illustrativegiven the considerable variation and uncertainty in coupledmodel results. While the large-scale patterns of future climatechange (e.g., warmer SSTs, increased stratification) arerobust across all current models, the magnitude and regionalpatterns vary widely. Overall, the CCSM climate sensitivity
tends to fall on the low side. The large amplitude changesobserved in the model North Atlantic subpolar gyre (whichdrives the predicted decline in coccolithophorids) are due to amelt back of sea-ice, which is overly extensive in the controlsimulation. Additionally, our model does not include thepotential decrease in calcification arising from the acidifica-
Figure 8. Projected global conditional probabilities of coccolithophorid bloom presence for (a) Juneand (b) December based upon the probability look up table using projected SST, Ecr, and DN/Dtclimatologies.
47 - 12 IGLESIAS-RODRIGUEZ ET AL.: COCCOLITHOPHORIDS IN OCEAN CARBON CYCLE MODELS
tion of the upper ocean as atmospheric CO2 levels increase[Riebesell et al., 2000].
3.4. Analysis of Genetic Diversity
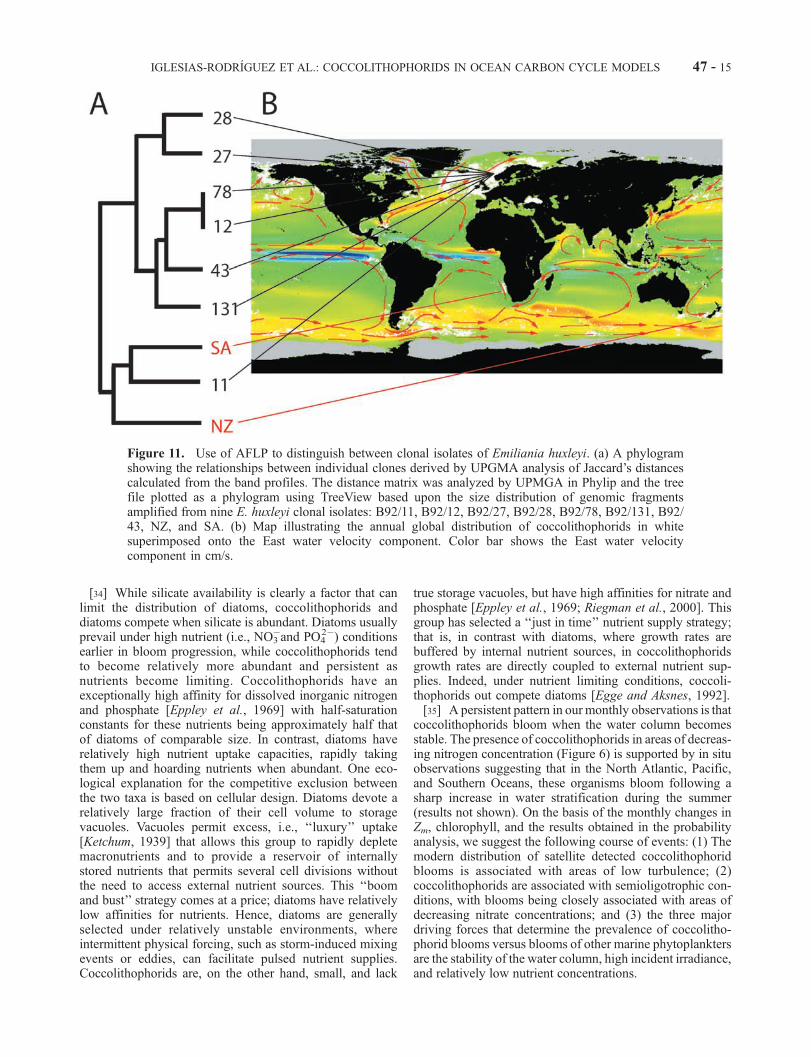
[28] An analysis of the AFLPs banding pattern revealssignificant genetic diversity within E. huxleyi (Figure 11).AFLP profiles for a selection of global isolates, a series ofNorth Atlantic isolates forming a time series through aNorwegian mesocosm bloom and two clones from SouthernHemisphere waters (off the coasts of New Zealand, NZ, andSouth Africa, SA), show that no two clones share an
identical genotype (results not shown). The complex band-ing patterns were analyzed by scoring the presence/absenceof each size fragment in each E. huxleyi clone and thencalculating Jaccard’s coefficient to give a measure ofgenetic distance. The distance matrix was analyzed byUPGMA in PHYLIP and the tree file plotted as a phylo-gram using TreeView (Figure 11a). The distances betweenthe E. huxleyi clones were rather small; 78 out of the 99amplification fragments were present in all the 9 clonesinvestigated. All but two clones (12 and 78) from a singleNorwegian mesocosm appear to have a unique genotype.These mesocosm clones form a single sister clade to twogeographically distinct isolates (NZ and SA).
4. Discussion
4.1. Biogeography of Coccolithophorids
[29] This is the first study providing monthly globalrepresentations of a specific phytoplankton functional groupin a statistical, diagnostic model. Among all the variablestested, DN/Dt, critical irradiance, and SST showed theclosest correlation with the presence of coccolithophorids,and among these, DN/Dt appears to explain most of thevariance (up to 50%) of P(C|V ). Our results reveal thatalthough coccolithophorid populations are cosmopolitan,the large-scale, seasonal blooms detected in SeaWiFSimagery are confined primarily to nutrient-depleted, temper-ate, and high-latitude oceans with relatively high criticalirradiances.[30] The conditional probability look-up table, generated
using the monthly climatologies of SST, Ecr, and DN/Dt,represents a significant improvement in our ability toquantify the probability of encountering a pixel containinga bloom of coccolithophorids anywhere in the ocean for anygiven month. Considering there are 1,374,065 ocean pixelsin our rectangular projections, the unconditional probabilityof randomly encountering a ‘‘bloom’’ pixel of coccolitho-phorids at any location varies between 0.03 and 0.53% forthe months of April and June, respectively (see Table 2). Incomparison, the conditional probability in the bloomregions was typically 1–25%, a more than 2 orders ofmagnitude improvement using the discriminative variables.When pixels are clustered into larger bins, the probabilityindices can be increased further, with an obvious sacrifice ofspatial resolution.[31] Our results compare with previous in situ observa-
tions of E. huxleyi and G. oceanica blooms and haveimproved previous investigations using remote sensing to
Figure 9. DN/Dt, SST, and Ecr in coccolithophore bloomareas (black) and projected values for 2060–2070 (red) inthe same areas.
Table 5. Probabilities for Current and Projected Conditions
aMaximum potential projected:current surface ratio calculated as the product of pixel number by pixel surface area (18 � 18 m2).
IGLESIAS-RODRIGUEZ ET AL.: COCCOLITHOPHORIDS IN OCEAN CARBON CYCLE MODELS 47 - 13
determine their distribution pattern. For example, we havereduced the number of likely misclassified coccolithophoridpixels in several ocean regions by applying a bathymetricthreshold compared with observations by Brown and Yoder[1994]. In our study, blooms were uncommon or absent inthe Persian Gulf, and Indonesian-northern Australian watersduring the entire period examined and in the western NorthAtlantic in 1997–1998. These regions are not known toharbor coccolithophorid blooms, although were categorizedas bloom regions in CZCS imagery [Brown and Yoder,1994] because they typically possess shallow (<100 m)calcareous sediments. The classified pixels located in theGulf of Mexico and around the Bahamas are likely the resultof this and suggest that the bathymetric map employed(within SeaDAS) is incorrect.[32] Classification of these blooms, though relatively
robust compared to remote sensing identification of otherphytoplankton taxa, has limitations. The detection of coc-colithophorid blooms in this study is dependent upon lightbackscattered from approximately one attenuation depth inthe water column and is primarily a function of coccolith,not cell concentration [Balch et al., 1991]. AlthoughEmiliania huxleyi is part of the highly diverse low latitu-dinal coccolithophorid populations, these are often domi-nated by coccolithophorid species other than E. huxleyi thatdo not shed coccoliths, rarely occur as blooms, live below50 m depth, and are, therefore, not manifested in a surfaceoptical signature. Our study does not account for nonbloompopulations of coccolithophorids, largely representative oftropical and subtropical regions. Satellite images of upperocean, broad spectrum scattering associated with coccoli-thophorid blooms could potentially be interpreted as sen-escent cells, resulting from the detachment of coccoliths. InEmiliania huxleyi, this phenomenon is most pronounced atthe end phase of a bloom. However, the transition to a
rapid increase in coccolith detachment measured in labo-ratory [Balch and Kilpatrick, 1993], mesocosm [Westbroeket al., 1993] and field [Garcia-Soto et al., 1995] experi-ments is relatively short, occurring on timescales of severaldays or a few weeks. Given that any classified bloomcorresponds to at least one occurrence during that particularmonth, they represent several, integrated stages of bloomdevelopment. While these inherent limitations of remotesensing of a specific phytoplankton functional groupshould not be ignored, they are offset by quasisynopticglobal observations that are only accessible through space-based observations.[33] The extensive coccolithophorid blooms south of Ice-
land and in the high-latitude regions in the Atlantic werefirst reported from satellite imagery [Brown and Yoder,1994; Holligan et al., 1993], but curiously, blooms of theseorganisms in the Antarctic have been poorly documented.The reports for the North Atlantic were greatly facilitated byCZCS imagery, which had poor coverage of the SouthernHemisphere oceans in general, and the Southern Ocean inparticular. In fact, E. huxleyi was first reported in theAntarctic waters by Hentschel [1932], and subsequentlyby McIntyre and Be [1967], who described monospecific E.huxleyi populations south of the APF. More recently,Hallegraeff [1984], Thomsen et al. [1988], Blackburn andCresswell [1993], Eynaud et al. [1999],Winter et al. [1999],Findlay and Giraudeau [2000], and S. Honjo et al. (per-sonal communication, 2001) described coccolithophorids inAntarctic waters as far south as 70�S. These reports and oursatellite retrievals suggest that the waters immediately northof the APF can support circumpolar blooms of coccolitho-phorids, and that these organisms can successfully competewith diatoms during the Austral summer. How is thiscompetition related to the physical proxies we adopted togenerate our probability analyses?
Figure 10. Difference between projected and current probability density functions of coccolithophoridoccurrence in the Northern and Southern Hemispheres (June and December, respectively.)
47 - 14 IGLESIAS-RODRIGUEZ ET AL.: COCCOLITHOPHORIDS IN OCEAN CARBON CYCLE MODELS
[34] While silicate availability is clearly a factor that canlimit the distribution of diatoms, coccolithophorids anddiatoms compete when silicate is abundant. Diatoms usuallyprevail under high nutrient (i.e., NO3
�and PO42�) conditions
earlier in bloom progression, while coccolithophorids tendto become relatively more abundant and persistent asnutrients become limiting. Coccolithophorids have anexceptionally high affinity for dissolved inorganic nitrogenand phosphate [Eppley et al., 1969] with half-saturationconstants for these nutrients being approximately half thatof diatoms of comparable size. In contrast, diatoms haverelatively high nutrient uptake capacities, rapidly takingthem up and hoarding nutrients when abundant. One eco-logical explanation for the competitive exclusion betweenthe two taxa is based on cellular design. Diatoms devote arelatively large fraction of their cell volume to storagevacuoles. Vacuoles permit excess, i.e., ‘‘luxury’’ uptake[Ketchum, 1939] that allows this group to rapidly depletemacronutrients and to provide a reservoir of internallystored nutrients that permits several cell divisions withoutthe need to access external nutrient sources. This ‘‘boomand bust’’ strategy comes at a price; diatoms have relativelylow affinities for nutrients. Hence, diatoms are generallyselected under relatively unstable environments, whereintermittent physical forcing, such as storm-induced mixingevents or eddies, can facilitate pulsed nutrient supplies.Coccolithophorids are, on the other hand, small, and lack
true storage vacuoles, but have high affinities for nitrate andphosphate [Eppley et al., 1969; Riegman et al., 2000]. Thisgroup has selected a ‘‘just in time’’ nutrient supply strategy;that is, in contrast with diatoms, where growth rates arebuffered by internal nutrient sources, in coccolithophoridsgrowth rates are directly coupled to external nutrient sup-plies. Indeed, under nutrient limiting conditions, coccoli-thophorids out compete diatoms [Egge and Aksnes, 1992].[35] A persistent pattern in our monthly observations is that
coccolithophorids bloom when the water column becomesstable. The presence of coccolithophorids in areas of decreas-ing nitrogen concentration (Figure 6) is supported by in situobservations suggesting that in the North Atlantic, Pacific,and Southern Oceans, these organisms bloom following asharp increase in water stratification during the summer(results not shown). On the basis of the monthly changes inZm, chlorophyll, and the results obtained in the probabilityanalysis, we suggest the following course of events: (1) Themodern distribution of satellite detected coccolithophoridblooms is associated with areas of low turbulence; (2)coccolithophorids are associated with semioligotrophic con-ditions, with blooms being closely associated with areas ofdecreasing nitrate concentrations; and (3) the three majordriving forces that determine the prevalence of coccolitho-phorid blooms versus blooms of other marine phytoplanktersare the stability of the water column, high incident irradiance,and relatively low nutrient concentrations.
Figure 11. Use of AFLP to distinguish between clonal isolates of Emiliania huxleyi. (a) A phylogramshowing the relationships between individual clones derived by UPGMA analysis of Jaccard’s distancescalculated from the band profiles. The distance matrix was analyzed by UPMGA in Phylip and the treefile plotted as a phylogram using TreeView based upon the size distribution of genomic fragmentsamplified from nine E. huxleyi clonal isolates: B92/11, B92/12, B92/27, B92/28, B92/78, B92/131, B92/43, NZ, and SA. (b) Map illustrating the annual global distribution of coccolithophorids in whitesuperimposed onto the East water velocity component. Color bar shows the East water velocitycomponent in cm/s.
IGLESIAS-RODRIGUEZ ET AL.: COCCOLITHOPHORIDS IN OCEAN CARBON CYCLE MODELS 47 - 15
[36] On ecological timescales, the effects of turbulenceand nutrient supply appear to have altered the dynamicequilibrium between coccolithophorids and nutrient supplyin two oceanic areas, namely the Black Sea and the BeringSea. The sedimentary record reveals that Emiliania huxleyifirst ‘‘invaded’’ the Black Sea about 1600 Ma before present[Hay et al., 1991]; indeed, the upper laminated sediments ofthis basin are carbonate rich. There is evidence however,that human activities have altered the biogeochemistry ofthe Black Sea, skewing the phytoplankton compositiontoward coccolithophorids. Prior to dam construction onthe Danube and other rivers that deliver nutrients to thebasin in circa 1970, the phytoplankton community wasbalanced with diatoms and dinoflagellates [Mihnea, 1997].An exhaustive analysis of the phytoplankton communitystructure of the Black Sea between 1979 and 1994 showsthat Emiliania huxleyi was present in bloom concentrations[Humborg et al., 1997; Mihnea, 1997]. It has been sug-gested that the dam construction resulted in a significantdecline in the silicate concentration, as the Danube river isresponsible for over two thirds of the river inputs into theBlack Sea [Humborg et al., 1997]. However, the geologicalsuccess of E. huxleyi in the Black Sea, with a salinity of ca.18% and relatively low nutrient inventories, suggests thatthe general profile derived for this taxa on the global scalewill function on a regional scale as well.[37] In the eastern portion of the Bering Sea, a large-scale
coccolithophorid bloom, instead of the usual diatom domi-nated system, was reported for the first time during thesummer of the 1997 El Nino year. Similar situationsoccurred during the summers of 1998 and 1999. Thischange in the phytoplankton community structure is possi-bly due to sudden alterations in the climate pattern of theNorth Pacific attributable to the Pacific Decadal Oscillation[Trenberth, 1990], in which a more stable water column ledto lower surface nutrients and resulted in a shift from a largediatom bloom to a small diatom bloom followed by a largecoccolithophorid bloom.[38] The appearance of satellite-detected coccolithophorid
blooms in high-latitude oceans, and the relative paucity ofsuch blooms in the tropics, does not always reflect the spatialpatterns of calcite deposition in marine sediments. Thespatial biogeochemical shifts between opal and carbonatereflect areas of different productivity regimes [Pondaven etal., 2000; Sarmiento et al., 2002]. The accumulation ofcalcite in surface sediments is dependent upon biotic andabiotic processes including grazing, dissolution processes,depth of the lysocline, and transport by ocean currents.Perhaps the most pronounced spatial variation in surfacecalcification is illustrated by Honjo et al. (personal commu-nication, 2001), who report on sediment trap data for theSouthern Ocean along 170�W. Their data reveal high carbo-nate:opal ratios north of the APF reflecting coccolithophoriddominance [Honjo, 1997], whereas this ratio decreasesdramatically south of the APF, where diatoms often domi-nate the phytoplankton community. Similarly, the relativeabundance of coccolithophorids in the geological past can beobtained from the sediment record where coccolithophorid-dominated areas show Sibio:Cinor ratios 1 compared todiatom-dominated areas with Sibiol:Cinor 1 [Honjo, 1997;
Falkowski et al., 1998]. Honjo et al. (personal communica-tion) suggest that at the APF and latitudes further south,more than half of the inorganic carbon originates frompteropod shells and the remaining fraction is representedby planktonic foraminifera. North of the APF the calcite fluxis dominated by coccolithophorids.
4.2. Evolutionary Success of Coccolithophorids in theGeological Past
[39] Calcareous nannoplankton appeared for the first timein the Late Triassic, showing great abundance in highlatitudes with a peak in diversity during the Late Cretaceous[Bown and Young, 1997]. Several mass extinction periodsaffected the diversity of calcifying nannoplankton, the mostpronounced being at the Cretaceous/Tertiary boundary,when approximately 90% of the calcifying nannoplanktontaxa became extinct. In the ensuing Cenozoic epoch, dia-toms rose to taxonomic prominence among the eucaryoticphytoplankton, a role these organisms enjoy to the presenttime. What fundamental process(es) determines the relativeabundance of coccolithophorids or diatoms in the globaloceans?[40] One major factor that can influence the competitive
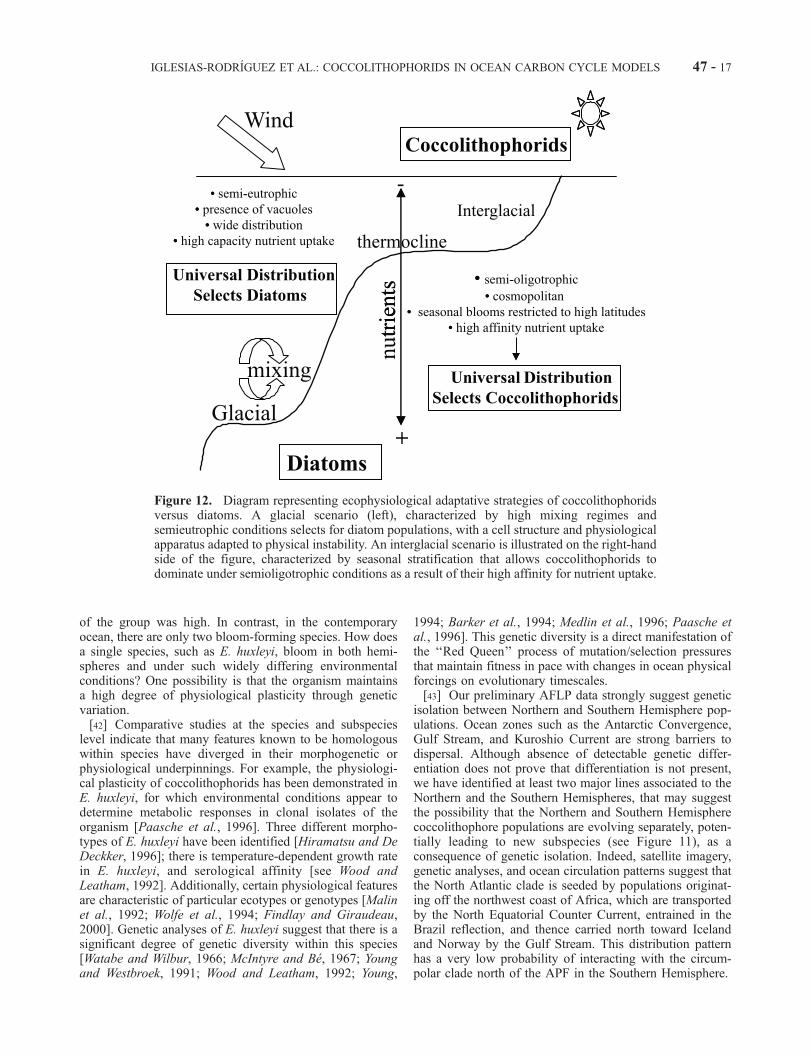
selection of one of these groups is upper ocean turbulence.High concentrations of coccoliths are found in interglacialsediments, whereas glacial sediments are relatively poor inbiogenic carbonate [Henrich, 1989]. One example is tran-sitions between glacial-interglacial periods that are evidentin the equatorial Atlantic, where decreasing concentrationsof coccoliths during glacial periods are thought to beassociated to the deepening of the thermocline [Kinkel etal., 2000]. These global scale observations relate to differ-ences in the physiological plasticity of two key eucaryoticphytoplankton functional groups, coccolithophorids anddiatoms, and in their ability to cope with physical disturb-ance. From an evolutionary perspective, these strategicadvantages might have been accentuated during glacial-interglacial transitions, when strong selection pressure isexerted. It is therefore fair to assume that the mid-Cenozoic,when there was an expansion of Arctic and Antarctic icecaps forcing sea level changes, and high winds, high mixing,and recycling of nutrients from the bottom layers, did notfavor coccolithophorid proliferation and that their ecologicalniche was threatened by diatoms. We argue that the cellularstrategies of diatoms and coccolithophorids, the presence ofnutrient vacuoles and high nutrient uptake capacity indiatoms [Grime, 1979; Raven, 1997], and lack of storagevacuoles and low nutrient uptake rates in coccolithophorids[Eppley et al., 1969; Riegman et al., 2000] may explain theglacial-interglacial transition in the relative abundance ofcarbonate/silicate deposited in marine sediments above thelysocline. This physical disturbance hypothesis proposesthat diatoms are selected when turbulent mixing and pulsednutrient inputs into the euphotic zone are high, whilecoccolithophorids are selected under relatively quiescentconditions when nutrient fluxes are low (Figure 12).
4.3. Coccolithophorid Genetic Diversity
[41] In the Cretaceous period, coccolithophorids wereextremely abundant throughout the oceans, and diversity
47 - 16 IGLESIAS-RODRIGUEZ ET AL.: COCCOLITHOPHORIDS IN OCEAN CARBON CYCLE MODELS
of the group was high. In contrast, in the contemporaryocean, there are only two bloom-forming species. How doesa single species, such as E. huxleyi, bloom in both hemi-spheres and under such widely differing environmentalconditions? One possibility is that the organism maintainsa high degree of physiological plasticity through geneticvariation.[42] Comparative studies at the species and subspecies
level indicate that many features known to be homologouswithin species have diverged in their morphogenetic orphysiological underpinnings. For example, the physiologi-cal plasticity of coccolithophorids has been demonstrated inE. huxleyi, for which environmental conditions appear todetermine metabolic responses in clonal isolates of theorganism [Paasche et al., 1996]. Three different morpho-types of E. huxleyi have been identified [Hiramatsu and DeDeckker, 1996]; there is temperature-dependent growth ratein E. huxleyi, and serological affinity [see Wood andLeatham, 1992]. Additionally, certain physiological featuresare characteristic of particular ecotypes or genotypes [Malinet al., 1992; Wolfe et al., 1994; Findlay and Giraudeau,2000]. Genetic analyses of E. huxleyi suggest that there is asignificant degree of genetic diversity within this species[Watabe and Wilbur, 1966; McIntyre and Be, 1967; Youngand Westbroek, 1991; Wood and Leatham, 1992; Young,
1994; Barker et al., 1994; Medlin et al., 1996; Paasche etal., 1996]. This genetic diversity is a direct manifestation ofthe ‘‘Red Queen’’ process of mutation/selection pressuresthat maintain fitness in pace with changes in ocean physicalforcings on evolutionary timescales.[43] Our preliminary AFLP data strongly suggest genetic
isolation between Northern and Southern Hemisphere pop-ulations. Ocean zones such as the Antarctic Convergence,Gulf Stream, and Kuroshio Current are strong barriers todispersal. Although absence of detectable genetic differ-entiation does not prove that differentiation is not present,we have identified at least two major lines associated to theNorthern and the Southern Hemispheres, that may suggestthe possibility that the Northern and Southern Hemispherecoccolithophore populations are evolving separately, poten-tially leading to new subspecies (see Figure 11), as aconsequence of genetic isolation. Indeed, satellite imagery,genetic analyses, and ocean circulation patterns suggest thatthe North Atlantic clade is seeded by populations originat-ing off the northwest coast of Africa, which are transportedby the North Equatorial Counter Current, entrained in theBrazil reflection, and thence carried north toward Icelandand Norway by the Gulf Stream. This distribution patternhas a very low probability of interacting with the circum-polar clade north of the APF in the Southern Hemisphere.
Figure 12. Diagram representing ecophysiological adaptative strategies of coccolithophoridsversus diatoms. A glacial scenario (left), characterized by high mixing regimes andsemieutrophic conditions selects for diatom populations, with a cell structure and physiologicalapparatus adapted to physical instability. An interglacial scenario is illustrated on the right-handside of the figure, characterized by seasonal stratification that allows coccolithophorids todominate under semioligotrophic conditions as a result of their high affinity for nutrient uptake.
IGLESIAS-RODRIGUEZ ET AL.: COCCOLITHOPHORIDS IN OCEAN CARBON CYCLE MODELS 47 - 17
[44] Overall, the relationships revealed by this analysissuggest genotypic variability within the species concept of E.huxleyi from geographic locations with distinct hydrographiccharacteristics. Hence, coccolithophorids such as E. huxleyican be considered widespread taxa but with phenotypesselected by environmental pressures and provided by geneticvariation. This process that we call ‘‘universal distributionand local selection’’ has important implications in the flex-ibility of phenotypic acclimation and genetic adaptation ofcoccolithophorids to changing environmental conditions.Therefore, while large-scale coccolithophorid blooms areassociated with high latitudinal ocean regions, the coccoli-thophorid group cannot be associated to any particularecological niche per se, but rather has evolved differentlyas a function of the evolutionary success of individualsubpopulations. In this sense, the species concept withinthe coccolithophorid community may need to be redefinedgiven the great deal of genetic and physiological plasticity ofE. huxleyi. What we refer to as species appears to be rather aconglomerate of subpopulations that have been selected byenvironmental pressures. The extent to which this phenom-enon can be generalized to eucaryotic phytoplankton remainsto be seen [Gallagher et al., 1984].
4.4. Response of Coccolithophorid Populations toChanging Climate: An Evolutionary Perspective
[45] Our future projections show that the largest coccoli-thophorid populations of the world oceans, the NorthAtlantic, could potentially suffer a major decrease in arealbloom. According to these predictions, approximately 20%of the negative DN/Dt values (areas of decreasing nitrate)associated with coccolithophorids pixels observed in ourstudy appear positive in the predicted scenario for the NorthAtlantic (Figure 9) while these changes are negligible in theNorth Pacific and in the Southern Ocean. While a draw-down of nutrients is also expected in future climate scenar-ios, the projected alterations in the nitrate cycling in theNorth Atlantic are a consequence of changes in deep wintermixing that appear to affect the projected onset of cocco-lithophorid blooms.[46] It has been suggested that the progressive increase in
atmospheric CO2 concentrations predicted for the next fewdecades may decrease the production of calcium carbonatein the surface ocean [Riebesell et al., 2000], and thus thisresponse could potentially act as a negative feedback onatmospheric CO2 levels. In the equilibrium CO2 + H2O +CaCO3 $ 2HCO3
� + Ca2+, an increase in CO2 concentrationleads to calcium carbonate dissolution, whereas a decrease inCO2 levels achieves the reverse. While photosyntheticcarbon fixation decreases the partial pressure of CO2 asdissolved inorganic carbon is being utilized, conditionsfavoring surface calcification by coccolithophorid bloomscontribute to the increase of dissolved CO2. Biologicallymediated calcification in upper ocean layers results in Caoversaturation compared to deep layers, and thus Ca is oftenprecipitated and redissolved several times before it reachesthe sediment [Stumm and Morgan, 1981]. By the middle ofthe 21st century, the concentration of CO2atm is predicted tobe double that of preindustrial levels [Houghton, 1996]. Thecarbonate ion concentration in seawater controls the rate of
precipitation and dissolution of calcium carbonate in theoceans. The relative abundance of the components of thecarbonate system (CO2, H2CO3, HCO3
�, and CO32�) depends
upon pH, dissolved inorganic carbon, and the total alkalinity.Under modern ocean water conditions (pH 8.0–8.2),[HCO3
�]:[CO32�]: [CO2] is approximately 200:10:2. A pre-
dicted future pH decrease of 0.35 units caused by thepredicted increase in pCO2 will result in a 30% increase inCO3
2�, and a corresponding 50% increase in dissolved CO2,that will directly affect marine biota, and will likely changeprocesses of biogenic CaCO3 formation and sedimentationand the elemental composition of primary produced organicand inorganic matter. A future increase in the CO2:HCO3
�ratio will diminish the evolutionary advantages ofCO2-concentrating mechanisms present in some phytoplank-ton taxa including coccolithophorids and diatoms [Nimer etal., 1997; Iglesias-Rodrıguez and Merrett, 1997] and willreduce the calcium carbonate saturation state of the surfaceocean,
� ¼ ½Ca2þ�½CO2�3 �=Ksp;
where Ksp is the solubility product, largely regulated bypressure [Byrne and Laurie, 1999]. � is mainly determinedby the concentration of CO3
2� because Ca2+ is approxi-mately conservative in seawater [Millero, 1996]. At pH 7.8,the concentration of CO3
2�would decreases by 30% frommodern ocean pH conditions and consequently, it woulddecrease calcite saturation by an equal percentage. Theglobal production of CaCO3 is �0.6 Gt C yr�1 [Milliman,1993] and represents up to 3% of the global marine carbonfixation [Berger, 1976; Longhurst et al., 1995]. In themodern ocean, coccolithophorids alter the Corganic:Ccarbonate
or ‘‘rain ratio’’ and increase surface pCO2 during calcifica-tion, producing one molecule of CO2 for each molecule ofCaCO3 fixed. Globally, the rain ratio from the surface oceanis roughly 4:1 [Broecker and Peng, 1982] and is animportant factor in determining the fate of the CO2 inseawater. This ratio is largely controlled by the dominanttaxon fixing carbon such that a shift in the phytoplanktoncommunity structure from one functional group to another(e.g., from calcifiers to silicifiers) would affect the capacityof the biological pump in the control of surface pCO2. Forexample, during a bloom of coccolithophorids, photo-synthesis:calcification and the rain ratio can approach 1:1,and the effect of such high calcification rates has been foundto change the air-sea gradient of CO2 [Robertson et al.,1994]. Considering that coccolithophorid blooms areresponsible for up to 80% of surface ocean calcification[Fabry, 1989; Deuser and Ross, 1989], the 50% predicteddecrease in potential surface coccolithophorid bloom arealextent may potentially lead to a significant increase in thePOC:PIC ratio. In half a century, under the worsepredictions of the Intergovernmental Panel on ClimateChange, an increase in dissolved CO2 and a decrease in theconcentration of CO3
2�will result in an increase in calciumcarbonate dissolution. Additionally, a potential shift in thephytoplankton community favoring noncalcifying phyto-plankters, as a result of projected changes in the mixingdynamics in areas responsible for more than half of the total
47 - 18 IGLESIAS-RODRIGUEZ ET AL.: COCCOLITHOPHORIDS IN OCEAN CARBON CYCLE MODELS
annual coccolithophorid bloom areas, will have a majorimpact on the capacity of the ocean as a reservoir ofcarbonate. A decrease in calcification is a short-term nega-tive feedback in the global carbon cycle.
[47] Acknowledgments. The authors wish to thank Oscar Schofieldfor his valuable comments and Robert Berk for his helpful discussions. Wealso thank John Green for providing strains of Emiliania huxleyi. Thisresearch was supported by the National Aeronautic and Space Adminis-tration through the Synthesis and Modeling Program of the U.S. JointGlobal Ocean Flux Studies (SMP) under grant NAG5-6982 (to P. G. F.),and the National Science Foundation Biocomplexity Research Programunder grant OCE-0084032 (to P. G. F.). The molecular analysis of AFLPwas funded by the Natural Environment Research Council under fellowshipGT5/99/MS/14 (to M. D. I.-R.). C. W. B. was supported by funding fromthe NOAA Ocean Remote Sensing Program.
ReferencesBalch, W. M., and K. Kilpatrick, Coccolith production and detachment byEmiliania huxleyi (Prymnesiophyceae), J. Phycol., 29, 566–575, 1993.
Balch, W. M., P. M. Holligan, S. G. Ackleson, and K. J. Voss, Biologicaland optical properties of mesoscale coccolithophorid blooms in the Gulfof Maine, Limnol. Oceanogr., 36, 629–643, 1991.
Balch, W. M., P. M. Holligan, and K. A. Kilpatrick, Calcification, photo-synthesis and growth of the bloom-forming coccolithophore, Emilianiahuxleyi, Cont. Shelf Res., 12, 1353–1374, 1992.
Barker, G. L. A., J. C. Green, P. K. Hayes, and L. L. Medlin, Preliminaryresults using the RAPD analysis to screen bloom populations of Emilia-nia-huxleyi (Haptophyta), Sarsia, 79, 301–306, 1994.
Berger, W. H., Biogenous deep-sea sediments: production, preservation andinterpretation, in Treatise on Chemical Oceanography, vol. 5, edited by J.P. Riley and R. Chester, pp. 265–388, Academic, San Diego, Calif.,1976.
Berthon, J. F., and A. Morel, Validation of a spectral light-photosynthesismodel and use of the model in conjunction with remotely sensed pigmentobservations, Limnol. Oceanogr., 37, 781–796, 1992.
Blackburn, S. I., and G. Cresswell, A coccolithophorid bloom in Jervis Bay,Australia, Aust. J. Mar. Freshwater Res., 44, 785–786, 1993.
Blackmon, M., et al., The Community Climate System Model, Bull. Am.Meteorol. Soc., 82, 2357–2376, 2001.
Boville, B. A., and P. R. Gent, The NCAR Climate System Model, versionone, J. Clim., 11, 1115–1130, 1998.
Bown, P. R., and J. R. Young, Mesozoic calcareous nannoplankton classi-fication, J. Nannoplankton Res., 19, 21–36, 1997.
Broecker, W., and T. H. Peng, Tracers in the Sea, Lamont-Doherty Geol.Obs., Columbia Univ., ELDEGEO Press, New York, 1982.
Brown, C. W., Spatial and temporal variability of Emiliania huxleyi bloomsin SeaWiFS imagery, Eos Trans. AGU, 80(49) Suppl., 153, 1999.
Brown, C. W., and J. A. Yoder, Coccolithophorid blooms in the globalocean, J. Geophys. Res., 99, 7467–7482, 1994.
Byrne, R. H., and S. H. Laurie, Influence of pressure on chemical equilibriain aqueous systems with particular reference to seawater, Pure Appl.Chem., 71, 871–890, 1999.
Conkright, M., et al., World Ocean Database 1998, Natl. Oceanogr. DataCent. Internal Rep. 14, 1998.
Denman, K. L., and M. A. Pena, A coupled 1-D biological/physical modelof the northeast subarctic Pacific Ocean with iron limitation, Deep SeaRes., Part II, 46, 2877–2908, 1999.
Deuser, W. G., and E. H. Ross, Seasonally abundant planktonic-foramini-fera of the Sargasso Sea: Succession, deep-water fluxes, isotopic compo-sitions, and paleoceanographic implications, J. Foraminiferal Res., 19,268–293, 1989.
Egge, J. K., and D. L. Aksnes, Silicate as regulating nutrient in phytoplank-ton competition, Mar. Ecol. Prog. Ser., 83, 281–289, 1992.
Eppley, R. W., J. N. Rogers, and J. J. McCarthy, Half saturation constant foruptake of nitrate and ammonium by marine phytoplankton, Limnol.Oceanogr., 14, 912–920, 1969.
Eynaud, F., J. Giradeaux, J.-J. Pichon, and C. J. Pudsey, Sea-surface dis-tribution of coccolithophorid, diatoms, silicoflagellates and dinoflagel-lates in the South Atlantic Ocean during the late austral summer 1995,Deep Sea Res., Part I, 46, 451–482, 1999.
Fabry, V. J., Aragonite production by pteropod mollusks in the subantarcticPacific, Deep Sea Res., 36, 1735–1751, 1989.
Falkowski, P. G., and J. A. Raven (Eds.), Aquatic Photosynthesis, Black-well Sci., Malden, Mass., 1997.
Falkowski, P. G., R. T. Barber, and V. Smetacek, Biogeochemical controlsand feedbacks on ocean primary production, Science, 281, 200–206, 1998.
Findlay, C. S., and J. Giraudeau, Extant calcareous nannoplankton in theAustralian Sector of the Southern Ocean (austral summers 1994 and1995), Mar. Micropaleontol., 40, 417–439, 2000.
Fisher, N. S., and S. Honjo, Intraspecific differences in temperature andsalinity responses in the coccolithophorid Emiliania huxleyi, Biol. Ocea-nogr., 6, 355–361, 1989.
Gallagher, J. C., A. M. Wood, and R. S. Alberte, Ecotypic differentiation inthe marine diatom Skeletonema costatum: Influence of light intensity onthe photosynthetic apparatus, Mar. Biol., 82, 121–134, 1984.
Garcia-Soto, C., E. Fernandez, R. D. Pingree, and D. S Harbour, Evolutionand structure of a shelf coccolithophorid bloom in the Western EnglishChannel, J. Plankton Res., 17, 2011–2036, 1995.
Gordon, H. R., and M. Wang, Retrieval of water-leaving radiance andaerosol optical thickness over the oceans with SeaWiFS: A preliminaryalgorithm, Appl. Opt., 33, 443–452, 1994.
Grime, J. P., Plant Strategies and Vegetation Processes, John Wiley, NewYork, 1979.
Gruber, N., and J. L. Sarmiento, Global patterns of marine nitrogen fixationand denitrification, Global Biogeochem. Cycles, 11, 235–266, 1997.
Hallegraeff, G. M., Coccolithophorids (calcareous nanoplankton) fromAustralian waters, Bot. Mar., 27, 229–247, 1984.
Hay, B. J., M. A. Arthur, W. E. Dean, E. D. Neff, and S. Honjo, Sedimentdeposition in the late Holocene abyssal Black Sea with climatic andchronological implications, Deep Sea Res., 38, 1211–1235, 1991.
Heimann, M., and E. Maier-Reimer, On the relations between the oceanicuptake of CO2 and its carbon isotopes, Global Biogeochem. Cycles, 10,89–110, 1996.
Henrich, R., Diagenetic environments of authigenic carbonates and opal-Ct crystallization in lower Miocene to upper Oligocene deposits of theNorwegian Sea (ODP Site 643, Leg 104), in Proceedings of the OceanDrilling Program, edited by O. Eldholm, J. Thiede, and E. Taylor, Sci.Result, 104, pp. 233–248, Ocean Drill. Program, College Station, Tex.,1989.
Hentschel, E., Die biologische Methoden und das biologische Beobach-tungsmaterial der Meteor-Expedition, Wiss. Ergeb. Atl. Exped. Meteorol.,10, 1–274, 1932.
Hiramatsu, C., and P. De Deckker, Distribution of calcareous nannoplank-ton near the subtropical convergence, south of Tasmania, Australia, Mar.Freshwater Res., 47, 707–713, 1996.
Holligan, P. M., M. Viollier, D. S. Harbour, P. Camus, and M. Champagne-Philippe, Satellite and ship studies of coccolithophorid production along acontinental shelf edge, Nature, 304, 339–342, 1983.
Holligan, P. M., et al., A biogeochemical study of the coccolithophorid,Emiliania huxleyi, in the North Atlantic, Global Biogeochem. Cycles, 7,879–900, 1993.
Honjo, S., The rain of ocean particles and Earth’s carbon cycle, Oceanus,40, 4–8, 1997.
Houghton, R. A., Converting terrestrial ecosystems from sources to sinks ofcarbon, Ambio, 25, 267–272, 1996.
Humborg, C., V. Ittekkot, A. Cociasu, and B. V. Bodungen, Effect ofDanube River dam on Black Sea biogeochemistry and ecosystem struc-ture, Nature, 386, 385–388, 1997.
Iglesias-Rodrıguez, M. D., and M. J. Merrett, Dissolved inorganic carbonutilization and the development of extracellular carbonic anhydrase bythe marine diatom Phaeodactylum tricornutum, New Phytol., 135, 163–168, 1997.
Joos, F., and M. Bruno, Long-term variability of the terrestrial and oceaniccarbon sinks and the budgets of the carbon isotopes C13 and C14, GlobalBiogeochem. Cycles, 12, 277–295, 1998.
Jordan, R. W., and J. C. Green, A checklist of the extant haptophyta of theworld, J. Mar. Biol. Assoc. U.K., 74, 149–174, 1994.
Ketchum, B. H., The absorption of phosphate and nitrate by illuminatedcultures of Nitzschia closterium, Am. J. Bot., 26, 399–407, 1939.
Kinkel, H., J. Young, H. Stoll, P. Ziveri, M. Geissen, I. Probert, and K. H.Baumann, Size matters: The influence of coccolith size and growth rateon paleobarometry and climates, paper presented at 8th InternationalConference, Nannoplankton Assoc., Bremen, Germany, 2000.
Levitus, S., Climatological Atlas of the World Ocean, Prof. Pap. 13, 173pp., NOAA/ERL Geophys. Fluid Dyn. Lab., Princeton, N.J., 1982.
Lipps, J. H., Fossil Prokaryotes and Protists, Blackwell Sci., Malden,Mass., 1993.
Longhurst, A., S. Sathyendranath, T. Platt, and C. Caverhill, An estimate ofglobal primary production in the ocean from satellite radiometer data,J. Plankton Res., 17, 1245–1271, 1995.
Malin, G., S. M. Turner, and P. S. Liss, Sulfur: The plankton climateconnection, J. Phycol., 28, 590–597, 1992.
IGLESIAS-RODRIGUEZ ET AL.: COCCOLITHOPHORIDS IN OCEAN CARBON CYCLE MODELS 47 - 19
McClain, C. R., M. L. Cleave, G. C. Feldman, W. W. Gregg, S. Hooker, andN. Kuring, Science quality SeaWiFS data for global biosphere research,Sea Technol., September 10–16, 1998.
McIntyre, A., and A. W. H. Be, Coccolithus neohelis sp. N., a coccolithfossil type in contemporary seas, Deep Sea Res., 14, 369–371, 1967.
Medlin, L. K., G. L. A. Barker, L. Campbell, J. C. Green, P. K. Hayes, D.Marie, S. Wrieden, and D. Vaulot, Genetic characterisation of Emilianiahuxleyi (Haptophyta), J. Mar. Syst., 9, 13–31, 1996.
Mihnea, P. E., Major shifts in the phytoplankton community (1980–1994)in the Romanian Black Sea, Oceanol. Acta, 20, 119–129, 1997.
Millero, F. K.,Chemical Oceanography, CRC Press, Boca Raton, Fla., 1996.Milliman, J. D., Production and accumulation of calcium carbonate in theocean: Budget of a nonsteady state, Global Biogeochem. Cycles, 7, 927–957, 1993.
Moore, J. K., S. C. Doney, J. A. Kleypas, D. M. Glover, and I. Y. Fung, Anintermediate complexity marine ecosystem model for the global domain,Deep Sea Res., Part II, 49, 403–462, 2001a.
Moore, J. K., S. C. Doney, J. A. Kleypas, D. M. Glover, and I. Y. Fung, Ironcycling and nutrient limitation patterns in surface waters of the WorldOcean, Deep Sea Res, Part II, 49, 463–508, 2001b.
Najjar, R. G., and R. F. Keeling, Analysis of the mean annual cycle of thedissolved oxygen anomaly in the World Ocean, J. Mar. Res., 55, 117–151, 1997.
Nimer, N. A., M. D. Iglesias-Rodrıguez, and M. J. Merrett, Bicarbonateutilization by marine phytoplankton species, J. Phycol., 33, 625–631,1997.
Paasche, E., S. Brubak, S. Skattbø, J. R. Young, and J. C. Green, Growthand calcification in the coccolithophorid Emiliania huxleyi (Haptophy-ceae) at low salinities, Phycologia, 35, 394–403, 1996.
Pondaven, P., O. Ragueneau, P. Treguer, A. Hauvespre, L. Dezileau, andJ. L. Reyss, Resolving the ‘‘opal paradox’’ in the Southern Ocean, Nat-ure, 405, 168–172, 2000.
Quay, P., Carbon sink: The role of oceans, Geotimes, 37, 16–18, 1992.Raven, J. A., The vacuole: A cost-benefit analysis, Adv. Bot. Res., 25, 59–86, 1997.
Reynolds, R. W., A real-time global sea surface temperature analysis,J. Clim., 11, 75–86, 1988.
Reynolds, R. W., and D. C. Marsico, An improved real-time global seasurface temperature analysis, J. Clim., 6, 114–119, 1993.
Riebesell, U., I. Zondervan, B. Rost, P. D. Tortell, R. E. Zeebe, and F. M.M. Morel, Reduced calcification of marine plankton in response to in-creased atmospheric CO2, Nature, 407, 364–367, 2000.
Riegman, R., W. Stolte, A. A. M. Noordeloos, and D. Slezak, Nutrientuptake, and alkaline phosphate (EC 3:1:3:1) activity of Emiliania huxleyi(Prymnesiophyceae) during growth under N and P limitation in contin-uous cultures, J. Phycol., 36, 87–96, 2000.
Robertson, J. E., C. Robinson, D. R. Turner, P. Holligan, A. J. Watson,P. Boyd, E. Fernandez, and M. Finch, The impact of a coccolithophor-id bloom on oceanic carbon uptake in the northeast Atlantic duringsummer 1991, Deep Sea Res., Part II, 41, 297–314, 1994.
Sarmiento, J. L., J. Dunne, A. Gnanadesikan, R. M. Key, K. Matsumoto,and R. Slater, A new estimate of the CaCO3 to organic carbon exportratio, Global Biogeochem. Cycles, 16, doi:10.1029/2002GB001919, inpress, 2002.
Steinke, M., G. Malin, S. D. Archer, P. H. Burkill, and P. S. Liss, Enzymaticproduction of dimethylsulfide during a coccolithophorid bloom in theNorth Atlantic, paper presented at American Society of Limnology andOceanography Aquatic Sciences Meeting, Santa Fe, N.M., 1999.
Stumm, W., and J. J. Morgan, Aquatic Chemistry: An Introduction Empha-sizing Chemical Equilibra In Natural Waters, John Wiley, New York,1981.
Thomsen, H. A., K. R. Buck, S. L. Coale, D. L. Garrison, andM.M. Gowing,Nanoplanktonic coccolithophorids (prymnesiophyceae, Haptophyceae)from the Wedell Sea, Antarctica, Nord. J. Bot., 8, 419–436, 1988.
Trenberth, K. E., Recent observed interdecadal climate changes in theNorthern Hemisphere, Bull. Am. Meteorol. Soc., 71, 988–993, 1990.
Vance, T. C., et al., Aquamarine waters recorded for first time in EasternBering Sea, Eos Trans. AGU, 79(10), 121, 1998.
Vos, P., et al., AFLP: A new technique for DNA-fingerprinting, NucleicAcids Res., 23, 4407–4414, 1995.
Watabe, N., and K. M. Wilbur, Effects of temperature in growth, calcifica-tion and coccolith form in Coccolithus huxleyi (Coccolithineae), Limnol.Oceanogr., 11, 567–575, 1966.
Westbroek, P., P. R. Youn, and K. Linschooten, Coccolith production (bio-mineralization) in the marine alga Emiliania huxleyi, J. Protozool., 36,368–373, 1989.
Westbroek, P., et al., A model system approach to biological climate for-cing: The example of Emiliania huxleyi, Global Planet. Change, 8, 27–46, 1993.
Winter, A., M. Elbrachter, and G. Krause, Subtropical coccolithophorids inthe Weddell Sea, Deep Sea Res., Part I, 46, 439–449, 1999.
Wolfe, G. V., E. B. Sherr, and B. F. Sherr, Release and consumption ofDMSP from Emiliania huxleyi during grazing by Oxyrrhis Marina, Mar.Ecol. Prog. Ser., 111, 111–119, 1994.
Wood, A. M., and T. Leatham, The species concept in phytoplankton ecol-ogy, J. Phycol., 28, 723–729, 1992.
Young, J. R., The functions of coccoliths, in, Coccolithophorids, edited byA. Winter and W. G. Siesser, pp. 63–82, Cambridge Univ. Press, NewYork, 1994.
Young, J. R., and P. Westbroek, Genotypic variation in the coccolithophoridspecies Emiliania-huxleyi, Mar. Micropaleontol., 18, 5–23, 1991.
�������������������������C. W. Brown, Office of Research and Applications, National Oceano-
graphic and Atmospheric Administration, 5200 Auth Road, Camp Springs,MD 20746-4304, USA. ([email protected])S. C. Doney and J. Kleypas, National Center for Atmospheric Research,
Climate and Global Dynamics, P.O. Box 3000, Boulder, CO 80307-3000,USA. ([email protected]; [email protected])P. G. Falkowski, M. D. Iglesias-Rodrıguez, D. Kolber, and Z. Kolber,
Environmental Biophysics and Molecular Ecology Program, Institute ofMarine and Coastal Sciences, Rutgers University, 71 Dudley Road, NewBrunswick, NJ 08901, USA. ([email protected]; [email protected]; [email protected]; [email protected])P. K. Hayes, School of Biological Sciences, University of Bristol,