Page 1
Reproductive synchrony in a recovering bottlenecked
sea turtle population
Virginie Plot1,2†, Benoıt de Thoisy3,4†, Stephane Blanc1,2, Laurent Kelle5, Anne Lavergne4,
Helene Roger-Berubet1,2, Yann Tremblay6, Sabrina Fossette1,2‡ and Jean-YvesGeorges1,2*
1Universite de Strasbourg, IPHC, 23 rue Becquerel, 67087 Strasbourg, France; 2CNRS, UMR7178, 67037 Strasbourg,
France; 3Kwata Association, 16 avenue Louis Pasteur, 97335 Cayenne, FrenchGuiana; 4Institut Pasteur de laGuyane,
97306Cayenne, FrenchGuiana; 5WWFFrance, 5 Lot. Katoury, 97300 Cayenne, FrenchGuiana; and 6Centre de
Recherche Halieutique, IRD, Avenue JeanMonnet BP 171, 34203 Sete, France
Summary
1. The assessment of species extinction risk has been well established for some time now. Assessing
the potential for recovery in endangered species is however much more challenging, because com-
plementary approaches are required to detect reliable signals of positive trends.
2. This study combines genetics, demography and behavioural data at three different time-scales
to assess historical and recent population changes and evidence of reproductive synchrony in a
small population of olive ridley sea turtle Lepidochelys olivacea. Lepidochelys is considered as the
most extraordinary example of reproductive synchrony in reptiles, yet to date, it has only been
reported in large populations.
3. Using Bayesian coalescent-based models on microsatellite nuclear DNA variability, we demon-
strate that effective population size in olive ridleys nesting in French Guiana has dramatically
declined by 99% over the last 20 centuries. This low current population size is further illustrated by
the absence of genetic mitochondrial DNA diversity in the present nesting population. Yet, moni-
toring of nesting sites in FrenchGuiana suggests a possible recovery of the population over the last
decade.
4. Satellite telemetry shows that over the first 14 days of their 28-days inter-nesting interval, i.e.
when eggs maturation is likely to occur, gravid females disperse over the continental shelf. They
then gather together with a striking spatiotemporal consistency close to the nesting site, where they
later emerge for their second nesting event.
5. Our results therefore suggest that reproductive synchrony also occurs in small populations.
Olive ridleys may ensure this synchrony by adjusting the duration of the second half of their inter-
nesting interval prior to landing, possibly through social mediation.
6. Such reproductive synchrony may be related to the maintenance of some species-specific strat-
egy despite former collapse andmay contribute to the present population recovery. The gregarious
behaviour of reproductive individuals close to shore where human-induced perturbations occur is
however a cause for conservation concern for this still poorly known species.
Key-words: population history, population recovery, reproductive synchrony, satellite tracking,
sea turtles
Introduction
Amongst life-history traits, reproductive synchrony (Darling
1938) is an important reproductive strategy that contributes
to population dynamics and species resilience. Reproductive
synchrony is the process by which certain plants and animals
time their reproduction to be temporally more clustered than
would have been explained by environmental seasonality
alone (for review see Ims 1990). Reproductive synchrony
may occur at different times of the breeding cycle, from
gametogenesis to parturition, and is expected to allow popu-
lations to persist and grow under environmental and demo-
graphic conditions that would otherwise make it impossible
*Correspondence author. E-mail: [email protected]
†Co-first authors.
‡Present address: Biosciences, College of Science, Swansea Univer-
sity, Swansea SA2 8PP,UK.
Journal of Animal Ecology 2012, 81, 341–351 doi: 10.1111/j.1365-2656.2011.01915.x
� 2011 TheAuthors. Journal ofAnimal Ecology� 2011 British Ecological Society
Page 2
(Henson, Cushing & Hayward 2011). Previous studies have
focused on the proximate factors acting as cues to maintain
synchronous breeding within a population, and on the ulti-
mate factors that act as selective forces giving survival values
to the adaptation. There is a considerable variation in the
degree of synchrony amongst species, and the complex mech-
anisms underlying this phenomenon are still not fully under-
stood.
So far, three main types of proximate causes for reproduc-
tive synchrony have been proposed (review in Ims 1990):
environmental cues directly connected to climatic seasonality
(e.g. photoperiod, temperature, humidity, food availability,
lunar and tidal rhythms); internal cues from the organisms’
own endogenous rhythms (i.e. biological clocks); and social
cues based on the exchange of signals between individuals
within a population. Early studies of reproductive synchrony
in colonially nesting birds led to the hypothesis that this
behaviour had evolved through reduced risks of predation to
individual offspring (Darling 1938). The most widely pro-
posed mechanism for this predator hypothesis is predation
dilution by which an individual’s risk of predation is reduced
owing to lower probability of encountering predators
through swamping (Ims 1990). This predator hypothesis has
further been validated in numerous species, from corals to
mammals (e.g. Gaillard et al. 1993; Hovel & Morgan 1997).
However, synchronous reproduction is unlikely to have
evolved solely in response to predation on offspring (Rutberg
1987). Indeed, synchrony within populations has also been
proposed to result from the selection of parturition timing by
individuals to produce offspring at the best time for ambient
conditions, food and water supply for optimal survival,
growth and recruitment (e.g. Rutberg 1987; Ogutu et al.
2010). Both predator and seasonality hypotheses may be not
exclusive but rather operate over a gradient depending on the
actual environmental and ecological contexts (Ims 1990).
Further environmental cues may be involved in synchrony,
the most widely reported being related to lunar rhythms (e.g.
Hanafy et al. 2010). Reproductive synchrony may also be
socially driven, as shown in mass-nesting marine olive ridley
turtle Lepidochelys olivacea (Plotkin et al. 1997), birds
(Henson, Cushing &Hayward 2011) and mammals (e.g. Ber-
ger 1992), where egg laying and ⁄or ovulation synchrony
increases with population density through pheromonal
and ⁄or olfactory cues. Reproductive synchrony may further
affect operational sex ratio, extra-pair mating and paternity
and ultimately may enhance total population size (e.g.
Henson, Cushing &Hayward 2011).
Reproductive synchrony has mostly been investigated in
species with parental care. Much less information is available
about the mechanisms and adaptive values of synchronous
nesting and hatching in species without parental care (but see
Spencer, Thompson & Banks 2001 for the freshwater turtle
Emydura macquarii, Colbert, Spencer & Janzen 2010 for the
painted turtle Chrysemys picta, Plotkin 2007 for the olive
ridley turtle). In the case of sea turtles, females lay eggs at
night on tropical sandy beaches without any further care.
Amongst sea turtles, the olive ridley turtle is one of the most
extraordinary examples of reproductive synchrony, also
referred as arribada (Pritchard 1969). Hundreds to thousands
of gravid females synchronously come ashore on tropical
sandy beaches within a spatially limited area, for a very lim-
ited period of time, to lay eggs.Arribada have been suggested
to result from group-coordinated responses to environmental
conditions such as rainfall (Plotkin et al. 1997) and ⁄or to
hormonally driven physiological cues (Plotkin 2007). How-
ever, these hypotheses have not actually been tested. It has
been suggested that arribada reduce adult female depredation
ashore by predator satiation (Plotkin 2007). Arribada have
also been suggested to enhance multiple mating with genetic
benefits to both maternal and offspring fitness (Plotkin
2007), which may partially explain why the olive ridley turtle
is considered to be the most abundant sea turtle world-wide
(Spotila 2004).
Like other sea turtles, olive ridley turtles are however con-
sidered to be an endangered species on a world-wide basis.
Sea turtles are emblematic of marine biodiversity erosion as
they show some of the sharpest historical population declines
(Lotze & Worm 2009), as evidenced by archaeological and
historical records of human exploitation on sea turtles
(McClenachan, Jackson & Newman 2006; Kennett et al.
2008), and by more recent demographic surveys of nesting
activity (IUCN 2009 Red List). It is therefore critically
important to have a sound knowledge of the historical popu-
lation baseline, current population dynamics and current
genetic structures of such endangered species to implement
the appropriate conservation strategies. Genetic diversity is
critical for the fitness and long-term survival of endangered
species (Frankham 2005). In addition, genetic structure and
demographic history need to be taken into account for suc-
cessful conservation action plans (Lande 1988). Yet, recent
demographic history has not been investigated in any small
sea turtle population. Indeed, the complex reproductive biol-
ogy of these species (Bowen & Karl 2007), further influenced
by global change (Reece, Castoe & Parkinson 2005), has con-
siderably complicated our understanding of their current
population dynamics and genetic structures. Furthermore,
reproduction and survival of sea turtles are both highly influ-
enced by their ecology at sea, as recently evidenced by satel-
lite telemetry and turtle–fishery interaction models (e.g.
Ferraroli et al. 2004). Yet the links between individual behav-
iour at sea, nesting activity on land and expected population
restoration have never been concurrently explored in any
given sea turtle population.
In this study, we used an original approach based on three
different time-scales combining genetic, demographic and
behavioural data to investigate recent demographic history
and population trend in a population of olive ridleys and
examine the potential mechanisms involved in these trends.
In this species, arribadawere historically reported in the large
populations in Mexico, Costa Rica, India, and to a lesser
extent in Suriname, western Atlantic Ocean (Pritchard 1969).
These populations have dramatically declined, mostly due to
egg poaching and fisheries bycatch, even though some may
have recently started recovering, such as in the Guianas
342 V. Plot et al.
� 2011 TheAuthors. Journal ofAnimal Ecology� 2011British Ecological Society, Journal of Animal Ecology, 81, 341–351
Page 3
(Guiana, Suriname, French Guiana; Kelle, Gratiot & De
Thoisy 2009). The Guianese olive ridley population is there-
fore considered now as the largest population in the Atlantic
Ocean (Kelle, Gratiot & De Thoisy 2009) and is a case study
for recent restoration in a population of marine vertebrates.
Materials andmethods
GENETIC ANALYSES
Current genetic diversity of the population and demographic history
were investigated using both mitochondrial and nuclear DNA vari-
ability. Skin samples were obtained from female olive ridley whilst
nesting on beaches of Cayenne and Remire-Montjoly (French Gui-
ana) in 2006. Sequences (N = 30) of cytochrome b and control
region (mitochondrial DNA) genes were obtained with primers
GLUDG tRNA Glu and H THR8 (Shaffer, Meylan & McKnight
1997) and LCM15382 and H879lo (Lopez-Castro & Rocha-Olivares
2005), respectively, using the conditions defined by the authors. All
sequences were deposited in the GenBank data base (accession num-
bers of cytochrome b sequences from FJ795374 to FJ795403; acces-
sion numbers of control region sequences from FJ795404 to
FJ795433). Low diversities on the cytochrome b and control region
sequences (see Results) precluded any further inference of past demo-
graphic investigations withmitochondrial markers.
Nuclear genetic variability was investigated using 11 nuclear mi-
crosatellite loci OR1, OR2, OR4, OR7, OR9, Ei8, OR11, OR14,
OR16, OR18 and OR22, according to the conditions reported in Ag-
garwal et al. (2004, 2008) for 46 females. Haplotypic and nucleotide
diversity in mitochondrial DNA were investigated with dnasp 4.20.2
(Rozas et al. 2003). As far as nuclear DNA is concerned, theMarkov
chain method was used to assess Hardy–Weinberg equilibrium and
observed heterozygote excess of microsatellites (genepop 1.2, Ray-
mond & Rousset 1995); nucleotidic diversity was calculated with
fstat 2.9.3.2 (http://www2.unil.ch/popgen/softwares/fstat.htm).
Absence of significant dropout, stuttering and null alleles was con-
firmed with Micro-Checker 2.2.3. (Van Oosterhout et al. 2004;
http://www.microchecker.hull.ac.uk/); absence of linkage disequilib-
rium amongst the 11 microsatellite loci was confirmed with genepop
1.2. We used a Bayesian clustering approach (software structure
2.3.1, Falush, Stephens & Pritchard 2007) to determine whether there
was any hidden population structure that could falsely generate a
signature of population collapse (Wakeley & Aliacar 2001). This
method uses a Markov Chain Monte Carlo (MCMC) approach to
group individuals into K (K = 1 from K = 4) populations based on
their genotypes without prior information, using the admixture
population model, 1 000 000 iterations, 500 000 burn-in replicates
and five independent replicates perK value.
Markov ChainMonte Carlo simulations were used to estimate the
posterior distribution of the genealogical history, including (i) muta-
tional and coalescent events and (ii) a demographic parameter,
including growth rate and time elapsed since expansion or decrease,
to assess long-term changes in historical population size. LogCom-
biner and Tracer (beast 1.4.7, Drummond & Rambaut 2007) were
used to obtain the ratio between ancestral and current population
sizes by combining five runs (2 · 109 iterations each) performed with
msvar0.4 (Storz & Beaumont 2002). Respective effective ancestral
and current population sizes and time since collapse or expansion
were obtained in a similar way, with msvar0.4 and msvar1.3 (Storz &
Beaumont 2002). To assess adult population sizes, we used an
effective population size ⁄ adult population size ratio of 0Æ08, as this
value is the mean of compiled ratios previously assessed in reptiles
(Frankham 1995). A priori mutation rates of nuclear DNA ranged
from 5Æ7 · 10)4 to 9Æ6 · 10)3, as previously set in several marine
turtle species (Fitzsimmons 1998). Generation time for olive ridley
was set at 13 years (Zug, Chaloupka & Balazs 2006). Bottleneck
populations can produce distinctive genetic signatures in expected
heterozygosity (Cornuet & Luikart 1996).When a population experi-
ences a reduction in its effective size, it generally develops excess gene
diversity at neutral loci, because the rare alleles that were lost contrib-
uted little to the overall heterozygosity (Cornuet & Luikart 1996).
We assessed the olive ridley population for a deficiency of low fre-
quency allele classes using Sign and Wilcoxon tests, as implemented
in the program bottleneck (Cornuet & Luikart 1996) under the two-
phase mutationmodel (TPM)with 95% single-step mutations.
NESTING ACTIV ITY MONITORING
Nesting beaches at Cayenne ⁄Remire-Montjoly (French Guiana)
were patrolled nightly from sunrise to sunset during the nesting sea-
son (early May to early September) from 2002 to 2010 to count indi-
vidual nesting events and tracks. The Grubbs’ test statistic (Snedecor
& Cochran 1989) for the detection of outliers, based onmedian abso-
lute deviation, was used to identify peaks of turtle landing from 2002
to 2008.
SATELL ITE TELEMETRY
Ten olive ridley turtles (N = 5 in 2006 andN = 5 in 2007) were indi-
vidually equipped with a Satellite Relay Data Logger (SRDL 9000X;
Sea Marine Research Unit, SMRU, St Andrews, UK, http://
www.smru.st-and.ac.uk/) whilst nesting on beaches at Cay-
enne ⁄Remire-Montjoly (French Guiana, N = 9) and Eilanti (Suri-
name, N = 1). SRDL units were glued on the highest scale of the
carapace using two-component fast set epoxy. Location data were
recovered from Collecte Localisation Satellites (http://www.cls.fr)
before being processed using iknos toolbox software (Tremblay, Rob-
inson & Costa 2009). Saltwater switch data were used to identify
haul-out events for defining the start and the end of the inter-nesting
period (time between two consecutive nesting events). In addition,
SRDLs provided 24-h summary statistics of diving behaviour: these
statistics include mean ± SD of dive duration (±10 s) and dive
depth (±1 m) and were used to assess individual daily diving behav-
iour. SRDLs also recorded in situwater temperatures (±0Æ1 �C).
Results
POPULATION GENETICS AND RECENT DEMOGRAPHIC
HISTORY
We investigated the genetic diversity of the olive ridley popu-
lation nesting in the Guianas with both mitochondrial and
nuclear DNA markers. The control region (795 bp) had a
nucleotide diversity h = 0Æ00063 ± 0Æ00002 (mean ± SD)
and a haplotype diversity h = 0Æ239 ± 0Æ096 for three
identified haplotypes. Theta and h diversities of the cyto-
chrome b (1144 bp) were nil, with only one haplotype
observed. For nuclear DNA, simulations revealed that
K = 1 ancestral population was the most likely (estimated
Ln probability of data = )1378, vs. )1418 for K = 2,
)1456 for K = 3, )1500 for K = 4). Genetic diversity and
Reproductive synchrony and population recovery in sea turtles 343
� 2011 TheAuthors. Journal ofAnimal Ecology� 2011 British Ecological Society, Journal of Animal Ecology, 81, 341–351
Page 4
observed heterozygosity averaged over loci were 0Æ61 ± 0Æ20and 0Æ62 ± 0Æ20, respectively. The population showed a
small (Fis = )0Æ0075) departure from the Hardy–Weinberg
equilibrium (P < 0Æ05), although both Chakraborty & Jin
(1992) and Brookfield (1996) methods did not reveal any sig-
nificant deviation from panmixia.
The demographic parameters of the Guianese population
were investigated using microsatellite variability (see Materi-
als and methods). Significant excess gene diversity suggested
a recent population decrease, although only the Sign test was
significant (P = 0Æ03). Assessment of ancestral and current
population sizes with MCMC simulations supported this
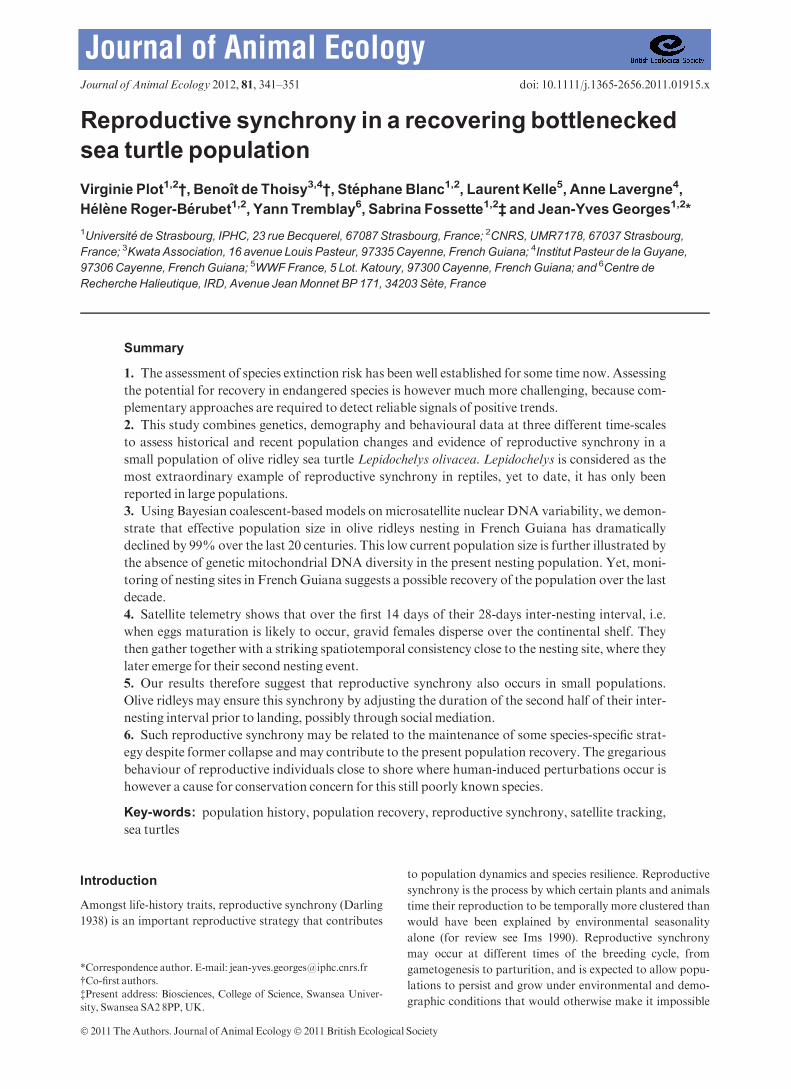
result. The mean strength of the posterior distribution of the
ratio between ancestral population size N1 and current
population sizeN0 was log(N0 ⁄N1)= )2Æ085 ± 0Æ156 (linearpopulation expansion model) and log(N0 ⁄N1) = )2Æ106 ±
0Æ147 (exponential population expansion model) (Fig. 1a).
The posterior distribution of log(T), T being the time since
the population collapsed, was 2Æ18 ± 0Æ30, indicating that
the decrease in the Guianese population occurred some
150 ± 10 generations ago, i.e. 1950 ± 130 years ago. The
posterior distributions for log(N1) and log(N0) had very lim-
ited overlap of 4Æ37 ± 0Æ64 and 1Æ86 ± 0Æ35 for N1 and N0,
respectively (Fig. 1b).
BEACH PATROLLING AND CURRENT POPULATION
TRENDS
The nesting activity of the present population was monitored
from 2002 to 2010 by daily patrols of the beaches surround-
ing Cayenne, French Guiana. An average of 2015 ± 284
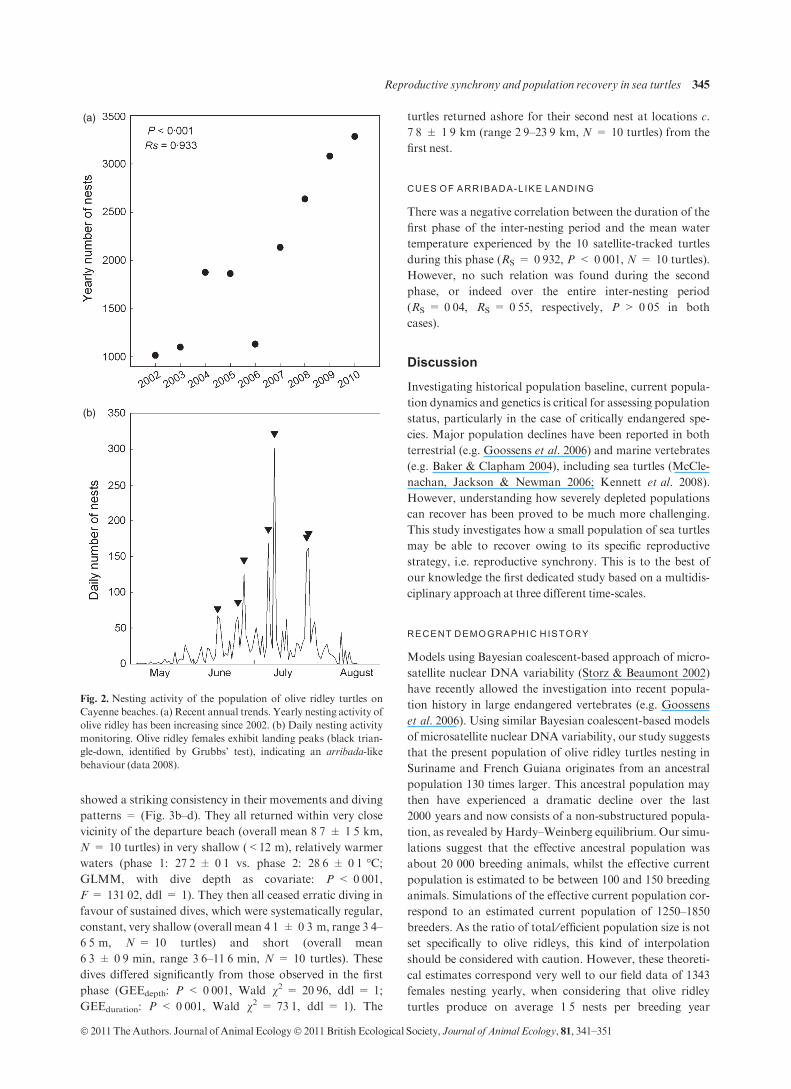
nests per year was reported (Fig. 2a). Importantly, current
field data showed a significant increase in the number of nests
per year (Spearman’s correlation RS = 0Æ933, P < 0Æ001,N = 9 years, Fig. 2a).
Daily beach patrols performed from 2002 to 2008 also
revealed mass landings of nesting turtles with peaks of
104 ± 11 nests (overall mean, N = 53 peaks, range 17–335
nests per peak) within 2 ± 0 nights (N = 53 peaks, range 1–
6 nights). The two largest landings occurred in 2008, when
302 and 319 females emerged in 1 and 2 nights, respectively
(Fig. 2b).
SATELL ITE TRACKING AND CURRENT AT-SEA
BEHAVIOUR
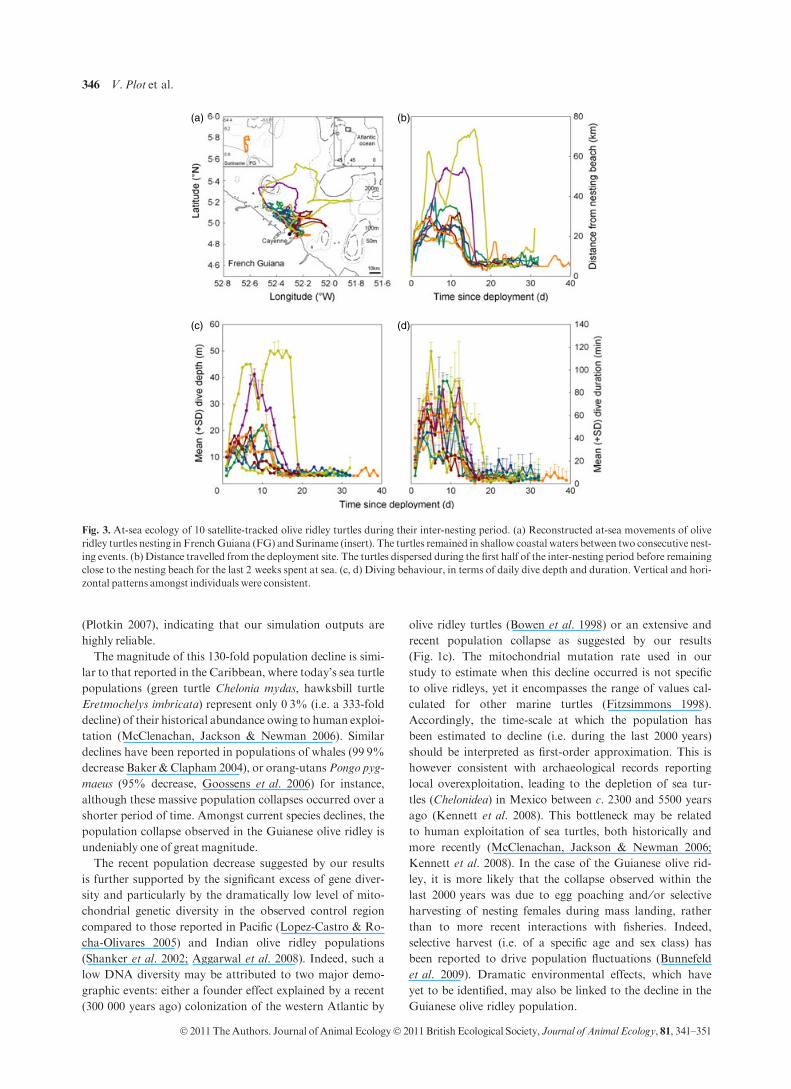
After nesting, the 10 satellite-tracked olive ridley turtles left
the beach for 28Æ5 ± 1Æ9 days (range 18Æ0 to 39Æ8 days,
Fig. 3a; Table 1) but remained relatively close to the beach
(mean maximum distance from the beach 18Æ4 ± 2Æ9 km,
N = 10 turtles, range 23Æ8 to 73Æ8 km, Fig. 3b). A concur-
rent analysis of dispersion and diving patterns indicated that
the inter-nesting period could be divided into two distinct
periods. During the first half of the inter-nesting period
(14Æ1 ± 0Æ6 days, N = 10 turtles), turtles dispersed from
17Æ3 ± 0Æ1 to 50Æ8 ± 0Æ6 km from the beach (overall mean
26Æ4 ± 3Æ3 km, N = 10 turtles). A wide range of diving
behaviours was observed amongst individuals, with mean
dive depths ranging from 6Æ8 to 37Æ9 m (overall mean
14Æ8 ± 3Æ0 m, overall max = 50 m, N = 10 turtles) with a
mean dive duration of 24Æ9 to 64Æ1 min (overall mean
42Æ6 ± 4Æ4 min, overall max = 130 min, N = 10 turtles).
During the second half of the inter-nesting period, all turtles
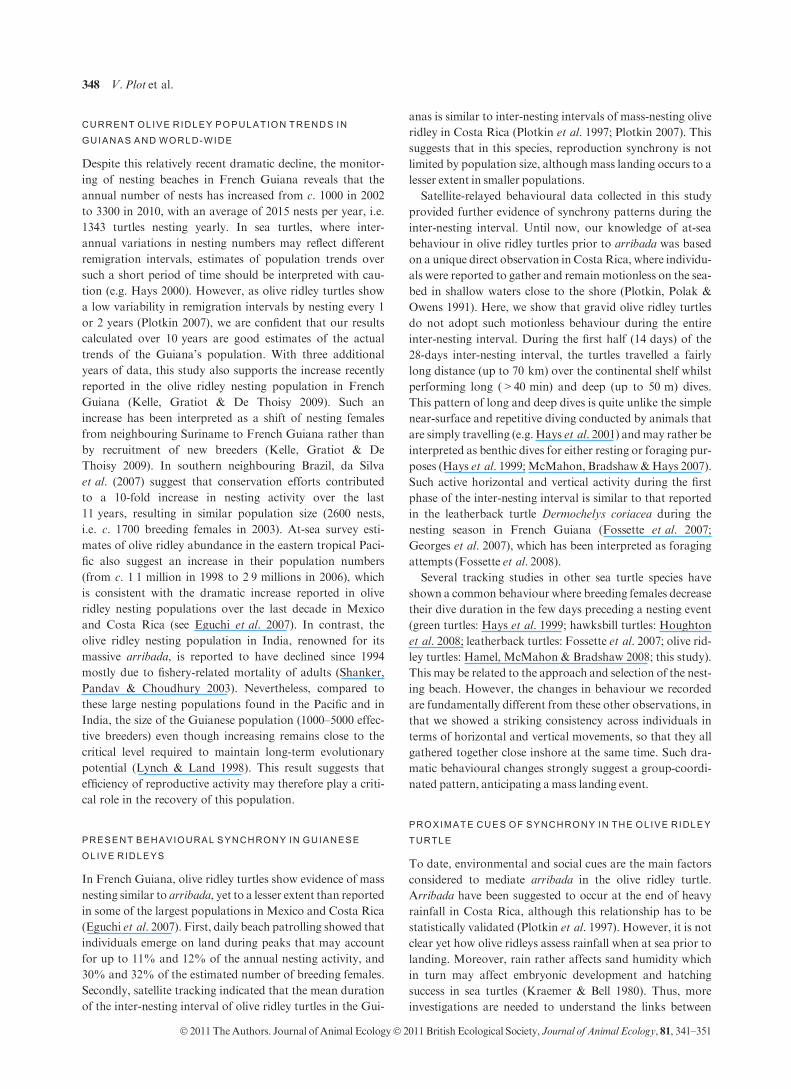
Fig. 1. Demographic history of the Guianese olive ridley population.
(a) Population size change. Posterior distribution of r = N0 ⁄N1, rep-
resenting the ratio on a logarithmic scale of present (N0) to past (N1)
population sizes. Solid curve: exponential model of population size
change; dash curve: linear model of population size change. (b) Past
and present population sizes and time since the size has changed. Pos-
terior distributions of past (N1), current (N0) and time since collapse
(T, in generations). (c) Schematic demographic history of the Guia-
nese olive ridley population. After a founder effect faced by their
Atlantic ancestral stock that colonized the Atlantic 300 000–
200 000 year ago (YA) (Bowen et al. 1998), the population faced a
dramatic bottleneck (1950 ± 130 YA), resulting in a 130-fold
decrease in the effective population size (this study).
344 V. Plot et al.
� 2011 TheAuthors. Journal ofAnimal Ecology� 2011British Ecological Society, Journal of Animal Ecology, 81, 341–351
Page 5
showed a striking consistency in their movements and diving
patterns = (Fig. 3b–d). They all returned within very close
vicinity of the departure beach (overall mean 8Æ7 ± 1Æ5 km,
N = 10 turtles) in very shallow (<12 m), relatively warmer
waters (phase 1: 27Æ2 ± 0Æ1 vs. phase 2: 28Æ6 ± 0Æ1 �C;GLMM, with dive depth as covariate: P < 0Æ001,F = 131Æ02, ddl = 1). They then all ceased erratic diving in
favour of sustained dives, which were systematically regular,
constant, very shallow (overall mean 4Æ1 ± 0Æ3 m, range 3Æ4–6Æ5 m, N = 10 turtles) and short (overall mean
6Æ3 ± 0Æ9 min, range 3Æ6–11Æ6 min, N = 10 turtles). These
dives differed significantly from those observed in the first
phase (GEEdepth: P < 0Æ001, Wald v2 = 20Æ96, ddl = 1;
GEEduration: P < 0Æ001, Wald v2 = 73Æ1, ddl = 1). The
turtles returned ashore for their second nest at locations c.
7Æ8 ± 1Æ9 km (range 2Æ9–23Æ9 km, N = 10 turtles) from the
first nest.
CUES OF ARRIBADA-L IKE LANDING
There was a negative correlation between the duration of the
first phase of the inter-nesting period and the mean water
temperature experienced by the 10 satellite-tracked turtles
during this phase (RS = 0Æ932, P < 0Æ001, N = 10 turtles).
However, no such relation was found during the second
phase, or indeed over the entire inter-nesting period
(RS = 0Æ04, RS = 0Æ55, respectively, P > 0Æ05 in both
cases).
Discussion
Investigating historical population baseline, current popula-
tion dynamics and genetics is critical for assessing population
status, particularly in the case of critically endangered spe-
cies. Major population declines have been reported in both
terrestrial (e.g. Goossens et al. 2006) and marine vertebrates
(e.g. Baker & Clapham 2004), including sea turtles (McCle-
nachan, Jackson & Newman 2006; Kennett et al. 2008).
However, understanding how severely depleted populations
can recover has been proved to be much more challenging.
This study investigates how a small population of sea turtles
may be able to recover owing to its specific reproductive
strategy, i.e. reproductive synchrony. This is to the best of
our knowledge the first dedicated study based on a multidis-
ciplinary approach at three different time-scales.
RECENT DEMOGRAPHIC HISTORY
Models using Bayesian coalescent-based approach of micro-
satellite nuclear DNA variability (Storz & Beaumont 2002)
have recently allowed the investigation into recent popula-
tion history in large endangered vertebrates (e.g. Goossens
et al. 2006). Using similar Bayesian coalescent-based models
of microsatellite nuclear DNA variability, our study suggests
that the present population of olive ridley turtles nesting in
Suriname and French Guiana originates from an ancestral
population 130 times larger. This ancestral population may
then have experienced a dramatic decline over the last
2000 years and now consists of a non-substructured popula-
tion, as revealed by Hardy–Weinberg equilibrium. Our simu-
lations suggest that the effective ancestral population was
about 20 000 breeding animals, whilst the effective current
population is estimated to be between 100 and 150 breeding
animals. Simulations of the effective current population cor-
respond to an estimated current population of 1250–1850
breeders. As the ratio of total ⁄ efficient population size is not
set specifically to olive ridleys, this kind of interpolation
should be considered with caution. However, these theoreti-
cal estimates correspond very well to our field data of 1343
females nesting yearly, when considering that olive ridley
turtles produce on average 1Æ5 nests per breeding year
(a)
(b)
Fig. 2. Nesting activity of the population of olive ridley turtles on
Cayenne beaches. (a) Recent annual trends. Yearly nesting activity of
olive ridley has been increasing since 2002. (b) Daily nesting activity
monitoring. Olive ridley females exhibit landing peaks (black trian-
gle-down, identified by Grubbs’ test), indicating an arribada-like
behaviour (data 2008).
Reproductive synchrony and population recovery in sea turtles 345
� 2011 TheAuthors. Journal ofAnimal Ecology� 2011 British Ecological Society, Journal of Animal Ecology, 81, 341–351
Page 6
(Plotkin 2007), indicating that our simulation outputs are
highly reliable.
The magnitude of this 130-fold population decline is simi-
lar to that reported in the Caribbean, where today’s sea turtle
populations (green turtle Chelonia mydas, hawksbill turtle
Eretmochelys imbricata) represent only 0Æ3% (i.e. a 333-fold
decline) of their historical abundance owing to human exploi-
tation (McClenachan, Jackson & Newman 2006). Similar
declines have been reported in populations of whales (99Æ9%decrease Baker & Clapham 2004), or orang-utansPongo pyg-
maeus (95% decrease, Goossens et al. 2006) for instance,
although these massive population collapses occurred over a
shorter period of time. Amongst current species declines, the
population collapse observed in the Guianese olive ridley is
undeniably one of great magnitude.
The recent population decrease suggested by our results
is further supported by the significant excess of gene diver-
sity and particularly by the dramatically low level of mito-
chondrial genetic diversity in the observed control region
compared to those reported in Pacific (Lopez-Castro & Ro-
cha-Olivares 2005) and Indian olive ridley populations
(Shanker et al. 2002; Aggarwal et al. 2008). Indeed, such a
low DNA diversity may be attributed to two major demo-
graphic events: either a founder effect explained by a recent
(300 000 years ago) colonization of the western Atlantic by
olive ridley turtles (Bowen et al. 1998) or an extensive and
recent population collapse as suggested by our results
(Fig. 1c). The mitochondrial mutation rate used in our
study to estimate when this decline occurred is not specific
to olive ridleys, yet it encompasses the range of values cal-
culated for other marine turtles (Fitzsimmons 1998).
Accordingly, the time-scale at which the population has
been estimated to decline (i.e. during the last 2000 years)
should be interpreted as first-order approximation. This is
however consistent with archaeological records reporting
local overexploitation, leading to the depletion of sea tur-
tles (Chelonidea) in Mexico between c. 2300 and 5500 years
ago (Kennett et al. 2008). This bottleneck may be related
to human exploitation of sea turtles, both historically and
more recently (McClenachan, Jackson & Newman 2006;
Kennett et al. 2008). In the case of the Guianese olive rid-
ley, it is more likely that the collapse observed within the
last 2000 years was due to egg poaching and ⁄or selective
harvesting of nesting females during mass landing, rather
than to more recent interactions with fisheries. Indeed,
selective harvest (i.e. of a specific age and sex class) has
been reported to drive population fluctuations (Bunnefeld
et al. 2009). Dramatic environmental effects, which have
yet to be identified, may also be linked to the decline in the
Guianese olive ridley population.
(a) (b)
(c) (d)
Fig. 3. At-sea ecology of 10 satellite-tracked olive ridley turtles during their inter-nesting period. (a) Reconstructed at-sea movements of olive
ridley turtles nesting in FrenchGuiana (FG) and Suriname (insert). The turtles remained in shallow coastal waters between two consecutive nest-
ing events. (b) Distance travelled from the deployment site. The turtles dispersed during the first half of the inter-nesting period before remaining
close to the nesting beach for the last 2 weeks spent at sea. (c, d) Diving behaviour, in terms of daily dive depth and duration. Vertical and hori-
zontal patterns amongst individuals were consistent.
346 V. Plot et al.
� 2011 TheAuthors. Journal ofAnimal Ecology� 2011British Ecological Society, Journal of Animal Ecology, 81, 341–351
Page 7
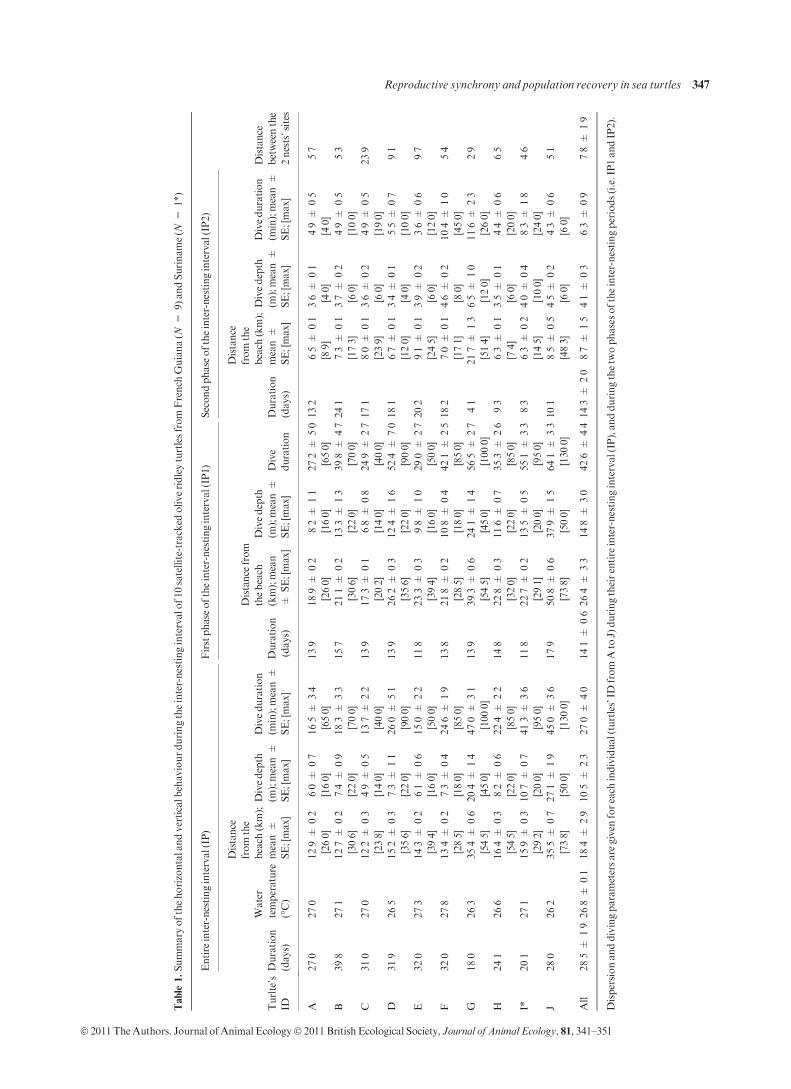
Table
1.Summaryofthehorizontalandverticalb
ehaviourduringtheinter-nestingintervalo
f10satellite-tracked
oliveridleyturtlesfrom
French
Guiana(N
=9)andSuriname(N
=1*)
Turlte’s
ID
Entire
inter-nestinginterval(IP)
Firstphase
oftheinter-nestinginterval(IP1)
Secondphase
oftheinter-nestinginterval(IP2)
Distance
betweenthe
2nests’sites
Duration
(days)
Water
temperature
(�C)
Distance
from
the
beach
(km);
mean±
SE;[max]
Divedepth
(m);mean±
SE;[max]
Diveduration
(min);mean±
SE;[max]
Duration
(days)
Distance
from
thebeach
(km);mean
±SE;[max]
Divedepth
(m);mean±
SE;[max]
Dive
duration
Duration
(days)
Distance
from
the
beach
(km);
mean±
SE;[max]
Divedepth
(m);mean±
SE;[max]
Diveduration
(min);mean±
SE;[max]
A27Æ0
27Æ0
12Æ9
±0Æ2
[26Æ0]
6Æ0
±0Æ7
[16Æ0]
16Æ5±
3Æ4
[65Æ0]
13Æ9
18Æ9±
0Æ2
[26Æ0]
8Æ2
±1Æ1
[16Æ0]
27Æ2
±5Æ0
[65Æ0]
13Æ2
6Æ5
±0Æ1
[8Æ9]
3Æ6
±0Æ1
[4Æ0]
4Æ9
±0Æ5
[4Æ0]
5Æ7
B39Æ8
27Æ1
12Æ7
±0Æ2
[30Æ6]
7Æ4
±0Æ9
[22Æ0]
18Æ3±
3Æ3
[70Æ0]
15Æ7
21Æ1±
0Æ2
[30Æ6]
13Æ3
±1Æ3
[22Æ0]
39Æ8
±4Æ7
[70Æ0]
24Æ1
7Æ3
±0Æ1
[17Æ3]
3Æ7
±0Æ2
[6Æ0]
4Æ9
±0Æ5
[10Æ0]
5Æ3
C31Æ0
27Æ0
12Æ2
±0Æ3
[23Æ8]
4Æ9
±0Æ5
[14Æ0]
13Æ7±
2Æ2
[40Æ0]
13Æ9
17Æ3±
0Æ1
[20Æ2]
6Æ8
±0Æ8
[14Æ0]
24Æ9
±2Æ7
[40Æ0]
17Æ1
8Æ0
±0Æ1
[23Æ9]
3Æ6
±0Æ2
[6Æ0]
4Æ9
±0Æ5
[19Æ0]
23Æ9
D31Æ9
26Æ5
15Æ2
±0Æ3
[35Æ6]
7Æ3
±1Æ1
[22Æ0]
26Æ0±
5Æ1
[90Æ0]
13Æ9
26Æ2±
0Æ3
[35Æ6]
12Æ4
±1Æ6
[22Æ0]
52Æ4
±7Æ0
[90Æ0]
18Æ1
6Æ7
±0Æ1
[12Æ0]
3Æ4
±0Æ1
[4Æ0]
5Æ5
±0Æ7
[10Æ0]
9Æ1
E32Æ0
27Æ3
14Æ3
±0Æ2
[39Æ4]
6Æ1
±0Æ6
[16Æ0]
15Æ0±
2Æ2
[50Æ0]
11Æ8
23Æ3±
0Æ3
[39Æ4]
9Æ8
±1Æ0
[16Æ0]
29Æ0
±2Æ7
[50Æ0]
20Æ2
9Æ1
±0Æ1
[24Æ5]
3Æ9
±0Æ2
[6Æ0]
3Æ6
±0Æ6
[12Æ0]
9Æ7
F32Æ0
27Æ8
13Æ4
±0Æ2
[28Æ5]
7Æ3
±0Æ4
[18Æ0]
24Æ6±
1Æ9
[85Æ0]
13Æ8
21Æ8±
0Æ2
[28Æ5]
10Æ8
±0Æ4
[18Æ0]
42Æ1
±2Æ5
[85Æ0]
18Æ2
7Æ0
±0Æ1
[17Æ1]
4Æ6
±0Æ2
[8Æ0]
10Æ4
±1Æ0
[45Æ0]
5Æ4
G18Æ0
26Æ3
35Æ4
±0Æ6
[54Æ5]
20Æ4
±1Æ4
[45Æ0]
47Æ0±
3Æ1
[100Æ0]
13Æ9
39Æ3±
0Æ6
[54Æ5]
24Æ1
±1Æ4
[45Æ0]
56Æ5
±2Æ7
[100Æ0]
4Æ1
21Æ 7
±1Æ3
[51Æ4]
6Æ5
±1Æ0
[12Æ0]
11Æ6
±2Æ3
[26Æ0]
2Æ9
H24Æ1
26Æ6
16Æ4
±0Æ3
[54Æ5]
8Æ2
±0Æ6
[22Æ0]
22Æ4±
2Æ2
[85Æ0]
14Æ8
22Æ8±
0Æ3
[32Æ0]
11Æ6
±0Æ7
[22Æ0]
35Æ3
±2Æ6
[85Æ0]
9Æ3
6Æ3
±0Æ1
[7Æ4]
3Æ5
±0Æ1
[6Æ0]
4Æ4
±0Æ6
[20Æ0]
6Æ5
I*20Æ1
27Æ1
15Æ9
±0Æ3
[29Æ2]
10Æ7
±0Æ7
[20Æ0]
41Æ3±
3Æ6
[95Æ0]
11Æ8
22Æ7±
0Æ2
[29Æ1]
13Æ5
±0Æ5
[20Æ0]
55Æ1
±3Æ3
[95Æ0]
8Æ3
6Æ3
±0Æ2
[14Æ5]
4Æ0
±0Æ4
[10Æ0]
8Æ3
±1Æ8
[24Æ0]
4Æ6
J28Æ0
26Æ2
35Æ5
±0Æ7
[73Æ 8]
27Æ1
±1Æ9
[50Æ0]
45Æ0±
3Æ6
[130Æ0]
17Æ9
50Æ8±
0Æ6
[73Æ8]
37Æ9
±1Æ5
[50Æ0]
64Æ1
±3Æ3
[130Æ0]
10Æ1
8Æ5
±0Æ5
[48Æ3]
4Æ5
±0Æ2
[6Æ0]
4Æ3
±0Æ6
[6Æ0]
5Æ1
All
28Æ5±
1Æ9
26Æ8±
0Æ1
18Æ4
±2Æ9
10Æ5
±2Æ3
27Æ0±
4Æ0
14Æ1±
0Æ6
26Æ4±
3Æ3
14Æ8
±3Æ0
42Æ6
±4Æ4
14Æ3
±2Æ0
8Æ7
±1Æ5
4Æ1
±0Æ3
6Æ3
±0Æ9
7Æ8
±1Æ9
Dispersionanddivingparametersare
given
foreach
individual(turtles’ID
from
Ato
J)duringtheirentire
inter-nestinginterval(IP),andduringthetw
ophases
oftheinter-nestingperiods(i.e.IP1andIP2).
Reproductive synchrony and population recovery in sea turtles 347
� 2011 TheAuthors. Journal ofAnimal Ecology� 2011 British Ecological Society, Journal of Animal Ecology, 81, 341–351
Page 8
CURRENT OLIVE RIDLEY POPULATION TRENDS IN
GUIANAS AND WORLD-WIDE
Despite this relatively recent dramatic decline, the monitor-
ing of nesting beaches in French Guiana reveals that the
annual number of nests has increased from c. 1000 in 2002
to 3300 in 2010, with an average of 2015 nests per year, i.e.
1343 turtles nesting yearly. In sea turtles, where inter-
annual variations in nesting numbers may reflect different
remigration intervals, estimates of population trends over
such a short period of time should be interpreted with cau-
tion (e.g. Hays 2000). However, as olive ridley turtles show
a low variability in remigration intervals by nesting every 1
or 2 years (Plotkin 2007), we are confident that our results
calculated over 10 years are good estimates of the actual
trends of the Guiana’s population. With three additional
years of data, this study also supports the increase recently
reported in the olive ridley nesting population in French
Guiana (Kelle, Gratiot & De Thoisy 2009). Such an
increase has been interpreted as a shift of nesting females
from neighbouring Suriname to French Guiana rather than
by recruitment of new breeders (Kelle, Gratiot & De
Thoisy 2009). In southern neighbouring Brazil, da Silva
et al. (2007) suggest that conservation efforts contributed
to a 10-fold increase in nesting activity over the last
11 years, resulting in similar population size (2600 nests,
i.e. c. 1700 breeding females in 2003). At-sea survey esti-
mates of olive ridley abundance in the eastern tropical Paci-
fic also suggest an increase in their population numbers
(from c. 1Æ1 million in 1998 to 2Æ9 millions in 2006), which
is consistent with the dramatic increase reported in olive
ridley nesting populations over the last decade in Mexico
and Costa Rica (see Eguchi et al. 2007). In contrast, the
olive ridley nesting population in India, renowned for its
massive arribada, is reported to have declined since 1994
mostly due to fishery-related mortality of adults (Shanker,
Pandav & Choudhury 2003). Nevertheless, compared to
these large nesting populations found in the Pacific and in
India, the size of the Guianese population (1000–5000 effec-
tive breeders) even though increasing remains close to the
critical level required to maintain long-term evolutionary
potential (Lynch & Land 1998). This result suggests that
efficiency of reproductive activity may therefore play a criti-
cal role in the recovery of this population.
PRESENT BEHAVIOURAL SYNCHRONY IN GUIANESE
OLIVE RIDLEYS
In French Guiana, olive ridley turtles show evidence of mass
nesting similar to arribada, yet to a lesser extent than reported
in some of the largest populations in Mexico and Costa Rica
(Eguchi et al. 2007). First, daily beach patrolling showed that
individuals emerge on land during peaks that may account
for up to 11% and 12% of the annual nesting activity, and
30% and 32% of the estimated number of breeding females.
Secondly, satellite tracking indicated that the mean duration
of the inter-nesting interval of olive ridley turtles in the Gui-
anas is similar to inter-nesting intervals of mass-nesting olive
ridley in Costa Rica (Plotkin et al. 1997; Plotkin 2007). This
suggests that in this species, reproduction synchrony is not
limited by population size, although mass landing occurs to a
lesser extent in smaller populations.
Satellite-relayed behavioural data collected in this study
provided further evidence of synchrony patterns during the
inter-nesting interval. Until now, our knowledge of at-sea
behaviour in olive ridley turtles prior to arribada was based
on a unique direct observation in Costa Rica, where individu-
als were reported to gather and remain motionless on the sea-
bed in shallow waters close to the shore (Plotkin, Polak &
Owens 1991). Here, we show that gravid olive ridley turtles
do not adopt such motionless behaviour during the entire
inter-nesting interval. During the first half (14 days) of the
28-days inter-nesting interval, the turtles travelled a fairly
long distance (up to 70 km) over the continental shelf whilst
performing long (>40 min) and deep (up to 50 m) dives.
This pattern of long and deep dives is quite unlike the simple
near-surface and repetitive diving conducted by animals that
are simply travelling (e.g. Hays et al. 2001) andmay rather be
interpreted as benthic dives for either resting or foraging pur-
poses (Hays et al. 1999;McMahon, Bradshaw&Hays 2007).
Such active horizontal and vertical activity during the first
phase of the inter-nesting interval is similar to that reported
in the leatherback turtle Dermochelys coriacea during the
nesting season in French Guiana (Fossette et al. 2007;
Georges et al. 2007), which has been interpreted as foraging
attempts (Fossette et al. 2008).
Several tracking studies in other sea turtle species have
shown a common behaviour where breeding females decrease
their dive duration in the few days preceding a nesting event
(green turtles: Hays et al. 1999; hawksbill turtles: Houghton
et al. 2008; leatherback turtles: Fossette et al. 2007; olive rid-
ley turtles: Hamel, McMahon & Bradshaw 2008; this study).
This may be related to the approach and selection of the nest-
ing beach. However, the changes in behaviour we recorded
are fundamentally different from these other observations, in
that we showed a striking consistency across individuals in
terms of horizontal and vertical movements, so that they all
gathered together close inshore at the same time. Such dra-
matic behavioural changes strongly suggest a group-coordi-
nated pattern, anticipating amass landing event.
PROXIMATE CUES OF SYNCHRONY IN THE OLIVE RIDLEY
TURTLE
To date, environmental and social cues are the main factors
considered to mediate arribada in the olive ridley turtle.
Arribada have been suggested to occur at the end of heavy
rainfall in Costa Rica, although this relationship has to be
statistically validated (Plotkin et al. 1997). However, it is not
clear yet how olive ridleys assess rainfall when at sea prior to
landing. Moreover, rain rather affects sand humidity which
in turn may affect embryonic development and hatching
success in sea turtles (Kraemer & Bell 1980). Thus, more
investigations are needed to understand the links between
348 V. Plot et al.
� 2011 TheAuthors. Journal ofAnimal Ecology� 2011British Ecological Society, Journal of Animal Ecology, 81, 341–351
Page 9
rainfall and arribada, and its potential costs ⁄benefits for oliveridley populations.
We found a negative relationship between the water tem-
perature experienced by the turtles and the duration of the
first half of the inter-nesting interval, but significance failed
for the duration of the second half and for the entire inter-
nesting interval. Consistent with the ectothermic physiology
of sea turtles, previous studies have reported the inter-nesting
interval to increase in cooler waters, with a mean raise from
10 to 25 days for water temperatures declining from 28 to
22 �C (Sato et al. 1998; Hays et al. 2002). If this relation
holds for olive ridleys in FrenchGuiana, where water temper-
ature averages c. 27 �C (Table 1), female turtles would per-
form inter-nesting intervals of about 13 days. However, our
results showed that in French Guiana, females performed
inter-nesting intervals of 28 days, similar to those reported in
olive ridleys nesting in arribada in Costa Rica (Plotkin 2007),
yet with a first – thermal dependent – phase of 14 days. This
suggests that the first half of the inter-nesting interval may be
associated with temperature-dependent egg maturation,
whereas the second half of the inter-nesting interval may be
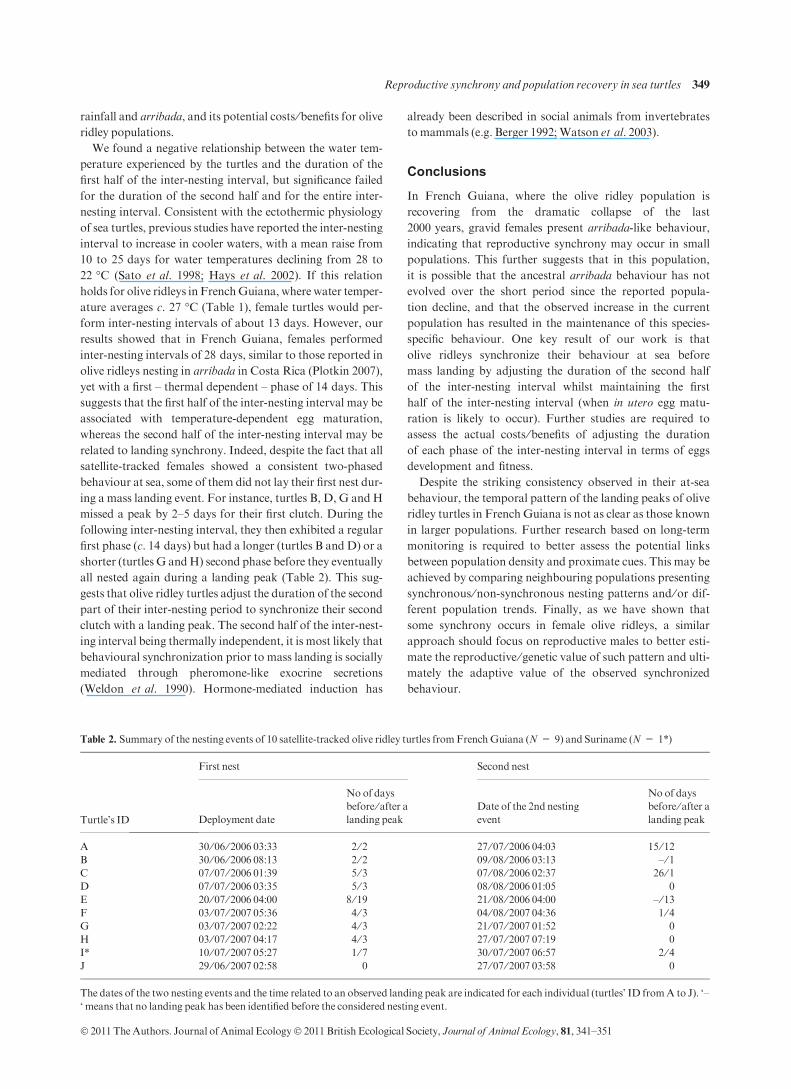
related to landing synchrony. Indeed, despite the fact that all
satellite-tracked females showed a consistent two-phased
behaviour at sea, some of them did not lay their first nest dur-
ing a mass landing event. For instance, turtles B, D, G and H
missed a peak by 2–5 days for their first clutch. During the
following inter-nesting interval, they then exhibited a regular
first phase (c. 14 days) but had a longer (turtles B and D) or a
shorter (turtles G andH) second phase before they eventually
all nested again during a landing peak (Table 2). This sug-
gests that olive ridley turtles adjust the duration of the second
part of their inter-nesting period to synchronize their second
clutch with a landing peak. The second half of the inter-nest-
ing interval being thermally independent, it is most likely that
behavioural synchronization prior to mass landing is socially
mediated through pheromone-like exocrine secretions
(Weldon et al. 1990). Hormone-mediated induction has
already been described in social animals from invertebrates
tomammals (e.g. Berger 1992;Watson et al. 2003).
Conclusions
In French Guiana, where the olive ridley population is
recovering from the dramatic collapse of the last
2000 years, gravid females present arribada-like behaviour,
indicating that reproductive synchrony may occur in small
populations. This further suggests that in this population,
it is possible that the ancestral arribada behaviour has not
evolved over the short period since the reported popula-
tion decline, and that the observed increase in the current
population has resulted in the maintenance of this species-
specific behaviour. One key result of our work is that
olive ridleys synchronize their behaviour at sea before
mass landing by adjusting the duration of the second half
of the inter-nesting interval whilst maintaining the first
half of the inter-nesting interval (when in utero egg matu-
ration is likely to occur). Further studies are required to
assess the actual costs ⁄benefits of adjusting the duration
of each phase of the inter-nesting interval in terms of eggs
development and fitness.
Despite the striking consistency observed in their at-sea
behaviour, the temporal pattern of the landing peaks of olive
ridley turtles in French Guiana is not as clear as those known
in larger populations. Further research based on long-term
monitoring is required to better assess the potential links
between population density and proximate cues. This may be
achieved by comparing neighbouring populations presenting
synchronous ⁄non-synchronous nesting patterns and ⁄or dif-ferent population trends. Finally, as we have shown that
some synchrony occurs in female olive ridleys, a similar
approach should focus on reproductive males to better esti-
mate the reproductive ⁄ genetic value of such pattern and ulti-
mately the adaptive value of the observed synchronized
behaviour.
Table 2. Summary of the nesting events of 10 satellite-tracked olive ridley turtles fromFrenchGuiana (N = 9) and Suriname (N = 1*)
Turtle’s ID
First nest Second nest
Deployment date
No of days
before ⁄ after alanding peak
Date of the 2nd nesting
event
No of days
before ⁄ after alanding peak
A 30 ⁄ 06 ⁄ 2006 03:33 2 ⁄ 2 27 ⁄ 07 ⁄ 2006 04:03 15 ⁄ 12B 30 ⁄ 06 ⁄ 2006 08:13 2 ⁄ 2 09 ⁄ 08 ⁄ 2006 03:13 – ⁄ 1C 07 ⁄ 07 ⁄ 2006 01:39 5 ⁄ 3 07 ⁄ 08 ⁄ 2006 02:37 26 ⁄ 1D 07 ⁄ 07 ⁄ 2006 03:35 5 ⁄ 3 08 ⁄ 08 ⁄ 2006 01:05 0
E 20 ⁄ 07 ⁄ 2006 04:00 8 ⁄ 19 21 ⁄ 08 ⁄ 2006 04:00 – ⁄ 13F 03 ⁄ 07 ⁄ 2007 05:36 4 ⁄ 3 04 ⁄ 08 ⁄ 2007 04:36 1 ⁄ 4G 03 ⁄ 07 ⁄ 2007 02:22 4 ⁄ 3 21 ⁄ 07 ⁄ 2007 01:52 0
H 03 ⁄ 07 ⁄ 2007 04:17 4 ⁄ 3 27 ⁄ 07 ⁄ 2007 07:19 0
I* 10 ⁄ 07 ⁄ 2007 05:27 1 ⁄ 7 30 ⁄ 07 ⁄ 2007 06:57 2 ⁄ 4J 29 ⁄ 06 ⁄ 2007 02:58 0 27 ⁄ 07 ⁄ 2007 03:58 0
The dates of the two nesting events and the time related to an observed landing peak are indicated for each individual (turtles’ ID fromA to J). ‘–
‘ means that no landing peak has been identified before the considered nesting event.
Reproductive synchrony and population recovery in sea turtles 349
� 2011 TheAuthors. Journal ofAnimal Ecology� 2011 British Ecological Society, Journal of Animal Ecology, 81, 341–351
Page 10
In terms of conservation, gathering together in a very
restricted coastal area during the last 2 weeks of their inter-
nesting interval may expose gravid females to high levels of
human activity (e.g. marine navigation, fisheries, pollution)
that may jeopardize their survival. As such potential inter-
actions are likely to occur during the critical reproductive
period, restoration of the small population of olive ridley
turtles in the Guianas will depend on adequate conservation
strategies ensuring the efficiency of reproductive activity and
survival. The immediate mitigation of threats and the fact
that this small population has maintained the ancestral arrib-
ada reproductive strategy are undeniable key factors for the
recovery of this species in the western Atlantic Ocean.
Acknowledgements
We are very grateful to Kwata field workers (particularly Sebastien Barrioz,
Guillaume Feuillet, Eddy Poirier), CNRS-IPHC students who contributed to
field work and CARET partners (STINASU, Suriname) for their contribution
to data collection in the field. We thank Graeme Hays and three anonymous
referees for their constructive comments of the original version of the manu-
script. The spelling and English was revised and edited by Munro Language
Services. This study was financially supported by Hardman Company-Tullow
Oil, Creocean, Interreg, Region Guyane, Region Guadeloupe, Region Marti-
nique and WWF Guianas. This study was carried out under CNRS-IPHC
institutional license (B67 482 18) with individual licenses attributed to JYG
(67–220 and 04–199 delivered by Direction des Services Veterinaires du Bas
Rhin, 05 ⁄ 04 ⁄ PN, 05 ⁄ 07 ⁄ PN, 06 ⁄ 13 ⁄ PN, 06 ⁄ 14 ⁄ PN, 07 ⁄ 02 ⁄ PN and
07 ⁄ 06 ⁄ PN delivered by Direction Regionale de l’Environnement and Prefec-
ture de Guyane). VP was supported by a studentship from the FrenchMinistry
of Research and by the projetMIRETTE funded by theANR (http://projetmi-
rette.fr). The study adhered strictly to both the legal requirements of the coun-
tries in which the workwas carried out and all institutional guidelines.
References
Aggarwal, R.K., Velavan, T.P., Udaykumar, D., Hendre, P.S., Shanker, K.,
Choudhury, B.C. & Singh, L. (2004) Development and characterization of
novel microsatellite markers from the olive ridley sea turtle (Lepidochelys
olivacea).Molecular EcologyNotes, 4, 77–79.
Aggarwal, R.K., Lalremruata, A., Velavan, T.P., Sowjanya, A.P. & Singh, L.
(2008) Development and characterization of ten novelmicrosatellitemarkers
from oliveRidley (Lepidochelys olivacea).Conservation Genetics, 9, 981–984.
Baker, C.S. & Clapham, P.J. (2004) Modelling the past and future of whales
and whaling.Trends in Ecology and Evolution, 19, 365–371.
Berger, J. (1992) Facilitation of reproductive synchrony by gestation adjust-
ment in gregariousmammals: a new hypothesis.Ecology, 73, 323–329.
Bowen, B.W. & Karl, S.A. (2007) Population genetics and phylogeography of
sea turtles.Molecular Ecology, 16, 4886–4907.
Bowen, B.W., Clark, A.M., Abreu-Grobois, F.A., Chaves, A., Reichart, H.A.
& Ferl, R.J. (1998) Global phylogeography of the Ridley sea turtles (Lepid-
ochelys spp.) as inferred frommitochondrial DNA sequences. Genetica, 101,
179–189.
Brookfield, J.F.Y. (1996) A simple new method for estimating null allele fre-
quency from heterozygote deficiency.Molecular Ecology, 5, 453–455.
Bunnefeld, N., Baines, D., Newborn, D. &Milner-Gulland, E.J. (2009) Factors
affecting unintentional harvesting selectivity in a monomorphic species.
Journal of Animal Ecology, 78, 485–492.
Chakraborty, R.& Jin, L. (1992)Heterozygote deficiency, population substruc-
ture and their implications in DNA fingerprinting? Human Genetics, 88,
267–272.
Colbert, P.L., Spencer, R.-J. & Janzen, F.J. (2010)Mechanism and cost of syn-
chronous hatching.Functional Ecology, 24, 112–121.
Cornuet, J.M.& Luikart, G. (1996) Description and power analysis of two tests
for detecting recent population bottlenecks from allele frequency data.
Genetics, 144, 2001–2014.
Darling, F.F. (1938) Bird Flocks and Breeding Cycle. Cambridge University
Press, Cambridge.
Drummond,A. &Rambaut, A. (2007) BEAST: Bayesian evolutionary analysis
by sampling trees.BMCEvolutionary Biology, 7, 214.
Eguchi, T., Gerrodette, T., Pitman, R.L., Seminoff, J.A. &Dutton, P.H. (2007)
At-sea density and abundance estimates of the olive ridley turtle Lepidoche-
lys olivacea in the eastern.
Falush, D., Stephens, M. & Pritchard, J.K. (2007) Inference of population
structure using multilocus genotype data: dominant markers and null alleles.
Molecular Ecology Notes, 7, 574–578.
Ferraroli, S., Georges, J.Y., Gaspar, P. & Le Maho, Y. (2004) Where leather-
back turtles meet fisheries.Nature, 249, 521–522.
Fitzsimmons, N.N. (1998) Single paternity of clutches and sperm storage in the
promiscuous green turtle (Chelonia mydas).Molecular Ecology, 7, 575–584.
Fossette, S., Tanaka, H., Ropert-Coudert, Y., Ferraroli, S., Arai, N., Sato, K.,
Le Maho, Y. & Georges, J.Y. (2007) Dispersal and dive patterns in gravid
leatherback turtles during the nesting season in French Guiana. Marine
Ecology Progress Series, 338, 233–247.
Fossette, S., Gaspar, P., Handrich, Y., Le Maho, Y. & Georges, J.Y. (2008)
Fine-scale diving behaviour and beak movements in leatherback turtles
(Dermochelys coriacea) nesting in French Guiana. Journal of Animal Ecol-
ogy, 77, 236–246.
Frankham, R. (1995) Effective population size ⁄ adult population size ratios in
wildlife: a review.Genetical Research, 66, 95–107.
Frankham, R. (2005) Genetics and extinction. Biological Conservation, 126,
131–140.
Gaillard, J.M., Delorme, D., Jullien, J.M. & Tatin, D. (1993) Timing and syn-
chrony of births in roe deer. Journal ofMammalogy, 74, 738–744.
Georges, J.-Y., Billes, A., Ferraroli, S., Fossette, S., Fretey, J., Gremillet, D.,
Le Maho, Y., Myers, A.E., Tanaka, H. & Hays, G.C. (2007) Meta-analysis
of movements in Atlantic leatherback turtles during nesting season: conser-
vation implications.Marine Ecology Progress Series, 338, 225–232.
Goossens, B., Chikhi, L., Ancrenaz, M., Lackman-Ancrenaz, I., Andau, P. &
Bruford, M.W. (2006) Genetic signature of anthropogenic population col-
lapse inOrang-utans.PLoSBiology, 4, e25.
Hamel, M.A., McMahon, C.R. & Bradshaw, C.J.A. (2008) Flexible inter-nest-
ing behaviour of generalist olive ridley turtles inAustralia. Journal of Experi-
mentalMarine Biology and Ecology, 359, 47–54.
Hanafy, M.H., Aamer, M.A., Habib, M., Rouphael, A.B. & Baird, A.H.
(2010) Synchronous reproduction of corals in the Red Sea. Coral Reefs, 29,
119–124.
Hays, G.C. (2000) The implications of variable remigration intervals for the
assessment of population size in marine turtles. Journal of Theoretical Biol-
ogy, 206, 221–227.
Hays, G.C., Luschi, P., Papi, F., del Seppia, C. & Marsh, R. (1999) Change in
behaviour during the inter-nesting period and post-nesting migration for
Ascension island green turtles. Marine Ecology Progress Series, 189, 263–
273.
Hays, G.C., Akesson, S., Broderick, A.C., Glen, F., Godley, B.J., Luschi, P.,
Martin, C., Metcalfe, J.D. & Papi, F. (2001) The diving behaviour of green
turtles undertaking oceanic migration to and from Ascension Island: dive
durations, dive profiles and depth distribution. The Journal of Experimental
Biology, 204, 4093–4098.
Hays, G.C., Broderick, A.C., Glen, F., Godley, B.G., Houghton, J.D.R. &
Metcalfe, J.D. (2002) Water temperature and internesting intervals for
loggerhead (Caretta caretta) and green (Chelonia mydas) turtles. Journal of
Thermal Biology, 27, 429–432.
Henson, S.M., Cushing, J.M. & Hayward, J.L. (2011) Socially-induced
ovulation synchrony and its effect on seabird population dynamics. Journal
of Biological Dynamics, 5, 495–516.
Houghton, J.D.R., Cedras, A., Myers, A.E., Liebsch, N., Metcalfe, J.D.,
Mortimer, J.A. &Hays, G.C. (2008) Measuring the state of consciousness in
a free-living diving sea turtle. Journal of Experimental Marine Biology and
Ecology, 356, 115–120.
Hovel, K. & Morgan, S.G. (1997) Planktivory as selective force for reproduc-
tive synchrony and larval dispersal. Marine Ecology Progress Series, 157,
79–95.
Ims, R.A. (1990) The ecology end evolution of reproductive synchrony. Trends
in Ecology and Evolution, 5, 135–140.
IUCN. (2009) RedList http://www.iucnredlist.org/details/11047/0/full
Kelle, L., Gratiot, N. & De Thoisy, B. (2009) Olive ridley turtle Lepidochelys
olivacea in French Guiana: back from the brink of regional extirpation?
Oryx, 43, 243–246.
Kennett, D.J., Voorhies, B., Wake, T.A. & Martinez, N. (2008) Long-term
effects of human predation on marine ecosystems in Guerrero, Mexico.
Human Impacts on Ancient Marine Ecosystems: A Global Perspective (eds
350 V. Plot et al.
� 2011 TheAuthors. Journal ofAnimal Ecology� 2011British Ecological Society, Journal of Animal Ecology, 81, 341–351
Page 11
T.C. Rick & J.M. Erlandson), pp. 103–124. University of California Press,
Berkeley and LosAngeles, California, USA.
Kraemer, J.E. & Bell, R. (1980) Rain-induced mortality of eggs and hatchlings
of loggerhead sea turtles (Caretta caretta) on the Georgia coast.Herpetolog-
ica, 36, 72–77.
Lande, R. (1988)Genetics and demography in biological conservation.Science,
241, 1455–1460.
Lopez-Castro, M.C. & Rocha-Olivares, A. (2005) The panmixia paradigm of
eastern Pacific olive Ridley turtles revised: consequences for their conserva-
tion and evolutionary biology.Molecular Ecology, 14, 3325–3334.
Lotze, H.K. & Worm, B. (2009) Historical baselines for large marine animals.
Trends in Ecology and Evolution, 24, 233–288.
Lynch, M. & Land, R. (1998) The critical effective size for a genetically secure
population.Animal Conservation, 1, 70–72.
McClenachan, L., Jackson, J.B.C. & Newman, M.J.H. (2006) Conservation
implications of historic sea turtle nesting beach loss. Frontiers in Ecology and
the Environment, 4, 290–296.
McMahon, C.R., Bradshaw, C.J.A. & Hays, G.C. (2007) Satellite tracking
reveals unusual diving characteristics for amarine reptile, the olive ridley tur-
tle (Lepidochelys olivacea).Marine Ecology Progress Series, 329, 239–252.
Ogutu, J.O., Piepho, H.-P., Dublin, T.H., Bhola, N. & Reid, R.S. (2010) Rain-
fall extremes explain interannual shifts in timing and synchrony of calving in
topi and warthog.Population Ecology, 52, 89–102.
Plotkin, P.T. (2007) Biology and Conservation of Ridley Sea Turtles. The Johns
HopkinsUniversity Press, Baltimore.
Plotkin, P.T., Polak, M. & Owens, D.W. (1991) Observations on olive Ridley
sea turtles behaviour prior to an arribada at PlayaNancite, Costa Rica.Mar-
ine Turtle Newsletter, 53, 9–10.
Plotkin, P.T., Rostal, D.V., Byles, R.A. & Owens, D.W. (1997) Reproduction
and developmental synchrony in female Lepidochelys olivacea. Journal of
Herpetology, 31, 17–22.
Pritchard, P.H.C. (1969) Sea turtles of the Guianas. Bulletin Florida State
Museum (Biological Sciences), 13, 85–140.
Raymond, M. & Rousset, F. (1995) GENEPOP version 1.2: population genet-
ics software for exact tests and ecumenicism. Journal of Heredity, 86, 248–
249.
Reece, J.S., Castoe, T.A. & Parkinson, C.L. (2005) Historical perspectives on
population genetics and conservation of three marine turtle species. Conser-
vation Genetics, 6, 235–251.
Rozas, J.C.J., Sanchez-DelBarrio, J.C., Messeguer, X. & Rozas, R. (2003)
DnaSP, DNA polymorphism analyses by the coalescent and other methods.
Bioinformatics, 19, 2496–2497.
Rutberg, A.T. (1987) Adaptive hypotheses of birth synchrony in ruminants: an
interspecific test.AmericanNaturalist, 130, 692–710.
Sato, K., Matsuzawa, Y., Tanaka, H., Bando, T., Minamikawa, S., Sakamoto,
W. & Naito, Y. (1998) Internesting intervals for loggerhead turtles, Caretta
caretta, and green Chelonia mydas, are affected by temperature. Canadian
Journal of Zoology, 76, 1651–1662.
Shaffer, H.B., Meylan, P. & McKnight, M.L. (1997) Tests of turtle phylogeny:
molecular, morphological, and paleontological approaches. Systematic Biol-
ogy, 46, 235–268.
Shanker, K., Pandav, B. & Choudhury, B.C. (2003) An assessment of the olive
ridley turtle (Lepidochelys olivacea) nesting population in Orissa, India. Bio-
logical Conservation, 115, 149–160.
Shanker, K., Ramadevi, J., Choudhury, B.C., Singh, L. & Aggarwal, R.K.
(2002) Phylogeography of olive Ridley turtles (Lepidochelys olivacea) on the
east coast of India: implications for conservation theory.Molecular Ecology,
13, 1899–1909.
da Silva, A.C.C.D., de Castilhos, J.C., Lopez, G.G. & Barata, P.C.R. (2007)
Nesting biology and conservation of the olive ridley sea turtle (Lepidochelys
olivacea) in Brazil, 1991 ⁄ 1992 to 2002 ⁄ 2003. Journal ofMarine BiologyAsso-
ciation of the United Kingdom, 87, 1047–1056.
Snedecor, G.W. & Cochran, W.G. (1989) Failures in the assumptions. Statisti-
cal Methods, 8th edn. (ed. Wiley-Blackwell), pp. 278–280. University Press,
IA, USA.
Spencer, R.-J., Thompson, M.B. & Banks, P.B. (2001) Hatch or wait? A
dilemma in reptilian incubation.Oikos, 93, 401–406.
Spotila, J.R. (2004) Sea Turtles a Complete Guide to their Biology, Behaviour
and Conservation. The Johns Hopkins University Press, Baltimore and Lon-
don.
Storz, J.F. & Beaumont, M.A. (2002) Testing for genetic evidence of popula-
tion expansion and contraction: an empirical analysis of microsatellite DNA
variation using a hierarchical Bayesianmodel.Evolution, 56, 154–166.
Tremblay, Y., Robinson, P.W. & Costa, D.P. (2009) A parsimonious approach
to modelling animal movement data. PLoS One, 4, e4711. doi:10.1371/jour-
nal.pone.0004711.
Van Oosterhout, C., Hutchinson, W.F., Wills, D.P.M. & Shipley, P. (2004)
Micro Checker: software for identifying and correcting genotyping errors in
microsatellite data.Molecular EcologyNotes, 4, 535–538.
Wakeley, J. & Aliacar, N. (2001) Gene genealogies in a metapopulation.Genet-
ics, 159, 893–905.
Watson, G.J., Bentley, M.G., Gaudron, S.M. & Hardege, J.D. (2003) The role
of chemical signals in the spawning induction of polychaete worms and other
marine invertebrates. Journal of ExperimentalMarine Biology, 294, 169–187.
Weldon, P.J., Mason, R.T., Tanner, M.J. & Eisner, T. (1990) Lipids in the
Rathke’s gland secretions of hatchling Kemp’s ridley sea turtles (Lepidoche-
lys kempi).Comparative Biochemistry and Physiology Part B, 96, 705–708.
Zug, G.R., Chaloupka, M. & Balazs, G.H. (2006) Age and growth in olive
ridley sea turtles (Lepidochelys olivacea) from the North-central Pacific: a
skeletochronological analysis.Marine Ecology, 27, 263–270.
Received 15October 2010; accepted 5 September 2011
Handling Editor: GraemeHays
Reproductive synchrony and population recovery in sea turtles 351
� 2011 TheAuthors. Journal ofAnimal Ecology� 2011 British Ecological Society, Journal of Animal Ecology, 81, 341–351