149
OVERVIEW c GET REVITALISED CITY DEVELOPMENTS LIMITED ANNUAL REPORT 2021
| Date post: | 08-May-2023 |
| Category: |
Documents |
| Upload: | khangminh22 |
| View: | 0 times |
| Download: | 0 times |
OVERVIEW
c
G E T R E V I T A L I S E D
C ITY DEVELO PMENTS L IMITEDA NNUAL REPORT 2021
OVERVIEW
1
City Developments Limited (CDL) is a leading global real estate company with a network spanning 104 locations in 29 countries and regions. Listed on the Singapore Exchange, the Group is one of the largest companies by market capitalisation. Its income-stable and geographically-diverse portfolio comprises residences, offices, hotels, serviced apartments, shopping malls and integrated developments.
With a proven track record of over 55 years in real estate development, investment and management, the Group has developed over 48,000 homes and owns around 23 million square feet of gross floor area in residential for lease, commercial and hospitality assets globally. Its diversified global landbank offers 3.3 million square feet of land area.
Along with its wholly-owned hotel subsidiary, Millennium & Copthorne Hotels Limited (M&C), the Group has over 130 hotels and over 40,000 rooms worldwide, many in key gateway cities.
Leveraging its deep expertise in developing and managing a diversified asset base, the Group is focused on enhancing the performance of its portfolio and strengthening its recurring income streams to deliver long-term sustainable value to shareholders. The Group is also developing a fund management business and targets to achieve US$5 billion in Assets Under Management (AUM) by 2023.
C O R P O R A T E
P R O F I L E
Artist's Impression
CITY DEVELOPMENTS LIMITED ANNUAL REPORT 2021
GET REVITALISED 2021 marked the continuation of a ‘new normal’ as global economies, businesses and communities adapted to a vastly different environment, all the while traversing the continued and ever-evolving disruption from the COVID-19 pandemic.
Embracing resilience, agility, adaptability and an innovative spirit that is the core to our DNA, we navigated the headwinds decisively and made a return to profitability. Today, backed by strong fundamentals, we are well-positioned for a full business recovery.
In the past two years, we have gained new perspectives and insights. These, together with the many lessons learnt from the pandemic, will shape our growth story – and pave the way for greater business sustainability.
OVERVIEW
2021 Highlights5-Year Financial HighlightsChairman’s StatementGroup CEO’s StatementCorporate NetworkCorporate StructureHighlights of the YearAwards & AccoladesCorporate Directory
CORPORATE GOVERNANCE
Board of DirectorsKey ManagementCorporate GovernanceRisk ManagementInvestor RelationsCalendar of Financial Events
SUSTAINABILITY
Sustainability Board Statement
BUSINESS OVERVIEW
Financial ReviewOperations and Market Review
PROPERTY PORTFOLIO
Property Portfolio AnalysisMajor Properties
FINANCIALS
Statutory Reports & Accounts
OTHER INFORMATION
Statistics of Ordinary ShareholdingsStatistics of Preference ShareholdingsShare Transaction StatisticsNotice of Annual General MeetingAdditional Information on Directors Seeking Election/Re-ElectionProxy Form
121314161819202223
243032576364
65
7981
8689
99
270272273274284
Cover and right:CanningHill Piers I Singapore

CITY DEVELOPMENTS LIMITED ANNUAL REPORT 2021 OVERVIEW
2 3
G R O W T H
In 2021, we continued to build our development pipeline and recurring income streams, driving portfolio growth in Singapore and our key overseas markets. With two highly successful residential launches in Singapore and sustained sales of our existing inventory, we achieved a new record for the highest annual property sales in our Group’s history. Overseas, we launched a mixed-use project in Melbourne and also acquired a development site in Brisbane that can yield 97 units. The Group continued to broaden our Private Rented Sector (PRS) portfolio, growing our footprint to enhance our recurring income segment.
In 2021, we grew our global Private Rented Sector (PRS) portfolio through strategic acquisitions in the UK and Japan, which includes a 250-year leasehold site in Birmingham for the development of the 370-unit The Octagon, which will be the world’s tallest pure octagonal residential skyscraper when completed in 2025.
RESHAPING CITYSCAPES Building a diversified portfolio
RESIDENTIAL LAUNCH PIPELINE
~2,350 UNITSin Singapore
NEW LAUNCHESSingapore
IRWELL HILL RESIDENCES (540 units) &
CANNINGHILL PIERS (696 units)
Australia
FITZROY FITZROY (Melbourne) (62 units)
GLOBAL PRS PORTFOLIO (Operational & Under Development)
1,734 UNITS in the UK, Japan and the US
PROPERTY DEVELOPMENT SINGAPORE
RECORD $4.3 BILLION
Irwell Hill Residences I SingaporeArtist’s Impression* Includes Executive Condominiums (ECs) and share of joint venture (JV) partners.
Property sales value achieved
for 2,185 UNITS sold*

CITY DEVELOPMENTS LIMITED ANNUAL REPORT 2021 OVERVIEW
4 5
E N H A N C E M E N T
RETHINKING SPACESRevitalising assets to propel future value
As part of our active asset management strategy, we continue to focus on portfolio rejuvenation and Asset Enhancement Initiatives to reposition our assets, unlock value, drive operational efficiency and returns.
In 2021, we unveiled the redevelopment of the former Liang Court site at Clarke Quay into one of the largest integrated redevelopment projects in the Central Area, with the launch of CanningHill Piers – the iconic 696-unit residence along the Singapore River. We have also embarked on another two large-scale rejuvenation projects in the area: the former Fuji Xerox Towers, Central Mall and Central Square sites will be transformed into mixed-used developments and enjoy Gross Floor Area (GFA) uplifts through redevelopment incentive schemes.
80 Anson Road I SingaporeArtist’s Impression
ASSET REJUVENATION
Redevelopment of mature assets
CANNINGHILL PIERS (former Liang Court site)Part of one of the largest integrated redevelopment projects in the Central Area with residential, retail and F&B, a hotel and serviced residence
80 ANSON ROAD (former Fuji Xerox Towers)Potential GFA uplift by 25% to ~655,000 sq ft under CBD Incentive Scheme
CENTRAL MALL & CENTRAL SQUAREPotential GFA uplift by 67% to ~735,500 sq ft under Strategic Development Incentive Scheme
GLOBAL PORTFOLIO
~23 MILLION SQ FTTotal GFA of residential for lease, commercial and hotel space
ASSET ENHANCEMENT INITIATIVESSingapore : Palais Renaissance, King's Centre and Tower Club – Ba Xian DiningThailand : JungceylonUK : Aldgate House and 125 Old Broad Street

CITY DEVELOPMENTS LIMITED ANNUAL REPORT 2021 OVERVIEW
6 7
T R A N S F O R M A T I O N
REINFORCINGSTRENGTHSCapitalising on strategic investments, new platforms and innovation
STRATEGIC INVESTMENT IN IREIT GLOBAL
76% INCREASEin AUM to €889.7MMsince the Group’s investment in April 2019
FUND MANAGEMENT
US$5 BILLION AUM target by 2023
GROUP’S TOTAL ASSETS
$23.9 BILLION
The Octagon I Birmingham, UKArtist’s Impression
To future-proof our business, we have embarked on platform initiatives for portfolio diversification and transformation.
We are actively pursuing growth of our fund management business organically and via mergers and acquisitions, with plans to establish a Singapore-listed REIT with UK commercial assets. Since our strategic investment into Singapore-listed IREIT Global in April 2019, we now hold a 21% stake in its units and a 50% stake in the REIT Manager. IREIT Global’s portfolio has also grown from five properties to 37 properties, with a 76% increase in Assets Under Management (AUM) today.
Keeping pace with an ever-changing world, we continue to embrace innovation and digitalisation for business optimisation and operational efficiency. Our push into new economy and technology ventures will revolutionise our product offerings, enhance our value proposition and elevate customer experience.
Through exploring growth platforms, new economy and technology ventures, we are positioned to propel our business forward for the future.
CITY DEVELOPMENTS LIMITED ANNUAL REPORT 2021 OVERVIEW
8 9
T R A N S F O R M A T I O N
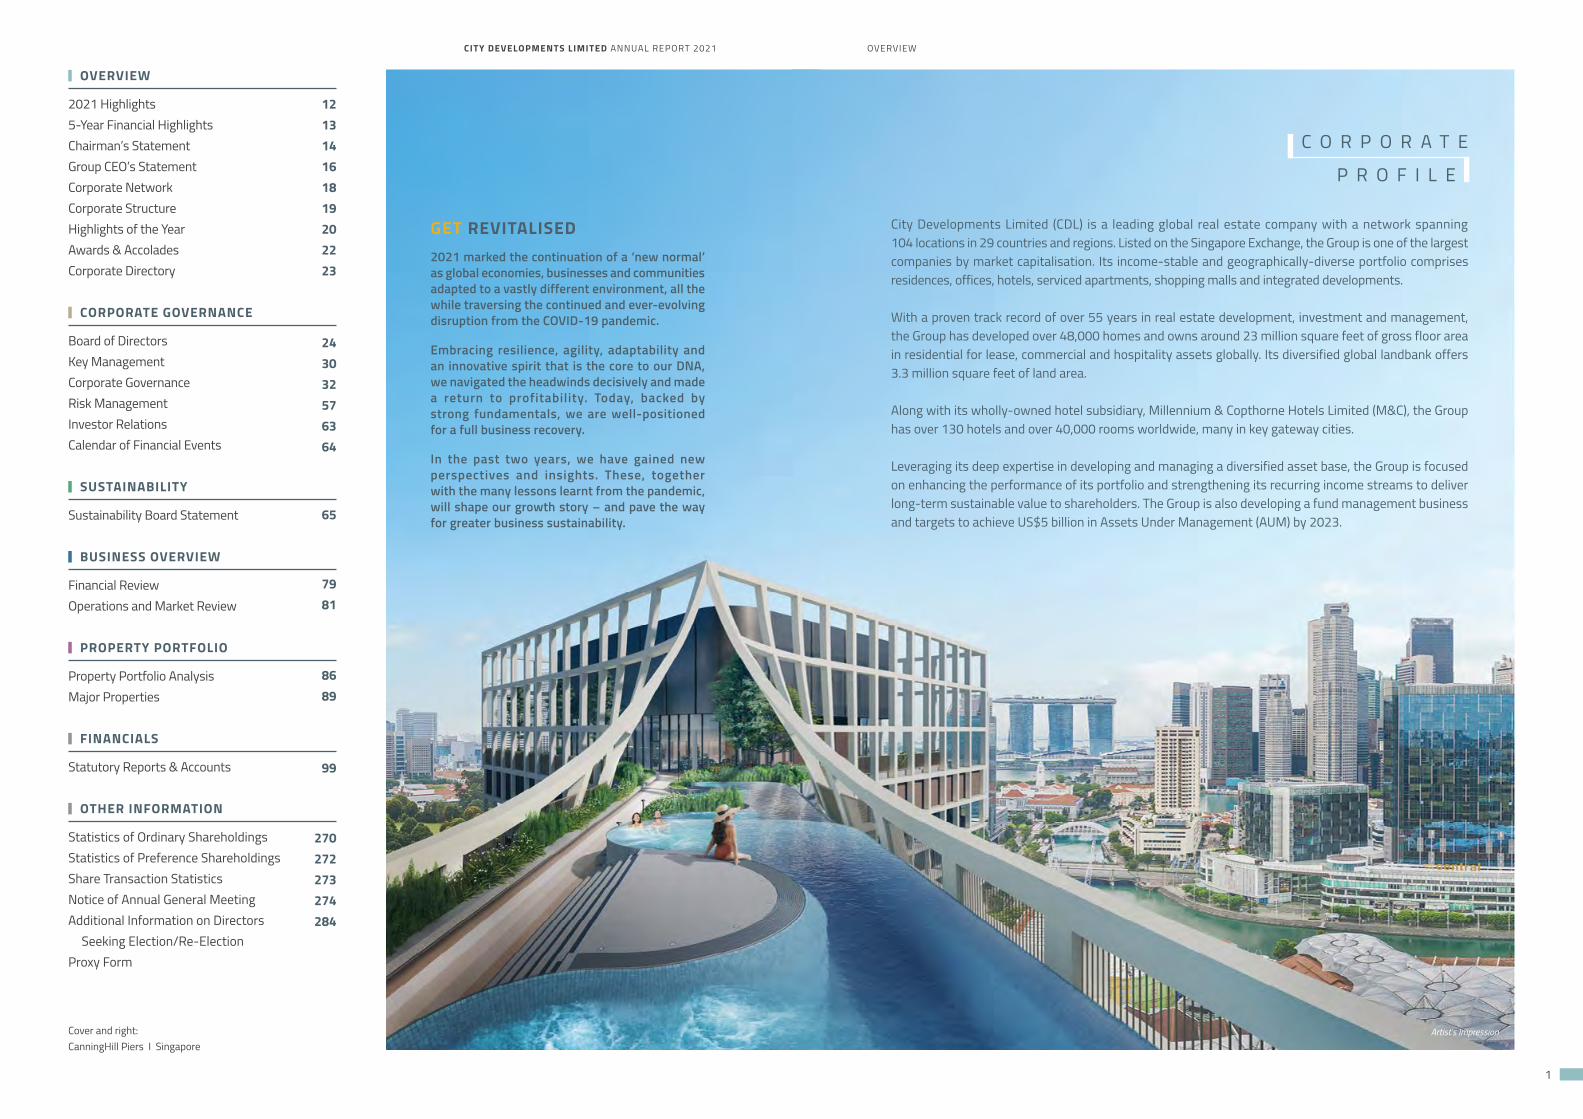
M Social Hotel Paris Opera I Paris, France
Enhancing efficiencies through asset reviews
ACTIVE CAPITAL RECYCLING FOCUSUnlock deep value of investment assets with KRW1.1 TRILLION divestment of Millennium Hilton Seoul & adjoining land
GLOBAL HOSPITALITY PORTFOLIO
>130 HOTELS, >40,000 ROOMS
HOTEL REPOSITIONINGCompleted 2 asset refurbishments: M SOCIAL HOTEL TIMES SQUARE NEW YORKFirst M Social property in the US
M SOCIAL HOTEL PARIS OPERAFirst M Social property in Europe
PORTFOLIO RESTRUCTURING - AS A COMMITTED SPONSOR & LARGEST UNITHOLDER OF CDLHTProposed special distribution in specie of 144.3 MILLION STAPLED SECURITIES in CDL Hospitality Trusts (CDLHT) on a pro-rata basis to reward shareholders and unlock value through accounting deconsolidation
Following our privatisation of Millennium & Copthorne Hotels Limited (M&C) in 2019, we have undertaken a holistic review of our hospitality portfolio to recycle capital, reposition assets and reorganise processes for synergies.
We have since made several opportunistic asset divestments to unlock value and reallocate capital for growth, including the strategic divestment of Millennium Hilton Seoul which completed on 24 February 2022. In 2021, we also completed the refurbishment of two hotel assets in the US and Europe – M Social Hotel Times Square New York and M Social Hotel Paris Opera – which reopened in May and September respectively.
With the hospitality sector on the cusp of an imminent rebound, led by pent-up demand for tourism and corporate travel, our hotels are well-positioned to ride a new growth trajectory.
REBALANCING PORTFOLIOS

CITY DEVELOPMENTS LIMITED ANNUAL REPORT 2021 OVERVIEW
10 11
S U S T A I N A B I L I T Y
Changing the present to protect the future
REIMAGINING TOMORROW
114 BCA GREEN MARKCertifications for its developments and office interiors. Most-awarded BCA Green Mark Platinum listed developer
NET ZERO OPERATIONAL CARBON BY 2030First Singapore real estate developer to sign World Green Building Council (WorldGBC)’s Net Zero Carbon Buildings Commitment
CDL is well placed to navigate the ever-evolving sustainability landscape globally and locally. For the past two decades, Environmental, Social and Governance (ESG) integration has been a fundamental aspect of CDL’s business strategy. By holding true to our corporate ethos of “Conserving as we Construct”, we continue to drive long-term sustainability and value creation for our businesses and stakeholders, building a climate-resilient future.
As a demonstration of our commitment, in February 2021, we pledged to achieve net zero in operational carbon by 2030, and expanded this commitment towards a net-zero whole life carbon-built environment in November 2021. In December 2021, we also aligned ourselves with even more ambitious SBTi-validated carbon emissions reduction targets that are aligned with a 1.5°C warmer scenario. Through these goals, we boldly pave the way ahead for a greener built environment.
ACHIEVED ENERGY SAVINGS OF
>$34 MILLION across all managed properties from 2012 to 2021
SINGAPORE GOVERNANCE AND TRANSPARENCY INDEX 2021
#4 out of 519 companies
>$3 BILLIONin sustainable financing secured since 2017 via a green bond, various green loans and a sustainability-linked loan
CDL Green Gallery I Singapore
Ranked world's top real estate management and development company for four consecutive years, and only Singapore company listed for 13 consecutive years
RANKED ON 13 LEADING GLOBAL SUSTAINABILITY RATINGS AND RANKINGS
Only Singapore real estate company listed since 2018
One of 45 global companies and only Singapore recipient of the Terra Carta Seal from His Royal Highness (HRH) The Prince of Wales
Only company in Southeast Asia and Hong Kong to achieve double 'A' honour for both climate change and water security for 3rd consecutive year
CITY DEVELOPMENTS LIMITED ANNUAL REPORT 2021 OVERVIEW
12 13
Notes:(1) 2017 comparative figures were adjusted to take into account retrospective adjustments arising from the adoption of Singapore Financial Reporting Standards (International)
(SFRS(I)) and International Financial Reporting Standards framework as well as SFRS(I) 9 - Financial Instruments and SFRS(I) 15 - Revenue from Contracts with Customers.(2) Final and special final tax-exempt (one-tier) ordinary dividends proposed for financial year ended 31 December 2021 will be subject to the approval of the ordinary
shareholders at the forthcoming Annual General Meeting.(3) Excludes fair value gains on investment properties as the Group’s accounting policy is to state its investment properties at cost less accumulated depreciation and
accumulated impairment losses.(4) Excluding non-cash impairment losses on investment properties and property, plant and equipment, and net loss from Sincere Property Group.(5) Excluding non-cash reversal of impairment losses on investment properties and property, plant and equipment, net loss from Sincere Property Group, and negative
goodwill on acquisition of subsidiaries.(6) Illustrative valuation based on CDLHT unit price of $1.20.
* Including only fair value gains on investment properties.^ Excluding non-cash reversal of impairment losses on investment properties and property, plant and equipment, net loss from Sincere Property Group and negative
goodwill on acquisition of subsidiaries.# Illustrative valuation based on CDLHT unit price of $1.20.
2021HIGHLIGHTS
5-YEAR FINANCIALHIGHLIGHTS
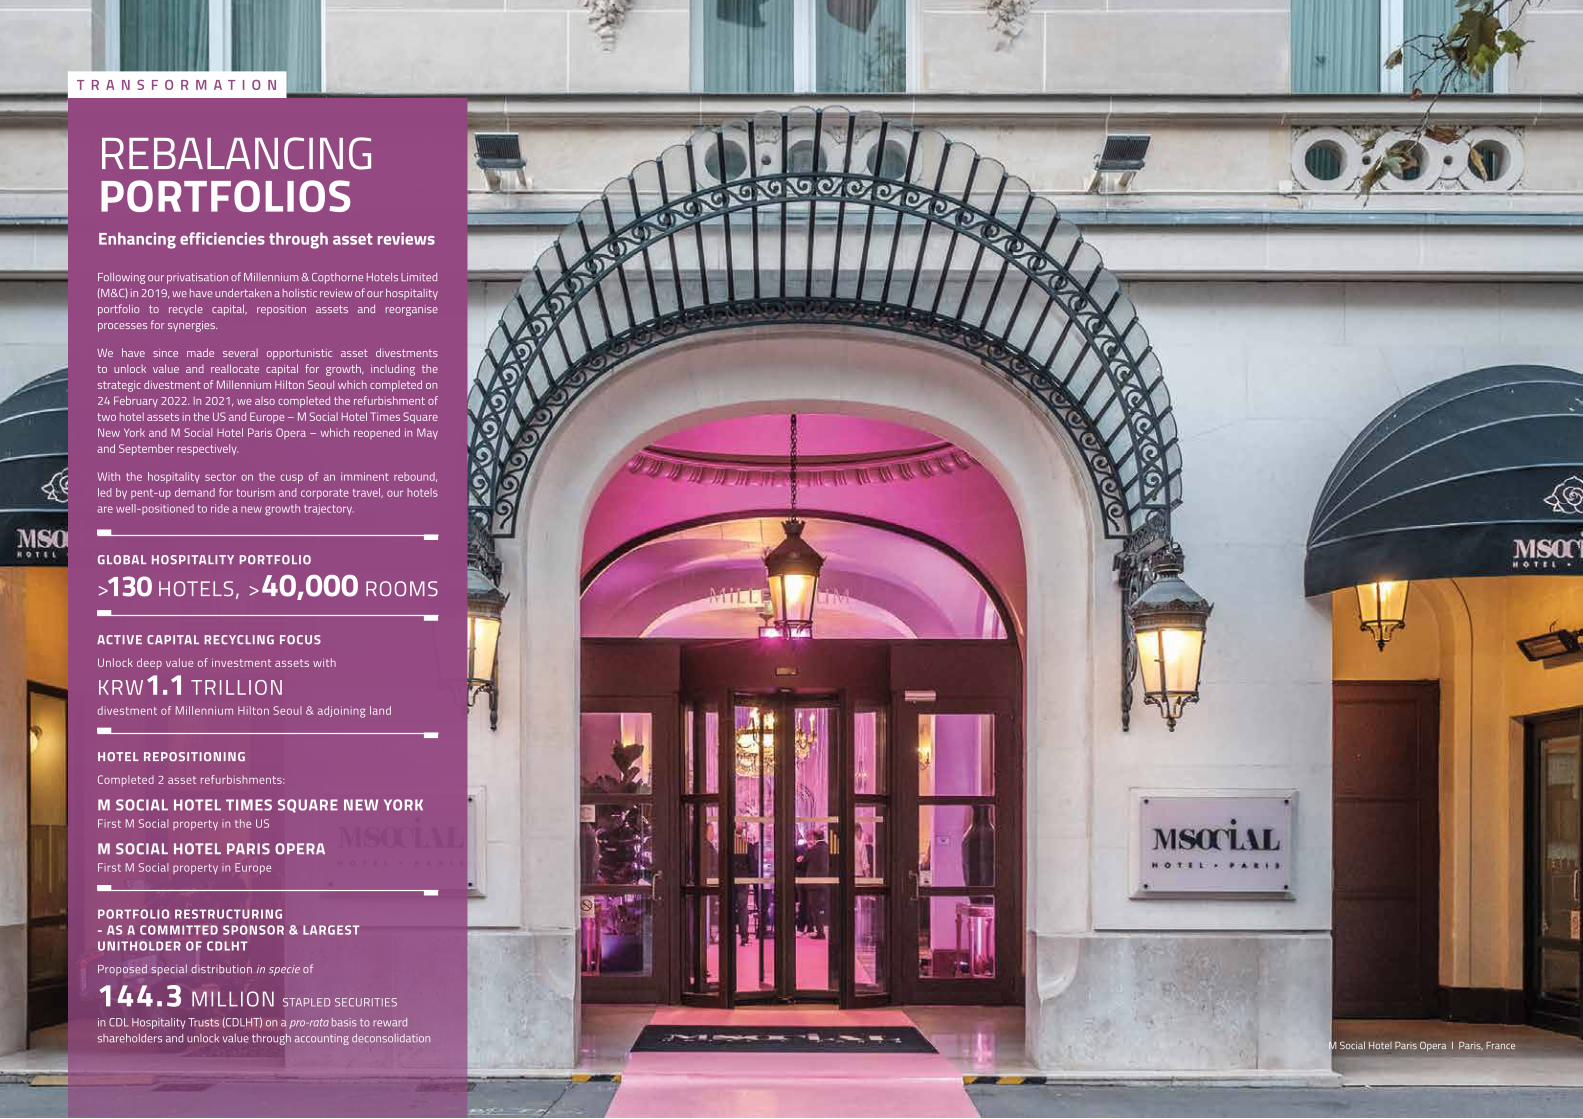
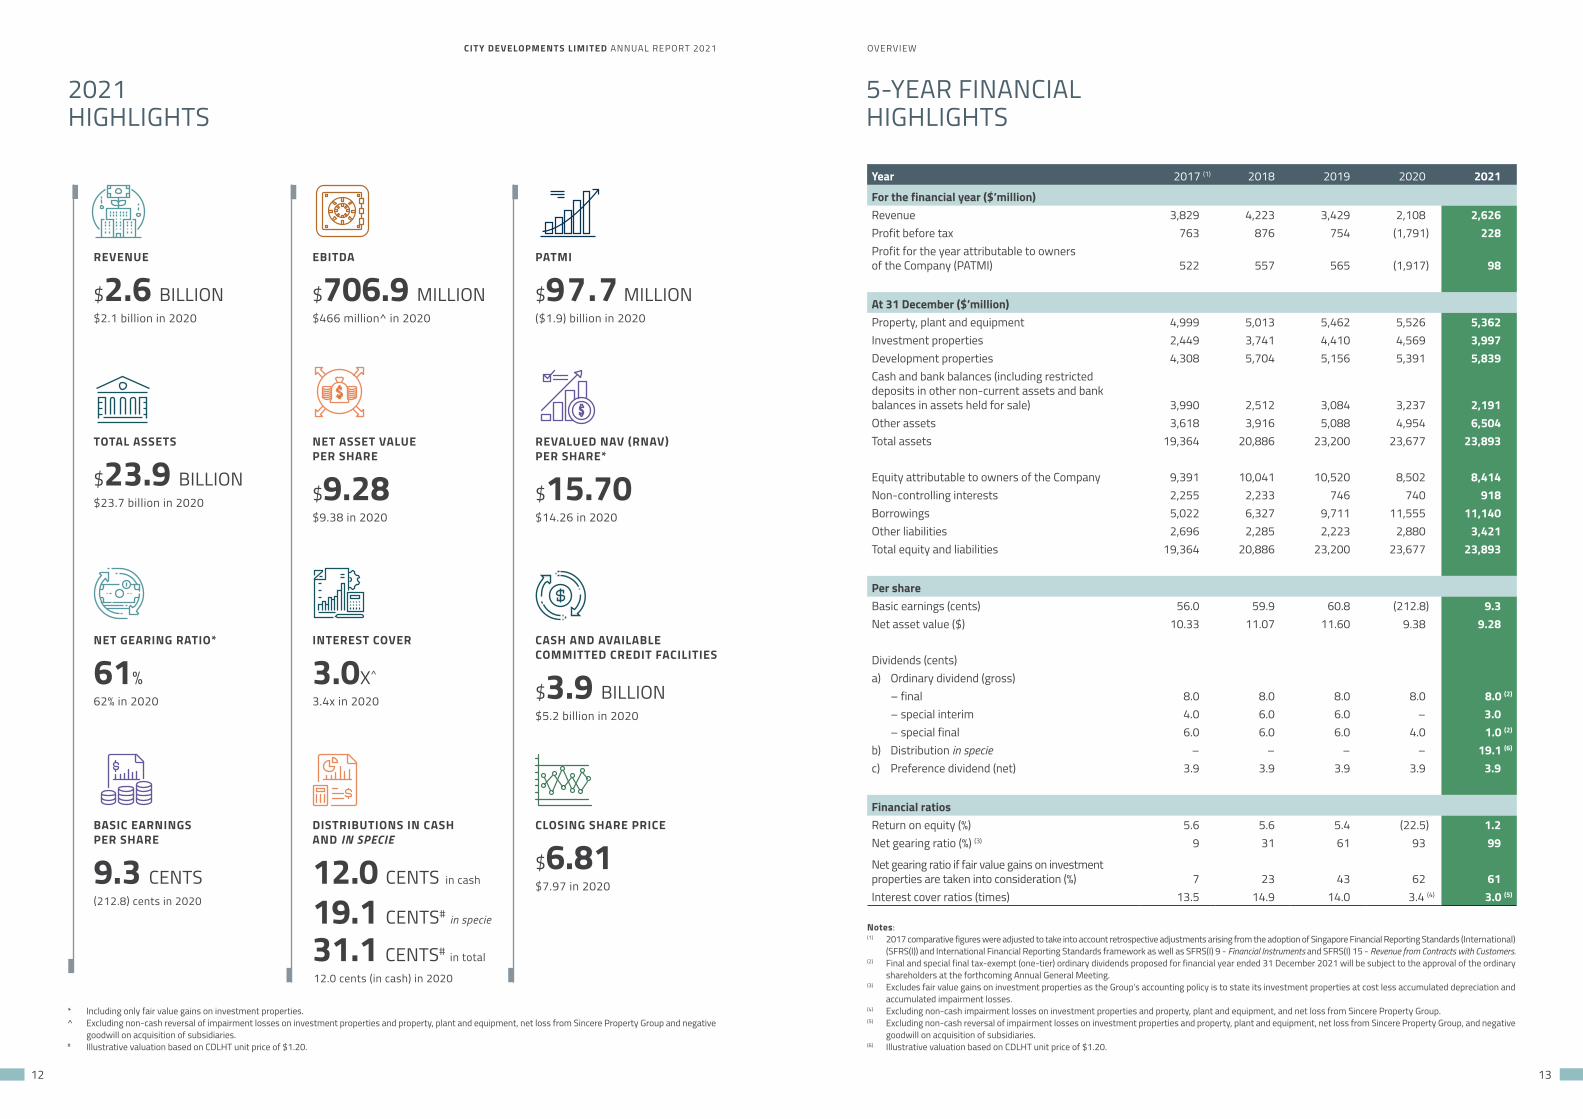
REVENUE
$2.6 BILLION$2.1 billion in 2020
NET GEARING RATIO*
61% 62% in 2020
INTEREST COVER
3.0X^ 3.4x in 2020
TOTAL ASSETS
$23.9 BILLION $23.7 billion in 2020
CASH AND AVAILABLECOMMITTED CREDIT FACILITIES
$3.9 BILLION $5.2 billion in 2020
BASIC EARNINGS PER SHARE
9.3 CENTS (212.8) cents in 2020
NET ASSET VALUE PER SHARE
$9.28 $9.38 in 2020
EBITDA
$706.9 MILLION $466 million^ in 2020
PATMI
$97.7 MILLION ($1.9) billion in 2020
REVALUED NAV (RNAV)PER SHARE*
$15.70 $14.26 in 2020
DISTRIBUTIONS IN CASH AND IN SPECIE
12.0 CENTS
19.1 CENTS#
31.1 CENTS#
CLOSING SHARE PRICE
$6.81 $7.97 in 2020
Year 2017 (1) 2018 2019 2020 2021
For the financial year ($’million)Revenue 3,829 4,223 3,429 2,108 2,626Profit before tax 763 876 754 (1,791) 228Profit for the year attributable to owners of the Company (PATMI) 522 557 565 (1,917) 98
At 31 December ($’million)Property, plant and equipment 4,999 5,013 5,462 5,526 5,362Investment properties 2,449 3,741 4,410 4,569 3,997Development properties 4,308 5,704 5,156 5,391 5,839Cash and bank balances (including restricted deposits in other non-current assets and bank balances in assets held for sale) 3,990 2,512 3,084 3,237 2,191Other assets 3,618 3,916 5,088 4,954 6,504Total assets 19,364 20,886 23,200 23,677 23,893
Equity attributable to owners of the Company 9,391 10,041 10,520 8,502 8,414Non-controlling interests 2,255 2,233 746 740 918Borrowings 5,022 6,327 9,711 11,555 11,140Other liabilities 2,696 2,285 2,223 2,880 3,421Total equity and liabilities 19,364 20,886 23,200 23,677 23,893
Per shareBasic earnings (cents) 56.0 59.9 60.8 (212.8) 9.3Net asset value ($) 10.33 11.07 11.60 9.38 9.28
Dividends (cents)a) Ordinary dividend (gross) – final 8.0 8.0 8.0 8.0 8.0 (2)
– special interim 4.0 6.0 6.0 – 3.0 – special final 6.0 6.0 6.0 4.0 1.0 (2)
b) Distribution in specie – – – – 19.1 (6)
c) Preference dividend (net) 3.9 3.9 3.9 3.9 3.9
Financial ratiosReturn on equity (%) 5.6 5.6 5.4 (22.5) 1.2Net gearing ratio (%) (3) 9 31 61 93 99
Net gearing ratio if fair value gains on investment properties are taken into consideration (%) 7 23 43 62 61Interest cover ratios (times) 13.5 14.9 14.0 3.4 (4) 3.0 (5)
in cash
in specie
in total
12.0 cents (in cash) in 2020
CITY DEVELOPMENTS LIMITED ANNUAL REPORT 2021 OVERVIEW
14 15
CHAIRMAN’SSTATEMENT
REVITALISING OUR GROWTH STORY
2022 started with the optimism of a global economic recovery, with many countries easing international travel restrictions and streamlining border controls. Despite the impact of the Russia-Ukraine conflict, which remains unpredictable, we stay focused on repositioning and growing our business, pushing ahead on our path towards full financial recovery.
One of our Group’s key engines for growth is our hospitality arm. Since the 1970s, we have amassed a portfolio of valuable assets through strategic acquisitions and geographical expansion. Many of these assets have been held at book value for decades. Today, our Group is a sizeable hotel owner and operator, with over 130 hotels and more than 40,000 rooms worldwide.
Since the start of the COVID-19 outbreak in 2020, the hospitality industry has been among the sectors hardest hit. Our prescient move to privatise our hotel arm, Millennium & Copthorne Hotels Limited (M&C) in November 2019 placed us in a strong position to restructure the business and steer it decisively through the operational challenges. It also enabled us greater flexibility in unlocking the deep value of M&C’s portfolio at the right time.
DivestmentsIn December, we announced the divestment of Millennium Hilton Seoul and its adjoining land for KRW 1.1 trillion ($1.25 billion). I led the acquisition of this asset in the late 1990s, and since then, we have steadfastly invested in the hotel, driven optimal performance and extracted good value from the property. I have always believed that this would be an asset that could provide tremendous value to shareholders at the right time and at the right price. The successful divestment of this property (which was completed on 24 February 2022), at a significant premium to book value, will enable the Group to realise a substantial gain estimated at $528.8 million.
The sale of the Seoul assets marks the Group’s third hotel divestment since the M&C privatisation and the most significant hotel divestment to date. The previous two M&C hotel divestments completed were Millennium Hotel Cincinnati and Copthorne Hotel Birmingham.
Apart from hotel divestments, the Group can also benefit from the sale of M&C’s interest in other commercial assets that have been held for long-term investment, such as Tanglin Shopping Centre. Through King’s Tanglin Shopping Pte Ltd, M&C’s wholly-owned subsidiary, we acquired our interest in the property in 1981 and currently own about 34.6% of share value and 60.2% of strata area. A public tender for the collective sale of Tanglin Shopping Centre closed on 22 February 2022 and received a top bid of $868 million, a premium of 10% over the reserve price. Upon completion of the transaction, we will realise a significant capital gain from our investment.
Repositioning and EnhancementsWe have also taken steps to reposition our assets to improve their performance and returns. In 2021, we expanded the footprint of our lifestyle hotel brand, M Social, with the debut of two properties in the US and Europe – M Social Hotel Times Square New York (M Social NY) and M Social Hotel Paris Opera (M Social Paris). Previously the Novotel New York Times Square, M Social NY opened in May 2021 and the property has turned in a strong performance and has been GOP positive. In September 2021, the former Millennium Hotel Paris Opera opened following a rebranding as M Social Paris, marking the first M Social property in Europe. We will continue the rollout of the M Social brand, with a second outpost in Europe planned in London’s Knightsbridge and other markets like Phuket and Suzhou.
The Group continues to progress with other refurbishment works to enhance our assets and prepare them for the imminent recovery in the global hospitality sector.
New Developments In Sunnyvale, California, the headquarters of many technology companies, we completed Phase 1 – a 250-unit residential development, which is over 80% leased. This asset is part of our Group’s Private Rented Sector (PRS) portfolio, contributing to our recurring income stream. The remaining phase is the 263-room M Social Sunnyvale hotel.
The Group will also be completing the 295-room M Social Suzhou in 2023. Located in the heart of Suzhou Industrial Park and adjacent to the beautiful Jinji Lake, it will be our fifth M Social hotel in the world.
Restructuring The Proposed Distribution in specie of units in CDL Hospitality Trusts (CDLHT) will reward CDL shareholders for their steadfast support of our Group and result in the accounting deconsolidation of CDLHT from the Group. With the deconsolidation, the Group would have the potential to book gains on any future sale of assets to CDLHT should the transaction value exceed the carrying book value of the assets. The Group will continue to be CDLHT’s largest unitholder and its committed sponsor following the exercise.
In addition to our hotel operations, our strong residential launch pipeline in Singapore and overseas, asset enhancements and redevelopment plans of our existing properties, and our fund management aspirations will be drivers of our growth plans. Our Group CEO has elaborated on our GET strategy in his statement.
Since 2010, the Group embarked on our strategic diversification push to build our overseas property development platforms, complementing our core Singapore market. Today, we have an enviable global portfolio with total assets amounting to $23.9 billion, with 45% of the assets in Singapore and the remaining spread across our key overseas markets – China, the UK, Japan and Australia. Going forward, we are committed to renewing, optimising and transforming our asset portfolio to unlock latent value.
As at 31 December 2021, the Group has cash reserves of $2.2 billion and total cash and available undrawn committed bank facilities totalling $3.9 billion. Complemented by our capital recycling efforts, we have adequate firepower for expansion. The Group will exercise discipline in our investments and temper our growth ambitions with prudence to maintain a strong liquidity position.
Dear Shareholders,
The Group returned to profitability with a net profit of $97.7 million and registered a 24.5% increase in revenue to $2.6 billion for FY 2021. Revenue contribution was led by the robust sales performance of our property d e v e l o p m e n t s e g m e n t , w h i c h contributed 48% to total revenue. Our hotel operations segment marked a turnaround, with revenue from all regions – particularly in the US and Europe – showing a strong increase in 2H 2021.
Whilst the COVID-19 pandemic persists and geopolitical tensions present uncertainties, the resumption of travel, opening of borders and an overall resolution to push ahead to open economies provide cause for a positive global outlook. The Group’s hotel operations segment is poised for a long-awaited rebound, boosted by imminent pent-up demand for tourism and corporate travel.
In 2022, the Board and Management will swiftly execute our Growth, Enhancement and Transformation (GET) strategy and deliver on our commitment to enhancing shareholder value.
We will continue reviewing and optimising our hospitality portfolio through operational improvements, port fo l io restructur ing , asset repositioning and strategic divestments to extract value. We will be agile and opportunistic in redeploying our capital to acquire assets in resilient sectors to enhance growth and generate sustainable returns for shareholders.
With the Group’s solid underlying fundamentals, a geographically diversified portfolio and a healthy balance sheet, we will continue to chart our post- COVID-19 corporate recovery.
APPRECIATION
On behalf of the Board, I would like to thank all our shareholders, customers, business associates and partners for your unwavering support.
We bade farewell to two Independent Non-Executive Directors during the year, Mr Tan Poay Seng who retired at the 2021 AGM, and Ms Jenny Lim Yin Nee. We also welcomed our new Independent Non-Executive Director, Mrs Wong Ai Ai, who brings fresh insights and strong legal expertise. To my fellow Directors, I am grateful for your invaluable stewardship, counsel and guidance as we strive to unleash our Group’s fullest potential.
To our shareholders, thank you for your confidence in our Group and for journeying with us through the challenging period. For FY 2021, the Board has recommended a final ordinary dividend of 8.0 cents per share and a special final dividend of 1.0 cent per share. Additionally, the Board proposes to reward shareholders with a special distribution in specie of 144,300,000 stapled securities in CDLHT on a pro rata basis, estimated to be valued at 19.1 cents per share. Together with the special interim dividend of 3.0 cents per share declared in mid-2021, the total full-year distribution to shareholders is expected to be 31.1 cents per share1.
Finally, to the management and staff, thank you for your steadfast dedication and diligence. The resilience and tenacity you have shown in navigating the business challenges truly reflect the Group’s spirit and core values.
We successfully weathered one of the worst storms in our past 59 years. Together, we achieved a remarkable turnaround in our financial performance and built strength and resilience from the many lessons learnt. With the Group’s solid underlying fundamentals, a geographically diversified portfolio and a healthy balance sheet, we will continue to chart our growth trajectory with renewed vigour and revitalised perspectives.
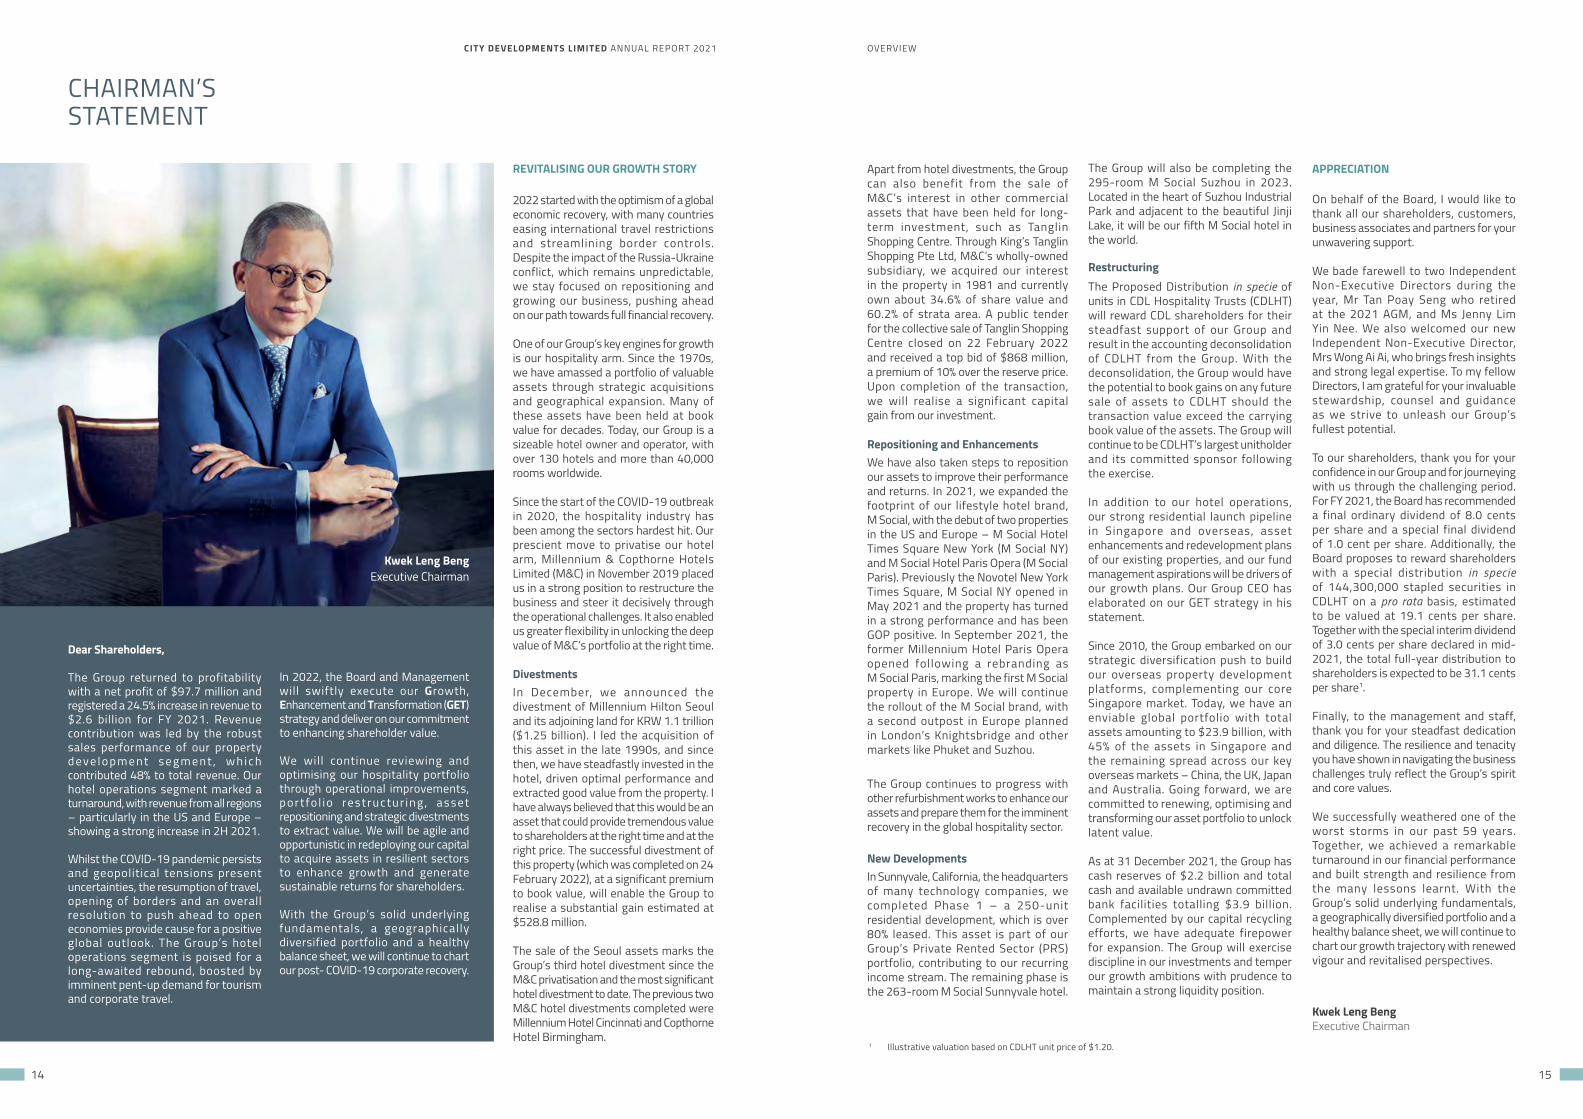
Kwek Leng BengExecutive Chairman
Kwek Leng BengExecutive Chairman
1 Illustrative valuation based on CDLHT unit price of $1.20.
CITY DEVELOPMENTS LIMITED ANNUAL REPORT 2021 OVERVIEW
16 17
GROUP CEO’SSTATEMENT
Dear Shareholders,
2021 continued to be a challenging year for the CDL Group but it was marked by resilience and recovery. We battled numerous challenges to overcome the disruption from the prolonged COVID-19 pandemic and the stringent cooling measures in China’s property market. Embracing the resilient spirit that is core to our DNA, we navigated the headwinds resolutely and returned to profitability.
The Group is well-positioned to redeploy capital to higher growth assets and expand our diversified portfolio. Revitalised by the new perspectives we have gained over the past two years, along with the improving macroeconomic conditions and a brighter outlook, we resume our growth journey with renewed confidence, backed by resiliency and strong fundamentals.
Building a Solid Development PipelineIn 2021, we completed a series of strategic acquisitions and investments. In Singapore, we secured two land sites – located at Northumberland Road and Tengah Garden Walk – in 1H 2021 through the Government Land Sales (GLS) programme with our joint venture (JV) partner MCL Land. In November, we also entered into an off-market agreement to acquire a residential development parcel at 798 and 800 Upper Bukit Timah Road. With the completion of this transaction in 1H 2022, along with a recent GLS site acquisition at Jalan Tembusu in January 2022 and our other existing development sites, we have built a significant launch pipeline of around 2,350 units.
In the UK, we expanded our Private Rented Sector (PRS) portfolio with the acquisition of a 250-year leasehold site in Birmingham’s vibrant Paradise precinct, on which we will develop The Octagon, an iconic 49-storey residential tower with 370 units, that will be the world’s tallest pure octagonal residential skyscraper when completed in 2025. Our other PRS project in the UK, the 665-unit The Junction in Leeds, will be completing in phases commencing in late 2022.
Over in Australia, we replenished our landbank with the acquisition of Kenmore Treetops, a 97-unit residential JV project in Brisbane, with Brisbane-based developer Metro Group.
To ensure a stable launch pipeline and optimal inventory levels, the Group will continue to actively replenish our landbank through the GLS programme or selective private acquisitions. We will also enhance our recurring income portfolio, focusing on the Living Sector comprising asset classes such as the PRS, senior housing, workers’ dormitories and student accommodations, which offer income stabil ity and strong growth potential.
Rejuvenating our Asset Portfolio Recent macroeconomic events, especially the pandemic and the ongoing Ukraine crisis, are fitting reminders that we cannot be overly reliant on a specific geography or asset class. We must continue to build a diversified portfolio, which will enable us to tap on various sustainable income streams to weather cyclical headwinds.
Asset rejuvenation and portfol io enhancement are key pillars of our GET strategy. The Group forged ahead with several of such initiatives for 2021, including Asset Enhancement Initiatives (AEIs) as well as redevelopment opportunities that will allow us to unlock asset value and capitalise on incentive schemes.
In December, the Group announced our plans for our Central Mall properties into a large-scale mixed-use project following the acquisition of Central Square. The enlarged site, comprising office, retail, hospitality and potentially a residential component, will be redeveloped under the Urban Redevelopment Authority (URA)’s Strategic Development Incentive Scheme. This exciting rejuvenation complements the revitalisation of the Singapore River planning area and is anticipated to yield a significant GFA uplift.
We also continued to progress with our redevelopment plans for our mature freehold asset at 80 Anson Road (former Fuji Xerox Towers) under the URA CBD Incentive Scheme. Demolition works have started and construction is expected to begin in late 2022. The development is the first to achieve the Building and Construction Authority’s Green Mark Platinum Super Low Energy (SLE) certification, with SLE certification for the residential, serviced apartments, office and retail categories.
Apart from these two large-scale redevelopment projects, the Group has also embarked on AEIs to reposition and refresh our asset portfolio. In 2021, we commenced an AEI for our mall located at Orchard Road, Palais Renaissance, to upgrade the common areas and increase its F&B provision, which is expected to fully complete by 1H 2022. With the AEI, committed occupancy for the retail space has improved to above 90%. Over in the UK, AEIs at both Aldgate House and 125 Old Broad Street are underway and these initiatives are expected to bolster rental rates. In Thailand, we will embark on a major AEI of the Jungceylon retail complex in Patong, Phuket, to increase the net lettable area with exciting new-to-market concepts and a refreshed trade mix.
Forging Ahead with TransformationSince we privatised Millennium & Copthorne Hotels Limited (M&C) in
2019, we have undertaken a holistic review of our entire hospitality portfolio. Our ongoing portfolio review is centred on a three-pronged approach: capital recycling to streamline the portfolio and unlock value through opportunistic divestments, portfolio restructuring and asset repositioning to improve performance, and driving operational efficiency through the reorganisation of structures and processes.
O u r c a p i t a l re c yc l i n g fo c u s , a s demonstrated by the divestment of Millennium Hilton Seoul for KRW 1.1 trillion ($1.25 billion) in 2021, and more recently, of our interest in the strata-titled Tanglin Shopping Centre through a collective sale tender that closed in February 2022, a l lows us to unlock the deep value of these two investment assets, which have been held for several decades.
The Proposed Distribution in specie of CDL Hospitality Trusts (CDLHT) units to our shareholders is another positive outcome of the strategic review of our hospitality portfolio. Its completion would reward shareholders for their support and result in an accounting deconsolidation of CDLHT from the Group. Apart from strengthening our balance sheet, the Group will also be well-positioned to unlock value from our hospitality portfolio through future value-accretive transactions with CDLHT. Shareholders will also have the opportunity to participate in the growth of the hospitality sector, which is on the cusp of a strong post-pandemic recovery.
EMERGING STRONGER
In 2021, we made the difficult decision to divest our entire equity interest in Sincere Property Group. This was to mitigate the Group from being engaged in a long, drawn out bankruptcy reorganisation of Sincere Property Group and we will continue to actively pursue our rights as a creditor.
Barring further disruptions from the pandemic, we look forward to the workforce gradually returning to the office in 2022. Collaboration at the office still plays a pivotal role in nurturing stronger teamwork and enhanced productivity, and allows for more effective mentorship and knowledge growth.
Since the start of 2022, geopolitical conflicts have cast a shadow on global recovery. These events are a stark reminder that the future is marked with unpredictability and the business environment is also changing rapidly. We must be better prepared for unforeseen events and strengthen our resilience.
APPRECIATION
On behalf of Senior Management, I wish to express our heartfelt gratitude to our shareholders, customers, business associates and partners for your unwavering support throughout the turbulent year. We are also grateful to our Board of Directors for their guidance and counsel.
To our valued employees, I am humbled by your loyalty and resilience in pushing through the storm. Your steadfast commitment has been integral to our growth and recovery plans.
We have a renewed focus to revitalise our business. Together, we will push forward to bring our plans to fruition, with the aim of delivering excellence and maximising value for all our stakeholders.
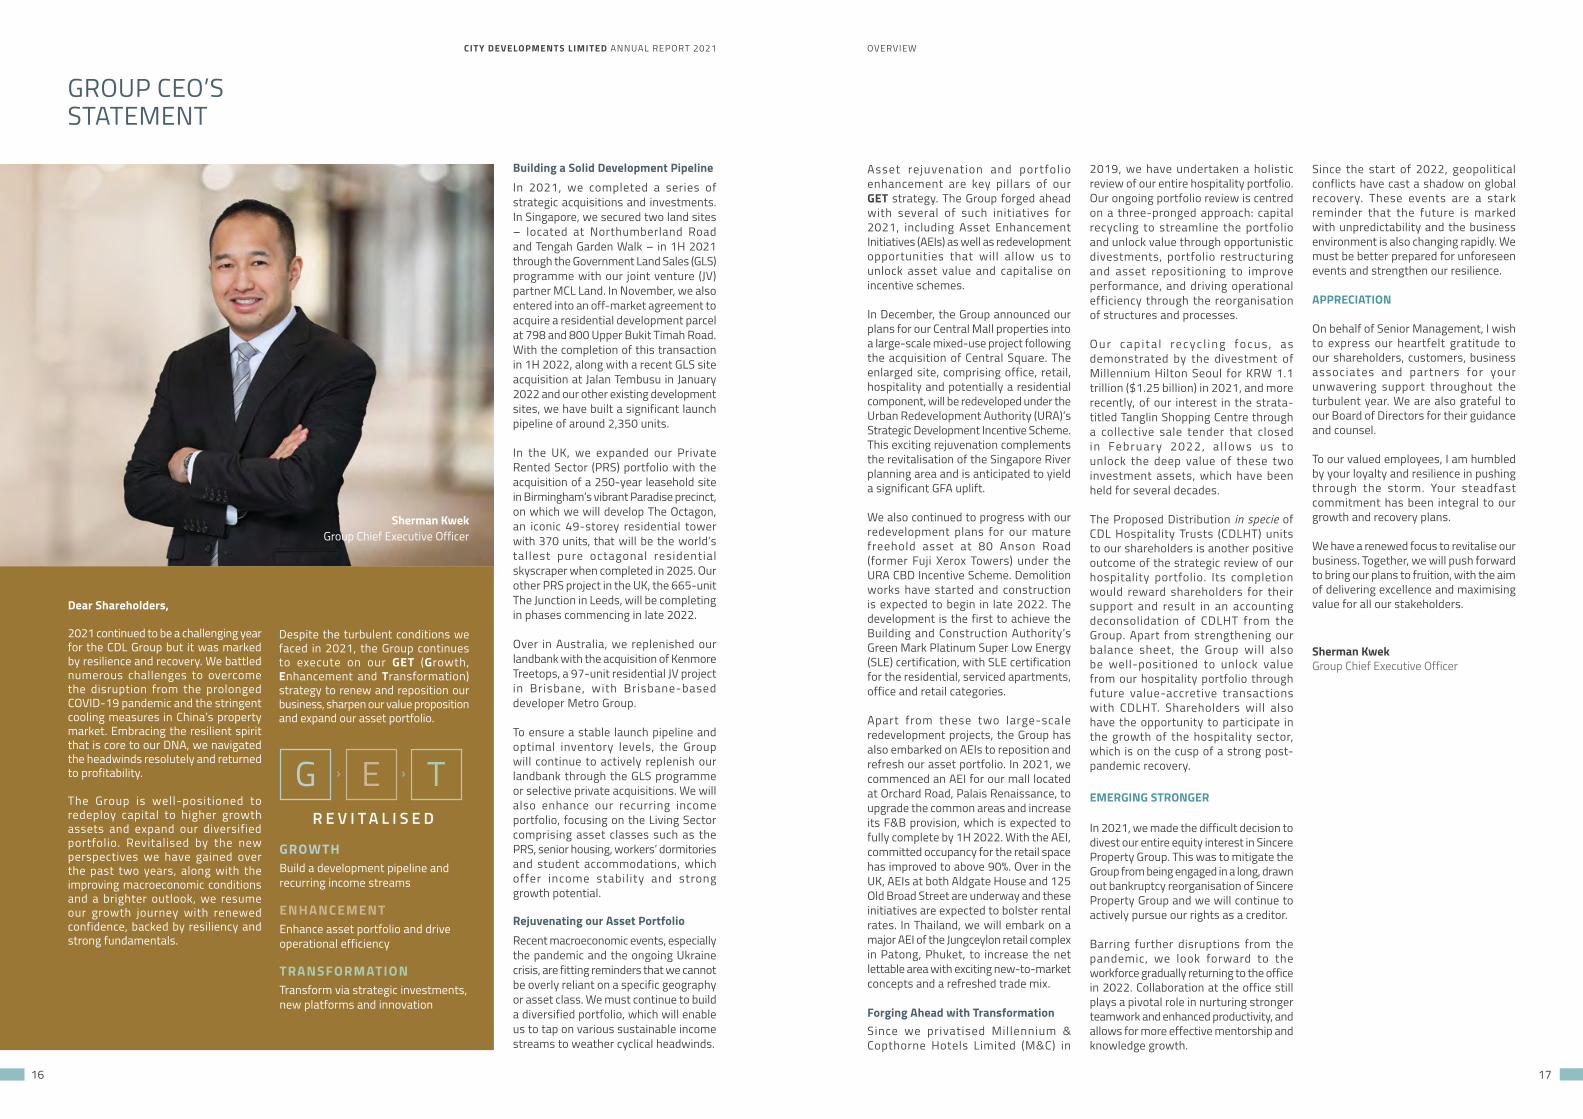
Sherman KwekGroup Chief Executive Officer
Sherman KwekGroup Chief Executive Officer
GROWTHBuild a development pipeline and recurring income streams
ENHANCEMENTEnhance asset portfolio and drive operational efficiency
TRANSFORMATIONTransform via strategic investments, new platforms and innovation
G E TR E V I T A L I S E D
Despite the turbulent conditions we faced in 2021, the Group continues to execute on our GET (Growth, Enhancement and Transformation) strategy to renew and reposition our business, sharpen our value proposition and expand our asset portfolio.
CITY DEVELOPMENTS LIMITED ANNUAL REPORT 2021 OVERVIEW
18 19
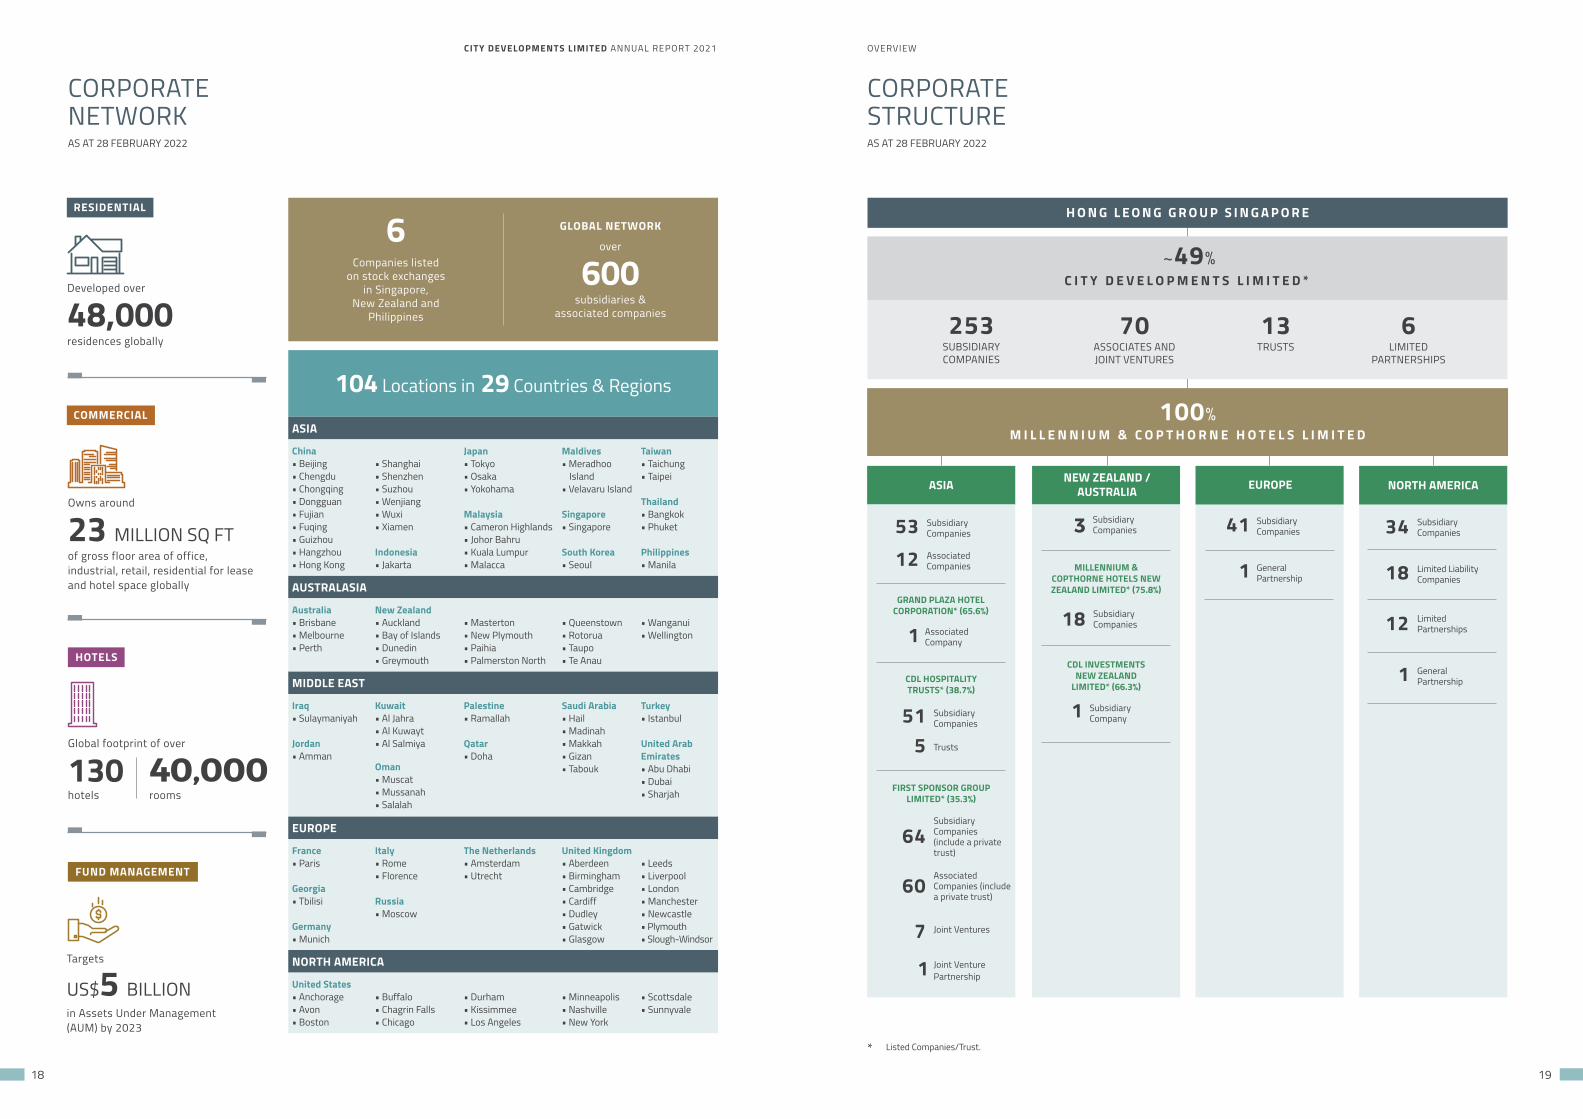
104 Locations in 29 Countries & Regions
GLOBAL NETWORK
over
600subsidiaries &
associated companies
6Companies listed
on stock exchangesin Singapore,
New Zealand andPhilippines
ASIA
China• Beijing• Chengdu• Chongqing• Dongguan• Fujian• Fuqing• Guizhou• Hangzhou• Hong Kong
• Shanghai• Shenzhen• Suzhou• Wenjiang• Wuxi• Xiamen
Indonesia• Jakarta
Japan• Tokyo• Osaka• Yokohama
Malaysia• Cameron Highlands• Johor Bahru• Kuala Lumpur• Malacca
Maldives• Meradhoo
Island• Velavaru Island
Singapore• Singapore
South Korea• Seoul
Taiwan• Taichung• Taipei
Thailand• Bangkok• Phuket
Philippines• Manila
AUSTRALASIA
Australia• Brisbane• Melbourne• Perth
New Zealand• Auckland• Bay of Islands• Dunedin• Greymouth
• Masterton• New Plymouth• Paihia• Palmerston North
• Queenstown • Rotorua• Taupo• Te Anau
• Wanganui• Wellington
MIDDLE EAST
Iraq• Sulaymaniyah
Jordan• Amman
Kuwait• Al Jahra• Al Kuwayt• Al Salmiya
Oman• Muscat• Mussanah• Salalah
Palestine• Ramallah
Qatar• Doha
Saudi Arabia• Hail• Madinah• Makkah• Gizan• Tabouk
Turkey• Istanbul
United ArabEmirates• Abu Dhabi• Dubai• Sharjah
EUROPE
France• Paris
Georgia• Tbilisi
Germany• Munich
Italy• Rome• Florence
Russia• Moscow
The Netherlands• Amsterdam• Utrecht
United Kingdom• Aberdeen• Birmingham• Cambridge• Cardiff• Dudley• Gatwick• Glasgow
• Leeds• Liverpool• London• Manchester• Newcastle• Plymouth• Slough-Windsor
NORTH AMERICA
United States• Anchorage• Avon• Boston
• Buffalo• Chagrin Falls• Chicago
• Durham• Kissimmee • Los Angeles
• Minneapolis• Nashville• New York
• Scottsdale• Sunnyvale
Owns around
23 MILLION SQ FTof gross floor area of office, industrial, retail, residential for lease and hotel space globally
Targets
US$5 BILLIONin Assets Under Management (AUM) by 2023
COMMERCIAL
HOTELS
FUND MANAGEMENT
Developed over
48,000residences globally
RESIDENTIAL
253SUBSIDIARY COMPANIES
6LIMITED
PARTNERSHIPS
13TRUSTS
70ASSOCIATES AND JOINT VENTURES
100%M I L L E N N I U M & C O P T H O R N E H O T E L S L I M I T E D
H O N G L E O N G G R O U P S I N G A P O R E
* Listed Companies/Trust.
41 Subsidiary Companies
1 General Partnership
EUROPE
3
18
Subsidiary Companies
Subsidiary Companies
Subsidiary Company
MILLENNIUM & COPTHORNE HOTELS NEW ZEALAND LIMITED* (75.8%)
CDL INVESTMENTS NEW ZEALAND
LIMITED* (66.3%)
NEW ZEALAND / AUSTRALIA
1
34 Subsidiary Companies
12 Limited Partnerships
18 Limited LiabilityCompanies
General Partnership
NORTH AMERICA
1
53 Subsidiary Companies
64Subsidiary Companies (include a private trust)
7 Joint Ventures
Associated Company
12 Associated Companies
60Associated Companies (include a private trust)
Joint Venture Partnership
GRAND PLAZA HOTEL CORPORATION* (65.6%)
51 Subsidiary Companies
5 Trusts
CDL HOSPITALITY TRUSTS* (38.7%)
FIRST SPONSOR GROUP LIMITED* (35.3%)
ASIA
1
1
C I T Y D E V E L O P M E N T S L I M I T E D *~49%
Global footprint of over
130hotels
40,000
rooms
CORPORATENETWORK
CORPORATE STRUCTURE
AS AT 28 FEBRUARY 2022 AS AT 28 FEBRUARY 2022
CITY DEVELOPMENTS LIMITED ANNUAL REPORT 2021 OVERVIEW
20 21
HIGHLIGHTS OFTHE YEAR
1ST QUARTER (JANUARY – MARCH)
• CDL emerged the world’s top real estate company and top ranked Singapore company in the 2021 Global 100 Most Sustainable Corporations in the World by Corporate Knights, the first and only Singapore company listed for 12 consecutive years. It also maintained its listing on the Bloomberg Gender-Equality Index 2021 for the fourth consecutive year – and was the only Singapore real estate company listed.
• Raising the bar on decarbonisation efforts, CDL was the first real estate developer in Singapore and Southeast Asia to sign the World Green Building Council (WorldGBC)’s Net Zero Carbon Buildings Commitment, pledging to achieve net zero operational carbon by 2030 for new and wholly-owned assets and developments under direct operational and management control.
• In February, CDL announced its acquisition of a collective 84.6% interest in Shenzhen Tusincere Technology Park Development Co. Ltd.
(Shenzhen Tusincere), which holds a 65% equity interest in Shenzhen Longgang Tusincere Tech Park (深圳龙岗区启迪协信科技园), from Sincere Property Group (Sincere Property) and two third parties, for a consideration of RMB 850 million (approximately $174 million), together with the assumption of proportionate existing shareholder loans. Following the transaction, the Group holds an effective 55% majority stake in the large-scale tech park in China’s high-growth “Silicon Valley”.
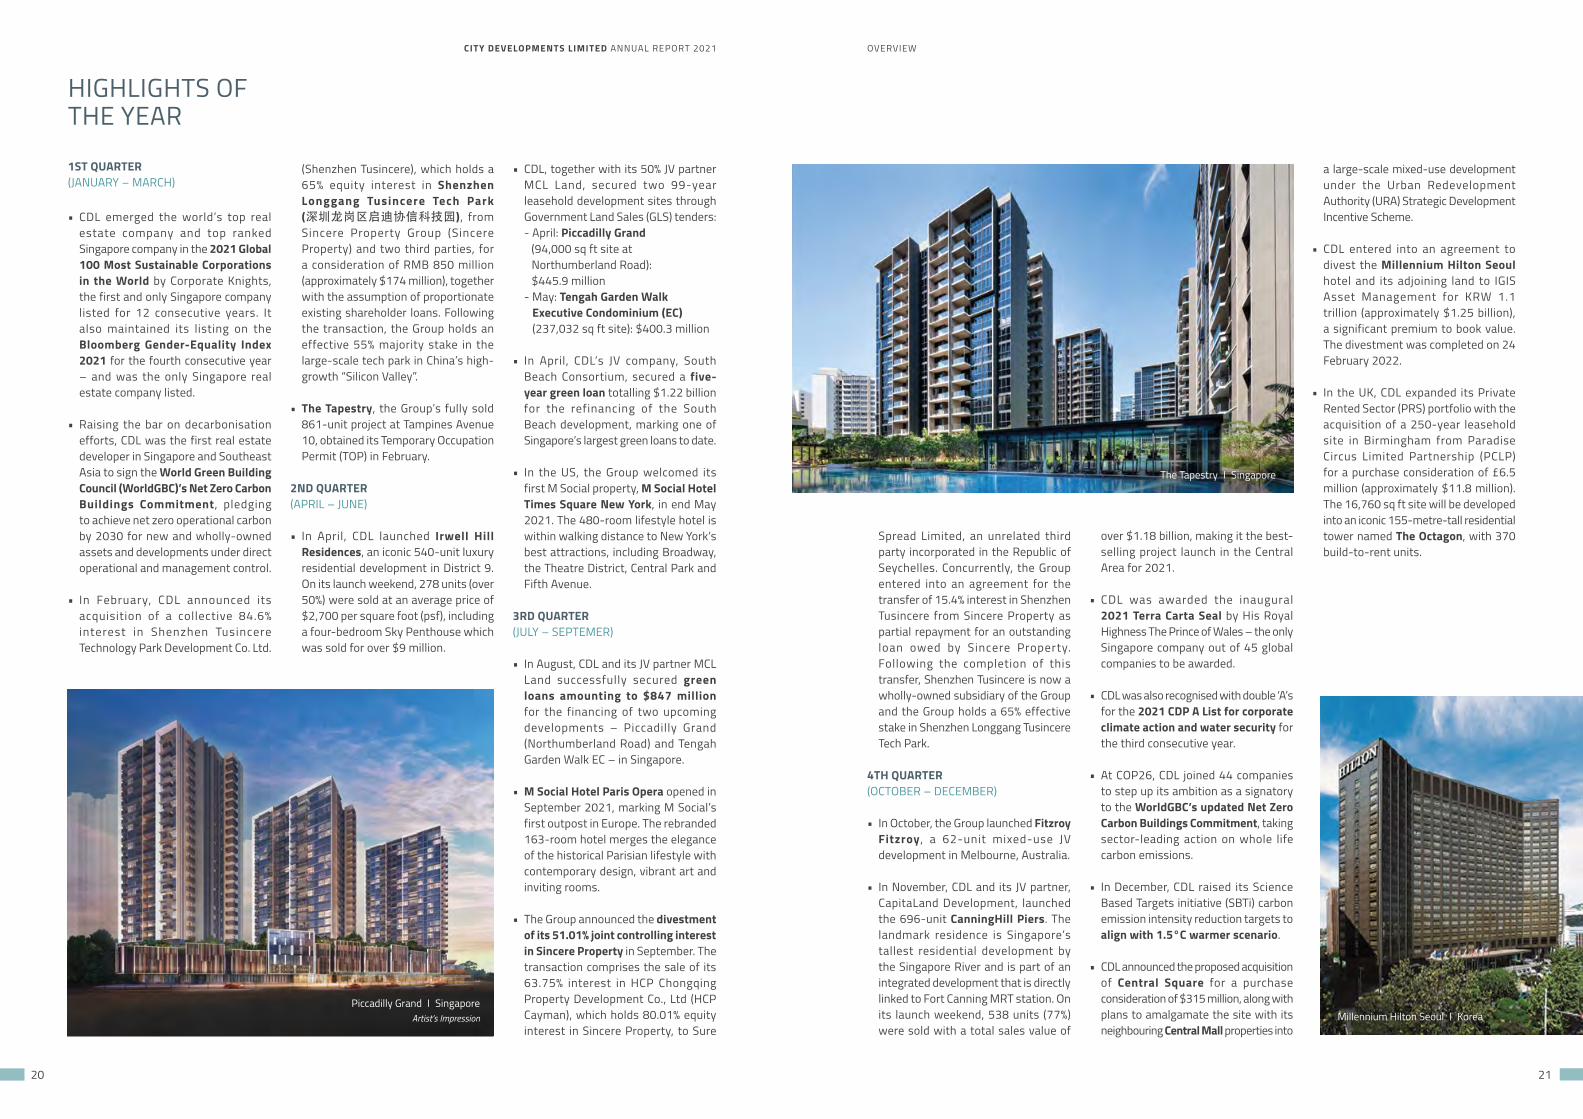
• The Tapestry, the Group’s fully sold 861-unit project at Tampines Avenue 10, obtained its Temporary Occupation Permit (TOP) in February.
2ND QUARTER (APRIL – JUNE)
• In April, CDL launched Irwell Hill Residences, an iconic 540-unit luxury residential development in District 9. On its launch weekend, 278 units (over 50%) were sold at an average price of $2,700 per square foot (psf), including a four-bedroom Sky Penthouse which was sold for over $9 million.
• CDL, together with its 50% JV partner MCL Land, secured two 99-year leasehold development sites through Government Land Sales (GLS) tenders:
- April: Piccadilly Grand (94,000 sq ft site at
Northumberland Road): $445.9 million
- May: Tengah Garden Walk Executive Condominium (EC) (237,032 sq ft site): $400.3 million
• In April, CDL’s JV company, South Beach Consortium, secured a five-year green loan totalling $1.22 billion for the refinancing of the South Beach development, marking one of Singapore’s largest green loans to date.
• In the US, the Group welcomed its first M Social property, M Social Hotel Times Square New York, in end May 2021. The 480-room lifestyle hotel is within walking distance to New York’s best attractions, including Broadway, the Theatre District, Central Park and Fifth Avenue.
3RD QUARTER (JULY – SEPTEMER)
• In August, CDL and its JV partner MCL Land successfully secured green loans amounting to $847 million for the financing of two upcoming developments – Piccadilly Grand (Northumberland Road) and Tengah Garden Walk EC – in Singapore.
• M Social Hotel Paris Opera opened in September 2021, marking M Social’s first outpost in Europe. The rebranded 163-room hotel merges the elegance of the historical Parisian lifestyle with contemporary design, vibrant art and inviting rooms.
• The Group announced the divestment of its 51.01% joint controlling interest in Sincere Property in September. The transaction comprises the sale of its 63.75% interest in HCP Chongqing Property Development Co., Ltd (HCP Cayman), which holds 80.01% equity interest in Sincere Property, to Sure
Spread Limited, an unrelated third party incorporated in the Republic of Seychelles. Concurrently, the Group entered into an agreement for the transfer of 15.4% interest in Shenzhen Tusincere from Sincere Property as partial repayment for an outstanding loan owed by Sincere Property. Following the completion of this transfer, Shenzhen Tusincere is now a wholly-owned subsidiary of the Group and the Group holds a 65% effective stake in Shenzhen Longgang Tusincere Tech Park.
4TH QUARTER (OCTOBER – DECEMBER)
• In October, the Group launched Fitzroy Fitzroy , a 62-unit mixed-use JV development in Melbourne, Australia.
• In November, CDL and its JV partner, CapitaLand Development, launched the 696-unit CanningHill Piers. The landmark residence is Singapore’s tallest residential development by the Singapore River and is part of an integrated development that is directly linked to Fort Canning MRT station. On its launch weekend, 538 units (77%) were sold with a total sales value of
over $1.18 billion, making it the best-selling project launch in the Central Area for 2021.
• CDL was awarded the inaugural 2021 Terra Carta Seal by His Royal Highness The Prince of Wales – the only Singapore company out of 45 global companies to be awarded.
• CDL was also recognised with double ‘A’s for the 2021 CDP A List for corporate climate action and water security for the third consecutive year.
• At COP26, CDL joined 44 companies to step up its ambition as a signatory to the WorldGBC’s updated Net Zero Carbon Buildings Commitment, taking sector-leading action on whole life carbon emissions.
• In December, CDL raised its Science Based Targets initiative (SBTi) carbon emission intensity reduction targets to align with 1.5°C warmer scenario.
• CDL announced the proposed acquisition of Central Square for a purchase consideration of $315 million, along with plans to amalgamate the site with its neighbouring Central Mall properties into
a large-scale mixed-use development under the Urban Redevelopment Authority (URA) Strategic Development Incentive Scheme.
• CDL entered into an agreement to divest the Millennium Hilton Seoul hotel and its adjoining land to IGIS Asset Management for KRW 1.1 trillion (approximately $1.25 billion), a significant premium to book value. The divestment was completed on 24 February 2022.
• In the UK, CDL expanded its Private Rented Sector (PRS) portfolio with the acquisition of a 250-year leasehold site in Birmingham from Paradise Circus Limited Partnership (PCLP) for a purchase consideration of £6.5 million (approximately $11.8 million). The 16,760 sq ft site will be developed into an iconic 155-metre-tall residential tower named The Octagon, with 370 build-to-rent units.
Piccadilly Grand I SingaporeArtist’s Impression Millennium Hilton Seoul I Korea
The Tapestry I Singapore
CITY DEVELOPMENTS LIMITED ANNUAL REPORT 2021 OVERVIEW
22 23
* Not exhaustive. For a full listing of CDL corporate and project awards, please refer to www.cdl.com.sg.^ Not exhaustive. For a full listing of CDL sustainability awards, please refer to www.cdlsustainability.com.
Irwell Hill Residences I SingaporeArtist’s Impression
• Bloomberg Gender-Equality Index (GEI) 2021
• DADs for Life & Centre for Fathering – Great Companies for Dads Awards
• Equileap Gender Equality 2021 Global Report and Ranking
• Euromoney Real Estate Survey – Best Residential Real Estate
Developer (Singapore), Ranked #1
• IDC Future Enterprise Awards 2021 – Best in Future of Connectedness
• HR Asia Best Companies to Work for in Asia 2021
• HRD Awards Asia 2021 – Excellence Awardee
• Best Leadership Development Program
• Best Reward & Recognition Programe
• Best Workplace Diversity & Inclusion Program
• Employer of Choice (100 - 999 Employees)
• HRD Asia 5-Star Employer of Choice 2021
• Singapore Governance and Transparency Index (SGTI) 2021
‒ – #4 out of 519 companies
• Asia Sustainability Reporting Awards – Asia’s Best Integrated Report Award
(Gold)‒ – Asia’s Best Integrated Report Design
Award (Gold)‒ – Asia’s Best Carbon Disclosure (Gold)‒ – Asia’s Best Materiality Reporting
(Gold)‒ – Asia’s Best Environmental Reporting
(Silver)
• CDP – A List for corporate climate action – A List for water security
• Dow Jones Sustainability Indices (World and Asia Pacific) 2021
• FTSE4Good Index Series
• Global 100 Most Sustainable Corporations in the World 2021
• Global Real Estate Sustainability Benchmark (GRESB) 2021
– Global Sector Leader (Diversified-Office/Retail)
‒ – Overall Regional Sector Leader (Diversified-Office/Retail)
• His Royal Highness The Prince of Wales’ Terra Carta Seal
• MSCI ESG Leaders Indexes 2021‒ – ‘AAA’ rating
• Royal Society for the Prevention of Accidents (RoSPA) Awards 2021
– Order of Distinction
• Sustainable Business Awards 2020/21‒ – Overall Winner (Large Corporations)‒ – Winner‒ • Sustainable Strategy‒ • Energy Management‒ • Water Management‒ • Waste Productivity and Materiality‒ • Climate Change & Emissions‒ • Stakeholder Management‒ – Significant Achievement‒ • Business Ethics and Responsibility‒ • UN SDGs
• S&P The Sustainability Yearbook 2021
• STOXX® Global ESG Leaders Indices 2021
• Workplace Safety and Health Awards 2021
‒ – Developer Award (Winner)
• Building and Construction Authority (BCA) Awards 2021
– Quality Excellence Award - Quality Champion (Platinum)
‒ – Green Mark Super Low Energy - Platinum
80 Anson Road (Residential)‒ – Green Mark Commercial and
Residential - Platinum South Beach (Recertified)– Green Mark - GoldPlus CanningHill Piers‒ – Universal Design Mark - Platinum City Square Mall (Renewal)‒ – Universal Design Mark - GoldPlus
The Tapestry Forest Woods‒ – Universal Design Mark -
Gold (Design) Amber Park • EdgeProp Excellence Awards 2021 – Top Developer‒ – Top Development Irwell Hill Residences The Tapestry Forest Woods‒ – Design Excellence The Tapestry‒ – Landscape Excellence The Tapestry‒ – Sustainability Excellence The Tapestry
BOARD OF DIRECTORS
Executive DirectorsKwek Leng Beng,Executive ChairmanSherman Kwek Eik Tse,Group Chief Executive Officer
Lead Independent DirectorLee Jee Cheng Philip
Non-Executive DirectorsPhilip Yeo Liat Kok, Non-IndependentOng Lian Jin Colin, IndependentDaniel Marie Ghislain Desbaillets, IndependentChong Yoon Chou, IndependentChan Swee Liang Carolina
(Carol Fong), IndependentTang Ai Ai Mrs Wong Ai Ai,
Independent
AUDIT & RISK COMMITTEELee Jee Cheng Philip, ChairmanChong Yoon ChouChan Swee Liang Carolina (Carol Fong)
NOMINATING COMMITTEEOng Lian Jin Colin, ChairmanKwek Leng BengChong Yoon ChouLee Jee Cheng PhilipTang Ai Ai Mrs Wong Ai Ai
REMUNERATION COMMITTEEChan Swee Liang Carolina
(Carol Fong), ChairmanOng Lian Jin ColinLee Jee Cheng PhilipDaniel Marie Ghislain Desbaillets
BOARD SUSTAINABILITY COMMITTEESherman Kwek Eik Tse, ChairmanChong Yoon ChouDaniel Marie Ghislain DesbailletsTang Ai Ai Mrs Wong Ai Ai
COMPANY SECRETARIESYeo Swee Gim, JoanneEnid Ling Peek Fong
SHARE REGISTRAR & SHARE TRANSFER OFFICEM & C Services Private Limited112 Robinson Road, #05-01Singapore 068902Tel : +65 6227 6660Fax : +65 6225 1452Email : [email protected]
REGISTERED OFFICE9 Raffles Place#12-01 Republic PlazaSingapore 048619Tel : +65 6877 8228Fax : +65 6223 2746Email : [email protected]
INVESTOR RELATIONSBelinda LeeHead, Investor Relations &Corporate CommunicationsEmail : [email protected]
AUDITORSKPMG LLPPublic Accountants andChartered Accountants, Singapore16 Raffles Quay#22-00 Hong Leong BuildingSingapore 048581(Partner-in-charge: Lo Mun Wai,appointment commenced from the auditof the financial statements for the yearended 31 December 2020)
PRINCIPAL BANKERSAgricultural Bank of ChinaBank of America Merrill LynchBank of China LimitedBank of Communications Co., LtdBNP ParibasChina Construction BankCrédit Agricole Corporate & Investment BankCrédit Industriel et CommercialCTBC Bank Co., Ltd.DBS Bank Ltd.Hang Seng Bank LimitedIndustrial and Commercial Bank of China LimitedMalayan Banking BerhadMizuho Bank, Ltd.MUFG Bank, Ltd.Oversea-Chinese Banking Corporation LimitedStandard Chartered BankSumitomo Mitsui Banking CorporationThe Hongkong and Shanghai Banking Corporation LimitedUnited Overseas Bank Limited
AWARDS & ACCOLADES
CORPORATE DIRECTORY
BUSINESS & PERFORMANCE* SUSTAINABILITY^PRODUCT*
CITY DEVELOPMENTS LIMITED ANNUAL REPORT 2021 CORPORATE GOVERNANCE
24 25
BOARD OFDIRECTORS
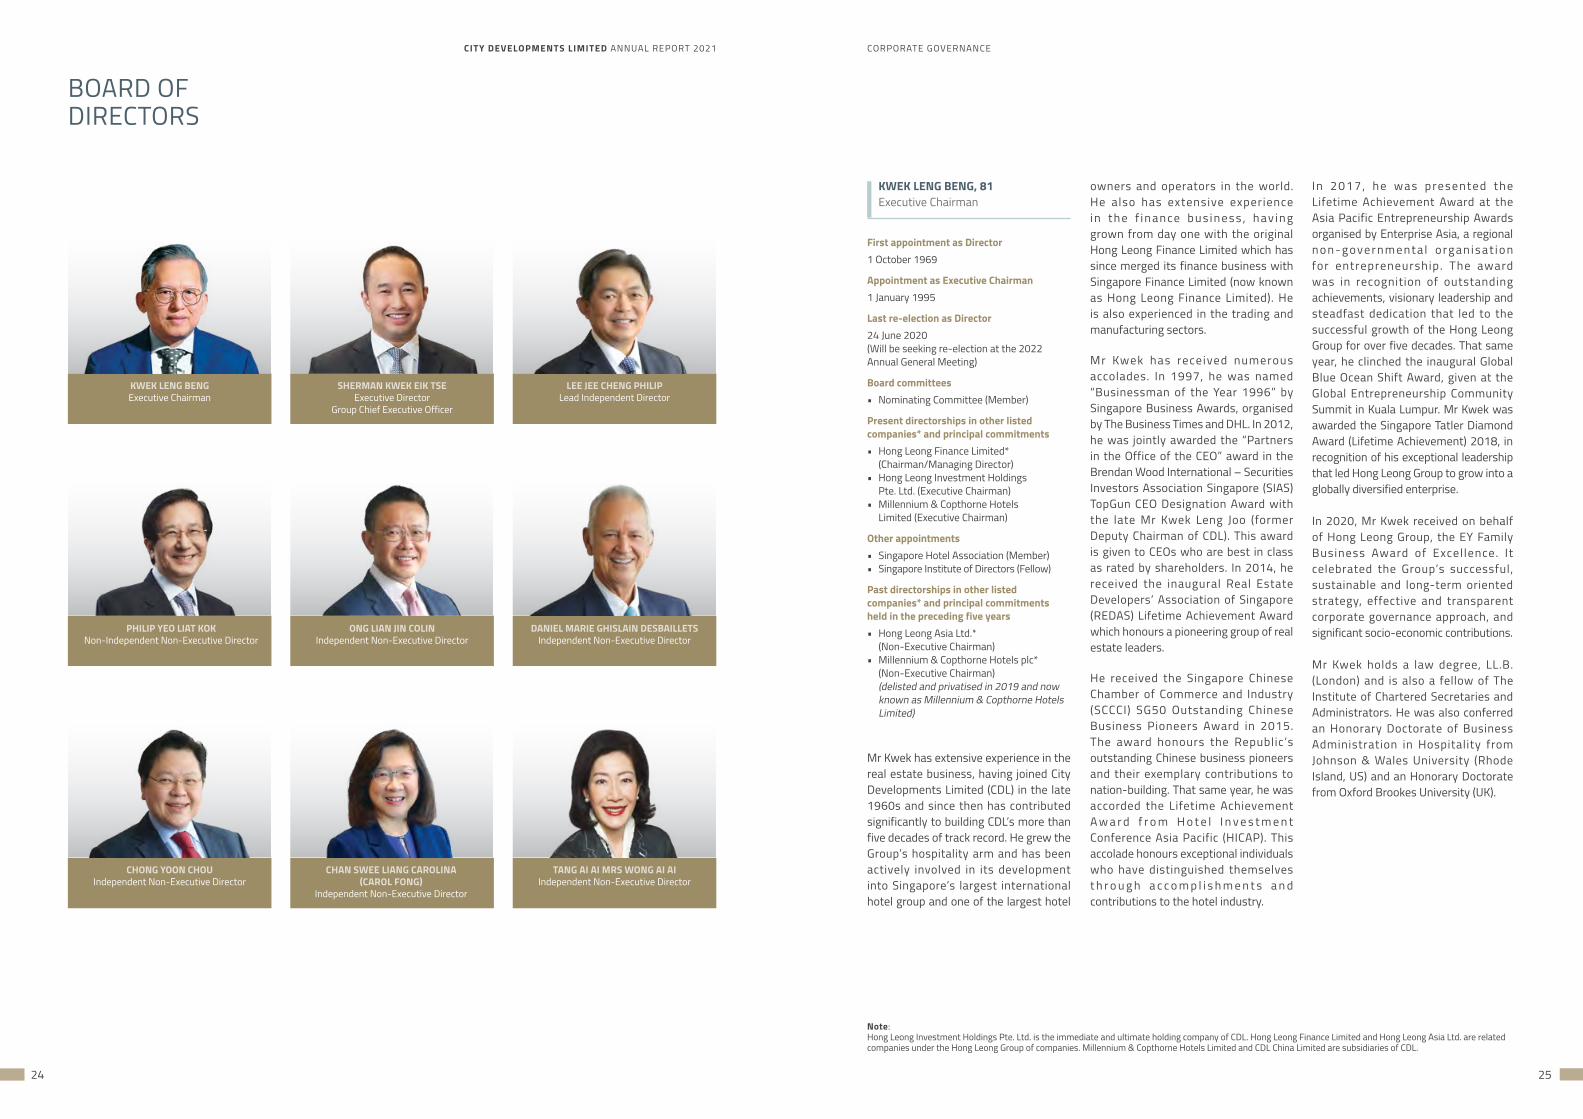
KWEK LENG BENGExecutive Chairman
PHILIP YEO LIAT KOKNon-Independent Non-Executive Director
ONG LIAN JIN COLINIndependent Non-Executive Director
DANIEL MARIE GHISLAIN DESBAILLETSIndependent Non-Executive Director
CHONG YOON CHOUIndependent Non-Executive Director
SHERMAN KWEK EIK TSEExecutive Director
Group Chief Executive Officer
LEE JEE CHENG PHILIPLead Independent Director
CHAN SWEE LIANG CAROLINA (CAROL FONG)
Independent Non-Executive Director
TANG AI AI MRS WONG AI AIIndependent Non-Executive Director
KWEK LENG BENG, 81Executive Chairman
First appointment as Director1 October 1969
Appointment as Executive Chairman1 January 1995
Last re-election as Director24 June 2020 (Will be seeking re-election at the 2022 Annual General Meeting)
Board committees• Nominating Committee (Member)
Present directorships in other listed companies* and principal commitments• Hong Leong Finance Limited* (Chairman/Managing Director)• Hong Leong Investment Holdings Pte. Ltd. (Executive Chairman)• Millennium & Copthorne Hotels Limited (Executive Chairman)
Other appointments• Singapore Hotel Association (Member)• Singapore Institute of Directors (Fellow)
Past directorships in other listed companies* and principal commitments held in the preceding five years• Hong Leong Asia Ltd.* (Non-Executive Chairman)• Millennium & Copthorne Hotels plc*
(Non-Executive Chairman) (delisted and privatised in 2019 and now known as Millennium & Copthorne Hotels Limited)
Mr Kwek has extensive experience in the real estate business, having joined City Developments Limited (CDL) in the late 1960s and since then has contributed significantly to building CDL’s more than five decades of track record. He grew the Group’s hospitality arm and has been actively involved in its development into Singapore’s largest international hotel group and one of the largest hotel
owners and operators in the world. He also has extensive experience i n t h e f i n a n ce b u s i n e s s , h av i n g grown from day one with the original Hong Leong Finance Limited which has since merged its finance business with Singapore Finance Limited (now known as Hong Leong Finance Limited). He is also experienced in the trading and manufacturing sectors.
Mr Kwek has received numerous accolades. In 1997, he was named “Businessman of the Year 1996” by Singapore Business Awards, organised by The Business Times and DHL. In 2012, he was jointly awarded the “Partners in the Office of the CEO” award in the Brendan Wood International – Securities Investors Association Singapore (SIAS) TopGun CEO Designation Award with the late Mr Kwek Leng Joo (former Deputy Chairman of CDL). This award is given to CEOs who are best in class as rated by shareholders. In 2014, he received the inaugural Real Estate Developers’ Association of Singapore (REDAS) Lifetime Achievement Award which honours a pioneering group of real estate leaders.
He received the Singapore Chinese Chamber of Commerce and Industry (SCCCI) SG50 Outstanding Chinese Business Pioneers Award in 2015. The award honours the Republic’s outstanding Chinese business pioneers and their exemplary contributions to nation-building. That same year, he was accorded the Lifetime Achievement A w a r d f r o m H o t e l I n v e s t m e n t Conference Asia Pacific (HICAP). This accolade honours exceptional individuals who have distinguished themselves t h r o u g h a c c o m p l i s h m e n t s a n d contributions to the hotel industry.
In 2017, he was presented the Lifetime Achievement Award at the Asia Pacific Entrepreneurship Awards organised by Enterprise Asia, a regional n o n - g ove r n m e n t a l o rg a n i s a t i o n for entrepreneurship. The award was in recognition of outstanding achievements, visionary leadership and steadfast dedication that led to the successful growth of the Hong Leong Group for over five decades. That same year, he clinched the inaugural Global Blue Ocean Shift Award, given at the Global Entrepreneurship Community Summit in Kuala Lumpur. Mr Kwek was awarded the Singapore Tatler Diamond Award (Lifetime Achievement) 2018, in recognition of his exceptional leadership that led Hong Leong Group to grow into a globally diversified enterprise.
In 2020, Mr Kwek received on behalf of Hong Leong Group, the EY Family Business Award of Excel lence. It celebrated the Group’s successful, sustainable and long-term oriented strategy, effective and transparent corporate governance approach, and significant socio-economic contributions.
Mr Kwek holds a law degree, LL.B. (London) and is also a fellow of The Institute of Chartered Secretaries and Administrators. He was also conferred an Honorary Doctorate of Business Administration in Hospitality from Johnson & Wales University (Rhode Island, US) and an Honorary Doctorate from Oxford Brookes University (UK).
Note:Hong Leong Investment Holdings Pte. Ltd. is the immediate and ultimate holding company of CDL. Hong Leong Finance Limited and Hong Leong Asia Ltd. are related companies under the Hong Leong Group of companies. Millennium & Copthorne Hotels Limited and CDL China Limited are subsidiaries of CDL.
CITY DEVELOPMENTS LIMITED ANNUAL REPORT 2021 CORPORATE GOVERNANCE
26 27
BOARD OFDIRECTORS
ONG LIAN JIN COLIN, 53Independent Non-Executive Director
First appointment as Director7 October 2020
Last re-election as Director30 April 2021 (Will be seeking re-election at the 2022 Annual General Meeting)
Board committees• Nominating Committee (Chairman)• Remuneration Committee (Member)
Present directorships in other listed companies* and principal commitments• Great Eastern Financial Advisers (Executive Senior Director)
Other appointments• Nil
Past directorships in other listed companies* and principal commitments held in the preceding five years
• Nil
Mr Ong is the Founder of Advisors’ Clique and Executive Senior Director of Great Eastern Financial Advisers, a position he has held since 2011. A veteran in the financial services industry with more than 29 years of experience, he has achieved the Million Dollar Round Table (MDRT) 26 times since 1993, achieved the Top of the Table in 2020 and is a member of its prestigious MDRT Quarter Century Club.
Mr Ong was a recipient of the Centennial Award by Great Eastern Life in 2008, an accolade awarded during its 100th anniversary in recognit ion of his contributions to the company.
He was conferred the IBF Fellow award from the Institute of Banking and Finance and was named Asia’s Inspirational Leader of the Year by the Asia Insurance Review in 2015.
Mr Ong holds a Bachelor of Arts & Social Sciences from the National University of Singapore. He is also a Chartered L i f e U n d e r w r i t e r a n d C h a r t e re d Financial Consultant.
BOARD OFDIRECTORS
SHERMAN KWEK EIK TSE, 46Executive DirectorGroup Chief Executive Officer
First appointment as Director15 May 2019
Last re-election as Director24 June 2020 (Will be seeking re-election at the 2022 Annual General Meeting)
Board committees• Board Sustainability Committee (Chairman)
Present directorships in other listed companies* and principal commitments• CDL China Limited (Executive Chairman) (non-listed)
Other appointments• Business China (Board Member)• Chinese Development Assistance Council (Member of Board of Trustees)• Singapore Health Services Pte Ltd (Member of SingHealth Property Committee)
Past directorships in other listed companies* and principal commitments held in the preceding five years• Singapore Chinese Chamber of Commerce and Industry (SCCCI) (Council Member)• SCCCI - Youth Business Affairs Committee (Chairman)
Mr Kwek assumed his current role as Group Chief Executive Officer in January 2018. He is responsible for setting and implementing the business direction and strategies for the CDL Group as endorsed by the Board, providing leadership to drive the pursuit of the Group’s strategic objectives, and having overall management oversight of the Group’s performance. He has held the position of Executive Chairman of CDL China Limited since 2016.
Prior to joining CDL, Mr Kwek was the CEO of City e-Solutions Limited (now known as China Tian Yuan Healthcare Group Limited), a Hong Kong-listed company that was formerly a subsidiary of the Group and which was engaged in the provision of hotel management and electronic distribution services to the global hospitality industry. It was divested by CDL in 2016 for a substantial gain on sale.
Since 2019, Mr Kwek has served as a board member of Business China, which aims to nurture an inclusive bilingual and bicultural group of Singaporeans to sustain Singapore’s multi-cultural heritage and develop a cultural and economic bridge linking the world and China. In 2020, he was appointed to the Board of Trustees of the Chinese Development Assistance Council (CDAC), a non-profit self-help group for the Chinese community, and in 2021, he was appointed as a member of the SingHealth Property Committee of Singapore Health Services Pte Ltd.
Mr Kwek stepped down from Singapore Chinese Chamber of Commerce and Industry (SCCCI) on 14 March 2022 after serving as a Council Member for 9 years and relinquished his appointments as a Council Member of SCCCI as well as the Chairman of its Youth Business Affairs Committee.
Mr Kwek was also formerly a member of the Council for Board Diversity and a board member of the Building and Construction Authority (BCA).
He graduated from Boston University, USA with a Bachelor of Science in Business Administration, majoring in Finance and Marketing with a minor in Psychology.
LEE JEE CHENG PHILIP, 62Lead Independent Director
First appointment as Director4 January 2021
Last re-election as Director30 April 2021
Board committees• Audit & Risk Committee (Chairman)• Nominating Committee (Member)• Remuneration Committee (Member)
Present directorships in other listed companies* and principal commitments• ComfortDelGro Corporation Limited*
Other appointments• Singapore Agro-Food Enterprises Federation Limited (Governing Council Member)
• Tech For Good Institute Limited (Board Member)
Past directorships in other listed companies* and principal commitments held in the preceding five years
• KPMG LLP (Partner)
Mr Lee has more than 35 years of experience in accounting and finance. He was admitted into the partnership of KPMG Singapore in 1995 where he served as an audit partner until his retirement in September 2018. During his time at KPMG, Mr Lee had served on the leadership team in KPMG Singapore and on the executive team at KPMG Asia Pacific. In addition, he was the Head of Real Estate, Investment Banking, Private Banking and the Head of an Audit Business Unit. He was also the Head of People and led KPMG to various HR Awards.
Mr Lee is also an independent non-executive director at ComfortDelGro Corporation Limited, a Member of the Governing Council of Singapore Agro- Food Enterprises Federation Limited and a Board Member of Tech For Good Institute Limited.
He is a Fellow of the Institute of Singapore Chartered Accountants and the Association of Chartered Certified Accountants, United Kingdom, and a member of the Singapore Institute of Directors.
PHILIP YEO LIAT KOK, 75Non-Independent Non-Executive Director
First appointment as Director11 May 2009
Last re-election as Director30 April 2021
Board committeesNil
Present directorships in other listed companies* and principal commitments• Economic Development Innovations Singapore Private Limited (EDIS) (Chairman)
• Accuron Technologies Limited (Chairman)• Advanced MedTech Holdings Pte. Ltd. (Chairman)• Sunway Berhad* (Independent Director)• Baiterek National Managing Holding (Independent Director)
Other appointments• Nil
Past directorships in other listed companies* and principal commitments held in the preceding five years• Hitachi Ltd* (Independent Director)• Kerry Logistics Network Limited* (Independent Director)
Mr Yeo is the Chairman of Economic Development Innovations Singapore Pte Ltd (EDIS) which provides strategic advice and undertakes the development a n d m a n a g e m e n t o f i n t e g r a t e d industrial and urban areas with an emphasis on job creation and industrial cluster development.
Mr Yeo received the Singapore Public Administration Medal (Silver) in 1974, the Public Administration Medal (Gold) in 1982, the Meritorious Service Medal in 1991 and the Order of Nila Utama (First Class), Singapore’s most prestigious National Day Awards in 2006. He also received the Order of the Rising Sun, Gold and Silver Star from the Government of Japan (2007) and the Distinguished Service (Star) award from the Singapore Labour Movement, National Trade Union Congress (2008).
Mr Yeo holds a Bachelor of Applied Science (Industrial Engineering), an honorary Doctorate in Engineering from the University of Toronto, Canada, an honorary Doctorate in Medicine from the Karolinska Institutet, Sweden, a Master of Science (Systems Engineering) from the University of Singapore, a Master of Business Administration from Harvard University, USA, a Doctor of Science from Imperial College, London, an honorary Doctor of Letters from National University of Singapore and an honorary Doctor of Law from Monash University of Australia.
DANIEL MARIE GHISLAIN DESBAILLETS, 72Independent Non-Executive Director
First appointment as Director20 November 2020
Last re-election as Director30 April 2021
Board committees• Board Sustainability Committee (Member)• Remuneration Committee (Member)
Present directorships in other listed companies* and principal commitments• FreshCreation Holdings Pte. Ltd. (Co-owner and Executive Chairman)• Salad Stop Pte. Ltd. (Co-owner and Executive Chairman)
Other appointments• Nil
Past directorships in other listed companies* and principal commitments held in the preceding five years• Millennium & Copthorne Hotels plc* (Independent Non-Executive Director) (delisted and privatised in 2019 and now known as Millennium & Copthorne Hotels Limited)
Mr Desbaillets has an extensive portfolio in the hospitality industry with 43 years of experience. Mr Desbaillets was appointed to the board of Millennium & Copthorne Hotels plc (prior to its privatisation) in 2016 as an Independent Non-Executive Director and had served in the Audit & Risk, Remuneration and Risk Committees. In 2010, he was the Independent Non-Executive Director of M&C REIT Management Limited, the manager for CDL Hospitality Real Estate Investment Trust (H-REIT) and also of M&C Business Trust Management Limited, the trustee-manager for CDL Hospitality Business Trust (HBT) and had served in their Nominating and Remuneration Committees. Both H-REIT and HBT are comprised as a stapled group in CDL Hospitality Trusts, which is listed on Singapore Exchange Securities Trading Limited.
CITY DEVELOPMENTS LIMITED ANNUAL REPORT 2021 CORPORATE GOVERNANCE
28 29
BOARD OFDIRECTORS
positions in various stockbroking firms. She is also currently the Chairman of the Singapore Exchange Securities Advisory Committee and is also appointed as an Independent Director of mainboard-listed Genting Singapore.
Ms Chan was conferred the IBF Distinguished Fellow award in 2016. The IBF Distinguished Fellow is a significant role model who serves as a beacon of excellence for the financial industry.
She holds a Bachelor of Arts degree from the National University of Singapore and a Diploma in Personnel Management. Ms Chan also obtained the Executive Diploma in Directorship from Singapore Management University – Singapore Institute of Directors in 2018.
TANG AI AI MRS WONG AI AI, 58Independent Non-Executive Director
First appointment as Director1 January 2022
Last re-election as DirectorN.A. (Will be seeking re-election at the 2022 Annual General Meeting)
Board committees• Nominating Committee (Member)• Board Sustainability Committee (Member)
Present directorships in other listed companies* and principal commitments• Baker & McKenzie.Wong & Leow (Principal)• Singapore Tourism Board (Director)• PSA International Pte Ltd (Director)
Since 1973, he has held senior positions with international hotel chains including InterContinental Hotel Group, Hilton, Shangri-La, Millennium & Copthorne Hotels Group, Fullerton Hotels and Resorts and TCC Hotels Thailand and has worked in various countries around the world. His responsibilities in the Corporate offices included regional hotel operations, finance, marketing, human resource, food & beverage (F&B) and asset management. Currently, Mr Desbaillets is the Executive Chairman of family-owned businesses in the F&B industry, FreshCreation Holdings Pte. Ltd. and Salad Stop Pte. Ltd., which have 65 outlets in Singapore, Malaysia, Indonesia, Philippines, Hong Kong, Japan, South Korea, Vietnam and Spain that are owned, franchised and under joint ventures.
He holds a Diploma in Commercial Studies from Ecole Benedict Geneva, Switzerland and a Certificate with Distinction in Service, Food Production and Administration from Lausanne Hotel School, Switzerland.
CHONG YOON CHOU, 54Independent Non-Executive Director
First appointment as Director20 November 2020
Last re-election as Director30 April 2021
Board committees• Audit & Risk Committee (Member)• Nominating Committee (Member)• Board Sustainability Committee (Member)
Present directorships in other listed companies* and principal commitments• Leanne Capital Pte. Ltd. (Founder/Director)
Other appointments• Nil
Past directorships in other listed companies* and principal commitments held in the preceding five years• Ostrum Asset Management Asia Ltd. (Chief Investment Officer, Equities)• Aberdeen Standard Investments (Asia) Limited (Investment Director)
M r C h o n g s t a r t e d h i s c a r e e r a t A b e rd e e n St a n d a rd I nve s t m e nt s (Asia) Limited in 1994 as an analyst and fund manager on Asian equities. He was later transferred to Sydney as Head of Austral ian Equit ies in 2001. Subsequently, he held roles in London, Edinburgh and Philadelphia as Head of Pan-European Equities and Head of Developed Markets ex-Asia, before returning to Singapore in 2008 as Investment Director where he oversaw equity investments in seven regional offices. He was also the Managing Director of Aberdeen Asset Management Malaysia.
Throughout his stint with the company, Mr Chong was involved in many restructuring initiatives in Australia and Europe whilst spearheading investment teams in various M&A projects such as the acquisition of Edinburgh Fund Managers in 2005, Deutsche Asset Management UK in 2006, Philadelphia Nationwide Financial Service US in 2007 and Credit Suisse Asset Management in 2009. He was also responsible for setting up the group’s research systems and led in transition projects during Europe’s implementation of Markets in Financial Instruments Directive II (MiFID II). Mr Chong’s 28 years of extensive experience in managing assets and funds also included his management of Asian and Emerging market equities at Ostrum Asset Management Asia Ltd, part of the Natixis Investment Management group with USD 1 trillion of funds under management.
Mr Chong graduated from the London School of Economics with a Bachelor of Science (Economics) in Accounting & Finance, a Master of Science in Finance and a Master of Science in Information Systems. He is a lso a Chartered Financial Analyst and has Leadership Development certifications at Harvard Business School and INSEAD. In 2021, h e h a s c o m p l e t e d t h e I N S E A D International Directors Programme.
CHAN SWEE LIANG CAROLINA (CAROL FONG), 60Independent Non-Executive Director
First appointment as Director29 December 2020
Last re-election as Director30 April 2021
Board committees• Remuneration Committee (Chairman)• Audit & Risk Committee (Member)
Present directorships in other listed companies* and principal commitments• CGS-CIMB Securities (Singapore) Pte Ltd (Group Chief Executive Officer)• Genting Singapore Limited* (Independent Non-Executive Director)
Other appointments• Leukemia and Lymphoma Foundation (Board Member, Honorary Treasurer and Chairperson, Finance Subcommittee)• Singapore Exchange Securities Advisory Committee (Chairman)
Past directorships in other listed companies* and principal commitments held in the preceding five years• Nil
Ms Chan has more than 30 years of experience in investment banking and financial markets. Currently the Group Chief Executive Officer of CGS-CIMB Securities, she is responsible for the overall management and financial performance of the CGS-CIMB Securities group’s equities business, a regional franchise covering Asia Pacific (ex-Japan), as well as offices in London and New York. Ms Chan is also a Non-Executive Director of Leukemia & Lymphoma Foundation.
Before this, she was the Singapore Country Investment Banking CEO of CIMB Group, where she was responsible for building up their investment banking business and management of key client and regulator relationships in Singapore.
Ms Chan’s career began at Oversea-Chinese Banking Corporation and she has since held several senior managerial
Other appointments• Climate Governance Singapore Limited (Director)• Justice of the Peace
Past directorships in other listed companies* and principal commitments held in the preceding five years• Baker McKenzie (Member of Global Executive Committee and Chair of Asia Pacific Region)• Singapore Tyler Print Institute (Board Member)• Yellow Ribbon Fund (Chairman)
Mrs Wong is one of Baker McKenzie.Wong & Leow’s most distinguished lawyers, with a career that spans leading a range of landmark transactions for blue-chip clients, to global management and leadership roles at the highest levels of Baker McKenzie, including serving as a member of Global Executive Committee and Chair of the Asia Pacific Region. Her legal expertise includes mergers and acquisitions, venture capital and private equity, hotels and real estate, and capital markets.
U n d e r h e r l e a d e r s h i p , B a k e r McKenzie has built out an aggressive transactional strategy that has seen its transactional teams secure industry leading mandates, and win many accolades across the world, including in key centres such as London, New York, Paris, Germany, Japan, Hong Kong, China and Brazil. Mrs Wong was also instrumental in the development and implementation of the firm’s Belt & Road Initiative, Sustainability and Financial Institutions strategies. As a
transactional lawyer, Mrs Wong has been recognised as a leading individual and eminent practitioner for Corporate/M&A matters by publications including Chambers Asia Pacific, Legal 500 Asia Pacific and IFLR1000.
Mrs Wong is a founding steering c o m m i t t e e m e m b e r o f C l i m a t e Governance Singapore Limited, an initiative led by World Economic Forum to educate non-executive directors on the opportunities and challenges for their companies arising from climate change and its consequences. She is also a Justice of the Peace.
She graduated from the University of Kent, with a Bachelor of Arts in Law First Class Honours, and holds a Master of Law from Harvard University Law School. She is admitted to practice in Singapore, New York, England and Wales (Grays Inn).
CITY DEVELOPMENTS LIMITED ANNUAL REPORT 2021
30
CORPORATE GOVERNANCE
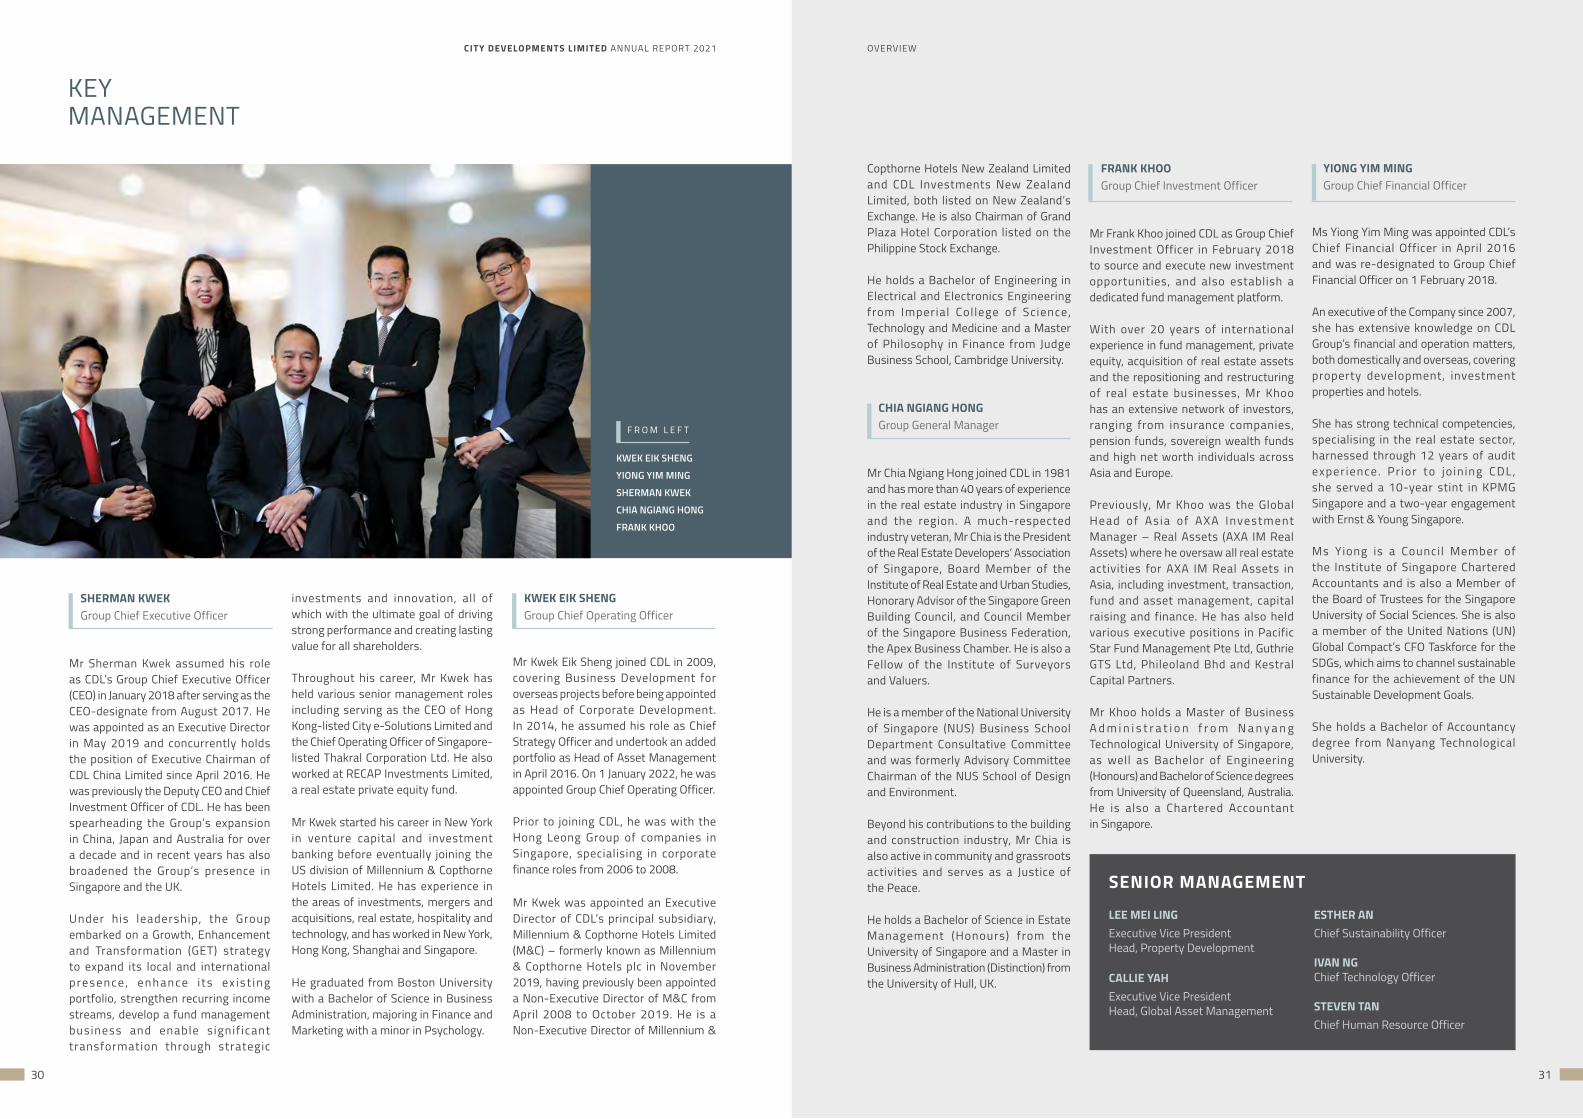
SHERMAN KWEKGroup Chief Executive Officer
Mr Sherman Kwek assumed his role as CDL’s Group Chief Executive Officer (CEO) in January 2018 after serving as the CEO-designate from August 2017. He was appointed as an Executive Director in May 2019 and concurrently holds the position of Executive Chairman of CDL China Limited since April 2016. He was previously the Deputy CEO and Chief Investment Officer of CDL. He has been spearheading the Group’s expansion in China, Japan and Australia for over a decade and in recent years has also broadened the Group’s presence in Singapore and the UK.
Under his leadership, the Group embarked on a Growth, Enhancement and Transformation (GET) strategy to expand its local and international presence , enhance i ts ex ist ing portfolio, strengthen recurring income streams, develop a fund management business and enable s ignif icant transformation through strategic
investments and innovation, all of which with the ultimate goal of driving strong performance and creating lasting value for all shareholders.
Throughout his career, Mr Kwek has held various senior management roles including serving as the CEO of Hong Kong-listed City e-Solutions Limited and the Chief Operating Officer of Singapore-listed Thakral Corporation Ltd. He also worked at RECAP Investments Limited, a real estate private equity fund.
Mr Kwek started his career in New York in venture capital and investment banking before eventually joining the US division of Millennium & Copthorne Hotels Limited. He has experience in the areas of investments, mergers and acquisitions, real estate, hospitality and technology, and has worked in New York, Hong Kong, Shanghai and Singapore.
He graduated from Boston University with a Bachelor of Science in Business Administration, majoring in Finance and Marketing with a minor in Psychology.
KWEK EIK SHENGGroup Chief Operating Officer
Mr Kwek Eik Sheng joined CDL in 2009, covering Business Development for overseas projects before being appointed as Head of Corporate Development. In 2014, he assumed his role as Chief Strategy Officer and undertook an added portfolio as Head of Asset Management in April 2016. On 1 January 2022, he was appointed Group Chief Operating Officer.
Prior to joining CDL, he was with the Hong Leong Group of companies in Singapore, specialising in corporate finance roles from 2006 to 2008.
Mr Kwek was appointed an Executive Director of CDL’s principal subsidiary, Millennium & Copthorne Hotels Limited (M&C) – formerly known as Millennium & Copthorne Hotels plc in November 2019, having previously been appointed a Non-Executive Director of M&C from April 2008 to October 2019. He is a Non-Executive Director of Millennium &
Copthorne Hotels New Zealand Limited and CDL Investments New Zealand Limited, both listed on New Zealand’s Exchange. He is also Chairman of Grand Plaza Hotel Corporation listed on the Philippine Stock Exchange.
He holds a Bachelor of Engineering in Electrical and Electronics Engineering from Imperial Col lege of Science, Technology and Medicine and a Master of Philosophy in Finance from Judge Business School, Cambridge University.
CHIA NGIANG HONGGroup General Manager
Mr Chia Ngiang Hong joined CDL in 1981 and has more than 40 years of experience in the real estate industry in Singapore and the region. A much-respected industry veteran, Mr Chia is the President of the Real Estate Developers’ Association of Singapore, Board Member of the Institute of Real Estate and Urban Studies, Honorary Advisor of the Singapore Green Building Council, and Council Member of the Singapore Business Federation, the Apex Business Chamber. He is also a Fellow of the Institute of Surveyors and Valuers.
He is a member of the National University of Singapore (NUS) Business School Department Consultative Committee and was formerly Advisory Committee Chairman of the NUS School of Design and Environment.
Beyond his contributions to the building and construction industry, Mr Chia is also active in community and grassroots activities and serves as a Justice of the Peace.
He holds a Bachelor of Science in Estate Management (Honours) from the University of Singapore and a Master in Business Administration (Distinction) from the University of Hull, UK.
FRANK KHOOGroup Chief Investment Officer
Mr Frank Khoo joined CDL as Group Chief Investment Officer in February 2018 to source and execute new investment opportunities, and also establish a dedicated fund management platform.
With over 20 years of international experience in fund management, private equity, acquisition of real estate assets and the repositioning and restructuring of real estate businesses, Mr Khoo has an extensive network of investors, ranging from insurance companies, pension funds, sovereign wealth funds and high net worth individuals across Asia and Europe.
Previously, Mr Khoo was the Global Head of As ia of AXA Investment Manager – Real Assets (AXA IM Real Assets) where he oversaw all real estate activities for AXA IM Real Assets in Asia, including investment, transaction, fund and asset management, capital raising and finance. He has also held various executive positions in Pacific Star Fund Management Pte Ltd, Guthrie GTS Ltd, Phileoland Bhd and Kestral Capital Partners.
Mr Khoo holds a Master of Business A d m i n i s t r a t i o n f r o m N a n y a n g Technological University of Singapore, as well as Bachelor of Engineering (Honours) and Bachelor of Science degrees from University of Queensland, Australia. He is also a Chartered Accountant in Singapore.
YIONG YIM MINGGroup Chief Financial Officer
Ms Yiong Yim Ming was appointed CDL’s Chief Financial Officer in April 2016 and was re-designated to Group Chief Financial Officer on 1 February 2018.
An executive of the Company since 2007, she has extensive knowledge on CDL Group’s financial and operation matters, both domestically and overseas, covering property development, investment properties and hotels.
She has strong technical competencies, specialising in the real estate sector, harnessed through 12 years of audit exper ience. Pr ior to jo in ing CDL, she served a 10-year stint in KPMG Singapore and a two-year engagement with Ernst & Young Singapore.
Ms Yiong is a Council Member of the Institute of Singapore Chartered Accountants and is also a Member of the Board of Trustees for the Singapore University of Social Sciences. She is also a member of the United Nations (UN) Global Compact’s CFO Taskforce for the SDGs, which aims to channel sustainable finance for the achievement of the UN Sustainable Development Goals.
She holds a Bachelor of Accountancy degree from Nanyang Technological University.
SENIOR MANAGEMENT
LEE MEI LINGExecutive Vice PresidentHead, Property Development
CALLIE YAHExecutive Vice PresidentHead, Global Asset Management
KEY MANAGEMENT
KWEK EIK SHENG
YIONG YIM MING
SHERMAN KWEK
CHIA NGIANG HONG
FRANK KHOO
F R O M L E F T
ESTHER ANChief Sustainability Officer
IVAN NGChief Technology Officer
STEVEN TANChief Human Resource Officer
OVERVIEW
31
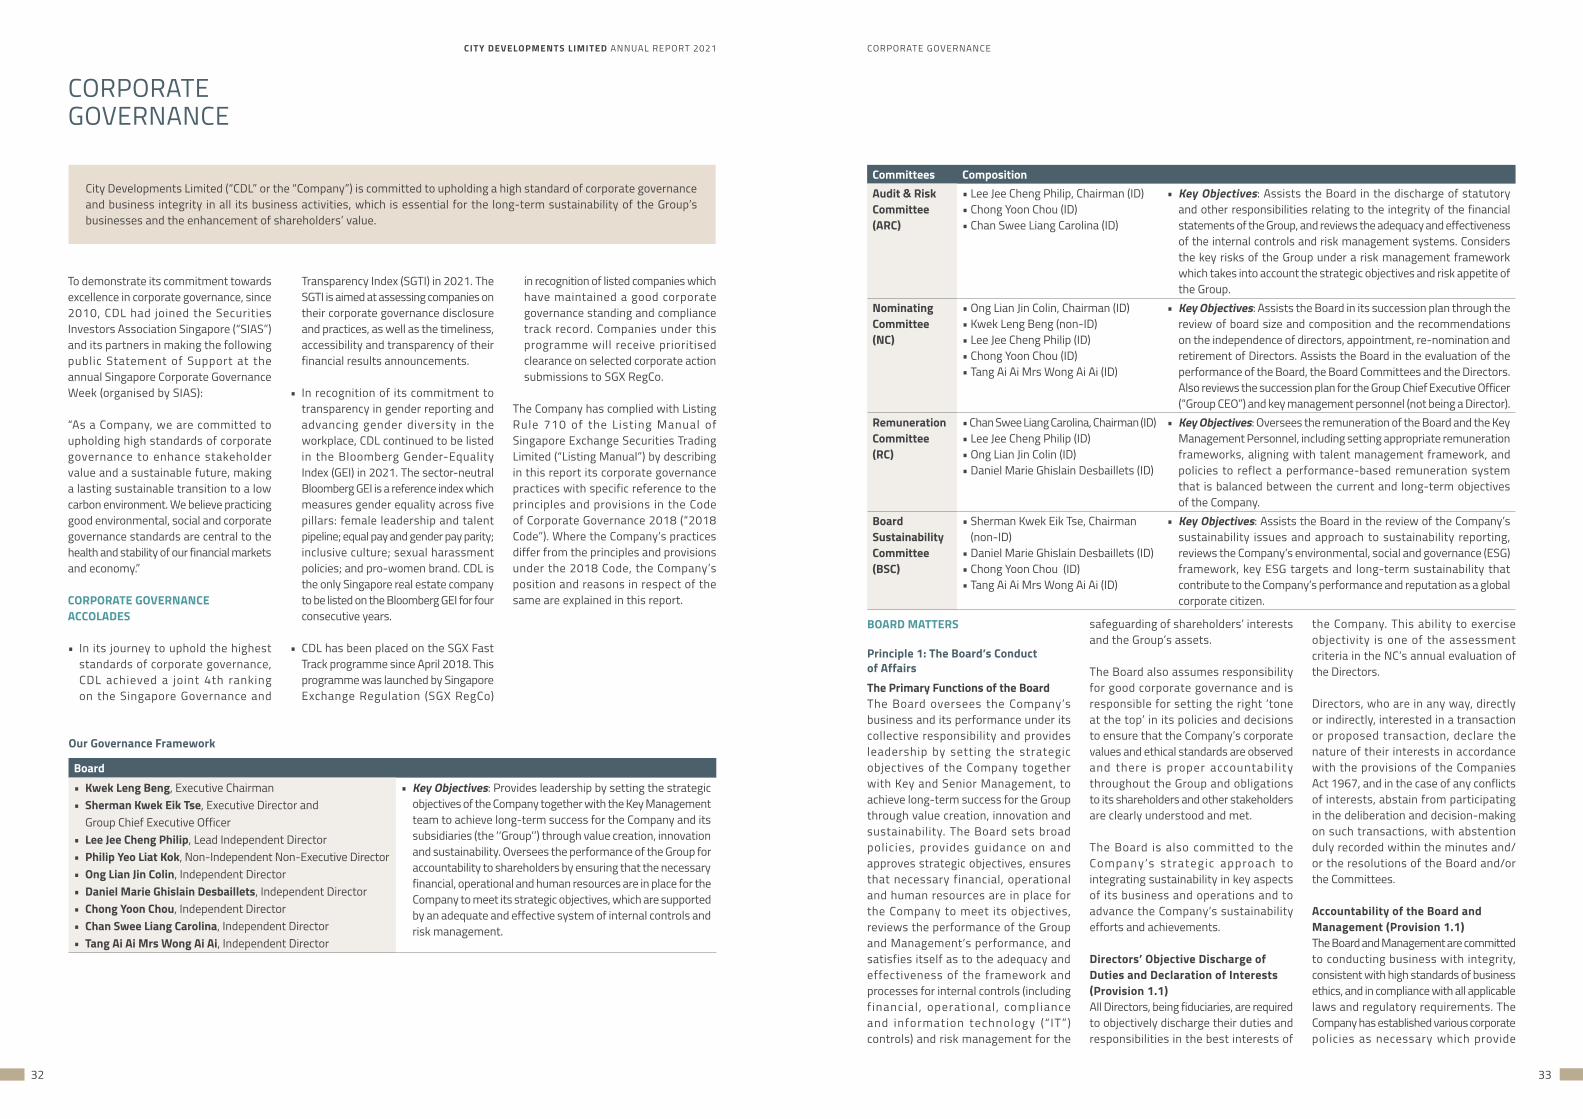
CITY DEVELOPMENTS LIMITED ANNUAL REPORT 2021 CORPORATE GOVERNANCE
32 33
CORPORATEGOVERNANCE
City Developments Limited (“CDL” or the “Company”) is committed to upholding a high standard of corporate governance and business integrity in all its business activities, which is essential for the long-term sustainability of the Group’s businesses and the enhancement of shareholders’ value.
To demonstrate its commitment towards excellence in corporate governance, since 2010, CDL had joined the Securities Investors Association Singapore (“SIAS”) and its partners in making the following public Statement of Support at the annual Singapore Corporate Governance Week (organised by SIAS):
“As a Company, we are committed to upholding high standards of corporate governance to enhance stakeholder value and a sustainable future, making a lasting sustainable transition to a low carbon environment. We believe practicing good environmental, social and corporate governance standards are central to the health and stability of our financial markets and economy.”
CORPORATE GOVERNANCE ACCOLADES
• In its journey to uphold the highest standards of corporate governance, CDL achieved a joint 4th ranking on the Singapore Governance and
Transparency Index (SGTI) in 2021. The SGTI is aimed at assessing companies on their corporate governance disclosure and practices, as well as the timeliness, accessibility and transparency of their financial results announcements.
• In recognition of its commitment to transparency in gender reporting and advancing gender diversity in the workplace, CDL continued to be listed in the Bloomberg Gender-Equality Index (GEI) in 2021. The sector-neutral Bloomberg GEI is a reference index which measures gender equality across five pillars: female leadership and talent pipeline; equal pay and gender pay parity; inclusive culture; sexual harassment policies; and pro-women brand. CDL is the only Singapore real estate company to be listed on the Bloomberg GEI for four consecutive years.
• CDL has been placed on the SGX Fast Track programme since April 2018. This programme was launched by Singapore Exchange Regulation (SGX RegCo)
in recognition of listed companies which have maintained a good corporate governance standing and compliance track record. Companies under this programme will receive prioritised clearance on selected corporate action submissions to SGX RegCo.
The Company has complied with Listing Rule 710 of the Listing Manual of Singapore Exchange Securities Trading Limited (“Listing Manual”) by describing in this report its corporate governance practices with specific reference to the principles and provisions in the Code of Corporate Governance 2018 (“2018 Code”). Where the Company’s practices differ from the principles and provisions under the 2018 Code, the Company’s position and reasons in respect of the same are explained in this report.
Our Governance Framework
Board • Kwek Leng Beng, Executive Chairman• Sherman Kwek Eik Tse, Executive Director and
Group Chief Executive Officer• Lee Jee Cheng Philip, Lead Independent Director• Philip Yeo Liat Kok, Non-Independent Non-Executive Director• Ong Lian Jin Colin, Independent Director• Daniel Marie Ghislain Desbaillets, Independent Director• Chong Yoon Chou, Independent Director• Chan Swee Liang Carolina, Independent Director• Tang Ai Ai Mrs Wong Ai Ai, Independent Director
• Key Objectives: Provides leadership by setting the strategic objectives of the Company together with the Key Management team to achieve long-term success for the Company and its subsidiaries (the ‘‘Group’’) through value creation, innovation and sustainability. Oversees the performance of the Group for accountability to shareholders by ensuring that the necessary financial, operational and human resources are in place for the Company to meet its strategic objectives, which are supported by an adequate and effective system of internal controls and risk management.
Committees CompositionAudit & Risk Committee(ARC)
• Lee Jee Cheng Philip, Chairman (ID)• Chong Yoon Chou (ID)• Chan Swee Liang Carolina (ID)
• Key Objectives: Assists the Board in the discharge of statutory and other responsibilities relating to the integrity of the financial statements of the Group, and reviews the adequacy and effectiveness of the internal controls and risk management systems. Considers the key risks of the Group under a risk management framework which takes into account the strategic objectives and risk appetite of the Group.
Nominating Committee(NC)
• Ong Lian Jin Colin, Chairman (ID)• Kwek Leng Beng (non-ID)• Lee Jee Cheng Philip (ID)• Chong Yoon Chou (ID)• Tang Ai Ai Mrs Wong Ai Ai (ID)
• Key Objectives: Assists the Board in its succession plan through the review of board size and composition and the recommendations on the independence of directors, appointment, re-nomination and retirement of Directors. Assists the Board in the evaluation of the performance of the Board, the Board Committees and the Directors. Also reviews the succession plan for the Group Chief Executive Officer (“Group CEO”) and key management personnel (not being a Director).
Remuneration Committee(RC)
• Chan Swee Liang Carolina, Chairman (ID)• Lee Jee Cheng Philip (ID)• Ong Lian Jin Colin (ID)• Daniel Marie Ghislain Desbaillets (ID)
• Key Objectives: Oversees the remuneration of the Board and the Key Management Personnel, including setting appropriate remuneration frameworks, aligning with talent management framework, and policies to reflect a performance-based remuneration system that is balanced between the current and long-term objectives of the Company.
BoardSustainabilityCommittee(BSC)
• Sherman Kwek Eik Tse, Chairman (non-ID)
• Daniel Marie Ghislain Desbaillets (ID)• Chong Yoon Chou (ID)• Tang Ai Ai Mrs Wong Ai Ai (ID)
• Key Objectives: Assists the Board in the review of the Company’s sustainability issues and approach to sustainability reporting, reviews the Company’s environmental, social and governance (ESG) framework, key ESG targets and long-term sustainability that contribute to the Company’s performance and reputation as a global corporate citizen.
BOARD MATTERS
Principle 1: The Board’s Conduct of AffairsThe Primary Functions of the BoardThe Board oversees the Company’s business and its performance under its collective responsibility and provides leadership by setting the strategic objectives of the Company together with Key and Senior Management, to achieve long-term success for the Group through value creation, innovation and sustainability. The Board sets broad policies, provides guidance on and approves strategic objectives, ensures that necessary financial, operational and human resources are in place for the Company to meet its objectives, reviews the performance of the Group and Management’s performance, and satisfies itself as to the adequacy and effectiveness of the framework and processes for internal controls (including f inancial , operational , compliance and information technology (“ IT”) controls) and risk management for the
safeguarding of shareholders’ interests and the Group’s assets.
The Board also assumes responsibility for good corporate governance and is responsible for setting the right ‘tone at the top’ in its policies and decisions to ensure that the Company’s corporate values and ethical standards are observed and there is proper accountabil ity throughout the Group and obligations to its shareholders and other stakeholders are clearly understood and met.
The Board is also committed to the Company’s strategic approach to integrating sustainability in key aspects of its business and operations and to advance the Company’s sustainability efforts and achievements.
Directors’ Objective Discharge of Duties and Declaration of Interests (Provision 1.1)All Directors, being fiduciaries, are required to objectively discharge their duties and responsibilities in the best interests of
the Company. This ability to exercise objectivity is one of the assessment criteria in the NC’s annual evaluation of the Directors.
Directors, who are in any way, directly or indirectly, interested in a transaction or proposed transaction, declare the nature of their interests in accordance with the provisions of the Companies Act 1967, and in the case of any conflicts of interests, abstain from participating in the deliberation and decision-making on such transactions, with abstention duly recorded within the minutes and/or the resolutions of the Board and/or the Committees.
Accountability of the Board and Management (Provision 1.1) The Board and Management are committed to conducting business with integrity, consistent with high standards of business ethics, and in compliance with all applicable laws and regulatory requirements. The Company has established various corporate policies as necessary which provide
CITY DEVELOPMENTS LIMITED ANNUAL REPORT 2021 CORPORATE GOVERNANCE
34 35
a communicable and understandable framework for employees to observe the Company’s principles on honesty, integrity, responsibility and accountability at all levels of the organisation and in the conduct of the Company’s business in their relationships with the Company’s stakeholders, including customers, suppl iers and employees. Further details of these policies are described in the segment entitled ‘Corporate Values and Conduct of Business’ at the end of this report.
Board Orientation and Training (Provision 1.2)Each newly appointed Director receives a formal letter, setting out his general duties and obligations as a Director pursuant to the relevant legislations and regulations. The new Director will also receive an electronic induction pack containing information and documents relating to the roles, duties and responsibilities of a director (and where applicable, as a member of the Committees), the Group’s principal businesses, the Company’s Board processes and corporate governance practices, relevant Company policies and procedures as well as a board meeting calendar for the year with a brief of the routine agenda for each meeting of the Board and where applicable, the Committees.
T h e C o m p a n y a l s o c o n d u c t s a comprehensive induction programme for newly appointed Directors and for existing Directors pursuant to their appointments to any of the Committees, which seeks to familiarise Directors with the Group’s principal businesses, the Company’s governance practices and processes, internal controls and r i s k m a n a g e m e nt sys t e m s , t h e i r responsibilities as directors and in the case of appointments to any of the Committees, the roles and areas of responsibilities of such Committees. The induction programme includes meetings with various key executives of the Management to allow the new Directors to be acquainted with the Management team and to facilitate their independent access to the Management team in
CORPORATEGOVERNANCE
future. The programme also includes briefings by the Management team on key areas of the Company’s operations.
For a first-time Director who has no prior experience as a director of a listed company, in addition to the induction as detailed above, he or she will be required to also attend certain specific modules of the Listed Entity Director (“LED”) Programme conducted by the Singapore Institute of Directors (“SID”) in order to acquire relevant knowledge of what is expected of a listed company director, this being a mandatory requirement under Singapore Exchange Securities Trading Limited (“SGX-ST”) Listing Rules (“the Mandatory Training”). Completion of the LED Programme, which focuses on comprehensive training of company directors on compliance, regulatory and corporate governance matters, should provide the first-time Director with a broad understanding of the roles and responsibilities of a director of a listed company under the requirements of the Companies Act 1967, the Listing Manual and the 2018 Code. A first-time director need not attend the Mandatory Training if the NC, in assessing the relevant experience of the director, is satisfied that he/she possesses relevant experience comparable to that of a person who has served as a director of an issuer listed on SGX-ST. Where such an assessment is made by the NC, the reasons are disclosed in the announcement made on the appointment of the director.
The Directors are also provided with updates and/or briefings from time to time by professional advisers, auditors, the Management and the Company Secretaries in areas such as directors’ duties and responsibilities, corporate governance practices, relevant legislations and regulations, risk management and financial reporting standards. The Directors are also regularly kept informed by the Company Secretaries of the availability of relevant courses, conferences and seminars including those conducted by the SID, and the Directors are encouraged to attend such training at the Company’s expense. The NC and the Board are kept
informed of the trainings attended by the Directors during the year. As part of the NC’s annual assessment of the skill sets of the Board and the Committees, the NC will also recommend further training for the Directors in specific areas, if so required, to supplement the regular updates/briefings provided to the Directors from time to time.
During the year, some of the trainings attended by the Directors included the ACRA-SGX-SID Audit Committee Seminar 2021, SID Directors Conference 2021, SID Corporate Governance Roundup 2021, SGX Regulatory Symposium, SID AC Chapter Pit-Stop Series, SGX S u s t a i n a b i l i t y Re p o r t i n g Rev i e w 2021, INSEAD International Directors Programme, briefings and seminars organised by SID, audit professionals and other consultants in relation to audit committee matters, remuneration committee matters, risk management and sustainability matters.
In addition, in-house seminars were also organised in 2021 and conducted by invited external speakers on the following topics:
• Insights from latest reports on corporate governance, sustainability and climate reporting
• Summary on SGX’s proposals on sustainability reporting and climate-related reporting and how listed companies can brace themselves for mandatory climate-related reporting
• Sustainability and the rising expectation of Boards to play a bigger role in driving ESG
• Internal audit and external assurance for sustainability reports; necessity of materiality assessments
• Task Force on Climate-Related Financial Disclosure (TCFD) reporting and climate change scenario planning
• Geopolitics• Data ethics and advanced analytics and
artificial intelligence
Members of the ARC were also provided with regular briefings from the Company’s external auditors on applicable Accounting Standards and Tax Updates during the year.
In addition to the training courses/programmes and briefing updates, Directors are also at liberty to approach Management should they require any further information or clarification concerning the Company’s operations.
Board Approval (Provision 1.3)Key matters which are specifically reserved for approval by the Board include the decisions over the strategic direction, plans and performance objectives of the Group (including its risk appetite); the Group’s financial objectives and annual budget; decisions to commence, discontinue or modify significantly any business activity or to enter into or withdraw from a particular market sector which have or may have material impact on the profitability or performance of the Group; corporate or financial restructuring; decisions over new borrowings or amendments to the terms and conditions of existing borrowings; adoption of key corporate policies and corporate governance practices and any other matters which require the Board’s approval as prescribed under the relevant legislations and regulations as well as the provisions of the Company’s Constitution. All issuance of the Group’s financial results requires the approval of the Board, including decisions with regard to the Company’s dividend policy and payouts.
Aligned with the Group’s strategy to develop growth platforms in Singapore and key international markets, the Board has put in place an approval matrix with established authority limits in connection with the Group’s investments and divestments, including funds and corporate holdings. The approval matrix is revised and updated when necessary, in line with the Group’s strategic objectives.
Management is fully apprised of such matters which require the approval of the Board or the Committees. For operational efficiency, the Company also has a structured approval limits matrix which sets out the delegated authority to various levels of Management to approve operating expenditure up to pre-determined limits.
Delegation by the Board (Provision 1.4)The primary functions of the Board are either carried out directly by the Board or delegated to the Committees with clear written terms of reference setting out their compositions, authorities and duties, including reporting back to the Board. The Committees established by the Board are the ARC, the NC, the RC and the BSC, all collectively referred to hereafter as the “Committees”.
Each Committee reports key matters to the Board at Board Meetings and submit its report at least once on an annual basis.
A l l t e r m s o f r e f e r e n c e f o r t h e Committees are approved by the Board a nd rev iewed a nnua l ly to ensure their continued relevance, taking into account the changes in the governance and regulatory environment.
The delegation of authority by the Board to the Committees enables the Board to achieve operational efficiency by empowering these Committees to decide, review and make recommendations on matters within their respective written terms of reference and/or limits of delegated authority, without abdicating the Board’s overall responsibility.
The Board Committee, which was established to assist the Board in approving routine and operational matters, including inter alia banking matters such as opening, closing and maintenance of banking accounts, operational matters relating to property development activities, was disbanded with effect from 3 May 2021. Approval of matters previously delegated to the Board Committee has now come under the direct purview of the Management and/or the Board, as appropriate.
Please refer to the sections on Principles 4, 5, 6, 7 and 10 in this report for further information on the activities of the NC, RC and ARC. Information on the activities of the BSC can be found under the ‘Sustainability’ segment towards the end of this report.
Board and Board Committees Meetings (Provision 1.5) Meetings of the Board and Committees are held regularly, with the Board meeting no less than four times a year. Four Board meetings were held in 2021. At the regular Board meetings, the Board agenda includes updates by the Management on the Group’s strategic initiatives and implementation status, updates on the Group’s investments and developments, and the review of the Group’s financial and operational performance. Of the four scheduled meetings, two are half-yearly Board meetings mainly to review and approve the Group’s financial results, and two are scheduled primarily for the Board to focus on the review of the Company’s strategic direction, including specific business strategies, business segmental
75% of the Board attended various training seminars and workshops in 2021
Accounted for more than 234.75 training hours in aggregate=
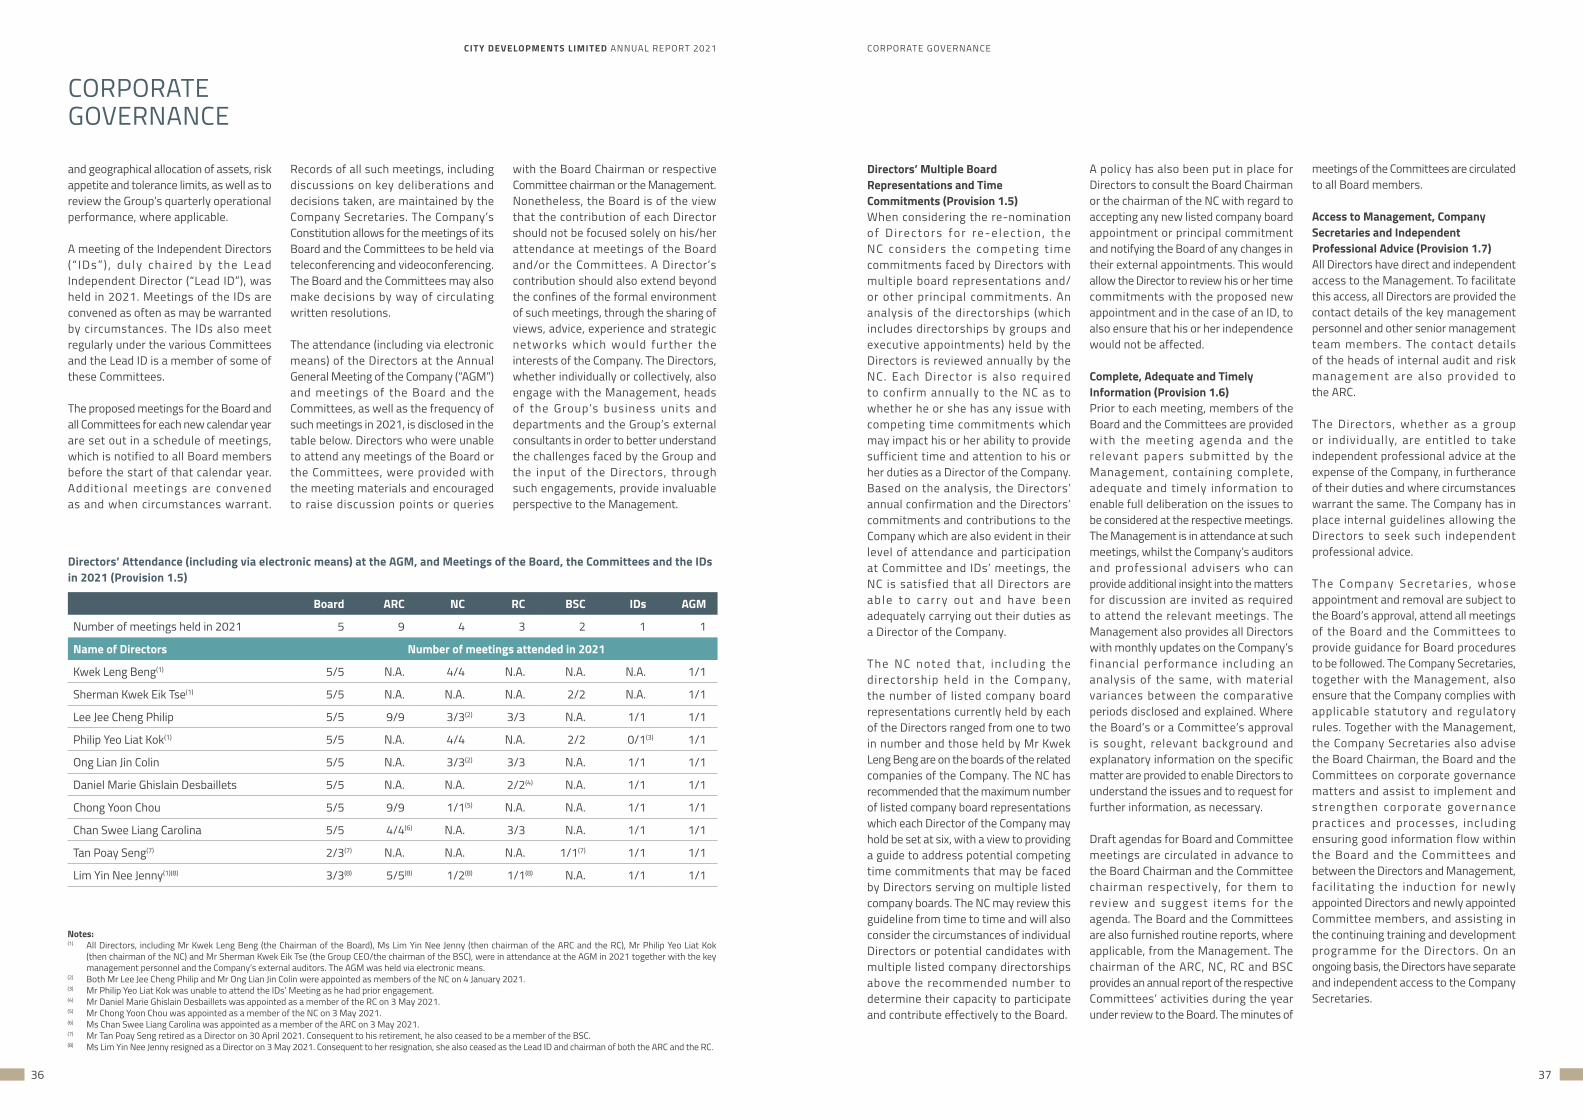
CITY DEVELOPMENTS LIMITED ANNUAL REPORT 2021 CORPORATE GOVERNANCE
36 37
and geographical allocation of assets, risk appetite and tolerance limits, as well as to review the Group’s quarterly operational performance, where applicable.
A meeting of the Independent Directors ( “ IDs” ) , du ly chaired by the Lead Independent Director (“Lead ID”), was held in 2021. Meetings of the IDs are convened as often as may be warranted by circumstances. The IDs also meet regularly under the various Committees and the Lead ID is a member of some of these Committees.
The proposed meetings for the Board and all Committees for each new calendar year are set out in a schedule of meetings, which is notified to all Board members before the start of that calendar year. Additional meetings are convened as and when circumstances warrant.
CORPORATEGOVERNANCE
Records of all such meetings, including discussions on key deliberations and decisions taken, are maintained by the Company Secretaries. The Company’s Constitution allows for the meetings of its Board and the Committees to be held via teleconferencing and videoconferencing. The Board and the Committees may also make decisions by way of circulating written resolutions.
The attendance (including via electronic means) of the Directors at the Annual General Meeting of the Company (“AGM”) and meetings of the Board and the Committees, as well as the frequency of such meetings in 2021, is disclosed in the table below. Directors who were unable to attend any meetings of the Board or the Committees, were provided with the meeting materials and encouraged to raise discussion points or queries
with the Board Chairman or respective Committee chairman or the Management. Nonetheless, the Board is of the view that the contribution of each Director should not be focused solely on his/her attendance at meetings of the Board and/or the Committees. A Director’s contribution should also extend beyond the confines of the formal environment of such meetings, through the sharing of views, advice, experience and strategic networks which would further the interests of the Company. The Directors, whether individually or collectively, also engage with the Management, heads of the Group’s business units and departments and the Group’s external consultants in order to better understand the challenges faced by the Group and the input of the Directors, through such engagements, provide invaluable perspective to the Management.
Directors’ Attendance (including via electronic means) at the AGM, and Meetings of the Board, the Committees and the IDs in 2021 (Provision 1.5)
Board ARC NC RC BSC IDs AGM
Number of meetings held in 2021 5 9 4 3 2 1 1
Name of Directors Number of meetings attended in 2021
Kwek Leng Beng(1) 5/5 N.A. 4/4 N.A. N.A. N.A. 1/1
Sherman Kwek Eik Tse(1) 5/5 N.A. N.A. N.A. 2/2 N.A. 1/1
Lee Jee Cheng Philip 5/5 9/9 3/3(2) 3/3 N.A. 1/1 1/1
Philip Yeo Liat Kok(1) 5/5 N.A. 4/4 N.A. 2/2 0/1(3) 1/1
Ong Lian Jin Colin 5/5 N.A. 3/3(2) 3/3 N.A. 1/1 1/1
Daniel Marie Ghislain Desbaillets 5/5 N.A. N.A. 2/2(4) N.A. 1/1 1/1
Chong Yoon Chou 5/5 9/9 1/1(5) N.A. N.A. 1/1 1/1
Chan Swee Liang Carolina 5/5 4/4(6) N.A. 3/3 N.A. 1/1 1/1
Tan Poay Seng(7) 2/3(7) N.A. N.A. N.A. 1/1(7) 1/1 1/1
Lim Yin Nee Jenny(1)(8) 3/3(8) 5/5(8) 1/2(8) 1/1(8) N.A. 1/1 1/1
Notes:(1) All Directors, including Mr Kwek Leng Beng (the Chairman of the Board), Ms Lim Yin Nee Jenny (then chairman of the ARC and the RC), Mr Philip Yeo Liat Kok
(then chairman of the NC) and Mr Sherman Kwek Eik Tse (the Group CEO/the chairman of the BSC), were in attendance at the AGM in 2021 together with the key management personnel and the Company’s external auditors. The AGM was held via electronic means.
(2) Both Mr Lee Jee Cheng Philip and Mr Ong Lian Jin Colin were appointed as members of the NC on 4 January 2021.(3) Mr Philip Yeo Liat Kok was unable to attend the IDs’ Meeting as he had prior engagement.(4) Mr Daniel Marie Ghislain Desbaillets was appointed as a member of the RC on 3 May 2021.(5) Mr Chong Yoon Chou was appointed as a member of the NC on 3 May 2021.(6) Ms Chan Swee Liang Carolina was appointed as a member of the ARC on 3 May 2021.(7) Mr Tan Poay Seng retired as a Director on 30 April 2021. Consequent to his retirement, he also ceased to be a member of the BSC.(8) Ms Lim Yin Nee Jenny resigned as a Director on 3 May 2021. Consequent to her resignation, she also ceased as the Lead ID and chairman of both the ARC and the RC.
Directors’ Multiple Board Representations and Time Commitments (Provision 1.5)When considering the re-nomination o f D i re c t o r s fo r re - e l e c t i o n , t h e NC considers the competing t ime commitments faced by Directors with multiple board representations and/or other principal commitments. An analysis of the directorships (which includes directorships by groups and executive appointments) held by the Directors is reviewed annually by the NC. Each Director is also required to confirm annually to the NC as to whether he or she has any issue with competing time commitments which may impact his or her ability to provide sufficient time and attention to his or her duties as a Director of the Company. Based on the analysis, the Directors’ annual confirmation and the Directors’ commitments and contributions to the Company which are also evident in their level of attendance and participation at Committee and IDs’ meetings, the NC is satisfied that all Directors are a b l e t o c a r r y o u t a n d h ave b e e n adequately carrying out their duties as a Director of the Company.
The NC noted that , inc luding the directorship held in the Company, the number of listed company board representations currently held by each of the Directors ranged from one to two in number and those held by Mr Kwek Leng Beng are on the boards of the related companies of the Company. The NC has recommended that the maximum number of listed company board representations which each Director of the Company may hold be set at six, with a view to providing a guide to address potential competing time commitments that may be faced by Directors serving on multiple listed company boards. The NC may review this guideline from time to time and will also consider the circumstances of individual Directors or potential candidates with multiple listed company directorships above the recommended number to determine their capacity to participate and contribute effectively to the Board.
A policy has also been put in place for Directors to consult the Board Chairman or the chairman of the NC with regard to accepting any new listed company board appointment or principal commitment and notifying the Board of any changes in their external appointments. This would allow the Director to review his or her time commitments with the proposed new appointment and in the case of an ID, to also ensure that his or her independence would not be affected.
Complete, Adequate and Timely Information (Provision 1.6) Prior to each meeting, members of the Board and the Committees are provided with the meeting agenda and the relevant papers submitted by the Management, containing complete, adequate and timely information to enable full deliberation on the issues to be considered at the respective meetings. The Management is in attendance at such meetings, whilst the Company’s auditors and professional advisers who can provide additional insight into the matters for discussion are invited as required to attend the relevant meetings. The Management also provides all Directors with monthly updates on the Company’s financial performance including an analysis of the same, with material variances between the comparative periods disclosed and explained. Where the Board’s or a Committee’s approval is sought, relevant background and explanatory information on the specific matter are provided to enable Directors to understand the issues and to request for further information, as necessary.
Draft agendas for Board and Committee meetings are circulated in advance to the Board Chairman and the Committee chairman respectively, for them to review and suggest items for the agenda. The Board and the Committees are also furnished routine reports, where applicable, from the Management. The chairman of the ARC, NC, RC and BSC provides an annual report of the respective Committees’ activities during the year under review to the Board. The minutes of
meetings of the Committees are circulated to all Board members.
Access to Management, Company Secretaries and Independent Professional Advice (Provision 1.7)All Directors have direct and independent access to the Management. To facilitate this access, all Directors are provided the contact details of the key management personnel and other senior management team members. The contact details of the heads of internal audit and risk management are also provided to the ARC.
The Directors, whether as a group or individually, are entitled to take independent professional advice at the expense of the Company, in furtherance of their duties and where circumstances warrant the same. The Company has in place internal guidelines allowing the Directors to seek such independent professional advice.
The Company Secretar ies , whose appointment and removal are subject to the Board’s approval, attend all meetings of the Board and the Committees to provide guidance for Board procedures to be followed. The Company Secretaries, together with the Management, also ensure that the Company complies with applicable statutory and regulatory rules. Together with the Management, the Company Secretaries also advise the Board Chairman, the Board and the Committees on corporate governance matters and assist to implement and strengthen corporate governance practices and processes, including ensuring good information flow within the Board and the Committees and between the Directors and Management, facilitating the induction for newly appointed Directors and newly appointed Committee members, and assisting in the continuing training and development programme for the Directors. On an ongoing basis, the Directors have separate and independent access to the Company Secretaries.
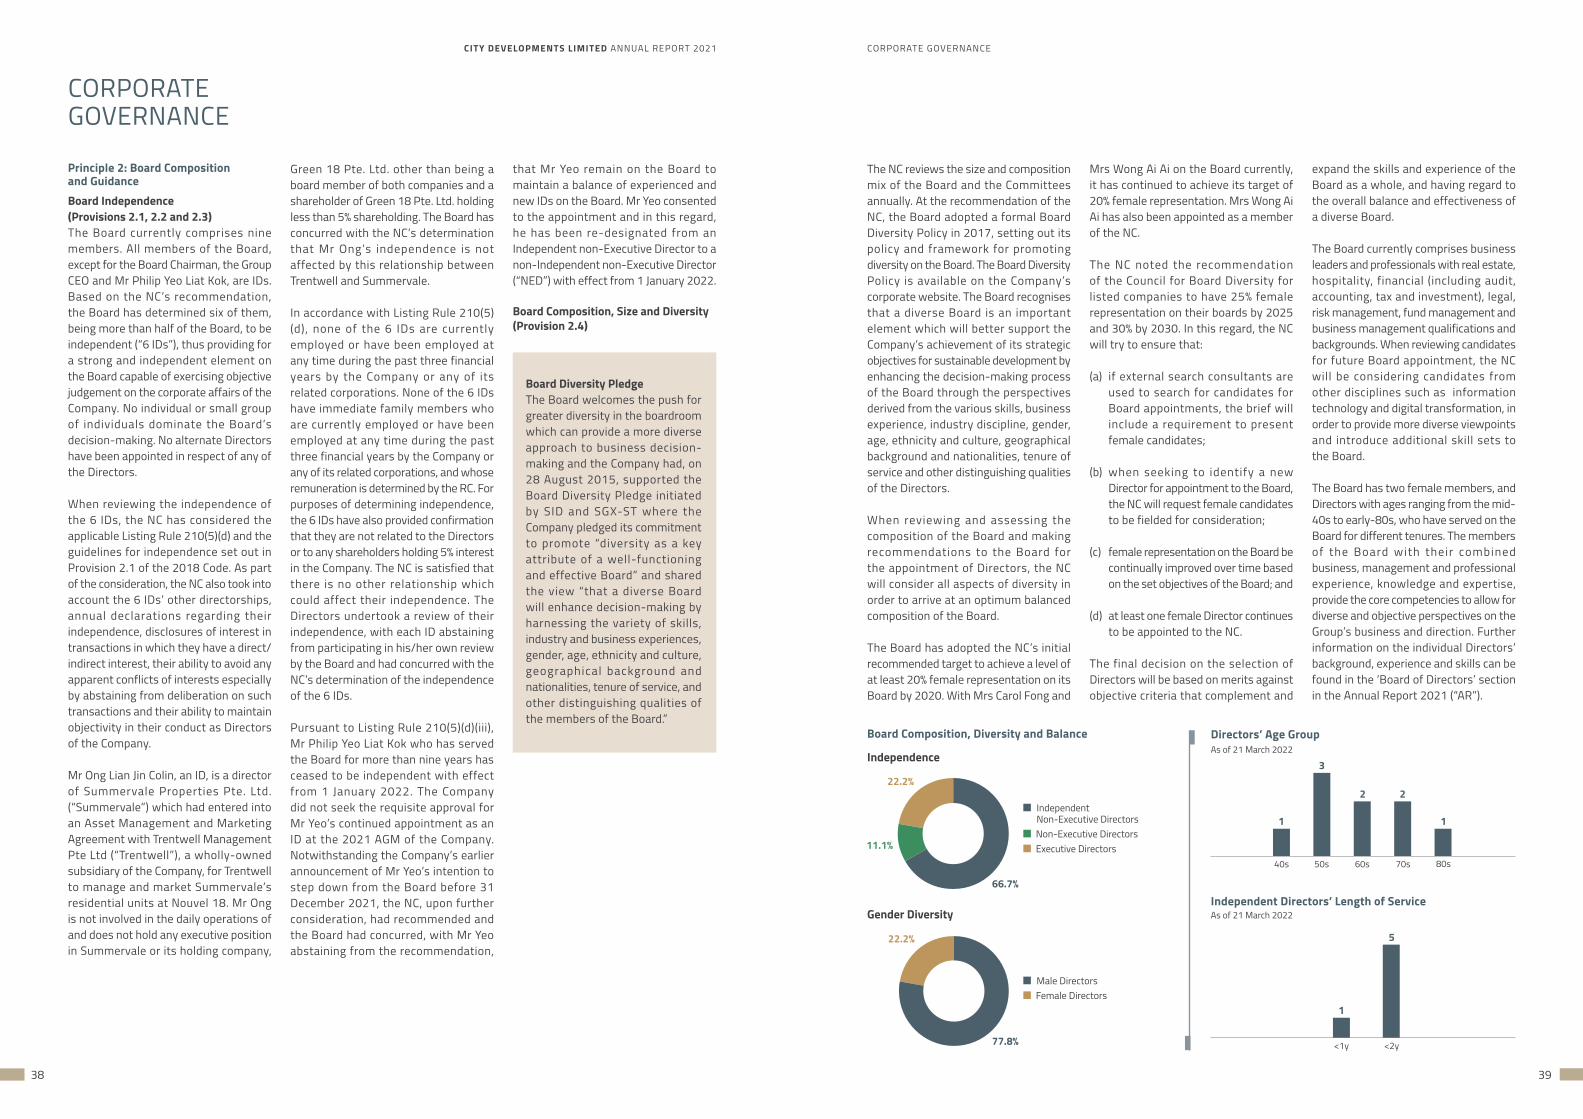
CITY DEVELOPMENTS LIMITED ANNUAL REPORT 2021 CORPORATE GOVERNANCE
38 39
Principle 2: Board Composition and GuidanceBoard Independence (Provisions 2.1, 2.2 and 2.3)The Board currently comprises nine members. All members of the Board, except for the Board Chairman, the Group CEO and Mr Philip Yeo Liat Kok, are IDs. Based on the NC’s recommendation, the Board has determined six of them, being more than half of the Board, to be independent (“6 IDs”), thus providing for a strong and independent element on the Board capable of exercising objective judgement on the corporate affairs of the Company. No individual or small group of individuals dominate the Board’s decision-making. No alternate Directors have been appointed in respect of any of the Directors.
When reviewing the independence of the 6 IDs, the NC has considered the applicable Listing Rule 210(5)(d) and the guidelines for independence set out in Provision 2.1 of the 2018 Code. As part of the consideration, the NC also took into account the 6 IDs’ other directorships, annual declarations regarding their independence, disclosures of interest in transactions in which they have a direct/indirect interest, their ability to avoid any apparent conflicts of interests especially by abstaining from deliberation on such transactions and their ability to maintain objectivity in their conduct as Directors of the Company.
Mr Ong Lian Jin Colin, an ID, is a director of Summervale Properties Pte. Ltd. (“Summervale”) which had entered into an Asset Management and Marketing Agreement with Trentwell Management Pte Ltd (“Trentwell”), a wholly-owned subsidiary of the Company, for Trentwell to manage and market Summervale’s residential units at Nouvel 18. Mr Ong is not involved in the daily operations of and does not hold any executive position in Summervale or its holding company,
CORPORATEGOVERNANCE
Green 18 Pte. Ltd. other than being a board member of both companies and a shareholder of Green 18 Pte. Ltd. holding less than 5% shareholding. The Board has concurred with the NC’s determination that Mr Ong’s independence is not affected by this relationship between Trentwell and Summervale.
In accordance with Listing Rule 210(5)(d), none of the 6 IDs are currently employed or have been employed at any time during the past three financial years by the Company or any of its related corporations. None of the 6 IDs have immediate family members who are currently employed or have been employed at any time during the past three financial years by the Company or any of its related corporations, and whose remuneration is determined by the RC. For purposes of determining independence, the 6 IDs have also provided confirmation that they are not related to the Directors or to any shareholders holding 5% interest in the Company. The NC is satisfied that there is no other relationship which could affect their independence. The Directors undertook a review of their independence, with each ID abstaining from participating in his/her own review by the Board and had concurred with the NC’s determination of the independence of the 6 IDs.
Pursuant to Listing Rule 210(5)(d)(iii), Mr Philip Yeo Liat Kok who has served the Board for more than nine years has ceased to be independent with effect from 1 January 2022. The Company did not seek the requisite approval for Mr Yeo’s continued appointment as an ID at the 2021 AGM of the Company. Notwithstanding the Company’s earlier announcement of Mr Yeo’s intention to step down from the Board before 31 December 2021, the NC, upon further consideration, had recommended and the Board had concurred, with Mr Yeo abstaining from the recommendation,
that Mr Yeo remain on the Board to maintain a balance of experienced and new IDs on the Board. Mr Yeo consented to the appointment and in this regard, he has been re-designated from an Independent non-Executive Director to a non-Independent non-Executive Director (“NED”) with effect from 1 January 2022.
Board Composition, Size and Diversity (Provision 2.4)
Board Diversity PledgeThe Board welcomes the push for greater diversity in the boardroom which can provide a more diverse approach to business decision-making and the Company had, on 28 August 2015, supported the Board Diversity Pledge initiated by SID and SGX-ST where the Company pledged its commitment to promote “diversity as a key attribute of a well-functioning and effective Board” and shared the view “that a diverse Board will enhance decision-making by harnessing the variety of skills, industry and business experiences, gender, age, ethnicity and culture, geographical background and nationalities, tenure of service, and other distinguishing qualities of the members of the Board.”
The NC reviews the size and composition mix of the Board and the Committees annually. At the recommendation of the NC, the Board adopted a formal Board Diversity Policy in 2017, setting out its policy and framework for promoting diversity on the Board. The Board Diversity Policy is available on the Company’s corporate website. The Board recognises that a diverse Board is an important element which will better support the Company’s achievement of its strategic objectives for sustainable development by enhancing the decision-making process of the Board through the perspectives derived from the various skills, business experience, industry discipline, gender, age, ethnicity and culture, geographical background and nationalities, tenure of service and other distinguishing qualities of the Directors.
When reviewing and assessing the composition of the Board and making recommendations to the Board for the appointment of Directors, the NC will consider all aspects of diversity in order to arrive at an optimum balanced composition of the Board.
The Board has adopted the NC’s initial recommended target to achieve a level of at least 20% female representation on its Board by 2020. With Mrs Carol Fong and
Mrs Wong Ai Ai on the Board currently, it has continued to achieve its target of 20% female representation. Mrs Wong Ai Ai has also been appointed as a member of the NC.
The NC noted the recommendation of the Council for Board Diversity for listed companies to have 25% female representation on their boards by 2025 and 30% by 2030. In this regard, the NC will try to ensure that:
(a) if external search consultants are used to search for candidates for Board appointments, the brief will include a requirement to present female candidates;
(b) when seeking to identify a new Director for appointment to the Board, the NC will request female candidates to be fielded for consideration;
(c) female representation on the Board be continually improved over time based on the set objectives of the Board; and
(d) at least one female Director continues to be appointed to the NC.
The final decision on the selection of Directors will be based on merits against objective criteria that complement and
Board Composition, Diversity and Balance
expand the skills and experience of the Board as a whole, and having regard to the overall balance and effectiveness of a diverse Board.
The Board currently comprises business leaders and professionals with real estate, hospitality, financial (including audit, accounting, tax and investment), legal, risk management, fund management and business management qualifications and backgrounds. When reviewing candidates for future Board appointment, the NC will be considering candidates from other disciplines such as information technology and digital transformation, in order to provide more diverse viewpoints and introduce additional skill sets to the Board.
The Board has two female members, and Directors with ages ranging from the mid-40s to early-80s, who have served on the Board for different tenures. The members of the Board with their combined business, management and professional experience, knowledge and expertise, provide the core competencies to allow for diverse and objective perspectives on the Group’s business and direction. Further information on the individual Directors’ background, experience and skills can be found in the ‘Board of Directors’ section in the Annual Report 2021 (“AR”).
Independence
66.7%
11.1%
77.8%
22.2%
22.2%
Gender Diversity
Independent Non-Executive Directors
Male Directors
Executive Directors Non-Executive Directors
Female Directors
Directors’ Age GroupAs of 21 March 2022
3
1 1
2 2
40s 50s 60s 70s 80s
Independent Directors’ Length of ServiceAs of 21 March 2022
1
5
<1y <2y
CITY DEVELOPMENTS LIMITED ANNUAL REPORT 2021 CORPORATE GOVERNANCE
40 41
Board Skill SetsIndustry Expertise Specific Expertise• Real estate development• Real estate investment• Hospitality• Fund management
• Business entrepreneurship and management• Strategic planning• Audit and tax• Accounting and financial management• Risk management• Legal
CORPORATEGOVERNANCE
Having considered the scope and nature of the operations of the Group, the Board is satisfied that the current composition mix and size of the Board provide for diversity and allow for informed and constructive discussions and effective decision-making at meetings of the Board and Committees. The Board w i l l h oweve r co nt i n u e t o rev i ew opportunities to refresh the Board with a view to expanding the skills, experience and diversity of the Board as a whole.
NEDs’ Participation (Provision 2.5)NEDs are encouraged to participate actively at Board meetings in the development of the Company’s strategic plans and direction, and in the review and monitoring of Management’s performance against targets. To facilitate this, they are kept informed of the Company’s businesses and performance through monthly reports from the Management and have unrestricted access to the Management. They also sit on various Committees established by the Board to provide unbiased and independent views, constructive input and the independent review and monitoring of performance of the Company and Management. One meeting of the IDs, chaired by the Lead ID, was held in 2021 without the presence of Management. The IDs would also confer among themselves without the presence of Management as and when the need arises. The Lead ID collates the feedback from the IDs and communicates the same to the Board and/or the Board Chairman as appropriate.
Principle 3: Chairman and Chief Executive Officer Roles of the Executive Chairman and the Group Chief Executive Officer (Provisions 3.1 and 3.2)The roles of Chairman of the Board and the Group CEO are separate to ensure a clear division of responsibilities and increased accountability.
The Chairman of the Board, Mr Kwek Leng Beng, is also the Executive Board Chairman. Mr Kwek Leng Beng plays an instrumental role in providing the Company with strong leadership and vision, leading the Board in its review of the Group’s strategies for sustainable growth. As the Board Chairman with written terms of reference approved by the Board, Mr Kwek Leng Beng also promotes and leads the Group in its commitment to achieve and maintain high standards of corporate governance. He bears primary responsibility for the workings of the Board, by ensuring effectiveness in all aspects of its role including setting the agenda for Board meetings with input from Management, ensuring sufficient allocation of time for thorough discussion of key agenda items at Board meetings, promoting an open environment within the Boardroom for constructive debate, encouraging the NEDs to speak freely and contribute effectively, and exercising control over the quality, quantity and timeliness of information flow between the Board and Management. At AGMs and other shareholders’ meetings, he plays a pivotal role in fostering constructive dialogue between shareholders, the Board and Management.
As Executive Board Chairman, he is the most senior executive in the Company
and bears overall executive responsibility for the Group’s business. Mr Kwek Leng Beng is assisted by the Group CEO, Mr Sherman Kwek. The Group CEO leads the members of the Management team and is responsible for implementing and reviewing the business direction and strategies for the Group as endorsed by the Board, and for operational p e r fo r m a n c e a n d o r g a n i s a t i o n a l excellence. He is the elder son of the Executive Board Chairman.
The Board has considered Mr Kwek Leng Beng’s role as an Executive Board Chairman and the strengths he brings to such a role by virtue of his stature and experience. Through the establishment of various Committees with power and authority to perform key functions without the undue influence from the Board Chairman, and the putting in place of internal controls for proper accountability and to allow for effective oversight by the Board of the Company’s business, the Board ensures that there is an appropriate balance of power which allows the Board to exercise objective decision-making in the best interests of the Company. The Board is of the view that Mr Kwek Leng Beng’s role as an Executive Board Chairman would continue to facilitate the Group’s decision-making and implementation process without diminishing the capacity of the Board for independent decision-making.
Lead Independent Director (Provision 3.3)Cognisant that the Board Chairman is an Executive Director and thus not independent, the Board has designated a Lead ID who serves as a sounding board for the Board Chairman and a s a n i nt e r m e d i a r y b et we e n t h e NEDs/IDs and the Board Chairman. The current Lead ID is Mr Lee Jee Cheng Philip who was appointed to the role on 3 May 2021.
The role of the Lead ID is set out in the written terms of reference for the Lead ID, which have been approved by the Board. The Lead ID is available to shareholders should they have concerns which cannot
be resolved or are inappropriate to raise through the normal communication channels of the Board Chairman or the Management. No query or request on any matter which requires the Lead ID’s attention was received from shareholders in 2021. Under the chairmanship of the Lead ID, a meeting of the IDs was convened in 2021 without the presence of Management or the Board Chairman, and the views expressed by the IDs at these meetings were communicated by the Lead ID to the Board Chairman and the Management, as appropriate.
Principle 4: Board MembershipNC Composition and Role (Provisions 4.1 and 4.2)Four out of the five members of the NC, including the NC chairman, are independent Directors. The Lead ID is one of the independent members of the NC.
The NC’s responsibilities as set out in its written terms of reference approved by the Board, are to examine Board size, review all Board and Committees composition and membership, board succession plans for the Directors (including the Board Chairman and the Group CEO) and the key management personnel (“KMP”) who are not Directors, determine each Director’s independence annually and as and when circumstances require, evaluate performance of the Board, Committees and the individual Directors, review appointments and re-appointment of Directors (including alternate directors, if any) and the reasons for resignations of Directors, review appointments and the reasons for resignations and terminations of the KMP who are not Directors, review and confirm the induction programmes for newly appointed Directors and for existing Directors in respect of their appointments to any of the Committees and review the training and continuous professional development programme for the Directors. The Company has identified the Group CEO, who is also a Director, the Group Chief Operating Officer (“Group COO”), the Group General Manager (“Group GM”), the Group Chief Investment Officer (“Group CIO”) and the Group Chief Financial Officer (“Group
CFO”), who are the most senior members of the Management team, as its KMP.
Four NC meetings were held in 2021. The Company Secretaries maintain records of all NC meetings including records of discussions on key deliberations and decisions taken.
For the financial year under review, the NC conducted a self-assessment of its own effectiveness in the discharge of its roles and responsibilities, which was facilitated through the use of a self-assessment checklist (“NC Self-Assessment Checklist”). The NC Self-Assessment Checklist covered, inter alia, the responsibilities of the NC under its terms of reference and considered also the contributions of NC members to the deliberation and decision-making process at NC meetings.
Based on the self-assessment, the NC is of the view that it has fulfilled its responsibilities and discharged its duties as set out in its terms of reference.
Nomination of Directors and Determination of Independence (Provisions 4.3 and 4.4)The NC reviews annually the nomination of the relevant Directors for re-election as well as the independence of Directors. When considering the nomination of Directors for re-election, the NC takes into account their contribution to the effectiveness of the Board (which includes their participation and candour at Board and Committee meetings) as well as their time commitment especially for Directors who have multiple board representations and/or other principal commitments, and also reviews their independence having regard to the provisions in the applicable Listing Rule 210(5)(d) and Provision 2.1 of the 2018 Code. The recommendation of the NC on the annual nomination of the Directors for re-election is submitted to the Board for decision and thereafter tabled at the AGM of the Company for consideration and approval by shareholders.
The Constitution of the Company provides that not less than one-third of the
Directors for the time being, shall retire as Directors at each AGM. All new Directors appointed by the Board shall hold office until the next AGM and are eligible for re-election at the said AGM.
In accordance with the Constitution of the Company, Mr Kwek Leng Beng, Mr Sherman Kwek Eik Tse and Mr Ong Lian Jin Colin are due to retire by rotation at the 59th Annual General Meeting (“2022 AGM”), and being eligible, have offered themselves for re-election at the 2022 AGM. Mrs Wong Ai Ai who was appointed by the Board prior to the 2022 AGM (“New Director”), will also retire and has offered herself for election at the 2022 AGM. The NC has considered their contribution and performance and recommended to the Board to nominate their re-election/election at the 2022 AGM.
Criteria and Process for Nomination and Selection of New Directors (Provision 4.3)The NC interviews shortlisted candidates b e fo re fo r m a l l y co n s i d e r i n g a n d recommending them for appointment to the Board and where applicable, to the Committees. Searches for potential candidates generally take into account recommendations from the Directors and various other sources, including candidates who may be suggested by SID, the Council for Board Diversity and other relevant organisations. Should it be necessary, the NC may consider the use of external search firms to find appropriate candidates. Shortlisted candidates would be required to furnish their curriculum vitae containing information on their academic/professional qualification, work experience, employment history and experience (if any) as directors of listed companies.
In reviewing and recommending to the Board any new Director appointments, the NC considers:
(a) the candidate’s track record, experience and capabilities or such other factors including age and gender, as may be determined by the NC to be relevant and which would contribute to the Board’s collective skill set;
CITY DEVELOPMENTS LIMITED ANNUAL REPORT 2021 CORPORATE GOVERNANCE
42 43
(b) any competing time commitments if the candidate has multiple listed company board representations and/or other principal commitments;
(c) the candidate’s independence, in the case of the appointment of an independent NED; and
(d) the composition requirements for the Board and Committees after matching the candidate’s skill set to the requirement of the relevant Committees (if the candidate is proposed to be appointed to any of the Committees).
Key Information on Directors (Provision 4.5)Please refer to the ‘Board of Directors’ section in the AR for key information on the Directors, including their date of first appointment and latest re-election to the Board, their academic/professional qualifications, major appointments/ principal commitments, directorships held in listed companies both currently and in the preceding five years, and other relevant information; ‘Additional Information on Directors seeking election/re-election at the 2022 AGM’; and the Notice of AGM for information on Directors proposed for election/re-election at the 2022 AGM.
Succession Planning for the Board, the Board Chairman and the KMP (Provision 4.1)The Board believes in carrying out succession planning for itself, the Board Chairman and the KMP to ensure continuity of leadership. Board renewal is a continuous process and in this regard, the NC reviews annually the composition of the Board and Committees, which includes size and mix, and recommends to the Board the selection and appointment of new Directors, whether in addition to the existing Board members or as replacement of retiring Board members, with a view to identifying any gaps in the Board’s skill sets taking into account the Group’s strategy and business operations. The Board will be able to function smoothly notwithstanding any resignation or retirement of any Director
CORPORATEGOVERNANCE
given the present number of members and mix of competencies on the Board.
Board Development (Provision 4.5)The NC rev iews the t ra in ing and development of the Directors to ensure that Directors receive appropriate development on a continuing basis, to perform their roles on the Board and where applicable, the Committees. The Directors are provided with updates and/or briefings to assist them to properly discharge their duties. The briefings are conducted either internally with invited speakers, or externally, at the Company’s expense. A separate programme is established for new Directors, details of which together with details of the internal briefing and updates provided to the Directors in 2021 are set out in the paragraph under the subject heading ‘Board Orientation and Training’ in this report.
The Board is kept apprised twice yearly on the list of training programmes attended by the Directors during the year.
Principle 5: Board PerformanceBoard Evaluation Process (Provision 5.1)The Company has in place a formal process for assessment of the effectiveness of the Board as a whole, the various Committees and the contribution by each Director towards the effectiveness of the Board and the Committees. No external facilitator has been used. The NC assesses the Board’s performance as a whole annually, using objective and appropriate criteria which were recommended by the NC and approved by the Board. When assessing the overall Board performance, the NC takes into consideration the feedback from individual Directors on areas relating to the Board’s role on strategy and performance, the Board’s process and governance (including oversight on internal controls and risk management), the Board’s competencies and effectiveness and the effectiveness of the Board Chairman. The results of the overall evaluation of the Board by the NC, including its recommendation, if any, for improvements, are presented to the Board.
The NC also undertook an evaluation of the performance of the Committees with the assistance of self-assessment c h e c k l i s t s c o m p l e t e d b y t h e s e Committees.
The annual evaluation process for the Board Chairman’s and the individual Director’s performance comprises two parts: (a) review of background information concerning the Director including his attendance records at Board, Committee and IDs’ (where applicable) meetings; and (b) NC’s evaluation based on certain assessment parameters, which were recommended by the NC and approved by the Board.
When deliberating on the performance of a particular Director who is also a member of the NC, that member abstains from the discussions in order to avoid any conflict of interests.
The results of the individual evaluation of the Directors are also used by the NC, in its consultation with the Board Chairman (who is also a member of the NC), to review, where appropriate, the composition of the Board and Committees, and to support its proposals, if any, for appointment of new members and its recommendations for the re-election of retiring Directors. The Board Chairman, as a member of the NC, is fully apprised of the results of the performance evaluation for the individual Directors and would take into consideration such evaluation and act as appropriate on the recommendations of the NC. Comments from the Directors, if any, concerning the Board as a whole and the general performance of the Directors, are also presented to the Board.
Board Evaluation Criteria (Provision 5.2)The qualitative criteria used by the NC to evaluate the Board covers six key areas relating to Board composition, Board independence, Board’s review o f t h e C o m p a n y ’ s s t r a t e g y a n d performance, Board’s oversight on the Company’s governance, including risk management and internal controls, and
the effectiveness of the Board Chairman and Board processes.
The quantitative criteria used to evaluate the overall Board performance comprises performance indicators which include a comparison of the Group’s performance (including segmental performance) for the financial period under review against the Group’s performance for the corresponding period in previous years, and other indicators such as the Company’s share price performance over a historical period.
Individual Director Evaluation Criteria (Provision 5.2) Factors taken into account in the assessment of a Director’s performance include their abilities and competencies, the ir ob ject iv i ty and the level of participation at Board and Committee meetings including their knowledge and contribution to Board processes and the business strategies and performance of the Group. The performance evaluation of each Director is taken into account in the NC’s consideration with regard to their re-election as Director.
REMUNERATION MATTERS
Principle 6: Procedures for Developing Remuneration PoliciesRC Composition and Role (Provisions 6.1, 6.2, 6.3 and 6.4)The RC comprises four NEDs, all of whom including the chairman of the RC, are independent. The RC’s principal responsibilities, as set out in its written terms of reference approved by the Board, are to review and recommend for the endorsement of the Board a framework of remuneration for the Directors, including the specific remuneration packages of the Executive Directors (“EDs”) and the KMP. Further, in consultation with the NC and the Management, the RC also considers the talent management framework so as to align with its review of the overall remuneration framework.
The Company has in place a remuneration framework (which covers all aspects of
remuneration) for the NEDs, EDs and KMP. On an annual basis, the RC reviews and recommends the specific remuneration packages for the EDs and the KMP, including the annual increments and year-end variable bonuses, for approval by the Board. The RC also considers the termination terms in the contracts of employment of the KMP to ensure that they are not unfair or unreasonable.
In 2021, Willis Towers Watson, external remuneration consultants, provided benchmark data on the remuneration for top executives in regional listed real estate companies of comparable size to the Company as well as the benchmark data for top listed companies in Singapore across all industries to help the RC in its consideration and proposal of the appropriate level of remuneration for the Company’s KMP to attract, retain and motivate for sustained performance and value creation. The Company has no relationship with the appointed remuneration consultants other than their engagement to provide such benchmark data, which could affect the said consultants’ independence.
The Company Secretaries maintain records of all RC meetings including records of discussions on key deliberations and decisions taken. Three meetings of the RC were held in 2021.
For the financial year under review, the RC conducted a self-assessment of its own effectiveness in the discharge of its roles and responsibilities, which was facilitated through the use of a self-assessment checklist (“RC Self-Assessment Checklist”). The RC Self-Assessment Checklist covered, inter alia, the responsibilities of the RC under its terms of reference and considered also the contribution of RC members to the deliberation and decision-making process at RC meetings.
Based on the self-assessment, the RC is of the view that it has fulfilled its responsibilities and discharged its duties as set out in its terms of reference.
Principle 7: Level and Mix of Remuneration of Directors and KMP (Provisions 7.1, 7.2 and 7.3)
The Company’s remuneration policy for Directors comprises the following distinct objectives:
• to ensure that the procedure for determining remuneration for Directors is formal and transparent;
• to ensure that the level of remuneration is sufficient (without being excessive) to attract and retain Directors to exercise oversight responsibility over the Company; and
• to ensure that no Director is involved in deciding on his own remuneration.
In reviewing the remuneration packages of the EDs and the KMP, the RC, with the assistance of external remuneration consultants, considers the level of remuneration based on the Company’s remuneration policy which comprises the following distinct objectives:
• to reward employees for achieving corporate and individual performance targets in a fair and equitable way; and
• to ensure that the remuneration reflects employees’ duties and responsibilities.
The Company advocates a performance-based remuneration system that is flexible and responsive to the market, and the performance of the Group’s business units and individual employees. In designing the compensation structure, the Company seeks to ensure that the level and mix of remuneration is competitive, relevant and appropriate in finding a balance between the current and long-term objectives of the Company. In its review of the KMP’s remuneration, the RC links the KMP’s incentive plans against the key performance indicators as measured by the pre-set targets of the GET (Growth, Enhancement and Transformation) strategy.
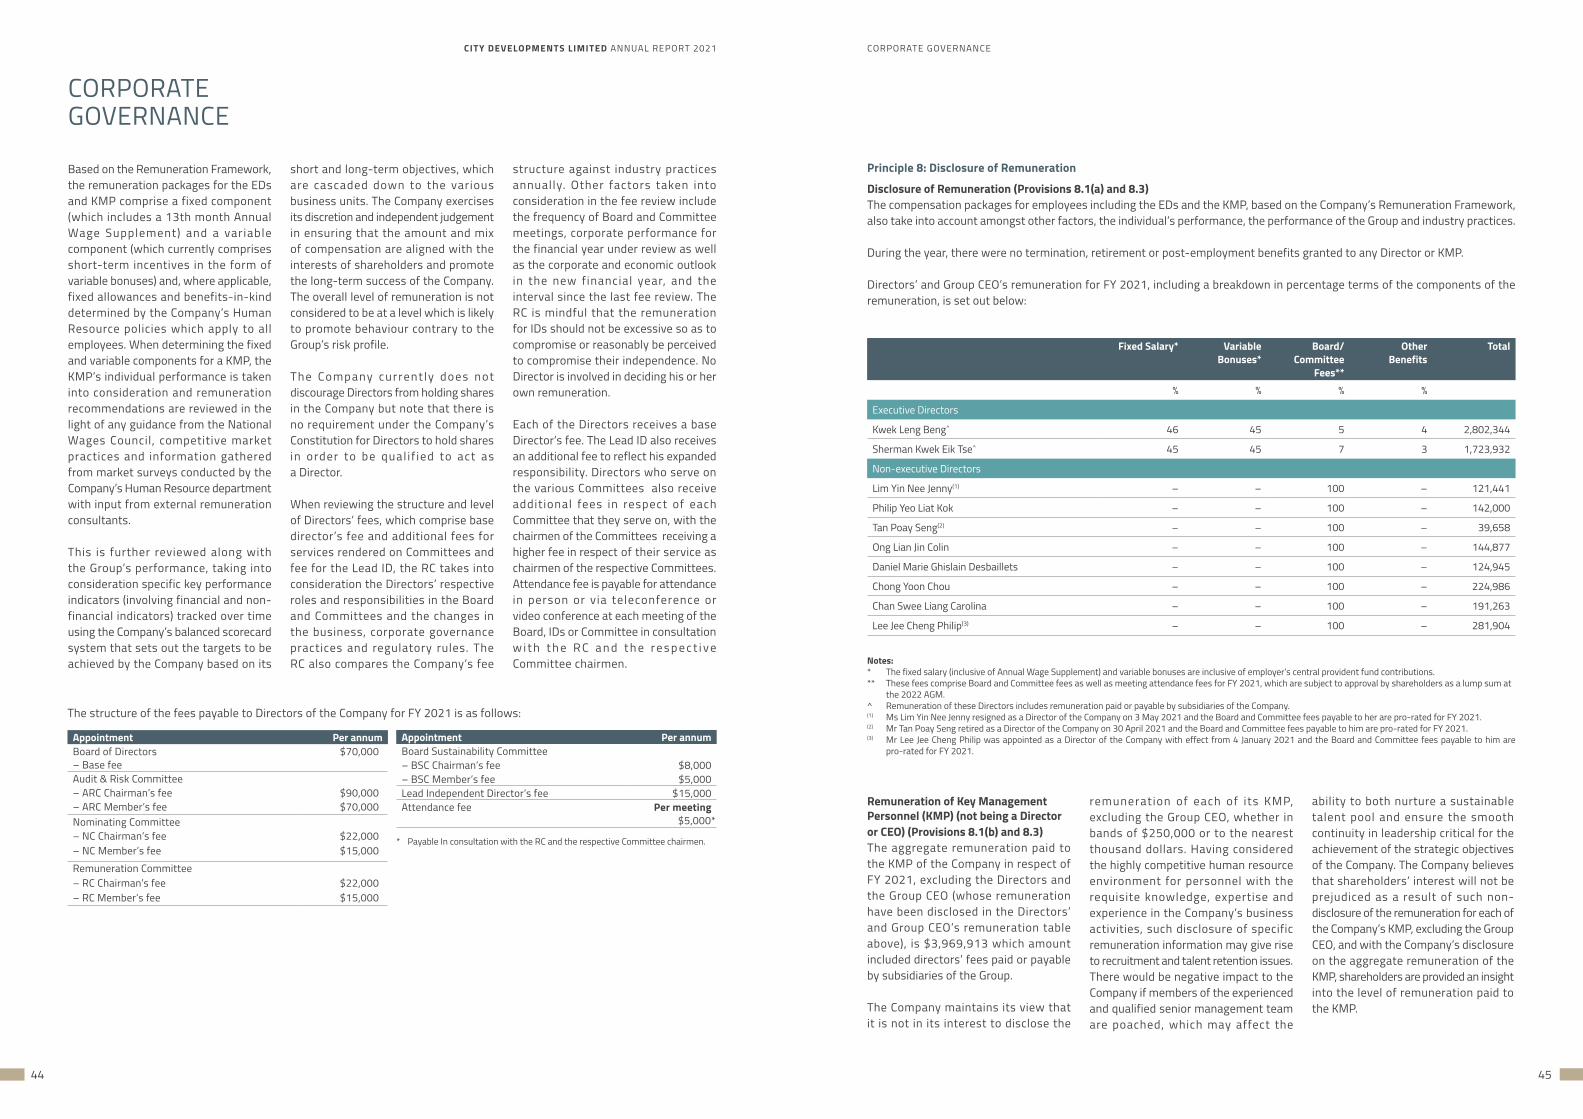
CITY DEVELOPMENTS LIMITED ANNUAL REPORT 2021 CORPORATE GOVERNANCE
44 45
Based on the Remuneration Framework, the remuneration packages for the EDs and KMP comprise a fixed component (which includes a 13th month Annual Wage Supplement) and a variable component (which currently comprises short-term incentives in the form of variable bonuses) and, where applicable, fixed allowances and benefits-in-kind determined by the Company’s Human Resource policies which apply to all employees. When determining the fixed and variable components for a KMP, the KMP’s individual performance is taken into consideration and remuneration recommendations are reviewed in the light of any guidance from the National Wages Council, competitive market practices and information gathered from market surveys conducted by the Company’s Human Resource department with input from external remuneration consultants.
This is further reviewed along with the Group’s performance, taking into consideration specific key performance indicators (involving financial and non-financial indicators) tracked over time using the Company’s balanced scorecard system that sets out the targets to be achieved by the Company based on its
CORPORATEGOVERNANCE
short and long-term objectives, which are cascaded down to the various business units. The Company exercises its discretion and independent judgement in ensuring that the amount and mix of compensation are aligned with the interests of shareholders and promote the long-term success of the Company. The overall level of remuneration is not considered to be at a level which is likely to promote behaviour contrary to the Group’s risk profile.
The Company current ly does not discourage Directors from holding shares in the Company but note that there is no requirement under the Company’s Constitution for Directors to hold shares in order to be qual i f ied to act as a Director.
When reviewing the structure and level of Directors’ fees, which comprise base director’s fee and additional fees for services rendered on Committees and fee for the Lead ID, the RC takes into consideration the Directors’ respective roles and responsibilities in the Board and Committees and the changes in the business, corporate governance practices and regulatory rules. The RC also compares the Company’s fee
structure against industry practices annually. Other factors taken into consideration in the fee review include the frequency of Board and Committee meetings, corporate performance for the financial year under review as well as the corporate and economic outlook in the new financial year, and the interval since the last fee review. The RC is mindful that the remuneration for IDs should not be excessive so as to compromise or reasonably be perceived to compromise their independence. No Director is involved in deciding his or her own remuneration.
Each of the Directors receives a base Director’s fee. The Lead ID also receives an additional fee to reflect his expanded responsibility. Directors who serve on the various Committees also receive addit ional fees in respect of each Committee that they serve on, with the chairmen of the Committees receiving a higher fee in respect of their service as chairmen of the respective Committees. Attendance fee is payable for attendance in person or via teleconference or video conference at each meeting of the Board, IDs or Committee in consultation w i t h t h e R C a n d t h e r e s p e c t i v e Committee chairmen.
The structure of the fees payable to Directors of the Company for FY 2021 is as follows:
Appointment Per annumBoard of Directors– Base fee
$70,000
Audit & Risk Committee– ARC Chairman’s fee $90,000– ARC Member’s fee $70,000Nominating Committee– NC Chairman’s fee $22,000– NC Member’s fee $15,000Remuneration Committee– RC Chairman’s fee $22,000– RC Member’s fee $15,000
Appointment Per annumBoard Sustainability Committee– BSC Chairman’s fee $8,000– BSC Member’s fee $5,000Lead Independent Director’s fee $15,000Attendance fee Per meeting
$5,000*
* Payable In consultation with the RC and the respective Committee chairmen.
Principle 8: Disclosure of Remuneration
Disclosure of Remuneration (Provisions 8.1(a) and 8.3)The compensation packages for employees including the EDs and the KMP, based on the Company’s Remuneration Framework, also take into account amongst other factors, the individual’s performance, the performance of the Group and industry practices.
During the year, there were no termination, retirement or post-employment benefits granted to any Director or KMP.
Directors’ and Group CEO’s remuneration for FY 2021, including a breakdown in percentage terms of the components of the remuneration, is set out below:
Fixed Salary* Variable Bonuses*
Board/ Committee
Fees**
Other Benefits
Total
% % % %
Executive Directors
Kwek Leng Beng^ 46 45 5 4 2,802,344
Sherman Kwek Eik Tse^ 45 45 7 3 1,723,932
Non-executive Directors
Lim Yin Nee Jenny(1) – – 100 – 121,441
Philip Yeo Liat Kok – – 100 – 142,000
Tan Poay Seng(2) – – 100 – 39,658
Ong Lian Jin Colin – – 100 – 144,877
Daniel Marie Ghislain Desbaillets – – 100 – 124,945
Chong Yoon Chou – – 100 – 224,986
Chan Swee Liang Carolina – – 100 – 191,263
Lee Jee Cheng Philip(3) – – 100 – 281,904
Notes:* The fixed salary (inclusive of Annual Wage Supplement) and variable bonuses are inclusive of employer’s central provident fund contributions.** These fees comprise Board and Committee fees as well as meeting attendance fees for FY 2021, which are subject to approval by shareholders as a lump sum at
the 2022 AGM.^ Remuneration of these Directors includes remuneration paid or payable by subsidiaries of the Company.(1) Ms Lim Yin Nee Jenny resigned as a Director of the Company on 3 May 2021 and the Board and Committee fees payable to her are pro-rated for FY 2021.(2) Mr Tan Poay Seng retired as a Director of the Company on 30 April 2021 and the Board and Committee fees payable to him are pro-rated for FY 2021.(3) Mr Lee Jee Cheng Philip was appointed as a Director of the Company with effect from 4 January 2021 and the Board and Committee fees payable to him are
pro-rated for FY 2021.
Remuneration of Key Management Personnel (KMP) (not being a Director or CEO) (Provisions 8.1(b) and 8.3)The aggregate remuneration paid to the KMP of the Company in respect of FY 2021, excluding the Directors and the Group CEO (whose remuneration have been disclosed in the Directors’ and Group CEO’s remuneration table above), is $3,969,913 which amount included directors’ fees paid or payable by subsidiaries of the Group.
The Company maintains its view that it is not in its interest to disclose the
remuneration of each of i ts KMP, excluding the Group CEO, whether in bands of $250,000 or to the nearest thousand dollars. Having considered the highly competitive human resource environment for personnel with the requisite knowledge, expertise and experience in the Company’s business activities, such disclosure of specific remuneration information may give rise to recruitment and talent retention issues. There would be negative impact to the Company if members of the experienced and qualified senior management team are poached, which may affect the
ability to both nurture a sustainable talent pool and ensure the smooth continuity in leadership critical for the achievement of the strategic objectives of the Company. The Company believes that shareholders’ interest will not be prejudiced as a result of such non-disclosure of the remuneration for each of the Company’s KMP, excluding the Group CEO, and with the Company’s disclosure on the aggregate remuneration of the KMP, shareholders are provided an insight into the level of remuneration paid to the KMP.
CITY DEVELOPMENTS LIMITED ANNUAL REPORT 2021 CORPORATE GOVERNANCE
46 47
Remuneration of Directors’ Immediate Family Members for FY 2021 (Provision 8.2)There are no other employees of the Company who are substantial share holde rs of the Company or i m m e d i a t e f a m i l y m e m b e r s o f a Director or of the Group CEO, and whose remuneration exceeds $100,000 during the year.
Share Option Schemes (Provision 8.3)Whilst the Company currently does not have a share option or long-term incentive scheme in place, it is open to establishing such a scheme to promote alignment towards long-term objectives. When such long-term incentive scheme is established in due course with the assistance of external advisers, the Company will consider the inclusion of claw-back provisions within the scheme which would give the right to the Company to reclaim incentive components from participants in exceptional circumstances of misstatement of financial results or of misconduct resulting in financial loss to the Company.
ACCOUNTABILITY AND AUDIT
Principle 9: Risk Management and Internal Controls
The Company maintains an adequate and ef fect ive system of interna l controls (including financial, operational, compliance and IT controls) and risk management systems to safeguard s t a ke h o l d e r s ’ i n t e r e s t s a n d t h e Group’s assets. The Board has overall responsibility for the governance of risk, including determining the risk strategy, risk appetite and risk limits, as well as the risk policies.
Oversight of Risk Management (Provision 9.1)The ARC assists the Board in carrying out the Board’s responsibility of overseeing the Company’s r isk management framework and policies for the Group and ensuring that Management maintains a sound system of internal controls and risk management.
CORPORATEGOVERNANCE
T h e C o m p a n y ’ s E n t e r p r i s e R i s k Management (“ERM”) Framework is implemented under the supervision of the Risk Management Committee (“RMC”), chaired by the Group CEO and comprising the Senior Management team, key functional leaders and heads of business divisions.
The ARC receives regular reports on the risk management activities of the Company and progress on the ERM framework. Key risks including Tier 1 risks are reviewed and refreshed to ensure that relevant emerging risks are being considered and included for proper assessment, monitoring and reporting as appropriate. Based on the reports of the RMC, the ARC is satisfied that significant risks identified are assessed, managed and monitored adequately within the Group’s ERM Framework. The ERM Framework includes a periodic review of the risk appetite statements and risk appetite and tolerance limits for these key risks, which statements and limits are considered and endorsed by the ARC and the Board.
Having regard to the risks to which the Group is exposed, the likelihood of such risks occurring and the risk tolerance accepted by the Group, an internal controls structure has been designed and put in place by the Management to provide reasonable assurance against material financial misstatements, for the safeguarding of assets, for the maintenance of proper accounting records, on the reliability, relevance and integrity of the information (including financial information).
The Group’s approach to risk management is set out in the ‘Risk Management’ section on pages 57 to 62 of this AR.
As part of the internal and external audit programmes, the internal and external auditors report to the ARC any audit findings relating to internal controls, and the ARC reviews the adequacy of the actions taken by Management to address the recommendations of the internal and external auditors.
The ARC also receives regular reports, briefings and updates from the RMC, the Chief Technology Officer, the internal and external auditors and the Management team during its meetings to help the ARC to review the adequacy and effectiveness of the Group’s material internal controls that address the Group’s financial, operational, compliance and IT controls.
Assurances from the Key Management Personnel (Provision 9.2)In relation to Provision 9.2 of the 2018 Code and Listing Rule 1207(10), the ARC received:
(i) written assurance from the Group CEO and the Group CFO that the Group’s financial records have been properly maintained and the financial statements give a true and fair view of the Group’s operations and finances; and
(ii) written assurance from the KMP that the Group’s risk management and internal controls systems in place were adequate and effective to address the principal risks (including financial, operational, compliance and IT risks) within the current scope of the Group’s business operations for FY 2021.
The above written assurances on the Group’s internal controls and risk management systems are provided half yearly and are supported by similar written assurances provided by the heads of the Group’s key operating divisions/functions and key operating subsidiaries.
T h e p r o c e s s o f r e v i e w i n g a n d strengthening the Group’s control environment is an evolving process. When controls should be enhanced, the Board and Management take action to rectify and strengthen the internal controls and risk management systems. The Board and Management will continue to devote resources and expertise towards improving the internal policies and procedures to maintain a high level of governance and internal
controls. However, the Board also notes that no system of internal controls and risk management can provide absolute assurance against poor judgement in decision-making, human errors, losses, fraud and other irregularities.
Based on the work performed by Internal Auditors, the external auditors and the periodic reports from the RMC and Management, as well as the written assurances from the KMP to support the opinion to be given by the ARC and the Board, the Board with the concurrence of the ARC, is of the opinion that the internal controls and risk management systems in place as at 31 December 2021 are adequate and effective to address principal risks (including financial, operational, compliance and IT risks) within the current scope of the Group’s business operations.
Principle 10: Audit & Risk CommitteeComposition of the ARC (Provisions 10.2 and 10.3)The ARC comprises three NEDs, all of whom including the chairman of the ARC are independent. During the year, Ms Lim Yin Nee Jenny ceased as the chairman of the ARC following her resignation from the Board on 3 May 2021. Mr Lee Jee Cheng Philip and Mrs Carol Fong were appointed the chairman and member of the ARC, respectively, on 3 May 2021. The chairman of the ARC, Mr Lee, possesses the relevant audit, accounting and related financial management and risk management expertise and experience, whilst the remaining members of the ARC, Mr Chong Yoon Chou and Mrs Fong each has financial and risk management experience as well as experience in investment banking and the financial markets respectively.
With the current composition, the ARC is of the opinion that it has the relevant accounting and related financial management expertise and experience to discharge its functions within its
written terms of reference which has been approved by the Board.
Based on the terms of reference of the ARC, a former partner or director of the Company’s existing auditing firm or auditing corporation should not act as a member of the ARC: (a) within a period of two years commencing on the date of his or her ceasing to be a partner of the auditing firm or director of the auditing corporation; and in any case, (b) for as long as he or she has any financial interest in the auditing firm or auditing corporation. Mr Lee ceased as a partner of KPMG LLP (“KPMG”), the Company’s existing auditors, in September 2018 and does not have any financial interest in KPMG. The remaining ARC members do not have any relationship with KPMG.
Powers and Duties of the ARC (Provision 10.1)The ARC is authorised by the Board to review or investigate any matters it deems appropriate within its terms of reference and has direct and unrestricted access to the external and internal auditors. It may invite any Director, Management, officer or employee of the Company to attend its meetings. It is also authorised to engage any firm of accountants, lawyers or other professionals as it sees fit to provide independent counsel and advice to assist in the review or investigation on such matters within its terms of reference as it deems appropriate at the Company’s expense.
The principal responsibility of the ARC is to assist the Board in maintaining a high standard of corporate governance, particularly by providing an independent review of the adequacy and effectiveness of the Group’s financial reporting process (including reviewing the accounting policies and practices of the Company and the Group on a consolidated basis) and key internal controls, including financial, operational, compliance, IT and risk management controls. Other duties within its written terms of reference include:
• to review with Management and, where appropriate, with the external auditors the significant financial reporting issues and judgements so as to ensure the integrity of the half yearly and full year financial statements of the Group to be issued by the Company before their submission to the Board and any other announcements relating to the Group’s financial performance;
• to review annually the scope and results of the external audit and the independence and objectivity of the external auditors, and in this regard to also review the nature and extent of any non-audit services provided by the external auditors to the Group;
• to make recommendations to the Board on the nomination for the appointment, re-appointment and removal of external auditors, and to approve the remuneration and terms of engagement of the external auditors;
• to assess the role and effectiveness of the internal audit (“IA”) function in the overall context of the Group’s internal controls and risk management systems, and to consider the results of their review and evaluation of the Group’s internal controls, including financial, operational, compliance and IT controls, and risk management policies and systems;
• to approve the appointment, resignation or dismissal of the Head of IA;
• t o r e v i e w i n t e r e s t e d p e r s o n transactions falling within the scope of Chapter 9 of the Listing Manual; and
• to oversee the establishment and operation of the Company’s whistle-blowing policy and arrangements put in place for raising concerns about possible improprieties on matters of financial reporting or any other matters.
CITY DEVELOPMENTS LIMITED ANNUAL REPORT 2021 CORPORATE GOVERNANCE
48 49
In the review of the financial statements for the year ended 31 December 2021, the ARC has discussed with both the Management and the external auditors the ongoing impact of the COVID-19 pandemic and its effects on the business segments in which the Group operates, and the accounting principles that were applied and their judgement of items that might affect the integrity of the financial statements. The following significant matters impacting the financial statements were discussed with Management and the external auditors:
CORPORATEGOVERNANCE
Significant Matters How the ARC reviewed these matters and what decisions were madeValuation of development properties
The ARC considered the approach and methodology applied in assessing the net realisable values of development properties especially development properties with low margins. Where appropriate, the ARC had inquired of Management on its basis and its strategy to sell the unsold units.
The ARC reviewed either Management’s or the valuers’ underlying assumptions on estimated future selling prices by comparing to recently transacted price or prices of comparable properties located in the vicinity of the Group’s development projects. The ARC also noted the historical accuracy of Management’s estimate of future selling prices in assessing the reasonableness of the estimated future selling prices.
The ARC also noted the uncertain global economic outlook, together with the ongoing uncertainties brought about by the COVID-19 pandemic and government measures implemented, might exert downward pressure on property prices in countries where the Group holds development properties for sale.
The ARC was satisfied with the approach and assessment adopted by Management in arriving at the net realisable values of the development properties as at 31 December 2021.
The valuation of the development properties was also an area of focus for the external auditors. The external auditors have included this item as a key audit matter in their audit report for the financial year ended 31 December 2021. Refer to pages 107 and 108 of the AR.
Valuation of hotel assets classified as property, plant and equipment
The ARC considered the approach and methodology applied in assessing the valuation of the hotel assets.
The ARC reviewed the Management’s approach and methodology in respect of the valuations of the hotel properties conducted by both internal and external valuers, including the review of the methodologies and key assumptions applied in the valuation of hotel properties such as forecasted cashflows, future market growth, occupancy rates, average room rate growth, discount rates, terminal rates and capitalisation rates in the valuation model.
COVID-19 continues to impact the hospitality sector and the implications of COVID-19 were considered in the key assumptions applied in the valuations undertaken. The ARC noted that the valuation reports obtained from the external valuers for certain hotels highlighted that the COVID-19 pandemic gave rise to an unprecedented set of circumstances on which to base a judgement. Consequently, less certainty and a higher degree of caution should be attached to these valuations than would normally be the case. Values may change more rapidly and significantly than during standard market conditions. Due to the uncertainties that the pandemic may have on the real estate market, external valuers have also recommended to keep the valuation of these properties under frequent review.
The ARC was satisfied with the valuation process and the valuers are members of recognised professional bodies for valuers and have considered their own independence in carrying out their work. The valuation methodologies used are in line with generally accepted market practices and the key assumptions used are generally comparable to currently observable market data, taking into consideration the uncertainties arising from the COVID-19 pandemic.
The valuation of the hotel assets was also an area of focus for the external auditors. The external auditors have included this item as a key audit matter in their audit report for the financial year ended 31 December 2021. Refer to pages 106 and 107 of the AR.
Internal Audit (Provisions 10.4 and 10.5)The IA function is independent of the activities it audits. The Head of IA’s primary reporting line is to the ARC. The appointment, resignation and dismissal of the Head of IA is reviewed and/or approved by the ARC. The ARC also provides input on the annual performance appraisal of the Head of IA and reviews his compensation within the compensation policies of the Company. The ARC meets the Head of IA at least once annually without the presence of Management. The Head of IA has unfettered access to the ARC, the Board and Management as well as the Group’s documents, records, properties and personnel relevant for the performance of audits.
IA operates within the framework stated in its IA Charter which is approved and reviewed by the ARC on an annual basis. The standards of the IA Charter are consistent with the International Standards for the Professional Practice of Internal Auditing set by the Institute of Internal Auditors (IIA), an international professional association with global headquarters in United States of America.
The Head of IA, Mr Benson Seah, is a Certified Internal Auditor and a member of various professional bodies, with over 20 years of experience. He has been with the Company since June 2019. All his team members have the relevant qualifications and experience and are members of The Institute of Internal Auditors of Singapore and/or members of relevant professional bodies. The IA function is a corporate member of the Institute of Internal Auditors Singapore (IIAS), an affiliate of the IIA. Processes are in place to ensure that the professional competence of the IA staff is maintained and upgraded t h ro u g h co n t i n u i n g p ro fe s s i o n a l education programmes which comprised technical and non-technical training for the development of the IA staff.
Role and Activities of IAThe primary role of IA is to assist the Board to evaluate the reliability, adequacy and effectiveness of the internal controls
and risk management processes of the Company, reviewing the internal controls of the Company to ensure prompt and accurate recording of transactions and proper safeguarding of assets and reviewing the Company’s compliance with the relevant laws, regulations and policies of the Company.
The ARC approved the annual IA plan and received regular reports during 2021 on the progress of the audit work under the IA plan. All IA reports are given to the ARC, the KMP and the Heads of the relevant business divisions, with a summary report of IA results presented at the ARC meetings. IA observations on internal control, operational and human lapses and recommendations to address them were also reviewed and discussed at ARC meetings. The ARC was satisfied that recommendations made were dealt with by the Management in a timely and appropriate manner, with outstanding exceptions or recommendations being closely monitored and reported back to the ARC.
The ARC reviewed the effectiveness and adequacy of the IA function including its resources through a review of the IA activities on a regular basis as well as its annual assessment of the IA function. The assessment was facilitated through the use of an evaluation framework which covers IA organisation, resources and continuing training, audit plans work scope, quality of reports and recommendations, IA Charter and IA internal control assessment. Based on the assessment conducted for 2021, the ARC is satisfied with the quality and effectiveness of the IA function and that the IA function is currently adequately resourced and has appropriate independent standing within the Group to perform its functions effectively.
Provision 10.5The ARC held nine meetings during the year and carried out its duties as set out within its terms of reference. The Company Secretaries maintain records of all ARC meetings including records of discussions on key deliberations and
decisions taken. The ARC meets with the internal and external auditors, each separately without the presence of Management, annually.
The ARC members keep themselves abreast of changes to accounting standards, risks and other issues which may have a material impact on financial statements. These included the following trainings attended in 2021:
• ACRA-SGX-SID Audit Committee Seminar 2021: Enterprise Resilience and Risk Management
• AC Chapter Pit-Stop Series: An Insider Guide to Cryptocurrency and Blockchain
• AC Chapter Pit-Stop Ser ies :The Insolvency and Restructuring Regime in Singapore – Changes and Consolidation
• AC Chapter Pit-Stop Series: Valuation – Addressing Challenges in Uncertain Economic Times
• Future of Assurance: Digital Risks• Roadmap to Mandatory Climate-
related Disclosures• Looking Beyond the Pandemic :
Important Role of the AC• SID Climate Governance Singapore
Launch• SID Directors Conference 2021: Asia’s
Renaissance - The new era of Recovery and Reopening
For the financial year under review, the ARC conducted a self-assessment of its own effectiveness in the discharge of its roles and responsibilities, which was facilitated through the use of a self-assessment checklist (“ARC Self-Assessment Checklist”).
The ARC Self-Assessment Checklist covered, inter alia, the responsibilities of the ARC under its terms of reference, and also considered the contribution of ARC members to the ARC’s deliberation and decision-making process.
Based on the self-assessment, the ARC is of the view that it has fulfilled its responsibilities and discharged its duties as set out in its terms of reference.
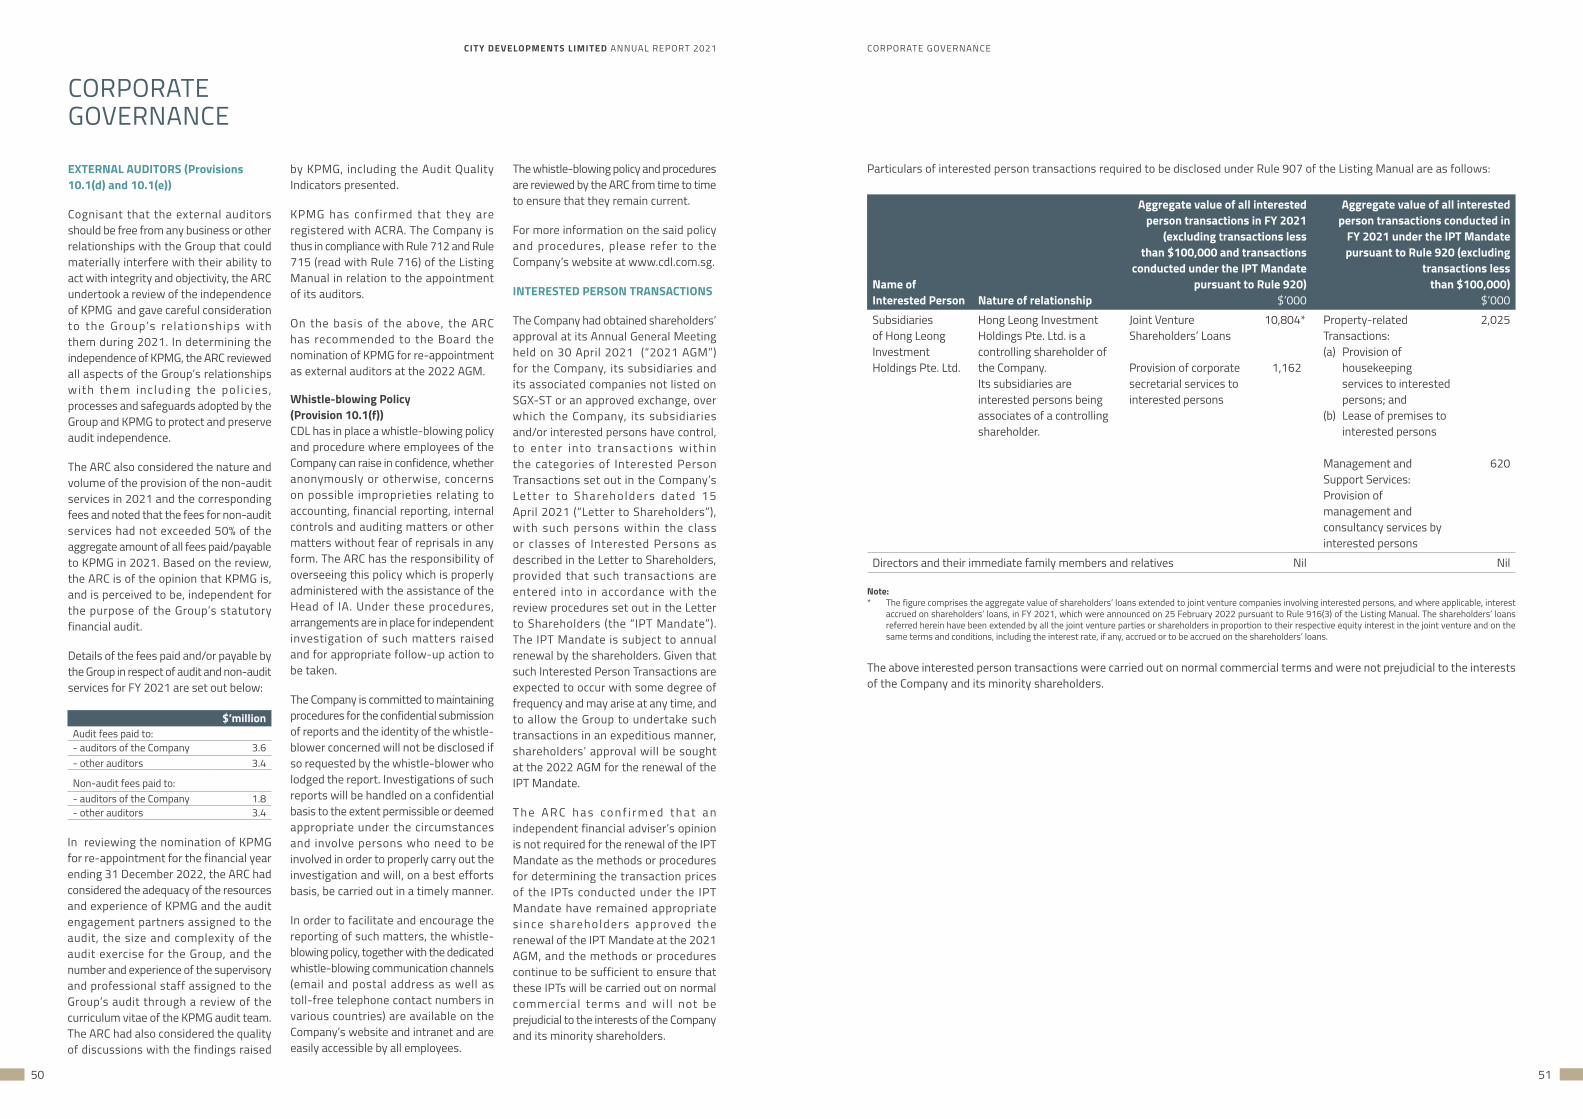
CITY DEVELOPMENTS LIMITED ANNUAL REPORT 2021 CORPORATE GOVERNANCE
50 51
CORPORATEGOVERNANCE
EXTERNAL AUDITORS (Provisions 10.1(d) and 10.1(e))
Cognisant that the external auditors should be free from any business or other relationships with the Group that could materially interfere with their ability to act with integrity and objectivity, the ARC undertook a review of the independence of KPMG and gave careful consideration to the Group’s relat ionships with them during 2021. In determining the independence of KPMG, the ARC reviewed all aspects of the Group’s relationships with them including the pol ic ies , processes and safeguards adopted by the Group and KPMG to protect and preserve audit independence.
The ARC also considered the nature and volume of the provision of the non-audit services in 2021 and the corresponding fees and noted that the fees for non-audit services had not exceeded 50% of the aggregate amount of all fees paid/payable to KPMG in 2021. Based on the review, the ARC is of the opinion that KPMG is, and is perceived to be, independent for the purpose of the Group’s statutory financial audit.
Details of the fees paid and/or payable by the Group in respect of audit and non-audit services for FY 2021 are set out below:
$’millionAudit fees paid to:- auditors of the Company 3.6- other auditors 3.4
Non-audit fees paid to:- auditors of the Company 1.8- other auditors 3.4
In reviewing the nomination of KPMG for re-appointment for the financial year ending 31 December 2022, the ARC had considered the adequacy of the resources and experience of KPMG and the audit engagement partners assigned to the audit, the size and complexity of the audit exercise for the Group, and the number and experience of the supervisory and professional staff assigned to the Group’s audit through a review of the curriculum vitae of the KPMG audit team. The ARC had also considered the quality of discussions with the findings raised
by KPMG, including the Audit Quality Indicators presented.
KPMG has confirmed that they are registered with ACRA. The Company is thus in compliance with Rule 712 and Rule 715 (read with Rule 716) of the Listing Manual in relation to the appointment of its auditors.
On the basis of the above, the ARC has recommended to the Board the nomination of KPMG for re-appointment as external auditors at the 2022 AGM.
Whistle-blowing Policy (Provision 10.1(f))CDL has in place a whistle-blowing policy and procedure where employees of the Company can raise in confidence, whether anonymously or otherwise, concerns on possible improprieties relating to accounting, financial reporting, internal controls and auditing matters or other matters without fear of reprisals in any form. The ARC has the responsibility of overseeing this policy which is properly administered with the assistance of the Head of IA. Under these procedures, arrangements are in place for independent investigation of such matters raised and for appropriate follow-up action to be taken.
The Company is committed to maintaining procedures for the confidential submission of reports and the identity of the whistle-blower concerned will not be disclosed if so requested by the whistle-blower who lodged the report. Investigations of such reports will be handled on a confidential basis to the extent permissible or deemed appropriate under the circumstances and involve persons who need to be involved in order to properly carry out the investigation and will, on a best efforts basis, be carried out in a timely manner.
In order to facilitate and encourage the reporting of such matters, the whistle-blowing policy, together with the dedicated whistle-blowing communication channels (email and postal address as well as toll-free telephone contact numbers in various countries) are available on the Company’s website and intranet and are easily accessible by all employees.
The whistle-blowing policy and procedures are reviewed by the ARC from time to time to ensure that they remain current.
For more information on the said policy and procedures, please refer to the Company’s website at www.cdl.com.sg.
INTERESTED PERSON TRANSACTIONS
The Company had obtained shareholders’ approval at its Annual General Meeting held on 30 April 2021 (“2021 AGM”) for the Company, its subsidiaries and its associated companies not listed on SGX-ST or an approved exchange, over which the Company, its subsidiaries and/or interested persons have control, to enter into transact ions within the categories of Interested Person Transactions set out in the Company’s Letter to Shareholders dated 15 April 2021 (“Letter to Shareholders”), with such persons within the class or classes of Interested Persons as described in the Letter to Shareholders, provided that such transactions are entered into in accordance with the review procedures set out in the Letter to Shareholders (the “IPT Mandate”). The IPT Mandate is subject to annual renewal by the shareholders. Given that such Interested Person Transactions are expected to occur with some degree of frequency and may arise at any time, and to allow the Group to undertake such transactions in an expeditious manner, shareholders’ approval will be sought at the 2022 AGM for the renewal of the IPT Mandate.
T h e A R C h a s c o n f i r m e d t h a t a n independent financial adviser’s opinion is not required for the renewal of the IPT Mandate as the methods or procedures for determining the transaction prices of the IPTs conducted under the IPT Mandate have remained appropriate s ince shareholders approved the renewal of the IPT Mandate at the 2021 AGM, and the methods or procedures continue to be sufficient to ensure that these IPTs will be carried out on normal commercial terms and wil l not be prejudicial to the interests of the Company and its minority shareholders.
Particulars of interested person transactions required to be disclosed under Rule 907 of the Listing Manual are as follows:
Name of Interested Person Nature of relationship
Aggregate value of all interested person transactions in FY 2021
(excluding transactions less than $100,000 and transactions
conducted under the IPT Mandate pursuant to Rule 920)
$’000
Aggregate value of all interested person transactions conducted in
FY 2021 under the IPT Mandate pursuant to Rule 920 (excluding
transactions lessthan $100,000)
$’000Subsidiaries of Hong Leong Investment Holdings Pte. Ltd.
Hong Leong Investment Holdings Pte. Ltd. is a controlling shareholder of the Company.Its subsidiaries are interested persons being associates of a controlling shareholder.
Joint Venture Shareholders’ Loans
Provision of corporate secretarial services to interested persons
10,804*
1,162
Property-related Transactions:(a) Provision of
housekeeping services to interested persons; and
(b) Lease of premises to interested persons
Management and Support Services: Provision of management and consultancy services by interested persons
2,025
620
Directors and their immediate family members and relatives Nil Nil
Note:* The figure comprises the aggregate value of shareholders’ loans extended to joint venture companies involving interested persons, and where applicable, interest
accrued on shareholders’ loans, in FY 2021, which were announced on 25 February 2022 pursuant to Rule 916(3) of the Listing Manual. The shareholders’ loans referred herein have been extended by all the joint venture parties or shareholders in proportion to their respective equity interest in the joint venture and on the same terms and conditions, including the interest rate, if any, accrued or to be accrued on the shareholders’ loans.
The above interested person transactions were carried out on normal commercial terms and were not prejudicial to the interests of the Company and its minority shareholders.
CITY DEVELOPMENTS LIMITED ANNUAL REPORT 2021 CORPORATE GOVERNANCE
52 53
For the 2021 AGM which was held by electronic means, shareholders were able to vote by appointing the Chairman of the Meeting as proxy to vote on their behalf. Proxy forms submitted by shareholders were independently verified by the independent scrutineers. Results of the valid votes submitted, showing the number of votes cast for and against each resolution and the respective percentages, were announced by the Chairman at the AGM and thereafter, via SGXNET.
Minutes of General Meetings (Provision 11.5)The Company also maintains minutes of its general meetings, which include the key comments and queries raised by shareholders and the responses from the Board, Management and/or the external auditors. The minutes of the general meetings are available on the Company’s corporate website, and the Company will also furnish the general meeting minutes to any shareholder upon request.
Dividend Policy (Provision 11.6)The Company has formalised its dividend policy which aims to provide a return to shareholders at least once a year through the payment of dividends, after taking into account the Group’s financial performance, short and long-term capital requirements, future investment plans, general global and business economic conditions and any regulatory factors. The Board endeavours to maintain a balance between meeting shareholders’ expectat ions and prudent capital management with a sustainable dividend policy. The Board will review the dividend policy from time to time and reserves the right to modify, amend and update the policy.
Principle 12: Engagement with Shareholders
The Company notifies its investors in advance of the date of release of its financial results via SGXNET. For FY 2021, results for the half year were released via SGXNET within 45 days of the end of 30 June 2021 whilst the full year results were released within 60 days from the financial year end. In
CORPORATEGOVERNANCE
presenting the Group’s financial results, the Board aims to provide investors with a balanced and understandable assessment of the Group’s performance and financial position with a commentary at the date of the announcement of the significant trends and competitive conditions of the industry in which it operates.
For the financial year under review, the Group CEO and the Group CFO provided assurance to the ARC and the Board on the integrity of the half year unaudited financial statements and the Board in turn provided a negative assurance confirmation in respect of the unaudited financial statements for the half year in accordance with the regulatory requirements.
The Company ensures that investors are notified of all material information in an accurate and timely manner. Should there be an inadvertent disclosure made to a select group, the Company will release the same information as promptly as possible via SGXNET. The financial statements and other presentation materials presented at the Company’s general meetings, including material and price-sensitive information, are disseminated and publicly released via SGXNET on a timely basis.
SHAREHOLDER RIGHTS AND ENGAGEMENT
Principle 11: Shareholder Rights and Conduct of General Meetings
Being committed to good corporate pract ices, the Company treats al l shareholders fairly and equitably. To facilitate the exercise of shareholders’ rights, the Company ensures that all material information relating to the Company and its financial performance is disclosed in an accurate and timely manner via SGXNET and uploaded at the Company’s corporate website.
General Meetings (Provisions 11.1, 11.2 and 11.3)All shareholders are entitled to attend and vote at general meetings in person or by proxy. The rules for the appointment of proxies, including information that voting will be conducted by way of poll, are set out in the notice of general meetings. In accordance with the Constitution of the Company, shareholders who are not relevant intermediaries may appoint not more than two proxies to attend, speak and vote at general meetings in their absence, and shareholders who are relevant intermediaries may appoint more than two proxies to attend, speak and vote at general meetings. The proxy forms must be deposited at such place or places specified in the notice or document accompanying the notice convening the general meetings at least seventy-two hours before the time set for the general meetings.
The Company provides for separate resolutions at general meetings on each substantial issue, including treating the re-election of each Director as a separate subject matter. Detailed information on each item in the AGM agenda is provided in the explanatory notes to the notice of AGM in the AR.
At general meetings of the Company, shareholders are given the opportunity to communicate their views and are encouraged to ask the Directors and the Management questions regarding matters affecting the Company.
2021 AGM and 2022 AGM
In view of the COVID-19 situation, the 2021 AGM was convened and held by electronic means on 30 April 2021 pursuant to the COVID-19 (Temporary Measures) (Alternative Arrangements for Meetings for Companies, Variable Capital Companies, Business Trusts, Unit Trusts and Debenture Holders) Order 2020 (the “Order”).
Alternative arrangements relating to attendance at the 2021 AGM via electronic means (including arrangements by which the meeting can be electronically accessed via ’live’ audio-visual webcast or ‘live’ audio only stream), submission of questions to the Chairman of the Meeting in advance of the 2021 AGM, addressing of substantial and relevant questions prior to the AGM and voting by appointing the Chairman of the Meeting as proxy at the AGM, were put in place for the 2021 AGM. In addition, arrangements were made for ‘live’ submission of questions for the 2021 AGM.
The Board Chairman and the chairmen of the ARC, NC, RC and BSC, together with the KMP (who are not Directors) were present on site at the 2021 AGM. The other Directors and the external auditors attended the 2021 AGM virtually.
In view of the ongoing COVID-19 situation, the Company will be convening the 2022 AGM via electronic means pursuant to the Order. Alternative arrangements have been put in place to allow shareholders to participate at the 2022 AGM by:
(i) observing and/or listening to AGM proceedings via ‘live’ audio-visual webcast or ‘live’ audio-only stream;
(ii) submitting questions to the Chairman of the AGM in advance of, or ‘live’ at, the AGM; and/or
(iii) (a) voting at the AGM ‘ l ive’ via electronic means; (b) appointing a proxy(ies) (other than the Chairman of the AGM) to vote ‘live’ via electronic means on their behalf at the AGM; or (c) appointing the Chairman of the AGM as proxy to vote on their behalf at the AGM.
Details of the steps for pre-registration, submission of questions and voting at the 2022 AGM are set out in a separate announcement to be released on SGXNET together with the Notice of AGM. In view of the constantly evolving COVID-19 situation in Singapore, the Company may be required to change its arrangements for the 2022 AGM at short notice. Shareholders should check the Company’s corporate website or the SGX website for the latest updates on the status of the 2022 AGM.
Voting at General Meetings (Provision 11.4)Shareholders are given the opportunity to vote at general meetings either in person or in absentia by way of appointed proxy (proxies). However, as the authentication of shareholder identity information and other related integrity issues still remain a concern, the Company has decided, for the time being, not to implement voting in absentia by electronic means.
Pursuant to Listing Rule 730A(2), all resolutions to be proposed at general meetings and at any adjournment thereof shall be put to the vote by way of poll.
In support of greater transparency and to allow for a more efficient voting system, the Company has been conducting electronic poll voting instead of voting by show of hands since the 2012 AGM up to the 2019 AGM. With electronic poll voting, shareholders present in person or represented by proxy at the meeting will be entitled to vote on a ‘one-share, one-vote’ basis. The voting results of all votes cast in respect of each resolution will also be instantaneously displayed on screen at the meeting. The detailed results setting out the number of votes cast for and against each resolution and the respective percentages will be announced via SGXNET after the AGM. An external firm is appointed as scrutineers for the AGM voting process, which is independent of the f i rm appointed to undertake the electronic poll voting process.
In 2021, the following documents were made available to shareholders solely by electronic means via publication on the (i) Company’s corporate website and (ii) SGXNET:
• Notice of the Company’s 2021 AGM;• Proxy Form for 2021 AGM;• Annual Report 2020 (and updated
shareholding statistics as at 16 March 2021); and
• Letter to Shareholders dated 15 April 2021, in relation to the proposed renewal of the (a) share purchase mandate; and (b) IPT mandate for interested person transactions.
Shareholder Communication (Provision 12.1) Shareholders and investors can contact the Company or access information on the Company at its website at www.cdl.com.sg which has a dedicated
‘Investor Relations’ link that provides, inter alia, information on the Board of Directors, Management team, the Company’s C o r p o r a t e G o v e r n a n c e R e p o r t s , Sustainability Reports, Annual Reports, Corporate Policies, Announcements, Press Releases and Financial Results as released by the Company on SGXNET, and other information which may be relevant to investors. In addition, the Company leverages on other communication platforms such as its online newsroom (www.cdl.com.sg/newsroom) and social media channels (LinkedIn, Twitter and Instagram) to provide latest updates on the Group’s business and performance milestones. Investors can subscribe to email alerts on the CDL website or follow its social media channels to receive updates on its latest news.
From time to time, the Board Chairman and the Company’s Management hold briefings with analysts and the media to coincide with the release of the Group’s half-year and full-year financial results. Media presentation sl ides are also released on SGXNET and on the Company’s website. A live video webcast was arranged for investors at the analysts/media briefing for the full year 2021 results in February 2022. In addition, the Management takes an active role in investor relations, meeting local and foreign fund managers regularly as well as participating in investor roadshows and conferences both locally and overseas. The Head, Investor Relations & Corporate Communications, is responsible for managing the Group’s investor relations programmes, including the communications with the financial community, research analysts and relevant stakeholders.
Investor Relations Policy (Provisions 12.2 and 12.3)The Company is committed to building investor confidence and trust through effective open, two-way communication with shareholders and the investment community. The Company’s Investor Relations (IR) Policy, available on the CDL corporate website (www.cdl.com.sg), sets out the process and mechanism
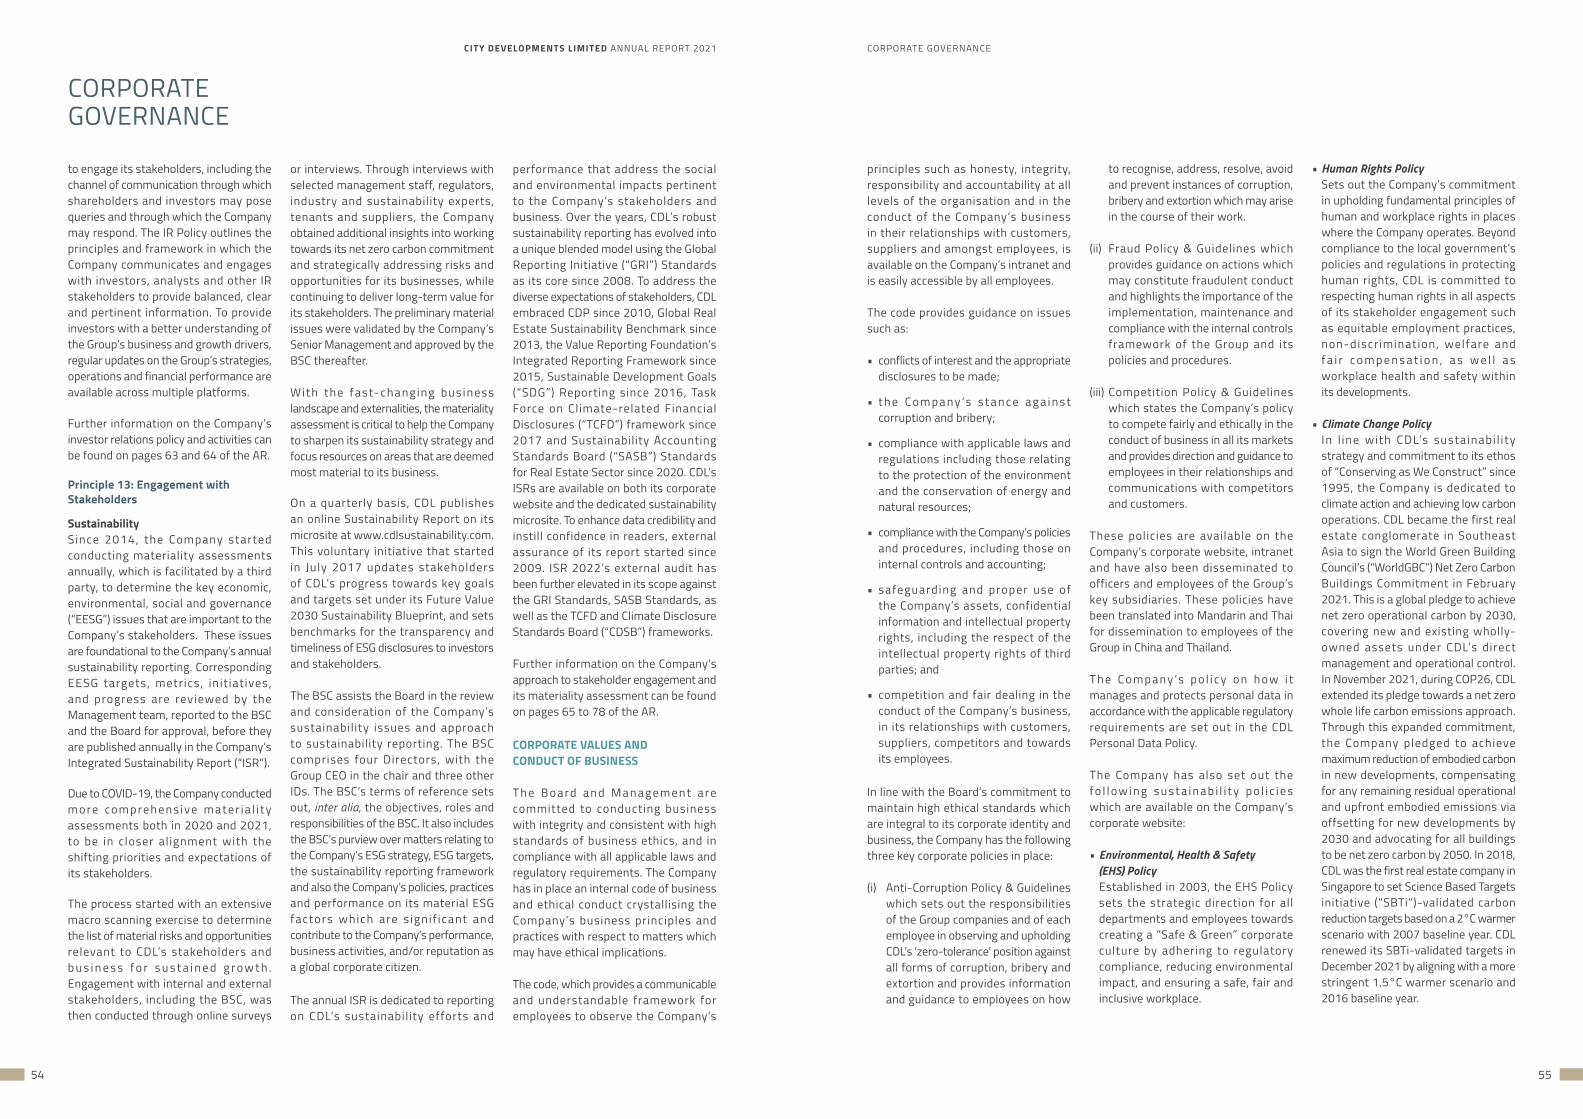
CITY DEVELOPMENTS LIMITED ANNUAL REPORT 2021 CORPORATE GOVERNANCE
54 55
or interviews. Through interviews with selected management staff, regulators, industry and sustainability experts, tenants and suppliers, the Company obtained additional insights into working towards its net zero carbon commitment and strategically addressing risks and opportunities for its businesses, while continuing to deliver long-term value for its stakeholders. The preliminary material issues were validated by the Company’s Senior Management and approved by the BSC thereafter.
With the fast-changing business landscape and externalities, the materiality assessment is critical to help the Company to sharpen its sustainability strategy and focus resources on areas that are deemed most material to its business.
On a quarterly basis, CDL publishes an online Sustainability Report on its microsite at www.cdlsustainability.com. This voluntary initiative that started in July 2017 updates stakeholders of CDL’s progress towards key goals and targets set under its Future Value 2030 Sustainability Blueprint, and sets benchmarks for the transparency and timeliness of ESG disclosures to investors and stakeholders.
The BSC assists the Board in the review and consideration of the Company’s sustainability issues and approach to sustainability reporting. The BSC comprises four Directors, with the Group CEO in the chair and three other IDs. The BSC’s terms of reference sets out, inter alia, the objectives, roles and responsibilities of the BSC. It also includes the BSC’s purview over matters relating to the Company’s ESG strategy, ESG targets, the sustainability reporting framework and also the Company’s policies, practices and performance on its material ESG factors which are s ignif icant and contribute to the Company’s performance, business activities, and/or reputation as a global corporate citizen.
The annual ISR is dedicated to reporting on CDL’s sustainability efforts and
CORPORATEGOVERNANCE
performance that address the social and environmental impacts pertinent to the Company’s stakeholders and business. Over the years, CDL’s robust sustainability reporting has evolved into a unique blended model using the Global Reporting Initiative (“GRI”) Standards as its core since 2008. To address the diverse expectations of stakeholders, CDL embraced CDP since 2010, Global Real Estate Sustainability Benchmark since 2013, the Value Reporting Foundation’s Integrated Reporting Framework since 2015, Sustainable Development Goals (“SDG”) Reporting since 2016, Task Force on Climate-related Financial Disclosures (“TCFD”) framework since 2017 and Sustainability Accounting Standards Board (“SASB”) Standards for Real Estate Sector since 2020. CDL’s ISRs are available on both its corporate website and the dedicated sustainability microsite. To enhance data credibility and instill confidence in readers, external assurance of its report started since 2009. ISR 2022’s external audit has been further elevated in its scope against the GRI Standards, SASB Standards, as well as the TCFD and Climate Disclosure Standards Board (“CDSB”) frameworks.
Further information on the Company’s approach to stakeholder engagement and its materiality assessment can be found on pages 65 to 78 of the AR.
CORPORATE VALUES AND CONDUCT OF BUSINESS
T h e B o a rd a n d M a n a g e m e n t a re committed to conducting business with integrity and consistent with high standards of business ethics, and in compliance with all applicable laws and regulatory requirements. The Company has in place an internal code of business and ethical conduct crystallising the Company’s business principles and practices with respect to matters which may have ethical implications.
The code, which provides a communicable and understandable framework for employees to observe the Company’s
principles such as honesty, integrity, responsibility and accountability at all levels of the organisation and in the conduct of the Company’s business in their relationships with customers, suppliers and amongst employees, is available on the Company’s intranet and is easily accessible by all employees.
The code provides guidance on issues such as:
• conflicts of interest and the appropriate disclosures to be made;
• t h e Co m p a n y ’s s t a n c e a g a i n s t corruption and bribery;
• compliance with applicable laws and regulations including those relating to the protection of the environment and the conservation of energy and natural resources;
• compliance with the Company’s policies and procedures, including those on internal controls and accounting;
• safeguarding and proper use of the Company’s assets, confidential information and intellectual property rights, including the respect of the intellectual property rights of third parties; and
• competition and fair dealing in the conduct of the Company’s business, in its relationships with customers, suppliers, competitors and towards its employees.
In line with the Board’s commitment to maintain high ethical standards which are integral to its corporate identity and business, the Company has the following three key corporate policies in place:
(i) Anti-Corruption Policy & Guidelines which sets out the responsibilities of the Group companies and of each employee in observing and upholding CDL’s ‘zero-tolerance’ position against all forms of corruption, bribery and extortion and provides information and guidance to employees on how
to engage its stakeholders, including the channel of communication through which shareholders and investors may pose queries and through which the Company may respond. The IR Policy outlines the principles and framework in which the Company communicates and engages with investors, analysts and other IR stakeholders to provide balanced, clear and pertinent information. To provide investors with a better understanding of the Group’s business and growth drivers, regular updates on the Group’s strategies, operations and financial performance are available across multiple platforms.
Further information on the Company’s investor relations policy and activities can be found on pages 63 and 64 of the AR.
Principle 13: Engagement with Stakeholders
SustainabilitySince 2014, the Company started conducting materiality assessments annually, which is facilitated by a third party, to determine the key economic, environmental, social and governance (“EESG”) issues that are important to the Company’s stakeholders. These issues are foundational to the Company’s annual sustainability reporting. Corresponding EESG targets, metrics, init iatives, and progress are reviewed by the Management team, reported to the BSC and the Board for approval, before they are published annually in the Company’s Integrated Sustainability Report (“ISR”).
Due to COVID-19, the Company conducted m o re co m p re h e n s i ve m a t e r i a l i t y assessments both in 2020 and 2021, to be in closer alignment with the shifting priorities and expectations of its stakeholders.
The process started with an extensive macro scanning exercise to determine the list of material risks and opportunities relevant to CDL’s stakeholders and b u s i n e s s f o r s u s t a i n e d g r o w t h . Engagement with internal and external stakeholders, including the BSC, was then conducted through online surveys
to recognise, address, resolve, avoid and prevent instances of corruption, bribery and extortion which may arise in the course of their work.
(ii) Fraud Policy & Guidelines which provides guidance on actions which may constitute fraudulent conduct and highlights the importance of the implementation, maintenance and compliance with the internal controls framework of the Group and its policies and procedures.
(iii) Competition Policy & Guidelines which states the Company’s policy to compete fairly and ethically in the conduct of business in all its markets and provides direction and guidance to employees in their relationships and communications with competitors and customers.
These policies are available on the Company’s corporate website, intranet and have also been disseminated to officers and employees of the Group’s key subsidiaries. These policies have been translated into Mandarin and Thai for dissemination to employees of the Group in China and Thailand.
T h e Co m p a ny ’s p o l i c y o n h ow i t manages and protects personal data in accordance with the applicable regulatory requirements are set out in the CDL Personal Data Policy.
The Company has also set out the fo l l o w i n g s u s t a i n a b i l i t y p o l i c i e s which are available on the Company’s corporate website:
• Environmental, Health & Safety (EHS) Policy
Established in 2003, the EHS Policy sets the strategic direction for all departments and employees towards creating a “Safe & Green” corporate culture by adhering to regulatory compliance, reducing environmental impact, and ensuring a safe, fair and inclusive workplace.
• Human Rights Policy Sets out the Company’s commitment
in upholding fundamental principles of human and workplace rights in places where the Company operates. Beyond compliance to the local government’s policies and regulations in protecting human rights, CDL is committed to respecting human rights in all aspects of its stakeholder engagement such as equitable employment practices, non-discrimination, welfare and f a i r c o m p e n s a t i o n , a s w e l l a s workplace health and safety within its developments.
• Climate Change Policy In l ine with CDL’s sustainabi l i ty
strategy and commitment to its ethos of “Conserving as We Construct” since 1995, the Company is dedicated to climate action and achieving low carbon operations. CDL became the first real estate conglomerate in Southeast Asia to sign the World Green Building Council’s (“WorldGBC”) Net Zero Carbon Buildings Commitment in February 2021. This is a global pledge to achieve net zero operational carbon by 2030, covering new and existing wholly-owned assets under CDL’s direct management and operational control. In November 2021, during COP26, CDL extended its pledge towards a net zero whole life carbon emissions approach. Through this expanded commitment, the Company pledged to achieve maximum reduction of embodied carbon in new developments, compensating for any remaining residual operational and upfront embodied emissions via offsetting for new developments by 2030 and advocating for all buildings to be net zero carbon by 2050. In 2018, CDL was the first real estate company in Singapore to set Science Based Targets initiative (“SBTi”)-validated carbon reduction targets based on a 2°C warmer scenario with 2007 baseline year. CDL renewed its SBTi-validated targets in December 2021 by aligning with a more stringent 1.5°C warmer scenario and 2016 baseline year.
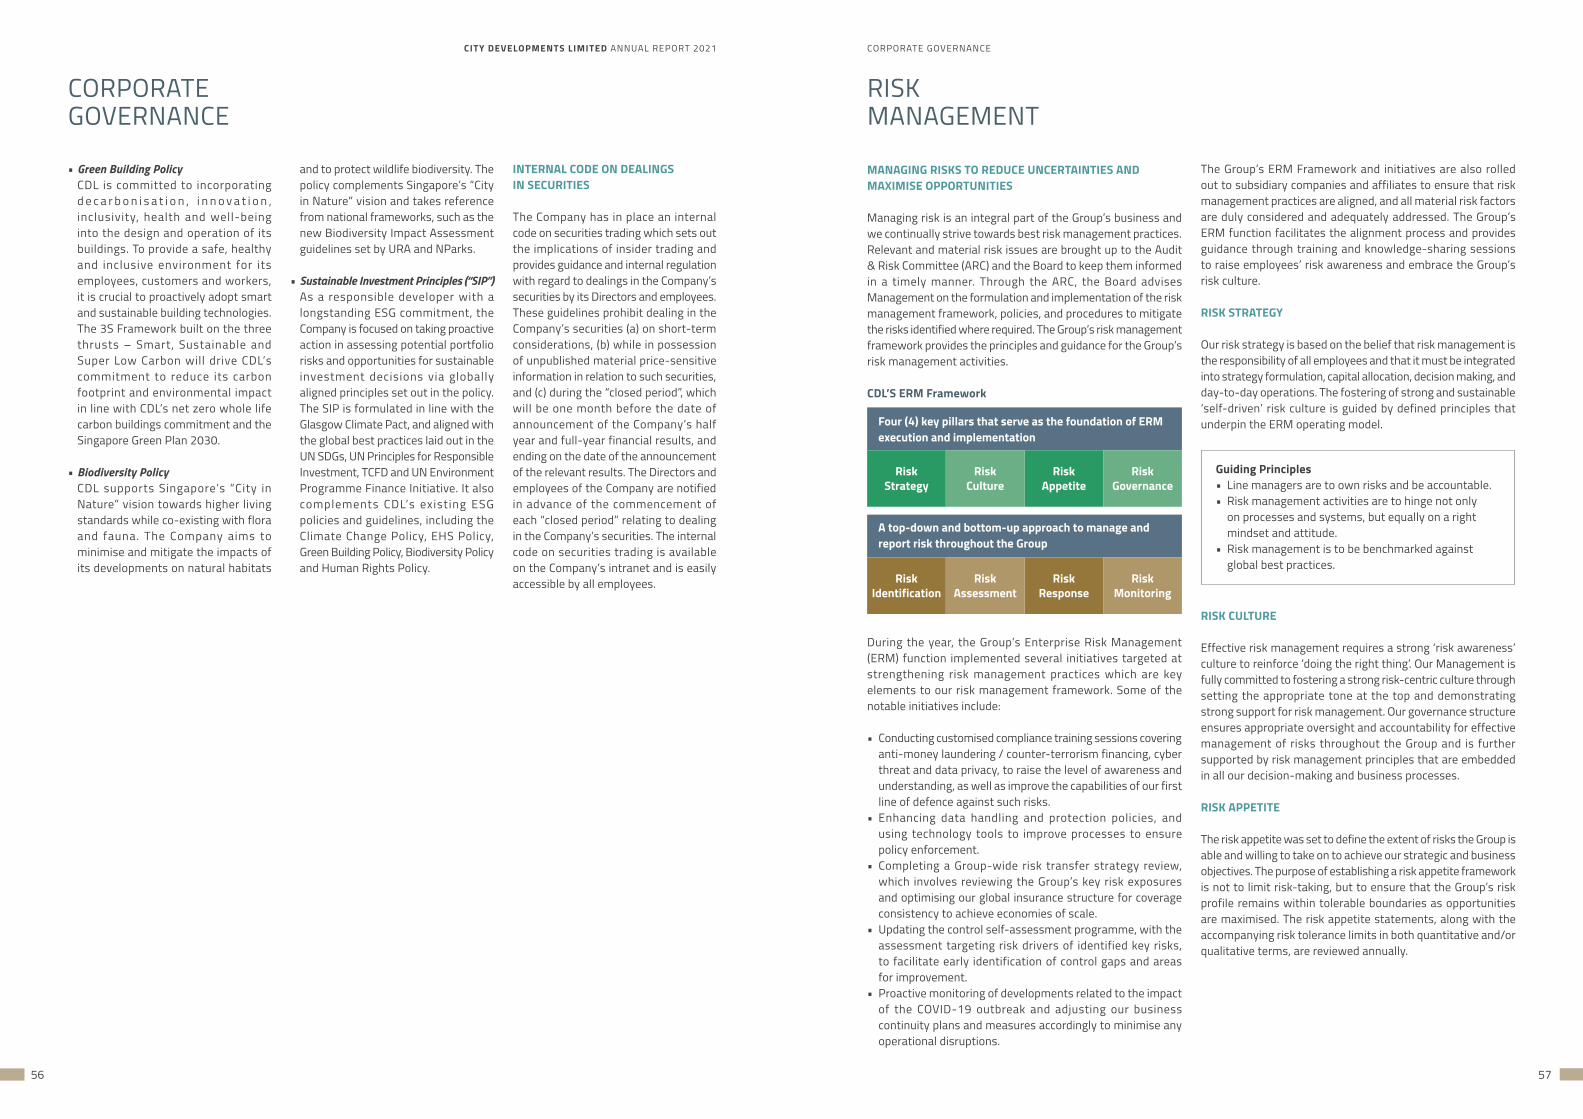
CITY DEVELOPMENTS LIMITED ANNUAL REPORT 2021 CORPORATE GOVERNANCE
56 57
RISKMANAGEMENT
MANAGING RISKS TO REDUCE UNCERTAINTIES AND MAXIMISE OPPORTUNITIES
Managing risk is an integral part of the Group’s business and we continually strive towards best risk management practices. Relevant and material risk issues are brought up to the Audit & Risk Committee (ARC) and the Board to keep them informed in a timely manner. Through the ARC, the Board advises Management on the formulation and implementation of the risk management framework, policies, and procedures to mitigate the risks identified where required. The Group’s risk management framework provides the principles and guidance for the Group’s risk management activities.
CDL’S ERM Framework
During the year, the Group’s Enterprise Risk Management (ERM) function implemented several initiatives targeted at strengthening risk management practices which are key elements to our risk management framework. Some of the notable initiatives include:
• Conducting customised compliance training sessions covering anti-money laundering / counter-terrorism financing, cyber threat and data privacy, to raise the level of awareness and understanding, as well as improve the capabilities of our first line of defence against such risks.
• Enhancing data handling and protection policies, and using technology tools to improve processes to ensure policy enforcement.
• Completing a Group-wide risk transfer strategy review, which involves reviewing the Group’s key risk exposures and optimising our global insurance structure for coverage consistency to achieve economies of scale.
• Updating the control self-assessment programme, with the assessment targeting risk drivers of identified key risks, to facilitate early identification of control gaps and areas for improvement.
• Proactive monitoring of developments related to the impact of the COVID-19 outbreak and adjusting our business continuity plans and measures accordingly to minimise any operational disruptions.
The Group’s ERM Framework and initiatives are also rolled out to subsidiary companies and affiliates to ensure that risk management practices are aligned, and all material risk factors are duly considered and adequately addressed. The Group’s ERM function facilitates the alignment process and provides guidance through training and knowledge-sharing sessions to raise employees’ risk awareness and embrace the Group’s risk culture.
RISK STRATEGY
Our risk strategy is based on the belief that risk management is the responsibility of all employees and that it must be integrated into strategy formulation, capital allocation, decision making, and day-to-day operations. The fostering of strong and sustainable ‘self-driven’ risk culture is guided by defined principles that underpin the ERM operating model.
RISK CULTURE
Effective risk management requires a strong ‘risk awareness’ culture to reinforce ‘doing the right thing’. Our Management is fully committed to fostering a strong risk-centric culture through setting the appropriate tone at the top and demonstrating strong support for risk management. Our governance structure ensures appropriate oversight and accountability for effective management of risks throughout the Group and is further supported by risk management principles that are embedded in all our decision-making and business processes.
RISK APPETITE
The risk appetite was set to define the extent of risks the Group is able and willing to take on to achieve our strategic and business objectives. The purpose of establishing a risk appetite framework is not to limit risk-taking, but to ensure that the Group’s risk profile remains within tolerable boundaries as opportunities are maximised. The risk appetite statements, along with the accompanying risk tolerance limits in both quantitative and/or qualitative terms, are reviewed annually.
Four (4) key pillars that serve as the foundation of ERM execution and implementation
A top-down and bottom-up approach to manage and report risk throughout the Group
Risk Strategy
Risk Identification
Risk Culture
Risk Assessment
Risk Appetite
Risk Response
Risk Governance
RiskMonitoring
Guiding Principles• Line managers are to own risks and be accountable.• Risk management activities are to hinge not only
on processes and systems, but equally on a right mindset and attitude.
• Risk management is to be benchmarked against global best practices.
• Green Building Policy CDL is committed to incorporating
d e c a r b o n i s a t i o n , i n n o v a t i o n , inclusivity, health and well-being into the design and operation of its buildings. To provide a safe, healthy and inclusive environment for its employees, customers and workers, it is crucial to proactively adopt smart and sustainable building technologies. The 3S Framework built on the three thrusts – Smart, Sustainable and Super Low Carbon will drive CDL’s commitment to reduce its carbon footprint and environmental impact in line with CDL’s net zero whole life carbon buildings commitment and the Singapore Green Plan 2030.
• Biodiversity Policy CDL supports Singapore’s “City in
Nature” vision towards higher living standards while co-existing with flora and fauna. The Company aims to minimise and mitigate the impacts of its developments on natural habitats
CORPORATEGOVERNANCE
and to protect wildlife biodiversity. The policy complements Singapore’s “City in Nature” vision and takes reference from national frameworks, such as the new Biodiversity Impact Assessment guidelines set by URA and NParks.
• Sustainable Investment Principles (“SIP”) As a responsible developer with a
longstanding ESG commitment, the Company is focused on taking proactive action in assessing potential portfolio risks and opportunities for sustainable investment decisions via globally aligned principles set out in the policy. The SIP is formulated in line with the Glasgow Climate Pact, and aligned with the global best practices laid out in the UN SDGs, UN Principles for Responsible Investment, TCFD and UN Environment Programme Finance Initiative. It also complements CDL’s existing ESG policies and guidelines, including the Climate Change Policy, EHS Policy, Green Building Policy, Biodiversity Policy and Human Rights Policy.
INTERNAL CODE ON DEALINGS IN SECURITIES
The Company has in place an internal code on securities trading which sets out the implications of insider trading and provides guidance and internal regulation with regard to dealings in the Company’s securities by its Directors and employees. These guidelines prohibit dealing in the Company’s securities (a) on short-term considerations, (b) while in possession of unpublished material price-sensitive information in relation to such securities, and (c) during the “closed period”, which will be one month before the date of announcement of the Company’s half year and full-year financial results, and ending on the date of the announcement of the relevant results. The Directors and employees of the Company are notified in advance of the commencement of each “closed period” relating to dealing in the Company’s securities. The internal code on securities trading is available on the Company’s intranet and is easily accessible by all employees.
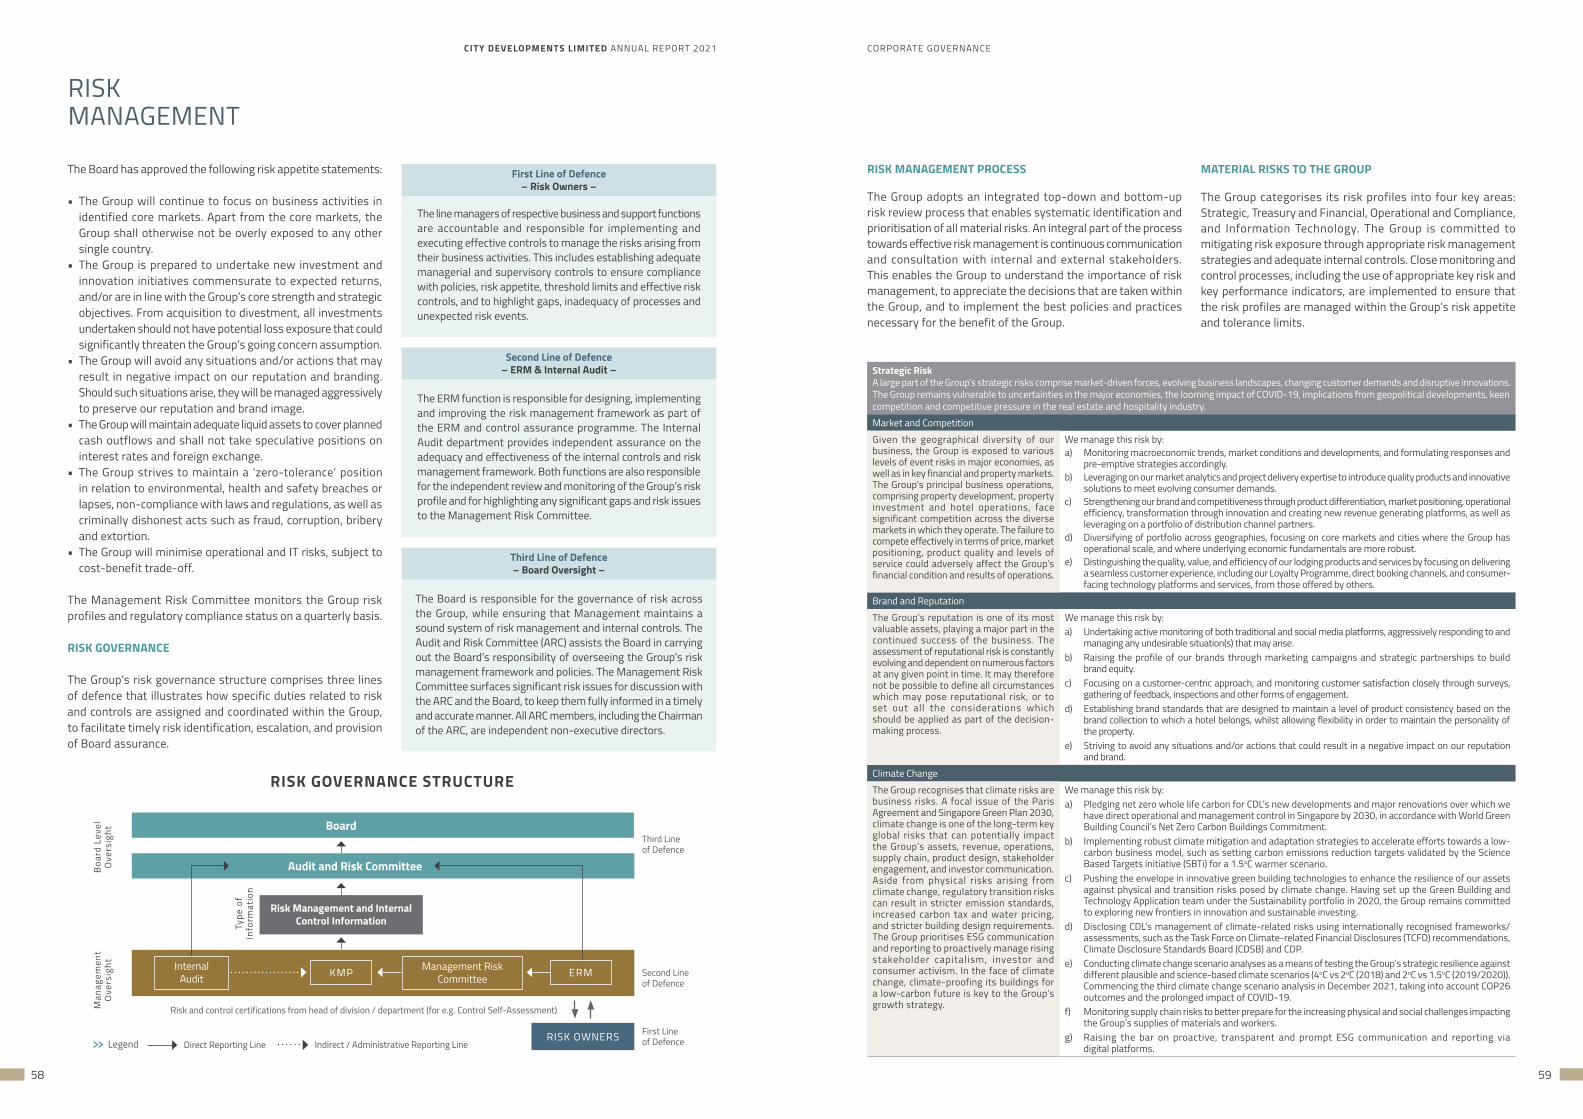
CITY DEVELOPMENTS LIMITED ANNUAL REPORT 2021 CORPORATE GOVERNANCE
58 59
The Board has approved the following risk appetite statements:
• The Group will continue to focus on business activities in identified core markets. Apart from the core markets, the Group shall otherwise not be overly exposed to any other single country.
• The Group is prepared to undertake new investment and innovation initiatives commensurate to expected returns, and/or are in line with the Group’s core strength and strategic objectives. From acquisition to divestment, all investments undertaken should not have potential loss exposure that could significantly threaten the Group’s going concern assumption.
• The Group will avoid any situations and/or actions that may result in negative impact on our reputation and branding. Should such situations arise, they will be managed aggressively to preserve our reputation and brand image.
• The Group will maintain adequate liquid assets to cover planned cash outflows and shall not take speculative positions on interest rates and foreign exchange.
• The Group strives to maintain a ‘zero-tolerance’ position in relation to environmental, health and safety breaches or lapses, non-compliance with laws and regulations, as well as criminally dishonest acts such as fraud, corruption, bribery and extortion.
• The Group will minimise operational and IT risks, subject to cost-benefit trade-off.
The Management Risk Committee monitors the Group risk profiles and regulatory compliance status on a quarterly basis.
RISK GOVERNANCE
The Group’s risk governance structure comprises three lines of defence that illustrates how specific duties related to risk and controls are assigned and coordinated within the Group, to facilitate timely risk identification, escalation, and provision of Board assurance.
RISK GOVERNANCE STRUCTURE
Board
InternalAudit
Management Risk CommitteeKMP
Third Line of Defence
Boar
d Le
vel
Ove
rsig
ht
Type
of
Info
rmat
ion
Man
agem
ent
Ove
rsig
ht
Second Line of Defence
First Line of Defence
Risk and control certifications from head of division / department (for e.g. Control Self-Assessment)
Legend Direct Reporting Line Indirect / Administrative Reporting Line
Risk Management and Internal Control Information
RISK OWNERS
ERM
Audit and Risk Committee
RISKMANAGEMENT
First Line of Defence – Risk Owners –
Second Line of Defence – ERM & Internal Audit –
The line managers of respective business and support functions are accountable and responsible for implementing and executing effective controls to manage the risks arising from their business activities. This includes establishing adequate managerial and supervisory controls to ensure compliance with policies, risk appetite, threshold limits and effective risk controls, and to highlight gaps, inadequacy of processes and unexpected risk events.
The ERM function is responsible for designing, implementing and improving the risk management framework as part of the ERM and control assurance programme. The Internal Audit department provides independent assurance on the adequacy and effectiveness of the internal controls and risk management framework. Both functions are also responsible for the independent review and monitoring of the Group’s risk profile and for highlighting any significant gaps and risk issues to the Management Risk Committee.
Third Line of Defence – Board Oversight –
The Board is responsible for the governance of risk across the Group, while ensuring that Management maintains a sound system of risk management and internal controls. The Audit and Risk Committee (ARC) assists the Board in carrying out the Board’s responsibility of overseeing the Group’s risk management framework and policies. The Management Risk Committee surfaces significant risk issues for discussion with the ARC and the Board, to keep them fully informed in a timely and accurate manner. All ARC members, including the Chairman of the ARC, are independent non-executive directors.
RISK MANAGEMENT PROCESS
The Group adopts an integrated top-down and bottom-up risk review process that enables systematic identification and prioritisation of all material risks. An integral part of the process towards effective risk management is continuous communication and consultation with internal and external stakeholders. This enables the Group to understand the importance of risk management, to appreciate the decisions that are taken within the Group, and to implement the best policies and practices necessary for the benefit of the Group.
MATERIAL RISKS TO THE GROUP
The Group categorises its risk profiles into four key areas: Strategic, Treasury and Financial, Operational and Compliance, and Information Technology. The Group is committed to mitigating risk exposure through appropriate risk management strategies and adequate internal controls. Close monitoring and control processes, including the use of appropriate key risk and key performance indicators, are implemented to ensure that the risk profiles are managed within the Group’s risk appetite and tolerance limits.
Strategic RiskA large part of the Group’s strategic risks comprise market-driven forces, evolving business landscapes, changing customer demands and disruptive innovations. The Group remains vulnerable to uncertainties in the major economies, the looming impact of COVID-19, implications from geopolitical developments, keen competition and competitive pressure in the real estate and hospitality industry. Market and CompetitionGiven the geographical diversity of our business, the Group is exposed to various levels of event risks in major economies, as well as in key financial and property markets. The Group’s principal business operations, comprising property development, property investment and hotel operations, face significant competition across the diverse markets in which they operate. The failure to compete effectively in terms of price, market positioning, product quality and levels of service could adversely affect the Group’s financial condition and results of operations.
We manage this risk by:a) Monitoring macroeconomic trends, market conditions and developments, and formulating responses and
pre-emptive strategies accordingly. b) Leveraging on our market analytics and project delivery expertise to introduce quality products and innovative
solutions to meet evolving consumer demands. c) Strengthening our brand and competitiveness through product differentiation, market positioning, operational
efficiency, transformation through innovation and creating new revenue generating platforms, as well as leveraging on a portfolio of distribution channel partners.
d) Diversifying of portfolio across geographies, focusing on core markets and cities where the Group has operational scale, and where underlying economic fundamentals are more robust.
e) Distinguishing the quality, value, and efficiency of our lodging products and services by focusing on delivering a seamless customer experience, including our Loyalty Programme, direct booking channels, and consumer-facing technology platforms and services, from those offered by others.
Brand and ReputationThe Group’s reputation is one of its most valuable assets, playing a major part in the continued success of the business. The assessment of reputational risk is constantly evolving and dependent on numerous factors at any given point in time. It may therefore not be possible to define all circumstances which may pose reputational risk, or to set out all the considerations which should be applied as part of the decision-making process.
We manage this risk by:a) Undertaking active monitoring of both traditional and social media platforms, aggressively responding to and
managing any undesirable situation(s) that may arise.b) Raising the profile of our brands through marketing campaigns and strategic partnerships to build
brand equity.c) Focusing on a customer-centric approach, and monitoring customer satisfaction closely through surveys,
gathering of feedback, inspections and other forms of engagement. d) Establishing brand standards that are designed to maintain a level of product consistency based on the
brand collection to which a hotel belongs, whilst allowing flexibility in order to maintain the personality of the property.
e) Striving to avoid any situations and/or actions that could result in a negative impact on our reputation and brand.
Climate ChangeThe Group recognises that climate risks are business risks. A focal issue of the Paris Agreement and Singapore Green Plan 2030, climate change is one of the long-term key global risks that can potentially impact the Group’s assets, revenue, operations, supply chain, product design, stakeholder engagement, and investor communication. Aside from physical risks arising from climate change, regulatory transition risks can result in stricter emission standards, increased carbon tax and water pricing, and stricter building design requirements. The Group prioritises ESG communication and reporting to proactively manage rising stakeholder capitalism, investor and consumer activism. In the face of climate change, climate-proofing its buildings for a low-carbon future is key to the Group’s growth strategy.
We manage this risk by:a) Pledging net zero whole life carbon for CDL’s new developments and major renovations over which we
have direct operational and management control in Singapore by 2030, in accordance with World Green Building Council’s Net Zero Carbon Buildings Commitment.
b) Implementing robust climate mitigation and adaptation strategies to accelerate efforts towards a low-carbon business model, such as setting carbon emissions reduction targets validated by the Science Based Targets initiative (SBTi) for a 1.5oC warmer scenario.
c) Pushing the envelope in innovative green building technologies to enhance the resilience of our assets against physical and transition risks posed by climate change. Having set up the Green Building and Technology Application team under the Sustainability portfolio in 2020, the Group remains committed to exploring new frontiers in innovation and sustainable investing.
d) Disclosing CDL’s management of climate-related risks using internationally recognised frameworks/ assessments, such as the Task Force on Climate-related Financial Disclosures (TCFD) recommendations, Climate Disclosure Standards Board (CDSB) and CDP.
e) Conducting climate change scenario analyses as a means of testing the Group’s strategic resilience against different plausible and science-based climate scenarios (4oC vs 2oC (2018) and 2oC vs 1.5oC (2019/2020)). Commencing the third climate change scenario analysis in December 2021, taking into account COP26 outcomes and the prolonged impact of COVID-19.
f) Monitoring supply chain risks to better prepare for the increasing physical and social challenges impacting the Group’s supplies of materials and workers.
g) Raising the bar on proactive, transparent and prompt ESG communication and reporting via digital platforms.
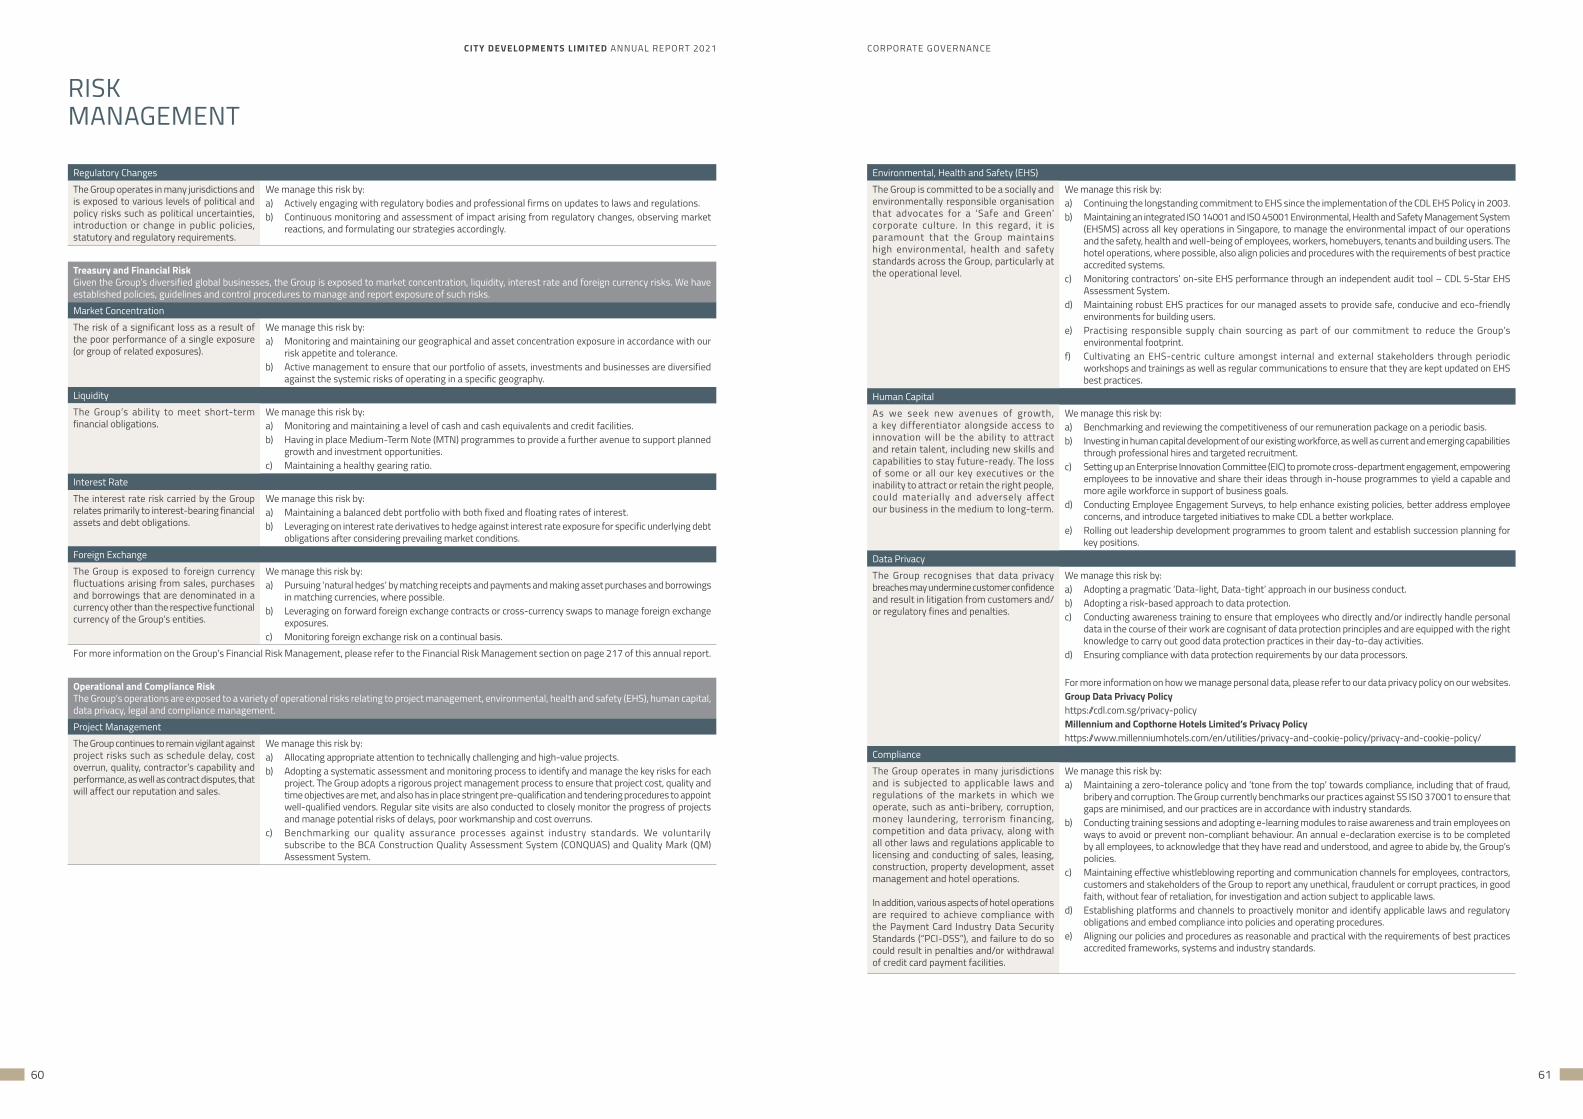
CITY DEVELOPMENTS LIMITED ANNUAL REPORT 2021 CORPORATE GOVERNANCE
60 61
Regulatory ChangesThe Group operates in many jurisdictions and is exposed to various levels of political and policy risks such as political uncertainties, introduction or change in public policies, statutory and regulatory requirements.
We manage this risk by:a) Actively engaging with regulatory bodies and professional firms on updates to laws and regulations.b) Continuous monitoring and assessment of impact arising from regulatory changes, observing market
reactions, and formulating our strategies accordingly.
Treasury and Financial RiskGiven the Group’s diversified global businesses, the Group is exposed to market concentration, liquidity, interest rate and foreign currency risks. We have established policies, guidelines and control procedures to manage and report exposure of such risks.Market ConcentrationThe risk of a significant loss as a result of the poor performance of a single exposure (or group of related exposures).
We manage this risk by:a) Monitoring and maintaining our geographical and asset concentration exposure in accordance with our
risk appetite and tolerance.b) Active management to ensure that our portfolio of assets, investments and businesses are diversified
against the systemic risks of operating in a specific geography.LiquidityThe Group’s ability to meet short-term financial obligations.
We manage this risk by:a) Monitoring and maintaining a level of cash and cash equivalents and credit facilities.b) Having in place Medium-Term Note (MTN) programmes to provide a further avenue to support planned
growth and investment opportunities.c) Maintaining a healthy gearing ratio.
Interest RateThe interest rate risk carried by the Group relates primarily to interest-bearing financial assets and debt obligations.
We manage this risk by:a) Maintaining a balanced debt portfolio with both fixed and floating rates of interest.b) Leveraging on interest rate derivatives to hedge against interest rate exposure for specific underlying debt
obligations after considering prevailing market conditions.Foreign ExchangeThe Group is exposed to foreign currency fluctuations arising from sales, purchases and borrowings that are denominated in a currency other than the respective functional currency of the Group’s entities.
We manage this risk by:a) Pursuing ‘natural hedges’ by matching receipts and payments and making asset purchases and borrowings
in matching currencies, where possible.b) Leveraging on forward foreign exchange contracts or cross-currency swaps to manage foreign exchange
exposures. c) Monitoring foreign exchange risk on a continual basis.
For more information on the Group’s Financial Risk Management, please refer to the Financial Risk Management section on page 217 of this annual report.
Operational and Compliance RiskThe Group’s operations are exposed to a variety of operational risks relating to project management, environmental, health and safety (EHS), human capital, data privacy, legal and compliance management. Project ManagementThe Group continues to remain vigilant against project risks such as schedule delay, cost overrun, quality, contractor’s capability and performance, as well as contract disputes, that will affect our reputation and sales.
We manage this risk by:a) Allocating appropriate attention to technically challenging and high-value projects.b) Adopting a systematic assessment and monitoring process to identify and manage the key risks for each
project. The Group adopts a rigorous project management process to ensure that project cost, quality and time objectives are met, and also has in place stringent pre-qualification and tendering procedures to appoint well-qualified vendors. Regular site visits are also conducted to closely monitor the progress of projects and manage potential risks of delays, poor workmanship and cost overruns.
c) Benchmarking our quality assurance processes against industry standards. We voluntarily subscribe to the BCA Construction Quality Assessment System (CONQUAS) and Quality Mark (QM) Assessment System.
RISKMANAGEMENT
Environmental, Health and Safety (EHS)The Group is committed to be a socially and environmentally responsible organisation that advocates for a ‘Safe and Green’ corporate culture. In this regard, it is paramount that the Group maintains high environmental, health and safety standards across the Group, particularly at the operational level.
We manage this risk by:a) Continuing the longstanding commitment to EHS since the implementation of the CDL EHS Policy in 2003.b) Maintaining an integrated ISO 14001 and ISO 45001 Environmental, Health and Safety Management System
(EHSMS) across all key operations in Singapore, to manage the environmental impact of our operations and the safety, health and well-being of employees, workers, homebuyers, tenants and building users. The hotel operations, where possible, also align policies and procedures with the requirements of best practice accredited systems.
c) Monitoring contractors’ on-site EHS performance through an independent audit tool – CDL 5-Star EHS Assessment System.
d) Maintaining robust EHS practices for our managed assets to provide safe, conducive and eco-friendly environments for building users.
e) Practising responsible supply chain sourcing as part of our commitment to reduce the Group’s environmental footprint.
f) Cultivating an EHS-centric culture amongst internal and external stakeholders through periodic workshops and trainings as well as regular communications to ensure that they are kept updated on EHS best practices.
Human CapitalAs we seek new avenues of growth, a key differentiator alongside access to innovation will be the ability to attract and retain talent, including new skills and capabilities to stay future-ready. The loss of some or all our key executives or the inability to attract or retain the right people, could materially and adversely affect our business in the medium to long-term.
We manage this risk by:a) Benchmarking and reviewing the competitiveness of our remuneration package on a periodic basis.b) Investing in human capital development of our existing workforce, as well as current and emerging capabilities
through professional hires and targeted recruitment.c) Setting up an Enterprise Innovation Committee (EIC) to promote cross-department engagement, empowering
employees to be innovative and share their ideas through in-house programmes to yield a capable and more agile workforce in support of business goals.
d) Conducting Employee Engagement Surveys, to help enhance existing policies, better address employee concerns, and introduce targeted initiatives to make CDL a better workplace.
e) Rolling out leadership development programmes to groom talent and establish succession planning for key positions.
Data PrivacyThe Group recognises that data privacy breaches may undermine customer confidence and result in litigation from customers and/or regulatory fines and penalties.
We manage this risk by:a) Adopting a pragmatic ‘Data-light, Data-tight’ approach in our business conduct.b) Adopting a risk-based approach to data protection.c) Conducting awareness training to ensure that employees who directly and/or indirectly handle personal
data in the course of their work are cognisant of data protection principles and are equipped with the right knowledge to carry out good data protection practices in their day-to-day activities.
d) Ensuring compliance with data protection requirements by our data processors.
For more information on how we manage personal data, please refer to our data privacy policy on our websites. Group Data Privacy Policyhttps://cdl.com.sg/privacy-policyMillennium and Copthorne Hotels Limited’s Privacy Policyhttps://www.millenniumhotels.com/en/utilities/privacy-and-cookie-policy/privacy-and-cookie-policy/
ComplianceThe Group operates in many jurisdictions and is subjected to applicable laws and regulations of the markets in which we operate, such as anti-bribery, corruption, money laundering, terrorism financing, competition and data privacy, along with all other laws and regulations applicable to licensing and conducting of sales, leasing, construction, property development, asset management and hotel operations.
In addition, various aspects of hotel operations are required to achieve compliance with the Payment Card Industry Data Security Standards (“PCI-DSS”), and failure to do so could result in penalties and/or withdrawal of credit card payment facilities.
We manage this risk by:a) Maintaining a zero-tolerance policy and ‘tone from the top’ towards compliance, including that of fraud,
bribery and corruption. The Group currently benchmarks our practices against SS ISO 37001 to ensure that gaps are minimised, and our practices are in accordance with industry standards.
b) Conducting training sessions and adopting e-learning modules to raise awareness and train employees on ways to avoid or prevent non-compliant behaviour. An annual e-declaration exercise is to be completed by all employees, to acknowledge that they have read and understood, and agree to abide by, the Group’s policies.
c) Maintaining effective whistleblowing reporting and communication channels for employees, contractors, customers and stakeholders of the Group to report any unethical, fraudulent or corrupt practices, in good faith, without fear of retaliation, for investigation and action subject to applicable laws.
d) Establishing platforms and channels to proactively monitor and identify applicable laws and regulatory obligations and embed compliance into policies and operating procedures.
e) Aligning our policies and procedures as reasonable and practical with the requirements of best practices accredited frameworks, systems and industry standards.
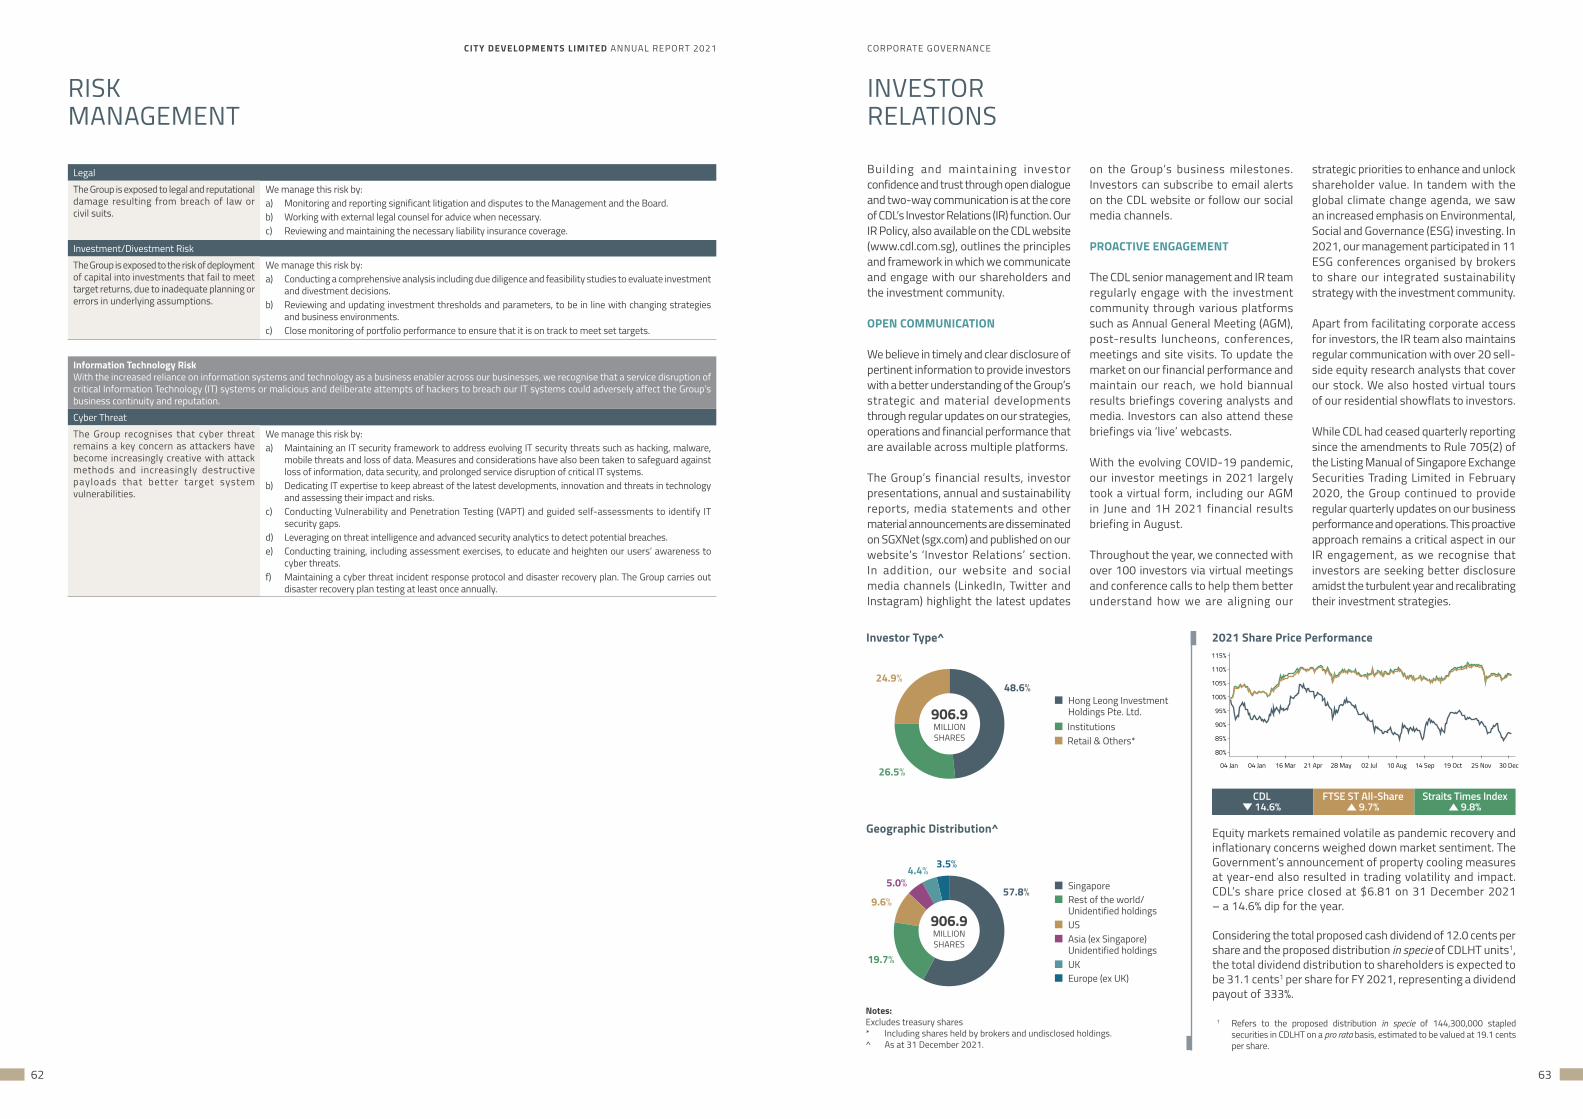
CITY DEVELOPMENTS LIMITED ANNUAL REPORT 2021 CORPORATE GOVERNANCE
62 63
RISKMANAGEMENT
LegalThe Group is exposed to legal and reputational damage resulting from breach of law or civil suits.
We manage this risk by:a) Monitoring and reporting significant litigation and disputes to the Management and the Board. b) Working with external legal counsel for advice when necessary.c) Reviewing and maintaining the necessary liability insurance coverage.
Investment/Divestment RiskThe Group is exposed to the risk of deployment of capital into investments that fail to meet target returns, due to inadequate planning or errors in underlying assumptions.
We manage this risk by: a) Conducting a comprehensive analysis including due diligence and feasibility studies to evaluate investment
and divestment decisions.b) Reviewing and updating investment thresholds and parameters, to be in line with changing strategies
and business environments.c) Close monitoring of portfolio performance to ensure that it is on track to meet set targets.
Information Technology RiskWith the increased reliance on information systems and technology as a business enabler across our businesses, we recognise that a service disruption of critical Information Technology (IT) systems or malicious and deliberate attempts of hackers to breach our IT systems could adversely affect the Group’s business continuity and reputation.Cyber ThreatThe Group recognises that cyber threat remains a key concern as attackers have become increasingly creative with attack methods and increasingly destructive payloads that better target system vulnerabilities.
We manage this risk by:a) Maintaining an IT security framework to address evolving IT security threats such as hacking, malware,
mobile threats and loss of data. Measures and considerations have also been taken to safeguard against loss of information, data security, and prolonged service disruption of critical IT systems.
b) Dedicating IT expertise to keep abreast of the latest developments, innovation and threats in technology and assessing their impact and risks.
c) Conducting Vulnerability and Penetration Testing (VAPT) and guided self-assessments to identify IT security gaps.
d) Leveraging on threat intelligence and advanced security analytics to detect potential breaches.e) Conducting training, including assessment exercises, to educate and heighten our users’ awareness to
cyber threats. f) Maintaining a cyber threat incident response protocol and disaster recovery plan. The Group carries out
disaster recovery plan testing at least once annually.
INVESTOR RELATIONS
Building and maintaining investor confidence and trust through open dialogue and two-way communication is at the core of CDL’s Investor Relations (IR) function. Our IR Policy, also available on the CDL website (www.cdl.com.sg), outlines the principles and framework in which we communicate and engage with our shareholders and the investment community.
OPEN COMMUNICATION
We believe in timely and clear disclosure of pertinent information to provide investors with a better understanding of the Group’s strategic and material developments through regular updates on our strategies, operations and financial performance that are available across multiple platforms.
The Group’s financial results, investor presentations, annual and sustainability reports, media statements and other material announcements are disseminated on SGXNet (sgx.com) and published on our website’s ‘Investor Relations’ section. In addition, our website and social media channels (LinkedIn, Twitter and Instagram) highlight the latest updates
on the Group’s business milestones. Investors can subscribe to email alerts on the CDL website or follow our social media channels.
PROACTIVE ENGAGEMENT
The CDL senior management and IR team regularly engage with the investment community through various platforms such as Annual General Meeting (AGM), post-results luncheons, conferences, meetings and site visits. To update the market on our financial performance and maintain our reach, we hold biannual results briefings covering analysts and media. Investors can also attend these briefings via ‘live’ webcasts.
With the evolving COVID-19 pandemic, our investor meetings in 2021 largely took a virtual form, including our AGM in June and 1H 2021 financial results briefing in August.
Throughout the year, we connected with over 100 investors via virtual meetings and conference calls to help them better understand how we are aligning our
strategic priorities to enhance and unlock shareholder value. In tandem with the global climate change agenda, we saw an increased emphasis on Environmental, Social and Governance (ESG) investing. In 2021, our management participated in 11 ESG conferences organised by brokers to share our integrated sustainability strategy with the investment community.
Apart from facilitating corporate access for investors, the IR team also maintains regular communication with over 20 sell-side equity research analysts that cover our stock. We also hosted virtual tours of our residential showflats to investors.
While CDL had ceased quarterly reporting since the amendments to Rule 705(2) of the Listing Manual of Singapore Exchange Securities Trading Limited in February 2020, the Group continued to provide regular quarterly updates on our business performance and operations. This proactive approach remains a critical aspect in our IR engagement, as we recognise that investors are seeking better disclosure amidst the turbulent year and recalibrating their investment strategies.
Investor Type^ 2021 Share Price Performance
Geographic Distribution^
Singapore Rest of the world/
Unidentified holdings
Asia (ex Singapore) Unidentified holdings
US
UK Europe (ex UK)
Notes: Excludes treasury shares* Including shares held by brokers and undisclosed holdings.^ As at 31 December 2021.
Hong Leong Investment Holdings Pte. Ltd.
Institutions Retail & Others*
24.9%48.6%
26.5%
906.9 MILLIONSHARES
9.6%
5.0%4.4% 3.5%
57.8%
19.7%
906.9 MILLIONSHARES
115%
110%
105%
100%
95%
90%
85%
80%
04 Jan 04 Jan 16 Mar 21 Apr 28 May 02 Jul 10 Aug 14 Sep 19 Oct 25 Nov 30 Dec
Equity markets remained volatile as pandemic recovery and inflationary concerns weighed down market sentiment. The Government’s announcement of property cooling measures at year-end also resulted in trading volatility and impact. CDL’s share price closed at $6.81 on 31 December 2021 – a 14.6% dip for the year.
Considering the total proposed cash dividend of 12.0 cents per share and the proposed distribution in specie of CDLHT units1, the total dividend distribution to shareholders is expected to be 31.1 cents1 per share for FY 2021, representing a dividend payout of 333%.
CDL 14.6%
FTSE ST All-Share 9.7%
Straits Times Index 9.8%
1 Refers to the proposed distribution in specie of 144,300,000 stapled securities in CDLHT on a pro rata basis, estimated to be valued at 19.1 cents per share.
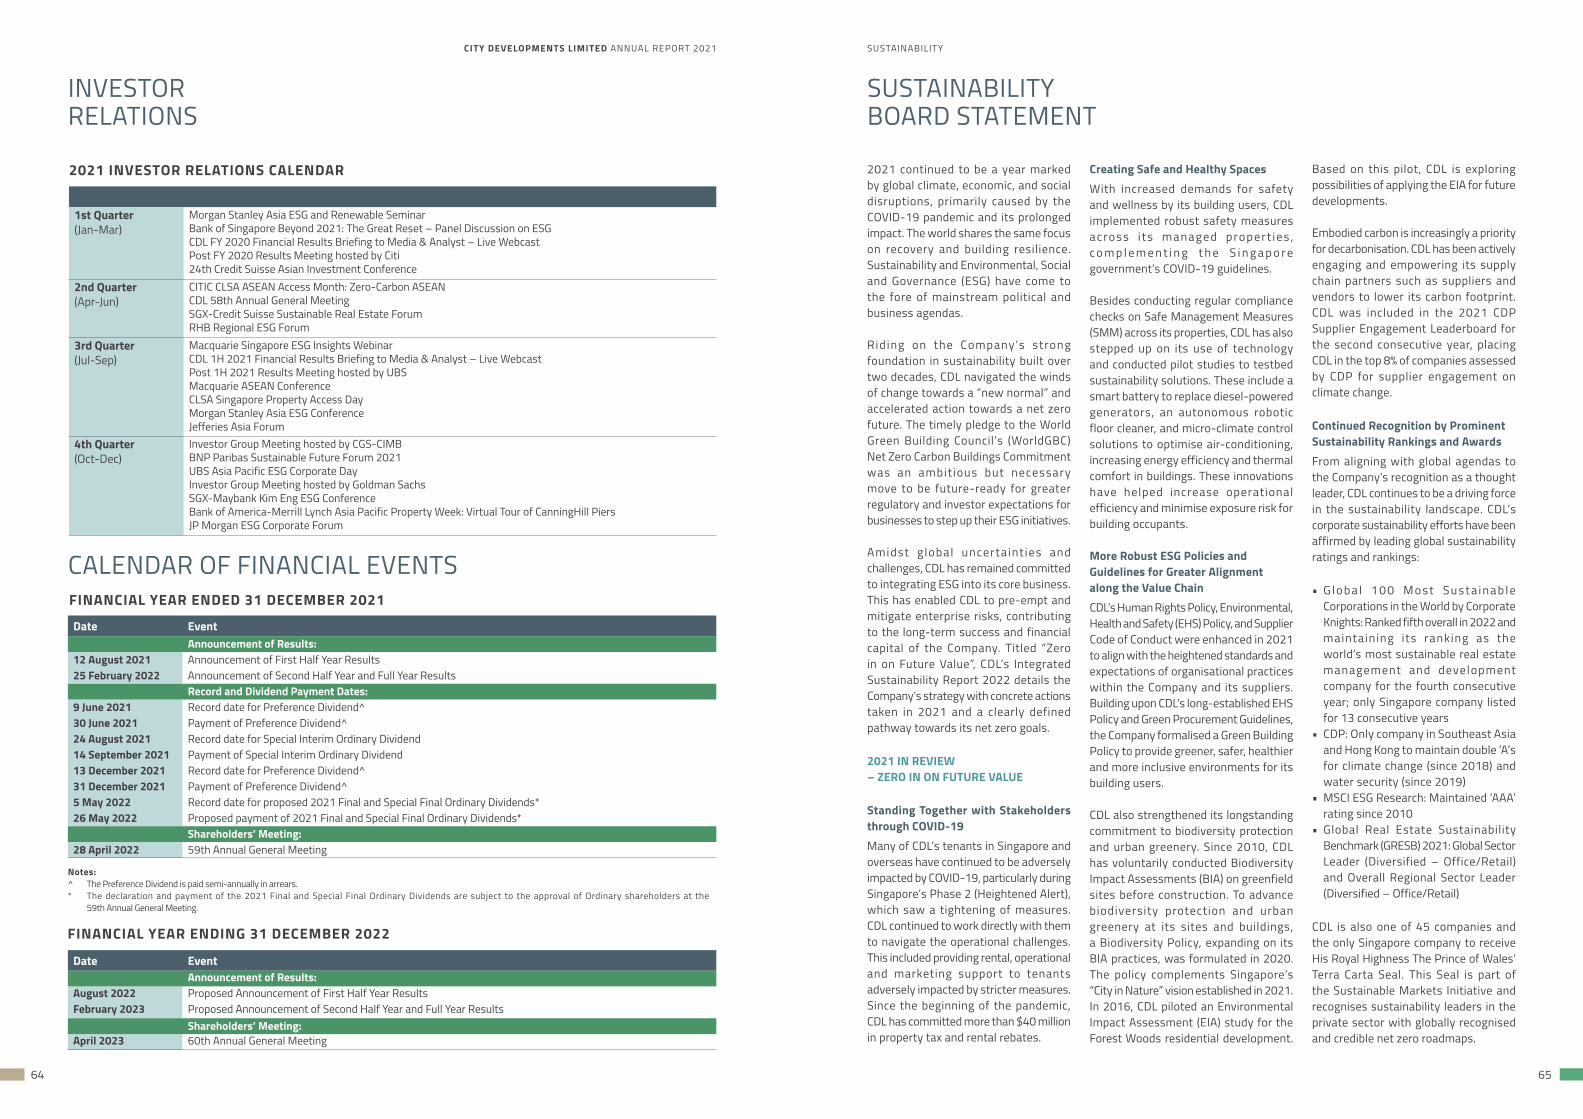
SUSTAINABILITY
65
CITY DEVELOPMENTS LIMITED ANNUAL REPORT 2021
64
Date EventAnnouncement of Results:
12 August 2021 Announcement of First Half Year Results25 February 2022 Announcement of Second Half Year and Full Year Results
Record and Dividend Payment Dates:9 June 2021 Record date for Preference Dividend^30 June 2021 Payment of Preference Dividend^24 August 2021 Record date for Special Interim Ordinary Dividend14 September 2021 Payment of Special Interim Ordinary Dividend13 December 2021 Record date for Preference Dividend^31 December 2021 Payment of Preference Dividend^5 May 2022 Record date for proposed 2021 Final and Special Final Ordinary Dividends*26 May 2022 Proposed payment of 2021 Final and Special Final Ordinary Dividends*
Shareholders’ Meeting:28 April 2022 59th Annual General Meeting
Notes:^ The Preference Dividend is paid semi-annually in arrears.* The declaration and payment of the 2021 Final and Special Final Ordinary Dividends are subject to the approval of Ordinary shareholders at the
59th Annual General Meeting.
INVESTOR RELATIONS
CALENDAR OF FINANCIAL EVENTS
1st Quarter(Jan-Mar)
Morgan Stanley Asia ESG and Renewable Seminar Bank of Singapore Beyond 2021: The Great Reset – Panel Discussion on ESG CDL FY 2020 Financial Results Briefing to Media & Analyst – Live WebcastPost FY 2020 Results Meeting hosted by Citi24th Credit Suisse Asian Investment Conference
2nd Quarter(Apr-Jun)
CITIC CLSA ASEAN Access Month: Zero-Carbon ASEAN CDL 58th Annual General MeetingSGX-Credit Suisse Sustainable Real Estate Forum RHB Regional ESG Forum
3rd Quarter(Jul-Sep)
Macquarie Singapore ESG Insights WebinarCDL 1H 2021 Financial Results Briefing to Media & Analyst – Live Webcast Post 1H 2021 Results Meeting hosted by UBSMacquarie ASEAN Conference CLSA Singapore Property Access Day Morgan Stanley Asia ESG Conference Jefferies Asia Forum
4th Quarter(Oct-Dec)
Investor Group Meeting hosted by CGS-CIMBBNP Paribas Sustainable Future Forum 2021 UBS Asia Pacific ESG Corporate Day Investor Group Meeting hosted by Goldman SachsSGX-Maybank Kim Eng ESG Conference Bank of America-Merrill Lynch Asia Pacific Property Week: Virtual Tour of CanningHill PiersJP Morgan ESG Corporate Forum
2021 INVESTOR RELATIONS CALENDAR
FINANCIAL YEAR ENDED 31 DECEMBER 2021
Date EventAnnouncement of Results:
August 2022 Proposed Announcement of First Half Year ResultsFebruary 2023 Proposed Announcement of Second Half Year and Full Year Results
Shareholders’ Meeting:April 2023 60th Annual General Meeting
FINANCIAL YEAR ENDING 31 DECEMBER 2022
SUSTAINABILITY BOARD STATEMENT
2021 continued to be a year marked by global climate, economic, and social disruptions, primarily caused by the COVID-19 pandemic and its prolonged impact. The world shares the same focus on recovery and building resilience. Sustainability and Environmental, Social and Governance (ESG) have come to the fore of mainstream political and business agendas.
Riding on the Company’s strong foundation in sustainability built over two decades, CDL navigated the winds of change towards a “new normal” and accelerated action towards a net zero future. The timely pledge to the World Green Building Council’s (WorldGBC) Net Zero Carbon Buildings Commitment was an ambit ious but necessary move to be future-ready for greater regulatory and investor expectations for businesses to step up their ESG initiatives.
Amidst g lobal uncertaint ies and challenges, CDL has remained committed to integrating ESG into its core business. This has enabled CDL to pre-empt and mitigate enterprise risks, contributing to the long-term success and financial capital of the Company. Titled “Zero in on Future Value”, CDL’s Integrated Sustainability Report 2022 details the Company’s strategy with concrete actions taken in 2021 and a clearly defined pathway towards its net zero goals.
2021 IN REVIEW – ZERO IN ON FUTURE VALUE
Standing Together with Stakeholders through COVID-19Many of CDL’s tenants in Singapore and overseas have continued to be adversely impacted by COVID-19, particularly during Singapore’s Phase 2 (Heightened Alert), which saw a tightening of measures. CDL continued to work directly with them to navigate the operational challenges. This included providing rental, operational and marketing support to tenants adversely impacted by stricter measures. Since the beginning of the pandemic, CDL has committed more than $40 million in property tax and rental rebates.
Creating Safe and Healthy SpacesWith increased demands for safety and wellness by its building users, CDL implemented robust safety measures across i ts managed propert ies , c o m p l e m e n t i n g t h e S i n g a p o r e government’s COVID-19 guidelines.
Besides conducting regular compliance checks on Safe Management Measures (SMM) across its properties, CDL has also stepped up on its use of technology and conducted pilot studies to testbed sustainability solutions. These include a smart battery to replace diesel-powered generators, an autonomous robotic floor cleaner, and micro-climate control solutions to optimise air-conditioning, increasing energy efficiency and thermal comfort in buildings. These innovations have helped increase operational efficiency and minimise exposure risk for building occupants.
More Robust ESG Policies and Guidelines for Greater Alignment along the Value ChainCDL’s Human Rights Policy, Environmental, Health and Safety (EHS) Policy, and Supplier Code of Conduct were enhanced in 2021 to align with the heightened standards and expectations of organisational practices within the Company and its suppliers. Building upon CDL’s long-established EHS Policy and Green Procurement Guidelines, the Company formalised a Green Building Policy to provide greener, safer, healthier and more inclusive environments for its building users.
CDL also strengthened its longstanding commitment to biodiversity protection and urban greenery. Since 2010, CDL has voluntarily conducted Biodiversity Impact Assessments (BIA) on greenfield sites before construction. To advance biodiversity protection and urban greenery at its sites and buildings, a Biodiversity Policy, expanding on its BIA practices, was formulated in 2020. The policy complements Singapore’s “City in Nature” vision established in 2021. In 2016, CDL piloted an Environmental Impact Assessment (EIA) study for the Forest Woods residential development.
Based on this pilot, CDL is exploring possibilities of applying the EIA for future developments.
Embodied carbon is increasingly a priority for decarbonisation. CDL has been actively engaging and empowering its supply chain partners such as suppliers and vendors to lower its carbon footprint. CDL was included in the 2021 CDP Supplier Engagement Leaderboard for the second consecutive year, placing CDL in the top 8% of companies assessed by CDP for supplier engagement on climate change.
Continued Recognition by Prominent Sustainability Rankings and AwardsFrom aligning with global agendas to the Company’s recognition as a thought leader, CDL continues to be a driving force in the sustainability landscape. CDL’s corporate sustainability efforts have been affirmed by leading global sustainability ratings and rankings: • G l o b a l 1 0 0 M o s t S u s t a i n a b l e
Corporations in the World by Corporate Knights: Ranked fifth overall in 2022 and maintaining its ranking as the world’s most sustainable real estate management and development company for the fourth consecutive year; only Singapore company listed for 13 consecutive years
• CDP: Only company in Southeast Asia and Hong Kong to maintain double ‘A’s for climate change (since 2018) and water security (since 2019)
• MSCI ESG Research: Maintained ‘AAA’ rating since 2010
• Global Real Estate Sustainability Benchmark (GRESB) 2021: Global Sector Leader (Diversified – Office/Retail) and Overall Regional Sector Leader (Diversified – Office/Retail)
CDL is also one of 45 companies and the only Singapore company to receive His Royal Highness The Prince of Wales’ Terra Carta Seal. This Seal is part of the Sustainable Markets Initiative and recognises sustainability leaders in the private sector with globally recognised and credible net zero roadmaps.
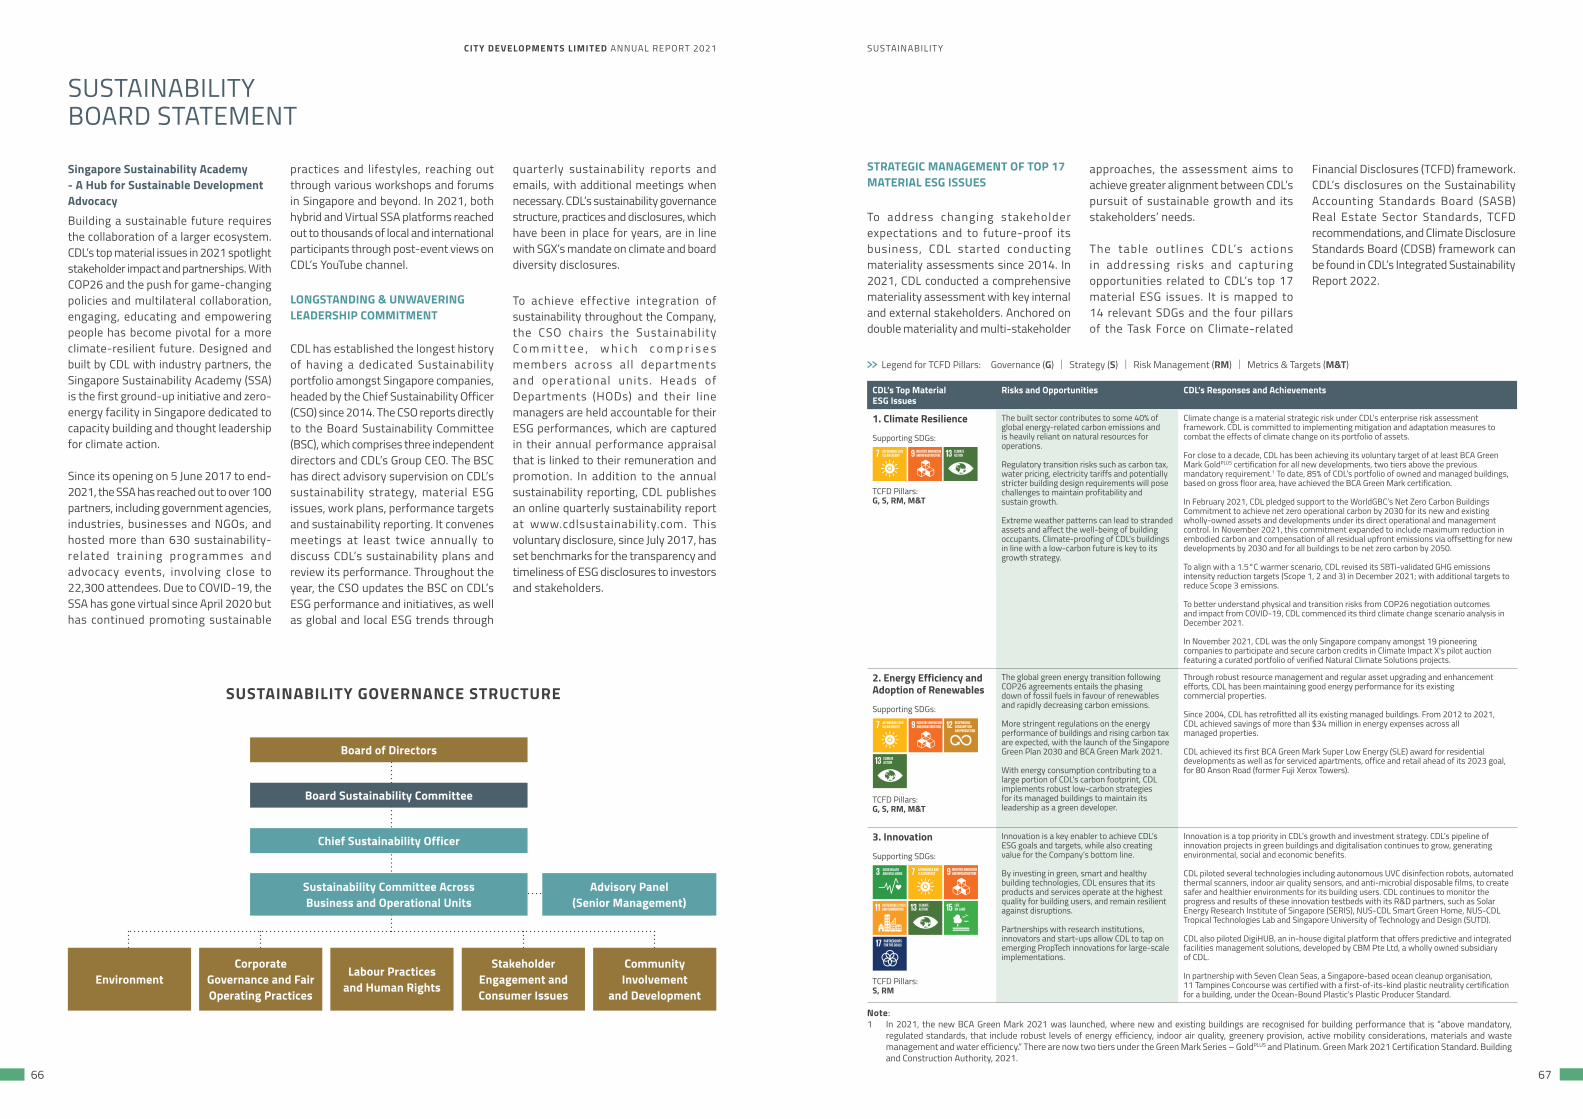
CITY DEVELOPMENTS LIMITED ANNUAL REPORT 2021 SUSTAINABILITY
66 67
Singapore Sustainability Academy - A Hub for Sustainable Development AdvocacyBuilding a sustainable future requires the collaboration of a larger ecosystem. CDL’s top material issues in 2021 spotlight stakeholder impact and partnerships. With COP26 and the push for game-changing policies and multilateral collaboration, engaging, educating and empowering people has become pivotal for a more climate-resilient future. Designed and built by CDL with industry partners, the Singapore Sustainability Academy (SSA) is the first ground-up initiative and zero-energy facility in Singapore dedicated to capacity building and thought leadership for climate action.
Since its opening on 5 June 2017 to end-2021, the SSA has reached out to over 100 partners, including government agencies, industries, businesses and NGOs, and hosted more than 630 sustainability-related training programmes and advocacy events, involving close to 22,300 attendees. Due to COVID-19, the SSA has gone virtual since April 2020 but has continued promoting sustainable
SUSTAINABILITY BOARD STATEMENT
practices and lifestyles, reaching out through various workshops and forums in Singapore and beyond. In 2021, both hybrid and Virtual SSA platforms reached out to thousands of local and international participants through post-event views on CDL’s YouTube channel.
LONGSTANDING & UNWAVERING LEADERSHIP COMMITMENT
CDL has established the longest history of having a dedicated Sustainability portfolio amongst Singapore companies, headed by the Chief Sustainability Officer (CSO) since 2014. The CSO reports directly to the Board Sustainability Committee (BSC), which comprises three independent directors and CDL’s Group CEO. The BSC has direct advisory supervision on CDL’s sustainability strategy, material ESG issues, work plans, performance targets and sustainability reporting. It convenes meetings at least twice annually to discuss CDL’s sustainability plans and review its performance. Throughout the year, the CSO updates the BSC on CDL’s ESG performance and initiatives, as well as global and local ESG trends through
quarterly sustainability reports and emails, with additional meetings when necessary. CDL’s sustainability governance structure, practices and disclosures, which have been in place for years, are in line with SGX’s mandate on climate and board diversity disclosures.
To achieve effective integration of sustainability throughout the Company, the CSO chairs the Sustainabil ity C o m m i t t e e , w h i c h c o m p r i s e s members across al l departments and operat ional units . Heads of Departments (HODs) and their line managers are held accountable for their ESG performances, which are captured in their annual performance appraisal that is linked to their remuneration and promotion. In addition to the annual sustainability reporting, CDL publishes an online quarterly sustainability report at www.cdlsustainability.com. This voluntary disclosure, since July 2017, has set benchmarks for the transparency and timeliness of ESG disclosures to investors and stakeholders.
Board of Directors
EnvironmentCorporate
Governance and Fair Operating Practices
Labour Practicesand Human Rights
StakeholderEngagement and Consumer Issues
CommunityInvolvement
and Development
Board Sustainability Committee
Chief Sustainability Officer
Sustainability Committee Across Business and Operational Units
Advisory Panel (Senior Management)
SUSTAINABILITY GOVERNANCE STRUCTURE
STRATEGIC MANAGEMENT OF TOP 17 MATERIAL ESG ISSUES
To address changing stakeholder expectations and to future-proof its business, CDL started conducting materiality assessments since 2014. In 2021, CDL conducted a comprehensive materiality assessment with key internal and external stakeholders. Anchored on double materiality and multi-stakeholder
approaches, the assessment aims to achieve greater alignment between CDL’s pursuit of sustainable growth and its stakeholders’ needs.
The table outl ines CDL’s actions in addressing risks and capturing opportunities related to CDL’s top 17 material ESG issues. It is mapped to 14 relevant SDGs and the four pillars of the Task Force on Climate-related
Financial Disclosures (TCFD) framework. CDL’s disclosures on the Sustainability Accounting Standards Board (SASB) Real Estate Sector Standards, TCFD recommendations, and Climate Disclosure Standards Board (CDSB) framework can be found in CDL’s Integrated Sustainability Report 2022.
Legend for TCFD Pillars: Governance (G) | Strategy (S) | Risk Management (RM) | Metrics & Targets (M&T)
CDL’s Top Material ESG Issues
Risks and Opportunities CDL’s Responses and Achievements
1. Climate Resilience
Supporting SDGs:
TCFD Pillars: G, S, RM, M&T
The built sector contributes to some 40% of global energy-related carbon emissions and is heavily reliant on natural resources for operations.
Regulatory transition risks such as carbon tax, water pricing, electricity tariffs and potentially stricter building design requirements will pose challenges to maintain profitability and sustain growth.
Extreme weather patterns can lead to stranded assets and affect the well-being of building occupants. Climate-proofing of CDL’s buildings in line with a low-carbon future is key to its growth strategy.
Climate change is a material strategic risk under CDL’s enterprise risk assessment framework. CDL is committed to implementing mitigation and adaptation measures to combat the effects of climate change on its portfolio of assets.
For close to a decade, CDL has been achieving its voluntary target of at least BCA Green Mark GoldPLUS certification for all new developments, two tiers above the previous mandatory requirement.1 To date, 85% of CDL’s portfolio of owned and managed buildings, based on gross floor area, have achieved the BCA Green Mark certification.
In February 2021, CDL pledged support to the WorldGBC’s Net Zero Carbon Buildings Commitment to achieve net zero operational carbon by 2030 for its new and existing wholly-owned assets and developments under its direct operational and management control. In November 2021, this commitment expanded to include maximum reduction in embodied carbon and compensation of all residual upfront emissions via offsetting for new developments by 2030 and for all buildings to be net zero carbon by 2050.
To align with a 1.5°C warmer scenario, CDL revised its SBTi-validated GHG emissions intensity reduction targets (Scope 1, 2 and 3) in December 2021; with additional targets to reduce Scope 3 emissions.
To better understand physical and transition risks from COP26 negotiation outcomes and impact from COVID-19, CDL commenced its third climate change scenario analysis in December 2021.
In November 2021, CDL was the only Singapore company amongst 19 pioneering companies to participate and secure carbon credits in Climate Impact X’s pilot auction featuring a curated portfolio of verified Natural Climate Solutions projects.
2. Energy Efficiency and Adoption of Renewables
Supporting SDGs:
TCFD Pillars: G, S, RM, M&T
The global green energy transition following COP26 agreements entails the phasing down of fossil fuels in favour of renewables and rapidly decreasing carbon emissions.
More stringent regulations on the energy performance of buildings and rising carbon tax are expected, with the launch of the Singapore Green Plan 2030 and BCA Green Mark 2021.
With energy consumption contributing to a large portion of CDL’s carbon footprint, CDL implements robust low-carbon strategies for its managed buildings to maintain its leadership as a green developer.
Through robust resource management and regular asset upgrading and enhancement efforts, CDL has been maintaining good energy performance for its existing commercial properties.
Since 2004, CDL has retrofitted all its existing managed buildings. From 2012 to 2021, CDL achieved savings of more than $34 million in energy expenses across all managed properties.
CDL achieved its first BCA Green Mark Super Low Energy (SLE) award for residential developments as well as for serviced apartments, office and retail ahead of its 2023 goal, for 80 Anson Road (former Fuji Xerox Towers).
3. Innovation
Supporting SDGs:
TCFD Pillars: S, RM
Innovation is a key enabler to achieve CDL’s ESG goals and targets, while also creating value for the Company’s bottom line.
By investing in green, smart and healthy building technologies, CDL ensures that its products and services operate at the highest quality for building users, and remain resilient against disruptions.
Partnerships with research institutions, innovators and start-ups allow CDL to tap on emerging PropTech innovations for large-scale implementations.
Innovation is a top priority in CDL’s growth and investment strategy. CDL’s pipeline of innovation projects in green buildings and digitalisation continues to grow, generating environmental, social and economic benefits.
CDL piloted several technologies including autonomous UVC disinfection robots, automated thermal scanners, indoor air quality sensors, and anti-microbial disposable films, to create safer and healthier environments for its building users. CDL continues to monitor the progress and results of these innovation testbeds with its R&D partners, such as Solar Energy Research Institute of Singapore (SERIS), NUS-CDL Smart Green Home, NUS-CDL Tropical Technologies Lab and Singapore University of Technology and Design (SUTD).
CDL also piloted DigiHUB, an in-house digital platform that offers predictive and integrated facilities management solutions, developed by CBM Pte Ltd, a wholly owned subsidiary of CDL.
In partnership with Seven Clean Seas, a Singapore-based ocean cleanup organisation, 11 Tampines Concourse was certified with a first-of-its-kind plastic neutrality certification for a building, under the Ocean-Bound Plastic’s Plastic Producer Standard.
Note: 1 In 2021, the new BCA Green Mark 2021 was launched, where new and existing buildings are recognised for building performance that is “above mandatory,
regulated standards, that include robust levels of energy efficiency, indoor air quality, greenery provision, active mobility considerations, materials and waste management and water efficiency.” There are now two tiers under the Green Mark Series – GoldPLUS and Platinum. Green Mark 2021 Certification Standard. Building and Construction Authority, 2021.
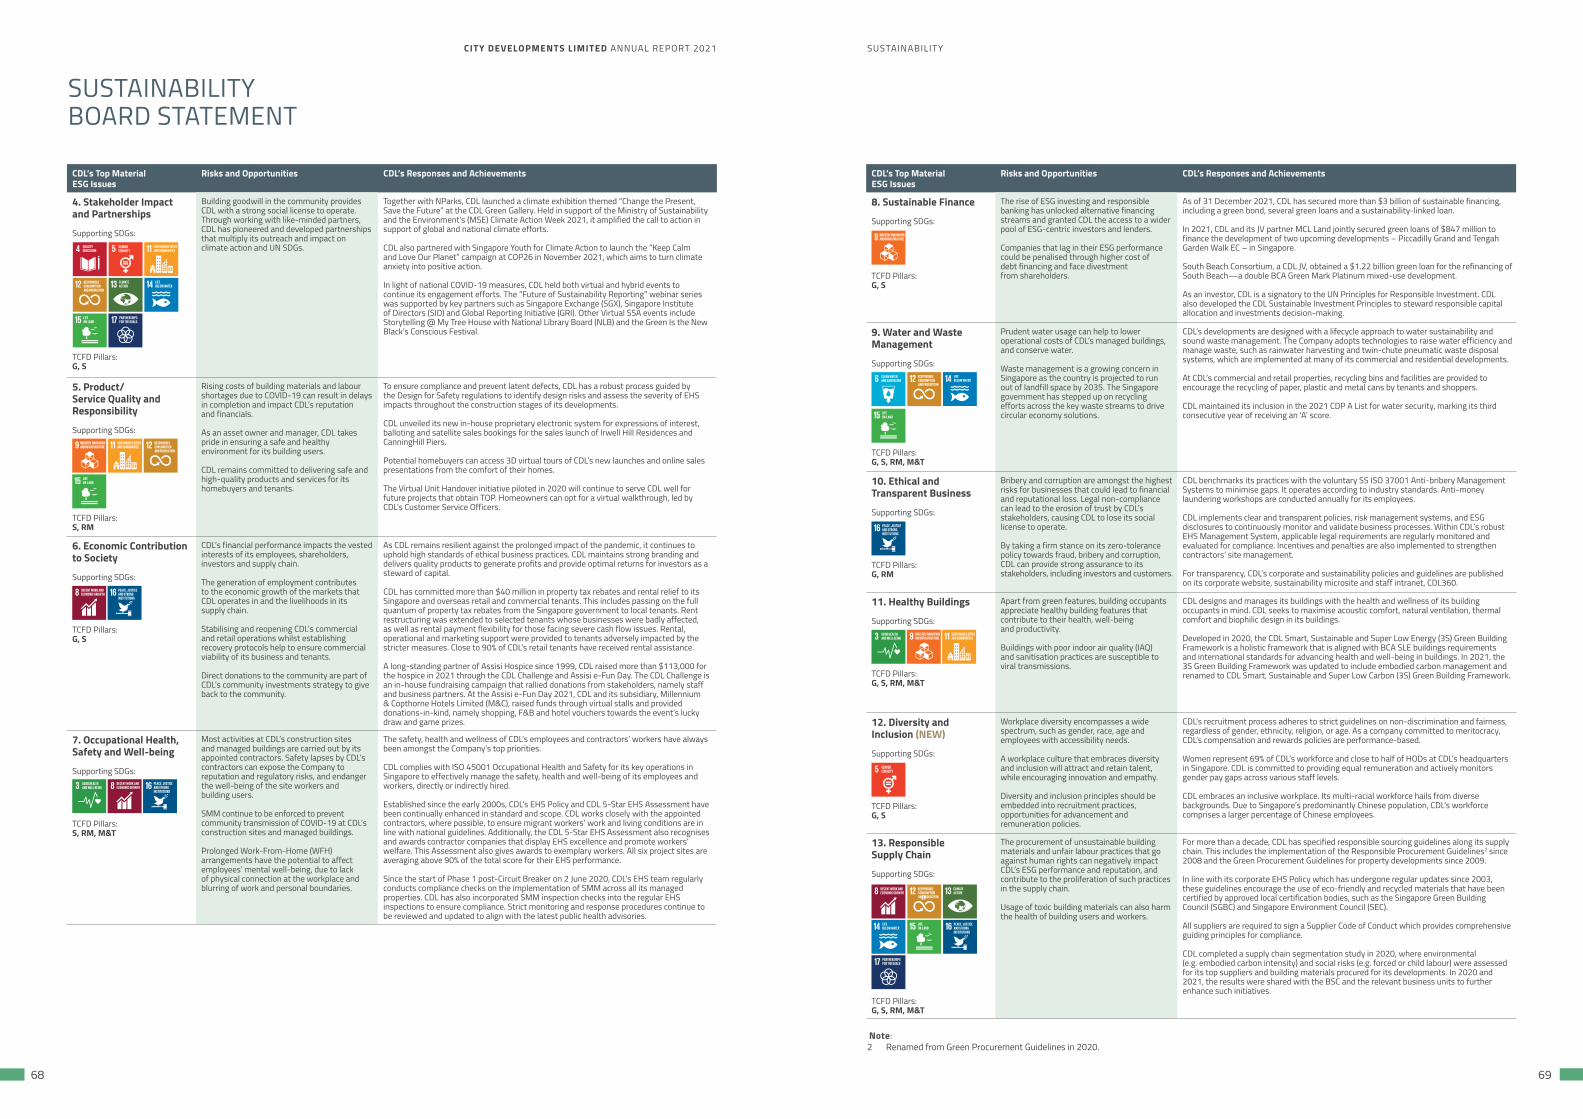
CITY DEVELOPMENTS LIMITED ANNUAL REPORT 2021 SUSTAINABILITY
68 69
CDL’s Top Material ESG Issues
Risks and Opportunities CDL’s Responses and Achievements
4. Stakeholder Impact and Partnerships
Supporting SDGs:
TCFD Pillars: G, S
Building goodwill in the community provides CDL with a strong social license to operate. Through working with like-minded partners, CDL has pioneered and developed partnerships that multiply its outreach and impact on climate action and UN SDGs.
Together with NParks, CDL launched a climate exhibition themed “Change the Present, Save the Future” at the CDL Green Gallery. Held in support of the Ministry of Sustainability and the Environment’s (MSE) Climate Action Week 2021, it amplified the call to action in support of global and national climate efforts.
CDL also partnered with Singapore Youth for Climate Action to launch the “Keep Calm and Love Our Planet” campaign at COP26 in November 2021, which aims to turn climate anxiety into positive action.
In light of national COVID-19 measures, CDL held both virtual and hybrid events to continue its engagement efforts. The “Future of Sustainability Reporting” webinar series was supported by key partners such as Singapore Exchange (SGX), Singapore Institute of Directors (SID) and Global Reporting Initiative (GRI). Other Virtual SSA events include Storytelling @ My Tree House with National Library Board (NLB) and the Green Is the New Black’s Conscious Festival.
5. Product/Service Quality and Responsibility
Supporting SDGs:
TCFD Pillars: S, RM
Rising costs of building materials and labour shortages due to COVID-19 can result in delays in completion and impact CDL’s reputation and financials.
As an asset owner and manager, CDL takes pride in ensuring a safe and healthy environment for its building users.
CDL remains committed to delivering safe and high-quality products and services for its homebuyers and tenants.
To ensure compliance and prevent latent defects, CDL has a robust process guided by the Design for Safety regulations to identify design risks and assess the severity of EHS impacts throughout the construction stages of its developments.
CDL unveiled its new in-house proprietary electronic system for expressions of interest, balloting and satellite sales bookings for the sales launch of Irwell Hill Residences and CanningHill Piers.
Potential homebuyers can access 3D virtual tours of CDL’s new launches and online sales presentations from the comfort of their homes.
The Virtual Unit Handover initiative piloted in 2020 will continue to serve CDL well for future projects that obtain TOP. Homeowners can opt for a virtual walkthrough, led by CDL’s Customer Service Officers.
6. Economic Contribution to Society
Supporting SDGs:
TCFD Pillars: G, S
CDL’s financial performance impacts the vested interests of its employees, shareholders, investors and supply chain.
The generation of employment contributes to the economic growth of the markets that CDL operates in and the livelihoods in its supply chain. Stabilising and reopening CDL’s commercial and retail operations whilst establishing recovery protocols help to ensure commercial viability of its business and tenants.
Direct donations to the community are part of CDL’s community investments strategy to give back to the community.
As CDL remains resilient against the prolonged impact of the pandemic, it continues to uphold high standards of ethical business practices. CDL maintains strong branding and delivers quality products to generate profits and provide optimal returns for investors as a steward of capital.
CDL has committed more than $40 million in property tax rebates and rental relief to its Singapore and overseas retail and commercial tenants. This includes passing on the full quantum of property tax rebates from the Singapore government to local tenants. Rent restructuring was extended to selected tenants whose businesses were badly affected, as well as rental payment flexibility for those facing severe cash flow issues. Rental, operational and marketing support were provided to tenants adversely impacted by the stricter measures. Close to 90% of CDL’s retail tenants have received rental assistance.
A long-standing partner of Assisi Hospice since 1999, CDL raised more than $113,000 for the hospice in 2021 through the CDL Challenge and Assisi e-Fun Day. The CDL Challenge is an in-house fundraising campaign that rallied donations from stakeholders, namely staff and business partners. At the Assisi e-Fun Day 2021, CDL and its subsidiary, Millennium & Copthorne Hotels Limited (M&C), raised funds through virtual stalls and provided donations-in-kind, namely shopping, F&B and hotel vouchers towards the event’s lucky draw and game prizes.
7. Occupational Health,Safety and Well-being
Supporting SDGs:
TCFD Pillars: S, RM, M&T
Most activities at CDL’s construction sites and managed buildings are carried out by its appointed contractors. Safety lapses by CDL’s contractors can expose the Company to reputation and regulatory risks, and endanger the well-being of the site workers and building users.
SMM continue to be enforced to prevent community transmission of COVID-19 at CDL’s construction sites and managed buildings.
Prolonged Work-From-Home (WFH) arrangements have the potential to affect employees’ mental well-being, due to lack of physical connection at the workplace and blurring of work and personal boundaries.
The safety, health and wellness of CDL’s employees and contractors’ workers have always been amongst the Company’s top priorities.
CDL complies with ISO 45001 Occupational Health and Safety for its key operations in Singapore to effectively manage the safety, health and well-being of its employees and workers, directly or indirectly hired.
Established since the early 2000s, CDL’s EHS Policy and CDL 5-Star EHS Assessment have been continually enhanced in standard and scope. CDL works closely with the appointed contractors, where possible, to ensure migrant workers’ work and living conditions are in line with national guidelines. Additionally, the CDL 5-Star EHS Assessment also recognises and awards contractor companies that display EHS excellence and promote workers’ welfare. This Assessment also gives awards to exemplary workers. All six project sites are averaging above 90% of the total score for their EHS performance.
Since the start of Phase 1 post-Circuit Breaker on 2 June 2020, CDL’s EHS team regularly conducts compliance checks on the implementation of SMM across all its managed properties. CDL has also incorporated SMM inspection checks into the regular EHS inspections to ensure compliance. Strict monitoring and response procedures continue to be reviewed and updated to align with the latest public health advisories.
CDL’s Top Material ESG Issues
Risks and Opportunities CDL’s Responses and Achievements
8. Sustainable Finance
Supporting SDGs:
TCFD Pillars: G, S
The rise of ESG investing and responsible banking has unlocked alternative financing streams and granted CDL the access to a wider pool of ESG-centric investors and lenders.
Companies that lag in their ESG performance could be penalised through higher cost of debt financing and face divestment from shareholders.
As of 31 December 2021, CDL has secured more than $3 billion of sustainable financing, including a green bond, several green loans and a sustainability-linked loan.
In 2021, CDL and its JV partner MCL Land jointly secured green loans of $847 million to finance the development of two upcoming developments – Piccadilly Grand and Tengah Garden Walk EC – in Singapore.
South Beach Consortium, a CDL JV, obtained a $1.22 billion green loan for the refinancing of South Beach—a double BCA Green Mark Platinum mixed-use development.
As an investor, CDL is a signatory to the UN Principles for Responsible Investment. CDL also developed the CDL Sustainable Investment Principles to steward responsible capital allocation and investments decision-making.
9. Water and Waste Management
Supporting SDGs:
TCFD Pillars: G, S, RM, M&T
Prudent water usage can help to lower operational costs of CDL’s managed buildings, and conserve water.
Waste management is a growing concern in Singapore as the country is projected to run out of landfill space by 2035. The Singapore government has stepped up on recycling efforts across the key waste streams to drive circular economy solutions.
CDL’s developments are designed with a lifecycle approach to water sustainability and sound waste management. The Company adopts technologies to raise water efficiency and manage waste, such as rainwater harvesting and twin-chute pneumatic waste disposal systems, which are implemented at many of its commercial and residential developments.
At CDL’s commercial and retail properties, recycling bins and facilities are provided to encourage the recycling of paper, plastic and metal cans by tenants and shoppers.
CDL maintained its inclusion in the 2021 CDP A List for water security, marking its third consecutive year of receiving an ‘A’ score.
10. Ethical and Transparent Business
Supporting SDGs:
TCFD Pillars: G, RM
Bribery and corruption are amongst the highest risks for businesses that could lead to financial and reputational loss. Legal non-compliance can lead to the erosion of trust by CDL’s stakeholders, causing CDL to lose its social license to operate.
By taking a firm stance on its zero-tolerance policy towards fraud, bribery and corruption, CDL can provide strong assurance to its stakeholders, including investors and customers.
CDL benchmarks its practices with the voluntary SS ISO 37001 Anti-bribery Management Systems to minimise gaps. It operates according to industry standards. Anti-money laundering workshops are conducted annually for its employees.
CDL implements clear and transparent policies, risk management systems, and ESG disclosures to continuously monitor and validate business processes. Within CDL’s robust EHS Management System, applicable legal requirements are regularly monitored and evaluated for compliance. Incentives and penalties are also implemented to strengthen contractors’ site management.
For transparency, CDL’s corporate and sustainability policies and guidelines are published on its corporate website, sustainability microsite and staff intranet, CDL360.
11. Healthy Buildings
Supporting SDGs:
TCFD Pillars: G, S, RM, M&T
Apart from green features, building occupants appreciate healthy building features that contribute to their health, well-being and productivity.
Buildings with poor indoor air quality (IAQ) and sanitisation practices are susceptible to viral transmissions.
CDL designs and manages its buildings with the health and wellness of its building occupants in mind. CDL seeks to maximise acoustic comfort, natural ventilation, thermal comfort and biophilic design in its buildings.
Developed in 2020, the CDL Smart, Sustainable and Super Low Energy (3S) Green Building Framework is a holistic framework that is aligned with BCA SLE buildings requirements and international standards for advancing health and well-being in buildings. In 2021, the 3S Green Building Framework was updated to include embodied carbon management and renamed to CDL Smart, Sustainable and Super Low Carbon (3S) Green Building Framework.
12. Diversity and Inclusion (NEW)
Supporting SDGs:
TCFD Pillars: G, S
Workplace diversity encompasses a wide spectrum, such as gender, race, age and employees with accessibility needs.
A workplace culture that embraces diversity and inclusion will attract and retain talent, while encouraging innovation and empathy.
Diversity and inclusion principles should be embedded into recruitment practices, opportunities for advancement and remuneration policies.
CDL’s recruitment process adheres to strict guidelines on non-discrimination and fairness, regardless of gender, ethnicity, religion, or age. As a company committed to meritocracy, CDL’s compensation and rewards policies are performance-based.
Women represent 69% of CDL’s workforce and close to half of HODs at CDL’s headquarters in Singapore. CDL is committed to providing equal remuneration and actively monitors gender pay gaps across various staff levels.
CDL embraces an inclusive workplace. Its multi-racial workforce hails from diverse backgrounds. Due to Singapore’s predominantly Chinese population, CDL’s workforce comprises a larger percentage of Chinese employees.
13. Responsible Supply Chain
Supporting SDGs:
TCFD Pillars: G, S, RM, M&T
The procurement of unsustainable building materials and unfair labour practices that go against human rights can negatively impact CDL’s ESG performance and reputation, and contribute to the proliferation of such practices in the supply chain.
Usage of toxic building materials can also harm the health of building users and workers.
For more than a decade, CDL has specified responsible sourcing guidelines along its supply chain. This includes the implementation of the Responsible Procurement Guidelines2 since 2008 and the Green Procurement Guidelines for property developments since 2009.
In line with its corporate EHS Policy which has undergone regular updates since 2003, these guidelines encourage the use of eco-friendly and recycled materials that have been certified by approved local certification bodies, such as the Singapore Green Building Council (SGBC) and Singapore Environment Council (SEC).
All suppliers are required to sign a Supplier Code of Conduct which provides comprehensive guiding principles for compliance.
CDL completed a supply chain segmentation study in 2020, where environmental (e.g. embodied carbon intensity) and social risks (e.g. forced or child labour) were assessed for its top suppliers and building materials procured for its developments. In 2020 and 2021, the results were shared with the BSC and the relevant business units to further enhance such initiatives.
SUSTAINABILITY BOARD STATEMENT
Note: 2 Renamed from Green Procurement Guidelines in 2020.
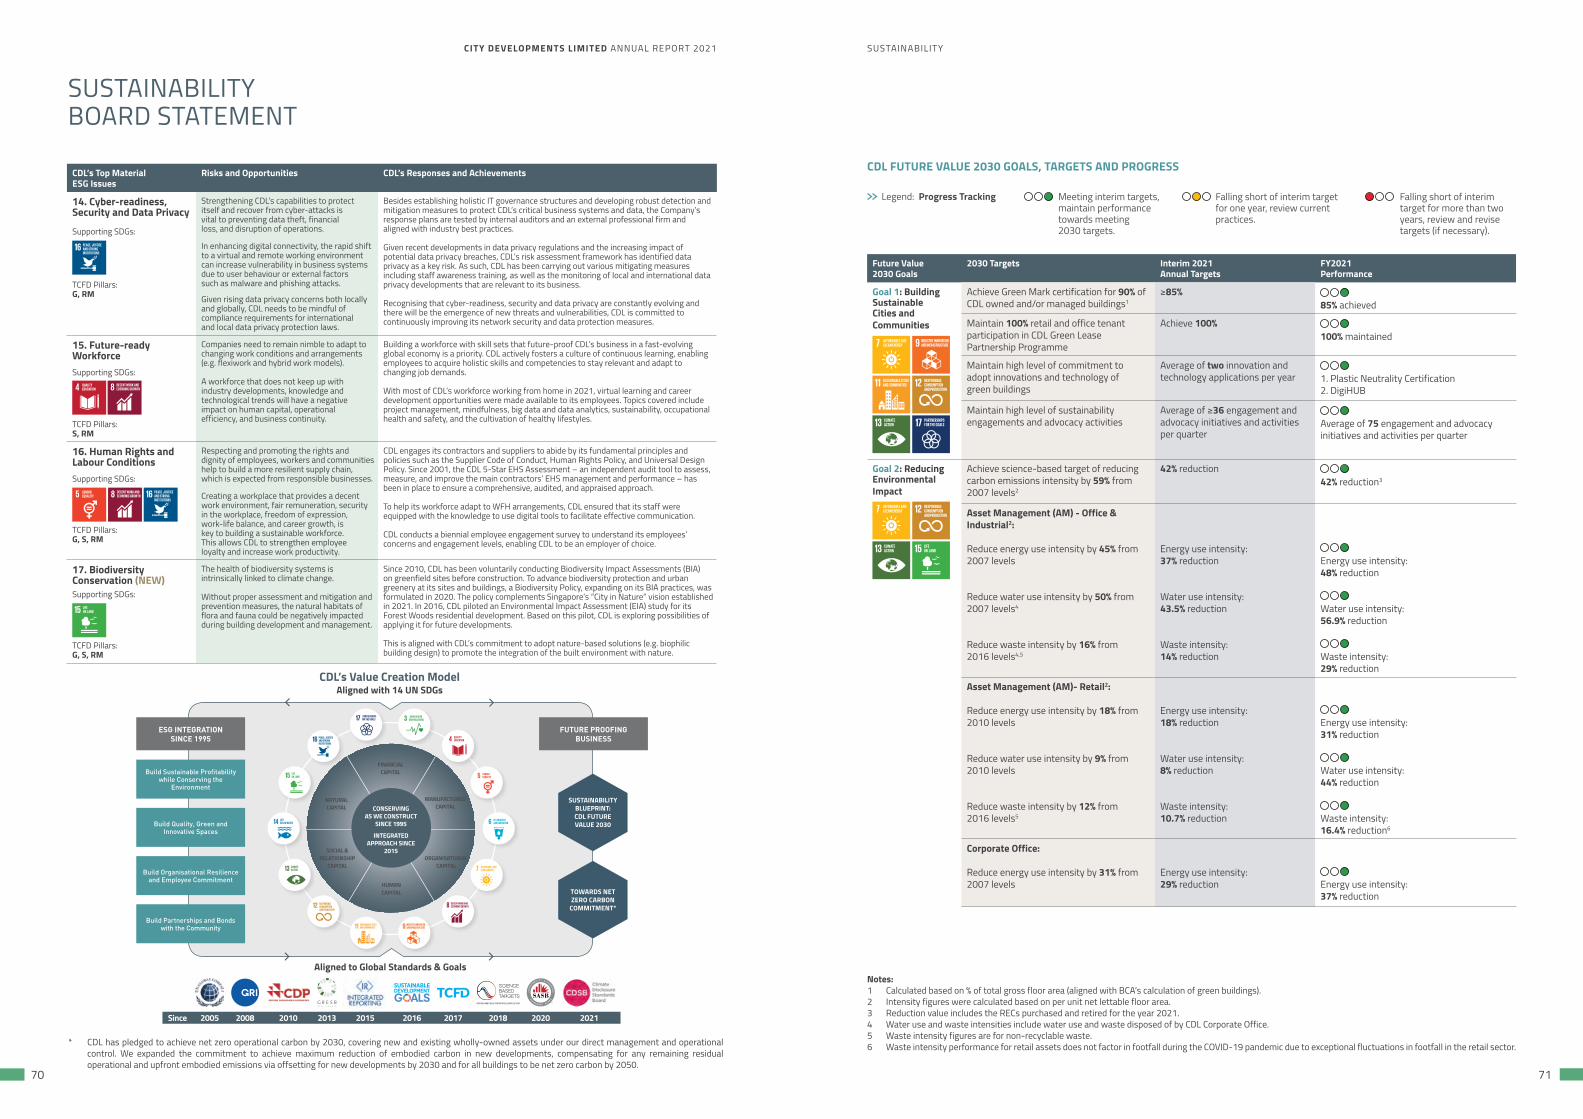
CITY DEVELOPMENTS LIMITED ANNUAL REPORT 2021 SUSTAINABILITY
70 71
CDL’s Top Material ESG Issues
Risks and Opportunities CDL’s Responses and Achievements
14. Cyber-readiness, Security and Data Privacy
Supporting SDGs:
TCFD Pillars: G, RM
Strengthening CDL’s capabilities to protect itself and recover from cyber-attacks is vital to preventing data theft, financial loss, and disruption of operations.
In enhancing digital connectivity, the rapid shift to a virtual and remote working environment can increase vulnerability in business systems due to user behaviour or external factors such as malware and phishing attacks.
Given rising data privacy concerns both locally and globally, CDL needs to be mindful of compliance requirements for international and local data privacy protection laws.
Besides establishing holistic IT governance structures and developing robust detection and mitigation measures to protect CDL’s critical business systems and data, the Company’s response plans are tested by internal auditors and an external professional firm and aligned with industry best practices.
Given recent developments in data privacy regulations and the increasing impact of potential data privacy breaches, CDL’s risk assessment framework has identified data privacy as a key risk. As such, CDL has been carrying out various mitigating measures including staff awareness training, as well as the monitoring of local and international data privacy developments that are relevant to its business.
Recognising that cyber-readiness, security and data privacy are constantly evolving and there will be the emergence of new threats and vulnerabilities, CDL is committed to continuously improving its network security and data protection measures.
15. Future-ready WorkforceSupporting SDGs:
TCFD Pillars: S, RM
Companies need to remain nimble to adapt to changing work conditions and arrangements (e.g. flexiwork and hybrid work models).
A workforce that does not keep up with industry developments, knowledge and technological trends will have a negative impact on human capital, operational efficiency, and business continuity.
Building a workforce with skill sets that future-proof CDL’s business in a fast-evolving global economy is a priority. CDL actively fosters a culture of continuous learning, enabling employees to acquire holistic skills and competencies to stay relevant and adapt to changing job demands.
With most of CDL’s workforce working from home in 2021, virtual learning and career development opportunities were made available to its employees. Topics covered include project management, mindfulness, big data and data analytics, sustainability, occupational health and safety, and the cultivation of healthy lifestyles.
16. Human Rights and Labour ConditionsSupporting SDGs:
TCFD Pillars: G, S, RM
Respecting and promoting the rights and dignity of employees, workers and communities help to build a more resilient supply chain, which is expected from responsible businesses.
Creating a workplace that provides a decent work environment, fair remuneration, security in the workplace, freedom of expression, work-life balance, and career growth, is key to building a sustainable workforce. This allows CDL to strengthen employee loyalty and increase work productivity.
CDL engages its contractors and suppliers to abide by its fundamental principles and policies such as the Supplier Code of Conduct, Human Rights Policy, and Universal Design Policy. Since 2001, the CDL 5-Star EHS Assessment – an independent audit tool to assess, measure, and improve the main contractors’ EHS management and performance – has been in place to ensure a comprehensive, audited, and appraised approach.
To help its workforce adapt to WFH arrangements, CDL ensured that its staff were equipped with the knowledge to use digital tools to facilitate effective communication.
CDL conducts a biennial employee engagement survey to understand its employees’ concerns and engagement levels, enabling CDL to be an employer of choice.
17. Biodiversity Conservation (NEW)Supporting SDGs:
TCFD Pillars: G, S, RM
The health of biodiversity systems is intrinsically linked to climate change.
Without proper assessment and mitigation and prevention measures, the natural habitats of flora and fauna could be negatively impacted during building development and management.
Since 2010, CDL has been voluntarily conducting Biodiversity Impact Assessments (BIA) on greenfield sites before construction. To advance biodiversity protection and urban greenery at its sites and buildings, a Biodiversity Policy, expanding on its BIA practices, was formulated in 2020. The policy complements Singapore’s “City in Nature” vision established in 2021. In 2016, CDL piloted an Environmental Impact Assessment (EIA) study for its Forest Woods residential development. Based on this pilot, CDL is exploring possibilities of applying it for future developments.
This is aligned with CDL’s commitment to adopt nature-based solutions (e.g. biophilic building design) to promote the integration of the built environment with nature.
SUSTAINABILITY BOARD STATEMENT
CDL FUTURE VALUE 2030 GOALS, TARGETS AND PROGRESS
Legend: Progress Tracking Falling short of interim target for more than two years, review and revise targets (if necessary).
Meeting interim targets, maintain performance towards meeting 2030 targets.
Falling short of interim target for one year, review current practices.
Future Value 2030 Goals
2030 Targets Interim 2021Annual Targets
FY2021 Performance
Goal 1: BuildingSustainable Cities and Communities
Achieve Green Mark certification for 90% of CDL owned and/or managed buildings1
≥85% 85% achieved
Maintain 100% retail and office tenant participation in CDL Green Lease Partnership Programme
Achieve 100% 100% maintained
Maintain high level of commitment to adopt innovations and technology of green buildings
Average of two innovation and technology applications per year
1. Plastic Neutrality Certification2. DigiHUB
Maintain high level of sustainability engagements and advocacy activities
Average of ≥36 engagement and advocacy initiatives and activities per quarter
Average of 75 engagement and advocacy initiatives and activities per quarter
Goal 2: Reducing Environmental Impact
Achieve science-based target of reducing carbon emissions intensity by 59% from 2007 levels2
42% reduction 42% reduction3
Asset Management (AM) - Office & Industrial2:
Reduce energy use intensity by 45% from 2007 levels
Reduce water use intensity by 50% from 2007 levels4
Reduce waste intensity by 16% from 2016 levels4,5
Energy use intensity: 37% reduction
Water use intensity: 43.5% reduction
Waste intensity:14% reduction
Energy use intensity: 48% reduction
Water use intensity: 56.9% reduction
Waste intensity: 29% reduction
Asset Management (AM)- Retail2:
Reduce energy use intensity by 18% from 2010 levels
Reduce water use intensity by 9% from 2010 levels
Reduce waste intensity by 12% from 2016 levels5
Energy use intensity: 18% reduction
Water use intensity: 8% reduction
Waste intensity:10.7% reduction
Energy use intensity: 31% reduction
Water use intensity: 44% reduction
Waste intensity: 16.4% reduction6
Corporate Office:
Reduce energy use intensity by 31% from 2007 levels
Energy use intensity: 29% reduction
Energy use intensity: 37% reduction
Notes: 1 Calculated based on % of total gross floor area (aligned with BCA’s calculation of green buildings). 2 Intensity figures were calculated based on per unit net lettable floor area.3 Reduction value includes the RECs purchased and retired for the year 2021.4 Water use and waste intensities include water use and waste disposed of by CDL Corporate Office.5 Waste intensity figures are for non-recyclable waste.6 Waste intensity performance for retail assets does not factor in footfall during the COVID-19 pandemic due to exceptional fluctuations in footfall in the retail sector.
CDL’s Value Creation ModelAligned with 14 UN SDGs
Aligned to Global Standards & Goals
Build Sustainable Profitability while Conserving the
Environment
Build Quality, Green and Innovative Spaces
Build Organisational Resilience and Employee Commitment
Build Partnerships and Bonds with the Community
FINANCIALCAPITAL
MANUFACTURED CAPITAL
ORGANISATIONAL CAPITAL
SOCIAL & RELATIONSHIP
CAPITAL
HUMAN CAPITAL
NATURAL CAPITAL
ESG INTEGRATION SINCE 1995
FUTURE PROOFING BUSINESS
SUSTAINABILITY BLUEPRINT:CDL FUTURE VALUE 2030
TOWARDS NET ZERO CARBON
COMMITMENT*
2005Since 2008 2016 2017 2018 2020 20212010 20152013
CONSERVING AS WE CONSTRUCT
SINCE 1995
INTEGRATED APPROACH SINCE
2015
* CDL has pledged to achieve net zero operational carbon by 2030, covering new and existing wholly-owned assets under our direct management and operational control. We expanded the commitment to achieve maximum reduction of embodied carbon in new developments, compensating for any remaining residual operational and upfront embodied emissions via offsetting for new developments by 2030 and for all buildings to be net zero carbon by 2050.
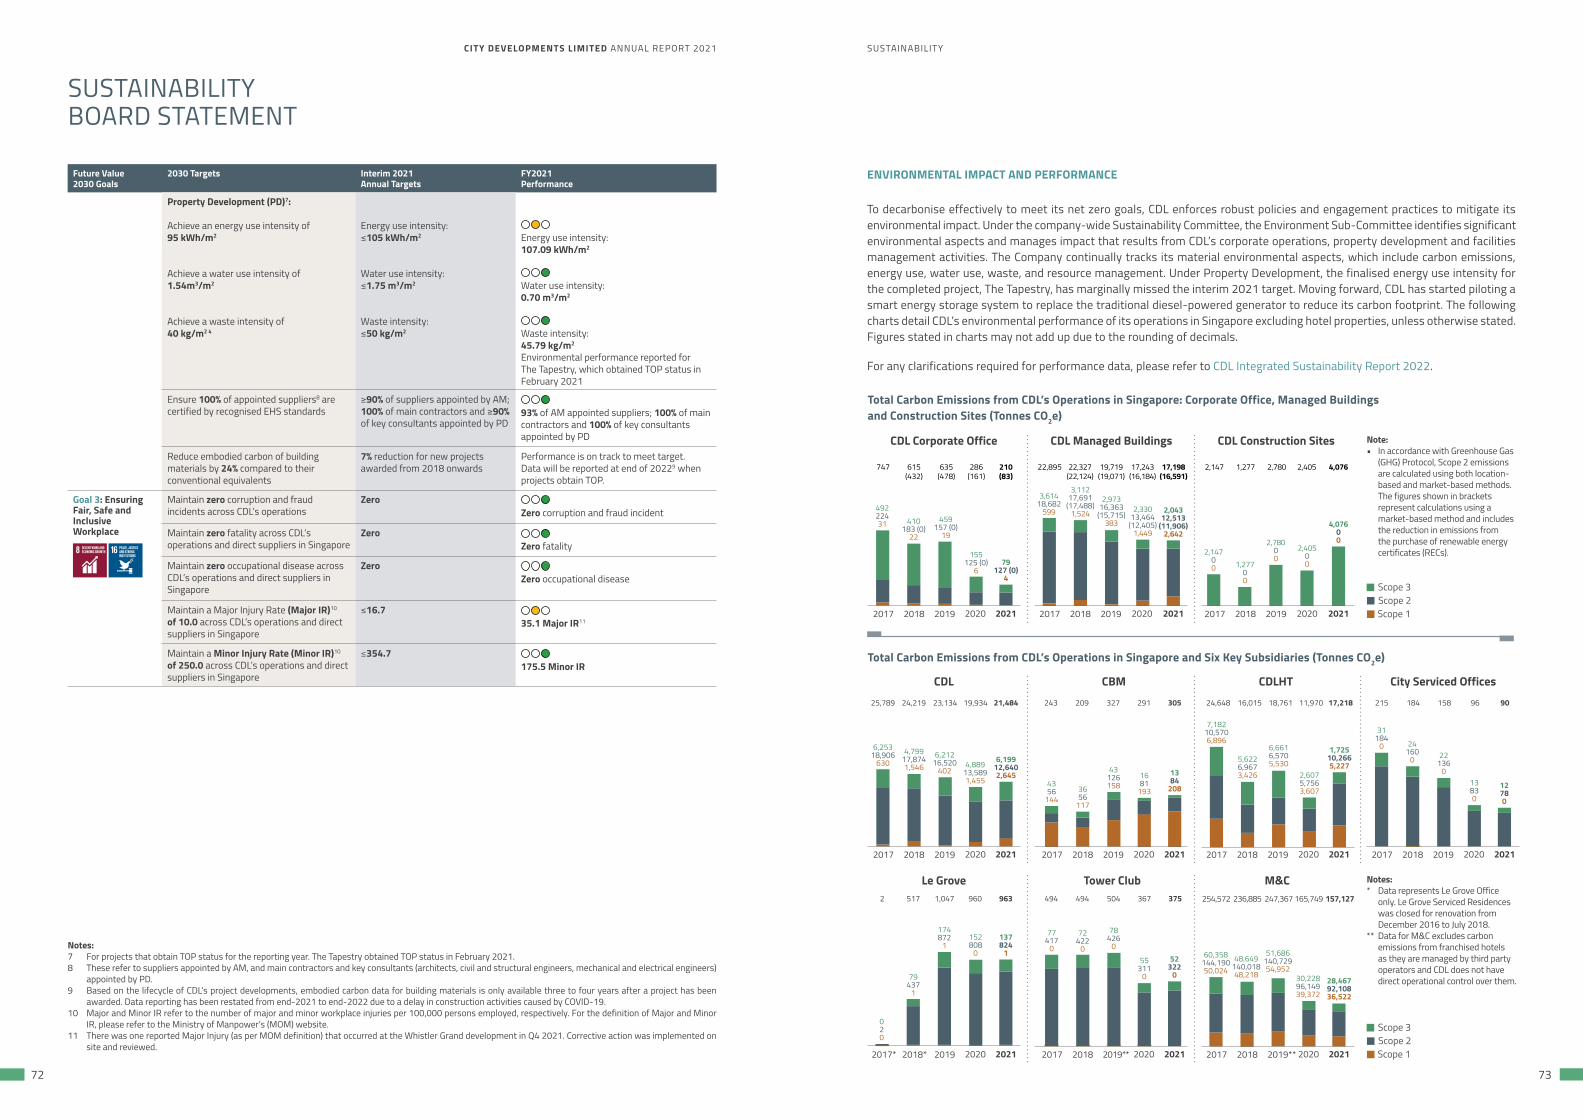
CITY DEVELOPMENTS LIMITED ANNUAL REPORT 2021 SUSTAINABILITY
72 73
Future Value 2030 Goals
2030 Targets Interim 2021Annual Targets
FY2021 Performance
Property Development (PD)7:
Achieve an energy use intensity of 95 kWh/m2
Achieve a water use intensity of 1.54m3/m2
Achieve a waste intensity of 40 kg/m2 4
Energy use intensity: ≤105 kWh/m2
Water use intensity: ≤1.75 m3/m2
Waste intensity:≤50 kg/m2
Energy use intensity: 107.09 kWh/m2
Water use intensity: 0.70 m3/m2
Waste intensity: 45.79 kg/m2
Environmental performance reported for The Tapestry, which obtained TOP status in February 2021
Ensure 100% of appointed suppliers8 are certified by recognised EHS standards
≥90% of suppliers appointed by AM; 100% of main contractors and ≥90% of key consultants appointed by PD
93% of AM appointed suppliers; 100% of main contractors and 100% of key consultants appointed by PD
Reduce embodied carbon of building materials by 24% compared to their conventional equivalents
7% reduction for new projects awarded from 2018 onwards
Performance is on track to meet target. Data will be reported at end of 20229 when projects obtain TOP.
Goal 3: Ensuring Fair, Safe and Inclusive Workplace
Maintain zero corruption and fraud incidents across CDL’s operations
Zero Zero corruption and fraud incident
Maintain zero fatality across CDL’s operations and direct suppliers in Singapore
Zero Zero fatality
Maintain zero occupational disease across CDL’s operations and direct suppliers in Singapore
Zero Zero occupational disease
Maintain a Major Injury Rate (Major IR)10 of 10.0 across CDL’s operations and direct suppliers in Singapore
≤16.735.1 Major IR11
Maintain a Minor Injury Rate (Minor IR)10
of 250.0 across CDL’s operations and direct suppliers in Singapore
≤354.7 175.5 Minor IR
SUSTAINABILITY BOARD STATEMENT
Notes: 7 For projects that obtain TOP status for the reporting year. The Tapestry obtained TOP status in February 2021.8 These refer to suppliers appointed by AM, and main contractors and key consultants (architects, civil and structural engineers, mechanical and electrical engineers)
appointed by PD.9 Based on the lifecycle of CDL’s project developments, embodied carbon data for building materials is only available three to four years after a project has been
awarded. Data reporting has been restated from end-2021 to end-2022 due to a delay in construction activities caused by COVID-19.10 Major and Minor IR refer to the number of major and minor workplace injuries per 100,000 persons employed, respectively. For the definition of Major and Minor
IR, please refer to the Ministry of Manpower’s (MOM) website.11 There was one reported Major Injury (as per MOM definition) that occurred at the Whistler Grand development in Q4 2021. Corrective action was implemented on
site and reviewed.
ENVIRONMENTAL IMPACT AND PERFORMANCE
To decarbonise effectively to meet its net zero goals, CDL enforces robust policies and engagement practices to mitigate its environmental impact. Under the company-wide Sustainability Committee, the Environment Sub-Committee identifies significant environmental aspects and manages impact that results from CDL’s corporate operations, property development and facilities management activities. The Company continually tracks its material environmental aspects, which include carbon emissions, energy use, water use, waste, and resource management. Under Property Development, the finalised energy use intensity for the completed project, The Tapestry, has marginally missed the interim 2021 target. Moving forward, CDL has started piloting a smart energy storage system to replace the traditional diesel-powered generator to reduce its carbon footprint. The following charts detail CDL’s environmental performance of its operations in Singapore excluding hotel properties, unless otherwise stated. Figures stated in charts may not add up due to the rounding of decimals.
For any clarifications required for performance data, please refer to CDL Integrated Sustainability Report 2022.
Total Carbon Emissions from CDL’s Operations in Singapore: Corporate Office, Managed Buildings and Construction Sites (Tonnes CO2e)
459157 (0)
19
155125 (0)
679
127 (0)4
2017 20172018 20182019 20192020 20202017 2018 2019 2020 2021
2017 2018 2019 2020 2021 2017 2018 2019 2020 2021 2017 2018 2019 2020 2021 2017 2018 2019 2020 2021
2017* 2018* 2019 2020 2021 2017 2018 2019** 2020 2021 2017 2018 2019** 2020 2021
2021 2021
49222431 410
183 (0)22
CDL Corporate Office
747 615(432)
635(478)
286(161)
210 (83)
Note:• In accordance with Greenhouse Gas
(GHG) Protocol, Scope 2 emissions are calculated using both location-based and market-based methods. The figures shown in brackets represent calculations using a market-based method and includes the reduction in emissions from the purchase of renewable energy certificates (RECs).
Scope 1Scope 2Scope 3
CDL Construction Sites
2,14700
2,147
1,27700
1,277
2,78000
2,780
2,40500
4,07600
2,405 4,076
CDL Managed Buildings
22,895 22,327(22,124)
19,719(19,071)
17,243(16,184)
17,198 (16,591)
2,97316,363
(15,715)383
2,33013,464
(12,405)1,449
2,04312,513
(11,906)2,642
3,61418,682
599
3,11217,691
(17,488)1,524
Total Carbon Emissions from CDL’s Operations in Singapore and Six Key Subsidiaries (Tonnes CO2e)
CDL
6,25318,906
6304,799
17,874 1,546
6,21216,520
4024,889
13,589 1,455
6,19912,640 2,645
CBM
4356
1443656
117
43126158
1681
193
1384
208
CDLHT
7,18210,5706,896
6,6616,5705,530
2,6075,7563,607
1,725 10,2665,227
5,6226,9673,426
City Serviced Offices
31184
0 24160
0 22136
013830
12780
25,789 243 24,648 21524,219 209 16,015 18423,134 327 18,761 15819,934 21,484 291 305 11,970 17,218 96 90
Notes:* Data represents Le Grove Office
only. Le Grove Serviced Residences was closed for renovation from December 2016 to July 2018.
** Data for M&C excludes carbon emissions from franchised hotels as they are managed by third party operators and CDL does not have direct operational control over them.
Le Grove
020
79437
1
174872
1152808
0
137824
1
Tower Club
77417
0
72422
0
78426
0
55311
0
52322
0
M&C
60,358144,19050,024
48,649140,01848,218 30,228
96,14939,372
28,46792,10836,522
51,686140,729 54,952
254,572 236,885 247,367 165,749 157,1272 494517 4941,047 504960 963 367 375
Scope 1Scope 2Scope 3
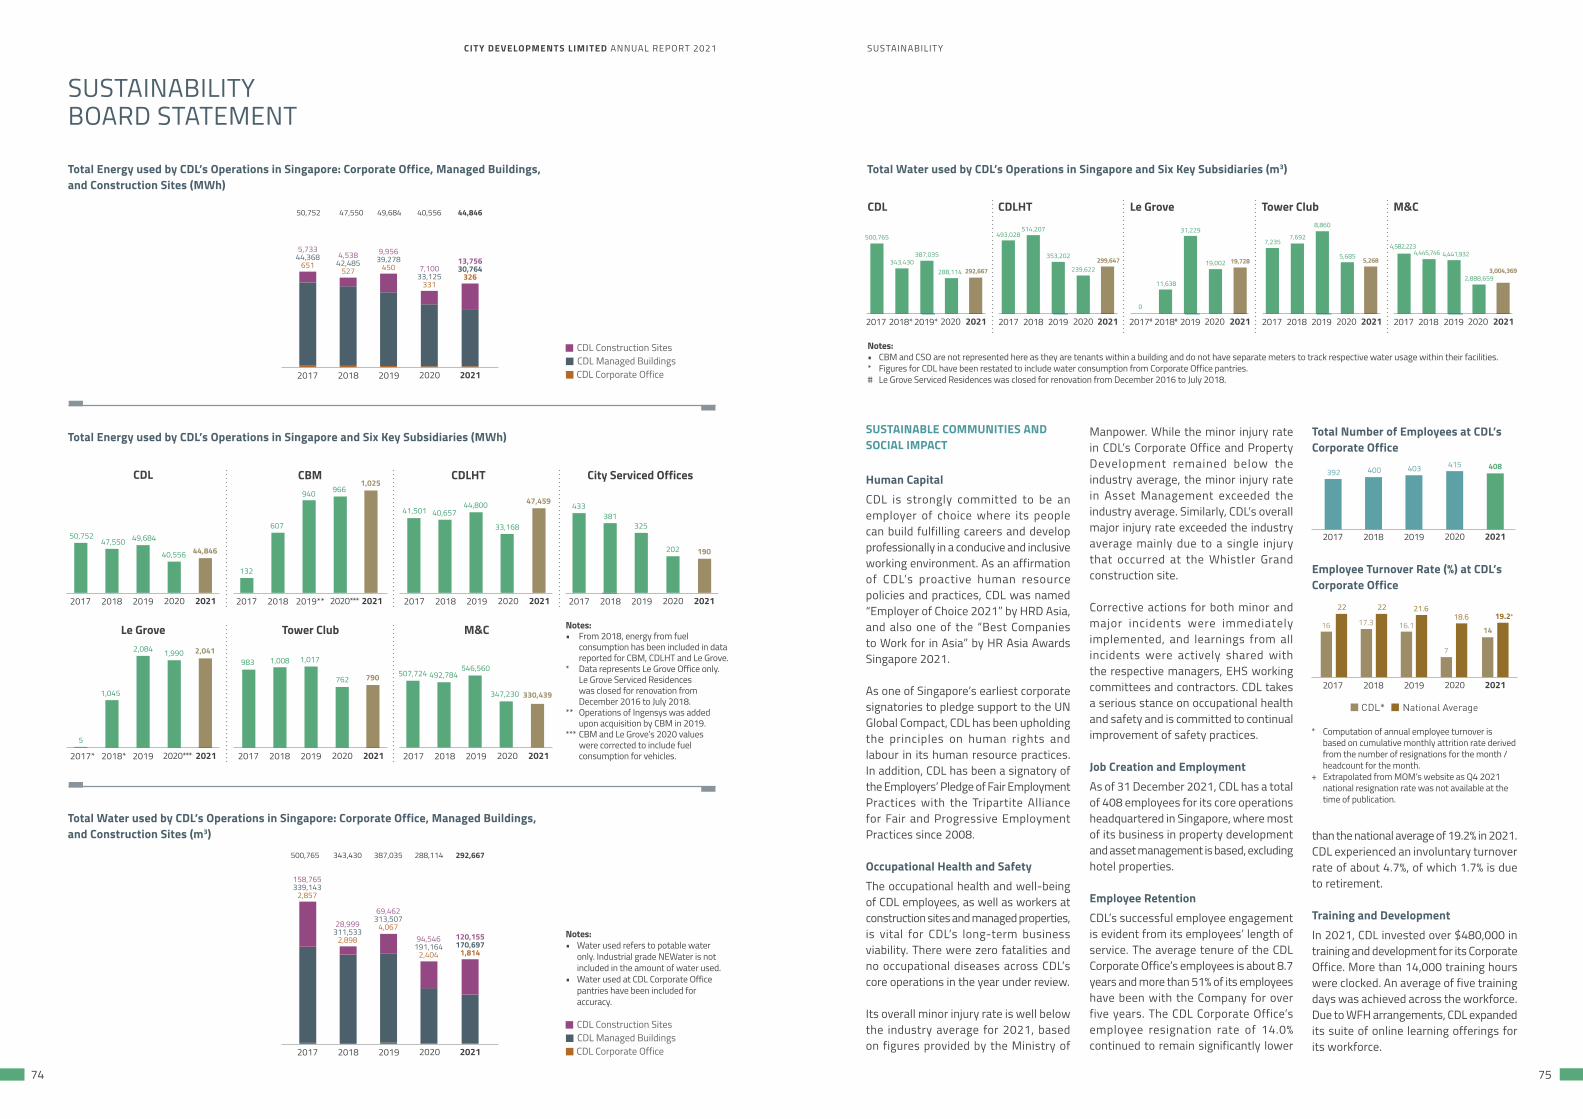
CITY DEVELOPMENTS LIMITED ANNUAL REPORT 2021 SUSTAINABILITY
74 75
Total Energy used by CDL’s Operations in Singapore: Corporate Office, Managed Buildings, and Construction Sites (MWh)
5,73344,368
6514,538
42,485527
9,95639,278
450 7,10033,125
331
13,75630,764
326
50,752 47,550 49,684 40,556 44,846
Total Energy used by CDL’s Operations in Singapore and Six Key Subsidiaries (MWh)
50,75247,550 49,684
40,556 44,846
2,041
1,025
790
330,439
47,459
190
292,667299,647 19,728 5,268
3,004,369
CBM
132
607
940 966CDLHT
41,501 40,65744,800
33,168
City Serviced Offices
433381
325
202
Notes:• From 2018, energy from fuel
consumption has been included in data reported for CBM, CDLHT and Le Grove.
* Data represents Le Grove Office only. Le Grove Serviced Residences was closed for renovation from December 2016 to July 2018.
** Operations of Ingensys was added upon acquisition by CBM in 2019.
*** CBM and Le Grove’s 2020 values were corrected to include fuel consumption for vehicles.
Notes:• Water used refers to potable water
only. Industrial grade NEWater is not included in the amount of water used.
• Water used at CDL Corporate Office pantries have been included for accuracy.
Le Grove Tower Club M&C
507,724 492,784546,560
983 1,008 1,017
762
5
1,045
2,084 1,990
347,230
SUSTAINABILITY BOARD STATEMENT
2017 2018 2019 2020 2021
2017 2018 2019 2020 2021
CDL Corporate OfficeCDL Managed BuildingsCDL Construction Sites
CDL
2017 2018 2019 2020 20212017 2018 2019 2020 20212017 2018 2019** 2020*** 20212017 2018 2019 2020 2021
2017* 2018* 2019 2020*** 2021 2017 2018 2019 2020 2021 2017 2018 2019 2020 2021
Total Water used by CDL’s Operations in Singapore: Corporate Office, Managed Buildings, and Construction Sites (m3)
158,765339,143
2,857
28,999311,533
2,898
69,462313,507
4,06794,546
191,1642,404
120,155170,697
1,814
500,765 343,430 387,035 288,114 292,667
CDL Corporate OfficeCDL Managed BuildingsCDL Construction Sites
Notes: • CBM and CSO are not represented here as they are tenants within a building and do not have separate meters to track respective water usage within their facilities.* Figures for CDL have been restated to include water consumption from Corporate Office pantries.# Le Grove Serviced Residences was closed for renovation from December 2016 to July 2018.
CDL CDLHT Le Grove Tower Club
Total Water used by CDL’s Operations in Singapore and Six Key Subsidiaries (m3)
500,765
343,430387,035
288,114
2017 2018* 2019* 2020
493,028514,207
353,202
239,622
2017 2018 2019 2020 2017# 2018# 2019 2020
11,638
31,229
19,002
0
7,2357,692
8,860
5,685
2017 2018 2019 2020
M&C
4,582,2234,445,746 4,441,932
2,888,659
2017
2017
2018
2018
2019
2019
2020
2020
2021 2021 2021 2021 2021
2021
SUSTAINABLE COMMUNITIES AND SOCIAL IMPACT
Human Capital CDL is strongly committed to be an employer of choice where its people can build fulfilling careers and develop professionally in a conducive and inclusive working environment. As an affirmation of CDL’s proactive human resource policies and practices, CDL was named “Employer of Choice 2021” by HRD Asia, and also one of the “Best Companies to Work for in Asia” by HR Asia Awards Singapore 2021.
As one of Singapore’s earliest corporate signatories to pledge support to the UN Global Compact, CDL has been upholding the principles on human rights and labour in its human resource practices. In addition, CDL has been a signatory of the Employers’ Pledge of Fair Employment Practices with the Tripartite Alliance for Fair and Progressive Employment Practices since 2008.
Occupational Health and Safety The occupational health and well-being of CDL employees, as well as workers at construction sites and managed properties, is vital for CDL’s long-term business viability. There were zero fatalities and no occupational diseases across CDL’s core operations in the year under review.
Its overall minor injury rate is well below the industry average for 2021, based on figures provided by the Ministry of
Manpower. While the minor injury rate in CDL’s Corporate Office and Property Development remained below the industry average, the minor injury rate in Asset Management exceeded the industry average. Similarly, CDL’s overall major injury rate exceeded the industry average mainly due to a single injury that occurred at the Whistler Grand construction site.
Corrective actions for both minor and major incidents were immediately implemented, and learnings from all incidents were actively shared with the respective managers, EHS working committees and contractors. CDL takes a serious stance on occupational health and safety and is committed to continual improvement of safety practices.
Job Creation and Employment As of 31 December 2021, CDL has a total of 408 employees for its core operations headquartered in Singapore, where most of its business in property development and asset management is based, excluding hotel properties.
Employee Retention CDL’s successful employee engagement is evident from its employees’ length of service. The average tenure of the CDL Corporate Office’s employees is about 8.7 years and more than 51% of its employees have been with the Company for over five years. The CDL Corporate Office’s employee resignation rate of 14.0% continued to remain significantly lower
Total Number of Employees at CDL’s Corporate Office
392 400 403 415 408
Employee Turnover Rate (%) at CDL’s Corporate Office
2017 2018 2019 2020 2021
16 17.3 16.1
7
14
22 22 21.618.6 19.2+
* Computation of annual employee turnover is based on cumulative monthly attrition rate derived from the number of resignations for the month / headcount for the month.
+ Extrapolated from MOM’s website as Q4 2021 national resignation rate was not available at the time of publication.
CDL* National Average
than the national average of 19.2% in 2021. CDL experienced an involuntary turnover rate of about 4.7%, of which 1.7% is due to retirement.
Training and Development In 2021, CDL invested over $480,000 in training and development for its Corporate Office. More than 14,000 training hours were clocked. An average of five training days was achieved across the workforce. Due to WFH arrangements, CDL expanded its suite of online learning offerings for its workforce.
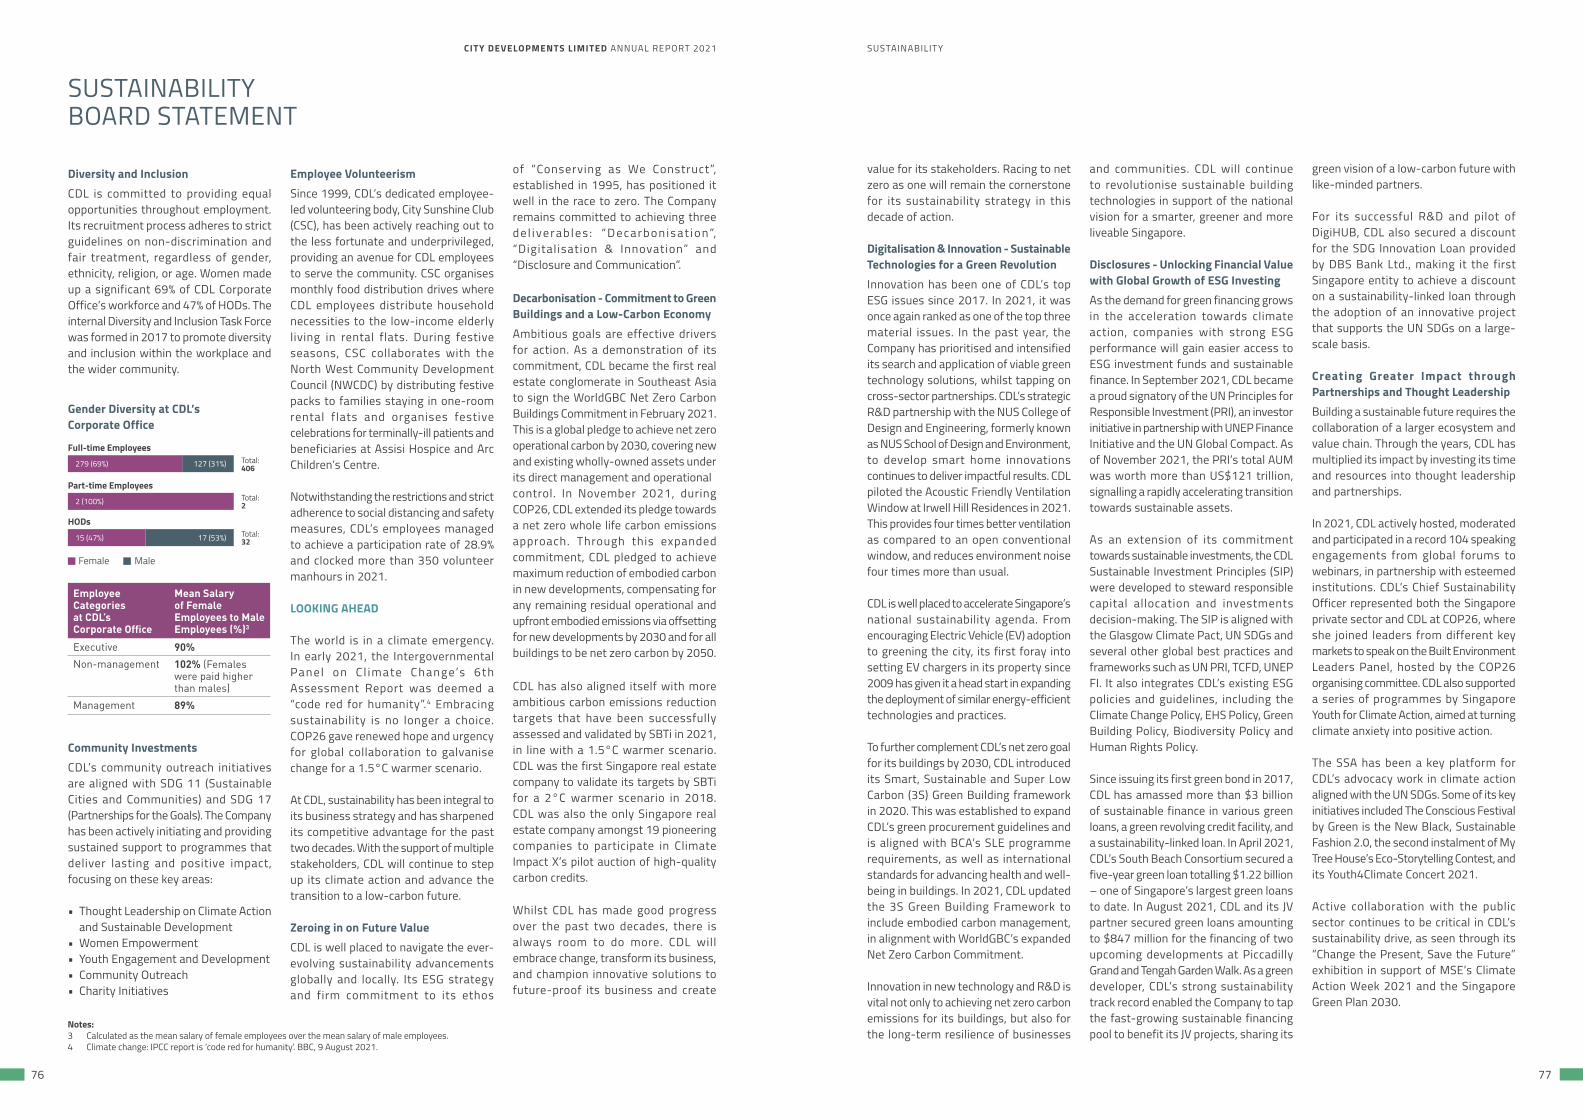
CITY DEVELOPMENTS LIMITED ANNUAL REPORT 2021 SUSTAINABILITY
76 77
Community InvestmentsCDL’s community outreach initiatives are aligned with SDG 11 (Sustainable Cities and Communities) and SDG 17 (Partnerships for the Goals). The Company has been actively initiating and providing sustained support to programmes that deliver lasting and positive impact, focusing on these key areas:
• Thought Leadership on Climate Action and Sustainable Development
• Women Empowerment• Youth Engagement and Development• Community Outreach• Charity Initiatives
SUSTAINABILITY BOARD STATEMENT
Gender Diversity at CDL’s Corporate Office
Full-time Employees 279 (69%) 127 (31%)
Part-time Employees 2 (100%)
HODs15 (47%) 17 (53%)
Female Male
Total: 406
Total: 2
Total: 32
Employee Volunteerism Since 1999, CDL’s dedicated employee-led volunteering body, City Sunshine Club (CSC), has been actively reaching out to the less fortunate and underprivileged, providing an avenue for CDL employees to serve the community. CSC organises monthly food distribution drives where CDL employees distribute household necessities to the low-income elderly living in rental flats. During festive seasons, CSC collaborates with the North West Community Development Council (NWCDC) by distributing festive packs to families staying in one-room rental flats and organises festive celebrations for terminally-ill patients and beneficiaries at Assisi Hospice and Arc Children’s Centre.
Notwithstanding the restrictions and strict adherence to social distancing and safety measures, CDL’s employees managed to achieve a participation rate of 28.9% and clocked more than 350 volunteer manhours in 2021.
LOOKING AHEAD
The world is in a climate emergency. In early 2021, the Intergovernmental Panel on C l imate Change’s 6th Assessment Report was deemed a “code red for humanity”.4 Embracing sustainability is no longer a choice. COP26 gave renewed hope and urgency for global collaboration to galvanise change for a 1.5°C warmer scenario.
At CDL, sustainability has been integral to its business strategy and has sharpened its competitive advantage for the past two decades. With the support of multiple stakeholders, CDL will continue to step up its climate action and advance the transition to a low-carbon future.
Zeroing in on Future Value CDL is well placed to navigate the ever-evolving sustainability advancements globally and locally. Its ESG strategy and firm commitment to its ethos
Notes: 3 Calculated as the mean salary of female employees over the mean salary of male employees.4 Climate change: IPCC report is ‘code red for humanity’. BBC, 9 August 2021.
of “Conserving as We Construct”, established in 1995, has positioned it well in the race to zero. The Company remains committed to achieving three d e l i ve r a b l e s : “ D e c a r b o n i s a t i o n”, “Digital isation & Innovation” and “Disclosure and Communication”.
Decarbonisation - Commitment to Green Buildings and a Low-Carbon Economy Ambitious goals are effective drivers for action. As a demonstration of its commitment, CDL became the first real estate conglomerate in Southeast Asia to sign the WorldGBC Net Zero Carbon Buildings Commitment in February 2021. This is a global pledge to achieve net zero operational carbon by 2030, covering new and existing wholly-owned assets under its direct management and operationalcontrol. In November 2021, during COP26, CDL extended its pledge towards a net zero whole life carbon emissions approach. Through this expanded commitment, CDL pledged to achieve maximum reduction of embodied carbon in new developments, compensating for any remaining residual operational and upfront embodied emissions via offsetting for new developments by 2030 and for all buildings to be net zero carbon by 2050.
CDL has also aligned itself with more ambitious carbon emissions reduction targets that have been successfully assessed and validated by SBTi in 2021, in line with a 1.5°C warmer scenario. CDL was the first Singapore real estate company to validate its targets by SBTi for a 2°C warmer scenario in 2018. CDL was also the only Singapore real estate company amongst 19 pioneering companies to participate in Climate Impact X’s pilot auction of high-quality carbon credits.
Whilst CDL has made good progress over the past two decades, there is always room to do more. CDL will embrace change, transform its business, and champion innovative solutions to future-proof its business and create
value for its stakeholders. Racing to net zero as one will remain the cornerstone for its sustainability strategy in this decade of action.
Digitalisation & Innovation - Sustainable Technologies for a Green RevolutionInnovation has been one of CDL’s top ESG issues since 2017. In 2021, it was once again ranked as one of the top three material issues. In the past year, the Company has prioritised and intensified its search and application of viable green technology solutions, whilst tapping on cross-sector partnerships. CDL’s strategic R&D partnership with the NUS College of Design and Engineering, formerly known as NUS School of Design and Environment, to develop smart home innovations continues to deliver impactful results. CDL piloted the Acoustic Friendly Ventilation Window at Irwell Hill Residences in 2021. This provides four times better ventilation as compared to an open conventional window, and reduces environment noise four times more than usual.
CDL is well placed to accelerate Singapore’s national sustainability agenda. From encouraging Electric Vehicle (EV) adoption to greening the city, its first foray into setting EV chargers in its property since 2009 has given it a head start in expanding the deployment of similar energy-efficient technologies and practices. To further complement CDL’s net zero goal for its buildings by 2030, CDL introduced its Smart, Sustainable and Super Low Carbon (3S) Green Building framework in 2020. This was established to expand CDL’s green procurement guidelines and is aligned with BCA’s SLE programme requirements, as well as international standards for advancing health and well-being in buildings. In 2021, CDL updated the 3S Green Building Framework to include embodied carbon management, in alignment with WorldGBC’s expanded Net Zero Carbon Commitment.
Innovation in new technology and R&D is vital not only to achieving net zero carbon emissions for its buildings, but also for the long-term resilience of businesses
and communities. CDL will continue to revolutionise sustainable building technologies in support of the national vision for a smarter, greener and more liveable Singapore.
Disclosures - Unlocking Financial Value with Global Growth of ESG InvestingAs the demand for green financing grows in the acceleration towards climate action, companies with strong ESG performance will gain easier access to ESG investment funds and sustainable finance. In September 2021, CDL became a proud signatory of the UN Principles for Responsible Investment (PRI), an investor initiative in partnership with UNEP Finance Initiative and the UN Global Compact. As of November 2021, the PRI’s total AUM was worth more than US$121 trillion, signalling a rapidly accelerating transition towards sustainable assets.
As an extension of its commitment towards sustainable investments, the CDL Sustainable Investment Principles (SIP) were developed to steward responsible capital allocation and investments decision-making. The SIP is aligned with the Glasgow Climate Pact, UN SDGs and several other global best practices and frameworks such as UN PRI, TCFD, UNEP FI. It also integrates CDL’s existing ESG policies and guidelines, including the Climate Change Policy, EHS Policy, Green Building Policy, Biodiversity Policy and Human Rights Policy.
Since issuing its first green bond in 2017, CDL has amassed more than $3 billion of sustainable finance in various green loans, a green revolving credit facility, and a sustainability-linked loan. In April 2021, CDL’s South Beach Consortium secured a five-year green loan totalling $1.22 billion – one of Singapore’s largest green loans to date. In August 2021, CDL and its JV partner secured green loans amounting to $847 million for the financing of two upcoming developments at Piccadilly Grand and Tengah Garden Walk. As a green developer, CDL’s strong sustainability track record enabled the Company to tap the fast-growing sustainable financing pool to benefit its JV projects, sharing its
green vision of a low-carbon future with like-minded partners.
For its successful R&D and pilot of DigiHUB, CDL also secured a discount for the SDG Innovation Loan provided by DBS Bank Ltd., making it the first Singapore entity to achieve a discount on a sustainability-linked loan through the adoption of an innovative project that supports the UN SDGs on a large- scale basis.
Creating Greater Impact through Partnerships and Thought Leadership Building a sustainable future requires the collaboration of a larger ecosystem and value chain. Through the years, CDL has multiplied its impact by investing its time and resources into thought leadership and partnerships.
In 2021, CDL actively hosted, moderated and participated in a record 104 speaking engagements from global forums to webinars, in partnership with esteemed institutions. CDL’s Chief Sustainability Officer represented both the Singapore private sector and CDL at COP26, where she joined leaders from different key markets to speak on the Built Environment Leaders Panel, hosted by the COP26 organising committee. CDL also supported a series of programmes by Singapore Youth for Climate Action, aimed at turning climate anxiety into positive action.
The SSA has been a key platform for CDL’s advocacy work in climate action aligned with the UN SDGs. Some of its key initiatives included The Conscious Festival by Green is the New Black, Sustainable Fashion 2.0, the second instalment of My Tree House’s Eco-Storytelling Contest, and its Youth4Climate Concert 2021.
Active collaboration with the public sector continues to be critical in CDL’s sustainability drive, as seen through its “Change the Present, Save the Future” exhibition in support of MSE’s Climate Action Week 2021 and the Singapore Green Plan 2030.
Employee Categories at CDL’s Corporate Office
Mean Salary of Female Employees to Male Employees (%)3
Executive 90%
Non-management 102% (Females were paid higher than males)
Management 89%
Diversity and Inclusion CDL is committed to providing equal opportunities throughout employment. Its recruitment process adheres to strict guidelines on non-discrimination and fair treatment, regardless of gender, ethnicity, religion, or age. Women made up a significant 69% of CDL Corporate Office’s workforce and 47% of HODs. The internal Diversity and Inclusion Task Force was formed in 2017 to promote diversity and inclusion within the workplace and the wider community.
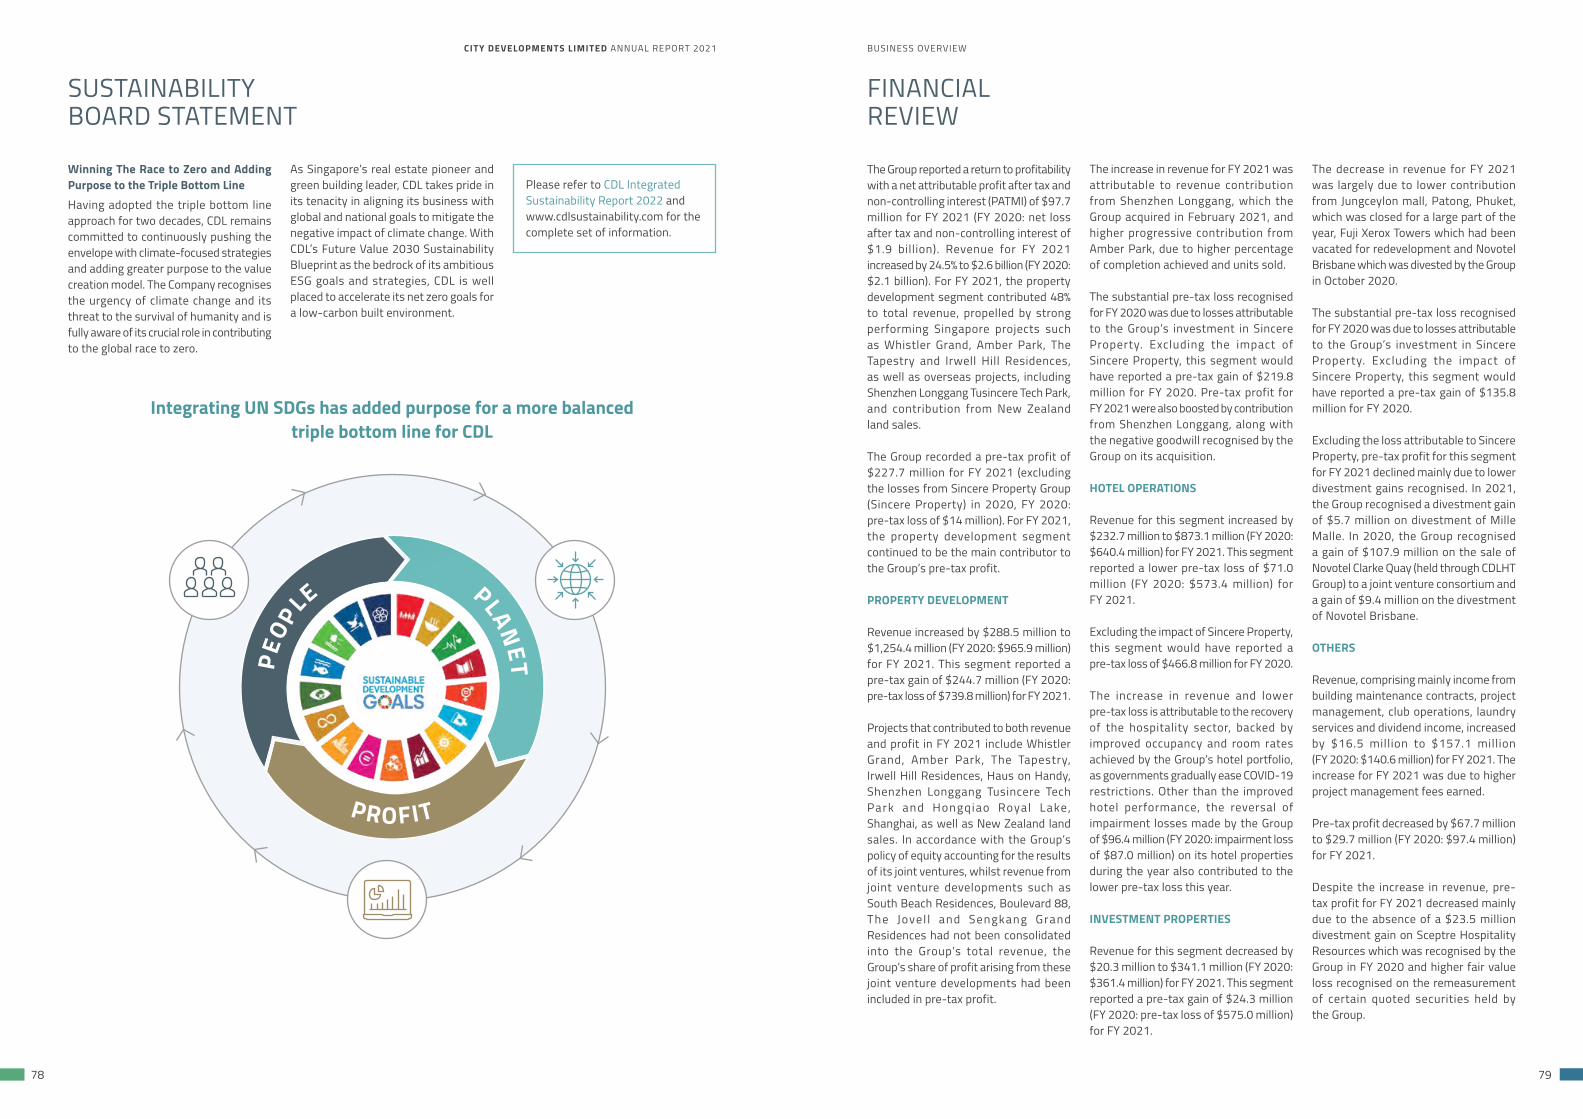
BUSINESS OVERVIEW
79
CITY DEVELOPMENTS LIMITED ANNUAL REPORT 2021
78
Winning The Race to Zero and Adding Purpose to the Triple Bottom Line Having adopted the triple bottom line approach for two decades, CDL remains committed to continuously pushing the envelope with climate-focused strategies and adding greater purpose to the value creation model. The Company recognises the urgency of climate change and its threat to the survival of humanity and is fully aware of its crucial role in contributing to the global race to zero.
Please refer to CDL Integrated Sustainability Report 2022 and www.cdlsustainability.com for the complete set of information.
As Singapore’s real estate pioneer and green building leader, CDL takes pride in its tenacity in aligning its business with global and national goals to mitigate the negative impact of climate change. With CDL’s Future Value 2030 Sustainability Blueprint as the bedrock of its ambitious ESG goals and strategies, CDL is well placed to accelerate its net zero goals for a low-carbon built environment.
PLANETPE
OPLE
PROFIT
Integrating UN SDGs has added purpose for a more balanced triple bottom line for CDL
SUSTAINABILITY BOARD STATEMENT
FINANCIALREVIEW
The Group reported a return to profitability with a net attributable profit after tax and non-controlling interest (PATMI) of $97.7 million for FY 2021 (FY 2020: net loss after tax and non-controlling interest of $1.9 billion). Revenue for FY 2021 increased by 24.5% to $2.6 billion (FY 2020: $2.1 billion). For FY 2021, the property development segment contributed 48% to total revenue, propelled by strong performing Singapore projects such as Whistler Grand, Amber Park, The Tapestry and Irwell Hill Residences, as well as overseas projects, including Shenzhen Longgang Tusincere Tech Park, and contribution from New Zealand land sales.
The Group recorded a pre-tax profit of $227.7 million for FY 2021 (excluding the losses from Sincere Property Group (Sincere Property) in 2020, FY 2020: pre-tax loss of $14 million). For FY 2021, the property development segment continued to be the main contributor to the Group’s pre-tax profit.
PROPERTY DEVELOPMENT
Revenue increased by $288.5 million to $1,254.4 million (FY 2020: $965.9 million) for FY 2021. This segment reported a pre-tax gain of $244.7 million (FY 2020: pre-tax loss of $739.8 million) for FY 2021.
Projects that contributed to both revenue and profit in FY 2021 include Whistler Grand, Amber Park, The Tapestry, Irwell Hill Residences, Haus on Handy, Shenzhen Longgang Tusincere Tech Park and Hongqiao Royal Lake, Shanghai, as well as New Zealand land sales. In accordance with the Group’s policy of equity accounting for the results of its joint ventures, whilst revenue from joint venture developments such as South Beach Residences, Boulevard 88, The Jovel l and Sengkang Grand Residences had not been consolidated into the Group’s total revenue, the Group’s share of profit arising from these joint venture developments had been included in pre-tax profit.
The increase in revenue for FY 2021 was attributable to revenue contribution from Shenzhen Longgang, which the Group acquired in February 2021, and higher progressive contribution from Amber Park, due to higher percentage of completion achieved and units sold.
The substantial pre-tax loss recognised for FY 2020 was due to losses attributable to the Group’s investment in Sincere Property. Excluding the impact of Sincere Property, this segment would have reported a pre-tax gain of $219.8 million for FY 2020. Pre-tax profit for FY 2021 were also boosted by contribution from Shenzhen Longgang, along with the negative goodwill recognised by the Group on its acquisition.
HOTEL OPERATIONS
Revenue for this segment increased by $232.7 million to $873.1 million (FY 2020: $640.4 million) for FY 2021. This segment reported a lower pre-tax loss of $71.0 million (FY 2020: $573.4 million) for FY 2021.
Excluding the impact of Sincere Property, this segment would have reported a pre-tax loss of $466.8 million for FY 2020.
The increase in revenue and lower pre-tax loss is attributable to the recovery of the hospitality sector, backed by improved occupancy and room rates achieved by the Group’s hotel portfolio, as governments gradually ease COVID-19 restrictions. Other than the improved hotel performance, the reversal of impairment losses made by the Group of $96.4 million (FY 2020: impairment loss of $87.0 million) on its hotel properties during the year also contributed to the lower pre-tax loss this year.
INVESTMENT PROPERTIES
Revenue for this segment decreased by $20.3 million to $341.1 million (FY 2020: $361.4 million) for FY 2021. This segment reported a pre-tax gain of $24.3 million (FY 2020: pre-tax loss of $575.0 million) for FY 2021.
The decrease in revenue for FY 2021 was largely due to lower contribution from Jungceylon mall, Patong, Phuket, which was closed for a large part of the year, Fuji Xerox Towers which had been vacated for redevelopment and Novotel Brisbane which was divested by the Group in October 2020.
The substantial pre-tax loss recognised for FY 2020 was due to losses attributable to the Group’s investment in Sincere Property. Excluding the impact of Sincere Property, this segment would have reported a pre-tax gain of $135.8 million for FY 2020.
Excluding the loss attributable to Sincere Property, pre-tax profit for this segment for FY 2021 declined mainly due to lower divestment gains recognised. In 2021, the Group recognised a divestment gain of $5.7 million on divestment of Mille Malle. In 2020, the Group recognised a gain of $107.9 million on the sale of Novotel Clarke Quay (held through CDLHT Group) to a joint venture consortium and a gain of $9.4 million on the divestment of Novotel Brisbane.
OTHERS
Revenue, comprising mainly income from building maintenance contracts, project management, club operations, laundry services and dividend income, increased by $16.5 million to $157.1 million (FY 2020: $140.6 million) for FY 2021. The increase for FY 2021 was due to higher project management fees earned.
Pre-tax profit decreased by $67.7 million to $29.7 million (FY 2020: $97.4 million) for FY 2021. Despite the increase in revenue, pre-tax profit for FY 2021 decreased mainly due to the absence of a $23.5 million divestment gain on Sceptre Hospitality Resources which was recognised by the Group in FY 2020 and higher fair value loss recognised on the remeasurement of certain quoted securities held by the Group.
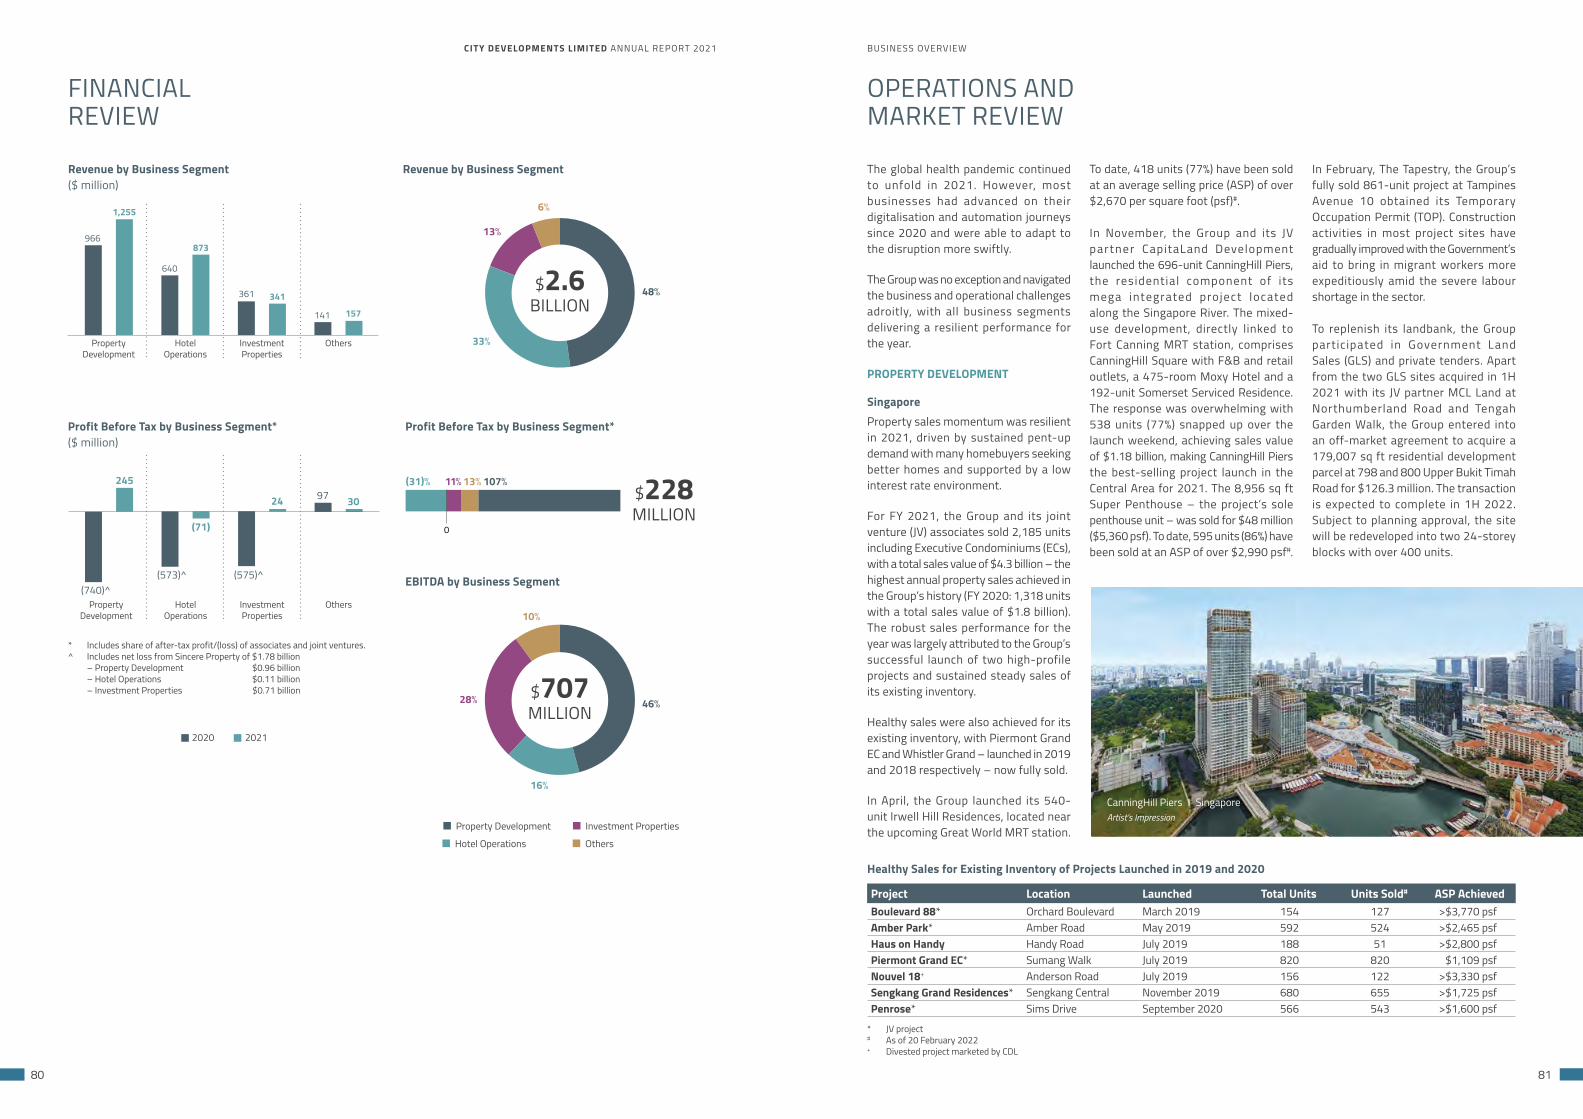
CITY DEVELOPMENTS LIMITED ANNUAL REPORT 2021 BUSINESS OVERVIEW
80 81
FINANCIALREVIEW
OPERATIONS AND MARKET REVIEW
Revenue by Business Segment($ million)
966
640
361
1,255
873
341
141 157
PropertyDevelopment
HotelOperations
InvestmentProperties
Others
Profit Before Tax by Business Segment*($ million)
245
24
(740)^(573)^ (575)^
(71)
97 30
PropertyDevelopment
HotelOperations
InvestmentProperties
Others
* Includes share of after-tax profit/(loss) of associates and joint ventures.^ Includes net loss from Sincere Property of $1.78 billion – Property Development $0.96 billion – Hotel Operations $0.11 billion – Investment Properties $0.71 billion
Property Development
Hotel Operations
Investment Properties
Others
2020 2021
Revenue by Business Segment
Profit Before Tax by Business Segment*
$228MILLION
0
EBITDA by Business Segment
13%11% 107%(31)%
6%
13%
48%
33%
$2.6 BILLION
16%
10%
28% 46%$707 MILLION
The global health pandemic continued to unfold in 2021. However, most businesses had advanced on their digitalisation and automation journeys since 2020 and were able to adapt to the disruption more swiftly.
The Group was no exception and navigated the business and operational challenges adroitly, with all business segments delivering a resilient performance for the year.
PROPERTY DEVELOPMENT
SingaporeProperty sales momentum was resilient in 2021, driven by sustained pent-up demand with many homebuyers seeking better homes and supported by a low interest rate environment.
For FY 2021, the Group and its joint venture (JV) associates sold 2,185 units including Executive Condominiums (ECs), with a total sales value of $4.3 billion – the highest annual property sales achieved in the Group’s history (FY 2020: 1,318 units with a total sales value of $1.8 billion). The robust sales performance for the year was largely attributed to the Group’s successful launch of two high-profile projects and sustained steady sales of its existing inventory.
Healthy sales were also achieved for its existing inventory, with Piermont Grand EC and Whistler Grand – launched in 2019 and 2018 respectively – now fully sold.
In April, the Group launched its 540-unit Irwell Hill Residences, located near the upcoming Great World MRT station.
To date, 418 units (77%) have been sold at an average selling price (ASP) of over $2,670 per square foot (psf)#.
In November, the Group and its JV partner CapitaLand Development launched the 696-unit CanningHill Piers, the residential component of its mega integrated project located along the Singapore River. The mixed-use development, directly linked to Fort Canning MRT station, comprises CanningHill Square with F&B and retail outlets, a 475-room Moxy Hotel and a 192-unit Somerset Serviced Residence. The response was overwhelming with 538 units (77%) snapped up over the launch weekend, achieving sales value of $1.18 billion, making CanningHill Piers the best-selling project launch in the Central Area for 2021. The 8,956 sq ft Super Penthouse – the project’s sole penthouse unit – was sold for $48 million ($5,360 psf). To date, 595 units (86%) have been sold at an ASP of over $2,990 psf#.
Project Location Launched Total Units Units Sold# ASP AchievedBoulevard 88* Orchard Boulevard March 2019 154 127 >$3,770 psfAmber Park* Amber Road May 2019 592 524 >$2,465 psfHaus on Handy Handy Road July 2019 188 51 >$2,800 psfPiermont Grand EC* Sumang Walk July 2019 820 820 $1,109 psfNouvel 18+ Anderson Road July 2019 156 122 >$3,330 psfSengkang Grand Residences* Sengkang Central November 2019 680 655 >$1,725 psfPenrose* Sims Drive September 2020 566 543 >$1,600 psf
* JV project # As of 20 February 2022 + Divested project marketed by CDL
CanningHill Piers I SingaporeArtist’s Impression
In February, The Tapestry, the Group’s fully sold 861-unit project at Tampines Avenue 10 obtained its Temporary Occupation Permit (TOP). Construction activities in most project sites have gradually improved with the Government’s aid to bring in migrant workers more expeditiously amid the severe labour shortage in the sector.
To replenish its landbank, the Group participated in Government Land Sales (GLS) and private tenders. Apart from the two GLS sites acquired in 1H 2021 with its JV partner MCL Land at Northumberland Road and Tengah Garden Walk, the Group entered into an off-market agreement to acquire a 179,007 sq ft residential development parcel at 798 and 800 Upper Bukit Timah Road for $126.3 million. The transaction is expected to complete in 1H 2022. Subject to planning approval, the site will be redeveloped into two 24-storey blocks with over 400 units.
Healthy Sales for Existing Inventory of Projects Launched in 2019 and 2020
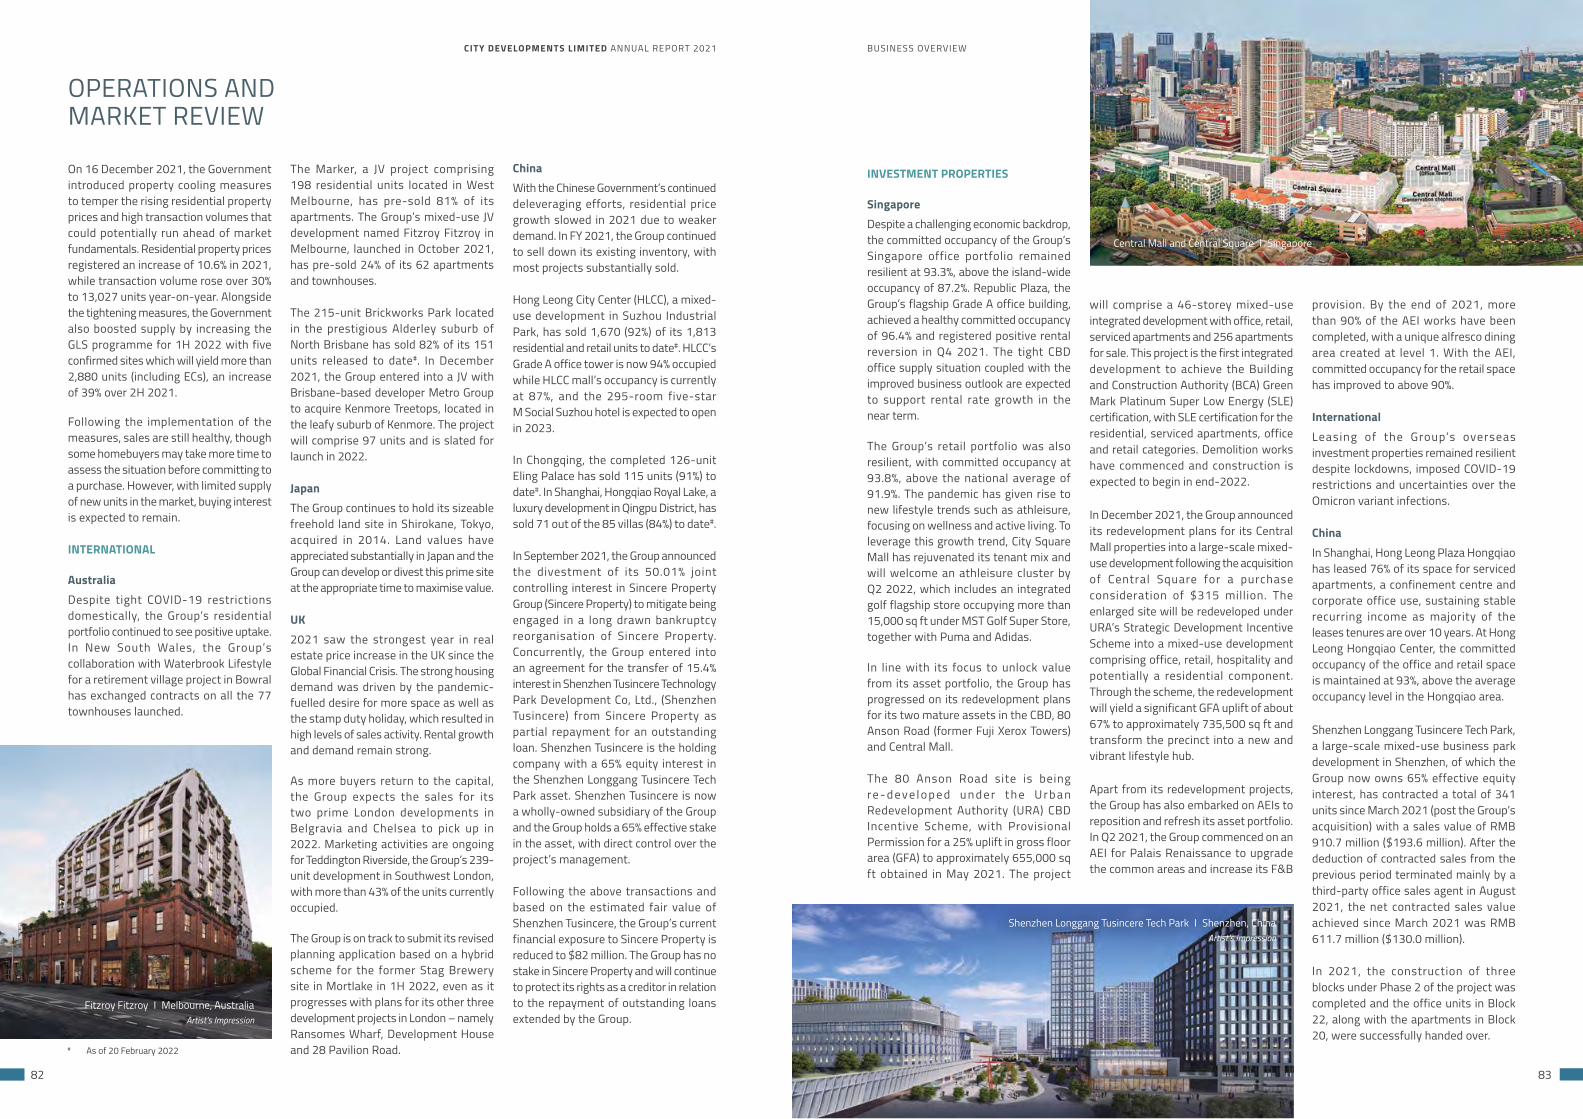
CITY DEVELOPMENTS LIMITED ANNUAL REPORT 2021 BUSINESS OVERVIEW
82 83
OPERATIONS AND MARKET REVIEW
On 16 December 2021, the Government introduced property cooling measures to temper the rising residential property prices and high transaction volumes that could potentially run ahead of market fundamentals. Residential property prices registered an increase of 10.6% in 2021, while transaction volume rose over 30% to 13,027 units year-on-year. Alongside the tightening measures, the Government also boosted supply by increasing the GLS programme for 1H 2022 with five confirmed sites which will yield more than 2,880 units (including ECs), an increase of 39% over 2H 2021.
Following the implementation of the measures, sales are still healthy, though some homebuyers may take more time to assess the situation before committing to a purchase. However, with limited supply of new units in the market, buying interest is expected to remain.
INTERNATIONAL
AustraliaDespite tight COVID-19 restrictions domestically, the Group’s residential portfolio continued to see positive uptake. In New South Wales, the Group’s collaboration with Waterbrook Lifestyle for a retirement village project in Bowral has exchanged contracts on all the 77 townhouses launched.
The Marker, a JV project comprising 198 residential units located in West Melbourne, has pre-sold 81% of its apartments. The Group’s mixed-use JV development named Fitzroy Fitzroy in Melbourne, launched in October 2021, has pre-sold 24% of its 62 apartments and townhouses.
The 215-unit Brickworks Park located in the prestigious Alderley suburb of North Brisbane has sold 82% of its 151 units released to date#. In December 2021, the Group entered into a JV with Brisbane-based developer Metro Group to acquire Kenmore Treetops, located in the leafy suburb of Kenmore. The project will comprise 97 units and is slated for launch in 2022.
JapanThe Group continues to hold its sizeable freehold land site in Shirokane, Tokyo, acquired in 2014. Land values have appreciated substantially in Japan and the Group can develop or divest this prime site at the appropriate time to maximise value.
UK2021 saw the strongest year in real estate price increase in the UK since the Global Financial Crisis. The strong housing demand was driven by the pandemic-fuelled desire for more space as well as the stamp duty holiday, which resulted in high levels of sales activity. Rental growth and demand remain strong.
As more buyers return to the capital, the Group expects the sales for its two prime London developments in Belgravia and Chelsea to pick up in 2022. Marketing activities are ongoing for Teddington Riverside, the Group’s 239-unit development in Southwest London, with more than 43% of the units currently occupied.
The Group is on track to submit its revised planning application based on a hybrid scheme for the former Stag Brewery site in Mortlake in 1H 2022, even as it progresses with plans for its other three development projects in London – namely Ransomes Wharf, Development House and 28 Pavilion Road.
INVESTMENT PROPERTIES
SingaporeDespite a challenging economic backdrop, the committed occupancy of the Group’s Singapore office portfolio remained resilient at 93.3%, above the island-wide occupancy of 87.2%. Republic Plaza, the Group’s flagship Grade A office building, achieved a healthy committed occupancy of 96.4% and registered positive rental reversion in Q4 2021. The tight CBD office supply situation coupled with the improved business outlook are expected to support rental rate growth in the near term.
The Group’s retail portfolio was also resilient, with committed occupancy at 93.8%, above the national average of 91.9%. The pandemic has given rise to new lifestyle trends such as athleisure, focusing on wellness and active living. To leverage this growth trend, City Square Mall has rejuvenated its tenant mix and will welcome an athleisure cluster by Q2 2022, which includes an integrated golf flagship store occupying more than 15,000 sq ft under MST Golf Super Store, together with Puma and Adidas.
In line with its focus to unlock value from its asset portfolio, the Group has progressed on its redevelopment plans for its two mature assets in the CBD, 80 Anson Road (former Fuji Xerox Towers) and Central Mall.
The 80 Anson Road site is being r e - d e v e l o p e d u n d e r t h e U r b a n Redevelopment Authority (URA) CBD Incentive Scheme, with Provisional Permission for a 25% uplift in gross floor area (GFA) to approximately 655,000 sq ft obtained in May 2021. The project
will comprise a 46-storey mixed-use integrated development with office, retail, serviced apartments and 256 apartments for sale. This project is the first integrated development to achieve the Building and Construction Authority (BCA) Green Mark Platinum Super Low Energy (SLE) certification, with SLE certification for the residential, serviced apartments, office and retail categories. Demolition works have commenced and construction is expected to begin in end-2022.
In December 2021, the Group announced its redevelopment plans for its Central Mall properties into a large-scale mixed-use development following the acquisition of Central Square for a purchase consideration of $315 million. The enlarged site will be redeveloped under URA’s Strategic Development Incentive Scheme into a mixed-use development comprising office, retail, hospitality and potentially a residential component. Through the scheme, the redevelopment will yield a significant GFA uplift of about 67% to approximately 735,500 sq ft and transform the precinct into a new and vibrant lifestyle hub.
Apart from its redevelopment projects, the Group has also embarked on AEIs to reposition and refresh its asset portfolio. In Q2 2021, the Group commenced on an AEI for Palais Renaissance to upgrade the common areas and increase its F&B
provision. By the end of 2021, more than 90% of the AEI works have been completed, with a unique alfresco dining area created at level 1. With the AEI, committed occupancy for the retail space has improved to above 90%.
InternationalLeasing of the Group’s overseas investment properties remained resilient despite lockdowns, imposed COVID-19 restrictions and uncertainties over the Omicron variant infections.
ChinaIn Shanghai, Hong Leong Plaza Hongqiao has leased 76% of its space for serviced apartments, a confinement centre and corporate office use, sustaining stable recurring income as majority of the leases tenures are over 10 years. At Hong Leong Hongqiao Center, the committed occupancy of the office and retail space is maintained at 93%, above the average occupancy level in the Hongqiao area.
Shenzhen Longgang Tusincere Tech Park, a large-scale mixed-use business park development in Shenzhen, of which the Group now owns 65% effective equity interest, has contracted a total of 341 units since March 2021 (post the Group’s acquisition) with a sales value of RMB 910.7 million ($193.6 million). After the deduction of contracted sales from the previous period terminated mainly by a third-party office sales agent in August 2021, the net contracted sales value achieved since March 2021 was RMB 611.7 million ($130.0 million).
In 2021, the construction of three blocks under Phase 2 of the project was completed and the office units in Block 22, along with the apartments in Block 20, were successfully handed over.
Fitzroy Fitzroy I Melbourne, AustraliaArtist’s Impression
Central Mall and Central Square I Singapore
# As of 20 February 2022
ChinaWith the Chinese Government’s continued deleveraging efforts, residential price growth slowed in 2021 due to weaker demand. In FY 2021, the Group continued to sell down its existing inventory, with most projects substantially sold.
Hong Leong City Center (HLCC), a mixed-use development in Suzhou Industrial Park, has sold 1,670 (92%) of its 1,813 residential and retail units to date#. HLCC’s Grade A office tower is now 94% occupied while HLCC mall’s occupancy is currently at 87%, and the 295-room five-star M Social Suzhou hotel is expected to open in 2023.
In Chongqing, the completed 126-unit Eling Palace has sold 115 units (91%) to date#. In Shanghai, Hongqiao Royal Lake, a luxury development in Qingpu District, has sold 71 out of the 85 villas (84%) to date#.
In September 2021, the Group announced the divestment of its 50.01% joint controlling interest in Sincere Property Group (Sincere Property) to mitigate being engaged in a long drawn bankruptcy reorganisation of Sincere Property. Concurrently, the Group entered into an agreement for the transfer of 15.4% interest in Shenzhen Tusincere Technology Park Development Co, Ltd., (Shenzhen Tusincere) from Sincere Property as partial repayment for an outstanding loan. Shenzhen Tusincere is the holding company with a 65% equity interest in the Shenzhen Longgang Tusincere Tech Park asset. Shenzhen Tusincere is now a wholly-owned subsidiary of the Group and the Group holds a 65% effective stake in the asset, with direct control over the project’s management.
Following the above transactions and based on the estimated fair value of Shenzhen Tusincere, the Group’s current financial exposure to Sincere Property is reduced to $82 million. The Group has no stake in Sincere Property and will continue to protect its rights as a creditor in relation to the repayment of outstanding loans extended by the Group.
Shenzhen Longgang Tusincere Tech Park I Shenzhen, China Artist’s Impression
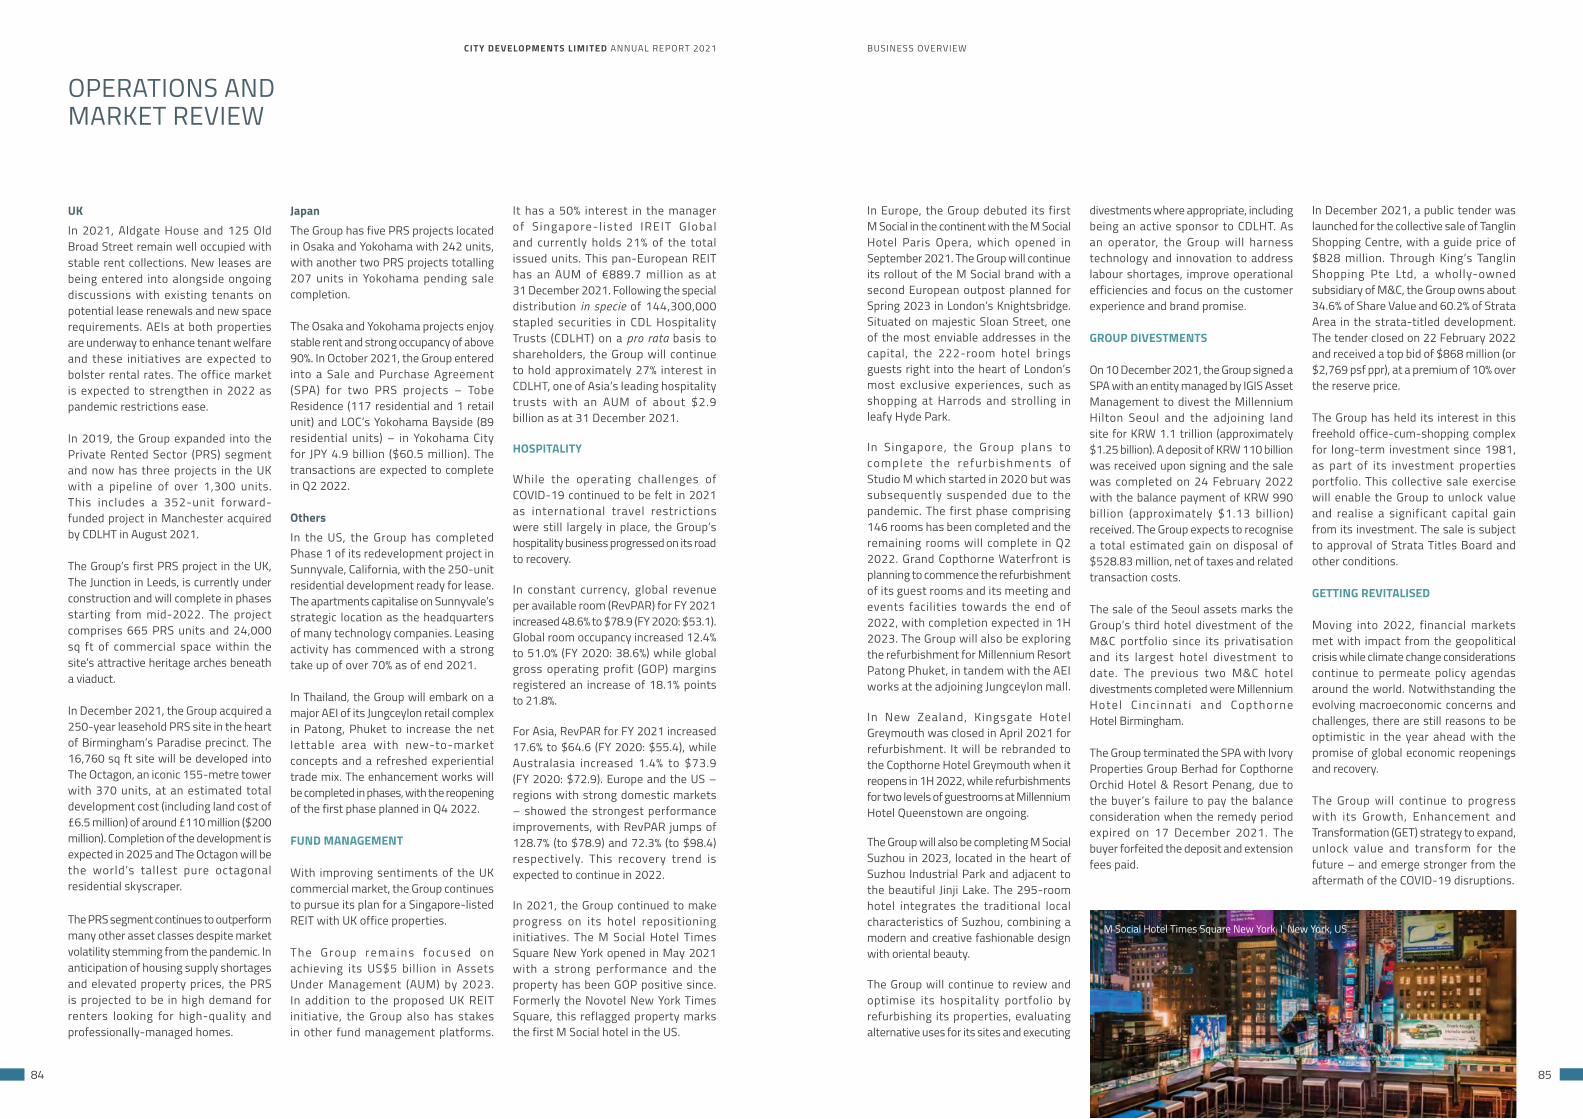
CITY DEVELOPMENTS LIMITED ANNUAL REPORT 2021
84 85
BUSINESS OVERVIEW
UKIn 2021, Aldgate House and 125 Old Broad Street remain well occupied with stable rent collections. New leases are being entered into alongside ongoing discussions with existing tenants on potential lease renewals and new space requirements. AEIs at both properties are underway to enhance tenant welfare and these initiatives are expected to bolster rental rates. The office market is expected to strengthen in 2022 as pandemic restrictions ease.
In 2019, the Group expanded into the Private Rented Sector (PRS) segment and now has three projects in the UK with a pipeline of over 1,300 units. This includes a 352-unit forward- funded project in Manchester acquired by CDLHT in August 2021.
The Group’s first PRS project in the UK, The Junction in Leeds, is currently under construction and will complete in phases starting from mid-2022. The project comprises 665 PRS units and 24,000 sq ft of commercial space within the site’s attractive heritage arches beneath a viaduct.
In December 2021, the Group acquired a 250-year leasehold PRS site in the heart of Birmingham’s Paradise precinct. The 16,760 sq ft site will be developed into The Octagon, an iconic 155-metre tower with 370 units, at an estimated total development cost (including land cost of £6.5 million) of around £110 million ($200 million). Completion of the development is expected in 2025 and The Octagon will be the world’s tallest pure octagonal residential skyscraper.
The PRS segment continues to outperform many other asset classes despite market volatility stemming from the pandemic. In anticipation of housing supply shortages and elevated property prices, the PRS is projected to be in high demand for renters looking for high-quality and professionally-managed homes.
OPERATIONS AND MARKET REVIEW
JapanThe Group has five PRS projects located in Osaka and Yokohama with 242 units, with another two PRS projects totalling 207 units in Yokohama pending sale completion.
The Osaka and Yokohama projects enjoy stable rent and strong occupancy of above 90%. In October 2021, the Group entered into a Sale and Purchase Agreement (SPA) for two PRS projects – Tobe Residence (117 residential and 1 retail unit) and LOC’s Yokohama Bayside (89 residential units) – in Yokohama City for JPY 4.9 billion ($60.5 million). The transactions are expected to complete in Q2 2022.
OthersIn the US, the Group has completed Phase 1 of its redevelopment project in Sunnyvale, California, with the 250-unit residential development ready for lease. The apartments capitalise on Sunnyvale’s strategic location as the headquarters of many technology companies. Leasing activity has commenced with a strong take up of over 70% as of end 2021.
In Thailand, the Group will embark on a major AEI of its Jungceylon retail complex in Patong, Phuket to increase the net lettable area with new-to-market concepts and a refreshed experiential trade mix. The enhancement works will be completed in phases, with the reopening of the first phase planned in Q4 2022.
FUND MANAGEMENT
With improving sentiments of the UK commercial market, the Group continues to pursue its plan for a Singapore-listed REIT with UK office properties.
The G ro u p re m a i n s fo c u s e d o n achieving its US$5 billion in Assets Under Management (AUM) by 2023. In addition to the proposed UK REIT initiative, the Group also has stakes in other fund management platforms.
It has a 50% interest in the manager of S ingapore-l isted IREIT Global and currently holds 21% of the total issued units. This pan-European REIT has an AUM of €889.7 million as at 31 December 2021. Following the special distribution in specie of 144,300,000 stapled securities in CDL Hospitality Trusts (CDLHT) on a pro rata basis to shareholders, the Group will continue to hold approximately 27% interest in CDLHT, one of Asia’s leading hospitality trusts with an AUM of about $2.9 billion as at 31 December 2021.
HOSPITALITY
While the operating challenges of COVID-19 continued to be felt in 2021 as international travel restrictions were still largely in place, the Group’s hospitality business progressed on its road to recovery.
In constant currency, global revenue per available room (RevPAR) for FY 2021 increased 48.6% to $78.9 (FY 2020: $53.1). Global room occupancy increased 12.4% to 51.0% (FY 2020: 38.6%) while global gross operating profit (GOP) margins registered an increase of 18.1% points to 21.8%.
For Asia, RevPAR for FY 2021 increased 17.6% to $64.6 (FY 2020: $55.4), while Australasia increased 1.4% to $73.9 (FY 2020: $72.9). Europe and the US – regions with strong domestic markets – showed the strongest performance improvements, with RevPAR jumps of 128.7% (to $78.9) and 72.3% (to $98.4) respectively. This recovery trend is expected to continue in 2022.
In 2021, the Group continued to make progress on its hotel repositioning initiatives. The M Social Hotel Times Square New York opened in May 2021 with a strong performance and the property has been GOP positive since. Formerly the Novotel New York Times Square, this reflagged property marks the first M Social hotel in the US.
In Europe, the Group debuted its first M Social in the continent with the M Social Hotel Paris Opera, which opened in September 2021. The Group will continue its rollout of the M Social brand with a second European outpost planned for Spring 2023 in London’s Knightsbridge. Situated on majestic Sloan Street, one of the most enviable addresses in the capital, the 222-room hotel brings guests right into the heart of London’s most exclusive experiences, such as shopping at Harrods and strolling in leafy Hyde Park.
In Singapore, the Group plans to complete the refurb ishments of Studio M which started in 2020 but was subsequently suspended due to the pandemic. The first phase comprising 146 rooms has been completed and the remaining rooms will complete in Q2 2022. Grand Copthorne Waterfront is planning to commence the refurbishment of its guest rooms and its meeting and events facilities towards the end of 2022, with completion expected in 1H 2023. The Group will also be exploring the refurbishment for Millennium Resort Patong Phuket, in tandem with the AEI works at the adjoining Jungceylon mall.
In New Zealand, Kingsgate Hotel Greymouth was closed in April 2021 for refurbishment. It will be rebranded to the Copthorne Hotel Greymouth when it reopens in 1H 2022, while refurbishments for two levels of guestrooms at Millennium Hotel Queenstown are ongoing.
The Group will also be completing M Social Suzhou in 2023, located in the heart of Suzhou Industrial Park and adjacent to the beautiful Jinji Lake. The 295-room hotel integrates the traditional local characteristics of Suzhou, combining a modern and creative fashionable design with oriental beauty.
The Group will continue to review and optimise its hospitality portfolio by refurbishing its properties, evaluating alternative uses for its sites and executing
divestments where appropriate, including being an active sponsor to CDLHT. As an operator, the Group will harness technology and innovation to address labour shortages, improve operational efficiencies and focus on the customer experience and brand promise.
GROUP DIVESTMENTS
On 10 December 2021, the Group signed a SPA with an entity managed by IGIS Asset Management to divest the Millennium Hilton Seoul and the adjoining land site for KRW 1.1 trillion (approximately $1.25 billion). A deposit of KRW 110 billion was received upon signing and the sale was completed on 24 February 2022 with the balance payment of KRW 990 billion (approximately $1.13 billion) received. The Group expects to recognise a total estimated gain on disposal of $528.83 million, net of taxes and related transaction costs.
The sale of the Seoul assets marks the Group’s third hotel divestment of the M&C portfolio since its privatisation and its largest hotel divestment to date. The previous two M&C hotel divestments completed were Millennium Hotel C inc innat i and Copthorne Hotel Birmingham.
The Group terminated the SPA with Ivory Properties Group Berhad for Copthorne Orchid Hotel & Resort Penang, due to the buyer’s failure to pay the balance consideration when the remedy period expired on 17 December 2021. The buyer forfeited the deposit and extension fees paid.
In December 2021, a public tender was launched for the collective sale of Tanglin Shopping Centre, with a guide price of $828 million. Through King’s Tanglin Shopping Pte Ltd, a wholly-owned subsidiary of M&C, the Group owns about 34.6% of Share Value and 60.2% of Strata Area in the strata-titled development. The tender closed on 22 February 2022 and received a top bid of $868 million (or $2,769 psf ppr), at a premium of 10% over the reserve price.
The Group has held its interest in this freehold office-cum-shopping complex for long-term investment since 1981, as part of its investment properties portfolio. This collective sale exercise will enable the Group to unlock value and realise a significant capital gain from its investment. The sale is subject to approval of Strata Titles Board and other conditions.
GETTING REVITALISED
Moving into 2022, financial markets met with impact from the geopolitical crisis while climate change considerations continue to permeate policy agendas around the world. Notwithstanding the evolving macroeconomic concerns and challenges, there are still reasons to be optimistic in the year ahead with the promise of global economic reopenings and recovery.
The Group will continue to progress with its Growth, Enhancement and Transformation (GET) strategy to expand, unlock value and transform for the future – and emerge stronger from the aftermath of the COVID-19 disruptions.
M Social Hotel Times Square New York I New York, US
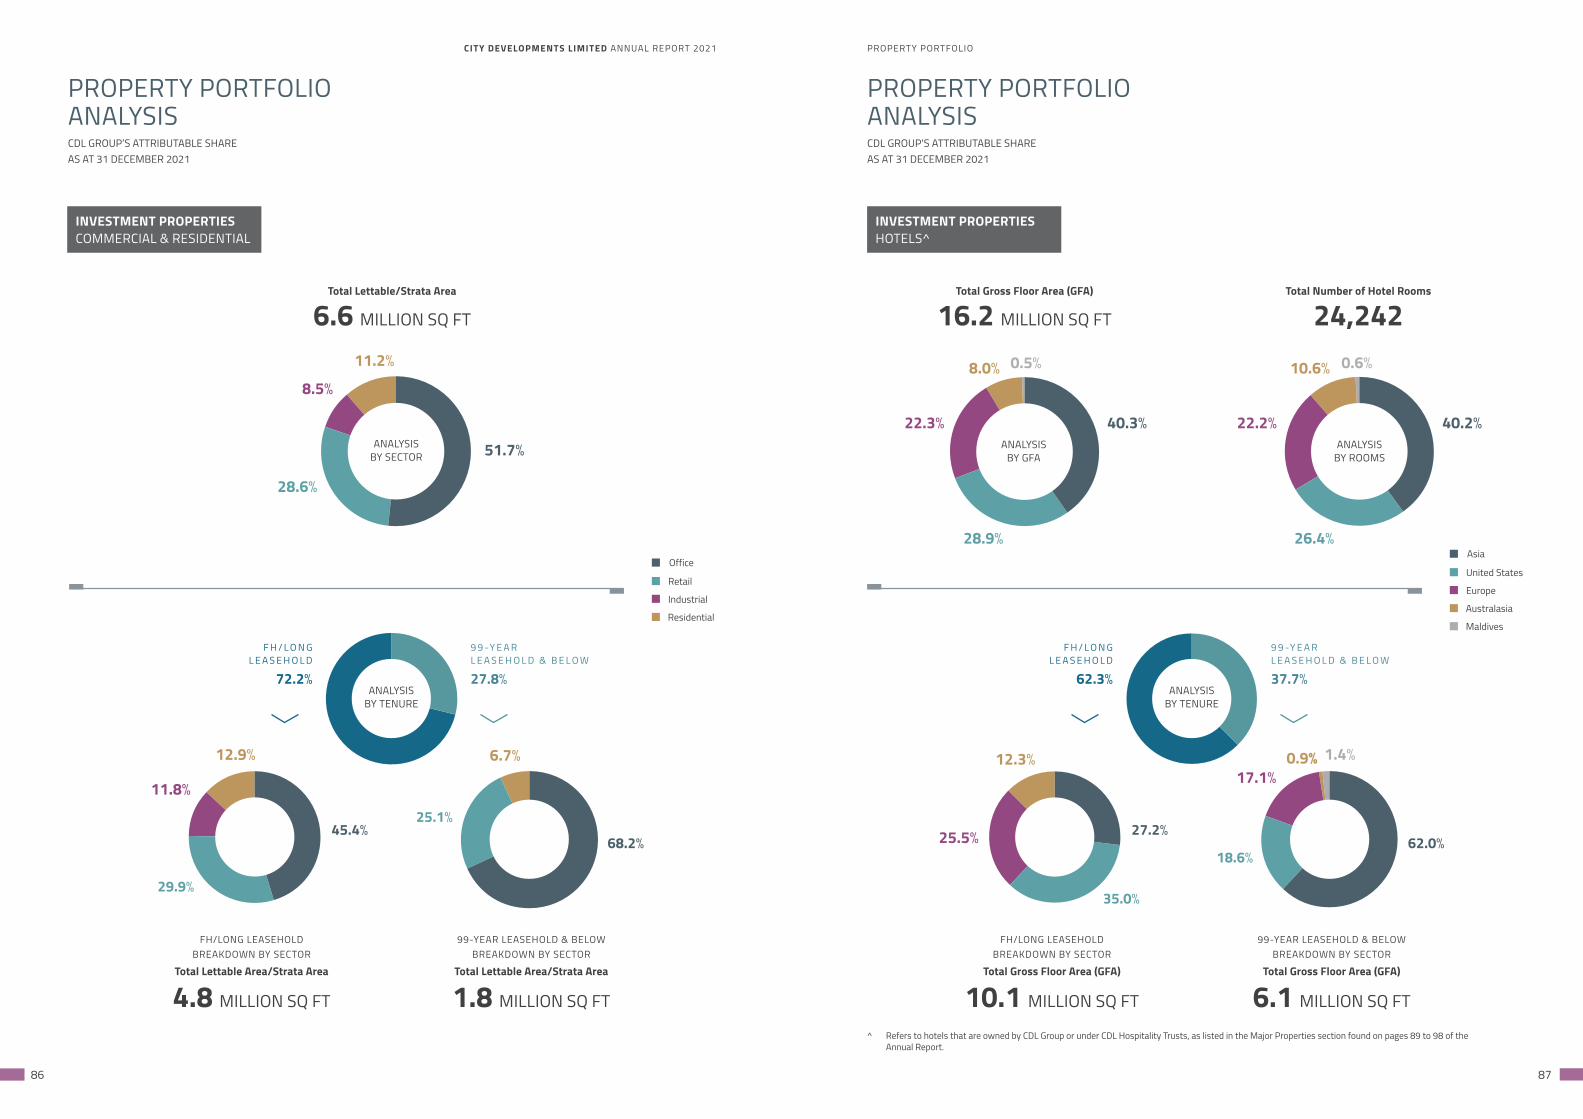
CITY DEVELOPMENTS LIMITED ANNUAL REPORT 2021 PROPERTY PORTFOLIO
86 87
INVESTMENT PROPERTIESCOMMERCIAL & RESIDENTIAL
INVESTMENT PROPERTIESHOTELS^
Total Lettable/Strata Area
6.6 MILLION SQ FT
11.2% 8.0% 10.6%0.5% 0.6%
1.4%
8.5%
22.3% 22.2%51.7%
40.3% 40.2%
28.6%
28.9% 26.4%
Total Number of Hotel Rooms
24,242Total Gross Floor Area (GFA)
16.2 MILLION SQ FT
FH/LONG LEASEHOLD BREAKDOWN BY SECTOR
Total Lettable Area/Strata Area
4.8 MILLION SQ FT
FH/LONG LEASEHOLD BREAKDOWN BY SECTOR
Total Gross Floor Area (GFA)
10.1 MILLION SQ FT
99-YEAR LEASEHOLD & BELOW BREAKDOWN BY SECTOR
Total Lettable Area/Strata Area
1.8 MILLION SQ FT
99-YEAR LEASEHOLD & BELOW BREAKDOWN BY SECTOR
Total Gross Floor Area (GFA)
6.1 MILLION SQ FT
72.2% 62.3%
F H / L O N G L E A S E H O L D
F H / L O N G L E A S E H O L D
27.8% 37.7%
9 9 -Y E A R L E A S E H O L D & B E L O W
9 9 -Y E A R L E A S E H O L D & B E L O W
25.1%
18.6%68.2% 62.0%
6.7% 0.9%12.9% 12.3%
11.8%
25.5%
17.1%
45.4% 27.2%
29.9%35.0%
PROPERTY PORTFOLIOANALYSIS
PROPERTY PORTFOLIOANALYSISCDL GROUP’S ATTRIBUTABLE SHAREAS AT 31 DECEMBER 2021
CDL GROUP’S ATTRIBUTABLE SHAREAS AT 31 DECEMBER 2021
Office
Retail
Industrial
Residential
Asia
United States
Europe
Australasia
Maldives
ANALYSIS BY TENURE
ANALYSIS BY TENURE
ANALYSIS BY SECTOR
ANALYSIS BY GFA
ANALYSIS BY ROOMS
^ Refers to hotels that are owned by CDL Group or under CDL Hospitality Trusts, as listed in the Major Properties section found on pages 89 to 98 of the Annual Report.
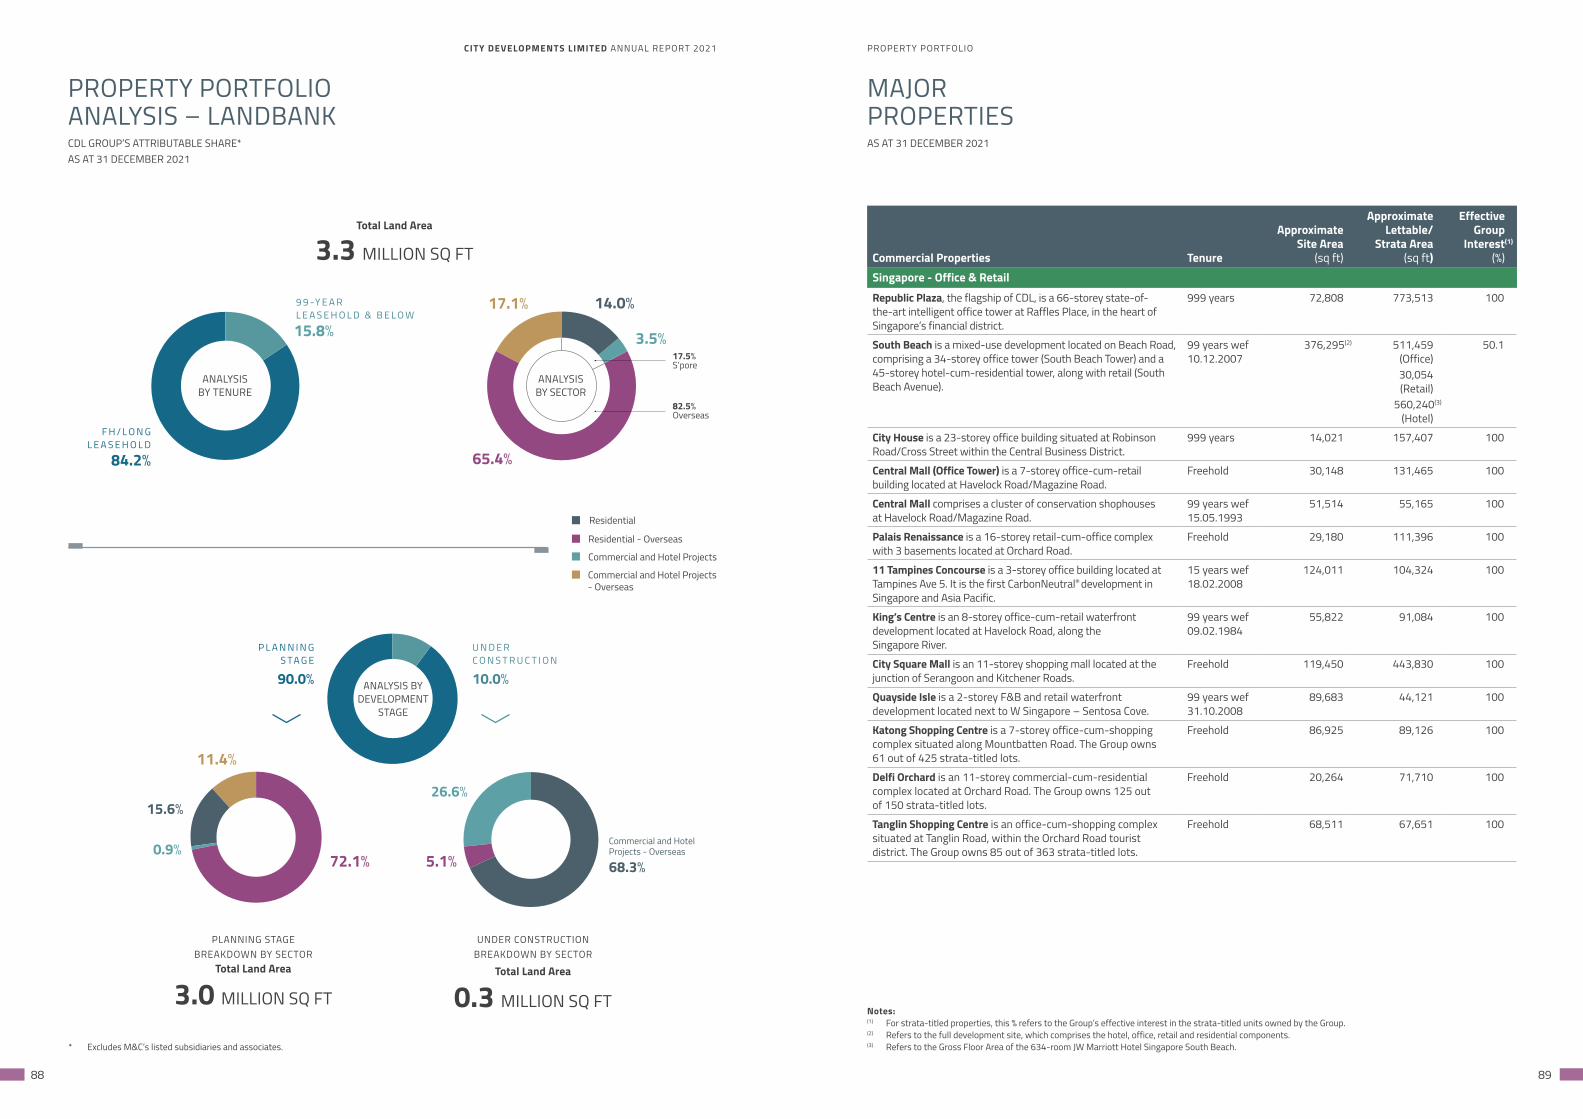
CITY DEVELOPMENTS LIMITED ANNUAL REPORT 2021 PROPERTY PORTFOLIO
88 89
PROPERTY PORTFOLIOANALYSIS – LANDBANKCDL GROUP’S ATTRIBUTABLE SHARE*AS AT 31 DECEMBER 2021
AS AT 31 DECEMBER 2021
17.1%
65.4%
14.0%
17.5%S’pore
82.5%Overseas
15.8% 3.5%
Total Land Area
3.3 MILLION SQ FT
PLANNING STAGEBREAKDOWN BY SECTOR
Total Land Area
3.0 MILLION SQ FT
UNDER CONSTRUCTIONBREAKDOWN BY SECTOR
Total Land Area
0.3 MILLION SQ FT
90.0%
84.2%
P L A N N I N GS TA G E
F H / L O N G L E A S E H O L D
10.0%
U N D E RC O N S T R U C T I O N
9 9 -Y E A R L E A S E H O L D & B E L O W
26.6%
Commercial and Hotel Projects - Overseas
68.3%
11.4%
72.1% 5.1%
15.6%
0.9%
Residential
Residential - Overseas
Commercial and Hotel Projects
Commercial and Hotel Projects - Overseas
ANALYSIS BYDEVELOPMENT
STAGE
ANALYSIS BY TENURE
ANALYSIS BY SECTOR
* Excludes M&C’s listed subsidiaries and associates.
Commercial Properties Tenure
ApproximateSite Area
(sq ft)
ApproximateLettable/
Strata Area(sq ft)
EffectiveGroup
Interest(1)
(%)Singapore - Office & RetailRepublic Plaza, the flagship of CDL, is a 66-storey state-of-the-art intelligent office tower at Raffles Place, in the heart of Singapore’s financial district.
999 years 72,808 773,513 100
South Beach is a mixed-use development located on Beach Road, comprising a 34-storey office tower (South Beach Tower) and a 45-storey hotel-cum-residential tower, along with retail (South Beach Avenue).
99 years wef10.12.2007
376,295(2) 511,459(Office)30,054(Retail)
560,240(3)
(Hotel)
50.1
City House is a 23-storey office building situated at Robinson Road/Cross Street within the Central Business District.
999 years 14,021 157,407 100
Central Mall (Office Tower) is a 7-storey office-cum-retail building located at Havelock Road/Magazine Road.
Freehold 30,148 131,465 100
Central Mall comprises a cluster of conservation shophouses at Havelock Road/Magazine Road.
99 years wef15.05.1993
51,514 55,165 100
Palais Renaissance is a 16-storey retail-cum-office complex with 3 basements located at Orchard Road.
Freehold 29,180 111,396 100
11 Tampines Concourse is a 3-storey office building located at Tampines Ave 5. It is the first CarbonNeutral® development in Singapore and Asia Pacific.
15 years wef18.02.2008
124,011 104,324 100
King’s Centre is an 8-storey office-cum-retail waterfront development located at Havelock Road, along the Singapore River.
99 years wef09.02.1984
55,822 91,084 100
City Square Mall is an 11-storey shopping mall located at the junction of Serangoon and Kitchener Roads.
Freehold 119,450 443,830 100
Quayside Isle is a 2-storey F&B and retail waterfront development located next to W Singapore – Sentosa Cove.
99 years wef31.10.2008
89,683 44,121 100
Katong Shopping Centre is a 7-storey office-cum-shopping complex situated along Mountbatten Road. The Group owns 61 out of 425 strata-titled lots.
Freehold 86,925 89,126 100
Delfi Orchard is an 11-storey commercial-cum-residential complex located at Orchard Road. The Group owns 125 out of 150 strata-titled lots.
Freehold 20,264 71,710 100
Tanglin Shopping Centre is an office-cum-shopping complexsituated at Tanglin Road, within the Orchard Road tourist district. The Group owns 85 out of 363 strata-titled lots.
Freehold 68,511 67,651 100
Notes:(1) For strata-titled properties, this % refers to the Group’s effective interest in the strata-titled units owned by the Group.(2) Refers to the full development site, which comprises the hotel, office, retail and residential components.(3) Refers to the Gross Floor Area of the 634-room JW Marriott Hotel Singapore South Beach.
MAJOR PROPERTIES
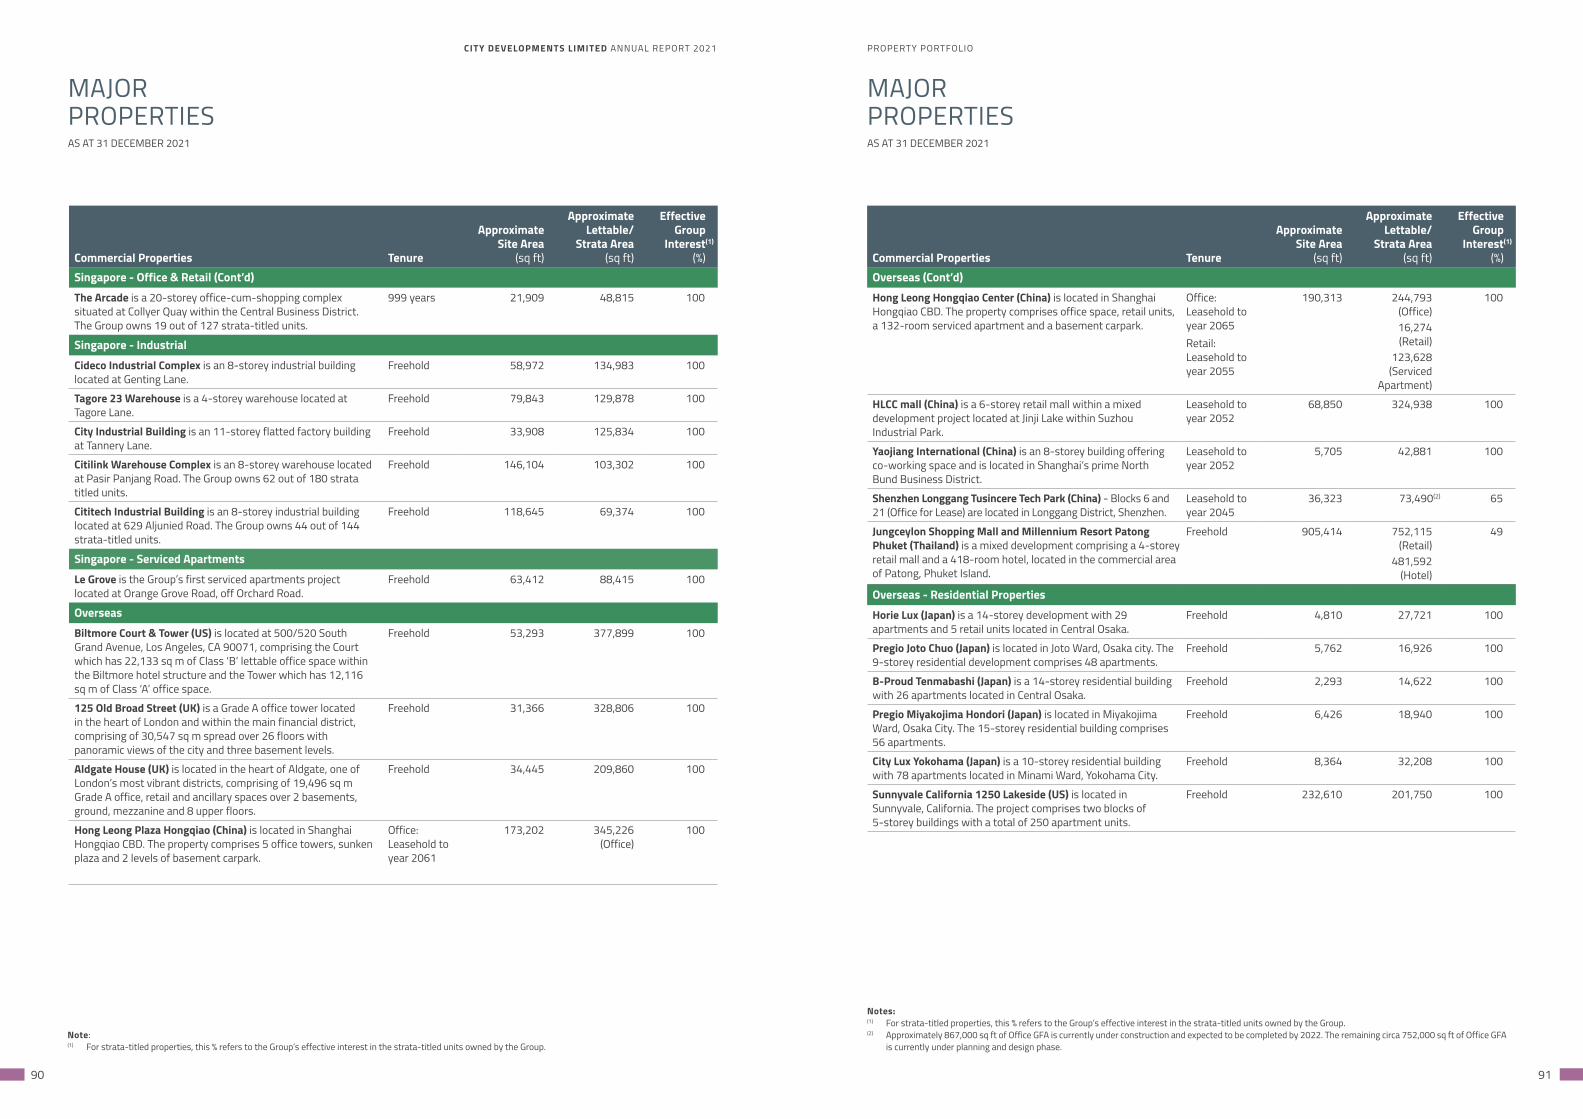
CITY DEVELOPMENTS LIMITED ANNUAL REPORT 2021 PROPERTY PORTFOLIO
90 91
AS AT 31 DECEMBER 2021 AS AT 31 DECEMBER 2021
MAJOR PROPERTIES
MAJOR PROPERTIES
Commercial Properties Tenure
ApproximateSite Area
(sq ft)
ApproximateLettable/
Strata Area(sq ft)
EffectiveGroup
Interest(1)
(%)Singapore - Office & Retail (Cont’d)The Arcade is a 20-storey office-cum-shopping complex situated at Collyer Quay within the Central Business District. The Group owns 19 out of 127 strata-titled units.
999 years 21,909 48,815 100
Singapore - IndustrialCideco Industrial Complex is an 8-storey industrial building located at Genting Lane.
Freehold 58,972 134,983 100
Tagore 23 Warehouse is a 4-storey warehouse located at Tagore Lane.
Freehold 79,843 129,878 100
City Industrial Building is an 11-storey flatted factory building at Tannery Lane.
Freehold 33,908 125,834 100
Citilink Warehouse Complex is an 8-storey warehouse located at Pasir Panjang Road. The Group owns 62 out of 180 strata titled units.
Freehold 146,104 103,302 100
Cititech Industrial Building is an 8-storey industrial building located at 629 Aljunied Road. The Group owns 44 out of 144 strata-titled units.
Freehold 118,645 69,374 100
Singapore - Serviced ApartmentsLe Grove is the Group’s first serviced apartments projectlocated at Orange Grove Road, off Orchard Road.
Freehold 63,412 88,415 100
OverseasBiltmore Court & Tower (US) is located at 500/520 South Grand Avenue, Los Angeles, CA 90071, comprising the Court which has 22,133 sq m of Class ‘B’ lettable office space within the Biltmore hotel structure and the Tower which has 12,116 sq m of Class ‘A’ office space.
Freehold 53,293 377,899 100
125 Old Broad Street (UK) is a Grade A office tower located in the heart of London and within the main financial district, comprising of 30,547 sq m spread over 26 floors with panoramic views of the city and three basement levels.
Freehold 31,366 328,806 100
Aldgate House (UK) is located in the heart of Aldgate, one of London’s most vibrant districts, comprising of 19,496 sq m Grade A office, retail and ancillary spaces over 2 basements, ground, mezzanine and 8 upper floors.
Freehold 34,445 209,860 100
Hong Leong Plaza Hongqiao (China) is located in Shanghai Hongqiao CBD. The property comprises 5 office towers, sunken plaza and 2 levels of basement carpark.
Office:Leasehold toyear 2061
173,202 345,226(Office)
100
Note:(1) For strata-titled properties, this % refers to the Group’s effective interest in the strata-titled units owned by the Group.
Notes:(1) For strata-titled properties, this % refers to the Group’s effective interest in the strata-titled units owned by the Group.(2) Approximately 867,000 sq ft of Office GFA is currently under construction and expected to be completed by 2022. The remaining circa 752,000 sq ft of Office GFA
is currently under planning and design phase.
Commercial Properties Tenure
ApproximateSite Area
(sq ft)
ApproximateLettable/
Strata Area(sq ft)
EffectiveGroup
Interest(1)
(%)Overseas (Cont’d)Hong Leong Hongqiao Center (China) is located in Shanghai Hongqiao CBD. The property comprises office space, retail units, a 132-room serviced apartment and a basement carpark.
Office:Leasehold toyear 2065Retail:Leasehold toyear 2055
190,313 244,793(Office)16,274(Retail)
123,628(Serviced
Apartment)
100
HLCC mall (China) is a 6-storey retail mall within a mixed development project located at Jinji Lake within Suzhou Industrial Park.
Leasehold toyear 2052
68,850 324,938 100
Yaojiang International (China) is an 8-storey building offering co-working space and is located in Shanghai’s prime North Bund Business District.
Leasehold toyear 2052
5,705 42,881 100
Shenzhen Longgang Tusincere Tech Park (China) - Blocks 6 and 21 (Office for Lease) are located in Longgang District, Shenzhen.
Leasehold toyear 2045
36,323 73,490(2) 65
Jungceylon Shopping Mall and Millennium Resort Patong Phuket (Thailand) is a mixed development comprising a 4-storey retail mall and a 418-room hotel, located in the commercial area of Patong, Phuket Island.
Freehold 905,414 752,115(Retail)
481,592(Hotel)
49
Overseas - Residential PropertiesHorie Lux (Japan) is a 14-storey development with 29 apartments and 5 retail units located in Central Osaka.
Freehold 4,810 27,721 100
Pregio Joto Chuo (Japan) is located in Joto Ward, Osaka city. The 9-storey residential development comprises 48 apartments.
Freehold 5,762 16,926 100
B-Proud Tenmabashi (Japan) is a 14-storey residential building with 26 apartments located in Central Osaka.
Freehold 2,293 14,622 100
Pregio Miyakojima Hondori (Japan) is located in Miyakojima Ward, Osaka City. The 15-storey residential building comprises 56 apartments.
Freehold 6,426 18,940 100
City Lux Yokohama (Japan) is a 10-storey residential building with 78 apartments located in Minami Ward, Yokohama City.
Freehold 8,364 32,208 100
Sunnyvale California 1250 Lakeside (US) is located in Sunnyvale, California. The project comprises two blocks of 5-storey buildings with a total of 250 apartment units.
Freehold 232,610 201,750 100
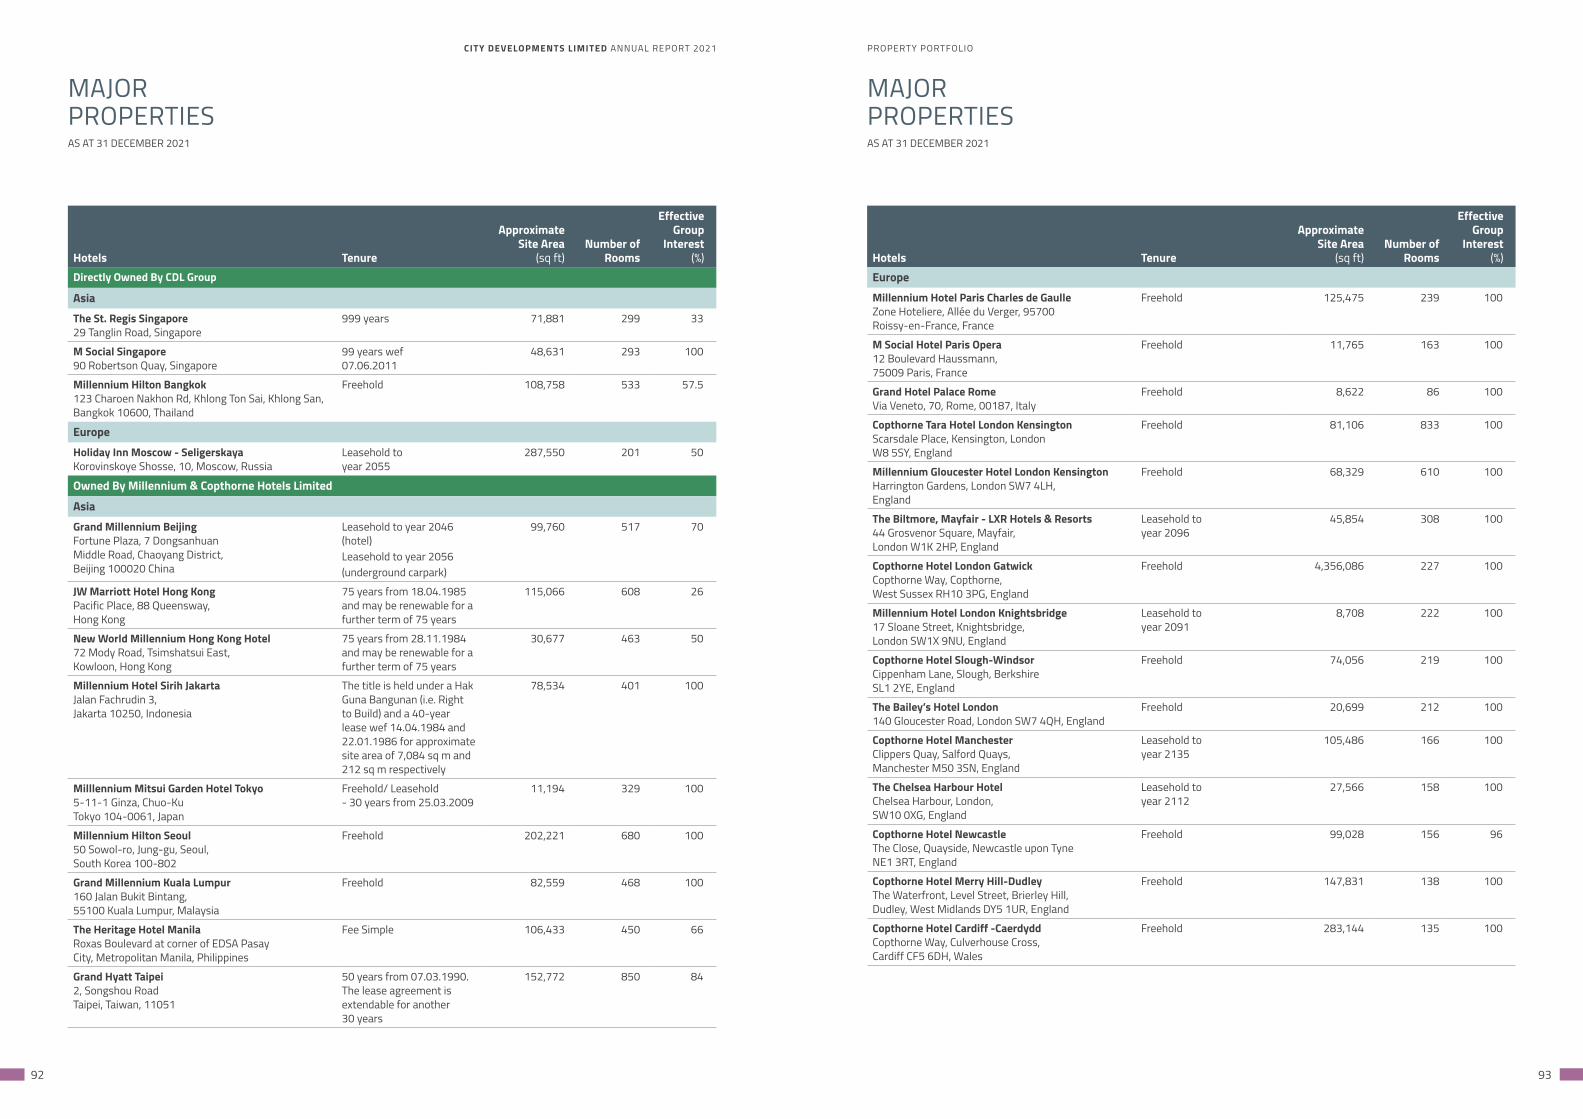
CITY DEVELOPMENTS LIMITED ANNUAL REPORT 2021 PROPERTY PORTFOLIO
92 93
AS AT 31 DECEMBER 2021 AS AT 31 DECEMBER 2021
MAJOR PROPERTIES
MAJOR PROPERTIES
Hotels Tenure
ApproximateSite Area
(sq ft)Number of
Rooms
EffectiveGroup
Interest
(%)Directly Owned By CDL Group
AsiaThe St. Regis Singapore29 Tanglin Road, Singapore
999 years 71,881 299 33
M Social Singapore90 Robertson Quay, Singapore
99 years wef07.06.2011
48,631 293 100
Millennium Hilton Bangkok123 Charoen Nakhon Rd, Khlong Ton Sai, Khlong San,Bangkok 10600, Thailand
Freehold 108,758 533 57.5
EuropeHoliday Inn Moscow - SeligerskayaKorovinskoye Shosse, 10, Moscow, Russia
Leasehold to year 2055
287,550 201 50
Owned By Millennium & Copthorne Hotels Limited
AsiaGrand Millennium BeijingFortune Plaza, 7 DongsanhuanMiddle Road, Chaoyang District,Beijing 100020 China
Leasehold to year 2046(hotel) Leasehold to year 2056(underground carpark)
99,760 517 70
JW Marriott Hotel Hong KongPacific Place, 88 Queensway,Hong Kong
75 years from 18.04.1985 and may be renewable for a further term of 75 years
115,066 608 26
New World Millennium Hong Kong Hotel72 Mody Road, Tsimshatsui East,Kowloon, Hong Kong
75 years from 28.11.1984 and may be renewable for a further term of 75 years
30,677 463 50
Millennium Hotel Sirih JakartaJalan Fachrudin 3,Jakarta 10250, Indonesia
The title is held under a Hak Guna Bangunan (i.e. Right to Build) and a 40-year lease wef 14.04.1984 and 22.01.1986 for approximate site area of 7,084 sq m and 212 sq m respectively
78,534 401 100
Milllennium Mitsui Garden Hotel Tokyo5-11-1 Ginza, Chuo-KuTokyo 104-0061, Japan
Freehold/ Leasehold- 30 years from 25.03.2009
11,194 329 100
Millennium Hilton Seoul50 Sowol-ro, Jung-gu, Seoul,South Korea 100-802
Freehold 202,221 680 100
Grand Millennium Kuala Lumpur160 Jalan Bukit Bintang,55100 Kuala Lumpur, Malaysia
Freehold 82,559 468 100
The Heritage Hotel ManilaRoxas Boulevard at corner of EDSA PasayCity, Metropolitan Manila, Philippines
Fee Simple 106,433 450 66
Grand Hyatt Taipei2, Songshou RoadTaipei, Taiwan, 11051
50 years from 07.03.1990. The lease agreement is extendable for another 30 years
152,772 850 84
Hotels Tenure
ApproximateSite Area
(sq ft)Number of
Rooms
EffectiveGroup
Interest
(%)EuropeMillennium Hotel Paris Charles de GaulleZone Hoteliere, Allée du Verger, 95700Roissy-en-France, France
Freehold 125,475 239 100
M Social Hotel Paris Opera12 Boulevard Haussmann,75009 Paris, France
Freehold 11,765 163 100
Grand Hotel Palace RomeVia Veneto, 70, Rome, 00187, Italy
Freehold 8,622 86 100
Copthorne Tara Hotel London KensingtonScarsdale Place, Kensington, LondonW8 5SY, England
Freehold 81,106 833 100
Millennium Gloucester Hotel London KensingtonHarrington Gardens, London SW7 4LH,England
Freehold 68,329 610 100
The Biltmore, Mayfair - LXR Hotels & Resorts44 Grosvenor Square, Mayfair,London W1K 2HP, England
Leasehold toyear 2096
45,854 308 100
Copthorne Hotel London GatwickCopthorne Way, Copthorne,West Sussex RH10 3PG, England
Freehold 4,356,086 227 100
Millennium Hotel London Knightsbridge17 Sloane Street, Knightsbridge,London SW1X 9NU, England
Leasehold toyear 2091
8,708 222 100
Copthorne Hotel Slough-WindsorCippenham Lane, Slough, BerkshireSL1 2YE, England
Freehold 74,056 219 100
The Bailey’s Hotel London140 Gloucester Road, London SW7 4QH, England
Freehold 20,699 212 100
Copthorne Hotel ManchesterClippers Quay, Salford Quays,Manchester M50 3SN, England
Leasehold toyear 2135
105,486 166 100
The Chelsea Harbour HotelChelsea Harbour, London,SW10 0XG, England
Leasehold toyear 2112
27,566 158 100
Copthorne Hotel NewcastleThe Close, Quayside, Newcastle upon TyneNE1 3RT, England
Freehold 99,028 156 96
Copthorne Hotel Merry Hill-DudleyThe Waterfront, Level Street, Brierley Hill,Dudley, West Midlands DY5 1UR, England
Freehold 147,831 138 100
Copthorne Hotel Cardiff -CaerdyddCopthorne Way, Culverhouse Cross,Cardiff CF5 6DH, Wales
Freehold 283,144 135 100
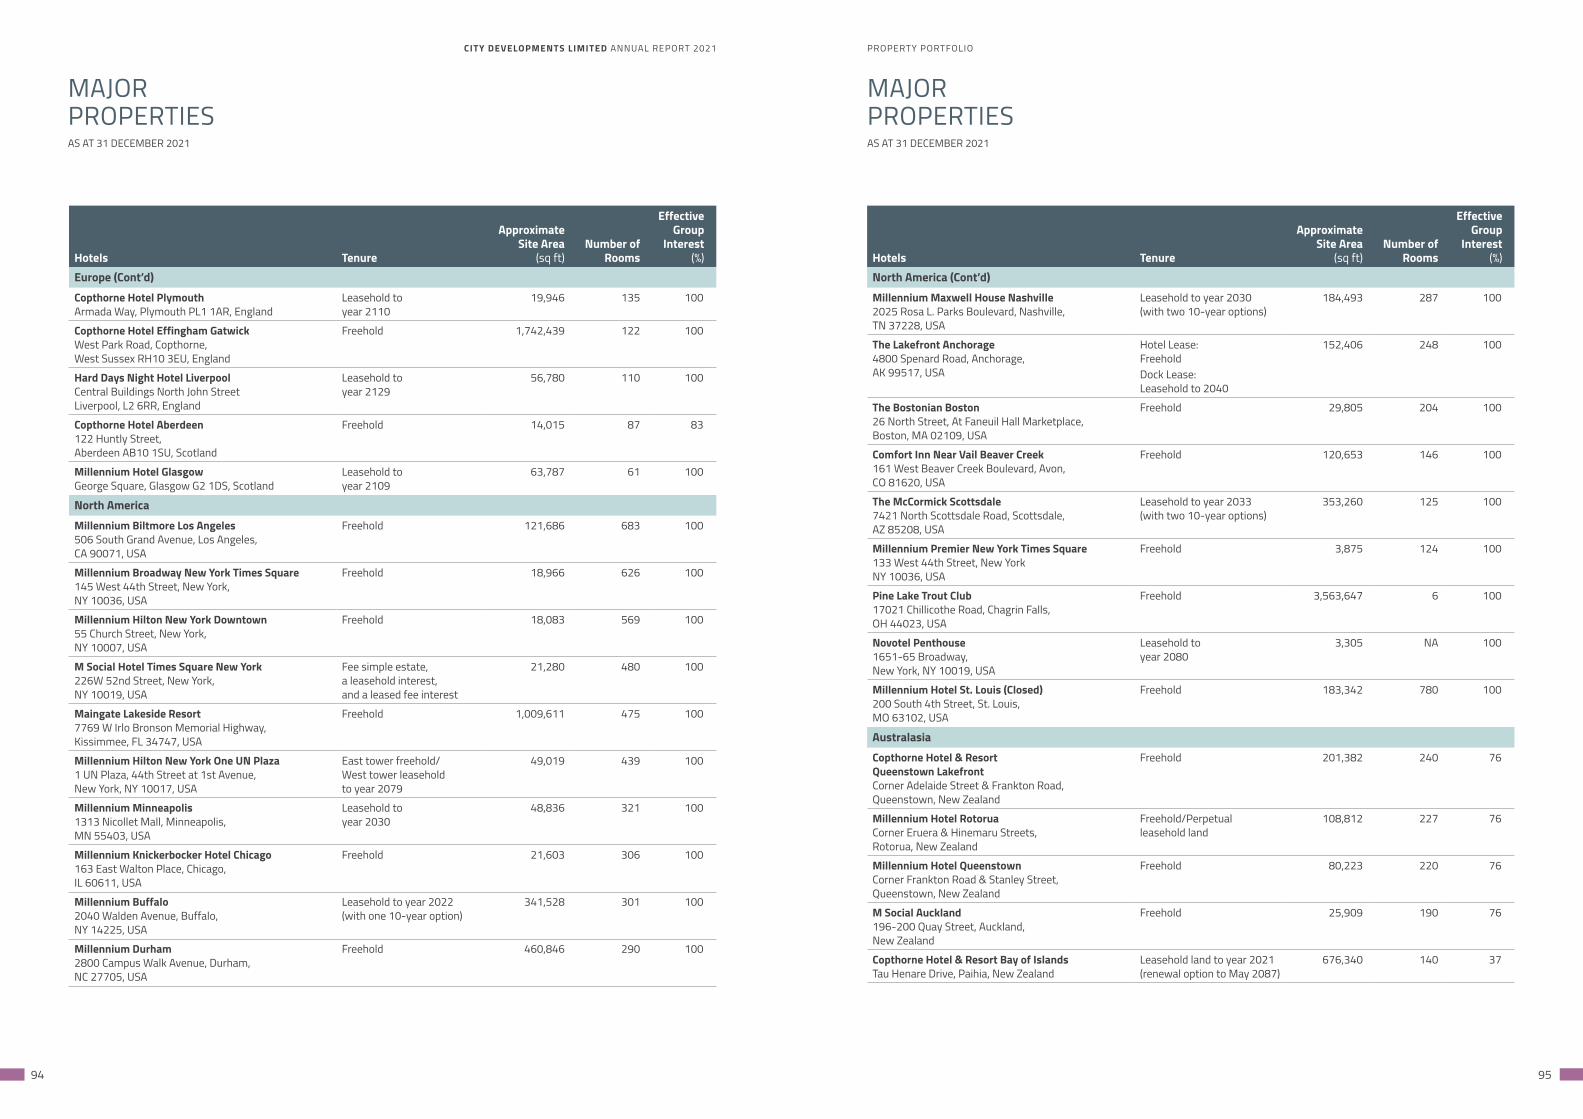
CITY DEVELOPMENTS LIMITED ANNUAL REPORT 2021 PROPERTY PORTFOLIO
94 95
AS AT 31 DECEMBER 2021 AS AT 31 DECEMBER 2021
MAJOR PROPERTIES
MAJOR PROPERTIES
Hotels Tenure
ApproximateSite Area
(sq ft)Number of
Rooms
EffectiveGroup
Interest
(%)Europe (Cont’d)Copthorne Hotel PlymouthArmada Way, Plymouth PL1 1AR, England
Leasehold toyear 2110
19,946 135 100
Copthorne Hotel Effingham GatwickWest Park Road, Copthorne,West Sussex RH10 3EU, England
Freehold 1,742,439 122 100
Hard Days Night Hotel LiverpoolCentral Buildings North John StreetLiverpool, L2 6RR, England
Leasehold toyear 2129
56,780 110 100
Copthorne Hotel Aberdeen 122 Huntly Street,Aberdeen AB10 1SU, Scotland
Freehold 14,015 87 83
Millennium Hotel GlasgowGeorge Square, Glasgow G2 1DS, Scotland
Leasehold toyear 2109
63,787 61 100
North AmericaMillennium Biltmore Los Angeles506 South Grand Avenue, Los Angeles,CA 90071, USA
Freehold 121,686 683 100
Millennium Broadway New York Times Square145 West 44th Street, New York,NY 10036, USA
Freehold 18,966 626 100
Millennium Hilton New York Downtown55 Church Street, New York,NY 10007, USA
Freehold 18,083 569 100
M Social Hotel Times Square New York226W 52nd Street, New York,NY 10019, USA
Fee simple estate, a leasehold interest, and a leased fee interest
21,280 480 100
Maingate Lakeside Resort7769 W Irlo Bronson Memorial Highway,Kissimmee, FL 34747, USA
Freehold 1,009,611 475 100
Millennium Hilton New York One UN Plaza1 UN Plaza, 44th Street at 1st Avenue,New York, NY 10017, USA
East tower freehold/West tower leaseholdto year 2079
49,019 439 100
Millennium Minneapolis1313 Nicollet Mall, Minneapolis,MN 55403, USA
Leasehold toyear 2030
48,836 321 100
Millennium Knickerbocker Hotel Chicago163 East Walton Place, Chicago,IL 60611, USA
Freehold 21,603 306 100
Millennium Buffalo2040 Walden Avenue, Buffalo,NY 14225, USA
Leasehold to year 2022 (with one 10-year option)
341,528 301 100
Millennium Durham2800 Campus Walk Avenue, Durham,NC 27705, USA
Freehold 460,846 290 100
Hotels Tenure
ApproximateSite Area
(sq ft)Number of
Rooms
EffectiveGroup
Interest
(%)North America (Cont’d)Millennium Maxwell House Nashville2025 Rosa L. Parks Boulevard, Nashville,TN 37228, USA
Leasehold to year 2030 (with two 10-year options)
184,493 287 100
The Lakefront Anchorage4800 Spenard Road, Anchorage,AK 99517, USA
Hotel Lease:FreeholdDock Lease:Leasehold to 2040
152,406 248 100
The Bostonian Boston26 North Street, At Faneuil Hall Marketplace,Boston, MA 02109, USA
Freehold 29,805 204 100
Comfort Inn Near Vail Beaver Creek161 West Beaver Creek Boulevard, Avon,CO 81620, USA
Freehold 120,653 146 100
The McCormick Scottsdale7421 North Scottsdale Road, Scottsdale,AZ 85208, USA
Leasehold to year 2033 (with two 10-year options)
353,260 125 100
Millennium Premier New York Times Square133 West 44th Street, New YorkNY 10036, USA
Freehold 3,875 124 100
Pine Lake Trout Club17021 Chillicothe Road, Chagrin Falls,OH 44023, USA
Freehold 3,563,647 6 100
Novotel Penthouse1651-65 Broadway,New York, NY 10019, USA
Leasehold toyear 2080
3,305 NA 100
Millennium Hotel St. Louis (Closed)200 South 4th Street, St. Louis,MO 63102, USA
Freehold 183,342 780 100
AustralasiaCopthorne Hotel & ResortQueenstown LakefrontCorner Adelaide Street & Frankton Road,Queenstown, New Zealand
Freehold 201,382 240 76
Millennium Hotel RotoruaCorner Eruera & Hinemaru Streets,Rotorua, New Zealand
Freehold/Perpetualleasehold land
108,812 227 76
Millennium Hotel QueenstownCorner Frankton Road & Stanley Street,Queenstown, New Zealand
Freehold 80,223 220 76
M Social Auckland196-200 Quay Street, Auckland,New Zealand
Freehold 25,909 190 76
Copthorne Hotel & Resort Bay of IslandsTau Henare Drive, Paihia, New Zealand
Leasehold land to year 2021 (renewal option to May 2087)
676,340 140 37
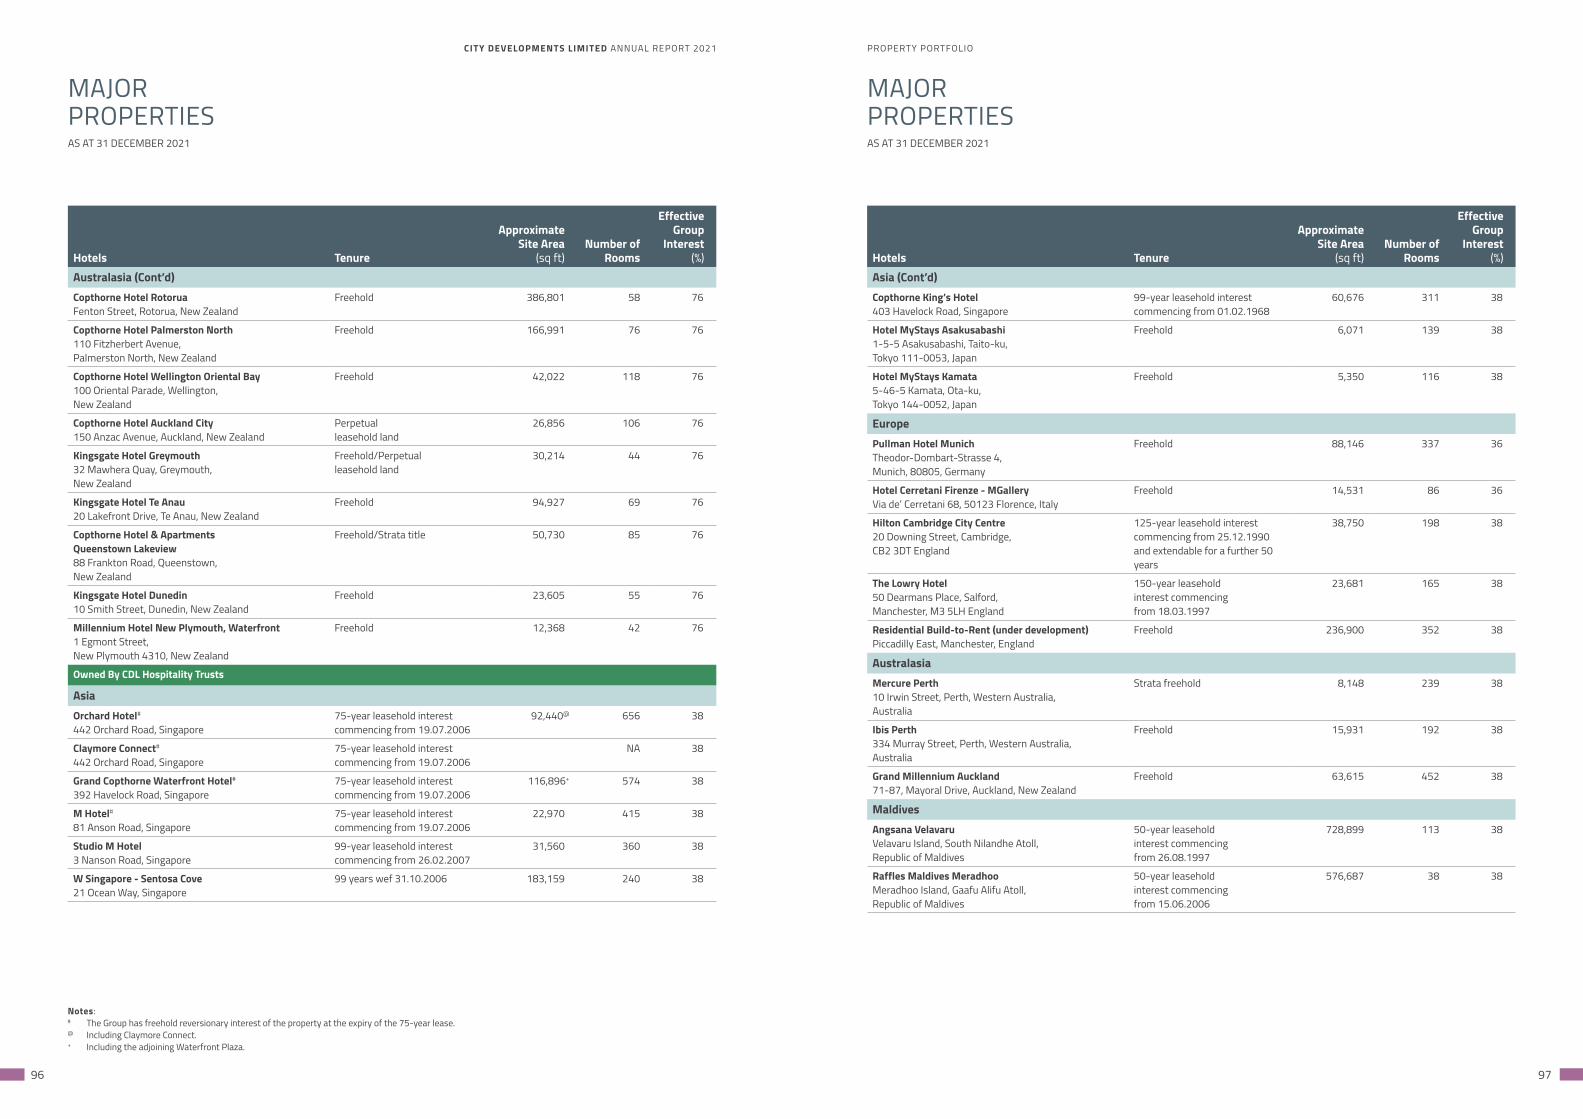
CITY DEVELOPMENTS LIMITED ANNUAL REPORT 2021 PROPERTY PORTFOLIO
96 97
AS AT 31 DECEMBER 2021 AS AT 31 DECEMBER 2021
MAJOR PROPERTIES
MAJOR PROPERTIES
Hotels Tenure
ApproximateSite Area
(sq ft)Number of
Rooms
EffectiveGroup
Interest
(%)Australasia (Cont’d)Copthorne Hotel RotoruaFenton Street, Rotorua, New Zealand
Freehold 386,801 58 76
Copthorne Hotel Palmerston North110 Fitzherbert Avenue,Palmerston North, New Zealand
Freehold 166,991 76 76
Copthorne Hotel Wellington Oriental Bay100 Oriental Parade, Wellington,New Zealand
Freehold 42,022 118 76
Copthorne Hotel Auckland City150 Anzac Avenue, Auckland, New Zealand
Perpetualleasehold land
26,856 106 76
Kingsgate Hotel Greymouth32 Mawhera Quay, Greymouth,New Zealand
Freehold/Perpetualleasehold land
30,214 44 76
Kingsgate Hotel Te Anau20 Lakefront Drive, Te Anau, New Zealand
Freehold 94,927 69 76
Copthorne Hotel & ApartmentsQueenstown Lakeview88 Frankton Road, Queenstown,New Zealand
Freehold/Strata title 50,730 85 76
Kingsgate Hotel Dunedin10 Smith Street, Dunedin, New Zealand
Freehold 23,605 55 76
Millennium Hotel New Plymouth, Waterfront1 Egmont Street,New Plymouth 4310, New Zealand
Freehold 12,368 42 76
Owned By CDL Hospitality Trusts
AsiaOrchard Hotel#
442 Orchard Road, Singapore75-year leasehold interest commencing from 19.07.2006
92,440@ 656 38
Claymore Connect#
442 Orchard Road, Singapore75-year leasehold interest commencing from 19.07.2006
NA 38
Grand Copthorne Waterfront Hotel#
392 Havelock Road, Singapore75-year leasehold interest commencing from 19.07.2006
116,896+ 574 38
M Hotel#
81 Anson Road, Singapore75-year leasehold interest commencing from 19.07.2006
22,970 415 38
Studio M Hotel3 Nanson Road, Singapore
99-year leasehold interest commencing from 26.02.2007
31,560 360 38
W Singapore - Sentosa Cove21 Ocean Way, Singapore
99 years wef 31.10.2006 183,159 240 38
Notes:# The Group has freehold reversionary interest of the property at the expiry of the 75-year lease.@ Including Claymore Connect.+ Including the adjoining Waterfront Plaza.
Hotels Tenure
ApproximateSite Area
(sq ft)Number of
Rooms
EffectiveGroup
Interest
(%)Asia (Cont’d)Copthorne King’s Hotel403 Havelock Road, Singapore
99-year leasehold interest commencing from 01.02.1968
60,676 311 38
Hotel MyStays Asakusabashi1-5-5 Asakusabashi, Taito-ku,Tokyo 111-0053, Japan
Freehold 6,071 139 38
Hotel MyStays Kamata5-46-5 Kamata, Ota-ku,Tokyo 144-0052, Japan
Freehold 5,350 116 38
EuropePullman Hotel MunichTheodor-Dombart-Strasse 4,Munich, 80805, Germany
Freehold 88,146 337 36
Hotel Cerretani Firenze - MGalleryVia de’ Cerretani 68, 50123 Florence, Italy
Freehold 14,531 86 36
Hilton Cambridge City Centre20 Downing Street, Cambridge,CB2 3DT England
125-year leasehold interest commencing from 25.12.1990 and extendable for a further 50 years
38,750 198 38
The Lowry Hotel50 Dearmans Place, Salford,Manchester, M3 5LH England
150-year leaseholdinterest commencingfrom 18.03.1997
23,681 165 38
Residential Build-to-Rent (under development)Piccadilly East, Manchester, England
Freehold 236,900 352 38
AustralasiaMercure Perth10 Irwin Street, Perth, Western Australia,Australia
Strata freehold 8,148 239 38
Ibis Perth334 Murray Street, Perth, Western Australia,Australia
Freehold 15,931 192 38
Grand Millennium Auckland71-87, Mayoral Drive, Auckland, New Zealand
Freehold 63,615 452 38
MaldivesAngsana VelavaruVelavaru Island, South Nilandhe Atoll,Republic of Maldives
50-year leasehold interest commencing from 26.08.1997
728,899 113 38
Raffles Maldives MeradhooMeradhoo Island, Gaafu Alifu Atoll,Republic of Maldives
50-year leaseholdinterest commencingfrom 15.06.2006
576,687 38 38
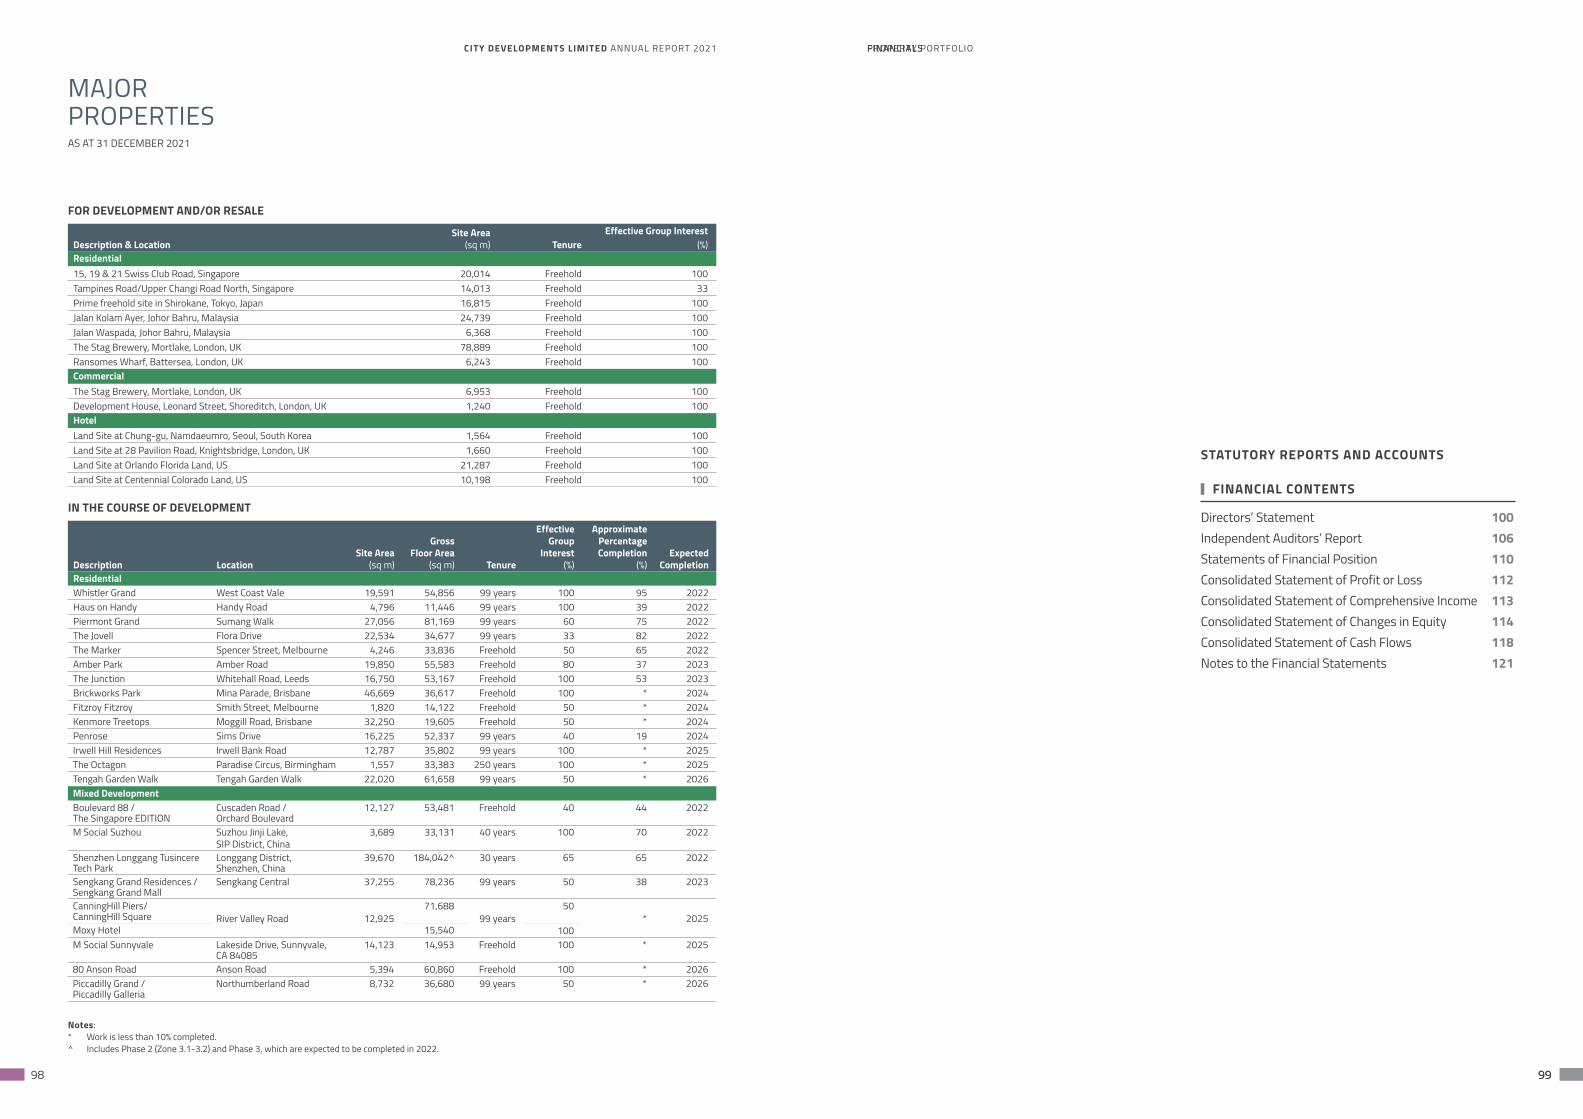
CITY DEVELOPMENTS LIMITED ANNUAL REPORT 2021 PROPERTY PORTFOLIO
98 99
FOR DEVELOPMENT AND/OR RESALE
Description & LocationSite Area
(sq m) TenureEffective Group Interest
(%)Residential15, 19 & 21 Swiss Club Road, Singapore 20,014 Freehold 100Tampines Road/Upper Changi Road North, Singapore 14,013 Freehold 33Prime freehold site in Shirokane, Tokyo, Japan 16,815 Freehold 100Jalan Kolam Ayer, Johor Bahru, Malaysia 24,739 Freehold 100Jalan Waspada, Johor Bahru, Malaysia 6,368 Freehold 100The Stag Brewery, Mortlake, London, UK 78,889 Freehold 100Ransomes Wharf, Battersea, London, UK 6,243 Freehold 100CommercialThe Stag Brewery, Mortlake, London, UK 6,953 Freehold 100Development House, Leonard Street, Shoreditch, London, UK 1,240 Freehold 100HotelLand Site at Chung-gu, Namdaeumro, Seoul, South Korea 1,564 Freehold 100Land Site at 28 Pavilion Road, Knightsbridge, London, UK 1,660 Freehold 100Land Site at Orlando Florida Land, US 21,287 Freehold 100Land Site at Centennial Colorado Land, US 10,198 Freehold 100
IN THE COURSE OF DEVELOPMENT
Description LocationSite Area
(sq m)
GrossFloor Area
(sq m) Tenure
EffectiveGroup
Interest (%)
ApproximatePercentageCompletion
(%)Expected
CompletionResidentialWhistler Grand West Coast Vale 19,591 54,856 99 years 100 95 2022Haus on Handy Handy Road 4,796 11,446 99 years 100 39 2022Piermont Grand Sumang Walk 27,056 81,169 99 years 60 75 2022The Jovell Flora Drive 22,534 34,677 99 years 33 82 2022The Marker Spencer Street, Melbourne 4,246 33,836 Freehold 50 65 2022Amber Park Amber Road 19,850 55,583 Freehold 80 37 2023The Junction Whitehall Road, Leeds 16,750 53,167 Freehold 100 53 2023Brickworks Park Mina Parade, Brisbane 46,669 36,617 Freehold 100 * 2024Fitzroy Fitzroy Smith Street, Melbourne 1,820 14,122 Freehold 50 * 2024Kenmore Treetops Moggill Road, Brisbane 32,250 19,605 Freehold 50 * 2024Penrose Sims Drive 16,225 52,337 99 years 40 19 2024Irwell Hill Residences Irwell Bank Road 12,787 35,802 99 years 100 * 2025The Octagon Paradise Circus, Birmingham 1,557 33,383 250 years 100 * 2025Tengah Garden Walk Tengah Garden Walk 22,020 61,658 99 years 50 * 2026Mixed DevelopmentBoulevard 88 /The Singapore EDITION
Cuscaden Road /Orchard Boulevard
12,127 53,481 Freehold 40 44 2022
M Social Suzhou Suzhou Jinji Lake, SIP District, China
3,689 33,131 40 years 100 70 2022
Shenzhen Longgang Tusincere Tech Park
Longgang District, Shenzhen, China
39,670 184,042^ 30 years 65 65 2022
Sengkang Grand Residences /Sengkang Grand Mall
Sengkang Central 37,255 78,236 99 years 50 38 2023
CanningHill Piers/ CanningHill Square River Valley Road 12,925
71,68899 years
50* 2025
Moxy Hotel 15,540 100M Social Sunnyvale Lakeside Drive, Sunnyvale,
CA 8408514,123 14,953 Freehold 100 * 2025
80 Anson Road Anson Road 5,394 60,860 Freehold 100 * 2026Piccadilly Grand / Piccadilly Galleria
Northumberland Road 8,732 36,680 99 years 50 * 2026
Notes:* Work is less than 10% completed.^ Includes Phase 2 (Zone 3.1-3.2) and Phase 3, which are expected to be completed in 2022.
AS AT 31 DECEMBER 2021
MAJOR PROPERTIES
FINANCIALSFINANCIALS
99
STATUTORY REPORTS AND ACCOUNTS
FINANCIAL CONTENTS
Directors’ Statement 100Independent Auditors’ Report 106Statements of Financial Position 110Consolidated Statement of Profit or Loss 112Consolidated Statement of Comprehensive Income 113Consolidated Statement of Changes in Equity 114Consolidated Statement of Cash Flows 118Notes to the Financial Statements 121
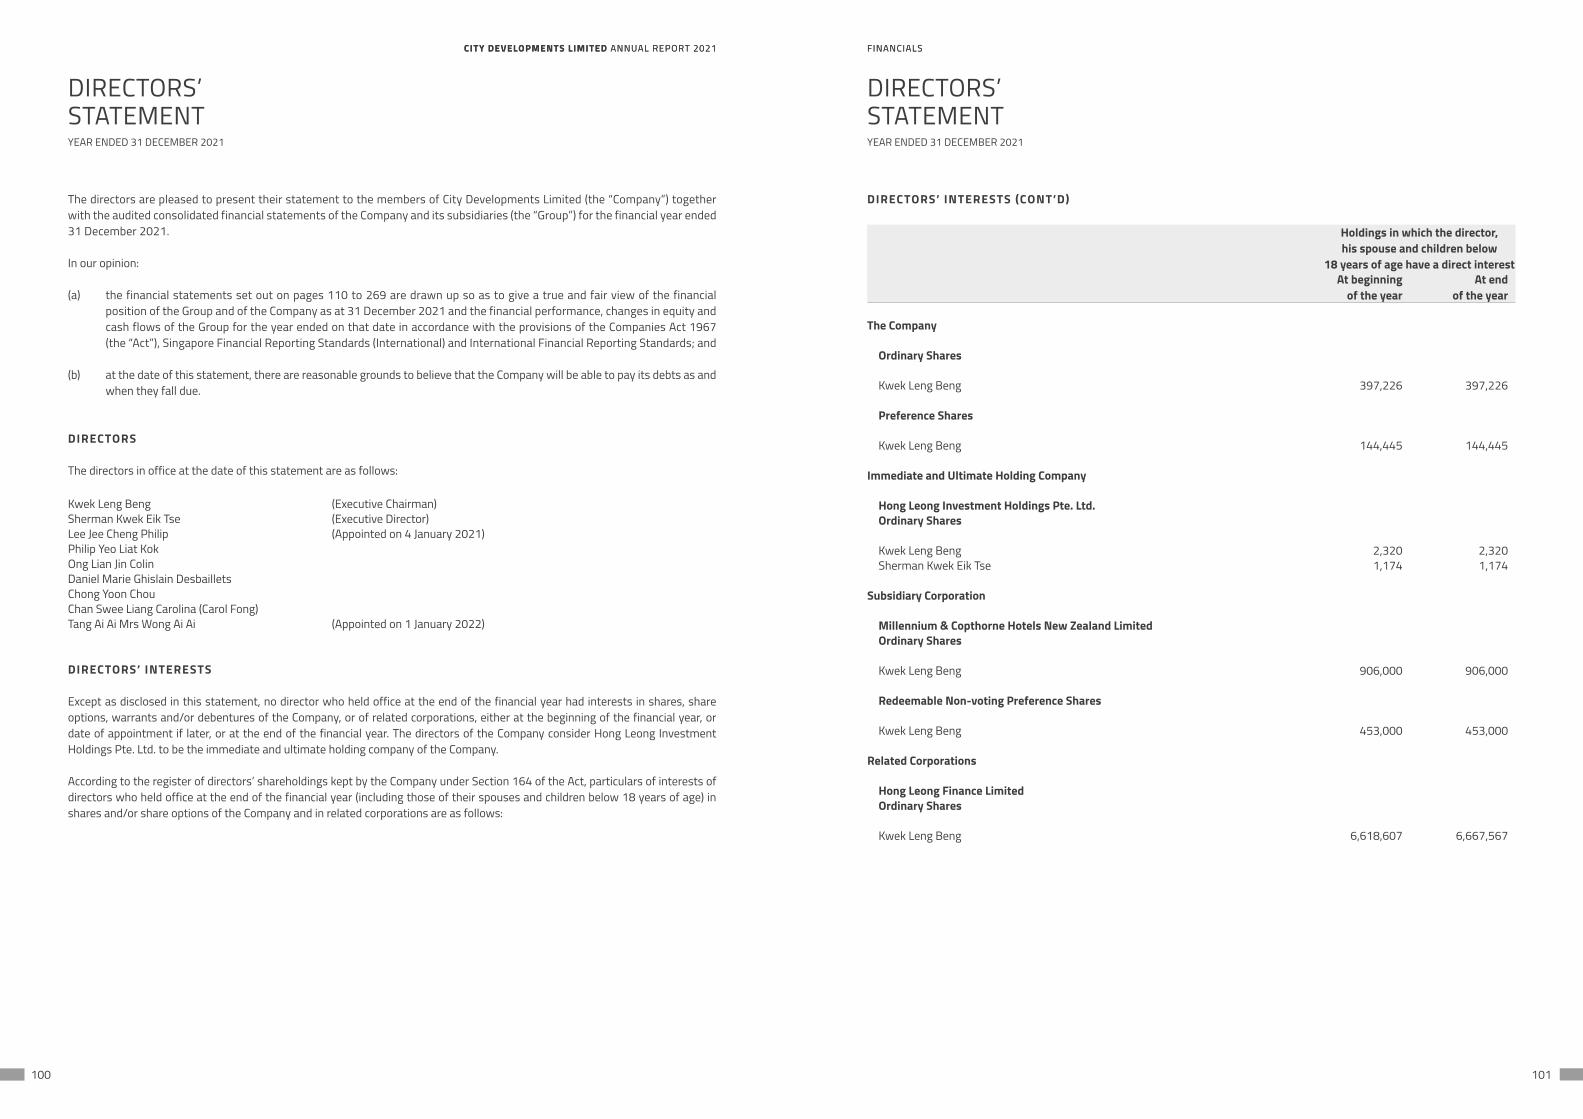
CITY DEVELOPMENTS LIMITED ANNUAL REPORT 2021 FINANCIALSCITY DEVELOPMENTS LIMITED ANNUAL REPORT 2021 FINANCIALS
100 101
The directors are pleased to present their statement to the members of City Developments Limited (the “Company”) together with the audited consolidated financial statements of the Company and its subsidiaries (the “Group”) for the financial year ended 31 December 2021.
In our opinion:
(a) the financial statements set out on pages 110 to 269 are drawn up so as to give a true and fair view of the financial position of the Group and of the Company as at 31 December 2021 and the financial performance, changes in equity and cash flows of the Group for the year ended on that date in accordance with the provisions of the Companies Act 1967 (the “Act”), Singapore Financial Reporting Standards (International) and International Financial Reporting Standards; and
(b) at the date of this statement, there are reasonable grounds to believe that the Company will be able to pay its debts as and when they fall due.
DIRECTORS
The directors in office at the date of this statement are as follows:
Kwek Leng Beng (Executive Chairman)Sherman Kwek Eik Tse (Executive Director)Lee Jee Cheng Philip (Appointed on 4 January 2021)Philip Yeo Liat KokOng Lian Jin ColinDaniel Marie Ghislain DesbailletsChong Yoon ChouChan Swee Liang Carolina (Carol Fong)Tang Ai Ai Mrs Wong Ai Ai (Appointed on 1 January 2022)
DIRECTORS’ INTERESTS
Except as disclosed in this statement, no director who held office at the end of the financial year had interests in shares, share options, warrants and/or debentures of the Company, or of related corporations, either at the beginning of the financial year, or date of appointment if later, or at the end of the financial year. The directors of the Company consider Hong Leong Investment Holdings Pte. Ltd. to be the immediate and ultimate holding company of the Company.
According to the register of directors’ shareholdings kept by the Company under Section 164 of the Act, particulars of interests of directors who held office at the end of the financial year (including those of their spouses and children below 18 years of age) in shares and/or share options of the Company and in related corporations are as follows:
DIRECTORS’STATEMENTYEAR ENDED 31 DECEMBER 2021
DIRECTORS’ INTERESTS (CONT’D)
Holdings in which the director,his spouse and children below
18 years of age have a direct interestAt beginning
of the yearAt end
of the year
The Company
Ordinary Shares
Kwek Leng Beng 397,226 397,226
Preference Shares
Kwek Leng Beng 144,445 144,445
Immediate and Ultimate Holding Company
Hong Leong Investment Holdings Pte. Ltd.Ordinary Shares
Kwek Leng Beng 2,320 2,320Sherman Kwek Eik Tse 1,174 1,174
Subsidiary Corporation
Millennium & Copthorne Hotels New Zealand Limited Ordinary Shares
Kwek Leng Beng 906,000 906,000
Redeemable Non-voting Preference Shares
Kwek Leng Beng 453,000 453,000
Related Corporations
Hong Leong Finance LimitedOrdinary Shares
Kwek Leng Beng 6,618,607 6,667,567
DIRECTORS’STATEMENTYEAR ENDED 31 DECEMBER 2021
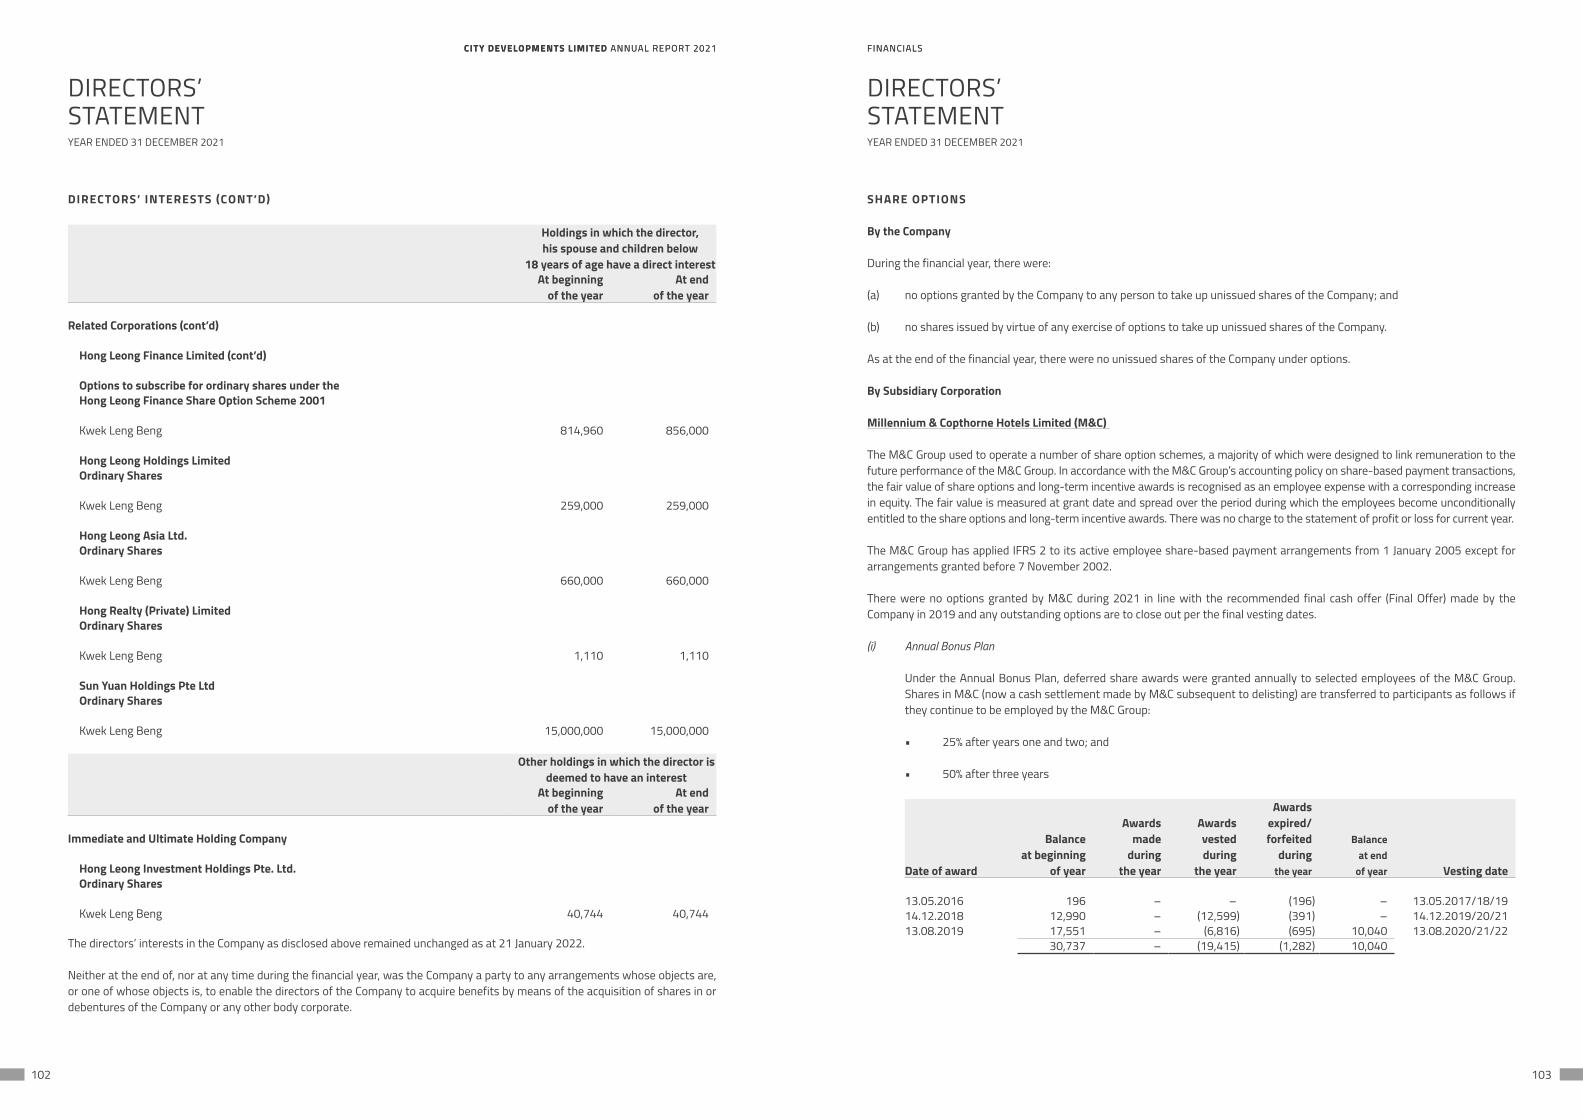
CITY DEVELOPMENTS LIMITED ANNUAL REPORT 2021 FINANCIALSCITY DEVELOPMENTS LIMITED ANNUAL REPORT 2021 FINANCIALS
102 103
DIRECTORS’ INTERESTS (CONT’D)
Holdings in which the director,his spouse and children below
18 years of age have a direct interestAt beginning
of the yearAt end
of the year
Related Corporations (cont’d)
Hong Leong Finance Limited (cont’d)
Options to subscribe for ordinary shares under theHong Leong Finance Share Option Scheme 2001
Kwek Leng Beng 814,960 856,000
Hong Leong Holdings LimitedOrdinary Shares
Kwek Leng Beng 259,000 259,000
Hong Leong Asia Ltd.Ordinary Shares
Kwek Leng Beng 660,000 660,000
Hong Realty (Private) LimitedOrdinary Shares
Kwek Leng Beng 1,110 1,110
Sun Yuan Holdings Pte LtdOrdinary Shares
Kwek Leng Beng 15,000,000 15,000,000
Other holdings in which the director is deemed to have an interest
At beginningof the year
At endof the year
Immediate and Ultimate Holding Company
Hong Leong Investment Holdings Pte. Ltd.Ordinary Shares
Kwek Leng Beng 40,744 40,744
The directors’ interests in the Company as disclosed above remained unchanged as at 21 January 2022.
Neither at the end of, nor at any time during the financial year, was the Company a party to any arrangements whose objects are, or one of whose objects is, to enable the directors of the Company to acquire benefits by means of the acquisition of shares in or debentures of the Company or any other body corporate.
DIRECTORS’STATEMENTYEAR ENDED 31 DECEMBER 2021
SHARE OPTIONS
By the Company
During the financial year, there were:
(a) no options granted by the Company to any person to take up unissued shares of the Company; and
(b) no shares issued by virtue of any exercise of options to take up unissued shares of the Company.
As at the end of the financial year, there were no unissued shares of the Company under options.
By Subsidiary Corporation
Millennium & Copthorne Hotels Limited (M&C)
The M&C Group used to operate a number of share option schemes, a majority of which were designed to link remuneration to the future performance of the M&C Group. In accordance with the M&C Group’s accounting policy on share-based payment transactions, the fair value of share options and long-term incentive awards is recognised as an employee expense with a corresponding increase in equity. The fair value is measured at grant date and spread over the period during which the employees become unconditionally entitled to the share options and long-term incentive awards. There was no charge to the statement of profit or loss for current year.
The M&C Group has applied IFRS 2 to its active employee share-based payment arrangements from 1 January 2005 except for arrangements granted before 7 November 2002.
There were no options granted by M&C during 2021 in line with the recommended final cash offer (Final Offer) made by the Company in 2019 and any outstanding options are to close out per the final vesting dates.
(i) Annual Bonus Plan
Under the Annual Bonus Plan, deferred share awards were granted annually to selected employees of the M&C Group. Shares in M&C (now a cash settlement made by M&C subsequent to delisting) are transferred to participants as follows if they continue to be employed by the M&C Group:
• 25% after years one and two; and
• 50% after three years
Date of award
Balanceat beginning
of year
Awards made
duringthe year
Awards vestedduring
the year
Awardsexpired/
forfeited during the year
Balanceat end
of year Vesting date
13.05.2016 196 – – (196) – 13.05.2017/18/1914.12.2018 12,990 – (12,599) (391) – 14.12.2019/20/2113.08.2019 17,551 – (6,816) (695) 10,040 13.08.2020/21/22
30,737 – (19,415) (1,282) 10,040
DIRECTORS’STATEMENTYEAR ENDED 31 DECEMBER 2021
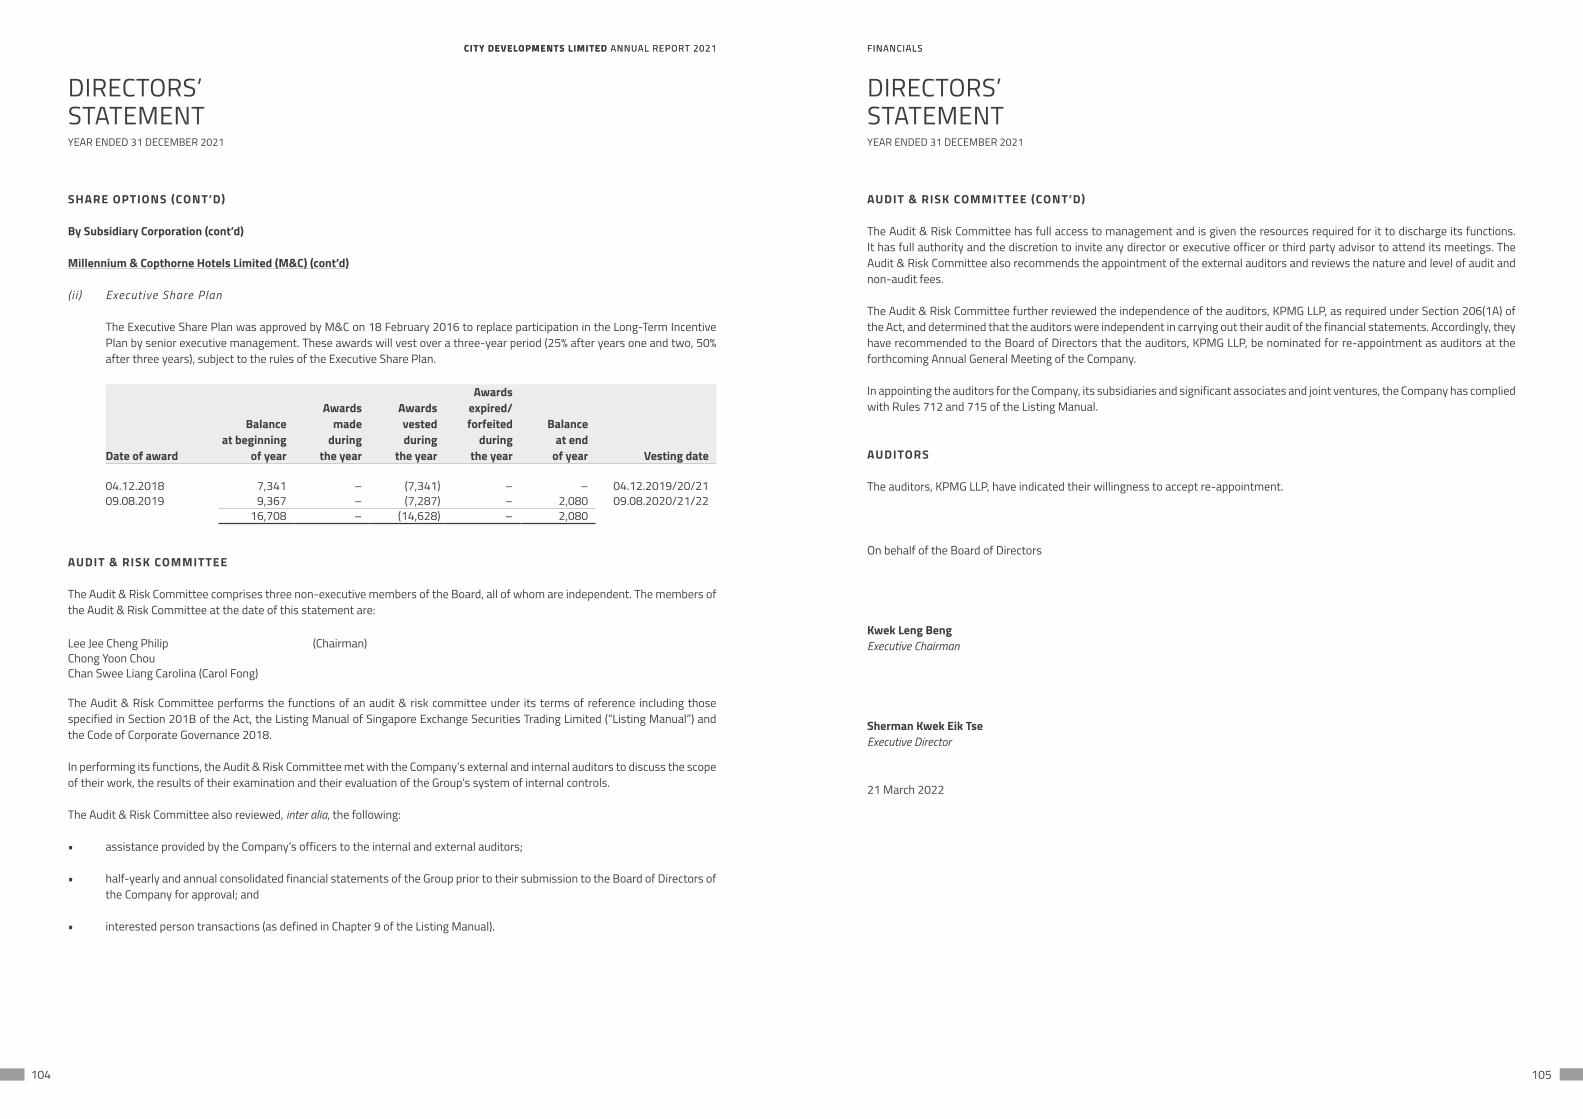
CITY DEVELOPMENTS LIMITED ANNUAL REPORT 2021 FINANCIALSCITY DEVELOPMENTS LIMITED ANNUAL REPORT 2021 FINANCIALS
104 105
SHARE OPTIONS (CONT’D)
By Subsidiary Corporation (cont’d)
Millennium & Copthorne Hotels Limited (M&C) (cont’d)
( i i ) Executive Share Plan
The Executive Share Plan was approved by M&C on 18 February 2016 to replace participation in the Long-Term Incentive Plan by senior executive management. These awards will vest over a three-year period (25% after years one and two, 50% after three years), subject to the rules of the Executive Share Plan.
Date of award
Balanceat beginning
of year
Awards made
duringthe year
Awards vestedduring
the year
Awardsexpired/
forfeited during
the year
Balanceat end
of year Vesting date
04.12.2018 7,341 – (7,341) – – 04.12.2019/20/2109.08.2019 9,367 – (7,287) – 2,080 09.08.2020/21/22
16,708 – (14,628) – 2,080
AUDIT & RISK COMMITTEE
The Audit & Risk Committee comprises three non-executive members of the Board, all of whom are independent. The members of the Audit & Risk Committee at the date of this statement are:
Lee Jee Cheng Philip (Chairman)Chong Yoon ChouChan Swee Liang Carolina (Carol Fong)
The Audit & Risk Committee performs the functions of an audit & risk committee under its terms of reference including those specified in Section 201B of the Act, the Listing Manual of Singapore Exchange Securities Trading Limited (“Listing Manual”) and the Code of Corporate Governance 2018.
In performing its functions, the Audit & Risk Committee met with the Company’s external and internal auditors to discuss the scope of their work, the results of their examination and their evaluation of the Group’s system of internal controls.
The Audit & Risk Committee also reviewed, inter alia, the following:
• assistance provided by the Company’s officers to the internal and external auditors;
• half-yearly and annual consolidated financial statements of the Group prior to their submission to the Board of Directors of the Company for approval; and
• interested person transactions (as defined in Chapter 9 of the Listing Manual).
DIRECTORS’STATEMENTYEAR ENDED 31 DECEMBER 2021
AUDIT & RISK COMMITTEE (CONT’D)
The Audit & Risk Committee has full access to management and is given the resources required for it to discharge its functions. It has full authority and the discretion to invite any director or executive officer or third party advisor to attend its meetings. The Audit & Risk Committee also recommends the appointment of the external auditors and reviews the nature and level of audit and non-audit fees.
The Audit & Risk Committee further reviewed the independence of the auditors, KPMG LLP, as required under Section 206(1A) of the Act, and determined that the auditors were independent in carrying out their audit of the financial statements. Accordingly, they have recommended to the Board of Directors that the auditors, KPMG LLP, be nominated for re-appointment as auditors at the forthcoming Annual General Meeting of the Company.
In appointing the auditors for the Company, its subsidiaries and significant associates and joint ventures, the Company has complied with Rules 712 and 715 of the Listing Manual.
AUDITORS
The auditors, KPMG LLP, have indicated their willingness to accept re-appointment.
On behalf of the Board of Directors
Kwek Leng BengExecutive Chairman
Sherman Kwek Eik TseExecutive Director
21 March 2022
DIRECTORS’STATEMENTYEAR ENDED 31 DECEMBER 2021
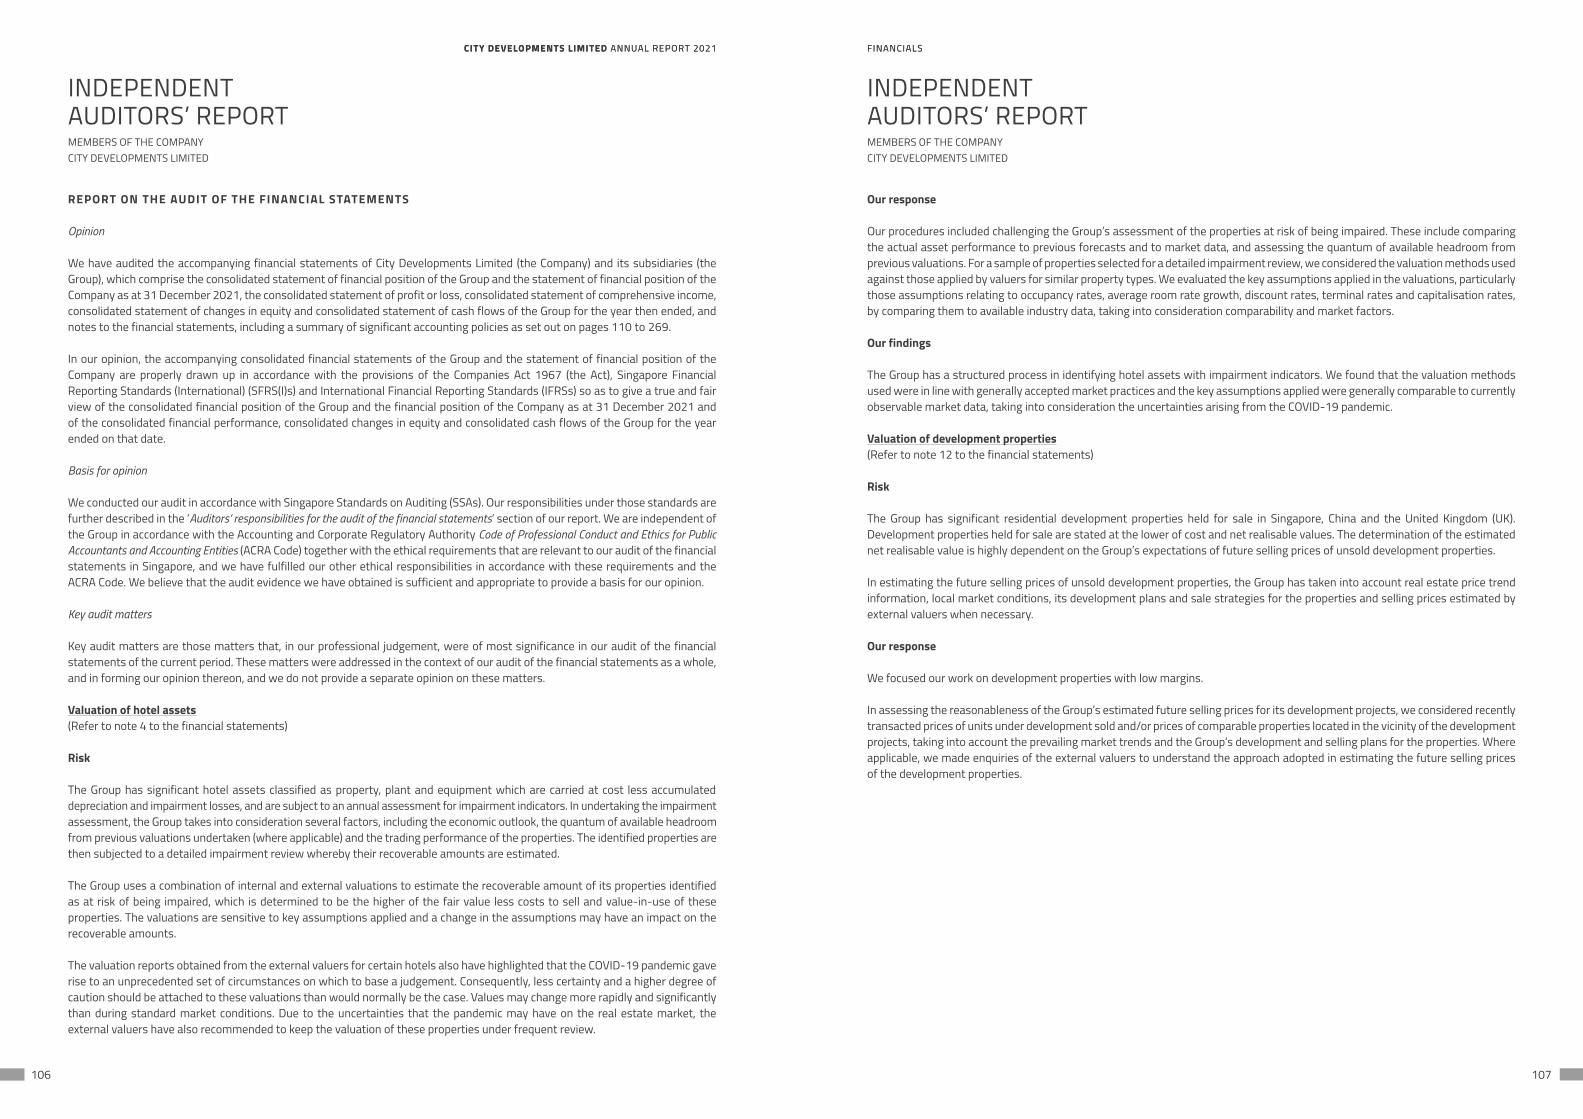
CITY DEVELOPMENTS LIMITED ANNUAL REPORT 2021 FINANCIALSCITY DEVELOPMENTS LIMITED ANNUAL REPORT 2021 FINANCIALS
106 107
REPORT ON THE AUDIT OF THE FINANCIAL STATEMENTS
Opinion
We have audited the accompanying financial statements of City Developments Limited (the Company) and its subsidiaries (the Group), which comprise the consolidated statement of financial position of the Group and the statement of financial position of the Company as at 31 December 2021, the consolidated statement of profit or loss, consolidated statement of comprehensive income, consolidated statement of changes in equity and consolidated statement of cash flows of the Group for the year then ended, and notes to the financial statements, including a summary of significant accounting policies as set out on pages 110 to 269.
In our opinion, the accompanying consolidated financial statements of the Group and the statement of financial position of the Company are properly drawn up in accordance with the provisions of the Companies Act 1967 (the Act), Singapore Financial Reporting Standards (International) (SFRS(I)s) and International Financial Reporting Standards (IFRSs) so as to give a true and fair view of the consolidated financial position of the Group and the financial position of the Company as at 31 December 2021 and of the consolidated financial performance, consolidated changes in equity and consolidated cash flows of the Group for the year ended on that date.
Basis for opinion
We conducted our audit in accordance with Singapore Standards on Auditing (SSAs). Our responsibilities under those standards are further described in the ‘Auditors’ responsibilities for the audit of the financial statements’ section of our report. We are independent of the Group in accordance with the Accounting and Corporate Regulatory Authority Code of Professional Conduct and Ethics for Public Accountants and Accounting Entities (ACRA Code) together with the ethical requirements that are relevant to our audit of the financial statements in Singapore, and we have fulfilled our other ethical responsibilities in accordance with these requirements and the ACRA Code. We believe that the audit evidence we have obtained is sufficient and appropriate to provide a basis for our opinion.
Key audit matters
Key audit matters are those matters that, in our professional judgement, were of most significance in our audit of the financial statements of the current period. These matters were addressed in the context of our audit of the financial statements as a whole, and in forming our opinion thereon, and we do not provide a separate opinion on these matters.
Valuation of hotel assets(Refer to note 4 to the financial statements)
Risk
The Group has significant hotel assets classified as property, plant and equipment which are carried at cost less accumulated depreciation and impairment losses, and are subject to an annual assessment for impairment indicators. In undertaking the impairment assessment, the Group takes into consideration several factors, including the economic outlook, the quantum of available headroom from previous valuations undertaken (where applicable) and the trading performance of the properties. The identified properties are then subjected to a detailed impairment review whereby their recoverable amounts are estimated.
The Group uses a combination of internal and external valuations to estimate the recoverable amount of its properties identified as at risk of being impaired, which is determined to be the higher of the fair value less costs to sell and value-in-use of these properties. The valuations are sensitive to key assumptions applied and a change in the assumptions may have an impact on the recoverable amounts.
The valuation reports obtained from the external valuers for certain hotels also have highlighted that the COVID-19 pandemic gave rise to an unprecedented set of circumstances on which to base a judgement. Consequently, less certainty and a higher degree of caution should be attached to these valuations than would normally be the case. Values may change more rapidly and significantly than during standard market conditions. Due to the uncertainties that the pandemic may have on the real estate market, the external valuers have also recommended to keep the valuation of these properties under frequent review.
INDEPENDENTAUDITORS’ REPORTMEMBERS OF THE COMPANYCITY DEVELOPMENTS LIMITED
Our response
Our procedures included challenging the Group’s assessment of the properties at risk of being impaired. These include comparing the actual asset performance to previous forecasts and to market data, and assessing the quantum of available headroom from previous valuations. For a sample of properties selected for a detailed impairment review, we considered the valuation methods used against those applied by valuers for similar property types. We evaluated the key assumptions applied in the valuations, particularly those assumptions relating to occupancy rates, average room rate growth, discount rates, terminal rates and capitalisation rates, by comparing them to available industry data, taking into consideration comparability and market factors.
Our findings
The Group has a structured process in identifying hotel assets with impairment indicators. We found that the valuation methods used were in line with generally accepted market practices and the key assumptions applied were generally comparable to currently observable market data, taking into consideration the uncertainties arising from the COVID-19 pandemic.
Valuation of development properties(Refer to note 12 to the financial statements)
Risk
The Group has significant residential development properties held for sale in Singapore, China and the United Kingdom (UK). Development properties held for sale are stated at the lower of cost and net realisable values. The determination of the estimated net realisable value is highly dependent on the Group’s expectations of future selling prices of unsold development properties.
In estimating the future selling prices of unsold development properties, the Group has taken into account real estate price trend information, local market conditions, its development plans and sale strategies for the properties and selling prices estimated by external valuers when necessary.
Our response
We focused our work on development properties with low margins.
In assessing the reasonableness of the Group’s estimated future selling prices for its development projects, we considered recently transacted prices of units under development sold and/or prices of comparable properties located in the vicinity of the development projects, taking into account the prevailing market trends and the Group’s development and selling plans for the properties. Where applicable, we made enquiries of the external valuers to understand the approach adopted in estimating the future selling prices of the development properties.
INDEPENDENTAUDITORS’ REPORTMEMBERS OF THE COMPANYCITY DEVELOPMENTS LIMITED
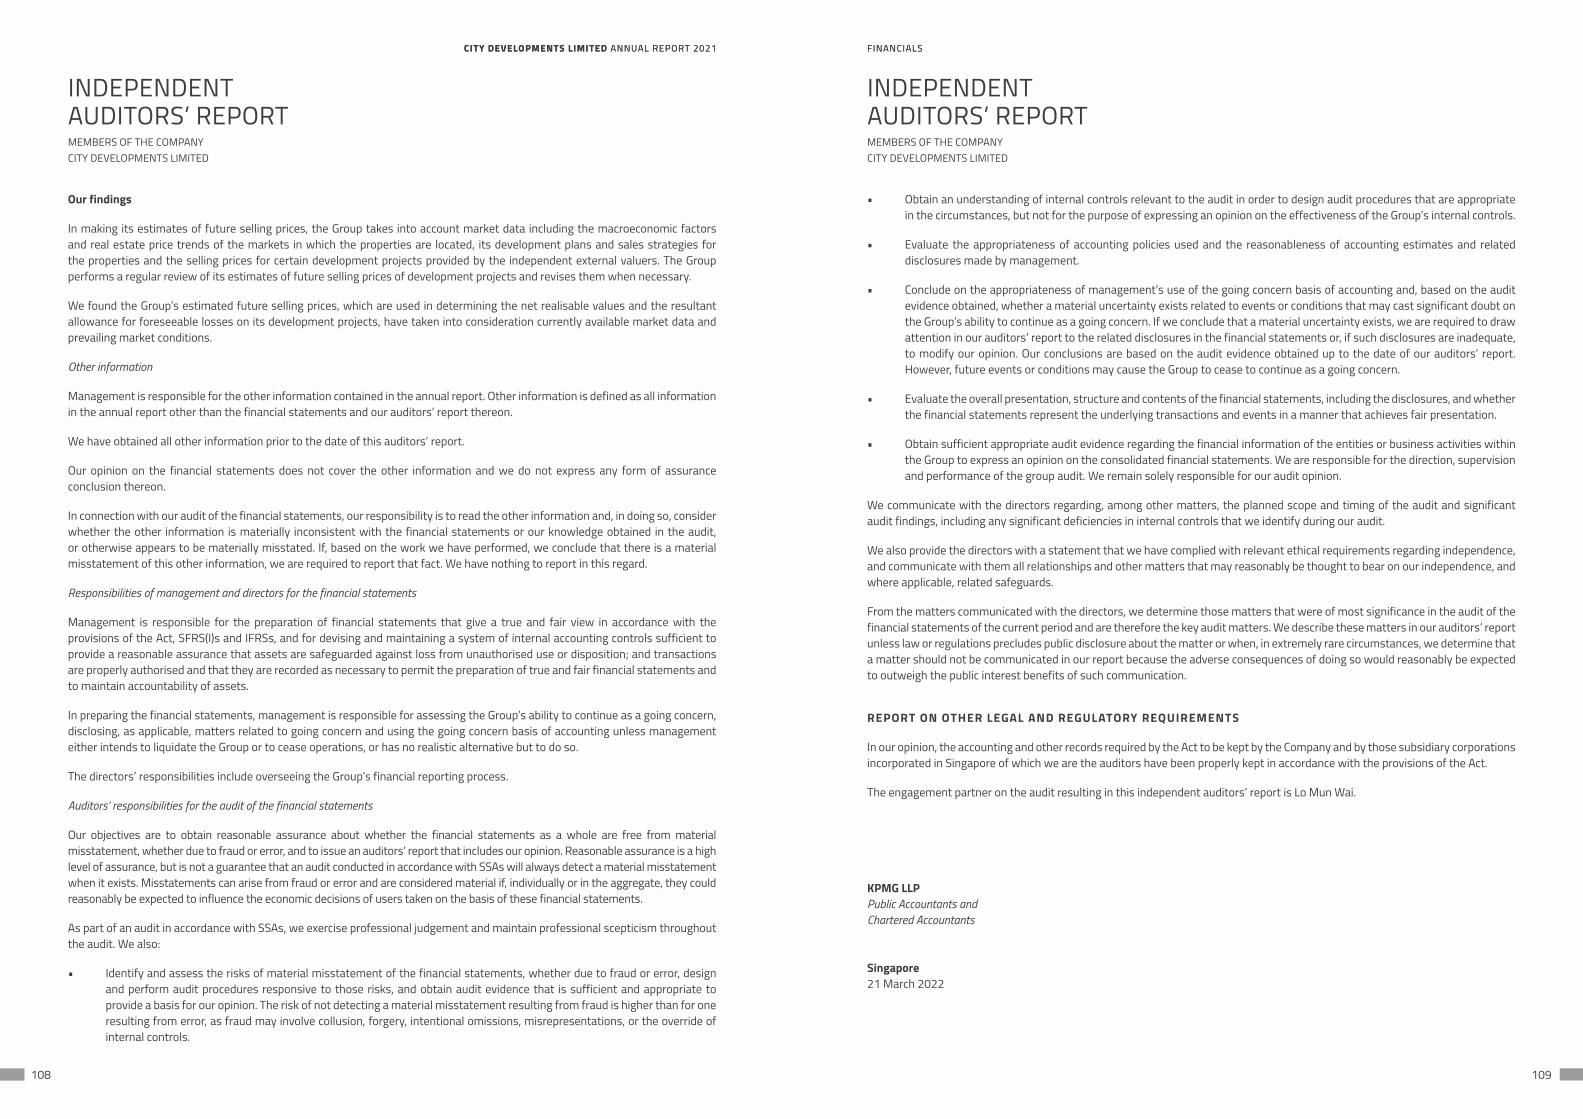
CITY DEVELOPMENTS LIMITED ANNUAL REPORT 2021 FINANCIALSCITY DEVELOPMENTS LIMITED ANNUAL REPORT 2021 FINANCIALS
108 109
Our findings
In making its estimates of future selling prices, the Group takes into account market data including the macroeconomic factors and real estate price trends of the markets in which the properties are located, its development plans and sales strategies for the properties and the selling prices for certain development projects provided by the independent external valuers. The Group performs a regular review of its estimates of future selling prices of development projects and revises them when necessary.
We found the Group’s estimated future selling prices, which are used in determining the net realisable values and the resultant allowance for foreseeable losses on its development projects, have taken into consideration currently available market data and prevailing market conditions.
Other information
Management is responsible for the other information contained in the annual report. Other information is defined as all information in the annual report other than the financial statements and our auditors’ report thereon.
We have obtained all other information prior to the date of this auditors’ report.
Our opinion on the financial statements does not cover the other information and we do not express any form of assurance conclusion thereon.
In connection with our audit of the financial statements, our responsibility is to read the other information and, in doing so, consider whether the other information is materially inconsistent with the financial statements or our knowledge obtained in the audit, or otherwise appears to be materially misstated. If, based on the work we have performed, we conclude that there is a material misstatement of this other information, we are required to report that fact. We have nothing to report in this regard.
Responsibilities of management and directors for the financial statements
Management is responsible for the preparation of financial statements that give a true and fair view in accordance with the provisions of the Act, SFRS(I)s and IFRSs, and for devising and maintaining a system of internal accounting controls sufficient to provide a reasonable assurance that assets are safeguarded against loss from unauthorised use or disposition; and transactions are properly authorised and that they are recorded as necessary to permit the preparation of true and fair financial statements and to maintain accountability of assets.
In preparing the financial statements, management is responsible for assessing the Group’s ability to continue as a going concern, disclosing, as applicable, matters related to going concern and using the going concern basis of accounting unless management either intends to liquidate the Group or to cease operations, or has no realistic alternative but to do so.
The directors’ responsibilities include overseeing the Group’s financial reporting process.
Auditors’ responsibilities for the audit of the financial statements
Our objectives are to obtain reasonable assurance about whether the financial statements as a whole are free from material misstatement, whether due to fraud or error, and to issue an auditors’ report that includes our opinion. Reasonable assurance is a high level of assurance, but is not a guarantee that an audit conducted in accordance with SSAs will always detect a material misstatement when it exists. Misstatements can arise from fraud or error and are considered material if, individually or in the aggregate, they could reasonably be expected to influence the economic decisions of users taken on the basis of these financial statements.
As part of an audit in accordance with SSAs, we exercise professional judgement and maintain professional scepticism throughout the audit. We also:
• Identify and assess the risks of material misstatement of the financial statements, whether due to fraud or error, design and perform audit procedures responsive to those risks, and obtain audit evidence that is sufficient and appropriate to provide a basis for our opinion. The risk of not detecting a material misstatement resulting from fraud is higher than for one resulting from error, as fraud may involve collusion, forgery, intentional omissions, misrepresentations, or the override of internal controls.
INDEPENDENTAUDITORS’ REPORTMEMBERS OF THE COMPANYCITY DEVELOPMENTS LIMITED
• Obtain an understanding of internal controls relevant to the audit in order to design audit procedures that are appropriate in the circumstances, but not for the purpose of expressing an opinion on the effectiveness of the Group’s internal controls.
• Evaluate the appropriateness of accounting policies used and the reasonableness of accounting estimates and related disclosures made by management.
• Conclude on the appropriateness of management’s use of the going concern basis of accounting and, based on the audit evidence obtained, whether a material uncertainty exists related to events or conditions that may cast significant doubt on the Group’s ability to continue as a going concern. If we conclude that a material uncertainty exists, we are required to draw attention in our auditors’ report to the related disclosures in the financial statements or, if such disclosures are inadequate, to modify our opinion. Our conclusions are based on the audit evidence obtained up to the date of our auditors’ report. However, future events or conditions may cause the Group to cease to continue as a going concern.
• Evaluate the overall presentation, structure and contents of the financial statements, including the disclosures, and whether the financial statements represent the underlying transactions and events in a manner that achieves fair presentation.
• Obtain sufficient appropriate audit evidence regarding the financial information of the entities or business activities within the Group to express an opinion on the consolidated financial statements. We are responsible for the direction, supervision and performance of the group audit. We remain solely responsible for our audit opinion.
We communicate with the directors regarding, among other matters, the planned scope and timing of the audit and significant audit findings, including any significant deficiencies in internal controls that we identify during our audit.
We also provide the directors with a statement that we have complied with relevant ethical requirements regarding independence, and communicate with them all relationships and other matters that may reasonably be thought to bear on our independence, and where applicable, related safeguards.
From the matters communicated with the directors, we determine those matters that were of most significance in the audit of the financial statements of the current period and are therefore the key audit matters. We describe these matters in our auditors’ report unless law or regulations precludes public disclosure about the matter or when, in extremely rare circumstances, we determine that a matter should not be communicated in our report because the adverse consequences of doing so would reasonably be expected to outweigh the public interest benefits of such communication.
REPORT ON OTHER LEGAL AND REGULATORY REQUIREMENTS
In our opinion, the accounting and other records required by the Act to be kept by the Company and by those subsidiary corporations incorporated in Singapore of which we are the auditors have been properly kept in accordance with the provisions of the Act.
The engagement partner on the audit resulting in this independent auditors’ report is Lo Mun Wai.
KPMG LLPPublic Accountants andChartered Accountants
Singapore21 March 2022
INDEPENDENTAUDITORS’ REPORTMEMBERS OF THE COMPANYCITY DEVELOPMENTS LIMITED
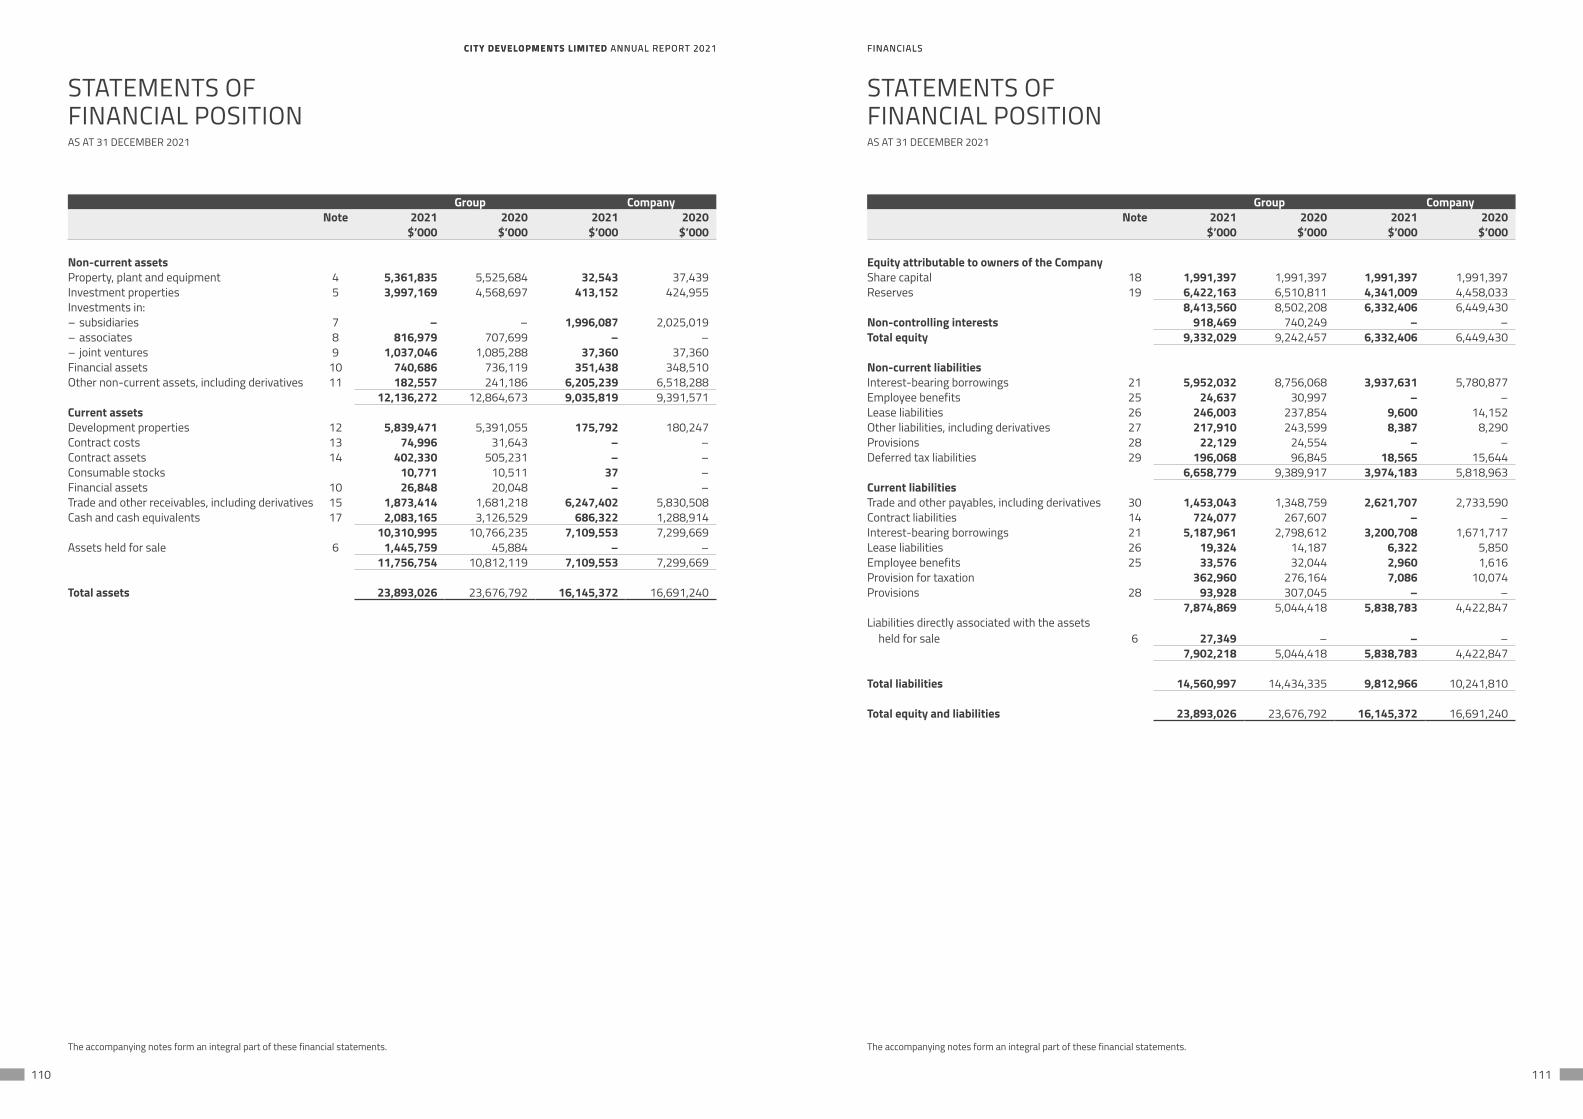
CITY DEVELOPMENTS LIMITED ANNUAL REPORT 2021 FINANCIALSCITY DEVELOPMENTS LIMITED ANNUAL REPORT 2021 FINANCIALS
110 111
Group CompanyNote 2021 2020 2021 2020
$’000 $’000 $’000 $’000
Non-current assetsProperty, plant and equipment 4 5,361,835 5,525,684 32,543 37,439Investment properties 5 3,997,169 4,568,697 413,152 424,955Investments in:– subsidiaries 7 – – 1,996,087 2,025,019– associates 8 816,979 707,699 – –– joint ventures 9 1,037,046 1,085,288 37,360 37,360Financial assets 10 740,686 736,119 351,438 348,510Other non-current assets, including derivatives 11 182,557 241,186 6,205,239 6,518,288
12,136,272 12,864,673 9,035,819 9,391,571Current assetsDevelopment properties 12 5,839,471 5,391,055 175,792 180,247Contract costs 13 74,996 31,643 – –Contract assets 14 402,330 505,231 – –Consumable stocks 10,771 10,511 37 –Financial assets 10 26,848 20,048 – –Trade and other receivables, including derivatives 15 1,873,414 1,681,218 6,247,402 5,830,508Cash and cash equivalents 17 2,083,165 3,126,529 686,322 1,288,914
10,310,995 10,766,235 7,109,553 7,299,669Assets held for sale 6 1,445,759 45,884 – –
11,756,754 10,812,119 7,109,553 7,299,669
Total assets 23,893,026 23,676,792 16,145,372 16,691,240
STATEMENTS OFFINANCIAL POSITIONAS AT 31 DECEMBER 2021
The accompanying notes form an integral part of these financial statements.
Group CompanyNote 2021 2020 2021 2020
$’000 $’000 $’000 $’000
Equity attributable to owners of the CompanyShare capital 18 1,991,397 1,991,397 1,991,397 1,991,397Reserves 19 6,422,163 6,510,811 4,341,009 4,458,033
8,413,560 8,502,208 6,332,406 6,449,430Non-controlling interests 918,469 740,249 – –Total equity 9,332,029 9,242,457 6,332,406 6,449,430
Non-current liabilitiesInterest-bearing borrowings 21 5,952,032 8,756,068 3,937,631 5,780,877Employee benefits 25 24,637 30,997 – –Lease liabilities 26 246,003 237,854 9,600 14,152Other liabilities, including derivatives 27 217,910 243,599 8,387 8,290Provisions 28 22,129 24,554 – –Deferred tax liabilities 29 196,068 96,845 18,565 15,644
6,658,779 9,389,917 3,974,183 5,818,963Current liabilitiesTrade and other payables, including derivatives 30 1,453,043 1,348,759 2,621,707 2,733,590Contract liabilities 14 724,077 267,607 – –Interest-bearing borrowings 21 5,187,961 2,798,612 3,200,708 1,671,717Lease liabilities 26 19,324 14,187 6,322 5,850Employee benefits 25 33,576 32,044 2,960 1,616Provision for taxation 362,960 276,164 7,086 10,074Provisions 28 93,928 307,045 – –
7,874,869 5,044,418 5,838,783 4,422,847Liabilities directly associated with the assets
held for sale 6 27,349 – – –7,902,218 5,044,418 5,838,783 4,422,847
Total liabilities 14,560,997 14,434,335 9,812,966 10,241,810
Total equity and liabilities 23,893,026 23,676,792 16,145,372 16,691,240
STATEMENTS OFFINANCIAL POSITIONAS AT 31 DECEMBER 2021
The accompanying notes form an integral part of these financial statements.
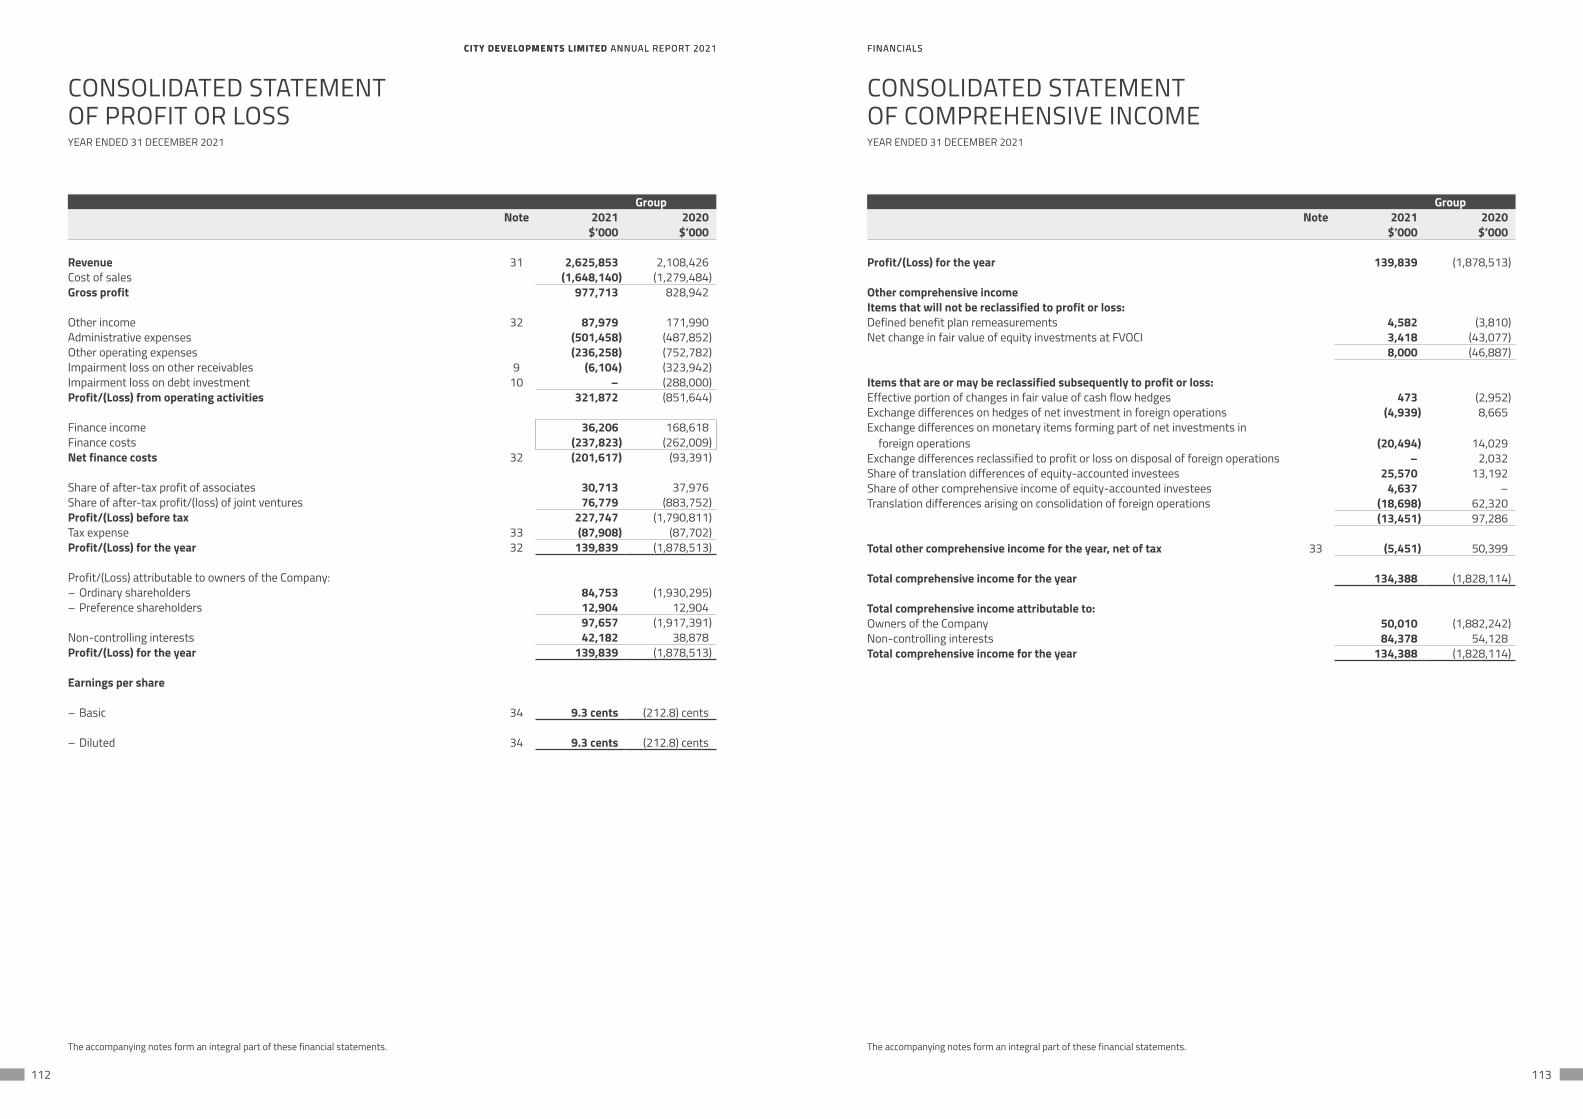
CITY DEVELOPMENTS LIMITED ANNUAL REPORT 2021 FINANCIALSCITY DEVELOPMENTS LIMITED ANNUAL REPORT 2021 FINANCIALS
112 113
GroupNote 2021 2020
$’000 $’000
Revenue 31 2,625,853 2,108,426Cost of sales (1,648,140) (1,279,484)Gross profit 977,713 828,942
Other income 32 87,979 171,990Administrative expenses (501,458) (487,852)Other operating expenses (236,258) (752,782)Impairment loss on other receivables 9 (6,104) (323,942)Impairment loss on debt investment 10 – (288,000)Profit/(Loss) from operating activities 321,872 (851,644)
Finance income 36,206 168,618Finance costs (237,823) (262,009)Net finance costs 32 (201,617) (93,391)
Share of after-tax profit of associates 30,713 37,976Share of after-tax profit/(loss) of joint ventures 76,779 (883,752)Profit/(Loss) before tax 227,747 (1,790,811)Tax expense 33 (87,908) (87,702)Profit/(Loss) for the year 32 139,839 (1,878,513)
Profit/(Loss) attributable to owners of the Company:– Ordinary shareholders 84,753 (1,930,295)– Preference shareholders 12,904 12,904
97,657 (1,917,391)Non-controlling interests 42,182 38,878Profit/(Loss) for the year 139,839 (1,878,513)
Earnings per share
– Basic 34 9.3 cents (212.8) cents
– Diluted 34 9.3 cents (212.8) cents
CONSOLIDATED STATEMENTOF PROFIT OR LOSSYEAR ENDED 31 DECEMBER 2021
The accompanying notes form an integral part of these financial statements.
GroupNote 2021 2020
$’000 $’000
Profit/(Loss) for the year 139,839 (1,878,513)
Other comprehensive incomeItems that will not be reclassified to profit or loss:Defined benefit plan remeasurements 4,582 (3,810)Net change in fair value of equity investments at FVOCI 3,418 (43,077)
8,000 (46,887)
Items that are or may be reclassified subsequently to profit or loss:Effective portion of changes in fair value of cash flow hedges 473 (2,952)Exchange differences on hedges of net investment in foreign operations (4,939) 8,665Exchange differences on monetary items forming part of net investments in
foreign operations (20,494) 14,029Exchange differences reclassified to profit or loss on disposal of foreign operations – 2,032Share of translation differences of equity-accounted investees 25,570 13,192Share of other comprehensive income of equity-accounted investees 4,637 –Translation differences arising on consolidation of foreign operations (18,698) 62,320
(13,451) 97,286
Total other comprehensive income for the year, net of tax 33 (5,451) 50,399
Total comprehensive income for the year 134,388 (1,828,114)
Total comprehensive income attributable to:Owners of the Company 50,010 (1,882,242)Non-controlling interests 84,378 54,128Total comprehensive income for the year 134,388 (1,828,114)
CONSOLIDATED STATEMENTOF COMPREHENSIVE INCOMEYEAR ENDED 31 DECEMBER 2021
The accompanying notes form an integral part of these financial statements.
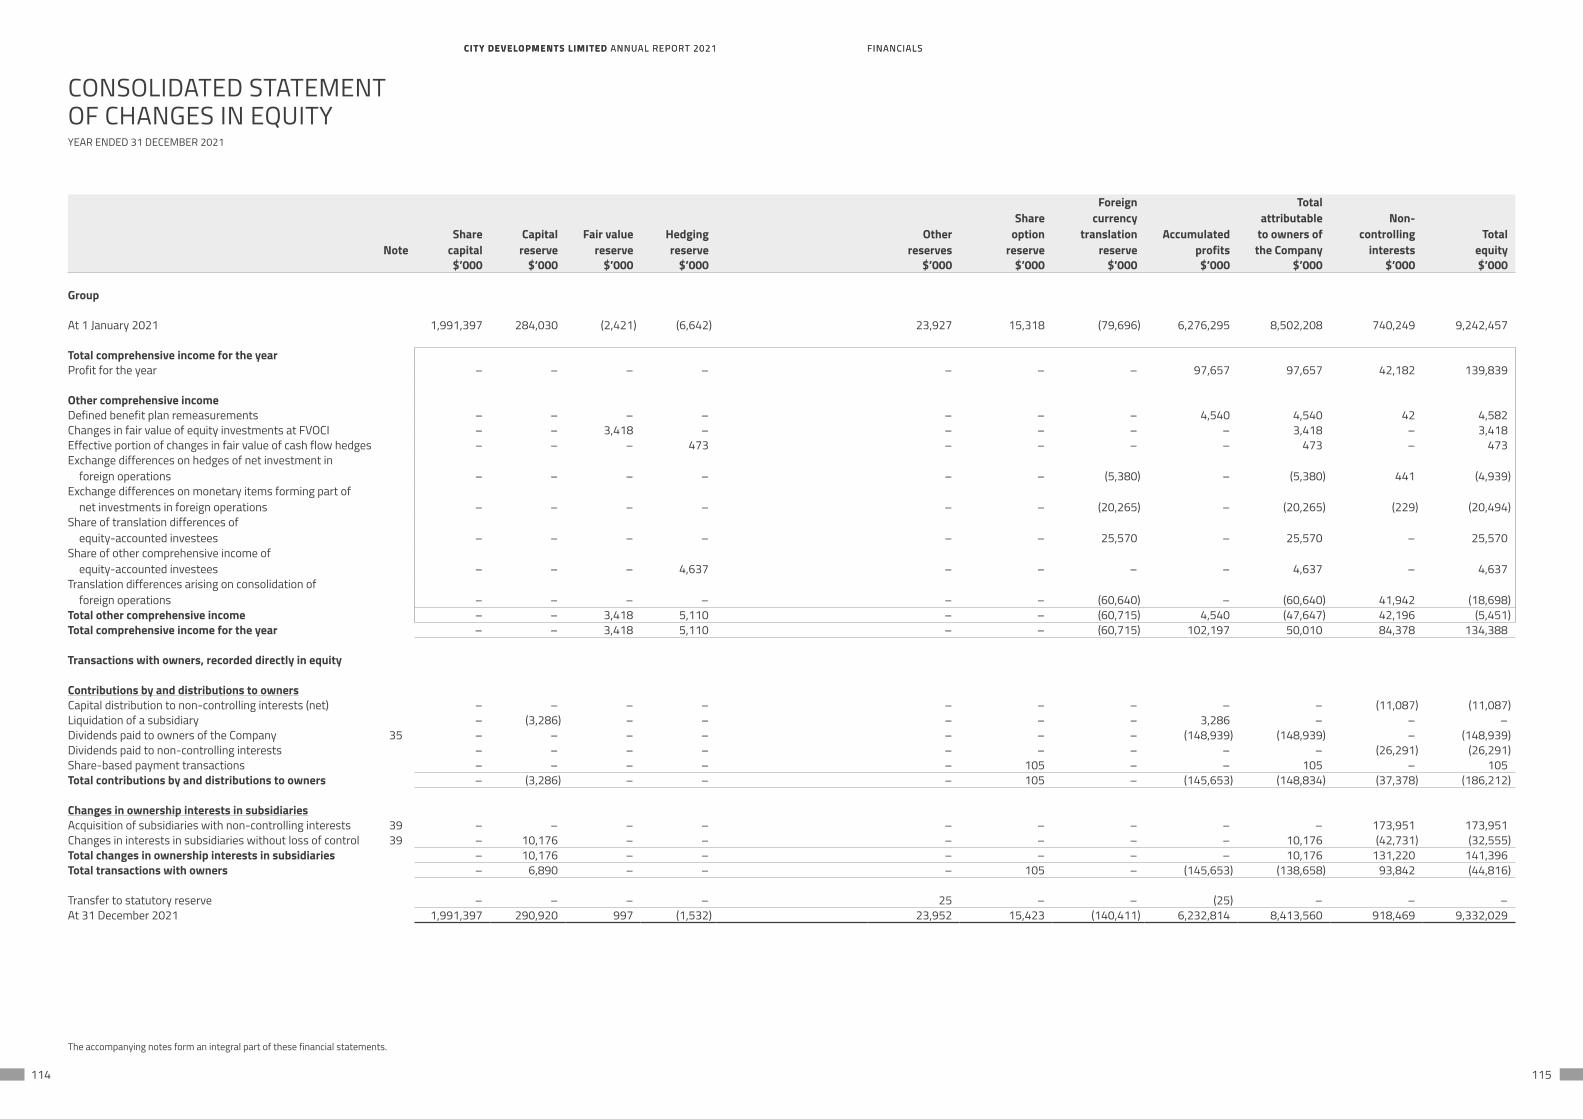
CITY DEVELOPMENTS LIMITED ANNUAL REPORT 2021 FINANCIALSCITY DEVELOPMENTS LIMITED ANNUAL REPORT 2021 FINANCIALS
114 115
CONSOLIDATED STATEMENTOF CHANGES IN EQUITYYEAR ENDED 31 DECEMBER 2021
The accompanying notes form an integral part of these financial statements.
NoteShare
capitalCapital
reserveFair value
reserveHedgingreserve
Otherreserves
Share option
reserve
Foreigncurrency
translationreserve
Accumulatedprofits
Totalattributable
to owners ofthe Company
Non-controlling
interestsTotal
equity$’000 $’000 $’000 $’000 $’000 $’000 $’000 $’000 $’000 $’000 $’000
Group
At 1 January 2021 1,991,397 284,030 (2,421) (6,642) 23,927 15,318 (79,696) 6,276,295 8,502,208 740,249 9,242,457
Total comprehensive income for the yearProfit for the year – – – – – – – 97,657 97,657 42,182 139,839
Other comprehensive incomeDefined benefit plan remeasurements – – – – – – – 4,540 4,540 42 4,582Changes in fair value of equity investments at FVOCI – – 3,418 – – – – – 3,418 – 3,418Effective portion of changes in fair value of cash flow hedges – – – 473 – – – – 473 – 473Exchange differences on hedges of net investment in
foreign operations – – – – – – (5,380) – (5,380) 441 (4,939)Exchange differences on monetary items forming part of
net investments in foreign operations – – – – – – (20,265) – (20,265) (229) (20,494)Share of translation differences of
equity-accounted investees – – – – – – 25,570 – 25,570 – 25,570Share of other comprehensive income of
equity-accounted investees – – – 4,637 – – – – 4,637 – 4,637Translation differences arising on consolidation of
foreign operations – – – – – – (60,640) – (60,640) 41,942 (18,698)Total other comprehensive income – – 3,418 5,110 – – (60,715) 4,540 (47,647) 42,196 (5,451)Total comprehensive income for the year – – 3,418 5,110 – – (60,715) 102,197 50,010 84,378 134,388
Transactions with owners, recorded directly in equity
Contributions by and distributions to ownersCapital distribution to non-controlling interests (net) – – – – – – – – – (11,087) (11,087)Liquidation of a subsidiary – (3,286) – – – – – 3,286 – – –Dividends paid to owners of the Company 35 – – – – – – – (148,939) (148,939) – (148,939)Dividends paid to non-controlling interests – – – – – – – – – (26,291) (26,291)Share-based payment transactions – – – – – 105 – – 105 – 105Total contributions by and distributions to owners – (3,286) – – – 105 – (145,653) (148,834) (37,378) (186,212)
Changes in ownership interests in subsidiariesAcquisition of subsidiaries with non-controlling interests 39 – – – – – – – – – 173,951 173,951Changes in interests in subsidiaries without loss of control 39 – 10,176 – – – – – – 10,176 (42,731) (32,555)Total changes in ownership interests in subsidiaries – 10,176 – – – – – – 10,176 131,220 141,396Total transactions with owners – 6,890 – – – 105 – (145,653) (138,658) 93,842 (44,816)
Transfer to statutory reserve – – – – 25 – – (25) – – –At 31 December 2021 1,991,397 290,920 997 (1,532) 23,952 15,423 (140,411) 6,232,814 8,413,560 918,469 9,332,029
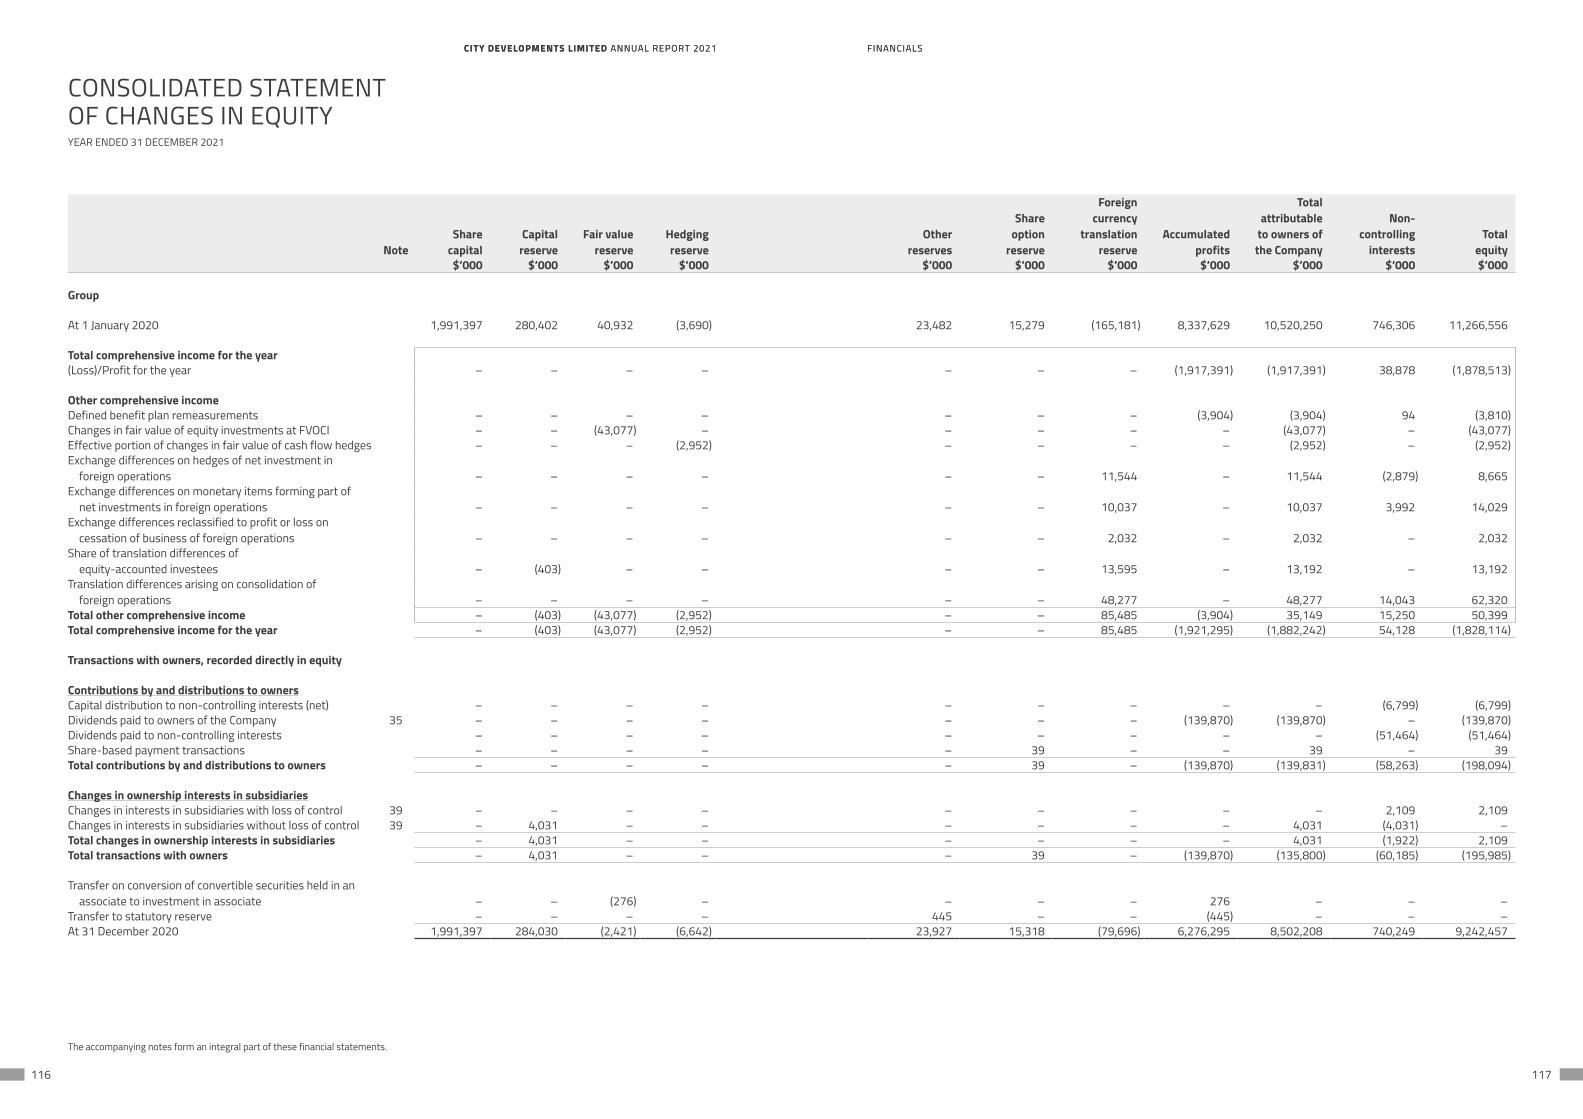
CITY DEVELOPMENTS LIMITED ANNUAL REPORT 2021 FINANCIALSCITY DEVELOPMENTS LIMITED ANNUAL REPORT 2021 FINANCIALS
116 117
CONSOLIDATED STATEMENTOF CHANGES IN EQUITYYEAR ENDED 31 DECEMBER 2021
The accompanying notes form an integral part of these financial statements.
NoteShare
capitalCapital
reserveFair value
reserveHedgingreserve
Otherreserves
Share option
reserve
Foreigncurrency
translationreserve
Accumulatedprofits
Totalattributable
to owners ofthe Company
Non-controlling
interestsTotal
equity$’000 $’000 $’000 $’000 $’000 $’000 $’000 $’000 $’000 $’000 $’000
Group
At 1 January 2020 1,991,397 280,402 40,932 (3,690) 23,482 15,279 (165,181) 8,337,629 10,520,250 746,306 11,266,556
Total comprehensive income for the year(Loss)/Profit for the year – – – – – – – (1,917,391) (1,917,391) 38,878 (1,878,513)
Other comprehensive incomeDefined benefit plan remeasurements – – – – – – – (3,904) (3,904) 94 (3,810)Changes in fair value of equity investments at FVOCI – – (43,077) – – – – – (43,077) – (43,077)Effective portion of changes in fair value of cash flow hedges – – – (2,952) – – – – (2,952) – (2,952)Exchange differences on hedges of net investment in
foreign operations – – – – – – 11,544 – 11,544 (2,879) 8,665Exchange differences on monetary items forming part of
net investments in foreign operations – – – – – – 10,037 – 10,037 3,992 14,029Exchange differences reclassified to profit or loss on
cessation of business of foreign operations – – – – – – 2,032 – 2,032 – 2,032Share of translation differences of
equity-accounted investees – (403) – – – – 13,595 – 13,192 – 13,192Translation differences arising on consolidation of
foreign operations – – – – – – 48,277 – 48,277 14,043 62,320Total other comprehensive income – (403) (43,077) (2,952) – – 85,485 (3,904) 35,149 15,250 50,399Total comprehensive income for the year – (403) (43,077) (2,952) – – 85,485 (1,921,295) (1,882,242) 54,128 (1,828,114)
Transactions with owners, recorded directly in equity
Contributions by and distributions to ownersCapital distribution to non-controlling interests (net) – – – – – – – – – (6,799) (6,799)Dividends paid to owners of the Company 35 – – – – – – – (139,870) (139,870) – (139,870)Dividends paid to non-controlling interests – – – – – – – – – (51,464) (51,464)Share-based payment transactions – – – – – 39 – – 39 – 39Total contributions by and distributions to owners – – – – – 39 – (139,870) (139,831) (58,263) (198,094)
Changes in ownership interests in subsidiariesChanges in interests in subsidiaries with loss of control 39 – – – – – – – – – 2,109 2,109Changes in interests in subsidiaries without loss of control 39 – 4,031 – – – – – – 4,031 (4,031) –Total changes in ownership interests in subsidiaries – 4,031 – – – – – – 4,031 (1,922) 2,109Total transactions with owners – 4,031 – – – 39 – (139,870) (135,800) (60,185) (195,985)
Transfer on conversion of convertible securities held in an associate to investment in associate – – (276) – – – – 276 – – –
Transfer to statutory reserve – – – – 445 – – (445) – – –At 31 December 2020 1,991,397 284,030 (2,421) (6,642) 23,927 15,318 (79,696) 6,276,295 8,502,208 740,249 9,242,457
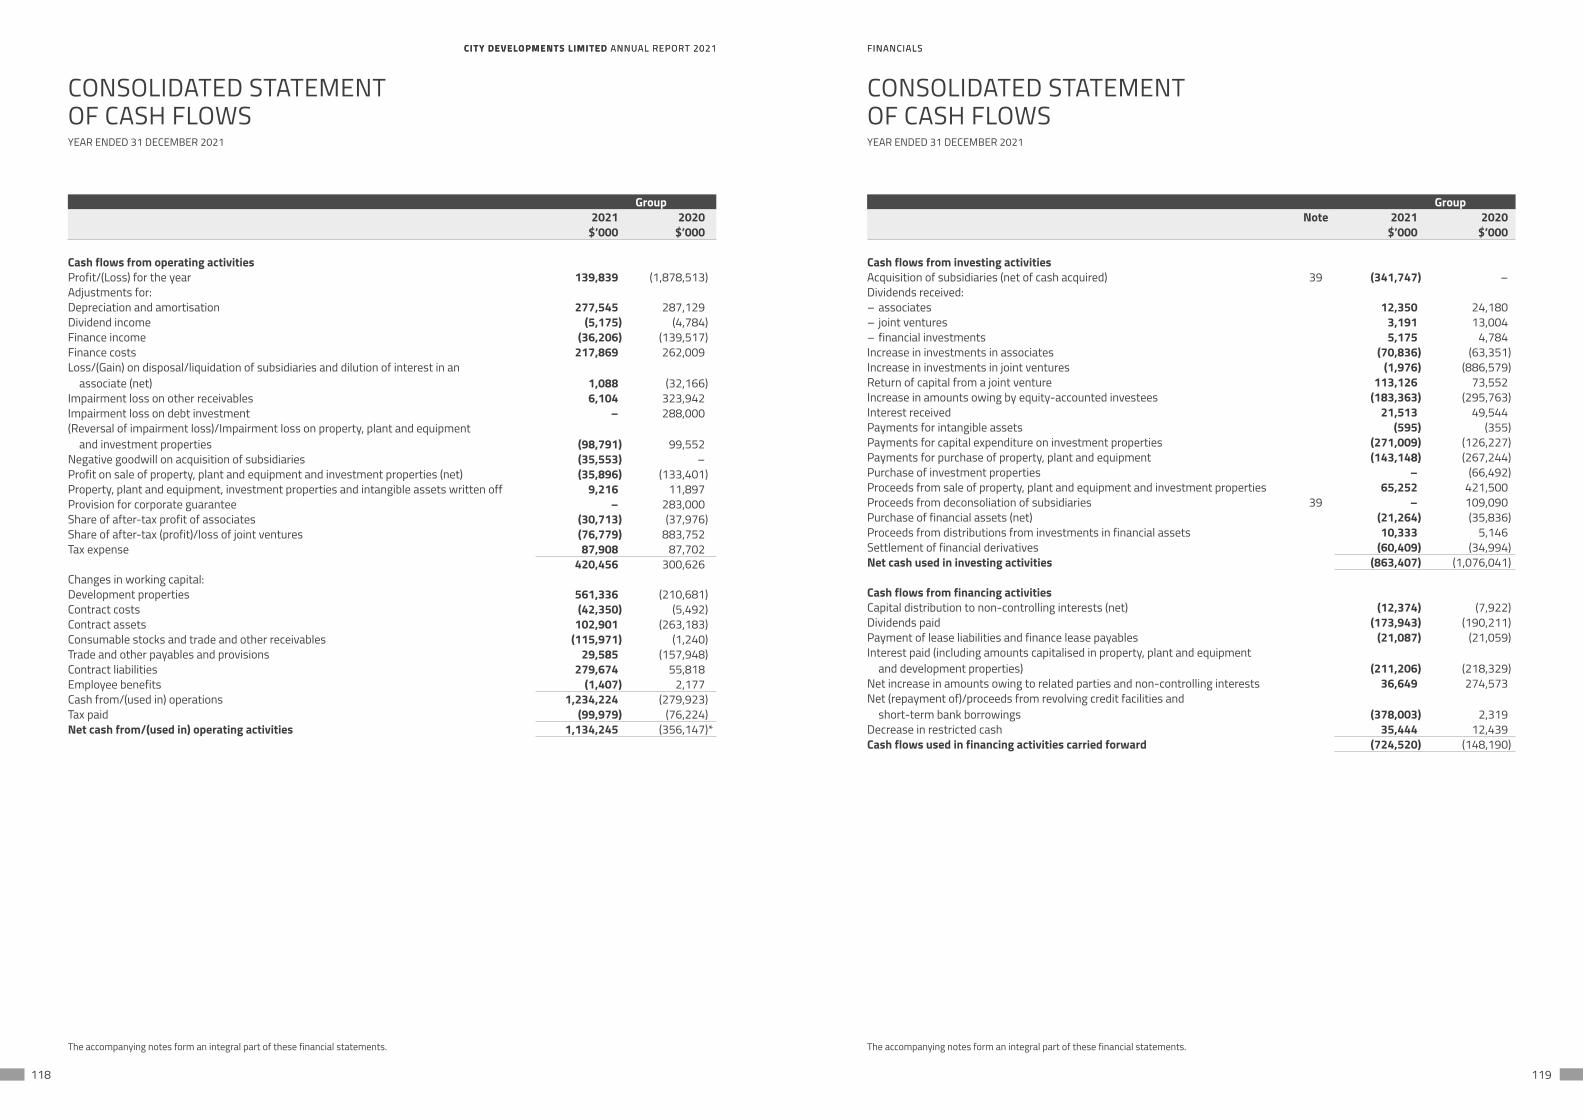
CITY DEVELOPMENTS LIMITED ANNUAL REPORT 2021 FINANCIALSCITY DEVELOPMENTS LIMITED ANNUAL REPORT 2021 FINANCIALS
118 119
Group2021 2020
$’000 $’000
Cash flows from operating activitiesProfit/(Loss) for the year 139,839 (1,878,513)Adjustments for:Depreciation and amortisation 277,545 287,129Dividend income (5,175) (4,784)Finance income (36,206) (139,517)Finance costs 217,869 262,009Loss/(Gain) on disposal/liquidation of subsidiaries and dilution of interest in an
associate (net) 1,088 (32,166)Impairment loss on other receivables 6,104 323,942Impairment loss on debt investment – 288,000(Reversal of impairment loss)/Impairment loss on property, plant and equipment
and investment properties (98,791) 99,552Negative goodwill on acquisition of subsidiaries (35,553) –Profit on sale of property, plant and equipment and investment properties (net) (35,896) (133,401)Property, plant and equipment, investment properties and intangible assets written off 9,216 11,897Provision for corporate guarantee – 283,000Share of after-tax profit of associates (30,713) (37,976)Share of after-tax (profit)/loss of joint ventures (76,779) 883,752Tax expense 87,908 87,702
420,456 300,626Changes in working capital:Development properties 561,336 (210,681)Contract costs (42,350) (5,492)Contract assets 102,901 (263,183)Consumable stocks and trade and other receivables (115,971) (1,240)Trade and other payables and provisions 29,585 (157,948)Contract liabilities 279,674 55,818Employee benefits (1,407) 2,177Cash from/(used in) operations 1,234,224 (279,923)Tax paid (99,979) (76,224)Net cash from/(used in) operating activities 1,134,245 (356,147)*
CONSOLIDATED STATEMENTOF CASH FLOWSYEAR ENDED 31 DECEMBER 2021
The accompanying notes form an integral part of these financial statements.
GroupNote 2021 2020
$’000 $’000
Cash flows from investing activitiesAcquisition of subsidiaries (net of cash acquired) 39 (341,747) –Dividends received:– associates 12,350 24,180– joint ventures 3,191 13,004– financial investments 5,175 4,784Increase in investments in associates (70,836) (63,351)Increase in investments in joint ventures (1,976) (886,579)Return of capital from a joint venture 113,126 73,552Increase in amounts owing by equity-accounted investees (183,363) (295,763)Interest received 21,513 49,544Payments for intangible assets (595) (355)Payments for capital expenditure on investment properties (271,009) (126,227)Payments for purchase of property, plant and equipment (143,148) (267,244)Purchase of investment properties – (66,492)Proceeds from sale of property, plant and equipment and investment properties 65,252 421,500Proceeds from deconsoliation of subsidiaries 39 – 109,090Purchase of financial assets (net) (21,264) (35,836)Proceeds from distributions from investments in financial assets 10,333 5,146Settlement of financial derivatives (60,409) (34,994)Net cash used in investing activities (863,407) (1,076,041)
Cash flows from financing activitiesCapital distribution to non-controlling interests (net) (12,374) (7,922)Dividends paid (173,943) (190,211)Payment of lease liabilities and finance lease payables (21,087) (21,059)Interest paid (including amounts capitalised in property, plant and equipment
and development properties) (211,206) (218,329)Net increase in amounts owing to related parties and non-controlling interests 36,649 274,573Net (repayment of)/proceeds from revolving credit facilities and
short-term bank borrowings (378,003) 2,319Decrease in restricted cash 35,444 12,439Cash flows used in financing activities carried forward (724,520) (148,190)
CONSOLIDATED STATEMENTOF CASH FLOWSYEAR ENDED 31 DECEMBER 2021
The accompanying notes form an integral part of these financial statements.
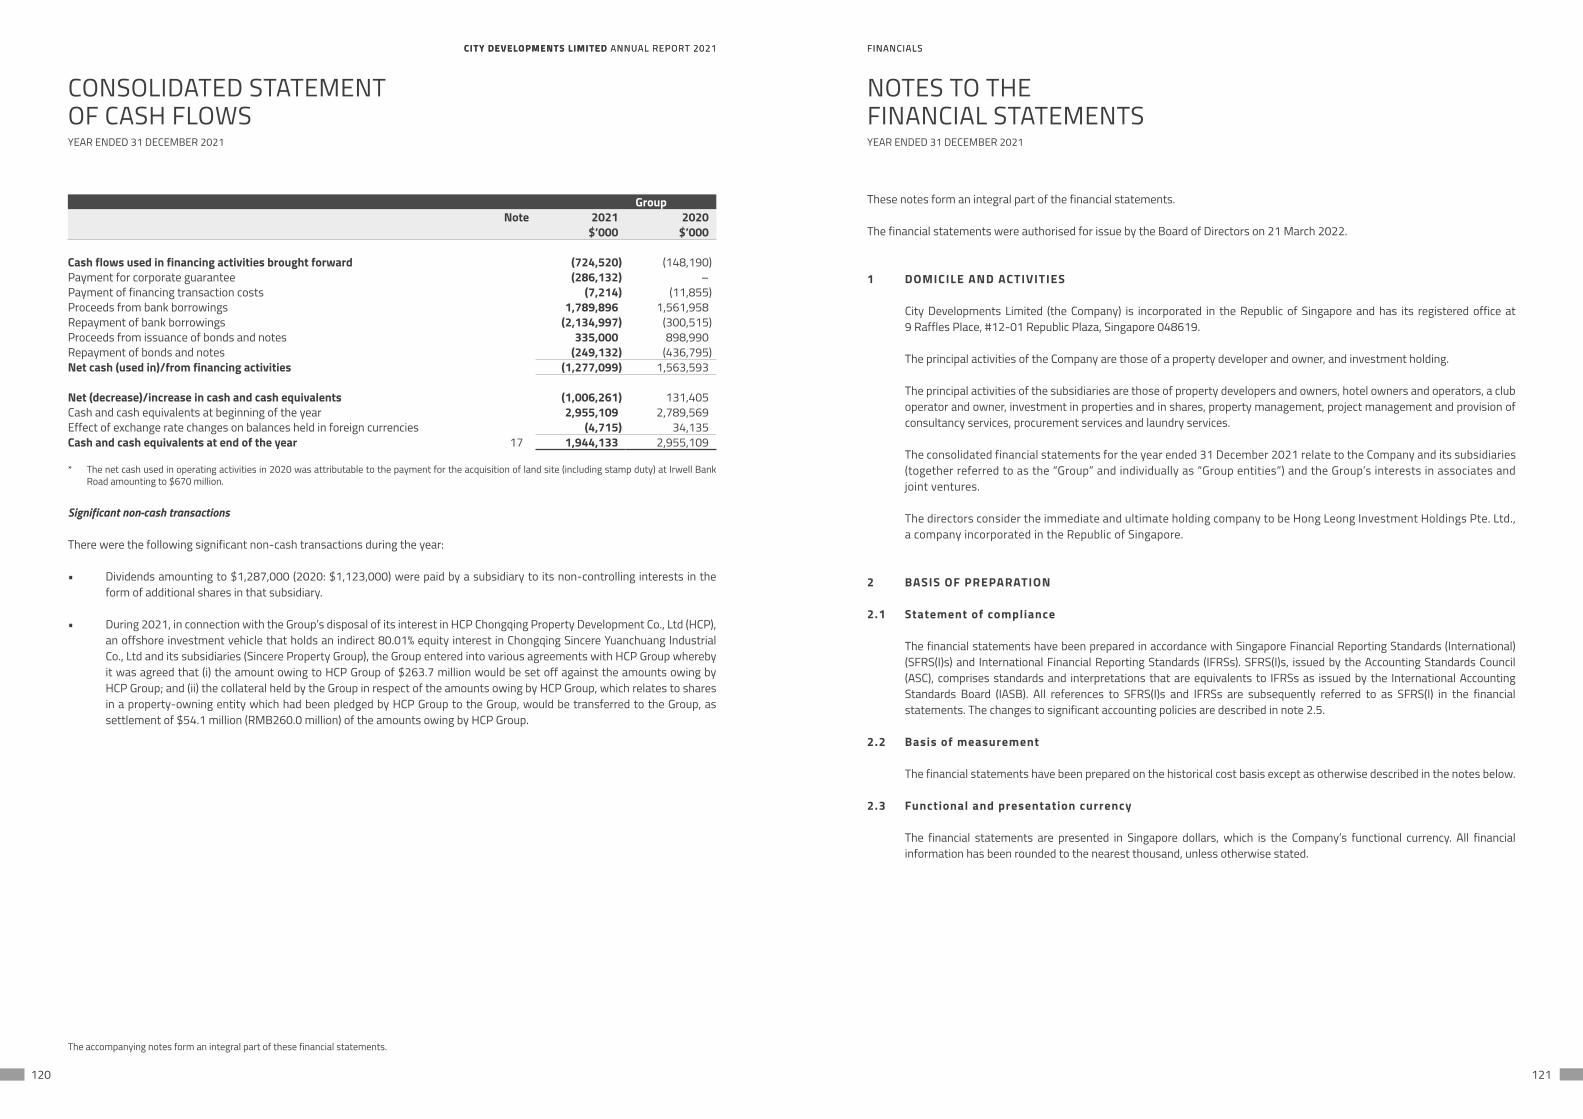
CITY DEVELOPMENTS LIMITED ANNUAL REPORT 2021 FINANCIALSCITY DEVELOPMENTS LIMITED ANNUAL REPORT 2021 FINANCIALS
120 121
NOTES TO THEFINANCIAL STATEMENTSYEAR ENDED 31 DECEMBER 2021
GroupNote 2021 2020
$’000 $’000
Cash flows used in financing activities brought forward (724,520) (148,190)Payment for corporate guarantee (286,132) –Payment of financing transaction costs (7,214) (11,855)Proceeds from bank borrowings 1,789,896 1,561,958Repayment of bank borrowings (2,134,997) (300,515)Proceeds from issuance of bonds and notes 335,000 898,990Repayment of bonds and notes (249,132) (436,795)Net cash (used in)/from financing activities (1,277,099) 1,563,593
Net (decrease)/increase in cash and cash equivalents (1,006,261) 131,405Cash and cash equivalents at beginning of the year 2,955,109 2,789,569Effect of exchange rate changes on balances held in foreign currencies (4,715) 34,135Cash and cash equivalents at end of the year 17 1,944,133 2,955,109
* The net cash used in operating activities in 2020 was attributable to the payment for the acquisition of land site (including stamp duty) at Irwell Bank Road amounting to $670 million.
Significant non-cash transactions
There were the following significant non-cash transactions during the year:
• Dividends amounting to $1,287,000 (2020: $1,123,000) were paid by a subsidiary to its non-controlling interests in the form of additional shares in that subsidiary.
• During 2021, in connection with the Group’s disposal of its interest in HCP Chongqing Property Development Co., Ltd (HCP), an offshore investment vehicle that holds an indirect 80.01% equity interest in Chongqing Sincere Yuanchuang Industrial Co., Ltd and its subsidiaries (Sincere Property Group), the Group entered into various agreements with HCP Group whereby it was agreed that (i) the amount owing to HCP Group of $263.7 million would be set off against the amounts owing by HCP Group; and (ii) the collateral held by the Group in respect of the amounts owing by HCP Group, which relates to shares in a property-owning entity which had been pledged by HCP Group to the Group, would be transferred to the Group, as settlement of $54.1 million (RMB260.0 million) of the amounts owing by HCP Group.
CONSOLIDATED STATEMENTOF CASH FLOWSYEAR ENDED 31 DECEMBER 2021
The accompanying notes form an integral part of these financial statements.
These notes form an integral part of the financial statements.
The financial statements were authorised for issue by the Board of Directors on 21 March 2022.
1 DOMICILE AND ACTIVITIES
City Developments Limited (the Company) is incorporated in the Republic of Singapore and has its registered office at 9 Raffles Place, #12-01 Republic Plaza, Singapore 048619.
The principal activities of the Company are those of a property developer and owner, and investment holding.
The principal activities of the subsidiaries are those of property developers and owners, hotel owners and operators, a club operator and owner, investment in properties and in shares, property management, project management and provision of consultancy services, procurement services and laundry services.
The consolidated financial statements for the year ended 31 December 2021 relate to the Company and its subsidiaries (together referred to as the “Group” and individually as “Group entities”) and the Group’s interests in associates and joint ventures.
The directors consider the immediate and ultimate holding company to be Hong Leong Investment Holdings Pte. Ltd., a company incorporated in the Republic of Singapore.
2 BASIS OF PREPARATION
2.1 Statement of compliance
The financial statements have been prepared in accordance with Singapore Financial Reporting Standards (International) (SFRS(I)s) and International Financial Reporting Standards (IFRSs). SFRS(I)s, issued by the Accounting Standards Council (ASC), comprises standards and interpretations that are equivalents to IFRSs as issued by the International Accounting Standards Board (IASB). All references to SFRS(I)s and IFRSs are subsequently referred to as SFRS(I) in the financial statements. The changes to significant accounting policies are described in note 2.5.
2.2 Basis of measurement
The financial statements have been prepared on the historical cost basis except as otherwise described in the notes below.
2.3 Functional and presentation currency
The financial statements are presented in Singapore dollars, which is the Company’s functional currency. All financial information has been rounded to the nearest thousand, unless otherwise stated.
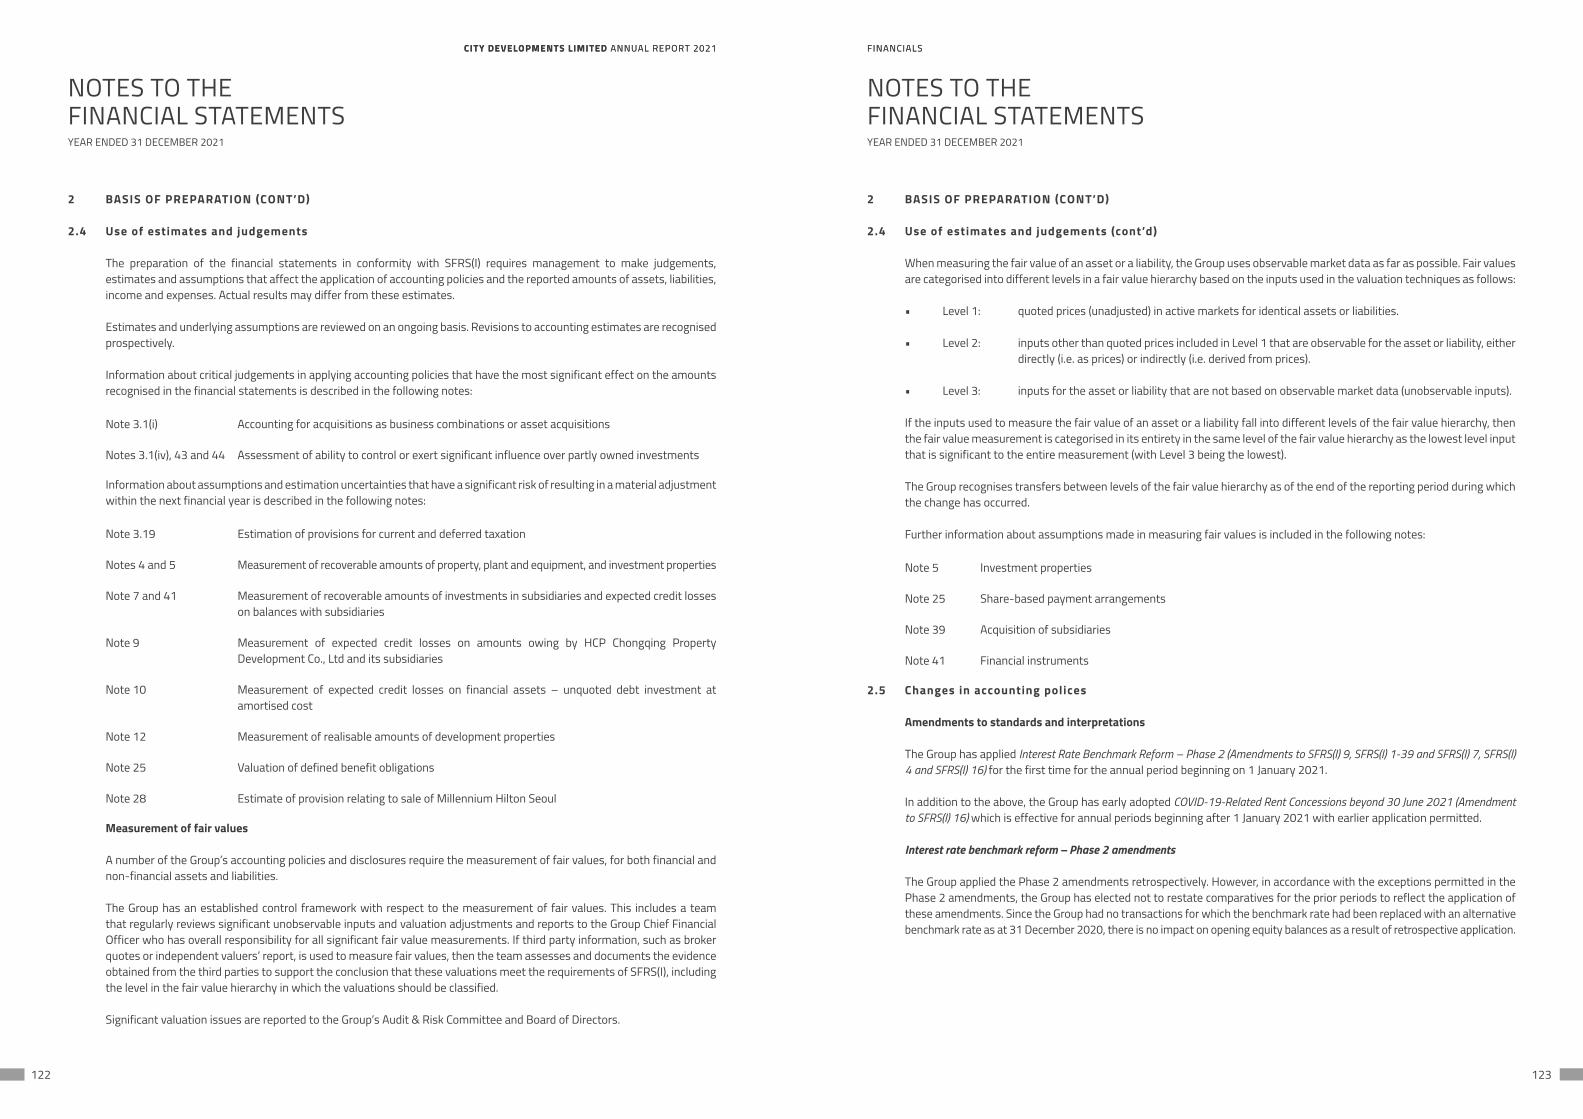
CITY DEVELOPMENTS LIMITED ANNUAL REPORT 2021 FINANCIALSCITY DEVELOPMENTS LIMITED ANNUAL REPORT 2021 FINANCIALS
122 123
NOTES TO THEFINANCIAL STATEMENTS
NOTES TO THEFINANCIAL STATEMENTS
YEAR ENDED 31 DECEMBER 2021 YEAR ENDED 31 DECEMBER 2021
2 BASIS OF PREPARATION (CONT’D)
2.4 Use of estimates and judgements
The preparation of the financial statements in conformity with SFRS(I) requires management to make judgements, estimates and assumptions that affect the application of accounting policies and the reported amounts of assets, liabilities, income and expenses. Actual results may differ from these estimates.
Estimates and underlying assumptions are reviewed on an ongoing basis. Revisions to accounting estimates are recognised prospectively.
Information about critical judgements in applying accounting policies that have the most significant effect on the amounts recognised in the financial statements is described in the following notes:
Note 3.1(i) Accounting for acquisitions as business combinations or asset acquisitions
Notes 3.1(iv), 43 and 44 Assessment of ability to control or exert significant influence over partly owned investments
Information about assumptions and estimation uncertainties that have a significant risk of resulting in a material adjustment within the next financial year is described in the following notes:
Note 3.19 Estimation of provisions for current and deferred taxation
Notes 4 and 5 Measurement of recoverable amounts of property, plant and equipment, and investment properties
Note 7 and 41 Measurement of recoverable amounts of investments in subsidiaries and expected credit losses on balances with subsidiaries
Note 9 Measurement of expected credit losses on amounts owing by HCP Chongqing Property Development Co., Ltd and its subsidiaries
Note 10 Measurement of expected credit losses on financial assets – unquoted debt investment at amortised cost
Note 12 Measurement of realisable amounts of development properties
Note 25 Valuation of defined benefit obligations
Note 28 Estimate of provision relating to sale of Millennium Hilton Seoul
Measurement of fair values
A number of the Group’s accounting policies and disclosures require the measurement of fair values, for both financial and non-financial assets and liabilities.
The Group has an established control framework with respect to the measurement of fair values. This includes a team that regularly reviews significant unobservable inputs and valuation adjustments and reports to the Group Chief Financial Officer who has overall responsibility for all significant fair value measurements. If third party information, such as broker quotes or independent valuers’ report, is used to measure fair values, then the team assesses and documents the evidence obtained from the third parties to support the conclusion that these valuations meet the requirements of SFRS(I), including the level in the fair value hierarchy in which the valuations should be classified.
Significant valuation issues are reported to the Group’s Audit & Risk Committee and Board of Directors.
2 BASIS OF PREPARATION (CONT’D)
2.4 Use of estimates and judgements (cont’d)
When measuring the fair value of an asset or a liability, the Group uses observable market data as far as possible. Fair values are categorised into different levels in a fair value hierarchy based on the inputs used in the valuation techniques as follows:
• Level 1: quoted prices (unadjusted) in active markets for identical assets or liabilities.
• Level 2: inputs other than quoted prices included in Level 1 that are observable for the asset or liability, either directly (i.e. as prices) or indirectly (i.e. derived from prices).
• Level 3: inputs for the asset or liability that are not based on observable market data (unobservable inputs).
If the inputs used to measure the fair value of an asset or a liability fall into different levels of the fair value hierarchy, then the fair value measurement is categorised in its entirety in the same level of the fair value hierarchy as the lowest level input that is significant to the entire measurement (with Level 3 being the lowest).
The Group recognises transfers between levels of the fair value hierarchy as of the end of the reporting period during which the change has occurred.
Further information about assumptions made in measuring fair values is included in the following notes:
Note 5 Investment properties
Note 25 Share-based payment arrangements
Note 39 Acquisition of subsidiaries
Note 41 Financial instruments
2.5 Changes in accounting polices
Amendments to standards and interpretations
The Group has applied Interest Rate Benchmark Reform – Phase 2 (Amendments to SFRS(I) 9, SFRS(I) 1-39 and SFRS(I) 7, SFRS(I) 4 and SFRS(I) 16) for the first time for the annual period beginning on 1 January 2021.
In addition to the above, the Group has early adopted COVID-19-Related Rent Concessions beyond 30 June 2021 (Amendment to SFRS(I) 16) which is effective for annual periods beginning after 1 January 2021 with earlier application permitted.
Interest rate benchmark reform – Phase 2 amendments
The Group applied the Phase 2 amendments retrospectively. However, in accordance with the exceptions permitted in the Phase 2 amendments, the Group has elected not to restate comparatives for the prior periods to reflect the application of these amendments. Since the Group had no transactions for which the benchmark rate had been replaced with an alternative benchmark rate as at 31 December 2020, there is no impact on opening equity balances as a result of retrospective application.
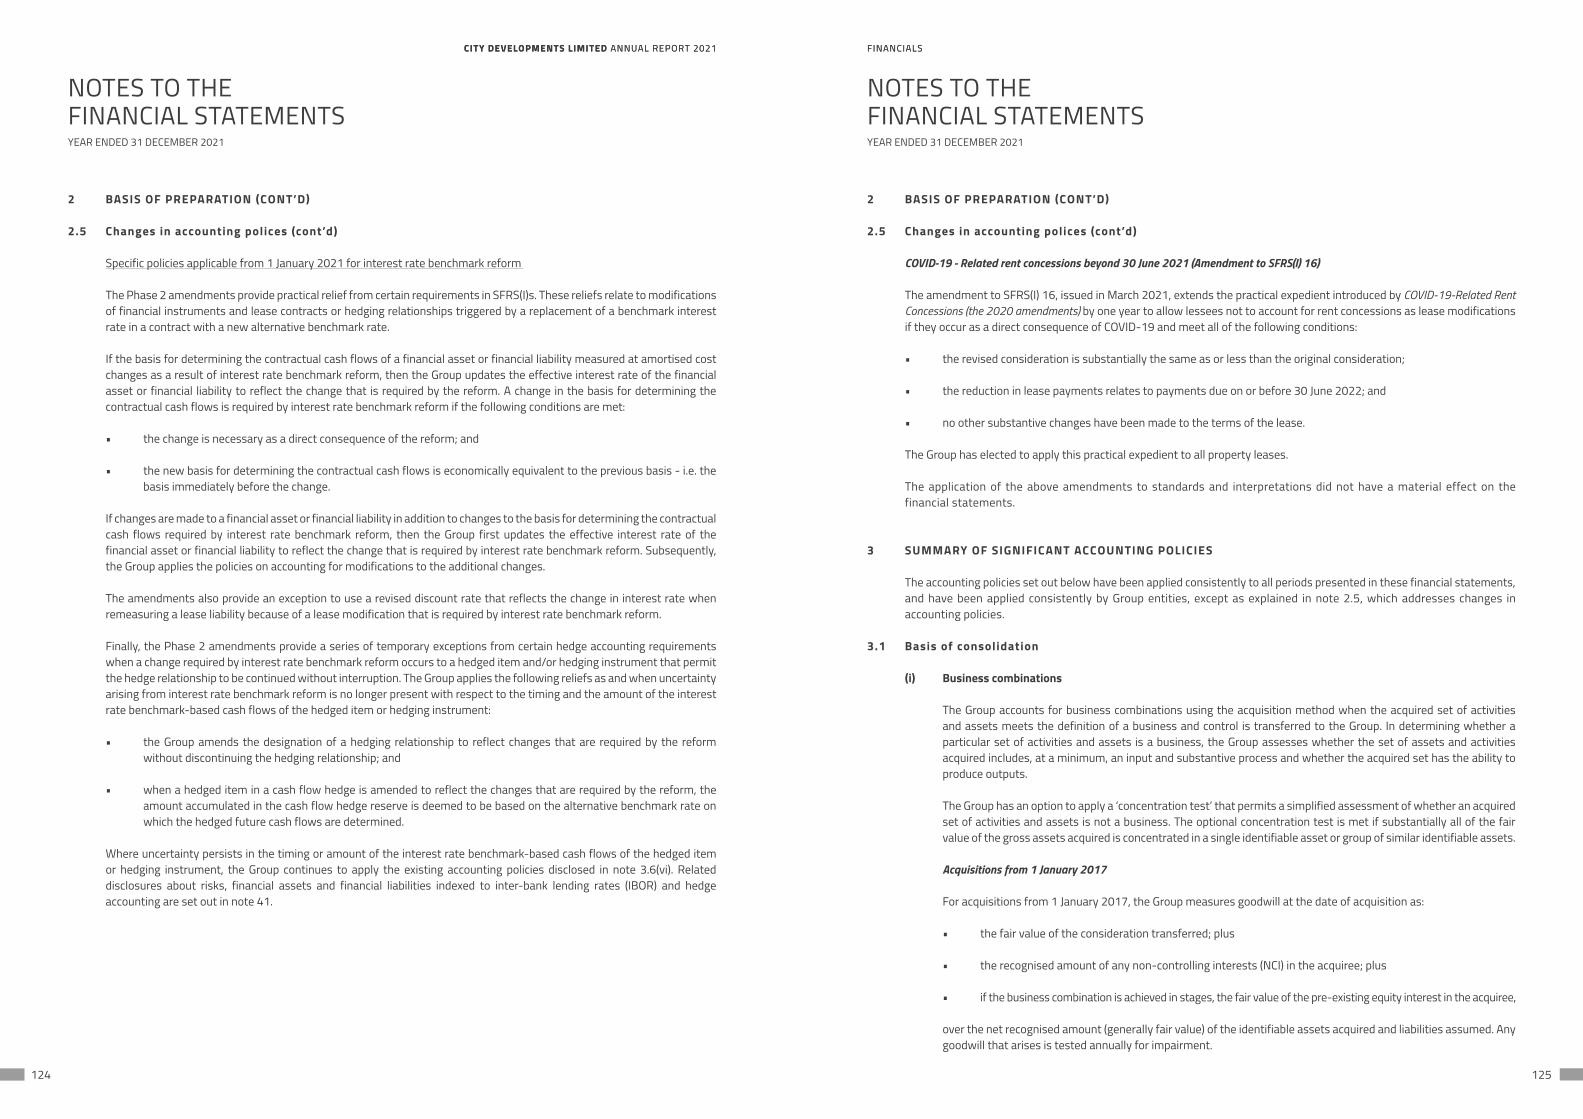
CITY DEVELOPMENTS LIMITED ANNUAL REPORT 2021 FINANCIALSCITY DEVELOPMENTS LIMITED ANNUAL REPORT 2021 FINANCIALS
124 125
NOTES TO THEFINANCIAL STATEMENTS
NOTES TO THEFINANCIAL STATEMENTS
YEAR ENDED 31 DECEMBER 2021 YEAR ENDED 31 DECEMBER 2021
2 BASIS OF PREPARATION (CONT’D)
2.5 Changes in accounting polices (cont’d)
Specific policies applicable from 1 January 2021 for interest rate benchmark reform
The Phase 2 amendments provide practical relief from certain requirements in SFRS(I)s. These reliefs relate to modifications of financial instruments and lease contracts or hedging relationships triggered by a replacement of a benchmark interest rate in a contract with a new alternative benchmark rate.
If the basis for determining the contractual cash flows of a financial asset or financial liability measured at amortised cost changes as a result of interest rate benchmark reform, then the Group updates the effective interest rate of the financial asset or financial liability to reflect the change that is required by the reform. A change in the basis for determining the contractual cash flows is required by interest rate benchmark reform if the following conditions are met:
• the change is necessary as a direct consequence of the reform; and
• the new basis for determining the contractual cash flows is economically equivalent to the previous basis - i.e. the basis immediately before the change.
If changes are made to a financial asset or financial liability in addition to changes to the basis for determining the contractual cash flows required by interest rate benchmark reform, then the Group first updates the effective interest rate of the financial asset or financial liability to reflect the change that is required by interest rate benchmark reform. Subsequently, the Group applies the policies on accounting for modifications to the additional changes.
The amendments also provide an exception to use a revised discount rate that reflects the change in interest rate when remeasuring a lease liability because of a lease modification that is required by interest rate benchmark reform.
Finally, the Phase 2 amendments provide a series of temporary exceptions from certain hedge accounting requirements when a change required by interest rate benchmark reform occurs to a hedged item and/or hedging instrument that permit the hedge relationship to be continued without interruption. The Group applies the following reliefs as and when uncertainty arising from interest rate benchmark reform is no longer present with respect to the timing and the amount of the interest rate benchmark-based cash flows of the hedged item or hedging instrument:
• the Group amends the designation of a hedging relationship to reflect changes that are required by the reform without discontinuing the hedging relationship; and
• when a hedged item in a cash flow hedge is amended to reflect the changes that are required by the reform, the amount accumulated in the cash flow hedge reserve is deemed to be based on the alternative benchmark rate on which the hedged future cash flows are determined.
Where uncertainty persists in the timing or amount of the interest rate benchmark-based cash flows of the hedged item or hedging instrument, the Group continues to apply the existing accounting policies disclosed in note 3.6(vi). Related disclosures about risks, financial assets and financial liabilities indexed to inter-bank lending rates (IBOR) and hedge accounting are set out in note 41.
2 BASIS OF PREPARATION (CONT’D)
2.5 Changes in accounting polices (cont’d)
COVID-19 - Related rent concessions beyond 30 June 2021 (Amendment to SFRS(I) 16)
The amendment to SFRS(I) 16, issued in March 2021, extends the practical expedient introduced by COVID-19-Related Rent Concessions (the 2020 amendments) by one year to allow lessees not to account for rent concessions as lease modifications if they occur as a direct consequence of COVID-19 and meet all of the following conditions:
• the revised consideration is substantially the same as or less than the original consideration;
• the reduction in lease payments relates to payments due on or before 30 June 2022; and
• no other substantive changes have been made to the terms of the lease.
The Group has elected to apply this practical expedient to all property leases.
The application of the above amendments to standards and interpretations did not have a material effect on the financial statements.
3 SUMMARY OF SIGNIFICANT ACCOUNTING POLICIES
The accounting policies set out below have been applied consistently to all periods presented in these financial statements, and have been applied consistently by Group entities, except as explained in note 2.5, which addresses changes in accounting policies.
3.1 Basis of consolidation
(i) Business combinations
The Group accounts for business combinations using the acquisition method when the acquired set of activities and assets meets the definition of a business and control is transferred to the Group. In determining whether a particular set of activities and assets is a business, the Group assesses whether the set of assets and activities acquired includes, at a minimum, an input and substantive process and whether the acquired set has the ability to produce outputs.
The Group has an option to apply a ‘concentration test’ that permits a simplified assessment of whether an acquired set of activities and assets is not a business. The optional concentration test is met if substantially all of the fair value of the gross assets acquired is concentrated in a single identifiable asset or group of similar identifiable assets.
Acquisitions from 1 January 2017
For acquisitions from 1 January 2017, the Group measures goodwill at the date of acquisition as:
• the fair value of the consideration transferred; plus
• the recognised amount of any non-controlling interests (NCI) in the acquiree; plus
• if the business combination is achieved in stages, the fair value of the pre-existing equity interest in the acquiree,
over the net recognised amount (generally fair value) of the identifiable assets acquired and liabilities assumed. Any goodwill that arises is tested annually for impairment.
CITY DEVELOPMENTS LIMITED ANNUAL REPORT 2021 FINANCIALSCITY DEVELOPMENTS LIMITED ANNUAL REPORT 2021 FINANCIALS
126 127
NOTES TO THEFINANCIAL STATEMENTS
NOTES TO THEFINANCIAL STATEMENTS
YEAR ENDED 31 DECEMBER 2021 YEAR ENDED 31 DECEMBER 2021
3 SUMMARY OF SIGNIFICANT ACCOUNTING POLICIES (CONT’D)
3.1 Basis of consolidation (cont’d)
(i) Business combinations (cont’d)
When the excess is negative, a bargain purchase gain is recognised immediately in profit or loss.
The consideration transferred does not include amounts related to the settlement of pre-existing relationships. Such amounts are generally recognised in profit or loss.
Any contingent consideration payable is recognised at fair value at the acquisition date. If the contingent consideration that meets the definition of a financial instrument is classified as equity, it is not remeasured and settlement is accounted for within equity. Otherwise, other contingent consideration is remeasured at fair value at each reporting date and subsequent changes to the fair value of the contingent consideration are recognised in profit or loss.
When share-based payment awards (replacement awards) are exchanged for awards held by the acquiree’s employees (acquiree’s awards) and relate to past services, then all or a portion of the amount of the acquirer’s replacement awards is included in measuring the consideration transferred in the business combination. This determination is based on the market-based value of the replacement awards compared with the market-based value of the acquiree’s awards and the extent to which the replacement awards relate to past and/or future service.
For non-controlling interests that are present ownership interests and entitle their holders to a proportionate share of the acquiree’s net assets in the event of liquidation, the Group elects on a transaction-by-transaction basis whether to measure them at fair value, or at the non-controlling interests’ proportionate share of the recognised amounts of the acquiree’s identifiable net assets, at the acquisition date. All other non-controlling interests are measured at acquisition-date fair value or, when applicable, on the basis specified in another standard.
Costs related to the acquisition, other than those associated with the issue of debt or equity investments, that the Group incurs in connection with a business combination are expensed as incurred.
Changes in the Group’s interest in a subsidiary that do not result in a loss of control are accounted for as transactions with owners in their capacity as owners and therefore no adjustments are made to goodwill and no gain or loss is recognised in profit or loss. The adjustments to non-controlling interests are based on a proportionate amount of the net assets of the subsidiary. Any difference between the adjustment to non-controlling interests and the fair value of consideration paid is recognised directly in equity and presented as part of equity attributable to owners of the Company.
Acquisitions before 1 January 2017
As part of transition to SFRS(I), the Group elected not to restate those business combinations that occurred before the date of transition to SFRS(I), i.e. 1 January 2017. Goodwill arising from acquisitions before 1 January 2017 has been carried forward from the previous FRS framework as at the date of transition.
(ii) Subsidiaries
Subsidiaries are entities controlled by the Group. The Group controls an entity when it is exposed to, or has rights to, variable returns from its involvement with the entity and has the ability to affect those returns through its power over the entity. The financial statements of subsidiaries are included in the consolidated financial statements from the date that control commences until the date that control ceases.
The accounting policies of subsidiaries have been changed when necessary to align them with the policies adopted by the Group. Losses applicable to the non-controlling interests in a subsidiary are allocated to the non-controlling interests even if doing so causes the non-controlling interests to have a deficit balance.
3 SUMMARY OF SIGNIFICANT ACCOUNTING POLICIES (CONT’D)
3.1 Basis of consolidation (cont’d)
(iii) Loss of control
When the Group loses control over a subsidiary, it derecognises the assets and liabilities of the subsidiary, and any related NCI and other components of equity. Any resulting gain or loss is recognised in profit or loss. Any interest retained in the former subsidiary is measured at fair value when control is lost.
(iv) Investments in associates and joint ventures (equity-accounted investees)
Associates are those entities in which the Group has significant influence, but not control or joint control, over their financial and operating policies. Significant influence is presumed to exist when the Group holds 20% or more of the voting power of another entity. A joint venture is an arrangement in which the Group has joint control, whereby the Group has rights to the net assets of the arrangement, rather than rights to its assets and obligations for its liabilities.
Associates and joint ventures are accounted for using the equity method. They are recognised initially at cost, which includes transaction costs. Subsequent to initial recognition, the consolidated financial statements include the Group’s share of the profit or loss and other comprehensive income (OCI) of equity-accounted investees, after adjustments to align the accounting policies with those of the Group, from the date that significant influence or joint control commences until the date that significant influence or joint control ceases.
When the Group’s share of losses exceeds its investment in an equity-accounted investee, the carrying amount of that interest, together with any long-term interests that, in substance, form part thereof, is reduced to zero, and the recognition of further losses is discontinued except to the extent that the Group has an obligation or has made payments on behalf of the investee.
(v) Joint operations
A joint operation is an arrangement in which the Group has joint control whereby the Group has rights to the assets, and obligations for the liabilities, relating to an arrangement. The Group accounts for each of its assets, liabilities and transactions, including its share of those held or incurred jointly, in relation to the joint operation.
The Group is a 51% (2020: 51%) partner in Hong Realty (Private) Limited – Pasir Ris Joint Venture (the Pasir Ris Joint Venture), a joint arrangement formed with two fellow subsidiaries, whose principal activity is that of a property developer and the place of business is in Singapore. The Group is also a 20% (2020: 20%) partner in Park Court Aoyama The Tower, a joint arrangement formed with a third party, whose principal activity is that of a property developer and the place of business is in Japan. The Group has classified both joint arrangements as joint operations as the joint venture partners control the joint arrangements collectively and the joint arrangements are not structured through separate legal vehicles.
(vi) Transactions eliminated on consolidation
Intra-group balances and transactions, and any unrealised income or expenses arising from intra-group transactions, are eliminated in preparing the consolidated financial statements. Unrealised gains arising from transactions with equity-accounted investee are eliminated against the investment to the extent of the Group’s interest in the investee. Unrealised losses are eliminated in the same way as unrealised gains, but only to the extent that there is no evidence of impairment.
(vii) Subsidiaries, associates and joint ventures in the separate financial statements
Investments in subsidiaries, associates and joint ventures are stated in the Company’s statement of financial position at cost less accumulated impairment losses.
CITY DEVELOPMENTS LIMITED ANNUAL REPORT 2021 FINANCIALSCITY DEVELOPMENTS LIMITED ANNUAL REPORT 2021 FINANCIALS
128 129
NOTES TO THEFINANCIAL STATEMENTS
NOTES TO THEFINANCIAL STATEMENTS
YEAR ENDED 31 DECEMBER 2021 YEAR ENDED 31 DECEMBER 2021
3 SUMMARY OF SIGNIFICANT ACCOUNTING POLICIES (CONT’D)
3.2 Foreign currencies
(i) Foreign currency transactions
Transactions in foreign currencies are translated to the respective functional currencies of Group entities at the exchange rates at the dates of the transactions. Monetary assets and liabilities denominated in foreign currencies at the reporting date are translated to the functional currencies at the exchange rates at that date. The foreign currency gain or loss on monetary items is the difference between amortised cost in the functional currency at the beginning of the year, adjusted for effective interest and payments during the year, and the amortised cost in foreign currency translated at the exchange rate at the end of the year.
Non-monetary assets and liabilities denominated in foreign currencies that are measured at fair value are translated to the functional currencies at the exchange rates at the dates that the fair values were determined. Non-monetary items in foreign currencies that are measured in terms of historical cost in a foreign currency are translated using the exchange rate at the date of the transactions. Foreign currency differences arising on translation are recognised in profit or loss. However, foreign currency differences arising from the translation of the following items are recognised in OCI:
• differences arising on the translation of monetary items that in substance form part of the Group’s net investment in a foreign operation;
• an investment in equity securities designated at fair value through other comprehensive income (FVOCI);
• a financial liability designated as a hedge of the net investment in a foreign operation to the extent that the hedge is effective; or
• qualifying cash flow hedges to the extent that the hedges are effective.
(ii) Foreign operations
The assets and liabilities of foreign operations, including goodwill and fair value adjustments arising on acquisition, are translated to Singapore dollars at exchange rates prevailing at the reporting date. The income and expenses of foreign operations are translated to Singapore dollars at exchange rates at the dates of the transactions.
Foreign currency differences are recognised in OCI. However, if the foreign operation is a non wholly-owned subsidiary, then the relevant proportionate share of the translation difference is allocated to the non-controlling interests. When a foreign operation is disposed of such that control, significant influence or joint control is lost, the cumulative amount in the foreign currency translation reserve related to that foreign operation is reclassified to profit or loss as part of the gain or loss on disposal. When the Group disposes of only part of its interest in a subsidiary that includes a foreign operation while retaining control, the relevant proportion of the cumulative amount is reattributed to non-controlling interests. When the Group disposes of only part of its investment in an associate or joint venture that includes a foreign operation while retaining significant influence or joint control, the relevant proportion of the cumulative amount is reclassified to profit or loss.
When the settlement of a monetary item receivable from or payable to a foreign operation is neither planned nor likely in the foreseeable future, foreign exchange gains and losses arising from such a monetary item that are considered to form part of the Group’s net investment in the foreign operation are recognised in OCI, and are presented within equity in the foreign currency translation reserve.
3 SUMMARY OF SIGNIFICANT ACCOUNTING POLICIES (CONT’D)
3.3 Property, plant and equipment
(i) Recognition and measurement
Items of property, plant and equipment are stated at cost, which includes capitalised borrowing costs, less accumulated depreciation and accumulated impairment losses.
Cost includes expenditure that is directly attributable to the acquisition of the asset. The cost of self-constructed assets includes:
• the cost of materials and direct labour;
• any other costs directly attributable to bringing the assets to a working condition for their intended use;
• when the Group has an obligation to remove the asset or restore the site, an estimate of the costs of dismantling and removing the items and restoring the site on which they are located; and
• capitalised borrowing costs.
Purchased software that is integral to the functionality of the related equipment is capitalised as part of that equipment.
If significant parts of an item of property, plant and equipment have different useful lives, they are accounted for as separate items (major components) of property, plant and equipment.
The gain or loss on disposal of an item of property, plant and equipment is recognised net in profit or loss.
(ii) Subsequent costs
The cost of replacing a component of an item of property, plant and equipment is recognised in the carrying amount of the item if it is probable that future economic benefits embodied within the component will flow to the Group, and its cost can be measured reliably. The carrying amount of the replaced component is derecognised. The costs of the day-to-day servicing of property, plant and equipment are recognised in profit or loss as incurred.
(iii) Depreciation
Depreciation is based on the cost of an asset less its residual value. Significant components of individual assets are assessed and if a component has a useful life that is different from the remainder of that asset, that component is depreciated separately.
Depreciation is recognised as an expense in profit or loss on a straight-line basis over the estimated useful lives of each component of an item of property, plant and equipment. Leased assets are depreciated over the shorter of the lease term and their useful lives unless it is reasonably certain that the Group will obtain ownership by the end of the lease term.
Depreciation is recognised from the date that the property, plant and equipment are installed and are ready for use, or in respect of internally constructed assets, from the date that the asset is completed and ready for use.
No depreciation is provided on freehold land (including 999-year leasehold land). For freehold and leasehold properties under development and renovation-in-progress, no depreciation is provided until these items have been completed.
CITY DEVELOPMENTS LIMITED ANNUAL REPORT 2021 FINANCIALSCITY DEVELOPMENTS LIMITED ANNUAL REPORT 2021 FINANCIALS
130 131
NOTES TO THEFINANCIAL STATEMENTS
NOTES TO THEFINANCIAL STATEMENTS
YEAR ENDED 31 DECEMBER 2021 YEAR ENDED 31 DECEMBER 2021
3 SUMMARY OF SIGNIFICANT ACCOUNTING POLICIES (CONT’D)
3.3 Property, plant and equipment (cont’d)
(iii) Depreciation (cont’d)
The estimated useful lives for the current and comparative years are as follows:
Freehold and leasehold land and buildings
• Core component of hotel buildings – 50 years, or lease term if shorter
• Surface, finishes and services of hotel buildings – 30 years, or lease term if shorter
• Leasehold land – Lease term
Furniture, fittings, plant and equipment and improvements – 3 to 20 years
Residual values ascribed to the core component of hotel buildings depend on the nature, location and tenure of each hotel property. No residual values are ascribed to surface, finishes and services of hotel buildings and right-of-use assets in respect of leases where the Group is a lessee.
Depreciation methods, useful lives and residual values are reviewed, and adjusted as appropriate, at each reporting date.
3.4 Investment properties
(i) Recognition and measurement
Investment properties are properties held either to earn rental income or capital appreciation or for both, but not for sale in the ordinary course of business, use in the production or supply of goods or services, or for administrative purposes.
Investment properties are stated at cost less accumulated depreciation and accumulated impairment losses.
Cost includes expenditure that is directly attributable to the acquisition of the investment properties. Costs of self-constructed investment properties include costs of materials and direct labour, any other costs directly attributable to bringing the investment properties to a working condition for their intended use and capitalised borrowing costs.
Gains and losses on disposal of investment properties (calculated as the difference between the net proceeds from disposal and the carrying amounts of the investment properties) are recognised in profit or loss.
(ii) Depreciation
Depreciation is recognised as an expense in profit or loss on a straight-line basis over the estimated useful lives of each component of an investment property. Leased assets are depreciated over the shorter of the lease term and their useful lives unless it is reasonably certain that the Group will obtain ownership by the end of the lease term.
No depreciation is provided on freehold land (including 999-year leasehold land) included in the investment properties.
3 SUMMARY OF SIGNIFICANT ACCOUNTING POLICIES (CONT’D)
3.4 Investment properties (cont’d)
(ii) Depreciation (cont’d)
The estimated useful lives for the current and comparative years are as follows:
Freehold and leasehold properties – 50 years, or lease term if shorter
Leasehold land – Lease term ranging from 50 to 96 years
Furniture, fittings, plant and equipment and improvements – 3 to 20 years
Depreciation methods and useful lives are reviewed, and adjusted as appropriate, at each reporting date.
3.5 Leases
At inception of a contract, the Group assesses whether a contract is, or contains, a lease. A contract is, or contains, a lease if the contract conveys the right to control the use of an identified asset for a period of time in exchange for consideration.
As a lessee
At commencement or on modification of a contract that contains a lease component, the Group allocates the consideration in the contract to each lease component on the basis of its relative stand-alone prices. However, for the leases of property, the Group has elected not to separate non-lease components and account for the lease and non-lease components as a single lease component.
The Group recognises a right-of-use asset and a lease liability at the lease commencement date. The right-of-use asset is initially measured at cost, which comprises the initial amount of the lease liability adjusted for any lease payments made at or before the commencement date, plus any initial direct costs incurred and an estimate of costs to dismantle and remove the underlying asset or to restore the underlying asset or the site on which it is located, less any lease incentives received.
The right-of-use asset is subsequently depreciated using the straight-line method from the commencement date to the end of the lease term, unless the lease transfers ownership of the underlying asset to the Group by the end of the lease term or the cost of the right-of-use asset reflects that the Group will exercise a purchase option. In that case, the right-of-use asset will be depreciated over the useful life of the underlying asset, which is determined on the same basis as those of property and equipment. In addition, the right-of-use asset is periodically reduced by impairment losses, if any, and adjusted for certain remeasurements of the lease liability.
The right-of-use asset is subsequently stated at cost less accumulated depreciation and impairment losses.
The lease liability is initially measured at the present value of the lease payments that are not paid at the commencement date, discounted using the interest rate implicit in the lease or, if that rate cannot be readily determined, the lessee’s incremental borrowing rate. Generally, the Group uses the lessee’s incremental borrowing rate as the discount rate.
The Group determines the lessee’s incremental borrowing rate by obtaining interest rates from various external financing sources and makes certain adjustments to reflect the terms of the lease and type of the asset leased.
CITY DEVELOPMENTS LIMITED ANNUAL REPORT 2021 FINANCIALSCITY DEVELOPMENTS LIMITED ANNUAL REPORT 2021 FINANCIALS
132 133
NOTES TO THEFINANCIAL STATEMENTS
NOTES TO THEFINANCIAL STATEMENTS
YEAR ENDED 31 DECEMBER 2021 YEAR ENDED 31 DECEMBER 2021
3 SUMMARY OF SIGNIFICANT ACCOUNTING POLICIES (CONT’D)
3.5 Leases (cont’d)
As a lessee (cont’d)
Lease payments included in the measurement of the lease liability comprise the following:
• fixed payments, including in-substance fixed payments;
• variable lease payments that depend on an index or a rate, initially measured using the index or rate as at the commencement date; and
• the exercise price under a purchase option that the Group is reasonably certain to exercise, lease payments in an optional renewal period if the Group is reasonably certain to exercise an extension option, and penalties for early termination of a lease unless the Group is reasonably certain not to terminate early.
The lease liability is measured at amortised cost using the effective interest method. It is remeasured when there is a change in future lease payments arising from a change in an index or rate, if there is a change in the Group’s estimate of the amount expected to be payable under a residual value guarantee, if the Group changes its assessment of whether it will exercise a purchase, extension or termination option or if there is a revised in-substance fixed lease payment.
When the lease liability is remeasured in this way, a corresponding adjustment is made to the carrying amount of the right-of-use asset, or is recorded in profit or loss if the carrying amount of the right-of-use asset has been reduced to zero.
From 1 January 2021, where the basis for determining future lease payments changes as required by interest rate benchmark reform (see note 2.5), the Group remeasures the lease liability by discounting the revised lease payments using the revised discount rate that reflects the change to an alternative benchmark interest rate.
The Group presents right-of-use assets that do not meet the definition of investment property in ‘property, plant and equipment’ and lease liabilities in the statement of financial position.
Short-term leases and leases of low-value assets
The Group has elected not to recognise right-of-use assets and lease liabilities for leases of low-value assets and short-term leases. The Group recognises the lease payments associated with these leases as an expense on a straight-line basis over the lease term.
COVID-19-related rent concessions
The Group applies the practical expedient allowing it not to assess whether eligible rent concessions that are a direct consequence of the COVID-19 pandemic are lease modifications. The Group applies the practical expedient consistently to contracts with similar characteristics and in similar circumstances. For rent concessions in leases to which the Group chooses not to apply the practical expedient, or that do not qualify for the practical expedient, the Group assesses whether there is a lease modification.
3 SUMMARY OF SIGNIFICANT ACCOUNTING POLICIES (CONT’D)
3.5 Leases (cont’d)
As a lessor
At inception or on modification of a contract that contains a lease component, the Group allocates the consideration in the contract to each lease component on the basis of their relative stand-alone prices.
When the Group acts as a lessor, it determines at lease inception whether each lease is a finance lease or an operating lease.
To classify each lease, the Group makes an overall assessment of whether the lease transfers substantially all of the risks and rewards incidental to ownership of the underlying asset. If this is the case, then the lease is a finance lease; if not, then it is an operating lease. As part of this assessment, the Group considers certain indicators such as whether the lease is for the major part of the economic life of the asset.
When the Group is an intermediate lessor, it accounts for its interests in the head lease and the sub-lease separately. It assesses the lease classification of a sub-lease with reference to the right-of-use asset arising from the head lease, not with reference to the underlying asset. If a head lease is a short-term lease to which the Group applies the exemption described above, then it classifies the sub-lease as an operating lease.
If an arrangement contains lease and non-lease components, then the Group applies SFRS(I) 15 to allocate the consideration in the contract.
The Group applies the derecognition and impairment requirements in SFRS(I) 9 to the net investment in the lease (see note 3.11(i)). The Group further regularly reviews estimated unguaranteed residual values used in calculating the gross investment in the lease.
The Group recognises lease payments received from investment property under operating leases as income on a straight-line basis over the lease term as part of ‘revenue’.
3.6 Financial instruments
(i) Recognition and initial measurement
Non-derivative financial assets and financial liabilities
Trade receivables and debt investments issued are initially recognised when they are originated. All other financial assets and financial liabilities are initially recognised when the Group becomes a party to the contractual provisions of the instrument.
A financial asset (unless it is a trade receivable without a significant financing component) or financial liability is initially measured at fair value plus, or minus, for an item not at fair value through profit or loss (FVTPL), transaction costs that are directly attributable to its acquisition or issue. A trade receivable without a significant financing component is initially measured at the transaction price.
CITY DEVELOPMENTS LIMITED ANNUAL REPORT 2021 FINANCIALSCITY DEVELOPMENTS LIMITED ANNUAL REPORT 2021 FINANCIALS
134 135
NOTES TO THEFINANCIAL STATEMENTS
NOTES TO THEFINANCIAL STATEMENTS
YEAR ENDED 31 DECEMBER 2021 YEAR ENDED 31 DECEMBER 2021
3 SUMMARY OF SIGNIFICANT ACCOUNTING POLICIES (CONT’D)
3.6 Financial instruments (cont’d)
(ii) Classification and subsequent measurement
Non-derivative financial assets
On initial recognition, a financial asset is classified as measured at: amortised cost; FVOCI – debt investment; FVOCI – equity investment; or FVTPL.
Financial assets are not reclassified subsequent to their initial recognition unless the Group changes its business model for managing financial assets, in which case all affected financial assets are reclassified on the first day of the first reporting period following the change in the business model.
Financial assets at amortised cost
A financial asset is measured at amortised cost if it meets both of the following conditions and is not designated as at FVTPL:
• it is held within a business model whose objective is to hold assets to collect contractual cash flows; and
• its contractual terms give rise on specified dates to cash flows that are solely payments of principal and interest on the principal amount outstanding.
Debt investments at FVOCI
A debt investment is measured at FVOCI if it meets both of the following conditions and is not designated as at FVTPL:
• it is held within a business model whose objective is achieved by both collecting contractual cash flows and selling financial assets; and
• its contractual terms give rise on specified dates to cash flows that are solely payments of principal and interest on the principal amount outstanding.
Equity investments at FVOCI
On initial recognition of an equity investment that is not held for trading, the Group may irrevocably elect to present subsequent changes in the investment’s fair value in OCI. This election is made on an investment-by-investment basis.
Financial assets at FVTPL
All financial assets not classified as measured at amortised cost or FVOCI as described above are measured at FVTPL. On initial recognition, the Group may irrevocably designate a financial asset that otherwise meets the requirements to be measured at amortised cost or at FVOCI or at FVTPL if doing so eliminates or significantly reduces an accounting mismatch that would otherwise arise.
3 SUMMARY OF SIGNIFICANT ACCOUNTING POLICIES (CONT’D)
3.6 Financial instruments (cont’d)
(ii) Classification and subsequent measurement (cont’d)
Financial assets: Business model assessment
The Group makes an assessment of the objective of the business model in which a financial asset is held at a portfolio level because this best reflects the way the business is managed and information is provided to management. The information considered includes:
• the stated policies and objectives for the portfolio and the operation of those policies in practice. These include whether management’s strategy focuses on earning contractual interest income, maintaining a particular interest rate profile, matching the duration of the financial assets to the duration of any related liabilities or expected cash outflows or realising cash flows through the sale of the assets;
• how the performance of the portfolio is evaluated and reported to the Group’s management;
• the risks that affect the performance of the business model (and the financial assets held within that business model) and how those risks are managed;
• how managers of the business are compensated e.g. whether compensation is based on the fair value of the assets managed or the contractual cash flows collected; and
• the frequency, volume and timing of sales of financial assets in prior periods, the reasons for such sales and expectations about future sales activity.
Transfers of financial assets to third parties in transactions that do not qualify for derecognition are not considered sales for this purpose, consistent with the Group’s continuing recognition of the assets.
Financial assets that are held for trading or are managed and whose performance is evaluated on a fair value basis are measured at FVTPL.
Non-derivative financial assets: Assessment whether contractual cash flows are solely payments of principal and interest
For the purposes of this assessment, ‘principal’ is defined as the fair value of the financial asset on initial recognition. ‘Interest’ is defined as consideration for the time value of money and for the credit risk associated with the principal amount outstanding during a particular period of time and for other basic lending risks and costs (e.g. liquidity risk and administrative costs), as well as a profit margin.
In assessing whether the contractual cash flows are solely payments of principal and interest, the Group considers the contractual terms of the instrument. This includes assessing whether the financial asset contains a contractual term that could change the timing or amount of contractual cash flows such that it would not meet this condition. In making this assessment, the Group considers:
• contingent events that would change the amount or timing of cash flows;
• terms that may adjust the contractual coupon rate, including variable rate features;
• prepayment and extension features; and
• terms that limit the Group’s claim to cash flows from specified assets (e.g. non-recourse features).
CITY DEVELOPMENTS LIMITED ANNUAL REPORT 2021 FINANCIALSCITY DEVELOPMENTS LIMITED ANNUAL REPORT 2021 FINANCIALS
136 137
NOTES TO THEFINANCIAL STATEMENTS
NOTES TO THEFINANCIAL STATEMENTS
YEAR ENDED 31 DECEMBER 2021 YEAR ENDED 31 DECEMBER 2021
3 SUMMARY OF SIGNIFICANT ACCOUNTING POLICIES (CONT’D)
3.6 Financial instruments (cont’d)
(ii) Classification and subsequent measurement (cont’d)
Non-derivative financial assets: Assessment whether contractual cash flows are solely payments of principal and interest (cont’d)
A prepayment feature is consistent with the solely payments of principal and interest criterion if the prepayment amount substantially represents unpaid amounts of principal and interest on the principal amount outstanding, which may include reasonable additional compensation for early termination of the contract. Additionally, for a financial asset acquired at a significant discount or premium to its contractual par amount, a feature that permits or requires prepayment at an amount that substantially represents the contractual par amount plus accrued (but unpaid) contractual interest (which may also include reasonable additional compensation for early termination) is treated as consistent with this criterion if the fair value of the prepayment feature is insignificant at initial recognition.
Non-derivative financial assets: Subsequent measurement and gains and losses
Financial assets at FVTPL
These assets are subsequently measured at fair value. Net gains and losses, including any interest or dividend income, are recognised in profit or loss.
Financial assets at amortised cost
These assets are subsequently measured at amortised cost using the effective interest method. The amortised cost is reduced by impairment losses. Interest income, foreign exchange gains and losses and impairment are recognised in profit or loss. Any gain or loss on derecognition is recognised in profit or loss.
Debt investments at FVOCI
These assets are subsequently measured at fair value. Interest income calculated using the effective interest method, foreign exchange gains and losses and impairment are recognised in profit or loss. Other net gains and losses are recognised in OCI. On derecognition, gains and losses accumulated in OCI are reclassified to profit or loss.
Equity investments at FVOCI
These assets are subsequently measured at fair value. Dividends are recognised as income in profit or loss unless the dividend clearly represents a recovery of part of the cost of the investment. Other net gains and losses are recognised in OCI and are never reclassified to profit or loss.
Non-derivative financial liabilities: Classification, subsequent measurement and gains and losses
Financial liabilities are classified as measured at amortised cost or FVTPL. A financial liability is classified as at FVTPL if it is classified as held for trading or it is designated as such on initial recognition. Financial liabilities at FVTPL are measured at fair value and net gains and losses, including any interest expense, are recognised in profit or loss. Directly attributable transaction costs are recognised in profit or loss as incurred.
Other financial liabilities are initially measured at fair value less directly attributable transaction costs. They are subsequently measured at amortised cost using the effective interest method. Interest expense and foreign exchange gains and losses are recognised in profit or loss.
3 SUMMARY OF SIGNIFICANT ACCOUNTING POLICIES (CONT’D)
3.6 Financial instruments (cont’d)
(iii) Derecognition
Financial assets
The Group derecognises a financial asset when the contractual rights to the cash flows from the financial asset expire, or it transfers the rights to receive the contractual cash flows in a transaction in which either substantially all of the risks and rewards of ownership of the financial asset are transferred, or the Group neither transfers nor retains substantially all of the risks and rewards of ownership and it does not retain control of the financial asset.
Transferred assets are not derecognised when the Group enters into transactions whereby it transfers assets recognised in its statement of financial position, but retains either all or substantially all of the risks and rewards of ownership of the transferred assets.
Financial liabilities
The Group derecognises a financial liability when its contractual obligations are discharged or cancelled, or when they expire. The Group also derecognises a financial liability when its terms are modified and the cash flows of the modified liability are substantially different, in which case a new financial liability based on the modified terms is recognised at fair value.
On derecognition of a financial liability, the difference between the carrying amount extinguished and the consideration paid (including any non-cash assets transferred or liabilities assumed) is recognised in profit or loss.
(iv) Offsetting
Financial assets and financial liabilities are offset and the net amount presented in the statement of financial position when, and only when, the Group currently has a legally enforceable right to set off the amounts and it intends either to settle them on a net basis or to realise the asset and settle the liability simultaneously.
(v) Cash and cash equivalents
Cash and cash equivalents comprise cash balances and bank deposits. For the purpose of the statement of cash flows, restricted cash is excluded whilst bank overdrafts that are repayable on demand and form an integral part of the Group’s cash management are included in cash and cash equivalents.
(vi) Derivative financial instruments and hedge accounting
The Group holds derivative financial instruments to hedge its foreign currency and interest rate risk exposures. Embedded derivatives are separated from the host contract and accounted for separately if the host contract is not a financial asset and certain criteria are met.
Derivatives are initially measured at fair value and any directly attributable transaction costs are recognised in profit or loss as incurred. Subsequent to initial recognition, derivatives are measured at fair value, and changes therein are generally recognised in profit or loss.
The Group designates certain derivatives and non-derivative financial instruments as hedging instruments in qualifying hedging relationships. At inception of designated hedging relationships, the Group documents the risk management objective and strategy for undertaking the hedge. The Group also documents the economic relationship between the hedged item and the hedging instrument, including whether the changes in cash flows of the hedged item and hedging instrument are expected to offset each other.
CITY DEVELOPMENTS LIMITED ANNUAL REPORT 2021 FINANCIALSCITY DEVELOPMENTS LIMITED ANNUAL REPORT 2021 FINANCIALS
138 139
NOTES TO THEFINANCIAL STATEMENTS
NOTES TO THEFINANCIAL STATEMENTS
YEAR ENDED 31 DECEMBER 2021 YEAR ENDED 31 DECEMBER 2021
3 SUMMARY OF SIGNIFICANT ACCOUNTING POLICIES (CONT’D)
3.6 Financial instruments (cont’d)
(vi) Derivative financial instruments and hedge accounting (cont’d)
Hedges directly affected by interest rate benchmark reform
Phase 1 amendments: Prior to interest rate benchmark reform – when there is uncertainty arising from interest rate benchmark reform
For the purpose of evaluating whether there is an economic relationship between the hedged item(s) and the hedging instrument(s), the Group assumes that the benchmark interest rate is not altered as a result of interest rate benchmark reform.
For a cash flow hedge of a forecast transaction, the Group assumes that the benchmark interest rate will not be altered as a result of interest rate benchmark reform for the purpose of assessing whether the forecast transaction is highly probable and presents an exposure to variations in cash flows that could ultimately affect profit or loss. In determining whether a previously designated forecast transaction in a discontinued cash flow hedge is still expected to occur, the Group assumes that the interest rate benchmark cash flows designated as a hedge will not be altered as a result of interest rate benchmark reform.
The Group will cease to apply the specific policy for assessing the economic relationship between the hedged item and the hedging instrument (i) to a hedged item or hedging instrument when the uncertainty arising from interest rate benchmark reform is no longer present with respect to the timing and the amount of the contractual cash flows of the respective item or instrument or (ii) when the hedging relationship is discontinued. For its highly probable assessment of the hedged item, the Group will no longer apply the specific policy when the uncertainty arising from interest rate benchmark reform about the timing and the amount of the interest rate benchmark-based future cash flows of the hedged item is no longer present, or when the hedging relationship is discontinued.
Phase 2 amendments: Replacement of benchmark interest rates – when there is no longer uncertainty arising from interest rate benchmark reform
When the basis for determining the contractual cash flows of the hedged item or the hedging instrument changes as a result of interest rate benchmark reform and therefore there is no longer uncertainty arising about the cash flows of the hedged item or the hedging instrument, the Group amends the hedge documentation of that hedging relationship to reflect the change(s) required by interest rate benchmark reform. A change in the basis for determining the contractual cash flows is required by interest rate benchmark reform if the following conditions are met:
• the change is necessary as a direct consequence of the reform; and
• the new basis for determining the contractual cash flows is economically equivalent to the previous basis - i.e. the basis immediately before the change.
For this purpose, the hedge designation is amended only to make one or more of the following changes:
• designating an alternative benchmark rate as the hedged risk;
• updating the description of hedged item, including the description of the designated portion of the cash flows or fair value being hedged; or
• updating the description of the hedging instrument.
3 SUMMARY OF SIGNIFICANT ACCOUNTING POLICIES (CONT’D)
3.6 Financial instruments (cont’d)
(vi) Derivative financial instruments and hedge accounting (cont’d)
Hedges directly affected by interest rate benchmark reform (cont’d)
Phase 2 amendments: Replacement of benchmark interest rates – when there is no longer uncertainty arising from interest rate benchmark reform (cont’d)
The Group amends the description of the hedging instrument only if the following conditions are met:
• it makes a change required by interest rate benchmark reform by changing the basis for determining the contractual cash flows of the hedging instrument or using another approach that is economically equivalent to changing the basis for determining the contractual cash flows of the original hedging instrument; and
• the original hedging instrument is not derecognised.
The Group amends the formal hedge documentation by the end of the reporting period during which a change required by interest rate benchmark reform is made to the hedged risk, hedged item or hedging instrument. These amendments in the formal hedge documentation do not constitute the discontinuation of the hedging relationship or the designation of a new hedging relationship.
If changes are made in addition to those changes required by interest rate benchmark reform described above, then the Group first considers whether those additional changes result in the discontinuation of the hedge accounting relationship. If the additional changes do not result in discontinuation of the hedge accounting relationship, then the Group amends the formal hedge documentation for changes required by interest rate benchmark reform as mentioned above.
When the interest rate benchmark on which the hedged future cash flows had been based is changed as required by interest rate benchmark reform, for the purpose of determining whether the hedged future cash flows are expected to occur, the Group deems that the hedging reserve recognised in OCI for that hedging relationship is based on the alternative benchmark rate on which the hedged future cash flows will be based.
Cash flow hedges
The Group designates certain derivatives as hedging instruments to hedge the variability in cash flows associated with highly probable forecast transactions arising from changes in foreign exchange rates and interest rates.
When a derivative is designated as a cash flow hedging instrument, the effective portion of changes in the fair value of the derivative is recognised in OCI and accumulated in the hedging reserve. The effective portion of changes in the fair value of the derivative that is recognised in OCI is limited to the cumulative change in fair value of the hedged item, determined on a present value basis, from inception of the hedge. Any ineffective portion of changes in the fair value of the derivative is recognised immediately in profit or loss.
The amount accumulated in the hedging reserve is reclassified to profit or loss in the same period or periods during which the hedged expected future cash flows affect profit or loss.
If the hedge no longer meets the criteria for hedge accounting or the hedging instrument is sold, expires, is terminated or is exercised, then hedge accounting is discontinued prospectively. When hedge accounting for cash flow hedges is discontinued, the amount that has been accumulated in the hedging reserve remains in equity until it is reclassified to profit or loss in the same period or periods as the hedged expected future cash flows affect profit or loss.
If the hedged future cash flows are no longer expected to occur, then the amounts that have been accumulated in the hedging reserve are immediately reclassified to profit or loss.
CITY DEVELOPMENTS LIMITED ANNUAL REPORT 2021 FINANCIALSCITY DEVELOPMENTS LIMITED ANNUAL REPORT 2021 FINANCIALS
140 141
NOTES TO THEFINANCIAL STATEMENTS
NOTES TO THEFINANCIAL STATEMENTS
YEAR ENDED 31 DECEMBER 2021 YEAR ENDED 31 DECEMBER 2021
3 SUMMARY OF SIGNIFICANT ACCOUNTING POLICIES (CONT’D)
3.6 Financial instruments (cont’d)
(vi) Derivative financial instruments and hedge accounting (cont’d)
Net investment hedges
The Group designates certain derivatives and non-derivative financial liabilities as hedges of foreign exchange risk on a net investment in a foreign operation.
When a derivative instrument or a non-derivative financial liability is designated as the hedging instrument in a hedge of a net investment in a foreign operation, the effective portion of, for a derivative, changes in the fair value of the hedging instrument or, for a non-derivative, foreign exchange gains and losses is recognised in OCI and presented in the translation reserve within equity. Any ineffective portion of the changes in the fair value of the derivative or foreign exchange gains and losses on the non-derivative is recognised immediately in profit or loss. The amount recognised in OCI is reclassified to profit or loss as a reclassification adjustment on disposal or partial disposal of the foreign operation, respectively.
(vii) Share capital
Ordinary shares
Ordinary shares are classified as equity. Incremental costs directly attributable to the issue of ordinary shares are recognised as a deduction from equity, net of any tax effects.
Preference shares
The Group’s non-redeemable convertible non-cumulative preference shares are classified as equity, because they bear discretionary dividends, do not contain any obligations to deliver cash or other financial assets and do not require settlement in a variable number of the Group’s equity instruments. Dividends thereon are recognised as distributions within equity.
3.7 Development properties
Development properties are measured at the lower of cost and net realisable value. Cost includes acquisition costs, development expenditure, capitalised borrowing costs (applicable to construction of a development for which revenue is to be recognised at a point in time) and other costs directly attributable to the development activities.
Net realisable value is the estimated selling price in the ordinary course of business, less estimated costs of completion and selling expenses. The write-down to net realisable value is presented as allowance for foreseeable losses.
3.8 Contract costs
Incremental costs of obtaining a contract for the sale of a development property are capitalised as contract costs only if (a) these costs relate directly to a contract or an anticipated contract which the Group can specifically identify; (b) these costs generate or enhance resources of the Group that will be used in satisfying (or in continuing to satisfy) performance obligations in the future; and (c) these costs are expected to be recovered. Otherwise, such costs are recognised as an expense immediately.
Capitalised contract costs are subsequently amortised on a systematic basis as the Group recognises the related revenue on the contract. An impairment loss is recognised in the profit or loss to the extent that the carrying amount of capitalised contract costs exceeds the expected remaining consideration less any directly related costs not yet recognised as expenses.
3 SUMMARY OF SIGNIFICANT ACCOUNTING POLICIES (CONT’D)
3.9 Contract assets and liabilities
Contract assets primarily relate to the Group’s rights to consideration for work completed but not billed at the reporting date on construction of development properties. Contract assets are transferred to trade receivables when the rights become unconditional. This usually occurs when the Group invoices the customer.
Contract liabilities primarily relate to:
• advance consideration received from customers; and
• progress billings issued in excess of the Group’s rights to the consideration.
3.10 Consumable stocks
Consumable stocks comprise principally food and beverage and other hotel related consumable supplies. Stocks are valued at the lower of cost and net realisable value. Cost is determined based on the weighted average cost method and includes expenditure incurred in acquiring the stocks, production or conversion costs and other costs incurred in bringing them to their existing location and condition. Net realisable value represents the estimated selling price in the ordinary course of business, less the estimated cost of completion and cost necessary to make the sale.
3.11 Impairment
(i) Non-derivative financial assets and contract assets
The Group recognises loss allowances for expected credit losses (ECL) on:
• financial assets measured at amortised cost;
• debt investments measured at FVOCI;
• contract assets (as defined in SFRS(I) 15); and
• lease receivables.
Loss allowances of the Group are measured on either of the following bases:
• 12-month ECL: these are ECL that result from default events that are possible within the 12 months after the reporting date (or for a shorter period if the expected life of the instrument is less than 12 months); or
• Lifetime ECL: these are ECL that result from all possible default events over the expected life of a financial instrument or contract asset.
Simplified approach
The Group applies the simplified approach to provide for ECL for all trade receivables (including lease receivables) and contract assets. The simplified approach requires the loss allowance to be measured at an amount equal to lifetime ECL.
CITY DEVELOPMENTS LIMITED ANNUAL REPORT 2021 FINANCIALSCITY DEVELOPMENTS LIMITED ANNUAL REPORT 2021 FINANCIALS
142 143
NOTES TO THEFINANCIAL STATEMENTS
NOTES TO THEFINANCIAL STATEMENTS
YEAR ENDED 31 DECEMBER 2021 YEAR ENDED 31 DECEMBER 2021
3 SUMMARY OF SIGNIFICANT ACCOUNTING POLICIES (CONT’D)
3.11 Impairment (cont’d)
(i) Non-derivative financial assets and contract assets (cont’d)
General approach
The Group applies the general approach to provide for ECL on all other financial instruments. Under the general approach, the loss allowance is measured at an amount equal to 12-month ECL at initial recognition.
At each reporting date, the Group assesses whether the credit risk of a financial instrument has increased significantly since initial recognition. When credit risk has increased significantly since initial recognition, loss allowance is measured at an amount equal to lifetime ECL.
When determining whether the credit risk of a financial asset has increased significantly since initial recognition and when estimating ECL, the Group considers reasonable and supportable information that is relevant and available without undue cost or effort. This includes both quantitative and qualitative information and analysis, based on the Group’s historical experience and informed credit assessment and includes forward-looking information.
If credit risk has not increased significantly since initial recognition or if the credit quality of the financial instruments improves such that there is no longer a significant increase in credit risk since initial recognition, loss allowance is measured at an amount equal to 12-month ECL.
The maximum period considered when estimating ECLs is the maximum contractual period over which the Group is exposed to credit risk.
Measurement of ECLs
ECLs are probability-weighted estimates of credit losses. Credit losses are measured at the present value of all cash shortfalls (i.e. the difference between the cash flows due to the entity in accordance with the contract and the cash flows that the Group expects to receive). ECLs are discounted at the effective interest rate of the financial asset.
Credit-impaired financial assets
At each reporting date, the Group assesses whether financial assets carried at amortised cost and debt investments at FVOCI are credit-impaired. A financial asset is ‘credit-impaired’ when one or more events that have a detrimental impact on the estimated future cash flows of the financial asset have occurred.
Evidence that a financial asset is credit-impaired includes the following observable data:
• significant financial difficulty of the borrower or issuer;
• a breach of contract such as a default;
• the restructuring of a loan or advance by the Group on terms that the Group would not consider otherwise;
• it is probable that the borrower will enter bankruptcy or other financial reorganisation; or
• the disappearance of an active market for a security because of financial difficulties.
3 SUMMARY OF SIGNIFICANT ACCOUNTING POLICIES (CONT’D)
3.11 Impairment (cont’d)
(i) Non-derivative financial assets and contract assets (cont’d)
Presentation of ECL in the statement of financial position
Loss allowances for financial assets measured at amortised cost and contract assets are deducted from the gross carrying amount of these assets.
Write-off
The gross carrying amount of a financial asset is written off (either partially or in full) to the extent that there is no realistic prospect of recovery. This is generally the case when the Group determines that the debtor does not have assets or sources of income that could generate sufficient cash flows to repay the amounts subject to the write-off. However, financial assets that are written off could still be subject to enforcement activities in order to comply with the Group’s procedures for recovery of amounts due.
(ii) Associates and joint ventures
An impairment loss in respect of an associate or joint venture is measured by comparing the recoverable amount of the investment with its carrying amount in accordance with the requirements for non-financial assets. An impairment loss is recognised in profit or loss. An impairment loss is reversed if there has been a favourable change in the estimates used to determine the recoverable amount and only to the extent that the recoverable amount increases.
(iii) Non-financial assets
The carrying amounts of the Group’s non-financial assets, other than development properties, contract costs, contract assets, consumable stocks and deferred tax assets are reviewed at each reporting date to determine whether there is any indication of impairment. If any such indication exists, then the assets’ recoverable amounts are estimated. For goodwill, the recoverable amount is estimated at each reporting date, and as and when indicators of impairment are identified. An impairment loss is recognised if the carrying amount of an asset or its related cash-generating unit (CGU) exceeds its estimated recoverable amount.
The recoverable amount of an asset or CGU is the greater of its value in use and its fair value less costs of disposal. In assessing value in use, the estimated future cash flows are discounted to their present value using a pre-tax discount rate that reflects current market assessments of the time value of money and the risks specific to the asset or CGU. For the purpose of impairment testing, assets that cannot be tested individually are grouped together into the smallest group of assets that generates cash inflows from continuing use that are largely independent of the cash inflows of other assets or CGUs. For the purposes of goodwill impairment testing, CGUs to which goodwill has been allocated are aggregated so that the level at which impairment testing is performed reflects the lowest level at which goodwill is monitored for internal reporting purposes. Goodwill acquired in a business combination is allocated to groups of CGUs that are expected to benefit from the synergies of the combination.
The Group’s corporate assets do not generate separate cash inflows and are utilised by more than one CGU. Corporate assets are allocated to CGUs on a reasonable and consistent basis and tested for impairment as part of the testing of the CGU to which the corporate asset is allocated.
Impairment losses are recognised in profit or loss. Impairment losses recognised in respect of CGUs are allocated first to reduce the carrying amount of any goodwill allocated to the CGU (group of CGUs), and then to reduce the carrying amounts of the other assets in the CGU (group of CGUs) on a pro rata basis.
CITY DEVELOPMENTS LIMITED ANNUAL REPORT 2021 FINANCIALSCITY DEVELOPMENTS LIMITED ANNUAL REPORT 2021 FINANCIALS
144 145
NOTES TO THEFINANCIAL STATEMENTS
NOTES TO THEFINANCIAL STATEMENTS
YEAR ENDED 31 DECEMBER 2021 YEAR ENDED 31 DECEMBER 2021
3 SUMMARY OF SIGNIFICANT ACCOUNTING POLICIES (CONT’D)
3.11 Impairment (cont’d)
(iii) Non-financial assets (cont’d)
An impairment loss in respect of goodwill is not reversed. In respect of other assets, impairment losses recognised in prior periods are assessed at each reporting date for any indications that the loss has decreased or no longer exists. An impairment loss is reversed if there has been a change in the estimates used to determine the recoverable amount. An impairment loss is reversed only to the extent that the asset’s carrying amount does not exceed the carrying amount that would have been determined, net of depreciation or amortisation, if no impairment loss had been recognised.
Goodwill that forms part of the carrying amount of an investment in an associate or a joint venture is not recognised separately, and therefore is not tested for impairment separately. Instead, the entire amount of the investment in an associate or a joint venture is tested for impairment as a single asset when there is objective evidence that the investment in an associate or a joint venture may be impaired.
3.12 Non-current assets held for sale
Non-current assets, or disposal groups comprising assets and liabilities, that are highly probable to be recovered primarily through sale rather than through continuing use, are classified as held for sale. Immediately before classification as held for sale, the assets, or components of a disposal group, are remeasured in accordance with the Group’s accounting policies. Thereafter, the assets, or disposal group, classified as held for sale are generally measured at the lower of their carrying amount and fair value less cost to sell.
Any impairment loss on a disposal group is first allocated to goodwill, and then to remaining assets and liabilities on a pro rata basis, except that no loss is allocated to financial assets and deferred tax assets, which continue to be measured in accordance with the Group’s accounting policies. Impairment losses on initial classification as held for sale and subsequent gains or losses on remeasurement are recognised in the profit or loss. Gains are not recognised in excess of any cumulative impairment loss.
Property, plant and equipment and investment property once classified as held for sale are not depreciated. In addition, equity accounting of associates and joint ventures ceases once classified as held for sale or distribution.
3.13 Employee benefits
(i) Defined contribution plans
A defined contribution plan is a post-employment benefit plan under which an entity pays fixed contributions into a separate entity and will have no legal or constructive obligation to pay further amounts. Obligations for contributions to defined contribution pension plans are recognised as an employee benefit expense in profit or loss in the periods during which services are rendered by employees.
3 SUMMARY OF SIGNIFICANT ACCOUNTING POLICIES (CONT’D)
3.13 Employee benefits (cont’d)
(ii) Defined benefit plans
A defined benefit plan is a post-employment benefit plan other than a defined contribution plan. The Group’s net obligation in respect of defined benefit post-employment plans, including pension plans, is calculated separately for each plan by estimating the amount of future benefit that employees have earned in return for their service in the current and prior periods. That benefit is discounted to determine its present value, and the fair value of any plan assets is deducted. The calculation is performed by a qualified actuary using the projected unit credit method.
When the benefits of a plan are improved, the portion of the increased benefit relating to past service by employees is recognised immediately as an expense in profit or loss.
The Group recognises remeasurement gains or losses within the consolidated statement of comprehensive income in the period in which they occur.
The Group determines the net interest expense/(income) on the net defined benefit liability/(asset) for the period by applying the discount rate used to measure the defined benefit obligation at the beginning of the annual period to the net defined benefit liability/(asset), taking into account any changes in the net defined benefit liability/(asset) during the period as a result of contributions and benefit payments. Net interest expense and other expenses related to defined benefit plans are recognised in profit or loss.
(iii) Other long-term service benefits
The Group’s net obligation in respect of long-term service benefits, other than defined contribution and defined benefit plans, is the amount of future benefit that employees have earned in return for their service in current and prior periods. The obligation is calculated using the projected unit credit method and is discounted to its present value and the fair value of any plan assets is deducted. Remeasurements are recognised in profit or loss in the period in which they arise.
(iv) Short-term employee benefits
Short-term employee benefit obligations are measured on an undiscounted basis and are expensed as the related service is provided. A liability is recognised for the amount expected to be paid under short-term cash bonus or profit-sharing plans if the Group has a present legal or constructive obligation to pay this amount as a result of past service provided by the employee, and the obligation can be estimated reliably.
(v) Share-based payment transactions
The grant date fair value of equity-settled share-based payment awards granted to employees is recognised as an employee expense, with a corresponding increase in equity, over the period that the employees unconditionally become entitled to the awards. The amount recognised as an expense is adjusted to reflect the number of awards for which the related service and non-market performance conditions are expected to be met, such that the amount ultimately recognised as an expense is based on the number of awards that meet the related service and non-market performance conditions at the vesting date. For share-based payment awards with non-vesting conditions, the grant date fair value of the share-based payment is measured to reflect such conditions and there is no true-up for differences between expected and actual outcomes.
CITY DEVELOPMENTS LIMITED ANNUAL REPORT 2021 FINANCIALSCITY DEVELOPMENTS LIMITED ANNUAL REPORT 2021 FINANCIALS
146 147
NOTES TO THEFINANCIAL STATEMENTS
NOTES TO THEFINANCIAL STATEMENTS
YEAR ENDED 31 DECEMBER 2021 YEAR ENDED 31 DECEMBER 2021
3 SUMMARY OF SIGNIFICANT ACCOUNTING POLICIES (CONT’D)
3.13 Employee benefits (cont’d)
(v) Share-based payment transactions (cont’d)
Share-based payment arrangements in which the Group receives goods or services as consideration for its equity instruments of the Group entities are accounted for as equity-settled share-based payment transactions, regardless of how the equity instruments are obtained by the Group.
Where the terms of an equity-settled transaction award are modified, the minimum expense recognised is the expense as if the terms had not been modified, if the original terms of the award are met. An additional expense is recognised for any modification that increases the total fair value of the share-based payment transaction, or is otherwise beneficial to the employees as measured at the date of modification.
Where an equity-settled award is cancelled, it is treated as if it vested on the date of cancellation, and any expense not yet recognised for the award is recognised immediately. This includes any award where non-vesting conditions within the control of either the entity or the employee are not met. However, if a new award is substituted for the cancelled award, and designated as a replacement award on the date that it is granted, the cancelled and new awards are treated as if they were a modification of the original award, as described in the previous paragraph. All cancellations of equity-settled transaction awards are treated equally.
3.14 Provisions
A provision is recognised if, as a result of a past event, the Group has a present legal or constructive obligation that can be estimated reliably, and it is probable that an outflow of economic benefits will be required to settle the obligation. Provisions are determined by discounting the expected future cash flows at a pre-tax rate that reflects current market assessments of the time value of money and the risks specific to the liability. The unwinding of the discount is recognised as finance cost.
Levies
A provision for levies is recognised when the condition that triggers the payment of the levy as specified in the relevant legislation is met. If a levy obligation is subject to a minimum activity threshold so that the obligating event is reaching a minimum activity, then a provision is recognised when that minimum activity threshold is reached.
3.15 Financial guarantee contracts
Financial guarantees are financial instruments issued by the Group that require the issuer to make specified payments to reimburse the holder for the loss it incurs because a specified debtor fails to meet payment when due in accordance with the original or modified terms of a debt instrument.
Financial guarantees contracts are accounted for as insurance contracts. A provision is recognised based on the Group’s estimate of the ultimate cost of settling all claims incurred but unpaid at the reporting date. The provision is assessed by reviewing individual claims and tested for adequacy by comparing the amount recognised and the amount that would be required to settle the guarantee contract.
3 SUMMARY OF SIGNIFICANT ACCOUNTING POLICIES (CONT’D)
3.16 Revenue recognition
(i) Development properties for sale
The Group develops and sells residential and mixed development projects to customers through fixed-price contracts. Revenue is recognised when the control over a development property has been transferred to the customer. At contract inception, the Group assesses whether the Group transfers control of the residential project over time or at a point in time by determining if (a) its performance does not create an asset with an alternative use to the Group; and (b) the Group has an enforceable right to payment for performance completed to date.
Where a development property has no alternative use for the Group due to contractual restriction, and the Group has enforceable rights to payment for performance completed to date arising from the contractual terms, revenue is recognised over time by reference to the Group’s progress towards completing the construction of the development property. The measure of progress is determined based on the stage of completion of construction certified by quantity surveyors. Costs incurred that are not related to the contract or that do not contribute towards satisfying a performance obligation are excluded from the measure of progress and instead are expensed as incurred.
In respect of contracts where the Group does not have an enforceable right to payment for performance completed to date, revenue is recognised only when the completed property is delivered to the customer and the customer has accepted it in accordance with the sales contract.
Under certain payment schemes, the time when payments are made by the buyer and the transfer of control of the property to the buyer do not coincide and where the difference between the timing of receipt of the payments and the satisfaction of a performance obligation is 12 months or more, the Group adjusts the transaction price with its customer and recognises a financing component. In adjusting for the financing component, the Group uses a discount rate that would reflect that of a separate financing transaction between the Group and its customer at contract inception. A finance income or finance expense will be recognised depending on the arrangement. The Group has elected to apply the practical expedient not to adjust the transaction price for the existence of significant financing component when the period between the transfer of control of goods or services to a customer and the payment date is 12 months or less.
Revenue is measured at the transaction price agreed under the contract entered into with customers. Estimates of revenues, costs or extent of progress towards completion are revised if circumstances change. Any resulting increases or decreases in estimated revenues or costs are reflected in the profit or loss in the period in which the circumstances that give rise to the revision become known by management.
The customer is invoiced based on a payment schedule which is typically triggered upon achievement of specified construction milestones. If the value of the goods transferred by the Group exceeds the payments, a contract asset is recognised. If the payments exceed the value of the goods transferred, a contract liability is recognised. The accounting policy for contract assets and contract liabilities is set out in note 3.9.
(ii) Rental income
Rental income (net of any lease incentives) is recognised on a straight-line basis over the lease term. Contingent rentals, which include gross turnover rental, are recognised as income in the accounting period in which it is earned and the amount can be reliably measured.
(iii) Hotel income
Revenue from hotel operations is recognised at the point when the accommodation and related services are rendered.
CITY DEVELOPMENTS LIMITED ANNUAL REPORT 2021 FINANCIALSCITY DEVELOPMENTS LIMITED ANNUAL REPORT 2021 FINANCIALS
148 149
NOTES TO THEFINANCIAL STATEMENTS
NOTES TO THEFINANCIAL STATEMENTS
YEAR ENDED 31 DECEMBER 2021 YEAR ENDED 31 DECEMBER 2021
3 SUMMARY OF SIGNIFICANT ACCOUNTING POLICIES (CONT’D)
3.16 Revenue recognition (cont’d)
(iv) Management services, consultancy services and laundry services
Management and consultancy fees and laundry services are recognised at the point when such services are rendered.
(v) Dividends
Dividend income is recognised in profit or loss when the shareholder’s right to receive payment is established.
3.17 Government grants
Government grants are initially recognised as deferred income at fair value when there is reasonable assurance that they will be received and the Group will comply with the conditions associated with the grant. Grants that compensate the Group for expenses incurred are recognised in profit or loss on a systematic basis in the same periods in which the expenses are recognised, unless the conditions for receiving the grant are met after the related expenses have been recognised. In this case, the grant is recognised when it becomes receivable.
3.18 Finance income and costs
The Group’s finance income and costs include:
• interest income on amounts owing by fellow subsidiaries, associates, joint ventures, debt investment and funds invested;
• interest expense on borrowings, financial derivatives and lease liabilities;
• amortisation of transaction costs on borrowings capitalised;
• the fair value gains or losses on financial derivatives;
• the net gains or losses on financial assets at FVTPL;
• the foreign currency gains or losses on financial assets and financial liabilities; and
• unwinding of discount on non-current liabilities.
Interest income or expense is recognised using the effective interest method.
The ‘effective interest rate’ is the rate that exactly discounts estimated future cash payments or receipts through the expected life of the financial instrument to:
• the gross carrying amount of the financial asset; or
• the amortised cost of the financial liability.
3 SUMMARY OF SIGNIFICANT ACCOUNTING POLICIES (CONT’D)
3.18 Finance income and costs (cont’d)
In calculating interest income and expense, the effective interest rate is applied to the gross carrying amount of the asset (when the asset is not credit-impaired) or to the amortised cost of the liability. However, for financial assets that have become credit-impaired subsequent to initial recognition, interest income is calculated by applying the effective interest rate to the amortised cost of the financial asset. If the asset is no longer credit-impaired, then the calculation of interest income reverts to the gross basis.
Borrowing costs that are not directly attributable to the acquisition, construction or production of a qualifying asset are recognised in profit or loss using the effective interest method.
3.19 Tax
Tax expense comprises current and deferred tax. Tax expense is recognised in profit or loss except to the extent that it relates to a business combination, or items recognised directly in equity or in other comprehensive income.
The Group has determined that interest and penalties related to income taxes, including uncertain tax treatments, do not meet the definition of income taxes, and therefore accounted for them under SFRS(I) 1-37 Provisions, Contingent Liabilities and Contingent Assets.
Current tax is the expected tax payable or receivable on the taxable income or loss for the year, using tax rates enacted or substantively enacted at the reporting date, and any adjustment to tax payable in respect of previous years. The amount of current tax payable or receivable is the best estimate of the tax amount expected to be paid or received that reflects uncertainty related to income taxes, if any. Current tax also includes any tax arising from dividends.
Current tax assets and liabilities are offset only if certain criteria are met.
Deferred tax is recognised in respect of temporary differences between the carrying amounts of assets and liabilities for financial reporting purposes and the amounts used for taxation purposes.
Deferred tax is not recognised for:
• temporary differences on the initial recognition of assets or liabilities in a transaction that is not a business combination and that affects neither accounting nor taxable profit or loss;
• temporary differences related to investments in subsidiaries, associates and joint arrangements to the extent that the Group is able to control the timing of the reversal of the temporary difference and it is probable that they will not reverse in the foreseeable future; and
• taxable temporary differences arising on the initial recognition of goodwill.
The measurement of deferred taxes reflects the consequences that follow the manner in which the Group expects, at the reporting date, to recover the carrying amount of its assets and liabilities. Deferred tax is measured at the tax rates that are expected to be applied to the temporary differences when they reverse, based on the laws that have been enacted or substantively enacted by the reporting date.
CITY DEVELOPMENTS LIMITED ANNUAL REPORT 2021 FINANCIALSCITY DEVELOPMENTS LIMITED ANNUAL REPORT 2021 FINANCIALS
150 151
NOTES TO THEFINANCIAL STATEMENTS
NOTES TO THEFINANCIAL STATEMENTS
YEAR ENDED 31 DECEMBER 2021 YEAR ENDED 31 DECEMBER 2021
3 SUMMARY OF SIGNIFICANT ACCOUNTING POLICIES (CONT’D)
3.19 Tax (cont’d)
Deferred tax assets and liabilities are offset if there is a legally enforceable right to offset current tax liabilities and assets and they relate to taxes levied by the same tax authority on the same taxable entity, or on different tax entities, but they intend to settle current tax liabilities and assets on a net basis or their tax assets and liabilities will be realised simultaneously.
Deferred tax assets are recognised for unused tax losses, unused tax credits and deductible temporary differences to the extent that it is probable that future taxable profits will be available against which they can be used. Future taxable profits are determined based on the reversal of relevant taxable temporary differences. If the amount of taxable temporary differences is insufficient to recognise a deferred tax asset in full, then future taxable profits, adjusted for reversals of existing temporary differences, are considered, based on the business plans for individual subsidiaries in the Group. Deferred tax assets are reviewed at each reporting date and are reduced to the extent that it is no longer probable that the related tax benefit will be realised; such reductions are reversed when the probability of future taxable profits improves.
Unrecognised deferred tax assets are reassessed at each reporting date and recognised to the extent that it has become probable that future taxable profits will be available against which they can be used.
In determining the amount of current and deferred tax, the Group takes into account the impact of uncertain tax positions and whether additional taxes and interest may be due. The Group believes that its accruals for tax liabilities are adequate for all open tax years based on its assessment of many factors, including interpretations of tax law and prior experience. This assessment relies on estimates and assumptions and may involve a series of judgements about future events. New information may become available that causes the Group to change its judgement regarding the adequacy of existing tax liabilities; such changes to tax liabilities will impact tax expense in the period that such a determination is made.
3.20 Earnings per share
The Group presents basic and diluted earnings per share (EPS) data for its ordinary shares. Basic EPS is calculated by dividing the profit or loss attributable to ordinary shareholders of the Company by the weighted average number of ordinary shares outstanding during the year. Diluted EPS is determined by adjusting the profit or loss attributable to ordinary shareholders of the Company and the weighted average number of ordinary shares outstanding, for the dilutive effect arising from the conversion of the non-redeemable convertible non-cumulative preference shares.
3 SUMMARY OF SIGNIFICANT ACCOUNTING POLICIES (CONT’D)
3.21 Segment reporting
An operating segment is a component of the Group that engages in business activities from which it may earn revenue and incur expenses, including revenue and expenses that relate to transactions with any of the Group’s other components. All operating segments’ operating results are reviewed regularly by the Board of Directors and Group Chief Executive Officer (CEO) to make decisions about resources to be allocated to the segment and assess its performance, and for which discrete financial information is available.
Segment results that are reported to the Group’s Board of Directors and Group CEO include items directly attributable to a segment as well as those that can be allocated on a reasonable basis. Unallocated items comprise mainly tax assets and liabilities.
3.22 New standards and interpretations not yet adopted
A number of new standards and amendments to standards are effective for annual periods beginning after 1 January 2021 and earlier application is permitted; however, the Group has not early adopted the new or amended standards in preparing these financial statements. The Group is in the process of assessing the impact of the new standards and amendments to standards on its financial statements.
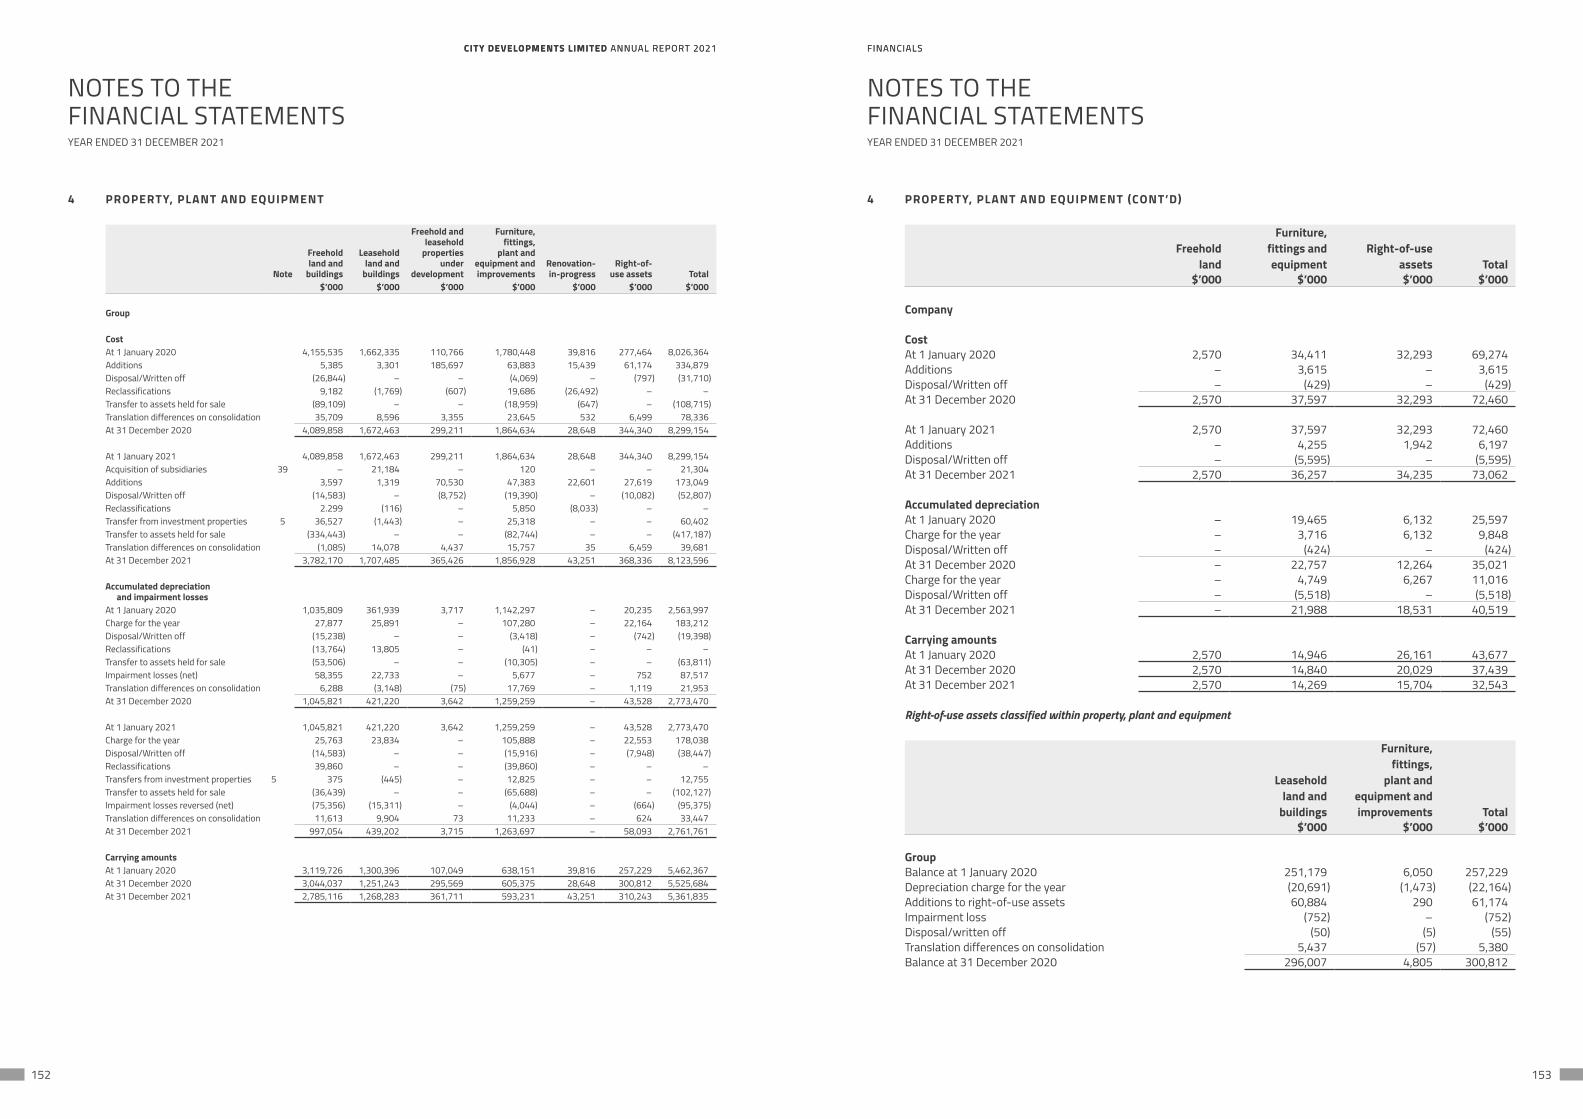
CITY DEVELOPMENTS LIMITED ANNUAL REPORT 2021 FINANCIALSCITY DEVELOPMENTS LIMITED ANNUAL REPORT 2021 FINANCIALS
152 153
NOTES TO THEFINANCIAL STATEMENTS
NOTES TO THEFINANCIAL STATEMENTS
YEAR ENDED 31 DECEMBER 2021 YEAR ENDED 31 DECEMBER 2021
4 PROPERTY, PLANT AND EQUIPMENT
Note
Freehold land and
buildings
Leasehold land and
buildings
Freehold andleasehold
propertiesunder
development
Furniture,fittings,
plant andequipment andimprovements
Renovation-in-progress
Right-of-use assets Total
$’000 $’000 $’000 $’000 $’000 $’000 $’000
Group
Cost At 1 January 2020 4,155,535 1,662,335 110,766 1,780,448 39,816 277,464 8,026,364Additions 5,385 3,301 185,697 63,883 15,439 61,174 334,879Disposal/Written off (26,844) – – (4,069) – (797) (31,710)Reclassifications 9,182 (1,769) (607) 19,686 (26,492) – –Transfer to assets held for sale (89,109) – – (18,959) (647) – (108,715)Translation differences on consolidation 35,709 8,596 3,355 23,645 532 6,499 78,336At 31 December 2020 4,089,858 1,672,463 299,211 1,864,634 28,648 344,340 8,299,154
At 1 January 2021 4,089,858 1,672,463 299,211 1,864,634 28,648 344,340 8,299,154Acquisition of subsidiaries 39 – 21,184 – 120 – – 21,304Additions 3,597 1,319 70,530 47,383 22,601 27,619 173,049Disposal/Written off (14,583) – (8,752) (19,390) – (10,082) (52,807)Reclassifications 2.299 (116) – 5,850 (8,033) – –Transfer from investment properties 5 36,527 (1,443) – 25,318 – – 60,402Transfer to assets held for sale (334,443) – – (82,744) – – (417,187)Translation differences on consolidation (1,085) 14,078 4,437 15,757 35 6,459 39,681At 31 December 2021 3,782,170 1,707,485 365,426 1,856,928 43,251 368,336 8,123,596
Accumulated depreciation and impairment losses
At 1 January 2020 1,035,809 361,939 3,717 1,142,297 – 20,235 2,563,997Charge for the year 27,877 25,891 – 107,280 – 22,164 183,212Disposal/Written off (15,238) – – (3,418) – (742) (19,398)Reclassifications (13,764) 13,805 – (41) – – –Transfer to assets held for sale (53,506) – – (10,305) – – (63,811)Impairment losses (net) 58,355 22,733 – 5,677 – 752 87,517Translation differences on consolidation 6,288 (3,148) (75) 17,769 – 1,119 21,953At 31 December 2020 1,045,821 421,220 3,642 1,259,259 – 43,528 2,773,470
At 1 January 2021 1,045,821 421,220 3,642 1,259,259 – 43,528 2,773,470Charge for the year 25,763 23,834 – 105,888 – 22,553 178,038Disposal/Written off (14,583) – – (15,916) – (7,948) (38,447)Reclassifications 39,860 – – (39,860) – – –Transfers from investment properties 5 375 (445) – 12,825 – – 12,755Transfer to assets held for sale (36,439) – – (65,688) – – (102,127)Impairment losses reversed (net) (75,356) (15,311) – (4,044) – (664) (95,375)Translation differences on consolidation 11,613 9,904 73 11,233 – 624 33,447At 31 December 2021 997,054 439,202 3,715 1,263,697 – 58,093 2,761,761
Carrying amountsAt 1 January 2020 3,119,726 1,300,396 107,049 638,151 39,816 257,229 5,462,367At 31 December 2020 3,044,037 1,251,243 295,569 605,375 28,648 300,812 5,525,684At 31 December 2021 2,785,116 1,268,283 361,711 593,231 43,251 310,243 5,361,835
4 PROPERTY, PLANT AND EQUIPMENT (CONT’D)
Freehold land
Furniture,fittings andequipment
Right-of-useassets Total
$’000 $’000 $’000 $’000
Company
CostAt 1 January 2020 2,570 34,411 32,293 69,274Additions – 3,615 – 3,615Disposal/Written off – (429) – (429)At 31 December 2020 2,570 37,597 32,293 72,460
At 1 January 2021 2,570 37,597 32,293 72,460Additions – 4,255 1,942 6,197Disposal/Written off – (5,595) – (5,595)At 31 December 2021 2,570 36,257 34,235 73,062
Accumulated depreciation At 1 January 2020 – 19,465 6,132 25,597Charge for the year – 3,716 6,132 9,848Disposal/Written off – (424) – (424)At 31 December 2020 – 22,757 12,264 35,021Charge for the year – 4,749 6,267 11,016Disposal/Written off – (5,518) – (5,518)At 31 December 2021 – 21,988 18,531 40,519
Carrying amountsAt 1 January 2020 2,570 14,946 26,161 43,677At 31 December 2020 2,570 14,840 20,029 37,439At 31 December 2021 2,570 14,269 15,704 32,543
Right-of-use assets classified within property, plant and equipment
Leaseholdland and
buildings
Furniture,fittings,
plant andequipment andimprovements Total
$’000 $’000 $’000
GroupBalance at 1 January 2020 251,179 6,050 257,229Depreciation charge for the year (20,691) (1,473) (22,164)Additions to right-of-use assets 60,884 290 61,174Impairment loss (752) – (752)Disposal/written off (50) (5) (55)Translation differences on consolidation 5,437 (57) 5,380Balance at 31 December 2020 296,007 4,805 300,812
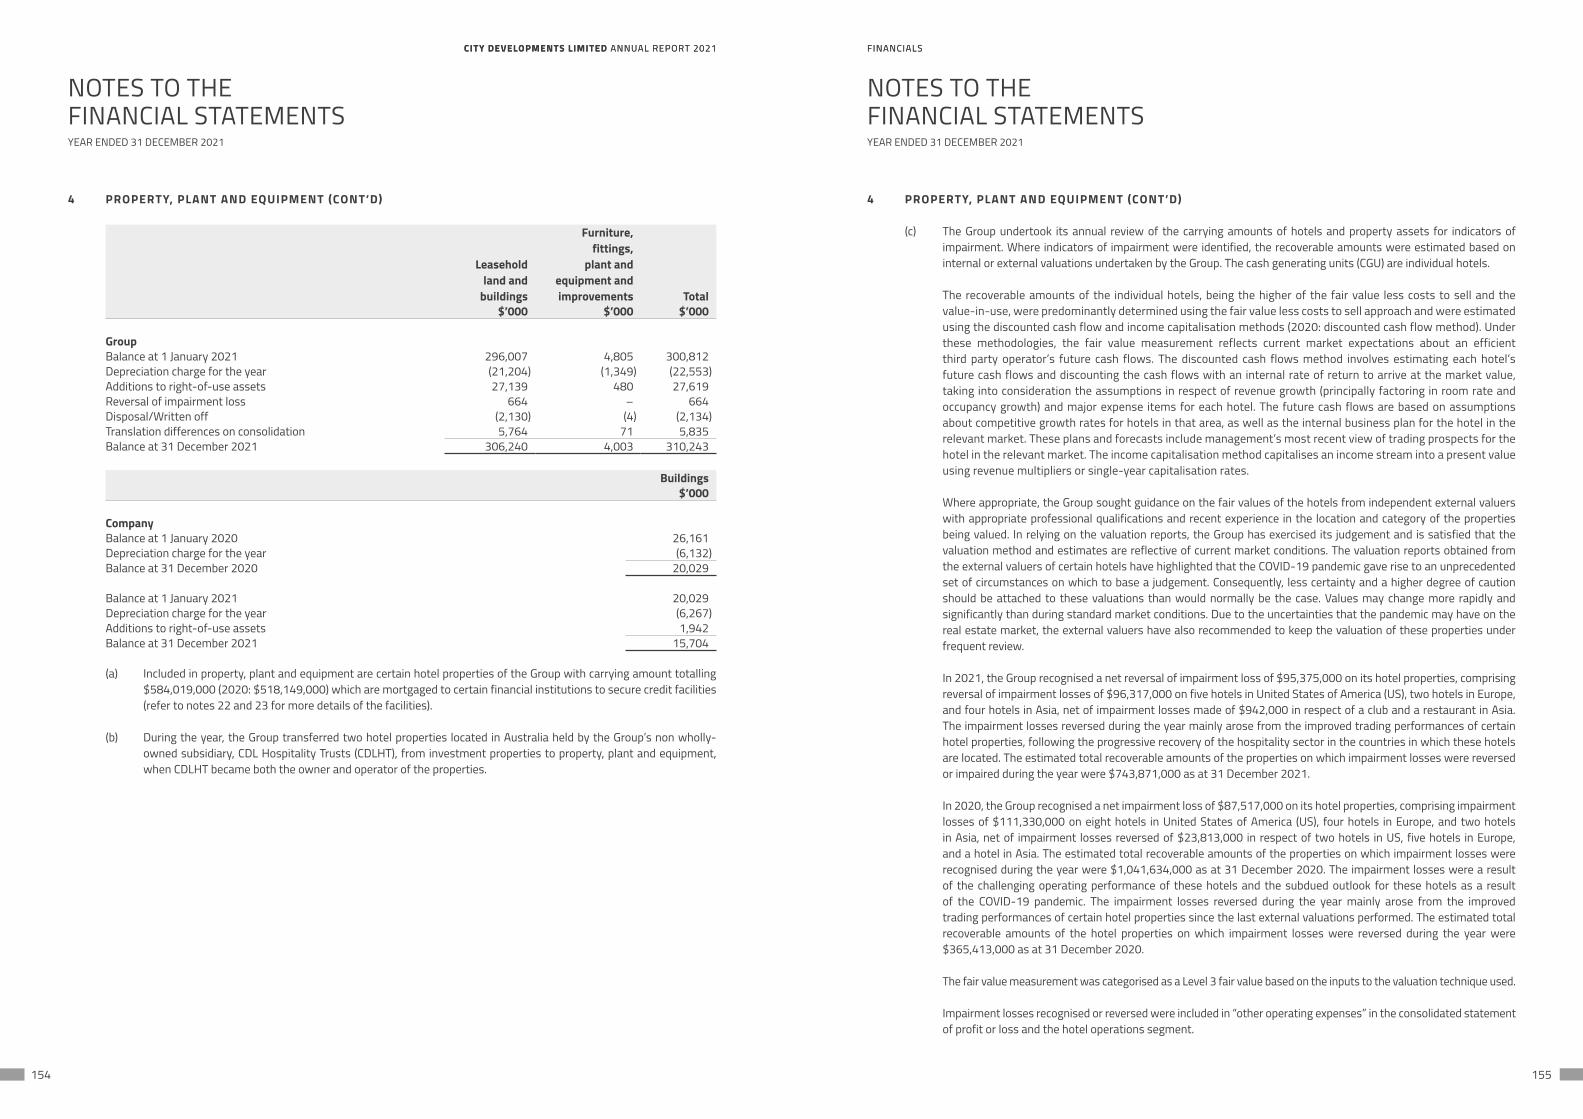
CITY DEVELOPMENTS LIMITED ANNUAL REPORT 2021 FINANCIALSCITY DEVELOPMENTS LIMITED ANNUAL REPORT 2021 FINANCIALS
154 155
NOTES TO THEFINANCIAL STATEMENTS
NOTES TO THEFINANCIAL STATEMENTS
YEAR ENDED 31 DECEMBER 2021 YEAR ENDED 31 DECEMBER 2021
4 PROPERTY, PLANT AND EQUIPMENT (CONT’D)
Leaseholdland and
buildings
Furniture,fittings,
plant andequipment andimprovements Total
$’000 $’000 $’000
GroupBalance at 1 January 2021 296,007 4,805 300,812Depreciation charge for the year (21,204) (1,349) (22,553)Additions to right-of-use assets 27,139 480 27,619Reversal of impairment loss 664 – 664Disposal/Written off (2,130) (4) (2,134)Translation differences on consolidation 5,764 71 5,835Balance at 31 December 2021 306,240 4,003 310,243
Buildings$’000
CompanyBalance at 1 January 2020 26,161Depreciation charge for the year (6,132)Balance at 31 December 2020 20,029
Balance at 1 January 2021 20,029Depreciation charge for the year (6,267)Additions to right-of-use assets 1,942Balance at 31 December 2021 15,704
(a) Included in property, plant and equipment are certain hotel properties of the Group with carrying amount totalling $584,019,000 (2020: $518,149,000) which are mortgaged to certain financial institutions to secure credit facilities (refer to notes 22 and 23 for more details of the facilities).
(b) During the year, the Group transferred two hotel properties located in Australia held by the Group’s non wholly-owned subsidiary, CDL Hospitality Trusts (CDLHT), from investment properties to property, plant and equipment, when CDLHT became both the owner and operator of the properties.
4 PROPERTY, PLANT AND EQUIPMENT (CONT’D)
(c) The Group undertook its annual review of the carrying amounts of hotels and property assets for indicators of impairment. Where indicators of impairment were identified, the recoverable amounts were estimated based on internal or external valuations undertaken by the Group. The cash generating units (CGU) are individual hotels.
The recoverable amounts of the individual hotels, being the higher of the fair value less costs to sell and the value-in-use, were predominantly determined using the fair value less costs to sell approach and were estimated using the discounted cash flow and income capitalisation methods (2020: discounted cash flow method). Under these methodologies, the fair value measurement reflects current market expectations about an efficient third party operator’s future cash flows. The discounted cash flows method involves estimating each hotel’s future cash flows and discounting the cash flows with an internal rate of return to arrive at the market value, taking into consideration the assumptions in respect of revenue growth (principally factoring in room rate and occupancy growth) and major expense items for each hotel. The future cash flows are based on assumptions about competitive growth rates for hotels in that area, as well as the internal business plan for the hotel in the relevant market. These plans and forecasts include management’s most recent view of trading prospects for the hotel in the relevant market. The income capitalisation method capitalises an income stream into a present value using revenue multipliers or single-year capitalisation rates.
Where appropriate, the Group sought guidance on the fair values of the hotels from independent external valuers with appropriate professional qualifications and recent experience in the location and category of the properties being valued. In relying on the valuation reports, the Group has exercised its judgement and is satisfied that the valuation method and estimates are reflective of current market conditions. The valuation reports obtained from the external valuers of certain hotels have highlighted that the COVID-19 pandemic gave rise to an unprecedented set of circumstances on which to base a judgement. Consequently, less certainty and a higher degree of caution should be attached to these valuations than would normally be the case. Values may change more rapidly and significantly than during standard market conditions. Due to the uncertainties that the pandemic may have on the real estate market, the external valuers have also recommended to keep the valuation of these properties under frequent review.
In 2021, the Group recognised a net reversal of impairment loss of $95,375,000 on its hotel properties, comprising reversal of impairment losses of $96,317,000 on five hotels in United States of America (US), two hotels in Europe, and four hotels in Asia, net of impairment losses made of $942,000 in respect of a club and a restaurant in Asia. The impairment losses reversed during the year mainly arose from the improved trading performances of certain hotel properties, following the progressive recovery of the hospitality sector in the countries in which these hotels are located. The estimated total recoverable amounts of the properties on which impairment losses were reversed or impaired during the year were $743,871,000 as at 31 December 2021.
In 2020, the Group recognised a net impairment loss of $87,517,000 on its hotel properties, comprising impairment losses of $111,330,000 on eight hotels in United States of America (US), four hotels in Europe, and two hotels in Asia, net of impairment losses reversed of $23,813,000 in respect of two hotels in US, five hotels in Europe, and a hotel in Asia. The estimated total recoverable amounts of the properties on which impairment losses were recognised during the year were $1,041,634,000 as at 31 December 2020. The impairment losses were a result of the challenging operating performance of these hotels and the subdued outlook for these hotels as a result of the COVID-19 pandemic. The impairment losses reversed during the year mainly arose from the improved trading performances of certain hotel properties since the last external valuations performed. The estimated total recoverable amounts of the hotel properties on which impairment losses were reversed during the year were $365,413,000 as at 31 December 2020.
The fair value measurement was categorised as a Level 3 fair value based on the inputs to the valuation technique used.
Impairment losses recognised or reversed were included in “other operating expenses” in the consolidated statement of profit or loss and the hotel operations segment.
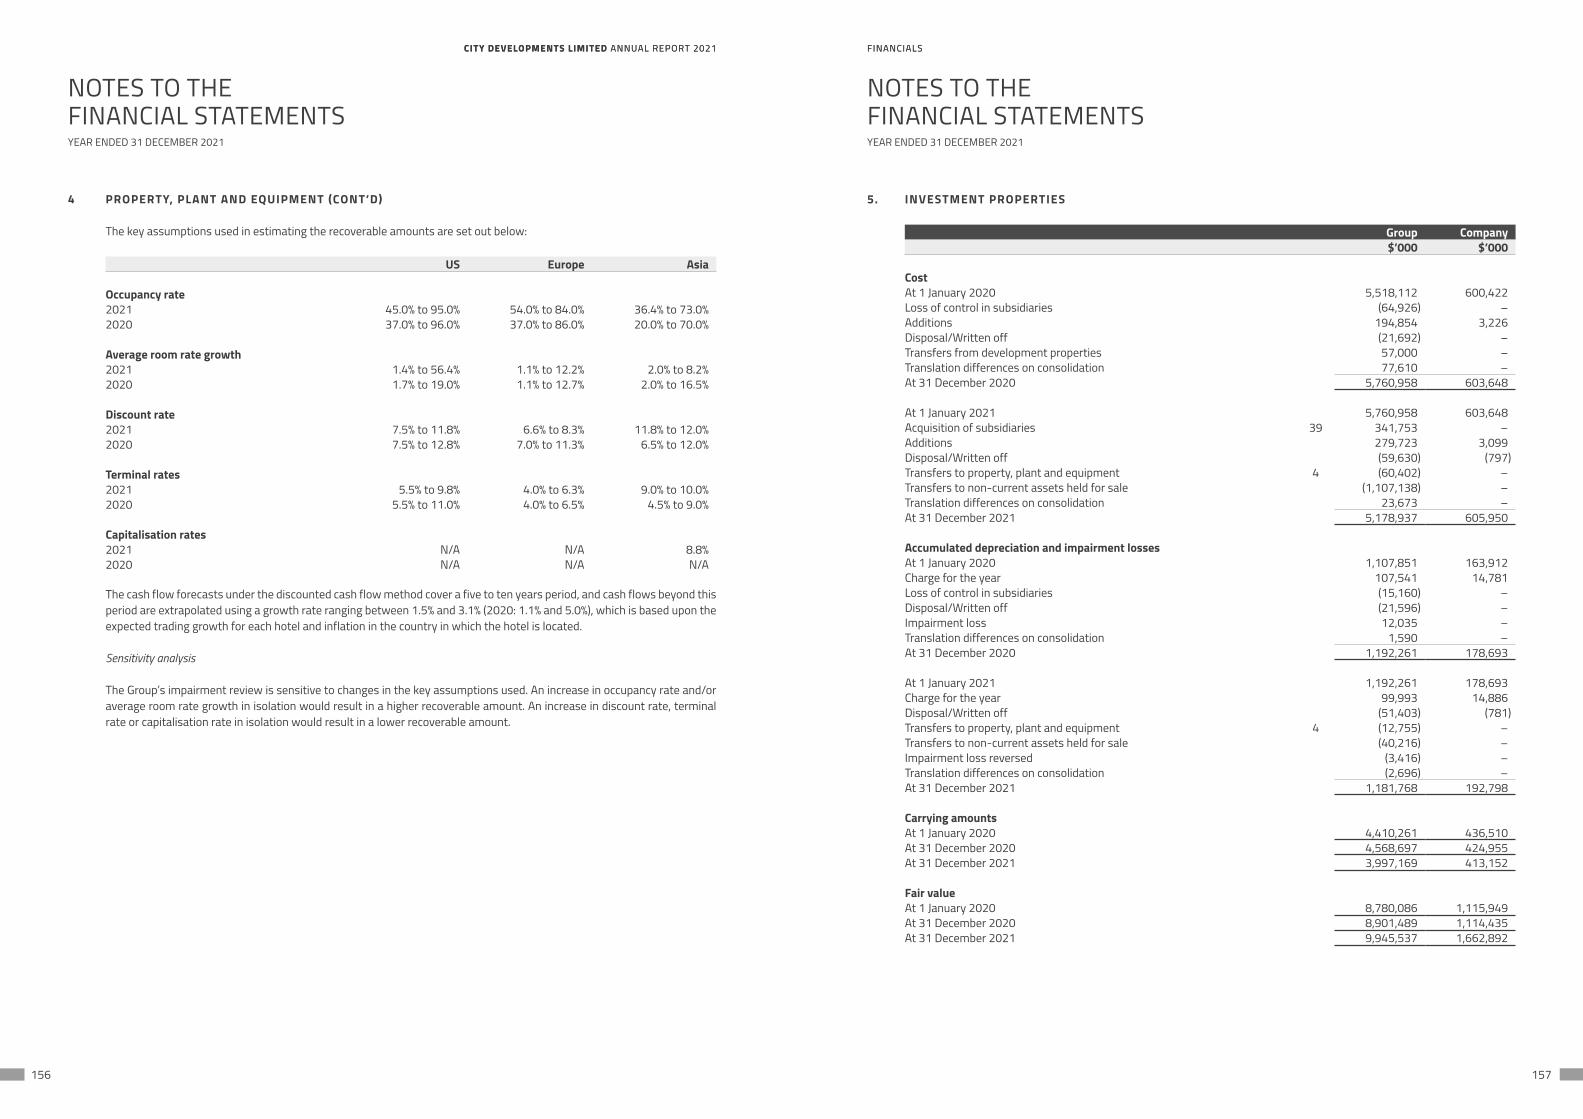
CITY DEVELOPMENTS LIMITED ANNUAL REPORT 2021 FINANCIALSCITY DEVELOPMENTS LIMITED ANNUAL REPORT 2021 FINANCIALS
156 157
NOTES TO THEFINANCIAL STATEMENTS
NOTES TO THEFINANCIAL STATEMENTS
YEAR ENDED 31 DECEMBER 2021 YEAR ENDED 31 DECEMBER 2021
4 PROPERTY, PLANT AND EQUIPMENT (CONT’D)
The key assumptions used in estimating the recoverable amounts are set out below:
US Europe Asia
Occupancy rate2021 45.0% to 95.0% 54.0% to 84.0% 36.4% to 73.0%2020 37.0% to 96.0% 37.0% to 86.0% 20.0% to 70.0%
Average room rate growth2021 1.4% to 56.4% 1.1% to 12.2% 2.0% to 8.2%2020 1.7% to 19.0% 1.1% to 12.7% 2.0% to 16.5%
Discount rate2021 7.5% to 11.8% 6.6% to 8.3% 11.8% to 12.0%2020 7.5% to 12.8% 7.0% to 11.3% 6.5% to 12.0%
Terminal rates2021 5.5% to 9.8% 4.0% to 6.3% 9.0% to 10.0%2020 5.5% to 11.0% 4.0% to 6.5% 4.5% to 9.0%
Capitalisation rates2021 N/A N/A 8.8%2020 N/A N/A N/A
The cash flow forecasts under the discounted cash flow method cover a five to ten years period, and cash flows beyond this period are extrapolated using a growth rate ranging between 1.5% and 3.1% (2020: 1.1% and 5.0%), which is based upon the expected trading growth for each hotel and inflation in the country in which the hotel is located.
Sensitivity analysis
The Group’s impairment review is sensitive to changes in the key assumptions used. An increase in occupancy rate and/or average room rate growth in isolation would result in a higher recoverable amount. An increase in discount rate, terminal rate or capitalisation rate in isolation would result in a lower recoverable amount.
5. INVESTMENT PROPERTIES
Group Company$’000 $’000
CostAt 1 January 2020 5,518,112 600,422Loss of control in subsidiaries (64,926) –Additions 194,854 3,226Disposal/Written off (21,692) –Transfers from development properties 57,000 –Translation differences on consolidation 77,610 –At 31 December 2020 5,760,958 603,648
At 1 January 2021 5,760,958 603,648Acquisition of subsidiaries 39 341,753 –Additions 279,723 3,099Disposal/Written off (59,630) (797)Transfers to property, plant and equipment 4 (60,402) –Transfers to non-current assets held for sale (1,107,138) –Translation differences on consolidation 23,673 –At 31 December 2021 5,178,937 605,950
Accumulated depreciation and impairment lossesAt 1 January 2020 1,107,851 163,912Charge for the year 107,541 14,781Loss of control in subsidiaries (15,160) –Disposal/Written off (21,596) –Impairment loss 12,035 –Translation differences on consolidation 1,590 –At 31 December 2020 1,192,261 178,693
At 1 January 2021 1,192,261 178,693Charge for the year 99,993 14,886Disposal/Written off (51,403) (781)Transfers to property, plant and equipment 4 (12,755) –Transfers to non-current assets held for sale (40,216) –Impairment loss reversed (3,416) –Translation differences on consolidation (2,696) –At 31 December 2021 1,181,768 192,798
Carrying amountsAt 1 January 2020 4,410,261 436,510At 31 December 2020 4,568,697 424,955At 31 December 2021 3,997,169 413,152
Fair valueAt 1 January 2020 8,780,086 1,115,949At 31 December 2020 8,901,489 1,114,435At 31 December 2021 9,945,537 1,662,892
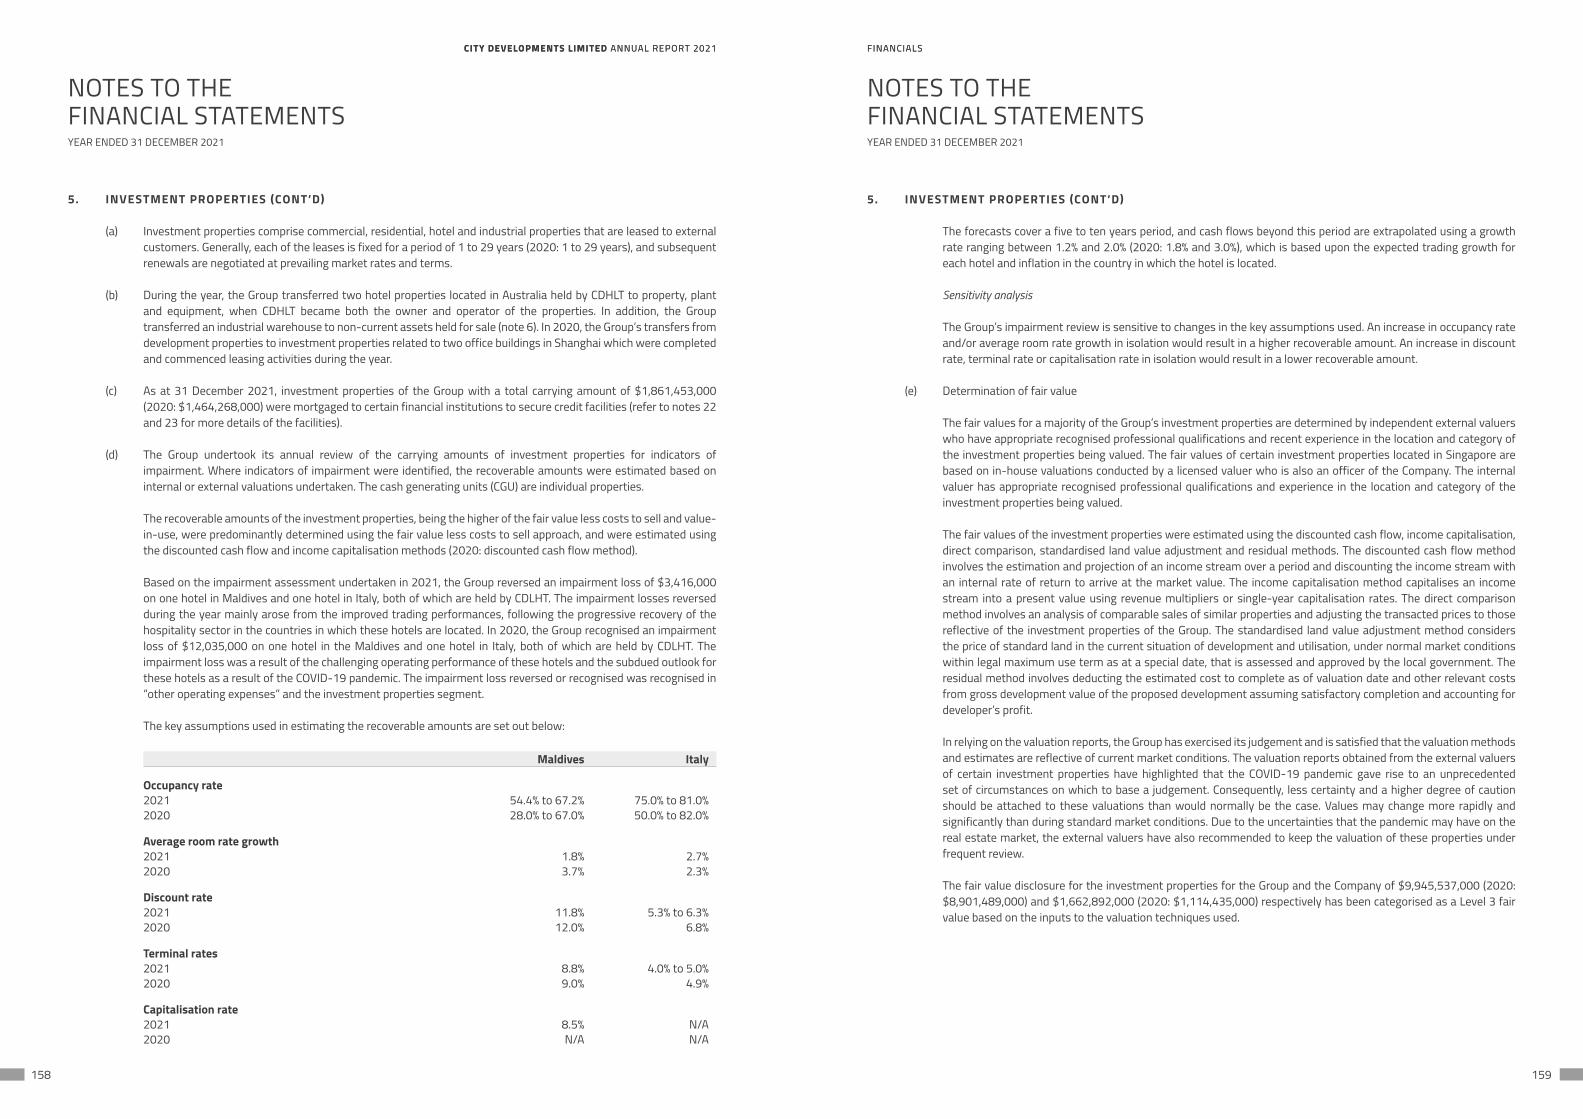
CITY DEVELOPMENTS LIMITED ANNUAL REPORT 2021 FINANCIALSCITY DEVELOPMENTS LIMITED ANNUAL REPORT 2021 FINANCIALS
158 159
NOTES TO THEFINANCIAL STATEMENTS
NOTES TO THEFINANCIAL STATEMENTS
YEAR ENDED 31 DECEMBER 2021 YEAR ENDED 31 DECEMBER 2021
5. INVESTMENT PROPERTIES (CONT’D)
(a) Investment properties comprise commercial, residential, hotel and industrial properties that are leased to external customers. Generally, each of the leases is fixed for a period of 1 to 29 years (2020: 1 to 29 years), and subsequent renewals are negotiated at prevailing market rates and terms.
(b) During the year, the Group transferred two hotel properties located in Australia held by CDHLT to property, plant and equipment, when CDHLT became both the owner and operator of the properties. In addition, the Group transferred an industrial warehouse to non-current assets held for sale (note 6). In 2020, the Group’s transfers from development properties to investment properties related to two office buildings in Shanghai which were completed and commenced leasing activities during the year.
(c) As at 31 December 2021, investment properties of the Group with a total carrying amount of $1,861,453,000 (2020: $1,464,268,000) were mortgaged to certain financial institutions to secure credit facilities (refer to notes 22 and 23 for more details of the facilities).
(d) The Group undertook its annual review of the carrying amounts of investment properties for indicators of impairment. Where indicators of impairment were identified, the recoverable amounts were estimated based on internal or external valuations undertaken. The cash generating units (CGU) are individual properties.
The recoverable amounts of the investment properties, being the higher of the fair value less costs to sell and value-in-use, were predominantly determined using the fair value less costs to sell approach, and were estimated using the discounted cash flow and income capitalisation methods (2020: discounted cash flow method).
Based on the impairment assessment undertaken in 2021, the Group reversed an impairment loss of $3,416,000 on one hotel in Maldives and one hotel in Italy, both of which are held by CDLHT. The impairment losses reversed during the year mainly arose from the improved trading performances, following the progressive recovery of the hospitality sector in the countries in which these hotels are located. In 2020, the Group recognised an impairment loss of $12,035,000 on one hotel in the Maldives and one hotel in Italy, both of which are held by CDLHT. The impairment loss was a result of the challenging operating performance of these hotels and the subdued outlook for these hotels as a result of the COVID-19 pandemic. The impairment loss reversed or recognised was recognised in “other operating expenses” and the investment properties segment.
The key assumptions used in estimating the recoverable amounts are set out below:
Maldives Italy
Occupancy rate2021 54.4% to 67.2% 75.0% to 81.0%2020 28.0% to 67.0% 50.0% to 82.0%
Average room rate growth2021 1.8% 2.7%2020 3.7% 2.3%
Discount rate2021 11.8% 5.3% to 6.3%2020 12.0% 6.8%
Terminal rates2021 8.8% 4.0% to 5.0%2020 9.0% 4.9%
Capitalisation rate2021 8.5% N/A2020 N/A N/A
5. INVESTMENT PROPERTIES (CONT’D)
The forecasts cover a five to ten years period, and cash flows beyond this period are extrapolated using a growth rate ranging between 1.2% and 2.0% (2020: 1.8% and 3.0%), which is based upon the expected trading growth for each hotel and inflation in the country in which the hotel is located.
Sensitivity analysis
The Group’s impairment review is sensitive to changes in the key assumptions used. An increase in occupancy rate and/or average room rate growth in isolation would result in a higher recoverable amount. An increase in discount rate, terminal rate or capitalisation rate in isolation would result in a lower recoverable amount.
(e) Determination of fair value
The fair values for a majority of the Group’s investment properties are determined by independent external valuers who have appropriate recognised professional qualifications and recent experience in the location and category of the investment properties being valued. The fair values of certain investment properties located in Singapore are based on in-house valuations conducted by a licensed valuer who is also an officer of the Company. The internal valuer has appropriate recognised professional qualifications and experience in the location and category of the investment properties being valued.
The fair values of the investment properties were estimated using the discounted cash flow, income capitalisation, direct comparison, standardised land value adjustment and residual methods. The discounted cash flow method involves the estimation and projection of an income stream over a period and discounting the income stream with an internal rate of return to arrive at the market value. The income capitalisation method capitalises an income stream into a present value using revenue multipliers or single-year capitalisation rates. The direct comparison method involves an analysis of comparable sales of similar properties and adjusting the transacted prices to those reflective of the investment properties of the Group. The standardised land value adjustment method considers the price of standard land in the current situation of development and utilisation, under normal market conditions within legal maximum use term as at a special date, that is assessed and approved by the local government. The residual method involves deducting the estimated cost to complete as of valuation date and other relevant costs from gross development value of the proposed development assuming satisfactory completion and accounting for developer’s profit.
In relying on the valuation reports, the Group has exercised its judgement and is satisfied that the valuation methods and estimates are reflective of current market conditions. The valuation reports obtained from the external valuers of certain investment properties have highlighted that the COVID-19 pandemic gave rise to an unprecedented set of circumstances on which to base a judgement. Consequently, less certainty and a higher degree of caution should be attached to these valuations than would normally be the case. Values may change more rapidly and significantly than during standard market conditions. Due to the uncertainties that the pandemic may have on the real estate market, the external valuers have also recommended to keep the valuation of these properties under frequent review.
The fair value disclosure for the investment properties for the Group and the Company of $9,945,537,000 (2020: $8,901,489,000) and $1,662,892,000 (2020: $1,114,435,000) respectively has been categorised as a Level 3 fair value based on the inputs to the valuation techniques used.
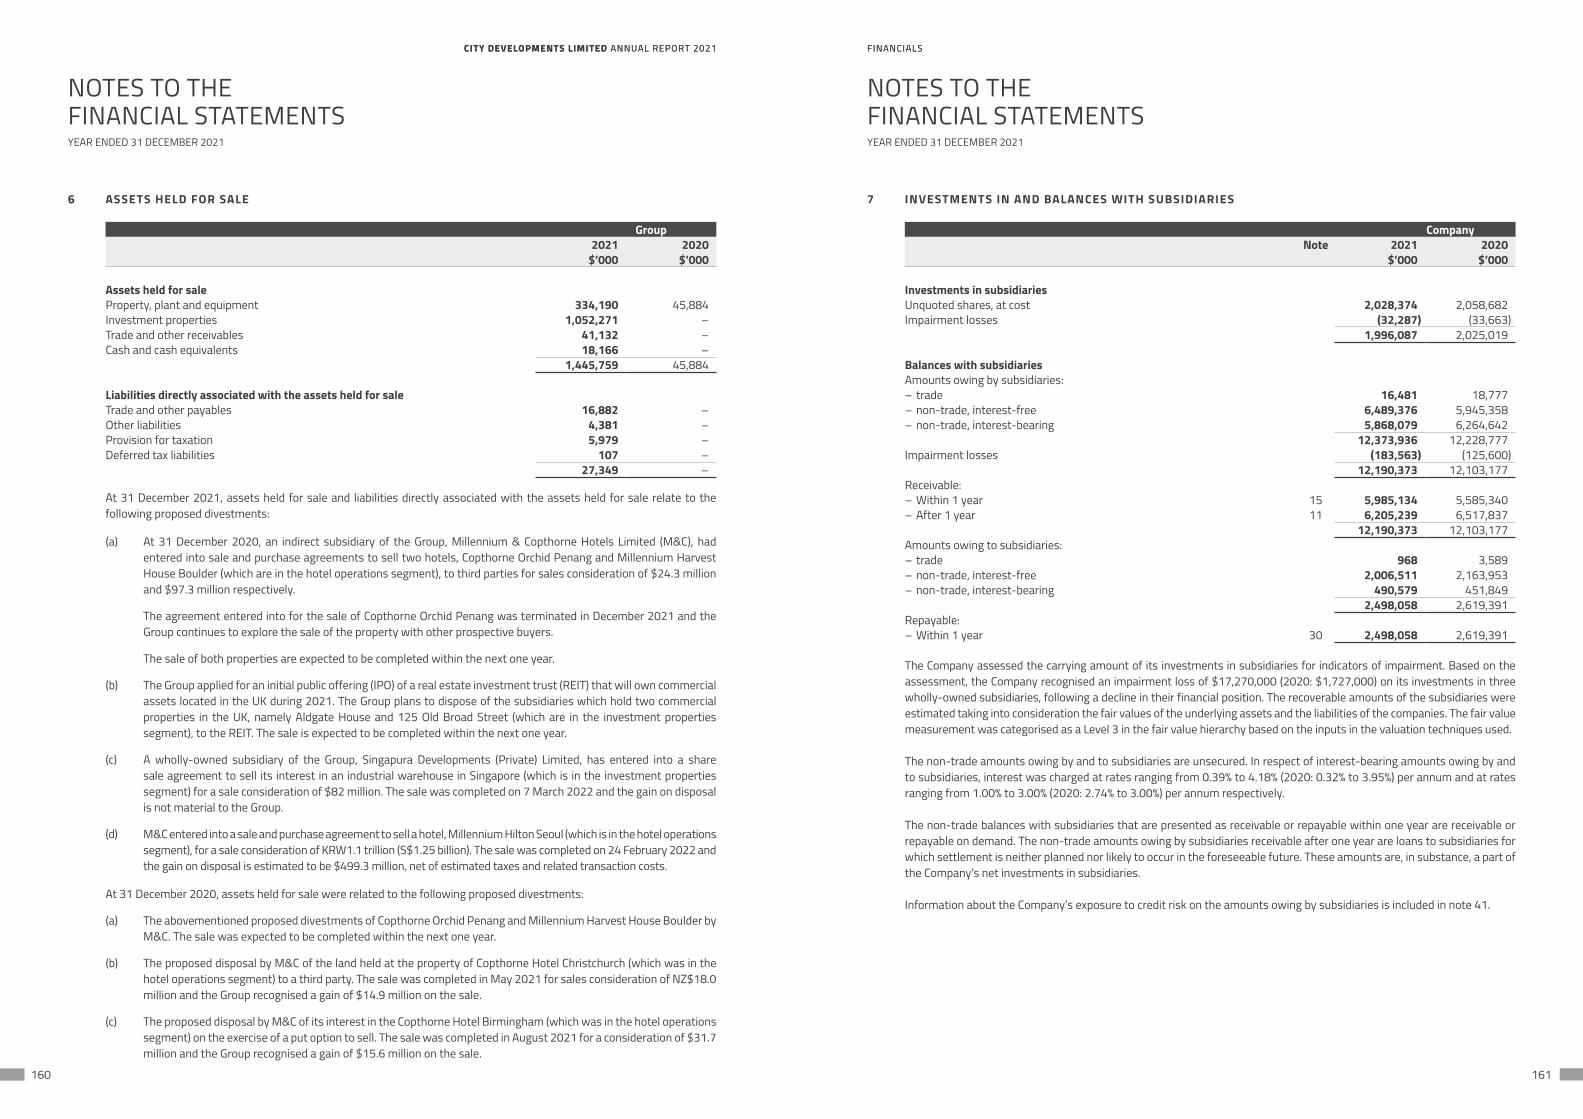
CITY DEVELOPMENTS LIMITED ANNUAL REPORT 2021 FINANCIALSCITY DEVELOPMENTS LIMITED ANNUAL REPORT 2021 FINANCIALS
160 161
NOTES TO THEFINANCIAL STATEMENTS
NOTES TO THEFINANCIAL STATEMENTS
YEAR ENDED 31 DECEMBER 2021 YEAR ENDED 31 DECEMBER 2021
6 ASSETS HELD FOR SALE
Group2021 2020
$’000 $’000
Assets held for saleProperty, plant and equipment 334,190 45,884Investment properties 1,052,271 –Trade and other receivables 41,132 –Cash and cash equivalents 18,166 –
1,445,759 45,884
Liabilities directly associated with the assets held for saleTrade and other payables 16,882 –Other liabilities 4,381 –Provision for taxation 5,979 –Deferred tax liabilities 107 –
27,349 –
At 31 December 2021, assets held for sale and liabilities directly associated with the assets held for sale relate to the following proposed divestments:
(a) At 31 December 2020, an indirect subsidiary of the Group, Millennium & Copthorne Hotels Limited (M&C), had entered into sale and purchase agreements to sell two hotels, Copthorne Orchid Penang and Millennium Harvest House Boulder (which are in the hotel operations segment), to third parties for sales consideration of $24.3 million and $97.3 million respectively.
The agreement entered into for the sale of Copthorne Orchid Penang was terminated in December 2021 and the Group continues to explore the sale of the property with other prospective buyers.
The sale of both properties are expected to be completed within the next one year.
(b) The Group applied for an initial public offering (IPO) of a real estate investment trust (REIT) that will own commercial assets located in the UK during 2021. The Group plans to dispose of the subsidiaries which hold two commercial properties in the UK, namely Aldgate House and 125 Old Broad Street (which are in the investment properties segment), to the REIT. The sale is expected to be completed within the next one year.
(c) A wholly-owned subsidiary of the Group, Singapura Developments (Private) Limited, has entered into a share sale agreement to sell its interest in an industrial warehouse in Singapore (which is in the investment properties segment) for a sale consideration of $82 million. The sale was completed on 7 March 2022 and the gain on disposal is not material to the Group.
(d) M&C entered into a sale and purchase agreement to sell a hotel, Millennium Hilton Seoul (which is in the hotel operations segment), for a sale consideration of KRW1.1 trillion (S$1.25 billion). The sale was completed on 24 February 2022 and the gain on disposal is estimated to be $499.3 million, net of estimated taxes and related transaction costs.
At 31 December 2020, assets held for sale were related to the following proposed divestments:
(a) The abovementioned proposed divestments of Copthorne Orchid Penang and Millennium Harvest House Boulder by M&C. The sale was expected to be completed within the next one year.
(b) The proposed disposal by M&C of the land held at the property of Copthorne Hotel Christchurch (which was in the hotel operations segment) to a third party. The sale was completed in May 2021 for sales consideration of NZ$18.0 million and the Group recognised a gain of $14.9 million on the sale.
(c) The proposed disposal by M&C of its interest in the Copthorne Hotel Birmingham (which was in the hotel operations segment) on the exercise of a put option to sell. The sale was completed in August 2021 for a consideration of $31.7 million and the Group recognised a gain of $15.6 million on the sale.
7 INVESTMENTS IN AND BALANCES WITH SUBSIDIARIES
CompanyNote 2021 2020
$’000 $’000
Investments in subsidiariesUnquoted shares, at cost 2,028,374 2,058,682Impairment losses (32,287) (33,663)
1,996,087 2,025,019
Balances with subsidiariesAmounts owing by subsidiaries:– trade 16,481 18,777– non-trade, interest-free 6,489,376 5,945,358– non-trade, interest-bearing 5,868,079 6,264,642
12,373,936 12,228,777Impairment losses (183,563) (125,600)
12,190,373 12,103,177Receivable:– Within 1 year 15 5,985,134 5,585,340– After 1 year 11 6,205,239 6,517,837
12,190,373 12,103,177Amounts owing to subsidiaries:– trade 968 3,589– non-trade, interest-free 2,006,511 2,163,953– non-trade, interest-bearing 490,579 451,849
2,498,058 2,619,391Repayable:– Within 1 year 30 2,498,058 2,619,391
The Company assessed the carrying amount of its investments in subsidiaries for indicators of impairment. Based on the assessment, the Company recognised an impairment loss of $17,270,000 (2020: $1,727,000) on its investments in three wholly-owned subsidiaries, following a decline in their financial position. The recoverable amounts of the subsidiaries were estimated taking into consideration the fair values of the underlying assets and the liabilities of the companies. The fair value measurement was categorised as a Level 3 in the fair value hierarchy based on the inputs in the valuation techniques used.
The non-trade amounts owing by and to subsidiaries are unsecured. In respect of interest-bearing amounts owing by and to subsidiaries, interest was charged at rates ranging from 0.39% to 4.18% (2020: 0.32% to 3.95%) per annum and at rates ranging from 1.00% to 3.00% (2020: 2.74% to 3.00%) per annum respectively.
The non-trade balances with subsidiaries that are presented as receivable or repayable within one year are receivable or repayable on demand. The non-trade amounts owing by subsidiaries receivable after one year are loans to subsidiaries for which settlement is neither planned nor likely to occur in the foreseeable future. These amounts are, in substance, a part of the Company’s net investments in subsidiaries.
Information about the Company’s exposure to credit risk on the amounts owing by subsidiaries is included in note 41.
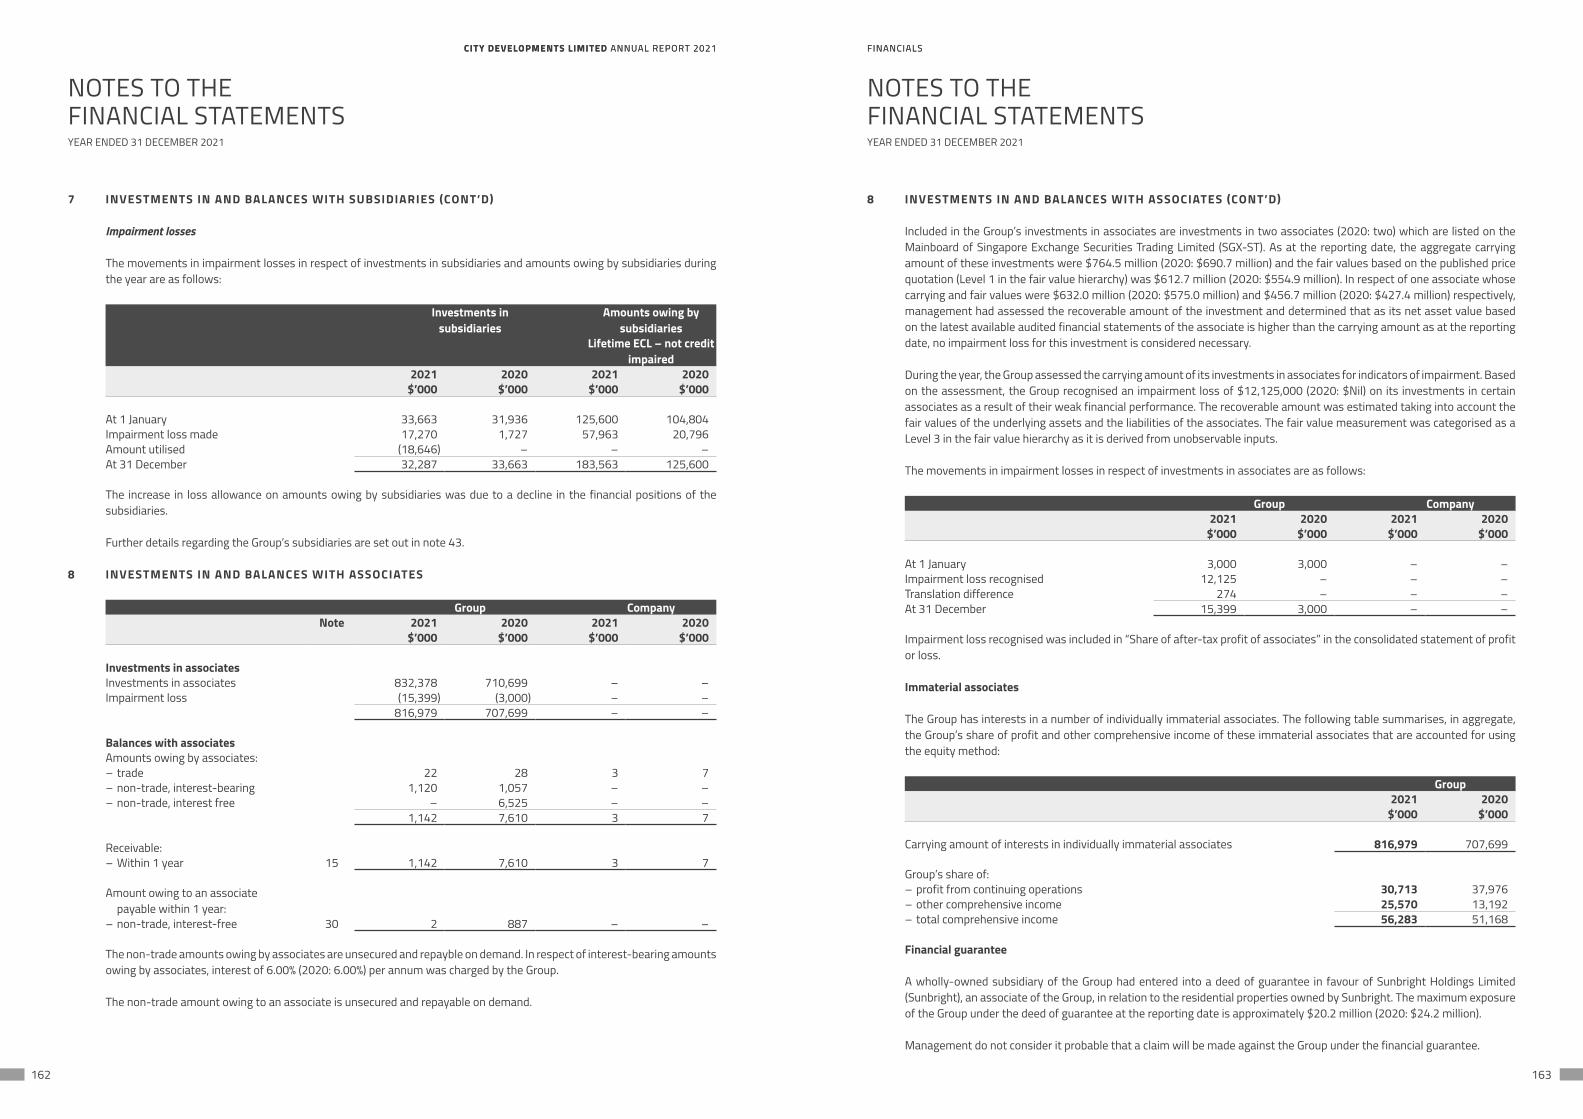
CITY DEVELOPMENTS LIMITED ANNUAL REPORT 2021 FINANCIALSCITY DEVELOPMENTS LIMITED ANNUAL REPORT 2021 FINANCIALS
162 163
NOTES TO THEFINANCIAL STATEMENTS
NOTES TO THEFINANCIAL STATEMENTS
YEAR ENDED 31 DECEMBER 2021 YEAR ENDED 31 DECEMBER 2021
7 INVESTMENTS IN AND BALANCES WITH SUBSIDIARIES (CONT’D)
Impairment losses
The movements in impairment losses in respect of investments in subsidiaries and amounts owing by subsidiaries during the year are as follows:
Investments in subsidiaries
Amounts owing bysubsidiaries
Lifetime ECL – not credit impaired
2021 2020 2021 2020$’000 $’000 $’000 $’000
At 1 January 33,663 31,936 125,600 104,804Impairment loss made 17,270 1,727 57,963 20,796Amount utilised (18,646) – – –At 31 December 32,287 33,663 183,563 125,600
The increase in loss allowance on amounts owing by subsidiaries was due to a decline in the financial positions of the subsidiaries.
Further details regarding the Group’s subsidiaries are set out in note 43.
8 INVESTMENTS IN AND BALANCES WITH ASSOCIATES
Group CompanyNote 2021 2020 2021 2020
$’000 $’000 $’000 $’000
Investments in associatesInvestments in associates 832,378 710,699 – –Impairment loss (15,399) (3,000) – –
816,979 707,699 – –
Balances with associatesAmounts owing by associates:– trade 22 28 3 7– non-trade, interest-bearing 1,120 1,057 – –– non-trade, interest free – 6,525 – –
1,142 7,610 3 7
Receivable:– Within 1 year 15 1,142 7,610 3 7
Amount owing to an associate payable within 1 year:
– non-trade, interest-free 30 2 887 – –
The non-trade amounts owing by associates are unsecured and repayble on demand. In respect of interest-bearing amounts owing by associates, interest of 6.00% (2020: 6.00%) per annum was charged by the Group.
The non-trade amount owing to an associate is unsecured and repayable on demand.
8 INVESTMENTS IN AND BALANCES WITH ASSOCIATES (CONT’D)
Included in the Group’s investments in associates are investments in two associates (2020: two) which are listed on the Mainboard of Singapore Exchange Securities Trading Limited (SGX-ST). As at the reporting date, the aggregate carrying amount of these investments were $764.5 million (2020: $690.7 million) and the fair values based on the published price quotation (Level 1 in the fair value hierarchy) was $612.7 million (2020: $554.9 million). In respect of one associate whose carrying and fair values were $632.0 million (2020: $575.0 million) and $456.7 million (2020: $427.4 million) respectively, management had assessed the recoverable amount of the investment and determined that as its net asset value based on the latest available audited financial statements of the associate is higher than the carrying amount as at the reporting date, no impairment loss for this investment is considered necessary.
During the year, the Group assessed the carrying amount of its investments in associates for indicators of impairment. Based on the assessment, the Group recognised an impairment loss of $12,125,000 (2020: $Nil) on its investments in certain associates as a result of their weak financial performance. The recoverable amount was estimated taking into account the fair values of the underlying assets and the liabilities of the associates. The fair value measurement was categorised as a Level 3 in the fair value hierarchy as it is derived from unobservable inputs.
The movements in impairment losses in respect of investments in associates are as follows:
Group Company2021 2020 2021 2020
$’000 $’000 $’000 $’000
At 1 January 3,000 3,000 – –Impairment loss recognised 12,125 – – –Translation difference 274 – – –At 31 December 15,399 3,000 – –
Impairment loss recognised was included in “Share of after-tax profit of associates” in the consolidated statement of profit or loss.
Immaterial associates
The Group has interests in a number of individually immaterial associates. The following table summarises, in aggregate, the Group’s share of profit and other comprehensive income of these immaterial associates that are accounted for using the equity method:
Group2021 2020
$’000 $’000
Carrying amount of interests in individually immaterial associates 816,979 707,699
Group’s share of:– profit from continuing operations 30,713 37,976– other comprehensive income 25,570 13,192– total comprehensive income 56,283 51,168
Financial guarantee
A wholly-owned subsidiary of the Group had entered into a deed of guarantee in favour of Sunbright Holdings Limited (Sunbright), an associate of the Group, in relation to the residential properties owned by Sunbright. The maximum exposure of the Group under the deed of guarantee at the reporting date is approximately $20.2 million (2020: $24.2 million).
Management do not consider it probable that a claim will be made against the Group under the financial guarantee.
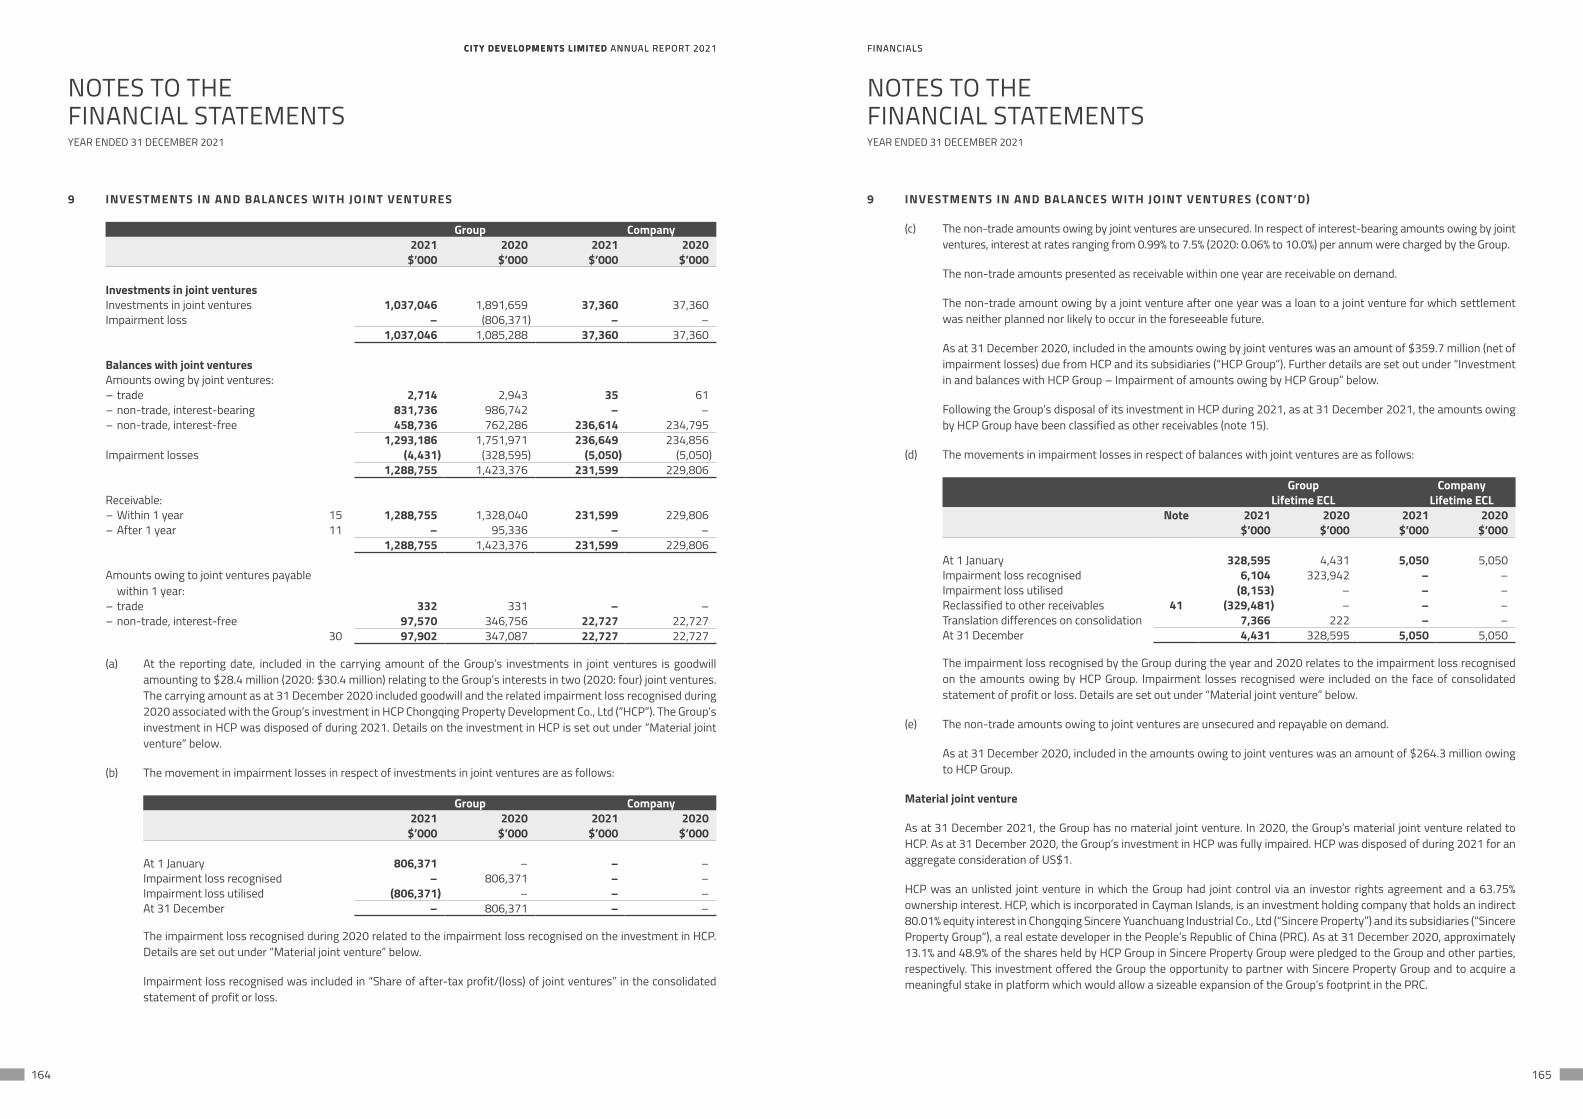
CITY DEVELOPMENTS LIMITED ANNUAL REPORT 2021 FINANCIALSCITY DEVELOPMENTS LIMITED ANNUAL REPORT 2021 FINANCIALS
164 165
NOTES TO THEFINANCIAL STATEMENTS
NOTES TO THEFINANCIAL STATEMENTS
YEAR ENDED 31 DECEMBER 2021 YEAR ENDED 31 DECEMBER 2021
9 INVESTMENTS IN AND BALANCES WITH JOINT VENTURES
Group Company2021 2020 2021 2020
$’000 $’000 $’000 $’000
Investments in joint venturesInvestments in joint ventures 1,037,046 1,891,659 37,360 37,360Impairment loss – (806,371) – –
1,037,046 1,085,288 37,360 37,360
Balances with joint venturesAmounts owing by joint ventures:– trade 2,714 2,943 35 61– non-trade, interest-bearing 831,736 986,742 – –– non-trade, interest-free 458,736 762,286 236,614 234,795
1,293,186 1,751,971 236,649 234,856Impairment losses (4,431) (328,595) (5,050) (5,050)
1,288,755 1,423,376 231,599 229,806
Receivable:– Within 1 year 15 1,288,755 1,328,040 231,599 229,806– After 1 year 11 – 95,336 – –
1,288,755 1,423,376 231,599 229,806
Amounts owing to joint ventures payable within 1 year:
– trade 332 331 – –– non-trade, interest-free 97,570 346,756 22,727 22,727
30 97,902 347,087 22,727 22,727
(a) At the reporting date, included in the carrying amount of the Group’s investments in joint ventures is goodwill amounting to $28.4 million (2020: $30.4 million) relating to the Group’s interests in two (2020: four) joint ventures. The carrying amount as at 31 December 2020 included goodwill and the related impairment loss recognised during 2020 associated with the Group’s investment in HCP Chongqing Property Development Co., Ltd (“HCP”). The Group’s investment in HCP was disposed of during 2021. Details on the investment in HCP is set out under “Material joint venture” below.
(b) The movement in impairment losses in respect of investments in joint ventures are as follows:
Group Company2021 2020 2021 2020
$’000 $’000 $’000 $’000
At 1 January 806,371 – – –Impairment loss recognised – 806,371 – –Impairment loss utilised (806,371) – – –At 31 December – 806,371 – –
The impairment loss recognised during 2020 related to the impairment loss recognised on the investment in HCP. Details are set out under “Material joint venture” below.
Impairment loss recognised was included in “Share of after-tax profit/(loss) of joint ventures” in the consolidated statement of profit or loss.
9 INVESTMENTS IN AND BALANCES WITH JOINT VENTURES (CONT’D)
(c) The non-trade amounts owing by joint ventures are unsecured. In respect of interest-bearing amounts owing by joint ventures, interest at rates ranging from 0.99% to 7.5% (2020: 0.06% to 10.0%) per annum were charged by the Group.
The non-trade amounts presented as receivable within one year are receivable on demand.
The non-trade amount owing by a joint venture after one year was a loan to a joint venture for which settlement was neither planned nor likely to occur in the foreseeable future.
As at 31 December 2020, included in the amounts owing by joint ventures was an amount of $359.7 million (net of impairment losses) due from HCP and its subsidiaries (“HCP Group”). Further details are set out under “Investment in and balances with HCP Group – Impairment of amounts owing by HCP Group” below.
Following the Group’s disposal of its investment in HCP during 2021, as at 31 December 2021, the amounts owing by HCP Group have been classified as other receivables (note 15).
(d) The movements in impairment losses in respect of balances with joint ventures are as follows:
Group CompanyLifetime ECL Lifetime ECL
Note 2021 2020 2021 2020$’000 $’000 $’000 $’000
At 1 January 328,595 4,431 5,050 5,050Impairment loss recognised 6,104 323,942 – –Impairment loss utilised (8,153) – – –Reclassified to other receivables 41 (329,481) – – –Translation differences on consolidation 7,366 222 – –At 31 December 4,431 328,595 5,050 5,050
The impairment loss recognised by the Group during the year and 2020 relates to the impairment loss recognised on the amounts owing by HCP Group. Impairment losses recognised were included on the face of consolidated statement of profit or loss. Details are set out under “Material joint venture” below.
(e) The non-trade amounts owing to joint ventures are unsecured and repayable on demand.
As at 31 December 2020, included in the amounts owing to joint ventures was an amount of $264.3 million owing to HCP Group.
Material joint venture
As at 31 December 2021, the Group has no material joint venture. In 2020, the Group’s material joint venture related to HCP. As at 31 December 2020, the Group’s investment in HCP was fully impaired. HCP was disposed of during 2021 for an aggregate consideration of US$1.
HCP was an unlisted joint venture in which the Group had joint control via an investor rights agreement and a 63.75% ownership interest. HCP, which is incorporated in Cayman Islands, is an investment holding company that holds an indirect 80.01% equity interest in Chongqing Sincere Yuanchuang Industrial Co., Ltd (“Sincere Property”) and its subsidiaries (“Sincere Property Group”), a real estate developer in the People’s Republic of China (PRC). As at 31 December 2020, approximately 13.1% and 48.9% of the shares held by HCP Group in Sincere Property Group were pledged to the Group and other parties, respectively. This investment offered the Group the opportunity to partner with Sincere Property Group and to acquire a meaningful stake in platform which would allow a sizeable expansion of the Group’s footprint in the PRC.
CITY DEVELOPMENTS LIMITED ANNUAL REPORT 2021 FINANCIALSCITY DEVELOPMENTS LIMITED ANNUAL REPORT 2021 FINANCIALS
166 167
NOTES TO THEFINANCIAL STATEMENTS
NOTES TO THEFINANCIAL STATEMENTS
YEAR ENDED 31 DECEMBER 2021 YEAR ENDED 31 DECEMBER 2021
9 INVESTMENTS IN AND BALANCES WITH JOINT VENTURES (CONT’D)
Material joint venture (cont’d)
As at 31 December 2020, the Group had a call option to acquire an additional 11.25% equity interest in HCP, which was exercisable at the Group’s discretion within a 6-month period commencing on 1 July 2022 for a consideration of approximately $157.3 million (RMB774.1 million). As at 31 December 2020, the fair value of this call option was nil. As part of the Group’s disposal of its interest in HCP during 2021, the deed for the aforesaid call option was terminated.
HCP was structured as a separate vehicle and the Group had residual interest in its net assets. In 2020, the Group had classified its interest in HCP as a joint venture, which was equity accounted. Following the Group’s disposal of its investment in HCP during 2021, the Group lost joint control over HCP and it ceased to be a joint venture of the Group.
Investment in and balances with HCP Group
(i) Accounting for acquisition of HCP Group
In April 2020, the Group acquired an equity interest of 63.75% in HCP for an aggregate consideration of approximately $0.9 billion. The Group accounted for the acquisition of HCP as a business combination, which required the purchase price to be allocated to the fair value of the identifiable assets acquired and liabilities assumed, including any contingent liabilities (purchase price allocation or “PPA”).
The fair values of assets and liabilities, which involved significant judgement and estimates, had been determined as follows:
• The fair values of the underlying properties held by HCP Group were determined based on external independent valuations undertaken.
A significant portion of the purchase price was allocated to HCP Group’s underlying property portfolio comprising development properties, property, plant and equipment and investment properties, based on the valuation amounts in the independent valuation reports. The valuation of development properties was critically dependent upon the estimated future selling prices. The valuation of property, plant and equipment and investment properties involved significant judgement in determining both the valuation methods to be used and the key assumptions to be applied. The valuations were sensitive to the key assumptions applied and a change in assumptions might have a significant impact on the valuations.
• The fair values of the amounts due from related parties of HCP Group were estimated, taking into consideration the repayment patterns and the settlement arrangements agreed between the HCP Group and its related parties.
• The fair values of contingent liabilities relating to financial guarantees issued by HCP Group for credit facilities granted to the related parties of HCP Group involved making estimates of the guarantees being invoked.
• The fair value of a put option granted by HCP Group to a non-controlling shareholder of Sincere Property Group (the “Put Option”) for the latter to sell its 19.99% of shares in Sincere Property Group was estimated based on the present value of the exercise price of the put option.
• The fair value of indemnities provided by the joint venture partner and its related parties in relation to the liabilities associated with the Put Option and contingent liabilities arising from the guarantees issued by Sincere Property Group to the joint venture partner and its related parties, was estimated to be nil, having considered the Group’s ability to recover these indemnity assets.
9 INVESTMENTS IN AND BALANCES WITH JOINT VENTURES (CONT’D)
(i) Accounting for acquisition of HCP Group (cont’d)
Measurement of fair values
The valuation techniques used for measuring the fair values of the underlying significant assets and liabilities were as follows:
Assets acquired and liabilities assumed Valuation technique
Property, plant and equipment andinvestment properties
Direct comparison, discounted cash flow, income capitalisation, cost and residual methods: The direct comparison method involved the analysis of comparable sales of similar assets and adjusting the sale prices to that reflective of the properties. The discounted cash flow method involved forecasting the properties’ income stream and discounting the income stream at the market rate of interest at the acquisition date. The income capitalisation method capitalised an income stream into a present value using revenue multipliers or single-year capitalisation rates. The cost method considered the current replacement cost of creating a comparable property. The residual method involved deducting the estimated cost to complete as of valuation date and other relevant costs from gross development value of the proposed development assuming satisfactory completion and accounting for developer profit.
Development properties Direct comparison, income capitalisation, cost and residual methods: The direct comparison method involved the analysis of comparable sales of similar assets and adjusting the sale prices to that reflective of the properties. The income capitalisation method capitalised an income stream into a present value using revenue multipliers or single-year capitalisation rates. The cost method considered the current replacement cost of creating a comparable property. The residual method involved deducting the estimated cost to complete as of valuation date and other relevant costs from gross development value of the proposed development assuming satisfactory completion and accounting for developer profit.
Amounts due from related parties Discounted cash flow method: The fair value was estimated as the present value of the expected future payments, discounted at the market rate of interest at the acquisition date.
Interest-bearing borrowings Discounted cash flow method: The fair value was estimated as the present value of future principal and interest cash flows, discounted at the market rates of interest at the acquisition date.
Contingent liabilities– financial guarantees issued
Probability adjusted expected value method: The fair value was estimated based on the exposure amount that the HCP Group is obliged to pay in the event of a default by the entity for the financial guarantee was issued, adjusted for the probability of default.
Put Option Discounted cash flow method: The fair value was estimated as the present value of the expected future payments, discounted at the market rate of interest at the acquisition date.
CITY DEVELOPMENTS LIMITED ANNUAL REPORT 2021 FINANCIALSCITY DEVELOPMENTS LIMITED ANNUAL REPORT 2021 FINANCIALS
168 169
NOTES TO THEFINANCIAL STATEMENTS
NOTES TO THEFINANCIAL STATEMENTS
YEAR ENDED 31 DECEMBER 2021 YEAR ENDED 31 DECEMBER 2021
9 INVESTMENTS IN AND BALANCES WITH JOINT VENTURES (CONT’D)
(i) Accounting for acquisition of HCP Group (cont’d)
Measurement of fair values (cont’d)
In relying on the valuation reports for the property, plant and equipment, investment properties and development properties, the Group had exercised its judgement and was satisfied that the valuation methods and estimates were reflective of current market conditions. The valuation reports obtained from external valuer of the properties had highlighted that as a result of the COVID-19 pandemic, giving rise to an unprecedented set of circumstances on which to base a judgement, less certainty and a higher degree of caution, should be attached to the valuations than would normally be the case. Due to the uncertainties that the pandemic may have on the real estate market, the external valuer had recommended to keep the valuations of these properties under frequent review.
The fair value measurements were categorised as Level 3 in the fair value hierarchy based on the inputs in the valuation techniques used.
The PPA exercise indicated that the Group’s cost of investment in HCP of $0.9 billion represented goodwill. Impairment of the Group’s investment in HCP in 2020 is set out in note (ii) below.
(ii) Impairment of the equity investment in HCP Group
2021
The impairment loss previously recognised was fully utilised in 2021, following the Group’s disposal of its interest in HCP.
2020
In 2020, subsequent to the Group’s acquisition of the equity investment in HCP Group, the Group identified indicators of impairment on the investment arising from the challenging macro-economic environment posed by the COVID-19 pandemic, the credit tightening measures imposed on China’s real estate sector and the liquidity challenges faced by Sincere Property Group. The Group assessed the recoverable amount of the investment using the fair value less costs to sell approach which was based on the financial position of the HCP Group, which took into consideration the fair values of the joint venture’s underlying assets and liabilities. Based on the assessment undertaken, the recoverable amount was estimated to be nil. After equity accounting for the Group’s share of HCP Group’s share of loss of $75.8 million, an impairment loss of $806.4 million was recognised. The impairment loss was included as part of “Share of after-tax profit/(loss) of joint ventures” in the consolidated statement of profit or loss, and in the property development ($435.4 million), hotel operations ($48.4 million) and investment properties ($322.6 million) segments.
As the Group’s cost of investment in HCP Cayman had been reduced to nil, the Group had discontinued equity accounting for further losses of HCP Group as the Group had no obligation to fund HCP Group’s operations or make payments on behalf of HCP Group (other than the financial guarantee that the Group had issued in relation to a loan undertaken by HCP Group for which a provision had been made for the full guarantee amount (refer to “Financial guarantee issued” below)).
9 INVESTMENTS IN AND BALANCES WITH JOINT VENTURES (CONT’D)
(ii) Impairment of the equity investment in HCP Group (cont’d)
The fair value measurement was categorised as Level 3 in the fair value hierarchy based on the inputs in the valuation technique used.
Valuation technique
Significant unobservable inputs
Inter-relationship between key unobservable inputs and fair value measurement
The fair value is calculated using the net asset value (NAV) of the investee entity adjusted for the fair value of the underlying properties, where applicable.
NAV The estimated fair value would increase/(decrease) if the NAV was higher/(lower).
(iii) Impairment of amounts owing by HCP Group
2021
During 2021, as part of the Group’s disposal of its interest in HCP, the Group had entered into various agreements with the HCP Group whereby it was agreed that (i) an amount owing by the Group to HCP Group of $263.7 million would be set off against the amounts owing by HCP Group; and (ii) the collateral held by the Group in respect of the amounts owing by HCP Group, which relate to shares in an investment holding company that holds an equity interest in a property-owning entity which had been pledged by HCP Group to the Group, in respect of the amounts owing by HCP Group, would be transferred to the Group, as settlement of $54.1 million (RMB260.0 million) of the amounts owing by HCP Group. The above arrangements resulted in a utilisation of $8.2 million (RMB39.2 million) impairment loss previously recognised in the current year (note 9(d)).
As at 31 December 2021, after the offset arrangements, the Group had gross amounts owing by HCP Group of $395.1 million (classified under other receivables in note 15) and amounts owing to HCP Group of $50.3 miliion (note 30).
In October 2021, the Chongqing No. 5 Intermediate People’s Court accepted the bankruptcy reorganisation application by a creditor against Sincere Property and a bankruptcy administrator was subsequently appointed. In addition, a local credit rating agency downgraded Sincere Property’s credit rating and its existing domestic corporate bonds as Sincere Property was unable to redeem its corporate bonds that matured in 2021.
As at 31 December 2021, the Group assessed that the amounts owing by HCP Group continue to be credit-impaired. The Group assessed the lifetime ECL to be recognised, taking into account the latest developments of Sincere Property Group based on publicly available information as described above, prevailing market conditions and price trends of corporate bonds issued by other China real estate developers with credit ratings similar to that of Sincere Property Group and face similar debt and liquidity challenges as those faced by Sincere Property Group, following regulatory tightening and systematic changes on financing imposed on China’s real estate sector.
The key parameter applied in estimating the ECL to be recognised include assuming a loss given default (“LGD”) of up to 95% which was estimated based on the range of decline in trading prices of bonds issued by other China real estate developers with credit ratings similar to that of Sincere Property Group and face similar debt and liquidity challenges as those faced by Sincere Property Group.
Based on the assessment undertaken, the Group estimated that no additional impairment is required on the amounts owing by HCP Group, other than an impairment loss of $6.1 million on the interest income recognised on the amounts owing by HCP Group during the year. At 31 December 2021, the carrying value of the amount owing by HCP Group was $63.9 million (net of impairment loss of $331.2 million), which is classified as other receivables (note 15).
CITY DEVELOPMENTS LIMITED ANNUAL REPORT 2021 FINANCIALSCITY DEVELOPMENTS LIMITED ANNUAL REPORT 2021 FINANCIALS
170 171
NOTES TO THEFINANCIAL STATEMENTS
NOTES TO THEFINANCIAL STATEMENTS
YEAR ENDED 31 DECEMBER 2021 YEAR ENDED 31 DECEMBER 2021
9 INVESTMENTS IN AND BALANCES WITH JOINT VENTURES (CONT’D)
(iii) Impairment of amounts owing by HCP Group (cont’d)
2021 (cont’d)
As the bankruptcy reorganisation for Sincere Property is ongoing, its outcome is uncertain and evolving. Changes to circumstances and estimates may impact the ECL on the amounts owing by HCP Group recognised. The ECL on the amounts owing by HCP Group is also sensitive to the assumptions used. A decrease in the LGD in isolation would result in a higher recoverable amount. An increase in the LGD in isolation would result in a lower recoverable amount.
2020
As at 31 December 2020, the Group had gross amounts owing by HCP Group of $683.6 million and amounts owing to HCP Group of $264.3 million. The Group undertook an impairment assessment of the amounts owing from HCP Group. The Group assessed that the amounts owing by HCP Group were credit-impaired, having considered past repayment trends, the debt maturity profile of Sincere Property Group, the default risk on the amounts owing by Sincere Property Group and the liquidity challenges faced by Sincere Property Group.
At 31 December 2020, the Group determined the lifetime ECL to be recognised, taking into account the adjusted financial position of Sincere Property Group (taking into account the estimated recoverable amounts of the properties held by Sincere Property Group and its associates and joint ventures, and potential additional costs to be incurred on borrowings of Sincere Property Group), the debt profile of Sincere Property Group, the value of collateral that the Group held and certain amounts owing by the Group to HCP Group.
The key parameters applied in estimating the ECL recognised included assuming a discount of up to 50% on the properties held by Sincere Property Group and the carrying values of investments in associates and joint ventures and additional costs including potential penalty interest of approximately 30% on borrowings. The discount assumptions used to estimate the difference between the fair value of the underlying properties and the expected sales price under a forced sale scenario are based on market data available. The Group also considered the value of the collateral held, which related to shares in a property-owing entity which had been pledged by HCP Group to the Group, based on the recently transacted price of the shares.
Based on the assessment undertaken, the Group recognised an impairment loss of $323.9 million on the amounts owing by HCP Group. At 31 December 2020, the Group had amounts owing by HCP Group of $$359.7 million (net of impairment loss recognised) and amounts owing to HCP Group of $264.3 million.
Changes to circumstances and estimates may impact the amount of expected credit losses recognised on the amounts owing by HCP Group. The expected credit losses on the amounts owing by HCP Group can be sensitive to the assumptions used. An increase in the discount adjustment on the properties held by the Group and the carrying values of investments in associates and joint ventures and additional costs including potential penalty interest on borrowings in isolation would result in a lower recoverable amount. A lower discount adjustment on the properties held by HCP Group and the carrying values of investments in associate and joint ventures and lower additional costs including potential penalty interest on borrowings in isolation would result in a higher recoverable amount.
9 INVESTMENTS IN AND BALANCES WITH JOINT VENTURES (CONT’D)
(iv) Financial information of HCP Group
Group2020
$’000
Group’s interest in net assets of investee at beginning of the year: –Investment during the year 882,141Share of after-tax loss– share of total comprehensive income (75,770)– impairment of goodwill (806,371)
(882,141)Carrying amount of interest in investee at end of the year –
2021
As the Group’s investment in HCP was fully impaired as at 31 December 2020, the Group had discontinued equity accounting for the results of HCP Group in 2020. The investment in HCP was disposed of in September 2021.
2020
In 2020, the challenging macro-economic environment posed by the COVID-19 pandemic, the credit tightening measures imposed on China’s real estate sector and the ongoing uncertainties had disrupted and negatively impacted HCP Group’s operations and performance. Furthermore, weak market conditions had derailed the intended divestment plan for some of HCP Group’s properties to reduce its debt, exacerbating the liquidity challenges that it faces. Subsequent to 31 December 2020, the credit ratings of certain of HCP Group’s bonds were downgraded and the HCP Group did not repay the principal amounts of certain bonds on their maturities. Arising from these key events and the evolving developments within the HCP Group up to the date of the Group’s issuance of the financial statements for the financial year ended 31 December 2020, management considered that the financial information of HCP Group as at 31 December 2020, prepared based on information then available, did not faithfully represent HCP Group’s financial position and would not be relevant to users of these financial statements.
The main business activities of HCP Group relate to the real estate business derived primarily from Sincere Property Group, which is an issuer of several domestic corporate bonds listed on the Shanghai Stock Exchange. As long as the listed bonds of Sincere Property Group remained outstanding, Sincere Property Group was required to abide by the regulations of China Securities Regulatory Commission (CSRC). Under the regulations of CSRC, any material information in relation to Sincere Property Group needs to be announced by Sincere Property Group in China no later than the announcement of the same elsewhere in the world, failing which Sincere Property Group and its controlling equity holder(s) could be liable under PRC laws. Sincere Property Group, which was required to announce its annual financial statements within 4 months from each financial year end was expected to announce its financial results for year ended 31 December 2020 in late April 2021. Accordingly, before Sincere Property Group announced its 2020 financial information in China, the Group was unable to disclose any financial information of HCP Group in its financial statements for the year ended 31 December 2020.
As a result of the above and the uncertainties surrounding the outcome of the matters highlighted, the summarised financial information of HCP Group as at 31 December 2020 and the Group’s unrecognised share of losses, commitments and contingent liabilities in relation to the HCP Group were not presented in the Group’s financial statements for the year ended 31 December 2020.
CITY DEVELOPMENTS LIMITED ANNUAL REPORT 2021 FINANCIALSCITY DEVELOPMENTS LIMITED ANNUAL REPORT 2021 FINANCIALS
172 173
NOTES TO THEFINANCIAL STATEMENTS
NOTES TO THEFINANCIAL STATEMENTS
YEAR ENDED 31 DECEMBER 2021 YEAR ENDED 31 DECEMBER 2021
9 INVESTMENTS IN AND BALANCES WITH JOINT VENTURES (CONT’D)
(v) Financial guarantee issued
2021
During 2021, the Group fully settled the obligation to the financial institution in connection with the financial guarantee in connection with a loan taken by the HCP Group (see below) for an aggregate sum of $286.1 million (USD213.1 million), and the provision previously made was fully utilised during the year (note 28). The second mortgage on the investment property of the Group that was previously secured for this loan (see below) was released by the financial institution during the year.
2020
During 2020, the Group had issued a financial guarantee of approximately $283.0 million to a financial institution in connection to loan taken by the HCP Group. Furthermore, the Group had pledged an investment property with a carrying value of $359.8 million under a second mortgage to the bank.
As at 31 December 2020, the Group had considered that the probability that the financial guarantee would be invoked and recognised a provision for the full amount of the guarantee (note 28), taking into consideration the available financial information of HCP Group, Sincere Property Group not repaying the principal amounts of certain bonds on their maturities post 31 December 2020, the liquidity challenges faced by Sincere Property Group and legal advice received.
Immaterial joint ventures
The Group has interests in a number of individually immaterial joint ventures. The following table summarises, in aggregate, the share of profit and other comprehensive income of these immaterial joint ventures that are accounted for using the equity method:
Group2021 2020
$’000 $’000
Carrying amount of interests in individually immaterial joint ventures 1,037,046 1,085,288
Group’s share of:– profit/(loss) from continuing operations 76,779 (1,611)– other comprehensive income 4,637 –– total comprehensive income 81,416 (1,611)
The Group’s share of the joint ventures’ commitments and contingent liabilities is as follows:
Group2021 2020*
$’000 $’000
CommitmentsDevelopment expenditure contracted but not provided for in the financial statements 514,917 325,766
Capital expenditure contracted but not provided for in the financial statements 59,367 42,884
Non-cancellable operating lease receivable 71,620 84,422
* Excluding HCP
10 FINANCIAL ASSETS
Group CompanyNote 2021 2020 2021 2020
$’000 $’000 $’000 $’000
Non-current investments
Unquoted debt investments mandatorily at FVTPL– non-related companies (a), (b) 175,409 181,202 – –
Unquoted debt investment at amortised cost– a joint venture (c) – 305,394 – –Impairment loss – (288,000) – –
– 17,394 – –
Unquoted equity investments at FVOCI– fellow subsidiaries 327,577 324,877 327,577 324,877– non-related companies 30,293 31,852 – –
357,870 356,729 327,577 324,877
Unquoted equity investments mandatorily at FVTPL– other related parties 57,307 47,407 – –– non-related companies 73,158 42,666 – –
130,465 90,073 – –
Quoted equity investments at FVOCI– fellow subsidiaries 26,006 25,897 21,868 21,777– non-related companies 11,174 9,006 – –
37,180 34,903 21,868 21,777
Quoted equity investments mandatorily at FVTPL– an associate 32,857 33,848 – –– non-related companies 6,905 21,970 1,993 1,856
39,762 55,818 1,993 1,856
Total non-current financial assets 740,686 736,119 351,438 348,510
Current investments
Quoted equity investments mandatorily at FVTPL– non-related companies 9,105 9,324 – –
Unquoted debt investments mandatorily at FVTPL– a joint venture (b) – 10,724 – –
Unquoted debt investment at amortised cost– a non-related company (c) 311,512 – – –– impairment loss (293,769) – – –
17,743 – – –
Total current financial assets 26,848 20,048 – –
Total financial assets 767,534 756,167 351,438 348,510
(a) Unquoted debt investments mandatorily at FVTPL with total carrying amount of $142,486,000 (2020: $157,536,000) bear interest at 2.46% (2020: 2.46% to 8.00%) per annum and mature within 1 to 2 (2020: 1 to 3) years.
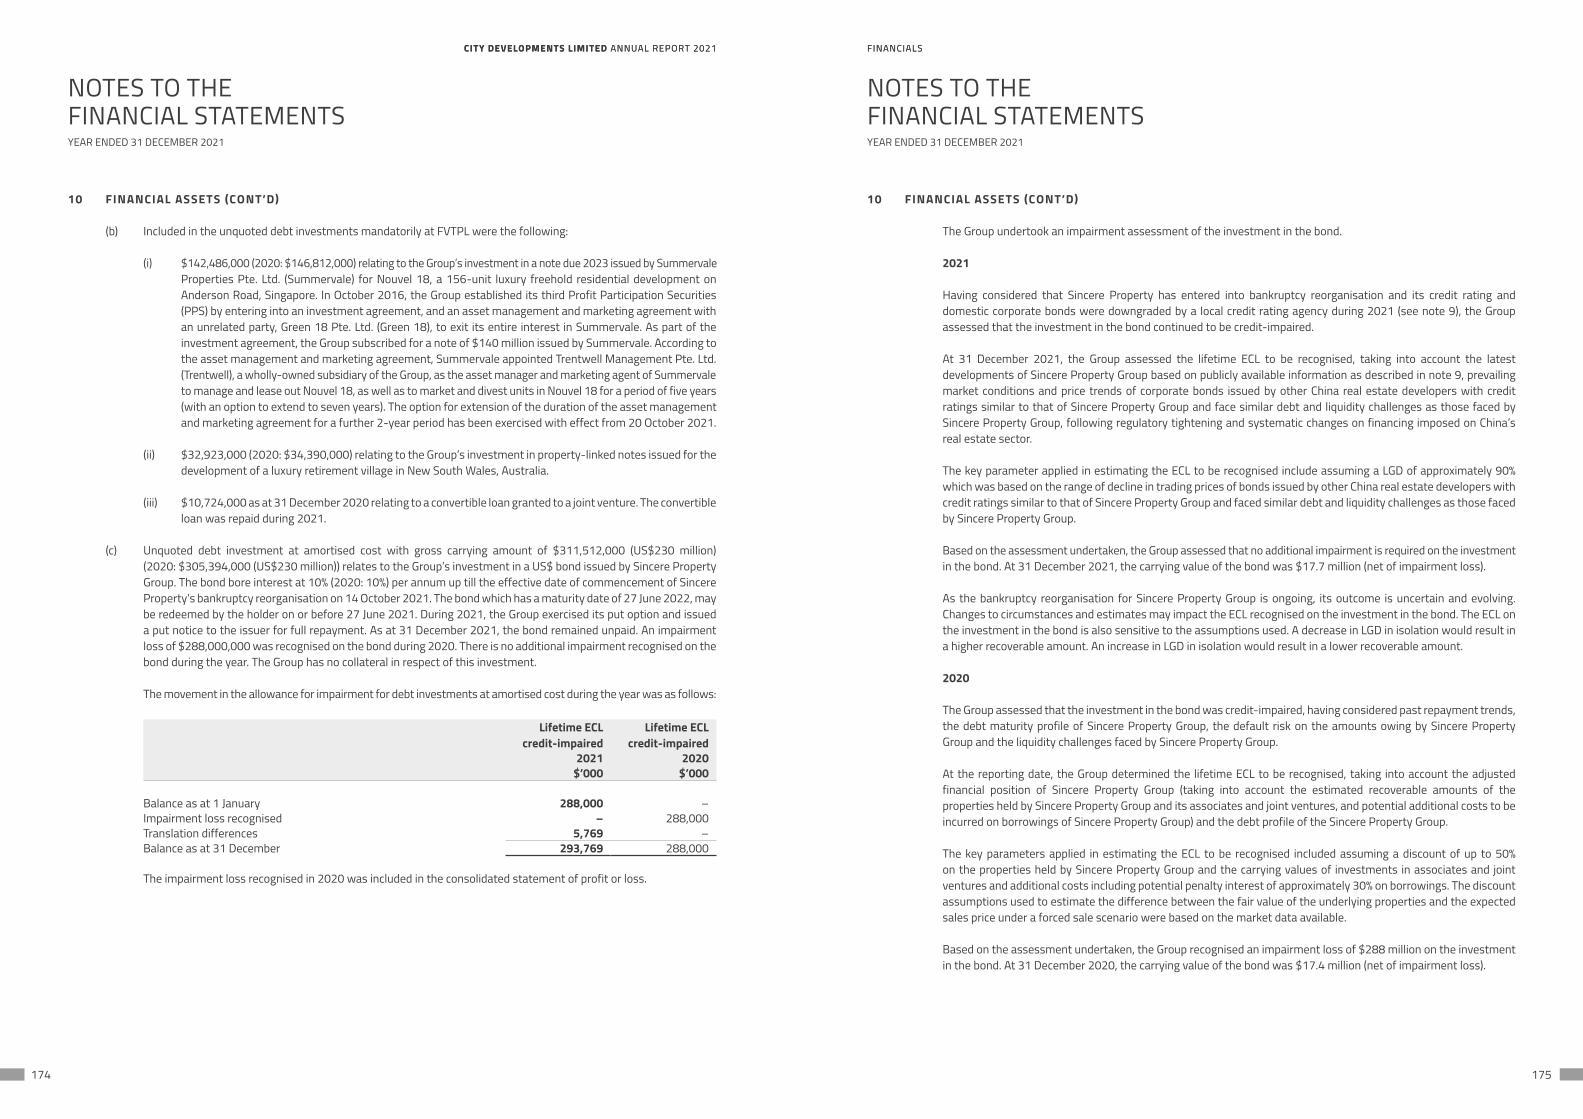
CITY DEVELOPMENTS LIMITED ANNUAL REPORT 2021 FINANCIALSCITY DEVELOPMENTS LIMITED ANNUAL REPORT 2021 FINANCIALS
174 175
NOTES TO THEFINANCIAL STATEMENTS
NOTES TO THEFINANCIAL STATEMENTS
YEAR ENDED 31 DECEMBER 2021 YEAR ENDED 31 DECEMBER 2021
10 FINANCIAL ASSETS (CONT’D)
(b) Included in the unquoted debt investments mandatorily at FVTPL were the following:
(i) $142,486,000 (2020: $146,812,000) relating to the Group’s investment in a note due 2023 issued by Summervale Properties Pte. Ltd. (Summervale) for Nouvel 18, a 156-unit luxury freehold residential development on Anderson Road, Singapore. In October 2016, the Group established its third Profit Participation Securities (PPS) by entering into an investment agreement, and an asset management and marketing agreement with an unrelated party, Green 18 Pte. Ltd. (Green 18), to exit its entire interest in Summervale. As part of the investment agreement, the Group subscribed for a note of $140 million issued by Summervale. According to the asset management and marketing agreement, Summervale appointed Trentwell Management Pte. Ltd. (Trentwell), a wholly-owned subsidiary of the Group, as the asset manager and marketing agent of Summervale to manage and lease out Nouvel 18, as well as to market and divest units in Nouvel 18 for a period of five years (with an option to extend to seven years). The option for extension of the duration of the asset management and marketing agreement for a further 2-year period has been exercised with effect from 20 October 2021.
(ii) $32,923,000 (2020: $34,390,000) relating to the Group’s investment in property-linked notes issued for the development of a luxury retirement village in New South Wales, Australia.
(iii) $10,724,000 as at 31 December 2020 relating to a convertible loan granted to a joint venture. The convertible loan was repaid during 2021.
(c) Unquoted debt investment at amortised cost with gross carrying amount of $311,512,000 (US$230 million) (2020: $305,394,000 (US$230 million)) relates to the Group’s investment in a US$ bond issued by Sincere Property Group. The bond bore interest at 10% (2020: 10%) per annum up till the effective date of commencement of Sincere Property’s bankruptcy reorganisation on 14 October 2021. The bond which has a maturity date of 27 June 2022, may be redeemed by the holder on or before 27 June 2021. During 2021, the Group exercised its put option and issued a put notice to the issuer for full repayment. As at 31 December 2021, the bond remained unpaid. An impairment loss of $288,000,000 was recognised on the bond during 2020. There is no additional impairment recognised on the bond during the year. The Group has no collateral in respect of this investment.
The movement in the allowance for impairment for debt investments at amortised cost during the year was as follows:
Lifetime ECLcredit-impaired
Lifetime ECLcredit-impaired
2021 2020$’000 $’000
Balance as at 1 January 288,000 –Impairment loss recognised – 288,000Translation differences 5,769 –Balance as at 31 December 293,769 288,000
The impairment loss recognised in 2020 was included in the consolidated statement of profit or loss.
10 FINANCIAL ASSETS (CONT’D)
The Group undertook an impairment assessment of the investment in the bond.
2021
Having considered that Sincere Property has entered into bankruptcy reorganisation and its credit rating and domestic corporate bonds were downgraded by a local credit rating agency during 2021 (see note 9), the Group assessed that the investment in the bond continued to be credit-impaired.
At 31 December 2021, the Group assessed the lifetime ECL to be recognised, taking into account the latest developments of Sincere Property Group based on publicly available information as described in note 9, prevailing market conditions and price trends of corporate bonds issued by other China real estate developers with credit ratings similar to that of Sincere Property Group and face similar debt and liquidity challenges as those faced by Sincere Property Group, following regulatory tightening and systematic changes on financing imposed on China’s real estate sector.
The key parameter applied in estimating the ECL to be recognised include assuming a LGD of approximately 90% which was based on the range of decline in trading prices of bonds issued by other China real estate developers with credit ratings similar to that of Sincere Property Group and faced similar debt and liquidity challenges as those faced by Sincere Property Group.
Based on the assessment undertaken, the Group assessed that no additional impairment is required on the investment in the bond. At 31 December 2021, the carrying value of the bond was $17.7 million (net of impairment loss).
As the bankruptcy reorganisation for Sincere Property Group is ongoing, its outcome is uncertain and evolving. Changes to circumstances and estimates may impact the ECL recognised on the investment in the bond. The ECL on the investment in the bond is also sensitive to the assumptions used. A decrease in LGD in isolation would result in a higher recoverable amount. An increase in LGD in isolation would result in a lower recoverable amount.
2020
The Group assessed that the investment in the bond was credit-impaired, having considered past repayment trends, the debt maturity profile of Sincere Property Group, the default risk on the amounts owing by Sincere Property Group and the liquidity challenges faced by Sincere Property Group.
At the reporting date, the Group determined the lifetime ECL to be recognised, taking into account the adjusted financial position of Sincere Property Group (taking into account the estimated recoverable amounts of the properties held by Sincere Property Group and its associates and joint ventures, and potential additional costs to be incurred on borrowings of Sincere Property Group) and the debt profile of the Sincere Property Group.
The key parameters applied in estimating the ECL to be recognised included assuming a discount of up to 50% on the properties held by Sincere Property Group and the carrying values of investments in associates and joint ventures and additional costs including potential penalty interest of approximately 30% on borrowings. The discount assumptions used to estimate the difference between the fair value of the underlying properties and the expected sales price under a forced sale scenario were based on the market data available.
Based on the assessment undertaken, the Group recognised an impairment loss of $288 million on the investment in the bond. At 31 December 2020, the carrying value of the bond was $17.4 million (net of impairment loss).
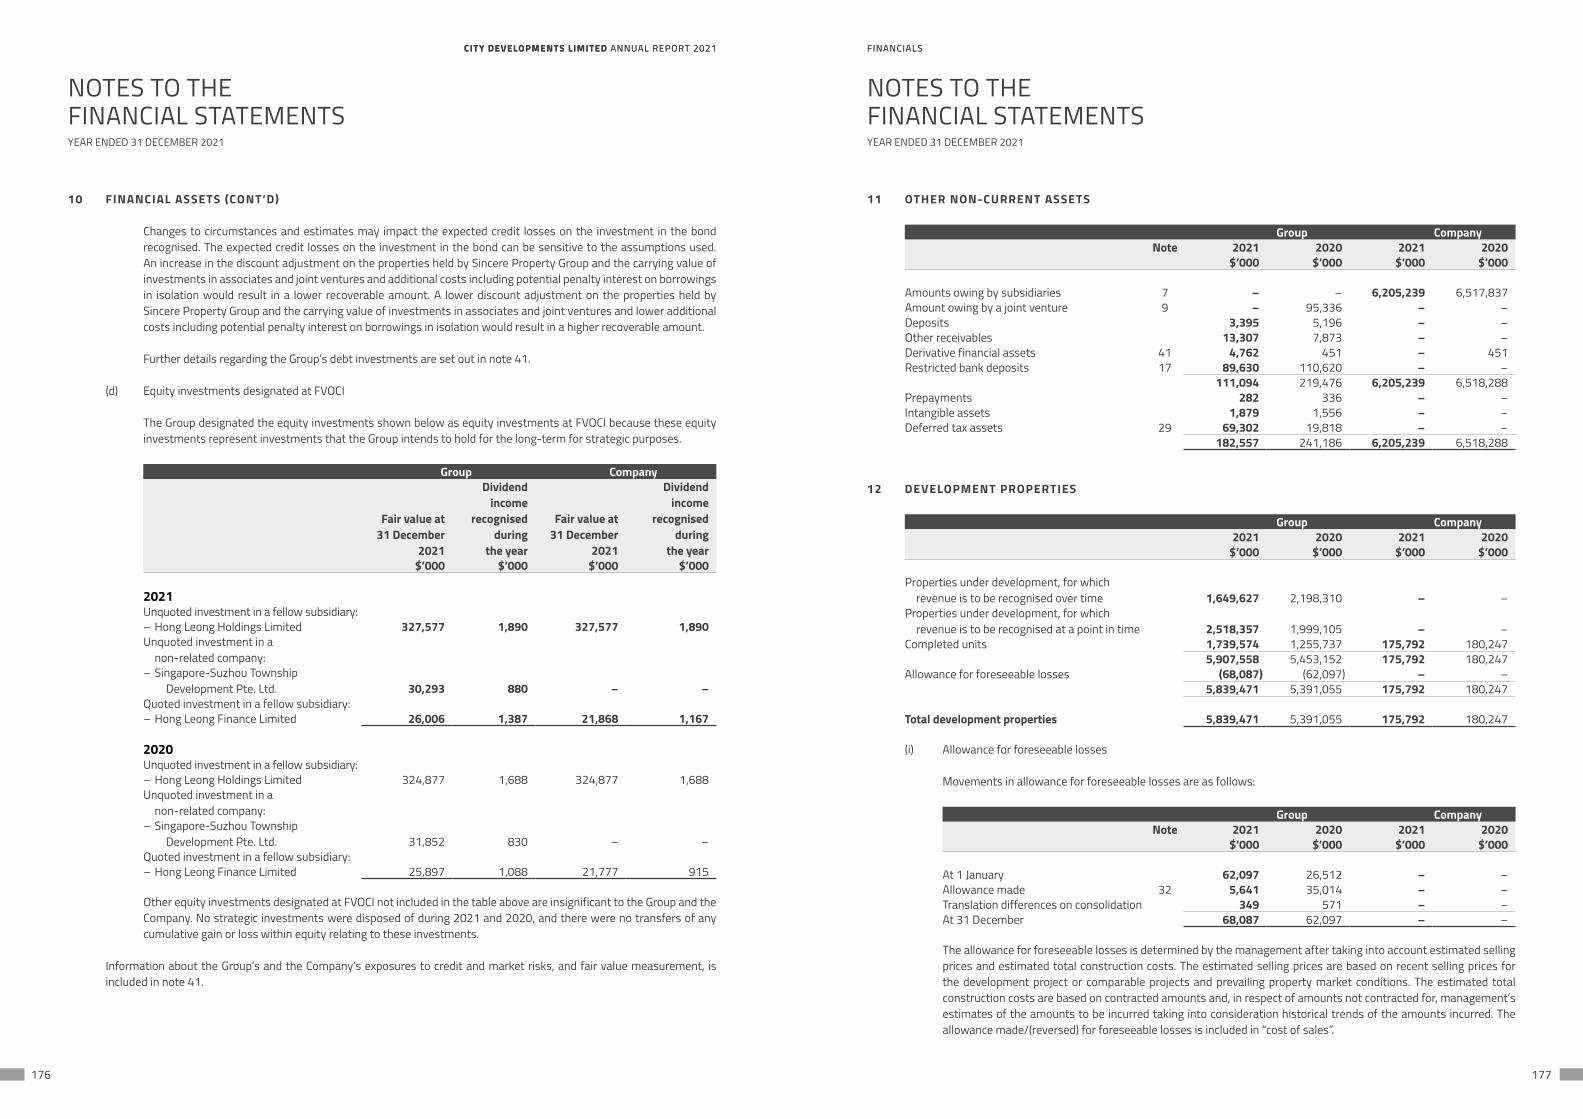
CITY DEVELOPMENTS LIMITED ANNUAL REPORT 2021 FINANCIALSCITY DEVELOPMENTS LIMITED ANNUAL REPORT 2021 FINANCIALS
176 177
NOTES TO THEFINANCIAL STATEMENTS
NOTES TO THEFINANCIAL STATEMENTS
YEAR ENDED 31 DECEMBER 2021 YEAR ENDED 31 DECEMBER 2021
10 FINANCIAL ASSETS (CONT’D)
Changes to circumstances and estimates may impact the expected credit losses on the investment in the bond recognised. The expected credit losses on the investment in the bond can be sensitive to the assumptions used. An increase in the discount adjustment on the properties held by Sincere Property Group and the carrying value of investments in associates and joint ventures and additional costs including potential penalty interest on borrowings in isolation would result in a lower recoverable amount. A lower discount adjustment on the properties held by Sincere Property Group and the carrying value of investments in associates and joint ventures and lower additional costs including potential penalty interest on borrowings in isolation would result in a higher recoverable amount.
Further details regarding the Group’s debt investments are set out in note 41.
(d) Equity investments designated at FVOCI
The Group designated the equity investments shown below as equity investments at FVOCI because these equity investments represent investments that the Group intends to hold for the long-term for strategic purposes.
Group Company
Fair value at 31 December
2021
Dividendincome
recognisedduring
the year
Fair value at 31 December
2021
Dividendincome
recognisedduring
the year$’000 $’000 $’000 $’000
2021Unquoted investment in a fellow subsidiary:– Hong Leong Holdings Limited 327,577 1,890 327,577 1,890Unquoted investment in a
non-related company:– Singapore-Suzhou Township
Development Pte. Ltd. 30,293 880 – –Quoted investment in a fellow subsidiary:– Hong Leong Finance Limited 26,006 1,387 21,868 1,167
2020Unquoted investment in a fellow subsidiary:– Hong Leong Holdings Limited 324,877 1,688 324,877 1,688Unquoted investment in a
non-related company:– Singapore-Suzhou Township
Development Pte. Ltd. 31,852 830 – –Quoted investment in a fellow subsidiary:– Hong Leong Finance Limited 25,897 1,088 21,777 915
Other equity investments designated at FVOCI not included in the table above are insignificant to the Group and the Company. No strategic investments were disposed of during 2021 and 2020, and there were no transfers of any cumulative gain or loss within equity relating to these investments.
Information about the Group’s and the Company’s exposures to credit and market risks, and fair value measurement, is included in note 41.
11 OTHER NON-CURRENT ASSETS
Group CompanyNote 2021 2020 2021 2020
$’000 $’000 $’000 $’000
Amounts owing by subsidiaries 7 – – 6,205,239 6,517,837Amount owing by a joint venture 9 – 95,336 – –Deposits 3,395 5,196 – –Other receivables 13,307 7,873 – –Derivative financial assets 41 4,762 451 – 451Restricted bank deposits 17 89,630 110,620 – –
111,094 219,476 6,205,239 6,518,288Prepayments 282 336 – –Intangible assets 1,879 1,556 – –Deferred tax assets 29 69,302 19,818 – –
182,557 241,186 6,205,239 6,518,288
12 DEVELOPMENT PROPERTIES
Group Company2021 2020 2021 2020
$’000 $’000 $’000 $’000
Properties under development, for which revenue is to be recognised over time 1,649,627 2,198,310 – –
Properties under development, for which revenue is to be recognised at a point in time 2,518,357 1,999,105 – –
Completed units 1,739,574 1,255,737 175,792 180,2475,907,558 5,453,152 175,792 180,247
Allowance for foreseeable losses (68,087) (62,097) – –5,839,471 5,391,055 175,792 180,247
Total development properties 5,839,471 5,391,055 175,792 180,247
(i) Allowance for foreseeable losses
Movements in allowance for foreseeable losses are as follows:
Group CompanyNote 2021 2020 2021 2020
$’000 $’000 $’000 $’000
At 1 January 62,097 26,512 – –Allowance made 32 5,641 35,014 – –Translation differences on consolidation 349 571 – –At 31 December 68,087 62,097 – –
The allowance for foreseeable losses is determined by the management after taking into account estimated selling prices and estimated total construction costs. The estimated selling prices are based on recent selling prices for the development project or comparable projects and prevailing property market conditions. The estimated total construction costs are based on contracted amounts and, in respect of amounts not contracted for, management’s estimates of the amounts to be incurred taking into consideration historical trends of the amounts incurred. The allowance made/(reversed) for foreseeable losses is included in “cost of sales”.
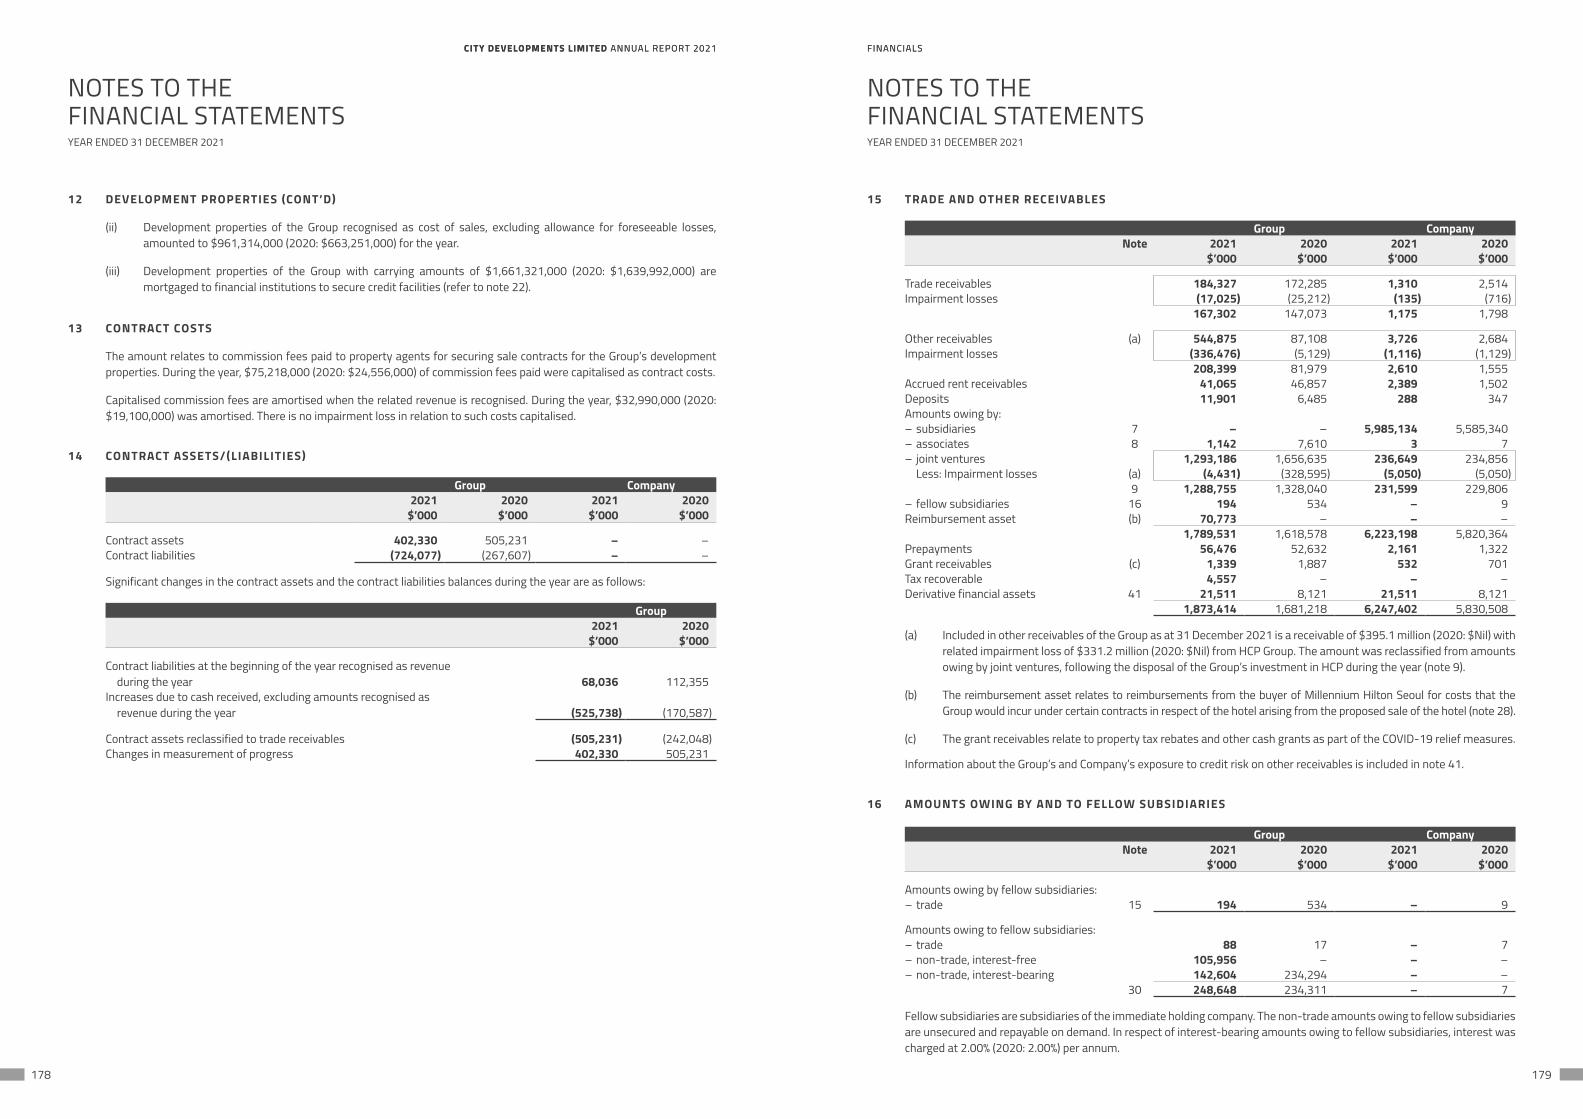
CITY DEVELOPMENTS LIMITED ANNUAL REPORT 2021 FINANCIALSCITY DEVELOPMENTS LIMITED ANNUAL REPORT 2021 FINANCIALS
178 179
NOTES TO THEFINANCIAL STATEMENTS
NOTES TO THEFINANCIAL STATEMENTS
YEAR ENDED 31 DECEMBER 2021 YEAR ENDED 31 DECEMBER 2021
12 DEVELOPMENT PROPERTIES (CONT’D)
(ii) Development properties of the Group recognised as cost of sales, excluding allowance for foreseeable losses, amounted to $961,314,000 (2020: $663,251,000) for the year.
(iii) Development properties of the Group with carrying amounts of $1,661,321,000 (2020: $1,639,992,000) are mortgaged to financial institutions to secure credit facilities (refer to note 22).
13 CONTRACT COSTS
The amount relates to commission fees paid to property agents for securing sale contracts for the Group’s development properties. During the year, $75,218,000 (2020: $24,556,000) of commission fees paid were capitalised as contract costs.
Capitalised commission fees are amortised when the related revenue is recognised. During the year, $32,990,000 (2020: $19,100,000) was amortised. There is no impairment loss in relation to such costs capitalised.
14 CONTRACT ASSETS/(LIABILITIES)
Group Company2021 2020 2021 2020
$’000 $’000 $’000 $’000
Contract assets 402,330 505,231 – –Contract liabilities (724,077) (267,607) – –
Significant changes in the contract assets and the contract liabilities balances during the year are as follows:
Group2021 2020
$’000 $’000
Contract liabilities at the beginning of the year recognised as revenue during the year 68,036 112,355
Increases due to cash received, excluding amounts recognised as revenue during the year (525,738) (170,587)
Contract assets reclassified to trade receivables (505,231) (242,048)Changes in measurement of progress 402,330 505,231
15 TRADE AND OTHER RECEIVABLES
Group CompanyNote 2021 2020 2021 2020
$’000 $’000 $’000 $’000
Trade receivables 184,327 172,285 1,310 2,514Impairment losses (17,025) (25,212) (135) (716)
167,302 147,073 1,175 1,798
Other receivables (a) 544,875 87,108 3,726 2,684Impairment losses (336,476) (5,129) (1,116) (1,129)
208,399 81,979 2,610 1,555Accrued rent receivables 41,065 46,857 2,389 1,502Deposits 11,901 6,485 288 347Amounts owing by:– subsidiaries 7 – – 5,985,134 5,585,340– associates 8 1,142 7,610 3 7– joint ventures 1,293,186 1,656,635 236,649 234,856 Less: Impairment losses (a) (4,431) (328,595) (5,050) (5,050)
9 1,288,755 1,328,040 231,599 229,806– fellow subsidiaries 16 194 534 – 9Reimbursement asset (b) 70,773 – – –
1,789,531 1,618,578 6,223,198 5,820,364Prepayments 56,476 52,632 2,161 1,322Grant receivables (c) 1,339 1,887 532 701Tax recoverable 4,557 – – –Derivative financial assets 41 21,511 8,121 21,511 8,121
1,873,414 1,681,218 6,247,402 5,830,508
(a) Included in other receivables of the Group as at 31 December 2021 is a receivable of $395.1 million (2020: $Nil) with related impairment loss of $331.2 million (2020: $Nil) from HCP Group. The amount was reclassified from amounts owing by joint ventures, following the disposal of the Group’s investment in HCP during the year (note 9).
(b) The reimbursement asset relates to reimbursements from the buyer of Millennium Hilton Seoul for costs that the Group would incur under certain contracts in respect of the hotel arising from the proposed sale of the hotel (note 28).
(c) The grant receivables relate to property tax rebates and other cash grants as part of the COVID-19 relief measures.
Information about the Group’s and Company’s exposure to credit risk on other receivables is included in note 41.
16 AMOUNTS OWING BY AND TO FELLOW SUBSIDIARIES
Group CompanyNote 2021 2020 2021 2020
$’000 $’000 $’000 $’000
Amounts owing by fellow subsidiaries:– trade 15 194 534 – 9
Amounts owing to fellow subsidiaries:– trade 88 17 – 7– non-trade, interest-free 105,956 – – –– non-trade, interest-bearing 142,604 234,294 – –
30 248,648 234,311 – 7
Fellow subsidiaries are subsidiaries of the immediate holding company. The non-trade amounts owing to fellow subsidiaries are unsecured and repayable on demand. In respect of interest-bearing amounts owing to fellow subsidiaries, interest was charged at 2.00% (2020: 2.00%) per annum.
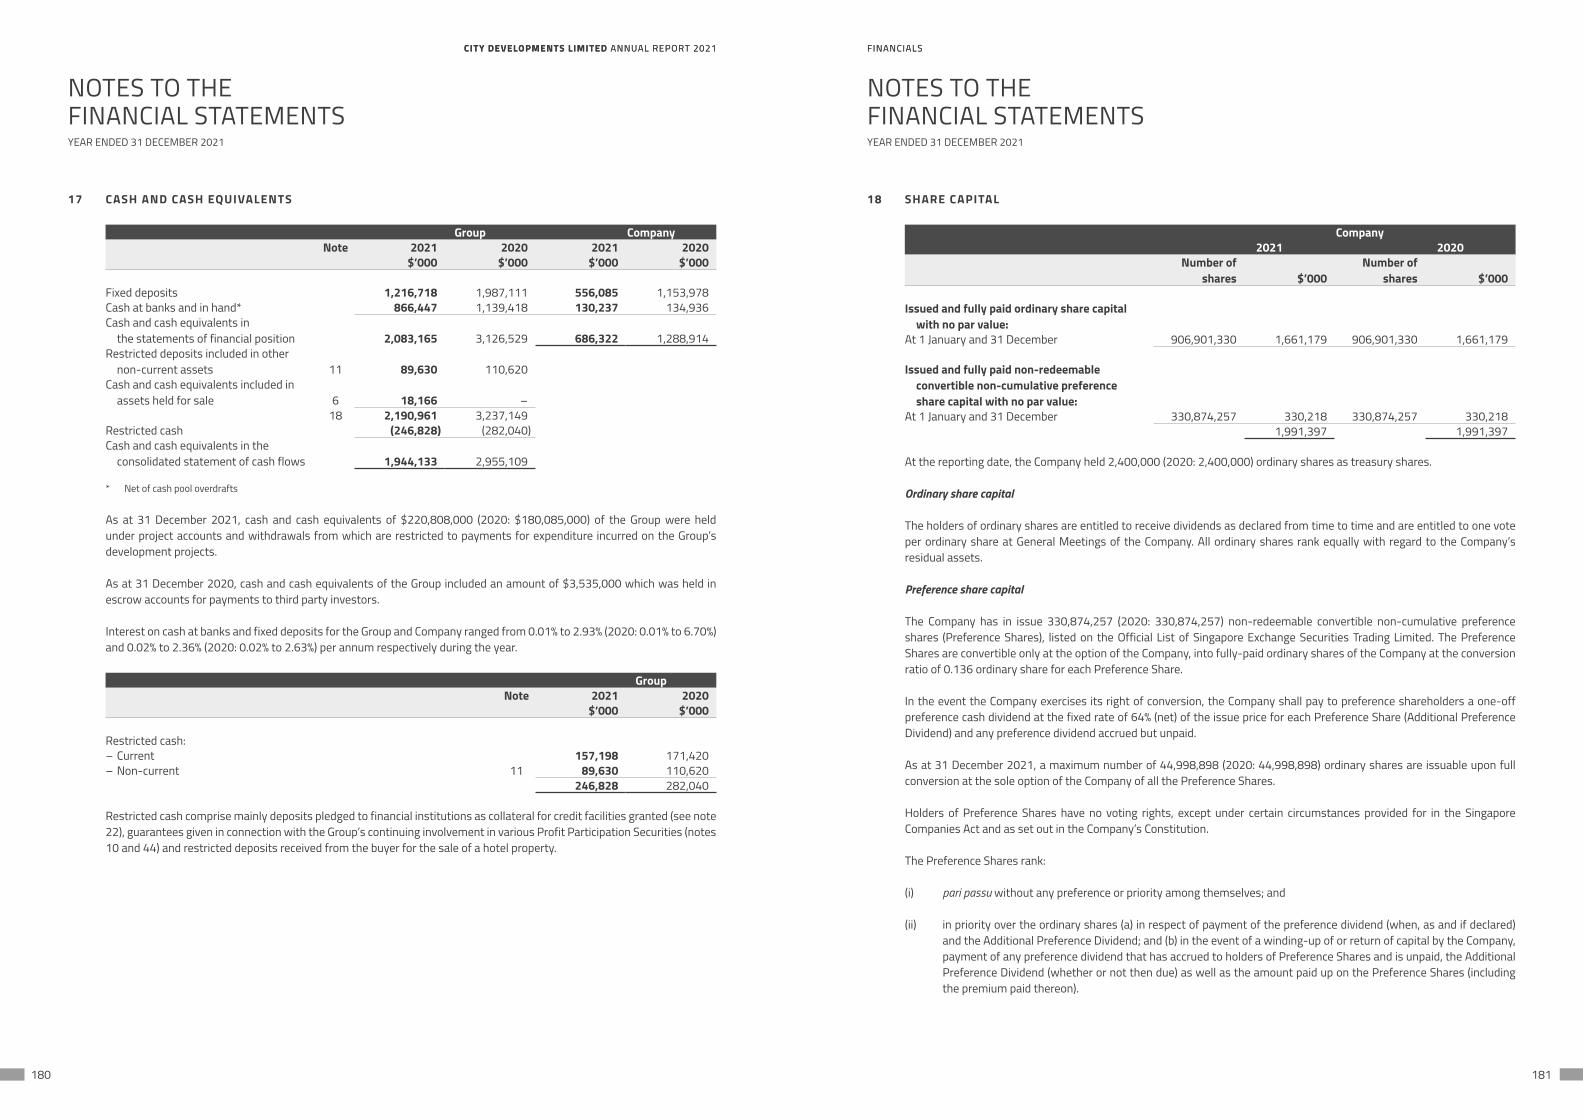
CITY DEVELOPMENTS LIMITED ANNUAL REPORT 2021 FINANCIALSCITY DEVELOPMENTS LIMITED ANNUAL REPORT 2021 FINANCIALS
180 181
NOTES TO THEFINANCIAL STATEMENTS
NOTES TO THEFINANCIAL STATEMENTS
YEAR ENDED 31 DECEMBER 2021 YEAR ENDED 31 DECEMBER 2021
17 CASH AND CASH EQUIVALENTS
Group CompanyNote 2021 2020 2021 2020
$’000 $’000 $’000 $’000
Fixed deposits 1,216,718 1,987,111 556,085 1,153,978Cash at banks and in hand* 866,447 1,139,418 130,237 134,936Cash and cash equivalents in
the statements of financial position 2,083,165 3,126,529 686,322 1,288,914Restricted deposits included in other
non-current assets 11 89,630 110,620Cash and cash equivalents included in
assets held for sale 6 18,166 –18 2,190,961 3,237,149
Restricted cash (246,828) (282,040)Cash and cash equivalents in the
consolidated statement of cash flows 1,944,133 2,955,109
* Net of cash pool overdrafts
As at 31 December 2021, cash and cash equivalents of $220,808,000 (2020: $180,085,000) of the Group were held under project accounts and withdrawals from which are restricted to payments for expenditure incurred on the Group’s development projects.
As at 31 December 2020, cash and cash equivalents of the Group included an amount of $3,535,000 which was held in escrow accounts for payments to third party investors.
Interest on cash at banks and fixed deposits for the Group and Company ranged from 0.01% to 2.93% (2020: 0.01% to 6.70%) and 0.02% to 2.36% (2020: 0.02% to 2.63%) per annum respectively during the year.
GroupNote 2021 2020
$’000 $’000
Restricted cash:– Current 157,198 171,420– Non-current 11 89,630 110,620
246,828 282,040
Restricted cash comprise mainly deposits pledged to financial institutions as collateral for credit facilities granted (see note 22), guarantees given in connection with the Group’s continuing involvement in various Profit Participation Securities (notes 10 and 44) and restricted deposits received from the buyer for the sale of a hotel property.
18 SHARE CAPITAL
Company2021 2020
Number ofshares $’000
Number ofshares $’000
Issued and fully paid ordinary share capital with no par value:
At 1 January and 31 December 906,901,330 1,661,179 906,901,330 1,661,179
Issued and fully paid non-redeemable convertible non-cumulative preference share capital with no par value:
At 1 January and 31 December 330,874,257 330,218 330,874,257 330,2181,991,397 1,991,397
At the reporting date, the Company held 2,400,000 (2020: 2,400,000) ordinary shares as treasury shares.
Ordinary share capital
The holders of ordinary shares are entitled to receive dividends as declared from time to time and are entitled to one vote per ordinary share at General Meetings of the Company. All ordinary shares rank equally with regard to the Company’s residual assets.
Preference share capital
The Company has in issue 330,874,257 (2020: 330,874,257) non-redeemable convertible non-cumulative preference shares (Preference Shares), listed on the Official List of Singapore Exchange Securities Trading Limited. The Preference Shares are convertible only at the option of the Company, into fully-paid ordinary shares of the Company at the conversion ratio of 0.136 ordinary share for each Preference Share.
In the event the Company exercises its right of conversion, the Company shall pay to preference shareholders a one-off preference cash dividend at the fixed rate of 64% (net) of the issue price for each Preference Share (Additional Preference Dividend) and any preference dividend accrued but unpaid.
As at 31 December 2021, a maximum number of 44,998,898 (2020: 44,998,898) ordinary shares are issuable upon full conversion at the sole option of the Company of all the Preference Shares.
Holders of Preference Shares have no voting rights, except under certain circumstances provided for in the Singapore Companies Act and as set out in the Company’s Constitution.
The Preference Shares rank:
(i) pari passu without any preference or priority among themselves; and
(ii) in priority over the ordinary shares (a) in respect of payment of the preference dividend (when, as and if declared) and the Additional Preference Dividend; and (b) in the event of a winding-up of or return of capital by the Company, payment of any preference dividend that has accrued to holders of Preference Shares and is unpaid, the Additional Preference Dividend (whether or not then due) as well as the amount paid up on the Preference Shares (including the premium paid thereon).
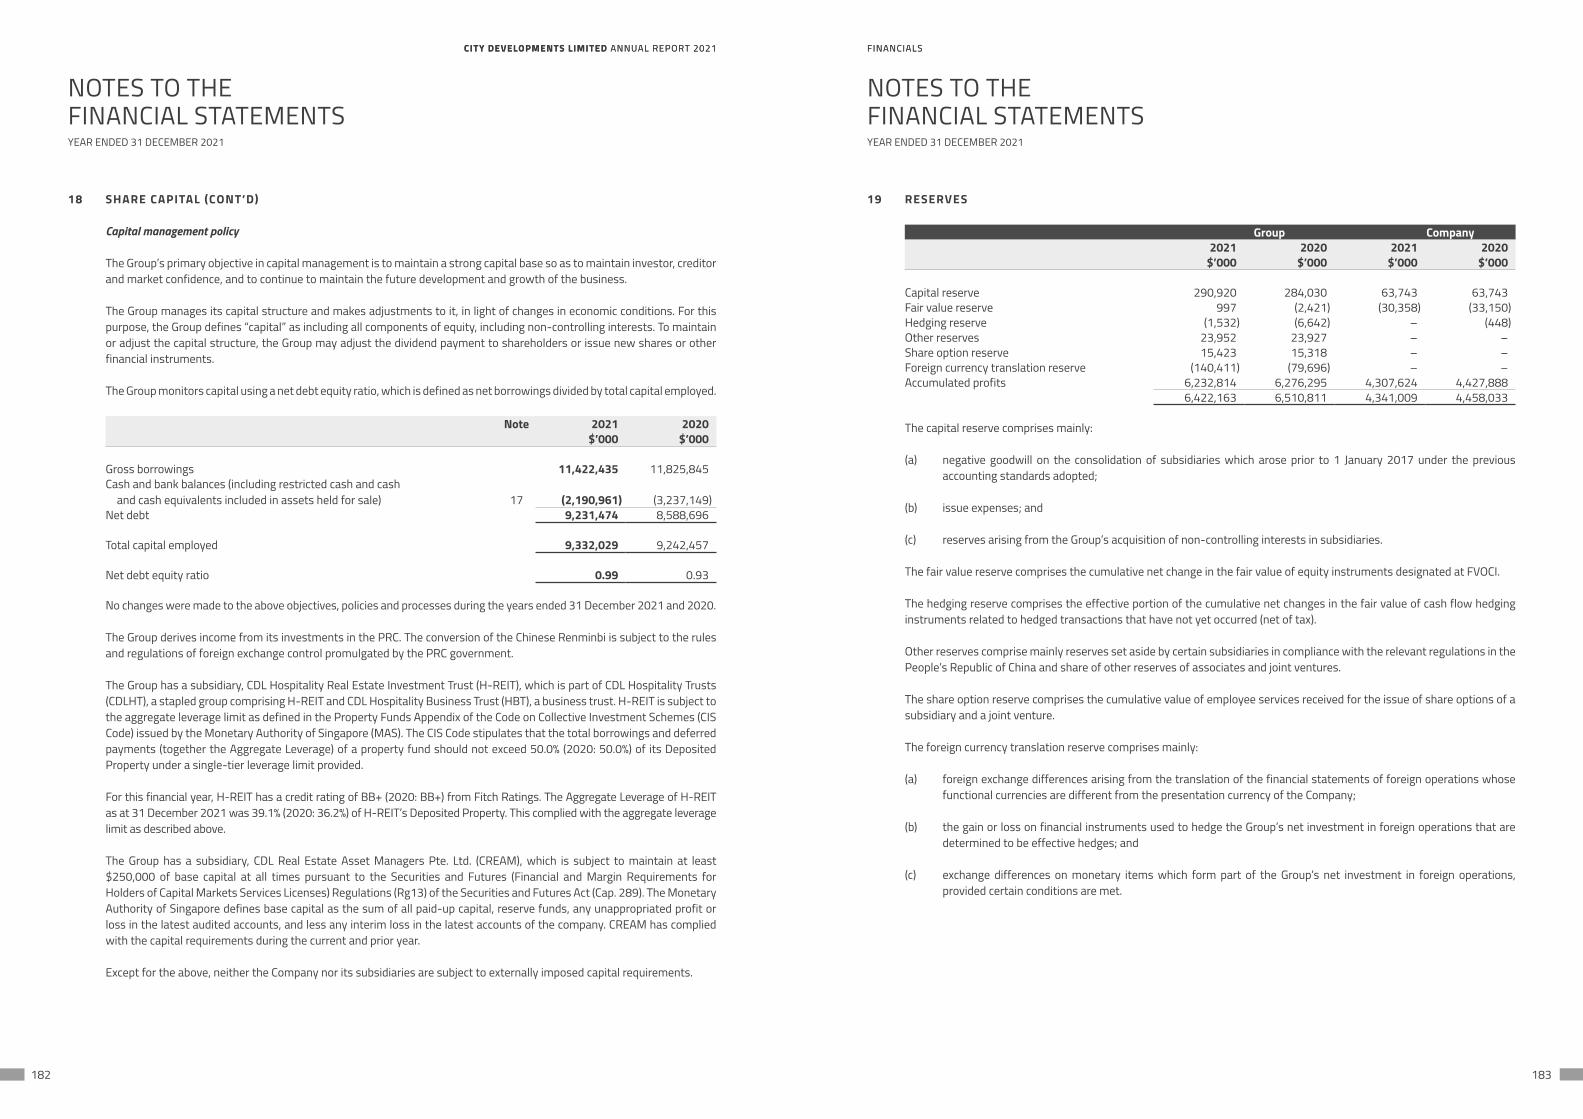
CITY DEVELOPMENTS LIMITED ANNUAL REPORT 2021 FINANCIALSCITY DEVELOPMENTS LIMITED ANNUAL REPORT 2021 FINANCIALS
182 183
NOTES TO THEFINANCIAL STATEMENTS
NOTES TO THEFINANCIAL STATEMENTS
YEAR ENDED 31 DECEMBER 2021 YEAR ENDED 31 DECEMBER 2021
18 SHARE CAPITAL (CONT’D)
Capital management policy
The Group’s primary objective in capital management is to maintain a strong capital base so as to maintain investor, creditor and market confidence, and to continue to maintain the future development and growth of the business.
The Group manages its capital structure and makes adjustments to it, in light of changes in economic conditions. For this purpose, the Group defines “capital” as including all components of equity, including non-controlling interests. To maintain or adjust the capital structure, the Group may adjust the dividend payment to shareholders or issue new shares or other financial instruments.
The Group monitors capital using a net debt equity ratio, which is defined as net borrowings divided by total capital employed.
Note 2021 2020$’000 $’000
Gross borrowings 11,422,435 11,825,845Cash and bank balances (including restricted cash and cash
and cash equivalents included in assets held for sale) 17 (2,190,961) (3,237,149)Net debt 9,231,474 8,588,696
Total capital employed 9,332,029 9,242,457
Net debt equity ratio 0.99 0.93
No changes were made to the above objectives, policies and processes during the years ended 31 December 2021 and 2020.
The Group derives income from its investments in the PRC. The conversion of the Chinese Renminbi is subject to the rules and regulations of foreign exchange control promulgated by the PRC government.
The Group has a subsidiary, CDL Hospitality Real Estate Investment Trust (H-REIT), which is part of CDL Hospitality Trusts (CDLHT), a stapled group comprising H-REIT and CDL Hospitality Business Trust (HBT), a business trust. H-REIT is subject to the aggregate leverage limit as defined in the Property Funds Appendix of the Code on Collective Investment Schemes (CIS Code) issued by the Monetary Authority of Singapore (MAS). The CIS Code stipulates that the total borrowings and deferred payments (together the Aggregate Leverage) of a property fund should not exceed 50.0% (2020: 50.0%) of its Deposited Property under a single-tier leverage limit provided.
For this financial year, H-REIT has a credit rating of BB+ (2020: BB+) from Fitch Ratings. The Aggregate Leverage of H-REIT as at 31 December 2021 was 39.1% (2020: 36.2%) of H-REIT’s Deposited Property. This complied with the aggregate leverage limit as described above.
The Group has a subsidiary, CDL Real Estate Asset Managers Pte. Ltd. (CREAM), which is subject to maintain at least $250,000 of base capital at all times pursuant to the Securities and Futures (Financial and Margin Requirements for Holders of Capital Markets Services Licenses) Regulations (Rg13) of the Securities and Futures Act (Cap. 289). The Monetary Authority of Singapore defines base capital as the sum of all paid-up capital, reserve funds, any unappropriated profit or loss in the latest audited accounts, and less any interim loss in the latest accounts of the company. CREAM has complied with the capital requirements during the current and prior year.
Except for the above, neither the Company nor its subsidiaries are subject to externally imposed capital requirements.
19 RESERVES
Group Company2021 2020 2021 2020
$’000 $’000 $’000 $’000
Capital reserve 290,920 284,030 63,743 63,743Fair value reserve 997 (2,421) (30,358) (33,150)Hedging reserve (1,532) (6,642) – (448)Other reserves 23,952 23,927 – –Share option reserve 15,423 15,318 – –Foreign currency translation reserve (140,411) (79,696) – –Accumulated profits 6,232,814 6,276,295 4,307,624 4,427,888
6,422,163 6,510,811 4,341,009 4,458,033
The capital reserve comprises mainly:
(a) negative goodwill on the consolidation of subsidiaries which arose prior to 1 January 2017 under the previous accounting standards adopted;
(b) issue expenses; and
(c) reserves arising from the Group’s acquisition of non-controlling interests in subsidiaries.
The fair value reserve comprises the cumulative net change in the fair value of equity instruments designated at FVOCI.
The hedging reserve comprises the effective portion of the cumulative net changes in the fair value of cash flow hedging instruments related to hedged transactions that have not yet occurred (net of tax).
Other reserves comprise mainly reserves set aside by certain subsidiaries in compliance with the relevant regulations in the People’s Republic of China and share of other reserves of associates and joint ventures.
The share option reserve comprises the cumulative value of employee services received for the issue of share options of a subsidiary and a joint venture.
The foreign currency translation reserve comprises mainly:
(a) foreign exchange differences arising from the translation of the financial statements of foreign operations whose functional currencies are different from the presentation currency of the Company;
(b) the gain or loss on financial instruments used to hedge the Group’s net investment in foreign operations that are determined to be effective hedges; and
(c) exchange differences on monetary items which form part of the Group’s net investment in foreign operations, provided certain conditions are met.
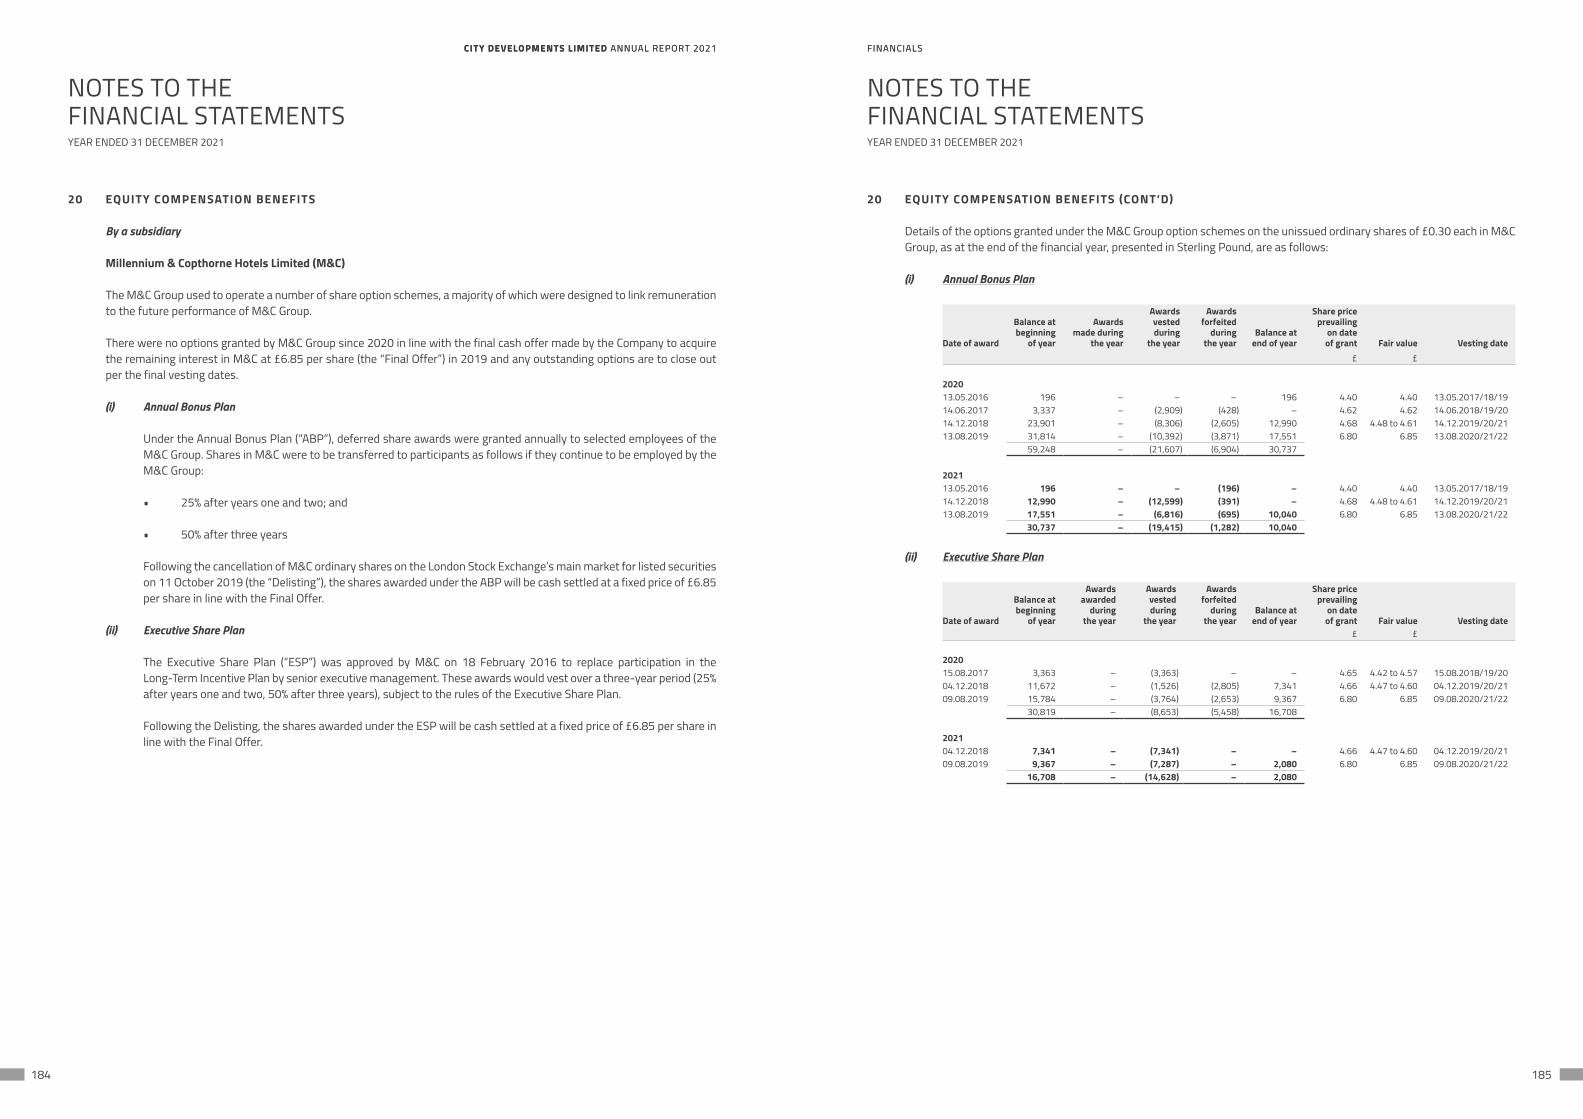
CITY DEVELOPMENTS LIMITED ANNUAL REPORT 2021 FINANCIALSCITY DEVELOPMENTS LIMITED ANNUAL REPORT 2021 FINANCIALS
184 185
NOTES TO THEFINANCIAL STATEMENTS
NOTES TO THEFINANCIAL STATEMENTS
YEAR ENDED 31 DECEMBER 2021 YEAR ENDED 31 DECEMBER 2021
20 EQUITY COMPENSATION BENEFITS
By a subsidiary
Millennium & Copthorne Hotels Limited (M&C)
The M&C Group used to operate a number of share option schemes, a majority of which were designed to link remuneration to the future performance of M&C Group.
There were no options granted by M&C Group since 2020 in line with the final cash offer made by the Company to acquire the remaining interest in M&C at £6.85 per share (the “Final Offer”) in 2019 and any outstanding options are to close out per the final vesting dates.
(i) Annual Bonus Plan
Under the Annual Bonus Plan (“ABP”), deferred share awards were granted annually to selected employees of the M&C Group. Shares in M&C were to be transferred to participants as follows if they continue to be employed by the M&C Group:
• 25% after years one and two; and
• 50% after three years
Following the cancellation of M&C ordinary shares on the London Stock Exchange’s main market for listed securities on 11 October 2019 (the “Delisting”), the shares awarded under the ABP will be cash settled at a fixed price of £6.85 per share in line with the Final Offer.
(ii) Executive Share Plan
The Executive Share Plan (“ESP”) was approved by M&C on 18 February 2016 to replace participation in the Long-Term Incentive Plan by senior executive management. These awards would vest over a three-year period (25% after years one and two, 50% after three years), subject to the rules of the Executive Share Plan.
Following the Delisting, the shares awarded under the ESP will be cash settled at a fixed price of £6.85 per share in line with the Final Offer.
20 EQUITY COMPENSATION BENEFITS (CONT’D)
Details of the options granted under the M&C Group option schemes on the unissued ordinary shares of £0.30 each in M&C Group, as at the end of the financial year, presented in Sterling Pound, are as follows:
(i) Annual Bonus Plan
Date of award
Balance atbeginning
of year
Awards made during
the year
Awardsvestedduring
the year
Awardsforfeited
duringthe year
Balance atend of year
Share priceprevailing
on dateof grant Fair value Vesting date
£ £
202013.05.2016 196 – – – 196 4.40 4.40 13.05.2017/18/1914.06.2017 3,337 – (2,909) (428) – 4.62 4.62 14.06.2018/19/2014.12.2018 23,901 – (8,306) (2,605) 12,990 4.68 4.48 to 4.61 14.12.2019/20/2113.08.2019 31,814 – (10,392) (3,871) 17,551 6.80 6.85 13.08.2020/21/22
59,248 – (21,607) (6,904) 30,737
202113.05.2016 196 – – (196) – 4.40 4.40 13.05.2017/18/1914.12.2018 12,990 – (12,599) (391) – 4.68 4.48 to 4.61 14.12.2019/20/2113.08.2019 17,551 – (6,816) (695) 10,040 6.80 6.85 13.08.2020/21/22
30,737 – (19,415) (1,282) 10,040
(ii) Executive Share Plan
Date of award
Balance atbeginning
of year
Awards awarded
duringthe year
Awardsvestedduring
the year
Awardsforfeited
duringthe year
Balance atend of year
Share priceprevailing
on dateof grant Fair value Vesting date
£ £
202015.08.2017 3,363 – (3,363) – – 4.65 4.42 to 4.57 15.08.2018/19/2004.12.2018 11,672 – (1,526) (2,805) 7,341 4.66 4.47 to 4.60 04.12.2019/20/2109.08.2019 15,784 – (3,764) (2,653) 9,367 6.80 6.85 09.08.2020/21/22
30,819 – (8,653) (5,458) 16,708
202104.12.2018 7,341 – (7,341) – – 4.66 4.47 to 4.60 04.12.2019/20/2109.08.2019 9,367 – (7,287) – 2,080 6.80 6.85 09.08.2020/21/22
16,708 – (14,628) – 2,080
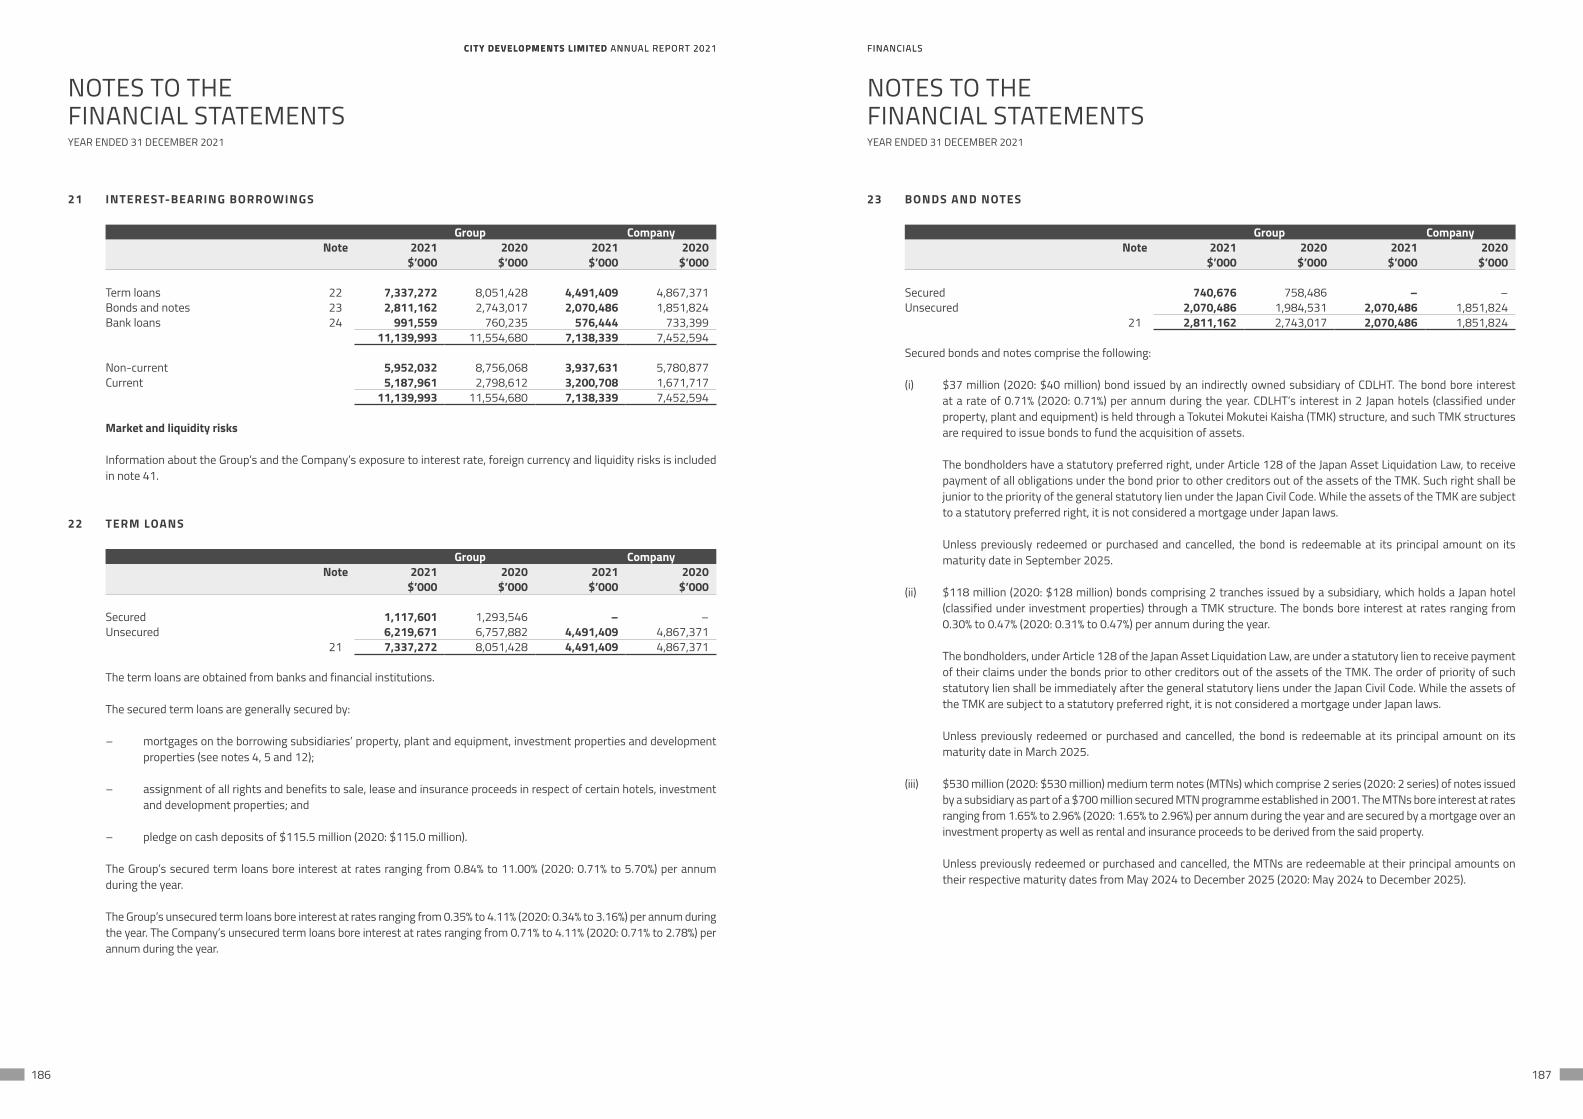
CITY DEVELOPMENTS LIMITED ANNUAL REPORT 2021 FINANCIALSCITY DEVELOPMENTS LIMITED ANNUAL REPORT 2021 FINANCIALS
186 187
NOTES TO THEFINANCIAL STATEMENTS
NOTES TO THEFINANCIAL STATEMENTS
YEAR ENDED 31 DECEMBER 2021 YEAR ENDED 31 DECEMBER 2021
21 INTEREST-BEARING BORROWINGS
Group CompanyNote 2021 2020 2021 2020
$’000 $’000 $’000 $’000
Term loans 22 7,337,272 8,051,428 4,491,409 4,867,371Bonds and notes 23 2,811,162 2,743,017 2,070,486 1,851,824Bank loans 24 991,559 760,235 576,444 733,399
11,139,993 11,554,680 7,138,339 7,452,594
Non-current 5,952,032 8,756,068 3,937,631 5,780,877Current 5,187,961 2,798,612 3,200,708 1,671,717
11,139,993 11,554,680 7,138,339 7,452,594
Market and liquidity risks
Information about the Group’s and the Company’s exposure to interest rate, foreign currency and liquidity risks is included in note 41.
22 TERM LOANS
Group CompanyNote 2021 2020 2021 2020
$’000 $’000 $’000 $’000
Secured 1,117,601 1,293,546 – –Unsecured 6,219,671 6,757,882 4,491,409 4,867,371
21 7,337,272 8,051,428 4,491,409 4,867,371
The term loans are obtained from banks and financial institutions.
The secured term loans are generally secured by:
– mortgages on the borrowing subsidiaries’ property, plant and equipment, investment properties and development properties (see notes 4, 5 and 12);
– assignment of all rights and benefits to sale, lease and insurance proceeds in respect of certain hotels, investment and development properties; and
– pledge on cash deposits of $115.5 million (2020: $115.0 million).
The Group’s secured term loans bore interest at rates ranging from 0.84% to 11.00% (2020: 0.71% to 5.70%) per annum during the year.
The Group’s unsecured term loans bore interest at rates ranging from 0.35% to 4.11% (2020: 0.34% to 3.16%) per annum during the year. The Company’s unsecured term loans bore interest at rates ranging from 0.71% to 4.11% (2020: 0.71% to 2.78%) per annum during the year.
23 BONDS AND NOTES
Group CompanyNote 2021 2020 2021 2020
$’000 $’000 $’000 $’000
Secured 740,676 758,486 – –Unsecured 2,070,486 1,984,531 2,070,486 1,851,824
21 2,811,162 2,743,017 2,070,486 1,851,824
Secured bonds and notes comprise the following:
(i) $37 million (2020: $40 million) bond issued by an indirectly owned subsidiary of CDLHT. The bond bore interest at a rate of 0.71% (2020: 0.71%) per annum during the year. CDLHT’s interest in 2 Japan hotels (classified under property, plant and equipment) is held through a Tokutei Mokutei Kaisha (TMK) structure, and such TMK structures are required to issue bonds to fund the acquisition of assets.
The bondholders have a statutory preferred right, under Article 128 of the Japan Asset Liquidation Law, to receive payment of all obligations under the bond prior to other creditors out of the assets of the TMK. Such right shall be junior to the priority of the general statutory lien under the Japan Civil Code. While the assets of the TMK are subject to a statutory preferred right, it is not considered a mortgage under Japan laws.
Unless previously redeemed or purchased and cancelled, the bond is redeemable at its principal amount on its maturity date in September 2025.
(ii) $118 million (2020: $128 million) bonds comprising 2 tranches issued by a subsidiary, which holds a Japan hotel (classified under investment properties) through a TMK structure. The bonds bore interest at rates ranging from 0.30% to 0.47% (2020: 0.31% to 0.47%) per annum during the year.
The bondholders, under Article 128 of the Japan Asset Liquidation Law, are under a statutory lien to receive payment of their claims under the bonds prior to other creditors out of the assets of the TMK. The order of priority of such statutory lien shall be immediately after the general statutory liens under the Japan Civil Code. While the assets of the TMK are subject to a statutory preferred right, it is not considered a mortgage under Japan laws.
Unless previously redeemed or purchased and cancelled, the bond is redeemable at its principal amount on its maturity date in March 2025.
(iii) $530 million (2020: $530 million) medium term notes (MTNs) which comprise 2 series (2020: 2 series) of notes issued by a subsidiary as part of a $700 million secured MTN programme established in 2001. The MTNs bore interest at rates ranging from 1.65% to 2.96% (2020: 1.65% to 2.96%) per annum during the year and are secured by a mortgage over an investment property as well as rental and insurance proceeds to be derived from the said property.
Unless previously redeemed or purchased and cancelled, the MTNs are redeemable at their principal amounts on their respective maturity dates from May 2024 to December 2025 (2020: May 2024 to December 2025).
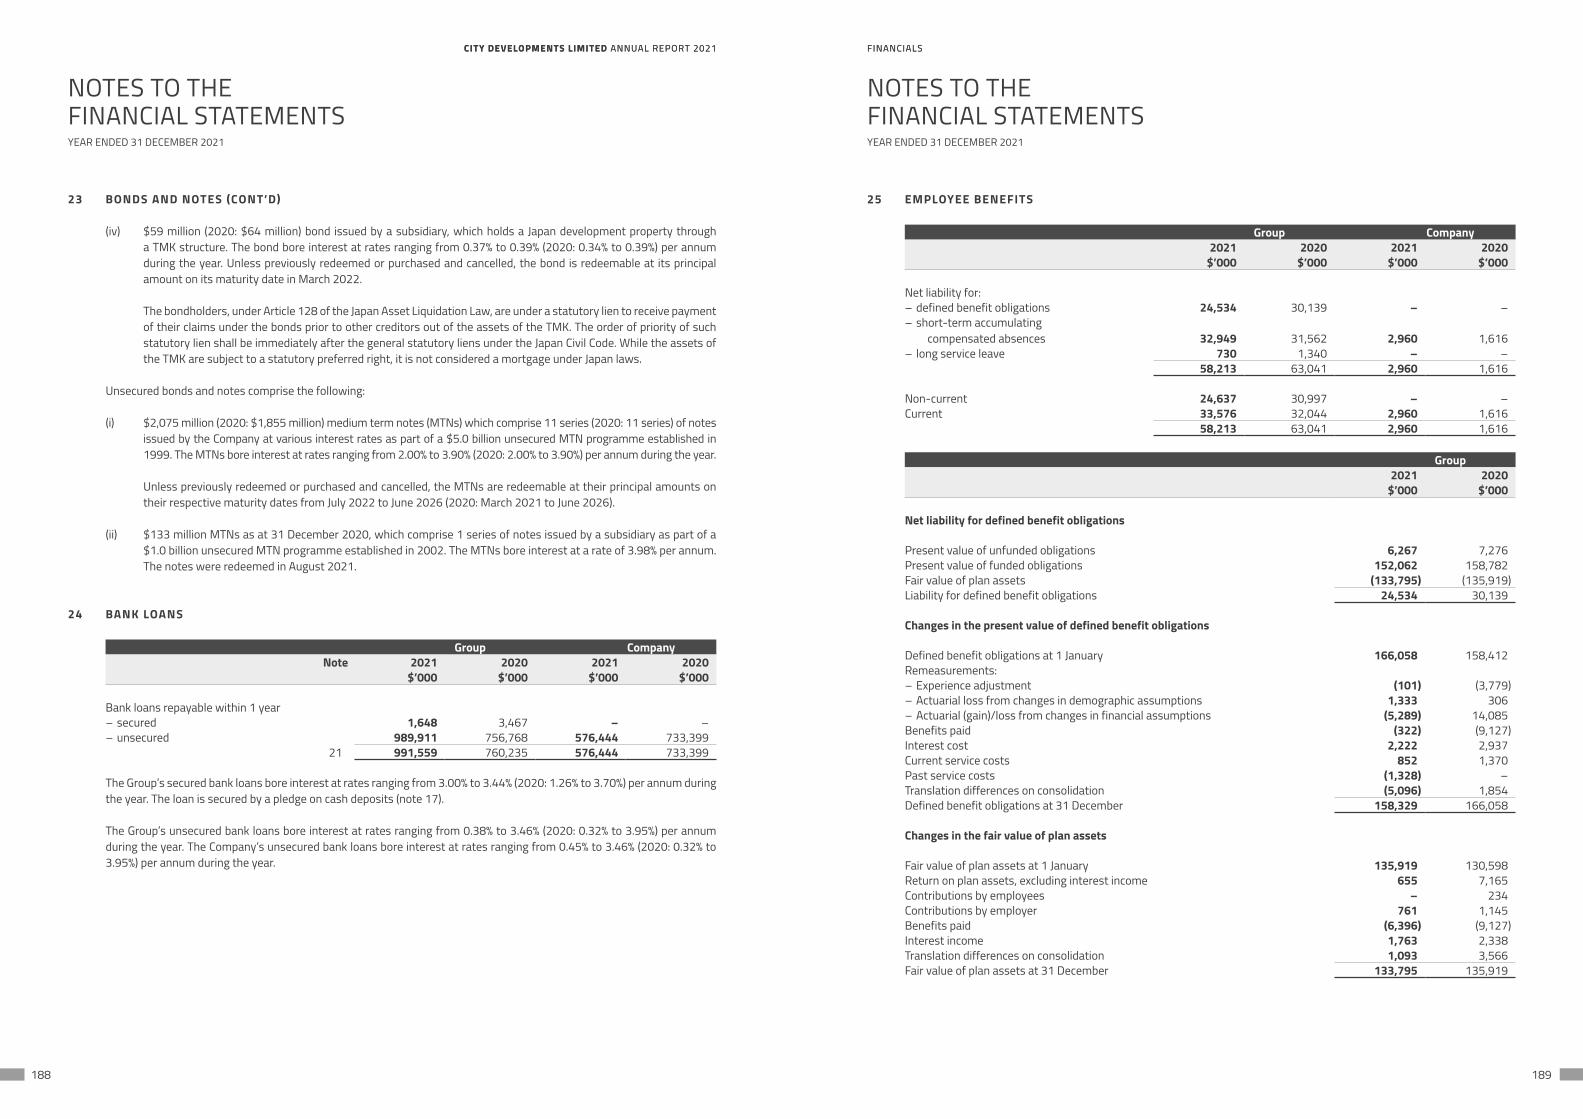
CITY DEVELOPMENTS LIMITED ANNUAL REPORT 2021 FINANCIALSCITY DEVELOPMENTS LIMITED ANNUAL REPORT 2021 FINANCIALS
188 189
NOTES TO THEFINANCIAL STATEMENTS
NOTES TO THEFINANCIAL STATEMENTS
YEAR ENDED 31 DECEMBER 2021 YEAR ENDED 31 DECEMBER 2021
23 BONDS AND NOTES (CONT’D)
(iv) $59 million (2020: $64 million) bond issued by a subsidiary, which holds a Japan development property through a TMK structure. The bond bore interest at rates ranging from 0.37% to 0.39% (2020: 0.34% to 0.39%) per annum during the year. Unless previously redeemed or purchased and cancelled, the bond is redeemable at its principal amount on its maturity date in March 2022.
The bondholders, under Article 128 of the Japan Asset Liquidation Law, are under a statutory lien to receive payment of their claims under the bonds prior to other creditors out of the assets of the TMK. The order of priority of such statutory lien shall be immediately after the general statutory liens under the Japan Civil Code. While the assets of the TMK are subject to a statutory preferred right, it is not considered a mortgage under Japan laws.
Unsecured bonds and notes comprise the following:
(i) $2,075 million (2020: $1,855 million) medium term notes (MTNs) which comprise 11 series (2020: 11 series) of notes issued by the Company at various interest rates as part of a $5.0 billion unsecured MTN programme established in 1999. The MTNs bore interest at rates ranging from 2.00% to 3.90% (2020: 2.00% to 3.90%) per annum during the year.
Unless previously redeemed or purchased and cancelled, the MTNs are redeemable at their principal amounts on their respective maturity dates from July 2022 to June 2026 (2020: March 2021 to June 2026).
(ii) $133 million MTNs as at 31 December 2020, which comprise 1 series of notes issued by a subsidiary as part of a $1.0 billion unsecured MTN programme established in 2002. The MTNs bore interest at a rate of 3.98% per annum. The notes were redeemed in August 2021.
24 BANK LOANS
Group CompanyNote 2021 2020 2021 2020
$’000 $’000 $’000 $’000
Bank loans repayable within 1 year– secured 1,648 3,467 – –– unsecured 989,911 756,768 576,444 733,399
21 991,559 760,235 576,444 733,399
The Group’s secured bank loans bore interest at rates ranging from 3.00% to 3.44% (2020: 1.26% to 3.70%) per annum during the year. The loan is secured by a pledge on cash deposits (note 17).
The Group’s unsecured bank loans bore interest at rates ranging from 0.38% to 3.46% (2020: 0.32% to 3.95%) per annum during the year. The Company’s unsecured bank loans bore interest at rates ranging from 0.45% to 3.46% (2020: 0.32% to 3.95%) per annum during the year.
25 EMPLOYEE BENEFITS
Group Company2021 2020 2021 2020
$’000 $’000 $’000 $’000
Net liability for:– defined benefit obligations 24,534 30,139 – –– short-term accumulating
compensated absences 32,949 31,562 2,960 1,616– long service leave 730 1,340 – –
58,213 63,041 2,960 1,616
Non-current 24,637 30,997 – –Current 33,576 32,044 2,960 1,616
58,213 63,041 2,960 1,616
Group2021 2020
$’000 $’000
Net liability for defined benefit obligations
Present value of unfunded obligations 6,267 7,276Present value of funded obligations 152,062 158,782Fair value of plan assets (133,795) (135,919)Liability for defined benefit obligations 24,534 30,139
Changes in the present value of defined benefit obligations
Defined benefit obligations at 1 January 166,058 158,412Remeasurements:– Experience adjustment (101) (3,779)– Actuarial loss from changes in demographic assumptions 1,333 306– Actuarial (gain)/loss from changes in financial assumptions (5,289) 14,085Benefits paid (322) (9,127)Interest cost 2,222 2,937Current service costs 852 1,370Past service costs (1,328) –Translation differences on consolidation (5,096) 1,854Defined benefit obligations at 31 December 158,329 166,058
Changes in the fair value of plan assets
Fair value of plan assets at 1 January 135,919 130,598Return on plan assets, excluding interest income 655 7,165Contributions by employees – 234Contributions by employer 761 1,145Benefits paid (6,396) (9,127)Interest income 1,763 2,338Translation differences on consolidation 1,093 3,566Fair value of plan assets at 31 December 133,795 135,919
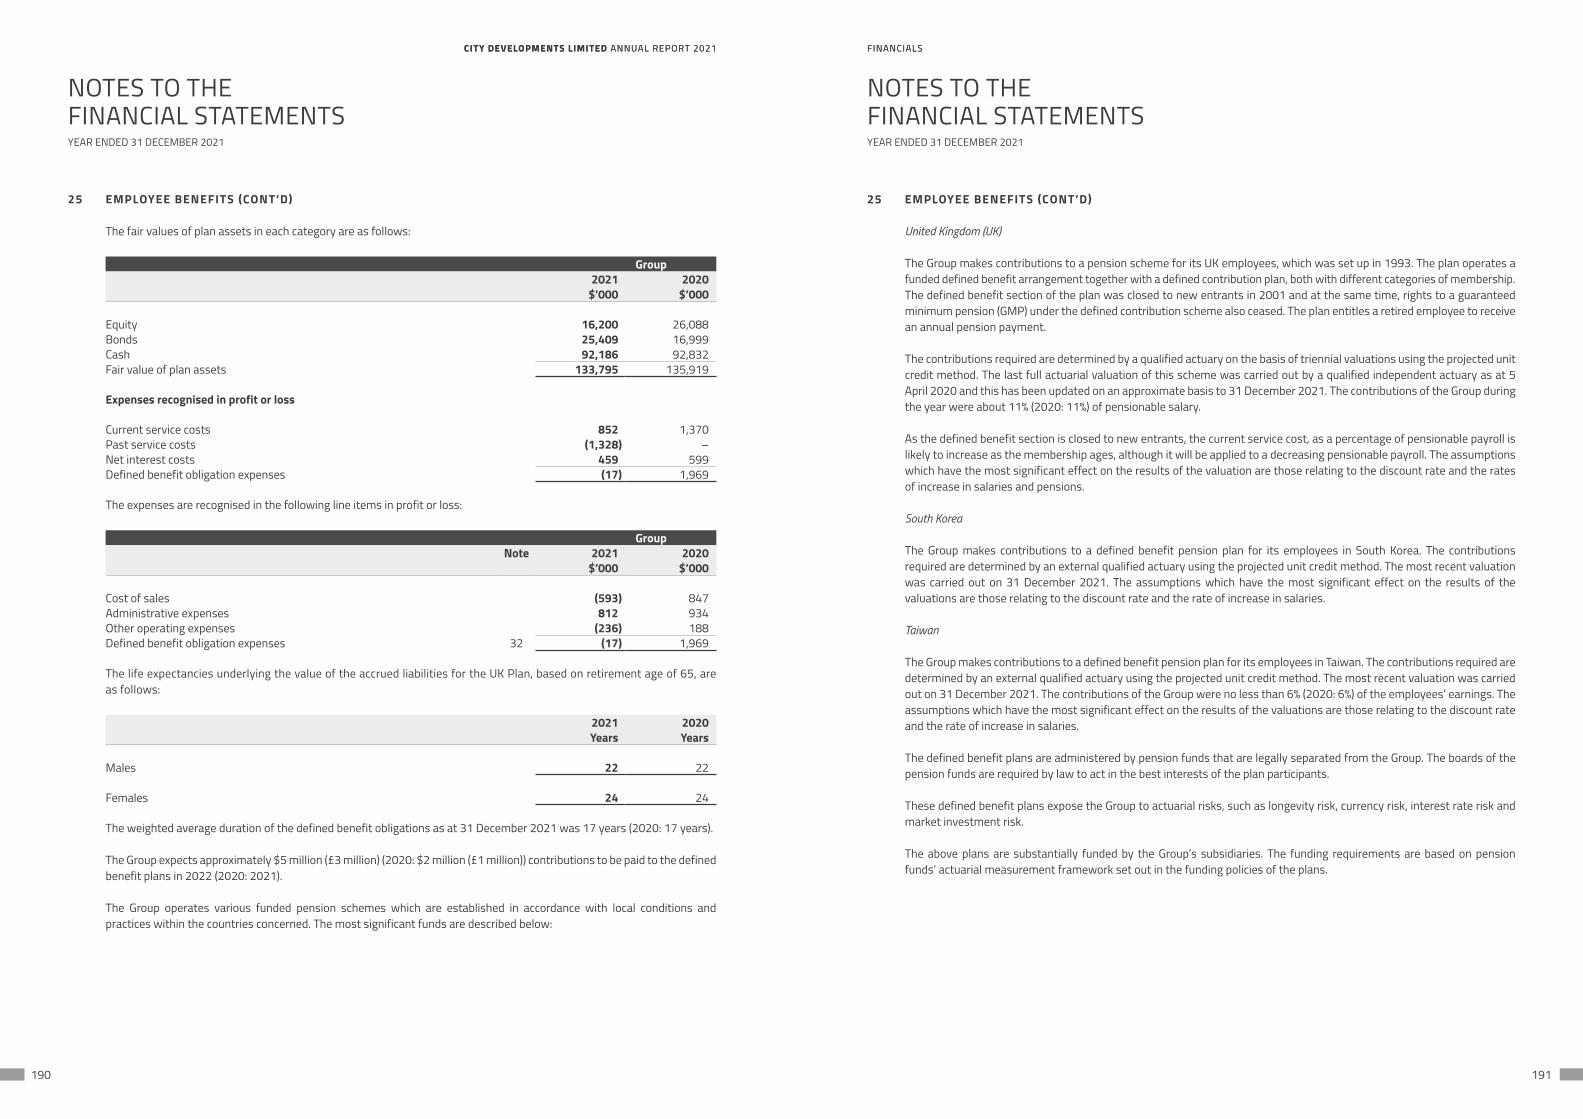
CITY DEVELOPMENTS LIMITED ANNUAL REPORT 2021 FINANCIALSCITY DEVELOPMENTS LIMITED ANNUAL REPORT 2021 FINANCIALS
190 191
NOTES TO THEFINANCIAL STATEMENTS
NOTES TO THEFINANCIAL STATEMENTS
YEAR ENDED 31 DECEMBER 2021 YEAR ENDED 31 DECEMBER 2021
25 EMPLOYEE BENEFITS (CONT’D)
The fair values of plan assets in each category are as follows:
Group2021 2020
$’000 $’000
Equity 16,200 26,088Bonds 25,409 16,999Cash 92,186 92,832Fair value of plan assets 133,795 135,919
Expenses recognised in profit or loss
Current service costs 852 1,370Past service costs (1,328) –Net interest costs 459 599Defined benefit obligation expenses (17) 1,969
The expenses are recognised in the following line items in profit or loss:
GroupNote 2021 2020
$’000 $’000
Cost of sales (593) 847Administrative expenses 812 934Other operating expenses (236) 188Defined benefit obligation expenses 32 (17) 1,969
The life expectancies underlying the value of the accrued liabilities for the UK Plan, based on retirement age of 65, are as follows:
2021 2020Years Years
Males 22 22
Females 24 24
The weighted average duration of the defined benefit obligations as at 31 December 2021 was 17 years (2020: 17 years).
The Group expects approximately $5 million (£3 million) (2020: $2 million (£1 million)) contributions to be paid to the defined benefit plans in 2022 (2020: 2021).
The Group operates various funded pension schemes which are established in accordance with local conditions and practices within the countries concerned. The most significant funds are described below:
25 EMPLOYEE BENEFITS (CONT’D)
United Kingdom (UK)
The Group makes contributions to a pension scheme for its UK employees, which was set up in 1993. The plan operates a funded defined benefit arrangement together with a defined contribution plan, both with different categories of membership. The defined benefit section of the plan was closed to new entrants in 2001 and at the same time, rights to a guaranteed minimum pension (GMP) under the defined contribution scheme also ceased. The plan entitles a retired employee to receive an annual pension payment.
The contributions required are determined by a qualified actuary on the basis of triennial valuations using the projected unit credit method. The last full actuarial valuation of this scheme was carried out by a qualified independent actuary as at 5 April 2020 and this has been updated on an approximate basis to 31 December 2021. The contributions of the Group during the year were about 11% (2020: 11%) of pensionable salary.
As the defined benefit section is closed to new entrants, the current service cost, as a percentage of pensionable payroll is likely to increase as the membership ages, although it will be applied to a decreasing pensionable payroll. The assumptions which have the most significant effect on the results of the valuation are those relating to the discount rate and the rates of increase in salaries and pensions.
South Korea
The Group makes contributions to a defined benefit pension plan for its employees in South Korea. The contributions required are determined by an external qualified actuary using the projected unit credit method. The most recent valuation was carried out on 31 December 2021. The assumptions which have the most significant effect on the results of the valuations are those relating to the discount rate and the rate of increase in salaries.
Taiwan
The Group makes contributions to a defined benefit pension plan for its employees in Taiwan. The contributions required are determined by an external qualified actuary using the projected unit credit method. The most recent valuation was carried out on 31 December 2021. The contributions of the Group were no less than 6% (2020: 6%) of the employees’ earnings. The assumptions which have the most significant effect on the results of the valuations are those relating to the discount rate and the rate of increase in salaries.
The defined benefit plans are administered by pension funds that are legally separated from the Group. The boards of the pension funds are required by law to act in the best interests of the plan participants.
These defined benefit plans expose the Group to actuarial risks, such as longevity risk, currency risk, interest rate risk and market investment risk.
The above plans are substantially funded by the Group’s subsidiaries. The funding requirements are based on pension funds’ actuarial measurement framework set out in the funding policies of the plans.
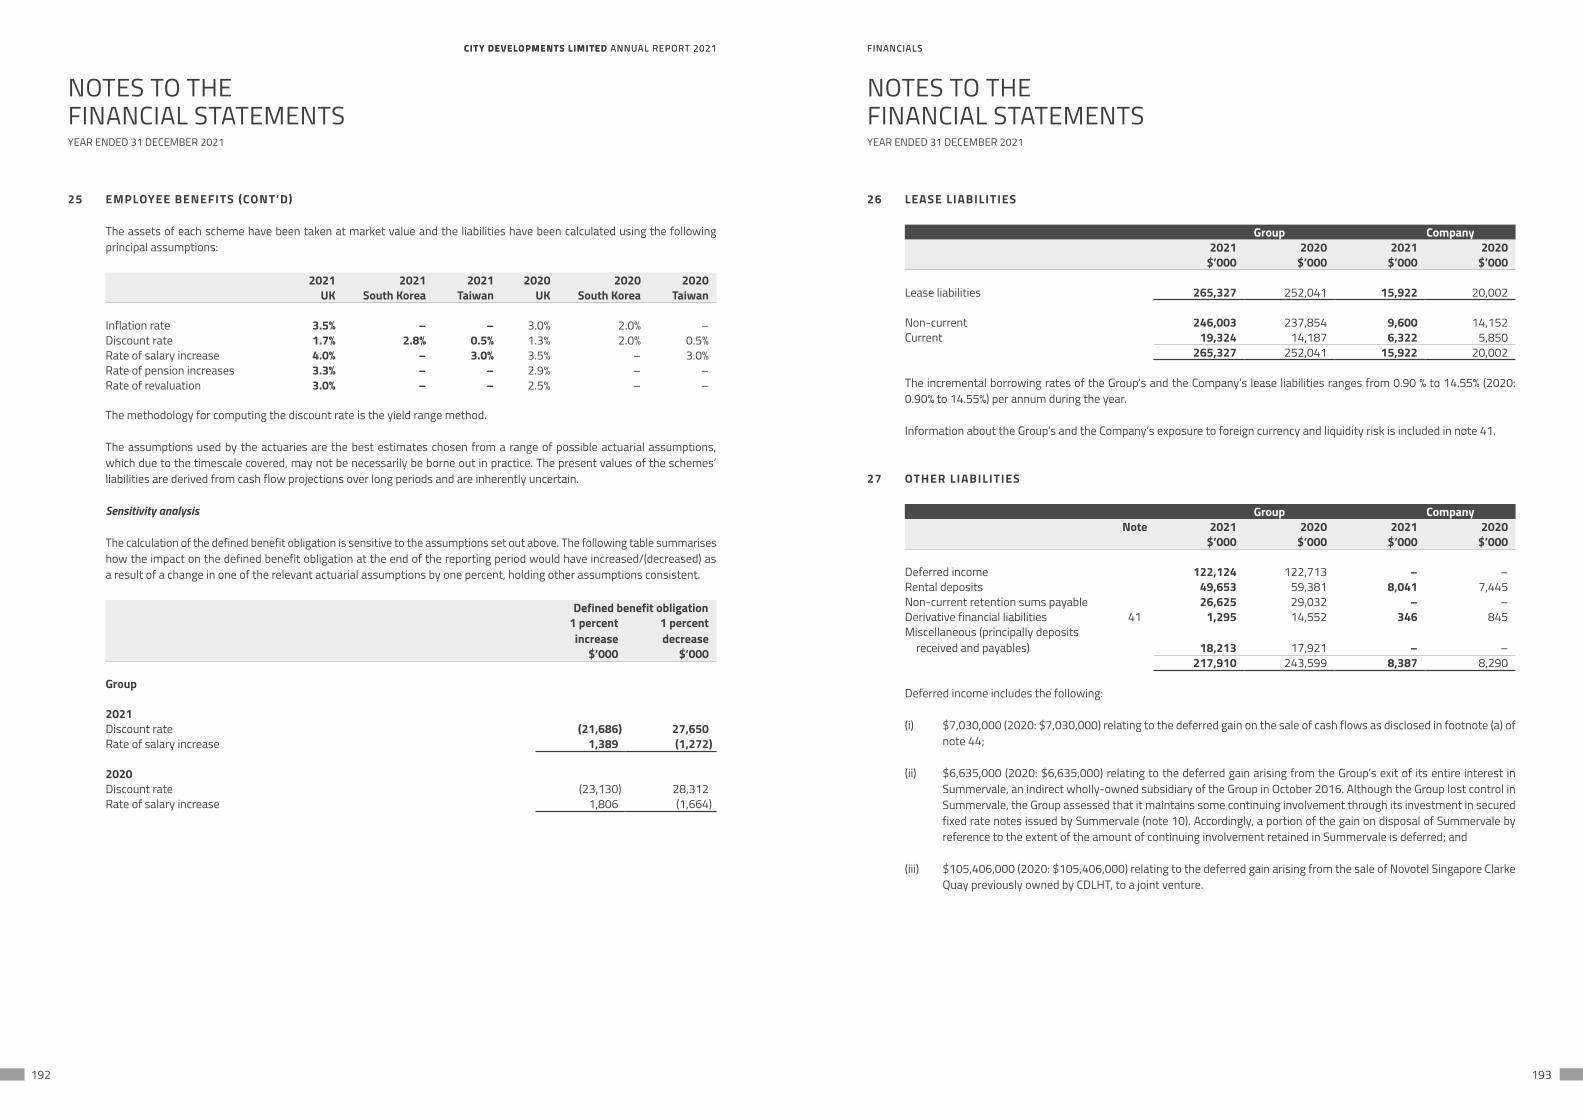
CITY DEVELOPMENTS LIMITED ANNUAL REPORT 2021 FINANCIALSCITY DEVELOPMENTS LIMITED ANNUAL REPORT 2021 FINANCIALS
192 193
NOTES TO THEFINANCIAL STATEMENTS
NOTES TO THEFINANCIAL STATEMENTS
YEAR ENDED 31 DECEMBER 2021 YEAR ENDED 31 DECEMBER 2021
25 EMPLOYEE BENEFITS (CONT’D)
The assets of each scheme have been taken at market value and the liabilities have been calculated using the following principal assumptions:
2021 2021 2021 2020 2020 2020UK South Korea Taiwan UK South Korea Taiwan
Inflation rate 3.5% – – 3.0% 2.0% –Discount rate 1.7% 2.8% 0.5% 1.3% 2.0% 0.5%Rate of salary increase 4.0% – 3.0% 3.5% – 3.0%Rate of pension increases 3.3% – – 2.9% – –Rate of revaluation 3.0% – – 2.5% – –
The methodology for computing the discount rate is the yield range method.
The assumptions used by the actuaries are the best estimates chosen from a range of possible actuarial assumptions, which due to the timescale covered, may not be necessarily be borne out in practice. The present values of the schemes’ liabilities are derived from cash flow projections over long periods and are inherently uncertain.
Sensitivity analysis
The calculation of the defined benefit obligation is sensitive to the assumptions set out above. The following table summarises how the impact on the defined benefit obligation at the end of the reporting period would have increased/(decreased) as a result of a change in one of the relevant actuarial assumptions by one percent, holding other assumptions consistent.
Defined benefit obligation1 percent
increase1 percentdecrease
$’000 $’000
Group
2021Discount rate (21,686) 27,650Rate of salary increase 1,389 (1,272)
2020Discount rate (23,130) 28,312Rate of salary increase 1,806 (1,664)
26 LEASE LIABILITIES
Group Company2021 2020 2021 2020
$’000 $’000 $’000 $’000
Lease liabilities 265,327 252,041 15,922 20,002
Non-current 246,003 237,854 9,600 14,152Current 19,324 14,187 6,322 5,850
265,327 252,041 15,922 20,002
The incremental borrowing rates of the Group’s and the Company’s lease liabilities ranges from 0.90 % to 14.55% (2020: 0.90% to 14.55%) per annum during the year.
Information about the Group’s and the Company’s exposure to foreign currency and liquidity risk is included in note 41.
27 OTHER LIABILITIES
Group CompanyNote 2021 2020 2021 2020
$’000 $’000 $’000 $’000
Deferred income 122,124 122,713 – –Rental deposits 49,653 59,381 8,041 7,445Non-current retention sums payable 26,625 29,032 – –Derivative financial liabilities 41 1,295 14,552 346 845Miscellaneous (principally deposits
received and payables) 18,213 17,921 – –217,910 243,599 8,387 8,290
Deferred income includes the following:
(i) $7,030,000 (2020: $7,030,000) relating to the deferred gain on the sale of cash flows as disclosed in footnote (a) of note 44;
(ii) $6,635,000 (2020: $6,635,000) relating to the deferred gain arising from the Group’s exit of its entire interest in Summervale, an indirect wholly-owned subsidiary of the Group in October 2016. Although the Group lost control in Summervale, the Group assessed that it maintains some continuing involvement through its investment in secured fixed rate notes issued by Summervale (note 10). Accordingly, a portion of the gain on disposal of Summervale by reference to the extent of the amount of continuing involvement retained in Summervale is deferred; and
(iii) $105,406,000 (2020: $105,406,000) relating to the deferred gain arising from the sale of Novotel Singapore Clarke Quay previously owned by CDLHT, to a joint venture.
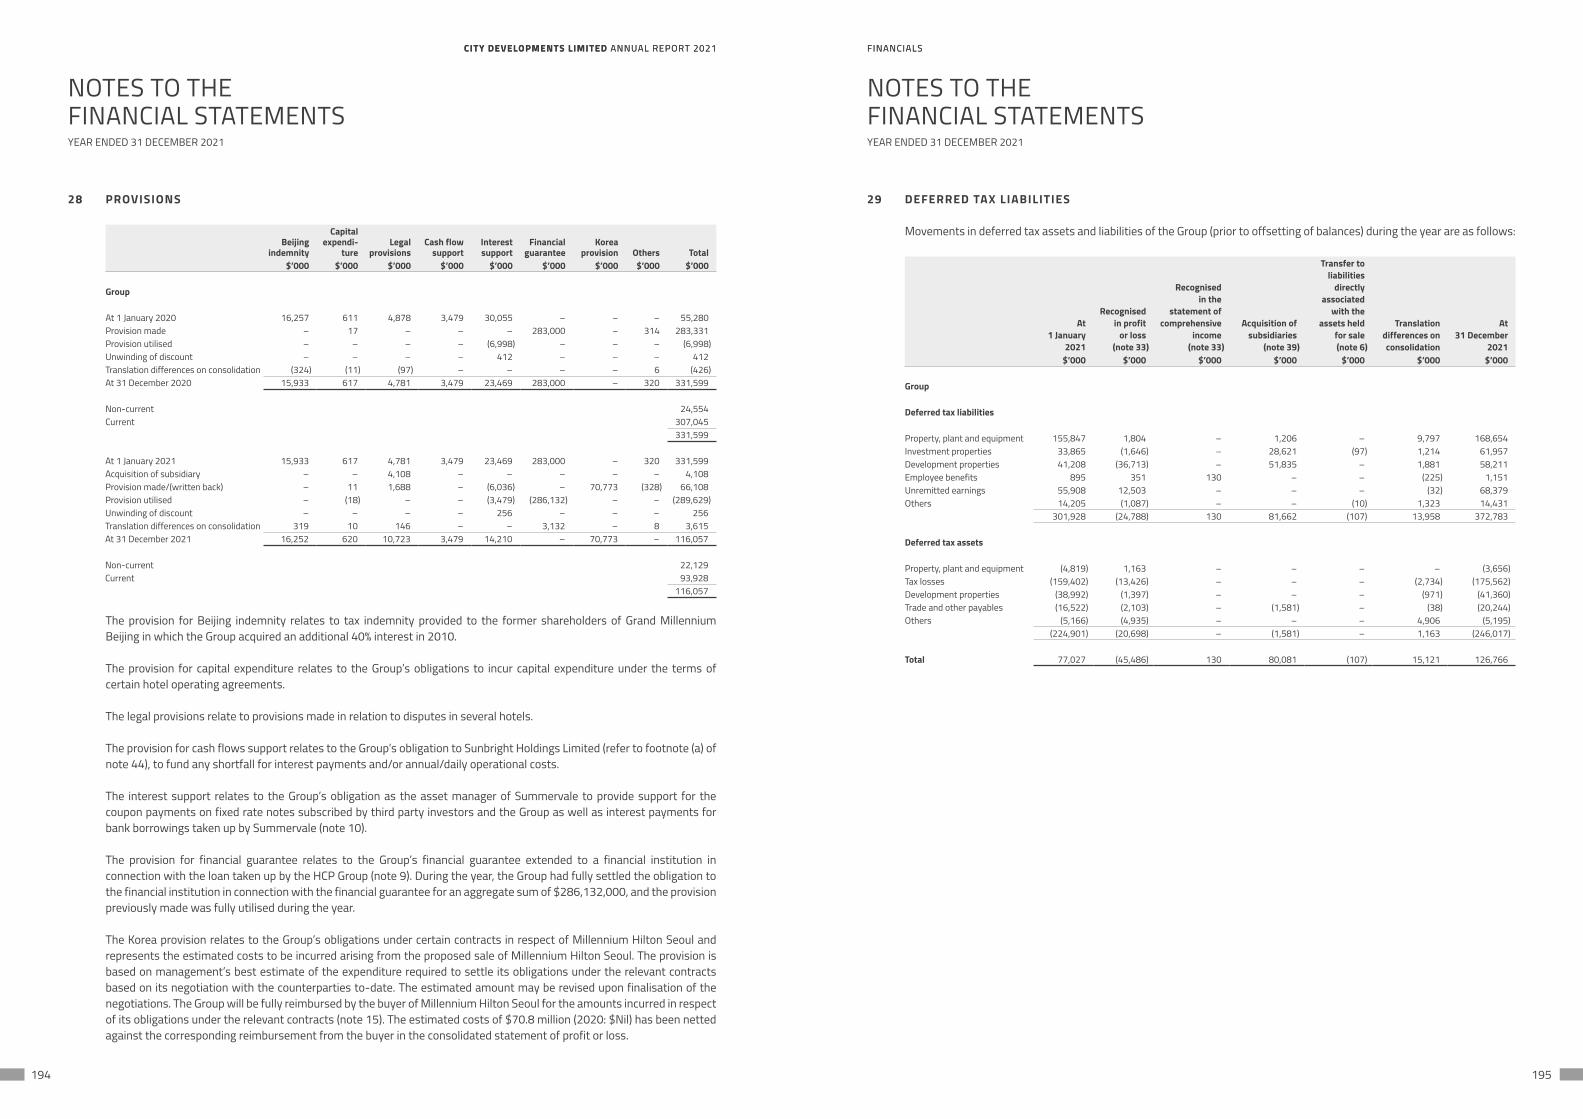
CITY DEVELOPMENTS LIMITED ANNUAL REPORT 2021 FINANCIALSCITY DEVELOPMENTS LIMITED ANNUAL REPORT 2021 FINANCIALS
194 195
NOTES TO THEFINANCIAL STATEMENTS
NOTES TO THEFINANCIAL STATEMENTS
YEAR ENDED 31 DECEMBER 2021 YEAR ENDED 31 DECEMBER 2021
28 PROVISIONS
Beijingindemnity
Capital expendi-
tureLegal
provisionsCash flow
support Interest support
Financial guarantee
Koreaprovision Others Total
$’000 $’000 $’000 $’000 $’000 $’000 $’000 $’000 $’000
Group
At 1 January 2020 16,257 611 4,878 3,479 30,055 – – – 55,280Provision made – 17 – – – 283,000 – 314 283,331Provision utilised – – – – (6,998) – – – (6,998)Unwinding of discount – – – – 412 – – – 412Translation differences on consolidation (324) (11) (97) – – – – 6 (426)At 31 December 2020 15,933 617 4,781 3,479 23,469 283,000 – 320 331,599
Non-current 24,554Current 307,045
331,599
At 1 January 2021 15,933 617 4,781 3,479 23,469 283,000 – 320 331,599Acquisition of subsidiary – – 4,108 – – – – – 4,108Provision made/(written back) – 11 1,688 – (6,036) – 70,773 (328) 66,108Provision utilised – (18) – – (3,479) (286,132) – – (289,629)Unwinding of discount – – – – 256 – – – 256Translation differences on consolidation 319 10 146 – – 3,132 – 8 3,615At 31 December 2021 16,252 620 10,723 3,479 14,210 – 70,773 – 116,057
Non-current 22,129Current 93,928
116,057
The provision for Beijing indemnity relates to tax indemnity provided to the former shareholders of Grand Millennium Beijing in which the Group acquired an additional 40% interest in 2010.
The provision for capital expenditure relates to the Group’s obligations to incur capital expenditure under the terms of certain hotel operating agreements.
The legal provisions relate to provisions made in relation to disputes in several hotels.
The provision for cash flows support relates to the Group’s obligation to Sunbright Holdings Limited (refer to footnote (a) of note 44), to fund any shortfall for interest payments and/or annual/daily operational costs.
The interest support relates to the Group’s obligation as the asset manager of Summervale to provide support for the coupon payments on fixed rate notes subscribed by third party investors and the Group as well as interest payments for bank borrowings taken up by Summervale (note 10).
The provision for financial guarantee relates to the Group’s financial guarantee extended to a financial institution in connection with the loan taken up by the HCP Group (note 9). During the year, the Group had fully settled the obligation to the financial institution in connection with the financial guarantee for an aggregate sum of $286,132,000, and the provision previously made was fully utilised during the year.
The Korea provision relates to the Group’s obligations under certain contracts in respect of Millennium Hilton Seoul and represents the estimated costs to be incurred arising from the proposed sale of Millennium Hilton Seoul. The provision is based on management’s best estimate of the expenditure required to settle its obligations under the relevant contracts based on its negotiation with the counterparties to-date. The estimated amount may be revised upon finalisation of the negotiations. The Group will be fully reimbursed by the buyer of Millennium Hilton Seoul for the amounts incurred in respect of its obligations under the relevant contracts (note 15). The estimated costs of $70.8 million (2020: $Nil) has been netted against the corresponding reimbursement from the buyer in the consolidated statement of profit or loss.
29 DEFERRED TAX LIABILITIES
Movements in deferred tax assets and liabilities of the Group (prior to offsetting of balances) during the year are as follows:
At1 January
2021
Recognisedin profit
or loss (note 33)
Recognisedin the
statement ofcomprehensive
income(note 33)
Acquisition ofsubsidiaries
(note 39)
Transfer toliabilities
directlyassociated
with theassets held
for sale(note 6)
Translationdifferences onconsolidation
At31 December
2021$’000 $’000 $’000 $’000 $’000 $’000 $’000
Group
Deferred tax liabilities
Property, plant and equipment 155,847 1,804 – 1,206 – 9,797 168,654Investment properties 33,865 (1,646) – 28,621 (97) 1,214 61,957Development properties 41,208 (36,713) – 51,835 – 1,881 58,211Employee benefits 895 351 130 – – (225) 1,151Unremitted earnings 55,908 12,503 – – – (32) 68,379Others 14,205 (1,087) – – (10) 1,323 14,431
301,928 (24,788) 130 81,662 (107) 13,958 372,783
Deferred tax assets
Property, plant and equipment (4,819) 1,163 – – – – (3,656)Tax losses (159,402) (13,426) – – – (2,734) (175,562)Development properties (38,992) (1,397) – – – (971) (41,360)Trade and other payables (16,522) (2,103) – (1,581) – (38) (20,244)Others (5,166) (4,935) – – – 4,906 (5,195)
(224,901) (20,698) – (1,581) – 1,163 (246,017)
Total 77,027 (45,486) 130 80,081 (107) 15,121 126,766
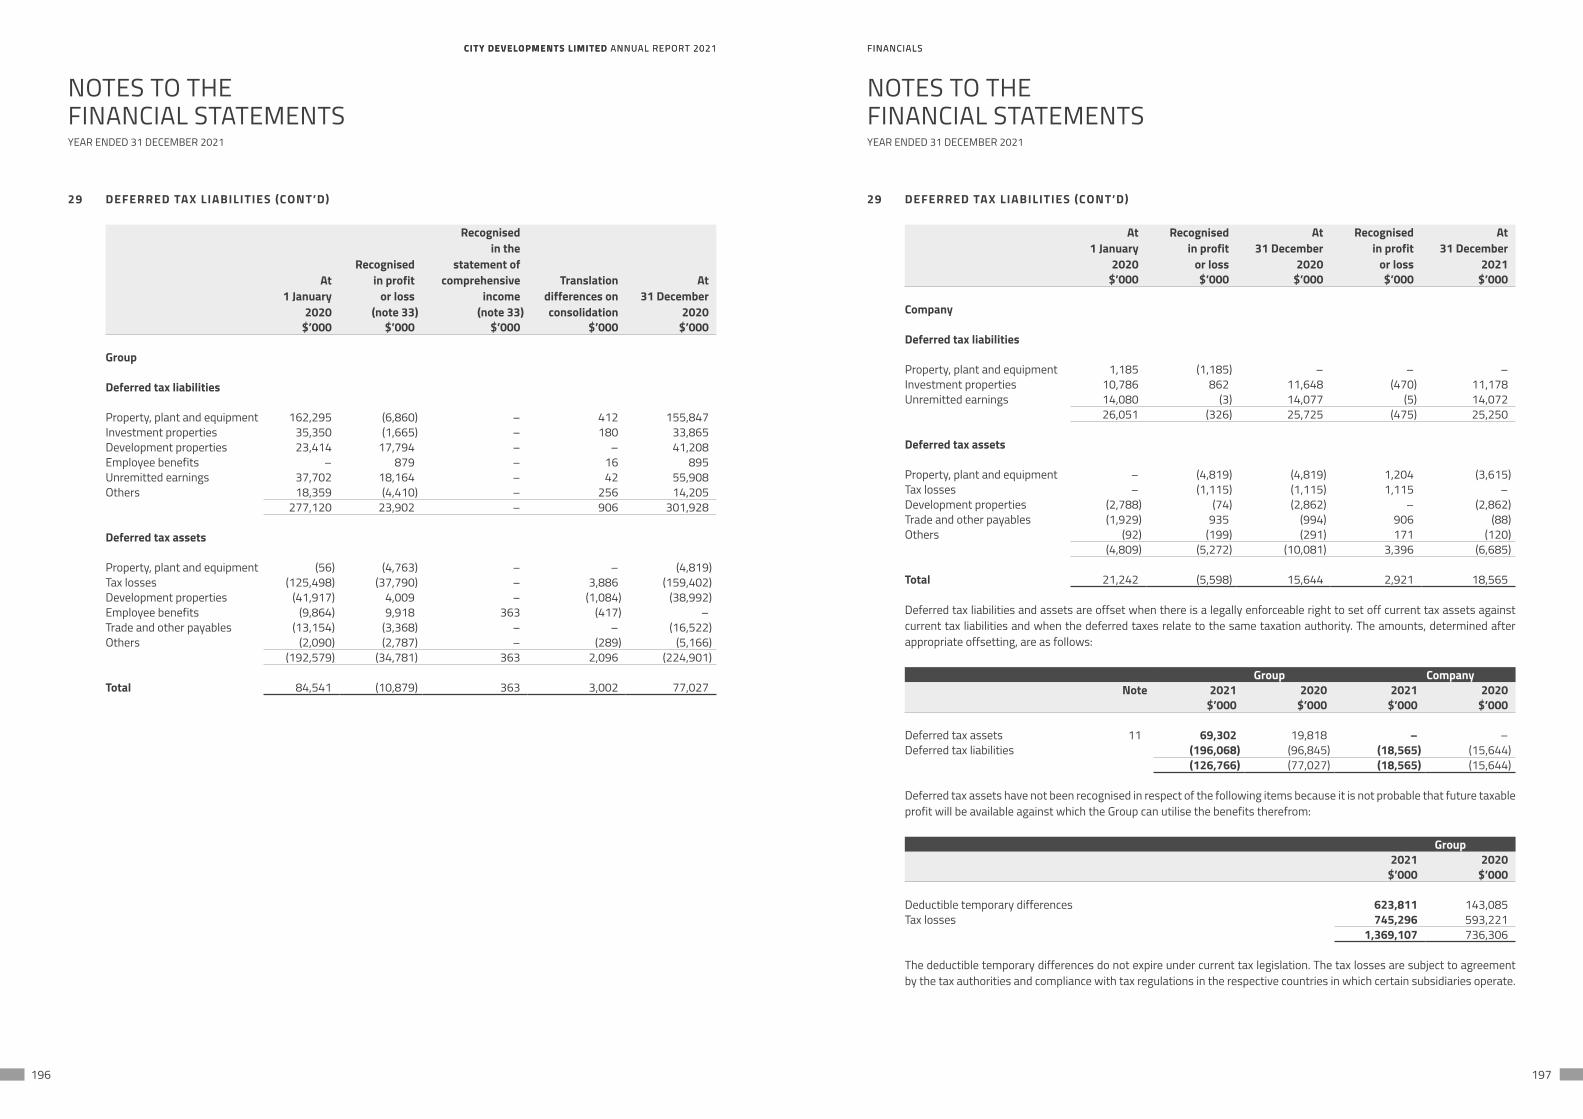
CITY DEVELOPMENTS LIMITED ANNUAL REPORT 2021 FINANCIALSCITY DEVELOPMENTS LIMITED ANNUAL REPORT 2021 FINANCIALS
196 197
NOTES TO THEFINANCIAL STATEMENTS
NOTES TO THEFINANCIAL STATEMENTS
YEAR ENDED 31 DECEMBER 2021 YEAR ENDED 31 DECEMBER 2021
29 DEFERRED TAX LIABILITIES (CONT’D)
At1 January
2020
Recognisedin profit
or loss (note 33)
Recognisedin the
statement ofcomprehensive
income(note 33)
Translationdifferences onconsolidation
At31 December
2020$’000 $’000 $’000 $’000 $’000
Group
Deferred tax liabilities
Property, plant and equipment 162,295 (6,860) – 412 155,847Investment properties 35,350 (1,665) – 180 33,865Development properties 23,414 17,794 – – 41,208Employee benefits – 879 – 16 895Unremitted earnings 37,702 18,164 – 42 55,908Others 18,359 (4,410) – 256 14,205
277,120 23,902 – 906 301,928
Deferred tax assets
Property, plant and equipment (56) (4,763) – – (4,819)Tax losses (125,498) (37,790) – 3,886 (159,402)Development properties (41,917) 4,009 – (1,084) (38,992)Employee benefits (9,864) 9,918 363 (417) –Trade and other payables (13,154) (3,368) – – (16,522)Others (2,090) (2,787) – (289) (5,166)
(192,579) (34,781) 363 2,096 (224,901)
Total 84,541 (10,879) 363 3,002 77,027
29 DEFERRED TAX LIABILITIES (CONT’D)
At1 January
2020
Recognisedin profit
or loss
At31 December
2020
Recognisedin profit
or loss
At31 December
2021$’000 $’000 $’000 $’000 $’000
Company
Deferred tax liabilities
Property, plant and equipment 1,185 (1,185) – – –Investment properties 10,786 862 11,648 (470) 11,178Unremitted earnings 14,080 (3) 14,077 (5) 14,072
26,051 (326) 25,725 (475) 25,250
Deferred tax assets
Property, plant and equipment – (4,819) (4,819) 1,204 (3,615)Tax losses – (1,115) (1,115) 1,115 –Development properties (2,788) (74) (2,862) – (2,862)Trade and other payables (1,929) 935 (994) 906 (88)Others (92) (199) (291) 171 (120)
(4,809) (5,272) (10,081) 3,396 (6,685)
Total 21,242 (5,598) 15,644 2,921 18,565
Deferred tax liabilities and assets are offset when there is a legally enforceable right to set off current tax assets against current tax liabilities and when the deferred taxes relate to the same taxation authority. The amounts, determined after appropriate offsetting, are as follows:
Group CompanyNote 2021 2020 2021 2020
$’000 $’000 $’000 $’000
Deferred tax assets 11 69,302 19,818 – –Deferred tax liabilities (196,068) (96,845) (18,565) (15,644)
(126,766) (77,027) (18,565) (15,644)
Deferred tax assets have not been recognised in respect of the following items because it is not probable that future taxable profit will be available against which the Group can utilise the benefits therefrom:
Group2021 2020
$’000 $’000
Deductible temporary differences 623,811 143,085Tax losses 745,296 593,221
1,369,107 736,306
The deductible temporary differences do not expire under current tax legislation. The tax losses are subject to agreement by the tax authorities and compliance with tax regulations in the respective countries in which certain subsidiaries operate.
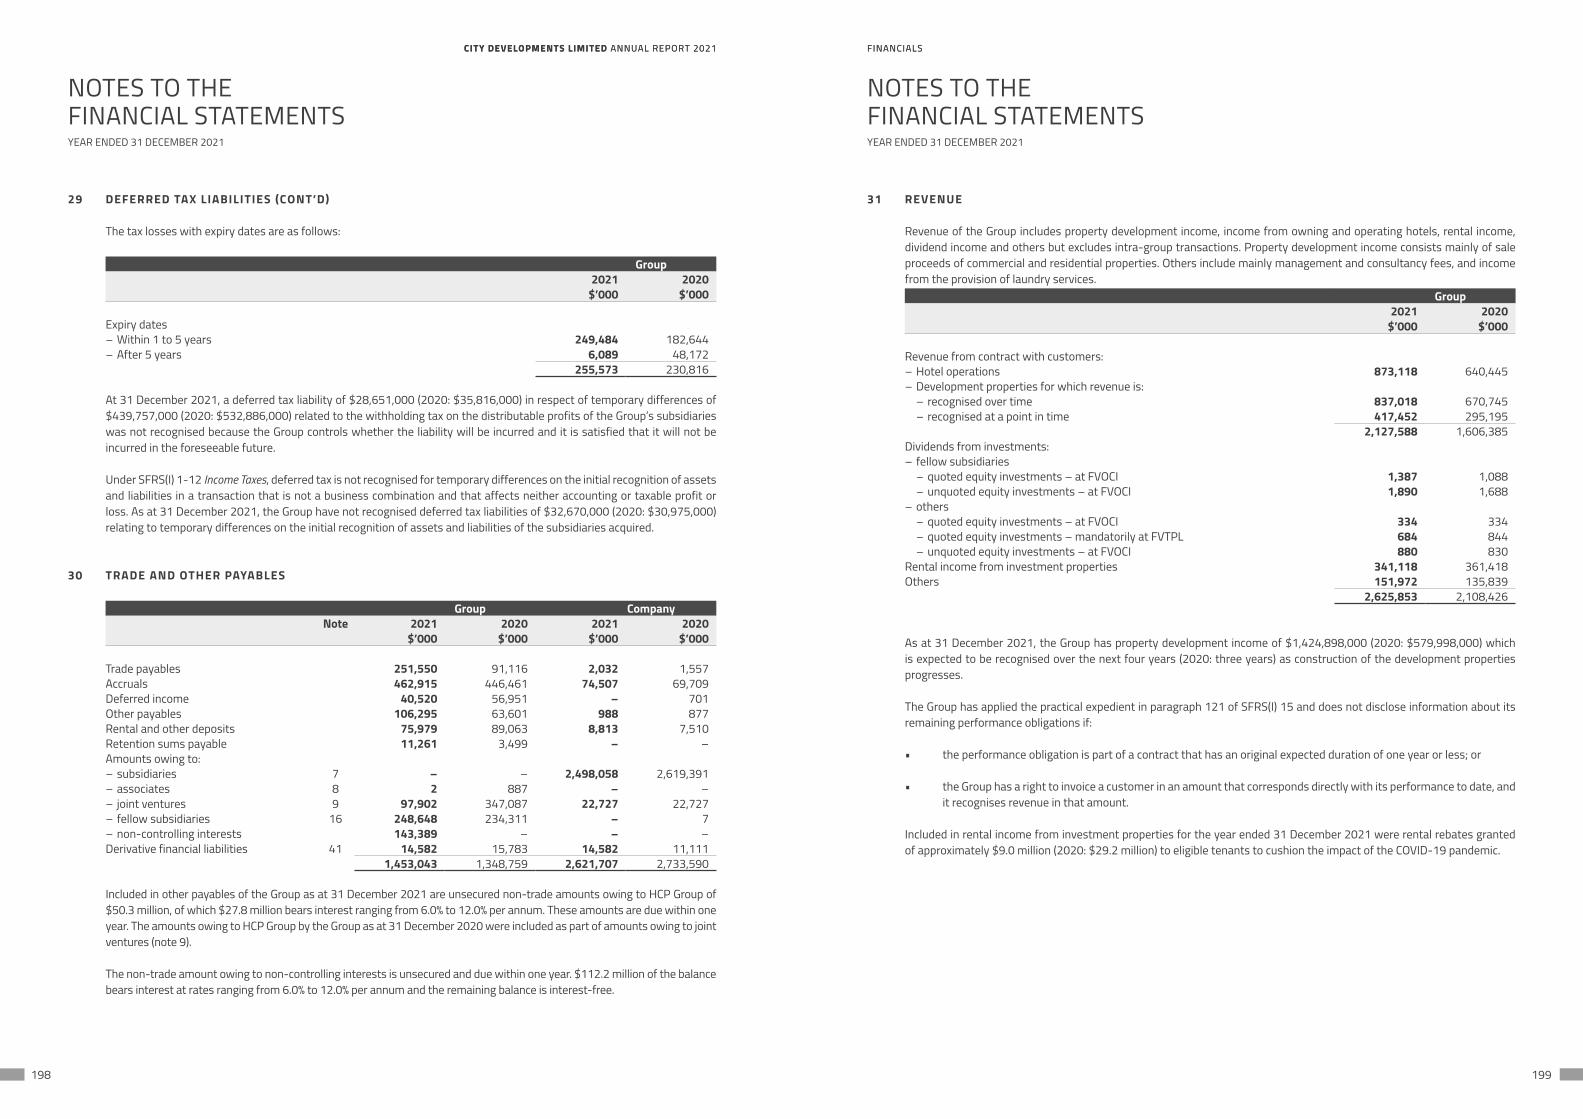
CITY DEVELOPMENTS LIMITED ANNUAL REPORT 2021 FINANCIALSCITY DEVELOPMENTS LIMITED ANNUAL REPORT 2021 FINANCIALS
198 199
NOTES TO THEFINANCIAL STATEMENTS
NOTES TO THEFINANCIAL STATEMENTS
YEAR ENDED 31 DECEMBER 2021 YEAR ENDED 31 DECEMBER 2021
29 DEFERRED TAX LIABILITIES (CONT’D)
The tax losses with expiry dates are as follows:
Group2021 2020
$’000 $’000
Expiry dates– Within 1 to 5 years 249,484 182,644– After 5 years 6,089 48,172
255,573 230,816
At 31 December 2021, a deferred tax liability of $28,651,000 (2020: $35,816,000) in respect of temporary differences of $439,757,000 (2020: $532,886,000) related to the withholding tax on the distributable profits of the Group’s subsidiaries was not recognised because the Group controls whether the liability will be incurred and it is satisfied that it will not be incurred in the foreseeable future.
Under SFRS(I) 1-12 Income Taxes, deferred tax is not recognised for temporary differences on the initial recognition of assets and liabilities in a transaction that is not a business combination and that affects neither accounting or taxable profit or loss. As at 31 December 2021, the Group have not recognised deferred tax liabilities of $32,670,000 (2020: $30,975,000) relating to temporary differences on the initial recognition of assets and liabilities of the subsidiaries acquired.
30 TRADE AND OTHER PAYABLES
Group CompanyNote 2021 2020 2021 2020
$’000 $’000 $’000 $’000
Trade payables 251,550 91,116 2,032 1,557Accruals 462,915 446,461 74,507 69,709Deferred income 40,520 56,951 – 701Other payables 106,295 63,601 988 877Rental and other deposits 75,979 89,063 8,813 7,510Retention sums payable 11,261 3,499 – –Amounts owing to:– subsidiaries 7 – – 2,498,058 2,619,391– associates 8 2 887 – –– joint ventures 9 97,902 347,087 22,727 22,727– fellow subsidiaries 16 248,648 234,311 – 7– non-controlling interests 143,389 – – –Derivative financial liabilities 41 14,582 15,783 14,582 11,111
1,453,043 1,348,759 2,621,707 2,733,590
Included in other payables of the Group as at 31 December 2021 are unsecured non-trade amounts owing to HCP Group of $50.3 million, of which $27.8 million bears interest ranging from 6.0% to 12.0% per annum. These amounts are due within one year. The amounts owing to HCP Group by the Group as at 31 December 2020 were included as part of amounts owing to joint ventures (note 9).
The non-trade amount owing to non-controlling interests is unsecured and due within one year. $112.2 million of the balance bears interest at rates ranging from 6.0% to 12.0% per annum and the remaining balance is interest-free.
31 REVENUE
Revenue of the Group includes property development income, income from owning and operating hotels, rental income, dividend income and others but excludes intra-group transactions. Property development income consists mainly of sale proceeds of commercial and residential properties. Others include mainly management and consultancy fees, and income from the provision of laundry services.
Group2021 2020
$’000 $’000
Revenue from contract with customers:– Hotel operations 873,118 640,445– Development properties for which revenue is: – recognised over time 837,018 670,745 – recognised at a point in time 417,452 295,195
2,127,588 1,606,385Dividends from investments:– fellow subsidiaries – quoted equity investments – at FVOCI 1,387 1,088 – unquoted equity investments – at FVOCI 1,890 1,688– others – quoted equity investments – at FVOCI 334 334 – quoted equity investments – mandatorily at FVTPL 684 844 – unquoted equity investments – at FVOCI 880 830Rental income from investment properties 341,118 361,418Others 151,972 135,839
2,625,853 2,108,426
As at 31 December 2021, the Group has property development income of $1,424,898,000 (2020: $579,998,000) which is expected to be recognised over the next four years (2020: three years) as construction of the development properties progresses.
The Group has applied the practical expedient in paragraph 121 of SFRS(I) 15 and does not disclose information about its remaining performance obligations if:
• the performance obligation is part of a contract that has an original expected duration of one year or less; or
• the Group has a right to invoice a customer in an amount that corresponds directly with its performance to date, and it recognises revenue in that amount.
Included in rental income from investment properties for the year ended 31 December 2021 were rental rebates granted of approximately $9.0 million (2020: $29.2 million) to eligible tenants to cushion the impact of the COVID-19 pandemic.
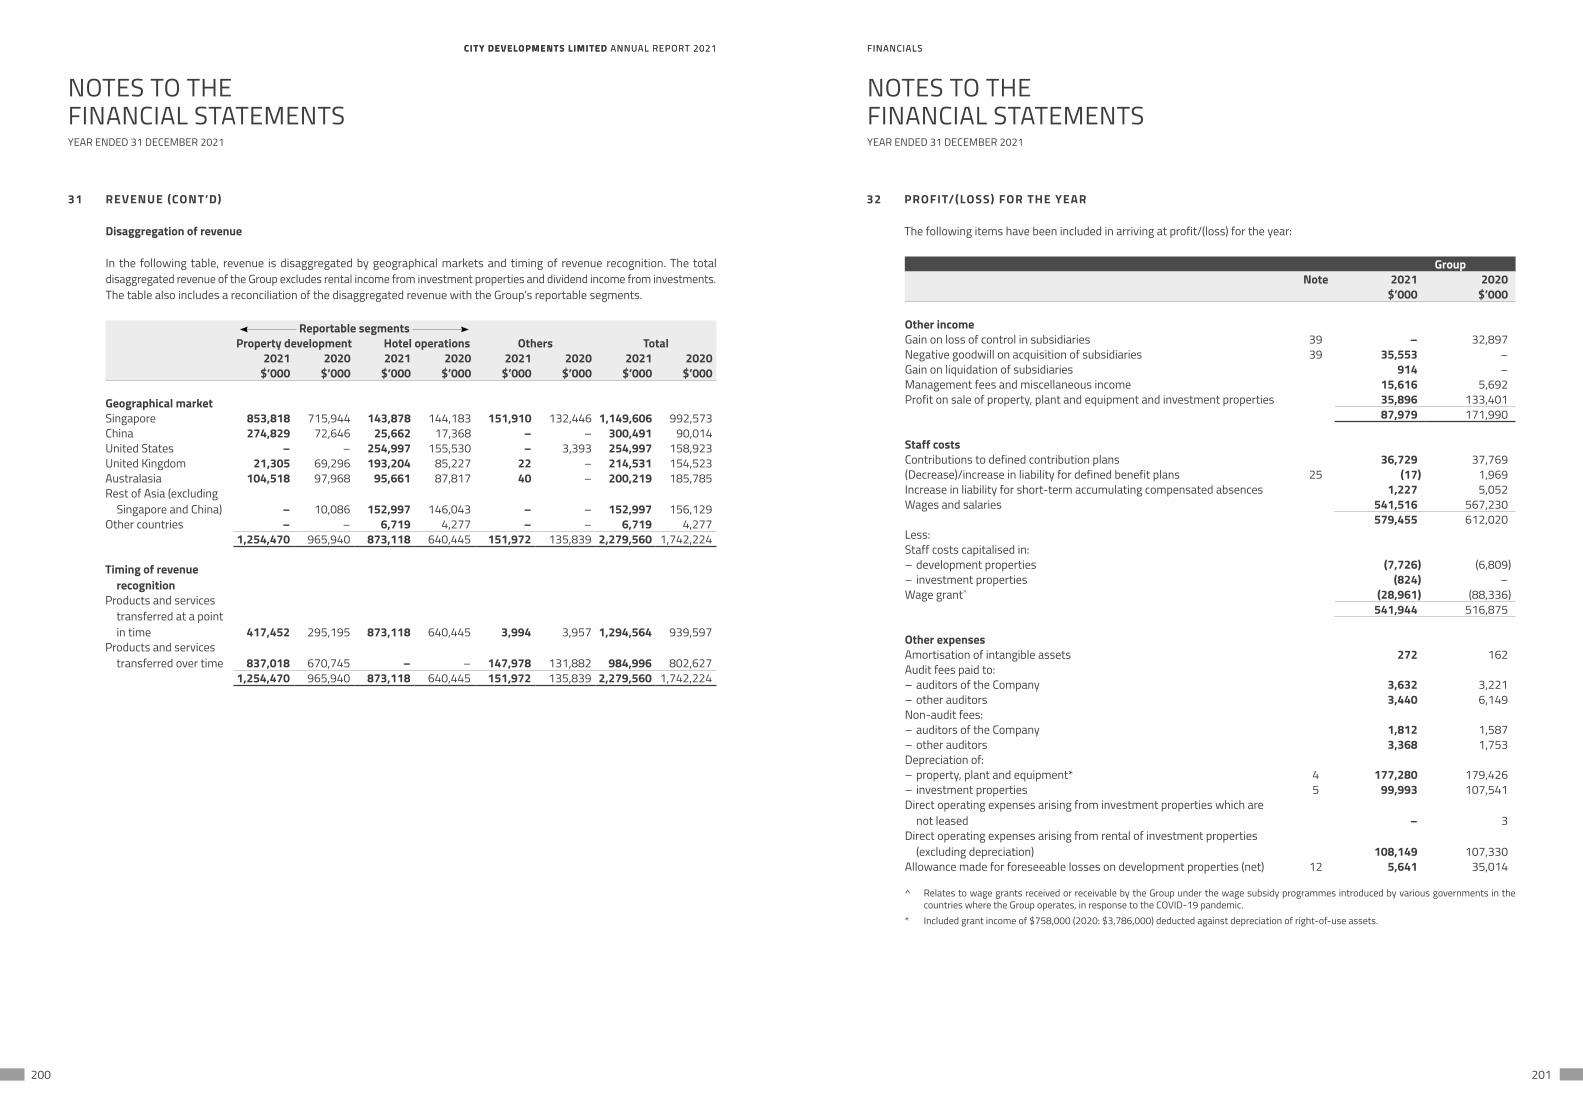
CITY DEVELOPMENTS LIMITED ANNUAL REPORT 2021 FINANCIALSCITY DEVELOPMENTS LIMITED ANNUAL REPORT 2021 FINANCIALS
200 201
NOTES TO THEFINANCIAL STATEMENTS
NOTES TO THEFINANCIAL STATEMENTS
YEAR ENDED 31 DECEMBER 2021 YEAR ENDED 31 DECEMBER 2021
31 REVENUE (CONT’D)
Disaggregation of revenue
In the following table, revenue is disaggregated by geographical markets and timing of revenue recognition. The total disaggregated revenue of the Group excludes rental income from investment properties and dividend income from investments. The table also includes a reconciliation of the disaggregated revenue with the Group’s reportable segments.
Reportable segments Property development Hotel operations Others Total
2021 2020 2021 2020 2021 2020 2021 2020$’000 $’000 $’000 $’000 $’000 $’000 $’000 $’000
Geographical marketSingapore 853,818 715,944 143,878 144,183 151,910 132,446 1,149,606 992,573China 274,829 72,646 25,662 17,368 – – 300,491 90,014United States – – 254,997 155,530 – 3,393 254,997 158,923United Kingdom 21,305 69,296 193,204 85,227 22 – 214,531 154,523Australasia 104,518 97,968 95,661 87,817 40 – 200,219 185,785Rest of Asia (excluding
Singapore and China) – 10,086 152,997 146,043 – – 152,997 156,129Other countries – – 6,719 4,277 – – 6,719 4,277
1,254,470 965,940 873,118 640,445 151,972 135,839 2,279,560 1,742,224
Timing of revenue recognition
Products and services transferred at a point in time 417,452 295,195 873,118 640,445 3,994 3,957 1,294,564 939,597
Products and services transferred over time 837,018 670,745 – – 147,978 131,882 984,996 802,627
1,254,470 965,940 873,118 640,445 151,972 135,839 2,279,560 1,742,224
32 PROFIT/(LOSS) FOR THE YEAR
The following items have been included in arriving at profit/(loss) for the year:
GroupNote 2021 2020
$’000 $’000
Other incomeGain on loss of control in subsidiaries 39 – 32,897Negative goodwill on acquisition of subsidiaries 39 35,553 –Gain on liquidation of subsidiaries 914 –Management fees and miscellaneous income 15,616 5,692Profit on sale of property, plant and equipment and investment properties 35,896 133,401
87,979 171,990
Staff costsContributions to defined contribution plans 36,729 37,769(Decrease)/increase in liability for defined benefit plans 25 (17) 1,969Increase in liability for short-term accumulating compensated absences 1,227 5,052Wages and salaries 541,516 567,230
579,455 612,020Less:Staff costs capitalised in:– development properties (7,726) (6,809)– investment properties (824) –Wage grant^ (28,961) (88,336)
541,944 516,875
Other expensesAmortisation of intangible assets 272 162Audit fees paid to:– auditors of the Company 3,632 3,221– other auditors 3,440 6,149Non-audit fees:– auditors of the Company 1,812 1,587– other auditors 3,368 1,753Depreciation of:– property, plant and equipment* 4 177,280 179,426– investment properties 5 99,993 107,541Direct operating expenses arising from investment properties which are
not leased – 3Direct operating expenses arising from rental of investment properties
(excluding depreciation) 108,149 107,330Allowance made for foreseeable losses on development properties (net) 12 5,641 35,014
^ Relates to wage grants received or receivable by the Group under the wage subsidy programmes introduced by various governments in the countries where the Group operates, in response to the COVID-19 pandemic.
* Included grant income of $758,000 (2020: $3,786,000) deducted against depreciation of right-of-use assets.
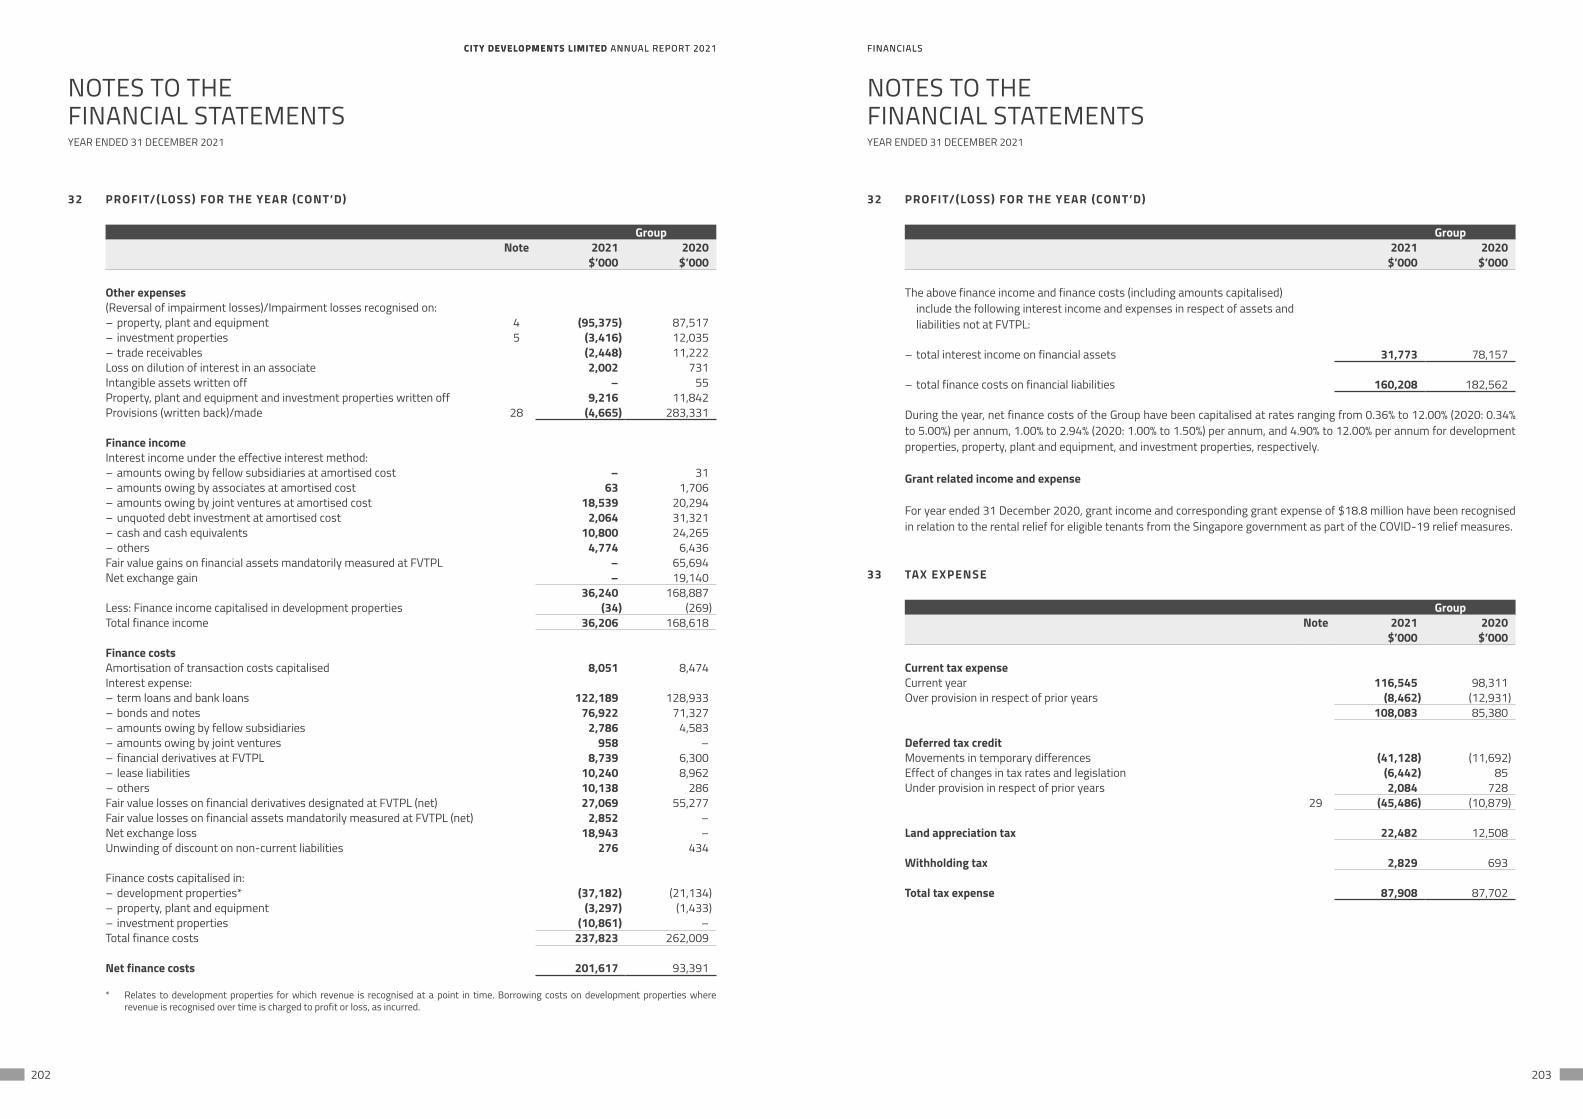
CITY DEVELOPMENTS LIMITED ANNUAL REPORT 2021 FINANCIALSCITY DEVELOPMENTS LIMITED ANNUAL REPORT 2021 FINANCIALS
202 203
NOTES TO THEFINANCIAL STATEMENTS
NOTES TO THEFINANCIAL STATEMENTS
YEAR ENDED 31 DECEMBER 2021 YEAR ENDED 31 DECEMBER 2021
32 PROFIT/(LOSS) FOR THE YEAR (CONT’D)
GroupNote 2021 2020
$’000 $’000
Other expenses(Reversal of impairment losses)/Impairment losses recognised on:– property, plant and equipment 4 (95,375) 87,517– investment properties 5 (3,416) 12,035– trade receivables (2,448) 11,222Loss on dilution of interest in an associate 2,002 731Intangible assets written off – 55Property, plant and equipment and investment properties written off 9,216 11,842Provisions (written back)/made 28 (4,665) 283,331
Finance incomeInterest income under the effective interest method:– amounts owing by fellow subsidiaries at amortised cost – 31– amounts owing by associates at amortised cost 63 1,706– amounts owing by joint ventures at amortised cost 18,539 20,294– unquoted debt investment at amortised cost 2,064 31,321– cash and cash equivalents 10,800 24,265– others 4,774 6,436Fair value gains on financial assets mandatorily measured at FVTPL – 65,694Net exchange gain – 19,140
36,240 168,887Less: Finance income capitalised in development properties (34) (269)Total finance income 36,206 168,618
Finance costsAmortisation of transaction costs capitalised 8,051 8,474Interest expense:– term loans and bank loans 122,189 128,933– bonds and notes 76,922 71,327– amounts owing by fellow subsidiaries 2,786 4,583– amounts owing by joint ventures 958 –– financial derivatives at FVTPL 8,739 6,300– lease liabilities 10,240 8,962– others 10,138 286Fair value losses on financial derivatives designated at FVTPL (net) 27,069 55,277Fair value losses on financial assets mandatorily measured at FVTPL (net) 2,852 –Net exchange loss 18,943 –Unwinding of discount on non-current liabilities 276 434
Finance costs capitalised in:– development properties* (37,182) (21,134)– property, plant and equipment (3,297) (1,433)– investment properties (10,861) –Total finance costs 237,823 262,009
Net finance costs 201,617 93,391
* Relates to development properties for which revenue is recognised at a point in time. Borrowing costs on development properties where revenue is recognised over time is charged to profit or loss, as incurred.
32 PROFIT/(LOSS) FOR THE YEAR (CONT’D)
Group2021 2020
$’000 $’000
The above finance income and finance costs (including amounts capitalised) include the following interest income and expenses in respect of assets and liabilities not at FVTPL:
– total interest income on financial assets 31,773 78,157
– total finance costs on financial liabilities 160,208 182,562
During the year, net finance costs of the Group have been capitalised at rates ranging from 0.36% to 12.00% (2020: 0.34% to 5.00%) per annum, 1.00% to 2.94% (2020: 1.00% to 1.50%) per annum, and 4.90% to 12.00% per annum for development properties, property, plant and equipment, and investment properties, respectively.
Grant related income and expense
For year ended 31 December 2020, grant income and corresponding grant expense of $18.8 million have been recognised in relation to the rental relief for eligible tenants from the Singapore government as part of the COVID-19 relief measures.
33 TAX EXPENSE
GroupNote 2021 2020
$’000 $’000
Current tax expenseCurrent year 116,545 98,311Over provision in respect of prior years (8,462) (12,931)
108,083 85,380
Deferred tax creditMovements in temporary differences (41,128) (11,692)Effect of changes in tax rates and legislation (6,442) 85Under provision in respect of prior years 2,084 728
29 (45,486) (10,879)
Land appreciation tax 22,482 12,508
Withholding tax 2,829 693
Total tax expense 87,908 87,702
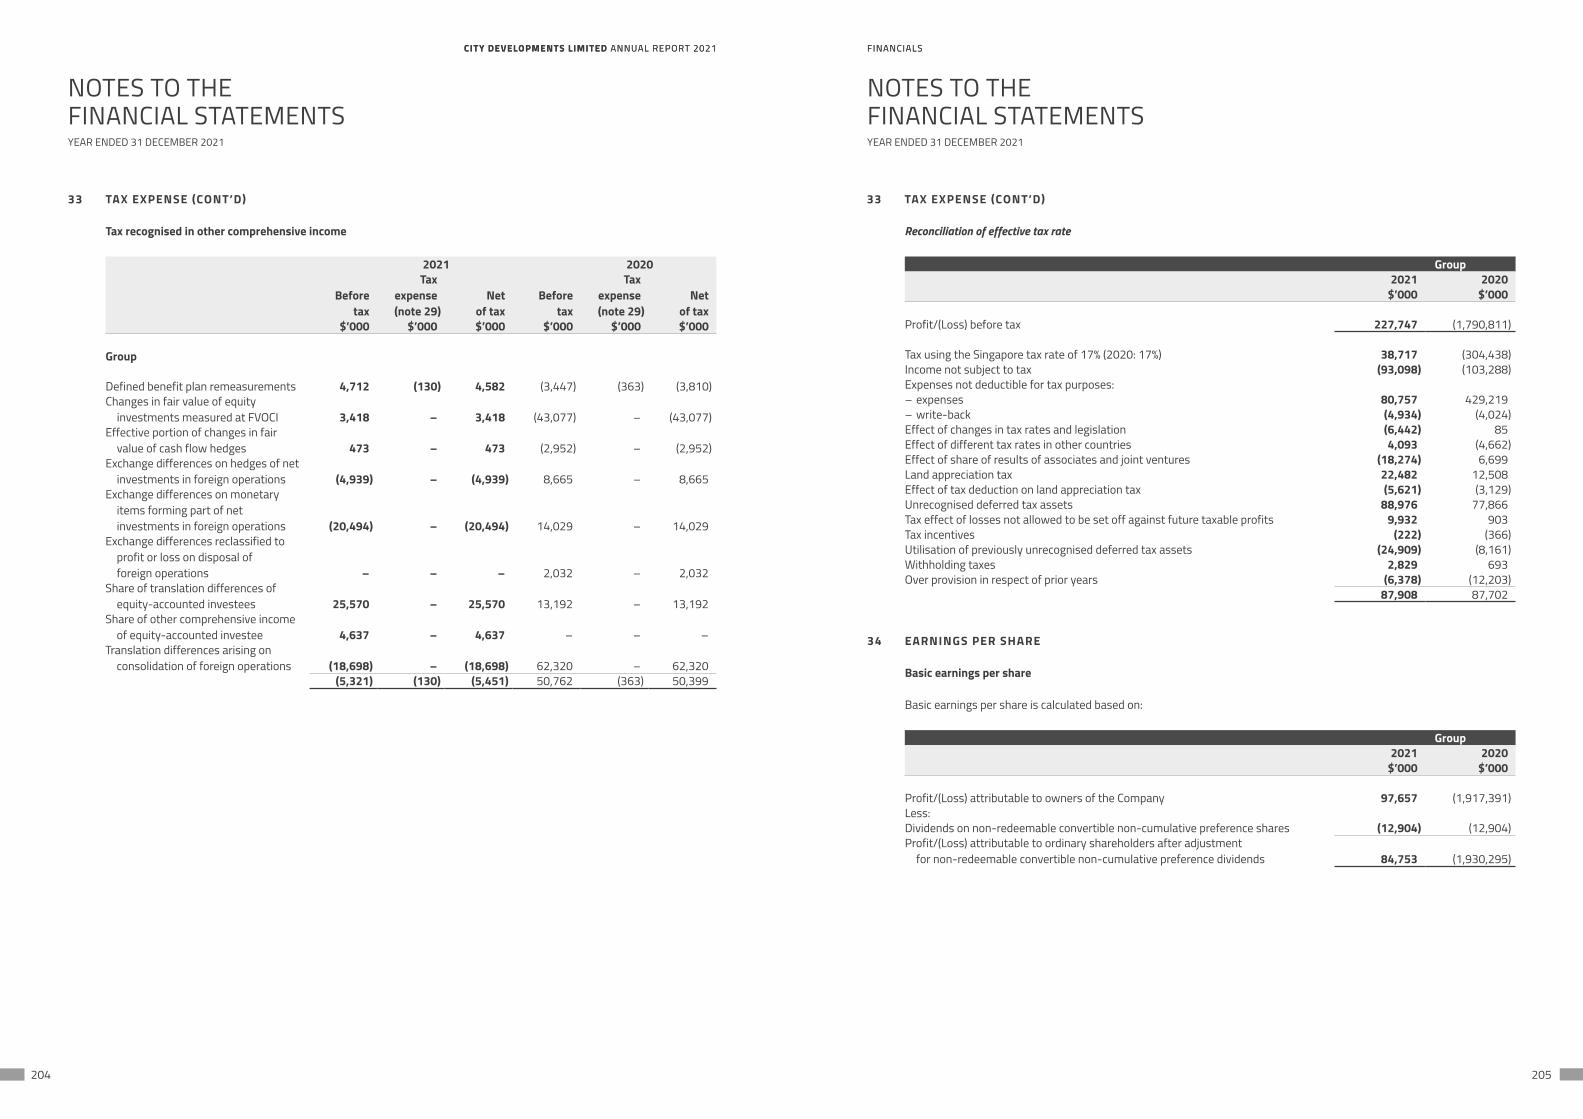
CITY DEVELOPMENTS LIMITED ANNUAL REPORT 2021 FINANCIALSCITY DEVELOPMENTS LIMITED ANNUAL REPORT 2021 FINANCIALS
204 205
NOTES TO THEFINANCIAL STATEMENTS
NOTES TO THEFINANCIAL STATEMENTS
YEAR ENDED 31 DECEMBER 2021 YEAR ENDED 31 DECEMBER 2021
33 TAX EXPENSE (CONT’D)
Tax recognised in other comprehensive income
2021 2020
Before tax
Taxexpense(note 29)
Net of tax
Before tax
Taxexpense(note 29)
Net of tax
$’000 $’000 $’000 $’000 $’000 $’000
Group
Defined benefit plan remeasurements 4,712 (130) 4,582 (3,447) (363) (3,810)Changes in fair value of equity
investments measured at FVOCI 3,418 – 3,418 (43,077) – (43,077)Effective portion of changes in fair
value of cash flow hedges 473 – 473 (2,952) – (2,952)Exchange differences on hedges of net
investments in foreign operations (4,939) – (4,939) 8,665 – 8,665Exchange differences on monetary
items forming part of net investments in foreign operations (20,494) – (20,494) 14,029 – 14,029
Exchange differences reclassified to profit or loss on disposal of foreign operations – – – 2,032 – 2,032
Share of translation differences of equity-accounted investees 25,570 – 25,570 13,192 – 13,192
Share of other comprehensive income of equity-accounted investee 4,637 – 4,637 – – –
Translation differences arising on consolidation of foreign operations (18,698) – (18,698) 62,320 – 62,320
(5,321) (130) (5,451) 50,762 (363) 50,399
33 TAX EXPENSE (CONT’D)
Reconciliation of effective tax rate
Group2021 2020
$’000 $’000
Profit/(Loss) before tax 227,747 (1,790,811)
Tax using the Singapore tax rate of 17% (2020: 17%) 38,717 (304,438)Income not subject to tax (93,098) (103,288)Expenses not deductible for tax purposes:– expenses 80,757 429,219– write-back (4,934) (4,024)Effect of changes in tax rates and legislation (6,442) 85Effect of different tax rates in other countries 4,093 (4,662)Effect of share of results of associates and joint ventures (18,274) 6,699Land appreciation tax 22,482 12,508Effect of tax deduction on land appreciation tax (5,621) (3,129)Unrecognised deferred tax assets 88,976 77,866Tax effect of losses not allowed to be set off against future taxable profits 9,932 903Tax incentives (222) (366)Utilisation of previously unrecognised deferred tax assets (24,909) (8,161)Withholding taxes 2,829 693Over provision in respect of prior years (6,378) (12,203)
87,908 87,702
34 EARNINGS PER SHARE
Basic earnings per share
Basic earnings per share is calculated based on:
Group2021 2020
$’000 $’000
Profit/(Loss) attributable to owners of the Company 97,657 (1,917,391)Less:Dividends on non-redeemable convertible non-cumulative preference shares (12,904) (12,904)Profit/(Loss) attributable to ordinary shareholders after adjustment
for non-redeemable convertible non-cumulative preference dividends 84,753 (1,930,295)
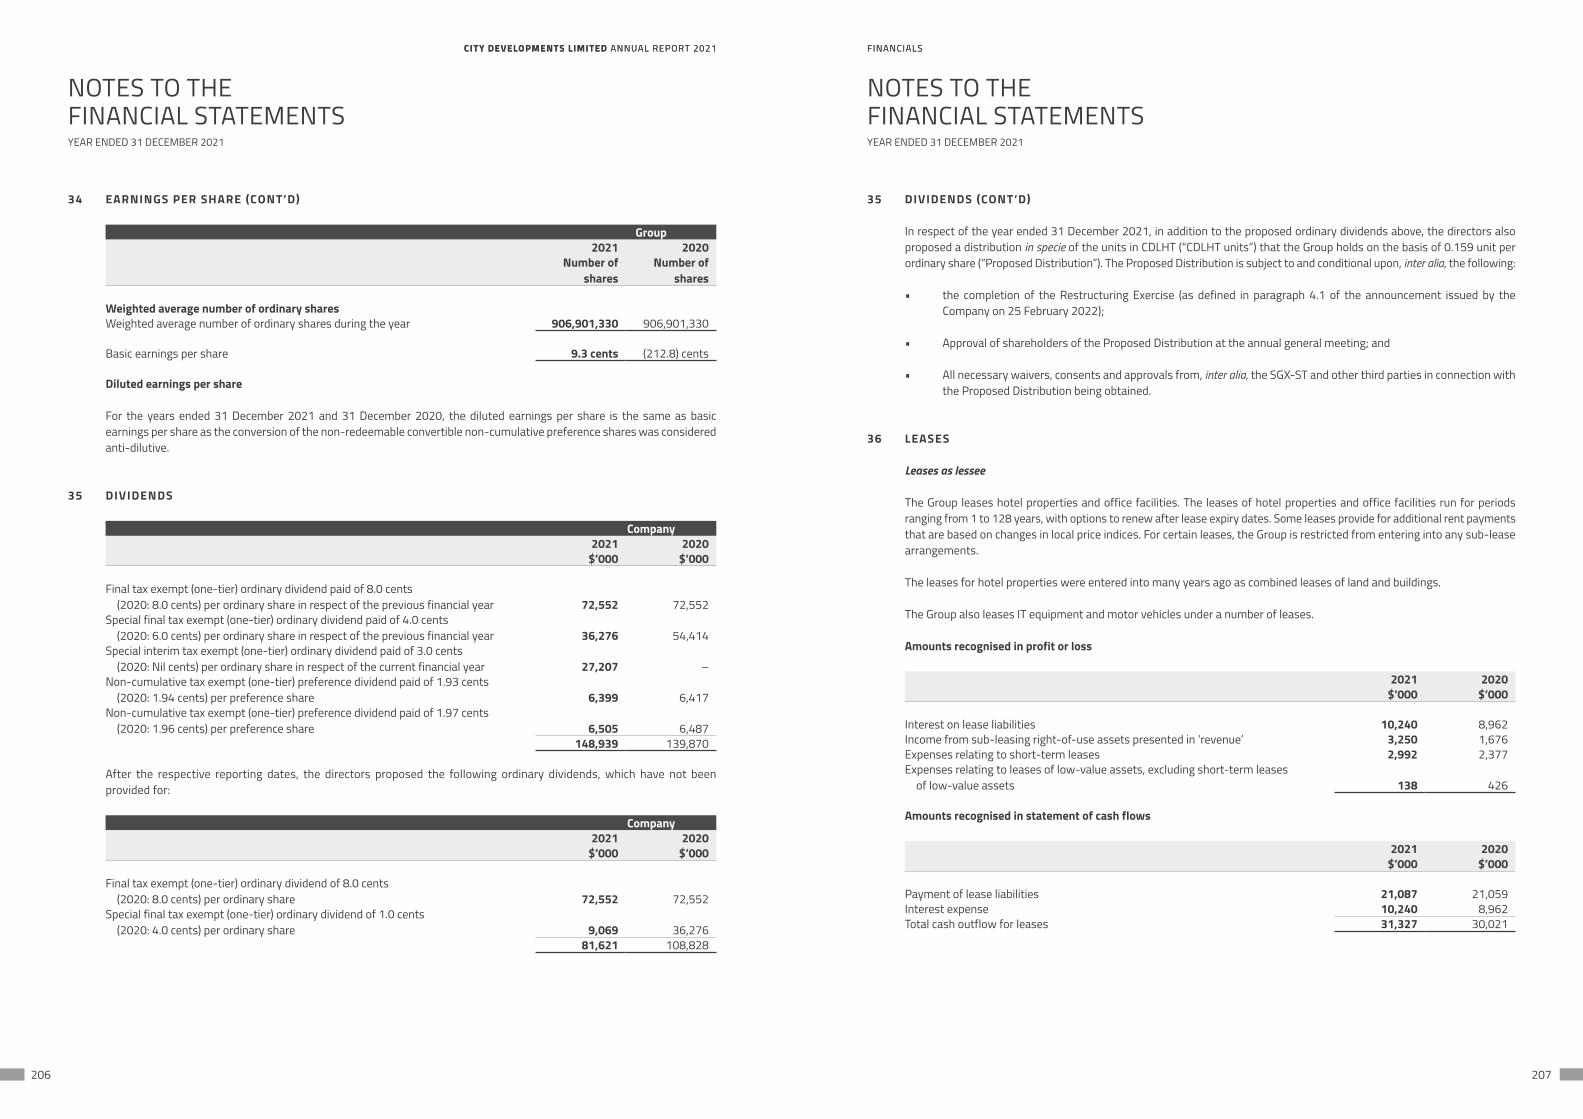
CITY DEVELOPMENTS LIMITED ANNUAL REPORT 2021 FINANCIALSCITY DEVELOPMENTS LIMITED ANNUAL REPORT 2021 FINANCIALS
206 207
NOTES TO THEFINANCIAL STATEMENTS
NOTES TO THEFINANCIAL STATEMENTS
YEAR ENDED 31 DECEMBER 2021 YEAR ENDED 31 DECEMBER 2021
34 EARNINGS PER SHARE (CONT’D)
Group2021 2020
Number ofshares
Number ofshares
Weighted average number of ordinary sharesWeighted average number of ordinary shares during the year 906,901,330 906,901,330
Basic earnings per share 9.3 cents (212.8) cents
Diluted earnings per share
For the years ended 31 December 2021 and 31 December 2020, the diluted earnings per share is the same as basic earnings per share as the conversion of the non-redeemable convertible non-cumulative preference shares was considered anti-dilutive.
35 DIVIDENDS
Company2021 2020
$’000 $’000
Final tax exempt (one-tier) ordinary dividend paid of 8.0 cents (2020: 8.0 cents) per ordinary share in respect of the previous financial year 72,552 72,552
Special final tax exempt (one-tier) ordinary dividend paid of 4.0 cents (2020: 6.0 cents) per ordinary share in respect of the previous financial year 36,276 54,414
Special interim tax exempt (one-tier) ordinary dividend paid of 3.0 cents (2020: Nil cents) per ordinary share in respect of the current financial year 27,207 –
Non-cumulative tax exempt (one-tier) preference dividend paid of 1.93 cents (2020: 1.94 cents) per preference share 6,399 6,417
Non-cumulative tax exempt (one-tier) preference dividend paid of 1.97 cents (2020: 1.96 cents) per preference share 6,505 6,487
148,939 139,870
After the respective reporting dates, the directors proposed the following ordinary dividends, which have not been provided for:
Company2021 2020
$’000 $’000
Final tax exempt (one-tier) ordinary dividend of 8.0 cents (2020: 8.0 cents) per ordinary share 72,552 72,552
Special final tax exempt (one-tier) ordinary dividend of 1.0 cents (2020: 4.0 cents) per ordinary share 9,069 36,276
81,621 108,828
35 DIVIDENDS (CONT’D)
In respect of the year ended 31 December 2021, in addition to the proposed ordinary dividends above, the directors also proposed a distribution in specie of the units in CDLHT (“CDLHT units”) that the Group holds on the basis of 0.159 unit per ordinary share (“Proposed Distribution”). The Proposed Distribution is subject to and conditional upon, inter alia, the following:
• the completion of the Restructuring Exercise (as defined in paragraph 4.1 of the announcement issued by the Company on 25 February 2022);
• Approval of shareholders of the Proposed Distribution at the annual general meeting; and
• All necessary waivers, consents and approvals from, inter alia, the SGX-ST and other third parties in connection with the Proposed Distribution being obtained.
36 LEASES
Leases as lessee
The Group leases hotel properties and office facilities. The leases of hotel properties and office facilities run for periods ranging from 1 to 128 years, with options to renew after lease expiry dates. Some leases provide for additional rent payments that are based on changes in local price indices. For certain leases, the Group is restricted from entering into any sub-lease arrangements.
The leases for hotel properties were entered into many years ago as combined leases of land and buildings.
The Group also leases IT equipment and motor vehicles under a number of leases.
Amounts recognised in profit or loss
2021 2020$’000 $’000
Interest on lease liabilities 10,240 8,962Income from sub-leasing right-of-use assets presented in ‘revenue’ 3,250 1,676Expenses relating to short-term leases 2,992 2,377Expenses relating to leases of low-value assets, excluding short-term leases
of low-value assets 138 426
Amounts recognised in statement of cash flows
2021 2020$’000 $’000
Payment of lease liabilities 21,087 21,059Interest expense 10,240 8,962Total cash outflow for leases 31,327 30,021
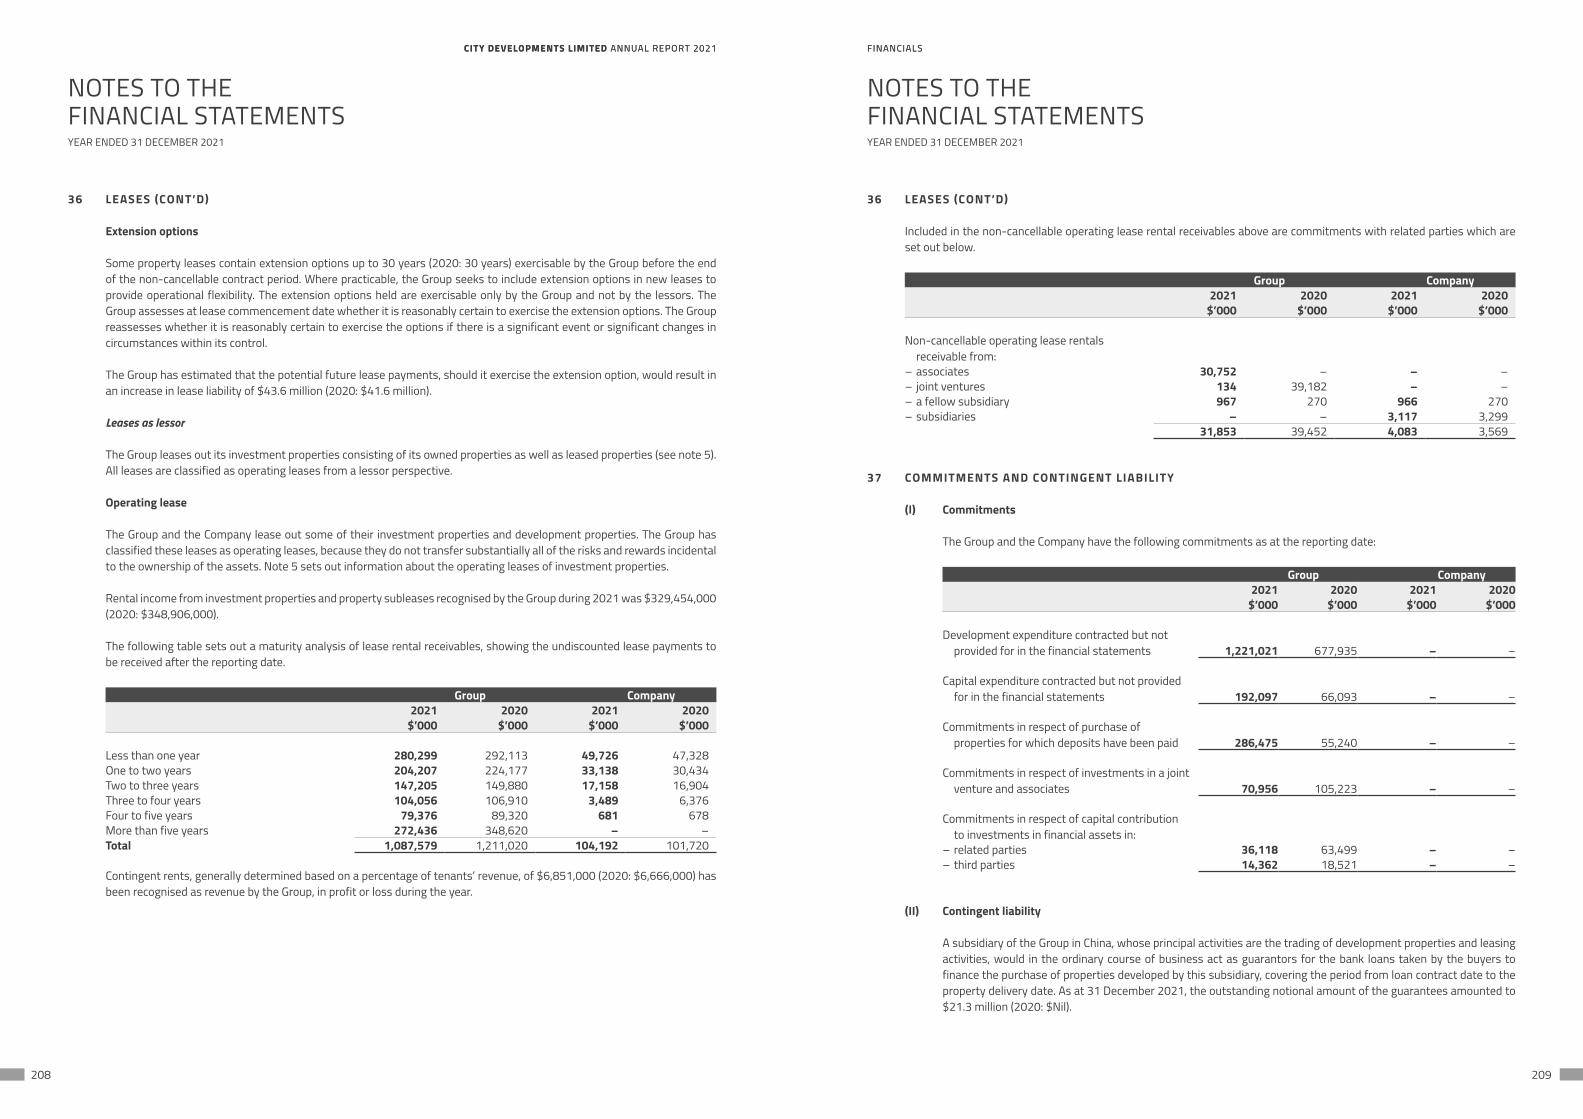
CITY DEVELOPMENTS LIMITED ANNUAL REPORT 2021 FINANCIALSCITY DEVELOPMENTS LIMITED ANNUAL REPORT 2021 FINANCIALS
208 209
NOTES TO THEFINANCIAL STATEMENTS
NOTES TO THEFINANCIAL STATEMENTS
YEAR ENDED 31 DECEMBER 2021 YEAR ENDED 31 DECEMBER 2021
36 LEASES (CONT’D)
Extension options
Some property leases contain extension options up to 30 years (2020: 30 years) exercisable by the Group before the end of the non-cancellable contract period. Where practicable, the Group seeks to include extension options in new leases to provide operational flexibility. The extension options held are exercisable only by the Group and not by the lessors. The Group assesses at lease commencement date whether it is reasonably certain to exercise the extension options. The Group reassesses whether it is reasonably certain to exercise the options if there is a significant event or significant changes in circumstances within its control.
The Group has estimated that the potential future lease payments, should it exercise the extension option, would result in an increase in lease liability of $43.6 million (2020: $41.6 million).
Leases as lessor
The Group leases out its investment properties consisting of its owned properties as well as leased properties (see note 5). All leases are classified as operating leases from a lessor perspective.
Operating lease
The Group and the Company lease out some of their investment properties and development properties. The Group has classified these leases as operating leases, because they do not transfer substantially all of the risks and rewards incidental to the ownership of the assets. Note 5 sets out information about the operating leases of investment properties.
Rental income from investment properties and property subleases recognised by the Group during 2021 was $329,454,000 (2020: $348,906,000).
The following table sets out a maturity analysis of lease rental receivables, showing the undiscounted lease payments to be received after the reporting date.
Group Company2021 2020 2021 2020
$’000 $’000 $’000 $’000
Less than one year 280,299 292,113 49,726 47,328One to two years 204,207 224,177 33,138 30,434Two to three years 147,205 149,880 17,158 16,904Three to four years 104,056 106,910 3,489 6,376Four to five years 79,376 89,320 681 678More than five years 272,436 348,620 – –Total 1,087,579 1,211,020 104,192 101,720
Contingent rents, generally determined based on a percentage of tenants’ revenue, of $6,851,000 (2020: $6,666,000) has been recognised as revenue by the Group, in profit or loss during the year.
36 LEASES (CONT’D)
Included in the non-cancellable operating lease rental receivables above are commitments with related parties which are set out below.
Group Company2021 2020 2021 2020
$’000 $’000 $’000 $’000
Non-cancellable operating lease rentals receivable from:
– associates 30,752 – – –– joint ventures 134 39,182 – –– a fellow subsidiary 967 270 966 270– subsidiaries – – 3,117 3,299
31,853 39,452 4,083 3,569
37 COMMITMENTS AND CONTINGENT LIABILITY
(I) Commitments
The Group and the Company have the following commitments as at the reporting date:
Group Company2021 2020 2021 2020
$’000 $’000 $’000 $’000
Development expenditure contracted but not provided for in the financial statements 1,221,021 677,935 – –
Capital expenditure contracted but not provided for in the financial statements 192,097 66,093 – –
Commitments in respect of purchase of properties for which deposits have been paid 286,475 55,240 – –
Commitments in respect of investments in a joint venture and associates 70,956 105,223 – –
Commitments in respect of capital contribution to investments in financial assets in:
– related parties 36,118 63,499 – –– third parties 14,362 18,521 – –
(II) Contingent liability
A subsidiary of the Group in China, whose principal activities are the trading of development properties and leasing activities, would in the ordinary course of business act as guarantors for the bank loans taken by the buyers to finance the purchase of properties developed by this subsidiary, covering the period from loan contract date to the property delivery date. As at 31 December 2021, the outstanding notional amount of the guarantees amounted to $21.3 million (2020: $Nil).
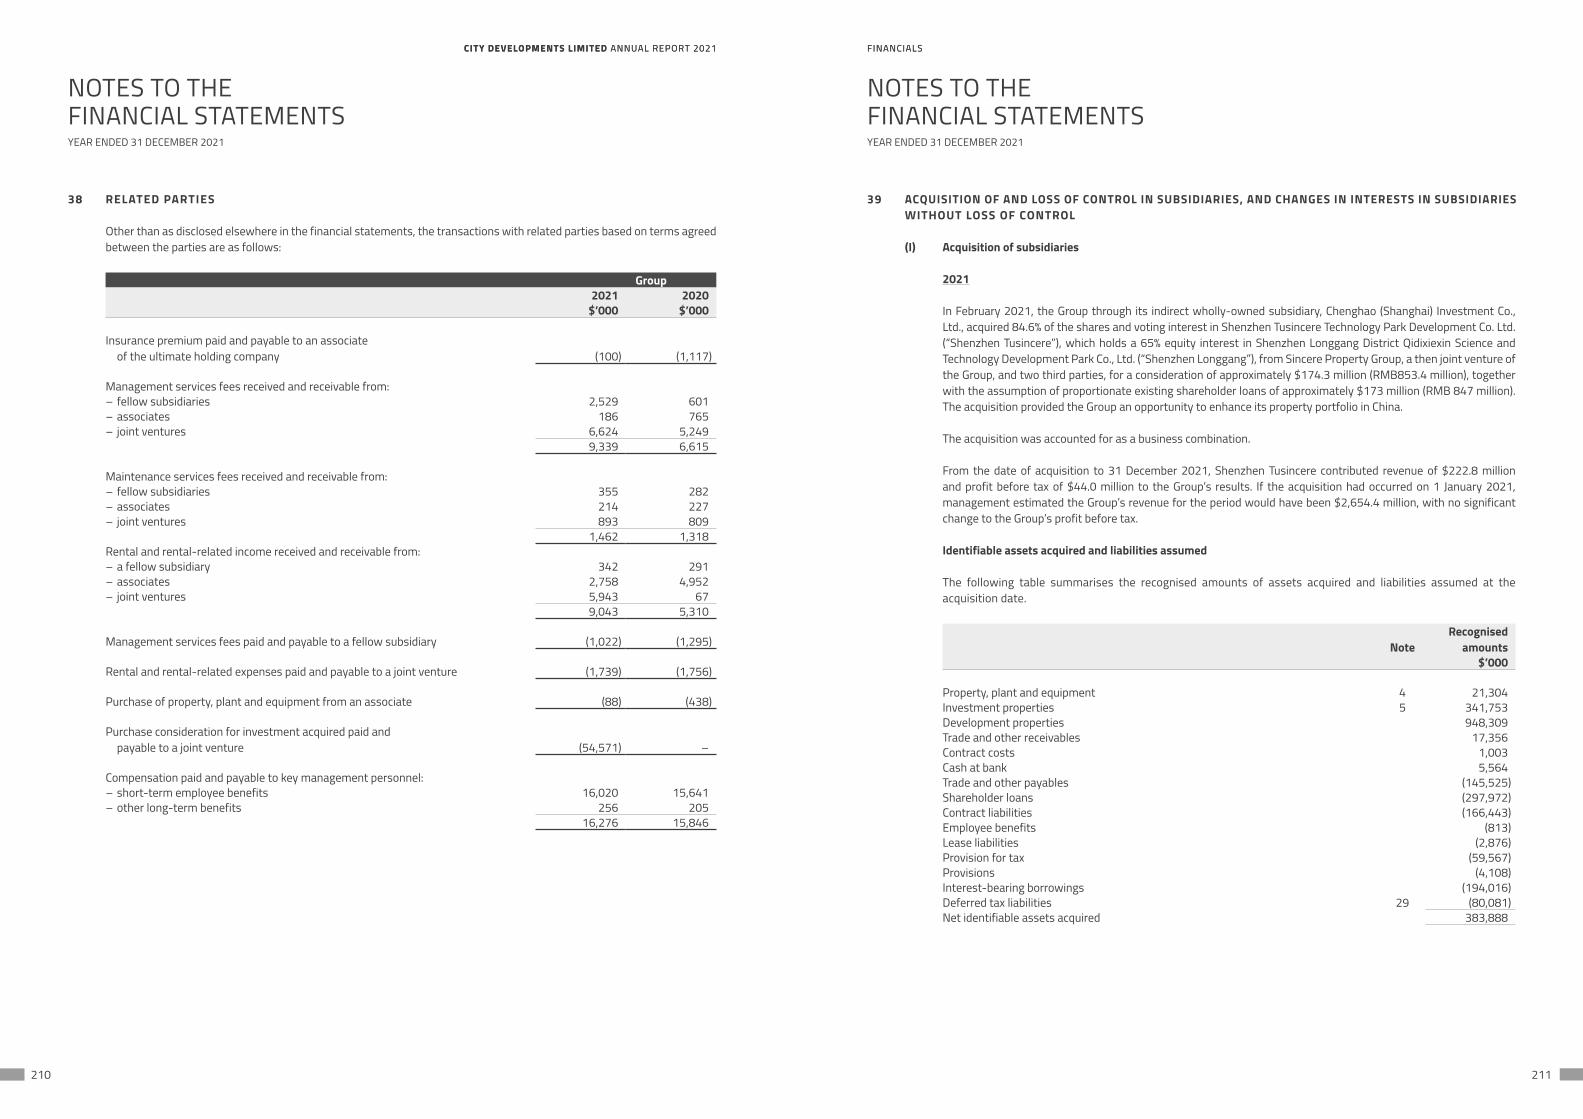
CITY DEVELOPMENTS LIMITED ANNUAL REPORT 2021 FINANCIALSCITY DEVELOPMENTS LIMITED ANNUAL REPORT 2021 FINANCIALS
210 211
NOTES TO THEFINANCIAL STATEMENTS
NOTES TO THEFINANCIAL STATEMENTS
YEAR ENDED 31 DECEMBER 2021 YEAR ENDED 31 DECEMBER 2021
38 RELATED PARTIES
Other than as disclosed elsewhere in the financial statements, the transactions with related parties based on terms agreed between the parties are as follows:
Group2021 2020
$’000 $’000
Insurance premium paid and payable to an associate of the ultimate holding company (100) (1,117)
Management services fees received and receivable from:– fellow subsidiaries 2,529 601– associates 186 765– joint ventures 6,624 5,249
9,339 6,615
Maintenance services fees received and receivable from:– fellow subsidiaries 355 282– associates 214 227– joint ventures 893 809
1,462 1,318Rental and rental-related income received and receivable from:– a fellow subsidiary 342 291– associates 2,758 4,952– joint ventures 5,943 67
9,043 5,310
Management services fees paid and payable to a fellow subsidiary (1,022) (1,295)
Rental and rental-related expenses paid and payable to a joint venture (1,739) (1,756)
Purchase of property, plant and equipment from an associate (88) (438)
Purchase consideration for investment acquired paid and payable to a joint venture (54,571) –
Compensation paid and payable to key management personnel:– short-term employee benefits 16,020 15,641– other long-term benefits 256 205
16,276 15,846
39 ACQUISITION OF AND LOSS OF CONTROL IN SUBSIDIARIES, AND CHANGES IN INTERESTS IN SUBSIDIARIES WITHOUT LOSS OF CONTROL
(I) Acquisition of subsidiaries
2021
In February 2021, the Group through its indirect wholly-owned subsidiary, Chenghao (Shanghai) Investment Co., Ltd., acquired 84.6% of the shares and voting interest in Shenzhen Tusincere Technology Park Development Co. Ltd. (“Shenzhen Tusincere”), which holds a 65% equity interest in Shenzhen Longgang District Qidixiexin Science and Technology Development Park Co., Ltd. (“Shenzhen Longgang”), from Sincere Property Group, a then joint venture of the Group, and two third parties, for a consideration of approximately $174.3 million (RMB853.4 million), together with the assumption of proportionate existing shareholder loans of approximately $173 million (RMB 847 million). The acquisition provided the Group an opportunity to enhance its property portfolio in China.
The acquisition was accounted for as a business combination.
From the date of acquisition to 31 December 2021, Shenzhen Tusincere contributed revenue of $222.8 million and profit before tax of $44.0 million to the Group’s results. If the acquisition had occurred on 1 January 2021, management estimated the Group’s revenue for the period would have been $2,654.4 million, with no significant change to the Group’s profit before tax.
Identifiable assets acquired and liabilities assumed
The following table summarises the recognised amounts of assets acquired and liabilities assumed at the acquisition date.
NoteRecognised
amounts$’000
Property, plant and equipment 4 21,304Investment properties 5 341,753Development properties 948,309Trade and other receivables 17,356Contract costs 1,003Cash at bank 5,564Trade and other payables (145,525)Shareholder loans (297,972)Contract liabilities (166,443)Employee benefits (813)Lease liabilities (2,876)Provision for tax (59,567)Provisions (4,108)Interest-bearing borrowings (194,016)Deferred tax liabilities 29 (80,081)Net identifiable assets acquired 383,888
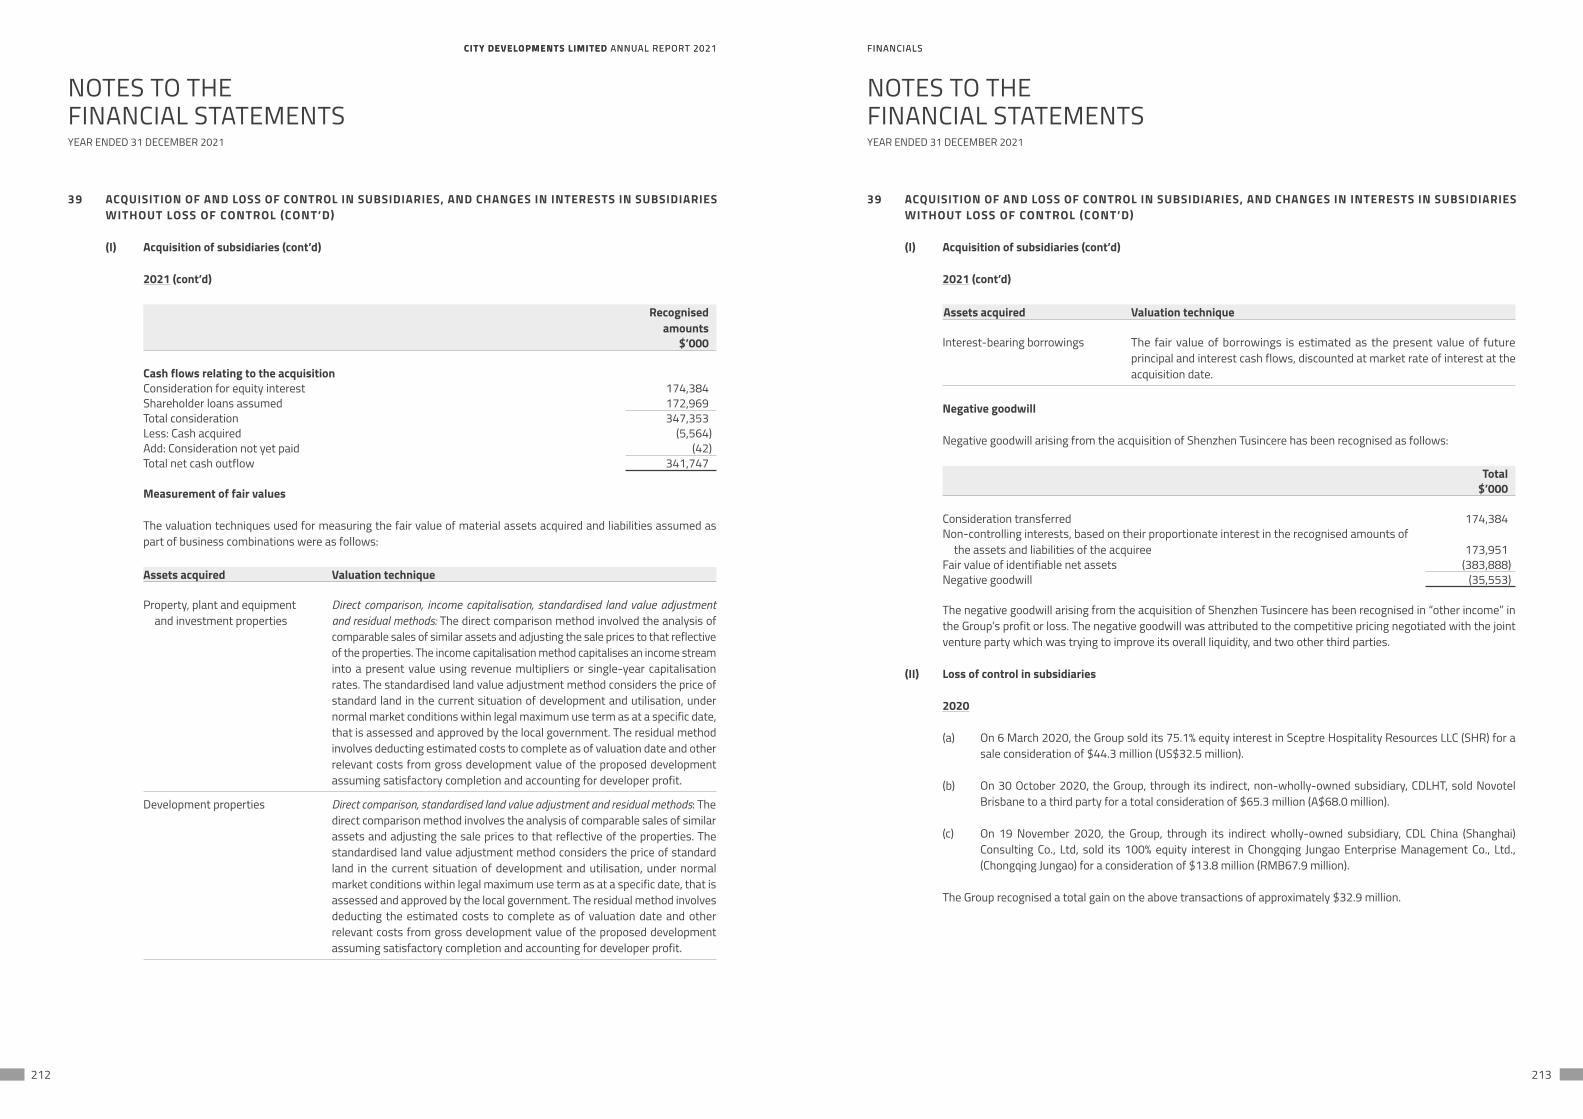
CITY DEVELOPMENTS LIMITED ANNUAL REPORT 2021 FINANCIALSCITY DEVELOPMENTS LIMITED ANNUAL REPORT 2021 FINANCIALS
212 213
NOTES TO THEFINANCIAL STATEMENTS
NOTES TO THEFINANCIAL STATEMENTS
YEAR ENDED 31 DECEMBER 2021 YEAR ENDED 31 DECEMBER 2021
39 ACQUISITION OF AND LOSS OF CONTROL IN SUBSIDIARIES, AND CHANGES IN INTERESTS IN SUBSIDIARIES WITHOUT LOSS OF CONTROL (CONT’D)
(I) Acquisition of subsidiaries (cont’d)
2021 (cont’d)
Recognisedamounts
$’000
Cash flows relating to the acquisitionConsideration for equity interest 174,384Shareholder loans assumed 172,969Total consideration 347,353Less: Cash acquired (5,564)Add: Consideration not yet paid (42)Total net cash outflow 341,747
Measurement of fair values
The valuation techniques used for measuring the fair value of material assets acquired and liabilities assumed as part of business combinations were as follows:
Assets acquired Valuation technique
Property, plant and equipment and investment properties
Direct comparison, income capitalisation, standardised land value adjustment and residual methods: The direct comparison method involved the analysis of comparable sales of similar assets and adjusting the sale prices to that reflective of the properties. The income capitalisation method capitalises an income stream into a present value using revenue multipliers or single-year capitalisation rates. The standardised land value adjustment method considers the price of standard land in the current situation of development and utilisation, under normal market conditions within legal maximum use term as at a specific date, that is assessed and approved by the local government. The residual method involves deducting estimated costs to complete as of valuation date and other relevant costs from gross development value of the proposed development assuming satisfactory completion and accounting for developer profit.
Development properties Direct comparison, standardised land value adjustment and residual methods: The direct comparison method involves the analysis of comparable sales of similar assets and adjusting the sale prices to that reflective of the properties. The standardised land value adjustment method considers the price of standard land in the current situation of development and utilisation, under normal market conditions within legal maximum use term as at a specific date, that is assessed and approved by the local government. The residual method involves deducting the estimated costs to complete as of valuation date and other relevant costs from gross development value of the proposed development assuming satisfactory completion and accounting for developer profit.
39 ACQUISITION OF AND LOSS OF CONTROL IN SUBSIDIARIES, AND CHANGES IN INTERESTS IN SUBSIDIARIES WITHOUT LOSS OF CONTROL (CONT’D)
(I) Acquisition of subsidiaries (cont’d)
2021 (cont’d)
Assets acquired Valuation technique
Interest-bearing borrowings The fair value of borrowings is estimated as the present value of future principal and interest cash flows, discounted at market rate of interest at the acquisition date.
Negative goodwill
Negative goodwill arising from the acquisition of Shenzhen Tusincere has been recognised as follows:
Total$’000
Consideration transferred 174,384Non-controlling interests, based on their proportionate interest in the recognised amounts of
the assets and liabilities of the acquiree 173,951Fair value of identifiable net assets (383,888)Negative goodwill (35,553)
The negative goodwill arising from the acquisition of Shenzhen Tusincere has been recognised in “other income” in the Group’s profit or loss. The negative goodwill was attributed to the competitive pricing negotiated with the joint venture party which was trying to improve its overall liquidity, and two other third parties.
(II) Loss of control in subsidiaries
2020
(a) On 6 March 2020, the Group sold its 75.1% equity interest in Sceptre Hospitality Resources LLC (SHR) for a sale consideration of $44.3 million (US$32.5 million).
(b) On 30 October 2020, the Group, through its indirect, non-wholly-owned subsidiary, CDLHT, sold Novotel Brisbane to a third party for a total consideration of $65.3 million (A$68.0 million).
(c) On 19 November 2020, the Group, through its indirect wholly-owned subsidiary, CDL China (Shanghai) Consulting Co., Ltd, sold its 100% equity interest in Chongqing Jungao Enterprise Management Co., Ltd., (Chongqing Jungao) for a consideration of $13.8 million (RMB67.9 million).
The Group recognised a total gain on the above transactions of approximately $32.9 million.
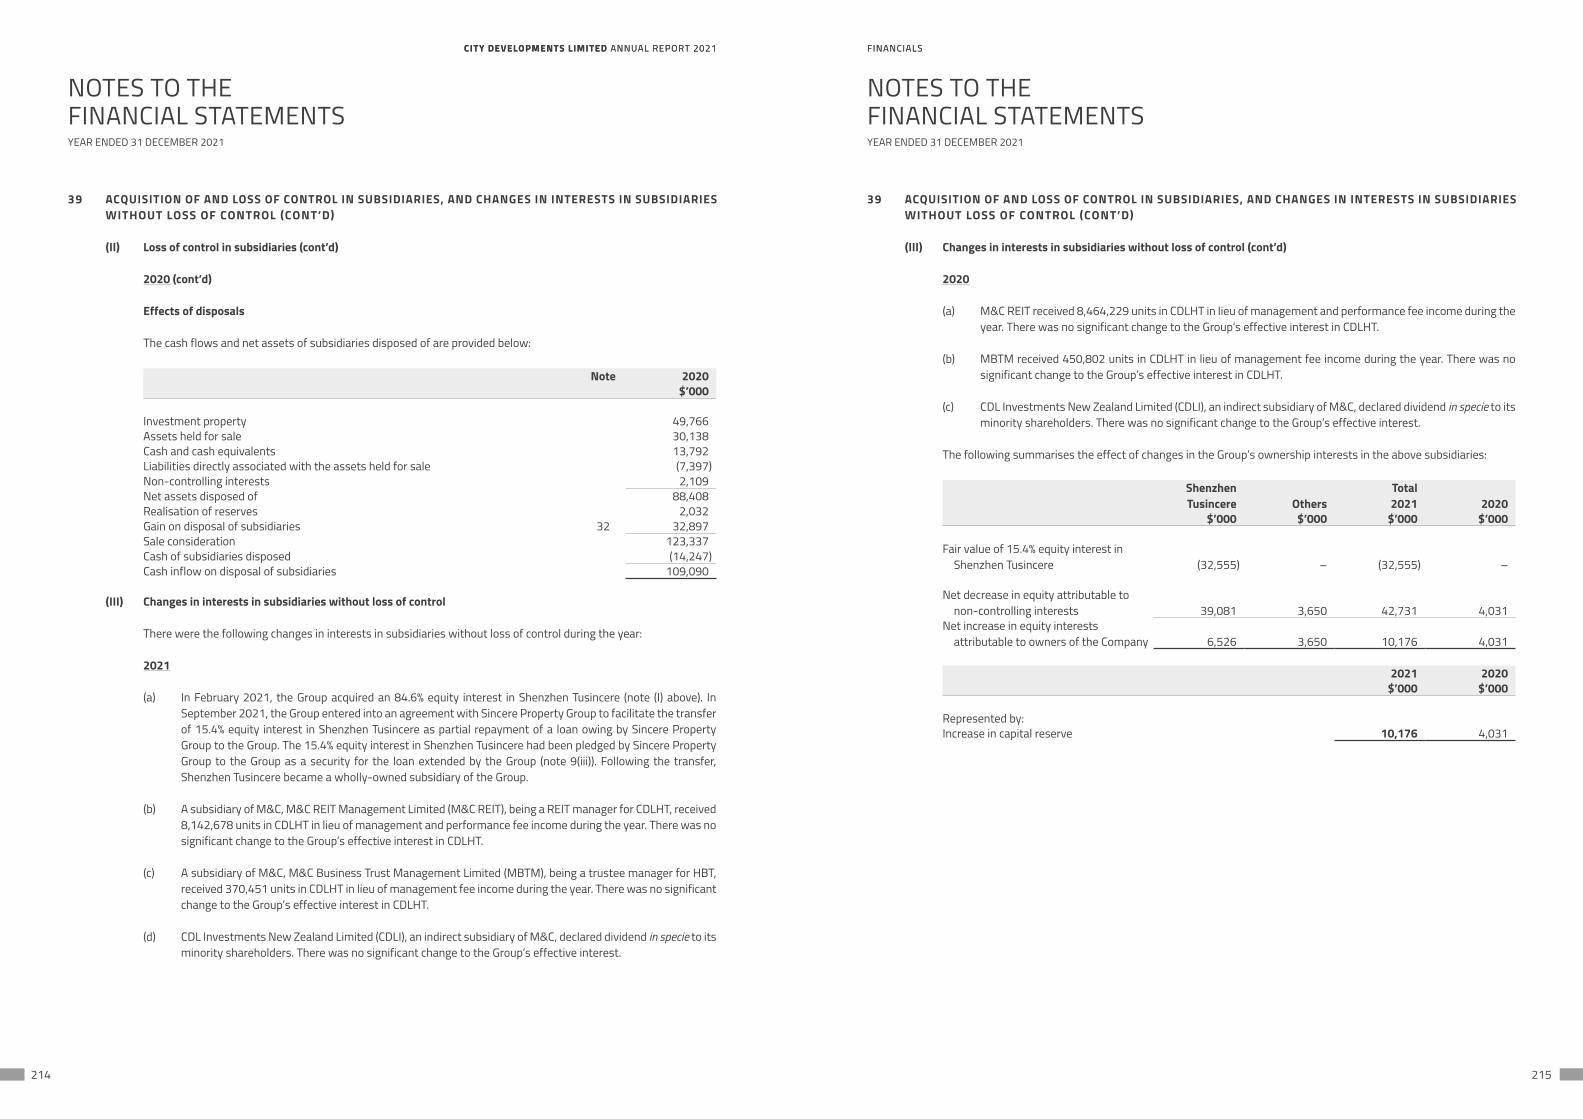
CITY DEVELOPMENTS LIMITED ANNUAL REPORT 2021 FINANCIALSCITY DEVELOPMENTS LIMITED ANNUAL REPORT 2021 FINANCIALS
214 215
NOTES TO THEFINANCIAL STATEMENTS
NOTES TO THEFINANCIAL STATEMENTS
YEAR ENDED 31 DECEMBER 2021 YEAR ENDED 31 DECEMBER 2021
39 ACQUISITION OF AND LOSS OF CONTROL IN SUBSIDIARIES, AND CHANGES IN INTERESTS IN SUBSIDIARIES WITHOUT LOSS OF CONTROL (CONT’D)
(II) Loss of control in subsidiaries (cont’d)
2020 (cont’d)
Effects of disposals
The cash flows and net assets of subsidiaries disposed of are provided below:
Note 2020$’000
Investment property 49,766Assets held for sale 30,138Cash and cash equivalents 13,792Liabilities directly associated with the assets held for sale (7,397)Non-controlling interests 2,109Net assets disposed of 88,408Realisation of reserves 2,032Gain on disposal of subsidiaries 32 32,897Sale consideration 123,337Cash of subsidiaries disposed (14,247)Cash inflow on disposal of subsidiaries 109,090
(III) Changes in interests in subsidiaries without loss of control
There were the following changes in interests in subsidiaries without loss of control during the year:
2021
(a) In February 2021, the Group acquired an 84.6% equity interest in Shenzhen Tusincere (note (I) above). In September 2021, the Group entered into an agreement with Sincere Property Group to facilitate the transfer of 15.4% equity interest in Shenzhen Tusincere as partial repayment of a loan owing by Sincere Property Group to the Group. The 15.4% equity interest in Shenzhen Tusincere had been pledged by Sincere Property Group to the Group as a security for the loan extended by the Group (note 9(iii)). Following the transfer, Shenzhen Tusincere became a wholly-owned subsidiary of the Group.
(b) A subsidiary of M&C, M&C REIT Management Limited (M&C REIT), being a REIT manager for CDLHT, received 8,142,678 units in CDLHT in lieu of management and performance fee income during the year. There was no significant change to the Group’s effective interest in CDLHT.
(c) A subsidiary of M&C, M&C Business Trust Management Limited (MBTM), being a trustee manager for HBT, received 370,451 units in CDLHT in lieu of management fee income during the year. There was no significant change to the Group’s effective interest in CDLHT.
(d) CDL Investments New Zealand Limited (CDLI), an indirect subsidiary of M&C, declared dividend in specie to its minority shareholders. There was no significant change to the Group’s effective interest.
39 ACQUISITION OF AND LOSS OF CONTROL IN SUBSIDIARIES, AND CHANGES IN INTERESTS IN SUBSIDIARIES WITHOUT LOSS OF CONTROL (CONT’D)
(III) Changes in interests in subsidiaries without loss of control (cont’d)
2020
(a) M&C REIT received 8,464,229 units in CDLHT in lieu of management and performance fee income during the year. There was no significant change to the Group’s effective interest in CDLHT.
(b) MBTM received 450,802 units in CDLHT in lieu of management fee income during the year. There was no significant change to the Group’s effective interest in CDLHT.
(c) CDL Investments New Zealand Limited (CDLI), an indirect subsidiary of M&C, declared dividend in specie to its minority shareholders. There was no significant change to the Group’s effective interest.
The following summarises the effect of changes in the Group’s ownership interests in the above subsidiaries:
ShenzhenTusincere Others
Total2021 2020
$’000 $’000 $’000 $’000
Fair value of 15.4% equity interest in Shenzhen Tusincere (32,555) – (32,555) –
Net decrease in equity attributable to non-controlling interests 39,081 3,650 42,731 4,031
Net increase in equity interests attributable to owners of the Company 6,526 3,650 10,176 4,031
2021 2020$’000 $’000
Represented by:Increase in capital reserve 10,176 4,031
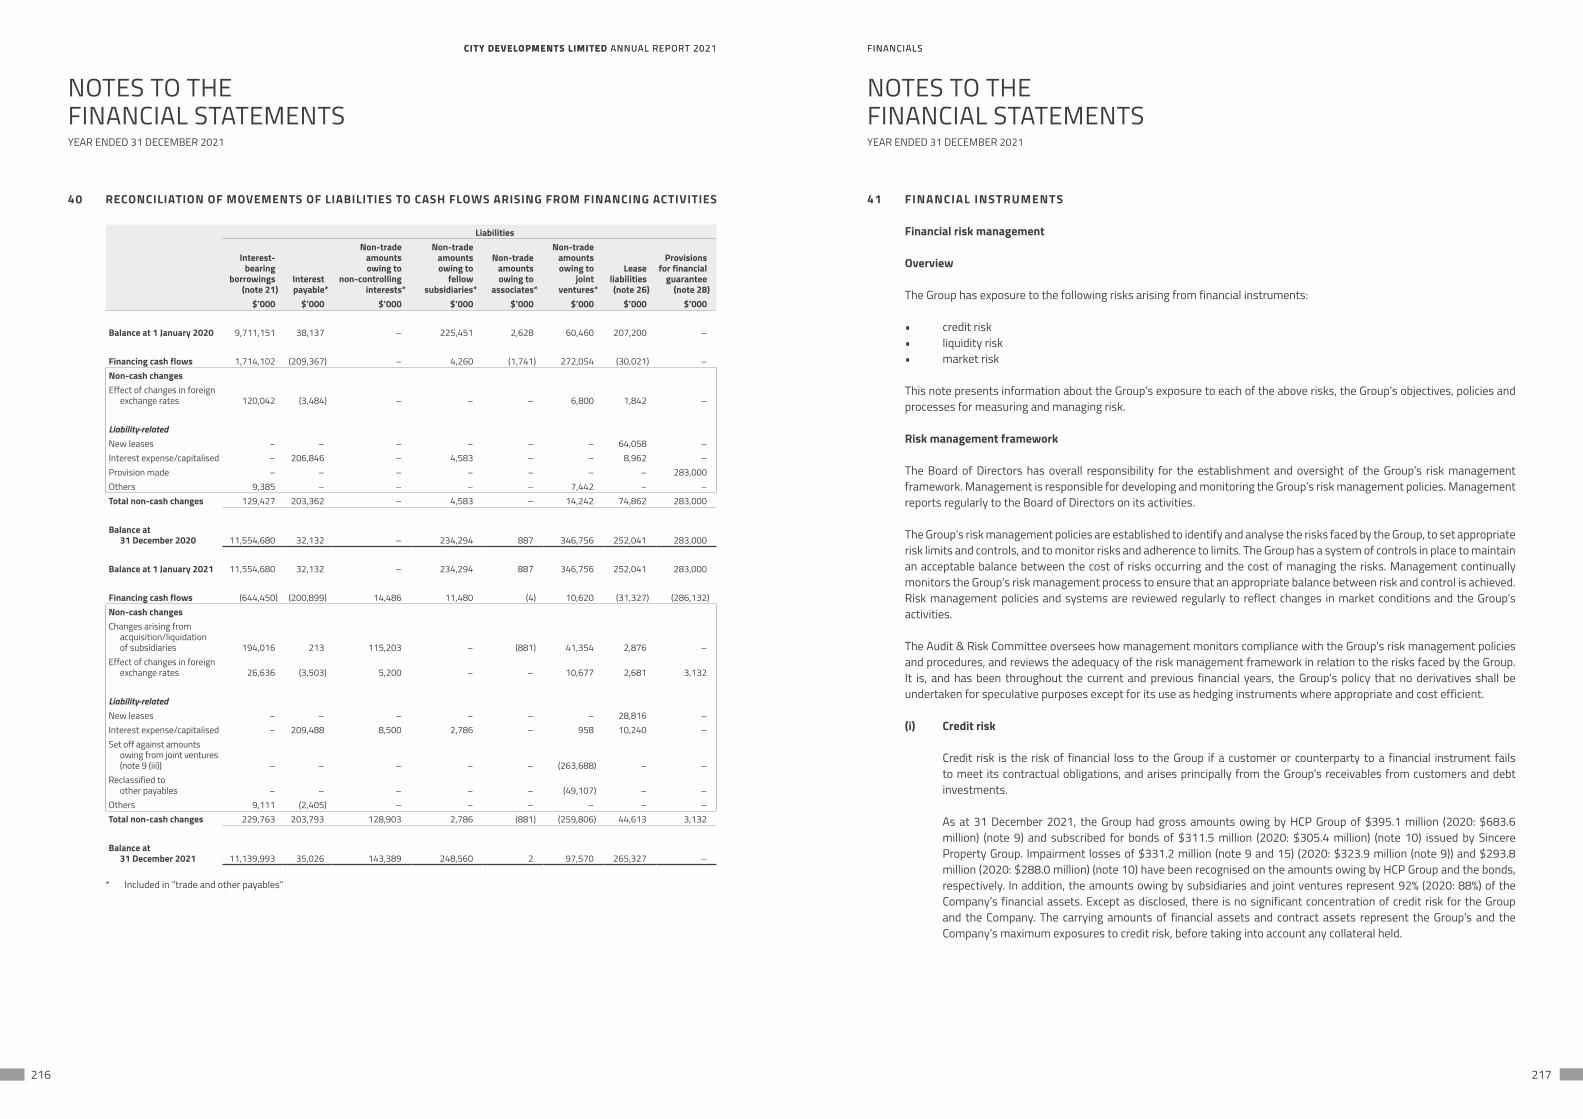
CITY DEVELOPMENTS LIMITED ANNUAL REPORT 2021 FINANCIALSCITY DEVELOPMENTS LIMITED ANNUAL REPORT 2021 FINANCIALS
216 217
NOTES TO THEFINANCIAL STATEMENTS
NOTES TO THEFINANCIAL STATEMENTS
YEAR ENDED 31 DECEMBER 2021 YEAR ENDED 31 DECEMBER 2021
40 RECONCILIATION OF MOVEMENTS OF LIABILITIES TO CASH FLOWS ARISING FROM FINANCING ACTIVITIES
Liabilities
Interest-bearing
borrowings(note 21)
Interestpayable*
Non-tradeamountsowing to
non-controllinginterests*
Non-tradeamountsowing to
fellowsubsidiaries*
Non-tradeamountsowing to
associates*
Non-tradeamountsowing to
jointventures*
Leaseliabilities (note 26)
Provisions for financial
guarantee(note 28)
$’000 $’000 $’000 $’000 $’000 $’000 $’000 $’000
Balance at 1 January 2020 9,711,151 38,137 – 225,451 2,628 60,460 207,200 –
Financing cash flows 1,714,102 (209,367) – 4,260 (1,741) 272,054 (30,021) –Non-cash changesEffect of changes in foreign
exchange rates 120,042 (3,484) – – – 6,800 1,842 –
Liability-relatedNew leases – – – – – – 64,058 –Interest expense/capitalised – 206,846 – 4,583 – – 8,962 –Provision made – – – – – – – 283,000Others 9,385 – – – – 7,442 – –Total non-cash changes 129,427 203,362 – 4,583 – 14,242 74,862 283,000
Balance at 31 December 2020 11,554,680 32,132 – 234,294 887 346,756 252,041 283,000
Balance at 1 January 2021 11,554,680 32,132 – 234,294 887 346,756 252,041 283,000
Financing cash flows (644,450) (200,899) 14,486 11,480 (4) 10,620 (31,327) (286,132)Non-cash changesChanges arising from
acquisition/liquidation of subsidiaries 194,016 213 115,203 – (881) 41,354 2,876 –
Effect of changes in foreign exchange rates 26,636 (3,503) 5,200 – – 10,677 2,681 3,132
Liability-relatedNew leases – – – – – – 28,816 –Interest expense/capitalised – 209,488 8,500 2,786 – 958 10,240 –Set off against amounts
owing from joint ventures (note 9 (iii)) – – – – – (263,688) – –
Reclassified to other payables – – – – – (49,107) – –
Others 9,111 (2,405) – – – – – –Total non-cash changes 229,763 203,793 128,903 2,786 (881) (259,806) 44,613 3,132
Balance at 31 December 2021 11,139,993 35,026 143,389 248,560 2 97,570 265,327 –
* Included in “trade and other payables”
41 FINANCIAL INSTRUMENTS
Financial risk management
Overview
The Group has exposure to the following risks arising from financial instruments:
• credit risk• liquidity risk• market risk
This note presents information about the Group’s exposure to each of the above risks, the Group’s objectives, policies and processes for measuring and managing risk.
Risk management framework
The Board of Directors has overall responsibility for the establishment and oversight of the Group’s risk management framework. Management is responsible for developing and monitoring the Group’s risk management policies. Management reports regularly to the Board of Directors on its activities.
The Group’s risk management policies are established to identify and analyse the risks faced by the Group, to set appropriate risk limits and controls, and to monitor risks and adherence to limits. The Group has a system of controls in place to maintain an acceptable balance between the cost of risks occurring and the cost of managing the risks. Management continually monitors the Group’s risk management process to ensure that an appropriate balance between risk and control is achieved. Risk management policies and systems are reviewed regularly to reflect changes in market conditions and the Group’s activities.
The Audit & Risk Committee oversees how management monitors compliance with the Group’s risk management policies and procedures, and reviews the adequacy of the risk management framework in relation to the risks faced by the Group. It is, and has been throughout the current and previous financial years, the Group’s policy that no derivatives shall be undertaken for speculative purposes except for its use as hedging instruments where appropriate and cost efficient.
(i) Credit risk
Credit risk is the risk of financial loss to the Group if a customer or counterparty to a financial instrument fails to meet its contractual obligations, and arises principally from the Group’s receivables from customers and debt investments.
As at 31 December 2021, the Group had gross amounts owing by HCP Group of $395.1 million (2020: $683.6 million) (note 9) and subscribed for bonds of $311.5 million (2020: $305.4 million) (note 10) issued by Sincere Property Group. Impairment losses of $331.2 million (note 9 and 15) (2020: $323.9 million (note 9)) and $293.8 million (2020: $288.0 million) (note 10) have been recognised on the amounts owing by HCP Group and the bonds, respectively. In addition, the amounts owing by subsidiaries and joint ventures represent 92% (2020: 88%) of the Company’s financial assets. Except as disclosed, there is no significant concentration of credit risk for the Group and the Company. The carrying amounts of financial assets and contract assets represent the Group’s and the Company’s maximum exposures to credit risk, before taking into account any collateral held.
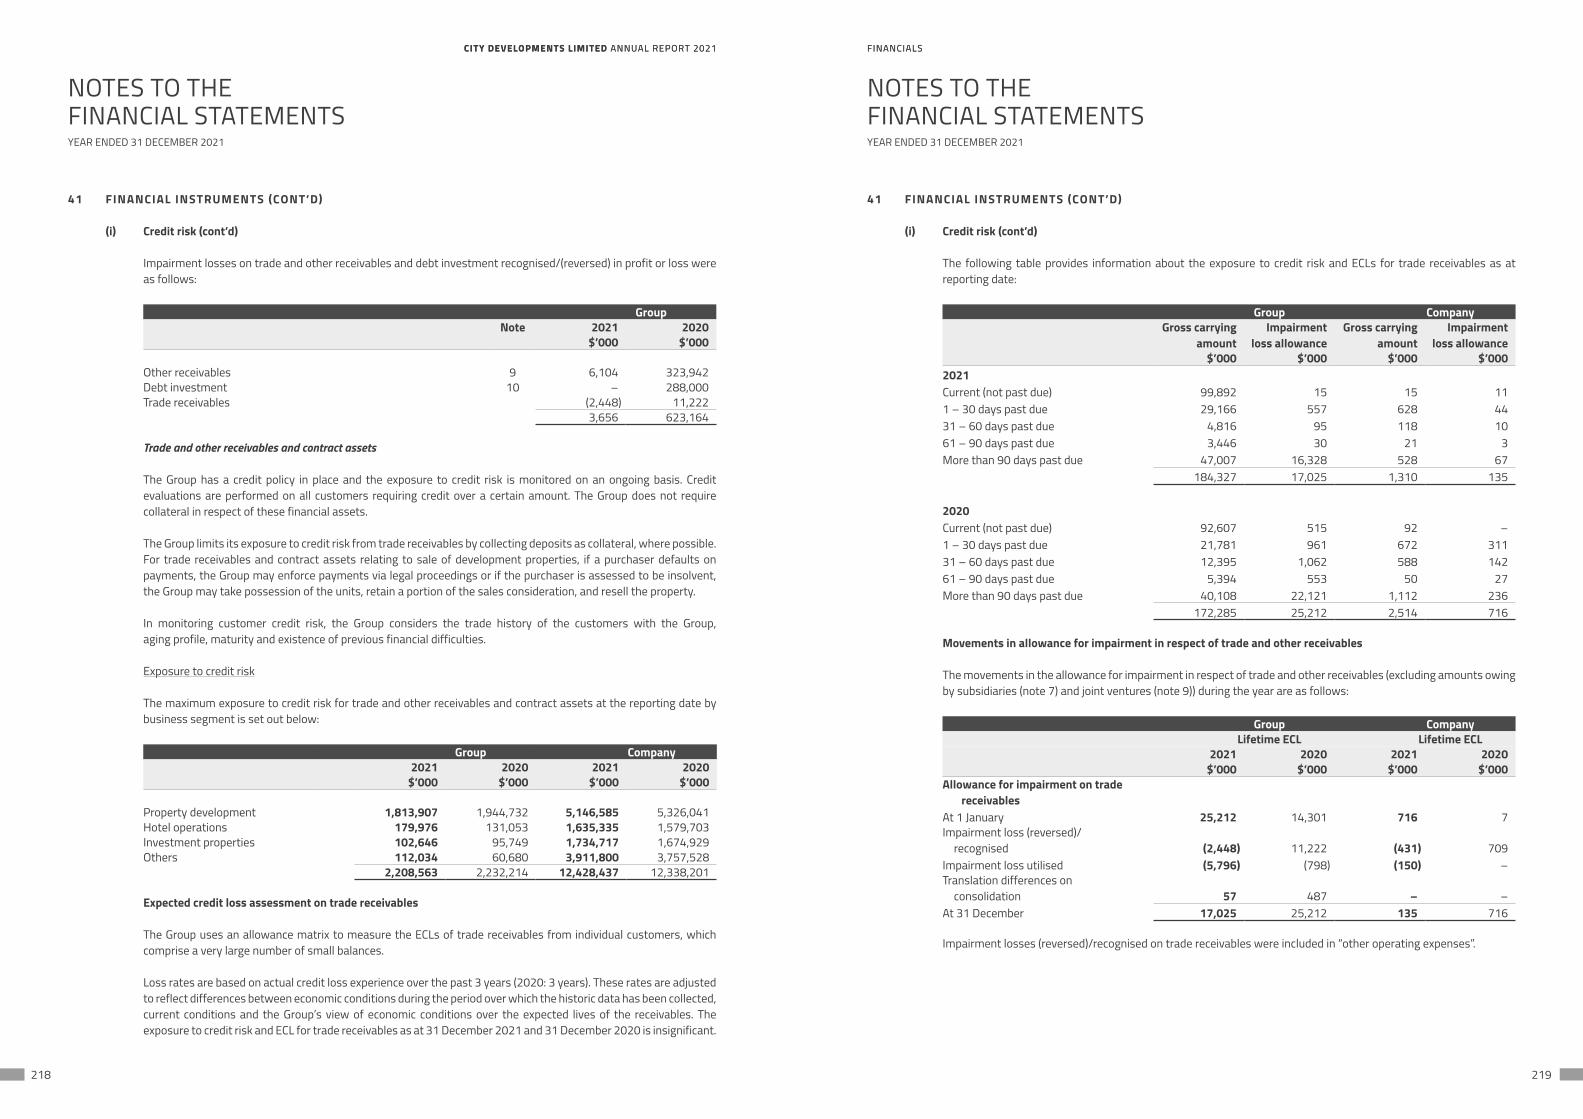
CITY DEVELOPMENTS LIMITED ANNUAL REPORT 2021 FINANCIALSCITY DEVELOPMENTS LIMITED ANNUAL REPORT 2021 FINANCIALS
218 219
NOTES TO THEFINANCIAL STATEMENTS
NOTES TO THEFINANCIAL STATEMENTS
YEAR ENDED 31 DECEMBER 2021 YEAR ENDED 31 DECEMBER 2021
41 FINANCIAL INSTRUMENTS (CONT’D)
(i) Credit risk (cont’d)
Impairment losses on trade and other receivables and debt investment recognised/(reversed) in profit or loss were as follows:
GroupNote 2021 2020
$’000 $’000
Other receivables 9 6,104 323,942Debt investment 10 – 288,000Trade receivables (2,448) 11,222
3,656 623,164
Trade and other receivables and contract assets
The Group has a credit policy in place and the exposure to credit risk is monitored on an ongoing basis. Credit evaluations are performed on all customers requiring credit over a certain amount. The Group does not require collateral in respect of these financial assets.
The Group limits its exposure to credit risk from trade receivables by collecting deposits as collateral, where possible. For trade receivables and contract assets relating to sale of development properties, if a purchaser defaults on payments, the Group may enforce payments via legal proceedings or if the purchaser is assessed to be insolvent, the Group may take possession of the units, retain a portion of the sales consideration, and resell the property.
In monitoring customer credit risk, the Group considers the trade history of the customers with the Group, aging profile, maturity and existence of previous financial difficulties.
Exposure to credit risk
The maximum exposure to credit risk for trade and other receivables and contract assets at the reporting date by business segment is set out below:
Group Company2021 2020 2021 2020
$’000 $’000 $’000 $’000
Property development 1,813,907 1,944,732 5,146,585 5,326,041Hotel operations 179,976 131,053 1,635,335 1,579,703Investment properties 102,646 95,749 1,734,717 1,674,929Others 112,034 60,680 3,911,800 3,757,528
2,208,563 2,232,214 12,428,437 12,338,201
Expected credit loss assessment on trade receivables
The Group uses an allowance matrix to measure the ECLs of trade receivables from individual customers, which comprise a very large number of small balances.
Loss rates are based on actual credit loss experience over the past 3 years (2020: 3 years). These rates are adjusted to reflect differences between economic conditions during the period over which the historic data has been collected, current conditions and the Group’s view of economic conditions over the expected lives of the receivables. The exposure to credit risk and ECL for trade receivables as at 31 December 2021 and 31 December 2020 is insignificant.
41 FINANCIAL INSTRUMENTS (CONT’D)
(i) Credit risk (cont’d)
The following table provides information about the exposure to credit risk and ECLs for trade receivables as at reporting date:
Group CompanyGross carrying
amountImpairment
loss allowanceGross carrying
amountImpairment
loss allowance$’000 $’000 $’000 $’000
2021Current (not past due) 99,892 15 15 111 – 30 days past due 29,166 557 628 4431 – 60 days past due 4,816 95 118 1061 – 90 days past due 3,446 30 21 3More than 90 days past due 47,007 16,328 528 67
184,327 17,025 1,310 135
2020Current (not past due) 92,607 515 92 –1 – 30 days past due 21,781 961 672 31131 – 60 days past due 12,395 1,062 588 14261 – 90 days past due 5,394 553 50 27More than 90 days past due 40,108 22,121 1,112 236
172,285 25,212 2,514 716
Movements in allowance for impairment in respect of trade and other receivables
The movements in the allowance for impairment in respect of trade and other receivables (excluding amounts owing by subsidiaries (note 7) and joint ventures (note 9)) during the year are as follows:
Group Company Lifetime ECL Lifetime ECL
2021 2020 2021 2020$’000 $’000 $’000 $’000
Allowance for impairment on tradereceivables
At 1 January 25,212 14,301 716 7Impairment loss (reversed)/
recognised (2,448) 11,222 (431) 709Impairment loss utilised (5,796) (798) (150) –Translation differences on
consolidation 57 487 – –At 31 December 17,025 25,212 135 716
Impairment losses (reversed)/recognised on trade receivables were included in “other operating expenses”.
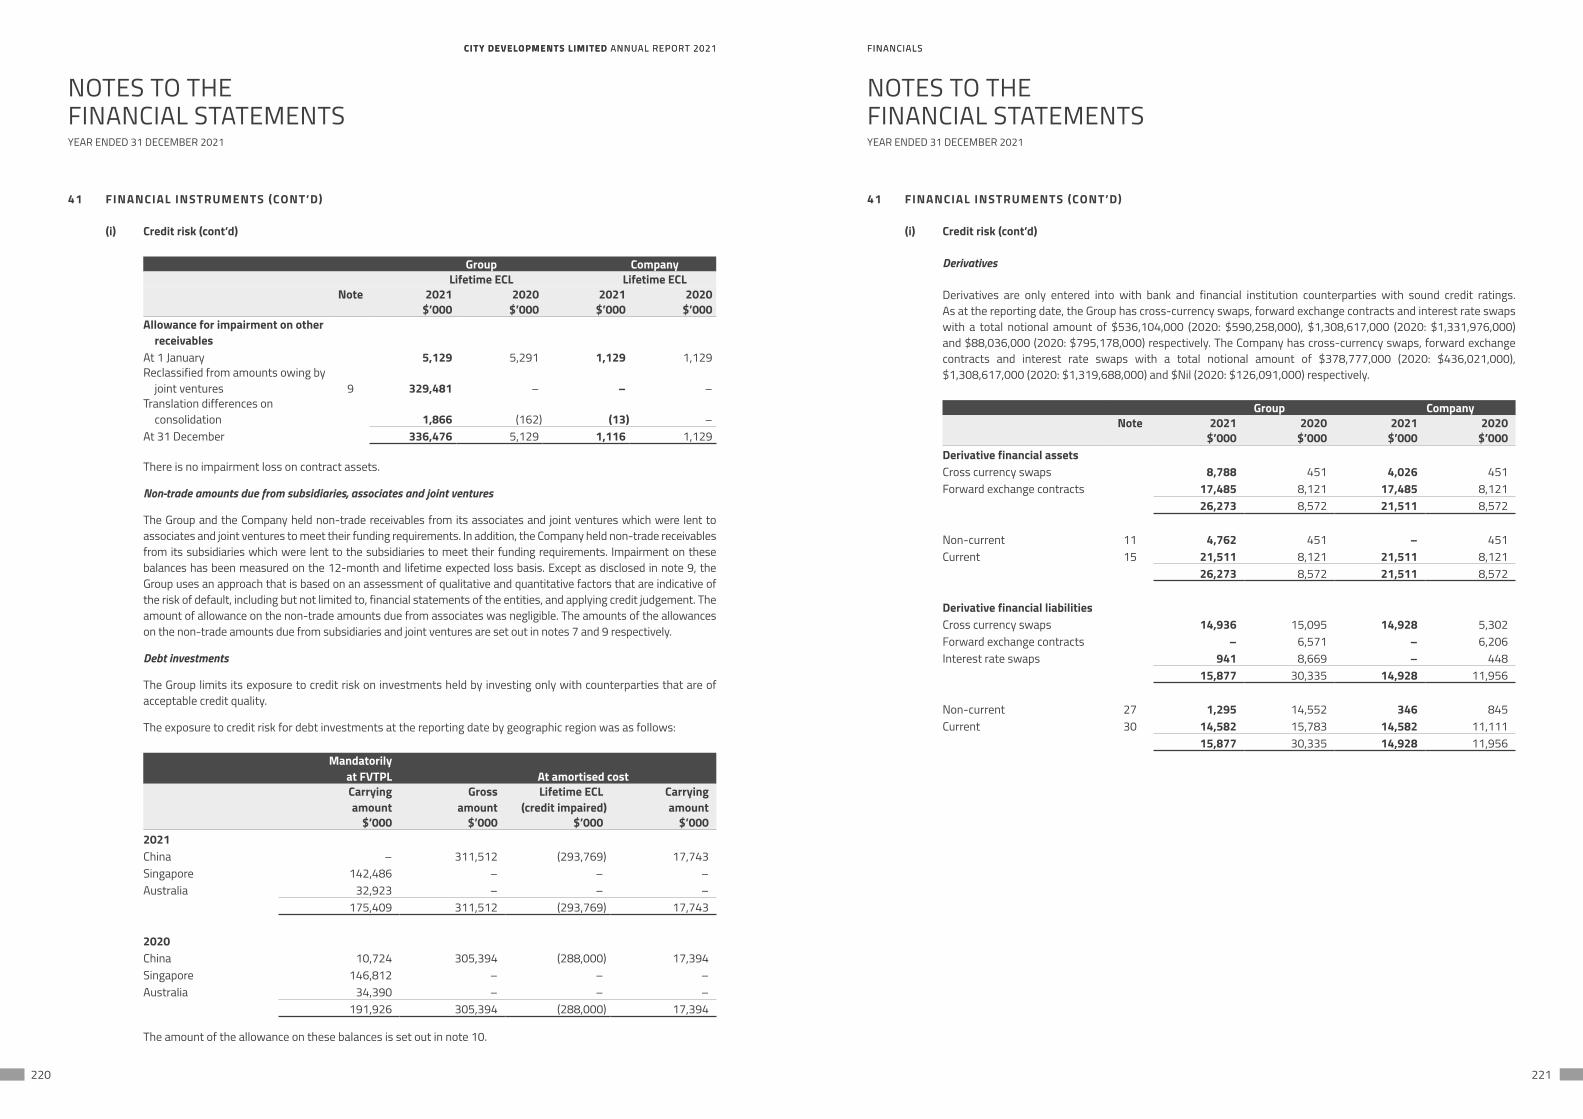
CITY DEVELOPMENTS LIMITED ANNUAL REPORT 2021 FINANCIALSCITY DEVELOPMENTS LIMITED ANNUAL REPORT 2021 FINANCIALS
220 221
NOTES TO THEFINANCIAL STATEMENTS
NOTES TO THEFINANCIAL STATEMENTS
YEAR ENDED 31 DECEMBER 2021 YEAR ENDED 31 DECEMBER 2021
41 FINANCIAL INSTRUMENTS (CONT’D)
(i) Credit risk (cont’d)
Group Company Lifetime ECL Lifetime ECL
Note 2021 2020 2021 2020$’000 $’000 $’000 $’000
Allowance for impairment on otherreceivables
At 1 January 5,129 5,291 1,129 1,129Reclassified from amounts owing by
joint ventures 9 329,481 – – –Translation differences on
consolidation 1,866 (162) (13) –At 31 December 336,476 5,129 1,116 1,129
There is no impairment loss on contract assets.
Non-trade amounts due from subsidiaries, associates and joint ventures
The Group and the Company held non-trade receivables from its associates and joint ventures which were lent to associates and joint ventures to meet their funding requirements. In addition, the Company held non-trade receivables from its subsidiaries which were lent to the subsidiaries to meet their funding requirements. Impairment on these balances has been measured on the 12-month and lifetime expected loss basis. Except as disclosed in note 9, the Group uses an approach that is based on an assessment of qualitative and quantitative factors that are indicative of the risk of default, including but not limited to, financial statements of the entities, and applying credit judgement. The amount of allowance on the non-trade amounts due from associates was negligible. The amounts of the allowances on the non-trade amounts due from subsidiaries and joint ventures are set out in notes 7 and 9 respectively.
Debt investments
The Group limits its exposure to credit risk on investments held by investing only with counterparties that are of acceptable credit quality.
The exposure to credit risk for debt investments at the reporting date by geographic region was as follows:
Mandatorilyat FVTPL At amortised costCarrying amount
Gross amount
Lifetime ECL (credit impaired)
Carrying amount
$’000 $’000 $’000 $’0002021China – 311,512 (293,769) 17,743Singapore 142,486 – – –Australia 32,923 – – –
175,409 311,512 (293,769) 17,743
2020China 10,724 305,394 (288,000) 17,394Singapore 146,812 – – –Australia 34,390 – – –
191,926 305,394 (288,000) 17,394
The amount of the allowance on these balances is set out in note 10.
41 FINANCIAL INSTRUMENTS (CONT’D)
(i) Credit risk (cont’d)
Derivatives
Derivatives are only entered into with bank and financial institution counterparties with sound credit ratings. As at the reporting date, the Group has cross-currency swaps, forward exchange contracts and interest rate swaps with a total notional amount of $536,104,000 (2020: $590,258,000), $1,308,617,000 (2020: $1,331,976,000) and $88,036,000 (2020: $795,178,000) respectively. The Company has cross-currency swaps, forward exchange contracts and interest rate swaps with a total notional amount of $378,777,000 (2020: $436,021,000), $1,308,617,000 (2020: $1,319,688,000) and $Nil (2020: $126,091,000) respectively.
Group CompanyNote 2021 2020 2021 2020
$’000 $’000 $’000 $’000Derivative financial assetsCross currency swaps 8,788 451 4,026 451Forward exchange contracts 17,485 8,121 17,485 8,121
26,273 8,572 21,511 8,572
Non-current 11 4,762 451 – 451Current 15 21,511 8,121 21,511 8,121
26,273 8,572 21,511 8,572
Derivative financial liabilitiesCross currency swaps 14,936 15,095 14,928 5,302Forward exchange contracts – 6,571 – 6,206Interest rate swaps 941 8,669 – 448
15,877 30,335 14,928 11,956
Non-current 27 1,295 14,552 346 845Current 30 14,582 15,783 14,582 11,111
15,877 30,335 14,928 11,956
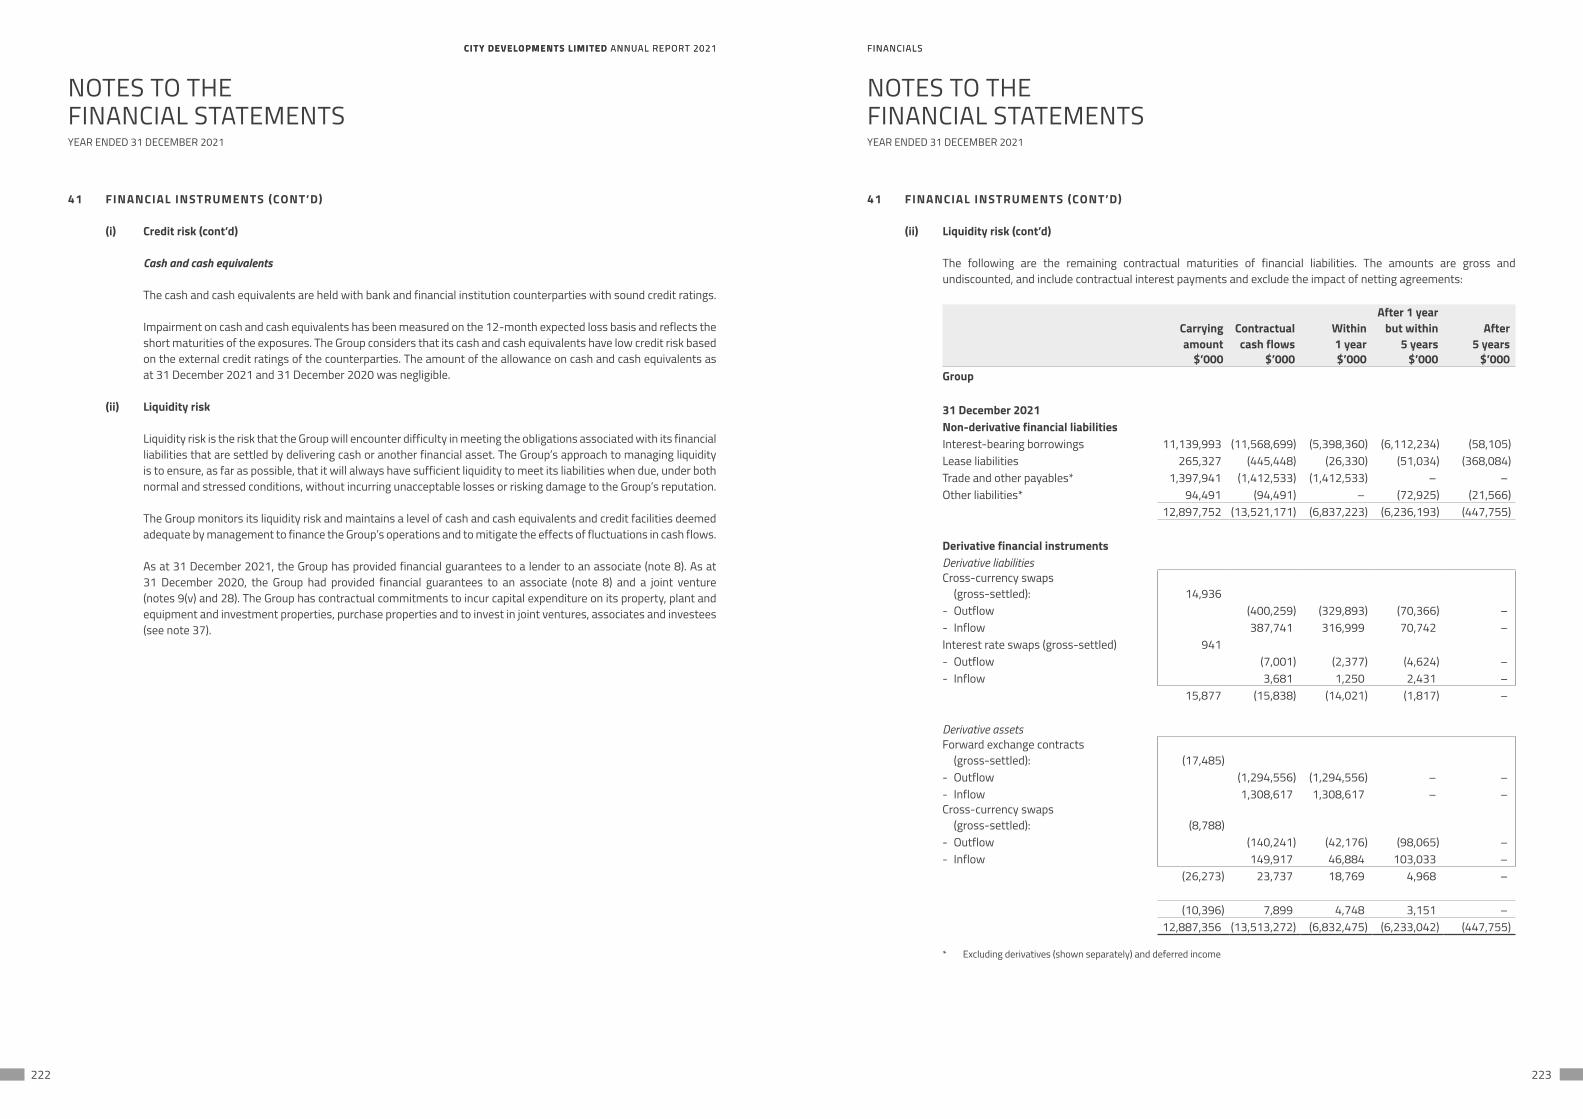
CITY DEVELOPMENTS LIMITED ANNUAL REPORT 2021 FINANCIALSCITY DEVELOPMENTS LIMITED ANNUAL REPORT 2021 FINANCIALS
222 223
NOTES TO THEFINANCIAL STATEMENTS
NOTES TO THEFINANCIAL STATEMENTS
YEAR ENDED 31 DECEMBER 2021 YEAR ENDED 31 DECEMBER 2021
41 FINANCIAL INSTRUMENTS (CONT’D)
(i) Credit risk (cont’d)
Cash and cash equivalents
The cash and cash equivalents are held with bank and financial institution counterparties with sound credit ratings.
Impairment on cash and cash equivalents has been measured on the 12-month expected loss basis and reflects the short maturities of the exposures. The Group considers that its cash and cash equivalents have low credit risk based on the external credit ratings of the counterparties. The amount of the allowance on cash and cash equivalents as at 31 December 2021 and 31 December 2020 was negligible.
(ii) Liquidity risk
Liquidity risk is the risk that the Group will encounter difficulty in meeting the obligations associated with its financial liabilities that are settled by delivering cash or another financial asset. The Group’s approach to managing liquidity is to ensure, as far as possible, that it will always have sufficient liquidity to meet its liabilities when due, under both normal and stressed conditions, without incurring unacceptable losses or risking damage to the Group’s reputation.
The Group monitors its liquidity risk and maintains a level of cash and cash equivalents and credit facilities deemed adequate by management to finance the Group’s operations and to mitigate the effects of fluctuations in cash flows.
As at 31 December 2021, the Group has provided financial guarantees to a lender to an associate (note 8). As at 31 December 2020, the Group had provided financial guarantees to an associate (note 8) and a joint venture (notes 9(v) and 28). The Group has contractual commitments to incur capital expenditure on its property, plant and equipment and investment properties, purchase properties and to invest in joint ventures, associates and investees (see note 37).
41 FINANCIAL INSTRUMENTS (CONT’D)
(ii) Liquidity risk (cont’d)
The following are the remaining contractual maturities of financial liabilities. The amounts are gross and undiscounted, and include contractual interest payments and exclude the impact of netting agreements:
Carrying amount
Contractual cash flows
Within1 year
After 1 yearbut within
5 yearsAfter
5 years$’000 $’000 $’000 $’000 $’000
Group
31 December 2021Non-derivative financial liabilitiesInterest-bearing borrowings 11,139,993 (11,568,699) (5,398,360) (6,112,234) (58,105)Lease liabilities 265,327 (445,448) (26,330) (51,034) (368,084)Trade and other payables* 1,397,941 (1,412,533) (1,412,533) – –Other liabilities* 94,491 (94,491) – (72,925) (21,566)
12,897,752 (13,521,171) (6,837,223) (6,236,193) (447,755)
Derivative financial instrumentsDerivative liabilitiesCross-currency swaps
(gross-settled): 14,936- Outflow (400,259) (329,893) (70,366) –- Inflow 387,741 316,999 70,742 –Interest rate swaps (gross-settled) 941- Outflow (7,001) (2,377) (4,624) –- Inflow 3,681 1,250 2,431 –
15,877 (15,838) (14,021) (1,817) –
Derivative assetsForward exchange contracts
(gross-settled): (17,485)- Outflow (1,294,556) (1,294,556) – –- Inflow 1,308,617 1,308,617 – –Cross-currency swaps
(gross-settled): (8,788)- Outflow (140,241) (42,176) (98,065) –- Inflow 149,917 46,884 103,033 –
(26,273) 23,737 18,769 4,968 –
(10,396) 7,899 4,748 3,151 –12,887,356 (13,513,272) (6,832,475) (6,233,042) (447,755)
* Excluding derivatives (shown separately) and deferred income
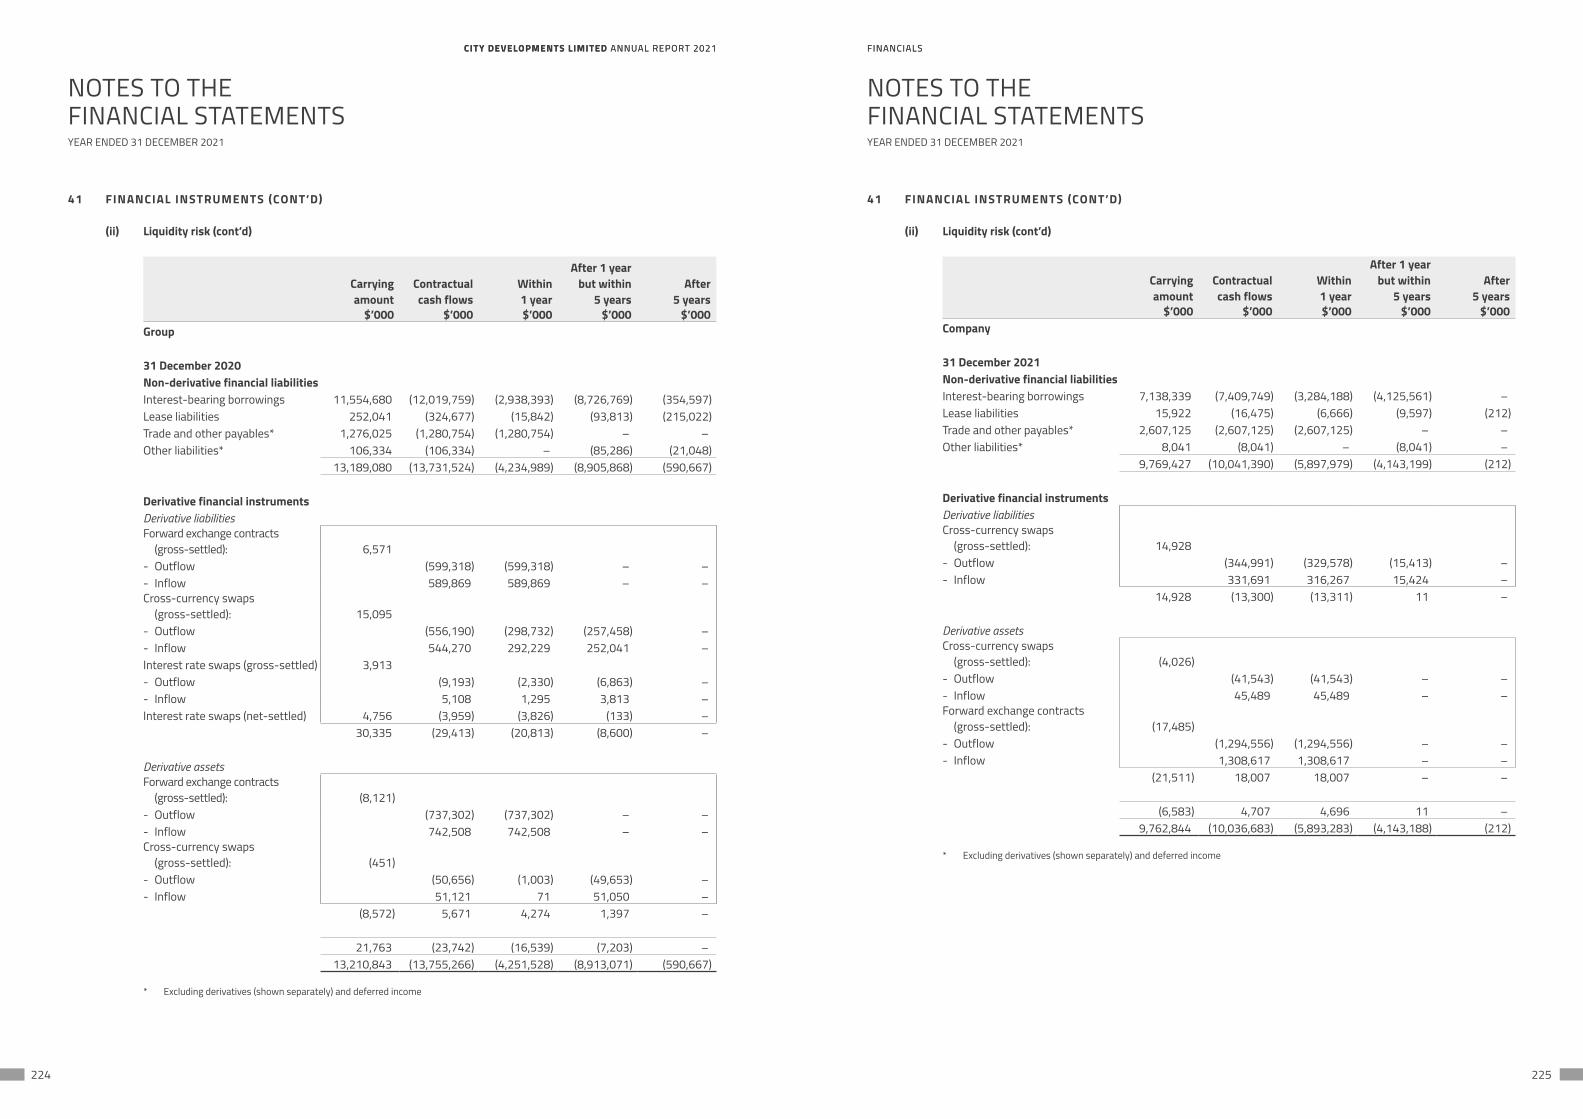
CITY DEVELOPMENTS LIMITED ANNUAL REPORT 2021 FINANCIALSCITY DEVELOPMENTS LIMITED ANNUAL REPORT 2021 FINANCIALS
224 225
NOTES TO THEFINANCIAL STATEMENTS
NOTES TO THEFINANCIAL STATEMENTS
YEAR ENDED 31 DECEMBER 2021 YEAR ENDED 31 DECEMBER 2021
41 FINANCIAL INSTRUMENTS (CONT’D)
(ii) Liquidity risk (cont’d)
Carrying amount
Contractual cash flows
Within1 year
After 1 yearbut within
5 yearsAfter
5 years$’000 $’000 $’000 $’000 $’000
Group
31 December 2020Non-derivative financial liabilitiesInterest-bearing borrowings 11,554,680 (12,019,759) (2,938,393) (8,726,769) (354,597)Lease liabilities 252,041 (324,677) (15,842) (93,813) (215,022)Trade and other payables* 1,276,025 (1,280,754) (1,280,754) – –Other liabilities* 106,334 (106,334) – (85,286) (21,048)
13,189,080 (13,731,524) (4,234,989) (8,905,868) (590,667)
Derivative financial instrumentsDerivative liabilitiesForward exchange contracts
(gross-settled): 6,571- Outflow (599,318) (599,318) – –- Inflow 589,869 589,869 – –Cross-currency swaps
(gross-settled): 15,095- Outflow (556,190) (298,732) (257,458) –- Inflow 544,270 292,229 252,041 –Interest rate swaps (gross-settled) 3,913- Outflow (9,193) (2,330) (6,863) –- Inflow 5,108 1,295 3,813 –Interest rate swaps (net-settled) 4,756 (3,959) (3,826) (133) –
30,335 (29,413) (20,813) (8,600) –
Derivative assetsForward exchange contracts
(gross-settled): (8,121)- Outflow (737,302) (737,302) – –- Inflow 742,508 742,508 – –Cross-currency swaps
(gross-settled): (451)- Outflow (50,656) (1,003) (49,653) –- Inflow 51,121 71 51,050 –
(8,572) 5,671 4,274 1,397 –
21,763 (23,742) (16,539) (7,203) –13,210,843 (13,755,266) (4,251,528) (8,913,071) (590,667)
* Excluding derivatives (shown separately) and deferred income
41 FINANCIAL INSTRUMENTS (CONT’D)
(ii) Liquidity risk (cont’d)
Carrying amount
Contractual cash flows
Within1 year
After 1 yearbut within
5 yearsAfter
5 years$’000 $’000 $’000 $’000 $’000
Company
31 December 2021Non-derivative financial liabilitiesInterest-bearing borrowings 7,138,339 (7,409,749) (3,284,188) (4,125,561) –Lease liabilities 15,922 (16,475) (6,666) (9,597) (212)Trade and other payables* 2,607,125 (2,607,125) (2,607,125) – –Other liabilities* 8,041 (8,041) – (8,041) –
9,769,427 (10,041,390) (5,897,979) (4,143,199) (212)
Derivative financial instrumentsDerivative liabilitiesCross-currency swaps
(gross-settled): 14,928- Outflow (344,991) (329,578) (15,413) –- Inflow 331,691 316,267 15,424 –
14,928 (13,300) (13,311) 11 –
Derivative assetsCross-currency swaps
(gross-settled): (4,026)- Outflow (41,543) (41,543) – –- Inflow 45,489 45,489 – –Forward exchange contracts
(gross-settled): (17,485)- Outflow (1,294,556) (1,294,556) – –- Inflow 1,308,617 1,308,617 – –
(21,511) 18,007 18,007 – –
(6,583) 4,707 4,696 11 –9,762,844 (10,036,683) (5,893,283) (4,143,188) (212)
* Excluding derivatives (shown separately) and deferred income
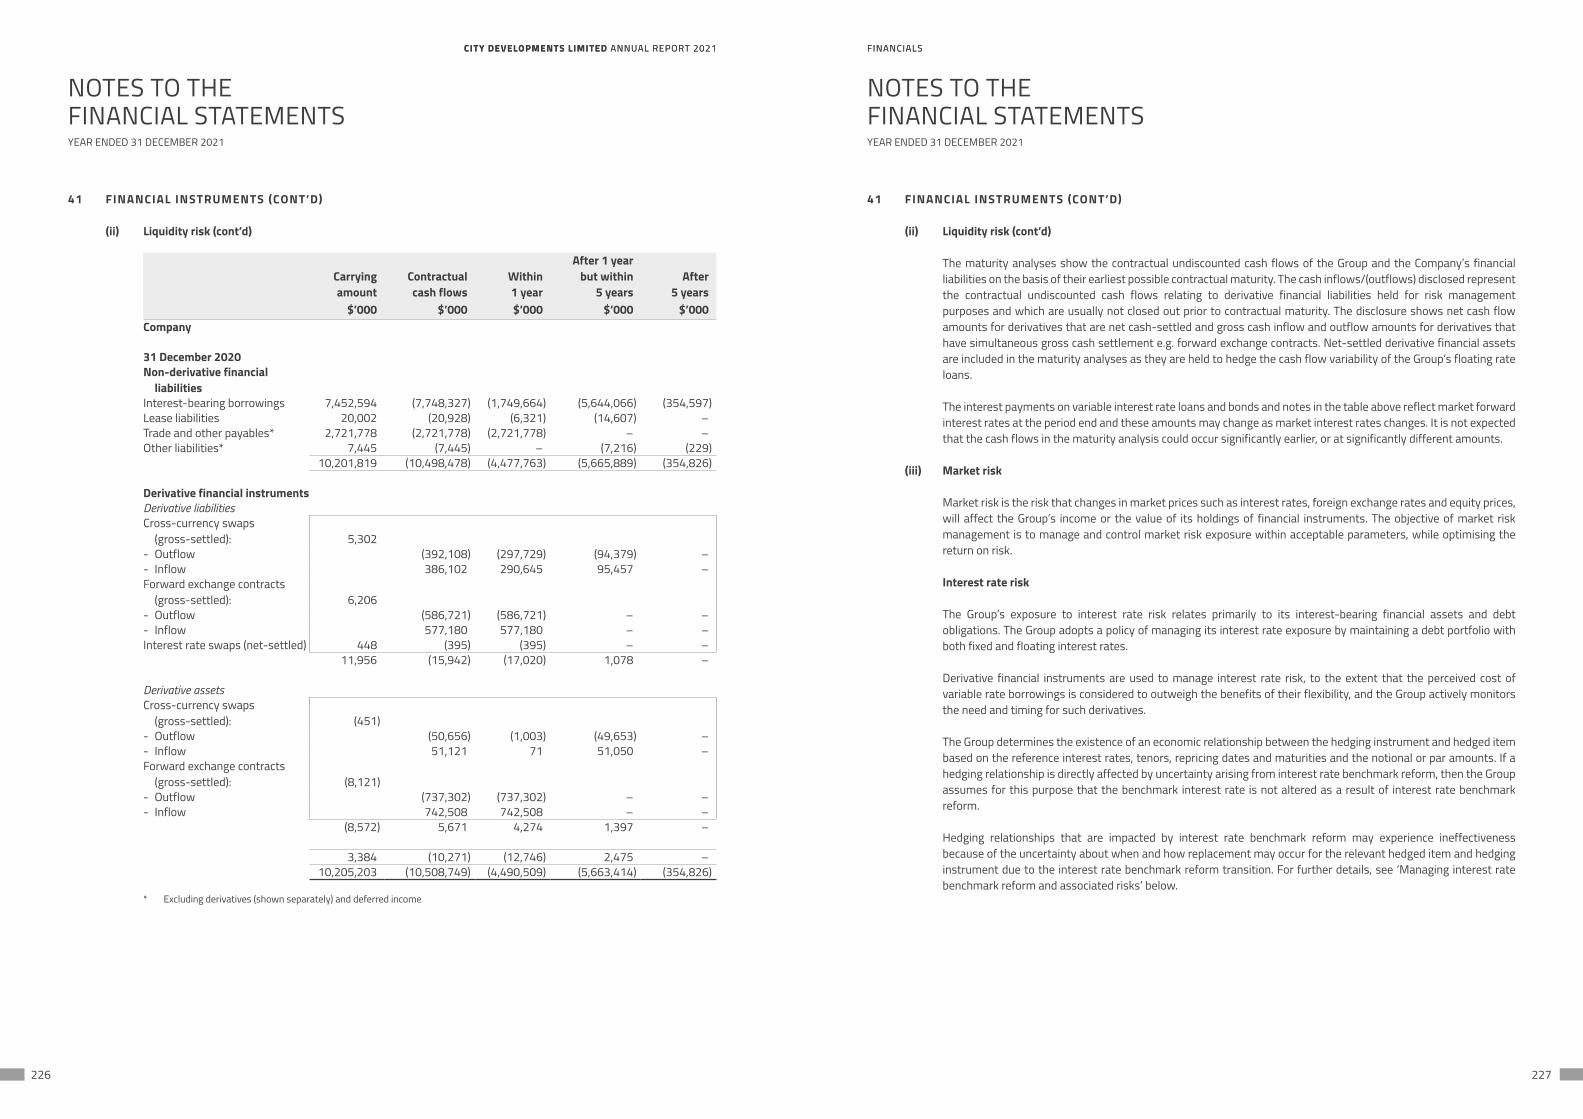
CITY DEVELOPMENTS LIMITED ANNUAL REPORT 2021 FINANCIALSCITY DEVELOPMENTS LIMITED ANNUAL REPORT 2021 FINANCIALS
226 227
NOTES TO THEFINANCIAL STATEMENTS
NOTES TO THEFINANCIAL STATEMENTS
YEAR ENDED 31 DECEMBER 2021 YEAR ENDED 31 DECEMBER 2021
41 FINANCIAL INSTRUMENTS (CONT’D)
(ii) Liquidity risk (cont’d)
Carryingamount
Contractualcash flows
Within1 year
After 1 year but within
5 yearsAfter
5 years$’000 $’000 $’000 $’000 $’000
Company
31 December 2020Non-derivative financial
liabilitiesInterest-bearing borrowings 7,452,594 (7,748,327) (1,749,664) (5,644,066) (354,597)Lease liabilities 20,002 (20,928) (6,321) (14,607) –Trade and other payables* 2,721,778 (2,721,778) (2,721,778) – –Other liabilities* 7,445 (7,445) – (7,216) (229)
10,201,819 (10,498,478) (4,477,763) (5,665,889) (354,826)
Derivative financial instrumentsDerivative liabilitiesCross-currency swaps
(gross-settled): 5,302- Outflow (392,108) (297,729) (94,379) –- Inflow 386,102 290,645 95,457 –Forward exchange contracts
(gross-settled): 6,206- Outflow (586,721) (586,721) – –- Inflow 577,180 577,180 – –Interest rate swaps (net-settled) 448 (395) (395) – –
11,956 (15,942) (17,020) 1,078 –
Derivative assetsCross-currency swaps
(gross-settled): (451)- Outflow (50,656) (1,003) (49,653) –- Inflow 51,121 71 51,050 –Forward exchange contracts
(gross-settled): (8,121)- Outflow (737,302) (737,302) – –- Inflow 742,508 742,508 – –
(8,572) 5,671 4,274 1,397 –
3,384 (10,271) (12,746) 2,475 –10,205,203 (10,508,749) (4,490,509) (5,663,414) (354,826)
* Excluding derivatives (shown separately) and deferred income
41 FINANCIAL INSTRUMENTS (CONT’D)
(ii) Liquidity risk (cont’d)
The maturity analyses show the contractual undiscounted cash flows of the Group and the Company’s financial liabilities on the basis of their earliest possible contractual maturity. The cash inflows/(outflows) disclosed represent the contractual undiscounted cash flows relating to derivative financial liabilities held for risk management purposes and which are usually not closed out prior to contractual maturity. The disclosure shows net cash flow amounts for derivatives that are net cash-settled and gross cash inflow and outflow amounts for derivatives that have simultaneous gross cash settlement e.g. forward exchange contracts. Net-settled derivative financial assets are included in the maturity analyses as they are held to hedge the cash flow variability of the Group’s floating rate loans.
The interest payments on variable interest rate loans and bonds and notes in the table above reflect market forward interest rates at the period end and these amounts may change as market interest rates changes. It is not expected that the cash flows in the maturity analysis could occur significantly earlier, or at significantly different amounts.
(iii) Market risk
Market risk is the risk that changes in market prices such as interest rates, foreign exchange rates and equity prices, will affect the Group’s income or the value of its holdings of financial instruments. The objective of market risk management is to manage and control market risk exposure within acceptable parameters, while optimising the return on risk.
Interest rate risk
The Group’s exposure to interest rate risk relates primarily to its interest-bearing financial assets and debt obligations. The Group adopts a policy of managing its interest rate exposure by maintaining a debt portfolio with both fixed and floating interest rates.
Derivative financial instruments are used to manage interest rate risk, to the extent that the perceived cost of variable rate borrowings is considered to outweigh the benefits of their flexibility, and the Group actively monitors the need and timing for such derivatives.
The Group determines the existence of an economic relationship between the hedging instrument and hedged item based on the reference interest rates, tenors, repricing dates and maturities and the notional or par amounts. If a hedging relationship is directly affected by uncertainty arising from interest rate benchmark reform, then the Group assumes for this purpose that the benchmark interest rate is not altered as a result of interest rate benchmark reform.
Hedging relationships that are impacted by interest rate benchmark reform may experience ineffectiveness because of the uncertainty about when and how replacement may occur for the relevant hedged item and hedging instrument due to the interest rate benchmark reform transition. For further details, see ‘Managing interest rate benchmark reform and associated risks’ below.
CITY DEVELOPMENTS LIMITED ANNUAL REPORT 2021 FINANCIALSCITY DEVELOPMENTS LIMITED ANNUAL REPORT 2021 FINANCIALS
228 229
NOTES TO THEFINANCIAL STATEMENTS
NOTES TO THEFINANCIAL STATEMENTS
YEAR ENDED 31 DECEMBER 2021 YEAR ENDED 31 DECEMBER 2021
41 FINANCIAL INSTRUMENTS (CONT’D)
(iii) Market risk (cont’d)
Interest rate risk (cont’d)
Managing interest rate benchmark reform and associated risks
Overview
A fundamental reform of major interest rate benchmarks is being undertaken globally, including the replacement of some interbank offered rates (IBORs) with alternative nearly risk-free rates (referred to as ‘interest rate benchmark reform’). The Group has exposures to IBORs on its financial instruments that will be replaced or reformed as part of these market-wide initiatives. The Group’s main IBOR exposure at 31 December 2021 was indexed to USD LIBOR and SGD SOR. These benchmark rates will lose representativeness or discontinue and be replaced with alternative interest rates benchmarks in US and Singapore with effect from 1 July 2023.
Management monitors and manages the Group’s transition to alternative rates. Management evaluates the extent to which contracts reference IBOR cash flows, whether such contracts will need to be amended as a result of interest rate benchmark reform and how to manage communication about interest rate benchmark reform with counterparties.
Non-derivative financial liabilities
The Group’s IBOR exposures to non-derivative financial liabilities as at 31 December 2021 were secured and unsecured borrowings indexed to USD LIBOR and SGD SOR. The Group is in the process of communicating with counterparties to progressively transition non-derivative financial liabilities which are indexed to the affected interest rate benchmarks to alternative risk-free rates.
Derivatives
The Group holds interest rate swaps and cross currency swaps for risk management purposes. The interest rate swap and cross currency swaps have floating legs that are indexed to USD LIBOR and SGD SOR. The Group’s derivative instruments are governed by contracts based on the International Swaps and Derivatives Association (ISDA)’s master agreements. The Group is in the process of communicating with counterparties to progressively transition derivative instruments which are indexed to the affected interest rate benchmarks to alternative risk-free rates.
Hedge accounting
The Group has evaluated the extent to which its cash flow hedging relationships are subject to uncertainty driven by interest rate benchmark reform as at 31 December 2021. The Group’s hedged items and hedging instruments continue to be indexed to IBOR benchmark rates which are USD LIBOR. These benchmark rates are quoted each day and the IBOR cash flows are exchanged with its counterparties as usual.
41 FINANCIAL INSTRUMENTS (CONT’D)
(iii) Market risk (cont’d)
Interest rate risk (cont’d)
Managing interest rate benchmark reform and associated risks (cont’d)
Hedge accounting (cont’d)
The Group’s USD LIBOR cash flow hedging relationships extend beyond the anticipated cessation dates of the respective rates. The Group continues to apply the amendments to SFRS(I) 9 issued in December 2020 (Phase 1) to those hedging relationships directly affected by interest rate benchmark reform. The Group is in the process of communicating with counterparties on all indexed exposures and the relevant hedging instruments and hedged items have not been amended to transition from USD LIBOR.
Hedging relationships impacted by interest rate benchmark reform may experience ineffectiveness attributable to market participants’ expectations of when and how the shift from the existing IBOR benchmark rate to an alternative benchmark interest rate will occur for the relevant hedged items and hedging instruments. This transition may also occur at different times for the hedged item and hedging instrument, which may lead to hedge ineffectiveness. The Group has measured its hedging instruments indexed to USD LIBOR using available quoted market rates for USD LIBOR-based instruments of the same tenor and similar maturity and has measured the cumulative change in the present value of hedged cash flows attributable to changes in USD LIBOR on a similar basis.
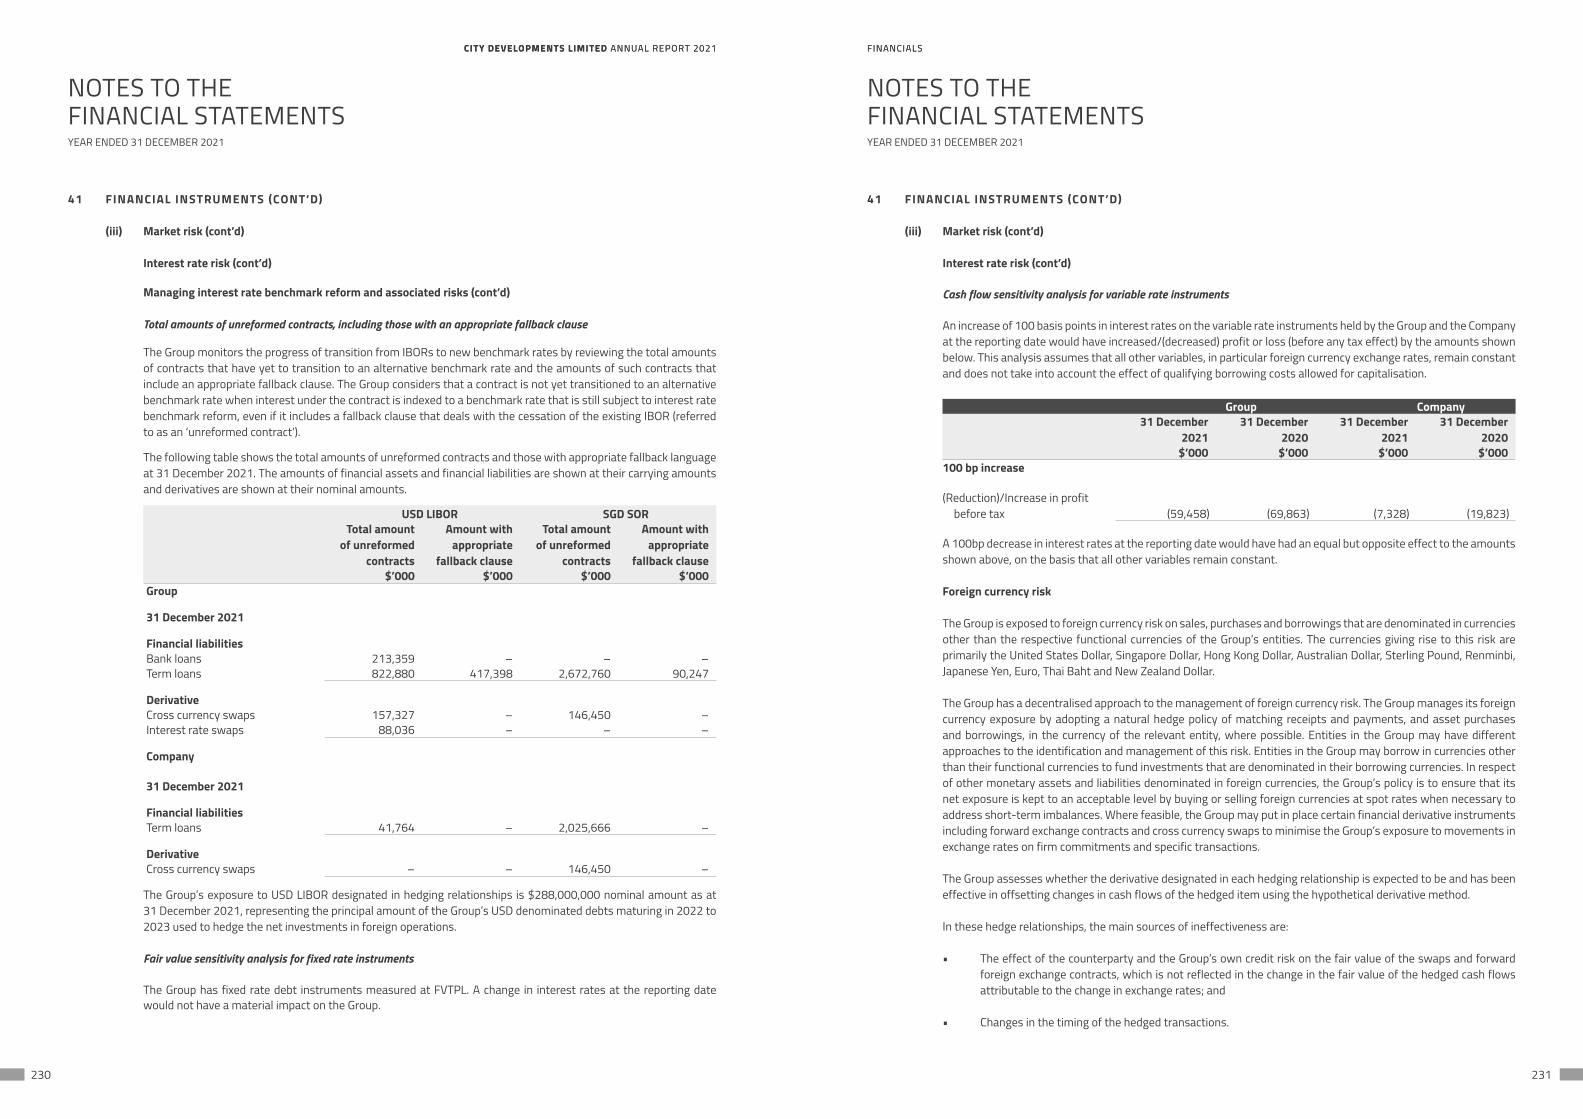
CITY DEVELOPMENTS LIMITED ANNUAL REPORT 2021 FINANCIALSCITY DEVELOPMENTS LIMITED ANNUAL REPORT 2021 FINANCIALS
230 231
NOTES TO THEFINANCIAL STATEMENTS
NOTES TO THEFINANCIAL STATEMENTS
YEAR ENDED 31 DECEMBER 2021 YEAR ENDED 31 DECEMBER 2021
41 FINANCIAL INSTRUMENTS (CONT’D)
(iii) Market risk (cont’d)
Interest rate risk (cont’d)
Managing interest rate benchmark reform and associated risks (cont’d)
Total amounts of unreformed contracts, including those with an appropriate fallback clause
The Group monitors the progress of transition from IBORs to new benchmark rates by reviewing the total amounts of contracts that have yet to transition to an alternative benchmark rate and the amounts of such contracts that include an appropriate fallback clause. The Group considers that a contract is not yet transitioned to an alternative benchmark rate when interest under the contract is indexed to a benchmark rate that is still subject to interest rate benchmark reform, even if it includes a fallback clause that deals with the cessation of the existing IBOR (referred to as an ‘unreformed contract’).
The following table shows the total amounts of unreformed contracts and those with appropriate fallback language at 31 December 2021. The amounts of financial assets and financial liabilities are shown at their carrying amounts and derivatives are shown at their nominal amounts.
USD LIBOR SGD SORTotal amount
of unreformed contracts
Amount with appropriate
fallback clause
Total amount of unreformed
contracts
Amount with appropriate
fallback clause$’000 $’000 $’000 $’000
Group
31 December 2021
Financial liabilitiesBank loans 213,359 – – –Term loans 822,880 417,398 2,672,760 90,247
DerivativeCross currency swaps 157,327 – 146,450 –Interest rate swaps 88,036 – – –
Company
31 December 2021
Financial liabilitiesTerm loans 41,764 – 2,025,666 –
DerivativeCross currency swaps – – 146,450 –
The Group’s exposure to USD LIBOR designated in hedging relationships is $288,000,000 nominal amount as at 31 December 2021, representing the principal amount of the Group’s USD denominated debts maturing in 2022 to 2023 used to hedge the net investments in foreign operations.
Fair value sensitivity analysis for fixed rate instruments
The Group has fixed rate debt instruments measured at FVTPL. A change in interest rates at the reporting date would not have a material impact on the Group.
41 FINANCIAL INSTRUMENTS (CONT’D)
(iii) Market risk (cont’d)
Interest rate risk (cont’d)
Cash flow sensitivity analysis for variable rate instruments
An increase of 100 basis points in interest rates on the variable rate instruments held by the Group and the Company at the reporting date would have increased/(decreased) profit or loss (before any tax effect) by the amounts shown below. This analysis assumes that all other variables, in particular foreign currency exchange rates, remain constant and does not take into account the effect of qualifying borrowing costs allowed for capitalisation.
Group Company31 December
202131 December
202031 December
202131 December
2020$’000 $’000 $’000 $’000
100 bp increase
(Reduction)/Increase in profit before tax (59,458) (69,863) (7,328) (19,823)
A 100bp decrease in interest rates at the reporting date would have had an equal but opposite effect to the amounts shown above, on the basis that all other variables remain constant.
Foreign currency risk
The Group is exposed to foreign currency risk on sales, purchases and borrowings that are denominated in currencies other than the respective functional currencies of the Group’s entities. The currencies giving rise to this risk are primarily the United States Dollar, Singapore Dollar, Hong Kong Dollar, Australian Dollar, Sterling Pound, Renminbi, Japanese Yen, Euro, Thai Baht and New Zealand Dollar.
The Group has a decentralised approach to the management of foreign currency risk. The Group manages its foreign currency exposure by adopting a natural hedge policy of matching receipts and payments, and asset purchases and borrowings, in the currency of the relevant entity, where possible. Entities in the Group may have different approaches to the identification and management of this risk. Entities in the Group may borrow in currencies other than their functional currencies to fund investments that are denominated in their borrowing currencies. In respect of other monetary assets and liabilities denominated in foreign currencies, the Group’s policy is to ensure that its net exposure is kept to an acceptable level by buying or selling foreign currencies at spot rates when necessary to address short-term imbalances. Where feasible, the Group may put in place certain financial derivative instruments including forward exchange contracts and cross currency swaps to minimise the Group’s exposure to movements in exchange rates on firm commitments and specific transactions.
The Group assesses whether the derivative designated in each hedging relationship is expected to be and has been effective in offsetting changes in cash flows of the hedged item using the hypothetical derivative method.
In these hedge relationships, the main sources of ineffectiveness are:
• The effect of the counterparty and the Group’s own credit risk on the fair value of the swaps and forward foreign exchange contracts, which is not reflected in the change in the fair value of the hedged cash flows attributable to the change in exchange rates; and
• Changes in the timing of the hedged transactions.
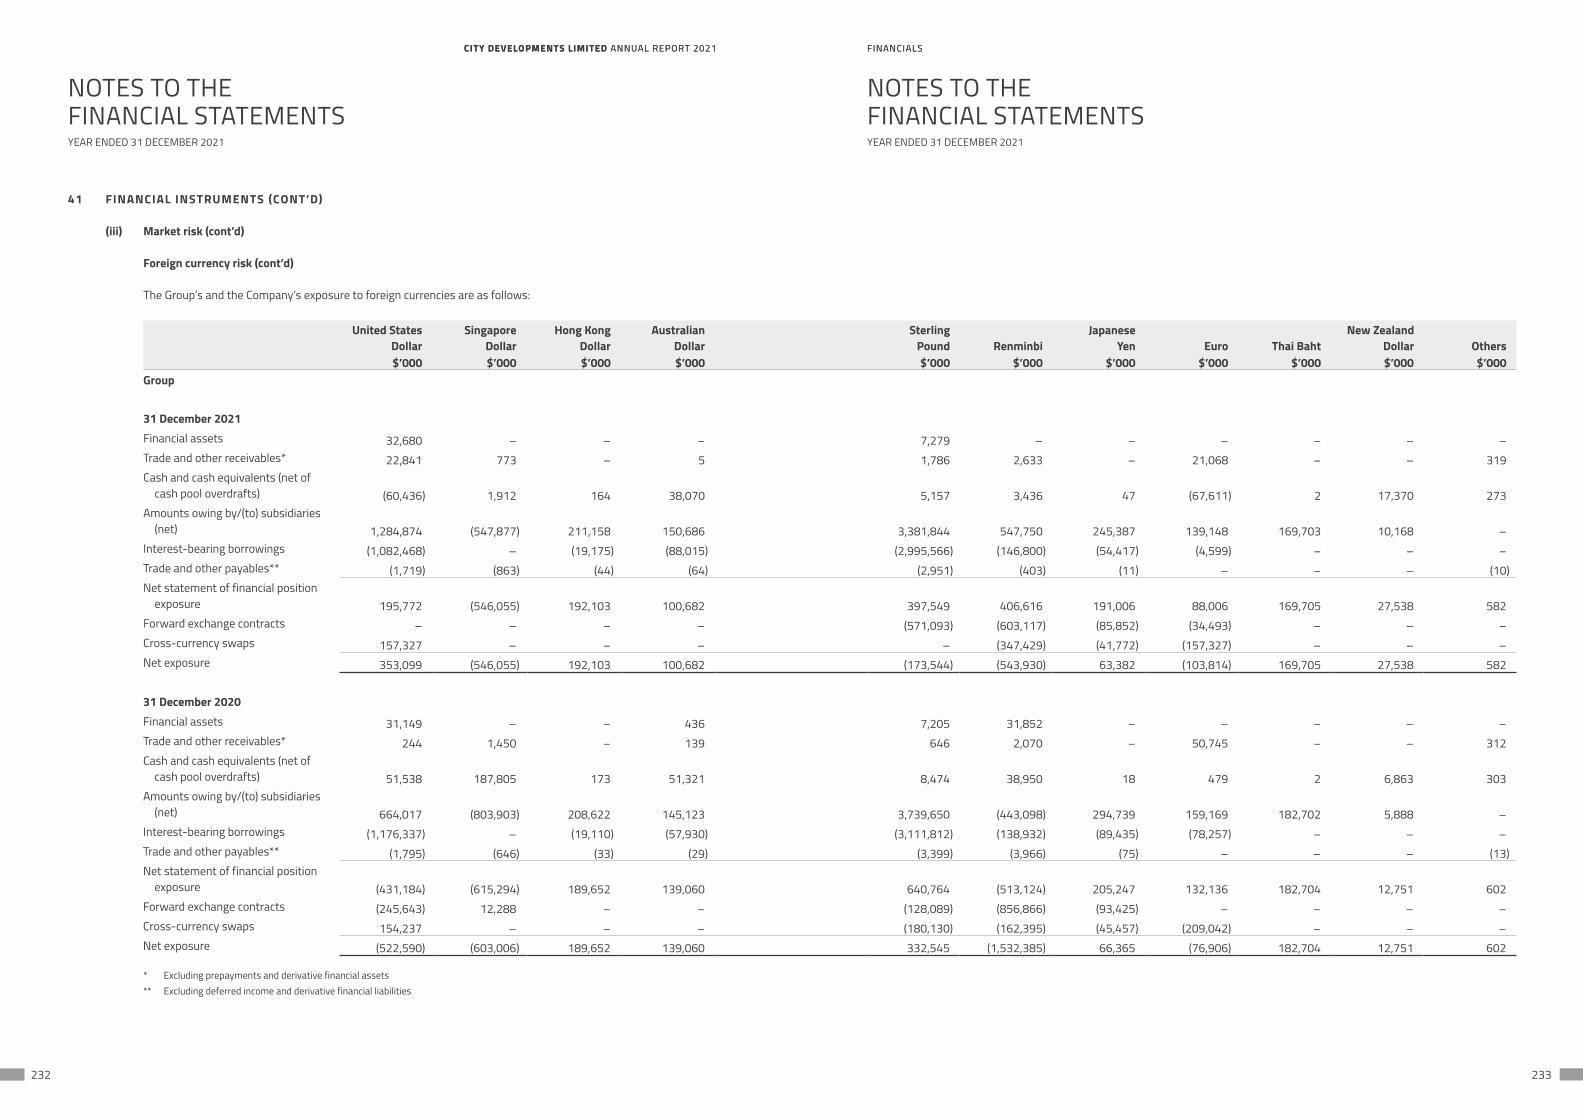
CITY DEVELOPMENTS LIMITED ANNUAL REPORT 2021 FINANCIALSCITY DEVELOPMENTS LIMITED ANNUAL REPORT 2021 FINANCIALS
232 233
NOTES TO THEFINANCIAL STATEMENTS
NOTES TO THEFINANCIAL STATEMENTS
YEAR ENDED 31 DECEMBER 2021 YEAR ENDED 31 DECEMBER 2021
41 FINANCIAL INSTRUMENTS (CONT’D)
(iii) Market risk (cont’d)
Foreign currency risk (cont’d)
The Group’s and the Company’s exposure to foreign currencies are as follows:
United StatesDollar
SingaporeDollar
Hong Kong Dollar
AustralianDollar
SterlingPound Renminbi
JapaneseYen Euro Thai Baht
New Zealand Dollar Others
$’000 $’000 $’000 $’000 $’000 $’000 $’000 $’000 $’000 $’000 $’000Group
31 December 2021Financial assets 32,680 – – – 7,279 – – – – – –Trade and other receivables* 22,841 773 – 5 1,786 2,633 – 21,068 – – 319Cash and cash equivalents (net of
cash pool overdrafts) (60,436) 1,912 164 38,070 5,157 3,436 47 (67,611) 2 17,370 273Amounts owing by/(to) subsidiaries
(net) 1,284,874 (547,877) 211,158 150,686 3,381,844 547,750 245,387 139,148 169,703 10,168 –Interest-bearing borrowings (1,082,468) – (19,175) (88,015) (2,995,566) (146,800) (54,417) (4,599) – – –Trade and other payables** (1,719) (863) (44) (64) (2,951) (403) (11) – – – (10)Net statement of financial position
exposure 195,772 (546,055) 192,103 100,682 397,549 406,616 191,006 88,006 169,705 27,538 582Forward exchange contracts – – – – (571,093) (603,117) (85,852) (34,493) – – –Cross-currency swaps 157,327 – – – – (347,429) (41,772) (157,327) – – –Net exposure 353,099 (546,055) 192,103 100,682 (173,544) (543,930) 63,382 (103,814) 169,705 27,538 582
31 December 2020 Financial assets 31,149 – – 436 7,205 31,852 – – – – –Trade and other receivables* 244 1,450 – 139 646 2,070 – 50,745 – – 312Cash and cash equivalents (net of
cash pool overdrafts) 51,538 187,805 173 51,321 8,474 38,950 18 479 2 6,863 303Amounts owing by/(to) subsidiaries
(net) 664,017 (803,903) 208,622 145,123 3,739,650 (443,098) 294,739 159,169 182,702 5,888 –Interest-bearing borrowings (1,176,337) – (19,110) (57,930) (3,111,812) (138,932) (89,435) (78,257) – – –Trade and other payables** (1,795) (646) (33) (29) (3,399) (3,966) (75) – – – (13)Net statement of financial position
exposure (431,184) (615,294) 189,652 139,060 640,764 (513,124) 205,247 132,136 182,704 12,751 602Forward exchange contracts (245,643) 12,288 – – (128,089) (856,866) (93,425) – – – –Cross-currency swaps 154,237 – – – (180,130) (162,395) (45,457) (209,042) – – –Net exposure (522,590) (603,006) 189,652 139,060 332,545 (1,532,385) 66,365 (76,906) 182,704 12,751 602
* Excluding prepayments and derivative financial assets** Excluding deferred income and derivative financial liabilities
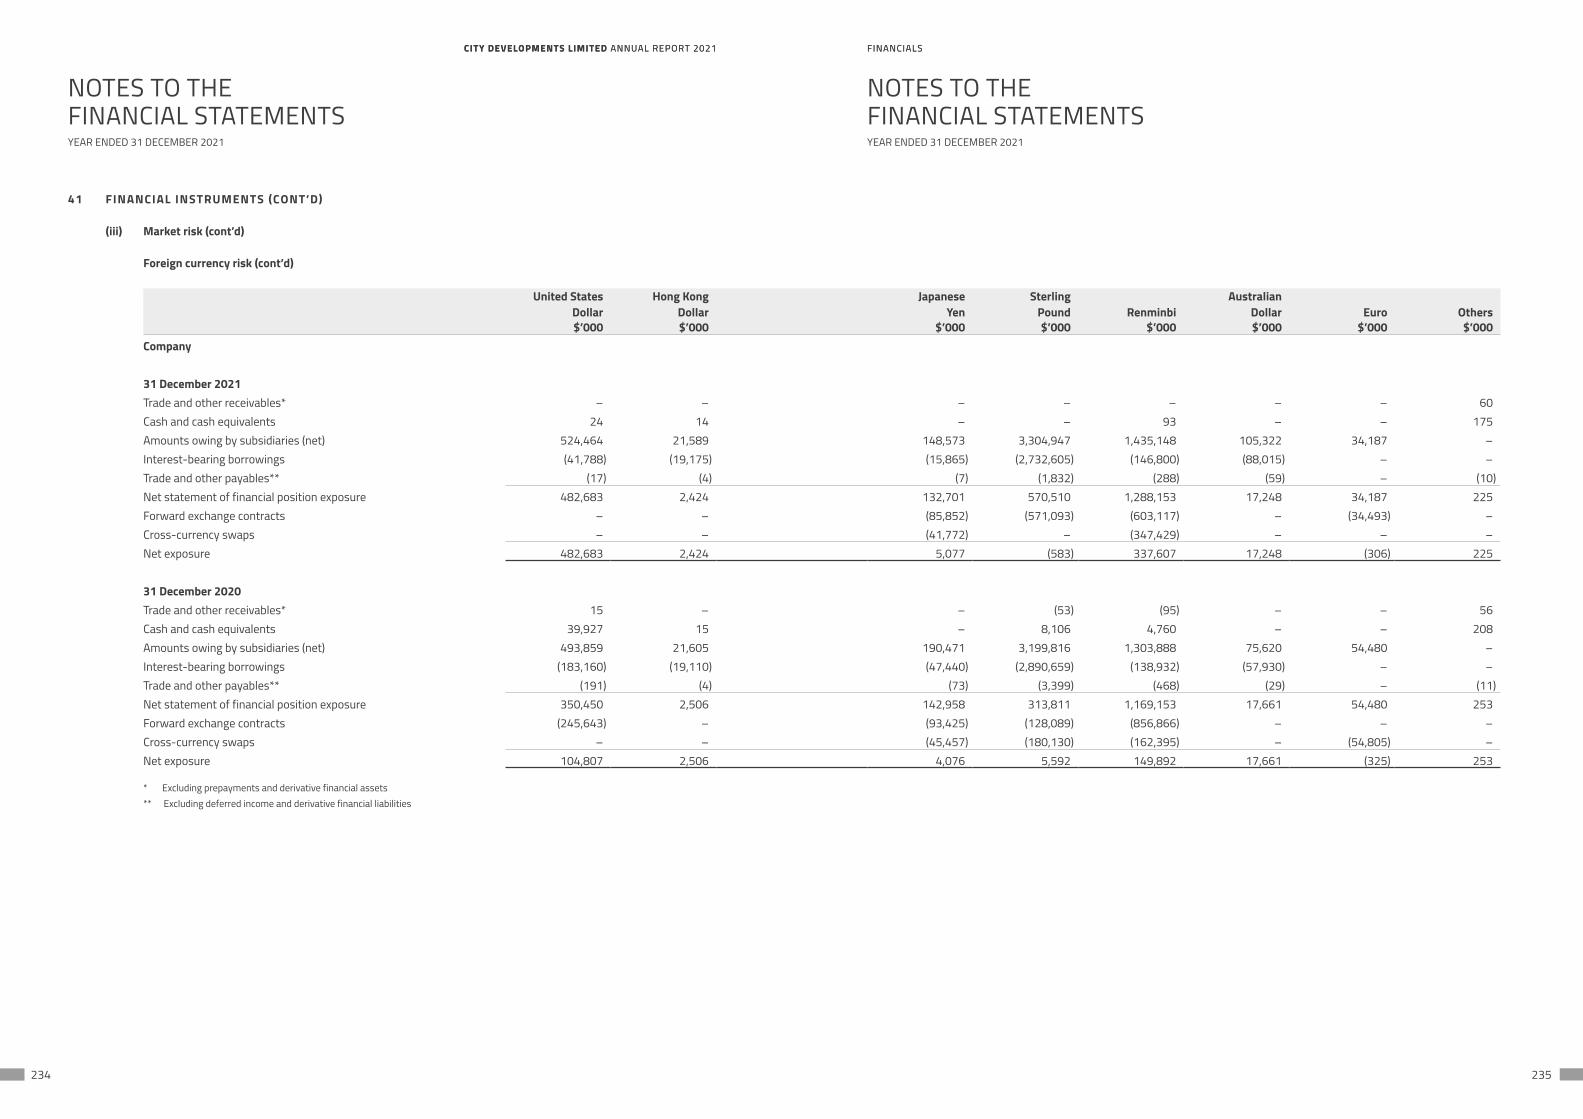
CITY DEVELOPMENTS LIMITED ANNUAL REPORT 2021 FINANCIALSCITY DEVELOPMENTS LIMITED ANNUAL REPORT 2021 FINANCIALS
234 235
NOTES TO THEFINANCIAL STATEMENTS
NOTES TO THEFINANCIAL STATEMENTS
YEAR ENDED 31 DECEMBER 2021 YEAR ENDED 31 DECEMBER 2021
41 FINANCIAL INSTRUMENTS (CONT’D)
(iii) Market risk (cont’d)
Foreign currency risk (cont’d)
United States Dollar
Hong Kong Dollar
Japanese Yen
Sterling Pound Renminbi
Australian Dollar Euro Others
$’000 $’000 $’000 $’000 $’000 $’000 $’000 $’000Company
31 December 2021Trade and other receivables* – – – – – – – 60Cash and cash equivalents 24 14 – – 93 – – 175Amounts owing by subsidiaries (net) 524,464 21,589 148,573 3,304,947 1,435,148 105,322 34,187 –Interest-bearing borrowings (41,788) (19,175) (15,865) (2,732,605) (146,800) (88,015) – –Trade and other payables** (17) (4) (7) (1,832) (288) (59) – (10)Net statement of financial position exposure 482,683 2,424 132,701 570,510 1,288,153 17,248 34,187 225Forward exchange contracts – – (85,852) (571,093) (603,117) – (34,493) –Cross-currency swaps – – (41,772) – (347,429) – – –Net exposure 482,683 2,424 5,077 (583) 337,607 17,248 (306) 225
31 December 2020Trade and other receivables* 15 – – (53) (95) – – 56Cash and cash equivalents 39,927 15 – 8,106 4,760 – – 208Amounts owing by subsidiaries (net) 493,859 21,605 190,471 3,199,816 1,303,888 75,620 54,480 –Interest-bearing borrowings (183,160) (19,110) (47,440) (2,890,659) (138,932) (57,930) – –Trade and other payables** (191) (4) (73) (3,399) (468) (29) – (11)Net statement of financial position exposure 350,450 2,506 142,958 313,811 1,169,153 17,661 54,480 253Forward exchange contracts (245,643) – (93,425) (128,089) (856,866) – – –Cross-currency swaps – – (45,457) (180,130) (162,395) – (54,805) –Net exposure 104,807 2,506 4,076 5,592 149,892 17,661 (325) 253
* Excluding prepayments and derivative financial assets** Excluding deferred income and derivative financial liabilities
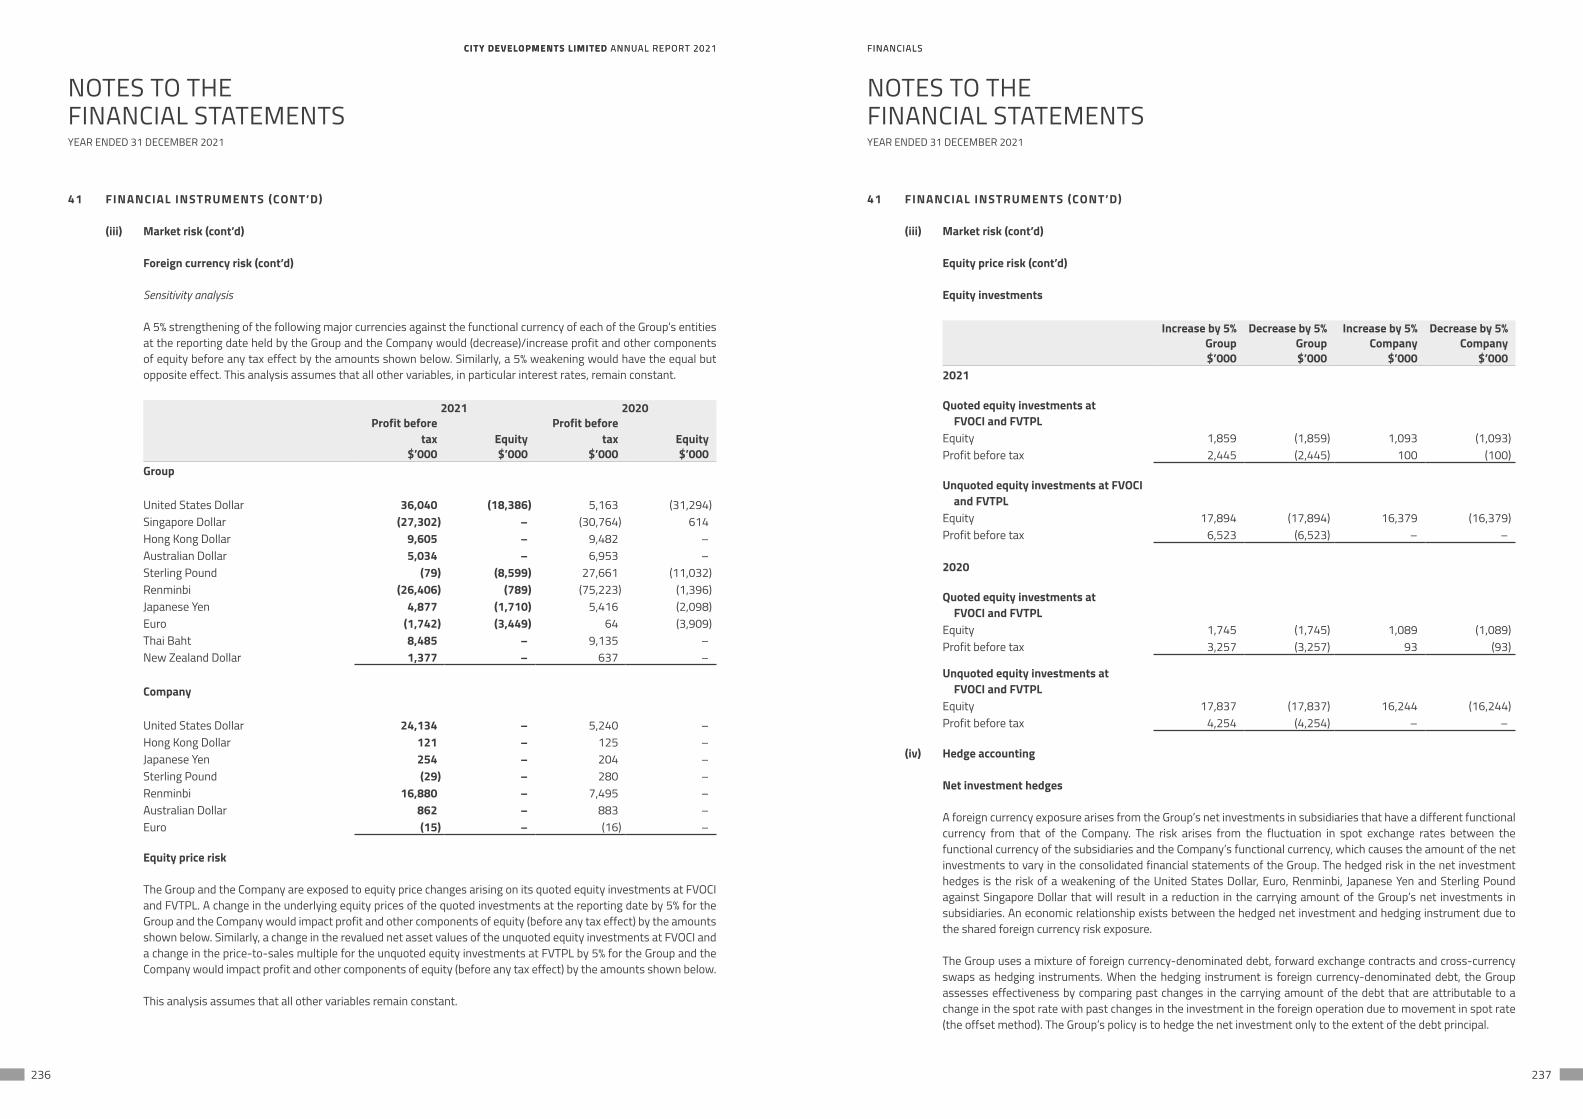
CITY DEVELOPMENTS LIMITED ANNUAL REPORT 2021 FINANCIALSCITY DEVELOPMENTS LIMITED ANNUAL REPORT 2021 FINANCIALS
236 237
NOTES TO THEFINANCIAL STATEMENTS
NOTES TO THEFINANCIAL STATEMENTS
YEAR ENDED 31 DECEMBER 2021 YEAR ENDED 31 DECEMBER 2021
41 FINANCIAL INSTRUMENTS (CONT’D)
(iii) Market risk (cont’d)
Foreign currency risk (cont’d)
Sensitivity analysis
A 5% strengthening of the following major currencies against the functional currency of each of the Group’s entities at the reporting date held by the Group and the Company would (decrease)/increase profit and other components of equity before any tax effect by the amounts shown below. Similarly, a 5% weakening would have the equal but opposite effect. This analysis assumes that all other variables, in particular interest rates, remain constant.
2021 2020Profit before
tax EquityProfit before
tax Equity$’000 $’000 $’000 $’000
Group
United States Dollar 36,040 (18,386) 5,163 (31,294)Singapore Dollar (27,302) – (30,764) 614Hong Kong Dollar 9,605 – 9,482 –Australian Dollar 5,034 – 6,953 –Sterling Pound (79) (8,599) 27,661 (11,032)Renminbi (26,406) (789) (75,223) (1,396)Japanese Yen 4,877 (1,710) 5,416 (2,098)Euro (1,742) (3,449) 64 (3,909)Thai Baht 8,485 – 9,135 –New Zealand Dollar 1,377 – 637 –
Company
United States Dollar 24,134 – 5,240 –Hong Kong Dollar 121 – 125 –Japanese Yen 254 – 204 –Sterling Pound (29) – 280 –Renminbi 16,880 – 7,495 –Australian Dollar 862 – 883 –Euro (15) – (16) –
Equity price risk
The Group and the Company are exposed to equity price changes arising on its quoted equity investments at FVOCI and FVTPL. A change in the underlying equity prices of the quoted investments at the reporting date by 5% for the Group and the Company would impact profit and other components of equity (before any tax effect) by the amounts shown below. Similarly, a change in the revalued net asset values of the unquoted equity investments at FVOCI and a change in the price-to-sales multiple for the unquoted equity investments at FVTPL by 5% for the Group and the Company would impact profit and other components of equity (before any tax effect) by the amounts shown below.
This analysis assumes that all other variables remain constant.
41 FINANCIAL INSTRUMENTS (CONT’D)
(iii) Market risk (cont’d)
Equity price risk (cont’d)
Equity investments
Increase by 5% Decrease by 5% Increase by 5% Decrease by 5%Group Group Company Company$’000 $’000 $’000 $’000
2021
Quoted equity investments at FVOCI and FVTPL
Equity 1,859 (1,859) 1,093 (1,093)Profit before tax 2,445 (2,445) 100 (100)
Unquoted equity investments at FVOCI and FVTPL
Equity 17,894 (17,894) 16,379 (16,379)Profit before tax 6,523 (6,523) – –
2020
Quoted equity investments at FVOCI and FVTPL
Equity 1,745 (1,745) 1,089 (1,089)Profit before tax 3,257 (3,257) 93 (93)
Unquoted equity investments at FVOCI and FVTPL
Equity 17,837 (17,837) 16,244 (16,244)Profit before tax 4,254 (4,254) – –
(iv) Hedge accounting
Net investment hedges
A foreign currency exposure arises from the Group’s net investments in subsidiaries that have a different functional currency from that of the Company. The risk arises from the fluctuation in spot exchange rates between the functional currency of the subsidiaries and the Company’s functional currency, which causes the amount of the net investments to vary in the consolidated financial statements of the Group. The hedged risk in the net investment hedges is the risk of a weakening of the United States Dollar, Euro, Renminbi, Japanese Yen and Sterling Pound against Singapore Dollar that will result in a reduction in the carrying amount of the Group’s net investments in subsidiaries. An economic relationship exists between the hedged net investment and hedging instrument due to the shared foreign currency risk exposure.
The Group uses a mixture of foreign currency-denominated debt, forward exchange contracts and cross-currency swaps as hedging instruments. When the hedging instrument is foreign currency-denominated debt, the Group assesses effectiveness by comparing past changes in the carrying amount of the debt that are attributable to a change in the spot rate with past changes in the investment in the foreign operation due to movement in spot rate (the offset method). The Group’s policy is to hedge the net investment only to the extent of the debt principal.
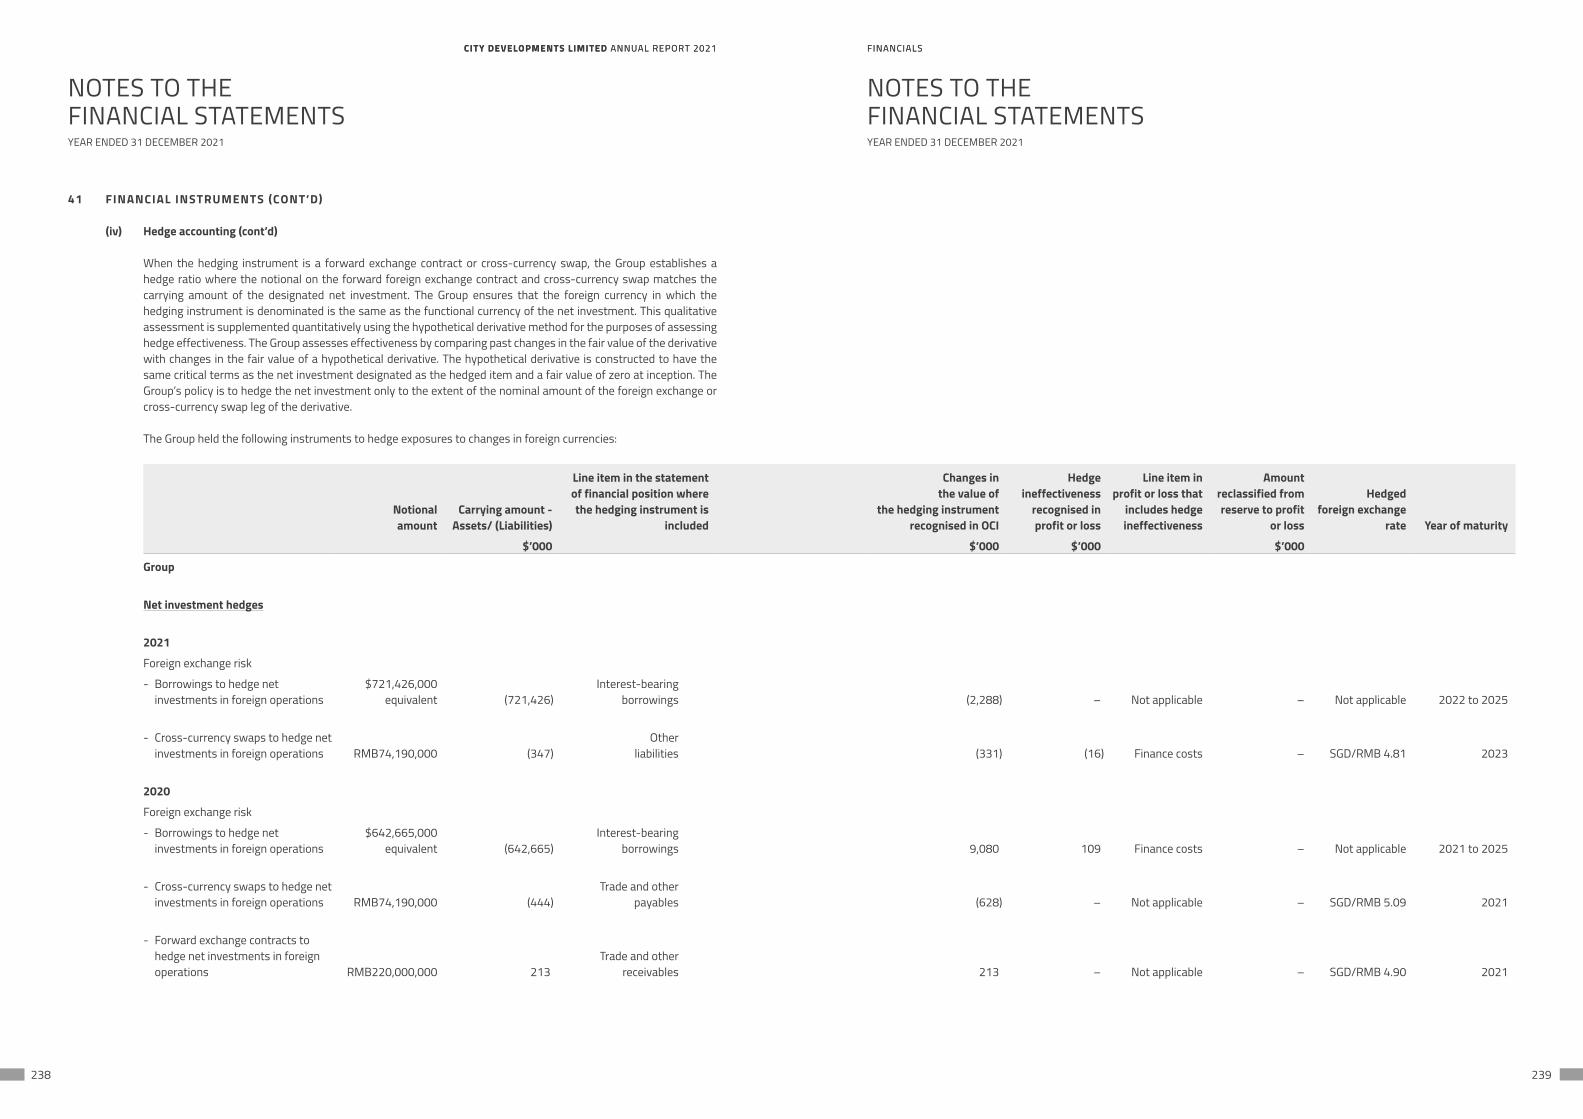
CITY DEVELOPMENTS LIMITED ANNUAL REPORT 2021 FINANCIALSCITY DEVELOPMENTS LIMITED ANNUAL REPORT 2021 FINANCIALS
238 239
NOTES TO THEFINANCIAL STATEMENTS
NOTES TO THEFINANCIAL STATEMENTS
YEAR ENDED 31 DECEMBER 2021 YEAR ENDED 31 DECEMBER 2021
41 FINANCIAL INSTRUMENTS (CONT’D)
(iv) Hedge accounting (cont’d)
When the hedging instrument is a forward exchange contract or cross-currency swap, the Group establishes a hedge ratio where the notional on the forward foreign exchange contract and cross-currency swap matches the carrying amount of the designated net investment. The Group ensures that the foreign currency in which the hedging instrument is denominated is the same as the functional currency of the net investment. This qualitative assessment is supplemented quantitatively using the hypothetical derivative method for the purposes of assessing hedge effectiveness. The Group assesses effectiveness by comparing past changes in the fair value of the derivative with changes in the fair value of a hypothetical derivative. The hypothetical derivative is constructed to have the same critical terms as the net investment designated as the hedged item and a fair value of zero at inception. The Group’s policy is to hedge the net investment only to the extent of the nominal amount of the foreign exchange or cross-currency swap leg of the derivative.
The Group held the following instruments to hedge exposures to changes in foreign currencies:
Notional amount
Carrying amount - Assets/ (Liabilities)
Line item in the statement of financial position where the hedging instrument is
included
Changes in the value of
the hedging instrument recognised in OCI
Hedge ineffectiveness
recognised in profit or loss
Line item in profit or loss that
includes hedge ineffectiveness
Amount reclassified from reserve to profit
or loss
Hedged foreign exchange
rate Year of maturity
$’000 $’000 $’000 $’000
Group
Net investment hedges
2021
Foreign exchange risk
- Borrowings to hedge net investments in foreign operations
$721,426,000 equivalent (721,426)
Interest-bearing borrowings (2,288) – Not applicable – Not applicable 2022 to 2025
- Cross-currency swaps to hedge net investments in foreign operations RMB74,190,000 (347)
Otherliabilities (331) (16) Finance costs – SGD/RMB 4.81 2023
2020
Foreign exchange risk
- Borrowings to hedge net investments in foreign operations
$642,665,000equivalent (642,665)
Interest-bearing borrowings 9,080 109 Finance costs – Not applicable 2021 to 2025
- Cross-currency swaps to hedge net investments in foreign operations RMB74,190,000 (444)
Trade and other payables (628) – Not applicable – SGD/RMB 5.09 2021
- Forward exchange contracts to hedge net investments in foreign operations RMB220,000,000 213
Trade and otherreceivables 213 – Not applicable – SGD/RMB 4.90 2021
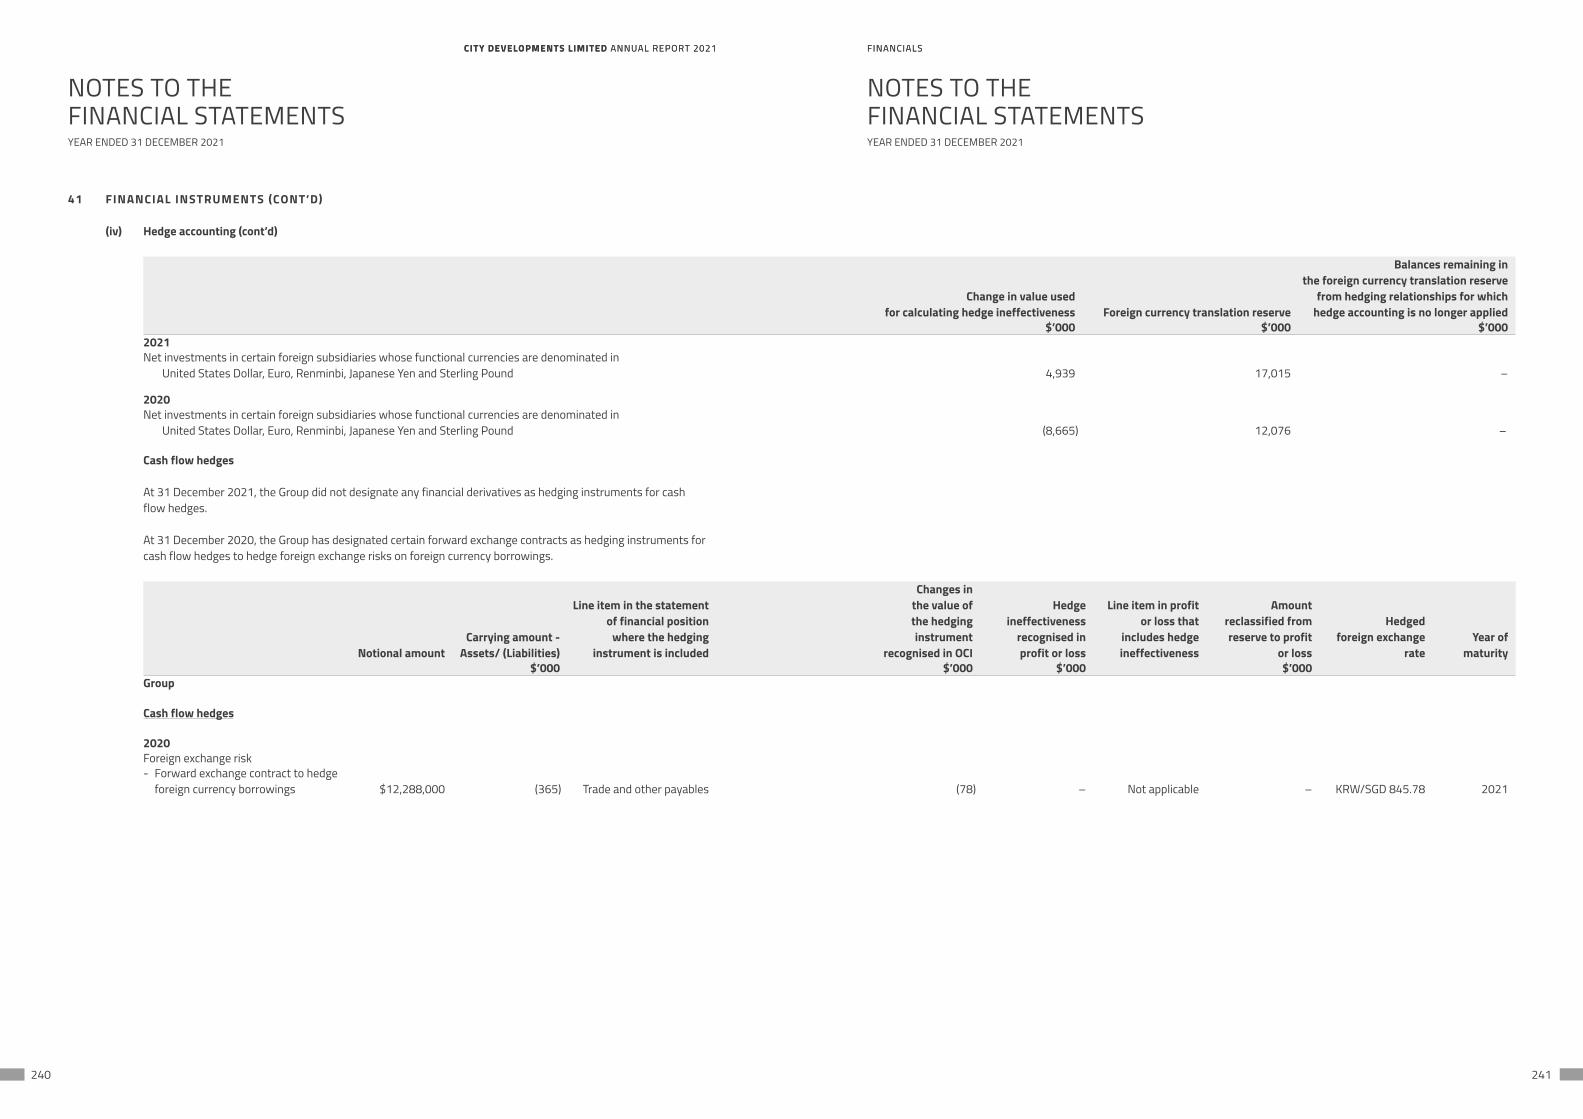
CITY DEVELOPMENTS LIMITED ANNUAL REPORT 2021 FINANCIALSCITY DEVELOPMENTS LIMITED ANNUAL REPORT 2021 FINANCIALS
240 241
NOTES TO THEFINANCIAL STATEMENTS
NOTES TO THEFINANCIAL STATEMENTS
YEAR ENDED 31 DECEMBER 2021 YEAR ENDED 31 DECEMBER 2021
41 FINANCIAL INSTRUMENTS (CONT’D)
(iv) Hedge accounting (cont’d)
Change in value used
for calculating hedge ineffectiveness Foreign currency translation reserve
Balances remaining in the foreign currency translation reserve
from hedging relationships for which hedge accounting is no longer applied
$’000 $’000 $’0002021Net investments in certain foreign subsidiaries whose functional currencies are denominated in
United States Dollar, Euro, Renminbi, Japanese Yen and Sterling Pound 4,939 17,015 –
2020Net investments in certain foreign subsidiaries whose functional currencies are denominated in
United States Dollar, Euro, Renminbi, Japanese Yen and Sterling Pound (8,665) 12,076 –
Cash flow hedges
At 31 December 2021, the Group did not designate any financial derivatives as hedging instruments for cash flow hedges.
At 31 December 2020, the Group has designated certain forward exchange contracts as hedging instruments for cash flow hedges to hedge foreign exchange risks on foreign currency borrowings.
Notional amountCarrying amount -
Assets/ (Liabilities)
Line item in the statement of financial position
where the hedging instrument is included
Changes in the value of the hedging instrument
recognised in OCI
Hedge ineffectiveness
recognised in profit or loss
Line item in profit or loss that
includes hedge ineffectiveness
Amount reclassified from reserve to profit
or loss
Hedged foreign exchange
rateYear of
maturity $’000 $’000 $’000 $’000
Group
Cash flow hedges
2020Foreign exchange risk- Forward exchange contract to hedge
foreign currency borrowings $12,288,000 (365) Trade and other payables (78) – Not applicable – KRW/SGD 845.78 2021
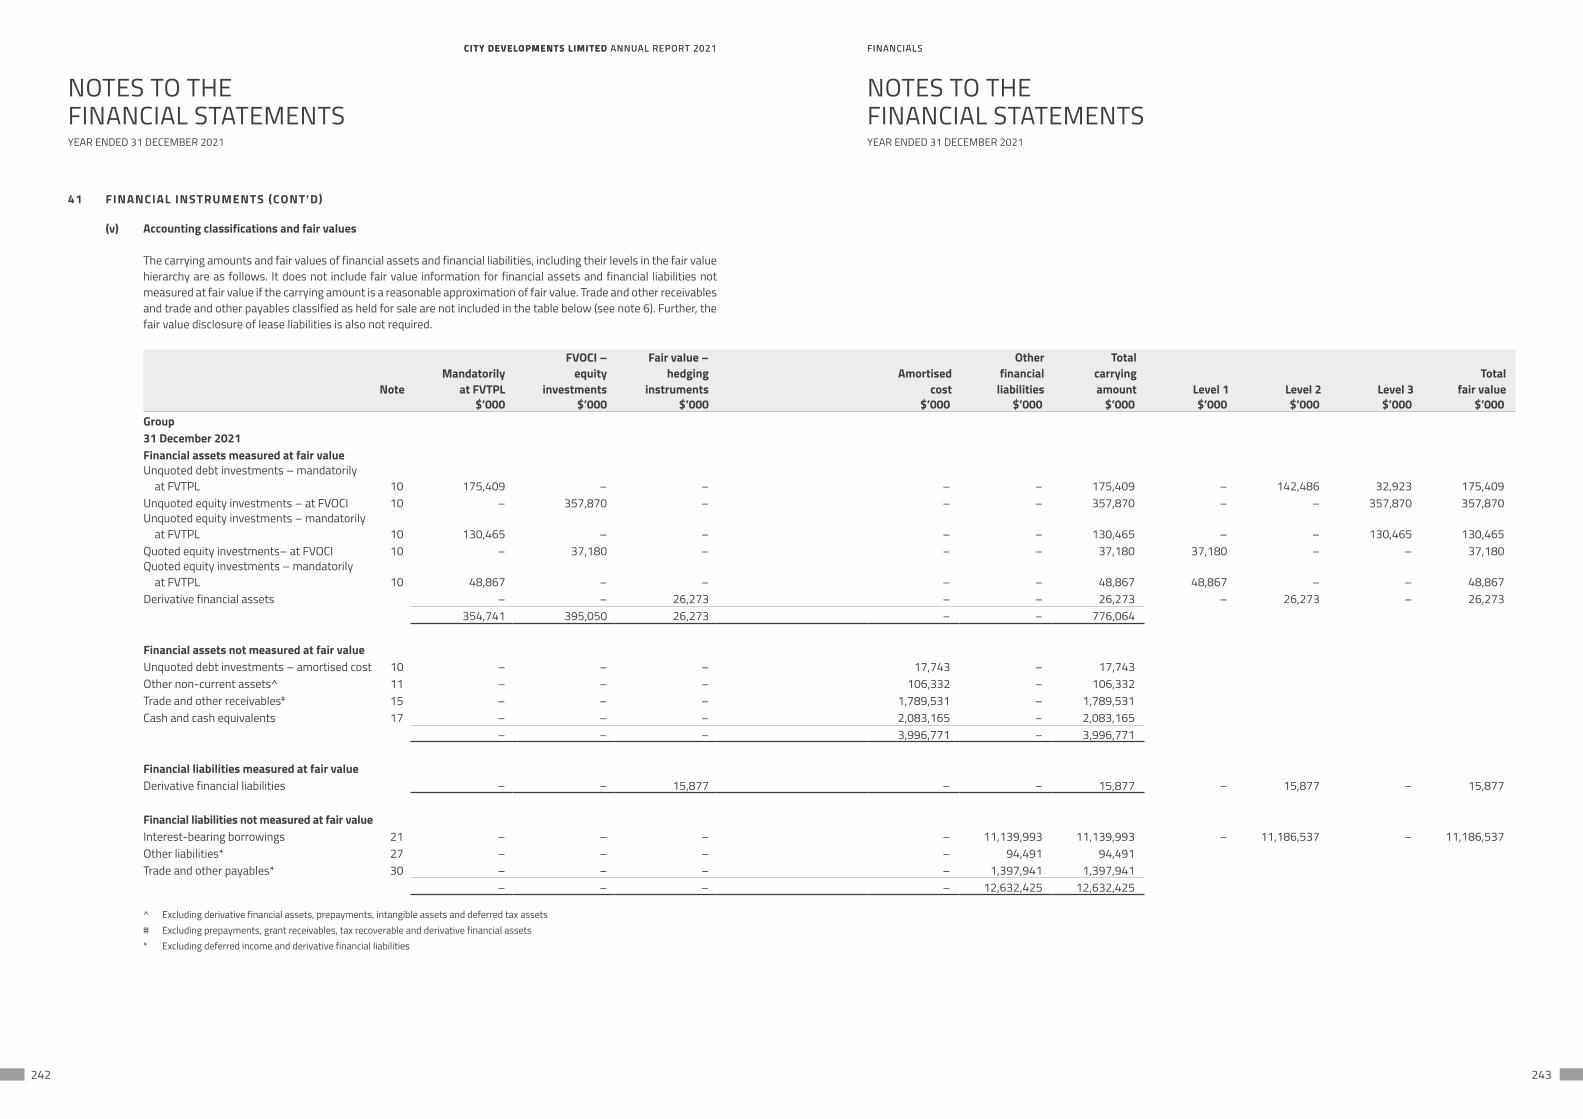
CITY DEVELOPMENTS LIMITED ANNUAL REPORT 2021 FINANCIALSCITY DEVELOPMENTS LIMITED ANNUAL REPORT 2021 FINANCIALS
242 243
NOTES TO THEFINANCIAL STATEMENTS
NOTES TO THEFINANCIAL STATEMENTS
YEAR ENDED 31 DECEMBER 2021 YEAR ENDED 31 DECEMBER 2021
41 FINANCIAL INSTRUMENTS (CONT’D)
(v) Accounting classifications and fair values
The carrying amounts and fair values of financial assets and financial liabilities, including their levels in the fair value hierarchy are as follows. It does not include fair value information for financial assets and financial liabilities not measured at fair value if the carrying amount is a reasonable approximation of fair value. Trade and other receivables and trade and other payables classified as held for sale are not included in the table below (see note 6). Further, the fair value disclosure of lease liabilities is also not required.
NoteMandatorily
at FVTPL
FVOCI –equity
investments
Fair value – hedging
instruments Amortised
cost
Otherfinancial
liabilities
Totalcarrying amount Level 1 Level 2 Level 3
Totalfair value
$’000 $’000 $’000 $’000 $’000 $’000 $’000 $’000 $’000 $’000Group31 December 2021Financial assets measured at fair valueUnquoted debt investments – mandatorily
at FVTPL 10 175,409 – – – – 175,409 – 142,486 32,923 175,409Unquoted equity investments – at FVOCI 10 – 357,870 – – – 357,870 – – 357,870 357,870Unquoted equity investments – mandatorily
at FVTPL 10 130,465 – – – – 130,465 – – 130,465 130,465Quoted equity investments– at FVOCI 10 – 37,180 – – – 37,180 37,180 – – 37,180Quoted equity investments – mandatorily
at FVTPL 10 48,867 – – – – 48,867 48,867 – – 48,867Derivative financial assets – – 26,273 – – 26,273 – 26,273 – 26,273
354,741 395,050 26,273 – – 776,064
Financial assets not measured at fair valueUnquoted debt investments – amortised cost 10 – – – 17,743 – 17,743Other non-current assets^ 11 – – – 106,332 – 106,332Trade and other receivables# 15 – – – 1,789,531 – 1,789,531Cash and cash equivalents 17 – – – 2,083,165 – 2,083,165
– – – 3,996,771 – 3,996,771
Financial liabilities measured at fair valueDerivative financial liabilities – – 15,877 – – 15,877 – 15,877 – 15,877
Financial liabilities not measured at fair valueInterest-bearing borrowings 21 – – – – 11,139,993 11,139,993 – 11,186,537 – 11,186,537Other liabilities* 27 – – – – 94,491 94,491Trade and other payables* 30 – – – – 1,397,941 1,397,941
– – – – 12,632,425 12,632,425
^ Excluding derivative financial assets, prepayments, intangible assets and deferred tax assets# Excluding prepayments, grant receivables, tax recoverable and derivative financial assets* Excluding deferred income and derivative financial liabilities
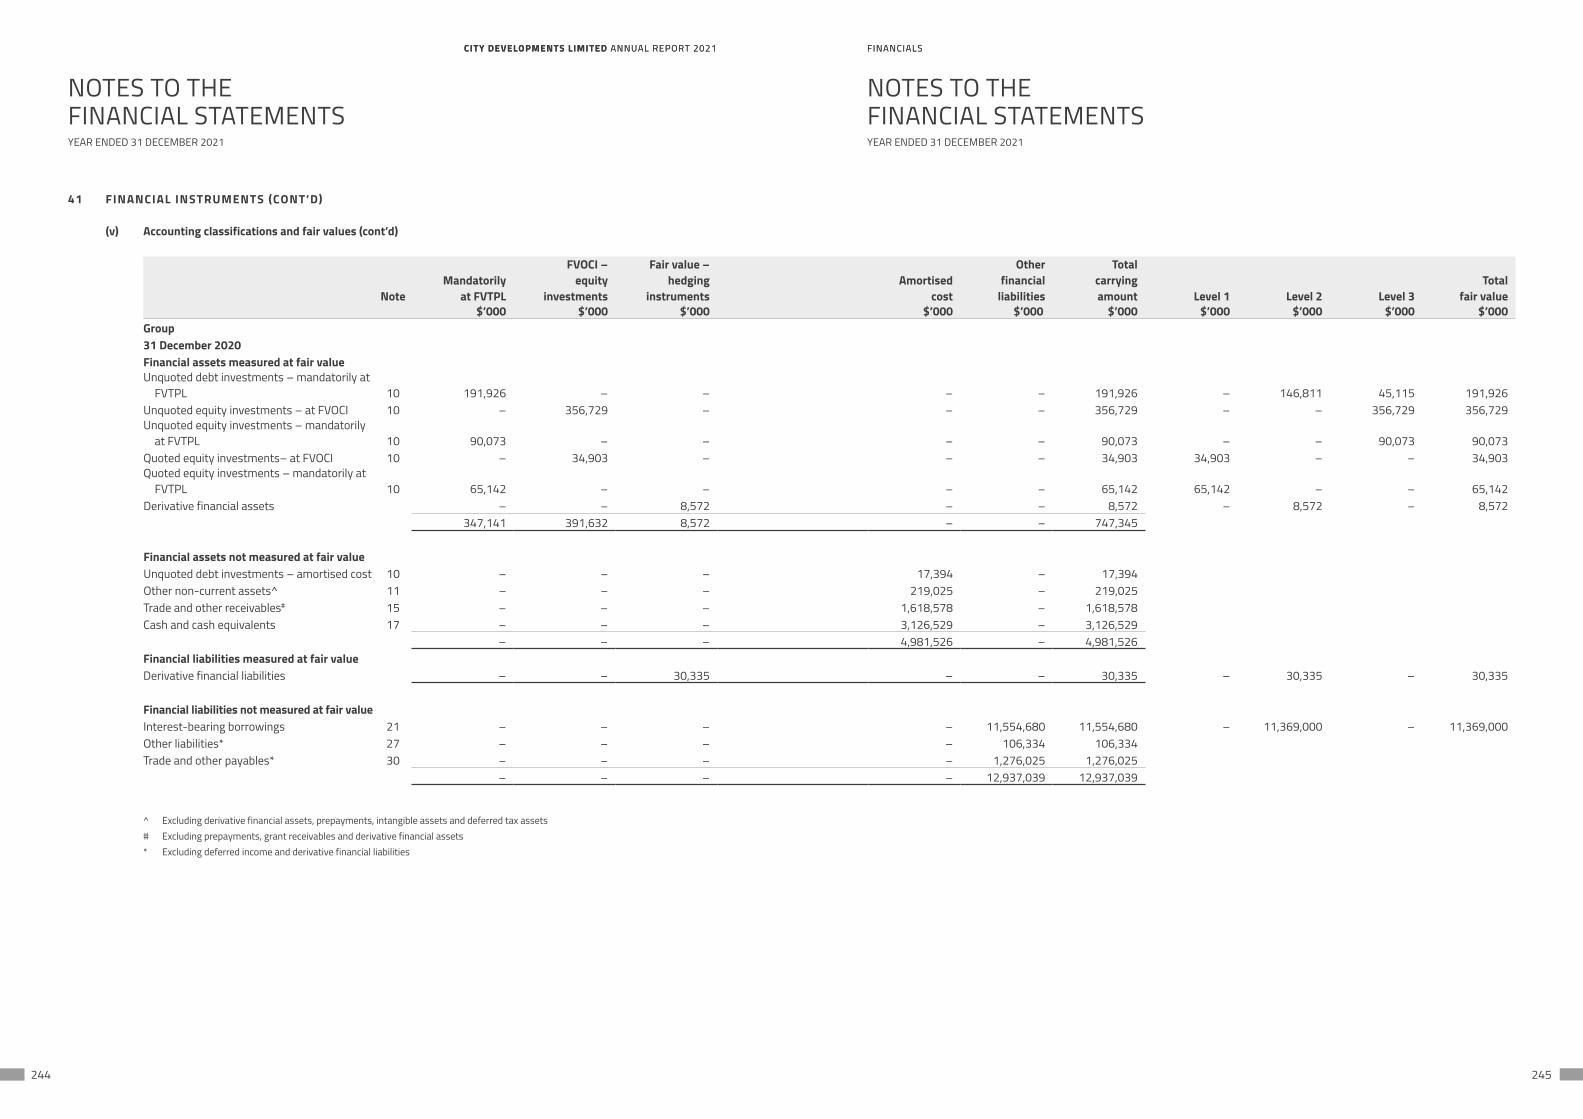
CITY DEVELOPMENTS LIMITED ANNUAL REPORT 2021 FINANCIALSCITY DEVELOPMENTS LIMITED ANNUAL REPORT 2021 FINANCIALS
244 245
NOTES TO THEFINANCIAL STATEMENTS
NOTES TO THEFINANCIAL STATEMENTS
YEAR ENDED 31 DECEMBER 2021 YEAR ENDED 31 DECEMBER 2021
41 FINANCIAL INSTRUMENTS (CONT’D)
(v) Accounting classifications and fair values (cont’d)
NoteMandatorily
at FVTPL
FVOCI –equity
investments
Fair value – hedging
instruments Amortised
cost
Otherfinancial
liabilities
Totalcarrying amount Level 1 Level 2 Level 3
Totalfair value
$’000 $’000 $’000 $’000 $’000 $’000 $’000 $’000 $’000 $’000Group31 December 2020Financial assets measured at fair valueUnquoted debt investments – mandatorily at
FVTPL 10 191,926 – – – – 191,926 – 146,811 45,115 191,926Unquoted equity investments – at FVOCI 10 – 356,729 – – – 356,729 – – 356,729 356,729Unquoted equity investments – mandatorily
at FVTPL 10 90,073 – – – – 90,073 – – 90,073 90,073Quoted equity investments– at FVOCI 10 – 34,903 – – – 34,903 34,903 – – 34,903Quoted equity investments – mandatorily at
FVTPL 10 65,142 – – – – 65,142 65,142 – – 65,142Derivative financial assets – – 8,572 – – 8,572 – 8,572 – 8,572
347,141 391,632 8,572 – – 747,345
Financial assets not measured at fair valueUnquoted debt investments – amortised cost 10 – – – 17,394 – 17,394Other non-current assets^ 11 – – – 219,025 – 219,025Trade and other receivables# 15 – – – 1,618,578 – 1,618,578Cash and cash equivalents 17 – – – 3,126,529 – 3,126,529
– – – 4,981,526 – 4,981,526Financial liabilities measured at fair valueDerivative financial liabilities – – 30,335 – – 30,335 – 30,335 – 30,335
Financial liabilities not measured at fair valueInterest-bearing borrowings 21 – – – – 11,554,680 11,554,680 – 11,369,000 – 11,369,000Other liabilities* 27 – – – – 106,334 106,334Trade and other payables* 30 – – – – 1,276,025 1,276,025
– – – – 12,937,039 12,937,039
^ Excluding derivative financial assets, prepayments, intangible assets and deferred tax assets# Excluding prepayments, grant receivables and derivative financial assets* Excluding deferred income and derivative financial liabilities
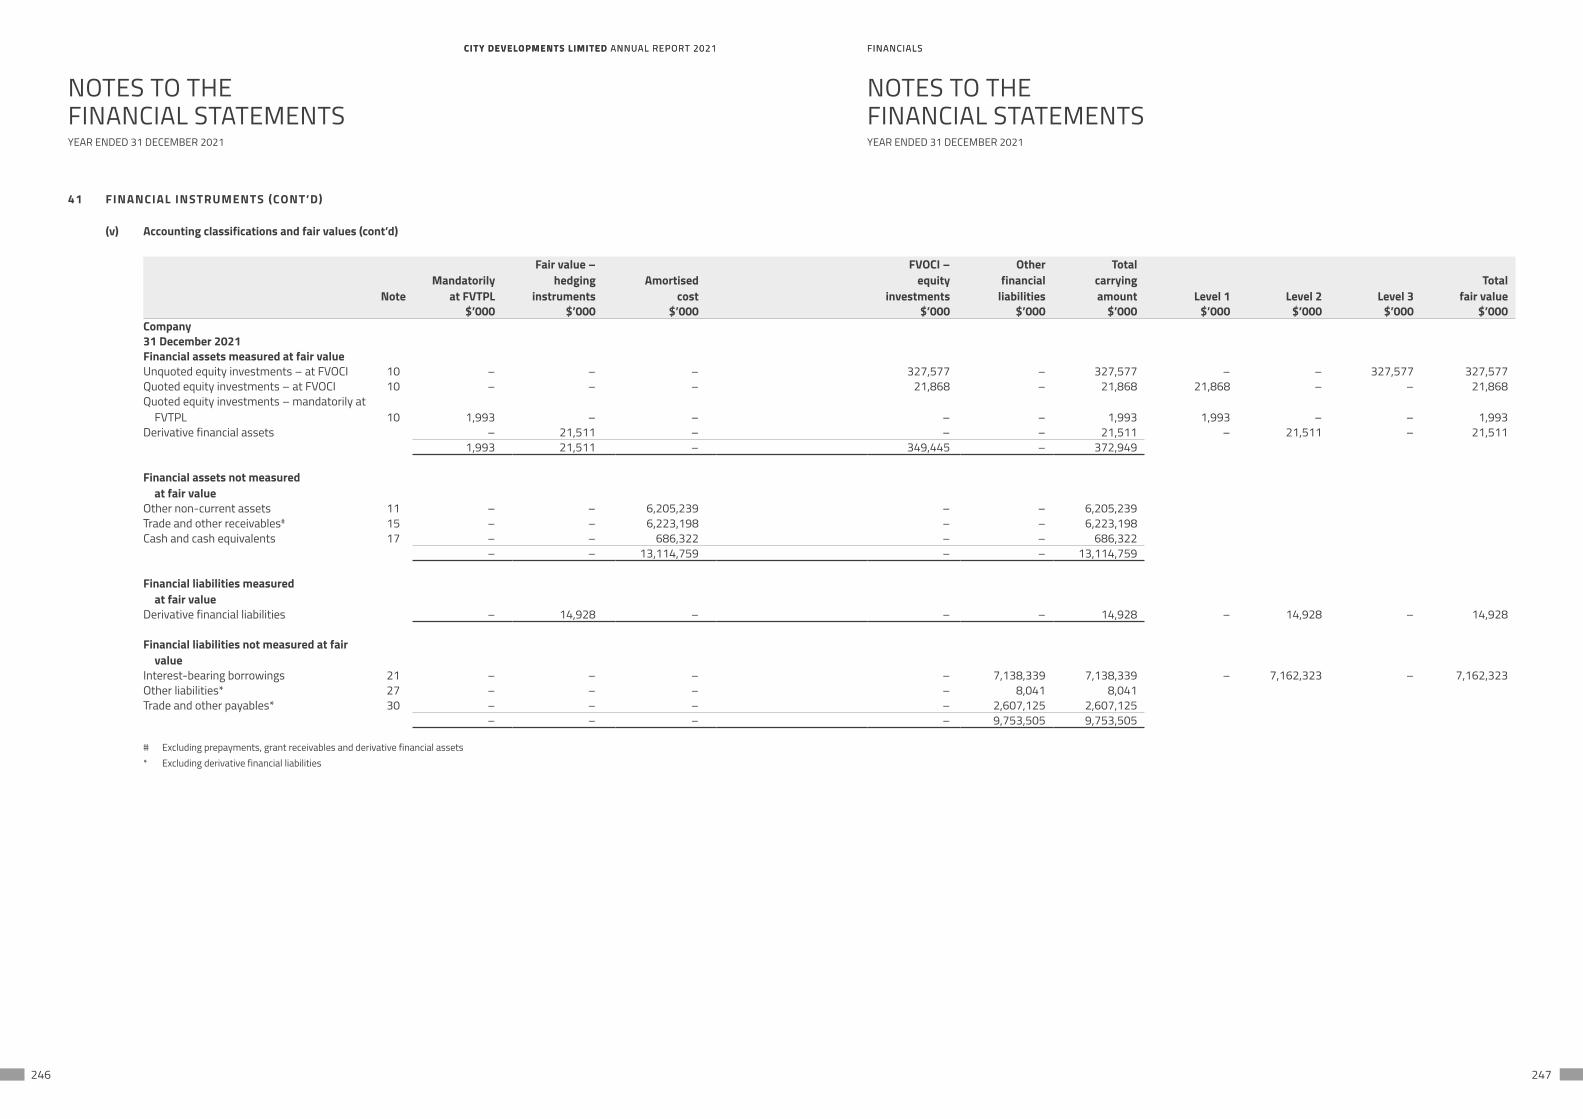
CITY DEVELOPMENTS LIMITED ANNUAL REPORT 2021 FINANCIALSCITY DEVELOPMENTS LIMITED ANNUAL REPORT 2021 FINANCIALS
246 247
NOTES TO THEFINANCIAL STATEMENTS
NOTES TO THEFINANCIAL STATEMENTS
YEAR ENDED 31 DECEMBER 2021 YEAR ENDED 31 DECEMBER 2021
41 FINANCIAL INSTRUMENTS (CONT’D)
(v) Accounting classifications and fair values (cont’d)
NoteMandatorily
at FVTPL
Fair value – hedging
instruments Amortised
cost
FVOCI – equity
investments
Otherfinancial
liabilities
Totalcarryingamount Level 1 Level 2 Level 3
Totalfair value
$’000 $’000 $’000 $’000 $’000 $’000 $’000 $’000 $’000 $’000Company31 December 2021Financial assets measured at fair valueUnquoted equity investments – at FVOCI 10 – – – 327,577 – 327,577 – – 327,577 327,577Quoted equity investments – at FVOCI 10 – – – 21,868 – 21,868 21,868 – – 21,868Quoted equity investments – mandatorily at
FVTPL 10 1,993 – – – – 1,993 1,993 – – 1,993Derivative financial assets – 21,511 – – – 21,511 – 21,511 – 21,511
1,993 21,511 – 349,445 – 372,949
Financial assets not measured at fair value
Other non-current assets 11 – – 6,205,239 – – 6,205,239Trade and other receivables# 15 – – 6,223,198 – – 6,223,198Cash and cash equivalents 17 – – 686,322 – – 686,322
– – 13,114,759 – – 13,114,759
Financial liabilities measured at fair value
Derivative financial liabilities – 14,928 – – – 14,928 – 14,928 – 14,928
Financial liabilities not measured at fair value
Interest-bearing borrowings 21 – – – – 7,138,339 7,138,339 – 7,162,323 – 7,162,323Other liabilities* 27 – – – – 8,041 8,041Trade and other payables* 30 – – – – 2,607,125 2,607,125
– – – – 9,753,505 9,753,505
# Excluding prepayments, grant receivables and derivative financial assets* Excluding derivative financial liabilities
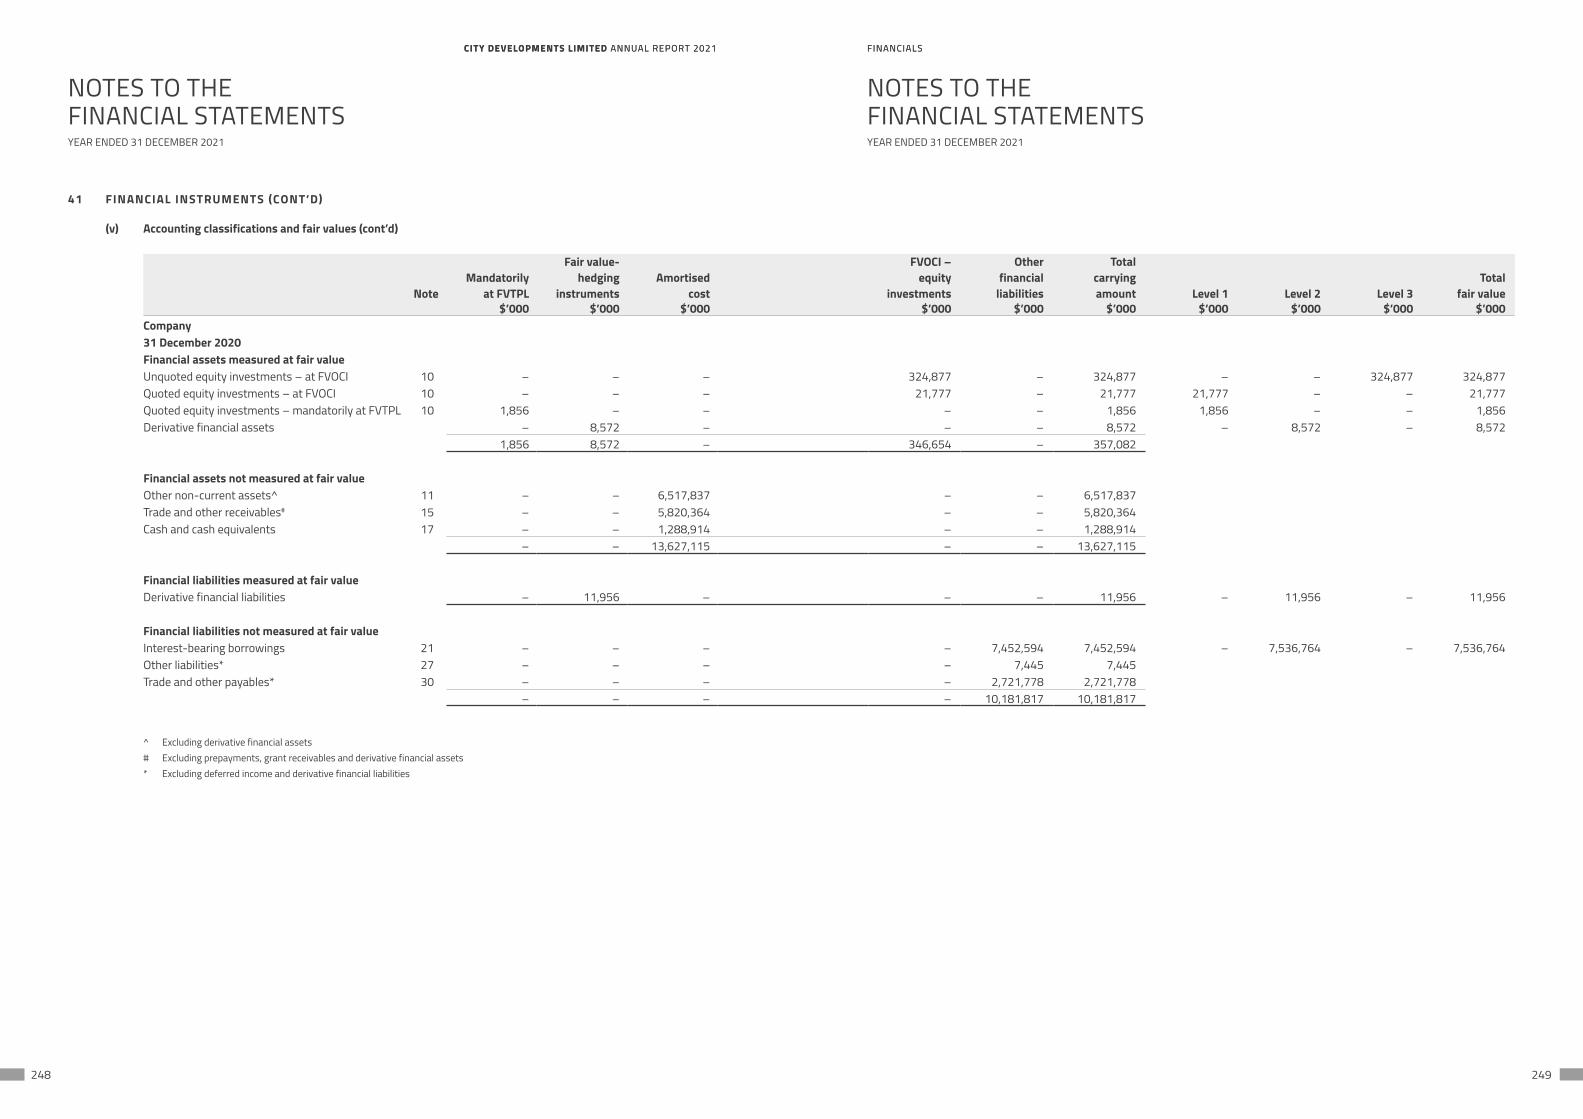
CITY DEVELOPMENTS LIMITED ANNUAL REPORT 2021 FINANCIALSCITY DEVELOPMENTS LIMITED ANNUAL REPORT 2021 FINANCIALS
248 249
NOTES TO THEFINANCIAL STATEMENTS
NOTES TO THEFINANCIAL STATEMENTS
YEAR ENDED 31 DECEMBER 2021 YEAR ENDED 31 DECEMBER 2021
41 FINANCIAL INSTRUMENTS (CONT’D)
(v) Accounting classifications and fair values (cont’d)
NoteMandatorily
at FVTPL
Fair value-hedging
instruments Amortised
cost
FVOCI –equity
investments
Otherfinancial
liabilities
Totalcarryingamount Level 1 Level 2 Level 3
Totalfair value
$’000 $’000 $’000 $’000 $’000 $’000 $’000 $’000 $’000 $’000Company31 December 2020Financial assets measured at fair valueUnquoted equity investments – at FVOCI 10 – – – 324,877 – 324,877 – – 324,877 324,877Quoted equity investments – at FVOCI 10 – – – 21,777 – 21,777 21,777 – – 21,777Quoted equity investments – mandatorily at FVTPL 10 1,856 – – – – 1,856 1,856 – – 1,856Derivative financial assets – 8,572 – – – 8,572 – 8,572 – 8,572
1,856 8,572 – 346,654 – 357,082
Financial assets not measured at fair valueOther non-current assets^ 11 – – 6,517,837 – – 6,517,837Trade and other receivables# 15 – – 5,820,364 – – 5,820,364Cash and cash equivalents 17 – – 1,288,914 – – 1,288,914
– – 13,627,115 – – 13,627,115
Financial liabilities measured at fair valueDerivative financial liabilities – 11,956 – – – 11,956 – 11,956 – 11,956
Financial liabilities not measured at fair valueInterest-bearing borrowings 21 – – – – 7,452,594 7,452,594 – 7,536,764 – 7,536,764Other liabilities* 27 – – – – 7,445 7,445Trade and other payables* 30 – – – – 2,721,778 2,721,778
– – – – 10,181,817 10,181,817
^ Excluding derivative financial assets# Excluding prepayments, grant receivables and derivative financial assets* Excluding deferred income and derivative financial liabilities
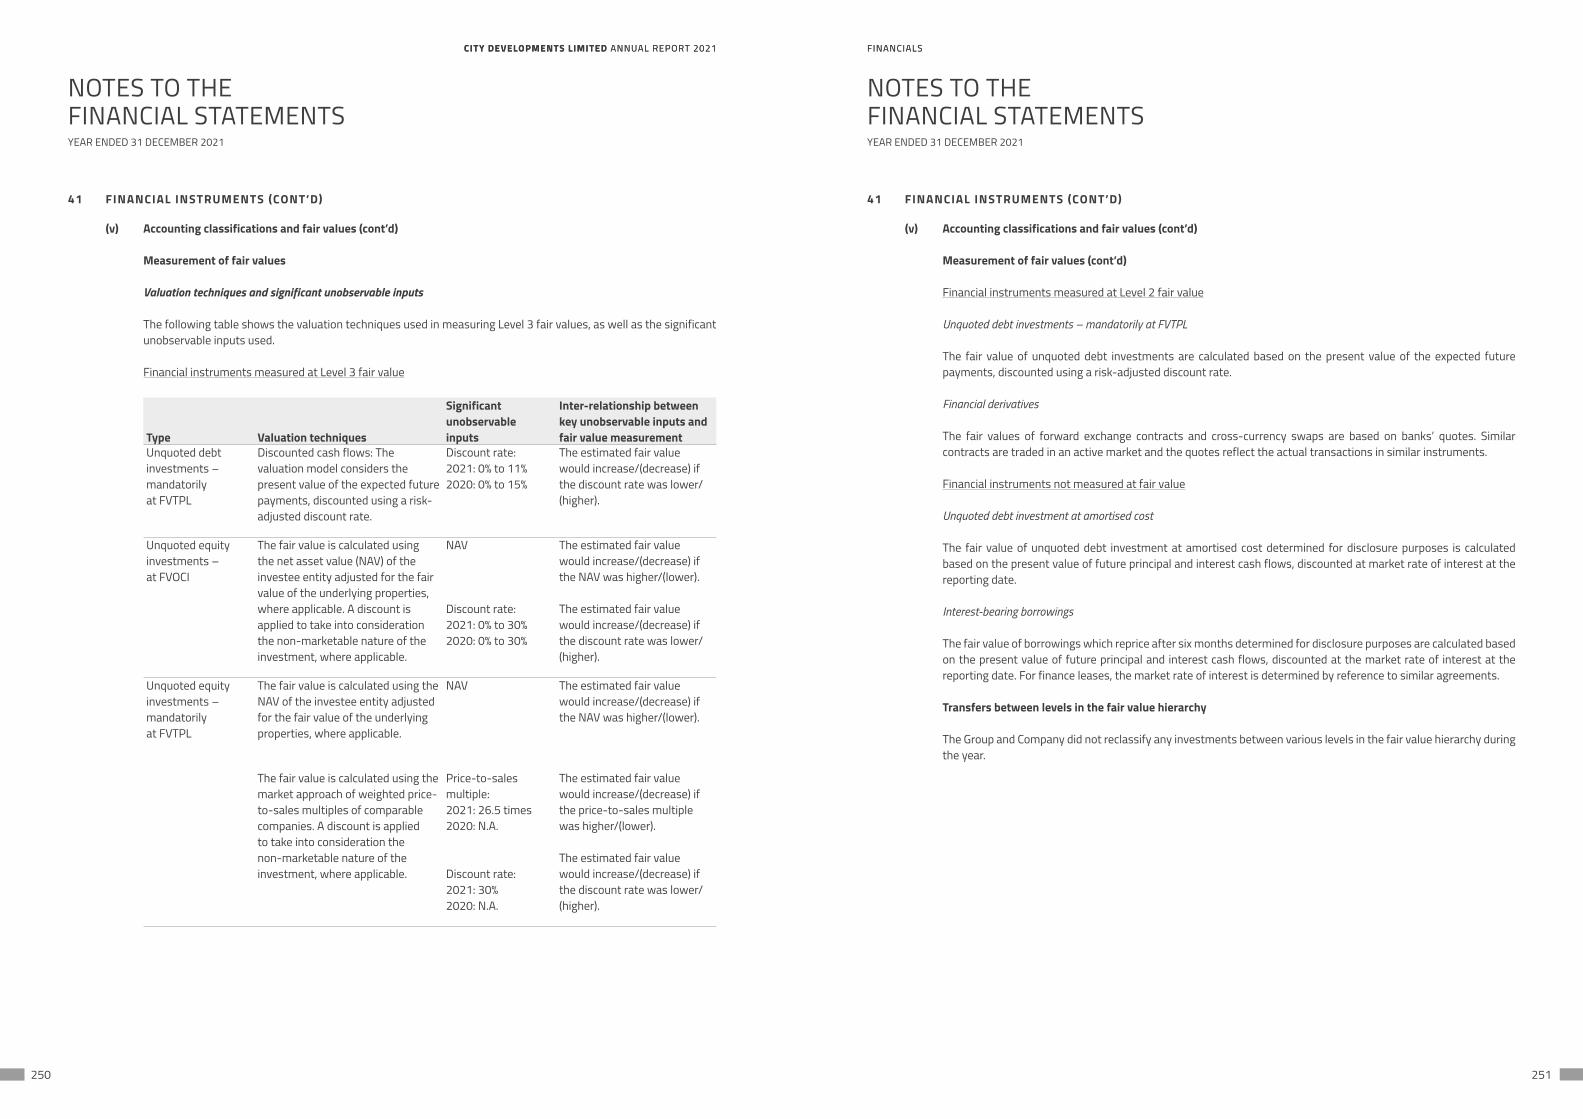
CITY DEVELOPMENTS LIMITED ANNUAL REPORT 2021 FINANCIALSCITY DEVELOPMENTS LIMITED ANNUAL REPORT 2021 FINANCIALS
250 251
NOTES TO THEFINANCIAL STATEMENTS
NOTES TO THEFINANCIAL STATEMENTS
YEAR ENDED 31 DECEMBER 2021 YEAR ENDED 31 DECEMBER 2021
41 FINANCIAL INSTRUMENTS (CONT’D)
(v) Accounting classifications and fair values (cont’d)
Measurement of fair values
Valuation techniques and significant unobservable inputs
The following table shows the valuation techniques used in measuring Level 3 fair values, as well as the significant unobservable inputs used.
Financial instruments measured at Level 3 fair value
Type Valuation techniques
Significantunobservableinputs
Inter-relationship betweenkey unobservable inputs andfair value measurement
Unquoted debt investments – mandatorily at FVTPL
Discounted cash flows: The valuation model considers the present value of the expected future payments, discounted using a risk-adjusted discount rate.
Discount rate:2021: 0% to 11%2020: 0% to 15%
The estimated fair value would increase/(decrease) if the discount rate was lower/(higher).
Unquoted equity investments – at FVOCI
The fair value is calculated using the net asset value (NAV) of the investee entity adjusted for the fair value of the underlying properties, where applicable. A discount is applied to take into consideration the non-marketable nature of the investment, where applicable.
NAV
Discount rate:2021: 0% to 30%2020: 0% to 30%
The estimated fair value would increase/(decrease) if the NAV was higher/(lower).
The estimated fair value would increase/(decrease) if the discount rate was lower/(higher).
Unquoted equity investments – mandatorily at FVTPL
The fair value is calculated using the NAV of the investee entity adjusted for the fair value of the underlying properties, where applicable.
NAV The estimated fair value would increase/(decrease) if the NAV was higher/(lower).
The fair value is calculated using the market approach of weighted price-to-sales multiples of comparable companies. A discount is applied to take into consideration the non-marketable nature of the investment, where applicable.
Price-to-sales multiple:2021: 26.5 times2020: N.A.
Discount rate:2021: 30%2020: N.A.
The estimated fair value would increase/(decrease) if the price-to-sales multiple was higher/(lower).
The estimated fair value would increase/(decrease) if the discount rate was lower/(higher).
41 FINANCIAL INSTRUMENTS (CONT’D)
(v) Accounting classifications and fair values (cont’d)
Measurement of fair values (cont’d)
Financial instruments measured at Level 2 fair value
Unquoted debt investments – mandatorily at FVTPL
The fair value of unquoted debt investments are calculated based on the present value of the expected future payments, discounted using a risk-adjusted discount rate.
Financial derivatives
The fair values of forward exchange contracts and cross-currency swaps are based on banks’ quotes. Similar contracts are traded in an active market and the quotes reflect the actual transactions in similar instruments.
Financial instruments not measured at fair value
Unquoted debt investment at amortised cost
The fair value of unquoted debt investment at amortised cost determined for disclosure purposes is calculated based on the present value of future principal and interest cash flows, discounted at market rate of interest at the reporting date.
Interest-bearing borrowings
The fair value of borrowings which reprice after six months determined for disclosure purposes are calculated based on the present value of future principal and interest cash flows, discounted at the market rate of interest at the reporting date. For finance leases, the market rate of interest is determined by reference to similar agreements.
Transfers between levels in the fair value hierarchy
The Group and Company did not reclassify any investments between various levels in the fair value hierarchy during the year.
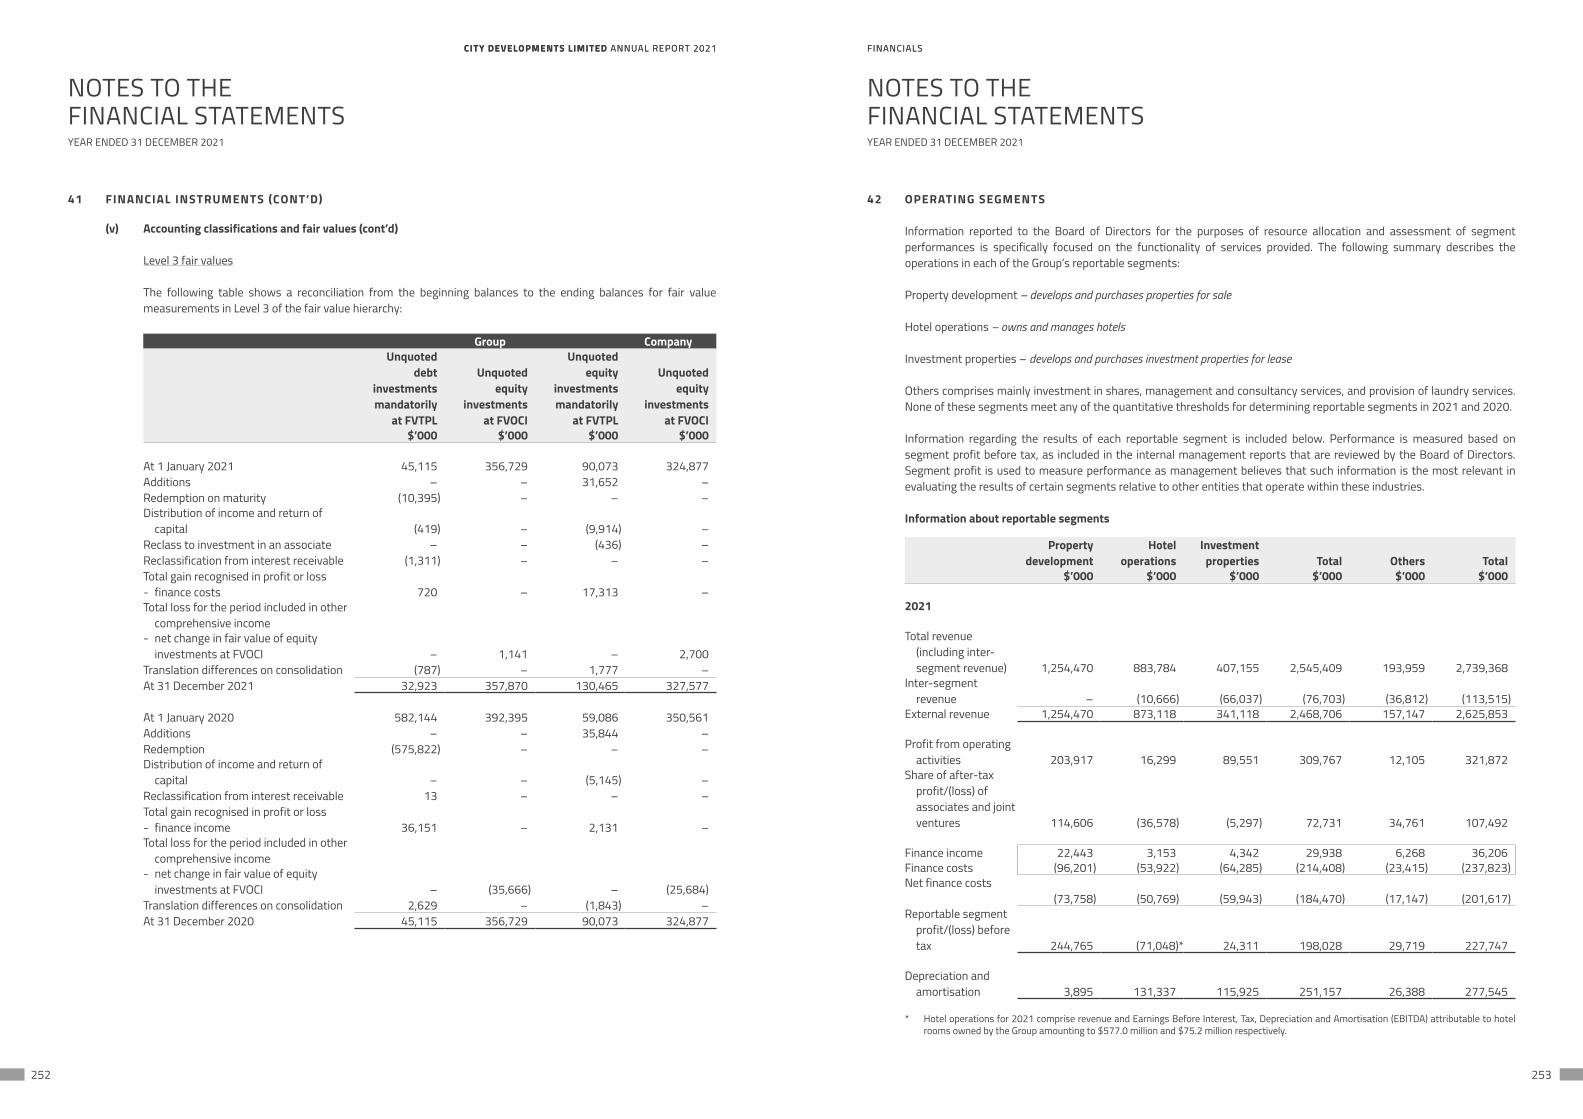
CITY DEVELOPMENTS LIMITED ANNUAL REPORT 2021 FINANCIALSCITY DEVELOPMENTS LIMITED ANNUAL REPORT 2021 FINANCIALS
252 253
NOTES TO THEFINANCIAL STATEMENTS
NOTES TO THEFINANCIAL STATEMENTS
YEAR ENDED 31 DECEMBER 2021 YEAR ENDED 31 DECEMBER 2021
41 FINANCIAL INSTRUMENTS (CONT’D)
(v) Accounting classifications and fair values (cont’d)
Level 3 fair values
The following table shows a reconciliation from the beginning balances to the ending balances for fair value measurements in Level 3 of the fair value hierarchy:
Group CompanyUnquoted
debtinvestmentsmandatorily
at FVTPL
Unquotedequity
investmentsat FVOCI
Unquotedequity
investmentsmandatorily
at FVTPL
Unquotedequity
investmentsat FVOCI
$’000 $’000 $’000 $’000
At 1 January 2021 45,115 356,729 90,073 324,877Additions – – 31,652 –Redemption on maturity (10,395) – – –Distribution of income and return of
capital (419) – (9,914) –Reclass to investment in an associate – – (436) –Reclassification from interest receivable (1,311) – – –Total gain recognised in profit or loss - finance costs 720 – 17,313 –Total loss for the period included in other
comprehensive income- net change in fair value of equity
investments at FVOCI – 1,141 – 2,700Translation differences on consolidation (787) – 1,777 –At 31 December 2021 32,923 357,870 130,465 327,577
At 1 January 2020 582,144 392,395 59,086 350,561Additions – – 35,844 –Redemption (575,822) – – –Distribution of income and return of
capital – – (5,145) –Reclassification from interest receivable 13 – – –Total gain recognised in profit or loss - finance income 36,151 – 2,131 –Total loss for the period included in other
comprehensive income- net change in fair value of equity
investments at FVOCI – (35,666) – (25,684)Translation differences on consolidation 2,629 – (1,843) –At 31 December 2020 45,115 356,729 90,073 324,877
42 OPERATING SEGMENTS
Information reported to the Board of Directors for the purposes of resource allocation and assessment of segment performances is specifically focused on the functionality of services provided. The following summary describes the operations in each of the Group’s reportable segments:
Property development – develops and purchases properties for sale
Hotel operations – owns and manages hotels
Investment properties – develops and purchases investment properties for lease
Others comprises mainly investment in shares, management and consultancy services, and provision of laundry services. None of these segments meet any of the quantitative thresholds for determining reportable segments in 2021 and 2020.
Information regarding the results of each reportable segment is included below. Performance is measured based on segment profit before tax, as included in the internal management reports that are reviewed by the Board of Directors. Segment profit is used to measure performance as management believes that such information is the most relevant in evaluating the results of certain segments relative to other entities that operate within these industries.
Information about reportable segments
Propertydevelopment
Hotel operations
Investmentproperties Total Others Total
$’000 $’000 $’000 $’000 $’000 $’000
2021
Total revenue (including inter-segment revenue) 1,254,470 883,784 407,155 2,545,409 193,959 2,739,368
Inter-segment revenue – (10,666) (66,037) (76,703) (36,812) (113,515)
External revenue 1,254,470 873,118 341,118 2,468,706 157,147 2,625,853
Profit from operating activities 203,917 16,299 89,551 309,767 12,105 321,872
Share of after-tax profit/(loss) of associates and joint ventures 114,606 (36,578) (5,297) 72,731 34,761 107,492
Finance income 22,443 3,153 4,342 29,938 6,268 36,206Finance costs (96,201) (53,922) (64,285) (214,408) (23,415) (237,823)Net finance costs
(73,758) (50,769) (59,943) (184,470) (17,147) (201,617)Reportable segment
profit/(loss) before tax 244,765 (71,048)* 24,311 198,028 29,719 227,747
Depreciation and amortisation 3,895 131,337 115,925 251,157 26,388 277,545
* Hotel operations for 2021 comprise revenue and Earnings Before Interest, Tax, Depreciation and Amortisation (EBITDA) attributable to hotel rooms owned by the Group amounting to $577.0 million and $75.2 million respectively.
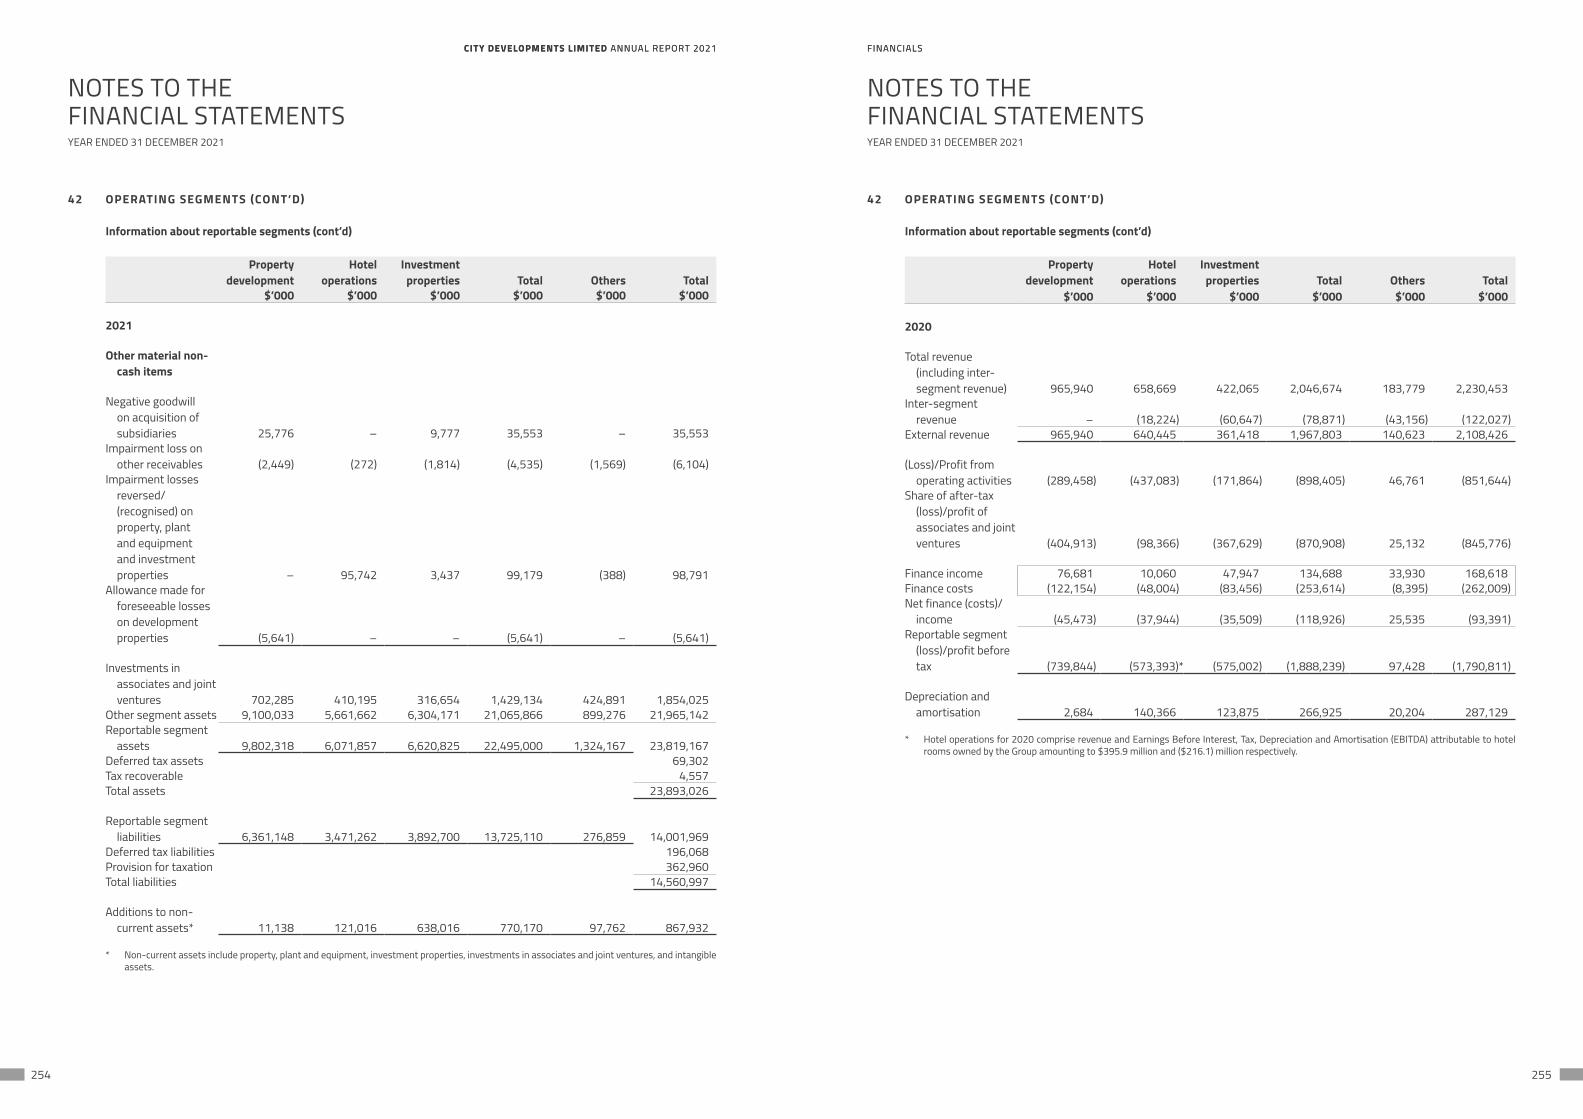
CITY DEVELOPMENTS LIMITED ANNUAL REPORT 2021 FINANCIALSCITY DEVELOPMENTS LIMITED ANNUAL REPORT 2021 FINANCIALS
254 255
NOTES TO THEFINANCIAL STATEMENTS
NOTES TO THEFINANCIAL STATEMENTS
YEAR ENDED 31 DECEMBER 2021 YEAR ENDED 31 DECEMBER 2021
42 OPERATING SEGMENTS (CONT’D)
Information about reportable segments (cont’d)
Propertydevelopment
Hotel operations
Investmentproperties Total Others Total
$’000 $’000 $’000 $’000 $’000 $’000
2021
Other material non-cash items
Negative goodwill on acquisition of subsidiaries 25,776 – 9,777 35,553 – 35,553
Impairment loss on other receivables (2,449) (272) (1,814) (4,535) (1,569) (6,104)
Impairment losses reversed/ (recognised) on property, plant and equipment and investment properties – 95,742 3,437 99,179 (388) 98,791
Allowance made for foreseeable losses on development properties (5,641) – – (5,641) – (5,641)
Investments in associates and joint ventures 702,285 410,195 316,654 1,429,134 424,891 1,854,025
Other segment assets 9,100,033 5,661,662 6,304,171 21,065,866 899,276 21,965,142Reportable segment
assets 9,802,318 6,071,857 6,620,825 22,495,000 1,324,167 23,819,167Deferred tax assets 69,302Tax recoverable 4,557Total assets 23,893,026
Reportable segment liabilities 6,361,148 3,471,262 3,892,700 13,725,110 276,859 14,001,969
Deferred tax liabilities 196,068Provision for taxation 362,960Total liabilities 14,560,997
Additions to non-current assets* 11,138 121,016 638,016 770,170 97,762 867,932
* Non-current assets include property, plant and equipment, investment properties, investments in associates and joint ventures, and intangible assets.
42 OPERATING SEGMENTS (CONT’D)
Information about reportable segments (cont’d)
Propertydevelopment
Hotel operations
Investmentproperties Total Others Total
$’000 $’000 $’000 $’000 $’000 $’000
2020
Total revenue (including inter-segment revenue) 965,940 658,669 422,065 2,046,674 183,779 2,230,453
Inter-segment revenue – (18,224) (60,647) (78,871) (43,156) (122,027)
External revenue 965,940 640,445 361,418 1,967,803 140,623 2,108,426
(Loss)/Profit from operating activities (289,458) (437,083) (171,864) (898,405) 46,761 (851,644)
Share of after-tax (loss)/profit of associates and joint ventures (404,913) (98,366) (367,629) (870,908) 25,132 (845,776)
Finance income 76,681 10,060 47,947 134,688 33,930 168,618Finance costs (122,154) (48,004) (83,456) (253,614) (8,395) (262,009)Net finance (costs)/
income (45,473) (37,944) (35,509) (118,926) 25,535 (93,391)Reportable segment
(loss)/profit before tax (739,844) (573,393)* (575,002) (1,888,239) 97,428 (1,790,811)
Depreciation and amortisation 2,684 140,366 123,875 266,925 20,204 287,129
* Hotel operations for 2020 comprise revenue and Earnings Before Interest, Tax, Depreciation and Amortisation (EBITDA) attributable to hotel rooms owned by the Group amounting to $395.9 million and ($216.1) million respectively.
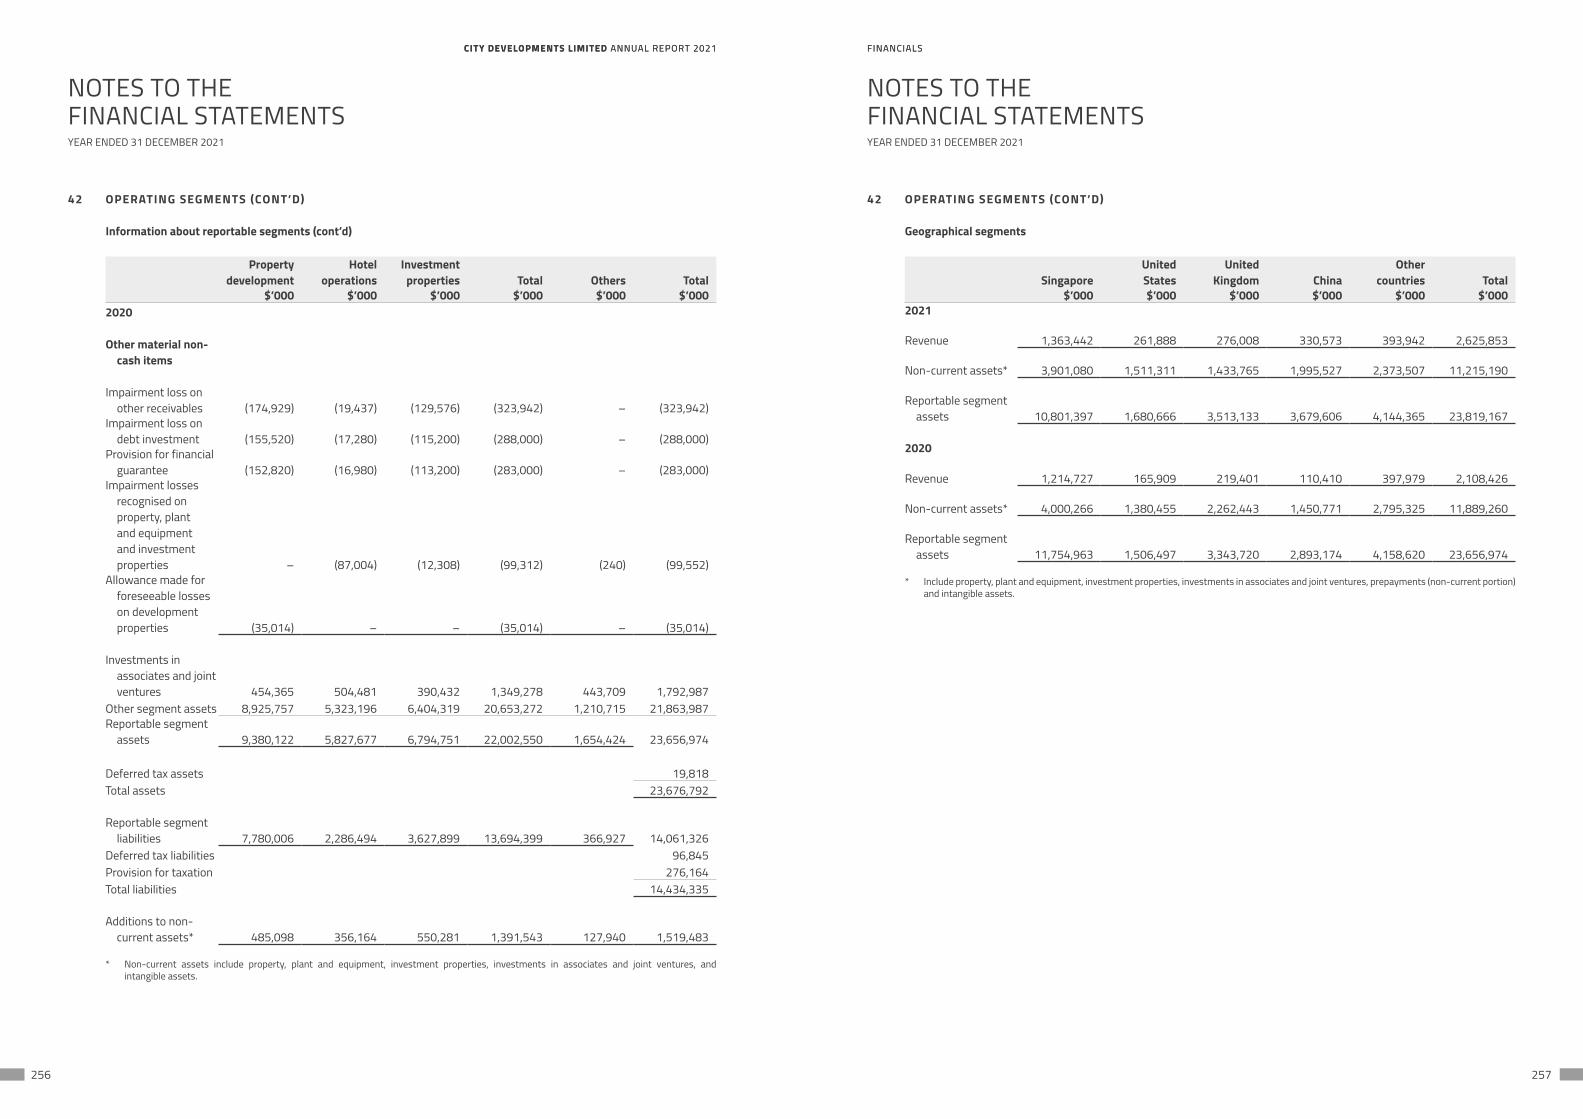
CITY DEVELOPMENTS LIMITED ANNUAL REPORT 2021 FINANCIALSCITY DEVELOPMENTS LIMITED ANNUAL REPORT 2021 FINANCIALS
256 257
NOTES TO THEFINANCIAL STATEMENTS
NOTES TO THEFINANCIAL STATEMENTS
YEAR ENDED 31 DECEMBER 2021 YEAR ENDED 31 DECEMBER 2021
42 OPERATING SEGMENTS (CONT’D)
Information about reportable segments (cont’d)
Propertydevelopment
Hotel operations
Investmentproperties Total Others Total
$’000 $’000 $’000 $’000 $’000 $’0002020
Other material non-cash items
Impairment loss on other receivables (174,929) (19,437) (129,576) (323,942) – (323,942)
Impairment loss on debt investment (155,520) (17,280) (115,200) (288,000) – (288,000)
Provision for financial guarantee (152,820) (16,980) (113,200) (283,000) – (283,000)
Impairment losses recognised on property, plant and equipment and investment properties – (87,004) (12,308) (99,312) (240) (99,552)
Allowance made for foreseeable losses on development properties (35,014) – – (35,014) – (35,014)
Investments in associates and joint ventures 454,365 504,481 390,432 1,349,278 443,709 1,792,987
Other segment assets 8,925,757 5,323,196 6,404,319 20,653,272 1,210,715 21,863,987Reportable segment
assets 9,380,122 5,827,677 6,794,751 22,002,550 1,654,424 23,656,974
Deferred tax assets 19,818Total assets 23,676,792
Reportable segment liabilities 7,780,006 2,286,494 3,627,899 13,694,399 366,927 14,061,326
Deferred tax liabilities 96,845Provision for taxation 276,164Total liabilities 14,434,335
Additions to non-current assets* 485,098 356,164 550,281 1,391,543 127,940 1,519,483
* Non-current assets include property, plant and equipment, investment properties, investments in associates and joint ventures, and intangible assets.
42 OPERATING SEGMENTS (CONT’D)
Geographical segments
SingaporeUnitedStates
UnitedKingdom China
Othercountries Total
$’000 $’000 $’000 $’000 $’000 $’0002021
Revenue 1,363,442 261,888 276,008 330,573 393,942 2,625,853
Non-current assets* 3,901,080 1,511,311 1,433,765 1,995,527 2,373,507 11,215,190
Reportable segment assets 10,801,397 1,680,666 3,513,133 3,679,606 4,144,365 23,819,167
2020
Revenue 1,214,727 165,909 219,401 110,410 397,979 2,108,426
Non-current assets* 4,000,266 1,380,455 2,262,443 1,450,771 2,795,325 11,889,260
Reportable segment assets 11,754,963 1,506,497 3,343,720 2,893,174 4,158,620 23,656,974
* Include property, plant and equipment, investment properties, investments in associates and joint ventures, prepayments (non-current portion) and intangible assets.
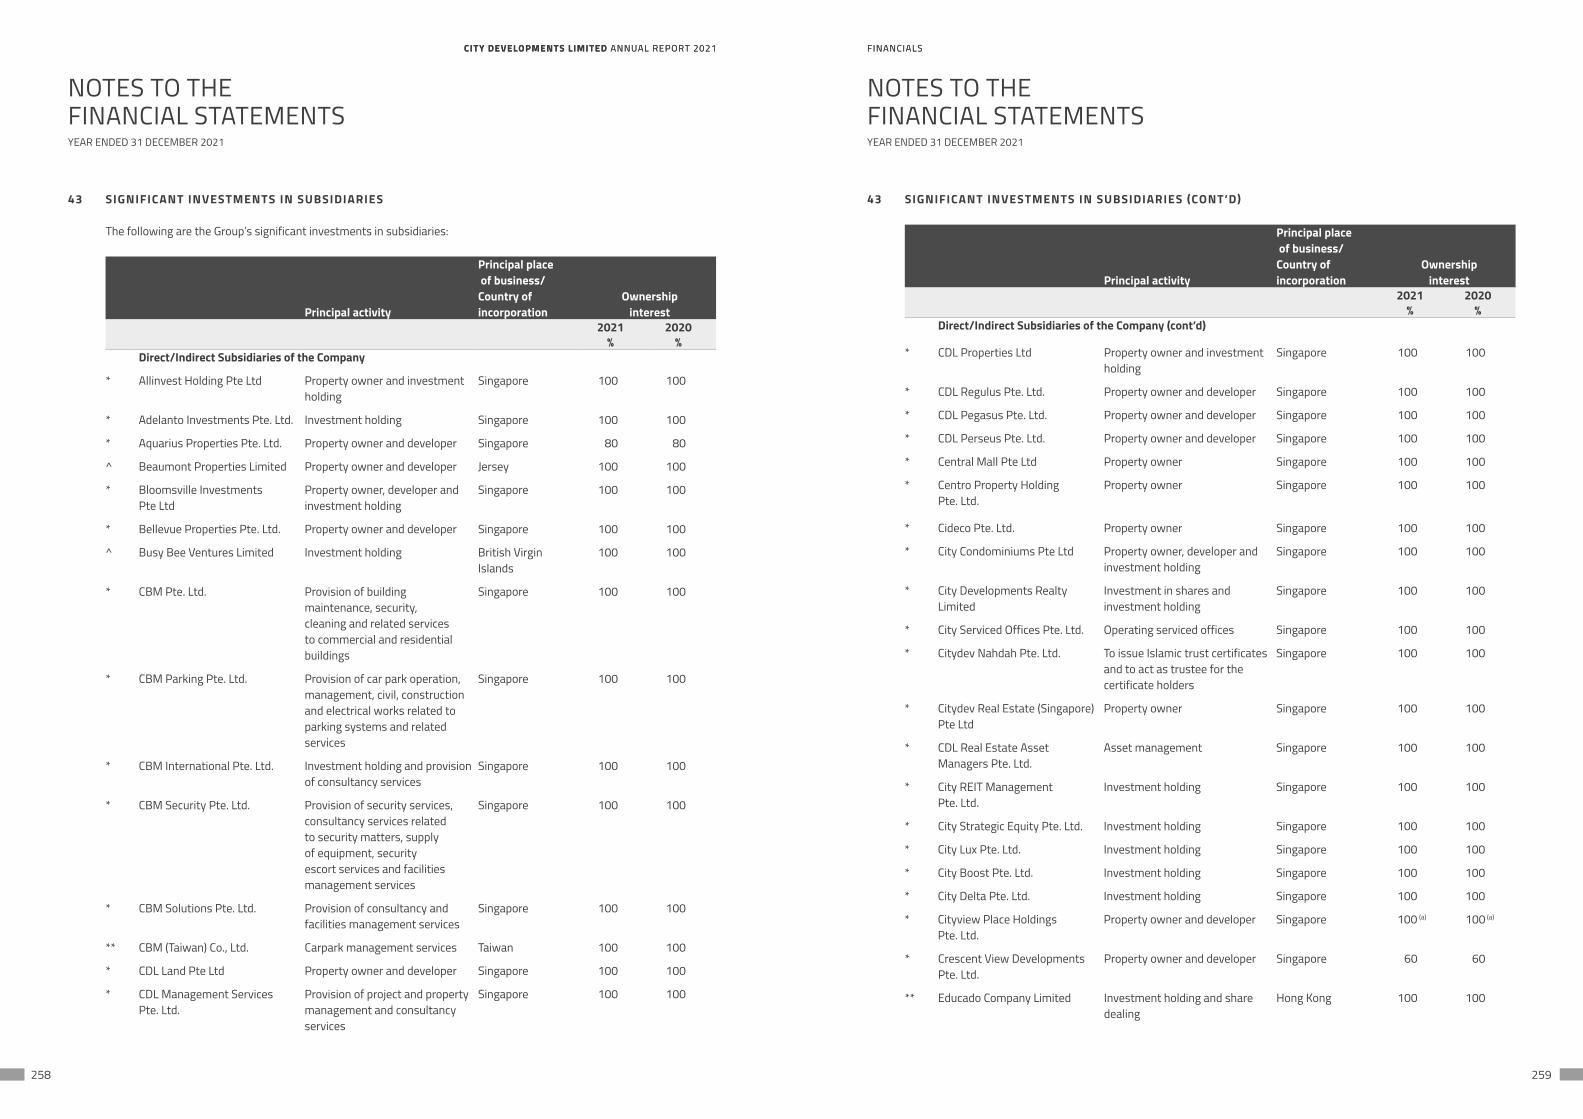
CITY DEVELOPMENTS LIMITED ANNUAL REPORT 2021 FINANCIALSCITY DEVELOPMENTS LIMITED ANNUAL REPORT 2021 FINANCIALS
258 259
NOTES TO THEFINANCIAL STATEMENTS
NOTES TO THEFINANCIAL STATEMENTS
YEAR ENDED 31 DECEMBER 2021 YEAR ENDED 31 DECEMBER 2021
43 SIGNIFICANT INVESTMENTS IN SUBSIDIARIES
The following are the Group’s significant investments in subsidiaries:
Principal activity
Principal place of business/Country ofincorporation
Ownership interest
2021 2020% %
Direct/Indirect Subsidiaries of the Company
* Allinvest Holding Pte Ltd Property owner and investment holding
Singapore 100 100
* Adelanto Investments Pte. Ltd. Investment holding Singapore 100 100
* Aquarius Properties Pte. Ltd. Property owner and developer Singapore 80 80
^ Beaumont Properties Limited Property owner and developer Jersey 100 100
* Bloomsville Investments Pte Ltd
Property owner, developer and investment holding
Singapore 100 100
* Bellevue Properties Pte. Ltd. Property owner and developer Singapore 100 100
^ Busy Bee Ventures Limited Investment holding British Virgin Islands
100 100
* CBM Pte. Ltd. Provision of building maintenance, security, cleaning and related services to commercial and residential buildings
Singapore 100 100
* CBM Parking Pte. Ltd. Provision of car park operation, management, civil, construction and electrical works related to parking systems and related services
Singapore 100 100
* CBM International Pte. Ltd. Investment holding and provision of consultancy services
Singapore 100 100
* CBM Security Pte. Ltd. Provision of security services, consultancy services related to security matters, supply of equipment, security escort services and facilities management services
Singapore 100 100
* CBM Solutions Pte. Ltd. Provision of consultancy and facilities management services
Singapore 100 100
** CBM (Taiwan) Co., Ltd. Carpark management services Taiwan 100 100
* CDL Land Pte Ltd Property owner and developer Singapore 100 100
* CDL Management Services Pte. Ltd.
Provision of project and property management and consultancy services
Singapore 100 100
43 SIGNIFICANT INVESTMENTS IN SUBSIDIARIES (CONT’D)
Principal activity
Principal place of business/Country ofincorporation
Ownership interest
2021 2020% %
Direct/Indirect Subsidiaries of the Company (cont’d)
* CDL Properties Ltd Property owner and investment holding
Singapore 100 100
* CDL Regulus Pte. Ltd. Property owner and developer Singapore 100 100
* CDL Pegasus Pte. Ltd. Property owner and developer Singapore 100 100
* CDL Perseus Pte. Ltd. Property owner and developer Singapore 100 100
* Central Mall Pte Ltd Property owner Singapore 100 100
* Centro Property Holding Pte. Ltd.
Property owner Singapore 100 100
* Cideco Pte. Ltd. Property owner Singapore 100 100
* City Condominiums Pte Ltd Property owner, developer and investment holding
Singapore 100 100
* City Developments Realty Limited
Investment in shares and investment holding
Singapore 100 100
* City Serviced Offices Pte. Ltd. Operating serviced offices Singapore 100 100
* Citydev Nahdah Pte. Ltd. To issue Islamic trust certificates and to act as trustee for the certificate holders
Singapore 100 100
* Citydev Real Estate (Singapore) Pte Ltd
Property owner Singapore 100 100
* CDL Real Estate Asset Managers Pte. Ltd.
Asset management Singapore 100 100
* City REIT Management Pte. Ltd.
Investment holding Singapore 100 100
* City Strategic Equity Pte. Ltd. Investment holding Singapore 100 100
* City Lux Pte. Ltd. Investment holding Singapore 100 100
* City Boost Pte. Ltd. Investment holding Singapore 100 100
* City Delta Pte. Ltd. Investment holding Singapore 100 100
* Cityview Place Holdings Pte. Ltd.
Property owner and developer Singapore 100 (a) 100 (a)
* Crescent View Developments Pte. Ltd.
Property owner and developer Singapore 60 60
** Educado Company Limited Investment holding and share dealing
Hong Kong 100 100
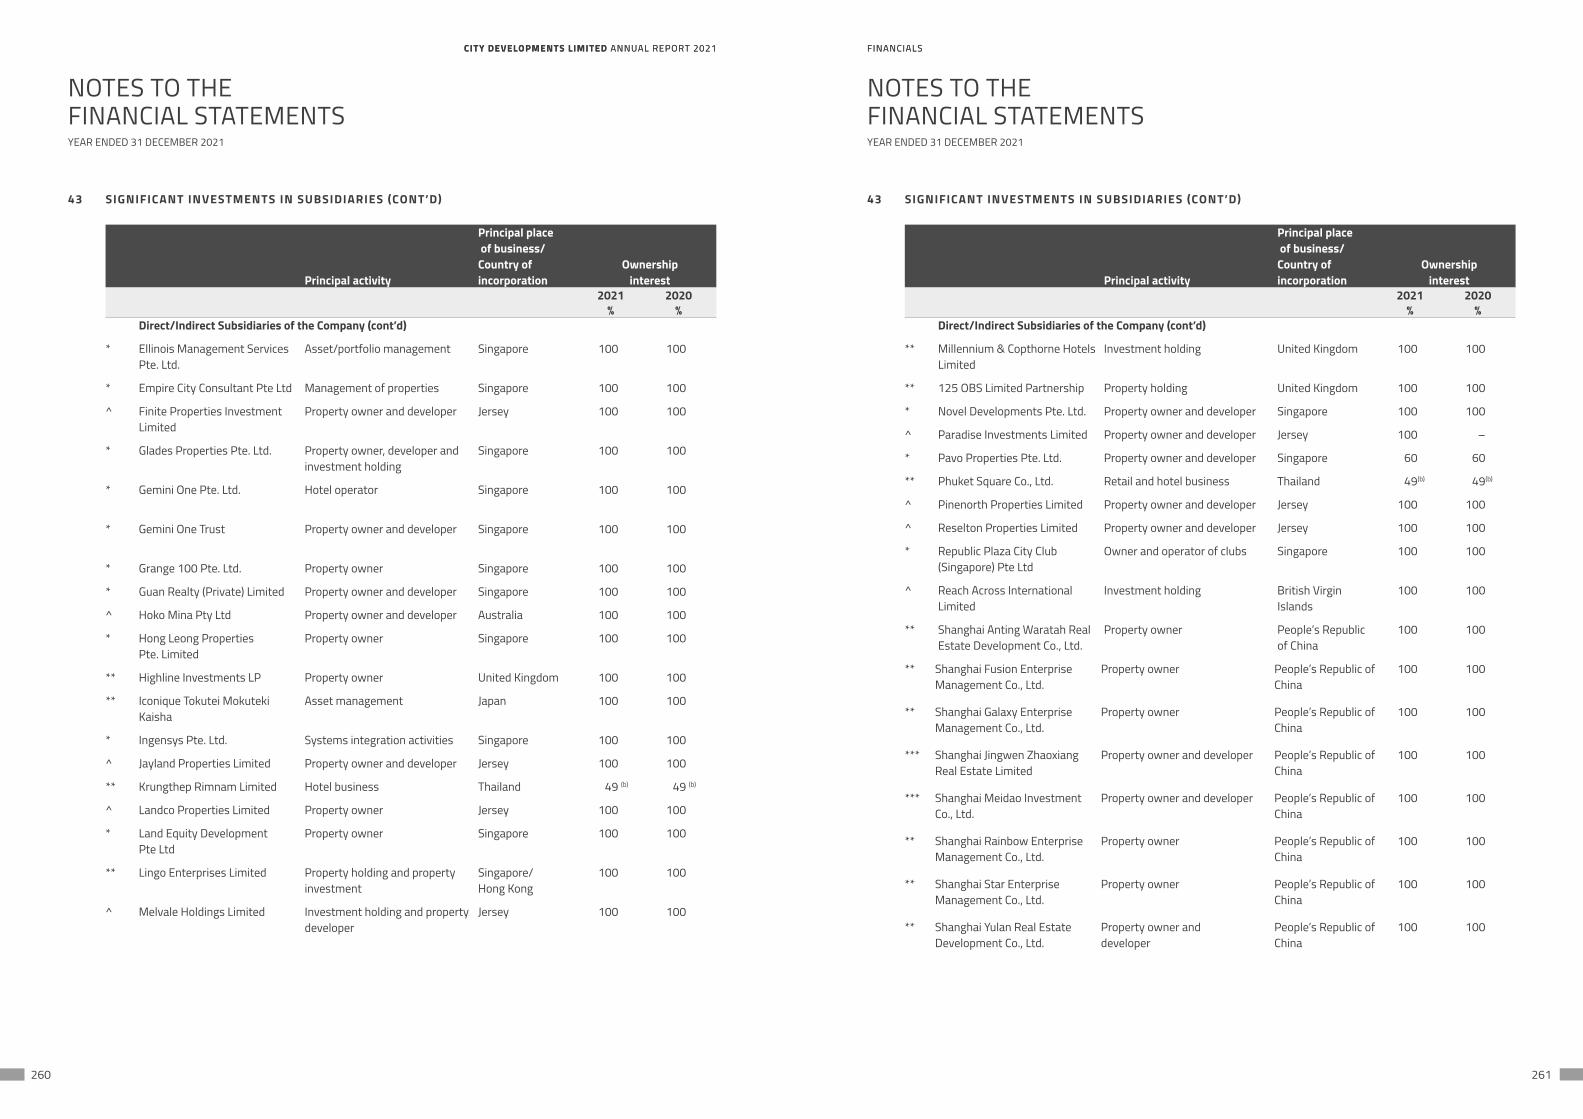
CITY DEVELOPMENTS LIMITED ANNUAL REPORT 2021 FINANCIALSCITY DEVELOPMENTS LIMITED ANNUAL REPORT 2021 FINANCIALS
260 261
NOTES TO THEFINANCIAL STATEMENTS
NOTES TO THEFINANCIAL STATEMENTS
YEAR ENDED 31 DECEMBER 2021 YEAR ENDED 31 DECEMBER 2021
43 SIGNIFICANT INVESTMENTS IN SUBSIDIARIES (CONT’D)
Principal activity
Principal place of business/Country ofincorporation
Ownership interest
2021 2020% %
Direct/Indirect Subsidiaries of the Company (cont’d)
* Ellinois Management Services Pte. Ltd.
Asset/portfolio management Singapore 100 100
* Empire City Consultant Pte Ltd Management of properties Singapore 100 100
^ Finite Properties Investment Limited
Property owner and developer Jersey 100 100
* Glades Properties Pte. Ltd. Property owner, developer and investment holding
Singapore 100 100
* Gemini One Pte. Ltd. Hotel operator Singapore 100 100
* Gemini One Trust Property owner and developer Singapore 100 100
* Grange 100 Pte. Ltd. Property owner Singapore 100 100
* Guan Realty (Private) Limited Property owner and developer Singapore 100 100
^ Hoko Mina Pty Ltd Property owner and developer Australia 100 100
* Hong Leong Properties Pte. Limited
Property owner Singapore 100 100
** Highline Investments LP Property owner United Kingdom 100 100
** Iconique Tokutei Mokuteki Kaisha
Asset management Japan 100 100
* Ingensys Pte. Ltd. Systems integration activities Singapore 100 100
^ Jayland Properties Limited Property owner and developer Jersey 100 100
** Krungthep Rimnam Limited Hotel business Thailand 49 (b) 49 (b)
^ Landco Properties Limited Property owner Jersey 100 100
* Land Equity Development Pte Ltd
Property owner Singapore 100 100
** Lingo Enterprises Limited Property holding and property investment
Singapore/ Hong Kong
100 100
^ Melvale Holdings Limited Investment holding and property developer
Jersey 100 100
43 SIGNIFICANT INVESTMENTS IN SUBSIDIARIES (CONT’D)
Principal activity
Principal place of business/Country ofincorporation
Ownership interest
2021 2020% %
Direct/Indirect Subsidiaries of the Company (cont’d)
** Millennium & Copthorne Hotels Limited
Investment holding United Kingdom 100 100
** 125 OBS Limited Partnership Property holding United Kingdom 100 100
* Novel Developments Pte. Ltd. Property owner and developer Singapore 100 100
^ Paradise Investments Limited Property owner and developer Jersey 100 –
* Pavo Properties Pte. Ltd. Property owner and developer Singapore 60 60
** Phuket Square Co., Ltd. Retail and hotel business Thailand 49(b) 49(b)
^ Pinenorth Properties Limited Property owner and developer Jersey 100 100
^ Reselton Properties Limited Property owner and developer Jersey 100 100
* Republic Plaza City Club (Singapore) Pte Ltd
Owner and operator of clubs Singapore 100 100
^ Reach Across International Limited
Investment holding British Virgin Islands
100 100
** Shanghai Anting Waratah Real Estate Development Co., Ltd.
Property owner People’s Republic of China
100 100
** Shanghai Fusion Enterprise Management Co., Ltd.
Property owner People’s Republic of China
100 100
** Shanghai Galaxy Enterprise Management Co., Ltd.
Property owner People’s Republic of China
100 100
*** Shanghai Jingwen Zhaoxiang Real Estate Limited
Property owner and developer People’s Republic of China
100 100
*** Shanghai Meidao Investment Co., Ltd.
Property owner and developer People’s Republic of China
100 100
** Shanghai Rainbow Enterprise Management Co., Ltd.
Property owner People’s Republic of China
100 100
** Shanghai Star Enterprise Management Co., Ltd.
Property owner People’s Republic of China
100 100
** Shanghai Yulan Real Estate Development Co., Ltd.
Property owner and developer
People’s Republic of China
100 100
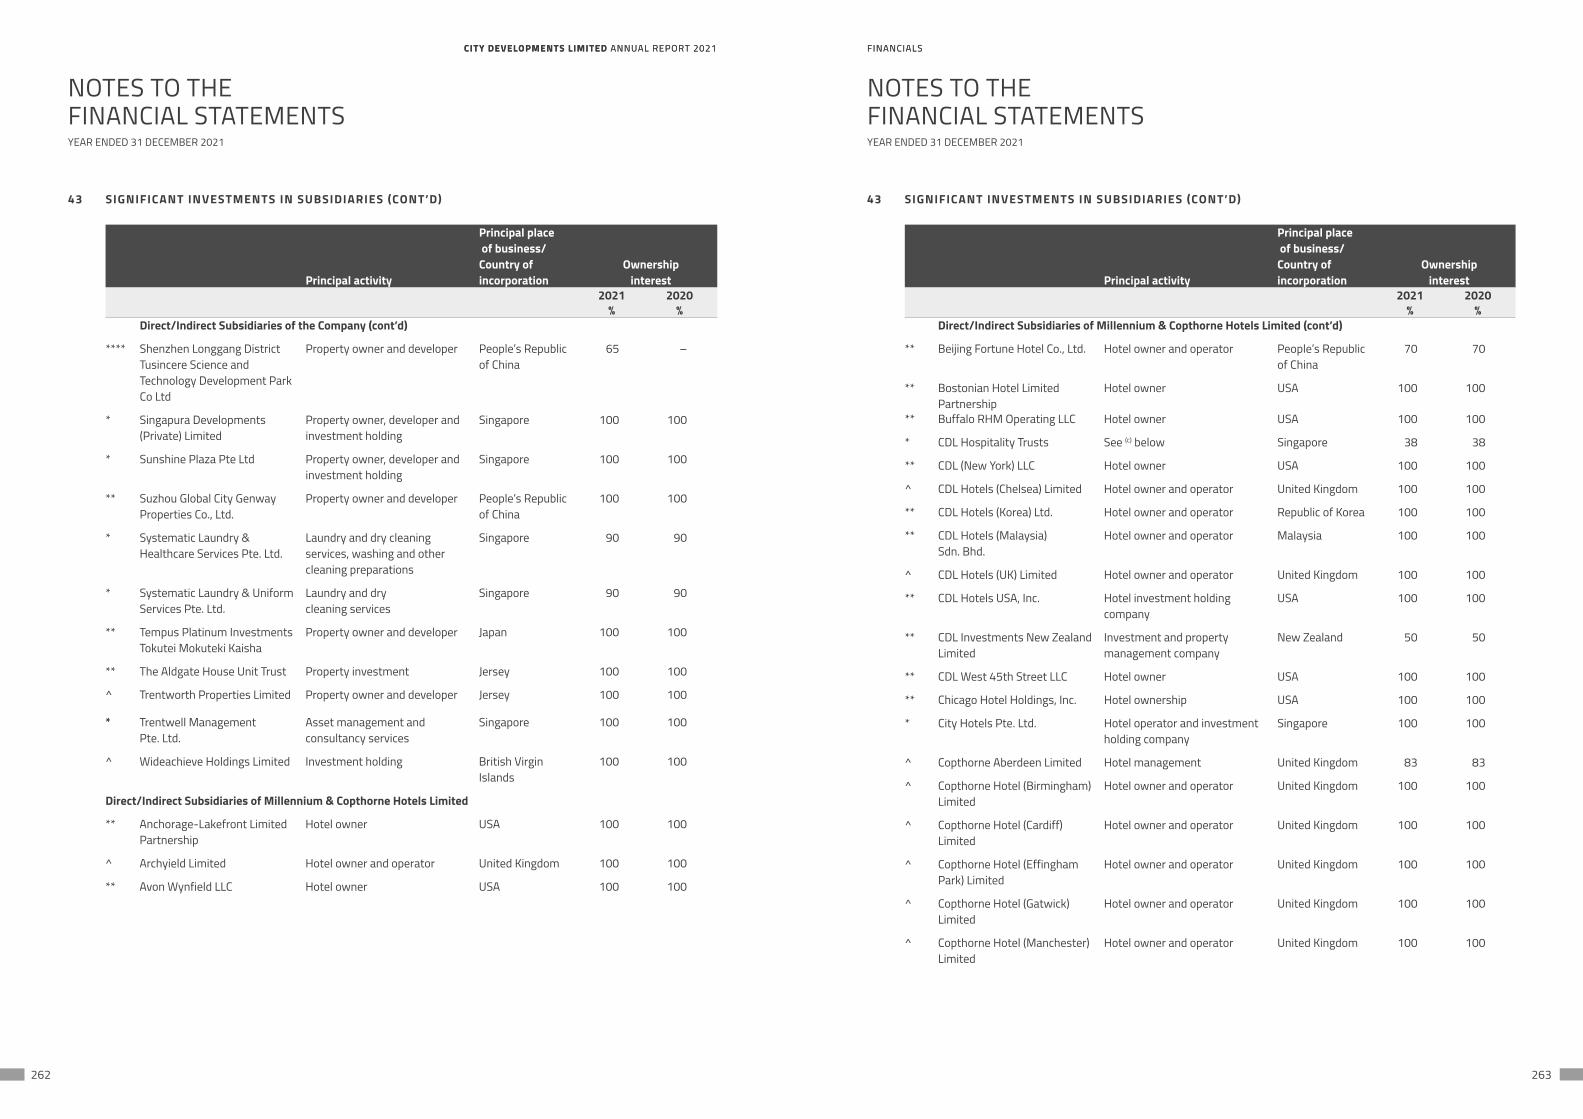
CITY DEVELOPMENTS LIMITED ANNUAL REPORT 2021 FINANCIALSCITY DEVELOPMENTS LIMITED ANNUAL REPORT 2021 FINANCIALS
262 263
NOTES TO THEFINANCIAL STATEMENTS
NOTES TO THEFINANCIAL STATEMENTS
YEAR ENDED 31 DECEMBER 2021 YEAR ENDED 31 DECEMBER 2021
43 SIGNIFICANT INVESTMENTS IN SUBSIDIARIES (CONT’D)
Principal activity
Principal place of business/Country ofincorporation
Ownership interest
2021 2020% %
Direct/Indirect Subsidiaries of the Company (cont’d)
**** Shenzhen Longgang District Tusincere Science and Technology Development Park Co Ltd
Property owner and developer People’s Republic of China
65 –
* Singapura Developments (Private) Limited
Property owner, developer and investment holding
Singapore 100 100
* Sunshine Plaza Pte Ltd Property owner, developer and investment holding
Singapore 100 100
** Suzhou Global City Genway Properties Co., Ltd.
Property owner and developer People’s Republic of China
100 100
* Systematic Laundry & Healthcare Services Pte. Ltd.
Laundry and dry cleaning services, washing and other cleaning preparations
Singapore 90 90
* Systematic Laundry & Uniform Services Pte. Ltd.
Laundry and dry cleaning services
Singapore 90 90
** Tempus Platinum Investments Tokutei Mokuteki Kaisha
Property owner and developer Japan 100 100
** The Aldgate House Unit Trust Property investment Jersey 100 100
^ Trentworth Properties Limited Property owner and developer Jersey 100 100
* Trentwell Management Pte. Ltd.
Asset management and consultancy services
Singapore 100 100
^ Wideachieve Holdings Limited Investment holding British Virgin Islands
100 100
Direct/Indirect Subsidiaries of Millennium & Copthorne Hotels Limited
** Anchorage-Lakefront Limited Partnership
Hotel owner USA 100 100
^ Archyield Limited Hotel owner and operator United Kingdom 100 100
** Avon Wynfield LLC Hotel owner USA 100 100
43 SIGNIFICANT INVESTMENTS IN SUBSIDIARIES (CONT’D)
Principal activity
Principal place of business/Country ofincorporation
Ownership interest
2021 2020% %
Direct/Indirect Subsidiaries of Millennium & Copthorne Hotels Limited (cont’d)
** Beijing Fortune Hotel Co., Ltd. Hotel owner and operator People’s Republic of China
70 70
** Bostonian Hotel Limited Partnership
Hotel owner USA 100 100
** Buffalo RHM Operating LLC Hotel owner USA 100 100
* CDL Hospitality Trusts See (c) below Singapore 38 38
** CDL (New York) LLC Hotel owner USA 100 100
^ CDL Hotels (Chelsea) Limited Hotel owner and operator United Kingdom 100 100
** CDL Hotels (Korea) Ltd. Hotel owner and operator Republic of Korea 100 100
** CDL Hotels (Malaysia) Sdn. Bhd.
Hotel owner and operator Malaysia 100 100
^ CDL Hotels (UK) Limited Hotel owner and operator United Kingdom 100 100
** CDL Hotels USA, Inc. Hotel investment holding company
USA 100 100
** CDL Investments New Zealand Limited
Investment and property management company
New Zealand 50 50
** CDL West 45th Street LLC Hotel owner USA 100 100
** Chicago Hotel Holdings, Inc. Hotel ownership USA 100 100
* City Hotels Pte. Ltd. Hotel operator and investment holding company
Singapore 100 100
^ Copthorne Aberdeen Limited Hotel management United Kingdom 83 83
^ Copthorne Hotel (Birmingham) Limited
Hotel owner and operator United Kingdom 100 100
^ Copthorne Hotel (Cardiff) Limited
Hotel owner and operator United Kingdom 100 100
^ Copthorne Hotel (Effingham Park) Limited
Hotel owner and operator United Kingdom 100 100
^ Copthorne Hotel (Gatwick) Limited
Hotel owner and operator United Kingdom 100 100
^ Copthorne Hotel (Manchester) Limited
Hotel owner and operator United Kingdom 100 100
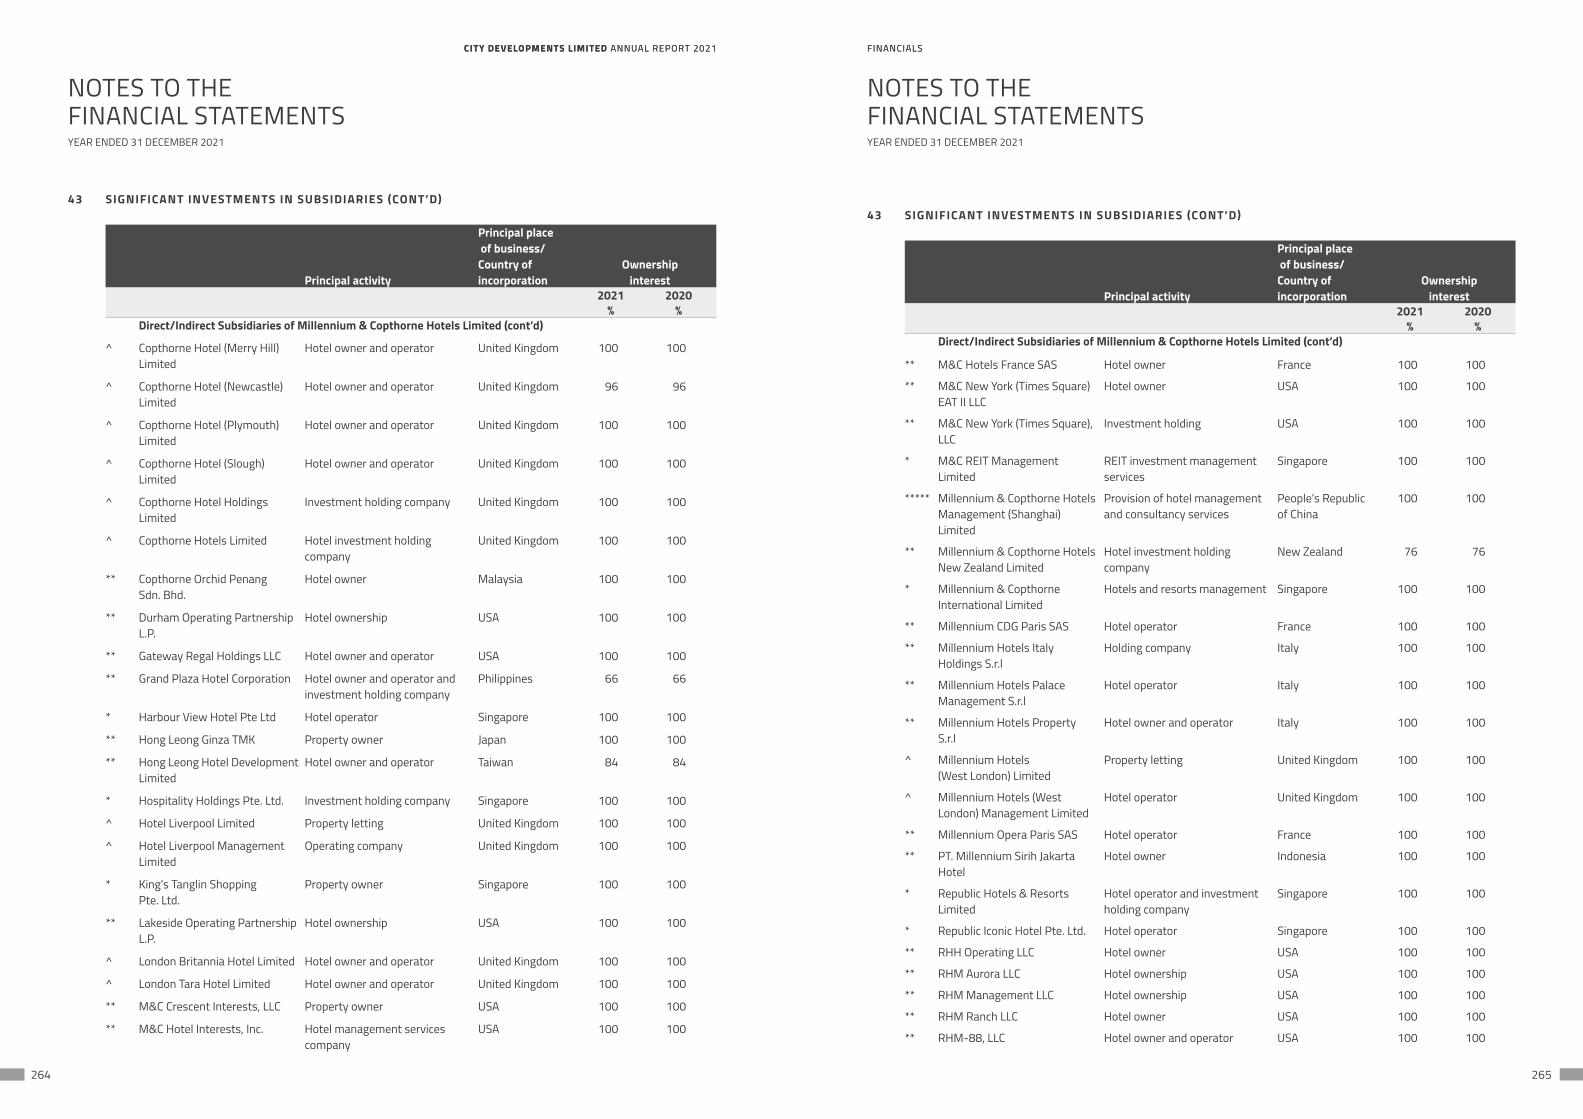
CITY DEVELOPMENTS LIMITED ANNUAL REPORT 2021 FINANCIALSCITY DEVELOPMENTS LIMITED ANNUAL REPORT 2021 FINANCIALS
264 265
NOTES TO THEFINANCIAL STATEMENTS
NOTES TO THEFINANCIAL STATEMENTS
YEAR ENDED 31 DECEMBER 2021 YEAR ENDED 31 DECEMBER 2021
43 SIGNIFICANT INVESTMENTS IN SUBSIDIARIES (CONT’D)
Principal activity
Principal place of business/Country ofincorporation
Ownership interest
2021 2020% %
Direct/Indirect Subsidiaries of Millennium & Copthorne Hotels Limited (cont’d)
^ Copthorne Hotel (Merry Hill) Limited
Hotel owner and operator United Kingdom 100 100
^ Copthorne Hotel (Newcastle) Limited
Hotel owner and operator United Kingdom 96 96
^ Copthorne Hotel (Plymouth) Limited
Hotel owner and operator United Kingdom 100 100
^ Copthorne Hotel (Slough) Limited
Hotel owner and operator United Kingdom 100 100
^ Copthorne Hotel Holdings Limited
Investment holding company United Kingdom 100 100
^ Copthorne Hotels Limited Hotel investment holding company
United Kingdom 100 100
** Copthorne Orchid Penang Sdn. Bhd.
Hotel owner Malaysia 100 100
** Durham Operating Partnership L.P.
Hotel ownership USA 100 100
** Gateway Regal Holdings LLC Hotel owner and operator USA 100 100
** Grand Plaza Hotel Corporation Hotel owner and operator and investment holding company
Philippines 66 66
* Harbour View Hotel Pte Ltd Hotel operator Singapore 100 100
** Hong Leong Ginza TMK Property owner Japan 100 100
** Hong Leong Hotel Development Limited
Hotel owner and operator Taiwan 84 84
* Hospitality Holdings Pte. Ltd. Investment holding company Singapore 100 100
^ Hotel Liverpool Limited Property letting United Kingdom 100 100
^ Hotel Liverpool Management Limited
Operating company United Kingdom 100 100
* King’s Tanglin Shopping Pte. Ltd.
Property owner Singapore 100 100
** Lakeside Operating Partnership L.P.
Hotel ownership USA 100 100
^ London Britannia Hotel Limited Hotel owner and operator United Kingdom 100 100
^ London Tara Hotel Limited Hotel owner and operator United Kingdom 100 100
** M&C Crescent Interests, LLC Property owner USA 100 100
** M&C Hotel Interests, Inc. Hotel management services company
USA 100 100
43 SIGNIFICANT INVESTMENTS IN SUBSIDIARIES (CONT’D)
Principal activity
Principal place of business/Country ofincorporation
Ownership interest
2021 2020% %
Direct/Indirect Subsidiaries of Millennium & Copthorne Hotels Limited (cont’d)
** M&C Hotels France SAS Hotel owner France 100 100
** M&C New York (Times Square) EAT II LLC
Hotel owner USA 100 100
** M&C New York (Times Square), LLC
Investment holding USA 100 100
* M&C REIT Management Limited
REIT investment management services
Singapore 100 100
***** Millennium & Copthorne Hotels Management (Shanghai) Limited
Provision of hotel management and consultancy services
People’s Republic of China
100 100
** Millennium & Copthorne Hotels New Zealand Limited
Hotel investment holding company
New Zealand 76 76
* Millennium & Copthorne International Limited
Hotels and resorts management Singapore 100 100
** Millennium CDG Paris SAS Hotel operator France 100 100
** Millennium Hotels Italy Holdings S.r.l
Holding company Italy 100 100
** Millennium Hotels Palace Management S.r.l
Hotel operator Italy 100 100
** Millennium Hotels Property S.r.l
Hotel owner and operator Italy 100 100
^ Millennium Hotels (West London) Limited
Property letting United Kingdom 100 100
^ Millennium Hotels (West London) Management Limited
Hotel operator United Kingdom 100 100
** Millennium Opera Paris SAS Hotel operator France 100 100
** PT. Millennium Sirih Jakarta Hotel
Hotel owner Indonesia 100 100
* Republic Hotels & Resorts Limited
Hotel operator and investment holding company
Singapore 100 100
* Republic Iconic Hotel Pte. Ltd. Hotel operator Singapore 100 100
** RHH Operating LLC Hotel owner USA 100 100
** RHM Aurora LLC Hotel ownership USA 100 100
** RHM Management LLC Hotel ownership USA 100 100
** RHM Ranch LLC Hotel owner USA 100 100
** RHM-88, LLC Hotel owner and operator USA 100 100
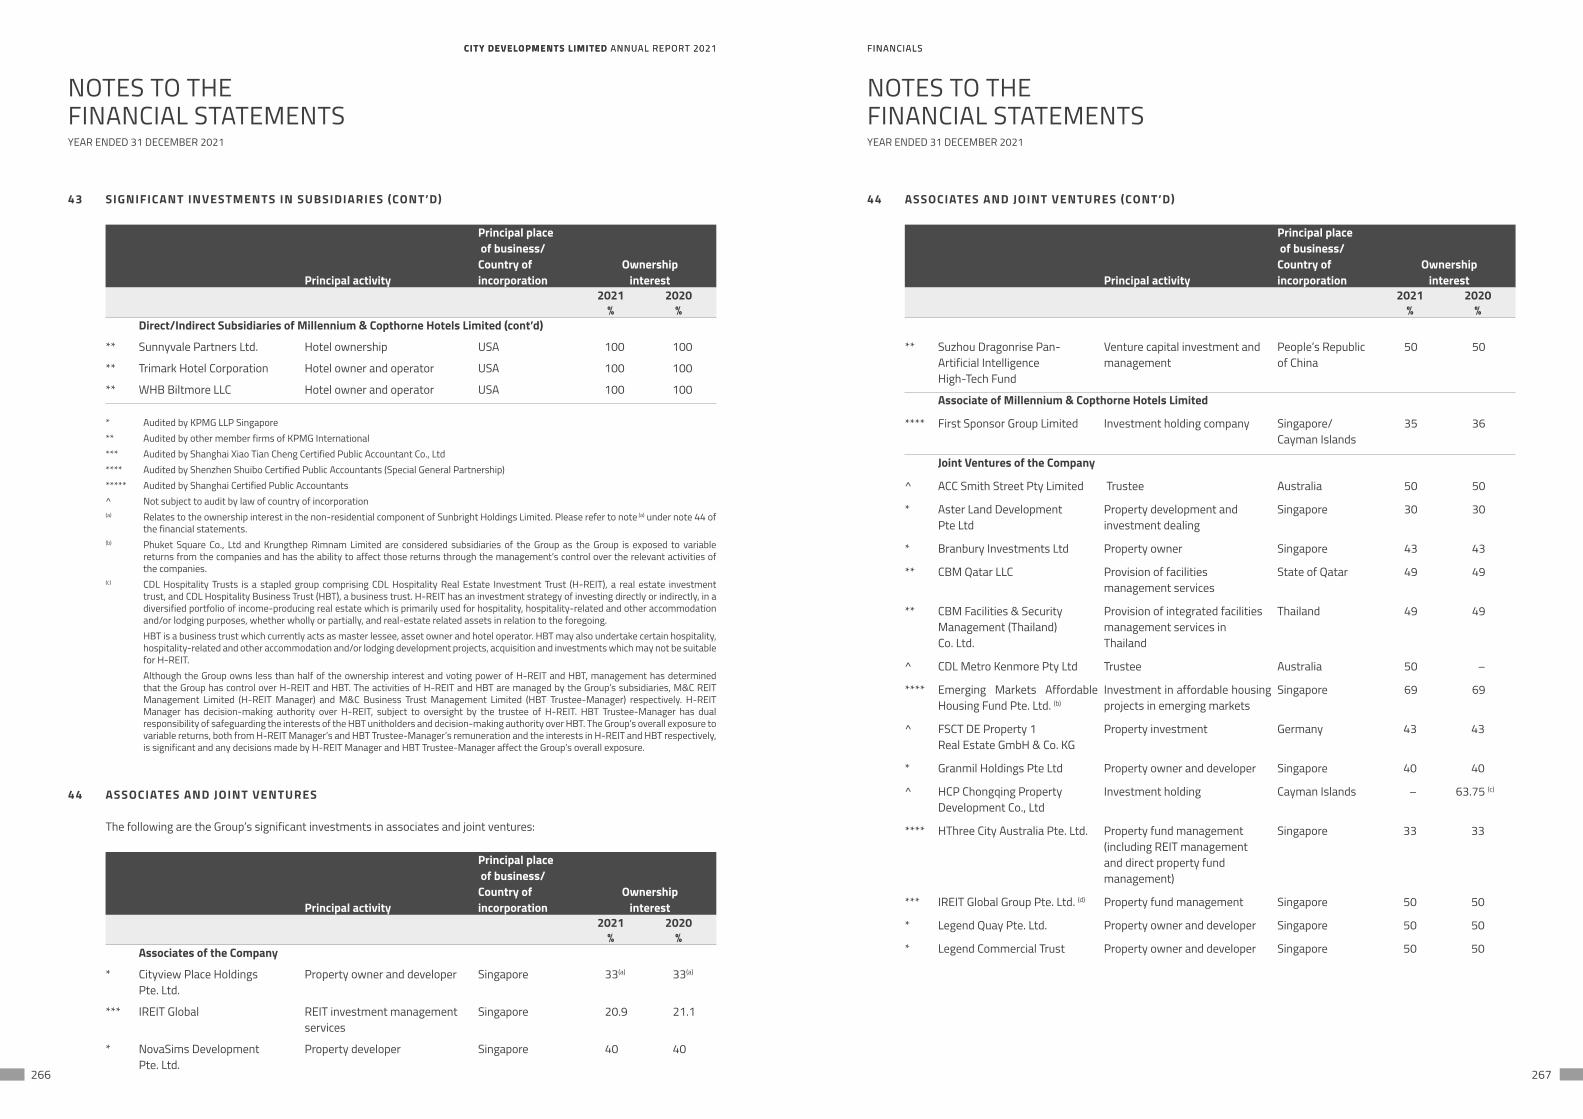
CITY DEVELOPMENTS LIMITED ANNUAL REPORT 2021 FINANCIALSCITY DEVELOPMENTS LIMITED ANNUAL REPORT 2021 FINANCIALS
266 267
NOTES TO THEFINANCIAL STATEMENTS
NOTES TO THEFINANCIAL STATEMENTS
YEAR ENDED 31 DECEMBER 2021 YEAR ENDED 31 DECEMBER 2021
43 SIGNIFICANT INVESTMENTS IN SUBSIDIARIES (CONT’D)
Principal activity
Principal place of business/Country ofincorporation
Ownership interest
2021 2020% %
Direct/Indirect Subsidiaries of Millennium & Copthorne Hotels Limited (cont’d)
** Sunnyvale Partners Ltd. Hotel ownership USA 100 100
** Trimark Hotel Corporation Hotel owner and operator USA 100 100
** WHB Biltmore LLC Hotel owner and operator USA 100 100
* Audited by KPMG LLP Singapore ** Audited by other member firms of KPMG International *** Audited by Shanghai Xiao Tian Cheng Certified Public Accountant Co., Ltd**** Audited by Shenzhen Shuibo Certified Public Accountants (Special General Partnership)***** Audited by Shanghai Certified Public Accountants ^ Not subject to audit by law of country of incorporation (a) Relates to the ownership interest in the non-residential component of Sunbright Holdings Limited. Please refer to note (a) under note 44 of
the financial statements.(b) Phuket Square Co., Ltd and Krungthep Rimnam Limited are considered subsidiaries of the Group as the Group is exposed to variable
returns from the companies and has the ability to affect those returns through the management’s control over the relevant activities of the companies.
(c) CDL Hospitality Trusts is a stapled group comprising CDL Hospitality Real Estate Investment Trust (H-REIT), a real estate investment trust, and CDL Hospitality Business Trust (HBT), a business trust. H-REIT has an investment strategy of investing directly or indirectly, in a diversified portfolio of income-producing real estate which is primarily used for hospitality, hospitality-related and other accommodation and/or lodging purposes, whether wholly or partially, and real-estate related assets in relation to the foregoing.
HBT is a business trust which currently acts as master lessee, asset owner and hotel operator. HBT may also undertake certain hospitality, hospitality-related and other accommodation and/or lodging development projects, acquisition and investments which may not be suitable for H-REIT.
Although the Group owns less than half of the ownership interest and voting power of H-REIT and HBT, management has determined that the Group has control over H-REIT and HBT. The activities of H-REIT and HBT are managed by the Group’s subsidiaries, M&C REIT Management Limited (H-REIT Manager) and M&C Business Trust Management Limited (HBT Trustee-Manager) respectively. H-REIT Manager has decision-making authority over H-REIT, subject to oversight by the trustee of H-REIT. HBT Trustee-Manager has dual responsibility of safeguarding the interests of the HBT unitholders and decision-making authority over HBT. The Group’s overall exposure to variable returns, both from H-REIT Manager’s and HBT Trustee-Manager’s remuneration and the interests in H-REIT and HBT respectively, is significant and any decisions made by H-REIT Manager and HBT Trustee-Manager affect the Group’s overall exposure.
44 ASSOCIATES AND JOINT VENTURES
The following are the Group’s significant investments in associates and joint ventures:
Principal activity
Principal place of business/Country ofincorporation
Ownership interest
2021 2020% %
Associates of the Company
* Cityview Place Holdings Pte. Ltd.
Property owner and developer Singapore 33(a) 33(a)
*** IREIT Global REIT investment management services
Singapore 20.9 21.1
* NovaSims Development Pte. Ltd.
Property developer Singapore 40 40
44 ASSOCIATES AND JOINT VENTURES (CONT’D)
Principal activity
Principal place of business/Country ofincorporation
Ownership interest
2021 2020% %
** Suzhou Dragonrise Pan- Artificial Intelligence High-Tech Fund
Venture capital investment and management
People’s Republic of China
50 50
Associate of Millennium & Copthorne Hotels Limited
**** First Sponsor Group Limited Investment holding company Singapore/ Cayman Islands
35 36
Joint Ventures of the Company
^ ACC Smith Street Pty Limited Trustee Australia 50 50
* Aster Land Development Pte Ltd
Property development and investment dealing
Singapore 30 30
* Branbury Investments Ltd Property owner Singapore 43 43
** CBM Qatar LLC Provision of facilities management services
State of Qatar 49 49
** CBM Facilities & Security Management (Thailand) Co. Ltd.
Provision of integrated facilities management services in Thailand
Thailand 49 49
^ CDL Metro Kenmore Pty Ltd Trustee Australia 50 –
**** Emerging Markets Affordable Housing Fund Pte. Ltd. (b)
Investment in affordable housing projects in emerging markets
Singapore 69 69
^ FSCT DE Property 1 Real Estate GmbH & Co. KG
Property investment Germany 43 43
* Granmil Holdings Pte Ltd Property owner and developer Singapore 40 40
^ HCP Chongqing Property Development Co., Ltd
Investment holding Cayman Islands – 63.75 (c)
**** HThree City Australia Pte. Ltd. Property fund management (including REIT management and direct property fund management)
Singapore 33 33
*** IREIT Global Group Pte. Ltd. (d) Property fund management Singapore 50 50
* Legend Quay Pte. Ltd. Property owner and developer Singapore 50 50
* Legend Commercial Trust Property owner and developer Singapore 50 50
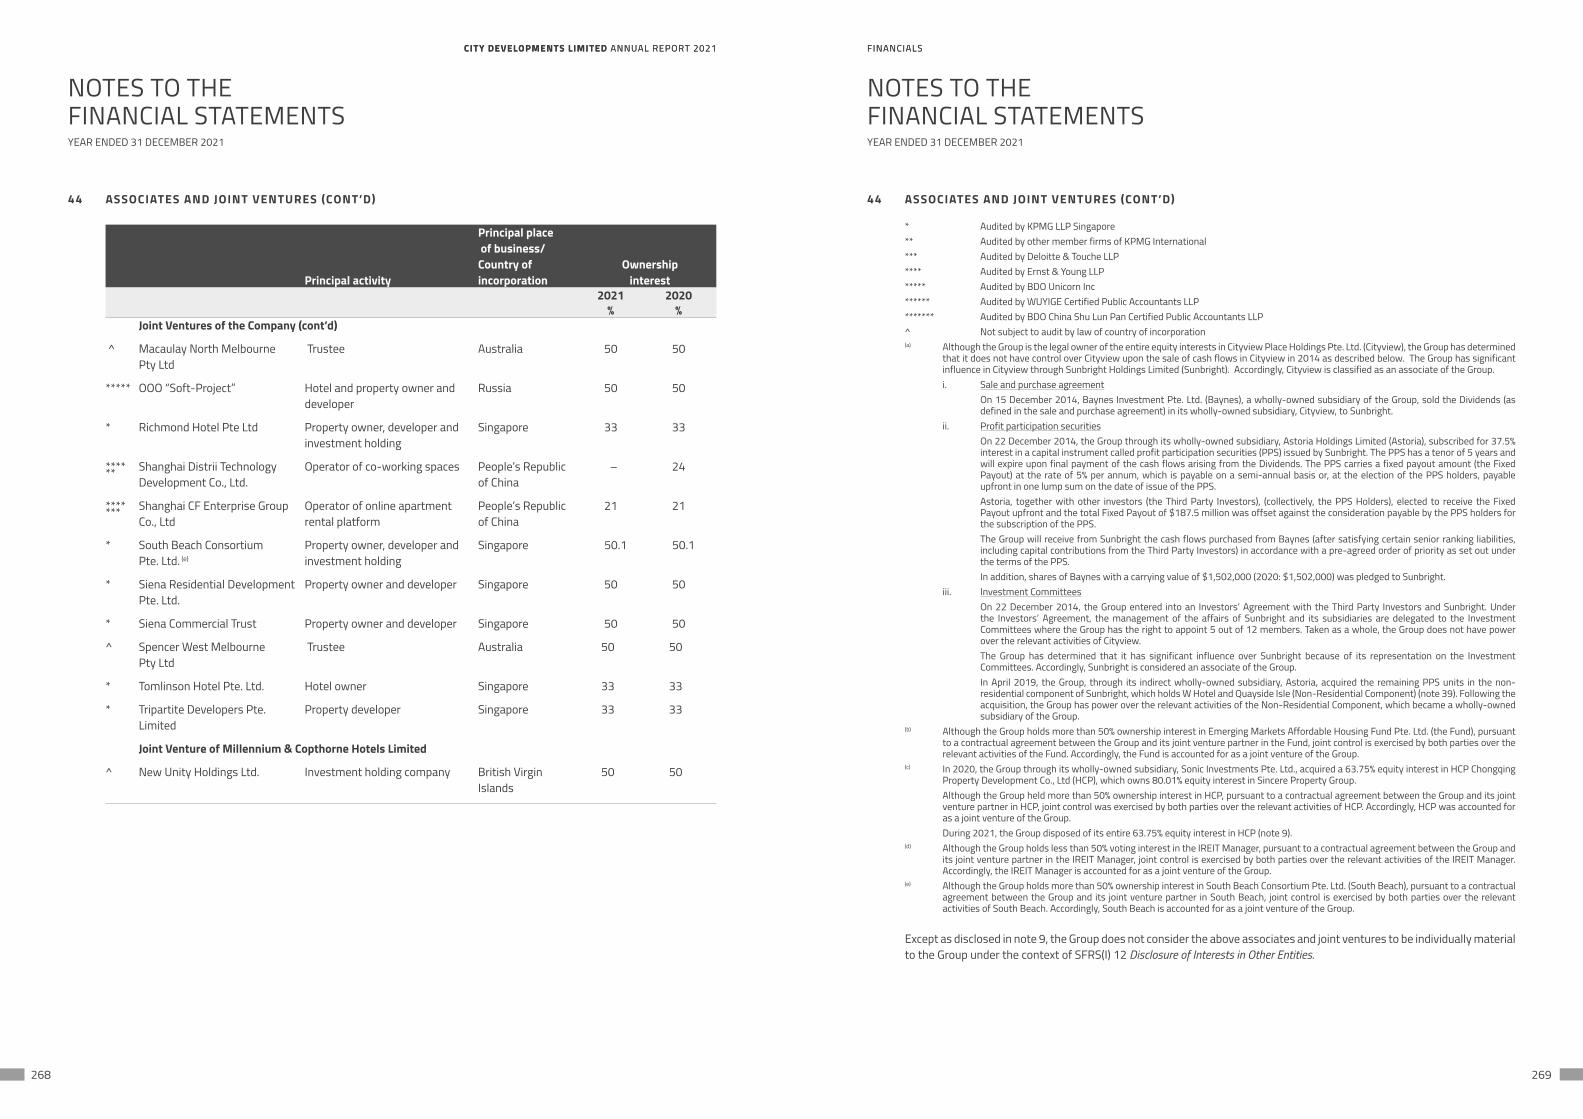
CITY DEVELOPMENTS LIMITED ANNUAL REPORT 2021 FINANCIALSCITY DEVELOPMENTS LIMITED ANNUAL REPORT 2021 FINANCIALS
268 269
NOTES TO THEFINANCIAL STATEMENTS
NOTES TO THEFINANCIAL STATEMENTS
YEAR ENDED 31 DECEMBER 2021 YEAR ENDED 31 DECEMBER 2021
44 ASSOCIATES AND JOINT VENTURES (CONT’D)
Principal activity
Principal place of business/Country ofincorporation
Ownership interest
2021 2020% %
Joint Ventures of the Company (cont’d)
^ Macaulay North Melbourne Pty Ltd
Trustee Australia 50 50
***** OOO “Soft-Project” Hotel and property owner and developer
Russia 50 50
* Richmond Hotel Pte Ltd Property owner, developer and investment holding
Singapore 33 33
****** Shanghai Distrii Technology Development Co., Ltd.
Operator of co-working spaces People’s Republic of China
– 24
******* Shanghai CF Enterprise Group Co., Ltd
Operator of online apartment rental platform
People’s Republic of China
21 21
* South Beach Consortium Pte. Ltd. (e)
Property owner, developer and investment holding
Singapore 50.1 50.1
* Siena Residential Development Pte. Ltd.
Property owner and developer Singapore 50 50
* Siena Commercial Trust Property owner and developer Singapore 50 50
^ Spencer West Melbourne Pty Ltd
Trustee Australia 50 50
* Tomlinson Hotel Pte. Ltd. Hotel owner Singapore 33 33
* Tripartite Developers Pte. Limited
Property developer Singapore 33 33
Joint Venture of Millennium & Copthorne Hotels Limited
^ New Unity Holdings Ltd. Investment holding company British Virgin Islands
50 50
44 ASSOCIATES AND JOINT VENTURES (CONT’D)
* Audited by KPMG LLP Singapore** Audited by other member firms of KPMG International*** Audited by Deloitte & Touche LLP**** Audited by Ernst & Young LLP***** Audited by BDO Unicorn Inc****** Audited by WUYIGE Certified Public Accountants LLP******* Audited by BDO China Shu Lun Pan Certified Public Accountants LLP^ Not subject to audit by law of country of incorporation(a) Although the Group is the legal owner of the entire equity interests in Cityview Place Holdings Pte. Ltd. (Cityview), the Group has determined
that it does not have control over Cityview upon the sale of cash flows in Cityview in 2014 as described below. The Group has significant influence in Cityview through Sunbright Holdings Limited (Sunbright). Accordingly, Cityview is classified as an associate of the Group.
i. Sale and purchase agreementOn 15 December 2014, Baynes Investment Pte. Ltd. (Baynes), a wholly-owned subsidiary of the Group, sold the Dividends (as defined in the sale and purchase agreement) in its wholly-owned subsidiary, Cityview, to Sunbright.
ii. Profit participation securities On 22 December 2014, the Group through its wholly-owned subsidiary, Astoria Holdings Limited (Astoria), subscribed for 37.5% interest in a capital instrument called profit participation securities (PPS) issued by Sunbright. The PPS has a tenor of 5 years and will expire upon final payment of the cash flows arising from the Dividends. The PPS carries a fixed payout amount (the Fixed Payout) at the rate of 5% per annum, which is payable on a semi-annual basis or, at the election of the PPS holders, payable upfront in one lump sum on the date of issue of the PPS.Astoria, together with other investors (the Third Party Investors), (collectively, the PPS Holders), elected to receive the Fixed Payout upfront and the total Fixed Payout of $187.5 million was offset against the consideration payable by the PPS holders for the subscription of the PPS.The Group will receive from Sunbright the cash flows purchased from Baynes (after satisfying certain senior ranking liabilities, including capital contributions from the Third Party Investors) in accordance with a pre-agreed order of priority as set out under the terms of the PPS.In addition, shares of Baynes with a carrying value of $1,502,000 (2020: $1,502,000) was pledged to Sunbright.
iii. Investment Committees On 22 December 2014, the Group entered into an Investors’ Agreement with the Third Party Investors and Sunbright. Under the Investors’ Agreement, the management of the affairs of Sunbright and its subsidiaries are delegated to the Investment Committees where the Group has the right to appoint 5 out of 12 members. Taken as a whole, the Group does not have power over the relevant activities of Cityview. The Group has determined that it has significant influence over Sunbright because of its representation on the Investment Committees. Accordingly, Sunbright is considered an associate of the Group.In April 2019, the Group, through its indirect wholly-owned subsidiary, Astoria, acquired the remaining PPS units in the non-residential component of Sunbright, which holds W Hotel and Quayside Isle (Non-Residential Component) (note 39). Following the acquisition, the Group has power over the relevant activities of the Non-Residential Component, which became a wholly-owned subsidiary of the Group.
(b) Although the Group holds more than 50% ownership interest in Emerging Markets Affordable Housing Fund Pte. Ltd. (the Fund), pursuant to a contractual agreement between the Group and its joint venture partner in the Fund, joint control is exercised by both parties over the relevant activities of the Fund. Accordingly, the Fund is accounted for as a joint venture of the Group.
(c) In 2020, the Group through its wholly-owned subsidiary, Sonic Investments Pte. Ltd., acquired a 63.75% equity interest in HCP Chongqing Property Development Co., Ltd (HCP), which owns 80.01% equity interest in Sincere Property Group.
Although the Group held more than 50% ownership interest in HCP, pursuant to a contractual agreement between the Group and its joint venture partner in HCP, joint control was exercised by both parties over the relevant activities of HCP. Accordingly, HCP was accounted for as a joint venture of the Group.
During 2021, the Group disposed of its entire 63.75% equity interest in HCP (note 9). (d) Although the Group holds less than 50% voting interest in the IREIT Manager, pursuant to a contractual agreement between the Group and
its joint venture partner in the IREIT Manager, joint control is exercised by both parties over the relevant activities of the IREIT Manager. Accordingly, the IREIT Manager is accounted for as a joint venture of the Group.
(e) Although the Group holds more than 50% ownership interest in South Beach Consortium Pte. Ltd. (South Beach), pursuant to a contractual agreement between the Group and its joint venture partner in South Beach, joint control is exercised by both parties over the relevant activities of South Beach. Accordingly, South Beach is accounted for as a joint venture of the Group.
Except as disclosed in note 9, the Group does not consider the above associates and joint ventures to be individually material to the Group under the context of SFRS(I) 12 Disclosure of Interests in Other Entities.
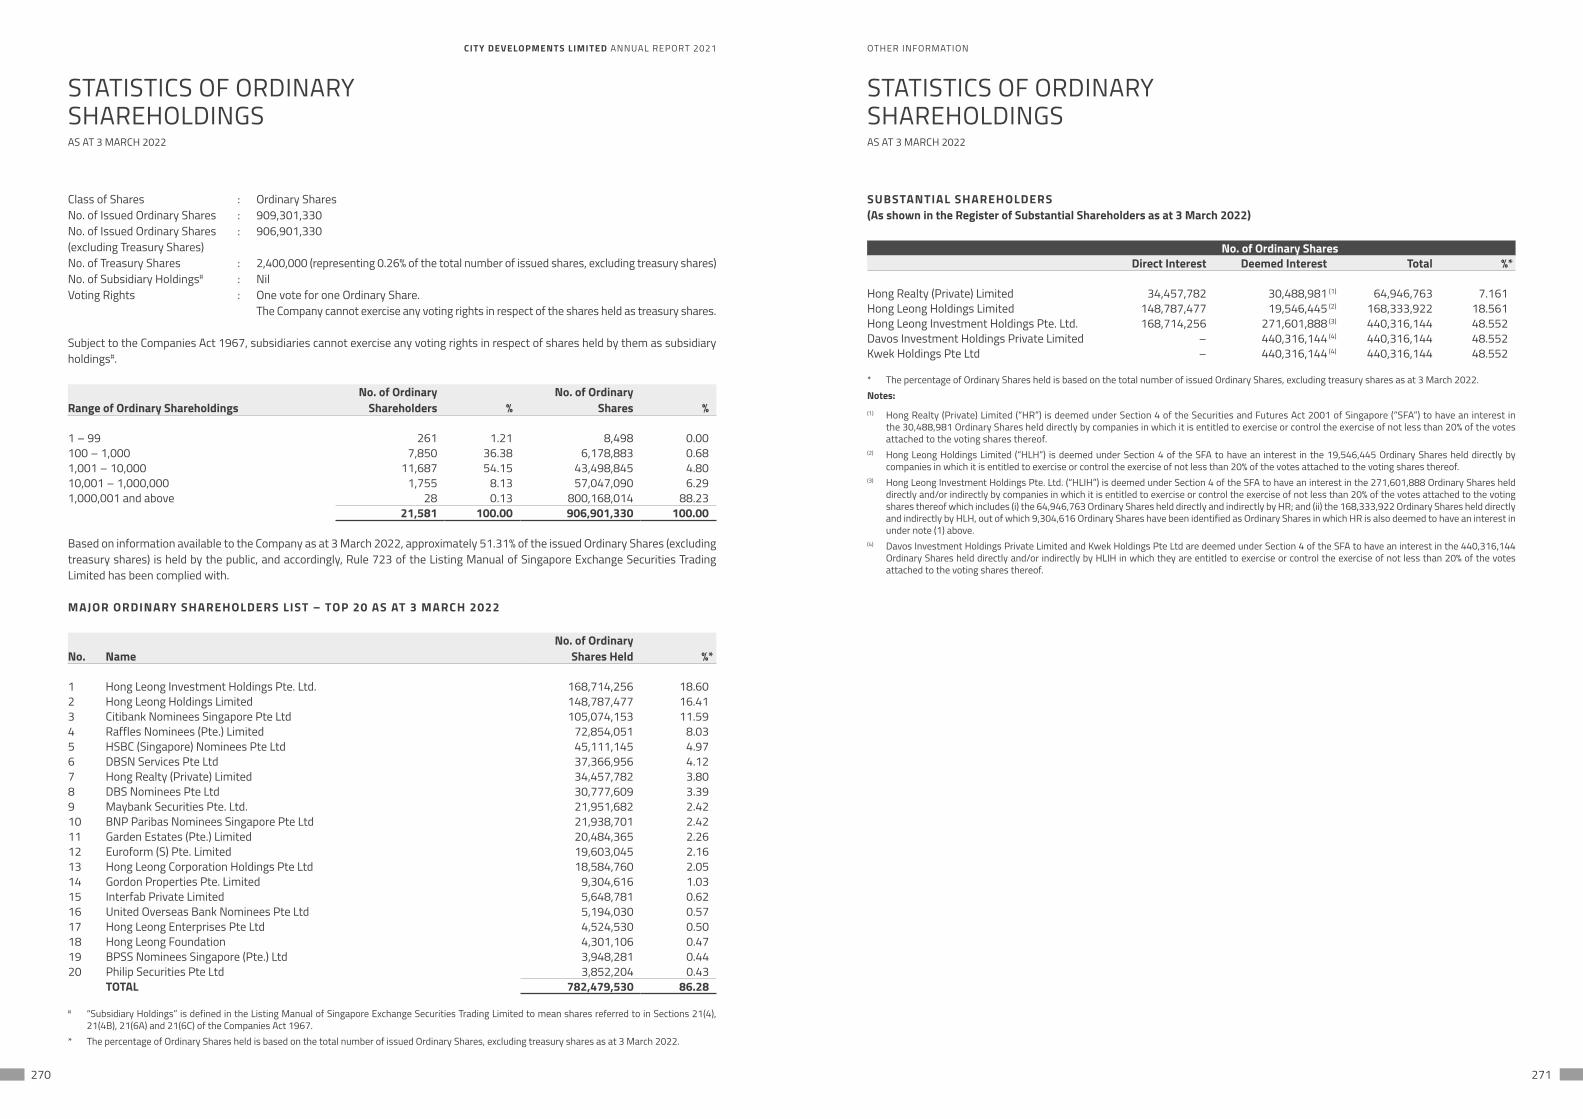
OTHER INFORMATIONCITY DEVELOPMENTS LIMITED ANNUAL REPORT 2021
270 271
Class of Shares : Ordinary SharesNo. of Issued Ordinary Shares : 909,301,330No. of Issued Ordinary Shares : 906,901,330(excluding Treasury Shares)No. of Treasury Shares : 2,400,000 (representing 0.26% of the total number of issued shares, excluding treasury shares)No. of Subsidiary Holdings# : NilVoting Rights : One vote for one Ordinary Share.
The Company cannot exercise any voting rights in respect of the shares held as treasury shares.
Subject to the Companies Act 1967, subsidiaries cannot exercise any voting rights in respect of shares held by them as subsidiary holdings#.
Range of Ordinary ShareholdingsNo. of Ordinary
Shareholders %No. of Ordinary
Shares %
1 – 99 261 1.21 8,498 0.00100 – 1,000 7,850 36.38 6,178,883 0.681,001 – 10,000 11,687 54.15 43,498,845 4.8010,001 – 1,000,000 1,755 8.13 57,047,090 6.291,000,001 and above 28 0.13 800,168,014 88.23
21,581 100.00 906,901,330 100.00
Based on information available to the Company as at 3 March 2022, approximately 51.31% of the issued Ordinary Shares (excluding treasury shares) is held by the public, and accordingly, Rule 723 of the Listing Manual of Singapore Exchange Securities Trading Limited has been complied with.
MAJOR ORDINARY SHAREHOLDERS LIST – TOP 20 AS AT 3 MARCH 2022
No. NameNo. of Ordinary
Shares Held %*
1 Hong Leong Investment Holdings Pte. Ltd. 168,714,256 18.602 Hong Leong Holdings Limited 148,787,477 16.413 Citibank Nominees Singapore Pte Ltd 105,074,153 11.594 Raffles Nominees (Pte.) Limited 72,854,051 8.035 HSBC (Singapore) Nominees Pte Ltd 45,111,145 4.976 DBSN Services Pte Ltd 37,366,956 4.127 Hong Realty (Private) Limited 34,457,782 3.808 DBS Nominees Pte Ltd 30,777,609 3.399 Maybank Securities Pte. Ltd. 21,951,682 2.4210 BNP Paribas Nominees Singapore Pte Ltd 21,938,701 2.4211 Garden Estates (Pte.) Limited 20,484,365 2.2612 Euroform (S) Pte. Limited 19,603,045 2.1613 Hong Leong Corporation Holdings Pte Ltd 18,584,760 2.0514 Gordon Properties Pte. Limited 9,304,616 1.0315 Interfab Private Limited 5,648,781 0.6216 United Overseas Bank Nominees Pte Ltd 5,194,030 0.5717 Hong Leong Enterprises Pte Ltd 4,524,530 0.5018 Hong Leong Foundation 4,301,106 0.4719 BPSS Nominees Singapore (Pte.) Ltd 3,948,281 0.4420 Philip Securities Pte Ltd 3,852,204 0.43
TOTAL 782,479,530 86.28
# “Subsidiary Holdings” is defined in the Listing Manual of Singapore Exchange Securities Trading Limited to mean shares referred to in Sections 21(4), 21(4B), 21(6A) and 21(6C) of the Companies Act 1967.
* The percentage of Ordinary Shares held is based on the total number of issued Ordinary Shares, excluding treasury shares as at 3 March 2022.
STATISTICS OF ORDINARYSHAREHOLDINGSAS AT 3 MARCH 2022
SUBSTANTIAL SHAREHOLDERS(As shown in the Register of Substantial Shareholders as at 3 March 2022)
No. of Ordinary SharesDirect Interest Deemed Interest Total %*
Hong Realty (Private) Limited 34,457,782 30,488,981 (1) 64,946,763 7.161Hong Leong Holdings Limited 148,787,477 19,546,445 (2) 168,333,922 18.561Hong Leong Investment Holdings Pte. Ltd. 168,714,256 271,601,888 (3) 440,316,144 48.552Davos Investment Holdings Private Limited – 440,316,144 (4) 440,316,144 48.552Kwek Holdings Pte Ltd – 440,316,144 (4) 440,316,144 48.552
* The percentage of Ordinary Shares held is based on the total number of issued Ordinary Shares, excluding treasury shares as at 3 March 2022.Notes:(1) Hong Realty (Private) Limited (“HR”) is deemed under Section 4 of the Securities and Futures Act 2001 of Singapore (“SFA”) to have an interest in
the 30,488,981 Ordinary Shares held directly by companies in which it is entitled to exercise or control the exercise of not less than 20% of the votes attached to the voting shares thereof.
(2) Hong Leong Holdings Limited (“HLH”) is deemed under Section 4 of the SFA to have an interest in the 19,546,445 Ordinary Shares held directly by companies in which it is entitled to exercise or control the exercise of not less than 20% of the votes attached to the voting shares thereof.
(3) Hong Leong Investment Holdings Pte. Ltd. (“HLIH”) is deemed under Section 4 of the SFA to have an interest in the 271,601,888 Ordinary Shares held directly and/or indirectly by companies in which it is entitled to exercise or control the exercise of not less than 20% of the votes attached to the voting shares thereof which includes (i) the 64,946,763 Ordinary Shares held directly and indirectly by HR; and (ii) the 168,333,922 Ordinary Shares held directly and indirectly by HLH, out of which 9,304,616 Ordinary Shares have been identified as Ordinary Shares in which HR is also deemed to have an interest in under note (1) above.
(4) Davos Investment Holdings Private Limited and Kwek Holdings Pte Ltd are deemed under Section 4 of the SFA to have an interest in the 440,316,144 Ordinary Shares held directly and/or indirectly by HLIH in which they are entitled to exercise or control the exercise of not less than 20% of the votes attached to the voting shares thereof.
STATISTICS OF ORDINARYSHAREHOLDINGSAS AT 3 MARCH 2022
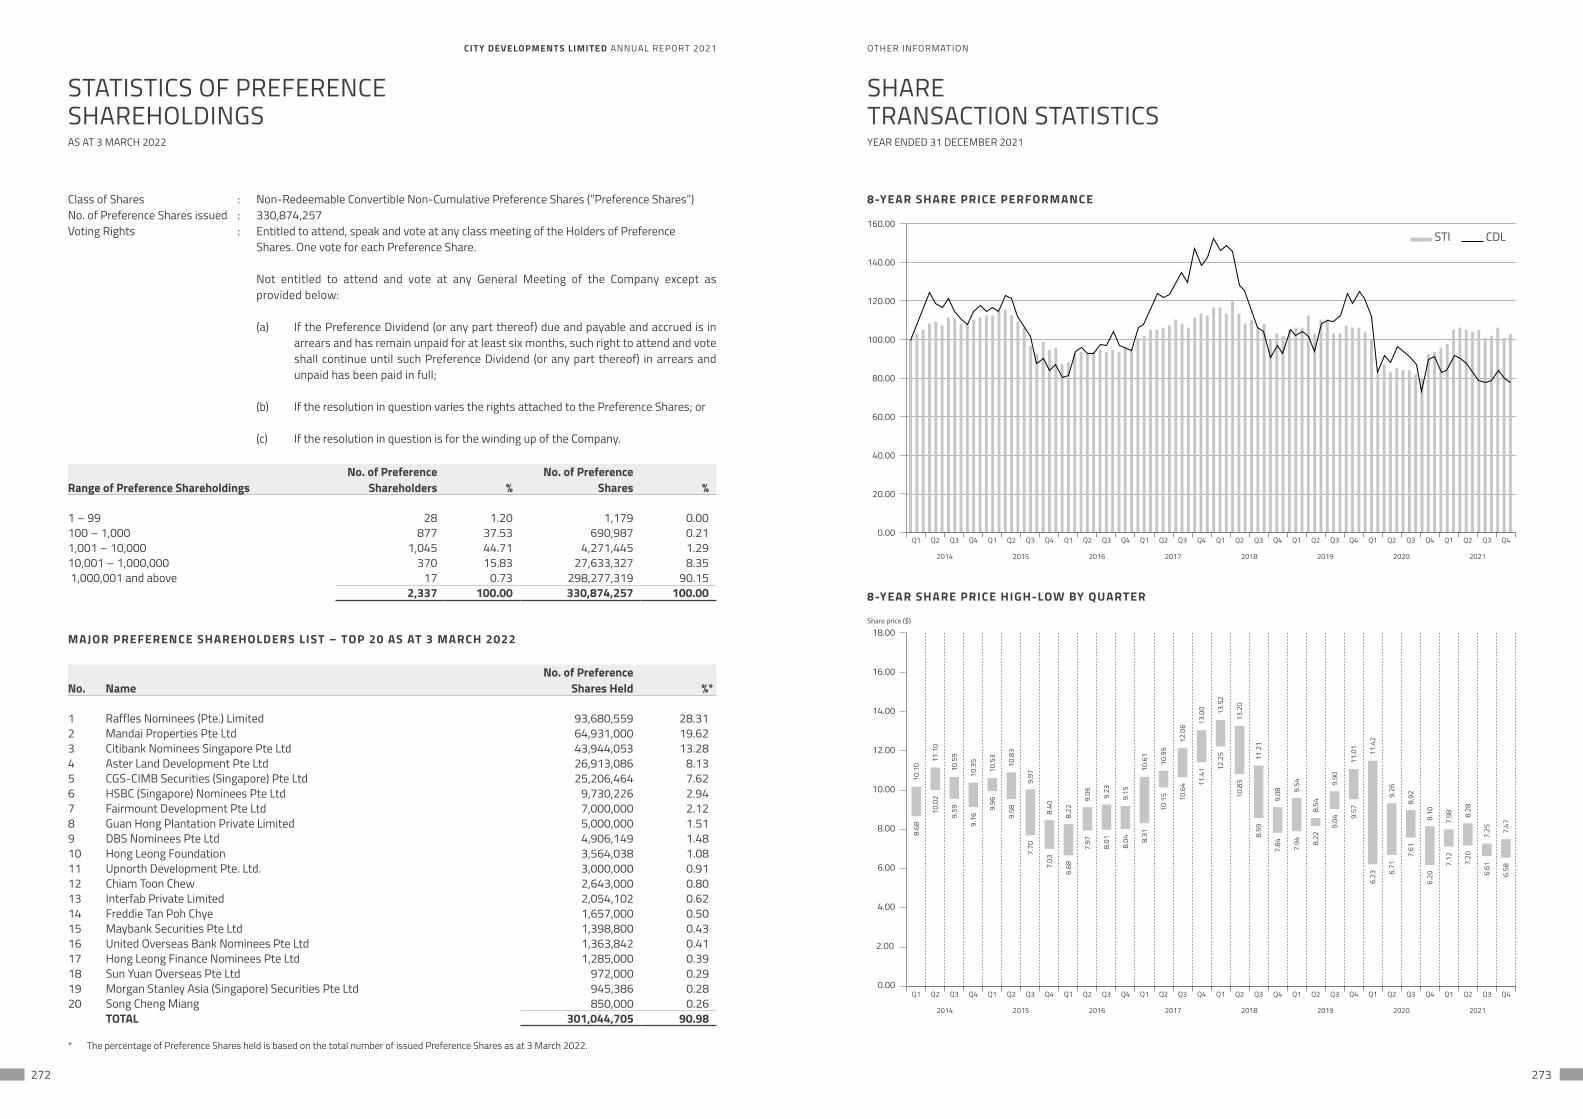
OTHER INFORMATIONCITY DEVELOPMENTS LIMITED ANNUAL REPORT 2021
272 273
Class of Shares : Non-Redeemable Convertible Non-Cumulative Preference Shares (“Preference Shares”)No. of Preference Shares issued : 330,874,257Voting Rights : Entitled to attend, speak and vote at any class meeting of the Holders of Preference
Shares. One vote for each Preference Share.
Not entitled to attend and vote at any General Meeting of the Company except as provided below:
(a) If the Preference Dividend (or any part thereof) due and payable and accrued is in arrears and has remain unpaid for at least six months, such right to attend and vote shall continue until such Preference Dividend (or any part thereof) in arrears and unpaid has been paid in full;
(b) If the resolution in question varies the rights attached to the Preference Shares; or
(c) If the resolution in question is for the winding up of the Company.
Range of Preference ShareholdingsNo. of Preference
Shareholders %No. of Preference
Shares %
1 – 99 28 1.20 1,179 0.00100 – 1,000 877 37.53 690,987 0.211,001 – 10,000 1,045 44.71 4,271,445 1.2910,001 – 1,000,000 370 15.83 27,633,327 8.35 1,000,001 and above 17 0.73 298,277,319 90.15
2,337 100.00 330,874,257 100.00
MAJOR PREFERENCE SHAREHOLDERS LIST – TOP 20 AS AT 3 MARCH 2022
No. NameNo. of Preference
Shares Held %*
1 Raffles Nominees (Pte.) Limited 93,680,559 28.312 Mandai Properties Pte Ltd 64,931,000 19.623 Citibank Nominees Singapore Pte Ltd 43,944,053 13.284 Aster Land Development Pte Ltd 26,913,086 8.135 CGS-CIMB Securities (Singapore) Pte Ltd 25,206,464 7.626 HSBC (Singapore) Nominees Pte Ltd 9,730,226 2.947 Fairmount Development Pte Ltd 7,000,000 2.128 Guan Hong Plantation Private Limited 5,000,000 1.519 DBS Nominees Pte Ltd 4,906,149 1.4810 Hong Leong Foundation 3,564,038 1.0811 Upnorth Development Pte. Ltd. 3,000,000 0.9112 Chiam Toon Chew 2,643,000 0.8013 Interfab Private Limited 2,054,102 0.6214 Freddie Tan Poh Chye 1,657,000 0.5015 Maybank Securities Pte Ltd 1,398,800 0.4316 United Overseas Bank Nominees Pte Ltd 1,363,842 0.4117 Hong Leong Finance Nominees Pte Ltd 1,285,000 0.3918 Sun Yuan Overseas Pte Ltd 972,000 0.2919 Morgan Stanley Asia (Singapore) Securities Pte Ltd 945,386 0.2820 Song Cheng Miang 850,000 0.26
TOTAL 301,044,705 90.98
* The percentage of Preference Shares held is based on the total number of issued Preference Shares as at 3 March 2022.
STATISTICS OF PREFERENCESHAREHOLDINGS AS AT 3 MARCH 2022
8-YEAR SHARE PRICE PERFORMANCE
160.00
140.00
120.00
100.00
80.00
60.00
40.00
20.00
0.00
2014 2015 2016 2017 2018 2019 2020 2021
STI
Q1 Q2 Q3 Q4 Q1 Q2 Q3 Q4 Q1 Q2 Q3 Q4 Q1 Q2 Q3 Q4 Q1 Q2 Q3 Q4 Q1 Q2 Q3 Q4 Q1 Q2 Q3 Q4 Q1 Q2 Q3 Q4
CDL
8-YEAR SHARE PRICE HIGH-LOW BY QUARTER
Q1 Q2 Q3 Q4 Q1 Q2 Q3 Q4 Q1 Q2 Q3 Q4 Q1 Q2 Q3 Q4 Q1 Q2 Q3 Q4 Q1 Q2 Q3 Q4 Q1 Q2 Q3 Q4 Q1 Q2 Q3 Q40.00
18.00
2.00
4.00
6.00
8.00
10.00
12.00
14.00
16.00
Share price ($)
8.68
10.1
0 12.2
513
.52
10.8
313
.20
10.0
211
.10
9.59
10.5
9
9.16
10.3
5
9.96
10.5
3
9.58
10.8
3
7.70
9.97
7.03
8.40
6.68
8.22
7.97
9.06
8.01
9.23
8.04
9.15
8.31
10.6
1
10.1
510
.95
10.6
412
.06
11.4
113
.00
8.59
11.2
1
7.84
9.08
7.94
9.54
8.22
8.54
9.04
9.90
9.57
11.0
1
6.71
9.26
7.61
8.92
7.12
7.98
7.20
8.28
6.23
11.4
2
6.20
8.10
6.61
7.25
6.58
7.47
2014 2015 2016 2017 2018 2019 2020 2021
SHARETRANSACTION STATISTICSYEAR ENDED 31 DECEMBER 2021
OTHER INFORMATION
NOTICE OFANNUAL GENERAL MEETING
NOTICE OFANNUAL GENERAL MEETING
CITY DEVELOPMENTS LIMITED ANNUAL REPORT 2021
274 275
NOTICE IS HEREBY GIVEN that the Fifty-Ninth Annual General Meeting (the “Meeting”) of City Developments Limited (the “Company”) will be convened and held by way of electronic means on Thursday, 28 April 2022 at 11.00 a.m. for the following purposes:
(A) ORDINARY BUSINESS
1. To receive and adopt the Directors’ Statement and Audited Financial Statements for the year ended 31 December (“FY”) 2021 and the Auditors’ Report thereon.
2. To declare a final one-tier tax-exempt ordinary dividend of $0.08 per ordinary share (“Final Ordinary Dividend”) and a special final one-tier tax-exempt ordinary dividend of $0.01 per ordinary share (“Special Final Ordinary Dividend”) for FY 2021.
3. To approve Directors’ Fees of $1,504,049.00 for FY 2021 (FY 2020: $1,337,559.00).
4. To re-elect the following Directors, who are retiring in accordance with Clause 83(a) of the Constitution of the Company and who, being eligible, offer themselves for re-election:
(a) Mr Kwek Leng Beng (b) Mr Sherman Kwek Eik Tse (c) Mr Ong Lian Jin Colin
Detailed information on Mr Kwek Leng Beng, Mr Sherman Kwek Eik Tse and Mr Ong Lian Jin Colin can be found under the sections on “Board of Directors” and “Additional Information on Directors Seeking Election/Re-election” of the Annual Report.
5. To elect Ms Tang Ai Ai Mrs Wong Ai Ai, who is retiring in accordance with Clause 76 of the Constitution of the Company and who, being eligible, offers herself for election.
Detailed information on Mrs Wong Ai Ai can be found under the sections on “Board of Directors” and “Additional Information on Directors Seeking Election/Re-election” of the Annual Report.
6. To re-appoint KPMG LLP as Auditors of the Company and to authorise the Directors to fix their remuneration.
(B) SPECIAL BUSINESS
To consider and, if thought fit, to pass, with or without any modifications, the following resolutions as Ordinary Resolutions:
7. That authority be and is hereby given to the Directors to:
(a) (i) issue ordinary shares of the Company whether by way of rights, bonus or otherwise; and/or
(ii) make or grant offers, agreements or options (collectively, “Instruments”) that might or would require ordinary shares to be issued, including but not limited to the creation and issue of (as well as adjustments to) warrants, debentures or other instruments convertible into ordinary shares,
at any time and upon such terms and conditions and for such purposes and to such persons as the Directors may, in their absolute discretion, deem fit; and
(b) (notwithstanding the authority conferred by this Ordinary Resolution may have ceased to be in force) issue ordinary shares in pursuance of any Instrument made or granted by the Directors while this Ordinary Resolution was in force,
provided that:
(1) the aggregate number of ordinary shares to be issued pursuant to this Ordinary Resolution (including ordinary shares to be issued in pursuance of Instruments made or granted pursuant to this Ordinary Resolution but excluding ordinary shares which may be issued pursuant to any adjustments effected under any relevant Instrument) does not exceed 50% of the total number of issued ordinary shares, excluding treasury shares and subsidiary holdings, of the Company (as calculated in accordance with paragraph (2) below), of which the aggregate number of ordinary shares to be issued other than on a pro rata basis to shareholders of the Company (including ordinary shares to be issued in pursuance of Instruments made or granted pursuant to this Ordinary Resolution but excluding ordinary shares which may be issued pursuant to any adjustments effected under any relevant Instrument) does not exceed 10% of the total number of issued ordinary shares, excluding treasury shares and subsidiary holdings, of the Company (as calculated in accordance with paragraph (2) below);
(2) (subject to such manner of calculation as may be prescribed by Singapore Exchange Securities Trading Limited (“SGX-ST”)) for the purpose of determining the aggregate number of ordinary shares that may be issued under paragraph (1) above, the percentage of issued ordinary shares, excluding treasury shares and subsidiary holdings, shall be based on the total number of issued ordinary shares, excluding treasury shares and subsidiary holdings, of the Company at the time this Ordinary Resolution is passed, after adjusting for:
(i) new ordinary shares arising from the conversion or exercise of any convertible securities or share options or vesting of share awards which are outstanding or subsisting at the time this Ordinary Resolution is passed; and
(ii) any subsequent bonus issue, consolidation or subdivision of ordinary shares,
and, in paragraph (1) above and this paragraph (2), “subsidiary holdings” has the meaning given to it in the Listing Manual of SGX-ST;
(3) in exercising the authority conferred by this Ordinary Resolution, the Company shall comply with the provisions of the Listing Manual of SGX-ST for the time being in force (unless such compliance has been waived by SGX-ST) and the Constitution for the time being of the Company; and
(4) (unless revoked or varied by the Company in a general meeting) the authority conferred by this Ordinary Resolution shall continue in force until the conclusion of the next Annual General Meeting of the Company (“AGM”) or the date by which the next AGM of the Company is required by law to be held, whichever is the earlier.
8. That:
(a) for the purposes of Sections 76C and 76E of the Companies Act 1967 (the “Companies Act”), the exercise by the Directors of the Company of all the powers of the Company to purchase or otherwise acquire issued ordinary shares (“Ordinary Shares”) and/or non-redeemable convertible non-cumulative preference shares (“Preference Shares”) of the Company not exceeding in aggregate the Prescribed Limit (as hereinafter defined), at such price or prices as may be determined by the Directors of the Company from time to time up to the Maximum Price (as hereinafter defined), whether by way of:
(i) market purchases (each a “Market Purchase”) on SGX-ST; and/or
(ii) off-market purchases (each an “Off-Market Purchase”) effected otherwise than on SGX-ST in accordance with any equal access scheme(s) as may be determined or formulated by the Directors of the Company as they may, in their absolute discretion, deem fit, which scheme(s) shall satisfy all the conditions prescribed by the Companies Act,
and otherwise in accordance with all other laws, regulations and rules of SGX-ST as may for the time being be applicable, be and is hereby authorised and approved generally and unconditionally (“Share Purchase Mandate”);
OTHER INFORMATION
NOTICE OFANNUAL GENERAL MEETING
NOTICE OFANNUAL GENERAL MEETING
CITY DEVELOPMENTS LIMITED ANNUAL REPORT 2021
276 277
(b) the authority conferred on the Directors of the Company pursuant to the Share Purchase Mandate may be exercised by the Directors of the Company at any time and from time to time during the period commencing from the date of the passing of this Ordinary Resolution and expiring on the earliest of:
(i) the date on which the next AGM of the Company is held or required by law to be held;
(ii) the date on which the authority conferred by the Share Purchase Mandate is varied or revoked in general meeting; or
(iii) the date on which the purchases or acquisitions of Ordinary Shares and/or Preference Shares pursuant to the Share Purchase Mandate are carried out to the full extent mandated;
(c) in this Ordinary Resolution:
“Prescribed Limit” means in relation to any purchase or acquisition of Ordinary Shares, the number of issued Ordinary Shares representing 10% of the total number of issued Ordinary Shares as at the date of the passing of this Ordinary Resolution (excluding treasury shares and subsidiary holdings (as defined in the Listing Manual of SGX-ST) as at that date), and in relation to any purchase or acquisition of Preference Shares, the number of issued Preference Shares representing 10% of the total number of issued Preference Shares as at the date of the passing of this Ordinary Resolution; and
“Maximum Price” in relation to an Ordinary Share or a Preference Share to be purchased or acquired (as the case may be) means an amount (excluding brokerage, stamp duties, applicable goods and services tax and other related expenses) not exceeding whether pursuant to a Market Purchase or an Off-Market Purchase, 105% of the Average Closing Price of the Ordinary Shares or Preference Shares (as the case may be).
where:
“Average Closing Price” means the average of the Closing Market Prices of the Ordinary Shares or Preference Shares (as the case may be) over the last five (5) Market Days on SGX-ST, on which transactions in the Ordinary Shares or Preference Shares (as the case may be) were recorded, immediately preceding the day of the Market Purchase by the Company or, as the case may be, the date of the making of the offer pursuant to the Off-Market Purchase, and deemed to be adjusted for any corporate action that occurs after such 5-Market Day period;
“Closing Market Price” means the last dealt price for an Ordinary Share or a Preference Share (as the case may be) transacted on SGX-ST as shown in any publication of SGX-ST or other sources;
“day of the making of the offer” means the day on which the Company makes an offer for the Off-Market Purchase of Ordinary Shares or Preference Shares (as the case may be) from holders of Ordinary Shares or holders of Preference Shares (as the case may be), stating the purchase price (which shall not be more than the Maximum Price for an Off-Market Purchase, calculated on the foregoing basis) for each Ordinary Share or Preference Share (as the case may be), and the relevant terms of the equal access scheme for effecting the Off-Market Purchase; and
“Market Day” means a day on which SGX-ST is open for trading in securities; and
(d) the Directors of the Company be and are hereby authorised to complete and do all such acts and things (including executing such documents as may be required) as they may consider expedient or necessary to give effect to the transactions contemplated by this Ordinary Resolution.
9. (a) That approval be and is hereby given, for the purpose of Chapter 9 of the Listing Manual of SGX-ST, for the Company, its subsidiaries and its associated companies that are not listed on SGX-ST, or an approved exchange, over which the Company, its subsidiaries and/or its interested person(s), have control, or any of them, to enter into any of the transactions falling within the category of Interested Person Transactions, particulars of which are set out in the Company’s Letter to Shareholders dated 30 March 2022 (the “Letter to Shareholders”) with any party who is of the class or classes of Interested Persons described in the Letter to Shareholders, provided that such transactions are entered into in accordance with the review procedures for Interested Person Transactions as set out in the Letter to Shareholders, and that such approval (the “IPT Mandate”), shall unless revoked or varied by the Company in general meeting, continue in force until the next AGM of the Company; and
(b) That the Directors of the Company and each of them be and are hereby authorised to complete and do all such acts and things (including executing all such documents as may be required) as they or he may consider expedient or necessary or in the interests of the Company to give effect to the IPT Mandate and/or this Ordinary Resolution.
10. That:
(a) approval be and is hereby given for the Company to make a distribution (the “Proposed Distribution”) of 144,300,000 stapled securities in CDL Hospitality Trusts (“CDLHT”, and the stapled securities, the “CDLHT Units”) held by the Company to the shareholders of the Company (the “Shareholders” and each a “Shareholder”), by way of a dividend in specie on a pro rata basis to all Shareholders as at a time and date to be determined by the Directors of the Company for the purposes of determining the entitlement of the Shareholders to the Proposed Distribution (the “Record Date” and such Shareholders who hold ordinary shares in the capital of the Company as at the Record Date, the “Entitled Shareholders”), fractional entitlements to be disregarded, free of encumbrances and together with all rights attaching thereto on and from the date the Proposed Distribution is completed, on and subject to the terms of the Letter to Shareholders, except that for practical reasons and in order to avoid violating applicable securities laws outside Singapore, or where the Directors of the Company are of the view that such distribution may infringe any foreign law or may necessitate compliance with conditions or requirements which the Directors of the Company, in their absolute discretion, regard as onerous or impracticable by reason of costs, delay or otherwise, the Directors of the Company reserve the discretion not to distribute the CDLHT Units to any Entitled Shareholder whose registered address as at the Record Date (as appearing in the Register of Holders of Ordinary Shares of the Company or in the Depository Register maintained by The Central Depository (Pte) Limited) is outside Singapore (the “Overseas Shareholder”) and to deal with such CDLHT Units in the manner set out in paragraph (b) below;
(b) where the Directors of the Company decide not to distribute the CDLHT Units to any Overseas Shareholder, arrangements be made for the distribution of the CDLHT Units which would otherwise be distributed to such Overseas Shareholders pursuant to the Proposed Distribution to such person(s) as the Directors of the Company may appoint to sell such CDLHT Units and thereafter the net proceeds of such sale, after deducting for all dealings and other expenses in connection therewith, shall be distributed proportionately among such Overseas Shareholders according to their respective entitlements to the CDLHT Units as at the Record Date in full satisfaction of their rights to the CDLHT Units which they would otherwise have become entitled to under the Proposed Distribution;
(c) the Directors of the Company and/or any of them be and are hereby authorised to appropriate an amount out of the retained profits of the Company to meet the amount of dividend to be declared, and such appropriated amount shall be based on the value of the CDLHT Units on the date which the Proposed Distribution is completed;
OTHER INFORMATION
NOTICE OFANNUAL GENERAL MEETING
NOTICE OFANNUAL GENERAL MEETING
CITY DEVELOPMENTS LIMITED ANNUAL REPORT 2021
278 279
(d) the Directors of the Company and/or any of them be authorised to deal with the CDLHT Units remaining with the Company (including any resulting fractional CDLHT Units arising from the Proposed Distribution) after the Proposed Distribution, in such manner as they deem fit; and
(e) the Directors of the Company and/or any of them be and are hereby authorised to do all acts and things and to execute all such documents as they or he or she may consider necessary or expedient to give effect to the transactions contemplated and/or authorised by this Resolution.
By Order of the Board
Yeo Swee Gim, Joanne Enid Ling Peek FongCompany Secretaries
Singapore, 30 March 2022
EXPLANATORY NOTES:
1. With reference to Resolution 2 of the Ordinary Business above, the Ordinary Share Transfer Books and Register of Holders of Ordinary Shares of the Company will be closed from 5.00 p.m. on 5 May 2022 up to (and including) 6 May 2022. Duly completed registrable transfers received by the Company’s Share Registrar up to 5.00 p.m. on 5 May 2022 will be registered to determine Ordinary Shareholders’ entitlement to the Final Ordinary Dividend and Special Final Ordinary Dividend. If approved at the Meeting, they will be paid on 26 May 2022.
2. With reference to Resolution 3 of the Ordinary Business above, the Directors’ Fees of $1,504,049.00 for FY 2021 will be payable upon approval of the shareholders at the Meeting. The structure of fees payable to Directors for FY 2021 is found on page 45 of the Annual Report.
3. With reference to Resolution 4(a) of the Ordinary Business above, Mr Kwek Leng Beng will, upon re-election as a Director of the Company, remain as Chairman of the Board and a member of Nominating Committee (“NC”).
Key information on Mr Kwek Leng Beng is found on page 25 and pages 284 to 287 of the Annual Report.
4. With reference to Resolution 4(b) of the Ordinary Business above, Mr Sherman Kwek Eik Tse will, upon re-election as a Director of the Company, remain as the chairman of the Board Sustainability Committee (“BSC”).
Key information on Mr Sherman Kwek Eik Tse is found on page 26 and pages 284 to 287 of the Annual Report.
5. With reference to Resolution 4(c) of the Ordinary Business above, Mr Ong Lian Jin Colin will, upon re-election as a Director of the Company, remain as the chairman of the NC and a member of the Remuneration Committee (“RC”).
Key information on Mr Ong Lian Jin Colin is found on page 27 and pages 284 to 287 of the Annual Report.
6. With reference to Resolution 5 of the Ordinary Business above, Ms Tang Ai Ai Mrs Wong Ai Ai will, upon election as a Director of the Company, remain as a member of the NC and the BSC.
Key information on Mrs Wong Ai Ai is found on page 29 and pages 284 to 287 of the Annual Report.
7. Ordinary Resolution 7 of the Special Business above, if passed, will empower the Directors of the Company from the date of the Meeting until the next AGM (unless such authority is previously revoked or varied at a general meeting), to issue Ordinary Shares and/or make or grant Instruments that might require new Ordinary Shares to be issued up to a number not exceeding 50% of the total number of issued Ordinary Shares, excluding treasury shares and subsidiary holdings, of the Company, of which up to 10% may be issued other than on a pro rata basis to shareholders. The aggregate number of Ordinary Shares which may be issued under this Ordinary Resolution will be calculated based on the total number of issued Ordinary Shares, excluding treasury shares and subsidiary holdings, of the Company at the time that this Ordinary Resolution is passed, after adjusting for new Ordinary Shares arising from the conversion or exercise of any convertible securities or share options or vesting of share awards which are outstanding or subsisting at the time this Ordinary Resolution is passed and any subsequent bonus issue, consolidation or subdivision of Ordinary Shares.
OTHER INFORMATION
NOTICE OFANNUAL GENERAL MEETING
NOTICE OFANNUAL GENERAL MEETING
CITY DEVELOPMENTS LIMITED ANNUAL REPORT 2021
280 281
8. Ordinary Resolution 8 of the Special Business above, if passed, will empower the Directors of the Company to make purchases or otherwise acquire the Company’s issued Ordinary Shares and/or Preference Shares (collectively, the “Shares”) from time to time subject to and in accordance with the guidelines set out in Annexure I of the Letter to Shareholders. This authority will expire at the conclusion of the next AGM of the Company, unless previously revoked or varied at a general meeting or when such purchases or acquisitions are carried out to the full extent mandated.
The Company intends to use internal resources and/or external borrowings to finance purchases or acquisitions of its Shares under the Share Purchase Mandate. The amount of financing required for the Company to purchase or acquire its Shares, and the impact on the Company’s financial position, cannot be ascertained as at the date of this Notice as these will depend on whether the Shares are purchased or acquired out of capital or profits of the Company, the aggregate number of Shares purchased or acquired, the consideration paid at the relevant time and whether the Shares purchased or acquired are held in treasury or cancelled.
Based on the existing number of issued Ordinary Shares and Preference Shares of the Company as at 3 March 2022 (the “Latest Practicable Date”) (disregarding the Ordinary Shares held in treasury), the exercise in full of the Share Purchase Mandate would result in the purchase of 90,690,133 Ordinary Shares (representing 10% of the total number of issued Ordinary Shares of the Company, disregarding the Ordinary Shares held in treasury) and 33,087,425 Preference Shares (representing 10% of the total number of issued Preference Shares of the Company).
In the case of Market Purchases and Off-Market Purchases by the Company and assuming that the Company purchases or acquires 90,690,133 Ordinary Shares at the Maximum Price of $7.46 for one Ordinary Share (being the price equivalent to 105% of the Average Closing Price as at the Latest Practicable Date) and 33,087,425 Preference Shares at the Maximum Price of $1.10 for one Preference Share (being the price equivalent to 105% of the Average Closing Price as at the Latest Practicable Date), the maximum amount of funds required for the purchase or acquisition of 90,690,133 Ordinary Shares and 33,087,425 Preference Shares is approximately $676.50 million and $36.40 million respectively.
The financial effects of the purchase or acquisition of such Shares pursuant to the proposed Share Purchase Mandate on the audited financial statements of the Group and the Company for the financial year ended 31 December 2021 based on these assumptions are set out in paragraph 3.5 of Annexure I of the Letter to Shareholders.
9. Ordinary Resolution 9 of the Special Business above, if passed, will renew the IPT Mandate which was last approved by shareholders on 30 April 2021, to facilitate the Company, its subsidiaries and its associated companies to enter into interested person transactions, the details of which are set out in Annexure II and Appendix A of the Letter to Shareholders. The IPT Mandate will continue in force until the conclusion of the next AGM of the Company, unless previously revoked or varied at a general meeting.
10. Ordinary Resolution 10 of the Special Business above, if passed, will empower the Directors of the Company to distribute 144,300,000 CDLHT Units held by the Company to the Entitled Shareholders, by way of a dividend in specie on a pro rata basis to all Entitled Shareholders as at the Record Date, fractional entitlements to be disregarded, on and subject to the terms of Annexure III of the Letter to Shareholders.
Voting restriction pursuant to Rule 921(7) of the Listing Manual of SGX-STHong Leong Investment Holdings Pte. Ltd. and its subsidiaries, the Directors of the Company and their associates, who are also shareholders of the Company and being Interested Persons under the IPT Mandate, are required to abstain from voting at the Meeting in respect of the Ordinary Resolution 9 in relation to the proposed renewal of the IPT Mandate.
MEETING NOTES:
1. The Meeting is being convened, and will be held, by way of electronic means pursuant to the COVID-19 (Temporary Measures) (Alternative Arrangements for Meetings for Companies, Variable Capital Companies, Business Trusts, Unit Trusts and Debenture Holders) Order 2020. Printed copies of this Notice will not be sent to members, instead, this Notice will be made available to members by electronic means via publication on the Company’s website at https://www.cdl.com.sg/agm. This Notice will also be made available on the SGX website at https://www.sgx.com/securities/company-announcements.
2. Alternative arrangements relating to:
(a) attendance at the Meeting via electronic means (including arrangements by which the Meeting can be electronically accessed via “live” audio-visual webcast or live audio-only stream);
(b) submission of questions to the Chairman of the Meeting in advance of, or “live” at, the Meeting, and addressing of substantial and relevant questions prior to, or “live” at, the Meeting; and
(c) voting at the Meeting (i) “live” by the member or his/her/its duly appointed proxy/proxies (other than the Chairman of the Meeting) via electronic means; or (ii) by appointing the Chairman of the Meeting as proxy to vote on the member’s behalf at the Meeting,
are set out in the accompanying Company’s announcement dated 30 March 2022. The announcement may be accessed at the Company’s website at https://www.cdl.com.sg/agm and will also be made available on the SGX website at https://www.sgx.com/securities/company-announcements.
3. As a precautionary measure due to the current COVID-19 situation in Singapore, a member will not be able to attend the Meeting in person. A member who wishes to exercise his/her/its voting rights at the Meeting may:
(a) (where the member is an individual) vote “live” via electronic means at the Meeting, or (whether the member is an individual or a corporate) appoint a proxy/proxies (other than the Chairman of the Meeting) to vote “live” via electronic means at the Meeting on his/her/its behalf; or
(b) (whether the member is an individual or a corporate) appoint the Chairman of the Meeting as his/her/its proxy to vote on his/her/its behalf at the Meeting.
The accompanying proxy form for the Meeting may be downloaded from the Company’s website at https://www.cdl.com.sg/agm and from the SGX website at https://www.sgx.com/securities/company-announcements. Where a member (whether individual or corporate) appoints a proxy/proxies, he/she/it should give specific instructions as to the voting, or abstentions from voting, in respect of that resolution. If no specific direction as to voting is given, the proxy/proxies will vote or abstain from voting at his/her/their discretion.
4. (a) A member who is not a relevant intermediary is entitled to appoint not more than two proxies. Where such member’s proxy form appoints more than one proxy, the proportion of the shareholding concerned to be represented by each proxy shall be specified in the proxy form.
(b) A member who is a relevant intermediary is entitled to appoint more than two proxies, but each proxy must be appointed to exercise the rights attached to a different share or shares held by such member. Where such member’s proxy form appoints more than two proxies, the number and class of shares in relation to which each proxy has been appointed shall be specified in the proxy form.
“Relevant intermediary” has the meaning ascribed to it in Section 181 of the Companies Act 1967.
5. A proxy need not be a member of the Company.
OTHER INFORMATION
NOTICE OFANNUAL GENERAL MEETING
NOTICE OFANNUAL GENERAL MEETING
CITY DEVELOPMENTS LIMITED ANNUAL REPORT 2021
282 283
6. The proxy form must be submitted to the Company in the following manner:
(a) if submitted by post, be lodged with the Company’s Share Registrar, M & C Services Private Limited at 112 Robinson Road, #05-01, Singapore 068902; or
(b) if submitted electronically, via email to the Company’s Share Registrar at [email protected], or via the pre-registration website at https://www.cdl.com.sg/agm2022,
in each case, by 11.00 a.m. on 25 April 2022, being at least 72 hours before the time appointed for holding the Meeting. A member who wishes to submit the proxy form must first download, complete and sign the proxy form, before submitting it by post to the address provided above, or before scanning and sending it by email to the email address provided above, or via the pre-registration website provided above.
Due to current COVID-19 situation in Singapore, members are strongly encouraged to submit completed proxy forms electronically via email or via the pre-registration website.
7. CPFIS members and SRS investors:
(a) may vote “live” via electronic means at the Meeting if they are appointed as proxies by their respective CPF Agent Banks or SRS Approved Banks, and should contact their respective CPF Agent Banks or SRS Approved Banks if they have any queries regarding their appointment as proxies; or
(b) may appoint the Chairman of the Meeting as proxy to vote on their behalf at the AGM, in which case they should approach their respective CPF Agent Banks or SRS Approved Banks to submit their votes by 5.00 p.m. on 18 April 2022.
8. The Annual Report 2021 and the Letter to Shareholders dated 30 March 2022 (“Letter to Shareholders”) are available on the Company’s website as follows:
(a) the Annual Report 2021 may be accessed at https://www.cdl.com.sg/annualreports by clicking on the hyperlink for ‘Annual Report 2021’; and
(b) the Letter to Shareholders may be accessed at https://www.cdl.com.sg/agm by clicking on the hyperlink for “Letter to Shareholders dated 30 March 2022”.
The above documents may also be accessed on the SGX website at https://www.sgx.com/securities/company-announcements. Members may request for printed copies of these documents by completing and submitting the Request Form.
PERSONAL DATA PRIVACY:
By (i) submitting a proxy form to attend, speak and vote at the Meeting and/or any adjournment thereof, or (ii) submitting details for the registration to observe the proceedings of the Meeting via a “live” audio-visual webcast or a “live” audio-only stream or (iii) submitting any question prior to the Meeting in accordance with this Notice, a member of the Company consents to the collection, use and disclosure of the member’s personal data by the Company (or its agents or service providers) for the following purposes:
(a) processing and administration by the Company (or its agents or service providers) of the appointment of proxy/proxies for the Meeting (including any adjournment thereof) and the preparation and compilation of the attendance lists, proxy lists, minutes and other documents relating to the Meeting (including any adjournment thereof);
(b) processing of the registration for purpose of granting access to members (or their corporate representatives in the case of members which are legal entities) to observe the proceedings of the Meeting and providing them with any technical assistance, where necessary;
(c) addressing relevant and substantial questions from members received before the Meeting and if necessary, following up with the relevant members in relation to such questions; and
(d) enabling the Company (or its agents or service providers) to comply with any applicable laws, listing rules, take-over rules, regulations and/or guidelines by the relevant authorities.
STATEMENT PURSUANT TO SECTION 64A OF THE COMPANIES ACT
Non-Redeemable Convertible Non-Cumulative Preference Shares (“Preference Shares”)
Class Meetings: Holders of Preference Shares (“Preference Shareholders”) shall be entitled to attend, speak and vote at any class meeting of the Preference Shareholders. Every Preference Shareholder who is present in person (or by proxy) at such class meetings shall have on a show of hands one vote and on a poll one vote for every Preference Share of which he is the holder.
General Meetings: Preference Shareholders shall be entitled to attend (in person or by proxy) any general meeting of the Company and shall have on a show of hands one vote and on a poll one vote in respect of each Preference Share of which he is the holder if (i) dividends with respect to the Preference Shares (or any part thereof) due and payable and accrued is in arrears and has remained unpaid for at least six months; (ii) the resolution in question varies the rights attached to the Preference Shares; or (iii) the resolution in question is for the winding up of the Company.
Except as provided above, Preference Shareholders shall not be entitled to attend or vote at General Meetings of the Company.
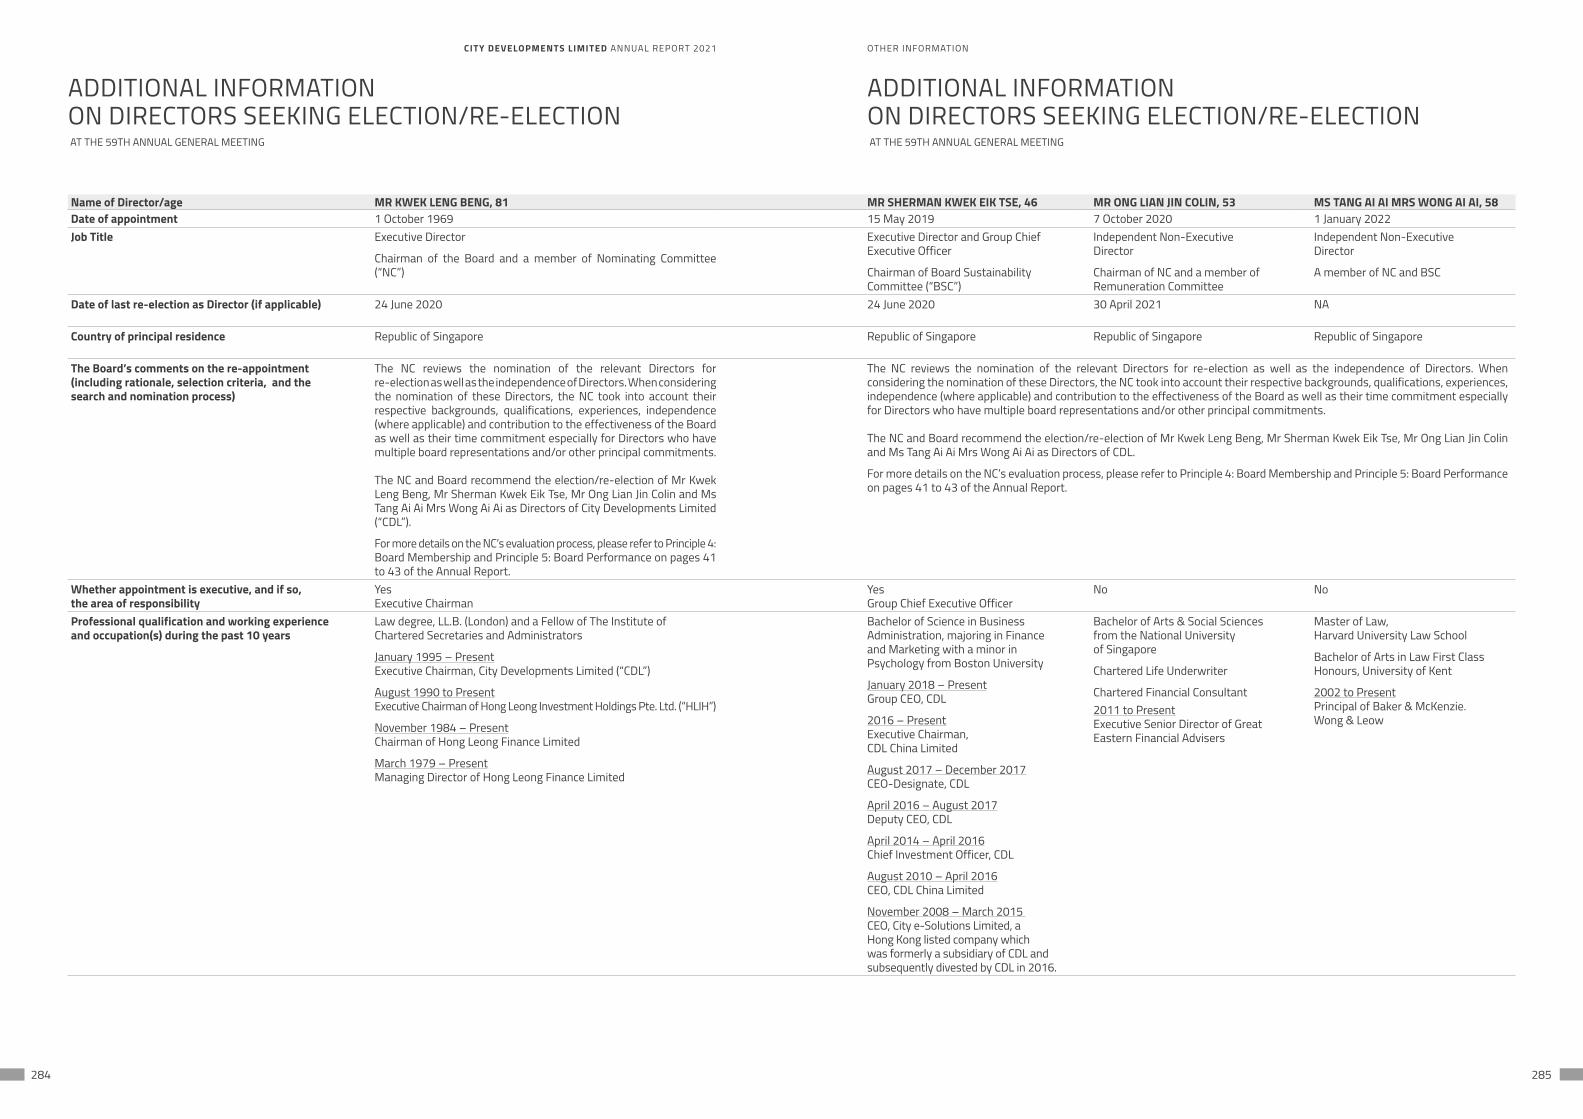
284 285
OTHER INFORMATION
ADDITIONAL INFORMATIONON DIRECTORS SEEKING ELECTION/RE-ELECTION
ADDITIONAL INFORMATIONON DIRECTORS SEEKING ELECTION/RE-ELECTION
AT THE 59TH ANNUAL GENERAL MEETING AT THE 59TH ANNUAL GENERAL MEETING
CITY DEVELOPMENTS LIMITED ANNUAL REPORT 2021
Name of Director/age MR KWEK LENG BENG, 81 MR SHERMAN KWEK EIK TSE, 46 MR ONG LIAN JIN COLIN, 53 MS TANG AI AI MRS WONG AI AI, 58Date of appointment 1 October 1969 15 May 2019 7 October 2020 1 January 2022Job Title Executive Director
Chairman of the Board and a member of Nominating Committee (“NC”)
Executive Director and Group Chief Executive Officer
Chairman of Board Sustainability Committee (“BSC”)
Independent Non-Executive Director
Chairman of NC and a member of Remuneration Committee
Independent Non-Executive Director
A member of NC and BSC
Date of last re-election as Director (if applicable) 24 June 2020 24 June 2020 30 April 2021 NA
Country of principal residence Republic of Singapore Republic of Singapore Republic of Singapore Republic of Singapore
The Board’s comments on the re-appointment (including rationale, selection criteria, and the search and nomination process)
The NC reviews the nomination of the relevant Directors for re-election as well as the independence of Directors. When considering the nomination of these Directors, the NC took into account their respective backgrounds, qualifications, experiences, independence (where applicable) and contribution to the effectiveness of the Board as well as their time commitment especially for Directors who have multiple board representations and/or other principal commitments. The NC and Board recommend the election/re-election of Mr Kwek Leng Beng, Mr Sherman Kwek Eik Tse, Mr Ong Lian Jin Colin and Ms Tang Ai Ai Mrs Wong Ai Ai as Directors of City Developments Limited (“CDL”).
For more details on the NC’s evaluation process, please refer to Principle 4: Board Membership and Principle 5: Board Performance on pages 41 to 43 of the Annual Report.
The NC reviews the nomination of the relevant Directors for re-election as well as the independence of Directors. When considering the nomination of these Directors, the NC took into account their respective backgrounds, qualifications, experiences, independence (where applicable) and contribution to the effectiveness of the Board as well as their time commitment especially for Directors who have multiple board representations and/or other principal commitments. The NC and Board recommend the election/re-election of Mr Kwek Leng Beng, Mr Sherman Kwek Eik Tse, Mr Ong Lian Jin Colin and Ms Tang Ai Ai Mrs Wong Ai Ai as Directors of CDL.
For more details on the NC’s evaluation process, please refer to Principle 4: Board Membership and Principle 5: Board Performance on pages 41 to 43 of the Annual Report.
Whether appointment is executive, and if so, the area of responsibility
YesExecutive Chairman
YesGroup Chief Executive Officer
No No
Professional qualification and working experience and occupation(s) during the past 10 years
Law degree, LL.B. (London) and a Fellow of The Institute of Chartered Secretaries and Administrators
January 1995 – PresentExecutive Chairman, City Developments Limited (“CDL”)
August 1990 to PresentExecutive Chairman of Hong Leong Investment Holdings Pte. Ltd. (“HLIH”)
November 1984 – PresentChairman of Hong Leong Finance Limited
March 1979 – PresentManaging Director of Hong Leong Finance Limited
Bachelor of Science in Business Administration, majoring in Finance and Marketing with a minor in Psychology from Boston University
January 2018 – PresentGroup CEO, CDL
2016 – Present Executive Chairman,CDL China Limited
August 2017 – December 2017 CEO-Designate, CDL
April 2016 – August 2017Deputy CEO, CDL
April 2014 – April 2016Chief Investment Officer, CDL
August 2010 – April 2016 CEO, CDL China Limited
November 2008 – March 2015 CEO, City e-Solutions Limited, a Hong Kong listed company which was formerly a subsidiary of CDL and subsequently divested by CDL in 2016.
Bachelor of Arts & Social Sciences from the National Universityof Singapore
Chartered Life Underwriter
Chartered Financial Consultant2011 to PresentExecutive Senior Director of Great Eastern Financial Advisers
Master of Law,Harvard University Law School
Bachelor of Arts in Law First Class Honours, University of Kent
2002 to PresentPrincipal of Baker & McKenzie. Wong & Leow
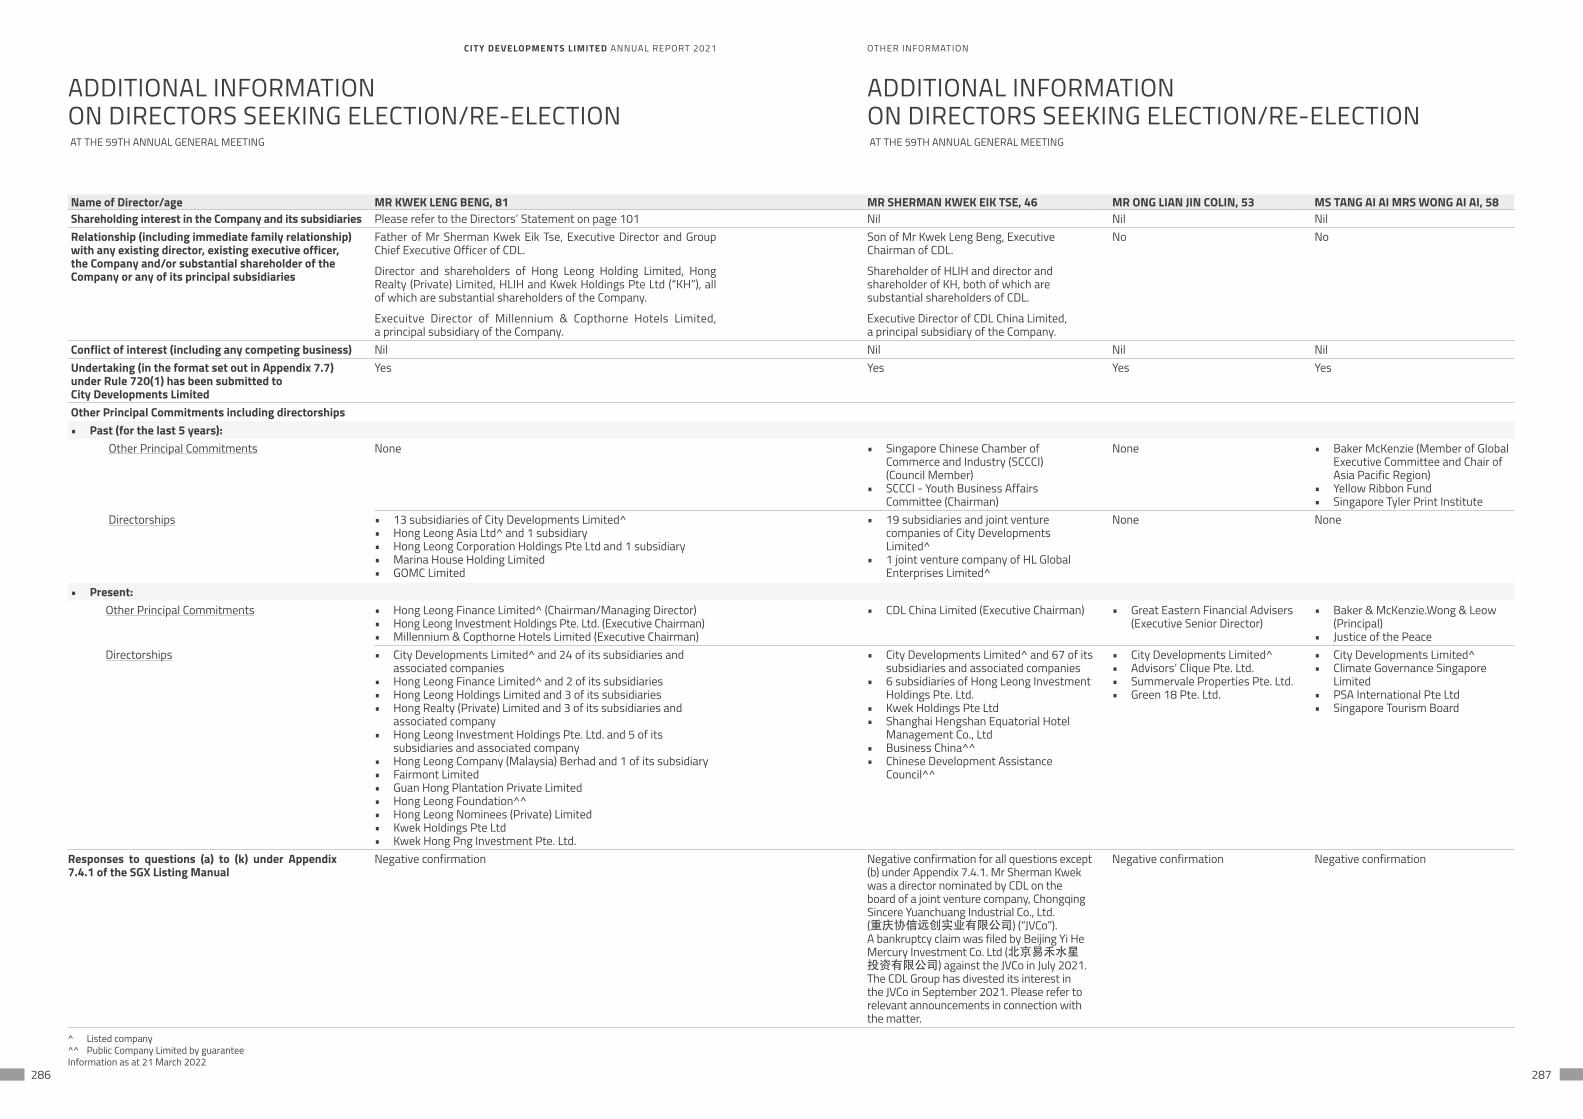
286 287
OTHER INFORMATION
ADDITIONAL INFORMATIONON DIRECTORS SEEKING ELECTION/RE-ELECTION
ADDITIONAL INFORMATIONON DIRECTORS SEEKING ELECTION/RE-ELECTION
AT THE 59TH ANNUAL GENERAL MEETING AT THE 59TH ANNUAL GENERAL MEETING
CITY DEVELOPMENTS LIMITED ANNUAL REPORT 2021
Name of Director/age MR KWEK LENG BENG, 81 MR SHERMAN KWEK EIK TSE, 46 MR ONG LIAN JIN COLIN, 53 MS TANG AI AI MRS WONG AI AI, 58Shareholding interest in the Company and its subsidiaries Please refer to the Directors’ Statement on page 101 Nil Nil NilRelationship (including immediate family relationship) with any existing director, existing executive officer, the Company and/or substantial shareholder of the Company or any of its principal subsidiaries
Father of Mr Sherman Kwek Eik Tse, Executive Director and Group Chief Executive Officer of CDL.
Director and shareholders of Hong Leong Holding Limited, Hong Realty (Private) Limited, HLIH and Kwek Holdings Pte Ltd (“KH”), all of which are substantial shareholders of the Company.
Execuitve Director of Millennium & Copthorne Hotels Limited, a principal subsidiary of the Company.
Son of Mr Kwek Leng Beng, Executive Chairman of CDL.
Shareholder of HLIH and director and shareholder of KH, both of which are substantial shareholders of CDL.
Executive Director of CDL China Limited, a principal subsidiary of the Company.
No No
Conflict of interest (including any competing business) Nil Nil Nil NilUndertaking (in the format set out in Appendix 7.7) under Rule 720(1) has been submitted to City Developments Limited
Yes Yes Yes Yes
Other Principal Commitments including directorships• Past (for the last 5 years):
Other Principal Commitments None • Singapore Chinese Chamber of Commerce and Industry (SCCCI) (Council Member)
• SCCCI - Youth Business Affairs Committee (Chairman)
None • Baker McKenzie (Member of Global Executive Committee and Chair of Asia Pacific Region)
• Yellow Ribbon Fund• Singapore Tyler Print Institute
Directorships • 13 subsidiaries of City Developments Limited^ • Hong Leong Asia Ltd^ and 1 subsidiary • Hong Leong Corporation Holdings Pte Ltd and 1 subsidiary • Marina House Holding Limited • GOMC Limited
• 19 subsidiaries and joint venture companies of City Developments Limited^
• 1 joint venture company of HL Global Enterprises Limited^
None None
• Present:Other Principal Commitments • Hong Leong Finance Limited^ (Chairman/Managing Director)
• Hong Leong Investment Holdings Pte. Ltd. (Executive Chairman)• Millennium & Copthorne Hotels Limited (Executive Chairman)
• CDL China Limited (Executive Chairman) • Great Eastern Financial Advisers (Executive Senior Director)
• Baker & McKenzie.Wong & Leow (Principal)
• Justice of the PeaceDirectorships • City Developments Limited^ and 24 of its subsidiaries and
associated companies • Hong Leong Finance Limited^ and 2 of its subsidiaries • Hong Leong Holdings Limited and 3 of its subsidiaries • Hong Realty (Private) Limited and 3 of its subsidiaries and
associated company • Hong Leong Investment Holdings Pte. Ltd. and 5 of its
subsidiaries and associated company • Hong Leong Company (Malaysia) Berhad and 1 of its subsidiary• Fairmont Limited • Guan Hong Plantation Private Limited • Hong Leong Foundation^^ • Hong Leong Nominees (Private) Limited • Kwek Holdings Pte Ltd • Kwek Hong Png Investment Pte. Ltd.
• City Developments Limited^ and 67 of its subsidiaries and associated companies
• 6 subsidiaries of Hong Leong Investment Holdings Pte. Ltd.
• Kwek Holdings Pte Ltd • Shanghai Hengshan Equatorial Hotel
Management Co., Ltd• Business China^^ • Chinese Development Assistance
Council^^
• City Developments Limited^• Advisors’ Clique Pte. Ltd.• Summervale Properties Pte. Ltd.• Green 18 Pte. Ltd.
• City Developments Limited^• Climate Governance Singapore
Limited• PSA International Pte Ltd• Singapore Tourism Board
Responses to questions (a) to (k) under Appendix 7.4.1 of the SGX Listing Manual
Negative confirmation Negative confirmation for all questions except (b) under Appendix 7.4.1. Mr Sherman Kwek was a director nominated by CDL on the board of a joint venture company, Chongqing Sincere Yuanchuang Industrial Co., Ltd. (重庆协信远创实业有限公司) (“JVCo”). A bankruptcy claim was filed by Beijing Yi He Mercury Investment Co. Ltd (北京易禾水星投资有限公司) against the JVCo in July 2021. The CDL Group has divested its interest in the JVCo in September 2021. Please refer to relevant announcements in connection with the matter.
Negative confirmation Negative confirmation
^ Listed company^^ Public Company Limited by guaranteeInformation as at 21 March 2022

This page has been intentionally left blank. This page has been intentionally left blank.
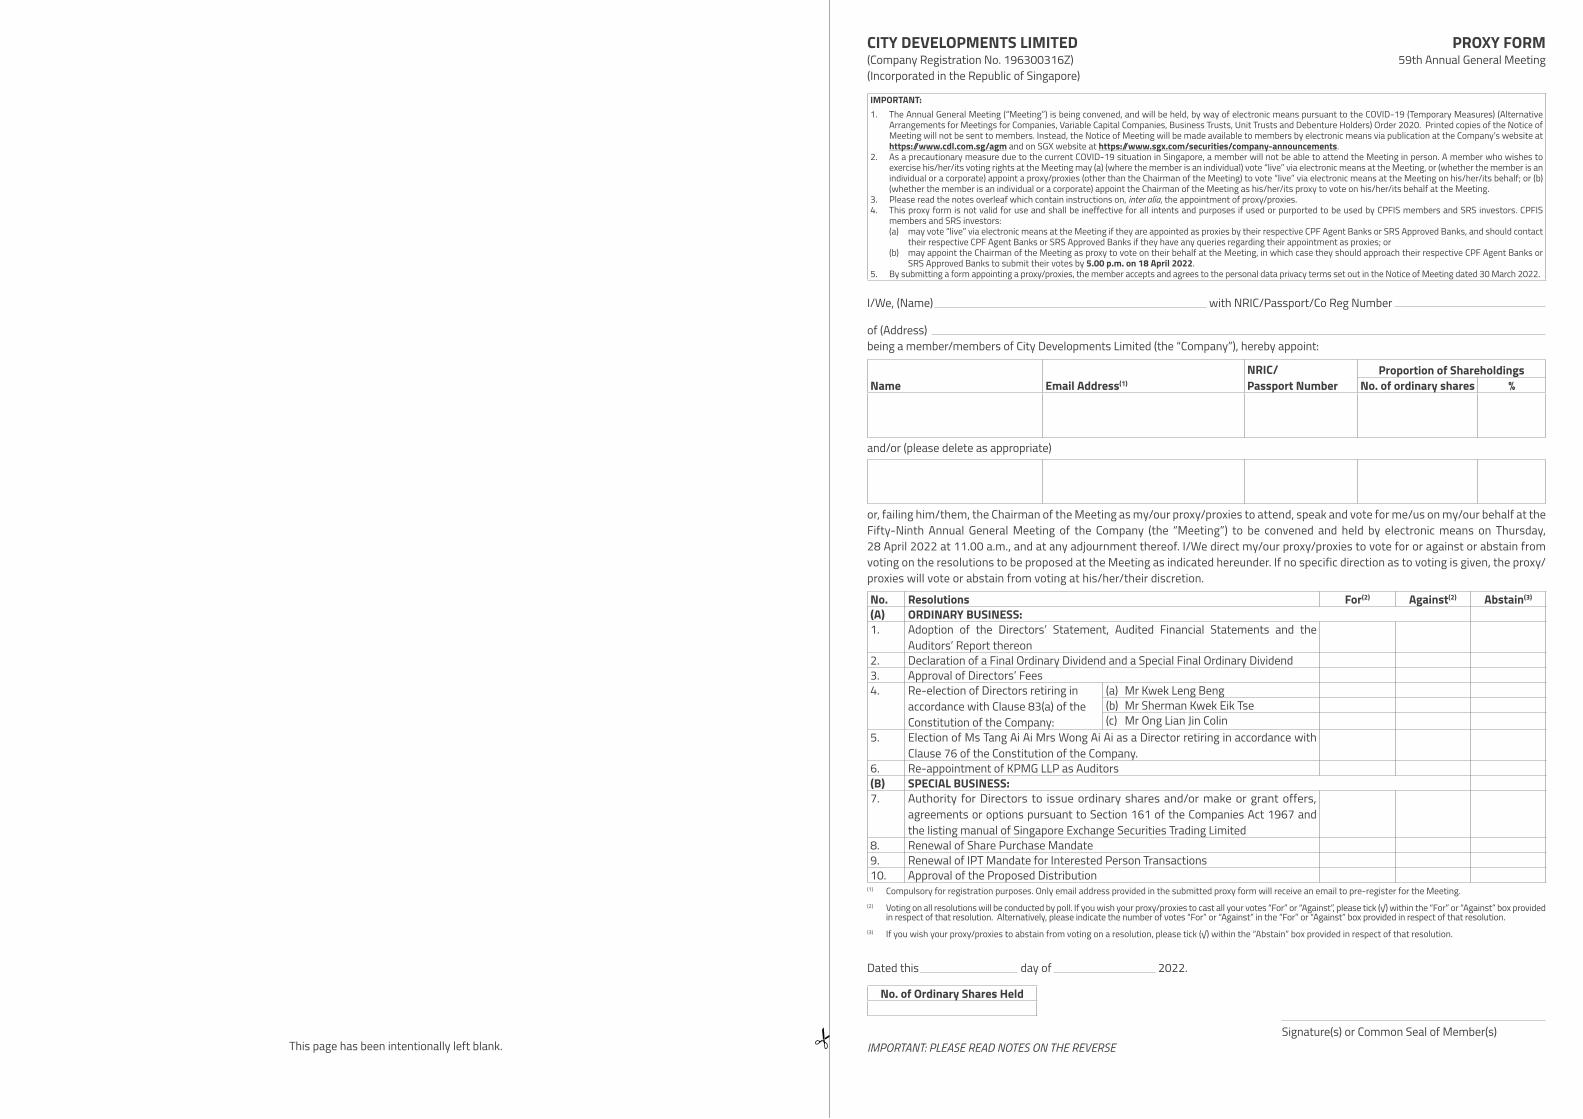
I/We, (Name) with NRIC/Passport/Co Reg Number
of (Address) being a member/members of City Developments Limited (the “Company”), hereby appoint:
Name Email Address(1)
NRIC/Passport Number
Proportion of ShareholdingsNo. of ordinary shares %
and/or (please delete as appropriate)
or, failing him/them, the Chairman of the Meeting as my/our proxy/proxies to attend, speak and vote for me/us on my/our behalf at the Fifty-Ninth Annual General Meeting of the Company (the “Meeting”) to be convened and held by electronic means on Thursday, 28 April 2022 at 11.00 a.m., and at any adjournment thereof. I/We direct my/our proxy/proxies to vote for or against or abstain from voting on the resolutions to be proposed at the Meeting as indicated hereunder. If no specific direction as to voting is given, the proxy/proxies will vote or abstain from voting at his/her/their discretion.
No. Resolutions For(2) Against(2) Abstain(3)
(A) ORDINARY BUSINESS:1. Adoption of the Directors’ Statement, Audited Financial Statements and the
Auditors’ Report thereon2. Declaration of a Final Ordinary Dividend and a Special Final Ordinary Dividend3. Approval of Directors’ Fees4. Re-election of Directors retiring in
accordance with Clause 83(a) of the Constitution of the Company:
(a) Mr Kwek Leng Beng (b) Mr Sherman Kwek Eik Tse (c) Mr Ong Lian Jin Colin
5. Election of Ms Tang Ai Ai Mrs Wong Ai Ai as a Director retiring in accordance with Clause 76 of the Constitution of the Company.
6. Re-appointment of KPMG LLP as Auditors(B) SPECIAL BUSINESS:7. Authority for Directors to issue ordinary shares and/or make or grant offers,
agreements or options pursuant to Section 161 of the Companies Act 1967 and the listing manual of Singapore Exchange Securities Trading Limited
8. Renewal of Share Purchase Mandate9. Renewal of IPT Mandate for Interested Person Transactions10. Approval of the Proposed Distribution
(1) Compulsory for registration purposes. Only email address provided in the submitted proxy form will receive an email to pre-register for the Meeting.(2) Voting on all resolutions will be conducted by poll. If you wish your proxy/proxies to cast all your votes “For” or “Against”, please tick (√) within the “For” or “Against” box provided
in respect of that resolution. Alternatively, please indicate the number of votes “For” or “Against” in the “For” or “Against” box provided in respect of that resolution. (3) If you wish your proxy/proxies to abstain from voting on a resolution, please tick (√) within the “Abstain” box provided in respect of that resolution.
Dated this day of 2022.
No. of Ordinary Shares Held
Signature(s) or Common Seal of Member(s)IMPORTANT: PLEASE READ NOTES ON THE REVERSEThis page has been intentionally left blank.
IMPORTANT: 1. The Annual General Meeting (“Meeting”) is being convened, and will be held, by way of electronic means pursuant to the COVID-19 (Temporary Measures) (Alternative
Arrangements for Meetings for Companies, Variable Capital Companies, Business Trusts, Unit Trusts and Debenture Holders) Order 2020. Printed copies of the Notice of Meeting will not be sent to members. Instead, the Notice of Meeting will be made available to members by electronic means via publication at the Company’s website at https://www.cdl.com.sg/agm and on SGX website at https://www.sgx.com/securities/company-announcements.
2. As a precautionary measure due to the current COVID-19 situation in Singapore, a member will not be able to attend the Meeting in person. A member who wishes to exercise his/her/its voting rights at the Meeting may (a) (where the member is an individual) vote “live” via electronic means at the Meeting, or (whether the member is an individual or a corporate) appoint a proxy/proxies (other than the Chairman of the Meeting) to vote “live” via electronic means at the Meeting on his/her/its behalf; or (b) (whether the member is an individual or a corporate) appoint the Chairman of the Meeting as his/her/its proxy to vote on his/her/its behalf at the Meeting.
3. Please read the notes overleaf which contain instructions on, inter alia, the appointment of proxy/proxies. 4. This proxy form is not valid for use and shall be ineffective for all intents and purposes if used or purported to be used by CPFIS members and SRS investors. CPFIS
members and SRS investors:(a) may vote “live” via electronic means at the Meeting if they are appointed as proxies by their respective CPF Agent Banks or SRS Approved Banks, and should contact
their respective CPF Agent Banks or SRS Approved Banks if they have any queries regarding their appointment as proxies; or(b) may appoint the Chairman of the Meeting as proxy to vote on their behalf at the Meeting, in which case they should approach their respective CPF Agent Banks or
SRS Approved Banks to submit their votes by 5.00 p.m. on 18 April 2022.5. By submitting a form appointing a proxy/proxies, the member accepts and agrees to the personal data privacy terms set out in the Notice of Meeting dated 30 March 2022.
CITY DEVELOPMENTS LIMITED(Company Registration No. 196300316Z)(Incorporated in the Republic of Singapore)
PROXY FORM59th Annual General Meeting
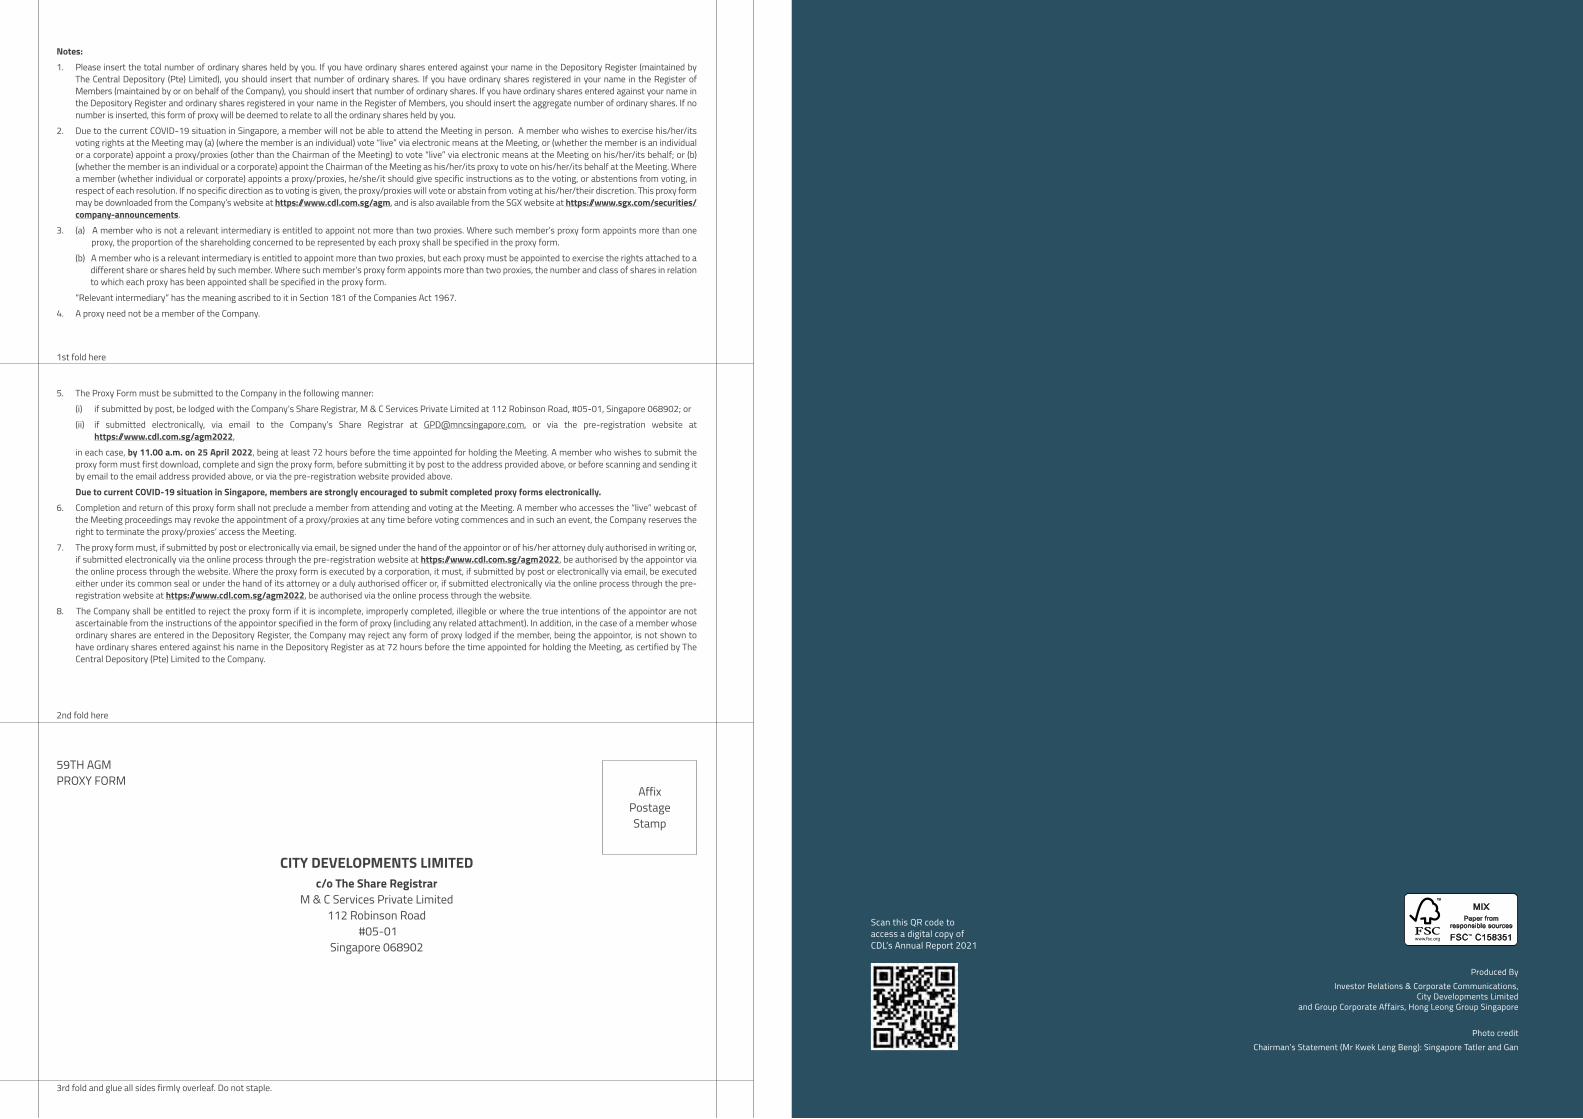
Scan this QR code toaccess a digital copy ofCDL’s Annual Report 2021
Photo creditChairman’s Statement (Mr Kwek Leng Beng): Singapore Tatler and Gan
Produced ByInvestor Relations & Corporate Communications,
City Developments Limitedand Group Corporate Affairs, Hong Leong Group Singapore
5. The Proxy Form must be submitted to the Company in the following manner:(i) if submitted by post, be lodged with the Company’s Share Registrar, M & C Services Private Limited at 112 Robinson Road, #05-01, Singapore 068902; or(ii) if submitted electronically, via email to the Company’s Share Registrar at [email protected], or via the pre-registration website at
https://www.cdl.com.sg/agm2022, in each case, by 11.00 a.m. on 25 April 2022, being at least 72 hours before the time appointed for holding the Meeting. A member who wishes to submit the proxy form must first download, complete and sign the proxy form, before submitting it by post to the address provided above, or before scanning and sending it by email to the email address provided above, or via the pre-registration website provided above.Due to current COVID-19 situation in Singapore, members are strongly encouraged to submit completed proxy forms electronically.
6. Completion and return of this proxy form shall not preclude a member from attending and voting at the Meeting. A member who accesses the “live” webcast of the Meeting proceedings may revoke the appointment of a proxy/proxies at any time before voting commences and in such an event, the Company reserves the right to terminate the proxy/proxies’ access the Meeting.
7. The proxy form must, if submitted by post or electronically via email, be signed under the hand of the appointor or of his/her attorney duly authorised in writing or, if submitted electronically via the online process through the pre-registration website at https://www.cdl.com.sg/agm2022, be authorised by the appointor via the online process through the website. Where the proxy form is executed by a corporation, it must, if submitted by post or electronically via email, be executed either under its common seal or under the hand of its attorney or a duly authorised officer or, if submitted electronically via the online process through the pre-registration website at https://www.cdl.com.sg/agm2022, be authorised via the online process through the website.
8. The Company shall be entitled to reject the proxy form if it is incomplete, improperly completed, illegible or where the true intentions of the appointor are not ascertainable from the instructions of the appointor specified in the form of proxy (including any related attachment). In addition, in the case of a member whose ordinary shares are entered in the Depository Register, the Company may reject any form of proxy lodged if the member, being the appointor, is not shown to have ordinary shares entered against his name in the Depository Register as at 72 hours before the time appointed for holding the Meeting, as certified by The Central Depository (Pte) Limited to the Company.
CITY DEVELOPMENTS LIMITEDc/o The Share Registrar
M & C Services Private Limited112 Robinson Road
#05-01Singapore 068902
AffixPostageStamp
59TH AGMPROXY FORM
3rd fold and glue all sides firmly overleaf. Do not staple.
2nd fold here
Notes: 1. Please insert the total number of ordinary shares held by you. If you have ordinary shares entered against your name in the Depository Register (maintained by
The Central Depository (Pte) Limited), you should insert that number of ordinary shares. If you have ordinary shares registered in your name in the Register of Members (maintained by or on behalf of the Company), you should insert that number of ordinary shares. If you have ordinary shares entered against your name in the Depository Register and ordinary shares registered in your name in the Register of Members, you should insert the aggregate number of ordinary shares. If no number is inserted, this form of proxy will be deemed to relate to all the ordinary shares held by you.
2. Due to the current COVID-19 situation in Singapore, a member will not be able to attend the Meeting in person. A member who wishes to exercise his/her/its voting rights at the Meeting may (a) (where the member is an individual) vote “live” via electronic means at the Meeting, or (whether the member is an individual or a corporate) appoint a proxy/proxies (other than the Chairman of the Meeting) to vote “live” via electronic means at the Meeting on his/her/its behalf; or (b) (whether the member is an individual or a corporate) appoint the Chairman of the Meeting as his/her/its proxy to vote on his/her/its behalf at the Meeting. Where a member (whether individual or corporate) appoints a proxy/proxies, he/she/it should give specific instructions as to the voting, or abstentions from voting, in respect of each resolution. If no specific direction as to voting is given, the proxy/proxies will vote or abstain from voting at his/her/their discretion. This proxy form may be downloaded from the Company’s website at https://www.cdl.com.sg/agm, and is also available from the SGX website at https://www.sgx.com/securities/company-announcements.
3. (a) A member who is not a relevant intermediary is entitled to appoint not more than two proxies. Where such member’s proxy form appoints more than one proxy, the proportion of the shareholding concerned to be represented by each proxy shall be specified in the proxy form.
(b) A member who is a relevant intermediary is entitled to appoint more than two proxies, but each proxy must be appointed to exercise the rights attached to a different share or shares held by such member. Where such member’s proxy form appoints more than two proxies, the number and class of shares in relation to which each proxy has been appointed shall be specified in the proxy form.
“Relevant intermediary” has the meaning ascribed to it in Section 181 of the Companies Act 1967.4. A proxy need not be a member of the Company.
1st fold here

9 RAFFLES PLACE#12-01 REPUBLIC PLAZASINGAPORE 048619
Co. Reg. No. 196300316Z
TEL +65 6877 8228FAX +65 6223 2746www.cdl.com.sg


