See discussions, stats, and author profiles for this publication at: https://www.researchgate.net/publication/222422370 Rift nucleation, rift propagation and the creation of basement micro-plates within active rifts ARTICLE in TECTONOPHYSICS · OCTOBER 2008 Impact Factor: 2.87 · DOI: 10.1016/j.tecto.2007.10.003 CITATIONS 35 READS 54 4 AUTHORS: Daniel Koehn University of Glasgow 94 PUBLICATIONS 721 CITATIONS SEE PROFILE Kevin Aanyu Makerere University 10 PUBLICATIONS 105 CITATIONS SEE PROFILE Samuel H. Haines Chevron 17 PUBLICATIONS 230 CITATIONS SEE PROFILE Till Sachau University of Tuebingen 20 PUBLICATIONS 88 CITATIONS SEE PROFILE Available from: Daniel Koehn Retrieved on: 04 February 2016
Keywords: Rifting; Micro-plate; Transfer zone; Tanzania craton; Spring model; Rwenzori
1. Introduction
Continental rifts are spectacular geomorphic and geologicfeatures on the Earth's surface. Their geometries are of greatinterest to the geological community, but the dynamics of theirevolution remains poorly understood. This evolution includes theinitial breaking stage, which we will term rift nucleation,subsequent rift propagation and the linking of rift segments.
Transfer zones between different rift basins are a commonfeature in continental rifts (Bosworth, 1985; Morley et al., 1990;
Nelson et al., 1992; Gawthorpe and Hurst, 1993; Upcott et al.,1996). These transfer zones can be the result of approaching riftsegments that originated as isolated nuclei where the first faultsformed. Nelson et al. (1992) concluded that such a scenario onthe scale of a continental rift is comparable with fracture and evenmicro-crack interaction on much smaller scales (Pollard andAydin, 1984). One possible structure that develops during riftsegment interaction is a horst, a crustal block that is bound bynormal faults. Rising horsts within continental rift systems arequite common (Bahat and Mohr, 1987) and are locally developedwithin the East African Rift System (EARS).
We use the EARS as a case study for rift nucleation andsegment interaction because it is one of the best-studied riftsystems on Earth. The EARS is an approximately 3000 km long,
106 D. Koehn et al. / Tectonophysics 458 (2008) 105–116
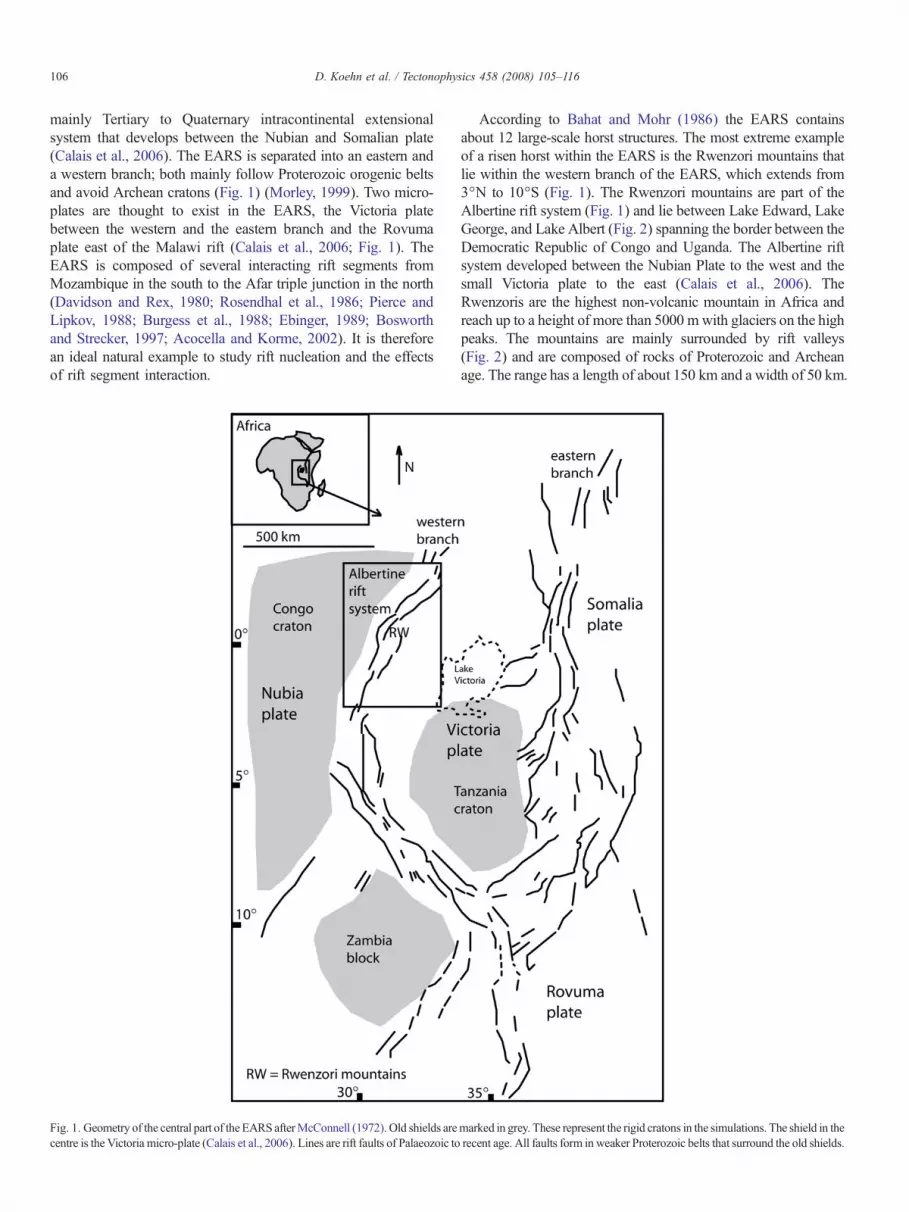
mainly Tertiary to Quaternary intracontinental extensionalsystem that develops between the Nubian and Somalian plate(Calais et al., 2006). The EARS is separated into an eastern anda western branch; both mainly follow Proterozoic orogenic beltsand avoid Archean cratons (Fig. 1) (Morley, 1999). Two micro-plates are thought to exist in the EARS, the Victoria platebetween the western and the eastern branch and the Rovumaplate east of the Malawi rift (Calais et al., 2006; Fig. 1). TheEARS is composed of several interacting rift segments fromMozambique in the south to the Afar triple junction in the north(Davidson and Rex, 1980; Rosendhal et al., 1986; Pierce andLipkov, 1988; Burgess et al., 1988; Ebinger, 1989; Bosworthand Strecker, 1997; Acocella and Korme, 2002). It is thereforean ideal natural example to study rift nucleation and the effectsof rift segment interaction.
Fig. 1. Geometry of the central part of the EARSafterMcConnell (1972). Old shields arecentre is the Victoria micro-plate (Calais et al., 2006). Lines are rift faults of Palaeozoic to
According to Bahat and Mohr (1986) the EARS containsabout 12 large-scale horst structures. The most extreme exampleof a risen horst within the EARS is the Rwenzori mountains thatlie within the western branch of the EARS, which extends from3°N to 10°S (Fig. 1). The Rwenzori mountains are part of theAlbertine rift system (Fig. 1) and lie between Lake Edward, LakeGeorge, and Lake Albert (Fig. 2) spanning the border between theDemocratic Republic of Congo and Uganda. The Albertine riftsystem developed between the Nubian Plate to the west and thesmall Victoria plate to the east (Calais et al., 2006). TheRwenzoris are the highest non-volcanic mountain in Africa andreach up to a height of more than 5000 mwith glaciers on the highpeaks. The mountains are mainly surrounded by rift valleys(Fig. 2) and are composed of rocks of Proterozoic and Archeanage. The range has a length of about 150 km and a width of 50 km.
marked in grey. These represent the rigid cratons in the simulations. The shield in therecent age. All faults form in weaker Proterozoic belts that surround the old shields.
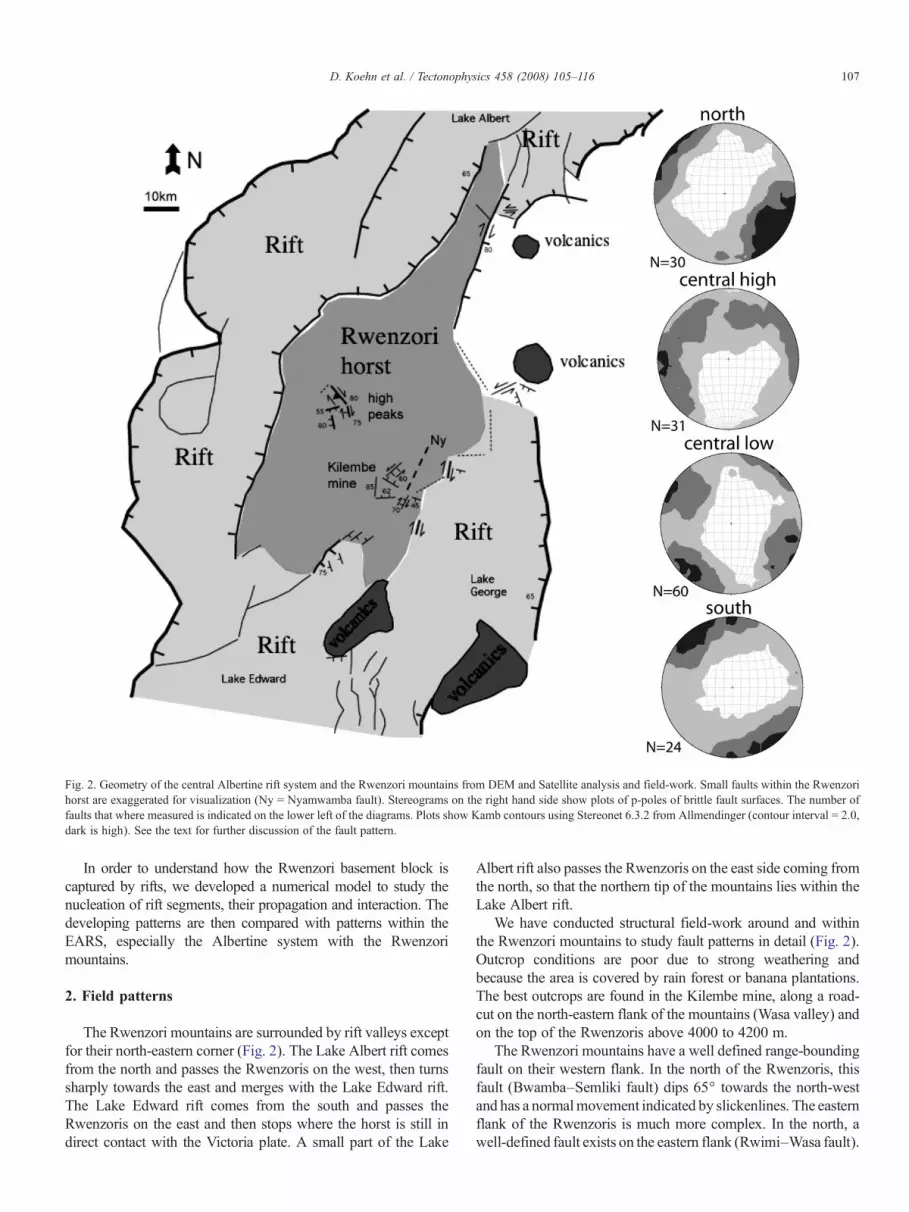
Fig. 2. Geometry of the central Albertine rift system and the Rwenzori mountains from DEM and Satellite analysis and field-work. Small faults within the Rwenzorihorst are exaggerated for visualization (Ny = Nyamwamba fault). Stereograms on the right hand side show plots of p-poles of brittle fault surfaces. The number offaults that where measured is indicated on the lower left of the diagrams. Plots show Kamb contours using Stereonet 6.3.2 from Allmendinger (contour interval = 2.0,dark is high). See the text for further discussion of the fault pattern.
107D. Koehn et al. / Tectonophysics 458 (2008) 105–116
In order to understand how the Rwenzori basement block iscaptured by rifts, we developed a numerical model to study thenucleation of rift segments, their propagation and interaction. Thedeveloping patterns are then compared with patterns within theEARS, especially the Albertine system with the Rwenzorimountains.
2. Field patterns
The Rwenzori mountains are surrounded by rift valleys exceptfor their north-eastern corner (Fig. 2). The Lake Albert rift comesfrom the north and passes the Rwenzoris on the west, then turnssharply towards the east and merges with the Lake Edward rift.The Lake Edward rift comes from the south and passes theRwenzoris on the east and then stops where the horst is still indirect contact with the Victoria plate. A small part of the Lake
Albert rift also passes the Rwenzoris on the east side coming fromthe north, so that the northern tip of the mountains lies within theLake Albert rift.
We have conducted structural field-work around and withinthe Rwenzori mountains to study fault patterns in detail (Fig. 2).Outcrop conditions are poor due to strong weathering andbecause the area is covered by rain forest or banana plantations.The best outcrops are found in the Kilembe mine, along a road-cut on the north-eastern flank of the mountains (Wasa valley) andon the top of the Rwenzoris above 4000 to 4200 m.
The Rwenzori mountains have a well defined range-boundingfault on their western flank. In the north of the Rwenzoris, thisfault (Bwamba–Semliki fault) dips 65° towards the north-westand has a normalmovement indicated by slickenlines. The easternflank of the Rwenzoris is much more complex. In the north, awell-defined fault exists on the eastern flank (Rwimi–Wasa fault).
Fig. 3. Setup of the numerical simulations. A triangular grid of springsrepresents the brittle crust and is attached to a visco-elastic base. Broken springsrepresent rift nuclei and merge to form larger rift structures. See text for furtherdiscussion and parameters used.
108 D. Koehn et al. / Tectonophysics 458 (2008) 105–116
This fault has a very steep dip of 80°, and slickenlines indicate amixed normal and dextral displacement. In the south of theRwenzoris, there is also a well-defined fault on the eastern flankwith a dip of about 75° ESE. In the center portion of the range, theRwenzoris are wider than in the north or south and show a gradualdecrease in topography from the high peaks to the rift valley in theeast. Since the Rwenzori basement block was uplifted relative tothe rift valley on the eastern side, faults should have a normalcomponent. However, no through-going fault scarp is discern-able. Rather, the boundary between the rift valley and thebasement has a zigzag shape. If boundary faults are visible theytend to show a combination of dextral strike slip and normalcomponents, which may represent dextral pull-aparts.
We collected a large fault data set from the Kilembe mine nearthe town of Kasese that lies within the lower Rwenzoris about 5 to10 km west of the eastern rift valley (Fig. 2). We found one set offaults that trends SSW–NNE parallel to the Rwenzori mountainrange, a second set that trends ESE–WNW and minor faultstrending N–S and E–W. Slickenlines mainly show a N–S and E–W movement. Both major fault sets show normal and strike slipcomponent, with the SSW–NNE trending faults dominated bystrike slip and the ESE–WNW trending faults dominated bynormal component. A large-scale possibly reactivated fault(Nyamwamba fault, dashed line in Fig. 2, McConnell, 1972)crops out close to the Kilembe mine. However, we found noindications of such a reactivation and interpret this fault as apurely ductile feature that is not related to Postproterozoictectonics. An additional data set of brittle faults was collected onthe top of the Rwenzoris around the high peaks (Fig. 2). Here wefind a set of steeply dipping NW–SE trending faults with a mixeddextral strike slip and normal component, a set of moderatelydipping normal faults with a E–W to ENE–WSW trend and a setof steeply dipping N–S trending normal to strike slip faults.
There is a pronounced difference between the centralRwenzoris on one hand and the northern and southern part onthe other hand. The northern and the southern part of theRwenzoris show one major fault set that strikes parallel to themountain range and some minor range-cutting fault sets. Thestereograms in Fig. 2 show that there is a small difference inthe strike of major faults between the north and the south.Faults in the north have a NE–SW trend whereas faults in thesouth a ENE–WSW trend. These trends follow roughly theoutline of the Rwenzori horst. In contrast to the fault sets inthe north and south, the eastern area of the central Rwenzorisshows a range-parallel set but also a major range-cutting faultset (Fig. 2, “central low”). The high Rwenzoris contain rangecutting NNW–SSE trending strike slip faults and E–Wtrending normal faults (Fig. 2, “central high”). In order toexplain these complex fault patterns we developed anumerical model that is introduced in the next section.
3. Numerical model
We use a visco-elasto-plastic spring network model for thesimulations (Malthe-Sørenssen et al., 1998a,b, 1999; Koehnet al., 2005, 2007). The brittle crust is represented by a 2-D sheetof elements that are connected via linear-elastic springs (Fig. 3).
These springs break once they have reached a given yield stress.In addition, elements are attached to a second visco-elastic sheetrepresenting lower parts of the crust that behave viscously.Boundary conditions for the model are a constant strain rateparallel to the lower boundary of the square simulation box. Theleft hand side of the box is fixed whereas the right hand side ismoved to the right. The lower and upper boundaries are free slipboundaries. Stresses in the crust are determined using an over-relaxation algorithm (Allen, 1954), where elements are movedaccording to forces that act on the elements until an equilibriumposition is found. The equilibrium condition is defined by arelaxation threshold.
The net force (Fi) acting on an element i at position xi is(Koehn et al., 2007)
Fi ¼Xjð Þj jxi � xjj � l� �
vi;j þ fv; ð1Þ
where the sum is over all neighbours j, κ is a spring constant, l isthe equilibrium distance between elements i and j, vij is a unitvector pointing from j to i and fv is the extra force from the visco-elastic sheet. The visco-elastic springs that attach the elastic sheetto a viscous base have a Maxwell character where the position ofthe attachment points relative to the elements of the upper sheet isa function of their viscosity η, their Young's modulus G and atime step dt according to
dltþdt ¼ dlt exp �Ggdt
� �; ð2Þ
where dl is the distance between the centre of the element of theelastic sheet and the attachment point. If dl is zero there is no extraforce from the viscous sheet.
Deformation is applied in discrete steps of 1 step per 1000 years.During a deformation step, all elements of the elastic sheet andpoints of the viscous layer are moved according to the applieddeformation. After that, the relaxation algorithm starts. Once thelattice is in equilibrium, we check if a spring has exceeded its yieldstress. The spring that is most likely to break does so. Breakingmeans that the spring cannot sustain tensile stresses and onlyrepulsion between elements remains active. When a spring breaks,the relaxation algorithm starts to calculate the new stress field, andthe yield stress of springs is checked until no springs break.Afterwards, the visco-elastic step relaxes the connections of elastic
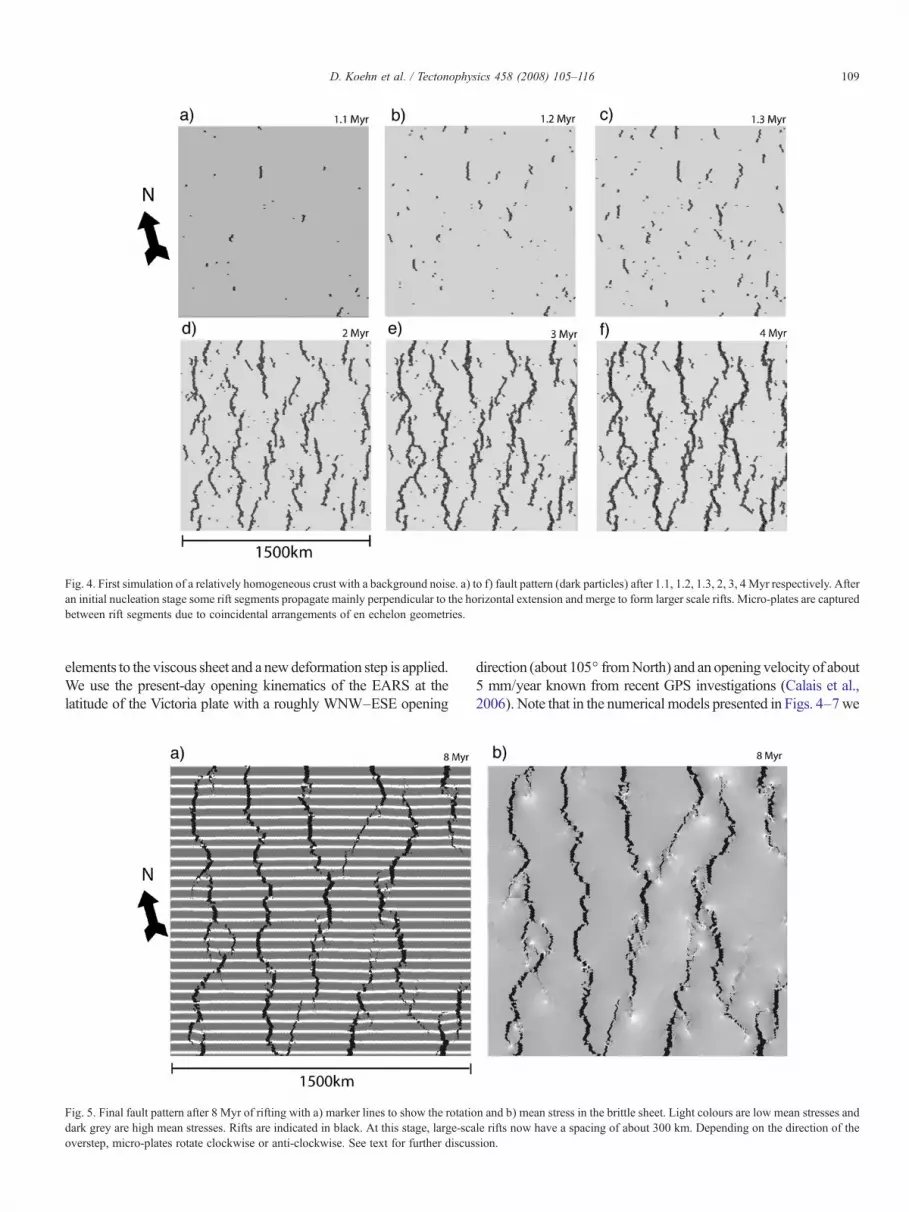
Fig. 4. First simulation of a relatively homogeneous crust with a background noise. a) to f) fault pattern (dark particles) after 1.1, 1.2, 1.3, 2, 3, 4 Myr respectively. Afteran initial nucleation stage some rift segments propagate mainly perpendicular to the horizontal extension and merge to form larger scale rifts. Micro-plates are capturedbetween rift segments due to coincidental arrangements of en echelon geometries.
109D. Koehn et al. / Tectonophysics 458 (2008) 105–116
elements to the viscous sheet and a newdeformation step is applied.We use the present-day opening kinematics of the EARS at thelatitude of the Victoria plate with a roughly WNW–ESE opening
Fig. 5. Final fault pattern after 8 Myr of rifting with a) marker lines to show the rotatiodark grey are high mean stresses. Rifts are indicated in black. At this stage, large-scaoverstep, micro-plates rotate clockwise or anti-clockwise. See text for further discus
direction (about 105° fromNorth) and an opening velocity of about5 mm/year known from recent GPS investigations (Calais et al.,2006). Note that in the numerical models presented in Figs. 4–7we
n and b) mean stress in the brittle sheet. Light colours are low mean stresses andle rifts now have a spacing of about 300 km. Depending on the direction of thesion.
Fig. 6. Closeup showing an a) anti-clockwise rotating micro-plate with a right lateral overstep of rift segments, a b) clockwise rotating micro-plate with a left lateraloverstep of rift segments, c) the mean stress field for b) with light colour low mean stress and dark colour high (compressive) mean stress and d) the deformed mesh ofthe micro-plate shown in c). Note how the rifts curve around the micro-plates to capture them.
110 D. Koehn et al. / Tectonophysics 458 (2008) 105–116
use a horizontal opening direction, so that the pictures have to berotated 15° clockwise to be compared with the natural examples.Parameters used for the model crust were a yield strength of0.5 GPa, a Young'sModulus of 50GPa and a viscosity of the lower
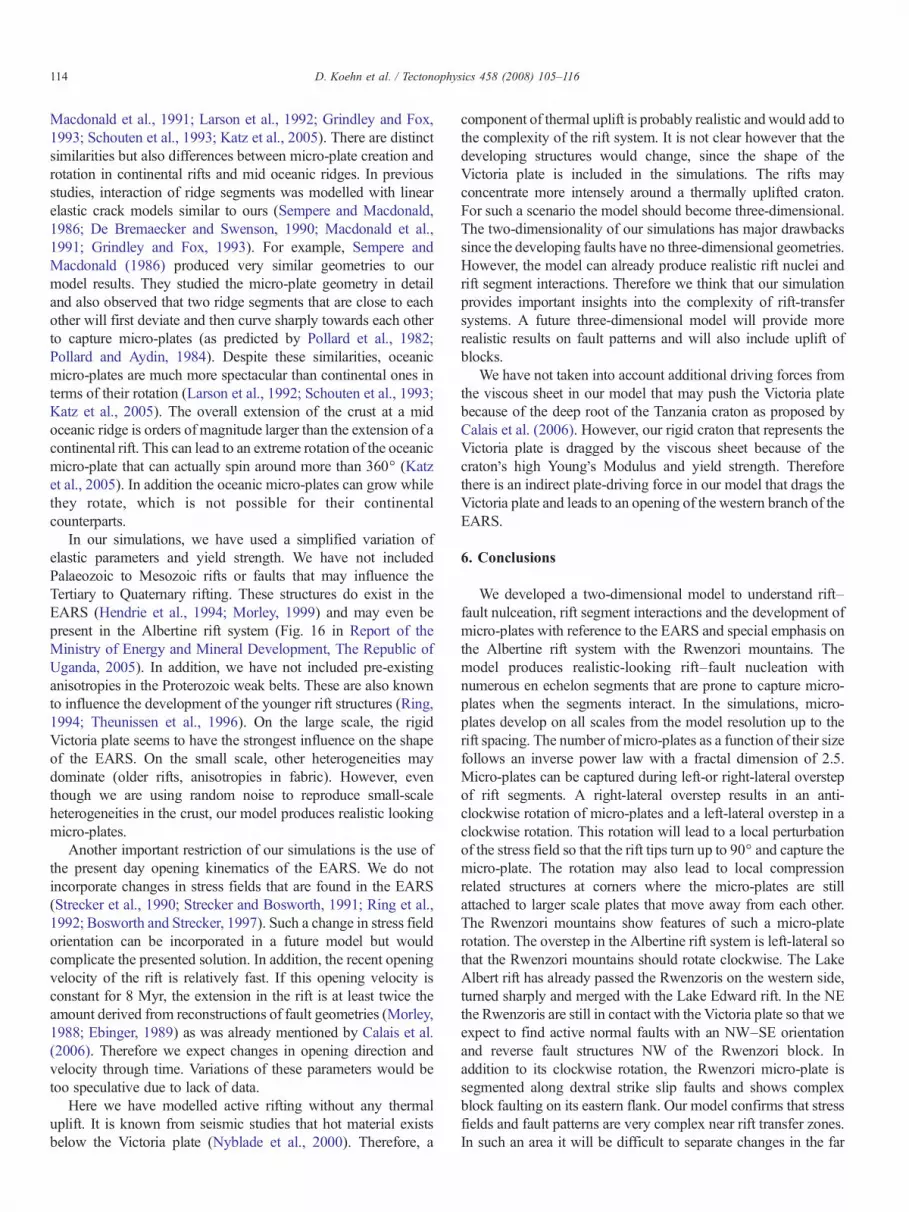
Fig. 7. Simulation with rigid cratons. a) Setup of the simulation with the Victoria plb) Fault pattern after 8.0 Myr. The western branch shows the typical curvature wheretext for further discussion.
sheet of 1019 Pas (Karner et al., 2000; Pollard and Fletcher, 2005).The Poisson ratio of the lattice is 1/3 because of its triangularconfiguration.We induce aGaussian variation on the yield strengthof single springs at the beginning of a simulation (quenched noise)
ate (Tanzania craton) in the center and the Nubian shield on the left hand side.as the eastern branch is straighter. c) Closeup of the curved western branch. See
111D. Koehn et al. / Tectonophysics 458 (2008) 105–116
and a larger scale variation of the Young's moduli of elementclusters (10 to 50 elements). These distributions should mimicgeological variations of these constants. In addition, we insert“strong” cratons in one simulation. The model resolution is200×230 particles. The absolute width of the model is 1500 km,and the running time 8–12 Myr simulates the Tertiary toQuaternary evolution. We are mainly simulating rift faultnucleation and segment interaction. Therefore we start with ascenario without rigid cratons. In a second simulation we insertcratons in the model to understand their influence on rift faultevolution.We do not have a perfect model of the EARS and we areonly using recent plate motions where plates have no large-scalerotation poles.We are not inserting changes in opening directions orplate velocities nor are we including any Palaeozoic or Mesozoicrifts. However, our model can provide first order insight into thenucleation behaviour of rift faults, the effects of rift segmentinteraction and the influence of rigid cratons on rift fault evolution.In the following, wewill term basement blocks that are captured byinteracting rift segmentsmicro-plates in order to use amore generalterm than horst. A horst is then a special kind of micro-plate thatmay be subject to uplift.
4. Model results
4.1. Rift fault nucleation and development of micro-plates
In the first simulation we extend a 1500 km wide crust that isrelatively homogeneous except for a background noise in yieldstrength and Young's modulus. This simulation will provideinformation on the spacing of rift fault zones under the givenconditions before proceeding with complex geometries thatinclude rigid cratons. Fig. 4 shows the results of such a simulationwith a horizontal extension. Fig. 4a–c show the nucleation of thefirst rift faults after 1.1, 1.2 and 1.3 Myr with an overall extensionof 5.5, 6.0 and 6.5 km. Fault nucleation is random as a function ofthe background noise in yield strength. Some of the nuclei start topropagate and form larger scale faults that are orientedperpendicular to the extension direction and have a length of upto 150 km, however not all nuclei become larger faults. The firsten echelon sets of fault segments develop in Fig. 4b and c.
After 2 Myr (Fig. 4d, 10 km extension) faults have mergedpartly to form larger sets. Even en echelon sets of fault segmentsstart to merge on the larger scale (Fig. 4d–f) to form larger faultzones that are not perfectly perpendicular to the extensiondirection. The average spacing of the larger fault zones is in therange of 300 km. The spacing is dependent on the Young'sModulus of elements and their yield strength. A high yieldstrength and low Young's Modulus favour a larger spacing. Faultzones capture a number of micro-plates of different size from theelement size of the model (about 7.5 km) up to the fault zonespacing of 300 km. Fig. 5 shows the final fault geometries afterabout 8 Myr (40 km extension). In Fig. 5a horizontal marker linesare inserted so that the rotation of basement blocks becomesevident. One can observe that the main extension is concentratedin the fault segments that are oriented nearly perpendicular to theextension direction. Fault zones that are inclined and faults thatare too close to opening zones show only a minor amount of
extension or die out. Micro-plates are often captured at transferzones where fault segments interact, especially if the segmentsoriginally had a certain offset. During successive opening of thefaults, these micro-plates rotate clockwise or anticlockwisedepending on the overstep of fault segments. If the overstep isright-lateral coming from the bottom of the picture, the micro-plates rotate anti-clockwise. If the overstep is left-lateral theyrotate clockwise. Micro-plates rotate up to 15° in thesesimulations. The rotation comes from the fact that most micro-plates are still attached to the neighbouring large-scale plates thatmove apart from each other. Since the plate-capturing faultsegments come from opposing directions, the micro-plates areconnected to the larger plates at opposing corners. When thelarge-scale fault system progressively opens, the micro-platesstart to rotate. During the rotation of micro-plates, stressesconcentrate at the tip of fault segments (Fig. 5b).
The shape of micro-plates, their rotation and the associatedstress field can be better observed in the close-ups presented inFig. 6. Fig. 6a shows a right-lateral fault overstep with an anti-clockwise rotation, Fig. 6b a left-lateral overstep with a clockwiserotation, Fig. 6c the stress field of the micro-plate of Fig. 6b and dthe associated deformation mesh. Fault segments next to micro-plates generally close towards the end of the plate. The sum of thewidth of the left and right hand fault segment next to a micro-plateremains constant. The micro-plate rotation matches the narrowingof the fault zones. Stresses concentrate where the micro-plates arestill attached to the main plates. A clockwise rotation of themicro-plate results in low mean stresses at the upper right andlower left corner and high compressive mean stresses at the upperleft and lower right corner (Fig. 6c).
Our model predicts two important scenarios. First, compres-sive stresses and thus inversion structures can be expected in theupper right and lower left corner of a clockwise rotating micro-plate. Second, normal faults may develop in the upper right andlower left corner of such a block. These normal faults have anorientation that is more or less parallel to the large field extensiondirection. One of these structures can be seen in Fig. 6a at the tipof the fault segment on the left-hand side of the micro-plate. Afault develops from the tip of the large fault segment, propagatestowards the right and will eventually merge with the faultsegment on the right-hand side of the micro-plate.
In the second simulation we insert rigid cratons in the model.These cratons have a higher yield stress than the surroundingmaterial. We thus mimic the existence of weaker Proterozoicmountain belts around rigid hard Archaean cratons (Ebingeret al., 1997; Ritsema et al., 1998; Nyblade and Brazier, 2002). Forsimplicity the cratons are circular. One craton in the centre isrepresenting the Tanzania craton that develops into the Victoriaplate (Fig. 7a; Calais et al., 2006). A second set of cratons that ismade up by 4 circles with high yield stress on the left hand side ofthe model mimics part of the Nubian plate (Congo craton andZambia block, Ring 1994). Since the actual geology of the area ismuch more complex and our model does not capture the fulldynamics of rifting processes, we do not expect that the faultgeometries developed in the model would perfectly replicate theEARS. However, the insertion of a rigid craton in the model isenough to produce fault zone geometries that curve around the
112 D. Koehn et al. / Tectonophysics 458 (2008) 105–116
craton (Fig. 7b,c) in contrast to the straight fault zones that wereproduced in the first simulation (Fig. 4).
During both simulations, a number of micro-plates arecaptured within the larger fault zones (Fig. 7d). We counted thenumber of micro-plates of a certain size in order to check possiblerelationships between size and frequency. It is a knownphenomenon that fragmentation processes lead to an inversepower–law relation between the size of fragments and theirfrequency (Turcotte, 1997). Since the development of rift faultsystems can also be viewed as a fragmentation process of thelithosphere, we expect similar scaling properties of our micro-plates. We measured the width and length of micro-plates,determined the area and took the square root of the area in order toget a characteristic length scale (l). We then plotted the log of lagainst the log of the number of micro-plates of that size in orderto see if the size distribution follows an inverse power law(Fig. 8). We find that the number of micro-plates of a certainlength N(l) is proportional to the length l to the power −2.5according to (Fig. 8)
N lð Þcl�2:5: ð3Þ
This power law with the fractal dimension of 2.5 is similar toscaling behaviours observed in other fragmentation processes(Turcotte, 1997). It is not clear if this power law, and especiallythe exponent determined from the simulations, is applicable tonatural systems. However, if we assume that this is a reasonablescaling relation we can estimate the amount of micro-plates of agiven size that one should find in the EARS. With respect to theRwenzori mountains with a length l of about 86 km, the graphfrom Fig. 8 indicates that we should expect roughly 12 micro-plates of this size. Indeed, as was mentioned earlier, Bahat and
Fig. 8. Plot of the number of micro-plates of a certain size (N(l)) versus the size (l) indimension of about 2.5. The scaling supports the idea that the development of micr
Mohr (1986) found about 12 large-scale horsts of this size in theEARS, indicating that the scaling relation may hold. The scalingrelation of Fig. 8 also predicts that one micro-plate may exist witha length l of 200 km, which is almost the spacing of rift segmentsand about 47 micro-plates with a length l of 50 km.
4.2. Comparison of the simulation and the natural example
We now compare the Rwenzori mountains with micro-platesthat developed in the simulations. If we compare Fig. 2 withFig. 6b and c we can observe that the natural and simulatedstructures have similar geometries. The surrounding rifts seem tocapture the Rwenzoris in the same way that micro-plates arecaptured by faults in the simulations. The Albertine rift systemhas a left-lateral overstep so that we can expect the Rwenzoris torotate clockwise (Fig. 9). If the micro-plate does not accommo-date the differential movement of the larger plates (Victoria andNubian plate) by rotation, it will be segmented and in the case of aleft-lateral overstep dextral strike-slip faults should form. This canexplain the steep dextral faults that we observe on top of theRwenzori mountains (Fig. 9). If the micro-plate rotates, we canexpect to have a scenario that is illustrated in Fig. 9b and c, whererift faults propagate first perpendicular to the extension directionand then turn sharply to form normal faults that are almostperpendicular to the main fault zone orientation. We can see sucha feature in the south of the Rwenzori mountains (Fig. 9) wherethe rift west of the Rwenzoris suddenly turns east and mergeswith the lake Edward rift. A similar feature may currently developin the north of the Rwenzoris where the mountains suddenlybecome much thinner and the basement is uplifted along a NW–SE trending structure (Fig. 9). This fault could have a mixeddextral and normal movement similar to the dextral strike slip to
log/log scale. The size distribution follows an inverse power law with a fractalo-plates is a typical fragmentation process (Turcotte, 1997).
Fig. 9. Interpretation of the Rwenzori structures based on field observations and the numerical model. a) field structures with proposed kinematics (GPS measurementsof Victoria plate motion relative to Nubian plate from Calais et al., 2006). b) and c) successive capturing of micro-plates based on the simulations. Note how the localstress field can turn and produce very unusual fault patterns. See text for further discussion.
113D. Koehn et al. / Tectonophysics 458 (2008) 105–116
normal faults on the high Rwenzoris. Unfortunately, so far wehave no age control on the actual propagation of the rift fromnatural data.
The Albertine rift system contains some reverse faultstructures and anticlines that can have two possible explanationswithout the need of a large scale inversion of the stress field(Abeinomugisha and Mugisha, 2004; Report of the Ministry ofEnergy and Mineral Development, The Republic of Uganda,2005; Calais et al., 2006). The first reason for local inversion isthe oblique orientation of the lake Albert rift with respect to thepresent day extension direction. This oblique orientation may bedue to the curvature of the western rift around the Victoria plate(Fig. 7b,c) and results in a sinistral wrench component (Fig. 9),which may lead to reverse faulting. Such reverse fault structuresand anticlines were found recently in seismic sections across thelake Albert rift (Abeinomugisha and Mugisha, 2004; Calais et al.,2006). The second reason for local reverse faults may be theclockwise rotation of the Rwenzori mountains, which can lead toa compression NWof the mountains in the Semliki valley. Here,the sinistral movement of the lake Albert rift and the compressioncoming from the rotating Rwenzoris might add up to form largerscale reverse faults and anticline structures (Fig. 9a and c).Indeed, the Semliki area shows a number of reverse faults and
anticline structures that are also potential oil traps (Report of theMinistry of Energy and Mineral Development, The Republic ofUganda, 2005).
5. Discussion
In this section we discuss the implications of our results forstress inversion techniques, compare continental micro-plateswith their oceanic counterparts and outline the limitations of ournumerical model.
Our simulations show that the variations of fault geometriesand stress fields within and near rift transfer zones can beenormous, since the stress field can rotate 70 to 90° (Fig. 9).Therefore stress inversion techniques may mainly record localstresses and are thus hard to apply in such an area. Thesetechniques should be restricted to the main rift segments awayfrom transfer zones. Otherwise it will be very hard to separatelarge-scale changes in the stress field orientation from local stressfield rotations due to rift segment interaction and micro-platerotation.
The initiation of micro-plates and their rotation were alsostudied at mid-oceanic ridges (Pollard and Aydin, 1984; Sempereand Macdonald, 1986; De Bremaecker and Swenson, 1990;
114 D. Koehn et al. / Tectonophysics 458 (2008) 105–116
Macdonald et al., 1991; Larson et al., 1992; Grindley and Fox,1993; Schouten et al., 1993; Katz et al., 2005). There are distinctsimilarities but also differences between micro-plate creation androtation in continental rifts and mid oceanic ridges. In previousstudies, interaction of ridge segments was modelled with linearelastic crack models similar to ours (Sempere and Macdonald,1986; De Bremaecker and Swenson, 1990; Macdonald et al.,1991; Grindley and Fox, 1993). For example, Sempere andMacdonald (1986) produced very similar geometries to ourmodel results. They studied the micro-plate geometry in detailand also observed that two ridge segments that are close to eachother will first deviate and then curve sharply towards each otherto capture micro-plates (as predicted by Pollard et al., 1982;Pollard and Aydin, 1984). Despite these similarities, oceanicmicro-plates are much more spectacular than continental ones interms of their rotation (Larson et al., 1992; Schouten et al., 1993;Katz et al., 2005). The overall extension of the crust at a midoceanic ridge is orders of magnitude larger than the extension of acontinental rift. This can lead to an extreme rotation of the oceanicmicro-plate that can actually spin around more than 360° (Katzet al., 2005). In addition the oceanic micro-plates can grow whilethey rotate, which is not possible for their continentalcounterparts.
In our simulations, we have used a simplified variation ofelastic parameters and yield strength. We have not includedPalaeozoic to Mesozoic rifts or faults that may influence theTertiary to Quaternary rifting. These structures do exist in theEARS (Hendrie et al., 1994; Morley, 1999) and may even bepresent in the Albertine rift system (Fig. 16 in Report of theMinistry of Energy and Mineral Development, The Republic ofUganda, 2005). In addition, we have not included pre-existinganisotropies in the Proterozoic weak belts. These are also knownto influence the development of the younger rift structures (Ring,1994; Theunissen et al., 1996). On the large scale, the rigidVictoria plate seems to have the strongest influence on the shapeof the EARS. On the small scale, other heterogeneities maydominate (older rifts, anisotropies in fabric). However, eventhough we are using random noise to reproduce small-scaleheterogeneities in the crust, our model produces realistic lookingmicro-plates.
Another important restriction of our simulations is the use ofthe present day opening kinematics of the EARS. We do notincorporate changes in stress fields that are found in the EARS(Strecker et al., 1990; Strecker and Bosworth, 1991; Ring et al.,1992; Bosworth and Strecker, 1997). Such a change in stress fieldorientation can be incorporated in a future model but wouldcomplicate the presented solution. In addition, the recent openingvelocity of the rift is relatively fast. If this opening velocity isconstant for 8 Myr, the extension in the rift is at least twice theamount derived from reconstructions of fault geometries (Morley,1988; Ebinger, 1989) as was already mentioned by Calais et al.(2006). Therefore we expect changes in opening direction andvelocity through time. Variations of these parameters would betoo speculative due to lack of data.
Here we have modelled active rifting without any thermaluplift. It is known from seismic studies that hot material existsbelow the Victoria plate (Nyblade et al., 2000). Therefore, a
component of thermal uplift is probably realistic andwould add tothe complexity of the rift system. It is not clear however that thedeveloping structures would change, since the shape of theVictoria plate is included in the simulations. The rifts mayconcentrate more intensely around a thermally uplifted craton.For such a scenario the model should become three-dimensional.The two-dimensionality of our simulations has major drawbackssince the developing faults have no three-dimensional geometries.However, the model can already produce realistic rift nuclei andrift segment interactions. Therefore we think that our simulationprovides important insights into the complexity of rift-transfersystems. A future three-dimensional model will provide morerealistic results on fault patterns and will also include uplift ofblocks.
We have not taken into account additional driving forces fromthe viscous sheet in our model that may push the Victoria platebecause of the deep root of the Tanzania craton as proposed byCalais et al. (2006). However, our rigid craton that represents theVictoria plate is dragged by the viscous sheet because of thecraton's high Young's Modulus and yield strength. Thereforethere is an indirect plate-driving force in our model that drags theVictoria plate and leads to an opening of the western branch of theEARS.
6. Conclusions
We developed a two-dimensional model to understand rift–fault nulceation, rift segment interactions and the development ofmicro-plates with reference to the EARS and special emphasis onthe Albertine rift system with the Rwenzori mountains. Themodel produces realistic-looking rift–fault nucleation withnumerous en echelon segments that are prone to capture micro-plates when the segments interact. In the simulations, micro-plates develop on all scales from the model resolution up to therift spacing. The number of micro-plates as a function of their sizefollows an inverse power law with a fractal dimension of 2.5.Micro-plates can be captured during left-or right-lateral overstepof rift segments. A right-lateral overstep results in an anti-clockwise rotation of micro-plates and a left-lateral overstep in aclockwise rotation. This rotation will lead to a local perturbationof the stress field so that the rift tips turn up to 90° and capture themicro-plate. The rotation may also lead to local compressionrelated structures at corners where the micro-plates are stillattached to larger scale plates that move away from each other.The Rwenzori mountains show features of such a micro-platerotation. The overstep in the Albertine rift system is left-lateral sothat the Rwenzori mountains should rotate clockwise. The LakeAlbert rift has already passed the Rwenzoris on the western side,turned sharply and merged with the Lake Edward rift. In the NEthe Rwenzoris are still in contact with the Victoria plate so that weexpect to find active normal faults with an NW–SE orientationand reverse fault structures NW of the Rwenzori block. Inaddition to its clockwise rotation, the Rwenzori micro-plate issegmented along dextral strike slip faults and shows complexblock faulting on its eastern flank. Our model confirms that stressfields and fault patterns are very complex near rift transfer zones.In such an area it will be difficult to separate changes in the far
115D. Koehn et al. / Tectonophysics 458 (2008) 105–116
field stress orientation from local effects due to micro-platerotation and segmentation.
Acknowledgements
This project was funded by the DFG grant KO 2114/4-1 of theForschergruppe “Rift Dynamics, Uplift and Climate Change inEquatorial Africa”. We thank Uwe Ring who initiated the project,Bert Rein and Ulli Bieg who provided satellite images, AndreasSchumann and the staff at Makerere University for their help. Inaddition we thank UgandaWildlife Authority for their permissionto work in the parks and their support as well as the UgandanNational Council for Science and Technology. We acknowledgethe use of the program Stereonet 6.3.2 from R.W. Allmendinger.We thank Chris Morley and an anonymous reviewer for theirsuggestions.
References
Abeinomugisha, D., Mugisha, F., 2004. Structural analysis of the Albertinegraben, Western Uganda. Abstract, East African rift System Evolution,Resources and Environmental Conference, Addis Abeba, June 2004.
Acocella, V., Korme, T., 2002. Holocene extension direction along the MainEthiopian rift, East Africa. Terra Nova 14, 191–197.
Allen, D.M. de G., 1954. Relaxation Methods. McGraw Hill, New York.Bahat, D., Mohr, P., 1987. Horst faulting in continental rifts. Tectonophysics 141,
61–73.Bosworth, W., 1985. Geometry of propagating continental rifts. Nature 316,
625–627.Bosworth, W., Strecker, M.R., 1997. Stress field changes in the Afro-Arabian
rift system during the Miocene to Recent period. Tectonophysics 278,47–62.
Burgess, C.F., Rosendahl, B.R., Sanders, S., Burgess, C.A., Lambiase, J.,Derksen, S., Meader, N., 1988. The structural and stratigraphic evolution oflake Tanganyika: a case history of continental rifting. In: Manspeizer, W.(Ed.), Rifting and the Opening of the Atlantic Ocean. Elsevier, Amsterdam,pp. 861–881.
Calais, E., Hartnady, C., Ebinger, C., Nocquet, J.M., 2006. Kinematics of the EastAfrican Rift from GPS and earthquake slip vector data. In: Yirgu, G., Ebinger,C.J., Maguire, P.K.H. (Eds.), Structure and Evolution of the Rift Systemswithin the Afar volcanic province, Northeast Africa. Geological SocietySpecial Publications, vol. 259, pp. 9–22.
Davidson, A., Rex, D.C., 1980. Age of volcanism and rifting in southwesternEthiopia. Nature 283, 657–658.
De Bremaecker, J.C., Swenson, D.V., 1990. Origin of overlapping spreadingcenters: a finite element study. Tectonics 9, 505–519.
Ebinger, C., 1989. Tectonic development of the western branch of the East Africanrift system. Geological Society of America Bulletin 101, 885–903.
Ebinger, C., Poudjom-Djomani, Y., Mbede, E., Foster, A., 1997. Rifting theArchean: development of the Natron–Manyara–Eyasi basins. Tanzania.Journal of the Geological Society (London) 154, 947–960.
Gawthorpe, R.L., Hurst, J.M., 1993. Transfer zones in extensional basins: theirstructural style and influence on drainage development and stratigraphy.Journal of the Geological Society of London 150, 1137–1152.
Grindley, N.R., Fox, P.J., 1993. Lithospheric stresses associated with non-transform offsets of the Mid-Atlantic ridge: implications from a finite elementanalysis. Tectonics 12, 982–1003.
Hendrie, D.B., Kusznir, N.J., Morley, C.K., Ebinger, C.J., 1994. Cenozoicextension in northern Kenya: a quantitative model of rift basin development inthe Turkana area. Tectonophysics 236, 409–438.
Karner, G., Byamungu, B., Ebinger, C., Kampunzu, A., Mukasa, R., Nyakaana, J.,Rubondo, E., Upcott, N., 2000. Distribution of crustal extension and regionalbasin architecture of the Albertine rift system, East Africa. Marine andPetroleum Geology 17, 1131–1150.
Katz, R.F., Ragnarsson, R., Bodenschatz, E., 2005. Tectonic microplates in a waxmodel of sea-floor spreading. New Journal of Physics 7, 37. doi:10.1088/1367–2630/7/1/037.
Koehn, D., Arnold, J., Passchier, C.W., 2005. Fracture and vein patterns asindicators of deformation history: a numerical study. In: Gapais, D., Brun, J.P.,Cobbold, P.R. (Eds.), Deformation Mechanisms, Rheology and Tectonics:from Minerals to the Lithosphere. Geological Society of London, SpecialPublications, vol. 243, pp. 11–24.
Koehn, D., Francois, R., Toussaint, R., Passchier, C.W., 2007. Growth of styloliteteeth patterns depending on normal stress and finite compaction. Earth andPlanetary Science Letters 257, 582–595.
Larson, R.L., Searlet, R.C., Kleinrock, M.C., Shouoten, H., Bird, R.T., Naar, D.F.,Rusby, R.I., Hooft, E.E., Lasthiotakis, H., 1992. Roller-bearing tectonicevolution of the Juan Fernandez microplate. Nature 356, 571–576.
Malthe-Sørenssen, A., Walmann, T., Jamtveit, B., Feder, J., Jøssang, T., 1998a.Modeling and characterization of fracture patterns in the Vatnajokull glacier.Geology 26, 931–934.
Malthe-Sørenssen, A., Walmann, T., Feder, J., Jøssang, T., Meakin, P., 1998b.Simulation of extensional clay fractures. Physical Review E 58 (5), 5548–5564.
Malthe-Sørenssen, A., Walmann, T., Jamtveit, B., Feder, J., Jøssang, T., 1999.Simulation and characterization of fracture patterns in glaciers. Journal ofGeophysical Research B104, 23157–23174.
McConnell, R.B., 1972. Geological development of the rift system of easternAfrica. Geological Society of America Bulletin 83, 2549–2572.
Ministry of Energy and Mineral Development, Petroleum Exploration andProduction Department, 2005. The hydrocarbon potential of the AlbertineGraben, Uganda. 20 pp.
Morley, C.K., 1988. Variable extension in Lake Tanganyika. Tectonics 7, 785–801.Morley, C.K., 1999. Geoscience of rift systems-evolution of East Africa. AAPG
Studies in Geology 44 242 pp.Morley, C.K., Nelson, R.A., Patton, T.L., Munn, S.G., 1990. Transfer zones in the
East African Rift System and their relevance to hydrocarbon exploration inrifts. The American Association of Petroleum Geologists Bulletin 74,1234–1253.
Nelson, R.A., Patton, T.L., Morley, C.K., 1992. Rift-segment interaction and itsrelation to hydrocarbon exploration in continental rift systems. The AmericanAssociation of Petroleum Geologists Bulletin 76, 1153–1169.
Nyblade, A., Brazier, R., 2002. Precambrain lithospheric controls on thedevelopment of the East African rift system. Geology 30, 755–758.
Nyblade, A.A., Owens, T.J., Gurrola, H., Ritsema, J., Langston, C.A., 2000.Seismic evidence for a deep upper mantle thermal anomaly beneath EastAfrica. Geology 7, 599–602.
Pierce, J., Lipkov, L., 1988. Structural interpretation of the Rukwa rift, Tanzania.Geophysics 53, 824–836.
Pollard, D.D., Aydin, A., 1984. Propagation and linkage of oceanic ridgesegments. Journal of Geophysical Research 89 (B12), 10,017–10,028.
Pollard, D.D., Fletcher, R.C., 2005. Fundamentals of Structural Geology.Cambridge University Press. 500 pp.
Pollard, D.D., Segall, P., Delaney, P.T., 1982. Formation and interpretation ofdilatant en echelon cracks. Geological Society of America Bulletin 3,1291–1303.
Ring, U., 1994. The influence of preexisting structure on the evolution of theCenozoic Malawi rift (East African rift system). Tectonics 13, 313–326.
Ring, U., Betzler, C., Delvaux, D., 1992. Normal vs. strike-slip faulting during riftdevelopment in East Africa: the Malawi rift. Geology 20, 1015–1018.
Ritsema, J., Nyblade, A.A., Owens, T.J., Langston, C.A., 1998. Upper mantleseismic velocity structure beneath Tanzania, east Africa: implications for thestability of cratonic lithosphere. Journal of Geophysical Research 103,21,201–21,213.
Rosendhal, B.R., Reynolds, D.J., Lorber, P.M., Burgess, C.F., McGill, J., Scott,D., Lambiase, J.J., Derksen, S.J., 1986. Structural expressions of rifting:lessons from Lake Tanganyika, Africa. In: Frostick, L.E., Renaut, R.W., Freid,I., Tiercelin, J.J. (Eds.), Sedimentation in the African rifts. Geological Societyof London Special Publications, vol. 25, pp. 29–43.
Schouten, H., Klitgord, K.D., Gallo, D.G., 1993. Edge-driven microplatekinematics. Journal of Geophysical Research 98, 6689–6701.
116 D. Koehn et al. / Tectonophysics 458 (2008) 105–116
Sempere, J., Macdonald, K.C., 1986. Overlapping spreading centers: implicationsfrom crack growth simulation by the displacement discontinuity method.Tectonics 5, 151–163.
Strecker, M.R., Bosworth, W., 1991. Quaternary stress-field change in theGregory Rift, Kenya. Eos 72, 21–22.
Strecker, M.R., Blisniuk, P.M., Eisbacher, G.H., 1990. Rotation of extensiondirection in the central Kenya rift. Geology 18, 299–302.
Theunissen, K., Klerkx, J., Melnikov, A., Mruma, A., 1996. Mechanisms ofinheritance of rift faulting in the western branch of the East African Rift,Tanzania. Tectonics 15, 776–790.
Turcotte, D.L., 1997. Fractals and Chaos in Geology and Geophysics. CambridgeUniversity Press. 398 pp.
Upcott, N.M., Mukasa, R.K., Ebinger, C.J., Karner, G.D., 1996. Along-axissegmentation and isostasy in the Western rift, East Africa. Journal ofGeophysical Research 101 (B2), 3247–3268.