Seagrass nurseries contribute to coral reef fish populations Marieke C. Verweij, 1 Ivan Nagelkerken, 2 Ingmar Hans, and Susanne M. Ruseler Department of Animal Ecology and Ecophysiology, Institute for Wetland and Water Research, Faculty of Science, Radboud University, Toernooiveld 1, 6525 ED Nijmegen, The Netherlands Paul R. D. Mason Department of Earth Sciences, Faculty of Geosciences, Utrecht University, P.O. Box 80021, 3508 TA Utrecht, The Netherlands Abstract We here provide strong evidence that seagrass beds act as nurseries providing fish to adult populations of a coral reef fish. We studied this habitat connectivity by tracing life history movements of the Caribbean reef fish Ocyurus chrysurus (yellowtail snapper). Carbon- and nitrogen-stable isotope variations in muscle tissue and otoliths (ear bones) record former food sources and show that 98% of the O. chrysurus reef population has likely passed through seagrass nurseries as juveniles during their first 2 yr of life. Our findings indicate a significant degree of habitat connectivity and stress; in order to conserve healthy reefs and sustainable fisheries of O. chrysurus, marine protected areas and fisheries reserves that traditionally focus on protecting only the coral reef habitat should be expanded to include seagrass nurseries. Marine protected areas (MPAs) and fishery reserves are essential to protect fish populations from intensive exploi- tation and to prevent habitat loss. Coral reefs are heavily overfished and threatened by loss of biodiversity (Bellwood et al. 2004; Newton et al. 2007). Most strategies for conservation, management, and sustainable fishing concen- trate on the reef environment. However, a significant proportion of reef fish biomass consists of commercially important species whose juveniles occur in high densities not on the reef, but in mangroves and/or seagrass beds (Nagelkerken et al. 2000; Mumby et al. 2004). This spatial segregation of juveniles and adults has led to the hypothesis that mangrove and seagrass nurseries sustain coral reef fish populations (Adams et al. 2006). For decades this has been inferred from density data (Beck et al. 2001; Gillanders et al. 2003), but the genuine contribution of these nurseries to the reef population has never been proven. Mangrove and seagrass habitats are supposedly attrac- tive settlement habitats to larval reef fish from the open ocean because of high food abundance and low predation pressure (Parrish 1989). It remains unclear whether these fish later restock the adult reef population because their movement to the reef has almost never conclusively been shown. Artificial tagging, although a direct measure of habitat connectivity, cannot be applied in most cases to small juvenile fish. Naturally occurring chemical and isotopic markers in bone and tissue samples are more promising for tracing migration patterns (Elsdon and Gillanders 2003; Rubenstein and Hobson 2004). Habitat differences such as temperature and salinity are recorded by trace element and oxygen isotope ratios in fish otoliths (ear bones) (Campana 1999). However, ambient water chemis- try in nonestuarine tropical regions is relatively uniform, making these tracers nondiscriminating (Chittaro et al. 2006). In these regions, carbon-stable isotopes are poten- tially more valuable tracers because d 13 C (the ratio of 13 C: 12 C) in both bone and tissue records food sources, which are typically enriched in (i.e., show higher values of) d 13 C in seagrass beds, compared to more depleted offshore food webs (Boutton 1991; Fry et al. 1999). In this study we link d 13 C recorded in muscle tissue and otoliths to life history movements of the coral reef fish Ocyurus chrysurus (yellowtail snapper) collected from two nonestuarine embayments harboring seagrass beds (Span- ish Water Bay and Piscadera Bay) and from their adjacent coral reefs on the Caribbean island of Curac ¸ao. A d 13 C enrichment has been previously found in food sources in the seagrass beds that are enclosed by inland embayments in our study area (Cocheret de la Morinie `re et al. 2003). These are spatially separated from nearby fringing coral reefs where food sources are depleted in d 13 C. For additional discriminating power between habitat types we used d 15 N (the ratio of 15 N: 14 N) in muscle tissue, because this value has been shown to be distinctively high in areas 1 Current address: Wageningen University / IMARES, Depart- ment of Social Sciences, Environmental Policy, P.O. Box 8130, 6700 EW Wageningen, The Netherlands. Acknowledgments We thank the Caribbean Research and Management of Biodiversity Foundation (CARMABI) (specifically A. O. Debrot and C. Winterdaal) in Curac ¸ao for support during the fieldwork; O. Stiekema from Utrecht University and J. Haerkens from Radboud University Nijmegen (RUN) for their help with otolith preparation; M. Orbons and J. Eygensteyn (RUN) for their help with muscle tissue isotope analysis; J. C. M. Hendriks (RUN) for help with the statistical analyses; and H. Vonhof, S. Verdegaal, and S. Jung from the University of Amsterdam for their assistance with the otolith isotope analysis. We also thank two anonymous reviewers for commenting on this manuscript. This research was financially supported by a Vidi grant from the Netherlands Organisation for Scientific Research (NWO) to I.N. and a grant from the Schure-Beijerinck-Popping Fund to I.H. and S.R. This is Centre for Wetland Ecology publication 501. 2 Corresponding author ([email protected]). Limnol. Oceanogr., 53(4), 2008, 1540–1547 E 2008, by the American Society of Limnology and Oceanography, Inc. 1540
Transcript
Seagrass nurseries contribute to coral reef fish populations
Marieke C. Verweij,1 Ivan Nagelkerken,2 Ingmar Hans, and Susanne M. RuselerDepartment of Animal Ecology and Ecophysiology, Institute for Wetland and Water Research, Faculty of Science,Radboud University, Toernooiveld 1, 6525 ED Nijmegen, The Netherlands
Paul R. D. MasonDepartment of Earth Sciences, Faculty of Geosciences, Utrecht University, P.O. Box 80021, 3508 TA Utrecht, TheNetherlands
Abstract
We here provide strong evidence that seagrass beds act as nurseries providing fish to adult populations of acoral reef fish. We studied this habitat connectivity by tracing life history movements of the Caribbean reef fishOcyurus chrysurus (yellowtail snapper). Carbon- and nitrogen-stable isotope variations in muscle tissue andotoliths (ear bones) record former food sources and show that 98% of the O. chrysurus reef population has likelypassed through seagrass nurseries as juveniles during their first 2 yr of life. Our findings indicate a significantdegree of habitat connectivity and stress; in order to conserve healthy reefs and sustainable fisheries of O.chrysurus, marine protected areas and fisheries reserves that traditionally focus on protecting only the coral reefhabitat should be expanded to include seagrass nurseries.
Marine protected areas (MPAs) and fishery reserves areessential to protect fish populations from intensive exploi-tation and to prevent habitat loss. Coral reefs are heavilyoverfished and threatened by loss of biodiversity (Bellwoodet al. 2004; Newton et al. 2007). Most strategies forconservation, management, and sustainable fishing concen-trate on the reef environment. However, a significantproportion of reef fish biomass consists of commerciallyimportant species whose juveniles occur in high densities noton the reef, but in mangroves and/or seagrass beds(Nagelkerken et al. 2000; Mumby et al. 2004). This spatialsegregation of juveniles and adults has led to the hypothesisthat mangrove and seagrass nurseries sustain coral reef fishpopulations (Adams et al. 2006). For decades this has beeninferred from density data (Beck et al. 2001; Gillanders et al.2003), but the genuine contribution of these nurseries to thereef population has never been proven.
Mangrove and seagrass habitats are supposedly attrac-tive settlement habitats to larval reef fish from the openocean because of high food abundance and low predationpressure (Parrish 1989). It remains unclear whether thesefish later restock the adult reef population because theirmovement to the reef has almost never conclusively beenshown. Artificial tagging, although a direct measure ofhabitat connectivity, cannot be applied in most cases tosmall juvenile fish. Naturally occurring chemical andisotopic markers in bone and tissue samples are morepromising for tracing migration patterns (Elsdon andGillanders 2003; Rubenstein and Hobson 2004). Habitatdifferences such as temperature and salinity are recorded bytrace element and oxygen isotope ratios in fish otoliths (earbones) (Campana 1999). However, ambient water chemis-try in nonestuarine tropical regions is relatively uniform,making these tracers nondiscriminating (Chittaro et al.2006). In these regions, carbon-stable isotopes are poten-tially more valuable tracers because d13C (the ratio of13C : 12C) in both bone and tissue records food sources,which are typically enriched in (i.e., show higher values of)d13C in seagrass beds, compared to more depleted offshorefood webs (Boutton 1991; Fry et al. 1999).
In this study we link d13C recorded in muscle tissue andotoliths to life history movements of the coral reef fishOcyurus chrysurus (yellowtail snapper) collected from twononestuarine embayments harboring seagrass beds (Span-ish Water Bay and Piscadera Bay) and from their adjacentcoral reefs on the Caribbean island of Curacao. A d13Cenrichment has been previously found in food sources inthe seagrass beds that are enclosed by inland embaymentsin our study area (Cocheret de la Moriniere et al. 2003).These are spatially separated from nearby fringing coralreefs where food sources are depleted in d13C. Foradditional discriminating power between habitat types weused d15N (the ratio of 15N : 14N) in muscle tissue, becausethis value has been shown to be distinctively high in areas
1 Current address: Wageningen University / IMARES, Depart-ment of Social Sciences, Environmental Policy, P.O. Box 8130,6700 EW Wageningen, The Netherlands.
AcknowledgmentsWe thank the Caribbean Research and Management of
Biodiversity Foundation (CARMABI) (specifically A. O. Debrotand C. Winterdaal) in Curacao for support during the fieldwork;O. Stiekema from Utrecht University and J. Haerkens fromRadboud University Nijmegen (RUN) for their help with otolithpreparation; M. Orbons and J. Eygensteyn (RUN) for their helpwith muscle tissue isotope analysis; J. C. M. Hendriks (RUN) forhelp with the statistical analyses; and H. Vonhof, S. Verdegaal,and S. Jung from the University of Amsterdam for their assistancewith the otolith isotope analysis. We also thank two anonymousreviewers for commenting on this manuscript.
This research was financially supported by a Vidi grant fromthe Netherlands Organisation for Scientific Research (NWO) toI.N. and a grant from the Schure-Beijerinck-Popping Fund to I.H.and S.R.
This is Centre for Wetland Ecology publication 501.
E 2008, by the American Society of Limnology and Oceanography, Inc.
1540
polluted with sewage (Hansson et al. 1997). The inlandbays around Curacao are expected to be much moreinfluenced by anthropogenic activity than the coral reefs.
O. chrysurus was selected for this study because size-frequency data strongly suggest that it grows up in coastalembayments with mangroves and seagrass beds (Nagel-kerken et al. 2000) with feeding predominantly taking placein seagrass beds (Nagelkerken and van der Velde 2004).Inside Spanish Water Bay O. chrysurus ranges in sizebetween 2.5 and 25 cm, whereas it has been observed onlyat sizes above 15 cm at the coral reef of Curacao(Nagelkerken et al. 2000). This suggests that migrationtakes place when the fish range between 15 and 25 cm inlength, which corresponds to ages of about 1–2 yr (usingequations of Garcia et al. 2003). Another benefit ofstudying O. chrysurus is that it seems to be highlydependent on nonreef nurseries. This is suggested by lowerpopulation densities, or even complete absence of thisspecies, on reefs of Caribbean islands without mangrovesor seagrass beds, as opposed to those with these habitats,including Curacao (Nagelkerken et al. 2002). Thus, themajority of O. chrysurus individuals collected from thecoral reef habitat should hypothetically contain tissue orother body parts that record feeding within seagrass bedsduring earlier life stages. Unfortunately, stable isotopesignatures remain in muscle tissue for as little as severalweeks or months after food consumption (Rubenstein andHobson 2004). This means that muscle tissue data alonecannot identify reef fish that have passed through seagrassnurseries, because these fish typically spend a significant
part of their adult lives on the coral reef. Therefore, weexpanded our study to include otoliths, which aremetabolically inert and should thus permanently recordthe initial seagrass feeding signature. This process isirrespective of fish size, as newly grown CaCO3 does notequilibrate with earlier mineralized and older core otolithzones (Campana 1999). Stable isotopes in otoliths, such asthose of carbon and oxygen, have already successfullytraced migration patterns of temperate and cold-waterfishes (see references in Campana 1999). By combiningmuscle and otolith stable isotope data, our study provideshighly plausible evidence of ontogenetic migration of coralreef fish between tropical coastal habitats.
Materials and methods
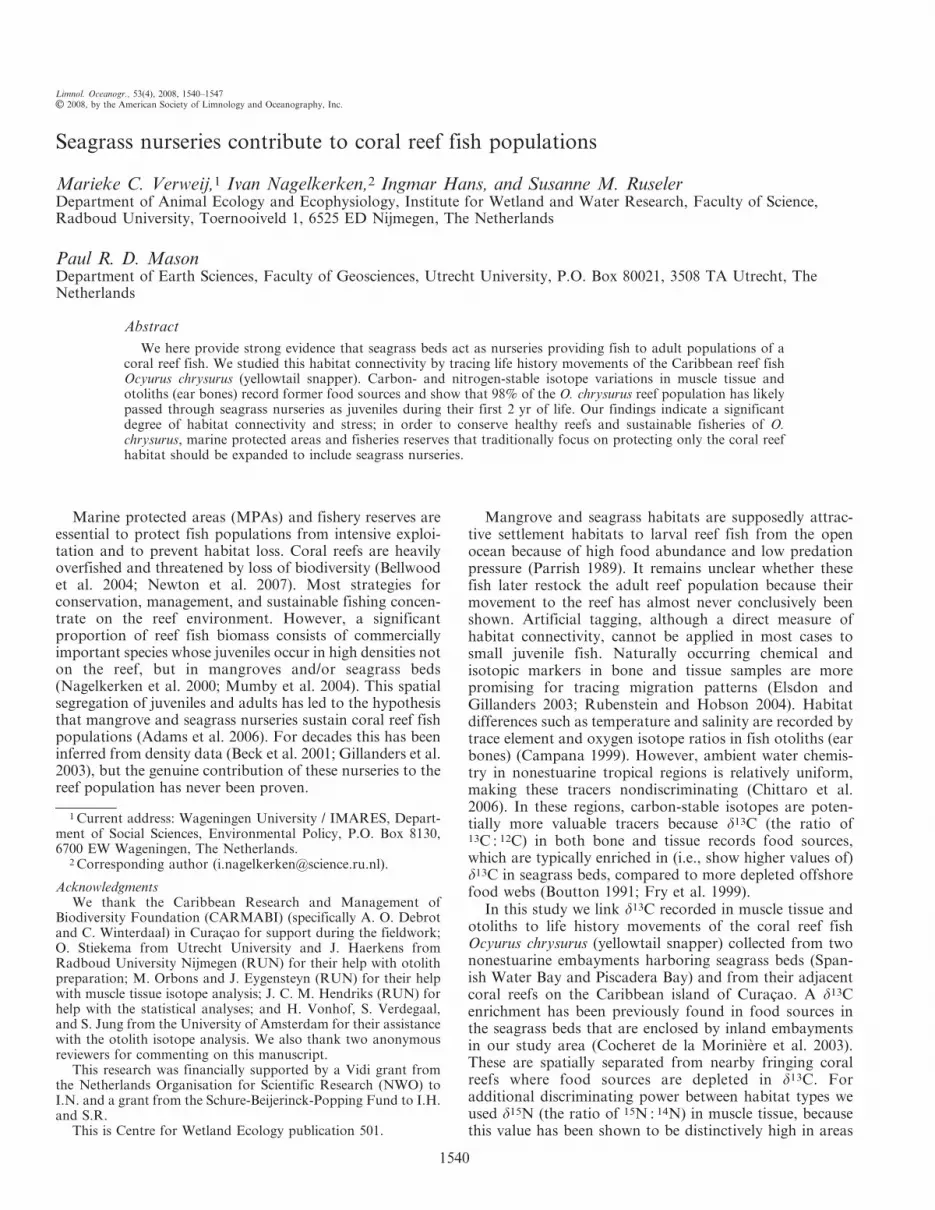
Study area—Spanish Water Bay and Piscadera Bay arenonestuarine inland embayments (Fig. 1). Both bays havenarrow mouths (70–100 m wide) and entrance channels ofup to 1 km in length. The channels lead to shallow (mostly,6 m deep) inland bay areas with seagrass beds, algalflats, submerged mudflats, and rocky shorelines (fossilizedreef terraces) with fringing mangroves. A fringing coralreef starts at the mouth of both bays and extendsoutwards, following the coastline both eastwards andwestwards. This reef is spatially separated from seagrassbeds and other bay habitats, and consists of a reef flat ofup to 150 m wide that leads to a drop-off at a depth ofabout 5–8 m. Here the reef slopes down to at least 30 mdeep.
Fig. 1. Study area and collection sites. Gray shading indicates seagrass beds and black shadingindicates coral reefs. Direction as indicated in upper left panel is the same for all other panels.
Seagrasses restock reef fish populations 1541
Species collection—Fish and potential food sources werecollected in bay (mainly in seagrass) and reef habitats (seeFig. 1 and Table 1). Reef fish were collected in two areas:300–1,500 m away from the bay mouth (reef-far) and in thebay mouth where the reef started (reef-mouth). Among reeffish, mostly the smaller specimens were captured, hypo-thetically recent immigrants from the bay. We collected fishusing hook and line. Muscle tissue was analyzed for fishcollected during the year of 2006 and for some additionalreef-far fish collected during 2002. Otoliths were analyzedfor bay and reef-far fish collected during 2002 and 2006.
The diet of O. chrysurus has been identified in earlierstudies of stomach contents, and consists mainly of benthiccrustaceans and zooplankton (Randall 1967; Cocheret de laMoriniere et al. 2003). Potential prey items from thesespecies groups were collected at the three collection areas(i.e., bay, reef-mouth, and reef-far) of both bays during2006. Plankton was collected at a water depth of approx.1 m, using a plankton net with a mesh size of 55 mm and agape diameter of 50 cm. Crustaceans were collected withtweezers or small hand nets while snorkeling (bay) orSCUBA diving (coral reef). Each group of potential preyconsisted of different species, which showed some varia-tions in d13C. Unfortunately, it is difficult to prove which ofthe selected prey samples were actually eaten by O.chrysurus, because the details of diet have never beenaccurately identified down to prey species level. Therefore,potential food items were pooled into species groups (seeTable 1, Fig. 2), and we also analyzed the stable isotoperatios of fish stomach contents. It is unclear how muchcarbon in the prey tissue in a stomach may be assimilatedinto muscle or otolith carbon. However, this approach ofanalyzing fish stomach contents does give more confidence
about which food items are actually ingested and thus likelyto be important. Moreover, the main reason for analyzingstomach contents was to examine whether fish living on thereef had ingested seagrass-derived food sources, whichwould indicate short-term feeding migrations into the bay.All specimens were stored in a freezer before furtherpreparation. Exact sample sizes of fish and food items aregiven in Table 1.
Sample preparation and analysis—Fish muscle tissue wastaken from the musculature below the dorsal fin, above thelateral line. Fish muscle, stomach contents, and potentialfood items were oven-dried at 60uC for at least 96 h. Driedsamples were ground to a homogenous powder with amortar and pestle. All inorganic carbon (CaCO3) from crabsamples was removed by adding 20–30% HCl (Jacob et al.2005). These acidified samples were dried at 90uC during90 h. Crab subsamples for N isotope analysis were notdecalcified. Samples were weighed accurately into tincontainers (fish muscle, 0.25–0.35 mg; stomach contentsand prey items, 0.25–3.50 mg, depending on the element [Cor N] and species). The isotope ratios of 12C and 13C andthose of 14N and 15N were measured using a Finnigan EA-
Table 1. Number of replicates of O. chrysurus samples ofmuscle tissue, otoliths, stomach contents, and potential fooditems. Bay collection sites consisted mainly of seagrass beds.Additionally, some fish and food items from the bay area werecollected in mangroves, mudflats, and rocky shoreline habitats.
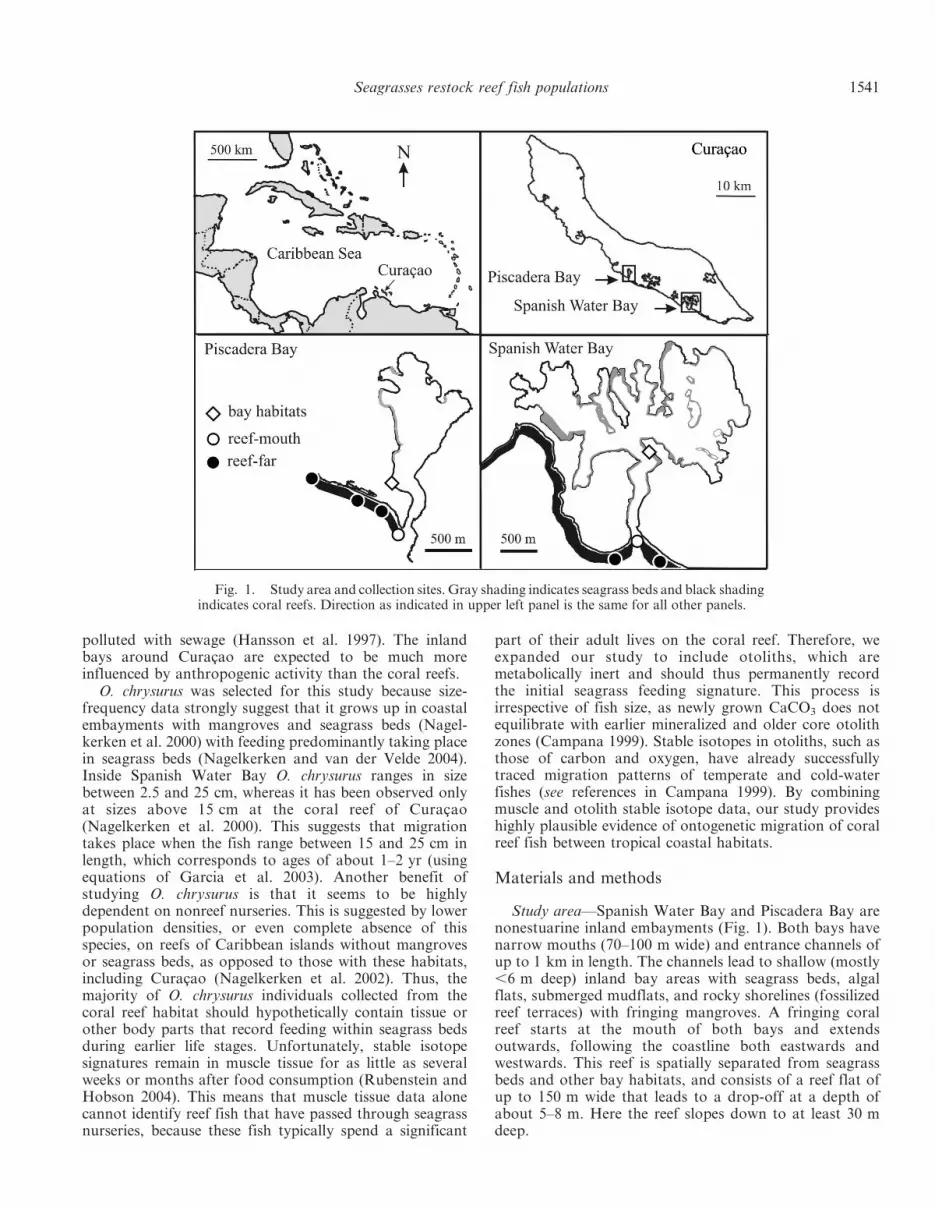
Fig. 2. C and N isotope ratios (mean % 6 SEM) of potentialfood items and of O. chrysurus stomach contents from (A) SpanishWater Bay and (B) Piscadera Bay. d13C and d15N are defined in thetext. The dashed line in (B) indicates the data range of SpanishWater Bay. Crustacea consisted of Amphipoda, Mysidacea, andcrabs and shrimp (Decapoda). The number of replicates per foodgroup varied between 6 and 47 (mean n 5 16; for exact n, seeTable 1). Note that the number of stomach content samples of thereef-mouth area of Spanish Water Bay was very low.
1542 Verweij et al.
IRMS (elemental analyzer–isotope ratio mass spectrometer)with Dynamic Flash Combustion. Carbon and nitrogenisotope ratios are expressed in standard delta notation: d13C5 ((Rsample/Rstandard) 2 1) 3 1,000 %, where R is the ratio of13C : 12C and Rstandard is Vienna Pee Dee Belemnite; d15N isexpressed using the same equation where R is the ratio of15N : 14N and Rstandard is atmospheric nitrogen. Meanreproducibility of d13C and d15N was within 0.15%.
Fish otoliths (sagittae) were removed and stored in afreezer. They were cleaned ultrasonically in 1 mL 100%methanol, and then in Milli-Q. Otoliths were driedovernight at 70uC. Sagittae from the right side of the headwere selected for analyses. They were measured, weighed,and mounted on glass plates. After the otoliths had beenembedded in resin, they were cross-sectioned in thetransverse plane through the core. For fish from bay andreef-far locations, we analyzed the otolith margin (reflect-ing the current habitat) and additionally, for reef fish, thejuvenile zone (possibly reflecting earlier life in baynurseries) (see inset, Fig. 4A). Juvenile zones targeted inreef fish otoliths were measured to have a similar meanwidth to those of juvenile bay fish. Otolith material wasdrilled out with a micromill that sampled a crater with adiameter of about 0.35 mm. Two craters were drilled persample on opposite sites of the cross section, approximat-ing the same life stage (see Fig. 4A), to provide sufficientotolith material for one analysis. Pulverized otolithmaterial (weight $10 mg) was collected with a scalpel andput into glass tubes. At a temperature of 80uC, a few dropsof 100% orthophosphoric acid were added to digest all
CaCO3. The isotope ratios of 12C and 13C of the releasedCO2 were measured by a Finnigan MAT 252 massspectrometer equipped with an automated carbonateextraction line (Kiel device). The NIST SRM 8544 (NBS19) carbonate standard was routinely monitored duringsample runs. Mean reproducibility of d13C by this lattertechnique was within 0.05%.
Statistical analyses—C and N isotope ratios of potentialfood items and stomach contents (dependent variables)were tested for differences among collection areas (inde-pendent variable) using one-way analysis of variance(ANOVA) (SPSS 14.0). Post hoc tests for ANOVA wereGabriel’s (for unequal sample sizes; Field 2005). In case ofheterogeneity of residual variances as shown by Levene’stest, we used the nonparametric Kruskal-Wallis testfollowed by the Games-Howell post hoc test (Field 2005).
C and N isotope ratios of muscle tissue and fish otoliths(dependent variables) were tested for differences amongcollection areas, years, size (i.e., fork length for muscletissues, otolith width for otoliths), and otolith zone (i.e.,juvenile vs. adult zones) (independent variables) using MixedLinear Models in SAS 8.2 (Verbeke and Molenberghs 1997).For otoliths of reef fish, the juvenile and adult zones of thesame fish were treated as a repeated variable.
Results
Food—Isotopic signatures for potential food itemscontrasted strongly between bay and reef locations.
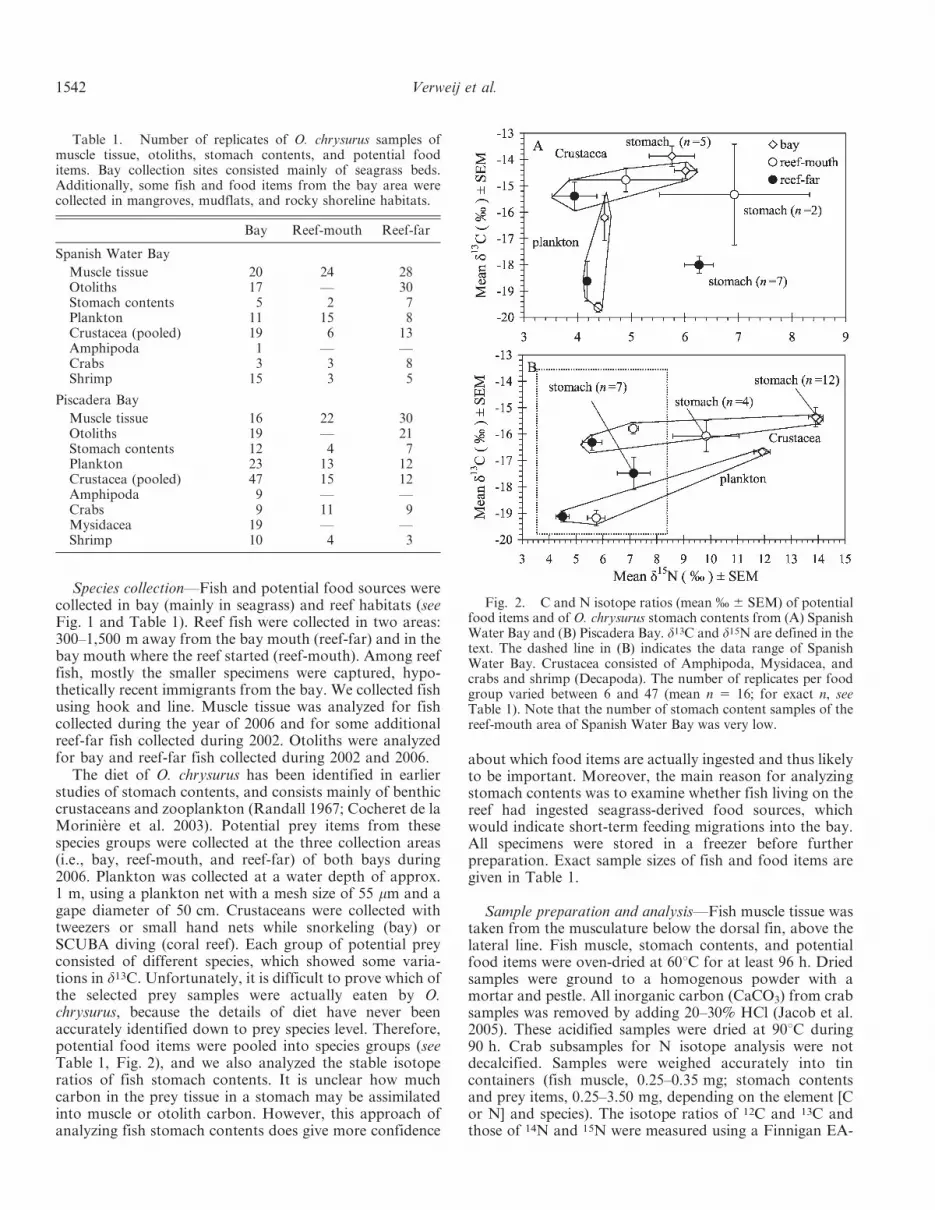
Table 2. Statistical analyses of stable isotopic variations. Dependent variables were isotopic ratios of potential food items, O.chrysurus stomach contents, muscle tissue, and otoliths; independent variables were collection area (bay, reef-mouth, reef-far), fish orotolith size, year, and otolith zone. Bold values indicate significance at a 5 0.05. — means not included in test. Size 5 fish fork length incase of muscle and otolith width in case of otoliths. A year effect was calculated for muscle and otolith data of fish collected during twodifferent years (see Study area and species collection in the Methods). Zone 5 the main effect of juvenile vs. adult otolith zones. Post hoctests or contrasts analyzed pairwise differences between collection areas (col. area) and different letters indicate significant differences.For food sources and stomachs, the post hoc tests used were Gabriel’s for ANOVA and Games-Howell for Kruskal-Wallis (see Statisticalanalyses in the Methods). p values represent main effects of independent variables, corrected for additional variables in the model. Thismeans that even though we found a significant year effect in some cases, the significant values for collection area and size were correctedfor this temporal difference, and thus represent true effects. For muscle and otolith data, contrast tests made pairwise comparisonsbetween the collection areas. These contrasts show the main effect of collection area, i.e., corrected for the effects of size, year, and zone.
d15N d13C
p valuesPost hoc or contrasts,
col. area p valuesPost hoc or contrasts,
col. area
Col.area Size Year Bay
Reef-mouth
Reef-far
Col.area Size Year Zone Bay
Reef-mouth
Reef-far
Spanish Water Bay
Crustacea 0.002 — — A AB B 0.239 — — — A A APlankton 0.001 — — A A B 0.017 — — — A B ABStomachs 0.376 — — A A A 0.013 — — — A AB BMuscle 0.139 0.886 0.428 A A A 0.044 ,0.001 0.251 — A B ABOtoliths — — — — — — 0.018 0.001 0.017 0.837 A — B
Piscadera Bay
Crustacea ,0.001 — — A B C 0.078 — — — A A APlankton ,0.001 — — A B C ,0.001 — — — A B BStomachs ,0.001 — — A B B 0.020 — — — A AB BMuscle ,0.001 0.006 ,0.001 A B C 0.008 ,0.001 ,0.001 — A B BOtoliths — — — — — — 0.800 0.310 0.127 0.052 A — A
Seagrasses restock reef fish populations 1543
Crustaceans and plankton from bay habitats were signif-icantly more enriched in d13C and/or d15N than those fromone or both reef areas (Fig. 2; Table 2). Enrichment ind15N of bay food sources was likely caused by higheutrophication, especially in Piscadera Bay. Isotopicvariations of fish stomach contents reflected those of themost likely food items: stomachs of bay fish closelyresembled isotopic values of bay crustaceans and weresignificantly enriched compared to stomach contents ofreef-far fish (Fig. 2; Table 2). Reef-mouth fish showedvalues in between these two, although the small sample sizemay have influenced our interpretation (Fig. 2; Table 2).
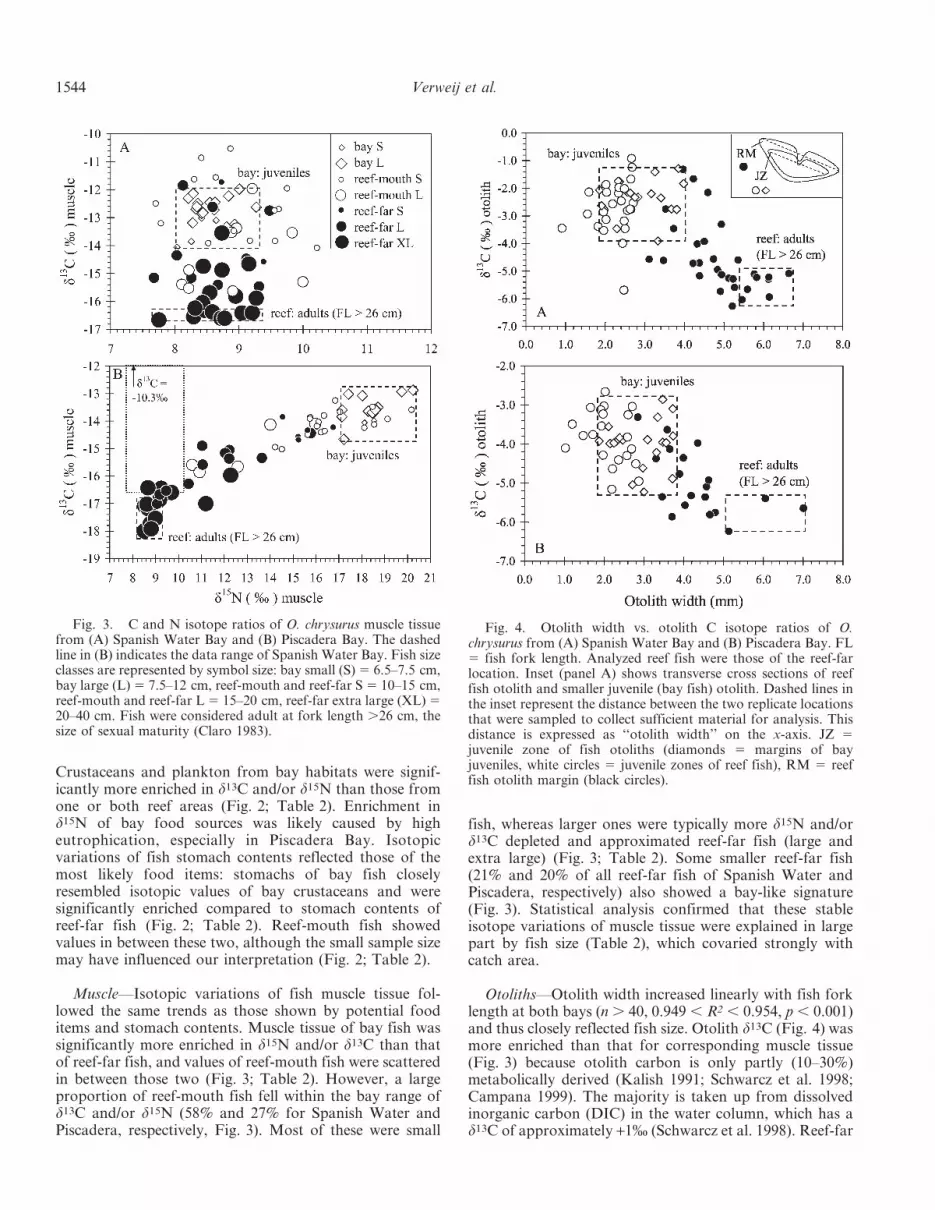
Muscle—Isotopic variations of fish muscle tissue fol-lowed the same trends as those shown by potential fooditems and stomach contents. Muscle tissue of bay fish wassignificantly more enriched in d15N and/or d13C than thatof reef-far fish, and values of reef-mouth fish were scatteredin between those two (Fig. 3; Table 2). However, a largeproportion of reef-mouth fish fell within the bay range ofd13C and/or d15N (58% and 27% for Spanish Water andPiscadera, respectively, Fig. 3). Most of these were small
fish, whereas larger ones were typically more d15N and/ord13C depleted and approximated reef-far fish (large andextra large) (Fig. 3; Table 2). Some smaller reef-far fish(21% and 20% of all reef-far fish of Spanish Water andPiscadera, respectively) also showed a bay-like signature(Fig. 3). Statistical analysis confirmed that these stableisotope variations of muscle tissue were explained in largepart by fish size (Table 2), which covaried strongly withcatch area.
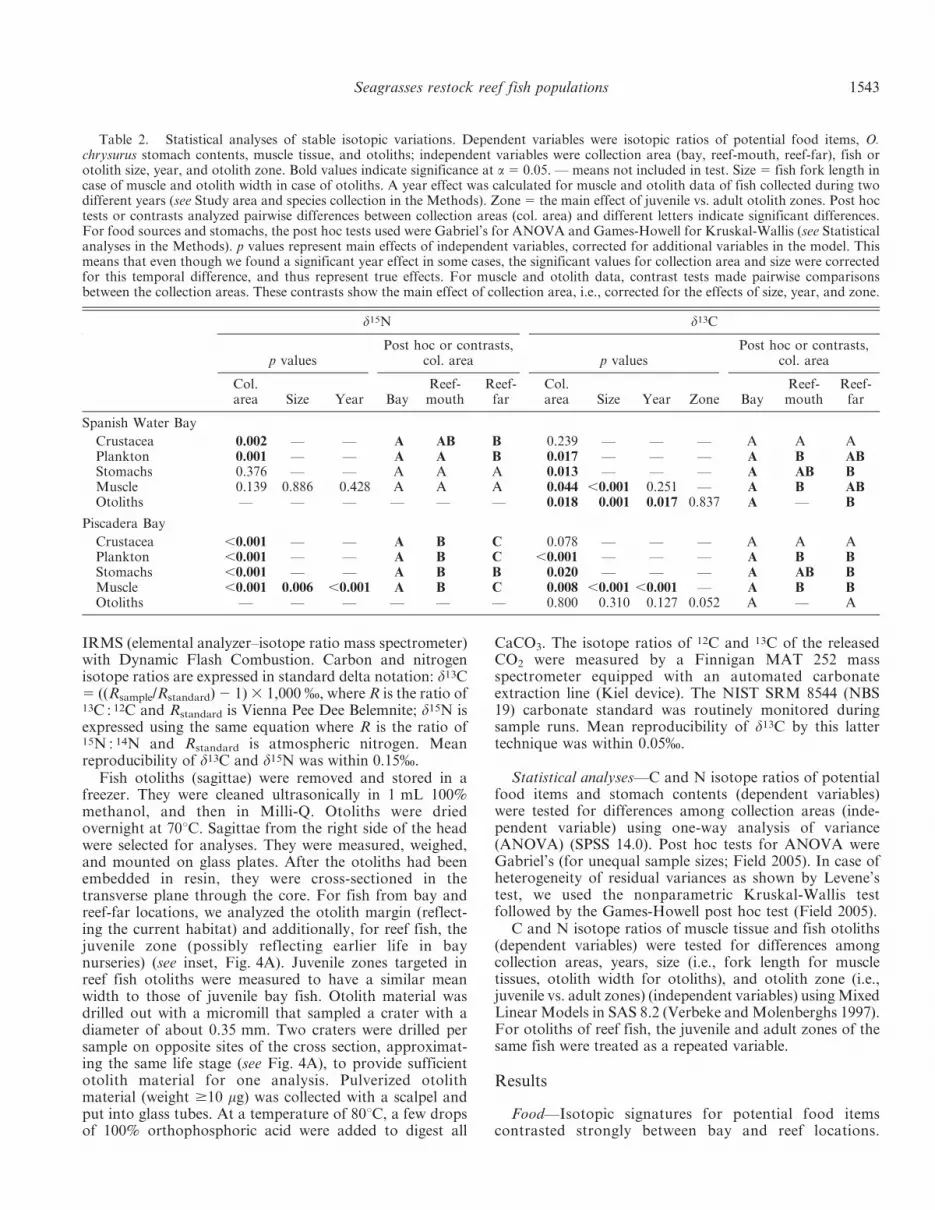
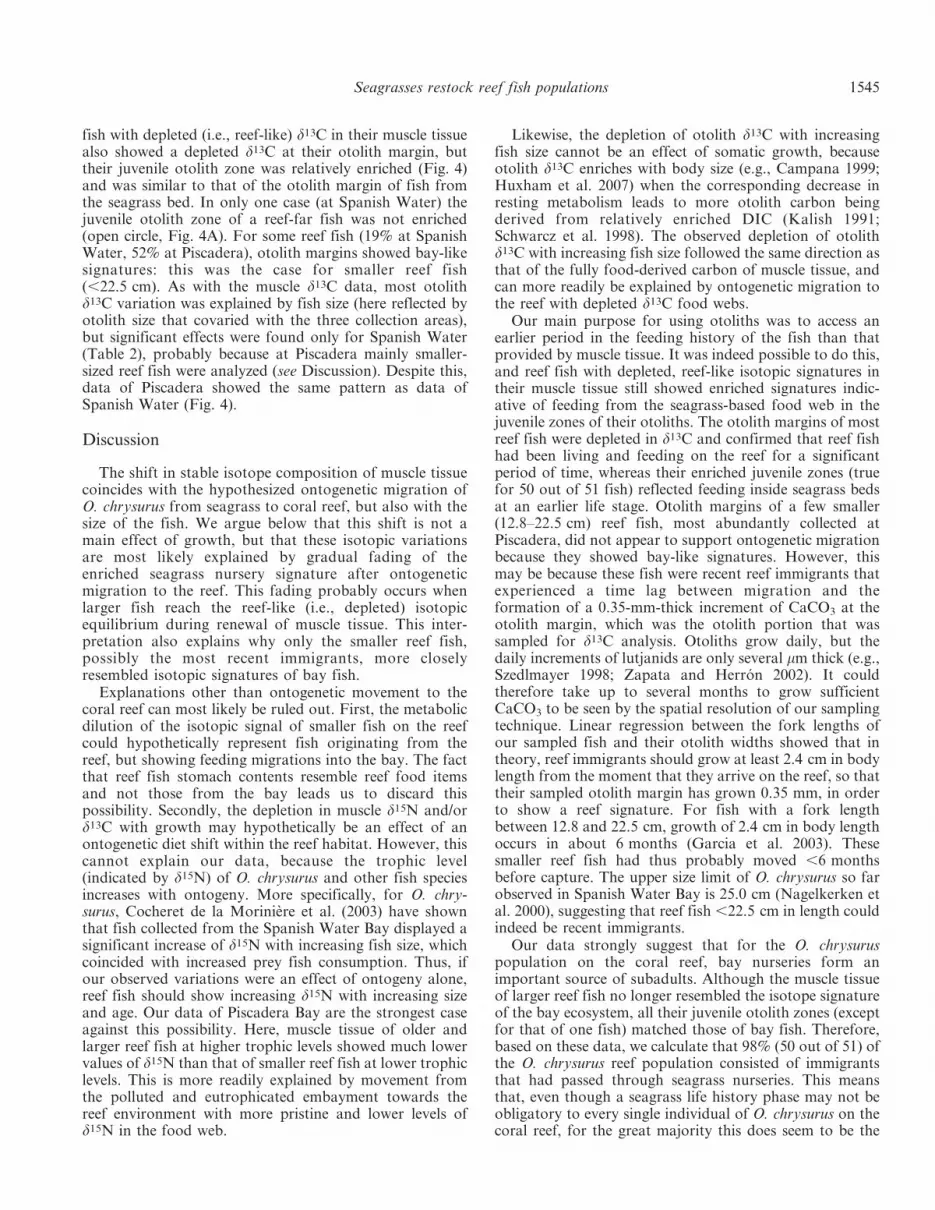
Otoliths—Otolith width increased linearly with fish forklength at both bays (n . 40, 0.949 , R2 , 0.954, p , 0.001)and thus closely reflected fish size. Otolith d13C (Fig. 4) wasmore enriched than that for corresponding muscle tissue(Fig. 3) because otolith carbon is only partly (10–30%)metabolically derived (Kalish 1991; Schwarcz et al. 1998;Campana 1999). The majority is taken up from dissolvedinorganic carbon (DIC) in the water column, which has ad13C of approximately +1% (Schwarcz et al. 1998). Reef-far
Fig. 3. C and N isotope ratios of O. chrysurus muscle tissuefrom (A) Spanish Water Bay and (B) Piscadera Bay. The dashedline in (B) indicates the data range of Spanish Water Bay. Fish sizeclasses are represented by symbol size: bay small (S) 5 6.5–7.5 cm,bay large (L) 5 7.5–12 cm, reef-mouth and reef-far S 5 10–15 cm,reef-mouth and reef-far L 5 15–20 cm, reef-far extra large (XL) 520–40 cm. Fish were considered adult at fork length .26 cm, thesize of sexual maturity (Claro 1983).
Fig. 4. Otolith width vs. otolith C isotope ratios of O.chrysurus from (A) Spanish Water Bay and (B) Piscadera Bay. FL5 fish fork length. Analyzed reef fish were those of the reef-farlocation. Inset (panel A) shows transverse cross sections of reeffish otolith and smaller juvenile (bay fish) otolith. Dashed lines inthe inset represent the distance between the two replicate locationsthat were sampled to collect sufficient material for analysis. Thisdistance is expressed as ‘‘otolith width’’ on the x-axis. JZ 5juvenile zone of fish otoliths (diamonds 5 margins of bayjuveniles, white circles 5 juvenile zones of reef fish), RM 5 reeffish otolith margin (black circles).
1544 Verweij et al.
fish with depleted (i.e., reef-like) d13C in their muscle tissuealso showed a depleted d13C at their otolith margin, buttheir juvenile otolith zone was relatively enriched (Fig. 4)and was similar to that of the otolith margin of fish fromthe seagrass bed. In only one case (at Spanish Water) thejuvenile otolith zone of a reef-far fish was not enriched(open circle, Fig. 4A). For some reef fish (19% at SpanishWater, 52% at Piscadera), otolith margins showed bay-likesignatures: this was the case for smaller reef fish(,22.5 cm). As with the muscle d13C data, most otolithd13C variation was explained by fish size (here reflected byotolith size that covaried with the three collection areas),but significant effects were found only for Spanish Water(Table 2), probably because at Piscadera mainly smaller-sized reef fish were analyzed (see Discussion). Despite this,data of Piscadera showed the same pattern as data ofSpanish Water (Fig. 4).
Discussion
The shift in stable isotope composition of muscle tissuecoincides with the hypothesized ontogenetic migration ofO. chrysurus from seagrass to coral reef, but also with thesize of the fish. We argue below that this shift is not amain effect of growth, but that these isotopic variationsare most likely explained by gradual fading of theenriched seagrass nursery signature after ontogeneticmigration to the reef. This fading probably occurs whenlarger fish reach the reef-like (i.e., depleted) isotopicequilibrium during renewal of muscle tissue. This inter-pretation also explains why only the smaller reef fish,possibly the most recent immigrants, more closelyresembled isotopic signatures of bay fish.
Explanations other than ontogenetic movement to thecoral reef can most likely be ruled out. First, the metabolicdilution of the isotopic signal of smaller fish on the reefcould hypothetically represent fish originating from thereef, but showing feeding migrations into the bay. The factthat reef fish stomach contents resemble reef food itemsand not those from the bay leads us to discard thispossibility. Secondly, the depletion in muscle d15N and/ord13C with growth may hypothetically be an effect of anontogenetic diet shift within the reef habitat. However, thiscannot explain our data, because the trophic level(indicated by d15N) of O. chrysurus and other fish speciesincreases with ontogeny. More specifically, for O. chry-surus, Cocheret de la Moriniere et al. (2003) have shownthat fish collected from the Spanish Water Bay displayed asignificant increase of d15N with increasing fish size, whichcoincided with increased prey fish consumption. Thus, ifour observed variations were an effect of ontogeny alone,reef fish should show increasing d15N with increasing sizeand age. Our data of Piscadera Bay are the strongest caseagainst this possibility. Here, muscle tissue of older andlarger reef fish at higher trophic levels showed much lowervalues of d15N than that of smaller reef fish at lower trophiclevels. This is more readily explained by movement fromthe polluted and eutrophicated embayment towards thereef environment with more pristine and lower levels ofd15N in the food web.
Likewise, the depletion of otolith d13C with increasingfish size cannot be an effect of somatic growth, becauseotolith d13C enriches with body size (e.g., Campana 1999;Huxham et al. 2007) when the corresponding decrease inresting metabolism leads to more otolith carbon beingderived from relatively enriched DIC (Kalish 1991;Schwarcz et al. 1998). The observed depletion of otolithd13C with increasing fish size followed the same direction asthat of the fully food-derived carbon of muscle tissue, andcan more readily be explained by ontogenetic migration tothe reef with depleted d13C food webs.
Our main purpose for using otoliths was to access anearlier period in the feeding history of the fish than thatprovided by muscle tissue. It was indeed possible to do this,and reef fish with depleted, reef-like isotopic signatures intheir muscle tissue still showed enriched signatures indic-ative of feeding from the seagrass-based food web in thejuvenile zones of their otoliths. The otolith margins of mostreef fish were depleted in d13C and confirmed that reef fishhad been living and feeding on the reef for a significantperiod of time, whereas their enriched juvenile zones (truefor 50 out of 51 fish) reflected feeding inside seagrass bedsat an earlier life stage. Otolith margins of a few smaller(12.8–22.5 cm) reef fish, most abundantly collected atPiscadera, did not appear to support ontogenetic migrationbecause they showed bay-like signatures. However, thismay be because these fish were recent reef immigrants thatexperienced a time lag between migration and theformation of a 0.35-mm-thick increment of CaCO3 at theotolith margin, which was the otolith portion that wassampled for d13C analysis. Otoliths grow daily, but thedaily increments of lutjanids are only several mm thick (e.g.,Szedlmayer 1998; Zapata and Herron 2002). It couldtherefore take up to several months to grow sufficientCaCO3 to be seen by the spatial resolution of our samplingtechnique. Linear regression between the fork lengths ofour sampled fish and their otolith widths showed that intheory, reef immigrants should grow at least 2.4 cm in bodylength from the moment that they arrive on the reef, so thattheir sampled otolith margin has grown 0.35 mm, in orderto show a reef signature. For fish with a fork lengthbetween 12.8 and 22.5 cm, growth of 2.4 cm in body lengthoccurs in about 6 months (Garcia et al. 2003). Thesesmaller reef fish had thus probably moved ,6 monthsbefore capture. The upper size limit of O. chrysurus so farobserved in Spanish Water Bay is 25.0 cm (Nagelkerken etal. 2000), suggesting that reef fish ,22.5 cm in length couldindeed be recent immigrants.
Our data strongly suggest that for the O. chrysuruspopulation on the coral reef, bay nurseries form animportant source of subadults. Although the muscle tissueof larger reef fish no longer resembled the isotope signatureof the bay ecosystem, all their juvenile otolith zones (exceptfor that of one fish) matched those of bay fish. Therefore,based on these data, we calculate that 98% (50 out of 51) ofthe O. chrysurus reef population consisted of immigrantsthat had passed through seagrass nurseries. This meansthat, even though a seagrass life history phase may not beobligatory to every single individual of O. chrysurus on thecoral reef, for the great majority this does seem to be the
Seagrasses restock reef fish populations 1545
case. The data do not show whether O. chrysurus spends itsentire juvenile phase in seagrass beds, because only a partof the juvenile otolith zone was sampled. It could also bepossible that other habitat types have an identical isotopiccomposition to that of the bay or reef ecosystems identifiedhere. This is highly unlikely in our relatively small-scalestudy area where only few major habitat types occur, but isan important consideration when extrapolating our ap-proach to other sites of greater spatial scales.
Although our results are likely to be applicable to otherCaribbean islands with marine embayments, the lifehistory–related patterns of habitat use by O. chrysurusmay be different for the same species in other geographicareas. Besides O. chrysurus, juveniles of 16 other Caribbeanreef fish species (most of which are commercially impor-tant) have been suggested to be strongly associated withseagrass and mangrove habitats based on size-frequencydistributions (Nagelkerken et al. 2000). A study on one ofthese species, Haemulon flavolineatum, using less discrim-inatory trace element data, suggested that 36% of the reefpopulation could be linked to mangrove nurseries (Chittaroet al. 2004). This is a much weaker association than foundin our study, but can be explained by the fact that thisspecies uses shallow coral reef zones (,3 m deep) as ajuvenile habitat in addition to mangroves and seagrass beds(Nagelkerken et al. 2000, 2001, 2002; Dorenbosch et al.2004). H. flavolineatum can thus be described as a‘‘facultative nursery species.’’ Besides O. chrysurus, at least10 of the 16 species identified above were referred to as‘‘obligate nursery species’’ and are believed to have a highdependence on bays with seagrass and mangrove nurseries(Nagelkerken et al. 2001, 2002; Dorenbosch et al. 2004). Ifthese 10 species show similar migration patterns to thoseindicated here for O. chrysurus, then an important part ofthe commercial reef fish population is likely to be sustainedby seagrass and/or mangrove nurseries.
The global decline in surface area of seagrass beds andmangroves has been estimated to be up to 35% (Shepherdet al. 1989; Valiela et al. 2001). In the light of the presentstudy, this gives great concern as far as vital coral reefsand sustainable fisheries are concerned. Marine reservesare promising management tools with effects extendingbeyond their boundaries (Roberts et al. 2001), but theeffectiveness of coral reef MPAs is heavily criticized (Moraet al. 2006). Worldwide, 247 MPAs include seagrass beds(as opposed to 980 for coral reefs; Mora et al. 2006), manyof which are rarely singled out as objects of protection(Spalding et al. 2003). We suggest that establishingcombined reef and seagrass MPAs should increase reefO. chrysurus biomass, and that of other seagrass-associ-ated species, even stronger than reef MPAs alone,promoting spillover into adjacent fishing grounds. Wethus stress the importance of introducing coral reefreserves comprised of a mosaic of interlinked coastalhabitats, including seagrass beds.
References
ADAMS, A. J., AND oTHERS. 2006. Nursery function of tropicalback-reef systems. Mar. Ecol. Prog. Ser. 318: 287–301.
BECK, M. W., AND oTHERS. 2001. The identification, conservation,and management of estuarine and marine nurseries for fishand invertebrates. BioScience 51: 633–641.
BELLWOOD, D. R., T. P. HUGHES, C. FOLKE, AND M. NYSTROM.2004. Confronting the coral reef crisis. Nature 429: 827–833.
BOUTTON, T. W. 1991. Stable carbon isotope ratios of naturalmaterials: II. Atmospheric, terrestrial, marine, and freshwaterenvironments, p. 173–185. In D. C. Coleman and B. Fry[eds.], Carbon isotope techniques. Academic.
CAMPANA, S. E. 1999. Chemistry and composition of fish otoliths:Pathways, mechanisms and applications. Mar. Ecol. Prog.Ser. 188: 263–297.
CHITTARO, P. M., B. J. FRYER, AND P. F. SALE. 2004.Discrimination of French grunts (Haemulon flavolineatum,Desmarest, 1823) from mangrove and coral reef habitatsusing otolith microchemistry. J. Exp. Mar. Biol. Ecol. 308:169–183.
———, P. USSEGLIO, B. J. FRYER, AND P. F. SALE. 2006. Spatialvariation in otolith chemistry of Lutjanus apodus at TurneffeAtoll, Belize. Estuar. Coast. Shelf Sci. 67: 673–680.
CLARO, R. 1983. Ecologıa y cicle de vida del caballerote, Lutjanusgriseus (Linnaeus), en la plataforma Cubana. I. Identidad,distribucion y habitat, nutricion y reproduccion. Rep. Invest.Inst. Oceanol. Acad. Cienc. Cuba 7: 1–30.
COCHERET DE LA MORINIERE, E., B. J. A. POLLUX, I. NAGELKERKEN,M. A. HEMMINGA, A. H. L. HUISKES, AND G. VAN DER
VELDE. 2003. Ontogenetic dietary changes of coral reeffishes in the mangrove-seagrass-reef continuum: Stableisotopes and gut-content analysis. Mar. Ecol. Prog. Ser.246: 279–289.
DORENBOSCH, M., M. C. VAN RIEL, I. NAGELKERKEN, AND G. VAN
DER VELDE. 2004. The relationship of reef fish densities to theproximity of mangrove and seagrass nurseries. Estuar. Coast.Shelf Sci. 60: 37–48.
ELSDON, T. S., AND B. M. GILLANDERS. 2003. Reconstructingmigratory patterns of fish based on environmental influenceson otolith chemistry. Rev. Fish Biol. Fish. 13: 219–235.
FIELD, A. 2005. Discovering statistics using SPSS for Windows,2nd ed. Sage.
FRY, B., P. L. MUMFORD, AND M. B. ROBBLEE. 1999. Stable isotopestudies of pink shrimp (Farfantepenaeus duorarum Burken-road) migrations on the southwestern Florida Shelf. Bull.Mar. Sci. 65: 419–430.
GARCIA, E. R., J. C. POTTS, R. A. RULIFSON, AND C. S. MANOOCH.2003. Age and growth of yellowtail snapper, Ocyuruschrysurus, from the southeastern United States. Bull. Mar.Sci. 72: 909–921.
GILLANDERS, B. M., K. W. ABLE, J. A. BROWN, D. B. EGGLESTON,AND P. F. SHERIDAN. 2003. Evidence of connectivity betweenjuvenile and adult habitats for mobile marine fauna: Animportant component of nurseries. Mar. Ecol. Prog. Ser. 247:281–295.
HANSSON, S., J. E. HOBBIE, R. ELMGREN, U. LARSSON, B. FRY, AND
S. JOHANSSON. 1997. The stable nitrogen isotope ratio as amarker of food-web interactions and fish migration. Ecology78: 2249–2257.
HUXHAM, M., E. KIMANI, J. NEWTON, AND J. AUGLEY. 2007. Stableisotope records from otoliths as tracers of fish migration in amangrove system. J. Fish Biol. 70: 1554–1567.
JACOB, U., K. MINTENBECK, T. BREY, R. KNUST, AND K. BEYER.2005. Stable isotope food web studies: A case for standardizedsample treatment. Mar. Ecol. Prog. Ser. 287: 251–253.
KALISH, J. M. 1991. C-13 and O-18 isotopic disequilibria in fishotoliths: Metabolic and kinetic effects. Mar. Ecol. Prog. Ser.75: 191–203.
1546 Verweij et al.
MORA, C., AND oTHERS. 2006. Coral reefs and the global networkof marine protected areas. Science 312: 1750–1751.
MUMBY, P. J., AND oTHERS. 2004. Mangroves enhance the biomassof coral reef fish communities in the Caribbean. Nature 427:533–536.
NAGELKERKEN, I., M. DORENBOSCH, W. C. E. P. VERBERK, E.COCHERET DE LA MORINIERE, AND G. VAN DER VELDE. 2000.Importance of shallow-water biotopes of a Caribbean bay forjuvenile coral reef fishes: Patterns in biotope association,community structure and spatial distribution. Mar. Ecol.Prog. Ser. 202: 175–192.
———, S. KLEIJNEN, T. KLOP, R. A. C. J. VAN DEN BRAND, E.COCHERET DE LA MORINIERE, AND G. VAN DER VELDE. 2001.Dependence of Caribbean reef fishes on mangroves andseagrass beds as nursery habitats: A comparison of fish faunasbetween bays with and without mangroves/seagrass beds.Mar. Ecol. Prog. Ser. 214: 225–235.
———, C. M. ROBERTS, G. VAN DER VELDE, M. DORENBOSCH, M.C. VAN RIEL, E. COCHERET DE LA MORINIERE, AND P. H.NIENHUIS. 2002. How important are mangroves and seagrassbeds for coral-reef fish? The nursery hypothesis tested on anisland scale. Mar. Ecol. Prog. Ser. 244: 299–305.
———, AND G. VAN DER VELDE. 2004. Are Caribbean mangrovesimportant feeding grounds for juvenile reef fish from adjacentseagrass beds? Mar. Ecol. Prog. Ser. 274: 143–151.
NEWTON, K., I. M. COTE, G. M. PILLING, S. JENNINGS, AND N. K.DULVY. 2007. Current and future sustainability of island coralreef fisheries. Curr. Biol. 17: 655–658.
PARRISH, J. D. 1989. Fish communities of interacting shallow-water habitats in tropical oceanic regions. Mar. Ecol. Prog.Ser. 58: 143–160.
RANDALL, J. E. 1967. Food habits of reef fishes of the West Indies.Stud. Trop. Oceanogr. 5: 665–847.
ROBERTS, C. M., J. A. BOHNSACK, F. GELL, J. P. HAWKINS, AND R.GOODRIDGE. 2001. Effects of marine reserves on adjacentfisheries. Science 294: 1920–1923.
RUBENSTEIN, D. R., AND K. A. HOBSON. 2004. From birds tobutterflies: Animal movement patterns and stable isotopes.Trends Ecol. Evol. 19: 256–263.
SCHWARCZ, H. P., Y. GAO, S. CAMPANA, D. BROWNE, M. KNYF,AND U. BRAND. 1998. Stable carbon isotope variations inotoliths of Atlantic cod (Gadus morhua). Can. J. Fish. Aquat.Sci. 55: 1798–1806.
SHEPHERD, S. A., A. J. MCCOMB, D. A. BULTHUIS, V. NEVER-
AUSKAS, D. A. STEFFENSEN, AND R. WEST. 1989. Decline ofseagrasses, p. 346–393. In A. W. D. Larkum, J. A. McComband S. A. Shepherd [eds.], Biology of seagrasses. Elsevier.
SPALDING, M., M. TAYLOR, C. RAVILIOUS, F. T. SHORT, AND E.GREEN. 2003. The distribution and status of seagrasses,p. 5–26. In E. P. Green and F. T. Short [eds.], World atlasof seagrasses. Univ. California Press.
SZEDLMAYER, S. T. 1998. Comparison of growth rate andformation of otolith increments in age-0 red snapper. J. FishBiol. 53: 58–65.
VALIELA, I., J. L. BOWEN, AND J. K. YORK. 2001. Mangrove forests:One of the world’s threatened major tropical environments.BioScience 51: 807–815.
VERBEKE, G., AND G. MOLENBERGHS. 1997. Linear mixed models inpractice: A SAS oriented approach. Springer-Verlag.
ZAPATA, F. A., AND P. A. HERRON. 2002. Pelagic larval duration andgeographic distribution of tropical eastern Pacific snappers(Pisces: Lutjanidae). Mar. Ecol. Prog. Ser. 230: 295–300.