Self-Assessed Contrast-Maximizing Adaptive Region Growing Carlos S. Mendoza 1 ? , Bego˜ na Acha 1 , Carmen Serrano 1 , and Tom´ as G´ omez-C´ ıa 2 1 Universidad de Sevilla Av. de los Descubrimientos s/n 41092 Sevilla, Spain 2 Grupo Unidad Cl´ ınica de Cirug´ ıa Pl´ astica y Grandes Quemados Hospitales Universitarios Virgen del Roc´ ıo de Sevilla Avda Manuel Siurot, s/n 41013 Sevilla, Spain {csanchez1,bacha,cserrano}@us.es, [email protected]Abstract. In the context of an experimental virtual-reality surgical planning software platform, we propose a fully self-assessed adaptive region growing segmentation algorithm. Our method successfully delin- eates main tissues relevant to head and neck reconstructive surgery, such as skin, fat, muscle/organs, and bone. We rely on a standardized and self- assessed region-based approach to deal with a great variety of imaging conditions with minimal user intervention, as only a single-seed selection stage is required. The detection of the optimal parameters is managed internally using a measure of the varying contrast of the growing regions. Validation based on synthetic images, as well as truly-delineated real CT volumes, is provided for the reader’s evaluation. Key words: CT, segmentation, region-growing, seed, muscle, bone, fat, surgical planning, virtual reality 1 Introduction One of the most promising applications of medical image computerized visu- alization is virtual reality surgical planning. Traditional surgical planning uses volumetric information stored in a stack of intensity-based images, usually from computerized tomography (CT) scanners. Based on a number of these image slices, surgeons build their own mental 3D model of the relevant tissues. This task is difficult, even for experienced surgeons. As a consequence, they can miss important information or draw incorrect conclusions due to anatomical vari- ability, either of which can lead to suboptimal treatment strategy decisions [1]. ? This work was supported by ”Fundaci´ on Reina Mercedes” from ”Hospital Univer- sitario Virgen del Roc´ ıo” (Sevilla), and ”Consejer´ ıa de Salud de la Junta de An- daluc´ ıa”. Carlos S. Mendoza was supported by a doctoral scholarship financed by Universidad de Sevilla.
Abstract. In the context of an experimental virtual-reality surgicalplanning software platform, we propose a fully self-assessed adaptiveregion growing segmentation algorithm. Our method successfully delin-eates main tissues relevant to head and neck reconstructive surgery, suchas skin, fat, muscle/organs, and bone. We rely on a standardized and self-assessed region-based approach to deal with a great variety of imagingconditions with minimal user intervention, as only a single-seed selectionstage is required. The detection of the optimal parameters is managedinternally using a measure of the varying contrast of the growing regions.Validation based on synthetic images, as well as truly-delineated real CTvolumes, is provided for the reader’s evaluation.
One of the most promising applications of medical image computerized visu-alization is virtual reality surgical planning. Traditional surgical planning usesvolumetric information stored in a stack of intensity-based images, usually fromcomputerized tomography (CT) scanners. Based on a number of these imageslices, surgeons build their own mental 3D model of the relevant tissues. Thistask is difficult, even for experienced surgeons. As a consequence, they can missimportant information or draw incorrect conclusions due to anatomical vari-ability, either of which can lead to suboptimal treatment strategy decisions [1].? This work was supported by ”Fundacion Reina Mercedes” from ”Hospital Univer-
sitario Virgen del Rocıo” (Sevilla), and ”Consejerıa de Salud de la Junta de An-dalucıa”. Carlos S. Mendoza was supported by a doctoral scholarship financed byUniversidad de Sevilla.
2 C.S. Mendoza, B. Acha, C. Serrano, Tomas Gomez-Cıa
Using volumetric renderings of anatomical structures, and the appropriate vir-tual tools for basic surgical operations (like tissue excision and repositioning),the complexity of many plastic surgery interventions can be addressed prior tothe actual physical procedure.
A main bottleneck for these computer environments is the delineation of thetissues involved, to such an extent that automated approaches become manda-tory. Automatic segmentation is a fundamental problem exhaustively addressedin the literature. Any inaccuracies in the process can distort the simulated mea-sures and surgical operations. In this paper we propose a novel segmentationstrategy in the context of the development of a virtual surgical planning envi-ronment.
The environment under study was initially conceived for the simulation ofhead and neck reconstructive surgery, providing virtual tools for tissue excisionand repositioning, tissue quantification and stereolithographic prototyping. Insuch a framework the need for proper delineation of diverse tissues like skin, fat,muscles, organs and bone becomes crucial. Although formerly relying on verysimple segmentation methods like thresholding and simple region growing [2–5],only further developments in automatic segmentation approaches, deprived ofuser parameters, can remain useful for the clinical practitioners and surgeons.According to our on-field inquiries, only a seed-selection stage seems to be tol-erated in such a non-technical environment. There is a strong restriction in theoperating human time, so parameter selection becomes unaffordable.
In order to pay back the cost and burden of this virtual surgical planningplatform development, a wide range of situations should be covered with the pro-posed technique. Most available physical resources, like imaging devices, shouldbe compatible with the method, even ensuring backwards compatibility (for im-ages acquired in the past). As a consequence neither resolution, contrast norSNR specific standards can be expected. Further, no imaging protocol can bepresumed, as related to patient positioning in the scanner, presence of radioac-tive contrast, body segment of the patient to be imaged and so on.
Few authors have referred to the issue of classifying a concrete set of tissuesusing a common method. In their work, Zhou et al. [6] developed a techniquefor skin, fat, muscle/organs and bone segmentation. Their approach consistedmainly of threshold selection except for bony tissue, for which they made useof a self-assessed adaptive region growing algorithm. Their threshold selectionmethod, based on hierarchical discriminant analysis made assumptions on thehistogram that turned out to be unaffordable in our less predictable context.Their strategy for bony tissue, that had been earlier proposed for bronchus seg-mentation by Law and Heng [7], computed the optimal adaptive threshold bydetecting sudden increases in the segmented volume. Its main weakness is theneed for an empirical range in this increase for distinguishing routinary growthfrom undesired leaking. This range would hardly be established in our more gen-eral problem. Apart from manual trial-and-error adaptive threshold selection [8],other self-assessed adaptive region growing strategies, outside our context of ap-plication, have been proposed in the past. In their work [9], Hojjatoleslami and
Self-Assessed Contrast-Maximizing ARG 3
Kittler proposed a method based on finding the global maxima for two differentcontrast measures which they computed iteratively as intensity-decreasing pixelswere added to the segmented region. The success of the assessment was foundedon the assumption that maximal contrast occurred on region boundaries, whichis a reformulation of approaches assuming that the variation of the gray valueswithin regions is smaller than across regions, an inherent assumption in all re-gion growing techniques [10]. Unfortunately, the exhaustivity of their per-pixelapproach entailed very low computational efficiency. Revol-Muller et al. [11] usedmorphological measures to assess the multiplier of the adaptive range for regiongrowing. Instead of computing their assessment function for every pixel additionto the region, they sampled the function for an evenly-spaced set of values.
In our method we propose an assessment function based on the evolving con-trast of the region-growing sequence. This strategy allows for segmentation ofimages without a bimodal histogram requirement as opposed to the assessmentmeasure proposed by Revol-Muller et al. [11]. To make this approach computa-tionally feasible in 3D we produce only evenly-spaced samples of this functionalong the values of the multiplier for the adaptive ranges that extend around theiteratively estimated mean. We guarantee the sufficiency of the sampling reso-lution by setting it to a small percentage of the continuously updated standarddeviation of the grown region. Globally, our goal is to provide fast automaticsegmentation based only on a seed selection step. The results should be compa-rable to those obtained by manually-tuned region-growing approaches, in a verywide variety of imaging conditions.
2 Method
2.1 Tissue Model
Since our goal is providing a mechanism for segmentation of skin, fat, mus-cle/organs and bone tissues with minimal user intervention, we have establisheda model for these tissues that takes into account their intensity distributions inCT images.
First of all, we consider here only tissue segments that exhibit an inherentdensity and thus an average intensity in the image domain. We model then ourobject of interest as a connected region whose pixel intensities are sampled froma Gaussian distribution with unknown mean and standard deviation. We maypresume that our tissues of interest are surrounded by other tissues derived fromother, sometimes adjacent, intensity distributions, like other authors have stated[12]. Although common in the literature, this assumption for the intensities israrely met in practice, in the sense that the intensity distributions of tissues areonly approximately Gaussian. To deal with this inconvenience, and also withpartial overlap of distributions between tissues, we propose the use of an assess-ment function that is to be evaluated along a sequence of region growing stages(region growing sequence).
4 C.S. Mendoza, B. Acha, C. Serrano, Tomas Gomez-Cıa
2.2 Segmentation Algorithm
Normalization and Denoising. Since our method was conceived for imagesfrom a wide range of scanners and acquisition protocols, we decided to developa normalizing stage that could account for such variability. As we will introducelater on, for the self-assessed region growing stage of the algorithm we require theinput intensity dynamic range to be normalized with respect to some parameterestimates of the objective intensity distribution.
In the following equations N is a cubic neighborhood of radius R around theseed, x is a voxel position, f(x) is the intensity for voxel at x, fN is the meanintensity estimate in N and |N | is the cardinality of N . Moreover, σfN
is theestimated standard deviation for intensities in N , K is a constant parameter,and f(x), f ′(x) are the input and output intensities for the non-linear mappingdescribed below.
fN =1|N |
∑xk∈N
f (xk) , (1)
σfN=√
1|N |
∑xk∈N
(f (xk)− fN
)2, (2)
f ′(x) =
1 + exp
−f(x)− fN(KσfN
3
)−1
. (3)
In a first step we proceed by maximum-likelihood (ML) estimation of the meanand standard deviation as in (1-2), and then perform a non-linear normalizationusing a sigmoidal transfer function centered on the estimated mean as in (3). Thewidth of the sigmoidal window extends Kσ around the center fN of the mapping.For K = 3 the width of the window would be enough to map 99.7% of thesamples, of a Gaussian distribution with similar mean and standard deviation.Greater values of K ensures robust mapping for the estimated distribution. Thesigmoidal mapping has been chosen because of its smoothness, and its ability tofocus the output dynamic range on a given input intensity range of interest.
Finally, we perform non-linear denoising using an in-slice bidimensional me-dian filter with kernel radius Γ . Other denoising schemes would be valid, alwayskeeping in mind that edge preservation is crucial in our approach. We chose touse bidimensional median filtering because it is as fast as using a smoothingkernel, and preserves edges better than most linear filtering techniques.
Self-Assessed Region Growing. Departing from a normalized version ofthe image under study, whose intensities lie in the range [0, 1], and a manu-ally provided seed, we perform the self-assessed contrast-maximizing algorithm,for which a generic iteration is described in the following steps:
1. Update multiplier ki = k0 + i∆k2. Compute, in last iteration grown region Ri−1, ML estimates for the mean
(available from last iteration) and standard deviation (f ′Ri−1, σf ′Ri−1
)
Self-Assessed Contrast-Maximizing ARG 5
3. For every candidate voxel xci−1 being 26-connected to Ri−1, xci−1 ∈ Ri if
f ′(xci−1
)∈[f ′Ri−1
± kiσf ′Ri−1
](4)
4. Compute the assessment function Oi(f ′Ri
, f ′Pi
)using the intensity average
f ′Riin Ri and the intensity average f ′Pi
in the external perimeter Pi of Riaccording to (1) and the following eqs.:
Pi = {xci} ∩RiC , (5)
Oi(f ′Ri
, f ′Pi
)=∣∣∣∣ f ′Pi
− f ′Ri
f ′Pi+ f ′Ri
∣∣∣∣ (6)
5. If Oi−1 was a local maximum, when compared to Oi−2 and Oi (only wheni ≥ 2), then the algorithm stops and the output is Ri−1. Otherwise anotheriteration takes place
Of all aforementioned parameters only k0 and ∆k are critical for the performanceof the algorithm. k0 affects computational efficiency requiring a greater numberof iterations before a local maximum of O
(fRi
, fPi
)is found. Therefore it should
be set to the largest possible value that guarantees that only a small percentageof tissue intensity samples are included in the first iteration, in order not tomiss the first local maximum. In what concerns ∆k, the choice must guaranteethat the assessment function is being sampled adequately in order to detectits local variations. Since the estimates for the mean and standard deviationare continually updated as the region grows, the estimates become increasinglyclose to the theoretical values. We argue that setting ∆k below one tenth of 3(which is the theoretical value multiplying the standard deviation of a Gaussiandistribution for 99.7% of its samples to be included in a range of that widtharound the mean) is enough for the segmentation process to be able not tomiss the available local maxima of the assessment function. This postulate issupported by our experimental results.
3 Results
We have implemented our algorithm using open source medical image processinglibraries, more precisely the Insight Toolkit for algorithm development, and thecommand line executable module infrastructure provided by 3DSlicer for fastprototyping, calibration, evaluation, and manual segmentation on real images forfurther validation [13]. The algorithm that we will validate, and that was finallyimplemented in the virtual reality platform that motivated its development, usesthe following parameter values: R = 2,K = 12, Γ = 1, k0 = 1 and ∆k = 0.1.
For validating our algorithm we have proposed several experiments, basedon synthetic as well as real images. In their inspiring work, Udupa et al. [14]proposed a methodology for the validation of medical volume segmentation al-gorithms. For a segmentation algorithm to be proven useful it has to demon-strate its accuracy (quality of results), precision (parameter independence) andefficiency (human and computational times).
6 C.S. Mendoza, B. Acha, C. Serrano, Tomas Gomez-Cıa
Accuracy is evaluated in terms of False Positive and False Negative VolumeFraction (FPV F and FNV F ). FPV F compares the number of voxels assignedto the object which actually belong to the background, with the number of voxelswhich compose the background. FNV F quantifies the number of voxels assignedto the background, which actually belong to the object, as compared to the num-ber of voxels in the object. To produce such a comparison a true delineation ofthe object must be available. This ground-truth can be accomplished either bymanual human-expert segmentation; or creating synthetic images, corruptingthem with simulations of typical acquisiton artifacts, and then performing seg-mentation on the result.
FPV F =|Segmented Region− True Region||Entire Volume− True Region|
, (7)
FNV F =|True Region− Segmented Region|
|True Region|, (8)
where | � | indicates again cardinality and subtracting means performing a setintersection with the complement of the subtrahend.
Precision is evaluated according to the so-called precision quotient (PR).Precision can be computed in terms of inter/intra-operator variability and inter-scanner variability. Since our method relies on only a seed selection procedure,and is supposed to work for a variety of acquisition devices, we decided to com-pute precision for inter-seed variability. This variability is accounted for by com-paring the resulting segmentation from differently placed seeds.
Several seeds can be used so that (9) is computed for all possible combinationsof outputs, and then averaged to obtain a more representative measure.
Efficiency relates to the segmentation performance time, human as well ascomputational time. According to Udupa et al. [14], it is extremely hard to pro-vide an efficiency measure that proves useful when comparing different methods.One possible way of summing up all efficiency factors is related to the economiccost of usage for an algorithm. Human time is much more expensive than com-puter time. In our method, usage is designed to be extremely simple, and reducesto placing one pin point on the desired object. For that reason we have computedhere only computational times for the execution of our algorithm.
3.1 First Experiment. Constant-valued spheres
To validate the claim that our contrast-based assessment function accuratelydetects homogeneous-intensity regions, we have created synthetic volume imagesand corrupted them with some typical CT acquisition artifacts. We have createda 3D volume composed by two ideal tissues, with constant intensity. The firsttissue is shaped as a ball centered in the image domain, with radius r = 20 voxels.
Self-Assessed Contrast-Maximizing ARG 7
10 20 30 40 50 60 70 80 900
0.1
0.2
0.3
0.4
0.5
0.6
0.7
0.8
Number of Iterations
Co
ntr
ast
0.1-0.10.3-0.30.5-0.50.7-0.7
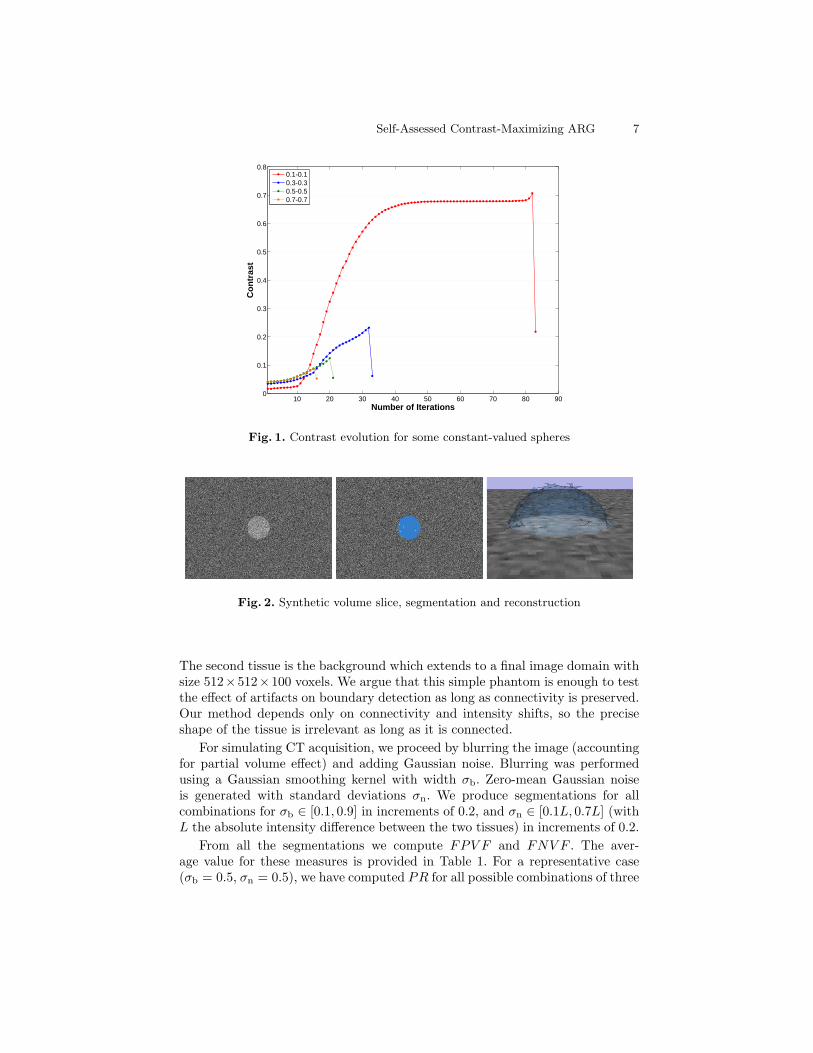
Fig. 1. Contrast evolution for some constant-valued spheres
Fig. 2. Synthetic volume slice, segmentation and reconstruction
The second tissue is the background which extends to a final image domain withsize 512×512×100 voxels. We argue that this simple phantom is enough to testthe effect of artifacts on boundary detection as long as connectivity is preserved.Our method depends only on connectivity and intensity shifts, so the preciseshape of the tissue is irrelevant as long as it is connected.
For simulating CT acquisition, we proceed by blurring the image (accountingfor partial volume effect) and adding Gaussian noise. Blurring was performedusing a Gaussian smoothing kernel with width σb. Zero-mean Gaussian noiseis generated with standard deviations σn. We produce segmentations for allcombinations for σb ∈ [0.1, 0.9] in increments of 0.2, and σn ∈ [0.1L, 0.7L] (withL the absolute intensity difference between the two tissues) in increments of 0.2.
From all the segmentations we compute FPV F and FNV F . The aver-age value for these measures is provided in Table 1. For a representative case(σb = 0.5, σn = 0.5), we have computed PR for all possible combinations of three
8 C.S. Mendoza, B. Acha, C. Serrano, Tomas Gomez-Cıa
different seeds, selected randomly inside the region of interest. The average PRis presented in Table 1. For efficiency evaluation, computational time tc has beencomputed and averaged across all images. Notice in Table 1 how the obtained
Table 1. Computed measures for constant-valued spheres
FPV F 2.46 · 10−4 ± 1.06 · 10−4
FNV F 0.0205 ± 0.0313
PR 0.925 ± 0.0413
tc(s) 72.6 ± 40.8
values for FPV F and FNV F are close to zero, indicating very high segmenta-tion fidelity. PR is close to 1, indicating weak dependence on seed placement.Times show great variance due to the iterative nature of the algorithm.
For illustrative purposes we have included in Fig. 1 a graphical representationof the evolution of the assessment function as the algorithm iterates. Notice howthe fall after the peak decreases as noise and blurring increase.
Also, in Fig. 2 we can see a slice of the generated volume for the case 0.5-0.5 and also a surface reconstruction of the segmented region. Notice the goodresults facing noise with standard deviation as high as half the intensity differencebetween the two tissues.
3.2 Second Experiment. Continuous-valued spheres
For this experiment we produced a similar synthetic image, only now the inten-sity inside the ball varies from 0 to 1 proportionally to the Euclidean distancefrom the center of the voxel to the center of the ball. The intensity value for thebackground was set to 1. In this scheme, no clear boundary is available, becausewe wanted to prove that our method does not require abrupt intensity changesfor boundaries to be detected. We corrupted the image only with Gaussian noiseof standard deviation σn = 0.1, 0.3 and 0.5. We computed the same accuracyand efficiency measures, as well as precision for the case σn = 0.3. Due to thenature of the values in the regions, seeds must be placed close to the center inorder for the condition (which is inherent to any region growing approach) ofgreater variance across than inside regions to be met [10]. According to Table
Table 2. Computed measures for continuous-valued spheres
FPV F 4.12 · 10−4 ± 4.44 · 10−4
FNV F 0.191 ± 0.110
PR 0.930 ± 0.0176
tc(s) 257 ± 12.9
Self-Assessed Contrast-Maximizing ARG 9
5 10 15 20 25 300
0.01
0.02
0.03
0.04
0.05
0.06
0.07
Number of Iterations
Co
ntr
ast
0.10.30.5
Fig. 3. Contrast evolution for some continuous-valued spheres
Fig. 4. Synthetic volume slice, segmentation and reconstruction
2, the results for this extremely subtle boundary are still acceptable. FPV Fand FNV F stay somewhat close to 0, and PR value is close enough to 1 asto support the claim of low seed location dependence. Time has increased dueto the greater variance of the segmented tissue, which forcer the algorithm toperform more iterations.
For Fig. 3 we can observe the same effect as in Fig. 1. Notice the increasedroughness in these curves as compared to those in Fig. 1. This is due to a greaterinfluence of noise on consecutive iterations of the region growing sequence, dueto the non-constant intensity of the tissue.
We present in Fig. 4 again a slice of the generated volume for the case 0.5and its segmentation reconstruction. The quality of the segmentation is prettygood even for extremely dim boundaries. This proves that our method detectsnot only intensity shifts, but also intensity evolution shifts.
10 C.S. Mendoza, B. Acha, C. Serrano, Tomas Gomez-Cıa
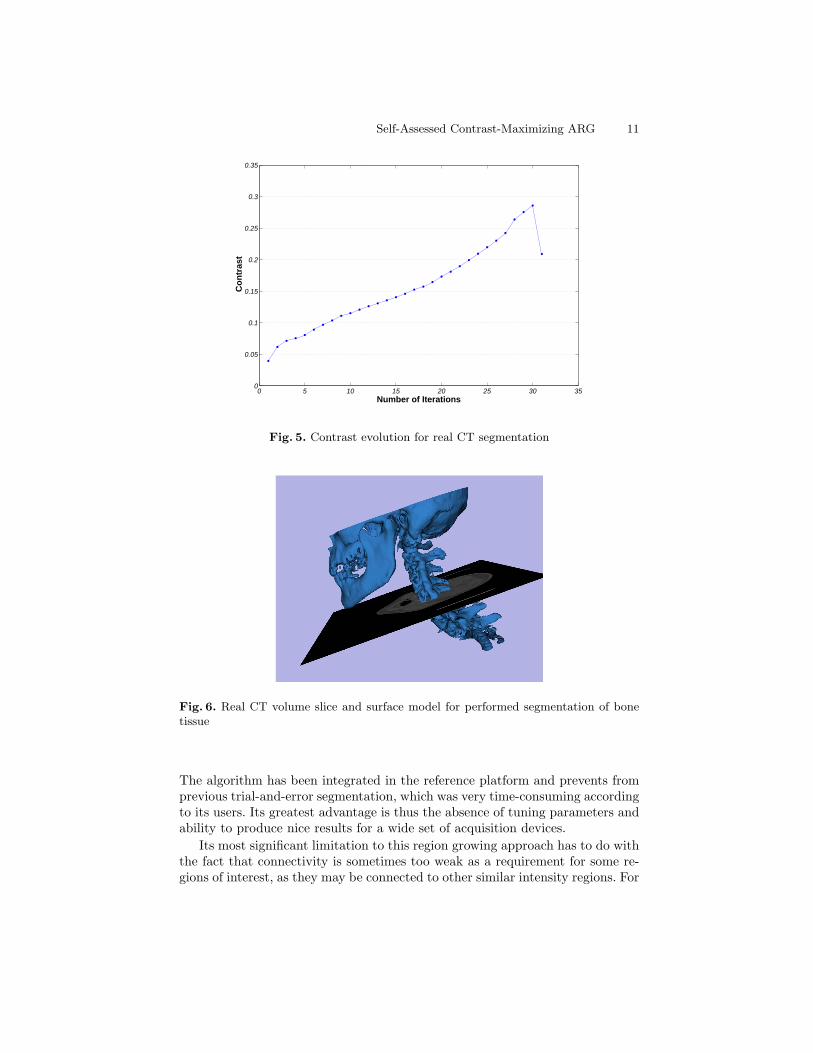
3.3 Third experiment. Real CT images
For this last experiment we have produced automatic segmentations for 10 realCT images for the tissues described (skin, muscle/organs, fat and bone). Thetesting set proceeds from all different scanners involved in our clinical setting.As explained above, validation of real CT images requires manual segmentationsprovided by a clinical expert. In our application context this manual segmenta-tion process can be extremely time-consuming, or even intractable, due to thelack of tissue localization. Just to give an example, manual segmentation of mus-cular tissue implies manually avoiding all blood vessels and fat traces, for up to500 slices. For this reason we have computed our accuracy and precision metricsfrom just 20 slices in 10 cases.
Moreover, the manual accuracy of the segmentation is bounded by humanperceptual limitations presenting considerable inter-subject variability, and we(the authors and the clinical practitioners) have observed that in many casespoorer results in accuracy are related to incomplete manual segmentations,rather than incomplete automatic segmentations. Let us say then, that the qual-ity of the segmentation is at least as good as the presented results.
For the results presented in Table 3, all segmentations have been used foraccuracy and efficiency assessment, and one particular segmentation and severalseeds for precision. While FPV F stays very low, ensuring self-contained seg-mented regions, FNV F is still reasonably close to 0. Precision is not as goodas for the synthetic images, due to the more complex shape of the segmentedregions, which produce a slightly greater dependence on seed placement. Com-putational time ranges between 2 or 3 minutes, which implies a great reductionas compared to previous trial-and-error parameter tuning, according to non-technical users’ opinions.
Again illustration for contrast evolution and a rendering of the resultingsegmented volume are presented in Figs. 5 and 6. All results were obtained froma single seed selection in each image.
Table 3. Computed measures for real CT images
FPV F 9.2 · 10−3 ± 1.75 · 10−3
FNV F 0.151 ± 0.0815
PR 0.733 ± 0.171
tc(s) 156.0 ± 36.2
4 Concluding Remarks, Limitations and Future Work
Considering the numeric results for the experimental validation we consider ourapproach successful in solving the particular needs for which it was conceived.
Self-Assessed Contrast-Maximizing ARG 11
0 5 10 15 20 25 30 350
0.05
0.1
0.15
0.2
0.25
0.3
0.35
Number of Iterations
Con
tras
t
Fig. 5. Contrast evolution for real CT segmentation
Fig. 6. Real CT volume slice and surface model for performed segmentation of bonetissue
The algorithm has been integrated in the reference platform and prevents fromprevious trial-and-error segmentation, which was very time-consuming accordingto its users. Its greatest advantage is thus the absence of tuning parameters andability to produce nice results for a wide set of acquisition devices.
Its most significant limitation to this region growing approach has to do withthe fact that connectivity is sometimes too weak as a requirement for some re-gions of interest, as they may be connected to other similar intensity regions. For
12 C.S. Mendoza, B. Acha, C. Serrano, Tomas Gomez-Cıa
this reason a future improvement for the technique could be incorporating somemorphological limitations to the growth of the region in order to impose somedegree of stiffness, to avoid flooding towards undesired regions. This improve-ment could make the algorithm useful in greater variety of situations (individualorgans, tumors...).
References
1. Reitinger, B., Bornik, A., Beichel, R., Schmalstieg, D.: Liver surgery planningusing virtual reality. IEEE Comput. Graph. Appl. 26(6) (2006) 36–47
2. Zucker, S.W.: Region growing: Childhood and adolescence. Computer Graphicsand Image Processing 5(3) (1976) 382–399
3. Sivewright, G.J., Elliott, P.J.: Interactive region and volume growing for segment-ing volumes in MR and CT images. Medical Informatics 19(1) (1994) 71–80
4. Sekiguchi, H., Sano, K., Yokoyama, T.: Interactive 3-dimensional segmentationmethod based on region growing method. Systems and Computers in Japan 25(1)(1994) 88–97
5. Suarez, C., Acha, B., Serrano, C., Parra, C., Gomez, T.: VirSSPA- a virtual realitytool for surgical planning workflow. International Journal of Computer AssistedRadiology and Surgery 4(2) (2009) 133–139
6. Zhou, X., Kamiya, N., Kara, T., Fujita, H., Yokoyama, R., Kiryu, T., Hoshi, H.:Automated recognition of human strucure from torso CT images. In: Proceedingsof the Fourth IASTED International Conference on Visualization, Imaging, andImage Processing. (2004) 584–589
7. Law, T.Y., Heng, P.A.: Automated extraction of bronchus from 3D CT images oflung based on genetic algorithm and 3D region growing. In: Proceedings of SPIE- The International Society for Optical Engineering. Volume 3979. (2000) I/–
8. Adams, R., Bischof, L.: Seeded region growing. IEEE Trans. Pattern Anal. Mach.Intell. 16(6) (1994) 641–647
9. Hojjatoleslami, S.A., Kittler, J.: Region growing: A new approach. IEEE Trans.Image Process. 7(7) (1998) 1079–1084
11. Revol-Muller, C., Peyrin, F., Carrillon, Y., Odet, C.: Automated 3D region growingalgorithm based on an assessment function. Pattern Recognition Letters 23(1-3)(2002) 137–150
12. Jian, W., Feng, Y., Ma, J.L., Sun, X.P., Jing, X., Cui, Z.M.: The segmentationand visualization of human organs based on adaptive region growing method. In:Proceedings - 8th IEEE International Conference on Computer and InformationTechnology Workshops, CIT Workshops 2008. (2008) 439–443
13. Pieper, S., Lorensen, B., Schroeder, W., Kikinis, R.: The NA-MIC Kit: ITK, VTK,pipelines, grids and 3D Slicer as an open platform for the medical image computingcommunity. In: 2006 3rd IEEE International Symposium on Biomedical Imaging:From Nano to Macro - Proceedings. Volume 2006. (2006) 698–701