Shale diapirism in the Quaternary tectonic evolution of the Northern Apennine, Bologna, Italy Andrea Borgia, 1 Giovanni Grieco, 2 Fabio Brondi, 1 Marcello Badalı `, 1 Olivier Merle, 3 Giorgio Pasquare `, 2 Luca Martelli, 4 and Teresa di Nardo 4 Received 8 August 2004; revised 10 July 2005; accepted 29 December 2005; published 24 August 2006. [1] We use morphologic, stratigraphic, and structural data to identify a set of diapirs just southward (uphill) of the northern margin of the Northern Apennine Range. The diapirs consist mainly of Ligurid chaotic shaley units that reach a maximum thickness of over 3 km. We also reconstruct marine sedimentation/abrasion surfaces that record a 1 cm/a differential uplift induced by diapirism. On the basis of this data we use the lubrication approximation of the Navier-Stokes equations and analogue experiments to show that thrusting of the Epiligurid units can be generated by diapirism of the underlying Ligurid units in addition to regional compression. Owing to a gravity component parallel to the strata, the structures formed by diapirism are similar to those generated by compressive tectonics, differing in that thrusting is lubricated by diapiric rise. Using the analogue experiments, we show that deformation begins with folding eventually evolving to thrusting, and we derive an empirical relation to infer the time remaining to the end of deformation. In our area, diapiric deformation is still in the folding regime, but it should eventually evolve to the thrusting regime and terminate in about 10 5 a. We suggest that the whole northeastern slope of the Northern Apennine is controlled by diapiric tectonics. Our interpretation contrasts with the more traditional one, which views regional tectonic compression as the only responsible for the structures observed in the field. Since our model is based on first principles, it could be applied to other areas with similar geology and topography. Citation: Borgia, A., G. Grieco, F. Brondi, M. Badalı `, O. Merle, G. Pasquare `, L. Martelli, and T. di Nardo (2006), Shale diapirism in the Quaternary tectonic evolution of the Northern Apennine, Bologna, Italy, J. Geophys. Res., 111, B08406, doi:10.1029/2004JB003375. 1. Introduction [2] Gravity tectonics requires two conditions to leave an imprint in the geological record. The first is a horizontal density gradient, which (by generating aerially heteroge- neous vertical pressure gradients) induces flow from high- density to low-density volumes. The second condition depends on rock viscosity. This must be sufficiently small to allow an adequate amount of deformation to be detectable in the geologic record before other processes, such as erosion, may reduce the density gradient, inhibiting further deformation. At the same time, the viscosity must be sufficiently high to avoid fast evolving process such as soil creep or landsliding. Therefore gravity tectonics appears to be characterized by strain rates ranging between 10 4 and 10 6 a 1 and by intervals of about 4 orders of magnitude in space (10 3 –10 6 m), time (10 4 –10 7 a), and viscosity (10 17 – 10 20 Pa s). [3] In this paper we describe the gravitational ‘‘skin- tectonics’’ evolution of a sector of the northeastern slope of the Northern Apennine Range (NAR), close to Bologna City, that falls into the space, time, and viscosity ranges indicated above. We show that gravity-induced flow and diapirism in clayey and shaley formations are so extensively distributed that they substantially overprint and in many cases erase the signature of regional tectonic compression. We base our thesis on a detailed stratigraphic, morphologic, and tectonic study. From these field data we develop a model based on the lubrication approximation of the Navier-Stokes equations and on scaled analogue experiments of the gravitational deformation that characterizes the area. The experimental results show an empirical equation that can describe the evolution of the northeastern slope of the NAR. Since our work is based on fundamental principles, it could be applied to similar geological settings. 2. Regional Geology and Stratigraphy [4] The NAR is a fold-and-thrust belt of Tertiary age, which developed from an accretionary prism along the JOURNAL OF GEOPHYSICAL RESEARCH, VOL. 111, B08406, doi:10.1029/2004JB003375, 2006 1 EDRA, Roma, Italy. 2 Dip. Scienze della Terra ‘‘A. Desio,’’ Univ. degli Studi di Milano, Milano, Italy. 3 Laboratoire Magmas et Volcans, Observatoire de Physique du Globe, Clermont-Ferrand, France. 4 Servizio Geologico, Sismico e dei Suoli, Regione Emilia-Romagna, Bologna, Italy. Copyright 2006 by the American Geophysical Union. 0148-0227/06/2004JB003375$09.00 B08406 1 of 25
Transcript
Shale diapirism in the Quaternary tectonic evolution of the Northern
Apennine, Bologna, Italy
Andrea Borgia,1 Giovanni Grieco,2 Fabio Brondi,1 Marcello Badalı,1 Olivier Merle,3
Giorgio Pasquare,2 Luca Martelli,4 and Teresa di Nardo4
Received 8 August 2004; revised 10 July 2005; accepted 29 December 2005; published 24 August 2006.
[1] We use morphologic, stratigraphic, and structural data to identify a set of diapirs justsouthward (uphill) of the northern margin of the Northern Apennine Range. The diapirsconsist mainly of Ligurid chaotic shaley units that reach a maximum thickness of over3 km. We also reconstruct marine sedimentation/abrasion surfaces that record a 1 cm/adifferential uplift induced by diapirism. On the basis of this data we use the lubricationapproximation of the Navier-Stokes equations and analogue experiments to show thatthrusting of the Epiligurid units can be generated by diapirism of the underlying Liguridunits in addition to regional compression. Owing to a gravity component parallel to thestrata, the structures formed by diapirism are similar to those generated by compressivetectonics, differing in that thrusting is lubricated by diapiric rise. Using the analogueexperiments, we show that deformation begins with folding eventually evolving tothrusting, and we derive an empirical relation to infer the time remaining to the end ofdeformation. In our area, diapiric deformation is still in the folding regime, but it shouldeventually evolve to the thrusting regime and terminate in about 105 a. We suggest thatthe whole northeastern slope of the Northern Apennine is controlled by diapirictectonics. Our interpretation contrasts with the more traditional one, which views regionaltectonic compression as the only responsible for the structures observed in the field. Sinceour model is based on first principles, it could be applied to other areas with similargeology and topography.
Citation: Borgia, A., G. Grieco, F. Brondi, M. Badalı, O. Merle, G. Pasquare, L. Martelli, and T. di Nardo (2006), Shale diapirism in
the Quaternary tectonic evolution of the Northern Apennine, Bologna, Italy, J. Geophys. Res., 111, B08406,
doi:10.1029/2004JB003375.
1. Introduction
[2] Gravity tectonics requires two conditions to leave animprint in the geological record. The first is a horizontaldensity gradient, which (by generating aerially heteroge-neous vertical pressure gradients) induces flow from high-density to low-density volumes. The second conditiondepends on rock viscosity. This must be sufficiently smallto allow an adequate amount of deformation to be detectablein the geologic record before other processes, such aserosion, may reduce the density gradient, inhibiting furtherdeformation. At the same time, the viscosity must besufficiently high to avoid fast evolving process such as soilcreep or landsliding. Therefore gravity tectonics appears tobe characterized by strain rates ranging between 10�4 and
10�6 a�1 and by intervals of about 4 orders of magnitude inspace (103–106 m), time (104–107 a), and viscosity (1017–1020 Pa s).[3] In this paper we describe the gravitational ‘‘skin-
tectonics’’ evolution of a sector of the northeastern slopeof the Northern Apennine Range (NAR), close to BolognaCity, that falls into the space, time, and viscosity rangesindicated above. We show that gravity-induced flow anddiapirism in clayey and shaley formations are so extensivelydistributed that they substantially overprint and in manycases erase the signature of regional tectonic compression.We base our thesis on a detailed stratigraphic, morphologic,and tectonic study. From these field data we develop a modelbased on the lubrication approximation of the Navier-Stokesequations and on scaled analogue experiments of thegravitational deformation that characterizes the area. Theexperimental results show an empirical equation that candescribe the evolution of the northeastern slope of the NAR.Since our work is based on fundamental principles, it couldbe applied to similar geological settings.
2. Regional Geology and Stratigraphy
[4] The NAR is a fold-and-thrust belt of Tertiary age,which developed from an accretionary prism along the
JOURNAL OF GEOPHYSICAL RESEARCH, VOL. 111, B08406, doi:10.1029/2004JB003375, 2006
1EDRA, Roma, Italy.2Dip. Scienze della Terra ‘‘A. Desio,’’ Univ. degli Studi di Milano,
Milano, Italy.3Laboratoire Magmas et Volcans, Observatoire de Physique du Globe,
Clermont-Ferrand, France.4Servizio Geologico, Sismico e dei Suoli, Regione Emilia-Romagna,
Bologna, Italy.
Copyright 2006 by the American Geophysical Union.0148-0227/06/2004JB003375$09.00
B08406 1 of 25
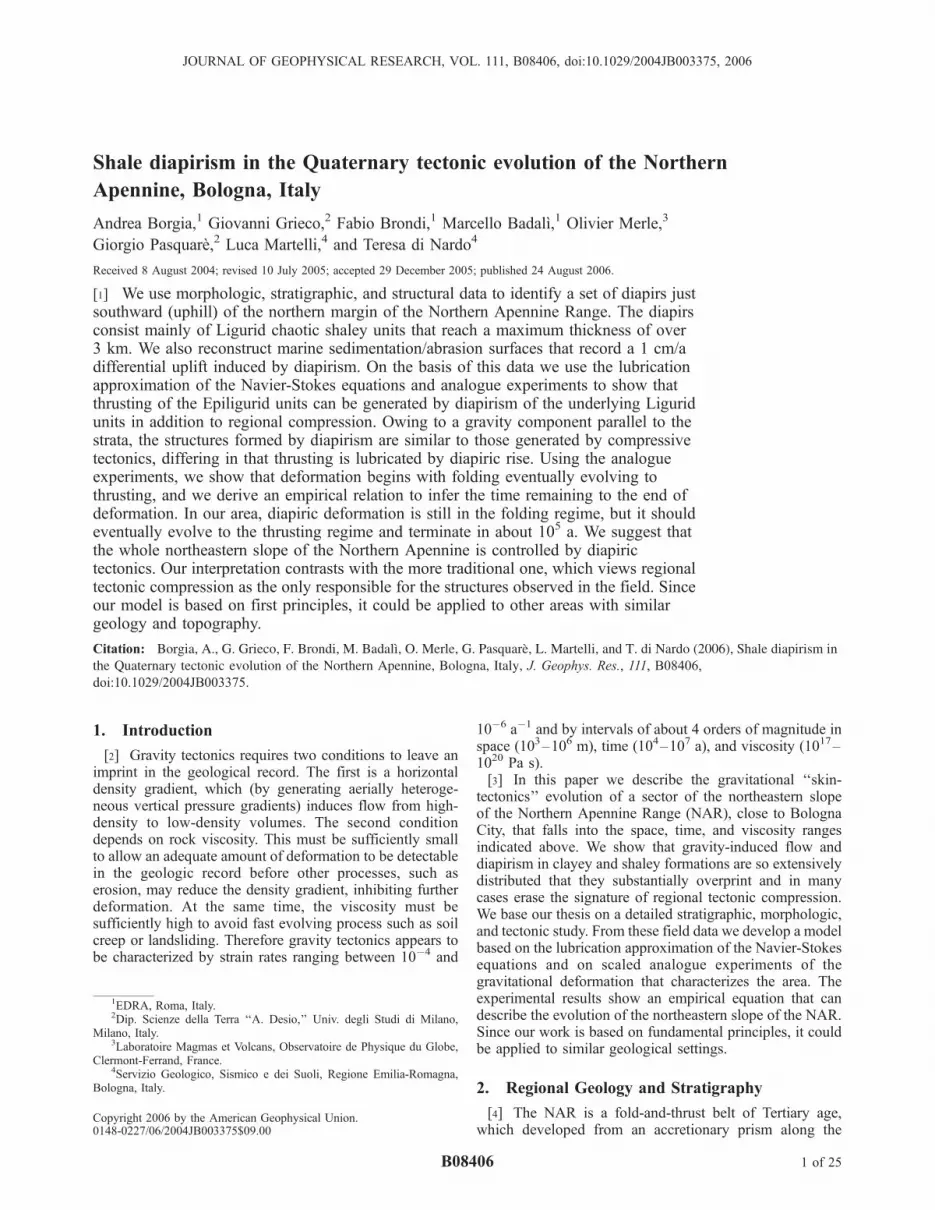
African and European plates margin [Treves, 1984]. Duringthe northeastward displacement of this belt, from Eocene toLower Pliocene, a set of piggyback basins formed along thenortheastern slope of the belt [Pieri, 1961; Lipparini, 1966;Ori and Friend, 1984; Ricci Lucchi, 1987; Bettelli andPanini, 1987; Boccaletti et al., 1990a, 1990b; Farabegoli etal., 2006; Panini et al., 2002]. The basin’s floors are mainlycomposed of a variably thick succession (ranging from 100to 1000 m) of chaotic ophiolitic-rich shaley complexes,
olistostromes and marls, known as the Ligurid units[Papani, 1964; Abbate et al., 1981; Bettelli and Panini,1984, 1987; Vai and Castellarin, 1992]. In turn, the Liguridunits were emplaced, at least since Middle Miocene, on theMarnoso Arenacea Formation [Boccaletti et al., 1990b].Compared to the Marnoso-Arenacea Formation, whichtends to show rigid behavior, the Ligurid units have aductile rheology [Carena et al., 2000].
Figure 1a. Geology of the northern slope of the Northern Apennine (NAR) south of Bologna Citybetween the Savena and Idice rivers. Schematic map of ductile and brittle units [after RER, 1998]. Seeinset for location of the study area in the NAR. Note that the ductile chaotic-shaley Ligurid units crop outall around the brittle sandy Epiligurid units, which form diapiric structures.
B08406 BORGIA ET AL.: SHALE DIAPIRISM IN THE NORTHERN APENNINE
2 of 25
B08406
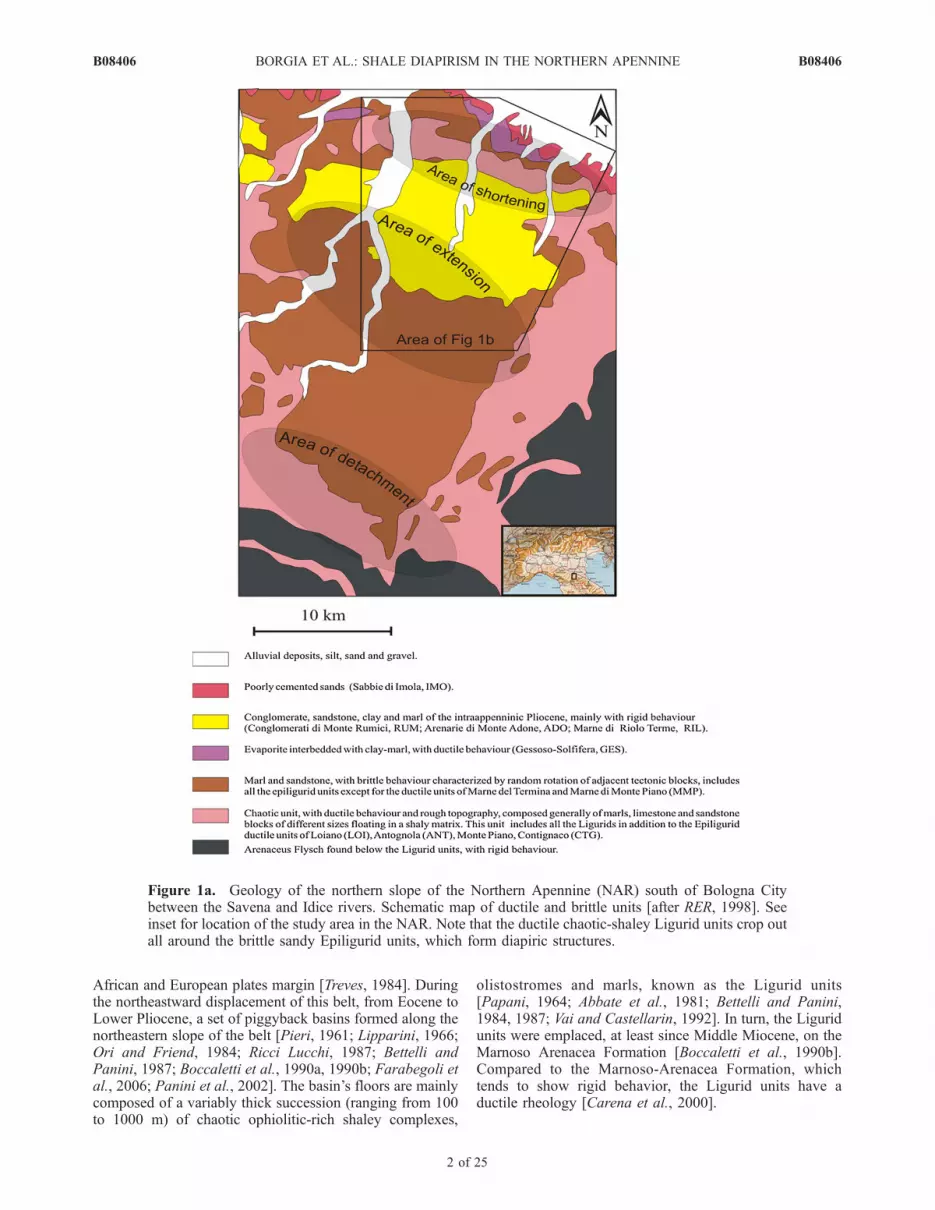
[5] The Epiligurid units (Figures 1a–1d) were depositedabove the Ligurids. The lower Epiligurid units are mainlyclays and shales and change upward to marls and sand-stones. After their deposition the arenaceous units began to
deform into brachisynclines separated by narrow and elon-gated uplifted areas of chaotic shaley units of Ligurids andlower Epiligurids (Figures 1a–1d) [Borgia et al., 1997;Carena et al., 2000].
Figure 1b. Detail geology of the study area shown in Figure 1a (after RER [2001]; filled boxes withnumbers are elevation of summits).
Figure 1c. Geologic cross-section of the study area (modified after RER [1998]).
B08406 BORGIA ET AL.: SHALE DIAPIRISM IN THE NORTHERN APENNINE
3 of 25
B08406
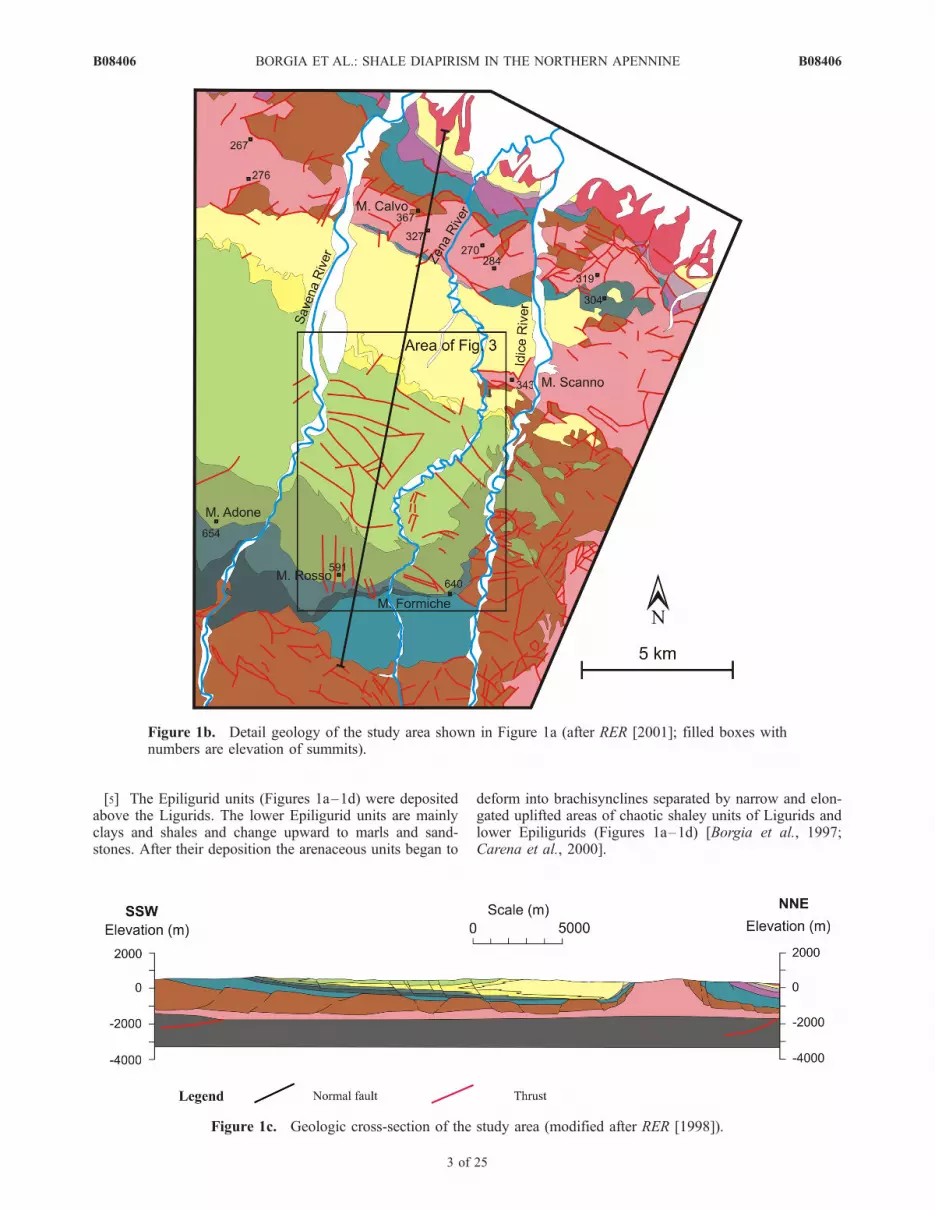
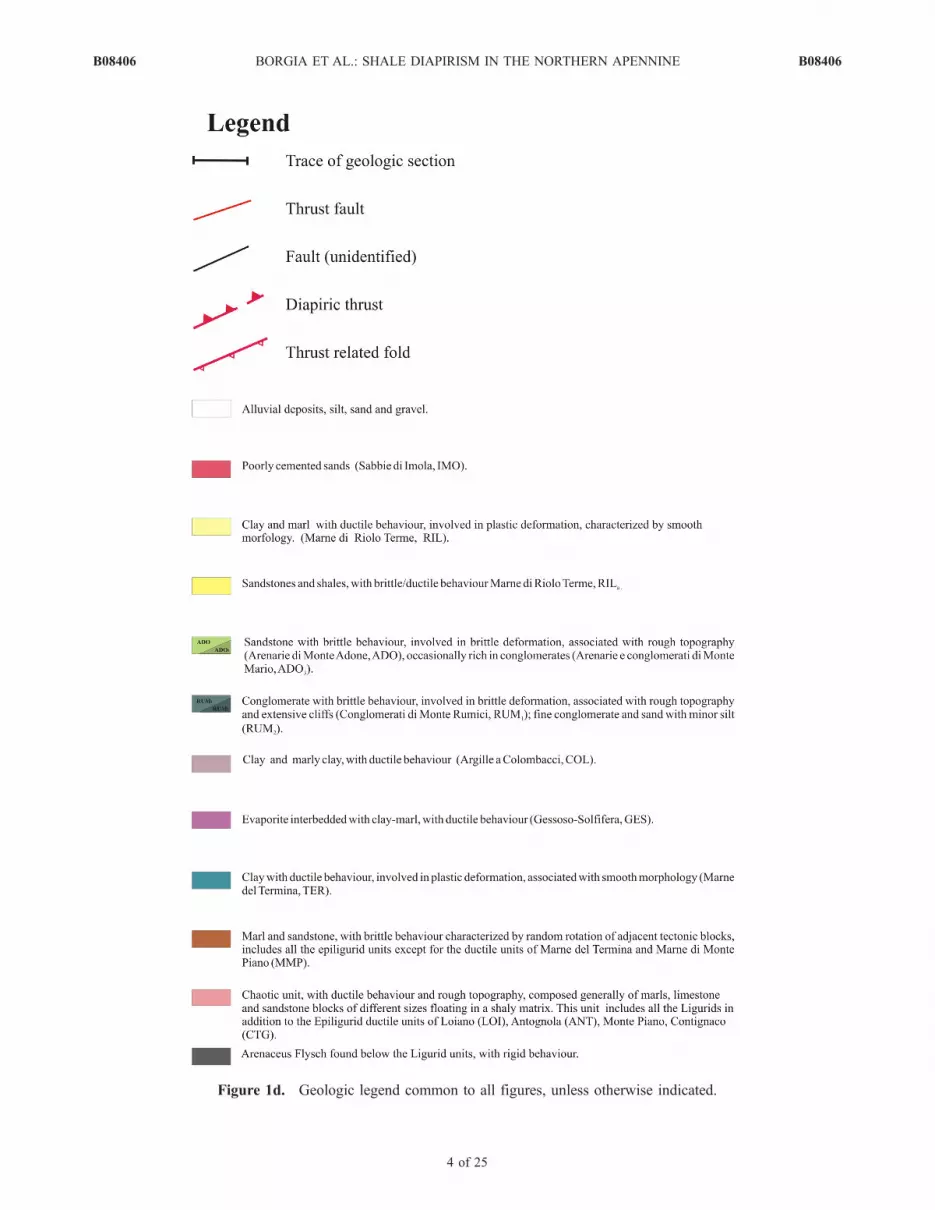
Figure 1d. Geologic legend common to all figures, unless otherwise indicated.
B08406 BORGIA ET AL.: SHALE DIAPIRISM IN THE NORTHERN APENNINE
4 of 25
B08406
[6] Since Miocene the compressive orogenic deforma-tions of the foreland (verging NNE) were associated withWNW striking extensional features occurring at the back ofthe orogenic belt [Castellarin et al., 1986; Castellarin andVai, 1986]. Subsequently, both compressional and exten-sional tectonics migrated toward NNE, with the extensionoverprinting the earlier compressional structures. This re-gional extension, though, has not affected the piggybackbasins.[7] By means of field observations and scaled analytic
and analogue modeling, we show that some superficialcompressive structures of the piggyback basins appear tohave formed by active gravity tectonic as opposed toregional compression; this gravity tectonic has influencedthe evolution of the sediments infilling the basins at leastsince the Oligocene. After emergence from the sea in theLower-Middle Pleistocene [Vai and Castellarin, 1992]gravitational tectonics lead to the formation of brachisyn-clines bordered by shale diapirs [cf. Carena et al., 2000].Bombicci [1882], Ogniben [1953], Bertocci and Casagli[1992], and Cazzoli et al. [1988] also give evidence ofdiapiric deformation in the chaotic clayey complexes of theLigurid units. This gravity tectonic imprints our study areaand has formed the Zena syncline and its surroundingprominent shale diapirs, which are focused on in thefollowing sections.
3. Morphology of the Zena-Syncline Area
[8] The youngest sequences of the Epiligurid units arefolded in a gentle syncline called the Zena syncline
(Figures 1b and 1c). This syncline is cut by the N-S-trendingrivers Idice in the east, Zena in the center, and Savena in thewest. The syncline is bounded in the north and south by tworidges trending WNW-ESE. The southern ridge is formed bya monocline of conglomeratic and arenaceous rocks thatstands above more-erodible clayey rocks. The northern ridgeis mainly composed of chaotic clays and reaches more than300 m above the Po Valley plain.[9] Generally, the valley morphology is at a younger
stage of evolution closer to the two ridges than far awayfrom them. This is justified in the area of the southern ridgebecause the ridge is made of less-erodible arenaceouslithologies. It is at odd, however, at the northern ridgewhere rivers cut steep rectilinear canons in highly erodibleshaley rocks and thus they are found in a highly activeerosional phase. Similar morphology is repeated at a smallerscale also at the ‘‘Scanno’’ ridge, a ridge located midway ofthe two major ones along the Zena River. The second-orderhydrologic network does not cut the ridges; in fact, to thesouth of them streams flow southward, opposite to theregional slope.[10] This younger morphology is characteristic of the
ridges only: the clayey units cropping out southward ofboth ridges have gentle slopes that uniformly degradetoward the Zena River and its tributaries. In addition, southof the ridges, the major rivers (Savena, Zena, and Idice)display a well-developed set of active meanders and fluvialterraces (Figure 1b).[11] Between the northern and southern ridges the mor-
phology is characterized by a number of planar surfaces(called simply ‘‘surfaces’’ in this paper), which degrade in
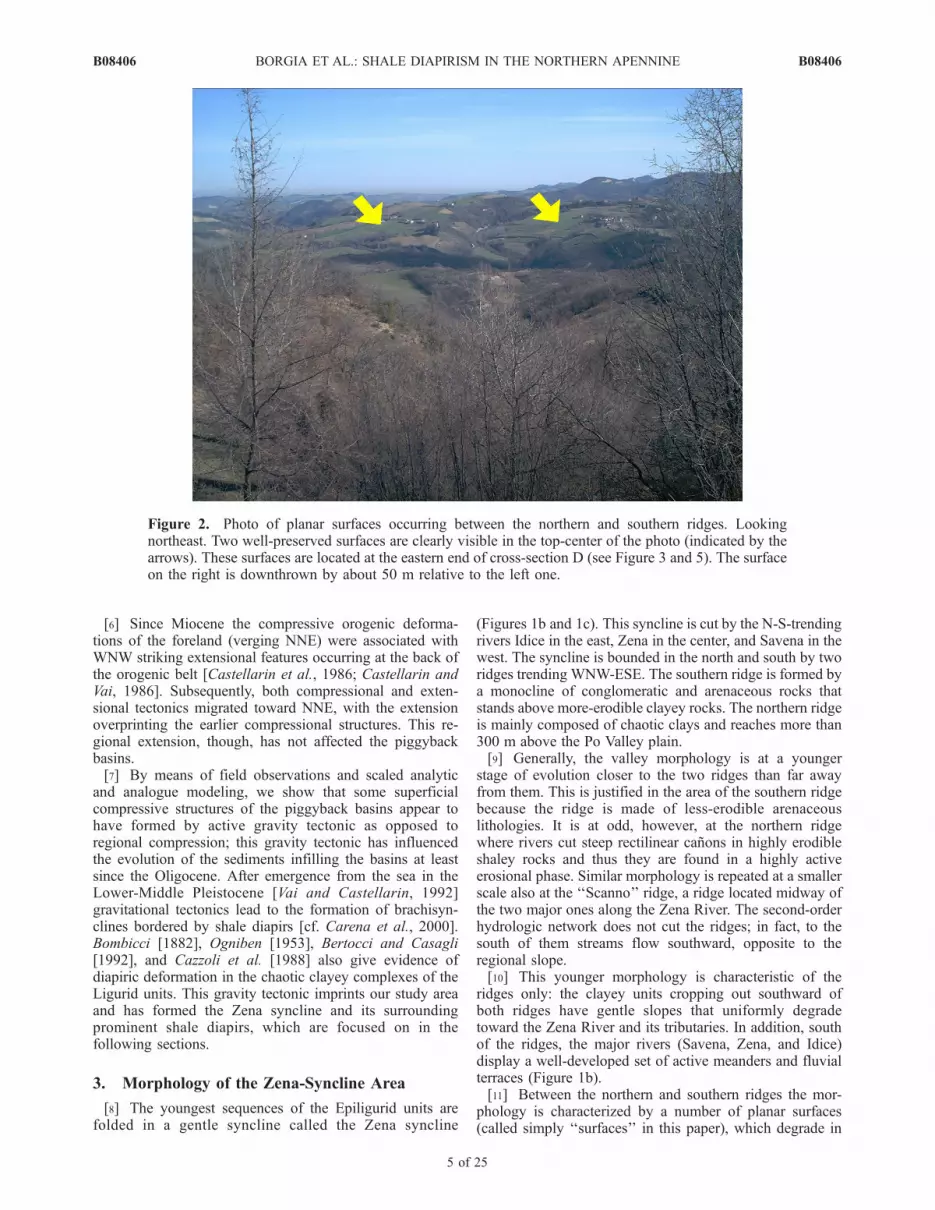
Figure 2. Photo of planar surfaces occurring between the northern and southern ridges. Lookingnortheast. Two well-preserved surfaces are clearly visible in the top-center of the photo (indicated by thearrows). These surfaces are located at the eastern end of cross-section D (see Figure 3 and 5). The surfaceon the right is downthrown by about 50 m relative to the left one.
B08406 BORGIA ET AL.: SHALE DIAPIRISM IN THE NORTHERN APENNINE
5 of 25
B08406
Figure 3
B08406 BORGIA ET AL.: SHALE DIAPIRISM IN THE NORTHERN APENNINE
6 of 25
B08406
elevation away from the two ridges (Figure 2). Suchsurfaces, which are also found to the north of the northernridge all the way down to the Po Valley plain [Parea, 1987],are very important in understanding the Zena structure andwill be described in detail in the following section 6.
4. Structure of the Zena Syncline
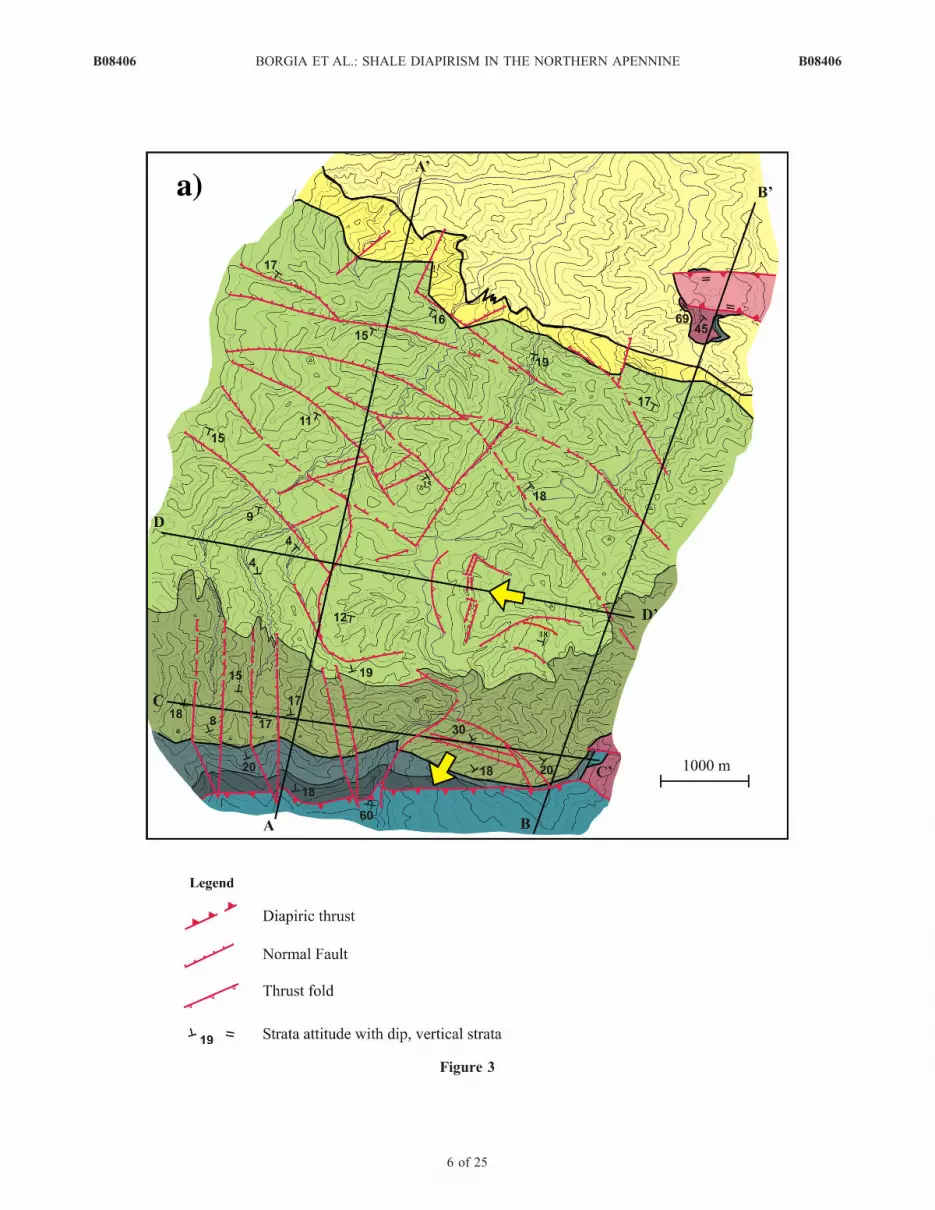
[12] The geological maps [Regione Emilia Romanga(RER), 1997] as well as our detailed geological and struc-tural survey (Figure 3) show that the Plio-Pleistoceneterrigenous formations are folded in a gentle syncline withESE striking major axis and limbs that rise toward theridges described above. In proximity of the ridges the stratabecome steeply dipping and occasionally overturned on themiddle and northern ridges (Figure 1b, Figures 3b and 3c).The syncline has wavelength of tenths of kilometers andamplitude of about 2 km. The syncline tends to close towardboth axial directions forming a brachisyncline (Figure 3a).
[13] Sets of normal faults cut the syncline in adjacentblocks. In general, faults strike parallel or perpendicular tothe ridges and are characterized by vertical displacementsranging from 10 to 50 m. Faults parallel to these ridges tendto be listric, downthrowing away from the core of thesyncline (Figures 3a and 3b); faults perpendicular to themtend to identify radial horst-and-graben structures(Figures 3a and 3d). The faults are recent and coeval tothe folding. In fact, the amplitude of the synclinal foldingappears to be falsely enhanced by the listric faulting.[14] As it has already been noted in the morphology
section, a structural anomaly occurs at the middle ridge,the ‘‘Scanno’’ ridge (Figure 3a and 3c). The gentle synclineis pierced by steeply dipping to overturned Epiligurid strataand Ligurid chaotic shales (Figure 4). The contacts betweenthese shales and the surrounding units are tectonic and box-shaped with the shorter side smaller than 500 m in length onoutcrop. On the basis of the thickness of the stratigraphicunits, we infer a vertical displacement of up to 2 km
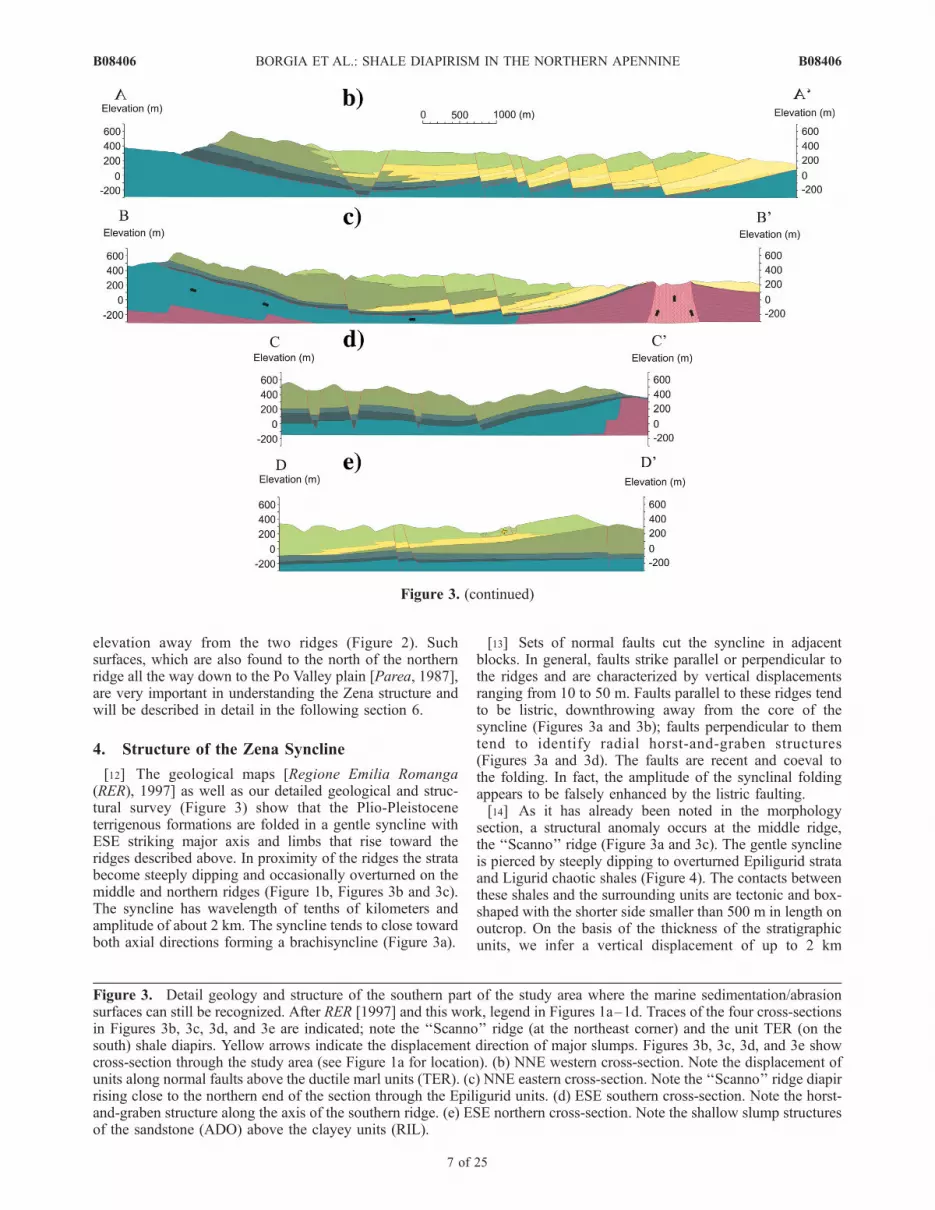
Figure 3. (continued)
Figure 3. Detail geology and structure of the southern part of the study area where the marine sedimentation/abrasionsurfaces can still be recognized. After RER [1997] and this work, legend in Figures 1a–1d. Traces of the four cross-sectionsin Figures 3b, 3c, 3d, and 3e are indicated; note the ‘‘Scanno’’ ridge (at the northeast corner) and the unit TER (on thesouth) shale diapirs. Yellow arrows indicate the displacement direction of major slumps. Figures 3b, 3c, 3d, and 3e showcross-section through the study area (see Figure 1a for location). (b) NNE western cross-section. Note the displacement ofunits along normal faults above the ductile marl units (TER). (c) NNE eastern cross-section. Note the ‘‘Scanno’’ ridge diapirrising close to the northern end of the section through the Epiligurid units. (d) ESE southern cross-section. Note the horst-and-graben structure along the axis of the southern ridge. (e) ESE northern cross-section. Note the shallow slump structuresof the sandstone (ADO) above the clayey units (RIL).
B08406 BORGIA ET AL.: SHALE DIAPIRISM IN THE NORTHERN APENNINE
7 of 25
B08406
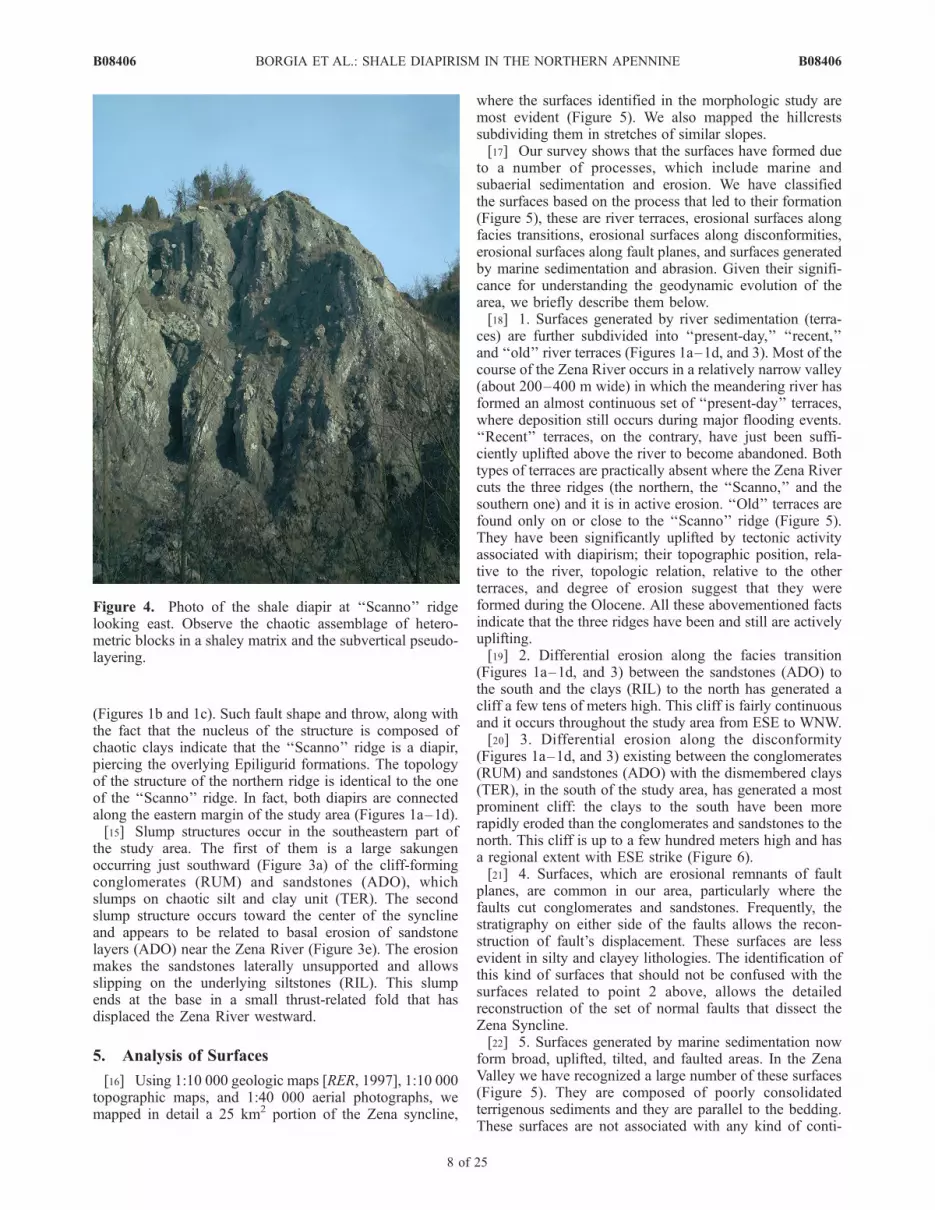
(Figures 1b and 1c). Such fault shape and throw, along withthe fact that the nucleus of the structure is composed ofchaotic clays indicate that the ‘‘Scanno’’ ridge is a diapir,piercing the overlying Epiligurid formations. The topologyof the structure of the northern ridge is identical to the oneof the ‘‘Scanno’’ ridge. In fact, both diapirs are connectedalong the eastern margin of the study area (Figures 1a–1d).[15] Slump structures occur in the southeastern part of
the study area. The first of them is a large sakungenoccurring just southward (Figure 3a) of the cliff-formingconglomerates (RUM) and sandstones (ADO), whichslumps on chaotic silt and clay unit (TER). The secondslump structure occurs toward the center of the synclineand appears to be related to basal erosion of sandstonelayers (ADO) near the Zena River (Figure 3e). The erosionmakes the sandstones laterally unsupported and allowsslipping on the underlying siltstones (RIL). This slumpends at the base in a small thrust-related fold that hasdisplaced the Zena River westward.
5. Analysis of Surfaces
[16] Using 1:10 000 geologic maps [RER, 1997], 1:10 000topographic maps, and 1:40 000 aerial photographs, wemapped in detail a 25 km2 portion of the Zena syncline,
where the surfaces identified in the morphologic study aremost evident (Figure 5). We also mapped the hillcrestssubdividing them in stretches of similar slopes.[17] Our survey shows that the surfaces have formed due
to a number of processes, which include marine andsubaerial sedimentation and erosion. We have classifiedthe surfaces based on the process that led to their formation(Figure 5), these are river terraces, erosional surfaces alongfacies transitions, erosional surfaces along disconformities,erosional surfaces along fault planes, and surfaces generatedby marine sedimentation and abrasion. Given their signifi-cance for understanding the geodynamic evolution of thearea, we briefly describe them below.[18] 1. Surfaces generated by river sedimentation (terra-
ces) are further subdivided into ‘‘present-day,’’ ‘‘recent,’’and ‘‘old’’ river terraces (Figures 1a–1d, and 3). Most of thecourse of the Zena River occurs in a relatively narrow valley(about 200–400 m wide) in which the meandering river hasformed an almost continuous set of ‘‘present-day’’ terraces,where deposition still occurs during major flooding events.‘‘Recent’’ terraces, on the contrary, have just been suffi-ciently uplifted above the river to become abandoned. Bothtypes of terraces are practically absent where the Zena Rivercuts the three ridges (the northern, the ‘‘Scanno,’’ and thesouthern one) and it is in active erosion. ‘‘Old’’ terraces arefound only on or close to the ‘‘Scanno’’ ridge (Figure 5).They have been significantly uplifted by tectonic activityassociated with diapirism; their topographic position, rela-tive to the river, topologic relation, relative to the otherterraces, and degree of erosion suggest that they wereformed during the Olocene. All these abovementioned factsindicate that the three ridges have been and still are activelyuplifting.[19] 2. Differential erosion along the facies transition
(Figures 1a–1d, and 3) between the sandstones (ADO) tothe south and the clays (RIL) to the north has generated acliff a few tens of meters high. This cliff is fairly continuousand it occurs throughout the study area from ESE to WNW.[20] 3. Differential erosion along the disconformity
(Figures 1a–1d, and 3) existing between the conglomerates(RUM) and sandstones (ADO) with the dismembered clays(TER), in the south of the study area, has generated a mostprominent cliff: the clays to the south have been morerapidly eroded than the conglomerates and sandstones to thenorth. This cliff is up to a few hundred meters high and hasa regional extent with ESE strike (Figure 6).[21] 4. Surfaces, which are erosional remnants of fault
planes, are common in our area, particularly where thefaults cut conglomerates and sandstones. Frequently, thestratigraphy on either side of the faults allows the recon-struction of fault’s displacement. These surfaces are lessevident in silty and clayey lithologies. The identification ofthis kind of surfaces that should not be confused with thesurfaces related to point 2 above, allows the detailedreconstruction of the set of normal faults that dissect theZena Syncline.[22] 5. Surfaces generated by marine sedimentation now
form broad, uplifted, tilted, and faulted areas. In the ZenaValley we have recognized a large number of these surfaces(Figure 5). They are composed of poorly consolidatedterrigenous sediments and they are parallel to the bedding.These surfaces are not associated with any kind of conti-
Figure 4. Photo of the shale diapir at ‘‘Scanno’’ ridgelooking east. Observe the chaotic assemblage of hetero-metric blocks in a shaley matrix and the subvertical pseudo-layering.
B08406 BORGIA ET AL.: SHALE DIAPIRISM IN THE NORTHERN APENNINE
8 of 25
B08406
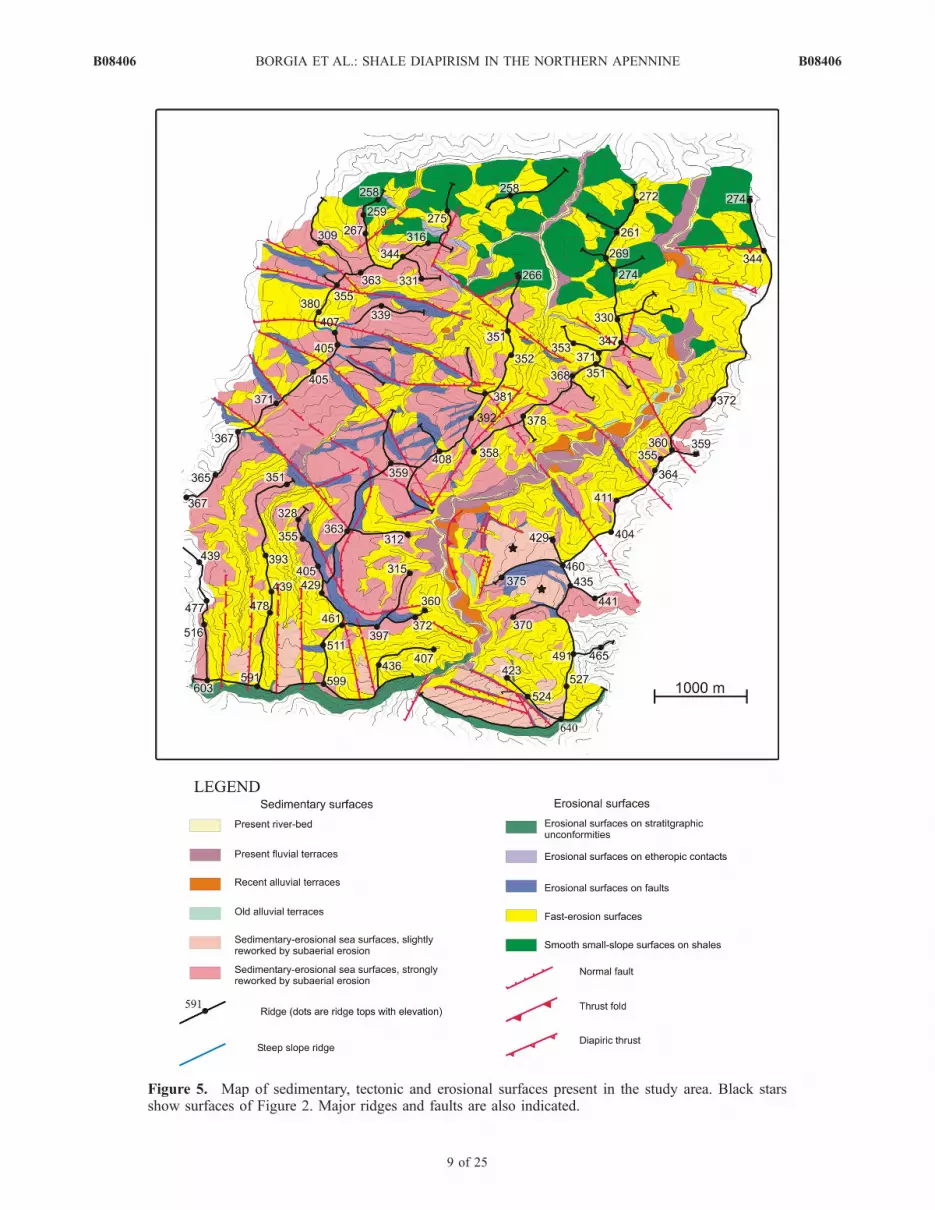
Figure 5. Map of sedimentary, tectonic and erosional surfaces present in the study area. Black starsshow surfaces of Figure 2. Major ridges and faults are also indicated.
B08406 BORGIA ET AL.: SHALE DIAPIRISM IN THE NORTHERN APENNINE
9 of 25
B08406
nental deposit, with the exception of restitic soil. Thestratigraphic and structural framework indicates that thesesurfaces are portions of an originally continuous surface,which formed at the end of marine sedimentation. Thissurface was subsequently uplifted above sea level and thendeformed in a synform and dismembered by tectonicactivity (Figure 2). In many cases, subaerial erosion hasmodeled the original planar surface into mild hills cut byclefts of creeks that are still actively eroding.[23] 6. Marine sedimentation surfaces are totally absent in
the northern part of the area northward of the sandstone-clayfacies transition, where the clayey lithology has not allowedtheir preservation from erosion. In this part of the area(Figure 5) the hills slope mildly toward the creeks. How-ever, the ridges maintain almost constant elevation for theirwhole extent (Figure 5). Only toward the northern and the‘‘Scanno’’ ridges they tend again to rise to higher elevationsbeing uplifted by the rising diapirs. We interpret these ridgesat constant elevation as the remains of a marine abrasionplane formed in front of a cliff, (see point 2 above),generated by differential erosion of the clays (RIL) withrespect to the sandstones (ADO).[24] Figure 7 is a reconstruction of the original surface
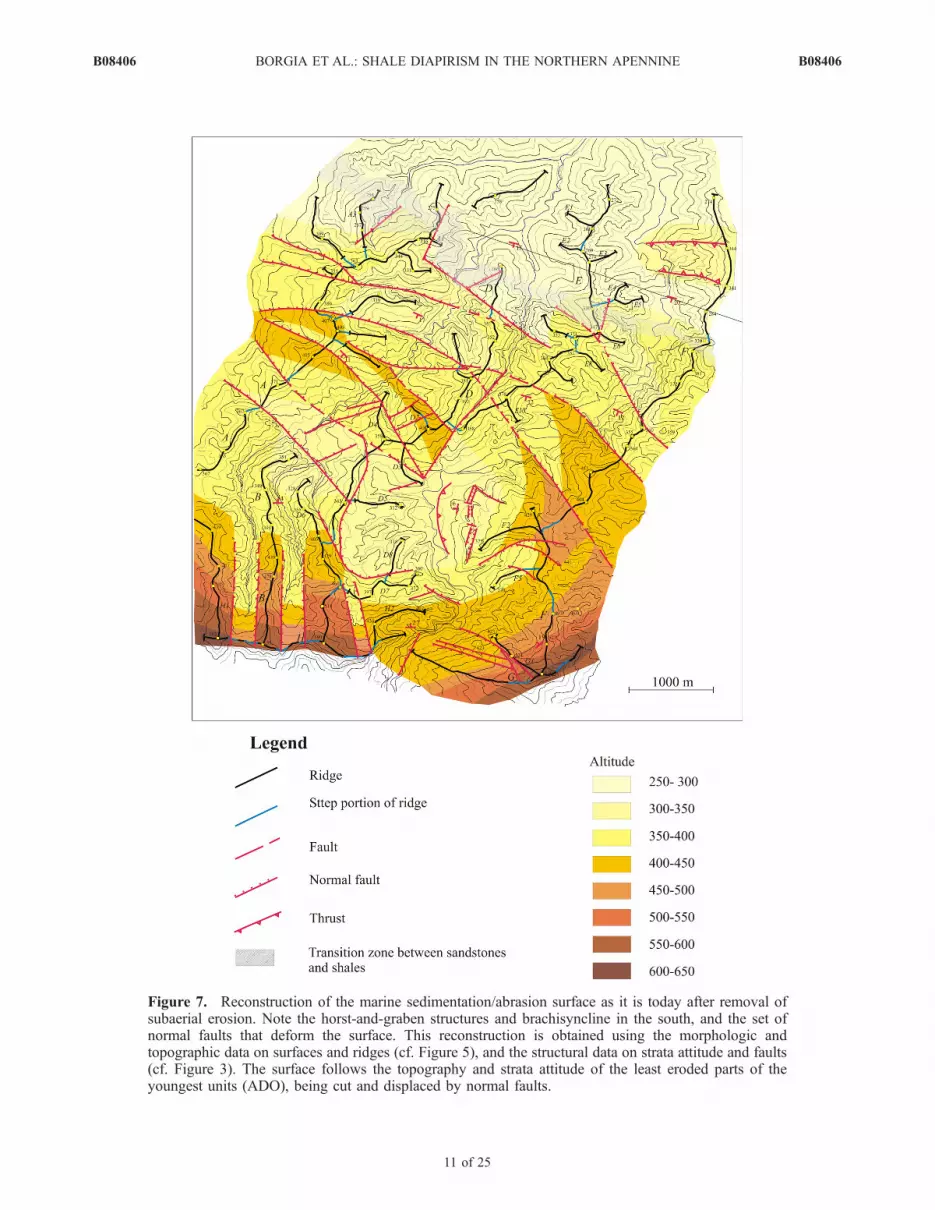
formed by the final sedimentation and marine abrasion (seepoints 5 and 6, respectively, above), as it would be todayafter removal of subaerial erosion. This reconstructionshows the folding and faulting of this surface (and of theunderlying rock units) due to gravity tectonic. The surfacemust have been deformed after the emergence from the sea,which occurred later than the Middle Pleistocene [Di Dio etal., 1997a, 1997b], because it must have been horizontal atthe end of its formation, just before the emergence.[25] Our reconstruction of the marine surface allows us
the identification of two units, in addition to the Ligurid,which, due to their ductile behavior, induced gravitationaltectonics. The first of them are the TER chaotic clayeymarls. We deduce that the conglomerates (RUM) and sand-
stones (ADO) found above sank into the TER giving rise tothe southern flank of the Zena brachisyncline. Similarstructures are found farther west on the NAR [Borgia etal., 1997; Carena et al., 2000]. The second (uppermost)ductile layers in the stratigraphy are the RIL clays andmarls. They are responsible for the second slump describedpreviously in section 5 (see Figures 3a and 3e).[26] In the following analysis, we will attempt to model
the gravity deformation related to the Ligurid units, whichform the lowermost ductile layer. This deformation influ-ences all the overlaying rock units, including those thatform the Zena syncline, as well as of the slumps describedabove. The syncline and the slumps, though, are furtherdeformed by a gravity deformation that is rooted at higherstratigrafic levels than the ligurids.
6. Analysis of Gravity Tectonics
[27] To analyze the effect of diapirism on the tectonicsobserved in our study area, specifically Figure 1a, we madea simple model composed of a box with a rigid basement(Figure 8), which corresponds to the arenaceous Tuscan andRomagna units (that are found below the Ligurids), overlaidby a ductile layer, which represents the chaotic clayeyLigurid units. Effectively, as described above and observedin other areas of the Apennine [Carena et al., 2000], theLigurid units display a clear ductile behavior since theyform conspicuous diapirs; their ductile behavior is due tothe large clay fraction, perhaps combined with overpressureand sufficiently low strain rates. In turn, the ductile layer isoverlaid by a brittle layer, which represents the arenaceousEpiligurid units.[28] As observed in our area the layers have a dip of
an angle a and, whereas the upper brittle layer tends tomaintain a constant thickness, the ductile layer pinches outnorthward. The lateral boundaries of the experimentalbox are rigid and fixed, while the upper boundary of
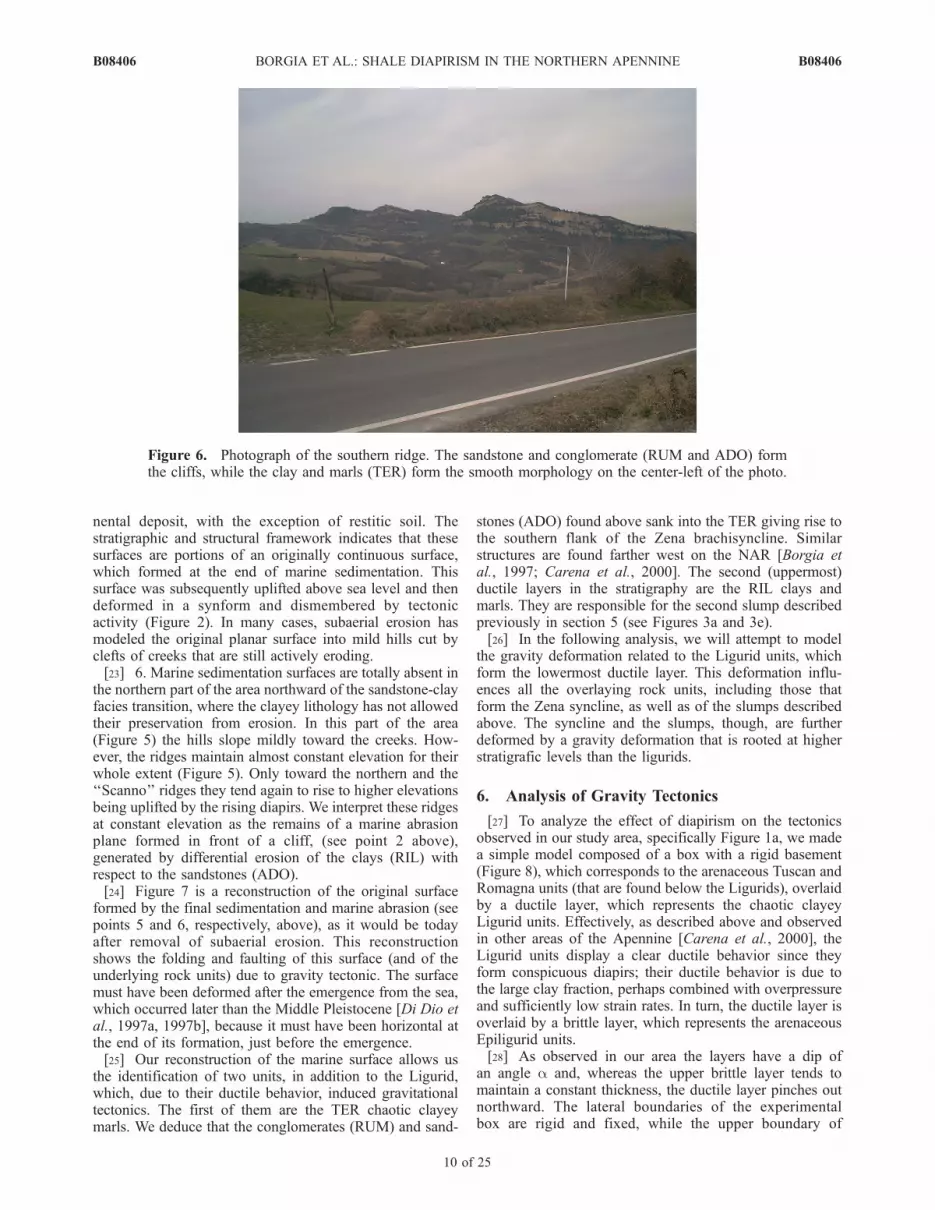
Figure 6. Photograph of the southern ridge. The sandstone and conglomerate (RUM and ADO) formthe cliffs, while the clay and marls (TER) form the smooth morphology on the center-left of the photo.
B08406 BORGIA ET AL.: SHALE DIAPIRISM IN THE NORTHERN APENNINE
10 of 25
B08406
Figure 7. Reconstruction of the marine sedimentation/abrasion surface as it is today after removal ofsubaerial erosion. Note the horst-and-graben structures and brachisyncline in the south, and the set ofnormal faults that deform the surface. This reconstruction is obtained using the morphologic andtopographic data on surfaces and ridges (cf. Figure 5), and the structural data on strata attitude and faults(cf. Figure 3). The surface follows the topography and strata attitude of the least eroded parts of theyoungest units (ADO), being cut and displaced by normal faults.
B08406 BORGIA ET AL.: SHALE DIAPIRISM IN THE NORTHERN APENNINE
11 of 25
B08406
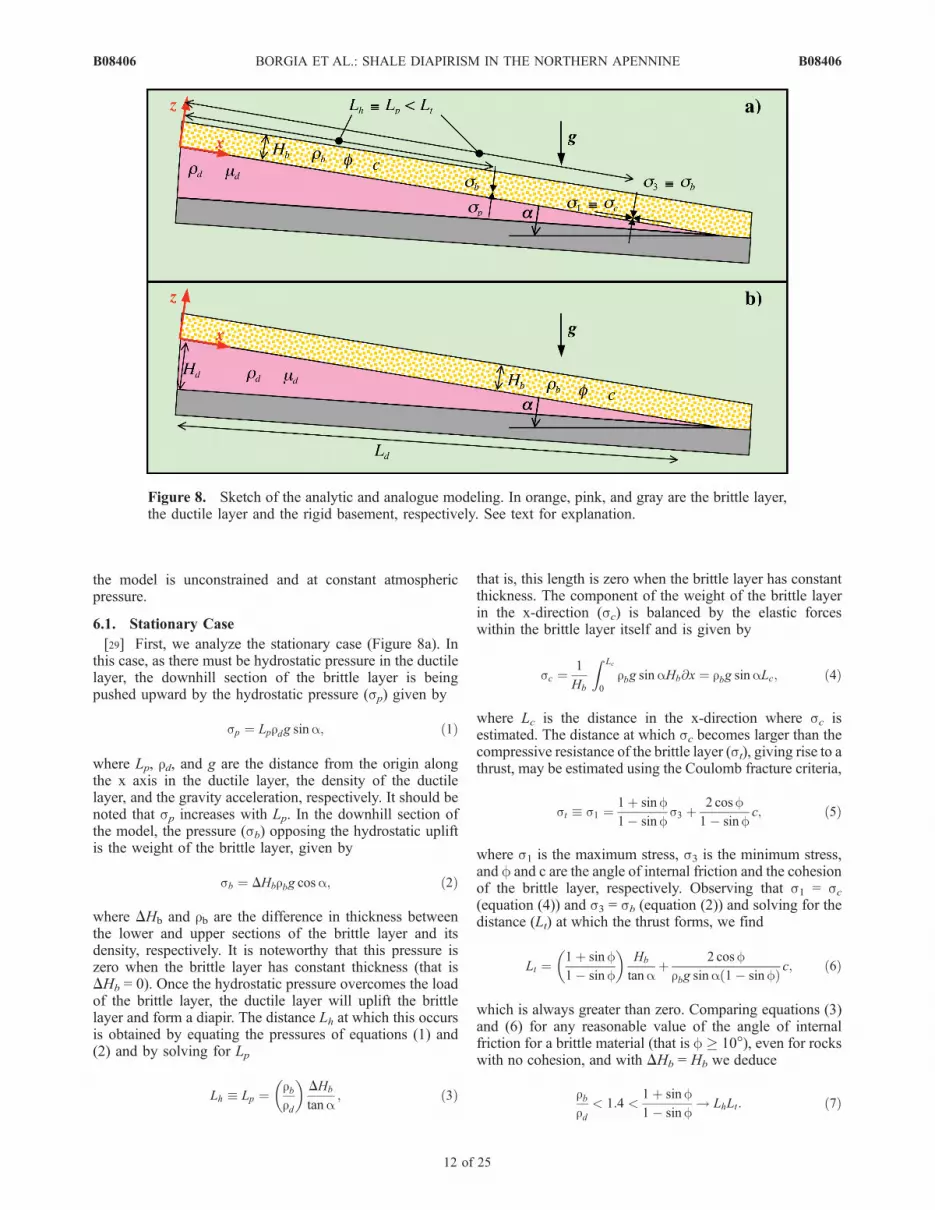
the model is unconstrained and at constant atmosphericpressure.
6.1. Stationary Case
[29] First, we analyze the stationary case (Figure 8a). Inthis case, as there must be hydrostatic pressure in the ductilelayer, the downhill section of the brittle layer is beingpushed upward by the hydrostatic pressure (sp) given by
sp ¼ Lprdg sina; ð1Þ
where Lp, rd, and g are the distance from the origin alongthe x axis in the ductile layer, the density of the ductilelayer, and the gravity acceleration, respectively. It should benoted that sp increases with Lp. In the downhill section ofthe model, the pressure (sb) opposing the hydrostatic upliftis the weight of the brittle layer, given by
sb ¼ DHbrbg cosa; ð2Þ
where DHb and rb are the difference in thickness betweenthe lower and upper sections of the brittle layer and itsdensity, respectively. It is noteworthy that this pressure iszero when the brittle layer has constant thickness (that isDHb = 0). Once the hydrostatic pressure overcomes the loadof the brittle layer, the ductile layer will uplift the brittlelayer and form a diapir. The distance Lh at which this occursis obtained by equating the pressures of equations (1) and(2) and by solving for Lp
Lh � Lp ¼rbrd
� �DHb
tana; ð3Þ
that is, this length is zero when the brittle layer has constantthickness. The component of the weight of the brittle layerin the x-direction (sc) is balanced by the elastic forceswithin the brittle layer itself and is given by
sc ¼1
Hb
Z Lc
0
rbg sinaHb@x ¼ rbg sinaLc; ð4Þ
where Lc is the distance in the x-direction where sc isestimated. The distance at which sc becomes larger than thecompressive resistance of the brittle layer (st), giving rise to athrust, may be estimated using the Coulomb fracture criteria,
st � s1 ¼1þ sinf1� sinf
s3 þ2 cosf1� sinf
c; ð5Þ
where s1 is the maximum stress, s3 is the minimum stress,and f and c are the angle of internal friction and the cohesionof the brittle layer, respectively. Observing that s1 = sc(equation (4)) and s3 = sb (equation (2)) and solving for thedistance (Lt) at which the thrust forms, we find
Lt ¼1þ sinf1� sinf
� �Hb
tanaþ 2 cosfrbg sina 1� sinfð Þ c; ð6Þ
which is always greater than zero. Comparing equations (3)and (6) for any reasonable value of the angle of internalfriction for a brittle material (that is f � 10�), even for rockswith no cohesion, and with DHb = Hb we deduce
rbrd
< 1:4 <1þ sinf1� sinf
! LhLt: ð7Þ
Figure 8. Sketch of the analytic and analogue modeling. In orange, pink, and gray are the brittle layer,the ductile layer and the rigid basement, respectively. See text for explanation.
B08406 BORGIA ET AL.: SHALE DIAPIRISM IN THE NORTHERN APENNINE
12 of 25
B08406
Therefore the length of brittle layer necessary for diapirism(Lh) is always smaller than the length needed for gravitationalthrusting (Lt). Therefore in the case of the NAR, diapirismshould prevail over gravitational thrusting, and maysignificantly overprint the signature of regional tectonics.This component has never been taken into adequateconsideration in evaluating the tectonic evolution of theRange, which is generally assumed to result from regionaltectonics only [cf. Picotti et al., 1997].[30] Clearly, once the diapirism in the ductile layer
uplifts the brittle layer, the x-component of the pressurein the brittle layer (sc) is no longer compensated by theelastic forces within it. As a consequence, the brittle layerwill begin to slide downward stretching the rising diapir.Although we have not investigated in detail the transitionsfrom simple diapirism to diapiric thrusting, from theexperimental work presented below (see Figures 10, 11,and 12) we deduce that the brittle layer goes through anearly stage of folding, eventually forming a thrust. We callthese structures diapiric fold and diapiric thrust to stressthe role of diapirism in their formation. In fact, the foldand thrust are actually initiated and lubricated by diapirismand are not the direct result of ‘‘regional tectonic shorten-ing’’ within the experimental box, although ‘‘regionaltectonics’’ remains essential in generating the tilting ofour box.[31] It is also important to observe that in a thrust, one
can usually identify a relatively thin layer (surface) acrosswhich most of the deformation occurs. In a diapiric thrust,on the contrary, the deformation involves the whole volumeof the diapir and not just the contact between the encasingunits.[32] As the diapiric thrust develops, extensional stresses
will build up in the uphill section of the brittle layer. Thesestresses are balanced by elastic stresses until they overcomethe Coulomb extensional fracture limit. This limit is essen-tially established by the strength of the brittle layer. Themaximum value of the extensional stress (se), equivalent tothe minimum principal stress, that the brittle layer is able tobalance before rupture, is estimated solving equation (5) fors3:
se � s3 ¼1� sinf1þ sinf
� �s1 �
2 cosf1þ sinf
� �c 0: ð8Þ
In this equation, s1 = sb is given by equation (2). The valueof the cohesion may be approximated by the height of thesubvertical cliffs (Hs) occurring in the rocks that form thebrittle layer [Philipponat and Hubert, 1997; Merle et al.,2001]
In the study area, we may assume for the brittle layer Hb �1000 m, rb = 2500 kg m�3, f = 30�, and a = 3�. Since, forthe highest scarps Hs 100 m, using g = 9.8 m s�2, wecalculate
or, observing that the second (cohesion) term is negligiblewith respect to the first,
se �1
3sb: ð12Þ
To sum up, we conclude that a relatively small reduction ins3, without ever becoming negative, is sufficient to initiateextensional tectonics in the uphill part of the brittle layer.Therefore following the hypothesis used in our model, thenecessary and sufficient condition for triggering ofcompressive and extensional diapiric tectonics is that givenby equation (3).
6.2. Dynamic Case
[33] The parameters we adopt for the analysis of thedeformation of the ductile layer in the dynamic case areindicated in Figure 8b. We use the lubrication approxima-tion of the Navier-Stokes equations, which includes thepressure and gravity stresses as deforming terms, may bewritten for the ductile layer as [Bird et al., 1960]:
@vx@x
þ @vz@z
¼ 0 conservation of mass ð13aÞ
� @p
@xþ md
@2vx
@z2þrdg sina ¼ 0 conservation of x-momentum
ð13bÞ@p
@z� rdg cosa ¼ 0 conservation of z-momentum
ð13cÞ
To derive this approximation, we use the standard viscous-scaling analysis with the following dimensionless variables,which are defined using educated guesses of the maximumvalues that the dimensional variables can reach in our model(see Figure 8b),
x* ¼ x
Ld; z* ¼ z
Hd
; h* ¼ h
Hd
; t* ¼ t
T; vx* ¼ vx
Vx
;
vz* ¼ vzVz; p* ¼ p
Pd:
ð14Þ
Our approximation implies the following conditions:
Hd
Ld¼ tana � 1 ð15aÞ
Hd
Ld tana¼ O 1ð Þ ð15bÞ
That is, for the gravity term to be significant in both x and z,Hd/Ld should be of the same order of magnitude as tana,
8>>>>>>>>>><>>>>>>>>>>:
B08406 BORGIA ET AL.: SHALE DIAPIRISM IN THE NORTHERN APENNINE
13 of 25
B08406
and both much smaller than 1. In other words, equation (13)is applicable for a thin viscous layer on a small slope.[34] The boundary conditions for equation (13a) are
vz z¼0j ¼ 0 ð16aÞ
vz z¼h ¼jZ vz z¼hj
vz z¼0j@vz ¼
dh
dtð16bÞ
The first of these boundary conditions implies masscontinuity across the lower boundary, between the rigidbasement and the ductile layer; the second condition ischaracteristic of a free boundary and implies that the verticalvelocity of the top of the ductile layer is equal to the timechange in ductile layer thickness h(x, t).
[35] A reasonable condition for both lower and upperboundaries in equation (13b) is no slip. For the lowerboundary this implies
vx z¼0j ¼ 0 ð16cÞ
For the upper boundary we must impose a constant stresscondition. In fact, because of the diapiric rise in the lowersection of our model (see conclusions derived fromequation (7)), the x-component of weight in the brittlelayer is not balanced by the elastic forces within it and mustbe balanced by the viscous forces of the deforming ductilelayer. That is,
@vx@z
����z¼h
¼ � rbg sinaHb
md: ð16dÞ
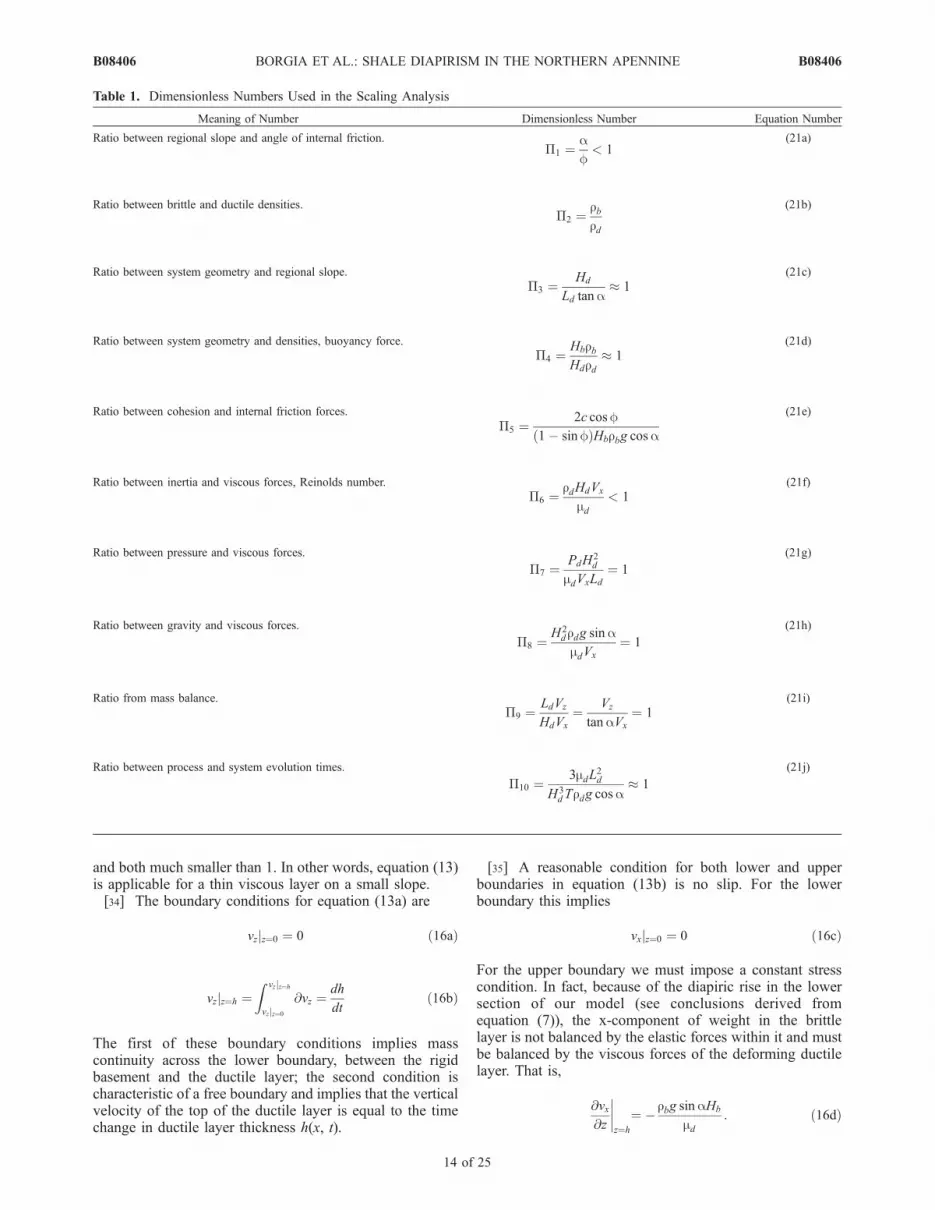
Table 1. Dimensionless Numbers Used in the Scaling Analysis
Meaning of Number Dimensionless Number Equation Number
Ratio between regional slope and angle of internal friction.�1 ¼
af< 1
(21a)
Ratio between brittle and ductile densities.�2 ¼
rbrd
(21b)
Ratio between system geometry and regional slope.
�3 ¼Hd
Ld tana 1
(21c)
Ratio between system geometry and densities, buoyancy force.
�4 ¼HbrbHdrd
1(21d)
Ratio between cohesion and internal friction forces.
�5 ¼2c cosf
1� sinfð ÞHbrbg cosa
(21e)
Ratio between inertia and viscous forces, Reinolds number.
�6 ¼rdHdVx
md< 1
(21f)
Ratio between pressure and viscous forces.
�7 ¼PdH
2d
mdVxLd¼ 1
(21g)
Ratio between gravity and viscous forces.
�8 ¼H2
d rdg sinamdVx
¼ 1
(21h)
Ratio from mass balance.
�9 ¼LdVz
HdVx
¼ Vz
tanaVx
¼ 1(21i)
Ratio between process and system evolution times.
�10 ¼3mdL
2d
H3d Trdg cosa
1
(21j)
B08406 BORGIA ET AL.: SHALE DIAPIRISM IN THE NORTHERN APENNINE
14 of 25
B08406
Finally, the boundary condition for equation (13c) is
p z¼hj ¼ Pb x; tð Þ ¼ rbg cosaHb þ P0: ð16eÞ
The condition for the pressure Pb(x, t) given by equation(16e) is a function of the thickness and density of the brittlelayer and of the pressure (P0) at the upper surface. Thiscondition satisfies the boundary condition for the pressurealso in equation (13b) because equations (13b) and (13c) arecoupled through pressure in addition to gravity.[36] Integrating equation (13) with the boundary condi-
tions given by equation (16) and combining the results, wefind
@h
@t¼ rdg cosa
3md
@
@xh3
@
@x
� x tanaþ h
�:
� 3
2Hb tana
rbrd
� �Z1
h
� �@x
��: ð17Þ
Using the scaled dimensionless variables in equation (14) inaddition to the conditions imposed by equation (15), wemay write equation (17) as
3mdL2d
rdg cosaTH3d
@h*
@t*¼ @
@x*h*3
@
@x*
� x*þ h*
�:
� 3
2
HbrbHdrd
� �Z1
h*@x*
��: ð18Þ
If our scaling is correct, all terms in this equation, except thefirst fraction and the fraction before the integral, for whichwe still have imposed no constraints, tend to vary between 0and 1; that is, they are of order unit. Therefore thedifferentials on either side of the equal sign are bothsignificant only if the first fraction is of order unit as well.Thus since the time T needed to complete the processremains unconstrained, we may obtain an order-of-magni-tude estimate of it by setting:
3mdL2d
rdg cosaTH3d
¼ O 1ð Þ ) T ¼ 3mdL2d
rdg cosaH3d
: ð19aÞ
The same argument can be applied to the fraction before theintegral sign, obtaining
HbrbHdrd
¼ O 1ð Þ: ð19bÞ
That is, in the order of magnitude, if the brittle layer is muchthinner than the ductile layer, the deformation dynamics ofthe second is not influenced by the first. Conversely, if thebrittle layer is much thicker than the ductile layer, theductile layer behaves as decollement, as opposed to a diapir,relative to the brittle layer.[37] These approximations reduce equation (18) to
@h*
@t*¼ @
@x*h*3
@
@x*�x*þ h*� 3
2
HbrbHdrd
� �Z1
h*@x*
�� �: ð20Þ
6.3. Scaled Experiments
[38] We find approximate solutions to equation (20) usinganalogue experiments. In order to scale the experimentsusing the Buckingham-� theorem [Bird et al., 1960], we
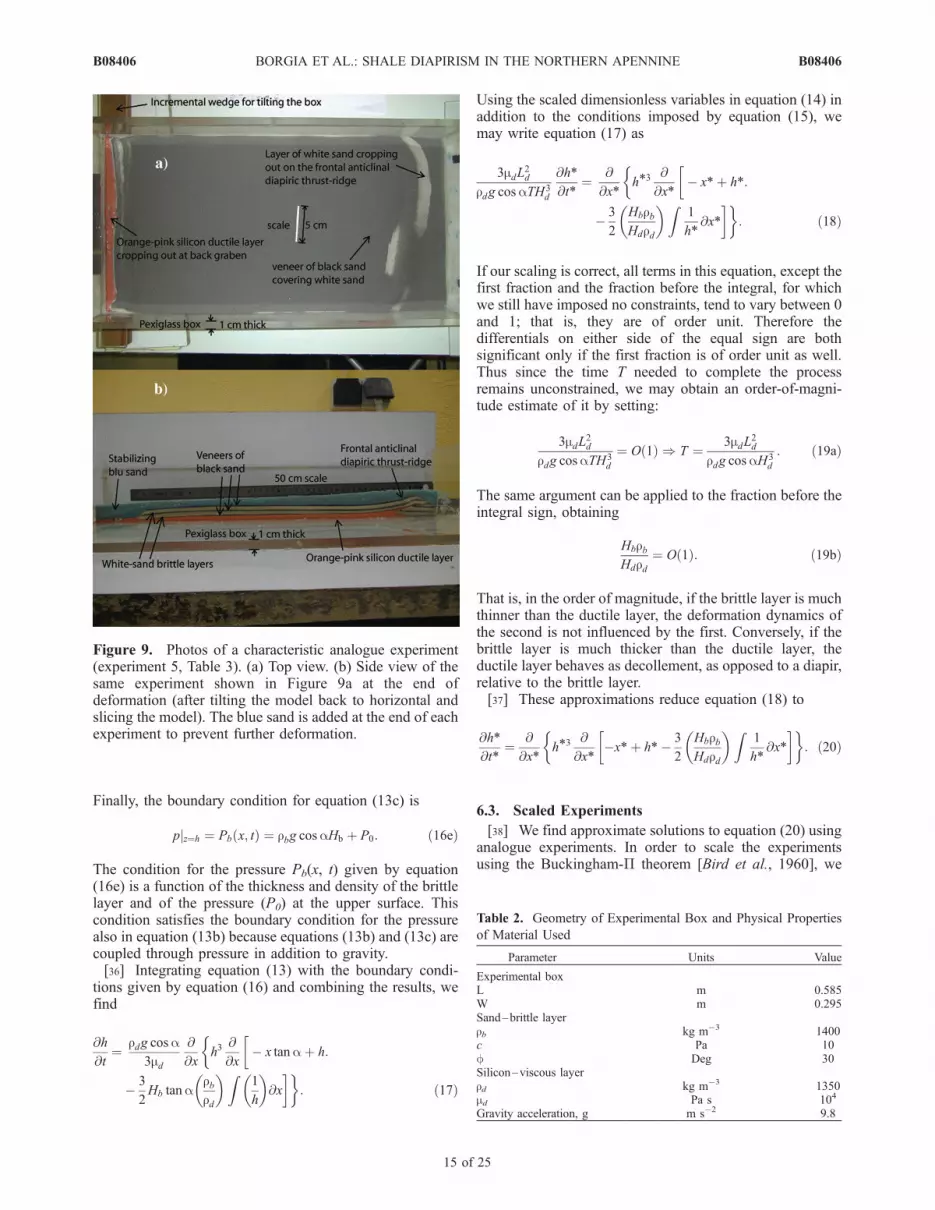
Figure 9. Photos of a characteristic analogue experiment(experiment 5, Table 3). (a) Top view. (b) Side view of thesame experiment shown in Figure 9a at the end ofdeformation (after tilting the model back to horizontal andslicing the model). The blue sand is added at the end of eachexperiment to prevent further deformation.
Table 2. Geometry of Experimental Box and Physical Properties
of Material Used
Parameter Units Value
Experimental boxL m 0.585W m 0.295Sand–brittle layerrb kg m�3 1400c Pa 10f Deg 30Silicon–viscous layerrd kg m�3 1350md Pa s 104
Gravity acceleration, g m s�2 9.8
B08406 BORGIA ET AL.: SHALE DIAPIRISM IN THE NORTHERN APENNINE
15 of 25
B08406
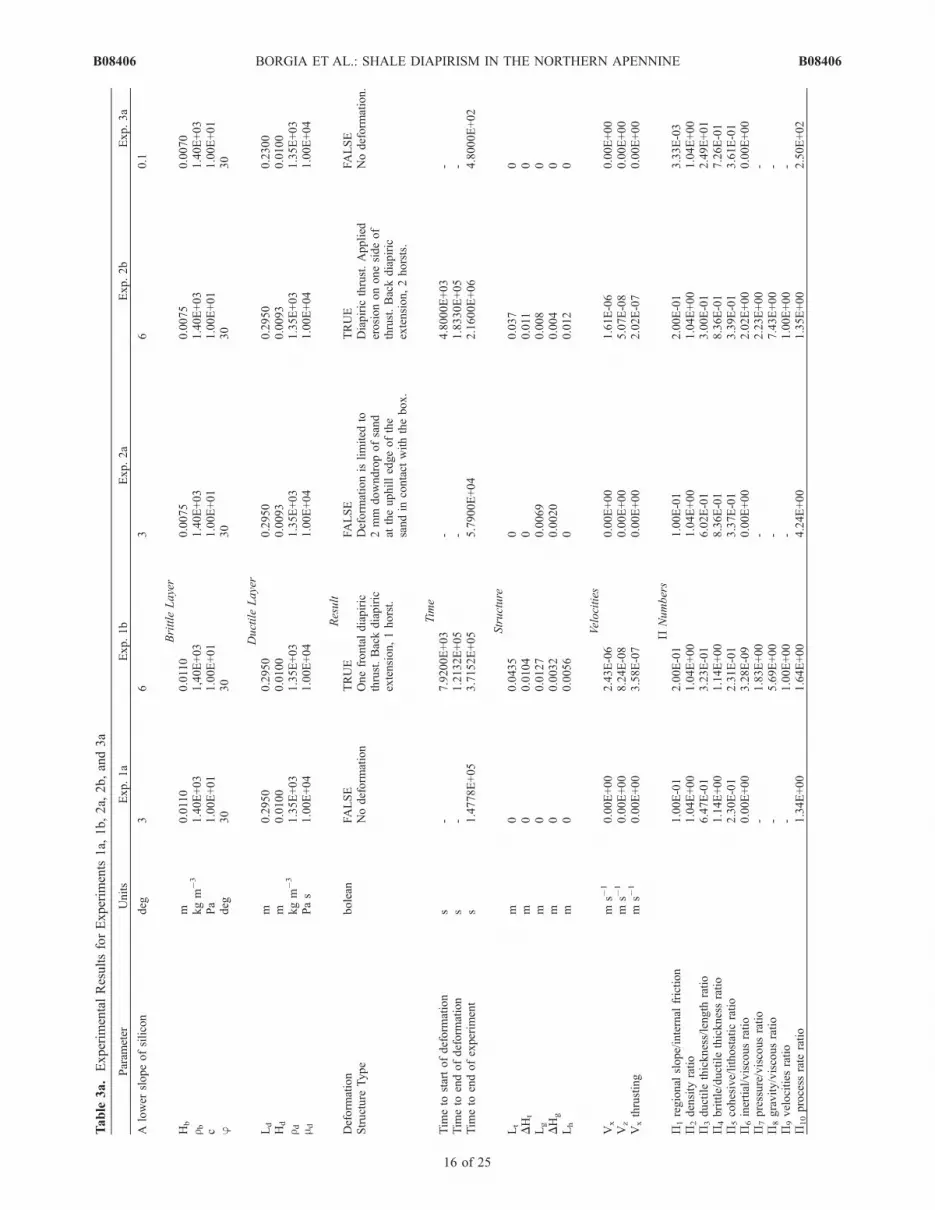
Table
3a.Experim
entalResultsforExperim
ents1a,
1b,2a,
2b,and3a
Param
eter
Units
Exp.1a
Exp.1b
Exp.2a
Exp.2b
Exp.3a
Alower
slopeofsilicon
deg
36
36
0.1
Brittle
Layer
Hb
m0.0110
0.0110
0.0075
0.0075
0.0070
r bkgm
�3
1.40E+03
1,40E+03
1.40E+03
1.40E+03
1.40E+03
cPa
1.00E+01
1.00E+01
1.00E+01
1.00E+01
1.00E+01
jdeg
30
30
30
30
30
DuctileLayer
Ld
m0.2950
0.2950
0.2950
0.2950
0.2300
Hd
m0.0100
0.0100
0.0093
0.0093
0.0100
r dkgm
�3
1.35E+03
1.35E+03
1.35E+03
1.35E+03
1.35E+03
m dPas
1.00E+04
1.00E+04
1.00E+04
1.00E+04
1.00E+04
Result
Deform
ation
bolean
FALSE
TRUE
FALSE
TRUE
FALSE
Structure
Type
Nodeform
ation
Onefrontaldiapiric
thrust.Backdiapiric
extension,1horst.
Deform
ationislimited
to2mm
downdropofsand
attheuphilledgeofthe
sandin
contact
withthebox.
Diapiric
thrust.Applied
erosionononesideof
thrust.Backdiapiric
extension,2horsts.
Nodeform
ation.
Time
Tim
eto
startofdeform
ation
s-
7.9200E+03
-4.8000E+03
-Tim
eto
endofdeform
ation
s-
1.2132E+05
-1.8330E+05
-Tim
eto
endofexperim
ent
s1.4778E+05
3.7152E+05
5.7900E+04
2.1600E+06
4.8000E+02
Structure
Lt
m0
0.0435
00.037
0DHt
m0
0.0104
00.011
0Lg
m0
0.0127
0.0069
0.008
0DHg
m0
0.0032
0.0020
0.004
0Lh
m0
0.0056
00.012
0
Velocities
Vx
ms�
10.00E+00
2.43E-06
0.00E+00
1.61E-06
0.00E+00
Vz
ms�
10.00E+00
8.24E-08
0.00E+00
5.07E-08
0.00E+00
Vxthrusting
ms�
10.00E+00
3.58E-07
0.00E+00
2.02E-07
0.00E+00
�Numbers
�1regional
slope/internal
friction
1.00E-01
2.00E-01
1.00E-01
2.00E-01
3.33E-03
�2density
ratio
1.04E+00
1.04E+00
1.04E+00
1.04E+00
1.04E+00
�3ductilethickness/length
ratio
6.47E-01
3.23E-01
6.02E-01
3.00E-01
2.49E+01
�4brittle/ductilethicknessratio
1.14E+00
1.14E+00
8.36E-01
8.36E-01
7.26E-01
�5cohesive/lithostatic
ratio
2.30E-01
2.31E-01
3.37E-01
3.39E-01
3.61E-01
�6inertial/viscousratio
0.00E+00
3.28E-09
0.00E+00
2.02E+00
0.00E+00
�7pressure/viscousratio
-1.83E+00
-2.23E+00
-�8gravity/viscousratio
-5.69E+00
-7.43E+00
-�9velocities
ratio
-1.00E+00
-1.00E+00
-�10process
rate
ratio
1.34E+00
1.64E+00
4.24E+00
1.35E+00
2.50E+02
B08406 BORGIA ET AL.: SHALE DIAPIRISM IN THE NORTHERN APENNINE
16 of 25
B08406
Table
3b.Experim
entalResultsforExperim
ents3b,3cRight,3cCenter,4Right,and4Center
Param
eter
Units
Exp.3b
Exp.3cRight
Exp.3cCenter
Exp.4Right
Exp.4Center
Alower
slopeofsilicon
deg
36
66
6
Brittle
Layer
Hb
m0.0070
0.0070
0.0070
0.0095
0.0085
r bkgm
�3
1.40E+03
1,40E+03
1.40E+03
1.40E+03
1.40E+03
cPa
1.00E+01
1.00E+01
1.00E+01
1.00E+01
1.00E+01
jdeg
30
30
30
30
30
DuctileLayer
Ld
m0.2300
0.2300
0.2300
0.5350
0.5350
Hd
m0.0100
0.0100
0.0078
0.0140
0.0140
r dkgm
�3
1.35E+03
1.35E+03
1.35E+03
1.35E+03
1.35E+03
m dPas
1.00E+04
1.00E+04
1.00E+04
1.00E+04
1.00E+04
Result
Deform
ation
bolean
FALSE
TRUE
TRUE
TRUE
TRUE
Structure
Type
Deform
ationislimited
to3.8
mm
downdropof
sandat
theuphilledgeof
thesandin
contact
with
thebox.
Diapiric
thrustin
front
anddiapirat
back.
Witherosionthrustmoves
only
asm
allam
ount.
Smalldiapiric
thrust
andbackthrustin
front
anddiapirat
back.
Slower
deform
ation.
Threediapiric
thrusts
atthefront.Diapiric
extensiononback
withtwoplates.
Threediapiric
folded
thrustsat
thefront.
Diapiric
extensionon
backwithoneplate.
Time
Tim
eto
startofdeform
ation
s-
0.0000E+00
4.8000E+04
2.7000E+03
2.7000E+03
Tim
eto
endofdeform
ation
s-
1.7688E+05
2.5092E+05
1.3560E+05
1.3560E+05
Tim
eto
endofexperim
ent
s1.3800E+04
3.3612E+05
3.3612E+05
1.6650E+05
1.6650E+05
Structure
Lt
m0
0.0194
0.0068
0.102
0.099
DHt
m0
0.009
0.0045
0.022
0.022
Lg
m0.0132
0.018
0.0115
0.06
0DHg
m0.003810512
00.0000
0.095
0Lh
m0
00
0.032
0
Velocities
Vx
ms�
10.00E+00
1.30E-06
9.17E-07
3.95E-06
3.95E-06
Vz
ms�
10.00E+00
5.65E-08
3.11E-08
1.03E-07
1.03E-07
Vxthrusting
ms�
10.00E+00
1.10E-07
2.17E-08
7.52E-07
7.03E-07
�Numbers
�1regional
slope/internal
friction
1.00E-01
2.00E-01
2.00E-01
2.00E-01
2.00E-01
�2density
ratio
1.04E+00
1.04E+00
1.04E+00
1.04E+00
1.04E+00
�3ductilethickness/length
ratio
8.30E-01
4.14E-01
3.23E-01
2.49E-01
2.49E+01
�4brittle/ductilethicknessratio
7.26E-01
7.26E-01
9.31E-01
7.04E-01
6.30E-01
�5cohesive/lithostatic
ratio
3.61E-01
3.63E-01
3.63E-01
2.67E-01
2.99E-01
�6inertial/viscousratio
0.00E+00
1.76E-09
9.65E-10
7.46E-09
7.46E-09
�7pressure/viscousratio
-4.40E+00
2.96E+00
1.71E+00
1.71E+00
�8gravity/viscousratio
-1.06E+01
9.18E+00
6.87E+00
6.87E+00
�9velocities
ratio
-1.00E+00
1.00E+00
1.00E+00
1.00E+00
�10process
rate
ratio
8.70E+00
6.82E-01
1.01E+00
1.75E+00
1.75E+00
B08406 BORGIA ET AL.: SHALE DIAPIRISM IN THE NORTHERN APENNINE
17 of 25
B08406
Table
3c.
Experim
entalResultsforExperim
ent4Left,5a,
5b,5c,
and5d
Param
eter
Units
Exp.4Left
Exp.5a
Exp.5b
Exp.5c
Exp.5d
Alower
slopeofsilicon
deg
66
78
9
Brittle
Layer
Hb
m0.0075
0.0165
0.0165
0.0165
0.0165
r bkgm
�3
1.40E+03
1,40E+03
1.40E+03
1.40E+03
1.40E+03
cPa
1.00E+01
1.00E+01
1.00E+01
1.00E+01
1.00E+01
jdeg
30
30
30
30
30
DuctileLayer
Ld
m0.5350
0.5350
0.5350
0.5350
0.5350
Hd
m0.0140
0.0110
0.0110
0.0110
0.0110
r dkgm
�3
1.35E+03
1.35E+03
1.35E+03
1.35E+03
1.35E+03
m dPas
1.00E+04
1.00E+04
1.00E+04
1.00E+04
1.00E+04
Result
Deform
ation
bolean
TRUE
FALSE
FALSE
FALSE
TRUE
Structure
Type
Threediapiric
foldsandone
thrustat
thefront.Diapiric
extensiononbackwithtwo
plates.
Deform
ationislimited
toa2mm
dropat
the
upper
sideofthebox.
Deform
ationislimited
toa
2mm
dropatheupper
sideofthebox.
Deform
ationislimited
toa2mm
dropatheupper
sideofthebox,asm
all
graben
form
s.
Onesingle
thrustin
frontandagraben
withan
extended
horstat
theupper
side
ofthebox.
Time
Tim
eto
startofdeform
ation
s2.700E+03
--
-3.0300E+04
Tim
eto
endofdeform
ation
s1.3560E+05
--
-1.1940E+05
Tim
eto
endofexperim
ent
s1.6650E+05
5.7690E+05
8.1600E+04
1.7220E+05
1.7160E+05
Structure
Lt
m0.096
00
00.062
DHt
m0.018
00
00.028
Lg
m0.058
0.005
0.005
0.005
0.09
DHg
m0.075
0.0087
0.0087
0.0087
0.016
Lh
m0.037
00
0.032
0
Velocities
Vx
ms�
13.95E-06
0.00E+00
0.00E+00
0.00E+00
4.48E-06
Vz
ms�
11.03E-07
0.00E+00
0.00E+00
0.00E+00
9.21E-08
Vxthrusting
ms�
17.08E-07
0.00E+00
0.00E+00
0.00E+00
5.19E-07
�Numbers
�1regional
slope/internal
friction
2.00E-01
2.00E-01
2.33E-01
2.67E-01
3.00E-01
�2density
ratio
1.04E+00
1.04E+00
1.04E+00
1.04E+00
1.04E+00
�3ductilethickness/length
ratio
2.49E-01
1.96E-01
1.67E-01
1.46E-01
1.30E+01
�4brittle/ductilethicknessratio
5.56E-01
1.56E-01
1.56E-01
1.56E-01
1.56E-01
�5cohesive/lithostatic
ratio
3.39E-01
1.54E-01
1.54E-01
1.55E-01
1.55E-01
�6inertial/viscousratio
7.46E-09
0.00E+00
0.00E+00
0.00E+00
6.65E-09
�7pressure/viscousratio
1.71E+00
--
-7.26E-01
�8gravity/viscousratio
6.87E+00
--
-5.59E+00
�9velocities
ratio
1.00E+00
--
-1.00E+00
�10process
rate
ratio
1.75E+00
8.50E-01
6.02E+00
2.86E+00
4.13E+00
B08406 BORGIA ET AL.: SHALE DIAPIRISM IN THE NORTHERN APENNINE
18 of 25
B08406
observe that our natural system has the following 14variables with four dimensions: Hb (m), rb (kg m�3), f(�), c (kg m�1 s�2), Ld (m), Hd (m), rd (kg m�3), md (kg m
�1
s�1), a (�), g (m s�2), T (s), Pd (kg m�1 s�2), Vx (m s�1) and
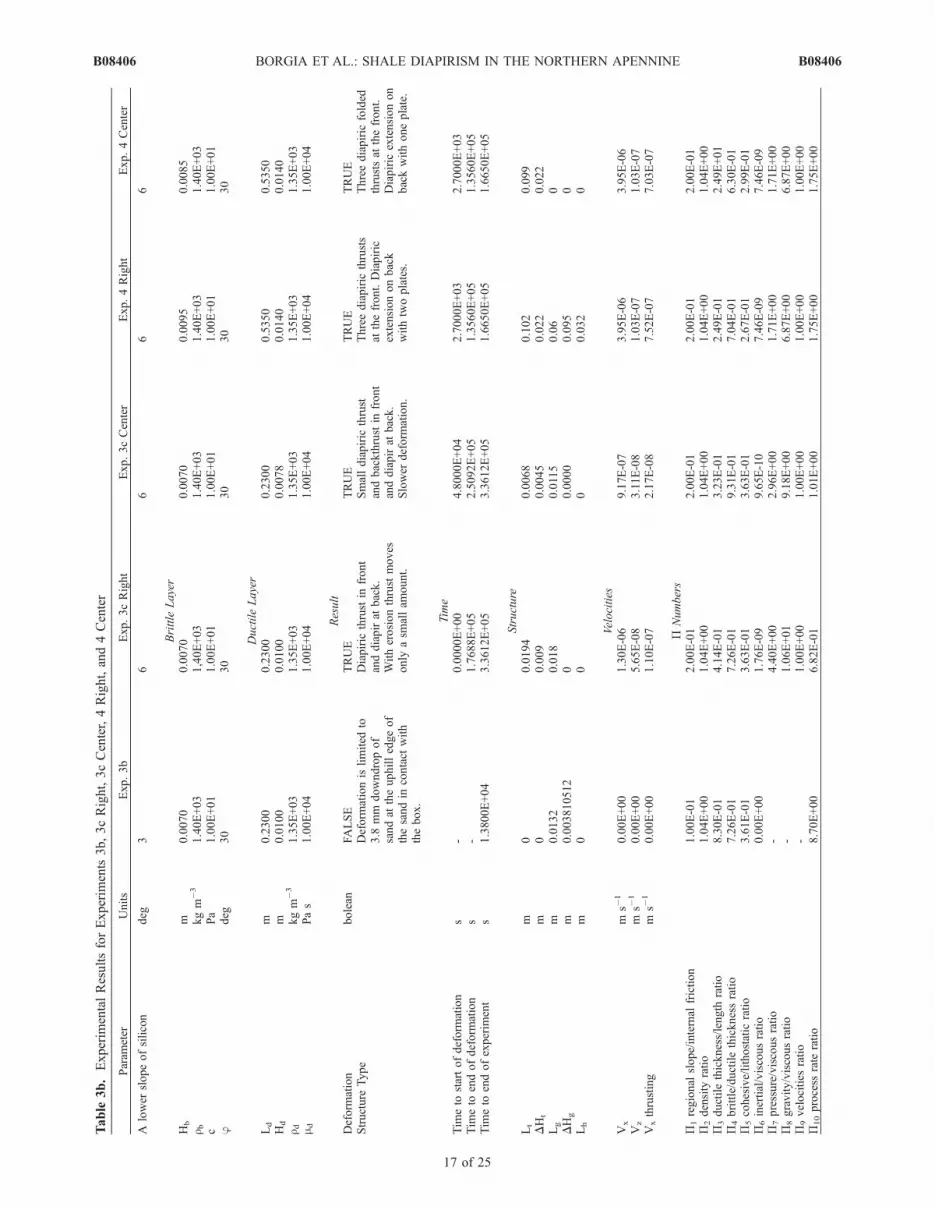
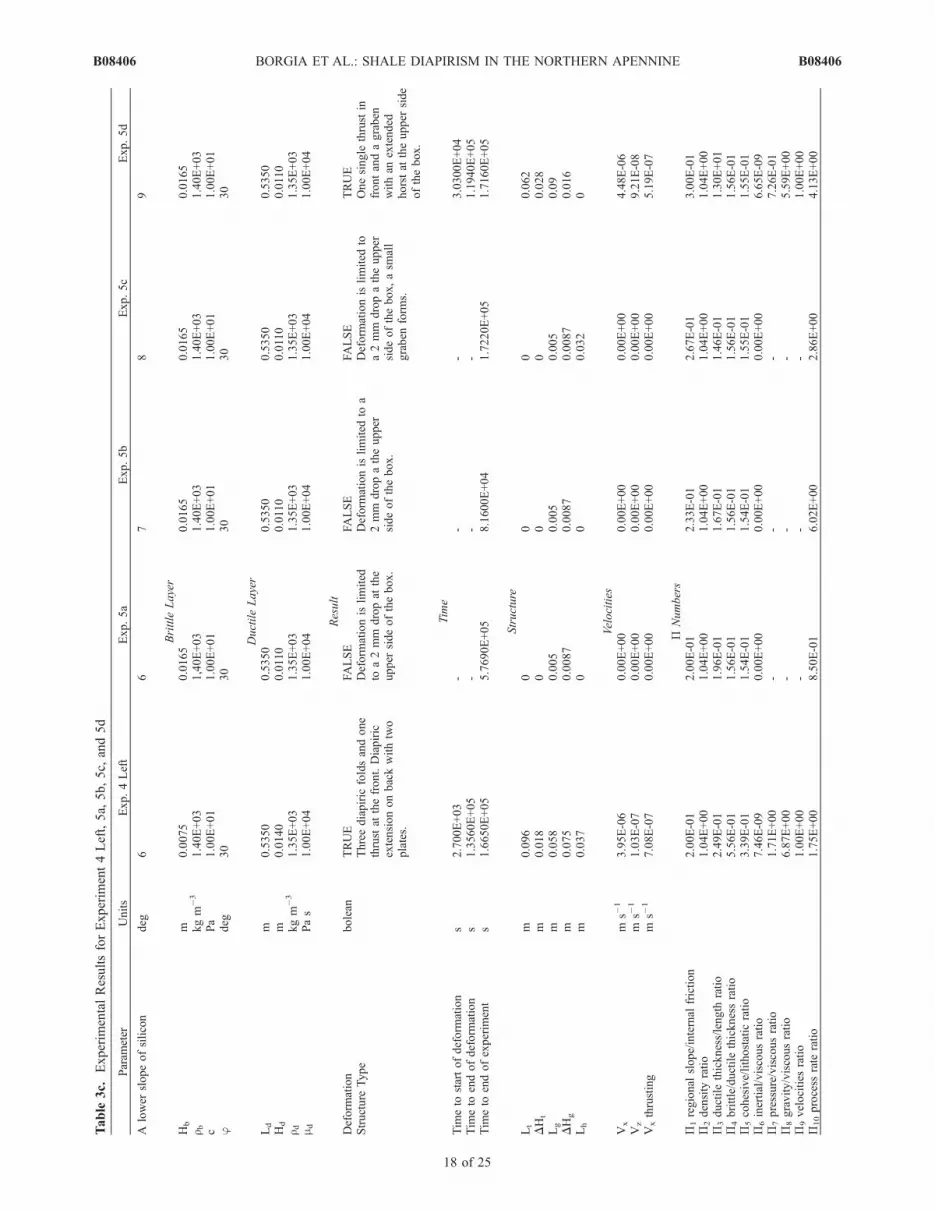
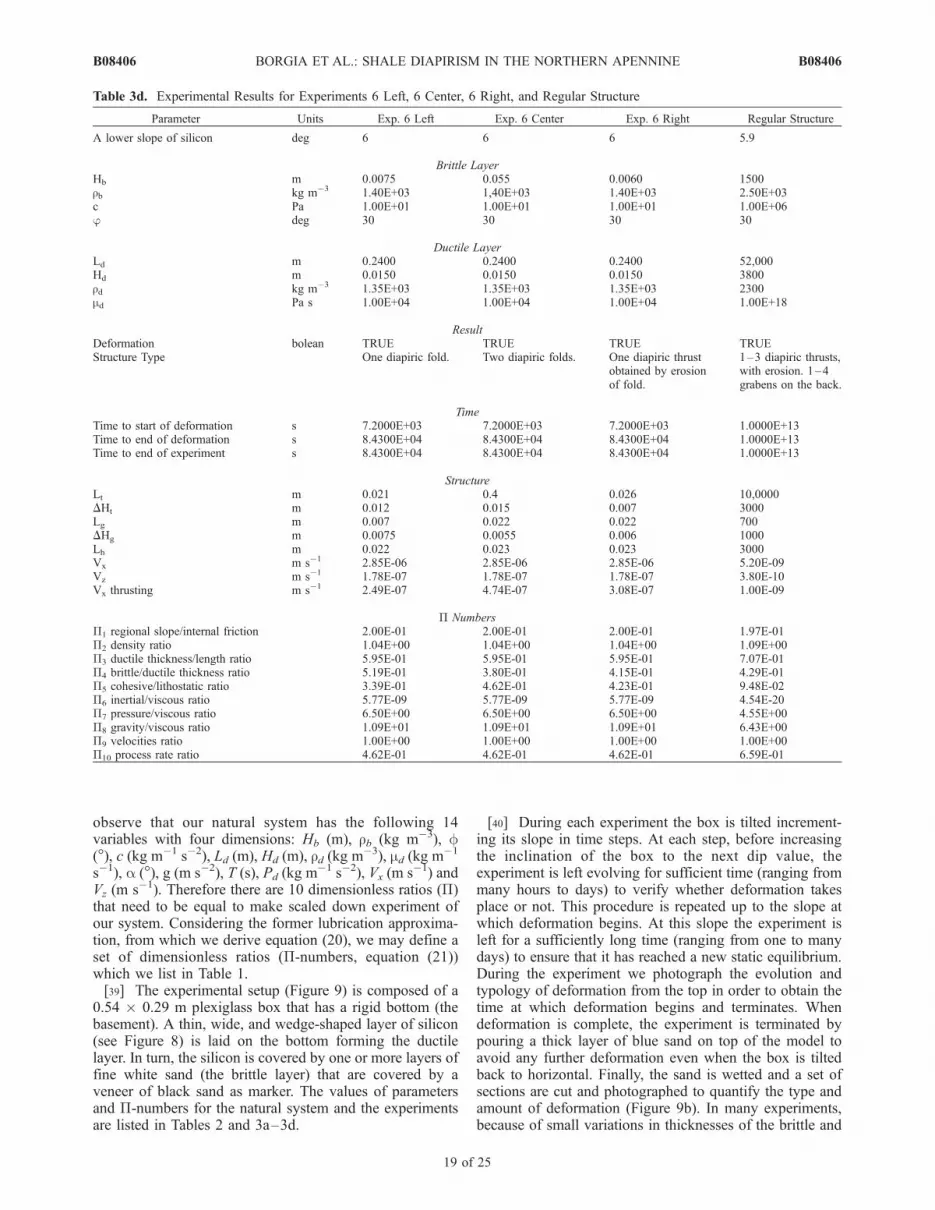
Vz (m s�1). Therefore there are 10 dimensionless ratios (�)that need to be equal to make scaled down experiment ofour system. Considering the former lubrication approxima-tion, from which we derive equation (20), we may define aset of dimensionless ratios (�-numbers, equation (21))which we list in Table 1.[39] The experimental setup (Figure 9) is composed of a
0.54 � 0.29 m plexiglass box that has a rigid bottom (thebasement). A thin, wide, and wedge-shaped layer of silicon(see Figure 8) is laid on the bottom forming the ductilelayer. In turn, the silicon is covered by one or more layers offine white sand (the brittle layer) that are covered by aveneer of black sand as marker. The values of parametersand �-numbers for the natural system and the experimentsare listed in Tables 2 and 3a–3d.
[40] During each experiment the box is tilted increment-ing its slope in time steps. At each step, before increasingthe inclination of the box to the next dip value, theexperiment is left evolving for sufficient time (ranging frommany hours to days) to verify whether deformation takesplace or not. This procedure is repeated up to the slope atwhich deformation begins. At this slope the experiment isleft for a sufficiently long time (ranging from one to manydays) to ensure that it has reached a new static equilibrium.During the experiment we photograph the evolution andtypology of deformation from the top in order to obtain thetime at which deformation begins and terminates. Whendeformation is complete, the experiment is terminated bypouring a thick layer of blue sand on top of the model toavoid any further deformation even when the box is tiltedback to horizontal. Finally, the sand is wetted and a set ofsections are cut and photographed to quantify the type andamount of deformation (Figure 9b). In many experiments,because of small variations in thicknesses of the brittle and
Table 3d. Experimental Results for Experiments 6 Left, 6 Center, 6 Right, and Regular Structure
Parameter Units Exp. 6 Left Exp. 6 Center Exp. 6 Right Regular Structure
A lower slope of silicon deg 6 6 6 5.9
Brittle LayerHb m 0.0075 0.055 0.0060 1500rb kg m�3 1.40E+03 1,40E+03 1.40E+03 2.50E+03c Pa 1.00E+01 1.00E+01 1.00E+01 1.00E+06j deg 30 30 30 30
Ductile LayerLd m 0.2400 0.2400 0.2400 52,000Hd m 0.0150 0.0150 0.0150 3800rd kg m�3 1.35E+03 1.35E+03 1.35E+03 2300md Pa s 1.00E+04 1.00E+04 1.00E+04 1.00E+18
ResultDeformation bolean TRUE TRUE TRUE TRUEStructure Type One diapiric fold. Two diapiric folds. One diapiric thrust
obtained by erosionof fold.
1–3 diapiric thrusts,with erosion. 1–4grabens on the back.
TimeTime to start of deformation s 7.2000E+03 7.2000E+03 7.2000E+03 1.0000E+13Time to end of deformation s 8.4300E+04 8.4300E+04 8.4300E+04 1.0000E+13Time to end of experiment s 8.4300E+04 8.4300E+04 8.4300E+04 1.0000E+13
StructureLt m 0.021 0.4 0.026 10,0000DHt m 0.012 0.015 0.007 3000Lg m 0.007 0.022 0.022 700DHg m 0.0075 0.0055 0.006 1000Lh m 0.022 0.023 0.023 3000Vx m s�1 2.85E-06 2.85E-06 2.85E-06 5.20E-09Vz m s�1 1.78E-07 1.78E-07 1.78E-07 3.80E-10Vx thrusting m s�1 2.49E-07 4.74E-07 3.08E-07 1.00E-09
� Numbers�1 regional slope/internal friction 2.00E-01 2.00E-01 2.00E-01 1.97E-01�2 density ratio 1.04E+00 1.04E+00 1.04E+00 1.09E+00�3 ductile thickness/length ratio 5.95E-01 5.95E-01 5.95E-01 7.07E-01�4 brittle/ductile thickness ratio 5.19E-01 3.80E-01 4.15E-01 4.29E-01�5 cohesive/lithostatic ratio 3.39E-01 4.62E-01 4.23E-01 9.48E-02�6 inertial/viscous ratio 5.77E-09 5.77E-09 5.77E-09 4.54E-20�7 pressure/viscous ratio 6.50E+00 6.50E+00 6.50E+00 4.55E+00�8 gravity/viscous ratio 1.09E+01 1.09E+01 1.09E+01 6.43E+00�9 velocities ratio 1.00E+00 1.00E+00 1.00E+00 1.00E+00�10 process rate ratio 4.62E-01 4.62E-01 4.62E-01 6.59E-01
B08406 BORGIA ET AL.: SHALE DIAPIRISM IN THE NORTHERN APENNINE
19 of 25
B08406
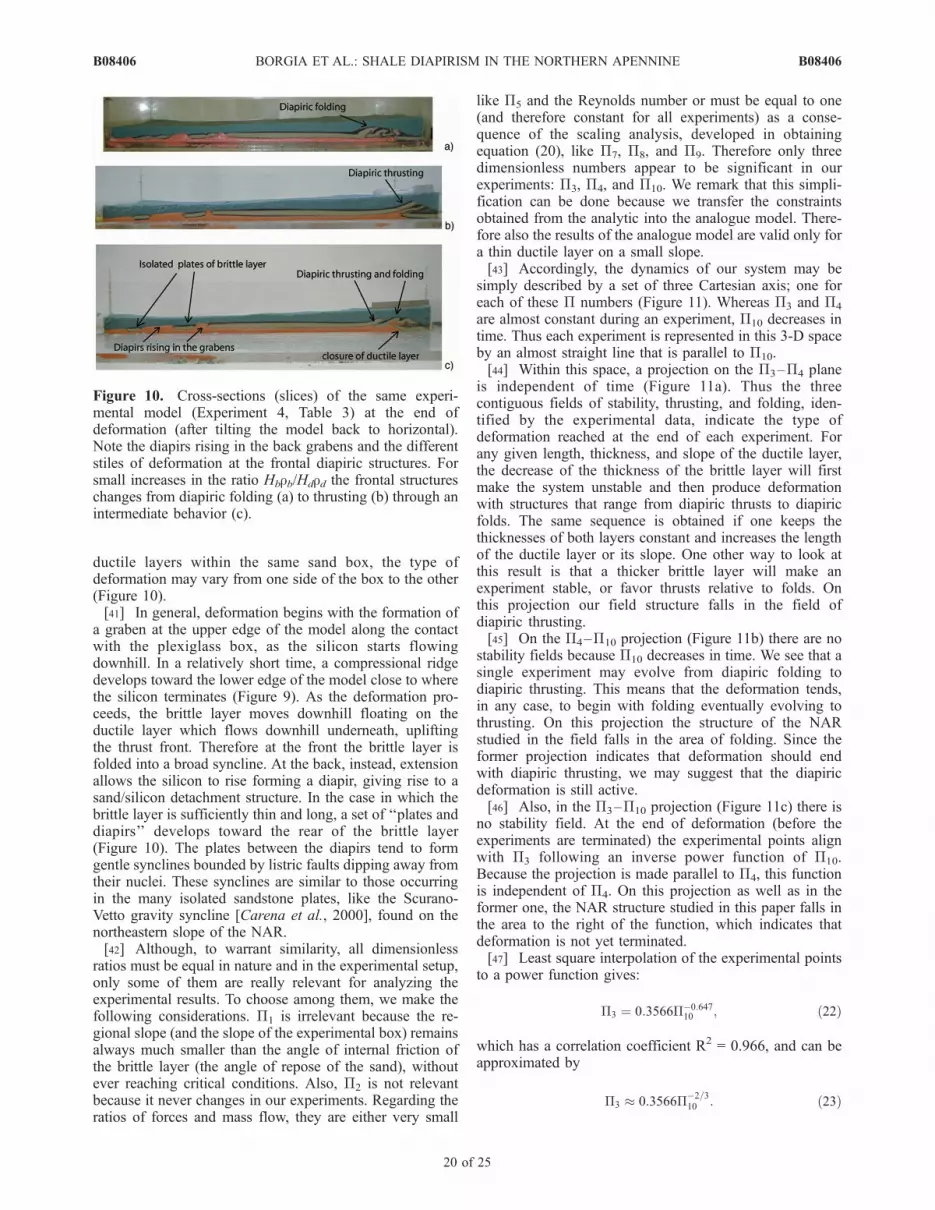
ductile layers within the same sand box, the type ofdeformation may vary from one side of the box to the other(Figure 10).[41] In general, deformation begins with the formation of
a graben at the upper edge of the model along the contactwith the plexiglass box, as the silicon starts flowingdownhill. In a relatively short time, a compressional ridgedevelops toward the lower edge of the model close to wherethe silicon terminates (Figure 9). As the deformation pro-ceeds, the brittle layer moves downhill floating on theductile layer which flows downhill underneath, upliftingthe thrust front. Therefore at the front the brittle layer isfolded into a broad syncline. At the back, instead, extensionallows the silicon to rise forming a diapir, giving rise to asand/silicon detachment structure. In the case in which thebrittle layer is sufficiently thin and long, a set of ‘‘plates anddiapirs’’ develops toward the rear of the brittle layer(Figure 10). The plates between the diapirs tend to formgentle synclines bounded by listric faults dipping away fromtheir nuclei. These synclines are similar to those occurringin the many isolated sandstone plates, like the Scurano-Vetto gravity syncline [Carena et al., 2000], found on thenortheastern slope of the NAR.[42] Although, to warrant similarity, all dimensionless
ratios must be equal in nature and in the experimental setup,only some of them are really relevant for analyzing theexperimental results. To choose among them, we make thefollowing considerations. �1 is irrelevant because the re-gional slope (and the slope of the experimental box) remainsalways much smaller than the angle of internal friction ofthe brittle layer (the angle of repose of the sand), withoutever reaching critical conditions. Also, �2 is not relevantbecause it never changes in our experiments. Regarding theratios of forces and mass flow, they are either very small
like �5 and the Reynolds number or must be equal to one(and therefore constant for all experiments) as a conse-quence of the scaling analysis, developed in obtainingequation (20), like �7, �8, and �9. Therefore only threedimensionless numbers appear to be significant in ourexperiments: �3, �4, and �10. We remark that this simpli-fication can be done because we transfer the constraintsobtained from the analytic into the analogue model. There-fore also the results of the analogue model are valid only fora thin ductile layer on a small slope.[43] Accordingly, the dynamics of our system may be
simply described by a set of three Cartesian axis; one foreach of these � numbers (Figure 11). Whereas �3 and �4
are almost constant during an experiment, �10 decreases intime. Thus each experiment is represented in this 3-D spaceby an almost straight line that is parallel to �10.[44] Within this space, a projection on the �3–�4 plane
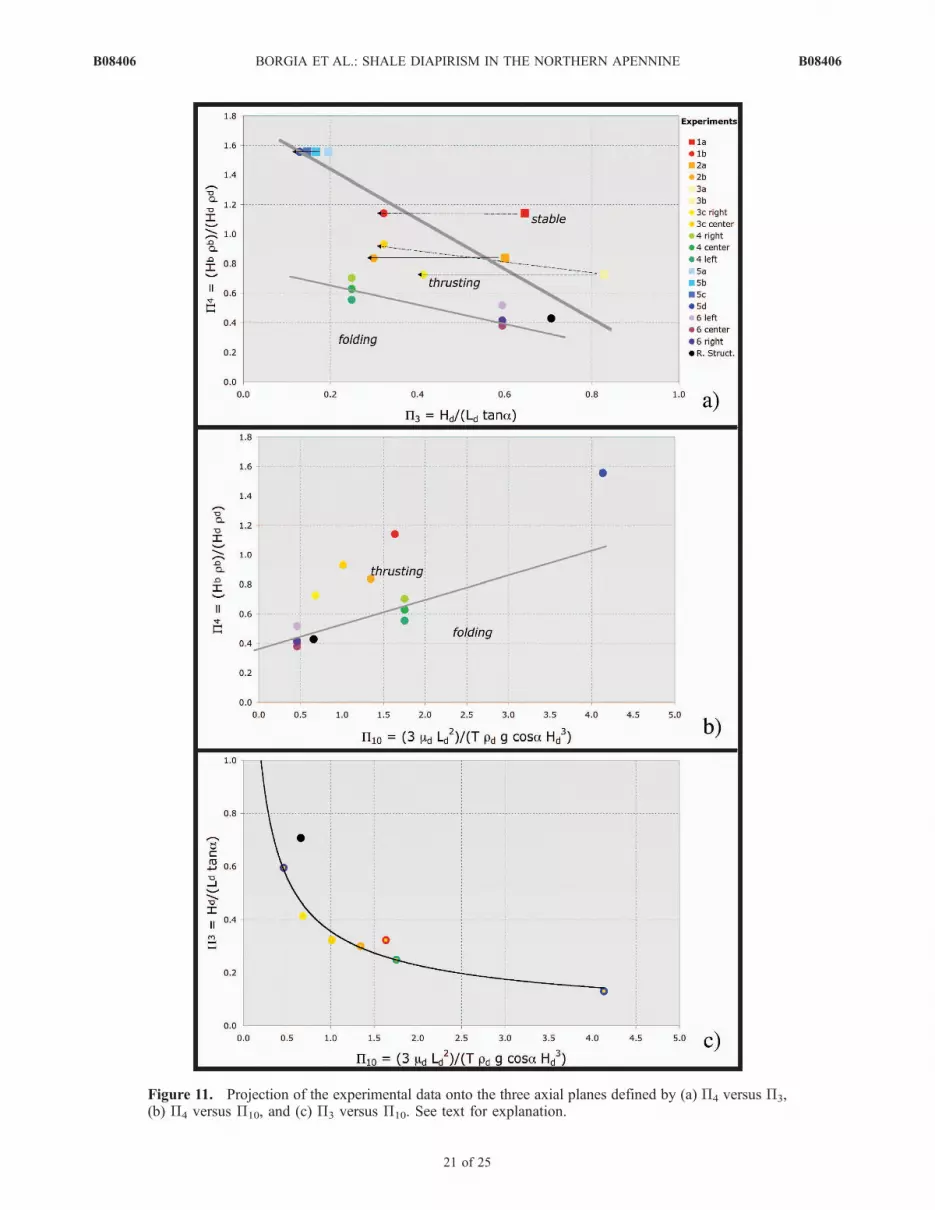
is independent of time (Figure 11a). Thus the threecontiguous fields of stability, thrusting, and folding, iden-tified by the experimental data, indicate the type ofdeformation reached at the end of each experiment. Forany given length, thickness, and slope of the ductile layer,the decrease of the thickness of the brittle layer will firstmake the system unstable and then produce deformationwith structures that range from diapiric thrusts to diapiricfolds. The same sequence is obtained if one keeps thethicknesses of both layers constant and increases the lengthof the ductile layer or its slope. One other way to look atthis result is that a thicker brittle layer will make anexperiment stable, or favor thrusts relative to folds. Onthis projection our field structure falls in the field ofdiapiric thrusting.[45] On the �4–�10 projection (Figure 11b) there are no
stability fields because �10 decreases in time. We see that asingle experiment may evolve from diapiric folding todiapiric thrusting. This means that the deformation tends,in any case, to begin with folding eventually evolving tothrusting. On this projection the structure of the NARstudied in the field falls in the area of folding. Since theformer projection indicates that deformation should endwith diapiric thrusting, we may suggest that the diapiricdeformation is still active.[46] Also, in the �3–�10 projection (Figure 11c) there is
no stability field. At the end of deformation (before theexperiments are terminated) the experimental points alignwith �3 following an inverse power function of �10.Because the projection is made parallel to �4, this functionis independent of �4. On this projection as well as in theformer one, the NAR structure studied in this paper falls inthe area to the right of the function, which indicates thatdeformation is not yet terminated.[47] Least square interpolation of the experimental points
to a power function gives:
�3 ¼ 0:3566��0:64710 ; ð22Þ
which has a correlation coefficient R2 = 0.966, and can beapproximated by
�3 0:3566��2=310 : ð23Þ
Figure 10. Cross-sections (slices) of the same experi-mental model (Experiment 4, Table 3) at the end ofdeformation (after tilting the model back to horizontal).Note the diapirs rising in the back grabens and the differentstiles of deformation at the frontal diapiric structures. Forsmall increases in the ratio Hbrb/Hdrd the frontal structureschanges from diapiric folding (a) to thrusting (b) through anintermediate behavior (c).
B08406 BORGIA ET AL.: SHALE DIAPIRISM IN THE NORTHERN APENNINE
20 of 25
B08406
Figure 11. Projection of the experimental data onto the three axial planes defined by (a) �4 versus �3,(b) �4 versus �10, and (c) �3 versus �10. See text for explanation.
B08406 BORGIA ET AL.: SHALE DIAPIRISM IN THE NORTHERN APENNINE
21 of 25
B08406
From equation (23) it is possible to infer the time stillneeded to reach the end of deformation in the studiedstructure. Substituting in this equation the value of �3 (seeTables 3a–3d), we obtain a final value �10 of about 0.36.
Given that today’s value of �10 is 0.66, we deduce that ourfield structure has overcome the first half of the deformationnot long ago. Therefore in the hypothesis that the tectonicconditions will remain the same, about 105 more years areneeded before the rate of deformation will becomenegligible.[48] Also the diapiric uplift of the regional structure may
be estimated from equation (21i) using the experimentalvalues (Tables 3a–3d):
Vz ¼Hd
LdVx ¼
Hd
T¼ 3:8 * 10�10 m=s � 1:2 * 10�2 m=a; ð24Þ
This is a significant vertical velocity and is consistent withthe fact that all major drainages are in active erosion onlywhere they cross the chaotic clays diapers and are inadepositional phase elsewhere (Figures 1a–1d). This rapiduplift may also explain the apparent morphologic contra-diction seen along the northern ridge where all the highestelevations are composed of easily erodible chaotic clayswith roots up to 3 km deep. If we make the hypothesis thatthe topography of the ridges is in steady state equilibrium,being feed by the diapiric rise from below and being erodedby landsliding from the top, considering an average width ofthe diapir of 3 � 103 m, we estimate that there are 30 m3 ofclay per meter of diapir length (parallel to the range)available for landsliding each year or more than a 1 km3 a�1
only for the section of diapir in our study area. On the otherhand, if the ridge top is uplifting, only a fraction of thismaterial is available each year for landsliding. In a longerterm, though, we argue that the balance between diapiricfeeding and landslide erosion should be maintained.
7. Neogene Evolution
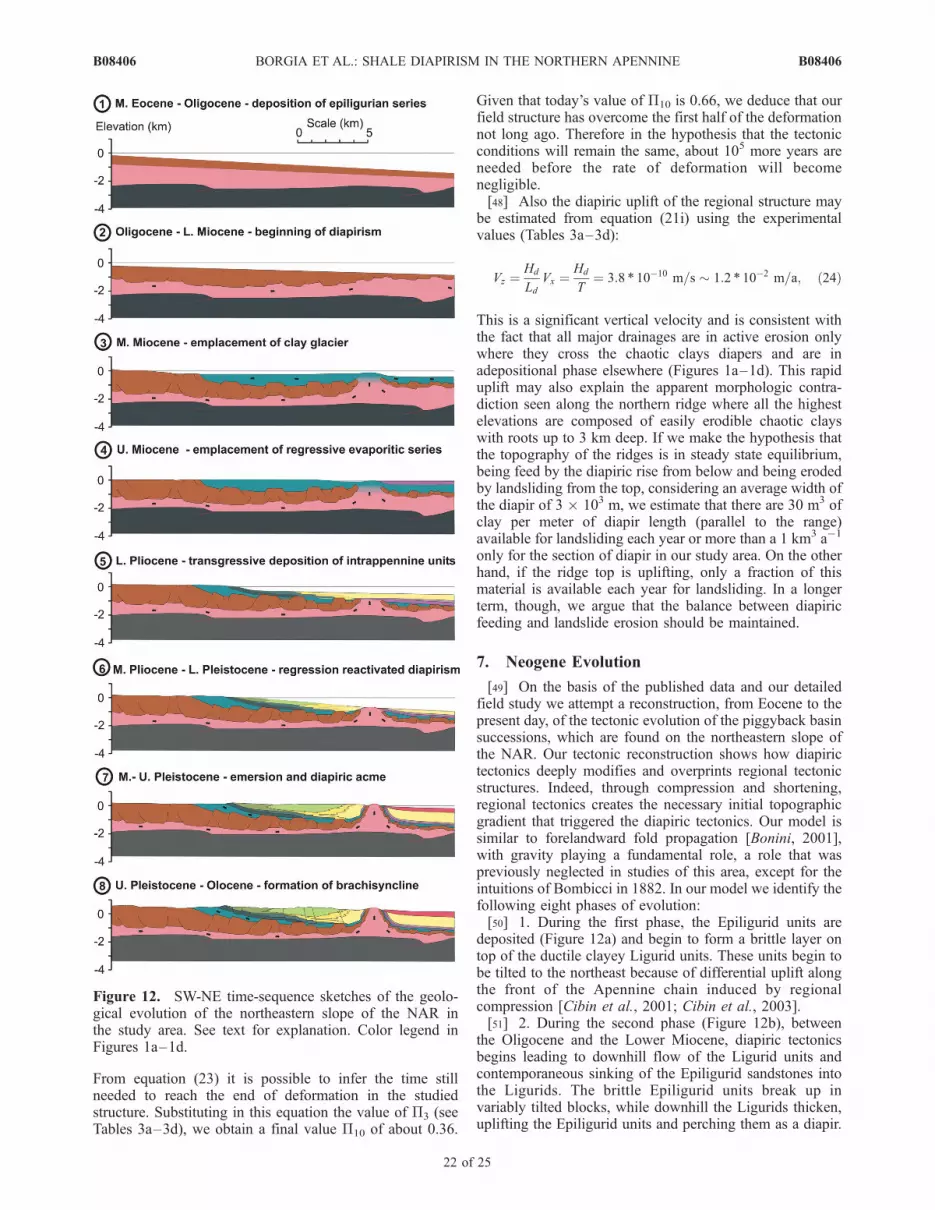
[49] On the basis of the published data and our detailedfield study we attempt a reconstruction, from Eocene to thepresent day, of the tectonic evolution of the piggyback basinsuccessions, which are found on the northeastern slope ofthe NAR. Our tectonic reconstruction shows how diapirictectonics deeply modifies and overprints regional tectonicstructures. Indeed, through compression and shortening,regional tectonics creates the necessary initial topographicgradient that triggered the diapiric tectonics. Our model issimilar to forelandward fold propagation [Bonini, 2001],with gravity playing a fundamental role, a role that waspreviously neglected in studies of this area, except for theintuitions of Bombicci in 1882. In our model we identify thefollowing eight phases of evolution:[50] 1. During the first phase, the Epiligurid units are
deposited (Figure 12a) and begin to form a brittle layer ontop of the ductile clayey Ligurid units. These units begin tobe tilted to the northeast because of differential uplift alongthe front of the Apennine chain induced by regionalcompression [Cibin et al., 2001; Cibin et al., 2003].[51] 2. During the second phase (Figure 12b), between
the Oligocene and the Lower Miocene, diapiric tectonicsbegins leading to downhill flow of the Ligurid units andcontemporaneous sinking of the Epiligurid sandstones intothe Ligurids. The brittle Epiligurid units break up invariably tilted blocks, while downhill the Ligurids thicken,uplifting the Epiligurid units and perching them as a diapir.
Figure 12. SW-NE time-sequence sketches of the geolo-gical evolution of the northeastern slope of the NAR inthe study area. See text for explanation. Color legend inFigures 1a–1d.
B08406 BORGIA ET AL.: SHALE DIAPIRISM IN THE NORTHERN APENNINE
22 of 25
B08406
As a consequence of ductile shear flow during millions ofyears over many kilometers, some Ligurid units will loosetheir ‘‘olistostrome’’ sedimentary structures becoming ‘‘tec-tonosomes’’ [Pini, 1999].[52] 3. The third phase (Figure 12c) occurs during the
Middle-Upper Miocene. The formation and uplift of thediapir leads to erosion, which is associated with flow andresedimentation of the chaotic clays also in the form of‘‘clay glaciers,’’ similar to the salt glaciers of the Gulf ofMexico [Diesel et al., 1995; Fletcher et al., 1995].[53] 4. The fourth phase (Figure 12d) occurs during the
Messinian regression that in the Mediterranean area, ischaracterized by the deposition of evaporitic rock sequen-ces. In the study area, these sequences are found onlynorthward of the main diapiric ridge, indicating that south-ward of the ridge the area was emerged.[54] 5. The fifth phase (Figure 12e) begins in the Lower
Pliocene with a new transgression, during which the Intra-Apennine terrigenous marine rock units begin to be depos-ited. These units have complex time-equivalent geometricrelationships with each other.[55] 6. The sixth phase (Figure 12f) starting in the Middle
Pliocene and ending in the Lower Pleistocene terminates thedepositional cycle of the Intra-Apennine units with a re-gression. Both deposition and regression reactivate newdiapiric tectonics, which become dominant also in theductile rock units found at stratigraphic levels higher thanthe Ligurid units (such as, for instance, in the clay glacier).Consequently, the tectonic deformation becomes more com-plex, occurring at various stratigraphic levels.[56] 7. The seventh, Middle-Upper Pleistocene phase, is
characterized by emersion from the sea (subaerial exposure)[Vai and Castellarin, 1992]. Because of the combined effectof density gradients and subaerial erosion, diapirism reachesthe highest intensity. All rock units above the Ligurids areinvolved in deformation during this phase. Erosion of theIntra-Apennine terrigenous units leads to deposition of theImola sandstones north of the main diapir (the northernridge).[57] 8. The eighth and the last phase (Figure 12h), from
Middle Pleistocene to Holocene, is characterized by theformation of the most recent tectonic structures, such as thefaulted Zena syncline and the small diapir structure of‘‘Scanno’’ ridge. The diapirs actively dam the rivers Idice,Zena, and Savena allowing the formation of river terracesand meanders uphill of them. Deep-seated gravity deforma-tion occurs during this time in the Intra-Apennine sandstonecliffs, due to the presence of clayey layers at their bottom(Figure 3e). According to the experimental results, thisphase of deformation is not yet concluded: it now showsdiapiric folding, while the deformation should terminatewith diapiric thrusting.[58] On comparing the cross section of the study area
(Figure 12h) and the experimental results (Figures 9 and10), there are some obvious differences in the details of thedeformation pattern. We remark that our experiments cangive only order-of-magnitude qualitative results because themodel does not fully reflect the heterogeneity and complex-ity of the natural structure and of its evolution. In fact, indrawing the cross sections of Figure 12 we take into accountthe deformation that occurred during sedimentation of theEpiligurid units and the Messinian and Pleistocene erosional
events, all of which are not modeled in our experiments.Also the second ductile layer (TER), which is located at ahigher stratigraphic level and is not modeled in our experi-ments, had an important role in reducing the wavelengthand faulting of the Zena syncline. Finally, the deformationof the natural structure is not yet completed, while it iscompleted in the experiments.
8. Conclusions
[59] 1. Taking into account morphologic, stratigraphic,and tectonic data, we reconstruct the marine sedimentation/abrasion surface, which records the emergence from the seaof the Intra-Apennine formations at the end of the LowerPleistocene. Subsequently, this surface was folded into abrachisyncline associated to listric faulting and horst-and-graben structures (Figure 7). The reconstruction of faultdisplacements allows us to calculate the thickness ofthe Intra-Apennine sedimentation rock cycle to be approx-imately 1/3 of what was previously thought (that is about200–300 m instead of 1 km).[60] 2. Just southward (uphill) of the northern margin of
the Apennine Range, a long (a few tens of kilometers) andnarrow (a few kilometers) diapir occurs. The diapir beganits activity with the deposition of the Epiligurid units fromEocene up to present day (Figure 1a). The diapir consists ofLigurid (and subordinate Epi-Ligurid) chaotic shaley unitsthat reach a maximum thickness of 3.5 km [RER, 1998].The diapir extends laterally around the brachisyncline alongthe Sillaro Valley and forms a number of minor diapirslike the one at ‘‘Scanno’’ ridge in the Zena Valley(Figures 1b, 3a, and 3c). The rock units that surround thediapirs are variably tilted, in a few cases overturned,stretched, and disjointed. In quite a few cases they havebeen directly involved in the diapiric deformation. The diapirhas a rate of uplift of approximately 1 cm/a and, even if madeof erodible rocks, actively dams the main rivers.[61] 3. Two other clayey units may form ductile layers
within the Epiliguid units: the clay glacier, formed duringthe Middle-Upper Miocene (TER), and the Pliocene-Pleistocene Marls of Riolo Terme. Both of these layersare ductile and play a determinant role in the developmentof thin-skinned gravitational tectonics in the sandy brittleunits overlaying them (Figures 1b, 1e, 3b, 3c, and 3d).[62] 4. Using an analytical approximation of the Navier-
Stokes equations and analogue scaled experiments, we haveshown that thrusting of the Epiligurid units may be gener-ated by diapiric tectonics and not only by regional com-pression. Because of a gravity component parallel to thestrata, the final structures formed by diapirism are substan-tially similar to those generated by compressive regionaltectonics. They differ, however, in the fact that thrusting isalways accompanied and lubricated by diapiric rise. Ourexperiments identify the fields of stability, folding, andthrusting (Figure 11a). Furthermore, they show that defor-mation always begins with folding, eventually evolving tothrusting (Figure 11b). Finally, we derive an empiricalrelation that calculates the time needed to reach the end ofdeformation (Figure 11c). These results indicate that thediapiric deformation in the study area is still in the foldingregime, but it should eventually evolve to the thrustingregime and terminate in about 105 a.
B08406 BORGIA ET AL.: SHALE DIAPIRISM IN THE NORTHERN APENNINE
23 of 25
B08406
[63] 5. The whole northeastern slope of the NAR appearsto be controlled by diapiric tectonics (Figure 1a). As amatter of fact, the clayey Ligurid units form a continuousductile layer below the sandy and calcareous Epiliguridunits, which once formed an almost continuous brittle layer(Figure 1c). Since the time of sedimentation of the Epi-ligurid units (but particularly after regional compression,differential uplift, and emergence) the clayey ductile unitsbegan to deform under the regional topographic gradientand the differential load of the sandy brittle units. Thisgravitational tectonics induced the formation of a long andnarrow diapir just uphill of the northeastern margin of theNAR. In turn, south of the diapir, the Epiligurid becamefolded into brachisynclines separated by rising clayeydiapirs composed of Ligurid units. The extention anddiapirism occurring at the southern margin of the epiliguridunits give rise to a detachment (Figure 1a). It appears thatdiapiric tectonics is so intense and widespread to over-whelm and erase, in many cases, the regional tectonicimprint in the deformed Ligurid and Epiligurid units. Thisinterpretation of the Neogene evolution of the NAR differsfrom the traditional interpretation, which considers com-pressive regional tectonics as the only controlling factor ofthe tectonic evolution of the Ligurid and Epiligurid units[cf. Boccaletti and Coli, 1982]. It also differs from a morerecent interpretation in which the Apennine superficiallayers gravitationally slide northward on a decollementidentified by seismic reflection data [Argnani et al., 2003]because in our model there is a thick ductile layer thatflows downhill on a ‘‘rigid’’ basement instead of a simpledecollement.[64] 6. Our model is developed for the northern slope of
the NAR taking into consideration a highly detailed geo-logical survey, which was mostly already available (RER[1997, 1998, 2001] and this work). Our interpretations andconclusions have been founded on mass and momentumconservation equations, which are of general applicability.Therefore we are confident that our model could be appliedto other areas where ductile units have undergone evenminor differential uplift.
[65] Acknowledgments. We acknowledge the careful reviews ofMassimiliano Zattin, Lykke Gemmer, and Jean Braun, which have sub-stantially improved our manuscript. This work is financed by RegioneEmilia-Romagna and EDRA. Analogue experiments were supported by theLaboratoire Magmas et Volcans (UMR 6524) at the Universite BlaisePascal, Clermont-Ferrand, France, through a Visiting Professor Fellow-ship to A. Borgia. We thank Nicoletta Ricciuto for assistance duringfieldwork.
ReferencesAbbate, E., V. Bortolotti, and M. Sagri (1981), An approach to olistos-tromes interpretation, paper presented at 2nd European Regional Meet-ing, Int. Assoc. of Sedimentol., Bologna, Italy.
Argnani, A., G. Barbacini, M. Bernini, F. Camurri, M. Ghielmi, G. Papani,F. Rizzino, S. Rogledi, and L. Torelli (2003), Gravity tectonics driver byquatenary uplift in the northern Appennines: Insight from the La Spezia–Reggio Emilia geo-transect, Quat. Int., 101–102, 13–26.
Bertocci, R., and N. Casagli (1992), Fenomeni di espansione laterale inalcune aree dell’Appennino tosco-romagnolo: Aspetti geomorfologici eproprieta geotecniche dei materiali argillosi coinvolti, Atti Tic. Sc. Terra,35, 31–42.
Bettelli, G., and F. Panini (1984), Il Melange sedimentario della Val Tiepido(Appennino modenese): Composizione litologica, distribuzione areale eposizione stratigrafica, Atti Soc. Natl. Mat. Modena, 115, 77–90.
Bettelli, G., and F. Panini (1987), I melanges dell’Appennino settentrionaledal t. Trasinaro al t. Sillaro, Mem. Soc. Geol. It., 39, 187–214.
Bird, R. B., W. E. Stewart, and E. N. Lightfoot (1960), Transport Phenom-ena, 780 pp., John Wiley, Hoboken, N. J.
Boccaletti, M., and M. Coli (Eds.) (1982), Carta strutturale dell’AppenninoSettentrionale. CNR, Prog. Fin. Geodin. S.P.5, pubbl. 429. S.EL.CA,Firenze.
Boccaletti, M., F. Calamita, G. Deiana, R. Gelati, F. Massari, G. Moratti,and F. Ricci Lucchi (1990a), Migrating foredeep-thrust belt system in theNorthern Apennines and Southern Alps, Palaeo., 77, 3–14.
Boccaletti, M., et al. (1990b), Palinspastic restoration and paleogeographicreconstruction of the peri-Tyrrhenian area during the Neogene, Palaeo.,77, 41–50.
Bombicci, L. (1882), Il sollevamento dell’Appennino bolognese per direttaazione della gravita e delle pressioni laterali, con appendice sulle origini esui reiterati trabocchi delle argille scagliose, Memo. Accad. Sci. Ist. Bo-logna, IV(III), 639–661.
Bonini, M. (2001), Passive roof thrusting and forelandward fold propaga-tion in scaled brittle-ductile physical models of thrust wedges, J. Geo-phys. Res., 106(B2), 2291–2311.
Borgia, A., S. Carena, A. Battaglia, G. Pasquare, M. Ferraris, L. Martelli,and M. T. De Nardo (1997), Genesis of isolated synclines: Is gravitationalstress sufficient to create them?, Quaternario, 10(2), 529–534.
Carena, S., A. Borgia, G. Pasquare, A. Battaglia, M. Ferrarsi, L. Martelli,and M. T. De Nardo (2000), Gravity synclines, J. Geophys. Res.,105(B9), 21,819–21,833.
Castellarin, A., and G. B. Vai (1986), Southalpine versus Po Plain Apen-ninic arcs, in The Origin of Arcs, edited by C. Wezel, Dev. Geotectonics,21, 253–280.
Castellarin, A., C. Eva, G. Giglia, and G. B. Vai (1986), Analisi strutturaledel fronte appenninico padano, Giornale Geol., 47, 47–75.
Cazzoli, M. A., P. Tabarroni, and A. Zanna (1988), Assetto tettonico dellazona pedemontana tra Bazzano e Zola Predosa – Appennino Bolognese,Rend. Soc. Geol. It., 11, 321–324.
Cibin, U., E. Spadafora, G. G. Zuffa, and A. Castellarin (2001), Continentalcollision history from arenites of episutural basins in the Northern Apen-nines, Italy, Geol. Soc. Am. Bull., 113, 4–19.
Cibin, U., A. Di Giulio, and L. Martelli (2003), Oligocene –EarlyMiocene tectonic evolution of the Northern Apennines (north-westernItaly) traced through provenance of piggy-back basin fill successions,in Tracing Tectonic Deformation Using the Sedimentary Record,edited by T. McCann and A. Saintot, Geol. Soc. Spec. Publ., 208,269–287.
Di Dio, G., S. Lasagna, D. Preti, and M. Sagne (1997a), Carta Geologicadei depositi quaternari della provincia di Parma, Quaternario, 10(2),443–450.
Di Dio, G., S. Lasagna, D. Preti, and M. Sagne (1997b), Stratigrafia deidepositi quaternari della Provincia di Parma, Boll. Soc. Paleont. It.,36(1–2), 179–187.
Diesel, F. A., D. C. Schuster, J. F. Karlo, R. C. Shoup, and P. R. Tauvers(1995), Cenozoic structural evolution and tectono-stratigraphic frame-work of the northern Gulf coast continental margin, in Salts Tectonics:A Global Perspective, edited by M. P. A. Jackson et al., AAPG Mem., 65,109–151.
Farabegoli, E., A. Benini, M. T. De Nardo, D. Preti, and P. Severi (2006),Carta geologica d’Italia alla scala 1:50.000, Foglio n. 238 Castel S. PietroTerme. APAT, Difesa del Suolo – Regione Emilia-Romagna, Serviziogeologico, sismico e dei suoli, in press.
Fletcher, R. C., M. R. Hudec, and I. A. Watson (1995), Salt glacier andcomposite sediment-salt glacier models for the emplacement and earlyburial of allochtonous salt sheets, in Salt Tectonics: A Global Perspective,edited by M. P. A. Jackson, D. G. Roberts, S. Snelson, AAPG Mem., 65,77–108.
Lipparini, T. (1966), Note illustrative della carta geologica d’Italia alla scala1:100.000, foglio 87 Bologna, Serv. Geol. d’Italia, Roma.
Merle, O., N. Vidal, and B. van Wyk de Vries (2001), Experiments onvertical basement fault reactivation below volcanoes, J. Geophys. Res.,106(B2), 2153–2162.
Ogniben, L. (1953), ‘‘Argille scagliose’’ e ‘‘Argille brecciate’’ in Sicilia,Boll. Serv. Geol. Ital., 75, 281–289.
Ori, G. G., and P. F. Friend (1984), Sedimentary basins formed and carriedpiggy-back on active thrust sheets, Geology, 12, 475–478.
Panini, F., G. Bettelli, and M. Pizziolo (2002), Carta Geologica d’Italia1:50.000, Foglio n. 237 Sasso Marconi. Servizio Geologico d’Italia –Regione Emilia-Romagna. S.EL.CA., Firenze.
Papani, G. (1964), Su un olistostroma di ‘‘argille scagliose’’ intercalatonella serie oligomiocenica del subappennino reggiano, Boll. Soc. Geol.It., 82, 195–202.
Parea, G. C. (1987), Paleogeografia e tettonica tardo-pleistoceniche delpedeappennino modenese, Boll. Soc. Geol. It., 39, 433–446.
Philipponat, G., and B. Hubert (1997), Fundations et Ouvrages en Terre,548 pp., Eyrolles, Paris.
B08406 BORGIA ET AL.: SHALE DIAPIRISM IN THE NORTHERN APENNINE
24 of 25
B08406
Picotti, V., G. Bertotti, R. Capozzi, and A. M. Fesce (1997), Evoluzionetettonica quaternaria della Pianura Padana centro-orientale e dei suoimargini, Quaternario, 10(2), 513–520.
Pieri, M. (1961), Nota introduttiva al rilevamento del versante appenninicopadano eseguito nel 1955–59 dai geologi dell’AGIP Mineraria, Boll.Soc. Geol. It., 80, 3–34.
Pini, A. (1999), Tectonosomes and olistostromes i the Argille Scaglioseof the northern Appennines, Italy, Geol. Soc. Am. Spec. Pap., 335,70 pp.
Regione Emilia Romanga (RER) (1997), Carta Geologica dell’AppenninoEmiliano-Romagnolo 1:10.000 sezz. 238010 and 238050. Regione Emi-lia-Romagna, Servizio Cartografico e Geologico. Archivio cartograficodella regione Emilia-Romagna, Bologna.
RER (1998), Riserve idriche sotterranee della Regione Emilia-Romagna. Acura di G. Di Dio. Regione Emilia-Romagna, ufficio geologico – ENIAgip, Divisione Esplorazione e Produzione. S.EL.CA, Firenze, 120 pp.
Regione Emilia-Romagna, viale Silvani 4/3, 40122 Bologna, Italia.([email protected]; [email protected])G. Grieco and G. Pasquare, Dip. Scienze della Terra ‘‘A. Desio’’, Univ.
degli Studi di Milano, via Botticelli 23, 20133 Milano, Italia. ([email protected]; [email protected])O. Merle, Laboratoire Magmas et Volcans, Observatoire de Physique du
Globe, 5 rue Kessler, 63038 Clermont-Ferrand, France. ([email protected])
B08406 BORGIA ET AL.: SHALE DIAPIRISM IN THE NORTHERN APENNINE