Soot superaggregates from flaming wildfires and their direct radiative forcing Rajan K. Chakrabarty 1,2 , Nicholas D. Beres 2 , Hans Moosmu ¨ller 2 , Swarup China 3 , Claudio Mazzoleni 3 , Manvendra K. Dubey 4 , Li Liu 5 & Michael I. Mishchenko 5 1 Department of Energy, Environmental & Chemical Engineering, Washington University in St. Louis, St. Louis, MO 63130, USA, 2 Desert Research Institute, Nevada System of Higher Education, Reno, Nevada, USA, 3 Atmospheric Sciences Program, Michigan Technological University, Houghton, Michigan, USA, 4 Earth System Observations, Los Alamos National Laboratory, Los Alamos, New Mexico, USA, 5 NASA Goddard Institute for Space Studies, New York, NY 10025, USA. Wildfires contribute significantly to global soot emissions, yet their aerosol formation mechanisms and resulting particle properties are poorly understood and parameterized in climate models. The conventional view holds that soot is formed via the cluster-dilute aggregation mechanism in wildfires and emitted as aggregates with fractal dimension D f < 1.8 mobility diameter D m # 1 mm, and aerodynamic diameter D a # 300 nm. Here we report the ubiquitous presence of soot superaggregates (SAs) in the outflow from a major wildfire in India. SAs are porous, low-density aggregates of cluster-dilute aggregates with characteristic D f < 2.6, D m . 1 mm, and D a # 300 nm that form via the cluster-dense aggregation mechanism. We present additional observations of soot SAs in wildfire smoke-laden air masses over Northern California, New Mexico, and Mexico City. We estimate that SAs contribute, per unit optical depth, up to 35% less atmospheric warming than freshly-emitted (D f < 1.8) aggregates, and <90% more warming than the volume-equivalent spherical soot particles simulated in climate models. O n a global scale, wildfires emit approximately 34% of total atmospheric soot mass, while in certain regions such as southeast Asia and Russia, these fires contribute as much as 63% of regional soot mass emissions 1 . In the context of climate change, soot emitted from wildfires and biomass burning episodes contribute to one of the largest uncertainties in current estimates of radiative forcing 2 . This large uncertainty is due to poor understanding of the microphysical properties of wildfire-emitted soot and their parameterizations in models and satellite retrieval algorithms 2,3 . In recent years, researchers have made thorough efforts to characterize these properties for soot emitted from small-scale, controlled combustion systems—such as prescribed and slash burns—as a function of various process parameters such as fuel type, flame temperature, environmental condi- tions driving the combustion process, and interrelationships of these parameters 4–7 . These studies have been conducted under the assumption that they may closely mimic natural wildfires in their soot formation mech- anism and emitted particle properties. Soot formation in small-scale combustion systems takes place in the cluster-dilute aggregation regime, wherein average aggregate–aggregate separation in the aerosol system is much larger than aggregate size 8 . Aggregation in this regime proceeds via a three-dimensional, diffusion-limited growth mechanism, governed by the mean-field Smoluchowski equation 8,9 . The resultant morphology of aggregates emitted into the atmosphere from this regime is described by a fractal dimension D f < 1.8, maximum lengths up to 1 mm, mobility diameter D m , 1 mm, and aerodynamic diameter D a —used for estimating the probability of deposition within lungs 10 —less than 300 nm 5 . These aggregates consist of tens to a few hundred monomers, with each monomer typically 30–50 nm in diameter 5 . Through atmospheric processing, it is possible for these aggregates to collapse into sphere-like morphologies with D f < 2.6 11,12 . Climate modelers assume the morphology of bare soot aggregates to be spherical in model parameterizations 2,13 . The unpredictable occurrence and nature of large-scale wildfires severely limit the opportunity for in-plume sampling of smoke particles for analysis of particle properties and understanding of soot formation mechan- isms 3,4 . Single-particle electron microscopy analysis provides crucial information toward accurate and size- unconstrained characterization of aerosol microphysical properties 5,14 . Additionally, information on the aerosol formation mechanism can be deduced from single-particle electron micrographs 8,9,15,16 . There have been only a limited number of studies conducted to investigate aerosols emitted from natural wildfires using electron micro- scopy 17–23 . The majority of these studies sampled particles during a fire’s smoldering combustion phase (low- OPEN SUBJECT AREAS: ATMOSPHERIC SCIENCE ENVIRONMENTAL SCIENCES Received 20 March 2014 Accepted 9 June 2014 Published 1 July 2014 Correspondence and requests for materials should be addressed to R.K.C. (rajan. chakrabarty@gmail. com) SCIENTIFIC REPORTS | 4 : 5508 | DOI: 10.1038/srep05508 1
Transcript
Soot superaggregates from flamingwildfires and their direct radiative forcingRajan K. Chakrabarty1,2, Nicholas D. Beres2, Hans Moosmuller2, Swarup China3, Claudio Mazzoleni3,Manvendra K. Dubey4, Li Liu5 & Michael I. Mishchenko5
1Department of Energy, Environmental & Chemical Engineering, Washington University in St. Louis, St. Louis, MO 63130, USA,2Desert Research Institute, Nevada System of Higher Education, Reno, Nevada, USA, 3Atmospheric Sciences Program, MichiganTechnological University, Houghton, Michigan, USA, 4Earth System Observations, Los Alamos National Laboratory, Los Alamos,New Mexico, USA, 5NASA Goddard Institute for Space Studies, New York, NY 10025, USA.
Wildfires contribute significantly to global soot emissions, yet their aerosol formation mechanisms andresulting particle properties are poorly understood and parameterized in climate models. The conventionalview holds that soot is formed via the cluster-dilute aggregation mechanism in wildfires and emitted asaggregates with fractal dimension Df < 1.8 mobility diameter Dm # 1 mm, and aerodynamic diameter Da #300 nm. Here we report the ubiquitous presence of soot superaggregates (SAs) in the outflow from a majorwildfire in India. SAs are porous, low-density aggregates of cluster-dilute aggregates with characteristicDf < 2.6, Dm . 1 mm, and Da # 300 nm that form via the cluster-dense aggregation mechanism. We presentadditional observations of soot SAs in wildfire smoke-laden air masses over Northern California, NewMexico, and Mexico City. We estimate that SAs contribute, per unit optical depth, up to 35% lessatmospheric warming than freshly-emitted (Df < 1.8) aggregates, and <90% more warming than thevolume-equivalent spherical soot particles simulated in climate models.
On a global scale, wildfires emit approximately 34% of total atmospheric soot mass, while in certainregions such as southeast Asia and Russia, these fires contribute as much as 63% of regional soot massemissions1. In the context of climate change, soot emitted from wildfires and biomass burning episodes
contribute to one of the largest uncertainties in current estimates of radiative forcing2. This large uncertainty isdue to poor understanding of the microphysical properties of wildfire-emitted soot and their parameterizations inmodels and satellite retrieval algorithms2,3. In recent years, researchers have made thorough efforts to characterizethese properties for soot emitted from small-scale, controlled combustion systems—such as prescribed and slashburns—as a function of various process parameters such as fuel type, flame temperature, environmental condi-tions driving the combustion process, and interrelationships of these parameters4–7. These studies have beenconducted under the assumption that they may closely mimic natural wildfires in their soot formation mech-anism and emitted particle properties.
Soot formation in small-scale combustion systems takes place in the cluster-dilute aggregation regime, whereinaverage aggregate–aggregate separation in the aerosol system is much larger than aggregate size8. Aggregation inthis regime proceeds via a three-dimensional, diffusion-limited growth mechanism, governed by the mean-fieldSmoluchowski equation8,9. The resultant morphology of aggregates emitted into the atmosphere from this regimeis described by a fractal dimension Df < 1.8, maximum lengths up to 1 mm, mobility diameter Dm , 1 mm, andaerodynamic diameter Da—used for estimating the probability of deposition within lungs10—less than 300 nm5.These aggregates consist of tens to a few hundred monomers, with each monomer typically 30–50 nm indiameter5. Through atmospheric processing, it is possible for these aggregates to collapse into sphere-likemorphologies with Df < 2.611,12. Climate modelers assume the morphology of bare soot aggregates to be sphericalin model parameterizations2,13.
The unpredictable occurrence and nature of large-scale wildfires severely limit the opportunity for in-plumesampling of smoke particles for analysis of particle properties and understanding of soot formation mechan-isms3,4. Single-particle electron microscopy analysis provides crucial information toward accurate and size-unconstrained characterization of aerosol microphysical properties5,14. Additionally, information on the aerosolformation mechanism can be deduced from single-particle electron micrographs8,9,15,16. There have been only alimited number of studies conducted to investigate aerosols emitted from natural wildfires using electron micro-scopy17–23. The majority of these studies sampled particles during a fire’s smoldering combustion phase (low-
temperature). Exceptions have been the aircraft sampling studiesconducted during the 1990’s in the over-fire regions of flaming forestfires in Brazil and southern Africa17,18. Observations of unusuallylarge soot aggregates were made from these fires, but the investiga-tors failed to distinguish the microphysical properties of these part-icles from conventional sub-micron soot aggregates. As a result,these unique observations have gone unnoticed, and there has beenno follow-up investigation conducted on the formation mechanismand frequency of occurrence of these unusually large soot aggregates,their microphysical properties, and their potential impact on radi-ative forcing and health.
Here, we investigate particles contained in the flaming-phaseplumes of the Nagarhole National Forest fire (NNFF)24 inKarnataka (India) and find the ubiquitous occurrence of superag-gregates (SAs), a hitherto unrecognized form of soot distinct fromconventional sub-micron aggregates. We report additional obser-vation of these SAs in wildfire smoke-laden air masses overSacramento (Northern California, USA), Los Alamos (NewMexico, USA), and the Mexico City metropolitan area (Mexico),respectively. Based on the unique morphological properties of SAs,we discuss their possible formation mechanism and their potentialimpact on human health. We also compute numerically-exact opticalproperties of these particles and compare them with those of sub-micron size soot particles. We make use of the optical properties tocalculate direct radiative forcing efficiencies of SAs at the top of theatmosphere and discuss their net warming or cooling of the atmo-sphere. Finally, we address the need for future research to betterunderstand and characterize the detection and atmospheric proces-sing of soot SAs for quantitatively estimating their impact on climateand health.
ResultsWe collected aerosol samples for scanning electron microscopy (SEM)analysis downwind of the NNFF over the Indian Ocean at the MaldivesClimate Observatory on Hanimaadhoo Island (MCOH) (6.78u N,73.18u E). The NNFF, which lasted for a week beginning February27, 2012, burned approximately 35 km2 of dry deciduous forest con-taining dry bamboo and teak trees. Dense smoke from intense flamingcombustion was reported, with the event turning into a firestormwithin a day24. The MCOH aerosol number concentration increasedfrom about 800 to 3000 cm23 during this period. The months ofNovember through May constitute the dry season in South Asia, whenlow-level flow brings a polluted air mass from Asia to the IndianOcean25. Ensemble back-trajectory analyses (Fig. 1a; Fig. S1 in supple-mentary information) coupled with satellite imagery and the CloudAerosol Lidar and Infrared Pathfinder Satellite (CALIPSO) measure-ments (Fig. 1 b and c) show a low-level polluted air mass—between 1to 3 km above sea level—transported from the forest fire site flowingsouthwest over the Indian Ocean. Gas chromatography interfaced withmass spectrometry analyses of aerosol samples, revealed the presenceof levoglucosan—a molecular marker for biomass burning emis-sions26—in trace amounts (about 0.09 ng/m3).
To investigate how commonly these SAs occur in different geo-graphical locations and atmospheric conditions, we sampled aerosolscontained in wildfire smoke-laden air masses over Sacramento dur-ing the CARES (Carbonaceous Aerosol and Radiative EffectsStudy)27 in June 2010 and over Mexico City as part of theMILAGRO (Megacity Initiative: Local And Global ResearchObservations)28,29 study during March-June 2006. Finally, in 2011at Los Alamos, we sampled the downwind plumes of the LasConchas wildfire19, the second largest wildfire in the state’s history.
Figure 1 | The 2012 Nagarhole forest wildfire smoke plume transport. (A) Average of NOAA HYSPLIT ensemble trajectories ending at the Maldives
Climate Observatory–Hanimaadhoo, Maldives (MCOH) on 01, 02, and 03 March 2012. (Image created using Adobe PhotoshopTM); (B) Visible imagery of
the Indian Peninsula from the MODIS sensor aboard the Terra satellite for 28 February 2012. (Image obtained from NASA Near Real-time (NRT) data
archive); (C) 532 nm backscatter return signal from the CALIOP Lidar aboard the CALIPSO satellite showing vertical distribution of aerosols (Image
obtained from NASA CALIPSO data archive). The color scale on the right indicates the strength of the LIDAR return signal: boundary layer clouds usually
show up as grey or white; cirrus clouds range from yellow to grey; and aerosols show up as green, yellow, and red (indicating low, medium, and high
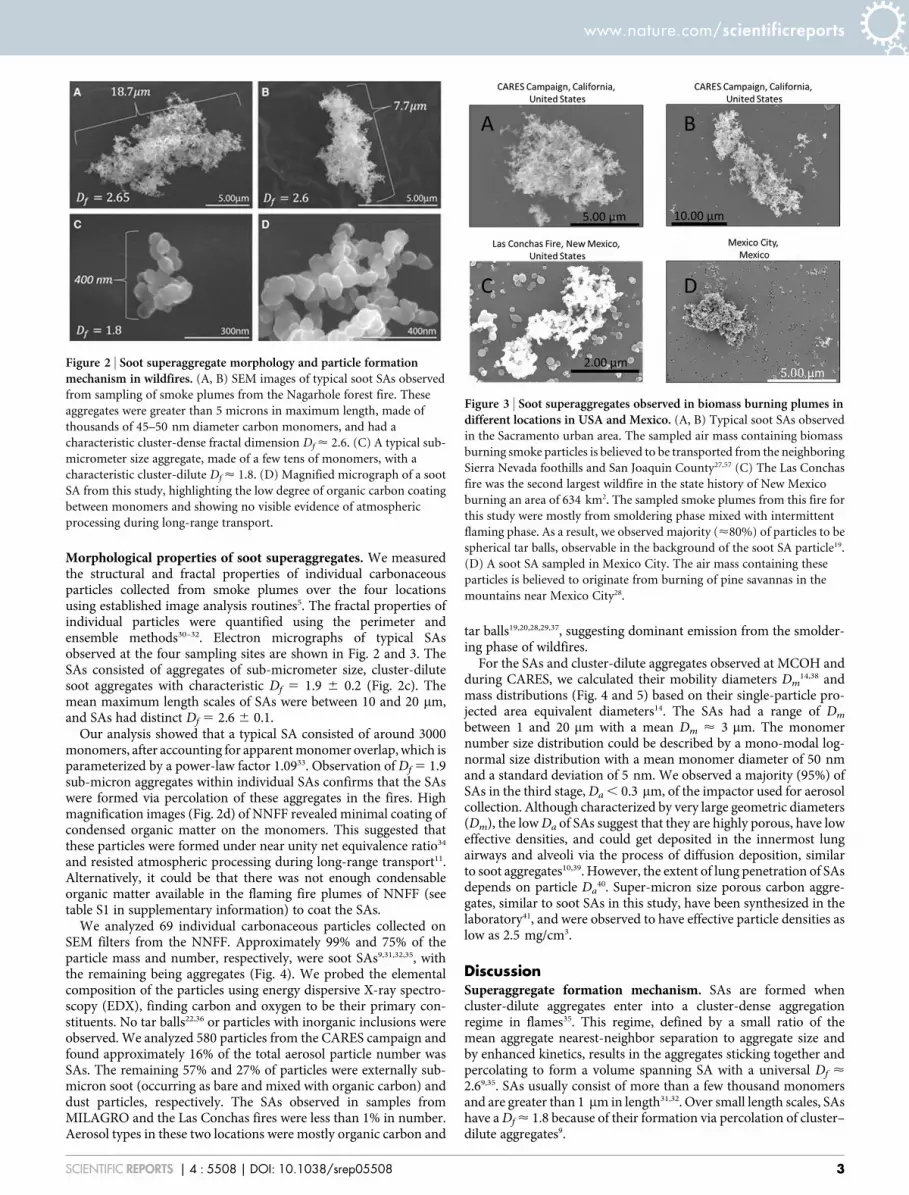
Morphological properties of soot superaggregates. We measuredthe structural and fractal properties of individual carbonaceousparticles collected from smoke plumes over the four locationsusing established image analysis routines5. The fractal properties ofindividual particles were quantified using the perimeter andensemble methods30–32. Electron micrographs of typical SAsobserved at the four sampling sites are shown in Fig. 2 and 3. TheSAs consisted of aggregates of sub-micrometer size, cluster-dilutesoot aggregates with characteristic Df 5 1.9 6 0.2 (Fig. 2c). Themean maximum length scales of SAs were between 10 and 20 mm,and SAs had distinct Df 5 2.6 6 0.1.
Our analysis showed that a typical SA consisted of around 3000monomers, after accounting for apparent monomer overlap, which isparameterized by a power-law factor 1.0933. Observation of Df 5 1.9sub-micron aggregates within individual SAs confirms that the SAswere formed via percolation of these aggregates in the fires. Highmagnification images (Fig. 2d) of NNFF revealed minimal coating ofcondensed organic matter on the monomers. This suggested thatthese particles were formed under near unity net equivalence ratio34
and resisted atmospheric processing during long-range transport11.Alternatively, it could be that there was not enough condensableorganic matter available in the flaming fire plumes of NNFF (seetable S1 in supplementary information) to coat the SAs.
We analyzed 69 individual carbonaceous particles collected onSEM filters from the NNFF. Approximately 99% and 75% of theparticle mass and number, respectively, were soot SAs9,31,32,35, withthe remaining being aggregates (Fig. 4). We probed the elementalcomposition of the particles using energy dispersive X-ray spectro-scopy (EDX), finding carbon and oxygen to be their primary con-stituents. No tar balls22,36 or particles with inorganic inclusions wereobserved. We analyzed 580 particles from the CARES campaign andfound approximately 16% of the total aerosol particle number wasSAs. The remaining 57% and 27% of particles were externally sub-micron soot (occurring as bare and mixed with organic carbon) anddust particles, respectively. The SAs observed in samples fromMILAGRO and the Las Conchas fires were less than 1% in number.Aerosol types in these two locations were mostly organic carbon and
tar balls19,20,28,29,37, suggesting dominant emission from the smolder-ing phase of wildfires.
For the SAs and cluster-dilute aggregates observed at MCOH andduring CARES, we calculated their mobility diameters Dm
14,38 andmass distributions (Fig. 4 and 5) based on their single-particle pro-jected area equivalent diameters14. The SAs had a range of Dm
between 1 and 20 mm with a mean Dm < 3 mm. The monomernumber size distribution could be described by a mono-modal log-normal size distribution with a mean monomer diameter of 50 nmand a standard deviation of 5 nm. We observed a majority (95%) ofSAs in the third stage, Da , 0.3 mm, of the impactor used for aerosolcollection. Although characterized by very large geometric diameters(Dm), the low Da of SAs suggest that they are highly porous, have loweffective densities, and could get deposited in the innermost lungairways and alveoli via the process of diffusion deposition, similarto soot aggregates10,39. However, the extent of lung penetration of SAsdepends on particle Da
40. Super-micron size porous carbon aggre-gates, similar to soot SAs in this study, have been synthesized in thelaboratory41, and were observed to have effective particle densities aslow as 2.5 mg/cm3.
DiscussionSuperaggregate formation mechanism. SAs are formed whencluster-dilute aggregates enter into a cluster-dense aggregationregime in flames35. This regime, defined by a small ratio of themean aggregate nearest-neighbor separation to aggregate size andby enhanced kinetics, results in the aggregates sticking together andpercolating to form a volume spanning SA with a universal Df <2.69,35. SAs usually consist of more than a few thousand monomersand are greater than 1 mm in length31,32. Over small length scales, SAshave a Df < 1.8 because of their formation via percolation of cluster–dilute aggregates9.
Figure 2 | Soot superaggregate morphology and particle formationmechanism in wildfires. (A, B) SEM images of typical soot SAs observed
from sampling of smoke plumes from the Nagarhole forest fire. These
aggregates were greater than 5 microns in maximum length, made of
thousands of 45–50 nm diameter carbon monomers, and had a
With the exception of large-scale sooty and turbulent fires32,upward-rising flame systems cannot emit SAs into the atmospheredue to their narrowing flame fronts and associated buoyancy-drivenaggregate fragmentation effects31. For SAs to be emitted as finalproducts, an aggregating system must maintain the right physicalconditions in terms of threshold particle volume fractions and res-idence time. A large-scale turbulent flame system provides theseconditions by trapping sub-micron aggregates in its vortices9,31,32,42
(Fig. 6). Once trapped, these aggregates begin to jam together underhigh particle volume fraction conditions to form SAs. For the sootSAs observed in this study, we hypothesize that they were formed inthe vortices of the wildfire flame bodies and subsequently emitted tothe atmosphere.
Impact on direct radiative forcing. Quantitative knowledge of thesoot morphologies enabled numerically-exact superposition T-matrix modeling of single-particle optical properties—asymmetryparameter g and single scattering albedo v—at 550 nm asfunctions of aggregate Df and monomer number (Fig. 7a and b).We also computed these parameters using Mie theory for volume-equivalent spherical particles14 as used by current climate models.Aggregate simulations and their T-matrix modeling methods aredescribed in detail elsewhere43. Note that the T-matrix calculationsrequired significant computational power and time, limiting the totalnumber of monomers that could be investigated to 1000, but it islikely that these results are broadly representative of SA opticalproperties. Both g and v are fundamental parameters for aerosolradiative transfer calculations44. v is the ratio of particle scatteringto extinction cross section, and ranges between 0 for a purelyabsorbing particle to 11 for a purely scattering particle. Theasymmetry parameter (g) is defined as the intensity-weightedaverage cosine of the scattering and ranges between 21 for entirely
backscattered light to 11 for entirely forward scattered light. vincreases with increasing monomer number as well as with Df inboth the aggregate and SA regimes. For Mie-spheres, their vincreases with increasing size. SAs have higher v values thanfreshly emitted aggregates (Df 5 1.8) and slightly lower and highervalues than aged aggregates (Df < 3) for monomer numbers 400–700and .700, respectively. Alternatively, SAs have higher g values thanboth aggregates and Mie-spheres. The g values for aggregatesincrease monotonically and reach a maximum value at Df < 2.75,after which they start to slowly decline to settle at a lower value forDf 5 3.0. Mie-spheres show even lower g values than Df 5 1.8aggregates. This behavior can be attributed to an increase inbackscattering by particles as they approach near-sphericalmorphology44.
Using these calculated single-particle optical properties, we esti-mated the top of the atmosphere direct forcing efficiency (DFE; theradiative forcing per unit optical depth and bandwidth45) at 550 nmfor aggregates, SAs, and Mie-spheres as functions of Df and size(Fig. 7c). We chose the complex refractive index of soot to be1.95–0.79i and the up-scatter fraction as a function of g per pastrecommendations46,47. The difference in the DFE value betweenfreshly emitted (i.e. Df 5 1.8)11 aggregates and SAs is up to17 Wm22. This positive difference in forcing is the excessive short-wave heating of an optically thin layer of the troposphere by freshlyemitted cluster-dilute aggregates compared to SAs. The forcing dif-ference between SAs and atmospherically processed or aged aggre-gates (Df 5 2.5–2.7)11,12 is negligible. However, in comparison withcompletely collapsed48 (Df < 3.0) aggregates, SAs contribute to anenhanced warming effect by <25% (14 Wm22). Note that a Df < 3.0aggregate shouldn’t be confused with a volume-equivalent Miesphere, as simulated in climate models. The morphology of aDf 5 3.0 aggregate differs from a volume-equivalent sphere. A sphere
Figure 4 | Number distribution of soot aggregates and superaggregates from the Nagarhole forest fire. (A, B) Number size distribution of the particles is
calculated in terms of the projected area equivalent diameter, which is equivalent to particle mobility diameter. (C, D) Single particle mass
distribution, calculated from two-dimensional particle images using a carbon monomer density value 5 1.8 g/cm3. It is to be noted that sea-salt particles
from the Indian Ocean accompanied the carbonaceous aerosols and were excluded from this analysis.
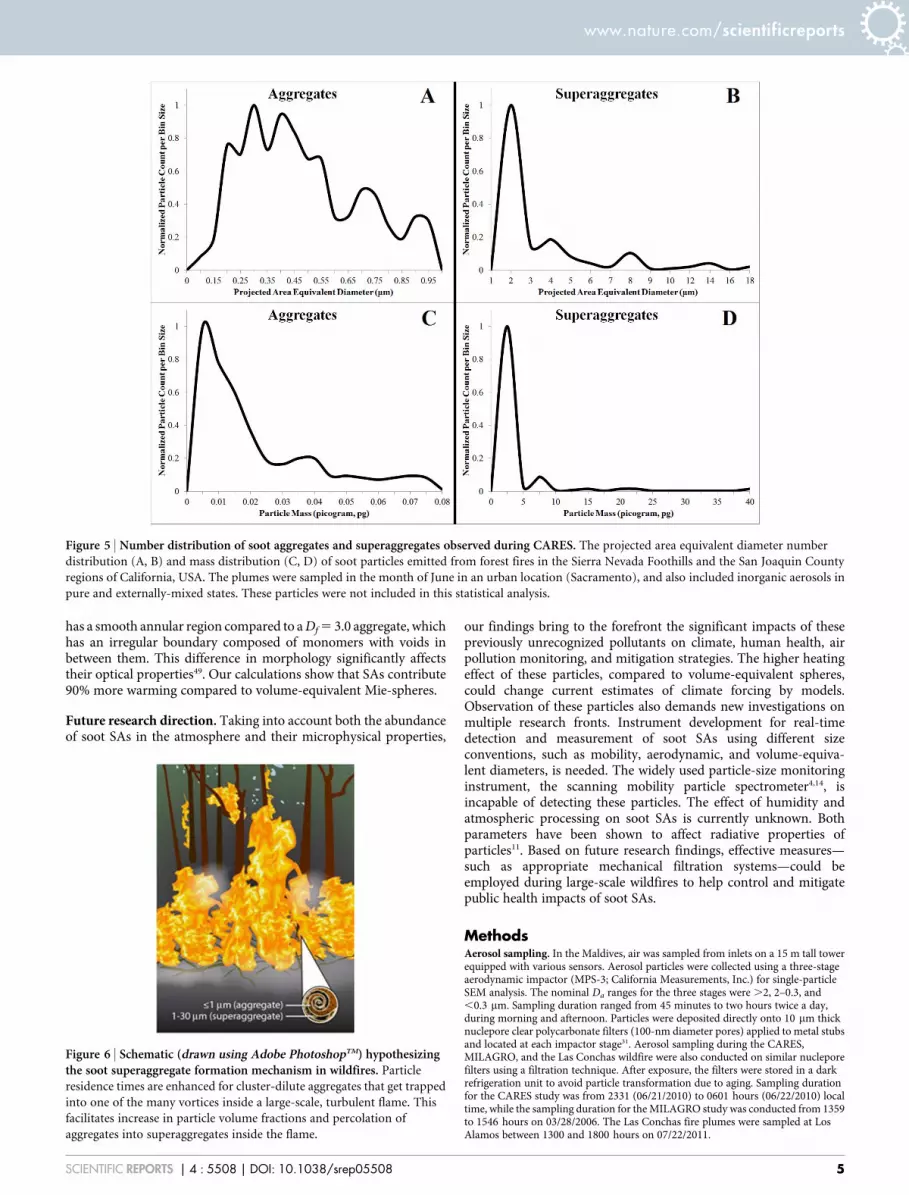
has a smooth annular region compared to a Df 5 3.0 aggregate, whichhas an irregular boundary composed of monomers with voids inbetween them. This difference in morphology significantly affectstheir optical properties49. Our calculations show that SAs contribute90% more warming compared to volume-equivalent Mie-spheres.
Future research direction. Taking into account both the abundanceof soot SAs in the atmosphere and their microphysical properties,
our findings bring to the forefront the significant impacts of thesepreviously unrecognized pollutants on climate, human health, airpollution monitoring, and mitigation strategies. The higher heatingeffect of these particles, compared to volume-equivalent spheres,could change current estimates of climate forcing by models.Observation of these particles also demands new investigations onmultiple research fronts. Instrument development for real-timedetection and measurement of soot SAs using different sizeconventions, such as mobility, aerodynamic, and volume-equiva-lent diameters, is needed. The widely used particle-size monitoringinstrument, the scanning mobility particle spectrometer4,14, isincapable of detecting these particles. The effect of humidity andatmospheric processing on soot SAs is currently unknown. Bothparameters have been shown to affect radiative properties ofparticles11. Based on future research findings, effective measures—such as appropriate mechanical filtration systems—could beemployed during large-scale wildfires to help control and mitigatepublic health impacts of soot SAs.
MethodsAerosol sampling. In the Maldives, air was sampled from inlets on a 15 m tall towerequipped with various sensors. Aerosol particles were collected using a three-stageaerodynamic impactor (MPS-3; California Measurements, Inc.) for single-particleSEM analysis. The nominal Da ranges for the three stages were .2, 2–0.3, and,0.3 mm. Sampling duration ranged from 45 minutes to two hours twice a day,during morning and afternoon. Particles were deposited directly onto 10 mm thicknuclepore clear polycarbonate filters (100-nm diameter pores) applied to metal stubsand located at each impactor stage31. Aerosol sampling during the CARES,MILAGRO, and the Las Conchas wildfire were also conducted on similar nucleporefilters using a filtration technique. After exposure, the filters were stored in a darkrefrigeration unit to avoid particle transformation due to aging. Sampling durationfor the CARES study was from 2331 (06/21/2010) to 0601 hours (06/22/2010) localtime, while the sampling duration for the MILAGRO study was conducted from 1359to 1546 hours on 03/28/2006. The Las Conchas fire plumes were sampled at LosAlamos between 1300 and 1800 hours on 07/22/2011.
Figure 5 | Number distribution of soot aggregates and superaggregates observed during CARES. The projected area equivalent diameter number
distribution (A, B) and mass distribution (C, D) of soot particles emitted from forest fires in the Sierra Nevada Foothills and the San Joaquin County
regions of California, USA. The plumes were sampled in the month of June in an urban location (Sacramento), and also included inorganic aerosols in
pure and externally-mixed states. These particles were not included in this statistical analysis.
Figure 6 | Schematic (drawn using Adobe PhotoshopTM) hypothesizingthe soot superaggregate formation mechanism in wildfires. Particle
residence times are enhanced for cluster-dilute aggregates that get trapped
into one of the many vortices inside a large-scale, turbulent flame. This
facilitates increase in particle volume fractions and percolation of
Microscopy analysis. The filter samples were prepared for SEM analysis by coatingthem with a 1-nm thick layer of platinum to prevent aerosol charging during SEManalysis. A field-emission SEM (Hitachi S-4700) was used to analyze the coated filtersfor individual particle morphology and EDX analysis. A relatively moderateaccelerating voltage of 20 kV was used for imaging most particles. Past studies haveshown that imaging at this operating voltage has negligible impact on aggregate shapedue to charging5,33. Images of individual particles were selected, based on the randomdistribution of particles on the SEM filter, for shape and size quantification.
The perimeter fractal analysis method. Calculating single-particle fractal dimensionwith the Perimeter Method is done by drawing grids of differing box sizes upon a 2-d
image of a fractal aggregate. Given a grid with a certain box size, the number ofgrid boxes through which the perimeter passes is counted. A grid with a different boxsize is then drawn, and the number of grid boxes through which the perimeter passesis counted once again. This process is repeated, and the logarithm of the box sizeplotted against the logarithm of the box count, providing the parameter fractaldimension Dp as the slope. Past experimental and simulation studies31,50,51 haveconfirmed the Dp of a superaggregate to be well defined and related to its mass fractaldimension Df using the following empirical relationship:
Dp~1z 3{Df� �3=2
, Df §2, ð1Þ
Dp~Df , Df v2: ð2Þ
The ensemble fractal analysis method. This method is the most accurate method forcalculating Df of an aggregate. Calculating aggregate Df with this method involvesusing the relationship expressed by Equation 3 below and determining the values forthe number of monomers N with the knowledge of the projected area of the aggregate(Aa), the mean projected area of the monomers (Ap), prefactor k0 (typicallyapproximated by a value < 1), and a 5 1.09
N~k0Aa
Ap
� �a
ð3Þ
Aggregate generation and T-matrix calculation. The aggregate simulation methodinvolved generating a 3-d fractal aggregate by the particle-cluster aggregationtechnique52 with a sequential algorithm that intrinsically satisfies the fundamentalfractal equation53. For pre-specified values of Df and prefactor (typically between 1.1and 1.3)54, the aggregate generation process is initiated by randomly attaching twomonomers to each other, followed by the controlled addition of further monomers tothe cluster at specific positions fulfilling the following conditions:1) the monomers donot intersect, i.e., they make point contact, and 2) the radius of gyration of the newaggregate (calculated based on the known positions of the monomers) satisfies thefundamental fractal equation for the fractal dimension and pre-factor selected. In thisstudy, the pre-factor was set at 1.18 for all fractals as recommended by Oh andSorensen54, and the monomer diameter was set to 50 nm for all calculations, based onelectron microscopy observation of superaggregates in this study. We calculate theoptical properties of fractal-like soot aggregates using the efficient superposition T-matrix code developed for multi-sphere groups with random orientation. The code isdocumented55 and is available on the Web, free of charge56. The critical advantages ofthis method are that it is numerically exact and is much more efficient than any othernumerical technique based on an explicit solution of the Maxwell equations.
Aerosol direct forcing efficiency calculation. The shortwave aerosol DFE at the topof the atmosphere caused by a uniform, optically thin aerosol layer in the lowertroposphere was calculated using
DFt
~SD 1{Acldð ÞT2atm 1{Rsfc� �2
2Rsfc1{v
1{Rsfc� �2 {bv
" #ð4Þ
where DF is the change in net solar flux at the top of the atmosphere due to thepresence of the aerosols, t is the aerosol optical depth, S is the solar constant, set to1370 Wm22, D is the fractional day length, set to 0.5, Acld is the fractional cloud cover,set to 0.6, Tatm is the solar atmospheric transmittance, set to 0.76, Rsfc is the surfacealbedo, set to 0.15 (appropriate for an urban area), and v is the aerosol singlescattering albedo. The parameter b is the up-scatter fraction, which is a function ofasymmetry parameter g as follows:
b~0:50{0:45gz0:25g2{0:29g3 ð5Þ
In all of the calculations, the relative humidity is assumed to be 0%.
1. Lamarque, J.-F. et al. Historical (1850–2000) gridded anthropogenic and biomassburning emissions of reactive gases and aerosols: methodology and application.Atmos. Chem. Phys. 10, 7017–7039 (2010).
2. Bond, T. et al. Bounding the role of black carbon in the climate system: a scientificassessment. J. Geophys. Res. 118, 5380–5552 (2013).
3. Ichoku, C., Kahn, R. & Chin, M. Satellite contributions to the quantitativecharacterization of biomass burning for climate modeling. Atmos. Res. 111, 1–28(2012).
4. Reid, J., Koppmann, R., Eck, T. & Eleuterio, D. A review of biomass burningemissions part II: intensive physical properties of biomass burning particles.Atmos. Chem. Phys 5, 799–825 (2005).
5. Chakrabarty, R. K. et al. Emissions from the laboratory combustion of wildlandfuels: Particle morphology and size. J. Geophys. Res 111, D07204 (2006).
Figure 7 | Radiative properties of soot superaggregates and comparisonwith aggregates and spherical particles. Optical properties–single
scattering albedo (A) and asymmetry parameter (B)–and direct forcing
efficiency (C) dependence of aggregates and superaggregates as functions
of size (number of monomers) and fractal dimension Df. Shaded regions
represent the upper and lower bound values for Df in the range between 1.8
and 3.0. The calculations used mean refractive index 5 1.95–0.79i,
6. Levin, E. et al. Biomass burning smoke aerosol properties measured during FireLaboratory at Missoula Experiments (FLAME). J. Geophys. Res. 115, D18210(2010).
7. McMeeking, G. R. et al. Emissions of trace gases and aerosols during the opencombustion of biomass in the laboratory. J. Geophys. Res. 114, D19210 (2009).
8. Chakrabarty, R. K. et al. Low fractal dimension cluster-dilute soot aggregates froma premixed flame. Phys. Rev. Lett. 102, 235504 (2009).
9. Sorensen, C. & Chakrabarti, A. The sol to gel transition in irreversible particulatesystems. Soft Matter 7, 2284–2296 (2011).
10. Kleinstreuer, C. & Zhang, Z. Airflow and particle transport in the humanrespiratory system. Annu. Rev. Fluid Mech. 42, 301–334 (2010).
11. Zhang, R. et al. Variability in morphology, hygroscopicity, and optical propertiesof soot aerosols during atmospheric processing. Proc. Natl. Acad. Sci. U. S. A. 105,10291–10296 (2008).
12. Kahnert, M., Nousiainen, T., Lindqvist, H. & Ebert, M. Optical properties of lightabsorbing carbon aggregates mixed with sulfate: assessment of different modelgeometries for climate forcing calculations. Optics Express 20, 10042–10058(2012).
13. Cappa, C. D. et al. Radiative Absorption Enhancements Due to the Mixing State ofAtmospheric Black Carbon. Science 337, 1078–1081 (2012).
14. Chakrabarty, R. K. et al. Light scattering and absorption by fractal-likecarbonaceous chain aggregates: Comparison of theories and experiment. Appl.Opt. 46, 6990–7006 (2007).
15. Abel, S. J., Haywood, J. M., Highwood, E. J., Li, J. & Buseck, P. R. Evolution ofbiomass burning aerosol properties from an agricultural fire in southern Africa.Geophys. Res. Lett. 30, 1783 (2003).
16. Posfai, M., Anderson, J. R., Buseck, P. R. & Sievering, H. Soot and sulfate aerosolparticles in the remote marine troposphere. J. Geophys. Res. 104, 21685–21693(1999).
17. Martins, J. V., Hobbs, P. V., Weiss, R. E. & Artaxo, P. Sphericity and morphologyof smoke particles from biomass burning in Brazil. J. Geophys. Res. 103,32051–32057 (1998).
18. Li, J., Posfai, M., Hobbs, P. V. & Buseck, P. R. Individual aerosol particles frombiomass burning in southern Africa: 2, Compositions and aging of inorganicparticles. J. Geophys. Res. 108, 8484 (2003).
19. China, S., Mazzoleni, C., Gorkowski, K., Aiken, A. C. & Dubey, M. K. Morphologyand mixing state of individual freshly emitted wildfire carbonaceous particles.Nat. Comm. 4 (2013).
20. Adachi, K. & Buseck, P. R. Atmospheric tar balls from biomass burning in Mexico.J. Geophys. Res. 116, D05204 (2011).
21. Lack, D. A. et al. Brown carbon and internal mixing in biomass burning particles.Proc. Natl. Acad. Sci. U. S. A. 109, 14802–14807 (2012).
22. Posfai, M., Simonics, R., Li, J., Hobbs, P. V. & Buseck, P. R. Individual aerosolparticles from biomass burning in southern Africa: 1. Compositions and sizedistributions of carbonaceous particles. J. Geophys. Res. 108, 8483 (2003).
23. Yokelson, R. et al. Emissions from biomass burning in the Yucatan. Atmos. Chem.Phys. 9, 5785–5812 (2009).
24. Hoover, J. in ‘‘Forest fire in Karnataka’s tiger reserves’’ published in Cable NewsNetwork (IBN) news website on 03/01/2012 (Available online at: http://ibnlive.in.com/news/forest-fire-in-karnatakas-tiger-reserves/234858-3.html Retrieved 03/18/2014).
25. Ramanathan, V. et al. Warming trends in Asia amplified by brown cloud solarabsorption. Nature 448, 575–578 (2007).
26. Mazzoleni, L. R., Zielinska, B. & Moosmuller, H. Emissions of levoglucosan,methoxy phenols, and organic acids from prescribed burns, laboratorycombustion of wildland fuels, and residential wood combustion. Environ. Sci.Technol. 41, 2115–2122 (2007).
27. Zaveri, R. A. et al. Overview of the 2010 carbonaceous aerosols and radiativeeffects study (CARES). Atmos. Chem. Phys. 12, 7647–7687 (2012).
28. Aiken, A. et al. Mexico City aerosol analysis during MILAGRO using highresolution aerosol mass spectrometry at the urban supersite (T0)–Part 1: Fineparticle composition and organic source apportionment. Atmos. Chem. Phys. 9,6633–6653 (2009).
29. DeCarlo, P. et al. Fast airborne aerosol size and chemistry measurements aboveMexico City and Central Mexico during the MILAGRO campaign. Atmos. Chem.Phys. 8, 4027–4048 (2008).
30. Chakrabarty, R. K. et al. Simulation of Aggregates with Point-ContactingMonomers in the Cluster–Dilute Regime. Part 1: Determining the Most ReliableTechnique for Obtaining Three-Dimensional Fractal Dimension from Two-Dimensional Images. Aerosol Sci. Technol. 45, 75–80 (2011).
31. Chakrabarty, R. K., Moosmuller, H., Garro, M. A. & Stipe, C. B. Observation ofSuperaggregates from a Reversed Gravity Low-Sooting Flame. Aerosol Sci.Technol. 46, I–Iii, doi:Doi 10.1080/02786826.2011.608389 (2012).
32. Kearney, S. P. & Pierce, F. Evidence of soot superaggregates in a turbulent poolfire. Combust. Flame 159, 3191–3198 (2012).
33. Chakrabarty, R. K. et al. Light Scattering and Absorption by Fractal-LikeCarbonaceous Chain Aggregates: Comparison of Theories and Experiment. Appl.Opt. 46, 6990–7006 (2007).
34. Stipe, C. B., Higgins, B. S., Lucas, D., Koshland, C. P. & Sawyer, R. F. Inverted co-flow diffusion flame for producing soot. Rev. Sci. Instrum. 76, 023908 (2005).
35. Kim, W., Sorensen, C. & Chakrabarti, A. Universal occurrence of sootsuperaggregates with a fractal dimension of 2.6 in heavily sooting laminardiffusion flames. Langmuir 20, 3969–3973 (2004).
36. Chakrabarty, R. et al. Brown carbon in tar balls from smoldering biomasscombustion. Atmos. Chem. Phys 10, 6363–6370 (2010).
37. Posfai, M. et al. Atmospheric tar balls: Particles from biomass and biofuel burning.J. Geophys. Res. 109 (2004).
38. Slowik, J. G. et al. Particle morphology and density characterization by combinedmobility and aerodynamic diameter measurements. Part 2: Application tocombustion-generated soot aerosols as a function of fuel equivalence ratio.Aerosol Sci. Technol. 38, 1206–1222 (2004).
39. Andreae, M. O. & Ramanathan, V. Climate’s dark forcings. Science 340, 280–281(2013).
40. Heyder, J., Gebhart, J., Rudolf, G., Schiller, C. F. & Stahlhofen, W. Deposition ofparticles in the human respiratory tract in the size range 0.005–15 mm. J. AerosolSci. 17, 811–825 (1986).
41. Dhaubhadel, R., Gerving, C. S., Chakrabarti, A. & Sorensen, C. M. Aerosolgelation: Synthesis of a novel, lightweight, high specific surface area material.Aerosol Sci. Technol. 41, 804–810 (2007).
42. Vilela, R. D. & Motter, A. E. Can aerosols be trapped in open flows? Phys. Rev. Lett.99, 264101 (2007).
43. Liu, L. & Mishchenko, M. I. Scattering and radiative properties of complex sootand soot-containing aggregate particles. J. Quant. Spectrosc. Radiat. Transfer 106,262–273 (2007).
44. Mishchenko, M. I., Travis, L. D. & Lacis, A. A. Scattering, absorption, and emissionof light by small particles. (Cambridge university press, 2002).
45. Chylek, P. & Wong, J. Effect of absorbing aerosols on global radiation budget.Geophys. Res. Lett. 22, 929–931 (1995).
46. Bond, T. C. & Bergstrom, R. W. Light absorption by carbonaceous particles: Aninvestigative review. Aerosol Sci. Technol. 40, 27–67 (2006).
47. Wiscombe, W. & Grams, G. The backscattered fraction in two-streamapproximations. J. Atmos. Sci. 33, 2240–2451 (1976).
48. Lewis, K. et al. Reduction in biomass burning aerosol light absorption uponhumidification: roles of inorganically-induced hygroscopicity, particle collapse, andphotoacoustic heat and mass transfer. Atmos. Chem. Phys 9, 8949–8966 (2009).
49. Liu, L., Mishchenko, M. I. & Patrick Arnott, W. A study of radiative properties offractal soot aggregates using the superposition T-matrix method. J. Quant.Spectrosc. Radiat. Transfer 109, 2656–2663 (2008).
50. Jullien, R., Kolb, M. & Botet, R. Diffusion limited aggregation with directed andanisotropic diffusion. J. de Phys. 45, 395–399 (1984).
51. Dhaubhadel, R., Pierce, F., Chakrabarti, A. & Sorensen, C. Hybrid superaggregatemorphology as a result of aggregation in a cluster-dense aerosol. Phys. Rev. E 73,011404 (2006).
52. Chakrabarty, R., Garro, M., Chancellor, C., Herald, C. & Moosmuller, H.FracMAP: A Graphical User-Interactive Package for Performing Simulation andMorphological Analysis of Fractal-Like Aerosol Agglomerates. Comput. Phys.Commun 180, 1376–1381 (2009).
53. Sorensen, C. M. Light scattering by fractal aggregates: A review. Aerosol Sci.Technol. 35, 648–687 (2001).
54. Oh, C. & Sorensen, C. M. The Effect of Overlap between Monomers on theDetermination of Fractal Cluster Morphology. J. Colloid Interface Sci. 193, 17–25(1997).
55. Mackowski, D. W. & Mishchenko, M. I. Calculation of the T-matrix and thescattering matrix for ensembles of spheres. JOSA A 13, 2266–2278 (1996).
56. Mackowski, D., Fuller, K. & Mishchenko, M. Codes for Calculation of Scattering byClusters of Spheres (Available at: ftp://ftp.eng.auburn.edu/pub/dmckwski/scatcodes/index.html), Retrieved 03/18/2014).
57. Haagenson, G. in ‘‘Fire on shore of Millerton Lake contained’’ published inAmerican Broadcasting Company (ABC30) news website on 06/22/2010 (Availableonline at: http://abclocal.go.com/kfsn/story?section5news/local&id57515202Retrieved 03/18/2014).
AcknowledgmentsThis material is based upon work supported by NASA (NNX10AR89A, NNX11AB79G andNNX12AN97H), the U.S. Department of Energy Atmospheric System Research(DE-SC0010019 and F265-LANL(PI-MKD)), the U.S. National Science FoundationDivision of Atmospheric and Geospace Sciences (ATM07-21142), and the Desert ResearchInstitute. We thank V. Ramanathan for facilitating our participation in the field campaign atMaldives; K. Gorkowski for his help with sampling aerosols during CARES and the LasConchas fire; O. Gustafsson for providing quartz fiber filter samples; B. Zielinska and herlaboratory for performing mass spectrometry analyses of quartz fiber filters; M. Ahmadianfor assisting with microscopy analysis; L. Wable for illustrations; R. Kreidberg for help withediting the manuscript; and C.M. Sorensen for insightful discussions.
Author contributionsR.K.C. conceived and led the study, including project coordination and manuscriptpreparation; N.D.B., S.C., C.M. and M.K.D. were involved with particle sampling and datacollection; N.D.B. and S.C. performed the SEM analysis; R.K.C., N.D.B. and S.C. wereinvolved with data analysis; R.K.C., N.D.B., H.M., L.L. and M.I.M. performed optical
modeling and radiative forcing calculations. All authors discussed the results andcontributed to the manuscript.
Additional informationSupplementary information accompanies this paper at http://www.nature.com/scientificreports
Competing financial interests: The authors declare no competing financial interests.
How to cite this article: Chakrabarty, R.K. et al. Soot superaggregates from flamingwildfires and their direct radiative forcing. Sci. Rep. 4, 5508; DOI:10.1038/srep05508 (2014).
This work is licensed under a Creative Commons Attribution-NonCommercial-ShareAlike 4.0 International License. The images or other third party material in thisarticle are included in the article’s Creative Commons license, unless indicatedotherwise in the credit line; if the material is not included under the CreativeCommons license, users will need to obtain permission from the license holderin order to reproduce the material. To view a copy of this license, visit http://creativecommons.org/licenses/by-nc-sa/4.0/