Acta bot. bras. 22(4): 970-982. 2008. Temporal variation of the phytoplankton community at short sampling intervals in the Mundaú reservoir, Northeastern Brazil Ênio Wocyli Dantas 1,2,3,6 , Ariadne do Nascimento Moura 2 , Maria do Carmo Bittencourt-Oliveira 3 , João Dias de Toledo Arruda Neto 4,5 and Airlton de Deus C. Cavalcanti 2 Received: July 19, 2007. Accepted: January 31, 2008 RESUMO – (Variação temporal da comunidade fitoplanctônica em curtos intervalos amostrais no reservatório de Mundaú, Nordeste brasileiro). O objetivo deste estudo foi detectar a influência dos fatores abióticos sobre a comunidade fitoplanctônica em um reservatório de abastecimento, em curtos intervalos amostrais. As amostras foram coletadas na subsuperfície (0,1 m) e fundo das regiões pelágica (8 m) e litorânea (2 m), durante dois períodos sazonais, estações seca e chuvosa. As variáveis abióticas analisadas foram: temperatura da água, oxigênio dissolvido, condutividade elétrica, sólidos totais dissolvidos, turbidez, pH, nitrogênio total, nitrito, nitrato, fósforo total, fósforo total dissolvido e ortofosfato. A biomassa fitoplanctônica foi determinada a partir de valores de biovolume. A influência das variáveis abióticas na dinâmica das espécies fitoplanctônicas foi determinada através da Análise de Correspondência Canônica. A biomassa algal variou de 1,17×10 4 a 9,21×10 4 μg.L -1 , sendo que as cianobactérias apresentaram valores de biomassa entre 1,07×10 4 e 8,21×10 4 μg.L -1 . A mais alta disponibilidade de fósforo, limitação de nitrogênio, pH alcalino e estabilidade térmica favoreceram florações de cianobactérias, especialmente durante o período seco. As diferenças entre os horários e as estações amostrais na distribuição da comunidade fitoplanctônica foram determinadas pelos valores de temperatura, pH, fósforo total e turbidez. As associações fitoplanctônicas que mais se destacaram foram do grupo funcional Sn, formado por Cylindrospermopsis raciborskii, que predominou no sistema em ambos períodos sazonais. Concluiu-se que o fitoplâncton apresentou uma forte influência das variáveis abióticas especialmente no estabelecimento de padrões sazonais de distribuição. Palavras-chave: Cylindrospermopsis raciborskii, eutrofização, nutrientes, reservatório de abastecimento ABSTRACT – (Temporal variation of the phytoplankton community at short sampling intervals in the Mundaú reservoir, Northeastern Brazil). The aim of this study was to determine how abiotic factors drive the phytoplankton community in a water supply reservoir within short sampling intervals. Samples were collected at the subsurface (0.1 m) and bottom of limnetic (8 m) and littoral (2 m) zones in both the dry and rainy seasons. The following abiotic variables were analyzed: water temperature, dissolved oxygen, electrical conductivity, total dissolved solids, turbidity, pH, total nitrogen, nitrite, nitrate, total phosphorus, total dissolved phosphorus and orthophosphate. Phytoplankton biomass was determined from biovolume values. The role abiotic variables play in the dynamics of phytoplankton species was determined by means of Canonical Correspondence Analysis. Algae biomass ranged from 1.17×10 4 to 9.21×10 4 μg.L -1 ; cyanobacteria had biomass values ranging from 1.07×10 4 to 8.21×10 4 μg.L -1 . High availability of phosphorous, nitrogen limitation, alkaline pH and thermal stability all favored cyanobacteria blooms, particularly during the dry season. Temperature, pH, total phosphorous and turbidity were key factors in characterizing the phytoplankton community between sampling times and stations. Of the species studied, Cylindrospermopsis raciborskii populations were dominant in the phytoplankton in both the dry and rainy seasons. We conclude that the phytoplankton was strongly influenced by abiotic variables, particularly in relation to seasonal distribution patterns. Key words: Cylindrospermopsis raciborskii, eutrophication, nutrients, water supply reservoir Introduction Reservoirs are continental environments generally viewed as a transition between lotic and lentic systems, as they are manmade lakes used to fulfill specific needs (Straskraba & Tundisi 2000). These artificial ecosystems exhibit space/time variability affecting the formation of several ecological niches. The ability or potential algae have to comply with habitat heterogeneity is a result of their behavior and reproduction characteristics. Thus, 1 Universidade Estadual da Paraíba, Centro de Ciências Biológicas e Sociais Aplicadas, Campus V, Av. das Baraúnas 352, João Pessoa, PB, Brasil 2 Universidade Federal Rural de Pernambuco, Departamento de Biologia, Área de Botânica, Rua D. Manoel de Medeiros s.n., 52171-030 Recife, PE, Brasil ([email protected]) 3 Escola Superior de Agricultura “Luiz de Queiroz”, Departamento de Ciências Biológicas, Av. Pádua Dias 11, C. Postal 9, 13418-900 Piracicaba, SP, Brasil 4 Universidade de São Paulo, Instituto de Física, Rua do Matão, Travessa R 187, 05508-090 Cidade Universitária, SP, Brasil 5 Universidade de Santo Amaro, Rua Prof. Enéas de Siqueira Neto 340, Jardim das Imbuias, 04829-300 São Paulo, SP, Brasil 6 Corresponding Author: [email protected]
Transcript
Acta bot. bras. 22(4): 970-982. 2008.
Temporal variation of the phytoplankton community at short sampling
intervals in the Mundaú reservoir, Northeastern Brazil
Ênio Wocyli Dantas1,2,3,6, Ariadne do Nascimento Moura2, Maria do Carmo Bittencourt-Oliveira3,João Dias de Toledo Arruda Neto4,5 and Airlton de Deus C. Cavalcanti2
Received: July 19, 2007. Accepted: January 31, 2008
RESUMO – (Variação temporal da comunidade fitoplanctônica em curtos intervalos amostrais no reservatório de Mundaú, Nordestebrasileiro). O objetivo deste estudo foi detectar a influência dos fatores abióticos sobre a comunidade fitoplanctônica em um reservatóriode abastecimento, em curtos intervalos amostrais. As amostras foram coletadas na subsuperfície (0,1 m) e fundo das regiões pelágica(8 m) e litorânea (2 m), durante dois períodos sazonais, estações seca e chuvosa. As variáveis abióticas analisadas foram: temperatura daágua, oxigênio dissolvido, condutividade elétrica, sólidos totais dissolvidos, turbidez, pH, nitrogênio total, nitrito, nitrato, fósforo total,fósforo total dissolvido e ortofosfato. A biomassa fitoplanctônica foi determinada a partir de valores de biovolume. A influência dasvariáveis abióticas na dinâmica das espécies fitoplanctônicas foi determinada através da Análise de Correspondência Canônica. Abiomassa algal variou de 1,17×10⁴ a 9,21×10⁴ µg.L-1, sendo que as cianobactérias apresentaram valores de biomassa entre 1,07×10⁴ e8,21×104 µg.L-1. A mais alta disponibilidade de fósforo, limitação de nitrogênio, pH alcalino e estabilidade térmica favoreceram floraçõesde cianobactérias, especialmente durante o período seco. As diferenças entre os horários e as estações amostrais na distribuição dacomunidade fitoplanctônica foram determinadas pelos valores de temperatura, pH, fósforo total e turbidez. As associações fitoplanctônicasque mais se destacaram foram do grupo funcional Sn, formado por Cylindrospermopsis raciborskii, que predominou no sistema emambos períodos sazonais. Concluiu-se que o fitoplâncton apresentou uma forte influência das variáveis abióticas especialmente noestabelecimento de padrões sazonais de distribuição.
Palavras-chave: Cylindrospermopsis raciborskii, eutrofização, nutrientes, reservatório de abastecimento
ABSTRACT – (Temporal variation of the phytoplankton community at short sampling intervals in the Mundaú reservoir, NortheasternBrazil). The aim of this study was to determine how abiotic factors drive the phytoplankton community in a water supply reservoir withinshort sampling intervals. Samples were collected at the subsurface (0.1 m) and bottom of limnetic (8 m) and littoral (2 m) zones in both thedry and rainy seasons. The following abiotic variables were analyzed: water temperature, dissolved oxygen, electrical conductivity, totaldissolved solids, turbidity, pH, total nitrogen, nitrite, nitrate, total phosphorus, total dissolved phosphorus and orthophosphate.Phytoplankton biomass was determined from biovolume values. The role abiotic variables play in the dynamics of phytoplankton specieswas determined by means of Canonical Correspondence Analysis. Algae biomass ranged from 1.17×10⁴ to 9.21×10⁴ µg.L-1; cyanobacteriahad biomass values ranging from 1.07×10⁴ to 8.21×10⁴ µg.L-1. High availability of phosphorous, nitrogen limitation, alkaline pH andthermal stability all favored cyanobacteria blooms, particularly during the dry season. Temperature, pH, total phosphorous and turbiditywere key factors in characterizing the phytoplankton community between sampling times and stations. Of the species studied,Cylindrospermopsis raciborskii populations were dominant in the phytoplankton in both the dry and rainy seasons. We conclude that thephytoplankton was strongly influenced by abiotic variables, particularly in relation to seasonal distribution patterns.
Key words: Cylindrospermopsis raciborskii, eutrophication, nutrients, water supply reservoir
Introduction
Reservoirs are continental environments generallyviewed as a transition between lotic and lentic systems,as they are manmade lakes used to fulfill specific needs
(Straskraba & Tundisi 2000). These artificial ecosystemsexhibit space/time variability affecting the formation ofseveral ecological niches. The ability or potential algaehave to comply with habitat heterogeneity is a result oftheir behavior and reproduction characteristics. Thus,
1 Universidade Estadual da Paraíba, Centro de Ciências Biológicas e Sociais Aplicadas, Campus V, Av. das Baraúnas 352, João Pessoa, PB, Brasil2 Universidade Federal Rural de Pernambuco, Departamento de Biologia, Área de Botânica, Rua D. Manoel de Medeiros s.n., 52171-030
Recife, PE, Brasil ([email protected])3 Escola Superior de Agricultura “Luiz de Queiroz”, Departamento de Ciências Biológicas, Av. Pádua Dias 11, C. Postal 9, 13418-900
Piracicaba, SP, Brasil4 Universidade de São Paulo, Instituto de Física, Rua do Matão, Travessa R 187, 05508-090 Cidade Universitária, SP, Brasil5 Universidade de Santo Amaro, Rua Prof. Enéas de Siqueira Neto 340, Jardim das Imbuias, 04829-300 São Paulo, SP, Brasil6 Corresponding Author: [email protected]
971Dantas, Moura, Bittencourt-Oliveira, Arruda Neto & Cavalcanti: Temporal variation of the phytoplankton...
phytoplankton is important in predicting environmentalevents and is a much-needed input in interpreting thefunctioning of reservoirs.
The small shift in daytime length in tropicalenvironments does not impede seasonal changes inphytoplankton communities. Fluctuations in biomass andphytoplankton composition are mainly related tohydrological changes (Huszar & Reynolds 1997). Short-term studies are important to the understanding ofprocesses occurring on short time scales, such asatelomixis, deoxygenating and denitrification, whichcontribute toward changes in the dynamics and structureof phytoplankton communities.
In Brazil, studies on phytoplankton in short samplingintervals (24 hours) have been carried out in systems ofthe southeastern region (Ramirez & Bicudo 2002; 2005;Lopes et al. 2005) and northern region (Huszar &Reynolds 1997; Melo & Huszar 2000), which exhibitdistinct climate characteristics from the northeasternregion. In Brazilian lakes and reservoirs studied in 24hour sampling intervals, temperature plays an importantrole in the structure and dynamics of the phytoplanktoncommunity, explaining the space and time variability ofalgae throughout a daily cycle.
The northeastern region of Brazil is mainlycharacterized by its semi-arid climate, where watershortages reflect the temporary aspect of itshydrographic basins and the low precipitation, typicallybelow 1.000 mm.y-1 (Strahler 1986). The constructionof reservoirs is a solution to problems associated to waterneeds, assuring availability in the dry season. However,influencing factors such as long water residence time inthe reservoirs, high temperatures and evapotranspiration,along with an ever increasing dumping of domestic andindustrial sewage from urban centers, have inflictedenvironmental problems such as eutrophication onreservoirs located in northeastern Brazil. In the regionand particularly in the state of Pernambuco, 90% of allreservoirs are eutrophic (Bouvy et al. 2000) and algaeblooms occur frequently in a number of aquatic systems.The most common cyanobacteria blooms are fromCylindrospermopsis raciborskii (Woloszynska) Seenayya& Subba Raju (Bouvy et al. 1999; 2000; 2001),Microcystis aeruginosa (Kützing) Kützing (Chellappa &Costa 2003) and Anabaena spiroides Klebahn (Molicaet al. 2005).
There are studies demonstrating that, undereutrophic conditions, phytoplankton biomass is controlledby abiotic factors (the bottom-up effect); small variationsin nutrient levels within short sampling intervals resultin a rapid change in the structure of the algae community.However, there is a lack of studies using short samplingintervals and associating environmental conditions of
aquatic systems in northeastern Brazil with thephytoplankton community. Thus, the aim of the presentstudy was to detect the influence of abiotic variables ontemporal distributions (daily and between the dry andrainy seasons) of a phytoplankton community in aeutrophic drinking water supply system (the MundaúReservoir) in northeastern Brazil during short periods.
Material and methods
The Mundaú reservoir lies within the coordinates08°56’47’’S and 36°29’33’’W at an altitude of 716 m.Maximum reservoir depths are 10 and 9 meters in therainy and dry seasons, respectively. The accumulationcapacity of this reservoir is 1. 968.000 m3 and the waterretention time coincides with the duration of the dryseason.
The occurrence of macrophytes is not important,but isolated banks of Nymphaea spp have been observed.The terrestrial vegetation around the reservoir is madeup of species featured in the caatinga (xeric scrublandand thorn forest). This reservoir is intended for the publicwater supply, but currently receives part of the urbandrainage from the city of Garanhuns, Pernambuco (SHR2000).
Samples were collected in two seasonal periods:dry (January 2005) and rainy (June 2005) over 20 hoursampling periods during daylight (8 am, 12 pm and 4 pm)and dark (8 pm, 12 am and 4 am) hours. Samples werecollected from the subsurface in pelagic (E1) and littoral(E2) zones using a van Dorn bottle. Samplings wereperformed at 8 m and 2 m, respectively.
Abiotic variables were determined in situ andincluded water temperature and dissolved oxygen usingan oximeter (Schott Glaswerke Mainz, handylab OX1);electrical conductivity and total dissolved solids (TSD)by means of a conductivimeter (Schott GlaswerkeMainz, handylab LF1); turbidity using a turbidimeter(Hanna Instruments, HI 93703), and pH using apotentiometer (Digimed, DMPH-2). Water transparencywas determined using a 25 cm diameter Secchi disc.The determination of the photic zone was performedfollowing the procedure described in Margalef (1983).
Samples were collected at two depths in each ofthe sampling seasons using a Van Dorn bottle forsubsequent laboratory analyses of dissolved and totalnutrients. The water was conditioned in 300 mLpolyethylene flasks and kept refrigerated until theanalysis. Samples were filtered through 47 mm AP20glass multi-pore filters for the determination of dissolvednutrients. Non-filtered aliquots were used for thedetermination of total nutrients. Analysis to determineconcentrations of total nitrogen (µg.TN.L-1), nitrite
Dantas, Moura, Bittencourt-Oliveira, Arruda Neto & Cavalcanti: Temporal variation of the phytoplankton...972
(µg.N-NO2.L-1) and nitrate (µg.N-NO3.L-1) followedprocedures described in Valderrama (1981), Mackerethet al. (1978) and Golterman et al. (1971), respectively.Total phosphorus (µg.TP.L-1) and total dissolvedphosphorus (µg.TDP.L-1) were determined followingValderrama (1981). Orthophosphate (µg.P-PO4.L-1) wasdetermined following Strickland & Parsons (1965). Thecontent of particulate phosphorus (µg.PP.L-1) anddissolved organic phosphorus (µg.DOP.L-1) weredetermined from the difference between TP and TDP,and PTD and P-PO4, respectively.
Samples for taxonomic analysis were preserved in4% formaldehyde. Identification was performed downto species level using an optical microscope (Zeiss/Axioskop) or to the highest possible taxonomic resolutionusing relevant literature (Komárek & Foot 1983;Sant’Anna 1984; Round et al. 1990; Komárek &Anagnostidis 1999; Komárek & Anagnostidis 2005).
Water aliquots of 100 mL were collected daily fromthe reservoir and preserved in acetic Lugol’s solutionfor the determination of cell density (cell.L-1) followingthe Utermöhl method (Hasle 1978). Densities wereconverted into biovolumes following the procedure inEdler (1979).
Analysis of variance (ANOVA) was calculated usingthe BioEstat 3.0 statistical package (Ayres et al. 2003)and employed to determine the degree of temporalvariation (time of the day and seasonal period) and spatialvariation (depth and sampling station). The significancelevel was set at 5%. Canonical Correspondence Analysisusing the PC-ORD software version 4.14 for Windows(McCune & Mefford 1999) was employed for theevaluation of the temporal gradient and to determine whatabiotic variables were influencing the dynamics ofphytoplankton species.
Results
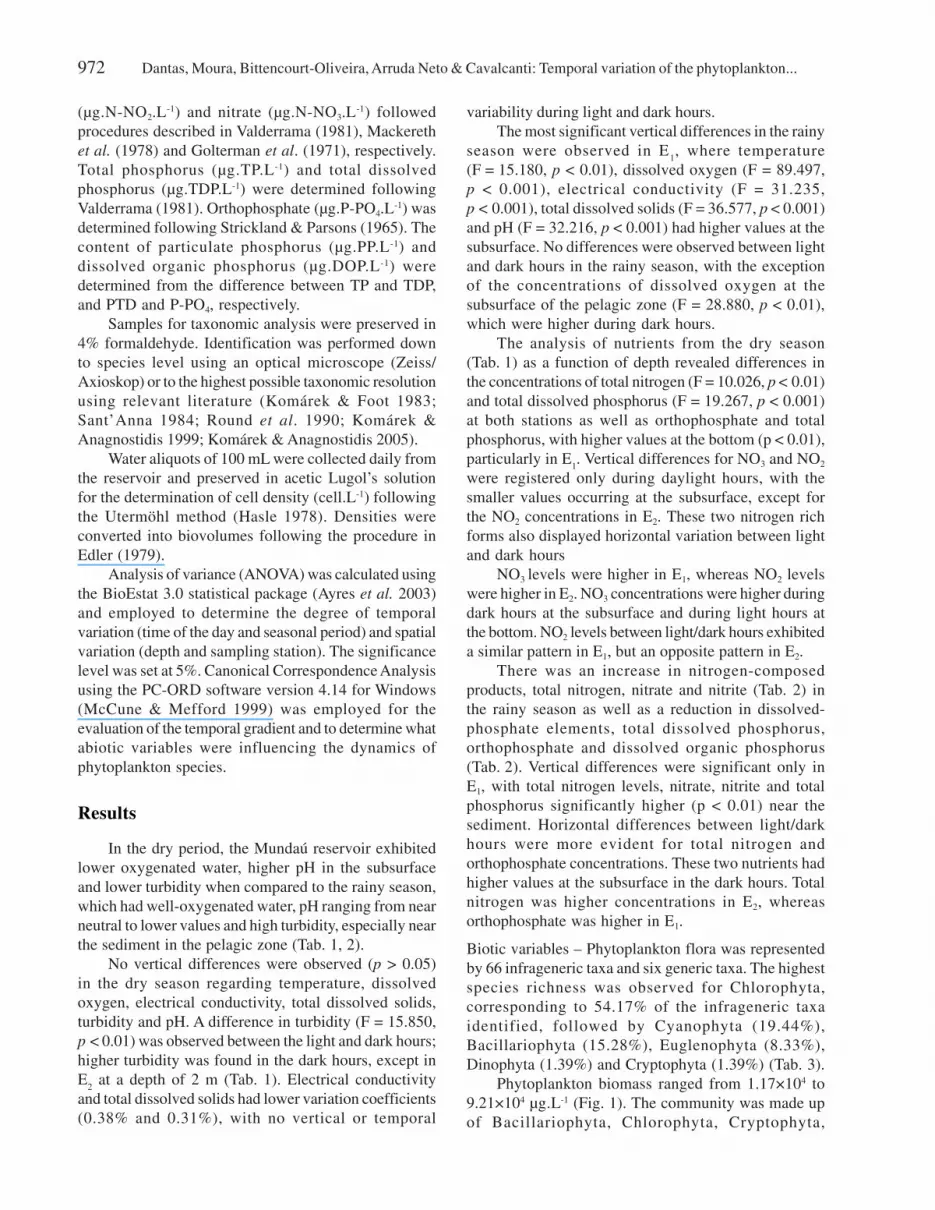
In the dry period, the Mundaú reservoir exhibitedlower oxygenated water, higher pH in the subsurfaceand lower turbidity when compared to the rainy season,which had well-oxygenated water, pH ranging from nearneutral to lower values and high turbidity, especially nearthe sediment in the pelagic zone (Tab. 1, 2).
No vertical differences were observed (p > 0.05)in the dry season regarding temperature, dissolvedoxygen, electrical conductivity, total dissolved solids,turbidity and pH. A difference in turbidity (F = 15.850,p < 0.01) was observed between the light and dark hours;higher turbidity was found in the dark hours, except inE
2 at a depth of 2 m (Tab. 1). Electrical conductivity
and total dissolved solids had lower variation coefficients(0.38% and 0.31%), with no vertical or temporal
variability during light and dark hours.The most significant vertical differences in the rainy
season were observed in E1, where temperature
(F = 15.180, p < 0.01), dissolved oxygen (F = 89.497,p < 0.001), electrical conductivity (F = 31.235,p < 0.001), total dissolved solids (F = 36.577, p < 0.001)and pH (F = 32.216, p < 0.001) had higher values at thesubsurface. No differences were observed between lightand dark hours in the rainy season, with the exceptionof the concentrations of dissolved oxygen at thesubsurface of the pelagic zone (F = 28.880, p < 0.01),which were higher during dark hours.
The analysis of nutrients from the dry season(Tab. 1) as a function of depth revealed differences inthe concentrations of total nitrogen (F = 10.026, p < 0.01)and total dissolved phosphorus (F = 19.267, p < 0.001)at both stations as well as orthophosphate and totalphosphorus, with higher values at the bottom (p < 0.01),particularly in E
1. Vertical differences for NO3 and NO2
were registered only during daylight hours, with thesmaller values occurring at the subsurface, except forthe NO2 concentrations in E2. These two nitrogen richforms also displayed horizontal variation between lightand dark hours
NO3 levels were higher in E1, whereas NO2 levels
were higher in E2. NO3 concentrations were higher duringdark hours at the subsurface and during light hours atthe bottom. NO2 levels between light/dark hours exhibiteda similar pattern in E1, but an opposite pattern in E2.
There was an increase in nitrogen-composedproducts, total nitrogen, nitrate and nitrite (Tab. 2) inthe rainy season as well as a reduction in dissolved-phosphate elements, total dissolved phosphorus,orthophosphate and dissolved organic phosphorus(Tab. 2). Vertical differences were significant only inE1, with total nitrogen levels, nitrate, nitrite and totalphosphorus significantly higher (p < 0.01) near thesediment. Horizontal differences between light/darkhours were more evident for total nitrogen andorthophosphate concentrations. These two nutrients hadhigher values at the subsurface in the dark hours. Totalnitrogen was higher concentrations in E2, whereasorthophosphate was higher in E1.
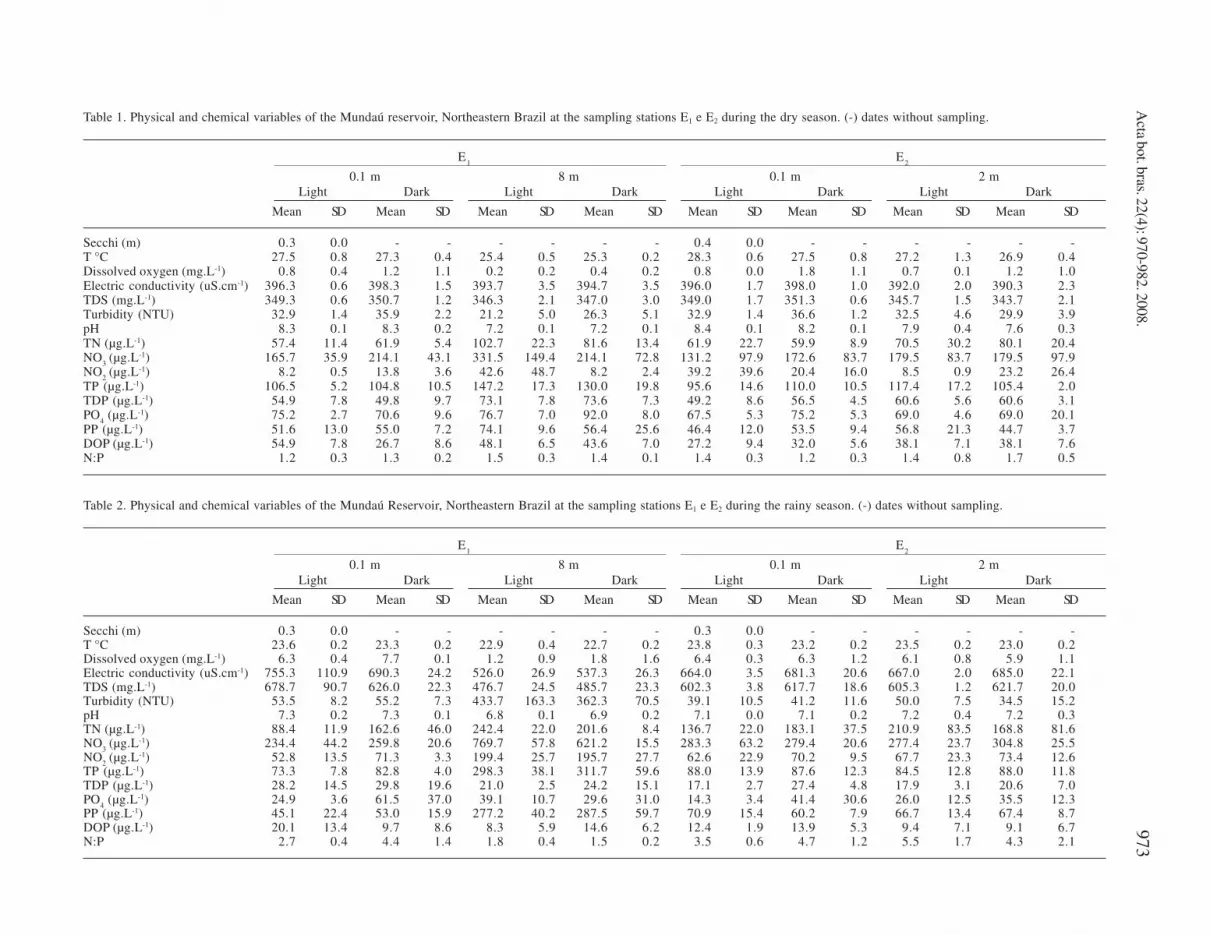
Biotic variables – Phytoplankton flora was representedby 66 infrageneric taxa and six generic taxa. The highestspecies richness was observed for Chlorophyta,corresponding to 54.17% of the infrageneric taxaidentified, followed by Cyanophyta (19.44%),Bacillariophyta (15.28%), Euglenophyta (8.33%),Dinophyta (1.39%) and Cryptophyta (1.39%) (Tab. 3).
Phytoplankton biomass ranged from 1.17×10⁴ to9.21×104 µg.L-1 (Fig. 1). The community was made upof Bacillariophyta, Chlorophyta, Cryptophyta,
Table 1. Physical and chemical variables of the Mundaú reservoir, Northeastern Brazil at the sampling stations E1 e E2 during the dry season. (-) dates without sampling.
E1
E2
0.1 m 8 m 0.1 m 2 mLight Dark Light Dark Light Dark Light Dark
Mean SD Mean SD Mean SD Mean SD Mean SD Mean SD Mean SD Mean SD
Table 2. Physical and chemical variables of the Mundaú Reservoir, Northeastern Brazil at the sampling stations E1 e E2 during the rainy season. (-) dates without sampling.
E1
E2
0.1 m 8 m 0.1 m 2 mLight Dark Light Dark Light Dark Light Dark
Mean SD Mean SD Mean SD Mean SD Mean SD Mean SD Mean SD Mean SD
Dantas, Moura, Bittencourt-Oliveira, Arruda Neto & Cavalcanti: Temporal variation of the phytoplankton...974
Hours Hours
Figure 1. Spatial and temporal variations of phytoplanktonic biomass in the Mundaú reservoir, Northeastern Brazil.
Cyanophyta, Dinophyta and Euglenophyta. Cyanophyta– the dominant group (Tab. 3), with more than 80% oftotal biomass – was the only group displaying significantdifferences in depth, particularly in E
1. Biomass values
were significantly higher at the subsurface (F = 18.255,p < 0.01). There were differences in total biomassbetween seasons, with less biomass in the rainy season(Fig. 1). In the dry season, the increase of phytoplanktonbiomass occurred beginning at 12 am, reaching itshighest values at the first daylight, especially in E1
(Fig. 1). Higher biomass in the rainy season wasregistered in E1 during daylight hours until 8 pm, with areduction beginning at 12 am to 4 am (Fig. 1).
Cylindrospermopsis raciborskii (Woloszinska)Seenayya et Subba-Raju, Geitlerinema amphibium
(Agardh ex Gomont) Anagnostidis, Cyclotella
meneghiniana Kützing and Synedra rumpens Kützingdisplayed higher biomasses in the dry season, whereasMicrocystis aeruginosa (Kützing) Kützing, M. flos-aquae
(Wittrock) Kirchner, Chlorella vulgaris Chodat andCryptomonas ovata Ehrenberg displayed higherbiomasses in the rainy season (Tab. 3).
C. raciborskii was the dominant species throughoutthe study (Tab. 3). In the dry season, this species hadstatistical differences as a function of depth at bothsampling sites (FE1
= 18.945 and FE2 = 8.291; p < 0.05and p < 0.01, respectively), with higher biomass at thesubsurface in E
1 and near the sediment in E2. This species
had higher biomass values in the dark hours in E1 and in
the daylight hours in E2. In the rainy season, differenceswere only detected in E1 and C. raciborskii had a higherbiomass at the subsurface, with an opposite light-darkpattern than that observed in the dry season.
S. rumpens was subdominant in the dry season, withbiomasses higher than 5% of total biomass average inboth sampling periods and seasons. C. meneghiniana
contributed with 5% of the total biomass in E1,particularly near the sediment. However, S. rumpens
displayed significant horizontal differences, with thebiomass enhanced in E2 (F = 24.959, p < 0.001).C. raciborskii was dominant in the rainy season, followedby M. aeruginosa, particularly at the subsurface in bothseasons. Other taxa, such as M. flos-aquae, C. ovata
and S. rumpens, were also important, with biomasseshigher than 5% of total biomass average at least at oneof the depths or sampling stations. M. flos-aquae andC. ovata were more abundant at the subsurface, withC. ovata having a more significant biomass in E2. Amongsubdominant species, only C. ovata and M. flos-aquae
exhibited a light-dark pattern. C. ovata had higherbiomass during daylight hours, particularly at thesubsurface. M. flos-aquae had higher biomass duringdark hours, except in E1 during the dry season.
The results from the Canonical CorrespondenceAnalysis are displayed in Tab. 4 and 5 as well as Fig. 2and 3. The Monte Carlo test proved significant(p < 0.01). There were relationships betweenenvironmental variables and biological information.
Eigenvalues of Axis 1 and 2 explain 27.4% of thebiological data variance. The correlation of the specieswith environmental conditions was high on both axes.
CCA Axis 1 clearly split the seasons. The samplingunits in the dry period were positively related to the axis,whereas those in the rainy period were negatively related.Taking into account the intra-set correlation, the variablespositively associated to Axis 1 were temperature, pH,total dissolved phosphorus and orthophosphate, and agrouping of sampling units in the dry season wasobserved. These environmental variables had highervalues in this season (Tab. 1 and 2). The chlorophytaClosterium parvulum Nägeli, Monoraphidium contortum
(Thret) Komárkova-Legnerová and Scenedesmus
quadricauda var. parvus G.M. Smith, cyanobacteria suchas Cylindrospermopsis raciborskii and the diatomsAulacoseira granulata (Ehrenberg) Simonsen, Cyclotella
meneghiniana and Synedra rumpens all displayed higherbiomasses in the dry season (Tab. 3).
Dissolved oxygen, electrical conductivity, totalnitrogen and nitrite were negatively associated to Axis 1and a grouping of sampling units in the rainy period was
Tabe
la 3
(con
tinu
ação
)
E1
Dry
sea
son
E2
Dry
sea
son
E1
Rai
ny s
easo
nE
2 R
ainy
sea
son
Spec
ies
0.1
m8
m0.
1 m
2 m
0.1
m8
m0.
1 m
2 m
Lig
htD
ark
Lig
htD
ark
Lig
htD
ark
Lig
htD
ark
Lig
htD
ark
Lig
htD
ark
Lig
htD
ark
Lig
htD
ark
DIN
OP
HY
TA
Gym
no
din
ium
sp.
-2
3-
-13
0-
89
44
--
--
--
-13
0
EU
GL
EN
OP
HY
TA
Eu
gle
na
oxyu
ris
Sch
mar
da-
--
48
--
--
--
--
--
--
Eu
gle
na
sp.
--
33
--
--
-3
23
2-
-3
1-
31
32
Lep
ocin
cli
s o
vu
m (
Ehr
enbe
rg)
Lem
mer
man
n-
--
--
-17
217
5-
--
--
--
-
Ph
acu
s sp
.-
--
--
--
--
--
--
--
132
Tra
ch
elo
mo
na
s o
blo
ng
a L
emm
erm
ann
173
--
--
--
118
-34
6-
-22
1-
-11
5
T.
vo
lvo
cin
a E
hren
berg
14
-1
52
81
4-
--
14
-2
94
22
71
41
41
4
CR
YP
TO
PH
YTA
Cry
pto
mo
na
s o
va
ta E
hren
berg
193
43
-2
159
720
639
113
272
947
24
129
394
741
983
472
4
Tota
l bi
omas
s64
786
6395
631
522
3726
950
265
4823
272
669
6110
037
719
3368
412
633
1555
424
447
2390
224
667
2543
2
Table 4. Statistical synthesis of the CCA first two axes performed inthe Mundaú reservoir Northeastern Brazil.
Axis 1 Axis 2
Eigenvalue 0.062 0.015Variance percentage explained 22.0 5.4Variance percentage accumulated 22.0 27.4Pearson correlation (species-environment) 0.934 0.844Monte Carlo test
Eingenvalues – p 0.01 0.03Correlations species-environment 0.01 0.01
Table 5. Canonic coefficients and intra-set correlation of theenvironmental variables for the axis 1 and 2 in the Mundaú reservoirNortheastern Brazil.
Dantas, Moura, Bittencourt-Oliveira, Arruda Neto & Cavalcanti: Temporal variation of the phytoplankton...978
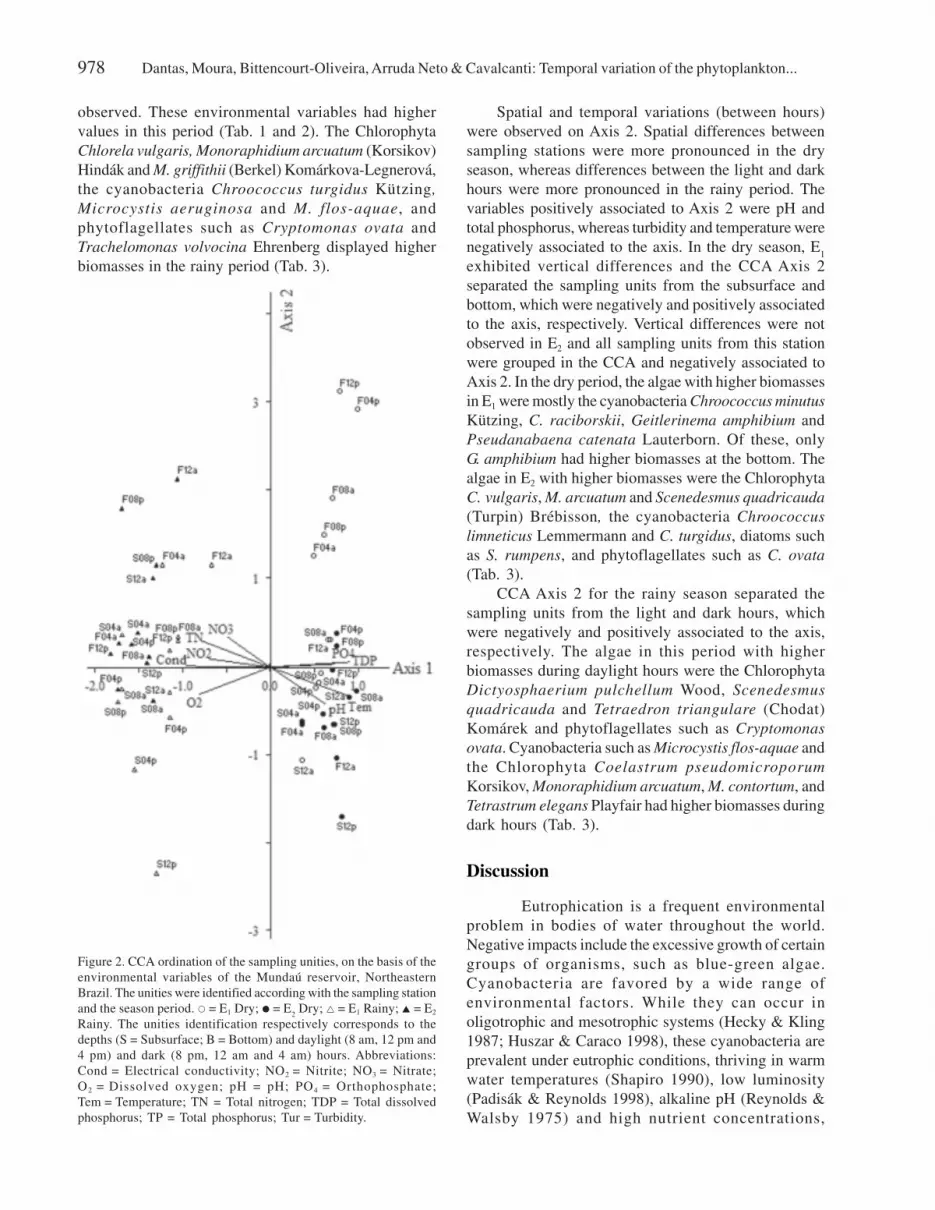
Figure 2. CCA ordination of the sampling unities, on the basis of theenvironmental variables of the Mundaú reservoir, NortheasternBrazil. The unities were identified according with the sampling stationand the season period. � = E1 Dry; � = E
2 Dry; r = E1 Rainy; p = E2
Rainy. The unities identification respectively corresponds to thedepths (S = Subsurface; B = Bottom) and daylight (8 am, 12 pm and4 pm) and dark (8 pm, 12 am and 4 am) hours. Abbreviations:Cond = Electrical conductivity; NO2
= Nitrite; NO3 = Nitrate;
O2 = Dissolved oxygen; pH = pH; PO4 = Orthophosphate;Tem = Temperature; TN = Total nitrogen; TDP = Total dissolvedphosphorus; TP = Total phosphorus; Tur = Turbidity.
observed. These environmental variables had highervalues in this period (Tab. 1 and 2). The ChlorophytaChlorela vulgaris, Monoraphidium arcuatum (Korsikov)Hindák and M. griffithii (Berkel) Komárkova-Legnerová,the cyanobacteria Chroococcus turgidus Kützing,
Microcystis aeruginosa and M. flos-aquae, andphytoflagellates such as Cryptomonas ovata andTrachelomonas volvocina Ehrenberg displayed higherbiomasses in the rainy period (Tab. 3).
Spatial and temporal variations (between hours)were observed on Axis 2. Spatial differences betweensampling stations were more pronounced in the dryseason, whereas differences between the light and darkhours were more pronounced in the rainy period. Thevariables positively associated to Axis 2 were pH andtotal phosphorus, whereas turbidity and temperature werenegatively associated to the axis. In the dry season, E
1
exhibited vertical differences and the CCA Axis 2separated the sampling units from the subsurface andbottom, which were negatively and positively associatedto the axis, respectively. Vertical differences were notobserved in E2 and all sampling units from this stationwere grouped in the CCA and negatively associated toAxis 2. In the dry period, the algae with higher biomassesin E1 were mostly the cyanobacteria Chroococcus minutus
Kützing, C. raciborskii, Geitlerinema amphibium andPseudanabaena catenata Lauterborn. Of these, onlyG. amphibium had higher biomasses at the bottom. Thealgae in E2 with higher biomasses were the ChlorophytaC. vulgaris, M. arcuatum and Scenedesmus quadricauda
(Turpin) Brébisson, the cyanobacteria Chroococcus
limneticus Lemmermann and C. turgidus, diatoms suchas S. rumpens, and phytoflagellates such as C. ovata
(Tab. 3).CCA Axis 2 for the rainy season separated the
sampling units from the light and dark hours, whichwere negatively and positively associated to the axis,respectively. The algae in this period with higherbiomasses during daylight hours were the ChlorophytaDictyosphaerium pulchellum Wood, Scenedesmus
quadricauda and Tetraedron triangulare (Chodat)Komárek and phytoflagellates such as Cryptomonas
ovata. Cyanobacteria such as Microcystis flos-aquae andthe Chlorophyta Coelastrum pseudomicroporum
Korsikov, Monoraphidium arcuatum, M. contortum, andTetrastrum elegans Playfair had higher biomasses duringdark hours (Tab. 3).
Discussion
Eutrophication is a frequent environmentalproblem in bodies of water throughout the world.Negative impacts include the excessive growth of certaingroups of organisms, such as blue-green algae.Cyanobacteria are favored by a wide range ofenvironmental factors. While they can occur inoligotrophic and mesotrophic systems (Hecky & Kling1987; Huszar & Caraco 1998), these cyanobacteria areprevalent under eutrophic conditions, thriving in warmwater temperatures (Shapiro 1990), low luminosity(Padisák & Reynolds 1998), alkaline pH (Reynolds &Walsby 1975) and high nutrient concentrations,
Acta bot. bras. 22(4): 970-982. 2008. 979
Figure 3. CCA ordination of the phytoplanktonic species found in the Mundaú reservoir, Northeastern Brazil. Abbreviations: Aha = Actinastrum
hantzschii; Ang = Ankistrodesmus gracilis; Aug = Aulacoseira granulata; Aua = A. granulata var. angustissima; Bpr = Botryococcus protuberans;Cac = Closteriopsis acicularis; Chl = Chroococcus limneticus; Chm = C. minutus; Cht = C. turgidus; Cme = Cyclotella meneghiniana;Com = Coelastrum microporum; Cop = C. pseudomicroporum; Cov = Cryptomonas ovata; Cpa = Closterium parvulum; Cqu = Crucigenia
quadrata; Cra = Cylindrospermopsis raciborskii; Cvu = Chlorella vulgaris; Deh = Dictyosphaerium ehrenbergianum; Dpu = D. pulchellum;Dov = Diploneis ovalis; Ema = Eunotia major; Emo = E. monodon; Eox = Euglena oxyuris; Esp = Euglena sp.; Gam = Geitlerinema amphibium;Gau = Gomphonema augur; Gra = Golenkinia radiata; Klu = Kirchneriella lunaris; Kob = K. obesa; Lov = Lepocinclis ovum; Mae = Microcystis
aeruginosa; Mar = Monoraphidium arcuatum; Mci = M. circinale; Mco = M. contortum; Mep = Merismopedia punctata; Mfl = Microcystis
sp.; Pls = Pleurosigma sp.; Pte = Pediastrum tetras; Rme = Raphidiopsis mediterranea; Sab = Scenedesmus acuminatus var. bernardii;Sac = S. acuminatus; Sar = S. arcuatus; Sat = S. acutus; Sbe = S. bernardii; Sbi = S. bicaudatus; Sec = S. ecornis; Squ = S. quadricauda;Spa = S. quadricauda var. parvus; Sps = Spirulina sp.; Sru = Synedra rumpens; Ssp = Scenedesmus sp.; Tca = Tetraedron caudatum; Tel = Tetrastrum
elegans; Tgr = Tetraedron gracile; Tin = T. incus; Tme = T. mediocris; Tmi = T. minima; Tob = Trachelomonas oblonga; Ttr = Tetraedron
triangulare; Tvi = T. victoriae; Tvo = Trachelomonas volvocina.
particularly phosphorus (Watson et al. 1997) and lowN:P ratio (Smith 1983). Such conditions are found inthe Mundaú reservoir and explain the development ofsubstantial cyanobacteria biomass in this system.
Nostocales, Oscillatoriales and Chroococcales alloccur in the Mundaú reservoir. Nostocales species
generally require a considerable luminosity and hightemperatures. They are also more resistant to nutrientdepletion, particularity nitrogen (Dokuil & Teubner 2000).Oscillatoriales are typical of high turbidity environmentsand low luminosity conditions (Reynolds 1997). Self-shadowing, due to the considerable development of
Dantas, Moura, Bittencourt-Oliveira, Arruda Neto & Cavalcanti: Temporal variation of the phytoplankton...980
heterocytes, results in a decreased availability ofluminosity, thereby accelerating the succession process.The Nostocales nitrogen pool is then released for theOscillatoriales by means of cell membrane disruption.
The above-mentioned conditions enable theoccurrence of a considerable development of speciesthat are able to fix nitrogen and tolerate low luminosity(Pádisák & Reynolds 1998; Dokuil & Teubner 2000).Cylindrospermopsis raciborskii has been reported as anopportunistic species (Istvánovics et al. 2000) able tomaintain perennial populations, particularly in tropicalsystems (Briand et al. 2002). Due to its similarity to theecology of Oscillatoriales, Pádisak & Reynolds (1998)moved this species to a new assemblage (denominatedSn), characterized by living in hot, de-stratified systems,while capable of tolerating low luminosity and lownitrogen concentrations. The strategies facilitatingdominance of this taxa include: 1) proliferation at hightemperatures; 2) first choosing NH3
and NO3 (Saker et al.
1999); 3) affinity and stocking of phosphorus(Istvánovics et al. 2000); 4) frequently reported asherbivore resistant (Fabbro & Duivenvoorden 1996); and5) the ability to regulate its position in the water column,mostly during thermally stratified periods (Pádisak 1997).We may therefore consider this species an R-strategist,which has developed under the favorable conditions inthe reservoir investigated.
The most representative colony-forming taxa ofcyanobacteria in the Mundaú reservoir belong to theMicrocystis genus. The blooming formation of speciesfrom this genus is related to the occurrence of anoxianear the sediment (Reynolds 1984). Sediment anoxia isresponsible for the non-stop release of phosphorus fromthe sediment, which favors the maintenance ofMicrocystis blooms at the subsurface of the system(Calijuri & Dos Santos 1996). Microcystis dominance intropical systems may be favored by changes in themixture throughout the day (Reynolds et al. 1987).Microcystis species are well known to be generally highlytoxic algae, responsible for a number of public healthproblems. The most worldwide-known incidents tookplace in the northeastern region of Brazil, whereMicrocystis blooms killed fish and shrimp in the state ofRio Grande do Norte (Chellappa et al. 2000) and led todeath over 70 patients in a dialysis clinic in Caruaru,Pernambuco (Jochimsen et al. 1998). However, bloomsof species from the Microcystis genus were massivelyreplaced by Cylindrospermopsis raciborskii, particularlyin the southeastern region of Brazil, as observed in theJuturnaíba reservoir, Rio de Janeiro (Marinho & Huszar2002) and the Garças reservoir in São Paulo (Tucci &Sant’Anna 2003). This species has been well documentedas the cause of blooms in the northeastern region (Bouvy
et al. 2000; Huszar et al. 2000), including the Mundaúreservoir (Moura et al. 2007).
Chlorophyta were represented particularly byChlorococcales, which are generally small in size whilehaving a high surface/volume ratio. This favors thenutrient absorption, thereby allowing adaptive advantages,especially in oligotrophic waters (Negro et al. 2000).Based on the phytosociological assemblages proposedby Reynolds (1997), the green algae found in the Mundaúreservoir, such as Chlorella vulgaris and Monoraphidium
contortum, are grouped within the X1 assemblages.Therefore, they are found in shallow, mixed, stratifiedenvironments and are not sensitive to nutrient shortages.
The importance of Bacillariophyta in eutrophicsystems is enhanced by changes in nutrient availabilityand water transparency (Sommer 1988). S. rumpens andC. meneghiniana (the taxa present in the reservoirinvestigated) are typical of shallow, turbid, enrichedsystems (especially S. rumpens), but are generallysensitive to nutrient depletion. Sommer (1988) statesthat diatoms are excellent competitors for reactive solublephosphorus and this could explain the occurrence ofhigher densities of these algae in the dry seasons. Tilman& Kilham (1976) found that Cyclotella meneghiniana
has a greater dependency on phosphorus when comparedto silicates. This corroborates our observations in theMundaú reservoir, particularly in the dry season.
Cryptomonas ovata had the highest greater numberof individuals among the flagellates. This species belongsto the Y functional group (Reynolds 1997), which isusually found in eutrophic systems and is resistant topoor luminosity. A greater biomass of this taxon in thereservoir investigated occurred in the rainy season, whenthermal stratification is absent. This finding is inagreement with Romo & Miracle (1995), who observedthat the development of Cryptomonas populations comeabout immediately following the occurrence of rains, asrain is responsible for the circulation of water throughoutthe water column and the re-suspension of nutrientstrapped in the sediment.
The Canonical Correspondence Analysis revealedthat the development of the phytoplankton communityin the dry season was mainly influenced by the availabilityof phosphorus. The positive correlations between bioticvariables and phosphorus products strongly suggest thatbottom-up effects play a role in phytoplankton biomasscontrol.
In the dry season, measurements of watertemperature, dissolved oxygen, turbidity and pHexhibited differences as a function of depth, with highervalues found at the subsurface. These variables influencethe spatial distribution of the phytoplankton community.Cyanobacteria, which are dominant in the pelagic zone,
Acta bot. bras. 22(4): 970-982. 2008. 981
had biomasses with significant vertical differencesbetween depths, with higher values at the subsurface,particularly for Cylindrospermopsis raciborskii. Althoughthe dominance of C. raciborskii persisted in the littoralzone, a higher abundance of diatoms was observed,particularly Synedra rumpens and cocoid chlorophyta.
The algae biomass decrease in the rainy season wasdriven by events associated to thermal de-stratificationand chemical stratification, especially dissolved oxygenand nitrogen. Phytoplankton development was influencedby an increase in allochtonous particulate nutrients,which gave rise to community reorganization events,thereby contributing to the establishment ofC. raciborskii and species from the Microcystis genus.
Water temperature and phosphorus were generallythe abiotic variables with a greater influence over bothspatial distribution (pelagic/littoral zones and depths) andtemporal distributions (times of the day and seasons) ofthe phytoplankton community in the Mundaú reservoirin northeastern Brazil. In the present study, thedemineralization of phosphorus during the dry seasoncontributed toward the re-suspension of diatom frustules.In the rainy season, the circulation of the water columnand increase in particulate elements, which wereresponsible for the low availability of resources, explainedthe development of the large biomass of Cryptomonas
ovata and Microcystis species. C. raciborskii was thespecies that most stood out in the Mundaú reservoir forbeing predominant in both seasons. The establishmentof cyanobacteria blooms, mainly made up ofC. raciborskii, was more pronounced in the dry season,which certainly occurred due to the high availability ofphosphorus, low NO3 levels, limited nitrogen, alkalinepH and thermal stability of the system.
Acknowledgements
We are grateful for the grants from Programa dePós Graduação em Botânica (PPGB) of the UniversidadeFederal Rural de Pernambuco (UFRPE) and from theConselho Nacional de Desenvolvimento Científico(CNPq), Processes 130109/2004-5, 503850/2003-9 aswell as the grants to ANM (300612/2005-20).
References
Ayres, M.; Ayres Júnior, M.; Ayres, D.L. & Dos Santos, A.A. 2003.Software BioEstat, aplicações estatísticas nas áreas das
ciências biomédicas. Versão 3.0. Belém, Sociedade CivilMamirauá/ MCT/ CNPq.
Bouvy, M.; Molica, R.; De Oliveira, S.; Marinho, M. & Becker, B.1999. Dynamics of a toxic cyanobacterial bloom(Cylindrospermopsis raciborskii) in a shallow reservoir in thesemi-arid region of northeast Brazil. Aquatic Microbial
Ecology 20: 285-297.
Bouvy, M.; Falcão, D.; Marinho, M.; Pagano, M. & Moura, A. 2000.Occurrence of Cylindrospermopsis (Cyanobacteria) in 39brazilian tropical reservoirs during the 1998 drought. Aquatic
Microbial Ecology 23: 13-27.Bouvy, M.; Molica, R.; Oliveira, S.; Marinho, M. & Beker, B. 2001.
Effects of a cyanobacterial bloom (Cylindrospermopsis
raciborskii) on bacterial and zooplankton communities inIngazeira reservoir (Northeast, Brazil). Aquatic Microbial
A. & Bernard, C. 2002. Environmental context ofCylindrospermopsis raciborskii (Cyanobacteria) blooms in ashallow pond in France. Water Research 36: 3183-3192.
Briand, J.F.; Lebourlanger, C.; Humbert, J.; Bernard, C. & Dufour, P.2004. Cylindrospermopsis raciborskii (Cyanobacteria) invasionat mid-latitudes: selection, wide physiological tolerance, or glo-bal warming? Journal of Phycology 40: 231-238.
Calijuri, M.C. & Dos Santos, A.C.A. 1996. Short-term changes inthe Barra Bonita reservoir (São Paulo, Brazil): emphasis on thephytoplankton communities. Hydrobiologia 330: 163-175.
Chellappa, N.T. & Costa, M.A.M. 2003. Dominant and co-existingepecies of Cyanobacteria from a eutrophicated reservoir of RioGrande do Norte State, Brazil. Acta Oecologica 24: S3-S10.
Chellappa, N.T.; Costa, M.A.M. & Marinho, I.R. 2000. Harmfulcyanobacterial blooms from semiarid freshwater ecosystems ofNorth-East Brazil. Australian Society of Limnology 38: 45-49.
Edler, L. 1979. Recommendations for marine biological studies inthe Baltic Sea: phytoplankton and chlorophyll. The Baltic
Marine Biologists 5: 1-38.Fabbro, L.D. & Duivenvoorden, L.J. 1996. Profile of a bloom of the
cyanobacteria Cylindrospermopsis raciborskii (Wolozysnska)Seenaya and Subba Raju in the Fitzroy River in tropical centerQueensland. Marine and Freshwater Research 47: 685-694.
for physical and chemical analysis of freshwaters. 2nd ed,Oxford, Blackwell Scientific Publications.
Hasle, G.R. 1978. The inverted-microscope methods. Pp. 88-96.In: A. Sournia (ed.). Phytoplankton manual. Paris, UNESCO.
Hecky, R. & Kling, H.J. 1987. Phytoplankton ecology of the greatlakes in the rift valleys of central Africa. Archiv für
Hydrobiologie Beihefte Ergebnisse der Limnologie 25:197-228.
Huszar, V.L.M. & Caraco, N.F. 1998. The relationship betweenphytoplankton composition and physical-chemical variables: acomparison of taxonomic and morphological-functionaldescriptors in six temperate lakes. Freshwater Biology 40:679-696.
Huszar, V.L.M. & Reynolds, C.S. 1997. Flood-plain lake (Lago Ba-tata, Pará, Brazil): responses to gradual environmental change.Hydrobiologia 346: 169-181.
Huszar, V.L.M.; Silva, L.H.S.; Marinho, M.; Domingos, P. &Sant’Anna, C.L. 2000. Cyanoprokaryote assemblages in eightproductive tropical Brazilian waters. Hydrobiologia 424: 67-77.
Istvánovics, V.; Shafik, H.M.; Préssing, M. & Juhos, S. 2000. Growthand phosphate uptake kinetics of the cyanobacteriumCylindrospermopsis raciborskii (Cyanophyceae) in a throughflowcultures. Freshwater Biology 43: 257-275.
Jochimsen, E.M.; Carmichael, W.W.J.; Cardo, D.M.; Cookson, S.T.;Holmes, C.E.M.; Antunes, B.C.; Melo Filho, D.A.; Lyra, T.M.;Barreto, V.S.T.; Azevedo, S.M.F.O. & Jarvis, W.R. 1998. Liverfailure and death after exposure to microcystins at a hemodialysiscenter in Brazil. New England Journal Medicine 338:873-878.
Komárek, J. & Foot, B. 1983. Das Phytoplankton des SübwassersSystematik und Biologie. 7. Teil: Chlorophyceae (Grünalgen)Ordnung: Chlorococcales. Pp. 1-1044. In: H.J. Elster & W.Ohle (eds.). Die Binnengewässer. Stutgart, Begründet vonAugust Thienemann.
Dantas, Moura, Bittencourt-Oliveira, Arruda Neto & Cavalcanti: Temporal variation of the phytoplankton...982
Komárek, J. & Anagnostidis, K. 1999. Cyanoprokaryota. 1. Teil:Chroococcales. In: H. Ettl; G. Gärtner; H. Heynig & D.Mollenhauer (eds.). Süsswasserflora von Mitteleuropa.Stutgart, Gustav Fischer.
Komárek, J. & Anagnostidis, K. 2005. Cyanoprokaryota 2. Teil:Oscillatoriales. Pp. 1-759. In: B. Bridel; G.L. Gastner & M.S.Krienitz (eds.). Süßwasserflora von Mitteleuropa. 19/2.London, Elsevier.
Lopes, M.R.M.; Bicudo, C.E.M. & Ferragut, C. 2005. Short termspatial and temporal variation of phytoplankton in a shallowtropical oligotrophic reservoir, southeast Brazil. Hydrobiologia
542: 235-247.Mackereth, J.J.H.; Heron, J. & Talling, J.F. 1978. Water analysis:
some revised methods for limnologists. Scientific Publicationn° 36, London, Freshwater Biological Association.
Margalef, R. 1983. Limnologia. Barcelona, Omega, S.A.Marinho, M.M. & Huszar, V.L.M. 2002. Nutrient availability and
physical conditions as controlling factors of phytoplanktoncomposition and biomass in a tropical reservoir (SoutheasternBrazil). Archiv für Hydrobiologie 153: 443-468.
McCune, B. & Mefford, M.J. 1999. PC-ORD for Windows:
multivariate analysis of ecological data. MjM Software,Oregon, Gleneden Beach.
Melo, S. & Huszar, V.L.M. 2000. Phytoplankton in an Amazonianflood-plain lake (Lago Batata, Brazil): diel variation and speciesstrategies. Journal of Plankton Research 22: 63-76.
Molica, R.J.R.; Oliveira, E.J.A.; Carvalho, P.V.V.C.; Costa, A.N.S.F.;Cunha, M.C.C.; Melo, G.L. & Azevedo, S.M.F.O. 2005. Occurrenceof saxitoxins and an anatoxin-a(s)-like anticholinesterase in aBrazilian drinking water supply. Harmful Algae 4: 743-753.
Moura, A.N.; Bittencourt-Oliveira, M.C.; Dantas, E.W. & ArrudaNeto, J.D.T. 2007. Phytoplanktonic Associations: A Tool toUnderstand Dominance Events in a Tropical Brazilian Reservoir.Acta Botanica Brasilica 21: 641-648.
Negro, A.I.; De Hoyos, C. & Veja, J. C. 2000. Phytoplanktonstructure and dynamics in Lake Sanabria and Valparaíso reservoir(NW Spain). Hydrobiologia 424: 25-37.
Padisák, J. 1997. Cylindrospermopsis raciborskii (Woloszynska)Seenayya et Subba Raju, an expanding, highly adaptativecyanobacterium: worldwide distribution and review of its ecology.Algological Studies 107: 563-593.
Padisák, J. & Reynolds, C.S. 1998. Selection of phytoplanktonassemblages in lake Balaton, Hungary, in response toeutrophication and restoration measures, with special referenceto the cyanoprokariotes. Hydrobiologia 384: 41-53.
Ramirez, J.J. & Bicudo, C.E.M. 2002. Variation of climatic andphysical co-determinants of phytoplankton community in fournictemeral sampling days in a shallow tropical reservoir,southeastern Brazil. Brazilian Journal of Biology 62: 1-14.
Ramirez, J.J. & Bicudo, C.E.M. 2005. Diurnal and spatial (vertical)dynamics of nutrient (N, P, Si) in four sampling days (summer,fall, winter and spring) in a tropical shallow reservoir and theirrelationships with the phytoplankton community. Brazilian
Journal of Biology 65: 141-157.Reynolds, C.S. 1984. Phytoplankton periodicity; the interactions
of form, function and environmental variability. Freshwater
Biology 14: 111-142.
Reynolds, C.S. 1997. Vegetation processes in the pelagic: a
model for ecosystem theory. Oldendorf, Ecology Institute.Reynolds, C.S. & Walsby, A.E. 1975. Water blooms. Biological
by blue-green algae in lake phytoplankton. Science 221:669-671.
SRH (Secretaria de Recursos Hídricos de Pernambuco) 2000. Plano
Estadual de Recursos Hídricos do Estado de Pernambuco
– Documento Síntese, Recife.Strahler, A. 1986. Geografia Física. Barcelona, Omega, S.A.Straskraba, M. & Tundisi, J.G. 2000. Diretrizes para o
gerenciamento de lagos: gerenciamento da qualidade dos
lagos. São Carlos, ILEC/IIE.Strickland, J.D. & Parsons, T.R. 1965. A manual of sea water analysis.
Bulletin of the Fisheries Research Board of Canada 125:1-185.
Sommer, U. 1988. Growth and survival strategies of planktonsuccession. Pp 57-106. In: U. Sommer (ed.). Plankton Ecology
– Succession in Plankton Communities. Springer Series ofContemporary Bioscience.
Tilman, D. & Kilham, S.S. 1976. Phosphate and silicate uptake andgrowth kinetics of the diatoms Asterionella formosa andCyclotella meneghiniana in batch and semi-continuous culture.Journal of Phycology 12: 375-383.
Tucci, A. & Sant’Anna, C.L. 2003. Cylindrospermopsis raciborskii
(Woloszynska) Seenayya & Subba Raju (Cyanobacteria): varia-ção semanal e relações com fatores ambientais em um reserva-tório eutrófico, São Paulo, SP, Brasil. Revista Brasileira de
Botânica 26: 97-112.Valderrama, G.C. 1981. The simultaneous analysis of total nitrogen
and total phosphorus in natural waters. Marine Chemistry
10: 109-122.Watson, S.B.; McCauley, E. & Downing, J.A. 1997. Patterns in
phytoplankton taxonomic composition across temperate lakesof differing nutrient status. Limnology and Oceanography
42: 487-495.
Versão eletrônica do artigo em www.scielo.br/abb e http://www.botanica.org.br/acta/ojs


![[B chromosome morphotypes of Apodemus peninsulae (Rodentia) from the Russian Far East]](https://static.documents.pub/doc/80x56/636204bf7cfdc0c82205cd6d/b-chromosome-morphotypes-of-apodemus-peninsulae-rodentia-from-the-russian-far.jpg)


