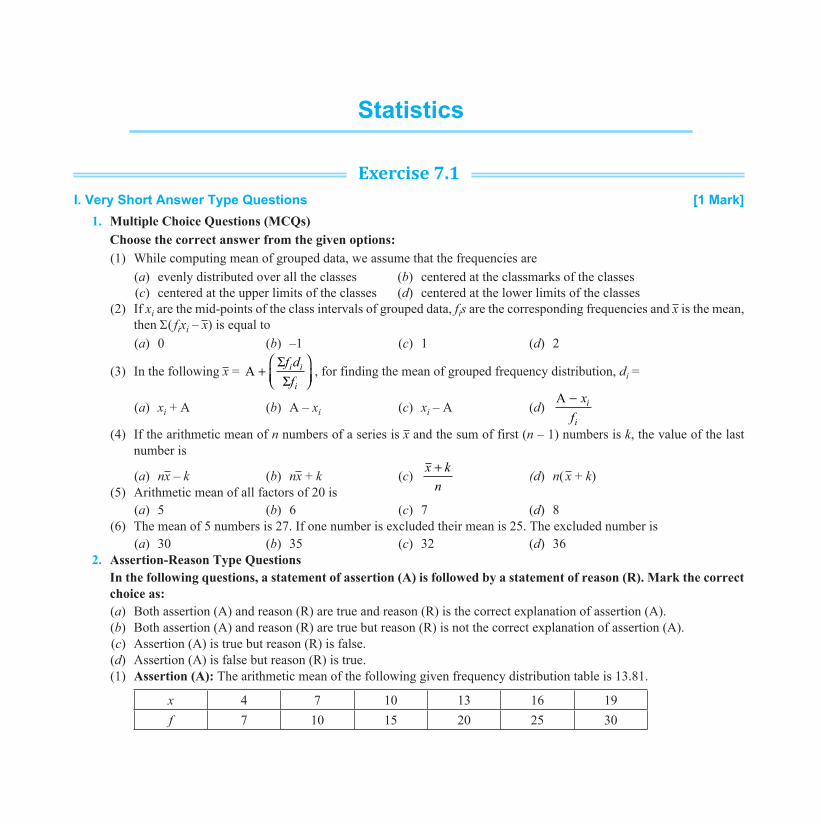
Statistics Exercise 7.1 I. Very Short Answer Type Questions [1 Mark] 1. Multiple Choice Questions (MCQs) Choose the correct answer from the given options: (1) While computing mean of grouped data, we assume that the frequencies are (a) evenly distributed over all the classes (b) centered at the classmarks of the classes (c) centered at the upper limits of the classes (d) centered at the lower limits of the classes (2) If x i are the mid-points of the class intervals of grouped data, f i s are the corresponding frequencies and x is the mean, then S( f i x i – x) is equal to (a) 0 (b) –1 (c) 1 (d) 2 (3) In the following x = A + Σ Σ fd f i i i , for finding the mean of grouped frequency distribution, d i = (a) x i + A (b) A – x i (c) x i – A (d) A - x f i i (4) If the arithmetic mean of n numbers of a series is x and the sum of first (n – 1) numbers is k, the value of the last number is (a) nx – k (b) nx + k (c) x k n + (d) n( x + k) (5) Arithmetic mean of all factors of 20 is (a) 5 (b) 6 (c) 7 (d) 8 (6) The mean of 5 numbers is 27. If one number is excluded their mean is 25. The excluded number is (a) 30 (b) 35 (c) 32 (d) 36 2. Assertion-Reason Type Questions In the following questions, a statement of assertion (A) is followed by a statement of reason (R). Mark the correct choice as: (a) Both assertion (A) and reason (R) are true and reason (R) is the correct explanation of assertion (A). (b) Both assertion (A) and reason (R) are true but reason (R) is not the correct explanation of assertion (A). (c) Assertion (A) is true but reason (R) is false. (d) Assertion (A) is false but reason (R) is true. (1) Assertion (A): The arithmetic mean of the following given frequency distribution table is 13.81. x 4 7 10 13 16 19 f 7 10 15 20 25 30
Transcript
E:\2020-2021\1. Delhi Mathematics-2021\14112021\1.X-Mathematics-G-EM-For Standard\Ch-7 Folder\Ch-7 \ 23-Nov-2021 Amit Proof-3 Reader’s Sign _______________________ Date __________
Statistics
Exercise 7.1I. Very Short Answer Type Questions [1 Mark] 1. Multiple Choice Questions (MCQs) Choose the correct answer from the given options: (1) While computing mean of grouped data, we assume that the frequencies are (a) evenly distributed over all the classes (b) centered at the classmarks of the classes (c) centered at the upper limits of the classes (d) centered at the lower limits of the classes (2) If xi are the mid-points of the class intervals of grouped data, fis are the corresponding frequencies and x is the mean,
then S( fixi – x) is equal to (a) 0 (b) –1 (c) 1 (d) 2
(3) In the following x = A +
ΣΣf dfi i
i, for finding the mean of grouped frequency distribution, di =
(a) xi + A (b) A – xi (c) xi – A (d) A − xf
i
i (4) If the arithmetic mean of n numbers of a series is x and the sum of first (n – 1) numbers is k, the value of the last
number is
(a) nx – k (b) nx + k (c) x kn+ (d) n( x + k)
(5) Arithmetic mean of all factors of 20 is (a) 5 (b) 6 (c) 7 (d) 8 (6) The mean of 5 numbers is 27. If one number is excluded their mean is 25. The excluded number is (a) 30 (b) 35 (c) 32 (d) 36 2. Assertion-Reason Type Questions In the following questions, a statement of assertion (A) is followed by a statement of reason (R). Mark the correct
choice as: (a) Both assertion (A) and reason (R) are true and reason (R) is the correct explanation of assertion (A). (b) Both assertion (A) and reason (R) are true but reason (R) is not the correct explanation of assertion (A). (c) Assertion (A) is true but reason (R) is false. (d) Assertion (A) is false but reason (R) is true. (1) Assertion (A): The arithmetic mean of the following given frequency distribution table is 13.81.
x 4 7 10 13 16 19f 7 10 15 20 25 30
E:\2020-2021\1. Delhi Mathematics-2021\14112021\1.X-Mathematics-G-EM-For Standard\Ch-7 Folder\Ch-7 \ 23-Nov-2021 Amit Proof-3 Reader’s Sign _______________________ Date __________
Reason (R): xf xfi i
i
=ΣΣ
(2) Assertion (A): To find mean of a grouped data, we use x af dfi i
i
= +ΣΣ
where a is the assumed mean and di the deviation.
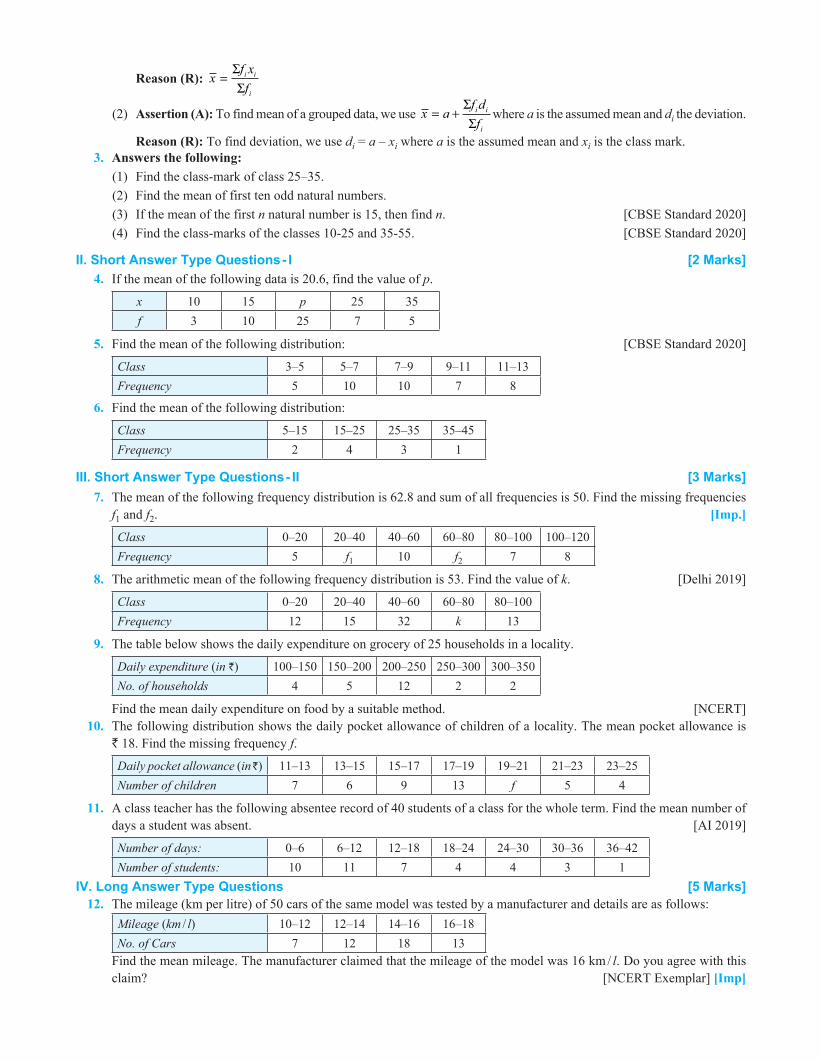
Reason (R): To find deviation, we use di = a – xi where a is the assumed mean and xi is the class mark. 3. Answers the following: (1) Find the class-mark of class 25–35. (2) Find the mean of first ten odd natural numbers. (3) If the mean of the first n natural number is 15, then find n. [CBSE Standard 2020] (4) Find the class-marks of the classes 10-25 and 35-55. [CBSE Standard 2020]
II. Short Answer Type Questions - I [2 Marks] 4. If the mean of the following data is 20.6, find the value of p.
x 10 15 p 25 35f 3 10 25 7 5
5. Find the mean of the following distribution: [CBSE Standard 2020]
Class 3–5 5–7 7–9 9–11 11–13Frequency 5 10 10 7 8
6. Find the mean of the following distribution:
Class 5–15 15–25 25–35 35–45Frequency 2 4 3 1
III. Short Answer Type Questions - II [3 Marks] 7. The mean of the following frequency distribution is 62.8 and sum of all frequencies is 50. Find the missing frequencies
f1 and f2. [Imp.]
Class 0–20 20–40 40–60 60–80 80–100 100–120Frequency 5 f1 10 f2 7 8
8. The arithmetic mean of the following frequency distribution is 53. Find the value of k. [Delhi 2019]
Class 0–20 20–40 40–60 60–80 80–100Frequency 12 15 32 k 13
9. The table below shows the daily expenditure on grocery of 25 households in a locality.
Daily expenditure (in `) 100–150 150–200 200–250 250–300 300–350No. of households 4 5 12 2 2
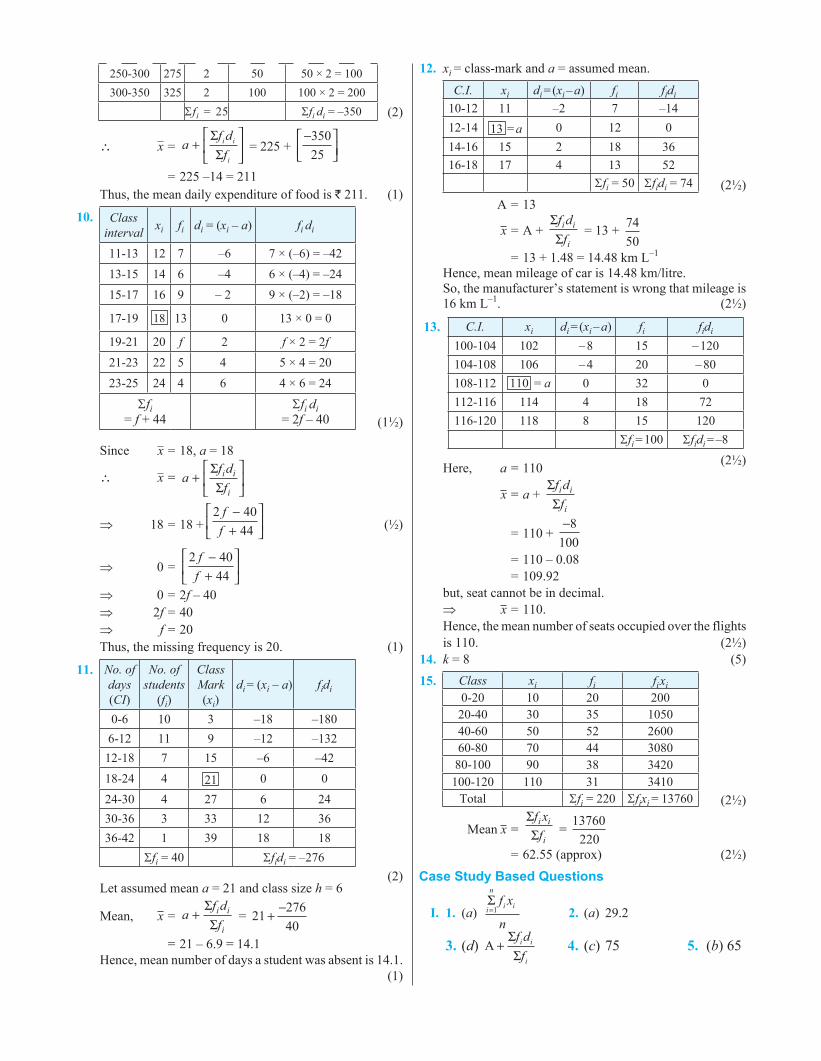
Find the mean daily expenditure on food by a suitable method. [NCERT] 10. The following distribution shows the daily pocket allowance of children of a locality. The mean pocket allowance is
` 18. Find the missing frequency f.
Daily pocket allowance (in ̀ ) 11–13 13–15 15–17 17–19 19–21 21–23 23–25Number of children 7 6 9 13 f 5 4
11. A class teacher has the following absentee record of 40 students of a class for the whole term. Find the mean number of days a student was absent. [AI 2019]
Number of days: 0–6 6–12 12–18 18–24 24–30 30–36 36–42Number of students: 10 11 7 4 4 3 1
IV. Long Answer Type Questions [5 Marks] 12. The mileage (km per litre) of 50 cars of the same model was tested by a manufacturer and details are as follows:
Find the mean mileage. The manufacturer claimed that the mileage of the model was 16 km / l. Do you agree with this claim? [NCERT Exemplar] [Imp]
E:\2020-2021\1. Delhi Mathematics-2021\14112021\1.X-Mathematics-G-EM-For Standard\Ch-7 Folder\Ch-7 \ 23-Nov-2021 Amit Proof-3 Reader’s Sign _______________________ Date __________
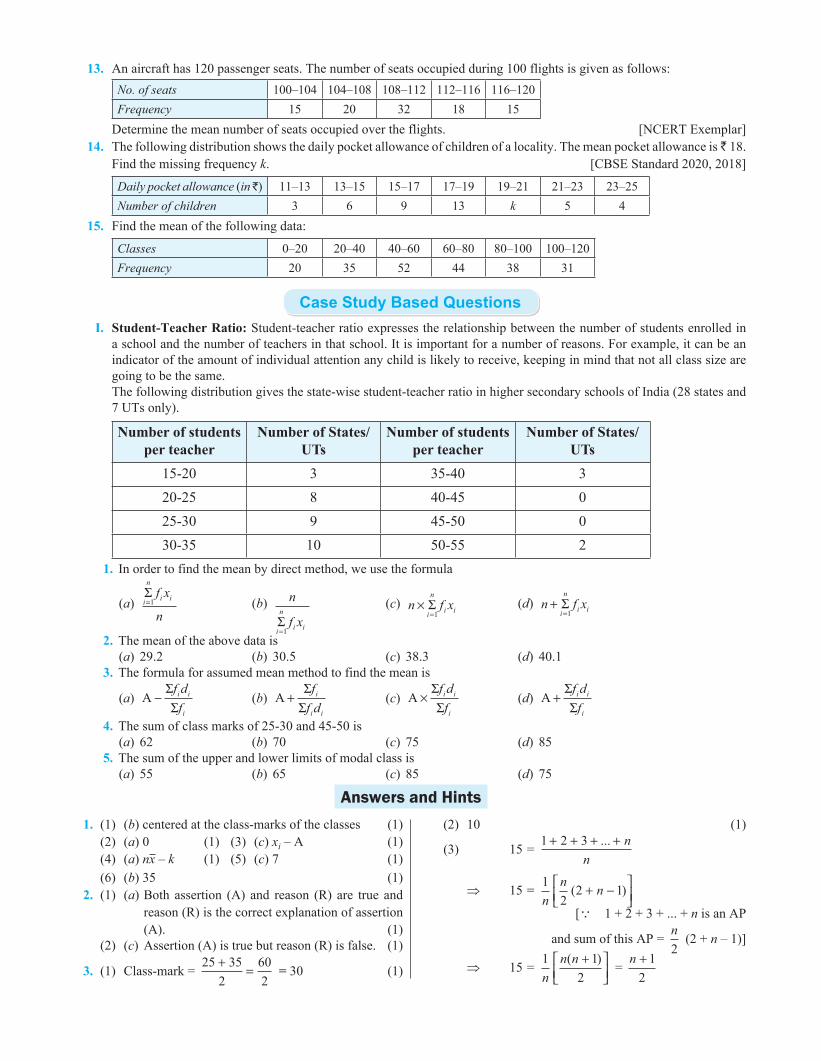
13. An aircraft has 120 passenger seats. The number of seats occupied during 100 flights is given as follows:No. of seats 100–104 104–108 108–112 112–116 116–120Frequency 15 20 32 18 15
Determine the mean number of seats occupied over the flights. [NCERT Exemplar] 14. The following distribution shows the daily pocket allowance of children of a locality. The mean pocket allowance is ̀ 18.
Find the missing frequency k. [CBSE Standard 2020, 2018]
Daily pocket allowance (in ̀ ) 11–13 13–15 15–17 17–19 19–21 21–23 23–25Number of children 3 6 9 13 k 5 4
Case Study Based Questions I. Student-Teacher Ratio: Student-teacher ratio expresses the relationship between the number of students enrolled in
a school and the number of teachers in that school. It is important for a number of reasons. For example, it can be an indicator of the amount of individual attention any child is likely to receive, keeping in mind that not all class size are going to be the same.
The following distribution gives the state-wise student-teacher ratio in higher secondary schools of India (28 states and 7 UTs only).
1. In order to find the mean by direct method, we use the formula
(a) Σi
n
i if x
n=1 (b) n
f xi
n
i iΣ=1
(c) n f xi
n
i i×=Σ
1 (d) n f x
i
n
i i+=Σ
1
2. The mean of the above data is (a) 29.2 (b) 30.5 (c) 38.3 (d) 40.1 3. The formula for assumed mean method to find the mean is
(a) A −ΣΣf dfi i
i
(b) A +Σ
Σff di
i i
(c) A ×ΣΣf dfi i
i
(d) A +ΣΣf dfi i
i
4. The sum of class marks of 25-30 and 45-50 is (a) 62 (b) 70 (c) 75 (d) 85 5. The sum of the upper and lower limits of modal class is (a) 55 (b) 65 (c) 85 (d) 75
Answers and Hints 1. (1) (b) centered at the class-marks of the classes (1) (2) (a) 0 (1) (3) (c) xi – A (1) (4) (a) nx – k (1) (5) (c) 7 (1) (6) (b) 35 (1) 2. (1) (a) Both assertion (A) and reason (R) are true and
reason (R) is the correct explanation of assertion (A). (1)
(2) (c) Assertion (A) is true but reason (R) is false. (1)
3. (1) Class-mark = 25 35
2
60
2
+= = 30 (1)
(2) 10 (1)
(3) 15 = 1 2 3+ + + +... nn
⇒ 15 = 1
22 1
nn n( )+ −
[Q 1 + 2 + 3 + ... + n is an AP
and sum of this AP = n2
(2 + n – 1)]
⇒ 15 = 1 1
2nn n( )+
= n + 1
2
E:\2020-2021\1. Delhi Mathematics-2021\14112021\1.X-Mathematics-G-EM-For Standard\Ch-7 Folder\Ch-7 \ 23-Nov-2021 Amit Proof-3 Reader’s Sign _______________________ Date __________
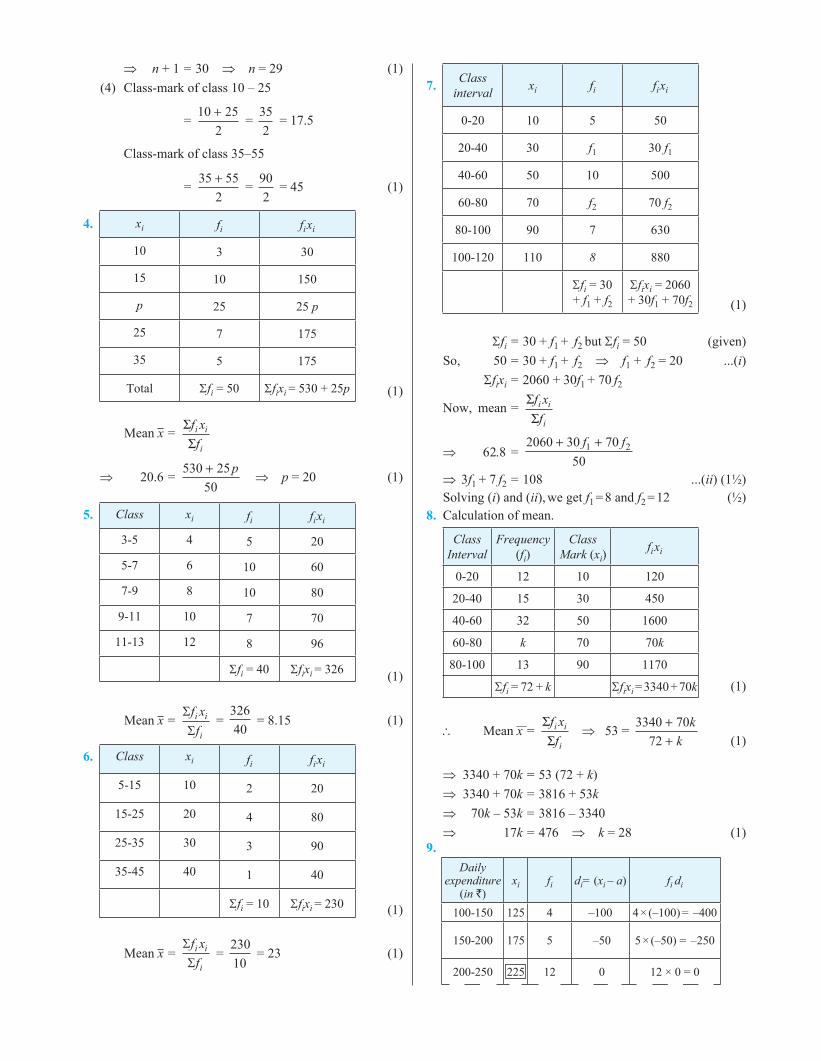
⇒ n + 1 = 30 ⇒ n = 29 (1) (4) Class-mark of class 10 – 25
= 10 25
2
+ = 35
2 = 17.5
Class-mark of class 35–55
= 35 55
2
+ = 90
2 = 45 (1)
4. xi fi fi xi
10 3 30
15 10 150
p 25 25 p
25 7 175
35 5 175
Total Sfi = 50 Sfixi = 530 + 25p
(1)
Mean x = ΣΣf xfi i
i
⇒ 20.6 = 530 25
50
+ p ⇒ p = 20 (1)
5. Class xi fi fi xi
3-5 4 5 20
5-7 6 10 60
7-9 8 10 80
9-11 10 7 70
11-13 12 8 96
Sfi = 40 Sfixi = 326
(1)
Mean x = SSf xfi i
i =
326
40 = 8.15 (1)
6. Class xi fi fi xi
5-15 10 2 20
15-25 20 4 80
25-35 30 3 90
35-45 40 1 40
Sfi = 10 Sfixi = 230
(1)
Mean x = SSf xfi i
i =
230
10 = 23 (1)
7. Class interval xi fi fi xi
0-20 10 5 50
20-40 30 f1 30 f1
40-60 50 10 500
60-80 70 f2 70 f2
80-100 90 7 630
100-120 110 8 880
Sfi = 30 + f1 + f2
Sfixi = 2060 + 30f1 + 70f2
(1)
Sfi = 30 + f1 + f2 but Sfi = 50 (given) So, 50 = 30 + f1 + f2 ⇒ f1 + f2 = 20 ...(i) Sfixi = 2060 + 30f1 + 70 f2
Now, mean = ΣΣf xfi i
i
⇒ 62.8 = 2060 30 70
50
1 2+ +f f
⇒ 3f1 + 7 f2 = 108 ...(ii) (1½) Solving (i) and (ii), we get f1 = 8 and f2 = 12 (½) 8. Calculation of mean.
E:\2020-2021\1. Delhi Mathematics-2021\14112021\1.X-Mathematics-G-EM-For Standard\Ch-7 Folder\Ch-7 \ 23-Nov-2021 Amit Proof-3 Reader’s Sign _______________________ Date __________
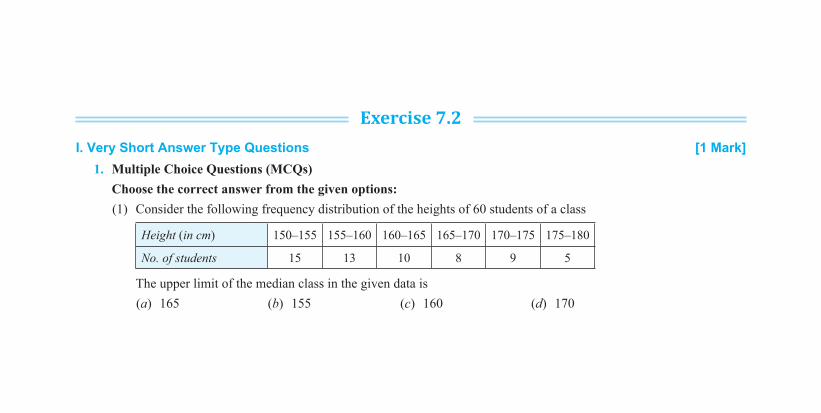
Exercise 7.2I. Very Short Answer Type Questions [1 Mark] 1. Multiple Choice Questions (MCQs) Choose the correct answer from the given options: (1) Consider the following frequency distribution of the heights of 60 students of a class
Height (in cm) 150–155 155–160 160–165 165–170 170–175 175–180
No. of students 15 13 10 8 9 5
The upper limit of the median class in the given data is (a) 165 (b) 155 (c) 160 (d) 170
E:\2020-2021\1. Delhi Mathematics-2021\14112021\1.X-Mathematics-G-EM-For Standard\Ch-7 Folder\Ch-7 \ 23-Nov-2021 Amit Proof-3 Reader’s Sign _______________________ Date __________
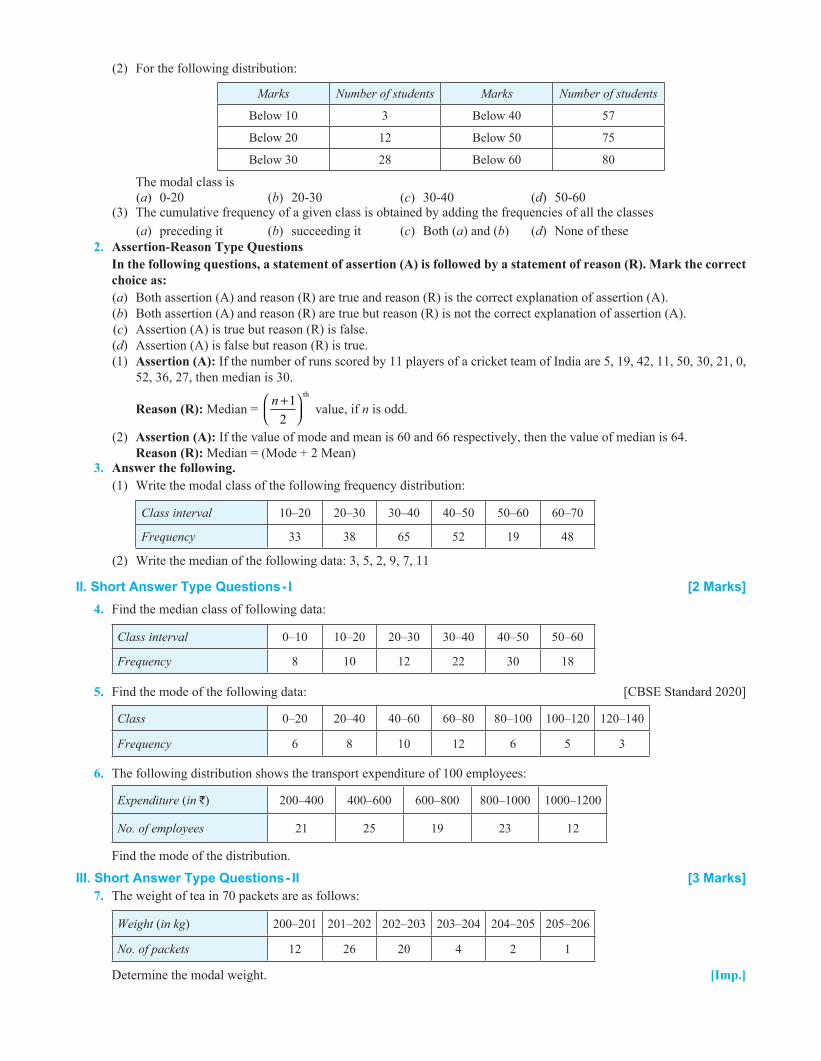
(2) For the following distribution:
Marks Number of students Marks Number of students
Below 10 3 Below 40 57
Below 20 12 Below 50 75
Below 30 28 Below 60 80
The modal class is (a) 0-20 (b) 20-30 (c) 30-40 (d) 50-60 (3) The cumulative frequency of a given class is obtained by adding the frequencies of all the classes (a) preceding it (b) succeeding it (c) Both (a) and (b) (d) None of these 2. Assertion-Reason Type Questions In the following questions, a statement of assertion (A) is followed by a statement of reason (R). Mark the correct
choice as: (a) Both assertion (A) and reason (R) are true and reason (R) is the correct explanation of assertion (A). (b) Both assertion (A) and reason (R) are true but reason (R) is not the correct explanation of assertion (A). (c) Assertion (A) is true but reason (R) is false. (d) Assertion (A) is false but reason (R) is true. (1) Assertion (A): If the number of runs scored by 11 players of a cricket team of India are 5, 19, 42, 11, 50, 30, 21, 0,
52, 36, 27, then median is 30.
Reason (R): Median = n +
1
2
th
value, if n is odd.
(2) Assertion (A): If the value of mode and mean is 60 and 66 respectively, then the value of median is 64. Reason (R): Median = (Mode + 2 Mean) 3. Answer the following. (1) Write the modal class of the following frequency distribution:
Class interval 10–20 20–30 30–40 40–50 50–60 60–70
Frequency 33 38 65 52 19 48
(2) Write the median of the following data: 3, 5, 2, 9, 7, 11
II. Short Answer Type Questions - I [2 Marks] 4. Find the median class of following data:
Class interval 0–10 10–20 20–30 30–40 40–50 50–60
Frequency 8 10 12 22 30 18
5. Find the mode of the following data: [CBSE Standard 2020]
Class 0–20 20–40 40–60 60–80 80–100 100–120 120–140
Frequency 6 8 10 12 6 5 3
6. The following distribution shows the transport expenditure of 100 employees:
Expenditure (in `) 200–400 400–600 600–800 800–1000 1000–1200
No. of employees 21 25 19 23 12
Find the mode of the distribution.
III. Short Answer Type Questions - II [3 Marks] 7. The weight of tea in 70 packets are as follows:
Weight (in kg) 200–201 201–202 202–203 203–204 204–205 205–206
No. of packets 12 26 20 4 2 1
Determine the modal weight. [Imp.]
E:\2020-2021\1. Delhi Mathematics-2021\14112021\1.X-Mathematics-G-EM-For Standard\Ch-7 Folder\Ch-7 \ 23-Nov-2021 Amit Proof-3 Reader’s Sign _______________________ Date __________
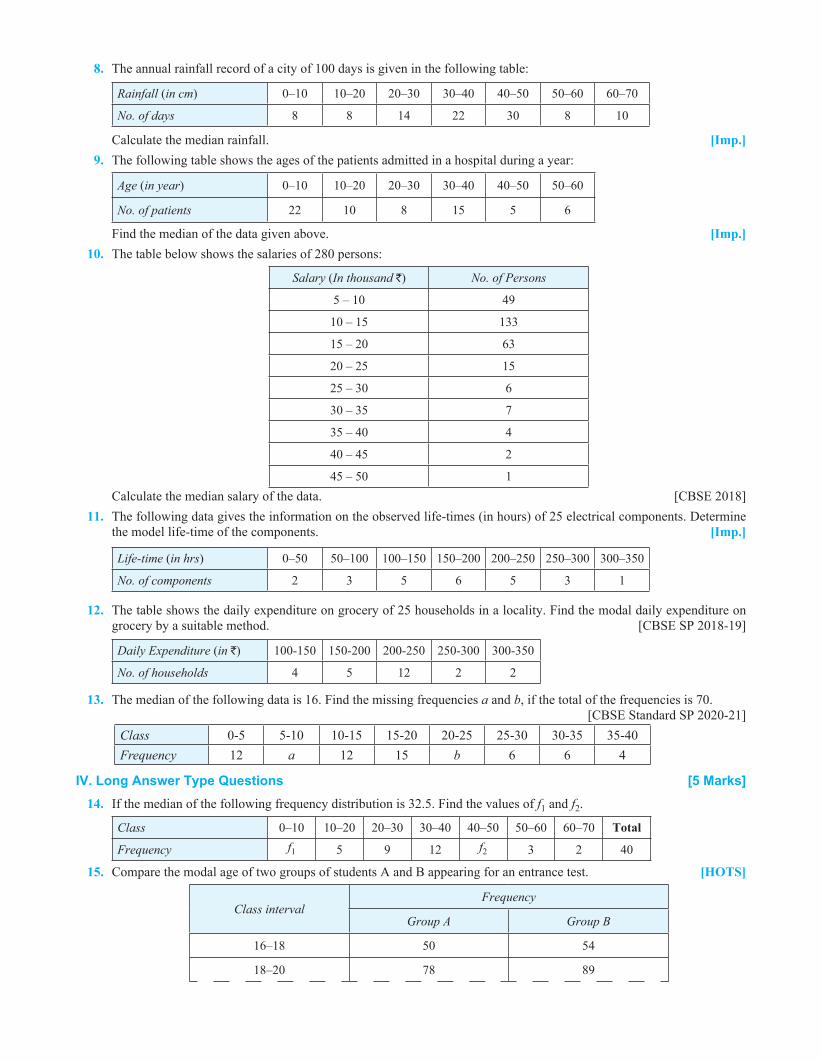
8. The annual rainfall record of a city of 100 days is given in the following table:
Rainfall (in cm) 0–10 10–20 20–30 30–40 40–50 50–60 60–70
No. of days 8 8 14 22 30 8 10
Calculate the median rainfall. [Imp.] 9. The following table shows the ages of the patients admitted in a hospital during a year:
Age (in year) 0–10 10–20 20–30 30–40 40–50 50–60
No. of patients 22 10 8 15 5 6
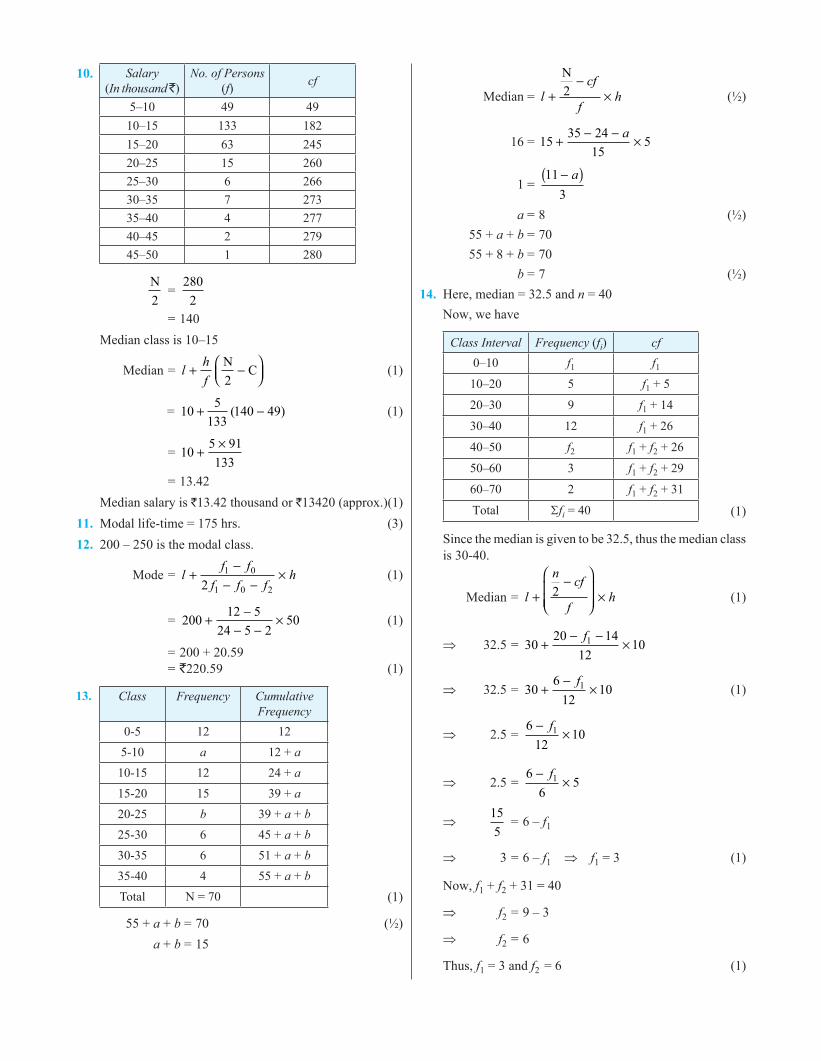
Find the median of the data given above. [Imp.] 10. The table below shows the salaries of 280 persons:
Salary (In thousand `) No. of Persons
5 – 10 49
10 – 15 133
15 – 20 63
20 – 25 15
25 – 30 6
30 – 35 7
35 – 40 4
40 – 45 2
45 – 50 1 Calculate the median salary of the data. [CBSE 2018] 11. The following data gives the information on the observed life-times (in hours) of 25 electrical components. Determine
the model life-time of the components. [Imp.]
Life-time (in hrs) 0–50 50–100 100–150 150–200 200–250 250–300 300–350
No. of components 2 3 5 6 5 3 1
12. The table shows the daily expenditure on grocery of 25 households in a locality. Find the modal daily expenditure on grocery by a suitable method. [CBSE SP 2018-19]
Daily Expenditure (in `) 100-150 150-200 200-250 250-300 300-350
No. of households 4 5 12 2 2
13. The median of the following data is 16. Find the missing frequencies a and b, if the total of the frequencies is 70. [CBSE Standard SP 2020-21]
Class 0-5 5-10 10-15 15-20 20-25 25-30 30-35 35-40Frequency 12 a 12 15 b 6 6 4
IV. Long Answer Type Questions [5 Marks] 14. If the median of the following frequency distribution is 32.5. Find the values of f1 and f2.
Class 0–10 10–20 20–30 30–40 40–50 50–60 60–70 Total
Frequency f1 5 9 12 f2 3 2 40
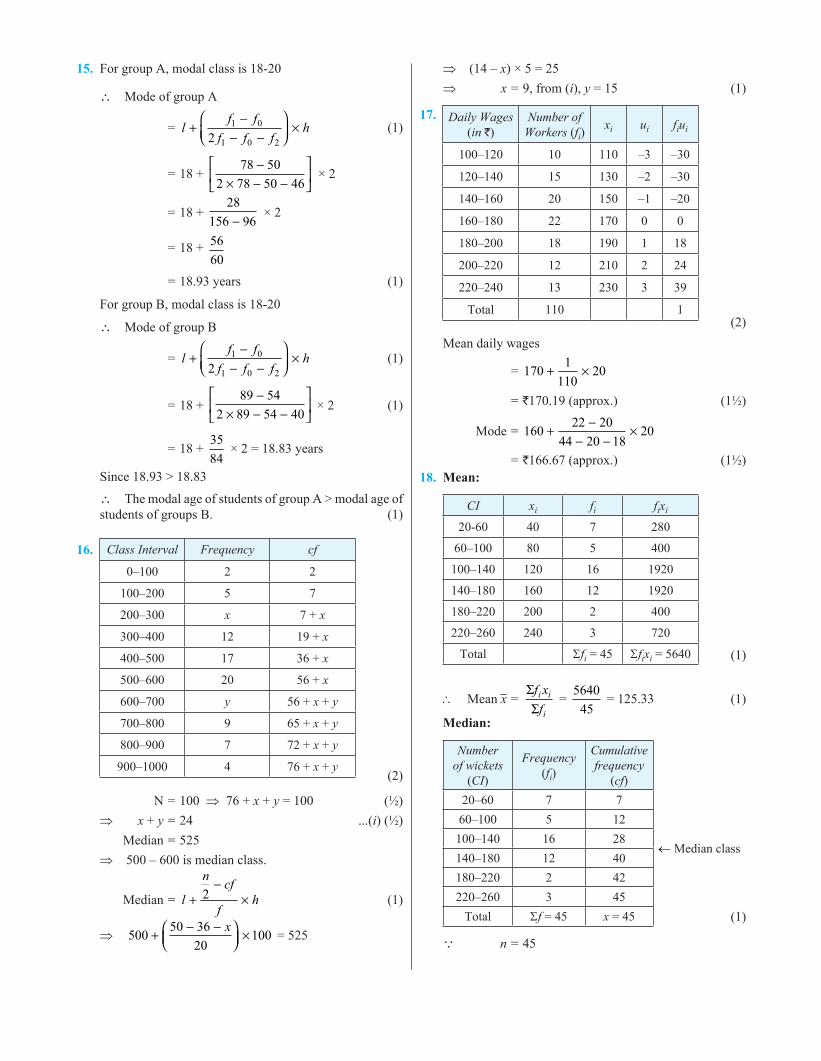
15. Compare the modal age of two groups of students A and B appearing for an entrance test. [HOTS]
Class intervalFrequency
Group A Group B
16–18 50 54
18–20 78 89
E:\2020-2021\1. Delhi Mathematics-2021\14112021\1.X-Mathematics-G-EM-For Standard\Ch-7 Folder\Ch-7 \ 23-Nov-2021 Amit Proof-3 Reader’s Sign _______________________ Date __________
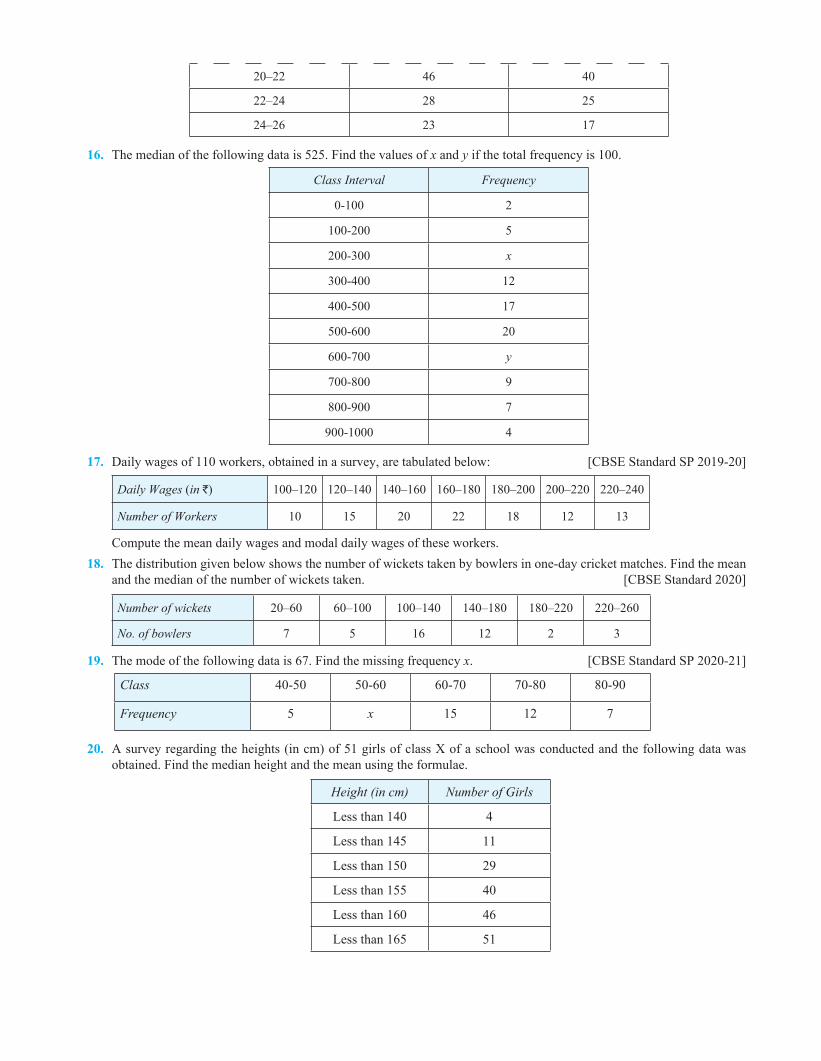
20–22 46 40
22–24 28 25
24–26 23 17
16. The median of the following data is 525. Find the values of x and y if the total frequency is 100.
Class Interval Frequency
0-100 2
100-200 5
200-300 x
300-400 12
400-500 17
500-600 20
600-700 y
700-800 9
800-900 7
900-1000 4
17. Daily wages of 110 workers, obtained in a survey, are tabulated below: [CBSE Standard SP 2019-20]
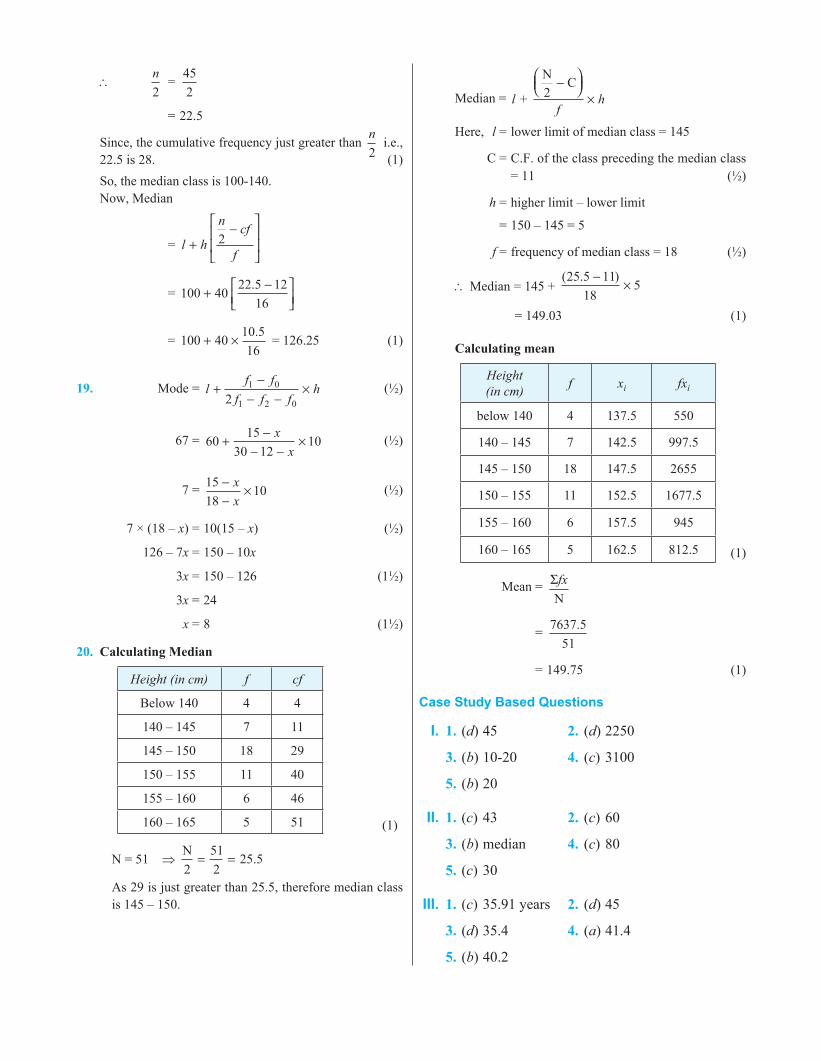
Compute the mean daily wages and modal daily wages of these workers. 18. The distribution given below shows the number of wickets taken by bowlers in one-day cricket matches. Find the mean
and the median of the number of wickets taken. [CBSE Standard 2020]
Number of wickets 20–60 60–100 100–140 140–180 180–220 220–260
No. of bowlers 7 5 16 12 2 3
19. The mode of the following data is 67. Find the missing frequency x. [CBSE Standard SP 2020-21]
Class 40-50 50-60 60-70 70-80 80-90
Frequency 5 x 15 12 7
20. A survey regarding the heights (in cm) of 51 girls of class X of a school was conducted and the following data was obtained. Find the median height and the mean using the formulae.
Height (in cm) Number of Girls
Less than 140 4
Less than 145 11
Less than 150 29
Less than 155 40
Less than 160 46
Less than 165 51
E:\2020-2021\1. Delhi Mathematics-2021\14112021\1.X-Mathematics-G-EM-For Standard\Ch-7 Folder\Ch-7 \ 23-Nov-2021 Amit Proof-3 Reader’s Sign _______________________ Date __________
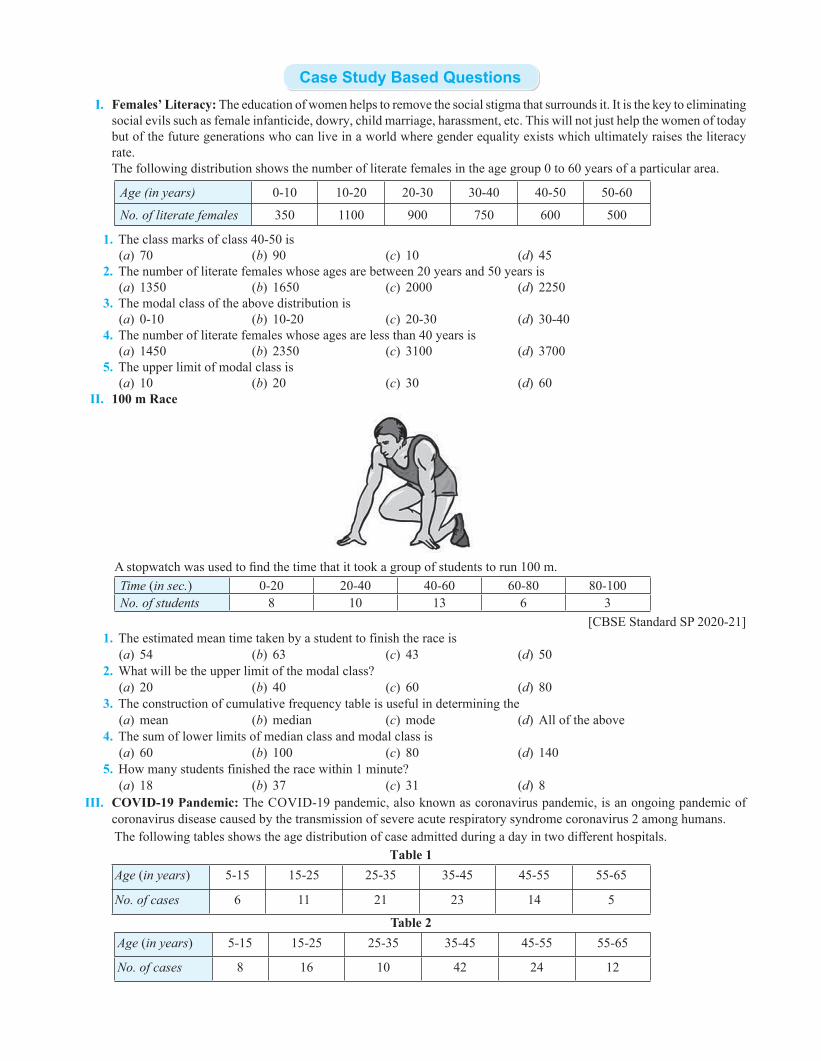
Case Study Based Questions I. Females’ Literacy: The education of women helps to remove the social stigma that surrounds it. It is the key to eliminating
social evils such as female infanticide, dowry, child marriage, harassment, etc. This will not just help the women of today but of the future generations who can live in a world where gender equality exists which ultimately raises the literacy rate.
The following distribution shows the number of literate females in the age group 0 to 60 years of a particular area.
Age (in years) 0-10 10-20 20-30 30-40 40-50 50-60
No. of literate females 350 1100 900 750 600 500
1. The class marks of class 40-50 is (a) 70 (b) 90 (c) 10 (d) 45 2. The number of literate females whose ages are between 20 years and 50 years is (a) 1350 (b) 1650 (c) 2000 (d) 2250 3. The modal class of the above distribution is (a) 0-10 (b) 10-20 (c) 20-30 (d) 30-40 4. The number of literate females whose ages are less than 40 years is (a) 1450 (b) 2350 (c) 3100 (d) 3700 5. The upper limit of modal class is (a) 10 (b) 20 (c) 30 (d) 60 II. 100 m Race
Astopwatchwasusedtofindthetimethatittookagroupofstudentstorun100m.Time (in sec.) 0-20 20-40 40-60 60-80 80-100No. of students 8 10 13 6 3
[CBSE Standard SP 2020-21] 1. The estimated mean time taken by a student to finish the race is (a) 54 (b) 63 (c) 43 (d) 50 2. What will be the upper limit of the modal class? (a) 20 (b) 40 (c) 60 (d) 80 3. The construction of cumulative frequency table is useful in determining the (a) mean (b) median (c) mode (d) All of the above 4. The sum of lower limits of median class and modal class is (a) 60 (b) 100 (c) 80 (d) 140 5. How many students finished the race within 1 minute? (a) 18 (b) 37 (c) 31 (d) 8 III. COVID-19 Pandemic: The COVID-19 pandemic, also known as coronavirus pandemic, is an ongoing pandemic of
coronavirus disease caused by the transmission of severe acute respiratory syndrome coronavirus 2 among humans. The following tables shows the age distribution of case admitted during a day in two different hospitals.
Table 1Age (in years) 5-15 15-25 25-35 35-45 45-55 55-65
No. of cases 6 11 21 23 14 5
Table 2Age (in years) 5-15 15-25 25-35 35-45 45-55 55-65
No. of cases 8 16 10 42 24 12
E:\2020-2021\1. Delhi Mathematics-2021\14112021\1.X-Mathematics-G-EM-For Standard\Ch-7 Folder\Ch-7 \ 23-Nov-2021 Amit Proof-3 Reader’s Sign _______________________ Date __________
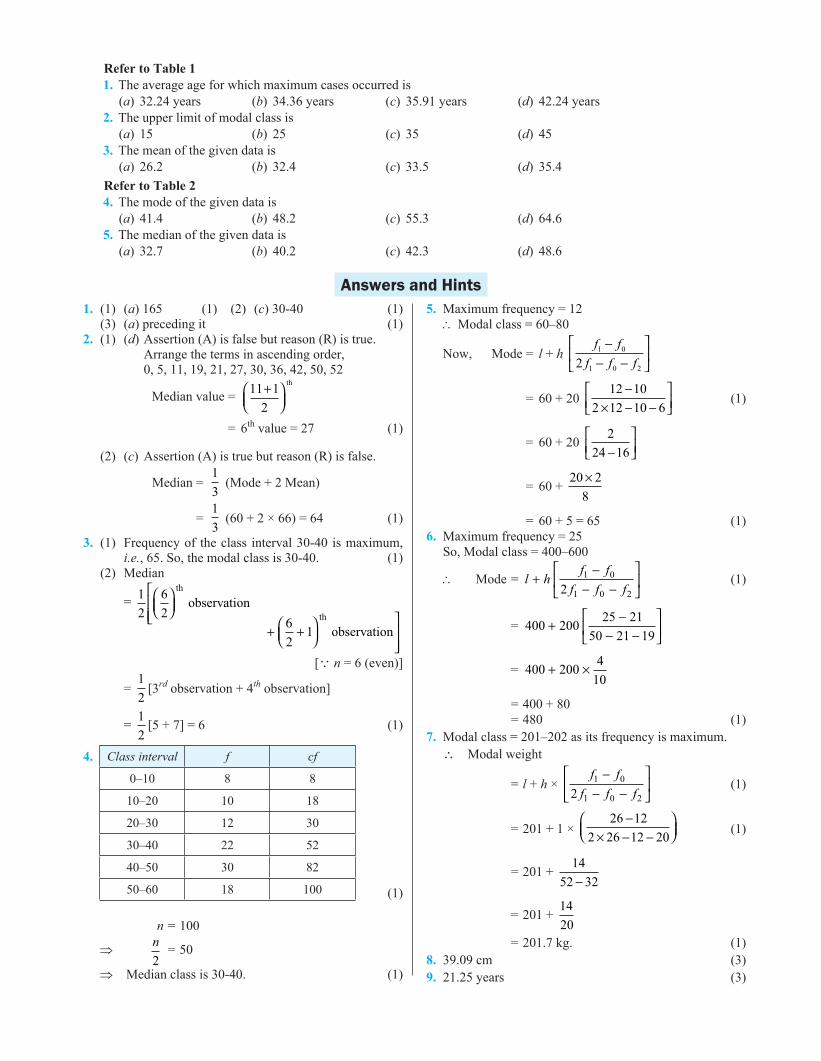
Refer to Table 1 1. The average age for which maximum cases occurred is (a) 32.24 years (b) 34.36 years (c) 35.91 years (d) 42.24 years 2. The upper limit of modal class is (a) 15 (b) 25 (c) 35 (d) 45 3. The mean of the given data is (a) 26.2 (b) 32.4 (c) 33.5 (d) 35.4 Refer to Table 2 4. The mode of the given data is (a) 41.4 (b) 48.2 (c) 55.3 (d) 64.6 5. The median of the given data is (a) 32.7 (b) 40.2 (c) 42.3 (d) 48.6
Answers and Hints 1. (1) (a) 165 (1) (2) (c) 30-40 (1) (3) (a) preceding it (1) 2. (1) (d) Assertion (A) is false but reason (R) is true. Arrange the terms in ascending order, 0, 5, 11, 19, 21, 27, 30, 36, 42, 50, 52
Median value = 11 1
2
+
th
= 6th value = 27 (1)
(2) (c) Assertion (A) is true but reason (R) is false.
Median = 1
3 (Mode + 2 Mean)
= 1
3 (60 + 2 × 66) = 64 (1)
3. (1) Frequency of the class interval 30-40 is maximum, i.e., 65. So, the modal class is 30-40. (1)
(2) Median
= 1
2
6
2
th
observation
+6
+
2
1
th
observation
[Q n = 6 (even)]
= 1
2[3rd observation + 4th observation]
= 1
2[5 + 7] = 6 (1)
4. Class interval f cf
0–10 8 8
10–20 10 18
20–30 12 30
30–40 22 52
40–50 30 82
50–60 18 100
(1)
n = 100
⇒ n2
= 50
⇒ Median class is 30-40. (1)
5. Maximum frequency = 12 ∴Modal class = 60–80
Now, Mode = l + h f f
f f f1 0
1 0 22
−− −
= 60 + 20 12 10
2 12 10 6
−× − −
(1)
= 60 + 20 2
24 16−
= 60 + 20 2
8
×
= 60 + 5 = 65 (1) 6. Maximum frequency = 25 So, Modal class = 400–600
∴ Mode = l hf ff f f
+−
− −
1 0
1 0 22 (1)
= 400 20025 21
50 21 19+
−− −
= 400 2004
10+ ×
= 400 + 80 = 480 (1) 7. Modal class = 201–202 as its frequency is maximum. \ Modal weight
= l + h × f f
f f f1 0
1 0 22
−− −
(1)
= 201 + 1 × 26 12
2 26 12 20
−× − −
(1)
= 201 + 14
52 32−
= 201 + 14
20
= 201.7 kg. (1) 8. 39.09 cm (3) 9. 21.25 years (3)
E:\2020-2021\1. Delhi Mathematics-2021\14112021\1.X-Mathematics-G-EM-For Standard\Ch-7 Folder\Ch-7 \ 23-Nov-2021 Amit Proof-3 Reader’s Sign _______________________ Date __________