This article appeared in a journal published by Elsevier. The attached copy is furnished to the author for internal non-commercial research and education use, including for instruction at the authors institution and sharing with colleagues. Other uses, including reproduction and distribution, or selling or licensing copies, or posting to personal, institutional or third party websites are prohibited. In most cases authors are permitted to post their version of the article (e.g. in Word or Tex form) to their personal website or institutional repository. Authors requiring further information regarding Elsevier’s archiving and manuscript policies are encouraged to visit: http://www.elsevier.com/copyright
Transcript
This article appeared in a journal published by Elsevier. The attachedcopy is furnished to the author for internal non-commercial researchand education use, including for instruction at the authors institution
and sharing with colleagues.
Other uses, including reproduction and distribution, or selling orlicensing copies, or posting to personal, institutional or third party
websites are prohibited.
In most cases authors are permitted to post their version of thearticle (e.g. in Word or Tex form) to their personal website orinstitutional repository. Authors requiring further information
regarding Elsevier’s archiving and manuscript policies areencouraged to visit:
Steady rifting in northern Kenya inferred from deformed Holocene lake shorelines ofthe Suguta and Turkana basins
Daniel Melnick a,b,⁎, Yannick Garcin a,b, Javier Quinteros c, Manfred R. Strecker a,b,Daniel Olago d, Jean-Jacques Tiercelin e
a Universität Potsdam, Institut für Erd- und Umweltwissenschaften, 14476 Potsdam, Germanyb DFG Leibniz Center for Surface Process and Climate Studies, 14476 Potsdam, Germanyc Deutsches GeoForschungsZentrum Potsdam, 14473 Potsdam, Germanyd University of Nairobi, Department of Geology, 30197-00100 Nairobi, Kenyae UMR CNRS 6118 Géosciences Rennes, Université de Rennes 1, Rennes, France
a b s t r a c ta r t i c l e i n f o
Article history:Accepted 2 March 2012Available online 1 April 2012
A comparison of deformation rates in active rifts over different temporal scales may help to decipher varia-tions in their structural evolution, controlling mechanisms, and evolution of sedimentary environmentsthrough time. Here we use deformed lake shorelines in the Suguta and Turkana basins in northern Kenyaas strain markers to estimate deformation rates at the 103–104 yr time scale and compare them with ratesspanning 101–107 yr. Both basins are internally drained today, but until 7 to 5 kyr lake levels were 300 and100 m higher, respectively, maintained by the elevation of overflow sills connecting them with the Niledrainage. Protracted high lake levels resulted in formation of a maximum highstand shoreline — a distinctgeomorphic feature virtually continuous for several tens of kilometers. We surveyed the elevation of this geo-morphic marker at 45 sites along >100 km of the rift, and use the overflow sills as vertical datum. Thin-shellelastic and thermomechanical models for this region predict up to ~10 m of rapid isostatic rebound associat-ed with lake-level falls lasting until ~2 kyr ago. Holocene cumulative throw rates along four rift-normal pro-files are 6.8–8.5 mm/yr, or 7.5–9.6 mm/yr if isostatic rebound is considered. Assuming fault dips of 55–65°,inferred from seismic reflection profiles, we obtained extension rates of 3.2–6 mm/yr (including uncer-tainties in field measurements, fault dips, and ages), or 3.5–6.7 mm/yr considering rebound. Our estimatesare consistent, within uncertainties, with extension rates of 4–5.1 mm/yr predicted by a modern plate-kinematic model and plate reconstructions since 3.2 Myr. The Holocene strain rate of 10−15 s−1 is similarto estimates on the ~106 yr scale, but over an order of magnitude higher than on the ~107 yr scale. This is co-herent with continuous localization and narrowing of the plate boundary, implying that the lithosphericblocks limiting the Kenya Rift are relatively rigid. Increasing strain rate under steady extension rate suggeststhat, as the magnitude of extension and crustal thinning increases, the role of regional processes such asweakening by volcanism becomes dominant over far-field plate tectonics controlling the breakup processand the transition from continental rifting to oceanic spreading.
Deformation rates of the Earth's crust constitute an observationalbasis for physical models of various processes associated with platemotions, including mountain building, the earthquake cycle, and rift-ing of continental crust. At divergent plate boundaries, the width ofthe deforming region may vary as well as the rates at which itstretches (e.g., Molnar, 1988). Continental rifts represent the initia-tion of divergent plate boundaries, and may evolve into continentalbreak-up, ultimately resulting in new ocean basins (e.g., McKenzie
et al., 1970). A crucial aspect to understanding the continentalbreak-up process is the dynamic link between far-field forces exertedby plate tectonics, regional stresses that may arise from mantleplumes, and local mechanical aspects such as fault weakening, inher-ited rheological discontinuities, and volcanism (e.g., Buck, 2004). Thislink is likely to dictate the rate and style of rifting.
The role of magmatic versus tectonic processes in continental rift-ing has been the matter of debate. Recent volcano-tectonic episodesassociated with rifting in regions with thin (Abdallah et al., 1979;Wright et al., 2006) as well as thick (Calais et al., 2008) lithospheresuggest that dyke intrusions accounted for most of the strain. Con-versely, numerical modeling indicates that continental lithospheremay be broken without volcanism, controlled by shear heating(Regenauer-Lieb et al., 2008). In the East African Rift System (EARS)
Earth and Planetary Science Letters 331–332 (2012) 335–346
frequent, low-magnitude seismicity has been associated with dykeintrusions (e.g., Tongue et al., 1994), but fault ruptures duringlarge earthquakes have occurred without coupled volcanism (e.g.,Ambraseys, 1991; Biggs et al., 2010; Zielke and Strecker, 2009).Thus, despite of its overall magmatic character, strain release in theEARS is not necessarily associatedwith dyke intrusions andmagmatism.
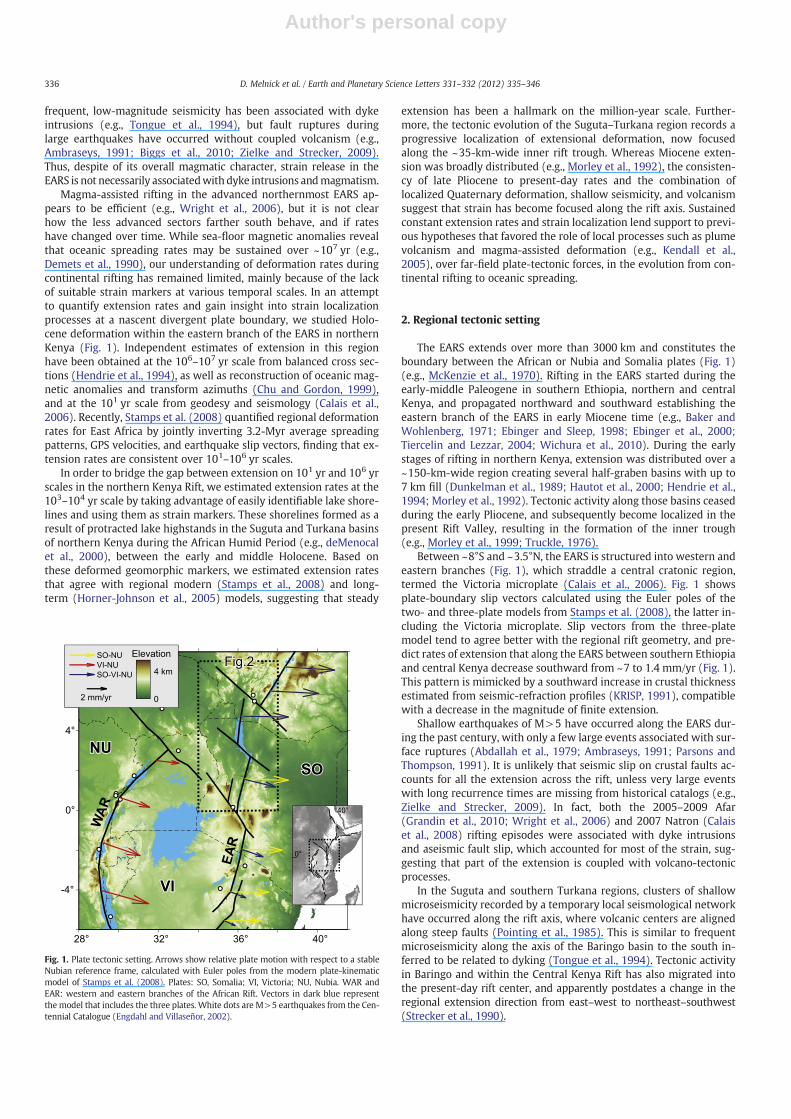
Magma-assisted rifting in the advanced northernmost EARS ap-pears to be efficient (e.g., Wright et al., 2006), but it is not clearhow the less advanced sectors farther south behave, and if rateshave changed over time. While sea-floor magnetic anomalies revealthat oceanic spreading rates may be sustained over ~107 yr (e.g.,Demets et al., 1990), our understanding of deformation rates duringcontinental rifting has remained limited, mainly because of the lackof suitable strain markers at various temporal scales. In an attemptto quantify extension rates and gain insight into strain localizationprocesses at a nascent divergent plate boundary, we studied Holo-cene deformation within the eastern branch of the EARS in northernKenya (Fig. 1). Independent estimates of extension in this regionhave been obtained at the 106–107 yr scale from balanced cross sec-tions (Hendrie et al., 1994), as well as reconstruction of oceanic mag-netic anomalies and transform azimuths (Chu and Gordon, 1999),and at the 101 yr scale from geodesy and seismology (Calais et al.,2006). Recently, Stamps et al. (2008) quantified regional deformationrates for East Africa by jointly inverting 3.2-Myr average spreadingpatterns, GPS velocities, and earthquake slip vectors, finding that ex-tension rates are consistent over 101–106 yr scales.
In order to bridge the gap between extension on 101 yr and 106 yrscales in the northern Kenya Rift, we estimated extension rates at the103–104 yr scale by taking advantage of easily identifiable lake shore-lines and using them as strain markers. These shorelines formed as aresult of protracted lake highstands in the Suguta and Turkana basinsof northern Kenya during the African Humid Period (e.g., deMenocalet al., 2000), between the early and middle Holocene. Based onthese deformed geomorphic markers, we estimated extension ratesthat agree with regional modern (Stamps et al., 2008) and long-term (Horner-Johnson et al., 2005) models, suggesting that steady
extension has been a hallmark on the million-year scale. Further-more, the tectonic evolution of the Suguta–Turkana region records aprogressive localization of extensional deformation, now focusedalong the ~35-km-wide inner rift trough. Whereas Miocene exten-sion was broadly distributed (e.g., Morley et al., 1992), the consisten-cy of late Pliocene to present-day rates and the combination oflocalized Quaternary deformation, shallow seismicity, and volcanismsuggest that strain has become focused along the rift axis. Sustainedconstant extension rates and strain localization lend support to previ-ous hypotheses that favored the role of local processes such as plumevolcanism and magma-assisted deformation (e.g., Kendall et al.,2005), over far-field plate-tectonic forces, in the evolution from con-tinental rifting to oceanic spreading.
2. Regional tectonic setting
The EARS extends over more than 3000 km and constitutes theboundary between the African or Nubia and Somalia plates (Fig. 1)(e.g., McKenzie et al., 1970). Rifting in the EARS started during theearly-middle Paleogene in southern Ethiopia, northern and centralKenya, and propagated northward and southward establishing theeastern branch of the EARS in early Miocene time (e.g., Baker andWohlenberg, 1971; Ebinger and Sleep, 1998; Ebinger et al., 2000;Tiercelin and Lezzar, 2004; Wichura et al., 2010). During the earlystages of rifting in northern Kenya, extension was distributed over a~150-km-wide region creating several half-graben basins with up to7 km fill (Dunkelman et al., 1989; Hautot et al., 2000; Hendrie et al.,1994; Morley et al., 1992). Tectonic activity along those basins ceasedduring the early Pliocene, and subsequently become localized in thepresent Rift Valley, resulting in the formation of the inner trough(e.g., Morley et al., 1999; Truckle, 1976).
Between ~8°S and ~3.5°N, the EARS is structured into western andeastern branches (Fig. 1), which straddle a central cratonic region,termed the Victoria microplate (Calais et al., 2006). Fig. 1 showsplate-boundary slip vectors calculated using the Euler poles of thetwo- and three-plate models from Stamps et al. (2008), the latter in-cluding the Victoria microplate. Slip vectors from the three-platemodel tend to agree better with the regional rift geometry, and pre-dict rates of extension that along the EARS between southern Ethiopiaand central Kenya decrease southward from ~7 to 1.4 mm/yr (Fig. 1).This pattern is mimicked by a southward increase in crustal thicknessestimated from seismic-refraction profiles (KRISP, 1991), compatiblewith a decrease in the magnitude of finite extension.
Shallow earthquakes of M>5 have occurred along the EARS dur-ing the past century, with only a few large events associated with sur-face ruptures (Abdallah et al., 1979; Ambraseys, 1991; Parsons andThompson, 1991). It is unlikely that seismic slip on crustal faults ac-counts for all the extension across the rift, unless very large eventswith long recurrence times are missing from historical catalogs (e.g.,Zielke and Strecker, 2009). In fact, both the 2005–2009 Afar(Grandin et al., 2010; Wright et al., 2006) and 2007 Natron (Calaiset al., 2008) rifting episodes were associated with dyke intrusionsand aseismic fault slip, which accounted for most of the strain, sug-gesting that part of the extension is coupled with volcano-tectonicprocesses.
In the Suguta and southern Turkana regions, clusters of shallowmicroseismicity recorded by a temporary local seismological networkhave occurred along the rift axis, where volcanic centers are alignedalong steep faults (Pointing et al., 1985). This is similar to frequentmicroseismicity along the axis of the Baringo basin to the south in-ferred to be related to dyking (Tongue et al., 1994). Tectonic activityin Baringo and within the Central Kenya Rift has also migrated intothe present-day rift center, and apparently postdates a change in theregional extension direction from east–west to northeast–southwest(Strecker et al., 1990).
Fig. 1. Plate tectonic setting. Arrows show relative plate motion with respect to a stableNubian reference frame, calculated with Euler poles from the modern plate-kinematicmodel of Stamps et al. (2008). Plates: SO, Somalia; VI, Victoria; NU, Nubia. WAR andEAR: western and eastern branches of the African Rift. Vectors in dark blue representthe model that includes the three plates. White dots are M>5 earthquakes from the Cen-tennial Catalogue (Engdahl and Villaseñor, 2002).
336 D. Melnick et al. / Earth and Planetary Science Letters 331–332 (2012) 335–346
3. Geomorphic and structural settings of the Suguta and Turkanabasins
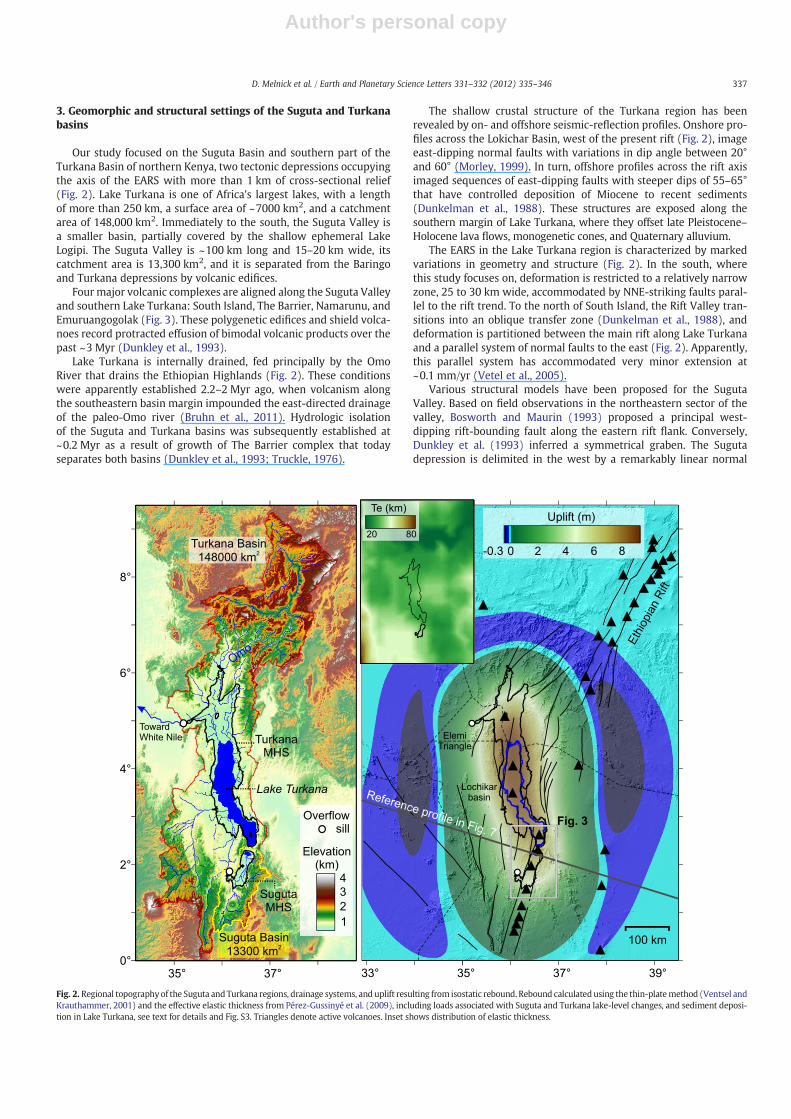
Our study focused on the Suguta Basin and southern part of theTurkana Basin of northern Kenya, two tectonic depressions occupyingthe axis of the EARS with more than 1 km of cross-sectional relief(Fig. 2). Lake Turkana is one of Africa's largest lakes, with a lengthof more than 250 km, a surface area of ~7000 km2, and a catchmentarea of 148,000 km2. Immediately to the south, the Suguta Valley isa smaller basin, partially covered by the shallow ephemeral LakeLogipi. The Suguta Valley is ~100 km long and 15–20 km wide, itscatchment area is 13,300 km2, and it is separated from the Baringoand Turkana depressions by volcanic edifices.
Four major volcanic complexes are aligned along the Suguta Valleyand southern Lake Turkana: South Island, The Barrier, Namarunu, andEmuruangogolak (Fig. 3). These polygenetic edifices and shield volca-noes record protracted effusion of bimodal volcanic products over thepast ~3 Myr (Dunkley et al., 1993).
Lake Turkana is internally drained, fed principally by the OmoRiver that drains the Ethiopian Highlands (Fig. 2). These conditionswere apparently established 2.2–2 Myr ago, when volcanism alongthe southeastern basin margin impounded the east-directed drainageof the paleo-Omo river (Bruhn et al., 2011). Hydrologic isolationof the Suguta and Turkana basins was subsequently established at~0.2 Myr as a result of growth of The Barrier complex that todayseparates both basins (Dunkley et al., 1993; Truckle, 1976).
The shallow crustal structure of the Turkana region has beenrevealed by on- and offshore seismic-reflection profiles. Onshore pro-files across the Lokichar Basin, west of the present rift (Fig. 2), imageeast-dipping normal faults with variations in dip angle between 20°and 60° (Morley, 1999). In turn, offshore profiles across the rift axisimaged sequences of east-dipping faults with steeper dips of 55–65°that have controlled deposition of Miocene to recent sediments(Dunkelman et al., 1988). These structures are exposed along thesouthern margin of Lake Turkana, where they offset late Pleistocene–Holocene lava flows, monogenetic cones, and Quaternary alluvium.
The EARS in the Lake Turkana region is characterized by markedvariations in geometry and structure (Fig. 2). In the south, wherethis study focuses on, deformation is restricted to a relatively narrowzone, 25 to 30 km wide, accommodated by NNE-striking faults paral-lel to the rift trend. To the north of South Island, the Rift Valley tran-sitions into an oblique transfer zone (Dunkelman et al., 1988), anddeformation is partitioned between the main rift along Lake Turkanaand a parallel system of normal faults to the east (Fig. 2). Apparently,this parallel system has accommodated very minor extension at~0.1 mm/yr (Vetel et al., 2005).
Various structural models have been proposed for the SugutaValley. Based on field observations in the northeastern sector of thevalley, Bosworth and Maurin (1993) proposed a principal west-dipping rift-bounding fault along the eastern rift flank. Conversely,Dunkley et al. (1993) inferred a symmetrical graben. The Sugutadepression is delimited in the west by a remarkably linear normal
Fig. 2. Regional topographyof the Suguta and Turkana regions, drainage systems, and uplift resulting from isostatic rebound. Rebound calculatedusing the thin-platemethod (Ventsel andKrauthammer, 2001) and the effective elastic thickness from Pérez-Gussinyé et al. (2009), including loads associated with Suguta and Turkana lake-level changes, and sediment deposi-tion in Lake Turkana, see text for details and Fig. S3. Triangles denote active volcanoes. Inset shows distribution of elastic thickness.
337D. Melnick et al. / Earth and Planetary Science Letters 331–332 (2012) 335–346
fault system with constant NNE strike for over ~100 km, whereas inthe east it is bounded by a series of smaller and less continuousfault systems (Fig. 3). Both fault arrays cut Holocene alluvium. Activefaulting also occurs along the rift axis, associated with monogeneticvolcanism and geothermal activity. The up to 20-km-wide monoclinedescribed by Bosworth and Maurin (1993) along the eastern Sugutamargin is a distinct feature of this region. The monocline bends and itsdip steepens east of Namarunu volcano, which has resulted in gravita-tional collapse of the rift flank and the formation of a large landslip.
Both first and second-order faults along the Suguta and southernTurkana basins strike parallel to the rift orientation (inset in Fig. 3),suggesting that rift-normal extension dominates. From the interpre-tation of satellite imagery, Vetel and Le Gall (2006) inferred that
oblique-striking transfer zones cut the Suguta and southern Turkanaregions, but neither the topography nor our field mapping (Fig. 3)supports the existence of such structures.
3.1. Late Pleistocene–Holocene lake highstands of the Suguta and Turkanabasins
At the end of the last glacial period, the generally dry climate oftropical Africa was superseded by a transient wet phase, also knownas the African Humid Period (deMenocal et al., 2000), which pre-vailed between ~12 and ~5 kyr (e.g., deMenocal et al., 2000; Ritchieet al., 1985). During this wet period lake levels were high in severalrift basins (e.g., Bergner et al., 2009; Garcin et al., 2009; Gasse,
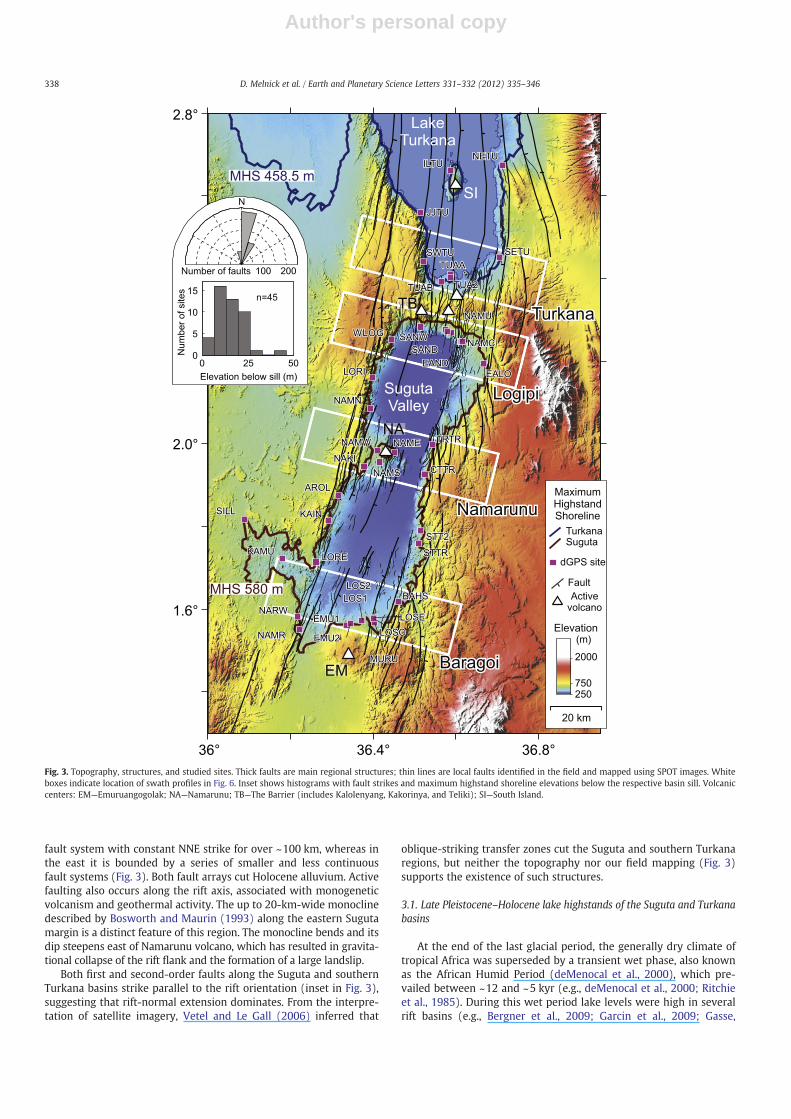
Fig. 3. Topography, structures, and studied sites. Thick faults are main regional structures; thin lines are local faults identified in the field and mapped using SPOT images. Whiteboxes indicate location of swath profiles in Fig. 6. Inset shows histograms with fault strikes and maximum highstand shoreline elevations below the respective basin sill. Volcaniccenters: EM—Emuruangogolak; NA—Namarunu; TB—The Barrier (includes Kalolenyang, Kakorinya, and Teliki); SI—South Island.
338 D. Melnick et al. / Earth and Planetary Science Letters 331–332 (2012) 335–346
2000; Owen et al., 1982; Truckle, 1976). Lake levels in the Suguta andTurkana basins were at that time 300 m and 100 m higher than today,respectively (Fig. 4). Both highstands were limited by the elevation ofthe overflow sills of each basin, the topographic thresholds that re-stricted fluvial connectivity with the White Nile (Owen et al., 1982)(Fig. 2). The Suguta sill is located on the western basin margin at anelevation of 580.15 m, as measured by dGPS (Garcin et al., 2009), pro-viding fluvial connectivity into Lake Turkana. The Turkana sill is locat-ed in the Elemi triangle region west of the lake (Fig. 2) to whichaccess is restricted due to political unrest; Shuttle Radar TopographyMission (SRTM) data constrains its elevation to between 457 and460 m (Brown and Fuller, 2008).
As a result of protracted periods of lake-overflow water-levelslasting several thousand years, a maximum highstand shoreline(MHS) was formed by wave erosion in each basin. The MHS is clearlyexposed on the surroundings of the Suguta and Turkana basins whereit forms distinctive features in the landscape that can be followedcontinuously for several tens of kilometers. Importantly, due to theirerosive origin and its longevity (Garcin et al., 2009), the MHS ismuch wider and better developed than the multiple regressive shore-lines at successively lower elevations (Fig. 5a).
The chronology of Suguta and Turkana lake levels has been de-duced from radiocarbon dating of gastropod and bivalve shells fromfreshwater organisms, bones, and charcoal in lacustrine sediments(Garcin et al., 2009; Garcin et al., this volume; Junginger, 2011). Ra-diocarbon ages from archeology have been also used to constrainthe level of Lake Turkana (e.g., Owen et al., 1982).
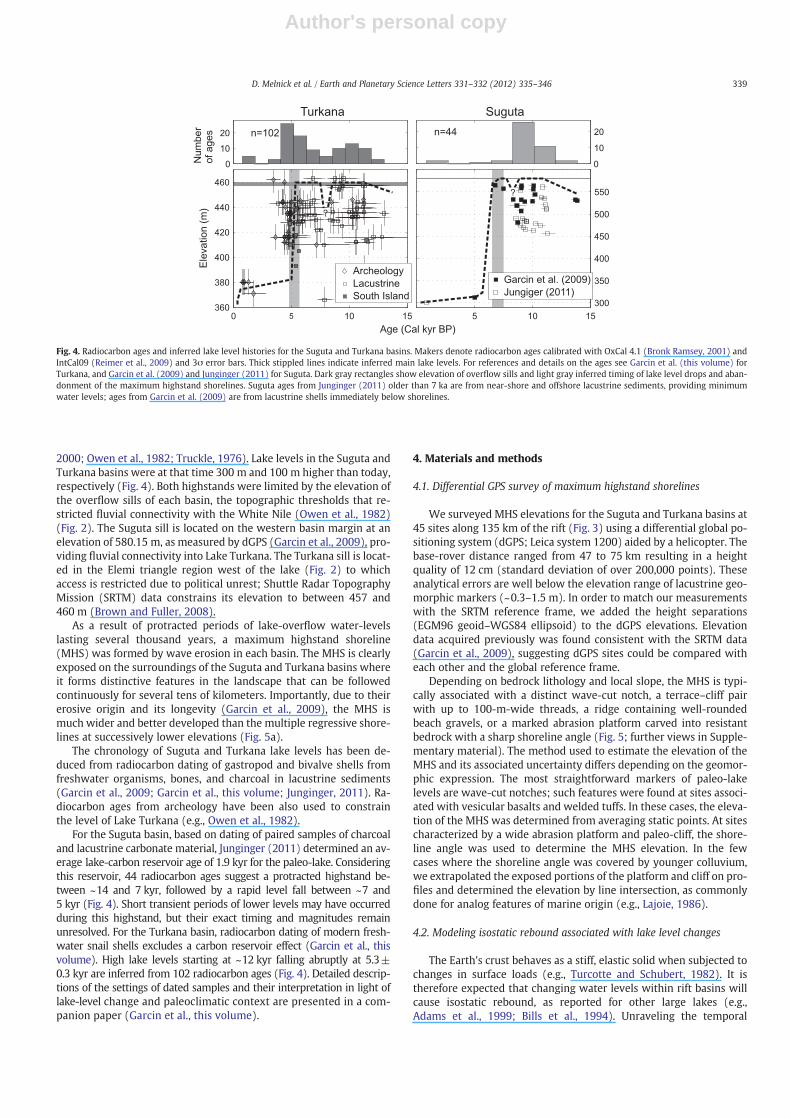
For the Suguta basin, based on dating of paired samples of charcoaland lacustrine carbonate material, Junginger (2011) determined an av-erage lake-carbon reservoir age of 1.9 kyr for the paleo-lake. Consideringthis reservoir, 44 radiocarbon ages suggest a protracted highstand be-tween ~14 and 7 kyr, followed by a rapid level fall between ~7 and5 kyr (Fig. 4). Short transient periods of lower levels may have occurredduring this highstand, but their exact timing and magnitudes remainunresolved. For the Turkana basin, radiocarbon dating of modern fresh-water snail shells excludes a carbon reservoir effect (Garcin et al., thisvolume). High lake levels starting at ~12 kyr falling abruptly at 5.3±0.3 kyr are inferred from 102 radiocarbon ages (Fig. 4). Detailed descrip-tions of the settings of dated samples and their interpretation in light oflake-level change and paleoclimatic context are presented in a com-panion paper (Garcin et al., this volume).
4. Materials and methods
4.1. Differential GPS survey of maximum highstand shorelines
We surveyed MHS elevations for the Suguta and Turkana basins at45 sites along 135 km of the rift (Fig. 3) using a differential global po-sitioning system (dGPS; Leica system 1200) aided by a helicopter. Thebase-rover distance ranged from 47 to 75 km resulting in a heightquality of 12 cm (standard deviation of over 200,000 points). Theseanalytical errors are well below the elevation range of lacustrine geo-morphic markers (~0.3–1.5 m). In order to match our measurementswith the SRTM reference frame, we added the height separations(EGM96 geoid–WGS84 ellipsoid) to the dGPS elevations. Elevationdata acquired previously was found consistent with the SRTM data(Garcin et al., 2009), suggesting dGPS sites could be compared witheach other and the global reference frame.
Depending on bedrock lithology and local slope, the MHS is typi-cally associated with a distinct wave-cut notch, a terrace–cliff pairwith up to 100-m-wide threads, a ridge containing well-roundedbeach gravels, or a marked abrasion platform carved into resistantbedrock with a sharp shoreline angle (Fig. 5; further views in Supple-mentary material). The method used to estimate the elevation of theMHS and its associated uncertainty differs depending on the geomor-phic expression. The most straightforward markers of paleo-lakelevels are wave-cut notches; such features were found at sites associ-ated with vesicular basalts and welded tuffs. In these cases, the eleva-tion of the MHS was determined from averaging static points. At sitescharacterized by a wide abrasion platform and paleo-cliff, the shore-line angle was used to determine the MHS elevation. In the fewcases where the shoreline angle was covered by younger colluvium,we extrapolated the exposed portions of the platform and cliff on pro-files and determined the elevation by line intersection, as commonlydone for analog features of marine origin (e.g., Lajoie, 1986).
4.2. Modeling isostatic rebound associated with lake level changes
The Earth's crust behaves as a stiff, elastic solid when subjected tochanges in surface loads (e.g., Turcotte and Schubert, 1982). It istherefore expected that changing water levels within rift basins willcause isostatic rebound, as reported for other large lakes (e.g.,Adams et al., 1999; Bills et al., 1994). Unraveling the temporal
Fig. 4. Radiocarbon ages and inferred lake level histories for the Suguta and Turkana basins. Makers denote radiocarbon ages calibrated with OxCal 4.1 (Bronk Ramsey, 2001) andIntCal09 (Reimer et al., 2009) and 3σ error bars. Thick stippled lines indicate inferred main lake levels. For references and details on the ages see Garcin et al. (this volume) forTurkana, and Garcin et al. (2009) and Junginger (2011) for Suguta. Dark gray rectangles show elevation of overflow sills and light gray inferred timing of lake level drops and aban-donment of the maximum highstand shorelines. Suguta ages from Junginger (2011) older than 7 ka are from near-shore and offshore lacustrine sediments, providing minimumwater levels; ages from Garcin et al. (2009) are from lacustrine shells immediately below shorelines.
339D. Melnick et al. / Earth and Planetary Science Letters 331–332 (2012) 335–346
evolution of rebounds is crucial to estimate the magnitude of upliftand assess the role of rebound on deformation rates. In addition,since isostatically driven warping influenced vertical movements onthe periphery of the basins it may have affected the degree of fluvialconnectivity at the overflow locations. The finite amplitude andwavelength of this rebound will depend on the elastic rheology ofthe lithosphere, which can be described by its effective elastic thick-ness (Te), Young's modulus, and Poisson ratio. The temporal evolu-tion of rebound, in turn, will depend on the viscosity of thelithosphere, a function of its composition and thermal state.
In order to assess both the magnitude and temporal evolution ofrebound associated with lake-level changes, we performed three ex-periments using different modeling strategies. We constructed a1000-km-long reference profile normal to the rift across the northernSuguta Valley (Fig. 2), where lake-level changes were most pro-nounced (300 m). The load considered the difference between MHSelevations and present topography, and a water density of 998 kg/m3 (modern Lake Turkana with temperature of 27.5 °C and salinityof 2500 mg/L; Johnson and Malala, 2009). In order to considermarked changes in lithospheric rheology across an active rift, we
performed a 3D experiment using the thin-shell method (Ventseland Krauthammer, 2001), a regional Te map (Pérez-Gussinyé et al.,2009), and volumetric loads. We fixed Young's modulus to 83 GPaand the Poisson ratio to 0.25, building on a previous modeling studyin the region (Golke and Mechie, 1994).
To obtain the temporal evolution of rebound we performed aset of simulations by means of a thermo-mechanical (TM) model(Popov and Sobolev, 2008); details of the model setup can be foundin the Supplementary material (Figs. S1 and S2). Fortunately, bothdetailed gravity (Mariita and Keller, 2007) and seismic refraction(KRISP, 1991) data are available for the region, providing key esti-mates of crustal thickness and density distributions across the refer-ence profile. We adopted variable lithospheric thicknesses fromregional seismic tomography studies (Artemieva, 2006; Conrad andLithgow-Bertelloni, 2006), and the geothermal gradient estimatedfrom mantle xenoliths found in recent lavas (Henjes-Kunst andAltherr, 1992) and its relationship to seismic velocities (Mechie etal., 1994). The lithospheric thickness and geothermal gradient areprobably the least well-constrained input parameters due to thelimited resolution of regional tomography and restricted spatial
a b
c d
e f
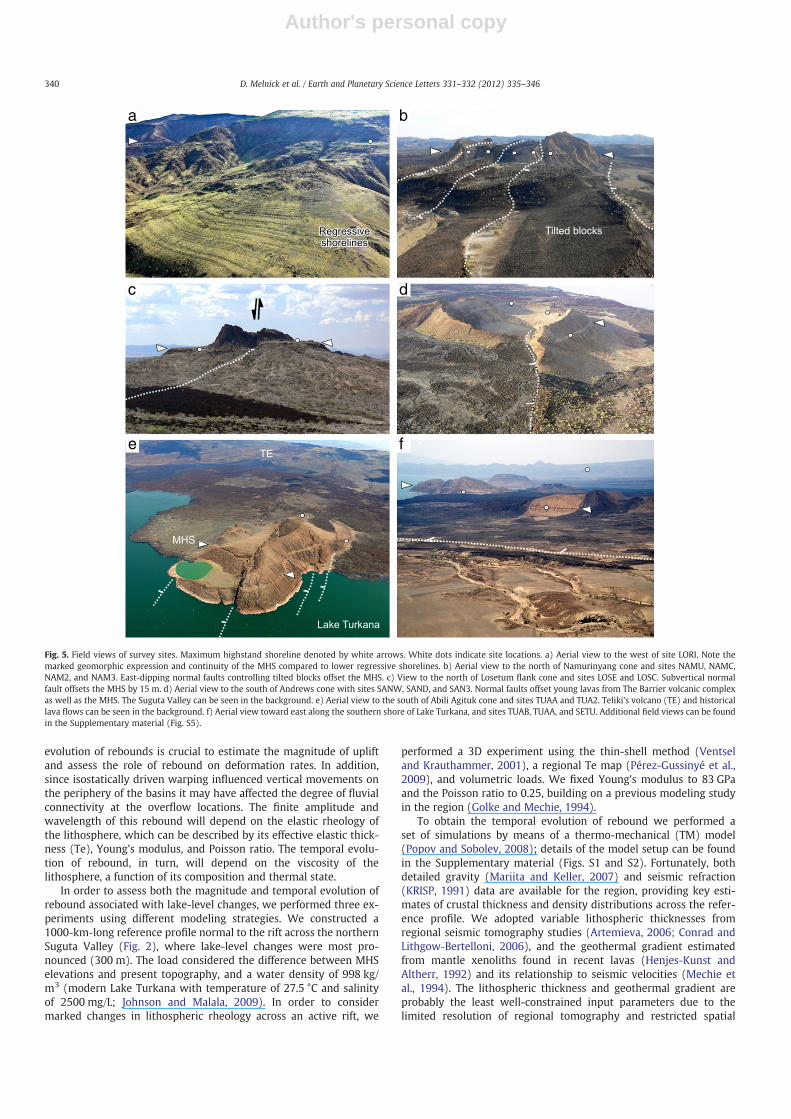
Fig. 5. Field views of survey sites. Maximum highstand shoreline denoted by white arrows. White dots indicate site locations. a) Aerial view to the west of site LORI. Note themarked geomorphic expression and continuity of the MHS compared to lower regressive shorelines. b) Aerial view to the north of Namurinyang cone and sites NAMU, NAMC,NAM2, and NAM3. East-dipping normal faults controlling tilted blocks offset the MHS. c) View to the north of Losetum flank cone and sites LOSE and LOSC. Subvertical normalfault offsets the MHS by 15 m. d) Aerial view to the south of Andrews cone with sites SANW, SAND, and SAN3. Normal faults offset young lavas from The Barrier volcanic complexas well as the MHS. The Suguta Valley can be seen in the background. e) Aerial view to the south of Abili Agituk cone and sites TUAA and TUA2. Teliki's volcano (TE) and historicallava flows can be seen in the background. f) Aerial view toward east along the southern shore of Lake Turkana, and sites TUAB, TUAA, and SETU. Additional field views can be foundin the Supplementary material (Fig. S5).
340 D. Melnick et al. / Earth and Planetary Science Letters 331–332 (2012) 335–346
distribution of xenoliths, respectively. To account for uncertainties,we performed a sensitivity analysis by changing the lithosphericthickness by 25 km and the geothermal gradient by ±50 °C. After astabilization period of 300 kyr, we removed the loads correspondingto the mass of water involved in the Suguta lake-level change epi-sode, and 2 kyr later for Lake Turkana.
Sediment cores from Lake Turkana have revealed relatively rapidsedimentation rates of 2–3.5 mm/yr over the past 3.5–4 kyr(Halfman et al., 1994). We estimated that a mean of 10 m of sedi-ments is likely to have been deposited since 5 kyr over an area of8100 km2. Using the measured sediment density (Barton andTorgersen, 1988) we estimated the flexural subsidence associatedwith this load and subtracted it from the unloading response (Fig. S3).
As a result of unloading, uplift at the center of the rift is greaterthan on the flanks where the overflow sills are located. Tectonicallydriven subsidence and extension may therefore be underestimatedif the effects of isostatic uplift are not included. Considering such is-sues is important because both the Suguta and Turkana sills are at dif-ferent locationswith respect to the center of unloading, and because theorientation of the rift changes between these regions. The rebound at
each MHS site is thus estimated as the deflection from the thin-shellmodel minus the deflection of the respective sill (Table 1).
4.3. Estimating extension rates from deformed Holocene shorelines
We determined extension in the uppermost crust by summingfault heave under the assumption that planar faults mapped in thefield account for all the strain. Because of the difficulty in measuringfault dips in the field due to limited deep vertical exposed sections,it is more accurate to determine fault throws and estimate heave fora range of dips (e.g., Bell et al., 2011; Lamarche et al., 2006).
We calculated the amount of extension along four profiles on SouthTurkana, Logipi, Namarunu, and Baragoi (Figs. 3 and 6). Tectonic subsi-dence was first estimated by calculating the cumulative vertical faultthrow for groups of faults that offset the MHS, both for the original ele-vations and those corrected for isostatic rebound (Fig. 6, Tables S1 andS2). For the faults located beyond the extent of theMHS, throwwas es-timated with respect to the elevation of the overflow sills. Fault throwwas converted to heave by assuming fault dips between 55° and 65°,the range estimated using seismic reflection profiles along the southern
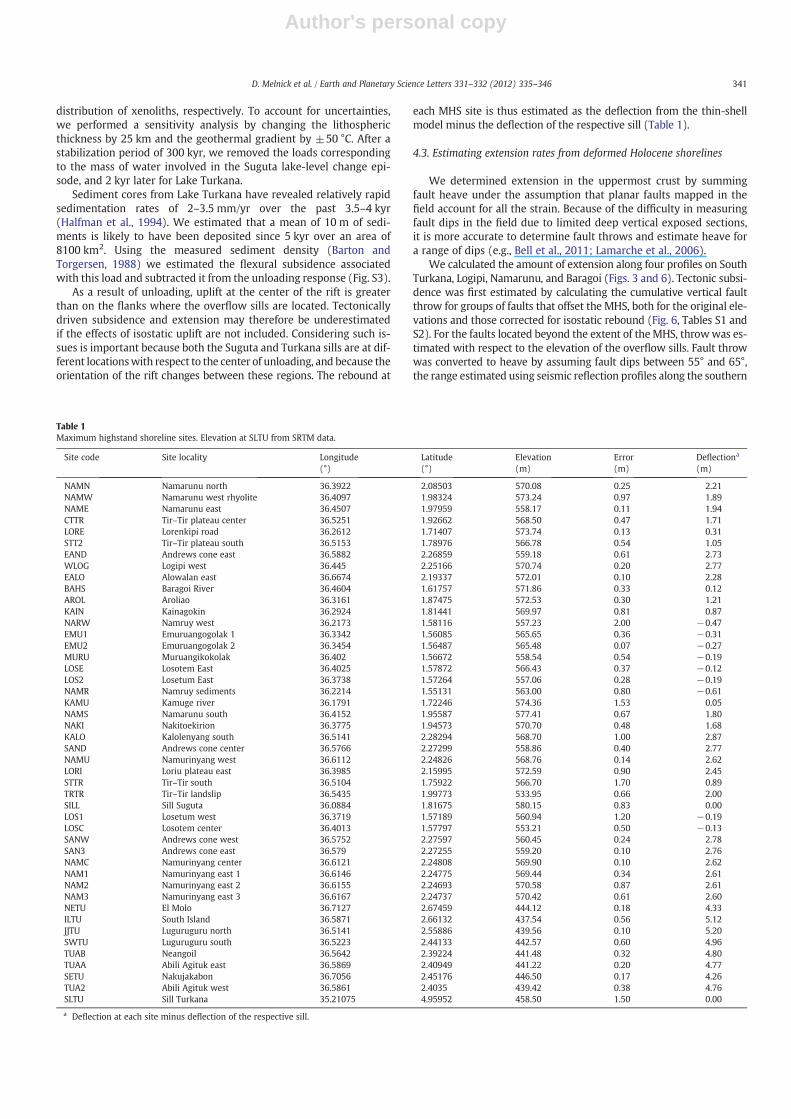
Table 1Maximum highstand shoreline sites. Elevation at SLTU from SRTM data.
Site code Site locality Longitude(°)
Latitude(°)
Elevation(m)
Error(m)
Deflectiona
(m)
NAMN Namarunu north 36.3922 2.08503 570.08 0.25 2.21NAMW Namarunu west rhyolite 36.4097 1.98324 573.24 0.97 1.89NAME Namarunu east 36.4507 1.97959 558.17 0.11 1.94CTTR Tir–Tir plateau center 36.5251 1.92662 568.50 0.47 1.71LORE Lorenkipi road 36.2612 1.71407 573.74 0.13 0.31STT2 Tir–Tir plateau south 36.5153 1.78976 566.78 0.54 1.05EAND Andrews cone east 36.5882 2.26859 559.18 0.61 2.73WLOG Logipi west 36.445 2.25166 570.74 0.20 2.77EALO Alowalan east 36.6674 2.19337 572.01 0.10 2.28BAHS Baragoi River 36.4604 1.61757 571.86 0.33 0.12AROL Aroliao 36.3161 1.87475 572.53 0.30 1.21KAIN Kainagokin 36.2924 1.81441 569.97 0.81 0.87NARW Namruy west 36.2173 1.58116 557.23 2.00 −0.47EMU1 Emuruangogolak 1 36.3342 1.56085 565.65 0.36 −0.31EMU2 Emuruangogolak 2 36.3454 1.56487 565.48 0.07 −0.27MURU Muruangikokolak 36.402 1.56672 558.54 0.54 −0.19LOSE Losotem East 36.4025 1.57872 566.43 0.37 −0.12LOS2 Losetum East 36.3738 1.57264 557.06 0.28 −0.19NAMR Namruy sediments 36.2214 1.55131 563.00 0.80 −0.61KAMU Kamuge river 36.1791 1.72246 574.36 1.53 0.05NAMS Namarunu south 36.4152 1.95587 577.41 0.67 1.80NAKI Nakitoekirion 36.3775 1.94573 570.70 0.48 1.68KALO Kalolenyang south 36.5141 2.28294 568.70 1.00 2.87SAND Andrews cone center 36.5766 2.27299 558.86 0.40 2.77NAMU Namurinyang west 36.6112 2.24826 568.76 0.14 2.62LORI Loriu plateau east 36.3985 2.15995 572.59 0.90 2.45STTR Tir–Tir south 36.5104 1.75922 566.70 1.70 0.89TRTR Tir–Tir landslip 36.5435 1.99773 533.95 0.66 2.00SILL Sill Suguta 36.0884 1.81675 580.15 0.83 0.00LOS1 Losetum west 36.3719 1.57189 560.94 1.20 −0.19LOSC Losotem center 36.4013 1.57797 553.21 0.50 −0.13SANW Andrews cone west 36.5752 2.27597 560.45 0.24 2.78SAN3 Andrews cone east 36.579 2.27255 559.20 0.10 2.76NAMC Namurinyang center 36.6121 2.24808 569.90 0.10 2.62NAM1 Namurinyang east 1 36.6146 2.24775 569.44 0.34 2.61NAM2 Namurinyang east 2 36.6155 2.24693 570.58 0.87 2.61NAM3 Namurinyang east 3 36.6167 2.24737 570.42 0.61 2.60NETU El Molo 36.7127 2.67459 444.12 0.18 4.33ILTU South Island 36.5871 2.66132 437.54 0.56 5.12JJTU Luguruguru north 36.5141 2.55886 439.56 0.10 5.20SWTU Luguruguru south 36.5223 2.44133 442.57 0.60 4.96TUAB Neangoil 36.5642 2.39224 441.48 0.32 4.80TUAA Abili Agituk east 36.5869 2.40949 441.22 0.20 4.77SETU Nakujakabon 36.7056 2.45176 446.50 0.17 4.26TUA2 Abili Agituk west 36.5861 2.4035 439.42 0.38 4.76SLTU Sill Turkana 35.21075 4.95952 458.50 1.50 0.00
a Deflection at each site minus deflection of the respective sill.
341D. Melnick et al. / Earth and Planetary Science Letters 331–332 (2012) 335–346
shore of Lake Turkana (Dunkelman et al., 1989; Morley et al., 1992). Ac-cordingly, the extension rate across the rift was calculated as the sum offault-heave values divided by the timing ofMHS abandonment, definedas 7.0±0.5 kyr and 6.0±0.5 kyr for the Suguta and Turkana basins,respectively (Fig. 4). Using the line-length change of each profile wealso estimated the total strain and strain rate (Table S2).
In some regions we observed block tilting in the field (Fig. 5b), andalso deduced it from the linear relation of MHS elevations with re-spect to fault positions and their correlation to the topography, suchas in the western sectors of the South Turkana and Namarunu profiles(Fig. 6). Extension associatedwith block tiltingwas estimated followingthe domino-block model (Wernicke and Burchfiel, 1982), neglectinginternal faulting within the blocks.
5. Results: using deformed shorelines to infer deformation rates
5.1. Flexural rebound associated with lake-level changes
The temporal and spatial evolution of unloading associated withlake-level changes was estimated along the reference profile (Figs. 7and 8). Despite introducing variations in the initial lithospheric thick-ness or geothermal gradient, the TM experiments converge towardstability after ~0.1 Myr (Fig. 8a). Changes in these initial conditionsonly affect the absolute elevation at the rift axis, and despite varia-tions in the input parameters the same overall evolution is observed.Therefore, our results for the relative elevation change associatedwith local unloading will not be strongly influenced by uncertainties
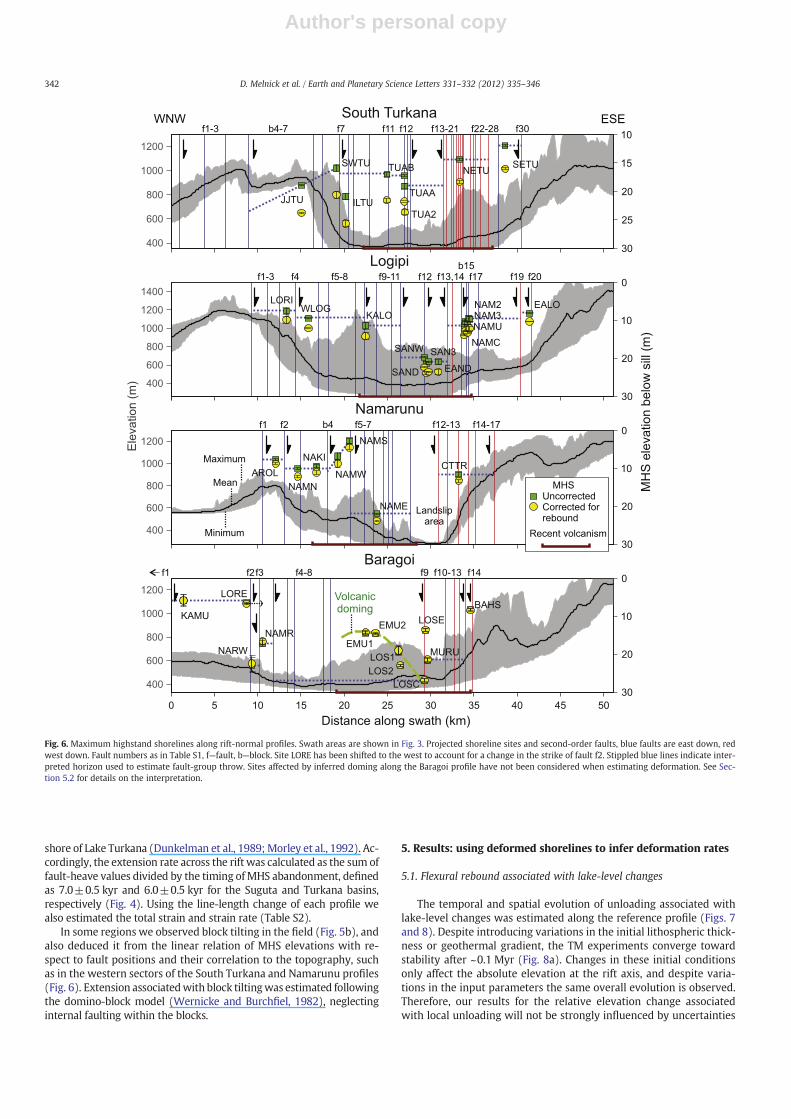
Fig. 6. Maximum highstand shorelines along rift-normal profiles. Swath areas are shown in Fig. 3. Projected shoreline sites and second-order faults, blue faults are east down, redwest down. Fault numbers as in Table S1, f—fault, b—block. Site LORE has been shifted to the west to account for a change in the strike of fault f2. Stippled blue lines indicate inter-preted horizon used to estimate fault-group throw. Sites affected by inferred doming along the Baragoi profile have not been considered when estimating deformation. See Sec-tion 5.2 for details on the interpretation.
342 D. Melnick et al. / Earth and Planetary Science Letters 331–332 (2012) 335–346
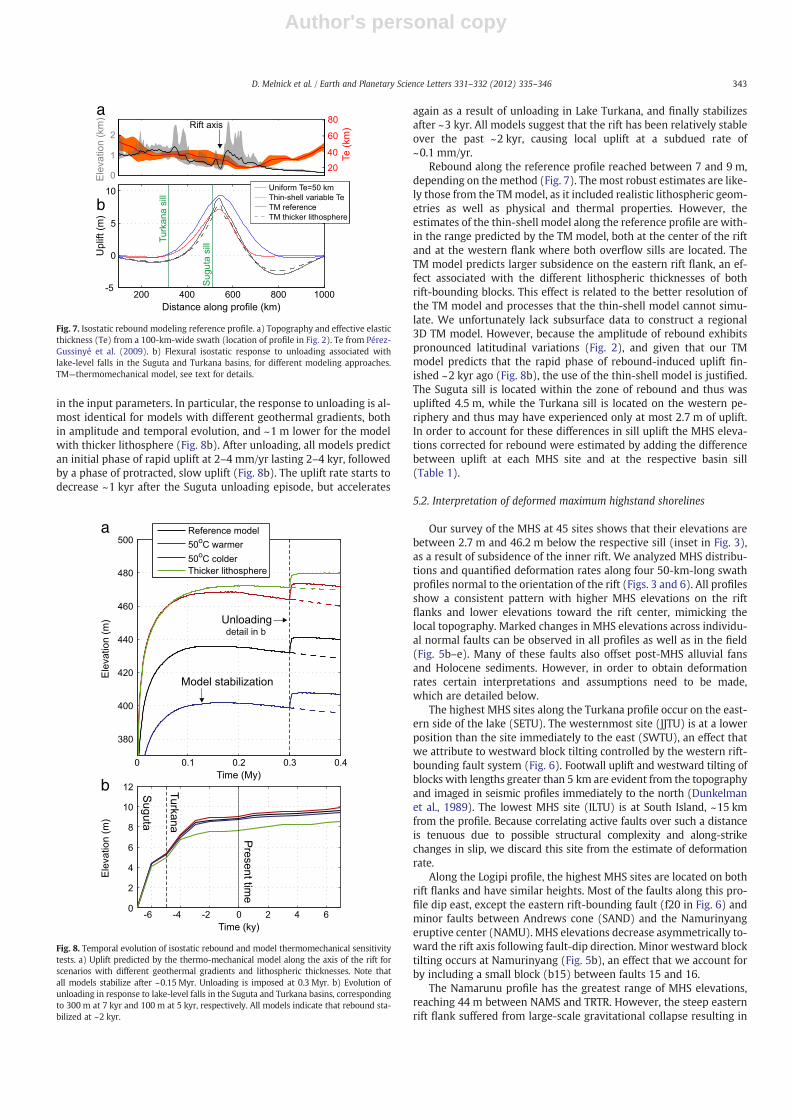
in the input parameters. In particular, the response to unloading is al-most identical for models with different geothermal gradients, bothin amplitude and temporal evolution, and ~1 m lower for the modelwith thicker lithosphere (Fig. 8b). After unloading, all models predictan initial phase of rapid uplift at 2–4 mm/yr lasting 2–4 kyr, followedby a phase of protracted, slow uplift (Fig. 8b). The uplift rate starts todecrease ~1 kyr after the Suguta unloading episode, but accelerates
again as a result of unloading in Lake Turkana, and finally stabilizesafter ~3 kyr. All models suggest that the rift has been relatively stableover the past ~2 kyr, causing local uplift at a subdued rate of~0.1 mm/yr.
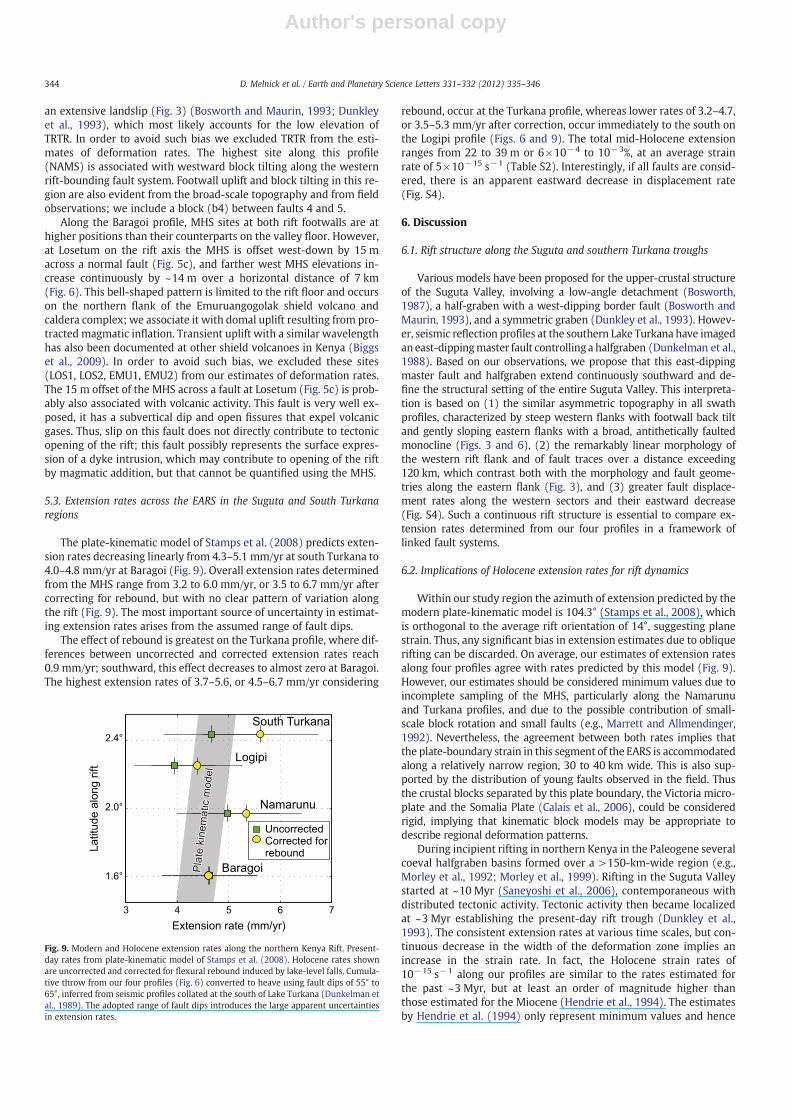
Rebound along the reference profile reached between 7 and 9 m,depending on the method (Fig. 7). The most robust estimates are like-ly those from the TMmodel, as it included realistic lithospheric geom-etries as well as physical and thermal properties. However, theestimates of the thin-shell model along the reference profile are with-in the range predicted by the TM model, both at the center of the riftand at the western flank where both overflow sills are located. TheTM model predicts larger subsidence on the eastern rift flank, an ef-fect associated with the different lithospheric thicknesses of bothrift-bounding blocks. This effect is related to the better resolution ofthe TM model and processes that the thin-shell model cannot simu-late. We unfortunately lack subsurface data to construct a regional3D TM model. However, because the amplitude of rebound exhibitspronounced latitudinal variations (Fig. 2), and given that our TMmodel predicts that the rapid phase of rebound-induced uplift fin-ished ~2 kyr ago (Fig. 8b), the use of the thin-shell model is justified.The Suguta sill is located within the zone of rebound and thus wasuplifted 4.5 m, while the Turkana sill is located on the western pe-riphery and thus may have experienced only at most 2.7 m of uplift.In order to account for these differences in sill uplift the MHS eleva-tions corrected for rebound were estimated by adding the differencebetween uplift at each MHS site and at the respective basin sill(Table 1).
5.2. Interpretation of deformed maximum highstand shorelines
Our survey of the MHS at 45 sites shows that their elevations arebetween 2.7 m and 46.2 m below the respective sill (inset in Fig. 3),as a result of subsidence of the inner rift. We analyzed MHS distribu-tions and quantified deformation rates along four 50-km-long swathprofiles normal to the orientation of the rift (Figs. 3 and 6). All profilesshow a consistent pattern with higher MHS elevations on the riftflanks and lower elevations toward the rift center, mimicking thelocal topography. Marked changes in MHS elevations across individu-al normal faults can be observed in all profiles as well as in the field(Fig. 5b–e). Many of these faults also offset post-MHS alluvial fansand Holocene sediments. However, in order to obtain deformationrates certain interpretations and assumptions need to be made,which are detailed below.
The highest MHS sites along the Turkana profile occur on the east-ern side of the lake (SETU). The westernmost site (JJTU) is at a lowerposition than the site immediately to the east (SWTU), an effect thatwe attribute to westward block tilting controlled by the western rift-bounding fault system (Fig. 6). Footwall uplift and westward tilting ofblocks with lengths greater than 5 km are evident from the topographyand imaged in seismic profiles immediately to the north (Dunkelmanet al., 1989). The lowest MHS site (ILTU) is at South Island, ~15 kmfrom the profile. Because correlating active faults over such a distanceis tenuous due to possible structural complexity and along-strikechanges in slip, we discard this site from the estimate of deformationrate.
Along the Logipi profile, the highest MHS sites are located on bothrift flanks and have similar heights. Most of the faults along this pro-file dip east, except the eastern rift-bounding fault (f20 in Fig. 6) andminor faults between Andrews cone (SAND) and the Namurinyangeruptive center (NAMU). MHS elevations decrease asymmetrically to-ward the rift axis following fault-dip direction. Minor westward blocktilting occurs at Namurinyang (Fig. 5b), an effect that we account forby including a small block (b15) between faults 15 and 16.
The Namarunu profile has the greatest range of MHS elevations,reaching 44 m between NAMS and TRTR. However, the steep easternrift flank suffered from large-scale gravitational collapse resulting in
b
a
Fig. 8. Temporal evolution of isostatic rebound and model thermomechanical sensitivitytests. a) Uplift predicted by the thermo-mechanical model along the axis of the rift forscenarios with different geothermal gradients and lithospheric thicknesses. Note thatall models stabilize after ~0.15 Myr. Unloading is imposed at 0.3 Myr. b) Evolution ofunloading in response to lake-level falls in the Suguta and Turkana basins, correspondingto 300 m at 7 kyr and 100 m at 5 kyr, respectively. All models indicate that rebound sta-bilized at ~2 kyr.
b
a
Fig. 7. Isostatic rebound modeling reference profile. a) Topography and effective elasticthickness (Te) from a 100-km-wide swath (location of profile in Fig. 2). Te from Pérez-Gussinyé et al. (2009). b) Flexural isostatic response to unloading associated withlake-level falls in the Suguta and Turkana basins, for different modeling approaches.TM—thermomechanical model, see text for details.
343D. Melnick et al. / Earth and Planetary Science Letters 331–332 (2012) 335–346
Author's personal copy
an extensive landslip (Fig. 3) (Bosworth and Maurin, 1993; Dunkleyet al., 1993), which most likely accounts for the low elevation ofTRTR. In order to avoid such bias we excluded TRTR from the esti-mates of deformation rates. The highest site along this profile(NAMS) is associated with westward block tilting along the westernrift-bounding fault system. Footwall uplift and block tilting in this re-gion are also evident from the broad-scale topography and from fieldobservations; we include a block (b4) between faults 4 and 5.
Along the Baragoi profile, MHS sites at both rift footwalls are athigher positions than their counterparts on the valley floor. However,at Losetum on the rift axis the MHS is offset west-down by 15 macross a normal fault (Fig. 5c), and farther west MHS elevations in-crease continuously by ~14 m over a horizontal distance of 7 km(Fig. 6). This bell-shaped pattern is limited to the rift floor and occurson the northern flank of the Emuruangogolak shield volcano andcaldera complex; we associate it with domal uplift resulting from pro-tracted magmatic inflation. Transient uplift with a similar wavelengthhas also been documented at other shield volcanoes in Kenya (Biggset al., 2009). In order to avoid such bias, we excluded these sites(LOS1, LOS2, EMU1, EMU2) from our estimates of deformation rates.The 15 m offset of the MHS across a fault at Losetum (Fig. 5c) is prob-ably also associated with volcanic activity. This fault is very well ex-posed, it has a subvertical dip and open fissures that expel volcanicgases. Thus, slip on this fault does not directly contribute to tectonicopening of the rift; this fault possibly represents the surface expres-sion of a dyke intrusion, which may contribute to opening of the riftby magmatic addition, but that cannot be quantified using the MHS.
5.3. Extension rates across the EARS in the Suguta and South Turkanaregions
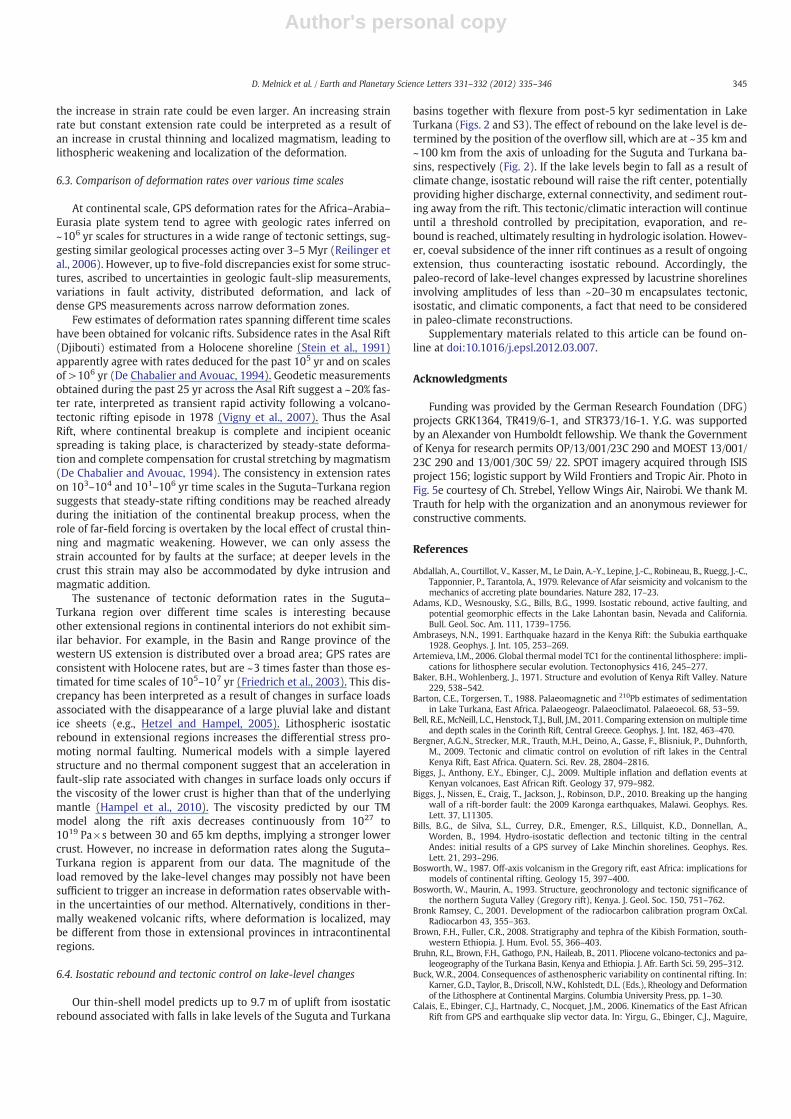
The plate-kinematic model of Stamps et al. (2008) predicts exten-sion rates decreasing linearly from 4.3–5.1 mm/yr at south Turkana to4.0–4.8 mm/yr at Baragoi (Fig. 9). Overall extension rates determinedfrom the MHS range from 3.2 to 6.0 mm/yr, or 3.5 to 6.7 mm/yr aftercorrecting for rebound, but with no clear pattern of variation alongthe rift (Fig. 9). The most important source of uncertainty in estimat-ing extension rates arises from the assumed range of fault dips.
The effect of rebound is greatest on the Turkana profile, where dif-ferences between uncorrected and corrected extension rates reach0.9 mm/yr; southward, this effect decreases to almost zero at Baragoi.The highest extension rates of 3.7–5.6, or 4.5–6.7 mm/yr considering
rebound, occur at the Turkana profile, whereas lower rates of 3.2–4.7,or 3.5–5.3 mm/yr after correction, occur immediately to the south onthe Logipi profile (Figs. 6 and 9). The total mid-Holocene extensionranges from 22 to 39 m or 6×10⁻⁴ to 10−3%, at an average strainrate of 5×10⁻¹⁵ s−1 (Table S2). Interestingly, if all faults are consid-ered, there is an apparent eastward decrease in displacement rate(Fig. S4).
6. Discussion
6.1. Rift structure along the Suguta and southern Turkana troughs
Various models have been proposed for the upper-crustal structureof the Suguta Valley, involving a low-angle detachment (Bosworth,1987), a half-graben with a west-dipping border fault (Bosworth andMaurin, 1993), and a symmetric graben (Dunkley et al., 1993). Howev-er, seismic reflection profiles at the southern Lake Turkana have imagedan east-dippingmaster fault controlling a halfgraben (Dunkelman et al.,1988). Based on our observations, we propose that this east-dippingmaster fault and halfgraben extend continuously southward and de-fine the structural setting of the entire Suguta Valley. This interpreta-tion is based on (1) the similar asymmetric topography in all swathprofiles, characterized by steep western flanks with footwall back tiltand gently sloping eastern flanks with a broad, antithetically faultedmonocline (Figs. 3 and 6), (2) the remarkably linear morphology ofthe western rift flank and of fault traces over a distance exceeding120 km, which contrast both with the morphology and fault geome-tries along the eastern flank (Fig. 3), and (3) greater fault displace-ment rates along the western sectors and their eastward decrease(Fig. S4). Such a continuous rift structure is essential to compare ex-tension rates determined from our four profiles in a framework oflinked fault systems.
6.2. Implications of Holocene extension rates for rift dynamics
Within our study region the azimuth of extension predicted by themodern plate-kinematic model is 104.3° (Stamps et al., 2008), whichis orthogonal to the average rift orientation of 14°, suggesting planestrain. Thus, any significant bias in extension estimates due to obliquerifting can be discarded. On average, our estimates of extension ratesalong four profiles agree with rates predicted by this model (Fig. 9).However, our estimates should be considered minimum values due toincomplete sampling of the MHS, particularly along the Namarunuand Turkana profiles, and due to the possible contribution of small-scale block rotation and small faults (e.g., Marrett and Allmendinger,1992). Nevertheless, the agreement between both rates implies thatthe plate-boundary strain in this segment of the EARS is accommodatedalong a relatively narrow region, 30 to 40 km wide. This is also sup-ported by the distribution of young faults observed in the field. Thusthe crustal blocks separated by this plate boundary, the Victoria micro-plate and the Somalia Plate (Calais et al., 2006), could be consideredrigid, implying that kinematic block models may be appropriate todescribe regional deformation patterns.
During incipient rifting in northern Kenya in the Paleogene severalcoeval halfgraben basins formed over a >150-km-wide region (e.g.,Morley et al., 1992; Morley et al., 1999). Rifting in the Suguta Valleystarted at ~10 Myr (Saneyoshi et al., 2006), contemporaneous withdistributed tectonic activity. Tectonic activity then became localizedat ~3 Myr establishing the present-day rift trough (Dunkley et al.,1993). The consistent extension rates at various time scales, but con-tinuous decrease in the width of the deformation zone implies anincrease in the strain rate. In fact, the Holocene strain rates of10−15 s−1 along our profiles are similar to the rates estimated forthe past ~3 Myr, but at least an order of magnitude higher thanthose estimated for the Miocene (Hendrie et al., 1994). The estimatesby Hendrie et al. (1994) only represent minimum values and hence
Fig. 9. Modern and Holocene extension rates along the northern Kenya Rift. Present-day rates from plate-kinematic model of Stamps et al. (2008). Holocene rates shownare uncorrected and corrected for flexural rebound induced by lake-level falls. Cumula-tive throw from our four profiles (Fig. 6) converted to heave using fault dips of 55° to65°, inferred from seismic profiles collated at the south of Lake Turkana (Dunkelman etal., 1989). The adopted range of fault dips introduces the large apparent uncertaintiesin extension rates.
344 D. Melnick et al. / Earth and Planetary Science Letters 331–332 (2012) 335–346
the increase in strain rate could be even larger. An increasing strainrate but constant extension rate could be interpreted as a result ofan increase in crustal thinning and localized magmatism, leading tolithospheric weakening and localization of the deformation.
6.3. Comparison of deformation rates over various time scales
At continental scale, GPS deformation rates for the Africa–Arabia–Eurasia plate system tend to agree with geologic rates inferred on~106 yr scales for structures in a wide range of tectonic settings, sug-gesting similar geological processes acting over 3–5 Myr (Reilinger etal., 2006). However, up to five-fold discrepancies exist for some struc-tures, ascribed to uncertainties in geologic fault-slip measurements,variations in fault activity, distributed deformation, and lack ofdense GPS measurements across narrow deformation zones.
Few estimates of deformation rates spanning different time scaleshave been obtained for volcanic rifts. Subsidence rates in the Asal Rift(Djibouti) estimated from a Holocene shoreline (Stein et al., 1991)apparently agree with rates deduced for the past 105 yr and on scalesof >106 yr (De Chabalier and Avouac, 1994). Geodetic measurementsobtained during the past 25 yr across the Asal Rift suggest a ~20% fas-ter rate, interpreted as transient rapid activity following a volcano-tectonic rifting episode in 1978 (Vigny et al., 2007). Thus the AsalRift, where continental breakup is complete and incipient oceanicspreading is taking place, is characterized by steady-state deforma-tion and complete compensation for crustal stretching by magmatism(De Chabalier and Avouac, 1994). The consistency in extension rateson 103–104 and 101–106 yr time scales in the Suguta–Turkana regionsuggests that steady-state rifting conditions may be reached alreadyduring the initiation of the continental breakup process, when therole of far-field forcing is overtaken by the local effect of crustal thin-ning and magmatic weakening. However, we can only assess thestrain accounted for by faults at the surface; at deeper levels in thecrust this strain may also be accommodated by dyke intrusion andmagmatic addition.
The sustenance of tectonic deformation rates in the Suguta–Turkana region over different time scales is interesting becauseother extensional regions in continental interiors do not exhibit sim-ilar behavior. For example, in the Basin and Range province of thewestern US extension is distributed over a broad area; GPS rates areconsistent with Holocene rates, but are ~3 times faster than those es-timated for time scales of 105–107 yr (Friedrich et al., 2003). This dis-crepancy has been interpreted as a result of changes in surface loadsassociated with the disappearance of a large pluvial lake and distantice sheets (e.g., Hetzel and Hampel, 2005). Lithospheric isostaticrebound in extensional regions increases the differential stress pro-moting normal faulting. Numerical models with a simple layeredstructure and no thermal component suggest that an acceleration infault-slip rate associated with changes in surface loads only occurs ifthe viscosity of the lower crust is higher than that of the underlyingmantle (Hampel et al., 2010). The viscosity predicted by our TMmodel along the rift axis decreases continuously from 1027 to1019 Pa×s between 30 and 65 km depths, implying a stronger lowercrust. However, no increase in deformation rates along the Suguta–Turkana region is apparent from our data. The magnitude of theload removed by the lake-level changes may possibly not have beensufficient to trigger an increase in deformation rates observable with-in the uncertainties of our method. Alternatively, conditions in ther-mally weakened volcanic rifts, where deformation is localized, maybe different from those in extensional provinces in intracontinentalregions.
6.4. Isostatic rebound and tectonic control on lake-level changes
Our thin-shell model predicts up to 9.7 m of uplift from isostaticrebound associated with falls in lake levels of the Suguta and Turkana
basins together with flexure from post-5 kyr sedimentation in LakeTurkana (Figs. 2 and S3). The effect of rebound on the lake level is de-termined by the position of the overflow sill, which are at ~35 km and~100 km from the axis of unloading for the Suguta and Turkana ba-sins, respectively (Fig. 2). If the lake levels begin to fall as a result ofclimate change, isostatic rebound will raise the rift center, potentiallyproviding higher discharge, external connectivity, and sediment rout-ing away from the rift. This tectonic/climatic interaction will continueuntil a threshold controlled by precipitation, evaporation, and re-bound is reached, ultimately resulting in hydrologic isolation. Howev-er, coeval subsidence of the inner rift continues as a result of ongoingextension, thus counteracting isostatic rebound. Accordingly, thepaleo-record of lake-level changes expressed by lacustrine shorelinesinvolving amplitudes of less than ~20–30 m encapsulates tectonic,isostatic, and climatic components, a fact that need to be consideredin paleo-climate reconstructions.
Supplementary materials related to this article can be found on-line at doi:10.1016/j.epsl.2012.03.007.
Acknowledgments
Funding was provided by the German Research Foundation (DFG)projects GRK1364, TR419/6-1, and STR373/16-1. Y.G. was supportedby an Alexander von Humboldt fellowship. We thank the Governmentof Kenya for research permits OP/13/001/23C 290 and MOEST 13/001/23C 290 and 13/001/30C 59/ 22. SPOT imagery acquired through ISISproject 156; logistic support by Wild Frontiers and Tropic Air. Photo inFig. 5e courtesy of Ch. Strebel, Yellow Wings Air, Nairobi. We thank M.Trauth for help with the organization and an anonymous reviewer forconstructive comments.
References
Abdallah, A., Courtillot, V., Kasser, M., Le Dain, A.-Y., Lepine, J.-C., Robineau, B., Ruegg, J.-C.,Tapponnier, P., Tarantola, A., 1979. Relevance of Afar seismicity and volcanism to themechanics of accreting plate boundaries. Nature 282, 17–23.
Adams, K.D., Wesnousky, S.G., Bills, B.G., 1999. Isostatic rebound, active faulting, andpotential geomorphic effects in the Lake Lahontan basin, Nevada and California.Bull. Geol. Soc. Am. 111, 1739–1756.
Ambraseys, N.N., 1991. Earthquake hazard in the Kenya Rift: the Subukia earthquake1928. Geophys. J. Int. 105, 253–269.
Artemieva, I.M., 2006. Global thermal model TC1 for the continental lithosphere: impli-cations for lithosphere secular evolution. Tectonophysics 416, 245–277.
Baker, B.H., Wohlenberg, J., 1971. Structure and evolution of Kenya Rift Valley. Nature229, 538–542.
Barton, C.E., Torgersen, T., 1988. Palaeomagnetic and 210Pb estimates of sedimentationin Lake Turkana, East Africa. Palaeogeogr. Palaeoclimatol. Palaeoecol. 68, 53–59.
Bell, R.E., McNeill, L.C., Henstock, T.J., Bull, J.M., 2011. Comparing extension onmultiple timeand depth scales in the Corinth Rift, Central Greece. Geophys. J. Int. 182, 463–470.
Bergner, A.G.N., Strecker, M.R., Trauth, M.H., Deino, A., Gasse, F., Blisniuk, P., Duhnforth,M., 2009. Tectonic and climatic control on evolution of rift lakes in the CentralKenya Rift, East Africa. Quatern. Sci. Rev. 28, 2804–2816.
Biggs, J., Anthony, E.Y., Ebinger, C.J., 2009. Multiple inflation and deflation events atKenyan volcanoes, East African Rift. Geology 37, 979–982.
Biggs, J., Nissen, E., Craig, T., Jackson, J., Robinson, D.P., 2010. Breaking up the hangingwall of a rift-border fault: the 2009 Karonga earthquakes, Malawi. Geophys. Res.Lett. 37, L11305.
Bills, B.G., de Silva, S.L., Currey, D.R., Emenger, R.S., Lillquist, K.D., Donnellan, A.,Worden, B., 1994. Hydro-isostatic deflection and tectonic tilting in the centralAndes: initial results of a GPS survey of Lake Minchin shorelines. Geophys. Res.Lett. 21, 293–296.
Bosworth, W., 1987. Off-axis volcanism in the Gregory rift, east Africa: implications formodels of continental rifting. Geology 15, 397–400.
Bosworth, W., Maurin, A., 1993. Structure, geochronology and tectonic significance ofthe northern Suguta Valley (Gregory rift), Kenya. J. Geol. Soc. 150, 751–762.
Bronk Ramsey, C., 2001. Development of the radiocarbon calibration program OxCal.Radiocarbon 43, 355–363.
Brown, F.H., Fuller, C.R., 2008. Stratigraphy and tephra of the Kibish Formation, south-western Ethiopia. J. Hum. Evol. 55, 366–403.
Bruhn, R.L., Brown, F.H., Gathogo, P.N., Haileab, B., 2011. Pliocene volcano-tectonics and pa-leogeography of the Turkana Basin, Kenya and Ethiopia. J. Afr. Earth Sci. 59, 295–312.
Buck, W.R., 2004. Consequences of asthenospheric variability on continental rifting. In:Karner, G.D., Taylor, B., Driscoll, N.W., Kohlstedt, D.L. (Eds.), Rheology and Deformationof the Lithosphere at Continental Margins. Columbia University Press, pp. 1–30.
Calais, E., Ebinger, C.J., Hartnady, C., Nocquet, J.M., 2006. Kinematics of the East AfricanRift from GPS and earthquake slip vector data. In: Yirgu, G., Ebinger, C.J., Maguire,
345D. Melnick et al. / Earth and Planetary Science Letters 331–332 (2012) 335–346
P.K.H. (Eds.), The Afar Volcanic Province Within the East African Rift System: Geo-logical Society Special Publication, London, pp. 9–22.
Calais, E., d'Oreye, N., Albaric, J., Deschamps, A., Delvaux, D., Deverchere, J., Ebinger, C.,Ferdinand, R.W., Kervyn, F., Macheyeki, A.S., Oyen, A., Perrot, J., Saria, E., Smets, B.,Stamps, D.S., Wauthier, C., 2008. Strain accommodation by slow slip and dyking ina youthful continental rift, East Africa. Nature 456, 783–788.
Chu, D., Gordon, R.G., 1999. Evidence for motion between Nubia and Somalia along theSouthwest Indian ridge. Nature 398, 64–67.
Conrad, C.P., Lithgow-Bertelloni, C., 2006. Influence of continental roots and astheno-sphere on plate–mantle coupling. Geophys. Res. Lett. 33, L05312.
De Chabalier, J.-B., Avouac, J.-P., 1994. Kinematics of the Asal Rift (Djibouti) determinedfrom the deformation of Fieale Volcano. Science 265, 1677–1681.
deMenocal, P., Ortiz, J., Guilderson, T., Adkins, J., Sarnthein, M., Baker, L., Yarusinsky, M.,2000. Abrupt onset and termination of the African Humid Period: rapid climateresponses to gradual insolation forcing. Quatern. Sci. Rev. 19, 347–361.
Dunkelman, T.J., Karson, J.A., Rosendahl, B.R., 1988. Structural style of the Turkana Rift,Kenya. Geology, pp. 258–261.
Dunkelman, T.J., Rosendahl, B.R., Karson, J.A., 1989. Structure and stratigraphy of theTurkana Rift from seismic-reflection data. J. Afr. Earth Sci. 489–510.
Dunkley, P.N., Smith, M., Allen, D.J., Darling, W.G., 1993. The geothermal activity andgeology of the northern sector of the Kenya Rift Valley. British Geological Survey.: Research Report SC/93/1. 185 pp.
Ebinger, C.J., Sleep, N.H., 1998. Cenozoic magmatism throughout east Africa resultingfrom impact of a single plume. Nature 395, 788–791.
Ebinger, C.J., Yemane, T., Harding, D.J., Tesfaye, S., Kelley, S., Rex, D.C., 2000. Rift deflection,migration, and propagation: linkage of the Ethiopian and Eastern rifts, Africa. Bull.Geol. Soc. Am. 112, 163–176.
Engdahl, E.R., Villaseñor, A., 2002. Global seismicity: 1900–1999. In: Lee, W.H.,Kanamori, H., Jennings, P.C., Kisslinger, C. (Eds.), InternationalHandbook of Earthquakeand Engineering Seismology. Academic Press, pp. 665–690.
Friedrich, A.M., Wernicke, B.P., Niemi, N.A., Bennett, R.A., Davis, J.L., 2003. Comparisonof geodetic and geologic data from the Wasatch region, Utah, and implications forthe spectral character of Earth deformation at periods of 10 to 10 million years. J.Geophys. Res. 108, 2199.
Garcin, Y., Junginger, A., Melnick, D., Olago, D.O., Strecker,M.R., Trauth,M.H., 2009. Late Pleis-tocene–Holocene rise and collapse of Lake Suguta, northern Kenya Rift. Quatern. Sci.Rev. 28, 911–925.
Garcin, Y., Melnick, D., Olago, D., Strecker, M., Tiercelin, J.J., this volume. East Africanmid-Holocene wet–dry transition recorded in fossil shorelines of Lake Turkana,northern Kenya Rift. Earth Planet. Sci. Lett.
Gasse, F., 2000. Hydrological changes in the African tropics since the last glacial maximum.Quatern. Sci. Rev. 19, 189–211.
Golke, M., Mechie, J., 1994. Finite-element modelling of the structure and evolution ofthe South Kenya Rift, East Africa. Tectonophysics 236, 439–452.
Grandin, R., Socquet, A., Doin, M.P., Jacques, E., de Chabalier, J.B., King, G.C.P., 2010.Transient rift opening in response to multiple dike injections in the Manda Hararorift (Afar, Ethiopia) imaged by time-dependent elastic inversion of interferometricsynthetic aperture radar data. J. Geophys. Res. 115, B09403.
Halfman, J.D., Johnson, T.C., Finney, B.P., 1994. New AMS dates, stratigraphic correlationsand decadal climatic cycles for the past 4 ka at Lake Turkana, Kenya. Palaeogeogr.Palaeoclimatol. Palaeoecol. 111, 83–98.
Hampel, A., Karow, T., Maniatis, G., Hetzel, R., 2010. Slip rate variations on faults duringglacial loading and post-glacial unloading: implications for the viscosity structureof the lithosphere. J. Geol. Soc. 167, 385–399.
Hautot, S., Tarits, P., Whaler, K., Le Gall, B., Tiercelin, J.-J., Le Turdu, C., 2000. Deepstructure of the Baringo Rift Basin (Central Kenya) from three-dimensional mag-netotelluric imaging: implications for rift evolution. J. Geophys. Res. 105,23493–23518.
Hendrie, D.B., Kusznir, N.J., Morley, C.K., Ebinger, C.J., 1994. Cenozoic extension innorthern Kenya: a quantitative model of rift basin development in the Turkana re-gion. Tectonophysics 236, 409–438.
Henjes-Kunst, F., Altherr, R., 1992. Metamorphic petrology of xenoliths from Kenya andNorthern Tanzania and implications for geotherms and lithospheric structures. J.Petrol. 33, 1125–1156.
Hetzel, R., Hampel, A., 2005. Slip rate variations on normal faults during glacial–interglacialchanges in surface loads. Nature 435, 81–84.
Horner-Johnson, B.C., Gordon, R.G., Cowles, S.M., Argus, D.F., 2005. The angular velocityof Nubia relative to Somalia and the location of the Nubia–Somalia–Antarctica triplejunction. Geophys. J. Int. 162, 221–238.
Johnson, T.C., Malala, J.O., 2009. Lake Turkana and its link to the Nile. In: Dumont, H.J.(Ed.), The Nile. : Monographiae Biologicae. Springer, pp. 287–304.
Junginger, A., 2011. East African Climate Variability on Different Time Scales: TheSuguta Valley in the African–Asian Monsoon Domain, PhD Thesis, University ofPotsdam, Potsdam, 153 pp.
KRISP, 1991. Large-scale variation in lithospheric structure along and across the KenyaRift. Nature 354, 223–227.
Lajoie, K.R., 1986. Coastal tectonics. Active Tectonics 95–124.Lamarche, G., Barnes, P.M., Bull, J.M., 2006. Faulting and extension rate over the last
20,000 years in the offshore Whakatane Graben, New Zealand continental shelf.Tectonics 25, TC4005.
Mariita, N.O., Keller, G.R., 2007. An integrated geophysical study of the northern Kenyarift. J. Afr. Earth Sci. 48, 80–94.
Marrett, R., Allmendinger, R.W., 1992. Amount of extension on “small” faults: an examplefrom the Viking graben. Geology 20, 47–50.
McKenzie, D., Davies, D., Molnar, P., 1970. Plate tectonics of the Red Sea and East Africa.Nature 226, 243–248.
Mechie, J., Fuchs, K., Altherr, R., 1994. The relationship between seismic velocity, mineralcomposition and temperature and pressure in the upper mantle—with an applicationto the Kenya Rift and its eastern flank. Tectonophysics 236, 453–464.
Molnar, P., 1988. Continental tectonics in the aftermath of plate tectonics. Nature 35,131–137.
Morley, C.K., 1999. Marked along-strike variations in dip of normal faults—the Lokicharfault, N. Kenya rift: a possible cause for metamorphic core complexes. J. Struct.Geol. 21, 479–492.
Morley, C.K., Wescott, W.A., Stone, D.M., Harper, R.M., Wigger, S.T., Karanja, F.M., 1992.Tectonic evolution of the northern Kenyan Rift. J. Geol. Soc. 149, 333–348.
Morley, C.K., Wescott, W.A., Stone, D.M., Harper, R.M., Wigger, S.T., Day, R.A., Karanja,F.M., 1999. Geology and geophysics of the Western Turkana Basins, Kenya. In:Morley, C.K. (Ed.), Geoscience of Rift Systems-evolution of East Africa: AmericanAssociation of Petroleum Geologists Studies in Geology, pp. 19–54.
Owen, R.B., Barthelme, J.W., Renaut, R.W., Vincens, A., 1982. Palaeolimnology andarchaeology of Holocene deposits north-east of Lake Turkana, Kenya. Nature298, 523–529.
Parsons, T., Thompson, G.A., 1991. The role of magma overpressure in suppressingearthquakes and topography: worldwide examples. Science 253, 1399–1402.
Pérez-Gussinyé, M., Metois, M., Fernandez, M., Verges, J., Fullea, J., Lowry, A.R., 2009. Ef-fective elastic thickness of Africa and its relationship to other proxies for lithosphericstructure and surface tectonics. Earth Planet. Sci. Lett. 287, 152–167.
Pointing, A.J., Maguire, P.K.H., Khan, M.A., Francis, D.J., Swain, C.J., Shah, E.R., Griffiths, D.H.,1985. Seismicity of the northern part of the Kenya Rift Valley. J. Geodynamics 3, 23–37.
Popov, A., Sobolev, S., 2008. Slim3d: a tool for three-dimensional thermomechanicalmodeling of the lithospheric deformation with elasto-viscoplastic rheology. Phys.Earth Planet. Inter. 171, 55–75.
Regenauer-Lieb, K., Rosenbaum, G., Weinberg, R.F., 2008. Strain localisation and weak-ening of the lithosphere during extension. Tectonophysics 458, 96–104.
Reilinger, R., McClusky, S., Vernant, P., Lawrence, S., Ergintav, S., Cakmak, R., Ozener, H.,Kadirov, F., Guliev, I., Stepanyan, R., Nadariya, M., Hahubia, G., Mahmoud, S., Sakr, K.,ArRajehi, A., Paradissis, D., Al-Aydrus, A., Prilepin, M., Guseva, T., Evren, E., Dmitrotsa,A., Filikov, S.V., Gomez, F., Al-Ghazzi, R., Karam, G., 2006. GPS constraints on continentaldeformation in the Africa–Arabia–Eurasia continental collision zone and implications forthe dynamics of plate interactions. J. Geophys. Res. 111, B05411.
Reimer, P.J., Baillie, M.G.L., Bard, E., Bayliss, A., Beck, J.W., Blackwell, P.G., Bronk Ramsey, C.,Buck, C.E., Burr, G.S., Edwards, R.L., Friedrich, M., Grootes, P.M., Guilderson, T.P.,Hajdas, I., Heaton, T.J., Hogg, A.G., Hughen, K.A., Kaiser, K.F., Kromer, B., McCormac,F.G., Manning, S.W., Reimer, R.W., Richards, D.A., Southon, J.R., Talamo, S., Turney,C.S.M., van der Plicht, J., Weyhenmeyer, C.E., 2009. IntCal09 and Marine09 radiocar-bon age calibration curves, 0–50,000 years cal BP. Radiocarbon 51, 1111–1150.
Ritchie, J.C., Eyles, C.H., Haynes, C.V., 1985. Sediment and pollen evidence for an early tomid-Holocene humid period in the eastern Sahara. Nature 314, 352–355.
Saneyoshi, M., Nakayama, K., Sakai, T., Sawada, Y., Ishida, H., 2006. Half graben fillingprocesses in the early phase of continental rifting: the Miocene Namurungule For-mation of the Kenya Rift. Sed. Geol. 186, 111–131.
Stamps,D.S., Calais, E., Saria, E., Hartnady, C., Nocquet, J.M., Ebinger, C.J., Fernandes, R.M., 2008.A kinematic model for the East African Rift. Geophys. Res. Lett. 35, L05304.
Stein, R.S., Briole, P., Ruegg, J.C., Tapponnier, P., Gasse, F., 1991. Contemporary, Holocene,and quaternary deformation of the Asal Rift, Djibouti: implications for the mechanicsof slow spreading ridges. J. Geophys. Res. 96, 21789–21806.
Strecker, M.R., Blisniuk, P.M., Eisbacher, G.H., 1990. Rotation of extension direction inthe central Kenya Rift. Geology 18, 299–302.
Tiercelin, J.J., Lezzar, K.E., 2004. A 300 million years history of rift lakes in Central andEast Africa: an updated broad review. In: Odada, E., Olago, D. (Eds.), The East AfricanGreat Lakes: Limnology, Palaeolimnology and Biodiversity. : Advances in GlobalChange Research. Springer, pp. 3–60.
Tongue, J., Maguire, P., Burton, P., 1994. An earthquake study in the Lake Baringo basinof the central Kenya Rift. Tectonophysics 236, 151–164.
Truckle, P.H., 1976. Geology and late Cainozoic lake sediments of the Suguta Trough,Kenya. Nature 263, 380–383.
Turcotte, D.L., Schubert, G., 1982. Geodynamics: Applications of Continuum Physics toGeological Problems. Cambridge University Press, New York.
Ventsel, E., Krauthammer, T., 2001. Thin Plates and Shells. Theory, Analysis, and Appli-cations. M Dekker, New York. 666 pp.
Vetel, W., Le Gall, B., 2006. Dynamics of prolonged continental extension in magmatic rifts:the Turkana Rift case study (North Kenya). Geol. Soc., Lond., Spec. Publ. 259, 209–233.
Vetel, W., Le Gall, B., Walsh, J.J., 2005. Geometry and growth of an inner rift fault pattern: theKino Sogo Fault Belt, Turkana Rift (North Kenya). J. Struct. Geol. 27, 2204–2222.
Vigny, C., de Chabalier, J.-B., Ruegg, J.-C., Huchon, P., Feigl, K.L., Cattin, R., Asfaw, L.,Kanbari, K., 2007. Twenty-five years of geodetic measurements along the Tadjoura–Asal rift system, Djibouti, East Africa. J. Geophys. Res. 112, B06410.
Wernicke, B., Burchfiel, B.C., 1982. Modes of extensional tectonics. J. Struct. Geol. 4,105–115.
Wichura, H., Bousquet, R., Oberhansli, R., Strecker,M.R., Trauth,M.H., 2010. Evidence formid-dle Miocene uplift of the East African Plateau. Geology 38, 543–546.
Wright, T.J., Ebinger, C., Biggs, J., Ayele, A., Yirgu, G., Keir, D., Stork, A., 2006. Magma-maintained rift segmentation at continental rupture in the 2005 Afar dyking episode.Nature 442, 291–294.
Zielke, O., Strecker, M.R., 2009. Recurrence of large earthquakes in magmatic continentalrifts: insights from a paleoseismic study along the Laikipia–Marmanet Fault, SubukiaValley, Kenya Rift. Bull. Seismol. Soc. Am. 99, 61–70.
346 D. Melnick et al. / Earth and Planetary Science Letters 331–332 (2012) 335–346