Page 1
Stimuli Responsive Barrier Materials for Breathable, Chemically-Protective Wearable
Fabrics
By
Kenneth Manning
A Dissertation Presented in Partial Fulfillment
of the Requirements for the Degree
Doctor of Philosophy
Approved June 2020 by the
Graduate Supervisory Committee:
Konrad Rykaczewski, Chair
Timothy Burgin
Heather Emady
Matthew Green
Marylaura Thomas
ARIZONA STATE UNIVERSITY
August 2020
Page 2
i
ABSTRACT
As experiencing hot months and thermal stresses is becoming more common,
chemically protective fabrics must adapt and provide protections while reducing the heat
stress to the body. These concerns affect first responders, warfighters, and workers
regularly surrounded by hazardous chemical agents. While adapting traditional garments
with cooling devices provides one route to mitigate this issue, these cooling methods add
bulk, are time limited, and may not be applicable in locations without logistical support.
Here I take inspiration from nature to guide the development of smart fabrics that have
high breathability, but self-seal on exposure to target chemical(s), providing a better
balance between cooling and protection.
Natural barrier materials were explored as a guide, focusing specifically on
prickly pear cacti. These cacti have a natural waxy barrier that provides protection from
dehydration and physically changes shape to modify surface wettability and water vapor
transport. The results of this study provided a basis for a shape changing polymer to be
used to respond directly to hazardous chemicals, swelling to contain the agent.
To create a stimuli responsive material, a novel superabsorbent polymer was
synthesized, based on acrylamide chemistry. The polymer was tested for swelling
properties in a wide range of organic liquids and found to highly swell in moderately
polar organic liquids. To help predict swelling in untested liquids, the swelling of
multiple test liquids were compared with their thermodynamic properties to observe
trends. As the smart fabric needs to remain breathable to allow evaporative cooling, while
retaining functionality when soaked with sweat, absorption of water, as well as that of an
absorbing liquid in the presence of water were tested.
Page 3
ii
Micron sized particles of the developed polymer were deposited on a plastic mesh
with pore size and open area similar to common clothing fabric to establish the proof of
concept of using a breathable barrier to provide chemical protection. The polymer coated
mesh showed minimal additional resistance to water vapor transport, relative to the mesh
alone, but blocked more than 99% of a xylene aerosol from penetrating the barrier.
Page 4
iii
ACKNOWLEDGMENTS
I sincerely thank everyone who has helped me get to this point in my life. I am
very thankful that I have had the opportunity to come back to graduate school and to have
the continued support of my family and friends.
I am very grateful to my wife Nora and her continued support both in coming to
Arizona and encouraging me throughout my PhD work. I am also very grateful for the
support from my family especially my parents (Monica, Richard, Tom, and Eleanor) in
supporting me throughout my early career and encouraging me to continue taking on
challenges.
I would also like to thank my advisor Dr. Konrad Rykaczewski for his continued
guidance through my doctoral studies and helping me grow and learn as a student. His
support, especially in scientific writing, has helped me become a better researcher and
candidate. Additionally, Dr. Tim Burgin has also provided me with wonderful guidance,
and I would like to thank him for his work and support throughout my studies.
Finally, I would like to thank my friends. They have provided me with a
wonderful support network, and I could not have asked for better people to work with and
aid me as I have grown and matured. Drs. Praveen Kotagama and Akshay Phadnis have
been incredible labmates and I thank them both for their friendship, our discussions, and
numerous insights. Thank you to my friend James Haliburton for always insisting that I
needed to go back to graduate school. Thank you to Craig Karduck for always being there
as my friend. And, thank you to R. Kevin Tindell, Kishen Rafiz, and Fallon Fumasi for
really being the group of friends I needed to thrive at ASU.
Page 5
iv
This work was supported through the Naval Engineering Education Consortium
grant number N00174-15-0001 administered by Naval Surface Warfare Center, Dahlgren
Division as well as the Biomimicry Center at Arizona State University. I thank them both
for providing funding throughout my PhD process.
Page 6
v
TABLE OF CONTENTS
Page
LIST OF FIGURES ................................................................................................................. iv
CHAPTER
1 INTRODUCION AND BACKGROUND ............................................................ 1
1.1 General Background .......................................................................................... 1
1.2 Structure of Thesis ............................................................................................. 6
2 STIMULI-RESPONSIVE MICROCRACKS IN PRICKLY PEAR CACTI .....8
2.1 Introduction ........................................................................................................ 8
2.2 Methods ........................................................................................................... 10
2.2.1 Sample Collection .............................................................................10
2.2.2 Accelerated Cladode Dehydration Measurements ............................10
2.2.3 Optical Profilometry of the Surface ..................................................11
2.3 Results and Discussion ................................................................................12
2.3.1 Hydration Dependent Epidermis Micro-Fracture Morphology ........12
2.3.2 Theoretical Estimates of Vapor Transport Across the Micro-Fracture
Network.............................................................................................14
2.4 Conclusions ...................................................................................................... 16
3 DEVELOPMENT OF A NON-ELECTROLYTIC SELECTIVELY
SUPERABSORBENT POLYMER ...................................................................18
3.1 Introduction ...................................................................................................... 18
3.2 Methods ........................................................................................................... 19
Page 7
vi
CHAPTER Page
3.2.1 Monomer Synthesis ..........................................................................19
3.2.2 Polymerization ..................................................................................20
3.2.3 Polymer Characterization ..................................................................21
3.3 Results .............................................................................................................. 21
3.3.1 Monomer and Polymer Synthesis .....................................................21
3.3.2 Swelling Behavior .............................................................................23
3.3.3 Selective Absorption .........................................................................29
3.4 Conclusions ...................................................................................................... 31
4 BREATHABLE, STIMULI-RESPONSIVE, AND SELF-SEALING
CHEMICAL BARRIER MATERIAL BASED ON SELECTIVELY
SUPERABSORBING POLYMER ....................................................................32
4.1 Introduction ...................................................................................................... 32
4.2 Methods ........................................................................................................... 34
4.3 Results and Discussion .................................................................................... 37
4.4 Conclusions ...................................................................................................... 40
5 CONCLUSIONS AND FUTURE WORKS ......................................................42
5.1 Main Findings .................................................................................................. 42
5.2 Synthesis of Works .......................................................................................... 44
5.2 Future Works ................................................................................................... 45
REFERENCES ...................................................................................................................... 47
Page 8
vii
APPENDIX Page
A SUPPORTING CODES FOR LINE PROFILES IN CHAPTER 2..............45
B SUPPORTING INFORMATION FOR CHAPTER 3 ..................................63
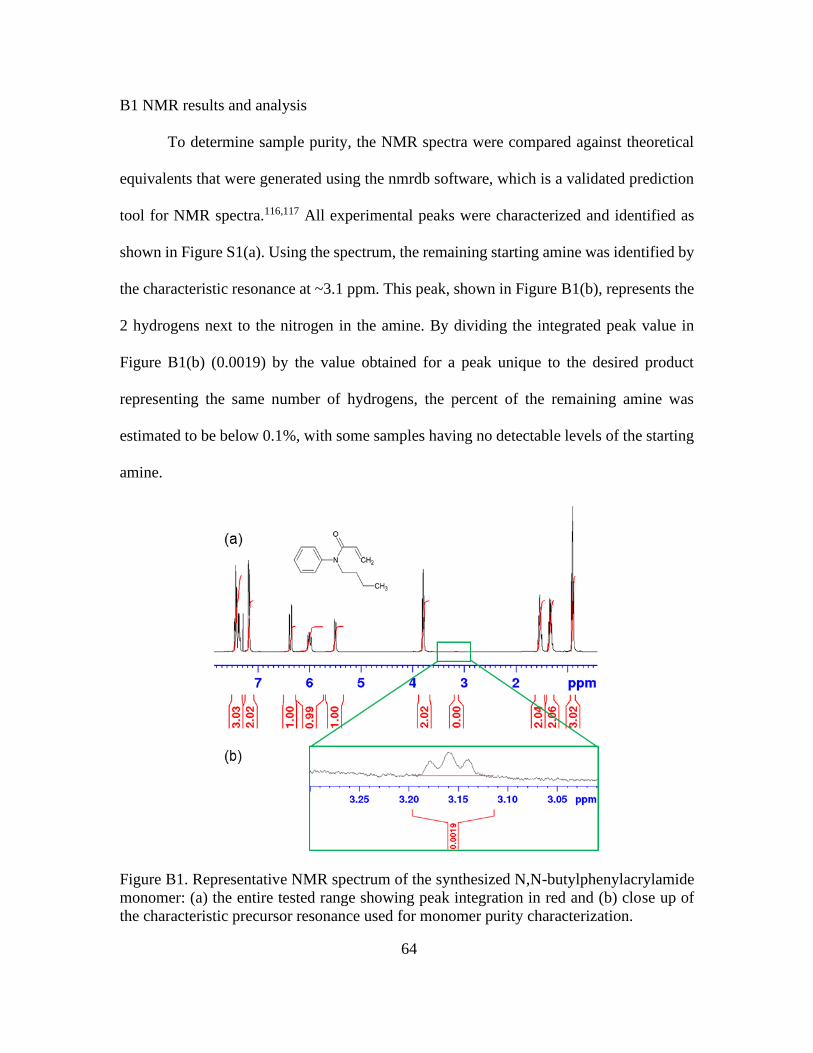
B1 NMR Results and Analysis ..................................................................64
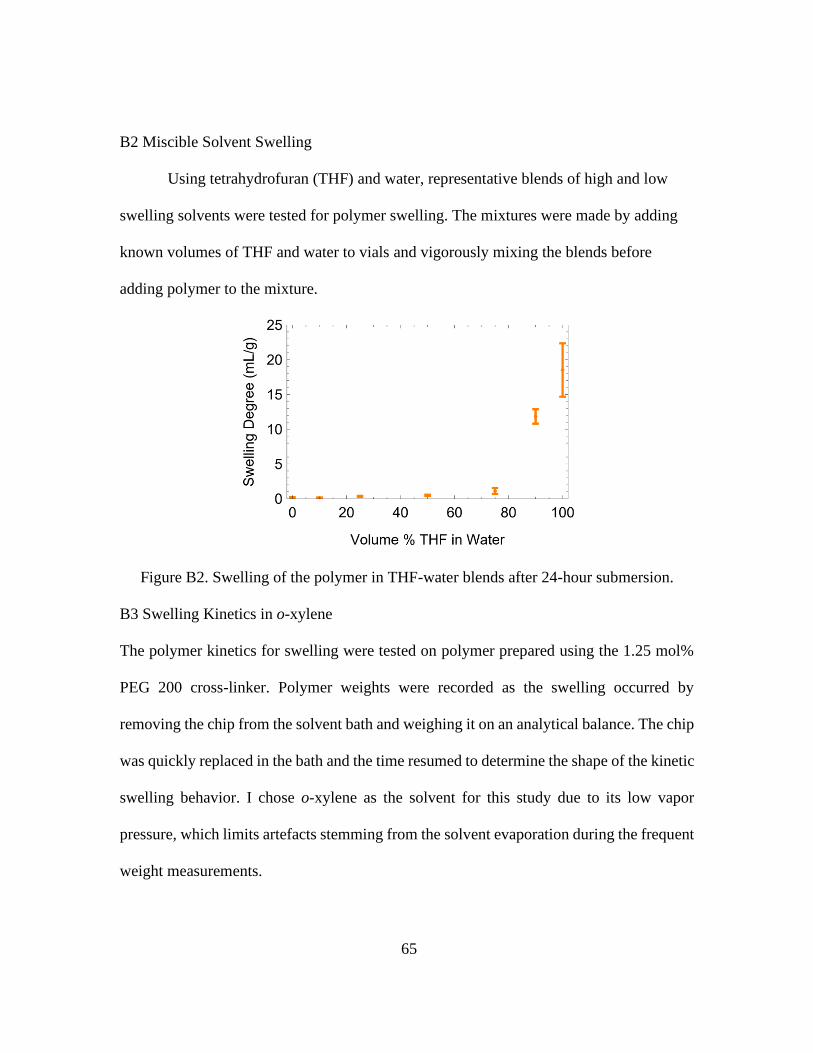
B2 Miscible Solvent Swelling ...................................................................65
B3 Swelling Kinetics in o-xylene ..............................................................65
C PARTICLE SIZE DISTRIBUTION AND MEASUREMENTS FOR
CHAPTER 4 .................................................................................................67
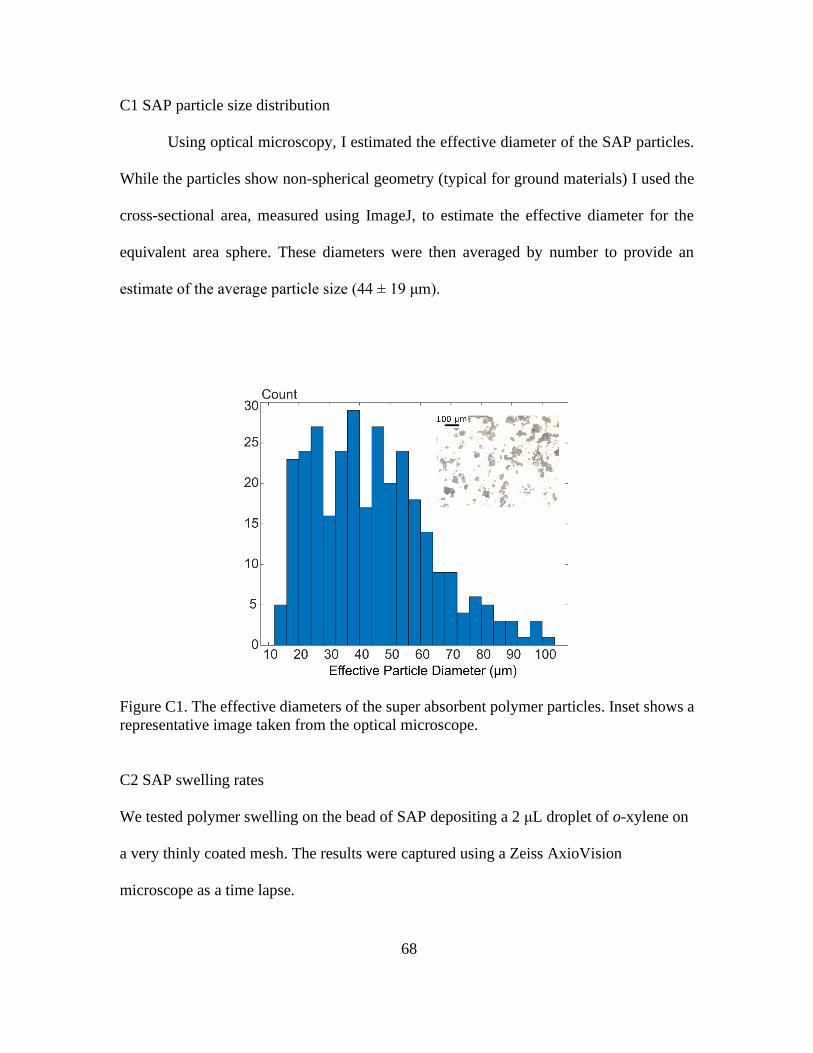
C1 SAP Particle Size Distribution .............................................................68
C2 SAP Swelling Rates .............................................................................68
Page 9
viii
LIST OF FIGURES
Figure Page
1.1. Illustration of the MOPP Levels Highlighting the Required Additional Garments
Warfighters Need to Carry and Wear to Protect Against Potentially Hazardous
Conditions ........................................................................................................................ 3
1.2. Heat Strain in Air Force Chemical Protective Clothing Done by Gonzalez et al.
Against Minutes of Moderate Exercise in a 35°C Environment. The Gray Area
Indicates Normal Body Temperatures (Red Highlights Expected Mean Body
Temperature) and Highlights Deviation into Hyperthermia ............................................ 4
2.1. Schematic Representations Highlighting the Crack Structures (i.e., Waxy Cuticle) on
the Cactus Epidermal Surface of a (a) Dehydrated Sample and (b) Hydrated Sample of
opuntia engelmannii. The Plants’ Physical Macroscale Structures are Shown Above
the Microscale Optical Profilometer Scans, Which Highlight the Changing Micro-
Fractured Wax Morphology. In the Profilometry Images, Black Arrows Indicate the
Location of Stomata on the Surface of the Cacti ............................................................. 9
2.2. (a) The Change in the Water Contact Angle During Controlled Dehydration of a
Freshly Cut Cladode, and (b) Histograms of Micro-Fracture Exterior Widths Extracted
from Optical Profilometry Images of Naturally Hydrated and Dehydrated Cladodes . 13
2.3. (a) Representative Line Profiles of Surface Micro-Fractures Showing the Variety of
Channel Types and (b) Corresponding Idealized System that was Modeled to Define
the Vapor Transport Out of the Surface Fractures ......................................................... 15
Page 10
ix
Figure Page
2.4. FEM Simulation Results Showing the Relative Vapor Loss Rates Based on the
Exterior Width of the Idealized Rectangular and Trapezoidal Cross-Section One-
Dimensional Wax Micro-Fractures ................................................................................ 16
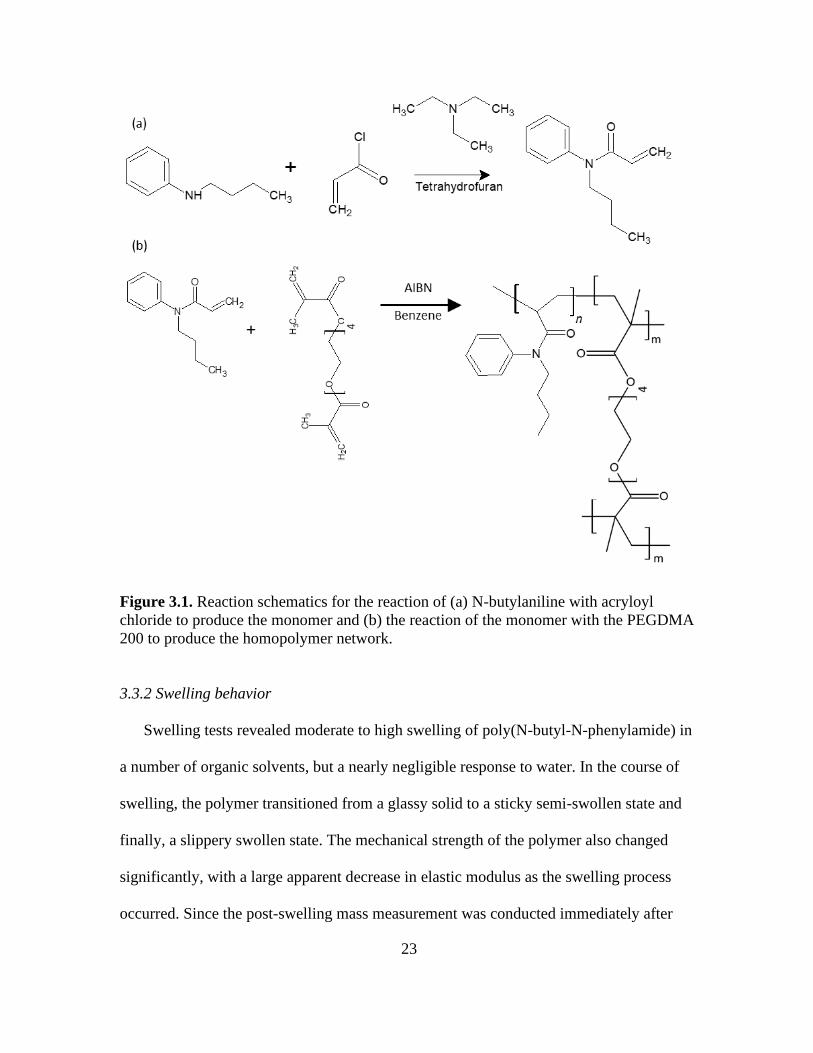
3.1. Reaction Schematics for the Reaction of (a) N-butylaniline with Acryloyl Chloride to
Produce the Monomer and (b) the Reaction of the Monomer with the PEGDMA 200
to Produce the Homopolymer Network .......................................................................... 23
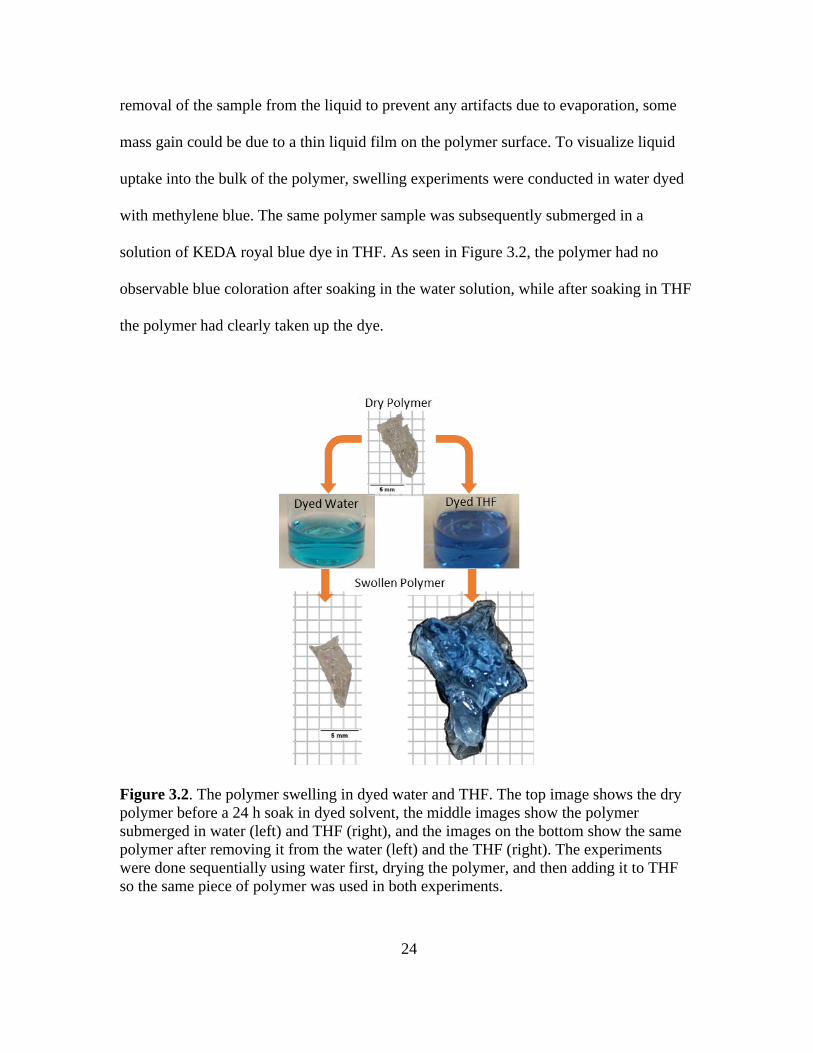
3.2. The Polymer Swelling in Dyed Water and THF. The Top Image Shows the Dry
Polymer Before a 24 h Soak in Dyed Solvent, the Middle Images Show the Polymer
Submerged in Water (left) and THF (right), and the Images on the Bottom Show the
Same Polymer After Removing it from the Water (left) and the THF (right). The
Experiments Were Done Sequentially Using Water First, Drying the Polymer, and
Then Adding it to THF so the Same Piece of Polymer Was Used in Both Experiments
......................................................................................................................................... 24
3.3. Solvent Swelling Ratios After 20-Hour Submersion 1% Crosslinking Density vs.
Solvent Property (a) Hansen Solubility Parameter, (b) Surface Tension, (c) Cohesive
Energy Density, and (d) Dielectric Constant .................................................................. 27
3.4. (a) Swelling of Select Solvents with the PEG200 Dimethacrylate, PEG400
Dimethacrylate, and PEG1000 Dimethacrylate Crosslinkers with Standard Deviations
and (b) Swelling in Dichloromethane at Different Crosslinking Percentages with One
Standard Deviation Indicated .......................................................................................... 29
Page 11
x
Figure Page
3.5. Polymer Swelling in Emulsified o-xylene (Dyed Red) and Water. A Polymer Chip
Before Swelling (upper left), is Added to the Emulsified Liquids for 24 Hours (lower
left). After 24 Hours, Additional Unabsorbed Xylene was Removed, and the Polymer
was Left In The Aqueous Phase Only (lower right) and Removed to be Imaged and
Massed (upper right) ....................................................................................................... 30
4.1. Schematic of a Sealable Fabric System That Allows Water Vapor to Freely Move
Through the Material While Hazardous Organic Droplets are Absorbed by the SAP
Microparticles, Blocking Their Transport ...................................................................... 34
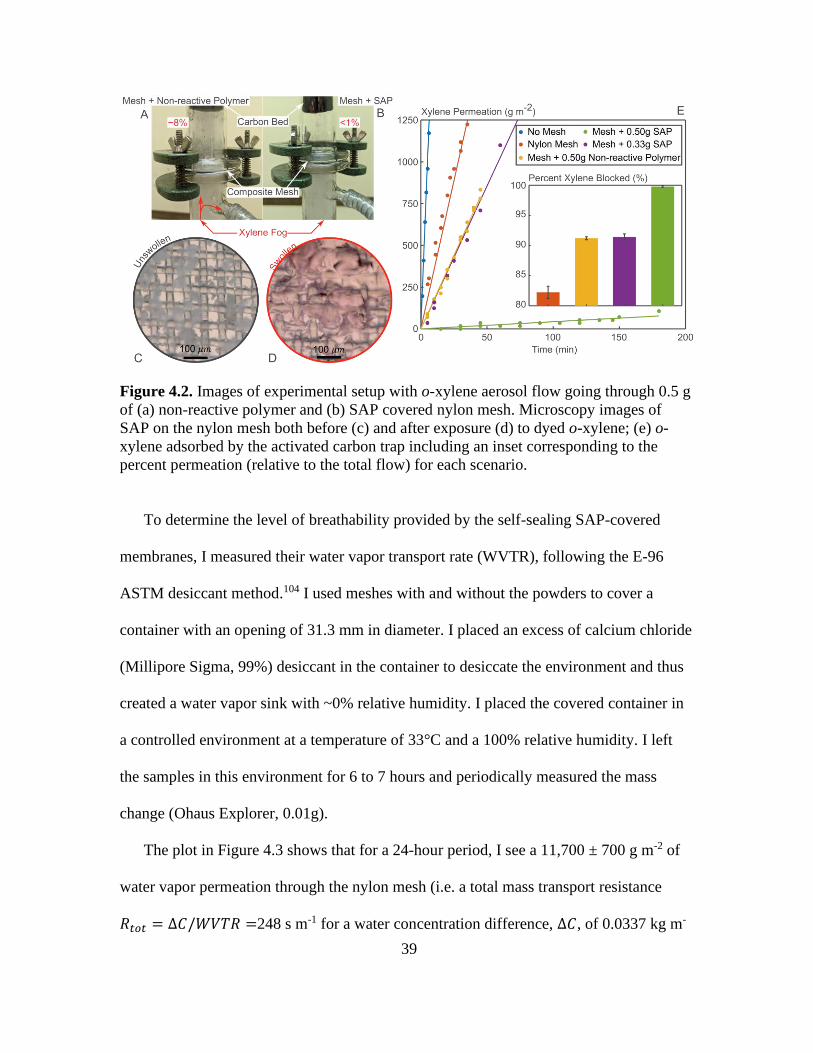
4.2. Images of Experimental Setup With o-xylene Aerosol Flow Going Through 0.5 g of
(a) Non-Reactive Polymer and (b) SAP Covered Nylon Mesh. Microscopy Images of
SAP on the Nylon Mesh Both Before (c) and After Exposure (d) to Dyed o-xylene; (e)
o-xylene Adsorbed by the Activated Carbon Trap Including an Inset Corresponding to
the Percent Permeation (Relative to the Total Flow) for Each Scenario ....................... 39
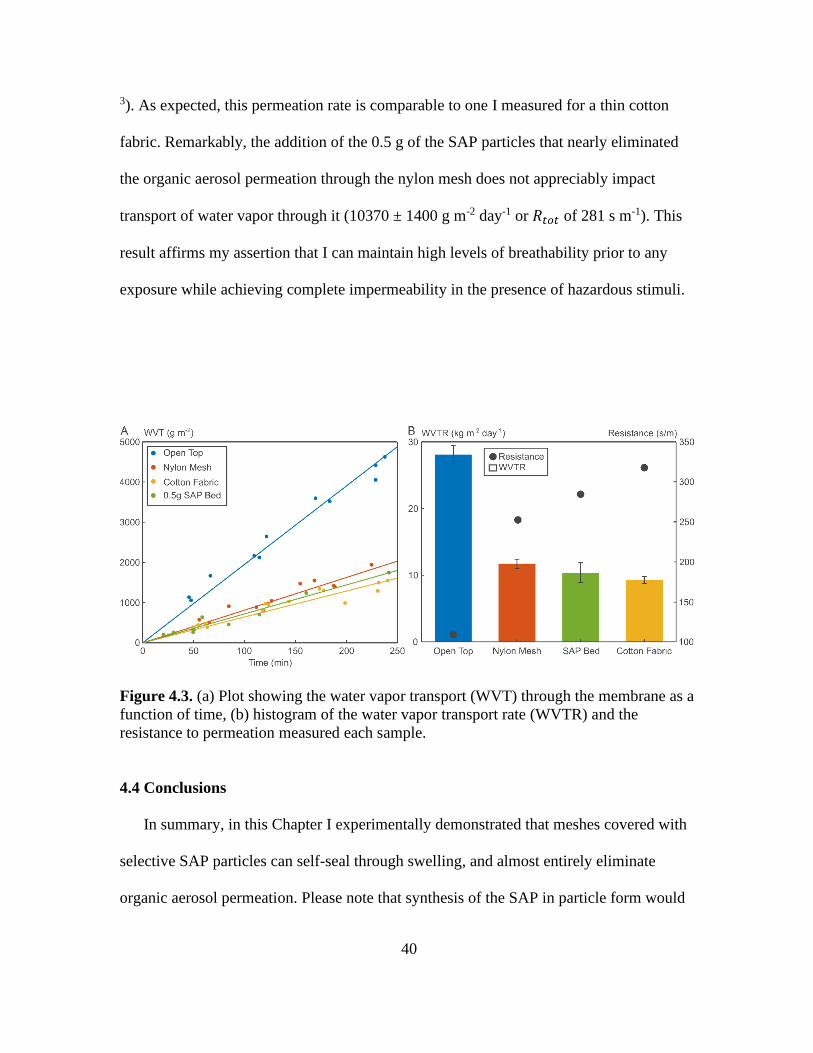
4.3. (a) Plot Showing the Water Vapor Transport (WVT) Through the Membrane as a
Function of Time, (b) Histogram of the Water Vapor Transport Rate (WVTR) and the
Resistance to Permeation Measured Each Sample......................................................... 40
B1. Representative NMR Spectrum of the Synthesized N,N-butylphenylacrylamide
Monomer: (a) the Entire Tested Range Showing Peak Integration in Red and (b) Close
Up of the Characteristic Precursor Resonance Used for Monomer Purity
Characterization .............................................................................................................. 64
B2. Swelling of the Polymer in THF-Water Blends After 24-Hour Submersion. ................ 65
Page 12
xi
Figure Page
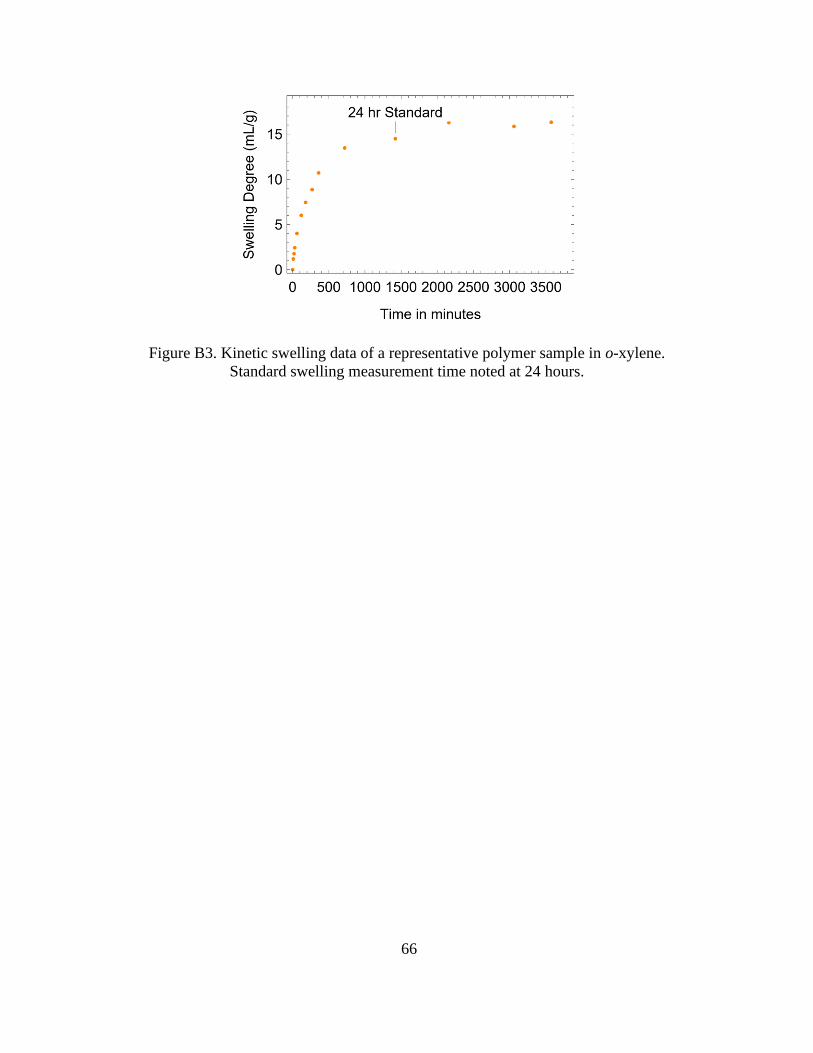
B3. Kinetic Swelling Data of a Representative Polymer Sample in o-xylene. Standard
Swelling Measurement Time Noted at 24 Hours ........................................................... 66
C1. The Effective Diameters of the Super Absorbent Polymer Particles. Inset Shows a
Representative Image Taken from the Optical Microscope .......................................... 68
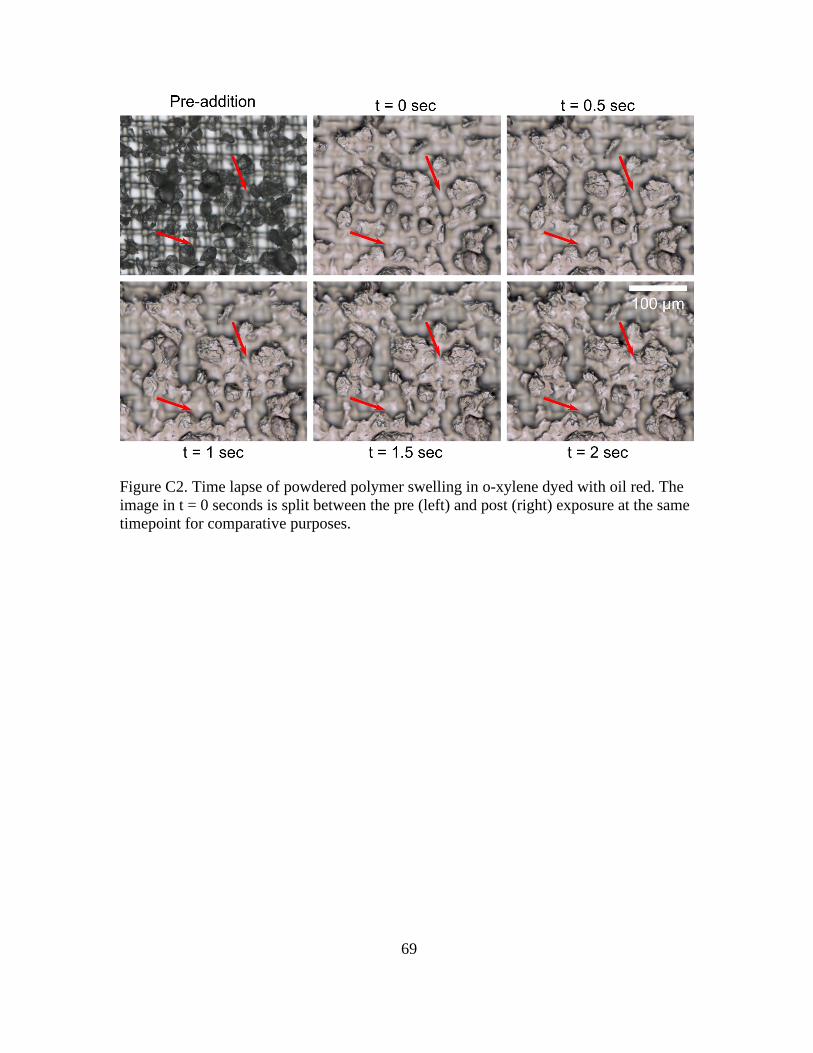
C2. Time lapse of Powdered Polymer Swelling in o-xylene Dyed with Oil Red. The Image
in t = 0 Seconds is Split Between the Pre (left) and Post (right) Exposure at the Same
Timepoint for Comparative Purposes. ............................................................................ 69
Page 13
1
CHAPTER 1
INTRODUCION AND BACKGROUND
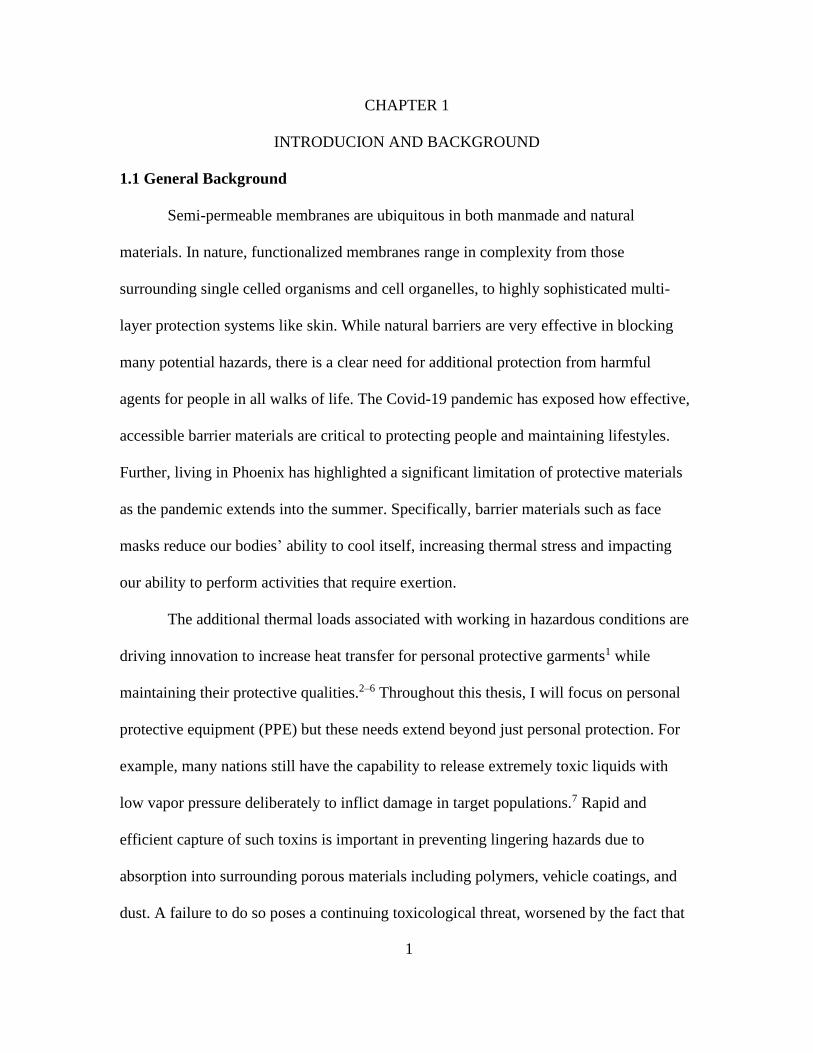
1.1 General Background
Semi-permeable membranes are ubiquitous in both manmade and natural
materials. In nature, functionalized membranes range in complexity from those
surrounding single celled organisms and cell organelles, to highly sophisticated multi-
layer protection systems like skin. While natural barriers are very effective in blocking
many potential hazards, there is a clear need for additional protection from harmful
agents for people in all walks of life. The Covid-19 pandemic has exposed how effective,
accessible barrier materials are critical to protecting people and maintaining lifestyles.
Further, living in Phoenix has highlighted a significant limitation of protective materials
as the pandemic extends into the summer. Specifically, barrier materials such as face
masks reduce our bodies’ ability to cool itself, increasing thermal stress and impacting
our ability to perform activities that require exertion.
The additional thermal loads associated with working in hazardous conditions are
driving innovation to increase heat transfer for personal protective garments1 while
maintaining their protective qualities.2–6 Throughout this thesis, I will focus on personal
protective equipment (PPE) but these needs extend beyond just personal protection. For
example, many nations still have the capability to release extremely toxic liquids with
low vapor pressure deliberately to inflict damage in target populations.7 Rapid and
efficient capture of such toxins is important in preventing lingering hazards due to
absorption into surrounding porous materials including polymers, vehicle coatings, and
dust. A failure to do so poses a continuing toxicological threat, worsened by the fact that
Page 14
2
these contamination zones are nearly impossible to fully contain.8 These concerns are
echoed in accidental spills where people and the environment are exposed to hazardous
materials.
Because of the simultaneous dangers of heat stress and chemical exposure in PPE,
research is being conducted to provide workers and warfighters with ways to alleviate
both stressors. Two main avenues of research have been explored to aid these high risk
workers: active cooling systems9,10,19,11–18 and breathable systems2–6 to augment natural
cooling. Active cooling systems generally rely on external, battery powered heat
exchangers to circulate a cooling medium (e.g. water) to keep the wearer cool. Other
active cooling systems involve using phase change materials that provide a limited
window of cooling.20,21 The alternative to these systems is to provide a more breathable
material that allows for natural evaporative cooling to take place.
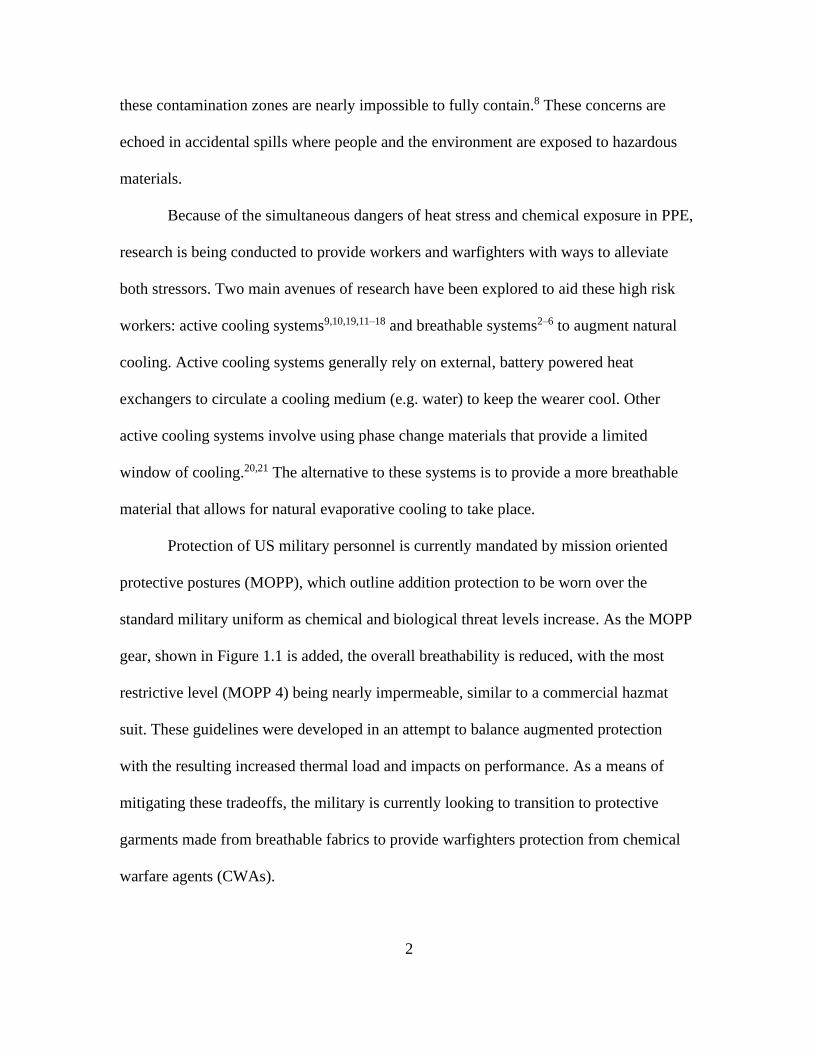
Protection of US military personnel is currently mandated by mission oriented
protective postures (MOPP), which outline addition protection to be worn over the
standard military uniform as chemical and biological threat levels increase. As the MOPP
gear, shown in Figure 1.1 is added, the overall breathability is reduced, with the most
restrictive level (MOPP 4) being nearly impermeable, similar to a commercial hazmat
suit. These guidelines were developed in an attempt to balance augmented protection
with the resulting increased thermal load and impacts on performance. As a means of
mitigating these tradeoffs, the military is currently looking to transition to protective
garments made from breathable fabrics to provide warfighters protection from chemical
warfare agents (CWAs).
Page 15
3
Figure 1.1 Illustration of the MOPP levels highlighting the required additional garments
warfighters need to carry and wear to protect against potentially hazardous conditions.22
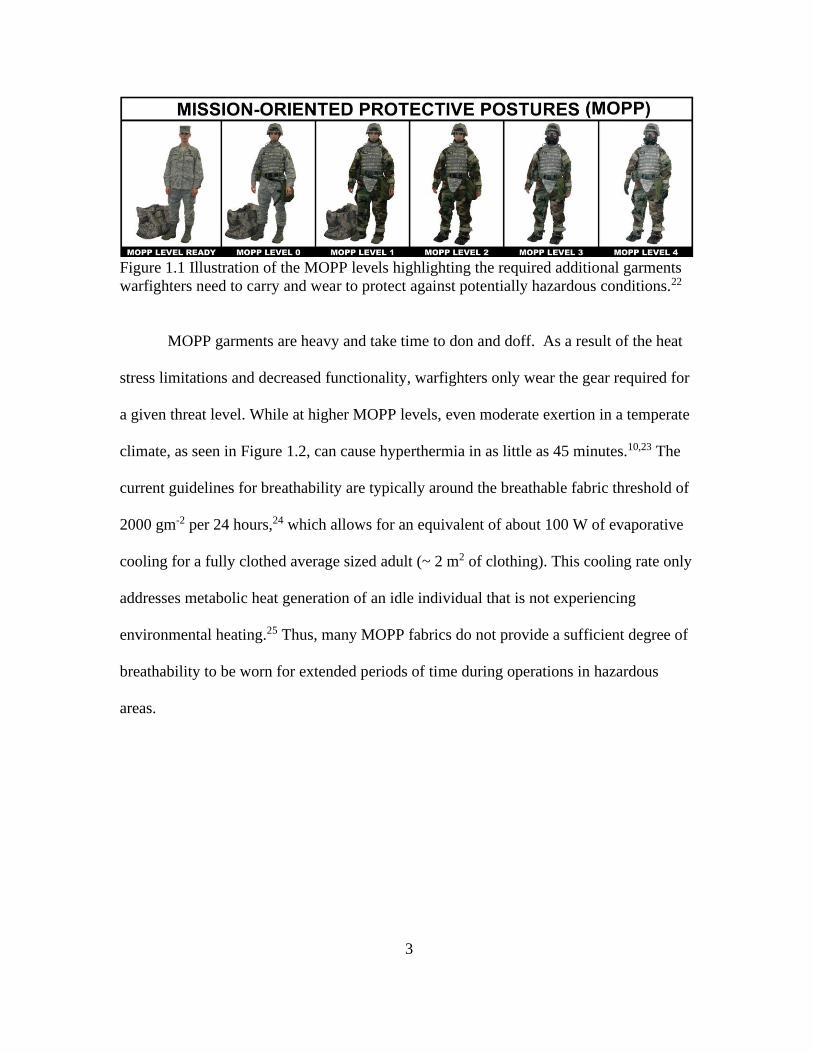
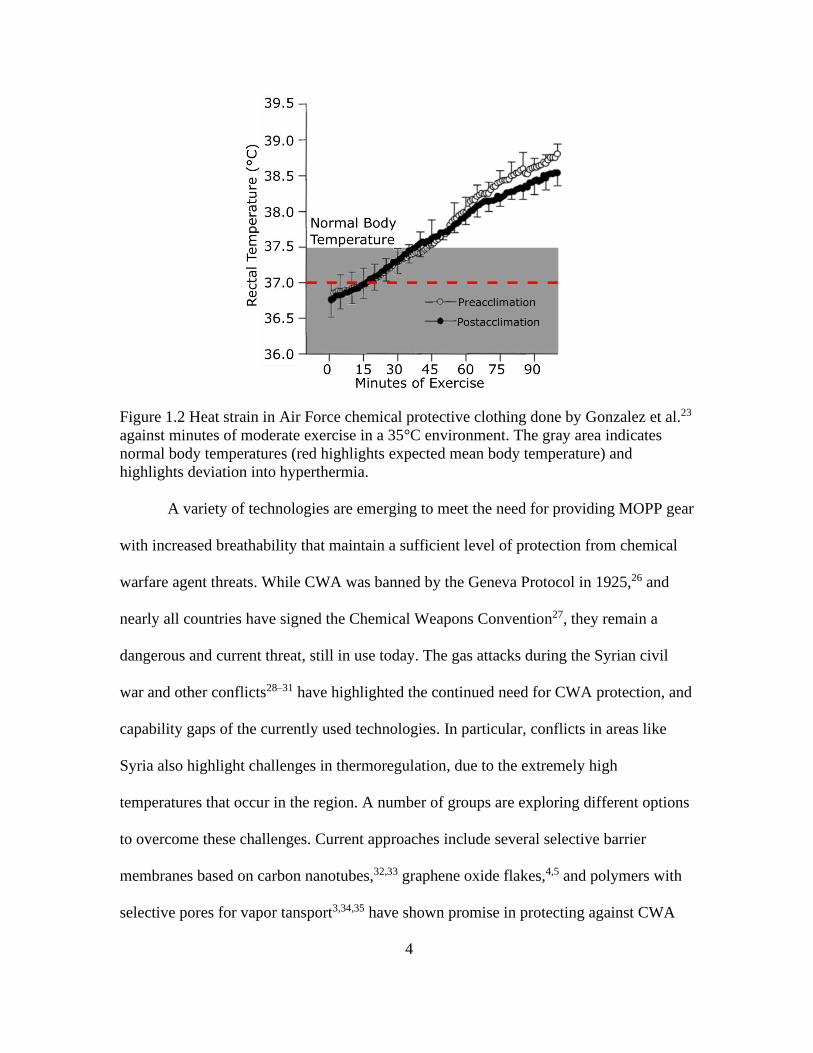
MOPP garments are heavy and take time to don and doff. As a result of the heat
stress limitations and decreased functionality, warfighters only wear the gear required for
a given threat level. While at higher MOPP levels, even moderate exertion in a temperate
climate, as seen in Figure 1.2, can cause hyperthermia in as little as 45 minutes.10,23 The
current guidelines for breathability are typically around the breathable fabric threshold of
2000 gm-2 per 24 hours,24 which allows for an equivalent of about 100 W of evaporative
cooling for a fully clothed average sized adult (~ 2 m2 of clothing). This cooling rate only
addresses metabolic heat generation of an idle individual that is not experiencing
environmental heating.25 Thus, many MOPP fabrics do not provide a sufficient degree of
breathability to be worn for extended periods of time during operations in hazardous
areas.
Page 16
4
Figure 1.2 Heat strain in Air Force chemical protective clothing done by Gonzalez et al.23
against minutes of moderate exercise in a 35°C environment. The gray area indicates
normal body temperatures (red highlights expected mean body temperature) and
highlights deviation into hyperthermia.
A variety of technologies are emerging to meet the need for providing MOPP gear
with increased breathability that maintain a sufficient level of protection from chemical
warfare agent threats. While CWA was banned by the Geneva Protocol in 1925,26 and
nearly all countries have signed the Chemical Weapons Convention27, they remain a
dangerous and current threat, still in use today. The gas attacks during the Syrian civil
war and other conflicts28–31 have highlighted the continued need for CWA protection, and
capability gaps of the currently used technologies. In particular, conflicts in areas like
Syria also highlight challenges in thermoregulation, due to the extremely high
temperatures that occur in the region. A number of groups are exploring different options
to overcome these challenges. Current approaches include several selective barrier
membranes based on carbon nanotubes,32,33 graphene oxide flakes,4,5 and polymers with
selective pores for vapor tansport3,34,35 have shown promise in protecting against CWA
Page 17
5
penetration while allowing some water vapor transport. These barrier materials tend to be
expensive to produce,36 provide minimal additional breathability,3,4 and carry potential
hazards of their own (e.g. carcinogenic).37
A protective fabric with integrated polymers that swell on contact with CWAs has
the potential to provide cheap, highly breathable personnel protection. Broadly, swelling
is an extremely common phenomenon in polymers but the ability for a polymer to swell
highly in a specific liquid is rarer. There are a multitude of hydrogel materials that will
absorb water and swell hundreds of times their original size.38–40 These gels are used
widely as sorbent materials,41–45 diffusers,46–48 and low modulus biological supports.49–51
While hydrogels are relatively common, highly swelling oil sorptive polymers are
relatively rare. Some examples have been created using electrolytic materials,52,53 but the
presence of reasonably polarizable liquids disrupts their swelling capabilities.
By using these high swelling capabilities, a fabric can remain mostly open and
breathable prior to exposure. Once the polymer comes into contact with the target
liquid(s), absorption closes off the pores, creating a layer of swollen gel that blocks the
penetration of any additional chemical that contacts the swollen region. In addition, by
swelling with the hazardous material, the polymer can contain the materials from
migrating and potentially contacting a different area. This method of action provides the
user with comfortable, breathable protection while also containing the hazard and thus
stopping any further spread. When combined with a heterogeneous decontaminant these
materials could potentially provide a complete personal protection solution. These
polymeric sorbent materials can also be used on spills that need to be cleaned up
Page 18
6
effectively. By adding a high swelling polymer, the gelled material can be more easily
disposed of without concern of a flowing liquid.
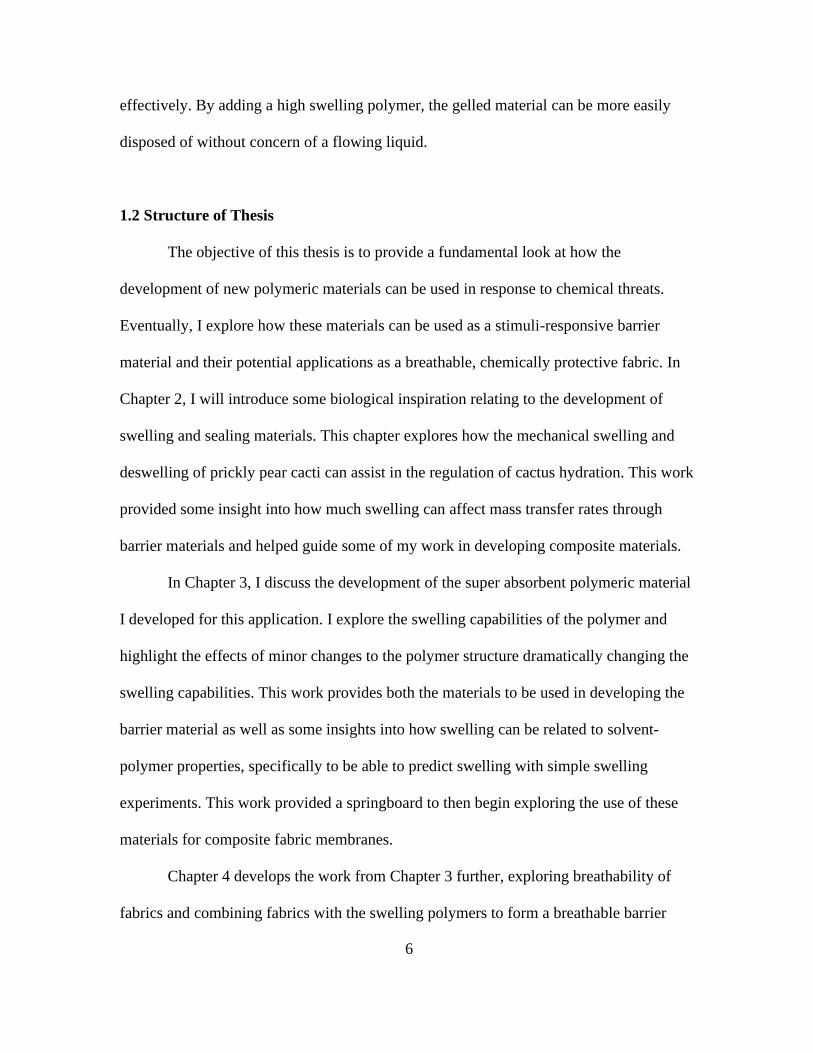
1.2 Structure of Thesis
The objective of this thesis is to provide a fundamental look at how the
development of new polymeric materials can be used in response to chemical threats.
Eventually, I explore how these materials can be used as a stimuli-responsive barrier
material and their potential applications as a breathable, chemically protective fabric. In
Chapter 2, I will introduce some biological inspiration relating to the development of
swelling and sealing materials. This chapter explores how the mechanical swelling and
deswelling of prickly pear cacti can assist in the regulation of cactus hydration. This work
provided some insight into how much swelling can affect mass transfer rates through
barrier materials and helped guide some of my work in developing composite materials.
In Chapter 3, I discuss the development of the super absorbent polymeric material
I developed for this application. I explore the swelling capabilities of the polymer and
highlight the effects of minor changes to the polymer structure dramatically changing the
swelling capabilities. This work provides both the materials to be used in developing the
barrier material as well as some insights into how swelling can be related to solvent-
polymer properties, specifically to be able to predict swelling with simple swelling
experiments. This work provided a springboard to then begin exploring the use of these
materials for composite fabric membranes.
Chapter 4 develops the work from Chapter 3 further, exploring breathability of
fabrics and combining fabrics with the swelling polymers to form a breathable barrier
Page 19
7
material that can respond rapidly to chemical hazards. I explore the barrier properties
against an aerosolized liquid (the state most persistent CWAs are when dispersed)7,54 and
the breathability of water vapor passing through the fabric. Finally, I wrap up the work
with conclusions I derived through this work and some additional work that could extend
this thesis and develop these materials further.
Page 20
8
CHAPTER 2
STIMULI-RESPONSIVE MICROCRACKS IN PRICKLY PEAR CACTI
2.1 Introduction
Self-regulating membranes that adjust mass transfer in response to environmental
stimuli have a wide range of potential applications that include thermoregulation,55 drug
delivery,56,57 chemical synthesis,58 and energy conversion (e.g., fuel cells).59,60 Many such
smart membranes occur in nature and some have provided inspiration for their synthetic
counterparts.60 In particular, Park et al.60 have created a wax nanocrack-regulated self-
humidifying membrane based on inspiration from the vapor transport regulation by
stomata in cactus surfaces. To minimize water loss in harsh desert conditions
(temperatures up to 63 °C and no rainfall for months61–63), this family of plants (i.e.,
Cactaceae) exhibits a unique form of photosynthesis that occurs during the day without
respiration, while gas exchange occurs through opening of the stomata at night64 (when
temperatures are lower and the humidity is higher).65,66 In addition to the 10 to 50 m
pore-like stomata,67 after the first dry season the surface of Opuntia cactus cladodes (i.e.,
flattened, photosynthetic stem segments) develop a network of surface micro-fractures in
the epicuticular wax that is a direct natural equivalent of the synthetic membrane
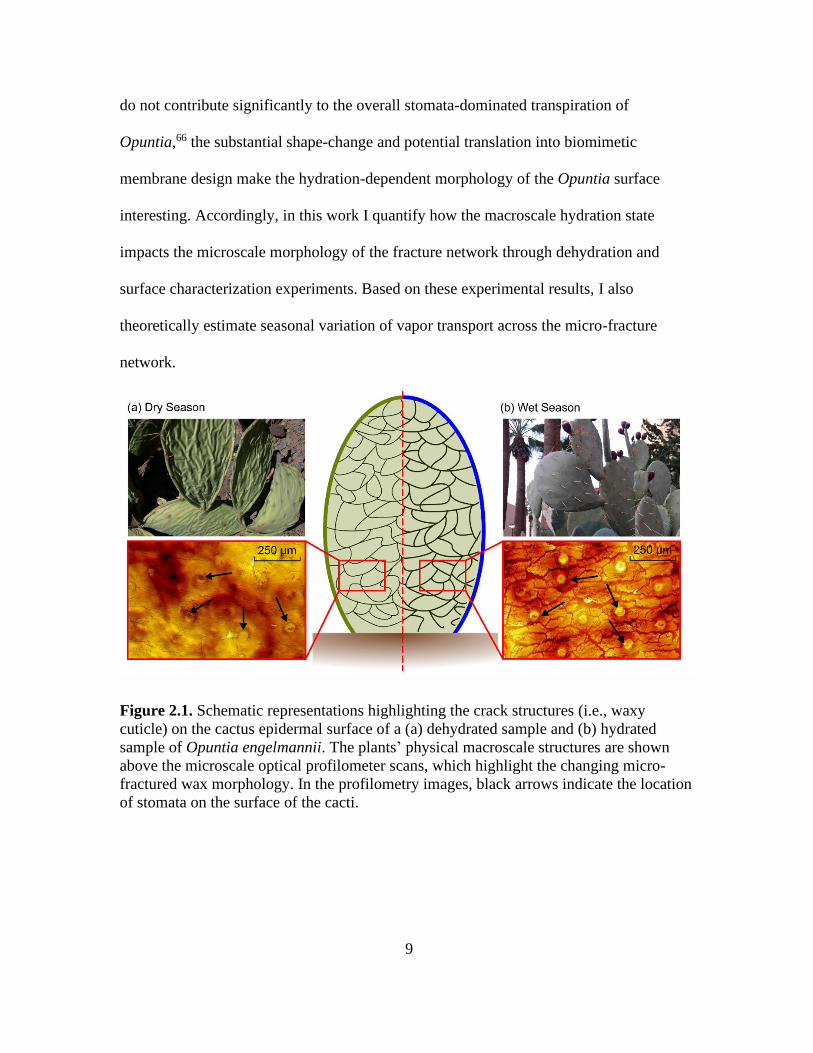
developed by Park et al.60 (see Figure 2.1).68,69 Furthermore, as with the morphology of
its synthetic equivalent, the shape of the micro-fractures is not static, but as I show in
optical profilometry scans in Figure 2.1, changes dependent on the seasonal hydration
state of the plant. As dehydration can reversibly decrease Opuntia pad volume by up to
60%, corresponding to a 30% decrease in area, the micro-fracture shape-change between
wet and dry seasons can be substantial. While it is known that these wax micro-fractures
Page 21
9
do not contribute significantly to the overall stomata-dominated transpiration of
Opuntia,66 the substantial shape-change and potential translation into biomimetic
membrane design make the hydration-dependent morphology of the Opuntia surface
interesting. Accordingly, in this work I quantify how the macroscale hydration state
impacts the microscale morphology of the fracture network through dehydration and
surface characterization experiments. Based on these experimental results, I also
theoretically estimate seasonal variation of vapor transport across the micro-fracture
network.
Figure 2.1. Schematic representations highlighting the crack structures (i.e., waxy
cuticle) on the cactus epidermal surface of a (a) dehydrated sample and (b) hydrated
sample of Opuntia engelmannii. The plants’ physical macroscale structures are shown
above the microscale optical profilometer scans, which highlight the changing micro-
fractured wax morphology. In the profilometry images, black arrows indicate the location
of stomata on the surface of the cacti.
Page 22
10
2.2. Methods
2.2.1 Sample collection
To collect data representative of highly hydrated and dehydrated plant states, I
harvested cladodes of Opuntia engelmannii on the Arizona State University Tempe
campus during March and June of 2018. Due to seasonal winter and spring rainfall, in
March the cacti have absorbed large quantities of water and are visibly swollen (see
image in Figure 2.1b). In contrast, in June temperatures are typically above 40 °C with
relative humidity below 10%, which leads to significant loss of water and visible
shrinking of the cacti (see Figure 2.1a). In both cases, to ensure that the cladodes were at
least a season old, I used new growth of buds and cladodes as age markers. The cladodes
were taken to a nearby laboratory and tested immediately after harvesting.
2.2.2 Accelerated cladode dehydration measurements
After harvesting of the cladodes, I removed a 2 cm by 2 cm rectangular surface
section using a stainless-steel razor blade. I gently rinsed the outside of these sections
with deionized water to remove any dust and quickly dried them using nitrogen gas. To
accelerate the dehydration process, I carefully reduced the thickness of the samples to
approximately 1 mm. I allowed the dehydration to occur naturally through exposure of
the bottom side of the cactus to an environmental chamber, which was maintained at 20
˚C ±2 °C and a relative humidity of 30-40%. To quantify the dehydration rate, I weighed
the samples on glass slides every 10 minutes using a 0.1 mg precision balance (Mettler-
Toledo). Over the same timeframe, I measured the static contact angles of the samples
every 30 minutes using Ramé-Hart 290 goniometer (6 drops per data point). I continued
Page 23
11
the dehydration of the samples until 50% of the weight of the sample was lost. At such
conditions, Opuntia frequently die in the wild.70
2.2.3 Optical profilometry of the surface
To directly measure the morphological changes on the cactus surface, I used a
ZeScope optical profilometer. I used a 20x objective lens and stitched a composite image
with 40% overlap between images to measure an approximately 1 x 1 mm2 area on the
cactus. I also attempted an in-situ measurement of the change in crack shape, but after
extended exposure the high intensity light the sample began to soften and the light visibly
reshaped the waxy surface. To ensure that the visible micro-fractures are indeed only in
the exterior wax (i.e., not in the underlying surfaces), I washed away the epicuticular wax
using dichloromethane and imaged the surface structure to see if any fractures remained.
As expected, after the solvent wash the surface surrounding the stomata was smooth (no
fractures were observed).
To systematically quantify the morphological characteristics of the cactus surface, I
developed a custom code in MATLAB which extracted linear profiles across the micro-
cracks manually selected by the user (see Appendix A for detailed coding). By selecting
multiple points within each identified crack, average crack profiles can be determined to
measure width and depth of the fractures. Using this approach, I analyzed over 300
fracture profiles.
Page 24
12
2.3. Results and discussion
2.3.1 Hydration dependent epidermis micro-fracture morphology
I quantified the hydration-induced micro-fracture network morphological changes
using macroscopic wettability measurements during controlled dehydration experiments
and using direct microscale imaging of plants harvested during wet and dry seasons.
First, I harvested highly hydrated cladodes (see image in Figure 2.1b) and periodically
measured their surface water contact angle during slow, controlled dehydration. The plot
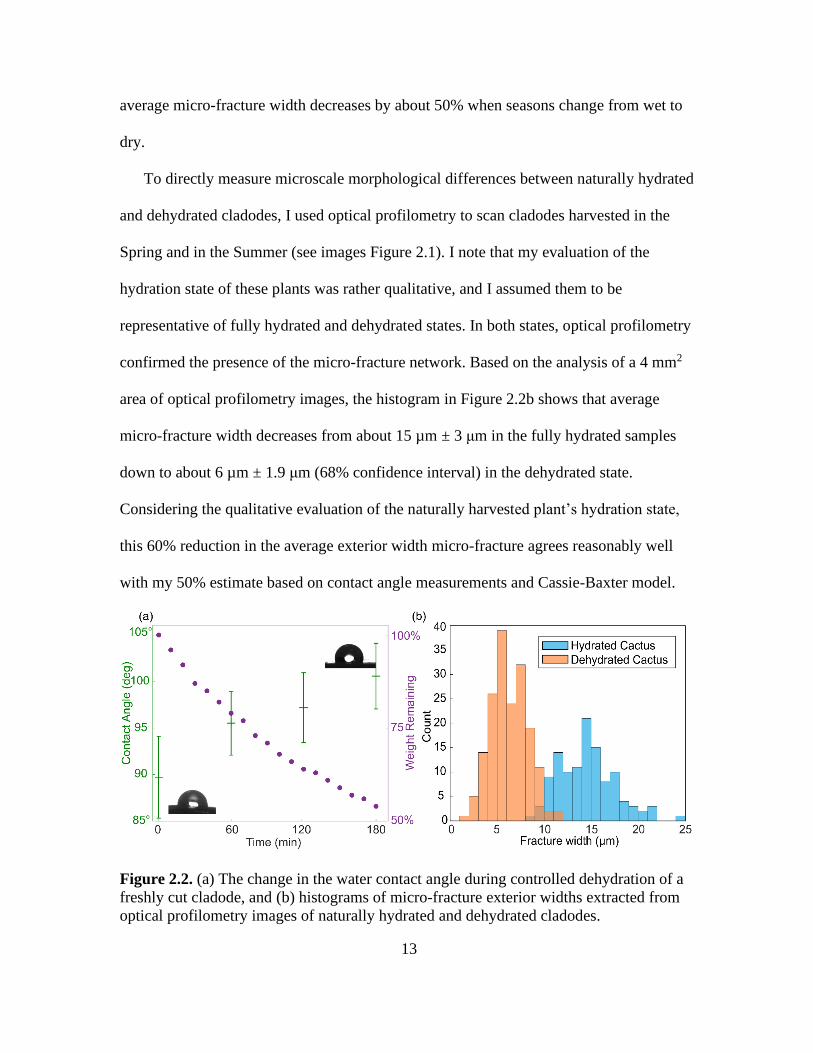
in Figure 2.2a shows that as the cladode gradually loses about half its weight through
water loss, the contact angle rises from just under 90° to just over 100°. The Cassie-
Baxter model for the apparent contact angle of a composite surface, θ*, can be used to
estimate the average micro-fracture shape-change corresponding to this wettability
increase.71 Specifically,
cos 𝜃∗ = 𝑓1 cos 𝜃1 + 𝑓2 cos 𝜃2 (1.1)
Where f is the fractional area and θ is the contact angle of the micro-fractures (subscript
1) and the epicuticular wax (subscript 2). Since air gaps under water droplets are unlikely
to form in the relatively shallow fractures, I can assume that f1 = 1 - f2. Based on previous
work, the bottom of the fissures is highly hydrophilic69 with θ1 ≈ 30°, while the
epicuticular wax static contact angle can be assumed to be hydrophobic with θ2 ≈ 110°.69
Using these values, I calculate the fractional area of the micro-fractures to be about 28%
for the hydrated state with θ* ≈ 90°, and 14% dehydrated for the state with θ* ≈ 100°,
respectively. I note that this hydrated state coverage estimate agrees well with the
previous estimation of micro-fracture cladode coverage.69 If I assume that the number of
micro-fractures remains constant, the calculated fractional area change implies that the
Page 25
13
average micro-fracture width decreases by about 50% when seasons change from wet to
dry.
To directly measure microscale morphological differences between naturally hydrated
and dehydrated cladodes, I used optical profilometry to scan cladodes harvested in the
Spring and in the Summer (see images Figure 2.1). I note that my evaluation of the
hydration state of these plants was rather qualitative, and I assumed them to be
representative of fully hydrated and dehydrated states. In both states, optical profilometry
confirmed the presence of the micro-fracture network. Based on the analysis of a 4 mm2
area of optical profilometry images, the histogram in Figure 2.2b shows that average
micro-fracture width decreases from about 15 µm ± 3 μm in the fully hydrated samples
down to about 6 µm ± 1.9 μm (68% confidence interval) in the dehydrated state.
Considering the qualitative evaluation of the naturally harvested plant’s hydration state,
this 60% reduction in the average exterior width micro-fracture agrees reasonably well
with my 50% estimate based on contact angle measurements and Cassie-Baxter model.
Figure 2.2. (a) The change in the water contact angle during controlled dehydration of a
freshly cut cladode, and (b) histograms of micro-fracture exterior widths extracted from
optical profilometry images of naturally hydrated and dehydrated cladodes.
Page 26
14
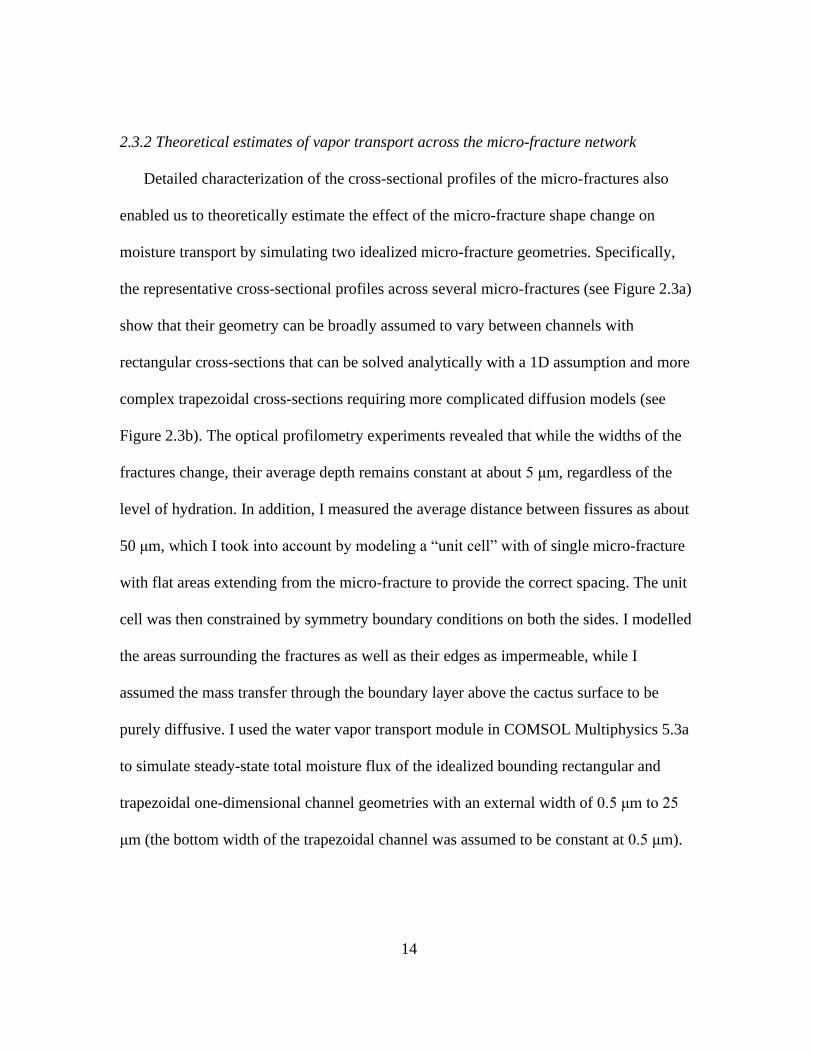
2.3.2 Theoretical estimates of vapor transport across the micro-fracture network
Detailed characterization of the cross-sectional profiles of the micro-fractures also
enabled us to theoretically estimate the effect of the micro-fracture shape change on
moisture transport by simulating two idealized micro-fracture geometries. Specifically,
the representative cross-sectional profiles across several micro-fractures (see Figure 2.3a)
show that their geometry can be broadly assumed to vary between channels with
rectangular cross-sections that can be solved analytically with a 1D assumption and more
complex trapezoidal cross-sections requiring more complicated diffusion models (see
Figure 2.3b). The optical profilometry experiments revealed that while the widths of the
fractures change, their average depth remains constant at about 5 μm, regardless of the
level of hydration. In addition, I measured the average distance between fissures as about
50 μm, which I took into account by modeling a “unit cell” with of single micro-fracture
with flat areas extending from the micro-fracture to provide the correct spacing. The unit
cell was then constrained by symmetry boundary conditions on both the sides. I modelled
the areas surrounding the fractures as well as their edges as impermeable, while I
assumed the mass transfer through the boundary layer above the cactus surface to be
purely diffusive. I used the water vapor transport module in COMSOL Multiphysics 5.3a
to simulate steady-state total moisture flux of the idealized bounding rectangular and
trapezoidal one-dimensional channel geometries with an external width of 0.5 μm to 25
μm (the bottom width of the trapezoidal channel was assumed to be constant at 0.5 μm).
Page 27
15
Figure 2.3. (a) Representative line profiles of surface micro-fractures showing the variety
of channel types and (b) corresponding idealized system that was modeled to define the
vapor transport out of the surface fractures.
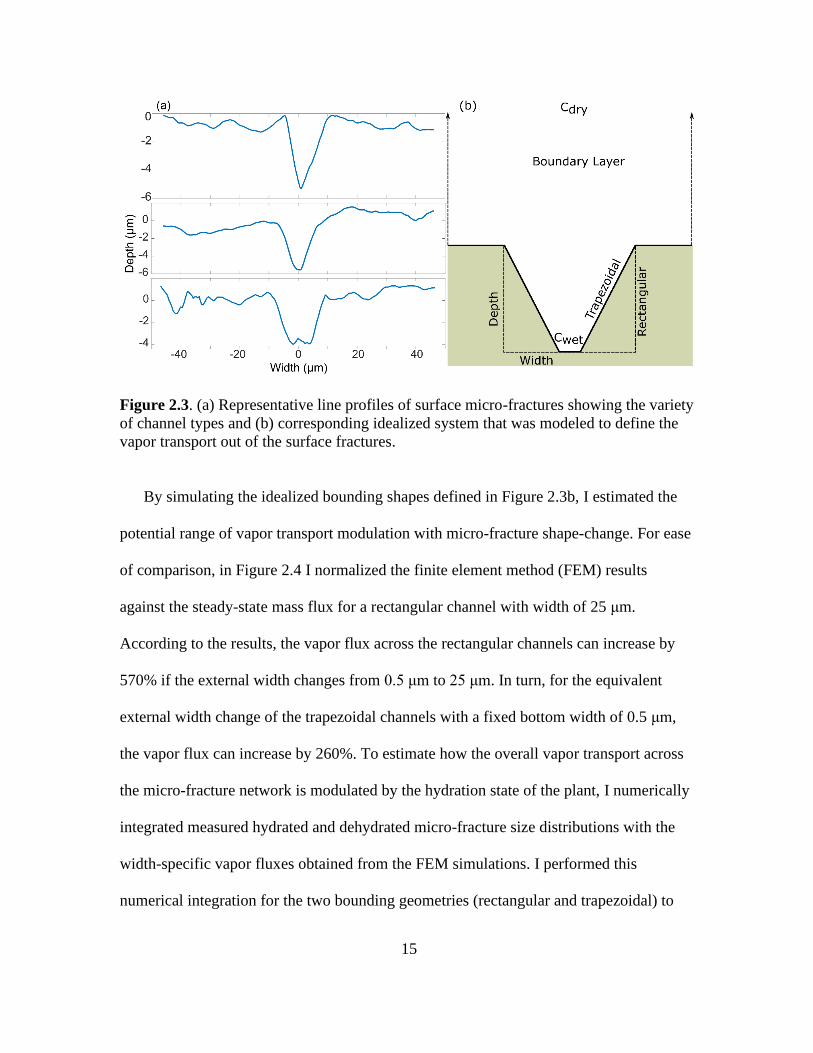
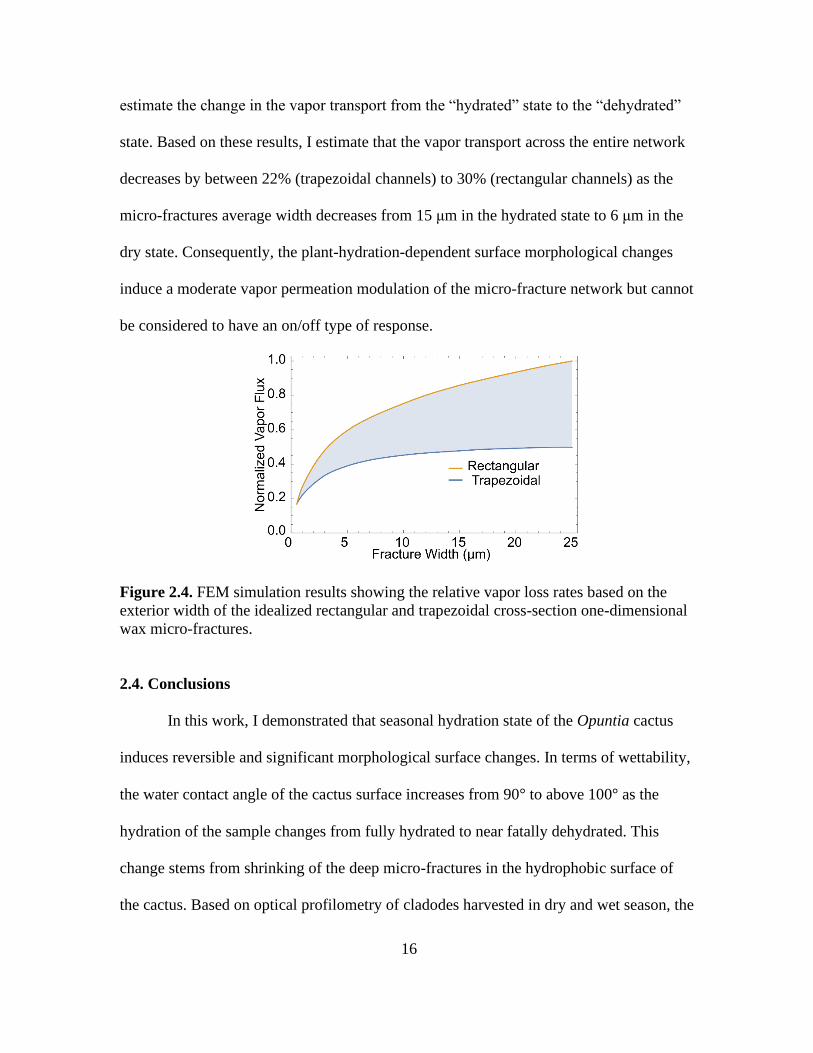
By simulating the idealized bounding shapes defined in Figure 2.3b, I estimated the
potential range of vapor transport modulation with micro-fracture shape-change. For ease
of comparison, in Figure 2.4 I normalized the finite element method (FEM) results
against the steady-state mass flux for a rectangular channel with width of 25 μm.
According to the results, the vapor flux across the rectangular channels can increase by
570% if the external width changes from 0.5 μm to 25 μm. In turn, for the equivalent
external width change of the trapezoidal channels with a fixed bottom width of 0.5 μm,
the vapor flux can increase by 260%. To estimate how the overall vapor transport across
the micro-fracture network is modulated by the hydration state of the plant, I numerically
integrated measured hydrated and dehydrated micro-fracture size distributions with the
width-specific vapor fluxes obtained from the FEM simulations. I performed this
numerical integration for the two bounding geometries (rectangular and trapezoidal) to
Page 28
16
estimate the change in the vapor transport from the “hydrated” state to the “dehydrated”
state. Based on these results, I estimate that the vapor transport across the entire network
decreases by between 22% (trapezoidal channels) to 30% (rectangular channels) as the
micro-fractures average width decreases from 15 μm in the hydrated state to 6 μm in the
dry state. Consequently, the plant-hydration-dependent surface morphological changes
induce a moderate vapor permeation modulation of the micro-fracture network but cannot
be considered to have an on/off type of response.
Figure 2.4. FEM simulation results showing the relative vapor loss rates based on the
exterior width of the idealized rectangular and trapezoidal cross-section one-dimensional
wax micro-fractures.
2.4. Conclusions
In this work, I demonstrated that seasonal hydration state of the Opuntia cactus
induces reversible and significant morphological surface changes. In terms of wettability,
the water contact angle of the cactus surface increases from 90° to above 100° as the
hydration of the sample changes from fully hydrated to near fatally dehydrated. This
change stems from shrinking of the deep micro-fractures in the hydrophobic surface of
the cactus. Based on optical profilometry of cladodes harvested in dry and wet season, the
Page 29
17
external width of these micro-fractures decreases from approximately 15 μm down to 6
μm, but their average depth remains fixed near 5 μm. By modeling vapor transport across
idealized rectangular and trapezoidal fractures, and integrating these results with
measured micro-fracture widths, I can estimate that dehydration can decrease the vapor
transport across the micro-fracture network by 22 to 30%. Consequently, the plant-
hydration-dependent surface morphological changes induce a moderate vapor permeation
modulation of the micro-fracture network but cannot be considered to have an on/off type
of response. Nevertheless, these fissures act as secondary vapor pathways, which creates
a hierarchical design to mediate water vapor loss from the surface. While in the Opuntia
cactus, this secondary pathway has a minor contribution as compared to the stomata,
achieving superior functionality through hierarchical design is one of the principle
biological strategies observed in nature.72 Consequently, this hierarchical design could be
adapted from nature to produce multi-stimuli responsive membranes to guide complex
membrane mass transfer regulation.
Page 30
18
CHAPTER 3
DEVELOPMENT OF A NON-ELECTROLYTIC SELECTIVELY
SUPERABSORBENT POLYMER
3.1 Introduction
A variety of polymer gels with a broad range of swelling characteristics are utilized
for sorbtive applications in gas-gas, gas-liquid, and liquid-liquid separation systems. In
gas-gas separation, polymers are often implemented as swollen membranes,73–75
improving membrane selectivity while retaining high transfer rates through the barrier.
Specifically, the permeability of the membrane is increased by the expansion of the
membrane pores via the active application of liquids.75,76 Addition of liquid to swell the
membrane can also increase the membrane throughput by absorbing the gas and
transporting it in the liquid phase.77 Swelling membranes are also often implemented for
separation of liquid-liquid systems. Due to their ability to alter surface properties,77–79
hydrophilic80,81 or hydrophobic82 compounds can selectively pass through the swollen
membrane, providing unique solvent-solute interactions and aiding the separation. If
separation of organic liquids from water is required, swelling polymers can also be used
in bulk, rather than as a membrane, to capture one phase in the matrix. While capture of
water is possible using hydrogels,78,79,83 removal of the less prevalent organic phase is
typically preferred. This can be achieved using, for example, hydrophobic fiber
networks,84–87 carbon nanotube based sponges,88,89 porous elastomers90 and gels.
Naturally, materials that can take up significant (>5x its own weight) content of the
organic liquid are highly desirable. For example, Ono et al. presented a series of
organophilic polyelectrolytic gels that can be tailored to swell in different solvents
Page 31
19
depending on their ionomeric constituents.52,53 These polymers were shown to swell best
in organic liquids with moderate dielectric constants, but had limited swelling with highly
non-polar substances, such as alkanes. Another limitation of these polyelectrolytic gels
stems from their interaction with water, which reduces their ionic dispersion causing the
swollen structure to collapse.91,92
In this Chapter, I build on work from Mamada et al. and Zhang et al.,93,94 and
describe the synthesis of an affordable non-electrolytic gel that swells significantly in a
variety of organic solvents while remaining unaffected by the presence of water.
Specifically, I synthesized non-ionic polymers comprised of an alkane chain backbone
with a N-butyl-N-phenylamide pendant group. Due to its structure, the cross-linked
polymer was expected to swell upon exposure to organic liquids of moderate polarity,
while not taking up water. Further, the swollen polymer should not collapse in water as
ion induced osmotic effects are absent. In addition to the effect of the new pendant group,
the effect of the crosslinker density and its length on swelling was studied. Solvents
covering a broad range of dipole moments, dielectric constants, and hydrogen bonding
capability were examined.
3.2. Methods
3.2.1 Monomer synthesis
N-butyl-N-phenylacrylamide was prepared in a one-step reaction of N-butylaniline
(TCI, 98+%) with acryloyl chloride (Sigma 99.5%). Acryloyl chloride (0.51 g, 5.6 mmol)
was added dropwise to a cold solution of N-butylaniline (1.00 g, 6.5 mmol), and
trimethylamine (0.93 g, 9.2 mmol) in dry tetrahydrofuran (THF, 6.0 mL) under nitrogen.
Page 32
20
Upon complete addition, the reaction was allowed to warm to room temperature and was
stirred overnight. Reaction completion was confirmed by thin layer chromatography
(TLC). Following reaction confirmation, the precipitated trimethylammonium salts were
removed by filtration. THF was removed via rotary evaporation. The resulting oil was
dissolved in dichloromethane and sequentially washed with 1% hydrochloric acid, 5%
sodium carbonate, and deionized water to remove residual acryloyl chloride and
trimethylamine. The organic phase was dried with magnesium sulfate and passed through
a column of basic alumina. Upon loading the column, ethyl acetate was used to elute the
product. Removal of the solvent via rotary evaporation resulted in a colorless oil (67%
yield), which crystalized when stored at -20 oC. The purity of the product was estimated
to be 99% based on hydrogen nuclear magnetic resonance spectroscopy (1H NMR, 400
MHz). See Appendix B for NMR analysis details and spectra.
3.2.2 Polymerization
Poly(ethylene glycol) dimethacrylate (PEGDMA 200, Polysciences) and 2,2’-
azobis(2-methylpropionitrile (AIBN) were added to a 3 M solution of the monomer in
benzene. The amount of PEGDMA 200 was varied from 0.75 mol% to 2 mol% while the
concentration of AIBN was held at 0.8 mol% (based on monomer). The reaction mixture
was degassed with 3 freeze-pump-thaw cycles using nitrogen prior to polymerization.
The polymerization was performed in a constant temperature bath overnight at 50 °C.
After polymerization, the sample was removed from the glass container and washed
overnight in a Soxhlet extractor with dichloromethane to remove any unreacted or non-
crosslinked material. The sample was then dried in preparation for testing.
Page 33
21
3.2.3 Polymer Characterization
Using a 0.1 mg precision balance (Mettler-Toledo), a small quantity of polymer was
added to a scintillation vial and weighed before swelling. Following the ASTM D3616 –
95 standard, the samples were flooded with the chosen solvent and sealed for 16-20 hours
before a swollen weight was recorded. The final weight was used to determine the
swelling degree, s, which is defined as:
𝑠 =𝑀𝑠𝑤𝑜𝑙𝑙𝑒𝑛−𝑀𝑑𝑟𝑦
𝑀𝑑𝑟𝑦 (3.1)
The polymer swelling was tested in dichloromethane (DCM) (Sigma, 99%), ethanol
(KOPTEC, 200 proof), hexane (Sigma, 95+%), DI water, N,N-dimethylformamide
(DMF) (Sigma, 99%), tetrahydrofuran (THF) (Sigma, 99%), 1,4-dioxane (Sigma, 98%)
and o-xylene (Sigma, 99%). Swelling measurements were performed 3 times for each
solvent. In addition to the single solvent swelling, 50:50 volumetric mixtures of water
and THF, or o-xylene were tested.
3.3. Results and Discussion
3.3.1 Monomer and Polymer Synthesis
N-butyl-N-phenylacrylamide was prepared in 67% yield and ~99% purity in a single
reaction step shown in Figure 3.1. The colorless to light yellow liquid was stable for
several months when stored at -20 °C, without added radical inhibitor and crystallized on
standing at this temperature.
The free radical polymerization, shown schematically in Figure 3.1b, was run
overnight at 50 °C to ensure a high degree of polymerization. Polymerization was
Page 34
22
considered successful when a firm gel was formed. Low molecular weight material was
removed by extraction and solvent was subsequently removed via evaporation, yielding
approximately 0.9 sol-gel fraction consistently. The polymer was a glassy, brittle solid in
the non-swollen state. Multiple polymerizations were performed at crosslinker
concentrations ranging from 0.75 to 2.00 mol% (based on monomer). Higher crosslinker
concentrations showed minimal deviation in the measured swelling ratios, while at lower
crosslinker concentrations the data was more variable.
Page 35
23
Figure 3.1. Reaction schematics for the reaction of (a) N-butylaniline with acryloyl
chloride to produce the monomer and (b) the reaction of the monomer with the PEGDMA
200 to produce the homopolymer network.
3.3.2 Swelling behavior
Swelling tests revealed moderate to high swelling of poly(N-butyl-N-phenylamide) in
a number of organic solvents, but a nearly negligible response to water. In the course of
swelling, the polymer transitioned from a glassy solid to a sticky semi-swollen state and
finally, a slippery swollen state. The mechanical strength of the polymer also changed
significantly, with a large apparent decrease in elastic modulus as the swelling process
occurred. Since the post-swelling mass measurement was conducted immediately after
Page 36
24
removal of the sample from the liquid to prevent any artifacts due to evaporation, some
mass gain could be due to a thin liquid film on the polymer surface. To visualize liquid
uptake into the bulk of the polymer, swelling experiments were conducted in water dyed
with methylene blue. The same polymer sample was subsequently submerged in a
solution of KEDA royal blue dye in THF. As seen in Figure 3.2, the polymer had no
observable blue coloration after soaking in the water solution, while after soaking in THF
the polymer had clearly taken up the dye.
Figure 3.2. The polymer swelling in dyed water and THF. The top image shows the dry
polymer before a 24 h soak in dyed solvent, the middle images show the polymer
submerged in water (left) and THF (right), and the images on the bottom show the same
polymer after removing it from the water (left) and the THF (right). The experiments
were done sequentially using water first, drying the polymer, and then adding it to THF
so the same piece of polymer was used in both experiments.
Page 37
25
The degree of swelling was highly dependent on the liquid and crosslinker content.
Polymer prepared with a crosslinker concentration of 1% swelled up to 33 mL/g in THF.
Similarly, dichloromethane, o-xylene, and 1,4-dioxane swelled between 20 and 24 mL/g.
Exposure to hexane, DMF, ethanol, and water caused little swelling, gaining only 1 to 4
mL/g. The observed swelling behavior in the different solvents is similar to that found
for polymers synthesized by Ono et al.52 In addition, as in the case of Ono work, there is
no evident correlation between the degree of swelling and Hansen solubility parameter
(δ) or surface tension of the solvent (see Figure 3.3a and 3.3b).
The Hansen solubility parameters for a given solvent are defined as the square root of
the combined cohesive energies including dispersion, intermolecular and hydrogen
bonding energy. The noncombinatorial free energy (ΔGmnoncomb) is given by:
𝛥𝐺𝑛𝑜𝑛𝑐𝑜𝑚𝑏𝑚 = 𝜑1𝜑2𝑉(𝛿1 – 𝛿2)2 (3.2)
With 𝜑1 being the volume fraction of the polymer and 𝜑2 being the solvent volume
fraction, 𝑉 is the total volume of the mixture, and 𝛿1 and 𝛿2 are the Hansen combined
solubility parameters for the polymer and solvent, respectively. The free energy of
swelling a polymer (𝛥𝐺𝑠𝑤𝑒𝑙𝑙) is given by:
𝛥𝐺𝑠𝑤𝑒𝑙𝑙 = 𝛥𝐺𝑠𝑡𝑟𝑒𝑡𝑐ℎ + 𝛥𝐺𝑚𝑖𝑥 (3.3)
Where 𝛥𝐺𝑠𝑡𝑟𝑒𝑡𝑐ℎ is the free energy of stretching the polymer and 𝛥𝐺𝑚𝑖𝑥 is the free energy
of mixing the polymer and the solvent.95 Absorption requires a negative free energy of
mixing. When this condition is met, the polymer network will expand until the favorable
interaction between the solvent and the polymer is offset by the energy cost of polymer
expansion. The 𝛥𝐺𝑚𝑖𝑥 can be expressed in terms of the noncombinatorial free energy of
mixing (𝛥𝐺𝑛𝑜𝑛𝑐𝑜𝑚𝑏𝑚 ) and the combinatorial entropy change of mixing (𝛥𝑆𝑐𝑜𝑚𝑏
𝑚 ):
Page 38
26
𝛥𝐺𝑚𝑖𝑥 = 𝛥𝐺𝑛𝑜𝑛𝑐𝑜𝑚𝑏𝑚 – 𝑇 𝛥𝑆𝑐𝑜𝑚𝑏
𝑚 (3.4)
Patterson et al. found that 𝛥𝐺𝑛𝑜𝑛𝑐𝑜𝑚𝑏𝑚 was equivalent to the change in enthalpy on mixing
(𝛥𝐻𝑚𝑖𝑥).96 The condition for absorption can then be defined as:
𝛥𝐻𝑚𝑖𝑥 ≤ 𝑇𝛥𝑆𝑐𝑜𝑚𝑏𝑚 − 𝛥𝐺𝑠𝑡𝑟𝑒𝑡𝑐ℎ (3.5)
where 𝑇 is the temperature. The value of the right side of the equation is not known for
this polymer system, but it nonetheless demonstrates that a threshold value of 𝛥𝐻𝑚𝑖𝑥 is
required for absorption to occur. The value of 𝛥𝐻𝑚𝑖𝑥 can be expressed as:
𝛥𝐻𝑚𝑖𝑥 = 𝑈𝑚– (𝑈1𝑥1 + 𝑈2𝑥1 ) (3.6)
where 𝑈𝑚, 𝑈1, and 𝑈2 are the internal energies of the polymer-solvent mixture, the
polymer, and the solvent, and 𝑥1 and 𝑥2 are the mole fractions of polymer and solvent in
the mixture, respectively. When expressed in terms of cohesive energy density (Ɛ) the
expression becomes:
𝛥𝐻𝑚𝑖𝑥 = [Ɛ𝑚 – (Ɛ1 𝜑1 + Ɛ2 𝜑2)]𝑉𝑚𝑚 (3.7)
where 𝑉𝑚𝑚 is the molar volume of the mixture. The Ɛ in Equation 3.7 can, in turn, be
expressed as sums of dispersion, intermolecular (principally permanent dipole-dipole
interactions), and hydrogen bonding terms.97 The solvent cohesive energy density can be
estimated using the equation:
Ɛ2 = (Δ𝐻𝑣𝑎𝑝 − 𝑅𝑇)/𝑉𝑚𝑠 (3.8)
where Δ𝐻𝑣𝑎𝑝 is the change in enthalpy of vaporization and 𝑉𝑚𝑠 is the molar volume of the
solvent. Changes in Ɛm relative to (Ɛ1 𝜑1 + Ɛ2 𝜑2) are due to changes in the number and
strength of these interactions. Cases where the strength of these interactions in the
mixture is reduced relative to those in either the pure polymer or solvent will disfavor
absorption. It is therefore reasonable to expect that strong absorption would occur at
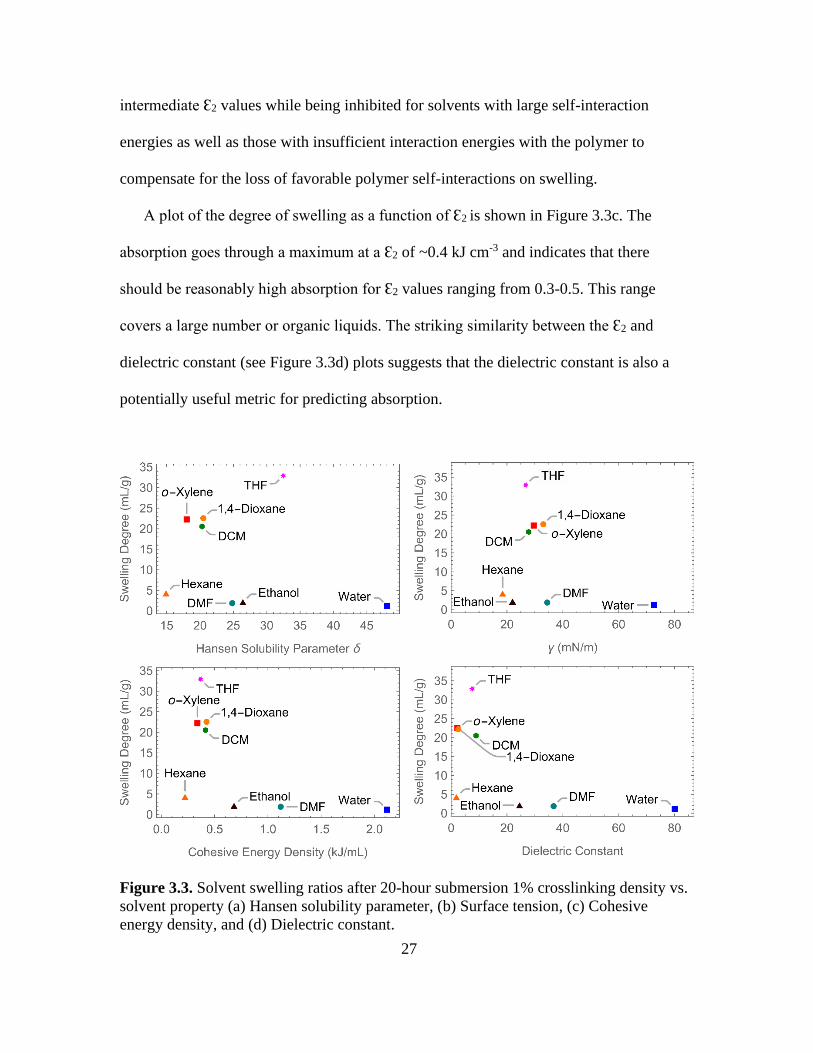
Page 39
27
intermediate Ɛ2 values while being inhibited for solvents with large self-interaction
energies as well as those with insufficient interaction energies with the polymer to
compensate for the loss of favorable polymer self-interactions on swelling.
A plot of the degree of swelling as a function of Ɛ2 is shown in Figure 3.3c. The
absorption goes through a maximum at a Ɛ2 of ~0.4 kJ cm-3 and indicates that there
should be reasonably high absorption for Ɛ2 values ranging from 0.3-0.5. This range
covers a large number or organic liquids. The striking similarity between the Ɛ2 and
dielectric constant (see Figure 3.3d) plots suggests that the dielectric constant is also a
potentially useful metric for predicting absorption.
Figure 3.3. Solvent swelling ratios after 20-hour submersion 1% crosslinking density vs.
solvent property (a) Hansen solubility parameter, (b) Surface tension, (c) Cohesive
energy density, and (d) Dielectric constant.
Page 40
28
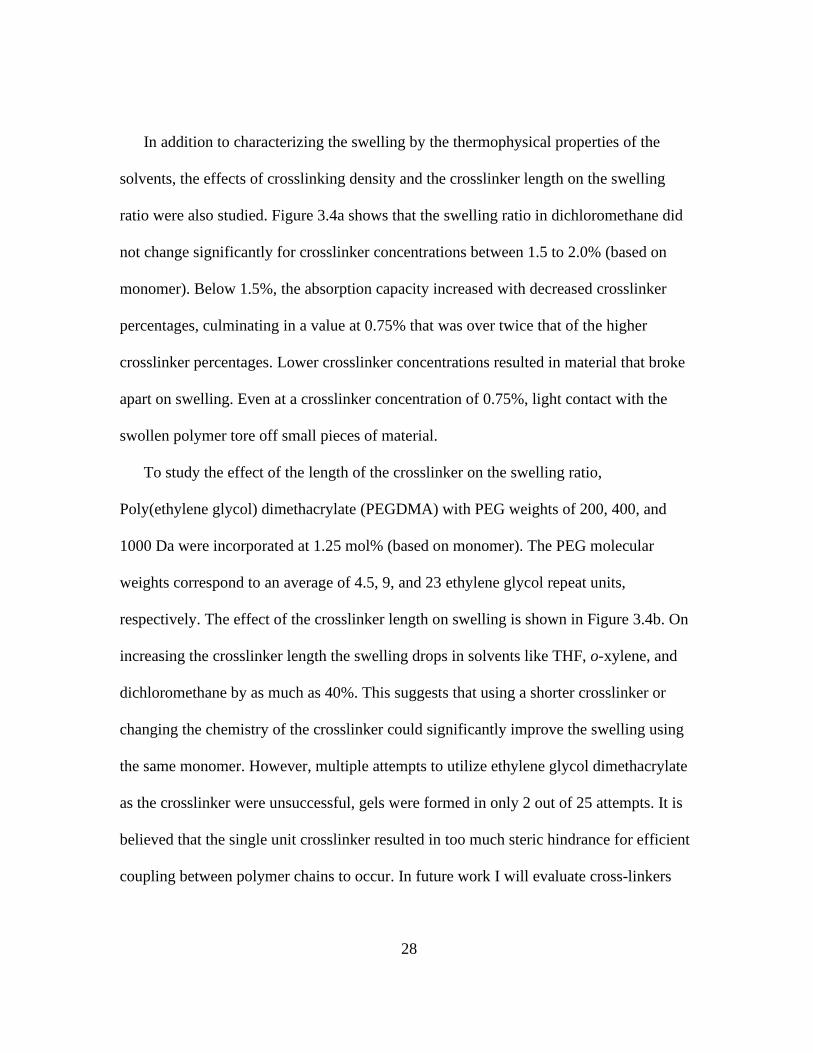
In addition to characterizing the swelling by the thermophysical properties of the
solvents, the effects of crosslinking density and the crosslinker length on the swelling
ratio were also studied. Figure 3.4a shows that the swelling ratio in dichloromethane did
not change significantly for crosslinker concentrations between 1.5 to 2.0% (based on
monomer). Below 1.5%, the absorption capacity increased with decreased crosslinker
percentages, culminating in a value at 0.75% that was over twice that of the higher
crosslinker percentages. Lower crosslinker concentrations resulted in material that broke
apart on swelling. Even at a crosslinker concentration of 0.75%, light contact with the
swollen polymer tore off small pieces of material.
To study the effect of the length of the crosslinker on the swelling ratio,
Poly(ethylene glycol) dimethacrylate (PEGDMA) with PEG weights of 200, 400, and
1000 Da were incorporated at 1.25 mol% (based on monomer). The PEG molecular
weights correspond to an average of 4.5, 9, and 23 ethylene glycol repeat units,
respectively. The effect of the crosslinker length on swelling is shown in Figure 3.4b. On
increasing the crosslinker length the swelling drops in solvents like THF, o-xylene, and
dichloromethane by as much as 40%. This suggests that using a shorter crosslinker or
changing the chemistry of the crosslinker could significantly improve the swelling using
the same monomer. However, multiple attempts to utilize ethylene glycol dimethacrylate
as the crosslinker were unsuccessful, gels were formed in only 2 out of 25 attempts. It is
believed that the single unit crosslinker resulted in too much steric hindrance for efficient
coupling between polymer chains to occur. In future work I will evaluate cross-linkers
Page 41
29
with 2-3 ethylene glycol repeat units or replace the ethylene glycol with an alkanediol of
similar length.
Figure 3.4. (a) Swelling of select solvents with the PEG200 dimethacrylate, PEG400
dimethacrylate, and PEG1000 dimethacrylate crosslinkers with standard deviations and
(b) Swelling in dichloromethane at different crosslinking percentages with one standard
deviation indicated.
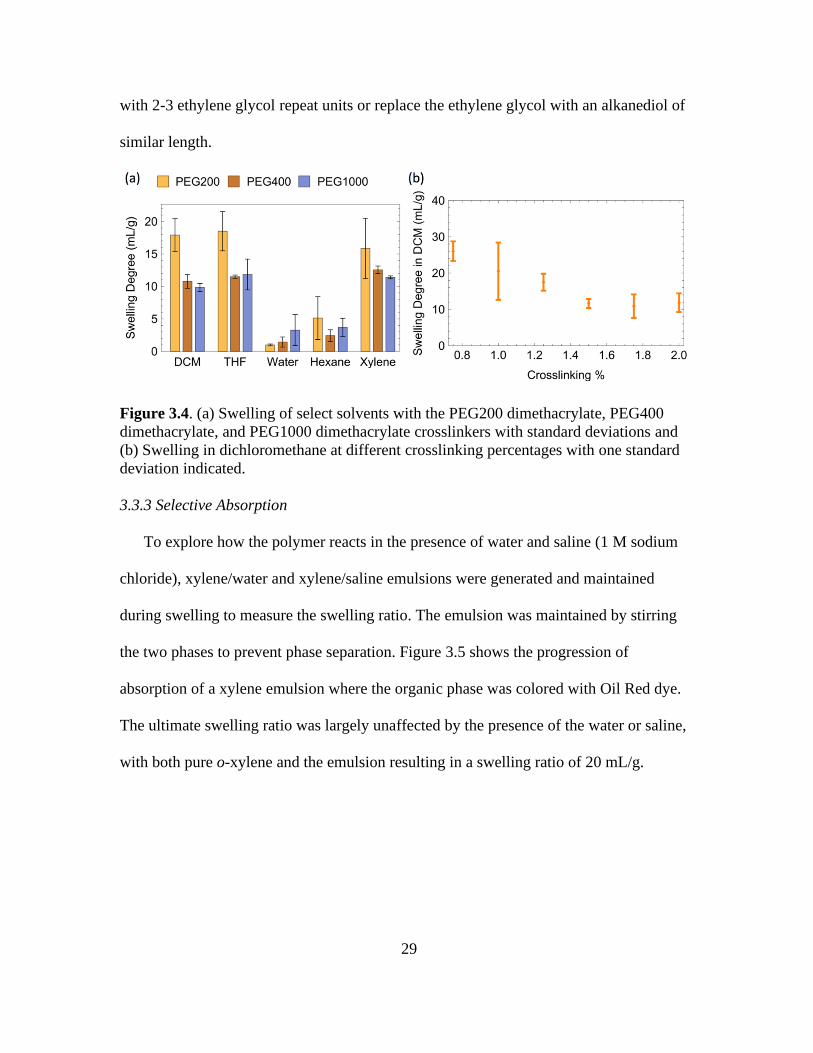
3.3.3 Selective Absorption
To explore how the polymer reacts in the presence of water and saline (1 M sodium
chloride), xylene/water and xylene/saline emulsions were generated and maintained
during swelling to measure the swelling ratio. The emulsion was maintained by stirring
the two phases to prevent phase separation. Figure 3.5 shows the progression of
absorption of a xylene emulsion where the organic phase was colored with Oil Red dye.
The ultimate swelling ratio was largely unaffected by the presence of the water or saline,
with both pure o-xylene and the emulsion resulting in a swelling ratio of 20 mL/g.
Page 42
30
Figure 3.5. Polymer swelling in emulsified o-xylene (dyed red) and water. A polymer
chip before swelling (upper left), is added to the emulsified liquids for 24 hours (lower
left). After 24 hours, additional unabsorbed xylene was removed, and the polymer was
left in the aqueous phase only (lower right) and removed to be imaged and massed (upper
right).
The ability for this polymer to absorb miscible liquids like THF in water was also
tested. While highly swelling in pure THF, as shown in Figure 3.3, a solution of 50%
THF in water showed no appreciable swelling after 24 hours. It is likely that the chemical
potential of the THF was sufficiently changed by the water that it was no longer
energetically favorable for it to enter into the polymer matrix. There may be miscible
water-solvent systems that at least partially swell the polymer. Additional tests will need
to be run to determine what levels of miscible water are tolerable to maintain swelling
properties.
Page 43
31
3.4. Conclusions
This work has shown that non-electrolytic gel networks can maintain moderate to
high swelling degrees for solvents covering a range of cohesive energies and dielectric
constants. The minimal interaction with water for these polymer gels, shown by
absorbing xylene from a water emulsion, highlights that they are also candidates for
organic liquid uptake even in aqueous environments. While the THF-water blend did not
achieve any swelling, it is worth exploring if partially miscible liquids such as the
azeotrope of water and ethyl acetate would be able to be absorbed.
Based on the crosslinker length study, the increasing length of the ethylene glycol
linker is detrimental to the swelling in high swelling solvents. An alternate crosslinker
like an alkane-diol diemethacrylate might provide better results while avoiding the steric
issues associated with this monomer. Additionally, a small percentage of a comonomer
with less steric hindrance may permit the use of a short crosslinker, such as ethylene
glycol dimethacrylate.
Page 44
32
CHAPTER 4
BREATHABLE, STIMULI-RESPONSIVE, AND SELF-SEALING CHEMICAL
BARRIER MATERIAL BASED ON SELECTIVELY SUPERABSORBING
POLYMER
4.1 Introduction
The occasional use of chemical warfare agents (CWA) by rogue states in current
conflicts provides a reminder that these hazards are a real threat and not a century old
warfare relic.98 Although hazmat suits made of fully impermeable barrier materials
provide an effective means of protecting against CWAs, their extended use presents
another challenge to the user. Specifically, the hazmat suits also prevent water vapor
transport and thus inhibit evaporative cooling. As a result, even moderate exertion in a
temperate climate can cause hyperthermia in as little as 45 minutes.10,23 To extend the
safe working time, active cooling systems must be worn under protective
clothing.10,12,18,19,99,100 Unfortunately, such systems are heavy, require batteries, and are
often not readily available in field conditions where CWA threats exist. This conundrum
has motivated a search for novel materials that allow water vapor but not CWA
permeation. So far, several such selective barrier membranes based on carbon
nanotubes,32,33 graphene oxide flakes,4,5 and selective polymers3,34,35 have shown promise
in protecting against CWA penetration while allowing some water vapor transport. For
many of these fabrics the degree of breathability is typically around or mildly above the
breathable fabric threshold of 2000 gm-2 per 24 hours,24 which allows for an equivalent of
about 100 W of evaporative cooling of a fully covered typical adult (~ 2 m2 of clothing).
This cooling rate only addresses metabolic heat generation of an idle individual that is not
Page 45
33
experiencing environmental heating.25 Thus, many of the fabrics provide too low of a
degree of breathability to be worn for extended periods of time during operations in
hazardous areas. For the few cases of the protective fabrics that have higher breathability,
the material cost is currently a challenge for their deployment.
Here I propose an alternative approach to extend operational time in hazardous
environments that is based on a highly breathable composite fabric that self-seals only
when exposed to target chemicals. This approach is based on the use of selectively super-
absorbing polymer (SAP) micro-beads dispersed on a highly breathable fabric. Many
CWAs, especially nerve and blistering agents, have low vapor pressure7 and can only be
dispersed as a “fog” via aerosolization. The proposed SAP micro-bead functionalized
fabric would seal on contact with an organic aerosol, preventing its penetration (Figure
4.1). In contrast, the fabric would remain porous on exposure to water, allowing its vapor
to pass. In this work, I demonstrate the feasibility of this approach and show that a
balance between high breathability under normal conditions, and the ability to completely
stop an organic aerosol, can be achieved.
Page 46
34
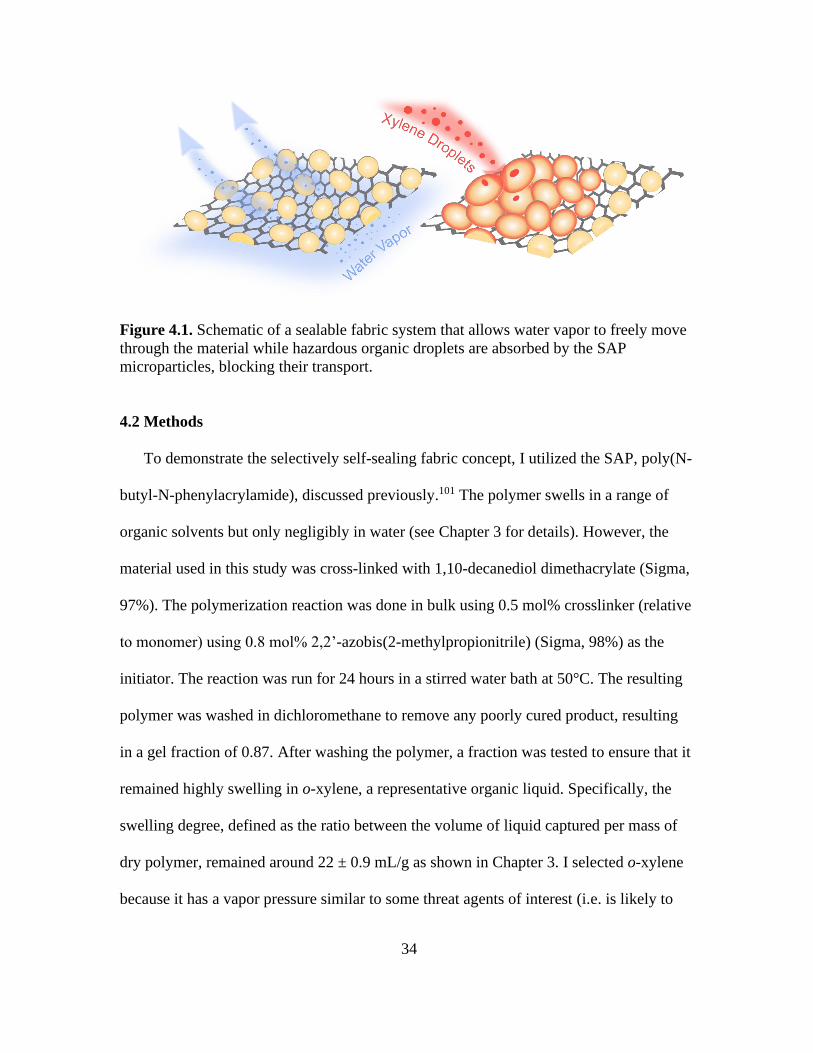
Figure 4.1. Schematic of a sealable fabric system that allows water vapor to freely move
through the material while hazardous organic droplets are absorbed by the SAP
microparticles, blocking their transport.
4.2 Methods
To demonstrate the selectively self-sealing fabric concept, I utilized the SAP, poly(N-
butyl-N-phenylacrylamide), discussed previously.101 The polymer swells in a range of
organic solvents but only negligibly in water (see Chapter 3 for details). However, the
material used in this study was cross-linked with 1,10-decanediol dimethacrylate (Sigma,
97%). The polymerization reaction was done in bulk using 0.5 mol% crosslinker (relative
to monomer) using 0.8 mol% 2,2’-azobis(2-methylpropionitrile) (Sigma, 98%) as the
initiator. The reaction was run for 24 hours in a stirred water bath at 50°C. The resulting
polymer was washed in dichloromethane to remove any poorly cured product, resulting
in a gel fraction of 0.87. After washing the polymer, a fraction was tested to ensure that it
remained highly swelling in o-xylene, a representative organic liquid. Specifically, the
swelling degree, defined as the ratio between the volume of liquid captured per mass of
dry polymer, remained around 22 ± 0.9 mL/g as shown in Chapter 3. I selected o-xylene
because it has a vapor pressure similar to some threat agents of interest (i.e. is likely to
Page 47
35
remain an aerosol when dispersed)7,54 and is predicted to have similar swelling properties
to that of agents like Soman and Sarin based on their cohesive energy density.7
After synthesizing the bulk polymer, I used a mortar and pestle to grind the material
into a powder. Next, I sieved the powder through 60 μm nylon mesh (Elko Filtering).
Using optical microscopy (Appendix C) I determined the particle distribution to have an
average effective diameter of 44 ± 19 μm. To complete fabrication of the membranes, I
dispersed the SAP particles onto a nylon mesh with 40 μm openings that covered 34% of
the area. I selected this mesh because it provides water vapor permeability equivalent to a
typical cotton t-shirt, but it does not absorb o-xylene (i.e. any swelling and sealing effects
stem from the SAP).
To determine the ability of the SAP micro-bead coated mesh to seal upon o-xylene
aerosol exposure, I built a custom testing setup. In it, I generated the aerosol using a 1.7
MHz piezoelectric fog generator (Amazon) in an in-line vessel which resulted in a
headspace densely packed with xylene droplets (see image in Figure 4.2a&b). According
to Donnelly et al.,102 I can estimate the size of the droplets based on intrinsic properties of
the liquid. Specifically, using the properties of o-xylene, I can estimate the average
droplet size by the following equation:
𝑑 = 2𝜋𝑐1 (𝜎
𝜌)
1
3(
2
𝜔)
2
3 (4.1)
Using 𝑐1 = 0.35, that is a fitted value for o-xylene (considering it an inviscid fluid),
surface tension of 𝜎 =30 mN m-1, density of 𝜌 = 878 kg m-3, and frequency of oscillation
of the piezoelectric element 𝜔 = 1.70 MHz, I calculated that the aerosol droplets had an
Page 48
36
average diameter of 8 μm (0.27 pL). This droplet size is appropriate for testing since it
corresponds to the range expected for many dangerous aerosol fogs.54
The nylon test membranes were placed between two glass joints (inner diameter of
26.8 mm), using a Viton O-ring (inner diameter of 37.7 mm) to create a seal between the
exposed side of the membrane and the glass joint. I dispersed a known mass of the SAP
powder onto the nylon mesh and spread it over the area inside the O-ring diameter by
vibrating the sample on a flat surface by hand. Notably, I created a separate fabric sample
for each individual experimental run. Subsequently, I inserted the coated mesh into the
glass joint and clamped it in place. The dense o-xylene fog that was generated using the
piezo was carried by a 400 sccm nitrogen sweep towards the target membrane. To
measure the penetration of o-xylene, an activated carbon bed was used as a trap for any
organic material that passed through the membrane (see Figure 4.2a&b). The carbon bed
was periodically removed and rapidly weighed to measure the mass gain of o-xylene and
replaced into the apparatus.
Additionally, to avoid building up a large pressure gradient, I installed a small vent
next to the sample exposure area. This alteration provided the sample with consistent
exposure to the aerosol. From unobstructed aerosol flow content, I found that the mesh
samples were exposed to 199 g m-2 min-1 of o-xylene. This exposure level corresponds to
a dense fog estimated to contain 280 g m-3; far greater than the 0.5 g m-3 found in most
natural fogs.54,103 Consequently, this high density aerosol flow likely represents an
extremely high loading of CWA and a “worst-case” scenario for exposure. We elected
this “worst-case” testing over more dilute fogs because we expect the SAP to rapidly take
up dilute fogs.
Page 49
37
While larger SAP chunks require minutes to hours for the bulk of the swelling to occur
(see Appendix B for details), for the ~40 μm sized particles used in this study, a similar
degree of swelling occurs on the order of 1 s (See Figure C2 for details). During testing,
the SAP coated mesh (~ 59% packing density) is exposed to approximately 0.1 g min-1 of
xylene. Given this packing density and loading, it would be expected that complete filling
of the void volume should occur within 4 minutes. Further, due to rapid diffusion of the
target liquid within the polymer, coupled with the high probability of adjacent particles
coming into contact, localized swelling regions become redistributed throughout the
matrix. The distributed swelling decreases the open area of the mesh and increases the
probability of aerosol particle capture. Although lower exposure fluxes were not
examined, it is our expectation that they should have a lower net breakthrough at equivalent
exposure levels. The presented results would therefore represent a worst-case scenario
relative to lower rates of exposure. Nonetheless, the examination of varying exposure rates
on aerosol penetration are planned in future work.
4.3 Results and Discussion
The images in Figure 4.2a and b and the plot in Figure 4.2e show that addition of the
SAP particles drastically reduces and even nearly eliminates o-xylene mass permeation
through the mesh. Without any particles, the nylon mesh reduces the aerosol permeation
rate from 199.4 to 35.4 g m-2 min-1 (i.e. blocks 80% of incoming aerosol). The addition of
0.3 g of the SAP particles (the equivalent of adding approximately 0.50 mm in bed
height) reduces the o-xylene permeation rate down to 17.1 g m-2 min-1 (i.e. blocks 90% of
incoming aerosol). In turn, addition of 0.5 g of the SAP particles (equivalent to a bed
height of 0.76 mm) almost eliminates the o-xylene permeation rate, reducing it down to
Page 50
38
0.43 g m-2 min-1 (i.e. blocks >99% of the incoming aerosol). The images of the pre- and
post- o-xylene exposure of SAP-covered meshes, shown in Figure 4.2c, demonstrate the
mesh sealing via the swollen polymer.
To separate the impact of swelling and geometrical blocking of the droplet, I also tested
permeation of mesh covered with a 1 mm bed of similarly sized particles (average size of
37 ± 13 μm) of a polymer that does not swell in o-xylene. The permeation of o-xylene
through the “mesh with 0.5 g of non-reactive polymer” is about the same as that of the
mesh covered by 0.3 g of the SAP beads. Consequently, the near complete blockage of the
mesh is not solely due to the physical presence of the particle bed but requires the additional
swelling effect. I compared the permeation rates of the SAP bed to that of the NSAP bed
and found that 97.5% of the o-xylene penetration was blocked relative to the latter sample.
This suggests that added back pressure from the mesh and polymer bed that could drive
more aerosol out the vent did not account for the majority of the stopping power of the
SAP bed.
Page 51
39
Figure 4.2. Images of experimental setup with o-xylene aerosol flow going through 0.5 g
of (a) non-reactive polymer and (b) SAP covered nylon mesh. Microscopy images of
SAP on the nylon mesh both before (c) and after exposure (d) to dyed o-xylene; (e) o-
xylene adsorbed by the activated carbon trap including an inset corresponding to the
percent permeation (relative to the total flow) for each scenario.
To determine the level of breathability provided by the self-sealing SAP-covered
membranes, I measured their water vapor transport rate (WVTR), following the E-96
ASTM desiccant method.104 I used meshes with and without the powders to cover a
container with an opening of 31.3 mm in diameter. I placed an excess of calcium chloride
(Millipore Sigma, 99%) desiccant in the container to desiccate the environment and thus
created a water vapor sink with ~0% relative humidity. I placed the covered container in
a controlled environment at a temperature of 33°C and a 100% relative humidity. I left
the samples in this environment for 6 to 7 hours and periodically measured the mass
change (Ohaus Explorer, 0.01g).
The plot in Figure 4.3 shows that for a 24-hour period, I see a 11,700 ± 700 g m-2 of
water vapor permeation through the nylon mesh (i.e. a total mass transport resistance
𝑅𝑡𝑜𝑡 = ∆𝐶/𝑊𝑉𝑇𝑅 =248 s m-1 for a water concentration difference, ∆𝐶, of 0.0337 kg m-
Page 52
40
3). As expected, this permeation rate is comparable to one I measured for a thin cotton
fabric. Remarkably, the addition of the 0.5 g of the SAP particles that nearly eliminated
the organic aerosol permeation through the nylon mesh does not appreciably impact
transport of water vapor through it (10370 ± 1400 g m-2 day-1 or 𝑅𝑡𝑜𝑡 of 281 s m-1). This
result affirms my assertion that I can maintain high levels of breathability prior to any
exposure while achieving complete impermeability in the presence of hazardous stimuli.
Figure 4.3. (a) Plot showing the water vapor transport (WVT) through the membrane as a
function of time, (b) histogram of the water vapor transport rate (WVTR) and the
resistance to permeation measured each sample.
4.4 Conclusions
In summary, in this Chapter I experimentally demonstrated that meshes covered with
selective SAP particles can self-seal through swelling, and almost entirely eliminate
organic aerosol permeation. Please note that synthesis of the SAP in particle form would
Page 53
41
allow for more uniform distribution over the mesh or fabric, thereby likely eliminating
any structural defects and completely blocking the aerosol. At the same time, the 1 mm
thick micro-particle bed remained as breathable as a cotton shirt. Relative to other
proposed breathable hazmat suit materials,3–5,32–35 these initial results suggest that this
approach will provide one of the highest levels of breathability. Specifically, the SAP-
particle covered membranes provide comparable permeation to the graphene oxide films
developed by Steinberg et al.4 (based on their estimates, at 37°C, they expected about 10
kg m-2 day-1) and the carbon nanotube film developed by Bui et al.32 These materials have
the obvious advantage of stopping not only aerosol but also vapor permeation, but at a
substantially increased cost (thus might not be able to cover entire hazmat suit area).
Consequently, an interesting scheme could include a combination of my concept with
these approaches (e.g. some regions of the hazmat suit coated with SAP particles and
some others with CNT films). The current work is a proof-of-concept of my approach.
With improved synthesis of the SAP particles and rational multiphysics model-based
design105 I might be able to generate nanoparticle films that also prevent vapor
permeation (albeit with a likely decrease in the water vapor permeation rate). In any case,
this highly breathable protective material concept is a promising route toward extending
operational time in areas where CWA threats exist and provides motivation for further
development of SAPs and SAP-based protective fabrics. Lastly, since such polymers can
be synthesized in large batches and dispersed using scalable approaches, the fabrication
cost is unlikely to be prohibitive.
Page 54
42
CHAPTER 5
CONCLUSIONS AND FUTURE WORKS
5.1 Main Findings
Chemically protective fabrics are potentially viable using swelling sealing polymers
as a protective barrier. Through this work, I developed a new polymeric network that can
swell highly and capture organic liquids. I explored how cactus wetting and shape change
revealed shifting cracks that accounted for changes in vapor transport and surface
wettability. And I combined these two works to create a composite fabric that provides
high breathability to water vapor, but responds to stimulus (e.g. xylene fog) to swell and
close the pore structures. I showed that combining these works provides a framework for
this idea to be further explored and adapted to many other chemicals.
These works fundamentally rely on using chemical moiety interactions to induce
mechanical deformation and create a stimulus driven shape changing material. I explored
a biological barrier material with a similar shape change to augment breathability and
showed that hydration levels in prickly pear cacti affect the microstructure of the surface
wax to reduce dehydration rates. I was able to find that the macroscale properties, namely
wettability, were able to be altered by relatively minor changes at the microscale. I
specifically found that decreasing the total weight of the cactus by 40% reduced
microfractures from 15 µm ± 3 μm in the fully hydrated samples down to about 6 µm ±
1.9 μm. While that reduction seems minor in absolute size, it changed the contact angle
on the surface of the pad from ~90° to over 100°. That these minor mechanical
Page 55
43
deformations manifest large macroscale change in properties provides guidance to
creating a material to change its breathability and create a protective fabric.
Starting from acrylamide chemistry, I developed a polymer network that showed
high swelling properties in a range of solvents. The swelling shows a rapid expansion
upon initial exposure to a swelling liquid that diminishes with time. The rates of liquid
uptake are suitable for use in breathable hazmat suit. By comparing different solvent
parameters with the swelling ratios, I showed that the swelling can be anticipated based
on the cohesive energy density of the solvent. This provides a metric by which to
evaluate new materials and see if they will likely swell highly in poly(N-butyl-N-
phenylamide). The observations I made in emulsified xylene-water mixtures highlight
that absorption by the polymer does not depend on the presence of water or saline
solution. This is an important distinction from previous electrolytic gels that rely on
charge dispersion to remain in a swollen state. It also provides a basis to assume the
polymer will be unaffected by the presence of water or perspiration; this is a critical
requirement if I adapt this to articles of clothing.
Developing the material concept further, I explored using poly(N-butyl-N-
phenylamide) in a composite fabric to test its sealing capabilities. With previous
simulation work106 it was expected that using polymer beads on the same size scale as the
pore openings of the fabric would provide the most efficient capture of aerosolized
material. Further, that work suggested that even as little as a monolayer of micron-sized
particles could seal-off 95% of the pore area in well under a second. From my
experimental work, I found that a monolayer was not enough to seal the fabric and avoid
xylene from penetrating to the activated carbon bed. In fact, I found that a polymer bead
Page 56
44
bed height of approximately 1 mm was needed to provide enough absorbing power to
stop significant xylene penetration. I speculate this discrepancy relates to the expectation
in the model that the aerosol is the same size as the beads and is forced to interact with
them. In contrast, the experimental work relied on smaller aerosols relative to the beads
providing a chance for aerosol to pass through the bed, potentially not contacting any
polymer absorbent materials. In addition to finding the ability to block the xylene fog, I
showed that the addition of the polymer bed on the nylon mesh support minimally
impacted the breathability of the fabric. This result highlighted that a barrier material
could be made to be highly breathable while remaining chemically protective.
5.2 Synthesis of Works
These individual works build on each other, and when combined, provide insight
on further work and how it can be approached. While Chapter 3 discusses the
development of a bulk scale polymer, in Chapter 4 I use the polymer in a powdered form.
This could loopback into Chapter 3 by redeveloping the polymer in emulsion
polymerizations in order to directly create beads. While this was initially tried with some
success, the size distribution of the particles remained near 1 μm. This became an issue
because the fabrics I investigated decreased from 34% to just 5% open area on decreasing
the average polymer particle size from 40 μm to 5 μm. This reduction would have
impacted breathability and reduced the potential usability of this system.
Connecting Chapter 2 with Chapter 4 provides an interesting insight that, while
the microfractures do augment the dehydration rate, it is the stomata that lose the
majority of water vapor. This suggests that composite fabrics could be further improved
by utilizing areas with higher breathability for regions of high heat exchange (e.g. the
Page 57
45
underarm). These regions would have a more open collapsible structure to provide high
rates of breathability while retaining aerosol protection. In contrast, areas with low
breathability requirements could use more dense fibers and restrict breathability but use a
lower loading of absorbent polymer to retain protection. Coupling the changes in size for
different areas of the body could provide high levels of protection with the minimal
addition of the super absorbent polymer.
5.2 Future works
Further development is beyond the scope of this thesis; however this work
provides a jumping point to explore many new ideas. In polymer development, there is a
body of evidence that acrylamide chemistry is a very strong candidate on which to serve
as a swelling platform.38,40,110–114,44,50,53,79,91,107–109 Further investigation of this approach
could provide a more fundamental analysis of how different chemical moieties attached
to the acrylamide backbone augment swelling, especially by controlling solvent-polymer
interactions to target specific molecules. Acrylamide gels have been shown to swell in
diverse solvents such as oil,53,101,113 alcohol,114 and water.48,94,115 By developing these
polymers further, it could broaden our understanding and find novel functional uses for
them. Additionally, gelled materials have unique properties that can be exploited to create
shape change, allowing them to be used in a variety of applications.
In regard to further development of the composite fabric introduced in Chapter 4,
one major hurdle that needs to be addressed is the breakdown/decontamination of the suit
from CWAs and other hazardous chemicals. While I am able to capture and block most
mass transport, retaining highly toxic materials near the skin is a very dangerous
Page 58
46
proposition. One potential area that can be explored is using a Pickering emulsion to
decorate the polymer beads with a decontaminating agent. By using nano-sized
decontamination agent particles, the emulsion polymerization can be stabilized and the
catalyst can be embedded to the surface creating a reactive swelling surface. This would
provide the immediate protection required while also destroying the CWA to limit further
risk of exposure to the wearer.
Finally, the other major limitation of the composite fabric concept is the
attachment of polymer bed to the underlying fabric. I did not investigate adding an
adhesive to anchor the polymer to the fabric. While compartmentalized pockets of
unbound particles could work, a more reasonable expectation is to adhere the particles to
the fibrous backbone to maintain uniform protection. Pressure sensitive adhesives, direct
polymer anchoring, and fiber-polymer bonding should all be explored to determine the
best way to prevent the absorbent moving or abrading from the surface. This work would
extend the preliminary results to make a super absorbent polymer augmented fabric a
viable protective system.
Models of this system, as done by Dr. Akshay Phadnis,106 can provide key
insights that combine with the experimental work and can continue to be used to inform
the research process. While some of the conclusions derived from his work are applied to
this work, there is still significant optimization that can be done to improve the
performance of the protective fabric. Throughout this thesis I worked towards a
breathable, wearable fabric that also provides chemical protection via stimuli-responsive
polymers. While this work has created new insights and developments towards this goal,
there is substantial further developed needed to achieve a commercializable product.
Page 59
47
REFERENCES
1. Kotagama, P., Phadnis, A., Manning, K. C. & Rykaczewski, K. Rational Design of
Soft , Thermally Conductive Composite Liquid-Cooled Tubes for Enhanced
Personal , Robotics , and Wearable Electronics Cooling. Adv. Mater. Technol. 4,
1800690 (1–12) (2019).
2. Fornasiero, F. Water vapor transport in carbon nanotube membranes and
application in breathable and protective fabrics. Curr. Opin. Chem. Eng. 16, 1–8
(2017).
3. Hudiono, Y. C. et al. A highly breathable organic/inorganic barrier material that
blocks the passage of mustard agent simulants. Ind. Eng. Chem. Res. 51, 7453–
7456 (2012).
4. Spitz Steinberg, R., Cruz, M., Mahfouz, N. G. A., Qiu, Y. & Hurt, R. H.
Breathable Vapor Toxicant Barriers Based on Multilayer Graphene Oxide. ACS
Nano 11, 5670–5679 (2017).
5. Peng, C., Iqbal, Z., Sirkar, K. K. & Peterson, G. W. Graphene Oxide-Based
Membrane as a Protective Barrier against Toxic Vapors and Gases. ACS Appl.
Mater. Interfaces 12, 11094–11103 (2020).
6. Giannakoudakis, D. A., Barczak, M., Pearsall, F., O’Brien, S. & Bandosz, T. J.
Composite porous carbon textile with deposited barium titanate nanospheres as
wearable protection medium against toxic vapors. Chem. Eng. J. 384, 123280
(2020).
7. Gorzkowska-Sobas, A. A. Chemical Warfare Agents and Their Interactions with
Solid Surfaces; Rapport 00574; Norwegian Defense Research Establishment:
Kjeller, Norway, 2013.
8. Varady, M. J., Pearl, T. P., Stevenson, S. M. & Mantooth, B. A. Decontamination
of VX from Silicone: Characterization of Multicomponent Diffusion Effects. Ind.
Eng. Chem. Res. 55, 3139–3149 (2016).
9. Chambers, A. B. & Blackaby, J. R. A liquid cooled garment temperature controller
based on sweat rate. (1972).
10. Cadarette, B. S. et al. Intermittent microclimate cooling during exercise-heat stress
in US army chemical protective clothing. Ergonomics 49, 209–219 (2006).
11. Dionne, J. P., Semeniuk, K., Makris, A., Teal, W. & Laprise, B. Thermal manikin
evaluation of liquid cooling garments intended for use in hazardous waste
management. (2003).
Page 60
48
12. Kim, J.-H., Coca, A., Williams, W. J. & Roberge, R. J. Effects of liquid cooling
garments on recovery and performance time in individuals performing strenuous
work wearing a firefighter ensemble. J. Occup. Environ. Hyg. 8, 409–416 (2011).
13. Gao, T. et al. Three-Dimensional Printed Thermal Regulation Textiles. ACS Nano
11, 11513–11520 (2017).
14. Chen, X., Su, Y., Reay, D. & Riffat, S. Recent research developments in polymer
heat exchangers - A review. Renewable and Sustainable Energy Reviews vol. 60
1367–1386 (2016).
15. Cao, H., Branson, D. H., Nam, J., Peksoz, S. & Farr, C. A. Development of a
cooling capability test method for liquid-cooled textile system. J. ASTM Int. 2, 1–
10 (2005).
16. Webb, R. C. et al. Ultrathin conformal devices for precise and continuous thermal
characterization of human skin. Nat. Mater. 12, 938 (2013).
17. Terrier, D., Clayton, R., Whitlock, D. & Conger, B. High Performance Mars
Liquid Cooling and Ventilation Garment Project. (2015) doi:JSC-CN-33642.
18. Kuznetz, L. H. Automatic control of human thermal comfort by a liquid-cooled
garment. J. Biomech. Eng. 102, 155–161 (1980).
19. Yang, Y., Stapleton, J., Diagne, B. T., Kenny, G. P. & Lan, C. Q. Man-portable
personal cooling garment based on vacuum desiccant cooling. Appl. Therm. Eng.
47, 18–24 (2012).
20. Hunter, I., Hopkins, J. T. & Casa, D. J. Warming up with an ice vest: Core body
temperature before and after cross-country racing. J. Athl. Train. 41, 371–374
(2006).
21. Almqvist, H., Cooling Garment Having Phase Change Material In Its Extremity
Portions. US8499367B2. (2005).
22. Force, U. S. A. AFVA 10-2512: Mission Oriented Protective Postures. (2012).
23. Gonzalez, R. R., McLellan, T. M., Withey, W. R., Chang, S. K. & Pandolf, K. B.
Heat strain models applicable for protective clothing systems: comparison of core
temperature response. J. Appl. Physiol. 83, 1017–1032 (1997).
24. Wartell, M., Kleinman, M. & Huey, B. Strategies to protect the health of deployed
US forces: force protection and decontamination. Health (San Francisco) (1999).
Page 61
49
25. Wissler, E. H. Human Temperature Control: A quantitative Approach. (Springer,
2018).
26. Nations, L. of. Protocol: For the Prohibition of the Use in War of Asphyxiating,
Poisonous or Other Gases, and of Bacteriological Methods of Warfare. UN
Conventions vol. 25 (1925).
27. UN. Convention on the Prohibition of the Development, Production, Stockpiling
and Use of Chemical Weapons and on theirDestruction. (1993).
28. Bhaganagar, K. & Bhimireddy, S. R. Assessment of the plume dispersion due to
chemical attack on April 4, 2017, in Syria. Nat. Hazards 88, 1893–1901 (2017).
29. Dolgin, E. Syrian gas attack reinforces need for better anti-sarin drugs. Nat. Med.
19, 1194–1195 (2013).
30. Sezigen, S. et al. Victims of chemical terrorism, a family of four who were
exposed to sulfur mustard. Toxicol. Lett. 303, 9–15 (2019).
31. Johnson, N. H., Larsen, J. C. & Meek, E. Historical Perspective of Chemical
Warfare Agents. Handbook of Toxicology of Chemical Warfare Agents: Second
Edition (INC, 2015). doi:10.1016/B978-0-12-800159-2.00002-6.
32. Bui, N. et al. Ultrabreathable and Protective Membranes with Sub-5 nm Carbon
Nanotube Pores. Adv. Mater. 28, 5871–5877 (2016).
33. Fornasiero, F. Water vapor transport in carbon nanotube membranes and
application in breathable and protective fabrics. Curr. Opin. Chem. Eng. 16, 1–8
(2017).
34. Sha, S. C., Zhu, R., Herbert, M. B., Kalow, J. A. & Swager, T. M. Chemical
warfare simulant-responsive polymer nanocomposites: Synthesis and evaluation. J.
Polym. Sci. Part A Polym. Chem. 55, 3034–3040 (2017).
35. Liu, X., Li, Y., Hu, J., Jiao, J. & Li, J. Smart moisture management and
thermoregulation properties of stimuli-responsive cotton modified with polymer
brushes. RSC Adv. 4, 63691–63695 (2014).
36. Mashkoor, F., Nasar, A. & Inamuddin. Carbon nanotube-based adsorbents for the
removal of dyes from waters: A review. Environ. Chem. Lett. 18, 605–629 (2020).
37. Erdely, A. et al. Carbon nanotube dosimetry: From workplace exposure
assessment to inhalation toxicology. Part. Fibre Toxicol. 10, 1–14 (2013).
Page 62
50
38. Hooper, H. H., Baker, J. P., Blanch, H. W. & Prausnitz, J. M. Swelling equilibria
for positively ionized polyacrylamide hydrogels. Macromolecules 23, 1096–1104
(1990).
39. Chang, C., Duan, B., Cai, J. & Zhang, L. Superabsorbent hydrogels based on
cellulose for smart swelling and controllable delivery. Eur. Polym. J. 46, 92–100
(2010).
40. Chen, J., Park, H. & Park, K. Synthesis of superporous hydrogels: Hydrogels with
fast swelling and superabsorbent properties. J. Biomed. Mater. Res. 44, 53–62
(1999).
41. Chauhan, K., Chauhan, G. S. & Ahn, J. H. Synthesis and characterization of novel
guar gum hydrogels and their use as Cu2+ sorbents. Bioresour. Technol. 100,
3599–3603 (2009).
42. Peralta Ramos, M. L. et al. Chitin hydrogel reinforced with TiO2 nanoparticles as
an arsenic sorbent. Chem. Eng. J. 285, 581–587 (2016).
43. Panic, V. V., Madzarevic, Z. P., Volkov-Husovic, T. & Velickovic, S. J.
Poly(methacrylic acid) based hydrogels as sorbents for removal of cationic dye
basic yellow 28: Kinetics, equilibrium study and image analysis. Chem. Eng. J.
217, 192–204 (2013).
44. Wang, Q., Wilfong, W. C., Kail, B. W., Yu, Y. & Gray, M. L. Novel
Polyethylenimine-Acrylamide/SiO2 Hybrid Hydrogel Sorbent for Rare-Earth-
Element Recycling from Aqueous Sources. ACS Sustain. Chem. Eng. 5, 10947–
10958 (2017).
45. Zhou, G. et al. A highly efficient polyampholyte hydrogel sorbent based fixed-bed
process for heavy metal removal in actual industrial effluent. Water Res. 89, 151–
160 (2016).
46. Brandl, F. et al. Hydrogel-based drug delivery systems: Comparison of drug
diffusivity and release kinetics. J. Control. Release 142, 221–228 (2010).
47. Ashley, G. W., Henise, J., Reid, R. & Santi, D. V. Hydrogel drug delivery system
with predictable and tunable drug release and degradation rates. Proc. Natl. Acad.
Sci. U. S. A. 110, 2318–2323 (2013).
48. Peppas, N. A. Hydrogels and drug delivery. Curr. Opin. Colloid Interface Sci. 2,
531–537 (1997).
Page 63
51
49. Fumasi, F. M., Stephanopoulos, N. & Holloway, J. L. Reversible control of
biomaterial properties for dynamically tuning cell behavior. J. Appl. Polym. Sci.
137, 1–16 (2020).
50. Tse, J. R. & Engler, A. J. Preparation of hydrogel substrates with tunable
mechanical properties. Curr. Protoc. Cell Biol. 1–16 (2010)
doi:10.1002/0471143030.cb1016s47.
51. Kuo, C. K. & Ma, P. X. Ionically crosslinked alginate hydrogels as scaffolds for
tissue engineering: Part 1. Structure, gelation rate and mechanical properties.
Biomaterials 22, 511–521 (2001).
52. Ono, T., Sugimoto, T., Shinkai, S. & Sada, K. Lipophilic polyelectrolyte gels as
super-absorbent polymers for nonpolar organic solvents. Nat. Mater. 6, 429–433
(2007).
53. Ono, T., Sugimoto, T., Shinkai, S. & Sada, K. Molecular design of superabsorbent
polymers for organic solvents by crosslinked lipophilic polyelectrolytes. Adv.
Funct. Mater. 18, 3936–3940 (2008).
54. Kukkonen, J., Riikonen, K., Nikmo, J., Jäppinen, A. & Nieminen, K. Modelling
aerosol processes related to the atmospheric dispersion of sarin. 85, 165–179
(2001).
55. Zhong, Y. et al. Reversible Humidity Sensitive Clothing for Personal
Thermoregulation. Sci. Rep. 7, 44208 (2017).
56. Makino, K., Mack, E. J., Okano, T. & Sung Wan Kim. A microcapsule self-
regulating delivery system for insulin. J. Control. Release 12, 235–239 (1990).
57. Siegel, R. A. & Firestone, B. A. Mechanochemical approaches to self-regulating
insulin pump design. J. Control. Release 11, 181–192 (1990).
58. He, X. et al. Synthetic homeostatic materials with chemo-mechano-chemical self-
regulation. Nature 487, 214–218 (2012).
59. Moghaddam, S., Pengwang, E., Masel, R. I. & Shannon, M. A. A self-regulating
hydrogen generator for micro fuel cells. J. Power Sources 185, 445–450 (2008).
60. Park, C. H. et al. Nanocrack-regulated self-humidifying membranes. Nature 532,
480–483 (2016).
61. Nisbet, R. A. & Patten, D. T. Seasonal temperature acclimation of a prickly-pear
cactus in south-central Arizona. Oecologia 15, 345–352 (1974).
Page 64
52
62. Altman, P. & Dittmer, D. Environmental Biology. (Federation of American
Societies for Experimental Biology, 1966).
63. Anderson, E. F. The cactus family. (Portland, Or. : Timber Press, 2001).
64. Mallona, I., Egea-Cortines, M. & Weiss, J. Conserved and divergent rhythms of
Crassulacean acid metabolism-related and core clock gene expression in the cactus
Opuntia ficus-indica. Plant Physiol. 156, 1978–1989 (2011).
65. Edwards, E. J. & Donoghue, M. J. and the Origin of the Cactus Life‐Form. Am.
Nat. 167, 777–793 (2006).
66. Acevedo, E., Badilla, I. & Nobel, P. S. Water Relations, Diurnal Acidity Changes,
and Productivity of a Cultivated Cactus, Opuntia ficus-indica. Plant Physiol. 72,
775–780 (1983).
67. Clark, D. Images of Leaf Stomata: Little Things that Matter. Micros. Today 27,
12–17 (2019).
68. Ben Salem-Fnayou, A., Zemni, H., Nefzaoui, A. & Ghorbel, A. Micromorphology
of cactus-pear (opuntia ficus-indica (L.) mill) cladodes based on scanning
microscopies. Micron 56, 68–72 (2014).
69. Rykaczewski, K. et al. Microscale Mechanism of Age Dependent Wetting
Properties of Prickly Pear Cacti (Opuntia). Langmuir 32, 9335–9341 (2016).
70. Barcikowski, W. & Nobel, P. S. Water Relations of Cacti During Desiccation:
Distribution of Water in Tissues. Bot. Gaz. 145, 110–115 (1984).
71. Cassie, A. B. D. & Baxter, S. Wettability of porous surfaces. Trans. Faraday Soc.
40, 546 (1944).
72. Smith, M., Hargroves, K., Smith, M. & Hargroves, K. Innovation inspired by
nature: Biomimicry. ECOS 2006, 27–29 (2006).
73. Akber Hassan, W. A. & Jiang, X. Upscaling and its application in numerical
simulation of long-term CO2 storage. Greenh. Gases Sci. Technol. 2, 408–418
(2012).
74. Park, Y. I. & Lee, K. H. Preparation of water-swollen hydrogel membranes for gas
separation. J. Appl. Polym. Sci. 80, 1785–1791 (2001).
75. Mittenthal, M. S. et al. Ionic Polyimides: Hybrid Polymer Architectures and
Composites with Ionic Liquids for Advanced Gas Separation Membranes. Ind.
Eng. Chem. Res. 56, 5055–5069 (2017).
Page 65
53
76. Mohshim, D. F., Mukhtar, H. & Man, Z. Composite blending of ionic liquid–
poly(ether sulfone) polymeric membranes: Green materials with potential for
carbon dioxide/methane separation. J. Appl. Polym. Sci. 133, 1–8 (2016).
77. Ward, W. J. & Robb, W. L. Carbon Dioxide-Oxygen Separation : Facilitated
Transport of Carbon Dioxide across a Liquid Film. Am. Assoc. Adv. Sci. 156,
1481–1484 (1967).
78. Fan, J. B. et al. Directly Coating Hydrogel on Filter Paper for Effective Oil-Water
Separation in Highly Acidic, Alkaline, and Salty Environment. Adv. Funct. Mater.
25, 5368–5375 (2015).
79. Hosseinzadeh, H. & Mohammadi, S. Synthesis of a Novel Hydrogel
Nanocomposite Coated on Cotton Fabric for Water-Oil Separation. Water, Air,
Soil Pollut. 225, (2014).
80. Kota, A. K., Kwon, G., Choi, W., Mabry, J. M. & Tuteja, A. Hygro-responsive
membranes for effective oil–water separation. Nat. Commun. 3, 1025 (2012).
81. Ju, H. et al. Crosslinked poly(ethylene oxide) fouling resistant coating materials
for oil/water separation. J. Memb. Sci. 307, 260–267 (2008).
82. Liu, N. et al. A facile solvent-manipulated mesh for reversible oil/water
separation. ACS Appl. Mater. Interfaces 6, 12821–12826 (2014).
83. Zhang, L., Zhong, Y., Cha, D. & Wang, P. A self-cleaning underwater
superoleophobic mesh for oil-water separation. Sci. Rep. 3, 2326 (2013).
84. Zhu, H., Qiu, S., Jiang, W., Wu, D. & Zhang, C. Evaluation of electrospun
polyvinyl chloride/polystyrene fibers as sorbent materials for oil spill cleanup.
Environ. Sci. Technol. 45, 4527–4531 (2011).
85. Holland, H. W. Bilge Oil Absorber and Solidifier. US005458773A. (1994).
86. Deschamps, G., Caruel, H., Borredon, M. E., Bonnin, C. & Vignoles, C. Oil
removal from water by selective sorption on hydrophobic cotton fibers. 1. Study of
sorption properties and comparison with other cotton fiber-based sorbents.
Environ. Sci. Technol. 37, 1013–1015 (2003).
87. Hayase, G., Kanamori, K., Fukuchi, M., Kaji, H. & Nakanishi, K. Facile synthesis
of marshmallow-like macroporous gels usable under harsh conditions for the
separation of oil and water. Angew. Chemie - Int. Ed. 52, 1986–1989 (2013).
88. Li, X. et al. Direct Oil Recovery from Saturated Carbon Nanotube Sponges. ACS
Appl. Mater. Interfaces 8, 12337–12343 (2016).
Page 66
54
89. Gupta, S. & Tai, N.-H. Carbon materials as oil sorbents: a review on the synthesis
and performance. J. Mater. Chem. A 4, 1550–1565 (2016).
90. Ma, M. & Hill, R. M. Superhydrophobic surfaces. Curr. Opin. Colloid Interface
Sci. 11, 193–202 (2006).
91. Ohmine, I. Salt effects on the phase transition of ionic gels. J. Chem. Phys. 77,
5725 (1982).
92. Boddu, V. M. et al. Lipophilic Super-Absorbent Swelling Gels as Cleaners for Use
on Weapons Systems and Platforms Final Report. (2011).
93. Mamada, A., Tanaka, T., Kungwatchakun, D. & Irie, M. Photoinduced Phase
Transition of Gels. Macromolecules 23, 1517–1519 (1990).
94. Zhang, X., Li, Y., Hu, Z. & Littler, C. L. Bending of N-isopropylacrylamide gel
under the influence of infrared light. J. Chem. Phys. 102, 551–555 (1995).
95. Flory, P. J. Principles of polymer chemistry. (Cornell University Press, 1953).
doi:10.1002/pen.760050321.
96. Patterson, D. & Delmas, G. New Aspects of Polymer Solution Thermodynamics.
Off. Dig. Fed. Soc. Paint Technol. 34, 677–692, (1962).
97. Hansen, C. M. Hansen Solubility Parameters: A User’s Handbook. (CRC Press,
2000).
98. Peplow, M. A century of chemical warfare: nations reflect on grim anniversary.
Nature (2015) doi:10.1038/nature.2015.17381.
99. Yang, Y., Rana, D., Lan, C. Q. & Matsuura, T. Development of Membrane-based
Desiccant Fiber for Vacuum Desiccant Cooling. ACS Appl. Mater. Interfaces
(2016).
100. Kotagama, P., Phadnis, A., Manning, K. C. & Rykaczewski, K. Rational Design of
Soft, Thermally Conductive Composite Liquid-Cooled Tubes for Enhanced
Personal, Robotics, and Wearable Electronics Cooling. Adv. Mater. Technol.
1800690, 1–12 (2019).
101. Manning, K. C., Phadnis, A., Simonet, D., Burgin, T. P. & Rykaczewski, K.
Development of a Nonelectrolytic Selectively Superabsorbent Polymer. Ind. Eng.
Chem. Res. 57, 13269–13274 (2018).
Page 67
55
102. Donnelly, T. D., Hogan, J., Mugler, A., Schubmehl, M. & Schommer, N. Using
ultrasonic atomization to produce an aerosol of micron-scale particles. 1–10 (2005)
doi:10.1063/1.2130336.
103. J. Allen Zak. Drop Size Distributions and Related Properties of Fog for Five
Locations Measured From Aircraft. (1994) doi:10.1175/1520-0477(1998)079.
104. ASTM. Standard Test Methods for Water Vapor Transmission of Materials
E96/E96M. Annu. B. ASTM Stand. i, 1–10 (2016).
105. Phadnis, A., Manning, K. C., Sanders, I., Burgin, T. P. & Rykaczewski, K.
Droplet-train induced spatiotemporal swelling regimes in elastomers. Soft Matter
14, 5869–5877 (2018).
106. Phadnis, A. Using Droplet Induced Deformations in Polymeric Functional
Materials for Heat and Mass Transport Modulation. Arizona State University.
107. Uz Okay, O. & Sariisik, S. B. Swelling behavior of poly(acrylamide-co-sodium
acrylate) hydrogels in aqueous salt solutions: theory versus experiments. Eur.
Polym. J. 36, 393–399 (2000).
108. Sotoudeh, S. et al. Dynamical Modeling and Experimental Analysis on the
Swelling Behavior of the sIPN Hydrogels. Ind. Eng. Chem. Res. 49, 10111–10115
(2010).
109. Achilleos, E. C., Prud’homme, R. K., Kevrekidis, I. G., Christodoulou, K. N. &
Gee, K. R. Quantifying deformation in gel swelling: Experiments and simulations.
Aiche J. 46, 2128–2139 (2000).
110. Luo, L., Kato, M., Tsuruta, T., Kataoka, K. & Nagasaki, Y. Stimuli-sensitive
polymer gels that stiffen upon swelling. Macromolecules 33, 4992–4994 (2000).
111. Zhang, X., Li, Y., Hu, Z. & Littler, C. L. Bending of N‐isopropylacrylamide gel
under the influence of infrared light. J. Chem. Phys. 102, 551–555 (1995).
112. Zarzar, L. D. & Aizenberg, J. Stimuli-responsive chemomechanical actuation: A
hybrid materials approach. Acc. Chem. Res. 47, 530–539 (2014).
113. Ono, T. & Sada, K. Toward the design of superabsorbent materials for non-polar
organic solvents and oils: ionic content dependent swelling behaviour of cross-
linked poly(octadecyl acrylate)-based lipophilic polyelectrolytes. J. Mater. Chem.
22, 20962 (2012).
114. Ozmen, M. M. & Okay, O. Swelling behavior of strong polyelectrolyte poly(N - t -
butylacrylamide-co-acrylamide) hydrogels. Eur. Polym. J. 39, 877–886 (2003).
Page 68
56
115. Wandera, D., Wickramasinghe, S. R. & Husson, S. M. Stimuli-responsive
membranes. J. Memb. Sci. 357, 6–35 (2010).
116. Binev, Y., Marques, M. M. B. & Aires-de-Sousa, J. Prediction of1H NMR
coupling constants with associative neural networks trained for chemical shifts. J.
Chem. Inf. Model. 47, 2089–2097 (2007).
117. Castillo, A. M., Patiny, L. & Wist, J. Fast and accurate algorithm for the
simulation of NMR spectra of large spin systems. J. Magn. Reson. 209, 123–130
(2011).
Page 69
57
APPENDIX A
SUPPORTING CODES FOR LINE PROFILES IN CHAPTER 2
Page 70
58
These codes, unless otherwise stated, were all custom developed to analyze the
crack profiles. Code sections are separated by a line break with all non-stock MATLAB
code listed in this appendix.
Cactus Surface Analyzer Main Code:
-----------------------------------------------------------
%Read Optical profilometer file and extract the relevant map of heights
ReadZMP_ES
%Extract the cracks from the image of the cactus surface
[crack_data2] = crack_definer (Map);
%Write the line profiles to a variable to be viewed and analyzed for depth, width, and
%shape
[profiles2] = crack_profiles (crack_data,Map); -----------------------------------------------------------
ReadZMP_ES Function, written by Wolfgang Kaehler for Zygo Inc. Provided for this
analysis for free, please see the copyright holder (Zygo) for a copy of the code.
Page 71
59
-----------------------------------------------------------
function [crack_data] = crack_definer (Map)
%crack_definer takes the 2D projection of the cactus surface and allows the
%user to manually specify a crack by data points along the crack line.
%This information is then sorted to create a set of points that are aligned
%to their nearest neighbors on the image
%Outputs x,y data in a single array of paired values
%View the 2D projection of the surface
imagesc(Map)
colormap('hot')
hold on
%Toggle - 'Yes' 'No' or 'Cancel'
toggle = 'Cancel';
%Get the first crack
while length(toggle) == 6
[a,b] = getpts;
[a , b] = crk_org (a,b);
a(end+1) = -1;
b(end+1) = -1;
toggle = questdlg('Additional cracks to classify?');
end
%Add previous crack points to the image
while length(toggle)>2
plot(a,b,'o','MarkerEdgeColor','k')
[c,d] = getpts;
[c,d] = crk_org (c,d);
toggle = questdlg('Additional cracks to classify?');
if length(toggle)<4
a(end+1:end+length(c)) = c;
b(end+1:end+length(d)) = d;
a(end+1) = -1;
b(end+1) = -1;
end
end
crack_data = [a,b];
end -----------------------------------------------------------
Page 72
60
-----------------------------------------------------------
function [profile] = line_extract_1(xs,ys,tol,im)
%Uses 2 points inside a crack to define the profile of the first point
%[x(1),y(1)]
%tol is the minimum number of pixels to move perpendicularly
%im is the image map from ZMP file
%xs and ys must be integers because we are pulling points from the grid
xs = round(xs);
ys = round(ys);
%Debug toggle
debug = 1;
B = reshape(ys,2,1); %avoids error from vertical vs horizontal vector
A = [1,xs(1);1,xs(2)]; %Matrix for linear algebra solving
lin_coeffs = A\B; %Coefficients from linear solving
m = -1/lin_coeffs(2); %Slope perpendicular to the two points
x_pix = tol;
y_pix = round(abs(m)*tol);
if x_pix < y_pix
y_pix = tol;
x_pix = round(abs(1/m)*tol);
%swap x and y values to make horizontal not vertical - just to reuse code
x=[ys(1)+y_pix ys(1)-y_pix];
y=[xs(1)+x_pix xs(1)-x_pix];
%set any out of bounds points to the minimum 1
x(x<=0)=1;
y(y<=0)=1;
%%%%RESET POINTS FOR VALUES GOING TO 1%%%%
%reshuffle so we go from small x to large x
if x(2)<x(1)
x = flip(x);
if sign((y(2)-y(1))/(x(2)-x(1)))~=sign(m)
y = flip(y);
end
end
X=x(1):x(2);
Page 73
61
Y=round(interp1(x,y,X));
profile = im(round(mean(Y)),X);
%For Debugging
if debug==1
imagesc(im)
hold on
plot(Y,X,'r',xs,ys,'o')
pause
% close gcf
end
else
x=[xs(1)+x_pix xs(1)-x_pix];
y=[ys(1)+y_pix ys(1)-y_pix];
%set any out of bounds points (Outside the image map) to the minimum 1
x(x<=0)=1;
y(y<=0)=1;
%%%%RESET POINTS FOR VALUES GOING TO 1%%%%
%reshuffle so we go from small x to large x
if x(2)<x(1)
x = flip(x);
if sign((y(2)-y(1))/(x(2)-x(1)))~=sign(m)
y = flip(y);
end
end
X=x(1):x(2);
Y=round(interp1(x,y,X));
profile = im(round(mean(Y)),X);
%For Debugging
if debug == 1
imagesc(im)
hold on
plot(X,Y,'b',xs,ys,'o')
pause
% close gcf
end
end -----------------------------------------------------------
Page 74
62
-----------------------------------------------------------
function [profiles] = crack_profiles (crack_data,im)
%Tolerance for profile % of resolution to extend in either direction
tol =round(0.04*max(size(im)));
%preallocate profiles variable
profiles = zeros(2*tol+1,length(crack_data));
%define crack stop/start points
breaks = find(crack_data(:,1)==-1);
breaks = [0;breaks];
for i = 2:length(breaks)
crack = crack_data(breaks(i-1)+1:breaks(i)-1,:);
for j = 1:length(crack)-1
profiles(:,j+breaks(i-1)) = line_extract_1(crack(j:j+1,1),crack(j:j+1,2),tol,im);
end
end
end -----------------------------------------------------------
Page 75
63
APPENDIX B
SUPPORTING INFORMATION FOR CHAPTER 3
Page 76
64
B1 NMR results and analysis
To determine sample purity, the NMR spectra were compared against theoretical
equivalents that were generated using the nmrdb software, which is a validated prediction
tool for NMR spectra.116,117 All experimental peaks were characterized and identified as
shown in Figure S1(a). Using the spectrum, the remaining starting amine was identified by
the characteristic resonance at ~3.1 ppm. This peak, shown in Figure B1(b), represents the
2 hydrogens next to the nitrogen in the amine. By dividing the integrated peak value in
Figure B1(b) (0.0019) by the value obtained for a peak unique to the desired product
representing the same number of hydrogens, the percent of the remaining amine was
estimated to be below 0.1%, with some samples having no detectable levels of the starting
amine.
Figure B1. Representative NMR spectrum of the synthesized N,N-butylphenylacrylamide
monomer: (a) the entire tested range showing peak integration in red and (b) close up of
the characteristic precursor resonance used for monomer purity characterization.
Page 77
65
B2 Miscible Solvent Swelling
Using tetrahydrofuran (THF) and water, representative blends of high and low
swelling solvents were tested for polymer swelling. The mixtures were made by adding
known volumes of THF and water to vials and vigorously mixing the blends before
adding polymer to the mixture.
Figure B2. Swelling of the polymer in THF-water blends after 24-hour submersion.
B3 Swelling Kinetics in o-xylene
The polymer kinetics for swelling were tested on polymer prepared using the 1.25 mol%
PEG 200 cross-linker. Polymer weights were recorded as the swelling occurred by
removing the chip from the solvent bath and weighing it on an analytical balance. The chip
was quickly replaced in the bath and the time resumed to determine the shape of the kinetic
swelling behavior. I chose o-xylene as the solvent for this study due to its low vapor
pressure, which limits artefacts stemming from the solvent evaporation during the frequent
weight measurements.
Page 78
66
Figure B3. Kinetic swelling data of a representative polymer sample in o-xylene.
Standard swelling measurement time noted at 24 hours.
Page 79
67
APPENDIX C
PARTICLE SIZE DISTRIBUTION AND MEASUREMENTS FOR CHAPTER 4
Page 80
68
C1 SAP particle size distribution
Using optical microscopy, I estimated the effective diameter of the SAP particles.
While the particles show non-spherical geometry (typical for ground materials) I used the
cross-sectional area, measured using ImageJ, to estimate the effective diameter for the
equivalent area sphere. These diameters were then averaged by number to provide an
estimate of the average particle size (44 ± 19 μm).
Figure C1. The effective diameters of the super absorbent polymer particles. Inset shows a
representative image taken from the optical microscope.
C2 SAP swelling rates
We tested polymer swelling on the bead of SAP depositing a 2 μL droplet of o-xylene on
a very thinly coated mesh. The results were captured using a Zeiss AxioVision
microscope as a time lapse.
Page 81
69
Figure C2. Time lapse of powdered polymer swelling in o-xylene dyed with oil red. The
image in t = 0 seconds is split between the pre (left) and post (right) exposure at the same
timepoint for comparative purposes.