52
Mastering Metrics Membership Number: 38460216 1 RESEARCH PORTFOLIO

Mastering Metrics Membership Number: 38460216
1
RESEARCH PORTFOLIO
Mastering Metrics Membership Number: 38460216
2
List of figures ......................................................................................................................................................................................... 3
List of Tables .......................................................................................................................................................................................... 3
1.0 Organization Background................................................................................................................................................................ 4
1.1 Role of Marketing Metrics in Victoria Secrets ................................................................................................................................ 6
1.1.1 Process of making Marketing Decisions in Victoria Secrets (VS) ............................................................................................ 6
1.1.2 How VS process “marketing decisions”? ................................................................................................................................. 6
1.2 Key metrics to measure brand and brand value ............................................................................................................................ 7
1.3 Key metrics that can be used to value brand valuation in VS ........................................................................................................ 8
1.4 The current metrics used at Victoria secrets to brand .................................................................................................................. 9
2.0 Brand value of Victoria’s Secret .................................................................................................................................................... 11
2.1: The elements involved in measuring brand. ............................................................................................................................... 11
2.1.2 Brand elements assisting the decision making at organizations .............................................................................................. 12
2.2 Valuation of Victoria’s Secret Brand. ............................................................................................................................................ 13
2.3 Brand Valuation Dashboard for Victoria’s Secret ......................................................................................................................... 15
3.0 Brand value and future decision making ...................................................................................................................................... 17
3.1. Marketing metrics assisting future decisions .............................................................................................................................. 18
3.1.1 Marketing brand metrics driving future decisions in Victoria secrets.................................................................................. 19
3.2 Primary and secondary research methods that assist to validate overall brand value. ............................................................. 20
3.3. Benefits and Challenges of using a metrics approach to value brand. ....................................................................................... 22
3.3.1 Challenges faced in evaluating the brand valuation metrics ................................................................................................ 23
Bibliography......................................................................................................................................................................................... 24
Appendix- Brand Valuation of Victoria secrets ................................................................................................................................... 26
Mastering Metrics Membership Number: 38460216
3
List of figures Figure 1 Victoria Secrets-L brands ........................................................................................................................................... 5
Figure 2 market share-L brands ............................................................................................................................................... 5
Figure 3 C.E.Os. Top concern ................................................................................................................................................... 6
Figure 4 7ps ........................................................................................................................................................................... 7
Figure 5 Royalty relief model ................................................................................................................................................. 11
Figure 6 Expected revenue-Victoria’s Secret .......................................................................................................................... 13
Figure 7 Average operating profit % of Victoria’s Secret ......................................................................................................... 14
Figure 8 operating profit & excess earnings ........................................................................................................................... 14
Figure 9 Brand Dashboard Victoria’s Secret ........................................................................................................................... 16
List of Tables Table 1 Metrics used for decision making at Victoria secrets .................................................................................................... 7
Table 2 Metrics that can be used to measure the brand value of the Retailer ............................................................................ 8
Table 3 marketing metrics are used in Victoria secrets ............................................................................................................. 9
Table 4 summary of Brand valuation models.......................................................................................................................... 11
Table 5 Brand elements & decision making ............................................................................................................................ 12
Table 6 Royalty rate Victoria’s Secret ..................................................................................................................................... 14
Table 7 Brand Beta analysis & Brand rating ............................................................................................................................ 15
Table 8 Dashboard brand metrics .......................................................................................................................................... 16
Table 9 brand value and brand elements driving future decisions ........................................................................................... 18
Table 10 Metrics & proactive decision making ....................................................................................................................... 19
Table 11 Research methods and data sources ........................................................................................................................ 21
Mastering Metrics Membership Number: 38460216
4
Task 1
Word count: 2329 Words
Page Count: 6 pages
Mastering Metrics Membership Number: 38460216
5
1.0 Organization Background
Overview
Victoria’s Secret, including Victoria’s Secret Pink, is the leading specialty retailer of women’s intimate and other apparel with fashion-inspired collections, prestige fragrances and cosmetics, celebrated supermodels and world famous runway shows.
Victoria Secrets (VS) is one of the biggest brands in the lingerie industry in the U.S. Market. Victoria's Secret Stores, LLC retails apparel, lingerie, and personal care products for women.
Victoria secrets is one of the Strategic business units of the Limited brands accounting to almost 50%
of sales, which currently owns and operate six other companies in the fast fashion industry.
Type Of organization publicly quoted Company in the New York Stock Exchange (Parent Company: Limited Brand)
Share price: Lb (NYSE) $96.91 (6th November 2015)
The Business model
VS’s operations are seasonal in nature and consist of two principal selling seasons: Spring
(the first and second quarters) and fall (the third and fourth quarters).
VS adopts a Fast fashion Business model with limited turnaround times. The sourcing
Partner being MAST global allows Victoria secrets to Shelf intimate apparel within 2-4 weeks of designing.
Geographic reach & Distribution Network
VS sells its merchandise through company-owned specialty retail stores in the United States, Canada and the United Kingdom,
which are primarily mall-based VS stores, and through websites, catalogue and international franchise, license and wholesale
partners.
On the Shelves
Victoria’s Secret market products to the college-age woman with Pink and then transition her into glamorous and sexy product
lines, such as Angels, Very Sexy and Body by Victoria. While bras and panties are the core, these brands also give our customers
choices in clothing, accessories, fragrances, personal care, swimwear and athletic attire.
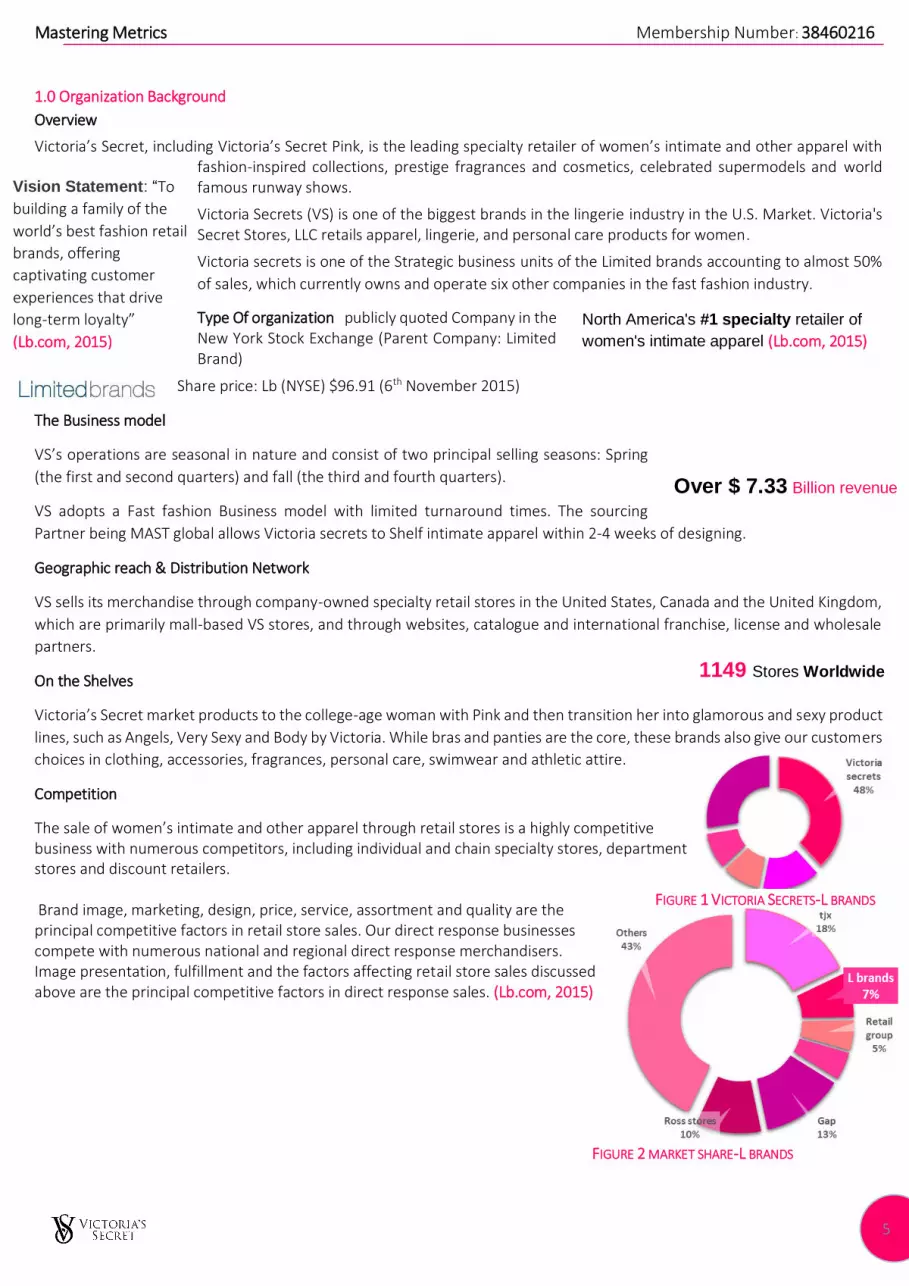
Competition
The sale of women’s intimate and other apparel through retail stores is a highly competitive business with numerous competitors, including individual and chain specialty stores, department stores and discount retailers. Brand image, marketing, design, price, service, assortment and quality are the principal competitive factors in retail store sales. Our direct response businesses compete with numerous national and regional direct response merchandisers. Image presentation, fulfillment and the factors affecting retail store sales discussed above are the principal competitive factors in direct response sales. (Lb.com, 2015)
North America's #1 specialty retailer of
women's intimate apparel (Lb.com, 2015)
Vision Statement: “To
building a family of the
world’s best fashion retail
brands, offering
captivating customer
experiences that drive
long-term loyalty”
(Lb.com, 2015)
Over $ 7.33 Billion revenue
in 2015
1149 Stores Worldwide
FIGURE 1 VICTORIA SECRETS-L BRANDS
FIGURE 2 MARKET SHARE-L BRANDS
Mastering Metrics Membership Number: 38460216
6
Marketing used to be about Creatives, but it’s not where we are anymore, METRICS is the new world… (Importance of
Marketing Metrics, INSEAD Executive education)
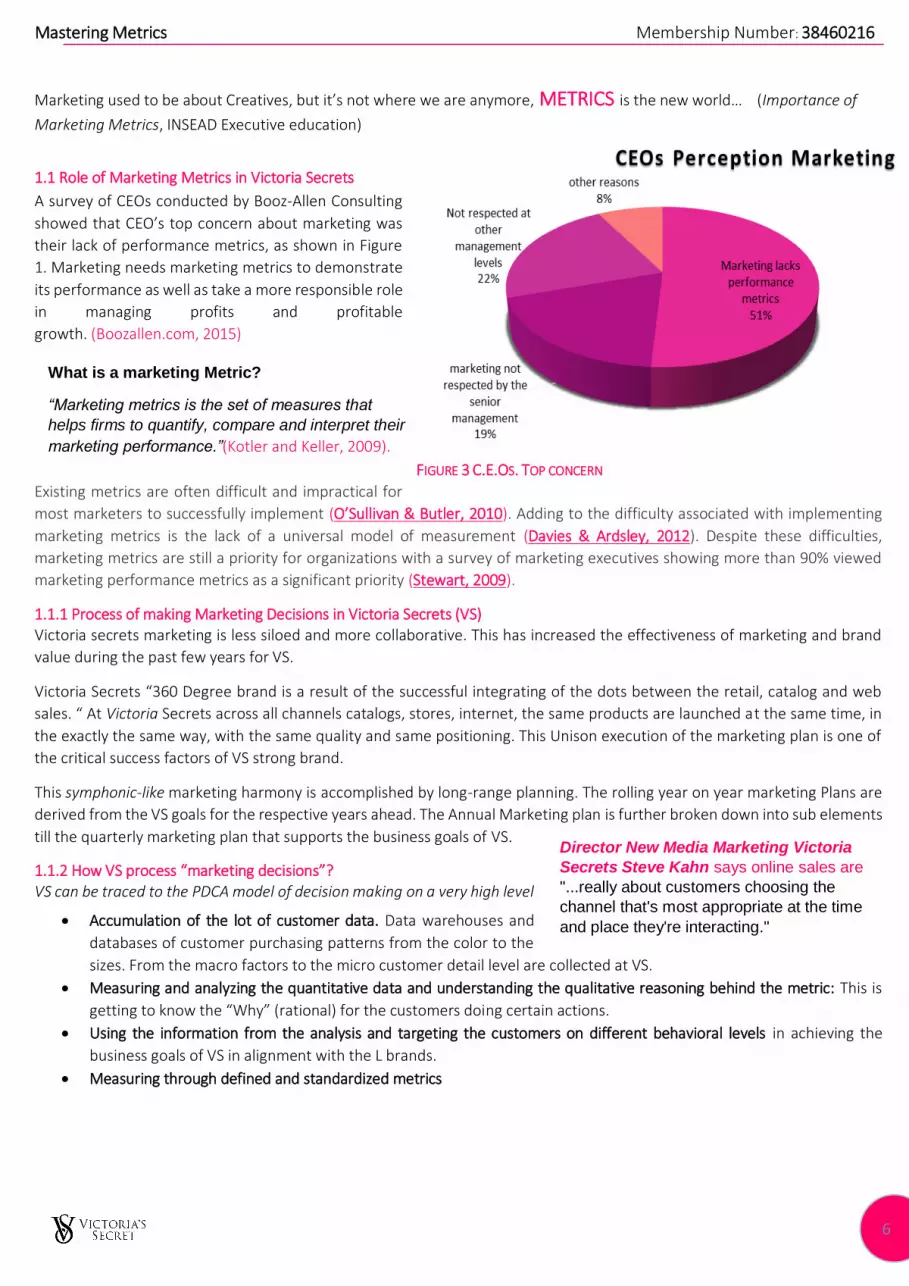
1.1 Role of Marketing Metrics in Victoria Secrets
A survey of CEOs conducted by Booz‐Allen Consulting
showed that CEO’s top concern about marketing was
their lack of performance metrics, as shown in Figure
1. Marketing needs marketing metrics to demonstrate
its performance as well as take a more responsible role
in managing profits and profitable
growth. (Boozallen.com, 2015)
Existing metrics are often difficult and impractical for
most marketers to successfully implement (O’Sullivan & Butler, 2010). Adding to the difficulty associated with implementing
marketing metrics is the lack of a universal model of measurement (Davies & Ardsley, 2012). Despite these difficulties,
marketing metrics are still a priority for organizations with a survey of marketing executives showing more than 90% viewed
marketing performance metrics as a significant priority (Stewart, 2009).
1.1.1 Process of making Marketing Decisions in Victoria Secrets (VS) Victoria secrets marketing is less siloed and more collaborative. This has increased the effectiveness of marketing and brand
value during the past few years for VS.
Victoria Secrets “360 Degree brand is a result of the successful integrating of the dots between the retail, catalog and web
sales. “ At Victoria Secrets across all channels catalogs, stores, internet, the same products are launched at the same time, in
the exactly the same way, with the same quality and same positioning. This Unison execution of the marketing plan is one of
the critical success factors of VS strong brand.
This symphonic-like marketing harmony is accomplished by long-range planning. The rolling year on year marketing Plans are
derived from the VS goals for the respective years ahead. The Annual Marketing plan is further broken down into sub elements
till the quarterly marketing plan that supports the business goals of VS.
1.1.2 How VS process “marketing decisions”? VS can be traced to the PDCA model of decision making on a very high level
Accumulation of the lot of customer data. Data warehouses and
databases of customer purchasing patterns from the color to the
sizes. From the macro factors to the micro customer detail level are collected at VS.
Measuring and analyzing the quantitative data and understanding the qualitative reasoning behind the metric: This is
getting to know the “Why” (rational) for the customers doing certain actions.
Using the information from the analysis and targeting the customers on different behavioral levels in achieving the
business goals of VS in alignment with the L brands.
Measuring through defined and standardized metrics
What is a marketing Metric?
“Marketing metrics is the set of measures that
helps firms to quantify, compare and interpret their
marketing performance.”(Kotler and Keller, 2009).
2009).
Director New Media Marketing Victoria
Secrets Steve Kahn says online sales are
"...really about customers choosing the
channel that's most appropriate at the time
and place they're interacting."
FIGURE 3 C.E.OS. TOP CONCERN
Mastering Metrics Membership Number: 38460216
7
1.2 Key metrics to measure brand and brand value
The decision making at VS is heavily data driven through rich data from social marketing
platform
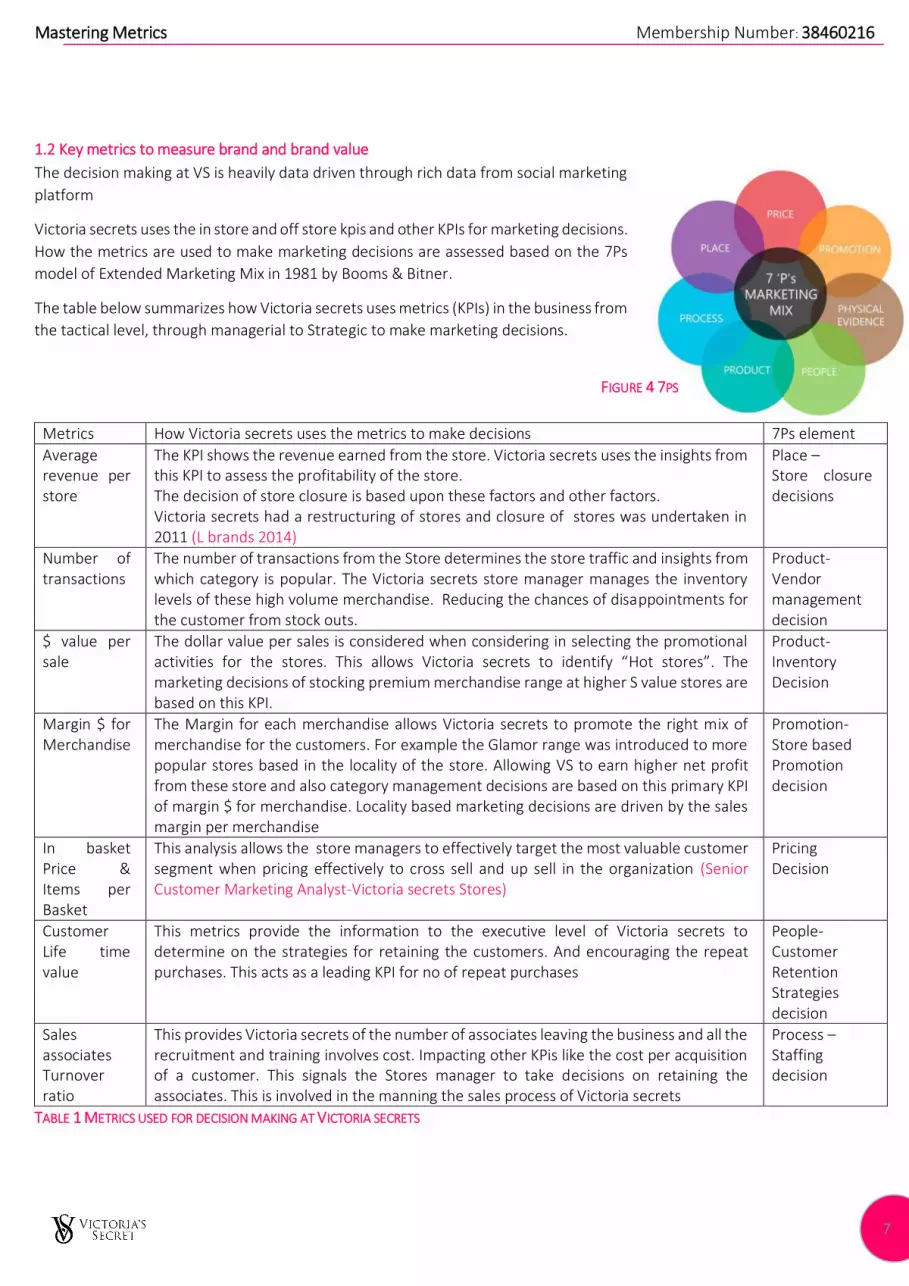
Victoria secrets uses the in store and off store kpis and other KPIs for marketing decisions.
How the metrics are used to make marketing decisions are assessed based on the 7Ps
model of Extended Marketing Mix in 1981 by Booms & Bitner.
The table below summarizes how Victoria secrets uses metrics (KPIs) in the business from
the tactical level, through managerial to Strategic to make marketing decisions.
Metrics How Victoria secrets uses the metrics to make decisions 7Ps element
Average revenue per store
The KPI shows the revenue earned from the store. Victoria secrets uses the insights from this KPI to assess the profitability of the store. The decision of store closure is based upon these factors and other factors. Victoria secrets had a restructuring of stores and closure of stores was undertaken in 2011 (L brands 2014)
Place – Store closure decisions
Number of transactions
The number of transactions from the Store determines the store traffic and insights from which category is popular. The Victoria secrets store manager manages the inventory levels of these high volume merchandise. Reducing the chances of disappointments for the customer from stock outs.
Product- Vendor management decision
$ value per sale
The dollar value per sales is considered when considering in selecting the promotional activities for the stores. This allows Victoria secrets to identify “Hot stores”. The marketing decisions of stocking premium merchandise range at higher S value stores are based on this KPI.
Product-Inventory Decision
Margin $ for Merchandise
The Margin for each merchandise allows Victoria secrets to promote the right mix of merchandise for the customers. For example the Glamor range was introduced to more popular stores based in the locality of the store. Allowing VS to earn higher net profit from these store and also category management decisions are based on this primary KPI of margin $ for merchandise. Locality based marketing decisions are driven by the sales margin per merchandise
Promotion- Store based Promotion decision
In basket Price & Items per Basket
This analysis allows the store managers to effectively target the most valuable customer segment when pricing effectively to cross sell and up sell in the organization (Senior Customer Marketing Analyst-Victoria secrets Stores)
Pricing Decision
Customer Life time value
This metrics provide the information to the executive level of Victoria secrets to determine on the strategies for retaining the customers. And encouraging the repeat purchases. This acts as a leading KPI for no of repeat purchases
People- Customer Retention Strategies decision
Sales associates Turnover ratio
This provides Victoria secrets of the number of associates leaving the business and all the recruitment and training involves cost. Impacting other KPis like the cost per acquisition of a customer. This signals the Stores manager to take decisions on retaining the associates. This is involved in the manning the sales process of Victoria secrets
Process – Staffing decision
TABLE 1 METRICS USED FOR DECISION MAKING AT VICTORIA SECRETS
FIGURE 4 7PS
Mastering Metrics Membership Number: 38460216
8
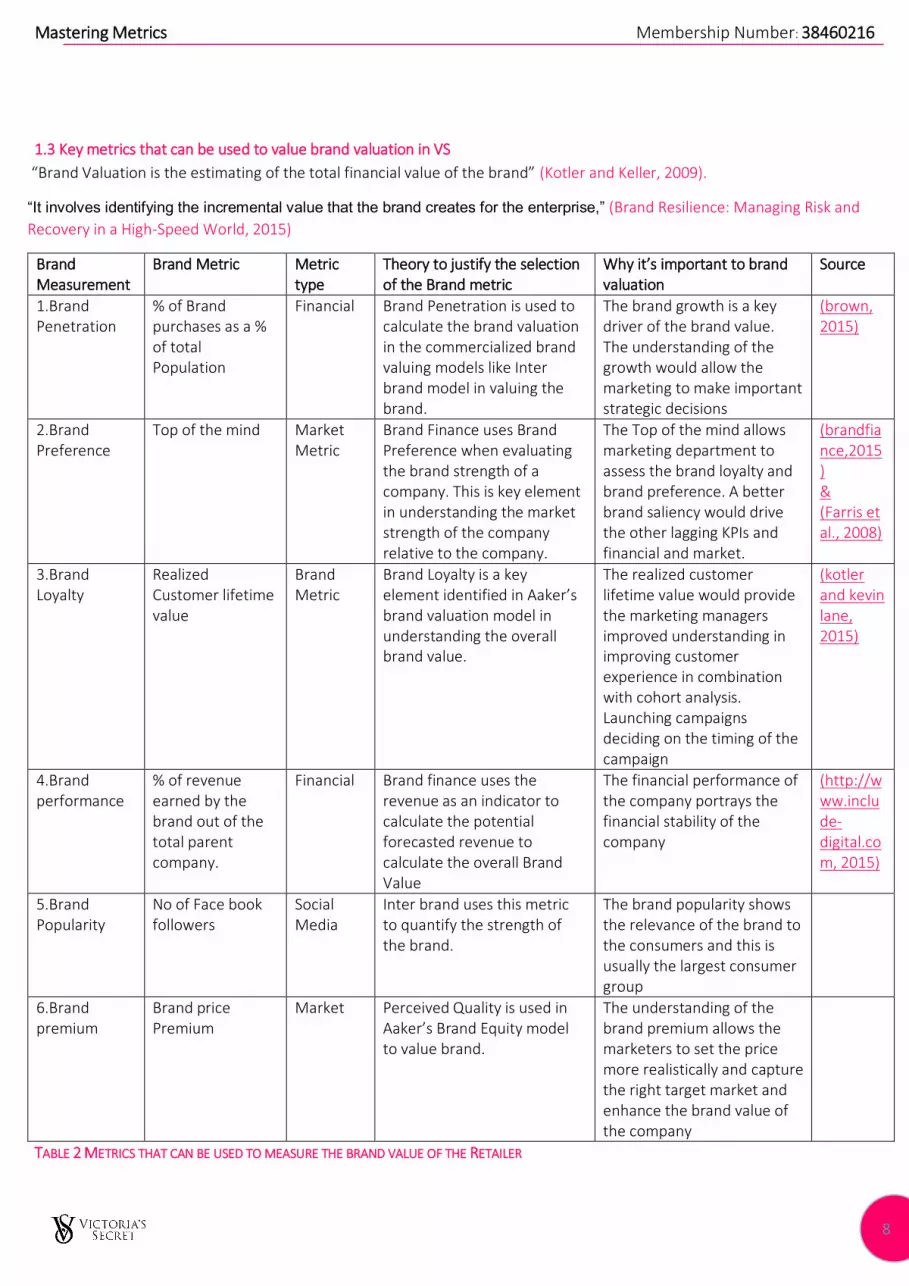
1.3 Key metrics that can be used to value brand valuation in VS
“Brand Valuation is the estimating of the total financial value of the brand” (Kotler and Keller, 2009).
“It involves identifying the incremental value that the brand creates for the enterprise,” (Brand Resilience: Managing Risk and
Recovery in a High-Speed World, 2015)
Brand Measurement
Brand Metric Metric type
Theory to justify the selection of the Brand metric
Why it’s important to brand valuation
Source
1.Brand Penetration
% of Brand purchases as a % of total Population
Financial Brand Penetration is used to calculate the brand valuation in the commercialized brand valuing models like Inter brand model in valuing the brand.
The brand growth is a key driver of the brand value. The understanding of the growth would allow the marketing to make important strategic decisions
(brown, 2015)
2.Brand Preference
Top of the mind Market Metric
Brand Finance uses Brand Preference when evaluating the brand strength of a company. This is key element in understanding the market strength of the company relative to the company.
The Top of the mind allows marketing department to assess the brand loyalty and brand preference. A better brand saliency would drive the other lagging KPIs and financial and market.
(brandfiance,2015) & (Farris et al., 2008)
3.Brand Loyalty
Realized Customer lifetime value
Brand Metric
Brand Loyalty is a key element identified in Aaker’s brand valuation model in understanding the overall brand value.
The realized customer lifetime value would provide the marketing managers improved understanding in improving customer experience in combination with cohort analysis. Launching campaigns deciding on the timing of the campaign
(kotler and kevin lane, 2015)
4.Brand performance
% of revenue earned by the brand out of the total parent company.
Financial Brand finance uses the revenue as an indicator to calculate the potential forecasted revenue to calculate the overall Brand Value
The financial performance of the company portrays the financial stability of the company
(http://www.include-digital.com, 2015)
5.Brand Popularity
No of Face book followers
Social Media
Inter brand uses this metric to quantify the strength of the brand.
The brand popularity shows the relevance of the brand to the consumers and this is usually the largest consumer group
6.Brand premium
Brand price Premium
Market Perceived Quality is used in Aaker’s Brand Equity model to value brand.
The understanding of the brand premium allows the marketers to set the price more realistically and capture the right target market and enhance the brand value of the company
TABLE 2 METRICS THAT CAN BE USED TO MEASURE THE BRAND VALUE OF THE RETAILER
Mastering Metrics Membership Number: 38460216
9
1.4 The current metrics used at Victoria secrets to brand
“Your brand is the single most important investment you
can make in your business”-Steve Forbes
Victoria secrets is a heavily data driven company
outsourcing the services from Alliance data. The
customized services provided have allowed Victoria
secrets to soar ahead of competition in terms of social
media.
Victoria's Secret use Gigya's products to harvest, manage and store social and identity data, and employ the information for
email programs and online ad targeting. Victoria’s Secret doesn’t extensively monitor the brand value, although interbred
and brand finance have ranked them in the annual brand valuation of companies. The valuation of trademarks and
intangibles are the indicators for the brand value in the company usually included in the published financial statements.
Victoria’s secret measures the brand value elements isolated for marketing decisions which affect the brand value of the
company.
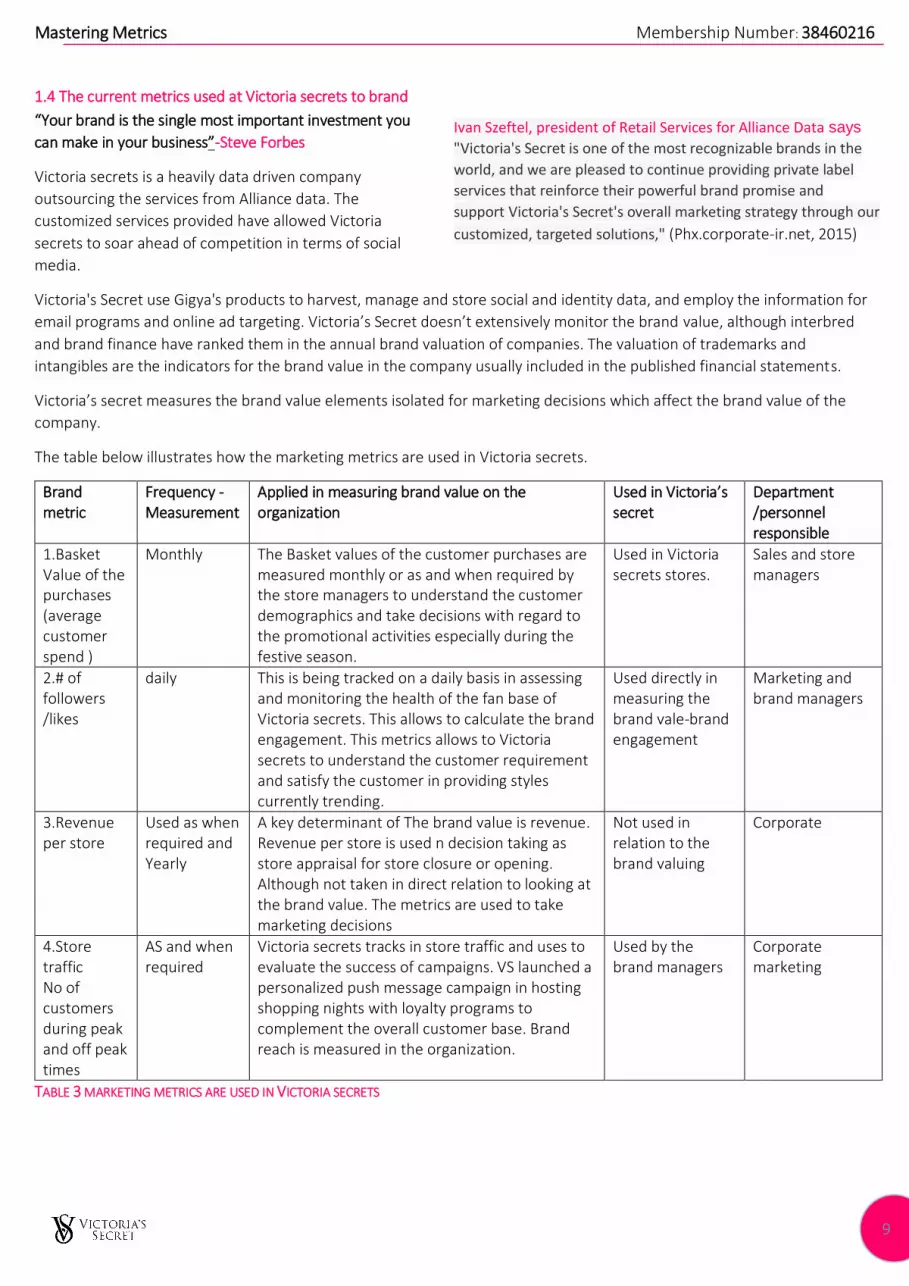
The table below illustrates how the marketing metrics are used in Victoria secrets.
Brand metric
Frequency -Measurement
Applied in measuring brand value on the organization
Used in Victoria’s secret
Department /personnel responsible
1.Basket Value of the purchases (average customer spend )
Monthly The Basket values of the customer purchases are measured monthly or as and when required by the store managers to understand the customer demographics and take decisions with regard to the promotional activities especially during the festive season.
Used in Victoria secrets stores.
Sales and store managers
2.# of followers /likes
daily This is being tracked on a daily basis in assessing and monitoring the health of the fan base of Victoria secrets. This allows to calculate the brand engagement. This metrics allows to Victoria secrets to understand the customer requirement and satisfy the customer in providing styles currently trending.
Used directly in measuring the brand vale-brand engagement
Marketing and brand managers
3.Revenue per store
Used as when required and Yearly
A key determinant of The brand value is revenue. Revenue per store is used n decision taking as store appraisal for store closure or opening. Although not taken in direct relation to looking at the brand value. The metrics are used to take marketing decisions
Not used in relation to the brand valuing
Corporate
4.Store traffic No of customers during peak and off peak times
AS and when required
Victoria secrets tracks in store traffic and uses to evaluate the success of campaigns. VS launched a personalized push message campaign in hosting shopping nights with loyalty programs to complement the overall customer base. Brand reach is measured in the organization.
Used by the brand managers
Corporate marketing
TABLE 3 MARKETING METRICS ARE USED IN VICTORIA SECRETS
Ivan Szeftel, president of Retail Services for Alliance Data says
"Victoria's Secret is one of the most recognizable brands in the
world, and we are pleased to continue providing private label
services that reinforce their powerful brand promise and
support Victoria's Secret's overall marketing strategy through our
customized, targeted solutions," (Phx.corporate-ir.net, 2015)

Mastering Metrics Membership Number: 38460216
10
If Love is Blind, Why is there so much demand for
Lingerie?
Task 2
Word count: 2743 Words
Page Count: 6 pages
Mastering Metrics Membership Number: 38460216
11
2.0 Brand value of Victoria’s Secret
2.1: The elements involved in measuring brand.
Brand valuation definition
“Brand value is the amount that the customer would be willing to pay for merchandise
that carries the brand‘s name over and above the price. “.(Farris, 2010)
“Trademarks and associated IP including the word mark and trademark iconography”
(Brand Finance, 2015).
The academic and commercialized models for brand valuation have been analyzed and evaluated. The table below on brand
valuation shows the brand models that are available to value brand. The classification have been made on the basis of
information or elements used to value the brand.
“Value of a Brand” valuation methods The Models that can be used Theory/Practicality Source
1.Economic income approach In this approach the brand is valued using one or more valuation methods using discounting models to arrive at the present value of the expected future benefits
Inter brand model Practical model (brand finance)(include-digital.com, 2015)
Royalty relief model (Brand finance model)
Practical model (Inter brand, 2015)
2.Market comparable approach The brand is valued based on the customer knowledge, how has the brand referring to have differentiated the consumer’s choice due to the marketing of the brand.
Brand asset valuator (young and Rubicon)
Theoretical (Farris, 2010)
Aaker’s Brand equity model
Theoretical (Kotler and Kevin lane, 2015)
3.Cost approach This approach uses the sum of individual costs or values of the brand assets and liabilities.
Asset based accounting models to value the brand.
Theoretical
TABLE 4 SUMMARY OF BRAND VALUATION MODELS
From the above brand valuation approaches and the models. The Economic income approach have been chosen and royalty
relief method of valuation is selected to be explained in detail.
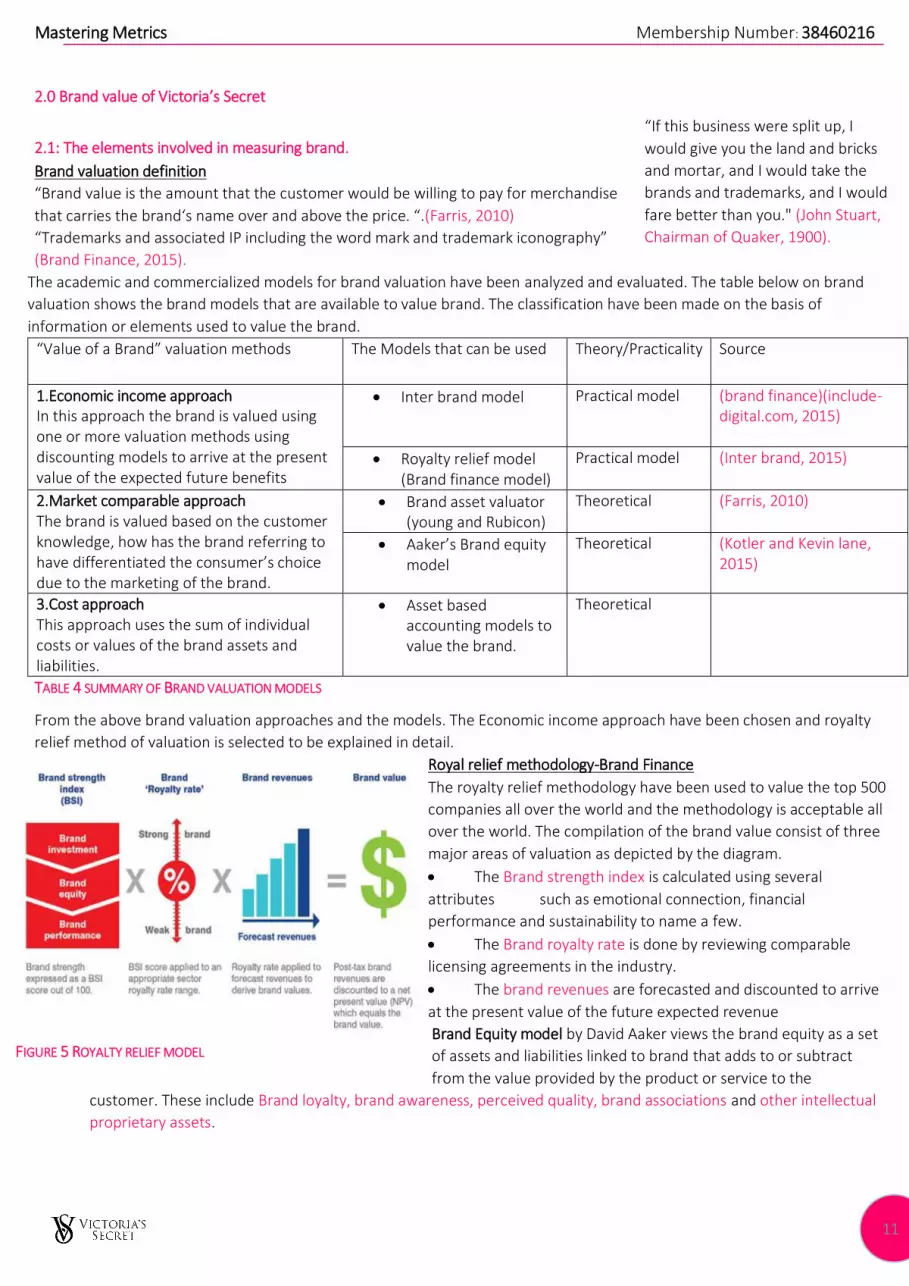
Royal relief methodology-Brand Finance
The royalty relief methodology have been used to value the top 500
companies all over the world and the methodology is acceptable all
over the world. The compilation of the brand value consist of three
major areas of valuation as depicted by the diagram.
The Brand strength index is calculated using several
attributes such as emotional connection, financial
performance and sustainability to name a few.
The Brand royalty rate is done by reviewing comparable
licensing agreements in the industry.
The brand revenues are forecasted and discounted to arrive
at the present value of the future expected revenue
Brand Equity model by David Aaker views the brand equity as a set
of assets and liabilities linked to brand that adds to or subtract
from the value provided by the product or service to the
customer. These include Brand loyalty, brand awareness, perceived quality, brand associations and other intellectual
proprietary assets.
“If this business were split up, I
would give you the land and bricks
and mortar, and I would take the
brands and trademarks, and I would
fare better than you." (John Stuart,
Chairman of Quaker, 1900).
FIGURE 5 ROYALTY RELIEF MODEL
Mastering Metrics Membership Number: 38460216
12
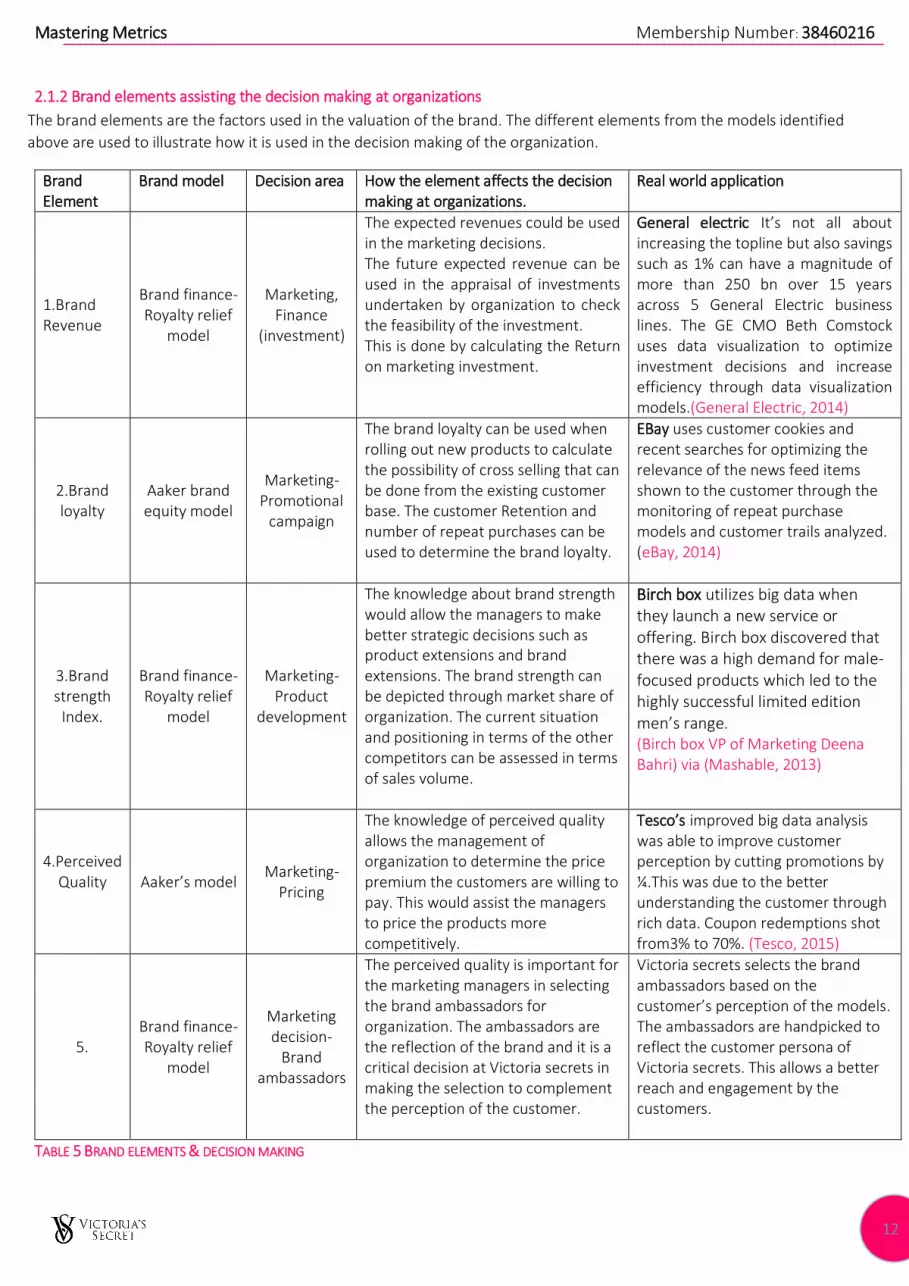
2.1.2 Brand elements assisting the decision making at organizations
The brand elements are the factors used in the valuation of the brand. The different elements from the models identified
above are used to illustrate how it is used in the decision making of the organization.
TABLE 5 BRAND ELEMENTS & DECISION MAKING
Brand Element
Brand model Decision area How the element affects the decision making at organizations.
Real world application
1.Brand Revenue
Brand finance-Royalty relief
model
Marketing, Finance
(investment)
The expected revenues could be used in the marketing decisions. The future expected revenue can be used in the appraisal of investments undertaken by organization to check the feasibility of the investment. This is done by calculating the Return on marketing investment.
General electric It’s not all about increasing the topline but also savings such as 1% can have a magnitude of more than 250 bn over 15 years across 5 General Electric business lines. The GE CMO Beth Comstock uses data visualization to optimize investment decisions and increase efficiency through data visualization models.(General Electric, 2014)
2.Brand loyalty
Aaker brand equity model
Marketing- Promotional
campaign
The brand loyalty can be used when rolling out new products to calculate the possibility of cross selling that can be done from the existing customer base. The customer Retention and number of repeat purchases can be used to determine the brand loyalty.
EBay uses customer cookies and recent searches for optimizing the relevance of the news feed items shown to the customer through the monitoring of repeat purchase models and customer trails analyzed. (eBay, 2014)
3.Brand strength
Index.
Brand finance-Royalty relief
model
Marketing- Product
development
The knowledge about brand strength would allow the managers to make better strategic decisions such as product extensions and brand extensions. The brand strength can be depicted through market share of organization. The current situation and positioning in terms of the other competitors can be assessed in terms of sales volume.
Birch box utilizes big data when they launch a new service or offering. Birch box discovered that there was a high demand for male-focused products which led to the highly successful limited edition men’s range. (Birch box VP of Marketing Deena Bahri) via (Mashable, 2013)
4.Perceived Quality
Aaker’s model
Marketing-Pricing
The knowledge of perceived quality allows the management of organization to determine the price premium the customers are willing to pay. This would assist the managers to price the products more competitively.
Tesco’s improved big data analysis was able to improve customer perception by cutting promotions by ¼.This was due to the better understanding the customer through rich data. Coupon redemptions shot from3% to 70%. (Tesco, 2015)
5. Brand finance-Royalty relief
model
Marketing decision-
Brand ambassadors
The perceived quality is important for the marketing managers in selecting the brand ambassadors for organization. The ambassadors are the reflection of the brand and it is a critical decision at Victoria secrets in making the selection to complement the perception of the customer.
Victoria secrets selects the brand ambassadors based on the customer’s perception of the models. The ambassadors are handpicked to reflect the customer persona of Victoria secrets. This allows a better reach and engagement by the customers.
Mastering Metrics Membership Number: 38460216
13
2.2 Valuation of Victoria’s Secret Brand.
Royalty Relief Method is used to value Victoria’s Secret.
Royalty relief is based on the notion that a brand holding company owns the brand and licenses it to an operating company. The
notional price paid by the operating company to the brand company is expressed as the notional rate. The net present value of
all future expected earnings is the value of the brand to the Victoria’s secret
Brand finance uses the Royalty relief model to calculate the brand value of over 500 companies worldwide. This is a highly
accepted and commercialized method to valuing brand.
This method is favored by tax authorities and the courts as it calculates brand values by reference to documented,
third party transactions.
It can be done based on publicly available financial information.
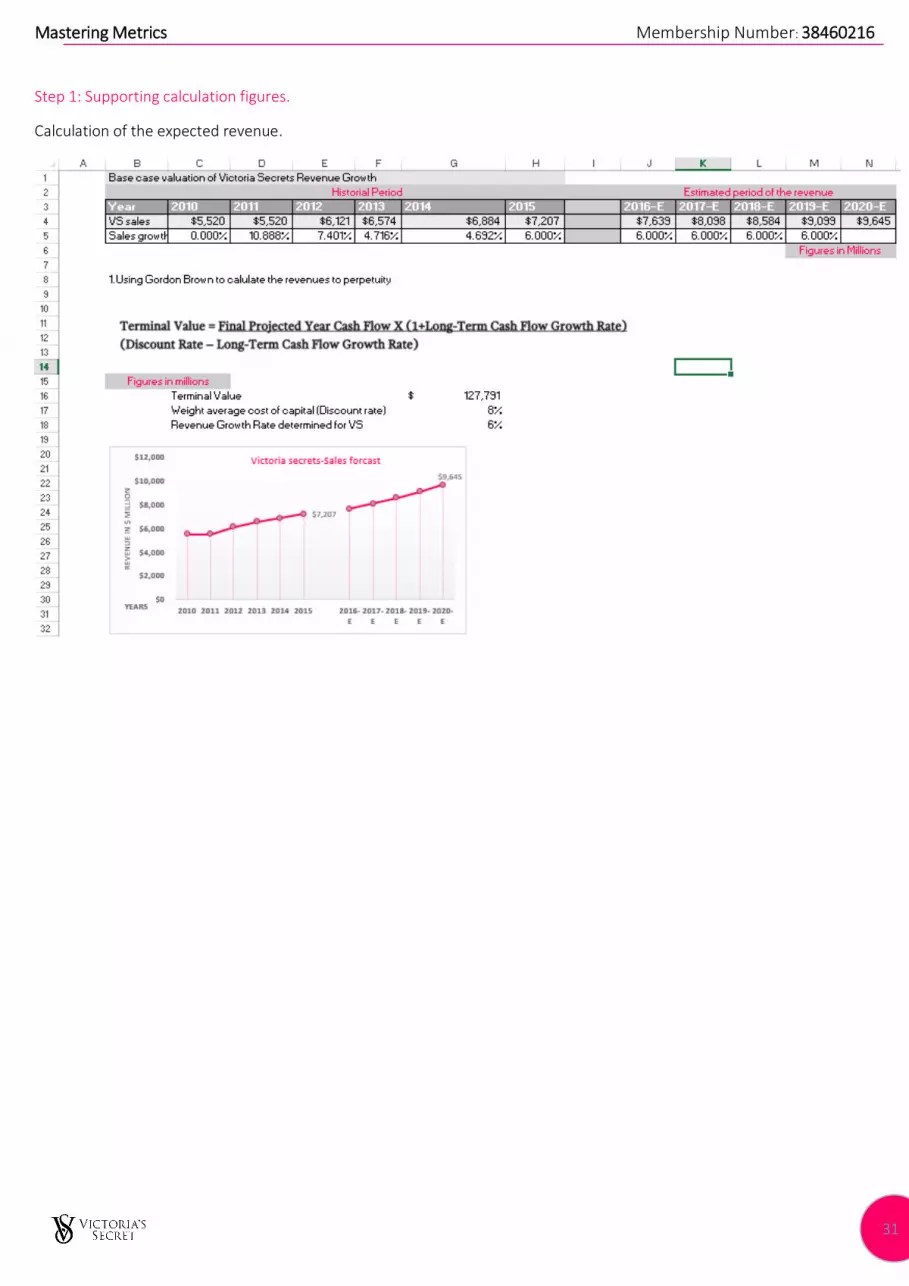
The forecasted revenue for Victoria secrets is based on the past trends (historic analysis) analysis done on the revenue figures
using the published annual reports from 2008-2015. The revenue is expected to grow by around 6% after the analysis. (Refer
annexure).
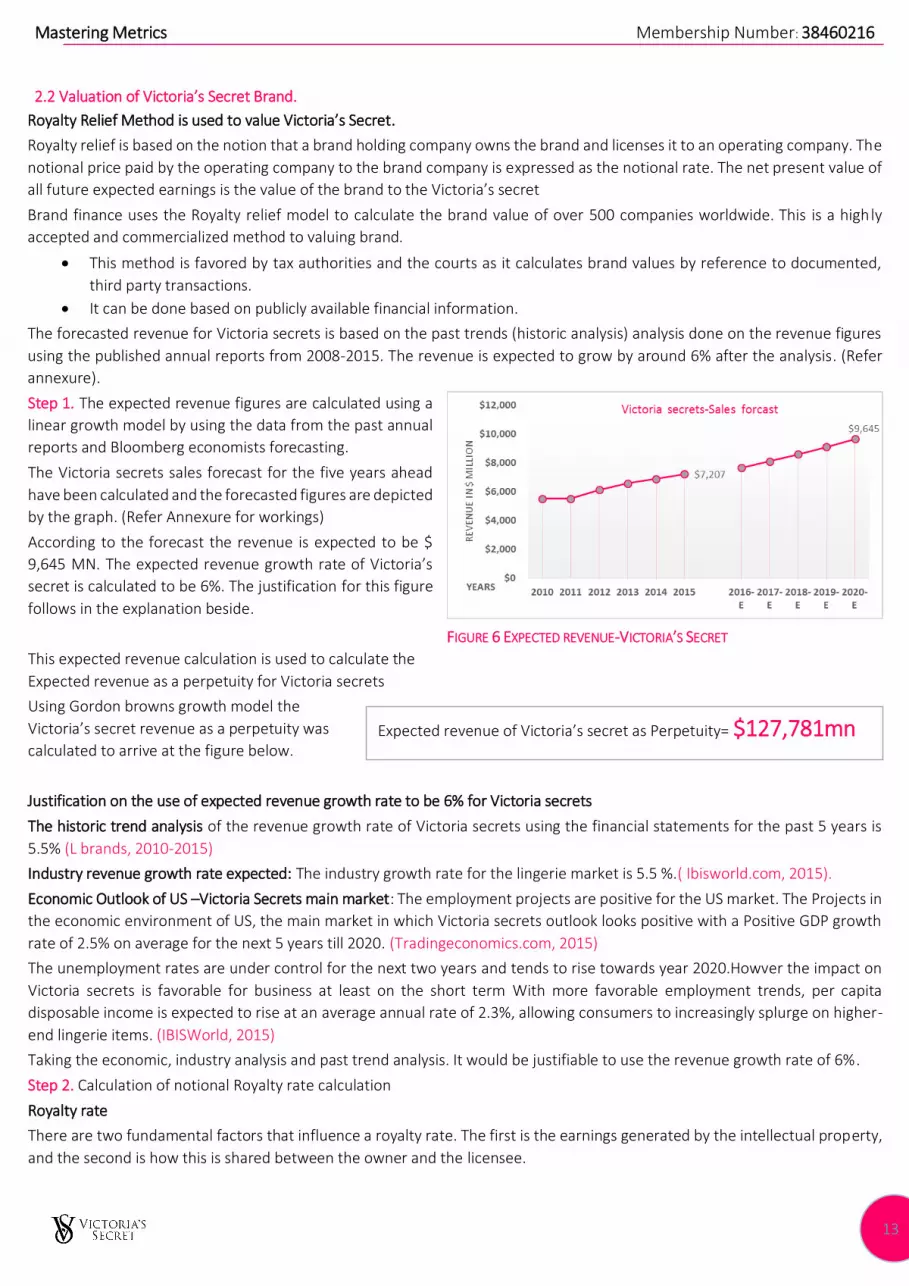
Step 1. The expected revenue figures are calculated using a
linear growth model by using the data from the past annual
reports and Bloomberg economists forecasting.
The Victoria secrets sales forecast for the five years ahead
have been calculated and the forecasted figures are depicted
by the graph. (Refer Annexure for workings)
According to the forecast the revenue is expected to be $
9,645 MN. The expected revenue growth rate of Victoria’s
secret is calculated to be 6%. The justification for this figure
follows in the explanation beside.
This expected revenue calculation is used to calculate the
Expected revenue as a perpetuity for Victoria secrets
Using Gordon browns growth model the
Victoria’s secret revenue as a perpetuity was
calculated to arrive at the figure below.
Justification on the use of expected revenue growth rate to be 6% for Victoria secrets
The historic trend analysis of the revenue growth rate of Victoria secrets using the financial statements for the past 5 years is
5.5% (L brands, 2010-2015)
Industry revenue growth rate expected: The industry growth rate for the lingerie market is 5.5 %.( Ibisworld.com, 2015).
Economic Outlook of US –Victoria Secrets main market: The employment projects are positive for the US market. The Projects in
the economic environment of US, the main market in which Victoria secrets outlook looks positive with a Positive GDP growth
rate of 2.5% on average for the next 5 years till 2020. (Tradingeconomics.com, 2015)
The unemployment rates are under control for the next two years and tends to rise towards year 2020.Howver the impact on
Victoria secrets is favorable for business at least on the short term With more favorable employment trends, per capita
disposable income is expected to rise at an average annual rate of 2.3%, allowing consumers to increasingly splurge on higher-
end lingerie items. (IBISWorld, 2015)
Taking the economic, industry analysis and past trend analysis. It would be justifiable to use the revenue growth rate of 6%.
Step 2. Calculation of notional Royalty rate calculation
Royalty rate
There are two fundamental factors that influence a royalty rate. The first is the earnings generated by the intellectual property,
and the second is how this is shared between the owner and the licensee.
Expected revenue of Victoria’s secret as Perpetuity= $127,781mn
Figure 2.2.1: Expected revenue-Victoria’s Secret FIGURE 6 EXPECTED REVENUE-VICTORIA’S SECRET
Mastering Metrics Membership Number: 38460216
14
Royalty determination is often complicated by uncertainty regarding the extent of the economic contribution of the IP. This is
accentuated by the fact that IP is typically bundled with complimentary assets in order to generate earnings. Dissecting the
earnings of a business between the contributing assets is a complicated and often imprecise task.
Hence in the valuation model used does not consider the economic contribution of the intellectual property.
In calculating the Notional royalty rate. The following methods are used for further assurance and cross checking of the royalty
rate being used as recommended by Brand Finance.
The Income approach to royalty valuation
25% rule
Apparel Industry Royalty rate.
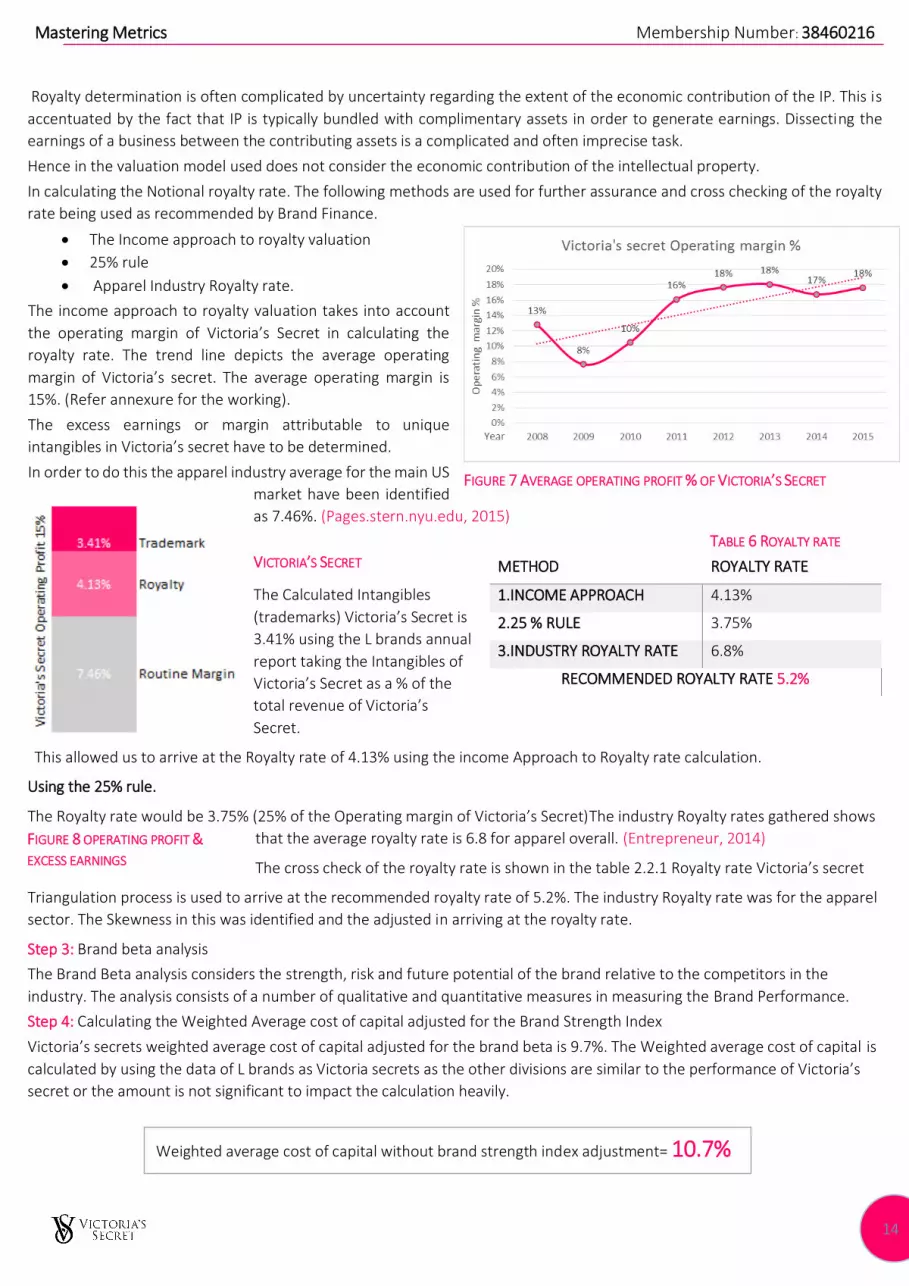
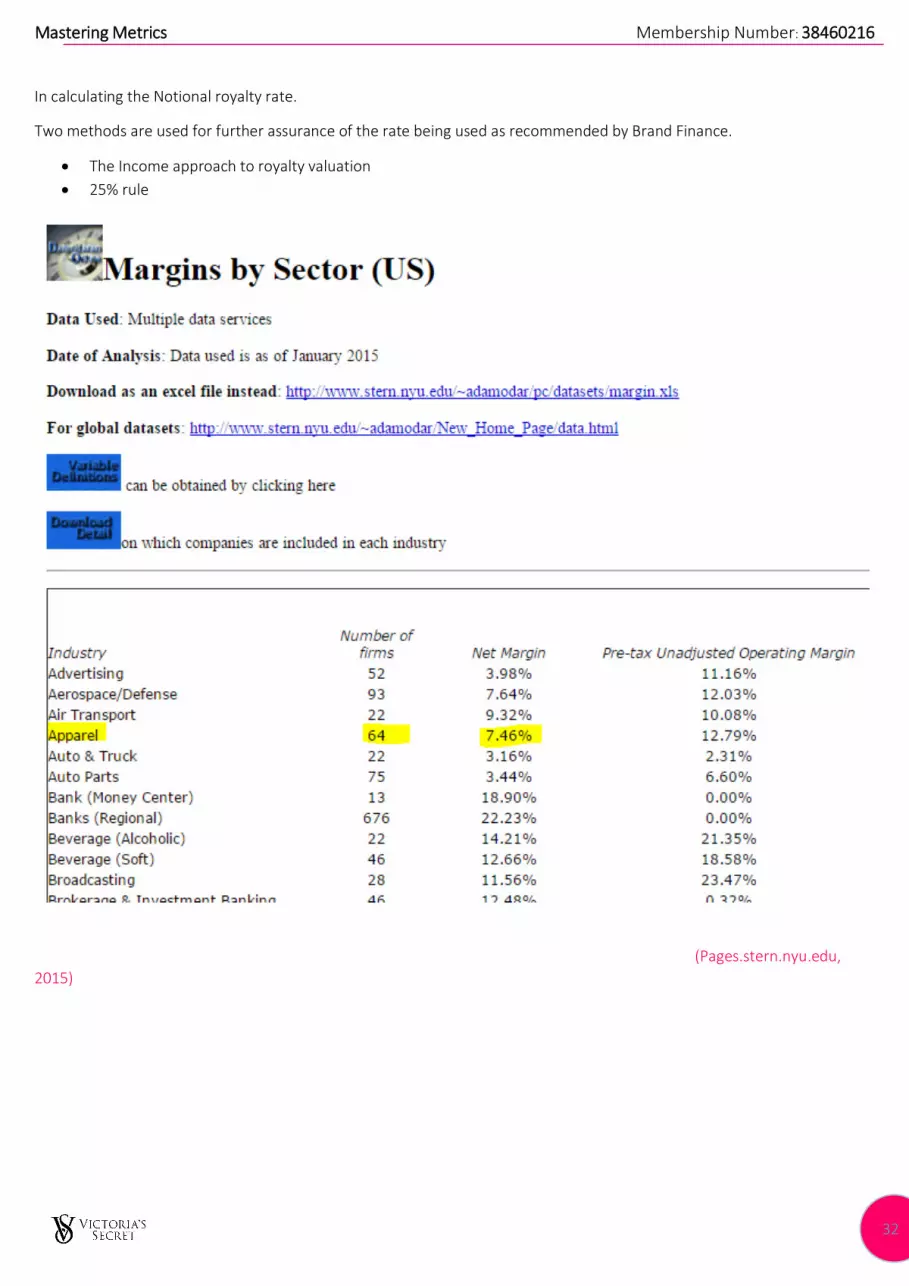
The income approach to royalty valuation takes into account
the operating margin of Victoria’s Secret in calculating the
royalty rate. The trend line depicts the average operating
margin of Victoria’s secret. The average operating margin is
15%. (Refer annexure for the working).
The excess earnings or margin attributable to unique
intangibles in Victoria’s secret have to be determined.
In order to do this the apparel industry average for the main US
market have been identified
as 7.46%. (Pages.stern.nyu.edu, 2015)
TABLE 6 ROYALTY RATE
VICTORIA’S SECRET
The Calculated Intangibles
(trademarks) Victoria’s Secret is
3.41% using the L brands annual
report taking the Intangibles of
Victoria’s Secret as a % of the
total revenue of Victoria’s
Secret.
This allowed us to arrive at the Royalty rate of 4.13% using the income Approach to Royalty rate calculation.
Using the 25% rule.
The Royalty rate would be 3.75% (25% of the Operating margin of Victoria’s Secret)The industry Royalty rates gathered shows
that the average royalty rate is 6.8 for apparel overall. (Entrepreneur, 2014)
The cross check of the royalty rate is shown in the table 2.2.1 Royalty rate Victoria’s secret
Triangulation process is used to arrive at the recommended royalty rate of 5.2%. The industry Royalty rate was for the apparel
sector. The Skewness in this was identified and the adjusted in arriving at the royalty rate.
Step 3: Brand beta analysis
The Brand Beta analysis considers the strength, risk and future potential of the brand relative to the competitors in the
industry. The analysis consists of a number of qualitative and quantitative measures in measuring the Brand Performance.
Step 4: Calculating the Weighted Average cost of capital adjusted for the Brand Strength Index
Victoria’s secrets weighted average cost of capital adjusted for the brand beta is 9.7%. The Weighted average cost of capital is
calculated by using the data of L brands as Victoria secrets as the other divisions are similar to the performance of Victoria’s
secret or the amount is not significant to impact the calculation heavily.
METHOD ROYALTY RATE
1.INCOME APPROACH 4.13%
2.25 % RULE 3.75%
3.INDUSTRY ROYALTY RATE 6.8%
RECOMMENDED ROYALTY RATE 5.2%
Weighted average cost of capital without brand strength index adjustment= 10.7%
FIGURE 7 AVERAGE OPERATING PROFIT % OF VICTORIA’S SECRET
FIGURE 8 OPERATING PROFIT &
EXCESS EARNINGS
Mastering Metrics Membership Number: 38460216
15
Step 5: Brand notional future royalty income stream for Victoria’s secret.
The Notional brand value for Victoria’s Secret is provides the value that the brand would be worth without any adjusted for
the time value of money.
Step 6: Discount Future royalty income
The brand value is calculated by discounting the notional brand value by the discounting rate determined for Victoria’s
secret. This is done to take account of the time value of money and state the brand vale in the present value terms.
Refer the appendix for the calculation of the brand value.
Brand value of the Victoria secrets derived through this calculation is approximately close to the published value by Brand
finance.
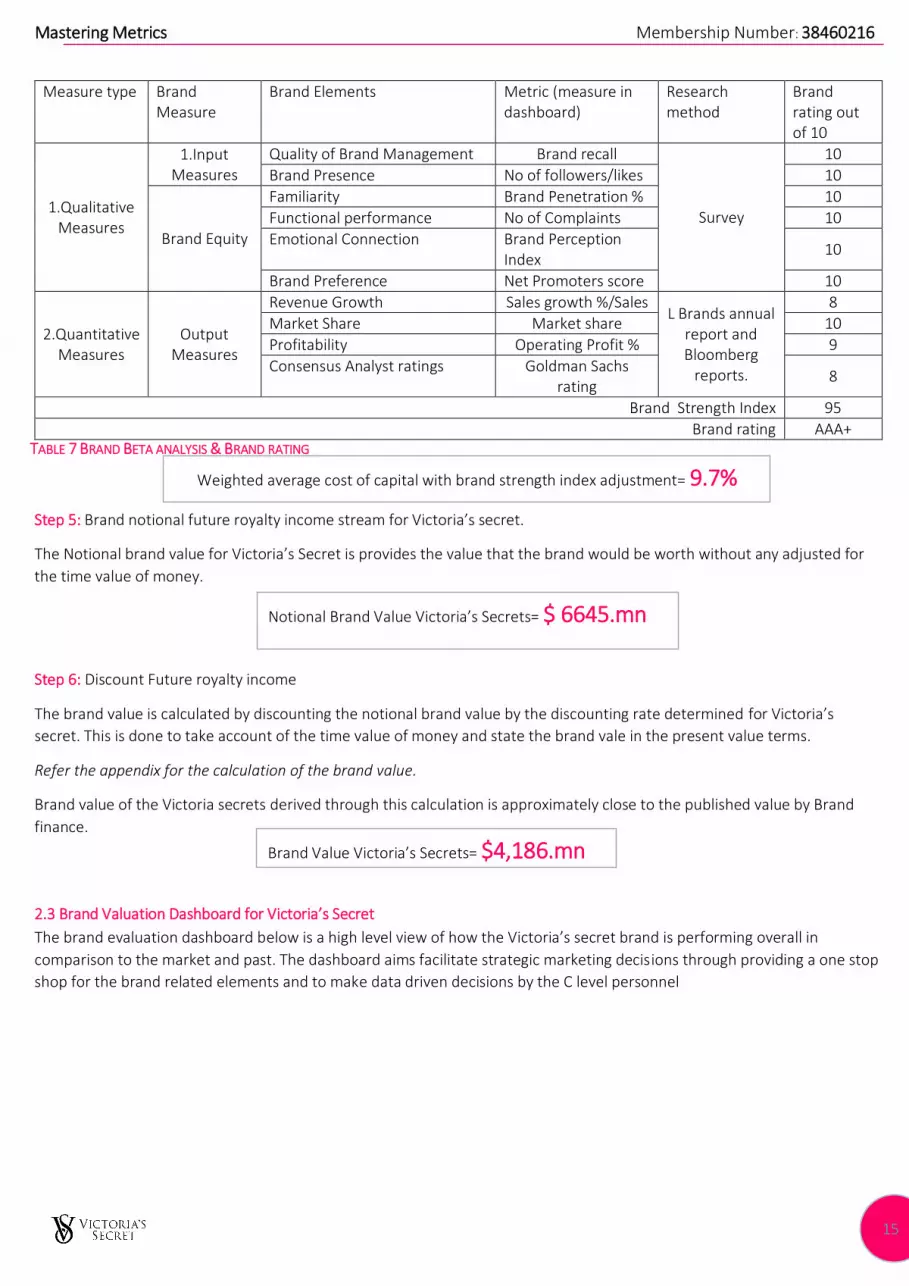
2.3 Brand Valuation Dashboard for Victoria’s Secret
The brand evaluation dashboard below is a high level view of how the Victoria’s secret brand is performing overall in
comparison to the market and past. The dashboard aims facilitate strategic marketing decisions through providing a one stop
shop for the brand related elements and to make data driven decisions by the C level personnel
Measure type Brand Measure
Brand Elements Metric (measure in dashboard)
Research method
Brand rating out of 10
1.Qualitative Measures
1.Input Measures
Quality of Brand Management Brand recall
Survey
10
Brand Presence No of followers/likes 10
Brand Equity
Familiarity Brand Penetration % 10
Functional performance No of Complaints 10
Emotional Connection Brand Perception Index
10
Brand Preference Net Promoters score 10
2.Quantitative Measures
Output Measures
Revenue Growth Sales growth %/Sales L Brands annual
report and Bloomberg
reports.
8
Market Share Market share 10
Profitability Operating Profit % 9
Consensus Analyst ratings Goldman Sachs rating
8
Brand Strength Index 95
Brand rating AAA+ TABLE 7 BRAND BETA ANALYSIS & BRAND RATING
Notional Brand Value Victoria’s Secrets= $ 6645.mn
=
Brand Value Victoria’s Secrets= $4,186.mn
Weighted average cost of capital with brand strength index adjustment= 9.7%
Mastering Metrics Membership Number: 38460216
16
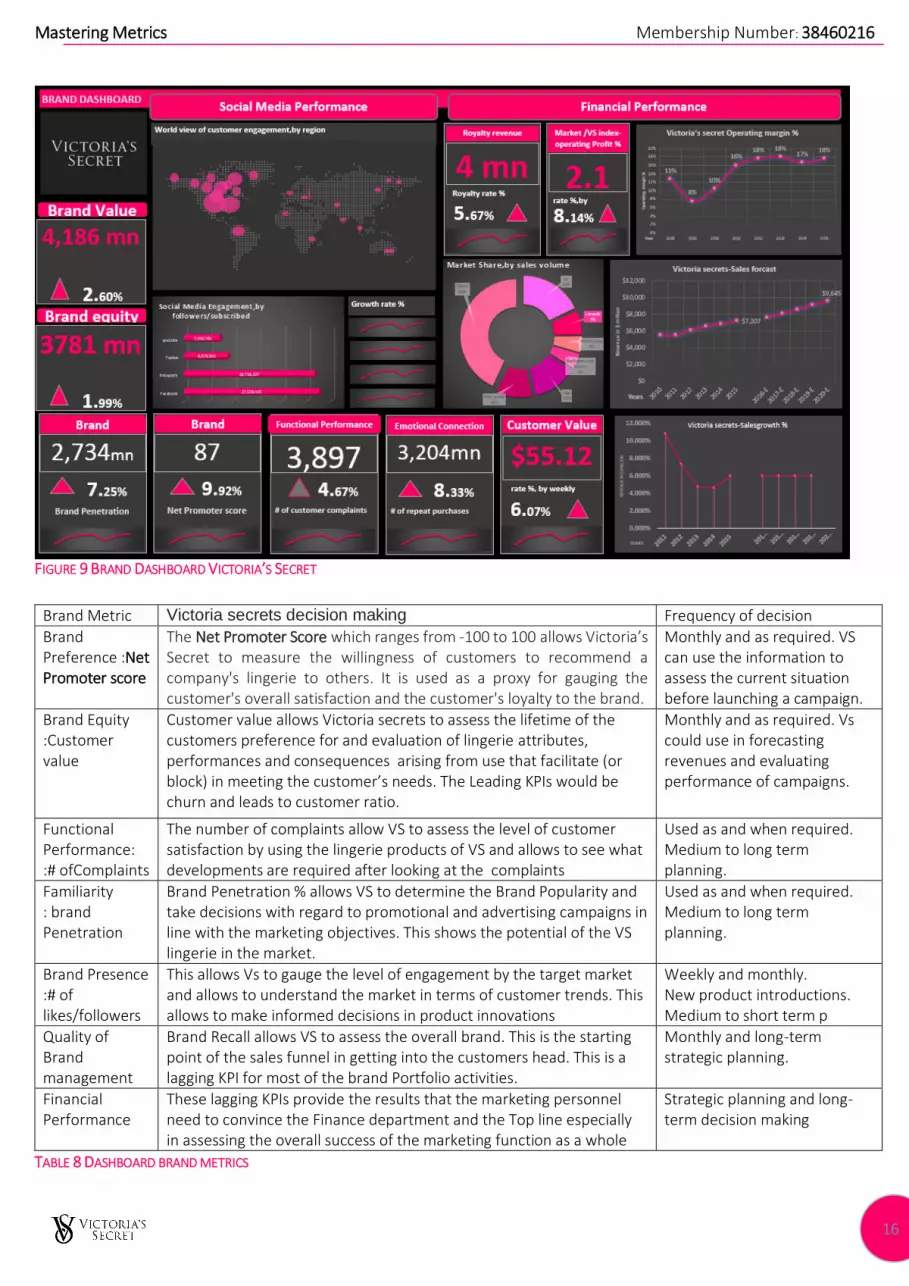
FIGURE 9 BRAND DASHBOARD VICTORIA’S SECRET
TABLE 8 DASHBOARD BRAND METRICS
Brand Metric Victoria secrets decision making Frequency of decision
Brand Preference :Net Promoter score
The Net Promoter Score which ranges from -100 to 100 allows Victoria’s Secret to measure the willingness of customers to recommend a company's lingerie to others. It is used as a proxy for gauging the customer's overall satisfaction and the customer's loyalty to the brand.
Monthly and as required. VS can use the information to assess the current situation before launching a campaign.
Brand Equity :Customer value
Customer value allows Victoria secrets to assess the lifetime of the customers preference for and evaluation of lingerie attributes, performances and consequences arising from use that facilitate (or block) in meeting the customer’s needs. The Leading KPIs would be churn and leads to customer ratio.
Monthly and as required. Vs could use in forecasting revenues and evaluating performance of campaigns.
Functional Performance: :# ofComplaints
The number of complaints allow VS to assess the level of customer satisfaction by using the lingerie products of VS and allows to see what developments are required after looking at the complaints
Used as and when required. Medium to long term planning.
Familiarity : brand Penetration
Brand Penetration % allows VS to determine the Brand Popularity and take decisions with regard to promotional and advertising campaigns in line with the marketing objectives. This shows the potential of the VS lingerie in the market.
Used as and when required. Medium to long term planning.
Brand Presence :# of likes/followers
This allows Vs to gauge the level of engagement by the target market and allows to understand the market in terms of customer trends. This allows to make informed decisions in product innovations
Weekly and monthly. New product introductions. Medium to short term p
Quality of Brand management
Brand Recall allows VS to assess the overall brand. This is the starting point of the sales funnel in getting into the customers head. This is a lagging KPI for most of the brand Portfolio activities.
Monthly and long-term strategic planning.
Financial Performance
These lagging KPIs provide the results that the marketing personnel need to convince the Finance department and the Top line especially in assessing the overall success of the marketing function as a whole
Strategic planning and long-term decision making
Mastering Metrics Membership Number: 38460216
17
Task 3
Word Count: 2576 Words
Page Count : 6 Pages
Very Very Sexy…..

Mastering Metrics Membership Number: 38460216
18
3.0 Brand value and future decision making
3.1. Marketing metrics assisting future decisions
Victoria’s secrets at the moment measures the brand value elements in isolation. A complete dashboard providing data at
one stop shop would allow the marketing to be more focused on the Omni integrated marketing platform that Victoria’s
secret is operating.
The evaluation process of brand valuation helping the future decision making.
1. Facilitates integrated SMART decision making for the future.
The strategic objectives can be set up using better and more integrated and comprehensive information to formulate and
establish SMART goals for the future. Performance evaluations of the brand can be done more precisely with the ability to
trace the result of marketing campaigns. Which at the moment for Victoria secrets is challenging.
2. Overall Pulse check of brand performance and
3. Facilitate a proactive approach to decision making with early identification of trends driving the marketing strategy more
purposefully,
4. Marketing mix improvements can be optimized with the improved knowledge of the Brand Value.
Better understanding of how the brand elements contribute to the whole of the brand value could allow the marketing teams
to see where Victoria’s’ secret is performing well and where more attention is needed to develop the brand. The monitoring
facilitates the improvement of a balanced marketing plan development.
The impact of measuring and evaluating the brand valuation metrics of Victoria’s secret marketing is being summarized in the
table below in applying the 7ps framework in use along with the level of decision making
The table below illustrates how the knowledge about the brand value and brand elements drives future decisions in Victoria’s
secret.
Level of decision making
Marketing area concerned
Brand element
How it helps in future making marketing decisions for Victoria secrets
Strategic level
1.Product- New lingerie range development
Brand attributes/Perceived value
The better understanding of the brand provides the designers to develop products to reflect the perception of the customers of the brand. This would improve the customer satisfaction by providing lingerie to match the needs of the customer in line with the Victoria’s secrets brand perception in the future.
Strategic level
2.Promotion- Digital marketing strategy
Brand awareness
The Promotional campaign reach could be optimized and targeted to market segments specifically to increase the conversion rates for the business. For example location based marketing for the customers can be sent push messages timely when there near a VS store and drive traffic to the Store.
Strategic level
3. Changing slogans Brand perception
The brand perception would be valuable when making high level decisions. Victoria secrets named the slogan “perfect body” which was heavily criticized in the media for discrimination of certain customer segments. The slogan was changed to “Body for everybody”. If the knowledge of the brand perception was readily available Victoria secrets would have the media criticisms (Prakash)
Strategic level
4.Partnering with Brand ambassadors
Brand Image.
Knowledge about the brand value elements would provide valuable insights when selecting brand ambassadors to keep in line with the brand perception and ultimately brand value.
TABLE 9 BRAND VALUE AND BRAND ELEMENTS DRIVING FUTURE DECISIONS
Mastering Metrics Membership Number: 38460216
19
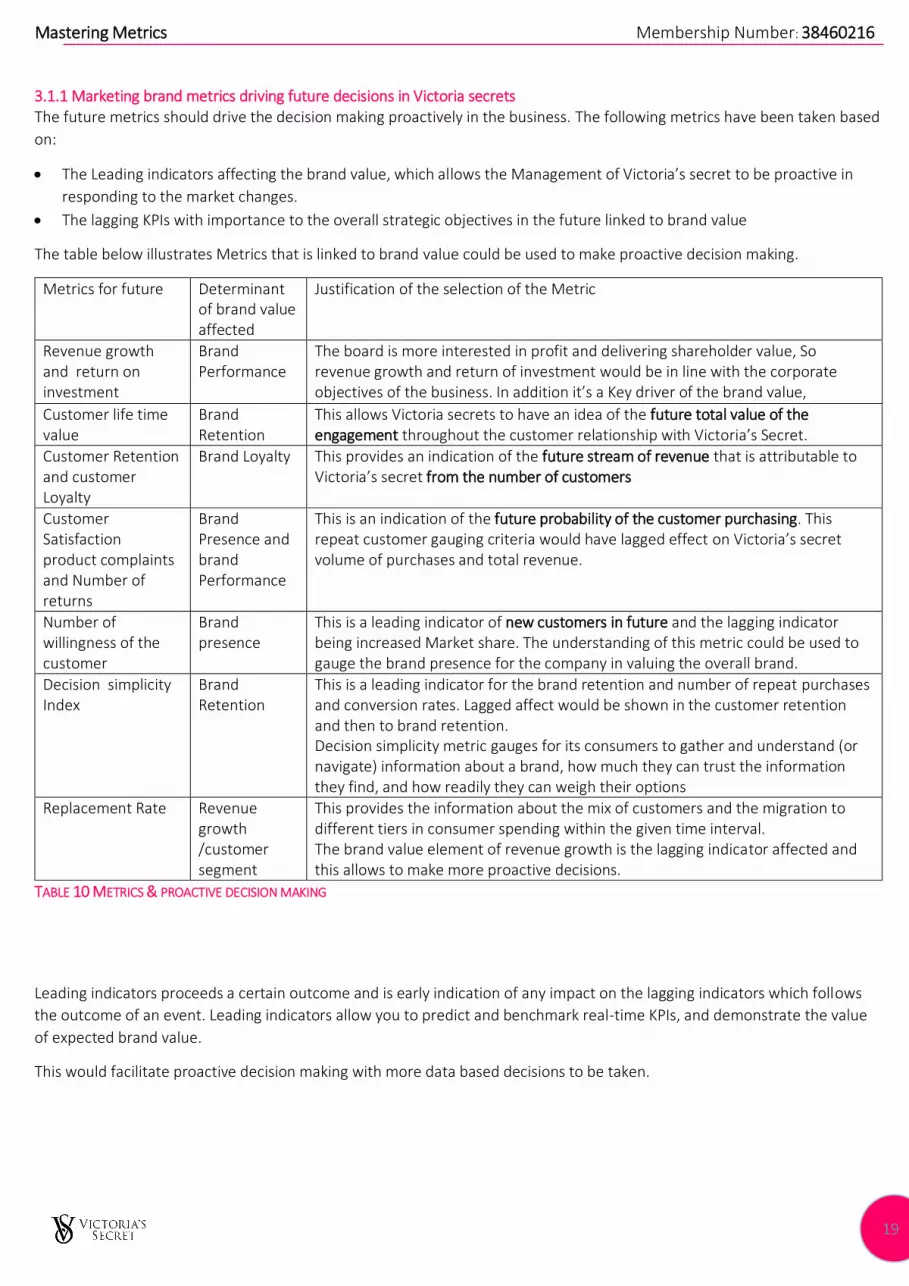
3.1.1 Marketing brand metrics driving future decisions in Victoria secrets The future metrics should drive the decision making proactively in the business. The following metrics have been taken based
on:
The Leading indicators affecting the brand value, which allows the Management of Victoria’s secret to be proactive in
responding to the market changes.
The lagging KPIs with importance to the overall strategic objectives in the future linked to brand value
The table below illustrates Metrics that is linked to brand value could be used to make proactive decision making.
Metrics for future Determinant of brand value affected
Justification of the selection of the Metric
Revenue growth and return on investment
Brand Performance
The board is more interested in profit and delivering shareholder value, So revenue growth and return of investment would be in line with the corporate objectives of the business. In addition it’s a Key driver of the brand value,
Customer life time value
Brand Retention
This allows Victoria secrets to have an idea of the future total value of the engagement throughout the customer relationship with Victoria’s Secret.
Customer Retention and customer Loyalty
Brand Loyalty This provides an indication of the future stream of revenue that is attributable to Victoria’s secret from the number of customers
Customer Satisfaction product complaints and Number of returns
Brand Presence and brand Performance
This is an indication of the future probability of the customer purchasing. This repeat customer gauging criteria would have lagged effect on Victoria’s secret volume of purchases and total revenue.
Number of willingness of the customer
Brand presence
This is a leading indicator of new customers in future and the lagging indicator being increased Market share. The understanding of this metric could be used to gauge the brand presence for the company in valuing the overall brand.
Decision simplicity Index
Brand Retention
This is a leading indicator for the brand retention and number of repeat purchases and conversion rates. Lagged affect would be shown in the customer retention and then to brand retention. Decision simplicity metric gauges for its consumers to gather and understand (or navigate) information about a brand, how much they can trust the information they find, and how readily they can weigh their options
Replacement Rate Revenue growth /customer segment
This provides the information about the mix of customers and the migration to different tiers in consumer spending within the given time interval. The brand value element of revenue growth is the lagging indicator affected and this allows to make more proactive decisions.
TABLE 10 METRICS & PROACTIVE DECISION MAKING
Leading indicators proceeds a certain outcome and is early indication of any impact on the lagging indicators which follows
the outcome of an event. Leading indicators allow you to predict and benchmark real-time KPIs, and demonstrate the value
of expected brand value.
This would facilitate proactive decision making with more data based decisions to be taken.
Mastering Metrics Membership Number: 38460216
20
3.2 Primary and secondary research methods that assist to validate overall brand value.
“Marketing research is the systematic design, collection, analysis and reporting of data and findings relevant to a specific
marketing situation facing the company.” (Keller, Aperia and Georgson)
Primary research is first hand data gathering techniques collected by market research firms through surveys, interviews and
other research methods.
Secondary research also known as desk research is the collection of data which have been already collected this could be
annual reports of companies, census data, government bodies surveys , articles ,journals and many more secondary research.
These methods provide data, but principally there is issues in the traditional data collection methods of questionnaires,
interviews or even observations.
The resources invested vs the timeliness to make decision and the quality of the data. Whether the data is bias when
collected through by these means have to be evaluated.
Identifying the problems to be
Timeliness of the data gathered
Quality of the data
Sample used in the data is small to correlate trends.
The quality, size of the sample and increased timeliness of data is the requirement
Social listening is technology based data gathering system through listening to conversations throughout the world. This is
efficient and the data sources are all around the world.
Companies like Radian 6, Spiral heat collects data by listening to conversation themes which is used to identify trends
In trying to validate the overall brand value of the company. The individual elements which have to be validated to provide a
confident brand value overall.
It is recommended that unless the data sources are 100% accurate. A triangulation approach to be taken in validating the
overall brand value of the company of the company. This could be done by cross checking the brand element with a number
of metrics to see the consistency of the metrics.
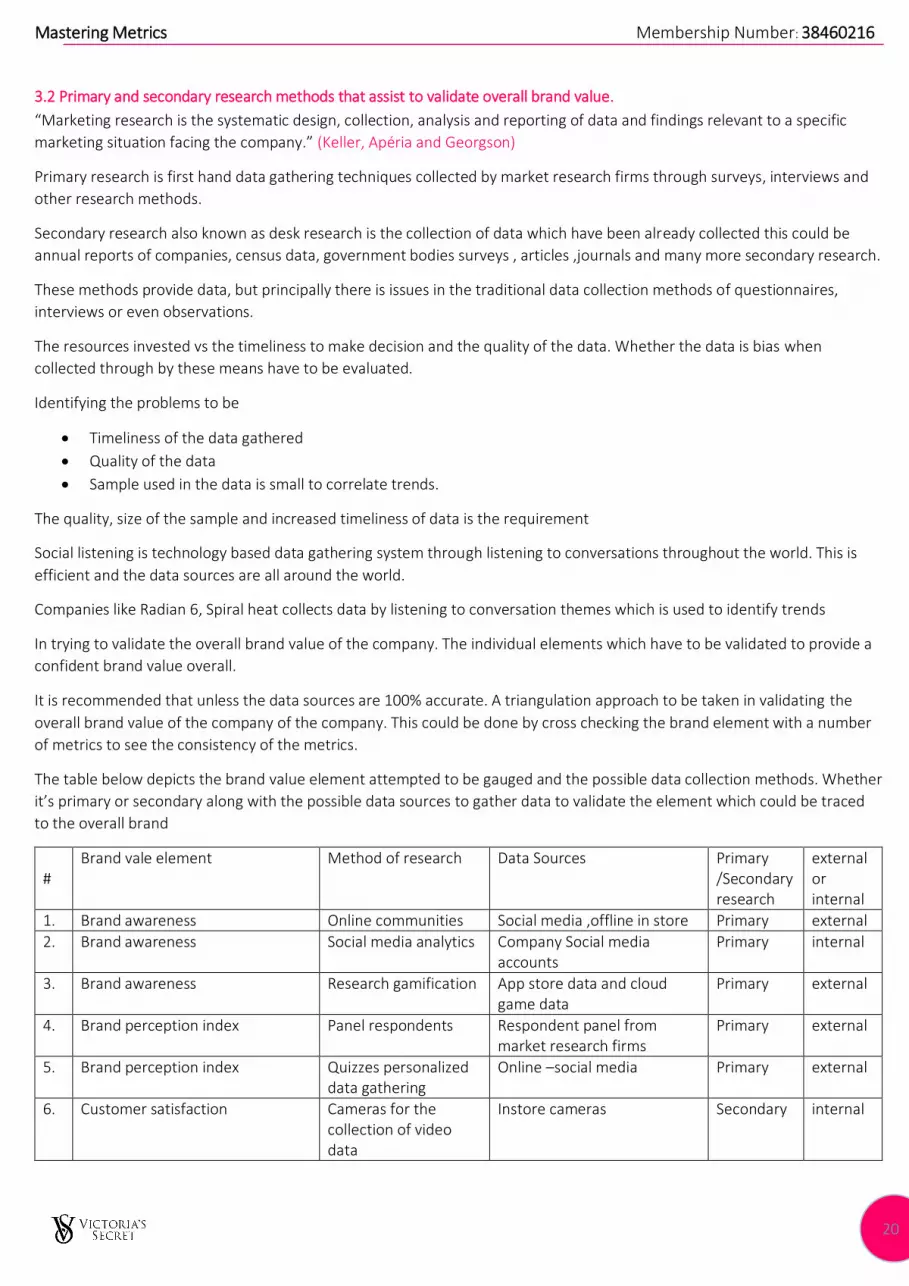
The table below depicts the brand value element attempted to be gauged and the possible data collection methods. Whether
it’s primary or secondary along with the possible data sources to gather data to validate the element which could be traced
to the overall brand
# Brand vale element Method of research Data Sources Primary
/Secondary research
external or internal
1. Brand awareness Online communities Social media ,offline in store Primary external
2. Brand awareness Social media analytics Company Social media accounts
Primary internal
3. Brand awareness Research gamification App store data and cloud game data
Primary external
4. Brand perception index Panel respondents Respondent panel from market research firms
Primary external
5. Brand perception index Quizzes personalized data gathering
Online –social media Primary external
6. Customer satisfaction Cameras for the collection of video data
Instore cameras Secondary internal
Mastering Metrics Membership Number: 38460216
21
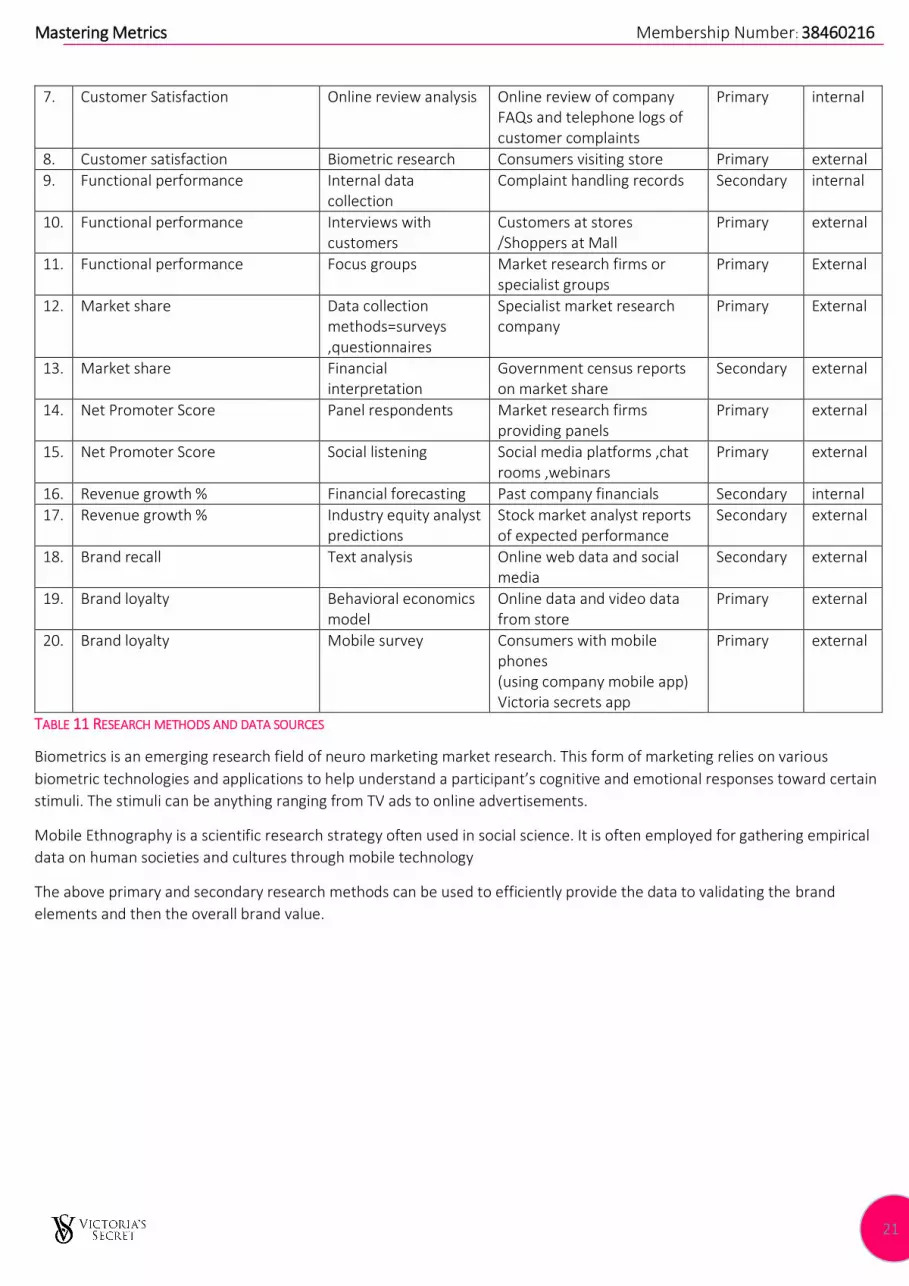
7. Customer Satisfaction Online review analysis Online review of company FAQs and telephone logs of customer complaints
Primary internal
8. Customer satisfaction Biometric research Consumers visiting store Primary external
9. Functional performance Internal data collection
Complaint handling records Secondary internal
10. Functional performance Interviews with customers
Customers at stores /Shoppers at Mall
Primary external
11. Functional performance Focus groups Market research firms or specialist groups
Primary External
12. Market share Data collection methods=surveys ,questionnaires
Specialist market research company
Primary External
13. Market share Financial interpretation
Government census reports on market share
Secondary external
14. Net Promoter Score Panel respondents Market research firms providing panels
Primary external
15. Net Promoter Score Social listening Social media platforms ,chat rooms ,webinars
Primary external
16. Revenue growth % Financial forecasting Past company financials Secondary internal
17. Revenue growth % Industry equity analyst predictions
Stock market analyst reports of expected performance
Secondary external
18. Brand recall Text analysis Online web data and social media
Secondary external
19. Brand loyalty Behavioral economics model
Online data and video data from store
Primary external
20. Brand loyalty Mobile survey Consumers with mobile phones (using company mobile app) Victoria secrets app
Primary external
TABLE 11 RESEARCH METHODS AND DATA SOURCES
Biometrics is an emerging research field of neuro marketing market research. This form of marketing relies on various
biometric technologies and applications to help understand a participant’s cognitive and emotional responses toward certain
stimuli. The stimuli can be anything ranging from TV ads to online advertisements.
Mobile Ethnography is a scientific research strategy often used in social science. It is often employed for gathering empirical
data on human societies and cultures through mobile technology
The above primary and secondary research methods can be used to efficiently provide the data to validating the brand
elements and then the overall brand value.
Mastering Metrics Membership Number: 38460216
22
3.3. Benefits and Challenges of using a metrics approach to value brand.
“Not everything that can be counted counts, and not everything that counts can be counted” albert Einstein
Benefits
Firstly it provides a value to work with (whether it is right or wrong is debatable)
The Metrics approach provide a theory (analogy behind which the brand is being valued). Which can be justifiable.
Some data used is universally accepted by the accounting bodies, hence the confidence on the numbers would provide a
logic in calculating brand value using the financial metrics.
The calculated figure would be accepted hence it is based on facts and figures (this is true for the part which uses a
financial model to calculate the brand value)
However the attempt to quantify qualitative factors provides some direction at least where the relative brand elements
are headed, it’s not definite but direction would also be valuable
Challenges
Analytics-Seeing the trends and cross links between the metrics to understand the rationale behind is challenging
The trends and cross linking from one metric to another metrics and seeing what really drove the change is challenging to
identify
For example brand retention and loyalty is an element of brand value which is widely accepted according to Aaker’s brand
equity model. Metrics used to measure would be the number of repeat purchases or the willingness to refer the brand.
Taking No of repeat purchases for this example if we are to go in-depth and see what drove the customer to come back it
would be insightful for the valuation of brand
A simply analogy developed using the decision simplicity index. This metric “gauges of how easy it is for consumers to gather
and understand (or navigate) information about a brand, how much they can trust the information they find, and how readily
they can weigh their options”. (Freeman and Spenner) Easier the consumer journey higher the decision score.
Therefore, here is a solid reason as why the customers return to buy, because it could be the consumer journey is easy.
Humans are lazy and always prefer simplified over difficult. Could this be one of the missing links to justify the No of repeat
purchases?
Metrics approach’s acceptability is questionable if the elements used to value the brand is subjective.
Used to compare brand value under two different models would be misleading.
No Universally acceptable brand valuation model. Different models give different justified outcomes. Therefore
comparison between different valued brands under different models would be meaningless.
The cost benefit analysis of gathering data Vs the real value to the organization in knowing the brand value is difficulty to
assess.
Depends on what the data about the valuation is used for if it is used, the time and resources used for it is very high in terms
of resources.
Credibility of the data sources, Metrics approach all depends on the quality of the data sources
The more credible and accurate the quality of data. The more confidently it could be used in decision making.
Else it would be “garbage in, garbage out”, Poor data would lead to meaningless insights
Mastering Metrics Membership Number: 38460216
23
3.3.1 Challenges faced in evaluating the brand valuation metrics
The brand value creation process for the brand and deciding the best brand metrics to reflect the brand value accurately.
Choice of brand valuation models to choose from theoretical, commercial or economics based to best reflect the
organization
Subjectivity involved and difficulty to Quantify-
Quantifying the exact value created from this process is very difficult to assess as it is based on the subjective in valuing the
value creation. For simplicity if we take two customers and ask showing a shoe with a company logo and without a company
logo and it is the same in terms of quality (it’s the logo different. It is quiet unlikely both the customers would be willing to
pay the same price.
Here price premium is used as an indicator for Brand loyalty. Is it right? I don’t know. For another it could be brand loyalty.
So Quantification is not possible due to the high degree of subjectivity involved in valuing and it’s very challenging.
Identifying the brand elements that would be used to value the particular organization
Identifying the process of creation value or brand value based, so appropriate metrics could be calculated to measure the
overall brand value
Identifying which metrics to use in determining the brand value for the organization in concern. Different organization would
be creating value at different positions of the product creation to the customer journey.
First identifying the value creation process and drilling down to the ones which are actually due to the brand (company name
or slogan) is difficult to assess. Hence lies the first challenge in identifying which stages or process is involved in creating
value.
Collection of data from different sources and finding credible sources in valuing the brand elements
Using financial models in calculating the brand value
Quantifying the qualitative brand elements and using numeric to represent the brand element value.
Mastering Metrics Membership Number: 38460216
24
Bibliography
Bloomberg, (2015). BUSY Quote - Bloomberg US Treasury Bond Index. [online] Available at:
http://www.bloomberg.com/quote/BUSY:IND [Accessed 21 Nov. 2015].
Boozallen, (2015). Management Consulting | Booz Allen Hamilton. [online] Available at:
http://www.boozallen.com/consulting/management-consulting [Accessed 16 Nov. 2015].
Brown, M. (2015). ValueDrivers Model: How Brands Drive Value Growth. [online] Available at:
http://www.millwardbrown.com/docs/default-source/insight-documents/articles-and-
reports/MillwardBrown_ValueDrivers.pdf [Accessed 11 Nov. 2015].
ebay, (2014). ebay. annaul report 2014.
Farris, P. (2010). Marketing metrics. Upper Saddle River, N.J.: FT Press.
Farris, P., bendle, N., Pfeifer, p. and Reibstein, D. (2008). Marketing metrics 50+ Metrics Every Executive should master. 10th
ed. Pearson eduction,Inc, pp.12-15.
Briggs, F. (2015). Forbes Welcome. [online] Available at: http://www.forbes.com/sites/fionabriggs/2015/06/28/tesco-q1-
results-are-step-in-the-right-direction-claim-analysts/ [Accessed 16 Nov. 2015].
Ge, J (2015). GE is redefining what it is to be a leading industrial company in the 21st century. Read all about it.. [online]
Available at: http://www.ge.com/ar2014/ceo-letter/ [Accessed 16 Nov. 2015].
Auarav, K. (2014). A NEW KIND OF INDUSTRIAL COMPANY. Annual report 2014. [online] pp.8-10. Available at:
http://www.ge.com/ar2014/assets/pdf/GE_AR14.pdf [Accessed 16 Nov. 2015].
Nielson, L (2015). L Brands Inc: NYSE:LB quotes & news - Google Finance. [online] Available at:
https://www.google.com/finance?cid=21513 [Accessed 21 Nov. 2015].
http://www.include-digital.com, I. (2015). Best Global Brands | Brand Profiles & Valuations of the World’s Top Brands |
Glossary - Brand Value. [online] Brandirectory.com. Available at:
http://brandirectory.com/glossary/definition/brand_value [Accessed 15 Nov. 2015].
IBISWorld, L. (2015). Lingerie Stores in the US Industry Market Research Report Now Available from IBISWorld. [online]
PRWeb. Available at: http://www.prweb.com/releases/2012/5/prweb9519577.htm [Accessed 16 Nov. 2015].
Nightingale, P (2015). Lingerie Stores in the US Market Research | IBISWorld. [online] Available at:
http://www.ibisworld.com/industry/lingerie-stores.html [Accessed 16 Nov. 2015].
Corea, I. (2015). Brand Finance - Brand Valuation Consultancy | Brand Value | Intangible Asset Valuation. [online] Brand
Finance. Available at: http://brandfinance.com/ [Accessed 15 Nov. 2015].
Mastering Metrics Membership Number: 38460216
25
Interbrand, (2015). Interbrand. [online] Available at: http://interbrand.com/ [Accessed 15 Nov. 2015].
kotler, P. and kevin , K (2015). Marketing management. 12th ed.
L brands, (2015). Proxy Statement for the 2015 Annual Meeting of Stockholders and 2014 Annual Report. Annual report.
[online] Available at: http://www.lb.com/investors/annual_report/AnnualReport.aspx [Accessed 16 Nov. 2015].
Labourav, N (2015). L Brands > Annual Report & Proxy. [online] Available at:
http://www.lb.com/investors/annual_report/AnnualReport.aspx [Accessed 16 Nov. 2015].
Adobe, V (2013). 8 Marketers Doing Big Data Right. [online] Available at: http://mashable.com/2013/05/06/cmo-
data/#9fYUykZVRSqb [Accessed 16 Nov. 2015].
Nasdaq , I (2015). L Brands, Inc. (LB). [online] Available at: http://www.nasdaq.com/symbol/lb [Accessed 21 Nov. 2015].
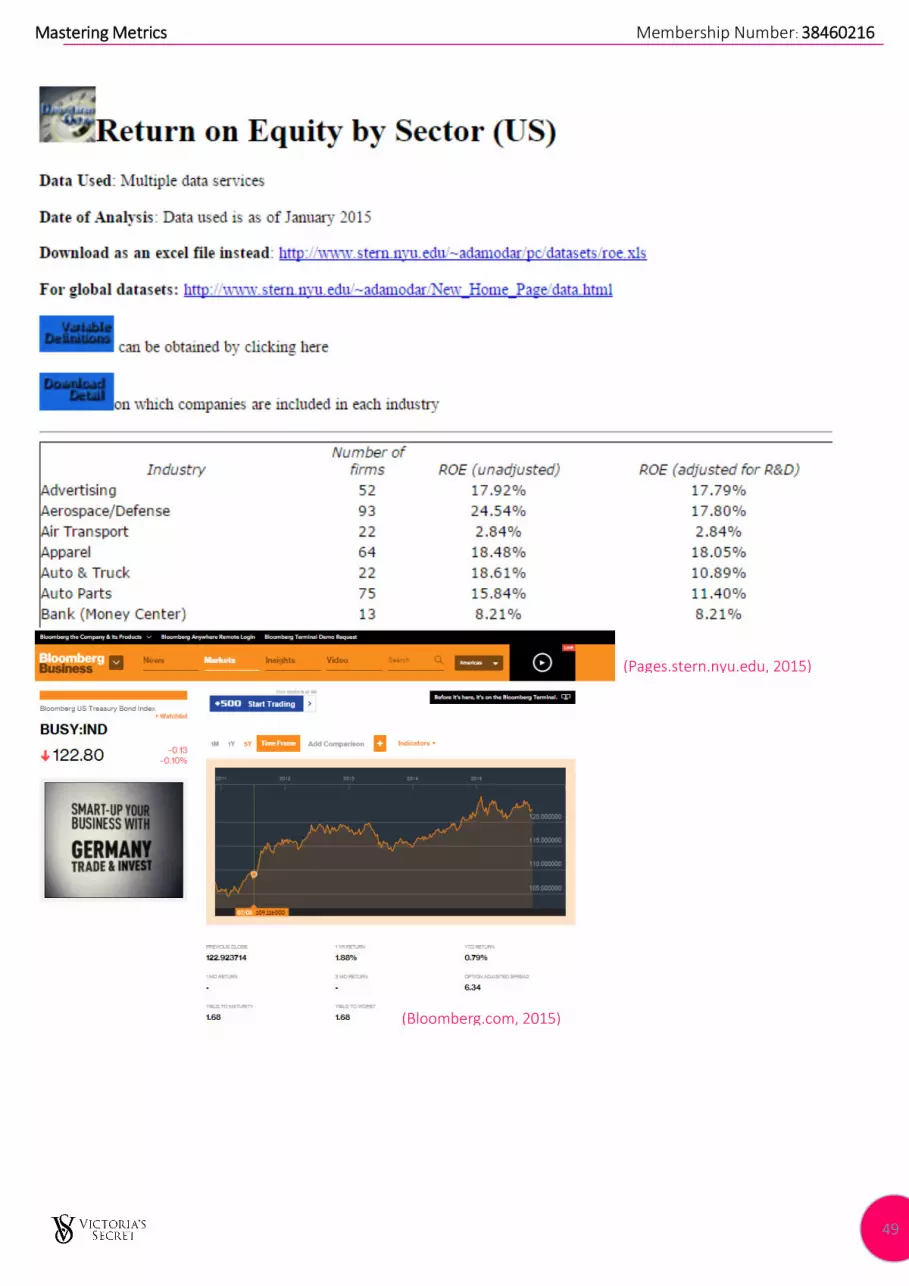
Pages.stern.nyu.edu, (2015). Operating and Net Margins. [online] Available at:
http://pages.stern.nyu.edu/~adamodar/New_Home_Page/datafile/margin.html [Accessed 17 Nov. 2015].
Pages.stern.nyu.edu, (2015). Return on Equity. [online] Available at:
http://pages.stern.nyu.edu/~adamodar/New_Home_Page/datafile/roe.html [Accessed 21 Nov. 2015].
Phx.corporate-ir.net, (2015). Alliance Data | News Release. [online] Available at: http://phx.corporate-
ir.net/phoenix.zhtml?c=120991&p=irol-newsArticle&ID=1567054 [Accessed 20 Nov. 2015].
REYNOLDS, T. and PHILLIPS, C. (2005). In Search of True Brand Equity Metrics: All Market Share Ain't Created Equal. Journal of
Advertising Research, 45(02), p.171.
Tesco, (2015). Annual Report and Financial Statements 2015 Tesco PLC Annual Report and Financial Statements 2015 Annual
Report and Financial Statements. annual report 2015. [online] pp.22,23,25. Available at:
http://www.tescoplc.com/files/pdf/reports/ar15/download_annual_report.pdf [Accessed 16 Nov. 2015].
Tradingeconomics, (2015). United States | Economic Forecasts | 2015-2050 Outlook. [online] Available at:
http://www.tradingeconomics.com/united-states/forecast [Accessed 16 Nov. 2015].
Zipkin,, N. (2014). Your One-Stop Guide to Royalty Rates (Infographic). [online] Entrepreneur. Available at:
http://www.entrepreneur.com/article/235851 [Accessed 17 Nov. 2015]
Mastering Metrics Membership Number: 38460216
26
Appendix- Brand Valuation of Victoria secrets
Task 2 Supporting documents
This annexure supports the findings presented in the main report with respect to Valuing Victoria’s Secret brand.
The Supporting Research for the calculation of expected revenues are illustrated below.
Aided in the collation of Expected revenues for Victoria’s secrets for the 5 years taken to perform the historic trend analysis.
Trend analysis
Industry analysis
Economic analysis
Weighted average cost of capital (WACC) calculation – discount rate used on the model.
The revenue growth model
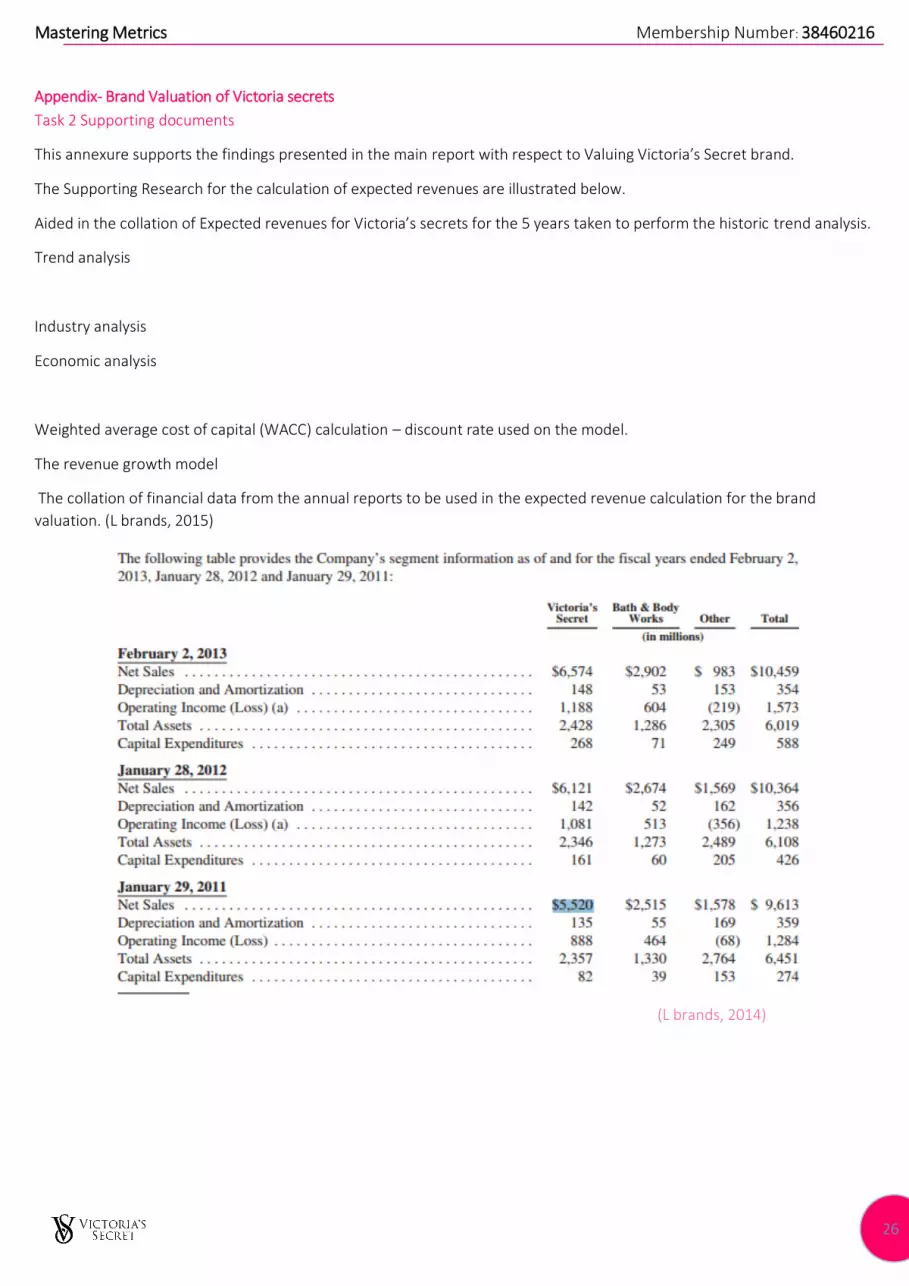
The collation of financial data from the annual reports to be used in the expected revenue calculation for the brand
valuation. (L brands, 2015)
(L brands, 2014)
Mastering Metrics Membership Number: 38460216
27
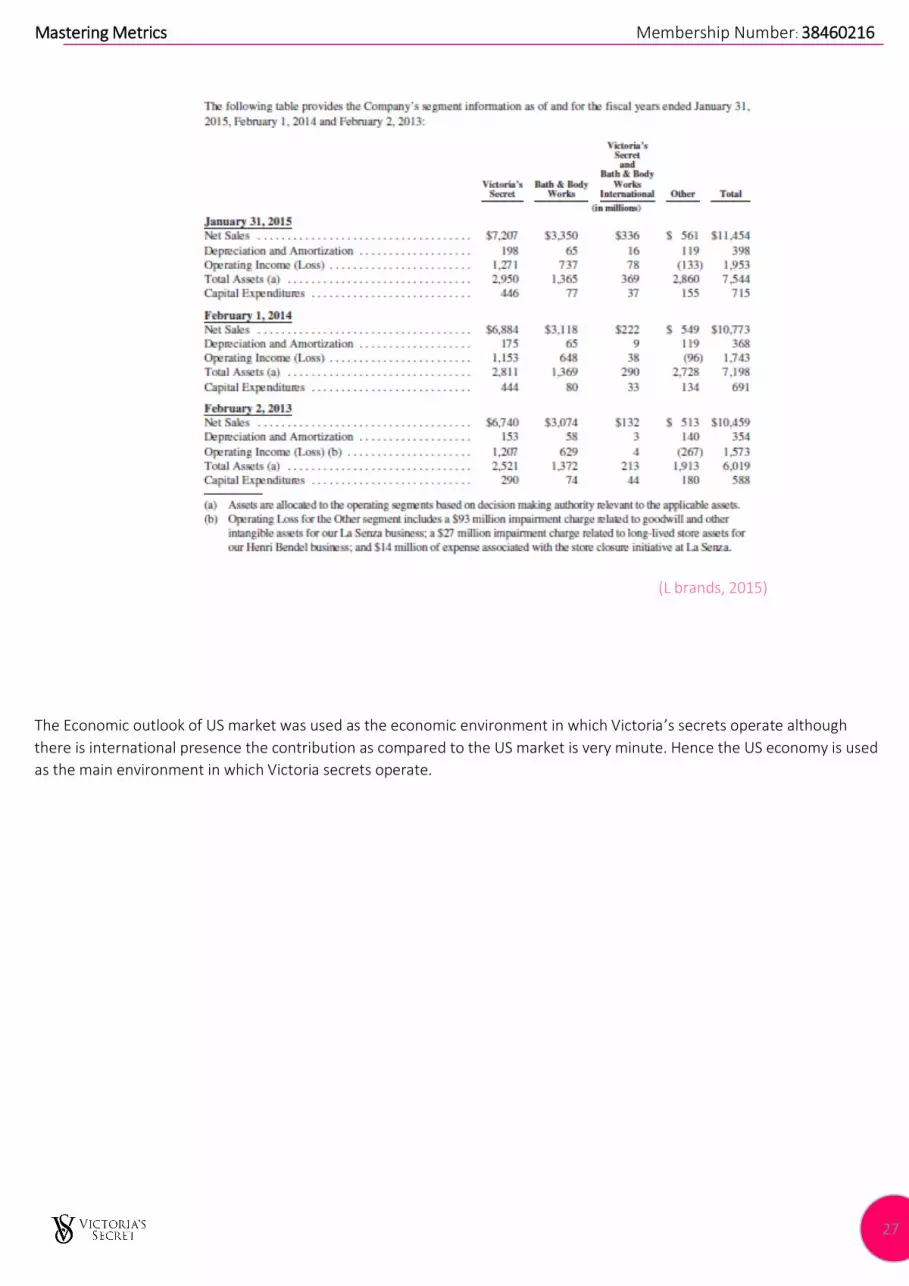
(L brands, 2015)
The Economic outlook of US market was used as the economic environment in which Victoria’s secrets operate although
there is international presence the contribution as compared to the US market is very minute. Hence the US economy is used
as the main environment in which Victoria secrets operate.
Mastering Metrics Membership Number: 38460216
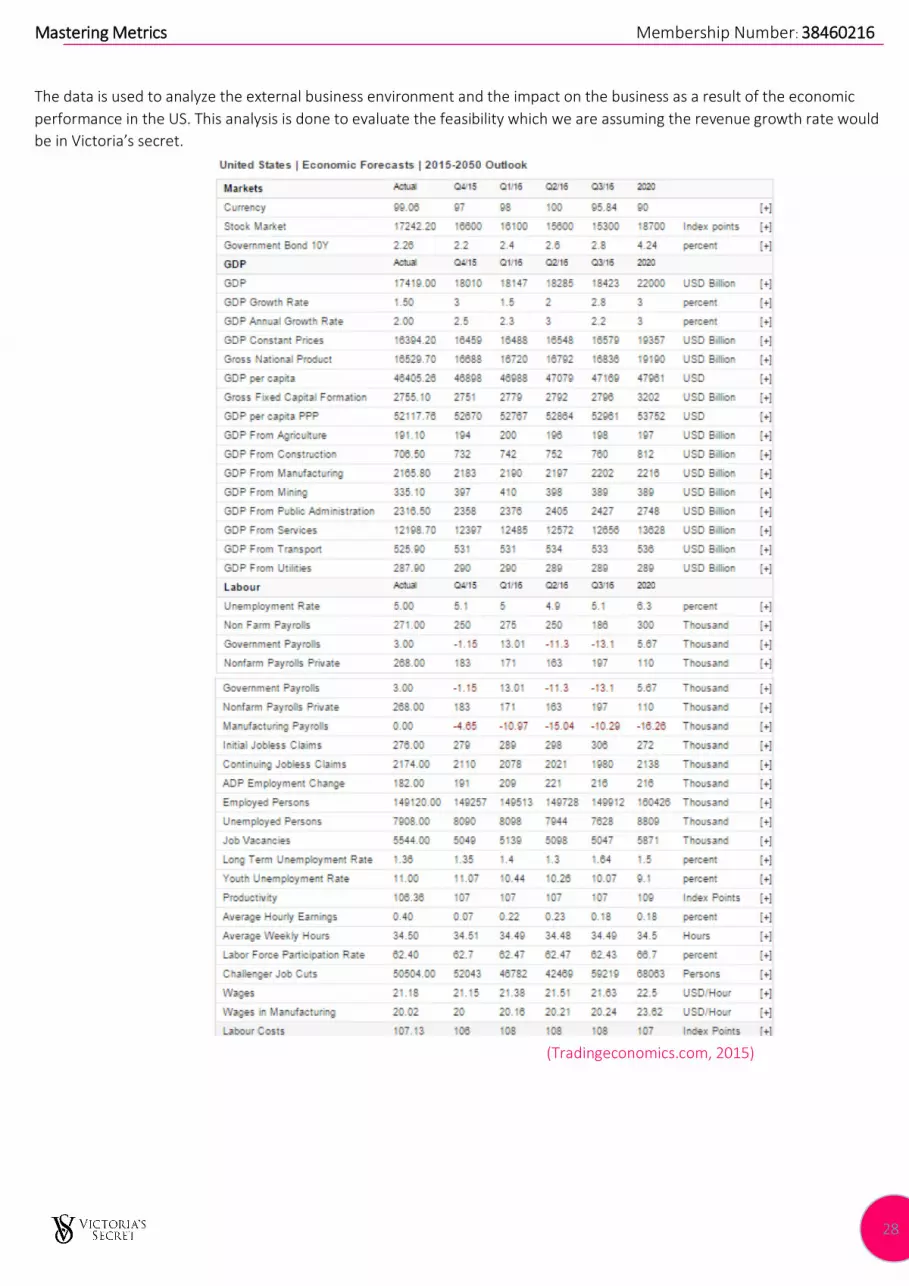
28
The data is used to analyze the external business environment and the impact on the business as a result of the economic
performance in the US. This analysis is done to evaluate the feasibility which we are assuming the revenue growth rate would
be in Victoria’s secret.
(Tradingeconomics.com, 2015)
Mastering Metrics Membership Number: 38460216
29
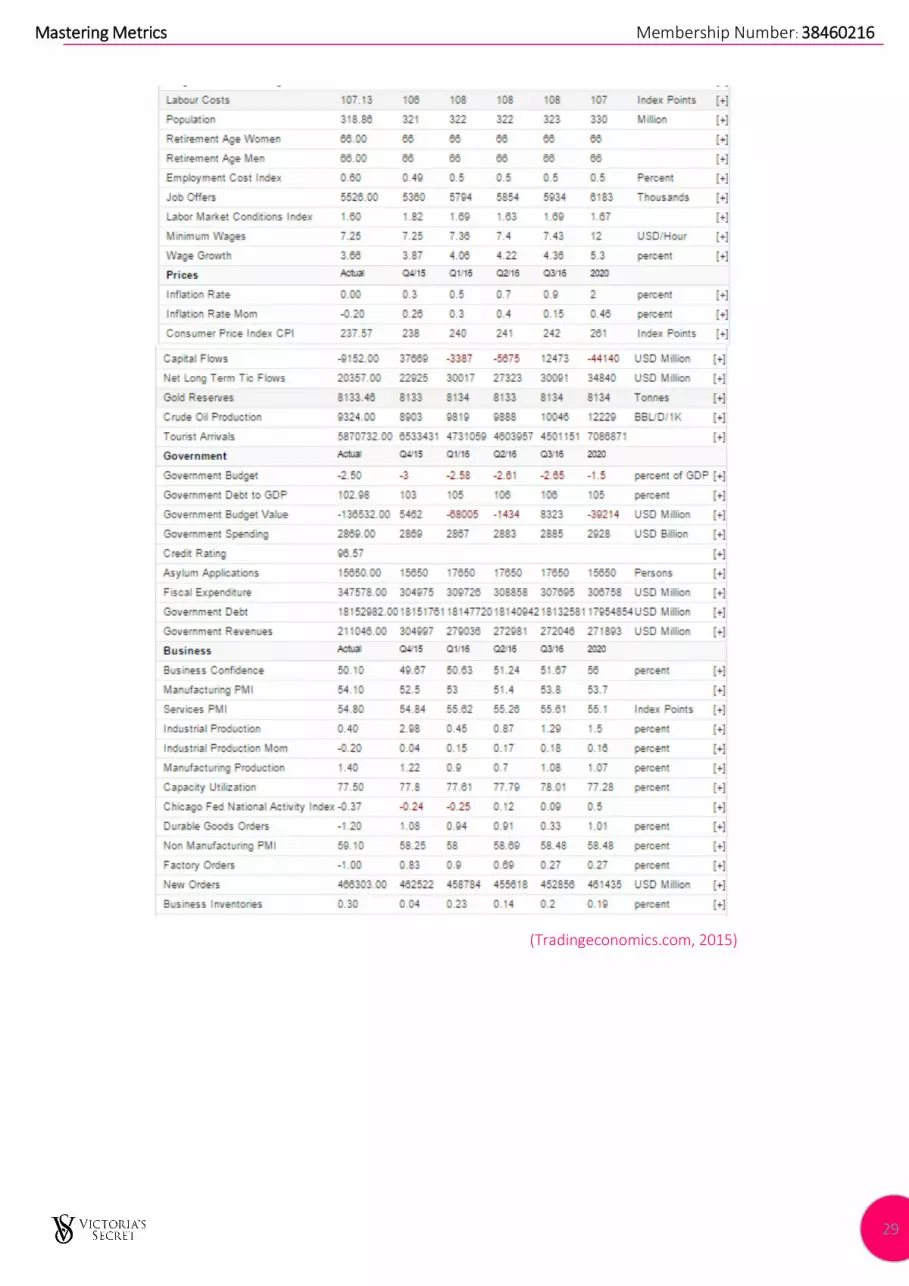
(Tradingeconomics.com, 2015)
Mastering Metrics Membership Number: 38460216
30
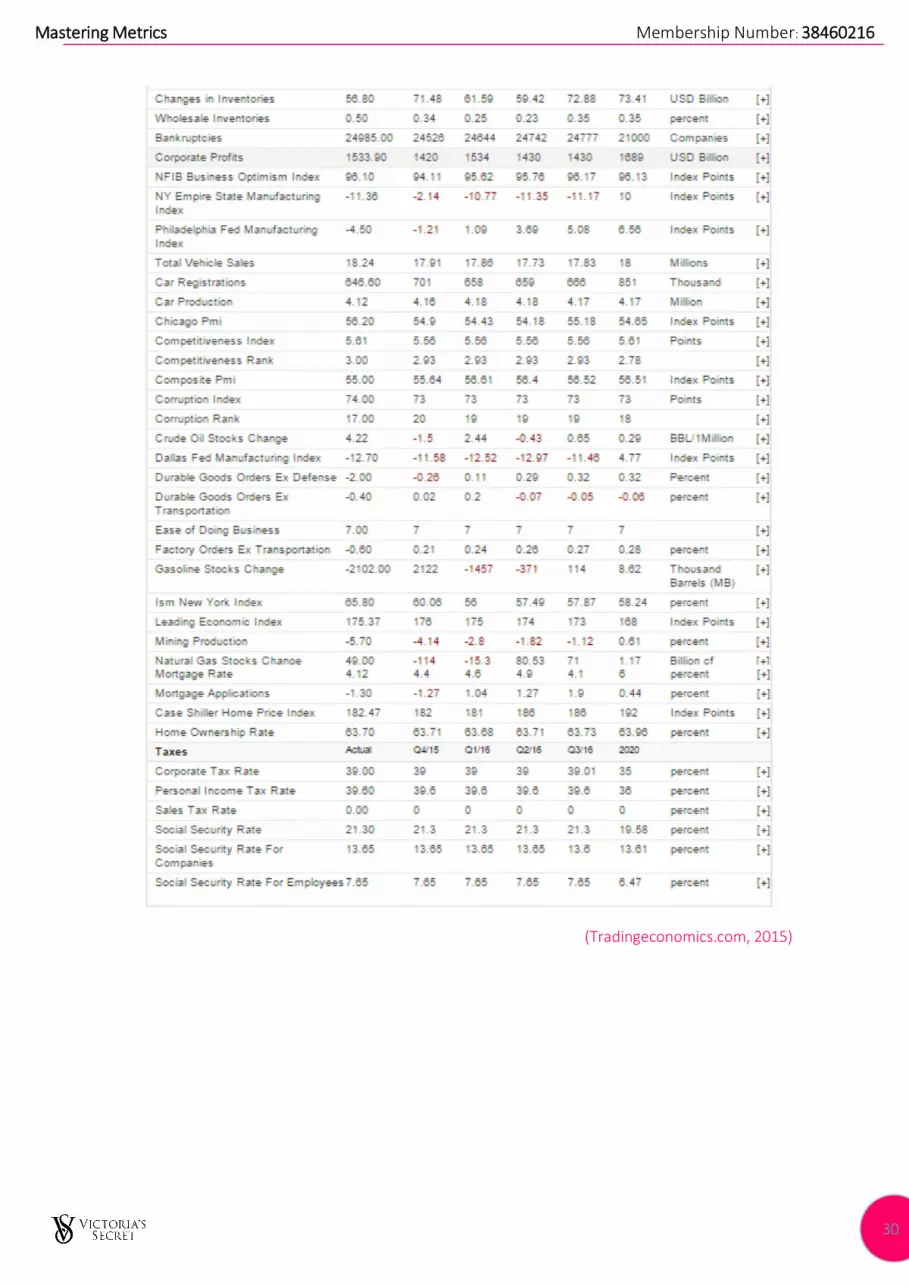
(Tradingeconomics.com, 2015)
Mastering Metrics Membership Number: 38460216
31
Step 1: Supporting calculation figures.
Calculation of the expected revenue.
Mastering Metrics Membership Number: 38460216
32
In calculating the Notional royalty rate.
Two methods are used for further assurance of the rate being used as recommended by Brand Finance.
The Income approach to royalty valuation
25% rule
(Pages.stern.nyu.edu,
2015)
Mastering Metrics Membership Number: 38460216
33
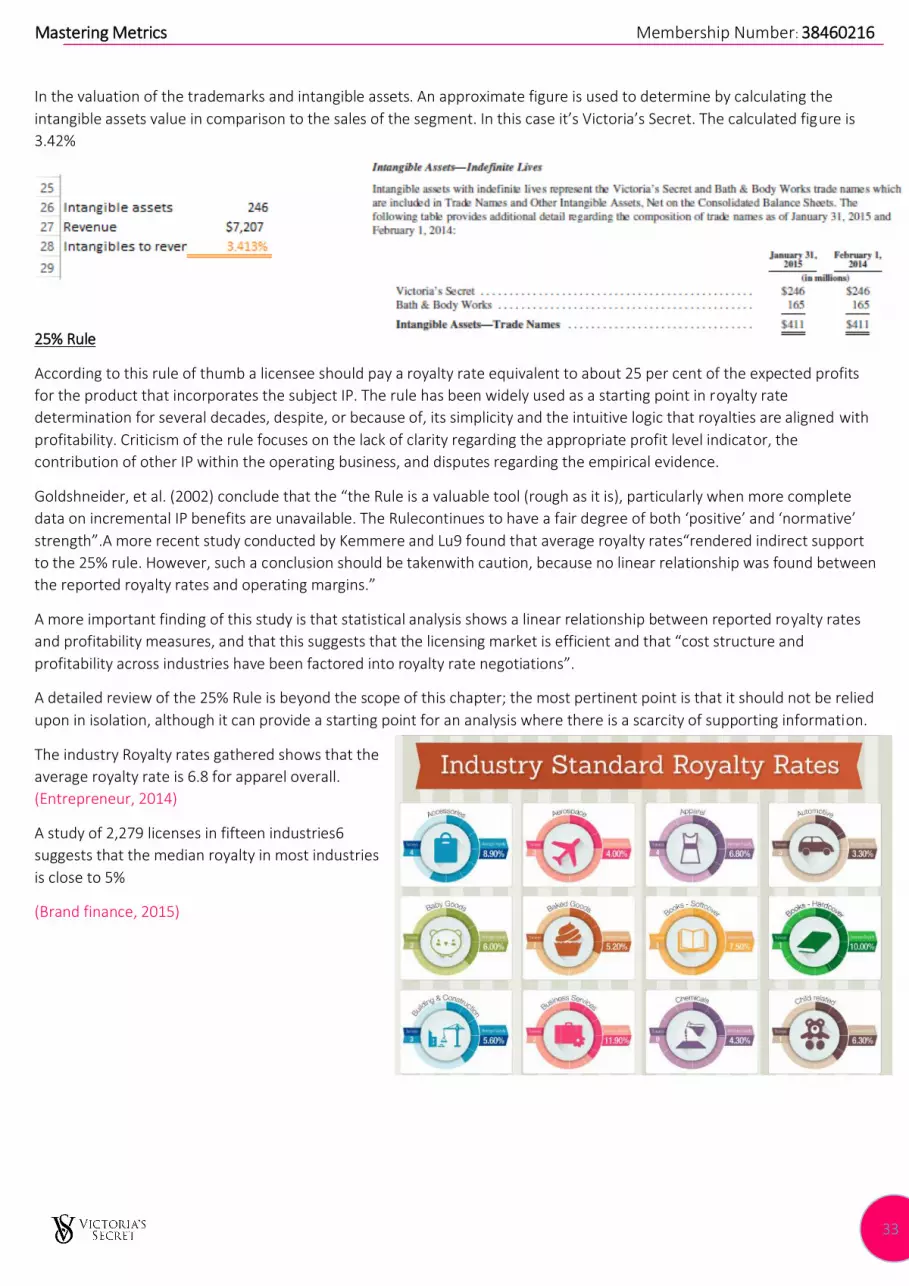
In the valuation of the trademarks and intangible assets. An approximate figure is used to determine by calculating the
intangible assets value in comparison to the sales of the segment. In this case it’s Victoria’s Secret. The calculated figure is
3.42%
25% Rule
According to this rule of thumb a licensee should pay a royalty rate equivalent to about 25 per cent of the expected profits
for the product that incorporates the subject IP. The rule has been widely used as a starting point in royalty rate
determination for several decades, despite, or because of, its simplicity and the intuitive logic that royalties are aligned with
profitability. Criticism of the rule focuses on the lack of clarity regarding the appropriate profit level indicator, the
contribution of other IP within the operating business, and disputes regarding the empirical evidence.
Goldshneider, et al. (2002) conclude that the “the Rule is a valuable tool (rough as it is), particularly when more complete
data on incremental IP benefits are unavailable. The Rulecontinues to have a fair degree of both ‘positive’ and ‘normative’
strength”.A more recent study conducted by Kemmere and Lu9 found that average royalty rates“rendered indirect support
to the 25% rule. However, such a conclusion should be takenwith caution, because no linear relationship was found between
the reported royalty rates and operating margins.”
A more important finding of this study is that statistical analysis shows a linear relationship between reported royalty rates
and profitability measures, and that this suggests that the licensing market is efficient and that “cost structure and
profitability across industries have been factored into royalty rate negotiations”.
A detailed review of the 25% Rule is beyond the scope of this chapter; the most pertinent point is that it should not be relied
upon in isolation, although it can provide a starting point for an analysis where there is a scarcity of supporting information.
The industry Royalty rates gathered shows that the
average royalty rate is 6.8 for apparel overall.
(Entrepreneur, 2014)
A study of 2,279 licenses in fifteen industries6
suggests that the median royalty in most industries
is close to 5%
(Brand finance, 2015)
Mastering Metrics Membership Number: 38460216
34
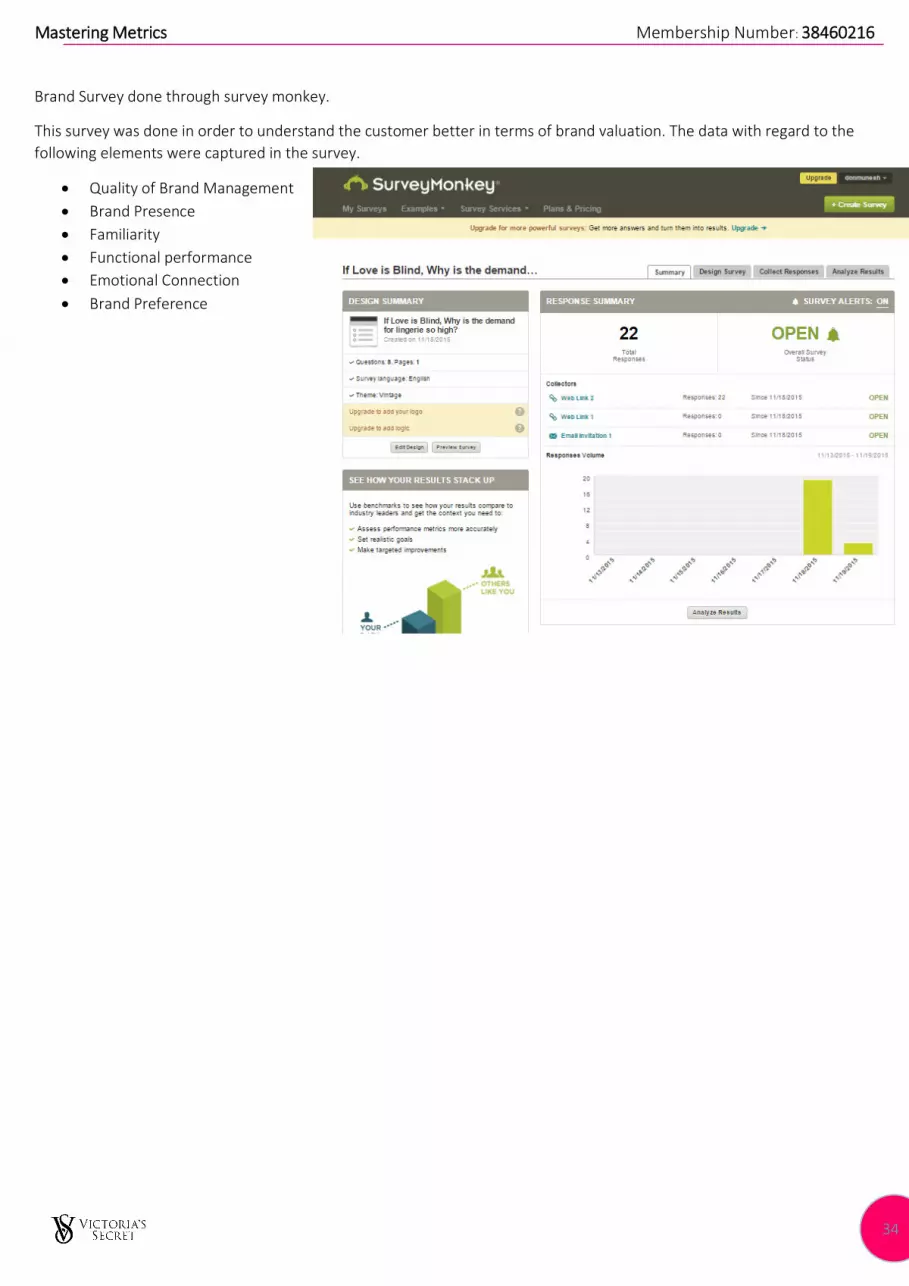
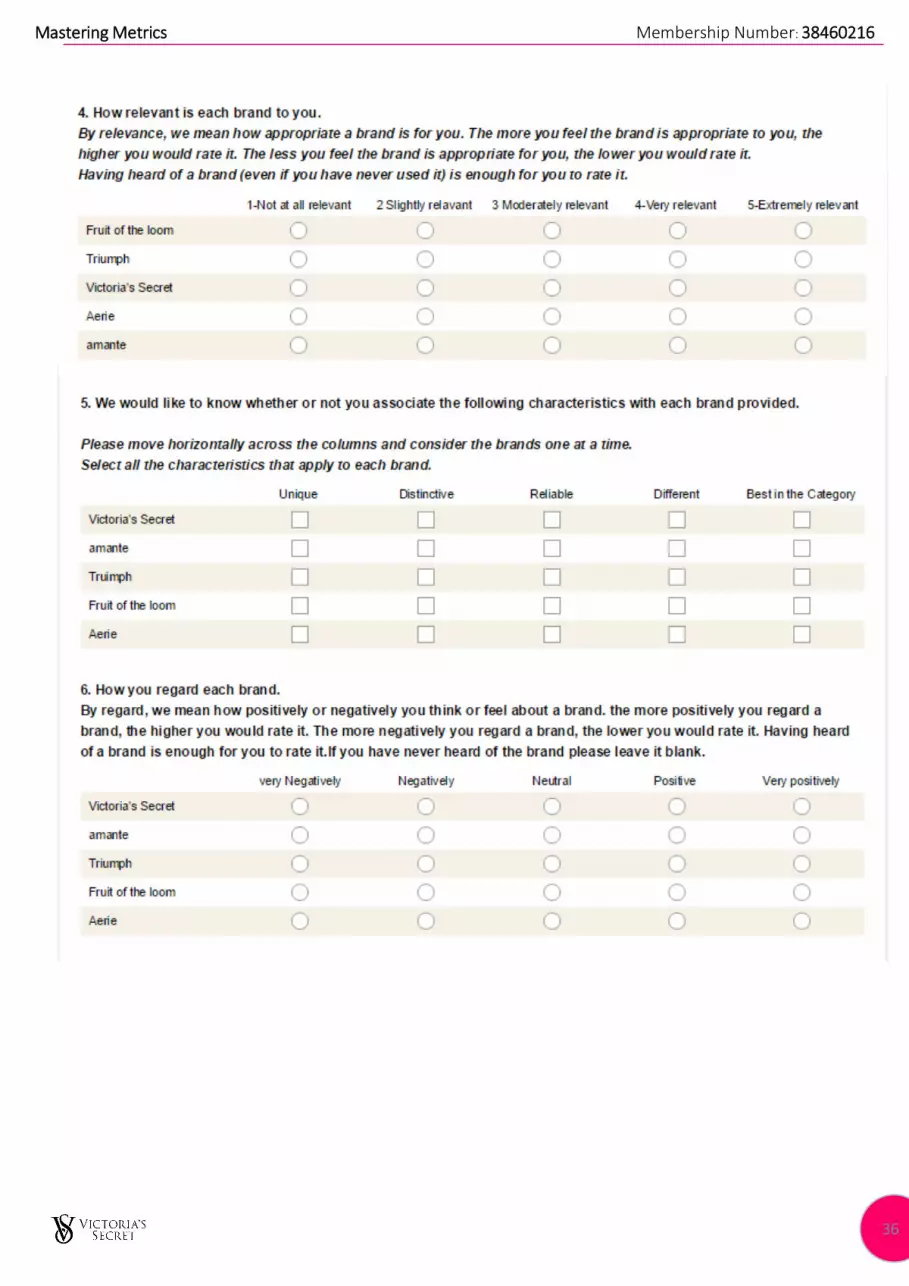
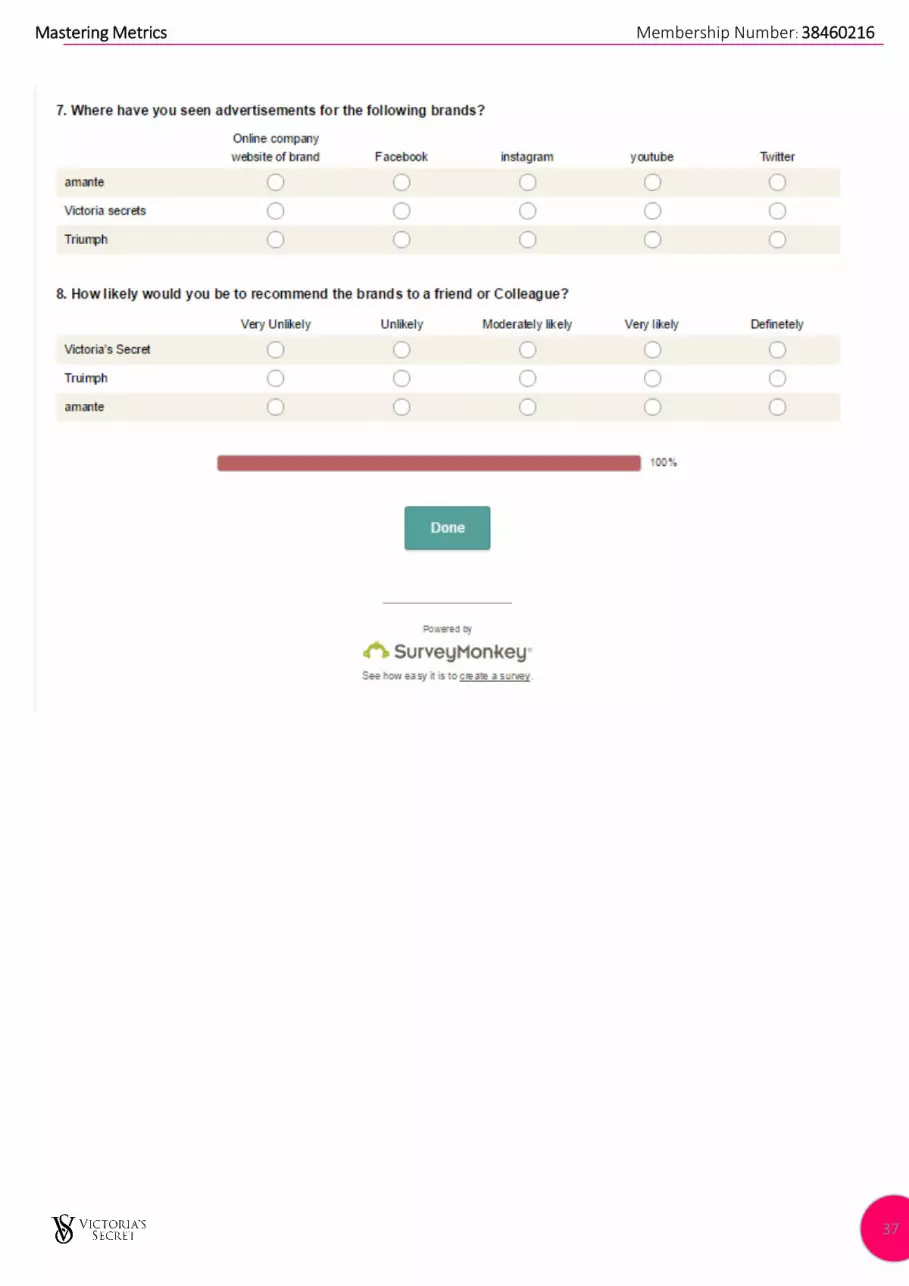
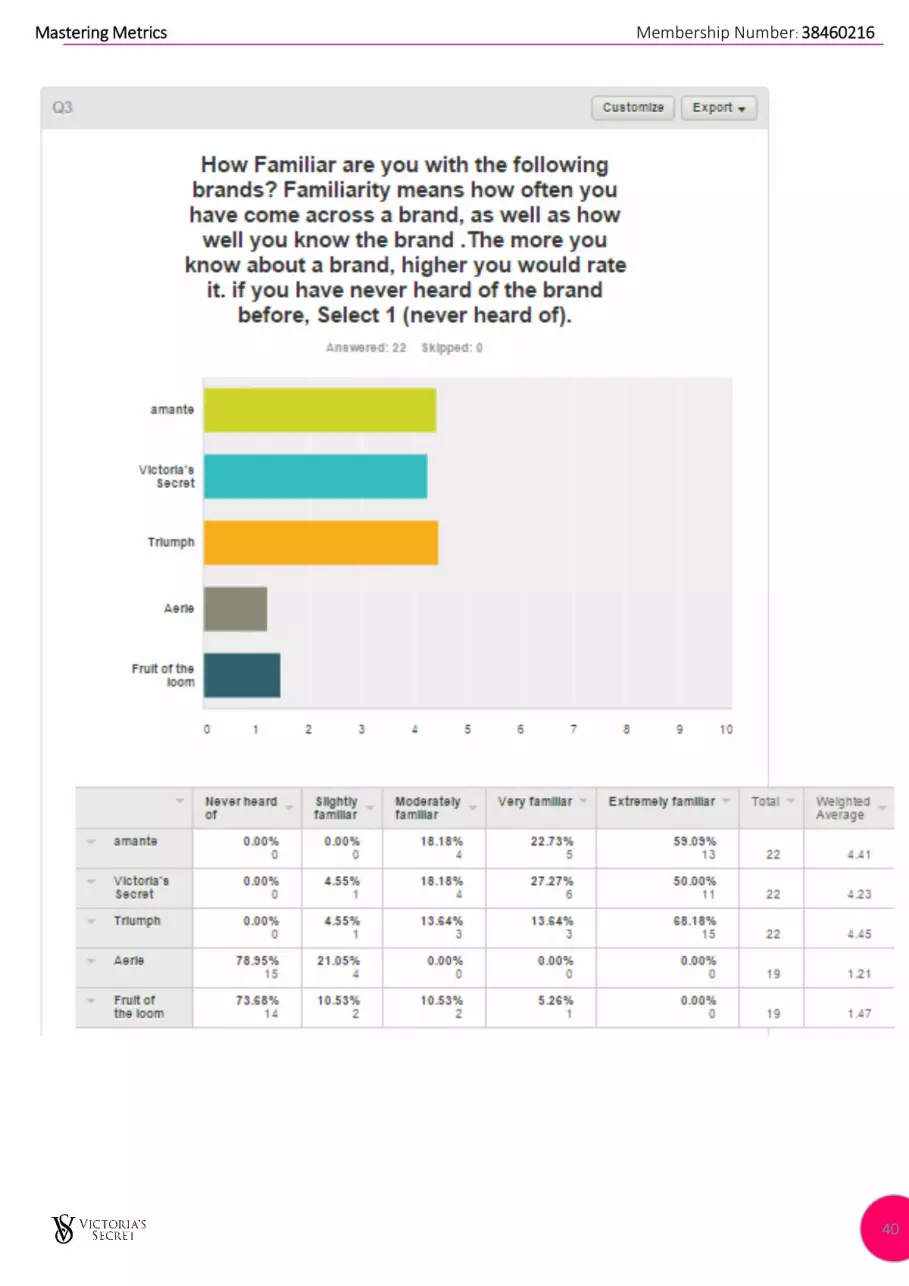
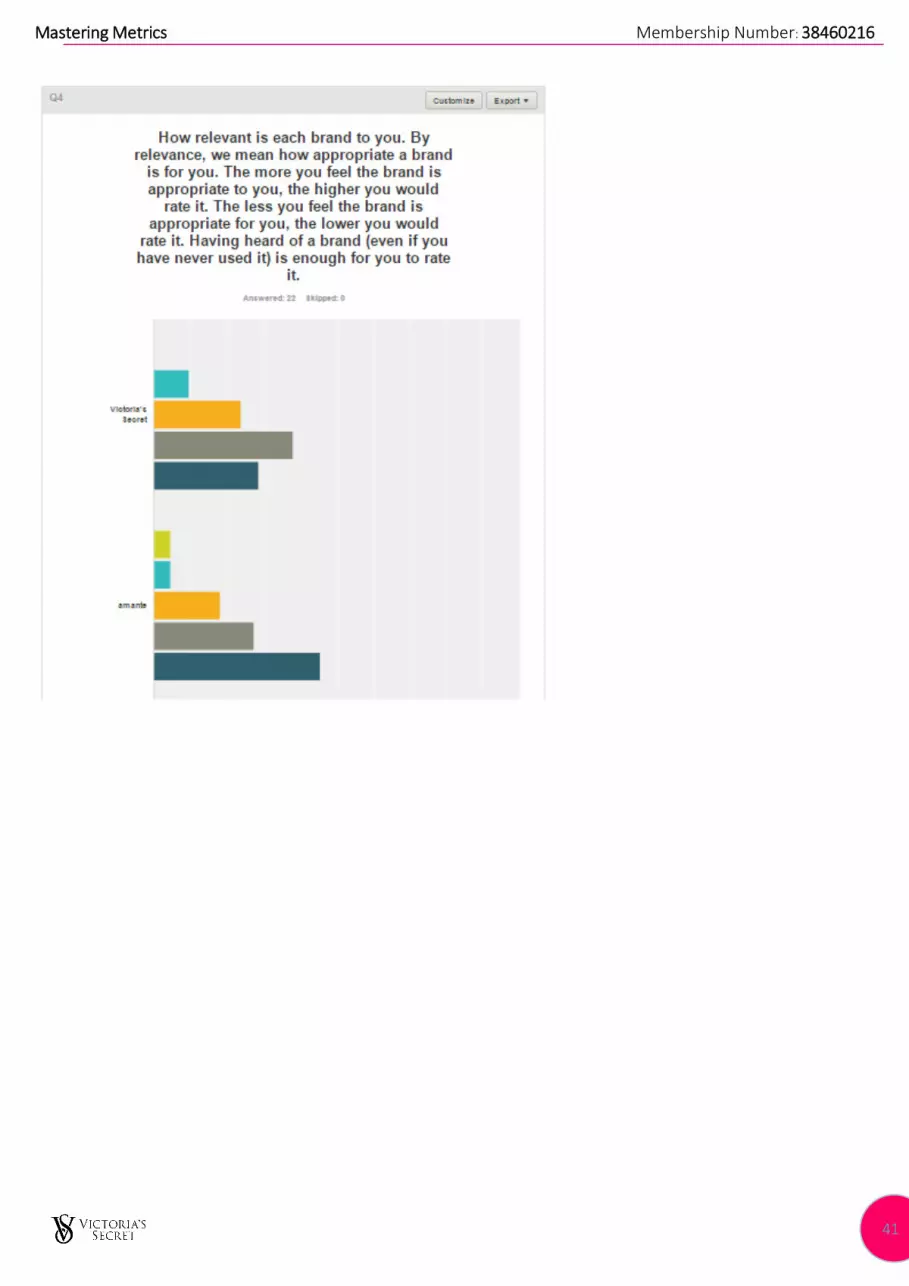
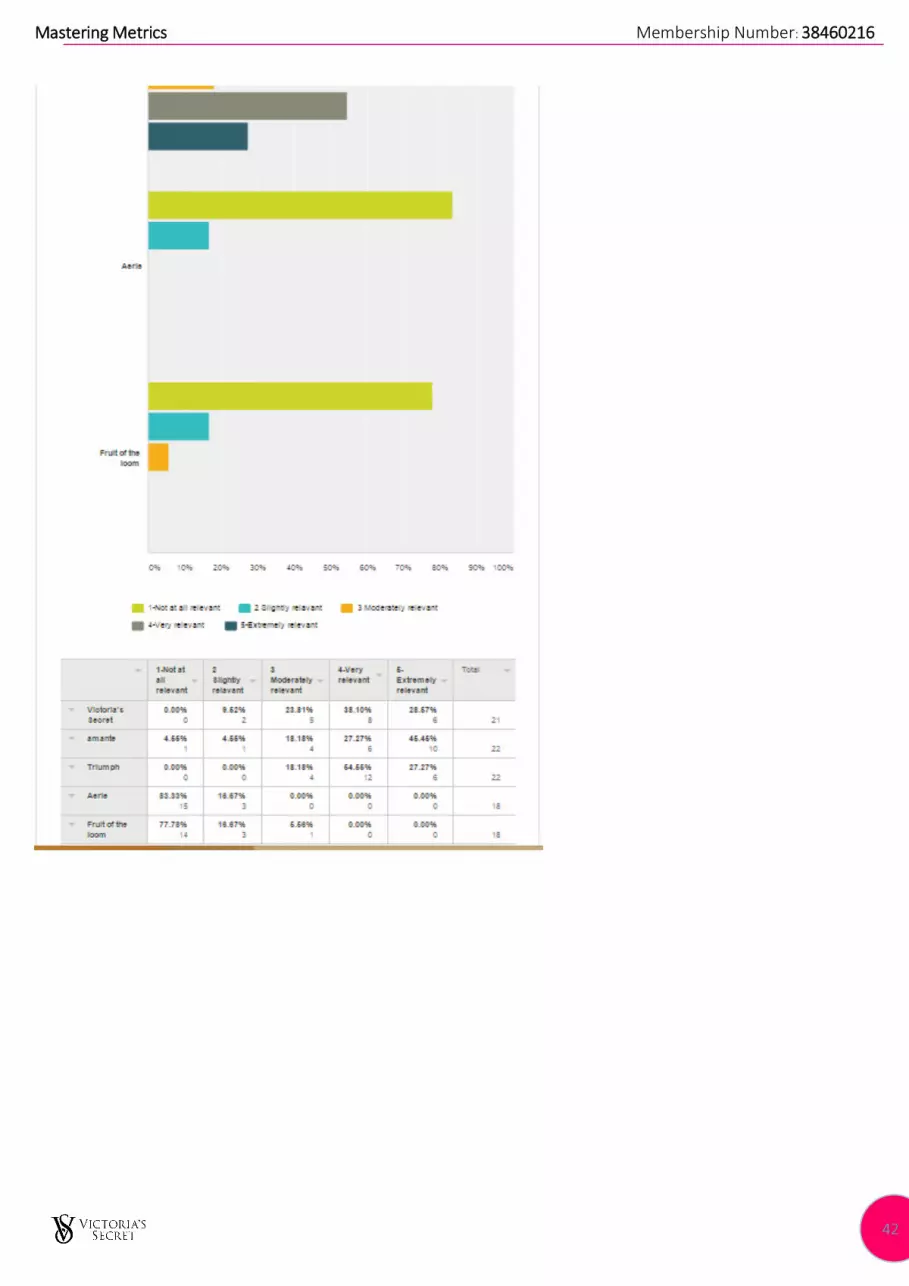
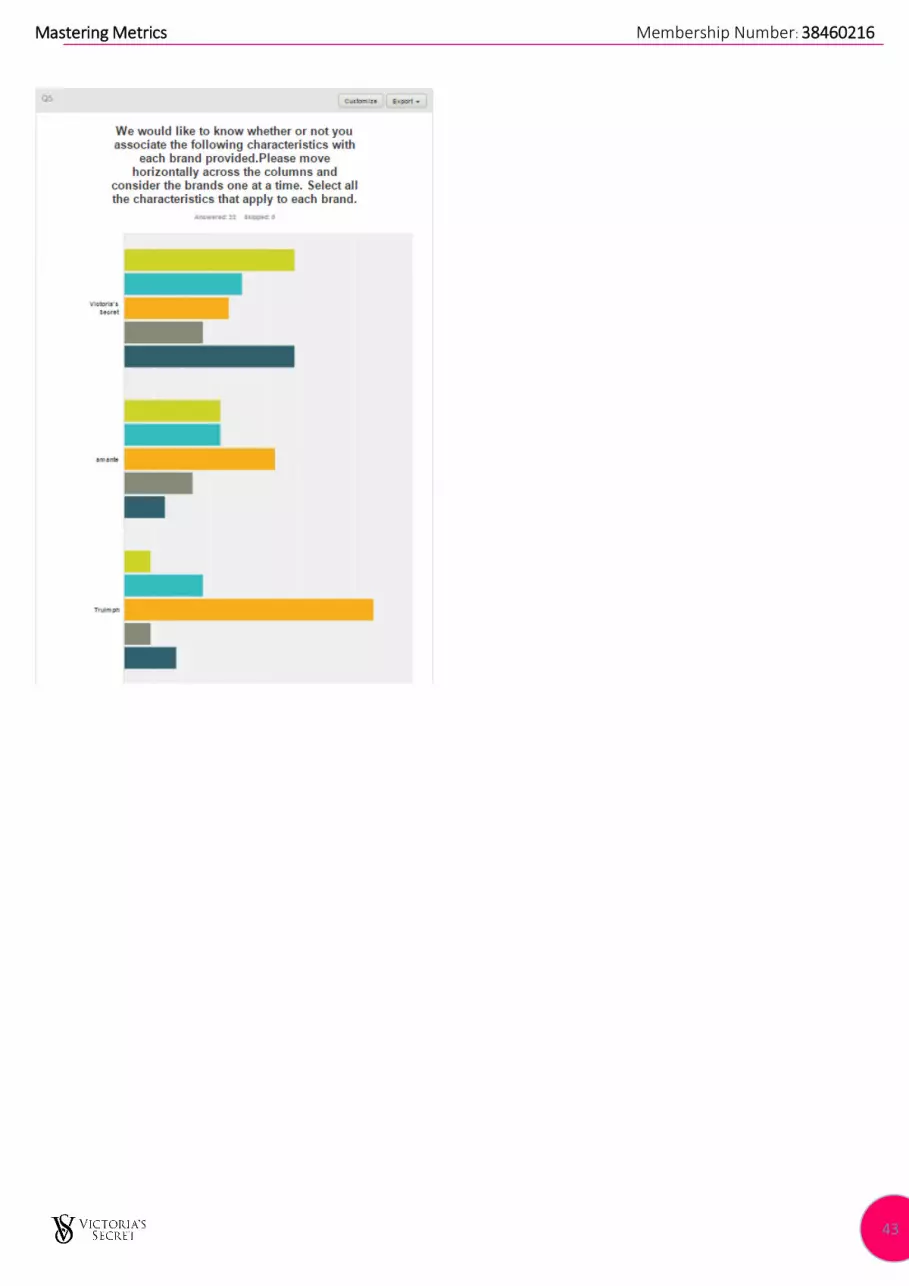
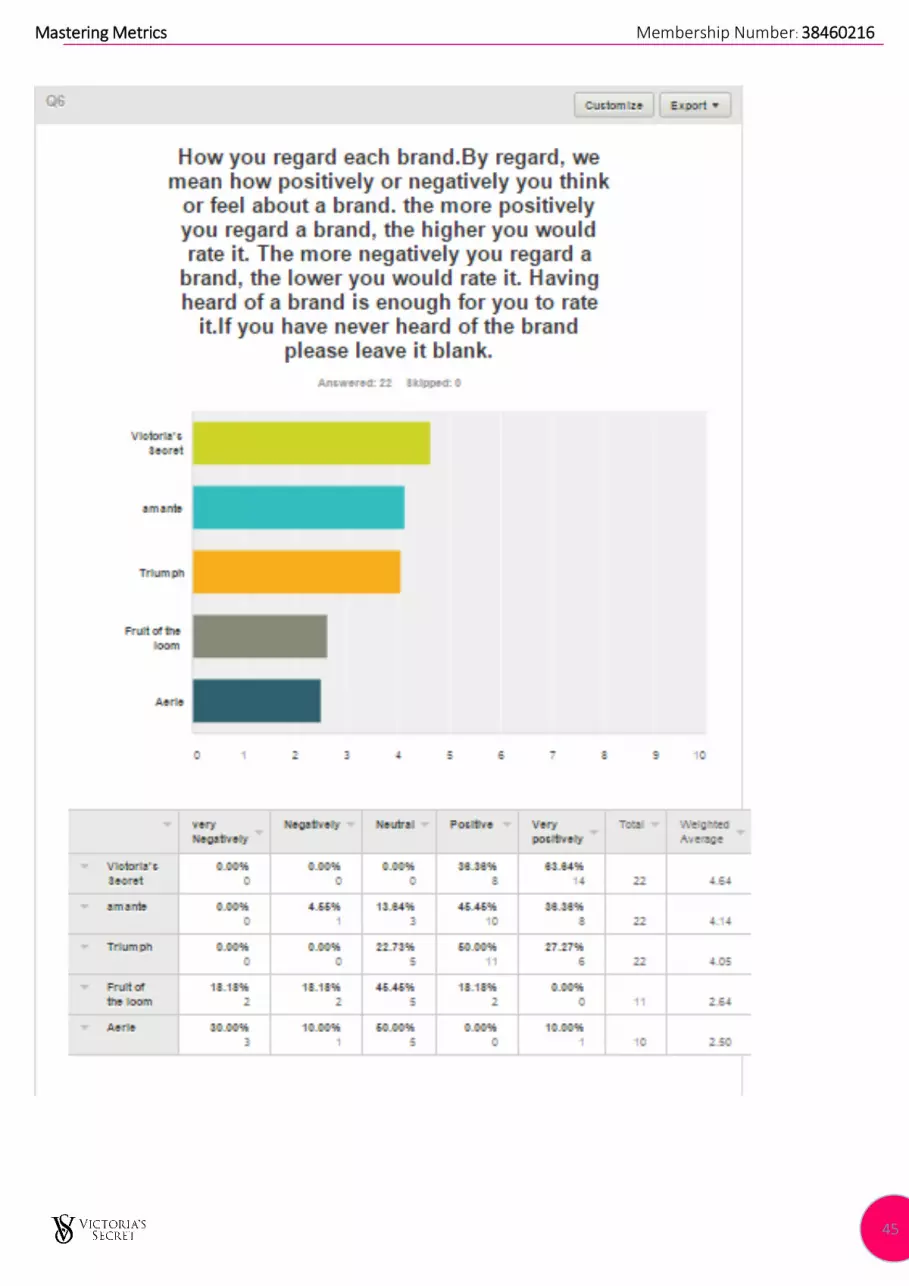
Brand Survey done through survey monkey.
This survey was done in order to understand the customer better in terms of brand valuation. The data with regard to the
following elements were captured in the survey.
Quality of Brand Management
Brand Presence
Familiarity
Functional performance
Emotional Connection
Brand Preference
Mastering Metrics Membership Number: 38460216
35
Mastering Metrics Membership Number: 38460216
36
Mastering Metrics Membership Number: 38460216
37
Mastering Metrics Membership Number: 38460216
38
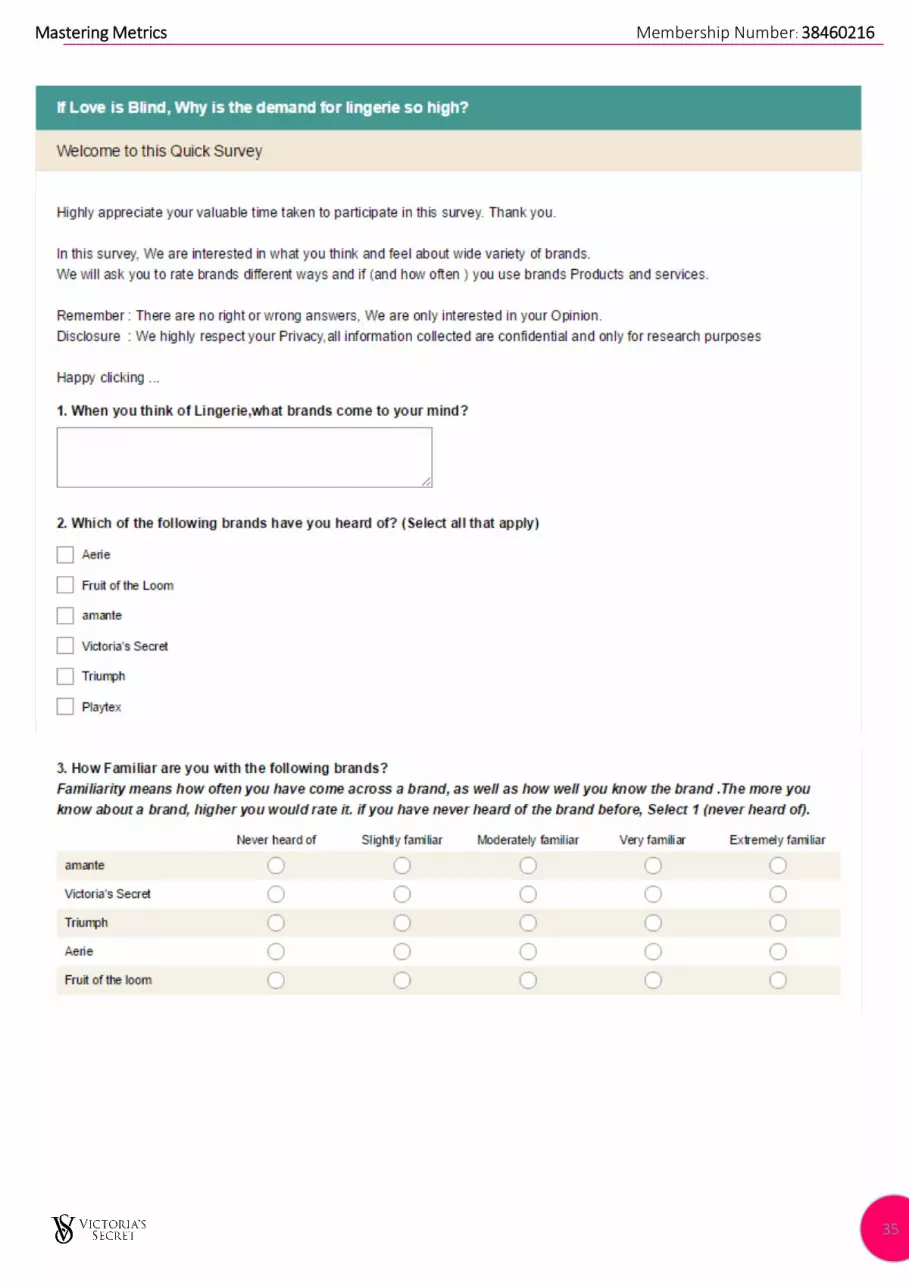
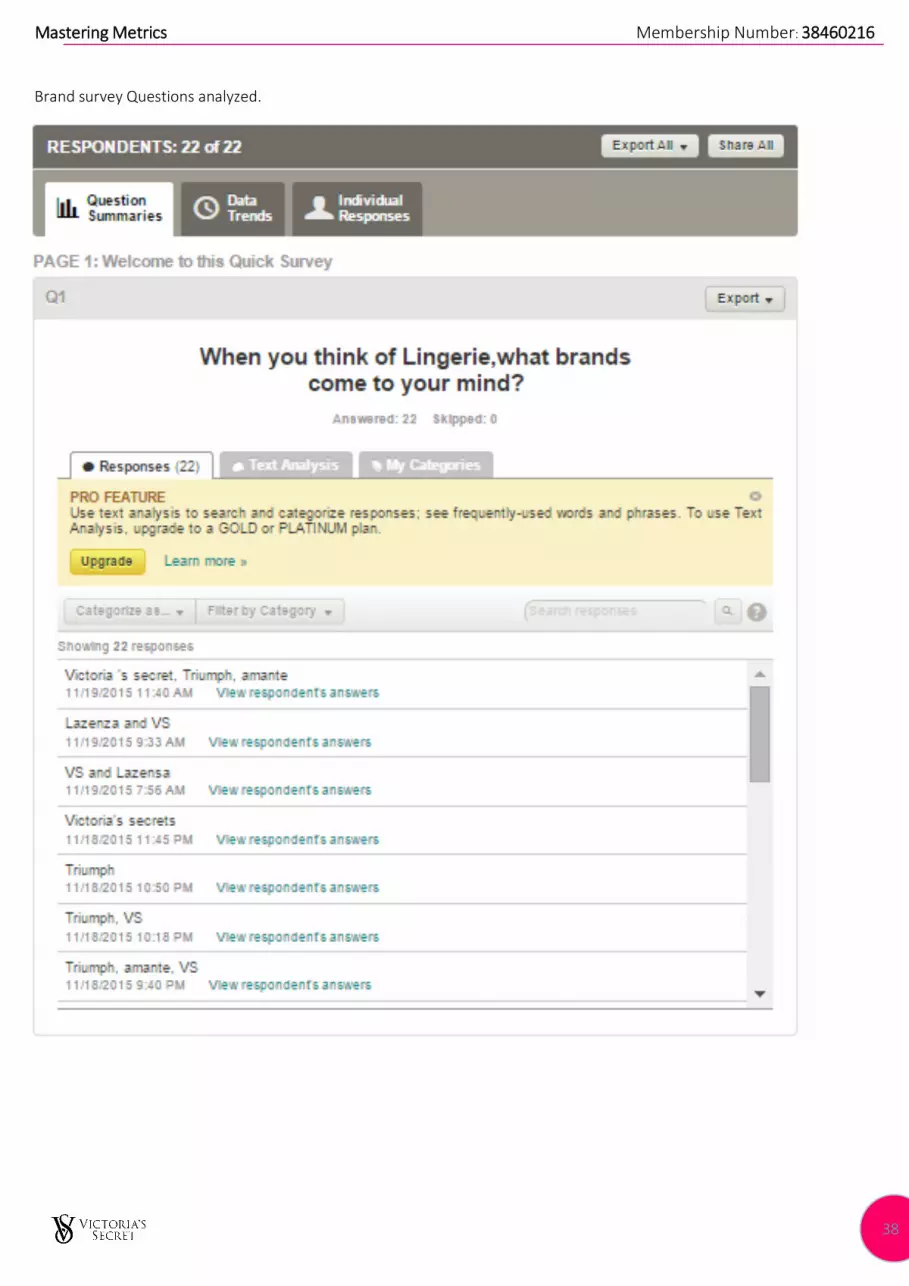
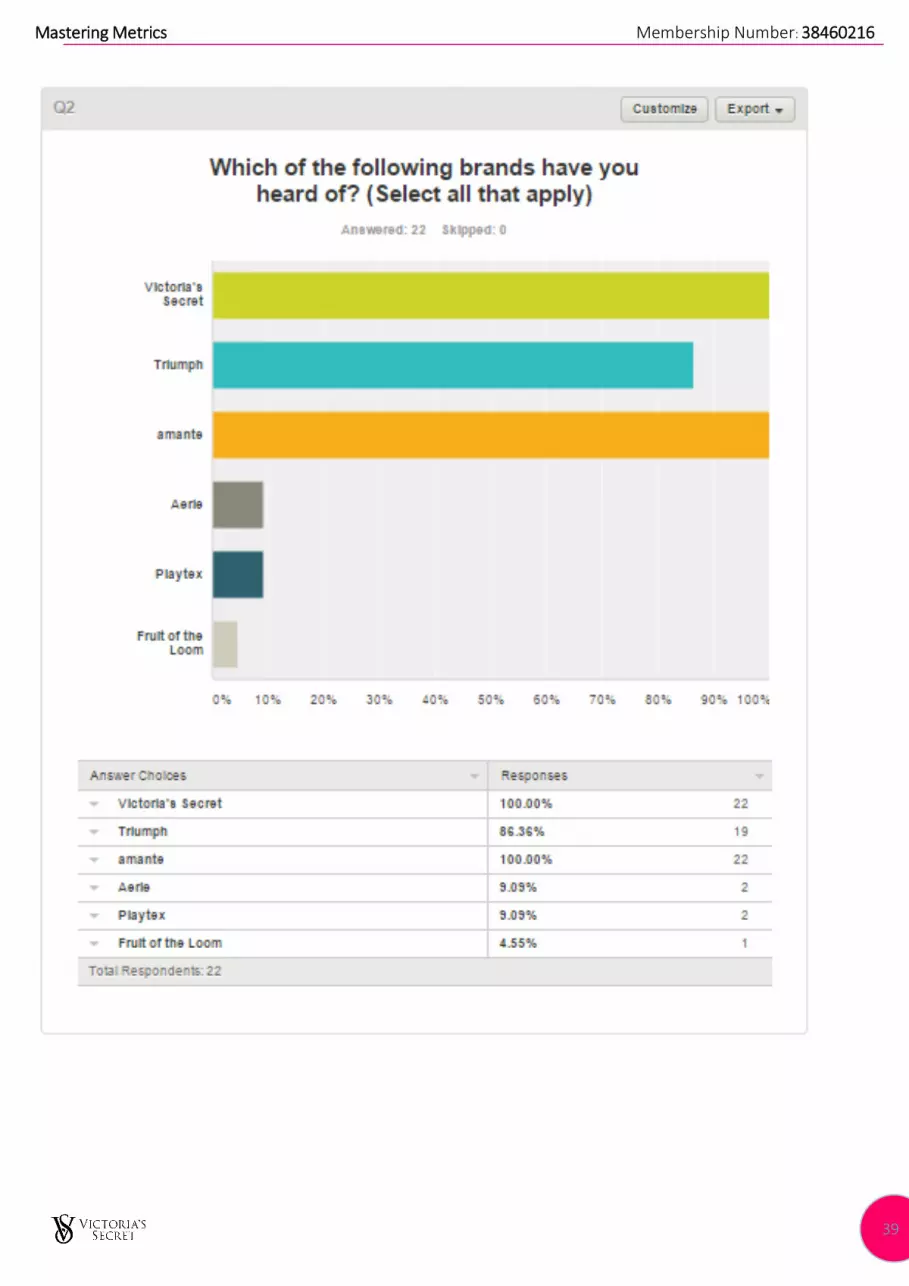
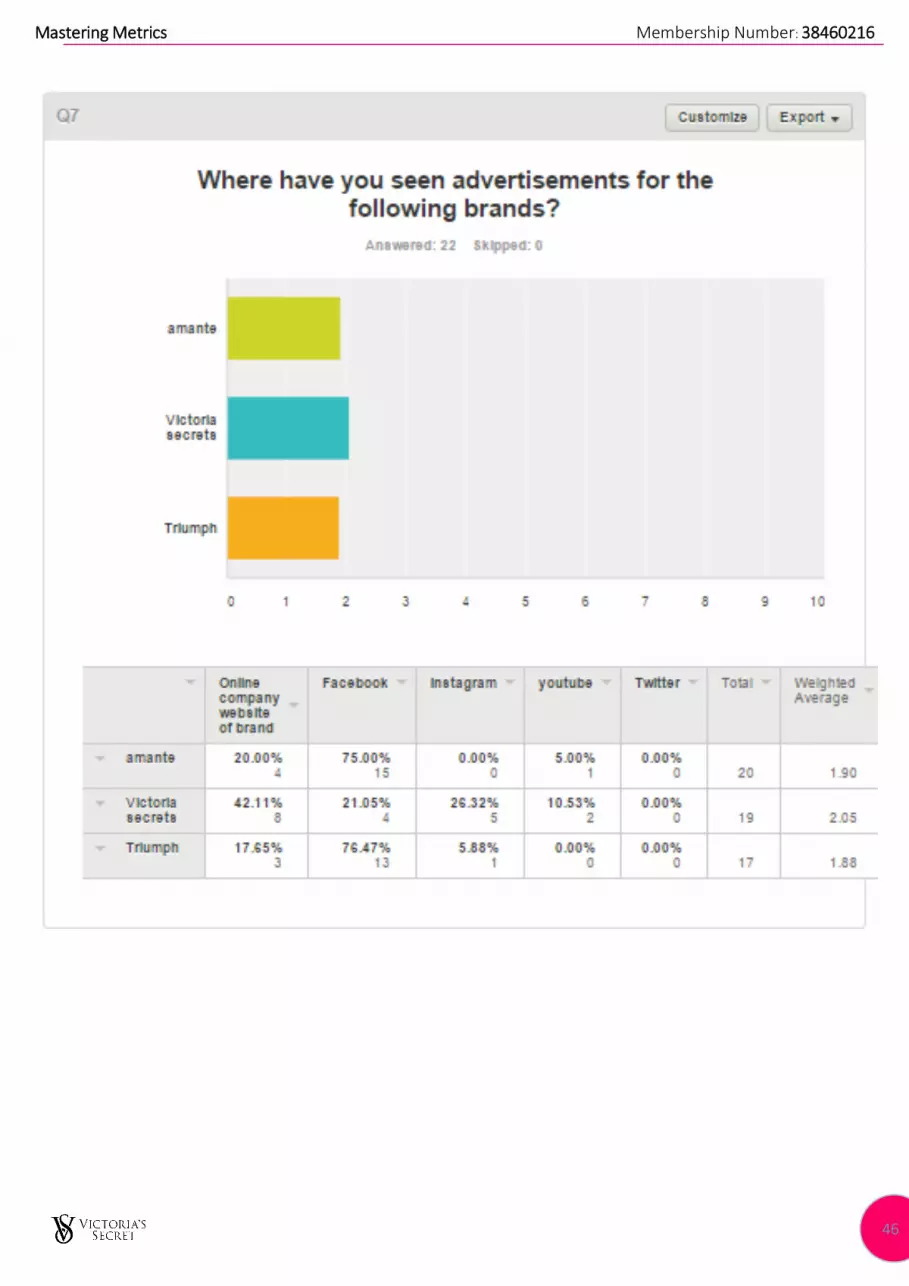
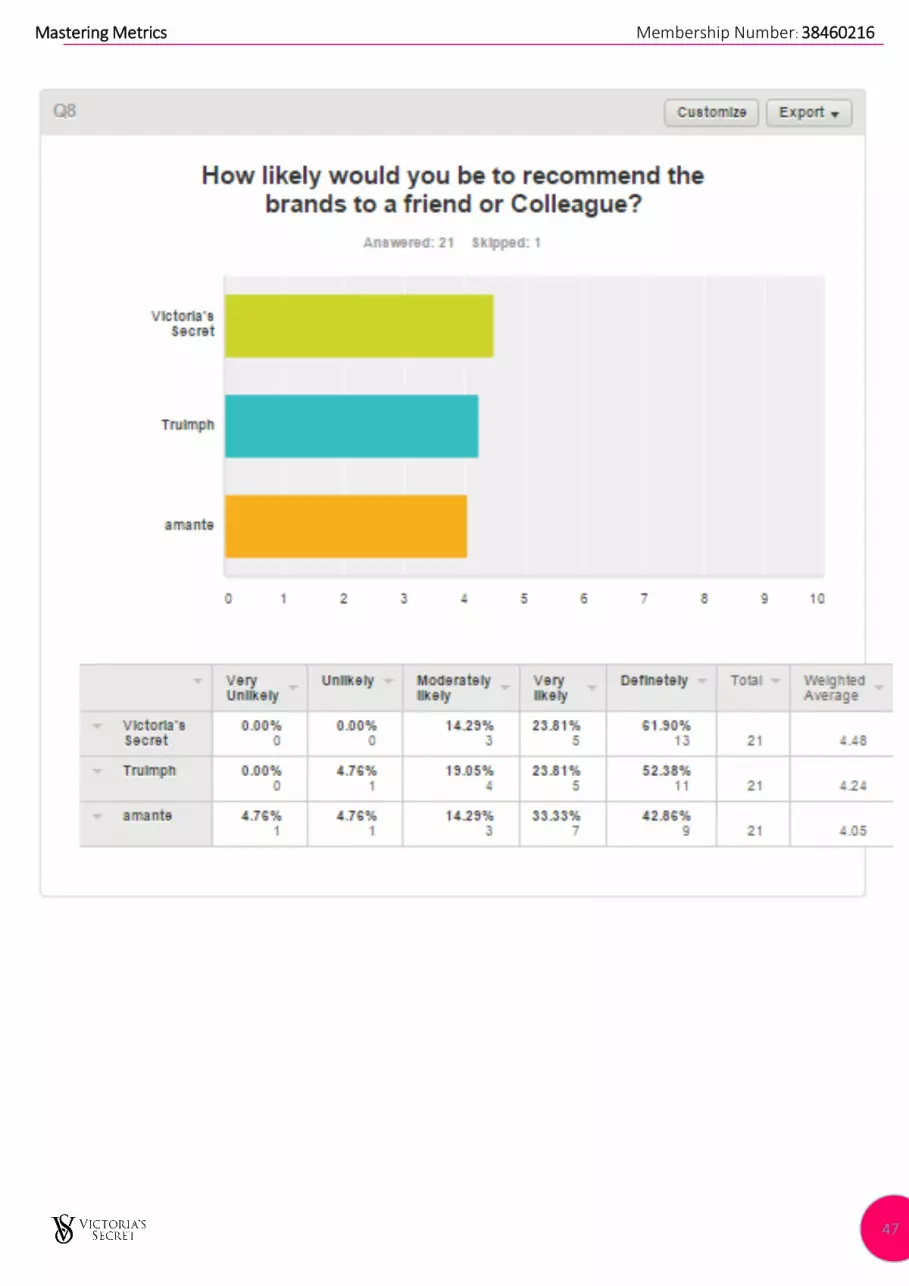
Brand survey Questions analyzed.
Mastering Metrics Membership Number: 38460216
39
Mastering Metrics Membership Number: 38460216
40
Mastering Metrics Membership Number: 38460216
41
Mastering Metrics Membership Number: 38460216
42
Mastering Metrics Membership Number: 38460216
43

Mastering Metrics Membership Number: 38460216
44
Mastering Metrics Membership Number: 38460216
45
Mastering Metrics Membership Number: 38460216
46
Mastering Metrics Membership Number: 38460216
47
Mastering Metrics Membership Number: 38460216
48
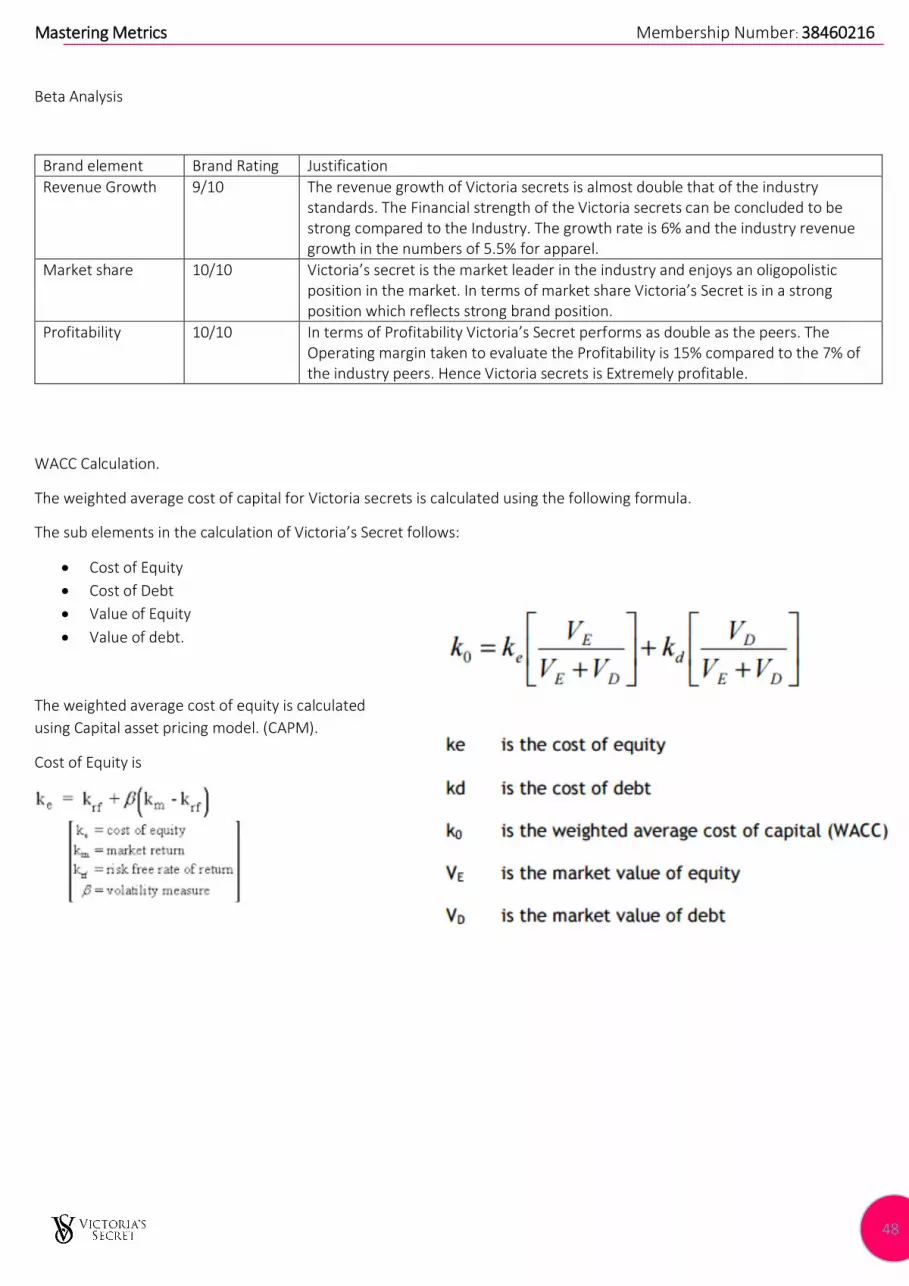
Beta Analysis
Brand element Brand Rating Justification
Revenue Growth 9/10 The revenue growth of Victoria secrets is almost double that of the industry standards. The Financial strength of the Victoria secrets can be concluded to be strong compared to the Industry. The growth rate is 6% and the industry revenue growth in the numbers of 5.5% for apparel.
Market share 10/10 Victoria’s secret is the market leader in the industry and enjoys an oligopolistic position in the market. In terms of market share Victoria’s Secret is in a strong position which reflects strong brand position.
Profitability 10/10 In terms of Profitability Victoria’s Secret performs as double as the peers. The Operating margin taken to evaluate the Profitability is 15% compared to the 7% of the industry peers. Hence Victoria secrets is Extremely profitable.
WACC Calculation.
The weighted average cost of capital for Victoria secrets is calculated using the following formula.
The sub elements in the calculation of Victoria’s Secret follows:
Cost of Equity
Cost of Debt
Value of Equity
Value of debt.
The weighted average cost of equity is calculated
using Capital asset pricing model. (CAPM).
Cost of Equity is
Mastering Metrics Membership Number: 38460216
49
(Pages.stern.nyu.edu, 2015)
(Bloomberg.com, 2015)
Mastering Metrics Membership Number: 38460216
50
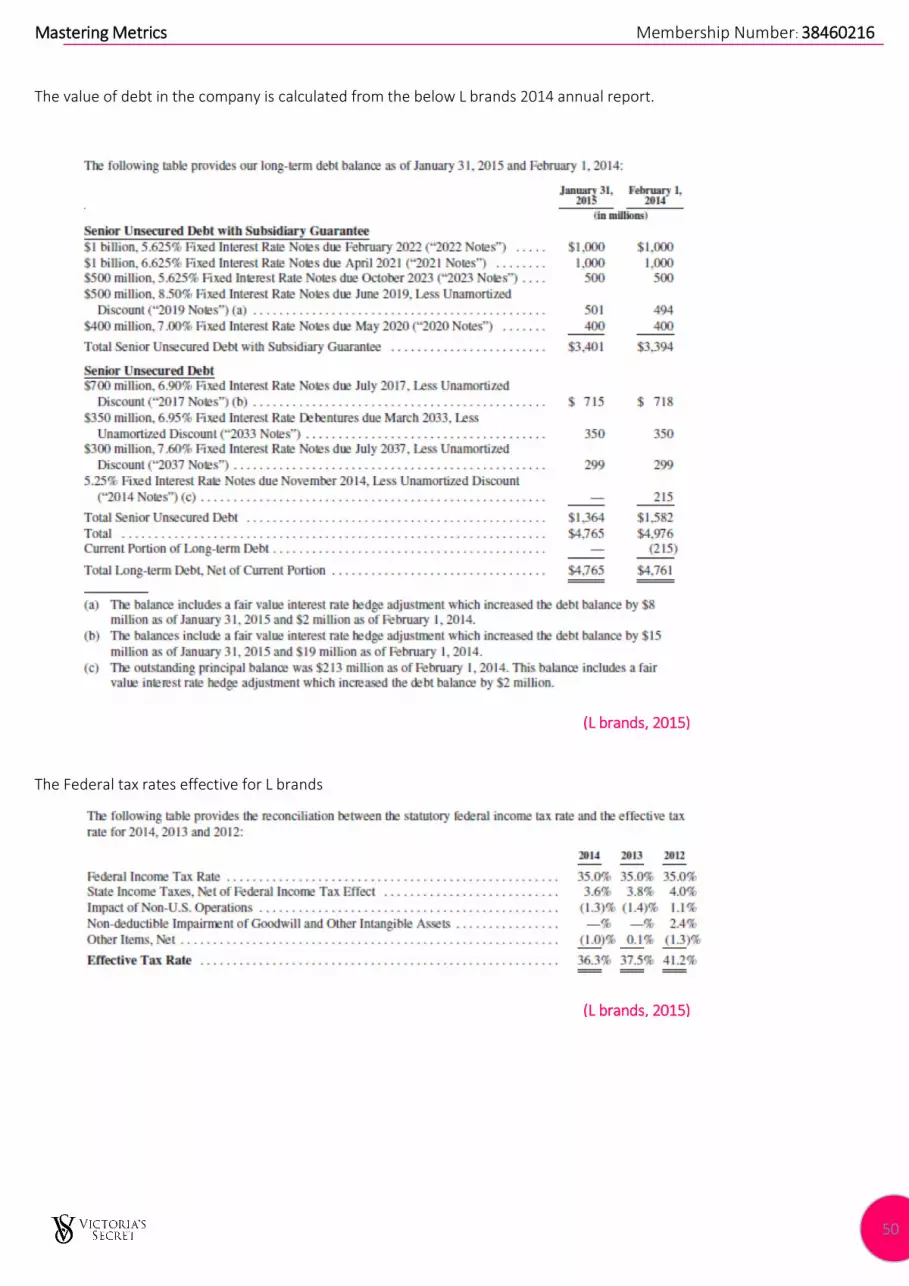
The value of debt in the company is calculated from the below L brands 2014 annual report.
The Federal tax rates effective for L brands
(L brands, 2015)
(L brands, 2015)
Mastering Metrics Membership Number: 38460216
51
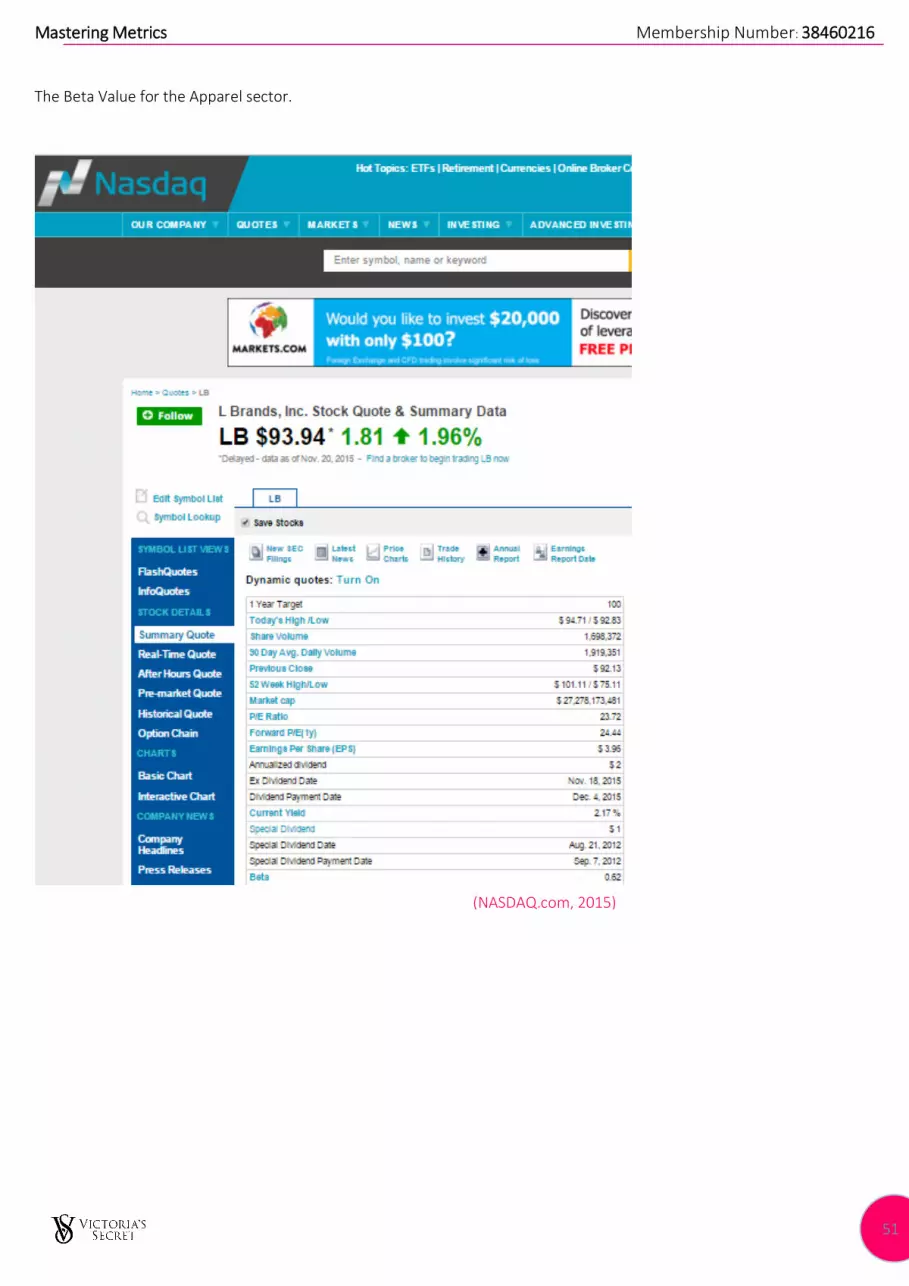
The Beta Value for the Apparel sector.
(NASDAQ.com, 2015)
Mastering Metrics Membership Number: 38460216
52
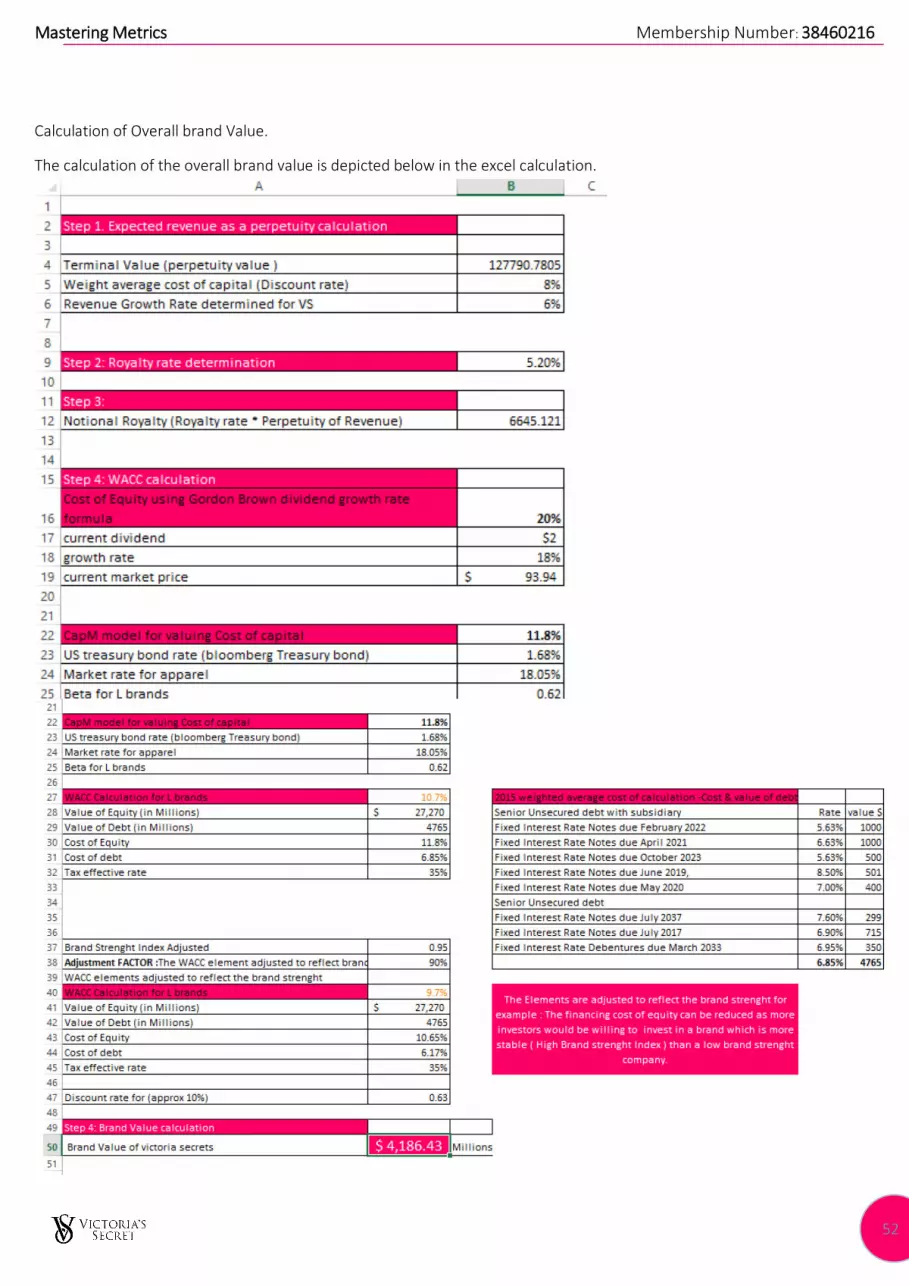
Calculation of Overall brand Value.
The calculation of the overall brand value is depicted below in the excel calculation.


