Subdiffusive Molecular Motion in Nanochannels Observed by Fluorescence Correlation Spectroscopy Ilaria De Santo, †,‡ Filippo Causa, § and Paolo A. Netti* ,†,‡ Interdisciplinary Research Centre on Biomaterials (CRIB), University Federico II, Piazzale Tecchio 80, 80125, Naples, Italy, Italian Institute of Technology (IIT), Via Morego, 30 Genoa, Italy, and Department of Experimental and Clinical Medicine, University Magna Graecia, Germaneto, 88100, Catanzaro, Italy The influence of confinement on biomolecule motion in glass channels of nanometric height has been investigated with fluorescence correlation spectroscopy (FCS). We measured intrachannel molecule diffusion time and con- centration based on a single-component diffusion model as a function of molecule size to channel height (r g /h). Poly(ethylene glycol) (PEG) of 20 kDa and dextran of 40 kDa showed a reduction of their diffusion coef- ficients of almost 1 order of magnitude when nanochan- nel height approached probe diameter, whereas rhoda- mine 6G (Rh6G) was shown to be almost unaffected from confinement. Subdiffusive motion has been proven for flexible molecules in nanochannels, and deviations toward a square root dependence of mobility with time for confinement up to molecule size r g /h ∼ 0.5 were registered. Diffusion coefficient time dependence has been evaluated and described with a model that ac- counts for diffusion time increase due to molecule rearrangements related to molecule flexibility and surface interactions dynamics. The evaluation of the subdiffusive mode and the key parameters extracted at the single-molecule level of partitioning, intrachannel diffusion time, desorption time, and binding probability at surfaces can be exploited for the engineering of bioanalytic nanodevices. Nanomaterials and nanodevices are receiving an increasing scientific and technological interest due to their high potential impact in biomedical applications such as single-molecule se- quencing, drug delivery devices, biosensors, and macromolecule separation devices. 1,2 Most of these devices’ functions rely upon the dynamic interaction between a molecule and the nanostructure that ultimately controls, at the single-molecule domain, specific molecular events, even in the absence of convective flux. Indeed, the presence of pores or channels on the nanometric range may allow a fine-tuning of these interactions resulting in very interest- ing features. 3,4 In particular, though usually adequate to describe mass exchange within a thin membrane, in the case of size proximity of the membrane’s pore and molecule’s diameter, Fick’s laws for diffusion were demonstrated to fail. 5,6 In drug release experiments, micromachined membranes with rectangular pores nanometric only in one direction showed an increasing deviation from Fick’s law in the release profile of therapeutic drugs and the attainment of zero-order release kinetic with the increasing ratio of molecule size to membrane height. 7 Reported deviations are usually ascribed 8 to a diverse diffusion regime associated to the mechanism commonly known in the physic field as single- file diffusion, 9 but there is still no experimental evidence in literature of such a single-file diffusion mechanism under nanoconfinement. The exploitation of nanofluidic technologies has led to a better comprehension of several transport phenomena arising on such length scales, revealing the increasing interest in this field. 10 A great contribution has been given recently especially to those nanoscale phenomena related to electrokinetic effects relevant for all applications implying charged molecules or charged nanostruc- tures. 11-13 In particular, DNA molecules have been widely investigated for the evaluation of both static and dynamic proper- ties under nanometer-sized confinements. 14 On the other hand, in relationship to neutral particles’ diffusion through nanopores, deviations from classic laws were already reported more than 20 years ago, 15 but still the mechanism of intrapore partitioning and diffusion in confined structures has not * To whom correspondence should be addressed. E-mail: [email protected]. † University Federico II. ‡ Italian Institute of Technology. § University Magna Graecia. (1) Han, J.; Craighead, H. G. Science 2000, 288, 1026–1029. (2) Eijkel, J. C. T.; van den Berg, A. Microfluid. Nanofluid. 2005, 1, 249–267. (3) Gee, M. L.; McGuiggan, P. M.; Israelachvili, J. N.; Homola, H. M. J. Chem. Phys. 1990, 93 (3), 1985–1990. (4) Mukhopadhyay, A.; Zhao, J.; Bae, S. C.; Granick, S. Phys. Rev. Lett. 2002, 89 (13), 136103–136106. (5) Martin, F.; Walczak, R.; Boiarski, A.; Cohen, M.; West, T.; Cosentino, C.; Ferrari, M. J. Controlled Release 2005, 102 (1), 123–133. (6) Cosentino, C.; Amato, F.; Walczak, R.; Boiarski, A.; Ferrari, M. J. Phys. Chem. B 2005, 109 (15), 7358–7364. (7) Desai, T. A.; Hansford, D.; Ferrari, M. J. Membr. Sci. 1999, 159 (1-2), 221–231. (8) Peng, L.; Mendelsohn, A. D.; LaTempa, T. J.; Yoriya, S.; Grimes, C. A.; Desai, T. A. Nano Lett. 2009, 9 (5), 1932–1936. (9) Kimmich, R. Chem. Phys. 2002, 284 (1-2), 253–285. (10) Sparreboom, W.; van den Berg, A.; Eijkel, J. C. T. Nat. Nanotechnol. 2009, 4, 713–720. (11) Schoch, R. B.; Han, J.; Renaud, P. Rev. Mod. Phys. 2008, 80, 839–883. (12) Abgrall, P.; Nguyen, N. T. Anal. Chem. 2008, 80 (7), 2326–2341. (13) Plecis, A.; Schoch, R. B.; Renaud, P. Nano Lett. 2005, 5 (6), 1147–1155. (14) Balducci, A.; Mao, P.; Han, J.; Doyle, P. S. Macromolecules 2006, 39, 6273– 6281. (15) Cannell, D. S.; Rondelez, F. Macromolecules 1980, 13, 1599–1602. Anal. Chem. 2010, 82, 997–1005 10.1021/ac902270k 2010 American Chemical Society 997 Analytical Chemistry, Vol. 82, No. 3, February 1, 2010 Published on Web 01/04/2010
Transcript
Subdiffusive Molecular Motion in NanochannelsObserved by Fluorescence CorrelationSpectroscopy
Ilaria De Santo,†,‡ Filippo Causa,§ and Paolo A. Netti*,†,‡
Interdisciplinary Research Centre on Biomaterials (CRIB), University Federico II, Piazzale Tecchio 80, 80125, Naples,Italy, Italian Institute of Technology (IIT), Via Morego, 30 Genoa, Italy, and Department of Experimental and ClinicalMedicine, University Magna Graecia, Germaneto, 88100, Catanzaro, Italy
The influence of confinement on biomolecule motion inglass channels of nanometric height has been investigatedwith fluorescence correlation spectroscopy (FCS). Wemeasured intrachannel molecule diffusion time and con-centration based on a single-component diffusion modelas a function of molecule size to channel height (rg/h).Poly(ethylene glycol) (PEG) of 20 kDa and dextran of40 kDa showed a reduction of their diffusion coef-ficients of almost 1 order of magnitude when nanochan-nel height approached probe diameter, whereas rhoda-mine 6G (Rh6G) was shown to be almost unaffectedfrom confinement. Subdiffusive motion has been provenfor flexible molecules in nanochannels, and deviationstoward a square root dependence of mobility with timefor confinement up to molecule size rg/h ! 0.5 wereregistered. Diffusion coefficient time dependence hasbeen evaluated and described with a model that ac-counts for diffusion time increase due to moleculerearrangements related to molecule flexibility andsurface interactions dynamics. The evaluation of thesubdiffusive mode and the key parameters extractedat the single-molecule level of partitioning, intrachanneldiffusion time, desorption time, and binding probabilityat surfaces can be exploited for the engineering ofbioanalytic nanodevices.
Nanomaterials and nanodevices are receiving an increasingscientific and technological interest due to their high potentialimpact in biomedical applications such as single-molecule se-quencing, drug delivery devices, biosensors, and macromoleculeseparation devices.1,2 Most of these devices’ functions rely uponthe dynamic interaction between a molecule and the nanostructurethat ultimately controls, at the single-molecule domain, specificmolecular events, even in the absence of convective flux. Indeed,the presence of pores or channels on the nanometric range mayallow a fine-tuning of these interactions resulting in very interest-
ing features.3,4 In particular, though usually adequate to describemass exchange within a thin membrane, in the case of sizeproximity of the membrane’s pore and molecule’s diameter, Fick’slaws for diffusion were demonstrated to fail.5,6 In drug releaseexperiments, micromachined membranes with rectangular poresnanometric only in one direction showed an increasing deviationfrom Fick’s law in the release profile of therapeutic drugs andthe attainment of zero-order release kinetic with the increasingratio of molecule size to membrane height.7 Reported deviationsare usually ascribed8 to a diverse diffusion regime associated tothe mechanism commonly known in the physic field as single-file diffusion,9 but there is still no experimental evidence inliterature of such a single-file diffusion mechanism undernanoconfinement.
The exploitation of nanofluidic technologies has led to a bettercomprehension of several transport phenomena arising on suchlength scales, revealing the increasing interest in this field.10 Agreat contribution has been given recently especially to thosenanoscale phenomena related to electrokinetic effects relevant forall applications implying charged molecules or charged nanostruc-tures.11-13 In particular, DNA molecules have been widelyinvestigated for the evaluation of both static and dynamic proper-ties under nanometer-sized confinements.14
On the other hand, in relationship to neutral particles’ diffusionthrough nanopores, deviations from classic laws were alreadyreported more than 20 years ago,15 but still the mechanism ofintrapore partitioning and diffusion in confined structures has not
* To whom correspondence should be addressed. E-mail: [email protected].† University Federico II.‡ Italian Institute of Technology.§ University Magna Graecia.
(1) Han, J.; Craighead, H. G. Science 2000, 288, 1026–1029.(2) Eijkel, J. C. T.; van den Berg, A. Microfluid. Nanofluid. 2005, 1, 249–267.
(3) Gee, M. L.; McGuiggan, P. M.; Israelachvili, J. N.; Homola, H. M. J. Chem.Phys. 1990, 93 (3), 1985–1990.
(4) Mukhopadhyay, A.; Zhao, J.; Bae, S. C.; Granick, S. Phys. Rev. Lett. 2002,89 (13), 136103–136106.
(5) Martin, F.; Walczak, R.; Boiarski, A.; Cohen, M.; West, T.; Cosentino, C.;Ferrari, M. J. Controlled Release 2005, 102 (1), 123–133.
(6) Cosentino, C.; Amato, F.; Walczak, R.; Boiarski, A.; Ferrari, M. J. Phys. Chem.B 2005, 109 (15), 7358–7364.
(7) Desai, T. A.; Hansford, D.; Ferrari, M. J. Membr. Sci. 1999, 159 (1-2),221–231.
(8) Peng, L.; Mendelsohn, A. D.; LaTempa, T. J.; Yoriya, S.; Grimes, C. A.;Desai, T. A. Nano Lett. 2009, 9 (5), 1932–1936.
(9) Kimmich, R. Chem. Phys. 2002, 284 (1-2), 253–285.(10) Sparreboom, W.; van den Berg, A.; Eijkel, J. C. T. Nat. Nanotechnol. 2009,
4, 713–720.(11) Schoch, R. B.; Han, J.; Renaud, P. Rev. Mod. Phys. 2008, 80, 839–883.(12) Abgrall, P.; Nguyen, N. T. Anal. Chem. 2008, 80 (7), 2326–2341.(13) Plecis, A.; Schoch, R. B.; Renaud, P. Nano Lett. 2005, 5 (6), 1147–1155.(14) Balducci, A.; Mao, P.; Han, J.; Doyle, P. S. Macromolecules 2006, 39, 6273–
6281.(15) Cannell, D. S.; Rondelez, F. Macromolecules 1980, 13, 1599–1602.
Anal. Chem. 2010, 82, 997–1005
10.1021/ac902270k ! 2010 American Chemical Society 997Analytical Chemistry, Vol. 82, No. 3, February 1, 2010Published on Web 01/04/2010
been fully modeled especially for the flexible molecules case.16
In addition, the influence upon diffusion reduction of steric factorsand surface interactions are often emphasized,17,18 but poorlyunderstood.
To assess the source of the departure of the transportmechanism from the Fickian behavior, it is necessary to investi-gate on the dynamics occurring within single nanochannels at asingle-molecule level. This makes feasible discriminating fromdynamics related to the nanochannel entrance event rather thandiverse diffusion mechanisms occurring within the confinednanochannel space.19 One way to study molecular motion at thenanoscale is to perform fluorescence correlation spectroscopy(FCS) in nanometer-sized apertures, which could allow single-molecule observations within small volumes down to attoliterdimensions.
In this paper the influence of slitlike confinement on themolecular motion is investigated by confining molecules innanochannels having only one dimension, the height h, close tothe bulk size rg of the molecule. Both small rigid moleculessuch as rhodamine 6G (Rh6G) dyes and uncharged flexiblemacromolecules such as dextran or poly(ethylene glycol)(PEG) were considered. We measured by FCS a reduction inmobility for the large flexible molecules giving experimentalevidence of deviations toward a subdiffusive mobility at thesingle-molecule level for increasing confinement extent. Thiswas correlated to the confinement degree over the nanometricdimensions through a parameter which takes into account adiverse mechanism of motion due to conformational rearrange-ments and transient binding to nanochannel surfaces. Partition-ing and adsorption times on channel walls have been extractedand characterized in relation to molecule properties. As a result,this study provides new insights in the understanding oftransport phenomena in nanofluidics of biomolecules understrong steric confinement extent.
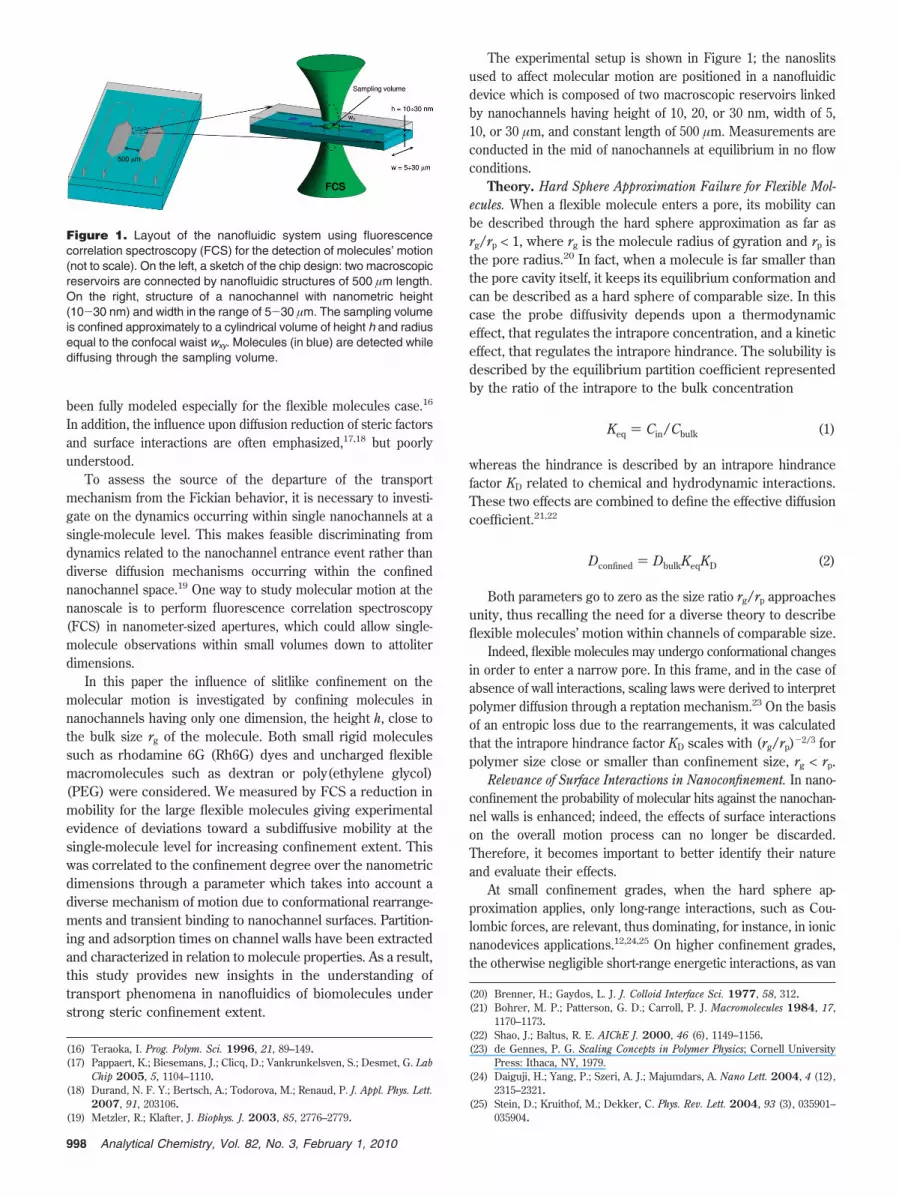
The experimental setup is shown in Figure 1; the nanoslitsused to affect molecular motion are positioned in a nanofluidicdevice which is composed of two macroscopic reservoirs linkedby nanochannels having height of 10, 20, or 30 nm, width of 5,10, or 30 µm, and constant length of 500 µm. Measurements areconducted in the mid of nanochannels at equilibrium in no flowconditions.
Theory. Hard Sphere Approximation Failure for Flexible Mol-ecules. When a flexible molecule enters a pore, its mobility canbe described through the hard sphere approximation as far asrg/rp < 1, where rg is the molecule radius of gyration and rp isthe pore radius.20 In fact, when a molecule is far smaller thanthe pore cavity itself, it keeps its equilibrium conformation andcan be described as a hard sphere of comparable size. In thiscase the probe diffusivity depends upon a thermodynamiceffect, that regulates the intrapore concentration, and a kineticeffect, that regulates the intrapore hindrance. The solubility isdescribed by the equilibrium partition coefficient representedby the ratio of the intrapore to the bulk concentration
Keq ) Cin/Cbulk (1)
whereas the hindrance is described by an intrapore hindrancefactor KD related to chemical and hydrodynamic interactions.These two effects are combined to define the effective diffusioncoefficient.21,22
Dconfined ) DbulkKeqKD (2)
Both parameters go to zero as the size ratio rg/rp approachesunity, thus recalling the need for a diverse theory to describeflexible molecules’ motion within channels of comparable size.
Indeed, flexible molecules may undergo conformational changesin order to enter a narrow pore. In this frame, and in the case ofabsence of wall interactions, scaling laws were derived to interpretpolymer diffusion through a reptation mechanism.23 On the basisof an entropic loss due to the rearrangements, it was calculatedthat the intrapore hindrance factor KD scales with (rg/rp)-2/3 forpolymer size close or smaller than confinement size, rg < rp.
Relevance of Surface Interactions in Nanoconfinement. In nano-confinement the probability of molecular hits against the nanochan-nel walls is enhanced; indeed, the effects of surface interactionson the overall motion process can no longer be discarded.Therefore, it becomes important to better identify their natureand evaluate their effects.
At small confinement grades, when the hard sphere ap-proximation applies, only long-range interactions, such as Cou-lombic forces, are relevant, thus dominating, for instance, in ionicnanodevices applications.12,24,25 On higher confinement grades,the otherwise negligible short-range energetic interactions, as van
(16) Teraoka, I. Prog. Polym. Sci. 1996, 21, 89–149.(17) Pappaert, K.; Biesemans, J.; Clicq, D.; Vankrunkelsven, S.; Desmet, G. Lab
Chip 2005, 5, 1104–1110.(18) Durand, N. F. Y.; Bertsch, A.; Todorova, M.; Renaud, P. J. Appl. Phys. Lett.
2007, 91, 203106.(19) Metzler, R.; Klafter, J. Biophys. J. 2003, 85, 2776–2779.
(20) Brenner, H.; Gaydos, L. J. J. Colloid Interface Sci. 1977, 58, 312.(21) Bohrer, M. P.; Patterson, G. D.; Carroll, P. J. Macromolecules 1984, 17,
1170–1173.(22) Shao, J.; Baltus, R. E. AIChE J. 2000, 46 (6), 1149–1156.(23) de Gennes, P. G. Scaling Concepts in Polymer Physics; Cornell University
Press: Ithaca, NY, 1979.(24) Daiguji, H.; Yang, P.; Szeri, A. J.; Majumdars, A. Nano Lett. 2004, 4 (12),
2315–2321.(25) Stein, D.; Kruithof, M.; Dekker, C. Phys. Rev. Lett. 2004, 93 (3), 035901–
035904.
Figure 1. Layout of the nanofluidic system using fluorescencecorrelation spectroscopy (FCS) for the detection of molecules’ motion(not to scale). On the left, a sketch of the chip design: two macroscopicreservoirs are connected by nanofluidic structures of 500 µm length.On the right, structure of a nanochannel with nanometric height(10-30 nm) and width in the range of 5-30 µm. The sampling volumeis confined approximately to a cylindrical volume of height h and radiusequal to the confocal waist wxy. Molecules (in blue) are detected whilediffusing through the sampling volume.
998 Analytical Chemistry, Vol. 82, No. 3, February 1, 2010
der Waals forces or hydrophobic attractions, may become sig-nificant, thus influencing the overall molecular motion. Thoseenergetic interactions at high confinement may balance theentropic loss attributed to conformational changes of confinedflexible molecules.26 In the case of attractive interactions betweenthe macromolecule and the pore walls, the intrachannel concen-tration is predicted to be higher than the bulk one, exponentiallydepending on rg/rp. When the surface interactions balance theentropic loss, the critical adsorption point is reached and thepartition factor Keq would not depend on rg/rp for ideal chains,whereas a moderate dependence is predicted for self-avoidingrandom walks.27 Moreover it was simulated that macromol-ecule motion within a pore is not suppressed even in the caseof strong adsorption and the intrapore chain diffusivity keepsthe same order of magnitude of the bulk value.28,29 Even thougha diverse scaling law of diffusivity addressed the surface dynamicsto a reptation mechanism, other results claimed the importanceof such other parameters related to surface properties (e.g.,chemistry, roughness).30,31 Surface interactions may thus play arelevant role on the overall mechanism of motion. Then theunderstanding of intrachannel diffusion is further complicated inthe case of flexible molecules where surface dynamics occur.Indeed, whereas ions are fully trapped when bound to a surface,flexible macromolecules have specific binding sites along theirchain and, hence, still may fluctuate on the surface. The ability tofluctuate around the binding sites was demonstrated to be aninverse function of the number of monomers, as demonstratedfor anionic DNA adsorbed via ionic attractions to cationic sur-faces,32 whereas a stronger power law dependence with themonomers number was shown in the case of PEG adsorbed ontohydrophobic solid surfaces.33
Fluorescence Correlation Spectroscopy. FCS measures fluores-cence intensity fluctuations due to Brownian motion of fewfluorochrome molecules in an illuminated volume smaller than afemtoliter. Through a time correlation analysis of the intensityfluctuations, it unravels molecular hydrodynamic properties at asingle-molecule level.34,35 Though usually applied to cellularenvironment investigations,36 FCS has also been applied to velocitymeasurements in microfluidics, to the detection of molecularmotion in micrometric and submicrometric structures,37-39 andrecently to the detection of proteins in nanochannels with a major
attention to the effects of ionic strength on the partition parameterunder the hard sphere assumption.40
For fluorescence fluctuations caused by Brownian diffusion ofone species in a Gaussian illumination profile, the classic three-dimensional (3D) autocorrelation function (ACF) is described bythe equation given below35
G(!) ) 1"N#(1 + "e-!/!T
1 - " )( 11 + (!/!diff
))" 11 + s2(!/!diff
)
(3)
where "N# is the mean number of particles, " is the triplet kineticsfraction, !T is the triplet time, !diff is the diffusion time, and s isthe structure parameter which is defined as the ratio of theheight wz and the lateral waist wxy of the detection volume, s )wz/wxy.
In nanochannels the detection volume is further confined tonanochannel height; therefore, a proper model to interpret motionis needed.41 Indeed, the confocal volume is reduced to a nano-metric slice as restricted from channel walls over the verticaldimension (left side of Figure 1). The sensitivity of the experi-mental setup over the z direction is drastically reduced; therefore,motion is perceived as a two-dimensional (2D) diffusion process.Moreover, additional lateral boundaries may influence the ACF,and the regions of applicability of the analytical solutions forunconfined geometries were demonstrated.42 In particular, in oursystems influence of lateral boundaries was avoided. Thus, anunconfined single-species 2D diffusion model was used to analyzedata as reported in eq 4.
G(!) ) 1"N#(1 + "e-!/!T
1 - " )( 11 + (!/!diff
)) (4)
In the presence of immobilized obstacles that hamper molec-ular motion by an excluded volume interaction, the ratio betweenthe mean square displacement, "r2#, and time43
D ) "r2#/2nt (5)
that is, the diffusion coefficient in Fickian diffusion exhibits a timedependence
D(t) ) !tR-1/2n (6)
where ! is usually referred to as the transport factor, and whereR is the anomaly coefficient which expresses the time dependenceof the diffusion process and spans from 0 to 1 in an n-dimensionalspace.44,45 This behavior is called anomalous subdiffusion. Anoma-lous diffusion was shown in intracellular diffusion motion, in
(26) Gorbunov, A. A.; Skvortsov, A. M. Adv. Colloid Interface Sci. 1995, 62 (1),31–108.
(27) Cifra, P.; Bleha, T. Polymer 2000, 41 (3), 1003–1009.(28) Milchev, A.; Paul, W.; Binder, K. Macromol. Theory Simul. 1994, 3, 305–
323.(29) Milchev, A.; Binder, K. J. Comput.-Aided Mater. Des. 1995, 2, 167–181.(30) Sukhishvili, S. A.; Chen, Y.; Muller, J. D.; Gratton, E.; Schweizer, K. S.;
Granick, S. Nature 2000, 406, 6792–146.(31) Mukherji, D.; Bartels, G.; Muser, M. H. Phys. Rev. Lett. 2008, 100, 068301–
068304.(32) Maier, B.; Radler, J. O. Phys. Rev. Lett. 1999, 82, 1911–1914.(33) Sukhishvili, S. A.; Chen, Y.; Muller, J. D.; Gratton, E.; Schweizer, K. S.;
Granick, S. Macromolecules 2002, 35, 1776–1784.(34) Elson, E. L.; Magde, D. Biopolymers 1974, 13 (1), 1–27.(35) Aragon, S.; Pecora, R. J. Chem. Phys. 1976, 64, 1791.(36) Schwille, P.; Haupts, U.; Maiti, S.; Webb, W. W. Biophys. J. 1999, 77, 2251–
2265.(37) Gosch, M.; Blom, H.; Holm, J.; Heino, T.; Rigler, R. Anal. Chem. 2000, 72
(14), 3260–3265.(38) Lenne, P.-F.; Colombo, D.; Giovannini, H.; Rigneault, H. Single Mol. 2002,
3 (4), 194–200.(39) Petrasek, Z.; Krishnan, M.; Monch, I.; Schwille, P. Microsc. Res. Tech. 2007,
70, 459–466.
(40) Durand, N. F. Y.; Dellagiacoma, C.; Goetschmann, R.; Bertsch, A.; Marki,I.; Lasser, T.; Renaud, P. Anal. Chem. 2009, 81, 5407–5412.
(41) Foquet, M.; Korlach, J.; Zipfel, W. R.; Webb, W. W.; Craighead, H. G. Anal.Chem. 2004, 76, 1618–1626.
(42) Gennerich, A.; Schild, D. Biophys. J. 2000, 79, 3294–3306.(43) Bouchaud, J.-P.; Georges, A. Phys. Rep. 1990, 195, 127–293.(44) Saxton, M. J. Biophys. J. 1994, 66, 394–401.(45) Wu, J.; Berland, K. M. Biophys. J. 2008, 95 (4), 2049–2052.
999Analytical Chemistry, Vol. 82, No. 3, February 1, 2010
diffusion in zeolites, and in mesoporous materials.9,46,47 Theanomaly parameter R is equal to 1 for free diffusion, and decreaseswith increasing obstacle concentration, thus being R < 1 forsubdiffusive processes. The analytical ACF model that accountsfor an anomalous diffusion behavior is reported in eq 7, where!diff is the diffusion time and R is the anomaly parameter.
G(!) ) 1"N#(1 + "e-!/!T
1 - " )( 11 + (!/!diff
)R) (7)
In particular, a nonuniform waiting time distribution wasdemonstrated to generate anomalous behaviors. In fact, theprobability to find a flexible chain at a position x at time t changesdramatically from the classic Brownian distribution if moleculardisplacement is affected by a waiting time distribution whichregulates the sticking time interval between motions.48 Surfaceinteractions may generate through reversible adsorption eventssuch a nonuniform waiting time distribution of mobility steps. TheACF model that accounts for diffusion as well as rare and strongadsorption events, having mean desorption time !Des, is given ineq 8, where funbound represents the probability that a moleculein equilibrium is in the unbound state.49,50
G(!) ) 1"N#(1 + "e-!/!T
1 - " )((funbound) 1
1 + ( !!diff)
+
(1 - funbound)e-!/!Des) (8)
In particular, !Des is equal to the inverse of the rate constantfor desorption of adsorbed molecules and reflects the averagelength of time the molecules spend adsorbed on the nanochan-nel walls. The diffusion time !diff can strongly differ from thebulk one under strong confinement, due to the molecularrearrangements adopted in a constrained scenario.
In addition, where no mutual passage of particles is allowed,the mean square displacement results proportional to the squareroot of time causing the onset of a single-file dynamic character-ized by a diffusion coefficient51-53
D(t) ) !/2n$t (9)
where the anomaly coefficient is equal to 0.5.
EXPERIMENTAL SECTIONBorosilicate nanochannels manufactured by chemical etching
and direct bonding procedures were used to affect molecules
mobility (Micronit Microfluidics, Enschede, The Netherlands).Channels are nanometric in depth and micrometric in width; inparticular, depths are 10, 20, and 30 nm, whereas widths are 5,10, or 30 µm with constant length of 500 µm. As declared frommanufacturer, the nanochannel’s surface roughness was less than1 nm and contact angle measured 18° ± 8°. Fluidic connectionswere purchased from Upchurch Scientific, U.S.A. Borosilicateglass syringes equipped with PEEK connectors were purchasedfrom ILS (Innovative Labor System, Germany). Microcapillarieswere used to connect the syringes to the chip. We performed FCSon Rh6G (MW ) 479) (Fulka, Sigma-Aldrich), dextran 40kDasTMR, neutral (Molecular Probes Invitrogen), and PEG 20kDasRB, neutral (Nanocs, New York) to evaluate the influenceof size, flexibility, and chemistry upon the undergoing transportmechanism. DI water (pH ) 6.3, 18 M" · cm-1) filtered with 100µm filters (Whatman), as to avoid dust clogging in thereservoirs, was used to prepare fresh solutions. A confocalfluorescence correlation spectroscope, ConfoCorII (Carl Zeiss,Jena, Germany), was used to carry out FCS experiments. Rh6Gand RB were excited by laser light at 488 nm, whereas TMRwas at 543 nm. The laser beam was focused by an Apochromat63% water immersion objective (numerical aperture of 1.2). Theemitted fluorescent light was collected by the same objectiveand separated from the excitation light by a dichroic mirror.The emission beam was mapped onto a pinhole in the imageplane of the objective (70 µm at 488 nm and 80 µm at 543 nm).Fluorescent emission was sent to a 530 nm LP or to a 560-615BP filter in correspondence of the two excitation lengths,respectively, and then acquired on the avalanche photodiode(APD). Fluorescence was detected by an APD in single-photon-counting mode. The system built-in correlator was employedfor bulk measurements though a custom-developed software(Fluctuation Analyzer) was dedicated to the analysis of allmeasurements in nanoconfinement. Nanochannels were placedin a custom-designed chip holder, and all the fluidic connectionswere properly set. Chips were connected by PEEK connectorsto a syringe filled with solution, preconditioned with DI water,and then loaded with a nanomolar solution of fluorescentmolecules. A small pressure was applied, and the solution wassucked into the micrometric reservoirs; then, when no residualflux was registered, microcapillaries were connected in orderto prevent evaporation from reservoirs. Nanochannels were letto equilibrate overnight before measurements to permit thefluorescent solution to diffuse from the micrometric reservoirsto the nanochannels, which were previously imaged for control.In order to minimize artifacts due to focus positioning withrespect to the channel height, focus was positioned in cor-respondence to the maximum molecular brightness41 andperformed in the middle of nanochannels to avoid laser beamlateral confinement. Each experiment was carried out at least10 times to have statistical information in three differentexperimental cells at 23 °C in a thermostatted environment.For each molecule, experiments were repeated in every channelheight available, i.e., 10, 20, and 30 nm. All ACFs werecalculated directly from signal trajectories. Data were acquiredwith a bin time of 1 µs. To optimize computer performance,data were further binned during analysis to 10 µs. Themaximum lag time was set to 30 s for bulk measurements and
(46) Wachsmuth, M.; Waldeck, W.; Langowski, J. J. Mol. Biol. 2000, 298, 677–689.
(47) Seymour, J. D.; Gage, J. P.; Codd, S. L.; Gerlach, R. Phys. Rev. Lett. 2004,93 (19), 198103–198106.
(48) Saxton, M. J. Biophys. J. 1996, 70, 1250–1262.(49) Wirth, M. J. Appl. Spectrosc. 2001, 55 (6), 663–669.(50) Wirth, M. J.; Legg, M. A. Annu. Rev. Phys. Chem. 2007, 58, 489–510.(51) Lutz, C.; Kollmann, M.; Bechinger, C. Phys. Rev. Lett. 2004, 93 (2), 26001–
26004.(52) Chou, C. Y.; Eng, B. C.; Robert, M. J. Chem. Phys. 2006, 124 (4), 044902.(53) Mathe, J.; Di Meglio, J. M.; Tinland, B. J. Colloid Interface Sci. 2008, 322
(1), 315–320.
1000 Analytical Chemistry, Vol. 82, No. 3, February 1, 2010
to 300 s for nanochannels measurements. Averaging wasperformed over an acquisition period up to 20 min formacromolecules measurements via post ACF calculation. Thetranslational diffusion time and the number of fluorescentparticles in the sampling volume were obtained from the ACFof the intensity fluctuations monitored as a function of time.In order to detect a significant count rate we increased thelabeled solution concentration of an order of magnitude.Solutions used for FCS measurements were 100 nM, whereasbulk solutions were 10 nM. Focal volume parameters were fitfrom AC curves of Rh6G dye diffusing in water (diffusioncoefficient 2.8 % 10-6 cm2/s) and eq 3 to obtain a preciseevaluation of beam radius, wxy, and height, wz, as needed in orderto obtain information on diffusing fluorophores that are relatedto the dimensions of the confocal volume.54 In particular 1/e2
radii wxy measured 0.19 µm at 488 nm and 0.23 µm at 543 nm.The measured ACFs were fitted with the nonlinear fittingroutineonOriginMicrocal7.0basedontheLevenberg-Marquardtalgorithm.
Hydrodynamic properties of molecules were calculated byusing the Stokes-Einstein equation
D ) kT/6#rh$ (10)
where D is the diffusion coefficient, rh is the hydrodynamicradius, $ is the viscosity of the solvent, T is the temperature,and k is Boltzmann’s constant. D was evaluated from thediffusion time extracted from fitting procedures followingequation
D ) wxy2/4!diff (11)
(where wxy has been fixed from calibration). PEG 20 kDamolecules showed rh of 5.3 nm, dextran 40 kDa of 4.5 nm, andRh6G of 0.8 nm.
Taking into account the sampling confocal volume shown inFigure 1, volume was evaluated from the cylindrical shapeobtained from fixed waist size and nominal channel height. Theinner molecule concentration within nanochannels was thenmeasured as
Cin )"N#
V# (12)
where # is the Avogadro number.
RESULTS AND DISCUSSIONSubdiffusive Motion in Nanoconfinement. The ACF for
Rh6G, PEG 20 kDa, and dextran 40 kDa molecules in bulk andnanochannels of 30, 20, and 10 nm heights were evaluated. Controlmeasurements were carried out in the macroscopic reservoirs toobtain bulk diffusion coefficients of the molecules investigated.Single-molecule observations from fluorescence fluctuations analy-sis were confirmed by measured experimental concentrationswhich assessed mean particle number around 1 in the confineddetection volume for all molecules investigated. The measure-
ments were reproducible within ±20% when made at differentpoints in the same channel or repeated in independent setups (newchannel, new labeled solution).
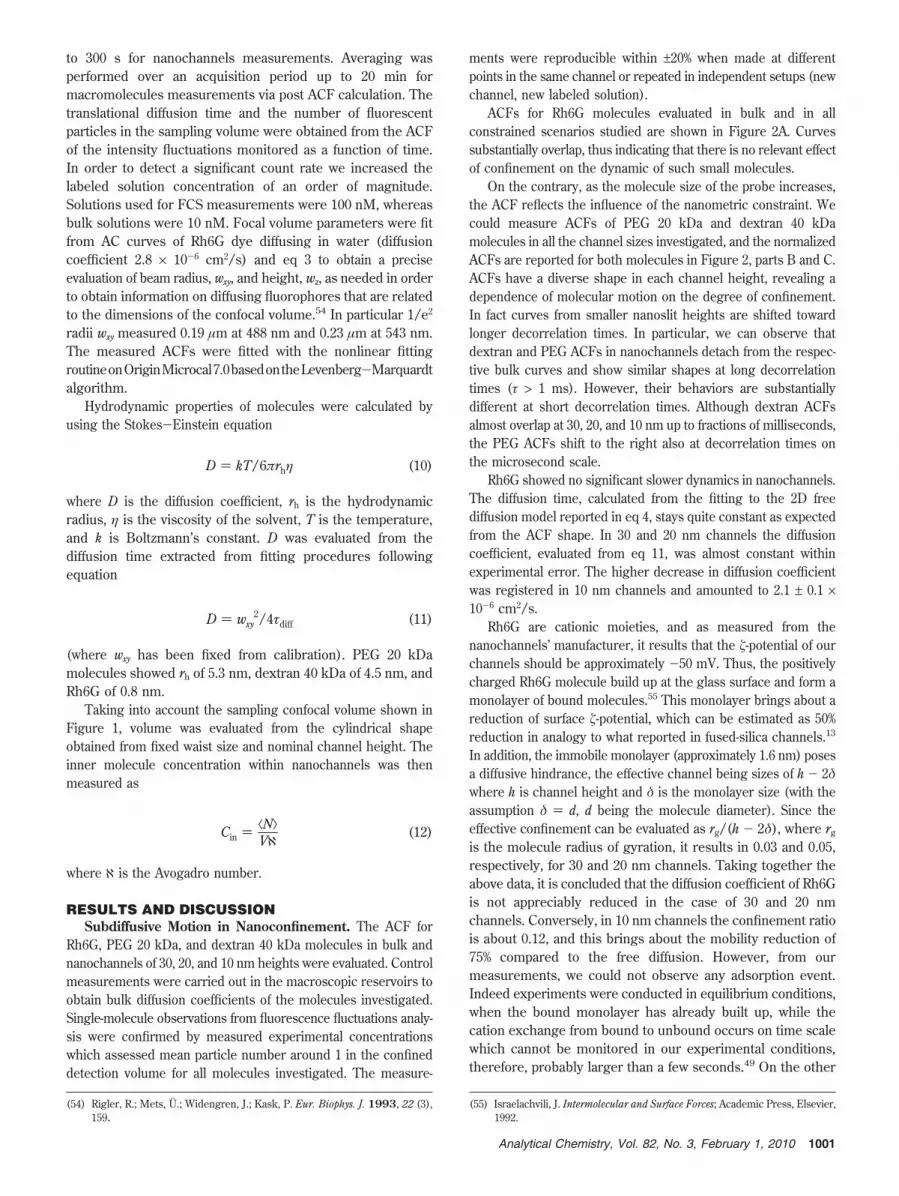
ACFs for Rh6G molecules evaluated in bulk and in allconstrained scenarios studied are shown in Figure 2A. Curvessubstantially overlap, thus indicating that there is no relevant effectof confinement on the dynamic of such small molecules.
On the contrary, as the molecule size of the probe increases,the ACF reflects the influence of the nanometric constraint. Wecould measure ACFs of PEG 20 kDa and dextran 40 kDamolecules in all the channel sizes investigated, and the normalizedACFs are reported for both molecules in Figure 2, parts B and C.ACFs have a diverse shape in each channel height, revealing adependence of molecular motion on the degree of confinement.In fact curves from smaller nanoslit heights are shifted towardlonger decorrelation times. In particular, we can observe thatdextran and PEG ACFs in nanochannels detach from the respec-tive bulk curves and show similar shapes at long decorrelationtimes (! > 1 ms). However, their behaviors are substantiallydifferent at short decorrelation times. Although dextran ACFsalmost overlap at 30, 20, and 10 nm up to fractions of milliseconds,the PEG ACFs shift to the right also at decorrelation times onthe microsecond scale.
Rh6G showed no significant slower dynamics in nanochannels.The diffusion time, calculated from the fitting to the 2D freediffusion model reported in eq 4, stays quite constant as expectedfrom the ACF shape. In 30 and 20 nm channels the diffusioncoefficient, evaluated from eq 11, was almost constant withinexperimental error. The higher decrease in diffusion coefficientwas registered in 10 nm channels and amounted to 2.1 ± 0.1 %10-6 cm2/s.
Rh6G are cationic moieties, and as measured from thenanochannels’ manufacturer, it results that the %-potential of ourchannels should be approximately -50 mV. Thus, the positivelycharged Rh6G molecule build up at the glass surface and form amonolayer of bound molecules.55 This monolayer brings about areduction of surface %-potential, which can be estimated as 50%reduction in analogy to what reported in fused-silica channels.13
In addition, the immobile monolayer (approximately 1.6 nm) posesa diffusive hindrance, the effective channel being sizes of h - 2&where h is channel height and & is the monolayer size (with theassumption & ) d, d being the molecule diameter). Since theeffective confinement can be evaluated as rg/(h - 2&), where rg
is the molecule radius of gyration, it results in 0.03 and 0.05,respectively, for 30 and 20 nm channels. Taking together theabove data, it is concluded that the diffusion coefficient of Rh6Gis not appreciably reduced in the case of 30 and 20 nmchannels. Conversely, in 10 nm channels the confinement ratiois about 0.12, and this brings about the mobility reduction of75% compared to the free diffusion. However, from ourmeasurements, we could not observe any adsorption event.Indeed experiments were conducted in equilibrium conditions,when the bound monolayer has already built up, while thecation exchange from bound to unbound occurs on time scalewhich cannot be monitored in our experimental conditions,therefore, probably larger than a few seconds.49 On the other
(54) Rigler, R.; Mets, U.; Widengren, J.; Kask, P. Eur. Biophys. J. 1993, 22 (3),159.
(55) Israelachvili, J. Intermolecular and Surface Forces; Academic Press, Elsevier,1992.
1001Analytical Chemistry, Vol. 82, No. 3, February 1, 2010
hand, adsorption phenomena for cationic moieties in negativelycharged mesoporous materials were found, and their kineticswere related mainly to interactions with topological irregulari-ties of the material surface.56-58 In our case surface corrugationsare very low thus probably attaining longer binding events.
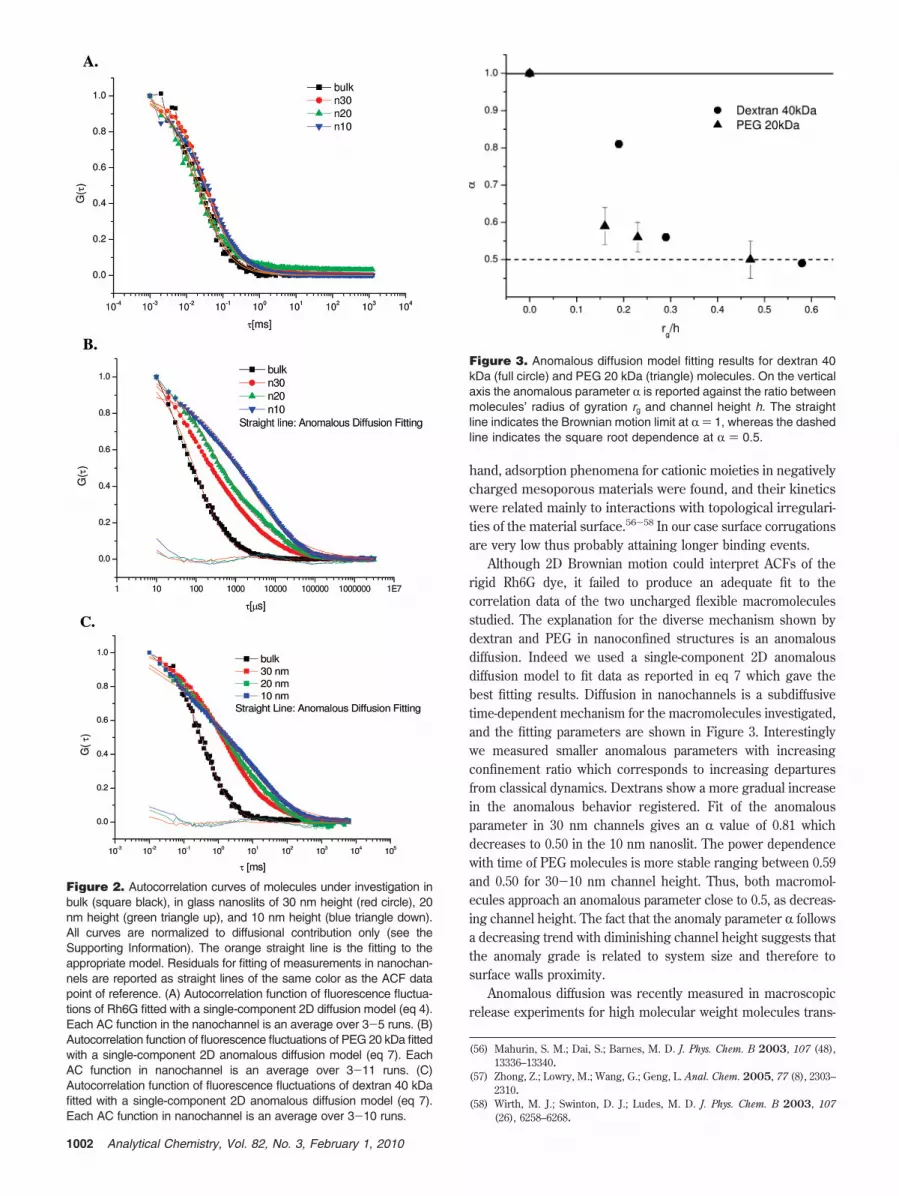
Although 2D Brownian motion could interpret ACFs of therigid Rh6G dye, it failed to produce an adequate fit to thecorrelation data of the two uncharged flexible macromoleculesstudied. The explanation for the diverse mechanism shown bydextran and PEG in nanoconfined structures is an anomalousdiffusion. Indeed we used a single-component 2D anomalousdiffusion model to fit data as reported in eq 7 which gave thebest fitting results. Diffusion in nanochannels is a subdiffusivetime-dependent mechanism for the macromolecules investigated,and the fitting parameters are shown in Figure 3. Interestinglywe measured smaller anomalous parameters with increasingconfinement ratio which corresponds to increasing departuresfrom classical dynamics. Dextrans show a more gradual increasein the anomalous behavior registered. Fit of the anomalousparameter in 30 nm channels gives an R value of 0.81 whichdecreases to 0.50 in the 10 nm nanoslit. The power dependencewith time of PEG molecules is more stable ranging between 0.59and 0.50 for 30-10 nm channel height. Thus, both macromol-ecules approach an anomalous parameter close to 0.5, as decreas-ing channel height. The fact that the anomaly parameter R followsa decreasing trend with diminishing channel height suggests thatthe anomaly grade is related to system size and therefore tosurface walls proximity.
Anomalous diffusion was recently measured in macroscopicrelease experiments for high molecular weight molecules trans-
(56) Mahurin, S. M.; Dai, S.; Barnes, M. D. J. Phys. Chem. B 2003, 107 (48),13336–13340.
(57) Zhong, Z.; Lowry, M.; Wang, G.; Geng, L. Anal. Chem. 2005, 77 (8), 2303–2310.
(58) Wirth, M. J.; Swinton, D. J.; Ludes, M. D. J. Phys. Chem. B 2003, 107(26), 6258–6268.
Figure 2. Autocorrelation curves of molecules under investigation inbulk (square black), in glass nanoslits of 30 nm height (red circle), 20nm height (green triangle up), and 10 nm height (blue triangle down).All curves are normalized to diffusional contribution only (see theSupporting Information). The orange straight line is the fitting to theappropriate model. Residuals for fitting of measurements in nanochan-nels are reported as straight lines of the same color as the ACF datapoint of reference. (A) Autocorrelation function of fluorescence fluctua-tions of Rh6G fitted with a single-component 2D diffusion model (eq 4).Each AC function in the nanochannel is an average over 3-5 runs. (B)Autocorrelation function of fluorescence fluctuations of PEG 20 kDa fittedwith a single-component 2D anomalous diffusion model (eq 7). EachAC function in nanochannel is an average over 3-11 runs. (C)Autocorrelation function of fluorescence fluctuations of dextran 40 kDafitted with a single-component 2D anomalous diffusion model (eq 7).Each AC function in nanochannel is an average over 3-10 runs.
Figure 3. Anomalous diffusion model fitting results for dextran 40kDa (full circle) and PEG 20 kDa (triangle) molecules. On the verticalaxis the anomalous parameter R is reported against the ratio betweenmolecules’ radius of gyration rg and channel height h. The straightline indicates the Brownian motion limit at R ) 1, whereas the dashedline indicates the square root dependence at R ) 0.5.
1002 Analytical Chemistry, Vol. 82, No. 3, February 1, 2010
location in nanopores.59 To this regard, our results demonstratethat the anomalous mechanism can be addressed solely tointrachannel diffusion thus discriminating between the two aspectsof entrance and diffusion inside the channels.
Partitioning. The number of molecules within nanochannelswas extracted by fitting the ACF to eqs 4 and 7 for Rh6G andmacromolecules, respectively. The partition coefficient was ob-tained from eq 1. In the case of Rh6G, in all nanochannels heightswe registered a partitioning coefficient higher than 1, and inparticular 2.3, 3.9, 5.6, respectively, in 30, 20, and 10 nm channels.The higher concentration measured within the nanochannels iscertainly due to the electrostatic attraction of cationic species torestore channel electroneutrality. In pure DI water the Debyelength would measure theoretically 960 nm;55 thus, the electricaldouble layers formed at each wall overlap, which results in thenanochannel being occupied mostly by counterions. Similar resultswere found in Pyrex nanoslits at low ionic strength.13 On the otherhand, a partition coefficient Keq close to 1 and increasing withconfinement was measured also for both uncharged macro-molecules. PEG had a partition coefficient of 1.3, 1.8, and 3 in30, 20, and 10 nm nanochannels, respectively, whereas dextransshowed higher Keq coefficients for the same system sizes, i.e.,1.2, 7.2, and 9.8. Since macromolecules do not bear any netcharge, the overall macromolecules neutrality will not causeany relevant Coulombic attraction with nanochannel walls. Forneutral particles there is no variation of relative permeabilityin a nanoslit even at high ionic strength;13 hence, the partition-ing measured in our nanochannels for the two neutral macro-molecules employed is addressed to short-range type attrac-tions, as expected for nonpolar polymers. By decreasingchannel height, macromolecules are closer to the surfaces, andshort-range attractions cause molecules to extensively resideon channel walls and the partitioning parameter to increase.
Surface Interactions and Flexibility. Positive partitioning forboth uncharged molecules evinces the presence of relevantpolymer-surface interactions under nanoconfinement. Thoseshort-range attractions, usually neglected, become relevant andpromote an otherwise energetically disadvantageous configuration.In addition, anomalous diffusion was modeled in the case ofmultiple trapping sites along the diffusion path due to short-rangeinteractions. Moreover, the anomalous mechanism of motion innanoporous membranes has already been related to macromol-ecule interactions with surface walls,59 whereby fluctuations onthe adsorption sites are still possible due to molecule flexibility.
On the basis of these concepts, our aim was to assess the rolesof surface interactions with channel walls as well as moleculeflexibility on the subdiffusive behavior registered within nanochan-nels. In order to weight the influence of these contributions tothe diffusion mechanism, eq 8 was adopted to measure, at thesame time, the mobility reduction ascribable to conformationalchangesofflexiblemoleculesandthatduetoadsorption-desorptionphenomena occurring at the walls.
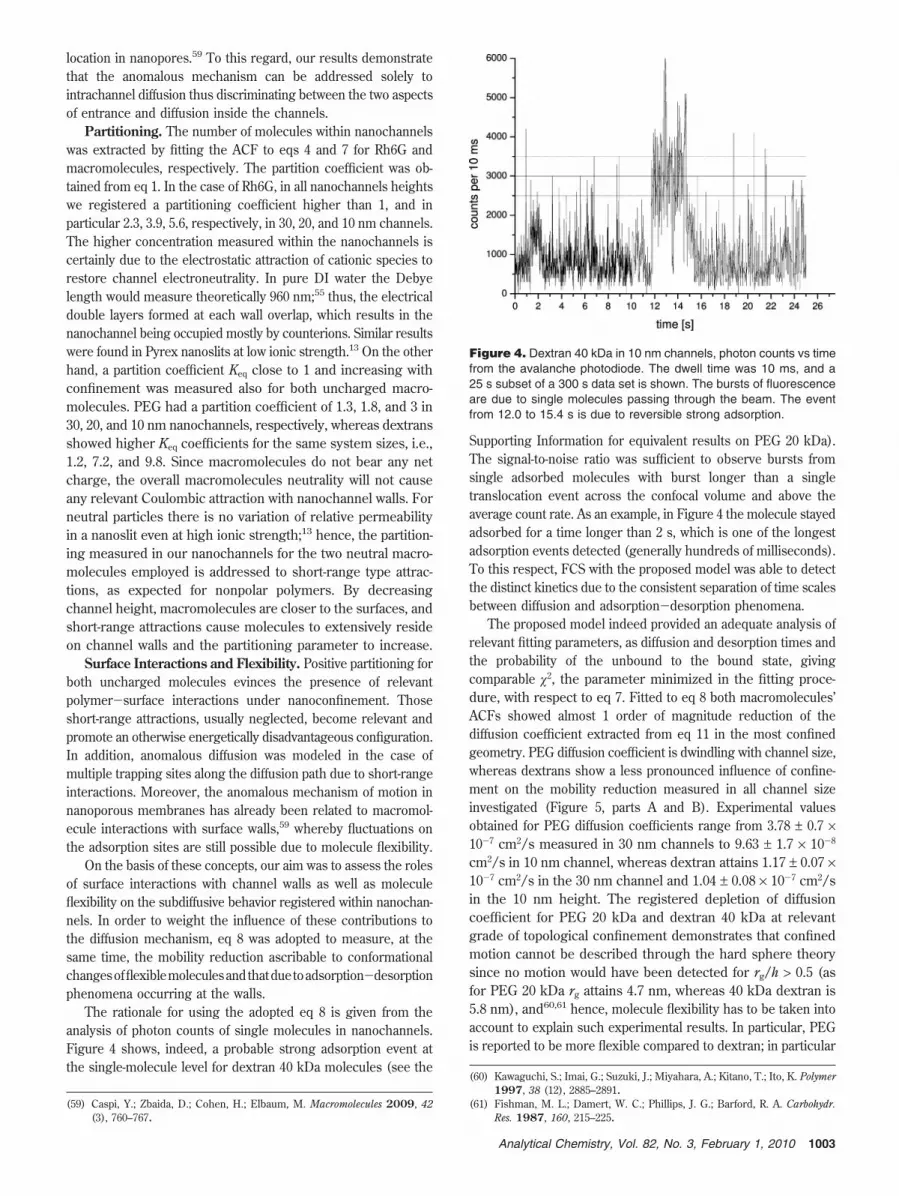
The rationale for using the adopted eq 8 is given from theanalysis of photon counts of single molecules in nanochannels.Figure 4 shows, indeed, a probable strong adsorption event atthe single-molecule level for dextran 40 kDa molecules (see the
Supporting Information for equivalent results on PEG 20 kDa).The signal-to-noise ratio was sufficient to observe bursts fromsingle adsorbed molecules with burst longer than a singletranslocation event across the confocal volume and above theaverage count rate. As an example, in Figure 4 the molecule stayedadsorbed for a time longer than 2 s, which is one of the longestadsorption events detected (generally hundreds of milliseconds).To this respect, FCS with the proposed model was able to detectthe distinct kinetics due to the consistent separation of time scalesbetween diffusion and adsorption-desorption phenomena.
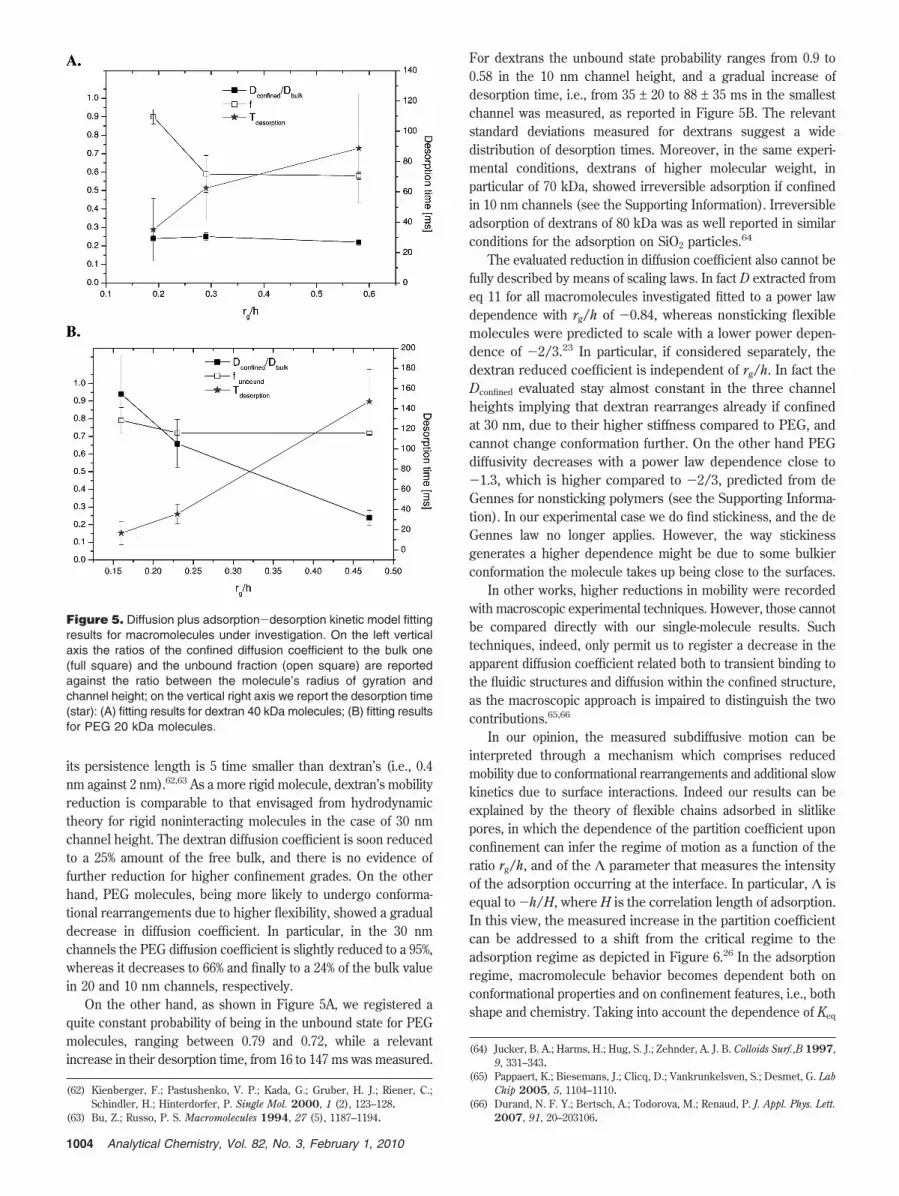
The proposed model indeed provided an adequate analysis ofrelevant fitting parameters, as diffusion and desorption times andthe probability of the unbound to the bound state, givingcomparable '2, the parameter minimized in the fitting proce-dure, with respect to eq 7. Fitted to eq 8 both macromolecules’ACFs showed almost 1 order of magnitude reduction of thediffusion coefficient extracted from eq 11 in the most confinedgeometry. PEG diffusion coefficient is dwindling with channel size,whereas dextrans show a less pronounced influence of confine-ment on the mobility reduction measured in all channel sizeinvestigated (Figure 5, parts A and B). Experimental valuesobtained for PEG diffusion coefficients range from 3.78 ± 0.7 %10-7 cm2/s measured in 30 nm channels to 9.63 ± 1.7 % 10-8
cm2/s in 10 nm channel, whereas dextran attains 1.17 ± 0.07 %10-7 cm2/s in the 30 nm channel and 1.04 ± 0.08 % 10-7 cm2/sin the 10 nm height. The registered depletion of diffusioncoefficient for PEG 20 kDa and dextran 40 kDa at relevantgrade of topological confinement demonstrates that confinedmotion cannot be described through the hard sphere theorysince no motion would have been detected for rg/h > 0.5 (asfor PEG 20 kDa rg attains 4.7 nm, whereas 40 kDa dextran is5.8 nm), and60,61 hence, molecule flexibility has to be taken intoaccount to explain such experimental results. In particular, PEGis reported to be more flexible compared to dextran; in particular
(61) Fishman, M. L.; Damert, W. C.; Phillips, J. G.; Barford, R. A. Carbohydr.Res. 1987, 160, 215–225.
Figure 4. Dextran 40 kDa in 10 nm channels, photon counts vs timefrom the avalanche photodiode. The dwell time was 10 ms, and a25 s subset of a 300 s data set is shown. The bursts of fluorescenceare due to single molecules passing through the beam. The eventfrom 12.0 to 15.4 s is due to reversible strong adsorption.
1003Analytical Chemistry, Vol. 82, No. 3, February 1, 2010
its persistence length is 5 time smaller than dextran’s (i.e., 0.4nm against 2 nm).62,63 As a more rigid molecule, dextran’s mobilityreduction is comparable to that envisaged from hydrodynamictheory for rigid noninteracting molecules in the case of 30 nmchannel height. The dextran diffusion coefficient is soon reducedto a 25% amount of the free bulk, and there is no evidence offurther reduction for higher confinement grades. On the otherhand, PEG molecules, being more likely to undergo conforma-tional rearrangements due to higher flexibility, showed a gradualdecrease in diffusion coefficient. In particular, in the 30 nmchannels the PEG diffusion coefficient is slightly reduced to a 95%,whereas it decreases to 66% and finally to a 24% of the bulk valuein 20 and 10 nm channels, respectively.
On the other hand, as shown in Figure 5A, we registered aquite constant probability of being in the unbound state for PEGmolecules, ranging between 0.79 and 0.72, while a relevantincrease in their desorption time, from 16 to 147 ms was measured.
For dextrans the unbound state probability ranges from 0.9 to0.58 in the 10 nm channel height, and a gradual increase ofdesorption time, i.e., from 35 ± 20 to 88 ± 35 ms in the smallestchannel was measured, as reported in Figure 5B. The relevantstandard deviations measured for dextrans suggest a widedistribution of desorption times. Moreover, in the same experi-mental conditions, dextrans of higher molecular weight, inparticular of 70 kDa, showed irreversible adsorption if confinedin 10 nm channels (see the Supporting Information). Irreversibleadsorption of dextrans of 80 kDa was as well reported in similarconditions for the adsorption on SiO2 particles.64
The evaluated reduction in diffusion coefficient also cannot befully described by means of scaling laws. In fact D extracted fromeq 11 for all macromolecules investigated fitted to a power lawdependence with rg/h of -0.84, whereas nonsticking flexiblemolecules were predicted to scale with a lower power depen-dence of -2/3.23 In particular, if considered separately, thedextran reduced coefficient is independent of rg/h. In fact theDconfined evaluated stay almost constant in the three channelheights implying that dextran rearranges already if confinedat 30 nm, due to their higher stiffness compared to PEG, andcannot change conformation further. On the other hand PEGdiffusivity decreases with a power law dependence close to-1.3, which is higher compared to -2/3, predicted from deGennes for nonsticking polymers (see the Supporting Informa-tion). In our experimental case we do find stickiness, and the deGennes law no longer applies. However, the way stickinessgenerates a higher dependence might be due to some bulkierconformation the molecule takes up being close to the surfaces.
In other works, higher reductions in mobility were recordedwith macroscopic experimental techniques. However, those cannotbe compared directly with our single-molecule results. Suchtechniques, indeed, only permit us to register a decrease in theapparent diffusion coefficient related both to transient binding tothe fluidic structures and diffusion within the confined structure,as the macroscopic approach is impaired to distinguish the twocontributions.65,66
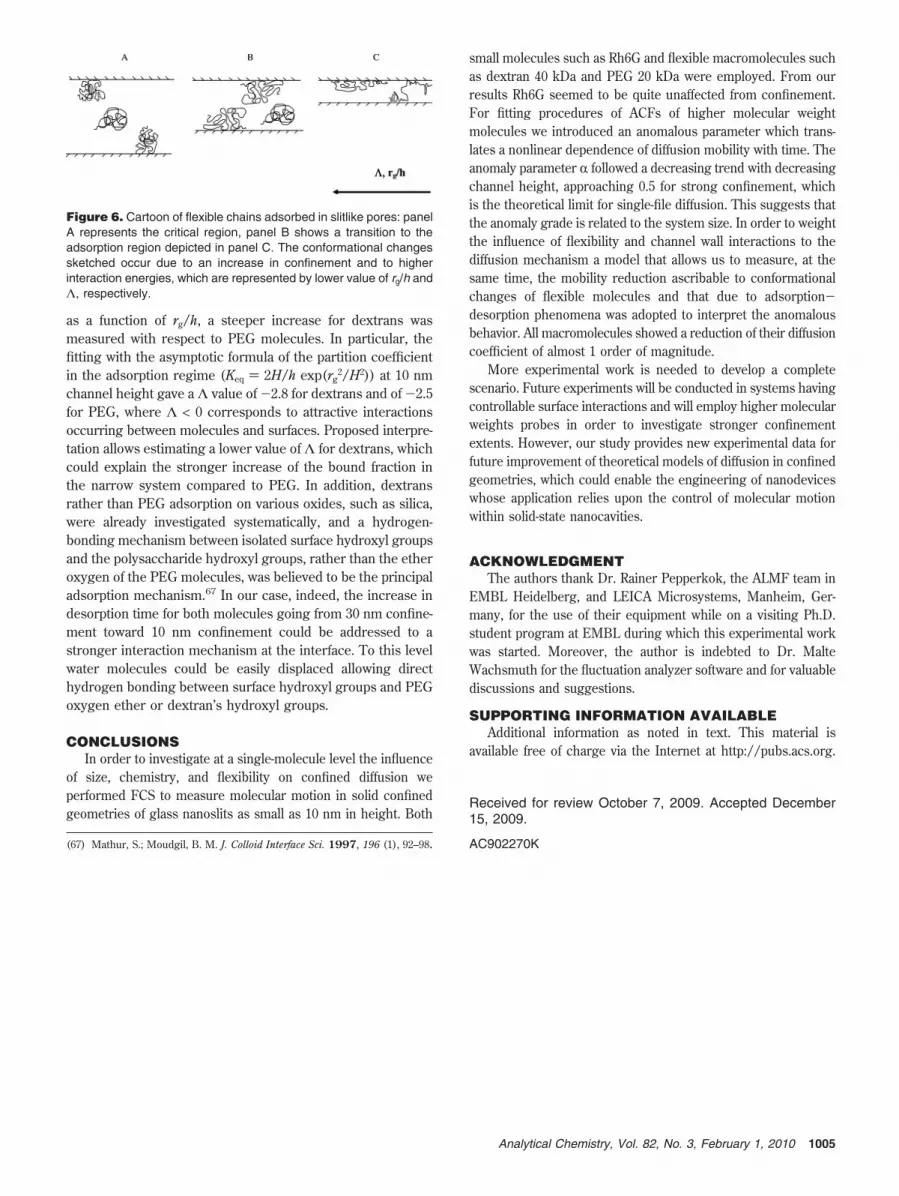
In our opinion, the measured subdiffusive motion can beinterpreted through a mechanism which comprises reducedmobility due to conformational rearrangements and additional slowkinetics due to surface interactions. Indeed our results can beexplained by the theory of flexible chains adsorbed in slitlikepores, in which the dependence of the partition coefficient uponconfinement can infer the regime of motion as a function of theratio rg/h, and of the # parameter that measures the intensityof the adsorption occurring at the interface. In particular, # isequal to -h/H, where H is the correlation length of adsorption.In this view, the measured increase in the partition coefficientcan be addressed to a shift from the critical regime to theadsorption regime as depicted in Figure 6.26 In the adsorptionregime, macromolecule behavior becomes dependent both onconformational properties and on confinement features, i.e., bothshape and chemistry. Taking into account the dependence of Keq
(62) Kienberger, F.; Pastushenko, V. P.; Kada, G.; Gruber, H. J.; Riener, C.;Schindler, H.; Hinterdorfer, P. Single Mol. 2000, 1 (2), 123–128.
(63) Bu, Z.; Russo, P. S. Macromolecules 1994, 27 (5), 1187–1194.
(64) Jucker, B. A.; Harms, H.; Hug, S. J.; Zehnder, A. J. B. Colloids Surf.,B 1997,9, 331–343.
(66) Durand, N. F. Y.; Bertsch, A.; Todorova, M.; Renaud, P. J. Appl. Phys. Lett.2007, 91, 20–203106.
Figure 5. Diffusion plus adsorption-desorption kinetic model fittingresults for macromolecules under investigation. On the left verticalaxis the ratios of the confined diffusion coefficient to the bulk one(full square) and the unbound fraction (open square) are reportedagainst the ratio between the molecule’s radius of gyration andchannel height; on the vertical right axis we report the desorption time(star): (A) fitting results for dextran 40 kDa molecules; (B) fitting resultsfor PEG 20 kDa molecules.
1004 Analytical Chemistry, Vol. 82, No. 3, February 1, 2010
as a function of rg/h, a steeper increase for dextrans wasmeasured with respect to PEG molecules. In particular, thefitting with the asymptotic formula of the partition coefficientin the adsorption regime (Keq ) 2H/h exp(rg
2/H2)) at 10 nmchannel height gave a # value of -2.8 for dextrans and of -2.5for PEG, where # < 0 corresponds to attractive interactionsoccurring between molecules and surfaces. Proposed interpre-tation allows estimating a lower value of # for dextrans, whichcould explain the stronger increase of the bound fraction inthe narrow system compared to PEG. In addition, dextransrather than PEG adsorption on various oxides, such as silica,were already investigated systematically, and a hydrogen-bonding mechanism between isolated surface hydroxyl groupsand the polysaccharide hydroxyl groups, rather than the etheroxygen of the PEG molecules, was believed to be the principaladsorption mechanism.67 In our case, indeed, the increase indesorption time for both molecules going from 30 nm confine-ment toward 10 nm confinement could be addressed to astronger interaction mechanism at the interface. To this levelwater molecules could be easily displaced allowing directhydrogen bonding between surface hydroxyl groups and PEGoxygen ether or dextran’s hydroxyl groups.
CONCLUSIONSIn order to investigate at a single-molecule level the influence
of size, chemistry, and flexibility on confined diffusion weperformed FCS to measure molecular motion in solid confinedgeometries of glass nanoslits as small as 10 nm in height. Both
small molecules such as Rh6G and flexible macromolecules suchas dextran 40 kDa and PEG 20 kDa were employed. From ourresults Rh6G seemed to be quite unaffected from confinement.For fitting procedures of ACFs of higher molecular weightmolecules we introduced an anomalous parameter which trans-lates a nonlinear dependence of diffusion mobility with time. Theanomaly parameter R followed a decreasing trend with decreasingchannel height, approaching 0.5 for strong confinement, whichis the theoretical limit for single-file diffusion. This suggests thatthe anomaly grade is related to the system size. In order to weightthe influence of flexibility and channel wall interactions to thediffusion mechanism a model that allows us to measure, at thesame time, the mobility reduction ascribable to conformationalchanges of flexible molecules and that due to adsorption-desorption phenomena was adopted to interpret the anomalousbehavior. All macromolecules showed a reduction of their diffusioncoefficient of almost 1 order of magnitude.
More experimental work is needed to develop a completescenario. Future experiments will be conducted in systems havingcontrollable surface interactions and will employ higher molecularweights probes in order to investigate stronger confinementextents. However, our study provides new experimental data forfuture improvement of theoretical models of diffusion in confinedgeometries, which could enable the engineering of nanodeviceswhose application relies upon the control of molecular motionwithin solid-state nanocavities.
ACKNOWLEDGMENTThe authors thank Dr. Rainer Pepperkok, the ALMF team in
EMBL Heidelberg, and LEICA Microsystems, Manheim, Ger-many, for the use of their equipment while on a visiting Ph.D.student program at EMBL during which this experimental workwas started. Moreover, the author is indebted to Dr. MalteWachsmuth for the fluctuation analyzer software and for valuablediscussions and suggestions.
SUPPORTING INFORMATION AVAILABLEAdditional information as noted in text. This material is
available free of charge via the Internet at http://pubs.acs.org.
Received for review October 7, 2009. Accepted December15, 2009.
AC902270K(67) Mathur, S.; Moudgil, B. M. J. Colloid Interface Sci. 1997, 196 (1), 92–98.
Figure 6. Cartoon of flexible chains adsorbed in slitlike pores: panelA represents the critical region, panel B shows a transition to theadsorption region depicted in panel C. The conformational changessketched occur due to an increase in confinement and to higherinteraction energies, which are represented by lower value of rg/h and#, respectively.
1005Analytical Chemistry, Vol. 82, No. 3, February 1, 2010