This discussion paper is/has been under review for the journal Biogeosciences (BG).Please refer to the corresponding final paper in BG if available.
Surface circulation and upwellingpatterns around Sri LankaA. de Vos, C. B. Pattiaratchi, and E. M. S. Wijeratne
School of Environmental Systems Engineering & The Oceans Institute, The University ofWestern Australia, 35 Stirling Highway, Crawley, Western Australia 6009, Australia
Received: 15 August 2013 – Accepted: 23 August 2013 – Published: 11 September 2013
Published by Copernicus Publications on behalf of the European Geosciences Union.
14953
Abstract
Sri Lanka occupies a unique location within the equatorial belt in the northern IndianOcean with the Arabian Sea on its western side and the Bay of Bengal on its east-ern side. The region is characterised by bi-annually reversing monsoon winds resultingfrom seasonal differential heating and cooling of the continental land mass and the5
ocean. This study explored elements of the dynamics of the surface circulation andcoastal upwelling in the waters around Sri Lanka using satellite imagery and the Re-gional Ocean Modelling System (ROMS) configured to the study region and forced withECMWF interim data. The model was run for 2 yr to examine the seasonal and shorterterm (∼10 days) variability. The results confirmed the presence of the reversing cur-10
rent system in response to the changing wind field: the eastward flowing SouthwestMonsoon Current (SMC) during the Southwest (SW) monsoon transporting 11.5 Svand the westward flowing Northeast Monsoon Current (NMC) transporting 9.5 Sv dur-ing the Northeast (NE) monsoon, respectively. A recirculation feature located to theeast of Sri Lanka during the SW monsoon, the Sri Lanka Dome, is shown to result15
from the interaction between the SMC and the Island of Sri Lanka. Along the east-ern and western coasts, during both monsoon periods, flow is southward convergingalong the south coast. During the SW monsoon the Island deflects the eastward flow-ing SMC southward whilst along the east coast the southward flow results from theSri Lanka Dome recirculation. The major upwelling region, during both monsoon pe-20
riods, is located along the south coast and is shown to be due to flow convergenceand divergence associated with offshore transport of water. Higher surface chlorophyllconcentrations were observed during the SW monsoon. The location of the flow con-vergence and hence the upwelling centre was dependent on the relative strengths ofwind driven flow along the east and west coasts: during the SW (NE) monsoon the flow25
along the western (eastern) coast was stronger and hence the upwelling centre wasshifted to the east (west). The presence of upwelling along the south coast during both
14954
monsoon periods may explain the blue whale (Balaenoptera musculus) aggregationsin this region.
1 Introduction
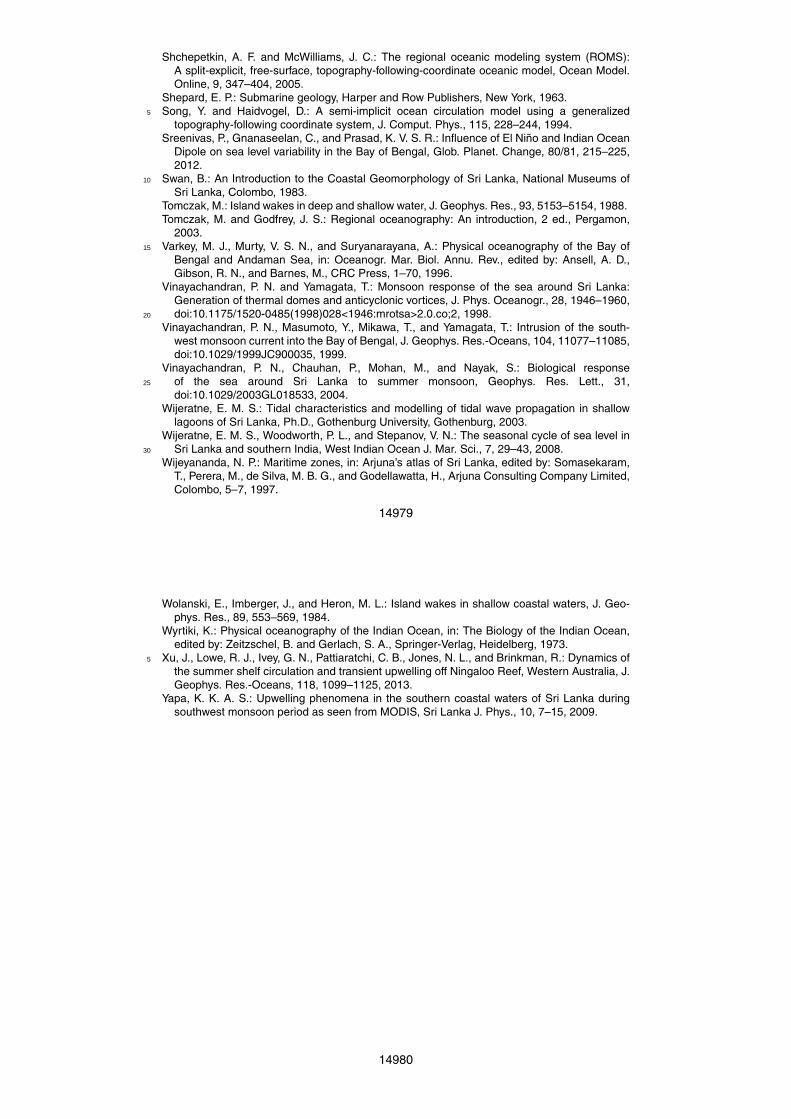
Sri Lanka is situated within the equatorial belt in the northern Indian Ocean, with theArabian Sea on its western side and the Bay of Bengal on its eastern side (Fig. 1).5
In an oceanographic sense the location of Sri Lanka is unique with its offshore waterstransporting water with different properties through reversing ocean currents, drivenby monsoon winds. The northern Indian Ocean is characterised by bi-annually re-versing monsoon winds resulting from the seasonal differential heating and coolingof the continental land mass and the ocean. The Southwest (SW) monsoon gener-10
ally operates between June and October and the Northeast (NE) monsoon operatesbetween December through April (Tomczak and Godfrey, 2003). The transition peri-ods are termed the First Inter-Monsoon (May) and Second Inter-Monsoon (Novem-ber). During the SW monsoon, the Southwest Monsoon Current (SMC) flows fromwest to east transporting higher salinity water from the Arabian Sea whilst during the15
NE monsoon the currents reverse in direction with the Northeast Monsoon Current(NMC) transporting lower salinity water originating from the Bay of Bengal from eastto west (Schott and McCreary, 2001). During the SW monsoon, increased chlorophyllconcentrations (>5 mg m−3) have been recorded around Sri Lanka, particularly alongthe southern coast (Vinayachandran et al., 2004) which appears to be a major up-20
welling region. These elevated chlorophyll concentrations persist for more than fourmonths and have been attributed to coastal upwelling, advection by the SMC and openocean Ekman pumping (Vinayachandran et al., 2004). Although during the SW mon-soon the winds are upwelling favourable in terms of Ekman dynamics, proximity tothe equator (∼6◦ N) may in fact preclude the development of wind-induced coastal up-25
welling. Chlorophyll concentrations during the NE monsoon appear to be low but thereis evidence of high productivity through documentation of feeding aggregations of blue
14955
whales (Balaenoptera musculus) along the southern coast of Sri Lanka (de Vos et al.,2013). To date, no studies have been undertaken to define the circulation patterns andassociated upwelling around Sri Lanka at a fine scale. Due to the paucity of field data,previous research has focussed on the analysis of satellite imagery and coarse reso-lution models designed to simulate basin scale features. In this paper we use satellite5
imagery and a high spatial resolution numerical model (ROMS) with realistic and ide-alised forcing to investigate the flow patterns and upwelling mechanisms particularlyoff the southern coast of Sri Lanka.
The continental shelf around Sri Lanka is narrower, shallower and steeper than isaverage for the world (Wijeyananda, 1997). Its mean width is 20 km, and it is narrow-10
est on the southwest coast where it is less than 10 km (Shepard, 1963; Swan, 1983;Wijeyananda, 1997). The continental slope around Sri Lanka is a concave feature thatextends from 100–4000 m in depth. The continental slope on the southern and easterncoasts has an inclination of 45◦ which is one of the steepest recorded globally (Sahini,1982). The abyssal plain around the island is 3000–4000 m deep (Swan, 1983).15
The seasonal difference of sea surface salinity (>2) around Sri Lanka is highly sig-nificant compared to other regions (Levitus et al., 1994). Salinity in the Bay of Bengalis generally lower (<33 PSU), whilst salinities in the Arabian Sea are higher with max-ima up to 36.5 PSU due to high evaporation and negligible freshwater input. The Bayof Bengal receives ∼1500 km3 yr−1 of freshwater through freshwater run-off whilst the20
total freshwater input into the Arabian Sea is ∼190 km3 yr−1. Including evaporationand rain, the Arabian Sea experiences a negative freshwater supply of about 1 m yr−1,whereas there is a positive freshwater supply of about 0.4 m yr−1 to the Bay of Bengal(Jensen, 2001).
The mean sea level pressure (SLP) in the northern Indian region is at a maximum25
during December-January and a minimum during June–July with a mean seasonalrange of 5–10 hPa (Wijeratne, 2003). There is significant seasonal variation in sealevel in the northeastern Indian Ocean with a range in the inner Bay of Bengal of∼0.80–0.90 m decreasing to the south (Wijeratne, 2003). The seasonal sea level vari-
14956
ability around Sri Lankan waters is around 0.2–0.3 m with maxima during June throughthe action of the SW monsoon (Wijeratne et al., 2008). The tides around the Island aremixed semidiurnal with a maximum spring tidal range of ∼0.70 m.
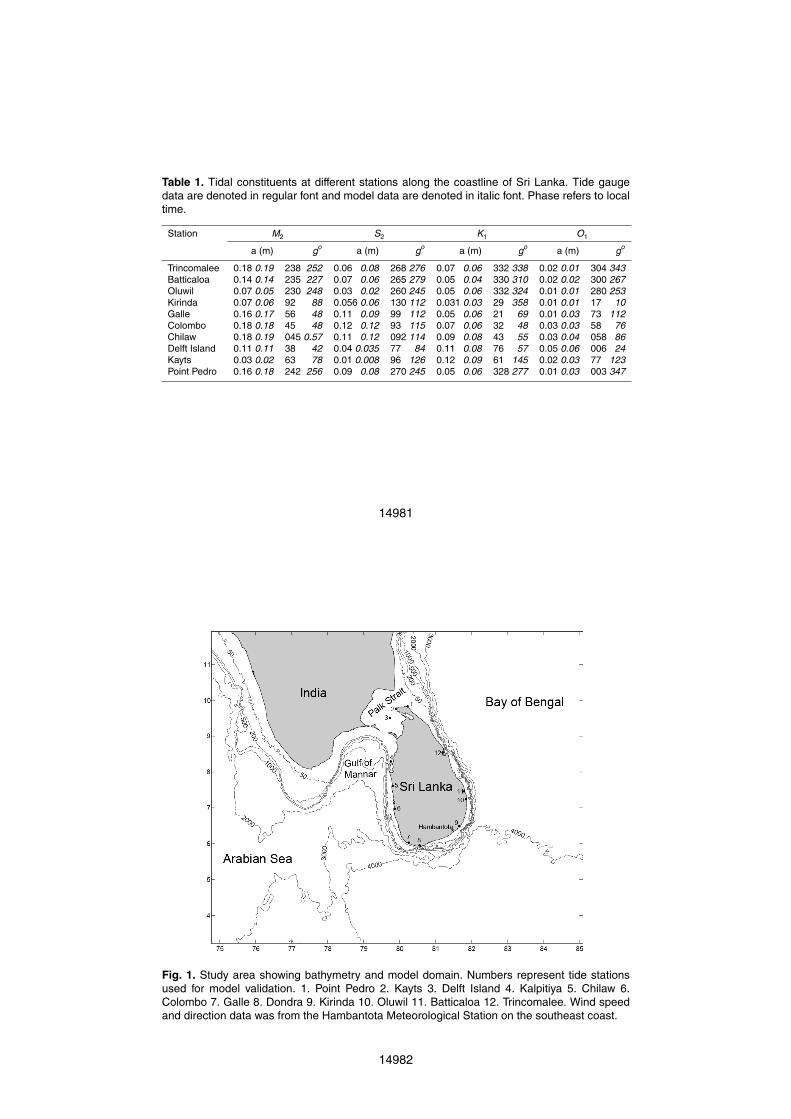
The surface circulation of the northern Indian Ocean may be described after Schottand McCreary (2001). A schematic of the circulation in the northern Indian Ocean, in5
the vicinity of Sri Lanka, during the SW monsoon is shown in Fig. 2b. Along India andSri Lanka, the eastern boundary current or West Indian Coastal Current (WICC) in theArabian Sea flows southwards along the West Indian coastline and joins the eastwardflowing Southwest Monsoon Current (SMC). Shankar et al. (2002) also postulated awesterly flow from the south central Arabian Sea entraining water into the SMC. The10
presence of the anti-clockwise Lakshadweep eddy off the southwest coast of Indiamodifies the current flow in this region. The SMC flows along the south coast of SriLanka from west to east (Schott et al., 1994) transporting ∼8 Sv (1 Sv=106 m3 s−1).After passing the coast of Sri Lanka, the currents form an anti-clockwise eddy definedas the Sri Lanka Dome (SD) centered around 83◦ E and 7◦ N (Vinayachandran and15
Yamagata, 1998). The western arm of this eddy drives a southward current along theeastern coast of Sri Lanka whilst the remainder flows northward along the easternIndian coast as the East Indian Coastal Current (EICC).
During the NE monsoon the currents reverse in direction (Fig. 2a). Along the easternIndian coast, the EICC flows southward past Sri Lanka and joins the Northeast Mon-20
soon Current (NMC) flowing from east to west transporting about 12 Sv (Schott et al.,1994). The currents then flow around the clockwise Lakshadweep eddy and northwardalong the western Indian coastline as the West Indian Coastal Current (WICC).
One of main features to note from this description from the perspective of Sri Lanka,is the reversal of currents along the western and southern coasts and the north to25
south flow along the eastern coast. This circulation pattern is confirmed by Shankar etal. (2002). However, Varkey et al. (1996) and Shankar and Shetye (1997) both providea different interpretation and suggest that currents along the east coast of Sri Lanka
14957
flow south to north irrespective of season. Hence, the circulation along the easterncoast of Sri Lanka remains to be resolved.
The upwelling off the south coast of Sri Lanka usually appears and intensifies duringthe summer months when the SW monsoon prevails, and is said to be due to a combi-nation of wind driven Ekman transport, advection by the SMC and open ocean Ekman5
pumping (McCreary Jr. et al., 2009; Vinayachandran et al., 2004; Vinayachandran etal., 1999). Monthly satellite image composites of chlorophyll analysed by Yapa (2009)show high productivity waters with mean chlorophyll concentrations >5 mg m−3 alongthe southern and western regions during the months of June-August that are accom-panied by a 2◦ to 3 ◦C decrease in sea surface temperature (SST) corresponding to10
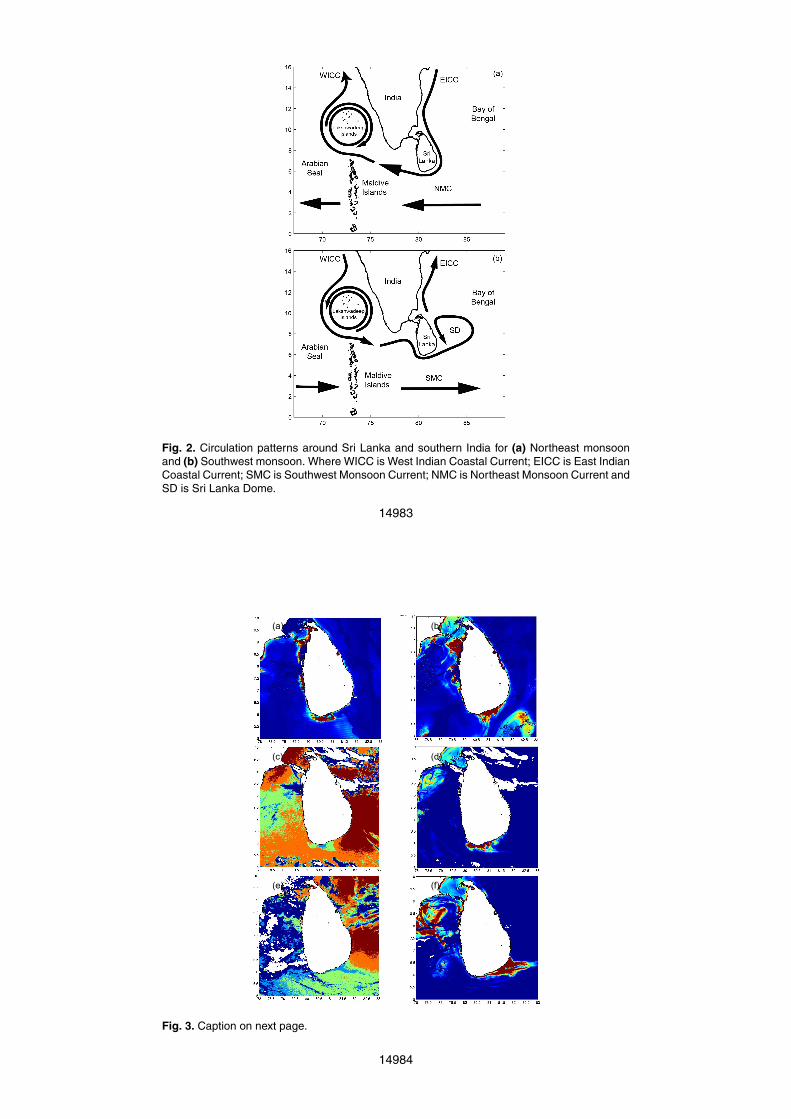
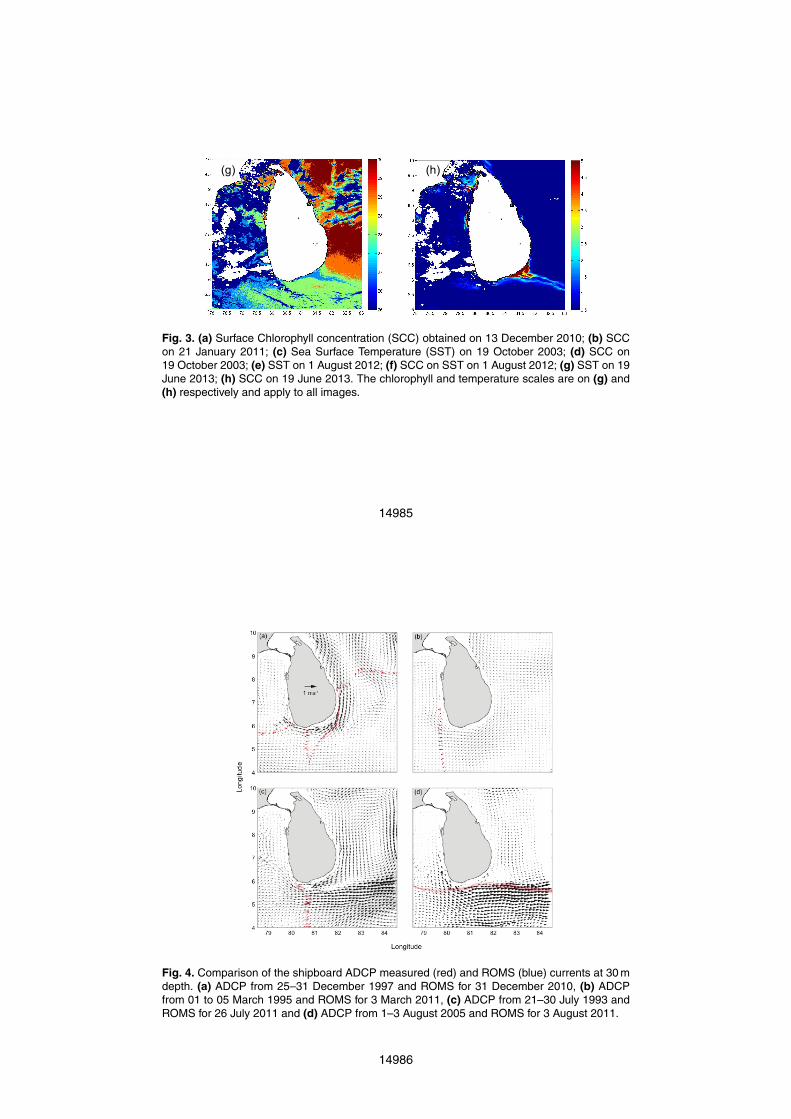
regions where high chlorophyll a concentrations are detected. To illustrate this relation-ship, MODIS images indicate the strong relationship between higher chlorophyll andcooler SSTs (Fig. 3). Data collected during the Dr. Fridtjof Nansen cruises between1978 and 1989 provide evidence that the SW monsoon bloom results from upwellingthat begins closer to the coast and progresses further offshore as it develops over15
subsequent months (Saetersdal et al., 1999). Michisaki et al. (1996) confirmed highprimary productivity when they recorded maximum nitrate concentrations of approx-imately 10 µM in mid-June accompanied by maximum chlorophyll concentrations of0.9 mg m−3 off the west coast of Sri Lanka.
The aim of this paper is to define the seasonal changes in circulation and upwelling20
patterns around Sri Lanka using a high resolution numerical model (ROMS) includ-ing realistic forcing complemented by satellite imagery. The motivation for the paper isthe observation of blue whale (Balaenoptera musculus) feeding aggregations off thesouthern coast of Sri Lanka during the NE monsoon period (de Vos et al., 2013) de-spite satellite imagery indicating lower productivity in the surface waters. This paper25
is organised as follows; In Sect. 2, we describe the numerical model configuration andvalidation; Sect. 3 presents the results from analysis of the wind fields, satellite imageryand numerical model output including idealised simulations to examine upwelling gen-
14958
eration mechanisms and the results are discussed in Sect. 4 with overall conclusionsgiven in Sect. 5.
2 Methodology
The main approach for the study is the use of a numerical model to identify the meancirculation patterns and upwelling around Sri Lanka. There is a lack of field data from5
this region and some of the available public domain data have been accessed andpresented in this paper. The data include: wind speed and direction data from a coastalmeteorological station located at Hambantota (Fig. 1); meteorological information fromECMWF ERA interim data which were also used for model forcing; and MODIS satelliteimagery (ocean colour and SST) accessed from the ocean colour website (Feldman10
and McClain, 2013).
2.1 ROMS configuration and validation
The Regional Ocean Modelling System (ROMS) is a three-dimensional numericalocean model based on the nonlinear terrain following coordinate system of Song andHaidvogel (1994). ROMS solves the incompressible, hydrostatic, primitive equations15
with a free sea surface, horizontal curvilinear coordinates, and a generalized terrain-following s-vertical coordinate that can be configured to enhance resolution at the seasurface or seafloor (Haidvogel et al., 2008). The model formulation and numerical al-gorithms are described in detail in Shchepetkin and McWilliams (2005), and have beenused to simulate the circulation and upwelling processes in a range of ocean basins20
(e.g. Di Lorenzo et al., 2007; Dong et al., 2009; Haidvogel et al., 2008; Marchesiello etal., 2003; Xu et al., 2013).
The model grid (Fig. 1) configured for this study included the continental shelf andslope waters surrounding Sri Lanka as well as the deeper ocean and consisted of ahorizontal grid with resolution <2 km with 30 vertical layers in a terrain-following s-25
14959
coordinate system. The minimum model depth was set to −15 m, i.e. coastal regionsshallower than 15 m were set to 15 m. The model was driven by direct air-sea inter-face heat and freshwater fluxes, momentum fluxes, inverted barometric effects, tide/sealevel, transport and tracers at open boundaries. The forcing data were interpolated ontothe corresponding model grid points to create initial and forcing files. The model was5
driven with 3 hourly atmospheric forcing and daily surface heat and freshwater fluxesusing ECMWF ERA interim data. HYCOM global ocean model (Bleck, 2002) daily out-puts of salinity, temperature, and horizontal velocities were used to specify the openboundary section 3-D tracers and transport. Open boundary barotropic velocities wereestimated by vertically averaging the eastward (u) and northward (v ) component data,10
which were interpolated at the boundary sections. At open boundaries ROMS offers awide array of conditions. We used a combination of nudging and radiation conditions for3-D transport and tracers at the model open boundaries. The model forcing tides werederived from the TPX07.2 global tidal model and monthly climatological mean sea lev-els derived from the AVISO database. The tides were provided as complex amplitudes15
of earth-relative sea-surface elevation and tidal currents for eight primary harmonicconstituents (M2, S2, N2, K2, K1, O1, P1, Q1). These harmonics were introduced inROMS through the open boundaries elevation using the Chapman and current ellipsevariable using the Flather condition (see Marchesiello et al., 2001). Model hindcast sim-ulations were undertaken to obtain optimal model results. Three-dimensional variables20
(salinity, temperature and velocity components) were output at daily intervals with seasurface heights at hourly intervals.
2.2 Experimental setup
In addition to realistic simulations to examine the seasonal circulation patterns and up-welling, numerical experiments were also designed to address the following: (1) role25
of land-mass effect contribution to upwelling around Sri Lanka; (2) variability in the up-welling centre in response to the magnitude and direction of winds along the westernand eastern sides of the Island; and, (3) mechanisms for the formation of the Sri Lanka
14960
Dome located to the east of Sri Lanka. In order to address (1), model simulations wereundertaken including and excluding the Coriolis term whilst model runs with syntheticwind fields were undertaken to examine (2), with different wind stress on the westernand eastern sides of Sri Lanka. Mechanisms for the formation of the Sri Lanka Dome(3) were explored by forcing the model with constant westerly winds of different mag-5
nitudes (2, 4, 6 and 8 ms−1). Additional model runs (not presented here) were alsoundertaken to investigate whether the tides played a role in the upwelling process.
2.3 Model validation
Model hindcasts were undertaken over a 2 yr period (2010 and 2011) using realisticsurface and boundary forcing (Sect. 2.1). The first year (2010) was considered as spin10
up and results presented here are from the second year (2011) of simulations. In theabsence of detailed field measurements from the region, predicted surface currentsand temperature distributions were compared with available data as well as with sealevel data.
2.3.1 Tide and mean sea level15
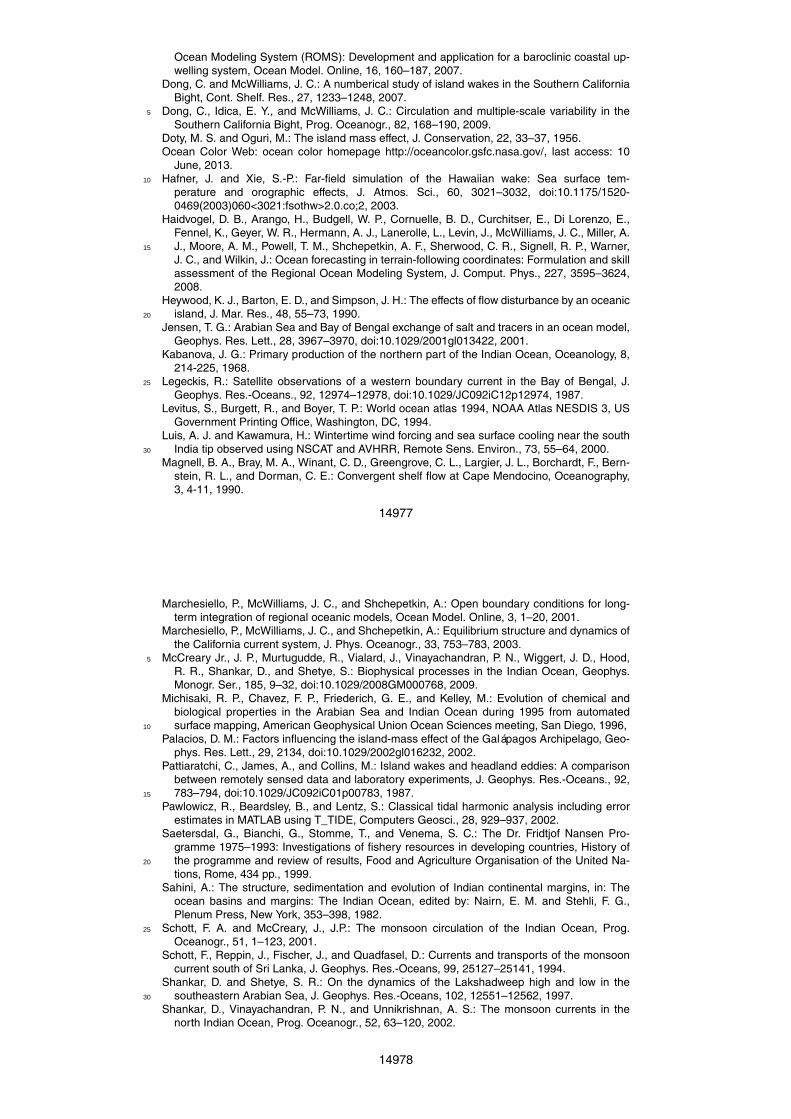
The predicted hourly sea levels at each grid point were subjected to harmonic analysisusing the T-Tide MATLAB toolbox (Pawlowicz et al., 2002). To visualise and interpretmodel results obtained around Sri Lanka, co-tidal charts for the main tidal constituents,M2, S2, K1, and O1, were produced (not shown). The predicted amplitudes and phasesfrom the simulation are in close agreement with measured data for four major tidal20
constituents (Table 1). The spring tidal range, 2(M2 +S2) varies from nearly zero to0.60 m along the coastline, the minimum range occurred at the southeast and north-west corners and the maximum range occurred at the central part of the western andnortheastern corners. The tidal phases on the east coast of Sri Lanka feature oppositephases from the west coast for the M2 and S2 constituents with a rapid phase change25
at the southeast and northwest corners. These features of the tidal characteristics are
14961
in agreement with Wijeratne (2003). The diurnal (K1 and O1) tidal amplitudes are small(<0.1 m) around the Island.
2.3.2 Large-scale circulation
Shipboard ADCP current measurements for the region are available from the WorldOcean Circulation Experiments (WOCE). However, it is important to note that there5
were no observations during the model simulation period (2010 and 2011). We com-pared the model results and observations based on time of year as shown in Fig. 4. Itis clear that there is good qualitative agreement between the predicted and observedcurrents throughout the ship tracks. The model results also reproduce some of the ob-served circulation features. For example, seasonal reversal of currents along the south10
coast during the two monsoon periods is reproduced: during the NE monsoon the cur-rents flow towards the west (Fig. 4a and b) whilst during the SW monsoon they flow tothe east (Fig. 4c and d). The reversing current pattern to the east of Sri Lanka duringthe NE monsoon with southward currents close to the coast and northward currentsfurther offshore is also reproduced (Fig. 4a). The model also reproduced fine-scale15
features that were represented in the ADCP transect such as the transition from westto eastward currents closer to the coast (Fig. 4c).
2.3.3 Satellite imagery
Suspended material (such as sediment, chlorophyll etc) in the surface waters may beused as a passive tracer to follow flow patterns using satellite imagery (Pattiaratchi20
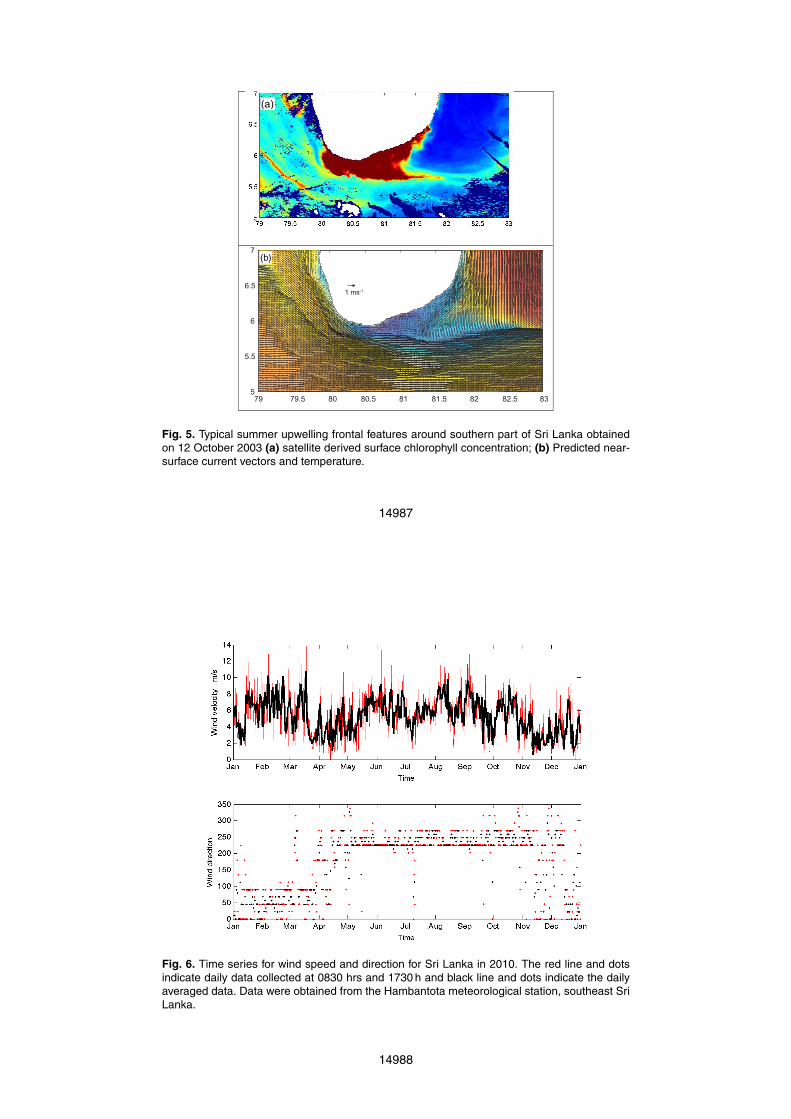
et al., 1987). In regions of upwelling (for example see Fig. 3), there is also a corre-spondence between regions of higher surface chlorophyll concentrations (SCC) andlower sea surface temperatures (SST). Thus, ocean colour imagery may be used toqualitatively validate numerical model outputs. Comparison between model predictedSST and satellite derived SCC indicate that the model reproduced observed patterns,25
particularly the higher chlorophyll ‘tongue’ feature, and sharp fronts (Fig. 5).
14962
3 Results
3.1 The wind field
The monsoon and inter-monsoon periods occur at similar times during the year. How-ever, there is an interannual variability in the onset of these climatic events and thusthe timing of each monsoon can vary by up to 1–2 months. Wind data recorded in5
2010, from a coastal meteorology station located along the southeast coast of SriLanka (Hambantota, Fig. 1), reflects changes in the wind field in accordance with themonsoons (Fig. 6): winds blew from between the north and east (0–90◦) from De-cember to April whilst the winds were predominantly from the southwest and west(225—270◦) between April to November (Fig. 6). Wind speeds were ∼8 ms−1 between10
mid-January and mid-March corresponding to the peak of the NE monsoon; <6 ms−1
between mid-March and mid-May (waning NE monsoon and first inter-monsoon); in-creased to >6 ms−1 from June until October reflecting the SW monsoon and decreasedto <6 ms−1 during the second inter-monsoon period in mid-November.
In addition to the temporal changes in the wind field there is also significant spatial15
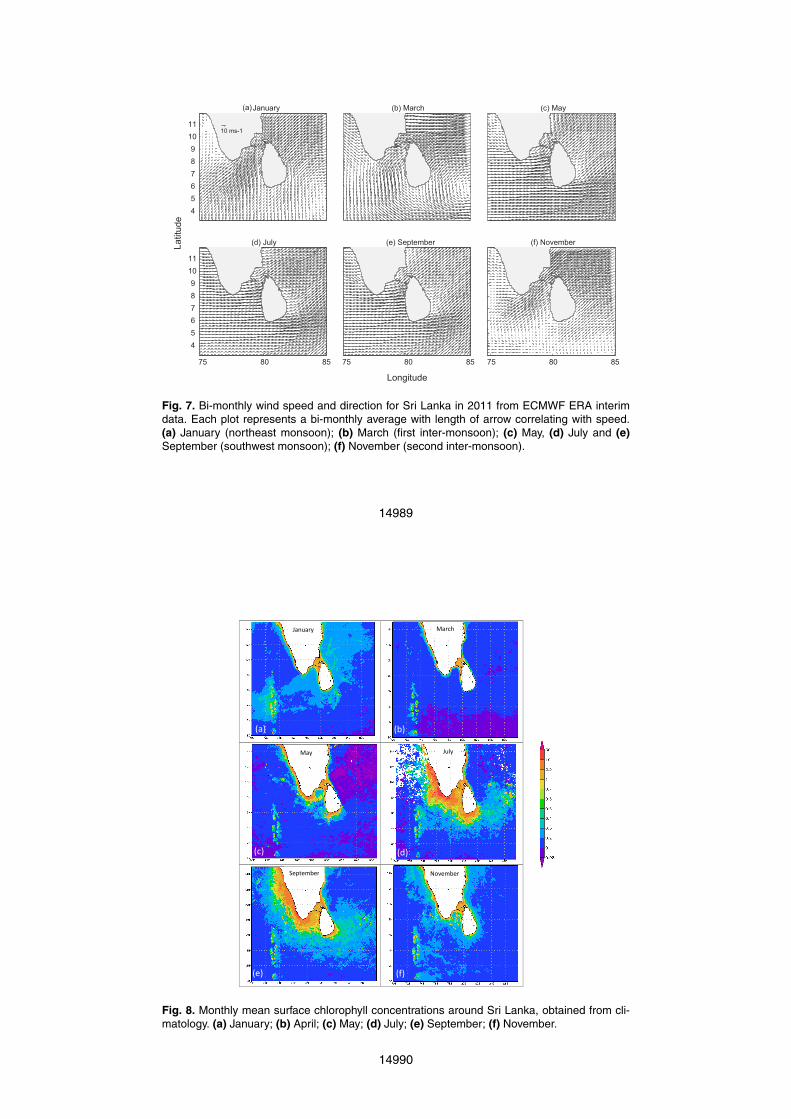
distribution as revealed by the ECMWF ERA interim data (Fig. 7). One of the factorsinfluencing the spatial wind field is the local land topography of Sri Lanka and southernIndia. Coastal regions around Sri Lanka are relatively flat and surround the elevatedcentral region that increases to a maximum elevation of 2500 m. Similarly, southernIndia consists of elevated terrain that exceeds 1,000 m (Luis and Kawamura, 2000).20
During the NE monsoon (Fig. 7a and f), winds are predominantly from the northeastacross the study region with stronger winds in the Gulf Mannar (Fig. 1) as a result oflocal land topography. Here, the northeasterly winds are funneled through the elevatedtopography between southern India and Sri Lanka resulting in strong winds over theGulf of Mannar (Luis and Kawamura, 2000). Off the southern coast of Sri Lanka, the25
winds are weaker and are mainly offshore during the NE monsoon (Fig. 7a and f).During the first inter-monsoon, the east coast of Sri Lanka experiences onshore winds(easterly) with northeasterly winds along the west coast and winds off the south coast
14963
remaining offshore (Fig. 7b). Along the western and southern coasts of Sri Lanka, dur-ing the SW monsoon, the winds are westerly (Fig. 7c, d and e) and, due perhaps tothe local topography, they veer northwards off the eastern side of the island (south-westerly winds). As such, both the temporal and spatial wind field influences the oceancirculation patterns around the island.5
3.2 Seasonal circulation
3.2.1 Satellite imagery
The seasonal circulation around Sri Lanka was examined through the use of surfacechlorophyll concentration (SCC) climatology data (resolution of 4 km from Feldman andMcClain, 2013) as a passive tracer and to understand seasonal variability in surface10
chlorophyll concentrations.In January, the Northeast Monsoon Current (NMC) flows from east to west (Fig. 8a).
This is reflected in the SCC data with slightly higher concentrations to the west of SriLanka. However, the more pronounced feature is the “stirring” caused by the NMC flow-ing from east to west past the Maldives island chain with enhanced SCC to the west of15
the island chain. During this period, the monsoon drift is shallow and will generally onlyhave a minimal effect on the waters below the thermocline (Wyrtiki, 1973). In March,during the monsoon transition period, SCC decreased to <0.20 mgm−3 (Fig. 8b) in thewhole study region. There is an absence of a ‘concentration wake’ in the vicinity of theMaldive islands indicating weak currents lacking unidirectionality in this region. Simi-20
lar conditions were observed in April (not shown). In May, during the onset of the SWmonsoon (Fig. 7c), a band of high SCC (∼2.5 mgm−3) water was present along thesouth coast of Sri Lanka (Fig. 8c) and also in the Gulf of Mannar. SCC levels along thesouth coast were 10 times higher than they were in April but low concentrations werepresent to the east of Sri Lanka. In June (not shown), the high SCC patch off southern25
India begins to extend to the east across the entrance to the Gulf of Mannar, whilst sur-rounding areas experienced decreased SCC. In July, enhanced SCC to the east of the
14964
Maldive islands and the plume of elevated SCC to the southeast of Sri Lanka confirmedthe eastward flow of the Southwest Monsoon Current (Fig. 8d). The high SCC plumegenerated by the SW monsoon current flowing past the Maldive islands, merged withthe high SCC patch off southern India and the higher SCC waters off the west coast ofSri Lanka (Fig. 8d). The SCC is now ∼5 mgm−3 along the west and southern coasts5
of Sri Lanka. A plume of higher SCC water originating from the southern coast of SriLanka extended to the east and shows evidence of an eddy – most likely the Sri LankaDome (Fig. 2b). There is also a band of lower SCC water adjacent to the east coastof Sri Lanka, which is due to the southward flow of water along this coast at this timeof year. In September, the SCC patterns were similar to that in July (Fig. 8e) except10
the maximum SCC was lower in the range of 0.20–0.40 mgm−3 and extended over alarger area particularly to the south and east of Sri Lanka. In November, the SCC levelsdecreased almost to those observed in January, the difference being the plume fromthe Maldive Islands was present to the east indicating that the SMC was still flowingeastwards (Fig. 8f).15
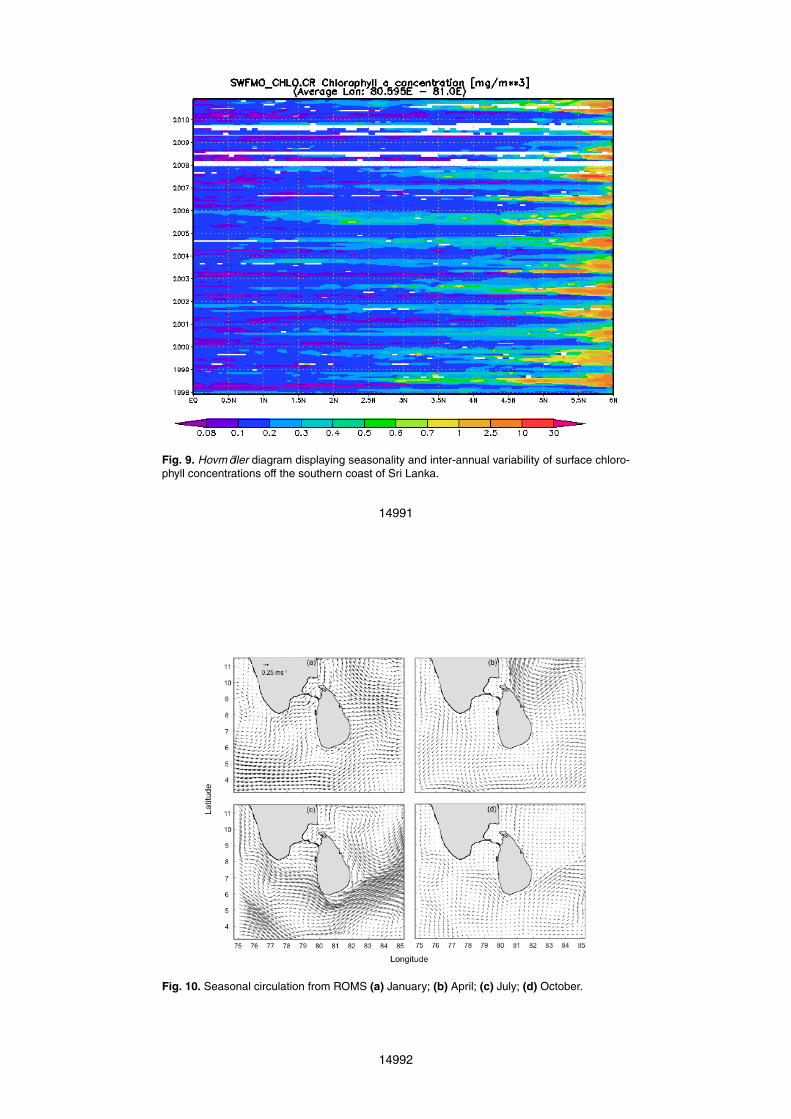
In general, chlorophyll a concentrations around Sri Lanka were relatively lower duringthe NE monsoon compared to the SW monsoon (Kabanova, 1968). This seasonality ismaintained year to year but with interannual variability (Fig. 9). A Hovmöller diagram ofmonthly mean SSC between the southern coast of Sri Lanka (6◦ N) and the equator in-dicates higher values closest to the Sri Lankan coast extending ∼2700 km offshore on20
average. In 2002 and 2006, the influence of this upwelling can be observed extendingto the equator. Although interannual variability is not within the scope of this paper it isinteresting that 2002 and 2006 reflect El Nino and positive Indian Ocean dipole years(Sreenivas et al., 2012).
3.2.2 Numerical modelling25
Numerical model results reproduce the general patterns identified in previous studies(Fig. 2) and from ocean colour imagery (Fig. 8). The seasonal mean currents showsignificant spatial variability due to the spatial and temporal changes in the wind climate
14965
(Fig. 10). This is evident when comparing the mean currents during the NE monsoon(Fig. 10a) and the instantaneous currents at the end of December (Fig. 4a and b).The reversing currents to the south of Sri Lanka: easterly during the SW monsoon andwesterly during the NE monsoon are reproduced by the model. The currents during theSW monsoon are stronger than those during the other seasons reflecting the stronger5
winds during this period (Fig. 10c). Schott and McCreary (2001) estimated that offsouthern Sri Lanka (north of the equator) transport rates resulting from the SMC andNMC were 8 and 12 Sv respectively, with SMC transport rates lower than those for theNMC. The numerical model output indicates transport rates of 11.5 and 9.5 Sv for theSMC and NMC respectively. These values are more realistic in that the NMC transport10
is similar to that estimated by Schott and McCreary (2001) but SMC transport is higher,as expected due to the stronger winds experienced during this period.
During the NE monsoon, currents along the east coast of Sri Lanka flow south-wards closer to the coast and northwards further offshore, separated by a shear zone(Figs. 10a, 4a and b). The presence of the shear zone is confirmed by a shipborne15
ADCP transect (Fig. 4a). The currents closer to the shore follow the coastline, flowingto the west along the south coast and northward along the west coast (Figs. 10a, 4aand b). Currents in the Gulf of Mannar flow towards the southwest and mirror the di-rection of the wind (Fig. 10a). During the first inter-monsoon, current speeds decrease(Fig. 10b) with currents along both the east and west coasts converging off southern20
Sri Lanka (south of ∼6.5◦ N). The presence of the Sri Lanka Dome centred at 84◦ E and8◦ N can be identified. Strong northward currents along the northeast coast extendingalong the southern Indian coastline are predicted. This flow pattern is similar to thatshown on satellite images by Legeckis (1987) postulating a western boundary currentin the Bay of Bengal.25
Under SW monsoon conditions, currents are higher across the entire region, partic-ularly along the south and southeast coasts of Sri Lanka (Fig. 10c). As a result, theSri Lanka Dome shifts to the north – now centered at 84◦ E, 9.5◦ N. Southward flowingwater along the east coast converges with water eastward of the SMC. There is also
14966
a stronger band of currents flowing past the southern tip of India and the west of SriLanka (Fig. 10c) which explains the merging of the SCC between the southern regionsof the Indian coast and Sri Lanka (Fig. 8d). The weakest currents are predicted duringthe second inter-monsoon with no evidence of the Sri Lanka Dome (Fig. 10d).
Flow patterns such as those described in Fig. 10 provide no indication on regions5
and periods of coastal upwelling around Sri Lanka. Therefore, the model predicted seasurface temperature (SST) and flow fields were examined at shorter time-scales withthe assumption that cooler waters (compared to the surrounding water) representedupwelling. Analysis of model output revealed that upwelling occurs on a seasonal ba-sis and/or during shorter period sporadic events along different parts of the coastline.10
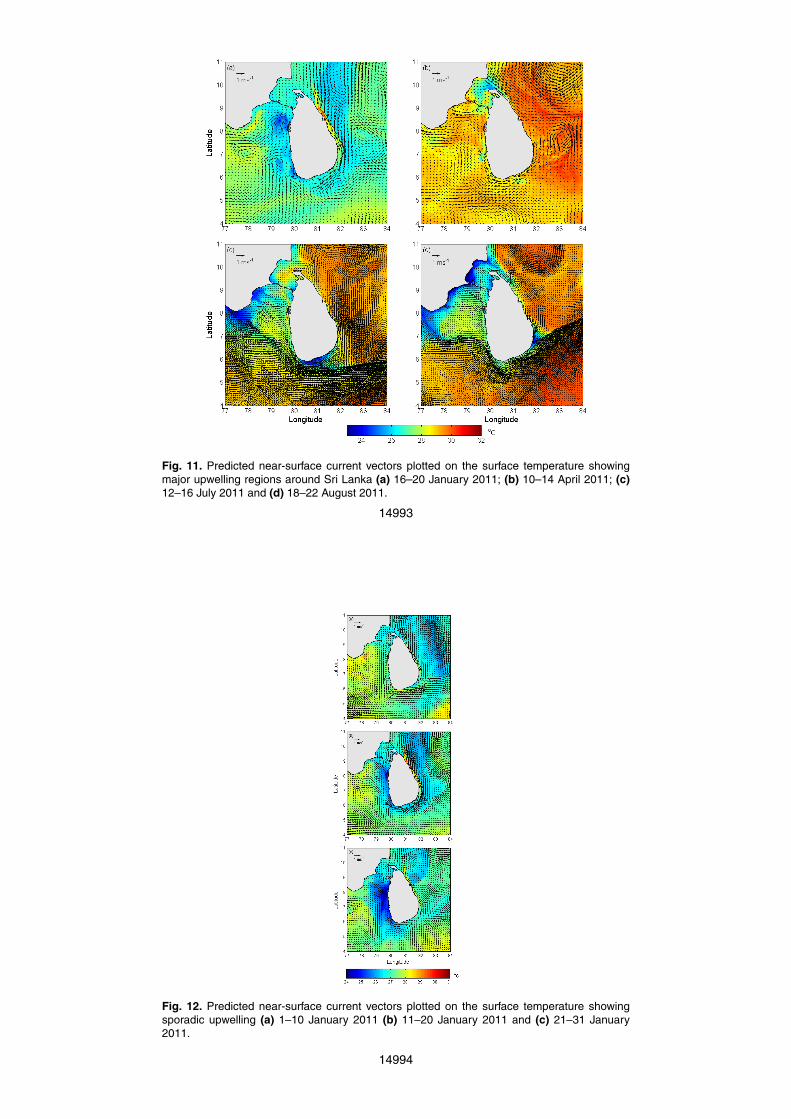
During the NE monsoon, cooler SSTs were observed along the western and southerncoasts with warmer water along the east coast of Sri Lanka (Fig. 11a). The latter is dueto the downwelling regime in this region with onshore winds during the NE monsoon re-flected in a band of narrow warm southward moving water. Colder waters were found inregions of divergence in the flow field where there was mainly offshore transport of wa-15
ter (Fig. 11a) reflecting that perhaps processes other than wind-driven upwelling maybe responsible for the upwelling. There was negligible colder surface water presentduring the first inter-monsoon period except perhaps along the extreme north of SriLanka (Fig. 11b). The southern coastal regions of both India and Sri Lanka experi-enced colder SST throughout the SW monsoon indicating strong upwelling during this20
period (Fig. 11c and d). There was also advection of colder water from the southern tipof India to the west coast of Sri Lanka during the SW monsoon (Fig. 11c and d). Themost notable feature is the shape of the cold water regions to the south and southeastof Sri Lanka (Fig. 11c and d, respectively). This shape is clearly visible on satellite im-ages as a result of the associated higher SCC (Figs. 2 and 5) and occurs in regions25
of convergence: in July 2011 (Figs. 3, 11c) water flowing southwards along both theeast and west coasts converges to the south and is transported offshore resulting in acolder water patch near the coast. In August, this colder water patch migrates to theeast and is present off the southeast coast of Sri Lanka (Fig. 11d). This feature is very
14967
similar to that observed in the August 2012 satellite image (Fig. 3c and d). These fea-tures indicate that wind driven upwelling through Ekman dynamics is most likely notresponsible for upwelling along the south coast of Sri Lanka.
3.3 Temporal (10 day) variability
In order to assess the shorter period spatial variability of surface circulation and up-5
welling around Sri Lanka, model output for surface currents and temperature averagedover a 10 day period, were examined. Initially, during the NE monsoon (January 2011)southward currents flowed along both the east and west coasts of Sri Lanka with east-erly currents along the south coast (Fig. 12a). The currents appear to converge alongthe southeast corner as indicated by the presence of colder water. Over the next 1010
days, the currents along the eastern coast increased due to stronger winds and this isaccompanied by a reversal in the currents along the south coast, which flow eastwardscausing the convergence zone (and colder water due to upwelling) to shift towardsthe southeast (Fig. 12b). During the subsequent 10 day period, there is colder wateralong the entire west coast of Sri Lanka including the Gulf of Mannar due to upwelling15
and a contribution through cooling due to air-sea fluxes (e.g. (Luis and Kawamura,2000). Analysis of scatterometer (NSCAT) winds by Luis and Kawamura (2000) indi-cated a 15-day periodicity in the wind field and these changes in the circulation patternsmay reflect the temporal changes associated with the wind field. Shorter period spatialvariability during January and July are shown in Figs. 9 and 10, respectively. ROMS20
simulations suggest that a small change in the direction of the currents incident on theIsland can change the nature of the current patterns around the island and the locationof the upwelling centre. This will be further analysed in the next section.
During the SW monsoon the eastward flowing SMC dominates the region. However,there is a similarity in the current fields to those observed during the NE monsoon:25
currents along both the western and eastern coasts flow southwards with a region ofconvergence either along the south or southeast coast of Sri Lanka (Fig. 13). Here overa 40-day period the convergence zone progressively migrates from the south coast to
14968
the east coast. As a result, the cold water region associated with the convergence ofthe currents also migrates to the east. The SST patterns predicted by the model arevery similar to those observed in the satellite imagery (cf. Figs. 13 and 3c and d).
The model results and satellite imagery for both the NE and SW monsoon periodsindicate that in general southward currents flow along both coasts of Sri Lanka re-5
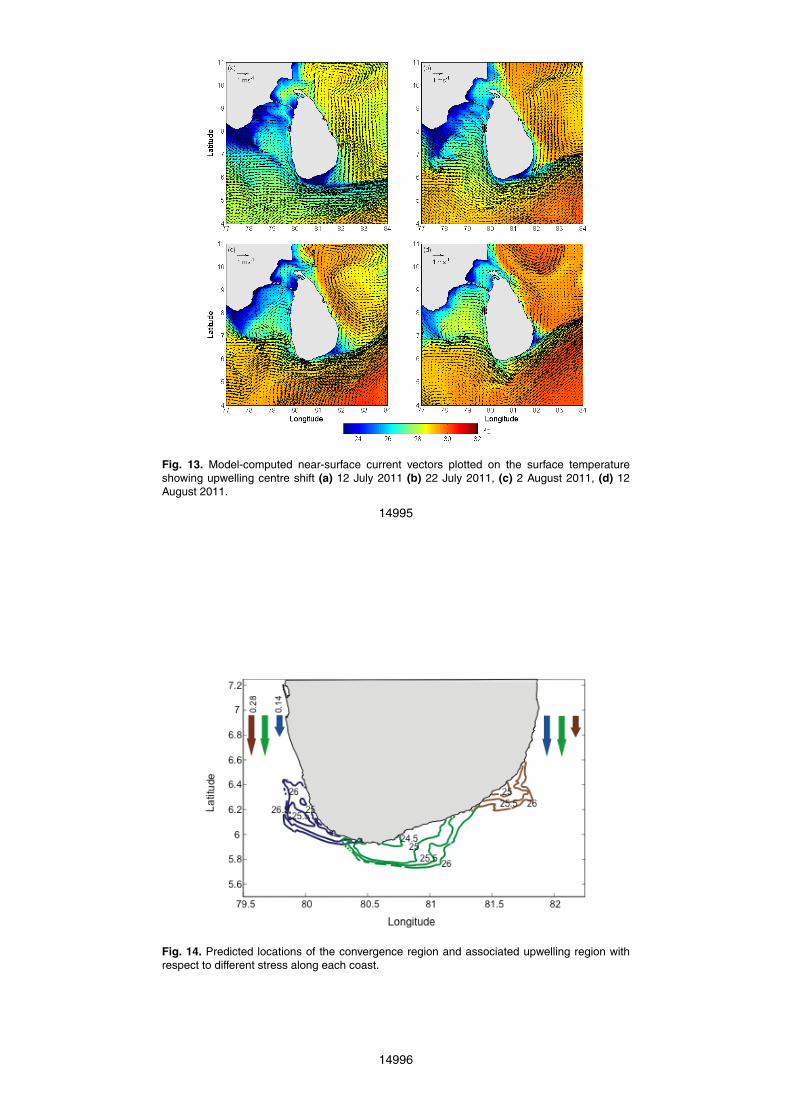
sulting in a convergence region along the southern half of the island. During the NEmonsoon, this convergence region migrates to the west (Fig. 12) whilst during the SWmonsoon the convergence region migrates to the east (Fig. 13). Idealised model runswere undertaken to investigate the mechanisms causing this migration which was hy-pothesised to be due to different wind stresses on each of the coasts. Three idealised10
model runs were undertaken with constant northerly winds as follows (1) wind stress of0.28 Pa off the east coast and 0.14 Pa along the west coast; (2) wind stress of 0.28 Paalong both coasts; and, (3) wind stress of 0.14 Pa off the east coast and 0.28 Pa alongthe west coast (i.e. the opposite of (1)). The results indicated that when the wind stresswas equal along both coasts the upwelling region was located directly off the south15
coast (Fig. 14) whilst when the wind stress was stronger on the west (east) coast theupwelling region migrated to the east (west). Thus the location of the upwelling ap-pears to be controlled by the relative strengths of the winds along each coast, whichchanges with season due to the changing monsoon. However, the surface currents andupwelling were much stronger during the SW monsoon compared to that during the NE20
monsoon due to the increased wind strengths.
3.4 Sri Lanka Dome
One of the major features observed during the SW monsoon period is the presenceof the Sri Lanka Dome (SD, Fig. 2). Here, the SMC flows eastward along the southcoast of Sri Lanka and creates a recirculation in the lee (east) of Sri Lanka with the25
western arm creating a southward current along the east coast. The features of thedome were identified in the satellite climatology (Fig. 8d) and in the numerical modeloutput (Fig. 10c). Analysis of the climatological thermal structure along 85◦E by Vinay-
14969
achandran and Yamagata (1998) indicated well-developed upward doming isothermsand they attributed the presence of the dome to open ocean Ekman pumping. The SDis analogous to flow patterns in the lee of headlands and islands with the Island ofSri Lanka acting as a headland interacting with the eastward flowing SMC (e.g. Pat-tiaratchi et al., 1987). A series of idealised model runs were undertaken to examine5
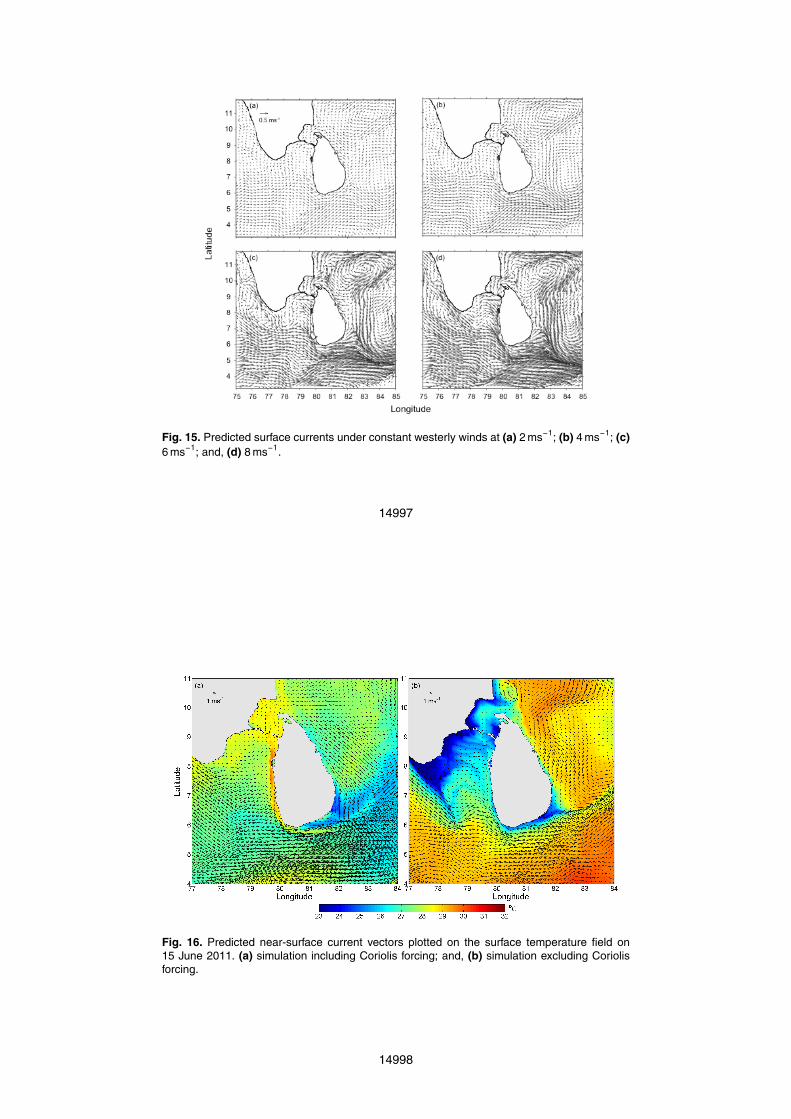
the hypothesis that the SD is formed through the interaction between the SMC and to-pography. Here, 15 day model runs with constant westerly winds of 2, 4, 6 and 8 ms−1
were undertaken. The wind speeds selected were based on observed winds (Fig. 6)and westerly winds were prescribed in the model as this was the main direction ofwinds to the west of Sri Lanka during the SW monsoon (Fig. 7). The results indicate10
that for all four cases, a recirculation occurred in the lee of Sri Lanka. The recirculationstrengthened (increased in vorticity) with an increase in the wind speed although thelocation of the centre remained at the same location around 84◦ E and 7–8◦ N with aslight migration to the east with increasing wind stress. These results indicate that theprimary formation mechanism of the SD is the interaction between the SMC and the15
landmass of Sri Lanka. This does not rule out the possibility that Ekman pumping mayplay a role in strengthening the dome.
4 Discussion
The seasonal and shorter term (∼10 days) changes in the surface circulation andupwelling patterns around Sri Lanka were examined using satellite imagery (mainly20
ocean colour) and a high spatial resolution numerical model (ROMS) configured to thestudy region and forced with ECMWF interim data. The model reproduced all of thedocumented major circulation features in the region: reversing monsoon currents inresponse to the changing wind field and the Sri Lanka Dome. The model predictions ofsea surface temperature patterns were similar to those observed by satellite imagery.25
Model output was used to update the transport rates of the SMC and NMC between SriLanka and the equator. Using a current meter array located to the south of Sri Lanka
14970
Schott et al. (1994) estimated transport rates of 8 and 12 Sv for SMC and NMC. Thesevalues are contradictory in that with stronger SW monsoon winds it would be expectedthat SMC transport rates are higher than those for the NMC. The numerical modeloutput indicates transport rates of 11.5 and 9.5 Sv for SMC and NMC respectively,which are likely more realistic. The values for the NMC are similar to those estimated5
by Schott et al. (1994) but that for the SMC is now higher. It should be noted that theestimates by Schott et al. (1994) were through the analysis of moored current meters,which did not sample the top 30 m of the water column.
Sri Lanka is a relatively large island (length 440 km; width 225 km) and, as mentionedin the Introduction, is situated in a unique geographic location in terms of oceano-10
graphic processes: experiencing seasonally reversing monsoon currents that interactwith the Island. Many studies have reported the influence of flow interaction with islandsand headlands leading to enhanced primary production – termed the island mass effect(IME) by Doty and Oguri (1956). These studies have included different spatial scalesusing laboratory and field experiments to understand circulation and enhanced pro-15
ductivity. They include those in the vicinity of oceanic islands: Johnston atolls (Barkley,1972), Aldabra and Cosmoledo atolls (Heywood et al., 1990), Barbados (Bowman etal., 1996; Cowen and Castro, 1994), Canary Islands (Barton et al., 2000), the Kergue-len Islands (Bucciarelli et al., 2001), Madeira Island (Caldeira et al., 2002), Galapagos(Palacios, 2002), Hawaii Islands (Hafner and Xie, 2003), Santa Catalina (Dong and20
McWilliams, 2007); and, in continental shelf and coastal regions: Wolanski et al. (1984),Pattiaratchi et al. (1987) and Alaee et al. (2007). Many scaling arguments have beenproposed to define the circulation patterns in the lee of islands based on the Reynoldsnumber which appear to reproduce the circulation in the lee of the island/headland(Tomczak, 1988; Wolanski et al., 1984). The predicted flow patterns around Sri Lanka25
are indicative of flow patterns observed in other regions both in deep and shallow wa-ter; however, due to the reversing flow patterns there are two distinct patterns that canbe identified:
14971
1. During the SW monsoon, the SMC interacts with the Island which acts more as aheadland as there is minimal flow through Palk Strait, the channel between Indiaand Sri Lanka (Fig. 1). The flow follows the curvature of the southern coast of SriLanka and generates a lee eddy in the form of the Sri Lanka Dome. Using val-ues of L∼200 km; U ∼0.8 ms−1; and Kh ∼104 m2 s−1, yields a Reynolds number5
(Re =UL/Kh; U – velocity scale, L – length scale and Kh – horizontal eddy vis-cosity; Tomczak, 1988) of ∼20 which predicts an attached eddy which is the SriLanka Dome (Fig. 1). This is confirmed by the idealised model runs with constantwesterly winds which predict a stronger eddy with increasing wind (flow) speeds(Fig. 15).10
2. During both the SW and NE monsoons, the model results indicated southwardflow along both east and west coasts converging along the south coast. In thiscase, circulation is similar to that of an Island with no discernible wake – definedas attached flow (e.g. Alaee et al., 2004). The currents are now weaker and us-ing values of L∼100 km; U ∼0.1 ms−1; and Kh ∼104 m2 s−1, yields a Reynolds15
number Re =∼1, in line with the theoretical predictions.
Flow along the south coast of Sri Lanka in both monsoons is subject to curvaturewhich can lead to secondary circulation (Alaee et al., 2004). Here, as a result of thecurvature induced centrifugal acceleration the surface waters move offshore and arereplaced by water from the sub-surface. In the case of Sri Lanka, although located20
close to the equator, scaling reveals that the Coriolis force is important in the dynamics(Rossby Number Ro <1) and that according to the flow regime proposed by Alaee etal. (2004) flow curvature is negligible in the generation of the secondary circulationwhen compared to the Coriolis force (Regime B where Ro <1 and Re >1). To furtherinvestigate the importance of the Coriolis term, model simulations were undertaken25
with the inclusion and exclusion of the Coriolis force during the SW monsoon. Theresults indicate that when the Coriolis force was omitted there was no upwelling (colderwater) to the west of Sri Lanka, particularly off the south Indian coast (Fig. 16). The
14972
upwelling feature with convergent flow to the southeast of the island is present in bothsimulations but is enhanced and pronounced in the model run with the inclusion of theCoriolis force. Hence, although the Coriolis force is important in the dynamics of theregion, it does not appear to play a major role in the upwelling along the south coast ofSri Lanka.5
In terms of upwelling patterns, case (1) clearly indicates the presence of higher SCCwithin the Sri Lanka Dome (Fig. 8) and Vinayachandran and Yamagata (1998) indi-cated well-developed upward doming isotherms in a climatological cross section of thedome. The main upwelling observed in the satellite imagery, both in terms of climatol-ogy (Fig. 3) and individual dates (Fig. 8) indicate the dominant upwelling regions along10
the south coast of Sri Lanka. Examining the climatological monthly means indicatesa wide band of higher SCC offshore of the southern coast which could be attributedto wind driven coastal upwelling due to Ekman dynamics. However, individual satelliteimages and numerical model outputs indicate that the mechanism of upwelling is morecomplicated. Located in the tropics the region is frequently under cloud cover and cloud15
free satellite imagery is very limited. Examination of the complete 10 yr archived dailyimages in the ocean colour imagery database (Feldman and McClain, 2013) yieldedless than 10 cloud free images for the region. However, these images often indicatesimilar patterns of upwelling where there is a ‘tongue’ (triangular shape) of high SCCwater with the wider section attached to the coast and tapering offshore (Fig. 3). The lo-20
cation of this tongue varied along the south coast and was present during both SW andNE monsoon periods. Similar high SCC patterns were reported by Vinayachandran etal. (2004) (Fig. 3). Although the numerical model did not include a biophysical model tosimulate phytoplankton growth (chlorophyll) the predicted SST distribution was remark-ably similar to the higher SCC patterns and the associated SST patterns observed by25
satellite (Fig. 3). The model output indicated that the lower SST patterns were associ-ated with regions of convergence: currents from both east and west coasts convergedin the upwelling centre defined by lower SST and the idealised model runs indicatedthat the location of the upwelling centre was dependent on the relative wind stress
14973
along each coast. During the NE monsoon the upwelling centre was shifted to the westwhilst during the SW monsoon the upwelling centre was shifted to the east (Fig. 14).It should also be noted that the south coast of Sri Lanka has a narrow continentalshelf hence shelf processes as a primary mechanism for upwelling may be neglected.There are no previous studies which have addressed this type of circulation pattern and5
upwelling: interaction between convergent flows around an island leading to upwelling.The island of Taiwan has a similar oceanographic setting with northward currents alongboth coastlines converging to the north of the island with upwelling along the northeastcorner (Chang et al., 2010). However, numerical experiments indicate that there is re-circulation to the north of the Island and the upwelling is due mainly to the Kuroshio10
Current encroaching onto the shelf (Chang et al., 2010). On a smaller scale, Magnellet al. (1990) show enhanced upwelling at Cape Mendocino resulting from convergingcurrents at the tip of the Cape. Through continuity, horizontal divergence at the seasurface results in vertical upwelling of water from depth. The numerical model results,confirmed by the high SCC patterns, confirm this process: the currents flowing parallel15
to the eastern and western coasts converge along the south coast and are deflectedoffshore. As the water flows offshore, there is divergence of water at the coast whichresults in upwelling of colder water from depth. This was confirmed by the numericalmodel output which indicated a lower sea surface height at the centre of upwelling.
The observation of blue whales (Balaenoptera musculus) feeding off the southern20
coast of Sri Lanka during the NE monsoon period (de Vos et al., 2013) provided themotivation for this study. The NE winds, under Ekman dynamics, would generate adownwelling system (onshore Ekman flow), along the south coast of Sri Lanka result-ing in a low primary productive system. The results of this study are able to explainthat the upwelling system along the south coast of Sri Lanka is not driven by Ekman25
dynamics rather through an interaction of the wind driven circulation around the Island.This results in a converging coastal current system that flows offshore creating a di-vergence at the coastline resulting in upwelling which is able to maintain a relativelyhigher productivity system during both monsoon periods.
14974
5 Conclusions
This paper has explored the elements of the dynamics of the surface circulation andcoastal upwelling in the waters around Sri Lanka, located in the northern Indian Ocean,a region influenced by seasonally reversing monsoon winds through satellite imageryand a numerical model. Numerical model predictions compared well with the limited5
field data and satellite observations. The main conclusions may be summarised asfollows:
1. The results confirmed the presence of the eastward flowing Southwest MonsoonCurrent (SMC) during the SW monsoon and the westward flowing Northeast Mon-soon Current (NMC), respectively. The predicted transport for the SMC and NMC10
of 11.5 and 9.5 Sv respectively are more realistic than previous estimates.
2. Sri Lanka Dome, a recirculation feature located to the east of Sri Lanka during theSW monsoon is the result of the interaction between SMC and the Island resultingin a recirculation eddy. It is possible that the eddy is enhanced through wind stresscurl.15
3. During both monsoon periods, the flow off the east and west coasts are south-ward, converging along the south coast. During the SW monsoon the Islanddeflected the eastward flowing SMC southward whilst along the east coast thesouthward flow results from the Sri Lanka Dome recirculation.
4. The major upwelling region, during both monsoon periods, is located along the20
south coast and results from flow convergence and associated offshore transportof water. Higher SCC values were observed during the SW monsoon. The locationof the flow convergence and hence the upwelling centre was dependent on therelative strengths of wind driven flow along the east and west coasts: during theSW (NE) monsoon the flow along the western (eastern) coast was stronger and25
hence the upwelling centre was shifted to the east (west).
14975
Acknowledgements. A. de Vos is supported by a UWA Scholarship for International ResearchFees (SIRF).
References
Alaee, J. M., Ivey, G., and Pattiaratchi, C.: Secondary circulation induced by flow curvature andCoriolis effects around headlands and islands, Ocean Dynam., 54, 27–38, 2004.5
Alaee, J. M., Pattiaratchi, C. B., and Ivey, G. N.: Numerical simulation of the summer wake ofRottenest Island, Western Australia, Dynam. Atmos. Oceans, 43, 171–198, 2007.
Barkley, R. A.: Johnston Atoll’s wake, J. Mar. Res., 30, 210–216, 1972.Barton, E. D., Basterretxea, G., Flament, P., Mitchelson-Jacob, E. G., Jones, B., Arístegui, J.,
and Herrera, F.: Lee region of Gran Canaria, J. Geophys. Res., 105, 173–117, 2000.10
Hybrid Coordinate Ocean Model (HYCOM) http://www.hycom.org, 2002.Bowman, M. J., Dietrich, D. E., and Lin, C. A.: Observations and modelling of mesoscale ocean
circulation near a small island, in: Small Islands: Marine Science and Sustainable Devel-opment, Coastal and Estuarine Studies, edited by: Maul, G., American Geophysical Union,Washington DC, 18–35, 1996.15
Bucciarelli, E., Blain, S., and Tréguer, P.: Iron and manganese in the wake of the KerguelenIslands (Southern Ocean), Mar. Chem., 73, 21–36, 2001.
Caldeira, R. M. A., Groom, S., Miller, P., Pilgrim, D., and Nezlin, N. P.: Sea-surface signatures ofthe island mass effect phenomena around Madeira Island, Northeast Atlantic, Remote Sens.Environ., 80, 336–360, 2002.20
Chang, Y.-L., Oey, L.-Y., Wu, C.-R., and Lu, H.-F.: Why are there upwellings on the north-ern shelf of Taiwan under northeasterly winds?, J. Phys. Oceanogr., 40, 1405–1417,doi:10.1175/2010jpo4348.1, 2010.
Cowen, R. K. and Castro, L. R.: Relation of coral reef fish larval distributions to island scalecirculation around Barbados, West Indies, Bull. Mar. Sci., 54, 228–244, 1994.25
de Vos, A., Kaltenberg, A. M., Friedlaender, A., Cripps, E., Harcourt, R., Pattiaratchi, C., andNowacek, D. P.: Spatial distribution of blue whales off southern Sri Lanka in relation to preyand oceanographic parameters, Mar. Ecol.-Prog. Ser., in review, 2013.
Di Lorenzo, E., Moore, A. M., Arango, H. G., Cornuelle, B. D., Miller, A. J., Powell, B., Chua, B.S., and Bennett, A. F.: Weak and strong constraint data assimilation in the inverse Regional30
14976
Ocean Modeling System (ROMS): Development and application for a baroclinic coastal up-welling system, Ocean Model. Online, 16, 160–187, 2007.
Dong, C. and McWilliams, J. C.: A numberical study of island wakes in the Southern CaliforniaBight, Cont. Shelf. Res., 27, 1233–1248, 2007.
Dong, C., Idica, E. Y., and McWilliams, J. C.: Circulation and multiple-scale variability in the5
Southern California Bight, Prog. Oceanogr., 82, 168–190, 2009.Doty, M. S. and Oguri, M.: The island mass effect, J. Conservation, 22, 33–37, 1956.Ocean Color Web: ocean color homepage http://oceancolor.gsfc.nasa.gov/, last access: 10
June, 2013.Hafner, J. and Xie, S.-P.: Far-field simulation of the Hawaiian wake: Sea surface tem-10
perature and orographic effects, J. Atmos. Sci., 60, 3021–3032, doi:10.1175/1520-0469(2003)060<3021:fsothw>2.0.co;2, 2003.
Haidvogel, D. B., Arango, H., Budgell, W. P., Cornuelle, B. D., Curchitser, E., Di Lorenzo, E.,Fennel, K., Geyer, W. R., Hermann, A. J., Lanerolle, L., Levin, J., McWilliams, J. C., Miller, A.J., Moore, A. M., Powell, T. M., Shchepetkin, A. F., Sherwood, C. R., Signell, R. P., Warner,15
J. C., and Wilkin, J.: Ocean forecasting in terrain-following coordinates: Formulation and skillassessment of the Regional Ocean Modeling System, J. Comput. Phys., 227, 3595–3624,2008.
Heywood, K. J., Barton, E. D., and Simpson, J. H.: The effects of flow disturbance by an oceanicisland, J. Mar. Res., 48, 55–73, 1990.20
Jensen, T. G.: Arabian Sea and Bay of Bengal exchange of salt and tracers in an ocean model,Geophys. Res. Lett., 28, 3967–3970, doi:10.1029/2001gl013422, 2001.
Kabanova, J. G.: Primary production of the northern part of the Indian Ocean, Oceanology, 8,214-225, 1968.
Legeckis, R.: Satellite observations of a western boundary current in the Bay of Bengal, J.25
Geophys. Res.-Oceans., 92, 12974–12978, doi:10.1029/JC092iC12p12974, 1987.Levitus, S., Burgett, R., and Boyer, T. P.: World ocean atlas 1994, NOAA Atlas NESDIS 3, US
Government Printing Office, Washington, DC, 1994.Luis, A. J. and Kawamura, H.: Wintertime wind forcing and sea surface cooling near the south
India tip observed using NSCAT and AVHRR, Remote Sens. Environ., 73, 55–64, 2000.30
Magnell, B. A., Bray, M. A., Winant, C. D., Greengrove, C. L., Largier, J. L., Borchardt, F., Bern-stein, R. L., and Dorman, C. E.: Convergent shelf flow at Cape Mendocino, Oceanography,3, 4-11, 1990.
14977
Marchesiello, P., McWilliams, J. C., and Shchepetkin, A.: Open boundary conditions for long-term integration of regional oceanic models, Ocean Model. Online, 3, 1–20, 2001.
Marchesiello, P., McWilliams, J. C., and Shchepetkin, A.: Equilibrium structure and dynamics ofthe California current system, J. Phys. Oceanogr., 33, 753–783, 2003.
McCreary Jr., J. P., Murtugudde, R., Vialard, J., Vinayachandran, P. N., Wiggert, J. D., Hood,5
R. R., Shankar, D., and Shetye, S.: Biophysical processes in the Indian Ocean, Geophys.Monogr. Ser., 185, 9–32, doi:10.1029/2008GM000768, 2009.
Michisaki, R. P., Chavez, F. P., Friederich, G. E., and Kelley, M.: Evolution of chemical andbiological properties in the Arabian Sea and Indian Ocean during 1995 from automatedsurface mapping, American Geophysical Union Ocean Sciences meeting, San Diego, 1996,10
Palacios, D. M.: Factors influencing the island-mass effect of the Galápagos Archipelago, Geo-phys. Res. Lett., 29, 2134, doi:10.1029/2002gl016232, 2002.
Pattiaratchi, C., James, A., and Collins, M.: Island wakes and headland eddies: A comparisonbetween remotely sensed data and laboratory experiments, J. Geophys. Res.-Oceans., 92,783–794, doi:10.1029/JC092iC01p00783, 1987.15
Pawlowicz, R., Beardsley, B., and Lentz, S.: Classical tidal harmonic analysis including errorestimates in MATLAB using T_TIDE, Computers Geosci., 28, 929–937, 2002.
Saetersdal, G., Bianchi, G., Stomme, T., and Venema, S. C.: The Dr. Fridtjof Nansen Pro-gramme 1975–1993: Investigations of fishery resources in developing countries, History ofthe programme and review of results, Food and Agriculture Organisation of the United Na-20
tions, Rome, 434 pp., 1999.Sahini, A.: The structure, sedimentation and evolution of Indian continental margins, in: The
ocean basins and margins: The Indian Ocean, edited by: Nairn, E. M. and Stehli, F. G.,Plenum Press, New York, 353–398, 1982.
Schott, F. A. and McCreary, J., J.P.: The monsoon circulation of the Indian Ocean, Prog.25
Oceanogr., 51, 1–123, 2001.Schott, F., Reppin, J., Fischer, J., and Quadfasel, D.: Currents and transports of the monsoon
current south of Sri Lanka, J. Geophys. Res.-Oceans, 99, 25127–25141, 1994.Shankar, D. and Shetye, S. R.: On the dynamics of the Lakshadweep high and low in the
southeastern Arabian Sea, J. Geophys. Res.-Oceans, 102, 12551–12562, 1997.30
Shankar, D., Vinayachandran, P. N., and Unnikrishnan, A. S.: The monsoon currents in thenorth Indian Ocean, Prog. Oceanogr., 52, 63–120, 2002.
14978
Shchepetkin, A. F. and McWilliams, J. C.: The regional oceanic modeling system (ROMS):A split-explicit, free-surface, topography-following-coordinate oceanic model, Ocean Model.Online, 9, 347–404, 2005.
Shepard, E. P.: Submarine geology, Harper and Row Publishers, New York, 1963.Song, Y. and Haidvogel, D.: A semi-implicit ocean circulation model using a generalized5
topography-following coordinate system, J. Comput. Phys., 115, 228–244, 1994.Sreenivas, P., Gnanaseelan, C., and Prasad, K. V. S. R.: Influence of El Niño and Indian Ocean
Dipole on sea level variability in the Bay of Bengal, Glob. Planet. Change, 80/81, 215–225,2012.
Swan, B.: An Introduction to the Coastal Geomorphology of Sri Lanka, National Museums of10
Sri Lanka, Colombo, 1983.Tomczak, M.: Island wakes in deep and shallow water, J. Geophys. Res., 93, 5153–5154, 1988.Tomczak, M. and Godfrey, J. S.: Regional oceanography: An introduction, 2 ed., Pergamon,
2003.Varkey, M. J., Murty, V. S. N., and Suryanarayana, A.: Physical oceanography of the Bay of15
Bengal and Andaman Sea, in: Oceanogr. Mar. Biol. Annu. Rev., edited by: Ansell, A. D.,Gibson, R. N., and Barnes, M., CRC Press, 1–70, 1996.
Vinayachandran, P. N. and Yamagata, T.: Monsoon response of the sea around Sri Lanka:Generation of thermal domes and anticyclonic vortices, J. Phys. Oceanogr., 28, 1946–1960,doi:10.1175/1520-0485(1998)028<1946:mrotsa>2.0.co;2, 1998.20
Vinayachandran, P. N., Masumoto, Y., Mikawa, T., and Yamagata, T.: Intrusion of the south-west monsoon current into the Bay of Bengal, J. Geophys. Res.-Oceans, 104, 11077–11085,doi:10.1029/1999JC900035, 1999.
Vinayachandran, P. N., Chauhan, P., Mohan, M., and Nayak, S.: Biological responseof the sea around Sri Lanka to summer monsoon, Geophys. Res. Lett., 31,25
doi:10.1029/2003GL018533, 2004.Wijeratne, E. M. S.: Tidal characteristics and modelling of tidal wave propagation in shallow
lagoons of Sri Lanka, Ph.D., Gothenburg University, Gothenburg, 2003.Wijeratne, E. M. S., Woodworth, P. L., and Stepanov, V. N.: The seasonal cycle of sea level in
Sri Lanka and southern India, West Indian Ocean J. Mar. Sci., 7, 29–43, 2008.30
Wijeyananda, N. P.: Maritime zones, in: Arjuna’s atlas of Sri Lanka, edited by: Somasekaram,T., Perera, M., de Silva, M. B. G., and Godellawatta, H., Arjuna Consulting Company Limited,Colombo, 5–7, 1997.
14979
Wolanski, E., Imberger, J., and Heron, M. L.: Island wakes in shallow coastal waters, J. Geo-phys. Res., 89, 553–569, 1984.
Wyrtiki, K.: Physical oceanography of the Indian Ocean, in: The Biology of the Indian Ocean,edited by: Zeitzschel, B. and Gerlach, S. A., Springer-Verlag, Heidelberg, 1973.
Xu, J., Lowe, R. J., Ivey, G. N., Pattiaratchi, C. B., Jones, N. L., and Brinkman, R.: Dynamics of5
the summer shelf circulation and transient upwelling off Ningaloo Reef, Western Australia, J.Geophys. Res.-Oceans, 118, 1099–1125, 2013.
Yapa, K. K. A. S.: Upwelling phenomena in the southern coastal waters of Sri Lanka duringsouthwest monsoon period as seen from MODIS, Sri Lanka J. Phys., 10, 7–15, 2009.
14980
Table 1. Tidal constituents at different stations along the coastline of Sri Lanka. Tide gaugedata are denoted in regular font and model data are denoted in italic font. Phase refers to localtime.
Figure 1: Study area showing bathymetry and model domain. Numbers represent tide stations used
for model validation. 1. Point Pedro 2. Kayts 3. Delft Island 4. Kalpitiya 5. Chilaw 6. Colombo 7.
Galle 8. Dondra 9. Kirinda 10. Oluwil 11. Batticaloa 12. Trincomalee. Wind speed and direction
data was from the Hambantota Meteorological Station on the southeast coast.
Fig. 1. Study area showing bathymetry and model domain. Numbers represent tide stationsused for model validation. 1. Point Pedro 2. Kayts 3. Delft Island 4. Kalpitiya 5. Chilaw 6.Colombo 7. Galle 8. Dondra 9. Kirinda 10. Oluwil 11. Batticaloa 12. Trincomalee. Wind speedand direction data was from the Hambantota Meteorological Station on the southeast coast.
14982
25
Figure 2: Circulation patterns around Sri Lanka and southern India for (a) Northeast monsoon and
(b) Southwest monsoon. Where WICC is West Indian Coastal Current; EICC is East Indian Coastal
Current; SMC is Southwest Monsoon Current; NMC is Northeast Monsoon Current and SD is Sri
Lanka Dome
Fig. 2. Circulation patterns around Sri Lanka and southern India for (a) Northeast monsoonand (b) Southwest monsoon. Where WICC is West Indian Coastal Current; EICC is East IndianCoastal Current; SMC is Southwest Monsoon Current; NMC is Northeast Monsoon Current andSD is Sri Lanka Dome.
14983
27
(a)
(d)
(b)
(f)
(c)
(e)
Fig. 3. Caption on next page.
14984
28
Figure 3: (a) Surface Chlorophyll concentration (SCC) obtained on 13 December 2010; (b) SCC on
21 January 2011; (c) Sea Surface Temperature (SST) on 19 October 2003; (d) SCC on 19 October
2003; (e) SST on 1 August 2012; (f) SCC on SST on 1 August 2012; (g) SST on 19 June 2013; (h)
SCC on 19 June 2013. The chlorophyll and temperature scales are on (g) and (h) respectively and
apply to all images.
(g) (h)
Fig. 3. (a) Surface Chlorophyll concentration (SCC) obtained on 13 December 2010; (b) SCCon 21 January 2011; (c) Sea Surface Temperature (SST) on 19 October 2003; (d) SCC on19 October 2003; (e) SST on 1 August 2012; (f) SCC on SST on 1 August 2012; (g) SST on 19June 2013; (h) SCC on 19 June 2013. The chlorophyll and temperature scales are on (g) and(h) respectively and apply to all images.
14985
29
Figure 4: Comparison of the shipboard ADCP measured (red) and ROMS (blue) currents at 30 m
depth. a) ADCP from 25 to 31 Dec 1997 and ROMS for 31 Dec 2010, b) ADCP from 01 to 05
March 1995 and ROMS for 03 March 2011, c) ADCP from 21 to 30 July 1993 and ROMS for 26
July 2011 and d) ADCP from 01 to 03 Aug 2005 and ROMS for 03 Aug 2011.
Fig. 4. Comparison of the shipboard ADCP measured (red) and ROMS (blue) currents at 30 mdepth. (a) ADCP from 25–31 December 1997 and ROMS for 31 December 2010, (b) ADCPfrom 01 to 05 March 1995 and ROMS for 3 March 2011, (c) ADCP from 21–30 July 1993 andROMS for 26 July 2011 and (d) ADCP from 1–3 August 2005 and ROMS for 3 August 2011.
14986
30
Figure 5. Typical summer upwelling frontal features around southern part of Sri Lanka obtained on
Fig. 5. Typical summer upwelling frontal features around southern part of Sri Lanka obtainedon 12 October 2003 (a) satellite derived surface chlorophyll concentration; (b) Predicted near-surface current vectors and temperature.
14987
31
Figure 6: Time series for wind speed and direction for Sri Lanka in 2010. The red line and dots
indicate daily data collected at 0830 hrs and 1730 hrs and black line and dots indicate the daily
averaged data. Data were obtained from the Hambantota meteorological station, southeast Sri
Lanka.
Fig. 6. Time series for wind speed and direction for Sri Lanka in 2010. The red line and dotsindicate daily data collected at 0830 hrs and 1730 h and black line and dots indicate the dailyaveraged data. Data were obtained from the Hambantota meteorological station, southeast SriLanka.
14988
32
Figure 7: Bi-monthly wind speed and direction for Sri Lanka in 2011 from ECMWF ERA interim
data. Each plot represents a bi-monthly average with length of arrow correlating with speed. (a)
January (northeast monsoon); (b) March (first inter-monsoon); (c) May, (d) July and (e) September
(southwest monsoon); (f) November (second inter-monsoon).
456789
1011
10 ms-1
January (b) March (c) May
75 80 85
456789
1011
(d) July
75 80 85
(e) September
75 80 85
(f) November
Longitude
Latit
ude
(a)
Fig. 7. Bi-monthly wind speed and direction for Sri Lanka in 2011 from ECMWF ERA interimdata. Each plot represents a bi-monthly average with length of arrow correlating with speed.(a) January (northeast monsoon); (b) March (first inter-monsoon); (c) May, (d) July and (e)September (southwest monsoon); (f) November (second inter-monsoon).
14989
January March
May July
September November
(c)
(e)
(d)
(f)
(a)
(b)
Fig. 8. Monthly mean surface chlorophyll concentrations around Sri Lanka, obtained from cli-matology. (a) January; (b) April; (c) May; (d) July; (e) September; (f) November.
14990
35
Figure 9: Hovmöller diagram displaying seasonality and inter-annual variability of surface
chlorophyll concentrations off the southern coast of Sri Lanka. Fig. 9. Hovmöller diagram displaying seasonality and inter-annual variability of surface chloro-phyll concentrations off the southern coast of Sri Lanka.
Figure 11: Predicted near-surface current vectors plotted on the surface temperature showing major
upwelling regions around Sri Lanka (a) 16-20 January 2011; (b) 10-14 April 2011; (c) 12-16 July
2011 and (d) 18-22 August 2011.
Fig. 11. Predicted near-surface current vectors plotted on the surface temperature showingmajor upwelling regions around Sri Lanka (a) 16–20 January 2011; (b) 10–14 April 2011; (c)12–16 July 2011 and (d) 18–22 August 2011.
14993
38
Figure 12. Predicted near-surface current vectors plotted on the surface temperature showing
sporadic upwelling (a) 01-10 January 2011 (b) 11-20 January 2011 and (c) 21 -31 January 2011. Fig. 12. Predicted near-surface current vectors plotted on the surface temperature showingsporadic upwelling (a) 1–10 January 2011 (b) 11–20 January 2011 and (c) 21–31 January2011.
14994
39
Figure 13. Model-computed near-surface current vectors plotted on the surface temperature
showing upwelling centre shift (a) 12 July 2011 (b) 22 July 2011, (c) 02 August 2011, (d) 12
August 2011.
Fig. 13. Model-computed near-surface current vectors plotted on the surface temperatureshowing upwelling centre shift (a) 12 July 2011 (b) 22 July 2011, (c) 2 August 2011, (d) 12August 2011.
14995
40
Figure 14. Predicted locations of the convergence region and associated upwelling region with
respect to different stress along each coast.
Fig. 14. Predicted locations of the convergence region and associated upwelling region withrespect to different stress along each coast.
14996
41
Figure15. Predicted surface currents under constant westerly winds at (a) 2 ms-1; (b) 4 ms-1; (c) 6
Figure 16. Predicted near-surface current vectors plotted on the surface temperature field on 15
June 2011. (a) simulation including Coriolis forcing; and, (b) simulation excluding Coriolis forcing.
Fig. 16. Predicted near-surface current vectors plotted on the surface temperature field on15 June 2011. (a) simulation including Coriolis forcing; and, (b) simulation excluding Coriolisforcing.