Date post: | 27-Nov-2023 |
Category: |
Documents |
Upload: | khangminh22 |
View: | 0 times |
Download: | 0 times |
www.rsc.org/advances
RSC Advances
This is an Accepted Manuscript, which has been through the Royal Society of Chemistry peer review process and has been accepted for publication.
Accepted Manuscripts are published online shortly after acceptance, before technical editing, formatting and proof reading. Using this free service, authors can make their results available to the community, in citable form, before we publish the edited article. This Accepted Manuscript will be replaced by the edited, formatted and paginated article as soon as this is available.
You can find more information about Accepted Manuscripts in the Information for Authors.
Please note that technical editing may introduce minor changes to the text and/or graphics, which may alter content. The journal’s standard Terms & Conditions and the Ethical guidelines still apply. In no event shall the Royal Society of Chemistry be held responsible for any errors or omissions in this Accepted Manuscript or any consequences arising from the use of any information it contains.
RSC Advances RSCPublishing
PAPER
This journal is © The Royal Society of Chemistry 2014 RSC Adv, 2014, 00, 1-3 | 1
Cite this: DOI: 10.1039/x0xx00000x
Received 00th January 201x,
Accepted 00th January 201x
DOI: 10.1039/x0xx00000x
www.rsc.org/
Synthesis and characterization of mixed phase
anatase TiO2 and sodium-doped TiO2(B) thin films by
low pressure chemical vapour deposition (LPCVD)
Yothin Chimupala,*a Geoffrey Hyett,b Robert Simpson,a Robert Mitchell,c Richard Douthwaite,c Steven J.Milne,a and Richard D. Brydson a
TiO2 thin films were synthesized using Low Pressure Chemical Vapour Deposition (LPCVD)
onto glass substrates. Titanium isopropoxide (TTIP) and N2 gas were used as the precursor and
carrier gas respectively. The effects of reaction temperature, carrier gas flow rate and deposited
area were studied. SEM, TEM, powder XRD and UV-Vis and Raman spectroscopy were
employed to characterize the phase and morphology of the synthesized materials. The results
show that a dual phase (sodium-doped TiO2(B) and anatase) nanocrystalline thin film was
successfully prepared by LPCVD with needle- and polygonal plate-shape crystallites
respectively. At the interface with the substrate, the thin film deposit exhibited a preferred
orientation of TiO2(B) needles in the [001] direction of average crystallite size 50-80 nm in
length and 5-10 nm in width, whilst the crystallite size of anatase polygonal-plates was around
200 nm. The optimal LPCVD condition for preparing this mixed phase of TiO2 was 550oC
(actual temperature) with a 1 mL/s N2 flow rate. A possible mechanism for the mixed-phase
formation by LPCVD on the glass substrates is described as well as the implications for the
production of self-cleaning structures.
Introduction
TiO2 semiconductor polymorphs (and in some cases polymorph
mixtures) are amongst the most widely used materials owing to
their cost effective, highly stable and environmentally-friendly
nature combined with their well-known electronic and optical
properties 1. Titania is extensively used for optical applications:
as a ubiquitous white pigment, as an opacifier and as an
optically reflective coating; additionally it is increasingly used
in sunscreens as an ultraviolet (uv) blocking agent 2.
Electronically, nanocrystalline and porous titania films are used
in the anodes of dye-sensitised solar cells 3. A further
interesting property of titania is the ability to photocatalyse
chemical reactions under uv irradiation. There are many
physical forms of TiO2 photocatalysts including powders, thin
films and aqueous suspensions, which have been widely
utilized in areas ranging from: treatment of both water and air
aInstitute of Materials Research, SPEME, University of Leeds, Leeds,
LS2 9JT, UK. Email: [email protected] bDepartment of Chemistry, University of Southampton, Highfield,
Southampton, SO17 1BJ, UK cDepartment of Chemistry, University of York, York, YO10 5DD, UK
pollution 4, water splitting reactions 5, antibacterial surfaces,
through to anti-fogging materials and self-cleaning materials
such as window glass 6,7. A major factor in the practical
application of TiO2 photocatalysts, is their ability to be reused
whilst retaining high photocatalytic efficiency. In this respect
immobilized TiO2 thin films on rigid substrates are a key form
if these photocatalysts are to be employed in the various
chemical industries and in construction materials.
In the case of self-cleaning materials, TiO2 thin films have
been prepared by a wide range of deposition methods such as
sol-gel 8, sputtering 9, pulsed laser deposition (PLD) 10, physical
vapour deposition (PVD) 11 and chemical vapour deposition
(CVD) 12. CVD is a low-cost process, which is easy to set up
and subsequently adjust, it permits a high degree of
compatibility with a wide range of substrates and also has the
potential for mass production. High quality self-cleaning thin
films on glass require three major attributes: little or no
scattering of visible light, the thin film to be of nanometre
dimension in both thickness and crystallite/particle size ; a high
mechanical resistance to any external abrasion; and finally
acceptable photo-catalytic properties such as catalytic-rate and
efficiency 6
Page 1 of 9 RSC Advances
RS
CA
dvan
ces
Acc
epte
dM
anus
crip
t
Paper RSC Advances
2 |RSC Advances, 2014, 00, 1-3 This journal is © The Royal Society of Chemistry 2014
Thin films based on the crystalline anatase phase of TiO2
are used in self-cleaning glass/windows 6 as this polymorph
possesses a higher photocatalytic activity than rutile. For
industrial production, the thin films are exclusively the anatase
phase, 50-500 nm thick and deposited using atmospheric
pressure CVD from TiCl4 and ethyl acetate precursors at
temperatures between 400-660 oC 13. Current improvement
strategies focus on the use of ultrafine nanoparticles in the thin
films, the modification of charge transfer processes to prevent
the recombination reaction, and the controlled production of
phase mixtures in the thin films which may provide higher
photocatalytic activities. Mixing two different phases of TiO2 14
15 such as anatase/rutile or anatase/TiO2(B), directly affects the
charge transfer process between the different phases possibly
reducing recombination of photo-generated electrons and so
enhancing the photocatalytic activity 16−19. This directly
improves the efficiency of oxidative stripping of organic
molecules from water or air.
The TiO2 (B) or bronze phase of titania has attracted
significant interest over the last decade because of the
distinctive monoclinic crystal structure which, because of its
low-density crystal framework, exhibits larger channels and
voids and also a higher specific storage capacity as compared to
the tetragonal structures of anatase and rutile 20−22 as shown in
figure 1. Commonly, alkali metal titanates have been used as
precursors for TiO2(B) preparation in many synthetic methods
such as sol-gel 23, hydrothermal 24 and solid-state reaction 21. In
this paper, the LPCVD method was employed to synthesise (for
the first time) dual phase anatase and sodium-doped TiO2(B)
thin films on glass substrates.
Fig.1 Crystal structures of anatase, rutile and TiO2(B) viewed along a, b
and c axes
Fig.2 (a) Schematic representation showing the LPCVD system for preparing
TiO2 (b) Temperature profile in the tube furnace for a nominal reaction
temperature of 600°C.
Experimental Procedure
Thin Film Preparation
Low pressure chemical vapour deposition (i.e. thermal
decomposition and oxidation of a precursor) at 25 mbar was
used to synthesize TiO2 thin films on substrates as shown
schematically in figure 2. Titanium tetra-isopropoxide (TTIP,
97%) was used as the titania precursor, 5-10 mL being placed
in a bubbling chamber which was set in an oil bath at 90°C. The
reactor was a quartz cylinder tube placed in a tube furnace and
was pre-heated from room temperature up to the desired
reaction temperature. N2 gas with a flow rate of 1 L/min was
used to carry the TTIP vapour into the reactor. Titania thin
films were deposited onto different substrates including: a soda-
lime glass slide (with wt% composition of 72.00 SiO2,14.50
Na2O, 7.05 CaO, 3.95 MgO, 1.65 Al2O3, 0.30 K2O and 0.06
Fe2O3 ) of dimensions 12 mm × 152 mm × 1 mm (width ×
length × thickness) and fused quartz (pure amorphous silica of
the same dimensions). The reaction temperature in the tube
furnace was varied between 450 and 600°C with a reaction time
of typically 15 min. However, we note that this is only a
nominal temperature as there will exist a temperature gradient
inside the reaction tube. This temperature gradient was
measured in air as a function of position inside the reaction
tube using a moveable thermocouple and the results for a
nominal furnace temperature of 600°C are shown in figure 2b.
Materials Characterization
Before being characterized, the TiO2 film deposited onto the
substrate (e.g. a soda-lime glass slide) was divided into 12
plates each of dimensions 12 mm × 12.6 mm × 1 mm. These
samples represented different reactor positions relative to the
gas entry point at plate1. In-plane and out of plane X-ray
diffraction (XRD) with a Philips X’Pert MPD diffractometer
using Cu Kα X-ray radiation, were employed to characterise the
crystalline phases in the samples. The surface morphology and
thickness of TiO2 thin films were investigated by scanning
electron microscopy (SEM, Carl Zeiss LEO 1530 Gemini
FEGSEM) and energy dispersive X-ray (EDX) spectroscopy
(Oxford Instruments) both in plan-view and in cross-section.
Raman spectroscopy (Renishaw’s inVia Raman microscope
with green laser of wavelength 514.5 nm-1) and UV-Vis diffuse
Page 2 of 9RSC Advances
RS
CA
dvan
ces
Acc
epte
dM
anus
crip
t
RSC Advances Paper
This journal is © The Royal Society of Chemistry 2014 RSC Advances, 2014, 00, 1-3 | 3
reflectance spectroscopy (Perkin Elmer UV-vis Lambda 900)
were also used to characterise these materials. Initial sample
preparation for transmission electron microscopy (TEM) was
achieved by using a scalpel to scrape off the deposited materials
from the substrates onto a holey carbon film supported on a Cu
TEM grid. In addition a Focused Ion Beam (FIB – FEI Nova
200) was used to prepare thin cross-sections of these materials
on the substrates for TEM analysis using imaging, selected area
electron diffraction (SAED) and EDX spectroscopy, mapping
and quantification (Oxford Instruments AZTEC) on a FEI
Tecnai G2 TEM/STEM operated at 200 kV.
Results
The optimum synthesis condition to achieve thin films
composed of mixed phase TiO2(B) and anatase was found to be
a nominal reaction temperature of 600°C for 15 min reaction
time with 5 mL of TTIP. The mixed phase of TiO2 only
occurred when the nominal reaction temperature reached
600oC. At lower nominal temperatures such as 400°C and
500°C, thin films tended to be composed of pure anatase with
an equiaxed particle morphology exhibiting extensive particle
aggregation, whilst at high temperatures (700°C) it was
observed that the substrate began to deform and the deposit
consisted of pure anatase with a non-aggregated spherical
particle morphology. In this report we focus solely on the
results obtained at a nominal temperature of 600°C as these
conditions appear to promote the formation of the TiO2(B)
phase. As shown in figure 2b the actual temperature in the
reaction tube had a maximum of ca. 550°C at the position of
plates 2-5 and decreased towards each end of the tube.
Fig. 3 Out of plane XRD patterns of TiO2 thin film deposited onto soda-lime
glass substrates and a quartz substrate at position Plate 4 prepared by LPCVD
at 600°C: A and B refer to the assignment of the anatase and TiO2(B) phases
respectively.
Fig 4. In plane and out of plane XRD patterns of Plate 4: A and B refer to
anatase and TiO2(B) phases respectively.
For these conditions, the out of plane XRD patterns of a
selection of 12 plates on a soda-lime glass substrate are shown
in figure 3, and are compared to the corresponding thin film on
a fused quartz substrate (referred to as TiO2-Quartz) prepared
under identical conditions and reactor position as Plate 4. The
XRD patterns show that almost all of 600°C synthesized thin
films on soda lime glass substrate consist of a combination of
both TiO2(B) (JCPDS 04-007-6246) and anatase phases
(JCPDS 00-021-1272) in different relative proportions
depending on the distance from the gas entry point. As will
become clear later, it is important to note that the XRD peaks
assigned to the TiO2(B) phase do not match with any sodium
titanate NaxTiO2+0.5X phase or any other related sodium-
containing phase in the JCPDS database. In Plate 1 anatase is
the majority component, nevertheless in other reactor positions
(as shown in Plates 2, 4, 5 and 8) XRD indicates the main
component is the TiO2(B) phase. In the case of Plate 10, the
patterns show only one peak at 2θ = 25.30° indicating the
anatase phase and two very broad features lying between 15-
35° and 60-70° characteristic of amorphous SiO2 from the glass
substrates. The influence of the substrate was more evident at
larger distances from the gas entry point possibly indicating the
presence of a thinner crystalline deposit.
Fig 5. Raman spectra of Plate 4 and Quartz-plate 4: A and B indicate the
anatase and TiO2(B) phases respectively.
Page 3 of 9 RSC Advances
RS
CA
dvan
ces
Acc
epte
dM
anus
crip
t
Paper RSC Advances
4 |RSC Advances, 2014, 00, 1-3 This journal is © The Royal Society of Chemistry 2014
Fig 6. (a) UV-Vis diffuse reflectance spectrums of the samples prepared at
optimum condition (b) Estimation of the band gap energy by plotting the
corresponding graph of absorption versus photon energy (eV).
The influence of the substrate on the film was studied using
a fused-quartz plate (at the same position as Plate 4) instead of
the normal soda-lime glass substrate under the same synthesis
conditions. The differences can be seen in figure 3 by
comparing the XRD patterns labeled Plate 4 and Quartz-plate 4
respectively. These results indicate that a mixed phase of
anatase and TiO2(B) can be indexed on Plate 4, whilst only the
anatase phase is evident on a fused quartz substrate indicating
that the soda-lime glass substrate promotes the formation of
TiO2(B) by LPCVD.
The (101) and (200) peaks of the anatase phase (at 2θ =
25.28° and 48.05° respectively) are very close to the (110) and
(020) peaks of the TiO2(B) phase at 2θ=24.98° and 48.63°. The
crystallite size derived from XRD line broadening in figure 3
was estimated to be in the range 40-60 nm for both phases. In
order to clarify the results, both in-plane and out-of-plane XRD
were recorded for Plate 4 to confirm the existence of both
phases, as illustrated in figure 4. The in-plane XRD pattern
shows additional peaks of the TiO2(B) phase when compared to
the TiO2(B) peaks evident in the out-of-plane pattern. Not only
does this confirm the existence of the TiO2(B) phase it also
Fig 7. (a) SEM secondary electron image of TiO2 thin film from the top surface of
Plate 4; (b) SEM secondary electron image of TiO2 thin film from the top surface
of Quartz-plate 4
reveals a preferred [001] crystallographic orientation of
TiO2(B)as illustrated by the strong (001), (002) and (003) hkl
reflections at 2θ = 14.16°, 28.62° and 43.5° in the out-of-plane
pattern.
Raman spectroscopy was employed to confirm the phases
on Plate 4 and Quartz-plate 4. The Raman active modes for
anatase are evident as an intense peak around 144 cm-1 as well
as three other peaks at 395, 517 and 637 cm-1 present in both
samples and indicating solely pure anatase on Quartz-plate 4
(figure 5). The remaining peaks, especially two strong peaks at
121.9 and 144.96 cm-1 signify the Raman active modes of the
TiO2(B) phase 25,26 indicating the presence of the mixed phase
on Plate 4.
UV-Vis diffuse reflectance spectroscopy was used to study
optical properties of the thin films and raw spectra are shown in
figure 6(a) 16 and the same data after a transformation to
absorption in figure 6(b). The band gaps of these materials were
calculated by extrapolating the linear portion of the slopes in
Figure 6(b) and determining the intercept with the background.
The band gap energies of anatase and TiO2(B) are
experimentally reported as being 3.2 eV and 3.0-3.2 eV
respectively 26−30. The present results curiously show a energy
band gap of between 3.25 and 3.31 eV which increased with an
increasing proportion of the TiO2(B) phase. It might be
expected that the presence of any dopants in the thin film may
cause changes including possible increases in the band gap
energy. In contrast, the anatase thin film on Quartz-plate 4
showed a band gap of 3.275 eV.
A SEM plan-view image of Plate 4 is shown in figure 7a
and illustrates the presence of two types of particle
morphology: large polygonal plates 100-200 nm in diameter
and smaller, more spherical particles with a diameter of around
20 nm. The average primary particle size of this bimodal
distribution at the film surface is 73±42 nm. A composition
derived from SEM/EDX, shown inset in figure 7a, confirms the
existence of titanium and oxygen in the thin film. As the TiO2
film thickness is only around 200 nm, as shown in the SEM
cross-section in figure 8a, the electron beam interaction volume
also samples the glass substrate and hence the Ti:O ratio is less
than 1:2 and this is also presumably why Na, Si, Ca and Mg are
detected. Inspection of figure 8a, reveals that the film cross-
section also contains two kinds of particles: smaller columnar
or needle-shaped particles present predominantly at the glass
substrate/film boundary and the larger plate-like particles
Page 4 of 9RSC Advances
RS
CA
dvan
ces
Acc
epte
dM
anus
crip
t
RSC Advances Paper
This journal is © The Royal Society of Chemistry 2014 RSC Advances, 2014, 00, 1-3 | 5
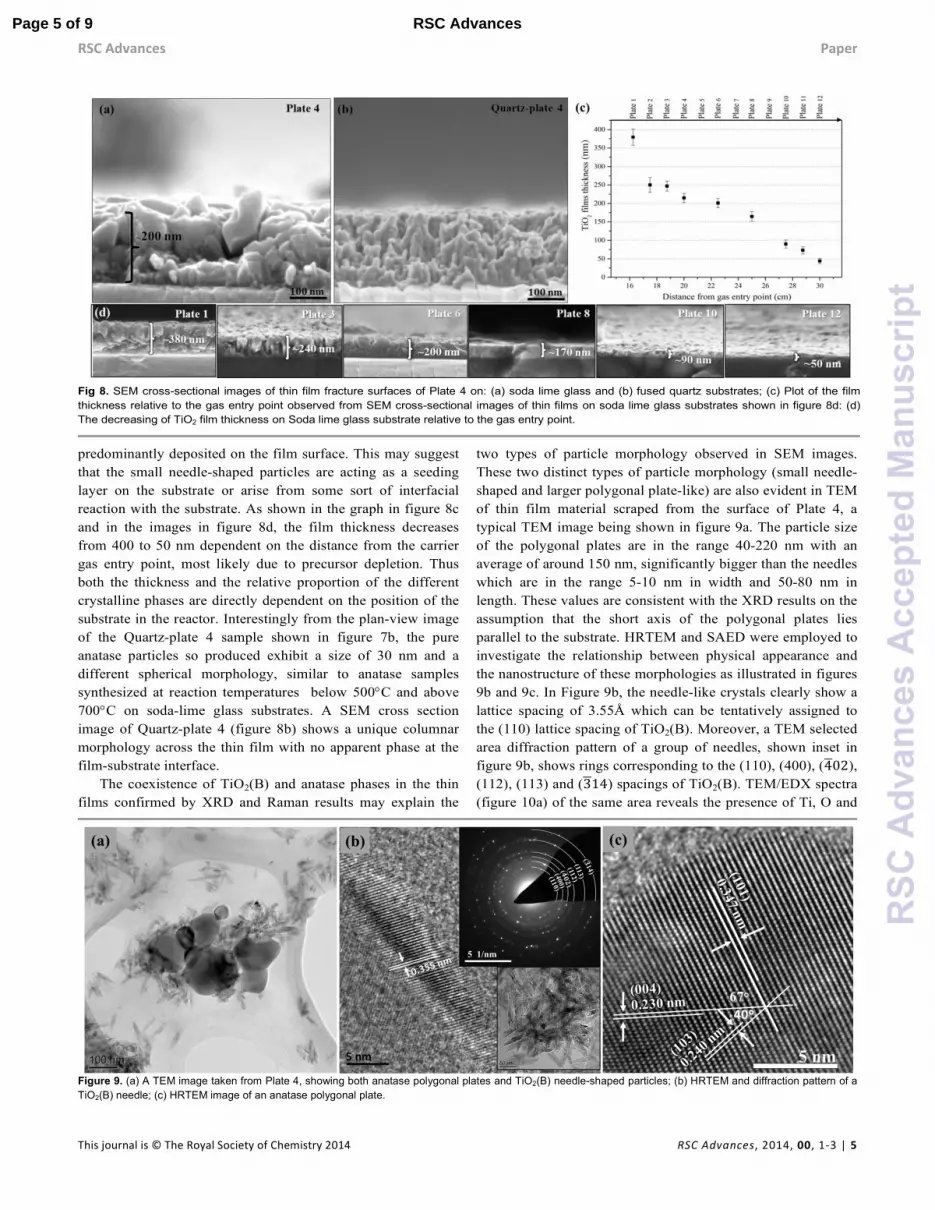
Fig 8. SEM cross-sectional images of thin film fracture surfaces of Plate 4 on: (a) soda lime glass and (b) fused quartz substrates; (c) Plot of the film
thickness relative to the gas entry point observed from SEM cross-sectional images of thin films on soda lime glass substrates shown in figure 8d: (d)
The decreasing of TiO2 film thickness on Soda lime glass substrate relative to the gas entry point.
predominantly deposited on the film surface. This may suggest
that the small needle-shaped particles are acting as a seeding
layer on the substrate or arise from some sort of interfacial
reaction with the substrate. As shown in the graph in figure 8c
and in the images in figure 8d, the film thickness decreases
from 400 to 50 nm dependent on the distance from the carrier
gas entry point, most likely due to precursor depletion. Thus
both the thickness and the relative proportion of the different
crystalline phases are directly dependent on the position of the
substrate in the reactor. Interestingly from the plan-view image
of the Quartz-plate 4 sample shown in figure 7b, the pure
anatase particles so produced exhibit a size of 30 nm and a
different spherical morphology, similar to anatase samples
synthesized at reaction temperatures below 500°C and above
700°C on soda-lime glass substrates. A SEM cross section
image of Quartz-plate 4 (figure 8b) shows a unique columnar
morphology across the thin film with no apparent phase at the
film-substrate interface.
The coexistence of TiO2(B) and anatase phases in the thin
films confirmed by XRD and Raman results may explain the
two types of particle morphology observed in SEM images.
These two distinct types of particle morphology (small needle-
shaped and larger polygonal plate-like) are also evident in TEM
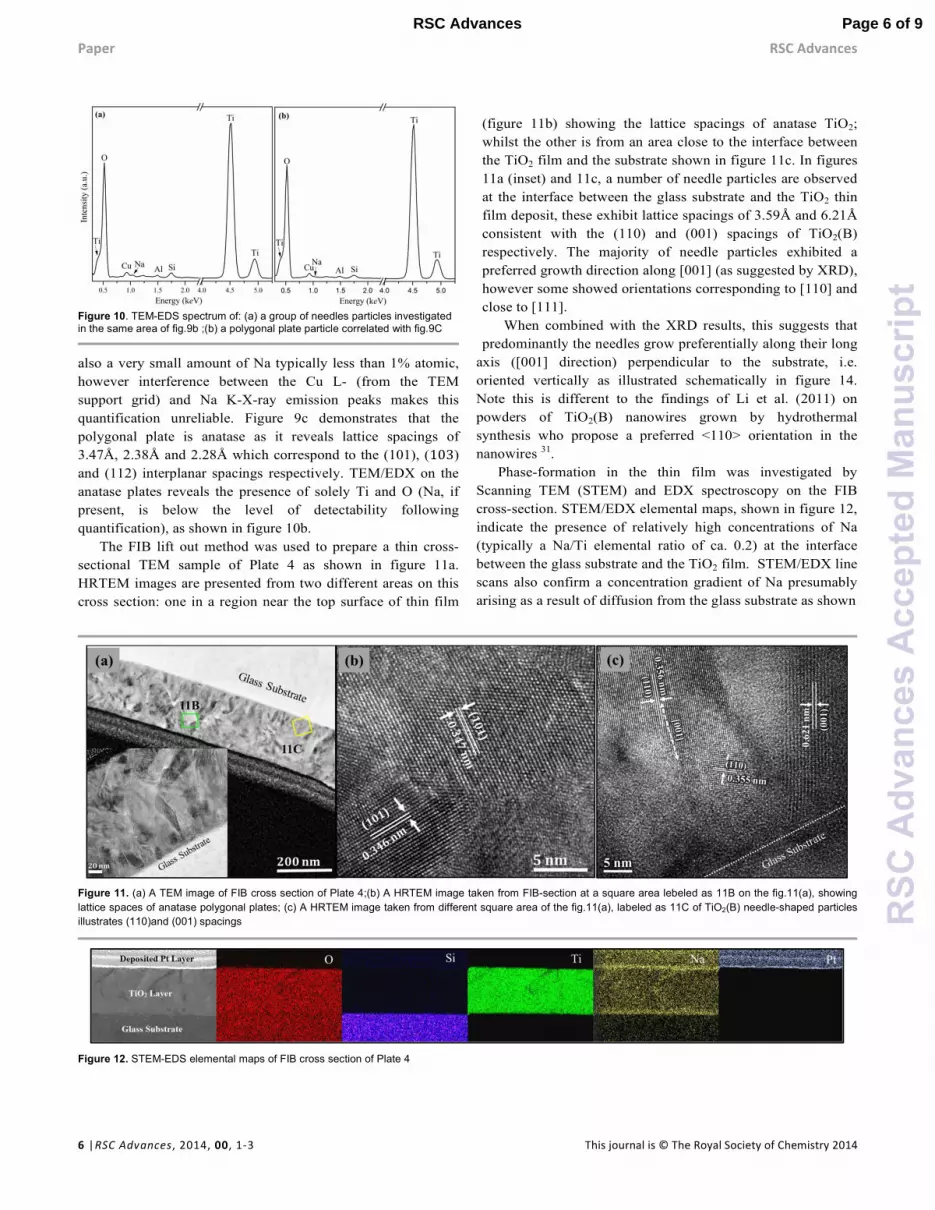
of thin film material scraped from the surface of Plate 4, a
typical TEM image being shown in figure 9a. The particle size
of the polygonal plates are in the range 40-220 nm with an
average of around 150 nm, significantly bigger than the needles
which are in the range 5-10 nm in width and 50-80 nm in
length. These values are consistent with the XRD results on the
assumption that the short axis of the polygonal plates lies
parallel to the substrate. HRTEM and SAED were employed to
investigate the relationship between physical appearance and
the nanostructure of these morphologies as illustrated in figures
9b and 9c. In Figure 9b, the needle-like crystals clearly show a
lattice spacing of 3.55Å which can be tentatively assigned to
the (110) lattice spacing of TiO2(B). Moreover, a TEM selected
area diffraction pattern of a group of needles, shown inset in
figure 9b, shows rings corresponding to the (110), (400), (4�02),
(112), (113) and (3�14) spacings of TiO2(B). TEM/EDX spectra
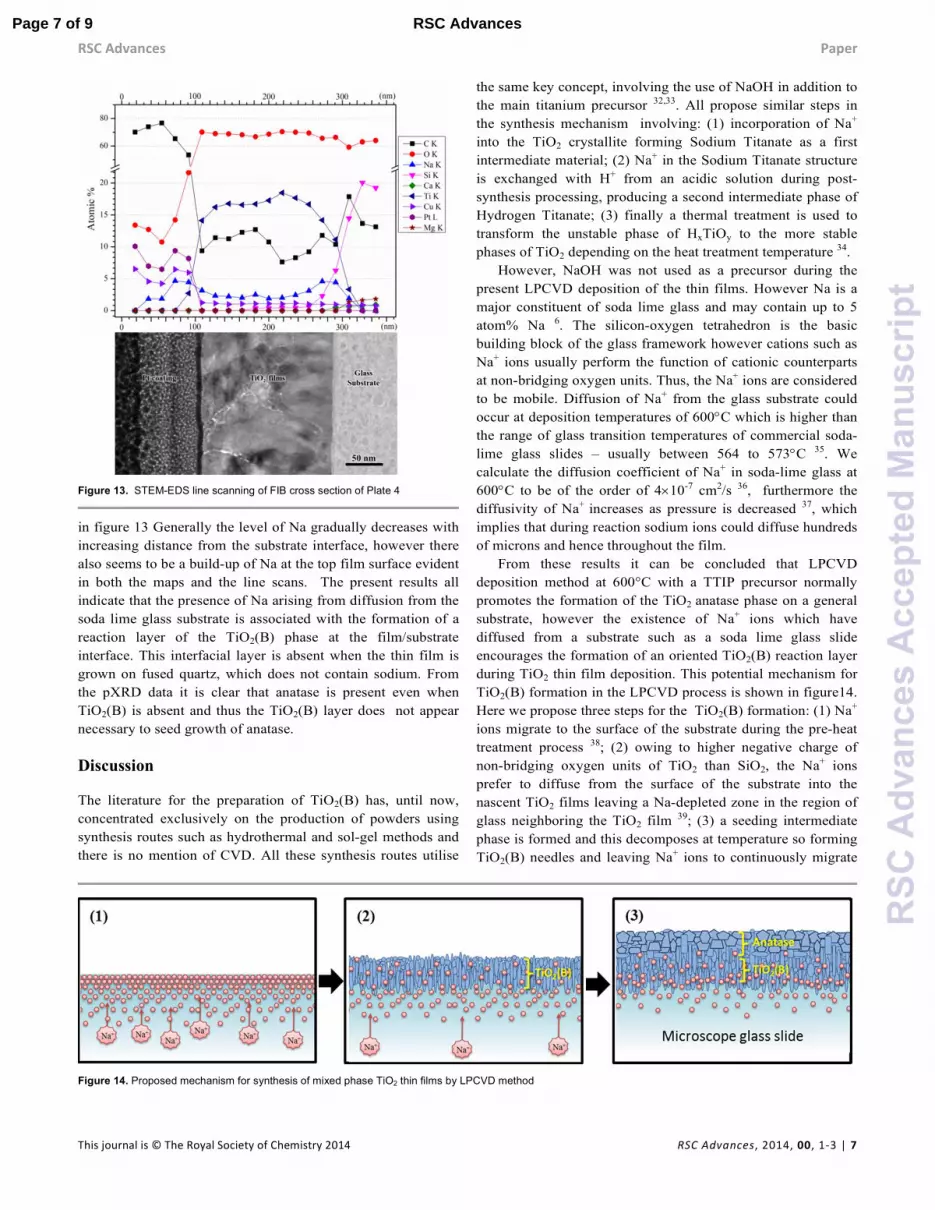
(figure 10a) of the same area reveals the presence of Ti, O and
Figure 9. (a) A TEM image taken from Plate 4, showing both anatase polygonal plates and TiO2(B) needle-shaped particles; (b) HRTEM and diffraction pattern of a
TiO2(B) needle; (c) HRTEM image of an anatase polygonal plate.
Page 5 of 9 RSC Advances
RS
CA
dvan
ces
Acc
epte
dM
anus
crip
t
Paper RSC Advances
6 |RSC Advances, 2014, 00, 1-3 This journal is © The Royal Society of Chemistry 2014
also a very small amount of Na typically less than 1% atomic,
however interference between the Cu L- (from the TEM
support grid) and Na K-X-ray emission peaks makes this
quantification unreliable. Figure 9c demonstrates that the
polygonal plate is anatase as it reveals lattice spacings of
3.47Å, 2.38Å and 2.28Å which correspond to the (101), (103)
and (112) interplanar spacings respectively. TEM/EDX on the
anatase plates reveals the presence of solely Ti and O (Na, if
present, is below the level of detectability following
quantification), as shown in figure 10b.
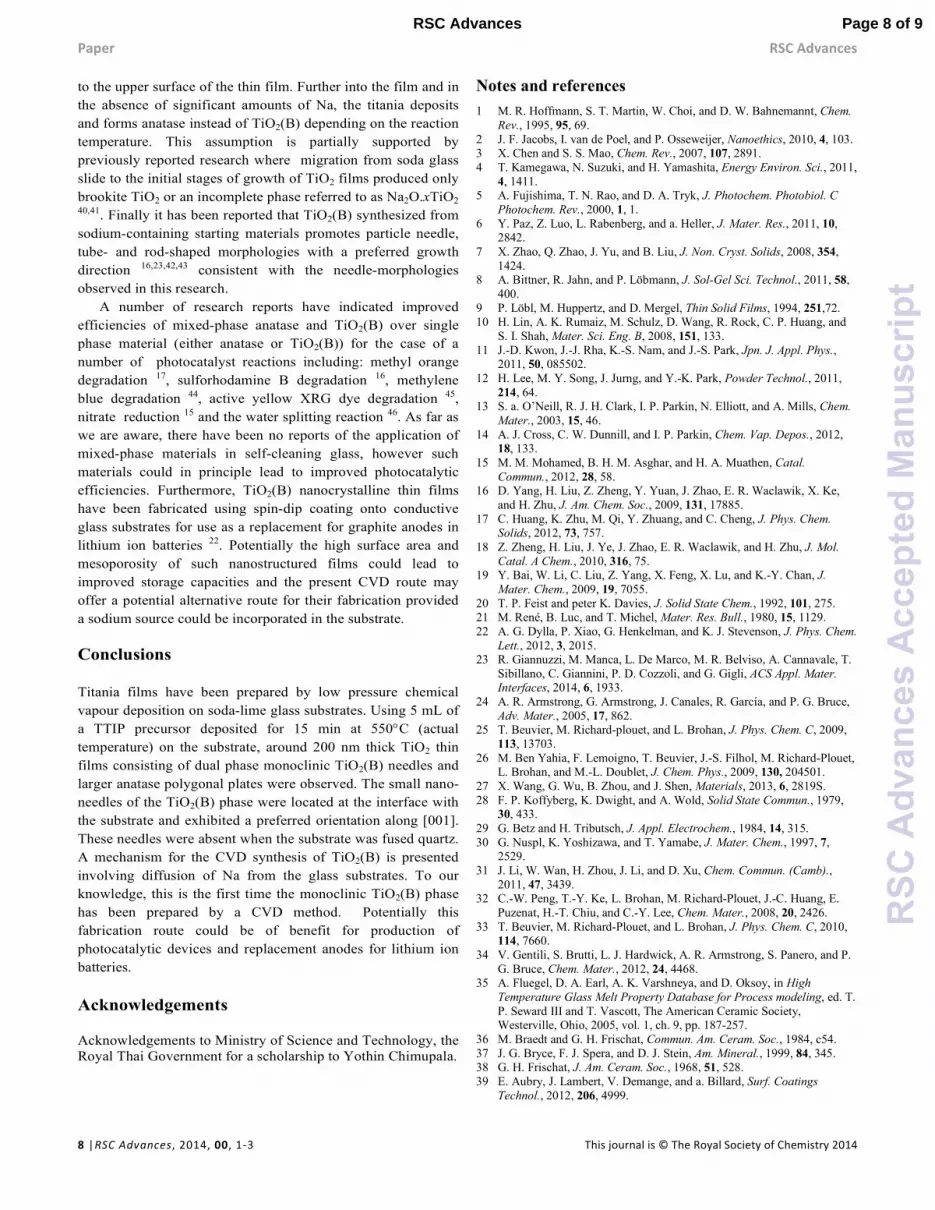
The FIB lift out method was used to prepare a thin cross-
sectional TEM sample of Plate 4 as shown in figure 11a.
HRTEM images are presented from two different areas on this
cross section: one in a region near the top surface of thin film
(figure 11b) showing the lattice spacings of anatase TiO2;
whilst the other is from an area close to the interface between
the TiO2 film and the substrate shown in figure 11c. In figures
11a (inset) and 11c, a number of needle particles are observed
at the interface between the glass substrate and the TiO2 thin
film deposit, these exhibit lattice spacings of 3.59Å and 6.21Å
consistent with the (110) and (001) spacings of TiO2(B)
respectively. The majority of needle particles exhibited a
preferred growth direction along [001] (as suggested by XRD),
however some showed orientations corresponding to [110] and
close to [111].
When combined with the XRD results, this suggests that
predominantly the needles grow preferentially along their long
axis ([001] direction) perpendicular to the substrate, i.e.
oriented vertically as illustrated schematically in figure 14.
Note this is different to the findings of Li et al. (2011) on
powders of TiO2(B) nanowires grown by hydrothermal
synthesis who propose a preferred <110> orientation in the
nanowires 31.
Phase-formation in the thin film was investigated by
Scanning TEM (STEM) and EDX spectroscopy on the FIB
cross-section. STEM/EDX elemental maps, shown in figure 12,
indicate the presence of relatively high concentrations of Na
(typically a Na/Ti elemental ratio of ca. 0.2) at the interface
between the glass substrate and the TiO2 film. STEM/EDX line
scans also confirm a concentration gradient of Na presumably
arising as a result of diffusion from the glass substrate as shown
Figure 11. (a) A TEM image of FIB cross section of Plate 4;(b) A HRTEM image taken from FIB-section at a square area lebeled as 11B on the fig.11(a), showing
lattice spaces of anatase polygonal plates; (c) A HRTEM image taken from different square area of the fig.11(a), labeled as 11C of TiO2(B) needle-shaped particles
illustrates (110)and (001) spacings
Figure 12. STEM-EDS elemental maps of FIB cross section of Plate 4
Figure 10. TEM-EDS spectrum of: (a) a group of needles particles investigated in the same area of fig.9b ;(b) a polygonal plate particle correlated with fig.9C
Page 6 of 9RSC Advances
RS
CA
dvan
ces
Acc
epte
dM
anus
crip
t
RSC Advances Paper
This journal is © The Royal Society of Chemistry 2014 RSC Advances, 2014, 00, 1-3 | 7
in figure 13 Generally the level of Na gradually decreases with
increasing distance from the substrate interface, however there
also seems to be a build-up of Na at the top film surface evident
in both the maps and the line scans. The present results all
indicate that the presence of Na arising from diffusion from the
soda lime glass substrate is associated with the formation of a
reaction layer of the TiO2(B) phase at the film/substrate
interface. This interfacial layer is absent when the thin film is
grown on fused quartz, which does not contain sodium. From
the pXRD data it is clear that anatase is present even when
TiO2(B) is absent and thus the TiO2(B) layer does not appear
necessary to seed growth of anatase.
Discussion
The literature for the preparation of TiO2(B) has, until now,
concentrated exclusively on the production of powders using
synthesis routes such as hydrothermal and sol-gel methods and
there is no mention of CVD. All these synthesis routes utilise
the same key concept, involving the use of NaOH in addition to
the main titanium precursor 32,33. All propose similar steps in
the synthesis mechanism involving: (1) incorporation of Na+
into the TiO2 crystallite forming Sodium Titanate as a first
intermediate material; (2) Na+ in the Sodium Titanate structure
is exchanged with H+ from an acidic solution during post-
synthesis processing, producing a second intermediate phase of
Hydrogen Titanate; (3) finally a thermal treatment is used to
transform the unstable phase of HxTiOy to the more stable
phases of TiO2 depending on the heat treatment temperature 34.
However, NaOH was not used as a precursor during the
present LPCVD deposition of the thin films. However Na is a
major constituent of soda lime glass and may contain up to 5
atom% Na 6. The silicon-oxygen tetrahedron is the basic
building block of the glass framework however cations such as
Na+ ions usually perform the function of cationic counterparts
at non-bridging oxygen units. Thus, the Na+ ions are considered
to be mobile. Diffusion of Na+ from the glass substrate could
occur at deposition temperatures of 600°C which is higher than
the range of glass transition temperatures of commercial soda-
lime glass slides – usually between 564 to 573°C 35. We
calculate the diffusion coefficient of Na+ in soda-lime glass at
600°C to be of the order of 4×10⁻⁷ cm2/s 36, furthermore the
diffusivity of Na+ increases as pressure is decreased 37, which
implies that during reaction sodium ions could diffuse hundreds
of microns and hence throughout the film.
From these results it can be concluded that LPCVD
deposition method at 600°C with a TTIP precursor normally
promotes the formation of the TiO2 anatase phase on a general
substrate, however the existence of Na+ ions which have
diffused from a substrate such as a soda lime glass slide
encourages the formation of an oriented TiO2(B) reaction layer
during TiO2 thin film deposition. This potential mechanism for
TiO2(B) formation in the LPCVD process is shown in figure14.
Here we propose three steps for the TiO2(B) formation: (1) Na+
ions migrate to the surface of the substrate during the pre-heat
treatment process 38; (2) owing to higher negative charge of
non-bridging oxygen units of TiO2 than SiO2, the Na+ ions
prefer to diffuse from the surface of the substrate into the
nascent TiO2 films leaving a Na-depleted zone in the region of
glass neighboring the TiO2 film 39; (3) a seeding intermediate
phase is formed and this decomposes at temperature so forming
TiO2(B) needles and leaving Na+ ions to continuously migrate
Figure 13. STEM-EDS line scanning of FIB cross section of Plate 4
Figure 14. Proposed mechanism for synthesis of mixed phase TiO2 thin films by LPCVD method
Page 7 of 9 RSC Advances
RS
CA
dvan
ces
Acc
epte
dM
anus
crip
t
Paper RSC Advances
8 |RSC Advances, 2014, 00, 1-3 This journal is © The Royal Society of Chemistry 2014
to the upper surface of the thin film. Further into the film and in
the absence of significant amounts of Na, the titania deposits
and forms anatase instead of TiO2(B) depending on the reaction
temperature. This assumption is partially supported by
previously reported research where migration from soda glass
slide to the initial stages of growth of TiO2 films produced only
brookite TiO2 or an incomplete phase referred to as Na2O.xTiO2 40,41. Finally it has been reported that TiO2(B) synthesized from
sodium-containing starting materials promotes particle needle,
tube- and rod-shaped morphologies with a preferred growth
direction 16,23,42,43 consistent with the needle-morphologies
observed in this research.
A number of research reports have indicated improved
efficiencies of mixed-phase anatase and TiO2(B) over single
phase material (either anatase or TiO2(B)) for the case of a
number of photocatalyst reactions including: methyl orange
degradation 17, sulforhodamine B degradation 16, methylene
blue degradation 44, active yellow XRG dye degradation 45,
nitrate reduction 15 and the water splitting reaction 46. As far as
we are aware, there have been no reports of the application of
mixed-phase materials in self-cleaning glass, however such
materials could in principle lead to improved photocatalytic
efficiencies. Furthermore, TiO2(B) nanocrystalline thin films
have been fabricated using spin-dip coating onto conductive
glass substrates for use as a replacement for graphite anodes in
lithium ion batteries 22. Potentially the high surface area and
mesoporosity of such nanostructured films could lead to
improved storage capacities and the present CVD route may
offer a potential alternative route for their fabrication provided
a sodium source could be incorporated in the substrate.
Conclusions
Titania films have been prepared by low pressure chemical
vapour deposition on soda-lime glass substrates. Using 5 mL of
a TTIP precursor deposited for 15 min at 550°C (actual
temperature) on the substrate, around 200 nm thick TiO2 thin
films consisting of dual phase monoclinic TiO2(B) needles and
larger anatase polygonal plates were observed. The small nano-
needles of the TiO2(B) phase were located at the interface with
the substrate and exhibited a preferred orientation along [001].
These needles were absent when the substrate was fused quartz.
A mechanism for the CVD synthesis of TiO2(B) is presented
involving diffusion of Na from the glass substrates. To our
knowledge, this is the first time the monoclinic TiO2(B) phase
has been prepared by a CVD method. Potentially this
fabrication route could be of benefit for production of
photocatalytic devices and replacement anodes for lithium ion
batteries.
Acknowledgements
Acknowledgements to Ministry of Science and Technology, the Royal Thai Government for a scholarship to Yothin Chimupala.
Notes and references
1 M. R. Hoffmann, S. T. Martin, W. Choi, and D. W. Bahnemannt, Chem.
Rev., 1995, 95, 69. 2 J. F. Jacobs, I. van de Poel, and P. Osseweijer, Nanoethics, 2010, 4, 103. 3 X. Chen and S. S. Mao, Chem. Rev., 2007, 107, 2891. 4 T. Kamegawa, N. Suzuki, and H. Yamashita, Energy Environ. Sci., 2011,
4, 1411. 5 A. Fujishima, T. N. Rao, and D. A. Tryk, J. Photochem. Photobiol. C
Photochem. Rev., 2000, 1, 1. 6 Y. Paz, Z. Luo, L. Rabenberg, and a. Heller, J. Mater. Res., 2011, 10,
2842. 7 X. Zhao, Q. Zhao, J. Yu, and B. Liu, J. Non. Cryst. Solids, 2008, 354,
1424. 8 A. Bittner, R. Jahn, and P. Löbmann, J. Sol-Gel Sci. Technol., 2011, 58,
400. 9 P. Löbl, M. Huppertz, and D. Mergel, Thin Solid Films, 1994, 251,72. 10 H. Lin, A. K. Rumaiz, M. Schulz, D. Wang, R. Rock, C. P. Huang, and
S. I. Shah, Mater. Sci. Eng. B, 2008, 151, 133. 11 J.-D. Kwon, J.-J. Rha, K.-S. Nam, and J.-S. Park, Jpn. J. Appl. Phys.,
2011, 50, 085502. 12 H. Lee, M. Y. Song, J. Jurng, and Y.-K. Park, Powder Technol., 2011,
214, 64. 13 S. a. O’Neill, R. J. H. Clark, I. P. Parkin, N. Elliott, and A. Mills, Chem.
Mater., 2003, 15, 46. 14 A. J. Cross, C. W. Dunnill, and I. P. Parkin, Chem. Vap. Depos., 2012,
18, 133. 15 M. M. Mohamed, B. H. M. Asghar, and H. A. Muathen, Catal.
Commun., 2012, 28, 58. 16 D. Yang, H. Liu, Z. Zheng, Y. Yuan, J. Zhao, E. R. Waclawik, X. Ke,
and H. Zhu, J. Am. Chem. Soc., 2009, 131, 17885. 17 C. Huang, K. Zhu, M. Qi, Y. Zhuang, and C. Cheng, J. Phys. Chem.
Solids, 2012, 73, 757. 18 Z. Zheng, H. Liu, J. Ye, J. Zhao, E. R. Waclawik, and H. Zhu, J. Mol.
Catal. A Chem., 2010, 316, 75. 19 Y. Bai, W. Li, C. Liu, Z. Yang, X. Feng, X. Lu, and K.-Y. Chan, J.
Mater. Chem., 2009, 19, 7055. 20 T. P. Feist and peter K. Davies, J. Solid State Chem., 1992, 101, 275. 21 M. René, B. Luc, and T. Michel, Mater. Res. Bull., 1980, 15, 1129. 22 A. G. Dylla, P. Xiao, G. Henkelman, and K. J. Stevenson, J. Phys. Chem.
Lett., 2012, 3, 2015. 23 R. Giannuzzi, M. Manca, L. De Marco, M. R. Belviso, A. Cannavale, T.
Sibillano, C. Giannini, P. D. Cozzoli, and G. Gigli, ACS Appl. Mater. Interfaces, 2014, 6, 1933.
24 A. R. Armstrong, G. Armstrong, J. Canales, R. García, and P. G. Bruce, Adv. Mater., 2005, 17, 862.
25 T. Beuvier, M. Richard-plouet, and L. Brohan, J. Phys. Chem. C, 2009, 113, 13703.
26 M. Ben Yahia, F. Lemoigno, T. Beuvier, J.-S. Filhol, M. Richard-Plouet, L. Brohan, and M.-L. Doublet, J. Chem. Phys., 2009, 130, 204501.
27 X. Wang, G. Wu, B. Zhou, and J. Shen, Materials, 2013, 6, 2819S. 28 F. P. Koffyberg, K. Dwight, and A. Wold, Solid State Commun., 1979,
30, 433. 29 G. Betz and H. Tributsch, J. Appl. Electrochem., 1984, 14, 315. 30 G. Nuspl, K. Yoshizawa, and T. Yamabe, J. Mater. Chem., 1997, 7,
2529. 31 J. Li, W. Wan, H. Zhou, J. Li, and D. Xu, Chem. Commun. (Camb).,
2011, 47, 3439. 32 C.-W. Peng, T.-Y. Ke, L. Brohan, M. Richard-Plouet, J.-C. Huang, E.
Puzenat, H.-T. Chiu, and C.-Y. Lee, Chem. Mater., 2008, 20, 2426. 33 T. Beuvier, M. Richard-Plouet, and L. Brohan, J. Phys. Chem. C, 2010,
114, 7660. 34 V. Gentili, S. Brutti, L. J. Hardwick, A. R. Armstrong, S. Panero, and P.
G. Bruce, Chem. Mater., 2012, 24, 4468. 35 A. Fluegel, D. A. Earl, A. K. Varshneya, and D. Oksoy, in High
Temperature Glass Melt Property Database for Process modeling, ed. T. P. Seward III and T. Vascott, The American Ceramic Society, Westerville, Ohio, 2005, vol. 1, ch. 9, pp. 187-257.
36 M. Braedt and G. H. Frischat, Commun. Am. Ceram. Soc., 1984, c54. 37 J. G. Bryce, F. J. Spera, and D. J. Stein, Am. Mineral., 1999, 84, 345. 38 G. H. Frischat, J. Am. Ceram. Soc., 1968, 51, 528. 39 E. Aubry, J. Lambert, V. Demange, and a. Billard, Surf. Coatings
Technol., 2012, 206, 4999.
Page 8 of 9RSC Advances
RS
CA
dvan
ces
Acc
epte
dM
anus
crip
t
RSC Advances Paper
This journal is © The Royal Society of Chemistry 2014 RSC Advances, 2014, 00, 1-3 | 9
40 H. Schroeder, in Physics of thin films, ed. G. Hass and R. E. Thun, Academic press, New York and London, 5th edn., 1969, vol. 5, pp. 87–140.
41 C. Ohara, T. Hongo, A. Yamazaki, and T. Nagoya, Appl. Surf. Sci., 2008, 254, 6619.
42 A.R. Armstrong, G. Armstrong, J. Canales, and P. G. Bruce, Adv. Mater., 2005, 17, 862.
43 Z. Liu, Y. G. Andreev, A. Robert Armstrong, S. Brutti, Y. Ren, and P. G. Bruce, Prog. Nat. Sci. Mater. Int., 2013, 23, 235.
44 C.-W. Peng, M. Richard-Plouet, T.-Y. Ke, C.-Y. Lee, H.-T. Chiu, C. Marhic, E. Puzenat, F. Lemoigno, and L. Brohan, Chem. Mater., 2008, 20, 7228.
45 J. Zhu, J. Zhang, F. Chen, and M. Anpo, Mater. Lett., 2005, 59, 3378. 46 S. K. Parayil, H. S. Kibombo, L. Mahoney, C. Wu, M. Yoon, and R. T.
Koodali, Mater. Lett., 2013, 95, 175.
Page 9 of 9 RSC Advances
RS
CA
dvan
ces
Acc
epte
dM
anus
crip
t