Targeted and Imaging-guided In Vivo Photodynamic Therapy of Tumors Using Dual- functional, Aggregation-induced Emission Nanoparticles Xianhe Sun 1, ‡ , Abudureheman zebibula 2, ‡ , Xiaobiao Dong 3 , Gonghui Li 2, * , Guanxin Zhang 3, * , Deqing Zhang 3 , Jun Qian 1 , Sailing He 1,4 * 1 State Key Laboratory of Modern Optical Instrumentations, Centre for Optical and Electromagnetic Research, Zhejiang University, Hangzhou, Zhejiang, 310058, China 2 Department of Urology, Sir Run Run Shaw Hospital, College of Medicine, Zhejiang University, Hangzhou, Zhejiang, 310016, China 3 Beijing National Laboratory for Molecular Sciences, CAS Key Laboratories of Organic Solids and Analytical Chemistry for Living Biosystems, Institute of Chemistry, Chinese Academy of Sciences, Beijing 100190, China 4 School of Electrical Engineering, Royal Institute of Technology, OSQULDAS VÄG 6, SE- 100 44 Stockholm, Sweden ‡These authors contributed equally
Transcript
Targeted and Imaging-guided In Vivo Photodynamic Therapy of Tumors Using Dual-
55], recorded as TPE-red-PEG. The long PEG chains were used to reduce the phagocytosis of
nanoparticles by the reticuloendothelial system (RES) [56, 57]. We then modified the target
moiety c(RGDfc) through click chemistry between –SH and maleimide at the surface of TPE-
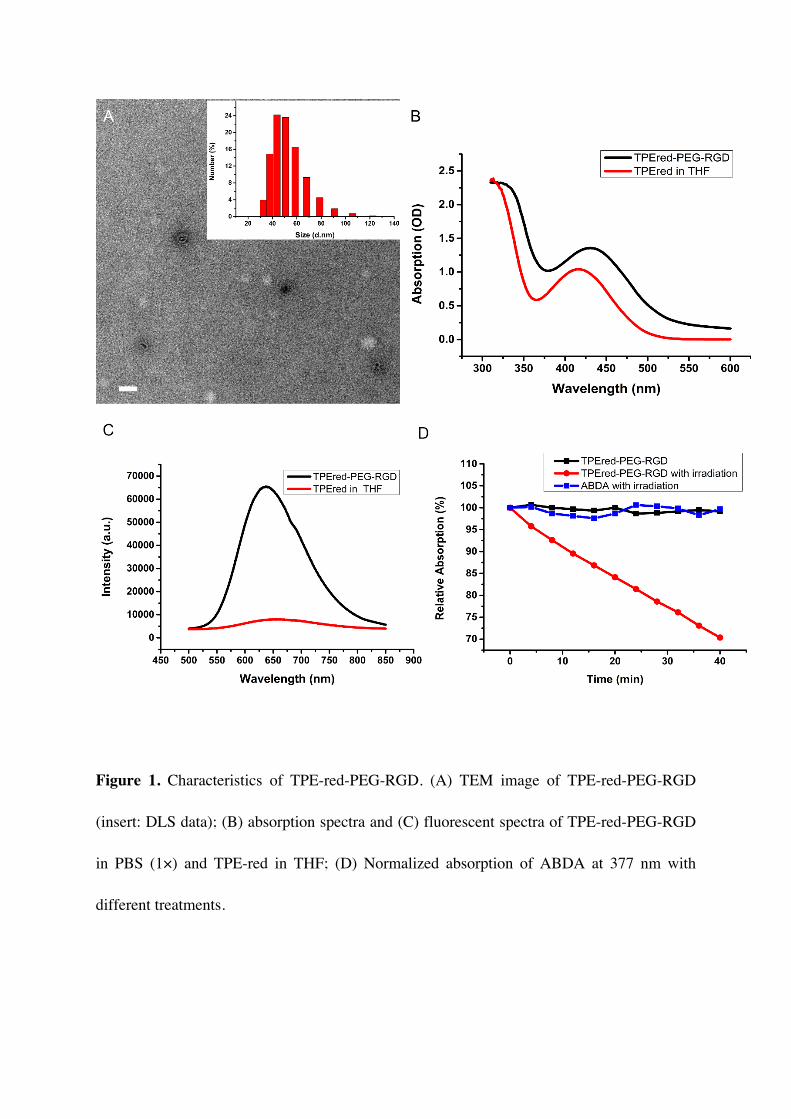
red-PEG, yielding TPE-red-PEG-RGD. The morphology and the cross-section structure of
TPE-red-PEG-RGD were first checked by transmission electron microscopy (TEM) (Figure
1A). The average size of the nanoparticles was about 50 nm, which was confirmed by dynamic
light scattering (DLS) (insert in Figure 1A). The absorption spectra of TPE-red in
tetrahydrofuran (THF) solution and TPE-red-PEG-RGD in PBS are shown in Figure 1B. We
find that, compared with the absorption spectrum of TPE-red, the spectrum of TPE-red-PEG-
RGD keeps the same shape but has a slight red-shift in wavelength due to the encapsulation
process. The fluorescence spectra were recorded using a lab-built fluorescence detection
system (Figure S1). We adjusted the absorption of both TPE-red and TPE-red-PEG-RGD to
the same value and measured the spectra under the same conditions. As can be seen from
Figure 1C, with the same location of the peak at 650 nm, the fluorescence of TPE-red-PEG-
RGD is much stronger than that of TPE-red, which confirms the AIE nature of the materials.
Meanwhile, we also compared the fluorescence emitting ability of TPE-red-PEG-RGD and
nanoparticles of a common PS, chlorin e6. Figure S2 shows that, with the same concentration
of 100 μg/mL, the fluorescence of TPE-red-PEG-RGD was obviously stronger than that of
chlorin e6 nanoparticles, which indicates the advantage of TPE-red-PEG-RGD over traditional
PSs. We then verified the ability of TPE-red-PEG-RGD to produce ROS by using a common
ROS probe, 9,10-anthracenediylbis (methylene) dimalonic acid (ABDA)[58]. Under
irradiation of 450 nm continuous wave (CW) laser light, when mixed with TPE-red-PEG-RGD,
the absorption of ABDA at 377 nm kept decreasing over 40 minutes and dropped to about 70 %
of the original value (Figure 1D, Figure S3C). At the same time, almost no change could be
observed in control groups (Figure 1D, Figure S3A, S3B). This phenomenon indicated that
the TPE-red-PEG-RGD has strong ability to produce ROS continuously under light irradiation.
3.2 In Vitro cell imaging
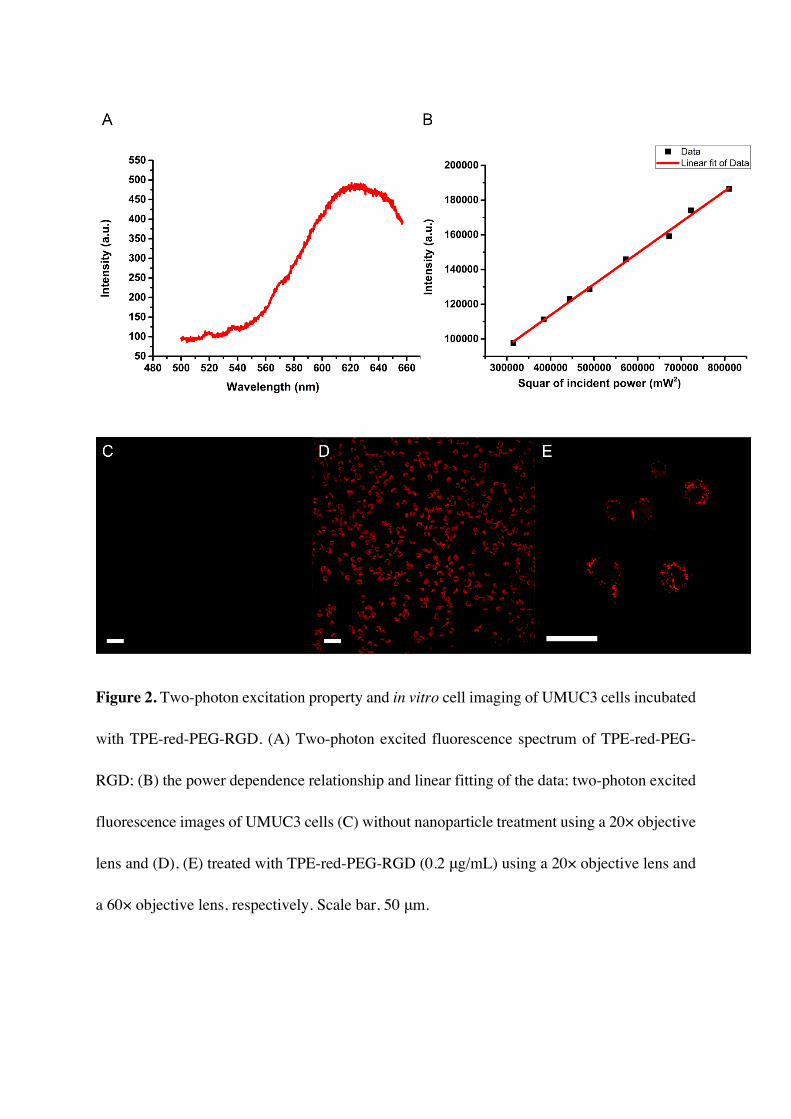
The targeting and endocytosis ability of TPE-red-PEG-RGD were verified by two-photon
excited fluorescence cell imaging. We first studied the two-photon excited fluorescence
properties of TPE-red-PEG-RGD; the spectra were recorded using our lab-built system (see
the “Methods” section and Figure S1, Figure 2A), and power dependence fitting furtherly
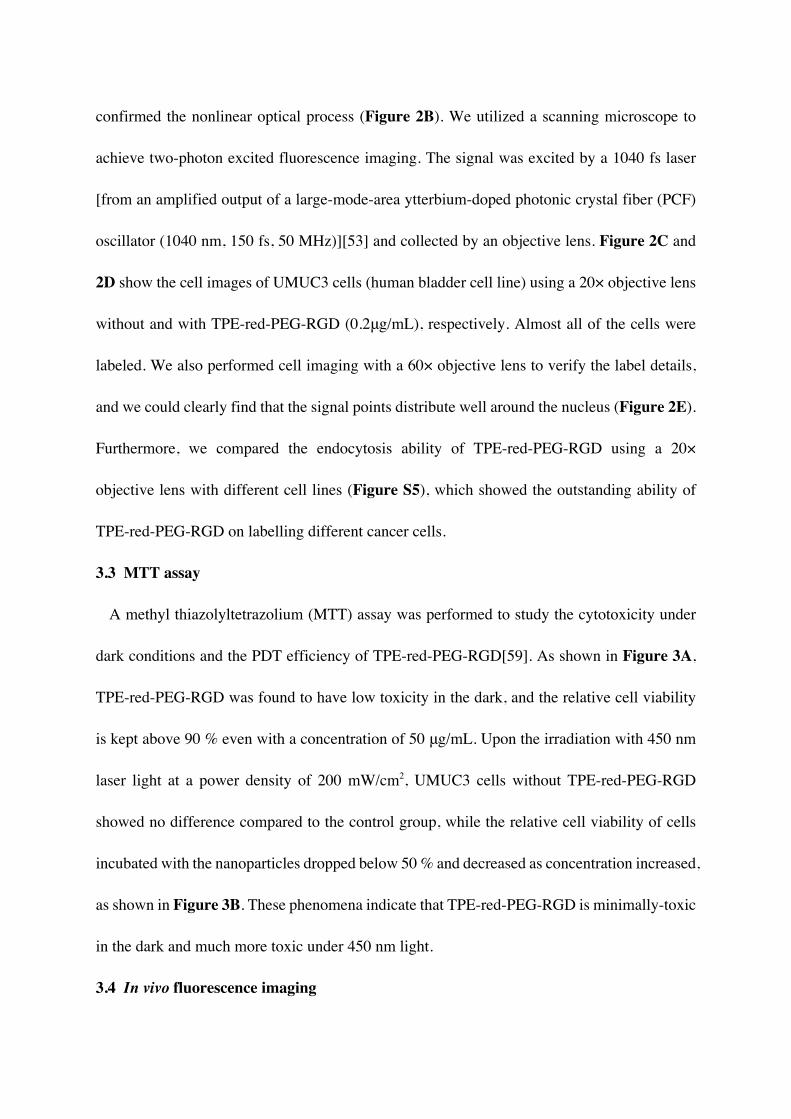
confirmed the nonlinear optical process (Figure 2B). We utilized a scanning microscope to
achieve two-photon excited fluorescence imaging. The signal was excited by a 1040 fs laser
[from an amplified output of a large-mode-area ytterbium-doped photonic crystal fiber (PCF)
oscillator (1040 nm, 150 fs, 50 MHz)][53] and collected by an objective lens. Figure 2C and
2D show the cell images of UMUC3 cells (human bladder cell line) using a 20× objective lens
without and with TPE-red-PEG-RGD (0.2μg/mL), respectively. Almost all of the cells were
labeled. We also performed cell imaging with a 60× objective lens to verify the label details,
and we could clearly find that the signal points distribute well around the nucleus (Figure 2E).
Furthermore, we compared the endocytosis ability of TPE-red-PEG-RGD using a 20×
objective lens with different cell lines (Figure S5), which showed the outstanding ability of
TPE-red-PEG-RGD on labelling different cancer cells.
3.3 MTT assay
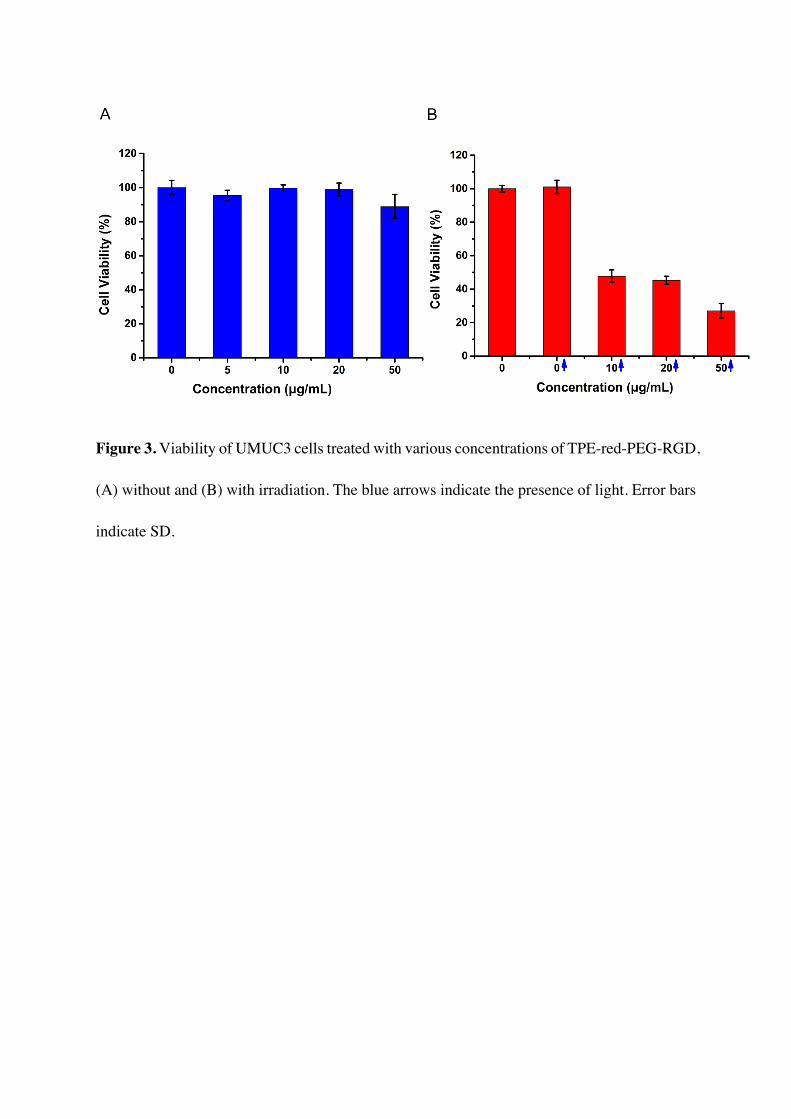
A methyl thiazolyltetrazolium (MTT) assay was performed to study the cytotoxicity under
dark conditions and the PDT efficiency of TPE-red-PEG-RGD[59]. As shown in Figure 3A,
TPE-red-PEG-RGD was found to have low toxicity in the dark, and the relative cell viability
is kept above 90 % even with a concentration of 50 μg/mL. Upon the irradiation with 450 nm
laser light at a power density of 200 mW/cm2, UMUC3 cells without TPE-red-PEG-RGD
showed no difference compared to the control group, while the relative cell viability of cells
incubated with the nanoparticles dropped below 50 % and decreased as concentration increased,
as shown in Figure 3B. These phenomena indicate that TPE-red-PEG-RGD is minimally-toxic
in the dark and much more toxic under 450 nm light.
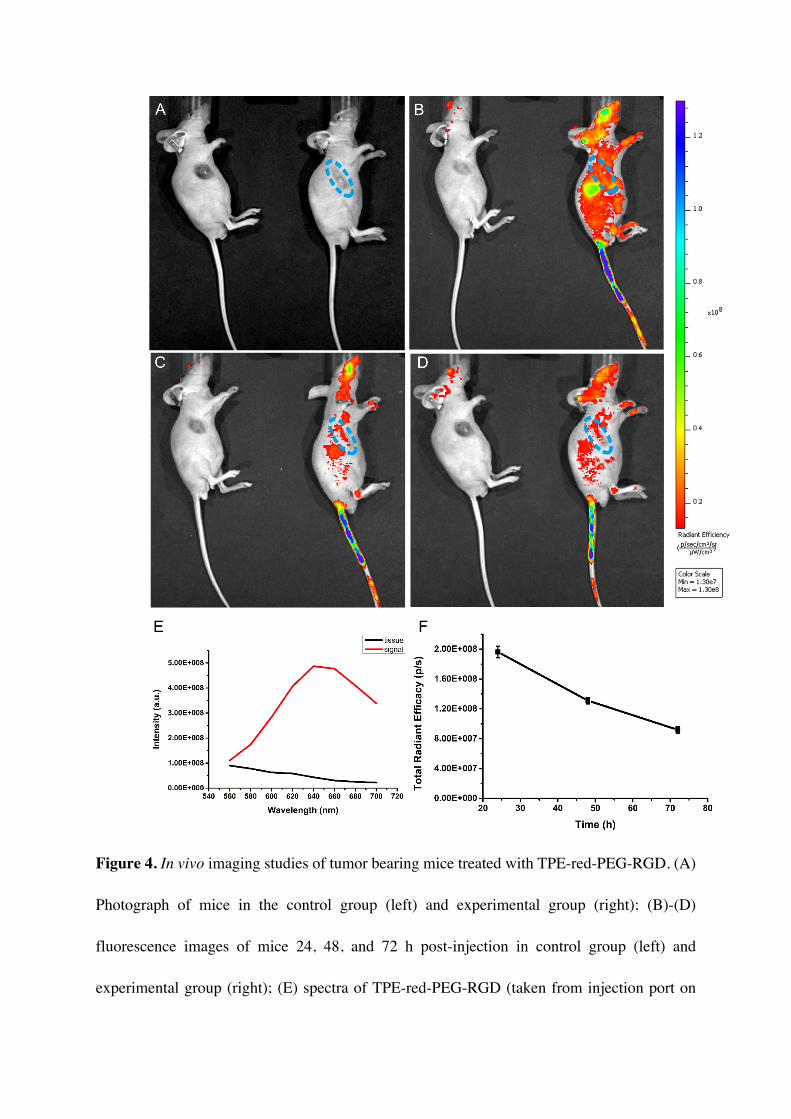
3.4 In vivo fluorescence imaging
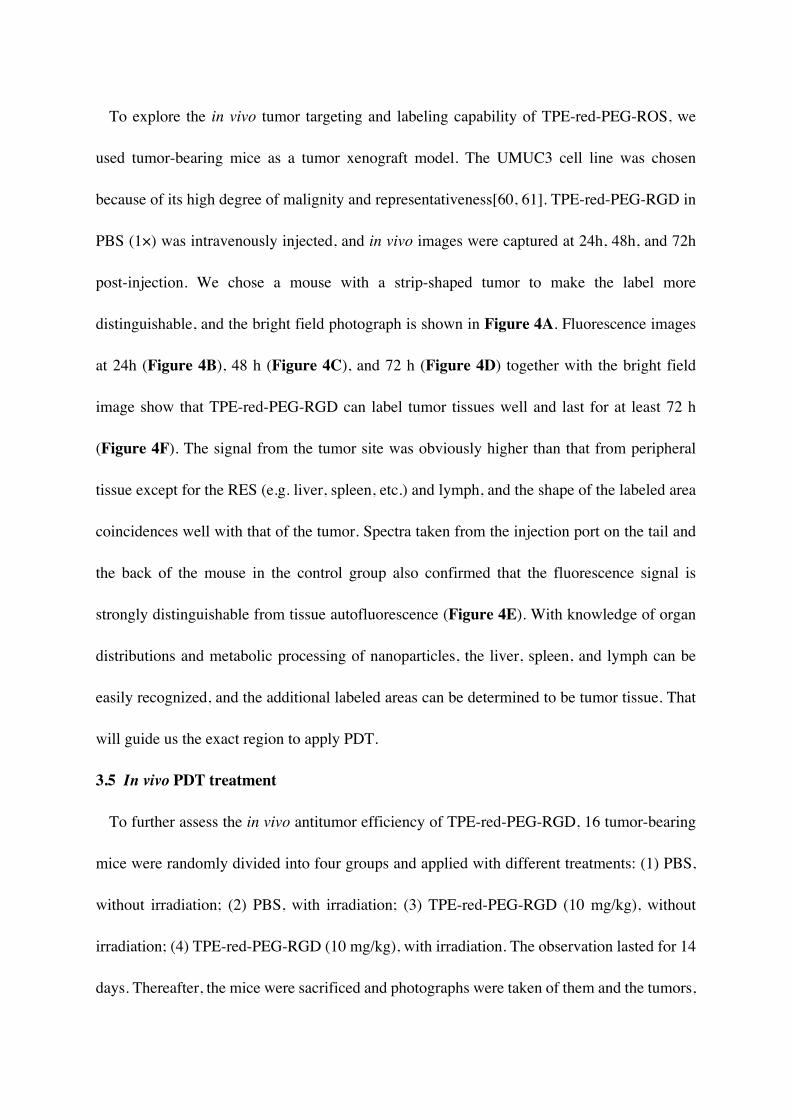
To explore the in vivo tumor targeting and labeling capability of TPE-red-PEG-ROS, we
used tumor-bearing mice as a tumor xenograft model. The UMUC3 cell line was chosen
because of its high degree of malignity and representativeness[60, 61]. TPE-red-PEG-RGD in
PBS (1×) was intravenously injected, and in vivo images were captured at 24h, 48h, and 72h
post-injection. We chose a mouse with a strip-shaped tumor to make the label more
distinguishable, and the bright field photograph is shown in Figure 4A. Fluorescence images
at 24h (Figure 4B), 48 h (Figure 4C), and 72 h (Figure 4D) together with the bright field
image show that TPE-red-PEG-RGD can label tumor tissues well and last for at least 72 h
(Figure 4F). The signal from the tumor site was obviously higher than that from peripheral
tissue except for the RES (e.g. liver, spleen, etc.) and lymph, and the shape of the labeled area
coincidences well with that of the tumor. Spectra taken from the injection port on the tail and
the back of the mouse in the control group also confirmed that the fluorescence signal is
strongly distinguishable from tissue autofluorescence (Figure 4E). With knowledge of organ
distributions and metabolic processing of nanoparticles, the liver, spleen, and lymph can be
easily recognized, and the additional labeled areas can be determined to be tumor tissue. That
will guide us the exact region to apply PDT.
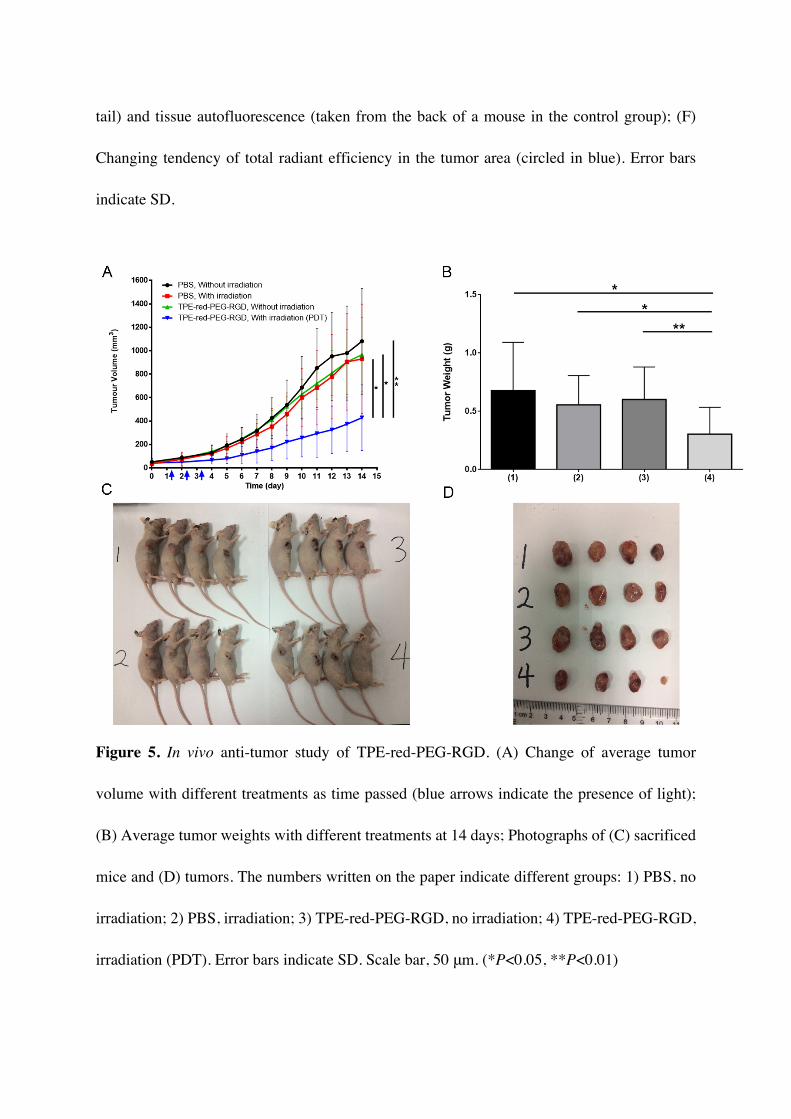
3.5 In vivo PDT treatment
To further assess the in vivo antitumor efficiency of TPE-red-PEG-RGD, 16 tumor-bearing
mice were randomly divided into four groups and applied with different treatments: (1) PBS,
without irradiation; (2) PBS, with irradiation; (3) TPE-red-PEG-RGD (10 mg/kg), without
irradiation; (4) TPE-red-PEG-RGD (10 mg/kg), with irradiation. The observation lasted for 14
days. Thereafter, the mice were sacrificed and photographs were taken of them and the tumors,
shown in Figure 5C and 5D, respectively. We recorded the change of tumor volumes. It could
be found that only when both TPE-red-PEG-RGD and 450 nm laser light were present could
the growth of the tumor volume be obviously inhibited (P<0.001) (Figure 5A), and the tumor
growth inhibition rate was calculated to be as high as 60.4 %. From Figure 5B, we could find
that the final average tumor weight of the PDT-treated group was significantly lower than the
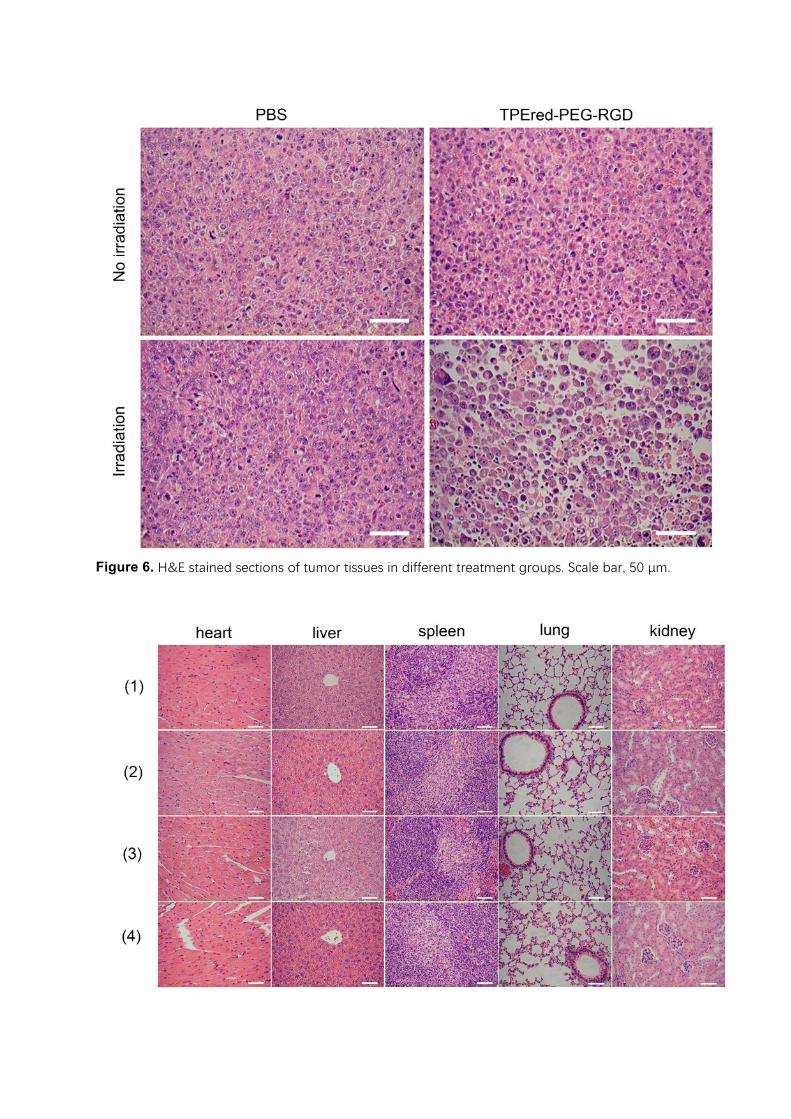
three other control groups (P<0.05). The therapeutic efficiency was also confirmed by the
tumor tissue sections. Only tumors that were treated with both TPE-red-PEG-RGD and 450-
nm-light irradiation have obvious signs of cell death, while nothing of significance happened
to tumors in other groups (Figure 6).
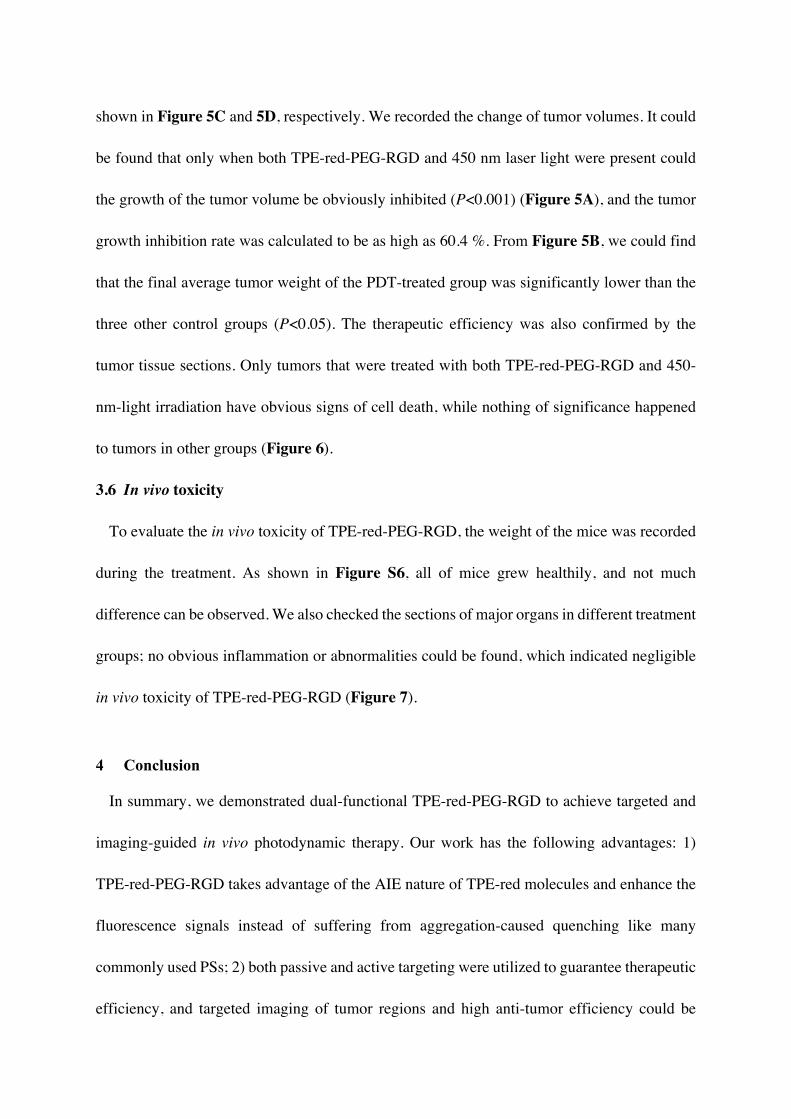
3.6 In vivo toxicity
To evaluate the in vivo toxicity of TPE-red-PEG-RGD, the weight of the mice was recorded
during the treatment. As shown in Figure S6, all of mice grew healthily, and not much
difference can be observed. We also checked the sections of major organs in different treatment
groups; no obvious inflammation or abnormalities could be found, which indicated negligible
in vivo toxicity of TPE-red-PEG-RGD (Figure 7).
4 Conclusion
In summary, we demonstrated dual-functional TPE-red-PEG-RGD to achieve targeted and
imaging-guided in vivo photodynamic therapy. Our work has the following advantages: 1)
TPE-red-PEG-RGD takes advantage of the AIE nature of TPE-red molecules and enhance the
fluorescence signals instead of suffering from aggregation-caused quenching like many
commonly used PSs; 2) both passive and active targeting were utilized to guarantee therapeutic
efficiency, and targeted imaging of tumor regions and high anti-tumor efficiency could be
achieved with a reasonably low dose, which may cause fewer side effects; 3) the structure of
TPE-red-PEG-RGD is simple and easy to fabricate, which could benefit further research and
mass production. Our research results show the promising role of AIE nanoparticles in
imaging-guided in vivo PDT, both in biomedical research and clinical applications.
ACKNOWLEDGMENT
This work was supported by National Basic Research Program of China (973 Program;
2013CB834704 and 2011CB503700), the National Natural Science Foundation of China
(11621101), and the Science and Technology Department of Zhejiang Province (2010R50007)
ASSOCIATED CONTENT
Supplementary materials. Supplementary figures: Schematic illustration of the lab-built
fluorescence detect system; Photograph of aqueous dispersion of TPE-red-PEG-RGD and
Chlorin e6 nanoparticles under daylight and under UV lamp; Absorption spectra of ABDA
containing solutions with different treatments; Schematic illustration of the two-photon
excited fluorescence imaging system; Average body weight variation of the mice during the
treatment.
This material is available free of charge via the Internet at http://
References
[1] Siegel, R. L.;Miller, K. D.; Jemal, A. Cancer Statistics, 2015. Ca-Cancer J Clin 2015, 65, 5-29.
[2] Chen, W. Q.;Zheng, R. S.;Baade, P. D.;Zhang, S. W.;Zeng, H. M.;Bray, F.;Jemal, A.;Yu, X. Q.; He, J. Cancer Statistics in China, 2015. Ca-Cancer J Clin 2016, 66, 115-132.
[3] Siegel, R. L.;Miller, K. D.; Jemal, A. Cancer statistics, 2016. Ca-Cancer J Clin 2016, 66, 7-30.
[4] Miller, K. D.;Siegel, R. L.;Lin, C. C.;Mariotto, A. B.;Kramer, J. L.;Rowland, J. H.;Stein, K. D.;Alteri, R.; Jemal, A. Cancer treatment and survivorship statistics, 2016. Ca-Cancer J Clin 2016, 66, 271-289.
[5] Siegel, R. L.;Miller, K. D.; Jemal, A. Cancer Statistics, 2017. Ca-Cancer J Clin 2017, 67, 7-30.
[6] Early Breast Cancer Trialists' Collaborative, G. Effects of radiotherapy and of differences in the extent of surgery for early breast cancer on local recurrence and 15-year survival: an overview of the randomised trials. The Lancet 2005, 366, 2087-2106.
[7] Cunningham , D.;Allum , W. H.;Stenning , S. P.;Thompson , J. N.;Van de Velde , C. J. H.;Nicolson , M.;Scarffe , J. H.;Lofts , F. J.;Falk , S. J.;Iveson , T. J.;Smith , D. B.;Langley , R. E.;Verma , M.;Weeden , S.; Chua , Y. J. Perioperative Chemotherapy versus Surgery Alone for Resectable Gastroesophageal Cancer. New Engl J Med 2006, 355, 11-20.
[8] De Angelis, R.;Bugatti, L.;Cerioni, A.;Del Medico, P.; Filosa, G. Diffuse scleroderma occurring after the use of paclitaxel for ovarian cancer. Clin Rheumatol 2003, 22, 49-52.
[9] Griffin, A. M.;Butow, P. N.;Coates, A. S.;Childs, A. M.;Ellis, P. M.;Dunn, S. M.; Tattersall, M. H. On the receiving end. V: Patient perceptions of the side effects of cancer chemotherapy in 1993. Ann Oncol 1996, 7, 189-195.
[10] Allison, R. R.;Sibata, C.; Patel, R. Future radiation therapy: photons, protons and particles. Future Oncol 2013, 9, 493-504.
[11] Gleave, M. E.; Monia, B. P. Antisense therapy for cancer. Nat Rev Cancer 2005, 5, 468-479.
[12] Peer, D.;Karp, J. M.;Hong, S.;FaroKHzad, O. C.;Margalit, R.; Langer, R. Nanocarriers as an emerging platform for cancer therapy. Nat Nanotechnol 2007, 2, 751-760.
[13] Davis, M. E.;Chen, Z.; Shin, D. M. Nanoparticle therapeutics: an emerging treatment modality for cancer. Nat Rev Drug Discov 2008, 7, 771-782.
[14] Grivennikov, S. I.;Greten, F. R.; Karin, M. Immunity, Inflammation, and Cancer. Cell 2010, 140, 883-899.
[15] Semenza, G. L. Targeting HIF-1 for cancer therapy. Nat Rev Cancer 2003, 3, 721-732. [16] Kelkar, S. S.; Reineke, T. M. Theranostics: Combining Imaging and Therapy.
Li, C. Guiding Brain-Tumor Surgery via Blood–Brain-Barrier-Permeable Gold Nanoprobes with Acid-Triggered MRI/SERRS Signals. Adv Mater 2017, 10.1002/adma.201603917, 1603917-n/a.
[18] Wang, C.;Cheng, L.;Liu, Y.;Wang, X.;Ma, X.;Deng, Z.;Li, Y.; Liu, Z. Imaging-Guided pH-Sensitive Photodynamic Therapy Using Charge Reversible Upconversion
Nanoparticles under Near-Infrared Light. Adv Funct Mater 2013, 23, 3077-3086. [19] Lv, R.;Yang, P.;He, F.;Gai, S.;Yang, G.;Dai, Y.;Hou, Z.; Lin, J. An imaging-guided
platform for synergistic photodynamic/photothermal/chemo-therapy with pH/temperature-responsive drug release. Biomaterials 2015, 63, 115-127.
[21] Dougherty, T. J.;Gomer, C. J.;Henderson, B. W.;Jori, G.;Kessel, D.;Korbelik, M.;Moan, J.; Peng, Q. Photodynamic Therapy. J Natl Cancer I 1998, 90, 889-905.
[22] Macdonald, I. J.; Dougherty, T. J. Basic principles of photodynamic therapy. J Porphyr Phthalocya 2001, 05, 105-129.
[23] Henderson, B. W.; Dougherty, T. J. HOW DOES PHOTODYNAMIC THERAPY WORK? Photochem Photobio 1992, 55, 145-157.
[24] Ormond, A. B.; Freeman, H. S. Dye Sensitizers for Photodynamic Therapy. Materials 2013, 6, 817-840.
[25] Lucky, S. S.;Soo, K. C.; Zhang, Y. Nanoparticles in Photodynamic Therapy. Chem Rev 2015, 115, 1990-2042.
[26] Lao, Y. H.;Phua, K. K. L.; Leong, K. W. Aptamer Nanomedicine for Cancer Therapeutics: Barriers and Potential for Translation. ACS Nano 2015, 9, 2235-2254.
[27] Doane, T. L.; Burda, C. The unique role of nanoparticles in nanomedicine: imaging, drug delivery and therapy. Chem Soc Rev 2012, 41, 2885-2911.
[28] Yang, G. B.;Gong, H.;Qian, X. X.;Tan, P. L.;Li, Z. W.;Liu, T.;Liu, J. J.;Li, Y. Y.; Liu, Z. Mesoporous silica nanorods intrinsically doped with photosensitizers as a multifunctional drug carrier for combination therapy of cancer. Nano Res 2015, 8, 751-764.
[29] Hamidi, M.;Azadi, A.; Rafiei, P. Hydrogel nanoparticles in drug delivery. Adv Drug Deliv Rev 2008, 60, 1638-1649.
[30] Brannon-Peppas, L.; Blanchette, J. O. Nanoparticle and targeted systems for cancer therapy. Adv Drug Deliv Rev 2012, 64, 206-212.
[31] Gunnoo, S. B.; Madder, A. Bioconjugation - using selective chemistry to enhance the properties of proteins and peptides as therapeutics and carriers. Org Biomol Chem 2016, 14, 8002-8013.
[32] Bao, C. C.;Conde, J.;Pan, F.;Li, C.;Zhang, C. L.;Tian, F. R.;Liang, S. J.;de la Fuente, J. M.; Cui, D. X. Gold nanoprisms as a hybrid in vivo cancer theranostic platform for in situ photoacoustic imaging, angiography, and localized hyperthermia. Nano Res 2016, 9, 1043-1056.
[33] Valente, G.;Depalo, N.;de Paola, I.;Iacobazzi, R. M.;Denora, N.;Laquintana, V.;Comparelli, R.;Altamura, E.;Latronico, T.;Altomare, M.;Fanizza, E.;Striccoli, M.;Agostiano, A.;Saviano, M.;Del Gatto, A.;Zaccaro, L.; Curri, M. L. Integrin-targeting with peptide-bioconjugated semiconductor-magnetic nanocrystalline heterostructures. Nano Res 2016, 9, 644-662.
[34] Hobbs, S. K.;Monsky, W. L.;Yuan, F.;Roberts, W. G.;Griffith, L.;Torchilin, V. P.; Jain, R. K. Regulation of transport pathways in tumor vessels: Role of tumor type and microenvironment. P Natl Acad Sci 1998, 95, 4607-4612.
[35] Maeda, H.;Wu, J.;Sawa, T.;Matsumura, Y.; Hori, K. Tumor vascular permeability and the EPR effect in macromolecular therapeutics: a review. J Control Release 2000, 65, 271-284.
[36] Birks, J. B. Photophysics of aromatic molecules. 1970. [37] Sekkat, N.;van den Bergh, H.;Nyokong, T.; Lange, N. Like a Bolt from the Blue:
Phthalocyanines in Biomedical Optics. Molecules 2012, 17, 98-144. [38] Ding, D.;Li, K.;Liu, B.; Tang, B. Z. Bioprobes Based on AIE Fluorogens. Accounts
Chem Res 2013, 46, 2441-2453. [39] Luo, J.;Xie, Z.;Lam, J. W. Y.;Cheng, L.;Tang, B. Z.;Chen, H.;Qiu, C.;Kwok, H. S.;Zhan,
X.;Liu, Y.; Zhu, D. Aggregation-induced emission of 1-methyl-1,2,3,4,5-pentaphenylsilole. Chem Commun 2001, 10.1039/b105159h, 1740-1741.
[40] Tang, B. Z.;Zhan, X.;Yu, G.;Sze Lee, P. P.;Liu, Y.; Zhu, D. Efficient blue emission from siloles. J Mater Chem 2001, 11, 2974-2978.
[41] Mei, J.;Leung, N. L. C.;Kwok, R. T. K.;Lam, J. W. Y.; Tang, B. Z. Aggregation-Induced Emission: Together We Shine, United We Soar! Chem Rev 2015, 115, 11718-11940.
[42] Han, K.;Wang, S. B.;Lei, Q.;Zhu, J. Y.; Zhang, X. Z. Ratiometric Biosensor for Aggregation-Induced Emission-Guided Precise Photodynamic Therapy. ACS Nano 2015, 9, 10268-10277.
[43] Chang, C. C.;Hsieh, M. C.;Lin, J. C.; Chang, T. C. Selective photodynamic therapy based on aggregation-induced emission enhancement of fluorescent organic nanoparticles. Biomaterials 2012, 33, 897-906.
[44] Hsieh, M. C.;Chien, C. H.;Chang, C. C.; Chang, T. C. Aggregation induced photodynamic therapy enhancement based on linear and nonlinear excited FRET of fluorescent organic nanoparticles. J Mater Chem B 2013, 1, 2350-2357.
[45] Jayaram, D. T.;Ramos-Romero, S.;Shankar, B. H.;Garrido, C.;Rubio, N.;Sanchez-Cid, L.;Gomez, S. B.;Blanco, J.; Ramaiah, D. In Vitro and in Vivo Demonstration of Photodynamic Activity and Cytoplasm Imaging through TPE Nanoparticles. Acs Chem Biol 2016, 11, 104-112.
[46] Yuan, Y.;Feng, G.;Qin, W.;Tang, B. Z.; Liu, B. Targeted and image-guided photodynamic cancer therapy based on organic nanoparticles with aggregation-induced emission characteristics. Chem Commun 2014, 50, 8757-8760.
[47] Yuan, Y.;Zhang, C.-J.;Gao, M.;Zhang, R.;Tang, B. Z.; Liu, B. Specific Light-Up Bioprobe with Aggregation-Induced Emission and Activatable Photoactivity for the Targeted and Image-Guided Photodynamic Ablation of Cancer Cells. Angewandte Chemie-International Edition 2015, 54, 1780-1786.
[48] Li, M.;Gao, Y.;Yuan, Y.;Wu, Y.;Song, Z.;Tang, B. Z.;Liu, B.; Zheng, Q. C. One-Step Formulation of Targeted Aggregation-Induced Emission Dots for Image-Guided Photodynamic Therapy of Cholangiocarcinoma. ACS Nano 2017, 10.1021/acsnano.7b00312.
[49] Hu, F.;Huang, Y.;Zhang, G.;Zhao, R.;Yang, H.; Zhang, D. Targeted Bioimaging and Photodynamic Therapy of Cancer Cells with an Activatable Red Fluorescent Bioprobe. Anal Chem 2014, 86, 7987-7995.
[50] Xu, S. D.;Yuan, Y. Y.;Cai, X. L.;Zhang, C. J.;Hu, F.;Liang, J.;Zhang, G. X.;Zhang, D. Q.; Liu, B. Tuning the singlet-triplet energy gap: a unique approach to efficient
[51] Dall'Angelo, S.;Zhang, Q. Z.;Fleming, I. N.;Piras, M.;Schweiger, L. F.;O'Hagan, D.; Zanda, M. Efficient bioconjugation of 5-fluoro-5-deoxy-ribose (FDR) to RGD peptides for positron emission tomography (PET) imaging of alpha(v)beta(3) integrin receptor. Org Biomol Chem 2013, 11, 4551-4558.
[52] Wang, D.;Qian, J.;He, S. L.;Park, J. S.;Lee, K. S.;Han, S. H.; Mu, Y. Aggregation-enhanced fluorescence in PEGylated phospholipid nanomicelles for in vivo imaging. Biomaterials 2011, 32, 5880-5888.
[53] Qian, J.;Wang, D.;Cai, F. H.;Zhan, Q. Q.;Wang, Y. L.; He, S. L. Photosensitizer encapsulated organically modified silica nanoparticles for direct two-photon photodynamic therapy and In Vivo functional imaging. Biomaterials 2012, 33, 4851-4860.
[54] Deng, L.;Zhang, Y. Y.;Ma, L. L.;Jing, X. L.;Ke, X. F.;Lian, J. H.;Zhao, Q.;Yan, B.;Zhang, J. F.;Yao, J. Z.; Chen, J. M. Comparison of anti-EGFR-Fab' conjugated immunoliposomes modified with two different conjugation linkers for siRNA delivery in SMMC-7721 cells. Int J Nanomed 2013, 8, 3271-3283.
[55] Liu, X. Y.;Ruan, L. M.;Mao, W. W.;Wang, J. Q.;Shen, Y. Q.; Sui, M. H. Preparation of RGD-modified Long Circulating Liposome Loading Matrine, and its in vitro Anti-cancer Effects. Int J Med Sci 2010, 7, 197-208.
[56] Langer, R. Drug delivery and targeting. Nature 1998, 392, 5-10. [57] Owens, D. E.; Peppas, N. A. Opsonization, biodistribution, and pharmacokinetics of
polymeric nanoparticles. Int J Pharm 2006, 307, 93-102. [58] Planas, O.;Macia, N.;Agut, M.;Nonell, S.; Heyne, B. Distance-Dependent Plasmon-
Enhanced Singlet Oxygen Production and Emission for Bacterial Inactivation. Journal Of the American Chemical Society 2016, 138, 2762-2768.
[59] Abe, R.;Ueo, H.; Akiyoshi, T. Evaluation of MTT assay in agarose for chemosensitivity testing of human cancers: comparison with MTT assay. Oncology 1994, 51, 416-425.
[60] Mohammed, S. I.;Dhawan, D.;Abraham, S.;Snyder, P. W.;Waters, D. J.;Craig, B. A.;Lu, M.;Wu, L.;Zheng, R.;Stewart, J.; Knapp, D. W. Cyclooxygenase inhibitors in urinary bladder cancer: in vitro and in vivo effects. Mol Cancer Ther 2006, 5, 329-336.
[61] Huang, C.;Neoh, K. G.;Xu, L.;Kang, E. T.; Chiong, E. Polymeric nanoparticles with encapsulated superparamagnetic iron oxide and conjugated cisplatin for potential bladder cancer therapy. Biomacromolecules 2012, 13, 2513-2520.
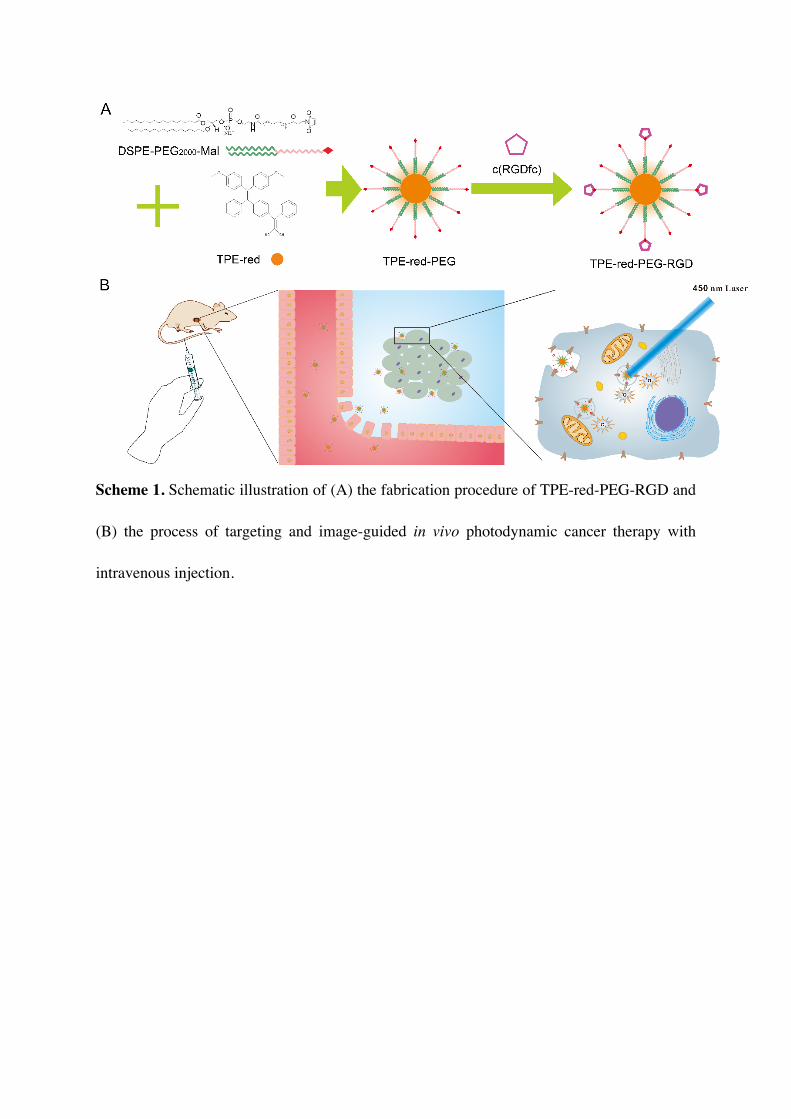
Scheme 1. Schematic illustration of (A) the fabrication procedure of TPE-red-PEG-RGD and
(B) the process of targeting and image-guided in vivo photodynamic cancer therapy with
intravenous injection.
Figure 1. Characteristics of TPE-red-PEG-RGD. (A) TEM image of TPE-red-PEG-RGD
(insert: DLS data); (B) absorption spectra and (C) fluorescent spectra of TPE-red-PEG-RGD
in PBS (1×) and TPE-red in THF; (D) Normalized absorption of ABDA at 377 nm with
different treatments.
Figure 2. Two-photon excitation property and in vitro cell imaging of UMUC3 cells incubated
with TPE-red-PEG-RGD. (A) Two-photon excited fluorescence spectrum of TPE-red-PEG-
RGD; (B) the power dependence relationship and linear fitting of the data; two-photon excited
fluorescence images of UMUC3 cells (C) without nanoparticle treatment using a 20× objective
lens and (D), (E) treated with TPE-red-PEG-RGD (0.2 μg/mL) using a 20× objective lens and
a 60× objective lens, respectively. Scale bar, 50 μm.
Figure 3. Viability of UMUC3 cells treated with various concentrations of TPE-red-PEG-RGD,
(A) without and (B) with irradiation. The blue arrows indicate the presence of light. Error bars
indicate SD.
Figure 4. In vivo imaging studies of tumor bearing mice treated with TPE-red-PEG-RGD. (A)
Photograph of mice in the control group (left) and experimental group (right); (B)-(D)
fluorescence images of mice 24, 48, and 72 h post-injection in control group (left) and
experimental group (right); (E) spectra of TPE-red-PEG-RGD (taken from injection port on
tail) and tissue autofluorescence (taken from the back of a mouse in the control group); (F)
Changing tendency of total radiant efficiency in the tumor area (circled in blue). Error bars
indicate SD.
Figure 5. In vivo anti-tumor study of TPE-red-PEG-RGD. (A) Change of average tumor
volume with different treatments as time passed (blue arrows indicate the presence of light);
(B) Average tumor weights with different treatments at 14 days; Photographs of (C) sacrificed
mice and (D) tumors. The numbers written on the paper indicate different groups: 1) PBS, no
irradiation; 2) PBS, irradiation; 3) TPE-red-PEG-RGD, no irradiation; 4) TPE-red-PEG-RGD,