13
Thai Economy Master of Economics Thammasat University
| Date post: | 10-Dec-2023 |
| Category: |
Documents |
| Upload: | independent |
| View: | 0 times |
| Download: | 0 times |

Thai Economy
Master of EconomicsThammasat University
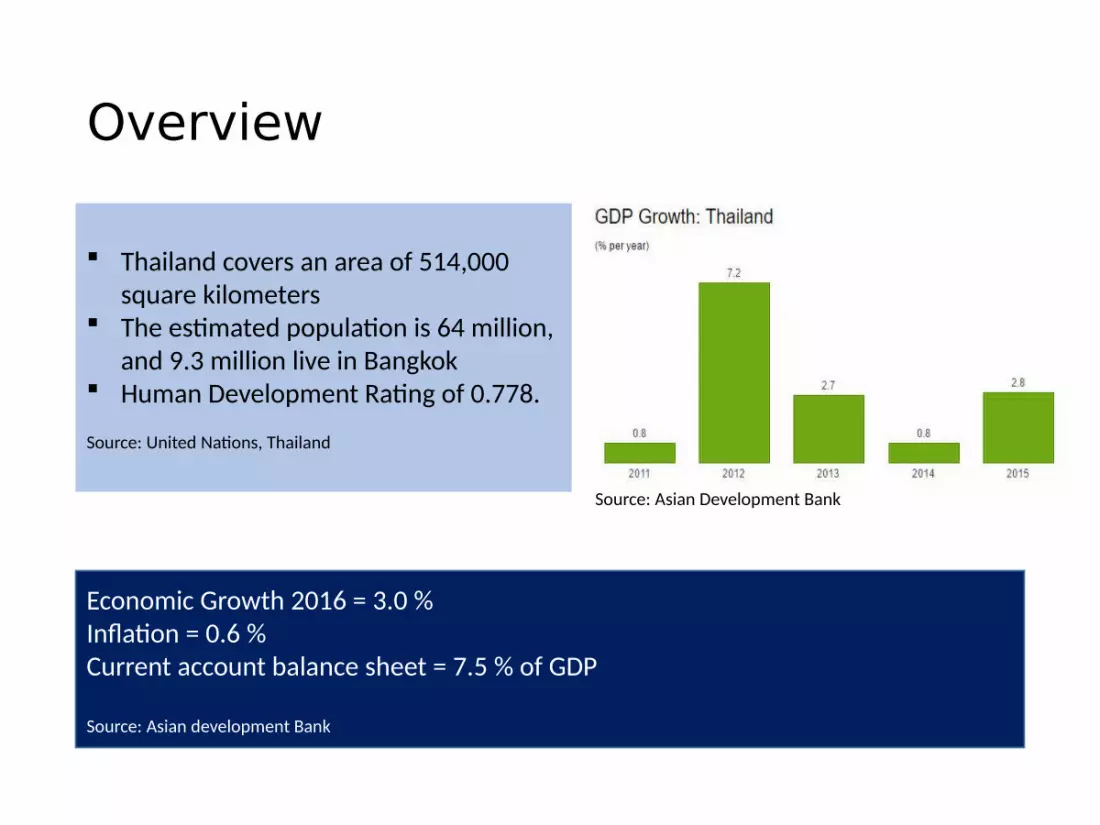
Overview
Thailand covers an area of 514,000 square kilometers
The estimated population is 64 million, and 9.3 million live in Bangkok
Human Development Rating of 0.778.
Source: United Nations, Thailand
Source: Asian Development Bank
Economic Growth 2016 = 3.0 %Inflation = 0.6 %Current account balance sheet = 7.5 % of GDP
Source: Asian development Bank

2011 2012 2013 2014 20150
50
100
150
200
250
-10-505
10152025303540
International sector
International Reserves (USD) Exports (USD billion) (RHS axis)Imports (USD billion) (RHS axis) Current Account (% of GDP)Current Account Balance (USD bn) Trade Balance (USD billion)
2011 2012 2013 2014 201550005200540056005800600062006400
6767.267.467.667.86868.268.468.668.869
Population, and GDP
GDP per capita (USD)Population (million) (RHS axis)
2011 2012 2013 2014 2015
-6-4-202468
101214
34
36
38
40
42
44
46
Unemployment, and Fiscal status
Unemployment Rate
Fiscal Balance (% of GDP)
Money (annual variation in %)
Public Debt (% of GDP) (PHS axis)
source: The Economist Intelligence

GDP contribution
2011 2012 2013 2014 20150%
10%20%30%40%50%60%70%80%90%
100%
-4.0
-2.0
0.0
2.0
4.0
6.0
8.0
0.8
7.2
2.7
0.8
2.8
Demand-side contributions to growth
Private consumption Government consumptionTotal investment Net exportsStatistical discrepancy Gross domestic product
Source: National Economic and Social Development Board
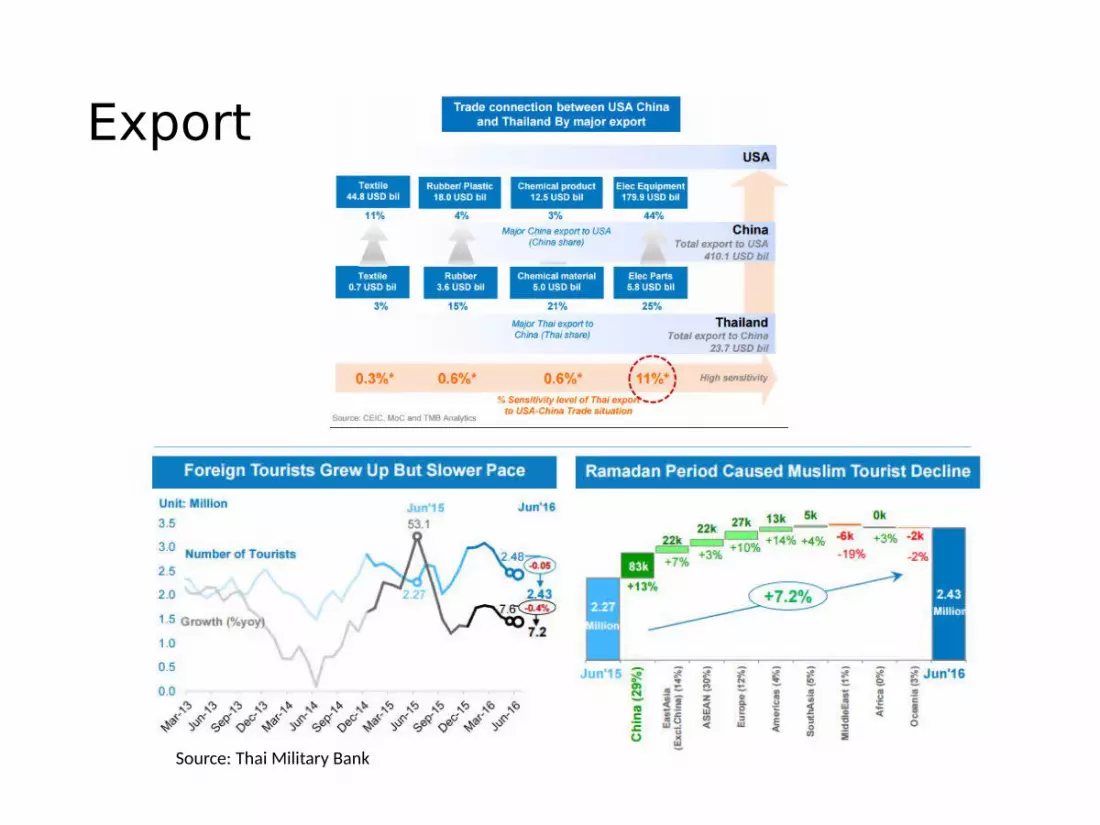
Export
Source: Thai Military Bank

Monetary
Jan-14
Mar-14
May-14
Jul-14Se
p-14
Nov-14Jan-15
Mar-15
May-15
Jul-15Se
p-15
Nov-15Jan-16
-1.5-1.0-0.50.00.51.01.52.02.53.0
Inflation and policy interest rate
Overall (%) year on year CorePolicy rate %
Sources: Bank of Thailand. http://www.bot.or.th; CEIC Data Company (both accessed 11 March 2016).
2011 2012 2013 2014 2015 2016 2017
-2.0
-1.0
0.0
1.0
2.0
3.0
4.0
5.0
Inflation
Inflation 5-year moving averageSource: Asian Development Outlook database.

Fiscal
Current Budget80%
Capital Budget20%
Budget Appropriations in 2016
Current BudgetCapital Budget
21%
17%
12%9%7%
6%6%5%
5%2%
10%
Budget Appropriations
Ministry of Education Central Fund Ministry of Interior Ministry of Finance Ministry of Defence Fund and Revolving Fund State Enterprises Independent Public
Agencies Ministry of Public Health Ministry of Agriculture and
Cooperatives Other
Source : Government Fiscal Management Information System
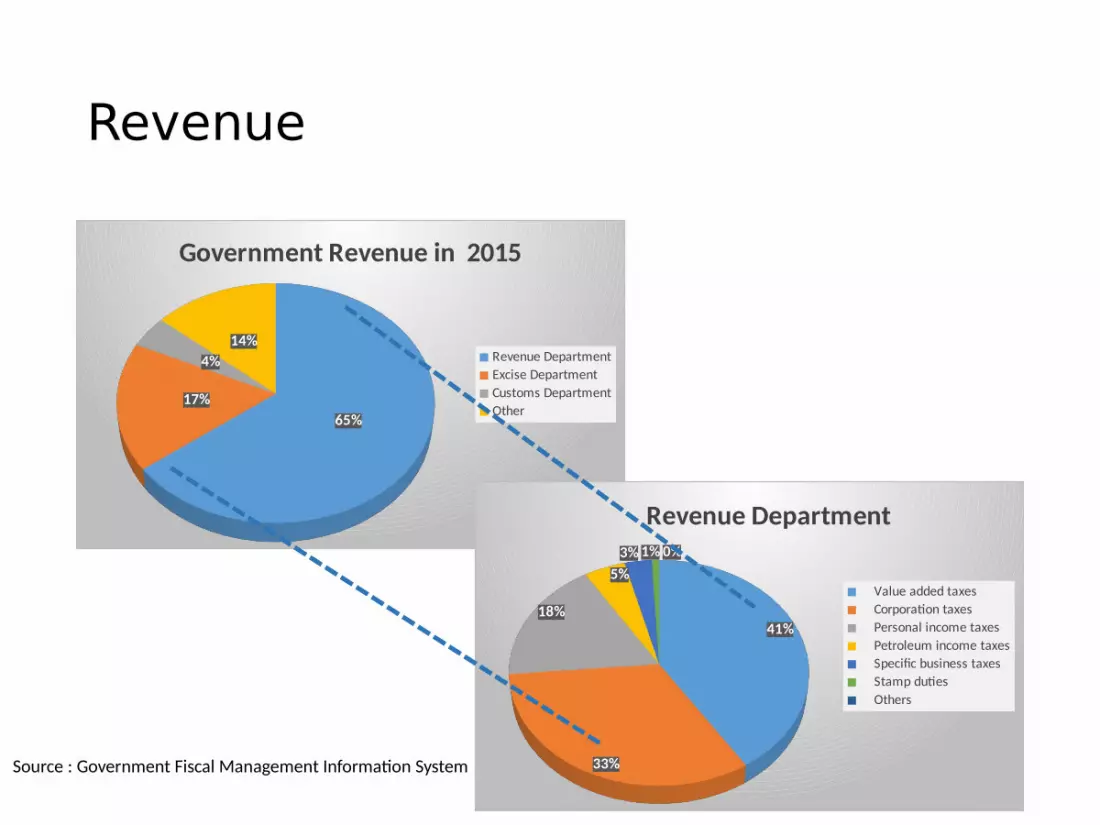
Revenue
65%17%
4%14%
Government Revenue in 2015
Revenue DepartmentExcise DepartmentCustoms DepartmentOther
41%
33%
18%
5%3% 1% 0%
Revenue Department
Value added taxes Corporation taxes Personal income taxes Petroleum income taxes Specific business taxes Stamp duties Others
Source : Government Fiscal Management Information System
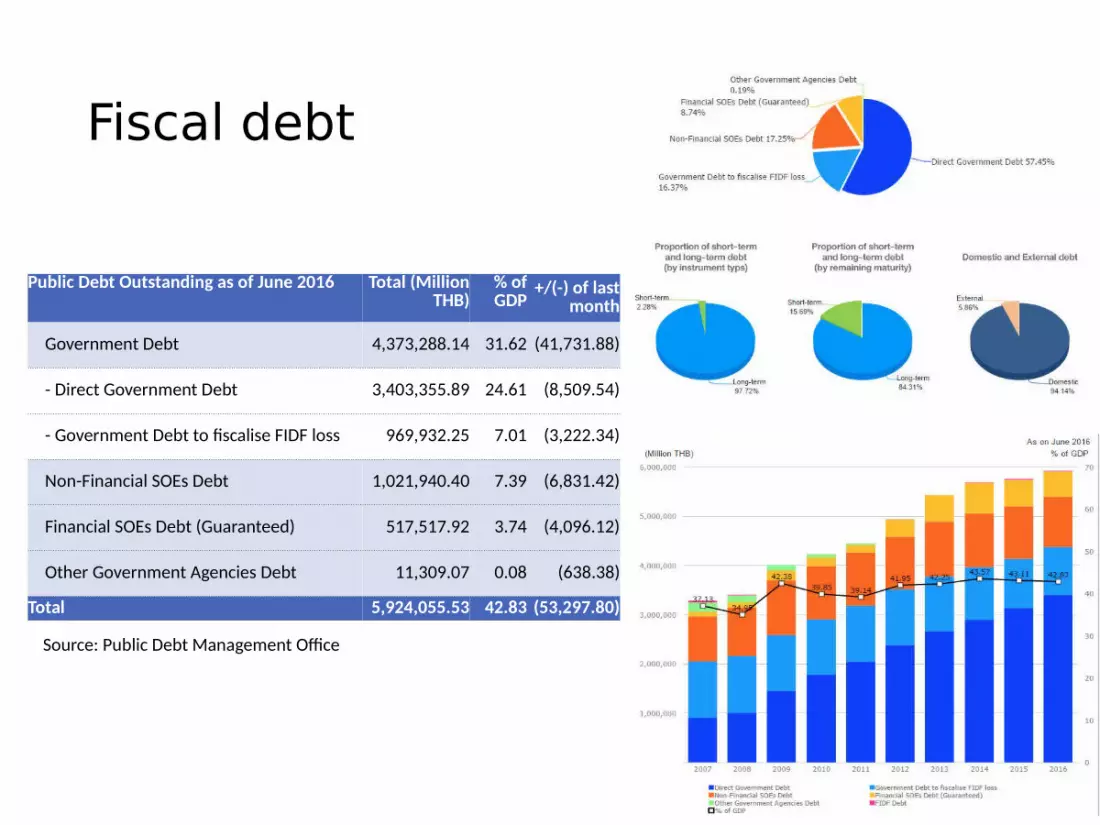
Fiscal debt
Public Debt Outstanding as of June 2016 Total (Million THB)
% of GDP
+/(-) of last month
Government Debt 4,373,288.14 31.62 (41,731.88)
- Direct Government Debt 3,403,355.89 24.61 (8,509.54)
- Government Debt to fiscalise FIDF loss 969,932.25 7.01 (3,222.34)
Non-Financial SOEs Debt 1,021,940.40 7.39 (6,831.42)
Financial SOEs Debt (Guaranteed) 517,517.92 3.74 (4,096.12)
Other Government Agencies Debt 11,309.07 0.08 (638.38)
Total 5,924,055.53 42.83 (53,297.80)
Source: Public Debt Management Office
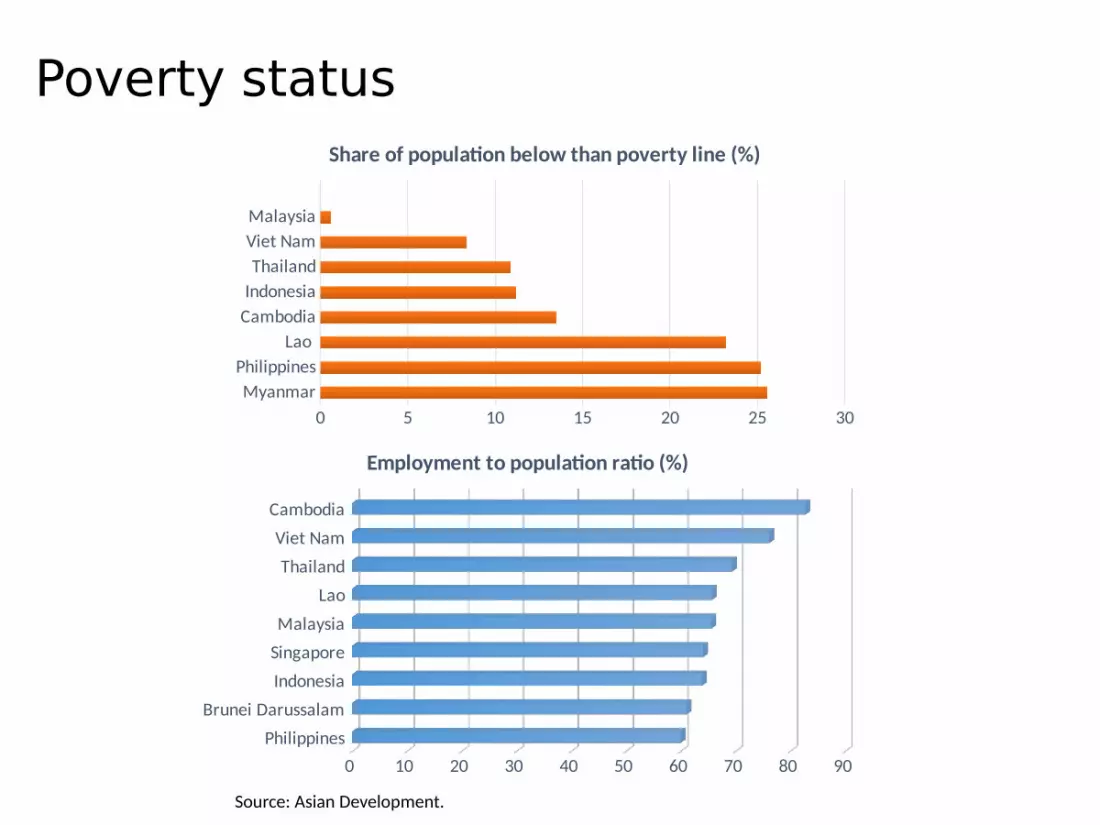
Poverty status
MyanmarPhilippines
Lao CambodiaIndonesiaThailand
Viet NamMalaysia
0 5 10 15 20 25 30
Share of population below than poverty line (%)
PhilippinesBrunei Darussalam
IndonesiaSingaporeMalaysia
LaoThailand
Viet NamCambodia
0 10 20 30 40 50 60 70 80 90
Employment to population ratio (%)
Source: Asian Development.

Human Development
Human Developme
nt Index (HDI)
Life expectancy
at birth
Expected years of
schoolingMean years of schooling
Gross national income (GNI)
per capita
GNI per capita rank
minus HDI rank
HDI rank Country Value (years) (years) (years) (2011 PPP $)
2014 2014 2014 2014 2014 2014
62 Malaysia 0.779 74.7 12.7 10.0 22,762 -14
93 Thailand 0.726 74.4 13.5 7.3 13,323 -13
110 Indonesia 0.684 68.9 13.0 7.6 9,788 -9
Source: Human Development Program : Human Development Report 2015
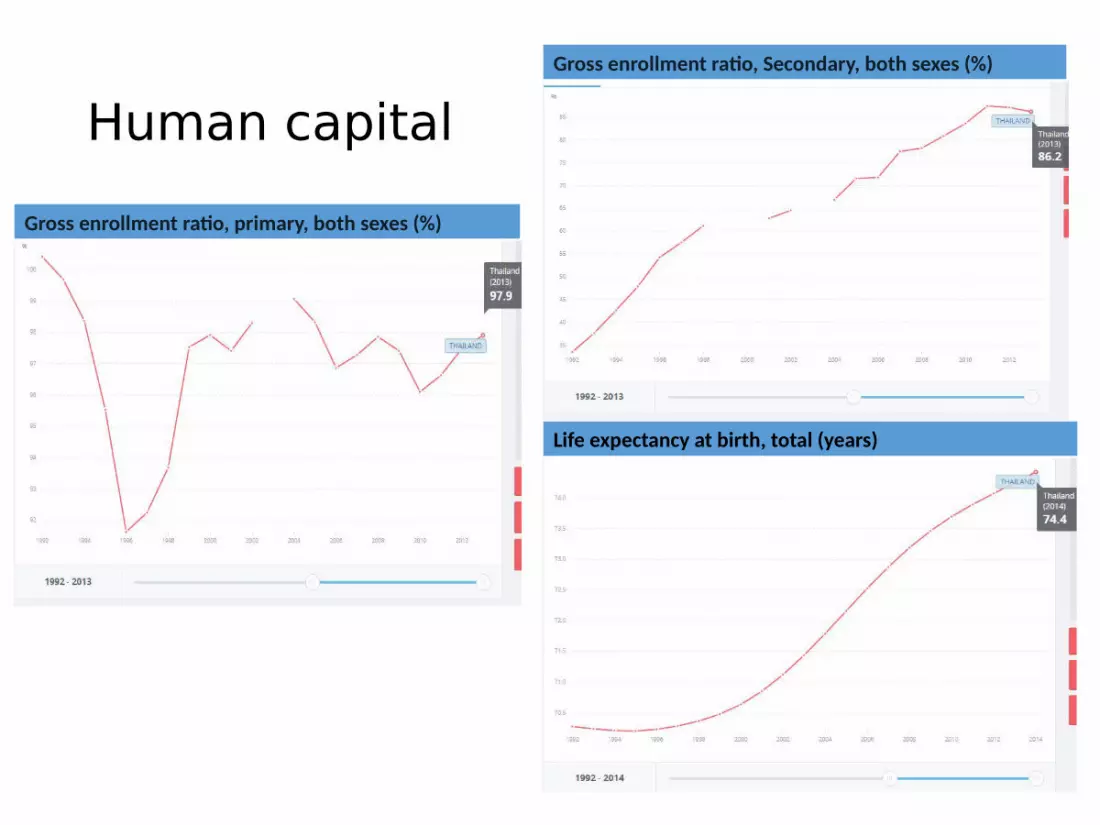
Human capital Gross enrollment ratio, primary, both sexes (%)
Life expectancy at birth, total (years)
Gross enrollment ratio, Secondary, both sexes (%)

Faculty of EconomicsThammasat University
8/26/2016
![OCCURRENCE AND FEASIBILITY OF AQUACULTURE OF THAI SPECIES OF ABALONES [1986. In Thai]](https://static.documents.pub/doc/80x56/6322f08a050768990e1014fc/occurrence-and-feasibility-of-aquaculture-of-thai-species-of-abalones-1986-in.jpg)


