Edited by The Circular Economy Challenge Towards a Sustainable Development Alessia Amato Printed Edition of the Special Issue Published in Sustainability www.mdpi.com/journal/sustainability
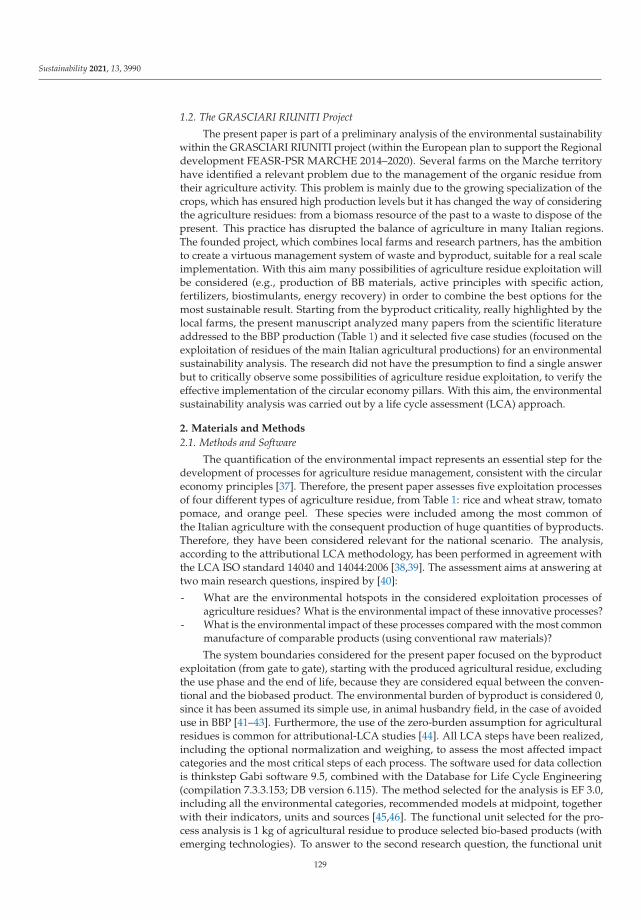
Transcript
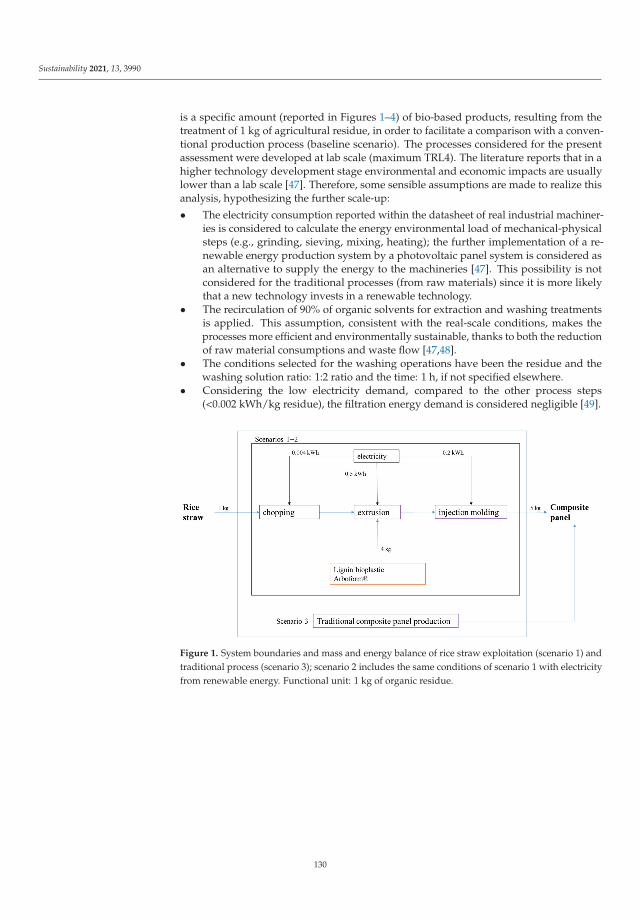
Edited by
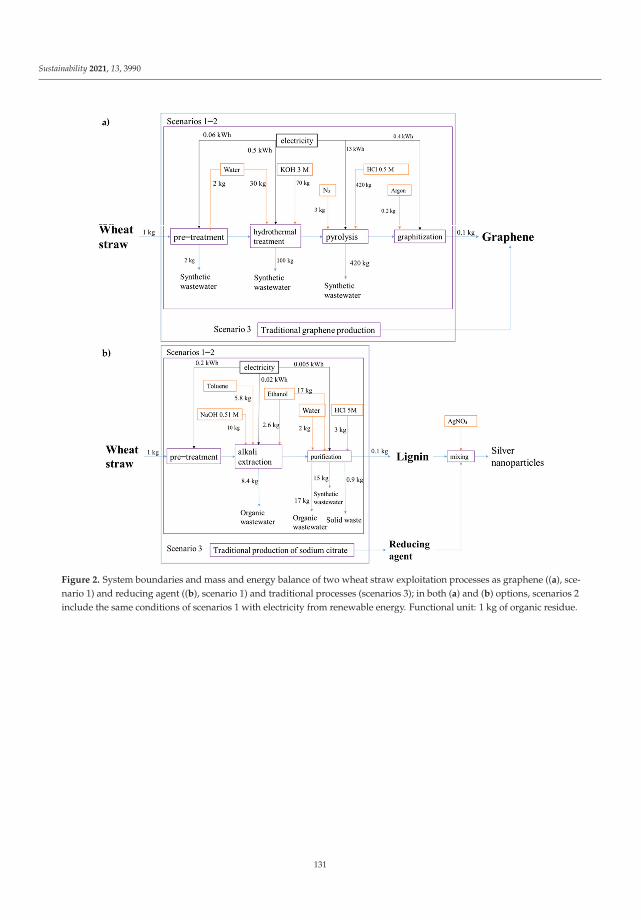
The Circular Economy ChallengeTowards a Sustainable Development
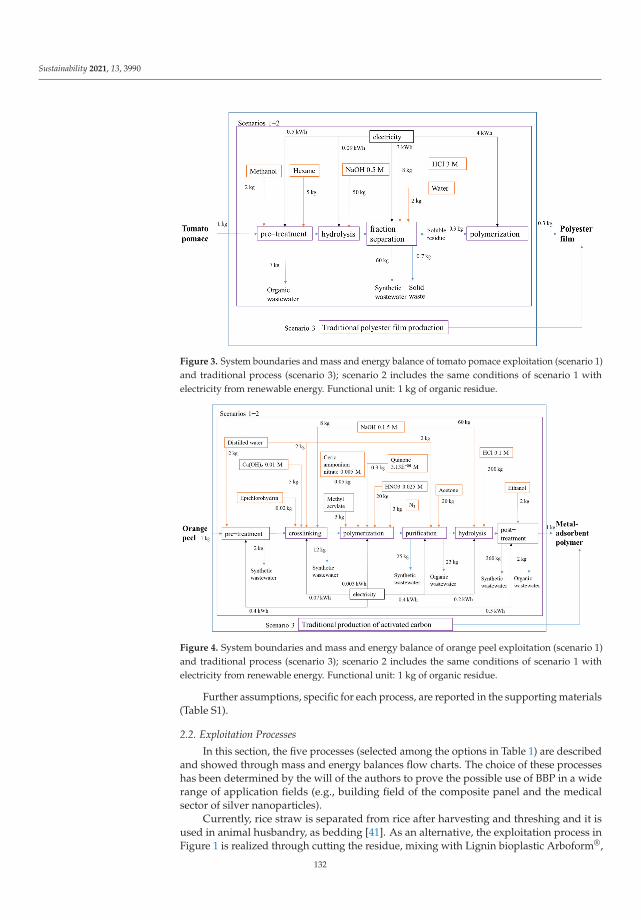
Alessia Amato
Printed Edition of the Special Issue Published in Sustainability
www.mdpi.com/journal/sustainability
The Circular Economy Challenge:Towards a Sustainable Development
The Circular Economy Challenge:Towards a Sustainable Development
Editor
Alessia Amato
MDPI • Basel • Beijing • Wuhan • Barcelona • Belgrade • Manchester • Tokyo • Cluj • Tianjin
Editor
Alessia Amato
Department of Life and Environmental Sciences (DiSVA)
Universita Politecnica of Marche
Italy
Editorial Office
MDPI
St. Alban-Anlage 66
4052 Basel, Switzerland
This is a reprint of articles from the Special Issue published online in the open access journal
Rocsana Bucea-Manea-T, onis, Aleksandar Sevic, Milena P. Ilic, Radu Bucea-Manea-T, onis,
Nevenka Popovic Sevic and Larisa Mihoreanu
Untapped Aspects of Innovation and Competition within a European Resilient CircularEconomy. A Dual Comparative StudyReprinted from: Sustainability 2021, 13, 8290, doi:10.3390/su13158290 . . . . . . . . . . . . . . . . 5
Boyao Zhang, Ubaldo Comite, Ali Gokhan Yucel, Xintao Liu, Mohammed Arshad Khan,
Shahid Husain, Muhammad Safdar Sial, Jozsef Popp and Judit Olah
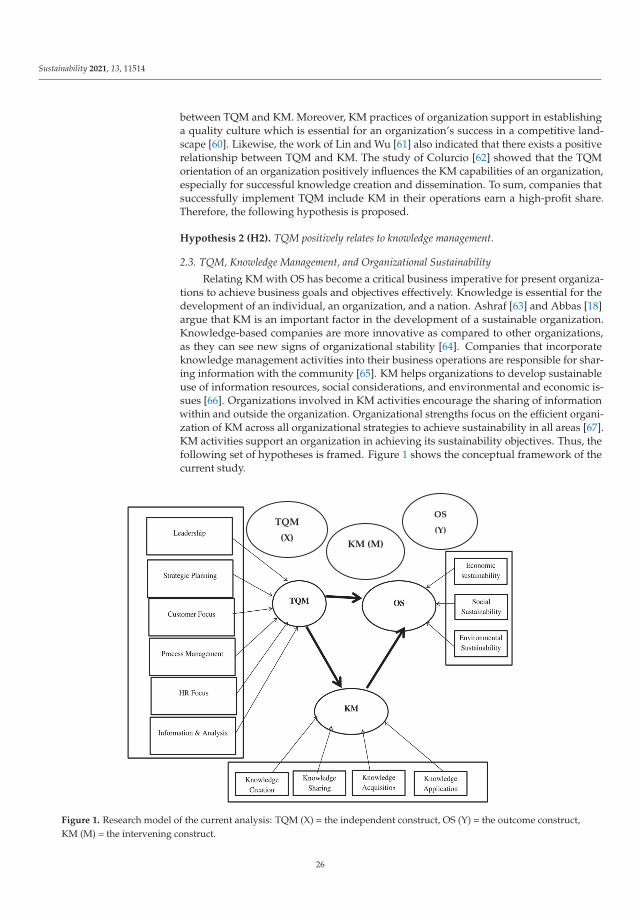
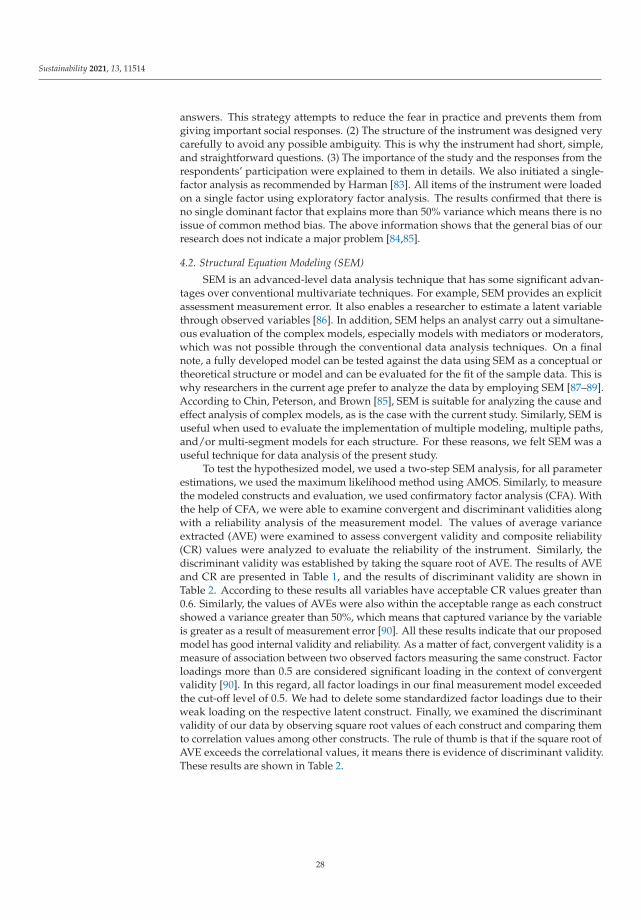
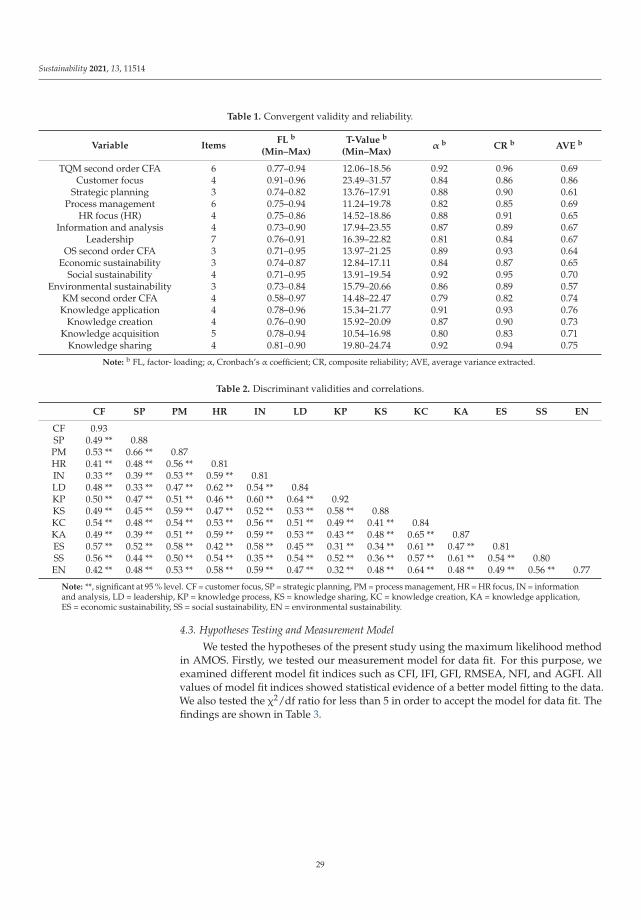
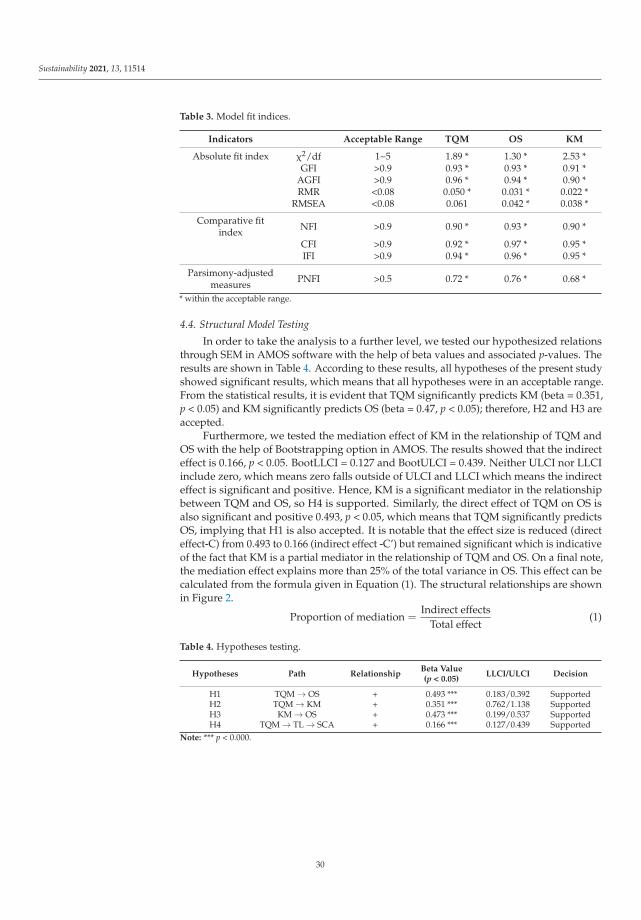
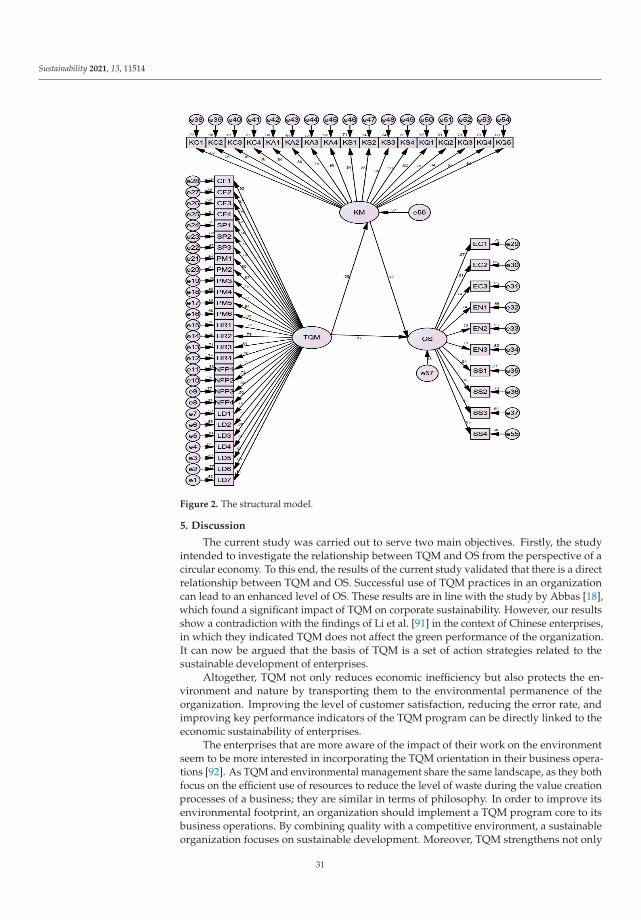
Unleashing the Importance of TQM and Knowledge Management for OrganizationalSustainability in the Age of Circular EconomyReprinted from: Sustainability 2021, 13, 11514, doi:10.3390/su132011514 . . . . . . . . . . . . . . 21
Rajesh Buch, Alicia Marseille, Matthew Williams, Rimjhim Aggarwal and Aparna Sharma
From Waste Pickers to Producers: An Inclusive Circular Economy Solution throughDevelopment of Cooperatives in Waste ManagementReprinted from: Sustainability 2021, 13, 8925, doi:10.3390/su13168925 . . . . . . . . . . . . . . . . 39
Milena P. Ilic, Marko Rankovic, Milutin Dobrilovic, Rocsana Bucea-Manea-T, onis, Larisa
Mihoreanu, Madalina Ionela Ghet, a and Violeta-Elena Simion
Challenging Novelties within the Circular Economy Concept under the Digital Transformationof SocietyReprinted from: Sustainability 2022, 14, 702, doi:10.3390/su14020702 . . . . . . . . . . . . . . . . 49
Joana Almeida, Catia Magro, Eduardo P. Mateus and Alexandra B. Ribeiro
Life Cycle Assessment of Electrodialytic Technologies to Recover Raw Materials from MineTailingsReprinted from: Sustainability 2021, 13, 3915, doi:10.3390/su13073915 . . . . . . . . . . . . . . . . 61
Marwa Dabaieh, Dalya Maguid and Deena El-Mahdy
Circularity in the New Gravity—Re-Thinking Vernacular Architecture and CircularityReprinted from: Sustainability 2022, 14, 328, doi:10.3390/su14010328 . . . . . . . . . . . . . . . . . 81
Simone Orcioni, Maria Letizia Ruello and Pierluigi Stipa
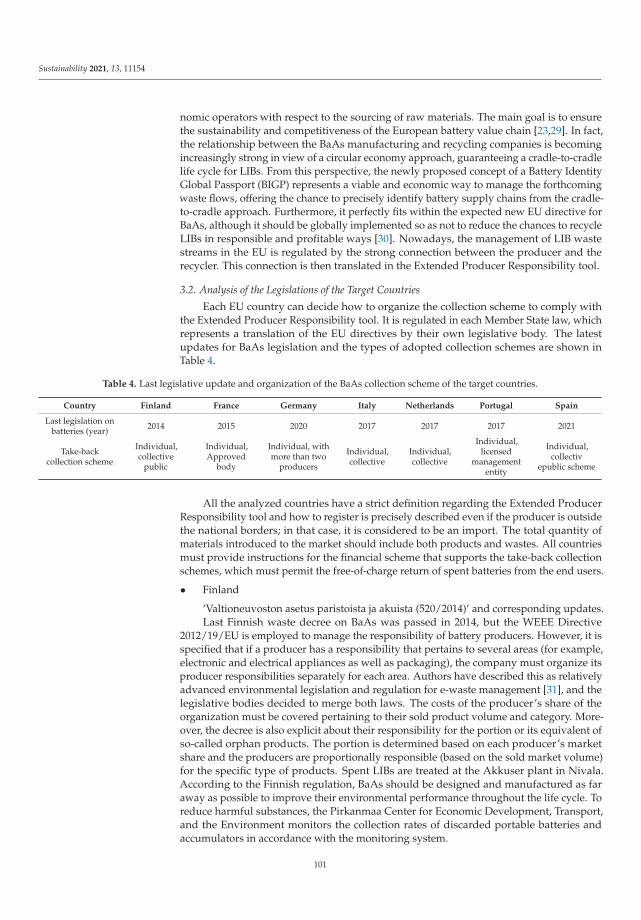
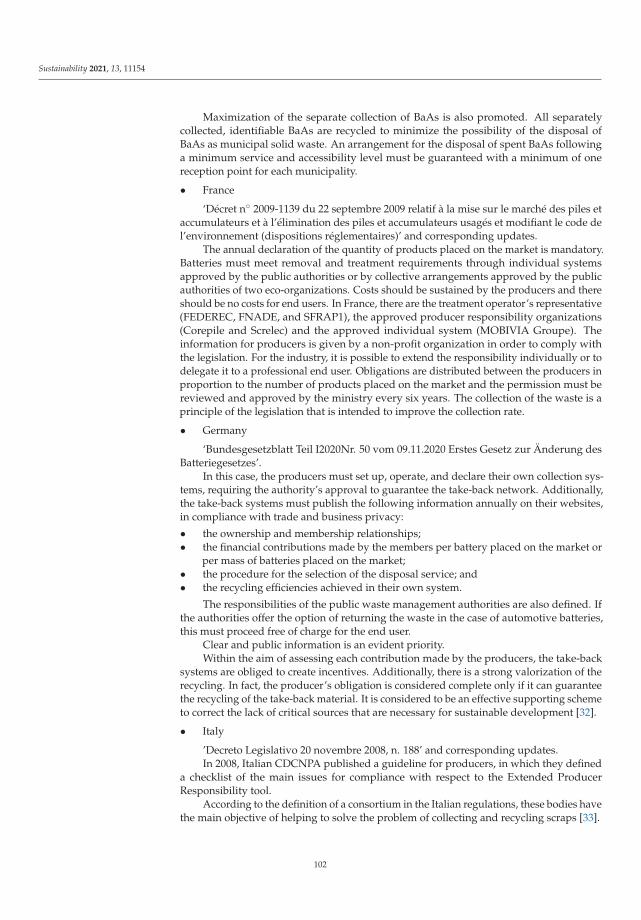
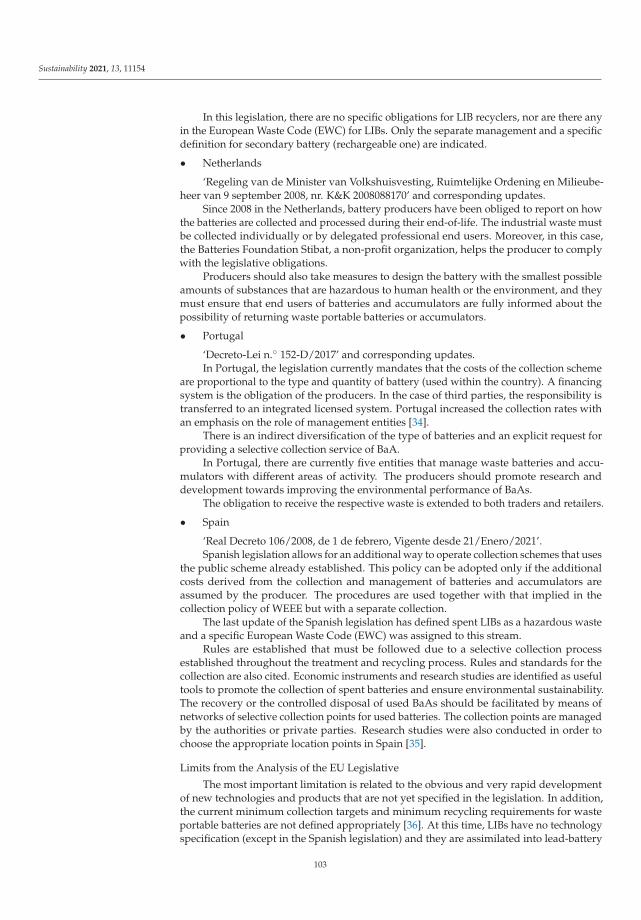
An Exploratory Study of the Policies and Legislative Perspectives on the End-of-Life ofLithium-Ion Batteries from the Perspective of Producer ObligationReprinted from: Sustainability 2021, 13, 11154, doi:10.3390/su132011154 . . . . . . . . . . . . . . . 95
Alessandro Becci, Dafina Karaj, Giulia Merli and Francesca Beolchini
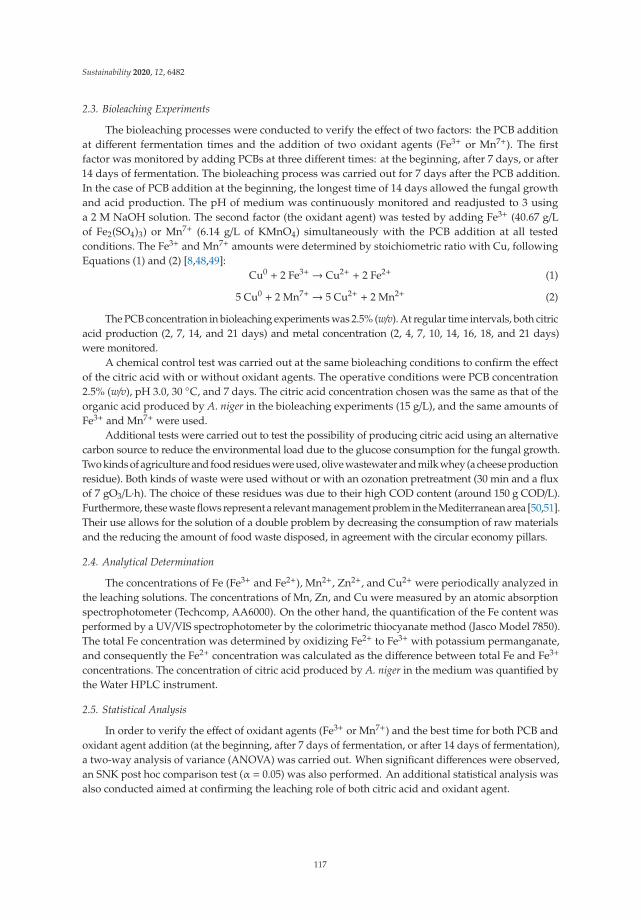
Biotechnology for Metal Recovery from End-of-Life Printed Circuit Boards with Aspergillus nigerReprinted from: Sustainability 2020, 12, 6482, doi:10.3390/su12166482 . . . . . . . . . . . . . . . . 115
Alessia Amato, Marianna Mastrovito, Alessandro Becci and Francesca Beolchini
The Circular Economy Challenge: Towards aSustainable Development
Alessia Amato
Department of Life and Environmental Sciences-DiSVA, Università Politecnica of Marche, Via Brecce Bianche,60131 Ancona, Italy; [email protected]
As it is now known, we have only one earth available for our life and it is our duty topreserve it.
The more recent manifestations in the squares worldwide confirm the increase ofpeople’s awareness of this subject. Nevertheless, the forecast is not promising to describea resource consumption equal to three planets by 2050 [1] and the effects are in frontof our eyes, just think of the biodiversity loss, the water stress and the climate change.Furthermore, the effect on the environment is often translated into economic impacts, theincrease of the social gap and the poverty growth [2,3].
In this context the conversion of our economic system, from linear to circular, repre-sents a challenge to overcome, no longer postpone.
Although the circular economy term is often reduced to the simple recycling concept,it represents a complex strategy which aims at the achievement of many ambitious targets.Among these: the increase of product life cycles, the implementation of the industrialsymbiosis, the conversion of products into services, the reduction of waste production,the creation of secondary raw materials market [4]. The four main actors of the circularchange are the institutions, the industry, the consumers, and the scientific research. Theiractions must be closely linked to push the global markets toward the sustainability. Policiescan dynamizing the low impact production and drive the consumers towards sustainablechoice. On the other hand, the research could supply innovative solutions to the industries,increasingly interested in low impact technological innovation.
In this regard, the COVID-19 pandemic has given us an important lesson provingthe resilience of our global market and its conversion rate to respond to the suddenchange of consumer demand. The pandemic has proved the capability of consumers,companies and researchers to act on the product design for example for the production ofdisinfectants from residual products and face masks from textile leftovers for hospitals [5].COVID-19 has tested the ability of countries to provide solutions (in a very short time)able to combine all the circular characteristics: repairability, reusability, and potentialfor remanufacturing, proving the relevance of secondary raw materials stocks and thecompetitiveness of countries [5].
Considering the results achieved in the most critical period of COVID-19 crisis, weshould be able to transform the crisis into a chance. The current step of world recoveryfrom pandemic must be the opportunity for the removal of barriers (bureaucratic, technicaland economical) that often slow down the conversion to an effective circular economy [6].
The possibilities offered by the post-pandemic period to match the targets of circu-lar economy and the Grean Deal are discussed by Bucea-Manea-Tonis et al., in the firstcontribution of Special Issue. They have carried out an analysis of competitiveness andinnovation focusing on Romania and Serbia, an emerging country from the EU and EUaccession country, respectively. They have proved a correlation between the eco-innovationindex and the research and development sector, using a dual comparative analysis. Theauthors have demonstrated the essential role of research and human resources that, stimu-lated through innovative teaching in the circular economy field, produce positive effectsfor both society and market levels. In this transition towards a sustainable system, policies
can make the difference by economic support and the monitoring of the best availabletechnique use (Contribution 1).
Zhang et al. have analyzed another geographical area, considering the manufacturingsector of Pakistan. They have deepened the concept of circular economy implementedin a developing country. They have studied the connection between the constructs oftotal quality management and organizational sustainability with the mediating effect ofknowledge management by the implementation of a structural equation modeling. Theauthors have proved that the transition towards the circular economy is not a very quickprocess and that it does not include only an industrial restructuring. There is the necessityof a structural shift and a change in the mindset, behavior, and priorities stakeholdersinvolved in the market. They have concluded the paper discussing the necessity of thetransition from a linear to a circular economy as opportunity to increase the competitivenessof companies in Pakistan (Contribution 2).
The implementation of an effective circular economy could have positive effects onseveral goals identified by The United Nation within the 2030 Agenda for SustainableDevelopment. In addition to the most obvious Target 12, related to the responsible con-sumption and production. In this regard, Buch et al. have proposed the circular economy assolution to address the issue of waste pickers in developing countries. They have describeda cooperative system able to maximize the collection and the waste sorting (mainly plasticfraction), with an environmental gain in emission terms and an increase of landfillingsite lifespans. Furthermore, the designed solution could alleviate several issues includ-ing in the 2030 Agenda, such as poverty, hunger, gender equality, and social inequality(Contribution 3).
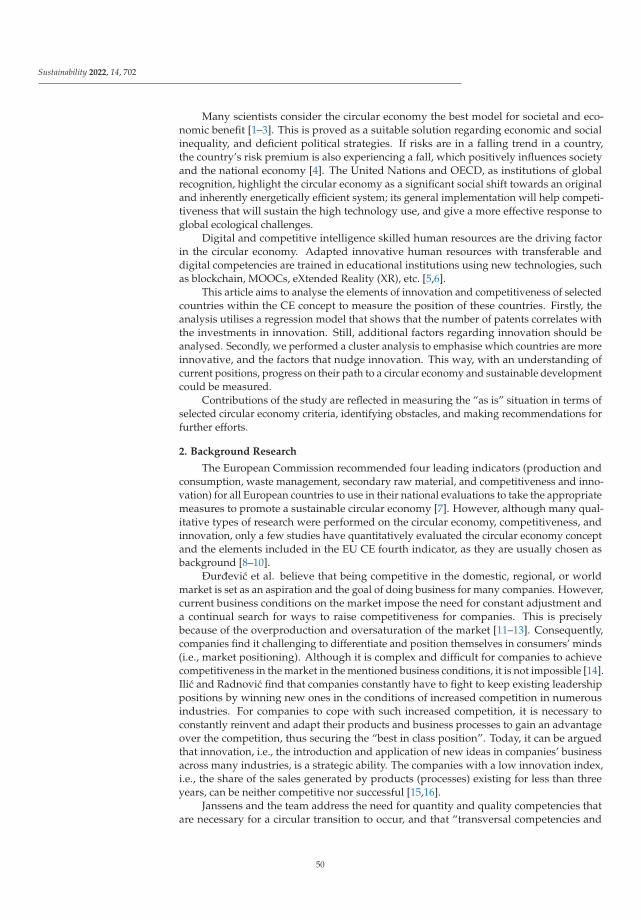
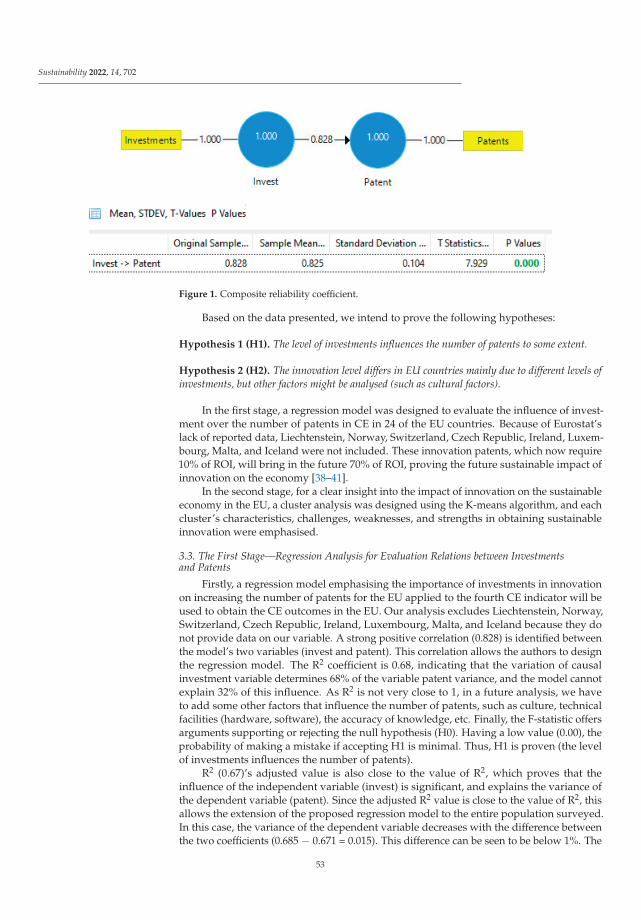
It is evident that circular economy means new opportunities and Ilic et al. have chosento analyze the European indicator of competitiveness and innovation considering bothinvestments and patents related to the circularity field. The regression model performedby authors has identified the investment as the most crucial factor that stimulates the newpatents. However, they have concluded that other elements should be added to the modelfor a sustainable economy, such as creating new jobs in the green field, the policy support,green public procurement, education for understanding, and the implementation of digitaland transferable knowledge and competencies. The paper represents the starting pointfor the development of successful strategies for the overcoming of the old linear model inRomania (Contribution 4).
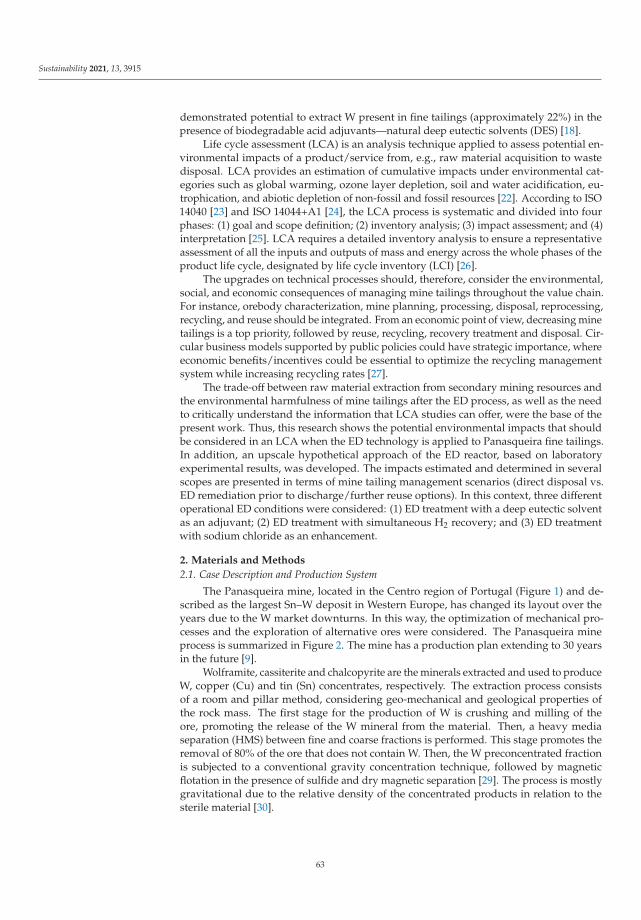
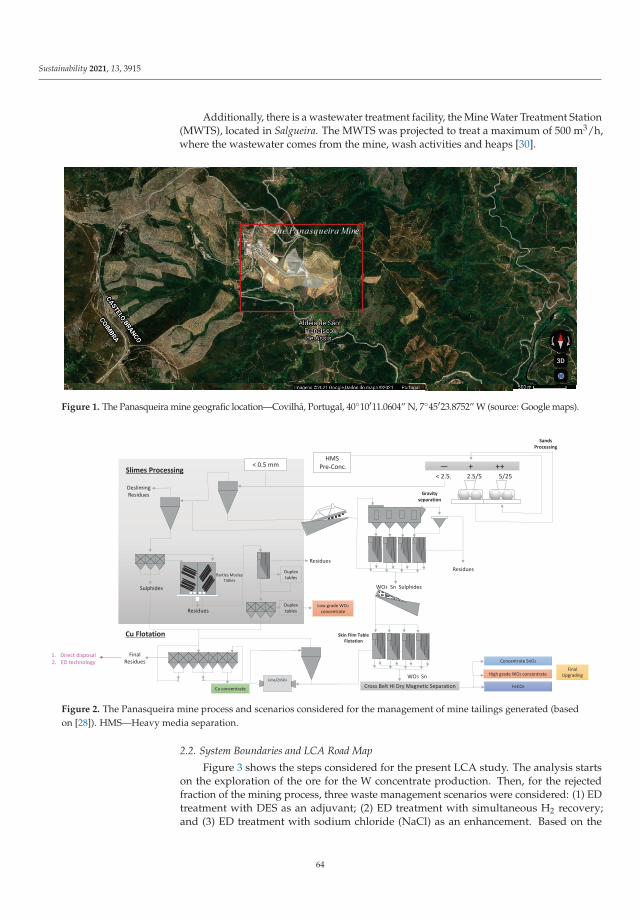
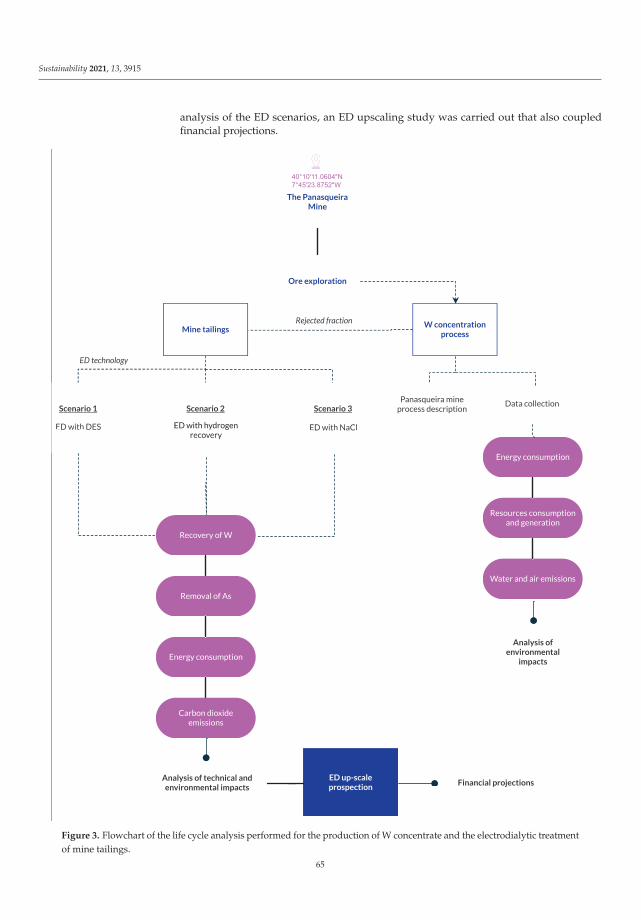
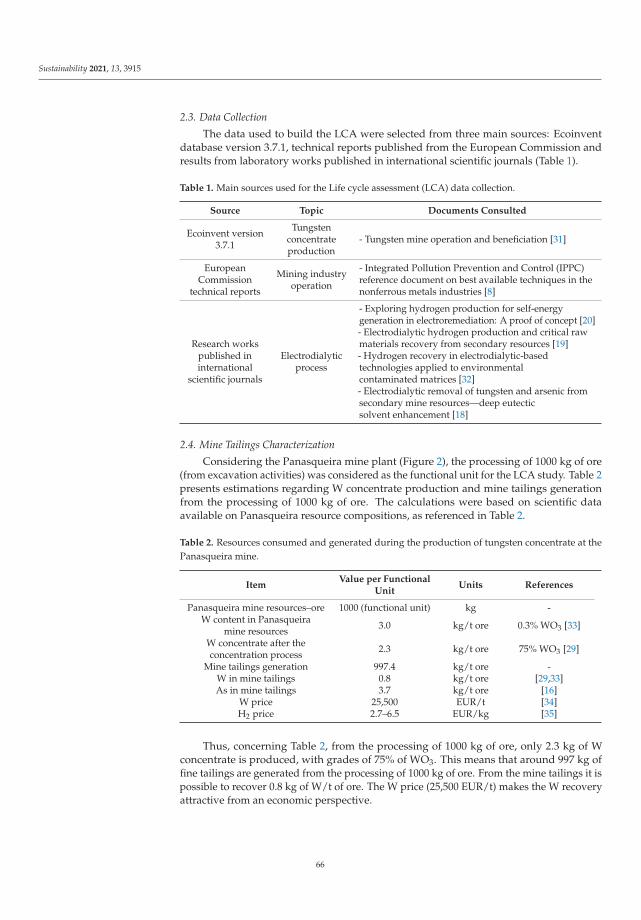
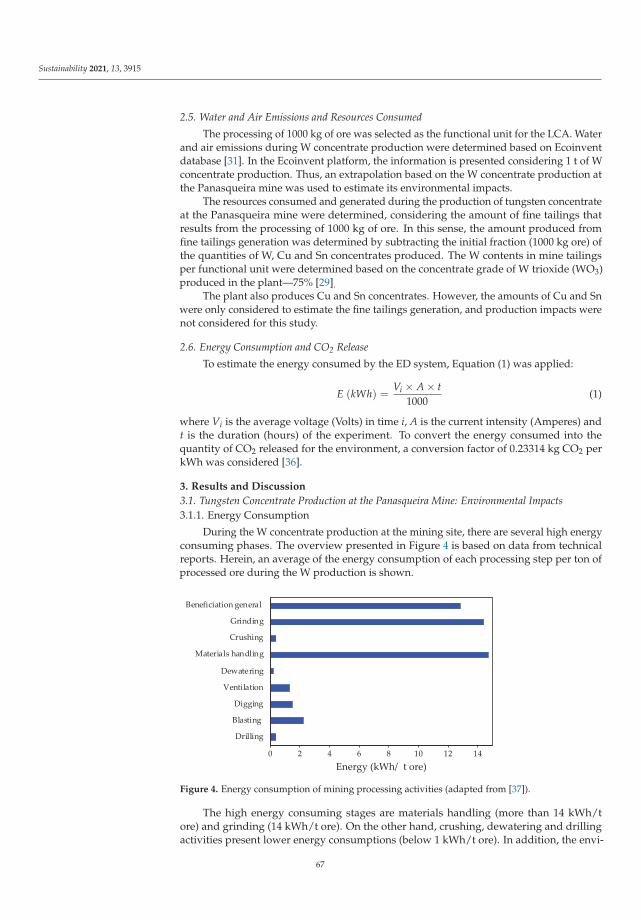
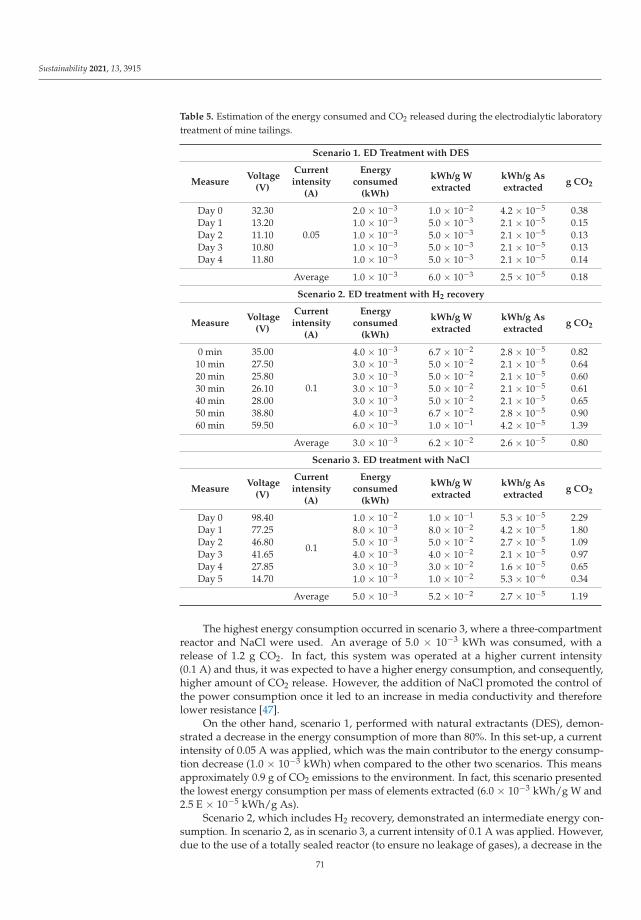
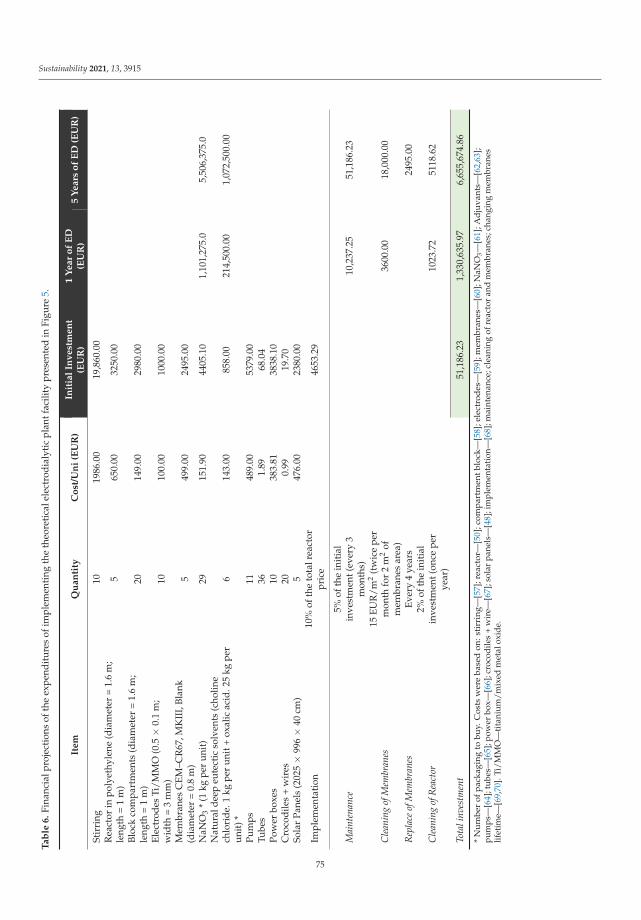
The availability of sustainable processes which respect the principles of circular econ-omy represents an urgent need. In this regard, Almeida et al. have compared differentstrategies for the exploitation of tailings from Panasqueira mine, located in Portugal andclassified as the largest Sn-W deposit in Western Europe. As reported by authors, theextractive industry needs technological innovations to increase its sustainability level anddecrease the resulting environmental burdens and waste to manage. The implementationof a life cycle approach has allowed to estimate the benefit of an innovative approach ableto combine the recovery of raw material, with the removal of hazardous As and the H2recovery which could drive the mine towards a clean energy transition (Contribution 5).
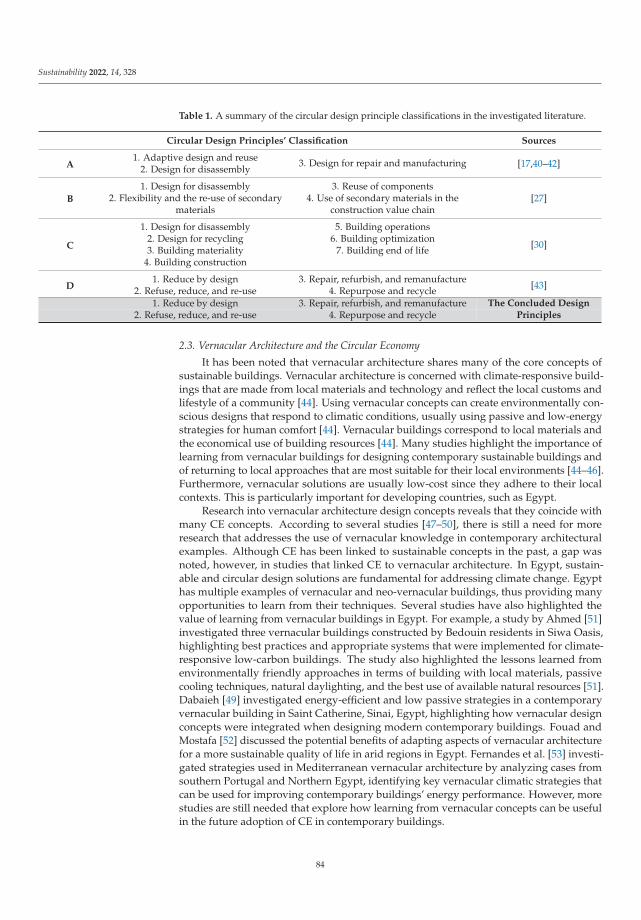
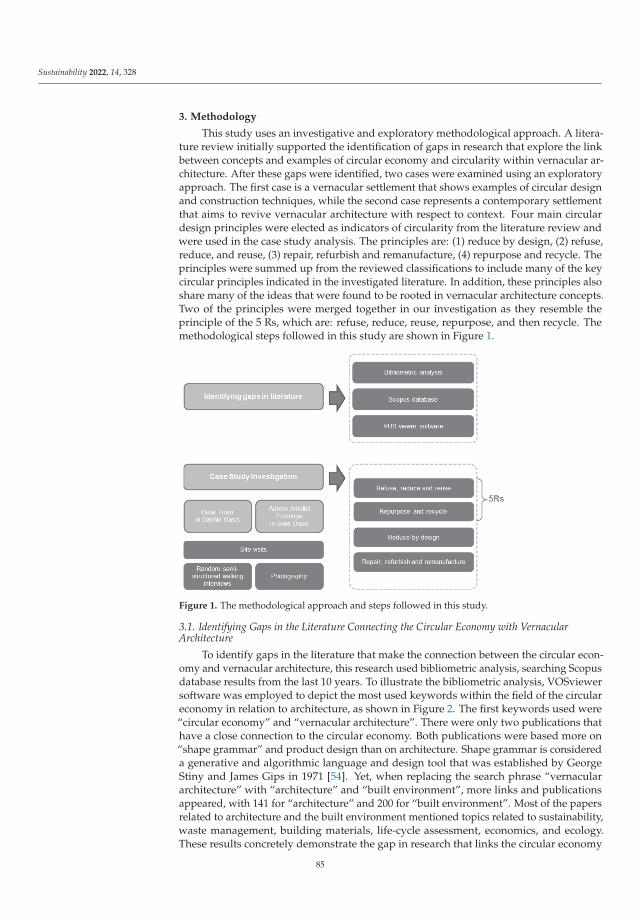
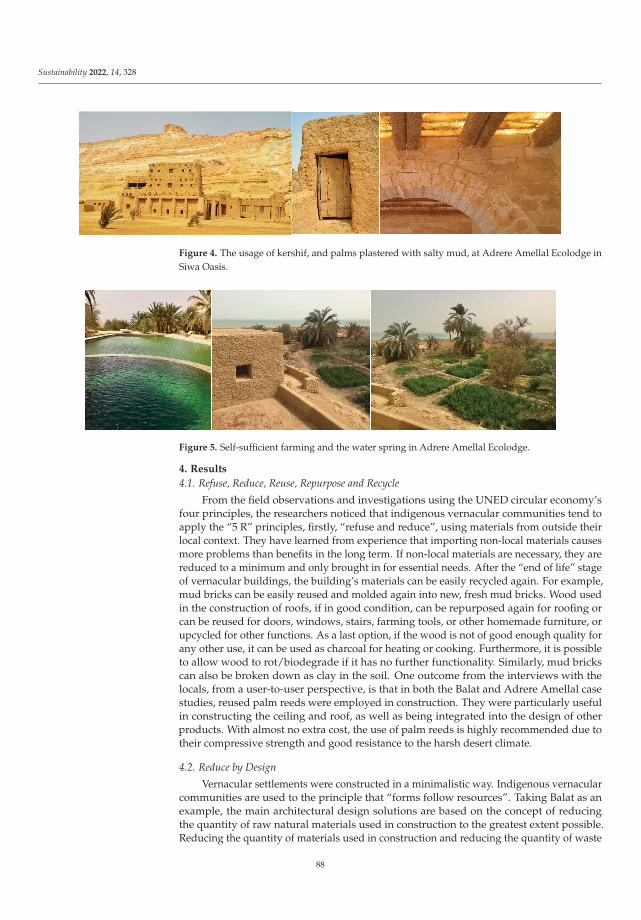
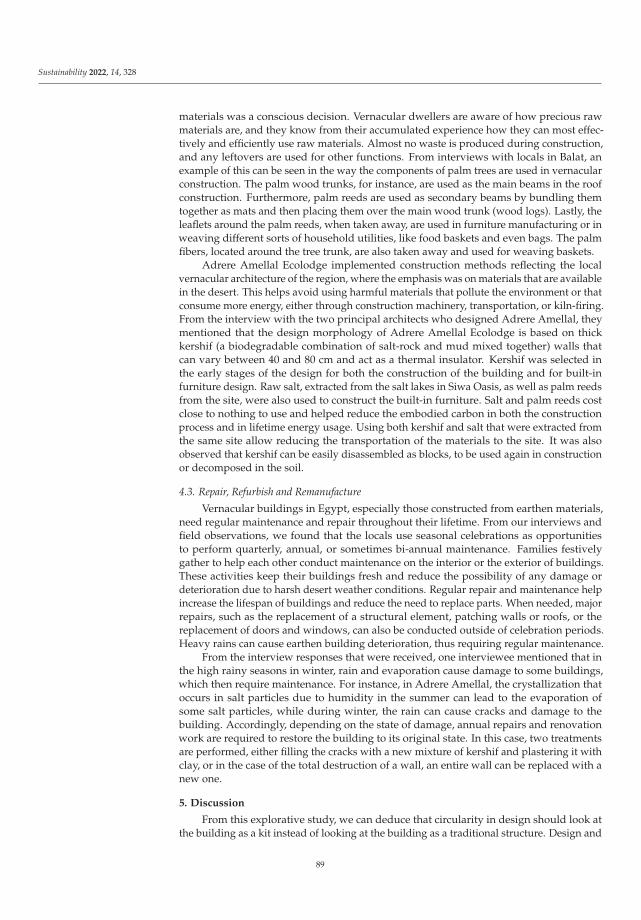
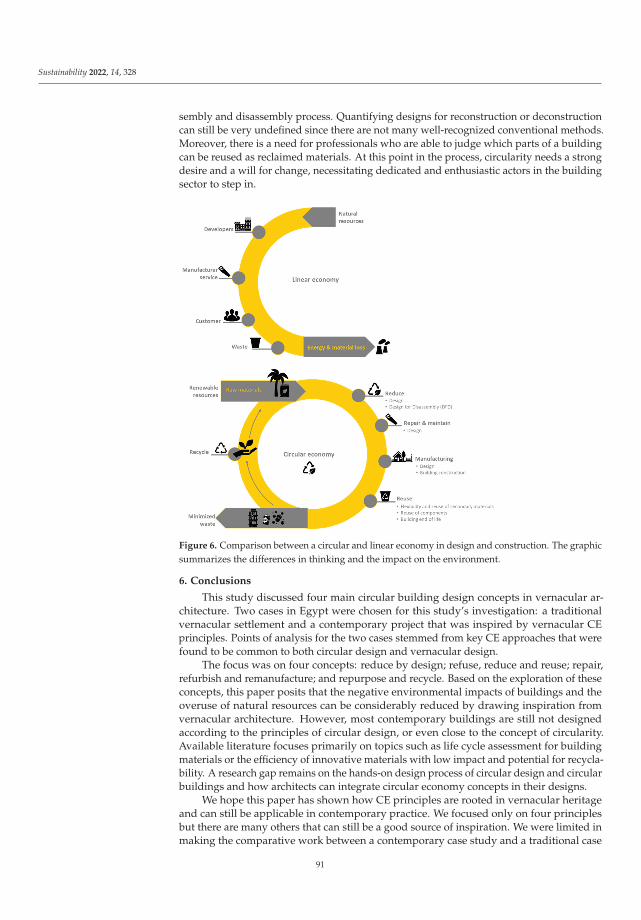
An interesting reflection is proposed in the Contribution 6, where authors have dis-cussed about construction and building sector, one of the key value chains reported inthe European circular economy action plan [4]. They have analyzed the vernacular ar-chitecture in Egypt, the oldest civilization in the world, identifying the compliance withthe principles of circular economy (i) Refuse, Reduce, Reuse, Repurpose and Recycle, (ii)Reduce by design, (iii) Repair, Refurbish and Remanufacture. Starting from the case studyanalysis, Debaieh et al. have suggested to draw inspiration from vernacular architecture toconsiderably reduce the impact of modern buildings (Contribution 6).
A connection with key product value chains could be recognized also in Contributions7 and 8 (in particular Batteries and vehicles and Electronics and ICT), which have addressedissues related to end-of-life batteries and printed circuit boards, respectively. As reported byGiosuè et al. the self-sufficiency in the battery sector is one of the most ambitious European
2
Sustainability 2022, 14, 3458
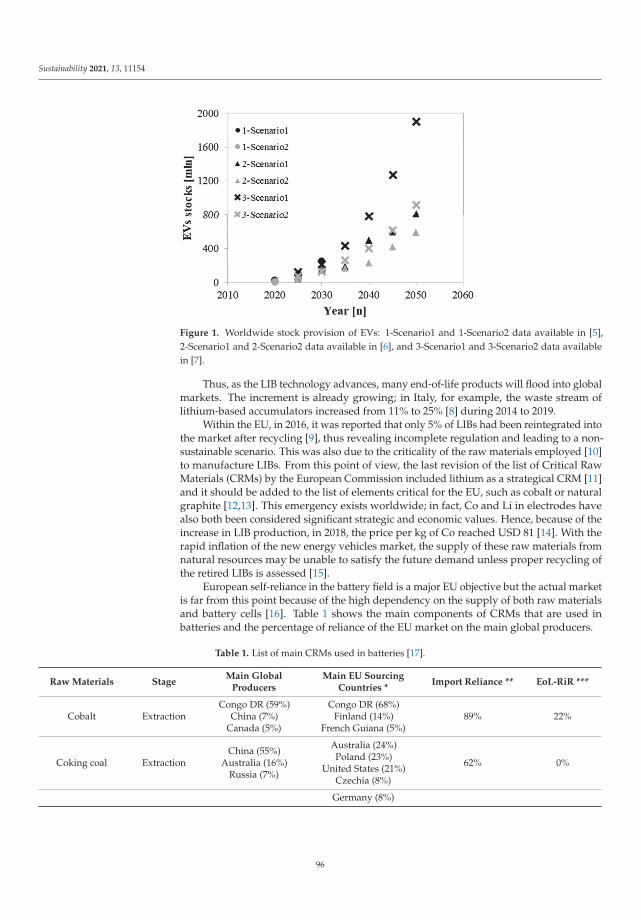
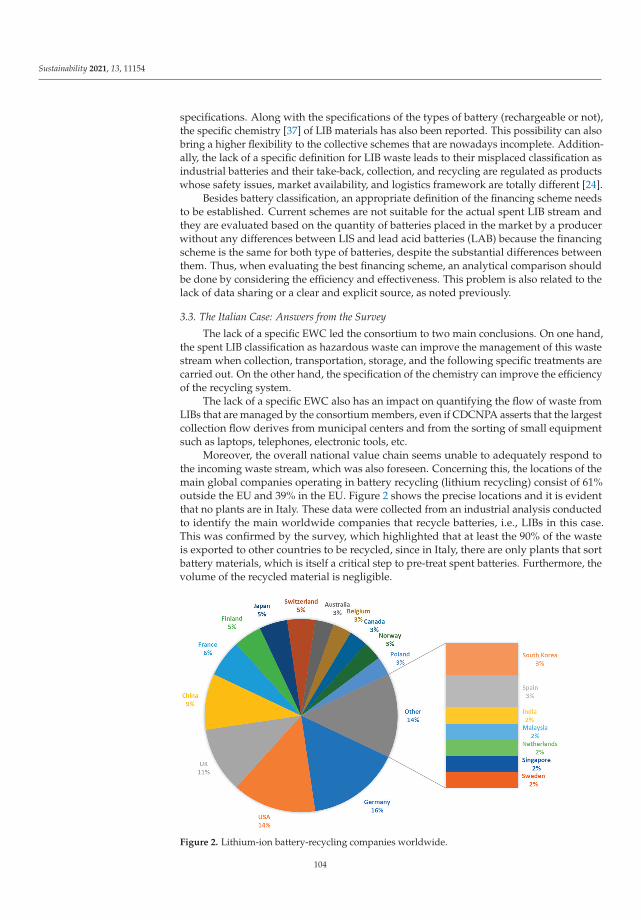
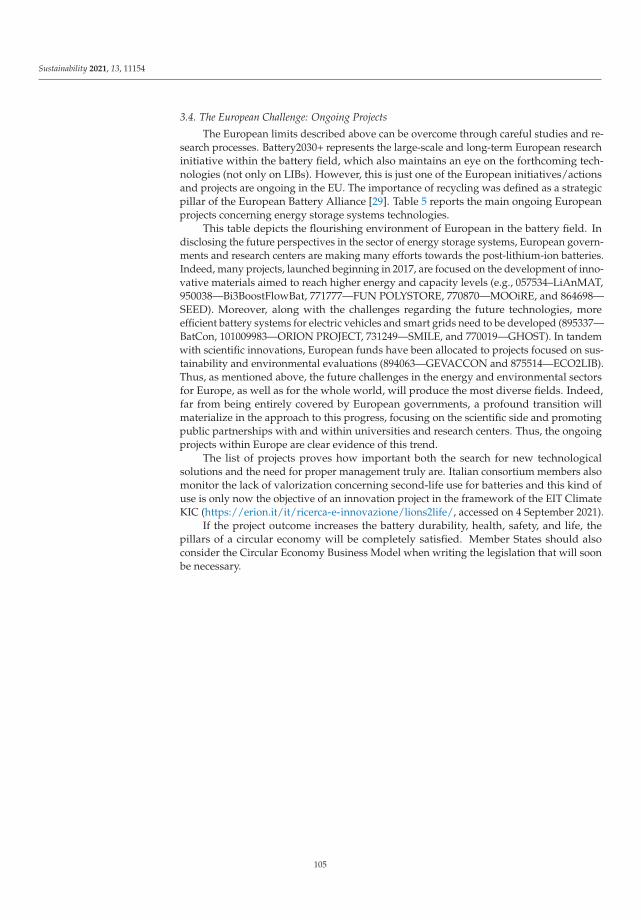
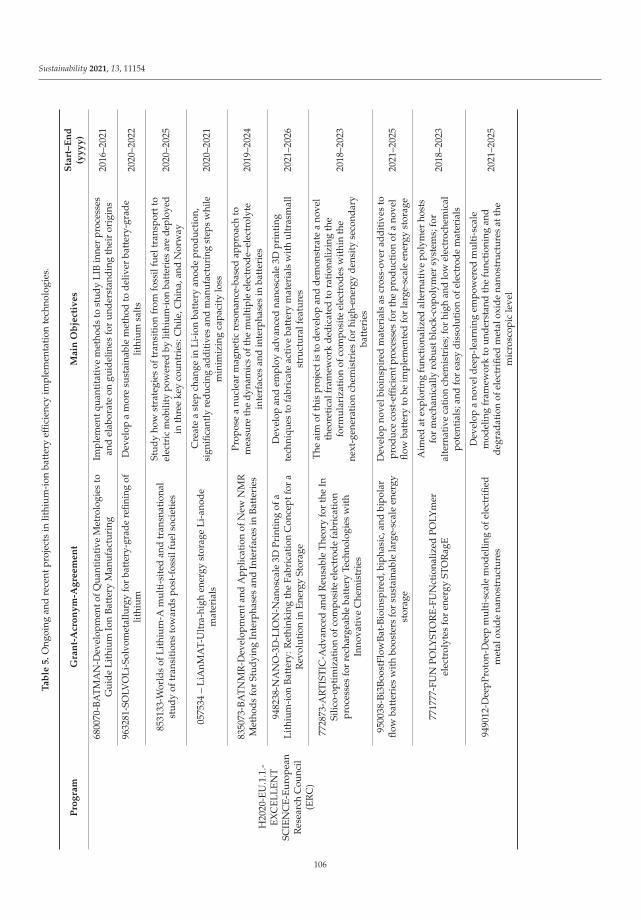
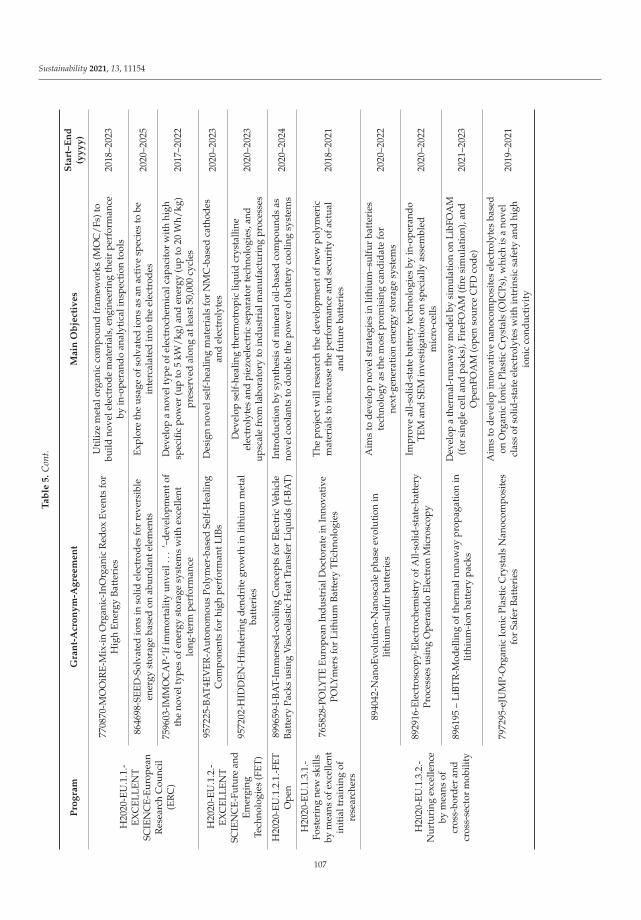
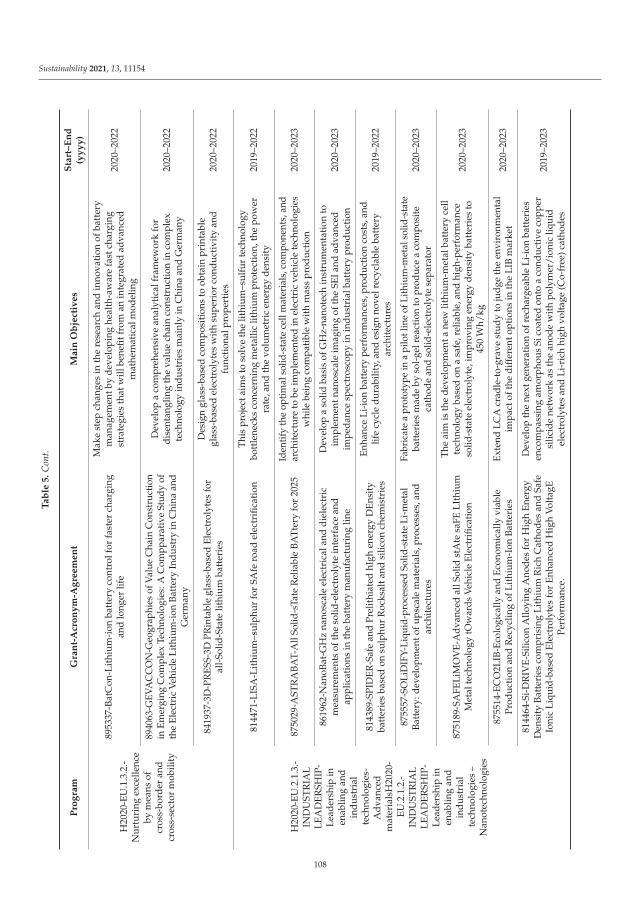
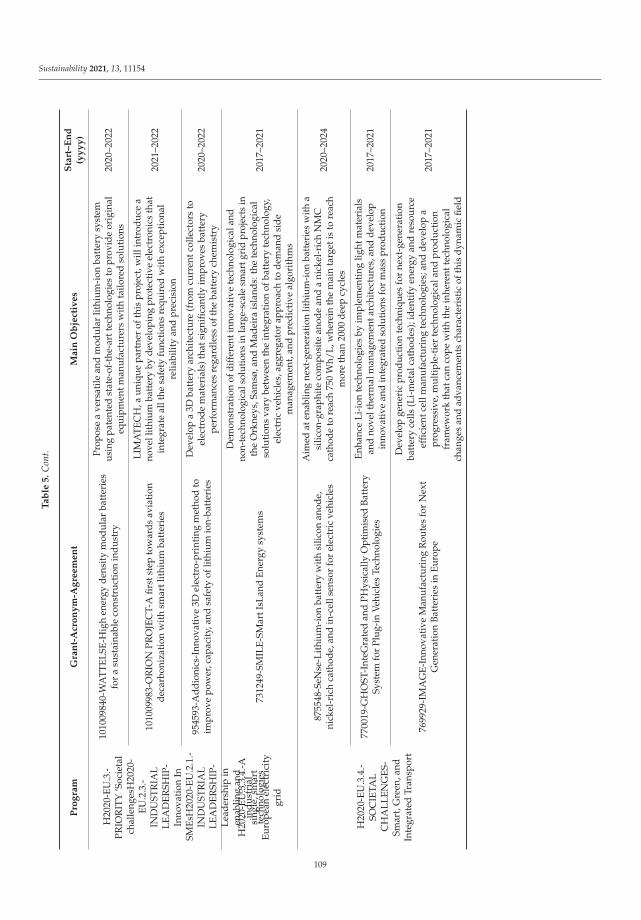
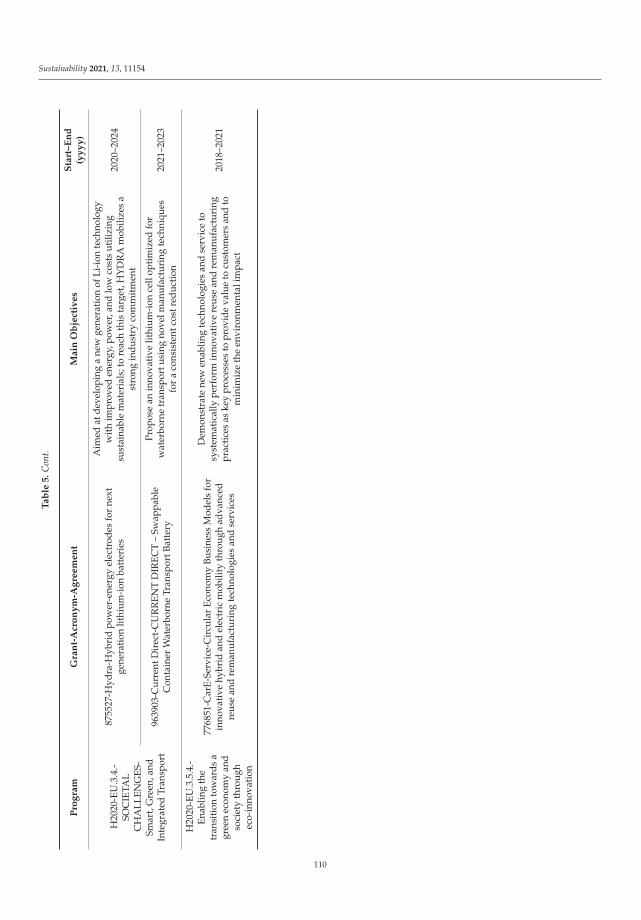
targets. Indeed, the demand of raw materials for battery manufacturing is expected toincrease due to the growing diffusion of electric vehicle, in response to the Green Dealobjective of reduction of the transport emissions [7]. The relevance of this topic has pushedthe authors to undertake the study of regulations on end-of-life batteries in differentEuropean countries. The paper has allowed the identification of strength and weaknessesof policies, highlighting the necessity of a creation of a homogeneous reference schema forwaste collection, able to improve the further recycling. The results have identified the needof specific regulations dedicated to Li-ion batteries to avoid loss of valuable materials tosend to exploitation (Contribution 7).
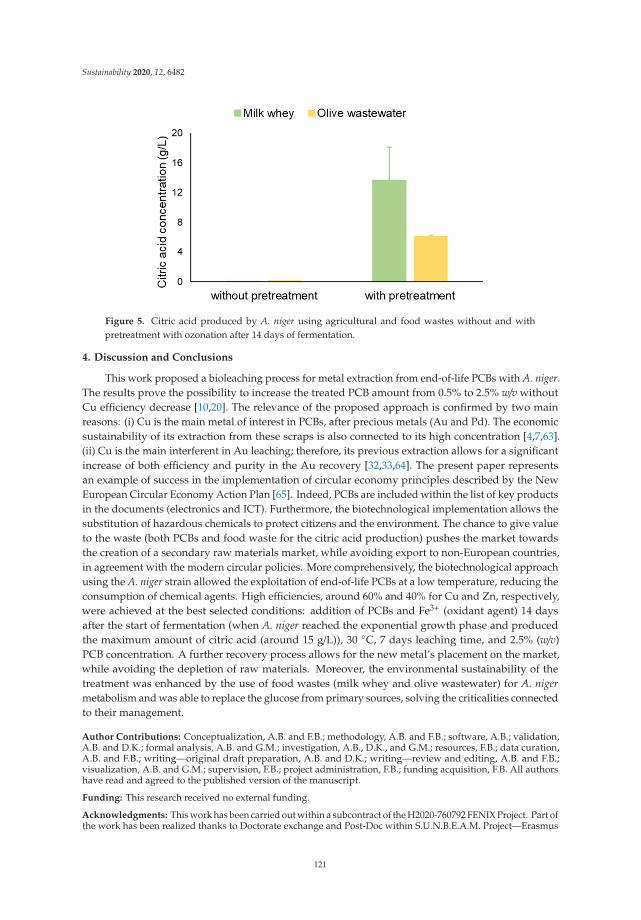
The development of urban mining strategies, where the waste becomes a resource ofsecondary raw materials in agreement with the circular economy pillars has been discussedin the Contribution 8. The choice of printed circuit boards as waste to treat has beendue to a double reason: the availability of high quantities of this kind of equipment(for its use in many applications) and its metal concentrations, higher than that the ores.Therefore, the identification of sustainable processes is essential to reduce the waste flowsto manage and to create relevant stocks of valuable elements. In this regard, Becci et al.have developed a biotechnological approach able to extract copper from printed circuitboard with high efficiency, using the fungal strain Aspergillus niger, avoiding the use ofboth high temperatures and high impact chemicals which characterize the most commonhydrometallurgical treatments. In the perspective to maximize the eco-design of theprocess authors have suggested the use of milk whey as substrate for the fungal growth(Contribution 8).
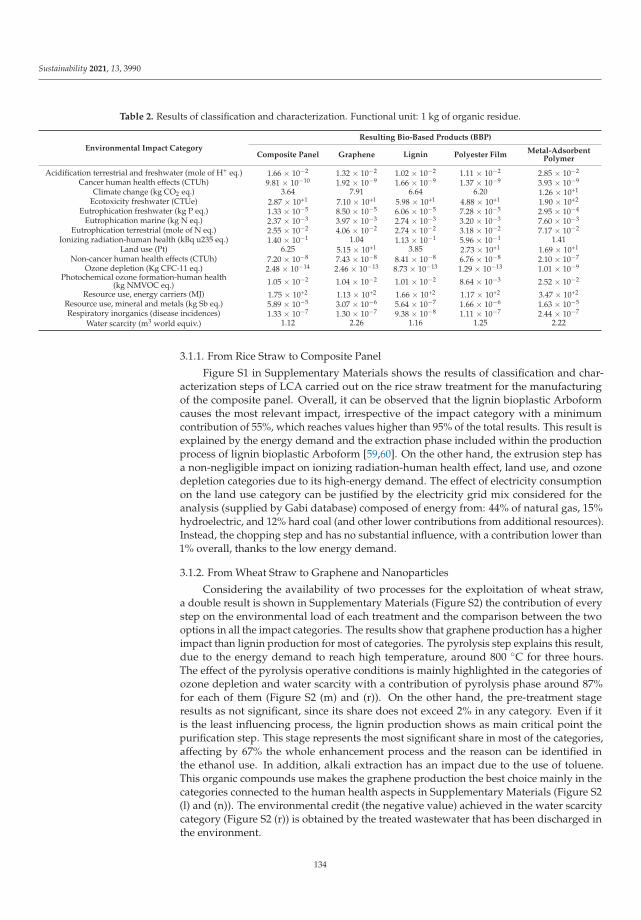
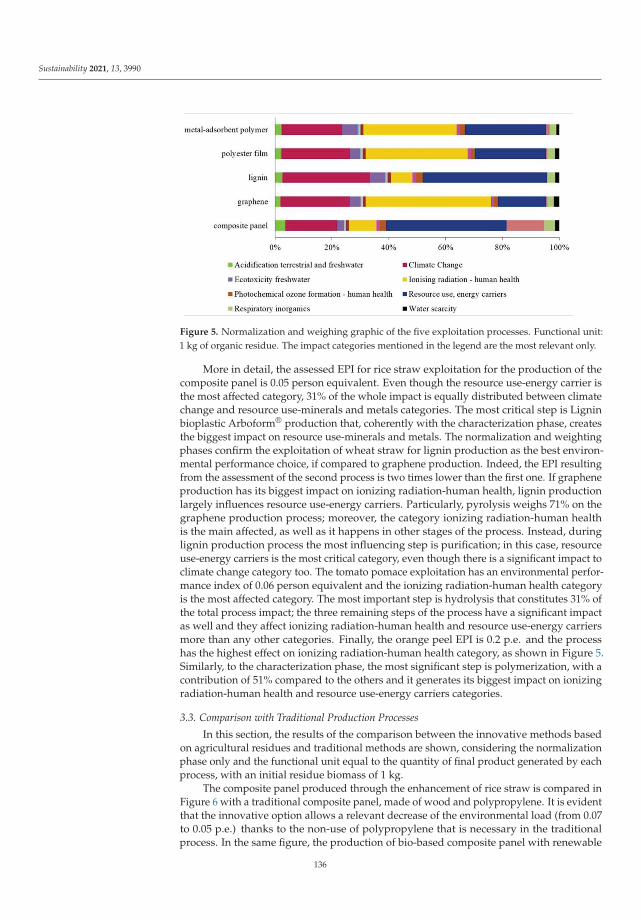
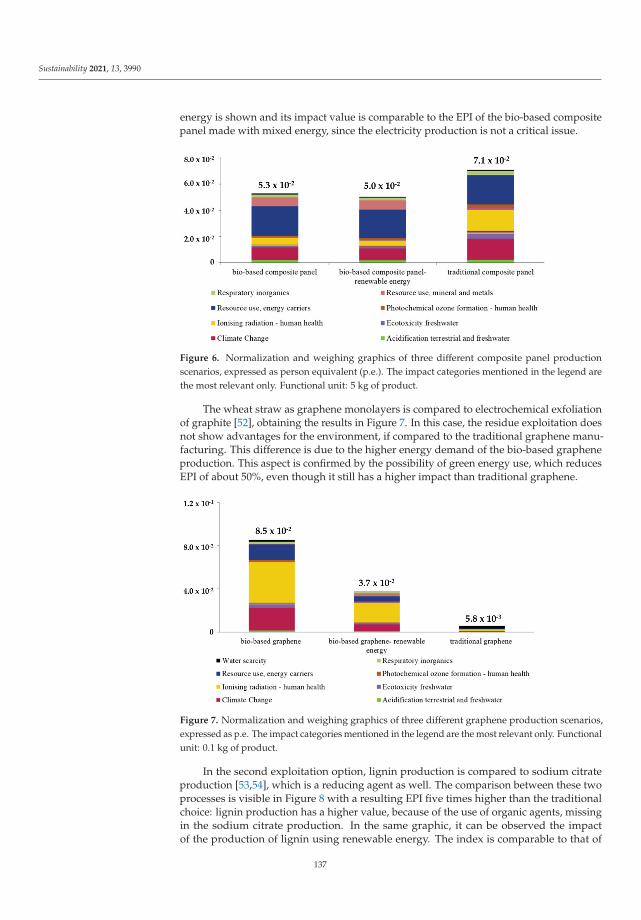
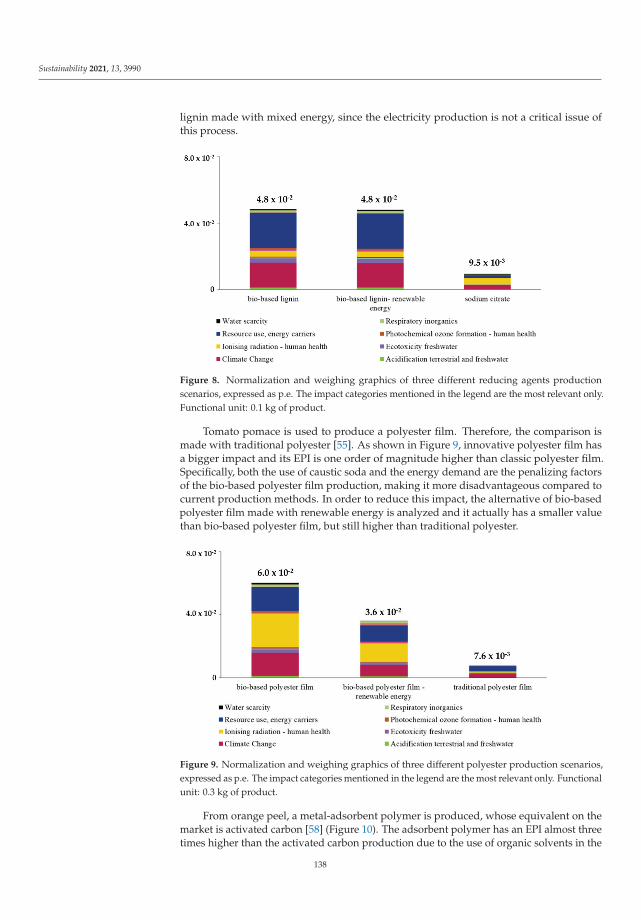
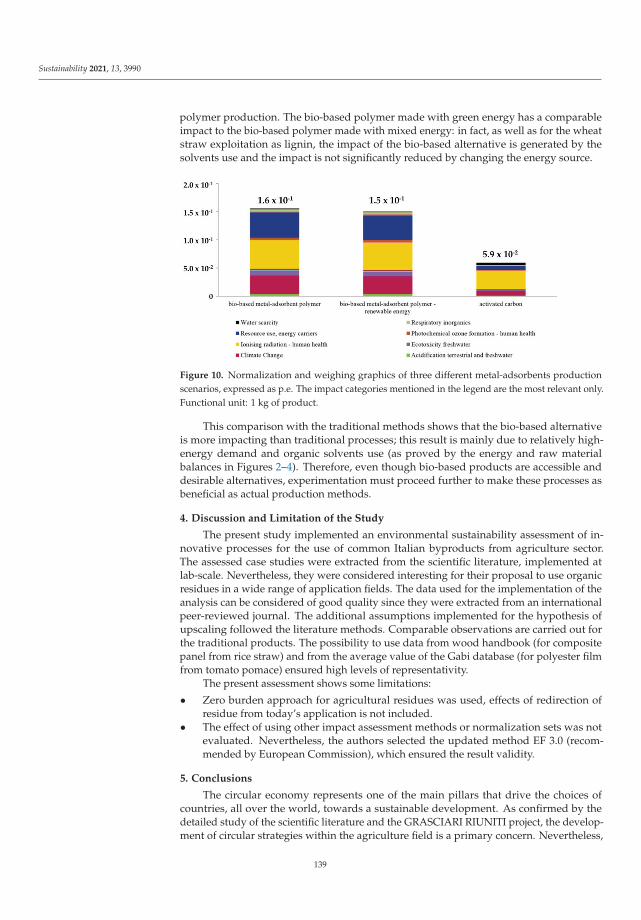
The results described in Contribution 9 seem almost a provocation, encouraging thereaders to a critical analysis of the solutions proposed in the circular economy field. Theother authors, and me, have carried out a critical review of the scientific literature aboutthe exploitation of agriculture by-products for the manufacturing of secondary products.The impact due to each process has been estimated by a life cycle assessment approachand compared to that of the corresponding traditional product (from virgin material). Theresults have proved that recycling is not always the most sustainable choice and that thedevelopment of innovative solutions should be always combined with a sustainabilityassessment, able to evaluate the real convenience of applications. These observationsdo not want to discourage the research of innovative recycling but want to sensitize thestakeholders to a more critical view of the available circular options (Contribution 9).
The development of the circular economy strategy has the great responsibility to facethe current crisis of earth. As reported in the European action plan, the new strategymust contribute to the climate neutrality by 2050 and decoupling economic growth fromresource use [4]. Innovation means opportunities so the environmental gain should betranslated into the competitiveness of the EU and developing countries, as discussed inseveral contributions of the present special issue.
Although the topic of circular economy is a very popular topic in the current scientificliterature, this special issue offers the possibility to broach the subject from different pointof views. Authors belong to very different Department allowing a holistic overview thatshould be the foundation of an effective circular economy. The papers combine economical,scientific, engineering, mathematical approaches to face the challenge of circular economyin different corners of globe each one with specific criticalities.
List of Contributions
1. Bucea-Manea-Tonis, R.; Ševic, A.; Ilic, M.P.; Bucea-Manea-Tonis, R.; Popovic Ševic, N.;Mihoreanu, L. Untapped Aspects of Innovation and Competition within a EuropeanResilient Circular Economy. A Dual Comparative Study.
2. Zhang, B.; Comite, U.; Yucel, A.G.; Liu, H.; Khan, M.A.; Husain, S.; Sial, M.S., Popp,J.; Oláh, J. Unleashing the Importance of TQM and Knowledge Management forOrganizational Sustainability in the Age of Circular Economy.
3
Sustainability 2022, 14, 3458
3. Buch, R.; Marseille, A.; Williams, M.; Aggarwal, R.; Sharma, A. From Waste Pickersto Producers: An Inclusive Circular Economy Solution through Development ofCooperatives in Waste Management.
4. Ilic, M.P.; Rankovic, M.; Dobrilovic, M.; Bucea-Manea-Tonis, R.; Mihoreanu, L.; Gheta,M.I.; Simion, V.-E. Challenging Novelties within the Circular Economy Concept underthe Digital Transformation of Society.
5. Almeida, J.; Magro, C.; Mateus, E.P.; Ribeiro, A.B. Life Cycle Assessment of Electrodi-alytic Technologies to Recover Raw Materials from Mine Tailings.
6. Dabaieh, M.; Maguid, D.; El-Mahdy, D. Circularity in the New Gravity—Re-ThinkingVernacular Architecture and Circularity.
7. Giosuè, C.; Marchese, D.; Cavalletti, M.; Isidori, R.; Conti, M.; Orcioni, S.; Ruello, M.L.;Stipa, P. An Exploratory Study of the Policies and Legislative Perspectives on theEnd-of-Life of Lithium-Ion Batteries from the Perspective of Producer Obligation.
8. Becci, A.; Karaj, D.; Merli, G.; Beolchini, F. Biotechnology for Metal Recovery fromEnd-of-Life Printed Circuit Boards with Aspergillus niger.
9. Amato, A.; Mastrovito, M.; Becci, A.; Beolchini, F. Environmental SustainabilityAnalysis of Case Studies of Agriculture Residue Exploitation.
Conflicts of Interest: Declares no conflict of interest.
References
1. United Nations. Sustainable Development. 2022. Available online: https://www.un.org/sustainabledevelopment/sustainable-consumption-production/ (accessed on 6 March 2022).
2. Hallegatte, S.; Rozenberg, J. Climate change through a poverty lens. Nat. Clim. Chang. 2017, 7, 250–256. [CrossRef]3. Hallegatte, S.; Fay, M.; Barbier, E.B. Poverty and climate change: Introduction. Environ. Dev. Econ. 2018, 201823, 217–233.
[CrossRef]4. Euroepan Commission. A New Circular Economy Action Plan for a Cleaner and More Competitive Europe; Euroepan Commission:
Brussels, Belgium, 2020.5. Nandi, S.; Sarkis, J.; Hervani, A.A.; Helms, M. Redesigning Supply Chains using Blockchain-Enabled Circular Economy and
M.M.; Yamoah, F.A.; et al. A critical analysis of the impacts of COVID-19 on the global economy and ecosystems and opportunitiesfor circular economy strategies. Resour. Conserv. Recycl. 2021, 164, 105169. [CrossRef] [PubMed]
7. European Commission. The European Green Deal; European Commission: Brussels, Belgium, 2019. [CrossRef]
4
sustainability
Article
Untapped Aspects of Innovation and Competition within aEuropean Resilient Circular Economy. A DualComparative Study
Rocsana Bucea-Manea-T, onis 1, Aleksandar Ševic 2, Milena P. Ilic 3,*, Radu Bucea-Manea-T, onis 4, Nevenka Popovic
1 Doctoral School, National University of Physical Education and Sport, 060057 Bucharest, Romania;[email protected]
2 Trinity College Dublin, Trinity Business School, D02 F6N2 Dublin, Ireland; [email protected] Faculty of Contemporary Arts Belgrade, University Business Academy in Novi Sad, 11000 Belgrade, Serbia;
[email protected] Faculty of Economic Sciences, Hyperion University, 060057 Bucharest, Romania; [email protected] Faculty of Administration and Public Management, Bucharest University of Economic Studies,
Abstract: The paper aims to develop—based on a particular dual comparative analysis that followsthe current European concerns—the concepts of competitiveness and innovation as pillars uprightingcompanies’ resilience, creating ecoinnovative jobs and social inclusion. In their struggle to meetthe Circular Economy principles and Green Deal objectives, the countries chosen for analyses—Romania and Serbia—have started implementing added-value blockchain concepts in their societiesto thrive in the resilient European market and build empowered societies. According to the WorldEconomic Forum Global Sources of Competitiveness, skills considered in our study refer to businesses’versatility and societies’ innovation capability. Based on specific data provided by Eurostat, the resultsshowed a correlation between the ecoinnovation index and R&D personnel by sector and helpeddesign a regression model. Hence, we demonstrate that R&D creativity, once stimulated throughinnovative teaching, blooms, having positive effects at society and market levels as reflected in theecoinnovation index. Furthermore, cluster analysis within E.U. innovation helped identify strengthsand weaknesses, provided new grounds in applying innovation, and led to further recommendations.
Keywords: circular economy; innovation capability and resilience; business dynamics; ecoinnovationindex; R&D personnel by sector
1. Introduction
The European Union has placed a clear emphasis on the recovery of E.U. membersfrom the COVID-19 pandemic in the Annual Plan for Sustainable Growth in 2021. It isenvisaged that within the national strategies, member states will take special measures tosupport the following postulates: productivity, environmental sustainability, equity, andmacroeconomic stability. All the stated goals ensure the full implementation of the GreenAgreement mentioned above and lay the basis for revitalizing the European economy andsociety after the appearance of the SARS-CoV-2 virus. In line with these goals, the E.U.budget for 2021 is planned to be 672.5 billion Euros, including nonrefundable aid to allmember states to “green recover”. In this way, the importance of economic growth andpreservation of the environment is further emphasised through sustainable investmentsbased on saving resources and maximising the use of available materials (Annual Sustain-able Growth Strategy, 2021). In addition, there is a “need to encourage a larger contributionof scholars from the Business and Economics area to explore the viability and profitabilityof CE strategies and related managerial practices to overcome akin issues” [1].
The circular economy (CE) represents a compelling management topic of the lastdecades. Expected and designed as a regenerative system, it subsists of effective andefficient utilisation of all resources of the ecosystem to optimise performance [2]. However,the scientific literature developed outside of management is mainly focused on defininginnovative models to be adopted and implemented by companies [3].
This paper successfully investigated how Romania and Serbia, emerging country fromthe E.U. and E.U. accession countriy, acknowledge and adopt CE principles and GreenDeal objectives, focusing on the CE Fourth Indicator—Competitiveness and Innovation.A regression model and a K-means cluster analysis showed a correlation between theecoinnovation index and R&D personnel by sector, under the assumption that innovativeteaching can stimulate the R&D creativity, as reflected in the ecoinnovation index increase.The K-means cluster analysis based on the PPIE subcriterion emphasises the (non) E.U.countries, showing specific week points that are to be acknowledged and corrected.
Regarding the motivation of the research, the authors motivated for their homecountries to follow other countries in their transition from linear to circular economiesreached the agreement that their purpose and tasks have been demonstrated and achieved.Sustainability is not a race, but there should be a shared interest among scientists, experts,national authorities, and society regarding the considerable expense in assisting countrieslagging due to insufficient investment, knowledge, or other constraints. The research aimsto help Serbia and Romania to choose the right path.
This article intended to measure innovation and competitiveness within the circulareconomy model by focusing on Romania’s and Serbia’s national elements and comparingeach country’s leadership and position with those of other countries. In this way, progresson Romania’s and Serbia’s paths to a circular economy and resilient development wouldbe quantified based on current positions, representing the innovative contributions ofthe research. The paper touched its purposess, the primary findings indicate a lack ofinvestment in Serbia and Romania, the critical importance of additional research anddevelopment investments, the use of new technologies (such as blockchain), and theimportance of benchmarking.
One of the significant challenges is the absence of comparable data specific to the E.U.member countries, since Serbia is not a E.U member yet and compatible data is not available.This, however, is offset by other types of data and qualitative research. Regarding the studystructure, after the introduction, chapter two presents the theoretical background of theresearch, prepared with document analysis. Chapter three outlines the data, variables, andresearch process and provides the results of the regression analysis and cluster analysis.The fourth chapter discusses the study results and divides the narrative into two separatesubchapters: Romania and Serbia. Finally, the fifth chapter, the conclusion, summarisesthe most important research results, while chapter six addresses the study’s limitations,mainly the lack of comparative and empirical data. Results achieved, based on the initialpurposes of the research show that assumptions have been overpassed and goals achieved.
2. Theoretical Background
Innovation and competition within the circular economy are of growing interest forcountries, companies, stakeholders, and civil society. CE is a unique system of achievementsof efficient economies by narrowing and slowing different energy flows [4]. We introducehere the two socioeconomic terms of resilience and sustainability to better define the needfor robustness and to point the value of innovative structural transformation. Hence,while sustainability defines the methods or process of harvesting by using resources thatdo not use up or destroy natural resources or permanently damage the environment,resilience represents the ability to create, adopt, and absorb new assets as energy; totranslate knowledge into new types of behaviour and versatile policies; and give to thesociety a more comfortable shape after structural changes.
Sustainability or circularity means continuous changes towards the way firms generatetheir business and values. Researchers are still analysing these fields as a synergy of
6
Sustainability 2021, 13, 8290
economic performance and environmental resilience, bringing apparent benefits to futuregenerations [4,5].
In 2015, the European Commission regulated the investment framework, affectingit with alterations favouring competitiveness and innovations and leading countries tofoster their growth in the future. On 11 December 2019, the same organisation earmarkedthe so-called European Green Deal as an essential work priority in the next decade. Thisprogram is the basis for fulfilling the signed goals from the Paris Agreement, which meansreducing CO2 emissions to 50% by 2030. The idea is for the European continent to becomethe first carbon-neutral territory and a world leader in the circular economy. The describedset of economic measures concentrates on reducing and eliminating waste, taking bettercare of it, but also on saving energy by 2030 [6]. By 2030, it is estimated that the possiblepotential economic gain emanating from the transition to a circular economy would amountto 1.8 billion Euros [7]. Within the circular economy, creativity and innovation are essentialpillars that support intelligent, resilient companies in their struggle to lead the market bycreating new ecoinnovative jobs and social inclusion. The organisation model needs to betransformed to production–consumption–reuse as all stakeholders must be representedwithin the model [8].
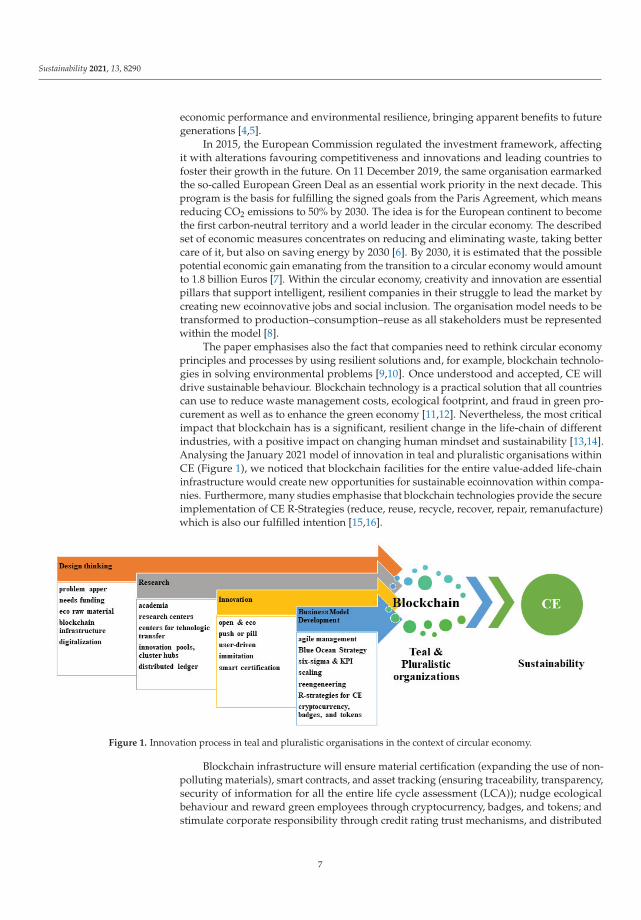
The paper emphasises also the fact that companies need to rethink circular economyprinciples and processes by using resilient solutions and, for example, blockchain technolo-gies in solving environmental problems [9,10]. Once understood and accepted, CE willdrive sustainable behaviour. Blockchain technology is a practical solution that all countriescan use to reduce waste management costs, ecological footprint, and fraud in green pro-curement as well as to enhance the green economy [11,12]. Nevertheless, the most criticalimpact that blockchain has is a significant, resilient change in the life-chain of differentindustries, with a positive impact on changing human mindset and sustainability [13,14].Analysing the January 2021 model of innovation in teal and pluralistic organisations withinCE (Figure 1), we noticed that blockchain facilities for the entire value-added life-chaininfrastructure would create new opportunities for sustainable ecoinnovation within compa-nies. Furthermore, many studies emphasise that blockchain technologies provide the secureimplementation of CE R-Strategies (reduce, reuse, recycle, recover, repair, remanufacture)which is also our fulfilled intention [15,16].
Figure 1. Innovation process in teal and pluralistic organisations in the context of circular economy.
Blockchain infrastructure will ensure material certification (expanding the use of non-polluting materials), smart contracts, and asset tracking (ensuring traceability, transparency,security of information for all the entire life cycle assessment (LCA)); nudge ecologicalbehaviour and reward green employees through cryptocurrency, badges, and tokens; andstimulate corporate responsibility through credit rating trust mechanisms, and distributed
7
Sustainability 2021, 13, 8290
ledger [17]. Furthermore, the decentralised ledger will facilitate information flux regardingthe materials and their sources [15].
Thus, blockchain technology will also ensure security and privacy, effectiveness, cost re-duction/profitability, decentralisation, new business models, and streamlining/automation [18].For these reasons, blockchain may be a good solution in surpassing the challenges ofCE [19]. Digitalisation (networks that provide real-time information about materials andensure supply chain transparency and traceability) will be translated into resilient actionssuch as circular resource flows and waste management. Human resources have to developnew ideas for practical innovation [19]. Tracking all the activities in an LCA from a distanceand blockchain safety proved to be an appropriate solution in the time of the COVID-19pandemic.
The development of information technologies-conditioned changes in business mod-els, especially the innovations brought by the digital revolution, concerning the fusion oftechnologies and their potentials in enabling changes in business and social spheres [20,21],have had a similar impact on new business models. Companies (especially) need to inno-vate within their business ecosystem networks. The authors of this paper present a modelmonitoring the entire life cycle of a product/service (awareness and training, analysis,product design, communication/certification) and the supply chain for the large companiesand state institutions, based on blockchain technology, to invest in an open innovationplatform and licenses. All companies with a new idea of a product/service can becomemembers of the ecosystem (Figure 1) [22–24]. Similarly, Gassman et al. believe that the mostsignificant innovation potential lies not in products or processes but innovative businessmodels [25]. The Figure 1 shows innovation process developed by the authors of this paperas an adaptation after [26]).
Many researchers have already studied the impact of CE on the growth and devel-opment of environmental protection [27,28]. At the same time, others have focused onstudying the impact of CE on progress in ecology and analysed the importance of its sus-tainability and the ramifications for the country’s economic development as a whole [8,29].The main pillars of sustainable implementation of CE principles are innovative and creativehuman resources, which can benefit from the hardware and software support of blockchaintechnology in developing green products using innovative green methods. These productscan be easier to dismantle and convert into green raw materials, mitigating the energyexpenditure and the ecological footprint. Waste management and averting pollution isalso the responsibility of human resources departments in their struggle to implementCE strategies [30–32]. Referring to the CE sphere, there is a direct link to the workforce,investment, employment, and innovation [33]. Other studies have also argued that inno-vation in, for instance, the recycling sector is the basis for GDP growth [34]. Innovationis usually considered the most effective tool to achieve a certain standard of living andovercome environmental problems. However, production and service innovations in thefield of CE are mainly observed from a long-term point of view. They are not always easyto generate, and therefore more researchers in this field deal with efficient business modelsthat represent innovation through strategic business policies [35].
Schiederig et al. define ecoinnovation as “an object that is defined by its market orien-tation as well as its environmental benefit over its entire life cycle and that establishes a newinnovation or green standard for the company, regardless of whether its primary objectiveis environmental or economic” [36]. Literature shows many types of ecoinnovation, suchas [24,26,27,35,37–39].
1. Product innovation—involves significant improvements in the capabilities, char-acteristics, and utility of goods and services, or the design of completely new goods andservices. Improvements are observed in the technical specifications, functional character-istics, components and materials from which products are made, product software, andutility and ergonomics in use. Examples include new car models and Tesla batteries [24].
2. Process innovation—involves important improvements in production or deliv-ery methods. Innovation is based on significant changes in technologies, equipment
8
Sustainability 2021, 13, 8290
and/or software (AI, machine learning, chatbot, blockchain, IoT, 5G, XR, robots, etc.).Process innovation creates new jobs and eliminate some of those based on functionallyoutdated technologies.
3. Marketing Innovation—involves important improvements in marketing methodsor even the discovery of new methods such as neuroscience or VR/AR (virtual real-ity/augmented reality) technologies used with great success in marketing. Innovations inmarketing include 7P + 1G (price, product, promotion, placement, process, people, physicalenvironment/location, green marketing). This innovation can be seen in: (a) product designand packaging (based on information provided by neuro-marketing/market surveys, focusgroups have proved to be quite ineffective in market research; large companies choose thebest advertising, packaging, presentation, etc. after analysing their impact on an experi-mental group by monitoring brain and emotional activity); (b) new promotion methods(e.g., with VR/AR you can place the customer in another time and space); placing products(e.g., moving a car showroom to the city centre, in very small spaces, where the customerexperiences all the sensations of VR driving); (c) methods of pricing goods and services(e.g., online prices changing constantly depending on the number of product/service andweb traffic requests and on the principle of auctions); (d) communicating with employeesand customers on the basis of new discoveries in neuroscience; (e) the use of recyclablematerials for production, in ecolabelling, etc. The goal of these innovations is to bettermeet the needs of customers and educate them by creating new needs and opening up newmarkets [2,7,35,37–39].
4. Organizational innovation—refers to the implementation of new organizationalmethods. In this context, leadership has a very strong impact on the modern managementof the company. Large companies like Google invest in relaxation, leisure (meal breaks),kindergartens specially designed within the company, etc. to provide comfort to employeesat work and stimulate innovation and productivity. Organizational innovation also includesthe implementation of the concepts of corporate responsibility, a circular sustainableeconomy and one-health [24,26].
5. Management innovation—refers management principles and processes that ulti-mately change managerial practice. This is done through project management. Modernmanagers use new business resource management methods such as Six-Sigma and newmanagement methods such as Agile. Outstanding results in human resources have beenachieved in management. Neuroscience has shown that the most innovative and produc-tive companies present are those that are directly concerned with the health and happinessof employees, materialised by methods of motivating mindfulness [26,33].
Summarising, the concept of ecoinnovation is important for both business and society.Correctly approached, it becomes a useful tool for policy makers to fully apply innovationsfor the benefit of the market and the environment. The value of ecoinnovation is higherif its analysis is holistic and serviceable, with environmental benefits. Defined by inter-national bodies (e.g., OECD, European Commission) as a tool in measuring “the creationor implementation of the new”, the qualities of ecoinnovation are in line with the mostimportant book of innovation and quality—the Oslo Manual.
In connection to direct measurement—number of innovations, descriptions of indi-vidual innovations, data on sales of new products—inputs like R&D or patents help theindirect measurement of changes in resource efficiency and productivity using decomposi-tion analysis. This approach, less explored, require a particular attention as it may enlargeand accelerate the knowledge base [40]. At the E.U. level, only two types of innovationsare standardised with indicators: product and process innovation, which are measuredthrough enterprises that introduce innovation (product and process innovative enterprises,PPIE). Thus, we choose to analyse PPIE in our paper and see which factors influence it.
Having these concerns in mind, we moved further and designed a research method-ology to evaluate the relationship among ecoinnovation, R&D, and PPIE in E.U. coun-tries. We analysed two primary skills: businesses’ versatility and societies’ innovationcapability (World Economic Forum Global Sources of Competitiveness). Then we ex-
9
Sustainability 2021, 13, 8290
panded/deepened our study on a detailed comparison of two partner countries, one fromthe E.U. (Romania) and one not (Serbia), dedicated to implementing CE principles. Thepurpose of this comparison was to see how the two countries (one with the support of theE.U. and the other without) perform in the context of the circular economy.
3. Experimental Data Complex Analysis and Significant Results
3.1. Data and Variables
The article used data published about Serbia and Romania by WEF and InnovationBalanced Scorecards. In addition, Eurostat databases were consulted to analyse the factorsand degree of innovation in both countries, and three variables were included in statisticalinterpretations. The variables included in the initial conceptual framework were:
1. PPIE = product and process innovative enterprises that introduced innovation bytype of innovation, innovation developer, NACE Rev.2 activity, and size class (Table 1)(INN_CIS10_PROD$DEFAULTVIEW) (last updated 03/07/2019) [41]
E.T. (R&D) Enterprise together with other enterprises or organisations (R&D performers)
E.T. (non-R&D) Enterprise together with other enterprises or organisations (non-R&D performers)
E.A. (R&D) Enterprise by adapting or modifying products and process originally developed by otherenterprises or organisations (R&D performers)
E.A. (non-R&D) Enterprise by adapting or modifying products and/or process originally developed byother enterprises or organisations (non-R&D performers)
O.E. (R&D) Other enterprises or organisations (R&D performers)
O.E. (R&D) Other enterprises or organisations (non-R&D performers)
We chose to analyse the ecoinnovation index because it brings a holistic perspectiveof economic, environmental, and social performance, in accordance with CE principlesof sustainability. It is composed of 16 subindexes, grouped into five categories: (1) ecoin-novation inputs (related to socioeconomic objectives and HR in science/technology andinvestments); (2) ecoinnovation activities (related to certification in innovation); (3) ecoinno-vation outputs (related to patents, academic publication, and media coverage); (4) resourceefficiency outcomes (GDP, domestic material consumption, freshwater abstraction, primaryenergy consumption, and greenhouse gas emissions); and (5) socioeconomic outcomes(exports of products from ecoindustries and employment/revenue in ecoindustries andthe circular economy) [42]. At a closer look, we may observe that all these subindexes arein strong correlation with or depend on HR. As the index emphasises that ecoinnovationdepends on research and development, we decided to analyse R&D personnel by sector.The literature review shows that innovation can be associated with product, processes,marketing, management, and organization. From Eurostat we can extract informationregarding only two types of innovation (process and product); thus, we decided to includethis PPIE indicator in our research.
3.2. Research Process
Our previous research regarding innovation within a network business environ-ment [44] urged us to check if there is a relation between ecoinnovation and R&D. Innova-
10
Sustainability 2021, 13, 8290
tion can be the result of many factors, including product and process innovative enterprises.Also, the market experience and other international studies provided by OSCE, WEF, CGIled us to the same assumption. In this regard, we decided to collect data from Eurostat.Having in mind the opportunities brought by introducing blockchain technology into theL.C.A. to gain a sustainable economy we collected data from Eurostat to ground our studyon very specific elements that can have an impact on innovation, such as PPIE and R&D.Literature review and our model (Figure 1) prove that a sustainable economy is facilitatedby using blockchain technology for the entire L.C.A. Also, other studies show that thereis a relation between ecoinnovation and smart working [21]. We applied, in this study, amore profound analysis to verify how ecoinnovation is influenced by R&D personnel bysector and PPIE (Product and process innovative enterprises which introduced innovationby type of innovation, and innovation developer), having the support and security offeredby blockchain technology. Thus, our study evaluates if there is any relation between ecoin-novation, R&D, and PPIE. In addition, our study evaluates the impact of R&D, and PPIE(and their subindexes) on the ecoinnovation index. In order to deepen our analysis, wedesigned a cluster analysis to find out where innovation potential comes from.
Hypothesis 1 (H1). R&D and PPIE have no influence on ECO_INNOV.
Hypothesis 2 (H2). R&D has a strong and positive correlation with ECO_INNOV, emphasisingthe importance of stimulating the creativity, motivation, cooperation, and communication of humanresources, which in turn positively impact ecoinnovation resilient development.
Hypothesis 3 (H3). Product and process innovative enterprises (PPIE) have a significant impacton the ecoinnovation index.
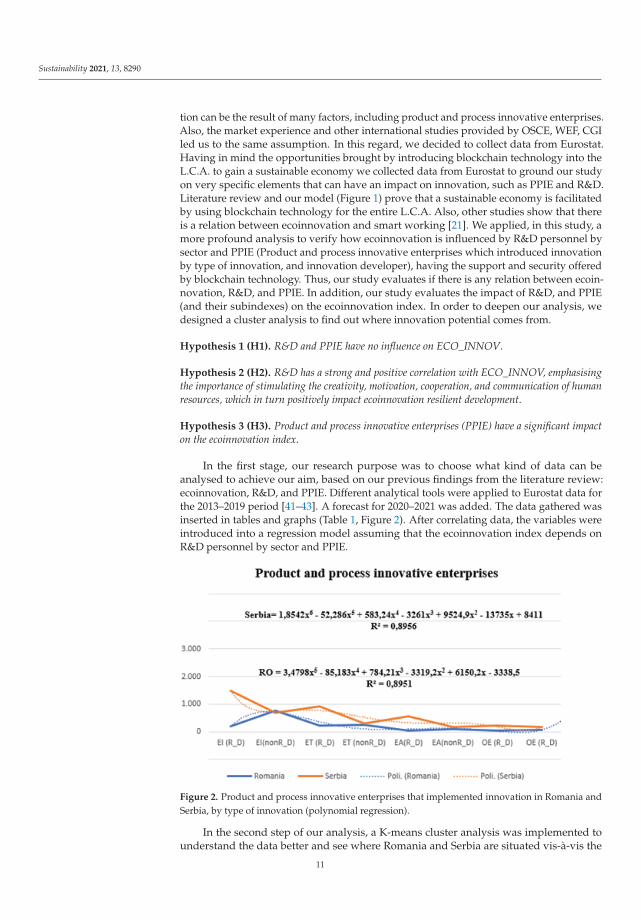
In the first stage, our research purpose was to choose what kind of data can beanalysed to achieve our aim, based on our previous findings from the literature review:ecoinnovation, R&D, and PPIE. Different analytical tools were applied to Eurostat data forthe 2013–2019 period [41–43]. A forecast for 2020–2021 was added. The data gathered wasinserted in tables and graphs (Table 1, Figure 2). After correlating data, the variables wereintroduced into a regression model assuming that the ecoinnovation index depends onR&D personnel by sector and PPIE.
Figure 2. Product and process innovative enterprises that implemented innovation in Romania andSerbia, by type of innovation (polynomial regression).
In the second step of our analysis, a K-means cluster analysis was implemented tounderstand the data better and see where Romania and Serbia are situated vis-à-vis the
11
Sustainability 2021, 13, 8290
E.U. from the point of view of competitiveness and innovation. This analysis grouped thecountries by product and process innovative enterprises. which introduced innovationPPIE subcriteria (Table 1). PPIE represents the criterion for introducing the data into groupsand the countries into a certain particular cluster.
3.3. Results
The results of the study are divided into separate subchapters. The first subchapterdiscusses the results of conducted regression analysis, and the second discusses the resultsof the cluster analysis.
3.3.1. The First Stage—Regression Analysis Results
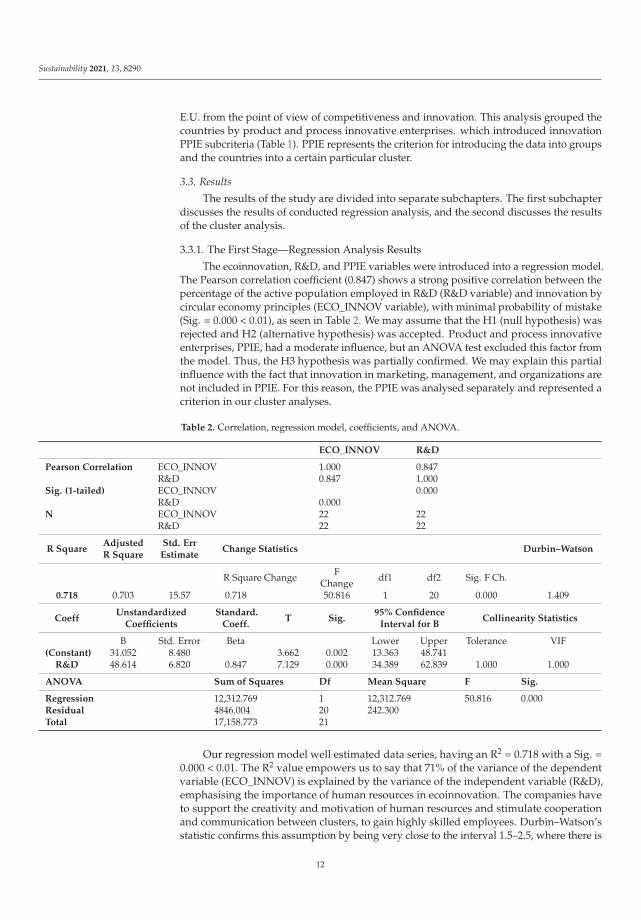
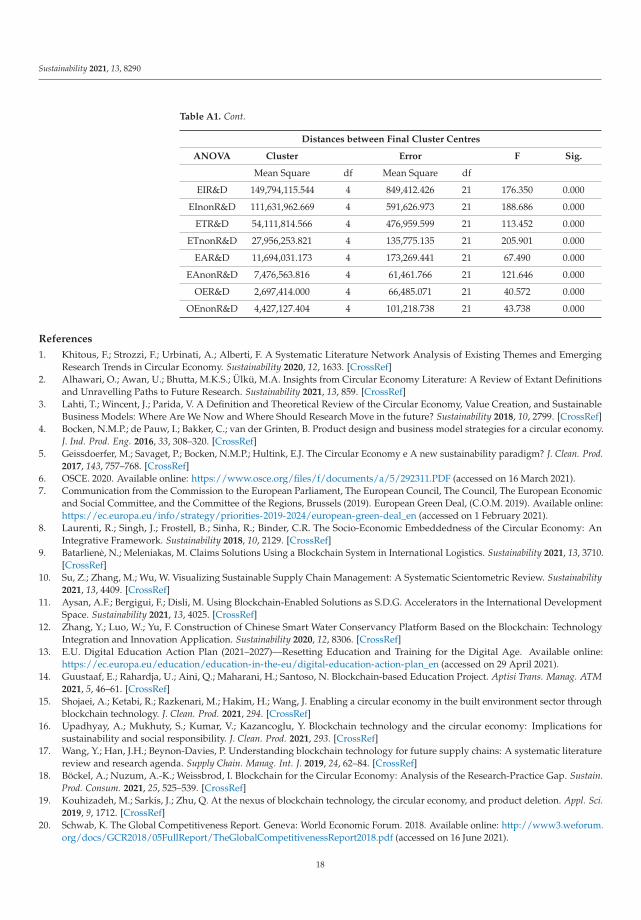
The ecoinnovation, R&D, and PPIE variables were introduced into a regression model.The Pearson correlation coefficient (0.847) shows a strong positive correlation between thepercentage of the active population employed in R&D (R&D variable) and innovation bycircular economy principles (ECO_INNOV variable), with minimal probability of mistake(Sig. = 0.000 < 0.01), as seen in Table 2. We may assume that the H1 (null hypothesis) wasrejected and H2 (alternative hypothesis) was accepted. Product and process innovativeenterprises, PPIE, had a moderate influence, but an ANOVA test excluded this factor fromthe model. Thus, the H3 hypothesis was partially confirmed. We may explain this partialinfluence with the fact that innovation in marketing, management, and organizations arenot included in PPIE. For this reason, the PPIE was analysed separately and represented acriterion in our cluster analyses.
Table 2. Correlation, regression model, coefficients, and ANOVA.
Our regression model well estimated data series, having an R2 = 0.718 with a Sig. =0.000 < 0.01. The R2 value empowers us to say that 71% of the variance of the dependentvariable (ECO_INNOV) is explained by the variance of the independent variable (R&D),emphasising the importance of human resources in ecoinnovation. The companies haveto support the creativity and motivation of human resources and stimulate cooperationand communication between clusters, to gain highly skilled employees. Durbin–Watson’sstatistic confirms this assumption by being very close to the interval 1.5–2.5, where there is
12
Sustainability 2021, 13, 8290
no autocorrelation between variables. The value of Durbin–Watson’s statistic =1.4 showsthat the residuals might have a very small linear autocorrelation.
Since the adjusted R2 value is close to the value of R2, this allows the extensionof the proposed regression model assumptions to the entire population. In this case,the variance of the dependent variable decreases with the difference between the twocoefficients (0.718 − 0.703 = 0.015). This difference can be seen to be below 1%. The t-testfor a constant and R&D variable validates the model and contributes to the predictivepower of regression. The significance threshold (Sig.) of the variables is less than 0.01,meaning that the coefficients are very well estimated.
SPSS statistics offer us the regression equation coefficients with a very small probabilityof error. This fact was confirmed by ANOVA analysis. On the other hand, the F-statisticoffers arguments in supporting or rejecting the null hypothesis (H1). As the F-statistic hasa low value (0.00), the probability of making a mistake if H1 was rejected was very small;thus, H2 (that R&D personnel influence the ecoinnovation index) was accepted.
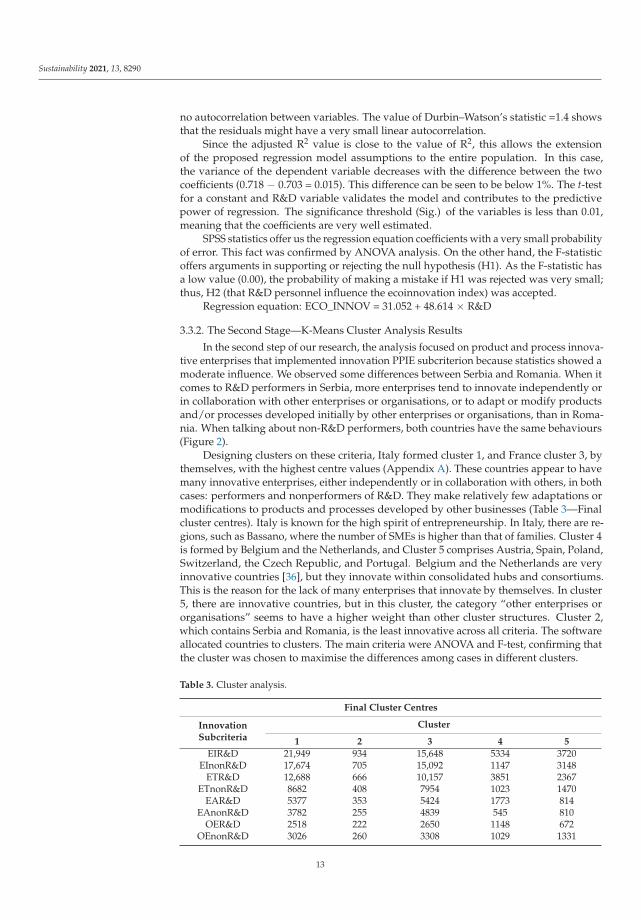
3.3.2. The Second Stage—K-Means Cluster Analysis Results
In the second step of our research, the analysis focused on product and process innova-tive enterprises that implemented innovation PPIE subcriterion because statistics showed amoderate influence. We observed some differences between Serbia and Romania. When itcomes to R&D performers in Serbia, more enterprises tend to innovate independently orin collaboration with other enterprises or organisations, or to adapt or modify productsand/or processes developed initially by other enterprises or organisations, than in Roma-nia. When talking about non-R&D performers, both countries have the same behaviours(Figure 2).
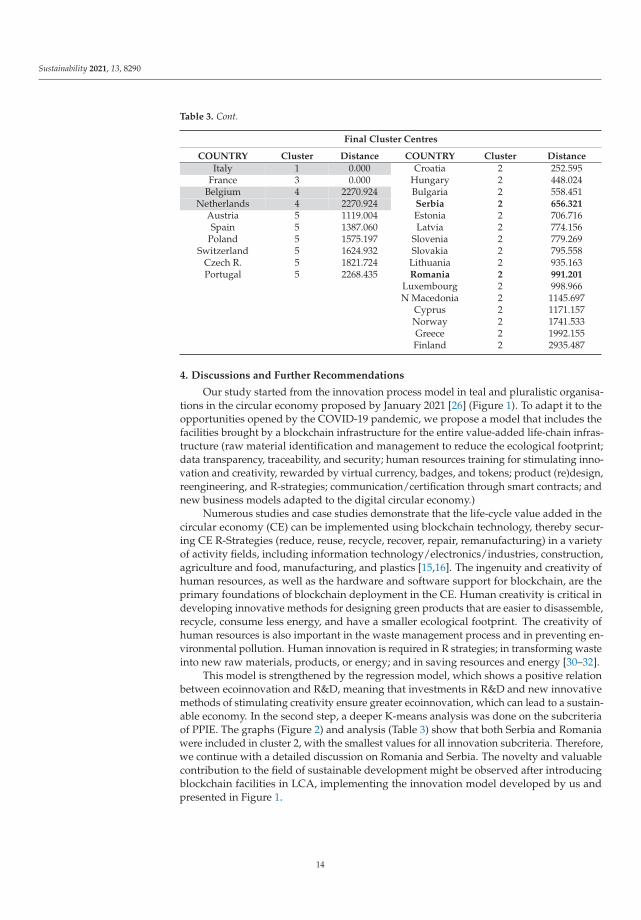
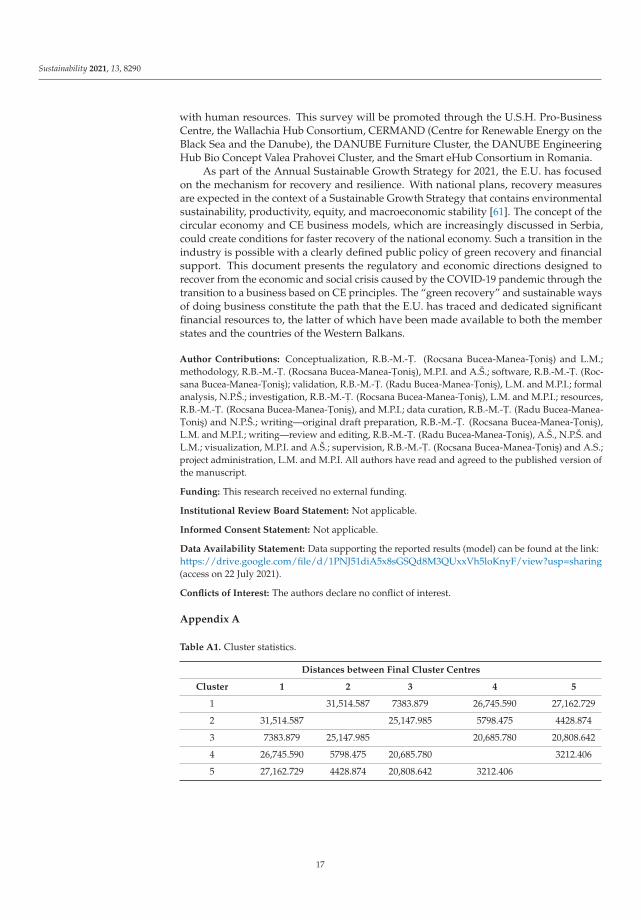
Designing clusters on these criteria, Italy formed cluster 1, and France cluster 3, bythemselves, with the highest centre values (Appendix A). These countries appear to havemany innovative enterprises, either independently or in collaboration with others, in bothcases: performers and nonperformers of R&D. They make relatively few adaptations ormodifications to products and processes developed by other businesses (Table 3—Finalcluster centres). Italy is known for the high spirit of entrepreneurship. In Italy, there are re-gions, such as Bassano, where the number of SMEs is higher than that of families. Cluster 4is formed by Belgium and the Netherlands, and Cluster 5 comprises Austria, Spain, Poland,Switzerland, the Czech Republic, and Portugal. Belgium and the Netherlands are veryinnovative countries [36], but they innovate within consolidated hubs and consortiums.This is the reason for the lack of many enterprises that innovate by themselves. In cluster5, there are innovative countries, but in this cluster, the category “other enterprises ororganisations” seems to have a higher weight than other cluster structures. Cluster 2,which contains Serbia and Romania, is the least innovative across all criteria. The softwareallocated countries to clusters. The main criteria were ANOVA and F-test, confirming thatthe cluster was chosen to maximise the differences among cases in different clusters.
Our study started from the innovation process model in teal and pluralistic organisa-tions in the circular economy proposed by January 2021 [26] (Figure 1). To adapt it to theopportunities opened by the COVID-19 pandemic, we propose a model that includes thefacilities brought by a blockchain infrastructure for the entire value-added life-chain infras-tructure (raw material identification and management to reduce the ecological footprint;data transparency, traceability, and security; human resources training for stimulating inno-vation and creativity, rewarded by virtual currency, badges, and tokens; product (re)design,reengineering, and R-strategies; communication/certification through smart contracts; andnew business models adapted to the digital circular economy.)
Numerous studies and case studies demonstrate that the life-cycle value added in thecircular economy (CE) can be implemented using blockchain technology, thereby secur-ing CE R-Strategies (reduce, reuse, recycle, recover, repair, remanufacturing) in a varietyof activity fields, including information technology/electronics/industries, construction,agriculture and food, manufacturing, and plastics [15,16]. The ingenuity and creativity ofhuman resources, as well as the hardware and software support for blockchain, are theprimary foundations of blockchain deployment in the CE. Human creativity is critical indeveloping innovative methods for designing green products that are easier to disassemble,recycle, consume less energy, and have a smaller ecological footprint. The creativity ofhuman resources is also important in the waste management process and in preventing en-vironmental pollution. Human innovation is required in R strategies; in transforming wasteinto new raw materials, products, or energy; and in saving resources and energy [30–32].
This model is strengthened by the regression model, which shows a positive relationbetween ecoinnovation and R&D, meaning that investments in R&D and new innovativemethods of stimulating creativity ensure greater ecoinnovation, which can lead to a sustain-able economy. In the second step, a deeper K-means analysis was done on the subcriteriaof PPIE. The graphs (Figure 2) and analysis (Table 3) show that both Serbia and Romaniawere included in cluster 2, with the smallest values for all innovation subcriteria. Therefore,we continue with a detailed discussion on Romania and Serbia. The novelty and valuablecontribution to the field of sustainable development might be observed after introducingblockchain facilities in LCA, implementing the innovation model developed by us andpresented in Figure 1.
14
Sustainability 2021, 13, 8290
4.1. Discussion on Romania
According to recent data on European innovation calculated by European InnovationScoreboard (https://ec.europa.euodest Innovators group—June 2020), based on 27 majorindicators, the E.U. countries fall into four groups—Innovation Leaders, Strong Innovators,Moderate Innovators, and Modest Innovators. Romania ranks the last group together withBulgaria, demonstrating long-term policy and national strategy misconduct. Romania hassome achievements and good results in the field of “innovation-friendly environment” and“sales impacts”, while the “innovators”, “firm investments”, and “human resources” arethe weakest. “Broadband penetration” and “medium- and high-tech product exports” arethe only two indicators showing close to EU average performance.
In Romania, technological innovation is based primarily on R&D and knowledgedevelopment from a highly skilled young working force driven by experienced special-ists in different fields. These factors are associated with highly populated countries’economies [45,46]. Romania exports medium- and high-tech products with outstand-ing productivity and have “high performance on knowledge generation—both R&D-basedand nontechnological—and are very successful in attracting money (R&D funding, FDI,ESIF funds, new enterprises), talents, and people into the region. They also have the mosteducated workforce and are experiencing positive population change”. Private enterprisesaccessed most FP7 funds, demonstrating a direct correlation between innovation and theR&D system in Romanian enterprises [47]. Universities in Romania became a pillar in stim-ulating this cooperation, responsible for nudging creativity and “interests in knowledge,technology, and innovation transfer”, contributing to a robust economy [48]. Furthermore,in Romania, heritage tourism brings important economic capitalization [48,49]. Greenprocurement sustained in Romania depends on market participants’ level of knowledgeand skills [50]. Companies that apply agile management and foster the working force’smotivation through innovative organisational culture have high productivity rates with alow footprint on the environment [51,52].
Our regression model’s close relation between ecoinnovation and R&D personnel in-cludes Romania. Romania holds innovation capability, but the overall business dynamismis not very relevant because of the very long time needed to start a business and a very highinsolvency rate. A smoother procedure to set up a business, more governmental support,consultancy, and knowledge technological transfer support are needed for sustainableinnovation. Romania also has to improve its entrepreneurial culture.
4.2. Discussion on Serbia
The Serbian legal framework in the field of innovation started to develop after theadoption of the Law of innovation in 2010. This law enables the formation of establishmentssupports for innovative activities and technological transfers, the setup of intellectualproperty rights, and the Serbian Innovation Fund. If ten years ago there were no bodieseffectively tracking the key metrics to evaluate the innovation capacity of companies inneed to assess particular sectors of interest to foreign direct investors, today the situation istotally different and shows people and market versatility as well as the desire to provide astrategic and legislative framework for innovation. [53–61].
Infrastructure and support for high-tech research expand academic applicative pro-grams, create venture/private equity investment, and channel R&D entrepreneurship topreserve the environment. Serbia has the ability to absorb new knowledge and adaptimported/purchased technologies—an essential capability to grow and innovate within anofficial service enabled to advertise competences and capacities to foreign investors, learnmetrics and innovation auditing, and create a set of key metrics to track for each industrygroup [53–61].
Thanks to the analysed effects of competitiveness and innovation in the field of CE inSerbia, it is certain that the introduction of the circular economy would move the countryfrom the manufacturing industry to an innovative industry that would automaticallyhave a higher value of finished products—this would assume a much faster transition
15
Sustainability 2021, 13, 8290
from manufacturing to services. Multiple connections would be established with foreigncompanies and potential investors, so Serbia would become more competitive in offeringproducts and services in the circular economy. The latter would mean automatic accessto several financial sources that would significantly support innovation processes andimprove relations with those countries that support CE through cooperation programs.All of the above would inevitably lead to technological and educational independenceand reduce the economic gap between Serbia and other highly developed countries in theregion and beyond. It is important to emphasise that Serbia will not be admitted to theEuropean Union unless it changes the way it uses existing resources; the implementationof CE is a unique opportunity for accelerated accession to this community [53–61].
5. Conclusions
We conducted an analysis of competitiveness and innovation in the E.U. based onEurostat data: ecoinnovation index, R&D personnel, and PPIE (with its subcriteria). Aregression model on innovation and a K-means analysis proved that investments in humanresources and proper management of LCA, based on blockchain technology, will createnew models of business and innovation that will ensure a sustainable economy. Ouranalysis revealed that R&D stimulates HR creativity, innovation, and collaboration, whichin turn have a positive impact on ecoinnovation and sustainable development. Secondly,product and process innovative enterprises (PPIE) have a relatively moderate impact onecoinnovation. Cluster analyses on this criterion grouped the E.U. countries from the pointof view of ecoinnovation. This revealed that Serbia and Romania are weak innovators.
Innovations in a business organisation can be stimulated and initiated, so they canalso be managed, keeping in mind that good ideas may also come from the environmentand the company itself. Wisdom is to recognise which ideas are good, realistic, achievable,and profitable enough to turn into innovations. It is much easier to copy a product than anorganisation with unique people, ideas, and values. A part of an organisation’s “magic”reflects its ability to be new, different, and better than the competition, thanks to newideas. Combined with other abilities, innovation gives companies a competitive advantage,depending on how revolutionary the innovation is and how long it takes the competitionto copy it or develop an equally revolutionary idea. The market race never stops.
In implementing these activities, it is desirable to actively involve representatives ofthe employees who are part of the team changes that are necessary to implement to achievebetterment in society. The importance of involving all actors identified through a particularworking group for CE should not be emphasised. Additionally, intensive capacity-buildingand training for the economy and public administration are needed in order to be ready toprepare project proposals for available transitional E.U. grants. It is necessary to activelymonitor E.U. policy regarding the coherent framework of production policies for differentsectors and the measurability of their contribution to CE, but also to monitor the use of bestavailable techniques in the context of CE. It is also essential to actively raise the capacityof the economy for the transition to the CE model. It is imperative to harmonise the timeframes for activities in the waste management sector following the new policies and theneeds of CE implementation.
6. The Limitations of the Study and Future Research Agenda
The main limitation of this study is that we based our analysis mainly on Eurostat,WEF, OSCE, and CGI data in the absence of strong contact with the business field (we gotinformation only from our universities and their partners, their entire value-added lifecycle). Another problem lies in the fact that Serbia does not have a comparative CE method-ology as a non-EU country. We have already developed a survey that contains questionsregarding (1) entrepreneurial and hybrid university capabilities and characteristics, (2)blockchain platform implementation case studies and future recommendations, (3) greenprocurement, green methodologies, and policies within the economic–social environment,and (4) future sustainability pillars regarding ecoinnovation and R&D, especially in relation
16
Sustainability 2021, 13, 8290
with human resources. This survey will be promoted through the U.S.H. Pro-BusinessCentre, the Wallachia Hub Consortium, CERMAND (Centre for Renewable Energy on theBlack Sea and the Danube), the DANUBE Furniture Cluster, the DANUBE EngineeringHub Bio Concept Valea Prahovei Cluster, and the Smart eHub Consortium in Romania.
As part of the Annual Sustainable Growth Strategy for 2021, the E.U. has focusedon the mechanism for recovery and resilience. With national plans, recovery measuresare expected in the context of a Sustainable Growth Strategy that contains environmentalsustainability, productivity, equity, and macroeconomic stability [61]. The concept of thecircular economy and CE business models, which are increasingly discussed in Serbia,could create conditions for faster recovery of the national economy. Such a transition in theindustry is possible with a clearly defined public policy of green recovery and financialsupport. This document presents the regulatory and economic directions designed torecover from the economic and social crisis caused by the COVID-19 pandemic through thetransition to a business based on CE principles. The “green recovery” and sustainable waysof doing business constitute the path that the E.U. has traced and dedicated significantfinancial resources to, the latter of which have been made available to both the memberstates and the countries of the Western Balkans.
Author Contributions: Conceptualization, R.B.-M.-T, . (Rocsana Bucea-Manea-T, onis) and L.M.;methodology, R.B.-M.-T, . (Rocsana Bucea-Manea-T, onis), M.P.I. and A.Š.; software, R.B.-M.-T, . (Roc-sana Bucea-Manea-T, onis); validation, R.B.-M.-T, . (Radu Bucea-Manea-T, onis), L.M. and M.P.I.; formalanalysis, N.P.Š.; investigation, R.B.-M.-T, . (Rocsana Bucea-Manea-T, onis), L.M. and M.P.I.; resources,R.B.-M.-T, . (Rocsana Bucea-Manea-T, onis), and M.P.I.; data curation, R.B.-M.-T, . (Radu Bucea-Manea-T, onis) and N.P.Š.; writing—original draft preparation, R.B.-M.-T, . (Rocsana Bucea-Manea-T, onis),L.M. and M.P.I.; writing—review and editing, R.B.-M.-T, . (Radu Bucea-Manea-T, onis), A.Š., N.P.Š. andL.M.; visualization, M.P.I. and A.Š.; supervision, R.B.-M.-T, . (Rocsana Bucea-Manea-T, onis) and A.S.;project administration, L.M. and M.P.I. All authors have read and agreed to the published version ofthe manuscript.
Funding: This research received no external funding.
Institutional Review Board Statement: Not applicable.
Informed Consent Statement: Not applicable.
Data Availability Statement: Data supporting the reported results (model) can be found at the link:https://drive.google.com/file/d/1PNJ51diA5x8sGSQd8M3QUxxVh5loKnyF/view?usp=sharing(access on 22 July 2021).
Conflicts of Interest: The authors declare no conflict of interest.
1. Khitous, F.; Strozzi, F.; Urbinati, A.; Alberti, F. A Systematic Literature Network Analysis of Existing Themes and EmergingResearch Trends in Circular Economy. Sustainability 2020, 12, 1633. [CrossRef]
2. Alhawari, O.; Awan, U.; Bhutta, M.K.S.; Ülkü, M.A. Insights from Circular Economy Literature: A Review of Extant Definitionsand Unravelling Paths to Future Research. Sustainability 2021, 13, 859. [CrossRef]
3. Lahti, T.; Wincent, J.; Parida, V. A Definition and Theoretical Review of the Circular Economy, Value Creation, and SustainableBusiness Models: Where Are We Now and Where Should Research Move in the future? Sustainability 2018, 10, 2799. [CrossRef]
4. Bocken, N.M.P.; de Pauw, I.; Bakker, C.; van der Grinten, B. Product design and business model strategies for a circular economy.J. Ind. Prod. Eng. 2016, 33, 308–320. [CrossRef]
5. Geissdoerfer, M.; Savaget, P.; Bocken, N.M.P.; Hultink, E.J. The Circular Economy e A new sustainability paradigm? J. Clean. Prod.2017, 143, 757–768. [CrossRef]
6. OSCE. 2020. Available online: https://www.osce.org/files/f/documents/a/5/292311.PDF (accessed on 16 March 2021).7. Communication from the Commission to the European Parliament, The European Council, The Council, The European Economic
and Social Committee, and the Committee of the Regions, Brussels (2019). European Green Deal, (C.O.M. 2019). Available online:https://ec.europa.eu/info/strategy/priorities-2019-2024/european-green-deal_en (accessed on 1 February 2021).
8. Laurenti, R.; Singh, J.; Frostell, B.; Sinha, R.; Binder, C.R. The Socio-Economic Embeddedness of the Circular Economy: AnIntegrative Framework. Sustainability 2018, 10, 2129. [CrossRef]
9. Batarliene, N.; Meleniakas, M. Claims Solutions Using a Blockchain System in International Logistics. Sustainability 2021, 13, 3710.[CrossRef]
10. Su, Z.; Zhang, M.; Wu, W. Visualizing Sustainable Supply Chain Management: A Systematic Scientometric Review. Sustainability2021, 13, 4409. [CrossRef]
11. Aysan, A.F.; Bergigui, F.; Disli, M. Using Blockchain-Enabled Solutions as S.D.G. Accelerators in the International DevelopmentSpace. Sustainability 2021, 13, 4025. [CrossRef]
12. Zhang, Y.; Luo, W.; Yu, F. Construction of Chinese Smart Water Conservancy Platform Based on the Blockchain: TechnologyIntegration and Innovation Application. Sustainability 2020, 12, 8306. [CrossRef]
13. E.U. Digital Education Action Plan (2021–2027)—Resetting Education and Training for the Digital Age. Available online:https://ec.europa.eu/education/education-in-the-eu/digital-education-action-plan_en (accessed on 29 April 2021).
15. Shojaei, A.; Ketabi, R.; Razkenari, M.; Hakim, H.; Wang, J. Enabling a circular economy in the built environment sector throughblockchain technology. J. Clean. Prod. 2021, 294. [CrossRef]
16. Upadhyay, A.; Mukhuty, S.; Kumar, V.; Kazancoglu, Y. Blockchain technology and the circular economy: Implications forsustainability and social responsibility. J. Clean. Prod. 2021, 293. [CrossRef]
17. Wang, Y.; Han, J.H.; Beynon-Davies, P. Understanding blockchain technology for future supply chains: A systematic literaturereview and research agenda. Supply Chain. Manag. Int. J. 2019, 24, 62–84. [CrossRef]
18. Böckel, A.; Nuzum, A.-K.; Weissbrod, I. Blockchain for the Circular Economy: Analysis of the Research-Practice Gap. Sustain.Prod. Consum. 2021, 25, 525–539. [CrossRef]
19. Kouhizadeh, M.; Sarkis, J.; Zhu, Q. At the nexus of blockchain technology, the circular economy, and product deletion. Appl. Sci.2019, 9, 1712. [CrossRef]
20. Schwab, K. The Global Competitiveness Report. Geneva: World Economic Forum. 2018. Available online: http://www3.weforum.org/docs/GCR2018/05FullReport/TheGlobalCompetitivenessReport2018.pdf (accessed on 16 June 2021).
18
Sustainability 2021, 13, 8290
21. Bucea-Manea-T, onisa, R.; Prokop, V.; Ilic, D.; Gurgu, E.; Bucea-Manea-T, onis, R.; Braicu, C.; Moant,ă, A. The Relationship betweenEco-Innovation and Smart Working as Support for Sustainable Management. Sustainability 2021, 13, 1437. [CrossRef]
22. Swarnakar, V.; Tiwari, A.K.; Singh, A.R. Evaluating critical failure factors for implementing sustainable lean six sigma frameworkin manufacturing organization: A case experience. Int. J. Lean Six Sigma 2020, 6, 1069–1104. [CrossRef]
23. Tokel, A.; Dagli, G.; Altinay, Z.; Altinay, F. The role of learning management in agile management for consensus culture. Int. J. Inf.Learn. Technol. 2019, 36, 364–372. [CrossRef]
24. Jana, S. Crisis-Triggered Innovation Systems. 2021. Available online: https://www.openinnovation.eu/14-04-2020/crisis-triggered-innovation-systems (accessed on 18 March 2021).
25. Gassmann, O.; Frankenberger, K.; Csik, M. The Business Model Navigator: 55 Models That Will Revolutionise Your Business; FinancialTimes Publishing International: Metro Manila, Philippines, 2014.
26. Jan, S. The Lean Scale-Up: Innovation & Entrepreneurship for New Ventures. 2016. Available online: https://openinnovation.eu/22-01-2016/the-lean-scale-up-innovation-entrepreneurship-for-new-ventures/ (accessed on 18 March 2021).
27. Hysa, E.; Kruja, A.; Naqeeb, R.; Laurenti, R. Circular Economy Innovation and Environmental Sustainability Impact on EconomicGrowth: An Integrated Model for Sustainable Development. Sustainability 2020, 12, 4831. [CrossRef]
28. Trica, C.L.; Banacu, C.S.; Busu, M. Environmental Factors and Sustainability of the Circular Economy Model at the EuropeanUnion level. Sustainability 2019, 11, 1114. [CrossRef]
29. Lazarevic, D.; Valve, H. Narrating expectations for the circular economy: Towards a common and contested European transition.Energy Res. Soc. Sci. 2017, 31, 60–69. [CrossRef]
30. Awasthi, A.K.; Li, J.; Koh, L.; Ogunseitan, O.A. Economia circulară s, i des, eurile electronice. Nat. Electron. 2019, 2, 86–89. [CrossRef]31. Chen, M.; Ogunseitan, O.A. Zero E-waste: Regulatory impediments and blockchain imperatives. Front. Environ. Sci. Eng. 2021,
15, 114. [CrossRef]32. Blomsma, F.; Tennant, M. Circular economy: Preserving materials or products? Introducing the Resource States framework.
Resources. Conserv. Recycl. 2020, 156, 104698. [CrossRef]33. Alfaro, E.; Yu, F.; Rehman, N.U.; Hysa, E.; Kabeya, P.K. Strategic management of innovation. In Routledge Companion to Innovation
Management; Routledge: London, UK, 2019; pp. 107–168.34. Kihl, A.; Aid, G. Driving Forces and Inhibitors of Secondary Stock Extraction. Open Waste Manag. J. 2016, 9, 11–18. [CrossRef]35. Zoboli, R.; Nicolò, B.; Ghisetti, C.; Giovanni, M.; Paleari, S. Towards an Innovationintensive Circular Economy. Integrating Research,
Industry, and Policy; FEEM Report: Milano, Italy, 2019.36. Schiederig, T.; Tietze, F.; Herstat, C. Green innovation in technology and innovation management—An exploratory literature
review. RD Manag. 2012, 42, 180–192. [CrossRef]37. Kijek, T.; Kasztelan, A. Eco-innovation as a Factor of Sustainable Development Ekoinnowacje jako czynnik zrównowazonego
rozwoju. Probl. Ekorozw. 2013, 8, 103–112.38. Better Policies to Support Eco-Innovation; OECD Publishing: Paris, France, 2011. Available online: https://www.oecd.org/env/
consumption-innovation/betterpoliciestosupporteco-innovation.htm (accessed on 6 July 2021).39. Kiefer, C.; Carrillo-Hermosilla, J.; Del Rio, P. A Taxonomy of Eco-Innovation Types in Firms; Documento de Trabajo nº1/2018; 2018;
30p, ISSN 2530-1292. Available online: https://www.researchgate.net/publication/322676773_A_taxonomy_of_eco-innovation_types_in_firms (accessed on 30 June 2021).
40. Anthony Arundel and René Kemp. 2009. Measuring Eco-Innovation. Working Paper Series. United Nations University—Maastricht Economic and Social Research and Training Centre on Innovation and Technology Keizer Karelplein 19, 6211 TCMaastricht, The Netherlands. #2009-017. Available online: http://collections.unu.edu/eserv/unu:324/wp2009-017.pdf (accessedon 16 June 2021).
41. Eurostat1—Product and Process Innovative Enterprises Which Introduced Innovation by Type of Innovation, InnovationdeveLoper, NACE Rev.2 Activity and Size Class [INN_CIS10_PROD$DEFAULTVIEW]. Available online: https://ec.europa.eu/eurostat/databrowser/view/inn_cis10_prod/default/table?lang=en (accessed on 16 June 2021).
42. Eurostat2—Eco-Innovation Index. Available online: https://ec.europa.eu/eurostat/databrowser/view/t2020_rt200/default/table?lang=en (accessed on 16 June 2021).
43. Eurostat3—R&D Personnel by Sector. Available online: https://ec.europa.eu/eurostat/databrowser/product/view/sdg_09_30?lang=en (accessed on 16 June 2021).
44. T, onis, -Bucea-Manea, R.; Catană, M.G.; Tonoiu, S. Network Business Environment for Open Innovation in SMEs. Appl. Mech.Mater. 2015, 760, 751–756. [CrossRef]
45. Pantea, M.C. A new elite? Higher education as seen through the lens of young people working in innovative technologies. Innov.Eur. J. Soc. Sci. Res. 2021. [CrossRef]
46. Serbanica, C. Territorial Innovation Pattents in Romania. Future Pathways for Smart Specialization. Transylv. Rev. Adm. Sci. 2021,62E, 153–175. [CrossRef]
47. Profiroiu, M.C.; Briscariu, M.R. Universities as ‘Drivers’ of Local and Regional Development. Transylv. Rev. Adm. Sci. 2021, 62E,134–152. [CrossRef]
48. Sava, D.; Badulescu, A. Creative and Cultural Sector: Focus on Romania; Vision 2020; Sustainable Economic Development andApplication of Innovation Management, 2018; pp. 2564–2572. Available online: https://www.researchgate.net/publication/329428528_Creative_and_cultural_sector_Focus_on_Romania (accessed on 30 June 2021).
19
Sustainability 2021, 13, 8290
49. Stefan, D.; Vasile, V.; Popa, M.A.; Cristea, A.; Bunduchi, E.; Sigmirean, C.; Stefan, A.B.; Comes, C.A.; Ciucan-Rusu, L. Trademarkpotential increase and entrepreneurship rural development: A case study of Southern Transylvania, Romania. PLoS ONE 2021, 16.[CrossRef]
50. Busu, C.; Busu, M. Research on the Factors of Competition in the Green Procurement Processes: A Case Study for the Conditionsof Romania Using PLS-SEM Methodology. Mathematics 2021, 9, 16. [CrossRef]
51. Bucea-Manea-T, onis, b, R.; Dourado, M.; Oliva, M.; Ilic, D.; Belous, M.; Bucea-Manea-T, onis, , R.; Braicu, C.; Simion, V.-E. Green andSustainable Public Procurement—An Instrument for Nudging Consumer Behavior. A Case Study on Romanian Green PublicAgriculture across Different Sectors of Activity. Sustainability 2021, 13, 12. [CrossRef]
52. Song, W.; Wang, G.-Z.; Ma, X. Environmental innovation practices and green product innovation performance: A perspectivefrom organisational climate. Sustain. Dev. 2020, 28, 224–234. [CrossRef]
53. Tanaskovic, S.; Ristic, B. Konkurentska Pozicija Srbija u 2019. Godini Prema Izveštaju Svetskog Ekonomskog Foruma; Fondacija zaRazvoj Ekonomske Nauke: Belgrade, Serbia, 2019.
54. Sopjani, L.; Arekrans, J.; Laurenti, R.; Ritzén, S. Unlocking the Linear Lock-In: Mapping Research on Barriers to Transition.Sustainability 2020, 12, 1034. [CrossRef]
55. Statistical Office of the Republic of Serbia. Indicators of Innovative Activities 2018; Statistical Office of the Republic of Serbia: Valjevo,Serbia, 2018.
56. S.M.E. Competitiveness Outlook 2020—COVID-19: The Great Lockdown and Its Effects of Small Business. Available online:https://www.intracen.org/publication/smeco2020/ (accessed on 15 March 2021).
57. Kamberovic, S.; Mitrovic, S.; Behrens, A. GAP Analiza Mogucnosti za Ekonomsko Jacanje Primenom Održivih Poslovnih Modela NakonPandemije COVID-19 u Republici Srbiji Izdavac; Misija OEBS-a u Srbiji: Beograd, Serbia, 2020.
58. Strategija Industrijske Politike Republike Srbije za Period 2021 do 2030 (Službeni glasnik RS br.35/2020). Available online:https://www.pravno-informacioni-sistem.rs/SlGlasnikPortal/eli/rep/sgrs/vlada/strategija/2020/35/1/reg (accessed on 30June 2021).
59. Ec.europa.eu. Available online: https://ec.europa.eu/info/sites/info/files/communication-support-western-balkan-regions-covid19-recovery_en.pdf (accessed on 30 June 2021).
60. Official Gazette of R.Serbia. Industrial Policy Strategy of the Republic of Serbia for the period 2021 to 2030. Official Gazette of RSNo. 35/2020). (Strategija industrijske politike Republike Srbije za period 2021 do 2030 (Službeni glasnik RS br.35/2020). 2020.Available online: http://demo.paragraf.rs/demo/combined/Old/t/t2020_03/SG_35_2020_001.htm (accessed on 30 June 2021).
61. Ekologija.gov.rs. Available online: https://www.ekologija.gov.rs/wp-content/uploads/javne_rasprave/2020/EXANTE-ANALIZA_KONACNO-V4.pdf (accessed on 12 March 2021).
20
sustainability
Article
Unleashing the Importance of TQM and KnowledgeManagement for Organizational Sustainability in the Ageof Circular Economy
Boyao Zhang 1, Ubaldo Comite 2, Ali Gokhan Yucel 3,4, Xintao Liu 5,*, Mohammed Arshad Khan 6,
Shahid Husain 6, Muhammad Safdar Sial 7, József Popp 8,9 and Judit Oláh 9,10
1 Faculty of Social Sciences, University of Southampton, Southampton SO17 1BJ, UK; [email protected] Department of Business Sciences, University Giustino Fortunato, 82100 Benevento, Italy;
[email protected] Faculty of Economics and Administrative Sciences, Erciyes University, Kayseri 38039, Turkey;
[email protected] Department of Economics, Finance and Legal Studies, University of Alabama, Tuscaloosa, AL 35487, USA5 Economics and Management School, Wuhan Sports University, Wuhan 430079, China6 Department of Accountancy, College of Administrative and Financial Sciences, Saudi Electronic University,
Riyadh 11673, Saudi Arabia; [email protected] (M.A.K.); [email protected] (S.H.)7 Department of Management Sciences, COMSATS University Islamabad (CUI), Islamabad 44000, Pakistan;
[email protected] Research Center, John von Neumann University, Izsáki út 10., 6000 Kecskemét, Hungary;
[email protected] College of Business and Economics, University of Johannesburg, Johannesburg 2006, South Africa;
Abstract: Despite the growing importance of the concept of circular economy, the case of developingcountries remains under-explored. Against this backdrop, the present research aims to examinethe association between the constructs of total quality management (TQM) and organizationalsustainability (OS) with the mediating effect of knowledge management (KM) from the perspective ofa circular economy. The data were collected from the manufacturing sector of a developing economy(n = 510) to serve the purpose of the current research through a self-administered questionnaire(paper-pencil technique). Structural equation modeling (SEM) was employed for hypothesis testingof the current survey. Six TQM dimensions were drawn from the Malcolm Baldridge National QualityAward (MBNQA) model. OS is composed of economic, social, and environmental sustainability,and KM is composed of four dimensions including acquisition, creation, sharing, and applicationof knowledge. The empirical examination suggests that TQM positively relates to OS, with KMplaying a partial mediation role between this association. This study provides important insightsfor the management of the manufacturing industry of Pakistan on how to ensure organizationalsustainability in the age of a circular economy by using the constructs of TQM and KM.
Keywords: organizational sustainability; knowledge management; total quality management; sus-tainable development; circular economy; linear economy
1. Introduction
Due to the technological, social, political, and environmental changes that emergedover the past few decades, sustaining a viable and competitive organization has becomea real challenge [1]. These changes not only create more opportunities for consumersbut also change their needs and wants patterns [2]. It also aims to reduce consumers’unnecessary usage of natural resources including, water, air, and soil [3], and encourage
companies to improve their environmental footprint through the use of environment-friendly activities. Currently, companies like to follow several methods simultaneouslyand continue to support their strategic guidelines to achieve sustainable developmentobjectives [4].
According to a report by the United Nations Brundtland Commission, if businessessense the requirements of upcoming generations without compromising their ability tofulfill their specific business needs, such businesses are referred to as “businesses withsustainable development practices” [5]. This information applies to individuals whovalue and share concerns for future generations, especially for the non-renewable naturalresources, so that the goal of sustainable development may be achieved. Organizationalsustainability (OS) is three-dimensional. That is, it comprises social stability, which impliesa stable economy that focuses on people, society, a stable environment, i.e., the naturalresources, and is also focused on the economic growth of the enterprises [6]. Previousstudies have also used the term triple bottom line (TBL) for these measurements [6–8].
With the rise of sustainability concerns and sustainable development, the notion of acircular economy has been receiving a lot of attention from scholars and policymakers inrecent years [9]. When businesses embrace the essence of circular economy, it benefits notonly the environment but the organization as a whole, as reducing the level of wastage isone of the primary objectives of such an approach [10]. Perhaps this is the reason that inthe current age, many corporations are striving to incorporate sustainability and practicesrelevant to the notion of a circular economy. Undoubtedly, embracing the concept of acircular economy not only benefits organizations by mitigating the level of waste but alsohelps an economy to improve its environmental footprint [11].
The words “reduce, reuse, and recycle” are at the heart of the philosophy of circulareconomy and sustainability [12]. This implies that corporations need to incorporate suchstrategies through which they can reduce not only their wastage but also can incorporatesuch practices that can enable them to reuse and even recycle their wastage for furthermanufacturing processes. Central to the concept of circular economy is the concern forwaste reduction [13]. To do this, businesses are required to conduct a waste audit toidentify defects in business operations that are producing more waste than necessary. Inthis scenario, the importance and relevance of total quality management (TQM) are self-explanatory as one of the basic concerns of TQM is cost reduction through waste reduction.Therefore, one of the objectives of the current research is to investigate the relationship ofTQM and organizational sustainability (OS) from the perspective of circular economy.
Given the large business competitive market landscape, regulated environment,customer care, quality products, and authorized incentive, companies believe in well-established modeling methods including TQM and knowledge management (KM). TQMrecognizes the method of improving organizational and individual performance to enhancecompetitiveness [14]. This not only improves business economic health but also increasescustomer and employee satisfaction [15]. The goal of TQM is to focus on sustainable perfor-mance, using the least resources to maintain a well-functioning working environment [16].In addition, the effective implementation of TQM, a key component of sustainability, willhave a significant influence on OS [17]. As Abbas, [18] noted, activity-focused companies(one of the critical factors of TQM) can offer an eco-friendly product or service.
Specifically, the implementation of the concept of circular economy is not an easy taskas this includes a shift from a linear economy (the traditional one) to an iterative economy(circular) [19]. This requires specific capabilities and KM abilities of an organization.More specifically, from the perspective of a circular economy, a close knowledge-relatedcollaboration from all stakeholders and continuous improvement in the specific businessprocesses are preconditions for OS and for a circular flow of manufacturing processes [20].Moreover, the process of circular value creation is imperative for improving ecosystems [21],implying that KM has a significant place in all these processes. Therefore, another objectiveof the current research is to investigate the mediating effect of KM between the relationshipof TQM and OS from the perspective of a circular economy.
22
Sustainability 2021, 13, 11514
The proposed relationships were tested in the manufacturing sector of Pakistan. Thissector was taken into consideration purposefully. Firstly, the majority of the manufacturingsector of Pakistan follows the linear economy pattern which results in an inefficient resourcemanagement approach [22,23]. The approach of circular economy is more holistic to extractvalue from the waste to achieve sustainability objectives [24]. In the current context, alongwith other issues, inefficient management, poor knowledge, and quality standards are thecritical factors that restrict this sector’s adoption of a circular economy. Thus, the findings ofthe current study will be helpful for this sector towards a circular economy by consideringKM and TQM practices. Secondly, Pakistan produces approximately 90,000 tons of solidwaste daily. The contribution of the industrial sector to this huge solid waste is critical [25].To address this discouraging situation, an approach of the circular economy characterizedby proper knowledge-based and quality management approaches may improve the currentsituation. Hassan and Daud [26] argue that the OS can be achieved through efficient KMactivities. Despite the importance of these ideas, researchers have paid limited attention tothe relationships between the “key operating structures” of TQM KM and OS.
The current study offers some significant contributions to existing knowledge. To be-gin with, this is one of the pioneering studies from the perspective of developing economiesthat attempt to bring to focus the importance of circular economy. Specifically, the currentstudy has a special focus on the manufacturing sector of Pakistan. Notably, the adoptionof the concept of circular economy is still in its evolving stages in most manufacturingcases in the country [22]. To further aggravate the issue, the concept of a linear economystill prevails and the full potential of the concept of circular economy has yet to be ana-lyzed [27–29]. Moreover, the bulk of literature on circular economy has largely focusedon sectors from developed economies [9,11,30], whereas the case of developing countriesis still underexplored, which clearly highlights the dire need to conduct more research inthis area. Especially, in the case of Pakistan, almost every sector follows the concept ofthe linear economy (take → make → waste), rather than adapting to a circular economy.Given that there is no synergic approach between different industries for a cyclical sharingof resources. This has led Pakistan to a situation of scarce resources along with differentenvironment-related issues. Poor waste management including unmanaged dumps hasplaced Pakistan on the list of the countries with high solid wastages. The country, onaverage, wastes more than 3 million rupees of plastic each year [31]. With the currentapproach of the linear economy, it will not be possible for Pakistan to achieve a sustainablefuture. Clearly, the circular economy model is at the heart of a sustainable approach. In thisregard, the scientific knowledge-related capabilities and TQM practices may be helpful forenterprises of Pakistan to achieve sustainable manufacturing practices along with achievingthe circular economy objectives.
Moreover, the current study also enriches the available literature by introducing KMas a mediator between the relationship of TQM and OS which has barely been discussedfrom the perspective of a circular economy in the context of developing countries, thoughthere have been some studies highlighting the importance of KM from the perspective of acircular economy [32,33]. However, these studies did not consider developing economies.In this context, it is to be stated that, due to the environmental complexity which changesfrom sector to sector and region to region, it is not possible to generalize the findings of pre-vious studies in the context of an emerging economy. In line with the above arguments, thecurrent research study investigates the effect of TQM practices on OS with the interveningeffect of KM practices in the manufacturing sector of Pakistan.
The remainder of the current work is divided into four major divisions. The comingsection deals with the related theories, literature, and hypotheses followed by the method-ology section in which we discuss the sample, data collection, and instrument-relateddiscussion. The last two sections are relevant with the analysis of the data and discussionof the results along with the implications.
23
Sustainability 2021, 13, 11514
2. Literature and Hypotheses Development
The current research seeks support from the concepts of knowledge management,sustainability management, and the concept of TQM. The perspective of corporate sus-tainability management stresses how corporations and communities, together, can thriveenvironmentally and socioeconomically in the long run [34].
More specifically, this theory asserts that by embracing sustainability practices, corpo-rations not only improve their environmental footprint but also can thrive with economicefficiency as at the heart of sustainability management is the use of the least resourcesto produce the greatest good. Meanwhile, in recent years, the importance of TQM hasalso been emphasized on all grounds. As a full-fledged organizational philosophy, TQMintends to grow across all departments of the organization [18]. This component is stronglyassociated with organizational stability [35]. The TQM spectrum can expand economies toa broad-based perspective ranging from a social to an environmental perspective. Likewise,to accomplish this objective, enterprises must accept the concept of quality management byselling valuables to consumers, even after the sale [36]. KM is generally regarded as a pro-cess of knowledge-creating, utilizing, sharing, storing, and managing by an organizationin order to achieve its business objectives [37]. During the past couple of decades, differentstudies reported on the relevance of KM with sustainable development [38–40]. The generalargument in this perspective is that contemporary organizations are likely to lose theircompetitive position if they do not incorporate sustainability into the core of their businessoperations. To this end, sustainability management requires an extensive and continuouslearning orientation from organizations based on several trial and error interventions toprepare a solid organizational knowledge for decision making and problem-solving [41].In a nutshell, all these perspectives seem helpful to develop the theoretical framework ofthe current research.
2.1. TQM and Organizational Sustainability (OS)
The European Foundation for Quality Management (EFQM), the Swedish QualityAward (SIQ), and the Malcolm Baldridge National Quality Award (MBNQA) describethe basic TQM based on its key themes. The American MBNQA model combines thestrengths and weaknesses of TQM with a focus on regulatory governance in both publicand private enterprises. The sample model includes six variables, i.e., strategic planning,leadership, process management, customer focus, information and analysis, and humanresource focus [42]. Because of the integrity of this model, this study used it to examine therelationship between TQM, OS, and KM.
Manufacturing companies are quickly utilizing natural resources to increase theirprofits; they produce more products. Compared to the services sector, manufacturingorganizations utilize more natural resources which cause environmental mutilation inthe form of pollution, especially water and air contamination [43]. Such practices havenow led to a constant increase in the temperature of the planet and a decrease in naturalresources. In response to this problem, many environmentalists, including several interna-tional organizations and NGOs are attempting to raise awareness on environmental issues.Enterprises of the recent era focus on stability, diversity, and cost savings [44].
The natural resource-based view (NRBV) focuses on organizational resources andcapabilities as a way of integrating its operations along with a sustainability perspective.Moreover, NRBV provides a basis for determining the relationship between TQM andorganizational sustainability [35]. These characteristics are related to the conditions thatallow companies to achieve sustainable development to attain a long-term sustainablecompetitive advantage, in line with NRBV. This method is similar in the manufacturingand service industries [45]. From the stand of green organizational practices, it is importantto discuss the three dimensions of the survival of an organization [46]. Companies thatinvest in organizational sustainability perform better, sell more to their consumers, andare more competitive in their maneuvers [47]. The theme of a sustainable environmentfocuses on the steps taken by corporations to preserve nature for future generations. It also
24
Sustainability 2021, 13, 11514
examines the environmental effect of business activities, the utilization of natural resources,and preservation [48].
Saving resources and energizing a sustainable environment is essential for the sur-vival of future generations. Organizations cannot neglect their moral responsibilities forsociety and the environment in the current age. Thus, different stakeholders, particularlygovernment, communities, and consumers expect enterprises to participate in society-environment-enhancing initiatives to balance the negative effect of their operations [49].Companies that take steps to protect the environment have a constructive effect on their cus-tomers and a satisfied workforce as well. Unlike economic stability, which is more abstractand numeric, environmental and social stability are more theoretic and conceptual [50]. Inthe social landscape of sustainability, organizations have moral programs for social welfarethat go beyond their financial and economic well-being [51], for example, organizations’contributions to community development programs, such as contributions to NGOs andparticipating in public awareness programs, including information on improving productsand quality responsibilities [52].
This dimension of OS also takes into account the effect of the organization’s socialactions on social structures, health protection, work ethics, etc. [53]. In this context, TQMfocuses on continuous improvement while striving for optimal performance; there is along-standing association with longevity, which is important for OS. TQM and OS are oneof the priorities of many organizations—their practice is crucial for the production andservice businesses [54]. As a result, many companies claim their environment is kind andsustainable in their operations. Since TQM is a process, it can be lengthened to containall aspects of the OS, as TQM aims not only to improve performance planning but also tomake better use of resources. Poor products or services not only lower the economy butalso deplete natural resources, resulting in an unsustainable environment. Therefore, wepropose the following hypothesis.
Hypothesis 1 (H1). TQM positively relates to organizational sustainability.
2.2. Knowledge Management and Organizational Sustainability
Knowledge is an inimitable asset for enterprises to base their competitive positionon a solid foundation. KM is the process of ensuring that a company’s representativeshave accurate information at the right time and place to make an efficient decision [18].Companies based on KM foundations have a high level of quality and efficiency. Effi-cient management and understanding processes of new products rely heavily on the KMsystem [55]. As a result, KM has been considered as a solid foundation for companies tobecome more competitive in the various industries in the current age. Moreover, KM hasevery potential to improve the company’s innovative potential which is a critical factor ofcompetitive advantage for an organization. According to Zizakov et al. [56], for the abilityof a company to develop new products, the process of workflow is highly dependent onefficient KM practices. Thus, KM creates a footing for enterprises to become more advancedand competitive in the market.
With the help of KM practices, organizations translate tacit knowledge into a clearidea so that it could move freely within the organization [57]. KM, through the knowledgeworkers, leads to knowledge-based economics and companies can receive knowledgeableinsights to improve their process [58] and be able to produce new products and services.Commitment to leadership and organizational repute are key factors in shared knowledge.Enterprises can only use KM efficiently and effectively when they use knowledge fromdiverse foundations. The company should use the knowledge gained from customers,employees, and other shareholders to improve the overall operation of the company.
There are different research studies in which the relationship between TQM and KMhas been established. For example, scholars like Stewart and Waddell [59] asserted thatenriching the intervention of quality to a wide range of business process including productspecifications, customer needs, and continuous improvement indicate a clear relationship
25
Sustainability 2021, 13, 11514
between TQM and KM. Moreover, KM practices of organization support in establishinga quality culture which is essential for an organization’s success in a competitive land-scape [60]. Likewise, the work of Lin and Wu [61] also indicated that there exists a positiverelationship between TQM and KM. The study of Colurcio [62] showed that the TQMorientation of an organization positively influences the KM capabilities of an organization,especially for successful knowledge creation and dissemination. To sum, companies thatsuccessfully implement TQM include KM in their operations earn a high-profit share.Therefore, the following hypothesis is proposed.
Hypothesis 2 (H2). TQM positively relates to knowledge management.
2.3. TQM, Knowledge Management, and Organizational Sustainability
Relating KM with OS has become a critical business imperative for present organiza-tions to achieve business goals and objectives effectively. Knowledge is essential for thedevelopment of an individual, an organization, and a nation. Ashraf [63] and Abbas [18]argue that KM is an important factor in the development of a sustainable organization.Knowledge-based companies are more innovative as compared to other organizations,as they can see new signs of organizational stability [64]. Companies that incorporateknowledge management activities into their business operations are responsible for shar-ing information with the community [65]. KM helps organizations to develop sustainableuse of information resources, social considerations, and environmental and economic is-sues [66]. Organizations involved in KM activities encourage the sharing of informationwithin and outside the organization. Organizational strengths focus on the efficient organi-zation of KM across all organizational strategies to achieve sustainability in all areas [67].KM activities support an organization in achieving its sustainability objectives. Thus, thefollowing set of hypotheses is framed. Figure 1 shows the conceptual framework of thecurrent study.
TQM (X) KM (M)
OS
(Y)
Figure 1. Research model of the current analysis: TQM (X) = the independent construct, OS (Y) = the outcome construct,KM (M) = the intervening construct.
26
Sustainability 2021, 13, 11514
Hypothesis 3 (H3). KM positively relates to organizational sustainability.
Hypothesis 4 (H4). KM mediates the relationship between TQM and OS.
3. Methodology
3.1. Data Collection
We collected the data from manufacturing organizations in Lahore city, Pakistan. It isto be mentioned here that Lahore city is the industrial hub of Pakistan which constitutes apopulation of several million. We intentionally selected this city to serve the purpose of thecurrent survey. The specific reason for this intention lies in the fact that during recent years,the city has been declared more than one time as the most polluted city in the world [68].In this regard, industrial malpractices have been regarded as one of the major reasons forthis poor environmental situation [69,70]. Mainly, we visited the Quaid E Azam industrialestate and the Sunder industrial zone of Lahore to collect the data. We only contactedISO-certified organizations because these ISO-certified organizations are ready to applyenvironmental certification and social responsibility (for example, ISO 14000 and 26000).In this regard, we formally contacted the selected organizations to support us in the datacollection process in the larger interest of academia and the industry. After receiving theirformal approval, we then planned a detailed schedule indicating the timing and frequencyof our visits in different organizations.
We included low, middle, and senior executives in our dataset, as they respondedpositively to the survey. Not only did they understand their organizational policies, but theywere able to understand different concepts like TQM, KM, and sustainability. Moreover,before starting the data collection phase, we ensured that the ethical guidelines given inthe Helsinki Declaration [71] were met accordingly. For example, informed consent fromeach respondent was obtained to participate in the survey voluntarily. For this purpose,a separate sheet was attached with every questionnaire. Likewise, each respondent wasgiven an equal opportunity to quit the survey at any stage if he/she felt uncomfortabledisclosing the information during this process. The instrument for collecting the datawas a questionnaire (self-administered) which was given to each participant. Initially,we distributed 800 questionnaires to different organizations. As happens in most datacollections through surveys, we did not receive back in full what we distributed. Ofthose 800 (initial distribution), some questionnaires were incomplete, thus, we could notinclude them in the final dataset. In this regard, we received 510 valid responses that wereprocessed to analyze the data. This method of data collected is also supported by differentscholars [72,73]. The data were collected between December 2020 and March 2021.
3.2. Measures
The questionnaire consisted of three parts. The first part included 36 items based onsix TQM dimensions adapted from the MBNQA model. Specifically, the items of TQMwere taken from the studies of Saraph et al. [74], Samson and Terziovski [75], Kaynak [76],and Sila [77]. The second part included 14 OS-related items, taken from Turker [78] andKaynak [76]. Finally, part 3 included 22 items of the KM construct which were taken fromDarroch [79] and Lee and Wong [80]. All items were rated on a 5-point Likert scale rangingfrom 1 = strongly disagree to 5 = strongly agree. To confirm the reliability and validity ofthe questionnaire, we conducted a pilot study and collected 42 responses from companieslocated in Lahore. Preliminary analysis showed an internal consistency of 0.89 for TQM,0.90 for OS, and 0.82 for KM, which met Hair et al. [81] guidelines of a 0.70 cut-off value.
4. Results
4.1. Common Method Bias
The general approach to detect a common method bias issue is suggested by Podsakoffet al. [82]. Thus, we followed several sequential steps. For instance, the respondent wastold that the questions must be answered honestly and that there are no “good” or “bad”
27
Sustainability 2021, 13, 11514
answers. This strategy attempts to reduce the fear in practice and prevents them fromgiving important social responses. (2) The structure of the instrument was designed verycarefully to avoid any possible ambiguity. This is why the instrument had short, simple,and straightforward questions. (3) The importance of the study and the responses from therespondents’ participation were explained to them in details. We also initiated a single-factor analysis as recommended by Harman [83]. All items of the instrument were loadedon a single factor using exploratory factor analysis. The results confirmed that there isno single dominant factor that explains more than 50% variance which means there is noissue of common method bias. The above information shows that the general bias of ourresearch does not indicate a major problem [84,85].
4.2. Structural Equation Modeling (SEM)
SEM is an advanced-level data analysis technique that has some significant advan-tages over conventional multivariate techniques. For example, SEM provides an explicitassessment measurement error. It also enables a researcher to estimate a latent variablethrough observed variables [86]. In addition, SEM helps an analyst carry out a simultane-ous evaluation of the complex models, especially models with mediators or moderators,which was not possible through the conventional data analysis techniques. On a finalnote, a fully developed model can be tested against the data using SEM as a conceptual ortheoretical structure or model and can be evaluated for the fit of the sample data. This iswhy researchers in the current age prefer to analyze the data by employing SEM [87–89].According to Chin, Peterson, and Brown [85], SEM is suitable for analyzing the cause andeffect analysis of complex models, as is the case with the current study. Similarly, SEM isuseful when used to evaluate the implementation of multiple modeling, multiple paths,and/or multi-segment models for each structure. For these reasons, we felt SEM was auseful technique for data analysis of the present study.
To test the hypothesized model, we used a two-step SEM analysis, for all parameterestimations, we used the maximum likelihood method using AMOS. Similarly, to measurethe modeled constructs and evaluation, we used confirmatory factor analysis (CFA). Withthe help of CFA, we were able to examine convergent and discriminant validities alongwith a reliability analysis of the measurement model. The values of average varianceextracted (AVE) were examined to assess convergent validity and composite reliability(CR) values were analyzed to evaluate the reliability of the instrument. Similarly, thediscriminant validity was established by taking the square root of AVE. The results of AVEand CR are presented in Table 1, and the results of discriminant validity are shown inTable 2. According to these results all variables have acceptable CR values greater than0.6. Similarly, the values of AVEs were also within the acceptable range as each constructshowed a variance greater than 50%, which means that captured variance by the variableis greater as a result of measurement error [90]. All these results indicate that our proposedmodel has good internal validity and reliability. As a matter of fact, convergent validity is ameasure of association between two observed factors measuring the same construct. Factorloadings more than 0.5 are considered significant loading in the context of convergentvalidity [90]. In this regard, all factor loadings in our final measurement model exceededthe cut-off level of 0.5. We had to delete some standardized factor loadings due to theirweak loading on the respective latent construct. Finally, we examined the discriminantvalidity of our data by observing square root values of each construct and comparing themto correlation values among other constructs. The rule of thumb is that if the square root ofAVE exceeds the correlational values, it means there is evidence of discriminant validity.These results are shown in Table 2.
28
Sustainability 2021, 13, 11514
Table 1. Convergent validity and reliability.
Variable ItemsFL b
(Min–Max)T-Value b
(Min–Max)α b CR b AVE b
TQM second order CFA 6 0.77–0.94 12.06–18.56 0.92 0.96 0.69Customer focus 4 0.91–0.96 23.49–31.57 0.84 0.86 0.86
Note: **, significant at 95 % level. CF = customer focus, SP = strategic planning, PM = process management, HR = HR focus, IN = informationand analysis, LD = leadership, KP = knowledge process, KS = knowledge sharing, KC = knowledge creation, KA = knowledge application,ES = economic sustainability, SS = social sustainability, EN = environmental sustainability.
4.3. Hypotheses Testing and Measurement Model
We tested the hypotheses of the present study using the maximum likelihood methodin AMOS. Firstly, we tested our measurement model for data fit. For this purpose, weexamined different model fit indices such as CFI, IFI, GFI, RMSEA, NFI, and AGFI. Allvalues of model fit indices showed statistical evidence of a better model fitting to the data.We also tested the χ2/df ratio for less than 5 in order to accept the model for data fit. Thefindings are shown in Table 3.
29
Sustainability 2021, 13, 11514
Table 3. Model fit indices.
Indicators Acceptable Range TQM OS KM
Absolute fit index χ2/df 1~5 1.89 * 1.30 * 2.53 *GFI >0.9 0.93 * 0.93 * 0.91 *
In order to take the analysis to a further level, we tested our hypothesized relationsthrough SEM in AMOS software with the help of beta values and associated p-values. Theresults are shown in Table 4. According to these results, all hypotheses of the present studyshowed significant results, which means that all hypotheses were in an acceptable range.From the statistical results, it is evident that TQM significantly predicts KM (beta = 0.351,p < 0.05) and KM significantly predicts OS (beta = 0.47, p < 0.05); therefore, H2 and H3 areaccepted.
Furthermore, we tested the mediation effect of KM in the relationship of TQM andOS with the help of Bootstrapping option in AMOS. The results showed that the indirecteffect is 0.166, p < 0.05. BootLLCI = 0.127 and BootULCI = 0.439. Neither ULCI nor LLCIinclude zero, which means zero falls outside of ULCI and LLCI which means the indirecteffect is significant and positive. Hence, KM is a significant mediator in the relationshipbetween TQM and OS, so H4 is supported. Similarly, the direct effect of TQM on OS isalso significant and positive 0.493, p < 0.05, which means that TQM significantly predictsOS, implying that H1 is also accepted. It is notable that the effect size is reduced (directeffect-C) from 0.493 to 0.166 (indirect effect -C’) but remained significant which is indicativeof the fact that KM is a partial mediator in the relationship of TQM and OS. On a final note,the mediation effect explains more than 25% of the total variance in OS. This effect can becalculated from the formula given in Equation (1). The structural relationships are shownin Figure 2.
Proportion of mediation =Indirect effects
Total effect(1)
Table 4. Hypotheses testing.
Hypotheses Path RelationshipBeta Value(p < 0.05)
LLCI/ULCI Decision
H1 TQM → OS + 0.493 *** 0.183/0.392 SupportedH2 TQM → KM + 0.351 *** 0.762/1.138 SupportedH3 KM → OS + 0.473 *** 0.199/0.537 SupportedH4 TQM → TL → SCA + 0.166 *** 0.127/0.439 Supported
Note: *** p < 0.000.
30
Sustainability 2021, 13, 11514
Figure 2. The structural model.
5. Discussion
The current study was carried out to serve two main objectives. Firstly, the studyintended to investigate the relationship between TQM and OS from the perspective of acircular economy. To this end, the results of the current study validated that there is a directrelationship between TQM and OS. Successful use of TQM practices in an organizationcan lead to an enhanced level of OS. These results are in line with the study by Abbas [18],which found a significant impact of TQM on corporate sustainability. However, our resultsshow a contradiction with the findings of Li et al. [91] in the context of Chinese enterprises,in which they indicated TQM does not affect the green performance of the organization.It can now be argued that the basis of TQM is a set of action strategies related to thesustainable development of enterprises.
Altogether, TQM not only reduces economic inefficiency but also protects the en-vironment and nature by transporting them to the environmental permanence of theorganization. Improving the level of customer satisfaction, reducing the error rate, andimproving key performance indicators of the TQM program can be directly linked to theeconomic sustainability of enterprises.
The enterprises that are more aware of the impact of their work on the environmentseem to be more interested in incorporating the TQM orientation in their business opera-tions [92]. As TQM and environmental management share the same landscape, as they bothfocus on the efficient use of resources to reduce the level of waste during the value creationprocesses of a business; they are similar in terms of philosophy. In order to improve itsenvironmental footprint, an organization should implement a TQM program core to itsbusiness operations. By combining quality with a competitive environment, a sustainableorganization focuses on sustainable development. Moreover, TQM strengthens not only
31
Sustainability 2021, 13, 11514
the organizational environmental initiatives but also boosts organizational repute andmarket share value which ultimately enhances the overall performance of the organization.Additionally, by applying the TQM approach to a wide range, companies can ensure theimpact of green systems, such as low levels of harmful gases and minimal use of natu-ral resources in order to be environmentally friendly. According to the results of Kanget al. [93], TQM had a significant and positive impact on a sustainable social environment.However, compared to economic and environmental sustainability, many companies haveneglected social stability in their policies due to the low stability of the triple bottom line(TBL) model [94]. To sum, socially sustainable organizations aim to recognize the impactof their actions on society and the environment in order to take steps, to improve theirenvironmental footprint, and to improve their community. Although social sustainabilityis complex to understand, it is easy to detect. Thus, the enterprises that understand theimportance of social sustainability give prime importance to the initiatives that can reducetheir negative impact on the environment. These results are in line with the findings ofAndrade Arteaga, Rodríguez-Rodríguez, Alfaro-Saiz, and Verdecho [16], Chen et al. [95],and [96].
Another objective of the current survey was to investigate the mediating effect ofKM between the relationship of TQM and OS. In this regard, the statistical findings ofthe current survey validated the mediating role of KM in the proposed relationship ofTQM and OS. It is stated that if organizations implement the TQM program effectively,they will improve their performance of KM and this will also have a significant impacton OS. Moreover, our study confirmed that TQM leads to a higher level of KM activity inthe organization. Intelligent organizations see TQM and KM as elements of collaboration,emphasizing the importance of individual employees for knowledge sharing, acquisition,and dissemination in an organization. The results have shown the efficacy of KM to enhanceOS, i.e., social, environmental, and economic well-being. The analysis of the mediationrole of KM between TQM and OS yielded significant implications and shows that theinclusion of KM in the proposed model is imperative to enhance the overall sustainabilityperformance of an organization. On a further note, both TQM and KM share the samevalues in many ways; for example, one of the core value of TQM is continuous improvementfor which the knowledge repository of an organization is of utmost importance. Likewise,to reduce the error rate, the role of the knowledge worker of an organization is critical. Thisline of reasoning can be seen in the work of Mendes [97]. In brief, our study brings it to thefore that to attain OS, the role of KM is of paramount importance, as our results provedthat when KM is introduced in the model, it explained a significant amount (more than25%) of the total variation in OS. Thus, the mediating role of KM between the relationshipof TQM and OS is proven as per the statistical findings of the current survey.
Implications
TQM and environmental management have a common orientation for long-term goalsas both of these concepts emphasize reducing resource utilization, reducing waste, andimproving customer satisfaction. To achieve such long-term goals, organizations mustfocus on integrating good standards of quality system management and environmentalmanagement. By combining quality with the environment, a capable organization will beable to induce its continuous improvement in all three areas of sustainability (environmen-tal, social, and economic). As TQM promotes environmental management practices, it canstrengthen the organizational image and market share. In addition, by following TQMpractices in a broader context, organizations can ensure the benefits of green manufacturingpractices, such as low greenhouse gas emissions and wastewater and low consumptionof energy and natural resources, making it a more environmentally friendly organization.These results are also in line with the findings of Green et al. [98] and Sriyakul et al. [99].
Similar to the sustainable environment, TQM has shown significant and positiveeffects on social sustainability in previous studies [93,100]. However, in comparison to theeconomy and the environment, many organizations have neglected social stability in their
32
Sustainability 2021, 13, 11514
policies, due to the low level of stability in the TBL model. Smart organizations continueto recognize the impact of their actions on society, both positive and negative, and takesteps to improve the quality of interaction with primary and secondary partners. Althoughit is difficult to classify activities for social care, they are easy to identify. Some of thegeneralizations develop a general policy for workers, consumer rights and workers’ rights,rest of employment, volunteering, living standards, health and safety, welfare, communityinvolvement, contributions, or participating in public development programs. Organiza-tions that understand customer experience and relationships recognize the importance ofmaintaining relationships and being part of their business plans. Thus, a well-plannedTQM philosophy not only considers environmental sustainability but also takes care of thesocial aspect of sustainability.
Our findings also show a positive relation between TQM and economic sustainability.These findings are consistent with various studies, such as García-Alcaraz et al. [101].According to the results, TQM practices are also helpful in improving the economic healthof an organization as the philosophy of TQM stresses efficient management of resources ateach level which undoubtedly improves the overall economic efficiency of an organization.One of the main reasons for these results is that both TQM and KM systems improvecompany performance, such as time management, efficient use of equipment, training,and development, which has an impact on employees and customer satisfaction. Anotherimportant reason for improving the economic efficiency of organizations through TQM isthat TQM systems reduce the cost of operations and inefficiency of operations, resultingin better and more stable services. While the quality of a product or service can build abrand and competition, firms need to ensure the quality of their operations and services.It is important to note that TQM practices are interdependent, and in order to receivethe maximum benefit from them, organizations must supplement the entire process withproper knowledge management practices. In this regard, leadership can play an importantstrategic role, as leaders have a responsibility to plan and implement organizational plans.
The study has some important social implications, which we will explain one by one.For example, the findings of the current study highlight the importance of TQM and KM inachieving sustainability objectives. Specifically, the study unveils the importance of TQMand KM from the perspective of a circular economy. The notion of circular economy is atthe heart of sustainable manufacturing in different developed countries. However, thesituation in the context of the developing countries is very different because most of thedeveloping countries (including Pakistan) do not have sufficient resources and knowledgeto properly execute the crux of a circular economy. In this context, the current study addsto the discussion of a circular economy by arguing that a well-planned TQM approachsupplemented by KM practices may be helpful for sustainable manufacturing. Morespecifically, the current study adds to the findings of Perey, et al. [102], who acknowledgedthe usefulness of TQM for waste management and sustainable practices but ignored theimportance of KM in this process. Thus, the leadership and management of businessesshould increase their commitment to implement TQM programs in the enterprises toensure not only the achievement of financial stability but also the social and sustainableenvironment in line with the concept of TBL.
Moreover, it is central to implement the TQM mechanism in all enterprises that canadhere to one of the standard benchmarks such as MBNQA, EFQM, and SQA. However,in Pakistan, many ISO-certified companies only have Lean Manufacturing, Kaizen, JuranTraining, and other quality management standards that do not properly acknowledge thephilosophy of sustainable development and circular economy. The policymakers of theenterprises have to realize that in the absence of a comprehensive TQM program, achievingorganizational sustainability will be a difficult task. The current study supports the basicfundamentals of the MBNQA model and leads to improved quality in organizationaldecision-making. The results show that TQM practices are important in the manufac-turing sector; this study provides a guideline that the TQM philosophy along with KM
33
Sustainability 2021, 13, 11514
should be fully applied in the manufacturing sector of Pakistan in order to get better andsustainable results.
Especially from the perspective of a circular economy, the findings of the currentsurvey have some specific implications. To begin with, it is to be noted that the currentpattern in most of the manufacturing organizations in Pakistan is a linear productionpattern that follows the philosophy of ‘take, make, and waste’ without any significantconsideration of the concept of a circular economy which is an antonym of linear economy.Although some organizations are striving to incorporate the concept of the circular economyinto their business operations, up until now, such organizations could not reap the fullbenefits of a circular economy. For such organizations, realizing the importance of TQM andKM from the perspective of a circular economy is of utmost importance. More specifically,Pakistan is one of the nations in the world that is ranked high for waste production, as thecountry has been reported to generate more than 70,000 tons of solid waste on daily basis.In the given scenario, if the manufacturing sector of Pakistan assumes its responsibilityand makes it a priority to follow the essence of a circular economy, there is every possibilityto think of a better and sustainable future for the country. To that end, the findings of thecurrent survey may be helpful as currently, several industries in Pakistan are ISO certified,but there is a need to shift the way the current organizations follow TQM philosophy inorder to think of it as an enabler for a circular economy.
6. Conclusions
The current study is helpful for the manufacturing sector of Pakistan to achieve thesustainability perspective, especially from a viewpoint of a circular economy. It is to benoted that economic transformation is not an overnight process, nor does it depend solelyon industrial restructuring. It is, in reality, a change in the mindset, behavior, and prioritiesof all the concerned stakeholders. Further, to achieve sustainable manufacturing, thecircular economy is a way forward for Pakistani businesses. This view can also be seenin some recent studies. For example, the studies of Rahman and Kim [29] and Umer andAbid [103] are some relevant cases in this regard. Furthermore, the industries in Pakistanhave to realize the potential of TQM to achieve sustainability and for a transition from alinear economy to a circular economy. Presently, different businesses in Pakistan have ISOstandards (14000, 26000, and others); however, most businesses follow such standards tosatisfy state laws or as a requirement imposed by the client organization. This is the time toassume TQM from a proactive approach, as the full potential of TQM is not just to satisfystate laws or clients, but beyond that, it can place an organization in a better competitiveposition through circular production. Similarly, the businesses in Pakistan need to realizethe importance of a knowledge resource for achieving a successful transition towards acircular economy. More specifically, proper creation and acquisition of knowledge arecritical for its successful application from the perspective of a circular economy [21]. Thereare some theoretical considerations of the present study as well; first, it enriches the gapbetween TQM and OS, especially in manufacturing companies of Pakistan. This supportsTQM’s position that effective implementation of TQM activities can significantly improvean organization’s sustainable performance. This study emphasizes the importance of theKM role in the relationship between TQM and CS and confirms KM’s principle that goodgovernance not only has a positive impact on personal and organizational activities butalso increases their ability to excel in a competitive landscape.
In sum, we have to think green before we can act green and ultimately go green. It ishigh time to start reimagining the relationship between resources in both our daily livesand the corporate sector and, as a result, reimagine the future we are creating for ournext generations. On a final note, our study may generate the same findings in similareconomies such as India and Bangladesh. However, in other economies, due considerationand care are necessary before implementing the findings of the current survey.
There are some limitations to the current research. First, the information collecteddoes not include any operational staff. Their opinion may add important insights to the
34
Sustainability 2021, 13, 11514
present research study, so future researchers are required to include operational staff aswell in order to get better insights.
In addition, the information was based on the understanding of the participants andnot on the financial statements provided in organizational documents, so the actual perfor-mance was not measured in the present study. Therefore, in addition to self-understanding,the real data of the organization, such as annual reports, may also provide other evidenceof the impact of TQM activity on OS. Data were only collected from industries located inthe Quaid E Azam industrial state and Sundar industrial zone of Lahore so the generaliz-ability of the present study is under question. In order to better address the issue, futureresearchers are required to include more cities in Pakistan.
Author Contributions: All of the authors contributed to conceptualization, formal analysis, investi-gation, methodology, and writing and editing of the original draft. All authors have read and agreedto the published version of the manuscript.
Funding: This research received no external funding.
Institutional Review Board Statement: Not applicable.
Informed Consent Statement: Informed consent was obtained from the respondents of the survey.
Data Availability Statement: The data will be made available on request from the correspondingauthor.
Conflicts of Interest: The authors declare no conflict of interest.
References
1. Cancino, C.A.; La Paz, A.I.; Ramaprasad, A.; Syn, T. Technological innovation for sustainable growth: An ontological perspective.J. Clean. Prod. 2018, 179, 31–41. [CrossRef]
2. Ali, S.; Ullah, H.; Akbar, M.; Akhtar, W.; Zahid, H. Determinants of consumer intentions to purchase energy-saving householdproducts in Pakistan. Sustainability 2019, 11, 1462. [CrossRef]
3. Yang, Q.; Li, Z.; Lu, X.; Duan, Q.; Huang, L.; Bi, J. A review of soil heavy metal pollution from industrial and agricultural regionsin China: Pollution and risk assessment. Sci. Total Environ. 2018, 642, 690–700. [CrossRef] [PubMed]
4. Albareda-Tiana, S.; Vidal-Raméntol, S.; Fernández-Morilla, M. Implementing the sustainable development goals at Universitylevel. Int. J. Sustain. High. Educ. 2018, 19, 473–497. [CrossRef]
5. Imperatives, S. Report of the World Commission on Environment and Development: Our Common Future; Oxford University Press:Oxford, UK, 1987; Volume 10.
6. Braccini, A.M.; Margherita, E.G. Exploring organizational sustainability of industry 4.0 under the triple bottom line: The case of amanufacturing company. Sustainability 2019, 11, 36. [CrossRef]
7. Henry, L.A.; Buyl, T.; Jansen, R.J. Leading corporate sustainability: T he role of top management team composition for triplebottom line performance. Bus. Strategy Environ. 2019, 28, 173–184. [CrossRef]
8. Longoni, A.; Cagliano, R. Sustainable innovativeness and the triple bottom line: The role of organizational time perspective. J.Bus. Ethics 2018, 151, 1097–1120. [CrossRef]
9. Geissdoerfer, M.; Savaget, P.; Bocken, N.M.; Hultink, E.J. The Circular Economy–A new sustainability paradigm? J. Clean. Prod.2017, 143, 757–768. [CrossRef]
10. Pieroni, M.P.; McAloone, T.C.; Pigosso, D.C. Business model innovation for circular economy and sustainability: A review ofapproaches. J. Clean. Prod. 2019, 215, 198–216. [CrossRef]
11. Korhonen, J.; Honkasalo, A.; Seppälä, J. Circular economy: The concept and its limitations. Ecol. Econ. 2018, 143, 37–46. [CrossRef]12. Kirchherr, J.; Reike, D.; Hekkert, M. Conceptualizing the circular economy: An analysis of 114 definitions. Resour. Conserv. Recycl.
2017, 127, 221–232. [CrossRef]13. Kerdlap, P.; Low, J.S.C.; Ramakrishna, S. Zero waste manufacturing: A framework and review of technology, research, and
implementation barriers for enabling a circular economy transition in Singapore. Resour. Conserv. Recycl. 2019, 151, 104438.[CrossRef]
14. Busu, M. Applications of TQM Processes to Increase the Management Performance of Enterprises in the Romanian RenewableEnergy Sector. Processes 2019, 7, 685. [CrossRef]
15. Kim, G.-S. The Effect of Quality Management and Big Data Management on Customer Satisfaction in Korea’s Public Sector.Sustainability 2020, 12, 5474. [CrossRef]
16. Andrade Arteaga, C.; Rodríguez-Rodríguez, R.; Alfaro-Saiz, J.-J.; Verdecho, M.-J. An ANP-Balanced Scorecard methodologyto quantify the impact of TQM elements on organisational strategic sustainable development: Application to an oil firm.Sustainability 2020, 12, 6207. [CrossRef]
35
Sustainability 2021, 13, 11514
17. Aquilani, B.; Silvestri, C.; Ruggieri, A. Sustainability, TQM and value co-creation processes: The role of critical success factors.Sustainability 2016, 8, 995. [CrossRef]
18. Abbas, J. Impact of total quality management on corporate green performance through the mediating role of corporate socialresponsibility. J. Clean. Prod. 2020, 242, 118458. [CrossRef]
19. Govindan, K.; Hasanagic, M. A systematic review on drivers, barriers, and practices towards circular economy: A supply chainperspective. Int. J. Prod. Res. 2018, 56, 278–311. [CrossRef]
20. Zucchella, A.; Previtali, P. Circular business models for sustainable development: A “waste is food” restorative ecosystem. Bus.Strategy Environ. 2019, 28, 274–285. [CrossRef]
21. Atiku, S.O. Knowledge management for the circular economy. In Handbook of Research on Entrepreneurship Development andOpportunities in Circular Economy; IGI Global: Hershey, PA, USA, 2020; pp. 520–537.
22. Agyemang, M.; Kusi-Sarpong, S.; Khan, S.A.; Mani, V.; Rehman, S.T.; Kusi-Sarpong, H. Drivers and barriers to circular economyimplementation. Manag. Decis. 2019, 57, 971–994. [CrossRef]
23. Tariq, H.; Ali, Y.; Khan, A.U.; Petrillo, A.; De Felice, F. Sustainable production of diapers and their potential outputs for thePakistani market in the circular economy perspective. Sci. Total Environ. 2021, 769, 145084. [CrossRef] [PubMed]
24. Sharma, N.K.; Govindan, K.; Lai, K.K.; Chen, W.K.; Kumar, V. The transition from linear economy to circular economy forsustainability among SMEs: A study on prospects, impediments, and prerequisites. Bus. Strategy Environ. 2021, 30, 1803–1822.[CrossRef]
25. Javed, H.; Fazal Firdousi, S.; Murad, M.; Jiatong, W.; Abrar, M. Exploring Disposition Decision for Sustainable Reverse Logisticsin the Era of A Circular Economy: Applying the Triple Bottom Line Approach in the Manufacturing Industry. Int. J. Supply Oper.Manag. 2021, 8, 53–68.
26. Hassan, H.; Daud, S. Fostering Corporate Sustainability Performance through Integrated Knowledge Management Strategy andEco-Innovation in Halal Pharmaceutical Companies: A Malaysia Case. World J. Islam. Hist. Civiliz. 2017, 7, 23–29. Availableonline: https//www.researchgate.net/publication/319122947 (accessed on 10 October 2021).
27. Chahal, H.; Fayza. An exploratory study on kaizen muda and organisational sustainability: Patients’ perspective. Int. J. LeanEnterp. Res. 2016, 2, 81–94. [CrossRef]
28. Siva, V.; Gremyr, I.; Bergquist, B.; Garvare, R.; Zobel, T.; Isaksson, R. The support of Quality Management to sustainabledevelopment: A literature review. J. Clean. Prod. 2016, 138, 148–157. [CrossRef]
29. Rahman, S.M.; Kim, J. Circular economy, proximity, and shipbreaking: A material flow and environmental impact analysis. J.Clean. Prod. 2020, 259, 120681. [CrossRef]
30. Stahel, W.R. The circular economy. Nat. News 2016, 531, 435. [CrossRef]31. Asim, A.B. A Circular Economy Business Model with Zero Waste. Available online: https://www.pakistantoday.com.pk/2021/0
6/23/a-circular-economy-business-model-with-zero-waste/ (accessed on 6 October 2021).32. Acerbi, F.; Sassanelli, C.; Terzi, S.; Taisch, M. Towards a data-based circular economy: Exploring opportunities from digital
knowledge management. In Proceedings of the European Lean Educator Conference, Milan, Italy, 11–13 November 2019;pp. 331–339.
33. De Marchi, V.; Di Maria, E. Achieving circular economy via the adoption of Industry 4.0 technologies: A Knowledge managementperspective. In Knowledge Management and Industry 4.0; Springer: Berlin/Heidleberg, Germany, 2020; pp. 163–178.
34. Fisk, P. People Planet Profit: How to Embrace Sustainability for Innovation and Business Growth; Kogan Page Publishers: London,UK, 2010.
35. Li, W. Research on the innovative development mode of quality education of college students based on the perspective of humanresource management. Educ. Sci. Theory Pract. 2018, 18. [CrossRef]
36. Anil, A.P.; Satish, K. Enhancing customer satisfaction through total quality management practices–an empirical examination.Total Qual. Manag. Bus. Excell. 2019, 30, 1528–1548. [CrossRef]
37. Wu, J.; Lo, M.F.; Ng, A.W. Knowledge management and sustainable development. Encycl. Sustain. High. Educ. 2019, 1049–1057.38. Ricardo, M.A. Knowledge management and the 2030 agenda for sustainable development in the United Nations context. Cienc.
Adm. 2021, 79–84. [CrossRef]39. Mohamed, M.; Stankosky, M.; Mohamed, M. An empirical assessment of knowledge management criticality for sustainable
development. J. Knowl. Manag. 2009, 13, 271–286. [CrossRef]40. Mabudafhasi, R. The role of knowledge management and information sharing in capacity building for sustainable development—
An example from South Africa. Ocean. Coast. Manag. 2002, 45, 695–707. [CrossRef]41. Metcalf, L.; Benn, S. Leadership for sustainability: An evolution of leadership ability. J. Bus. Ethics 2013, 112, 369–384. [CrossRef]42. Yusr, M.M.; Mokhtar, S.S.M.; Othman, A.R.; Sulaiman, Y. Does interaction between TQM practices and knowledge management
processes enhance the innovation performance? Int. J. Qual. Reliab. Manag. 2017, 34, 955–974. [CrossRef]43. Mahmood, Z.; Kouser, R.; Masud, M.A.K. An emerging economy perspective on corporate sustainability reporting–main actors’
views on the current state of affairs in Pakistan. Asian J. Sustain. Soc. Responsib. 2019, 4, 8. [CrossRef]44. Nikolaou, I.E.; Tsalis, T.A.; Evangelinos, K.I. A framework to measure corporate sustainability performance: A strong
sustainability-based view of firm. Sustain. Prod. Consum. 2019, 18, 1–18. [CrossRef]45. Donnellan, J.; Rutledge, W.L. A case for resource-based view and competitive advantage in banking. Manag. Decis. Econ. 2019, 40,
728–737. [CrossRef]
36
Sustainability 2021, 13, 11514
46. Calza, F.; Parmentola, A.; Tutore, I. Types of green innovations: Ways of implementation in a non-green industry. Sustainability2017, 9, 1301. [CrossRef]
47. Lozano, R. A holistic perspective on corporate sustainability drivers. Corp. Soc. Responsib. Environ. Manag. 2015, 22, 32–44.[CrossRef]
48. Davenport, M.; Delport, M.; Blignaut, J.N.; Hichert, T.; Van der Burgh, G. Combining theory and wisdom in pragmatic,scenario-based decision support for sustainable development. J. Environ. Plan. Manag. 2019, 62, 692–716. [CrossRef]
49. Advantage, C. Corporate Social Responsibility. In CSR and Socially Responsible Investing Strategies in Transitioning and EmergingEconomies; IGI Global: Hershey, PA, USA, 2020; p. 65.
50. Abbas, J. Impact of total quality management on corporate sustainability through the mediating effect of knowledge management.J. Clean. Prod. 2020, 244, 118806. [CrossRef]
51. Gorski, H. Leadership and corporate social responsibility. In Proceedings of the International Conference Knowledge-BasedOrganization, Sibiu, Romania, 15–17 June 2017; pp. 372–377.
52. Banerjee, S.; Wathieu, L. Corporate social responsibility and product quality: Complements or substitutes? Int. J. Res. Mark. 2017,34, 734–745. [CrossRef]
53. Ingenbleek, P.; Dentoni, D. Learning from stakeholder pressure and embeddedness: The roles of absorptive capacity in thecorporate social responsibility of Dutch Agribusinesses. Sustainability 2016, 8, 1026. [CrossRef]
54. Unnikrishnan, P.; Tikoria, J.; Agariya, A.K. TQM to business excellence: A research journey (1985–2018). Int. J. Bus. Excell. 2019,19, 323–363. [CrossRef]
55. Marchiori, D.; Mendes, L. Knowledge management and total quality management: Foundations, intellectual structures, insightsregarding evolution of the literature. Total Qual. Manag. Bus. Excell. 2020, 31, 1135–1169. [CrossRef]
56. Zizakov, M.; Vasic, S.; Delic, M.; Orosnjak, M.; Vulanovic, S. The Interdependencies of Quality Management, KnowledgeManagement and Innovation Performance. A Literature Review. In Proceedings of the IFIP International Conference onAdvances in Production Management Systems, Novi Sad, Serbia, 30 August–3 September 2020; pp. 575–582.
57. Demir, A.; Budur, T.; Omer, H.M.; Heshmati, A. Links between knowledge management and organisational sustainability: Doesthe ISO 9001 certification have an effect? Knowl. Manag. Res. Pract. 2021, 1–14. [CrossRef]
58. Wilson, J.P.; Campbell, L. ISO 9001: 2015: The evolution and convergence of quality management and knowledge managementfor competitive advantage. Total Qual. Manag. Bus. Excell. 2020, 31, 761–776. [CrossRef]
59. Stewart, D.; Waddell, D. Knowledge Management: The fundamental component for delivery of quality. Total Qual. Manag. 2008,19, 987–996. [CrossRef]
60. Kogut, B.; Zander, U. Knowledge of the firm, combinative capabilities, and the replication of technology. Organ. Sci. 1992, 3,383–397. [CrossRef]
61. Lin, C.; Wu, C. Managing knowledge contributed by ISO 9001:2000. Int. J. Qual. Reliab. Manag. 2005, 22, 968–985. [CrossRef]62. Colurcio, M. TQM: A knowledge enabler? TQM J. 2009, 21, 236–248. [CrossRef]63. Ashraf, A.A. Total quality management, knowledge management and corporate culture: How do they synchronized for
performance excellence. Pak. J. Commer. Soc. Sci. 2016, 10, 200–211.64. Lopes, C.M.; Scavarda, A.; Hofmeister, L.F.; Thomé, A.M.T.; Vaccaro, G.L.R. An analysis of the interplay between organizational
sustainability, knowledge management, and open innovation. J. Clean. Prod. 2017, 142, 476–488. [CrossRef]65. Akram, M.S.; Goraya, M.; Malik, A.; Aljarallah, A.M. Organizational performance and sustainability: Exploring the roles of IT
capabilities and knowledge management capabilities. Sustainability 2018, 10, 3816. [CrossRef]66. Manab, N.; Aziz, N. Integrating knowledge management in sustainability risk management practices for company survival.
Manag. Sci. Lett. 2019, 9, 585–594. [CrossRef]67. Sanguankaew, P.; Vathanophas Ractham, V. Bibliometric review of research on knowledge management and sustainability,
1994–2018. Sustainability 2019, 11, 4388. [CrossRef]68. IQAir. Air Quality in Pakistan. Available online: https://www.iqair.com/us/pakistan (accessed on 9 May 2021).69. Chao, A.C.; Hong, L. Corporate Social Responsibility Strategy, Environment and Energy Policy. Struct. Change Econ. Dyn. 2019,
51, 311–317. [CrossRef]70. Ahmad, N.; Ullah, Z.; Arshad, M.Z.; waqas Kamran, H.; Scholz, M.; Han, H. Relationship between corporate social responsibility
at the micro-level and environmental performance: The mediating role of employee pro-environmental behavior and themoderating role of gender. Sustain. Prod. Consum. 2021, 27, 1138–1148. [CrossRef]
71. Declaration, H. Human experimentation: Code of ethics of World Medical Association. Declaration of Helsinki. Br. Med. J. 1964,2, 177.
72. Qing, M.; Asif, M.; Hussain, A.; Jameel, A. Exploring the impact of ethical leadership on job satisfaction and organizationalcommitment in public sector organizations: The mediating role of psychological empowerment. Rev. Manag. Sci. 2020, 14,1405–1432. [CrossRef]
73. Guo, M.; Ahmad, N.; Adnan, M.; Scholz, M.; Naveed, R.T. The Relationship of CSR and Employee Creativity in the Hotel Sector:The Mediating Role of Job Autonomy. Sustainability 2021, 13, 10032. [CrossRef]
74. Saraph, J.V.; Benson, P.G.; Schroeder, R.G. An instrument for measuring the critical factors of quality management. Decis. Sci.1989, 20, 810–829. [CrossRef]
37
Sustainability 2021, 13, 11514
75. Samson, D.; Terziovski, M. The relationship between total quality management practices and operational performance. J. Oper.Manag. 1999, 17, 393–409. [CrossRef]
76. Kaynak, H. The relationship between total quality management practices and their effects on firm performance. J. Oper. Manag.2003, 21, 405–435. [CrossRef]
77. Sila, I. Examining the effects of contextual factors on TQM and performance through the lens of organizational theories: Anempirical study. J. Oper. Manag. 2007, 25, 83–109. [CrossRef]
78. Turker, D. Measuring corporate social responsibility: A scale development study. J. Bus. Ethics 2009, 85, 411–427. [CrossRef]79. Darroch, J. Knowledge management, innovation and firm performance. J. Knowl. Manag. 2005, 9, 101–115. [CrossRef]80. Lee, C.S.; Wong, K.Y. Development and validation of knowledge management performance measurement constructs for small
and medium enterprises. J. Knowl. Manag. 2015, 19, 711–734. [CrossRef]81. Hair, J.F.; Money, A.H.; Samouel, P.; Page, M. Research methods for business. Educ. + Train. 2007, 49, 336–337. [CrossRef]82. Podsakoff, P.M.; MacKenzie, S.B.; Podsakoff, N.P. Sources of method bias in social science research and recommendations on how
to control it. Annu. Rev. Psychol. 2012, 63, 539–569. [CrossRef]83. Harman, H.H. Modern Factor Analysis; University of Chicago Press: Chicago, IL, USA, 1976.84. Civelek, M.E. Essentials of Structural Equation Modeling; Zea Books: Lincoln, NE, USA, 2018.85. Chin, W.W.; Peterson, R.A.; Brown, S.P. Structural equation modeling in marketing: Some practical reminders. J. Mark. Theory
Pract. 2008, 16, 287–298. [CrossRef]86. Byrne, B.M. Structural Equation Modeling with Mplus: Basic Concepts, Applications, and Programming; Routledge: Abingdon-on-
Thames, UK, 2013.87. Streukens, S.; Leroi-Werelds, S. Bootstrapping and PLS-SEM: A step-by-step guide to get more out of your bootstrap results. Eur.
Manag. J. 2016, 34, 618–632. [CrossRef]88. Streukens, S.; Leroi-Werelds, S.; Willems, K. Dealing with nonlinearity in importance-performance map analysis (IPMA): An
integrative framework in a PLS-SEM context. In Partial Least Squares Path Modeling; Springer: Berlin/Heidleberg, Germany, 2017;pp. 367–403.
89. Mustafa, M.B.; Nordin, M.B.; Razzaq, A.B.A. Structural Equation Modelling Using AMOS: Confirmatory Factor Analysis forTaskload of Special Education Integration Program Teachers. Univers. J. Educ. Res. 2020, 8, 127–133. [CrossRef]
90. Fornell, C.; Larcker, D.F. Structural equation models with unobservable variables and measurement error: Algebra and statistics.J. Mark. Res. 1981. [CrossRef]
91. Li, D.; Zhao, Y.; Zhang, L.; Chen, X.; Cao, C. Impact of quality management on green innovation. J. Clean. Prod. 2018, 170, 462–470.[CrossRef]
92. Dieste, M.; Panizzolo, R.; Garza-Reyes, J.A. Evaluating the impact of lean practices on environmental performance: Evidencesfrom five manufacturing companies. Prod. Plan. Control 2020, 31, 739–756. [CrossRef]
93. Kang, J.-S.; Chiang, C.-F.; Huangthanapan, K.; Downing, S. Corporate social responsibility and sustainability balanced scorecard:The case study of family-owned hotels. Int. J. Hosp. Manag. 2015, 48, 124–134. [CrossRef]
94. Shahzad, M.; Qu, Y.; Ur Rehman, S.; Zafar, A.U.; Ding, X.; Abbas, J. Impact of knowledge absorptive capacity on corporatesustainability with mediating role of CSR: Analysis from the Asian context. J. Environ. Plan. Manag. 2020, 63, 148–174. [CrossRef]
95. Chen, R.; Wang, C.-H.; Lee, Y.-D. Total quality management (TQM) is the lifeline of an organization’s sustainable development:Leadership is the impetus to change’. Int. J. Innov. Stud. Sociol. Humanit. 2018, 3, 5–18.
96. Hamdan, Y.; Alheet, A.F. Toward sustainability: The role of tqm and corporate green performance in the manufacturing sector.Int. J. Entrep. 2021, 25, 1–15.
97. Mendes, L. TQM and knowledge management: An integrated approach towards tacit knowledge management. In Handbook ofResearch on Tacit Knowledge Management for Organizational Success; IGI Global: Hershey, PA, USA, 2017; pp. 236–263.
98. Green, K.W.; Inman, R.A.; Sower, V.E.; Zelbst, P.J. Impact of JIT, TQM and green supply chain practices on environmentalsustainability. J. Manuf. Technol. Manag. 2019, 30, 26–47. [CrossRef]
99. Sriyakul, T.; Umam, R.; Jermsittiparsert, K. Supplier Relationship Management, TQM Implementation, Leadership and Environ-mental Performance: Does Institutional Pressure Matter. Int. J. Innov. Creat. Chang. 2019, 5, 211–227.
100. Tasleem, M.; Khan, N.; Nisar, A. Impact of technology management on corporate sustainability performance. Int. J. Qual. Reliab.Manag. 2019, 36, 1574–1599. [CrossRef]
101. García-Alcaraz, J.L.; Flor-Montalvo, F.J.; Avelar-Sosa, L.; Sánchez-Ramírez, C.; Jiménez-Macías, E. Human resource abilities andskills in TQM for sustainable enterprises. Sustainability 2019, 11, 6488. [CrossRef]
102. Perey, R.; Benn, S.; Agarwal, R.; Edwards, M. The place of waste: Changing business value for the circular economy. Bus. StrategyEnviron. 2018, 27, 631–642. [CrossRef]
103. Umer, M.; Abid, M. Economic practices in plastic industry from raw material to waste in Pakistan: A case study. Asian J. WaterEnviron. Pollut. 2017, 14, 81–90. [CrossRef]
38
sustainability
Article
From Waste Pickers to Producers: An Inclusive CircularEconomy Solution through Development of Cooperatives inWaste Management
Rajesh Buch *, Alicia Marseille, Matthew Williams, Rimjhim Aggarwal and Aparna Sharma
Abstract: The world’s global plastics waste crisis demands policy coordination and technologi-cal solutions to improve waste management systems, and organizations worldwide have createdmomentum around the concept of a circular economy. This paper advances a holistic, inclusivecircular economy framework that aims to empower waste pickers with the following basic pillars:(1) build collaborative networks of stakeholders to enable inclusion of waste pickers; (2) establishcooperative enterprise models to integrate waste pickers into the formal economy; (3) build wastepickers’ technical skills and capacity for entrepreneurship; and (4) provide access to technologies andmarkets that enable waste pickers to manufacture upcycled products.
The world faces a global plastics waste crisis that demands policy coordination andtechnological solutions to improve waste management systems at every stage, includingthe collection, transport, sorting, treatment, and final disposal or reprocessing of waste.International organizations, governments, and the private sector have created momen-tum behind rethinking the after-market plastics economy through a circular economy,defined as “keeping materials and products in circulation for as long as possible throughpractices such as reuse of products, sharing of underused assets, repairing, recycling andremanufacturing . . . [and] restoring natural systems, designing out waste, and substitut-ing non-renewable materials with biological and renewable ones” [1]. Circular economysolutions have the potential to drive economic growth [2] and create between 9 and12 million new jobs worldwide [3] in addition to alleviating the environmental and eco-nomic consequences of plastic waste. Critically, circular economy solutions, if designed andimplemented with an eye for the needs of vulnerable workers, also offer new opportunitiesto maximize social equity and economic inclusion.
This paper advances an inclusive circular economy solution that aims to empowerwaste pickers in the developing world. Waste pickers have the potential to act as environ-mental stewards by mitigating the effects of waste, contributing to the resilience of urbansystems, reducing greenhouse gas (GHG) emissions through recovery of materials fromwaste streams, and saving energy and preserving natural resources by enabling recyclingand reuse [4]. They play critical roles in waste management, but their full potential to con-tribute to the circular economy remains unrealized due to their marginalized social status,lack of recognition by authorities, and disconnection from the formal economy. Addition-ally, they face significant occupational hazards and social exclusion, and their livelihoodsare at risk of being displaced by private-sector-led waste management approaches.
Due to the prevalence of plastic waste, combined with its unique harms and rela-tive ease of reprocessing, this paper emphasizes the strong potential of plastics recoveryand remanufacturing as an initial input for this approach to catalyzing greater inclusionand entrepreneurial capacity for waste pickers; however, the inclusive circular economysolution described here has wide applicability for nearly any other waste stream. Afterdescribing the global plastics crisis, we discuss the unique social, occupational, and eco-nomic challenges faced by waste pickers. We then propose a new strategy for empoweringwaste pickers through education and capacity strengthening that leverages cooperativeenterprise models, along with low-cost micro-manufacturing technologies, that will allowwaste pickers to create value-added products out of plastic waste—enabling new economicopportunities for waste pickers-as-producers while realizing their enormous potential toaccelerate the transition to a circular economy.
2. The Growth in Plastics Use and Waste
Plastics are integral to the global economy, acting as an enabling technology in almostevery sector of economic activity. For decades, the production of plastics increased at acompound annual growth rate of 8.4%, from 2 Mt in 1950 to 380 Mt in 2015—roughly2.5 times the compound annual growth rate of global GDP during the same period. Onlya relatively small share of plastics produced throughout history have ever been recycled.By one estimate, of the 6300 Mt of plastics produced from 1950–2015, 79% accumulatedin landfills or in the environment, 12% was incinerated, and only 9% was recycled [5].The fate of plastics is invariably intertwined with waste management systems that arepoorly optimized for recycling and reuse. Globally 37% of waste is disposed in landfills,33% is openly dumped, 11% is incinerated for final disposal, and only 19% is recycled. Inlow-income countries, 90% of solid waste is still burned or openly dumped, and low- andmiddle-income countries are expected to see a threefold increase in total waste productionby 2050 [6]—a fact that is especially significant to the solution described here, given thelarge numbers of informal sector waste pickers in these countries.
3. Harmful Impact of Plastic Waste
The harms of plastic waste can broadly be categorized in environmental and economicterms. Regarding the environment, plastic waste contributes to the destruction of naturalecosystems, especially oceans and riverways. Ten rivers account for 88–95% of plasticdebris that makes its way to the ocean [7]. Eight million tons of plastic waste are depositedinto oceans each year—the equivalent of dumping a garbage truck full of plastic into theocean every minute. By 2050, the rate of plastic dumping into the ocean will increase tofour dump trucks per minute, and the volume of plastics by weight will exceed that offish [8]. Plastics that litter the earth also disintegrate into microplastic particles that becomeatmospheric pollutants. One study recorded 365 microplastic particles per square footfalling from the sky [9]. The health consequences of microplastics inhalation and ingestionare unknown [10]. An additional environmental harm of plastics waste is the productionof GHGs from after-use incineration, estimated at 390 Mt in 2012. From now through 2050,GHG emissions from the plastics sector will increase from 1% of global carbon emissionsto 15%, contributing significantly to climate change [8].
The mismanagement of plastic waste also has significant financial impacts. Ninety-five percent of the material value of plastics packaging, estimated at 80–120 billion USD, islost after a single usage cycle [8]. Plastics waste annually causes 13 billion USD in damagesto marine ecosystems and 1.3 billion USD in losses to tourism, fishing, and shippingindustries in the Asia-Pacific Economic Cooperation (APEC) region alone. The total after-use externalities created by plastic waste, accounting for GHGs emitted in production andincineration, are estimated at 40 billion USD annually [8].
40
Sustainability 2021, 13, 8925
4. Waste Picking as Informal Sector Labor
The informal sector accounts for 61% of employment globally—approximately 2 bil-lion people—and comprises 90% of employment in developing countries [11]. Informalworkers are most heavily concentrated in the agricultural sector, but many informal occu-pations exist ranging from housekeeping to construction. The International Labour Officeestimates that in the developing world, 1% of the urban workforce, or 15 to 20 millionpeople, is engaged in recycling [12]. Known as waste pickers, they collect, wash, sort,and process waste from streets, waterways, and landfills. Waste pickers are generally notcompensated for collecting trash, but instead earn income through low-value forms ofresource valorization through volatile commodity markets.
International organizations have attempted to determine the number of waste pickersfrom local to global scales, and although some data are available for cities, country-leveland global data are scarce. Waste pickers comprise an estimated 0.1–0.4% of workersin seven West African cities; 0.7% of workers in South Africa; and 0.1% of workers inIndia [13]. These figures, although proportionately small, represent millions of workers.Some municipal and national governments, such as Brazil, have created employmentclassifications to monitor the waste picker population and track the economic impactsthey create.
The level of organization and labor formality of waste pickers varies, and these twofactors bear heavily on their ability to earn a living wage. Generally, waste pickers fallinto three categories: unorganized (independent), organized (e.g., through a businesscollective or union), and contract laborers [13]. Local authorities often maintain informalarrangements with waste pickers who supplement formal private sector contracts by fillingsmall niches in urban waste management. In Pune, India, municipal authorities offer formalrecognition to waste pickers, providing identity cards and access to health insurance [14],but this is an exceptional case; in most cities, local authorities reap significant benefits fromthe contributions of waste pickers without formally recognizing or paying them [15].
5. Occupational Hazards of Waste Picking
Informal sector workers are uniquely vulnerable to exploitation and mistreatment andlack the security provided by connection to the formal economy, such as banking services,business licensure, and insurance. Waste pickers are no exception to these dynamics andface unique additional challenges. First, waste picking is an inherently high-risk occupationthat brings significant health hazards, such as exposure to hazardous chemicals and biolog-ical waste; threats to occupational safety; and lack of access to basic sanitation amenitieswhen working in landfills, such as drinking water, toilets, and places to wash [16]. In onestudy of waste pickers in Mumbai, India, the “prevalence of morbidities was significantlyhigher among the waste-pickers, particularly for injuries (75%), respiratory illness (28%),eye infection (29%), and stomach problems (32%), compared to the comparison group(17%, 15%, 18%, and 19% respectively)” [17]. Secondly, waste pickers face social alienationand exclusion, ranging from daily mistreatment and humiliation to police harassment andbeatings [18]. Third, waste pickers face a variety of social problems including racial conflict,violence and infighting, theft, insecure living conditions, and substance abuse [16]. Finally,waste pickers are often deprived of opportunities for education and social mobility. Infamilies that rely on waste picking for income, children are often put to work before theycan finish school, reinforcing the cycle of social exclusion and poverty [19]. Importantly,women in waste picking may also suffer gender-based income discrimination: One surveyshowed that where there are larger concentrations of women in informal valorization, junkshops pay women lower rates for materials [14].
41
Sustainability 2021, 13, 8925
6. Economic Vulnerability of Waste Pickers
Waste pickers’ livelihoods are constantly under threat due to their dependence uponvolatility-prone commodity markets and the ever-present possibility of losing access towaste streams as municipalities adopt “cleaner” private sector solutions. Both problemsare exacerbated by their lack of collective economic and political influence. Consequently,waste pickers are uniquely economically vulnerable and often live at the edge of subsistence:for example, in Mumbai, waste pickers earn between 2.71 and 3.62 USD per day [20].
Labor informality adds to the challenges that waste pickers face as service providersat the bottom of the global waste value chain. The primary value that waste pickersprovide is in the highly labor-intensive tasks of door-to-door collection and segregation andpreparation of materials for recycling, which are sold to middlemen who pay low prices—generally only about 10% of the acquired value of the materials, or one-third of what theywould pay to actors in the formal sector [21]. In recent years, the livelihoods of wastepickers have also become increasingly vulnerable to displacement by the private sector,such as when cities establish contracts with waste management providers—sometimesat the behest of donor agencies [12]. For example, the Inter-American DevelopmentBank and the World Bank have encouraged Latin American countries to adopt IntegratedSolid Waste Management (ISWM) solutions that include source reduction, recycling andcomposting, waste transportation, and landfilling. These systems, if designed withoutan eye for inclusion of all stakeholders—including the informal sector—may limit wastepickers’ access to the waste sources that are most profitable for recycling [19]. Althoughsome municipalities have consulted with waste picker cooperatives in ISWM planning tocreate complementarities between waste pickers and the private sector, waste pickers aregenerally left out of deliberation and planning processes that shape their futures [1].
Importantly, top-down, private-sector-implemented approaches to waste manage-ment not only put waste pickers at risk financially, but also reinforce the linear economy.Private sector actors handle waste in whatever manner is most profitable, even if it meansincineration—which creates 25 times the emissions of recycling [12]. In contrast, wastepickers are incentivized to maximize the quantity and quality of recyclable material forresale, and thus devote significant effort to segregating the waste and connecting to appro-priate buyers using their local knowledge. One study of six cities found that where privatesector recycling has replaced informal valorization, results have been inconsistent, andrecycling plants have tended to show disappointing performance. The study concludesthat, partially as a result of waste pickers’ reliance on lower technology solutions (suchas human and animal transport of waste), “an integration of the informal sector wouldcontribute significantly to reducing GHG emissions, as it results in increases in the quantityof recovered material . . . [and] more material recovery at lower environmental cost” [14].
7. An Inclusive Circular Economy Solution for Waste Pickers
The transition to a global circular economy is often characterized as a solution toenvironmental problems, but this effort also presents opportunities to design solutions toalleviate inequity and social exclusion. Prevailing top-down approaches to waste man-agement in developing countries, even if they mobilize waste picker cooperatives tofacilitate recycling, encourage a race to the bottom in which waste pickers are squeezedby middlemen and left to the mercy of commodity market price fluctuations. Holistic,inclusive circular economy solutions would allow waste pickers to diversify their opera-tions and develop new revenue streams; increase interdependency between waste pickersand conventional waste management actors to facilitate mutually beneficial cooperationthat leverages their distinct competitive advantages; and achieve greater efficiency byshortening waste supply chain movements through decentralized waste processing.
An approach that starts from the bottom up and mobilizes collaborative networksto empower waste pickers with training, organization, and technology will allow themto ascend the value chain by utilizing recyclable materials to manufacture value-addedproducts rather than limiting their role to collecting waste and brokering low-margin sales
42
Sustainability 2021, 13, 8925
to commodity buyers. The integration of the informal sector into waste managementsystems can increase recycling rates, while eliminating child labor; provide waste pickerswith the benefits of formalization such as healthcare, education, and social recognition;and create new jobs and improved livelihoods [3]. More broadly, an equitable transition toa circular economy will improve occupational health and safety for waste pickers, createopportunities for job and venture creation and skills development, and reduce economicharm and displacement.
Although the needs of waste picker communities vary from city to city and country tocountry, a holistic, inclusive circular economy solution should incorporate the followingbasic pillars: (1) foster collaborative networks of international, national, and local stake-holders to support waste pickers; (2) establish and support cooperative enterprise modelsto integrate waste pickers into the formal economy; (3) build waste pickers’ technical skillsand capacity for entrepreneurship; and (4) provide access to technologies and markets thatenable waste pickers to manufacture upcycled products.
7.1. Pillar #1: Building Networks of Stakeholders to Include Waste Pickers
The waste management ecosystems of developing countries comprise multiple ac-tors, including municipalities, waste pickers and waste picker cooperatives, private wastemanagement companies, purchasers of recyclable material and products, academic insti-tutions, international development organizations, and community-based organizations.Successful ISWM planning can ensure the inclusion of the informal sector by facilitatingcollaboration between these stakeholders through transparent, accessible, and participa-tory decision-making and policymaking. Identifying complementary and differentiatedroles for waste pickers within ISWM systems can also improve waste diversion rates,such as by capitalizing on their natural incentives to maximize collection and sort wasteeffectively, and by leveraging their abilities to provide certain services with greater effi-ciency. Improving the working conditions and income potential of waste pickers—andrealizing their full potential to increase recycling rates in order to reduce GHG emissions,improve landfill lifespan and utilization, and maximize the economic value of recyclablematerials—requires raising awareness among diverse stakeholders of the benefits thatwaste pickers provide. Better understanding and measurement of informal valorizationactivities can contribute to national and international recycling goals [14] and facilitateeffective, sustainable collaboration towards common goals related to the empowerment ofwaste pickers. Raising awareness among diverse stakeholders of the benefits that wastepickers provide, and identifying complementary and differentiated roles for waste pickerswithin ISWM systems, can ultimately improve waste system operational, financial, andenvironmental performance, while improving the working conditions and livelihoods ofwaste pickers.
7.2. Pillar #2: Forming and Strengthening Waste Picker Cooperatives
Waste picker cooperatives have proven to be a successful model for integrating wastepickers into the formal economy and domestic and global supply chains, but realizing theirfull potential requires targeted efforts to increase inclusion and empowerment, includingfrom international non-governmental organizations and development agencies [3]. Co-operatives are critical to helping waste pickers to secure living wages by increasing theirability to negotiate with municipalities to maintain access to waste and with buyers tosecure better prices [11]. They provide job security, improved working conditions andhigher wages, resilience to economic shocks, and leadership opportunities for women.Most importantly, they provide connection to the formal economy, as cooperatives arelegally recognized entities that are considered to be part of the formal sector [4]. Inter-ventions aimed at empowering waste pickers must therefore invest in the organization ofbusiness cooperatives, especially in cases where cooperatives have not yet been formed orare weak [22]. To be effective, solutions should strengthen “the internal organization of
43
Sustainability 2021, 13, 8925
waste cooperatives by providing better business skills [and] management training, withparticular emphasis on the core values and principles particular to cooperatives” [19].
7.3. Pillar #3: Capacity Strengthening for Entrepreneurship
Engaging directly with cooperatives allows local and international stakeholders towork with waste pickers to establish comprehensive, community-based economic devel-opment mechanisms. An effective approach for catalyzing enterprise-building shouldaddress topics such as financial literacy, venture formation, business skills, technical skills,end market development, and cooperative formation and management. Addressing theseissues will empower waste pickers to improve the profitability of their current activitiesand begin a shift towards diversified livelihoods, such as micro-manufacturing productsfrom recycled materials, that give them a larger stake in national and regional economies.Capacity strengthening will also allow them to maximize their contributions to wastemanagement systems [23].
7.4. Pillar #4: Access to Technology for Remanufacturing and Production
Critically, even waste pickers who are organized into effective cooperatives andtrained in new business and entrepreneurship skills still find themselves at the mercy ofvolatile commodities markets. Recycling machinery is prohibitively expensive for manycooperatives, and even those that sell fully processed bulk recycled material will remain assmall players in a vast global market as long as their contributions are limited to the baselayer of the recycling value chain [11]. The value added from the work of waste pickers isin collection, sorting, washing, and reselling of waste resources, limiting their ability tosecure and reinvest financial resources to expand the scope of their operations to engage inhigher value activities.
International organizations can play an important role in helping cooperatives toascend the value chain by helping them to obtain affordable, low-tech machines that uti-lize recyclable materials to produce marketable plastic products. They can work withwaste picker cooperatives and local authorities to create networks of decentralized micro-manufacturing facilities in low-income and underserved neighborhoods, helping to createnew revenues that revitalize communities. This approach has the added benefit of short-ening waste supply chains, thereby reducing waste transportation costs and emissions,as waste pickers can process and remanufacture waste nearer to the areas in which theycollect waste rather than at centralized materials recovery facilities. Several private sectorcompanies in India have demonstrated that the production of upcycled products can beprofitable, such as Aarohana Ecosocial Development, which produces crafts and clothingfrom recycled bags [24]. Examples of the kind of products that can be produced with plasticwaste include yoga mats, shoes, clothing, jewelry, athletic gear, backpacks, tools, buildingmaterials, and furniture. Machines for micro-manufacturing upcycled products can beobtained at low cost, such as Precious Plastic USA’s open-source machinery, which costsless than 10,000 USD for a full set including a shredder, compression oven, extruder, andinjector [25].
If waste picker cooperatives can be equipped with the organizational and technologicalcapacity to diversify into the production of value-added products, they can earn highermargins by selling upcycled goods locally, nationally, and even internationally. Localplastic picking and producing cooperatives could scale to become national cooperativessimilar to agriculture-based ones, such as the Amul Dairy Cooperative in India, whichsupports nearly 1 million farmers and generates over 1 billion USD in revenue per year [26].The revenues provided by waste reprocessing and micro-manufacturing, in turn, will allowcooperatives to be self-sustaining, generating revenues that can support increased memberincomes, ongoing venture diversification, and reinvestment into community resourcessuch as education.
44
Sustainability 2021, 13, 8925
8. Conclusions: Circular Economy as a Catalyst for Sustainable Development
Circular economy models are often characterized in terms of concepts such as techno-logical innovation, policy change, industrial systems, and natural capital. These and otherconceptual lenses are essential, but an intentional focus on equitable, inclusive economicdevelopment that creates new livelihoods and maximizes social value is also necessary torealize the full potential of the circular economy. The case of waste pickers demonstrateshow top-down approaches—such as focusing on improving the recyclability of plastics, orcompanies collaborating to standardize packaging protocols—are insufficient to addressthe broader spectrum of socioeconomic concerns surrounding the transition to a circulareconomy, especially the working conditions and livelihoods of workers in developing coun-tries. Although these approaches are necessary, the inclusive circular economy solution forwaste pickers articulated here is an example of how a bottom-up approach can also ensurethat vulnerable workers are not left behind.
Waste pickers have long been marginalized and treated with suspicion by governmentsaround the world, holding them back from realizing their full potential to contribute toresilient urban ecosystems as key players in effective waste management strategies. Evenwhere waste pickers have organized through business cooperatives, their reliance ontraditional business models—based on low-value valorization activities and brokeringthe sale of recyclables at margins that barely turn a profit—limits their ability to earn aliving wage. Cooperatives have proven effective in helping waste pickers to earn betterlivelihoods, improve their working conditions, and achieve formal recognition from localgovernments, but these efforts are limited in their ability to create enduring economicstability for waste pickers. For example, in Pune, India, the nearly 3000 members of theSolid Waste Collection and Handling (SWaCH) cooperative provide waste managementservices to 70% of the city [27]. However, SWaCH still faces threats from large scale, private-sector-led approaches that deprive waste pickers of income while driving environmentallyunfriendly practices such as waste incineration [28].
A holistic, intentionally designed inclusive circular economy solution can build on thesuccess of cooperatives like SWaCH by mobilizing broad networks of stakeholders fromlocal to international scales to assist waste pickers in forming and maintaining cooperativesand in brokering sustainable arrangements with local authorities that secure their access towaste resources. With the training and technology to manufacture products that can be soldfor significantly higher profits than bulk recyclables, these picker–producer cooperativescan diversify their revenues and realize higher returns for their members, catalyzingbottom-up economic growth that has the potential to help waste pickers thrive financiallyand transform the communities in which they live. Moreover, although plastic waste isan ideal initial focus for this approach, this solution can readily be applied to many otherwaste streams—including construction debris, textiles, and even organic matter.
Circular economy practices are critical to solving the global waste crisis, but withholistic design that prioritizes inclusion of the world’s most vulnerable workers, they canalso drive the achievement of sustainable development goals related to poverty, hunger,gender equality, and social inequality [1]. The approach described here is only one exampleof how the transition to a circular economy can be leveraged to maximize inclusion andequitable outcomes for the world’s poorest and ensure that the benefits of the circulareconomy are accessible to all.
Author Contributions: Conceptualization, R.B., A.M. and M.W.; methodology not applicable; soft-ware not applicable; validation, not applicable; formal analysis, not applicable; investigation, notapplicable; resources, not applicable; data curation, not applicable; writing—original draft prepara-tion, M.W., A.S.; writing—review and editing, R.B., A.M., M.W. and R.A.; visualization, not applicable;supervision, R.B., A.M. and R.A.; project administration, not applicable; funding acquisition, notapplicable. All authors have read and agreed to the published version of the manuscript.
Funding: This research received no external funding.
Institutional Review Board Statement: Not applicable.
45
Sustainability 2021, 13, 8925
Informed Consent Statement: Not applicable.
Data Availability Statement: Data sharing not applicable.
Conflicts of Interest: The authors declare no conflict of interest.
References
1. Schroeder, P. Promoting a Just Transition to an Inclusive Circular Economy. Royal Institute of International Affairs. 2020. Availableonline: https://circulareconomy.europa.eu/platform/sites/default/files/2020-04-01-inclusive-circular-economy-schroder.pdf(accessed on 25 April 2020).
2. McCarthy, A.; Dellink, R.; Bibas, R. The Macroeconomics of the Circular Economy Transition: A Critical Review of ModellingApproaches. OECD Environ. Work. Pap. 2018, 130. [CrossRef]
3. Wilson, D.C.; Rodic, L.; Modak, P.; Soos, R.; Carpintero, A.; Velis, K.; Iyer, M.; Simonett, O. Global Waste Management Outlook.2015. Available online: http://web.unep.org/ourplanet/september-2015/unep-publications/global-waste-management-outlook(accessed on 20 April 2020).
4. Gutberlet, J. Waste Picker Social Economy Organizations Addressing the Sustainable Development Goals. In Implementingthe Sustainable Development Goals: What Role for Social and Solidarity Economy? UNTFSSE Knowledge Hub (Online): Geneva,Switzerland, 2019; Available online: https://knowledgehub.unsse.org/wp-content/uploads/2019/06/199_Gutberlet_Waste-picker-social-economy_En.pdf (accessed on 12 April 2020).
5. Geyer, R.; Jambeck, J.R.; Law, K.L. Production, Use, and Fate of All Plastics Ever Made. Sci. Adv. 2017, 3, e1700782. [CrossRef][PubMed]
6. Kaza, S.; Yao, L.; Bhada-Tata, P.; Woerden, F.V. What a Waste 2.0: A Global Snapshot of Solid Waste Management to 2050; World BankPublications: Washington, DC, USA, 2018.
7. Schmidt, C.; Krauth, T.; Wagner, S. Export of Plastic Debris by Rivers into the Sea. Environ. Sci. Technol. 2017, 51, 12246–12253.[CrossRef] [PubMed]
8. Ellen Macarthur Foundation. The New Plastics Economy: Rethinking the Future of Plastics & Catalysing Action. Ellen MacarthurFoundation. 2017. Available online: https://www.ellenmacarthurfoundation.org/assets/downloads/publications/NPEC-Hybrid_English_22-11-17_Digital.pdf (accessed on 1 April 2020).
9. Allen, S.; Allen, D.; Phoenix, V.R.; Le Roux, G.; Durántez Jiménez, P.; Simonneau, A.; Binet, S.; Galop, D. Atmospheric Transportand Deposition of Microplastics in a Remote Mountain Catchment. Nat. Geosci. 2019, 12, 339–344. [CrossRef]
10. Leahy, S. “Microplastics Are Raining Down from the Sky.” National Geographic. 15 April 2019. Available online: https://www.nationalgeographic.com/environment/2019/04/microplastics-pollution-falls-from-air-even-mountains (accessed on 21April 2020).
11. WIEGO. Counting the World’s Informal Workers: A Global Snapshot. 2019. Available online: https://www.wiego.org/sites/default/files/resources/files/WIEGO-Global-Statistics-Snapshot-Pamphlet-English-2019.pdf (accessed on 12 April 2020).
12. WIEGO. Urban Informal Workers and the Green Economy. Available online: https://www.wiego.org/sites/default/files/resources/files/WIEGO_Urban_Informal_Workers_Green_Economy.pdf (accessed on 12 April 2020).
13. Awad, A.B.; de Medina, R.; Vanek, J. Women and Men in the Informal Economy: A Statistical Picture, 2nd ed.; International LabourOffice: Geneva, Switzerland, 2013.
14. Gunsilius, E.; Chaturvedi, B.; Scheinberg, A. The Economics of Informal Sector in Solid Waste Management. CWG/GIZ. 2011.Available online: https://www.giz.de/en/downloads/giz2011-cwg-booklet-economicaspects.pdf (accessed on 15 April 2020).
15. Dias, S.M. Waste Pickers and Cities. Environ. Urban. 2016, 28, 375–390. [CrossRef]16. Schenck, C.J.; Blaauw, P.F.; Viljoen, J.M.; Swart, E.C. Exploring the Potential Health Risks Faced by Waste Pickers on Landfills in
South Africa: A Socio-Ecological Perspective. Int. J. Environ. Res. Public Health 2019, 16, 2059. [CrossRef] [PubMed]17. Chokhandre, P.; Singh, S.; Kashyap, G.C. Prevalence, Predictors and Economic Burden of Morbidities among Waste-Pickers of
Mumbai, India: A Cross-Sectional Study. J. Occup. Med. Toxicol. 2017, 12, 30. [CrossRef] [PubMed]18. Dandapani, S. Unpaid and Undervalued, How India’s Waste Pickers Fight Apathy to Keep Our Cities Clean, the News Minute
[Online]. 30 November 2017. Available online: https://www.thenewsminute.com/article/oppressed-and-unrecognised-life-waste-pickers-crucial-india-s-sanitation- (accessed on 15 April 2020).
19. Marello, M. Waste Pickers: Strategies to Enhance Livelihoods. Master’s Thesis, Boston University, Boston, MA, USA, 2013.Available online: http://www.bu.edu/pardeeschool/files/2014/08/Sample-Policy-Paper-1.pdf (accessed on 20 April 2020).
20. Global Alliance of Waste Pickers. City Report: Interview with a Local Waste Picker. Available online: https://globalrec.org/city/mumbai/ (accessed on 15 April 2020).
21. WIEGO. Waste Pickers. Available online: https://www.wiego.org/informal-economy/occupational-groups/waste-pickers#stats(accessed on 12 April 2020).
22. Dias, S. Three Ways Waste Pickers Can Be Included in the New Circular Economy. Equal Times [Online]. 28 March 2018. Availableonline: https://www.equaltimes.org/three-ways-waste-pickers-can-be?lang=en (accessed on 15 April 2020).
23. Talbot, T.C. A Green Army Is Ready to Keep Plastic Waste Out of the Ocean. Scientific American [Online]. 7 October 2019.Available online: https://blogs.scientificamerican.com/observations/a-green-army-is-ready-to-keep-plastic-waste-out-of-the-ocean/ (accessed on 24 April 2020).
46
Sustainability 2021, 13, 8925
24. Aarohana Ecosocial Development. Watch Our Story! Available online: https://aarohana.org/how-its-made/ (accessed on 1 May2020).
25. Precious Plastic USA. Machines. Available online: https://www.preciousplastic-usa.com/machines (accessed on 24 April 2020).26. Amul Dairy. An Overview. Available online: http://www.amuldairy.com (accessed on 20 April 2020).27. SWaCH homepage. Available online: https://swachcoop.com (accessed on 24 April 2020).28. Talbot, T.C. Picking Dignity. Resource Recycling [Online], Updated 6 February 2018. 4 September 2017. Available online:
https://resource-recycling.com/recycling/2017/09/04/picking-dignity/ (accessed on 24 April 2020).
Challenging Novelties within the Circular Economy Conceptunder the Digital Transformation of Society
Milena P. Ilic 1,*, Marko Rankovic 2, Milutin Dobrilovic 3, Rocsana Bucea-Manea-T, onis 4,5, Larisa Mihoreanu 6,
Mădălina Ionela Ghet,a7 and Violeta-Elena Simion 8
1 Information Technology School ITS-Belgrade, LINK Group Belgrade, Faculty of Contemporary Arts Belgrade,University Business Academy, 11000 Belgrade, Serbia
2 Faculty of Information Technology and Engineering, University Union Nikola Tesla, 11080 Belgrade, Serbia;[email protected]
3 Faculty of Economics, University of Belgrade, 11000 Belgrade, Serbia; [email protected] Doctoral School, National University of Physical Education and Sport, 060057 Bucharest, Romania;
[email protected] USH Pro Business, Spiru Haret University, 030167 Bucharest, Romania6 Faculty of Administration and Public Management, Bucharest University of Economic Studies,
010374 Bucharest, Romania; [email protected] Business Administration Doctoral School, Bucharest University of Economic Studies,
Abstract: The study makes, under a new configuration of the circular economy, a cross-countryanalysis based on the Competitiveness and Innovation Indicators in the E.U., i.e., two sub-criteria:private investments, jobs, and gross value added; and patents related to recycling and secondaryraw materials as a proxy for innovation. The analysis proved that investments influence the numberof patents, and participate in societal transformation. A further cluster analysis classified countrieson the level of innovation. The cluster analysis in SPSS centres on significant potential, weaknesses,impact, and waste management control through blockchain technology. It is found that the factorsthat influence innovation, according to the Global Competitiveness Report, link the business dy-namism and innovation capability with the capacity to sustain resilient ideas, such as competitiveintelligence and social entrepreneurship. The discussions aim to prove that the efforts to rethink thecircular economy principles contribute to its conceptual and societal transformation role through theimplementation of innovative processes, inventive solutions, and blockchain technologies, and theirsocial consequences to solve environmental problems. Once understood and accepted, CE will drivesustainable behaviour.
Keywords: circular economy; competitiveness; investments and patents governance; innovation andpolicy for sustainability; societal transformation
1. Introduction
The circular economy sustains economic return, and strengthens the quality of lifethrough its multiple roles. Its principles can positively impact individuals, establishments,and economies. In 2020, the European Union set up the Action Plan for Circular Economy(CE) as the healthiest way to outline sustainability through respect and responsibility withinthe environment and society. The circular economy can drive systemic change, and sustainthe value circulation within the ecosystem, eliminating the concept of waste. The circulareconomy represents a model to restore ecosystems. Both innovation and habit-alteringdefine its implicative characteristics [1–4].
Many scientists consider the circular economy the best model for societal and eco-nomic benefit [1–3]. This is proved as a suitable solution regarding economic and socialinequality, and deficient political strategies. If risks are in a falling trend in a country,the country’s risk premium is also experiencing a fall, which positively influences societyand the national economy [4]. The United Nations and OECD, as institutions of globalrecognition, highlight the circular economy as a significant social shift towards an originaland inherently energetically efficient system; its general implementation will help competi-tiveness that will sustain the high technology use, and give a more effective response toglobal ecological challenges.
Digital and competitive intelligence skilled human resources are the driving factorin the circular economy. Adapted innovative human resources with transferable anddigital competencies are trained in educational institutions using new technologies, suchas blockchain, MOOCs, eXtended Reality (XR), etc. [5,6].
This article aims to analyse the elements of innovation and competitiveness of selectedcountries within the CE concept to measure the position of these countries. Firstly, theanalysis utilises a regression model that shows that the number of patents correlates withthe investments in innovation. Still, additional factors regarding innovation should beanalysed. Secondly, we performed a cluster analysis to emphasise which countries are moreinnovative, and the factors that nudge innovation. This way, with an understanding ofcurrent positions, progress on their path to a circular economy and sustainable developmentcould be measured.
Contributions of the study are reflected in measuring the “as is” situation in terms ofselected circular economy criteria, identifying obstacles, and making recommendations forfurther efforts.
2. Background Research
The European Commission recommended four leading indicators (production andconsumption, waste management, secondary raw material, and competitiveness and inno-vation) for all European countries to use in their national evaluations to take the appropriatemeasures to promote a sustainable circular economy [7]. However, although many qual-itative types of research were performed on the circular economy, competitiveness, andinnovation, only a few studies have quantitatively evaluated the circular economy conceptand the elements included in the EU CE fourth indicator, as they are usually chosen asbackground [8–10].
Ðurdevic et al. believe that being competitive in the domestic, regional, or worldmarket is set as an aspiration and the goal of doing business for many companies. However,current business conditions on the market impose the need for constant adjustment anda continual search for ways to raise competitiveness for companies. This is preciselybecause of the overproduction and oversaturation of the market [11–13]. Consequently,companies find it challenging to differentiate and position themselves in consumers’ minds(i.e., market positioning). Although it is complex and difficult for companies to achievecompetitiveness in the market in the mentioned business conditions, it is not impossible [14].Ilic and Radnovic find that companies constantly have to fight to keep existing leadershippositions by winning new ones in the conditions of increased competition in numerousindustries. For companies to cope with such increased competition, it is necessary toconstantly reinvent and adapt their products and business processes to gain an advantageover the competition, thus securing the “best in class position”. Today, it can be arguedthat innovation, i.e., the introduction and application of new ideas in companies’ businessacross many industries, is a strategic ability. The companies with a low innovation index,i.e., the share of the sales generated by products (processes) existing for less than threeyears, can be neither competitive nor successful [15,16].
Janssens and the team address the need for quantity and quality competencies thatare necessary for a circular transition to occur, and that “transversal competencies and
50
Sustainability 2022, 14, 702
valorisation competencies are equally important as technical competencies for a circulareconomy” [17,18].
The classical meaning of innovation, referring to the creation of new things, is rede-fined by Stošic as “renewal and expansion of products, services and markets”, so those“new ways are set up in management, work organisation, conditions and skills” [19].Miletic et al. find that innovations enable improved quality of products and services,increase security, and lead to increased competitiveness [20]. Gay and Szostak point outthe importance of innovation and creativity for the small- and medium-sized enterprises(SMEs), accounting for more than 90% of companies worldwide, which have to be creativeand innovative to survive in their market, and differ from the competition. They find thatSMEs are not the scaled-down versions of large enterprises [21], a view also confirmed byTorres [22]. Adding that they have their specificities and laws and that, despite specificinherent difficulties, SMEs provide a favourable environment for developing creative ideas.However, specific characteristics are preventing them from implementing innovations. Gayand Szostak believe that innovation is of great importance for driving the competitive-ness of an enterprise and the growth of a country, which is presented through a dilemmaimplying that, although necessary, it brings uncertainty, and is complex to understandand implement. The dilemma worries all companies regardless of the company size. Theauthors, however, note that SMEs are more exposed to uncertainty. Increasing competitionand globalisation have put innovation at the forefront of industrial development. A lack ofthe capacity to successfully manage uncertainty risks is particularly detrimental to smallfirms [21].
Schiederig et al. identify six characteristics of an eco-environmental innovation as “anobject which is characterised by its market orientation, its environmental benefit over itswhole life cycle and which sets the innovative green standard to the company even if itsprimary intention may be environmental or economic” [23].
The technologies’ development and innovative implementation in the market cannotbe conceived outside societal life. They influence everything: work, development, life.Patents play a significant role in technology, from development as a concept, and marketingas a tool. Moreover, transferring innovative technologies to third parties opens up newdevelopment and financial opportunities. Gross domestic spending on research and de-velopment is the first link in the innovation chain. An important step has been taken byintroducing in the Europe 2020 Strategy the leading indicator “research and developmentintensity”, a measure that refers to the dimensions of production and output of innovation.The share of research and development staff in the workforce reached 1.2% of total employ-ment in 2015, most of whom were employed in the business field. This was observed inreporting almost half of the EU enterprises’ innovation activity in 2014. At the same time,the size of GDP per capita was significant; the states with the largest number of innovativeenterprises also had this indicator relatively high. Moreover, one-third of them developedcooperative activities with other enterprises in 2012–2014 [24]. But, it is true that thoughsome countries are spreading technologies [25], others use the know-how generated byother countries [26]. This suggests that research and development is not the only criteriaunderpinning innovation. Other factors need to be considered. Raghupathi V and Raghu-pathi W (2017) noted that the association between living standards and innovation suggeststhat to improve innovation and drive growth, countries need to focus on improving livingstandards in terms of high minimum wages, and better working conditions. At the sametime, they point out that countries with high foreign patents have low tax revenues as apercentage of GDP, and this income is mobile. Patent ownership can be found in locationsother than the country in which they were created [27]. Through answers to some questionsabout the proportion of patented innovations, the pace and continuity of this process in acountry, how patenting affects the dissemination of knowledge, etc., Mosser shows thatinnovation measures are not influenced by local patenting [28]. Having a solid patentsystem is not the essential development policy for low- and middle-income countries, asBronwyn H. (2020) shows [29]. According to the observation of Gold et al. (2017), the
51
Sustainability 2022, 14, 702
relationship between intellectual property and economic growth is a placebo effect ratherthan growth, valid locally, both at the level of companies and the macro level [30–33].
3. Experimental Data, Complex Analysis, and Significant Results
3.1. Data and Variables
The European Commission recommended four leading indicators for European coun-tries to use in their national evaluations to take the appropriate measures to promote asustainable circular economy. These are [7]:
• The production and consumption indicator—consider households’ and economicsectors’ waste product, which has to be reduced as much as possible. It is measuredthrough green public procurement, and the quantity of waste generation and foodwaste to reach self-sufficiency of raw materials for production in the EU [7].
• Waste management indicator—based on the reuse-recycle-repair principle to createvalue from treated waste, and is measured by two determinants: recycling rates; andspecific waste streams, such as packaging waste, biowaste, e-waste, etc. [34].
• Secondary raw materials indicator—recycled materials bring added value once re-introduced into the economy circuits, saving natural resources consumption, mitigat-ing the environmental footprint, and offering a continuous supply of raw materials. Itis evaluated through the contribution of recycled materials to raw materials demand,and the trade of recyclable raw materials between the EU member states [28,35].
• Competitiveness and innovation indicator—creates continuously new types of jobsand sustainable activities, green forms of products, industries, agriculture. Innovationin technology, raw material, design, production, and methodology will facilitate thereuse of waste. Private investments, jobs, gross value added, and patents relatedto recycling and secondary raw materials as a proxy for innovation. The privateinvestment and patents will be analysed in this paper.
The authors chose to analyse the competitiveness and innovation EU CE indicator,collecting Eurostat data [7] regarding the average investment (private investments, jobs andgross value added related to circular economy sectors—CEI_CIE010) and patents (patentsabout recycling and secondary raw materials—CEI_CIE020) for 2012–2018, by country in EU(Appendix A). We chose 2012 as the starting date for the analysis, referring primarily to thesituation in Romania. In 2012, the industrial production stagnated after 2010, and in 2011, itregistered uninterrupted increases, according to the National Institute of Statistics [36]. Wethen looked at how this aspect is found at the European level. Furthermore, in the followingfew years, the worldwide growth rate of gross world product fell to the lowest level sincethe global financial crisis, with significant losses, especially in the period 2014–2015. Forexample, in 2016, 49 countries saw a decline in per capita income [37].
Nevertheless, global growth reached 3.1% in 2017—the fastest pace since 2011. Sub-sequently, due to increased investment in several sectors of activity, the world economyexperienced a revival. The United States, for example, was supported in 2018 by a fiscalexpansion that offset the deficit of other economies [37].
3.2. Research Process
The analysis is based on public statistical data available, accessed and collected fromthe European official statistics databases (Eurostat WEF, Balance Innovation scorecard).In addition, we also accessed national authorities’ data to understand the dynamics andimpact of the CE policies in selected countries (Appendix A, Table 2). Finally, figures wereused to present the descriptive statistics of the analysed data (Figure 1).
52
Sustainability 2022, 14, 702
Figure 1. Composite reliability coefficient.
Based on the data presented, we intend to prove the following hypotheses:
Hypothesis 1 (H1). The level of investments influences the number of patents to some extent.
Hypothesis 2 (H2). The innovation level differs in EU countries mainly due to different levels ofinvestments, but other factors might be analysed (such as cultural factors).
In the first stage, a regression model was designed to evaluate the influence of invest-ment over the number of patents in CE in 24 of the EU countries. Because of Eurostat’slack of reported data, Liechtenstein, Norway, Switzerland, Czech Republic, Ireland, Luxem-bourg, Malta, and Iceland were not included. These innovation patents, which now require10% of ROI, will bring in the future 70% of ROI, proving the future sustainable impact ofinnovation on the economy [38–41].
In the second stage, for a clear insight into the impact of innovation on the sustainableeconomy in the EU, a cluster analysis was designed using the K-means algorithm, and eachcluster’s characteristics, challenges, weaknesses, and strengths in obtaining sustainableinnovation were emphasised.
3.3. The First Stage—Regression Analysis for Evaluation Relations between Investmentsand Patents
Firstly, a regression model emphasising the importance of investments in innovationon increasing the number of patents for the EU applied to the fourth CE indicator will beused to obtain the CE outcomes in the EU. Our analysis excludes Liechtenstein, Norway,Switzerland, Czech Republic, Ireland, Luxembourg, Malta, and Iceland because they donot provide data on our variable. A strong positive correlation (0.828) is identified betweenthe model’s two variables (invest and patent). This correlation allows the authors to designthe regression model. The R2 coefficient is 0.68, indicating that the variation of causalinvestment variable determines 68% of the variable patent variance, and the model cannotexplain 32% of this influence. As R2 is not very close to 1, in a future analysis, we haveto add some other factors that influence the number of patents, such as culture, technicalfacilities (hardware, software), the accuracy of knowledge, etc. Finally, the F-statistic offersarguments supporting or rejecting the null hypothesis (H0). Having a low value (0.00), theprobability of making a mistake if accepting H1 is minimal. Thus, H1 is proven (the levelof investments influences the number of patents).
R2 (0.67)’s adjusted value is also close to the value of R2, which proves that theinfluence of the independent variable (invest) is significant, and explains the variance ofthe dependent variable (patent). Since the adjusted R2 value is close to the value of R2, thisallows the extension of the proposed regression model to the entire population surveyed.In this case, the variance of the dependent variable decreases with the difference betweenthe two coefficients (0.685 − 0.671 = 0.015). This difference can be seen to be below 1%. The
53
Sustainability 2022, 14, 702
t-test generated for the invest variable validates the model, and contributes to the predictivepower of regression. The variables’ significance threshold (Sig.) should be less than oraround 0.05. In our case, Sig. 0.00 is lower than 0.01 for investment, meaning that thecoefficient of this variable is very well estimated, and Sig. 0.44 for constant is higher than0.05, meaning that the constant could be better estimated.
Durbin–Watson’s statistic strengthens the model, showing no autocorrelation betweenvariables. Durbin–Watson tests the null hypothesis that residuals are not linearly auto-correlated. Though the test can take values between 0 and 4, the values around 2 indicateno autocorrelation. As a rule, values of 1.5 < d <2.5 show no autocorrelation in the data.The VIF value helps us make the collinearity diagnostics. If the VIF value is greater than 3,there is a chance of multi-collinearity between independent variables. If this value is above5, then the chances of multi-collinearity are high. If this value is over 10, the independentvariables indeed show multi-collinearity. In this case, the VIF is 1, meaning there is nocollinearity between variables. In conclusion, the present model is valuable.
The regression equation it might be seen below (Tables 1–3):
Table 2 shows model Summary for the regression equation.Table 3 presents Coefficients for the regression equation.Furthermore, the authors used SmartPLS 3.0 software to calculate the composite
reliability coefficient. The coefficient of composite reliability analysis strengthens ourhypothesis, and shows good internal consistency because it is higher than the acceptedlimit of 0.7. In our case (Figure 1), the coefficient is 1 for both variables: investment andpatent. Furthermore, the path coefficient (0.828 higher than 0.7) and p-Value (0.00 smallerthan 0.1) and a very low standard deviation (0.09) also empowers us to consider that themodel is very reliable.
54
Sustainability 2022, 14, 702
3.4. The Second Stage—K Means Cluster Analysis
Secondly, a cluster analysis was performed to emphasise which countries are moreinnovative, and the factors that nudge innovation [42–44]. Studying the two criteria (patent,invest), one may observe that countries such as Italy (cluster 1), France (cluster 2), andSpain (cluster 6) form clusters by themselves (Table 4). France has almost the same numberof patents as Poland, but France receives a higher investment amount. Spain and Italy havea small number of patents, under the average. Spain must review their innovation policybecause of such low results while receiving a larger number of investments. Countries suchas Belgium, Netherlands, Austria, Poland, and Sweden form cluster 3, representing theaverage sample: they have a medium investment amount and a medium number of patents.However, in this cluster, three countries, mainly the Nordic countries, show a higher degreeof innovation due to significant investment, competitive human resources, and culturalbackground: pro-innovation attitude and the leadership mentality, which urges them to becreative, and find solutions in hostile environments. Germany and the United Kingdom(UK) form cluster 4 because they have a high investment, but the highest number of patentsare obtained by Germany, being the most innovative European country. The complex infras-tructure, technology, pro-innovation attitude, and competitive spirit make the difference inGermany’s case. There is no doubt that the same countries show outstanding digitalisationand competitive intelligence outputs. This helps market actors to easier amass, study,and use information from all the fields of the market—competitors, decision-makers, orcustomers. Other countries, such as Romania, represent the extreme side, and form cluster5. The low level of investment received reflects a small number of patents [45,46]. Still,other very complex factors are challenging to measure in figures/numbers, such as culturalpatterns, self-esteem, lack of perspective, and lack of accurate and useful information thatkeep these countries far from innovation [46–48].
Table 4. Cluster membership, based on both criteria, Patents and Invest.
The European Union conducted a competitiveness and innovation analysis basedon Eurostat data: the eco-innovation index, R&D staff, and the product and innovativeprocess enterprise (with its sub-criteria/items). Investments in human resources, andproper management of life cycle assessments (LCAs), based on blockchain technology,created new business models and innovations that ensured a sustainable economy. Thisassumption was validated by a regression model and K-means analysis [46]. We showthat R&D promotes HR creativity, innovation, and collaboration, which positively affecteco-innovation and sustainable development. Product- and process-innovative companieshave a limited impact on eco-innovation. We continue our previous research with thiscurrent article. The regression analysis shows a strong and positive correlation between
55
Sustainability 2022, 14, 702
investment and patents (0.828—when the investments increase by 1 unit, the number ofpatents increases by 0.828 units). Finally, the European Union countries were groupedbased on investment and patent numbers in clusters. The results showed that all countriesin cluster 5 have a poor track record of innovation. In contrast, clusters 3 and 4 countriesare more innovative, having a good infrastructure, competitive human resources, and apro-innovation culture [47–49].
The good and bad sides of how waste management and energy consumption arecurrently dealt with and treated are subjected to analyses and recommendations for futuresolutions. Promoting the CE indicators represents a recommended solution, to be woveninto all educational programs in everyday communication until they become a conceptfamiliar to all citizens, changing their mindset through ecological sustainability. Dataanalytics, digital technologies, and competitive intelligence are essential facilitators of thecircular economy, changing development towards social entrepreneurship [47]. Competi-tive innovation sustains the idea that learning from what is happening inside and outsidethe business box helps increase both competitiveness and chances for catching any newopportunities. The more one understands, the bigger the profit and the chances to overcomecompetitors, satisfying customers, and facilitating operational management developmentfor society and the environment. This also contributes to a new design of entrepreneurshipto combine the classical and modern professions, develop new ways of business, and speedup decisions linked to environment preservation.
Executive decisions and societal wellbeing [48–51] could help those countries sufferingbecause of insufficient investment, limited access to knowledge, and other constraints thatstop their move for a better and more-accomplished life. Here, social entrepreneurs havean important word to say and a challenging task for the circular economy to drive the nextlevel of development and impact their future.
Although this research has shown a strong positive correlation between investmentsand innovation, using the number of patents as proxy, the creation of patents solely doesnot guarantee their usability or an economic return or contribution to societal develop-ment. Indeed, there are many patents and innovations that never reach the market due tounfavourable economic and business conditions. An object of further study would be toassess the quality of patents, and their impact on society and the economy, as it is difficultto quantify the impact of these patents on the circular economy. It is indeed possible thatsome technologies prove to be unsustainable, and rather hinder the progress to a circulareconomy. As this study has only explained part of the causes of innovation growth throughinvestments, further factors that affect this should be identified and included.
5. Conclusions
The CE influences national economies, organisations, and consumers. Given that fact,each actor participating in either social or business life, and every representative nominatedby the Government, has to find their respective role and interest in sustainable behaviourto reach Green Deal objectives.
The regression model shows that investment proved the most crucial factor thatstimulates patents in CE innovation. However, some other elements deserve to be addedto the model for a sustainable economy, such as creating new jobs in the green economy,governmental support, green public procurement, education for understanding, and theimplementation of digital and transferable knowledge and competencies.
Based on quantitative and qualitative analyses, the paper helps better understandRomania’s current situation regarding innovation and competitiveness.
Some results confirm the hypotheses: (a) the level of investments influences thenumber of patents to some extent; (b) the innovation level differs in EU countries due toinvestment and cultural factors. Therefore, if Romania has an intention to approach theEU average, it has to increase in investments, which will be reflected in the number ofpatents and technology transfers, which would bring numerous benefits to the economyand society, as well as to sustainable development.
56
Sustainability 2022, 14, 702
The importance of the article is subjective. However, the authors are highly motivatedfor their home countries to take a better course in their transition from linear to circularto follow the results of other countries in the lead. Sustainability is neither a race nora competition; it might be a run through different shades of interest in science and pro-fessional education. Executive decisions considering societal wellbeing could help thosecountries in suffering because of insufficient investment, limited access to knowledge, andother constraints that stop their move for a better and more-accomplished life. Here, socialentrepreneurs have an important word and a challenging task for the circular economy todrive the next level of development and impact their future. And they could be assistedby competitive intelligence to unlock the creation of new frameworks; help align targets,activities, and operations across information systems; and increase the speed of circulareconomy transformation into a resilient cornerstone for both people and society.
Author Contributions: Conceptualisation, M.P.I., M.R., M.D., R.B.-M.-T, ., L.M. and V.-E.S.; methodol-ogy, R.B.-M.-T, ., L.M. and V.-E.S.; software, R.B.-M.-T, . and L.M.; validation, M.I.G. and V.-E.S.; formalanalysis, R.B.-M.-T, .; investigation, M.P.I., M.I.G. and R.B.-M.-T, .; resources, M.P.I. and R.B.-M.-T, .; datacuration, R.B.-M.-T, .; writing—original draft preparation, M.P.I., M.R., M.D., M.I.G., R.B.-M.-T, ., L.M.and V.-E.S.; writing—review and editing, M.P.I., M.R., M.D., M.I.G., R.B.-M.-T, ., L.M. and V.-E.S.;visualisation, L.M., M.I.G. and M.D.; supervision, M.D.; project administration, V.-E.S.; fundingacquisition, M.P.I. All authors have read and agreed to the published version of the manuscript.
Funding: This research received no external funding.
Institutional Review Board Statement: Not applicable.
Informed Consent Statement: Not applicable.
Data Availability Statement: The data are available on request from the corresponding author.
Conflicts of Interest: The authors declare no conflict of interest.
Appendix A. Average of Investment and Patents for 2012–2018, by Country in EU
Table A1. Average of Investment and Patents for 2012–2018, by country in EU.
1. Franco-García, M.; Carpio Aguilar, J.-C.; Bressers, H.T. Towards Zero Waste—Circular Economy Boost, Waste to Resources; SpringerInternational: London, UK, 2019.
2. Tonelli, M.; Cristoni, N. Strategic Management and the Circular Economy; Routledge: London, UK, 2019.3. Stahel, W. The Circular Economy A User’s Guide; Routledge: London, UK, 2019.4. Petrovic, D.; Ilic, M.; Rankovic, M.; Dobrilovic, M. Calculation of the Risk of Investment in Southeast European Countries by
Applying the CAPM Model. Vision 2025: Education Excellence and Management of Innovations through Sustainable EconomicCompetitive Advantage. In Proceedings of the International Business Information Management Conference (34th IBIMA),Madrid, Spain, 13–14 November 2019; pp. 1600–1603.
6. Yumna, H.; Khan, M.M.; Ikram, M.; Ilyas, S. Use of Blockchain in Education: A Systematic Literature Review. In Proceedings ofthe 11th Asian Conference on Intelligent Information and Database Systems, ACIIDS 2019, Yogyakarta, Indonesia, 8–11 April2019; Part II, pp. 191–202.
7. Eurostat. Circular Economy Indicators. Available online: https://ec.europa.eu/eurostat/web/circular-economy/indicators(accessed on 15 February 2021).
8. Grafström, J.; Siri, A. Breaking circular economy barriers. J. Clean. Prod. 2021, 292, 126002. [CrossRef]9. Hysa, E.; Kruja, A.; Naqeeb, R.; Laurenti, R. Circular Economy Innovation and Environmental Sustainability Impact on Economic
Growth: An Integrated Model for Sustainable Development. Sustainability 2020, 12, 4831. [CrossRef]10. Trica, C.L.; Banacu, C.S.; Busu, M. Environmental Factors and Sustainability of the Circular Economy Model at the European
Union level. Sustainability 2019, 11, 1114. [CrossRef]11. Laurenti, R.; Singh, J.; Frostell, B.; Sinha, R.; Binder, C.R. The Socio-Economic Embeddedness of the Circular Economy:
An Integrative Framework. Sustainability 2018, 10, 2129. [CrossRef]12. Lazarevic, D.; Valve, H. Narrating expectations for the circular economy: Towards a common and contested European transition.
Energy Res. Soc. Sci. 2017, 31, 60–69. [CrossRef]13. Bucea-Manea-T, onis, , R.; Dourado Martins, O.M.; Ilic, D.; Belous, M.; Bucea-Manea-T, onis, , R.; Braicu, C.; Simion, V.-E. Green and
Sustainable Public Procurement—An Instrument for Nudging Consumer Behavior. A Case Study on Romanian Green PublicAgriculture across Different Sectors of Activity. Sustainability 2020, 13, 12. [CrossRef]
14. Ðurdevic, D.; Radnovic, B.; lic, M. Organizacija marketing logistike u funkciji tržišne konkurentnosti. Posl. Ekon. 2017, 11,165–183.
15. Ilic, M.; Radnovic, B. Inoviranje u Turizmu kao nacin Obezbedenja Konkurentske prednosti, sa Konkretnim Primerima. QualityFestival Kragujevac. 2008. Available online: http://www.cqm.rs/2008/pdf/35/27.pdf (accessed on 4 January 2022).
16. Brydges, T. Closing the loop on take, make, waste: Investigating circular economy practices in the Swedish fashion industry.J. Clean. Prod. 2021, 293, 126245. [CrossRef]
17. Hull, C.E.; Millette, S.; William, E. Challenges and opportunities in building circular-economy incubators: Stakeholder perspec-tives in Trinidad and Tobago. J. Clean. Prod. 2021, 296, 126412. [CrossRef]
18. Janssens, L.; Kuppens, T.; Schoubroeck, S.V. Competences of the professional of the future in the circular economy: Evidence fromthe case of Limburg, Belgium. J. Clean. Prod. 2021, 281, 125365. [CrossRef]
19. Stošic, B. Menadžment inovacija u ekonomiji baziranoj na znanju. Manag.—Casopis Za Teor. I Praksu Menadžmenta 2006, 11, 11–16.20. Miletic, L.; Ilic, M.; Kastratovic, E. The role of financial institutions from the aspect of innovated banking products and services as
the reply of banks in Serbia to the changes in the environment. Int. Rev. 2018, 1, 111–118. [CrossRef]21. Gay, C.; Szostak, B. Innovation and Creativity in SMEs; STE Ltd.: London, UK; John Wiley & Sons, Inc.: Hoboken, NJ, USA, 2019.22. Torrès, O. Les PME, Tiers État permanent. In Sociétal; Daniel, J.M., Monlouis-Felicité, F., Eds.; Eyrolles: Paris, France, 2017;
pp. 58–70.23. Schiederig, T.; Tietze, F.; Herstat, C. Green innovation in technology and innovation management–An exploratory literature
review. R&D Manag. 2012, 42, 180–192.24. Europe 2020 Indicators—R&D and Innovation. July 2017. Available online: https://ec.europa.eu/eurostat/statistics-explained/
index.php?title=Europe_2020_indicators_-_R%26D_and_innovation&oldid=335438 (accessed on 15 November 2021).25. Wang, E. Determinants of R&D investment: The extreme-bounds analysis approach applied to 26 OECD countries. Res. Policy
2010, 39, 103–116.26. Guloglu, B.; Tekin, R.B. A panel causality analysis of the relationship among research and development, innovation, and economic
growth in high-income OECD countries. Eurasian Econ. Rev. 2012, 2, 32–47.27. Raghupathi, V.; Raghupathi, W. Innovation at country-level: Association between economic development and patents. J. Innov.
Entrep. 2017, 6, 4. [CrossRef]28. Moser, P. Patents and Innovation: Evidence from Economic History. J. Econ. Perspect. 2013, 27, 23–44. [CrossRef]29. Hall, B.H. Patents, Innovation, and Development; NBER Working Paper No. 27203, JEL No. L65,O25,O30,O34; NBER: Cambridge,
MA, USA, 2020.30. Gold, E.R.; Morin, J.-F.; Shadeed, E. Does intellectual property lead to economic growth? Insights from a novel IP dataset. Regul.
Gov. 2017, 13, 107–124. [CrossRef]
58
Sustainability 2022, 14, 702
31. Fidélis, T.; Saavedra Cardoso, A.; Ri, F.; Catarina Miranda, A.; Abrantes, J.; Teles, F.; Roebeling, P.C. Policy narratives of circulareconomy in the E.U.—Assessing the embeddedness of water and land in national action plans. J. Clean. Prod. 2021, 288, 125685.[CrossRef]
32. Matthews, C.; Moran, F.; Jaiswalt, A.K. A review on European Union’s strategy for plastics in a circular economy and its impacton food safety. J. Clean. Prod. 2021, 283, 125263. [CrossRef]
33. Lacy, P.; Long, J.; Spinder, W. The Circular Economy Handbook, Realising the Circular Advantage; Palgrave Macmillan: London,UK, 2020.
34. Sharma, S.; Basu, S.; Shetti, N.P.; Aminabhavi, T.M. Waste-to-energy nexus for circular economy and environmental protection:Recent trends in hydrogen energy. Sci. Total Environ. 2020, 713, 136633. [CrossRef]
35. Raw Materials Information System. E.U. Science Hub. Available online: https://rmis.jrc.ec.europa.eu/?page=circular-economy-monitoring (accessed on 10 September 2021).
36. National Institute of Statistics. Available online: http://www.insse.ro/cms/ro/content/comunicate-de-presa-arhiva (accessedon 19 December 2021).
37. United Nations, Department of Economic and Social Affairs Economic Analysis. World Economic Situation and Prospects:November 2018 Briefing, No. 120. 2018. Available online: https://www.un.org/development/desa/dpad/publication/world-economic-situation-and-prospects-november-2018-briefing-no-120 (accessed on 19 December 2021).
38. Rocsana & Radu Bucea Manea Tonis, Lianu Costin, Gudei Corina, Lianu Cosmin. Inovare si digitalizare din perspectivă man-agerială. Ed. Economica, 2020. Available online: https://www.librarie.net/p/398233/inovare-si-digitalizare-din-perspectiva-manageriala (accessed on 19 December 2021).
39. Yadav, S.; Lenka, U. Diversity management: A systematic review. Equal. Divers. Incl. 2020, 39, 901–929. [CrossRef]40. Kukenberger, M.R.; D’Innocenzo, L. The building blocks of shared leadership: The interactive effects of diversity types, team
climate, and time. Pers. Psychol. 2020, 73, 125–150. [CrossRef]41. Roh, H.; Chun, K.; Ryou, Y.; Son, J. Opening the Black Box: A Meta-Analytic Examination of the Effects of Top Management Team
Diversity on Emergent Team Processes and Multilevel Contextual Influence. Group Organ. Manag. 2019, 44, 112–164. [CrossRef]42. Pocol, C.B.; Pinoteau, M.; Amuza, A.; Burlea-Schiopoiu, A.; Glogovetan, A.I. Food Waste Behavior among Romanian Consumers:
A Cluster Analysis. Sustainability 2020, 12, 9708. [CrossRef]43. Resti, Y.; Burlian, F.; Yani, I.; Rosiliani, D. Analysis of a cans waste classification system based on the CMYK colour model using
different metric distances on the k-means method. J. Phys. Conf. Ser. 2020, 1500, 012010. [CrossRef]44. Özlem, T.; Turkish, B.S. SMES corporate sustainability approaches: Cluster analysis method, an empirical study. Mediterr. J. Soc.
Sci. 2014, 5, 175. [CrossRef]45. Prokop, V.; Stejskal, J. Different approaches to managing innovation activities: An analysis of strong, moderate, and modest
Innovation and Competition within a European Resilient Circular Economy. A Dual Comparative Study. Sustainability 2021,13, 8290. [CrossRef]
47. Kristoffersen, E.; Blomsma, F.; Mikalef, P.J. The smart circular economy: A digital-enabled circular strategies framework formanufacturing companies. J. Bus. Res. 2020, 120, 241–261. [CrossRef]
48. Costea, C. Complexity: New opportunities for understanding consumption. Proc. SPIE 2008, 6802, 9.49. Profiroiu, A.; Profiroiu, M. Developing Strategic Management Capacity of the Central Government: Limits and Challenges,
American Society for Public Administration. In Proceedings of the 2014 ASPA Annual Conference—Celebrating the Successand Promoting the Future of Public Service, Washington, DC, USA, 14–18 March 2014; 2014. Panel: Strategic Management inPublic Organizations and Local Communities: Pitfalls and Opportunities. Available online: http://issuu.com/aspanational/docs/aspa_2014_conference_program (accessed on 15 November 2021).
50. Kuleto, V.; Ilic, M. AI and developing human intelligence, future learning and educational innovation, John Senior and ÉvaGyarmathy. Rev. Za Soc. Polit. 2021, 28, 429–446. [CrossRef]
1 CENSE—Center for Environmental and Sustainability Research, Department of Environmental Sciencesand Engineering, NOVA School of Science and Technology, NOVA University Lisbon,2829-516 Caparica, Portugal; [email protected] (C.M.); [email protected] (E.P.M.)
2 Department of Civil Engineering, NOVA School of Science and Technology, NOVA University Lisbon,2829-516 Caparica, Portugal
3 Department of Physics, NOVA School of Science and Technology, NOVA University Lisbon,2829-516 Caparica, Portugal
Abstract: Currently, the development of new sustainable technologies to recover raw materials fromsecondary resources has shown a lack of available data on the processes and supplies involved, aswell as their environmental impacts. The present research has conducted a life cycle assessment ofelectrodialytic (ED) technologies to improve critical raw materials recovery in the Portuguese miningindustry. To critically appraise the activities from the mining sector and gather data on technicaland environmental issues, three waste management scenarios were considered: (1) ED treatmentwith a deep eutectic solvent as an adjuvant; (2) ED treatment with simultaneous H2 recovery; and(3) ED treatment with sodium chloride as an enhancement. The data presented were based onglobal databases, technical reports from official sources, and peer-reviewed published experimentaloutcomes. The estimated results indicated that one of the constraints in applying ED technologies isenergy consumption and thus the impacts are highly dependent on energy source choices. On theother hand, as a consequence of the H2 inherently produced by ED technologies, there is a directpotential for energy recovery. Therefore, considering an upscale approach of the ED reactor based onbench scale experimental results, the H2 could be reused in the ED facility or stored. Additionally,according to experimental data, 22% of the tungsten from the fine mine tailings could be recovered.Finally, the possibility to remove 63% of arsenic from mine tailings could decrease contaminationrisks while creating additional marketable co-products.
The European Union 2030 climate action targets aim to reduce 55% of the greenhousegases emissions compared to the values in 1990 [1] and increase the total renewable energyshare in energy consumption by up to 32% by 2030 [2]. Moreover, the Sustainable Devel-opment Goals include targets for water and energy consumption, waste and biodiversitymanagement, and adaptation of mining operations to climate changing conditions [3].
The European Commission has recently launched the fourth critical raw materials list,where tungsten (W) continues, together with other 29 elements, to be included as a materialof high risk of scarcity and economic relevance [4]. Strategies for sustainable reprocessingof mine tailings should be applied to extract valuable raw materials before their disposalor further reuse options.
Tungsten is a valuable transition metal that can be extracted from tungstate min-erals [5], such as scheelite (CaWO4) [6] and wolframite ((Fe,Mn)WO4) [7]. Tungsten isapplied to produce hard metal and metal carbide powder that can be further treated by
powder metallurgical methods for hard metal tools production [8]. If Europe could takefull advantage of its own resources, the dependency on other countries to produce hardmetal tools could be overcome.
Panasqueira is an underground mine located in Portugal, on the southern edge of theEstrela mountain near the Zezere river, which has operated for more than 130 years. ThePanasqueira ores are composed of a series of subhorizontal, stacked, and hydrothermalquartz veins, promoting the mineralization of wolfram-bearing schists and shales. Themineralized area at the Panasqueira mine is 400–2200 m wide, 2500 m long and 500 mdeep. During the mining process two types of mine waste are generated: coarse aggregatesderived from rock blasting and fine tailings conveyed into dams, both of which haveaccumulated for more than 100 years [9].
Storage and/or deposition of mine tailings constitute the main threat to the surround-ing environment of Panasqueira, particularly via water contamination due to their physical,chemical and mineralogical characteristics and to the volume/area occupied by them.These residues, namely, the most ancient, may leach harmful elements from storage sites,designated by acid mine drainage [10]. These residues are more exposed to oxygen andwater, increasing the chance of acids being formed due to sulfide minerals (e.g., pyrite).Other problems that may arise are related to high levels of cyanide and nitrogen com-pounds in waters at mine sites from heap leaching and blasting. Particulate matter can bereleased by the wind from mining activities, such as excavations, blasting, transportation ofmaterials and wind erosion. Moreover, exhaust emissions of the vehicles from mining sitesincrease the levels of particulates [11]. To prevent and control the pollution from severalstreams, the Panasqueira mine has an environmental license that complies with limits andconditions for the management of the environmental pressures [12].
The current decrease in ore grade has prompted the assessment of existing resources,energy needs and environmental impacts of mine tailings in a life cycle overview, concern-ing a circular economy perspective. These approaches play not only an important role insupporting cleaner production, resource management and decision-making in the miningindustry, but also in identifying new business opportunities. The current demand andmetal prices have leveraged the interest in secondary mining resources for critical rawmaterials, where the recycling of W has lower-energy negative impacts (<6000 kWht−1)compared to virgin production (10,000 kWht−1), depending on the grade and cut-off [13].
The impacts from the processing of raw materials should be considered during theselection of the Best Available Techniques (BATs), which are the up to date technologies forpreventing and minimizing emissions and impacts on the environment [14]. Generally, theBATs promote the improvement of the output and energy efficiency of the raw materialproduction process through replacement of the old equipment with new apparatus, whichis less energy consuming [15].
One feasible method to alleviate the impacts of rejected fractions from mining ac-tivities is the electrodialytic (ED) process, which consists of the application of a directlow-level current density (mA/cm2) between pairs of electrodes, to remove substancesfrom different environmental substrates. In the ED treatment of mine tailings, anion (AEM)and cation exchange membranes (CEMs) were used to separate the matrix from the elec-trodes’ compartments [16]. This aimed at controlling the pH conditions of the electrolyteand the matrix, improving the selectivity of the removal of contaminants [17]. The mem-brane surface attracts dissolved ions with the opposite charge (counter-ions) from thepore water of membranes. Thus, the counter-ions are transported through the membranedue to the electrical current while co-ions, that have the same charge of the membrane,are rejected [17].
Research has been performed to assess the feasibility of applying the ED treatmentto W mine tailings to (1) recover W contents and other elements of interest [16], (2) re-move harmful compounds [18], (3) to recover H2 that is inherently produced during thetreatment [19,20], and (4) to provide a suitable matrix for further reuse in the constructionsector as a supplementary cementitious material [21]. Furthermore, the ED process has
62
Sustainability 2021, 13, 3915
demonstrated potential to extract W present in fine tailings (approximately 22%) in thepresence of biodegradable acid adjuvants—natural deep eutectic solvents (DES) [18].
Life cycle assessment (LCA) is an analysis technique applied to assess potential en-vironmental impacts of a product/service from, e.g., raw material acquisition to wastedisposal. LCA provides an estimation of cumulative impacts under environmental cat-egories such as global warming, ozone layer depletion, soil and water acidification, eu-trophication, and abiotic depletion of non-fossil and fossil resources [22]. According to ISO14040 [23] and ISO 14044+A1 [24], the LCA process is systematic and divided into fourphases: (1) goal and scope definition; (2) inventory analysis; (3) impact assessment; and (4)interpretation [25]. LCA requires a detailed inventory analysis to ensure a representativeassessment of all the inputs and outputs of mass and energy across the whole phases of theproduct life cycle, designated by life cycle inventory (LCI) [26].
The upgrades on technical processes should, therefore, consider the environmental,social, and economic consequences of managing mine tailings throughout the value chain.For instance, orebody characterization, mine planning, processing, disposal, reprocessing,recycling, and reuse should be integrated. From an economic point of view, decreasing minetailings is a top priority, followed by reuse, recycling, recovery treatment and disposal. Cir-cular business models supported by public policies could have strategic importance, whereeconomic benefits/incentives could be essential to optimize the recycling managementsystem while increasing recycling rates [27].
The trade-off between raw material extraction from secondary mining resources andthe environmental harmfulness of mine tailings after the ED process, as well as the needto critically understand the information that LCA studies can offer, were the base of thepresent work. Thus, this research shows the potential environmental impacts that shouldbe considered in an LCA when the ED technology is applied to Panasqueira fine tailings.In addition, an upscale hypothetical approach of the ED reactor, based on laboratoryexperimental results, was developed. The impacts estimated and determined in severalscopes are presented in terms of mine tailing management scenarios (direct disposal vs.ED remediation prior to discharge/further reuse options). In this context, three differentoperational ED conditions were considered: (1) ED treatment with a deep eutectic solventas an adjuvant; (2) ED treatment with simultaneous H2 recovery; and (3) ED treatmentwith sodium chloride as an enhancement.
2. Materials and Methods
2.1. Case Description and Production System
The Panasqueira mine, located in the Centro region of Portugal (Figure 1) and de-scribed as the largest Sn–W deposit in Western Europe, has changed its layout over theyears due to the W market downturns. In this way, the optimization of mechanical pro-cesses and the exploration of alternative ores were considered. The Panasqueira mineprocess is summarized in Figure 2. The mine has a production plan extending to 30 yearsin the future [9].
Wolframite, cassiterite and chalcopyrite are the minerals extracted and used to produceW, copper (Cu) and tin (Sn) concentrates, respectively. The extraction process consistsof a room and pillar method, considering geo-mechanical and geological properties ofthe rock mass. The first stage for the production of W is crushing and milling of theore, promoting the release of the W mineral from the material. Then, a heavy mediaseparation (HMS) between fine and coarse fractions is performed. This stage promotes theremoval of 80% of the ore that does not contain W. Then, the W preconcentrated fractionis subjected to a conventional gravity concentration technique, followed by magneticflotation in the presence of sulfide and dry magnetic separation [29]. The process is mostlygravitational due to the relative density of the concentrated products in relation to thesterile material [30].
63
Sustainability 2021, 13, 3915
Additionally, there is a wastewater treatment facility, the Mine Water Treatment Station(MWTS), located in Salgueira. The MWTS was projected to treat a maximum of 500 m3/h,where the wastewater comes from the mine, wash activities and heaps [30].
The Panasqueira Mine
Figure 1. The Panasqueira mine geografic location—Covilhã, Portugal, 40◦10′11.0604” N, 7◦45′23.8752” W (source: Google maps).
Figure 2. The Panasqueira mine process and scenarios considered for the management of mine tailings generated (basedon [28]). HMS—Heavy media separation.
2.2. System Boundaries and LCA Road Map
Figure 3 shows the steps considered for the present LCA study. The analysis startson the exploration of the ore for the W concentrate production. Then, for the rejectedfraction of the mining process, three waste management scenarios were considered: (1) EDtreatment with DES as an adjuvant; (2) ED treatment with simultaneous H2 recovery;and (3) ED treatment with sodium chloride (NaCl) as an enhancement. Based on the
64
Sustainability 2021, 13, 3915
analysis of the ED scenarios, an ED upscaling study was carried out that also coupledfinancial projections.
Ore exploration
The Panasqueira Mine
ED with DESED with DES
Scenario 1
ED with hydrogen recovery
ED with hydrogenrecovery
Scenario 2
ED with NaClED with NaCl
Scenario 3
Mine tailingsW concentration
process
Data collection
Water and air emissions
Resources consumption and generation
Energy consumption
Analysis of environmental
impacts
Panasqueira mine process description
Rejected fraction
Carbon dioxide emissions
Energy consumption
Removal of As
Recovery of W
ED up-scale prospection
Analysis of technical and environmental impacts
40°10′11.0604″N7°45′23.8752″W
ED technology
Financial projections
Figure 3. Flowchart of the life cycle analysis performed for the production of W concentrate and the electrodialytic treatmentof mine tailings.
65
Sustainability 2021, 13, 3915
2.3. Data Collection
The data used to build the LCA were selected from three main sources: Ecoinventdatabase version 3.7.1, technical reports published from the European Commission andresults from laboratory works published in international scientific journals (Table 1).
Table 1. Main sources used for the Life cycle assessment (LCA) data collection.
Source Topic Documents Consulted
Ecoinvent version3.7.1
Tungstenconcentrateproduction
- Tungsten mine operation and beneficiation [31]
EuropeanCommission
technical reports
Mining industryoperation
- Integrated Pollution Prevention and Control (IPPC)reference document on best available techniques in thenonferrous metals industries [8]
Research workspublished ininternational
scientific journals
Electrodialyticprocess
- Exploring hydrogen production for self-energygeneration in electroremediation: A proof of concept [20]- Electrodialytic hydrogen production and critical rawmaterials recovery from secondary resources [19]- Hydrogen recovery in electrodialytic-basedtechnologies applied to environmentalcontaminated matrices [32]- Electrodialytic removal of tungsten and arsenic fromsecondary mine resources—deep eutecticsolvent enhancement [18]
2.4. Mine Tailings Characterization
Considering the Panasqueira mine plant (Figure 2), the processing of 1000 kg of ore(from excavation activities) was considered as the functional unit for the LCA study. Table 2presents estimations regarding W concentrate production and mine tailings generationfrom the processing of 1000 kg of ore. The calculations were based on scientific dataavailable on Panasqueira resource compositions, as referenced in Table 2.
Table 2. Resources consumed and generated during the production of tungsten concentrate at thePanasqueira mine.
ItemValue per Functional
UnitUnits References
Panasqueira mine resources–ore 1000 (functional unit) kg -W content in Panasqueira
mine resources 3.0 kg/t ore 0.3% WO3 [33]
W concentrate after theconcentration process 2.3 kg/t ore 75% WO3 [29]
W price 25,500 EUR/t [34]H2 price 2.7–6.5 EUR/kg [35]
Thus, concerning Table 2, from the processing of 1000 kg of ore, only 2.3 kg of Wconcentrate is produced, with grades of 75% of WO3. This means that around 997 kg offine tailings are generated from the processing of 1000 kg of ore. From the mine tailings it ispossible to recover 0.8 kg of W/t of ore. The W price (25,500 EUR/t) makes the W recoveryattractive from an economic perspective.
66
Sustainability 2021, 13, 3915
2.5. Water and Air Emissions and Resources Consumed
The processing of 1000 kg of ore was selected as the functional unit for the LCA. Waterand air emissions during W concentrate production were determined based on Ecoinventdatabase [31]. In the Ecoinvent platform, the information is presented considering 1 t of Wconcentrate production. Thus, an extrapolation based on the W concentrate production atthe Panasqueira mine was used to estimate its environmental impacts.
The resources consumed and generated during the production of tungsten concentrateat the Panasqueira mine were determined, considering the amount of fine tailings thatresults from the processing of 1000 kg of ore. In this sense, the amount produced fromfine tailings generation was determined by subtracting the initial fraction (1000 kg ore) ofthe quantities of W, Cu and Sn concentrates produced. The W contents in mine tailingsper functional unit were determined based on the concentrate grade of W trioxide (WO3)produced in the plant—75% [29].
The plant also produces Cu and Sn concentrates. However, the amounts of Cu and Snwere only considered to estimate the fine tailings generation, and production impacts werenot considered for this study.
2.6. Energy Consumption and CO2 Release
To estimate the energy consumed by the ED system, Equation (1) was applied:
E (kWh) =Vi × A × t
1000(1)
where Vi is the average voltage (Volts) in time i, A is the current intensity (Amperes) andt is the duration (hours) of the experiment. To convert the energy consumed into thequantity of CO2 released for the environment, a conversion factor of 0.23314 kg CO2 perkWh was considered [36].
3. Results and Discussion
3.1. Tungsten Concentrate Production at the Panasqueira Mine: Environmental Impacts3.1.1. Energy Consumption
During the W concentrate production at the mining site, there are several high energyconsuming phases. The overview presented in Figure 4 is based on data from technicalreports. Herein, an average of the energy consumption of each processing step per ton ofprocessed ore during the W production is shown.
0 2 4 6 8 10 12 14
Drilling
Blasting
Digging
Ventilation
Dewatering
Materials handling
Crushing
Grinding
Beneficiation general
Energy (kWh/ t ore)
Figure 4. Energy consumption of mining processing activities (adapted from [37]).
The high energy consuming stages are materials handling (more than 14 kWh/tore) and grinding (14 kWh/t ore). On the other hand, crushing, dewatering and drillingactivities present lower energy consumptions (below 1 kWh/t ore). In addition, the envi-
67
Sustainability 2021, 13, 3915
ronmental categories which are more affected by those processing steps are global warmingpotential (12.6 kg CO2 eq/t ore), cumulative energy demand (133 MJ eq/kg), terrestrialacidification (0.29 kg SO2 eq/t ore) and human toxicity (3.4 × 10⁻⁵ CTUh/t ore) [37].
3.1.2. Air and Water Emissions
During the processing of 1000 kg of ore, air and water emissions are generated,causing the main environmental pressures. Table 3 presents the emissions that weredetermined for Panasqueira mine processing based on Ecoinvent data from W concentrateproduction impacts.
Table 3. Emissions to the environment during the tungsten concentrate production (determinedbased on Ecoinvent data for tungsten concentrate production [31]).
Carbon dioxide is the major substance released to air (0.35 kg/t ore) and as observedin Figure 4, the materials handling and grinding are the main operations contributingto its release, in addition to the emission of particles. Regarding water load emissionsper ton of ore, the chemical parameters that have higher impacts on aquatic systems arechemical oxygen demand (COD) (4.15 × 10⁻³ kg), biochemical oxygen demand (BOD5)(2.08 × 10⁻³ kg) and total organic carbon (TOC) (1.54 × 10⁻³ kg).
COD is generally used to indirectly determine the amount of organic compounds inaquatic systems and is useful as an indicator of the degree of organic pollution in surface wa-ters [38]. The COD is the most affected parameter by mining activities (4.15 × 10⁻³ kg/t ore),indicating that not all forms of organic matter (biodegradable and nonbiodegradable)are available.
The BOD5 presents the second highest impacts (2.08 × 10⁻³ kg/t ore), meaning adecrease in the amount of oxygen consumed, by aerobic biological organisms, to decomposethe organic matter in 5 days. An excessive microbial activity causes a reduction in thequantity of oxygen in the water, which may foment the growth of anaerobic organisms anddecay the development of other existing communities [39].
The dissolved organic carbon (DOC), which is a potential source of carbon and energyfor ecosystem metabolism, plays a central role in many limnological processes, since itis largely derived from terrestrial vegetation, deposited from lake catchments either bystreams or by overland flow [40]. The mining impacts in terms of DOC are less pronounced(1.54 × 10⁻³ kg/t ore), although changes in DOC cycling can result in air–water exchangeof CO2 alterations [41].
68
Sustainability 2021, 13, 3915
Mining processes demonstrated the lowest impacts on the total organic carbon (TOC)(1.54 × 10⁻³ kg/t ore), mainly in the form of DOC. The TOC measures the amount ofcarbon found in an organic compound. A high organic content means a higher oxygenconsumption and, consequently, an increase in the growth of microorganisms that depleteoxygen supplies [42].
The chemical water contamination is reflected in composition changes, while physicalcontamination results from the presence of fine material, affecting both surface waterand aquifers. In the case of metallic ores, chemical contamination can be relevant dueto the oxidation of pyrite producing sulfides that may leach heavy metals. In addition,yellowish to red Fe(OH)3 precipitates are formed when acidic water meets neutral waterin river basins. These precipitates affect the growth of aquatic plants [30]. Physicalcontamination by fines occurs when there is a discharge of treatment effluents in watercourses. Contamination by suspended solids seriously affects fish communities [30]. In thecase of the Panasqueira mine, the Zezere river is the main concern of water pollution.
Mining at levels below the water table will subsequently promote risks of evaporationof aquifers, water degradation by eutrophication and chemical contamination [43]. Acidmining drainage is characterized by a pH below 5 and is related to the sulfides (S2− andS2
2−), sulfur (S) or thiosulfate (S2O32−) being in contact with water and the atmospheric
oxygen (oxidizing conditions). Acid water results from the oxidation of pyrite (FeS2), usu-ally catalyzed by bacteria. Other sulfides such as blends (ZnS), galena (PbS), chalcopyrite(CuFeS2), pyrrhotite (Fe7S8) and arsenopyrite (FeAsS) can contribute to acidifying waterresources. Generally, acidic effluents present high concentrations of Fe, manganese (Mn)and aluminum (Al) [30].
To decrease water resources contamination in the area, the Panasqueira mine has anin-house Mine Water Treatment Station (MWTS). The wastewater comes from the surfacethrough infiltration and from the production process, since a significant amount of water isused during drilling and irrigation of the work fronts. The wastewater treatment facilityhas a volume capacity of 7000 m3. The outlet and the receiving tank were designed toconvert relatively soluble ions, such as Fe2+ and Mn2+, into the respective less solubleoxidized forms (Fe3+ and Mn4+). The treatment plant is composed of four tanks withmechanical agitation in which the addition of flocculant and lime is carried out. Lime isadded to increase the pH of acidic water and prevent a possible drop in pH when ions suchas Fe3+ and Mn4+ precipitate in the form of hydroxides. The solid hydroxides formed and insuspension are deposited at the bottom of the tank, being pumped into the mud dam [30].
Following the assessment of air and water emissions during W concentrate production,the environmental pressures of mine tailings were studied in particular in terms of EDprocess efficiency for elements extraction and recovery, energy consumption and CO2emissions. This assessment was based on experimental data from previous works. In fact,the major impacts from waste disposal at mine sites can be divided into two categories [37]:
(1) the loss of productive land following its conversion to a waste storage area;(2) the introduction of sediment, acidity, and other contaminates into surrounding sur-
face water and groundwater from water running over exposed problematic or chemicallyreactive wastes, and the consequent soil contamination.
In this sense, alternative ways to direct disposal of mine tailings are desired. Table 4presents three different scenarios where the ED technology was studied as an alternativeto direct disposal. The systems defined have diverse extraction ratios of elements andother features, being important to compare the ED scenarios in terms of achievements andenvironmental impacts.
69
Sustainability 2021, 13, 3915
Table 4. Data from the electrodialytic treatment of mine tailings.
Extraction(%/kg t ore)
Scenario ED SchemeDuration
(h)
CurrentIntensity
(A)W As
H2 Purity/Recovery
(%)
1. ED treatmentwith DES 1 96 0.05 22/0.2 16/0.6 n.a.
3. ED treatmentwith NaCl 3 120 0.1 13/0.1 63/2.4 n.a.
1 According to [18]; 2 according to [20,32]; 3 according to [19]; AEM—Anion Exchange Membrane; CEM—Cation Exchange Membrane; DES—Deep Eutectic Solvent; Electrolyte (NaNO3 0.01 M); NaCl—sodium chloride;n.a.—not applicable.
Scenario 1 involves the use of a DES in the sample compartment during the EDtreatment. DES present advantages in terms of yield, costs and toxicity when comparedto conventional ionic liquids [44], which are composed of strong acids and bases [45]. Inthis way, a two-compartment reactor was operated for 4 days at 0.05 A. The electrolyteand sample sections were separated by an anion exchange membrane [18]. The mainoutcome of this reactor configuration was the quantity of W extracted from the matrix. Theuse of choline chloride/oxalic acid (1:1) promoted a higher solubilization of the W and,together with the current applied, a synergetic effect on the recovery of this critical elementwas observed.
Scenario 2 includes a three-compartment ED reactor and the simultaneous collectionof self-produced H2 in an eco-friendlier manner. This configuration presented the lowerW recovery, where only 7.5% of W was extracted. However, it should be noted that thissystem operated only for 1 hour at 0.1 A. Applying this current intensity was possible toaccess the production of H2, an energy carrier, with 74% H2 purity. Electrokinetics havebeen coupled with electrodialytic technology for H2 production during the removal ofpollutants [20], where the energy requirements for this system are considerably smallerowing to the higher conductivity of the matrix [46]. Additionally, regarding the As removal,a better performance was achieved (48%) in comparison with scenario 1 (16%). Consideringthe functional unit defined for this study, hypothetically, this system could avoid 1.8 kg ofAs contamination (Table 4).
Finally, in scenario 3, a three-compartment ED reactor was tested at 0.1 A for 5 daysusing NaCl to improve the current passage [19]. The main achievement of this system wasa 63% As removal from a total of 3.7 kg As/t ore (Table 2), meaning less than 2.4 kg of Ascontamination per t of ore (Table 4).
Regarding different market segments and environmental concerns, the scenarios con-sidered may show different potentials. In this way, the trade-off for the three scenarioswas studied to understand the impacts on resources consumption and its economic fea-sibility. Table 5 presents an energy assessment for the three bench scale ED treatmentscenarios. These tests were performed to treat 39 [18] and 22 g [16,20] of fine tailings ina two- and/or three-compartment ED reactor, respectively. The energy was determinedaccording to Equation (1).
70
Sustainability 2021, 13, 3915
Table 5. Estimation of the energy consumed and CO2 released during the electrodialytic laboratorytreatment of mine tailings.
The highest energy consumption occurred in scenario 3, where a three-compartmentreactor and NaCl were used. An average of 5.0 × 10⁻³ kWh was consumed, with arelease of 1.2 g CO2. In fact, this system was operated at a higher current intensity(0.1 A) and thus, it was expected to have a higher energy consumption, and consequently,higher amount of CO2 release. However, the addition of NaCl promoted the control ofthe power consumption once it led to an increase in media conductivity and thereforelower resistance [47].
On the other hand, scenario 1, performed with natural extractants (DES), demon-strated a decrease in the energy consumption of more than 80%. In this set-up, a currentintensity of 0.05 A was applied, which was the main contributor to the energy consump-tion decrease (1.0 × 10⁻³ kWh) when compared to the other two scenarios. This meansapproximately 0.9 g of CO2 emissions to the environment. In fact, this scenario presentedthe lowest energy consumption per mass of elements extracted (6.0 × 10⁻³ kWh/g W and2.5 E × 10−5 kWh/g As).
Scenario 2, which includes H2 recovery, demonstrated an intermediate energy con-sumption. In scenario 2, as in scenario 3, a current intensity of 0.1 A was applied. However,due to the use of a totally sealed reactor (to ensure no leakage of gases), a decrease in the
71
Sustainability 2021, 13, 3915
voltage occurred and thus a decrease in the resistivity inside the reactor was observed.Based on Ohm’s law, if the current intensity is constant, the voltage and the resistivity(or conductivity) are strongly related. The decrease in the ED cell voltage is linked to aconductivity increase in the electrodes’ compartments [20].
This may explain the lower energy consumed (3.0 × 10⁻³ kWh) compared to scenario3 (ED with NaCl). Additionally, the possibility to recover the self-hydrogen produced bythe ED treatment and reuse to feed the reactor in terms of energetic requirements couldprovide energy savings of up to 50% [32].
Regarding the water needs for sample suspensions and electrolyte preparation withsodium nitrate (NaNO3), ED configurations that have three compartments require 700 mL(32 times the sample weight) and the two-compartment systems require 600 mL (15 timesthe sample weight). However, the reuse of secondary water resources during the EDtreatment (e.g., secondary effluent) have shown promising results [16] that may contributeto alleviate tap water needs.
Summing up, the laboratory experiments could follow structural designs, such as acentral factorial design. However, it is pivotal to properly assess the industrial interest. Ina scale-up perspective, the experiments should be carried out sequentially, followed by aprocess analysis and economic evaluation. Even in the first steps of the research, which canaffect the experimental domain of interest, the quality of the information provided couldbe improved and be key factor for a pilot unit.
In order to increase the understanding of the scenarios studied, a perspective ofa full scalable ED reactor model to support commercial roll-out was carried out. Theimplementation of the theoretical ED pilot reactor would result in a full running removaland recovery of the target compounds from the fine mine tailings, hypothetically aimingzero liquid or solid discharges. A full closed-loop of residues would change the perspectiveof mine tailings, which would become a valuable resource instead of a costly waste stream.
The ED plant, which can be either vertical or horizontal, is presented in Figure 5,showing a simplified flow sheet of a loop reactor. It is important to point out that thedesign of the reactor does not need to be similar to the laboratory scheme. However, ithas to be designed to achieve the best data, both in terms of fluid dynamics and transportproperties. In Figure 5, the design of the reactor is used as an example of the concept, andmerges the best parts of both scenarios 1 and 2:
(1) two-compartment reactor design, which is easier to operate;(2) DES as enhancements, alleviating the consumption of strong acids and bases while
incrementing the W recovery;(3) cation-exchange membrane, which allows H2 recovery for depreciation of implemen-
tation and maintenance costs, as well as flexibility in different market segments.
A balance between the ED treatment plant and downstream units needs to be ensuredin order to decrease environmental pressures from the disposal of mine tailings. Thefinal product (after the ED treatment) needs to have such a quality that consecutive EDphases will work optimally at minimal operational costs. Since the Panasqueira minehas available land, the installation of solar panels in the south direction with 144 cells at400 W (2025 × 996 × 40 cm) [48] will promote the use of renewable energy and overcomethe environmental pressures and costs regarding ED technology. The use of solar panelsdecreases the investment cost by avoiding the use of batteries, solar inverters, and powersupplies and the maintenance cost since there is no battery waste to manage [49].
Figure 5. Theoretical electrodialytic plant facility based on bench scale experiments.
Additionally, the scaled-up reactor was dimensioned addressing issues related to aseamless operation with minimal needs for cleaning. The material selected for the reactorwas polyethylene due to its chemical and impact resistance, electrical properties and lowcoefficient of friction. In addition, polyethylene is lightweight, easily processed and offersnear-zero moisture absorption [50]. The reactor was dimensioned to treat 10 m3 per day (8 hrunning time, based on average labor schedules in Portugal) in five conjugate sequentialunits. The capacity of each block is 2 m3, as reported by other pilot studies [51]. Thesedimensions promote the treatment of the volume of mine tailings produced per day (0.4 m3),considering: (1) mud’s density of 3031 kg/m3 [52]; (2) 997 kg volume of mine tailings; (3)water needs both for the electrolyte (NaNO3 0.01 M) and sample suspensions. The EDfacility was projected to be fully distributed by individual blocks. Each section includespumps (when gravity transport is not possible), membranes, and sample and electrolytecompartments. Additionally, it includes reservoirs for ED treated and nontreated minetailings (before the ED process), water, electrolyte and H2, to either reuse or storage. Thissimplifies the maintenance of the reactor and, consequently, reduces the problems duringthe treatment.
Scaling in ED occurs due to inorganic species, e.g., PO43−, NH4
+, Mg2+, Ca2+ andCO3
2−, forming low-solubility minerals. The more effective the process is at removingthese elements, the less scale will be formed and therefore the maintenance costs for theED unit will be lower [53].
A constraint of the ED facility is the goal of achieving total reuse of water, since thereis a need to treat and/or crystallize the salt from the brine stream (NaNO3) and the effluentsuspension produced. There are several technological options for waste brine crystalliza-tion. The projection of the ED facility intends to concentrate and crystallize the salts in thebrine solution. Crystallization plays an important role in many industries where waterrecycling is implemented. If it is not possible to perform the purification of brine solutions,the Panasqueira MWTS (capacity = 500 m3/h) [30] could also include the treatment ofboth brine solution and effluent suspension. In addition, treated water resources from thePanasqueira MWTS could be used to prepare the mine tailings suspensions, aiming forcircularity of by-products. This step would promote savings in water consumption by thegeneration of suitable mixtures to reuse in the ED system.
73
Sustainability 2021, 13, 3915
Moreover, the proposed ED unit combines a reservoir for the collection of the self-produced H2, increasing the value proposition of the ED pilot. Lead-acid batteries are themost useable storage systems, as well as rechargeable batteries, supercapacitors, and redoxflow batteries. The most promising systems for renewable energy storage are the lithium-ion batteries and redox flow batteries [49]. Coupling a unit for H2 recovery at the mine candirect the site towards a clean energy transition [54]. In fact, the implementation of H2 asa flexible energy carrier in future energy systems is a top priority in the new EU GreenDeal. The smart integration across sectors is encouraged and promotes investments oncutting-edge research and innovation for clean energies [1]. Together with W recovery andAs removal, the H2 transfer to be used in the mine ED facility could have socio-economicimpacts both on recovery of raw materials and clean energy transition, since it addressesapplicable solutions to industries. This stimulates the fostering of synergies in industrialsectors, the creation of new services and the transition and adaptation to eco-innovatedsystems. The ED treated fine tailings can be further used in construction materials withcompatible applications with conventional concrete and fired brick masonry walls [21]. Onthe other hand, the As can be used in purification processes of zinc leach solutions [55],and residues containing As could be recovered by glass industries, since arsenates can beturned into silicoarsenates during vitrification [56].
Further roll-out may be hampered by the lack on financial commitment to implemen-tation in a declining industry, where investments in utilities are not seen as strategic tothe core business. However, low investment solutions with limited capital expenditures(CAPEX) and operating expenditures (OPEX) costs are required. Table 6 presents thefinancial projections of the ED plant for the initial investment, as well as the first and thefifth years of ED operation.
74
Sustainability 2021, 13, 3915
Ta
ble
6.
Fina
ncia
lpro
ject
ions
ofth
eex
pend
itur
esof
impl
emen
ting
the
theo
reti
cale
lect
rodi
alyt
icpl
antf
acili
typr
esen
ted
inFi
gure
5.
Ite
mQ
ua
nti
tyC
ost
/Un
i(E
UR
)In
itia
lIn
ve
stm
en
t(E
UR
)1
Ye
ar
of
ED
(EU
R)
5Y
ea
rso
fE
D(E
UR
)
Stir
ring
1019
86.0
019
,860
.00
Rea
ctor
inpo
lyet
hyle
ne(d
iam
eter
=1.
6m
;le
ngth
=1
m)
565
0.00
3250
.00
Bloc
kco
mpa
rtm
ents
(dia
met
er=
1.6
m;
leng
th=
1m
)20
149.
0029
80.0
0
Elec
trod
esTi
/MM
O(0
.5×
0.1
m;
wid
th=
3m
m)
1010
0.00
1000
.00
Mem
bran
esC
EM–C
R67
,MK
III,
Blan
k(d
iam
eter
=0.
8m
)5
499.
0024
95.0
0
NaN
O3
*(1
kgpe
run
it)
2915
1.90
4405
.10
1,10
1,27
5.0
5,50
6,37
5.0
Nat
ural
deep
eute
ctic
solv
ents
(cho
line
chlo
ride
.1kg
per
unit
+ox
alic
acid
.25
kgpe
run
it)*
614
3.00
858.
0021
4,50
0.00
1,07
2,50
0.00
Pum
ps11
489.
0053
79.0
0Tu
bes
361.
8968
.04
Pow
erbo
xes
1038
3.81
3838
.10
Cro
codi
les
+w
ires
200.
9919
.70
Sola
rPa
nels
(202
5×
996×
40cm
)5
476.
0023
80.0
0
Impl
emen
tati
on10
%of
the
tota
lrea
ctor
pric
e46
53.2
9
Mai
nten
ance
5%of
the
init
ial
inve
stm
ent(
ever
y3
mon
ths)
10,2
37.2
551
,186
.23
Cle
anin
gof
Mem
bran
es15
EUR
/m2
(tw
ice
per
mon
thfo
r2
m2
ofm
embr
anes
area
)36
00.0
018
,000
.00
Rep
lace
ofM
embr
anes
Ever
y4
year
s24
95.0
0
Cle
anin
gof
Rea
ctor
2%of
the
init
ial
inve
stm
ent(
once
per
year
)10
23.7
251
18.6
2
Tota
linv
estm
ent
51,1
86.2
31,
330,
635.
976,
655,
674.
86
*N
um
ber
ofp
acka
ging
tobu
y.C
osts
wer
eba
sed
on:s
tirr
ing—
[57]
;rea
ctor
—[5
0];c
omp
artm
entb
lock
—[5
8];e
lect
rod
es—
[59]
;mem
bran
es—
[60]
;NaN
O3—
[61]
;Ad
juva
nts—
[62,
63];
pum
ps—
[64]
;tub
es—
[65]
;pow
erbo
x—[6
6];c
roco
dile
s+
wir
e—[6
7];s
olar
pane
ls—
[48]
;im
plem
enta
tion
—[6
8];m
aint
enan
ce;c
lean
ing
ofre
acto
ran
dm
embr
anes
;cha
ngin
gm
embr
anes
lifet
ime—
[69,
70].
Ti/M
MO
—ti
tani
um/m
ixed
met
alox
ide.
75
Sustainability 2021, 13, 3915
It should be noted that Table 6 shows a simplified economic approach of the EDconcept, considering only its physical implementation. Through this assessment it ispossible to understand the impact of these figures on the broad uptake potential in themine industry. This section does not cover the fully CAPEX or OPEX estimating procedures.Nevertheless, it provides concepts that can be used in the project evaluation to help theunderstanding of its application in a full implementation mode. Moreover, Table 6 alsodetails the costs of the components needed for the ED facility. The materials for the EDplant construction (e.g., electrodes, membranes, pumps, tubes) and the reagents neededfor the electrolyte and sample suspensions (NaNO3 and DES) are the main contributorsof the costs reported in the first- and fifth-year projections. Together with the costs forthe manufacturing, and, therefore, the total investment in the first year, a set of otherexpenses to guarantee the success of the ED process during its lifetime is also foreseen.The total investment before developing the ED facility in a full run mode is approximately51,000 euros, increasing from around 1 to 7 millions of euros in the first and fifth years,mainly due to NaNO3 and DES consumption.
The investments can be considered high, although further optimization of the pro-cesses and research could decrease the values presented. Additionally, the up-scalingtheoretical approach should be further optimized, based on a pilot study, to decreaseinputs related to energy and resources in a more positive way. This strategy may promoteminimization of the negative pressures in the environment and the adaptation of industrialsectors to eco-innovative markets. In particular, the ED plant presented could leverage newmarket possibilities, the requalification of mining areas after close and the development ofnew technologies with regard to achieving the Sustainable Development Goals [3].
4. Conclusions
Mining industries have been stimulated to operate in a more sustainable way, reducingtheir environmental burdens and improving resource management. In this way, eco-efficient processes and alternative scenarios to direct waste disposal of rejected fractionsare desired.
This research work evaluated the impacts on the environment that may come frommining processes and three potential scenarios that involve the ED treatment of fine tailingsfrom the Panasqueira mine.
Regarding the impacts of mining processes, materials handling and grinding presentedthe highest energy consumption and, consequently, CO2 release (0.35 kg/functional unit).A carbon footprint of 12.6 kg CO2 eq/t ore is associated with mining activities. On theother hand, the chemical parameters that have the highest impacts on aquatic systems areCOD (4.15 × 10⁻³ kg), BOD5 (2.08 × 10⁻³ kg) and TOC (1.54 × 10⁻³ kg).
The analysis of previous ED data at the bench scale was a key factor to estimate thepotential environmental burdens involved in an ED plant conception. In particular, energyconsumption is a major concern at an industrial scale. Herein, the ED technology couldhave a central role in the recovery of metals below 45 microns, a main challenge for themine. In addition, the mine has a project spanning more than 30 years, which means thatnew market segments could be explored to keep the development and the requalificationof the Panasqueira area after its closure. In this context, aligned with the removal of Ascontents, the recovery of W and H2 seems to be attractive for the development of theCentro region of Portugal, considering a circular economy perspective, both in terms ofraw materials recovery and sustainable energy production. These aspects might decreasethe risk associated with mining activities and leverage new business opportunities in themining sector in the upcoming years.
Thus, concerning the three scenarios studied, different advantages were pointed out.Scenario 1, which involves the use of DES, exhibited a better performance in terms of thequantity of W extracted from the matrix (22%). Scenario 2 considers self-produced H2recovery during the ED treatment with 74% H2 purity. Scenario 3 presents an approach withconventional reagents and the main achievement of this system was the As removal (63%).
76
Sustainability 2021, 13, 3915
Based on the best features of the scenarios analyzed, a sequential theoretical ED facilitywas presented. The dimensioning of the reactor was based on the quantity of mine tailingsthat need to be treated and laboratory data. An investment of approximately 51,000 euroswas estimated, increasing from 1 to 7 millions euros in the first and fifth years due tomaintenance and operational costs. Nevertheless, the upscaling effect may reduce theinputs—namely, those regarding operational costs and energy consumption. In futureworks, a pilot study of the ED treatment should be performed to assess the scaling-upinfluence on technical aspects and to determine the economy of scale’s percentage.
This study provides new insights for the life cycle of mine tailings and a basis forenvironmental decision-support in the application and roll-out of ED technologies.
Author Contributions: Conceptualization, J.A. and C.M.; Data curation, J.A. and C.M.; Formalanalysis, E.P.M. and A.B.R.; Funding acquisition, A.B.R.; Methodology, J.A.; Project administration,A.B.R.; Resources, E.P.M., and A.B.R.; Supervision, A.B.R.; Validation, E.P.M. and A.B.R.; Writing—original draft, J.A.; Writing—review and editing, J.A., C.M., E.P.M., and A.B.R. All authors have readand agreed to the published version of the manuscript.
Funding: This work has received funding from the European Union’s Horizon 2020 research andinnovation program under the Marie Skłodowska-Curie grant agreement No. 778045. The au-thors acknowledge the Portuguese Foundation for Science and Technology (FCT) for the supportgiven to CENSE through the strategic project UIDB/04085/2020 and for J. Almeida PhD fellowshipPD/BD/135170/2017 from the EcoCoRe Doctoral program.
Institutional Review Board Statement: Not applicable.
Informed Consent Statement: Not applicable.
Acknowledgments: The authors acknowledge Eng. Manuel Pacheco from Panasqueira mine forproviding the sample and Eng. António Galvão for the support in LCA development. This researchis anchored by the RESOLUTION LAB, an infrastructure at NOVA School of Science and Technology.
Conflicts of Interest: The authors declare no conflict of interest.
References
1. European Commission. Communication from the Commission to the European Parliament, the European Council, the Council, theEuropean Economic and Social Committee and the Committee of the Regions—The European Green Deal. COM/2019/640 final; EC: Brussels,Belgium, 2019.
2. European Commission. Going Climate-Neutral by 2050—A Strategic Long Term Vision for a Prosperous, Modern, Competitive andClimate-Neutral EU; EC: Brussels, Belgium, 2019.
3. Mancini, L.; Vidal-Legaz, B.; Vizzarri, M.; Wittmer, D.; Grassi, G.; Pennington, D.W. Mapping the role of raw materials insustainable development goals. In Sustainable Development Goals. A preliminary Analysis of Links, Monitoring Indicators and RelatedPolicy Initiatives; P O of the European Union: Luxembourg, 2019; p. JRC112892. ISBN 978-92-76-08385.
4. European Commission. Critical Raw Materials Resilience: Charting a Path towards Greater Security and Sustainability. COM/2020/474Final; EC: Brussels, Belgium, 2020.
5. Sharma, P.; Minakshi, M.; Whale, J.; Jean-Fulcrand, A.; Garnweitner, G. Effect of the anionic counterpart: Molybdate vs. tungstatein energy storage for pseudo-capacitor applications. Nanomaterials 2021, 11, 580. [CrossRef] [PubMed]
6. Minakshi, M.; Mitchell, D.R.G.; Baur, C.; Chable, J.; Barlow, A.J.; Fichtner, M.; Banerjee, A.; Chakraborty, S.; Ahuja, R. Phaseevolution in calcium molybdate nanoparticles as a function of synthesis temperature and its electrochemical effect on energystorage. Nanoscale Adv. 2019, 1, 565–580. [CrossRef]
7. Yang, X. Beneficiation studies of tungsten ores—A review. Miner. Eng. 2018, 125, 111–119. [CrossRef]8. European Commission. Integrated Pollution Prevention and Control (IPPC): Reference Document on Best Available Techniques in the Non
Ferrous Metals Industries; EC: Belgium, Brussels, 2001.9. Ávila, P.F.; Silva, E.F.; Salgueiro, A.R.; Farinha, J.A. Geochemistry and mineralogy of mill tailings impoundments from the
Panasqueira Mine (Portugal): Implications for the surrounding environment. Mine Water Environ. 2008, 27, 210–224. [CrossRef]10. Candeias, C.; Ávila, P.F.; Silva, E.F.; Ferreira, A.; Salgueiro, A.R.; Teixeira, J.P. Acid mine drainage from the Panasqueira mine and
its influence on Zêzere river (Central Portugal). J. Afr. Earth Sci. 2014, 99, 705–712. [CrossRef]11. Environmental Law Alliance. Worldwide Guidebook for Evaluating Mining Project EIAs, 1st ed; ELAW: Eugene, OR, USA, 2010.12. Agência Portuguesa do Ambiente. Environmental License No 347/0.1/2017—Extraction and Preparation of Non-Ferrous Metal Ores,
Comprising Hazardous and Non-Hazardous Waste Disposal Activities; APDO: Lisbon, Portugal, 2017. (In Portuguese)
77
Sustainability 2021, 13, 3915
13. Okvist, L.; Ye, G.; Hu, X. Innovation Potential in the Recovery of Refractory Metals from Secondary Resources—MSP-REFRAM H2020project; D3.3; EC: Brussels, Belgium, 2016.
14. Valderrama, C.; Granados, R.; Cortina, J.L.; Gasol, C.M.; Guillem, M.; Josa, A. Implementation of best available techniques incement manufacturing: A life-cycle assessment study. J. Clean. Prod. 2012, 25, 60–67. [CrossRef]
15. Garbarino, E.; Orveillon, G.; Saveyn, H.; Barthe, P.; Eder, P. Best Available Techniques (BAT) Reference Document for the Management of Wastefrom Extractive Industries in Accordance with Directive 2006/21/EC|EU Science Hub; European Commission: Brussels, Belgium, 2018.
17. Ribeiro, A.B.; Rodríguez-Maroto, J.M. Electroremediation of heavy metal-contaminated soils -processes and applications. In TraceElements in the Environment: Biogeochemistry, Biotechnology, and Bioremediation; Prasad, M.N.V., Sajwan, K.S., Naidu, R., Eds.; CRCPress: Boca Raton, FL, USA, 2006; pp. 341–368. ISBN 9781420032048.
19. Almeida, J.; Magro, C.; Mateus, E.P.; Ribeiro, A.B. Electrodialytic hydrogen production and critical raw materials recovery fromsecondary resources. Water 2020, 12, 1262. [CrossRef]
20. Magro, C.; Almeida, J.; Paz-Garcia, J.M.; Mateus, E.P.; Ribeiro, A.B. Exploring hydrogen production for self-energy generation inelectroremediation: A proof of concept. Appl. Energy 2019, 255, 113839. [CrossRef]
21. Almeida, J.; Faria, P.; Ribeiro, A.B.; Silva, A.S. Effect of mining residues treated with an electrodialytic technology on cement-basedmortars. Clean. Eng. Technol. 2020, 1, 100001. [CrossRef]
22. European Commission. CEN EN 15804:2012+A2:2019—Sustainability of Construction Works. Environmental Product Declarations.Core Rules for the Product Category of Construction Products; EC: Brussels, Belgium, 2012.
23. International Organization for Standardization. Environmental Management: Life Cycle Assessment. Principles and Framework; ISO:Geneva, Switzerland, 2006.
24. International Organization for Standardization. Environmental Management: Life Cycle Assessment. Requirements and Guidelines;ISO: Geneva, Switzerland, 2006.
25. Santos, T.; Almeida, J.; Silvestre, J.; Faria, P. Life cycle assessment of mortars: A review on technical potential and drawbacks.Constr. Build. Mater. 2021, 288, 123069. [CrossRef]
26. Cuenca-Moyano, G.M.; Zanni, S.; Bonoli, A.; Valverde-Palacios, I. Development of the life cycle inventory of masonry mortarmade of natural and recycled aggregates. J. Clean. Prod. 2017, 140, 1272–1286. [CrossRef]
27. Almeida, J.; Ribeiro, A.B.; Silva, A.S.; Faria, P. Overview of mining residues incorporation in construction materials and barriersfor full-scale application. J. Build. Eng. 2020, 29, 101215. [CrossRef]
28. Leite, M. Reflection contributions on the topic of useful substances formation from extractive production residues. In Proceedingsof the Mining Waste: Contributions to the Circular Economy Seminar, Lisbon, Portugal, 26 June 2017. (In Portuguese).
29. Franco, A.; Vieira, R.; Bunting, R. The Panasqueira Mine at a Glance; International Tungsten Industry Association Newsletter:London, UK, 2014; Volume 3, pp. 1–12.
30. Gonçalves, D. Recovery of Heavy Metals from Waste Water; Internship Report, The Panasqueira mine; University of Beira Interior:Covilhã, Portugal, 2015. (In Portuguese)
31. Ecoinvent Tungsten Mine Operation and Beneficiation. Zurich, Switzerland. Available online: https://v371.ecoquery.ecoinvent.org/Details/UPR/c054cf42-f2c0-49ad-a431-a2ef7b4b13fe/8b738ea0-f89e-4627-8679-433616064e82 (accessed on 8 January 2021).
32. Magro, C.; Almeida, J.; Paz-Garcia, J.; Mateus, E.; Ribeiro, A. Hydrogen recovery in electrodialytic-based technologies appliedto environmental contaminated matrices. In Electrokinetic Remediation for Environmental Security and Sustainability; Ribeiro, A.,Prasad, M., Eds.; John Wiley & Sons Ltd: Hoboken, NJ, USA, 2021; pp. 251–270. ISBN 978-1-119-67011-7.
33. GOV.UK Streamlined Energy and Carbon Reporting (SECR) UK. Available online: https://www.gov.uk/government/publications/academy-trust-financial-management-good-practice-guides/streamlined-energy-and-carbon-reporting (accessedon 26 January 2021).
34. Politis, A.; Paspaliaris, I.; Taxiarchou, M. Management of Wastes from Primary Resource Processing: Identification, EnvironmentalEvaluations-MSP-REFRAM H2020 Project; EU: Luxembourg, 2017; Volume D2.4.
35. Candeias, C.; Melo, R.; Ávila, P.F.; Ferreira da Silva, E.; Salgueiro, A.R.; Teixeira, J.P. Heavy metal pollution in mine-soil-plantsystem in S. Francisco de Assis—Panasqueira mine (Portugal). Appl. Geochem. 2014, 44, 12–26. [CrossRef]
36. Metalary Tungsten Price 2020. Available online: https://www.metalary.com/tungsten-price/ (accessed on 11 January 2021).37. International Energy Agency Global Average Levelised Cost of Hydrogen Production by Energy Source and Technology, 2019 and
2050. Available online: https://www.iea.org/data-and-statistics/charts/global-average-levelised-cost-of-hydrogen-production-by-energy-source-and-technology-2019-and-2050 (accessed on 22 March 2021).
38. Islam, M.M.M.; Shafi, S.; Bandh, S.A.; Shameem, N. Impact of environmental changes and human activities on bacterial diversityof lakes. In Freshwater Microbiology; Bandh, S.A., Shafi, S., Shameem, N., Eds.; Elsevier: London, UK, 2019; pp. 105–136.ISBN 9780128174951.
39. Donoso, N.; Gobeyn, S.; Villa-Cox, G.; Boets, P.; Meers, E.; Goethals, P.L.M. Assessing the ecological relevance of organic dischargelimits for constructed wetlands by means of a model-based analysis. Water 2018, 10, 63. [CrossRef]
78
Sustainability 2021, 13, 3915
40. Antoniades, D. Paleolimnology—Lake chemistry. In Encyclopedia of Quaternary Science; Elias, S., Ed.; Elsevier: London, UK, 2007;pp. 2038–2046. ISBN 9780444527479.
41. Lønborg, C.; Carreira, C.; Jickells, T.; Álvarez-Salgado, X.A. Impacts of global change on ocean dissolved organic carbon (DOC)cycling. Front. Mar. Sci. 2020, 7, 466. [CrossRef]
42. Roudi, A.M.; Kamyab, H.; Chelliapan, S.; Ashokkumar, V.; Kumar, A.; Yadav, K.K.; Gupta, N. Application of response surfacemethod for total organic carbon reduction in leachate treatment using Fenton process. Environ. Technol. Innov. 2020, 19, 101009.[CrossRef]
43. Pacheco, M. Panasqueira. Atypical Mining Project. Master’s Thesis, University of Porto, Portugal, 2017.44. Schaeffer, N.; Martins, M.A.R.; Neves, C.M.S.S.; Pinho, S.P.; Coutinho, J.A.P. Sustainable hydrophobic terpene-based eutectic
solvents for the extraction and separation of metals. Chem. Commun. 2018, 54, 8104–8107. [CrossRef]45. Abbott, A.P.; Frisch, G.; Hartley, J.; Ryder, K.S. Processing of metals and metal oxides using ionic liquids. Green Chem. 2011, 13,
471–481. [CrossRef]46. Miller de Melo Henrique, J.; Cañizares, P.; Saez, C.; Vieira dos Santos, E.; Rodrigo, M.A. Relevance of gaseous flows in
electrochemically assisted soil thermal remediation. Curr. Opin. Electrochem. 2021, 100698. [CrossRef]47. Shalaby, A.; Nassef, E.; Mubark, A.; Hussein, M. Phosphate removal from wastewater by electrocoagulation using aluminium
electrodes. Am. J. Environ. Eng. Sci. 2014, 1, 90–98.48. Greenice. Toledo, Spain. Available online: https://greenice.com/pt/816-economia-de-energia (accessed on 29 January 2021).49. Ganiyu, S.O.; Martínez-Huitle, C.A. The use of renewable energies driving electrochemical technologies for environmental
applications. Curr. Opin. Electrochem. 2020, 22, 211–220. [CrossRef]50. Chave Vertical Lda. Aveiro, Portugal. Available online: http://www.chavevertical.pt/crbst_192.html (accessed on 29 January
2021).51. Christensen, I.V.; Pedersen, A.J.; Ottosen, L.M.; Ribeiro, A.B. Electrodialytic remediation of CCA-treated waste wood in a 2 m3
pilot plant. Sci. Total Environ. 2006, 364, 45–54. [CrossRef] [PubMed]52. Castro-Gomes, J.; Magrinho, M.; Sedira, N.; Beghoura, I.; Humbert, P.; Manso, M.; Fernandes, A.; Silva, R. Alkali-activation of
tungsten mining waste mud blended with waste glass: Reactivity, performance and innovative applications. In Proceedings ofthe ICEUBI 2017—International Conference on Engineering—A Vision for the Future, Covilhã, Portugal, 5–7 December 2017.
54. United Nations. Transforming Our World: The 2030 Agenda for Sustainable Development. A/RES/70/1; UN: New York, NY, USA, 2015.55. Liu, W.; Huang, C.; Han, J.; Qin, W. Removal and reuse of arsenic from arsenic-bearing purified residue by alkaline pressure
oxidative leaching and reduction of As (V). Hydrometallurgy 2021, 199, 105541. [CrossRef]56. U.S. Environmental Protection Agency. Arsenic Treatment Technologies for Soil, Waste, and Water; U.S. Environmental Protection
Agency: Washington, DC, USA, 2002.57. Denios online shop. Porto, Portugal. Available online: https://www.denios.pt/shop/ (accessed on 29 January 2020).58. ABC do Acrílico. Almada, Portugal. Available online: http://www.abcdoacrilico.com (accessed on 29 January 2021).59. Changsheng Titanium Co., Ltd. Baoji City, China. Available online: https://www.bjcstytitanium.com/products (accessed on 29
January 2021).60. Xion Water Solutions. London, UK. Available online: http://xionwater.com/products.html (accessed on 29 January 2021).61. Merck KGaA., Darmstadt, Germany. Available online: https://www.merckgroup.com/en/expertise.html (accessed on
29 January 2021).62. La Tienda del Apicultor. Valencia, Spain. Available online: https://www.latiendadelapicultor.com/pt/ (accessed on
29 January 2021).63. Chemical Book. China. Available online: https://www.chemicalbook.com/ProductList_En.aspx?kwd=cholinechloride (accessed
on 29 January 2021).64. Ferramentas.pt. Seixal, Portugal. Available online: https://ferramentas.pt (accessed on 29 January 2021).65. Paipu Technology Co., Ltd. Changzhou, China. Available online: http://www.paiputech.com/EN/Productlist.Asp?SortID=48
(accessed on 29 January 2021).66. Expondo. Portugal. Available online: https://www.expondo.pt/artigos-industriais/ (accessed on 29 January 2021).67. PT Robotics. Rio de Mouro, Portugal. Available online: https://www.ptrobotics.com (accessed on 29 January 2021).68. European Commission. Guidelines on the Eligibility of Costs under the Connecting Europe Facility; EC: Brussels, Belgium, 2018.69. Andrade, L.H.; Mendes, F.D.S.; Espindola, J.C.; Amaral, M.C.S. Reuse of dairy wastewater treated by membrane bioreactor and
nanofiltration: Technical and economic feasibility. Braz. J. Chem. Eng. 2015, 32, 735–747. [CrossRef]70. Samhaber, W.M.; Nguyen, M.T. Applicability and costs of nanofiltration in combination with photocatalysis for the treatment of
dye house effluents. Beilstein J. Nanotechnol. 2014, 5, 476–484. [CrossRef]
Circularity in the New Gravity—Re-Thinking VernacularArchitecture and Circularity
Marwa Dabaieh 1,*, Dalya Maguid 2 and Deena El-Mahdy 2
1 Unit of Built Environment, Department of Urban Studies, Faculty of Culture and Society, Malmo University,211 19 Malmö, Sweden
2 Architectural Engineering Department, Faculty of Engineering, The British University in Egypt,Al-Sherouk 11837, Egypt; [email protected] (D.M.); [email protected] (D.E.-M.)
Abstract: The mounting climate change crisis and the rapid urbanization of cities have pressuredmany practitioners, policymakers, and even private investors to develop new policies, processes,and methods for achieving more sustainable construction methods. Buildings are considered to beamong the main contributors to harmful environmental impacts, resource consumption, and wastegeneration. The concept of a circular economy (CE), also referred to as “circularity”, has gained agreat deal of popularity in recent years. CE, in the context of the building industry, is based on theconcept of sustainable construction, which calls for reducing negative environmental impacts whileproviding a healthier indoor environment and closing material loops. Both vernacular architecturedesign strategies and circular economy principles share many of the same core concepts. This paperaims at investigating circular economy principles in relation to vernacular architecture principlesin the built environment. The study demonstrates how circular principles can be achieved throughthe use of vernacular construction techniques and using local building materials. This paper willfocus on Egypt as one of the oldest civilizations in the world, with a wide vernacular heritage,exploring how circularity is rooted in old vernacular settlements and how it can inspire contemporarycircular practices.
The growing climate change crisis and urbanization have urged more governmentdecision-makers, urban planners, architects, and private investors to develop new policies,processes, and methods for leading more sustainable lifestyles [1]. According to the UnitedNations Environment Programme (UNEP) [2], cities consume 75% of the world’s primaryenergy capacity (such as crude oil, coal, wind, natural gas, etc.), produce 60–80% of globalgreenhouse gas emissions, and produce 50% of the world’s waste [3,4]. Buildings areconsidered among the main contributors to harmful environmental impacts, resourceconsumption, and waste generation [5]. According to UNEP [6] and the World ResarchInstitute (WRI) [7], buildings account for 40% of all waste generated by volume, 40% of allmaterial resources use by volume, and 33% of all human-induced emissions. Furthermore,the construction industry and the built environment are among the greatest contributors tonatural resource depletion [3,8,9]. Thus, it is imperative for governments to start adoptingmore sustainable practices in the construction industry.
The concept of the circular economy (CE), also referred to as “circularity”, is one ofthe sustainable concepts that has been gaining traction in recent years as an approachfor reducing the environmental footprint of different industries, including the buildingsector [5,10–13]. While there is no standard definition for the CE model, it has beendefined by several organizations as the opposite of the linear economy (LE) and its “make-take-waste” model [12,14]. The linear production-consumption model is concerned with
producing and consuming goods made from raw materials, selling them, using them, andthen disposing of them as waste [3,5]. This model, however, has become ineffective dueto the increase in global populations and depleting natural resources [12]. In the buildingindustry, CE calls for reducing the negative environmental impacts on the environmentwhile providing a healthier indoor environment and closing material loops [15]. CE is notnecessarily considered a new concept but rather one that combines several pre-existingprinciples for closing material loops, reducing energy and raw material waste [16,17], andprolonging the lifespan of products through maintenance and repair [18,19].
Vernacular architecture can also be linked to circular sustainable concepts. Vernaculararchitecture is defined as the design of buildings based on local needs, using local materials,and reflecting the local culture and traditions. In addition, they are usually built byinhabitants without any formal design training (architecture without architects) [20–22].Vernacular buildings provide optimal solutions for local problems [22] that are in harmonywith nature, in a durable, healthy, and sustainable manner [23]. Furthermore, vernacularbuildings all over the world are dependent on the use of low-impact natural materialsand construction techniques. Such techniques have proven to be resilient to weatherconditions and fulfill the locals’ needs at minimal cost and with a minimal impact on theenvironment [24–26]. Thus, the importance of local architecture is quite evident, along withthe need to return to many of the simple, sustainable solutions that have been devised inthe past [22].
2. Literature Review
2.1. The Circular Economy in the Built Environment
CE in the built environment has gained academic, governmental, and organizationalrecognition over the past few years [3]. The EU has developed a series of actions andlegislative proposals for future reuse and recycling targets for construction and demolitionwaste [27,28]. Shifting to CE provides several opportunities for reducing primary materialusage and carbon footprints [29], and can positively impact economic, environmental,and social sustainability [30]. Circular economy concepts can be integrated in the scaleof buildings, products, and components, in two main aspects: circular material usage,and circular design [12]. The use of circular materials is concerned with the selection ofmaterials that are renewable (biological cycles), or that are reusable after first use (technicalcycles), while the circular design is defined as the design of products and componentsthat can be easily disassembled at the end of their use, facilitating their reuse in otherprojects [12]. Furthermore, circular building design (CBD) is concerned with buildingsthat are designed, planned, constructed, operated, and maintained with CE principles inmind [31]. To be able to shift toward CBD, CE principles need to be applied to the differentlife cycle stages of the building, managing the building and its component parts from cradleto cradle [30]. This also entails ensuring that all materials used in the building can berecycled or composted at the end of its lifecycle [32].
Previous studies have approached CE in the built environment from different pointsof view. A few examples of recent studies on this topic are outlined in this section.Akhimien et al. [30], for instance, provided a review for circular economy interventions inbuildings under seven main circular economy principles or strategies and highlighted thepossible gaps in research on this topic. Similarly, Cimen [33] and Eberhardt et al. [5]presented a review of the literature on the circular economy in the construction andbuilt environment sector, highlighting key findings and gaps in the reviewed studies.Munaro et al. [3] provided a state-of-the-art review on CE research and focused on ana-lyzing what has already been done in terms of circular practices in the construction valuechain. The study also proposed a theoretical framework to be used as a starting pointby designers, researchers, and stakeholders for introducing circular practices in the builtenvironment [3], while Amory [12] developed a framework (guidance tool) for the designof circular buildings, based on the “circular design” and “circular material usage” strate-gies. Furthermore, Cambier et al. [34] presented an overview of the available design tools
82
Sustainability 2022, 14, 328
related to circular design that can be implemented at different stages of the design process.Eberhardt et al. [35] conducted life cycle assessment models that compared linear andcircular building components, suggesting the potential benefits of the re-use and recyclingof building components in the circular approach. Huuhka and Vestergaard [36] presented acomparison between building conservation and CE concepts, addressing the relationshipsamong them, their commonalities, and their differences. However, there was a gap instudies that linked the CE with vernacular architecture.
Moreover, despite the efforts being made, the wide-scale adoption and implementationof CE in building design and construction strategies still lack a common direction, oftenimplemented through small-scale and fragmented approaches [3,5,33]. Buildings arecomplex and dynamic, involving many different systems and components, each with itsown life cycle, functions, and characteristics. The environmental performance of buildingsdepends on several different attributes, such as building design, materials choice, operation,and maintenance [5,37]. The literature also indicates that CE initiatives are directed towarddifferent focus areas and use different tools [38]. Thus, it is argued that these fragmentedinitiatives prevent the universal adoption of CE in the building industry [33,35]. Studiesindicate that there is also a lack of knowledge on the definition of CE, its fundamentalprinciples, and its implementation in an innovative manner in the building sector’s businessmodel [27,36], while Kirchherr and Van Santen [39] indicate that most CE studies focuson developed countries, making many of the CE studies irrelevant to construction inless-developed countries. This is due to differences in policy environments, access tofunding, and infrastructure [39]. Cambier et al. [34] have also asserted the need for morepractical examples, such as case studies and best practices for circular buildings. All ofthis indicates the importance of providing more studies that investigate CE in the buildingsector. In addition, it highlights the need for more studies on best practice in developingcountries [39].
2.2. Circular Design Principles
Various CE design principles were highlighted in the literature in different classifica-tions. These principles include adaptive design and reuse, design for disassembly (DFD),and design for repair and manufacturing [17,40–42]. Adams et al. [27] classified the CEprinciples regarding: designing for disassembly, flexibility and the reuse of secondary mate-rials, the reuse of components, and the use of secondary materials in the construction valuechain [5]. Likewise, Akhimien et al. [30] concluded that there were seven main circulareconomy principles in buildings: design for disassembly, design for recycling, buildingmateriality, building construction, building operations, building optimization, and thebuilding’s end-of-life. Akhimien et al. [30] also highlighted that most studies were focusedon two main aspects: the recycling of waste components and end-of-life. Buildings that canbe disassembled are more adaptable, according to CE principles, since their parts can bereused, renewed, optimized, or exchanged for others while maintaining their value. Lastly,UNEP [43] classified CE according to four main principles. These are: (1) reduce by design,(2) refuse, reduce and re-use, (3) repair, refurbish and remanufacture, and (4) repurpose andrecycle. From these classifications, four main principles were summed up to be adoptedthroughout this study. The concluded principles combine most of the principles discussedin the different sources reviewed and are rooted in vernacular architecture principles. Theseare (1) reduce by design, (2). refuse, reduce, and re-use, (3) repair, refurbish, and reman-ufacture and (4) repurpose and recycle. Table 1 summarizes the various classificationsmentioned and highlights the circular design principles that are adopted in this study.
83
Sustainability 2022, 14, 328
Table 1. A summary of the circular design principle classifications in the investigated literature.
A1. Adaptive design and reuse 3. Design for repair and manufacturing [17,40–42]2. Design for disassembly
B
1. Design for disassembly 3. Reuse of components[27]2. Flexibility and the re-use of secondary
materials4. Use of secondary materials in the
construction value chain
C
1. Design for disassembly 5. Building operations
[30]2. Design for recycling 6. Building optimization3. Building materiality 7. Building end of life
4. Building construction
D1. Reduce by design 3. Repair, refurbish, and remanufacture
[43]2. Refuse, reduce, and re-use 4. Repurpose and recycle1. Reduce by design 3. Repair, refurbish, and remanufacture
2. Refuse, reduce, and re-use 4. Repurpose and recycleThe Concluded Design
Principles
2.3. Vernacular Architecture and the Circular Economy
It has been noted that vernacular architecture shares many of the core concepts ofsustainable buildings. Vernacular architecture is concerned with climate-responsive build-ings that are made from local materials and technology and reflect the local customs andlifestyle of a community [44]. Using vernacular concepts can create environmentally con-scious designs that respond to climatic conditions, usually using passive and low-energystrategies for human comfort [44]. Vernacular buildings correspond to local materials andthe economical use of building resources [44]. Many studies highlight the importance oflearning from vernacular buildings for designing contemporary sustainable buildings andof returning to local approaches that are most suitable for their local environments [44–46].Furthermore, vernacular solutions are usually low-cost since they adhere to their localcontexts. This is particularly important for developing countries, such as Egypt.
Research into vernacular architecture design concepts reveals that they coincide withmany CE concepts. According to several studies [47–50], there is still a need for moreresearch that addresses the use of vernacular knowledge in contemporary architecturalexamples. Although CE has been linked to sustainable concepts in the past, a gap wasnoted, however, in studies that linked CE to vernacular architecture. In Egypt, sustain-able and circular design solutions are fundamental for addressing climate change. Egypthas multiple examples of vernacular and neo-vernacular buildings, thus providing manyopportunities to learn from their techniques. Several studies have also highlighted thevalue of learning from vernacular buildings in Egypt. For example, a study by Ahmed [51]investigated three vernacular buildings constructed by Bedouin residents in Siwa Oasis,highlighting best practices and appropriate systems that were implemented for climate-responsive low-carbon buildings. The study also highlighted the lessons learned fromenvironmentally friendly approaches in terms of building with local materials, passivecooling techniques, natural daylighting, and the best use of available natural resources [51].Dabaieh [49] investigated energy-efficient and low passive strategies in a contemporaryvernacular building in Saint Catherine, Sinai, Egypt, highlighting how vernacular designconcepts were integrated when designing modern contemporary buildings. Fouad andMostafa [52] discussed the potential benefits of adapting aspects of vernacular architecturefor a more sustainable quality of life in arid regions in Egypt. Fernandes et al. [53] investi-gated strategies used in Mediterranean vernacular architecture by analyzing cases fromsouthern Portugal and Northern Egypt, identifying key vernacular climatic strategies thatcan be used for improving contemporary buildings’ energy performance. However, morestudies are still needed that explore how learning from vernacular concepts can be usefulin the future adoption of CE in contemporary buildings.
84
Sustainability 2022, 14, 328
3. Methodology
This study uses an investigative and exploratory methodological approach. A litera-ture review initially supported the identification of gaps in research that explore the linkbetween concepts and examples of circular economy and circularity within vernacular ar-chitecture. After these gaps were identified, two cases were examined using an exploratoryapproach. The first case is a vernacular settlement that shows examples of circular designand construction techniques, while the second case represents a contemporary settlementthat aims to revive vernacular architecture with respect to context. Four main circulardesign principles were elected as indicators of circularity from the literature review andwere used in the case study analysis. The principles are: (1) reduce by design, (2) refuse,reduce, and reuse, (3) repair, refurbish and remanufacture, (4) repurpose and recycle. Theprinciples were summed up from the reviewed classifications to include many of the keycircular principles indicated in the investigated literature. In addition, these principles alsoshare many of the ideas that were found to be rooted in vernacular architecture concepts.Two of the principles were merged together in our investigation as they resemble theprinciple of the 5 Rs, which are: refuse, reduce, reuse, repurpose, and then recycle. Themethodological steps followed in this study are shown in Figure 1.
Figure 1. The methodological approach and steps followed in this study.
3.1. Identifying Gaps in the Literature Connecting the Circular Economy with VernacularArchitecture
To identify gaps in the literature that make the connection between the circular econ-omy and vernacular architecture, this research used bibliometric analysis, searching Scopusdatabase results from the last 10 years. To illustrate the bibliometric analysis, VOSviewersoftware was employed to depict the most used keywords within the field of the circulareconomy in relation to architecture, as shown in Figure 2. The first keywords used were“circular economy” and “vernacular architecture”. There were only two publications thathave a close connection to the circular economy. Both publications were based more on“shape grammar” and product design than on architecture. Shape grammar is considereda generative and algorithmic language and design tool that was established by GeorgeStiny and James Gips in 1971 [54]. Yet, when replacing the search phrase “vernaculararchitecture” with “architecture” and “built environment”, more links and publicationsappeared, with 141 for “architecture” and 200 for “built environment”. Most of the papersrelated to architecture and the built environment mentioned topics related to sustainability,waste management, building materials, life-cycle assessment, economics, and ecology.These results concretely demonstrate the gap in research that links the circular economy
85
Sustainability 2022, 14, 328
and vernacular architecture, compared to research focused on circularity and architecturein general.
Figure 2. The gap between research on the circular economy and vernacular architecture is shown in(a), while (b) and (c) show the connection between research on the circular economy and the builtenvironment/architecture.
3.2. Case Study Investigation
The two case studies chosen are located in the Western Desert of Egypt. The traditionalvernacular case study that was selected is in Balat Town in Dakhla Oasis, whereas thecontemporary case study is Adrere Amellall Ecolodge in Siwa Oasis. Following suggestionsfrom [55–57] to select a single case study location to maximize what can be learned in termsof comparability in the period of time available for the study, field trips to the WesternDesert were conducted in 2016 and 2017 to visit the two case-study sites. Several toolswere used during these visits, including field notes, field observations, random semi-structured walking interviews with 20 locals, structured interviews with two architects,
86
Sustainability 2022, 14, 328
and photography. After a year of site visits, the data was analyzed using circular economyapproaches from the literature review to assess the vernacular architecture.
3.3. Case Study Description
The town of Balat, built at the eastern entrance of the Dakhla Oasis, is situated atthe junction of two old caravan routes in the Western Desert of Egypt [58]. Records referto Balat as early as the 14th century [59]. Ancient Balat was a significant kingdom in theoasis [60] and was considered the chief town and headquarters for the governor of theoasis in Egypt at the end of the Old Empire (2350-2150 BCE) [61]. The main economicactivity in Balat was and still is farming. They have a self-sufficient system for growingtheir local crops, given their remote location. Balat residents rely on underground fossilwater for irrigation and drinking, as there is no water supply or drainage infrastructure.Furthermore, dry toilets are used, where organic wastes are composted to be used as soilfertilizers or as bio-fuel dunk cakes. This is one example of “closing the loop”. Inhabitantshave long adapted their dwellings to the tough, hot dry desert climate. Balat’s inhabitantsare accustomed to using passive techniques, especially for cooling. This is evident in theuse of air shafts, shading, cross-ventilation, and high-thermal-mass building envelopes. Inaddition, the construction solutions adopted, using locally available materials, decrease theprocessing and transportation costs of building materials. Thus, the building outcomes areless energy-demanding and more environmentally friendly than many modern solutions.The main construction materials in Balat are clay, palm reeds, and acacia wood, as shownin Figure 3. Bearing-wall construction using sun-dried adobe mud bricks is the typicalbuilding technique. Such applications in building design and construction are based oncumulative previous experiences and tacit knowledge through trial and error.
Figure 3. The usage of adobe clay bricks, together with reeds and acacia wood, in construction atBalat Town in Dakhla Oasis.
Adrere Amellal Ecolodge was built in 2000 and is located in Siwa Oasis. It faces thesalty lakes prevalent in the Western Desert and is surrounded by the white mountainsof Siwa. The Oasis offers materials such as limestone, palm and olive trees, salt rocks,and clay that are unique compared to the typical materials available in the surroundingenvironment [62]. One of the most significant resources in the Oasis is the salt extractedfrom the salt lakes and the therapeutic mud, which is considered a unique geologicalphenomenon of the area [63]. The lodge includes residential units, a restaurant, and ahealing center, which are all built from local salt “kershif” and clay for bearing-wall building,as shown in Figure 4. In addition, there is a water spring, as well as an organic farm thatproduces crops for self-sufficient farming. Adrere Amellal applies circular thinking andself-sufficiency, inspired by traditional and vernacular thinking. For example, the ecolodgedepends on growing and cultivating its own crops, and the use of locally sourced naturalmaterials in building construction and for furniture pieces. The eco-lodge has a local wastemanagement station for treating wastewater and garbage, as well as an organic wastecomposting station, as shown in Figure 5. The architectural design of the building includesmany passive strategies, like solar orientation, high thermal mass through the thickness ofthe wall, shading, passive cooling, and cross-ventilation.
87
Sustainability 2022, 14, 328
Figure 4. The usage of kershif, and palms plastered with salty mud, at Adrere Amellal Ecolodge inSiwa Oasis.
Figure 5. Self-sufficient farming and the water spring in Adrere Amellal Ecolodge.
4. Results
4.1. Refuse, Reduce, Reuse, Repurpose and Recycle
From the field observations and investigations using the UNED circular economy’sfour principles, the researchers noticed that indigenous vernacular communities tend toapply the “5 R” principles, firstly, “refuse and reduce”, using materials from outside theirlocal context. They have learned from experience that importing non-local materials causesmore problems than benefits in the long term. If non-local materials are necessary, they arereduced to a minimum and only brought in for essential needs. After the “end of life” stageof vernacular buildings, the building’s materials can be easily recycled again. For example,mud bricks can be easily reused and molded again into new, fresh mud bricks. Wood usedin the construction of roofs, if in good condition, can be repurposed again for roofing orcan be reused for doors, windows, stairs, farming tools, or other homemade furniture, orupcycled for other functions. As a last option, if the wood is not of good enough quality forany other use, it can be used as charcoal for heating or cooking. Furthermore, it is possibleto allow wood to rot/biodegrade if it has no further functionality. Similarly, mud brickscan also be broken down as clay in the soil. One outcome from the interviews with thelocals, from a user-to-user perspective, is that in both the Balat and Adrere Amellal casestudies, reused palm reeds were employed in construction. They were particularly usefulin constructing the ceiling and roof, as well as being integrated into the design of otherproducts. With almost no extra cost, the use of palm reeds is highly recommended due totheir compressive strength and good resistance to the harsh desert climate.
4.2. Reduce by Design
Vernacular settlements were constructed in a minimalistic way. Indigenous vernacularcommunities are used to the principle that “forms follow resources”. Taking Balat as anexample, the main architectural design solutions are based on the concept of reducingthe quantity of raw natural materials used in construction to the greatest extent possible.Reducing the quantity of materials used in construction and reducing the quantity of waste
88
Sustainability 2022, 14, 328
materials was a conscious decision. Vernacular dwellers are aware of how precious rawmaterials are, and they know from their accumulated experience how they can most effec-tively and efficiently use raw materials. Almost no waste is produced during construction,and any leftovers are used for other functions. From interviews with locals in Balat, anexample of this can be seen in the way the components of palm trees are used in vernacularconstruction. The palm wood trunks, for instance, are used as the main beams in the roofconstruction. Furthermore, palm reeds are used as secondary beams by bundling themtogether as mats and then placing them over the main wood trunk (wood logs). Lastly, theleaflets around the palm reeds, when taken away, are used in furniture manufacturing or inweaving different sorts of household utilities, like food baskets and even bags. The palmfibers, located around the tree trunk, are also taken away and used for weaving baskets.
Adrere Amellal Ecolodge implemented construction methods reflecting the localvernacular architecture of the region, where the emphasis was on materials that are availablein the desert. This helps avoid using harmful materials that pollute the environment or thatconsume more energy, either through construction machinery, transportation, or kiln-firing.From the interview with the two principal architects who designed Adrere Amellal, theymentioned that the design morphology of Adrere Amellal Ecolodge is based on thickkershif (a biodegradable combination of salt-rock and mud mixed together) walls thatcan vary between 40 and 80 cm and act as a thermal insulator. Kershif was selected inthe early stages of the design for both the construction of the building and for built-infurniture design. Raw salt, extracted from the salt lakes in Siwa Oasis, as well as palm reedsfrom the site, were also used to construct the built-in furniture. Salt and palm reeds costclose to nothing to use and helped reduce the embodied carbon in both the constructionprocess and in lifetime energy usage. Using both kershif and salt that were extracted fromthe same site allow reducing the transportation of the materials to the site. It was alsoobserved that kershif can be easily disassembled as blocks, to be used again in constructionor decomposed in the soil.
4.3. Repair, Refurbish and Remanufacture
Vernacular buildings in Egypt, especially those constructed from earthen materials,need regular maintenance and repair throughout their lifetime. From our interviews andfield observations, we found that the locals use seasonal celebrations as opportunitiesto perform quarterly, annual, or sometimes bi-annual maintenance. Families festivelygather to help each other conduct maintenance on the interior or the exterior of buildings.These activities keep their buildings fresh and reduce the possibility of any damage ordeterioration due to harsh desert weather conditions. Regular repair and maintenance helpincrease the lifespan of buildings and reduce the need to replace parts. When needed, majorrepairs, such as the replacement of a structural element, patching walls or roofs, or thereplacement of doors and windows, can also be conducted outside of celebration periods.Heavy rains can cause earthen building deterioration, thus requiring regular maintenance.
From the interview responses that were received, one interviewee mentioned that inthe high rainy seasons in winter, rain and evaporation cause damage to some buildings,which then require maintenance. For instance, in Adrere Amellal, the crystallization thatoccurs in salt particles due to humidity in the summer can lead to the evaporation ofsome salt particles, while during winter, the rain can cause cracks and damage to thebuilding. Accordingly, depending on the state of damage, annual repairs and renovationwork are required to restore the building to its original state. In this case, two treatmentsare performed, either filling the cracks with a new mixture of kershif and plastering it withclay, or in the case of the total destruction of a wall, an entire wall can be replaced with anew one.
5. Discussion
From this explorative study, we can deduce that circularity in design should look atthe building as a kit instead of looking at the building as a traditional structure. Design and
89
Sustainability 2022, 14, 328
building should be considered from the lens of disassembly, easy maintenance, and beingeasy to upcycle or reuse. Architects should design buildings to be easily taken apart sotheir materials can be reused in another building. Increasing not only a building’s life spanbut the life span of its materials is another essential part of circular thinking and the circulareconomy. This might sound a bit challenging, but designers have to not only get used toworking with smaller palettes of reusable materials but also design building componentsfor disassembly as well as assembly. Yet design for disassembly, or, as some call it, “Designfor Deconstruction” (DfD), offers other concerns that need to be considered. For instance,the circular design process itself requires new skills; it needs more flexibility in drawingsand designs and more flexibility in terms of deadlines for assembly and disassembly.
Design for disassembly or for re-building was the primary method of conceptualiz-ing vernacular architecture in Egypt. Designs differ from one building type to anotherand depend on the availability and use of construction materials. Earth, reeds, straw,wood, woven textiles, and jute are raw building materials that are easy to disassemble assmall components and re-assemble again. As shown earlier in this paper, the focus is onearthen construction, mainly in the form of sun-dried mud blocks and mud-brick (Adobe)construction. Bricks are modular units that are easy to cast and assemble and easy todisassemble for rebuilding. The only design drawback of mud bricks is the time it takes todisassemble them for re-use. The use of mud bricks in construction can be labor-intensiveand time-consuming in terms of casting and drying. However, nowadays, there are severalmethods for mechanical casting using hydraulic machines, which is a fossil-free process.Nevertheless, they are not as fragile as fired bricks, which can later be broken up easilyduring disassembly. Additionally, if any damage happens to sun-dried adobe bricks, theycan be easily repaired using mud paste or clay mortar.
Both case studies in this paper were rich in showing the different usage of the localmaterials in many ways, whether in construction or in products. In addition, using adobeand kershif as traditional building techniques through time opens new doors for integratingmany advanced techniques in construction, from 3D printing or robotics to traditionaltechniques, to enable faster building. For reducing the maintenance of adobe and kershifbuildings, new additives can be integrated into the mixture that will prevent or reducestructure cracks and shrinkage with time, like adding lime and natural fibers.
Some circular materials also rooted in vernacular architecture are bio-based materials.Very soon, natural substances, such as weeds, algae, bacteria, enzymes, and even proteins,will be used to grow materials that will replace today’s plastics and other industrialbuilding and construction materials. The main goal of the development of these nature-based materials is to avoid the production of toxic waste during materials manufacturingprocesses and during their reuse and disposal. Ideally, these biomaterials can have positiveimpacts once they are no longer used in construction. For example, at the end of theirlifespan, they could be used as animal feed or compost. It is worth mentioning that bio-fabrication is the future for circular design and soon, a supply chain will be integrated intothe materials for building construction. Figure 6 illustrates a linear way of thinking, usingindustrial materials, and a circular way of thinking, using natural and renewable materials.
Still, there are challenges facing circular design and construction. Firstly, even ifbuildings are designed and constructed with circularity in mind, we cannot always buildeverything from new. Transforming existing old buildings through rehabilitation or adap-tive reuse must be the number-one alternative, and rehabilitation can be performed withcircular design concepts. One other challenge, depending on the size of the building, isthat the process of assessment for reclaiming old materials can be time-consuming. It canalso be hard to identify every single building component and decide which materials arereclaimable or not, especially when the issues of toxicity and the carbon footprint have tobe considered. This chain of decision-making can hinder material reuse. Another challengeis the lack of standardization, in terms of how different architecture firms and contractorsassess and reclaim materials for reuse. Labor cost is another issue, as experienced workerscan be expensive and could be considered an economic burden on the project during the as-
90
Sustainability 2022, 14, 328
sembly and disassembly process. Quantifying designs for reconstruction or deconstructioncan still be very undefined since there are not many well-recognized conventional methods.Moreover, there is a need for professionals who are able to judge which parts of a buildingcan be reused as reclaimed materials. At this point in the process, circularity needs a strongdesire and a will for change, necessitating dedicated and enthusiastic actors in the buildingsector to step in.
Figure 6. Comparison between a circular and linear economy in design and construction. The graphicsummarizes the differences in thinking and the impact on the environment.
6. Conclusions
This study discussed four main circular building design concepts in vernacular ar-chitecture. Two cases in Egypt were chosen for this study’s investigation: a traditionalvernacular settlement and a contemporary project that was inspired by vernacular CEprinciples. Points of analysis for the two cases stemmed from key CE approaches that werefound to be common to both circular design and vernacular design.
The focus was on four concepts: reduce by design; refuse, reduce and reuse; repair,refurbish and remanufacture; and repurpose and recycle. Based on the exploration of theseconcepts, this paper posits that the negative environmental impacts of buildings and theoveruse of natural resources can be considerably reduced by drawing inspiration fromvernacular architecture. However, most contemporary buildings are still not designedaccording to the principles of circular design, or even close to the concept of circularity.Available literature focuses primarily on topics such as life cycle assessment for buildingmaterials or the efficiency of innovative materials with low impact and potential for recycla-bility. A research gap remains on the hands-on design process of circular design and circularbuildings and how architects can integrate circular economy concepts in their designs.
We hope this paper has shown how CE principles are rooted in vernacular heritageand can still be applicable in contemporary practice. We focused only on four principlesbut there are many others that can still be a good source of inspiration. We were limited inmaking the comparative work between a contemporary case study and a traditional case
91
Sustainability 2022, 14, 328
study. This research is part of ongoing work on investigating more hands-on circularitystrategies in vernacular architecture. Although case studies from Egypt were displayedin this investigation, the study findings can surely be applied to other climatic zones andgeographical locations. The methodological approach is holistic and will be applicable indifferent contexts.
Author Contributions: Conceptualization, M.D., D.M. and D.E.-M.; methodology, M.D.; software,D.E.-M.; validation, M.D., D.M. and D.E.-M.; formal analysis, M.D., D.M. and D.E.-M.; investigation,M.D., D.M. and D.E.-M.; resources, D.M.; data curation, M.D., D.M. and D.E.-M.; writing—originaldraft preparation, M.D., D.M. and D.E.-M.; writing—review and editing, M.D., D.M. and D.E.-M.visualization, D.E.-M.; supervision, M.D.; project administration, M.D.; funding acquisition, M.D. Allauthors have read and agreed to the published version of the manuscript.
Funding: This research received no external funding.
Institutional Review Board Statement: Not applicable.
Informed Consent Statement: Informed consent was obtained from all subjects involved in thestudy.
Data Availability Statement: Not applicable.
Acknowledgments: We thank all the interviewees for their time and contribution to this study.
Conflicts of Interest: The authors declare no conflict of interest.
References
1. Ibáñez, C.S. Circular design in everyday urbanism: Towards regenerative and restorative dynamic spaces in cities. Vis. Sustain.2019, 11, 9–16.
2. United Nations Environment Programme (UNEP). The Emissions Gap Report 2016; United Nations Environment Programme(UNEP): Nairobi, Kenya, 2016. Available online: https://www.unep.org/resources/emissions-gap-report-2016 (accessed on 20June 2021).
3. Munaro, M.R.; Tavares, S.F.; Bragança, L. Towards circular and more sustainable buildings: A systematic literature review on thecircular economy in the built environment. J. Clean. Prod. 2020, 260, 121134. [CrossRef]
4. Ellen MacArthur Foundation (EMF). Growth within: A Circular Economy Vision for a Competitive Europe. EllenMacArthur Found. 2015, 100, 81–92. Available online: www.ellenmacarthurfoundation.org/assets/downloads/publications/EllenMacArthurFoundation_Growth-Within_July15.pdf (accessed on 21 June 2021).
5. Eberhardt, L.C.M.; Birkved, M.; Birgisdottir, H. Building design and construction strategies for a circular economy. Arch. Eng. Des.Manag. 2020, 1–21. [CrossRef]
6. United Nations Environment Programme (UNEP). Sustainable, Resource Efficient Cities–Making It Happen; UNEP: Paris, France,2012. Available online: https://sustainabledevelopment.un.org/content/documents/1124SustainableResourceEfficientCities.pdf(accessed on 21 June 2021).
7. World Resources Institute (WRI). Accelerating Building Efficiency: Eight Actions for Urban Leaders. 2016. Available online:https://www.wri.org/publication/accelerating-building-efficiency-actions-city-leaders (accessed on 21 June 2021).
8. Leising, E.; Quist, J.; Bocken, N. Circular Economy in the building sector: Three cases and a collaboration tool. J. Clean. Prod. 2018,176, 976–989. [CrossRef]
9. Zimmann, R.; O’Brien, H.; Hargrave, J.; Morrell, M. The Circular Economy in the Built Environment; ARUP: London, UK, 2016.10. Ellen MacArthur Foundation (EMF). Cities in the Circular Economy. 2017. Available online: https://www.ellenmacarthurfoundation.
org/assets/downloads/publications/Cities-in-the-CE_An-Initial-Exploration.pdf (accessed on 20 June 2021).11. Liu, Y.; Bai, Y. An exploration of firms’ awareness and behavior of developing circular economy: An empirical research in China.
Resour. Conserv. Recycl. 2014, 87, 145–152. [CrossRef]12. Amory, J. A Guidance Tool for Circular Building Design; Delft University of Technology, Architecture and the Built Environment:
Delft, The Netherlands, 2019.13. Przepiórkowska, S. The Circular Economy approach in architecture—A study of 5 bottom-up cases. Builder 2020, 279, 33–39.
[CrossRef]14. Saidani, M.; Yannou, B.; Leroy, Y.; Cluzel, F. How to Assess Product Performance in the Circular Economy? Proposed Requirements
for the Design of a Circularity Measurement Framework. Recycling 2017, 2, 6. [CrossRef]15. Díaz-López, C.; Carpio, M.; Martín-Morales, M.; Zamorano, M. Defining strategies to adopt Level(s) for bringing buildings into
the circular economy. A case study of Spain. J. Clean. Prod. 2020, 287, 125048. [CrossRef]16. Homrich, A.S.; Galvão, G.; Abadia, L.G.; Carvalho, M.M. The circular economy umbrella: Trends and gaps on integrating
pathways. J. Clean. Prod. 2018, 175, 525–543. [CrossRef]
92
Sustainability 2022, 14, 328
17. Dokter, G. Circular Design in Practice- towards a Co-Created Circular Economy through Design; Chalmers University of Technology,Department of Architecture and Civil Engineering: Gothenburg, Sweden, 2021.
18. Kirchherr, J.; Piscicelli, L. Towards an education for the circular economy (ECE): Five teaching principles and a case study. Resour.Conserv. Recycl. 2019, 150, 104406. [CrossRef]
19. Van Buren, N.; Demmers, M.; Van Der Heijden, R.; Witlox, F. Towards a Circular Economy: The Role of Dutch Logistics Industriesand Governments. Sustainability 2016, 8, 647. [CrossRef]
20. Oliver, P. (Ed.) Encyclopedia of Vernacular Architecture of the World; Cambridge University Press: Cambridge, UK, 1997.21. Dabaieh, M. More than Vernacular: Vernacular Architecture between Past Tradition and Future Vision; Media-Tryck Lund University:
Lund, Sweden, 2016.22. Sala, M.; Trombadore, A.; Fantacci, L. Chapter 12: The Intangible Resources of Vernacular Architecture for the Development of a
Green and Circular Economy. In Sustainable Vernacular Architecture-How the Past Can Enrich the Future; Sayigh, A., Ed.; Springer:Berlin/Heidelberg, Germany, 2019; pp. 229–256.
23. Simoes, R.N.; Cabral, I.; Barros, F.C.; Carlos, G.; Correia, M.; Marques, B.; Guedes, M.C. Chapter 4: Vernacular Architecture inPortugal: Regional Variations. In Sustainable Vernacular Architecture-How the Past Can Enrich the Future; Sayigh, A., Ed.; Springer:Berlin/Heidelberg, Germany, 2019; pp. 55–91.
24. Turan, M. Vernacular Architecture: Paradigms of Environmental Response (Ethnoscapes); Aldershot: Avebury, UK, 1990.25. Dabaieh, M. A Future for the Past of Desert Vernacular Architecture: Testing a Novel Conservation Model and Applied Methodology in the
Town of Balat in Egypt; Lund University: Lund, Sweden, 2011. Available online: https://lucris.lub.lu.se/ws/files/5906883/2224661.pdf (accessed on 10 October 2021).
26. Dabaieh, M. Dare to Build: Designing with earth, reeds and straw for contemporary sustainable welfare architecture. InProceedings of the ICOMOS-CIAV&ISCEAH 2019 Joint Annual Meeting & International Conference on Vernacular & EarthenArchitecture towards Local Development, Pingyao, China, 5–7 September 2019; pp. 241–247.
27. Adams, K.T.; Osmani, M.; Thorpe, T.; Thornback, J. Circular economy in construction: Current awareness, challenges, andenablers. Proc. Inst. Civ. Eng.-Waste Resour. Manag. 2017, 170, 15–24. [CrossRef]
28. European Commission (EC). Circular Economy Implementation of the Circular Economy Action Plan. 2019. Available online:https://ec.europa.eu/environment/circular-economy/ (accessed on 20 June 2021).
29. Ellen MacArthur Foundation (EMF). Towards the Circular Economy-Opportunities for the Consumer Goods Sector (Vol. 2). 2013.Available online: https://eco.nomia.pt/contents/documentacao/tce-report-2013.pdf (accessed on 10 October 2021).
30. Akhimien, N.G.; Latif, E.; Hou, S.S. Application of circular economy principles in buildings: A systematic review. J. Build. Eng.2020, 38, 102041. [CrossRef]
31. Pomponi, F.; Moncaster, A. Circular economy for the built environment: A research framework. J. Clean. Prod. 2017, 143, 710–718.[CrossRef]
32. Kopnina, H. Circular economy and Cradle to Cradle in educational practice. J. Integr. Environ. Sci. 2018, 15, 119–134. [CrossRef]33. Çimen, O. Construction and built environment in circular economy: A comprehensive literature review. J. Clean. Prod. 2021, 305,
127180. [CrossRef]34. Cambier, C.; Galle, W.; De Temmerman, N. Research and Development Directions for Design Support Tools for Circular Building.
Buildings 2020, 10, 142. [CrossRef]35. Eberhardt, L.C.M.; Birgisdóttir, H.; Birkved, M. Life cycle assessment of a Danish office building designed for disassembly. Build.
Res. Inf. 2018, 47, 666–680. [CrossRef]36. Huuhka, S.; Vestergaard, I. Building conservation and the circular economy: A theoretical consideration. J. Cult. Herit. Manag.
Sustain. Dev. 2020, 10, 29–40. Available online: https://www.emerald.com/insight/content/doi/10.1108/JCHMSD-06-2019-0081/full/pdf?title=building-conservation-and-the-circular-economy-a-theoretical-consideration (accessed on 10 October 2021).[CrossRef]
37. Maslesa, E.; Jensen, P.A.; Birkved, M. Indicators for quantifying environmental building performance: A systematic literaturereview. J. Build. Eng. 2018, 19, 552–560. [CrossRef]
38. Ellen MacArthur Foundation (EMF). Potential for Denmark as a Circular Economy a Case Study from: Delivering the CircularEconomy–a Toolkit for Policy Makers. 2014. Available online: http://mst.dk/media/151170/15-11-25-cirkulaer-oekonomi.pd(accessed on 10 October 2021).
39. Kirchherr, J.; Van Santen, R. Research on the circular economy: A critique of the field. Resour. Conserv. Recycl. 2019, 150, 104480.[CrossRef]
40. Benachio, G.L.F.; Freitas, M.D.C.D.; Tavares, S.F. Circular economy in the construction industry: A systematic literature review. J.Clean. Prod. 2020, 260, 121046. [CrossRef]
41. Hopkinson, P.; De Angelis, R.; Zils, M. Systemic building blocks for creating and capturing value from circular economy. Resour.Conserv. Recycl. 2019, 155, 104672. [CrossRef]
42. Minunno, R.; O’Grady, T.; Morrison, G.M.; Gruner, R.L. Exploring environmental benefits of reuse and recycle practices: Acircular economy case study of a modular building. Resour. Conserv. Recycl. 2020, 160, 104855. [CrossRef]
43. United Nations Environmental Programme (UNEP). Understanding Circularity. 2021. Available online: https://buildingcircularity.org (accessed on 20 June 2021).
44. Wahid, A. Adaptive vernacular options for sustainable architecture. J. Int. Soc. Study Vernac. Settl. 2012, 2, 74–87.
93
Sustainability 2022, 14, 328
45. Naciri, N. Sustainable Features of the Vernacular Architecture. 2007. Available online: http://www.solaripedia.com/files/488.pdf(accessed on 20 June 2021).
46. Sundarraja, M.; Radhakrishnan, S.; Priya, R. Understanding Vernacular Architecture as a tool for Sustainability. In Proceedings ofthe 10th National Conference on Technological Trends, Trivandrum, India, 6–7 November 2009.
47. Vellinga, M.; Asquith, L. Vernacular Architecture in the Twenty-First Century: Theory, Education and Practice; Taylor & Francis: NewYork, NY, USA, 2006.
48. Rashid, M.; Ara, D. Modernity in tradition: Reflections on building design and technology in the Asian vernacular. Front. Arch.Res. 2015, 4, 46–55. [CrossRef]
49. Dabaieh, M. Energy efficient design strategies for contemporary vernacular buildings in Egypt. In Vernacular Heritage and EarthenArchitecture: Contributions for Sustainable Development; Correia, C., Rocha, Eds.; Taylor & Francis Group: London, UK, 2013;pp. 599–604.
50. Dabaieh, M. Earth vernacular architecture in the Western Desert of Egypt. In Vernadoc RWW 2002; Markku, M., Ed.; InternationalVERNADOC Network; 2013; pp. 24–30.
51. Ahmed, R. Lessons learnt from the vernacular architecture of bedouins in Siwa Oasis, Egypt. In Proceedings of the 31st Interna-tional Symposium on Automation and Robotics in Construction and Mining (ISARC 2014), Sydney, Australia, 9–11 July 2014; pp.910–917. [CrossRef]
52. Fouad, W.; Moustafa, O. Vernacular architecture approach to achieve sustainability in informal settlements. In World SustainableBuildings SB14; Green Building Council España: Madrid, Spain, 2014; pp. 200–207.
53. Fernandes, J.; Dabaieh, M.; Mateus, R.; Bragança, L. The influence of the Mediterranean climate on vernacular architecture:A comparative analysis between the vernacular responsive architecture of Southern Portugal and North of Egypt. In WorldSustainable Buildings SB14; Barcelona, Spain, 2014; pp. 264–270.
54. Tepavcevic, B.; Stojakovic, V. Shape grammar in contemporary architectural theory and design. Archit. Civ. Eng. 2017, 10, 169–178.[CrossRef]
55. Yin, R.K. Case Study Research: Design and Methods, 4th ed.; SAGE: London, UK, 2009.56. Stake, R.E. The Art of Case Study Research; Sage: Thousand Oaks, CA, USA, 1995.57. Feagin, J.R.; Orum, A.M.; Sjoberg, G. (Eds.) A Case for the Case Study; University of North Carolina Press: Chapel Hill, NC, USA,
1991.58. Bard, K.A.; Shubert, S.B. (Eds.) Encyclopedia of the Archaeology of Ancient Egypt; Routledge: New York, NY, USA, 1999.59. Maqrızı, A. Mawaiz wa Al-’I’tibar bi Dhikr Al-Khitat wa Al-’Athar; National Archives of Egypt: Bulaq, Egypt, 1895; Volume 1.60. Pantalacci, L. Epistolary Documentation of the Governor’s Palace in Balat-’Ayn Asil. Bulletin of the French Oriental Institute of Eastern
Archeology; BIFAO-98; The French Institute for Oriental Archology: Cairo, Egypt, 2013; pp. 303–315.61. Krieger, P.P. The Archives of the Temple Funeral of Neferirkare-Kakai (BdE 65/1-2); Institut Francais D’archeologie Orientale du Caire:
Cairo, Egypt, 1976.62. Abdelsalam, T. A vision for future: Analysis of the prominent synthesis of culture and sustainability in Hassan Fathy architecture.
Int. J. Contemp. Archit. 2014, 1, 7–16.63. Sallam, E.S.; El-Aal, A.K.A.; Fedorov, Y.A.; Bobrysheva, O.R.; Ruban, D.A. Geological heritage as a new kind of natural resource
in the Siwa Oasis, Egypt: The first assessment, comparison to the Russian South, and sustainable development issues. J. Afr. EarthSci. 2018, 144, 151–160. [CrossRef]
94
sustainability
Article
An Exploratory Study of the Policies and LegislativePerspectives on the End-of-Life of Lithium-Ion Batteries fromthe Perspective of Producer Obligation
3 Department of Information Engineering (DII), Università Politecnica delle Marche, 60131 Ancona, Italy;[email protected] (M.C.); [email protected] (S.O.)
Abstract: European self-sufficiency in the battery sector is one of the major EU needs. The key lithium-ion batteries (LIBs) materials demand is expected to increase in the next decade as a consequenceof the increment in the LIBs production and a massive amount of spent LIBs will flood globalmarkets. Hence, these waste streams would be a potential source of secondary raw materials to bevalorized, under the principle of circular economy. European governments first, and then companiesin the battery sector second, are addressing many efforts in improving legislation on batteries andaccumulators. This study explores the current legislative aspects, the main perspective from theproducer’s point of view, and the possibility to guarantee a proper recycle of spent LIBs. A monitoringproposal by means of a survey has been carried out and the Italian context, which has been takenas an example of the European context, and it was used to evaluate the practical implication of thecurrent legislation. The main result of the survey is that a specific identification as well as regulationsfor LIBs are needed. The benefit from a cradle-to-cradle circular economy is still far from the actualsituation but several industrial examples and ongoing European projects show the importance andfeasibility of the reuse (e.g., second life) and recycle of LIBs.
Keywords: lithium-ion batteries (LIBs); energy storage; Extended Producer Responsibility (EPR);European Union (EU) legislation; critical raw materials (CRM)
1. Introduction
The demand for lithium-ion batteries (LIBs) is increasing worldwide due to their highefficiency as well as due to the versatility of rechargeable batteries [1]. This steep increasehas called attention to several challenges that must be faced: on the one hand, the supplyof raw materials, and on the other hand, the valorization of end-of-life products. In thecase of the electric vehicles (EVs) market, the registration of passenger cars in the EuropeanUnion (EU) has seen a double-digit growth in most of the Member States. In 2016–2018,EVs comprised from 8.5% (Poland) to 33.4% (Norway) of passenger cars in European FreeTrade Association (EFTA) countries [2]. Figure 1 summarizes the total global volume ofEVs predicted for 2050 as well as under different scenarios. In 2019, the number of electricand plug-in hybrid cars reached 2 million (3% of the fleet) and it is predicted that it willhit 28 million in 2030 (31% of the fleet) [3,4]. However, the estimations vary because ofthe several legislative perspectives, the different simulation analyses, and the probabletechnological evolution.
Figure 1. Worldwide stock provision of EVs: 1-Scenario1 and 1-Scenario2 data available in [5],2-Scenario1 and 2-Scenario2 data available in [6], and 3-Scenario1 and 3-Scenario2 data availablein [7].
Thus, as the LIB technology advances, many end-of-life products will flood into globalmarkets. The increment is already growing; in Italy, for example, the waste stream oflithium-based accumulators increased from 11% to 25% [8] during 2014 to 2019.
Within the EU, in 2016, it was reported that only 5% of LIBs had been reintegrated intothe market after recycling [9], thus revealing incomplete regulation and leading to a non-sustainable scenario. This was also due to the criticality of the raw materials employed [10]to manufacture LIBs. From this point of view, the last revision of the list of Critical RawMaterials (CRMs) by the European Commission included lithium as a strategical CRM [11]and it should be added to the list of elements critical for the EU, such as cobalt or naturalgraphite [12,13]. This emergency exists worldwide; in fact, Co and Li in electrodes havealso both been considered significant strategic and economic values. Hence, because of theincrease in LIB production, in 2018, the price per kg of Co reached USD 81 [14]. With therapid inflation of the new energy vehicles market, the supply of these raw materials fromnatural resources may be unable to satisfy the future demand unless proper recycling ofthe retired LIBs is assessed [15].
European self-reliance in the battery field is a major EU objective but the actual marketis far from this point because of the high dependency on the supply of both raw materialsand battery cells [16]. Table 1 shows the main components of CRMs that are used inbatteries and the percentage of reliance of the EU market on the main global producers.
Table 1. List of main CRMs used in batteries [17].
Raw Materials StageMain Global
ProducersMain EU Sourcing
Countries *Import Reliance ** EoL-RiR ***
Cobalt ExtractionCongo DR (59%)
China (7%)Canada (5%)
Congo DR (68%)Finland (14%)
French Guiana (5%)89% 22%
Coking coal ExtractionChina (55%)
Australia (16%)Russia (7%)
Australia (24%)Poland (23%)
United States (21%)Czechia (8%)
62% 0%
Germany (8%)
96
Sustainability 2021, 13, 11154
Table 1. Cont.
Raw Materials StageMain Global
ProducersMain EU Sourcing
Countries *Import Reliance ** EoL-RiR ***
Lithium ProcessingChile (44%)China (39%)
Argentina (13%)
Chile (78%)United States (8%)
Russia (4%)100% 0%
Magnesium Processing China (89%)United States (4%) China (93) 100% 13%
* Based on domestic production and import (export excluded). ** IR = (import − export)/(domestic production + import − export).*** The End-of-Life Recycling Input Rate (EoL-RIR) is the percentage of the overall demand that can be satisfied through secondaryraw materials.
The LIB recycling industry is working on the batteries from EVs, electronics, andportable instruments nearing their end-of-life. The EU has set a target to improve thecollection rate and recycle percentage of LIB raw materials, as shown in Table 2.
Table 2. European Li-ion battery collection rate and percentage of materials recycling [18].
Actually, the EU is a net importer of nickel-cadmium (NiCd), nickel metal hydride(NiMH), and lithium-based cells; the volume of these products manufactured in the EUis around 5% of the global output, which is lower than the EU’s share of the global grossnational product (GNP) [3]. The waste stream of these products is increasing year by yearand it is critical that this becomes a new source of raw material.
It must also be considered that the performance of new LIBs usually decreases withuse. In the case of EV batteries, for example, when the performance drops to 75–80% ofits original value, the battery should be replaced. This means that the battery could haveseveral usages also after these percentages, as technically proven by research projects andindustrial application [19].
97
Sustainability 2021, 13, 11154
The absence of raw material and the need to guarantee a sufficient supply of batter-ies suggest that operators (recyclers) and producers should be directly involved in thetreatment and recycling of waste batteries and accumulators. As far as an EU directiveis concerned, according to Directive 2006/66/EC on Battery and Accumulators (BaAs),producers of BaAs and associated products are responsible for the related management ofwastes in proportion to the products that are introduced into the market, even in the case ofLIBs [20]. The corresponding directive was consolidated in 2013 [21] and 2018 [22] as partof larger intent to promote circular economy. Recently, a new document was provided bythe European Parliament that established the new EU regulatory framework for batteries.Directive 2006/66/EC is currently under revision and the exponential growth of the LIBmarket as well as its unique features during recycling processes were considered [23].
A circular economy approach can be summarized in several steps, following theprocess from cradle-to-cradle. It begins with the design of the battery (standard formatsand materials, international and standardized methodology for material labeling, andassembly strategy); followed by a review of the different possibilities of raw materialsmining (from traditional extraction to secondary raw material mining, such as recycledmaterials); next, LIB production and use (implementation of new chemistry and technologyfor the production of LIBs); post-use collection of spent LIBs (minimum battery collectionrate requirement also from EU directives); re-use (the valorization of end-of-life productscan represent new business opportunities for second-life applications); and the process endswith recycling (LIB recycling allows for reducing energy consumption and CO2 emissions,saving natural resources by avoiding virgin materials mining and imports, minimizingenvironmental toxicity, creating an economic gain, decreasing waste, and managing safetyissues) [24].
Several promising implementations have already been applied at an industrial scale byproducers and recyclers all over the world [24]. The most representative examples, accord-ing to the authors’ knowledge and in the interest of this specific research study on industrialscale and patent, adopted by the major companies in the LIB field are listed below:
• Honda Motors Europe and Snam: are studying the feasibility of re-using end-of-lifebatteries (NiMH batteries) deriving from hybrid vehicles.
• The Volkswagen group (production site in Salzgitter) is designing a pilot plant for thedirect production of LIB cells with a specific section for recycling.
• Fortum, BASF, and Nornickel are planning a pilot plant for the recycling of LIBs inHarjavalta, Finland.
• The Sony-Sumimoto process represents one of the best examples of a circular economyapproach where the recovered Co(OH)2 from Sony’s spent LIBs from electronic devicesis directly re-used in the fabrication of new cells. The process involves the calcinationof spent cells and utilizes the cogeneration resulting from burning electrolytes [25].
• Northvolt recently approved the recycling program Revolt that will aim to source 50%of recycled material by 2030 in the recycling plant in Västerås, Sweden, and will targetan initial recycling capacity of 100 tons per year due to a hydrometallurgical treatmentof LIBs.
• Chinese Green Eco-Manufacture (200,000 ton/year) and Bangpo Ni/Co (30,600 ton/year)obtain regenerated cathodic materials through a hydrometallurgical process (992 MJ/ton)that are required for organic material incineration [24].
• Riciclo Made in Italy is a new patented technology (2018) developed by the collabora-tion of the Italian consortium COBAT (COBAT RIPA) and CNR ICCOM (Istituto diChimica dei Composti Organometallici, Firenze) since 2014.
• Umicore patented a pyrometallurgical process to recover Co-alloy (WO, 2011/035915A1) and a hydrometallurgical process to recover LIB electrolytes (US, EP 2 410 603 A1).
• Duesenfeld (Germany) patented a recovery process for LIBs electrolytes (US, 2018/0301769).• Avestor Limited Partnership patented a combined process (pyro and hydrometallurgi-
cal) to recover high grade purity of Li2CO3 (US 7192654 B2) [24].
98
Sustainability 2021, 13, 11154
Many automotive companies are investing in projects involved in the reuse batteriesfrom EVs for a second life in different applications, as reported in Table 3.
Table 3. Project of second-life applications of EVs batteries [26].
Company Second-Life Application
BMW Energy storage farmBYD Energy storage
Chevrolet Data centerEaton Energy storage
EcarACCU Solar energy storageEVgo EVs charging
Florida Power & Light Grid managementNissan/Sumitomo Street lighting, large scale power storage
Nissan/Eaton/Mobility House Renewable Storage, backup power for elevatorsRenault Street lighting, large scale power storage
Renault/Connected Energy EVs charging
The clusterification of recycling facilities in a few countries as well as limited areasraises many challenges, including the transportation of significant quantities of spent LIBs,which represents the highest effort [27] among them.
This study reports on the current and future European vision of more sustainablewaste prevention and management legislation for LIBs, beginning with an analysis ofthe producers’ legislative obligation to a practical checklist for its application in severalEU Member States to better satisfy both the demand of the European market and thesustainability requirements.
2. Materials and Methods
EU directives on BaAs were considered and analyzed to extrapolate the basic princi-ples for all the EU Member States.
After an analysis of the European legislation, several national laws were taken asexamples of significant representations of the issue, at least for the EU countries mosthistorically consolidated (i.e., from 1995, before the inclusion of central and eastern Eu-rope); for this reason, only the current regulations of Finland, France, Germany, Italy, theNetherlands, Portugal, and Spain have been compared.
The practical implication of the legislative acts was assessed by means of a surveyand was applied to the collective schemes (consortia) associated with the (Italian) NationalCoordination Center for Batteries and Accumulators (Centro di Coordinamento NazionalePile e Accumulatori (CDCNPA), https://www.cdcnpa.it/) (accessed on 4 September 2021).The Italian case was chosen as it is descriptive at the European level: the legislationhas not undergone a substantial change in recent years. Furthermore, the sample is rep-resentative because the answers were collected from consortia, but the collection wascoordinated by CDCNPA, an independent center. Currently, the consortium CDCNPAincludes 16 members, 14 of which are collective systems and two are individual systems.The answers were collected from both oral interviews and online surveys. Comprehen-sively, 43% of CDCNPA members’ systems completed the survey and both their competentanswers and comments represent a very useful contribution to the legislative issue.
This survey was prepared following the most recent EU directive proposal in termsof both legislative adaptation and scientific development, and the practical implication ofthe legislative acts was assessed and applied to the collective schemes associated with thenational CDCNPA. The answers were both oral and from an online survey.
The survey was organized into two main parts: the first was correlated to the relevanceof the European Waste Code (EWC) 160605, while the second explored the effectiveness ofan efficient valorization of the waste stream by means of a circular economy approach tothe battery value chain. The survey is available in the Supplementary Materials.
99
Sustainability 2021, 13, 11154
Then, the current EU project and main initiatives were compared.
3. Results and Discussion
Several EU directives and regulations aim to manage wastes from electric and elec-tronic equipment (WEEE), namely end-of-life vehicles containing LIBs and BaAs. In mostcases, a clear regulation connected with Directive 2006/66/EC (and corresponding updates)on managing spent battery flows is missing, hence, it represents a limitation to the indus-trial treatment mostly because of the lack of data sharing, the uncertainty about extendedproducer responsibility, and the unrealistic targets for collection and recycling. In fact, LIBsare actually classified as industrial batteries and their take-back, collection, and recyclingprocedures are regulated as products whose safety issues, market availability, and logisticframeworks are totally different [24]. Following the directive, it appeared appropriatefor us to define industrial battery or accumulator, automotive battery or accumulator,and portable battery. More precisely, industrial battery or accumulator is defined as anybattery or accumulator that is designed exclusively for industrial or professional uses or isused in any type of electric vehicle; automotive battery or accumulator is defined as anybattery or accumulator that is used for automotive starters, lighting, or ignition power;and portable battery or accumulator is defined as any battery, button cell, battery pack,or accumulator that (a) is sealed, (b) can be hand-carried, and (c) is neither an industrialbattery or accumulator nor an automotive battery or accumulator [20].
3.1. Analysis of the EU Legislation
The key points of the EU active legislation are summarized as follows:
• Collection scheme for the waste of portable BaAs is ensured by the Member State,wherein producers of industrial BaAs or third parties acting on their behalf will notrefuse to take back industrial BaAs waste;
• Producers of automotive BaAs or third parties will set up schemes for the collec-tion of waste automotive BaAs from users or from an accessible collection point intheir vicinity;
• Member States shall ensure that producers or third parties acting on their behalf willfinance any net costs;
• Producers and users of industrial and automotive BaAs may conclude agreementsstipulating financing arrangements (and organizations);
• Member States shall ensure that all economic operators and all competent publicauthorities may participate in the collection, treatment, and recycling schemes theyare referred to;
• These schemes will also apply to BaAs imported from third countries under non-discriminatory conditions and will be designed to avoid barriers to trade or distortionsof competition;
• Member States shall ensure that each producer is registered; and• The technical development of new types of batteries that do not use hazardous sub-
stances should also be considered.
It is worth noticing that despite the research progress and development in this field,there are still no common labels or codes for the identification of different types of BaAand their chemistry.
Producers must be registered on the national list, even if they originate from a differentcountry, and the number of registrations should be evident. Furthermore, the total volumeof the product that is introduced into the national market should be communicated toevaluate the financial support of the recycling net.
The proposal for the revision was published on 10 December 2020 [28]. The require-ments relating to sustainability would become mandatory, for example, concerning thecarbon footprint rules, content of recycled materials in being higher than the minimumpercentage and durability criteria, and requirements for end-of-life management, safety,and labelling for marketing. The proposal also includes due diligence obligations for eco-
100
Sustainability 2021, 13, 11154
nomic operators with respect to the sourcing of raw materials. The main goal is to ensurethe sustainability and competitiveness of the European battery value chain [23,29]. In fact,the relationship between the BaAs manufacturing and recycling companies is becomingincreasingly strong in view of a circular economy approach, guaranteeing a cradle-to-cradlelife cycle for LIBs. From this perspective, the newly proposed concept of a Battery IdentityGlobal Passport (BIGP) represents a viable and economic way to manage the forthcomingwaste flows, offering the chance to precisely identify battery supply chains from the cradle-to-cradle approach. Furthermore, it perfectly fits within the expected new EU directive forBaAs, although it should be globally implemented so as not to reduce the chances to recycleLIBs in responsible and profitable ways [30]. Nowadays, the management of LIB wastestreams in the EU is regulated by the strong connection between the producer and therecycler. This connection is then translated in the Extended Producer Responsibility tool.
3.2. Analysis of the Legislations of the Target Countries
Each EU country can decide how to organize the collection scheme to comply withthe Extended Producer Responsibility tool. It is regulated in each Member State law, whichrepresents a translation of the EU directives by their own legislative body. The latestupdates for BaAs legislation and the types of adopted collection schemes are shown inTable 4.
Table 4. Last legislative update and organization of the BaAs collection scheme of the target countries.
Country Finland France Germany Italy Netherlands Portugal Spain
All the analyzed countries have a strict definition regarding the Extended ProducerResponsibility tool and how to register is precisely described even if the producer is outsidethe national borders; in that case, it is considered to be an import. The total quantity ofmaterials introduced to the market should include both products and wastes. All countriesmust provide instructions for the financial scheme that supports the take-back collectionschemes, which must permit the free-of-charge return of spent batteries from the end users.
• Finland
‘Valtioneuvoston asetus paristoista ja akuista (520/2014)’ and corresponding updates.Last Finnish waste decree on BaAs was passed in 2014, but the WEEE Directive
2012/19/EU is employed to manage the responsibility of battery producers. However, it isspecified that if a producer has a responsibility that pertains to several areas (for example,electronic and electrical appliances as well as packaging), the company must organize itsproducer responsibilities separately for each area. Authors have described this as relativelyadvanced environmental legislation and regulation for e-waste management [31], and thelegislative bodies decided to merge both laws. The costs of the producer’s share of theorganization must be covered pertaining to their sold product volume and category. More-over, the decree is also explicit about their responsibility for the portion or its equivalent ofso-called orphan products. The portion is determined based on each producer’s marketshare and the producers are proportionally responsible (based on the sold market volume)for the specific type of products. Spent LIBs are treated at the Akkuser plant in Nivala.According to the Finnish regulation, BaAs should be designed and manufactured as faraway as possible to improve their environmental performance throughout the life cycle. Toreduce harmful substances, the Pirkanmaa Center for Economic Development, Transport,and the Environment monitors the collection rates of discarded portable batteries andaccumulators in accordance with the monitoring system.
101
Sustainability 2021, 13, 11154
Maximization of the separate collection of BaAs is also promoted. All separatelycollected, identifiable BaAs are recycled to minimize the possibility of the disposal ofBaAs as municipal solid waste. An arrangement for the disposal of spent BaAs followinga minimum service and accessibility level must be guaranteed with a minimum of onereception point for each municipality.
• France
‘Décret n◦ 2009-1139 du 22 septembre 2009 relatif à la mise sur le marché des piles etaccumulateurs et à l’élimination des piles et accumulateurs usagés et modifiant le code del’environnement (dispositions réglementaires)’ and corresponding updates.
The annual declaration of the quantity of products placed on the market is mandatory.Batteries must meet removal and treatment requirements through individual systemsapproved by the public authorities or by collective arrangements approved by the publicauthorities of two eco-organizations. Costs should be sustained by the producers and thereshould be no costs for end users. In France, there are the treatment operator’s representative(FEDEREC, FNADE, and SFRAP1), the approved producer responsibility organizations(Corepile and Screlec) and the approved individual system (MOBIVIA Groupe). Theinformation for producers is given by a non-profit organization in order to comply withthe legislation. For the industry, it is possible to extend the responsibility individually or todelegate it to a professional end user. Obligations are distributed between the producers inproportion to the number of products placed on the market and the permission must bereviewed and approved by the ministry every six years. The collection of the waste is aprinciple of the legislation that is intended to improve the collection rate.
• Germany
‘Bundesgesetzblatt Teil I2020Nr. 50 vom 09.11.2020 Erstes Gesetz zur Änderung desBatteriegesetzes’.
In this case, the producers must set up, operate, and declare their own collection sys-tems, requiring the authority’s approval to guarantee the take-back network. Additionally,the take-back systems must publish the following information annually on their websites,in compliance with trade and business privacy:
• the ownership and membership relationships;• the financial contributions made by the members per battery placed on the market or
per mass of batteries placed on the market;• the procedure for the selection of the disposal service; and• the recycling efficiencies achieved in their own system.
The responsibilities of the public waste management authorities are also defined. Ifthe authorities offer the option of returning the waste in the case of automotive batteries,this must proceed free of charge for the end user.
Clear and public information is an evident priority.Within the aim of assessing each contribution made by the producers, the take-back
systems are obliged to create incentives. Additionally, there is a strong valorization of therecycling. In fact, the producer’s obligation is considered complete only if it can guaranteethe recycling of the take-back material. It is considered to be an effective supporting schemeto correct the lack of critical sources that are necessary for sustainable development [32].
• Italy
’Decreto Legislativo 20 novembre 2008, n. 188’ and corresponding updates.In 2008, Italian CDCNPA published a guideline for producers, in which they defined
a checklist of the main issues for compliance with respect to the Extended ProducerResponsibility tool.
According to the definition of a consortium in the Italian regulations, these bodies havethe main objective of helping to solve the problem of collecting and recycling scraps [33].
102
Sustainability 2021, 13, 11154
In this legislation, there are no specific obligations for LIB recyclers, nor are there anyin the European Waste Code (EWC) for LIBs. Only the separate management and a specificdefinition for secondary battery (rechargeable one) are indicated.
• Netherlands
‘Regeling van de Minister van Volkshuisvesting, Ruimtelijke Ordening en Milieube-heer van 9 september 2008, nr. K&K 2008088170’ and corresponding updates.
Since 2008 in the Netherlands, battery producers have been obliged to report on howthe batteries are collected and processed during their end-of-life. The industrial waste mustbe collected individually or by delegated professional end users. Moreover, in this case,the Batteries Foundation Stibat, a non-profit organization, helps the producer to complywith the legislative obligations.
Producers should also take measures to design the battery with the smallest possibleamounts of substances that are hazardous to human health or the environment, and theymust ensure that end users of batteries and accumulators are fully informed about thepossibility of returning waste portable batteries or accumulators.
• Portugal
‘Decreto-Lei n.◦ 152-D/2017’ and corresponding updates.In Portugal, the legislation currently mandates that the costs of the collection scheme
are proportional to the type and quantity of battery (used within the country). A financingsystem is the obligation of the producers. In the case of third parties, the responsibility istransferred to an integrated licensed system. Portugal increased the collection rates withan emphasis on the role of management entities [34].
There is an indirect diversification of the type of batteries and an explicit request forproviding a selective collection service of BaA.
In Portugal, there are currently five entities that manage waste batteries and accu-mulators with different areas of activity. The producers should promote research anddevelopment towards improving the environmental performance of BaAs.
The obligation to receive the respective waste is extended to both traders and retailers.
• Spain
‘Real Decreto 106/2008, de 1 de febrero, Vigente desde 21/Enero/2021’.Spanish legislation allows for an additional way to operate collection schemes that uses
the public scheme already established. This policy can be adopted only if the additionalcosts derived from the collection and management of batteries and accumulators areassumed by the producer. The procedures are used together with that implied in thecollection policy of WEEE but with a separate collection.
The last update of the Spanish legislation has defined spent LIBs as a hazardous wasteand a specific European Waste Code (EWC) was assigned to this stream.
Rules are established that must be followed due to a selective collection processestablished throughout the treatment and recycling process. Rules and standards for thecollection are also cited. Economic instruments and research studies are identified as usefultools to promote the collection of spent batteries and ensure environmental sustainability.The recovery or the controlled disposal of used BaAs should be facilitated by means ofnetworks of selective collection points for used batteries. The collection points are managedby the authorities or private parties. Research studies were also conducted in order tochoose the appropriate location points in Spain [35].
Limits from the Analysis of the EU Legislative
The most important limitation is related to the obvious and very rapid developmentof new technologies and products that are not yet specified in the legislation. In addition,the current minimum collection targets and minimum recycling requirements for wasteportable batteries are not defined appropriately [36]. At this time, LIBs have no technologyspecification (except in the Spanish legislation) and they are assimilated into lead-battery
103
Sustainability 2021, 13, 11154
specifications. Along with the specifications of the types of battery (rechargeable or not),the specific chemistry [37] of LIB materials has also been reported. This possibility can alsobring a higher flexibility to the collective schemes that are nowadays incomplete. Addition-ally, the lack of a specific definition for LIB waste leads to their misplaced classification asindustrial batteries and their take-back, collection, and recycling are regulated as productswhose safety issues, market availability, and logistics framework are totally different [24].
Besides battery classification, an appropriate definition of the financing scheme needsto be established. Current schemes are not suitable for the actual spent LIB stream andthey are evaluated based on the quantity of batteries placed in the market by a producerwithout any differences between LIS and lead acid batteries (LAB) because the financingscheme is the same for both type of batteries, despite the substantial differences betweenthem. Thus, when evaluating the best financing scheme, an analytical comparison shouldbe done by considering the efficiency and effectiveness. This problem is also related to thelack of data sharing or a clear and explicit source, as noted previously.
3.3. The Italian Case: Answers from the Survey
The lack of a specific EWC led the consortium to two main conclusions. On one hand,the spent LIB classification as hazardous waste can improve the management of this wastestream when collection, transportation, storage, and the following specific treatments arecarried out. On the other hand, the specification of the chemistry can improve the efficiencyof the recycling system.
The lack of a specific EWC also has an impact on quantifying the flow of waste fromLIBs that are managed by the consortium members, even if CDCNPA asserts that the largestcollection flow derives from municipal centers and from the sorting of small equipmentsuch as laptops, telephones, electronic tools, etc.
Moreover, the overall national value chain seems unable to adequately respond tothe incoming waste stream, which was also foreseen. Concerning this, the locations of themain global companies operating in battery recycling (lithium recycling) consist of 61%outside the EU and 39% in the EU. Figure 2 shows the precise locations and it is evidentthat no plants are in Italy. These data were collected from an industrial analysis conductedto identify the main worldwide companies that recycle batteries, i.e., LIBs in this case.This was confirmed by the survey, which highlighted that at least the 90% of the wasteis exported to other countries to be recycled, since in Italy, there are only plants that sortbattery materials, which is itself a critical step to pre-treat spent batteries. Furthermore, thevolume of the recycled material is negligible.
The European limits described above can be overcome through careful studies and re-search processes. Battery2030+ represents the large-scale and long-term European researchinitiative within the battery field, which also maintains an eye on the forthcoming tech-nologies (not only on LIBs). However, this is just one of the European initiatives/actionsand projects are ongoing in the EU. The importance of recycling was defined as a strategicpillar of the European Battery Alliance [29]. Table 5 reports the main ongoing Europeanprojects concerning energy storage systems technologies.
This table depicts the flourishing environment of European in the battery field. Indisclosing the future perspectives in the sector of energy storage systems, European govern-ments and research centers are making many efforts towards the post-lithium-ion batteries.Indeed, many projects, launched beginning in 2017, are focused on the development of inno-vative materials aimed to reach higher energy and capacity levels (e.g., 057534–LiAnMAT,950038—Bi3BoostFlowBat, 771777—FUN POLYSTORE, 770870—MOOiRE, and 864698—SEED). Moreover, along with the challenges regarding the future technologies, moreefficient battery systems for electric vehicles and smart grids need to be developed (895337—BatCon, 101009983—ORION PROJECT, 731249—SMILE, and 770019—GHOST). In tandemwith scientific innovations, European funds have been allocated to projects focused on sus-tainability and environmental evaluations (894063—GEVACCON and 875514—ECO2LIB).Thus, as mentioned above, the future challenges in the energy and environmental sectorsfor Europe, as well as for the whole world, will produce the most diverse fields. Indeed,far from being entirely covered by European governments, a profound transition willmaterialize in the approach to this progress, focusing on the scientific side and promotingpublic partnerships with and within universities and research centers. Thus, the ongoingprojects within Europe are clear evidence of this trend.
The list of projects proves how important both the search for new technologicalsolutions and the need for proper management truly are. Italian consortium members alsomonitor the lack of valorization concerning second-life use for batteries and this kind ofuse is only now the objective of an innovation project in the framework of the EIT ClimateKIC (https://erion.it/it/ricerca-e-innovazione/lions2life/, accessed on 4 September 2021).
If the project outcome increases the battery durability, health, safety, and life, thepillars of a circular economy will be completely satisfied. Member States should alsoconsider the Circular Economy Business Model when writing the legislation that will soonbe necessary.
105
Sustainability 2021, 13, 11154
Ta
ble
5.
Ong
oing
and
rece
ntpr
ojec
tsin
lithi
um-i
onba
tter
yef
ficie
ncy
impl
emen
tati
onte
chno
logi
es.
Pro
gra
mG
ran
t-A
cro
ny
m-A
gre
em
en
tM
ain
Ob
ject
ive
sS
tart
–E
nd
(yy
yy
)
H20
20-E
U.1
.1.-
EXC
ELLE
NT
SCIE
NC
E-Eu
rope
anR
esea
rch
Cou
ncil
(ER
C)
6800
70-B
ATM
AN
-Dev
elop
men
tofQ
uant
itativ
eM
etro
logi
esto
Gui
deLi
thiu
mIo
nBa
tter
yM
anuf
actu
ring
Impl
emen
tqua
ntit
ativ
em
etho
dsto
stud
yLI
Bin
ner
proc
esse
san
del
abor
ate
ongu
idel
ines
for
unde
rsta
ndin
gth
eir
orig
ins
2016
–202
1
9632
81-S
OLV
OLi
-Sol
vom
etal
lurg
yfo
rba
tter
y-gr
ade
refin
ing
oflit
hium
Dev
elop
am
ore
sust
aina
ble
met
hod
tode
liver
batt
ery-
grad
elit
hium
salt
s20
20–2
022
8531
33-W
orld
sof
Lith
ium
-Am
ulti
-sit
edan
dtr
ansn
atio
nal
stud
yof
tran
siti
ons
tow
ards
post
-fos
silf
uels
ocie
ties
Stud
yho
wst
rate
gies
oftr
ansi
tion
from
foss
ilfu
eltr
ansp
ortt
oel
ectr
icm
obili
typo
wer
edby
lithi
um-io
nba
tter
ies
are
depl
oyed
inth
ree
key
coun
trie
s:C
hile
,Chi
na,a
ndN
orw
ay20
20–2
025
0575
34–
LiA
nMA
T-U
ltra
-hig
hen
ergy
stor
age
Li-a
node
mat
eria
ls
Cre
ate
ast
epch
ange
inLi
-ion
batt
ery
anod
epr
oduc
tion
,si
gnifi
cant
lyre
duci
ngad
ditiv
esan
dm
anuf
actu
ring
step
sw
hile
min
imiz
ing
capa
city
loss
2020
–202
1
8350
73-B
ATN
MR
-Dev
elop
men
tand
App
licat
ion
ofN
ewN
MR
Met
hods
for
Stud
ying
Inte
rpha
ses
and
Inte
rfac
esin
Batt
erie
s
Prop
ose
anu
clea
rm
agne
tic
reso
nanc
e-ba
sed
appr
oach
tom
easu
reth
edy
nam
ics
ofth
em
ulti
ple
elec
trod
e–el
ectr
olyt
ein
terf
aces
and
inte
rpha
ses
inba
tter
ies
2019
–202
4
9482
38-N
AN
O-3
D-L
ION
-Nan
osca
le3D
Prin
ting
ofa
Lith
ium
-ion
Batt
ery:
Ret
hink
ing
the
Fabr
icat
ion
Con
cept
for
aR
evol
utio
nin
Ener
gySt
orag
e
Dev
elop
and
empl
oyad
vanc
edna
nosc
ale
3Dpr
inti
ngte
chni
ques
tofa
bric
ate
acti
veba
tter
ym
ater
ials
wit
hul
tras
mal
lst
ruct
ural
feat
ures
2021
–202
6
7728
73-A
RTI
STIC
-Adv
ance
dan
dR
eusa
ble
Theo
ryfo
rth
eIn
Silic
o-op
tim
izat
ion
ofco
mpo
site
elec
trod
efa
bric
atio
npr
oces
ses
for
rech
arge
able
batt
ery
Tech
nolo
gies
wit
hIn
nova
tive
Che
mis
trie
s
The
aim
ofth
ispr
ojec
tis
tode
velo
pan
dde
mon
stra
tea
nove
lth
eore
tica
lfra
mew
ork
dedi
cate
dto
rati
onal
izin
gth
efo
rmul
ariz
atio
nof
com
posi
teel
ectr
odes
wit
hin
the
next
-gen
erat
ion
chem
istr
ies
for
high
-ene
rgy
dens
ityse
cond
ary
batt
erie
s
2018
–202
3
9500
38-B
i3Bo
ostF
low
Bat-
Bioi
nspi
red,
biph
asic
,and
bipo
lar
flow
batt
erie
sw
ith
boos
ters
for
sust
aina
ble
larg
e-sc
ale
ener
gyst
orag
e
Dev
elop
nove
lbio
insp
ired
mat
eria
lsas
cros
s-ov
erad
diti
ves
topr
oduc
eco
st-e
ffici
entp
roce
sses
for
the
prod
ucti
onof
ano
vel
flow
batt
ery
tobe
impl
emen
ted
for
larg
e-sc
ale
ener
gyst
orag
e20
21–2
025
7717
77-F
UN
POLY
STO
RE-
FUN
ctio
naliz
edPO
LYm
erel
ectr
olyt
esfo
ren
ergy
STO
Rag
E
Aim
edat
expl
orin
gfu
ncti
onal
ized
alte
rnat
ive
poly
mer
host
sfo
rm
echa
nica
llyro
bust
bloc
k-co
poly
mer
syst
ems;
for
alte
rnat
ive
catio
nch
emis
trie
s;fo
rhi
ghan
dlo
wel
ectr
oche
mic
alpo
tent
ials
;and
for
easy
diss
olut
ion
ofel
ectr
ode
mat
eria
ls
2018
–202
3
9490
12-D
eepP
roto
n-D
eep
mul
ti-s
cale
mod
ellin
gof
elec
trifi
edm
etal
oxid
ena
nost
ruct
ures
Dev
elop
ano
veld
eep-
lear
ning
empo
wer
edm
ulti
-sca
lem
odel
ing
fram
ewor
kto
unde
rsta
ndth
efu
ncti
onin
gan
dde
grad
atio
nof
elec
trifi
edm
etal
oxid
ena
nost
ruct
ures
atth
em
icro
scop
icle
vel
2021
–202
5
106
Sustainability 2021, 13, 11154
Ta
ble
5.
Con
t.
Pro
gra
mG
ran
t-A
cro
ny
m-A
gre
em
en
tM
ain
Ob
ject
ive
sS
tart
–E
nd
(yy
yy
)
H20
20-E
U.1
.1.-
EXC
ELLE
NT
SCIE
NC
E-Eu
rope
anR
esea
rch
Cou
ncil
(ER
C)
7708
70-M
OO
iRE-
Mix
-in
Org
anic
-InO
rgan
icR
edox
Even
tsfo
rH
igh
Ener
gyBa
tter
ies
Uti
lize
met
alor
gani
cco
mpo
und
fram
ewor
ks(M
OC
/Fs)
tobu
ildno
vele
lect
rode
mat
eria
ls,e
ngin
eeri
ngth
eir
perf
orm
ance
byin
-ope
rand
oan
alyt
ical
insp
ecti
onto
ols
2018
–202
3
8646
98-S
EED
-Sol
vate
dio
nsin
solid
elec
trod
esfo
rre
vers
ible
ener
gyst
orag
eba
sed
onab
unda
ntel
emen
tsEx
plor
eth
eus
age
ofso
lvat
edio
nsas
anac
tive
spec
ies
tobe
inte
rcal
ated
into
the
elec
trod
es20
20–2
025
7596
03-I
MM
OC
AP-
‘Ifim
mor
talit
yun
veil
...
’–de
velo
pmen
tof
the
nove
ltyp
esof
ener
gyst
orag
esy
stem
sw
ith
exce
llent
long
-ter
mpe
rfor
man
ce
Dev
elop
ano
velt
ype
ofel
ectr
oche
mic
alca
paci
tor
wit
hhi
ghsp
ecifi
cpo
wer
(up
to5
kW/k
g)an
den
ergy
(up
to20
Wh/
kg)
pres
erve
dal
ong
atle
ast5
0,00
0cy
cles
2017
–202
2
H20
20-E
U.1
.2.-
EXC
ELLE
NT
SCIE
NC
E-Fu
ture
and
Emer
ging
Tech
nolo
gies
(FET
)
9572
25-B
AT4
EVER
-Aut
onom
ous
Poly
mer
-bas
edSe
lf-H
ealin
gC
ompo
nent
sfo
rhi
ghpe
rfor
man
tLIB
sD
esig
nno
vels
elf-
heal
ing
mat
eria
lsfo
rN
MC
-bas
edca
thod
esan
del
ectr
olyt
es20
20–2
023
9572
02-H
IDD
EN-H
inde
ring
dend
rite
grow
thin
lithi
umm
etal
batt
erie
s
Dev
elop
self
-hea
ling
ther
mot
ropi
cliq
uid
crys
talli
neel
ectr
olyt
esan
dpi
ezoe
lect
ric
sepa
rato
rte
chno
logi
es,a
ndup
scal
efr
omla
bora
tory
toin
dust
rial
man
ufac
turi
ngpr
oces
ses
2020
–202
3
H20
20-E
U.1
.2.1
.-FET
Ope
n89
9659
-I-B
AT-
Imm
erse
d-co
olin
gC
once
pts
for
Elec
tric
Vehi
cle
Batt
ery
Pack
sus
ing
Vis
coel
asti
cH
eatT
rans
fer
Liqu
ids
(I-B
AT)
Intr
oduc
tion
bysy
nthe
sis
ofm
iner
aloi
l-ba
sed
com
poun
dsas
nove
lcoo
lant
sto
doub
leth
epo
wer
ofba
tter
yco
olin
gsy
stem
s20
20–2
024
H20
20-E
U.1
.3.1
.-Fo
ster
ing
new
skill
sby
mea
nsof
exce
llent
init
ialt
rain
ing
ofre
sear
cher
s
7658
28-P
OLY
TEEu
rope
anIn
dust
rial
Doc
tora
tein
Inno
vati
vePO
LYm
ers
for
Lith
ium
Batt
ery
TEch
nolo
gies
The
proj
ectw
illre
sear
chth
ede
velo
pmen
tofn
ewpo
lym
eric
mat
eria
lsto
incr
ease
the
perf
orm
ance
and
secu
rity
ofac
tual
and
futu
reba
tter
ies
2018
–202
1
H20
20-E
U.1
.3.2
.-N
urtu
ring
exce
llenc
eby
mea
nsof
cros
s-bo
rder
and
cros
s-se
ctor
mob
ility
8940
42-N
anoE
volu
tion
-Nan
osca
leph
ase
evol
utio
nin
lithi
um–s
ulfu
rba
tter
ies
Aim
sto
deve
lop
nove
lstr
ateg
ies
inlit
hium
–sul
fur
batt
erie
ste
chno
logy
asth
em
ostp
rom
isin
gca
ndid
ate
for
next
-gen
erat
ion
ener
gyst
orag
esy
stem
s20
20–2
022
8929
16-E
lect
rosc
opy-
Elec
troc
hem
istr
yof
All-
solid
-sta
te-b
atte
ryPr
oces
ses
usin
gO
pera
ndo
Elec
tron
Mic
rosc
opy
Impr
ove
all-
solid
-sta
teba
tter
yte
chno
logi
esby
in-o
pera
ndo
TEM
and
SEM
inve
stig
atio
nson
spec
ially
asse
mbl
edm
icro
-cel
ls20
20–2
022
8961
95–
LiBT
R-M
odel
ling
ofth
erm
alru
naw
aypr
opag
atio
nin
lithi
um-i
onba
tter
ypa
cks
Dev
elop
ath
erm
al-r
unaw
aym
odel
bysi
mul
atio
non
LibF
OA
M(f
orsi
ngle
cell
and
pack
s),F
ireF
OA
M(fi
resi
mul
atio
n),a
ndO
penF
OA
M(o
pen
sour
ceC
FDco
de)
2021
–202
3
7972
95-e
JUM
P-O
rgan
icIo
nic
Plas
tic
Cry
stal
sN
anoc
ompo
site
sfo
rSa
fer
Batt
erie
s
Aim
sto
deve
lop
inno
vativ
ena
noco
mpo
site
sel
ectr
olyt
esba
sed
onO
rgan
icIo
nic
Plas
tic
Cry
stal
s(O
ICPs
),w
hich
isa
nove
lcl
ass
ofso
lid-s
tate
elec
trol
ytes
wit
hin
trin
sic
safe
tyan
dhi
ghio
nic
cond
ucti
vity
2019
–202
1
107
Sustainability 2021, 13, 11154
Ta
ble
5.
Con
t.
Pro
gra
mG
ran
t-A
cro
ny
m-A
gre
em
en
tM
ain
Ob
ject
ive
sS
tart
–E
nd
(yy
yy
)
H20
20-E
U.1
.3.2
.-N
urtu
ring
exce
llenc
eby
mea
nsof
cros
s-bo
rder
and
cros
s-se
ctor
mob
ility
8953
37-B
atC
on-L
ithi
um-i
onba
tter
yco
ntro
lfor
fast
erch
argi
ngan
dlo
nger
life
Mak
est
epch
ange
sin
the
rese
arch
and
inno
vati
onof
batt
ery
man
agem
entb
yde
velo
ping
heal
th-a
war
efa
stch
argi
ngst
rate
gies
that
will
bene
fitfr
oman
inte
grat
edad
vanc
edm
athe
mat
ical
mod
elin
g
2020
–202
2
8940
63-G
EVA
CC
ON
-Geo
grap
hies
ofV
alue
Cha
inC
onst
ruct
ion
inEm
ergi
ngC
ompl
exTe
chno
logi
es:A
Com
ppar
ativ
eSt
udy
ofth
eEl
ectr
icVe
hicl
eLi
thiu
m-i
onBa
tter
yIn
dust
ryin
Chi
naan
dG
erm
any
Dev
elop
aco
mpr
ehen
sive
anal
ytic
alfr
amew
ork
for
dise
ntan
glin
gth
eva
lue
chai
nco
nstr
ucti
onin
com
plex
tech
nolo
gyin
dust
ries
mai
nly
inC
hina
and
Ger
man
y20
20–2
022
8419
37-3
D-P
RES
S-3D
PRin
tabl
egl
ass-
base
dEl
ectr
olyt
esfo
ral
l-So
lid-S
tate
lithi
umba
tter
ies
Des
ign
glas
s-ba
sed
com
posi
tion
sto
obta
inpr
inta
ble
glas
s-ba
sed
elec
trol
ytes
wit
hsu
peri
orco
nduc
tivi
tyan
dfu
ncti
onal
prop
erti
es20
20–2
022
H20
20-E
U.2
.1.3
.-IN
DU
STR
IAL
LEA
DER
SHIP
-Le
ader
ship
inen
ablin
gan
din
dust
rial
tech
nolo
gies
-A
dvan
ced
mat
eria
lsH
2020
-EU
.2.1
.2.-
IND
UST
RIA
LLE
AD
ERSH
IP-
Lead
ersh
ipin
enab
ling
and
indu
stri
alte
chno
logi
es–
Nan
otec
hnol
ogie
s
8144
71-L
ISA
-Lit
hium
–sul
phur
for
SAfe
road
elec
trifi
cati
onTh
ispr
ojec
taim
sto
solv
eth
elit
hium
–sul
fur
tech
nolo
gybo
ttle
neck
sco
ncer
ning
met
allic
lithi
umpr
otec
tion
,the
pow
erra
te,a
ndth
evo
lum
etri
cen
ergy
dens
ity
2019
–202
2
8750
29-A
STR
ABA
T-A
llSo
lid-s
Tate
Rel
iabl
eBA
Tter
yfo
r20
25Id
entif
yth
eop
timal
solid
-sta
tece
llm
ater
ials
,com
pone
nts,
and
arch
itec
ture
tobe
impl
emen
ted
inel
ectr
icve
hicl
ete
chno
logi
esw
hile
bein
gco
mpa
tibl
ew
ith
mas
spr
oduc
tion
2020
–202
3
8619
62-N
anoB
at-G
Hz
nano
scal
eel
ectr
ical
and
diel
ectr
icm
easu
rem
ents
ofth
eso
lid-e
lect
roly
tein
terf
ace
and
appl
icat
ions
inth
eba
tter
ym
anuf
actu
ring
line
Dev
elop
aso
lidba
sis
ofG
Hz-
nano
tech
inst
rum
enta
tion
toim
plem
entn
anos
cale
imag
ing
ofth
eSE
Iand
adva
nced
impe
danc
esp
ectr
osco
pyin
indu
stri
alba
tter
ypr
oduc
tion
2020
–202
3
8143
89-S
PID
ER-S
afe
and
Prel
ithi
ated
hIgh
ener
gyD
Ensi
tyba
tter
ies
base
don
sulp
hur
Roc
ksal
tand
silic
onch
emis
trie
s
Enha
nce
Li-i
onba
tter
ype
rfor
man
ces,
prod
ucti
onco
sts,
and
life
cycl
edu
rabi
lity,
and
esig
nno
velr
ecyc
labl
eba
tter
yar
chit
ectu
res
2019
–202
2
8755
57-S
OLi
DIF
Y-Li
quid
-pro
cess
edSo
lid-s
tate
Li-m
etal
Batt
ery:
deve
lopm
ento
fups
cale
mat
eria
ls,p
roce
sses
,and
arch
itec
ture
s
Fabr
icat
ea
prot
otyp
ein
api
lotl
ine
ofLi
thiu
m-m
etal
solid
-sta
teba
tter
ies
mad
eby
sol-
gelr
eact
ion
topr
oduc
ea
com
posi
teca
thod
ean
dso
lid-e
lect
roly
tese
para
tor
2020
–202
3
8751
89-S
AFE
LiM
OV
E-A
dvan
ced
allS
olid
stA
tesa
FELI
thiu
mM
etal
tech
nolo
gytO
war
dsVe
hicl
eEl
ectr
ifica
tion
The
aim
isth
ede
velo
pmen
tane
wlit
hium
-met
alba
tter
yce
llte
chno
logy
base
don
asa
fe,r
elia
ble,
and
high
-per
form
ance
solid
-sta
teel
ectr
olyt
e,im
prov
ing
ener
gyde
nsit
yba
tter
ies
to45
0W
h/kg
2020
–202
3
8755
14-E
CO
2LIB
-Eco
logi
cally
and
Econ
omic
ally
viab
lePr
oduc
tion
and
Rec
yclin
gof
Lith
ium
-Ion
Batt
erie
sEx
tend
LCA
crad
le-t
o-gr
ave
stud
yto
judg
eth
een
viro
nmen
tal
impa
ctof
the
diff
eren
topt
ions
inth
eLI
Bm
arke
t20
20–2
023
8144
64-S
i-D
RIV
E-Si
licon
Allo
ying
Ano
des
for
Hig
hEn
ergy
Den
sity
Batt
erie
sco
mpr
isin
gLi
thiu
mR
ich
Cat
hode
san
dSa
feIo
nic
Liqu
id-b
ased
Elec
trol
ytes
for
Enha
nced
Hig
hVo
ltag
EPe
rfor
man
ce.
Dev
elop
the
next
gene
rati
onof
rech
arge
able
Li-i
onba
tter
ies
enco
mpa
ssin
gam
orph
ous
Sico
ated
onto
aco
nduc
tive
copp
ersi
licid
ene
twor
kas
the
anod
ew
ith
poly
mer
/ion
icliq
uid
elec
trol
ytes
and
Li-r
ich
high
volt
age
(Co-
free
)cat
hode
s
2019
–202
3
108
Sustainability 2021, 13, 11154
Ta
ble
5.
Con
t.
Pro
gra
mG
ran
t-A
cro
ny
m-A
gre
em
en
tM
ain
Ob
ject
ive
sS
tart
–E
nd
(yy
yy
)
H20
20-E
U.3
.-PR
IOR
ITY
‘Soc
ieta
lch
alle
nges
H20
20-
EU.2
.3.-
IND
UST
RIA
LLE
AD
ERSH
IP-
Inno
vati
onIn
SMEs
H20
20-E
U.2
.1.-
IND
UST
RIA
LLE
AD
ERSH
IP-
Lead
ersh
ipin
enab
ling
and
indu
stri
alte
chno
logi
es
1010
0984
0-W
ATT
ELSE
-Hig
hen
ergy
dens
ity
mod
ular
batt
erie
sfo
ra
sust
aina
ble
cons
truc
tion
indu
stry
Prop
ose
ave
rsat
ilean
dm
odul
arlit
hium
-ion
batt
ery
syst
emus
ing
pate
nted
stat
e-of
-the
-art
tech
nolo
gies
topr
ovid
eor
igin
aleq
uipm
entm
anuf
actu
rers
wit
hta
ilore
dso
luti
ons
2020
–202
2
1010
0998
3-O
RIO
NPR
OJE
CT-
Afir
stst
epto
war
dsav
iati
onde
carb
oniz
atio
nw
ith
smar
tlit
hium
batt
erie
s
LIM
ATE
CH
,aun
ique
part
ner
ofth
ispr
ojec
t,w
illin
trod
uce
ano
vell
ithi
umba
tter
yby
deve
lopi
ngpr
otec
tive
elec
tron
ics
that
inte
grat
eal
lthe
safe
tyfu
ncti
ons
requ
ired
wit
hex
cept
iona
lre
liabi
lity
and
prec
isio
n
2021
–202
2
9545
93-A
ddio
nics
-Inn
ovat
ive
3Del
ectr
o-pr
inti
ngm
etho
dto
impr
ove
pow
er,c
apac
ity,
and
safe
tyof
lithi
umio
n-ba
tter
ies
Dev
elop
a3D
batt
ery
arch
itec
ture
(fro
mcu
rren
tcol
lect
ors
toel
ectr
ode
mat
eria
ls)t
hats
igni
fican
tly
impr
oves
batt
ery
perf
orm
ance
sre
gard
less
ofth
eba
tter
ych
emis
try
2020
–202
2
H20
20-E
U.3
.3.4
.-Asi
ngle
,sm
art
Euro
pean
elec
tric
ity
grid
7312
49-S
MIL
E-SM
artI
sLan
dEn
ergy
syst
ems
Dem
onst
rati
onof
diff
eren
tinn
ovat
ive
tech
nolo
gica
land
non-
tech
nolo
gica
lsol
utio
nsin
larg
e-sc
ale
smar
tgri
dpr
ojec
tsin
the
Ork
neys
,Sam
sø,a
ndM
adei
rais
land
s:th
ete
chno
logi
cal
solu
tion
sva
rybe
twee
nth
ein
tegr
atio
nof
batt
ery
tech
nolo
gy,
elec
tric
vehi
cles
,agg
rega
tor
appr
oach
tode
man
dsi
dem
anag
emen
t,an
dpr
edic
tive
algo
rith
ms
2017
–202
1
H20
20-E
U.3
.4.-
SOC
IETA
LC
HA
LLEN
GES
-Sm
art,
Gre
en,a
ndIn
tegr
ated
Tran
spor
t
8755
48-S
eNse
-Lit
hium
-ion
batt
ery
wit
hsi
licon
anod
e,ni
ckel
-ric
hca
thod
e,an
din
-cel
lsen
sor
for
elec
tric
vehi
cles
Aim
edat
enab
ling
next
-gen
erat
ion
lithi
um-i
onba
tter
ies
with
asi
licon
-gra
phit
eco
mpo
site
anod
ean
da
nick
el-r
ich
NM
Cca
thod
eto
reac
h75
0W
h/L,
whe
rein
the
mai
nta
rget
isto
reac
hm
ore
than
2000
deep
cycl
es
2020
–202
4
7700
19-G
HO
ST-I
nteG
rate
dan
dPH
ysic
ally
Opt
imis
edBa
tter
ySy
stem
for
Plug
-in
Vehi
cles
Tech
nolo
gies
Enha
nce
Li-i
onte
chno
logi
esby
impl
emen
ting
light
mat
eria
lsan
dno
velt
herm
alm
anag
emen
tarc
hite
ctur
es,a
ndde
velo
pin
nova
tive
and
inte
grat
edso
luti
ons
for
mas
spr
oduc
tion
2017
–202
1
7699
29-I
MA
GE-
Inno
vati
veM
anuf
actu
ring
Rou
tes
for
Nex
tG
ener
atio
nBa
tter
ies
inEu
rope
Dev
elop
gene
ric
prod
ucti
onte
chni
ques
for
next
-gen
erat
ion
batt
ery
cells
(Li-
met
alca
thod
es);
iden
tify
ener
gyan
dre
sour
ceef
ficie
ntce
llm
anuf
actu
ring
tech
nolo
gies
;and
deve
lop
apr
ogre
ssiv
e,m
ulti
ple-
tier
tech
nolo
gica
land
prod
ucti
onfr
amew
ork
that
can
cope
wit
hth
ein
here
ntte
chno
logi
cal
chan
ges
and
adva
ncem
ents
char
acte
rist
icof
this
dyna
mic
field
2017
–202
1
109
Sustainability 2021, 13, 11154
Ta
ble
5.
Con
t.
Pro
gra
mG
ran
t-A
cro
ny
m-A
gre
em
en
tM
ain
Ob
ject
ive
sS
tart
–E
nd
(yy
yy
)
H20
20-E
U.3
.4.-
SOC
IETA
LC
HA
LLEN
GES
-Sm
art,
Gre
en,a
ndIn
tegr
ated
Tran
spor
t
8755
27-H
ydra
-Hyb
rid
pow
er-e
nerg
yel
ectr
odes
for
next
gene
rati
onlit
hium
-ion
batt
erie
s
Aim
edat
deve
lopi
nga
new
gene
rati
onof
Li-i
onte
chno
logy
wit
him
prov
eden
ergy
,pow
er,a
ndlo
wco
sts
utili
zing
sust
aina
ble
mat
eria
ls;t
ore
ach
this
targ
et,H
YD
RA
mob
ilize
sa
stro
ngin
dust
ryco
mm
itm
ent
2020
–202
4
9639
03-C
urre
ntD
irec
t-C
UR
REN
TD
IREC
T–
Swap
pabl
eC
onta
iner
Wat
erbo
rne
Tran
spor
tBat
tery
Prop
ose
anin
nova
tive
lithi
um-i
once
llop
tim
ized
for
wat
erbo
rne
tran
spor
tusi
ngno
velm
anuf
actu
ring
tech
niqu
esfo
ra
cons
iste
ntco
stre
duct
ion
2021
–202
3
H20
20-E
U.3
.5.4
.-En
ablin
gth
etr
ansi
tion
tow
ards
agr
een
econ
omy
and
soci
ety
thro
ugh
eco-
inno
vati
on
7768
51-C
arE-
Serv
ice-
Cir
cula
rEc
onom
yBu
sine
ssM
odel
sfo
rin
nova
tive
hybr
idan
del
ectr
icm
obili
tyth
roug
had
vanc
edre
use
and
rem
anuf
actu
ring
tech
nolo
gies
and
serv
ices
Dem
onst
rate
new
enab
ling
tech
nolo
gies
and
serv
ice
tosy
stem
atic
ally
perf
orm
inno
vati
vere
use
and
rem
anuf
actu
ring
prac
tices
aske
ypr
oces
ses
topr
ovid
eva
lue
tocu
stom
ers
and
tom
inim
ize
the
envi
ronm
enta
lim
pact
2018
–202
1
110
Sustainability 2021, 13, 11154
4. Conclusions
In order to guarantee the sustainability and the optimum EU management of LIBs, theunification and communication among the different stakeholders within the whole valuechain are of utmost importance.
This goal becomes fully clear considering that the needs and the challenges of thelegislation in various countries acquire more relevance if tied to the generalized overviewof circular economy needs/challenges. In 2015, the European Commission adopted “Themissing link: a European action plan for the Circular Economy”, in which the interde-pendence of all the processes in the value chain were analyzed, from the extraction ofraw materials to product design; from production to distribution; and from consumptionto reuse and recycling, inserting measures aimed precisely at designing products in anintelligent way. The commitment of the European Commission to these issues is also con-tained in the European New Green Deal presented by the new president of the EuropeanCommission in September 2019. Subsequently, on 11 March 2020, the Action Plan wasupdated and, in this version, the European Commission identified some production sectorsas priorities, including the sectors of batteries and vehicles.
In this context, indeed, electric mobility represents one of the main areas requiring theimplementation of circular economy logic, making it necessary to develop best practices toachieve sustainable mobility.
There is a clear need to apply a “Life Cycle Thinking” type approach that covers theentire life cycle of the vehicle and its components, and not only that of the LIB. The mainissues to be addressed for a transition to a circular economy by the electric mobility sectorconsist of interventions along the entire electric mobility chain, such as (i) the developmentof charging infrastructures; (ii) the adoption of an eco-design logic through the choiceof materials on the basis of their availability, recyclability, and ease of reprocessing; (iii)the spread of innovative and sustainable technologies based on “product as a service”business models, sharing platforms, and auxiliary services (“vehicle to grid” technology);(iv) an effective end-of-life management and regeneration system of the equipment andcomponents; and (v) the development in each national territory of skills throughout thevalue chain (production of new vehicles, systems for assistance and repairs, and end-of-lifetreatment, where a second-life battery use system as well as LIB recycling and disposalprocesses are only one of the issues).
The Extended Producer Responsibility is recognized as an optimum tool to summonthe various parties operating in the LIBs sector. However, after an analysis of the legislation(both European and of the target state), the following limits were detected:
• the financing systems for the collection schemes are not unique and a comparativeanalysis must be performed in order to identify the most effective and efficient systems;
• there is an absence of identification or codes that easily recognize LIBs, thus difficultiesin sorting and recycling them are increasing; and
• there is an absence of specific regulations dedicated to LIBs, implying the loss ofvolume that is potentially detectable and valorized.
The upload of directives has been devoted to increasing the sustainability of LIBs but,at the same time, a revolution in the industrial sector is needed to guarantee the benefit ofa cradle-to-cradle cycle for LIBs. Urgent innovation and legislative adaptation have beenmade more difficult considering the awareness that the use of accumulators cannot be thedefinitive or long-term solution.
Supplementary Materials: The following are available online at https://www.mdpi.com/article/10.3390/su132011154/s1, Main point of the survey.
Author Contributions: Conceptualization, C.G.; methodology, C.G.; validation, M.C. (Matteo Caval-letti) and R.I.; formal analysis, C.G., M.L.R. and M.C. (Massimo Conti); investigation, C.G.; resources,C.G., M.C. (Matteo Cavalletti), M.C. (Massimo Conti) and D.M.; data curation, S.O.; writing—originaldraft preparation, C.G., D.M., M.L.R. and P.S.; writing—review and editing, D.M., M.L.R., P.S., C.G.,M.C. (Massimo Conti) and S.O.; supervision, P.S.; project administration, P.S. and M.C. (Massimo
111
Sustainability 2021, 13, 11154
Conti); funding acquisition, M.C. (Massimo Conti). All authors have read and agreed to the publishedversion of the manuscript.
Funding: This research study received no external funding.
Institutional Review Board Statement: Not applicable.
Informed Consent Statement: Not applicable.
Data Availability Statement: The data presented in this study are openly available in all citedreferences as reported in the References.
Acknowledgments: Special thanks is given to the national Centro di Coordinamento NazionalePile e Accumulatori CDCNPA https://www.cdcnpa.it/ (accessed on 4 September 2021) for theircontribution and collaboration, and to Fondazione Cariverona for providing the grant for the researchfellow activities.
Conflicts of Interest: The authors declare no conflict of interest.
References
1. Giegerich, M.; Akdere, M.; Freund, C.; Fühner, T.; Grosch, J.L.; Koffel, S.; Schwarz, R.; Waldhör, S.; Wenger, M.; Lorentz,V.R.H.; et al. Open, flexible and extensible battery management system for lithium-ion batteries in mobile and stationaryapplications. In Proceedings of the 2016 IEEE 25th International Symposium on Industrial Electronics (ISIE), Santa Clara, CA,USA, 8–10 June 2016.
2. Eurostat. Passenger Cars in the EU. Stat. Explain. 2020. Available online: https://ec.europa.eu/eurostat/statistics-explained/index.php?title=Passenger_cars_in_the_EU (accessed on 4 September 2021).
3. European Commission. COMMISSION STAFF WORKING DOCUMENT on the Evaluation of the Directive 2006/66/EC onBatteries and Accumulators and Waste Batteries and Accumulators and Repealing Directive 91/157/EEC. Available online: https://ec.europa.eu/environment/pdf/waste/batteries/evaluation_report_batteries_directive.pdf (accessed on 4 September 2021).
4. Engel, H.; Hensley, R.; Knupfer, S.; Sahdev, S. Charging Ahead: Electric-Vehicle Infrastructure Demand. Available on-line: https://www.mckinsey.com/industries/automotive-and-assembly/our-insights/charging-ahead-electric-vehicle-infrastructure-demand (accessed on 4 September 2021).
5. IEA. Global EV Outlook 2019 to Electric Mobility. Available online: https://doi.org/10.1787/35fb60bd-en (accessed on4 September 2021).
6. Ghandi, A.; Paltsev, S. Global CO2 impacts of light-duty electric vehicles. Transp. Res. Part D Transp. Environ. 2020, 87, 102524.[CrossRef]
7. Xu, C.; Dai, Q.; Gaines, L.; Hu, M.; Tukker, A.; Steubing, B. Future material demand for automotive lithium-based batteries.Commun. Mater. 2020, 1, 1–10. [CrossRef]
8. CDCNPA. 6 Rapporto Annuale. Available online: https://cdcnpa.it/presentazione-6-rapporto-annuale/ (accessed on4 September 2021).
9. Heelan, J.; Gratz, E.; Zheng, Z.; Wang, Q.; Chen, M.; Apelian, D.; Wang, Y. Current and Prospective Li-Ion Battery Recycling andRecovery Processes. Jom Miner. Met. Mater. Soc. Curr. 2016, 68, 2632–2638. [CrossRef]
10. Girtan, M.; Wittenberg, A.; Grilli, M.L.; de Oliveira, D.P.S.; Giosuè, C.; Ruello, M.L. The Critical Raw Materials Issue betweenScarcity, Supply Risk, and Unique Properties. Materials 2021, 14, 1826. [CrossRef] [PubMed]
11. European Commission. Study on the EU’s List of Critical Raw Materials (2020) Final Report. Available online: https://ec.europa.eu/docsroom/documents/42883/attachments/1/translations/en/renditions/native (accessed on 4 September 2021).
12. European Commission COM(2008) 699 Final, The Raw Materials Initiative—Meeting our Critical Needs for Growth and Jobsin Europe 6. 2008. Available online: https://www.eumonitor.eu/9353000/1/j9vvik7m1c3gyxp/vikqhmxxruzl (accessed on4 September 2021).
13. European Commission COM(2014) 297 Final, On the Review of the List of Critical Raw Materials for the EU a 2014. 2014.Available online: https://www.eumonitor.eu/9353000/1/j9vvik7m1c3gyxp/vjk3t59dq1zk (accessed on 4 September 2021).
14. Turcheniuk, K.; Bondarev, D.; Singhal, V.; Yushin, G. Ten years left for redesign of Li battery. Nature 2018, 559, 467–471. [CrossRef][PubMed]
15. Wang, Y.; An, N.; Wen, L.; Wang, L.; Jiang, X.; Hou, F.; Yin, Y.; Liang, J. Recent progress on the recycling technology of Li-ionbatteries. J. Energy Chem. 2021, 55, 391–419. [CrossRef]
16. Lebedeva, N.; Di Persio, F.; Boon-Brett, L. Lithium Ion Battery Value Chain and Related Opportunities for Europe; Publications Officeof the European Union: Luxembourg, 2017; ISBN 978-92-79-66948-4.
17. European Commission COM(2020) 474 Final, Critical Raw Materials Resilience: Charting a Path towards Greater Security andSustainability. 2020. Available online: https://www.eumonitor.eu/9353000/1/j9vvik7m1c3gyxp/vlbrebsa5yxl (accessed on4 September 2021).
112
Sustainability 2021, 13, 11154
18. European Commission. Batteries Europe: Strategic Research Agenda for 2020. Available online: https://ec.europa.eu/energy/sites/default/files/documents/batteries_europe_strategic_research_agenda_december_2020__1.pdf (accessed on4 September 2021).
19. Zhao, Y.; Pohl, O.; Bhatt, A.I.; Collis, G.E.; Mahon, P.J.; Rüther, T.; Hollenkamp, A.F. A Review on Battery Market Trends,Second-Life Reuse, and Recycling. Sustain. Chem. 2021, 2, 167–205. [CrossRef]
20. European Commission. Directive 2006/66/EC of the European Parliament and of the Council of 6 September 2006 on Batteriesand Accumulators and Waste Batteries and Accumulators and Repealing Directive 91/157/EEC. Available online: https://eur-lex.europa.eu/legal-content/EN/ALL/?uri=CELEX%3A32006L0066 (accessed on 4 September 2021).
21. European Commission. Directive 2013/56/EU of the European Parliament and of the Council of 20 November 2013 AmendingDirective 2006/66/EC of the European Parliament and of the Council on Batteries and Accumulators and Waste Batteries andAccumulators as Regards the Placing on. 2013. Available online: https://eur-lex.europa.eu/legal-content/EN/TXT/?uri=celex%3A32013L0056 (accessed on 4 September 2021).
22. European Commission. Directive (EU) 2018/849 of the European Parliament and of the Council of 30 May 2018 Amending Direc-tives 2000/53/EC on End-of-Life Vehicles, 2006/66/EC on Batteries and Accumulators and Waste Batteries and Accumulators,and 2012/19/EU on Waste Electrical. 2018. Available online: https://eur-lex.europa.eu/legal-content/EN/TXT/?uri=CELEX%3A32018L0849 (accessed on 4 September 2021).
23. European Parliament. EU Legislation in Progress New EU Regulatory Framework for Batteries Setting Sustainability Require-ments. 2021. Available online: https://www.europarl.europa.eu/thinktank/en/document.html?reference=EPRS_BRI (accessedon 4 September 2021).
24. Mossali, E.; Picone, N.; Gentilini, L.; Rodrìguez, O.; P, J.M.; Colledani, M. Lithium-ion batteries towards circular economy: Aliterature review of opportunities and issues of recycling treatments. J. Environ. Manag. 2020, 264, 110500. [CrossRef] [PubMed]
25. Bernardes, A.M.; Espinosa, D.C.R.; Tenório, J.A.S. Recycling of batteries: A review of current processes and technologies. J. PowerSources 2004, 130, 291–298. [CrossRef]
26. Where 3 Million Electric Vehicle Batteries Will Go When They Retire. Available online: https://www.bloomberg.com/news/features/2018-06-27/where-3-million-electric-vehicle-batteries-will-go-when-they-retire. (accessed on 6 August 2021).
27. Chen, M.; Ma, X.; Chen, B.; Arsenault, R.; Karlson, P.; Simon, N.; Wang, Y. Recycling End-of-Life Electric Vehicle Lithium-IonBatteries. Joule 2019, 3, 2622–2646. [CrossRef]
28. European Commission. Proposal for a Regulation of the European Parliament and of the Council Concerning Batteries andWaste Batteries, Repealing Directive 2006/66/EC and Amending Regulation (EU) No 2019/1020. 2020. Available online:https://eur-lex.europa.eu/legal-content/EN/TXT/?uri=CELEX%3A52020PC0798 (accessed on 4 September 2021).
29. Danino-Perraud, R. The Recycling of Lithium-Ion Batteries. A Strategic Pillar for the European Battery Alliance. Available online:https://www.ifri.org/sites/default/files/atoms/files/danino_recycling_batteries_2020.pdf. (accessed on 6 August 2021).
30. Bai, Y.; Muralidharan, N.; Sun, Y.K.; Passerini, S.; Stanley Whittingham, M.; Belharouak, I. Energy and environmental aspects inrecycling lithium-ion batteries: Concept of Battery Identity Global Passport. Mater. Today 2020, 41, 304–315. [CrossRef]
31. Levänen, J.; Lyytinen, T.; Gatica, S. Modelling the Interplay Between Institutions and Circular Economy Business Models: A CaseStudy of Battery Recycling in Finland and Chile. Ecol. Econ. 2018, 154, 373–382. [CrossRef]
32. Bongartz, L.; Shammugam, S.; Gervais, E.; Schlegl, T. Multidimensional criticality assessment of metal requirements for lithium-ion batteries in electric vehicles and stationary storage applications in Germany by 2050. J. Clean. Prod. 2021, 292, 126056.[CrossRef]
33. Sancilio, C. COBAT: Collection and recycling spent lead/acid batteries in Italy. J. Power Sources 1995, 57, 75–80. [CrossRef]34. Vieceli, N.; Margarido, F.; Durão, F.; Guimarães, C.; Nogueira, C.A. Collection of waste batteries in Portugal and Brazil. In
WASTES 2015-Solutions, Treatments and Opportunities: Selected Papers from the 3rd Edition of the International Conference on Wastes:Solutions, Treatments and Opportunities, Viana Do Castelo, Portugal, 14–16 September 2015 (1st ed.); CRC Press, Taylor & FrancisGroup: Boca Raton, FL, USA, 2015; p. 349.
35. Ponce-Cueto, E.; Manteca, J.Á.G.; Carrasco-Gallego, R. Reverse logistics for used portable batteries in Spain-An analyticalproposal for collecting batteries. Environ. Sci. Eng. 2011, 593–604. [CrossRef]
36. Pouikli, K. Concretising the role of extended producer responsibility in European Union waste law and policy through the lens ofthe circular economy. ERA Forum 2020, 20, 491–508. [CrossRef]
37. Martinez-Laserna, E.; Gandiaga, I.; Sarasketa-Zabala, E.; Badeda, J.; Stroe, D.I.; Swierczynski, M.; Goikoetxea, A. Battery secondlife: Hype, hope or reality? A critical review of the state of the art. Renew. Sustain. Energy Rev. 2018, 93, 701–718. [CrossRef]
113
sustainability
Article
Biotechnology for Metal Recovery from End-of-LifePrinted Circuit Boards with Aspergillus niger
1 Department of Life and Environmental Sciences-DiSVA, Università Politecnica delle Marche,Via Brecce Bianche, 60131 Ancona, Italy; [email protected] (G.M.); [email protected] (F.B.)
2 Department of Chemistry, Universiteti Politeknik I Tiranes, Sheshi Nënë Tereza,1001 Tiranë, Albania; [email protected]
Received: 23 July 2020; Accepted: 10 August 2020; Published: 11 August 2020
Abstract: The growing production and use of electric and electronic components has led to higher ratesof metal consumption and waste generation. To solve this double criticality, the old linear managementmethod (in which a product becomes waste to dispose), has evolved towards a circular approach.Printed circuit boards (PCBs) are the brains of many electronic devices. At the end of their life, thisequipment represents a valuable scrap for the content of base metals such as Cu and Zn (25 and 2 wt %,respectively) and precious metals such as Au, Ag, and Pd (250, 1000, and 110 ppm, respectively).Recently, biotechnological approaches have gained increasing prominence in PCB exploitation sincethey can be more cost-efficient and environmentally friendly than the chemical techniques. In thiscontext, the present paper describes a sustainable process which uses the fungal strain Aspergillus nigerfor Cu and Zn extraction from PCBs. The best conditions identified were PCB addition after 14 days,Fe3+ as oxidant agent, and a pulp density of 2.5% (w/v). Extraction efficiencies of 60% and 40% for Cuand Zn, respectively, were achieved after 21 days of fermentation. The ecodesign of the process wasfurther enhanced by using milk whey as substrate for the fungal growth and the consequent citric acidproduction, which was selected as a bioleaching agent.
In recent years, the production of electrical and electronic equipment (EEE) has substantially increasedwith the development of science and technology [1,2]. At the same time, the average lifetime of electronicproducts has also been drastically reduced (to around 2 years), resulting in a massive generation of wastefrom electrical and electronic equipment (WEEE) (around 44.7 million tons in 2016) [3,4]. Printed circuitboards (PCBs) represent about 3–5% of the total WEEE collected every year [5]. They are composed ofmetals (around 40 wt %), ceramics (around 30 wt %), and plastics (about 30 wt %) [3,6–9]. The metal fractionincludes 20% Cu, 5% Al, 1% Ni, 1.5% Pb, 2% Zn, and 3% Sn (w/w) [2,4,10,11]. The presence of considerableamounts of metals represents a very critical issue for their possible release into the environment inthe case of incorrect management [12]. Nevertheless, this aspect also represents an opportunity for atransition towards a circular approach following the principle “resource–product–regenerated resource”,where the waste is converted into a resource (urban mining) [13,14]. The most conventional options used byindustries to extract metals from PCBs are pyrometallurgy and hydrometallurgy [6,15]. Pyrometallurgicalapproaches produce pollutant emissions (dioxins and furans), and they usually involve high operationcosts. Hydrometallurgy is a low energy-cost process which needs large amounts of chemical agents.Alternatively, biohydrometallurgy is often simple, environmentally friendly, and economical, responding tothe sustainability principles essential for the development of a circular economy [15–17].
Several studies have described metal extraction from PCBs using bacteria, mainly Leptospirillumferrooxidans, Acidithiobacillus thiooxidans, A. ferrooxidans, and Sulfobacillus thermosulfidooxidans, principally forthe recovery of Cu and other metals such as Zn, Sn, Pb, and Ni [18–30]; Chromobacterium violaceum,Pseudomonas fluorescens, and Bacillus megaterium have also been used for Au recovery [31–35]. On theother hand, fungal bioleaching has several advantages since fungi show a greater ability to toleratetoxic materials, a faster leaching action than bacteria, and the ability to grow in both alkaline and acidicmediums [36]. Penicillium simplissimum, P. chrysogenum, and Aspergillus niger are the most commoneukaryotic microorganisms used for metal leaching from different solid residues such as electronicscraps [10,15,20,36], contaminated soil [37], spent catalyst [38–40], flay ash [41–43], and red mud [44,45].Citric, oxalic, and gluconic acids are the organic acids produced in the highest quantities by A. nigerand are used for waste exploitation [37,46,47]. In detail, bioleaching with A. niger uses PCBs [10,20] orbatteries [15,36] as substrate for metal extractions. High leaching efficiencies of 60% and 100% for Cu andZn, respectively, were achieved after 21 days of fermentation with low pulp density of 0.1–0.5% (w/v).
Considering the current end-of-life PCB availability and the relevant content of Cu and Zn,the present paper aims to improve the sustainability of the process compared to the current state of theart. The possibility to increase the quantity of treated PCBs makes the treatment more attractive forstakeholders and suitable for industrial scale-up. Many conditions were investigated, including thepossible inclusion of food industry waste as fungal growth substrate to improve the environmentalsustainability of the treatment.
2. Materials and Methods
2.1. Preparation of Waste Printed Circuit Boards (PCBs)
PCBs used in this paper were obtained from computer devices. They were shredded by stainlesssteel blades and pliers after manually removing the main parts of electronic components (e.g., capacitors,batteries, and resistors). Finally, the residue was crushed to obtain a granulometry smaller than 0.5 mm,suitable for the bioleaching experiments. The metal fraction was separated from the plastic and flameretardants by density and the PCB powder was washed with NaCl-saturated water. The resulting PCBshad mean metal concentrations of 25% Cu and 2% Zn.
2.2. Microorganisms and Inoculum
Fungal microorganisms, classified as A. niger, were isolated in the laboratory from environmentalsamples. The inoculation of fungi was carried out inside sterile Petri dishes with a diameter of 100 mmin YPD broth (10 g/L yeast extract (Y), 20 g/L peptone (P), and 20 g/L D-glucose (D)), where 1.5% agarwas added. The medium, before being used, was stirred and heated to 60 ◦C to achieve a homogeneousamber color and subsequently autoclaved. Finally, 100 mg/L of antibiotic (rifampicin) was added.The inoculated plates were incubated at room temperature for about 7–10 days. One-milliliter aliquotsof the prepared inoculums were inoculated to 100 mL of the glucose medium. The glucose medium wasprepared with the following composition: solution A was composed of 2.5 g of (NH4)2SO4, 0.25 g ofMgSO4·7H2O, and 0.025 g of KH2PO4 dissolved in 450 mL of distilled water; solution B was composedof 1 g of yeast in 50 mL of distilled water; solution C was composed of 150 g of D-glucose dissolved in500 mL of distilled water; and solution D was composed of 1 g/L ZnSO4·7H2O, 0.05 g/L MnSO4·H2O,and 0.1 g/L FeSO4·7H2O. The solutions A, B, and C were mixed and autoclaved, and 1 mL of thesolution D was added to the resulting solution. The pH of solution was adjusted to 6.5 in the first dayand readjusted to pH 3 during the bioleaching experiments. The bioleaching tests were carried out in250 mL Erlenmeyer flasks which were incubated at 30 ◦C and shaken at 120 rpm. Each treatment wasperformed in duplicate. The pH was recorded by a pH meter inoLab Multi 720 (WTW).
116
Sustainability 2020, 12, 6482
2.3. Bioleaching Experiments
The bioleaching processes were conducted to verify the effect of two factors: the PCB additionat different fermentation times and the addition of two oxidant agents (Fe3+ or Mn7+). The firstfactor was monitored by adding PCBs at three different times: at the beginning, after 7 days, or after14 days of fermentation. The bioleaching process was carried out for 7 days after the PCB addition.In the case of PCB addition at the beginning, the longest time of 14 days allowed the fungal growthand acid production. The pH of medium was continuously monitored and readjusted to 3 usinga 2 M NaOH solution. The second factor (the oxidant agent) was tested by adding Fe3+ (40.67 g/Lof Fe2(SO4)3) or Mn7+ (6.14 g/L of KMnO4) simultaneously with the PCB addition at all testedconditions. The Fe3+ and Mn7+ amounts were determined by stoichiometric ratio with Cu, followingEquations (1) and (2) [8,48,49]:
Cu0 + 2 Fe3+→ Cu2+ + 2 Fe2+ (1)
5 Cu0 + 2 Mn7+→ 5 Cu2+ + 2 Mn2+ (2)
The PCB concentration in bioleaching experiments was 2.5% (w/v). At regular time intervals, both citricacid production (2, 7, 14, and 21 days) and metal concentration (2, 4, 7, 10, 14, 16, 18, and 21 days)were monitored.
A chemical control test was carried out at the same bioleaching conditions to confirm the effectof the citric acid with or without oxidant agents. The operative conditions were PCB concentration2.5% (w/v), pH 3.0, 30 ◦C, and 7 days. The citric acid concentration chosen was the same as that of theorganic acid produced by A. niger in the bioleaching experiments (15 g/L), and the same amounts ofFe3+ and Mn7+ were used.
Additional tests were carried out to test the possibility of producing citric acid using an alternativecarbon source to reduce the environmental load due to the glucose consumption for the fungal growth.Two kinds of agriculture and food residues were used, olive wastewater and milk whey (a cheese productionresidue). Both kinds of waste were used without or with an ozonation pretreatment (30 min and a fluxof 7 gO3/L·h). The choice of these residues was due to their high COD content (around 150 g COD/L).Furthermore, these waste flows represent a relevant management problem in the Mediterranean area [50,51].Their use allows for the solution of a double problem by decreasing the consumption of raw materialsand the reducing the amount of food waste disposed, in agreement with the circular economy pillars.
2.4. Analytical Determination
The concentrations of Fe (Fe3+ and Fe2+), Mn2+, Zn2+, and Cu2+ were periodically analyzed inthe leaching solutions. The concentrations of Mn, Zn, and Cu were measured by an atomic absorptionspectrophotometer (Techcomp, AA6000). On the other hand, the quantification of the Fe content wasperformed by a UV/VIS spectrophotometer by the colorimetric thiocyanate method (Jasco Model 7850).The total Fe concentration was determined by oxidizing Fe2+ to Fe3+ with potassium permanganate,and consequently the Fe2+ concentration was calculated as the difference between total Fe and Fe3+
concentrations. The concentration of citric acid produced by A. niger in the medium was quantified bythe Water HPLC instrument.
2.5. Statistical Analysis
In order to verify the effect of oxidant agents (Fe3+ or Mn7+) and the best time for both PCB andoxidant agent addition (at the beginning, after 7 days of fermentation, or after 14 days of fermentation),a two-way analysis of variance (ANOVA) was carried out. When significant differences were observed,an SNK post hoc comparison test (α = 0.05) was also performed. An additional statistical analysis wasalso conducted aimed at confirming the leaching role of both citric acid and oxidant agent.
117
Sustainability 2020, 12, 6482
3. Results
3.1. Bioleaching Experiments
Figure 1 shows the Cu and Zn leaching profiles in the bioleaching tests with PCBs. These resultsdemonstrated that the leaching efficiency for both Cu and Zn increased when the PCBs and oxidantagent were added 14 days after the beginning of fermentation. This was achieved thanks to the highestcitric acid production by A. niger when PCBs/oxidant agent were added at the end of fungal metabolism(Figure 2). In detail, the citric acid reached the concentration of 13.8 ± 4.5 g/L at these conditions,even though 0.033 ± 0.002 and 1.6 ± 0.7 g/L of citric acid were produced when PCBs and oxidant agentwere added at the beginning of fermentation and after 7 days after the start of fermentation starting,respectively. The lowest citric acid production by A. niger was due to both the metal toxicity and thePCB inhibition on fungal metabolism due to the high substrate concentration [5,10,20].
Figure 1. Cu (a,c,e) and Zn (b,d,f) leaching efficiency time profile in the bioleaching tests with A. nigerand with the printed circuit boards (PCBs) and/or oxidant agent (ferric iron or potassium permanganate)added at the beginning (a,b), after 7 days (c,d), or after 14 days (e,f) of the fermentation period.
The results proved the positive effect of Fe3+ as an oxidant agent, with an increase of both Cu andZn leaching (Figure 1). On the other hand, the Mn7+ were not relevant at all to the tested conditions.In further detail, Cu leaching rose from 19.0 ± 0.2% when Fe3+ was added at the fermentation beginningto 57.0 ± 3.0% when it was added after 14 days. The same trend was observed for Zn leaching efficiency,from 5.6± 0.1% to 36.5± 4.8%. The highest recovery efficiency of PCBs and Fe3+ added after 14 days wasexplained by the highest citric acid concentration, which increased the Fe dissolution from 10.6 ± 2.6%to 60.5 ± 5.3% (Figure 3). Moreover, the Fe speciation demonstrated that the total dissolved Fe reactedwith PCB powder at the highest citric acid concentration [52]. Therefore, at the end of the experiment,Fe was completely in the reduced form (Fe2+) due to the reaction with Cu and Zn (Equation (1)).In the other tested conditions, around 50% of the dissolved Fe reacted with PCBs to leach metals.The statistical analysis (ANOVA) confirmed the positive effects of both the PCB and the oxidative agent(Fe3+) addition after 14 days with a P value lower than 0.05. The Fe3+ use produced an additional
118
Sustainability 2020, 12, 6482
advantage. In the tests without Fe3+, the Zn leaching efficiency after 2 days decreased from 2.8 ± 0.5%,10.3 ± 0.7%, and 51.5 ± 0.5% to around 0% when PCBs were added at the beginning, after 7 days,or after 14 days of the fermentation period, respectively. Fe created a stable complex able to preventthe Zn precipitation in oxalate form [53,54]; this was due to the oxalic acid present as a by-product ofcitric acid synthesis by A. niger metabolism [36,46].
Figure 2. Citric acid concentration in the bioleaching experiments with A. niger.
Figure 3. Fe dissolution and speciation in the bioleaching experiments: PCBs and Fe3+ added at thebeginning (a), after 7 days (b), or after 14 days (c) of the fermentation period.
119
Sustainability 2020, 12, 6482
3.2. Chemical Controls and Statistical Analysis
To verify that both the Cu and Zn extractions were due to the citric acid produced by A. nigerand to the oxidant agent added (Fe3+ or Mn7+), chemical controls were carried out reproducing thebioleaching conditions. The results in Figure 4 confirmed the positive effect of Fe3+ addition with finalyields of 59.4 ± 0.9% and 24.6 ± 5.0% for Cu and Zn, respectively. The statistical analysis, carried out tocompare the chemical results with the corresponding bioleaching ones, demonstrated that the resultswere not statistically different, with a P value higher than 0.05 for both the metal targets (Table 1).These results confirmed that the Cu and Zn leaching from PCBs were due to the concurrent effects ofcitric acid and oxidant agent and excluded the possible effect of glucose or other organic acids (such asoxalic or gluconic acid) produced by A. niger.
Figure 4. Cu (a) and Zn (b) leaching efficiency in the chemical control carried out with citric acid (C.A.)and oxidant agents (Fe3+ or Mn7+).
Table 1. The variance analysis comparing the chemical controls with the respective bioleaching experiments.
Treatment
Statistical Analysis (ANOVA)
dfCu Zn
MS F P MS F P
C.A. 1 2.98 3.74 0.19 2.06 50.75 0.05
C.A.+Fe3+ 1 5.74 0.46 0.57 140.6 2.98 0.23
C.A.+Mn7+ 1 0.58 0.33 0.62 1.48 8.74 0.10
3.3. Citric Acid Production Using Alternative Carbon Sources
When food wastes (olive wastewater or milk whey) were used for the fungal growth, only 0.13 ± 0.01 g/Lof citric acid was produced (Figure 5). The main problems were the toxic effect of phenols on fungalmetabolism in the case of olive wastewater [55–57] and the low availability of lactose as a carbon sourcefor fungal metabolism in the milk whey experiment [58–62]. The additional pretreatment by ozonationallowed reducing the concentration of phenols and decomposing lactose in a more available saccharidesuch as glucose, galactose, or fructose. After the pretreatment step, A. niger produced around 6.1 ± 0.1 and13.7 ± 4.4 g/L of citric acid after 14 fermentation days with olive wastewater and milk whey, respectively.These quantities were enough to complete the leaching of the two metal targets. The decrease of the finalCOD concentration in both food wastes simplified the final sludge management.
120
Sustainability 2020, 12, 6482
Figure 5. Citric acid produced by A. niger using agricultural and food wastes without and withpretreatment with ozonation after 14 days of fermentation.
4. Discussion and Conclusions
This work proposed a bioleaching process for metal extraction from end-of-life PCBs with A. niger.The results prove the possibility to increase the treated PCB amount from 0.5% to 2.5% w/v withoutCu efficiency decrease [10,20]. The relevance of the proposed approach is confirmed by two mainreasons: (i) Cu is the main metal of interest in PCBs, after precious metals (Au and Pd). The economicsustainability of its extraction from these scraps is also connected to its high concentration [4,7,63].(ii) Cu is the main interferent in Au leaching; therefore, its previous extraction allows for a significantincrease of both efficiency and purity in the Au recovery [32,33,64]. The present paper representsan example of success in the implementation of circular economy principles described by the NewEuropean Circular Economy Action Plan [65]. Indeed, PCBs are included within the list of key productsin the documents (electronics and ICT). Furthermore, the biotechnological implementation allows thesubstitution of hazardous chemicals to protect citizens and the environment. The chance to give valueto the waste (both PCBs and food waste for the citric acid production) pushes the market towardsthe creation of a secondary raw materials market, while avoiding export to non-European countries,in agreement with the modern circular policies. More comprehensively, the biotechnological approachusing the A. niger strain allowed the exploitation of end-of-life PCBs at a low temperature, reducing theconsumption of chemical agents. High efficiencies, around 60% and 40% for Cu and Zn, respectively,were achieved at the best selected conditions: addition of PCBs and Fe3+ (oxidant agent) 14 daysafter the start of fermentation (when A. niger reached the exponential growth phase and producedthe maximum amount of citric acid (around 15 g/L)), 30 ◦C, 7 days leaching time, and 2.5% (w/v)PCB concentration. A further recovery process allows for the new metal’s placement on the market,while avoiding the depletion of raw materials. Moreover, the environmental sustainability of thetreatment was enhanced by the use of food wastes (milk whey and olive wastewater) for A. nigermetabolism and was able to replace the glucose from primary sources, solving the criticalities connectedto their management.
Author Contributions: Conceptualization, A.B. and F.B.; methodology, A.B. and F.B.; software, A.B.; validation,A.B. and D.K.; formal analysis, A.B. and G.M.; investigation, A.B., D.K., and G.M.; resources, F.B.; data curation,A.B. and F.B.; writing—original draft preparation, A.B. and D.K.; writing—review and editing, A.B. and F.B.;visualization, A.B. and G.M.; supervision, F.B.; project administration, F.B.; funding acquisition, F.B. All authorshave read and agreed to the published version of the manuscript.
Funding: This research received no external funding.
Acknowledgments: This work has been carried out within a subcontract of the H2020-760792 FENIX Project. Part ofthe work has been realized thanks to Doctorate exchange and Post-Doc within S.U.N.B.E.A.M. Project—Erasmus
121
Sustainability 2020, 12, 6482
Mundus Action 2-Strand 1. Part of the work has been realized within a PhD program funded by FondazioneCARIVERONA. The authors are highly grateful to Marcello Centofanti for his support for the chemical analyses.
Conflicts of Interest: The authors declare no conflict of interest.
References
1. Arshadi, M.; Mousavi, S.M. Multi-objective optimization of heavy metals bioleaching from discarded mobilephone PCBs: Simultaneous Cu and Ni recovery using Acidithiobacillus ferrooxidans. Sep. Purif. Technol.2015, 147, 210–219. [CrossRef]
2. Baldé, C.P.; Forti, V.; Gray, V.; Kuehr, R.; Stegmann, P. The Global E-waste Monitor 2017. Available online: https://www.itu.int/en/ITU-D/Climate-Change/Pages/Global-E-waste-Monitor-2017.aspx (accessed on 11 August 2020).
3. Jadhav, C.H.H.; Su, U. Waste Printed Circuit Boards recycling: An extensive assessment of current status.J. Clean. Prod. 2015, 94, 5–19. [CrossRef]
4. Kaya, M. Electronic Waste and Printed Circuit Board Recycling Technologies; Springer: Berlin, Germany, 2019.[CrossRef]
5. Jadhav, C.H.H.; Su, U. RSC Advances leaching of metals from printed circuit board powder by anAspergillus niger culture supernatant and hydrogen peroxide. R. Soc. Chem. 2016, 6, 43442–43452. [CrossRef]
6. Rocchetti, L.; Amato, A.; Beolchini, F. Printed circuit board recycling: A patent review. J. Clean. Prod.2018, 178, 814–832. [CrossRef]
7. Evangelopoulos, P.; Kantarelis, E.; Yang, W. Waste Electric and Electronic Equipment: Current Legislation,Waste Management, and Recycling of Energy, Materials, and Feedstocks. Available online: https://www.sciencedirect.com/science/article/pii/B9780444642004000177 (accessed on 11 August 2020).
8. Zhang, L.; Xu, Z. A review of current progress of recycling technologies for metals from waste electrical andelectronic equipment. J. Clean. Prod. 2016, 127, 19–36. [CrossRef]
9. Vermes, an, H.; Tiuc, A.E.; Purcar, M. Advanced Recovery Techniques for Waste Materials from IT andTelecommunication Equipment Printed Circuit Boards. Sustainability 2020, 12, 74. [CrossRef]
10. Faraji, F.; Golmohammadzadeh, R.; Rashchi, F. Fungal bioleaching of WPCBs using Aspergillus niger:Observation, optimization and kinetics. J. Environ. Manag. 2018, 217, 775–787. [CrossRef]
11. Birloaga, I.; Vegliò, F. Study of multi-step hydrometallurgical methods to extract the valuable content of gold,silver and copper from waste printed circuit boards. J. Environ. Chem. Eng. 2016, 4, 20–29. [CrossRef]
12. Xia, M.; Bao, P.; Liu, A.; Zhang, S.; Peng, T.; Shen, L.; Yu, R.; Wu, X.; Li, J.; Liu, Y.; et al. Isolation andidentification of Penicillium chrysogenum strain Y5 and its copper extraction characterization from wasteprinted circuit boards. J. Biosci. Bioeng. 2018, 126, 78–87. [CrossRef]
13. D’Adamo, I.; Ferella, F.; Gastaldi, M.; Maggiore, F.; Rosa, P.; Terzi, S. Towards sustainable recycling processes:Wasted printed circuit boards as a source of economic opportunities. Resour. Conserv. Recycl. 2019, 149,455–467. [CrossRef]
14. Ljunggren Söderman, M.; André, H. Effects of circular measures on scarce metals in complex products–Casestudies of electrical and electronic equipment. Resour. Conserv. Recycl. 2019, 151, 104464. [CrossRef]
15. Kim, M.; Seo, J.; Choi, Y.; Kim, G. Bioleaching of spent Zn–Mn or Ni–Cd batteries by Aspergillus species.Waste Manag. 2016, 51, 168–173. [CrossRef] [PubMed]
16. Jadhav, U.; Hocheng, H. Use of Aspergillus niger 34770 culture supernatant for tin metal removal. Corros. Sci.2014, 82, 248–254. [CrossRef]
17. Beolchini, F.; Fonti, V.; Dell’Anno, A.; Rocchetti, L.; Vegliò, F. Assessment of biotechnological strategies forthe valorization of metal bearing wastes. Waste Manag. 2012, 32, 949–956. [CrossRef] [PubMed]
18. Arshadi, M.; Mousavi, S.M. Simultaneous recovery of Ni and Cu from computer-printed circuit boards usingbioleaching: Statistical evaluation and optimization. Bioresour. Technol. 2014, 174, 233–242. [CrossRef]
20. Brandl, H.; Bosshard, R.; Wegmann, M. Computer-munching microbes: Metal leaching from electronic scrapby bacteria and fungi. Hydrometallurgy 2001, 59, 319–326. [CrossRef]
21. Wang, J.; Bai, J.; Xu, J.; Liang, B. Bioleaching of metals from printed wire boards by Acidithiobacillus ferrooxidansand Acidithiobacillus thiooxidans and their mixture. J. Hazard. Mater. 2009, 172, 1100–1105. [CrossRef]
122
Sustainability 2020, 12, 6482
22. Lee, J.; Dhar, B. Bio-processing of solid wastes and secondary resources for metal extraction–A review.Waste Manag. 2012, 32, 3–18. [CrossRef]
23. Isıldar, A.; van de Vossenberg, J.; Rene, E.R.; van Hullebusch, E.D.; Lens, P.N. Two-step bioleaching of copperand gold from discarded printed circuit boards (PCB). Waste Manag. 2016, 57, 149–157. [CrossRef]
24. Hong, Y.; Valix, M. Bioleaching of electronic waste using acidophilic sulfur oxidising bacteria. J. Clean. Prod.2014, 65, 465–472. [CrossRef]
25. Gu, W.; Bai, J.; Dai, J.; Zhang, C.; Yuan, W.; Wang, J.; Wang, P.; Zhao, X. Characterization of extreme acidophilebacteria (Acidithiobacillus ferrooxidans) bioleaching copper from flexible PCB by ICP-AES. J. Spectrosc.2014, 2014, 269351. [CrossRef]
26. Ilyas, S.; Lee, J.; Chi, R. Bioleaching of metals from electronic scrap and its potential for commercialexploitation. Hydrometallurgy 2013, 131, 138–143. [CrossRef]
27. Rodrigues, M.L.M.; Leão, V.A.; Gomes, O.; Lambert, F.; Bastin, D.; Gaydardzhiev, S. Copper extraction fromcoarsely ground printed circuit boards using moderate thermophilic bacteria in a rotating-drum reactor.Waste Manag. 2015, 41, 148–158. [CrossRef]
28. Priya, A.; Hait, S. Extraction of metals from high grade waste printed circuit board by conventional andhybrid bioleaching using Acidithiobacillus ferrooxidans. Hydrometallurgy 2018, 177, 132–139. [CrossRef]
29. Liang, G.; Tang, J.; Liu, W.; Zhou, Q. Optimizing mixed culture of two acidophiles to improve copper recoveryfrom printed circuit boards (PCBs). J. Hazard. Mater. 2013, 250, 238–245. [CrossRef]
30. Becci, A.; Amato, A.; Fonti, V.; Karaj, D.; Beolchini, F. An innovative biotechnology for metal recovery fromprinted circuit boards. Resour. Conserv. Recycl. 2020, 153, 104549. [CrossRef]
31. Arshadi, M.; Mousavi, S.M. Enhancement of simultaneous gold and copper extraction from computer printedcircuit boards using Bacillus megaterium. Bioresour. Technol. 2015, 175, 315–324. [CrossRef]
32. Pradhan, J.K.; Kumar, S. Metals bioleaching from electronic waste by Chromobacterium violaceum andPseudomonads sp. Waste Manag. Res. 2012, 30, 1151–1159. [CrossRef]
34. Pham, V.A.; Ting, Y.P. Gold bioleaching of electronic waste by cyanogenic bacteria and its enhancement withBio-Oxidation. Adv. Mater. Res. 2009, 71, 661–664. [CrossRef]
35. Chi, T.D.; Lee, J.; Pandey, B.D.; Yoo, K.; Jeong, J. Bioleaching of gold and copper from waste mobile phonePCBs by using a cyanogenic bacterium. Miner. Eng. 2011, 24, 1219–1222. [CrossRef]
36. Horeh, N.B.; Mousavi, S.M.; Shojaosadati, S.A. Bioleaching of valuable metals from spent lithium-ion mobilephone batteries using Aspergillus niger. J. Power Sources 2016, 320, 257–266. [CrossRef]
37. Ren, W.X.; Li, P.J.; Geng, Y.; Li, X.J. Biological leaching of heavy metals from a contaminated soil byAspergillus niger. J. Hazard. Mater. 2009, 167, 164–169. [CrossRef] [PubMed]
39. Santhiya, D.; Ting, Y. Bioleaching of spent refinery processing catalyst using Aspergillus niger with high-yieldoxalic acid. J. Biotechnol. 2005, 116, 171–184. [CrossRef] [PubMed]
40. Santhiya, D.; Ting, Y. Use of adapted Aspergillus niger in the bioleaching of spent refinery processing catalyst.J. Biotechnol. 2006, 121, 62–74. [CrossRef]
41. Rasoulnia, P.; Mousavi, S.M.; Rastegar, S.O.; Azargoshasb, H. Fungal leaching of valuable metals from apower plant residual ash using Penicillium simplicissimum: Evaluation of thermal pretreatment and differentbioleaching methods. Waste Manag. 2016, 52, 309–317. [CrossRef]
42. Xu, T.; Ramanathan, T.; Ting, Y. Bioleaching of incineration fly ash by Aspergillus niger–precipitation ofmetallic salt crystals and morphological alteration of the fungus. Biotechnol. Rep. 2014, 3, 8–14. [CrossRef]
43. Rasoulnia, P.; Mousavi, S.M. Maximization of organic acids production by Aspergillus niger in a bubblecolumn bioreactor for V and Ni recovery enhancement from power plant residual ash in spent-mediumbioleaching experiments. Bioresour. Technol. 2016, 216, 729–736. [CrossRef]
44. Vakilchap, F.; Mousavi, S.M.; Shojaosadati, S.A. Role of Aspergillus niger in recovery enhancement of valuablemetals from produced red mud in Bayer process. Bioresour. Technol. 2016, 218, 991–998. [CrossRef] [PubMed]
45. Qu, Y.; Lian, B.; Mo, B.; Liu, C. Bioleaching of heavy metals from red mud using Aspergillus niger.Hydrometallurgy 2013, 136, 71–77. [CrossRef]
123
Sustainability 2020, 12, 6482
46. Magnuson, J.K.; Lasure, L.L. Organic Acid Production by filamentous fungi. In Advances in Fungal Biotechnologyfor Industry, Agriculture, and Medicine; Springer: Boston, MA, USA, 2004; pp. 307–340. [CrossRef]
48. Becci, A.; Amato, A.; Rodríguez Maroto, J.M.; Beolchini, F. Prediction model for Cu chemical leaching fromprinted circuit boards. Ind. Eng. Chem. Res. 2019, 58, 20585–20591. [CrossRef]
49. Cui, J.; Zhang, L. Metallurgical recovery of metals from electronic waste: A review. J. Hazard. Mater.2008, 158, 228–256. [CrossRef]
50. Boukhoubza, F.; Jail, A.; Korchi, F.; Idrissi, L.L.; Hannache, H.; Duarte, J.C.; Hassani, L.; Nejmeddine, A.Application of lime and calcium hypochlorite in the dephenolisation and discolouration of olive millwastewater. J. Environ. Manag. 2009, 91, 124–132. [CrossRef]
51. Hande Gursoy-Haksevenler, B.; Arslan-Alaton, I. Treatment of olive mill wastewater by chemical processes:Effect of acid cracking pretreatment. Water Sci. Technol. 2014, 69, 1453. [CrossRef]
52. Choi, M.; Cho, K.; Kim, D.S.; Kim, D. Microbial recovery of copper from printed circuit boards of wastecomputer by Acidithiobacillus ferrooxidans. J. Environ. Sci. Health Part A 2004, 39, 2973–2982. [CrossRef]
53. Amato, A.; Becci, A.; Beolchini, F. Sustainable recovery of Cu, Fe and Zn from end-of-life printed circuitboards. Resour. Conserv. Recycl. 2020, 158, 104792. [CrossRef]
54. De Michelis, I.; Ferella, F.; Karakaya, E.; Beolchini, F.; Vegliò, F. Recovery of zinc and manganese from alkalineand zinc-carbon spent batteries. J. Power Sources 2007, 172, 975–983. [CrossRef]
55. Öngen, G.; Güngör, G.; Kanberoglu, B. Decolourisation and dephenolisation potential of selected Aspergillussection Nigri strains—Aspergillus tubingensis in olive mill wastewater. World J. Microbiol. Biotechnol. 2007, 23,519–524. [CrossRef]
56. Hamdi, M.; Khadir, A.; Garcia, J. The use of Aspergillus niger for the bioconversion of olive mill wastewaters.Appl. Microbiol. Biotechnol. 1991, 34, 828–831. [CrossRef]
57. Andreozzi, R.; Longo, G.; Majone, M.; Modesti, G. Integrated treatment of olive oil mill effluents (OME):Study of ozonation coupled with anaerobic digestion. Water Res. 1998, 32, 2357–2364. [CrossRef]
58. Xu, D.; Madrid, C.; Rohr, M.; Kubicek, C. The influence of type and concentration of the carbon sourceon production of citric acid by Aspergillus niger Ding-Bang. Appl. Microbiol. Biotechnol. 1989, 30, 553–558.[CrossRef]
60. Singh, G.; Kaur, S.; Verma, M. Utilization of different agro-industrial wastes for sustainable bioproduction ofcitric acid by Aspergillus niger. Biochem. Eng. J. 2011, 54, 83–92. [CrossRef]
61. Murad, A.E.H.; Khalaf, S.A.D. Citric acid production from whey with sugars and additives by Aspergillus niger.Afr. J. Biotechnol. 2003, 2, 356–359. [CrossRef]
62. Santoro, R.; Cameselle, C.; Rodríguez-Couto, S.; Sanromán, Á. Influence of milk whey, nitrogen andphosphorus concentration on oxalic acid production by Aspergillus niger. Bioprocess Eng. 1999, 20, 1–5.[CrossRef]
63. Manjengwa, E.R. Evaluating the Economics of znd Business Models for Metal Recycling from Waste PrintedCircuit Boards in a South African Context. Ph.D. Thesis, Stellenbosch University, Stellenbosch, South Africa, 2019.
64. Natarajan, G.; Ting, Y. Chemosphere gold biorecovery from e-waste: An improved strategy through spentmedium leaching with pH modification. Chemosphere 2015, 136, 232–238. [CrossRef]
65. European Commission. A New Circular Economy Action Plan for a Cleaner and More Competitive Europe.Available online: https://moderndiplomacy.eu/2020/03/17/a-new-circular-economy-action-plan-for-a-cleaner-and-more-competitive-europe/ (accessed on 11 August 2020).
Abstract: The agriculture sector produces significant amounts of organic residues and the choice ofthe management strategy of these flows affects the environmental sustainability of the sector. The sci-entific literature is rich with innovative processes for the production of bio-based products (BBP)from agriculture residues, aimed at the implementation of circular economy principles. Based onliterature data, the present paper performed a life cycle assessment and assessed the environmentalsustainability of five processes for the exploitation of rice and wheat straw, tomato pomace, and or-ange peel. The analysis identified as significant issues the high energy demand and the use ofhigh impact organic solvent. The comparison of BBP with conventional products showed higherenvironmental loads for the innovative processes that used organic residues (except for rice strawcase). The obtained results do not want to discourage the circular strategy in the agriculture sector,but rather to draw the attention of all stakeholders to the environmental sustainability aspects,focusing on the necessity to decrease the electricity demand and identify ecological agents to use inBBP manufacturing, in agreement with the most recent European policies.
1.1. State of the Art of Exploitation of Agriculture Residues
The agricultural production is genuinely diverse; nevertheless, it focuses on somecentral species fundamental for human diet, such as cereals, but also fruits and vegetables,whose quantities exceed billions of tons of biomass produced [1]. Italian agriculture has asignificant role in Europe, being the 3rd country based on its production value in 2019 [2].From the ISTAT database, it appears to be dominated by fodder plants, but cereals are an-other important role in every regional production; besides these main species, horticultureand fruit growing have another important role to play [3]. Due to the world populationgrowth in the current century, food demand has increased worldwide and consequentlythe residues that food production generates too [4]. This biomass can reach huge quantitiesand sometimes its disposal might create environmental or health issues. For this reason,a further exploitation can be pursued to reduce these negative effects and enhance theunderused potential; in this context, the bio-based products (BBP) can be a viable option [5].In the scientific literature, several studies have been conducted about agricultural residuesand byproducts exploitation. As shown in Table 1, many studies propose solutions for theexploitation of residues from species actually produced in Italy (but not only), i.e., cereals tohorticultural species, but also fruits and fodder plants. As reported in the literature, the BBPmanufacturing can start from both residual biomass, collected during harvesting stage,and industrial processes. The BBP from agriculture residues can be classified on the basisof the levels of residue manipulation. The first level of manipulation is the lowest (mainlymechanical, physical treatments, and mixing with other components), e.g., composite
panels used in the building sector made from sunflower or maize lignocellulosic fibers [6,7].A greater manipulation level allows the extraction of molecules used in their unalteredstate, such as antioxidants and vitamins [8,9]. A third level of transformation consists ofmore complex processes, creating nanoparticles or functional polymers [10,11]. As an alter-native, they can be categorized as chemicals and composites. Acids, enzymes, and coloringsubstances are chemicals used in pharmaceutical and textile industries, as well as food andbiomedical sectors [12]. Among these molecules, there are also the functional ingredientsthat improve or provide more value to other products of food and cosmetic industries [13].Examples of these substances are vitamins, fibers, antioxidants, and pigments derived fromfruits and vegetables peels [8,9]. On the other hand, composite materials are made of twomain elements, a matrix and a filler [14]. Among composite materials, polymers, e.g., hy-drogel [15] or plastic films [5], have great importance and they can have several structures,e.g., adsorbent polymers for metal particles [16] or packaging materials. This second typeof products includes the smart polymers that can react to some parameter variations topoint out the initial deterioration, preventing food loss [17]. Moreover, nanoparticles (NPs)have gained great attraction due to their submicronic dimensions that make them moreperforming than macro and micro composites for nanocomposites production [14]. In thisregard, lignin molecule is used as capping and reducing agent on the surface of silvernanoparticles. Possible applications can be in the textile industry and in biomedical andelectronic fields [18,19].
Several articles carried out a comparison between traditional products on the mar-ket (produced by conventional manufacturing chain, from raw materials different frombyproducts) and bio-based alternatives from organic residues, identifying as the mostcommon benefit the use of low value residual biomass available in huge quantities, for ex-ample wheat, rice, and maize [16,20–24]. A common goal of the processes presented by thescientific literature about organic residue exploitation is the green production, meaninglow energy consumption and nontoxic agent applications [15,19,23,25]. To complete thecurrent overview about BBP, mainly in an Italian context, the SPRING cluster deserves tobe mentioned. It is an Italian cluster that involves bio-refineries and innovation stakeholderwith the common goal of enhancing the circular and sustainable economy in the greenchemistry sector [26]. Despite the several advantages of BBP manufacturing, the use oforganic byproducts shows some relevant challenges. The first one is due to the residueavailability, concentrated in a short time span [7], which makes the stocking methodsessential [9]. There are also mechanical-physical observations to do about these materials.In this regard, the advantage of the use of bio-based polymers, mainly lignocellulosicmaterials, is their performance, also as far as it concerns the flammability behavior [7,27].Nevertheless, they show some disadvantages as the scarce mechanical properties that canbe improved by mixing different polymers [11,28]. Furthermore, the literature underlinesthe necessity to combine studies of BBP production with the analysis of the specific aspectsof these products; for example, for human health applications, by clinical tests of the realphysiological action [8,18]. Last but definitely not least, the environmental performance ofmanufacturing processes should be assessed, supported by tools able to implement a lifecycle approach.
126
Sustainability 2021, 13, 3990
Ta
ble
1.
Sele
cted
expl
oita
tion
proc
esse
sfo
rth
eus
eof
agri
cult
ural
resi
dues
.
Bio
-Ba
sed
Pro
du
ctE
xp
loit
ati
on
Pro
cess
Re
fere
nce
Ric
eby
prod
ucts
Com
posi
tepa
nelfi
lter
Cho
ppin
g;m
ixin
gw
ith
Lign
inbi
opla
stic
Arb
ofor
m®
;ext
rusi
on;i
njec
tion
mol
ding
[27]
Cer
amic
mat
eria
lC
ombu
stio
n;ca
lcin
atio
n;pr
essi
ng;s
inte
ring
[29]
Brea
kfas
tbar
Mix
ing
wit
hpa
ssio
nfr
uitp
eela
ndw
hey;
extr
usio
n[3
0]R
ice
husk
brot
hfo
rpo
lym
erpr
oduc
tion
Pulv
eriz
ing;
acid
hydr
olys
isan
dst
eam
trea
tmen
t;ne
utra
lizat
ion
wit
hN
aOH
;dilu
tion
[24]
Whe
atby
prod
ucts
Fille
rin
poly
prop
ylen
e-ba
sed
com
posi
tes
Mill
ing;
mix
ing
wit
hpo
lypr
opyl
ene
and
addi
tive
;dry
ing;
extr
usio
n;gr
anul
atio
n;dr
ying
;inj
ecti
onm
oldi
ng[3
1]Li
-Ag
NPs
Mec
hani
calp
re-t
reat
men
t;al
kali
extr
acti
on;p
urifi
cati
on;m
ixin
gw
ith
AgN
O3
[18]
Hyd
roge
lM
illin
g;tr
eatm
entw
ith
sodi
umm
onoc
hlor
oace
tate
inis
opro
pano
l/N
aOH
;cro
sslin
king
;cru
shin
g;si
evin
g;w
ater
susp
ensi
on;w
ashi
ng;d
ryin
g[1
5]
Gra
phen
ela
yers
Mec
hani
calp
re-t
reat
men
t;hy
drot
herm
altr
eatm
ent;
pyro
lysi
s;gr
aphi
tiza
tion
[23]
Cor
nby
prod
ucts
Ads
orbe
ntpo
wde
rW
ashi
ng;c
utti
ng;d
ryin
g;cr
ushi
ng;s
ievi
ng[2
1]
Ads
orbe
ntsp
ongy
aero
gel
Mec
hani
calp
re-t
reat
men
t;st
irri
ngin
NaO
Hso
luti
on;H
Cla
ddit
ion;
was
hing
;mix
ing
wit
hfil
ter
pape
r;fr
eezi
ng;f
reez
e-dr
ying
;sila
niza
tion
wit
hm
ethy
ltri
met
hoxy
sila
ne[2
2]
Tom
ato
by-p
rodu
cts
Van
illin
,syr
inga
ldeh
yde
Mill
ing;
susp
ensi
onin
NaO
Hso
luti
on;h
eati
ngun
der
mic
row
ave
radi
atio
n;va
cuum
filtr
atio
n;ac
idifi
cati
onw
ith
HC
l;ex
trac
tion
wit
het
hyla
ceta
te[2
0]
Poly
este
rfil
mD
ryin
g;cr
ushi
ng;d
ewax
ing
wit
hhe
xane
and
met
hano
l;dr
ying
;hyd
roly
sis;
frac
tion
sepa
rati
on;
mel
t-po
lyco
nden
sati
on[5
]
Gra
peby
prod
ucts
Ag
NPs
Mec
hani
calp
re-t
reat
men
t;ex
trac
tion
;cen
trif
ugat
ion;
mix
ing
wit
hsi
lver
nitr
ate;
cent
rifu
gati
on[3
2]
Indi
cato
rin
inte
llige
ntfil
mFr
eeze
-dry
ing;
mill
ing;
siev
ing;
mix
ing
wit
hk-
carr
agee
nan,
sorb
itol
,dis
tille
dw
ater
,hyd
roxy
prop
ylm
ethy
lcel
lulo
se;c
asti
ng;d
ryin
g[2
5]
Sunfl
ower
bypr
oduc
ts
Part
icle
boar
dsG
rind
ing;
siev
ing;
mix
ing
wit
hsy
nthe
tic
bind
er;t
herm
opre
ssin
g[7
]
Rei
nfor
cem
entf
orth
erm
opla
stic
mat
eria
lSt
eam
ing;
dryi
ng;e
xtru
sion
wit
hpo
lypr
opyl
ene
and
coup
ling
agen
t;gr
anul
atio
n;dr
ying
;com
pres
sion
mol
ding
[6]
Ora
nge
bypr
oduc
ts
Func
tion
alin
gred
ient
info
odpr
oduc
tsW
ashi
ng;s
anit
izat
ion
inso
dium
hypo
chlo
rite
solu
tion
;deh
ydra
tion
;gro
undi
ng;s
ievi
ng[3
3]A
dsor
bent
poly
mer
Mec
hani
calp
re-t
reat
men
t;cr
ossl
inki
ng;p
olym
eriz
atio
n;ex
trac
tion
;hyd
roly
sis;
post
-tre
atm
ent
[16]
127
Sustainability 2021, 13, 3990
Ta
ble
1.
Con
t.
Bio
-Ba
sed
Pro
du
ctE
xp
loit
ati
on
Pro
cess
Re
fere
nce
Oth
erag
ricu
ltur
eby
prod
ucts
Act
ive
poly
mer
icfil
mfr
ompo
tato
peel
Mec
hani
calp
re-t
reat
men
t;w
ater
susp
ensi
on;g
lyce
rola
ddit
ion;
stir
ring
;bac
teri
alce
llulo
sead
diti
on;
hom
ogen
izat
ion;
stir
ring
;deg
asifi
cati
onby
ultr
asou
nd;p
ouri
ngin
petr
ipla
tes;
dryi
ng[2
8]
Fille
rin
poly
hydr
oxya
lkan
oate
sco
mpo
site
sfr
ompe
asfib
ers
Dry
ing;
mill
ing;
mix
ing
with
poly
(3-h
ydro
xybu
tyra
te-c
o-3-
hydr
oxyv
aler
ate)
,ace
tyltr
ibut
ylci
trat
ean
dC
aCO
3;ex
trus
ion;
inje
ctio
nm
oldi
ng[3
4]
Cel
lulo
sena
nocr
ysta
lsfo
rth
epr
epar
atio
nof
agar
-bas
edbi
o-na
noco
mpo
site
sfil
ms
from
onio
npe
el
Mec
hani
calp
re-t
reat
men
t;bl
each
ing
wit
hso
dium
chlo
rite
solu
tion
;boi
ling;
was
hing
;tre
atm
entw
ith
NaO
H;
trea
tmen
twit
hac
etic
acid
;was
hing
;dry
ing;
acid
hydr
olys
isw
ith
sulf
uric
acid
;cen
trif
ugat
ion;
soni
cati
on;
free
ze-d
ryin
g[3
5]
Film
from
pric
kly
pear
peel
sM
echa
nica
lpre
ssin
g;et
hano
ladd
ition
;dry
ing;
disp
ersi
onin
wat
er;g
lyce
rola
dditi
on;s
tirri
ng;c
astin
g;dr
ying
[11]
Poly
phen
ols,
flavo
noid
s,an
thoc
yani
ns,v
itam
inC
from
peac
hpe
el,s
eeds
,an
dpu
lpD
ispe
rsio
nin
etha
nol;
mix
ing;
extr
acti
on(u
ltra
soun
d/m
icro
wav
e)[9
]
Func
tion
alin
gred
ient
info
odpr
oduc
tsfr
ombe
etle
aves
Cut
ting
;ext
ract
ion
inet
hano
l;ce
ntri
fuga
tion
;dry
ing;
resu
spen
sion
inw
ater
[36]
Rei
nfor
cem
entf
orth
erm
opla
stic
mat
eria
lfro
mba
gass
efib
erSt
eam
ing;
dryi
ng;e
xtru
sion
wit
hpo
lypr
opyl
ene
and
coup
ling
agen
t;gr
anul
atio
n;dr
ying
;com
pres
sion
mol
ding
[6]
Poly
uret
hane
foam
from
rice
,oils
eed
rape
and
whe
atst
raw
and
corn
stov
erD
ryin
g;liq
uefa
ctio
n;w
ashi
ngw
ith
acet
one;
rota
ryev
apor
atio
n;dr
ying
;pol
yoln
eutr
aliz
atio
nw
ith
NaO
H;
mix
ing
wit
hre
agen
ts[1
0]
Func
tion
alin
gred
ient
info
odpr
oduc
tsfr
omca
ulifl
ower
and
cele
ryle
aves
and
stem
,oni
onpe
el,c
arro
tbot
tom
and
tips
Extr
acti
onin
boili
ngw
ater
;han
d-sq
ueez
ing;
hom
ogen
izat
ion
[8]
CuO
NPs
from
caul
iflow
erw
aste
,pot
atoe
san
dpe
aspe
els
Mec
hani
calp
re-t
reat
men
t;w
ater
-dis
pers
ion;
shak
ing;
mix
ing
wit
hso
luti
ons
ofC
uCl 2·2H
2Oun
der
shak
ing;
was
hing
;dry
ing;
sint
erin
g[1
9]
128
Sustainability 2021, 13, 3990
1.2. The GRASCIARI RIUNITI Project
The present paper is part of a preliminary analysis of the environmental sustainabilitywithin the GRASCIARI RIUNITI project (within the European plan to support the Regionaldevelopment FEASR-PSR MARCHE 2014–2020). Several farms on the Marche territoryhave identified a relevant problem due to the management of the organic residue fromtheir agriculture activity. This problem is mainly due to the growing specialization of thecrops, which has ensured high production levels but it has changed the way of consideringthe agriculture residues: from a biomass resource of the past to a waste to dispose of thepresent. This practice has disrupted the balance of agriculture in many Italian regions.The founded project, which combines local farms and research partners, has the ambitionto create a virtuous management system of waste and byproduct, suitable for a real scaleimplementation. With this aim many possibilities of agriculture residue exploitation willbe considered (e.g., production of BB materials, active principles with specific action,fertilizers, biostimulants, energy recovery) in order to combine the best options for themost sustainable result. Starting from the byproduct criticality, really highlighted by thelocal farms, the present manuscript analyzed many papers from the scientific literatureaddressed to the BBP production (Table 1) and it selected five case studies (focused on theexploitation of residues of the main Italian agricultural productions) for an environmentalsustainability analysis. The research did not have the presumption to find a single answerbut to critically observe some possibilities of agriculture residue exploitation, to verify theeffective implementation of the circular economy pillars. With this aim, the environmentalsustainability analysis was carried out by a life cycle assessment (LCA) approach.
2. Materials and Methods
2.1. Methods and Software
The quantification of the environmental impact represents an essential step for thedevelopment of processes for agriculture residue management, consistent with the circulareconomy principles [37]. Therefore, the present paper assesses five exploitation processesof four different types of agriculture residue, from Table 1: rice and wheat straw, tomatopomace, and orange peel. These species were included among the most common ofthe Italian agriculture with the consequent production of huge quantities of byproducts.Therefore, they have been considered relevant for the national scenario. The analysis,according to the attributional LCA methodology, has been performed in agreement withthe LCA ISO standard 14040 and 14044:2006 [38,39]. The assessment aims at answering attwo main research questions, inspired by [40]:
- What are the environmental hotspots in the considered exploitation processes ofagriculture residues? What is the environmental impact of these innovative processes?
- What is the environmental impact of these processes compared with the most commonmanufacture of comparable products (using conventional raw materials)?
The system boundaries considered for the present paper focused on the byproductexploitation (from gate to gate), starting with the produced agricultural residue, excludingthe use phase and the end of life, because they are considered equal between the conven-tional and the biobased product. The environmental burden of byproduct is considered 0,since it has been assumed its simple use, in animal husbandry field, in the case of avoideduse in BBP [41–43]. Furthermore, the use of the zero-burden assumption for agriculturalresidues is common for attributional-LCA studies [44]. All LCA steps have been realized,including the optional normalization and weighing, to assess the most affected impactcategories and the most critical steps of each process. The software used for data collectionis thinkstep Gabi software 9.5, combined with the Database for Life Cycle Engineering(compilation 7.3.3.153; DB version 6.115). The method selected for the analysis is EF 3.0,including all the environmental categories, recommended models at midpoint, togetherwith their indicators, units and sources [45,46]. The functional unit selected for the pro-cess analysis is 1 kg of agricultural residue to produce selected bio-based products (withemerging technologies). To answer to the second research question, the functional unit
129
Sustainability 2021, 13, 3990
is a specific amount (reported in Figures 1–4) of bio-based products, resulting from thetreatment of 1 kg of agricultural residue, in order to facilitate a comparison with a conven-tional production process (baseline scenario). The processes considered for the presentassessment were developed at lab scale (maximum TRL4). The literature reports that in ahigher technology development stage environmental and economic impacts are usuallylower than a lab scale [47]. Therefore, some sensible assumptions are made to realize thisanalysis, hypothesizing the further scale-up:
• The electricity consumption reported within the datasheet of real industrial machiner-ies is considered to calculate the energy environmental load of mechanical-physicalsteps (e.g., grinding, sieving, mixing, heating); the further implementation of a re-newable energy production system by a photovoltaic panel system is considered asan alternative to supply the energy to the machineries [47]. This possibility is notconsidered for the traditional processes (from raw materials) since it is more likelythat a new technology invests in a renewable technology.
• The recirculation of 90% of organic solvents for extraction and washing treatmentsis applied. This assumption, consistent with the real-scale conditions, makes theprocesses more efficient and environmentally sustainable, thanks to both the reductionof raw material consumptions and waste flow [47,48].
• The conditions selected for the washing operations have been the residue and thewashing solution ratio: 1:2 ratio and the time: 1 h, if not specified elsewhere.
• Considering the low electricity demand, compared to the other process steps(<0.002 kWh/kg residue), the filtration energy demand is considered negligible [49].
Figure 1. System boundaries and mass and energy balance of rice straw exploitation (scenario 1) andtraditional process (scenario 3); scenario 2 includes the same conditions of scenario 1 with electricityfrom renewable energy. Functional unit: 1 kg of organic residue.
130
Sustainability 2021, 13, 3990
Figure 2. System boundaries and mass and energy balance of two wheat straw exploitation processes as graphene ((a), sce-nario 1) and reducing agent ((b), scenario 1) and traditional processes (scenarios 3); in both (a) and (b) options, scenarios 2include the same conditions of scenarios 1 with electricity from renewable energy. Functional unit: 1 kg of organic residue.
131
Sustainability 2021, 13, 3990
Figure 3. System boundaries and mass and energy balance of tomato pomace exploitation (scenario 1)and traditional process (scenario 3); scenario 2 includes the same conditions of scenario 1 withelectricity from renewable energy. Functional unit: 1 kg of organic residue.
Figure 4. System boundaries and mass and energy balance of orange peel exploitation (scenario 1)and traditional process (scenario 3); scenario 2 includes the same conditions of scenario 1 withelectricity from renewable energy. Functional unit: 1 kg of organic residue.
Further assumptions, specific for each process, are reported in the supporting materials(Table S1).
2.2. Exploitation Processes
In this section, the five processes (selected among the options in Table 1) are describedand showed through mass and energy balances flow charts. The choice of these processeshas been determined by the will of the authors to prove the possible use of BBP in a widerange of application fields (e.g., building field of the composite panel and the medicalsector of silver nanoparticles).
Currently, rice straw is separated from rice after harvesting and threshing and it isused in animal husbandry, as bedding [41]. As an alternative, the exploitation process inFigure 1 is realized through cutting the residue, mixing with Lignin bioplastic Arboform®,
132
Sustainability 2021, 13, 3990
extrusion and injection molding, obtaining 5 kg of composite panel for interior design asfinal product [27]. On the other hand, the manufacturing of a traditional panel involveswood and polypropylene, by a process comparable to the innovative one [50].
As well as rice straw, wheat straw is produced after harvesting and threshing andit is used in animal husbandry, as bedding [42]. Two processes have been considered asalternative enhancements of this residue and they both represent innovative solutions inelectronics and biomedicine, respectively: graphene (Figure 2a) and lignin as reducingagent for silver nanoparticles (Figure 2b). More in detail, the graphene is produced throughhydrothermal treatment, pyrolysis and graphitization [23]. Lignin, as reducing agent is ex-tracted from wheat straw, purified, and mixed with silver nitrate [18,51]. There are severaltechniques currently used for the graphene and lignin productions. The present study con-siders, as traditional scenario, the electrochemical exfoliation of graphite, which producesgraphene monolayer [52] and the production of sodium citrate, as reducing agent [53,54].In the reducing agent case, system boundaries exclude the silver nitrate addition for thenanoparticles production, since it is a common step in both innovative and traditionalscenarios and does not affect the comparison results.
Tomato pomace is a byproduct of the transformation industry and it is currently usedin animal feed composition [43]. In the study taken into account (Figure 3), this residue isexploited through the extraction of fatty acids that are used to produce a polyester polymer,after hydrolysis and fraction separation. The product shows many promising qualities, it isinsoluble, nontoxic, biodegradable, and waterproof, which are optimal features resultingfrom the chemical composition of the initial biomass matrix [5]. The comparison has beencarried out with a traditional polyester production described in the Gabi database [55].
Orange peel is a byproduct of the juice industry [16] and it is currently used as animalfeed, as some of the previous agriculture scraps analyzed [43]. In the innovative scenario(Figure 4), this residue undergoes several steps: it is cut into small pieces, washed and dried,crushed and sieved during the pre-treatment. Thereafter, it is crosslinked with epichlorohy-drine [16,56], a crosslinking agent that, owing to covalent bonds with the polymer, makes itmore stable in acid conditions improving its adsorbing capacity [57]. The polymerizationis realized with methyl acrylate and the following steps aim at the product purification.The process produces 1 kg of polymer characterized by a high adsorbent capacity, usefulin wastewater treatment. This purification mechanism can be achieved with differenttechniques, mainly with activated carbons [16]. This material is selected for the comparisonwith the innovative proposed adsorbent; in detail, the manufacture of activated carbonsincludes a chemical activation with potassium hydroxide and pyrolysis of biomass [58].
3. Results
3.1. Classification and Characterization
The step of the analysis including classification and characterization steps has beenperformed (by thinkstep Gabi software 9.2.1, Database for Life Cycle Engineering, Sphera,Chicago, IL, USA) with the aim to identify both the strengths and weaknesses of theconsidered processes. The total results for the considered impact categories (referred tothe functional unit) are reported in Table 2; the detail of each process is reported in thesupporting materials.
133
Sustainability 2021, 13, 3990
Table 2. Results of classification and characterization. Functional unit: 1 kg of organic residue.
Water scarcity (m3 world equiv.) 1.12 2.26 1.16 1.25 2.22
3.1.1. From Rice Straw to Composite Panel
Figure S1 in Supplementary Materials shows the results of classification and char-acterization steps of LCA carried out on the rice straw treatment for the manufacturingof the composite panel. Overall, it can be observed that the lignin bioplastic Arboformcauses the most relevant impact, irrespective of the impact category with a minimumcontribution of 55%, which reaches values higher than 95% of the total results. This result isexplained by the energy demand and the extraction phase included within the productionprocess of lignin bioplastic Arboform [59,60]. On the other hand, the extrusion step hasa non-negligible impact on ionizing radiation-human health effect, land use, and ozonedepletion categories due to its high-energy demand. The effect of electricity consumptionon the land use category can be justified by the electricity grid mix considered for theanalysis (supplied by Gabi database) composed of energy from: 44% of natural gas, 15%hydroelectric, and 12% hard coal (and other lower contributions from additional resources).Instead, the chopping step and has no substantial influence, with a contribution lower than1% overall, thanks to the low energy demand.
3.1.2. From Wheat Straw to Graphene and Nanoparticles
Considering the availability of two processes for the exploitation of wheat straw,a double result is shown in Supplementary Materials (Figure S2) the contribution of everystep on the environmental load of each treatment and the comparison between the twooptions in all the impact categories. The results show that graphene production has a higherimpact than lignin production for most of categories. The pyrolysis step explains this result,due to the energy demand to reach high temperature, around 800 ◦C for three hours.The effect of the pyrolysis operative conditions is mainly highlighted in the categories ofozone depletion and water scarcity with a contribution of pyrolysis phase around 87%for each of them (Figure S2 (m) and (r)). On the other hand, the pre-treatment stageresults as not significant, since its share does not exceed 2% in any category. Even if itis the least influencing process, the lignin production shows as main critical point thepurification step. This stage represents the most significant share in most of the categories,affecting by 67% the whole enhancement process and the reason can be identified inthe ethanol use. In addition, alkali extraction has an impact due to the use of toluene.This organic compounds use makes the graphene production the best choice mainly in thecategories connected to the human health aspects in Supplementary Materials (Figure S2(l) and (n)). The environmental credit (the negative value) achieved in the water scarcitycategory (Figure S2 (r)) is obtained by the treated wastewater that has been discharged inthe environment.
134
Sustainability 2021, 13, 3990
3.1.3. From Tomato Pomace to Polyester
The results of the tomato pomace exploitation for the polyester film production arepresented in Supplementary Materials (Figure S3). The impact of the different stepsdepends on the impact category; therefore, the further normalization and weighting stepsare essential to identify the significant issues of the process. The fraction separation step isthe most influencing phase because of the 72 h-vacuum thermic treatment, whose impactis higher than 37%. However, in the water scarcity category (Figure S3 (r)), the fractionseparation step has a negative share, an environmental credit derived from the waterrecovery from the wastewater treatment. In the same category, the most significant step isthe hydrolysis due to the high request of water. Overall, pre-treatment and polymerizationphases are not negligible with variable contribution to the different categories, between3% and 48% and between 9% and 40%, respectively. The reasons are the energy demandin the polymer synthesis and the use of organic solvents (hexane and methanol) in thepre-treatment. This information suggests the relevance of the organic agents recirculationto enhance the environmental sustainability of the process.
3.1.4. From Orange Peel to Metal-Adsorbent Polymer
As concern the orange peel exploitation for metal-adsorbent polymer manufacturing,the highest environmental load of polymerization is shown in Supplementary Materisls(Figure S4). The main reason of this impact, starting from 35% up, is the use of methylacrylate that is an organic compound, essential for the reaction. In agreement to what hasbeen observed in the tomato pomace exploitation process, the hydrolysis phase causesthe main contribution (85%) in the water scarcity category (Figure S4 (r)). In addition,the wastewater treatment included in the post-treatment phase produces an environmentalcredit in the water scarcity category, even though this step has the highest contribution ineutrophication freshwater category. On the other hand, pre-treatment is a negligible phasein almost each category, with a low contribution, steady under 1%, due to the low energyand water consumption.
3.2. Normalization and Weighing
The classification and characterization steps showed relevant information to identifythe most critical steps in each process. Nevertheless, the normalization and weightingphases were necessary to assess the whole magnitude of each phase of the treatmentsand to estimate the environmental performance index (EPI), able to include all the impactcategories. In agreement with the selected method, this value is expressed as personequivalent (p.e.), i.e., the number of people (average citizens) that generates the same effectin one year [61].
Overall, Figure 5 shows that the most affected categories in the five processes areresource use-energy carriers (in dark blue), ionizing radiation-human health (in yellow)(both connected to energy issue [62]) and climate change (in plum). More in detail, the effecton ionizing radiation-human health is due to the radionuclides (potentially toxic forhumans) resulting from both the nuclear energy production, and the mineral oil and gasextraction, used as energy carriers [63,64]. Moreover, greenhouse gas emissions (e.g., CO2,CH4, and more) are the main drivers of climate change, whose biggest contribution stemsfrom energy and industrial activities [65]. From these observations, it is evident that themain criticalities in the innovative processes are the huge energy demand (e.g., pyrolysis ingraphene production) and the organic solvents use (e.g., methyl acrylate in orange peelexploitation and ethanol in wheat straw enhancement as lignin). The further detail ofimpact category loads for all the assessed scenarios is reported in Supplementary Material(Table S2).
135
Sustainability 2021, 13, 3990
Figure 5. Normalization and weighing graphic of the five exploitation processes. Functional unit:1 kg of organic residue. The impact categories mentioned in the legend are the most relevant only.
More in detail, the assessed EPI for rice straw exploitation for the production of thecomposite panel is 0.05 person equivalent. Even though the resource use-energy carrier isthe most affected category, 31% of the whole impact is equally distributed between climatechange and resource use-minerals and metals categories. The most critical step is Ligninbioplastic Arboform® production that, coherently with the characterization phase, createsthe biggest impact on resource use-minerals and metals. The normalization and weightingphases confirm the exploitation of wheat straw for lignin production as the best environ-mental performance choice, if compared to graphene production. Indeed, the EPI resultingfrom the assessment of the second process is two times lower than the first one. If grapheneproduction has its biggest impact on ionizing radiation-human health, lignin productionlargely influences resource use-energy carriers. Particularly, pyrolysis weighs 71% on thegraphene production process; moreover, the category ionizing radiation-human healthis the main affected, as well as it happens in other stages of the process. Instead, duringlignin production process the most influencing step is purification; in this case, resourceuse-energy carriers is the most critical category, even though there is a significant impact toclimate change category too. The tomato pomace exploitation has an environmental perfor-mance index of 0.06 person equivalent and the ionizing radiation-human health categoryis the most affected category. The most important step is hydrolysis that constitutes 31% ofthe total process impact; the three remaining steps of the process have a significant impactas well and they affect ionizing radiation-human health and resource use-energy carriersmore than any other categories. Finally, the orange peel EPI is 0.2 p.e. and the processhas the highest effect on ionizing radiation-human health category, as shown in Figure 5.Similarly, to the characterization phase, the most significant step is polymerization, with acontribution of 51% compared to the others and it generates its biggest impact on ionizingradiation-human health and resource use-energy carriers categories.
3.3. Comparison with Traditional Production Processes
In this section, the results of the comparison between the innovative methods basedon agricultural residues and traditional methods are shown, considering the normalizationphase only and the functional unit equal to the quantity of final product generated by eachprocess, with an initial residue biomass of 1 kg.
The composite panel produced through the enhancement of rice straw is compared inFigure 6 with a traditional composite panel, made of wood and polypropylene. It is evidentthat the innovative option allows a relevant decrease of the environmental load (from 0.07to 0.05 p.e.) thanks to the non-use of polypropylene that is necessary in the traditionalprocess. In the same figure, the production of bio-based composite panel with renewable
136
Sustainability 2021, 13, 3990
energy is shown and its impact value is comparable to the EPI of the bio-based compositepanel made with mixed energy, since the electricity production is not a critical issue.
Figure 6. Normalization and weighing graphics of three different composite panel productionscenarios, expressed as person equivalent (p.e.). The impact categories mentioned in the legend arethe most relevant only. Functional unit: 5 kg of product.
The wheat straw as graphene monolayers is compared to electrochemical exfoliationof graphite [52], obtaining the results in Figure 7. In this case, the residue exploitation doesnot show advantages for the environment, if compared to the traditional graphene manu-facturing. This difference is due to the higher energy demand of the bio-based grapheneproduction. This aspect is confirmed by the possibility of green energy use, which reducesEPI of about 50%, even though it still has a higher impact than traditional graphene.
Figure 7. Normalization and weighing graphics of three different graphene production scenarios,expressed as p.e. The impact categories mentioned in the legend are the most relevant only. Functionalunit: 0.1 kg of product.
In the second exploitation option, lignin production is compared to sodium citrateproduction [53,54], which is a reducing agent as well. The comparison between these twoprocesses is visible in Figure 8 with a resulting EPI five times higher than the traditionalchoice: lignin production has a higher value, because of the use of organic agents, missingin the sodium citrate production. In the same graphic, it can be observed the impactof the production of lignin using renewable energy. The index is comparable to that of
137
Sustainability 2021, 13, 3990
lignin made with mixed energy, since the electricity production is not a critical issue ofthis process.
Figure 8. Normalization and weighing graphics of three different reducing agents productionscenarios, expressed as p.e. The impact categories mentioned in the legend are the most relevant only.Functional unit: 0.1 kg of product.
Tomato pomace is used to produce a polyester film. Therefore, the comparison ismade with traditional polyester [55]. As shown in Figure 9, innovative polyester film hasa bigger impact and its EPI is one order of magnitude higher than classic polyester film.Specifically, both the use of caustic soda and the energy demand are the penalizing factorsof the bio-based polyester film production, making it more disadvantageous compared tocurrent production methods. In order to reduce this impact, the alternative of bio-basedpolyester film made with renewable energy is analyzed and it actually has a smaller valuethan bio-based polyester film, but still higher than traditional polyester.
Figure 9. Normalization and weighing graphics of three different polyester production scenarios,expressed as p.e. The impact categories mentioned in the legend are the most relevant only. Functionalunit: 0.3 kg of product.
From orange peel, a metal-adsorbent polymer is produced, whose equivalent on themarket is activated carbon [58] (Figure 10). The adsorbent polymer has an EPI almost threetimes higher than the activated carbon production due to the use of organic solvents in the
138
Sustainability 2021, 13, 3990
polymer production. The bio-based polymer made with green energy has a comparableimpact to the bio-based polymer made with mixed energy: in fact, as well as for the wheatstraw exploitation as lignin, the impact of the bio-based alternative is generated by thesolvents use and the impact is not significantly reduced by changing the energy source.
Figure 10. Normalization and weighing graphics of three different metal-adsorbents productionscenarios, expressed as p.e. The impact categories mentioned in the legend are the most relevant only.Functional unit: 1 kg of product.
This comparison with the traditional methods shows that the bio-based alternativeis more impacting than traditional processes; this result is mainly due to relatively high-energy demand and organic solvents use (as proved by the energy and raw materialbalances in Figures 2–4). Therefore, even though bio-based products are accessible anddesirable alternatives, experimentation must proceed further to make these processes asbeneficial as actual production methods.
4. Discussion and Limitation of the Study
The present study implemented an environmental sustainability assessment of in-novative processes for the use of common Italian byproducts from agriculture sector.The assessed case studies were extracted from the scientific literature, implemented atlab-scale. Nevertheless, they were considered interesting for their proposal to use organicresidues in a wide range of application fields. The data used for the implementation of theanalysis can be considered of good quality since they were extracted from an internationalpeer-reviewed journal. The additional assumptions implemented for the hypothesis ofupscaling followed the literature methods. Comparable observations are carried out forthe traditional products. The possibility to use data from wood handbook (for compositepanel from rice straw) and from the average value of the Gabi database (for polyester filmfrom tomato pomace) ensured high levels of representativity.
The present assessment shows some limitations:
• Zero burden approach for agricultural residues was used, effects of redirection ofresidue from today’s application is not included.
• The effect of using other impact assessment methods or normalization sets was notevaluated. Nevertheless, the authors selected the updated method EF 3.0 (recom-mended by European Commission), which ensured the result validity.
5. Conclusions
The circular economy represents one of the main pillars that drive the choices ofcountries, all over the world, towards a sustainable development. As confirmed by thedetailed study of the scientific literature and the GRASCIARI RIUNITI project, the develop-ment of circular strategies within the agriculture field is a primary concern. Nevertheless,
139
Sustainability 2021, 13, 3990
this analysis proved that there is still a necessity to evaluate the proposed solutions com-bining technical/experimental aspects with environmental sustainability issues. More indetail, the LCA of five case studies highlighted some significant issues due to both thesignificant energy demand and the high impact organic solvents, despite the reducedorganic agent demand assumed for the upscaling. The obtained results had not the targetto discourage the development of alternatives for the agriculture residue enhancement,but rather to draw the attention to the environmental sustainability aspects. Indeed, an ef-fective implementation of circular economy strategy should have a holistic view, able toconsider the effect of the technologies in different environmental categories (as well as insocial and economic spheres). In this regard, many aspects play an essential role (as alsodiscussed in the European circular economy action plan and the European Green Deal),as the avoided use of toxic (for both human and environmental health) agents and thelow energy demand. Overall, the implemented LCA proved the significant effect of therenewable energy transition and the current necessity to identify ecological agents for aneffective environmentally sustainable production of BBP.
Supplementary Materials: The following are available online at https://www.mdpi.com/article/10.3390/su13073990/s1, Figure S1: Classification and characterization graphics of rice straw exploita-tion process. Functional unit: 1 kg of organic residue, Figure S2: Classification and characterizationgraphics of two wheat straw exploitation processes. Functional unit: 1 kg of organic residue, Figure S3:Classification and characterization graphics of tomato pomace exploitation process. Functional unit:1 kg of organic residue, Figure S4: Classification and characterization graphics of orange peel exploita-tion process. Functional unit: 1 kg of organic residue, Table S1: Specific assumptions: comparableraw materials chosen to substitute the raw materials missing in the database, Table S2: Weight ofeach impact category on the normalization and weighing results. Functional unit: 1 kg of organicresidue. References [66–76] are cited in the Supplementary Materials.
Author Contributions: Conceptualization, A.A. and F.B.; methodology, A.A.; software, A.A.; vali-dation, M.M. and A.A.; formal analysis, M.M. and A.B.; investigation, M.M.; resources, F.B.; datacuration, A.A. and M.M.; writing—original draft preparation, A.A. and M.M.; writing—review andediting, A.A.; visualization, A.B.; supervision, A.A. and F.B.; project administration, F.B.; fundingacquisition, F.B. All authors have read and agreed to the published version of the manuscript.
Funding: This research received no external funding.
Institutional Review Board Statement: Not applicable.
Informed Consent Statement: Not applicable.
Data Availability Statement: No new data were created or analyzed in this study. Data sharing isnot applicable to this article.
Acknowledgments: With the support of European funds for the Regional development FEASR-PSRMARCHE 2014–2020 within the project GRASCIARI RIUNITI.
Conflicts of Interest: The authors declare no conflict of interest.
References
1. Ritchie, H.; Roser, M. Agricultural Production. Available online: https://ourworldindata.org/agricultural-production (accessedon 30 July 2020).
2. ISTAT. Andamento dell’Economia Agricola. Available online: https://www.istat.it/it/archivio/243183#:~{}:text=L\T1\textquoterightagricoltura%20in%20senso%20stretto,%2C7%25%20del%20valore%20aggiunto.&text=Nel%202019%20%C3%A8%20proseguita%20la,2%2C0%25%20in%20volume (accessed on 30 July 2020).
3. ISTAT. Istituto Nazionale di Statistica. Available online: https://www.istat.it/it/agricoltura?dati (accessed on 20 November2019).
4. Food and Agriculture Organization of the United Nations (FAO). The Future of Food and Agriculture—Trends and Challenges; Foodand Agriculture Organization of the United Nations (FAO): Rome, Italy, 2017.
5. Benítez, J.J.; Castillo, P.M.; Del Río, J.C.; León-Camacho, M.; Domínguez, E.; Heredia, A.; Guzmán-Puyol, S.; Athanassiou,A.; Heredia-Guerrero, J.A. Valorization of tomato processing by-products: Fatty acid extraction and production of bio-basedmaterials. Materials 2018, 11, 2211. [CrossRef]
140
Sustainability 2021, 13, 3990
6. Ashori, A.; Nourbakhsh, A. Bio-based composites from waste agricultural residues. Waste Manag. 2010, 30, 680–684. [CrossRef]7. Mahieu, A.; Alix, S.; Leblanc, N. Properties of particleboards made of agricultural by-products with a classical binder or
self-bound. Ind. Crop. Prod. 2019, 130, 371–379. [CrossRef]8. Larrosa, M.; Llorach, R.; Espìn, J.C.; Tomás-Barberán, F.A. Increase of antioxidant activity of tomato juice upon functionalisation
with vegetable by-product extracts. LWT Food Sci. Technol. 2002, 35, 532–542. [CrossRef]9. Plazzotta, S.; Ibarz, R.; Manzocco, L.; Martín-Belloso, O. Optimizing the antioxidant biocompound recovery from peach waste
extraction assisted by ultrasounds or microwaves. Ultrason. Sonochem. 2020, 63, 104954. [CrossRef]10. Zhang, J.; Hori, N.; Takemura, A. Optimization of agricultural wastes liquefaction process and preparing biobased polyurethane
foams by the obtained polyols. Ind. Crop. Prod. 2019, 138, 111455. [CrossRef]11. Gheribi, R.; Habibi, Y.; Khwaldia, K. Prickly pear peels as a valuable resource of added-value polysaccharide: Study of structural,
functional and film forming properties. Int. J. Biol. Macromol. 2018, 126, 238–245. [CrossRef]12. Teigiserova, D.A.; Hamelin, L.; Thomsen, M. Review of high-value food waste and food residues biorefineries with focus on
unavoidable wastes from processing. Resour. Conserv. Recycl. 2019, 149, 413–426. [CrossRef]13. Petruccioli, M.; Raviv, M.; Di Silvestro, R.; Dinelli, G. Agriculture and agro-industrial wastes, by-products, and wastewaters:
Origin, characteristics, and potential in bio-based-compounds production. In Comprehensive Biotechnology; Murray, M.Y., Ed.;Environmental Biotechnology and Safety; Elsevier Inc.: Amsterdam, The Netherlands, 2011; Volume 6, pp. 531–545. [CrossRef]
14. Sharma, R.; Jafari, S.M.; Sharma, S. Antimicrobial bio-nanocomposites and their potential applications in food packaging.Food Control 2020, 112, 107086. [CrossRef]
15. Heise, K.; Kirsten, M.; Schneider, Y.; Jaros, D.; Keller, H.; Rohm, H.; Kalbitz, K.; Fischer, S. From agricultural by-products tovalue-added materials: Wheat straw-based hydrogels as soil conditioners? ACS Sustain. Chem. Eng. 2019, 7, 8604–8612. [CrossRef]
16. Feng, N.; Guo, X.; Liang, S. Adsorption study of copper (II) by chemically modified orange peel. J. Hazard. Mater. 2009, 164,1286–1292. [CrossRef]
17. Nešic, A.; Cabrera-Barjas, G.; Dimitrijevic-Brankovic, S.; Davidovic, S.; Radovanovic, N.; Delattre, C. Prospect of polysaccharide-based materials as advanced food packaging. Molecules 2019, 25, 135. [CrossRef] [PubMed]
19. Ullah, H.; Ullah, Z.; Fazal, A.; Irfan, M. Use of vegetable waste extracts for controlling microstructure of CuO nanoparticles:Green synthesis, characterization, and photocatalytic applications. J. Chem. 2017. [CrossRef]
20. Tabasso, S.; Mariatti, F.; Grillo, G.; Boffa, L.; Tibaldi, P.S.; Cravotto, G. Sustainable microwave-assisted aerobic oxidation of tomatoplant waste into bioaromatics and organic acids. Ind. Eng. Chem. Res. 2019, 58, 8578–8584. [CrossRef]
21. Choi, H.J. Agricultural bio-waste for adsorptive removal of crude oil in aqueous solution. J. Mater. Cycles Waste Manag. 2018, 21,356–364. [CrossRef]
22. Li, Y.; Liu, X.; Cai, W.; Cao, Y.; Sun, Y.; Tan, F. Preparation of corn straw based spongy aerogel for spillage oil capture. Korean J.Chem. Eng. 2018, 35, 1119–1127. [CrossRef]
23. Chen, F.; Yang, J.; Bai, T.; Long, B.; Zhou, Z. Facile synthesis of few-layer graphene from biomass waste and its application inlithium ion batteries. J. Electroanal. Chem. 2016, 768, 18–26. [CrossRef]
24. Narayanan, A.; Kumar, V.A.S.; Ramana, K.V. Production and characterization of poly (3-Hydroxybutyrateco-3-Hydroxyvalerate)from Bacillus mycoides DFC1 using rice husk hydrolysate. Waste Biomass Valorization 2013, 5, 109–118. [CrossRef]
25. Chi, W.; Cao, L.; Sun, G.; Meng, F.; Zhang, C.; Li, J.; Wang, L. Developing a highly pH-sensitive k-carrageenan-based intelligentfilm incorporating grape skin powder via a cleaner process. J. Clean. Prod. 2019, 244, 118862. [CrossRef]
26. Spring. Available online: http://www.clusterspring.it/home/ (accessed on 30 July 2020).27. Dahy, H. Efficient fabrication of sustainable building products from annually generated non-wood cellulosic fibres and bioplastics
with improved flammability resistance. Waste Biomass Valorization 2017, 10, 1167–1175. [CrossRef]28. Xie, Y.; Niu, X.; Yang, J.; Fan, R.; Shi, J.; Ullah, N.; Feng, X.; Chen, L. Active biodegradable films based on the whole potato peel
incorporated with bacterial cellulose and curcumin. Int. J. Biol. Macromol. 2020, 150, 480–491. [CrossRef]29. Guzmán, Á.; Delvasto, S.; Sánchez, E. Valorization of rice straw waste: An alternative ceramic raw material. Cerâmica 2015, 61,
126–136. [CrossRef]30. Dos Santos, P.A.; Caliari, M.; Júnior, M.S.S.; Silva, K.S.; Viana, L.F.; Garcia, L.G.C.; De Lima, M.S. Use of agricultural by-products
in extruded gluten-free breakfast cereals. Food Chem. 2019, 297, 124956. [CrossRef]31. Andrzejewski, J.; Barczewski, M.; Szostak, M. Injection molding of highly filled polypropylene-based biocomposites. buckwheat
husk and wood flour filler: A comparison of agricultural and wood industry waste utilization. Polymers 2019, 11, 1881. [CrossRef]32. Bastos-Arrieta, J.; Florido, A.; Pérez-Ràfols, C.; Serrano, N.; Fiol, N.; Poch, J.; Villaescusa, I. Green synthesis of Ag nanoparticles
using grape stalk waste extract for the modification of screen-printed electrodes. Nanomaterials 2018, 8, 946. [CrossRef] [PubMed]33. Crizel, T.D.M.; Jablonski, A.; Rios, A.D.L.; Rech, R.; Flôres, S.H. Dietary fiber from orange byproducts as a potential fat replacer.
LWT Food Sci. Technol. 2013, 53, 9–14. [CrossRef]34. Cinelli, P.; Mallegni, N.; Gigante, V.; Montanari, A.; Seggiani, M.; Coltelli, M.B.; Bronco, S.; Lazzeri, A. Biocomposites based on
polyhydroxyalkanoates and natural fibres from renewable by-products. Appl. Food Biotechnol. 2018, 6, 35–43. [CrossRef]
141
Sustainability 2021, 13, 3990
35. Rhim, J.W.; Reddy, J.P.; Luo, X. Isolation of cellulose nanocrystals from onion skin and their utilization for the preparation ofagar-based bio-nanocomposites films. Cellulose 2014, 22, 408–420. [CrossRef]
36. Verónica, F.M.; Bengardino, M.; Jagus, R.J.; Agüero, M.V. Enrichment and preservation of a vegetable smoothie with an antioxidantand antimicrobial extract obtained from beet by-products. LWT 2019, 117, 108622. [CrossRef]
37. Schott, A.B.S.; Wenzel, H.; la Cure Jansen, J. Identification of decisive factors for greenhouse gas emissions in comparative lifecycle assessments of food waste management—An analytical review. J. Clean. Prod. 2016, 119, 13–24. [CrossRef]
38. Ekvall, T.; Weidema, B.P. System boundaries and input data in consequential life cycle inventory analysis. Int. J. LCA 2004, 9,161–171. [CrossRef]
39. ISO Valutazione del Ciclo di Vita, Definizione e Linee Guida. 2018. Available online: https://www.uni.com/index.php?option=com_content&view=article&id=6978%3Avalutazione-del-ciclo-di-vita&catid=170&Itemid=2612 (accessed on 30 July 2020).
40. Ahlgren, S.; Björklund, A.; Ekman, H.; Berlin, J.; Börjesson, P.; Ekvall, T.; Finnveden, G.; Jansenn, M.; Strid, I. Review ofmethodological choices in LCA of biorefinery systems-key issues and recommendations. Biofuels Bioprod. Biorefin. 2015, 9, 606–619.[CrossRef]
41. CIA Lombardia. Available online: http://www.cialombardia.org/fattoriascuola/C-r-lavorazione.htm#:~{}:text=In%20funzione%20della%20variet%C3%A0%2C%20dell,usate%20per%20gli%20altri%20cereali (accessed on 30 July 2020).
42. Perozzi, D. PROGETTO GLUME Ricerca Sperimentale per la Valorizzazione Degli Scarti di Molitura. Caso Studio: MulinoMarino (PROGETTO GLUME Experimental Research to Valorize Milling Waste. Case Study: Mulino Marino). Ph.D. Thesis,Politecnico di Torino, Torino, Italy, 2019.
43. Rossi, L.; Piccinini, S. Sottoprodotti agroindustriali, un potenziale da sfruttare. Inf. Agrar. 2007, 63, 67.44. Espadas-Aldana, G.; Vialle, C.; Belaud, J.P.; Vaca-Garcia, C.; Sablayrolles, C. Analysis and trends for Life Cycle Assessment of
olive oil production. Sustain. Prod. Consum. 2019, 19, 216–230. [CrossRef]45. European Commission-Joint Research Centre (JRC). Characterisation Factors of the ILCD Recommended Life Cycle Impact Assessment
Methods; European Commission-Joint Research Centre—Institute for Environment and Sustainability: Ispra, Italy, 2012. [CrossRef]46. European Commission. The Development of the PEF and OEF Methods. Available online: https://ec.europa.eu/environment/
eussd/smgp/dev_methods.htm (accessed on 8 March 2021).47. Van der Hulst, M.K.; Huijbregts, M.A.; van Loon, N.; Theelen, M.; Kootstra, L.; Bergesen, J.D.; Hauck, M. A systematic approach
to assess the environmental impact of emerging technologies: A case study for the GHG footprint of CIGS solar photovoltaiclaminate. J. Ind. Ecol. 2020, 24, 1234–1249. [CrossRef]
48. Piccinno, F.; Hischier, R.; Seeger, S.; Som, C. Predicting the environmental impact of a future nanocellulose production at industrialscale: Application of the life cycle assessment scale-up framework. J. Clean. Prod. 2018, 174, 283–295. [CrossRef]
49. Adiansyah, J.S.; Haque, N.; Rosano, M.; Biswas, W. Application of a life cycle assessment to compare environmental performancein coal mine tailings management. J. Environ. Manag. 2017, 199, 181–191. [CrossRef] [PubMed]
50. Stark, N.M.; Cai, Z.; Carll, C. Wood-based composite materials-panel products, glued-laminated timber, structural compositelumber, and wood-nonwood composite materials. In Wood Handbook: Wood as an Engineering Material; General technical reportFPL.; GTR-190; Centennial, Ed.; Department of Agriculture, Forest Service, Forest Products Laboratory: Madison, WI, USA, 2010;Chapter 11; pp. 11.1–11.28.
51. Aadil, K.R.; Barapatre, A.; Sahu, S.; Jha, H.; Tiwary, B.N. Free radical scavenging activity and reducing power of Acacia niloticawood lignin. Int. J. Biol. Macromol. 2014, 67, 220–227. [CrossRef]
52. Cossutta, M.; McKechnie, J.; Pickering, S.J. A comparative LCA of different graphene production routes. Green Chem. 2017, 19,5874–5884. [CrossRef]
53. Pourzahedi, L.; Eckelman, M.J. Comparative life cycle assessment of silver nanoparticle synthesis. Environ. Sci. Nano 2015, 2,361–369. [CrossRef]
55. GABI Process Data Eet: Polyester Resin Unsaturated (UP); Esterification and Polymerization, from Propylene Glycol, PhthalicAnhydride and Styrene; Single Route, at Plant; 1.22 to 1.38 g/cm3 (en). Available online: http://gabi-documentation-2019.gabi-software.com/xml-data/processes/b6801f51-3d8e-47d1-96bb-dbbea7b14e16.xml (accessed on 30 July 2020).
56. Liu, Y.; Cao, Q.; Luo, F.; Chen, J. Biosorption of Cd2+, Cu2+, Ni2+ and Zn2+ ions from aqueous solutions by pretreated biomass ofbrown algae. J. Hazard. Mater. 2008, 163, 931–938. [CrossRef]
57. Józwiak, T.; Filipkowska, U.; Szymczyk, P.; Rodziewicz, J.; Mielcarek, A. Effect of ionic and covalent crosslinking agents onproperties of chitosan beads and sorption effectiveness of Reactive Black 5 dye. React. Funct. Polym. 2017, 114, 58–74. [CrossRef]
58. Loya-Gonzalez, D.; Loredo-Cancino, M.; Soto-Regalado, E.; Rivas-García, P.; Cerino-Cordova, F.D.J.; García-Reyes, R.B.; Bustos-Martínez, D.; Estrada-Baltazar, A. Optimal activated carbon production from corn pericarp: A life cycle assessment approach.J. Clean. Prod. 2019, 219, 316–325. [CrossRef]
59. Bernier, E.; Lavigne, C.; Robidoux, P.Y. Life cycle assessment of kraft lignin for polymer applications. Int. J. LCA 2012, 18, 520–528.[CrossRef]
60. Nägele, H.; Pfitzer, J.; Nägele, E.; Inone, E.R.; Eisenreich, N.; Eckl, W.; Eyerer, P. Arboform®—A thermoplastic, processablematerial from lignin and natural fibers. In Chemical Modification, Properties, and Usage of Lignin; Springer: Boston, MA, USA, 2002;pp. 101–119. [CrossRef]
142
Sustainability 2021, 13, 3990
61. Schmidt, A.; Frydendal, J. Methods for calculating the environmental benefits of “green” products. In Buying into the Environment;Routledge: Oxfordshire, UK, 2003.
62. Van Oers, L.; Guinée, J. The abiotic depletion potential: Background, updates, and future. Resources 2016, 5, 16. [CrossRef]63. Amato, A.; Becci, A.; Birloaga, I.; Michelis, I.D.; Ferella, F.; Innocenzi, V.; Ippolito, N.; Gomez, C.P.J.; Vegliò, F.; Beolchini, F.
Sustainability analysis of innovative technologies for the rare earth elements recovery. Renew. Sustain. Energy Rev. 2019, 106,41–53. [CrossRef]
64. Frischknecht, R.; Braunschweig, A.; Hofstetter, P.; Suter, P. Human health damages due to ionizing radiation in life cycle impactassessment. Environ. Impact Assess. Rev. 2000, 20, 159–189. [CrossRef]
65. Stocker, T.; Qin, D.; Plattner, G.K.; Tignor, M.; Allen, S.; Boschung, J.; Nauels, A.; Xia, Y.; Bex, V.; Midgley, P. Climate Change 2013:The Physical Science Basis. Contribution of Working Group I to the Fifth Assessment Report of the Intergovernmental Panel onClimate Change. In Proceedings of the Intergovernmental Panel on Climate Change, Batumi, GA, USA, 14–17 October 2013.
67. Chevanana, N.; Womac, A.R.; Bitra, V.S.P.; Igathinathene, C.; Yang, Y.T.; Miu, P.I.; Sokhansanj, S. Bulk density and compactionbehavior of knife mill chopped switchgrass, wheat straw, and corn stover. Bioresour. Technol. 2009, 101, 207–214. [CrossRef][PubMed]
68. Sin, E.H.K. The Extraction and Fractionation of Waxes from Biomass. Ph.D. Thesis, University of York, York, UK, 2012.69. Jahanbakhshi, A.; Sharabiani, V.R.; Heidarbeigi, K.; Kaveh, M.; Taghinezhad, E. Evaluation of engineering properties for waste
control of tomato during harvesting and postharvesting. Food Sci. Technol. 2019, 7, 1473–1481. [CrossRef]70. Stelte, W.; Clemons, C.; Holm, J.K.; Ahrenfeldt, J.; Henriksen, U.B.; Sanadi, A.R. Fuel pellets from wheat straw: The effect of lignin
glass transition and surface waxes on pelletizing properties. Bioenergy Res. 2011, 5, 450–458. [CrossRef]71. Cuccolini, S.; Aldini, A.; Visai, L.; Daglia, M.; Ferrari, D. Environmentally friendly lycopene purification from tomato peel waste:
Enzymatic assisted aqueous extraction. J. Agric. Food Chem. 2012, 61, 1646–1651. [CrossRef]72. Olabinjo, O.O.; Ogunlowo, A.S.; Ajayi, O.O.; Olalusi, A.P. Analysis of physical and chemical composition of sweet orange
(Citrus sinensis) peels. Int. J. Environ. Agric. Biotechnol. 2017, 2, 238892. [CrossRef]73. Munagapati, V.S.; Kim, D.S. Adsorption of anionic azo dye Congo Red from aqueous solution by cationic modified orange peel
powder. J. Mol. Liq. 2016, 220, 540–548. [CrossRef]74. National Library of Medicine. Available online: https://pubchem.ncbi.nlm.nih.gov/compound/1_4-Benzoquinone#section=
Solubility (accessed on 30 July 2020).75. Ahmed, M.; Mashkoor, F.; Nasar, A. Development, characterization, and utilization of magnetized orange peel waste as a novel
adsorbent for the confiscation of crystal violet dye from aqueous solution. Groundw. Sustain. Dev. 2019, 10, 100322. [CrossRef]76. Cai, J.; Gao, Y.; Zhu, X.; Su, Q. Matrix solid phase dispersion–Soxhlet simultaneous extraction clean-up for determination of