The Colonization Dynamics of the Gut Microbiota in Tilapia Larvae Christos Giatsis 1 *, Detmer Sipkema 2 , Hauke Smidt 2 , Johan Verreth 1 , Marc Verdegem 1 1 Aquaculture and Fisheries Group, Wageningen University, Wageningen, The Netherlands, 2 Laboratory of Microbiology, Wageningen University, Wageningen, The Netherlands Abstract The gut microbiota of fish larvae evolves fast towards a complex community. Both host and environment affect the development of the gut microbiota; however, the relative importance of both is poorly understood. Determining specific changes in gut microbial populations in response to a change in an environmental factor is very complicated. Interactions between factors are difficult to separate and any response could be masked due to high inter-individual variation even for individuals that share a common environment. In this study we characterized and quantified the spatio-temporal variation in the gut microbiota of tilapia larvae, reared in recirculating aquaculture systems (RAS) or active suspension tanks (AS). Our results showed that variation in gut microbiota between replicate tanks was not significantly higher than within tank variation, suggesting that there is no tank effect on water and gut microbiota. However, when individuals were reared in replicate RAS, gut microbiota differed significantly. The highest variation was observed between individuals reared in different types of system (RAS vs. AS). Our data suggest that under experimental conditions in which the roles of deterministic and stochastic factors have not been precisely determined, compositional replication of the microbial communities of an ecosystem is not predictable. Citation: Giatsis C, Sipkema D, Smidt H, Verreth J, Verdegem M (2014) The Colonization Dynamics of the Gut Microbiota in Tilapia Larvae. PLoS ONE 9(7): e103641. doi:10.1371/journal.pone.0103641 Editor: Pikul Jiravanichpaisal, Fish Vet Group, Thailand Received December 9, 2013; Accepted July 6, 2014; Published July 29, 2014 Copyright: ß 2014 Giatsis et al. This is an open-access article distributed under the terms of the Creative Commons Attribution License, which permits unrestricted use, distribution, and reproduction in any medium, provided the original author and source are credited. Funding: This work was funded by The European Community’s Seventh Framework Program (FP7/2007–2013) under grant agreement no. 227197 Promicrobe ‘‘Microbes as positive actors for more sustainable aquaculture’’. The funders had no role in study design, data collection and analysis, decision to publish, or preparation of the manuscript. Competing Interests: The authors have declared that no competing interests exist. * Email: [email protected]Introduction The gut of fish harbors a diverse microbial community. It provides niches for adherence, colonization and proliferation of mutualistic, benign commensal and pathogenic microbial species that affect many physiological and immunological functions of the host [1–3]. The microbial community in the gut changes with the developmental stage of the host and constantly adapts to the nutritional and environmental situation [4–7]. Impacts on fish gut microbiota are more pronounced during early ontogenetic stages when the fish gut is not yet fully developed and the immune system is immature [8]. However, due to high inter-individual variation between fish and rapid changes in the microbial community composition during early life stages, it is difficult to relate changes in gut microbiota to alterations of a single factor. It has been suggested that inter-individual variation in gut microbial community composition both in humans [9] and animals [10] might mask treatment effects. High individual variation was suggested as the reason for not detecting differences in gut microbiota in Atlantic salmon (Salmo salar) fed with different diets [11]. High inter- individual variation in quantity, diversity and richness of gut bacteria was also observed between individuals from the same tank in Bluefin tuna [12] as well as in cod larvae [13]. Inter-individual variation in gut microbiota between individuals reared under the same conditions can be partially explained by stochastic processes [14]. However, ‘‘stochastic variation’’ cannot just be considered as ‘‘noise’’. To comprehend the full range of genetic and metabolic diversity of gut microbiota, it is very important to characterize and quantify the inter- and intra- individual variation in space and time. In fact, the characterization of the variation between identically reared individuals can serve as baseline to determine the contribution of stochastic factors to the overall variation. In this study we characterized and quantified the spatio- temporal variation of water and gut microbiota of Nile tilapia larvae, reared for six weeks in two replicate recirculation aquaculture systems (RAS). The location effects on larvae gut microbiota were compared for individuals reared within the same or between replicate tanks, and between replicate RAS systems. To determine the generality of any pattern observed in the RAS, and to avoid any affinity of the results with the specific habitat (RAS), temporal and replication effects were also studied in replicate active suspension (AS) systems also known as zero- exchange activated sludge systems or biofloc systems [15]. Materials and Methods Ethics statement The experiment was approved by the Ethical Commission for Animal Experiments of Wageningen University (Project Name: Promicrobe; Registration code: 2009055d). PLOS ONE | www.plosone.org 1 July 2014 | Volume 9 | Issue 7 | e103641
Transcript
The Colonization Dynamics of the Gut Microbiota inTilapia LarvaeChristos Giatsis1*, Detmer Sipkema2, Hauke Smidt2, Johan Verreth1, Marc Verdegem1
1 Aquaculture and Fisheries Group, Wageningen University, Wageningen, The Netherlands, 2 Laboratory of Microbiology, Wageningen University, Wageningen, The
Netherlands
Abstract
The gut microbiota of fish larvae evolves fast towards a complex community. Both host and environment affect thedevelopment of the gut microbiota; however, the relative importance of both is poorly understood. Determining specificchanges in gut microbial populations in response to a change in an environmental factor is very complicated. Interactionsbetween factors are difficult to separate and any response could be masked due to high inter-individual variation even forindividuals that share a common environment. In this study we characterized and quantified the spatio-temporal variationin the gut microbiota of tilapia larvae, reared in recirculating aquaculture systems (RAS) or active suspension tanks (AS). Ourresults showed that variation in gut microbiota between replicate tanks was not significantly higher than within tankvariation, suggesting that there is no tank effect on water and gut microbiota. However, when individuals were reared inreplicate RAS, gut microbiota differed significantly. The highest variation was observed between individuals reared indifferent types of system (RAS vs. AS). Our data suggest that under experimental conditions in which the roles ofdeterministic and stochastic factors have not been precisely determined, compositional replication of the microbialcommunities of an ecosystem is not predictable.
Citation: Giatsis C, Sipkema D, Smidt H, Verreth J, Verdegem M (2014) The Colonization Dynamics of the Gut Microbiota in Tilapia Larvae. PLoS ONE 9(7):e103641. doi:10.1371/journal.pone.0103641
Editor: Pikul Jiravanichpaisal, Fish Vet Group, Thailand
Received December 9, 2013; Accepted July 6, 2014; Published July 29, 2014
Copyright: � 2014 Giatsis et al. This is an open-access article distributed under the terms of the Creative Commons Attribution License, which permitsunrestricted use, distribution, and reproduction in any medium, provided the original author and source are credited.
Funding: This work was funded by The European Community’s Seventh Framework Program (FP7/2007–2013) under grant agreement no. 227197 Promicrobe‘‘Microbes as positive actors for more sustainable aquaculture’’. The funders had no role in study design, data collection and analysis, decision to publish, orpreparation of the manuscript.
Competing Interests: The authors have declared that no competing interests exist.
Experimental animals and set upThree to four days old fertilized Nile tilapia eggs, obtained from
TilAqua International (Velden, the Netherlands) were incubated
at 27uC. Two different culture systems were used to rear the newly
hatched larvae: a recirculating aquaculture system (RAS) with two
replicates (Ra and Rb), and an active suspension (AS) system with
five replicates (AS 1-5). Each RAS contained five 20-L tanks and
the tanks were connected to the same water purification unit. The
two replicate RAS systems were not connected to each other. The
five 120-L AS tanks were independent units and they did not share
the same water. Initially, all systems were filled with water from
the same source. In addition, before the start of the experiment,
water and filter materials from the two RAS were mixed. Water of
the five AS systems was treated similarly. The larvae were
incubated together in a common tank before stocking. In each
tank, 100 randomly selected swim-up larvae (7 days post
fertilization) were introduced before the first feed application.
Feeding started 9 days post fertilization (referred to as day 0; D00)
and was continued for 42 days. Each day, larvae were fed with
0.5 mm commercial starter tilapia diet (F-0.5 GR Pro Aqua Brut –
Trouw Nutrition, France) until apparent satiation for maximum
30 minutes at 9.00, 12.30 and 16.00 hours. The same type of feed,
originating from a common batch, was used throughout the 42
day experimental period. Feed pellets were introduced slowly
while observing feeding behaviour, and administration stopped
when it took more than 15 seconds before fishes reacted to newly
fed pellets. Just before the first feeding, water and gut samples were
collected, to determine the ‘‘initial’’ microbiota. Other samples
were taken before the first daily feeding on day 07, 14, 28 and 42
(Figure S1).
Water physicochemical characteristics were maintained at safe
levels for Nile tilapia larvae (pH 6.6–8.5, temperature 26–28uC,
NH3-N,0.2 mg l21, NO2-N,1 mg l21 and DO .5 mg l21). The
photoperiod was set to 12 hours light –12 hours dark. During the
experiment both RAS and AS were operated as fully closed
systems.
Collection of gut and water samplesOn each sampling day ten larvae per tank were collected for
microbial community analysis. The larvae were euthanized with
0.6 g l21 Tricaine Methanesulfonate (TMS, Crescent Research
Chemicals, Phoenix, Arizona, USA), buffered with 0.12 g l21
sodium bicarbonate in water originating from the corresponding
rearing tank. Subsequently, larvae were rinsed with 70% ethanol
and sterile water before dissecting out aseptically the gut under a
dissection microscope. Whole gut samples were flash frozen in
liquid nitrogen and stored individually at 280uC until subsequent
analyses.
All tools and dissecting surfaces were disinfected with chlora-
mine-T (Halamid-d, Veip BV, The Netherlands) and 70% ethanol
between dissections. In addition, the tools were always held in a
propane gas flame before use.
From each tank, 250 mL water samples were collected at the
same time of gut sampling. The water was filtered through
0.45 mm (type HAWP) and 0.22 mm (type GTTP) membrane
filters (Millipore - Isopore) using a vacuum apparatus.
The microbiota in the water and gut was analyzed using
denaturing gradient gel electrophoresis (DGGE) of PCR-amplified
16S ribosomal RNA (rRNA) gene fragments. One water and 3 gut
samples were taken from each of the 15 tanks and analyzed by
using PCR-DGGE on days 0, 7, 14, 28 and 42. In addition, 1
water and 3 gut samples were taken from 2 replicate tanks of each
RAS and from 2 AS tanks. Those samples were analyzed by 454
pyrosequencing of partial 16S rRNA genes on days 7 and 42.
Samples that were analyzed with 454 pyrosequencing were a
subset of the sample set that was analyzed with PCR-DGGE.
Genomic DNA isolationDNA was extracted from larval gut samples using the DNeasy
Blood & Tissue Kit (Qiagen, Venlo, Netherlands) according to the
manufacturer’s protocol with the following modifications: The gut
samples were added to 180 mL enzymatic lysis buffer and
incubated at 37uC for 1 hour. Furthermore, 40 ml proteinase K
and 180 mL ATL buffer were added to improve cell lysis, and the
mix was incubated for 1.5 h at 55uC. Cell-lysis was further
optimized by performing an additional step in which gut tissue was
homogenized in 200 ml AL buffer (Qiagen) with the aid of a
custom bead mix (4 glass beads 2–3 mm, 0.5 g zirconia beads
0,1 mm) (MO-BIO Carlsbad, CA USA) and using the FastPrep
instrument (QBioGene, Irvine, CA, USA) for 1 min at 6,000 rpm.
The samples were eluted twice in 50 ml AE buffer. DNA
concentration was measured with a NanoDrop ND-1000 spectro-
photometer (NanoDrop Technologies, Wilmington, DE), and
DNA samples were stored at 220uC until use.
For DNA extraction from water samples, the FastDNA SPIN kit
for soil (MP Biomedicals, Ohio, USA) was used. The DNA was
extracted from water membrane filters. Briefly, homogenization
was achieved by addition of 978 mL sodium phosphate and 122 ml
MT buffer, and the cell lysis in the lysing matrix was enhanced by
a bead beating step of 40 s at 6000 rpm. DNA purification was
achieved by addition of 1 mL silica binding matrix and 500 mL
SEWS-M (salt ethanol wash) followed by centrifugation at
14,000 g for 5 min. The DNA was eluted by the addition of
50 mL DES (DNA elution solution ultra-pure water) and incubated
at room temperature for 5 min. Subsequently, the DNA was
collected by centrifugation at 14,000 g for 5 min. For more details
see instructions given by the manufacturer.
PCR-DGGE analysisTarget fragments of the bacterial 16S ribosomal RNA gene
were amplified from the extracted DNA by PCR by using the
following cycling conditions: 95uC for 2 min, followed by 35 cycles
consisting of 95uC for 30 s, 53uC for 40 s and 72uC for 1 min and
then a final 5 min extension step at 72uC. Samples were cooled to
4uC. PCR for DGGE was performed by using primers L1401-R
(59-CGGTGTGTACAAGACCC-39) and U968-F (59-CGCCCG-
GGGCGCGC CCCGG GCGGGGCGGGGGCACGGGGGG-
AACGCGAAGAACCTTAC-39) fitted with a GC-clamp [16].
The PCR reaction mixture consisted of Phusion HF buffer,
0.2 mM of each primer, 200 mM of each dNTP, and 1 unit of
Phusion Hot Start II High Fidelity Polymerase. To the 50 ml
reactions 20–50 ng of DNA was added. Five ml of all PCR
products were visualized by gel electrophoresis using 1% agarose
gel with ethidium bromide to check the quality. DGGE analysis of
PCR amplicons was performed as described previously [17] using
the DCode system (Bio-Rad Laboratories, Hercules, CA).
Polyacrylamide gels consisted of 8% (vol/vol) polyacrylamide
(37.5:1 acrylamide-bisacrylamide) in 0.5xTris-acetate-EDTA. A
denaturing acrylamide containing 7 M urea and 40% formamide
was defined as 100%. The gels were poured from the top by using
a gradient maker (Econopump; Bio-Rad, La Jolla, CA) and
pumping the solution at a speed of 4.5 ml min21. A gradient from
30 to 60% was used for the separation of the PCR amplicons.
Electrophoresis was performed for 16 h at 85 V in a 0.5xTris-
acetate-EDTA buffer at a constant temperature of 60uC.
Subsequently, gels were stained with AgNO3 according to the
method described by Sanguinetti et al. [18].
Fish Gut Microbiota
PLOS ONE | www.plosone.org 2 July 2014 | Volume 9 | Issue 7 | e103641
454 PyrosequencingFor more detailed 16S rRNA gene-based microbial composition
profiling, barcoded amplicons from the V1–V2 region of 16S
rRNA genes were generated by PCR using the 27F-DegS primer
[19] that was appended with the titanium sequencing adaptor A
and an 8 nucleotide sample-specific barcode [20] at the 59 end. As
a reverse primer, an equimolar mix of two primers 338R I and II
[21] was used that carried the titanium adaptor B at the 59 end.
Extracted DNA was diluted to a concentration of 20 ng ml21 based
on Nanodrop readings. PCR was performed using a GS0001
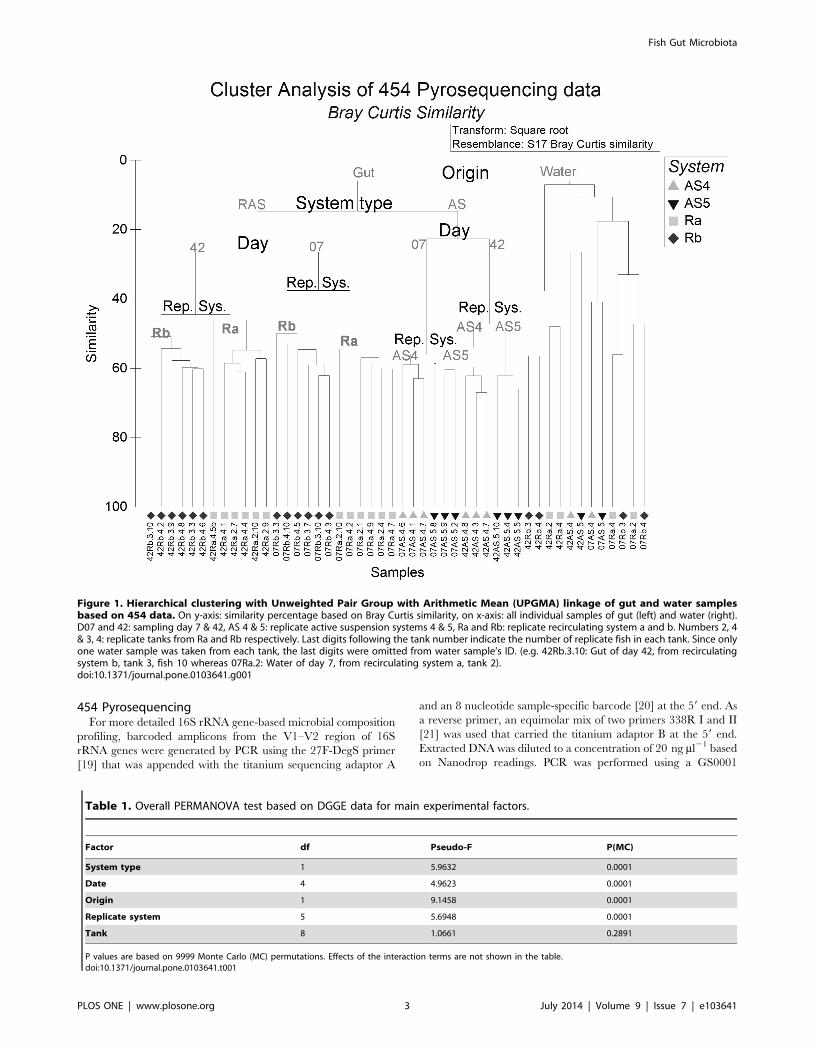
Figure 1. Hierarchical clustering with Unweighted Pair Group with Arithmetic Mean (UPGMA) linkage of gut and water samplesbased on 454 data. On y-axis: similarity percentage based on Bray Curtis similarity, on x-axis: all individual samples of gut (left) and water (right).D07 and 42: sampling day 7 & 42, AS 4 & 5: replicate active suspension systems 4 & 5, Ra and Rb: replicate recirculating system a and b. Numbers 2, 4& 3, 4: replicate tanks from Ra and Rb respectively. Last digits following the tank number indicate the number of replicate fish in each tank. Since onlyone water sample was taken from each tank, the last digits were omitted from water sample’s ID. (e.g. 42Rb.3.10: Gut of day 42, from recirculatingsystem b, tank 3, fish 10 whereas 07Ra.2: Water of day 7, from recirculating system a, tank 2).doi:10.1371/journal.pone.0103641.g001
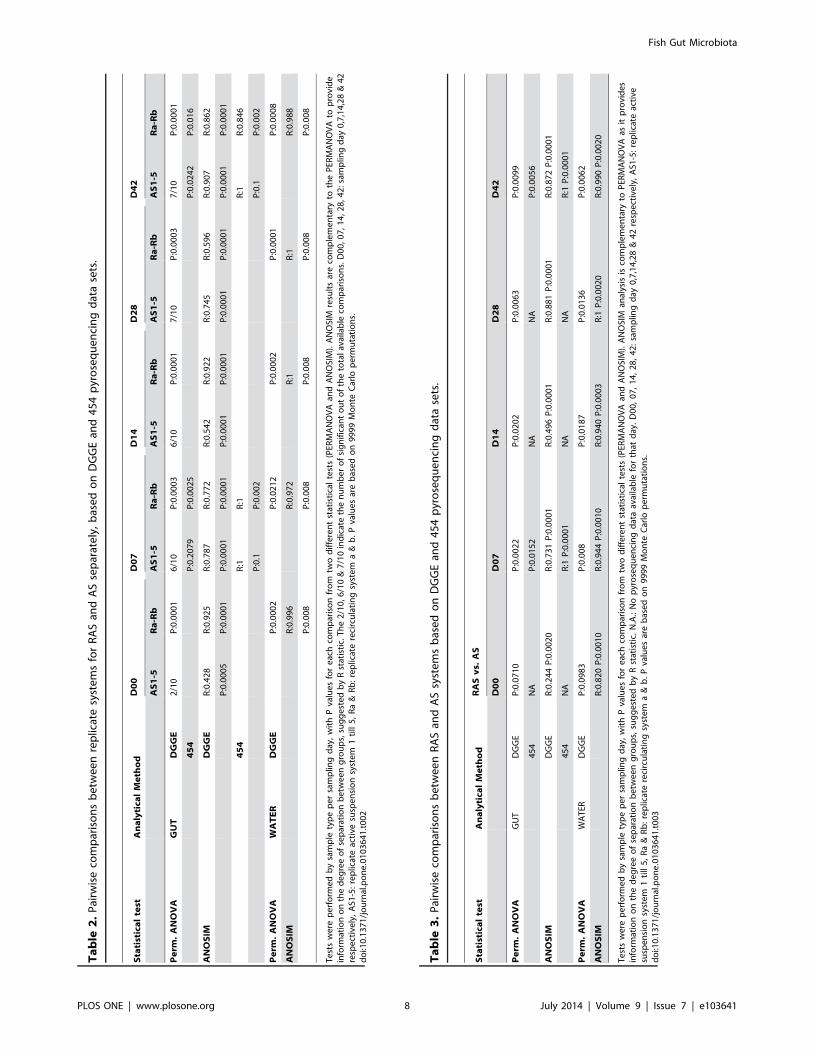
Table 1. Overall PERMANOVA test based on DGGE data for main experimental factors.
Factor df Pseudo-F P(MC)
System type 1 5.9632 0.0001
Date 4 4.9623 0.0001
Origin 1 9.1458 0.0001
Replicate system 5 5.6948 0.0001
Tank 8 1.0661 0.2891
P values are based on 9999 Monte Carlo (MC) permutations. Effects of the interaction terms are not shown in the table.doi:10.1371/journal.pone.0103641.t001
Fish Gut Microbiota
PLOS ONE | www.plosone.org 3 July 2014 | Volume 9 | Issue 7 | e103641
Fish Gut Microbiota
PLOS ONE | www.plosone.org 4 July 2014 | Volume 9 | Issue 7 | e103641
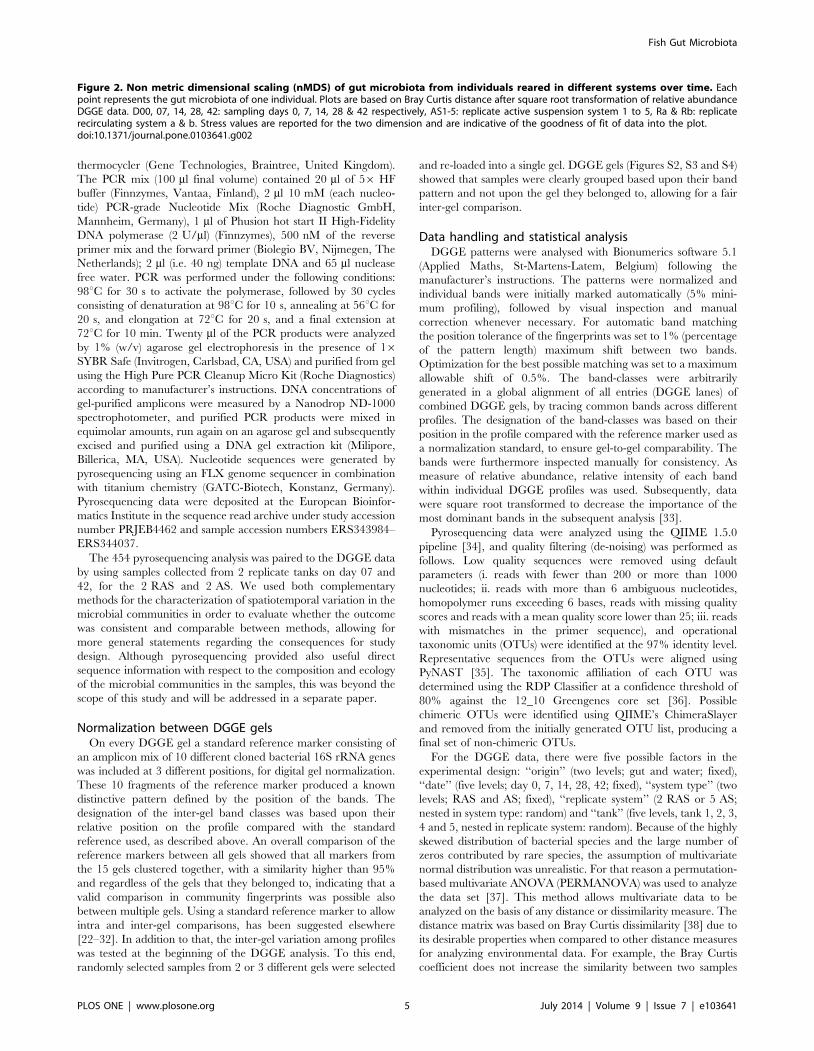
thermocycler (Gene Technologies, Braintree, United Kingdom).
The PCR mix (100 ml final volume) contained 20 ml of 56 HF
buffer (Finnzymes, Vantaa, Finland), 2 ml 10 mM (each nucleo-
levels; RAS and AS; fixed), ‘‘replicate system’’ (2 RAS or 5 AS;
nested in system type: random) and ‘‘tank’’ (five levels, tank 1, 2, 3,
4 and 5, nested in replicate system: random). Because of the highly
skewed distribution of bacterial species and the large number of
zeros contributed by rare species, the assumption of multivariate
normal distribution was unrealistic. For that reason a permutation-
based multivariate ANOVA (PERMANOVA) was used to analyze
the data set [37]. This method allows multivariate data to be
analyzed on the basis of any distance or dissimilarity measure. The
distance matrix was based on Bray Curtis dissimilarity [38] due to
its desirable properties when compared to other distance measures
for analyzing environmental data. For example, the Bray Curtis
coefficient does not increase the similarity between two samples
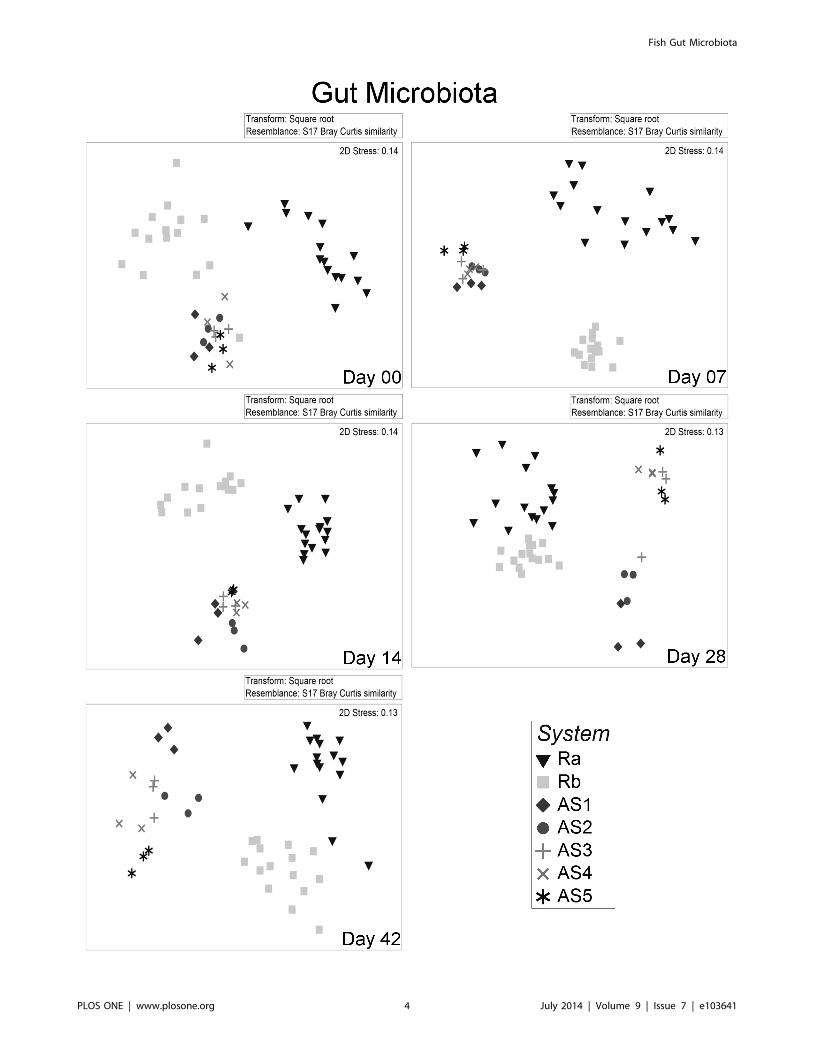
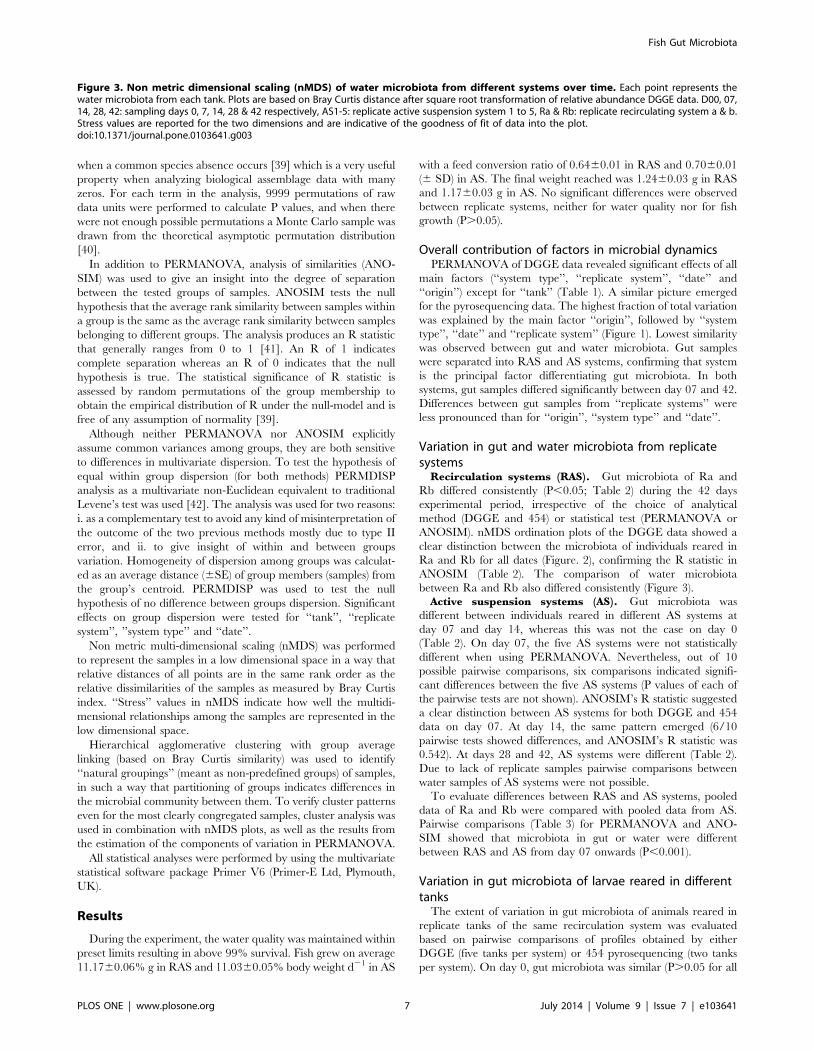
Figure 2. Non metric dimensional scaling (nMDS) of gut microbiota from individuals reared in different systems over time. Eachpoint represents the gut microbiota of one individual. Plots are based on Bray Curtis distance after square root transformation of relative abundanceDGGE data. D00, 07, 14, 28, 42: sampling days 0, 7, 14, 28 & 42 respectively, AS1-5: replicate active suspension system 1 to 5, Ra & Rb: replicaterecirculating system a & b. Stress values are reported for the two dimension and are indicative of the goodness of fit of data into the plot.doi:10.1371/journal.pone.0103641.g002
Fish Gut Microbiota
PLOS ONE | www.plosone.org 5 July 2014 | Volume 9 | Issue 7 | e103641
Fish Gut Microbiota
PLOS ONE | www.plosone.org 6 July 2014 | Volume 9 | Issue 7 | e103641
when a common species absence occurs [39] which is a very useful
property when analyzing biological assemblage data with many
zeros. For each term in the analysis, 9999 permutations of raw
data units were performed to calculate P values, and when there
were not enough possible permutations a Monte Carlo sample was
drawn from the theoretical asymptotic permutation distribution
[40].
In addition to PERMANOVA, analysis of similarities (ANO-
SIM) was used to give an insight into the degree of separation
between the tested groups of samples. ANOSIM tests the null
hypothesis that the average rank similarity between samples within
a group is the same as the average rank similarity between samples
belonging to different groups. The analysis produces an R statistic
that generally ranges from 0 to 1 [41]. An R of 1 indicates
complete separation whereas an R of 0 indicates that the null
hypothesis is true. The statistical significance of R statistic is
assessed by random permutations of the group membership to
obtain the empirical distribution of R under the null-model and is
free of any assumption of normality [39].
Although neither PERMANOVA nor ANOSIM explicitly
assume common variances among groups, they are both sensitive
to differences in multivariate dispersion. To test the hypothesis of
equal within group dispersion (for both methods) PERMDISP
analysis as a multivariate non-Euclidean equivalent to traditional
Levene’s test was used [42]. The analysis was used for two reasons:
i. as a complementary test to avoid any kind of misinterpretation of
the outcome of the two previous methods mostly due to type II
error, and ii. to give insight of within and between groups
variation. Homogeneity of dispersion among groups was calculat-
ed as an average distance (6SE) of group members (samples) from
the group’s centroid. PERMDISP was used to test the null
hypothesis of no difference between groups dispersion. Significant
effects on group dispersion were tested for ‘‘tank’’, ‘‘replicate
system’’, ’’system type’’ and ‘‘date’’.
Non metric multi-dimensional scaling (nMDS) was performed
to represent the samples in a low dimensional space in a way that
relative distances of all points are in the same rank order as the
relative dissimilarities of the samples as measured by Bray Curtis
index. ‘‘Stress’’ values in nMDS indicate how well the multidi-
mensional relationships among the samples are represented in the
low dimensional space.
Hierarchical agglomerative clustering with group average
linking (based on Bray Curtis similarity) was used to identify
‘‘natural groupings’’ (meant as non-predefined groups) of samples,
in such a way that partitioning of groups indicates differences in
the microbial community between them. To verify cluster patterns
even for the most clearly congregated samples, cluster analysis was
used in combination with nMDS plots, as well as the results from
the estimation of the components of variation in PERMANOVA.
All statistical analyses were performed by using the multivariate
statistical software package Primer V6 (Primer-E Ltd, Plymouth,
UK).
Results
During the experiment, the water quality was maintained within
preset limits resulting in above 99% survival. Fish grew on average
11.1760.06% g in RAS and 11.0360.05% body weight d21 in AS
with a feed conversion ratio of 0.6460.01 in RAS and 0.7060.01
(6 SD) in AS. The final weight reached was 1.2460.03 g in RAS
and 1.1760.03 g in AS. No significant differences were observed
between replicate systems, neither for water quality nor for fish
growth (P.0.05).
Overall contribution of factors in microbial dynamicsPERMANOVA of DGGE data revealed significant effects of all
main factors (‘‘system type’’, ‘‘replicate system’’, ‘‘date’’ and
‘‘origin’’) except for ‘‘tank’’ (Table 1). A similar picture emerged
for the pyrosequencing data. The highest fraction of total variation
was explained by the main factor ‘‘origin’’, followed by ‘‘system
type’’, ‘‘date’’ and ‘‘replicate system’’ (Figure 1). Lowest similarity
was observed between gut and water microbiota. Gut samples
were separated into RAS and AS systems, confirming that system
is the principal factor differentiating gut microbiota. In both
systems, gut samples differed significantly between day 07 and 42.
Differences between gut samples from ‘‘replicate systems’’ were
less pronounced than for ‘‘origin’’, ‘‘system type’’ and ‘‘date’’.
Variation in gut and water microbiota from replicatesystems
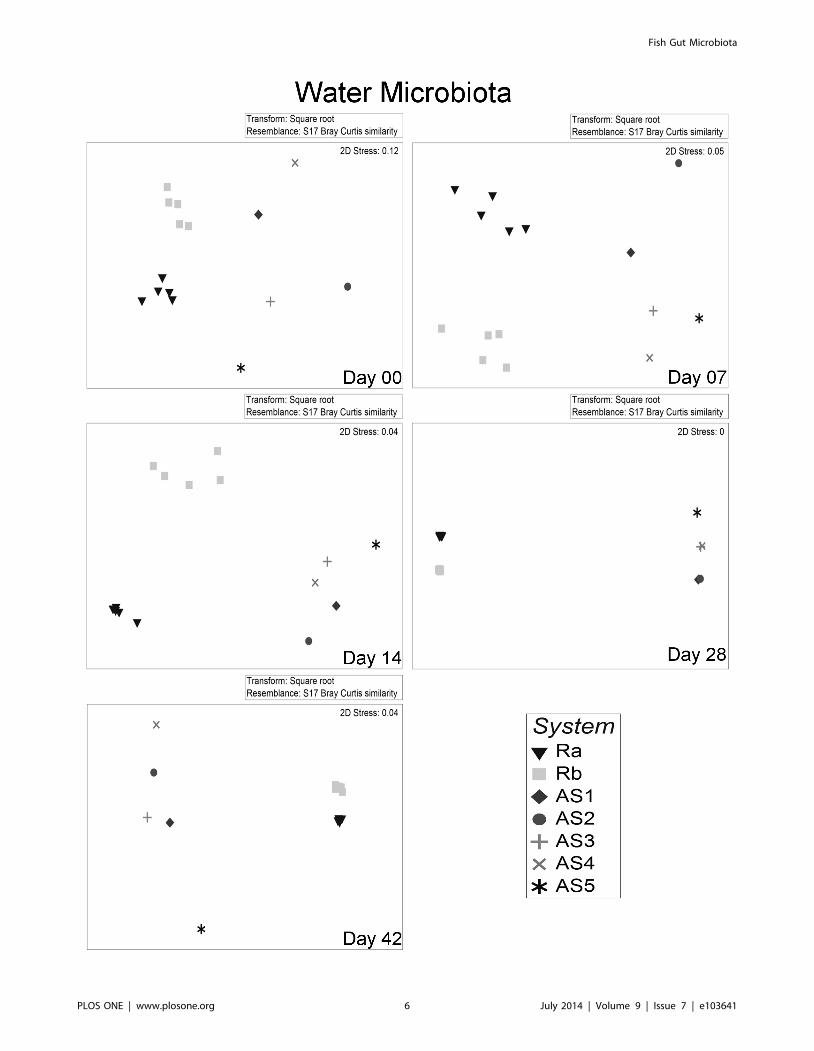
Recirculation systems (RAS). Gut microbiota of Ra and
Rb differed consistently (P,0.05; Table 2) during the 42 days
experimental period, irrespective of the choice of analytical
method (DGGE and 454) or statistical test (PERMANOVA or
ANOSIM). nMDS ordination plots of the DGGE data showed a
clear distinction between the microbiota of individuals reared in
Ra and Rb for all dates (Figure. 2), confirming the R statistic in
ANOSIM (Table 2). The comparison of water microbiota
between Ra and Rb also differed consistently (Figure 3).Active suspension systems (AS). Gut microbiota was
different between individuals reared in different AS systems at
day 07 and day 14, whereas this was not the case on day 0
(Table 2). On day 07, the five AS systems were not statistically
different when using PERMANOVA. Nevertheless, out of 10
possible pairwise comparisons, six comparisons indicated signifi-
cant differences between the five AS systems (P values of each of
the pairwise tests are not shown). ANOSIM’s R statistic suggested
a clear distinction between AS systems for both DGGE and 454
data on day 07. At day 14, the same pattern emerged (6/10
pairwise tests showed differences, and ANOSIM’s R statistic was
0.542). At days 28 and 42, AS systems were different (Table 2).
Due to lack of replicate samples pairwise comparisons between
water samples of AS systems were not possible.
To evaluate differences between RAS and AS systems, pooled
data of Ra and Rb were compared with pooled data from AS.
Pairwise comparisons (Table 3) for PERMANOVA and ANO-
SIM showed that microbiota in gut or water were different
between RAS and AS from day 07 onwards (P,0.001).
Variation in gut microbiota of larvae reared in differenttanks
The extent of variation in gut microbiota of animals reared in
replicate tanks of the same recirculation system was evaluated
based on pairwise comparisons of profiles obtained by either
DGGE (five tanks per system) or 454 pyrosequencing (two tanks
per system). On day 0, gut microbiota was similar (P.0.05 for all
Figure 3. Non metric dimensional scaling (nMDS) of water microbiota from different systems over time. Each point represents thewater microbiota from each tank. Plots are based on Bray Curtis distance after square root transformation of relative abundance DGGE data. D00, 07,14, 28, 42: sampling days 0, 7, 14, 28 & 42 respectively, AS1-5: replicate active suspension system 1 to 5, Ra & Rb: replicate recirculating system a & b.Stress values are reported for the two dimensions and are indicative of the goodness of fit of data into the plot.doi:10.1371/journal.pone.0103641.g003
Fish Gut Microbiota
PLOS ONE | www.plosone.org 7 July 2014 | Volume 9 | Issue 7 | e103641
Ta
ble
2.
Pai
rwis
eco
mp
aris
on
sb
etw
ee
nre
plic
ate
syst
em
sfo
rR
AS
and
AS
sep
arat
ely
,b
ase
do
nD
GG
Ean
d4
54
pyr
ose
qu
en
cin
gd
ata
sets
.
Sta
tist
ica
lte
stA
na
lyti
cal
Me
tho
dD
00
D0
7D
14
D2
8D
42
AS
1-5
Ra
-Rb
AS
1-5
Ra
-Rb
AS
1-5
Ra
-Rb
AS
1-5
Ra
-Rb
AS
1-5
Ra
-Rb
Pe
rm.
AN
OV
AG
UT
DG
GE
2/1
0P
:0.0
00
16
/10
P:0
.00
03
6/1
0P
:0.0
00
17
/10
P:0
.00
03
7/1
0P
:0.0
00
1
45
4P
:0.2
07
9P
:0.0
02
5P
:0.0
24
2P
:0.0
16
AN
OS
IMD
GG
ER
:0.4
28
R:0
.92
5R
:0.7
87
R:0
.77
2R
:0.5
42
R:0
.92
2R
:0.7
45
R:0
.59
6R
:0.9
07
R:0
.86
2
P:0
.00
05
P:0
.00
01
P:0
.00
01
P:0
.00
01
P:0
.00
01
P:0
.00
01
P:0
.00
01
P:0
.00
01
P:0
.00
01
P:0
.00
01
45
4R
:1R
:1R
:1R
:0.8
46
P:0
.1P
:0.0
02
P:0
.1P
:0.0
02
Pe
rm.
AN
OV
AW
AT
ER
DG
GE
P:0
.00
02
P:0
.02
12
P:0
.00
02
P:0
.00
01
P:0
.00
08
AN
OS
IMR
:0.9
96
R:0
.97
2R
:1R
:1R
:0.9
88
P:0
.00
8P
:0.0
08
P:0
.00
8P
:0.0
08
P:0
.00
8
Te
sts
we
rep
erf
orm
ed
by
sam
ple
typ
ep
er
sam
plin
gd
ay,
wit
hP
valu
es
for
eac
hco
mp
aris
on
fro
mtw
od
iffe
ren
tst
atis
tica
lte
sts
(PER
MA
NO
VA
and
AN
OSI
M).
AN
OSI
Mre
sult
sar
eco
mp
lem
en
tary
toth
eP
ERM
AN
OV
Ato
pro
vid
ein
form
atio
no
nth
ed
eg
ree
of
sep
arat
ion
be
twe
en
gro
up
s,su
gg
est
ed
by
Rst
atis
tic.
Th
e2
/10
,6/1
0&
7/1
0in
dic
ate
the
nu
mb
er
of
sig
nif
ican
to
ut
of
the
tota
lav
aila
ble
com
par
iso
ns.
D0
0,0
7,1
4,2
8,
42
:sam
plin
gd
ay0
,7,1
4,2
8&
42
resp
ect
ive
ly,
AS1
-5:
rep
licat
eac
tive
susp
en
sio
nsy
ste
m1
till
5,
Ra
&R
b:
rep
licat
ere
circ
ula
tin
gsy
ste
ma
&b
.P
valu
es
are
bas
ed
on
99
99
Mo
nte
Car
lop
erm
uta
tio
ns.
do
i:10
.13
71
/jo
urn
al.p
on
e.0
10
36
41
.t0
02
Ta
ble
3.
Pai
rwis
eco
mp
aris
on
sb
etw
ee
nR
AS
and
AS
syst
em
sb
ase
do
nD
GG
Ean
d4
54
pyr
ose
qu
en
cin
gd
ata
sets
.
Sta
tist
ica
lte
stA
na
lyti
cal
Me
tho
dR
AS
vs.
AS
D0
0D
07
D1
4D
28
D4
2
Pe
rm.
AN
OV
AG
UT
DG
GE
P:0
.07
10
P:0
.00
22
P:0
.02
02
P:0
.00
63
P:0
.00
99
45
4N
AP
:0.0
15
2N
AN
AP
:0.0
05
6
AN
OS
IMD
GG
ER
:0.2
44
P:0
.00
20
R:0
.73
1P
:0.0
00
1R
:0.4
96
P:0
.00
01
R:0
.88
1P
:0.0
00
1R
:0.8
72
P:0
.00
01
45
4N
AR
:1P
:0.0
00
1N
AN
AR
:1P
:0.0
00
1
Pe
rm.
AN
OV
AW
AT
ERD
GG
EP
:0.0
98
3P
:0.0
08
P:0
.01
87
P:0
.01
36
P:0
.00
62
AN
OS
IMR
:0.8
20
P:0
.00
10
R:0
.94
4P
:0.0
01
0R
:0.9
40
P:0
.00
03
R:1
P:0
.00
20
R:0
.99
0P
:0.0
02
0
Te
sts
we
rep
erf
orm
ed
by
sam
ple
typ
ep
er
sam
plin
gd
ay,
wit
hP
valu
es
for
eac
hco
mp
aris
on
fro
mtw
od
iffe
ren
tst
atis
tica
lte
sts
(PER
MA
NO
VA
and
AN
OSI
M).
AN
OSI
Man
alys
isis
com
ple
me
nta
ryto
PER
MA
NO
VA
asit
pro
vid
es
info
rmat
ion
on
the
de
gre
eo
fse
par
atio
nb
etw
ee
ng
rou
ps,
sug
ge
ste
db
yR
stat
isti
c.N
.A.:
No
pyr
ose
qu
en
cin
gd
ata
avai
lab
lefo
rth
atd
ay.
D0
0,
07
,1
4,
28
,4
2:
sam
plin
gd
ay0
,7,1
4,2
8&
42
resp
ect
ive
ly,
AS1
-5:
rep
licat
eac
tive
susp
en
sio
nsy
ste
m1
till
5,
Ra
&R
b:
rep
licat
ere
circ
ula
tin
gsy
ste
ma
&b
.P
valu
es
are
bas
ed
on
99
99
Mo
nte
Car
lop
erm
uta
tio
ns.
do
i:10
.13
71
/jo
urn
al.p
on
e.0
10
36
41
.t0
03
Fish Gut Microbiota
PLOS ONE | www.plosone.org 8 July 2014 | Volume 9 | Issue 7 | e103641
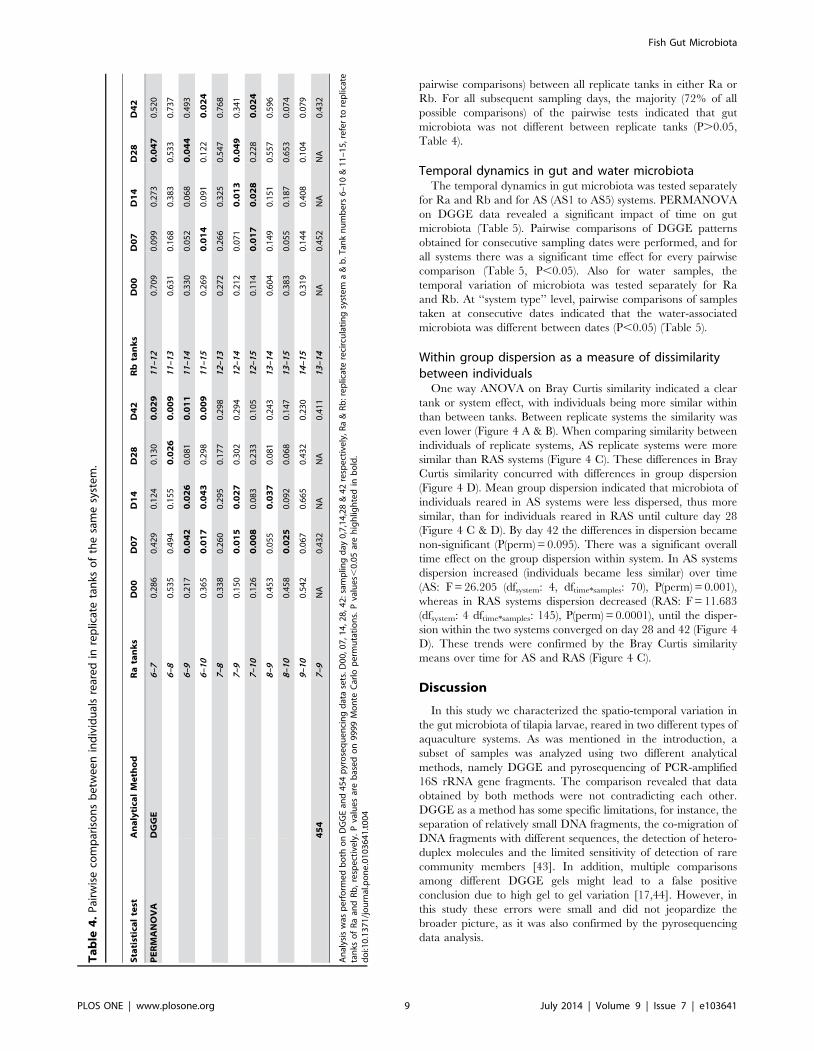
pairwise comparisons) between all replicate tanks in either Ra or
Rb. For all subsequent sampling days, the majority (72% of all
possible comparisons) of the pairwise tests indicated that gut
microbiota was not different between replicate tanks (P.0.05,
Table 4).
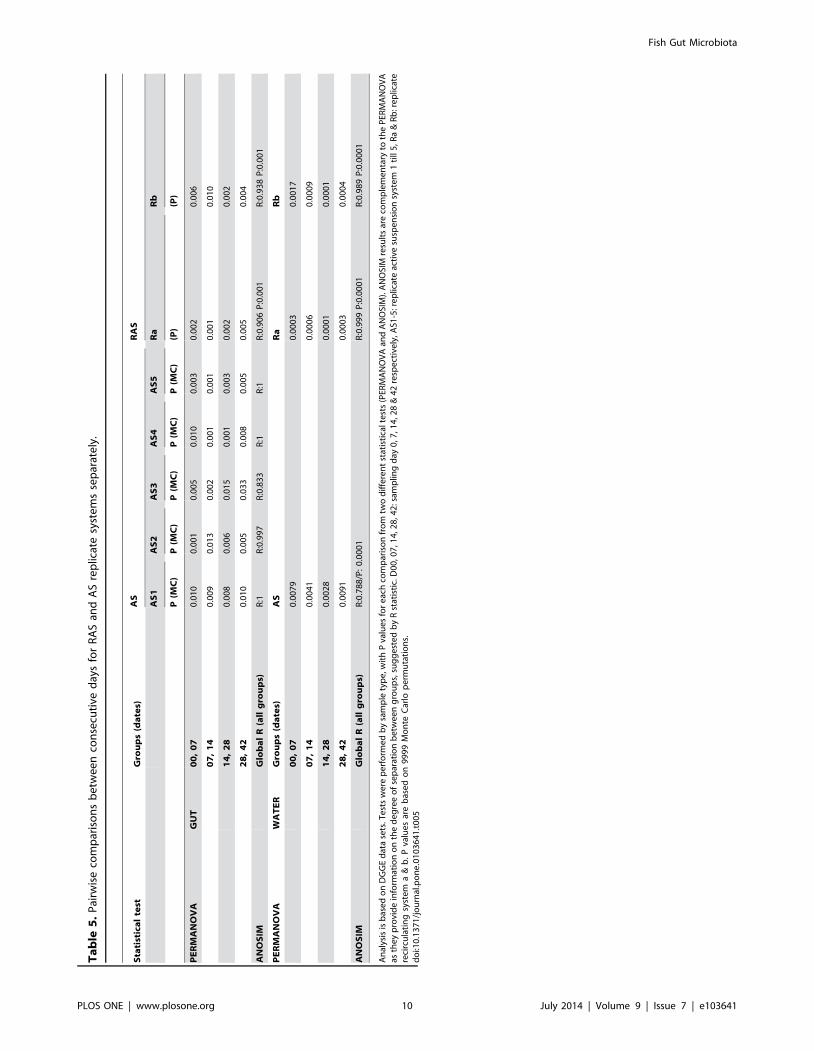
Temporal dynamics in gut and water microbiotaThe temporal dynamics in gut microbiota was tested separately
for Ra and Rb and for AS (AS1 to AS5) systems. PERMANOVA
on DGGE data revealed a significant impact of time on gut
microbiota (Table 5). Pairwise comparisons of DGGE patterns
obtained for consecutive sampling dates were performed, and for
all systems there was a significant time effect for every pairwise
comparison (Table 5, P,0.05). Also for water samples, the
temporal variation of microbiota was tested separately for Ra
and Rb. At ‘‘system type’’ level, pairwise comparisons of samples
taken at consecutive dates indicated that the water-associated
microbiota was different between dates (P,0.05) (Table 5).
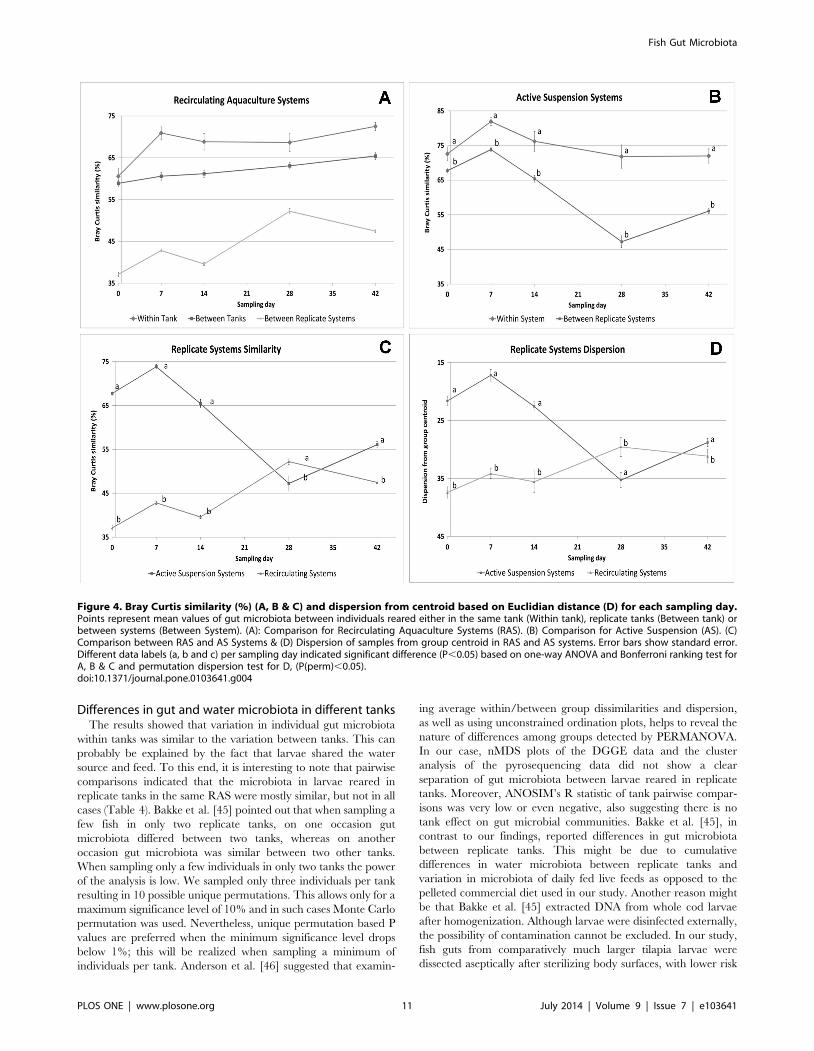
Within group dispersion as a measure of dissimilaritybetween individuals
One way ANOVA on Bray Curtis similarity indicated a clear
tank or system effect, with individuals being more similar within
than between tanks. Between replicate systems the similarity was
even lower (Figure 4 A & B). When comparing similarity between
individuals of replicate systems, AS replicate systems were more
similar than RAS systems (Figure 4 C). These differences in Bray
Curtis similarity concurred with differences in group dispersion
(Figure 4 D). Mean group dispersion indicated that microbiota of
individuals reared in AS systems were less dispersed, thus more
similar, than for individuals reared in RAS until culture day 28
(Figure 4 C & D). By day 42 the differences in dispersion became
non-significant (P(perm) = 0.095). There was a significant overall
time effect on the group dispersion within system. In AS systems
dispersion increased (individuals became less similar) over time
whereas in RAS systems dispersion decreased (RAS: F = 11.683
(dfsystem: 4 dftime*samples: 145), P(perm) = 0.0001), until the disper-
sion within the two systems converged on day 28 and 42 (Figure 4
D). These trends were confirmed by the Bray Curtis similarity
means over time for AS and RAS (Figure 4 C).
Discussion
In this study we characterized the spatio-temporal variation in
the gut microbiota of tilapia larvae, reared in two different types of
aquaculture systems. As was mentioned in the introduction, a
subset of samples was analyzed using two different analytical
methods, namely DGGE and pyrosequencing of PCR-amplified
16S rRNA gene fragments. The comparison revealed that data
obtained by both methods were not contradicting each other.
DGGE as a method has some specific limitations, for instance, the
separation of relatively small DNA fragments, the co-migration of
DNA fragments with different sequences, the detection of hetero-
duplex molecules and the limited sensitivity of detection of rare
community members [43]. In addition, multiple comparisons
among different DGGE gels might lead to a false positive
conclusion due to high gel to gel variation [17,44]. However, in
this study these errors were small and did not jeopardize the
broader picture, as it was also confirmed by the pyrosequencing
data analysis.
Ta
ble
4.
Pai
rwis
eco
mp
aris
on
sb
etw
ee
nin
div
idu
als
rear
ed
inre
plic
ate
tan
kso
fth
esa
me
syst
em
.
Sta
tist
ica
lte
stA
na
lyti
cal
Me
tho
dR
ata
nk
sD
00
D0
7D
14
D2
8D
42
Rb
tan
ks
D0
0D
07
D1
4D
28
D4
2
PE
RM
AN
OV
AD
GG
E6
–70
.28
60
.42
90
.12
40
.13
00
.02
91
1–1
20
.70
90
.09
90
.27
30
.04
70
.52
0
6–8
0.5
35
0.4
94
0.1
55
0.0
26
0.0
09
11
–13
0.6
31
0.1
68
0.3
83
0.5
33
0.7
37
6–9
0.2
17
0.0
42
0.0
26
0.0
81
0.0
11
11
–14
0.3
30
0.0
52
0.0
68
0.0
44
0.4
93
6–1
00
.36
50
.01
70
.04
30
.29
80
.00
91
1–1
50
.26
90
.01
40
.09
10
.12
20
.02
4
7–8
0.3
38
0.2
60
0.2
95
0.1
77
0.2
98
12
–13
0.2
72
0.2
66
0.3
25
0.5
47
0.7
68
7–9
0.1
50
0.0
15
0.0
27
0.3
02
0.2
94
12
–14
0.2
12
0.0
71
0.0
13
0.0
49
0.3
41
7–1
00
.12
60
.00
80
.08
30
.23
30
.10
51
2–1
50
.11
40
.01
70
.02
80
.22
80
.02
4
8–9
0.4
53
0.0
55
0.0
37
0.0
81
0.2
43
13
–14
0.6
04
0.1
49
0.1
51
0.5
57
0.5
96
8–1
00
.45
80
.02
50
.09
20
.06
80
.14
71
3–1
50
.38
30
.05
50
.18
70
.65
30
.07
4
9–1
00
.54
20
.06
70
.66
50
.43
20
.23
01
4–1
50
.31
90
.14
40
.40
80
.10
40
.07
9
45
47
–9N
A0
.43
2N
AN
A0
.41
11
3–1
4N
A0
.45
2N
AN
A0
.43
2
An
alys
isw
asp
erf
orm
ed
bo
tho
nD
GG
Ean
d4
54
pyr
ose
qu
en
cin
gd
ata
sets
.D0
0,0
7,1
4,2
8,4
2:s
amp
ling
day
0,7
,14
,28
&4
2re
spe
ctiv
ely
,Ra
&R
b:r
ep
licat
ere
circ
ula
tin
gsy
ste
ma
&b
.Tan
kn
um
be
rs6
–1
0&
11
–1
5,r
efe
rto
rep
licat
eta
nks
of
Ra
and
Rb
,re
spe
ctiv
ely
.P
valu
es
are
bas
ed
on
99
99
Mo
nte
Car
lop
erm
uta
tio
ns.
Pva
lue
s,0
.05
are
hig
hlig
hte
din
bo
ld.
do
i:10
.13
71
/jo
urn
al.p
on
e.0
10
36
41
.t0
04
Fish Gut Microbiota
PLOS ONE | www.plosone.org 9 July 2014 | Volume 9 | Issue 7 | e103641
Ta
ble
5.
Pai
rwis
eco
mp
aris
on
sb
etw
ee
nco
nse
cuti
ved
ays
for
RA
San
dA
Sre
plic
ate
syst
em
sse
par
ate
ly.
Sta
tist
ica
lte
stG
rou
ps
(da
tes)
AS
RA
S
AS
1A
S2
AS
3A
S4
AS
5R
aR
b
P(M
C)
P(M
C)
P(M
C)
P(M
C)
P(M
C)
(P)
(P)
PE
RM
AN
OV
AG
UT
00
,0
70
.01
00
.00
10
.00
50
.01
00
.00
30
.00
20
.00
6
07
,1
40
.00
90
.01
30
.00
20
.00
10
.00
10
.00
10
.01
0
14
,2
80
.00
80
.00
60
.01
50
.00
10
.00
30
.00
20
.00
2
28
,4
20
.01
00
.00
50
.03
30
.00
80
.00
50
.00
50
.00
4
AN
OS
IMG
lob
al
R(a
llg
rou
ps)
R:1
R:0
.99
7R
:0.8
33
R:1
R:1
R:0
.90
6P
:0.0
01
R:0
.93
8P
:0.0
01
PE
RM
AN
OV
AW
AT
ER
Gro
up
s(d
ate
s)A
SR
aR
b
00
,0
70
.00
79
0.0
00
30
.00
17
07
,1
40
.00
41
0.0
00
60
.00
09
14
,2
80
.00
28
0.0
00
10
.00
01
28
,4
20
.00
91
0.0
00
30
.00
04
AN
OS
IMG
lob
al
R(a
llg
rou
ps)
R:0
.78
8/P
:0
.00
01
R:0
.99
9P
:0.0
00
1R
:0.9
89
P:0
.00
01
An
alys
isis
bas
ed
on
DG
GE
dat
ase
ts.T
est
sw
ere
pe
rfo
rme
db
ysa
mp
lety
pe
,wit
hP
valu
es
for
eac
hco
mp
aris
on
fro
mtw
od
iffe
ren
tst
atis
tica
lte
sts
(PER
MA
NO
VA
and
AN
OSI
M).
AN
OSI
Mre
sult
sar
eco
mp
lem
en
tary
toth
eP
ERM
AN
OV
Aas
the
yp
rovi
de
info
rmat
ion
on
the
de
gre
eo
fse
par
atio
nb
etw
ee
ng
rou
ps,
sug
ge
ste
db
yR
stat
isti
c.D
00
,07
,14
,28
,42
:sam
plin
gd
ay0
,7,1
4,2
8&
42
resp
ect
ive
ly,A
S1-5
:re
plic
ate
acti
vesu
spe
nsi
on
syst
em
1ti
ll5
,Ra
&R
b:r
ep
licat
ere
circ
ula
tin
gsy
ste
ma
&b
.P
valu
es
are
bas
ed
on
99
99
Mo
nte
Car
lop
erm
uta
tio
ns.
do
i:10
.13
71
/jo
urn
al.p
on
e.0
10
36
41
.t0
05
Fish Gut Microbiota
PLOS ONE | www.plosone.org 10 July 2014 | Volume 9 | Issue 7 | e103641
Differences in gut and water microbiota in different tanksThe results showed that variation in individual gut microbiota
within tanks was similar to the variation between tanks. This can
probably be explained by the fact that larvae shared the water
source and feed. To this end, it is interesting to note that pairwise
comparisons indicated that the microbiota in larvae reared in
replicate tanks in the same RAS were mostly similar, but not in all
cases (Table 4). Bakke et al. [45] pointed out that when sampling a
few fish in only two replicate tanks, on one occasion gut
microbiota differed between two tanks, whereas on another
occasion gut microbiota was similar between two other tanks.
When sampling only a few individuals in only two tanks the power
of the analysis is low. We sampled only three individuals per tank
resulting in 10 possible unique permutations. This allows only for a
maximum significance level of 10% and in such cases Monte Carlo
permutation was used. Nevertheless, unique permutation based P
values are preferred when the minimum significance level drops
below 1%; this will be realized when sampling a minimum of
individuals per tank. Anderson et al. [46] suggested that examin-
ing average within/between group dissimilarities and dispersion,
as well as using unconstrained ordination plots, helps to reveal the
nature of differences among groups detected by PERMANOVA.
In our case, nMDS plots of the DGGE data and the cluster
analysis of the pyrosequencing data did not show a clear
separation of gut microbiota between larvae reared in replicate
tanks. Moreover, ANOSIM’s R statistic of tank pairwise compar-
isons was very low or even negative, also suggesting there is no
tank effect on gut microbial communities. Bakke et al. [45], in
contrast to our findings, reported differences in gut microbiota
between replicate tanks. This might be due to cumulative
differences in water microbiota between replicate tanks and
variation in microbiota of daily fed live feeds as opposed to the
pelleted commercial diet used in our study. Another reason might
be that Bakke et al. [45] extracted DNA from whole cod larvae
after homogenization. Although larvae were disinfected externally,
the possibility of contamination cannot be excluded. In our study,
fish guts from comparatively much larger tilapia larvae were
dissected aseptically after sterilizing body surfaces, with lower risk
Figure 4. Bray Curtis similarity (%) (A, B & C) and dispersion from centroid based on Euclidian distance (D) for each sampling day.Points represent mean values of gut microbiota between individuals reared either in the same tank (Within tank), replicate tanks (Between tank) orbetween systems (Between System). (A): Comparison for Recirculating Aquaculture Systems (RAS). (B) Comparison for Active Suspension (AS). (C)Comparison between RAS and AS Systems & (D) Dispersion of samples from group centroid in RAS and AS systems. Error bars show standard error.Different data labels (a, b and c) per sampling day indicated significant difference (P,0.05) based on one-way ANOVA and Bonferroni ranking test forA, B & C and permutation dispersion test for D, (P(perm),0.05).doi:10.1371/journal.pone.0103641.g004
Fish Gut Microbiota
PLOS ONE | www.plosone.org 11 July 2014 | Volume 9 | Issue 7 | e103641
for contamination. High within tank variation in gut bacteria of
cod larvae was also reported by Fjellheim et al. [13]. Here too,
larvae were fed live feeds, and whole larvae were used for DNA
extraction. In addition, larvae were sampled only from one tank
per treatment, and conclusions were drawn based on a combina-
tion of culture dependent and independent techniques. These
results should be considered with caution, because the cultivability
of microbiota varies with species composition.
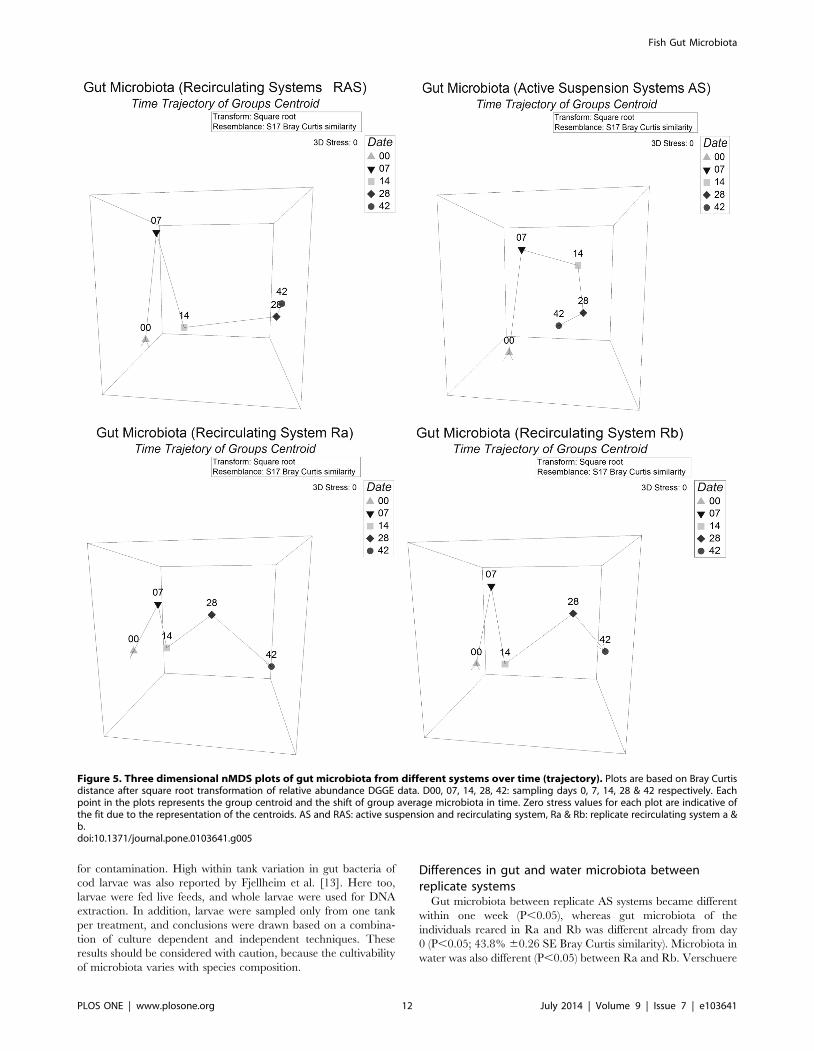
Differences in gut and water microbiota betweenreplicate systems
Gut microbiota between replicate AS systems became different
within one week (P,0.05), whereas gut microbiota of the
individuals reared in Ra and Rb was different already from day
0 (P,0.05; 43.8% 60.26 SE Bray Curtis similarity). Microbiota in
water was also different (P,0.05) between Ra and Rb. Verschuere
Figure 5. Three dimensional nMDS plots of gut microbiota from different systems over time (trajectory). Plots are based on Bray Curtisdistance after square root transformation of relative abundance DGGE data. D00, 07, 14, 28, 42: sampling days 0, 7, 14, 28 & 42 respectively. Eachpoint in the plots represents the group centroid and the shift of group average microbiota in time. Zero stress values for each plot are indicative ofthe fit due to the representation of the centroids. AS and RAS: active suspension and recirculating system, Ra & Rb: replicate recirculating system a &b.doi:10.1371/journal.pone.0103641.g005
Fish Gut Microbiota
PLOS ONE | www.plosone.org 12 July 2014 | Volume 9 | Issue 7 | e103641
et al. [47] monitored the water microbial communities in three
patterns and r/K-strategists in the intensive culture of Artemia juveniles. J ApplMicrobiol 83: 603–612.
48. Mouchet M a, Bouvier C, Bouvier T, Troussellier M, Escalas A, et al. (2012)Genetic difference but functional similarity among fish gut bacterial commu-
nities through molecular and biochemical fingerprints. FEMS Microbiol Ecol79: 568–580.
49. Bell T, Newman JA, Silverman BW, Turner SL, Lilley AK (2005) The
contribution of species richness and composition to bacterial services. Nature436: 1157–1160.
50. Wilson J, Castro L (2010) Morphological diversity of the gastrointestinal tract infishes. Fish Physiol 30: 1–55.
51. Burford M, Thompson P, McIntosh R (2003) Nutrient and microbial dynamics
in high-intensity, zero-exchange shrimp ponds in Belize. Aquaculture 219: 393–411.
52. Avnimelech Y (2007) Feeding with microbial flocs by tilapia in minimaldischarge bio-flocs technology ponds. Aquaculture 264: 140–147.
Fish Gut Microbiota
PLOS ONE | www.plosone.org 15 July 2014 | Volume 9 | Issue 7 | e103641