October, 2013 Ackerman, R. (in press). The Diminishing Criterion Model for metacognitive regulation of time investment. Journal of Experimental Psychology: General. http://www.apa.org/pubs/journals/xge/ This article may not exactly replicate the final version published in the APA journal. It is not the copy of record. The Diminishing Criterion Model for Metacognitive Regulation of Time Investment Rakefet Ackerman Faculty of Industrial Engineering and Management, Technion–Israel Institute of Technology, Haifa, Israel Corresponding Author - E-mail: [email protected].
Transcript
October, 2013
Ackerman, R. (in press). The Diminishing Criterion Model for metacognitive regulation of
time investment. Journal of Experimental Psychology: General. http://www.apa.org/pubs/journals/xge/
This article may not exactly replicate the final version published in the APA journal.
It is not the copy of record.
The Diminishing Criterion Model for
Metacognitive Regulation of Time Investment
Rakefet Ackerman
Faculty of Industrial Engineering and Management,
Technion–Israel Institute of Technology, Haifa, Israel
generalization beyond Koriat et al.’s (2006) stimuli, CRA problems offer another advantage
for the current study, in that they require complex processing with only a minimal reading
challenge (see Thompson et al., 2013, on the difference between perceptual fluency and
1 CRA problems are a subset of the Remote Associate Test (RAT; Mednick, 1962). The
distinguishing feature of CRA problems is that the solution word is not merely associated with each cue word, as is the case in RAT problems, but forms a compound word or two-word phrase with each one.
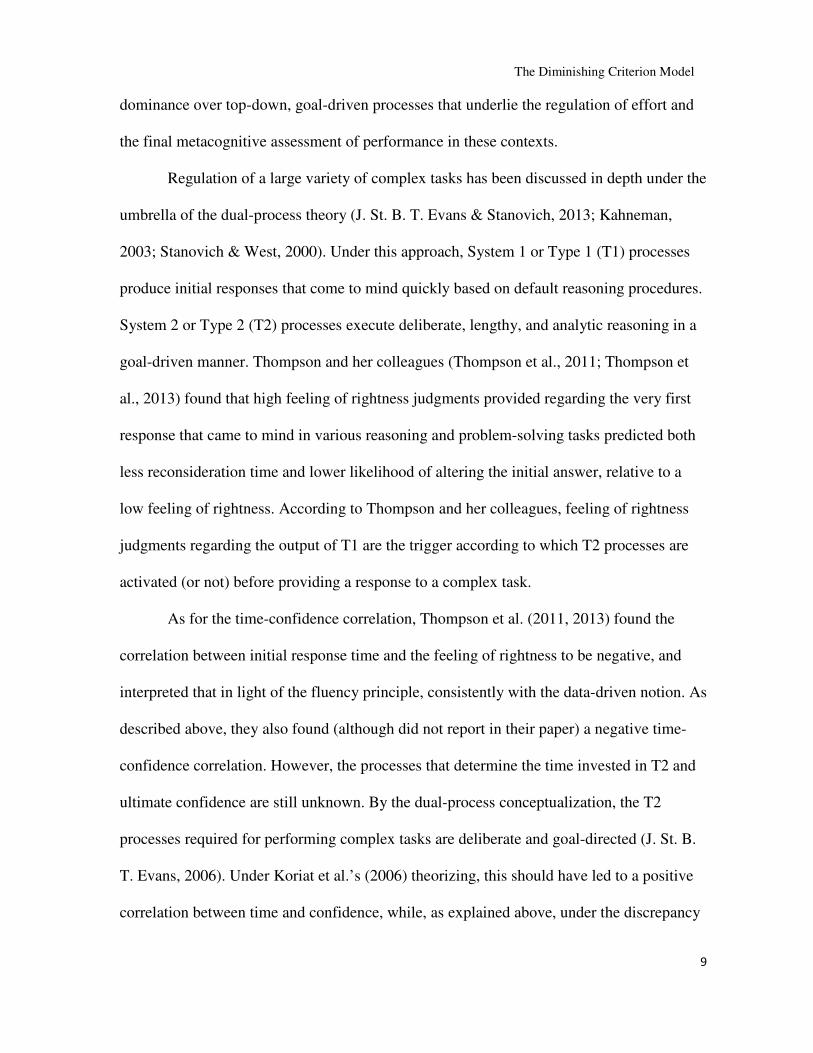
The Diminishing Criterion Model
13
processing fluency). As will be seen, this was important for Experiment 1, as it allowed
comparison between a (complex) CRA task, which involves reading three words, and a
(simple) word-pair memorization task, involving reading of two words per item.
Experiment 5 generalized the findings to yet another type of a problem-solving task:
misleading math problems of the type often used for studies in the context of the dual-
process theory. For both task types, the relevant metacognitive judgment is a confidence
rating, which reflects the solver’s assessment of the likelihood that the solution is correct.
The detailed predictions derived from the DCM are explained in the introduction to
each experiment. In brief, the purpose of Experiment 1 was to expose boundary conditions
for the bottom-up effect of fluency and a difference in this respect between simple and
complex tasks. This difference calls for an alternative explanation for the negative
correlations in complex tasks. Experiment 2 and Experiment 3 examined the prediction that
manipulations that have been found to lower the stopping criterion, low incentive for
success and time pressure, in fact do not affect all responses equally, but affect instances
that involve lengthy processing more than those involving quick processing. Experiment 3,
Experiment 4, and Experiment 5 were based on findings that intermediate metacognitive
judgments rise (either linearly, logarithmically, or with a sudden spike) during learning,
reasoning, and problem solving (Ackerman & Goldsmith, 2011; Metcalfe & Wiebe, 1987;
Thompson et al., 2011; Vernon & Usher, 2003). These experiments used intermediate
confidence ratings to examine whether this upwards progress coexists with a negative time-
confidence correlation. Experiment 4 and Experiment 5 also examined the prediction that a
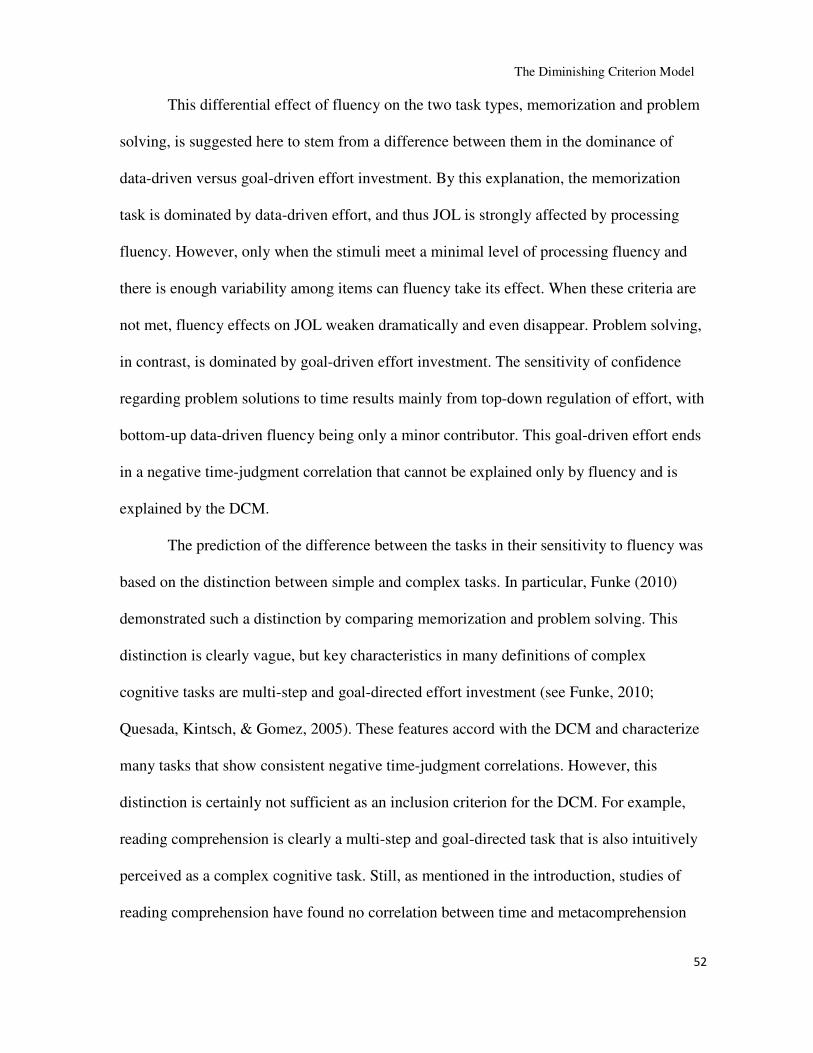
free-report procedure (which allows participants to provide a “don’t know” response) does
not eliminate volunteering of low-confidence solutions after lengthy thinking, even under
The Diminishing Criterion Model
14
conditions of time pressure. This point responds to the question raised by cases C and D in
Figure 2, where a slow problem-solving process eventually yields a solution at a low level
of confidence. The free-report procedure allows examination of whether lengthy low-
confidence solutions indeed satisfy a diminishing stopping criterion, or reflect
abandonment of solving attempts which result in responses participants would prefer to
withhold, if given the option.
Experiment 1
As explained above, previous studies have suggested that the negative time-
judgment correlation seen consistently in both simple and complex tasks stems from
fluency, where respondents use ease of processing as a bottom-up cue for their JOL or
confidence judgments (e.g., Kelley & Lindsay, 1993; Koriat et al., 2006). The DCM
proposes that in fact, this negative correlation stems from processing fluency only in simple
tasks, while in more complex tasks, it stems from top-down regulation. The former are
tasks in which data-driven regulation dominates, while in the latter, goal-driven regulation
dominates.
The aim of Experiment 1 was to contrast a simple and a complex task, both of
which show overall negative time-judgment correlations, and expose a difference between
them in their association with processing fluency. The chosen tasks were word-pair
memorization and CRA problems. As explained above, CRA problems share a minimal
reading challenge with paired associates, allowing a focus on task-directed processing
efforts.
Sensitivity to processing fluency was examined by including some highly difficult
items in both tasks. Studies of memorization processes often combine related and unrelated
The Diminishing Criterion Model
15
paired associates (e.g., SOCK-SHOE vs. KITE-POT), and find consistent negative time-
judgment correlations (e.g., Koriat et al., 2006; Undorf & Erdfelder, 2011). However, it is
well established in the literature that metacognitive judgments are more sensitive to item
characteristics, such as difficulty, when there is within-participant and even within-block
variability (Koriat et al., in press; Koriat, Bjork, Sheffer, & Bar, 2004; Yue, Castel, &
Bjork, 2013), as is the case with many other judgments (see Unkelbach & Greifeneder,
2013 for a review). For instance, Koriat, Ackerman, Lockl, and Schneider (2009) found
(with a sample of 4th graders) a stronger negative time-JOL correlation with a mixed list,
including related and unrelated word pairs, than with a list containing only unrelated pairs,
despite greater time variability in the latter. This finding raises some doubts regarding the
strength of the association between time and JOL when processing the unrelated pairs,
which are more challenging and thus less fluent. With CRAs, in contrast, Ackerman and
Zalmanov (2012) found the negative time-confidence correlation to be as strong for wrong
responses as for correct responses, although the former generally took longer to provide.
Thus, low processing fluency did not weaken the correlation.
The hypothesis guiding the design of the present experiment was that difficult items
in both tasks would expose a boundary condition for the dependency of metacognitive
judgments on processing fluency. That is, it was hypothesized that for word-pair
memorization, only relatively easy items would show sensitivity of JOLs to invested time,
while with CRAs, a negative time-confidence correlation would be seen regardless of the
difficulty level. The explanation offered here, and examined in the following experiments,
is that for CRAs the negative correlation does not stem from fluency as the main source,
but rather from top-down regulation with a diminishing stopping criterion.
The Diminishing Criterion Model
16
How can the challenge imposed by word pairs be increased? Notably, in commonly
used word pairs, the stimuli are associations between familiar words. Several studies using
paired associates have challenged participants by employing less familiar stimuli, such as
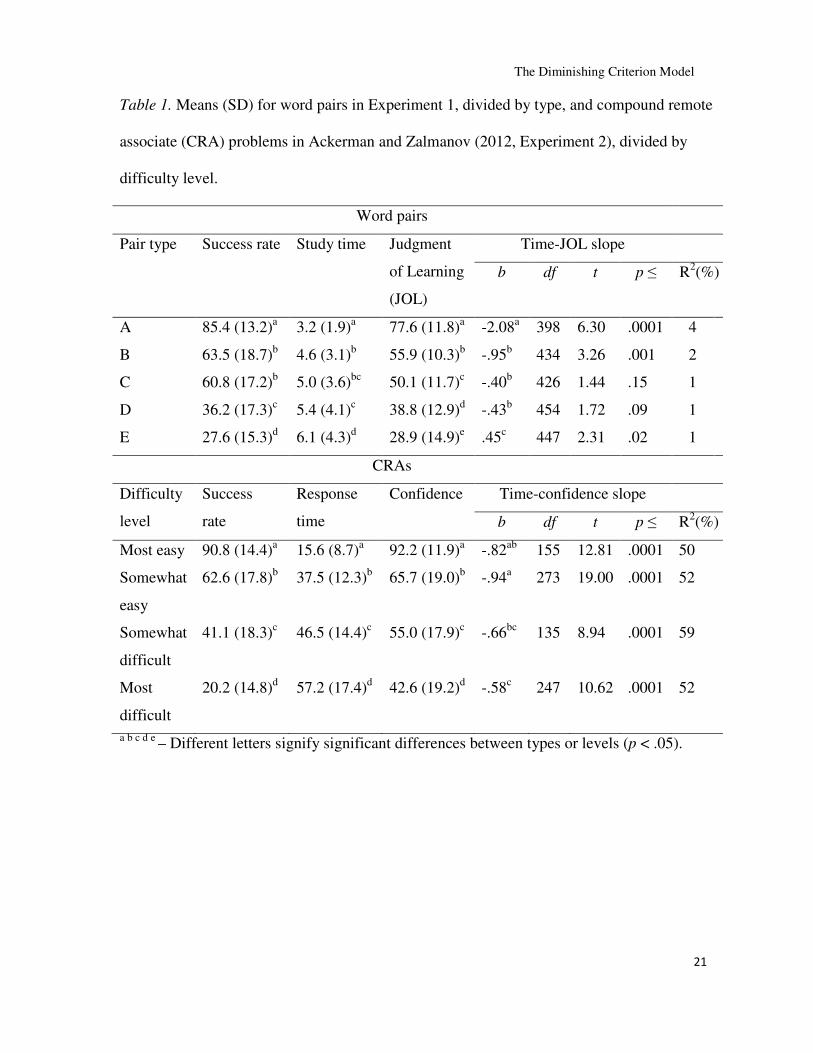
a b c d e – Different letters signify significant differences between types or levels (p < .05).
The Diminishing Criterion Model
22
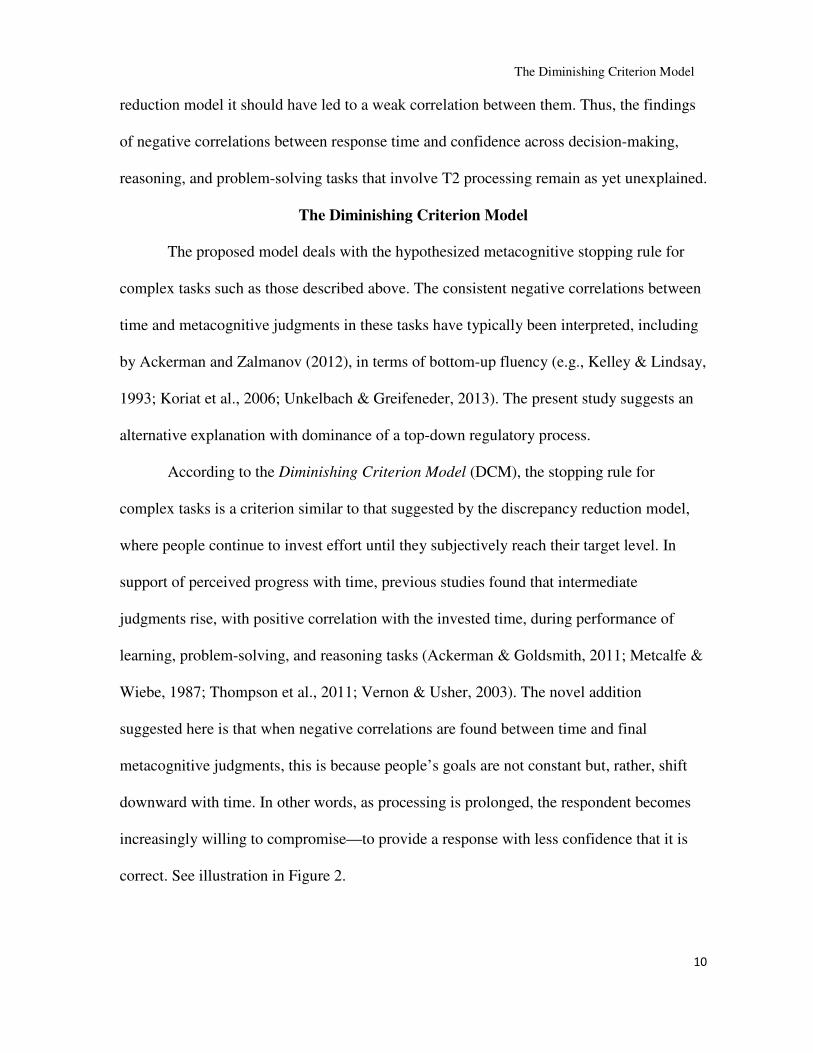
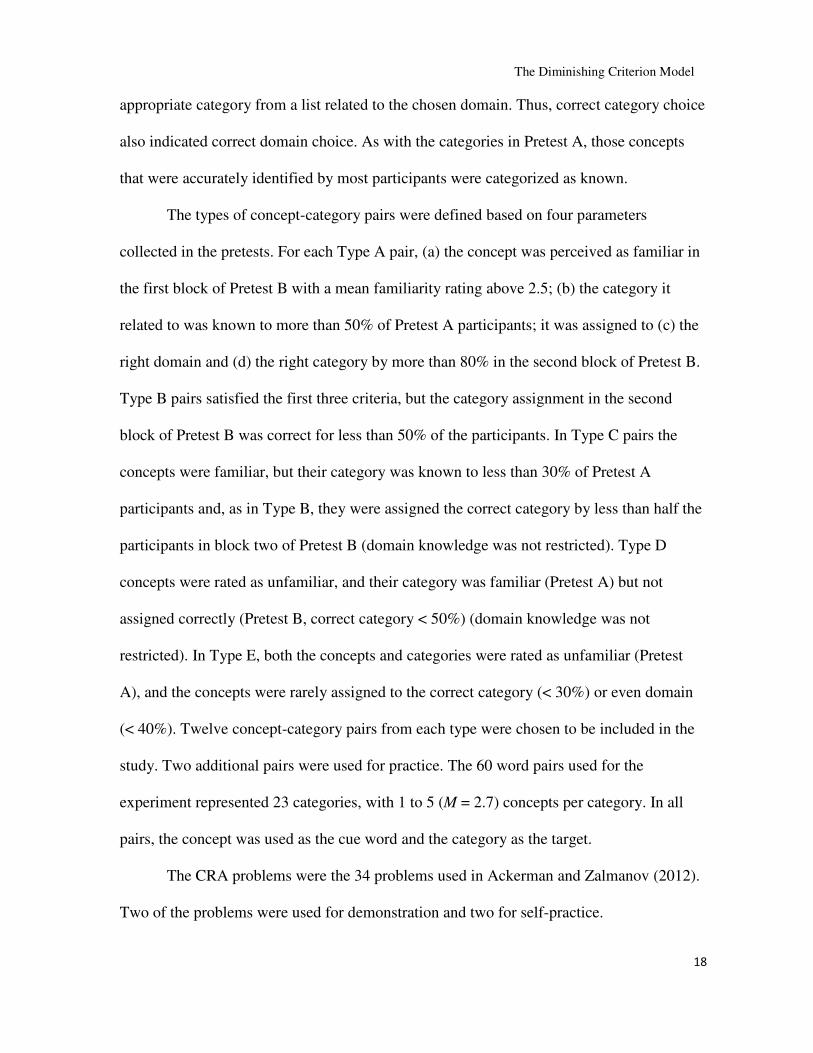
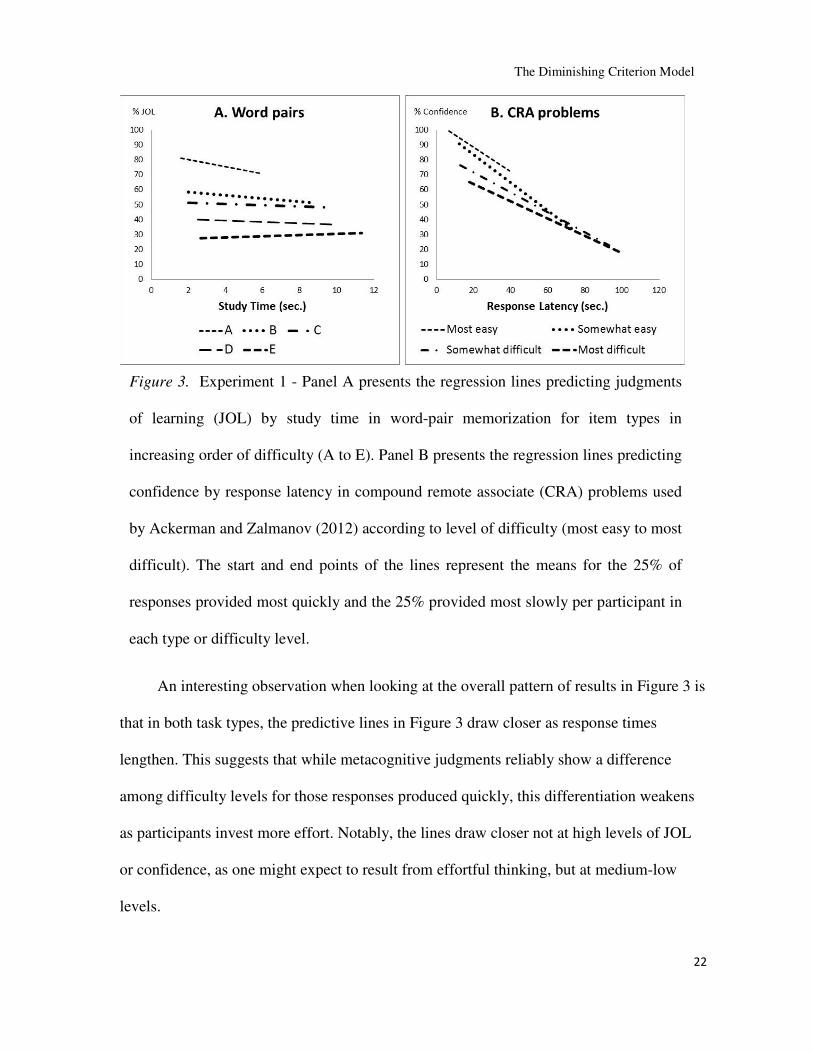
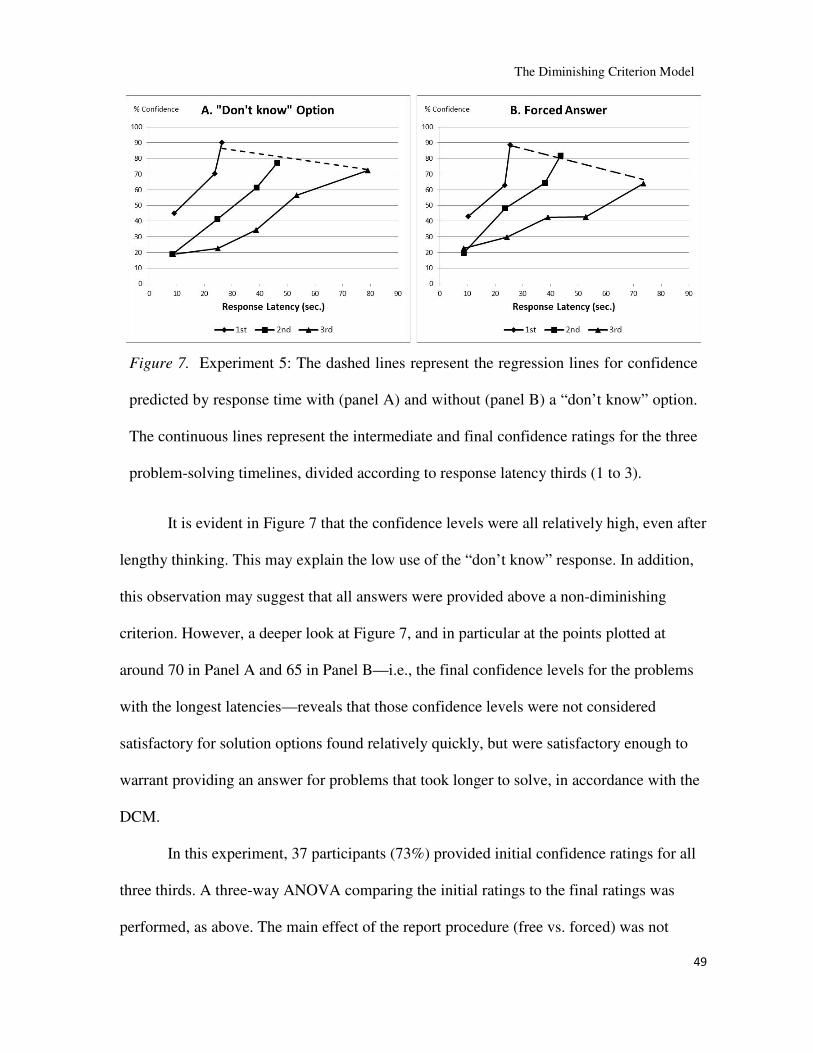
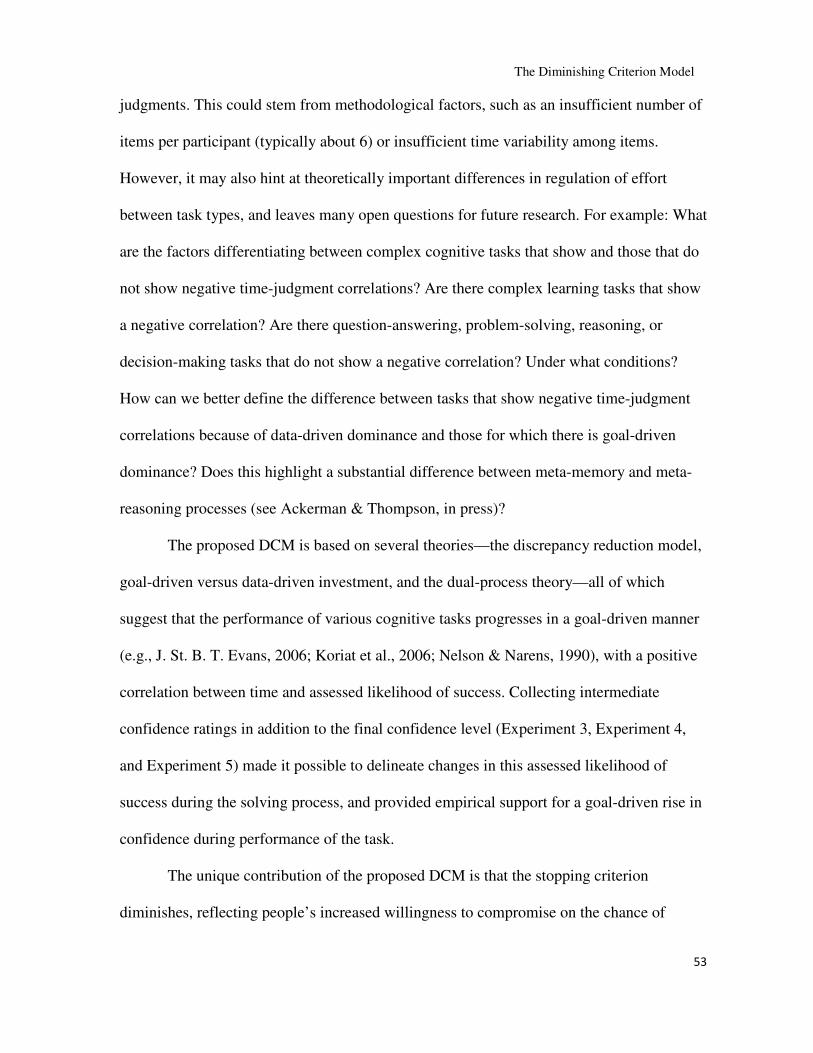
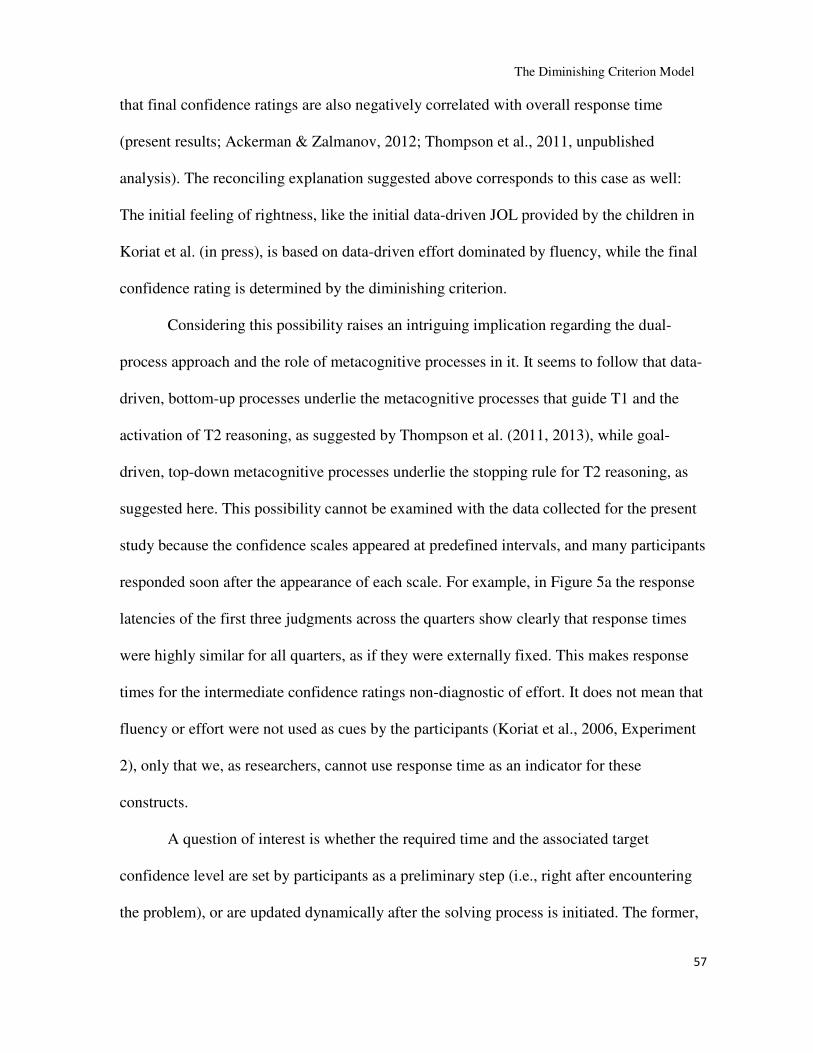
An interesting observation when looking at the overall pattern of results in Figure 3 is
that in both task types, the predictive lines in Figure 3 draw closer as response times
lengthen. This suggests that while metacognitive judgments reliably show a difference
among difficulty levels for those responses produced quickly, this differentiation weakens
as participants invest more effort. Notably, the lines draw closer not at high levels of JOL
or confidence, as one might expect to result from effortful thinking, but at medium-low
levels.
Figure 3. Experiment 1 - Panel A presents the regression lines predicting judgments
of learning (JOL) by study time in word-pair memorization for item types in
increasing order of difficulty (A to E). Panel B presents the regression lines predicting
confidence by response latency in compound remote associate (CRA) problems used
by Ackerman and Zalmanov (2012) according to level of difficulty (most easy to most
difficult). The start and end points of the lines represent the means for the 25% of
responses provided most quickly and the 25% provided most slowly per participant in
each type or difficulty level.
The Diminishing Criterion Model
23
A closer look at the findings supports the prediction that the negative time-judgment
correlation depends on the type and difficulty of the task. In word-pair memorization, the
effect sizes of the regression lines (last column in Table 1) were much weaker when the
data were broken down by difficulty level than the overall effect reported above, when the
data were considered across difficulty levels. The study time-JOL correlation was negative
but weak for types A and B. It was weaker for type B, which involved less-familiar
associations, than for type A, where the associations were chosen to be well-known. For
types C and D, time did not reliably predict JOL, and for type E the relationship was
actually positive, but weak. For the problem-solving task, in contrast, the negative time-
confidence relationships had consistent large effects, similar in size to the overall effect
across difficulty levels. Nevertheless, in this case as well, the slopes were shallower for the
more challenging items.
Why does the predictive value of latency for confidence in CRA answers have such a
strong effect? A potential alternative explanation for considering the negative confidence
slopes as associated with response times is that confidence is tightly associated with answer
accuracy, and correct solutions are provided more quickly than wrong solutions. Indeed,
this was the case under all conditions, all ps < .0001. This information source was absent
for participants in the memorization task when they rated their JOLs, because the
judgments were provided immediately after studying, with both words present, without a
diagnostic attempt to recall them (the interested reader may refer to explanations of the
delayed JOL effect, Dunlosky & Nelson, 1992; see Rhodes & Tauber, 2011 for a review).
When solution accuracy was controlled for (partialled out) in the regression analyses, the
latency-confidence slopes remained significantly negative, all ps < .0001 with residual
The Diminishing Criterion Model
24
effect sizes above 18%. This finding assures us that the association between latency and
confidence is strong above and beyond the association between latency and accuracy (see
additional support in Ackerman & Zalmanov, 2012). To ensure a focus on the effect of
latency on confidence, accuracy was controlled for in all the time-confidence regression
analyses reported in this paper.
The differences between the tasks in the strength and consistency of the association
between time and metacognitive judgment demonstrates that bottom-up fluency does not
always provide a satisfactory explanation for the negative time-judgment correlation. For
the word-pair memorization task, the negative correlation depends on the items’ processing
fluency and pronounced difficulty variability among them. The CRA problems, in contrast,
show consistent negative time-confidence correlations, regardless of processing fluency.
The explanation suggested here is that word-pair memorization is a simple task dominated
by bottom-up fluency, which thus falls out of the scope of the DCM, while CRA problems
represent a complex task dominated by a top-down regulatory process that nevertheless
ends up with a negative correlation, and that fits the scope of the DCM. It should be noted,
however, that although by the DCM top-down processes dominate in leading to the
negative time-judgment correlations in complex tasks, this does not preclude fluency
effects on these tasks as well, as reflected in the slope attenuation with difficulty (Figure 3,
Panel B; see General Discussion).
Experiment 2
The aim of Experiment 2 was to begin examining the predictions derived from the
DCM by replicating the results of Koriat et al. (2006, Experiment 7) and considering
evidence for the proposed alternative explanation for the negative time-confidence
The Diminishing Criterion Model
25
correlation. Koriat et al. manipulated incentives for success by allocating low or high point
values to each item. In traditional regulation studies, such motivation manipulation was
hypothesized to shift the stopping criterion downwards or upwards, respectively (e.g.,
Koriat & Goldsmith, 1996; Thiede & Dunlosky, 1999). These theories did not take into
account the time it takes to perform the task as a factor that affects the criterion level.
Similarly, the goal-driven explanation of Koriat et al. (2006) predicts a similar shift in the
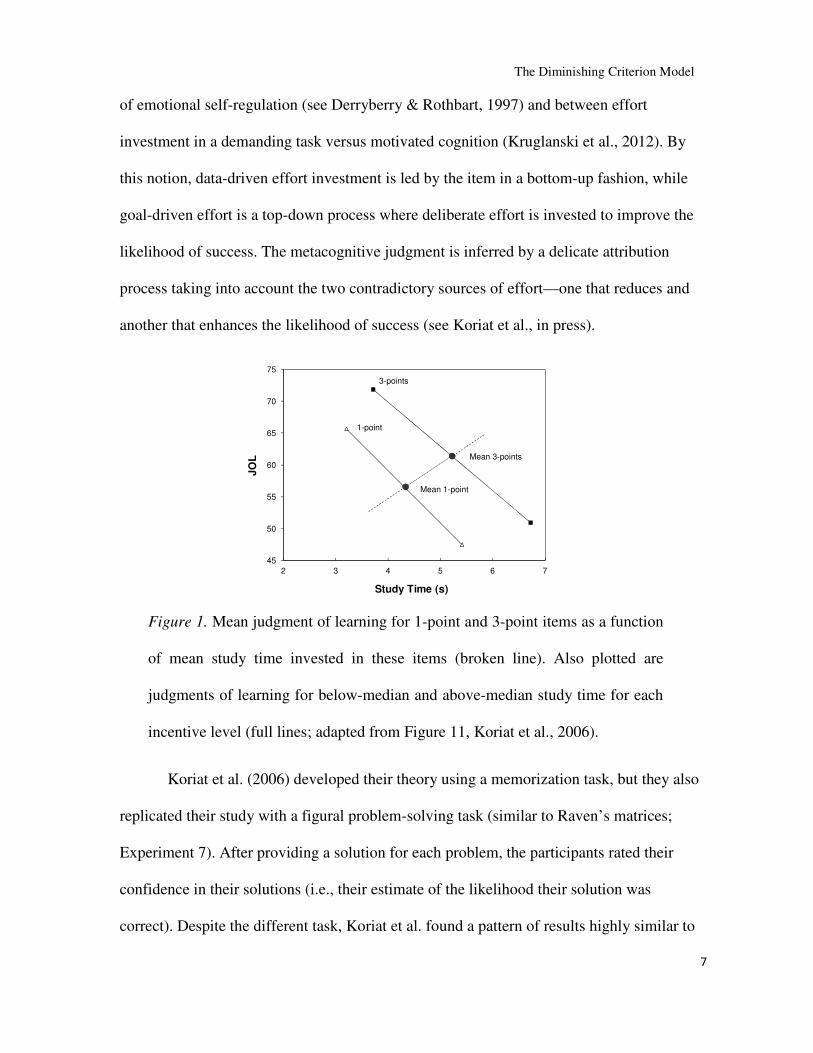
stopping criterion for both quickly and slowly provided responses (see Figure 1). The
prediction under the DCM, in contrast, is that the stopping criterion should not be affected
by the motivation manipulation for responses provided quickly. That is, early in the solving
process the criterion is expected to be high regardless of the incentive, because until
sufficient time has passed there is no reason to compromise. The effect of the motivation
manipulation was expected to manifest itself in a more rapid fall in the criterion level for
low-incentive items than for high-incentive items. This should lead to a confidence
difference between the incentive levels only for responses that take some time to produce.
Experiment 2 was designed to distinguish between these two possibilities.
In this experiment, an incentive group and a control group faced CRA problems.
For the incentive group, half the problems were assigned 1 point and the others 5 points,
indicating higher priority. The overall pattern of results was expected to replicate the
findings of Koriat et al., who used Raven-like matrices as their problem-solving task, in
that both were expected to end up with negative time-confidence correlations, and both
tasks were hypothesized to be dominated by goal-driven regulation of effort. However, in
addition, using a mixed linear regression to predict confidence by response latency was
expected to expose the pattern of results predicted by the DCM. By this hypothesis, the
The Diminishing Criterion Model
26
predicted pattern was concealed in the analysis of Koriat et al. by the median split
methodology (see Figure 1). Specifically, the use of a regression model would expose any
differences between the incentive levels at the regression line origins (intersects with the Y
axis) and in the slopes of the predictive lines. According to Koriat et al. (2006) there should
be a difference in the origins but not in the slopes, while according to the DCM, it should
be vice versa.
The control group solved the CRA problems with no particular instructions, as in
Ackerman and Zalmanov (2012, Experiment 2—the experiment which provided the data
analyzed in Experiment 1 above). Their results provided the baseline for this study. An
open question was whether in the incentive group, relative to the control group, (a) high
incentives would attenuate the slope (less compromise), suggesting stronger motivation for
success; (b) low incentives would lead to a steeper slope (greater compromise), suggesting
greater readiness to compromise on confidence for the less-important items; or (c) both.
Method
Participants. Sixty undergraduates participated in the experiment for course credit
or for payment (Mage = 25.6; 28% females). They were randomly assigned to groups such
that 20 participants were in the no-incentive group and 40 in the incentive group.
Materials. These were 34 CRA problems, with two of the problems used for
demonstration and two for self-practice. The set of problems was based on the 34 problems
used by Ackerman and Zalmanov (2012). Ten problems that showed extremely high or
extremely low confidence levels were replaced, so as to allow room for variability in
confidence ratings for all problems.
Procedure. The experiment was conducted in groups of 2 to 8 participants. For the
The Diminishing Criterion Model
27
no-incentive group, the instruction booklet detailed the procedure, explained what
comprised a valid solution, and illustrated the procedure using two problems. Pressing a
“Start” button on an empty screen brought up each problem. The three words appeared side
by side. Respondents had to type the solution into a designated space below the three words
and press “Continue” when done. Response time was measured from when participants
pressed “Start” to when they pressed “Continue”. Pressing "Continue" exposed the
confidence scale. Pressing the “Next” button cleared the screen for the next problem. After
the demonstrations, the two self-practice problems appeared first, and the rest were
randomly ordered for each participant. The session lasted 30 minutes.
The procedure for the incentive group differed from that described above in that
either one star or five stars appeared on the screen two seconds before the problem. Half the
problems were preceded by one star and half by five stars. The meaning of the point values
was explained in the instructions and demonstrated by the first two problems.
Results and discussion
The participants provided meaningful solution words (rather than “--”, for example)
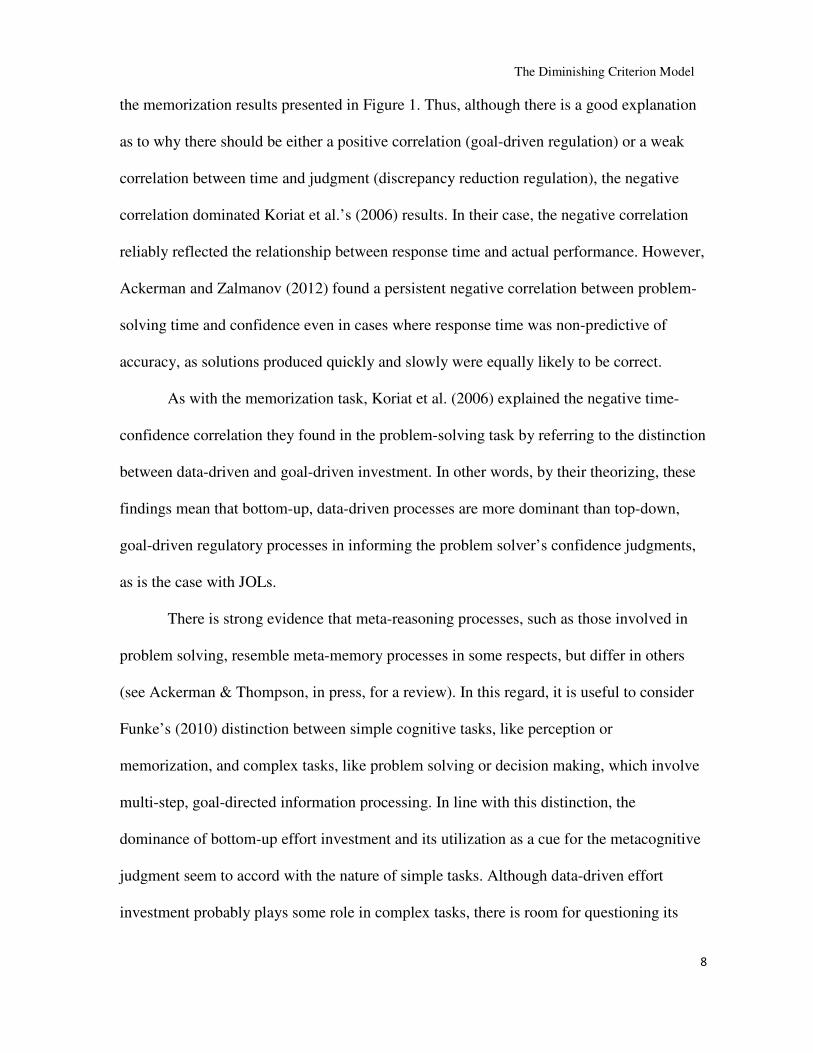
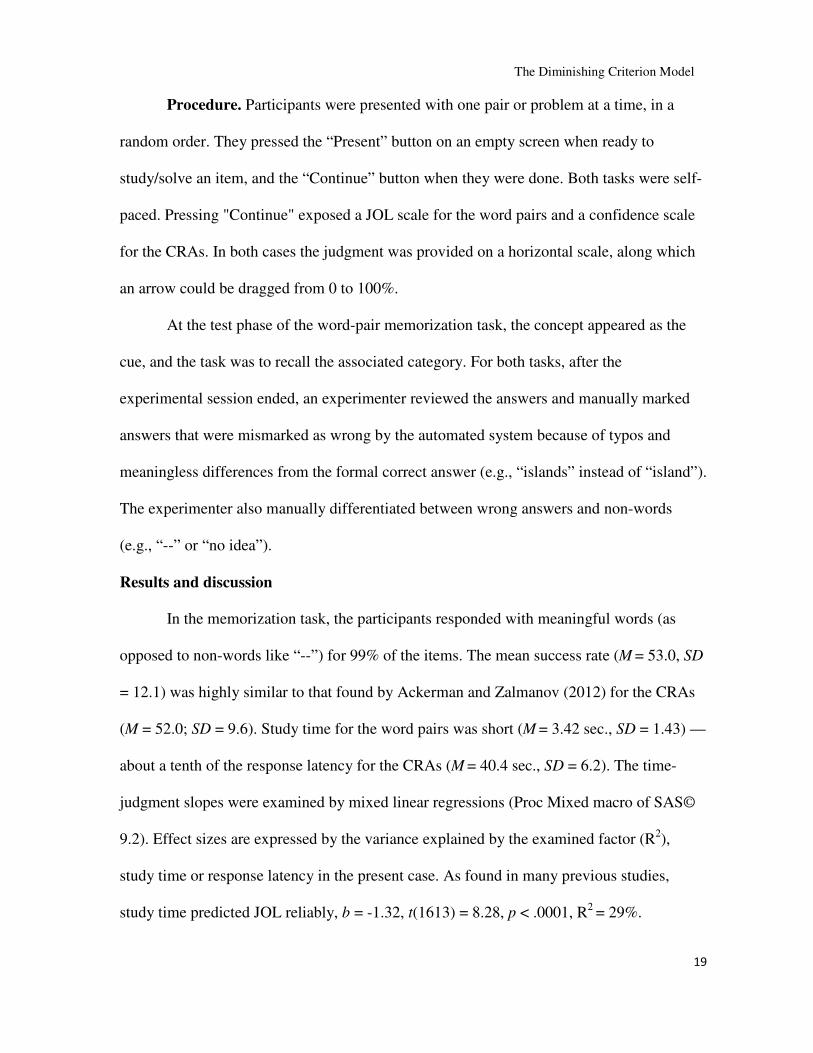
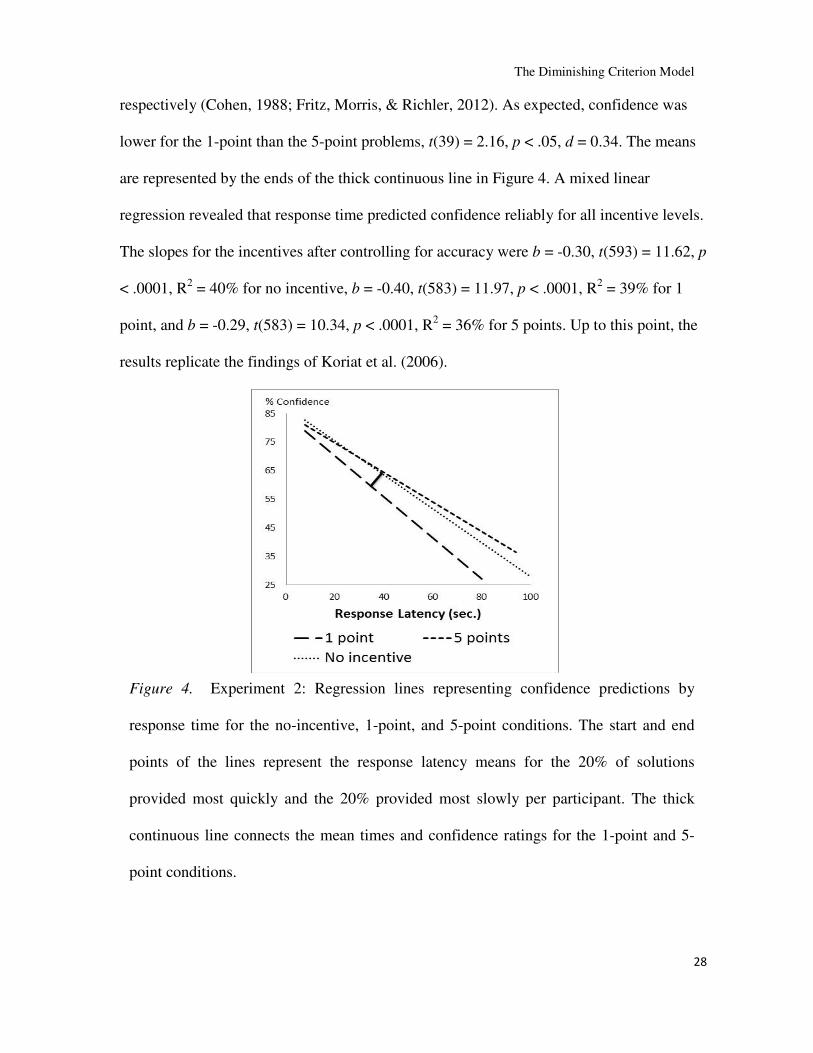
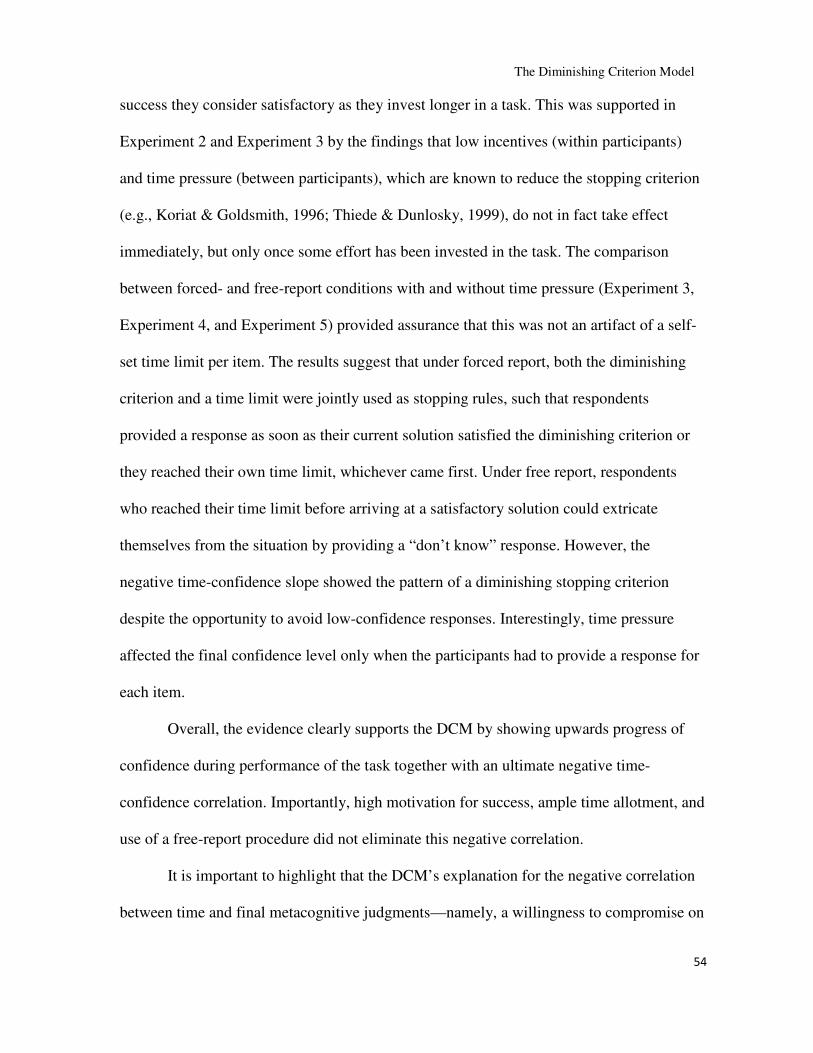
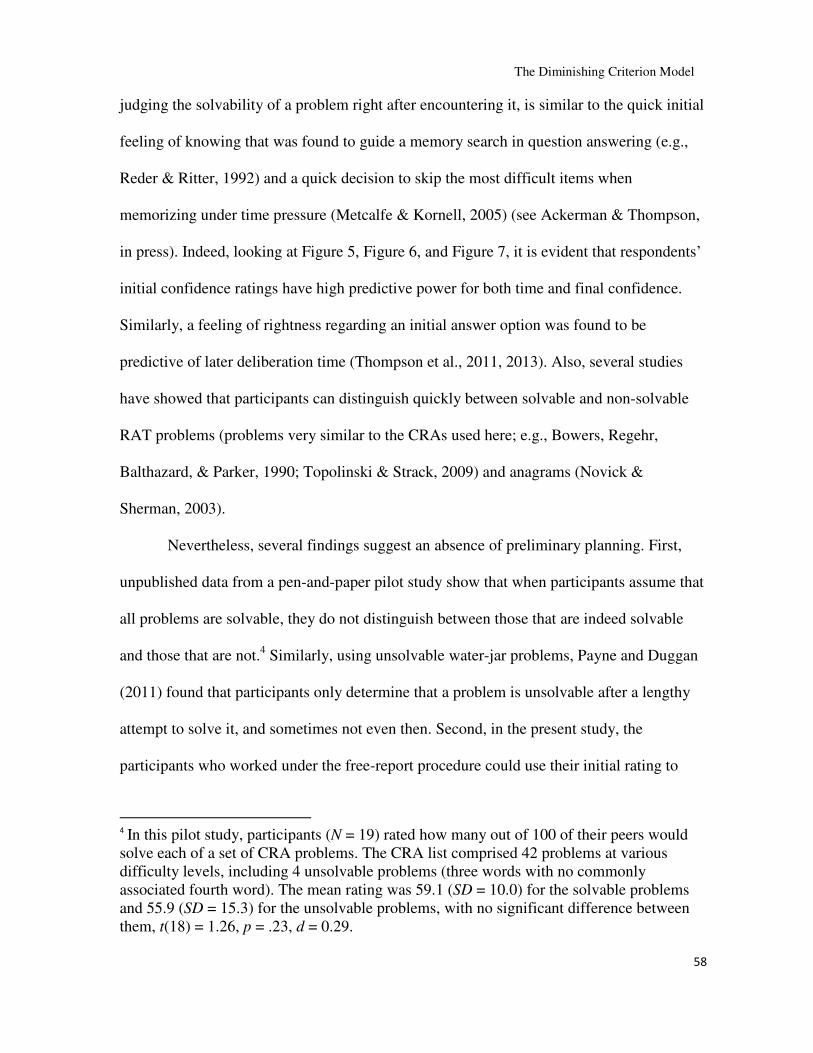
for 97% of the problems, and their overall success rate was 46.7% (SD = 16.1). Figure 4
presents the results. There were no significant differences between the control and incentive
groups when taking into account both incentives together. A within-participant comparison
of response time between the 1-point and 5-point problems revealed a significant
difference, with participants investing less time in the 1-point problems (M = 34.8 sec.; SD
= 11.0) than in the 5-point problems (M = 40.2 sec.; SD = 13.6), t(39) = 2.34, p < .05,
Cohen’s d = 0.37. This effect size represents a small-to-medium effect according to the
accepted guidelines, where 0.20, 0.50, and 0.80 represent small, medium, and large effects,
The Diminishing Criterion Model
28
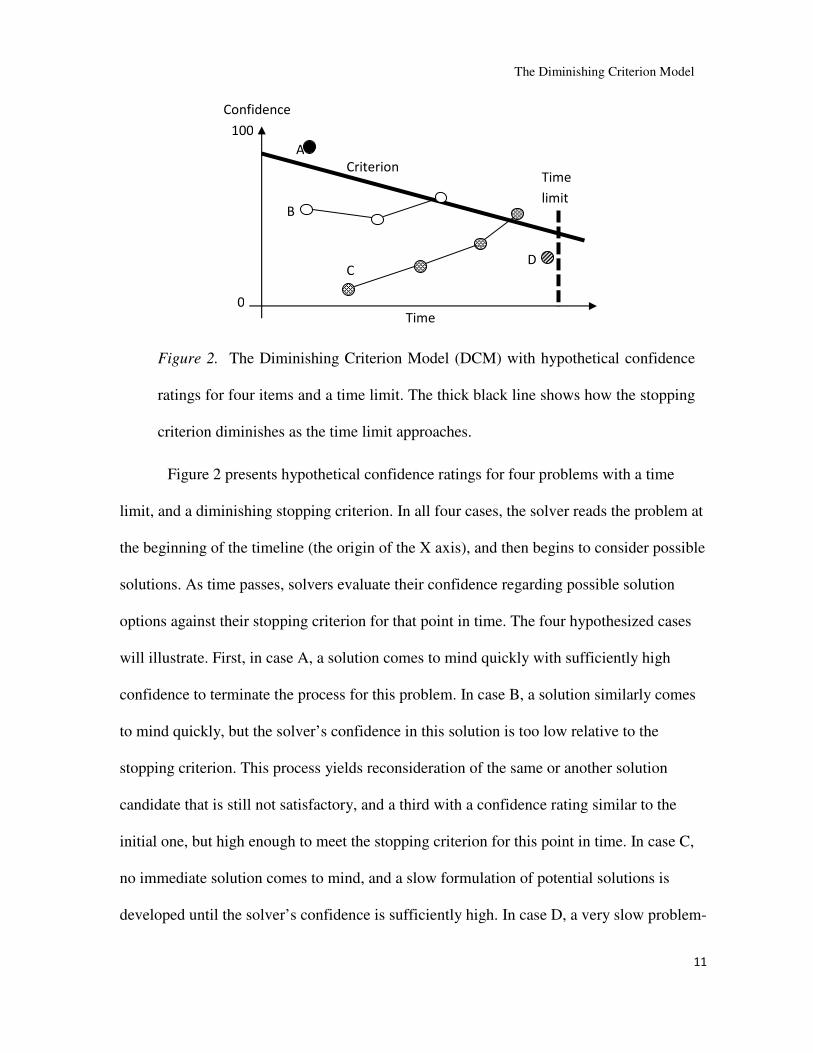
respectively (Cohen, 1988; Fritz, Morris, & Richler, 2012). As expected, confidence was
lower for the 1-point than the 5-point problems, t(39) = 2.16, p < .05, d = 0.34. The means
are represented by the ends of the thick continuous line in Figure 4. A mixed linear
regression revealed that response time predicted confidence reliably for all incentive levels.
The slopes for the incentives after controlling for accuracy were b = -0.30, t(593) = 11.62, p
< .0001, R2 = 40% for no incentive, b = -0.40, t(583) = 11.97, p < .0001, R2 = 39% for 1
point, and b = -0.29, t(583) = 10.34, p < .0001, R2 = 36% for 5 points. Up to this point, the
results replicate the findings of Koriat et al. (2006).
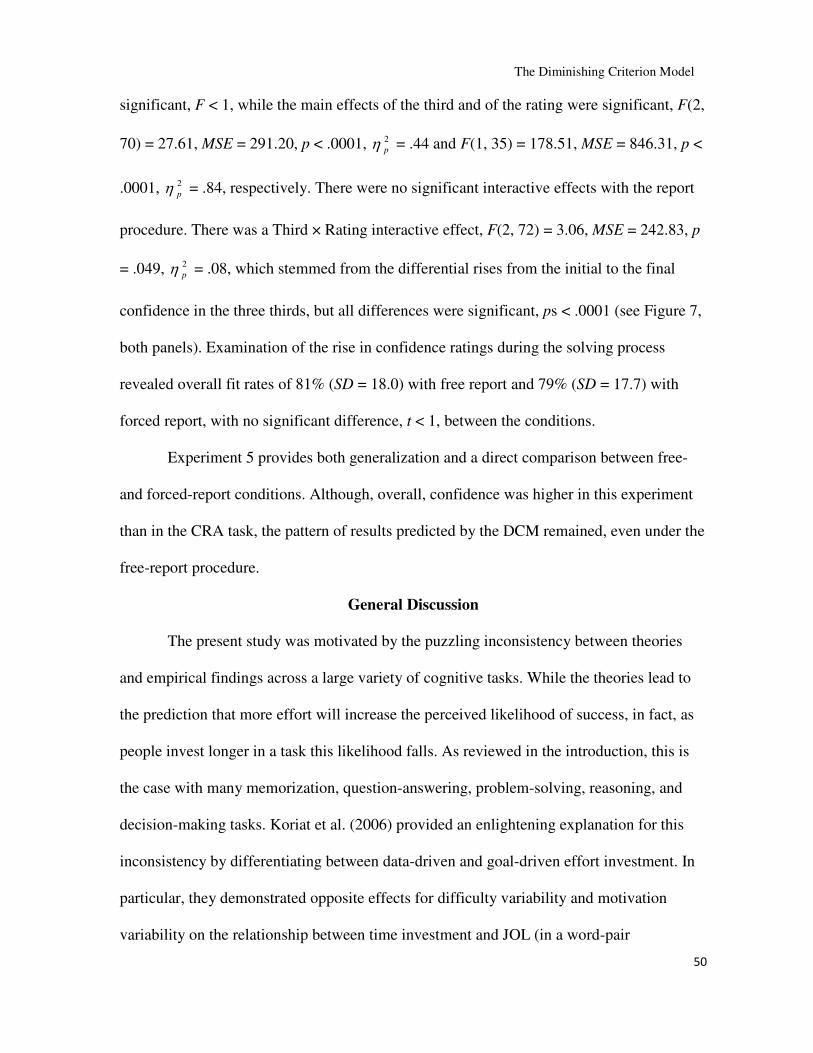
Figure 4. Experiment 2: Regression lines representing confidence predictions by
response time for the no-incentive, 1-point, and 5-point conditions. The start and end
points of the lines represent the response latency means for the 20% of solutions
provided most quickly and the 20% provided most slowly per participant. The thick
continuous line connects the mean times and confidence ratings for the 1-point and 5-
point conditions.
The Diminishing Criterion Model
29
The predictions guided by the DCM were supported as well. First, the conditions
did not differ at their origin, all ts < 1. This finding is consistent with the prediction that
solutions generated quickly are reported if they are accompanied by high confidence levels,
and this satisficing level was similar under all conditions. The difference in mean
confidence between the incentive levels stems, then, from problems which took a relatively
long time to answer. Second, the slopes of the 1-point and 5-point conditions differed, as
indicated by the interactive effect found in the regression, t(1154) = 3.34, p < .001, R2 =
2%.2 This result suggests that the strong effect of latency could be affected, albeit slightly,
by the incentive manipulation. This is consistent with the numerically small, though
significant, confidence and latency differences between the incentive levels (see Figure 4).
A comparison to the no-incentive condition revealed a significant difference
between the slopes for the 1-point condition and the no-incentive condition, t(1167) = 3.10,
p < .005, R2 = 1%, and no difference between the slopes for the 5-point condition and the
no-incentive condition, t < 1. These findings suggest that when presented with items that
took longer to solve, participants reduced their criterion for the 1-point items rather than
increasing their criterion for the 5-point items.
In sum, this experiment generalized Koriat et al.’s (2006, Experiment 7) results by
using a different type of problem. The common findings across the task types support the
DCM as a general model. This experiment also extended Koriat et al.’s (2006) findings by
using a different data analysis approach and interpreting the findings in light of the DCM.
The findings suggest that participants were more willing to compromise on their stopping
2 Throughout the paper, the reported effect size for interactive effects was calculated by deducting the variance explained by latency from the variance explained by the full model that included the manipulation interaction with latency. Accuracy was partialled out in both models.
The Diminishing Criterion Model
30
criterion for the low-incentive items than for the high-incentive items, and this pattern
became stronger as it took longer to respond.
Experiment 3
A low-incentive condition, such as that used in Experiment 2, is one way to lower
the stopping criterion. Another way to lower it is by making participants work under time
pressure (Kruglanski et al., 2012; Thiede & Dunlosky, 1999). The prediction arising from
the DCM is that time pressure will increase the slope of the confidence criterion relative to
an ample time condition, because people are expected to compromise more quickly on their
confidence level when they are motivated to move quickly to the next problem in the set.
The time pressure was manipulated between participants. This contributes to the
generalizability of the findings beyond Experiment 2, because, as mentioned above,
metacognitive judgments were found to be more sensitive to variability within the list of
items than to variability in between-participant manipulations, or even to variability
between blocks (Koriat et al., in press; Koriat et al., 2004; Yue et al., 2013). Sensitivity to
variability within the list emphasizes the experience associated with each item relative to
the experience of processing adjacent items. This experience-based judgment regarding
each particular item accords with Koriat et al.’s (2006) data-driven explanation. However,
if the same pattern of results is generalized to a between-participants manipulation, this will
support the notion that the metacognitive judgment reflects top-down strategic regulation in
light of global goal-setting which stems from task characteristics common across items, and
that it is this top-down regulation which underlies the slope difference between conditions.
Beyond the slope differences in light of motivational and time constraints, another
aim of Experiment 3 was to delve into participants’ ongoing metacognitive monitoring
The Diminishing Criterion Model
31
while performing the task. The prediction derived from the DCM is based on findings that
intermediate metacognitive judgments rise (either linearly, logarithmically, or with a
sudden spike) during learning, reasoning, and problem solving, with the final judgments
generally higher than the preceding ones (Ackerman & Goldsmith, 2011; Metcalfe &
Wiebe, 1987; Thompson et al., 2011; Vernon & Usher, 2003). The novel prediction here is
that despite this rise along the process, lengthy processing ends with a lower judgment than
quick processing. This pattern was not expected to be affected by the global time frame.
Participants were asked to provide initial and intermediate confidence ratings for the
solution options they considered while solving CRA problems. An illustration of such
intermediate ratings is provided by cases B and C in Figure 2. The initial ratings were
solicited shortly after the problem was presented, and the intermediate and final ratings
followed. For simplicity of phrasing, in what follows the term “intermediate ratings” also
encompasses initial ratings, unless initial ratings are explicitly specified. Final confidence
ratings are distinguished from intermediate ratings throughout the paper.
Similarly to the feeling of rightness collected by Thompson and her colleagues
(Thompson et al., 2011, 2013), the initial ratings allowed examination of their predictive
value early in the attempt to solve the problem. However, unlike in Thompson et al.’s
studies, the participants were not required to provide interim solutions, and were permitted
to skip ratings. Thus, a finding that participants did indeed provide intermediate ratings
would by itself—i.e., regardless of any predictive power of the ratings—suggest that the
solving process can be interrupted voluntarily for progress assessment and then continued.
In other words, interruptions to provide ratings without disturbing the time-confidence
The Diminishing Criterion Model
32
slope (and its effect size) would argue against fluency as a dominant cue for the final
metacognitive judgments in multi-step processes involved in performing complex tasks.
Method
Participants. Forty-two participants drawn from the same population as in the
previous experiments (Mage = 24.6; 44% females) were randomly assigned to the time
conditions, time pressure (N = 20) and ample time (N = 22).
Materials. The problem set was the same as for Experiment 2.
Procedure. The procedure per item was the same as in Experiment 2, with one
exception: intermediate confidence rating scales appeared on the screen while the
participant solved each problem. The ends of the scale were marked “I still have no idea”
and “I’ve got it.” The scale for the first rating appeared 3 seconds after presentation of the
problem. A new scale then appeared below the previous one every 15 seconds, and the
previous scale became inactive, even if no rating was entered. The screen could present up
to 5 scales. The space for the answer was present in the lower part of the window during the
entire process, such that participants could enter their answer, rate their final confidence,
and move on to the next problem whenever they wanted. Times were documented when
participants entered their intermediate and final confidence ratings.
The instructions for the ample time group stated that the session time the
participants were invited for (30 min.) should allow them to work at ease and solve the
entire problem set. The instructions for the time pressure group stated that this experiment
was similar to tests the students were used to, in which time was limited. It was explained
that they were allowed 16 minutes to solve the entire problem set, which meant about half a
minute per problem. This time frame was significantly shorter than the time used by the
The Diminishing Criterion Model
33
control (no-incentive) group in Experiment 2 (M = 41.7 sec., SD = 11.9, t(19) = 15.6, p <
.0001, d = 0.98). The problems were numbered at the top of the screen, and participants
knew the number of problems in the set, so they could track their progress through the
problems. Both groups were told that they should manage their time and try to solve all
problems before the time elapsed. For both time conditions, the experimenter announced
the middle point of the time frame and one minute before the time elapsed. Participants
were told to stop working once the time elapsed.
Results and discussion
The participants worked on a mean of 27.5 (SD = 2.5) problems under time pressure
and 29.3 (SD = 1.4) problems under the ample time condition. As in Experiment 2,
participants provided meaningful solution words for 97% of the problems they worked on
under both time conditions. The overall success rate under the ample time condition (M =
48.0%, SD = 16.8) was similar to that in Experiment 2. Comparisons of time, confidence,
and success rates between the ample time condition of the present experiment and the
control condition in Experiment 2 revealed no significant differences, all ts < 1. Most
importantly, no differences in origins or slopes were found in a time-confidence regression
analysis (both ts < 1). These findings suggest, as expected, that interruptions did not affect
the outcomes.
A between-participant comparison between the time conditions revealed, as
expected, shorter response latencies in the time pressure condition (M = 28.9 sec.; SD =
5.2) than in the ample time condition (M = 41.6 sec.; SD = 12.6), t(40) = 4.23, p < .0001, d
= 1.33. The result was a lower success rate (Time pressure: M = 36.7%, SD = 11.8) than
under the ample time condition (reported in the previous paragraph), t(40) = 2.49, p < .05, d
The Diminishing Criterion Model
34
= 0.79, and lower confidence ratings (Time pressure: M = 49.9; SD = 14.2; Ample time: M
= 60.0; SD = 15.6), t(40) = 2.20, p < .05, d = 0.69.
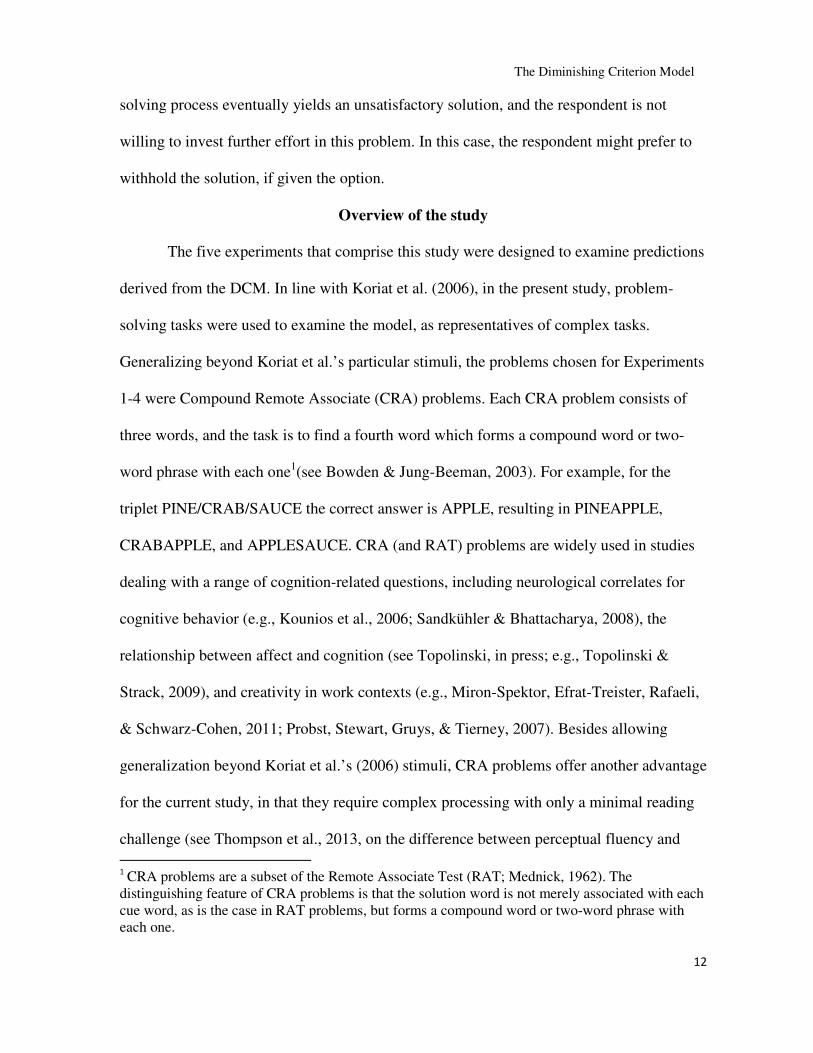
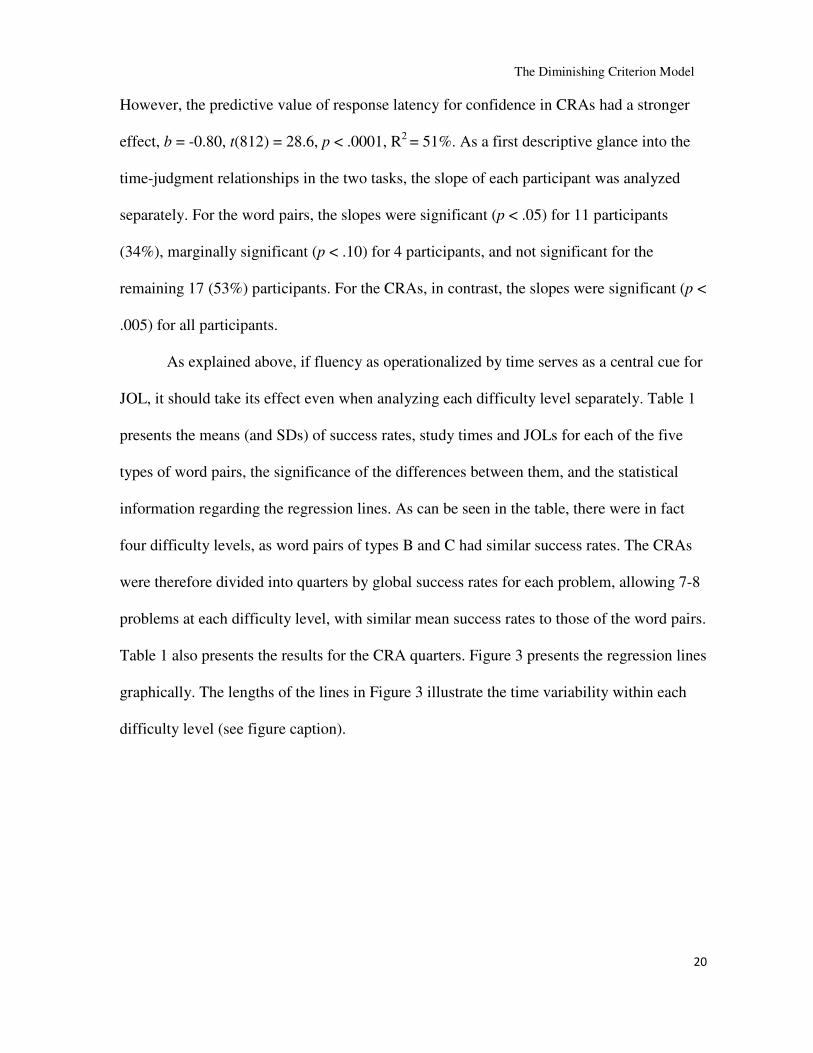
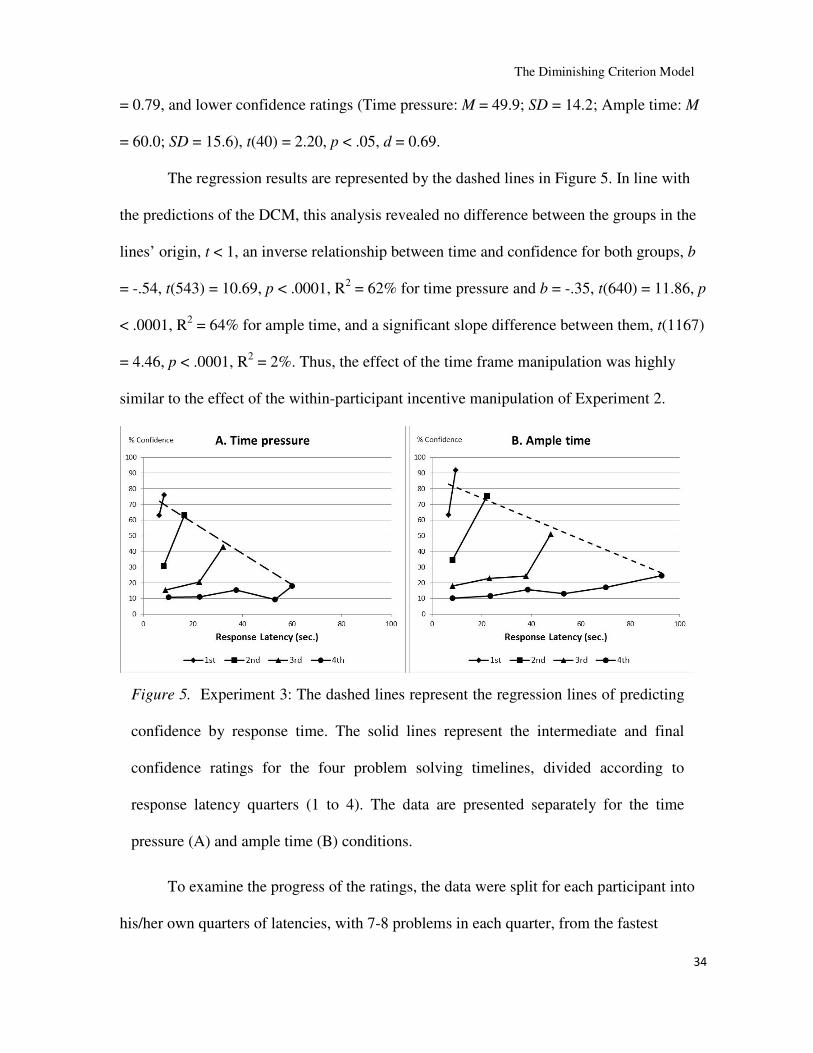
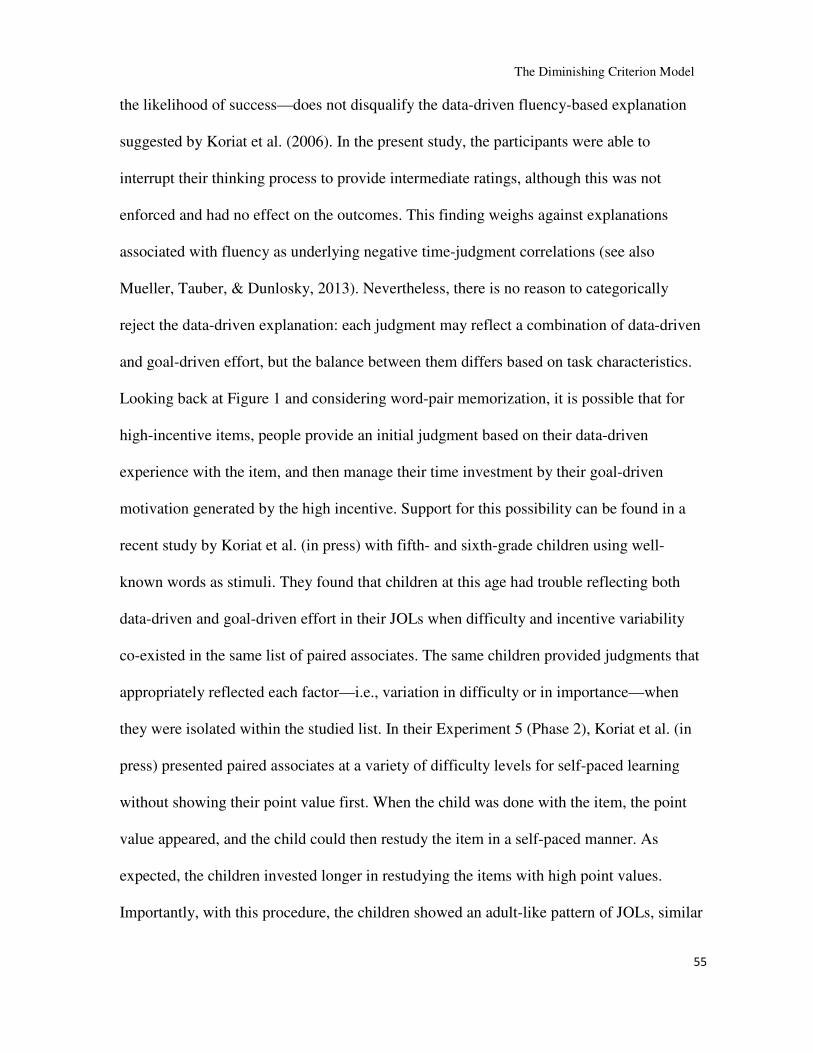
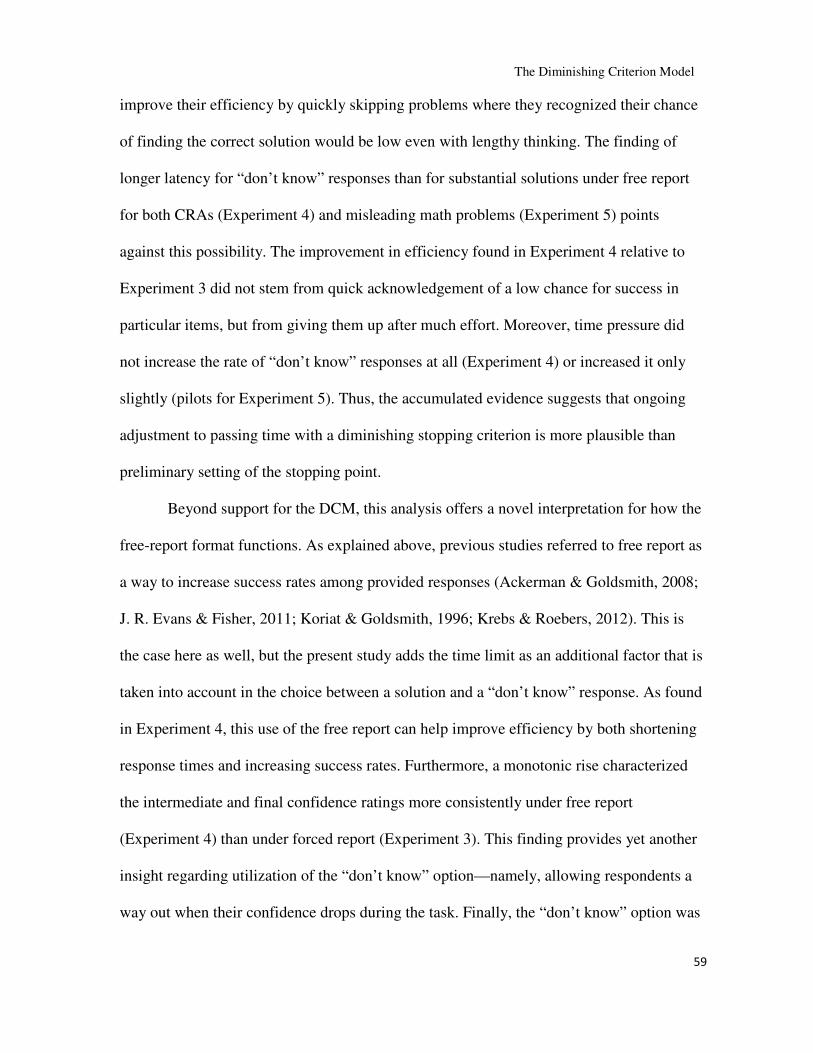
The regression results are represented by the dashed lines in Figure 5. In line with
the predictions of the DCM, this analysis revealed no difference between the groups in the
lines’ origin, t < 1, an inverse relationship between time and confidence for both groups, b
= -.54, t(543) = 10.69, p < .0001, R2 = 62% for time pressure and b = -.35, t(640) = 11.86, p
< .0001, R2 = 64% for ample time, and a significant slope difference between them, t(1167)
= 4.46, p < .0001, R2 = 2%. Thus, the effect of the time frame manipulation was highly
similar to the effect of the within-participant incentive manipulation of Experiment 2.
To examine the progress of the ratings, the data were split for each participant into
his/her own quarters of latencies, with 7-8 problems in each quarter, from the fastest
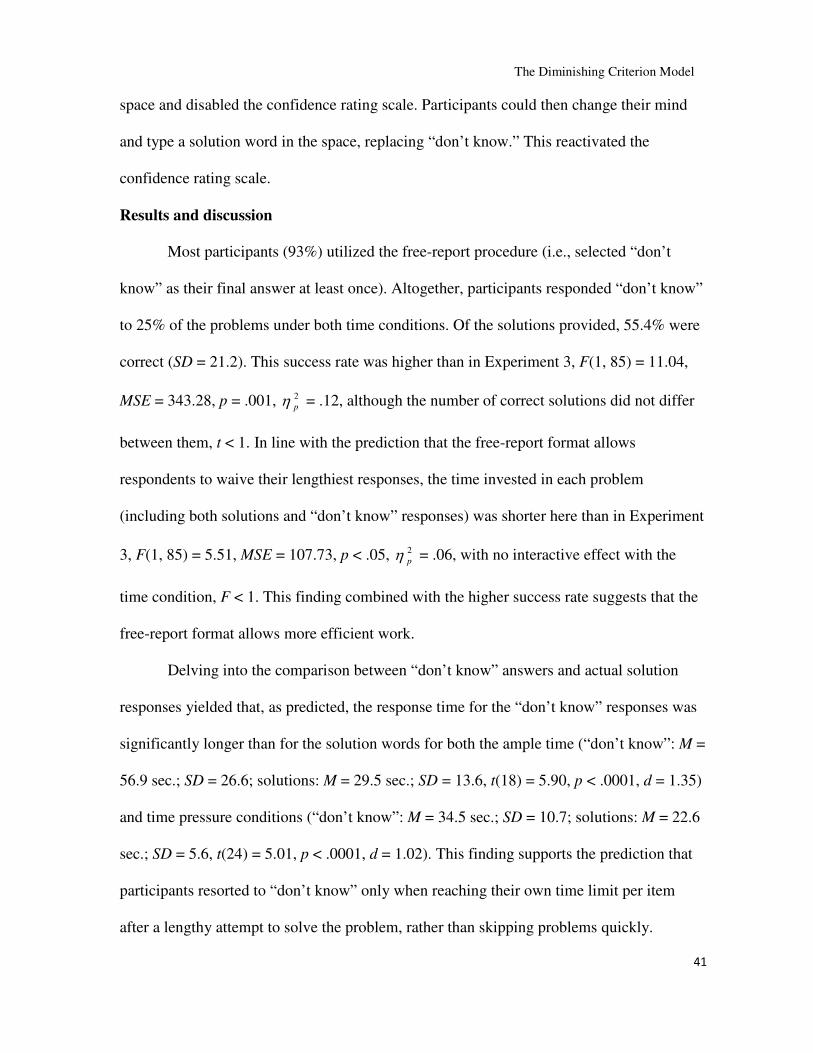
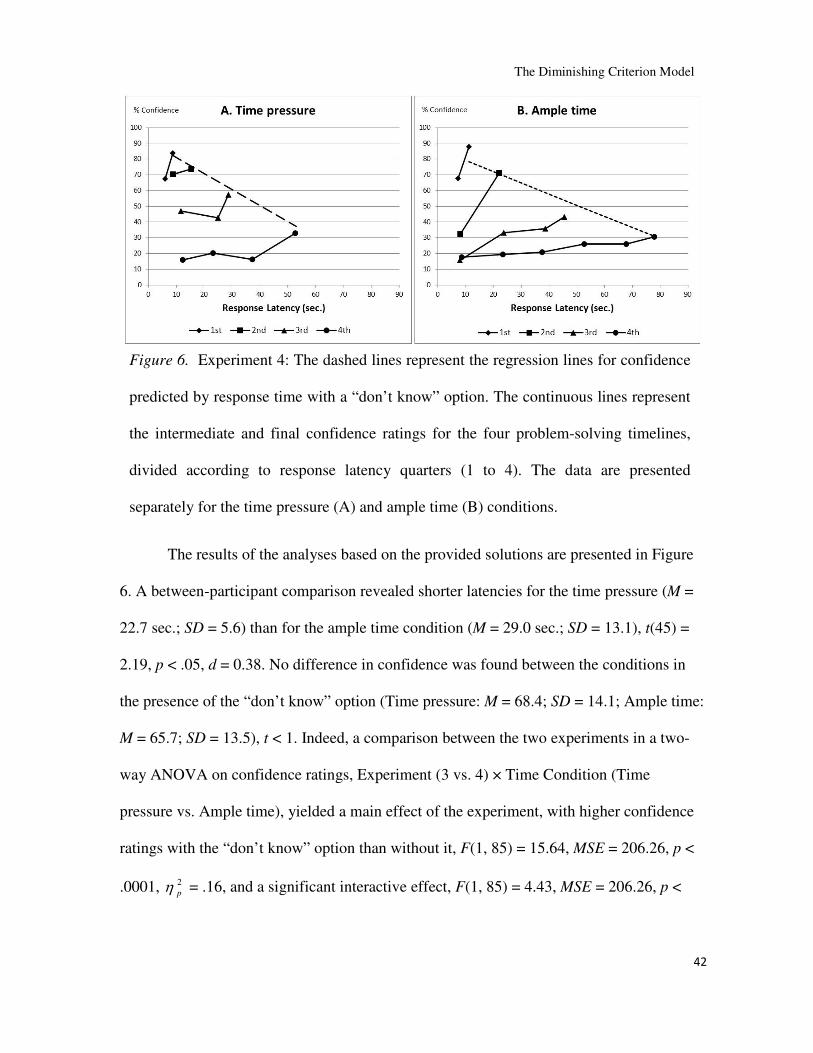
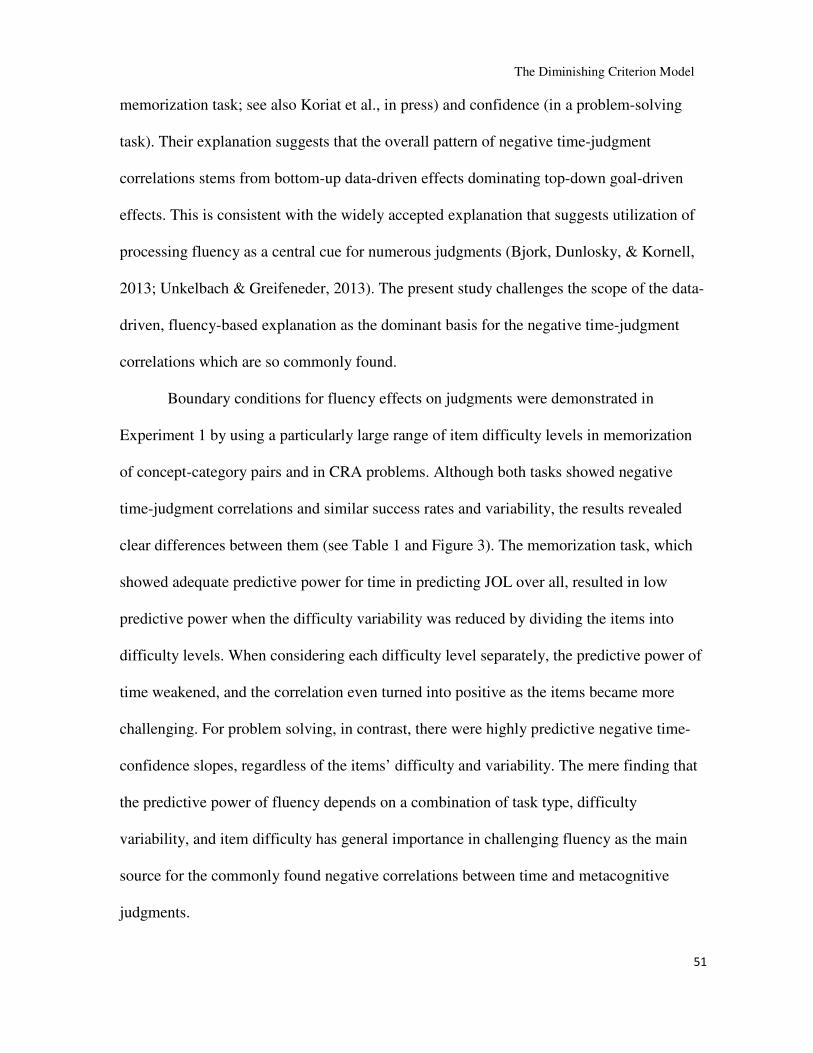
Figure 5. Experiment 3: The dashed lines represent the regression lines of predicting
confidence by response time. The solid lines represent the intermediate and final
confidence ratings for the four problem solving timelines, divided according to
response latency quarters (1 to 4). The data are presented separately for the time
pressure (A) and ample time (B) conditions.
The Diminishing Criterion Model
35
provided solutions to the slowest ones. The mean success rates per quarter were 66.4, 50.0,
24.7, and 6.1 for quarters 1-4 of the time pressure condition, and 85.4, 62.7, 31.0, and 13.7,
respectively, for the ample time condition. Figure 5 presents the intermediate and final
confidence ratings for each quarter for each of the two time conditions. The standard error
of the means for response times per quarter ranged from 0.3 for the 1st quarter of the time
pressure condition to 6.2 for the 4th quarter of the ample time condition. The standard error
of the means for the final confidence ranged from 2.5 for the 1st quarter of the ample time
condition to 5.6 for the 1st quarter of the time pressure condition.
An important observation is that there was an almost perfect linear relationship
between latency and final confidence even when using the means per latency quarter. The
regression analysis used throughout this study necessarily results in linear predictive lines.
This would be the case even for data that is not linear in nature (e.g., data forming a
logarithmic curve). The breakdown by latency quarters allows examination of whether the
linear regression lines are representative. The proximity between the regression lines and
the final confidence means per quarter suggests that linear regressions reliably describe the
relationship between latency and confidence.
Initial ratings were provided for 59% of the solutions. The following intermediate
confidence ratings were provided for 40%, 27%, 19%, and 13% of the second, third, fourth,
and fifth rating scales, respectively. Although the literature is somewhat vague regarding
the definition of insight problems, CRAs (or the similar RAT problems) are often
accounted as such problems (e.g., Kounios et al., 2006). One characteristic of insight
problems is low ongoing confidence for some time followed by a spike upward (Metcalfe
& Wiebe, 1987). This pattern is clearly evident in Figure 5. However, previous analyses did
The Diminishing Criterion Model
36
not include a detailed time analysis and/or a 0-100% confidence rating scale. Here, the
analyses exposed diminishing confidence at the end of the solving process despite this
spike pattern.
To examine the general pattern of a rise in confidence from initial to final ratings, a
mixed three-way Analysis of Variance (ANOVA) for Time Condition (Pressured vs.
Ample) × Quarter (1-4) × Rating (Initial vs. Final) was used. The analysis was based on
participants who provided initial ratings under all four quarters (N = 28, 67%). The final
confidence rating was necessarily provided by all participants. The main effect of the time
condition was not significant, F(1, 26) = 1.10, MSE = 1465.57, p > .30, 2
pη = .04. The main
effect of the quarter was significant, F(3, 78) = 103.37, MSE = 332.98, p < .0001, 2
pη = .80,
reflecting that the ratings fell from the first to the fourth quarters. The main effect of the
rating was also significant, F(1, 26) = 59.50, MSE = 617.16, p < .0001, 2
pη = .70, reflecting
the increase from the initial to the final confidence ratings. The Quarter × Rating
interaction across the two time conditions was significant, F(3, 81) = 9.87, MSE = 232.60,
p < .0001, 2
pη = .27. This interaction can be seen in Figure 5 by the differential increase
from the first to the last confidence rating for the four quarters, but all were significant, ps
<= .001. Importantly, the triple interaction was insignificant, F < 1, suggesting a similar
pattern of results for both time conditions.
An additional examination using the entire data set was conducted to examine the
pattern of a rise in ratings leading to a decision to stop investing effort in the problem. Each
problem-solving process was marked as “fit” if the last intermediate rating was the highest
among the intermediate ratings and the final confidence rating was still higher, and “unfit”
otherwise. The percentage of solutions that fit this criterion averaged 77% (SD = 17) for the
The Diminishing Criterion Model
37
time pressure condition and 76% (SD = 15) for the ample time condition, with no
difference between them, t < 1. This finding suggests that in most cases, confidence ratings
rose consistently during the solving process. Nevertheless, about a quarter of the solving
processes showed swerves in the intermediate ratings. This finding is discussed further
under Experiment 4, below.
Overall, the results are similar for time pressure manipulated between participants
and for the incentives manipulated within participants in Experiment 2. This provides
further support for the goal-directed nature of time investment, because the effect was
found even without manipulation variability among items, and despite interruptions for
providing the intermediate ratings. The goal-directed nature of the process is also supported
by the positive relationship between time and confidence ratings during the solving process,
together with the negative relationship between time and final confidence ratings in both
time conditions. These results are clearly consistent with the DCM (see Figure 2): They
accord with the notion that participants progress in a goal-driven manner to achieve a
satisfactory confidence level, which diminishes as processing lengthens. Experiment 4 was
designed to challenge the diminishing pattern of the stopping criterion by considering an
alternative explanation for the findings.
Experiment 4
According to the DCM, people provide answers which satisfy their confidence
criterion, and this criterion diminishes as more time is invested in a particular task item.
However, what happens when people decide to give up on a problem—i.e., to abandon the
effort to solve it? If the diminishing confidence criterion were the only stopping rule,
respondents would be expected to continue to invest effort until their confidence reached a
The Diminishing Criterion Model
38
level judged as satisfactory for that time point—even if that level of confidence was zero.
However, another stopping rule that may take effect in this case is a limit to the effort one
is willing to invest in a particular item. Illustrating this idea, Kruglanski et al. (2012)
offered an analogy between effort investment in cognitive tasks and physical forces. They
suggested the term “potential driving force” to represent the maximal amount of energy an
individual is prepared to invest in a cognitive task. This theorizing offers an alternative
explanation for the low-confidence responses found in the previous experiments of the
present study. By this explanation, it is not that low-confidence solutions became
satisfactory after a certain length of time, but, rather, that they reflect cases in which
participants reached the limit of the effort they were willing to invest in a problem, even
though their confidence did not meet their criterion. Because they gave up on the problem
but had to provide a response, they provided their best solution despite being unsatisfied
with it, and moved on to the next item. This possibility suggests that the limit on effort
overruled the aim of finding a satisfactory solution. Thus, it may be that the effort limit
concealed a straight, non-diminishing, confidence criterion, while the found slope stemmed
from the lengthy but non-satisfactory solving processes.
In order to examine this alternative explanation, Experiment 4 employed a free-
report procedure, rather than the forced-report procedure used in the previous experiments.
Under free report, participants are given the option of responding to items with “don’t
know.” Previous studies in the context of knowledge questions have found that people
utilize a free-report format to adhere their confidence criterion, by waiving their low-
confidence responses and providing those in which their confidence is satisfactory. This
was found to be the case for general knowledge questions (Ackerman & Goldsmith, 2008;
The Diminishing Criterion Model
39
Koriat & Goldsmith, 1996), in educational settings (e.g., Krebs & Roebers, 2012), and in
eyewitness contexts (e.g., J. R. Evans & Fisher, 2011). Similarly, setting a global low-goal,
low-reward, or time-pressure condition to learning tasks led people to waive difficult items,
thereby allowing more time for items with a better chance for success (Ariel et al., 2009;
Nevertheless, several findings suggest an absence of preliminary planning. First,
unpublished data from a pen-and-paper pilot study show that when participants assume that
all problems are solvable, they do not distinguish between those that are indeed solvable
and those that are not.4 Similarly, using unsolvable water-jar problems, Payne and Duggan
(2011) found that participants only determine that a problem is unsolvable after a lengthy
attempt to solve it, and sometimes not even then. Second, in the present study, the
participants who worked under the free-report procedure could use their initial rating to
4 In this pilot study, participants (N = 19) rated how many out of 100 of their peers would
solve each of a set of CRA problems. The CRA list comprised 42 problems at various difficulty levels, including 4 unsolvable problems (three words with no commonly associated fourth word). The mean rating was 59.1 (SD = 10.0) for the solvable problems and 55.9 (SD = 15.3) for the unsolvable problems, with no significant difference between them, t(18) = 1.26, p = .23, d = 0.29.
The Diminishing Criterion Model
59
improve their efficiency by quickly skipping problems where they recognized their chance
of finding the correct solution would be low even with lengthy thinking. The finding of
longer latency for “don’t know” responses than for substantial solutions under free report
for both CRAs (Experiment 4) and misleading math problems (Experiment 5) points
against this possibility. The improvement in efficiency found in Experiment 4 relative to
Experiment 3 did not stem from quick acknowledgement of a low chance for success in
particular items, but from giving them up after much effort. Moreover, time pressure did
not increase the rate of “don’t know” responses at all (Experiment 4) or increased it only
slightly (pilots for Experiment 5). Thus, the accumulated evidence suggests that ongoing
adjustment to passing time with a diminishing stopping criterion is more plausible than
preliminary setting of the stopping point.
Beyond support for the DCM, this analysis offers a novel interpretation for how the
free-report format functions. As explained above, previous studies referred to free report as
a way to increase success rates among provided responses (Ackerman & Goldsmith, 2008;
J. R. Evans & Fisher, 2011; Koriat & Goldsmith, 1996; Krebs & Roebers, 2012). This is
the case here as well, but the present study adds the time limit as an additional factor that is
taken into account in the choice between a solution and a “don’t know” response. As found
in Experiment 4, this use of the free report can help improve efficiency by both shortening
response times and increasing success rates. Furthermore, a monotonic rise characterized
the intermediate and final confidence ratings more consistently under free report
(Experiment 4) than under forced report (Experiment 3). This finding provides yet another
insight regarding utilization of the “don’t know” option—namely, allowing respondents a
way out when their confidence drops during the task. Finally, the “don’t know” option was
The Diminishing Criterion Model
60
used only rarely for the misleading problems (Experiment 5), even when the incentive
policy included a loss of points for wrong solutions that should have led to loss aversion
(Tversky & Kahneman, 1991). This may be why some of the effects found with CRAs were
not found with the misleading problems. Future studies are called for to improve our
understanding of the factors that affect the willingness to admit failure.
Finally, the present study suggests the diminishing criterion as a metacognitive
stopping rule for performing complex cognitive tasks, but other stopping rules for similar
tasks have also been considered in the literature. For example, Payne and Duggan (2011)
focused on the conditions that lead people to give up when facing unsolvable problems.
They found that more time is invested in problems as the likelihood that the problem is
actually solvable rises and as the number of problem states it allows increases. That study
put the emphasis on characteristics of the problem. By looking into the processes involved
in training for problem solving, Josephs, Silvera, and Giesler (1996) dealt with the effect of
the subjective feeling of skill improvement on the stopping criterion people adopt.
Dougherty and Harbison (2007) looked at individual differences in motivation which led
participants to terminate attempts to free recall lists of 10 words—a task for which
participants had no doubt that at least partial success could be achieved. Future studies are
called for to integrate these and other stopping rules in cognitive tasks with the presently
proposed DCM, which focuses on metacognitive regulatory processes and the time limit
people set.
To conclude, metacognitive studies traditionally focus on memorization of very
simple stimuli with well-known words. The present study evolved by considering highly
challenging paired associates and problem-solving tasks, which are both understudied from
The Diminishing Criterion Model
61
the metacognitive point of view. Investigating more challenging tasks brings to the fore
factors that were not previously considered despite having broad ecological validity. For
instance, the principle of the diminishing criterion may help people interpret answers they
receive to challenging problems presented to others (e.g., in expert consultations in
medicine or law). The analysis of the free-report format with and without time pressure has
implications for efficient answering (e.g., in educational exams). By proposing the DCM,
this study aimed to shed new light on the processes that lead people to end up with low
confidence in their chance of success, even when they can potentially avoid it by
continuing improvement attempts or admitting failure.
References
Ackerman, R. (2013). A metacognitive stopping rule for problem solving. In M. Knauff, M.
Pauen, N. Sebanz & I. Wachsmuth (Eds.), Proceedings of the 35th Annual
Conference of the Cognitive Science Society (pp. 121-126). Austin, TX: Cognitive
Science Society.
Ackerman, R., & Goldsmith, M. (2008). Control over grain size in memory reporting--With
and without satisficing knowledge. Journal of Experimental Psychology: Learning,
Memory, and Cognition, 34(5), 1224-1245.
Ackerman, R., & Goldsmith, M. (2011). Metacognitive regulation of text learning: On
screen versus on paper. Journal of Experimental Psychology: Applied, 17(1), 18-32.
Ackerman, R., & Koriat, A. (2011). Response latency as a predictor of the accuracy of
children's reports. Journal of Experimental Psychology: Applied, 17(4), 406-417.
The Diminishing Criterion Model
62
Ackerman, R., Leiser, D., & Shpigelman, M. (2013). Is comprehension of problem
solutions resistant to misleading heuristic cues? Acta Psychologica, 143(1), 105-
112.
Ackerman, R., & Thompson, V. (in press). Meta-reasoning: What can we learn from meta-
memory? In A. Feeney & V. Thompson (Eds.), Reasoning as memory. Hove, UK:
Psychology Press.
Ackerman, R., & Zalmanov, H. (2012). The persistence of the fluency–confidence
association in problem solving. Psychonomic Bulletin & Review, 19(6), 1189-1192.
Ariel, R., Dunlosky, J., & Bailey, H. (2009). Agenda-based regulation of study-time
allocation: When agendas override item-based monitoring. Journal of Experimental
Psychology: General, 138(3), 432-447.
Beaman, C. P. (2002). Why are we good at detecting cheaters? A reply to Fodor. Cognition,
83(2), 215-220.
Begg, I., Duft, S., Lalonde, P., Melnick, R., & Sanvito, J. (1989). Memory predictions are
based on ease of processing. Journal of Memory and Language, 28(5), 610-632.
Bjork, R. A., Dunlosky, J., & Kornell, N. (2013). Self-regulated learning: Beliefs,
techniques, and illusions. Annual Review of Psychology, 64, 417-444.
Bowden, E. M., & Jung-Beeman, M. (2003). Normative data for 144 compound remote
associate problems. Behavior Research Methods, 35(4), 634-639.
Bowers, K. S., Regehr, G., Balthazard, C., & Parker, K. (1990). Intuition in the context of
discovery. Cognitive Psychology, 22(1), 72-110.
The Diminishing Criterion Model
63
Casscells, W., Schoenberger, A., & Graboys, T. B. (1978). Interpretation by physicians of
clinical laboratory results. The New England Journal of Medicine, 299(18), 999-
1001.
Cohen, J. E. (1988). Statistical power analysis for the behavioral sciences. Hillsdale, NJ:
Lawrence Erlbaum Associates, Inc.
Derryberry, D., & Rothbart, M. K. (1997). Reactive and effortful processes in the
organization of temperament. Development and Psychopathology, 9(4), 633-652.
Dougherty, M. R., & Harbison, J. (2007). Motivated to retrieve: How often are you willing
to go back to the well when the well is dry? Journal of Experimental Psychology:
Learning, Memory, and Cognition, 33(6), 1108-1117.
Dunlosky, J., & Hertzog, C. (1998). Training programs to improve learning in later
adulthood: Helping older adults educate themselves. In D. J. Hacker (Ed.),
Metacognition in educational theory and practice (pp. 249-275). Mahwah, NJ:
Lawrence Erlbaum Associates Inc.
Dunlosky, J., & Nelson, T. O. (1992). Importance of the kind of cue for judgments of
learning (JOL) and the delayed-JOL effect. Memory & Cognition, 20(4), 374-380.
Evans, J. R., & Fisher, R. P. (2011). Eyewitness memory: Balancing the accuracy,
precision and quantity of information through metacognitive monitoring and
Yue, C. L., Castel, A. D., & Bjork, R. A. (2013). When disfluency is—and is not—a
desirable difficulty: The influence of typeface clarity on metacognitive judgments
and memory. Memory & Cognition, 41(2), 229-241.
Journal of Experimental Psychology: General
Supplemental Materials
The Diminishing Criterion Model for Metacognitive Regulation of Time Investment
Rakefet Ackerman
The Diminishing Criterion Model
72
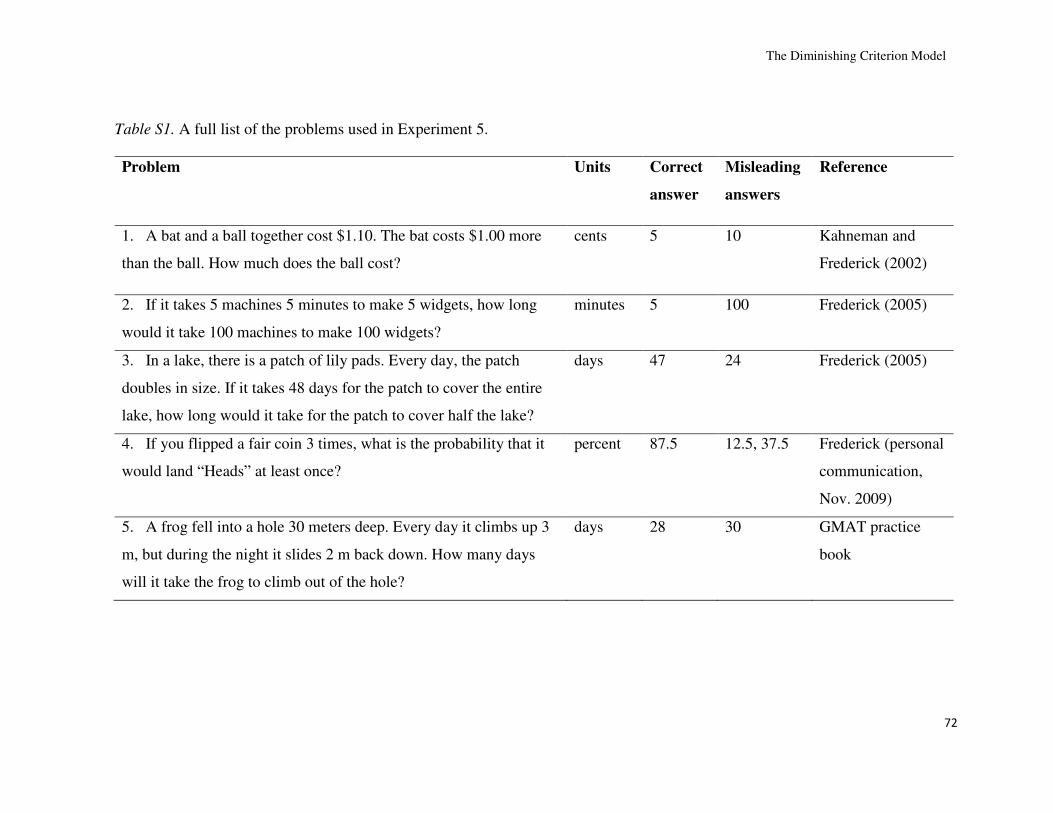
Table S1. A full list of the problems used in Experiment 5.
Problem Units Correct
answer
Misleading
answers
Reference
1. A bat and a ball together cost $1.10. The bat costs $1.00 more
than the ball. How much does the ball cost?
cents 5 10 Kahneman and
Frederick (2002)
2. If it takes 5 machines 5 minutes to make 5 widgets, how long
would it take 100 machines to make 100 widgets?
minutes 5 100 Frederick (2005)
3. In a lake, there is a patch of lily pads. Every day, the patch
doubles in size. If it takes 48 days for the patch to cover the entire
lake, how long would it take for the patch to cover half the lake?
days 47 24 Frederick (2005)
4. If you flipped a fair coin 3 times, what is the probability that it
would land “Heads” at least once?
percent 87.5 12.5, 37.5 Frederick (personal
communication,
Nov. 2009)
5. A frog fell into a hole 30 meters deep. Every day it climbs up 3
m, but during the night it slides 2 m back down. How many days
will it take the frog to climb out of the hole?
days 28 30 GMAT practice
book
The Diminishing Criterion Model
73
Problem Units Correct
answer
Misleading
answers
Reference
6. Apple mash is comprised of 99% water and 1% apple solids. I
left 100 kg mash in the sun and some of the water evaporated. Now
the water is 98% of the mash. What is the mash weight?
kg 50 99 Uri Leron (personal
communication,
Nov. 2009;
Attributed to
Abraham Arcavi)
7. Jack is looking at Anne, and Anne is looking at George. Jack is
married, but George is not. Is a married person looking at an
unmarried person? A) Yes B) No C) Cannot be determined
A C Stanovich (2009)
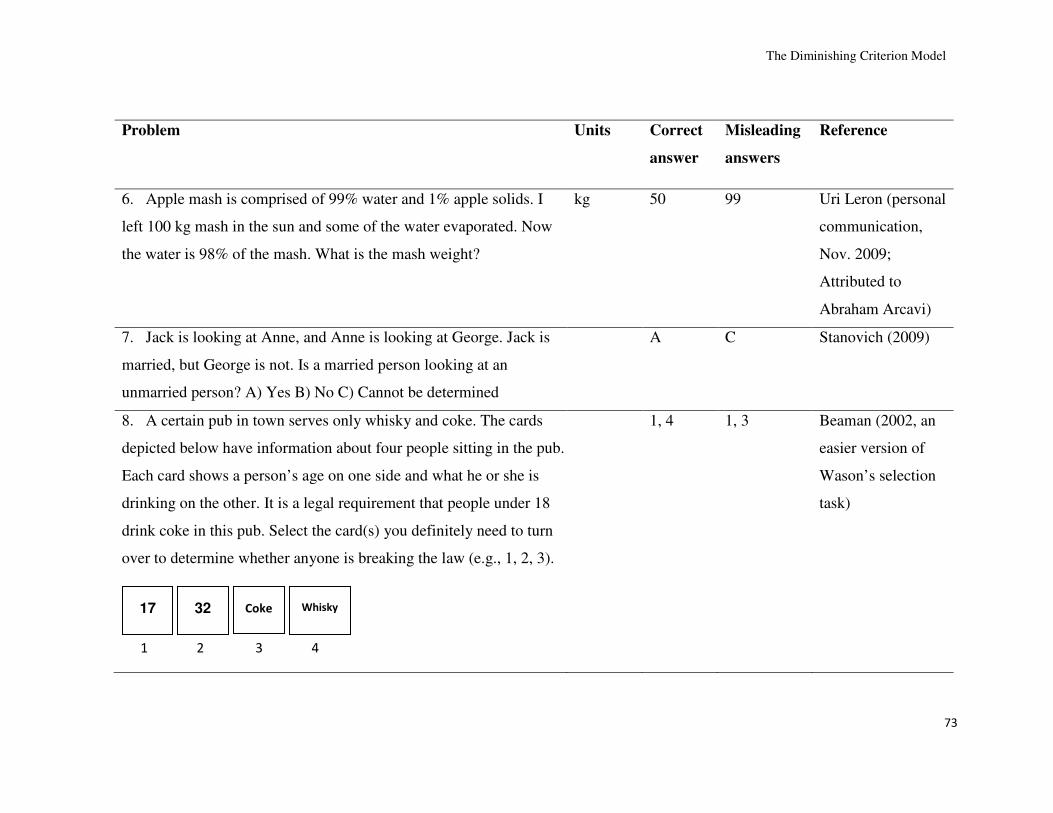
8. A certain pub in town serves only whisky and coke. The cards
depicted below have information about four people sitting in the pub.
Each card shows a person’s age on one side and what he or she is
drinking on the other. It is a legal requirement that people under 18
drink coke in this pub. Select the card(s) you definitely need to turn
over to determine whether anyone is breaking the law (e.g., 1, 2, 3).
1, 4 1, 3 Beaman (2002, an
easier version of
Wason’s selection
task)
Coke Whisky 17
1 2 3 4
32
The Diminishing Criterion Model
74
Problem Units Correct
answer
Misleading
answers
Reference
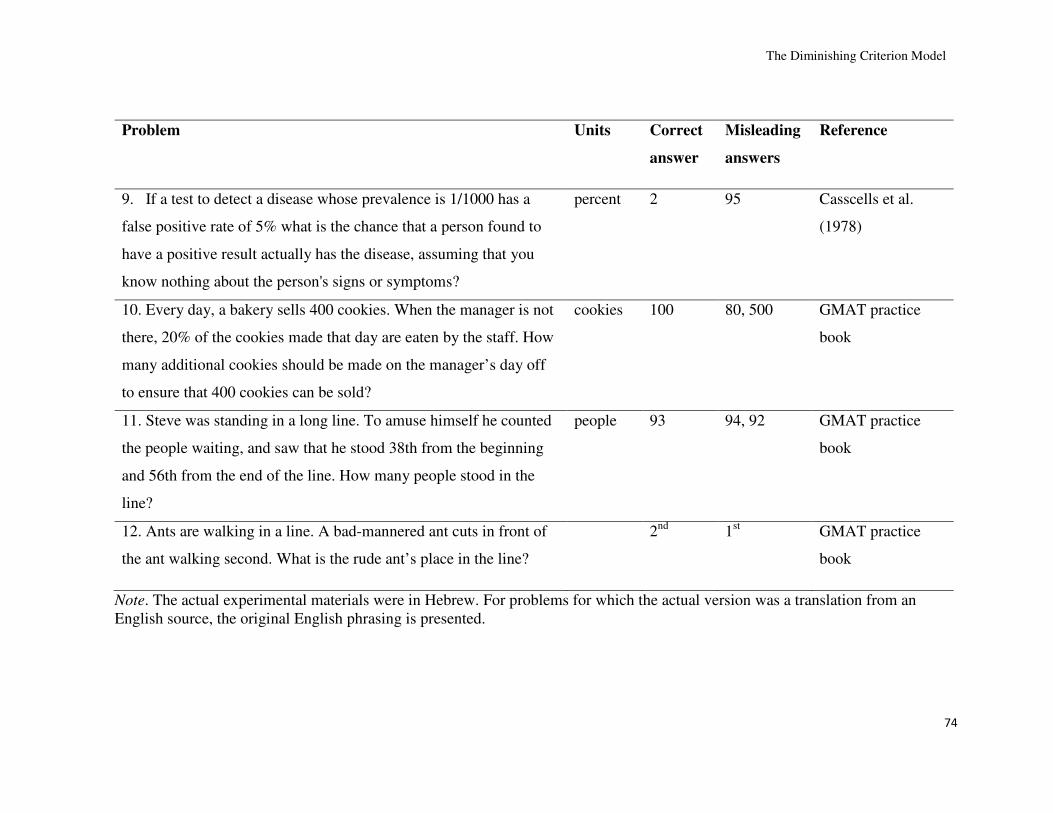
9. If a test to detect a disease whose prevalence is 1/1000 has a
false positive rate of 5% what is the chance that a person found to
have a positive result actually has the disease, assuming that you
know nothing about the person's signs or symptoms?
percent 2 95 Casscells et al.
(1978)
10. Every day, a bakery sells 400 cookies. When the manager is not
there, 20% of the cookies made that day are eaten by the staff. How
many additional cookies should be made on the manager’s day off
to ensure that 400 cookies can be sold?
cookies 100 80, 500 GMAT practice
book
11. Steve was standing in a long line. To amuse himself he counted
the people waiting, and saw that he stood 38th from the beginning
and 56th from the end of the line. How many people stood in the
line?
people 93 94, 92 GMAT practice
book
12. Ants are walking in a line. A bad-mannered ant cuts in front of
the ant walking second. What is the rude ant’s place in the line?
2nd 1st GMAT practice
book
Note. The actual experimental materials were in Hebrew. For problems for which the actual version was a translation from an English source, the original English phrasing is presented.