journa l homepage: www.e lsev ier .com/ locate /chromb
The human cerebrospinal fluid metabolome�
David S. Wisharta,d,e,∗, Michael J. Lewisa, Joshua A. Morrisseya, Mitchel D. Flegela, Kevin Jeroncica,Yeping Xiongb, Dean Chenga, Roman Eisnera, Bijaya Gautama, Dan Tzura, Summit Sawhneyd,
c a b
Fiona Bamforth , Russ Greiner , Liang Lia Department of Computing Science, University of Alberta, Edmonton, AB, Canada T6G 2E8b Department of Chemistry, University of Alberta, Edmonton, AB, T6G 2E8, Canada T6G 2E8
ada T6E8ada T6
menfluid
n clinrt torst bitograetrythe mme. Tns the.ca
c Department of Clinical Laboratory Medicine, University of Alberta, Edmonton, AB, Cand Department of Biological Sciences, University of Alberta, Edmonton, AB, Canada T6G 2e National Institute for Nanotechnology, 11421 Saskatchewan Drive, Edmonton, AB, Can
a r t i c l e i n f o
Article history:Received 11 February 2008Accepted 2 May 2008Available online 8 May 2008
Keywords:Cerebrospinal fluidCSFMetabolomeMetabolomicsNuclear magnetic resonanceMass spectrometry
a b s t r a c t
With continuing improvemetabolic profiling of bioence resources for certai(CSF). As part of our effocharacterize CSF as the fihensive NMR, gas chromatransform–mass spectromquantify essentially all ofthe human CSF metabololinks to disease associatiohttp://www.csfmetabolom
1. Introduction
Metabolomics is an emerging area of “omics” researchthat involves the global or near global analysis of the smallmolecule metabolites (<1500 Da) found in living organisms (i.e. themetabolome). While still in its infancy we are already beginningto see applications of metabolomics in many fields, including dis-ease diagnostics [1], pharmaceutical research and development [2],and agriculture and food safety [3]. These applications are leadingto the discovery of many useful biomarkers and the developmentof a number of improved screening assays. Continued advances indetection and separation technologies certainly suggest that thepotential range of metabolomics applications will continue to grow.However, a common criticism about this field is the fact that in anygiven metabolomics study, relatively few metabolites are identifiedor quantified. In other words, metabolomics is not as quantitativeas the other “omics” sciences. With the release of the first draft
� This paper is part of a special volume entitled “Hyphenated Techniques for GlobalMetabolite Profiling”, guest edited by Georgios Theodoridis and Ian D. Wilson.
ts in analytical technology and an increased interest in comprehensives and tissues, there is a growing need to develop comprehensive refer-ically important biofluids, such as blood, urine and cerebrospinal fluidsystematically characterize the human metabolome we have chosen toofluid to be intensively scrutinized. In doing so, we combined compre-phy–mass spectrometry (GC–MS) and liquid chromatography (LC) Fourier(FTMS) methods with computer-aided literature mining to identify andetabolites that can be commonly detected (with today’s technology) in
ables containing the compounds, concentrations, spectra, protocols andat we have found for the human CSF metabolome are freely available at.
of the Human Metabolome [4], we believe an important step hasbeen taken to make metabolomics studies much more quantitative.
In an effort to lay an even more solid foundation to quantitativemetabolomics we have started to systematically determine thedetectable metabolic composition of clinically important biofluidsand tissue types. Based on its relative metabolic simplicity and itspotential importance to central nervous system (CNS) diseases, wehave selected cerebrospinal fluid (CSF) as our first biofluid to becomprehensively characterized. Presented herein is the most com-plete catalogue of the human CSF metabolome to date.
CSF is the secretion product of the central nervous system thatfills the ventricles and the subarachnoid space of the brain andspinal column [5,6]. Apart from it’s role in protecting the brainfrom physical shock, CSF also has a function in circulating nutrientsand chemicals filtered from the blood along with waste manage-ment by removing organic acids either by active transport or bulkflow from the extracellular fluid in the brain to the subarachnoidcompartment, and ultimately into the venous blood stream and thelymphatic system [5,6,7]. Since the composition of CSF is directlydependent upon metabolite production rates in the brain [7], anal-ysis of the CSF metabolome can offer biochemical insights intocentral nervous system disorders, such as brain injury [8], Parkin-son’s disease [9] and multiple sclerosis [10].
ting for each metabolite was done using the standard Chenomx
D.S. Wishart et al. / J. Chro
Over the past 50 years several different routes have been pur-sued to characterize the CSF metabolome including: (1) modernmetabolomic or metabolic profiling approaches; (2) referentialclinical chemistry studies and (3) targeted metabolite identificationstudies. In terms of metabolite profiling methods, several differentgroups have applied 1H NMR [11–14], gas chromatography–massspectrometry (GC–MS) [7,13,14] and amino acid analysis [15,16] tocharacterize a significant portion of the CSF metabolome. Largenumbers of referential clinical chemistry studies, largely focusingon a single metabolite at a time, were also conducted on CSF inthe 1960s and 1970s [17,18]. The intent of these studies was todetermine reference concentrations for many easily detected com-pounds. Information on these compounds and their concentrationranges has been compiled in a number of well known clinical chem-istry texts [19]. With improvements to instrumentation sensitivityand separation capacity, dozens of other targeted metabolite stud-ies have been conducted on CSF that have led to the identificationand quantification of many previously undetectable CSF metabo-lites. Unfortunately, this information is not located in any centralrepository and is rather scattered across numerous journals andperiodicals [4].
In order to facilitate future CSF research, it is important toestablish a comprehensive, electronically accessible database ofthe detectable metabolites in human CSF. In this report wepresent a catalogue of detectable metabolites (including theirconcentrations and disease associations) that can be found inhuman cerebral spinal fluid. This catalogue was assembled usinga combination of both experimental and literature-based research.Experimentally, we used nuclear magnetic resonance (NMR),gas chromatography–mass spectrometry, Fourier transform–massspectrometry (FTMS) and liquid chromatography (LC) to separate,identify, quantify and validate CSF metabolites. To complimentthese “global” metabolic profiling efforts, our team also surveyedand extracted metabolite and disease-association data from morethan 2000 books and journal articles that had been identifiedthrough computer-aided literature mining. In undertaking thiseffort we wished to address four key questions: (1) what com-pounds can be or have ever been identified in CSF? (2) What arethe concentration ranges for these metabolites? (3) What portionof the CSF metabolome can be routinely identified and/or quanti-fied in CSF using conventional, untargeted metabolomics methods?(4) What analytical methods (NMR, GC–MS, LC–MS) are bestsuited for comprehensively characterizing the CSF metabolome?Comprehensive tables containing the compounds, concentrations,
spectra, protocols and links to disease associations that wereuncovered or identified from this work are freely available athttp://www.csfmetabolome.ca.
2. Experimental
2.1. CSF collection
Lumbar CSF samples were collected from 50 patients screenedfor meningitis in accordance with guidelines established by theUniversity of Alberta Health Research Ethics Board. As part ofthe disease screening procedure, CSF samples were required tobe stored at 4 ◦C for 2 days, after which they were placed ina freezer for long-term storage at −80 ◦C. Studies with CSF andother biofluids indicate that these fluids are quite stable at low(<5 ◦C) temperatures [16,20,21]. Samples that were colored dueto blood contamination (erythrochromic and xanthochromic) [5]were eliminated from further analyses, leaving a total of 35 usableCSF samples. The typical volume of each CSF sample was 0.5–1.0 mL.Since degradation of CSF metabolites has been seen in CSF left at
r. B 871 (2008) 164–173 165
room temperature for >2 h [16,20], NMR samples were preparedand spectra collected almost immediately after thawing.
2.2. NMR spectroscopy
Fresh CSF samples were prepared by transferring a 300 �Laliquot of CSF fluid to a 1.5 mL Eppendorf tube followedby the addition of 35 �L D2O and 15 �L of a standardsolution (3.73 mM DSS (disodium-2,2-dimethyl-2-silapentane-5-sulphonate), 233 mM imidazole, and 0.47% NaN3 in H2O,Sigma–Aldrich, Mississauga, ON). The CSF sample (350 �L) wasthen transferred to a standard SHIGEMI microcell NMR tube. Intotal, 35 CSF samples were prepared in this manner, each con-taining 0.16 mM DSS, 10 mM imidazole, and 0.02% NaN3 at a pHof 7.3–7.7. The samples were not filtered prior to data collection asCSF contains very little protein [5]. Furthermore, previous studieshave found that using ultracentrifugation to remove high molecularweight metabolites does not improve the quantitative or qualitativeanalysis of low molecular weight metabolites [20].
All 1H NMR spectra were collected on a 500 MHz Inova (VarianInc., Palo Alto, CA) spectrometer equipped with either a 5 mm HCNZ-gradient pulsed-field gradient (PFG) room-temperature probe ora Z-gradient PFG Varian cold-probe. 1H NMR spectra were acquiredat 25 ◦C using the first transient of the tnnoesy-presaturation pulsesequence, which was chosen for its high degree of high quantitativeaccuracy [21]. Spectra were collected with 64 transients using a 4 sacquisition time and a 1 s recycle delay. For certain confirmatoryexperiments, higher field (800 MHz Varian Inova) instruments andlarger numbers of transients (256) were used.
2.3. NMR compound identification and quantification
Prior to spectral analysis, all FIDs were zero-filled to 64k datapoints, and a line broadening of 0.5 Hz was applied. The methyl sin-glet of the buffer constituent DSS served as an internal standard forchemical shift referencing (set to 0 ppm) and for quantification. All1H NMR spectra were processed and analyzed using the ChenomxNMR Suite Professional software package version 4.6 (ChenomxInc., Edmonton, AB). The Chenomx NMR Suite software allows forqualitative and quantitative analysis of an NMR spectrum by “fit-ting” spectral signatures from an internal database of referencespectra to the full NMR spectrum [22]. Specifically, the spectral fit-
500 MHz (pH 6–8) metabolite library, with a set of additionalcompound signatures (1,5-anhydrosorbitol, dimethyl sulfone, 2-oxoisovalerate, 3-hydroxyisobutyrate) that were added in-house.It has been previously shown that this fitting procedure providesabsolute concentration accuracies of 90% or better [23]. Concentra-tion data was corrected for bandpass filter attenuation as previouslydescribed [21]. Each spectrum was processed and analyzed bymultiple NMR spectroscopists to minimize compound misidentifi-cation and misquantification. Concentrations were averaged over35 patient samples. As a further check of sample identificationand quantification accuracy, “outlier” concentrations were iden-tified (using a Q-test with a 99% confidence interval) and furtheranalyzed to check or correct the compound identification. Extremeoutlier concentrations, which may have represented an underlyingor undetected disease condition, were removed in calculating thefinal metabolite concentration averages and standard deviations.In addition to these statistical checks, we also used sample spik-ing to confirm the identity of every spectral signature seen in ourNMR spectra. This was done by adding 20–200 �M of the presump-tive compound to selected CSF samples and checking to see if thecorresponding 1H NMR signals changed as expected.
The literature-derived concentration values also simplified someof the searches for putative metabolite matches.
166 D.S. Wishart et al. / J. Chro
2.4. GC–MS compound identification and quantification
Because of the need for relatively larger volumes for GC–MS andLC–MS work (particularly for quantification as well as for separationand derivatization trials), a pooled CSF sample was prepared fromthe un-used portion of the 35 samples used in the NMR studies.This ∼10 mL sample was divided equally between the LC–MS andGC–MS studies. The CSF extraction and derivatization protocol forour GC–MS work was adapted from previously described methods[24]. Fresh GC–MS samples were prepared by transferring a 200 �Laliquot of CSF fluid to a 1 mL Eppendorf tube followed by the addi-tion of 800 �L of 8:1 HPLC grade methanol:de-ionized water. Thesample was then vortexed for 2 min followed by centrifugation at5000 rpm for 5 min to remove any precipitate from the supernatant.After centrifugation, 200 �L of the supernatant was transferred intoa 2 mL glass vial with a 400 �L insert and evaporated to drynessusing a Speedvac concentrator. To the residue was added 40 �L ofmethoxyamine hydrochloride (Sigma–Aldrich), and was incubatedat 30 ◦C for 90 min using a hotplate. After methoximation, 40 �Lof MSTFA derivitization agent (Sigma–Aldrich) and 20 �L of pro-line internal standard solution were added to the residue followedby incubation at 30 ◦C for 45 min. GC–MS samples were then vor-texed twice throughout incubation to ensure complete dissolution.Samples were analyzed immediately after derivitization.
Derivatized extracts were analyzed using an HP 6890/5975quadrupole GC/MS operating in an electron impact (EI) mode. Foranalysis, 1 �L of extract was injected splitless onto a DB-5 column(J&W Scientific, Folsom, CA) with helium carrier gas set to a flowrate of 1 mL/min and initial oven temperature of 70 ◦C. The tem-perature was increased at 1 ◦C/min to 76 ◦C, and then increasedat 6.1 ◦C/min, for a final run time of 45 min (and a final tempera-ture of 310 ◦C). Samples were run using full scan at a mass range of50–500 m/z, with a solvent delay of 6 min. Retention indices werecalculated using an internal alkane standard [24].
Trimethylsilated metabolites were identified using AMDISGC/MS processing software in one of two ways. Those peaks match-ing to known retention indices had their MS data (EI fragmentspectra) compared to AMDIS’s NIST/EPA/NIH library to confirm thecompound’s identity. This identity was double-checked using addi-tional published retention index libraries [25]. Those peaks havingno match to published retention indices and/or no match to theAMDIS GC/MS spectral library, were identified using pure standardsobtained from the Human Metabolite Library [4] and quantifiedusing external five-point calibration curves. Where peak baseline
resolution was not observed, peak deconvolution software wasused to separate peaks based on Gaussian shape recognition. Usingthe mass spectral information obtained in this manner, peaks weresuccessfully identified and peak areas successfully quantified. Asa final check, pure standards of all 41 compounds initially identi-fied by this process were derivitized and run through the GC–MS(using the same protocol described above) to confirm their identity,retention indices and EI spectra.
2.5. FT ICR–MS compound identification
CSF samples from the previously prepared pooled CSF samplewere analyzed using a Bruker Daltonics 9.4T Apex-Qe FT-ICR massspectrometer operating in positive and negative ion mode equippedwith a Waters UPLC system. For a typical analysis, 8 �L of CSF wasinjected onto a Waters BEH C18 column (Waters Corp., Milford, MA,1.0 internal diameter (i.d.) × 150 mm). The flow rate was 50 �L/minusing a mobile phase of 0.1% acetic acid solution in water (solu-tion A) and acetonitrile (solution B). The column was equilibratedin a 5% B solution. After an initial equilibration time of 5 min, thesolvent was ramped to 98% B over a period of 60 min. Further sep-
gr. B 871 (2008) 164–173
aration was achieved using a HILIC UPLC column (Waters Corp.,Milford, MA, 1.0 i.d. × 150 mm). The mobile phase constituents forthis separation were 8.5 �m ammonium acetate in 95% acetonitrile(solution A), and 8.5 mM ammonium acetate in 55% acetonitrile(solution B). After injection, a mobile phase concentration of 5% Bwas held for 10 min, then ramped at 1.3% B/min for 30 min. Themobile phase concentration was ramped to 100% B to a final timeof 60 min.
Metabolites were identified and confirmed by high-resolutionFT mass spectrometry (FTMS) by comparing their parent ion andfragment ion masses to known masses or fragment ion spectrawith the Human Metabolome Database [4], DrugBank [26] andknown literature. Unknown peaks needing further confirmationwere identified by detailed analysis of MS/MS spectral patternsor comparison of LC retention time and/or MS/MS data obtainedwith authentic chemical standards obtained from the HumanMetabolome Library.
2.6. Literature survey of CSF metabolites
In addition to the experimental analysis of the CSF metabolomementioned above, a complete literature review of known metabo-lites and metabolite concentrations in CSF was also conducted.This literature survey was also facilitated by several computationaltools developed for the Human Metabolome Database [4]. Oneof the more useful programs was an in-house text-mining toolcalled PolySearch (http://wishart.biology.ualberta.ca/polysearch/).This program was used to generate a hyperlinked list of abstractsand papers from PubMed containing relevant information aboutCSF metabolites and CSF concentration data. Specifically, Pol-ySearch compiled a ranked list of metabolites based on thefrequency of word co-occurrence with the terms “CSF”, “cere-brospinal fluid” or “cerebral spinal fluid” in conjunction with wordssuch as “concentration”, “identification”, “quantification”, “mM”,or “micromol”. PolySearch also extracted key sentences from theabstracts, then labeled and hyperlinked the metabolites mentionedin the text. From the resulting papers and abstracts, our annotatorsextracted metabolite information (metabolite identities, concen-trations, disease states, etc.) and entered the data into our databasesystem. The resulting list of literature-derived CSF metaboliteshelped confirm metabolites found in our experimental analyses.
3. Results and discussion
In this study, we have attempted to perform a quantita-tive, “base-line” characterization of the human CSF metabolomeusing a combination of both experimental and literature-basedapproaches. The literature-based data proved to be critical to theidentification of a number of previously unidentified or misidenti-fied peaks in our experimental data sets. Likewise, the experimentaldata allowed correction or confirmation of a number of question-able literature-derived values. The combination of both methodsallowed us to assemble a very complete picture of the detectableCSF metabolome. It also allowed us the opportunity to addressfour key questions: (1) what compounds can be or have ever beenidentified in CSF? (2) What are the concentration ranges for thesemetabolites? (3) What portion of the CSF metabolome can beroutinely identified and/or quantified in CSF using conventional,untargeted metabolomics methods? (4) What analytical methods(NMR, GC–MS, LC–MS) are best suited for comprehensively char-acterizing the CSF metabolome?
3.1. The content of the CSF metabolome—the CSFmetabolomedatabase
A complete listing of the type and quantity of endogenousmetabolites that can be detected in human CSF is given athttp://www.csfmetabolome.ca. This freely available, web-enableddatabase provides a list of the metabolite names, concentrationranges (normal and disease associated), diseases and referencesfor all human CSF metabolites that have ever been detected ordescribed in the literature. It also contains the concentration datacompiled from the experimental studies described here. Each CSFmetabolite entry in this database is linked to a MetaboCard buttonwhich, in turn, is hyperlinked to the Human Metabolome Database(HMDB). The HMDB data provides up to 90 data fields coveringdetails on the nomenclature, chemistry, biology and biochemistryof the metabolite of interest [4]. The CSFmetabolome databaseitself is searchable by compound name and concentration ranges.It can also be re-sorted to display metabolites on the basis of theirname, concentration or disease association. Users may also use theChemQuery search tool to search the database via the chemicalstructure, SMILES string or mass of the compound of interest. TheCSFmetabolome database also supports searches on the basis ofNMR chemical shifts (NMRSearch), mass spectra (MS-Search) andGC–MS data (GCMS-Search).
Currently the human CSFmetabolome database contains 308detectable metabolites, as defined in the present literature. This isnot a number that will remain unchanged. Rather it reflects thetotal number of endogenous metabolites (organic and inorganic)that have ever been detected and quantified by ourselves and oth-ers. Certainly as technology improves, it is likely that this numberwill increase as other, lower abundance metabolites are detectedand added to future versions of the CSFmetabolome database. Like-wise, if the list was expanded to include intermittent, exogenouscompounds such as drugs, food additives and drug metabolites, itcould be substantially larger. Inspection of our on-line tables gen-erally shows that CSF contains very few detectable hydrophobic orlipid-like molecules. This is further emphasized in Table 1, whichprovides a listing of the metabolite categories in CSF and the num-ber of representative compounds that can be found in this biofluid.Certainly lipids and steroids do exist in CSF, but they are at very lowabundance and therefore, not easily detectable. Overall, the com-position of CSF is dominated by amino acids, metal ions or salts,steroids and steroid derivatives, short chain fatty acids, hydroxyacids, short chain fatty acids, alcohols, dicarboxylic acids and car-
bohydrates.
Not unexpectedly, a significant number of the metabolites inCSF are neurotransmitters or metabolites of neurotransmitters.These include the catecholamines, excitatory amino acids (GABA,NAA, glutamate), acetylcholine and choline. Their presence obvi-ously reflects the neurotransmitter activity and metabolism in thebrain and central nervous system. Based on the existing litera-ture data, the majority of metabolites in CSF are relatively smallmolecules (<400 Da) with a maximum molecular weight of 1500 Da(for sphingolipids). This restricted size limit may be an artifact ofthe experimental methodology employed, or it may reflect on theupper limit of small molecules that can easily pass through theblood brain barrier without the need for active transport.
3.2. Metabolite concentrations in CSF—literature survey
The CSFmetabolome database provides both concentration aver-ages and concentration ranges for 308 endogenous metabolitescorresponding to both normal and diseased conditions. These con-centrations were derived from both literature reviews and fromour own experimental efforts (vide infra). In many cases, multi-
ple concentration values are given for “normal” conditions. This isdone to provide users/readers a better estimate of the potentialconcentration variations that different technologies or laborato-ries may measure. As a general rule, there is good agreement
between most laboratories and methods. However, the generalconsensus in this table does not reflect the true state of the raw lit-erature. A number of literature-derived concentration values wereeliminated through the curation process after being deemed mis-taken, disproven (by subsequent published studies), mis-typed orphysiologically impossible. Much of the curation process involvedcarefully reading and re-reading the primary literature to check forunit type, unit conversion and typographical inconsistencies.
Other than the inorganic ions such as sodium (145 mM),bicarbonate (10 mM), potassium (3 mM), calcium and magnesium(∼1 mM), the 12 most abundant organic metabolites found inCSF are glucose (5 mM), urea (4 mM), lactic acid (2 mM), gluat-mine (500 �M), citrate (400 �M), acetic acid (300 �M), fructose(200 �M), myo-inositol (170 �M), galactose (170 �M), ascorbic acid(160 �M), pyruvic acid (150 �M) and acetic acid (120 �M). The 12least abundant metabolites in CSF are estradiol (1 pM), serotonin(10 pM), 8-isoprostane (20 pM), cyanocobalamin (25 pM), nore-pinephrine (100 pM), 3,4-dihydroxybenzeneacetic acid (100 pM),pregnenalone (130 pM), allopregnanolone (160 pM), epinephrine(220 pM), dihydropbiopterin (400 pM), homovanillic acid (400 pM)and 5-hydroxyindoleacetic acid (400 pM). Despite the high abun-
dance of acids and acidic amino acids, CSF is heavily buffered bybicarbonate ions, allowing it to maintain a constant pH of 7.3 [7].The relatively high levels of glucose and urea in CSF also reflect theprimary activity of CSF (waste disposal and nutrient circulation).Other metabolites, such as trimethylamine, methanol, acetone,DMSO2, etc. are primarily metabolic waste products that need tobe removed from the brain.
One point that is particularly interesting is the fact that the con-centration of the average metabolite in normal CSF varies by about±50%, with some metabolites varying by as much as ±100% (suchas acetoacetic acid, acetone and glutamic acid). Likewise, drawingconclusions about potential disease biomarkers without properlytaking into account this variation would be ill-advised. Since CSFis like the “brain’s urine” we believe this variation may be due to anumber of factors, including age, gender, diurnal variation, healthstatus, activity and diet [27]. Some entries in the CSFmetabolomedatabase show these variations explicitly with information aboutthe populations (age, gender) from which these metabolite con-centrations were derived. Clearly more study on the contributionsto the observed variations in CSF is warranted, although given thedifficulty with which CSF is normally acquired, these studies willbe difficult.
3.3. Experimental quantification and identification—NMR
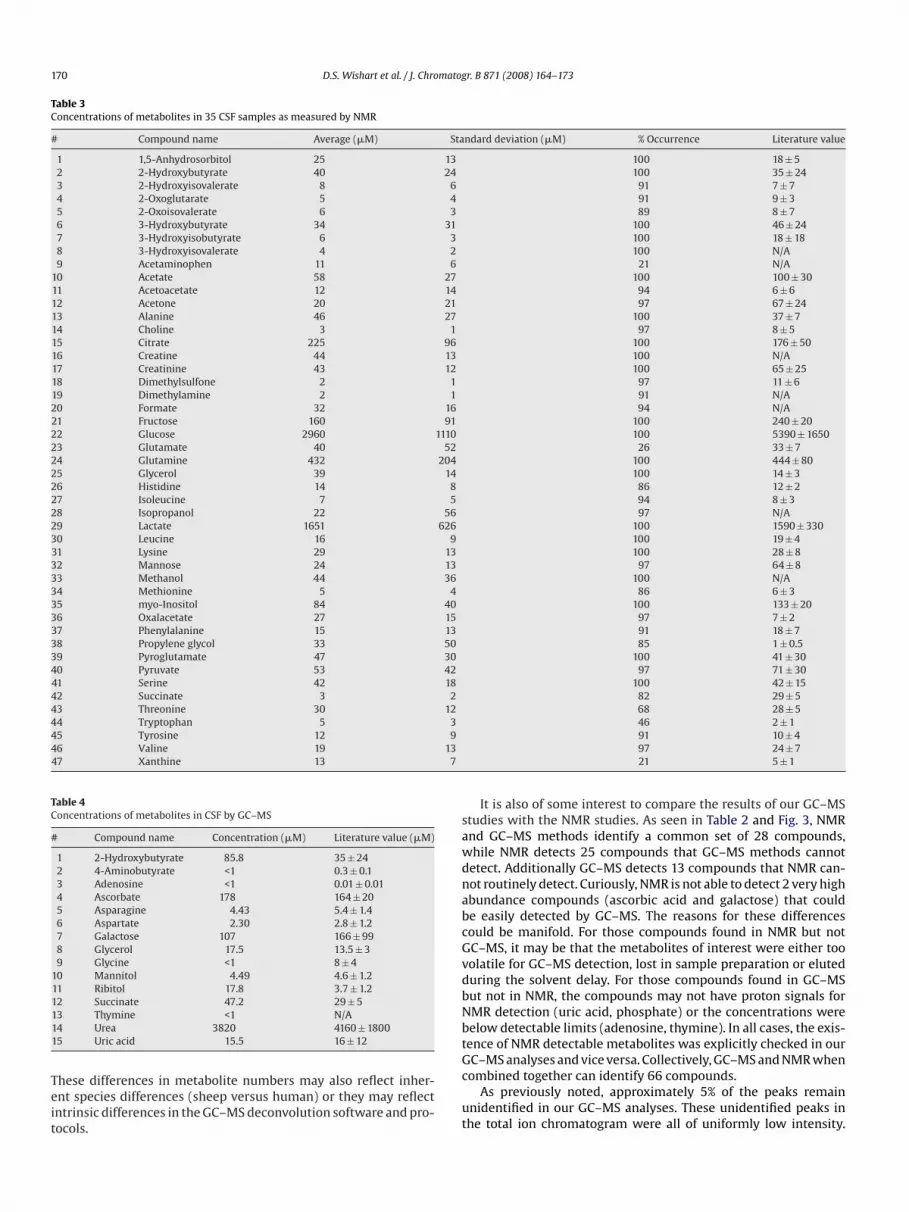
Fig. 1 illustrates a typical high-resolution NMR spectrum ofCSF. As can be seen in this figure, most of the visible peaks areannotated with a compound name. In processing and analyzingthe 35 CSF spectra we were generally able to assign >95% of allvisible peaks and account for >99% of the spectral area for eachCSF spectrum. In other words the level of assignment is essen-tially complete. On average, a single CSF sample will yield about45–50 identifiable metabolites by NMR. Analysis of the entire col-lection of CSF samples yielded a total of 53 metabolites of which47 could be precisely quantified (Tables 2 and 3). Of the 53 com-pounds identified, three metabolites are exogenous or potentiallyexogenous, including acetaminophen (a drug), propylene glycol (apossible container contaminant) and isopropanol (from needlesused to perform the lumbar punctures). However, propylene gly-col and isopropanol are also known to be produced in the humanbody [28].
As seen in Table 3 some compounds are found in only a fewCSF samples, while about 45 compounds (with >90% occurrence)seem universal. Efforts certainly were made to identify these
“rare” compounds in a larger fraction of CSF samples. However,we found that collection of NMR spectra for longer periods oftime or at higher fields only improved quantification accuracy butdid not lead to an increase in the number of signals detected.Inspection of Table 3 also reveals the generally good agreementbetween the NMR-measured concentrations and those reported inthe literature (often obtained by other analytical means). How-ever, not all of the NMR-derived CSF concentrations agree withthe literature derived values. Compounds exhibiting the great-est discrepancy between NMR measured values and literaturederived values include: 3-hydroxyisobutyrate, acetone, glycerol,dimethylsulfone, mannose, oxalacetate, succinate and propyleneglycol. Some of these may be explained by the inherent volatil-ity or chemical instability of certain compounds (dimethylsulfone,acetone and propylene glycol). Other discrepancies may be dueto sample collection/preservation effects or possibly sample sizeeffects (2 patients versus 35 patients). A third source that mightaccount for some of the observed variation may be technical prob-lems with the analytical methods themselves or the calibrationstandards used in the original analyses. We have carefully re-investigated our concentration measurements by NMR for these
nine “problem” compounds and are convinced that they are accu-rate.
It should be noted that given the invasive nature of CSF collec-tion as well as the ethical and legal issues associated with obtainingCSF, it is almost impossible to collect this fluid from truly healthyindividuals. Many CSF samples are collected “with cause” or as aprecautionary measure due to some underlying condition. Con-sequently defining a normal or healthy concentration range fora given set of CSF metabolites is always going to be somewhatchallenging. Nevertheless, we would estimate that the list of 53metabolites given in Table 2 and the concentrations give in Table 3essentially defines the “normal NMR-detectable CSF metabolome”.Furthermore, we believe that this set of 53 should make NMR char-acterization of unprocessed CSF essentially automatic.
D.S. Wishart et al. / J. Chromatogr. B 871 (2008) 164–173 169
Fig. 1. Varian 500 MHz 1H NMR spectrum of human CSF. Resonan
3.4. Experimental quantification and identification—GC–MS
Fig. 2 illustrates a high-resolution GC–MS spectrum of ourpooled sample of CSF. As can be seen in this figure, most of thevisible peaks are annotated with a compound name. Approxi-mately 95% of peaks in the total ion chromatogram were identified.All chemical peaks for identified metabolites were verified bypure standards and correlated to literature values. In total wewere able to identify 41 metabolites via GC–MS (Table 2). Anadditional 15 metabolites that could not be detected/quantifiedby NMR were quantified by GC–MS using external calibration(Table 4). Compound concentrations that were below the 1 �Mlimit could not be accurately quantified, however these com-pounds were identified based on identification methods previously
Fig. 2. HP 6890/5975 GC/MS spectrum of human CSF. Peaks a
ces are labeled with their corresponding metabolite names.
described. Given that there are slightly over 75 compounds inthe CSFmetabolome database that have normal concentrations>1 �M, one might have expected that the number of compoundsdetectable by GC–MS would be much higher than 41. One pos-sible reason for this lower-than-expected number is our use ofa relatively slow scanning quadrupole instrument that may nothave allowed sufficient sampling across the GC peaks to permitfull spectral deconvolution. The use of faster scanning quadrupoleor TOF instruments with greater sensitivity may have improvedcompound detection or identification. Indeed, a recent report byPears et al. [14] has shown that up to 80 metabolite signalscould be detected in the CSF of domestic sheep using a higherquality GC–TOF instrument. However, only 45 of the 80 metabo-lites could be unambiguously identified (versus 41 reported here).
re labeled with their corresponding metabolite names.
170 D.S. Wishart et al. / J. Chromatogr. B 871 (2008) 164–173
Table 3Concentrations of metabolites in 35 CSF samples as measured by NMR
# Compound name Average (�M) Standard deviation (�M) % Occurrence Literature value
These differences in metabolite numbers may also reflect inher-ent species differences (sheep versus human) or they may reflectintrinsic differences in the GC–MS deconvolution software and pro-tocols.
It is also of some interest to compare the results of our GC–MSstudies with the NMR studies. As seen in Table 2 and Fig. 3, NMRand GC–MS methods identify a common set of 28 compounds,while NMR detects 25 compounds that GC–MS methods cannotdetect. Additionally GC–MS detects 13 compounds that NMR can-not routinely detect. Curiously, NMR is not able to detect 2 very highabundance compounds (ascorbic acid and galactose) that couldbe easily detected by GC–MS. The reasons for these differencescould be manifold. For those compounds found in NMR but notGC–MS, it may be that the metabolites of interest were either toovolatile for GC–MS detection, lost in sample preparation or elutedduring the solvent delay. For those compounds found in GC–MSbut not in NMR, the compounds may not have proton signals forNMR detection (uric acid, phosphate) or the concentrations werebelow detectable limits (adenosine, thymine). In all cases, the exis-tence of NMR detectable metabolites was explicitly checked in ourGC–MS analyses and vice versa. Collectively, GC–MS and NMR whencombined together can identify 66 compounds.
As previously noted, approximately 5% of the peaks remainunidentified in our GC–MS analyses. These unidentified peaks inthe total ion chromatogram were all of uniformly low intensity.
D.S. Wishart et al. / J. Chromatog
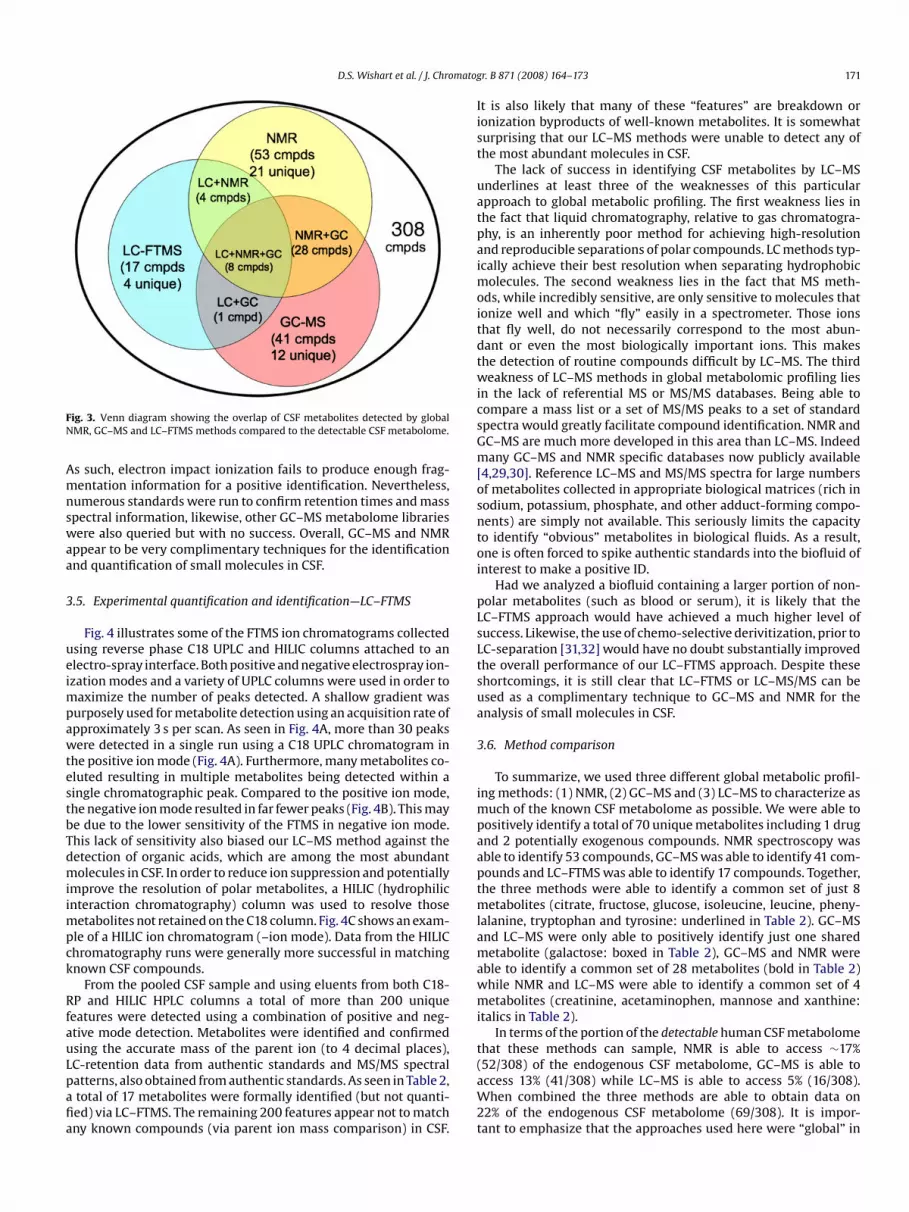
Fig. 3. Venn diagram showing the overlap of CSF metabolites detected by globalNMR, GC–MS and LC–FTMS methods compared to the detectable CSF metabolome.
As such, electron impact ionization fails to produce enough frag-mentation information for a positive identification. Nevertheless,numerous standards were run to confirm retention times and massspectral information, likewise, other GC–MS metabolome librarieswere also queried but with no success. Overall, GC–MS and NMRappear to be very complimentary techniques for the identificationand quantification of small molecules in CSF.
3.5. Experimental quantification and identification—LC–FTMS
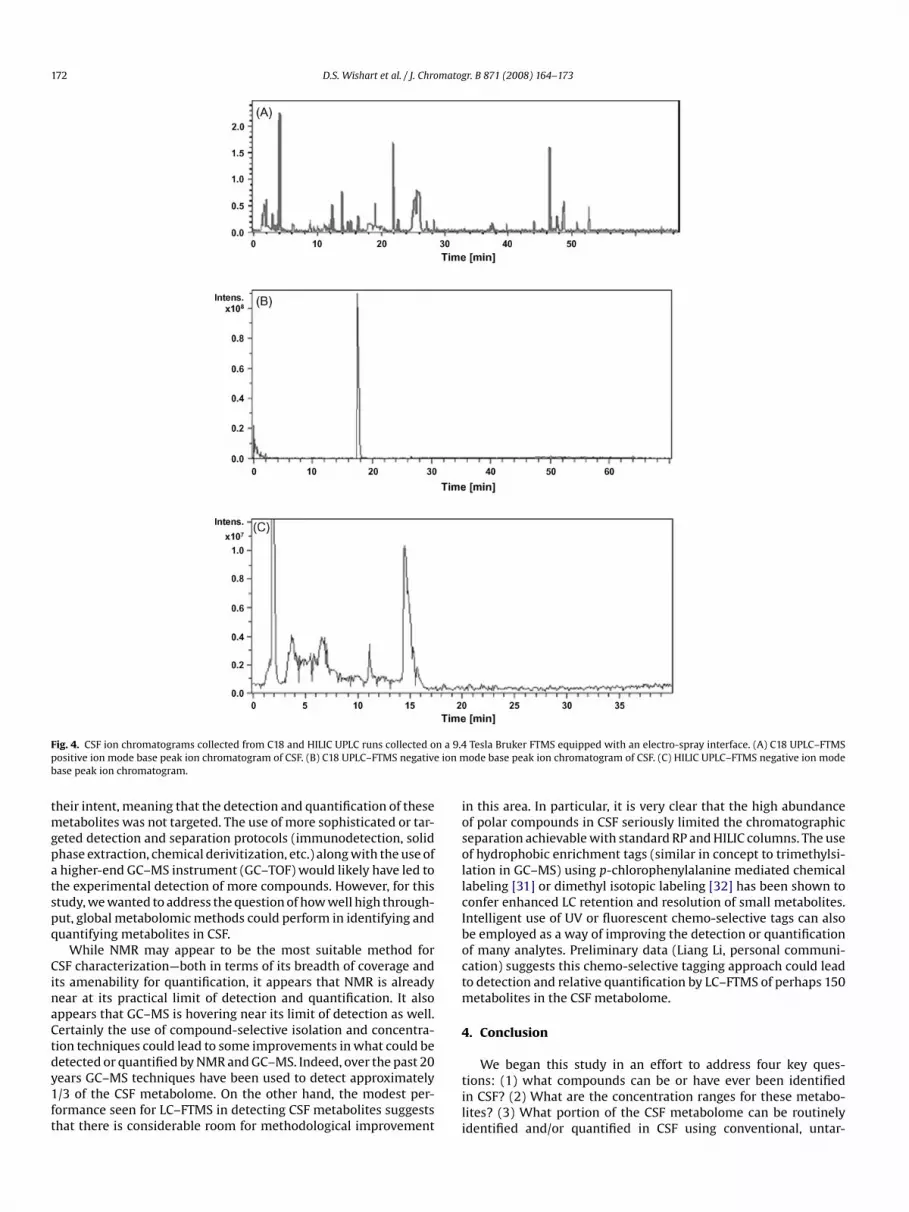
Fig. 4 illustrates some of the FTMS ion chromatograms collectedusing reverse phase C18 UPLC and HILIC columns attached to anelectro-spray interface. Both positive and negative electrospray ion-ization modes and a variety of UPLC columns were used in order tomaximize the number of peaks detected. A shallow gradient waspurposely used for metabolite detection using an acquisition rate ofapproximately 3 s per scan. As seen in Fig. 4A, more than 30 peakswere detected in a single run using a C18 UPLC chromatogram inthe positive ion mode (Fig. 4A). Furthermore, many metabolites co-eluted resulting in multiple metabolites being detected within asingle chromatographic peak. Compared to the positive ion mode,
the negative ion mode resulted in far fewer peaks (Fig. 4B). This maybe due to the lower sensitivity of the FTMS in negative ion mode.This lack of sensitivity also biased our LC–MS method against thedetection of organic acids, which are among the most abundantmolecules in CSF. In order to reduce ion suppression and potentiallyimprove the resolution of polar metabolites, a HILIC (hydrophilicinteraction chromatography) column was used to resolve thosemetabolites not retained on the C18 column. Fig. 4C shows an exam-ple of a HILIC ion chromatogram (–ion mode). Data from the HILICchromatography runs were generally more successful in matchingknown CSF compounds.
From the pooled CSF sample and using eluents from both C18-RP and HILIC HPLC columns a total of more than 200 uniquefeatures were detected using a combination of positive and neg-ative mode detection. Metabolites were identified and confirmedusing the accurate mass of the parent ion (to 4 decimal places),LC-retention data from authentic standards and MS/MS spectralpatterns, also obtained from authentic standards. As seen in Table 2,a total of 17 metabolites were formally identified (but not quanti-fied) via LC–FTMS. The remaining 200 features appear not to matchany known compounds (via parent ion mass comparison) in CSF.
r. B 871 (2008) 164–173 171
It is also likely that many of these “features” are breakdown orionization byproducts of well-known metabolites. It is somewhatsurprising that our LC–MS methods were unable to detect any ofthe most abundant molecules in CSF.
The lack of success in identifying CSF metabolites by LC–MSunderlines at least three of the weaknesses of this particularapproach to global metabolic profiling. The first weakness lies inthe fact that liquid chromatography, relative to gas chromatogra-phy, is an inherently poor method for achieving high-resolutionand reproducible separations of polar compounds. LC methods typ-ically achieve their best resolution when separating hydrophobicmolecules. The second weakness lies in the fact that MS meth-ods, while incredibly sensitive, are only sensitive to molecules thationize well and which “fly” easily in a spectrometer. Those ionsthat fly well, do not necessarily correspond to the most abun-dant or even the most biologically important ions. This makesthe detection of routine compounds difficult by LC–MS. The thirdweakness of LC–MS methods in global metabolomic profiling liesin the lack of referential MS or MS/MS databases. Being able tocompare a mass list or a set of MS/MS peaks to a set of standardspectra would greatly facilitate compound identification. NMR andGC–MS are much more developed in this area than LC–MS. Indeedmany GC–MS and NMR specific databases now publicly available[4,29,30]. Reference LC–MS and MS/MS spectra for large numbersof metabolites collected in appropriate biological matrices (rich insodium, potassium, phosphate, and other adduct-forming compo-nents) are simply not available. This seriously limits the capacityto identify “obvious” metabolites in biological fluids. As a result,one is often forced to spike authentic standards into the biofluid ofinterest to make a positive ID.
Had we analyzed a biofluid containing a larger portion of non-polar metabolites (such as blood or serum), it is likely that theLC–FTMS approach would have achieved a much higher level ofsuccess. Likewise, the use of chemo-selective derivitization, prior toLC-separation [31,32] would have no doubt substantially improvedthe overall performance of our LC–FTMS approach. Despite theseshortcomings, it is still clear that LC–FTMS or LC–MS/MS can beused as a complimentary technique to GC–MS and NMR for theanalysis of small molecules in CSF.
3.6. Method comparison
To summarize, we used three different global metabolic profil-ing methods: (1) NMR, (2) GC–MS and (3) LC–MS to characterize as
much of the known CSF metabolome as possible. We were able topositively identify a total of 70 unique metabolites including 1 drugand 2 potentially exogenous compounds. NMR spectroscopy wasable to identify 53 compounds, GC–MS was able to identify 41 com-pounds and LC–FTMS was able to identify 17 compounds. Together,the three methods were able to identify a common set of just 8metabolites (citrate, fructose, glucose, isoleucine, leucine, pheny-lalanine, tryptophan and tyrosine: underlined in Table 2). GC–MSand LC–MS were only able to positively identify just one sharedmetabolite (galactose: boxed in Table 2), GC–MS and NMR wereable to identify a common set of 28 metabolites (bold in Table 2)while NMR and LC–MS were able to identify a common set of 4metabolites (creatinine, acetaminophen, mannose and xanthine:italics in Table 2).
In terms of the portion of the detectable human CSF metabolomethat these methods can sample, NMR is able to access ∼17%(52/308) of the endogenous CSF metabolome, GC–MS is able toaccess 13% (41/308) while LC–MS is able to access 5% (16/308).When combined the three methods are able to obtain data on22% of the endogenous CSF metabolome (69/308). It is impor-tant to emphasize that the approaches used here were “global” in
172 D.S. Wishart et al. / J. Chromatogr. B 871 (2008) 164–173
n a 9.4e ion m
Fig. 4. CSF ion chromatograms collected from C18 and HILIC UPLC runs collected opositive ion mode base peak ion chromatogram of CSF. (B) C18 UPLC–FTMS negativbase peak ion chromatogram.
their intent, meaning that the detection and quantification of thesemetabolites was not targeted. The use of more sophisticated or tar-geted detection and separation protocols (immunodetection, solidphase extraction, chemical derivitization, etc.) along with the use ofa higher-end GC–MS instrument (GC–TOF) would likely have led tothe experimental detection of more compounds. However, for thisstudy, we wanted to address the question of how well high through-put, global metabolomic methods could perform in identifying andquantifying metabolites in CSF.
While NMR may appear to be the most suitable method forCSF characterization—both in terms of its breadth of coverage andits amenability for quantification, it appears that NMR is alreadynear at its practical limit of detection and quantification. It alsoappears that GC–MS is hovering near its limit of detection as well.Certainly the use of compound-selective isolation and concentra-tion techniques could lead to some improvements in what could bedetected or quantified by NMR and GC–MS. Indeed, over the past 20years GC–MS techniques have been used to detect approximately1/3 of the CSF metabolome. On the other hand, the modest per-formance seen for LC–FTMS in detecting CSF metabolites suggeststhat there is considerable room for methodological improvement
Tesla Bruker FTMS equipped with an electro-spray interface. (A) C18 UPLC–FTMSode base peak ion chromatogram of CSF. (C) HILIC UPLC–FTMS negative ion mode
in this area. In particular, it is very clear that the high abundanceof polar compounds in CSF seriously limited the chromatographicseparation achievable with standard RP and HILIC columns. The useof hydrophobic enrichment tags (similar in concept to trimethylsi-lation in GC–MS) using p-chlorophenylalanine mediated chemicallabeling [31] or dimethyl isotopic labeling [32] has been shown toconfer enhanced LC retention and resolution of small metabolites.Intelligent use of UV or fluorescent chemo-selective tags can alsobe employed as a way of improving the detection or quantificationof many analytes. Preliminary data (Liang Li, personal communi-cation) suggests this chemo-selective tagging approach could leadto detection and relative quantification by LC–FTMS of perhaps 150metabolites in the CSF metabolome.
4. Conclusion
We began this study in an effort to address four key ques-tions: (1) what compounds can be or have ever been identifiedin CSF? (2) What are the concentration ranges for these metabo-lites? (3) What portion of the CSF metabolome can be routinelyidentified and/or quantified in CSF using conventional, untar-
matog
[
[
[
[
[
[
D.S. Wishart et al. / J. Chro
geted metabolomics methods? (4) What analytical methods (NMR,GC–MS, LC–MS) are best suited for comprehensively charac-terizing the CSF metabolome? Our computer-aided literaturesurvey allowed us to identify 308 metabolites that constitute thedetectable human CSF metabolome. In assessing this collection wefound that CSF is a metabolically diverse biofluid, with representa-tive metabolites spanning 33 different compound categories. Morespecifically we found that CSF, not unexpectedly, is rich in aminoacids, inorganic salts, organic acids, and sugars. A large variety ofcatecholamines and steroids are also present, but at very low abun-dance. CSF metabolites range in concentration from 1 picomolar(for estradiol) to 145 mM (for sodium), although many metaboliteshave “normal” concentrations can vary by more than 50%. Approx-imately 75 metabolites in CSF have normal concentrations above1 �M.
Our experimental efforts revealed that global metabolic pro-filing methods can (and should) routinely detect 70 differentcompounds in CSF, or about 22% of the detectable metabolome.NMR methods (alone) can detect and quantify 53 compounds,GC–MS methods (alone) can detect and quantify 41 compounds,and LC–FTMS methods (alone) can detect 17 different compounds.The fact that these three methods could only detect 8 commonmetabolites underlines the fact that global metabolic profilingmethods must use more than one detection technology to obtaina complete picture of any given biofluid metabolome. Whileclear differences do exist in the number and type of compoundsdetected by the three technologies employed in this study, theintent was not to negatively bias any technology, but simplyto characterize the human CSF metabolome with the tools wehad at hand. In our hands, NMR appears to be the best methodfor performing global or non-targeted metabolic profiling of CSF.However, its general lack of sensitivity (>1 �M) suggests thatNMR will tend to miss a number of metabolites (i.e. inflam-matory or oxidation-status markers) of clinical interest. GC–MSappears to have similar or slightly better sensitivity to NMR andthe two methods, when combined, can detect and/or quantify
66 metabolites. Potentially, the use of GC–TOF instrument or afast scanning quadrupole instrument would have yielded morefavorable results for the GC–MS studies. Interestingly, we foundthat LC–FTMS methods did not perform particularly well in char-acterizing the CSF metabolome. However, recent developmentsand continuing advances in LC–MS and LC–MS/MS technolo-gies [31,32] suggest that this technology should soon match andeventually surpass the performance of NMR and GC–MS meth-ods.
Our primary objective for undertaking these studies andcompiling this data was to advance the fields of quantitativemetabolomics and global metabolic profiling. Experimentally,our data should serve as a useful benchmark from which tocompare other technologies or assess coming methodologicalimprovements in CSF characterization. From a clinical stand-point, we think the information contained in the CSFMetabolomedatabase should provide clinicians, clinical chemists and neuro-scientists a convenient, centralized resource from which to learnmore about CSF and to better appreciate the window it canprovide on brain function and the biochemical activity in thebrain.
[[
[
[[
[[
[
[
[
[[
[
[[
r. B 871 (2008) 164–173 173
Acknowledgements
This research was supported by Genome Alberta, GenomeCanada and the University of Alberta. The authors would like tothank Connie Sobsey, Jun Peng and Ryan Fradette for their help inpreparing the figures and Dr. Xingye Su for help with implementingthe HILIC technique.
References
[1] D.I. Ellis, R. Goodacre, Analyst 131 (2006) 875.[2] J.C. Lindon, E. Holmes, J.K. Nicholson, FEBS J. 274 (2007) 1140.[3] R.A. Dixon, D.R. Gang, A.J. Charlton, O. Fiehn, H.A. Kuiper, T.L. Reynolds, R.S.
[4] D.S. Wishart, D. Tzur, C. Knox, R. Eisner, A.C. Guo, N. Young, D. Cheng, K. Jewell,D. Arndt, S. Sawhney, C. Fung, L. Nikolai, M. Lewis, M.-A. Coutouly, I. Forsythe,P. Tang, S. Shrivastava, K. Jeroncic, P. Stothard, G. Amegbey, D. Block, D. Hau, J.Wagner, J. Miniaci, M. Clements, M. Gebremedhin, N. Guo, Y. Zhang, G.E. Duggan,G.D. MacInnis, A.M. Weljie, R. Dowlatabadi, F. Bamforth, D. Clive, R. Greiner, L.Li, T. Marrie, B.D. Sykes, H.J. Vogel, L. Querengesser, Nucleic Acids Res. 35 (2007)D521.
[5] C. Lentner, A. Wink, Geigy Scientific Tables, 8th rev. ed., CIBA-Geigy, Basel,Switzerland, 1981.
[6] M.B. Segal, J. Inherit. Metab. Dis. 16 (1993) 617.[7] G. Hoffmann, W. Meier-Augenstein, S. Stockler, R. Surtees, D. Rating, W. Nyhan,
J. Inherit. Metab. Dis. 16 (1993) 648.[8] B. Toczylowska, M. Chalimoniuk, M. Wodowska, E. Mayzner-Zawadzka, Brain
Res. 1104 (2006) 183.[9] F.J. Jimenez-Jimenez, J.C. Rubio, J.A. Molina, M.A. Martın, Y. Campos, J. Benito-
Leon, M. Ortı-Pareja, T. Gasalla, J. Arenas, J. Neurol. Sci. 145 (1997) 183.10] I.L. Simone, F. Federico, M. Trojano, C. Tortorella, M. Liguori, P. Giannini, E.
Piccola, G. Natile, P. Livrea, J. Neurol. Sci. 144 (1996) 182.[11] E. Holmes, T.M. Tsang, J.T. Huang, F.M. Leweke, D. Koethe, C.W. Gerth, B.M.
Nolden, S. Gross, D. Schreiber, J.K. Nicholson, S. Bahn, PLoS Med. 3 (2006) e327.12] B.C. Sweatman, R.D. Farrant, E. Holmes, F.Y. Ghauri, J.K. Nicholson, J.C. Lindon,
J. Pharm. Biomed. Anal. 11 (1993) 651.13] R.A. Wevers, U. Engelke, U. Wendel, J.G. de Jong, F.J. Gabreels, A. Heerschap, Clin.
(2006) 4430.23] E.J. Saude, B.D. Sykes, Metabolomics 3 (2007) 19.24] J. A, J. Trygg, J. Gullberg, A.I. Johansson, P. Jonsson, H. Antti, S.L. Marklund, T.
Maritz, Anal. Chem. 77 (2005) 8086.25] N. Schauer, D. Steinhauser, S. Strelkov, D. Schomburg, G. Allison, T. Moritz, K.
Lundren, U. Roessner-Tunali, M. Forbes, L. Willmitzer, FEBS Lett. 579 (2005)1332.
26] D.S. Wishart, C. Knox, A.C. Guo, S. Shrivastava, M. Hassanali, P. Stothard, Z. Chang,J. Woolsey, Nucleic Acids Res. 34 (2006) D668.
27] C.M. Slupsky, K.N. Rankin, J. Wagner, H. Fu, D. Chang, A.M. Weljie, E.J. Saude,B. Lix, D.J. Adamko, S. Shah, R. Greiner, B.D. Sykes, T.J. Marrie, Anal. Chem. 79(2007) 6995.
28] A.E. Jones, R.L. Summers, J. Emerg. Med. 19 (2000) 165.29] C.A. Smith, G. O’Maille, E.J. Want, C. Qin, S.A. Trauger, T.R. Brandon, D.E. Custodio,
R. Abagyan, G. Siuzdak, Ther. Drug Monit. 27 (2005) 747.30] J. Kopka, N. Schauer, S. Krueger, C. Birkemeyer, B. Usadel, E. Bergmuller, P.
Dormann, W. Weckwerth, Y. Gibon, M. Stitt, L. Willmitzer, A.R. Fernie, D. Stein-hauser, Bioinformatics 15 (2005) 1635.
31] E.E. Carlson, B.F. Cravatt, J. Am. Chem. Soc. 129 (2007) 15780.32] K. Guo, C. Ji, L. Li, Anal. Chem. 79 (2007) 8631.