The Post-merger Performance Puzzle Anup Agrawal Jeffrey F. Jaffe Culverhouse College of Business Department of Finance University of Alabama The Wharton School Tuscaloosa, AL 35487-0224 University of Pennsylvania Philadelphia, PA 19104 (205) 348-8970 (215) 898-5615 [email protected][email protected]December 1999 Forthcoming, Cary Cooper and Alan Gregory, eds., Advances in Mergers and Acquisitions, Stamford, CT: JAI Press, 2000.
Transcript
The Post-merger Performance Puzzle
Anup Agrawal Jeffrey F. Jaffe Culverhouse College of Business Department of Finance University of Alabama The Wharton School Tuscaloosa, AL 35487-0224 University of Pennsylvania Philadelphia, PA 19104 (205) 348-8970 (215) 898-5615 [email protected][email protected]
December 1999
Forthcoming, Cary Cooper and Alan Gregory, eds., Advances in Mergers and
Acquisitions, Stamford, CT: JAI Press, 2000.
1
The Post-merger Performance Puzzle
Abstract
While the bulk of the research on the financial performance of mergers and acquisitions
has focused on stock returns around the merger announcement, a surprisingly large set of
papers has also examined long-run stock returns following acquisitions. We review this
literature, concluding that long-run performance is negative following mergers, though
performance is non-negative (and perhaps even positive) following tender offers. However, the
effects of both methodology (see Lyon, Barber and Tsai (1999)) and chance (see Fama
(1998)) may modify this conclusion. Two explanations of under-performance (speed of price-
adjustment and EPS myopia) are not supported by the data, while two other explanations
(method of payment and performance extrapolation) receive greater support.
2
1. Introduction
Most research on the financial performance of mergers and acquisitions has focused on
stock returns surrounding announcement dates. Virtually all researchers have reported large
positive average abnormal returns to targets, a result that is not surprising given the significant
premiums typically involved in takeovers. Conversely, these same researchers have found
surprisingly small abnormal returns to bidders over the announcement period. In fact, while
some papers have reported significantly positive performance here, quite a few others have
found either zero performance or even negative performance to acquirers. In a well-known
review article, Roll (1986) concludes that the null hypothesis of zero abnormal performance to
acquirers should not be rejected. And, while there have been many subsequent articles, the
results appear to be mixed enough that Roll’s conclusion appears to hold.
Parallel to the research on announcement period returns, a smaller body of work has
investigated long-run post acquisition returns. The earlier research here was typically a small
section in a paper primarily devoted to announcement period returns. The profession often paid
little attention to the results on long-run returns, perhaps because the strong belief in market
efficiency indicated what the results should be. However, enough of the earlier papers reported
negative long-run returns following mergers that the topic could not be completely ignored. In
fact, the results caused Jensen and Ruback (1983, p.20) to comment: “These post-outcome
negative abnormal returns are unsettling because they are inconsistent with market efficiency and
suggest that changes in stock prices overestimate the future efficiency gains from mergers.”
3
prices overestimate the future efficiency gains from mergers.”
Over the years, the initial trickle of studies has widened to a steady stream. We count
22 different papers examining long-run post-acquisition returns, with 10 having seen print
in the 1990s. As the literature has grown, we have witnessed three concomitant
developments. A number of the more recent papers have been fully devoted to long-run
returns and perhaps an equal number have searched for explanations of the phenomenon,
both signs of increased academic interest. In addition, recent papers have adopted the
more sophisticated empirical methodologies now available.
Because of the substantial body of work in the area, we believe that a review of the
literature is called for. Our paper seeks to answer two questions. First, does the
accumulated evidence suggest that post-acquisition performance is, indeed, negative? The
evidence on this question is presented in Section 2 of our paper. The answer to this
question seems quite important. In addition to the obvious implication for market
efficiency, an answer clearly informs the debate on gains from mergers. Studies focussing
on announcement period performance conclude that mergers produce wealth gains to
stockholders of the target and acquiring firms combined. A finding of negative
performance after mergers can overturn this conclusion. Second, what are possible
explanations for the literature’s findings on long-run performance? Of course, if long-run
performance is generally insignificantly different from zero, no explanation is needed.
However, if past research suggests under-performance (or out-performance), a convincing
explanation enhances the plausibility of that finding. The evidence on this question is
4
presented in Section 3. Section 4 provides a summary and conclusion.
2. Long-Run Performance Following Acquisitions
We start by providing a summary of the literature in section 2.1. Section 2.2 provides
a detailed review of the individual studies that have examined this issue in various
contexts.
2.1 Summary of the Evidence
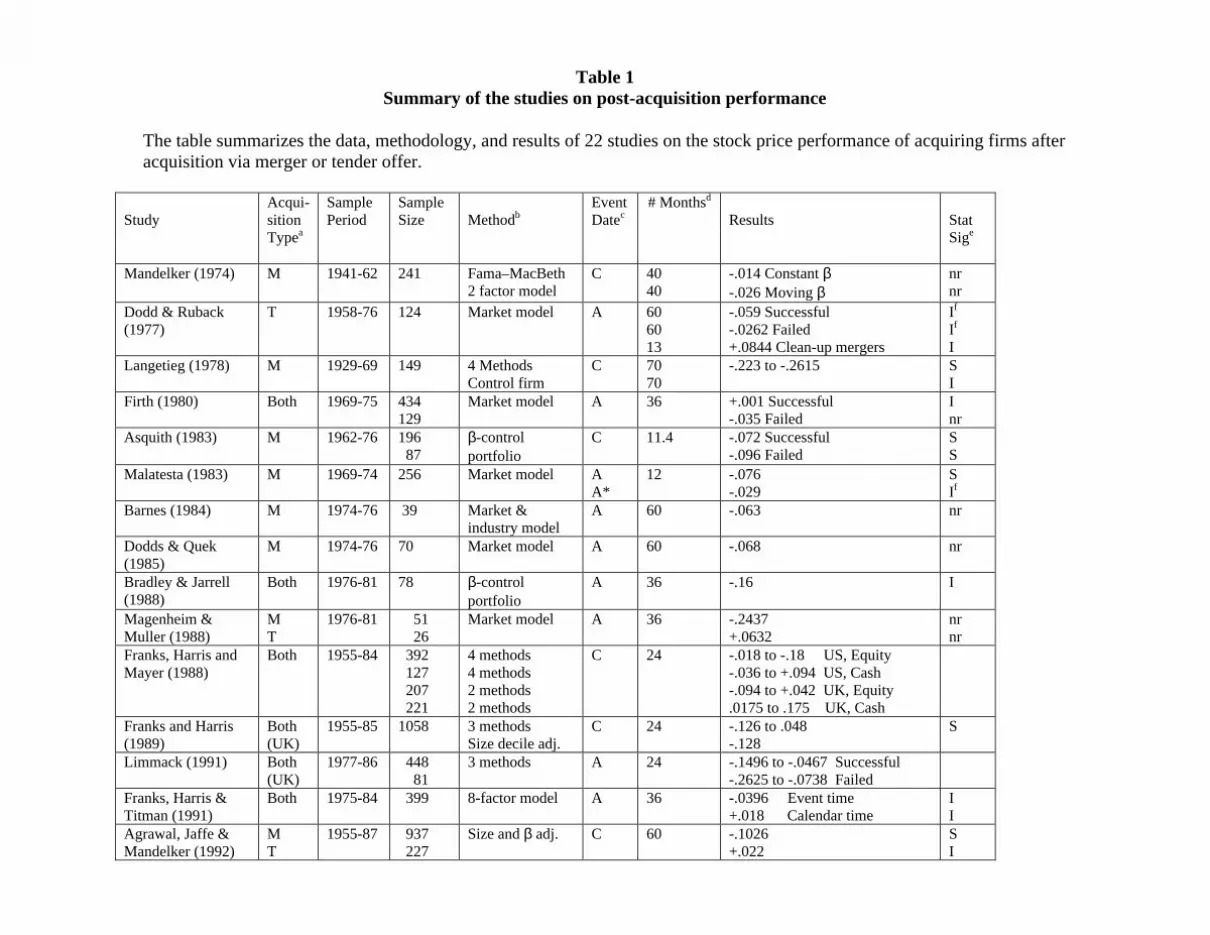
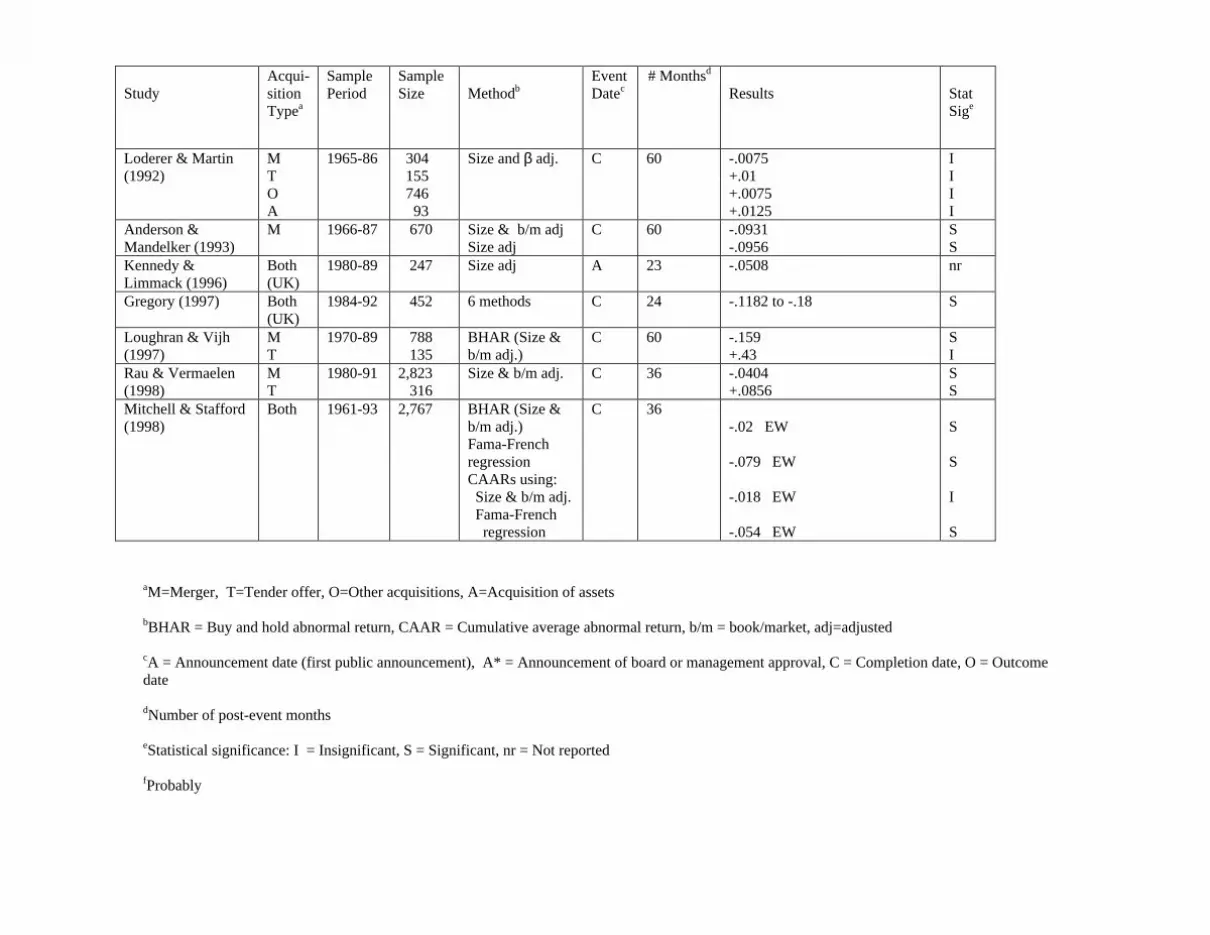
Section 2.2 reviews 22 articles that have examined the stock price performance of
acquiring firms following acquisitions. All of these articles are listed in Table 1. We now
attempt to summarize this body of research, a task made easier by separating mergers
from tender offers. In addition, since Franks, Harris and Titman (FHT) (1991) altered
this literature both by devoting their entire paper to post-acquisition performance and by
using more sophisticated measurement techniques, we separate pre-FHT from post-FHT
findings.
2.1.1 Pre-FHT Findings on Performance Following Mergers
The first thirteen articles listed in Table 1 all occurred prior to FHT.1 Of the 13,
we exclude Dodd and Ruback (1977), because it deals with tender offers,2 and Firth
1It is not clear whether Limmack came before FHT, since both were published in 1991. However, we treatthe Limmack article as the earlier one, since it does not use the sophisticated techniques of FHT and itdevotes little attention to post-acquisition performance.
5
(1980), Barnes (1984), Dodds and Quek (1985), Franks, Harris and Mayer (1988) and
Franks and Harris (1989), because they do not separate mergers from tender offers.3 Of
the remaining seven, Mandelker (1974) provides the least support for negative post-
acquisition performance. The CAARs, though negative, are not economically significant.
In addition, while no t-statistics are provided for his entire 40-month post-acquisition
period, t-statistics for both a 10-month and a 20-month period are insignificant. On the
other extreme, Asquith reports CAARs of –0.072 in the 240 days following merger
outcome. This return is both economically and statistically significant, providing perhaps
the strongest evidence against the null hypothesis of zero abnormal returns.
All of the other five papers are ambiguous to some extent. Using the same data
but different methodologies, Magenheim and Mueller (MM) and Bradley and Jarrell (BJ)
reach opposite conclusions. MM find what are most likely significant CAARs over three
years, while BJ find insignificant results over the same time period. We are inclined to
put more weight on BJ’s results, since their approach specifically avoids MM’s
methodological problem. However, BJ do not separate mergers from tender offers as
MM do. Langetieg (1978) reports CAARs between -0.223 and -0.2615 over 70 months
using four different statistical methods. While these abnormal returns are both
economically and statistically significant, his control firm approach yields insignificant
returns. Langetieg places more weight on the control firm approach, though readers may
2Actually, as shown in our Table 1, Dodd and Ruback also examine performance following clean-upmergers, finding one-year CAARs of 0.0844. However, the small sample of 19 and the special nature ofthis type of merger reduce the informativeness of their result to our discussion.
6
not. Malatesta (1983) finds statistically significant abnormal returns for the year after the
first public announcement of merger but insignificant results for the year after
over two years, finding significantly negative CAARs for two of his three methodologies.
However, Limmack does not separate mergers from tender offers, leaving interpretation
somewhat ambiguous. We include this article in the present section of our paper on the
(perhaps dubious) premise that abnormal returns would likely have been even more
negative if tender offers had been removed from his sample.
Thus, taken together, the literature at this point only suggests the possibility of an
anomaly. The lack of corroboration across papers, as well as the use of empirical
methodologies now considered inadequate for measuring long-run abnormal stock
performance, prevents one from drawing a strong conclusion at this point.
2.1.2 Pre-FHT Findings on Performance Following Tender Offers
Prior to FHT, only two papers examined performance following tender offers.
Our calculations, based on Dodd and Ruback’s (1977) Table 3, yield a CAAR of -0.0591
for the 60 months following tender offers. By contrast, our calculations, based on
Magenheim and Mueller’s Table 11.3, yield a CAAR of 0.0632 for the three years
following tender offers. Statistical significance can not be assessed for either of these
calculations. However, since the CAARs are of opposite signs and of similar magnitudes
3Franks, Harris and Mayer (1988) do separate cash offers from equity offers. While tender offers arepredominantly made with cash and mergers are predominantly made with equity, the correlation is notperfect. We leave a discussion of cash vs. equity to a later section of the paper.
7
(though for different post-event time periods), we conclude that the null hypothesis of
zero abnormal returns following acquisition should not be rejected.
2.1.3 Post-FHT Performance Following Mergers
As shown in Table 1, FHT is followed by eight papers. Of these nine, we exclude
FHT, Kennedy and Limmack (1996) and Mitchell and Stafford (1988) because they do
not separate mergers from tender offers. Of the remaining six articles, Loderer and Martin
(LM) (1992) provide the least support for negative post-merger performance. LM find
that five-year performance, while negative, is not statistically different from zero.
However, this is not to say that the authors provide no support for negative post-merger
performance, since three-year abnormal returns are significantly below zero.
By contrast, a number of articles provide stronger evidence of negative post-
merger performance. Agrawal, Jaffe and Mandelker (AJM) (1992) find a statistically
significant five-year CAAR of -0.1026 under a size and beta adjustment. Anderson and
Mandelker (AM) (1993) report five-year CAARs of –0.0956 and –0.0931, under a size
and a size & book-to-market (b/m) adjustment, respectively. Both of AM’s CAARs are
statistically significant. However, one should not view these two studies as independent.
The two datasets greatly overlap, since AM use the 1966 to 1987 portion of AJM’s data.
Loughran and Vijh (1997) find a statistically significant five-year buy-and-hold return
8
relative to a size and b/m control of –0.159. However, when overlapping cases are
eliminated, the buy-and-hold return relative to a control becomes –0.142, which is only
marginally significant (t=-1.69). Rau and Vermaelen (1998) find a statistically significant
three-year CAAR of –0.0404. However, one is likely to view this CAAR as
economically insignificant. Finally, Gregory (1997) finds two-year CAARs between -
0.1182 to –0.1801 under six different models, all of which are statistically significant.
Gregory uses U.K. data, providing an out-of-sample test of the anomaly. While Gregory
does not separate mergers from tender offers, our discussion below suggests that post-
acquisition performance would have been even worse if tender offers had been removed
from the sample.
Taken together, we believe that the post-FHT articles suggest strong evidence of
an anomaly following mergers. One can find some evidence of statistically significant
negative abnormal returns in each of the six articles above and strong evidence of both
economically important and statistically significant negative performance in a few of the
articles. As a group, the studies cover a long time period and two countries (United
States and United Kingdom). A wide variety of statistical techniques are used, all of
which go beyond the old-style CAPM/market model approaches. While there has been a
fair amount of criticism of long-run return studies in general (see e.g., Kothari and Warner
(1997), Barber and Lyon (1997) and Lyon, Barber and Tsai (1999)), the differing results
on tender offers (see below), as well as the differing methodologies in the six papers,
suggest that something more than a statistical bias is at work here. Furthermore, in our
9
opinion, the results discussed in section 3 below on explanations strengthen one’s belief
in the anomaly.
2.1.4 Post-FHT Performance Following Tender Offers
Of the nine papers beginning with FHT, four examine tender offers. AJM state
that five-year CAARs following tender offers are (p. 1611) “small and insignificantly
different from zero. Thus, we find no evidence of unusual performance for tender offers.”
Loderer and Martin (LM) find that five-year abnormal performance is positive but
insignificantly different from zero. Loughran and Vijh (LV) find a five-year buy and hold
abnormal return (BHAR) following tender offers of 0.43. While this number is
economically significant, it is only marginally statistically significant (t=1.67). When
overlapping cases are eliminated, the five-year BHAR is even greater at 0.613, though the
t-statistic is still marginally significant (t=1.86). Rau and Vermaelen (RV) find a lower,
but statistically significant three-year CAAR of 0.0856.
Two related conclusions seem warranted. First, while there is strong evidence, in
our opinion, of negative abnormal returns following mergers, there is no similar evidence
following tender offers. Abnormal returns are predominantly positive, not negative.
Secondly, one could perhaps even make the case that abnormal returns are significantly
positive here, as suggested by the evidence of LV and RV. However, this might be
stretching the case, because LV report only marginal statistical significance and both AJM
and LM report insignificance.
10
2.1.5 Performance Following Failed Bids
While the profession has always been more interested in long-run returns
following successful acquisitions, the literature has occasionally examined bidder returns
following unsuccessful bids as well. Our Table 1 notes four such papers. Dodd and
Ruback (1977) find a 60-month CAAR of –0.0262 following the announcement of tender
offers that later turn out to be unsuccessful. While this appears to be economically
insignificant, the absence of t-tests prevents an assessment of statistical significance.
Similarly, Firth (1980) reports a CAAR of -0.035 over 36 months following the
announcement of acquisition attempts that turn out to be unsuccessful. No t-test is
reported over this interval. Asquith (1983) finds a statistically significant CAAR of -
0.096 over the 240 days following unsuccessful merger bids. Finally, Limmack (1991)
finds 24-month post-bid CAARs of –0.2420, -0.2625, and –0.0738 under three models.
The first two are significantly negative, while the third is statistically insignificant.
The results above are merely suggestive at best. The finding of Asquith for
unsuccessful merger bids is similar to his finding for successful bids. And, the abnormal
returns are generally even more negative for Limmack. However, the results raise more
questions than they answer. For example, the methodologies of these papers are not the
most current. Will the results change under newer methodologies? Also, Limmack does
not separate mergers from tender offers. Are his negative returns driven by mergers?
These questions can only be answered by new research.
11
2.2 Review of the Individual Studies
Mandelker (1974) is generally considered the first modern treatment of the
financial consequences of mergers, with merger completion dates being precisely
determined and abnormal returns (or residuals, as they were then called) being calculated
relative to a benchmark. The paper analyzes 241 mergers that took place during 1941-
1962. Both the acquiring and the acquired firms were listed on the New York Stock
Exchange (NYSE). The abnormal return for stock j in calendar month t, jt , is calculated
as:
= − −jt jt ot t jtR $ $ ,γ γ β1
where Rjt is the return on stock j in month t,
$ , $γ γot t1 are the ex-post coefficients between return and risk for calendar month t,
as estimated by Fama and MacBeth (1973),
βjt is the beta for security j in month t.
Mandelker’s major focus is on returns around the time of the merger, with
perhaps his most important finding being (p. 303): “stockholders of acquiring firms seem
to earn normal returns from mergers as from other investment-production activities with
commensurate risk levels. Stockholders of acquired firms earn abnormal returns of
approximately 14%, on the average, in the seven months preceding the merger.”
In addition, his rather exhaustive work also presents returns for the combined
entity subsequent to the merger. His Table 1 shows cumulative average abnormal returns
12
(CAARs) of -0.014 over the 40 months following merger completion, clearly an
economically insignificant drop. While no t-statistics over the 40-month period are
provided, Mandelker’s Table 4 shows statistically insignificant abnormal returns over the
first 10 months and the first 20 months following merger completion.
In his Table 1, a firm’s beta for month t is measured using data over the previous
60 months. In his Table 8, the beta for month t is measured using data from months (t-
30, t-1) and (t+1, t+30). Here, the CAAR over the 40 months following merger
completion is -0.026. This CAAR, though somewhat bigger in magnitude than that in
Table 1, still seems economically insignificant.
Results on post-merger returns were given little weight in Mandelker’s paper,
perhaps for two reasons. Research on other market anomalies, which has questioned the
efficient market paradigm to some extent, had not yet arisen. In addition, other work
showing negative abnormal returns following mergers was to come later as well.
Dodd and Ruback (DR) (1977) examine stock return performance both before and
after tender offers. They compile a sample of 124 NYSE firms making successful tender
offers and 48 NYSE firms making unsuccessful tender offers over the period from 1958 to
1976. Abnormal returns are calculated from the market model.
The study measures the post-acquisition performance of acquirers over two
periods, months (+1, +12) and (+13, +60), relative to the first public announcement of
the bid. From their Table 3, we calculate that the CAAR for the successful acquirers over
this entire 60-month period is –0.0591. While this performance may be economically
13
important, the t-statistics reported for the two periods are both insignificant. In addition,
we calculate that abnormal returns are –0.0262 for unsuccessful acquirers for the same 60-
month period. Again, t-statistics are insignificant for each of the two periods.
The paper also calculates post-acquisition performance following 19 clean-up
mergers, i.e. offers where the acquirer owned over one-half of the target firm’s shares
prior to the merger. DR’s Table 4 indicates that the CAAR for acquirers over months
(+1, +13) is 0.0844, with a marginally significant t-value of 1.60. No results are reported
for months (+13, +60).
Langetieg (1978) examines 149 mergers between NYSE firms over the period from
1929 to 1969. He begins by adjusting returns for both market and industry factors. He
abstracts from market returns by using either the Capital Asset Pricing Model (CAPM)
or the Black (1972) two-factor model, and employs two industry indices, yielding four
measures of abnormal performance. Regardless of the measure, the results in his Table 1
show large negative returns over three intervals (months (+1, +12), (+13, +24), and (+25,
+70)) after the merger. Our summations over the three periods yield cumulative abnormal
performance over months (+1, +70) between –0.223 and –0.2615.
However, in his Table 2, Langetieg uses a control firm approach as well. His
control firm “represents the firm in the merging firm’s two-digit industry having the
highest residual (i.e. returns net of market influence) correlation to the merging firm” (p.
371). He calculates abnormal performance as the difference between the acquiring firm’s
performance using one of the four measures above and the performance of the control firm
14
using the same measure. We calculate his cumulative abnormal performance over months
(+1, +72) to be –0.055, which is much smaller in magnitude than his first set of results.
He summarizes his results as follows (p. 376): “If we were to draw preliminary
conclusions based only on the results for merging firms, we would be forced to conclude
that the post-merger excess return experience is inconsistent with the efficient markets
hypothesis. However, it would be wrong to draw conclusions based only on merging firm
results, since the control firm results and the ‘paired-difference’ results must also be
considered. The control firm also shows a generally negative average excess return in
most post-merger time intervals. Examination of the ‘paired-difference’ results shows
average excess returns that are still predominantly negative, but never significantly
different from zero. Hence, we conclude that the post-merger excess return experience is
consistent with the efficient markets hypothesis.”
This quote indicates that Langetieg puts more weight on the control firm results.
However, it is not clear whether this second approach is preferable. After all, the first
approach abstracts from industry effects. A control firm may be superfluous in this set-
up, since this firm is meant to abstract from industry effects as well. Subsequent
academic studies have not used a control firm this way.
Firth (1980) examines bidders in 434 successful bids and 129 unsuccessful bids in
the United Kingdom over the period from 1969 to 1975. Takeover bids where the bidder
holds at least 30% of the target stock six months prior to the bid announcement are
excluded from the sample. Both bidders and targets are exchange-listed firms. Abnormal
15
performance is measured via the market model, with a moving average method used for
beta estimation. Specifically, the parameters of the model for a given month t are
estimated over months (t-48, t-1), excluding months (-12, +12) around the takeover bid
month. His Table III shows CAARs for successful bidders of only 0.001 over the 36
months following the bid announcement. This is clearly an economically insignificant
return, and his Table V indicates that this is statistically insignificant as well. Table IV
shows CAARs for unsuccessful bidders of 0.035 over the 36 months following bid
announcement. Table V indicates statistical significance over the first year but not over
the next two years following the bid announcement. However, the table does not allow a
statistical inference over the full three-year period.
Asquith (1983) provides a comprehensive study of mergers, with particular
attention given to announcement dates. As opposed to the monthly returns in the
Mandelker and Langetieg studies, Asquith uses daily data, allowing him to measure
returns relative to both the “press day” and “outcome day.” The press day is the day
that The Wall Street Journal (WSJ) reports news of the merger bid and the outcome day is
the day that the WSJ publishes the outcome.
The study examines 196 NYSE or American Stock Exchange (AMEX) acquirers in
successful mergers involving NYSE targets over the 1962-1976 period. Daily abnormal
returns are calculated as the difference between the return on the merging firm and the
return on a control portfolio with a similar beta. To form this control, all securities on the
NYSE and AMEX are ranked once a year according to their betas and placed into one of
16
10 decile portfolios.
Asquith’s Table 1 shows abnormal returns from 480 days before the
announcement date to 240 days after the outcome day. Bidding firms experience positive
abnormal returns of 0.134 over days (-480,-40) prior to the press day, perhaps indicating
that firms are more likely to make acquisitions after performing well. However,
cumulative excess returns are –0.072 over the 240 days following the outcome, with
almost all of this decline occurring after day +60. In addition, cumulative excess returns
are –0.096 over the 240 day period following the outcome day for a sample of 87
unsuccessful bidders.
While Mandelker makes little mention of the slight post-merger decline in his
sample and Langetieg concludes that post-merger performance is not significantly
negative, Asquith states (p. 74) “These results are surprising, especially since the post-
outcome decline in equity value is delayed by sixty days or more. ...The stock price
behavior of merged firms during the post-outcome period thus remains a puzzle. There is
no immediate stock price reaction after a merger, but within a year there are large negative
excess returns.”
Malatesta (1983) examines 256 firms that acquired targets with asset size greater
than $10 million over the period 1969-1974. Abnormal returns are calculated from the
market model in risk premium form. For months (+1, +12) after the merger
announcement, the market model parameters, αjt and βjt, are estimated from the 36
observations closest to a given month t drawn from months (+13, t+60).
17
Malatesta’s Table 4 presents cumulative average abnormal returns for acquiring
firms over the periods (+1, +6) and (+7, +12) relative to the first public announcement
date of the merger. Abnormal returns are significantly negative over both periods, with a
total CAAR (our calculation) of –0.076 over months (+1, +12). While this cumulative
return is similar in magnitude to that in Asquith (1983), Asquith measures returns from
the outcome date. Since the first public announcement of a merger is often made after its
completion, Malatesta also looks at the subset of roughly one-half of his sample where an
announcement of board or management approval of the merger appears in the WSJ. For
this subset, his Table 5 reports statistically insignificant negative CAARs in both periods
(+1, +6) and (+7, +12) relative to this more precise announcement date.
While Malatesta takes the significantly negative returns following the first public
announcement quite seriously, he argues (p. 179), “Market inefficiency is an unlikely
explanation for negative abnormal post-merger returns to acquiring firms. Information
concerning mergers is widely disseminated. The general characteristics of mergers are well
known. It is implausible that investors systematically misinterpret the implications of
these common phenomena.” Instead, he suggests the possibility that post-merger losses
are mere statistical artifacts due to changes in risk parameters around the merger event.
Barnes (1984) examines all mergers between companies listed on the London
Stock Exchange over the period from June 1974 to February 1976. Post-merger
performance of the resulting 39 acquiring firms was assessed using the market model with
an added industry factor. The author’s Figure 1 indicates that the CAAR over the 60
18
months following the month of announcement is –0.063. No statistical tests are reported.
Dodds and Quek (1985) examine 70 mergers during 1974-1976 where the acquirer
is listed on the Industrial Sector of the London Stock Exchange. Post-merger performance
is computed using the market model. The Industrial Group Index of the Financial Times
Actuarial Share Index is used as a proxy for the market. Their Table 1 shows a CAAR of
–0.068 over the 60 months following the month of merger announcement. No statistical
tests are reported for this interval.
Magenheim and Mueller (1988) examine 78 NYSE/AMEX acquiring firms that
completed takeovers worth at least $15 million over the period 1976-1981. The authors
classify 51 of the acquisitions as mergers and 26 as tender offers. They calculate abnormal
returns from the market model, estimating the parameters α and β over one of three
periods: months (-60, -4), (-36, -4) or (+13, +36) relative to the initial announcement
month. For the first two estimation periods, the authors’ Table 11.5 presents CAARs
for each of the first three years subsequent to the announcement. Our calculations show
that the CAARs over the entire three-year post-announcement period are –0.1436 and
–0.3896 using the first and second estimation periods, respectively. Only the CAAR over
the first year (-0.0321) is presented using the third estimation period, which runs over the
second and third post-announcement years. While the two three-year estimates differ
substantially, they both appear to be economically significant. The authors do not report
statistical significance over the three-year period. However, they present z-values
(standard normal) of –1.2464 and –4.9307 for performance over months (-3, +36) relative
19
to the month of initial announcement, using the first and second estimation periods,
respectively.
The authors present post-announcement returns for mergers and tender offers
separately in Table 11.3, using only the (-60, -4) estimation period. Our calculations
show CAARs over the first three years after the announcement to be –0.2437 and +
0.0632, respectively, for the two sub-samples. Once again, z-values are reported for the
period (-3, +36). They are –2.60 for mergers and 0.56 for tender offers. Magenheim and
Mueller appear to be the first to calculate post-acquisition returns for the two types of
acquisitions separately. And, like Magenheim and Mueller, subsequent researchers
generally find that returns are higher after tender offers than after mergers.
Bradley and Jarrell (BJ) (1988) criticize Magenheim and Mueller’s methodology
stating (p. 255), “It is well known that market model parameter estimates based on
monthly data are inefficient and nonstationary.” And, indeed, financial economists have
long pointed out that if the true abnormal performance is non-zero during the estimation
period, measurement of abnormal performance in the forecast period will be biased. BJ
estimate abnormal returns using a method similar, if not, identical to that of Asquith
(1983). Here, a daily abnormal return is the difference between the return on the
acquirer’s stock and the return on a portfolio of securities of similar beta. The authors
find a statistically insignificant CAAR of –0.16 over the first three post-acquisition years.
Franks, Harris and Mayer (1988) examine post-acquisition returns for both the
United Kingdom and the United States, as a small part of their detailed study on
20
takeovers. The authors use a sample of takeovers over the period 1955-1985, as recorded
in the London Share Price Database (LSPD). The dataset covers all U.K. companies
listed on the London Stock Exchange (LSE) after 1975 and about two-thirds of the
companies (generally larger firms) on the LSE before 1975. The U.S. sample includes all
companies that disappeared by acquisition from the University of Chicago Center for
Research in Security Prices (CRSP) files over the period 1955-1984. The CRSP database
covers all NYSE-listed firms since 1926 and all AMEX-listed firms since 1962. The
authors calculate post-acquisition abnormal returns in four ways:
1. The market model approach, using α and β estimated over the 60-month period
beginning 71 months before the announcement month.
2. The market model approach, using months (+25, +60) relative to merger completion
as the estimation period.
3. The return on the acquiring firm minus the return on the market
4. The capital asset pricing model.
Post-merger returns are computed relative to the month of the final bid for mergers
in the U.S. and the month when the merger was unconditionally accepted in the U.K. The
U.S. sample includes 127 all-cash acquisitions and 392 equity acquisitions. The U.K.
sample includes 221 cash and 207 equity takeovers.
For the United States, the authors’ Table 8.9 shows cumulative average abnormal
returns to acquirers over the first two years following all-equity takeovers to be around
–0.18 under methods (1), (3), and (4). All three estimates are statistically significant.
21
However, the CAAR is a statistically insignificant –0.018 under the second method.
Since Method 2 may lead to a bias if abnormal performance is still negative over months
(+25, +60), one might feel less confident with this method than with any of the other
three. Taking this view, one would conclude that post-takeover performance in the
United States is strongly negative for all-equity acquisitions. Results are quite different
for all-cash deals in the U.S., with post-acquisition performance being insignificantly
different from zero under each of the four methods.
Only methods (1) and (4) are used for acquisitions in the United Kingdom. Here,
abnormal returns following all-equity acquisitions are significantly negative (-0.094) under
the first method but insignificant under the fourth. By contrast, abnormal returns
following all-cash acquisitions are insignificant under the first method but significantly
positive (0.175) under the fourth. One can draw two conclusions from the U.K. results.
First, the benchmark is important in studies of long-run returns, as previously shown by
Dimson and Marsh (1986) and others. Second, returns following cash acquisitions are
higher than those following equity acquisitions, a result that the authors found for the
U.S. as well. And, since tender offers are likely financed with cash while mergers are
likely financed with equity, the results of Franks, Harris and Mayer are consistent with
those of Magenheim and Mueller.
Franks and Harris (1989) examine wealth effects of corporate acquisitions in the
United Kingdom. While the bulk of their work concerns the time immediately prior to the
takeover event, they consider post-acquisition performance as well. They use a sample
22
of 1,058 acquiring firms in acquisitions recorded on the LSPD during 1955-1985. Post-
acquisition returns are measured over the 24 months following what they term the
“unconditional date,” which occurs when a sufficient percentage of shares has been
pledged to the acquirer to result in legal control. The authors begin by calculating post-
takeover abnormal returns in three ways:
1. Returns relative to the market index
2. Returns relative to the market model, where α and β are estimated over the 60-month
period beginning 71 months before the announcement month
3. The capital asset pricing model.
In their Table 10, the CAAR over the 24 months following the unconditional date
is approximately 0.05, and statistically significant, under methods 1 and 3. However, the
CAAR is a statistically significant –0.126 under the market model. The authors state (p.
245): “The differences in model results are directly attributable in this case to the
cumulative effects of subtracting the α values from the realized returns of bidding
companies when the market model is used. The average bidder α is 0.0095 per month
(average β=0.92), which indicates that bidding firms (premerger) were outperforming the
market by almost 1% per month. A failure to repeat this performance after the merger
would show abnormal losses of over 20% over a 24-month period.”
In their Table 11, the authors measure each return relative to the return on the
appropriate size decile portfolio. For each decile, the acquiring firms under-perform their
23
control portfolio. We calculate an average abnormal return of –0.128 across all acquirers
over the two-year period. To our knowledge, this is the first paper in the post-
acquisition performance literature that abstracts from a priced factor other than beta.
While Franks and Harris do not express a preference between this size adjustment and
their other approaches, later research generally gives primary emphasis to methodologies
that adjust for size (and other empirically-based factors).
Limmack (1991) examines the post-acquisition performance of acquirers in 448
successful and 81 unsuccessful bids announced during 1977-1986, where both target and
bidder were quoted on the International Stock Exchange in London. The author measures
abnormal returns in three ways. First, the market model is employed with α and β
estimated from return data over months (-67, –7) relative to the announcement month.
Second, adjusted betas supplied by the London Business School Risk Measurement
Service (RMS) are used in the market model. The author states (p. 242): “RMS betas are
estimated on the basis of regressing trade-to-trade security returns on the market returns
observed over identical periods of time. The betas so calculated are then Bayesian-
adjusted following Vasicek (1973).” The alpha for any company is estimated as:
αj = R Rj j M− ?β ,
where R j and RM are the average returns on firm j and the market, respectively,
over the market model estimation period. Third, abnormal performance is measured
relative to the market index.
24
For the period from the bid month (month 0) to 24 months following the outcome
month, Limmack’s Table 5 reports CAARs for the acquirers of –0.1496, -0.0467 and
–0.0743 for the market model, the adjusted beta model and the market index adjustment,
respectively. The first and third abnormal returns are significantly different from zero at
the 1% level, while the second CAAR is significant at the 10% level. The author presents
value-weighted abnormal returns as well. The numbers here are smaller in magnitude,
with only the market model adjustment yielding statistical significance, and only at the
10% level.
Limmack also calculates abnormal returns for unsuccessful acquirers over the same
interval. CAARs are –0.2420, -0.2625, and –0.0738 for the market model, the adjusted-
beta model and the index adjustment, respectively. Here, the first two CAARs are
significant at the 1% level and the third is significant at the 10% level. Value-weighted
abnormal performance is similar in magnitude, with two of the three abnormal returns
being significant at the 5% level.
Franks, Harris and Titman (FHT) (1991) must be viewed as an important paper in
the literature on long-run returns following takeovers for two reasons. First, FHT devote
their entire paper to this topic, while previous papers consider long-run returns as a small
part of their analyses. Second, the authors use a more sophisticated set of benchmarks
than those in prior research.
The paper investigates 399 acquisitions, both mergers and tender offers, over the
period 1975-1984. Both the acquirer and the target were on NYSE/AMEX. The authors
25
measure abnormal returns relative to four benchmarks:
1. the CRSP equally-weighted index
2. the CRSP value-weighted index
3. a ten-factor model provided by Lehmann and Modest (1987)
4. an eight-portfolio model from Grinblatt and Titman (1988, 1989).
The last benchmark consists of four portfolios based on firm size, three based on dividend
yield and one based on past returns. The authors prefer this benchmark, stating (p. 86):
“In developing this benchmark, Grinblatt and Titman (1988) formed 72 portfolios using
rankings of firms based on market capitalization, dividend yield, past returns, interest rate
sensitivity, co-skewness with the equally-weighted index and beta measured with the
equally-weighted index. Since these are passive portfolios (i.e., their composition does
not change over time), they should not exhibit abnormal performance when performance
is measured relative to an efficient benchmark. However, Grinblatt and Titman found that
the single-factor, the ten-factor, and another benchmark consisting of portfolios formed
solely on the basis of market capitalization all generated significant nonzero performance.
This significant performance was eliminated with the eight-portfolio benchmark, which
was efficient relative to various subsets of the sample over different sample periods and
robust with respect to minor changes in the composition of the benchmark. In addition, a
sample of 37 industry portfolios did not exhibit significant abnormal performance when
measured against this benchmark.”
The authors calculate average abnormal performance in two ways. First, for each
26
acquiring company, excess returns (above the one-month Treasury bill rate) are regressed
against the relevant set of benchmark portfolios over the 36 months since the final bid
date. The intercept in this regression is then averaged across all acquirers. Second, for
each calendar month in their sample, the authors form an equally-weighted portfolio of all
companies that have acquired a firm in the last 36 months. The excess return on this
portfolio is then regressed against the relevant set of benchmark portfolios. The authors
motivate the second approach by arguing that the first approach ignores cross-correlation
between the abnormal returns of different acquirers.
The basic results of FHT, as presented in their Table 2, show significantly
negative post-acquisition abnormal returns using the equally-weighted benchmark,
significantly positive abnormal returns using the value-weighted benchmark, and
insignificant abnormal returns using either the ten-factor or the eight-portfolio benchmark.
Since the authors emphasize the eight-portfolio approach, they argue that post-
acquisition abnormal returns are not significantly different from zero. They “conclude
that previous findings of poor performance after takeover are likely due to benchmark
errors rather than mispricing at the time of the takeover” (p. 81).
The authors separate their sample by (1) size of bidder, (2) medium of exchange,
(3) number of bidders, (4) opposition of target management and (5) relative size of target
to bidder. While the abnormal returns on a number of sub-samples are significantly
different under either an equally-weighted index or a value-weighted index, and the
abnormal returns on a few sub-samples are significant under the ten-factor benchmark, no
27
abnormal returns are significant under the eight-portfolio benchmark. Because of these
results under the last benchmark, the sub-samples do not cause FHT to change their
conclusion of zero abnormal performance.
Agrawal, Jaffe and Mandelker (AJM) (1992) completed their paper on the heel of
the Franks, Harris and Titman work. While AJM employ similar methodology to that of
FHT and even use a sample supplied by Robert Harris, AJM reach different conclusions.
AJM’s sample of 937 mergers and 227 tender offers (p. 1607) “represents nearly the
entire population of acquisitions of NYSE and AMEX firms by NYSE firms over the
period 1955 to 1987.” An acquisition is classified as a tender offer if the bidder
purchased at least 60% of the target’s outstanding shares via tender offer.
The authors use two methods to measure long-run abnormal returns with an
adjustment for both size and beta. In the first approach, the abnormal performance of
stock i in month t, εit, is calculated as:
εit = Rit - Rst - (βi - βs) (Rmt - Rft),
where Rit is the return on security i in month t; Rst is the equally-weighted return across
all firms in the same size decile as firm i; βi and βs are the betas of stock i and the size
control portfolio, respectively, measured over months (+1, +60) relative to the month of
merger completion; Rmt is the return on the NYSE value-weighted index in month t; and
Rft is the yield in month t on a one-month Treasury bill. With this approach, abnormal
returns are cumulated over a five-year period beginning with the month of merger
completion.
28
The second approach combines the Returns Across Time and Securities (RATS)
methodology of Ibbotson (1975) with an adjustment for firm size. The following cross-
sectional regression is estimated for each month t relative to the month of merger
completion:
Rit – Rst = αt + βt (Rmt – Rft) + ηit,
where Rit, Rst, Rmt and Rft are defined above.
AJM’s Table I shows steadily negative average abnormal returns following merger
completion under the first method, with CAARs reaching a statistically significant
–0.1026 by month +60. Results for the RATS methodology are quite similar. By
contrast, FHT report insignificance with a similar procedure, adjusting for size as well as
past performance and dividend yield. AJM also examine long-run abnormal performance
following tender offers, finding insignificance under both methods.
In addition, the authors also examine the behavior over different sub-periods in
their sample. Five-year cumulative average abnormal returns are significantly negative for
mergers that took place in the 1950s, the 1960s and the 1980s. However, CAARs are
insignificantly positive over the 1970-79 period. Since this period overlaps with FHT,
AJM also examine FHT’s sample period. AJM write (p. 1614): “The last two columns
of Table II show the post-merger performance over the 1975-1984 time period of the
recent paper by Franks, Harris, and Titman (1991). We find no abnormal performance
during this time period, a result consistent with that of Franks, Harris, and Titman. A
breakdown (not reported) of our 33-year sample period into five-year subperiods (1955
29
to 1959, 1960 to 1964, etc.) shows that 1975 to 1979 is the only five-year period when
the post-merger performance is significantly positive. This period constitutes one half of
Franks, Harris, and Titman’s sample. Over the remainder of their sample period, 1980 to
1984, the post-merger performance is significantly negative. Thus, the performance over
the combined period, 1975 to 1984, is insignificant. We conclude that Franks, Harris and
Titman’s results are specific to their sample period.”
Loderer and Martin (LM) (1992) examine a sample of 1,298 acquisitions over the
period from 1965 to 1986. The sample includes mergers, acquisitions of privately-held
corporations, tender offers, and comprehensive acquisitions of the assets of individual
firms. Long-run performance is measured relative to the completion date, as reported in
Mergers and Acquisitions.
The authors use the following regression, which is a variant of the Ibbotson RATS
following mergers. However, the BCAR across all mergers of –0.0404 is small in
magnitude. The BCAR for acquirers where the targets are publicly-traded is only
–0.0258. By contrast, AJM find a three-year CAAR of –0.0738. The BCAR is 0.0885
in the 36 months following all tender offers and is 0.0856 following takeovers of public
targets. Both values are statistically significant.
Mitchell and Stafford (MS) (1998) examine performance following three corporate
events: takeovers, equity issues and equity repurchases. Their sample of takeovers
consists of 2,767 acquisitions (including both mergers and tender offers) of CRSP-listed
firms over the period 1961-1993.
MS measure abnormal performance in three ways. First, a three-year buy-and-
hold abnormal return (BHAR) is calculated for each acquirer as the difference between the
buy-and-hold return of the acquirer and the buy-and-hold return of the appropriate size
and b/m portfolio. Both value-weighted and equal-weighted averages of the BHARs are
computed across acquirers. Second, equal-weighted and value-weighted portfolios are
formed each calendar month using the sample of all acquirers with an acquisition within
the last three years. Monthly excess returns on these ‘event’ portfolios are then
regressed on the three Fama and French factors. Third, equal-weighted and value-
weighted portfolios of acquiring firms are again formed as in the previous approach.
However, an abnormal return each calendar month is calculated as the difference between
38
the realized return on the event portfolio and an estimate of its expected return. The
latter is estimated from either the Fama-French three-factor model or the appropriate size
and b/m portfolio.
MS’s Table 2a shows equal-weighted BHARs for acquirers of –0.02 and value-
weighted BHARs of –0.05 over the first three post-acquisition years. While both returns
are significantly below zero, the authors state (p. 9) “The first notable result to emerge is
the strong statistical significance associated with economically inconsequential numbers
for acquirers”.
Table 3a shows intercepts from the Fama-French regressions (the second
approach) of –0.22% and –0.08% per month when portfolios are equal-weighted and
value-weighted, respectively. The three-year cumulations implied by these intercepts are
–0.079 and –0.029 respectively. The first number is statistically significant, while the
second is not.
The third approach yields significantly negative average abnormal monthly returns
with Fama-French benchmarks of –0.15% and –0.13% for equal-weighted and value-
weighted portfolios, respectively. These numbers are similar in magnitude to those
reported under the previous approach. However, the average abnormal monthly returns
are smaller in magnitude and statistically insignificant with size and b/m benchmarks.
In conclusion, one should note that five of the eight abnormal returns mentioned
above are statistically significant. However, the small magnitude of the buy-and-hold
returns versus the larger returns under the other approaches makes it difficult to draw
39
inferences on return magnitudes.
3. Explanations
The previous section summarized studies examining long-run post-acquisition
returns on acquirers. Because of the unusual findings of the literature, recent studies have
searched for explanations. Below, we review this search.
3.1 Speed of Adjustment
Agrawal, Jaffe and Mandelker (AJM) (1992) argue that the negative post-
acquisition abnormal returns they observe following mergers are consistent with two
hypotheses. First, the market may fully react to the merger at the announcement date,
with the subsequent price decline being due to unrelated causes. Alternatively, the market
may adjust slowly to news of the merger. Here, the long-run decline reflects that part of
the value of the acquisition not captured in the announcement period return.
AJM examine these two hypotheses with the following regression:
CARci = bo + b1 CARai + ei
where CARci is the post-merger cumulative average abnormal return for firm i. The
cumulation period always begins with the month following merger completion and,
depending on the regression, ends one to five years after completion. CARai is the
cumulative average abnormal return for firm i over the announcement period. The study
defines the announcement period as either the three-month period ending with the month
40
of announcement or the period beginning two months before the announcement and
ending with the month of merger completion. Under the hypothesis that the market
reacts slowly to merger news, b1 should be positive. That is, a high (low) return around a
merger announcement should be coupled with a high (low) return following its
completion. A variant of the hypothesis is that the market overreacts to the merger
event, implying a negative value for b1. By contrast, the coefficient should be zero, if the
under-performance following the merger is due to factors unrelated to the merger.
AJM’s Table IV shows significantly negative values for b1 under both definitions
of CARai when the period used to measure CARci ends five years after completion. In
addition, b1 is marginally significant in a number of cases where CARci is measured over
shorter periods. Thus, the authors state (p. 167), “The evidence seems to indicate a
negative relation between the market reaction to the announcement and the subsequent
performance of the firm.” Nevertheless, the authors temper their conclusion after
observing sub-period results. They say (p. 167), “However, when we examine these
regressions by subperiods, we find that the coefficient b1 is negative for the decades of the
1960s, 1970s, and 1980s but is statistically significant only for the 1960s. Thus, we
cannot conclude that the negative relationship is pervasive over our entire sample period.”
AJM also argue that if post-merger performance reflects slow adjustment, this
performance should be related to the size of the acquisition relative to the size of the
acquirer. They rank all mergers by relative size in order to form five quintile portfolios.
They state (p. 1618): “Portfolios 4 and 5 [the largest relative size] exhibit large under-
41
performance, particularly over four to five years after the acquisition. However, the
relationship is not monotonic, since large under-performance occurs for portfolio 2 as
well. Furthermore, very few of the post-merger time periods in any of the five portfolios
exhibit significant returns. Thus, the evidence here does not suggest that the acquirer’s
post-merger return is a function of the relative size of the acquisition.”
In addition, Franks, Harris, and Titman (1991), Loderer and Martin (1992) and
Loughran and Vijh (1997) also find no relationship between post-acquisition performance
and the relative size of the acquisition.
Given their evidence from the regression above as well as the relative size
quintiles, AJM conclude that the hypothesis that negative post-merger abnormal returns
are due to slow adjustment to the merger announcement is not supported by the evidence.
Since they do not identify the cause of the negative performance, they merely conclude
(p. 1620): “The resolution of this anomaly remains a challenge to the profession.”
3.2 Method of Payment
3.2.1 Results from Individual Studies
Loughran and Vijh (LV) provide an interesting explanation based on the work of
Myers and Majluf (MM) (1984). MM argue that a firm tends to issue stock when its
shares are overvalued and to issue debt or to finance out of retained earnings when its
shares are undervalued. Consequently, a firm’s share price should drop upon the news of
an equity issuance. LV suggest that acquirers who issue stock are overvalued, with a
42
stock price decline following issuance. Though MM predict an immediate drop in the
price of the stock, LV look for long-run post-acquisition under-performance. Negative
abnormal returns in the long-run here would be consistent with the finding of under-
performance following seasoned equity offerings (SEOs), as reported by Loughran and
Ritter (1995) and others. While a long-term price drop following equity issuance is
inconsistent with market efficiency, it still must be viewed as a possible explanation,
given the results reviewed earlier in this paper.
Though LV present the most detailed discussion of the differences between equity
and cash financing of acquisitions, they are by no means the first to look for long-run
performance for the two types of acquisitions. We identify seven studies examining
performance following cash and stock takeovers, many of them published prior to LV.
Barnes (1984) appears to be the first to split acquirers into those that finance with
cash and those that finance with equity. Our interpolation of his Figures 3 and 4 indicates
that abnormal performance to the acquirer is approximately –0.056 and -0.054 in the 60
months following the announcement of cash and equity acquisitions, respectively. While
these numbers are inconsistent with LV’s hypothesis, no t-statistics are reported. In
addition, Barnes’ total sample contains only 39 firms, making it difficult to draw strong
conclusions.
Dodds and Quek (1985) examine a sample of 34 acquisitions financed with equity
and 36 acquisitions financed with cash. Their Table 4 indicates a CAAR of -0.072 in the
60 months following equity-financed acquisitions, while their Table 5 indicates a CAAR
43
of -0.044 following cash-financed acquisitions over the same time period. Unlike Barnes,
the difference in performance is in the direction predicted by LV, although the magnitude
appears to be rather small. No test statistics over the five-year period are provided.
Because Franks, Harris and Mayer (FHM) (1988) always separate the post-
acquisition performance following cash-mergers from that following equity-mergers, we
presented their results for both types of mergers in Section 2.2. Rather than repeat this
material, we quote FHM (p. 253): “In summary, acquirers that made all-cash bids on
average did not suffer postmerger losses and did better than the bidders that made all-
equity offers. Whether all-equity bidders have postmerger losses depends on the
benchmark employed. Compared with premerger performance, postmerger returns are
negative. But using a benchmark based on postmerger parameters, we find all-equity
acquirers did not experience abnormal losses in the two years after an acquisition, but
they did have negative α values three to five years after the acquisitions.”
Table 4 of Franks, Harris and Titman (1991) reports average post-merger
abnormal performance over 36 months of 0.26% per month under their eight-portfolio
benchmark for 156 all-cash bids. The table also shows abnormal performance for
acquirers of –0.17% per month for 128 all-equity bids over the same time period. Though
the difference is again in the direction predicted by LV, the t-value of 1.37 for the
difference between the two returns is insignificantly different from zero. In addition,
while the abnormal performance is positive following all-cash bids and negative following
all-equity bids, both numbers are insignificantly different from zero.
44
Gregory (1997) examines abnormal performance over 24 post-acquisition months
using six models. For each of the six models, average abnormal performance is lower for
his sample of about 300 equity bids than for his sample of about 80 cash bids, a result
consistent with LV’s hypothesis. However, acquirers with mixed offers have the highest
API under each of the six models. It is difficult to square this result with Myers-Majluf,
since equity financing is part of any mixed offer.
Loughran and Vijh (1997) create a two-way classification scheme whereby all
takeovers are classified by both mode of acquisition and form of payment. Their Table II
shows that the cumulative average abnormal post-acquisition return over five years is
–0.25 for a group of 385 equity-financed mergers and 0.617 for a group of 111 cash-
financed tender offers. Both returns are significantly different from zero. By contrast,
the post-acquisition returns are insignificantly different from zero for both a group of 196
cash-financed mergers and a group of 8 equity-financed tender offers. The authors state
(p. 1789): “This evidence is consistent with two hypotheses. First, the post-acquisition
wealth gains are greater for tender offers which are usually hostile to incumbent managers
as compared to mergers. The wealth gains could occur because of the appointment of
more efficient managers as proposed by Martin and McConnell (1991). Second, the
acquirer’s managers are likely to choose stock payment when their stock is overvalued
and cash payment when it is undervalued. Apparently, the market does not react
efficiently to the likely wealth gains from the business combination or to the news
conveyed by the form of payment.”
45
In addition, the paper’s Table V measures abnormal performance relative to a
matching firm of similar size and b/m ratio that did an IPO or an SEO in the previous five
years. (By contrast, the matching firms in earlier tables were selected on just their size
and b/m ratio.) Now, the post-acquisition abnormal returns on both stock-financed
mergers and stock-financed tender offers are insignificantly different from zero. This
result provides further evidence that the under-performance of stock-financed acquisitions
can be explained by the form of payment.
As discussed in section 2.2 above, Mitchell and Stafford (1998) calculate three-year
post-acquisition abnormal performance in three ways: buy-and-hold abnormal returns
(BHARs), monthly intercepts from Fama and French regressions, and the difference
between the return on the acquirer’s portfolio in a calendar month and the return on the
event portfolio, where the event portfolio is taken from the Fama and French three-factor
model or the appropriate size and b/m portfolio.
The authors’ Table 2a shows three-year BHARs of –0.09 and –0.07 for a sample
of 1374 stock-financed acquisitions where the portfolio of acquirers is equal-weighted and
value-weighted, respectively. Both the returns are significantly negative. By contrast, a
sample of 1393 acquisitions without stock financing has BHARs of 0.04 and –0.02 when
portfolios are equal-weighted and value-weighted, respectively. The first number here is
marginally significant while the second number is insignificant.
Table 3a shows significantly negative intercepts in Fama-French regressions for
stock-financed acquisitions whether equal-weighted or value-weighted portfolios are
46
employed. The intercepts for acquisitions financed without stock are marginally
significantly negative and marginally significantly positive for equal-weighted and value-
weighted portfolios, respectively. The results in Table 4a are similar.4
Taken together, the results in the Mitchell and Stafford paper show that abnormal
performance is worse for acquirers using stock-financing than for acquirers avoiding stock.
3.2.2 Summary
As with our summary in section 2.1, we separate results prior to Franks, Harris
and Titman (FHT) (1992) from those after it. Three articles before FHT contrast cash
with equity offers. Barnes (1984) finds lower abnormal returns following cash-financed
acquisitions than those following equity-financed acquisitions, while Dodds and Quek
(1985) find the reverse. However, differences in abnormal returns between the two types
of acquisitions are small in both studies. In addition, neither article presents test statistics
for the entire post-acquisition time period. Franks, Harris and Mayer (1988) generally
find significantly positive post-acquisition abnormal performance following all-cash
takeovers and significantly negative performance following all-equity takeovers. Taken
together, the above studies are not particularly supportive of the method of financing
hypothesis.
The evidence beginning with FHT is generally more supportive of this
hypothesis. MS report higher performance following acquisitions that are financed with
4Mark Mitchell informs us that the last two row labels in MS’s Table 4a were switched. See thediscussion on page 22 of their paper.
47
cash rather than equity. Loughran and Vijh find significantly positive abnormal returns
following cash-financed tender offers and significantly negative returns following stock-
financed mergers. LV conclude that both the acquisition form and the mode of payment
are important. Gregory (1997) finds worse performance following all-equity takeovers
than following all-cash ones for each of six models, although he does not provide
statistical tests of the differences. However, FHT find that performance following cash-
financed takeovers is not significantly different from that following stock-financed
takeovers.
We see the evidence, taken together, as generally supportive of the method of
payment hypothesis. In our view Barnes (1984) and Dodds and Quek (1985) should be
accorded the least weight, because of both their small sample sizes and their less
sophisticated methodologies. Of the remaining five papers, four present evidence
consistent with the hypothesis.
3.3 Performance Extrapolation
Rau and Vermaelen (RV) (1998) posit the performance extrapolation hypothesis,
which states that both the market and the board of directors or top management of a
bidder extrapolate its past performance when assessing the value of a new acquisition.
The hypothesis has at least three implications, two of which RV test. First, because of
good (bad) past performance, the market assumes that glamour (value) firms make good
(bad) acquisitions. Thus, glamour bidders should realize greater abnormal returns at the
48
takeover announcement date than should value bidders. Second, the market slowly
reassesses the acquirer’s quality as information from the acquisition is received. Since
glamour (value) firms are initially overvalued (undervalued), long-run post-acquisition
abnormal performance should be negative (positive). Third, since both the board and top
management are influenced by a bidder’s past performance, value bidders will exercise
greater prudence toward takeovers than will glamour bidders. Thus, glamour acquirers
will pay greater acquisition premiums.
RV do not test the first implication, but, instead, merely state that it is consistent
with the empirical observation of Lang, Stulz and Walkling (1989) and Servaes (1991) that
a bidder’s announcement period return is positively related to the bidder’s Q-ratio.
Second, RV’s Table 4 shows that glamour acquirers in mergers significantly under-
perform other glamour firms in the 36 months following acquisition. Glamour acquirers in
tender offers outperform other glamour firms following acquisition but the differences are
not significant. By contrast, value acquirers significantly outperform other value firms
following both mergers and tender offers. Thus, the results of RV’s Table 4 support the
performance extrapolation hypothesis.
The authors’ Table 6 relates long-run returns to three attributes: nature of the
acquirer (glamour vs. value), means of payment and type of acquisition. Three-year post-
acquisition abnormal returns are higher for value firms than for growth firms for both
means of payment (cash and equity) and for both types of acquisitions (mergers and
tender offers). By contrast, while three-year abnormal performance for value acquirers is
49
higher following cash-financed mergers than following stock-financed mergers, the reverse
is true for glamour acquirers.5 Thus, the authors conclude that while these results are
consistent with the performance extrapolation hypothesis, they are not always consistent
with the method of payment hypothesis.
RV’s Table 7 examines the third implication of the performance extrapolation
hypothesis. The table shows that glamour acquirers pay significantly higher takeover
premiums than do value acquirers in both stock-financed mergers and cash-financed tender
offers, results consistent with the performance extrapolation hypothesis. However,
premiums are nearly equal for glamour and value acquirers in cash-financed mergers.
3.4 EPS Myopia Hypothesis
RV also posit that managers might be more willing to overpay for an acquisition if it
results in an increase in earnings per share (EPS). In addition, the market might initially
overvalue these acquirers, leading to poor long-run post-acquisition performance. For
each merger, the authors calculate the difference between the actual growth in the bidder’s
EPS following the merger and the estimated growth had the merger not taken place. Table
8 does not show a significant relationship between the impact of the merger on EPS and
the acquirer’s subsequent long-run abnormal performance. Thus, the authors conclude
that their results do not support the EPS myopia hypothesis.
5Since there were only seven stock-financed tender offers in RV’s sample, this type of comparison is notmade for tender offers.
50
4. Summary
This article examines the literature on long-run abnormal returns following
mergers. We focus on two issues: the magnitude of the abnormal returns and, to the
extent that the abnormal returns have deviated from zero, possible explanations. We
place more emphasis on the studies beginning with Franks, Harris and Titman (FHT)
(1991), because of both their more sophisticated methodologies and their greater
thoroughness.
In our opinion, the work starting with FHT shows strong evidence of abnormal
under-performance following mergers. Except for FHT itself, each paper shows at least
some evidence of under-performance. Perhaps the greatest counter-evidence comes from
research on broader topics, rather than from the studies we have reviewed. A number of
recent papers, e.g. Kothari and Warner (KW) (1997), Barber and Lyon (BL) (1997) and
Lyon, Barber, and Tsai (LBT) (1999), have criticized the methodologies of long-run
return studies in general. In addition, Fama (1998) surveys the entire long-run
performance literature, concluding (p.304), “Consistent with the market efficiency
hypothesis that the anomalies are chance results, apparent overreaction of stock prices to
information is about as common as underreaction. And post-event continuation of pre-
event abnormal returns is about as frequent as post-event reversal.” According to this
view, the papers summarized here might be nothing more than chance results.
These criticisms are quite important and can not be easily dismissed. None of the
papers that we have reviewed were specifically designed to conform to LBT, perhaps the
51
paper with the most specific prescriptions for avoiding bias. And, it would be surprising
if KW, BL, and LBT represent the last word on long-run methodologies anyway.
Certainly, future research will suggest other prescriptions as well. In addition, since our
survey focuses on acquisitions, we are not in a position to dispute Fama’s conclusions on
a much broader topic.
Perhaps the strongest rebuttal is the diversity of the research reviewed here.
Many papers using different methodologies and different sample periods in both the U.S.
and the U.K. report similar results. And, these same researchers find uniformly non-
negative long-run performance following tender offers. Viewed in this context, the
criticisms of KW, BL, LBT, and Fama might be somewhat mitigated.
Our paper also examines explanations for any findings of under-performance
following mergers. We conclude that the evidence does not support the conjecture that
under-performance is specifically due to a slow adjustment to merger news. Similarly,
Rau and Vermaelen convincingly reject the EPS myopia hypothesis, i.e. the hypothesis
that the market initially overvalues acquirers if the acquisition increases EPS, ultimately
leading to long-run under-performance.
The evidence in favor of both the method of payment hypothesis and the
performance extrapolation hypothesis is stronger. Recent papers generally report greater
under-performance following stock-financed acquisitions than cash-financed acquisitions,
a result consistent with the work of Myers and Majluf (1984). Similarly, Rau and
Vermaelen (1998) present a number of pieces of evidence that glamour bidders under-
52
perform value bidders, after abstracting from the effects of method of payment and form
of acquisition.
53
REFERENCES
Agrawal, Anup, Jeffrey F. Jaffe, and Gershon N. Mandelker, 1992, “The Post-MergerPerformance of Acquiring Firms: A Re-examination of an Anomaly,” Journal of Finance,47: 1605-1621.
Anderson, Christopher and Gershon Mandelker, 1993, “Long Run Return Anomalies andthe Book-to-Market Effect: Evidence on Mergers and IPOs,” unpublished paper, JosephM. Katz Graduate School of Business, University of Pittsburgh.
Barber, Brad M. and John D. Lyon, 1997, “Detecting Long-Run Abnormal StockReturns: The Empirical Power and Specification of Test Statistics, Journal of FinancialEconomics, 43: 341-372.
Barnes, Paul, 1984, “The Effect of a Merger on the Share Price of the Attacker,Revisited,” Accounting and Business Research, 15: 45-49.
Blume, Marshall E. and Robert F. Stambaugh, 1983, “Biases in Computed Returns: AnApplication to the Size Effect,” Journal of Financial Economics, 12: 387-404.
Bradley, Michael and Gregg A. Jarrell, 1988, “Comment,” in John C. Coffee, LouisLowenstein, Jr. and Susan Rose-Ackerman, editors, Knights, Raiders and Targets: TheImpact of the Hostile Takeover, New York: Oxford University Press.
Dimson, Elroy and Paul Marsh, 1986, “Event Study Methodologies and the Size Effect:The Case of UK Press Recommendations,” Journal of Financial Economics,17: 113-142.
Dodd, Peter and Richard Ruback, 1977, “Tender Offers and Shareholder Returns: AnEmpirical Analysis,” Journal of Financial Economics, 5: 351-373.
Dodds, J.C. and J.P. Quek, 1985, “Effect of Mergers on the Share Price Movement of theAcquiring Firms: A UK Study,” Journal of Business Finance and Accounting, 12: 285-296.
Fama, Eugene F., 1998, “Market Efficiency, Long-Term Returns, and BehavioralFinance,” Journal of Financial Economics, 49: 283-306.
Fama, Eugene F. and Kenneth R. French, 1992, “The Cross-Section of Expected StockReturns,” Journal of Finance, 47: 427-465.
54
Fama, Eugene F. and Kenneth R.French, 1993, “Common Risk Factors in the Returns onStock and Bonds,” Journal of Financial Economics, 33: 3-56.
Fama, Eugene F. and James D. MacBeth, 1973, “Risk, Return, and Equilibrium: EmpiricalTests,” Journal of Political Economy, 81: 607-636.
Firth, Michael, 1980, “Takeovers, Shareholder Returns, and the Theory of the Firm,”Quarterly Journal of Economics, 94: 235-260.
Franks, Julian R. and Robert S. Harris, 1989, “Shareholder Wealth Effects of CorporateTakeovers: The U.K. Experience 1955-1985,” Journal of Financial Economics, 23:225-249.
Franks, Julian R., Robert S. Harris, and Colin Mayer, 1988, “Means of Payment inTakeovers: Results for the United Kingdom and the United States,” in Alan J. Auerbach,editor, Corporate Takeovers: Causes and Consequences, Chicago: University of ChicagoPress.
Franks, Julian, Robert Harris and Sheridan Titman, 1991, “The Postmerger Share-PricePerformance of Acquiring Firms,” Journal of Financial Economics, 29: 81-96.
Gregory, Alan, 1997, “An Examination of the Long Run Performance of UK AcquiringFirms,” Journal of Business Finance and Accounting, 24: 971-1002.
Grinblatt, Mark and Sheridan D. Titman, 1988, “The Evaluation of Mutual FundPerformance: An Analysis of Monthly Returns,” University of California at Los AngelesWorking Paper.
Grinblatt, Mark and Sheridan D. Titman, 1989, “Mutual Fund Performance: AnAnalysis of Quarterly Portfolio Holdings,” Journal of Business, 62: 393-416.
Ibbotson, Roger G., 1975, “Price Performance of Common Stock New Issues,” Journal ofFinancial Economics, 2: 235-272.
Jensen, Michael C. and Richard S. Ruback, 1983, “The Market for Corporate Control:The Scientific Evidence,” Journal of Financial Economics, 11: 5-50.
Kennedy, V.A. and R.J. Limmack, 1996, “Takeover Activity, CEO Turnover, and theMarket for Corporate Control,” Journal of Business Finance and Accounting, 23: 267-285.
Kothari, S.P. and Jerold B. Warner, 1997, “Measuring Long-Horizon Security PricePerformance,” Journal of Financial Economics, 43: 301-340.
55
Lakonishok, Josef, Andrei Shleifer, and Robert W.Vishny, 1994, “Contrarian Investment,Extrapolation, and Risk,” Journal of Finance, 49: 1541-1578.
Lang, Larry, Rene Stulz and Ralph Walking, 1989, “Managerial Performance, Tobin’s Qand the Gains from Successful Tender Offers,” Journal of Financial Economics, 24: 137-154.
Langetieg, Terence C., 1978, “An Application of a Three-Factor Performance Index toMeasure Stockholder Gains from Merger,” Journal of Financial Economics, 6: 365-383.
Lehmann, Bruce N. and David M.Modest, 1987, “Mutual Fund Performance Evaluation:A Comparison of Benchmarks and Benchmark Comparisons,” Journal of Finance, 42:233-265.
Limmack, R.J. 1991, “Corporate Mergers and Shareholder Wealth Effects: 1977-1986,”Accounting and Business Research, 21: 239-251.
Loderer, Claudio and Kenneth Martin, 1992, “Postacquisition Performance of AcquiringFirms,” Financial Management, 21(3): 69-79.
Loughran, Tim and Jay R. Ritter, 1995, “The New Issues Puzzle,” Journal of Finance,50: 23-51.
Loughran, Tim and Anand M. Vijh, 1997, “Do Long-Term Shareholders Benefit fromCorporate Acquisitions,” Journal of Finance, 52: 1765-1790.
Lyon, John D., Brad M. Barber, and Chih-Ling Tsai, 1999, “Improved Methods forTests of Long-Run Abnormal Stock Returns,” Journal of Finance, 54: 165-201.
Magenheim, Ellen B. and Dennis C. Mueller, 1988, “Are Acquiring-Firm ShareholdersBetter off after an Acquisition,” in John C. Coffee, Jr., Louis Lowenstein, and SusanRose-Ackerman, editors, Knights, Raiders and Targets: The Impact of the HostileTakeover, New York: Oxford University Press.
Malatesta, Paul H., 1983, “The Wealth Effect of Merger Activity and the ObjectiveFunctions of Merging Firms,” Journal of Financial Economics, 11: 155-181.
Mandelker, Gershon, 1974, “Risk and Return: The Case of Merging Firms,” Journal ofFinancial Economics, 1: 303-335.
Martin, Kenneth J. and John J.McConnell, 1991, “Corporate Performance, CorporateTakeovers, and Management Turnover,” Journal of Finance, 46: 671-687.
56
Mitchell, Mark L. and Erik Stafford, 1998, “Managerial Decisions and Long-Term StockPrice Performance,” working paper, Harvard Business School.
Myers, Stewart C. and Nicholas S. Majluf, 1984, “Corporate Financing and InvestmentDecisions when Firms have Information that Investors Do Not Have,” Journal ofFinancial Economics, 13: 187-221.
Rau, P. Raghavendra and Theo Vermaelen, 1998, “Glamour, Value and the Post-Acquisition Performance of Acquiring Firms,” Journal of Financial Economics, 49: 223-253.
Roll, Richard, 1986, “The Hubris Hypothesis of Corporate Takeovers,” Journal ofBusiness, 59: 197-216.
Servaes, Henri, 1991, “Tobin’s Q and the Gains from Takeovers,” Journal of Finance, 46:409-419.
Vasicek, Oldrich A., 1973, “A Note on Using Cross-Sectional Information in BayesianEstimation of Security Betas,” Journal of Finance, 28: 1233-1239.
Table 1Summary of the studies on post-acquisition performance
The table summarizes the data, methodology, and results of 22 studies on the stock price performance of acquiring firms afteracquisition via merger or tender offer.
StudyAcqui-sitionTypea
SamplePeriod
SampleSize Methodb
EventDatec
# Monthsd
Results StatSige
Mandelker (1974) M 1941-62 241 Fama–MacBeth2 factor model