S S t t r r e e n n g g t t h h e e n n i i n n g g E E m me e r r g g e e n n c c y y N Ne e e e d d s s A A s s s s e e s s s s m me e n n t t C C a a p p a a c c i i t t y y ( ( S S E E N NA A C C ) ) T T i i m m o o r r L L e e s s t t e e C Co m mp p r r e e h h e e n n s s i i v v e e F F o o o o d d S S e e c c u u r r i i t t y y a a n n d d V V u u l l n n e e r r a a b b i i l l i i t t y y A A n n a a l l y y s s i i s s ( ( C C F F S S V V A A ) ) Conducted in December 2005 --January 2006
Timor Leste - Comprehensive Food Security and Vulnerability Analysis
3
Timor Leste: Comprehensive Food Security and Vulnerability Analysis (CFSVA)
Conducted in December 2005 -January 2006
Timor Leste - Comprehensive Food Security and Vulnerability Analysis
4
Acknowledgements This Comprehensive Food Security and Vulnerability Analysis in Timor-Leste has benefited from the valuable contribution of many people in the field, representatives of NGOs, the Government of the Democratic Republic of Timor-Leste and the World Food Programme team, who gave their time to provide information essential to this report.
This effort is part of a broader project to Strengthen Emergency Needs Assessment Capacity (SENAC) in WFP, which was made possible through funding and support of the Humanitarian Aid Department of the European Commission (ECHO).
A special acknowledgement goes to the National Statistics Directorate for providing valuable geographical and demographic data, assisted with the hiring of enumerators and data entry clerks and provided logistical support. Contributions by the Ministry of Transport and the Ministry of Health with the loan of vehicles and of anthropometric materials are also greatly appreciated.
In addition this work would not have been completed without the support of Tarek Elguindi and the whole WFP Timor Leste team, which provided the essential background information and logistical support. For their field work in very difficult environmental and climatic conditions the enumerators, drivers and supervisors are greatly acknowledged. Spatial analysis and sampling was provided by Livia Peiser and Mark Gordon of WFP-Rome and Michael Sheinkman of WFP-Bangkok and multivariate analysis was provided by Andrea Berardo and overall guidance and practical contribution by Jan Delbaere and Samir Wanmali of WFP-Rome.
Finally our great appreciation goes to the households who accepted the enumerators in their villages and homes and spared some valuable time to provide the vital information which greatly contributed to the understanding of the key risks faced by households vulnerable to food insecurity and how this may change in response to future crises in Timor-Leste.
For questions or comments concerning this report please contact: Jan Delbaere, Crisis Information Specialist, VAM, WFP, Rome [email protected] Tarek Elguindi Country Director, WFP, Timor Leste [email protected]
Timor Leste - Comprehensive Food Security and Vulnerability Analysis
1. Scope and Methods...................................................................................... 11 2. Who are the food insecure?........................................................................... 11 3. How many are they? .................................................................................... 11 4. Where do they live? ..................................................................................... 11 5. What are the underlying causes of food insecurity and malnutrition? ................... 14 6. What are the interventions recommended?...................................................... 14
1. PART I – INTRODUCTION, STUDY OBJECTIVES AND METHODOLOGY......................................15
1.1. Introduction................................................................................................ 15 1.2. CFSVA objectives ........................................................................................ 16 1.3. Definitions, terminology, and concepts ........................................................... 16 1.4. Secondary data review ................................................................................. 17 1.5. Primary data collection ................................................................................. 17
1.5.1. Survey instruments ............................................................................... 17 1.5.2. Sampling procedures ............................................................................. 17 1.5.3. Data collection, entry, and statistical analysis ............................................ 19
1.6. Limitations to the Study ............................................................................... 20
2. PART II – COUNTRY BACKGROUND ...................................................................................21
2.1. General historical and political context............................................................ 21 2.2. Geography, climate and natural resources....................................................... 21 2.3. Oecussi emergency of February 2006 ............................................................. 22 2.4. WFP’s Protracted Relief and Recovery Operation (PRRO) in Timor Leste ............... 22
3. PART III – SOCIO-ECONOMIC SITUATION..........................................................................25
3.1. Population and demographics ........................................................................ 25 3.2. Economic characteristics............................................................................... 25
3.2.3.1. Home ownership, housing materials, house size...................................26 3.2.3.2. Sanitation and water........................................................................27 3.2.3.3. Sources of lighting and cooking fuel ...................................................27
3.2.4. Main activities and income sources- Livelihood groups ................................ 28 3.2.4.1. Characteristics of livelihood groups ....................................................28 3.2.4.2. Geographic distribution of livelihood zones ..........................................29
3.2.5. Household expenditures ......................................................................... 29 3.2.5.1. Overall Expenditure Patterns.............................................................30 3.2.5.2. Per capita expenditures and quintiles .................................................31 3.2.5.3. Distribution of livelihood groups across expenditure quintiles .................31
3.2.6. Access to credit..................................................................................... 32 3.3. Literacy/Education ....................................................................................... 33
4. PART IV – HOUSEHOLD FOOD SECURITY AND VULNERABILITY .............................................35
4.1. Availability and access to food ....................................................................... 35 4.1.1. Agriculture ........................................................................................... 35
4.1.1.1. Land distribution/tenure ...................................................................35 4.1.1.2. Farming systems.............................................................................36 4.1.1.3. Cropping seasons ............................................................................37 The seasonality of rainfall affects produce with the northern part having a main production from November to April and the south and east often benefiting from a bi-seasonal rainfall with production extending until August. Although production peaks seasonally in the southern coast where rainfall is prolonged, and on higher grounds where the climate is cooler, production of vegetables is possible all year round. Lack of storage facilities to extend shelf-life of produce dramatically reduces the availability of fruits and vegetables..............................37
4.1.2. Agricultural production ........................................................................... 37 4.1.3. Post harvest Losses ............................................................................... 38
Timor Leste - Comprehensive Food Security and Vulnerability Analysis
4.1.6.1. Methodology for analyzing food access data ........................................43 4.1.6.2. Household food access profiles ..........................................................44 4.1.6.3. Geographic distribution of food access profiles .....................................44 4.1.6.4. Distribution of food access profiles among livelihood groups ..................44
4.2.1.1. Frequency of consumption and dietary diversity...................................46 4.2.1.2. Methodology for analyzing food consumption data................................46 4.2.1.3. Household food consumption groups and profiles .................................46 4.2.1.4. Household food sources....................................................................47 4.2.1.5. Geographic distribution of diet and consumption profiles .......................48 4.2.1.6. Distribution of consumption profiles among livelihood groups.................49
4.3. Household food security and vulnerability profiling ........................................... 49 4.3.1. Methodology for analyzing food security and vulnerability data..................... 49 4.3.2. Household food security and vulnerability profiles ...................................... 50
4.3.2.1. The food insecure............................................................................50 4.3.2.2. The highly vulnerable.......................................................................51 4.3.2.3. The moderately vulnerable ...............................................................51 4.3.2.4. The food secure ..............................................................................52 4.3.2.5. Other differences/similarities between food security groups ...................52
4.3.3. Geographic distribution of food security and vulnerability profiles ................. 53 4.3.4. Distribution of profiles among livelihood groups ......................................... 54
4.4. Sources of food insecurity and vulnerability- Shocks and coping strategies........... 55 4.4.1. Idiosyncratic and Covariate shocks ....................................................55 4.4.2. Coping strategies ............................................................................58
4.5. Food utilization, health, and nutritional status.................................................. 58 4.5.1. Access to health care ............................................................................. 58 4.5.2. Knowledge of HIV/AIDS.......................................................................... 59 4.5.3. Maternal health and nutrition .................................................................. 59 4.5.4. Child health and nutrition ....................................................................... 60
4.5.4.1. Sampling, methodology, representativeness........................................60 4.5.4.2. Nutritional status and comparison with other surveys ...........................61 4.5.4.3. Child nutrition by age and gender ......................................................62 4.5.4.4. Child morbidity ...............................................................................63 4.5.4.5. Breastfeeding and weaning practices..................................................63 4.5.4.6. Determinants of health and nutrition status.........................................64
5. PART V RECOMMENDATIONS FOR PROGRAM INTERVENTIONS ..............................................69
5.1. Priority areas and causes of food insecurity and vulnerability ....................... 69 5.2. Current food and non food-aid interventions.............................................. 70 5.3. Food and non-food intervention recommendations by priority areas and groups70 5.4. Recommendations for future studies ........................................................ 71
ANNEX 1 - ADDITIONAL DATA TABLES ....................................................................................72
1. Sample information ..................................................................................... 72 2. Demographics............................................................................................. 72 3. Housing and Facilities................................................................................... 73 4. Assets........................................................................................................ 74 5. Credit ........................................................................................................ 75 6. Livestock.................................................................................................... 76 7. Agriculture ................................................................................................. 77 8. Ministry of Agriculture, Forest, and Fisheries food balance sheets (maize)............ 78
Timor Leste - Comprehensive Food Security and Vulnerability Analysis
7
9. Ministry of Agriculture, Forest, and Fisheries food balance sheets (rice) ............... 79 10. Income ...................................................................................................... 80 11. Expenditures (food) ..................................................................................... 81 12. Expenditures (Non-food) .............................................................................. 82 13. Expenditures (overall) .................................................................................. 83 14. Food sources .............................................................................................. 84 15. Food aid and shocks .................................................................................... 85 16. Food security classes ................................................................................... 86 17. Under 5 nutrition......................................................................................... 87 18. Knowledge of HIV/AIDS................................................................................ 88
ANNEX 2: FOOD ACCESS AND FOOD CONSUMPTION SCORE EQUATIONS .....................................89
ANNEX 3: MAPS OF DATA USED TO CREATE VAM ZONES ...........................................................90
Timor Leste - Comprehensive Food Security and Vulnerability Analysis
8
LIST OF FIGURES, TABLES AND MAPS
Figure 1 - Household sources of lighting...................................................................................................... 28 Figure 2 - Distribution of livelihood groups .................................................................................................. 28 Figure 3 - Estimated annual income by source and livelihood group................................................................ 29 Figure 4 - Percent of households in livelihood group by Region....................................................................... 30 Figure 5 - Livelihood groups across total expenditure quintiles ....................................................................... 31 Figure 6 - Household head educational attainment ....................................................................................... 32 Figure 7 - Access to credit and income monetized by livelihood group............................................................. 32 Figure 8 - Access to credit and income by Region ......................................................................................... 32 Figure 9 - Household head education by Region ........................................................................................... 34 Figure 10 - Spouse of household head education by Region ........................................................................... 34 Figure 11 - Household access to land, irrigation, and rice and corn cultivation by Region................................... 35 Figure 12 - Main Crop Harvest Months in Northern Areas............................................................................... 36 Figure 13 - Main Crop Harvest Months in Southern Areas (percentage of farmers engaged in harvesting)17 ......... 36 Figure 14 - Sucos reporting lack of food and harvest by month ..................................................................... 37 Figure 15 - Food access by region .............................................................................................................. 44 Figure 16 - Mean food consumption ............................................................................................................ 45 Figure 17 - Macronutrient consumption by region ......................................................................................... 48 Figure 18 - Protein consumption frequency by region.................................................................................... 48 Figure 19 - Main staple consumption frequency by region.............................................................................. 48 Figure 20 - Food consumption groups by region ........................................................................................... 49 Figure 21 - Food consumption group by livelihood group ............................................................................... 49 Figure 22 - Food security groups by region .................................................................................................. 53 Figure 23 - Food security group by VAM zone............................................................................................... 53 Figure 24 - Food security groups by livelihood groups ................................................................................... 54 Figure 25 - Percentage of respondents having ever heard of HIV/AIDS by region ............................................. 59 Figure 26 - Antenatal care provision ........................................................................................................... 60 Figure 27 - Wasting prevalence by age group and gender.............................................................................. 62 Figure 28 - Stunting prevalence by age group and gender ............................................................................. 62 Figure 29 - Underweight prevalence by age group and gender ....................................................................... 62 Figure 30 - Child morbidity (fever, diarrhea)............................................................................................... 63 Figure 31 - Prevalence of wasting by recent diarrhea and age group............................................................... 63 Figure 32 - Prevalence of wasting by recent fever and age group ................................................................... 63 Figure 33 - Current breastfeeding status by age group.................................................................................. 64 Figure 34 - Wasting prevalence by current breastfeeding status and age group................................................ 64 Figure 35 - Wasting prevalence by VAM zone (corrected) .............................................................................. 65 Figure 36 - Wasting prevalence by livelihood group (corrected)...................................................................... 65 Figure 37 - Wasting prevalence by sex of child (corrected) ............................................................................ 65 Figure 38 - Wasting prevalence by shock of unemployment (corrected) .......................................................... 65 Figure 39 - Wasting prevalence by age (corrected) ....................................................................................... 66 Figure 40 - Wasting prevalence by recent diarrhea (corrected)....................................................................... 66 Figure 41 - Stunting prevalence by VAM zone (corrected).............................................................................. 66 Figure 42 - Stunting prevalence by livelihood group (corrected) ..................................................................... 66 Figure 43 - Stunting prevalence by age of child (corrected) ........................................................................... 67 Figure 44 - Stunting prevalence by land access and irrigation (corrected)........................................................ 67 Figure 45 - Diarrhea prevalence by VAM zone (corrected).............................................................................. 67 Figure 46 - Diarrhea prevalence by supplemental feeding (corrected) ............................................................. 67 Figure 47 - Diarrhea prevalence by livelihood group (corrected) ..................................................................... 68 Figure 48 - Diarrhea prevalence by mother’s diarrhea prevalence (corrected) .................................................. 68 Figure 49 - Percentage of households having received food or other assistance................................................ 70 Table 1 - Districts comprised by each Region ............................................................................................... 19 Table 2 - Percent of households with access to toilet facilities by Region ......................................................... 27 Table 3 - Main Sources of Water by Region (% of sampled households) .......................................................... 27 Table 4 - Contribution of Livelihood Activities to Annual Income ..................................................................... 29 Table 5 - Percent of households in livelihood group by Region........................................................................ 29 Table 6 - Proportions of Household Food Expenditures Across Regions ............................................................ 30 Table 7 - Mean Per Capita MonthlyHousehold Expenditures across Regions in US$............................................ 31 Table 8 - Expenditure quintiles across Regions ............................................................................................. 31 Table 9 - Main Reasons for Absence from School .......................................................................................... 34 Table 10 - Livestock ownership and average for whole sample ....................................................................... 40 Table 11 - Livestock Holdings by Region (% of Households Reporting Ownership) ............................................ 41 Table 12 - Household Food Access Groups ................................................................................................... 44 Table 13 - Level of food access indicators by region...................................................................................... 44 Table 14 - Food groups based on actual weekly consumption......................................................................... 45 Table 15 - Mean food consumption ............................................................................................................. 46 Table 16 - Household Food consumption Groups .......................................................................................... 47 Table 17 - Household’s Exposure to Shocks across Regions .......................................................................... 55 Table 18 - Coping strategies ...................................................................................................................... 58
Timor Leste - Comprehensive Food Security and Vulnerability Analysis
9
Table 19 - Supplements and Care Practices across Regions ........................................................................... 59 Table 20 - Hand-washing knowledge across Regions..................................................................................... 60 Table 21 - Standard deviations of z-scores .................................................................................................. 60 Table 22 - Stunting prevalence by age group and gender .............................................................................. 61 Table 23 - Past nutrition surveys results...................................................................................................... 61 Table 24 - Food Security and Vulnerability profiles........................................................................................ 50 Table 25 - Food Security groups................................................................................................................. 50 Map 1 - Percentage of food insecure/highly vulnerable population .................................................................. 12 Map 2 - Percentage of wasted and stunted children under 5 .......................................................................... 13 Map 3 - Map of clustered districts (VAM Zones)............................................................................................ 18 Map 4 - Map of 1st level administrative boundaries (Regions) ......................................................................... 19 Map 5 – Districts of Timor Leste ................................................................................................................. 21 Map 6 - Map of percentage of food insecure/highly vulnerable population........................................................ 54
Timor Leste - Comprehensive Food Security and Vulnerability Analysis
10
Timor Leste - Comprehensive Food Security and Vulnerability Analysis
11
Executive Summary 1. Scope and Methods
A 1700 household national food security survey was conducted from November to December, 2005. This survey also included information from 173 key informants, and nutritional information on 1877 children between 6 and 59 months of age. The sample was drawn and analyzed to be representative in each of 5 regions of Timor Leste, as well as in each of 5 VAM zones, which are clusters of districts found, a priori, to be relatively homogenous for several agricultural, economic, and geographical characteristics. Data collected include demographic information at the individual level, housing and facilities, asset ownership, agricultural practices, income, expenditures, dietary diversity, shocks and coping strategies, maternal and child health and nutrition, and HIV/AIDS knowledge.
Key variables related to food access, dietary diversity, and food consumption frequency were combined using a process of principal component analysis, cluster analysis, subjective scoring, regression analysis, and re-grouping of households to provide four food security groups, their characteristics, and their prevalences at the national level, and also for the 5 regions and zones. Additionally, principle component analysis and cluster analysis were used to create livelihood profiles.
Additionally, anthropometric measurements of children 6 to 59 months were used to calculate the prevalences of stunting, wasting, and underweight, in order to capture the utilization component of food security.
This leads to two main indicators on which recommendations are based: food security status, based on a combination of access and diet indicators, and nutritional status (stunting, wasting, underweight) of children 6 to 59 months. It is important to note that these two indicators look at different aspects of food insecurity, and provide insight into regional variations of the underlying causes of food insecurity. Additionally, nutritional status may be an outcome of food security status, or of other factors.
2. Who are the food insecure?
Looking at these two main indicators of food insecurity (food security groups and under 5 nutritional status), several general characteristics of the food insecure can be identified:
• Female headed households • Subsistence agriculturalists, those households relying primarily on agriculture for both the food
source and income generation, without access to livelihoods based on trading, skilled labor, or salaried jobs.
• Households without access to irrigated land • The uneducated • Households that are victims of shocks, particularly unemployment. • Households with poorer access to health care and services
3. How many are they?
Nationally, 20% of households are considered to be food insecure, 23% to be highly vulnerable, 21% to be moderately vulnerable, and 36% to be food secure. This analysis relies on access and dietary diversity.
Using the July 2006 population estimate of 1,062,777, this means that approximately 213,000 people are food insecure, 244,000 are highly vulnerable, 223,000 are moderately vulnerable, and 383,000 are food secure.
Looking at utilization, as measured by child nutrition, 57% of children between 6 and 59 months of age are underweight, 21% are wasted, and 46% are stunted (moderate and severe).
4. Where do they live?
Food insecure households are found throughout the country. However, there are some geographic patterns to the prevalence of food secure households and to child undernutrition. It is important to note that the underlying causes for food insecurity, and therefore the ‘type’ of food insecurity varies geographically.
Looking at the geographic distribution of the prevalence of the food insecure (as determined by food access and dietary diversity/frequency) the most food secure areas are the urban and peri-urban areas of Dili (VAM zone 5), where only 29% of households are considered food insecure or highly
Timor Leste - Comprehensive Food Security and Vulnerability Analysis
12
vulnerable. The most food insecure areas are VAM zone 3, located in the north east quadrant of the country, with 51% of households considered food insecure/highly vulnerable, and Oceussi, where 49% of households are considered food insecure/highly vulnerable. The lease food insecure area is VAM zone 1, located in the southern half of the country, where 40% of households are considered to be food insecure/highly vulnerable. Looking at the 5 administrative Regions (Regiões), two areas stand out as having heightened food insecurity: Region 2, in the center of the country, with 53% of households considered food insecure or highly vulnerable, and Region 5 (Oecussi), with 49% of households considered food insecure/highly vulnerable.
Map 1 - Percentage of food insecure/highly vulnerable population
Combining the food security prevalence stratified by Region and stratified by VAM zone, a mathematical prediction of the prevalence of food insecurity at each combination of Region and VAM zone is made. This parametric map is presented in Figure one. Here, the center/north areas appear to be the most food insecure, with prevalences of 58 to 59% of food insecure/highly vulnerable households. This is followed by the central and south west, and the south east areas of the country, with prevalences between 42 and 50%. The urban and peri-urban areas of Dili have a predicted prevalence of 29%.
Looking at mild and severe child undernutrition by Region, Region 5 (Oecussi) has the highest prevalence of underweight children at 69%, with 31% wasting and 39% stunting. This is followed by Region 4, in the west of the country, with 60% of children underweight, 27% wasted, and 46% stunted. Regions 1, 2, and 3 in the center and east of the country have similar levels of underweight prevalence (56%, 52%, and 54% respectively).
Looking at moderate and severe child undernutrition by VAM zone, VAM zone 4 (Oecussi) has the highest levels of underweight children (70%), with 30% wasted and 20% stunted. This is followed by VAM zone 1 and 2, located in the west and south of the country. VAM zone 1 has 58% of children underweight, with 21% wasted, and 45% stunted. VAM zone 2 also has a underweight prevalence of 58%, with 15% stunting and 56% stunting. The urban and peri-urban area around Dili (VAM 5) has the lowest prevalence of underweight children (48%), with 17% wasting, and 35% stunting.
Timor Leste - Comprehensive Food Security and Vulnerability Analysis
13
Map 2 - Percentage of wasted and stunted children under 5
Timor Leste - Comprehensive Food Security and Vulnerability Analysis
14
5. What are the underlying causes of food insecurity and malnutrition? Several underlying causes of food insecurity have been identified. These causes are related to food availability, although poor access appears to be the main causes. Poor utilization seems to be the main cause of malnutrition. Some of the key underlying causes include:
• General isolation and lack of infrastructure, particularly in the case of Oecussi • Poor access to adequate farmland, particularly irrigated • Poor access to income generating activities outside of agriculture • Low purchasing power, related to livelihood methods. • Food taboos and dietary practices lead to poor diets. • Poor access to healthcare, which is particularly linked to poor health status of children. • Inadequate sanitation and hygiene practices.
6. What are the interventions recommended?
Several interventions are recommended, due to the varying underlying causes of food insecurity, and the distribution of these groups. These recommendations are made to address both the current situation of food insecurity itself, and also the underlying causes of food insecurity. These recommendations include:
• Maternal and child health programs. Targeting pregnant and nursing mothers and young children, with a nutrition education component focusing on improving diet through an increase in diversity.
• Supplemental feeding programs. Geographical targeting, followed by targeting by health status.
• School feeding. Targeted geographically (areas of increased food insecurity overall), with a nutrition education component
• Agricultural programs. Focused on improving agricultural methods and improving access to agricultural inputs and irrigation, as well as increasing the use of livestock
• Micro-credit schemes, micro-finance programs, and small enterprise creation programs. These programs can focus on increasing income, purchasing power and access to credit.
Targeting should be geographic primarily, followed by socio-economic targeting at the household (or individual) level.
WFP can take a lead role in programs that are primarily food centered, but it is suggested that WFP partner with other UN organizations, NGOs, and government counterparts in the design and implementation of programs where food aid only plays a partial role. Finally, WFP can provide incentive and support to other organizations that can take non-food based food security and livelihood protection programs.
Timor Leste - Comprehensive Food Security and Vulnerability Analysis
15
1. Part I – Introduction, study objectives and methodology 1.1. Introduction1
Most of Timor Leste suffers from food shortages for about four months each year: October-November and February-March. Availability, access and utilization all combine to severely limit the country’s food insecurity.
In 2002-3, Timor Leste was hit by two consecutive droughts, a direct result of the El Nino climatic phenomenon. Since then, drought-like conditions have due to erratic rainfall both in 2003-4 and 2004-5 leading to an annual deficit in production of food. In particular, Timor Leste’s cereal production falls short of overall consumption requirements.
With 38 percent of the population living on less than 55 cents per capita per day, poverty and the rising price of food products, especially cereals, also severely restrict the access of the poor to food, especially in rural areas.
Despite the fact that the average household spends over 60 percent of their average income on food (75 percent among the poor families), about 38 percent of the population below poverty line consume less than 2,100 kcal required.
Facts & Figures
Capital: Dili
Population: 1,062,777 (July 2006 estimate)
Land area: 18,900 sq km (Timor Leste Government website)
Climate: very hot and humid; rainfall has been erratic; monsoon rainfall from October/November to February/March,
Terrain: mainly hills and mountains separated by deep, narrow valleys; open plains limited to coastal strips
Food Production:
rice, corn/maize, cassava, sweet potatoes, soybeans, mung beans, kidney beans; livestock (goats, cow and pigs), poultry
Annual Harvest(s):
February/March
Agricultural Production (% GDP):
25 percent (2002)
Agricultural Labour force (% total):
about 80 percent
% total pop malnourished:
Latest Demographic Health Survey (2004): malnutrition among children under-5: Stunting, 47.8 percent; Underweight, 44 percent; Wasting, 12 percent Malnutrition among women (2003): low BMI (<18.5) 33 percent
Average daily calorie intake:
not available
GNP per capita:
430 US$ (Year - 2003)
Aid (% GNP): Not available
The high food insecurity is apparent in Timor Leste’s high malnutrition rates. About 47 percent of children under the age of five are chronically malnourished (stunted) and 43 percent severely malnourished (underweight). The rate of wasting is about 12 percent nationwide. Malnutrition continues even among children aged more than five, when they go to the school. Furthermore, more than 30 percent of the women suffer from chronic energy deficiency (low BMI<18.5).
Risks to food insecurity include: 1 Taken from WFP Timor Leste Country Brief
Timor Leste - Comprehensive Food Security and Vulnerability Analysis
16
• Erratic rainfall and droughts • Heavy winds • Flooding • Subsistence farming and limited off-farm employment • Land/mudslides • Deforestation • Potential economic downturn • Potential civil unrest (in some parts)
Besides weak food availability and access, the other reasons of high malnutrition are weak child and mother health and care facilities, lack of safe drinking water, etc.
1.2. CFSVA objectives
The overall objective of the comprehensive food security and vulnerability analysis is to strengthen the knowledge base on issues related to food security and vulnerability in Timor Leste. In order to achieve this goal, the following questions needed to be answered:
• Who are the food insecure? • How many are they? • Where do they live? • Why are they food insecure? • Does food aid have a role to play?
In answering these questions, it is hoped that this report can provide WFP and its partners in government, civil society and the UN system guidance and criteria upon which aid resources, both food and non-food, can be targeted.
1.3. Definitions, terminology, and concepts2
At the 1996 World Food Summit (WFS) it was agreed that food security exists when: “all people, at all times, have physical and economic access to sufficient, safe and nutritious food to meet their dietary needs and food preferences for an active and healthy life.” (CFS, 1996)
This definition of food insecurity incorporates three dimensions or elements: • Food Availability is the amount of food that is physically present in a country or area through all
forms of domestic production, commercial imports and food aid. (WFP, EFSA Handbook, 2004) • Food Access is a household’s ability to regularly acquire adequate amounts of food through a
combination of their own stock and home production, purchases, barter, gifts, borrowing or food aid. (WFP, EFSA Handbook, 2004)
• Biological Utilization of Food refers to: (a) households’ use of the food to which they have access, and (b) individuals’ ability to absorb nutrients – the conversion efficiency of food by the body. (WFP, EFSA Handbook, 2004)
The term food security (defined above) describes a condition at a given point in time. By contrast, the term vulnerability is used to describe the level of risk for future food insecurity.
FIVIMS defines vulnerability as: “the full range of factors that place people at risk of becoming food-insecure. The degree of vulnerability of individuals, households or groups of people is determined by their exposure to the risk factors and their ability to cope with or withstand stressful situations.”
The term “livelihood” is used in many different ways depending on the operational and institutional context within which it is employed. For the purposes of these guidelines, the following definition forms the basis of our future discussions:
A livelihood comprises the capabilities, assets (including both material and social resources) and activities utilized by a household for a means of living. A household livelihood is secure when it can cope with and recover from stresses and shocks and maintain or enhance its capabilities and productive asset base.
Generally speaking, the goal of most household livelihood strategies is to improve welfare levels in some way: (a) having enough to eat; (b) stabilizing the fluctuation of income; (c) ensuring that children are able to go to school; (d) being able to afford or access health services; or (d) better management and utilization of natural resources. These aspirations are generally termed livelihood outcomes—a set of factors that govern household welfare.
2 Adapted from the WFP VAM Thematic Guidelines
Timor Leste - Comprehensive Food Security and Vulnerability Analysis
17
Livelihood strategies are often based on a set of assets available and accessible to households. These assets are both tangible (e.g., land, labor, credit, and livestock) and intangible (e.g., skills, knowledge, social networks). Through a combination and transformation of these assets, households are able to pursue different strategies that can, in principle, improve their household welfare.
1.4. Secondary data review
Secondary data is drawn from a variety of sources including both quantitative and qualitative surveys, government statistics, and informal conversations with key informants. This data is included throughout the report, but as a triangulation for the survey results, and to add complementary information related to food security but outside the scope of the primary data collection exercise. These data sources are cited in footnotes throughout the report.
1.5. Primary data collection
Primary data collection took place from November to December, 2005. The two primary data collection instruments (household and key informant) are described below.
1.5.1. Survey instruments
The survey was designed to collect quantitative information at the household and individual level and more qualitative data at the community level. Two different data collection instruments were designed to serve this purpose: a household questionnaire with an anthropometric module and a key informant interview. All instruments were prepared in English, but then were translated into Tetun for data collection purposes.
The household questionnaire included modules on household demography, education, health, housing, income activities, household expenditures, household asset ownership, risk exposure and response, agricultural activities, livestock ownership, and food consumption (7-day food frequency). Furthermore, it collected information on maternal and child health and nutrition. For child anthropometry, height and weight/length were measured of all children from 6-59 months of age found within sampled households.
The key-informant questionnaire was used to collect information from key informants, such as local community leaders, teachers, nurses, religious leaders, etc. Usually three knowledgeable community members were gathered for one interview, preferably at least one of them female. The key-informant interviews provided an overview of the community access to schools, markets and health facilities.
1.5.2. Sampling procedures
The sample was drawn to be statistically representative at both district cluster level (VAM Zone, describe below) and Regional level (Regions 1 to 5). Data from the 2004 National Census allowed the use of 10 indicators plus land cover and elevation (Figure 1-a) to find homogeneous zones through Principal Component Analysis (PCA) and non-hierarchical clustering using ADDATI software. Homogeneous zones share a higher degree of similarity with respect to the selected indicators (see Table in Figure 1-b). The results where classified into 5 Vulnerability Assessment Mapping (VAM) Zones as detailed below Sucos are commonly identified as villages but often are sparsely dispersed in a cluster of hamlets (Aldeias) often spaced at several kilometers from each other. Households were randomized systematically from the updated census list of occupied households at the Suco administrative level. All Sucos had a sample of 10 households each, except 2 Sucos with a sample of 20 and one with 30. The CFSVA was the first survey to benefit from the updated census list and household recognition which was made possible by the use of geographic waypoints and GPSs.
Map 3 - Map of clustered districts (VAM Zones)
Map 4 - Map of 1st level administrative boundaries (Regions)
Two Sucos were not safely accessible because of landslides and were replaced by pre- selected alternative Sucos in the same Region. Six households were found to be in areas not safely accessible during the rainy season, 5 houses were found to be not occupied and 13 households refused to participate in the survey. In all occasions the team chose an accessible household as close as possible to the original selection.
The final sample consisted of 1700 households spread over 163 Sucos in 13 districts. 173 key informant interviews were completed.
Survey results will be discussed using primarily the 1st level Administrative boundaries, termed Regions, depicted in Figure 1-c and comprising the districts detailed in Table 1-a. Additionally, some results will be given by VAM Zone. It is important to note that the results, presented by Region or VAM Zone, may mask small areas of food security or insecurity.
Table 1 - Districts comprised by each Region
Region 1 Region 2 Region 3 Region 4 Region 5 (Especial)
Lautem, Baucau Viqueque
Manatuto Manufahi Ainaro
Dili Aileu Ermera
Liquica Bobonaro Covalima
Oecussi
1.5.3. Data collection, entry, and statistical analysis
The design of the data collection methodology was carried out by the Vulnerability Analysis and Mapping (VAM) units of WFP Rome, Bangkok and Dili. Data collection was organized and carried by WFP Timor Leste with staff provided by the National Statistic Directorate. Two 5-day training sessions, including training on anthropometric measurements, were held with 27 enumerators. Questionnaires were revised though discussions and then pilot tested for relevance and appropriateness of posed questions.
Pilot tests were run in the Sucos of Hera and Tibar in order to refine use of GPSs and interviewing and measurement techniques prior to start of the survey. Ongoing monitoring was provided by 3 Field supervisors and a Survey coordinator. A debriefing session took place in the end to identify possible problems/constraints that occurred during data collection process that could hamper data quality or help with the interpretation of results.
Data were collected by 6 teams of 4 enumerators each, between mid November to mid December 2005.
Before the commencement of field survey, The National Statistics Directorate communicated the objectives of the survey and the itinerary to all 13 districts administrations and local authorities provided assistance to the field survey teams.
Data were entered into a Microsoft Access Database and subsequently analyzed in SPSS (11.5). Nutritional status was analyzed using EpiInfo 2000 version 3.23 using the WHO/NCHS 1978 growth charts reference standards. ADATTI was used to run the Principal Component Analysis (PCA) and non-hierarchical clustering.
Timor Leste - Comprehensive Food Security and Vulnerability Analysis
20
1.6. Limitations to the Study
As in all large scale household surveys, there are some limitations. General limitations of particular note in this survey include the following:
Due to the sampling methodology, the nutritional information collected by this survey should only be interpreted in the context of the sample taken for correlation to household food security, and not as an indicator of national or Regional malnutrition rates. Malnutrition results at the national level have been weighted to adjust for sampling, and should be a good representation of the nutritional status in the country. However, these results are not meant to replace or update other nutritional surveys since the margin of error is too high. Results for stunting also indicate the possibility of inaccurate age reporting which has also been reported in previous nutritional surveys.
It would be reasonable to assume that the inaccessible Sucos or households suffer from increased food insecurity and vulnerability because of their isolation. However, this cannot be accurately measured.
The translation of the questionnaire to Tetun presented several challenges. Many technical words are borrowed from Portuguese or Bhasa Indonesian, and may not be known by the general population. Additionally, although the teams were assigned working areas accordingly to their knowledge of the several local languages spoken in the country, none of the enumerators could speak Baiqueno, which is the only language spoken in a few villages in Oecussi, forcing the utilization of unskilled local translators when Bhasa or Tetun was not sufficient.
The timing of the survey coincided with the onset of the lean season, which may cause an overestimation the estimate of food insecure households.
Finally, respondent bias may be of concern for some indicators, affecting the accuracy of the responses. One example is the ages of children, which, with some respondents, was difficult to estimate.
Timor Leste - Comprehensive Food Security and Vulnerability Analysis
21
2. Part II – Country Background 2.1. General historical and political context
On 20th May 2002, Timor-Leste officially gained independence after four and half centuries of Portuguese colonial occupation and 24 years of Indonesian occupation. The lead to Independence was marked by widespread violence in 1999 which had immediate and wide ranging impacts on the socio-economic status of the country; almost 90% of all infrastructures were destroyed; electricity and communications lines were damaged, 80% of schools and clinics were closed, livestock was lost and most agricultural assets, including all stocks of grain, were ruined3.
The resulting mass displacement, loss of markets followed by three consecutive years of drought, 2001-02, 2002-03, and 2003-04, have exacerbated existing food insecurity. Two thirds of the rural population, almost 600,000 people experience food shortages at some time during the year and malnutrition rates are amongst the highest in Asia4.
2.2. Geography, climate and natural resources
The country is administratively divided into 5 Regions, further divided into 13 districts. Each district is divided into 65 sub-districts comprising 443 Sucos (villages). Sucos are further divided into 2,500 Aldeias (hamlets). Sucos and Aldeias are traditionally governed by chiefs who met out a traditional system of law and justice. The first elections for the chief positions occurred in 2005. District and sub-districts are governed by administrators appointed centrally by the National Government5.
Timor-Leste has a total land area of approximately 14,500 sq. km and includes the eastern part of the island of Timor, the enclave of Oecussi and the islands of Atauro and Jaco. The island is covered by a core of rugged hills and mountains running from east to west and physically dividing the country in distinctive climatic patterns for the northern and southern parts.
The landscape is scoured by dry river beds that transform into torrents during the Monsoons, winding down to steep valleys. The land rises to 2,000 meters and above, including Mount Ramelau at 3,000 meters. Around 44% of the country has a slope of approximately 40%, which when combined with heavy rainfall and deforestation, encourages soil erosion.
Map 5 – Districts of Timor Leste
The climate is hot, with an average temperature of 24 degrees Celsius on the coastline and 20 degrees in the highlands. There are two main seasons, the rainy season from November to March which may extend with less intensity until June, especially in the southern half of the country, and the dry season from July to October. While the northern area receives an average yearly rainfall of 500 to 1500mm of rainfall the southern part recive1500 to 2000 with a second peak of precipitation during May and June. Altitudes above 500m usually receive a higher annual rainfall.
3 Asian development Bank, (Aug 2004- Jan 2005)Gender and Nation Building in Timor-Leste: Country Gender Assessment, , pg 12 4 DHS,Timor Leste, Demographic and Health Survey (2003) 5 UNDP Human Development Report Timor-Leste, Paths out of Poverty, 2005, pg 42
Timor Leste - Comprehensive Food Security and Vulnerability Analysis
22
Timor-Leste is situated on a cyclone belt, is vulnerable to earthquakes, and is prone to the El Nino/Southern Oscillation climate phenomenon which is associated with drought in this area. The country also suffers from floods, landslides and erosion resulting from the combination of heavy monsoonal rain, steep topography and widespread deforestation.
Substantial oil and natural gas deposits lie under the Timor Sea between Australia and Timor-Leste. Disputes over maritime boundaries between the countries have meant a significant loss in revenue for Timor-Leste since Independence. On 20 May 2002, Timor-Leste and Australia signed an interim agreement, The Timor Sea Treaty, creating the Joint Petroleum Development Area (JDPA). The Timor-Leste Government has since received both tax revenue and royalty payments from the petroleum fields in JDPA which was initially managed by a savings policy established under UNTAET (United Nations Transitional Administration in East Timor). Under this policy, the Government spent the tax revenue from petroleum projects as part of its regular budget, but saved the royalty payments. From 1st July 2005, a permanent Petroleum Fund was created where all revenue was placed and from which any withdrawals had to be approved by the National Parliament.
On 12 January 2006, Australia and East Timor signed a new deal establishing a 50-50 split of royalties from the lucrative Greater Sunrise gas field in the Timor Sea. This arrangement is expected to increase the royalties for Timor-Leste from US$6 billion to US$15 billion.
Gold and marble are two of the other main natural resources in Timor-Leste.
2.3. Oecussi emergency of February 2006
Oecussi is currently facing an emergency situation due to consistent heavy rains resulting in floods and reports of widespread landslides. Three weeks later the waters have receded but have left extensive damage behind.
Maize and rice productions have suffered major damage, the full extent of which will take some time to estimate since some areas are still inaccessible. Much of the maize crop was almost ready to be harvested and the young seedling of the rice crop had recently been planted. Most Irrigation infrastructures were washed away by the floods or by landslides. Access to safe drinking water is also greatly affected since many wells are either contaminated or have collapsed.
In consideration that most areas of the enclave only have one crop season per year, Oecussi will have limited capacity of recuperation. An emergency assessment has been conducted, and the accessible areas of Cunha, Lalisuk and Oesilo are currently receiving assistance. However, the majority of the enclave remains very difficult to access making assistance difficult. Damage is more extensive in the highlands
The isolation of the Oecussi enclave makes delivery of emergency supplies very difficult and slow. The Local Government, WFP and the International NGOs based in Oecussi are working together to assess the damage and develop an appropriate coordinated emergency response.
The effects of this emergency situation postdate the survey data collection, and so the effects will not be accounted for in the survey results.
2.4. WFP’s Protracted Relief and Recovery Operation (PRRO) in Timor Leste
The current PRRO project, Investing in People’s Future, has a budget of US$9.5 million (12,400 MT), comprising two main activities, Safety Net and Emergency Preparedness and Response. The overall goal is to contribute to the reduction of malnutrition among vulnerable groups, to universal primary education and to strengthened emergency preparedness and response by the government.
The Safety Net activity involves both Maternal and Child Health (MCH) and School Feeding (SF). Through a supplementary feeding program and increased access to health care, the MCH will reduce malnutrition among over 40,000 children under five and 9,000 pregnant and lactating women. The SF will provide daily snacks for over 103,000 primary school children. All food rations are fortified with micronutrients.
Through an assessment of secondary data conducted in 2004, WFP identified seven districts in need of immediate assistance. Both MCH and SF were officially launched in December 2005. At the time of this report, the MCH and SF have been introduced to Liquica, with expansion into other identified districts planned for February/April 2006.
The Emergency Preparedness and Response activity will address food insecurity by strengthening the capacity of the Government to prepare for and respond to natural disasters and other emergencies. Included is contingency planning whereby emergency stocks of food items will be located in strategic
Timor Leste - Comprehensive Food Security and Vulnerability Analysis
23
warehouses to facilitate rapid response to disaster-prone areas of the country. Over 1,650mt will assist 20,000 of the nation’s most affected households.
The strategic reserves were recently called upon in the Enclave of Oecussi where heavy rains, high winds and flash floods caused enormous damage to property, crops, livestock and infrastructure. A team was sent from WFP to perform Rapids Emergency Food Needs Assessment. To date, 556 affected households were identified as in need of immediate food aid. To meet this need, WFP sent an extra 110mt of food in addition to the 52mt already in place as part of the Emergency Strategic Reserve.
The Government of Timor-Leste has made the aims of the PRRO as part of its National Development Plan and is solely responsible for implementing the activities. The Ministry of Health has responsibility for the MCH and will complement the supplementary feeding by providing health awareness and pre and post-natal care at the Health Posts where the beneficiaries will collect rations.
The Ministry of Education and Culture implementing the SF and is using Parent’s Teachers Association to manage and deliver activities. The Emergency Preparedness component is being led by the Ministry of Interior.
Timor Leste - Comprehensive Food Security and Vulnerability Analysis
24
Timor Leste - Comprehensive Food Security and Vulnerability Analysis
25
3. PART III – Socio-economic situation 3.1. Population and demographics
The current survey collected extensive demographic information; however the 2004 National Census data is more complete and reliable. The information gathered in this survey related to population and demographics is meant to further describe the results of this survey, and not to replace those results of the National Census.
The 2004 National Census reports the total population as 923,198. As of July 2006, the current population is estimated to be 1,062,777. The Census indicates that this is a 17.4% growth in population since the National Survey of 2001. Growth is more evident in the western districts, particularly in Dili with a growth of 39.3%. Baucau and Ermera are the second largest districts with populations just over 100,0006.
Around 26% of the population resides in urban areas, with 17% residing in the urban area of Dili.
Forty-three percent of all Timorese are under 15 years of age and 16.3% are under five (150,764). High fertility rates combined with low contraceptive use is creating a 4% population growth rate7. The average household size according to the 2004 census is 4.7, while the average size of household for the sample is 6.
Tetun and Portuguese are the official national languages, although Tetun is the most commonly spoken language. There are more than 20 different languages spoken throughout the nation, and approximately half of the population speaks Bahasa Indonesian. Less then 5% of the populations speaks Portuguese, and 2% speak English.
Detailed data on household demographics were collected in this survey for all 1700 sampled households and the 10,960 individuals therein. Individual level data included information on age, sex, education levels, marital status and health. Additional information on the size of the household, sex of the household head and the status of education among children between the ages of 6 – 14 is also reported.
Overall patterns within the sample show a similar distribution of female and male populations (Table 1, Annex 1). Children between the ages of 6-14 constitute the largest age cohort in the sample followed by children under 5. Results are similar to that of the national census.
Approximately 92% of all heads of these households are male with an average age of 43 years. For female heads of households (the remaining 8% of the sample), their average age is 44 years. In terms of marital status, 97% of all males who are head of households reported being married. Only 34% of female-headed households reported being married and 54% reported being widows.
For the sample, 6% of the households reported at least one of its members suffering from a disability or a long-term illness. Of these households, 81% have at least one member chronically ill or disabled and 17% reported having two to three ill or disabled members.
3.2. Economic characteristics
This section takes a brief look at the macro-economic situation, utilizing secondary data sources. Additionally, household economy and other socio-economic indicators are explored.
3.2.1. Economy
The national GDP sits at 366$US per capita with an estimated 40% of the population subsisting below the poverty line which although for most countries is set at 1$US for Timor Leste has been set at the lower value of 0.55$US. GDP growth in 2004 was only modest at under 2%. Given the population growth GDP has declined steadily since a value of 466$US in 2001, indicating an increase of poverty. Income poverty is more evident in rural (46%) rather than urban areas (26%)8.
Ranked 140 out of 175 countries in the UNDP Human Development Index, Timor-Leste is currently the lowest ranking nation in Southeast Asia.
Agriculture remains the main livelihood with an estimated 82% of the workforce employed in the agricultural sector, 14% in services and 4% in industry. Coffee is the only major export of Timor-Leste and the main source of cash income for a sizeable proportion of the rural poor.
6 Timor-Leste National Census, 2004 7 UNDP Human Development Report Timor-Leste, Paths out of Poverty, 2005, pg 8 8 UNDP Human Development Report Timor-Leste, Paths out of Poverty, 2005, pg 1
Timor Leste - Comprehensive Food Security and Vulnerability Analysis
26
Poverty in Timor-Leste increases from East to West. The three districts in the west, Oecussi, Bobonaro and Covalima account for one quarter of the poor, although they only account for one-fifth of the national population. Conversely, the three districts of the East, Baucau, Lautem and Viqueque, account for one-quarter of the population, but less than one fifth of the poor. Poverty is also more pronounced in the highlands9.
Besides poverty and purchasing power, the household food insecurity in Timor-Leste is also affected by range of natural disasters such as droughts, floods, strong winds, as well as agricultural risks such as pests and diseases which are a recurrent feature and ensure that subsistence farmers remain vulnerable to intermittent food crisis.
The US dollar was adopted as the national currency instead of the Indonesian Rupiah in January 2000. Although the dollar facilitates import of cereals, eliminating exchange costs, it has negatively affected Timor Leste’s export potential. For a while after its introduction, monetary units smaller than one dollar were scarce and wide use of the one dollar notes in a subsistence economy resulted in a skewed market and increased inflation. Being pegged to a first world currency but not a strong economy resulted in the country’s inability to compete with the neighboring Rupiah and even the Australian dollar which are devalued.
3.2.2. Infrastructure
Over 80% of all infrastructures was destroyed during the 1999 conflict. While the country has recovered in some areas, there are widespread and severe problems with water and electricity supplies, roads and other transport services and communication networks.
Access to electricity is high in Dili, reaching 92% of households, although power cuts are common. Electricity access for rural areas drops to 10% with many highland areas having no access to electricity. Town generators and other equipment in rural areas are old and require regular maintenance. Parts are often expensive and not readily available and there is a lack of technical skill to maintain and repair equipment10.
Timor-Leste’s primary road network is reasonable, but heavy rains continuously damage roads and bridges. Secondary and feeder roads are rudimentary and often inaccessible during the rainy season. Secondary and tertiary road systems are often in poor condition, neglected in terms of maintenance and subject to the adverse effects of rain. It has been estimated that 63 percent of main village roads are in poor condition11.
Air transport is only available in Dili, there is no internal air-service. The districts of Baucau and Suai have air strips which have been unused since Independence. The longest ferry route runs from Dili to the enclave of Oecussi, but is unusable during high winds. For international travel connections, private air and shipping companies operate services to Indonesia and Australia.
Telecommunications are based on cellular handsets. Non-urban centers and many highland areas have no reception. The UN has primarily employed two-way radio communications system which has also been relied on by the police and local government12. Internet access is limited.
3.2.3. Living conditions/amenities/wealth
According to the 2001 Suco survey, only 20% of Sucos had access to electricity, although they were subject to frequent power cuts. Only 7% of Aldeias were reported to have access to in-home piped water. Further results at the Suco and household level as collected in this survey are presented below.
3.2.3.1. Home ownership, housing materials, house size
Ninety-five percent of sampled households reported that they own the dwellings in which they live. Of the remainder only 4 households declared paying rent, ranging between 10 and 36 $US per month, while the rest did not own the land or property but occupied the premise rent-free.
Thirty-nine percent of housing materials were from palm trees, 30% from cement bonded bricks, and 28% from other wood or bamboo. Seventy percent of all roofing materials were CGI sheeting and
9 Joint report of the Government of Timor-Leste, ADB, JICA, UNDP and the World Bank, Timor-Leste Poverty Assessment, April 2003, pg 19 10 UNDP Human Development Report Timor-Leste, Paths out of Poverty, 2005, pg 18 11 FAO/WFP CROP AND FOOD SUPPLY ASSESSMENT MISSION TO TIMOR-LESTE, June 2003 pg 17 12 UNDP Human Development Report Timor-Leste, Paths out of Poverty, 2005, pg 18
Timor Leste - Comprehensive Food Security and Vulnerability Analysis
27
25% palm thatch roofs Floors were predominantly made of compacted earth with 35% being made of cement or stone.
Sampled household usually have less than 3 rooms and the average household size is 6. At least two rooms are used for cooking and living while one room is for sleeping. Often additional beds or Hadak are placed on the side of the verandas and double up as seating areas during the day.
3.2.3.2. Sanitation and water
Table 2 - Percent of households with access to toilet facilities by Region
Regions
Type of facility 1 2 3 4 5
Flush latrine 16% 38% 63% 53% 15% Traditional pit latrine
37% 43% 26% 23% 22%
Open pit (no walls)
4% 5.2% 4.6% 2.4% 0.4%
Communal latrine 0% 0.6% 0.9% 1% 0%
No toilet facility 43% 13% 5% 20% 63%
Table 2 summarizes access to sanitation for the five Regions. Overall, 25% of households reported that they do not have any toilet facility whatsoever and use the outdoors while 32% use traditional pit latrines and 41% used toilets that could be flushed using scoops of water. There was a marked Regional difference with Region 5 reporting the highest percentage of households having no facilities (63%) and the lowest presence of flush toilets (15%).
Region 3 had the highest percentage of flush latrines (63%) and the lowest proportion without any facilities (5.4%).
Past reports indicated that access to reliable and safe water sources is scarce in much of the country and where available, interrupted by frequent cut-offs. Wells are shallow and often contaminated. Nationwide, three in five persons are without safe sanitation and one in two persons without safe drinking water13.
Access to safe drinking water is an important component of food security; especially relating to food utilization. A water source was available on the premises for 22% of households. For 38% of households the main source of water was a public tap. Another 10% reported using tube wells/boreholes with a hand pump. Use of protected wells was reported by a combined 21% of households
Table 3 - Main Sources of Water by Region (% of sampled households)
Source of Water 1 2 3 4 5
Water on premises 7% 36% 41% 5% 3%
Public Tap 26% 37% 50% 41% 24% Tube well/Borehole
with pump 6% 9% 15% 7% 12%
Protected dug well or spring
24% 24% 9% 15% 50%
Unprotected dug well or spring
24% 14% 8% 4% 1%
Pond, river, stream, lake
16% 7% 6% 17% 7%
Tanker 1% 6% 4% 10% 0%
Unprotected wells or rivers/streams were reported 20% of all households. Table 3 summarizes the main sources of water for sampled households by Region.
For those households needing to fetch water the average time for a return trip was 25 minutes. Inter-Regional variance indicates a mean average range of 16 minutes for Region 4 and a maximum of 43 minutes for Region 1. Although less than 1% of respondents indicated rain water as a main source for the household, rain water channeling into large containers was frequent.
3.2.3.3. Sources of lighting and cooking fuel
Kerosene was the main source of lighting with 65% of households reporting use, followed by 22% reporting use of electricity (Figure 1). Electricity is mainly available in Region 3 with 52% of households having access to electricity while for the rest of the country it was less than 10% of households. Even in Region 3 availability of public electricity is sporadic. In the eastern Regions, 24% of the population relied on the Candle nut (Aleurites Molucana), whose high-fat-content kernel once mashed can be rolled up into candle shapes and burned like wax. On average, households spent 4$US per month on lighting. 13 Joint report of the Government of Timor-Leste, ADB, JICA, UNDP and the World Bank, Timor-Leste Poverty Assessment, April 2003, pg 32
Timor Leste - Comprehensive Food Security and Vulnerability Analysis
28
Figure 1 - Household sources of lighting
Household sources of lighting by Region
0%
20%
40%
60%
80%
100%
1 2 3 4 5
Region
Perc
ent o
f hou
seho
lds
oil or gas lampcandlesotherelectricitykerosene
The main source of cooking fuel for 98.5% of households is wood, while a few reported using kerosene. Only 14% of households reported paying for fuel and 90% of these, lived in the urban areas of Region 3 and their average expenditure was 8.50$US per month.
The high demand for wood as a domestic fuel is putting the forest resources closer to urban areas under severe strain.
3.2.4. Main activities and income sources- Livelihood groups
The achievement of securing food, income or other services relies on a combination of activities conducted by one or more members of the household. From this set of activities emerge specific patterns indicating a livelihood profile. In this context, enumerated households were asked to identify from 20 potential options, the four main activities which when combined, provided them with a source of food consumed directly by the household and annual income. In turn, respondents were asked to estimate the relative contribution of each activity towards annual income, food consumed by the household or a combination of the two.
3.2.4.1. Characteristics of livelihood groups
Most households rely on a combination of income producing activities, involving one or more household members and a combination of cash and in-kind incomes. The sets of activities constituting each livelihood profile are depicted in Figure 3-c. Agriculture and livestock farming are important component for most profiles. The income described, is an estimation derived from expenditure including cash and an in-kind income component. In-kind income tends to be the main component of direct consumption by the household or exchanged for food items.
Figure 2 - Distribution of livelihood groups
Distribution of livelihood groups
ordinary farmers
42%
unskilled laborers
3%
Artisans6%
petty traders13%
livestock farmers
22%
skilled labor, trader2%
wage earners
12%
Given that several sets of activities constitute the income and livelihood portfolio of sampled households, it is necessary, for purposes of analysis, to determine which types of combinations are common across the sample. Using the information gathered on the 4 main livelihoods practiced by each household, and the percentage of each livelihood that contributes to the total household income, principal component (PCA) and cluster analysis was run, resulting in seven homogeneous livelihood profiles (Figure 2).
Timor Leste - Comprehensive Food Security and Vulnerability Analysis
29
Figure 3 - Estimated annual income by source and livelihood group
In Region 3 only 35% of the respondents relied on agriculture or livestock farming as a main source of income while other Regions ranged from 78% to 83% of respondents. Wage earners, traders and skilled laborers were more frequent in Region 3 with 34% of households against the other Regions ranging between 4% and 7%.
In order to supplement income from agriculture and livestock farming, gathering of natural resources like collection and sale of firewood, fishing, honey collection, palm wine brewing are common complementary activities.
3.2.4.2. Geographic distribution of livelihood zones
As seen in Table 5 below, Region 1, Region 2, and Region 5 have the highest percentage of farmers. Region 3, which includes the Dili area, has a higher percentage of wage earners and petty traders.
Table 5 - Percent of households in livelihood group by Region
ordinary farmers
farmers - small
livestock
farmers -artisans
petty traders
unskilled laborers
skilled labor, traders
wage earners
Region 1 34% 43% 10% 9% 0% 2% 2% Region 2 49% 25% 7% 11% 1% 1% 6% Region 3 37% 11% 5% 16% 5% 3% 23% Region 4 41% 29% 3% 13% 2% 2% 9% Region 5 61% 11% 10% 9% 0% 0% 8%
3.2.5. Household expenditures
Data on expenditure for food and non-food items were collected to better understand household resource allocation. Monthly food and non-food expenditures are also good proxy indicators of the level of household access to food. Sampled households were asked to report on a range of food and non-food expenditures (e.g., health, education, meat, fish, vegetables, rice, etc.). All food expenditures were based on a one-month recall period, and non-food expenditures were based on
Timor Leste - Comprehensive Food Security and Vulnerability Analysis
30
either a one or six-month recall period, since many non-food items are bulk outlays that happen once in six months. All expenditure data were later converted to monthly.
Usually, the higher the percentage of total expenditures spent on food, the greater the likelihood that a household has poor food access. Food, on average, is cheaper than other goods such as health care, education or investments in productive assets such as livestock; therefore, for households having low levels of income and unable to produce enough food, buying food becomes the main priority. A higher percentage of food expenditure would not necessarily be a problem if a greater variety and diversity of foods were purchased; however, food insecure households may prefer to allocate their scarce resources to purchase foods that are more filling and energy dense, at the expense of a balanced nutritional content.
Care must be taken in interpreting food expenditures analyses. In some cases, households may have a lower share of food expenditures because they rely on their own production; similarly, better off households may spend a higher proportion on costly food items (e.g., meat), increasing their percentage of income spent on food; therefore, it is important not only to understand the generalities of expenditure patterns, but also to investigate what types of items are being prioritized.
3.2.5.1. Overall Expenditure Patterns
Figure 4 - Percent of households in livelihood group by Region
Food and non-food expenditures: sample average
Vegetables and Fruit, 4%Medical, 1%
Education, 3%
Clothing, 3%
Celebrations, 6%
Debt, 2%
Construction, 2%
Kerosene, 5%
Firew ood, 1%
Transport, 6%
Alcohol/tobacco, 3%Soap, 4%
Other, 1%
Utilities, 8%
Milk/curd, 2%
Fish/poultry/meant/ eggs, 6%
Pulses, 1%
Cassava, roots/tubers, 2%
Maize and other grains, 6%
Rice, 24%
Oil/butter, 6%
Sugar, 5%
food, 55%
On average, sampled households allocate 55% of their monthly expenditures to food (Figure 4). When disaggregating the types of food items purchased, cereals represent 30% with rice being the predominant item, with an average of 24% of all food outlays. Fish, meat (e.g., poultry, goat, pork, beef, etc) and animal products (e.g., milk and curds) are the second priority for sampled households and account for an average of 8% of monthly food expenditures. Vegetables and fruit do not figure prominently and neither do cassava and other roots and tubers, with only 6% of combined expenditure and are likely to be sourced primarily from own production.
With respect to non-food expenditures, the remaining 45% of monthly expenditures, data show that household upkeep is clearly favored. For example taken together, outlays on utilities, kerosene, soap, firewood and clothing account for 21% of average non-food expenditures.
Health and education have lower expenditure priorities with only 1% and 3% being earmarked for these services. The cost of 0.50$US per month for a primary school and 1$US for government pre-secondary schools may be affordable by most households. An explanation of the low reported expenditure may be that medical costs are incurred only when absolutely necessary, and so not accurately accounted for in the household expenditure data.
Table 6 - Proportions of Household Food Expenditures Across Regions Region 1 Region 2 Region 3 Region 4 Region 5
Vegetables & Fruit 5% 4% 5% 3% 2% Oil and Butter 6% 6% 6% 5% 9% Sugar & Salt 6% 6% 4% 4% 7%
Total 60% 55% 54% 51% 53%
When looking across Regions, food expenditure data show some important variations among households (Table 6). Sampled households in Region 1 have, on average, the highest share of
Timor Leste - Comprehensive Food Security and Vulnerability Analysis
31
expenditures going towards food (60%) as well as the highest average outlays on cereals (35%). Outlays on fish, meat and animal products are slightly higher than the sample average among households in Region 3.
For non-food expenditures, households sampled in Region 5 have, higher average outlays on kerosene, utilities and alcohol and tobacco. Region 4 has the highest share of non-food expenditures with celebration and funeral expenditures being double the sample average (Table 12, Annex 1).
3.2.5.2. Per capita expenditures and quintiles
Table 7 - Mean Per Capita MonthlyHousehold Expenditures across Regions in US$
Zone Per Capita
Food Per Capita Non-Food
Per Capita Total
Region 1 5.6 3.8 9.4
Region 2 5.1 4.4 9.5
Region 3 7.7 7.3 15.0
Region 4 6.4 6.2 12.6
Region 5 4.3 3.5 7.8
Total 6.1 5.4 11.6
Table 8 - Expenditure quintiles across Regions
(low) ← Quintiles → (high)
1 2 3 4 5
Region 1 25% 25% 22% 18% 10%
Region 2 30% 21% 19% 16% 14%
Region 3 11% 18% 18% 23% 30%
Region 4 14% 18% 23% 24% 21%
Region 5 40% 20% 18% 13% 9%
The above explanation provides a relative picture of the distribution of food and non-food expenditures. One of the constraints of providing relative figures is that it does not sufficiently capture differences in household size or absolute expenditures; therefore, data were re-organized according to per capita expenditures and per capita expenditure quintiles for households across Regions. Overall, total per capita expenditures are highest among households in Region 3 and lowest in Region 5, as seen in Table 7.
Looking at absolute expenditure quintiles, the lowest quintile represents the bottom 20% of households in terms of total per capita monthly expenditures whereas the highest quintile is the opposite: the top 20% of households in terms of their total per capita monthly expenditures.
As seen in Table 8, half of all reporting households in Region 1 and Region 2 are found in the two lowest expenditure quintiles; however, the highest concentration of households belonging to the two lowest expenditure quintiles (i.e., Quintile 1 and Quintile 2) can be found in Region 5 (60%).
Looking at households in the first quintile of Regions 1, 2 and 5, we see that on average, total per capita expenditures are 3$US, 3$US and 2.50$US, respectively. These figures are considerably lower than sample averages for all households in these zones and warrant concern since the ability of such households to access basic social services and meet food needs not covered by their own production is questionable.
3.2.5.3. Distribution of livelihood groups across expenditure quintiles
Figure 5 - Livelihood groups across total expenditure quintiles
Livelihood groups by total per capita expenditure quintiles
Timor Leste - Comprehensive Food Security and Vulnerability Analysis
32
Figure 5 indicates that households relying primarily on agriculture or farming in combination with livestock or handicraft work are likely to be concentrated into the lowest two expenditure quintiles.
Agricultural production and farming appear to be subsistence activities, rather than a reliable source of disposable income. On the other hand, the data show that more specialized types of livelihood activities are better remunerated and fall in the higher expenditure quintiles
The level of education attained is directly correlated to purchasing capacity and total expenditure of the different livelihood profiles as detailed in Figure 6.
Figure 6 - Household head educational attainment
0% 25% 50% 75% 100%
ordinary farmers
livestock farmers
petty traders
farmers -artisan
unskilled laborers
skilled labor, trader
wage earners
Household's head education attainment across livelihoods
None primary pre-secondary secondary vocational university
More than half of all head of household that indicated farming as their main source of income had no schooling. On average, skilled and unskilled laborers had some pre-secondary education and wage-earners had completed secondary education.
3.2.6. Access to credit
Figure 7 - Access to credit and income monetized by livelihood group
0% 20% 40% 60% 80%
ordinary farmers
livestock farmers
petty traders
farmers -artisan
unskilled laborers
skilled labor, trader
wage earners
Proportion of Households with access to credit and income monetised
across livelihood profiles
Average proportion of income monetisedHouseholds with access to credit
Figure 8 - Access to credit and income by Region
0% 20% 40% 60% 80%
Region 1
Region 2
Region 3
Region 4
Region 5
Proportion of Households with access to credit and income monetised across regions
Average proportion of income monetised
Households with access to credit
There is currently no formalized system of credit, with the majority of people having no access to credit. The Indonesians had provided credit through agencies, banks, village cooperative credit unions and traders. Since independence, however, these official forms of credit have yet to be established. There are also small micro-credit schemes run by NGOs in pockets of Timor-Leste, which have had varying degrees of success. While the commercial banks do offer loans, most farmers and other small
Timor Leste - Comprehensive Food Security and Vulnerability Analysis
33
entrepreneurs would not be eligible for such loans14. Credit access across livelihood profiles is detailed in Figure 7.
Eighty nine percent of all sampled households reported having no access to cash credit. For the remaining 11% of households having access to some form of credit, 39% stated being able to borrow from friends, 36% from banks and 17% from charities or NGOs, 4% from a local lender and 3% from a cooperative.
Households in Region 5 have considerably reduced access to credit probably more due to lack of infrastructure than because of the higher frequency of livelihoods profiles with a poorer credit rating (Figure 8).
Only 8% of respondents indicated being able to purchase food on credit or to borrow money to purchase food. Credit to purchase food was used on one occasion for 38% of respondents, for 29% on two occasions, for 14% on three occasions and for 18% on more than three occasions.
Households having access to credit to buy food were more frequent in Region 2 and 4 with 11% of respondents, Region 3 with 10%, Region 1 with 2% and no household in Region 5. All households using credit to acquire food including those using credit on more than 3 occasions, owned on average more than 10 animals per household including an average of at least 2 pigs and 5 chickens. The frequency of using credit to acquire food and the quantity of livestock owned suggests a capacity to repay the debt in this group.
3.3. Literacy/Education
Educational attainment is an essential determinant of food security. Households whose members are educated are more likely to be economically mobile, have better health and nutritional status, and are better able to meet their food and non-food needs. Moreover, having educated household members also decreases the inter-generational transmission of poverty and food insecurity.
During the Portuguese colonial rule, the education system was small; secondary schools were only available in a few towns, the vast majority accommodating only primary schools. Schooling was also generally only affordable for wealthier Timorese and tertiary education was not available at all. The Indonesians introduced the first nation-wide education system, the result of which is most keenly seen in the generation of 30 year-olds, many of whom have experienced primary, secondary and tertiary education. Education was more affordable and more widely available than in any other time of Timor’s history. Even though illiteracy has remained high, many younger Timorese, particularly those born during the occupation, have received some education under the Indonesian system. However, the quality of this education is questionable.15
In 1999 over 90% of all educational facilities were closed or destroyed. The country also suffered a loss of almost 80% of all its specialized teachers and administrators16. Another legacy of Indonesian rule was that the majority of top administrative and managerial positions were held by non-Timorese, the vast majority of whom left after 1999. This caused a serious vacuum of skills and experience in the country.
3.3.1. Literacy
Data was not collected on literacy in this survey. According to the 2001 East Timor Household Survey, the adult literacy rate is 43% (Males 43.1%, Females 42.8%), with rural literacy at 37% and urban literacy at 82%
3.3.2. Education
According to this survey’s data, 46% of all household heads reported having no schooling whatsoever. And only 16% reported having some primary schooling while spouses of the heads of households had no schooling in 52% of cases and 14% had some primary schooling. Attainment of primary, and pre-secondary education was similar for both sexes although completing secondary education was more frequent for the heads of households with 12% versus 8% for the spouses (Figures 9 and 10).
The situation for the 6 to 14 years age cohort seems to be much better with only 5% not attending school, 84% in primary school which lasts 6 years and 11% in pre-secondary school lasting 3 years. The distribution between boys and girls of attendance was equal.
14 UNDP Human Development Report Timor-Leste, Paths out of Poverty, 2005, pg29 15 UNDP East Timor Human Development Report, 2002 pg. 48 16 Gender and Nation Building in Timor-Leste: Country Gender Assessment, Aug 2004- Jan 2005, pg 12
Timor Leste - Comprehensive Food Security and Vulnerability Analysis
34
Figure 9 - Household head education by Region
0% 10% 20% 30% 40% 50% 60% 70% 80% 90% 100%
Region 1
Region 2
Region 3
Region 4
Region 5
Education of Household Head across regions
None some primary primary some pre-secondary pre-secondary
some secondary secondary vocational some university university
Figure 10 - Spouse of household head education by Region
0% 10% 20% 30% 40% 50% 60% 70% 80% 90% 100%
Region 1
Region 2
Region 3
Region 4
Region 5
Education of Household Head's spouse across regions
None some primary primary some pre-secondary pre-secondary
some secondary secondary vocational some university university
Of those children currently attending school, parents were asked whether their children had been absent for at least a week in the last month and the reasons for absence. Eighty-nine percent of all children currently attending school had not been absent, and for the remaining 11%, not attending for at least one week in the previous month, reasons for absence are detailed in Table 9.
Table 9 - Main Reasons for Absence from School
Reason for Absence % Total % Boys % Girls Sickness/Illness of child 48% 52% 48% Work 9% 4% 5% Household chores 9% 5% 4% Refusal to go to school 18% 12% 6% Rain 5% 3% 2% School fees not paid 4% 1% 2% School too far away 3% 3% 3% Caring for siblings 2% 2% 2% Lack of uniform 2% 3% 1%
Although the main reason for absence was illness (48%), 9% missed school because of work either in or outside of the household. 18% of the children refused to go to school and 3% because the school was too far. There is no apparent geographical pattern of non attendance. However, the sample of children having missed school is very small.
Although 98% of Sucos reported having a primary school in their community only 21% had a functioning secondary school and the average distance to one for those without was 4 hours walk.
Timor Leste - Comprehensive Food Security and Vulnerability Analysis
35
4. Part IV – Household Food Security and Vulnerability 4.1. Availability and access to food
The following sections cover indicators related to the availability and access of food. According the 2004 WFP EFSA Handbook, Food Availability is the amount of food that is physically present in a country or area through all forms of domestic production, commercial imports and food aid, and Food Access is a household’s ability to regularly acquire adequate amounts of food through a combination of their own stock and home production, purchases, barter, gifts, borrowing or food aid. (WFP, EFSA Handbook, 2004)
4.1.1. Agriculture
Agriculture makes up or is the main livelihood activity for the majority of households in East Timor. This section outlines both secondary data and information collected in this survey related to agricultural practices throughout the country.
4.1.1.1. Land distribution/tenure
Land access is determined by a traditional system of land tenure; four-fifths of the land owned by people is inherited and two-thirds is held on the basis of customary right. There has never been a formal system of land registration.
In some areas, especially in the Viqueque district, younger family members leave the main village to move to previously uncultivated grasslands. These are cleared and planted with rice for 3 or 4 seasons after which the soil becomes compact and more difficult to cultivate without mechanized means and is then planted with coconut palms. The process is known as Opening New Lands and is also a way of asserting land ownership.
Land ownership has not historically been an issue of dispute; ownership was a known and accepted fact in the community and all land disputes were usually resolved by traditional leaders. While this still remains the case, some problems with land ownership began to arise after the departure of the Indonesians as land formally held by Indonesians was suddenly left vacant. Empty lots of land have since been disputed, and with no land titles, resolving disputes has been difficult. The issue of land titles is still unsettled with no legislation governing this area passed as yet; the most immediate consequence of this is that land cannot be legally bought in Timor. Farmers without land can lease or work on private land, but not purchase. This may bring significant problems in the future as the population increases and competition for land grows. Because of the insecurity regarding land ownership since Independence, many farmers are reluctant to invest or to expand.
According to the survey, access to a kitchen garden was high, with 79% of households responding positively. Only 9% of all households reported having neither agricultural land nor a kitchen garden.
Figure 11 - Household access to land, irrigation, and rice and corn cultivation by Region
0%10%20%30%40%50%60%70%80%90%
100%
Region 1 Region 2 Region 3 Region 4 Region 5
Proportion of households with access to land and irrigation and maize or rice crops cultivated across regions
Access to agricultural land Access to irrigation Maize cultivators Rice cultivators
Although kitchen gardens tend to have a variety of produce grown, respondents were asked what was the main produce and again maize was the most important for 50% of households, followed by cassava 15.5%, fruits 13%, vegetables 6%, coconut 4.5%, beans 1% and other produce like rice, potatoes, pumpkin, beetle-nut and tobacco at less than 1%.
Timor Leste - Comprehensive Food Security and Vulnerability Analysis
36
According to the survey, access to agricultural land was good with 78% of all households responding positively. Among those having access to land, the most common way to access land was by inheritance with 85% of respondents. Use of community land was reported by 11% of respondents while the practice known as Opening New Land was reported by 2%. Renting, share-cropping or buying were used in less than 2% of cases combined. Estimation of land cultivated was difficult since land is not easily defined by boundaries and yields are not recorded
The main source of water for agricultural land is rain (80%) with 15% only indicating some irrigation system stemming from rivers and 1% from retention systems like dams or canals and less than 1% from pump-driven irrigation. Rehabilitation of non functional irrigation schemes is reported as ongoing with new emphasis on upland rice cultivations which are rain-fed. In Figure 11, Region 1 indicated the lowest access to irrigation with only 4% of households responding positively.
4.1.1.2. Farming systems
Figure 12 - Main Crop Harvest Months in Northern Areas (percentage of farmers engaged in harvesting)17
Figure 13 - Main Crop Harvest Months in Southern Areas (percentage of
farmers engaged in harvesting)17
Farming predominantly consists of subsistence cultivation employing household members on small plots of land of an average size of 1.2 hectares18.
Agriculture was badly affected in 1999, with agricultural GDP estimated to have declined by 40 % relative to 1998. The country then suffered two consecutive years of drought during the 2001/02 and 2002/03 seasons resulting in very low crop productions which saw some improvements in the 2003/4 season. After a late and erratic start the season 2004-5 is reported to have lowered the deficit for both maize and rice19.
Maize, cassava and rice are the main staple crops grown in the country. The agricultural cycle begins at the onset of the main north-east monsoon and rainy season with the planting of maize. Planting to harvesting period is around 90-110 days for both maize and rice.
Maize is collected during February to April while paddy rice is harvested around June/July in the north and August/September in the south. In the south and in irrigated areas a second crop of maize is possible although its contribution is usually only 10 to 20% of total production.
Estimation of land coverage suitable to paddy rice cultivation is of 65,000 ha but at present only 54% of this is currently planted. Lack of manpower, lack of mechanical tools and high costs of labor are quoted by landowners as the main impediments to land development.
According to the survey, cultivation is done predominantly with hand-tools, for 90% of households while animal drawn ploughs or hand tractors are used by 4.5% of households respectively and 1% stated having access to a big tractor.
The main crop cultivated was maize for 83% of households, followed by rice with 13.5%, cassava 1% and potatoes, vegetables and fruit on just over 1% of cases combined. All Regions indicated maize as the main crop produced but the questionnaire lacked sufficient detail to describe further
17 JICA, (2002); Japan International Cooperation Agency; Study on integrated agriculture development of East Timor. 18 UNDP Human Development Report Timor-Leste, Paths out of Poverty, 2005, pg 12 19 Personal communications with Mr Claudino Ninas Nabais, Head of Crop Production Department of Ministry of Agriculture Food and Fisheries during January 2006.
Timor Leste - Comprehensive Food Security and Vulnerability Analysis
37
details of crop production; in subsistence type agriculture, multiple crops are often grown, but this data was not gathered. For example, rice production as the main crop is reported by only 5% of households in Region 1. Given that the Region produces 43% of the total national rice crop in addition to 50% of the national maize crop, this could also explain that although consumption of cassava seems to be almost as frequent as maize only 1 household stated it being its main crop.
The survey indicates that less than 1% of households cite the government as a source of seeds, while 80% mentioned their own stocks as a source. A mixture of purchase and own seed stock was reported for 9% of households and sole purchase by 6%. Borrowing, exchange and NGOs were also mentioned as a source by less than one percent combined. In the past few years, erratic rainfall forced many farmers to replant maize several times often to the extent of complete depletion of seed stocks.
Timor Leste’s agricultural production of coffee, its only export, has been referred to as Organic by Default since it has traditionally been a crop with no fertilizer input, effectively making it an organic produce of quality for a niche international market. The definition could safely be extended to the other crops produced although the marketing potential for other produce is, so far, not as high.
Overall, 92% of households used no fertilizers for agricultural production. Besides land rotation, slash and burn is a common method of preparing the fields before the rainy season. In the midlands and highlands this means that the thin layer of productive soil is more easily washed away if the first rains are particularly heavy and increases the extent of land erosion and the risk of landslides. Only 5% of households reported using some chemical pesticides or herbicides 57% of which was purchased and about 6% received from the government or NGOs/INGOs.
Mulching and nitrogen fixing legumes are often used to increase maize production in conjunction with a gradual introduction of improved seeds variety but low input and low fertilizers use remain important constraints.
4.1.1.3. Cropping seasons
Figure 14 - Sucos reporting lack of food and harvest by month 20
Sucos reporting lack of food and harvest by month
0
10
20
30
40
50
60
70
80
90
100
Jan Feb Mar Apr May Jun Jul Aug Sep Oct Nov Dec
%
Rice Maize Sucos
The seasonality of rainfall affects produce with the northern part having a main production from November to April and the south and east often benefiting from a bi-seasonal rainfall with production extending until August. Although production peaks seasonally in the southern coast where rainfall is prolonged, and on higher grounds where the climate is cooler, production of vegetables is possible all year round. Lack of storage facilities to extend shelf-life of produce dramatically reduces the availability of fruits and vegetables.
In Timor Leste, food security is closely tied to having enough maize and rice. Many rural households face food shortages in the lean months of November to February, between the rice and the maize harvest as detailed in Figure 14.
4.1.2. Agricultural production
Prior to the Indonesian occupation, rice was primarily consumed by wealthier land owners. The majority of the population subsisted on a steady diet of maize, beans, cassava and sweet potato. The occupation saw a substantial amount of migration to Timor-Leste by Indonesian farmers who began to cultivate rice on a much wider scale. Imports from other Indonesian provinces also increased steadily during the occupation. Increased demand with a large population growth strains the precarious production capacity and more than 50% of rice stocks are imported every year. Current demand growth rate is unlikely to be met in the long run by local production even if the enlargement of cultivation areas and improved methodology currently taking place is maximized, because of limited land suitability.
20 Source: Suco Survey 2001 by ADB, WB and UNDP.
Timor Leste - Comprehensive Food Security and Vulnerability Analysis
38
Production data are presented in Tables 8 and 9 in Annex 1, compiled using data from MAFF (Ministry of Agriculture, Forestry, and Fisheries). Indications are that despite the insufficient rain in the November 04 to March 05 period, production has been rescued by a late season improvement, a good second harvest and the introduction of higher yielding seed varieties. The districts of Liquica, Manufahi, Bobonaro and Viqueque seem to have had a reduction of around 10% in rice production while all other districts indicate an increase in production resulting in a decrease in the national deficit.
Rice production is estimated at 1.5mt/ha up to 2003-4 and 1.7mt/ha for 2004-5 while maize in the same period has increased its yield from 1mt/ha to 1.2mt/ha The MAFF indicated that the latest production figures provided in January 2006 and used in these Tables had only recently been revised from more conservative estimations of previous months not taking full consideration of the improvements in the later part of the 2004-5 crop season.
Maize production figures indicate that at the National level there has been increased crop production with Lautem and Viqueque showing a surplus. The districts of Dili, Ermera, Liquica, Manufahi and Oecussi have seen reduction in production. Despite the problems, the national deficit is estimated to have been reduced by 38%.
In terms of production quantities cassava is the second most important crop after Maize but production data are not available because of its intercropping with maize. Consumption of cassava was found in this survey to be as frequent as maize.
Although there are a few surpluses of production, because of lack of central crop planning, surpluses tend to be coincidental rather than planned and poor distribution channels make it difficult to redistribute to shortage areas.
Seed and post-harvest losses are difficult to estimate given the predominance of inter-cropping. A seed rate of 20 kg/ha for maize and a paddy seed rate of 40 kg/ha are assumed. Post harvest losses vary substantially, but an average of 25% for maize and 5% for rice are assumed. Small amounts of grains are used as feed; about 5% of rice production, left in the husk due to poor milling process21. Local rice production seems to suffer greatly from lack of distribution channels while the same can not be said of imported rice which can be easily found even in remote areas.
Shortage of qualified manpower limits the capacity of the reporting system of crop production which uses data compiled at each level from reports submitted by lower administrative levels and is based on often inconsistent production units and land area measurements, therefore the statistics used are only indicative22.
At the time of data collection for this report, MAFF expects this season’s first crop productions of maize to be good after a steady rainfall. During March and April, harvests of mung-beans, red-beans, soy-beans, and peanuts are generally expected to be good with the exception of Oecussi, following flooding and landslides damage at the beginning of February.
Cassava is usually planted in December and harvested during the following September or October but in some areas, especially in the highlands, it is left for longer and harvested when needed. Consumption is usually as a breakfast meal, and is estimated to increase during the lean season.
Coffee is currently the country’s only cash crop and major export. Under the Portuguese, Timor-Leste produced of up to 45,000 tons of Arabica beans. An Indonesian monopoly over the coffee industry also resulted in low, fixed prices for coffee farmers. In 2004, 7691mt of high quality coffee of the Arabica variety were exported for a total value of 6.9 million $US, and in 2005 it reached just over 7 million $US, representing by far the biggest export in a negative trade balance of 60.6 million $US. Coffee production is concentrated mainly in the Ermera, Liquica, Manufahi, Aileu and Ainaro districts. This crop substantially contributes to the household economy of the production areas.
4.1.3. Post harvest Losses
Post harvest losses are difficult to quantify when the commodities are not precisely measured at the time of harvest and records of productions are not kept. Losses tend to be due mostly to pests because of poor storage facilities or during processing and handling of produce.
Processing, like milling, can have a considerable effect on post-harvest losses. Currently milled rice quantities are estimated by MAFF to be only 65% of paddy production. Locally produced rice tends to have smaller grains than imported rice which results in substantial breakage of grain during milling.
21 FAO/WFP, (2003); FAO/WFP Crop and Food Supply assessment mission to Timor Leste. 22 FAO (2004); Development of an Agricultural Statistics System, available on http://www.fao.org/es/ess/tap/timor.asp accessed on 16/01/05.
Timor Leste - Comprehensive Food Security and Vulnerability Analysis
39
Moreover, given the smaller size, the mill is often unable to completely remove the outer layer of the grain whose higher percentage of oil causes the grain to go rancid more easily.
Storage of crops can play an important role in food security since post harvest losses can be substantial and sudden, dramatically reducing the household’s capacity to overcome the lean season.
At present local produce is brought on the same day to the local market for sale and immediate consumption. When the food is eaten over several days or when the producer does not sell all the products, ways to increase shelf-life become important. In the case of fruit little care is given to packaging and prevention of bruising which when combined with temperature greatly reduces shelf-life.
Systematic storage of root vegetables does not exist and these are often left in the ground until needed. Potatoes are in some areas stored before being brought to the market but the lack of storage facilities makes them more easily perishable.
According to the survey, maize is hung from the ceiling of 70% of respondents’ households. Other storage methods include using containers built on trees for 12% and in drums for 8% of respondents. Silos or sacks were reported by less than 2% of respondents respectively.
Rice is mainly stored in small silos for 20% of households, in the house for 5% of respondents and in sacks or drums for 4% and 3% respectively. Post harvest losses due to spoilage or pests are difficult to evaluate but were frequently reported.
4.1.4. Assets (goods and livestock)
Assets, be they physical, natural, social, financial or human, are essential elements of household livelihoods. Assets are, in essence, the inputs into household livelihood strategies. As such, they represent the ability or inability of a household to engage in specific activities that can secure food and other basic needs.
The number and combination of different assets owned by a household is often used as a proxy indicator for households’ wealth and, therefore, is related to household food security. A greater variety of current asset holdings usually indicates that a household has more purchasing power. Moreover it signifies that the household has not been forced to sell assets in the past to meet household needs and that it may be able to buffer itself against shocks occurring in the future.
However, not all assets are equal in terms of their utility to sustain household livelihoods. Some assets have a greater inherent value than others insofar as they facilitate economic productivity (e.g. land, livestock, credit, tools) whereas others can be considered non-productive or basic assets as they relate more to living standards (e.g., beds, tables, televisions).
Previous and subsequent sections examine different asset holdings within a particular context (i.e., human assets in terms of levels of education). This section, however, intends to explain the ownership patterns of three types of productive and non-productive assets: physical (e.g., beds, radios, bicycles), natural (e.g., livestock) and financial (e.g., credit access).
Beginning with physical assets, sample respondents were asked if the household possessed one or more of 12 physical household assets, ranging from basic assets such beds and tables to productive assets such as sewing machines, push carts, automobiles and agricultural tools.
During the data analysis phase, physical asset holdings were separated into two groups:
• Productive assets that can be used to generate income: sewing machines, bicycles, motorcycle, automobiles, and farming tools (e.g., hand tools, plough, tractors); and
With respect to non-productive assets, the most common across all sampled households are beds (99%), tables (93%) and radio/tape players (28%). The assets least commonly held are refrigerators (4%), and televisions (11%).
Even non productive assets have an important developmental role since assets like radios and televisions are an important medium of communication enabling the household to keep abreast with current developments and important public information messages which may affect their lives and livelihoods.
Timor Leste - Comprehensive Food Security and Vulnerability Analysis
40
Distribution of assets by Region (Table 4, Annex 1) indicates that assets requiring a considerable amount of electricity such as televisions and refrigerators are almost exclusively available in Region 3 comprising Dili, while animal drawn or mechanical agricultural tools are more frequent in the eastern and western districts.
When looking at non-productive asset ownership by livelihood group, some patterns are observed (Annex 1, Table 4). Radios, televisions, for example, have a higher prevalence of ownership among the unskilled laborers, skilled laborers, and wage earners.
4.1.4.2. Productive assets (goods)
In terms of productive assets, according to the survey, 90% of households owned some hand tools for working the land although they were mostly machetes and metal pointed sticks. Animal drawn plough and hand tractors were owned by 4% of the households respectively and 1% had access to a big tractor. Other productive assets included small carts (7%) which tend to be hand or cycle-pushed, motorcycles and bicycles owned by 6% respectively, sewing machines (3%) and cars (2%). Seventeen percent of household stated not owning any productive assets. The levels of productive asset ownership by Region are found in Table 5, Annex 1.
Patterns of productive asset ownership are also seen among livelihood groups (Table 5, Annex 1). For example, Motorcycles and automobiles are most often owned by wage earners.
4.1.4.3. Livestock
Livestock rearing is part of the traditional household farming system comprising mainly chickens, pigs, goats, cows, buffaloes and a few sheep. Small livestock are produced for subsistence while the larger animals are considered a family asset. Small and medium livestock are usually fed with agricultural production by-product or household leftovers. Livestock can be considered a productive asset since households rely on it as a form of savings and investment as well as a source of food
It has been suggested that the loss of a large proportion of livestock during the last conflict has dramatically increased the aspiration of rebuilding the current stocks held, at the expense of a reduction of consumption. In rural coastal areas the price of a live chicken is almost twice as expensive as for a fish of equivalent weight prioritizing the rearing potential rather than the value of food for immediate consumption.
MAFF figures for 2004 indicate livestock population to be: 170,565 cows, 112,381 buffalos, 46,841 horses, 120,572 goats, 32,677 sheep, 379,907 pigs, 605,967 chickens, 9,208 pedigree chickens, 17,413 ducks, 219 rabbits, and 20,525 pigeons.
Respondents in this survey were asked whether their households owned one or more types of the following livestock: Cows/bullocks, buffalo, goat, sheep, chicken/ducks/gooses, pigeons, horses, and pigs. Ninety four percent of households reported owning livestock. Ownership ranged between 88% in Region 3 and 98% in Region 1.
Table 10 - Livestock ownership and average for whole sample Animal Pigs Poultry Cows/Buffalo Goat/sheep
Ownership % 90% 84% 39% 36% Average stock ownership 2.8 5.8 5.3 4.4 Average for whole sample 2.4 4.6 1.9 1.5
Among households owning livestock, pig ownership was the most frequent with 90% of households followed by poultry with 84%, then large livestock like cows/bullocks or buffaloes and then medium livestock like goats or sheep. Table 10 details the percentage of ownership among livestock owners, average ownership stock and average for the population sampled.
Although pig ownership is the most frequent, the average stock of poultry is bigger. Poultry rearing is frequently an undervalued source of income since when proper care is given small livestock can be easily liquidated to face cash needs, especially for poorer households. Small livestock is frequently used bartering currency in rural areas. Medium and large livestock are owned only by a minority of the sample. Only 1% of the sample owned more than 20 poultry and less than 1% of the sample owned more than 20 of any other animal.
The distribution of main livestock across Regions, detailed in Table 11, suggests a higher percentage of buffalo ownership in the eastern districts while cows/bullocks ownership is more frequent in the west. Region 3 including Dili has the lowest rate of ownership for all livestock while small livestock ownership like poultry and pigs are more homogeneously distributed across all Regions.
Timor Leste - Comprehensive Food Security and Vulnerability Analysis
41
Overall dog ownership is indicated by 42% of households with an average of 2.4 animals. Livestock, including dogs are not consumed regularly by the poorer households but their consumption is a very important component of special events.
Table 11 - Livestock Holdings by Region (% of Households Reporting Ownership) Livestock
Type Region1 Region 2 Region 3 Region 4 Region 5
Cows/Bullocks 24% 29% 13% 50% 38%
Buffaloes 35% 19% 3% 11% 14%
Goats/Sheep 45% 31% 26% 38% 43%
Poultry 87% 83% 67% 83% 84%
Pigs 94% 86% 75% 90% 86%
Large herds of cows and buffaloes are rare, our sample only included 13 herds of cows or buffaloes between 20 and a maximum of 50 animals but an absence of clear land boundaries could pose a problem for communal grazing in some areas.
Looking at livestock ownership by livelihood group, the farmers-livestock are consistently the most likely to own livestock. Conversely, wage earners have lower prevalences of livestock ownership.
4.1.4.4. Fishing
Marine resources are greatly under developed considering a coastline of approximately 700km and a potential exclusive economic zone of approximately 75,000km2. During the Indonesian occupation, there was an influx of larger and better equipped fishing vessels but occasional use of highly destructive methods such as explosives and poisons were reported. The increase of activity played a very important contribution to the economy of costal areas in the past but the destruction ensuing 1999 did not spare the fishing community whose equipment and canoes were burned and cold storage facilities destroyed23. Subsistence fishing is assumed to have largely recovered and supply is approaching the level of demand in main urban areas24. There is still no gathering, processing and packaging of catch in East Timor but a joint venture involving Timorese and Thai investors has been launched recently, with two large fishing vessels based in the port of Com.
Fishing activities are reduced in the months of December, January July and August because of strong winds and waves and reported poorer fish catch close to the shore. The reduction of activities is more evident in the south because of the more exposed shoreline. In Dili there are 3 temporary areas where fish is sold in poor hygienic conditions but in other coastal areas fish is predominantly sold by fish peddlers.
4.1.4.5. Avian influenza
So far no avian influenza cases have been reported in Timor Leste although neighboring Indonesia is among the nations having confirmed the presence of the virus and have instituted the necessary contingency plans. The World Health Organization (WHO) has warned that direct contact with infected poultry, or surfaces and objects contaminated by their droppings, is considered the main route of human infection; direct contact with dead migratory birds or any birds showing signs of disease should also be avoided.
The effect of infection in Timor Leste would be very difficult to contain given the lack of animal pens and the dispersion of poultry and its full effect difficult to predict. Although small livestock are considered a capital asset which can be easily monetized and selling poultry was found in this study to be the most frequent coping strategy in the face of shocks, after reducing the number of meals and the meal sizes, the damaging effects of a possible mass poultry culling in case of infection may be attenuated by the following factors:
• Although poultry was thought to be a principal item exchanged, bartering was found to be a non relevant form of acquisition of food, in this study. Bartering may still be used to pay for some other goods or services.
• Widespread death of poultry occurs annually due to other infectious diseases. • Even for households classified as livestock farmers, livestock rearing and selling represents
only a secondary source of income (20%) after agriculture (75%). The proportion attributable to poultry rearing and selling is likely to be less than half of that.
23 Correia JC, Saldahna JM, Da Silva H, (2004) On the feasibility of a Fish Market in Dili, East Timor. Report commissioned by JICA, Japan International Cooperation Agency. 24 Ministry of Planning and Finance, (2005) Overview of Sector Investment Programs,Vol.II
Timor Leste - Comprehensive Food Security and Vulnerability Analysis
42
• No consumption of poultry and or eggs in the weeks prior to this survey was reported by 51% of households.
Poultry and poultry products do not seem to play an important role both for livelihoods as well as food and nutrition security in East Timor. Therefore it is not expected that mass culling of poultry would have massive negative impacts.
However mass culling would affect especially farmers of small livestock and ordinary farmers. 18% of all households will loose their protein source in terms of poultry from own production while 23% have to sacrifice home produced eggs. 37% of the egg consuming food insecure households would be affected because the eggs stem from own production. 47% of highly vulnerable households that consume one egg per week will loose their protein source from own production which rises to 70% for those who eat two eggs per week.
4.1.5. Markets
The centuries of colonialism did not lay the foundation for a market system which can compete in Aisa. During the Indonesian times markets were highly regulated by a large contingent of Indonesian civil servants. Collection and distribution were centralized and trade was conducted in a wide network. After independence a free trade system was implemented with no import quotas and low import tax and the country is still struggling to enable a functional market.
Production is primarily for direct consumption for the household with any surplus sold to the local markets. Subsistence production is a flexible system with minimal input costs and overheads but also with low outputs. In times of hardship, or to cover cash needs, food reserves are often sold, causing household food deficits.
Very low import and sale duty on major agricultural products (12% total) has dramatically reduced the price differential between imported and locally produced rice. The ready availability of imported rice stabilizes the market price even in periods of reduced local production. Although the low import duty penalizes rice producers by forcing them to compete with more established economies, it has benefited the urban poor population as they are the principal net consumer of imported rice25.
Locally produced rice is often thought to be uncompetitive against imported rice but this is not backed up by price differentiation. Taste preference for local rice was reported in some areas although the imported long grain tends to grow more during cooking and therefore is more filling. Retail price of either is around 15$US per sack, or ranging between 0.30$ and 0.40$ per Kilogram when sold in smaller quantities al local markets using volumetric measures26. Maize is sold on local markets for around 0.20$ per kg or 15$ for a rice bag unit.
The absence of an absolute weight system in the market makes consumer choice more difficult. Farmers do not use a systematic weighing system and have difficulties in assessing production quantities, costs and potential economic return. Most produce is sold volumetrically not allowing a fair comparison of market prices27.
Locally produced maize and rice are predominantly distributed directly to the consumer or local retailers by the producer with only a smaller percentage being assembled and distributed by wholesalers. Given the limited scale of production and the high unit cost of transportation of small quantities farmers are forced to market directly their own produce. Traders are discouraged to take the risk of aggregating produce for the supply of markets but efforts are being made to foster the link between farmers and traders.
Information collected during this study indicated that only 10% of Sucos have a permanent food market in the community and only 30% have a periodic market. For Sucos having no market in their community the average distance from the nearest market was 3 hours.
There is no centralized system sustaining market development. Efforts are being made by MAFF to promote product specialization to help farmers move away from subsistence production to a strategically planned commercial production for the supply of specific markets. The shift from subsistence to commercial production forces the producers to change and adapt to maximize productivity, to be able to compete in a wider market especially against cheaply imported produce.
4.1.6. Household food access profiling
25 WFP (2006) Timor Leste, Pre-crisis Market Profile. 26 WFP (2006) Timor Leste, Pre-crisis Market Profile. 27 K Ur-Rahim, (2005) Market feasibility Study for AMCAP. Report commissioned by UNOPS, Bangkok, Thailand.
Timor Leste - Comprehensive Food Security and Vulnerability Analysis
43
Food access is a measure of the households’ ability to regularly acquire adequate amounts of food through a combination of livelihood strategies, including home production and rearing of own stock, purchase, barter, gifts, borrowing or food aid. In order to provide a description of the level of food access, data related to food access were analyzed.
4.1.6.1. Methodology for analyzing food access data
Using a methodology similar to that described for the consumption profiling, the Household Access Profiles are based on information collected at the household level on:
• Access to agricultural land. • Access to kitchen garden. • Food expenditure as proportion of total expenditures. • Monthly per capita total expenditures (logarithm scale for normalization). • Having irrigation on agriculture land.
The above parameters are considered to be good proxies of the access dimension of food security and therefore complement well the consumption profiles. Other indicators used in the preliminary grouping and scoring, but found to be co-linear or non-predictive in the regression analysis, and so excluded, include percent of food acquired through own production, percent of food purchased, and percent of food acquired as gifts, This does not mean that these indicators are not related to food access, but simply that to predict the subjective scores, they are not needed. With the same approach used for food consumption profiling, PCA was run on the indicators and resulted into 7 principal components that explained more than 96% of the variance. Cluster analysis was run on the base of those 7 principal components. The analyst scored the obtained 15 clusters from “worst” to “best”. A score of “1” means “very weak access” – the way these households obtain food is very unreliable and insufficient; a score “2” means “weak access” – the way these households obtain food is unreliable and insufficient; “3” means “medium access” – these households can obtain sufficient food without too much difficulties, but there is little margin; “4” means “good access”, households who can easily obtain sufficient food. Since some clusters in the same category are slightly better and some are worse, a more refined, decimal score was attributed to each cluster to take these small differences into account. A regression model was built per each household profile to mimic the scoring. This model is primarily driven by the monthly per capita expenditures and to a lesser extent by access to land and access to irrigation. The variables percent of expenditures on food and access to kitchen garden account for only a small amount of variation in the model. The formula is described in Annex 2.
Households were then grouped into 4 main categories labeled from “Very Weak Access” to “Good Access”. The same cut-off points used for food consumption (section 4.2.1.1) were applied to differentiate households with different level of accessibility to food. Presenting average characteristics by the 4 main access groups might be misleading because it would hide the different combination of accessibility variables reported by single households making interpretation more difficult. Moreover, some differences among main access groups, while strong within single profiles, became not statistically significant when comparing one group against the other three. Nevertheless, some relevant characteristics were detected which clearly indicates a trend in household accessibility.
The ranking score and the division of households into main groups allow a definition of the level of food accessibility in “global terms”. The cut-off points were again derived by careful judgment of detailed profiles obtained by clustering upon the principal component analysis.
Timor Leste - Comprehensive Food Security and Vulnerability Analysis
44
4.1.6.2. Household food access profiles
The 4 main access groups of clustered sampled households are detailed in Table 12:
Table 12 - Household Food Access Groups
% of HH
(weighted) Ranking cut-off points
1. Very Weak Access
• Usually characterized by very low purchasing power.
• For households having land, they generally have no irrigation.
• Some households depend strongly on sources other than own production or purchase for their food.
10.2 % Below / equal 1.50
2. Weak Access
• Households having access to land but low purchasing power.
• Households who do not have land but their purchasing power is around the sample average.
41.8 % Between 1.51 and 2.50
3. Medium Access
• Households with land, but medium purchasing power.
• Households with no land but having a high purchasing power.
27.9 % Between 2.51 and 3.50
4. Good Access
• Households with land and high (sometimes very high) purchasing power, generalized by a low proportion of expenditure spent on food.
• Households with no land having a very high purchasing power.
20.1 % Above 3.51 (included)
4.1.6.3. Geographic distribution of food access profiles
Food access profiling indicates Region 5 has the highest percentage of households with weak or very weak food access profiles, followed by Regions 1 and 2 (Figure 15). Table 13 outlines some of the key variables used in the calculation of the access profiles, by Region, with key difference s highlighted in red.
Figure 15 - Food access by region
Food access by Region
0% 25% 50% 75% 100%
Region 1
Region 2
Region 3
Region 4
Region 5
very weakweakmediumgood
Table 13 - Level of food access indicators by region
Region
Access to
agrgi. land?
Do you have a kitchen garden?
Monthly Per
capita tot. exp.
% of
exp. on
food
Access to
irrig.
Region 1
97% 61% 9.4 60% 4%
Region 2
97% 80% 9.5 55% 25%
Region 3
57% 72% 14.9 54% 9%
Region 4
86% 93% 12.6 51% 27%
Region 5
69% 98% 7.8 53% 12%
Total 79% 78% 11.9 55% 15%
4.1.6.4. Distribution of food access profiles among livelihood groups
The proportion of food accessibility across livelihood profile helps to underline the increased vulnerability of farmers against other livelihood profiles like wage earners (Figure 16).
Access and consumption need to be analyzed in combination in order to provide a more accurate portrayal of food security (see section 4.5).
Timor Leste - Comprehensive Food Security and Vulnerability Analysis
45
Figure 16 - Mean food consumption
Food access by livelihood profiles
0% 25% 50% 75% 100%
farmers -artisans
ordinary farmers
farmers - small livestock
unskilled laborers
petty traders
wage earners
skilled labor, traders
very weakweakmediumgood
4.2. Food Consumption
Although this survey did not specifically look at nutritional knowledge, its level in Timor Leste is reported to be very low with many misconceptions and food taboos limiting the utilization of foods.
Food taboos can be found in many rural areas and have been better detailed by Oxfam Australia in the Oecussi enclave where taboos are reported to be widespread. Food taboos often include protein rich foods like fish, chicken, dog meat and some of the more colorful fruit and vegetables. White foods are perceived as more pure and nutritious, especially for children whom often receive little meat or vegetables. Breast milk, although being white, is believed not enough for a healthy growth and rice water is often given at 1 month of age and rice porridge after 3 or 4 months.
Fresh fruits are generally not valued as major contributors to a good diet and it is reflected by 70% of households not having consumed any fruit in the previous week and a remaining 25% having had only between 1 to 3 eating occasions in the same period.
It is believed that imported food or foods from towns are superior to locally produce. The misconception is more evident for rice where imported longer grain and better polished imported rice is available in every village while the same can not be said of locally produced rice. Although some taste preference for locally produced rice has been expressed in some areas the imported variety remains the favorite because it expands more during cooking. Rice also seems to be regarded with a higher nutritional value than other produces.
To evaluate the consumption patterns in East Timor, households included in the survey were asked how many days in the past week they had eaten foods from the list in Table 14 and the sources of these foods. Analysis of this retrospective weekly food consumption recall recording both frequency of consumption (0 to 7 days) and variety (nineteen food items or food groups) allowed a classification of sampled households into four food consumption profiles (described below).
Table 14 - Food groups based on actual weekly consumption
• Rice • Roots and tubers • Beef / buffalo • Vegetables • Maize • Fish • Eggs • Fresh fruit
• Wheat • Poultry • Milk / curd • Oil / butter
• Other grains • Pork • Pulses • Sugar / salt
• Cassava • Goat / sheep • Pumpkin
Households were also asked about the main sources of each of the foods consumed, including own production, hunting/fishing, gathering, borrowed, purchase, exchanged for labor, exchanged for goods, gift from friends/relatives, food aid, and other.
4.2.1. Household food consumption profiling
Household food consumption profiles were developed, using information on dietary diversity and the consumption frequency of staple and non-staple food as well as the sources of staple foods consumed. Diet diversity, measured by the number of different foods from different food groups consumed in a household, and frequency of consumption are good proxy indicators of the access dimension of food
Timor Leste - Comprehensive Food Security and Vulnerability Analysis
46
security and nutrition intake and research has demonstrated that dietary diversity is highly correlated with caloric and protein adequacy, percentage of protein from animal sources (high quality protein) and household income.
To assess nutritional adequacy of a diet different food items are grouped into Food Groups which should be consumed in different combinations on a daily basis to ensure a healthy and balanced diet. The main food groups are: cereals, legumes and oilseeds, tubers and roots, vegetables and fruit, animal products, oil and fats.
4.2.1.1. Frequency of consumption and dietary diversity
Table 15 - Mean food consumption
Days consumed in the past 7 days Food Item/Group 0-1
days 2-3 days
4-5 days
6-7 days
rice maize
pumpkin wheat
other grains cassava other
roots/tubers
fish poultry pork
goat/sheep days
beef/buffalo
eggs pulses/lentils vegetables oil/butter
fruit sugar/salt milk/curd
Overall consumption of animal products is low. Twenty five percent of sampled households reported not eating any animal products including eggs or milk in the previous week. Thirty percent reported not having eaten any meat or fish but having eaten some eggs or milk and 45% having had no meat but some fish and/or eggs and milk.
Although 65% of sampled households reported eating vegetables 7 times a week, 70% reported eating no fruits and 25% consumed fruits only 1 to 3 times a week.
In general, the diet in East Timor consists of frequent consumption of rice, maize, vegetables, oil/butter, and sugar/salt. Occasional consumption of cassava and pulses/lentils is observed. There is very little consumption of fruit, animal products, or other grains.
It must be noted that the dietary patterns illustrated above may mask Regional, socio-economic, cultural, food security status, or other variations within the country.
4.2.1.2. Methodology for analyzing food consumption data
Because there is the need to analyze several variables simultaneously, multivariate statistical techniques are used, specifically principal component analysis (PCA) followed by cluster analysis28 . The goal of the analysis is to cluster together households that share a particular food consumption pattern. The advantage of running a cluster analysis on principal components and not on the original variables is that clustering takes place on the relationships among variables rather than on discrete individual variables. PCA was run on the frequency of consumption of the above mentioned food items.
As different foods have different nutritional and economic values29, such a high level of consistency with the original complexity of the dataset ensures that variance due to peculiar combination of items are not thrown out just because they account for small part of the total variance. In other words, using a “light” data reduction approach, avoids smoothing the different consumption patterns too much without knowing what peculiarities are being flattened down.
For nutritional evaluation different food items are divided into a number of food-groups, of which a combination should be consumed on a daily basis to ensure a healthy diet. The key food-groups used to interpret the result of the analysis were: cereals, legumes and oilseeds, tubers and roots, vegetables and fruit, animal products, oils and fats.
4.2.1.3. Household food consumption groups and profiles
Based on the methodology described above, 19 distinct profiles of households characterized by their different food consumption patterns were identified. Five of them were broken apart to improve
28 The software used for multivariate analyses is ADDATI 5.3c, developed by Silvio Griguolo, IUAV Venice, Italy, freely available at http://cidoc.iuav.it/~silvio/addati_en.html 29 Different types of foods (for example, meat versus vegetables) but also different types of items within each food group (wheat versus rice).
Timor Leste - Comprehensive Food Security and Vulnerability Analysis
47
homogeneity and to isolate households with consumption patterns which were particularly low in terms of cereals.
Table 16 - Household Food consumption Groups
% of HH (weight-
ed)
# of profiles
Ranking cut-off point
1. Poor food consumption group:
Six different diet patterns characterized by poor diversification. All are mainly based on consumption of staple (cereals, tubers), frequently lacking animal protein, consumed from 1 to 3 days per week only. Different combinations of consumption frequency for vegetables, oil, and sugar/salt were found, but few households consumed items from these 3 food groups on a regular basis.
23.7% 6 Below /
equal 1.50
2. Borderline (better frequency, poor quality):
Households in this group have a regular food intake, which can even be abundant in term of quantity but still lacking quality. Cereals, vegetables, oil and sugar/salt are regularly consumed in this group. Caloric intake and micronutrients are less likely to be a problem for these households; however, protein intake (animal and vegetable), is still low.
36.1% 7 Between 1.51 and
2.50
3. Fairly good food consumption:
Frequency of consumption average. With maize or rice, vegetables, oil and sugar/salt being eaten daily or very frequently. Just one profile shows frequent consumption of fish. In the others, animal products are infrequently eaten but the combination of proteins from cereals and pulses should provide the adequate levels of protein for nutritional adequacy.
25.6% 3 Between 2.51 and
3.50
4. Good food consumption:
Eight diversified food patterns characterized by high consumption frequency of items from all the food groups. Households in these profiles indicated a combined consumption of different animal products plus pulses.
14.6% 8 Above 3.51 (included)
The resulting 24 profiles were scored by the analyst from “worst” to “best” on a continuous scale and this scale was iteratively revisited and adjusted through a regression analysis which assigned a predicted ranking value to each household. The formula resulting from this regression analysis is presented in Annex 2. Ranking values fall between 0.5 and 4.5. “1” means “poor food consumption” – households with insufficient nutritionally inadequate food intake; “2” means “borderline food consumption” – households with still unsatisfactory food intake, nutritionally not yet adequate; “3” means “fairly good food consumption” – households with just satisfactory food intake, nutritionally acceptable, “4” means “good food consumption” – households with largely satisfactory food intake of good nutritional quality.
In order to clearly define main food consumption groups, precise cut-off points were used to separate households. The rationale is that households within a certain range of score are very likely to belong to determinate consumption profiles because of the high intra-homogeneity within each sub-group.
Labels of main food consumption groups, short description of different dietary profiles and their defining cut-off points are reported in Table 16. Cut-off points were decided after qualitative judgment of the different food consumption profiles. These profiles were then summarized into four distinct food consumption groups following the characteristics described below in Table 4-g:
4.2.1.4. Household food sources
As described above, households were asked the sources of the food groups consumed. Up to three answers for each food group were recorded. Looking at the sources of all foods, purchase is the most frequently cited source, making up 59% of responses. This is followed by own production (33% of responses). All other sources make up 4% or less each of the responses given. For example, although bartering was often reported as common in rural areas exchange of labor or items was reported as a way to acquire food in less than 1% of cases.
Looking at the main foods consumed, 81% of the responses for the source of rice cite purchase, followed by own production, at 15%. For maize a different pattern is observed, with 64% of responses citing own production, and 30% citing purchase. For vegetables, 52% of responses are own production, and 38% purchase. 90% of the responses for oil/butter are purchase.
Timor Leste - Comprehensive Food Security and Vulnerability Analysis
48
4.2.1.5. Geographic distribution of diet and consumption profiles
Figure 17 - Macronutrient consumption by region
0.00 3.00 6.00 9.00 12.00 15.00 18.00
Region 1
Region 2
Region 3
Region 4
Region 5
Score of macronutrient of consumption frequency across regions
Fats
Proteins (animal)
Proteins (pulses)
Carbohydrates
Assessment of dietary consumption in a survey setting always relies some degree of approximation, although frequency of consumption and dietary diversity are considered good indicators of dietary adequacy. In order to explore macronutrient intake, sources of carbohydrates, proteins, and fats were grouped and their frequency of consumption from overall food group consumption was scored and compared. Although the different food groups representing the main sources of macronutrient can not be compared to each other in terms of quantities (since an eating occasion of a given food has a different quantitative value for another), the same inequality can be assumed across Regions, allowing a comparison.
Figure 17 indicates that although some Regions have a more frequent consumption of rice while others include a higher frequency of maize and/or cassava the overall frequency of carbohydrates and fats intake across Regions are relatively homogeneous. Region 3 has the highest frequency of animal product consumption while Region 5 has achieves a proportion of overall protein intake second only to Region 3, thanks to a greater frequency of pulses consumption (Figure 18).
Figure 18 - Protein consumption frequency by region
0 2 4 6 8
Region 1
Region 2
Region 3
Region 4
Region 5
Score of protein consumption frequency across regions
Proteins (animal)
Proteins (pulses)
Figure 19 - Main staple consumption frequency by region
0.0
1.0
2.0
3.0
4.0
5.0
6.0
7.0
Region1
Region2
Region3
Region4
Region5
Score of main staples consumption frequency
across regions
Cassava Maize Rice
Rice was the staple most frequently eaten with 52% of all households reporting 6 or 7 eating occasions a week. Figure 4-i indicates patterns of frequency across Region from the total frequency of consumption for each staple, suggesting a higher frequency of rice consumption in Region 1 in comparison to the other staples while in Region 5, rice is consumed less frequently with maize and cassava being more frequent. Households in Region 1 reported the highest rice consumption frequency with 75% of households eating rice 7 times a week. Region 5 had the lowest frequency of consumption of rice with only 22% eating rice 7 times a week,
Timor Leste - Comprehensive Food Security and Vulnerability Analysis
49
From the sum of overall consumption frequencies for rice maize and cassava, Rice has 46% of eating occasions while maize 28% and cassava 26%, indicating their relative importance in the food basket.
Despite producing 50% of the national maize crop, 43% of rice crop and being the only Region having a net surplus of maize production, Region 1 has the second poorest food consumption profile. Poor diet diversification and low protein from either animal or vegetable sources are strong contributing factors. Although Region 1 has a good frequency of consumption for rice the profile results from a combination of consumed foods, not just averages of consumption.
Figure 20 - Food consumption groups by region
0% 25% 50% 75% 100%
Region 1
Region 2
Region 3
Region 4
Region 5
Food consumption across regions
poor
borderline
fairly good
good
These profiles attempt to highlight the quality of the diet looking at different items from different food groups
4.2.1.6. Distribution of consumption profiles among livelihood groups
Figure 21 - Food consumption group by livelihood group
0% 25% 50% 75% 100%
ordinary farmers
livestock farmers
petty traders
farmers -artisan
unskilled laborers
skilled labor,
wage earners
Food consumption across livelihood profile
poor borderline fairly good good
Subsistence farmers tend to spread the risk of production by combining a variety of crop production with livestock rearing. Despite the supposed variety of produce and traditionally having the highest percentage of results and or goods from their main activity directly consumed by the household, ordinary farmers in Timor Leste have the poorest food consumption profile with 71% of households below the borderline level as detailed in Figure 21. This could be an indicator of production with little surpluses and of pressure to sell any food reserves in order to finance the purchase of essential goods or services.
4.3. Household food security and vulnerability profiling
The combination of household food consumption (Section 4.2) and the household food access (Section 4.1.6) groupings form the basis for a classification of food security. As such they can be used as indicators of food security and vulnerability status. The household food security and vulnerability ranking constitute the main objective and result of the Timor-Leste CFSVA.
4.3.1. Methodology for analyzing food security and vulnerability data
The combination of “Food Consumption” and “Food Access” results in a certain Food Security category as detailed in Table 4-r, each cell here giving the number of households in that combination of access and consumption categories.
To define the Food Security and Vulnerability level, the summed value for Consumption and Access was calculated for each household obtaining a Food Security Score. Cut-off points were used to divide into 4 groups the sampled households, assessing them as Food Insecure, Very Vulnerable, Moderately Vulnerable and Food Secure. Those cut-off points were: Below/equal 3.50, Between 3.51 and 4.50,
Timor Leste - Comprehensive Food Security and Vulnerability Analysis
50
Between 4.51 and 5.50, Above 5.51. Each of these new groups is presented in the following sections with some additional characteristics to further describe these groups.
Table 17 - Food Security and Vulnerability profiles
Access to food
very weak
weak sufficient good
Total households = 1684
1 2 3 4
poor 1 67 187 78 42
borderline 2 92 264 165 89
fairly good 3 28 172 127 113
Food consumption
good 4 11 88 80 81
4.3.2. Household food security and vulnerability profiles
Based on the described methodology above, the four Food Security groups are detailed in Table 25:
Table 18 - Food Security groups
Food Security category % of the
sample (weighted)
Ranking cut-off points
Food Insecure: households with generally poor or borderline food consumption and very weak food access; or households with weak or very weak access and poor consumption.
20% Below/equal 3.50
Highly vulnerable: food-access and/or food-consumption are so insufficient that these households are close to being food insecure.
23% 3.51 – 4.50
Moderately vulnerable: food-access and/ or consumption are not good enough to categorize them as food –secure.
21% 5.51 – 5.50
Food Secure: in general: fairly good to good food consumption and medium to good food access, includes also “good access + borderline consumption” and “good consumption + weak access”.
36% Above 5.51
Total 100%
In the following sections, each of these food security groups is described.
4.3.2.1. The food insecure
The food insecure make up 20% of the sample, having poor or borderline consumption, and weak or very weak food access. Looking at other indicators, the food insecure group is also typified by the following characteristics:
• The highest prevalence of female headed households of any group, at 10%. • The lowest percent of expenditures on food (50%), although they also have the lowest total
per capita expenditure on food (US$2.3/person/month), and the lowest total household expenditures (US$4.6/person/month), indicating decreased purchasing power.
• The food insecure report directly consuming 51% of the goods or income produced by their main livelihood activity, the highest of any group.
• The food insecure report eating meat fish or poultry on average less than once per week. • The food insecure have a lower frequency of consumption of most food groups, except for
maize, which is eaten slightly more often than in other groups. • The food insecure report a slightly higher percent of their total food coming from their own
production (39%), and slightly lower from purchases (56%) • Lowest rates of asset ownership, such as radios (18% of households), tables (88%)
Timor Leste - Comprehensive Food Security and Vulnerability Analysis
51
• 62% of household heads in this group have NO education, the highest of all groups. • Compared to the other groups, the food insecure more often have homes with bamboo walls
(36%), thatch roofs (30%), and earth floors (72%). • The food insecure have the poorest access to adequate sanitation, with 31% of households
having no sanitation facilities (none/bush), the highest of any group. • The lowest use of electricity for lighting of any group (16%). • Although there is not a lot of variation between groups with respect to drinking water source,
the food insecure are the most likely to use surface water (12%). • The food insecure are similar to other groups in terms of land access, with 79% of households
having access to agricultural land (regardless of amount). However, they are least likely to have access to irrigation (24%), and they are also the most likely to be using community land (16% of food insecure households).
• The food insecure report agriculture production as the main income activity more often than any other group (66%).
• The food insecure are more likely to report having experienced a problem/shock in the past 12 months of all groups (77%).
• There is little difference in the prevalences of stunting, wasting, and underweight children under 5 years old between the food insecure and the other groups, although this group has a slightly higher prevalence of stunting (50%) than the other groups.
• Women in this group are less likely to have medical consultations during pregnancies- 17% of pregnancies did not have a consultation with anyone, the highest of any group. Additionally, 29% sought consultation during pregnancy with relatives or friends. Only 20% of pregnancies had a consultation with a doctor or nurse, the lowest of all groups.
• Children under 5 from food insecure households are the least likely to have received a de-worming tablet in the past 6 months, with only 37% of children having received them.
4.3.2.2. The highly vulnerable
The highly vulnerable make up 23% of the sample. Their food consumption is considered to be poor, borderline, or fairly good, but those with improved food consumption and poorer food access are included in this group. This group, along with the moderately vulnerable, fall in between the food insecure and the food secure with relation to many of the descriptive characteristics. Some of the outstanding characteristics of this group include:
• Slightly higher level of female headed households (9%) than the moderately vulnerable or vulnerable.
• 53% of household heads have received no education, higher than the moderately vulnerable or food secure groups.
• Out of total expenditures, 55% is spent on food. The total monthly per capita total expenditures is US$7.6
• The highly vulnerable eat animal protein only about once per week. • This group also has a slightly higher frequency of maize consumption that the moderately
vulnerable or food secure.
4.3.2.3. The moderately vulnerable
The moderately vulnerable make up 21% of the sample. They are lacking the combination of good food consumption and good food access to classify them as food secure. This group, along with the highly vulnerable, fall in between the food insecure and the food secure with relation to many of the descriptive characteristics. However, the gap between this group and the food secure appears to be larger than between this group and the highly vulnerable.
• This group has a higher percent of households that own more poultry than the median for the sample.
• 48% of the moderately vulnerable household heads have no schooling. • Out of total expenditures, 57% is spend on food. However, the average total per capita
monthly expenditure is US$10.7, nearly double that of the food insecure, but only slightly over half that of the food secure.
• This group eats more frequently rice, and less frequently maize than the food insecure or highly vulnerable.
• The moderately vulnerable eat animal protein about 3 days per week, on average.
Timor Leste - Comprehensive Food Security and Vulnerability Analysis
52
4.3.2.4. The food secure
The food secure make up 36 % of the sample having good or fairly good consumption and sufficient or good food access. Looking at other indicators, the food secure group is also typified by the following characteristics:
• The food secure households have the greatest purchasing power of any group, with a monthly per capita expenditure on food of US$10.1, and a total monthly per capita expenditure of US$19.3
• The food secure, in general, have a more frequent consumption of rice than other groups, as well as pumpkin, pulses, meat poultry and fish, and milk/curd.
• The highest percentage of household heads with completed secondary education or above of any group (15%), and the lowest percent of household heads with no education (38%) of any group.
• The food secure are the least likely to have a chronically ill or disabled member of the family, 5% of households vs. 6% to 7% in other groups. However, this difference is small.
• 75% of the food secure homes have corrugated roofs, and 43% have cement/stone/brick floors, the highest of any group.
• 55% of food secure homes use a flush latrine, the highest of all groups. Only 14% use nothing/bush, lower than all other groups.
• The food secure are the least likely to have access to agricultural land, although 76% of food secure households still report access. These households are more likely than other food insecure or highly vulnerable to have irrigated land- 44% of food secure households that have agricultural land practice primarily irrigated agriculture.
• 19% of food secure households report salaries/wages as their primary income source, the highest of any group. Only 52% report agricultural production as the primary income source.
• The food secure (together with the moderately vulnerable) are less likely to report having experienced any problem or shock in the past 12 months of any group, with only 41% of food secure households reporting positively.
• Among the food secure, 64% of children under 5 had received a deworming tablet in the previous 6 months, the highest of all groups.
• During the pregnancies of children under 5 years, 56% of women in this group consulted a doctor or nurse, the highest of all groups, while only 7% of these pregnancies had no consultation with anyone, the lowest of all groups.
4.3.2.5. Other differences/similarities between food security groups
When looking at the characteristics of the food security groups, there are also some interesting and unexpected differences and similarities between groups that are worth noting:
• Very little difference in nutritional status between groups. There is no significant difference in wasting, stunting, or underweight status of children 6 to 59 months between groups.
• The food secure have the highest prevalence of diarrhea of any group. This may be related to the geographic distribution of the food secure- they are more common in urban/peri-urban areas, where hygiene and safe water may be more compromised due to increased population density. However, this merits further exploration.
• The percent of expenditures on food shows little difference between groups, although the food insecure have a significantly lower percent than the other 3 groups. This may be due to the increased reliance on own production for food, decreasing the expenditures on food. However, this merits further exploration.
• School attendance for children ages 6-14 is high in all groups, with few households reporting children not going to school.
• When asking households if they had received food aid in the last 6 months, there were not large differences between groups- 8% of the highly vulnerable and 7% of the moderately vulnerable reported having received. 3% of the food insecure and 4% of the food secure reported having received. These minor differences may not be indicative of targeting, and should not be interpreted as such.
• Looking at other forms of external assistance received in the previous 6 months, there is also little variation between groups- ranging only from 9% to 11%.
• Livestock ownership is not closely related to food security status, nor is, in general, the number of livestock owned.
• The differences for most indicators between the highly vulnerable and the moderately vulnerable are usually very small.
Timor Leste - Comprehensive Food Security and Vulnerability Analysis
53
4.3.3. Geographic distribution of food security and vulnerability profiles
The distribution of household consumption and the household food access groupings averages indicates a higher convergence of vulnerability patterns or scores towards region 1, 2, and 5.
Figure 22 - Food security groups by region
24%
25%
17%
15%
24%
21%
29%
18%
25%
25%
19%
20%
22%
23%
20%
35%
26%
43%
37%
30%
0% 25% 50% 75% 100%
Region 1
Region 2
Region 3
Region 4
Region 5FoodInsecure
Highlyvulnerable
Moderatelyvulnerable
FoodSecure
When looking at VAM zones, the regions that appear to have decreased food security appear to be zones 2, 3, and 4. Region 5, which is Dili and the peri-urban and near-urban areas surrounding Dili, appear to have the lowest levels of food insecurity.
Figure 23 - Food security group by VAM zone
16%
24%
27%
24%
14%
25%
24%
24%
25%
15%
23%
20%
18%
20%
22%
36%
32%
31%
30%
49%
0% 25% 50% 75% 100%
VAM zone 1
VAM zone 2
VAM zone 3
VAM zone 4
VAM zone 5FoodInsecure
Highlyvulnerable
Moderatelyvulnerable
FoodSecure
In order to map these results, a parametric map was produced. In place of mapping the results only by the 5 VAM zones, or by the 5 Regions, an additive model was constructed that includes both systems of stratification. The dependant variable is the prevalence of food insecure/highly vulnerable households by Suco, and the independent variables the VAM zone and Region of each Suco. This factorial model gives a slightly improved estimation of prevalence of food insecurity/highly vulnerable households at smaller strata by combining the effects of the two forms of stratification. The adjusted R2 of the Region only model is .074, the adjusted R2 of the VAM zone only model is .078, and the model that includes both VAM zone and Region has an adjusted R2 of 0.111.
This crossing of VAM zone and Region stratification systems gives a total of 11 sub-zones (unique areas of VAM zone and Region overlap). These 11 areas are mapped below in Figure 4-mm. It should be noted that these are predicted prevalences, and NOT observed prevalences, although the predicted and observed prevalences for these 11 areas are similar.
Timor Leste - Comprehensive Food Security and Vulnerability Analysis
54
Map 6 - Map of percentage of food insecure/highly vulnerable population
4.3.4. Distribution of profiles among livelihood groups
The livelihoods primarily dependent on agriculture (ordinary farmers and artisan farmers) are most vulnerable to food insecurity followed by unskilled laborers and livestock farmers (Figure 4-mm).
Figure 24 - Food security groups by livelihood groups
30%
23%
23%
14%
13%
5%
6%
26%
23%
18%
25%
18%
18%
6%
18%
23%
23%
24%
24%
22%
30%
26%
32%
38%
37%
45%
56%
58%
0% 25% 50% 75% 100%
ordinary farmers
farmers -artisans
unskilled laborers
farmers - smalllivestock
petty traders
wage earners
skilled labor, traders
FoodInsecure
Highlyvulnerable
Moderatelyvulnerable
FoodSecure
Timor Leste - Comprehensive Food Security and Vulnerability Analysis
55
4.4. Sources of food insecurity and vulnerability- Shocks and coping strategies
In times of stress, food insecure and vulnerable households will adopt strategies that hopefully allow them to mitigate the effects of these shocks on their livelihood and food security. Coping strategies may produce short-term relief but may have longer term negative effects.
Shocks are defined as an event that has negative consequences for individuals, households, or communities. They can be of natural, economic, political, or social nature. Risk is defined as the likelihood of a particular shock to occur. For example, communities in earthquake-prone areas are at greater risk of experiencing the shock of an earthquake. Shocks can be further classified as covariate, or shocks that affect all households in an area (such as a flood, drought, epidemic), or idiosyncratic, which are shocks that affect individual households, such as a family death or sickness, robbery, or loss of employment.
Coping strategies are defined as the ways a community, household, or individual adjusts their livelihood strategies in response to a shock or risk. Coping strategies may involve short-term changes in behaviors as switching diets, consuming less expensive foods or borrowing money. When normal coping and response strategies are exhausted, households will use negative crisis strategies, such as selling productive assets (e.g. female livestock). Repeated shocks and the use of crisis strategies to manage their effects can lead to increased vulnerability and a decrease in food security at the individual and household levels.
Households were first asked if they had experienced any problems or shocks in the last 12 months. They were then requested to rank up to four important shocks according to their level of impact. For each of the main shocks, respondents were requested to report whether the effect had reduced their ability to produce or purchase enough food to eat for the period of the shock. Third, for each reported shock, households were asked to indicate whether the outcome had resulted in a loss of income, loss of assets or a combination of the two. Fourth, households were asked which coping strategies were employed to manage and mitigate the effects of the shock on their households. Finally, a question was posed as to whether the household had recovered from the effects of the shock.
It should be noted that reported shocks and impacts are subject to the perception of the respondent. In other words, what one household might perceive as a shock might not be reported by another. In this sense the household data can depict trends but figures are only indicative.
4.4.1. Idiosyncratic and Covariate shocks
Approximately 36% of all sampled households reported that they were not exposed to any shock whatsoever in the previous 12 months. For the outstanding 64% of sampled households, multiple response analysis techniques (percentages do not add up to 100%) were employed and four main shocks/risk factors were reported as being as being the most important. These are: (a) high costs of agricultural inputs such as seeds and/or fertilizer (83% of all responses); (b) drought/irregular rainfall (46% of responses); and (c) reduced availability of food (42% of responses); and (d) reduced income for a household member (35% of responses).
These shocks, when disaggregated across Regions, showed some important variations. Table 17 summarizes household reporting on the most important shocks based on multiple responses.
Table 19 - Household’s Exposure to Shocks across Regions (% of responses in each Zone) Region 1 Region 2 Region 3 Region 4 Region 5
Drought/Irregular Rain 79% 46% 46% 33% 35% Unavailability of Food 45% 35% 44% 33% 44% Reduced Income for HH member 38% 28% 44% 20% 53% High Costs of Agricultural Inputs 74% 88% 80% 97% 75%
As can be seen from the Table, the high costs of agricultural inputs are the predominant shock reported by sampled households across all Regions; however, Region 4 had the highest reporting frequency with almost all of the 202 sampled households indicating this particular problem as being most pressing. Unfortunately data collected do not allow a detailed description of such costs and they encompass all costs involved with the production and sale of products. Drought or irregular rains were most frequently reported among the 258 households sampled in Region1 whereas reduced incomes for family members was common among 53% of the 79 sampled households in Region 5. Unavailability of food, a common response among households in all Regions, is marginally higher in Region 1. When assessing the effect of food shortages on the household’s welfare it is intended as a decrease in the ability to produce or purchase enough food to eat for a period of time not including the annual lean season.
Timor Leste - Comprehensive Food Security and Vulnerability Analysis
56
In addition to the main shocks reported in each Region, a few additional shocks were reported by sampled households, but particular to certain Regions. For example, high levels of crop infestations and pests constituted 19% of responses of shocks for households in Region 1. And lack of employment and loss of employment of a household member accounted for 11% and 9% of all responses for households in Region 3.
The following paragraphs give an account of the main shocks reported in each region
Region 1: • Among households that reported facing drought/irregular rains in the last 12 months, 42%
indicated that the effect was a loss of assets (i.e., livestock or cash savings). Another 51% reported that the drought/irregular rains had resulting in a combination of asset loss and income loss. Around four percent reported only income losses and the remaining three percent reported no change in their assets or income.
• For households that indicated unavailability of food as being a major shock, 44% reported having lost assets; 48% indicated losing assets and income; seven percent stating that the major loss was of income; and one percent reporting no change in their welfare status.
• Of those households that reported reduction of earned income for a household member, 36% indicated that it resulted in a loss of assets; 52% reported a combination of income and asset losses; nine percent stated that only income had been lost; and three percent reported no changes.
• Households which reported facing high costs of agricultural inputs also indicated that this resulted in a loss of assets—notably use of savings (91% of responses). Of the remaining nine percent of households, eight percent reported that a combination of income and asset losses and one percent reported only a loss of income.
• Forty-five percent (45%) of sampled households in this zone reported that the shocks had an effect on food acquisition. Two percent reported no negative effect on food acquisition
• 53% of households provided no information regarding shocks—indicating problems in formulation of the question itself by enumerators or that no response was given. Either way, this represents a significant gap in the data for Region 1.
Region 2: • Sixty-two percent (62%) of households in reported losses of both income and assets as a
result of drought/irregular rains. Twenty-seven percent (27%) reported only asset losses while nine percent (9%) indicated that they faced only income losses. The remaining households reported no changes. 89% of these households who were exposed to drought/irregular rains, indicated that they were not able to secure enough food for household consumption and 87% of households couldn’t acquire enough food because of income losses for a household member.
• With respect to households reporting unavailability of food, 56% indicated that this event had resulted in a loss of income and assets; 21% reported only asset losses; nine percent loss of income; and 14% stated that there were no changes in their asset and income holdings.
• Of those households that reported a shock in terms of reduced income for a household member, 65% stated that this had resulted in the loss of income streams and asset holdings. Surprisingly, around 16% reported that this same shock did not have any negative effects on income or asset holdings. The remaining 19% of households facing this same shock indicated that it had resulted in income losses (10%) or asset losses only (9%).
Region 3: • Among households in this zone reporting drought/irregular rains, 75% reported losses of
income and assets; 15% indicated that they had lost only assets; five percent with only income losses; and the remaining five percent stated that they had experienced no change whatsoever.
• Similar figures were reported for households facing food shortages/unavailability of food. Approximately 72% indicated that this event had resulted in loss of income and assets; 17% reporting asset losses; seven percent experiencing losses of income; and four percent indicating no change.
• For households that had seen reductions of income streams among household members, 68% indicated that they had decreases in both asset holdings and lost income streams. 19% reported losing only assets and eight percent stating loss of income only. Four percent experienced no changes in their income or asset base.
• When it came to the effects of high agricultural input prices on household welfare, 65% of households reported that price increases resulted in a loss of income and asset holdings. Around 20% stated only asset losses while approximately 11% reported income losses only.
Timor Leste - Comprehensive Food Security and Vulnerability Analysis
57
Again, four percent experienced no change whatsoever in their income flows and asset holdings.
• With respect to the ability of households to secure sufficient amounts of food after being exposed to the four aforementioned shocks, approximately 90% of households that faced drought and/or irregular rains reported that they found it difficult to produce or purchase enough food after facing that specific shock. The same proportion was reported by households stating that food was unavailable.
• Approximately, 88% of sampled households indicated problems with food acquisition as a result of reductions in income streams among household members. For those reporting high costs of agricultural inputs, the same figure was reported (88%).
Region 4 • Sixty-three percent of sampled households in this zone reported a loss of income and assets
as a result of drought/irregular rains. For the same shock, a little over a quarter (27%) indicated that they had lost only assets and eight percent reported income losses only. Two percent reported no changes in their welfare status.
• Welfare losses as a result of food shortages or food unavailability are a mix of income and asset losses (61% of reporting households). A little over a fifth of sampled households (22%) indicated that they had lost only assets while eight percent reported reductions in income streams. Nine percent of sampled households in Admin 4 reported no changes in their welfare status.
• For households whose members had seen reductions in their income, 57% reported that they faced the combination of income and asset loss; 26% reported only asset losses; and nine percent income losses. Approximately seven percent reported no change.
• For those households reporting high costs for agricultural inputs, around 63% indicated that these costs had resulted in reductions of both income and asset holdings. Another 25% stated that asset holdings were mainly depleted. Nine percent noted that price increases led to income losses and only three percent reported no change.
• In the context of how these shocks affected food acquisition (whether by own production or purchase), ninety-one percent (91%) of households affected by drought/irregular rains reported that they had problems acquiring food for household consumption as a result of said shock. Eighty-four percent (84%) of sampled households reported problems accessing food (via production or purchase) as a result of food shortages and food availability. And the same proportion was given for households whose members had seen reductions in their income streams. Finally, among households who reported high input costs, 90% found it difficult to produce or purchase enough food for the period of the shock.
Region 5 • Of the sampled households in this Region reporting being exposed to drought, 53% indicated
that assets and income were lost as a result. Approximately 39% reported that they had lost only assets and eight percent faced income losses.
• For unavailability of food, 60% of households that reported this shock indicated that they had reductions in both assets and income; 35% stated asset losses only; and five percent reported income shortfalls.
• Households with members who had their income streams reduced also reported adverse effects in terms of their household welfare. Almost 70% of these reporting households saw reductions in income and assets and 29% reported asset losses. Among households that reported facing rising costs of agricultural inputs, 61% indicated that this had resulted in a loss of both income and assets; 32% faced asset losses only; and seven percent reported income losses.
• For each shock and ensuing period of time, households in this zone also had problems securing sufficient amounts of food. Eighty-percent of households that reported drought conditions indicated that this had an effect on their ability to secure food for consumption. The remaining 20%, did not indicate any adverse effects. Over three-quarters (78%) of sampled households that reported having faced food shortages or unavailability indicated that this affected access to food. Again, roughly 22% reported no adverse implications on their ability to secure food. Around 68% of households that had members with diminished income streams also reported they had problems in accessing food. Finally, similar proportions emerge among households that report high input costs: 80% report having problems with securing food for household consumption while 20% reported no adverse effects.
Timor Leste - Comprehensive Food Security and Vulnerability Analysis
58
4.4.2. Coping strategies
Table 20 - Coping strategies
Coping strategies Drought Unavailability of
Food Reduced Income for HH member
High Costs of Ag. Inputs
Consumed seed stock 20% 17% 17% 18% Reduced number of daily meals 15% 13% 14% 14% Reduced meal portions 13% 14% 12% 13% Ate less expensive or less preferred foods 13% 15% 13% 11% Borrowed food/helped by relatives 5% 6% 7% 5% Purchase food on credit 1% 1% 1% 1% Sold Poultry 8% 7% 6% 7% Spent Savings 3% 4% 3% 6%
Borrowed Money 4% 6% 6% 5% Sold Ag tools 2% 2% 2% 2% Sold Goat/Sheep 4% 4% 4% 4% Sold Cow/Oxen 2% 2% 1% 2% Worked for food only 6% 7% 10% 6% Reduced expenditures on health and education 1% 0% 1% 1%
Households are not passive in the face of shocks, but rather employ a series of risk management and coping strategies aimed at reducing or mitigating negative welfare outcomes. Not all of these strategies are successful insofar as they may be positive in the short-run, but create additional problems in the long-term. In order to better understand how households dealt with the main shocks, each household was asked to report on the actions it had taken in the wake of each main shock. Findings were analyzed using multiple response analysis.
As described in Table 18, consuming seed stock is the most common form of response strategy for households—irrespective of shock. Shocks such as drought tend to elicit a greater frequency and range of food-based coping strategies like reducing the number of meals per day and reduction of meal proportions (size).
Not all food-based response strategies are “coping” in the strict sense of the term. Rather, these actions are mostly aimed at consumption smoothing. For example, relying on less expensive or less preferred foods or reducing the size and number of meals per day are likely to be common phenomena regardless of whether households have faced a shock or not. Such strategies are practiced in high-income, food secure countries as well.
4.5. Food utilization, health, and nutritional status
In August 2002 UNICEF conducted a countrywide Multiple Indicator Cluster Survey (MICS), finding a Global Acute Malnutrition (GAM) or wasting rate of 12% and a Global Chronic Malnutrition (GCM) or stunting rate of 47% in children under age 5. Almost one third of mothers were also reported as malnourished defined as a Body Mass Index (BMI) less than 18.5.
The demographic and health Survey of 2003 also found that 38% of women had a BMI less than 18.5 and this was more prevalent in the rural west and rural central Regions and in the highlands. The survey also found a GAM of 12% and GCM of 49% in children under 5. Both wasting and stunting were highest in the rural west.
This survey attempted to gather information on access to health care, HIV/AIDS knowledge of reproductive age women, and maternal health and nutrition. Although the results presented here are similar to other studies, the health and nutrition figures are not meant to substitute for those measured by these other more health and nutrition focused surveys.
4.5.1. Access to health care
Results from this study’s key informant questionnaire indicate that 41% of Sucos do not have a functioning health post in the community. The average walking distance of the nearest health post was just over 4 hours. Region 3 had the lowest frequency of health posts with only 40% of Sucos having one although the average distance to the nearest post of two hours was lower than in other Regions. The average distance for the whole sample was over four hours.
Timor Leste - Comprehensive Food Security and Vulnerability Analysis
59
4.5.2. Knowledge of HIV/AIDS Figure 25 - Percentage of respondents having ever heard of HIV/AIDS by region
Percentage of respondents having ever heard of HIV/AIDS by region
0% 10% 20% 30% 40% 50% 60% 70% 80%
1
2
3
4
5
The main objective of the HIV/AIDS section in the questionnaire was to obtain an approximate idea about the awareness of the disease, its prevention and the prevailing beliefs related to its transmission amongst the sample. Thus the emphasis of this section of the questionnaire was on gauging what people across the country knew about HIV and its prevention.
The respondents (women of reproductive age, 15-49 years) were given a choice of various options ranging from accurate (using condoms will prevent HIV infection) to completely baseless (avoiding mosquito bites will prevent HIV infection). This was followed by questions that required more knowledge/awareness about the disease such as “Can the AIDS virus be transmitted from a mother to child during delivery?”
Half of the women interviewed declared having no knowledge of HIV/AIDS. Figure 22 indicates the percentage of respondents having heard of AIDS by Regions. The higher awareness of the Region comprising Dili with 67% of respondents having heard of HIV/AIDS, is offset by Oecussi (Region 5) with only 19%.
Among the respondents avoiding sex with prostitutes was rated more important than using condoms, common fallacies such as the avoidance of kissing and avoiding mosquito bites were also mentioned by a minority as a way of preventing transmission (Annex 1, Table 18).
Respondents who had heard of HIV/AIDS were also asked questions to test their knowledge on how HIV was transmitted. A range of questions were asked, for example, “Can people reduce their chances of getting the HIV/AIDS virus by using a condom every time they have sex?” The respondents could answer “Yes”, “No” or “Don’t know”. The most common ways people reported HIV/AIDS transmission occurs include from mother to child (whether through breastfeeding, pregnancy, or childbirth), having sex with multiple partners, and by not using a condom. (Annex 1, Table 18)
It is evident that HIV/AIDS awareness is not high especially in the western Region and Oecussi. Information campaigns should be implemented through the media but also through active involvement of communities especially in rural settings where media messages are not as widely received.
4.5.3. Maternal health and nutrition Information was collected from 1795 women with an average age of 32 regarding reproductive history, health and hygiene. At the time of the interview, 11% of women were pregnant and 42% were breastfeeding.
The percentage of women reported receiving a vitamin A capsule immediately after their last birth (Table 4-l) is reflective of the percentage of women receiving professional antenatal care (66%).
Table 21 - Supplements and Care Practices across Regions
In terms of care practices, less than 10% of women reported not boiling drinking water and more than half reported sleeping under a mosquito net (Table 19).
Timor Leste - Comprehensive Food Security and Vulnerability Analysis
Other care practices like washing hands were poorly observed with only 22% washing after using the toilet and less than 1% after changing diapers (Table 20).
Antenatal care questionnaires indicate that antenatal care provisions are primarily given by a nurse or a midwife (50%) followed by a relative or friend (19%) and by a doctor in 16% of cases (Figure 23).
Anti-tetanus vaccinations were reported by 70% of expectant mothers indicating an improvement since the finding of 41% by the MICS-2002.30
4.5.4. Child health and nutrition
Nutritional status of children is an important determinant of their health and well-being and a good indicator of the health of the whole population. Childhood malnutrition is associated with an increased risk of morbidity and mortality although for children suffering from stunting in the first few years of age, there is often some catch-up growth in older childhood years or during the adolescence growth-spurt. Far too often chronic malnutrition in young children leads to short stature in adulthood which is associated with reduced productivity and for women, increased obstetric risks and low birth weight. Tackling maternal malnutrition, low birth weight, inadequate breastfeeding and weaning practices and high levels of infectious disease morbidity can dramatically improve the nutritional status of children and the population as a whole.
This section outlines the results of the information gathered for children under 5 years of age related to health and nutritional status.
Anthropometric measurements collected in this survey the sample, although likely to reflect true Regional and national levels, are not meant to provide accurate population level estimates. They are gathered only as an additional descriptive food security indicator. The nutritional data reported should only be interpreted in the context of the sample taken for correlation to household food security and not as an indicator of malnutrition prevalences. Children were weighed and measured, and their age was estimated using their birth date, recorded from their health card, or as reported by the mother/caretaker. Bilateral edema was not recorded, so global acute malnutrition (GAM)31 cannot be calculated. A total of 1877 children were included.
WHO32 provides reference ranges for Standard Deviation (SD) of z-scores, as a guide to accuracy measurements. The SD for both WHZ and HAZ are within the acceptable range.
Table 23 - Standard deviations of z-scores WHZ HAZ WHO reference range in SD 0.85 – 1.1 1.1 – 1.3 CFSVA SD 0.97 1.23
30 UNICEF, (2002) Multiple Indicator Cluster Survey (MICS-2002) Timor Leste, Dili. Pg.90 31 GAM is the prevalence of wasting and/or bilateral edema in children under 5 years of age. 32 WHO (2006); World health Organisation. Cut-off points and summary statistics . Available at http://www.who.int/nutgrowthdb/about/introduction/en/index5.html, accessed on 15/01/06.
Figure 26 - Antenatal care provision
Antenatal Care Provision
Doctor16%
Nurse27%
Midwife23% Other
3%
None12%
Relative friend19%
Timor Leste - Comprehensive Food Security and Vulnerability Analysis
61
Several parents had difficulties in remembering the child’s age and when in doubt the interviewer tried to estimate the age by asking questions relating to important national events of the last 5 years. Age estimation was probably more accurate in children less than one year old but with infants the likelihood of measurement errors increases, resulting in z-score inaccuracy.
4.5.4.2. Nutritional status and comparison with other surveys
Looking at the raw anthropometric outcomes, the following results were found:
Table 24 - Stunting prevalence by age group and gender
Table 23 summarizes the results of past nutrition surveys. The results are generally comparable; this survey finds higher levels of wasting and similar levels of stunting than the MICS survey (as compared to global acute and chronic malnutrition).
Table 25 - Past nutrition surveys results
Date Organization Area covered Global Acute Malnutrition
May.04 Oxfam Australia Oecussi 17.8% 58% Aug.04 Care Australia LIquica,
Covalima, Bobonaro
14.5% 12.9%
52.8% 58.9%
May.05 Care Australia Covalima 16.6% 55.1
These surveys explore the different aspects in different degrees of depth for the areas of pertinence. Common contributing factors were found to be poor nutritional and health practices, limited access to health care especially in rural areas, limited access to safe drinking water and poor sanitation. Food availability and access was also reported but not as the primary or only factor. The contribution factors found in this survey are discussed in section 4.4.4.6.
This survey did not gather information on child mortality; however, there are a few reports of child mortality, including the 2002 UNICEF’s MICS using indirect methods estimated infant mortality at 88 per 1000 live births, retrospective for a period about four years. Using direct assessment methods the Demographic and Health Survey of 2003 found infant mortality for the previous four years at 84 per 1000 live births.
33 A wasted child has a weight-for-height Z-score that is below -2 SD based on the NCHS/CDC/WHO reference population. Acute malnutrition is the result of a recent failure to receive adequate nutrition and may be affected by acute illness, especially diarrhea. 34 A stunted child has a height-for-age Z-score that is below -2 SD based on the NCHS/CDC/WHO reference population. Chronic malnutrition is the result of an inadequate intake of food over a long period and may be exacerbated by chronic illness 35An underweight child has a weight-for-age Z-score that is below -2 SD based on the NCHS/CDC/WHO reference population. This condition can result from either chronic or acute malnutrition or a combination of both.
Timor Leste - Comprehensive Food Security and Vulnerability Analysis
62
4.5.4.3. Child nutrition by age and gender
Figure 27 - Wasting prevalence by age group and gender
Wasting prevalence by age group and gender
0%
10%
20%
30%
40%
50%
6-11months
12 to 17months
18 to 23months
24 to 35months
36 to 47months
48 to 59months
boysgirls
Figure 28 - Stunting prevalence by age group and gender
Stunting prevalence by age group and gender
0%
10%
20%
30%
40%
50%
60%
70%
6-11months
12 to 17months
18 to 23months
24 to 35months
36 to 47months
48 to 59months
boysgirls
As seen in Figures 24, 25, and 26, wasting, stunting, and underweight prevalence appears to be highest in the age group of 18 to 23 months, and lowest in the age group of 6 to 11 months.
Looking at the difference between boys and girls, there is only an observed difference in wasting, where at all age groups, boys appear to have a higher wasting prevalence than girls.
This is significant looking both at the mean z-scores (p=.002), and at the prevalence (p<.001).
For all age groups, the odds ratio of boys to girls is 1.67, meaning that boys are 1.67 times more likely to be wasted than girls.
Figure 29 - Underweight prevalence by age group and gender
Underweight prevalence by age group and gender
0%10%20%30%40%50%60%70%80%
6-11months
12 to 17months
18 to 23months
24 to 35months
36 to 47months
48 to 59months
boysgirls
Timor Leste - Comprehensive Food Security and Vulnerability Analysis
63
4.5.4.4. Child morbidity
Looking at Figure 27, the prevalence of children suffering from fever or diarrhea in the previous two weeks is highest among children 12 to 23 months, and lowest among children 24 to 59 months.
A comparison wasting prevalence by recent fever and diarrhea is illustrated in Figures 4-r and 4-s. There is no significant difference in wasting prevalence and recent diarrhea. However, those children reported to have had a fever in the previous 2 weeks are more likely to be wasted (odds ration = 1.6, p<0.001). The difference between the mean wasting z-scores of those with and without recent fever is also significant (p=0.007).
Figure 31 - Prevalence of wasting by recent diarrhea and age group
Figure 32 - Prevalence of wasting by recent fever and age group
Prevalence of wasting by recent diarrhea and age group
0%
10%
20%
30%
40%
50%
6-11months
12 to 17months
18 to 23months
24 to 35months
36 to 47months
48 to 59months
No diarrheadiarrhea
Prevalence of wasting by recent fever and age group
0%
10%
20%
30%
40%
50%
6-11months
12 to 17months
18 to 23months
24 to 35months
36 to 47months
48 to 59months
No fever
Fever
4.5.4.5. Breastfeeding and weaning practices As seen in Figure 30, breastfeeding is most common (regardless of complimentary feeding habits) in children 6 to 12 months. Children ages 36 to 59 months are very rarely breast fed (the few reporting breastfeeding at these later ages may be due to misreporting).
Figure 30 - Child morbidity (fever, diarrhea)
Child morbidity (diarrhea, fever)
0%5%
10%15%20%25%30%35%40%
6-11months
12 to 17months
18 to 23months
24 to 35months
36 to 47months
48 to 59months
Age
illne
ss- 2
wee
k re
call
prev
alen
ce
diarrheafever
Timor Leste - Comprehensive Food Security and Vulnerability Analysis
64
Looking at children 6 to 24 months, wasting prevalence is lower among children that are currently breastfeeding, as seen in Figure 31, although age is also a factor- breastfeeding appears to have more of a protective effect at younger ages; or weaning practices at older ages may decrease the protective effect of breastfeeding. Mean wasting z-scores are significantly lower for children 6 to 24 months
Figure 33 - Current breastfeeding status by age group
Current breastfeeding status by age group
0%
10%
20%
30%
40%
50%
60%
70%
80%
90%
6-11months
12 to 17months
18 to 23months
24 to 35months
36 to 47months
48 to 59months
Prev
alen
ce o
f chi
ldre
n cu
rren
tly
brea
stfe
d
Figure 34 - Wasting prevalence by current breastfeeding status and age group
Wasting prevalence by current breastfeeding status and age group
0%
10%
20%
30%
40%
50%
6-11 months 12 to 17 months 18 to 23 months
not bfcurrently bf
(p<.001), as are prevalences, with children not breastfeeding 1.5 times as likely to be wasted as those that are breastfeeding (p=.046).
Although breastfeeding appears to be common among younger children, previous reports36 indicate that exclusive breastfeeding, even in the first few months of age, is infrequent, exposing the child to sources of infection from the complementary foods or drinks
4.5.4.6. Determinants of health and nutrition status
Factors closely related to the causes of malnutrition in children have been studied to evaluate how they influence the nutrition outcome. Linear regressions and hierarchical regressions were used to explore the relation between selected independent variables and then malnutrition z-score (or alternatively, logistic regression and the incidence of diarrhea). A model constructed in this way is able to assess, to a certain degree, the effect of one factor while controlling for all the other factors.
For the hierarchical regression analysis, the dependent variable of nutritional status was split into 4 groups: Severe (<-3.0 z-scores), Moderate (-3.0 to -2.01 z-scores), mild (-2.0 to -1.01 z-scores), and normal (-1.0 z-scores and higher). Linear regression analysis37 was then run on the same independent variables, using the raw z-score as the dependant variable.
4.5.4.6.1. Wasting
Looking at wasting, several variables were considered and explored to determine their relationship to wasting status, and as potential confounders. The final hierarchical model includes: child age, the shock of unemployment, diarrhea, sex of the child, livelihood group, and VAM zone. This does NOT mean that these are directly linked to wasting; they may also be proxies for other predictors. Looking at the same variables using linear regression, similar relationships are observed between the dependant and independent variables.
36 UNICEF, (2002) Multiple Indicator Cluster Survey (MICS-2002) Timor Leste, Dili. pg.53 37 Linear regression analysis is a more standard methodology for multivariate analysis of anthropometric data, but has the disadvantage of having results that are less intuitively understandable.
Timor Leste - Comprehensive Food Security and Vulnerability Analysis
65
Figure 35 - Wasting prevalence by VAM zone (corrected)
0%20%40%60%80%
100%
VAMzone 1
VAMzone 2
VAMzone 3
VAMzone 4
VAMzone 5
severe moderatemild normal
Proportion wasted children
In Figure 4-v, controlling for these other variables, it can be observed that there is significantly less wasting in VAM zone 2, and significantly more in VAM zone 4 (Oecussi).
Looking at wasting by livelihood group, children of the skilled laborers, traders and the wage earners have less wasting than the other livelihood groups, as seen in Figure 4-w.
Figure 36 - Wasting prevalence by livelihood group (corrected)
0%20%40%
60%80%
100%
ordina
ry
farm
ers*
**
farm
ers
-
small
petty
trade
rs**
farm
ers
-
artis
ans*
*
unsk
illed
labo
rers
*
skille
d
labo
r,
wag
e
earn
ers
severe moderate mild normalProportion wasted children
Controlling for other factors, boys have a higher prevalence of wasting than girls (however, this relationship is not significant, p=0.07), as seen in Figure 34 below. Additionally, controlling for the other factors in the model, there is a higher prevalence of wasting among households that suffered from unemployment, as seen in Figure 35 below. No other shocks experienced by the households were significantly related to wasting.
Figure 37 - Wasting prevalence by sex of child (corrected)
Figure 38 - Wasting prevalence by shock of unemployment (corrected)
0% 50% 100%
boygirl
severe moderate mild normal
Proportion wasted children 0% 50% 100%
no shock ofunemployment
unemployment*
severe moderate mild normal
Proportion wasted children
As observed in Figure 36, Incidence of wasting increases slightly with age, controlling for the other factors in the model, however around the age of 3 years old wasting becomes less common. Controlling for the other factors in the model, children with diarrhea show a higher prevalence of wasting (however, this is not significant, p=0.06)
Timor Leste - Comprehensive Food Security and Vulnerability Analysis
66
Figure 39 - Wasting prevalence by age (corrected)
Figure 40 - Wasting prevalence by recent diarrhea (corrected)
0%
20%
40%
60%
80%
100%
6 12 18 24 30 36 42 48 54
severe moderatemild normal
Age (months)
Proportion wasted children
0% 50% 100%
diarrhea in the past 2weeks
no diarrhea in the past 2weeks
severe moderate mild normal
Proportion wasted children
Note also that there is a strong relation between the use of deworming medication and diarrhea: children with diarrhea are more often given the medication. Since the causality seems to be reversed, deworming was excluded from the model.
The two main components of the food security assessment (food consumption score and food access score) don’t show a significant effect on wasting status of children under 5. No effects are observed from gender and age of the household head, or the level of education of the head of household or the spouse.
4.5.4.6.2. Stunting
Looking at stunting, the variables child age, VAM zone, livelihood group, and agricultural system (no land vs. rain-fed agriculture vs. irrigated agriculture) were found to be the best combination of predictors. Controlling for these variables, the level of stunting in VAM zone 2 is significantly higher.
Looking at the same variables using linear regression, similar relationships are observed between the dependant and independent variables. Controlling for these other factors, the mean stunting z-score is significantly lower in VAM zone 2. Looking at livelihood groups, controlling for the other variables in the model, unskilled laborers and wage earners have fewer stunted children, and farmers-artisans have more.
Figure 41 - Stunting prevalence by VAM zone (corrected)
Figure 42 - Stunting prevalence by livelihood group (corrected)
0%20%40%60%80%
100%
VAMzone 1
VAMzone 2*
VAMzone 3
VAMzone 4
VAMzone 5
severe moderatemild normal
Proportion stunted children
0%
20%
40%
60%
80%
100%
ordin
ary
farme
rs*far
mers
-sm
alllive
stock
petty
trade
rs*
farme
rs -
artis
ans**
*
unsk
illed
labor
ers
skille
dlab
or,
trade
rswa
geea
rner
s
severe moderate mild normalProportion stunted children
Stunting increase by age until children are 3 years old, when the stunting ratio stabilizes, as illustrated in Figure 40. Intriguingly, children from households with irrigated lands show more stunting, shown in Figure 41. The reason for this is not clear.
The two main components of the food security assessment (food consumption score and food access score) don’t show a significant effect on stunting status of children under 5. No effects are observed from gender and age of the household head, or the level of education of the head of household or the spouse.
Timor Leste - Comprehensive Food Security and Vulnerability Analysis
67
Figure 43 - Stunting prevalence by age of child (corrected)
Figure 44 - Stunting prevalence by land access and irrigation (corrected)
0%
20%
40%
60%
80%
100%
6 12 18 24 30 36 42 48 54
severe moderatemild normal
Age (months)
Proportion stunted children
0% 20% 40% 60% 80% 100%
no land**
rainfed***
irrigated
severe moderate mild normal
Proportion stunted children
4.5.4.6.3. Diarrhea
Another important indicator of child health and nutrition is the prevalence of diarrhea among children. Caretakers were asked if their children had had diarrhea in the previous 2 weeks. Diarrhea can be linked to poor health, poor nutrition, and/or poor hygiene and unsafe water.
Figure 45 - Diarrhea prevalence by VAM zone (corrected)
0%
10%
20%30%
40%
50%
VAMzone 1
VAMzone 2*
VAMzone 3
VAMzone 4
VAMzone 5*
Children (6-59 m) w ith diarrhea in the last 2 w eeks
A logistic regression was run on diarrhea; the variables controlled for include a wealth index (made up of appliance ownership), mother’s diarrhea, consumption of goat meat, consumption of milk or curd in the household, livelihood group, and VAM zone. It was found that, controlling for other variables, VAM zone 2 has significantly lower diarrhea prevalence than VAM zone 5.
The two main components of the food security assessment (food consumption score and food access score) don’t show a significant effect on diarrhea prevalence of children under 5.
However, children in households with “better” food consumption (and hence higher food security levels) have a higher prevalence of diarrhea. Further investigation showed that this is related in part to the consumption of milk in the household, and as a component of supplemental feeding, as seen in Figure 43.
Figure 46 - Diarrhea prevalence by supplemental feeding (corrected) Among children between 6 and 24 months, complementary feeding of milk is clearly linked with increased diarrhea prevalence (controlling for the other variables, as in the model described above).
This incidence of diarrhea remains significant even when controlling for the water source that the household is commonly using, or the practice of boiling the water. Note that only very few HH (0.4%) give milk to kids when they only have access to unsafe water.
0%
10%
20%
30%
40%
50%
60%
70%
80%
none v it / med plainw ater
juice,sw eetw ater*
milk*** other liq solid /semi
solid***Supplemental feeding received during the last 24 hrs
Children (<24 m) with diarrhea in the last 2 weeks
Timor Leste - Comprehensive Food Security and Vulnerability Analysis
68
Although a causal link cannot be established without further investigation, it may be that mothers are substituting breast feeding with milk, removing the protective effects of breastfeeding against diarrhea. An alternative explanation is that the preparation and conservation of milk and bottles lacks the necessary hygiene, even if drinking water is of acceptable quality.
Increased wealth (as measured by appliance ownership) is correlated with decreased diarrhea prevalence, controlling for other variables. This is not to say that appliance ownership decreases diarrhea, but that improved wealth may mean better education, access to healthcare, nutritional knowledge, better hygienic practices, safer water sources, and other variables associated with decreased diarrhea prevalence.
Children from the poorer livelihood groups, the unskilled laborers are particularly prone to diarrhea, whereas among children of skilled laborers and traders diarrhea is much less common, as seen in Figure 44. Controlling for the other factors in the model, children of mothers with diarrhea have a higher prevalence of diarrhea themselves (Figure 45). This may indicate a lack of proper hygiene, however, the source of water, type of toilet, and practice of washing by the mother didn’t show any significant effect.
Figure 47 - Diarrhea prevalence by livelihood group (corrected) Figure 48 - Diarrhea prevalence by
mother’s diarrhea prevalence (corrected)
0%5%
10%15%20%25%30%35%40%
ordi
nary
farm
ers
farm
ers
-sm
all
lives
tock
petty
trade
rs
farm
ers
-ar
tisan
s
unsk
illed
labo
rers
*
skill
edla
bor,
trade
rsw
age
earn
ers
Children (6-59 m) with diarrhea in the last 2 weeks
0%10%20%30%40%50%60%
yes no
Children (6-59 m) with diarrhea in the last 2 weeks
Mother ill with Diarrhea during last 2 weeks***
Incidence of diarrhea among children seems also to be related to the fact that goat or sheep meat is consumed in the household- increased goat meat consumption is correlated with increased diarrhea prevalence. This needs to be further confirmed and investigated.
No effects are observed caused by gender and age of the household head, and the level of education of the head or the spouse.
Timor Leste - Comprehensive Food Security and Vulnerability Analysis
69
5. Part V Recommendations for program interventions Recommendations are made based on two main indicators: the food security groups (created from the combination of food access and food consumption), and child malnutrition, measured in children ages 6 to 59 months.
5.1. Priority areas and causes of food insecurity and vulnerability
Food insecure households are found throughout the country. Nationally, 20% of households are considered to be food insecure, 23% to be highly vulnerable, 21% to be moderately vulnerable, and 36% to be food secure. Looking at utilization, as measured by child nutrition, 57% of children between 6 and 59 months of age are underweight, 21% are wasted, and 46% are stunted. However, there are some geographic patterns to the prevalence of food secure households and to child undernutrition. It is important to note that the underlying causes for food insecurity, and therefore the ‘type’ of food insecurity, vary geographically.
Looking at the geographic distribution of the prevalence of the food insecure (as determined by food access and dietary diversity/frequency) The least food insecure area is VAM zone 1, located in the southern half of the country, where 40% of households are considered to be food insecure/highly vulnerable. The most food secure areas are the urban and peri-urban areas of Dili (VAM zone 5), where 29% of households are considered food insecure or highly vulnerable. The most food insecure areas are VAM zone 3, located in the north east quadrant of the country, with 51% of households considered food insecure/highly vulnerable, and Oceussi, where 49% of households are considered food insecure/highly vulnerable.
Looking at the 5 administrative Regions (Regiões), two areas stand out as having heightened food insecurity: Region 2, in the center of the country, with 53% of households considered food insecure or highly vulnerable, and Region 5 (Oecussi), with 49% of households considered food insecure/highly vulnerable.
Combining the food security prevalence stratified by Region and stratified by VAM zone, a mathematical prediction of the prevalence of food insecurity at each combination of Region and VAM zone is made. This parametric map is presented in Figure one. Here, the center/north areas appear to be the most food insecure, with prevalences of 58 to 59% of food insecure/highly vulnerable households. This is followed by the central and south west, and the south east areas of the country, with prevalences between 42 and 50%. The urban and peri-urban areas of Dili have a predicted prevalence of 29%. It should be noted that outside of the peri-urban area of Dili, the range of prevalences of food insecurity is not great.
Looking at moderate and severe child undernutrition by VAM zone, VAM zone 4 (Oecussi) has the highest levels of underweight children (70%), with 30% wasted and 20% stunted. This is followed by VAM zone 1 and 2, located in the west and south of the country. VAM zone 1 has 58% of children underweight, with 21% wasted, and 45% stunted. VAM zone 2 also has a underweight prevalence of 58%, with 15% stunting and 56% stunting. The urban and peri-urban area around Dili (VAM 5) has the lowest prevalence of underweight children (48%), with 17% wasting, and 35% stunting.
Looking at child undernutrition by Region, Region 5 (Oecussi) has the highest prevalence of underweight children at 69%, with 31% wasting and 39% stunting. This is followed by Region 4, in the west of the country, with 60% of children underweight, 27% wasted, and 46% stunted. Regions 1, 2, and 3 in the center and east of the country have similar levels of underweight prevalence (56%, 52%, and 54% respectively).
Looking at these two main indicators (food security groups and under 5 nutritional status), several general characteristics of the food insecure can be identified:
• Female headed households • Subsistence agriculturalists, those households relying primarily on agriculture for both the food
source and income generation, without access to livelihoods based on trading, skilled labor, or salaried jobs.
• Households without access to irrigated land • The uneducated • Households that are victims of shocks, particularly unemployment. • Households with poorer access to health care and services
Several underlying causes of food insecurity have been identified. These causes are related to food availability, although poor access and poor utilization appear to be the main causes. Several underlying causes of food insecurity have been identified.
Timor Leste - Comprehensive Food Security and Vulnerability Analysis
70
Poor access and poor utilization appear to be the main causes of food insecurity, although some causes are related to food availability. Some of the key underlying causes include: • Low purchasing power, related to livelihood methods. • Poor access to income generating activities outside of agriculture • General isolation and lack of infrastructure, particularly in the case of Oecussi • Poor access to healthcare, which is particularly linked to poor health status of children. • Inadequate sanitation and hygiene practices. • Food taboos and dietary practices lead to poor diets. • Poor access to adequate farmland, particularly irrigation
5.2. Current food and non food-aid interventions
Overall 5% of households in this survey stated having received food-aid in the previous six months while 10% indicated having benefited from assistance other than food-aid. Distribution of beneficiaries across Regions is detailed in Figure 5-a. For the 81 households having received food-aid the majority did so in the form of supplementary feeding.
Assistance other than food aid was provided to 166 households primarily by INGOs in the form of mosquito nets, agricultural assistance, medical services and construction materials.
5.3. Food and non-food intervention recommendations by priority areas and groups
Several interventions are recommended, due to the varying underlying causes of food insecurity, and the distribution of these groups. WFP can take a lead role in programs that are primarily food centered, but it is suggested that WFP partner with other UN organizations, NGOs, and government counterparts in the design and implementation of programs where food aid only plays a partial role. Finally, WFP can provide incentive and support to other organizations that can deliver non-food based food security and livelihood protection programs.
• Maternal and child health programs. Targeting pregnant and nursing mothers and young children, with a nutrition education component focusing on improving diet through an increase in diversity. Additional aspects to this program could include HIV/AIDS education programs, health and hygiene education, and caring practices, focusing on breastfeeding and weaning practices. A food component to this program is appropriate, as an incentive for attendance and participation.
• Supplemental feeding programs. The high prevalence of wasting throughout the country suggests the need for supplemental feeding programs for children. Additional food rations to households with children in these programs are also appropriate. This should be combined with programs to improve care practices; water and sanitation programs; and health services, aimed at improving food utilization.
• School feeding. The prevalence of food insecurity is high throughout the country; school feeding should target all kids in the program areas. Therefore, school feeding should be targeted geographically (areas of increased food insecurity overall), as a tool to fight food security. School feeding may affect attendance (decreasing absenteeism). However, as enrollment is already high among all kids in all FS groups and between genders, school feeding may not improve enrollment of poor, food insecure, or girls. School feeding programs are also an area where nutrition education programs can be introduced.
Figure 49 - Percentage of households having received food or other assistance
0%
5%
10%
15%
20%
25%
Region 1 Region 2 Region 3 Region 4 Region 5
p
Food aid External assistance other than food aid
Timor Leste - Comprehensive Food Security and Vulnerability Analysis
71
• Agricultural programs. These should focus on improving agricultural methods and improving access to agricultural inputs and irrigation, as well as increasing the use of livestock (farmers who also use livestock as part of their livelihoods appear less food insecure than those who rely upon cultivation of field crops alone). Food insecure households can be targeted for these programs through Food for Work or Food for Training, or other agricultural extension programs.
• Micro-credit schemes, micro-finance programs, and small enterprise creation programs. These programs can focus on increasing income, purchasing power and access to credit.
• Targeting should be geographic primarily, followed by socio-economic targeting at the household (or individual) level.
o Maternal and child health programs, although needed throughout the country, are most needed in Region 5 (Oecussi), followed by Region 4 (in the West of the country), then followed by Regions 1, 2, and 3 (in the center and west of the country).
o Supplementary feeding programs should concentrate first on Region 5 (Oecussi), and Region 4 (in the west), although the levels of Wasting in the rest of the country my warrant supplementary feeding programs there as well.
o School feeding programs have a role to play throughout the country. Rural areas outside of Dili and the peri-urban areas appear to have a greater need, although even in the more food secure urban and peri-urban areas school feeding will have a positive role.
o Agricultural programs have a role throughout the country. Areas of principle concern include Oecussi, where access to agricultural land, as well as use of livestock as part of livelihoods, is the lowest.
5.4. Recommendations for future studies
Future household surveys in Timor Leste should perhaps adopt the lower administrative level of the Aldeias as a base for sampling (and then, necessarily, a larger sample size), given the availability of information and the logistical practicalities. Key indicators include agricultural and dietary practices. Although expenditure data did show some interesting trends, the use of percent expenditures on food as an indicator of food security does not appear to be a viable indicator, whether due to poor data collection/response giving faulty results, or reliable data that does not provide much insight in the case of East Timor.
Additionally, regular data collection to monitor the food security situation is recommended. Key indicators to include are rainfall, planting and harvest information, market price information, and dietary diversity. Other indicators to include, potentially with support from partners, include health and nutrition data such as anthropometry of children under 5.
Timor Leste - Comprehensive Food Security and Vulnerability Analysis
72
Annex 1 - Additional Data Tables 1. Sample information
Individuals Sampled- Population by Age and Sex
Age Cohort Male % Female % Sum Total
% of Total
0-5 years 1238 51% 1203 49% 2441 22%
6-14 years 1514 52% 1404 48% 2918 27%
15-19 years 600 53% 523 47% 1123 10%
20-24 years 382 49% 401 51% 783 7%
25-29 years 293 43% 382 57% 675 6%
30-34 years 345 50% 351 50% 696 6%
35-39 years 307 51% 300 49% 607 6%
40-59 years 727 54% 610 46% 1337 12%
60 years and above 189 50% 191 50% 380 3%
Total 5595 51% 5365 49% 10960 100%
2. Demographics
VAM zones Female Headed
HHs
Married Divorced Apart Widow Single Age of Head of
HH
Average No. of
members
vam1 6% 88% 0% 0% 6% 0% 42 7
vam2 8% 91% 0% 1% 6% 1% 40 7
vam3 7% 94% 0% 1% 4% 0% 42 6
vam4 8% 88% 0% 0% 8% 2% 41 5
vam5 9% 90% 1% 1% 5% 2% 40 7
Administrative Regions
Region 1 7% 90% 0% 1% 4% 1% 41 6
Region 2 8% 92% 0% 0% 6% 1% 41 7
Region 3 7% 91% 0% 1% 5% 1% 41 7
Region 4 6% 87% 0% 1% 8% 1% 42 6
Region 5 8% 88% 0% 0% 8% 2% 41 5
FS class
Food Insecure 10% 90% 0% 0% 6% 1% 41 7
Highly Vulnerable 9% 90% 0% 1% 7% 1% 41 7
Moderately Vulnerable 5% 92% 0% 0% 4% 1% 41 7
Food Secure 7% 89% 0% 0% 6% 1% 41 6
Livelihood Groups
Ordinary farmers 9% 89% 0% 0% 7% 1% 41 6
Farmers - small livestock
8% 88% 0% 1% 8% 1% 43 7
Petty traders 7% 90% 0% 2% 6% 1% 42 7
Farmers / artisans 3% 95% 1% 0% 1% 0% 41 7
Unskilled laborers 5% 91% 2% 0% 0% 2% 37 7
Skilled labor / traders 12% 97% 0% 0% 3% 0% 39 7
Wage earners 4% 94% 0% 0% 2% 2% 37 7
Timor Leste - Comprehensive Food Security and Vulnerability Analysis
Timor Leste - Comprehensive Food Security and Vulnerability Analysis
75
5. Credit
VAM Zones Do you borrow money from
relative/friends?
Do you borrow money from
charities/NGOs?
Do you borrow
money from local lender?
Do you borrow
money from bank?
Do you borrow money from
co-operatives?
NO access to
credit
Have you often purchase food on
credit/borrow money to buy food?
vam1 3% 2% 1% 4% 0% 87% 7%
vam2 9% 3% 0% 4% 0% 84% 15%
vam3 3% 0% 0% 2% 1% 85% 5%
vam4 2% 0% 0% 0% 0% 95% 0%
vam5 3% 2% 0% 8% 0% 84% 9%
Administrative
Regions
Region 1 1% 0% 0% 1% 0% 88% 2%
Region 2 6% 2% 1% 3% 1% 84% 11%
Region 3 5% 2% 0% 6% 1% 85% 11%
Region 4 5% 4% 1% 5% 0% 83% 11%
Region 5 2% 0% 0% 0% 0% 95% 0%
FS class
Food Insecure 7% 1% 0% 2% 1% 86% 13%
Highly Vulnerable 5% 3% 0% 1% 1% 88% 7%
Moderately Vulnerable 4% 2% 0% 4% 0% 86% 8%
Food Secure 2% 2% 1% 7% 0% 84% 7%
Livelihood Groups
Ordinary farmers 4% 1% 0% 1% 1% 91% 6%
Farmers - small livestock 2% 1% 0% 1% 0% 94% 6%
Petty traders 7% 8% 2% 7% 1% 66% 18%
Farmers / artisans 3% 2% 1% 1% 0% 89% 2%
Unskilled laborers 13% 0% 0% 15% 0% 64% 21%
Skilled labor / traders 3% 3% 0% 16% 0% 75% 15%
Wage earners 5% 1% 0% 17% 1% 76% 13%
Timor Leste - Comprehensive Food Security and Vulnerability Analysis
76
6. Livestock VAM Zones Do you
have any farm-
animals?
cows/bullocks
buffaloes goats sheep chickens/ducks/g
ooses
pigeons horses pigs other animals
vam1 97% 2 1 1 0 6 0 0 3 1
vam2 96% 1 0 1 0 5 0 1 2 1
vam3 96% 1 2 2 1 5 0 0 3 2
vam4 96% 1 1 1 0 3 0 0 2 1
vam5 77% 0 0 1 0 3 0 0 2 1
Administrative Regions
Region 1 97% 1 2 2 1 6 0 1 3 2
Region 2 96% 1 1 1 0 5 0 1 3 1
Region 3 87% 0 0 1 0 3 0 0 2 1
Region 4 96% 2 1 2 0 6 0 0 3 1
Region 5 96% 1 1 1 0 3 0 0 2 1
FS class
Food Insecure 94% 1 0 1 0 4 0 0 2 1
Highly Vulnerable 94% 1 1 2 0 5 0 0 3 1
Moderately Vulnerable 94% 1 1 1 0 5 0 0 3 1
Food Secure 91% 1 1 1 0 5 0 0 3 1
Livelihood Groups
Ordinary farmers 94% 1 0 1 0 4 0 0 2 1
Farmers - small livestock 98% 3 2 2 1 8 0 1 4 2
Petty traders 92% 2 0 1 0 5 0 0 2 1
Farmers / artisans 96% 1 1 1 0 4 0 1 2 1
Unskilled laborers 88% 1 0 1 0 4 0 0 2 1
Skilled labor / traders 88% 0 1 2 0 4 2 0 2 1
Wage earners 81% 1 0 1 0 4 0 0 2 1
Timor Leste - Comprehensive Food Security and Vulnerability Analysis
77
7. Agriculture VAM Zones Access to
agriculture land?
Is your land
irrigated?
Number of months your
maize harvest lasted
Do you use chemical
pesticides/herbicides?
Do you have a kitchen garden?
vam1 92% 35% 6 6% 78%
vam2 93% 19% 5 1% 98%
vam3 97% 14% 4 1% 65%
vam4 69% 43% 5 9% 98%
vam5 20% 83% 1 1% 49%
Administrative Regions
Region 1 97% 7% 5 2% 61%
Region 2 97% 28% 5 3% 80%
Region 3 57% 52% 3 1% 72%
Region 4 86% 41% 6 7% 93%
Region 5 69% 43% 5 9% 98%
FS class
Food Insecure 79% 24% 4 2% 75%
Highly Vulnerable 85% 27% 5 3% 77%
Moderately Vulnerable 77% 44% 5 3% 79%
Food Secure 76% 44% 4 5% 79%
Livelihood Groups
Ordinary farmers 93% 24% 5 3% 86%
Farmers - small livestock 90% 26% 5 3% 75%
Petty traders 69% 47% 4 2% 81%
Farmers / artisans 78% 38% 4 1% 76%
Unskilled laborers 39% 64% 1 5% 60%
Skilled labor / traders 41% 75% 2 3% 57%
Wage earners 37% 74% 2 4% 58%
Timor Leste - Comprehensive Food Security and Vulnerability Analysis
78
8. Ministry of Agriculture, Forest, and Fisheries food balance sheets (maize) Maize - Estimated production against population needs (mt). (production figures are for dried grains at 75% of total production)
38 Current MAFF estimations for population needs for maize and rice are of 105kg and 90kg respectively, per person per year. Needs are based on Indonesian consumption figures adjusted for local consumption patterns.
Timor Leste - Comprehensive Food Security and Vulnerability Analysis
79
9. Ministry of Agriculture, Forest, and Fisheries food balance sheets (rice)
Rice - Estimated production against population needs (mt) (production figures are for milled rice at 65% of total production)
Total 924,642 83,218 26,556 -56,662 33,405 -49,812 38,794 -44,423
39 Current MAFF estimations for population needs for maize and rice are of 105kg and 90kg respectively, per person per year. Needs are based on Indonesian consumption figures adjusted for local consumption patterns.
Timor Leste - Comprehensive Food Security and Vulnerability Analysis
Timor Leste - Comprehensive Food Security and Vulnerability Analysis
88
18. Knowledge of HIV/AIDS
Responses on various precautions to avoid AIDS
What can a person do to avoid getting HIV or the virus that causes AIDS?
Respondents (%)
Abstain from sex 8 % Use condoms 23 % Stay faithful to one partner 14 % Avoid sex with prostitutes 29 % Avoid sex with persons who have many partners 22 % Avoid sex with persons who inject drugs intravenously 11 % Avoid blood transfusions 14 % Avoid injections 8 % Avoid sharing of razors / blades 4 % Avoid kissing 2 % Avoid mosquito bites 5 % Seek protection from a traditional practitioner 1 % Note: Respondents offered multiple responses, Total number of respondents = 1629
Responses on various ways by which HIV/AIDS is transmitted Yes No Don’t know Can people reduce their chances of getting the AIDS virus by having just one sex partner who is not infected and who has no other partners?
55%
18%
27%
Can people reduce their chances of getting the AIDS virus by using a condom every time they have sex?
54%
16%
33%
Can people get the AIDS virus by sharing food with a person who has AIDS?
22% 42% 36%
Is it possible for a healthy-looking person to have the AIDS virus?
35% 18% 47%
Can the AIDS virus be transmitted from a mother to a child? 56% 12% 32% Can the AIDS virus be transmitted from a mother to her child during pregnancy?
54% 12% 34%
Can the AIDS virus be transmitted from a mother to her child during delivery?
51% 14% 35%
Can the AIDS virus be transmitted from a mother to a child by breastfeeding?
60% 8% 32%
Annex 2: Food access and food consumption score equations Food consumption scoring Principle component and cluster analysis were performed on the consumption scoring. Subjective scores reflecting the quality of the diet of each of these resulting groups were assigned by the analyst. Using these scores, a regression model was built to mimic the subjective scoring. As part of this model, a simple food variety score was calculated for each household: for each food group, the consumption frequency is divided by 8, and 0.48 is added to this number, and the result is rounded to the nearest whole number, then these values are summed. This value is referred to as diversity in the equation below. Next, food groups surveyed were further combined, with a maximum value of 7 days. These groups are cereals, roots/tubers, meat/poultry/fish, eggs/dairy, pulses, vegetables, and oil/butter. The regression analysis produces the following equation: Food Consumption Score = -2.727 + 0.155*cereals + 0.042*roots/tubers + 0.091*meat/poultry/fish + 0.074*eggs/dairy + 0.086*pulses + 0.107*vegetables + 0.190*oil/butter + 0.143*diversity This equation was then applied to each household. Scores below 0.5 were converted to 0.5, scores above 4.5 were converted to 4.5. This process gives the food consumption scores. Food access scoring A similar methodology was used for food access. After creating the clusters using principle component and cluster analysis, a subjective score reflecting the level of food access was applied to each of the groups between 0.5 and 4.5. Using these scores, a regression model was built to mimic the subjective scoring. As part of this regression, model, the following variables were included:
Access to agricultural land (yes/no) Access to kitchen garden (yes/no) Food expenditure as proportion of total expenditures (as decimal percent) Monthly per capita total expenditures (log of dollar value) • Having irrigation on agriculture land (yes/no)
This regression model resulted in the following equation: Food Access Score = - 0.194 + 0.823 * (access to agricultural land) + 0.167 * (access to kitchen garden) + 0.679 * (food expenditure percent) + 0.151 * (per capita expenditure) + 0.342 * (irrigation) This equation was then applied to each household. Scores below 0.5 were converted to 0.5; scores above 4.5 were converted to 4.5. This process gives the food access score.
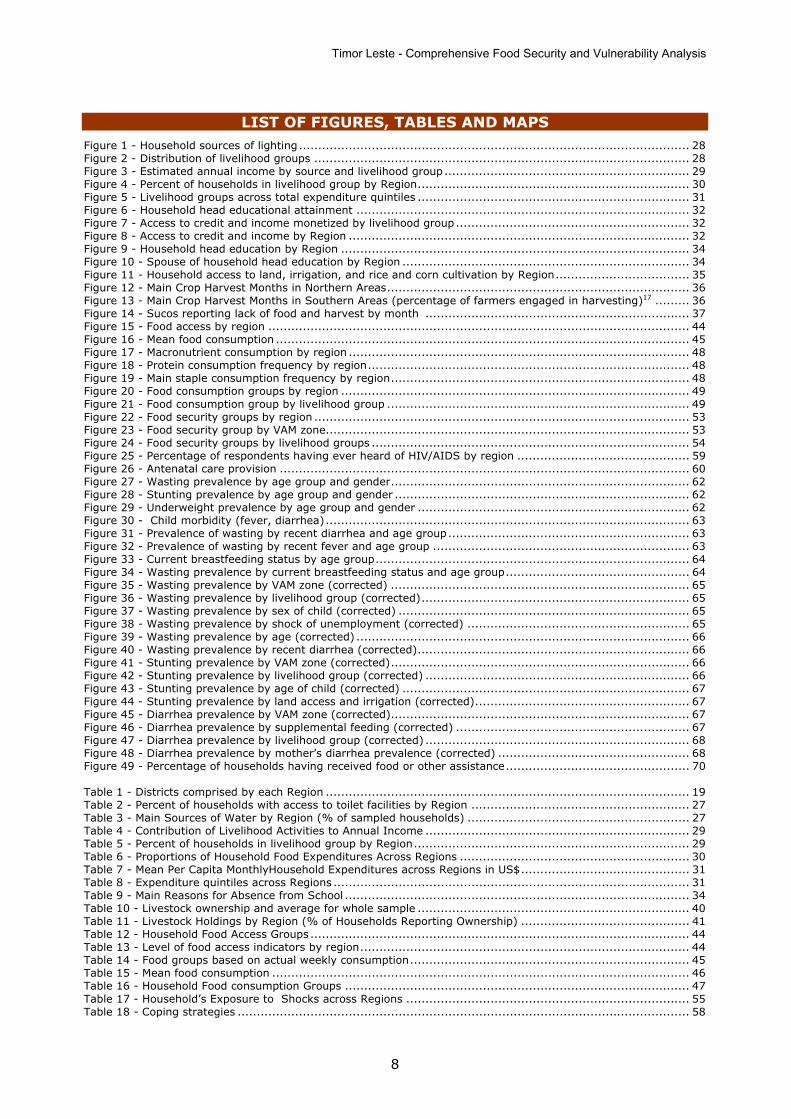

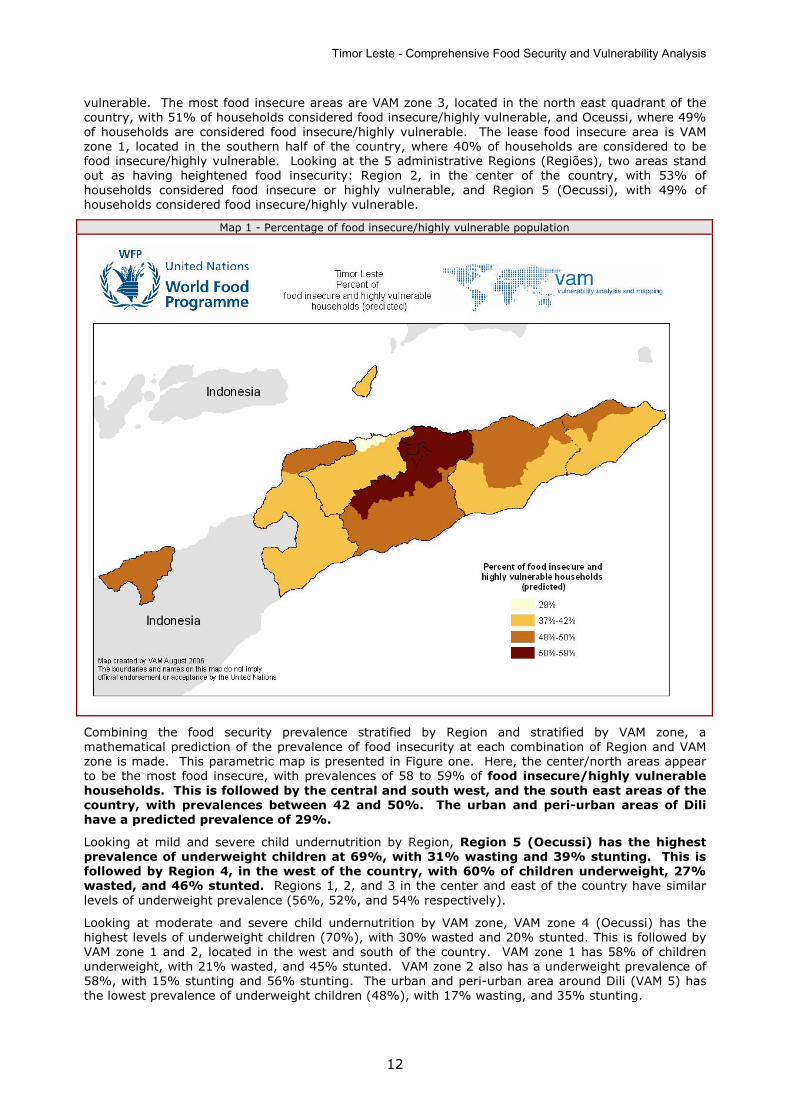
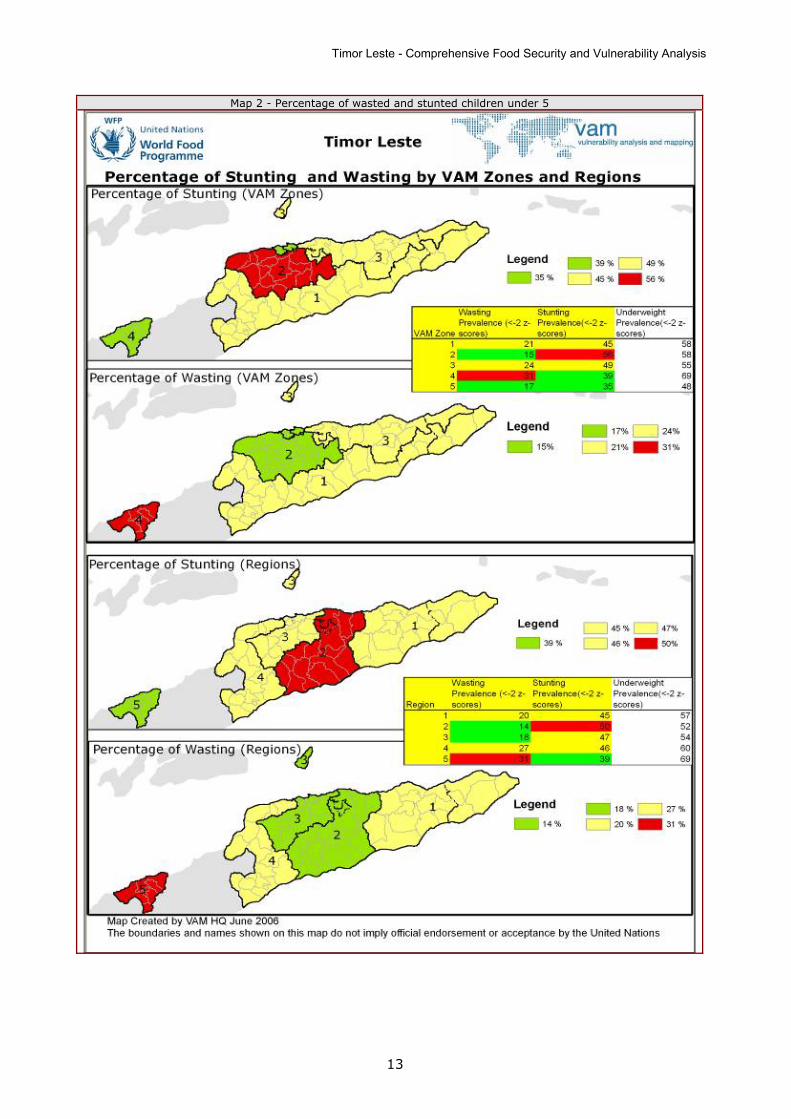
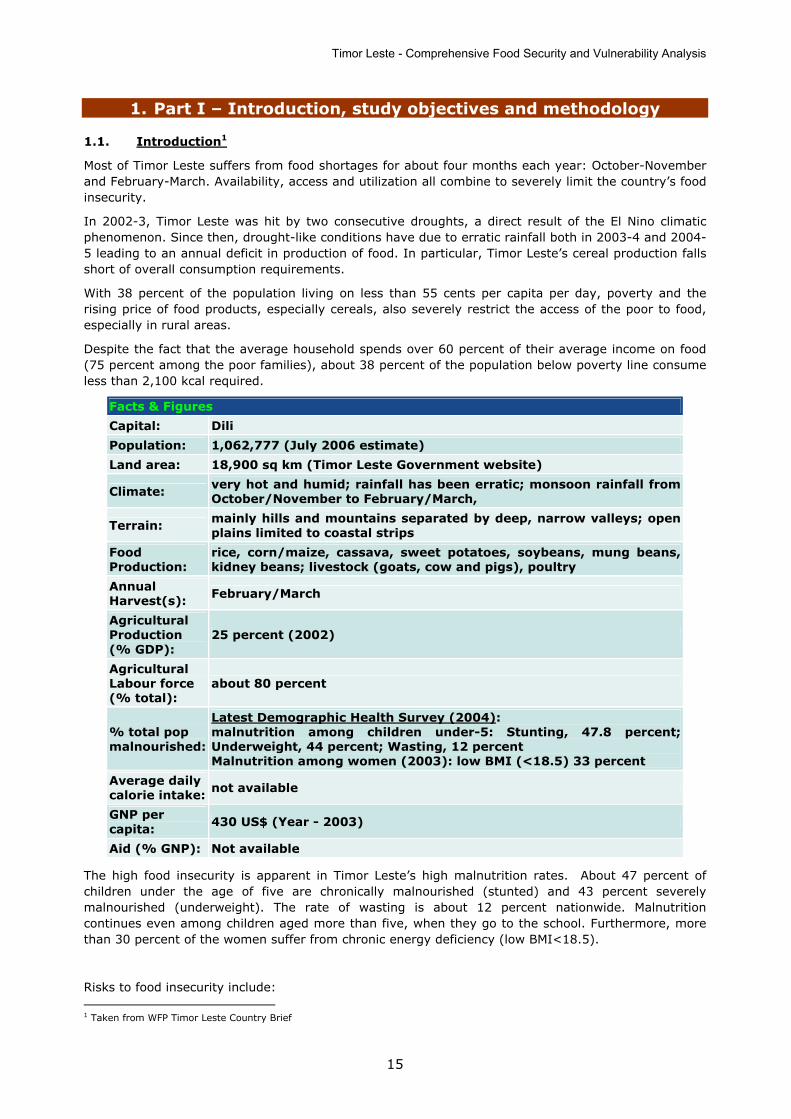
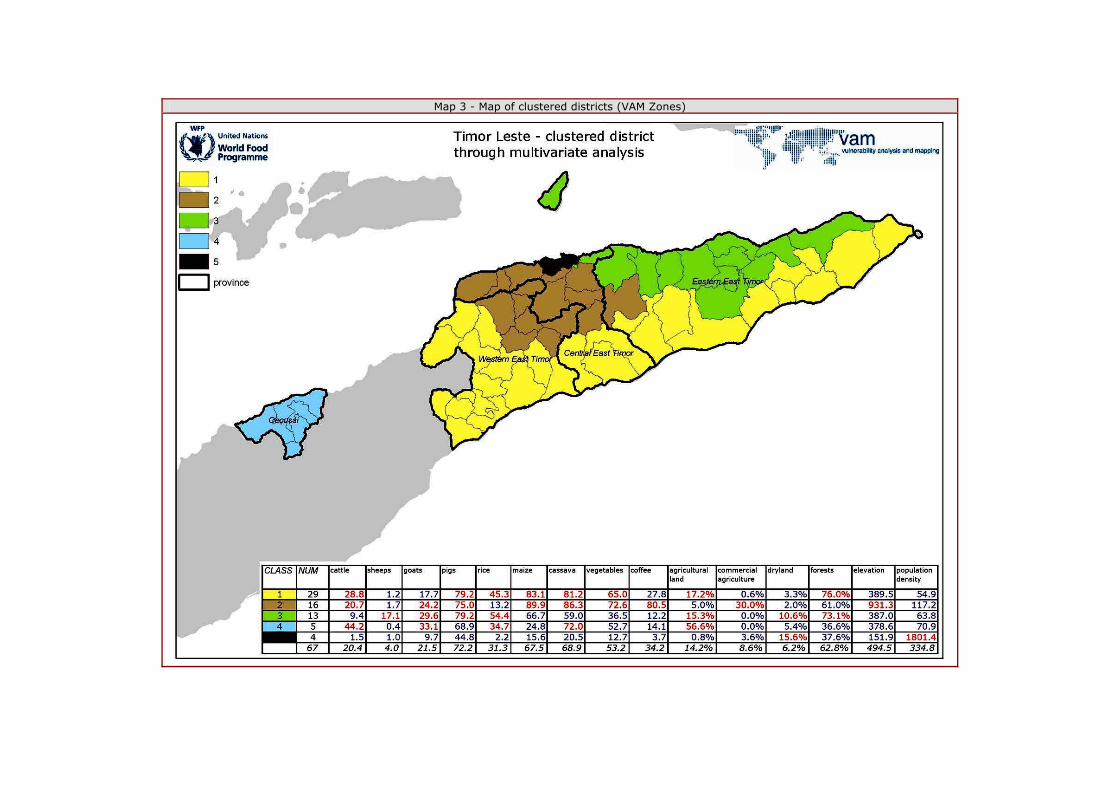
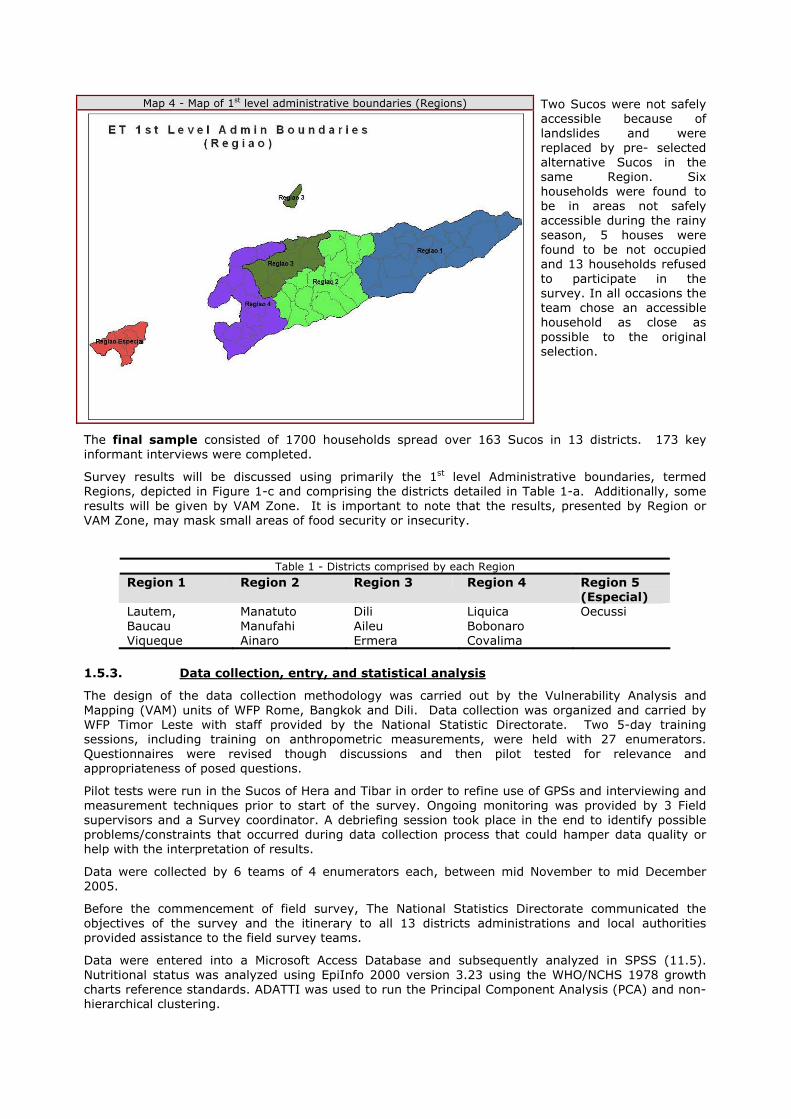
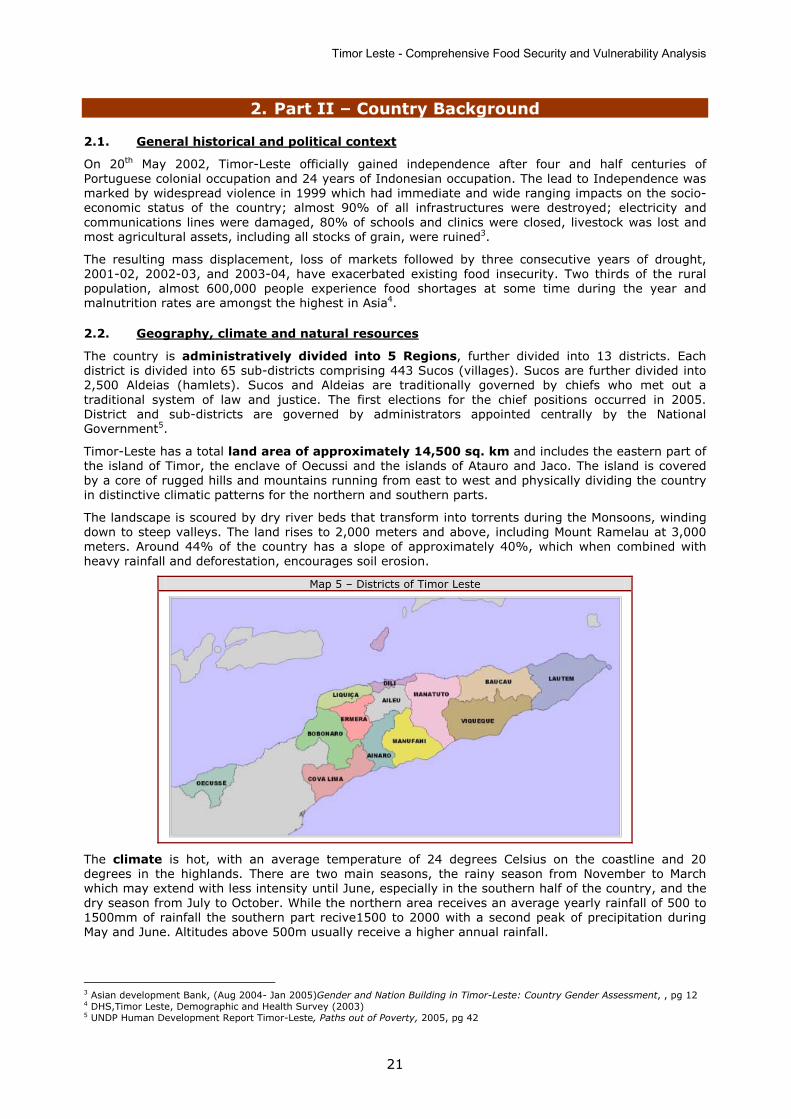
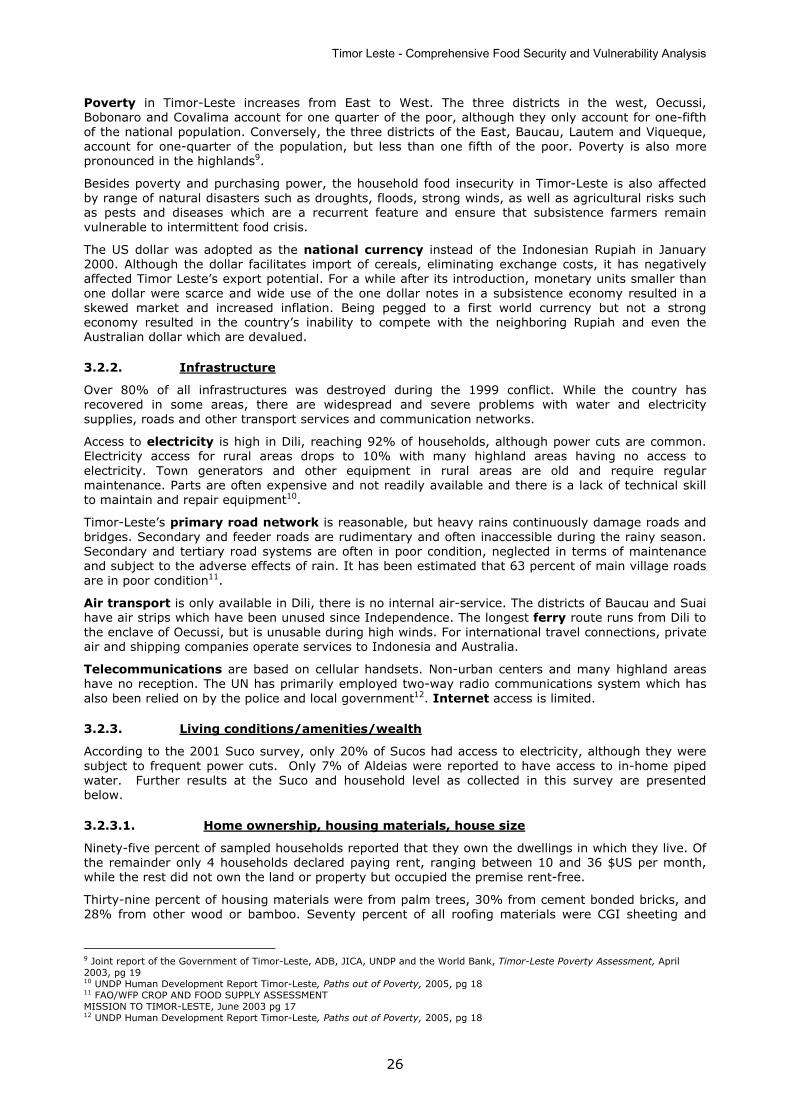
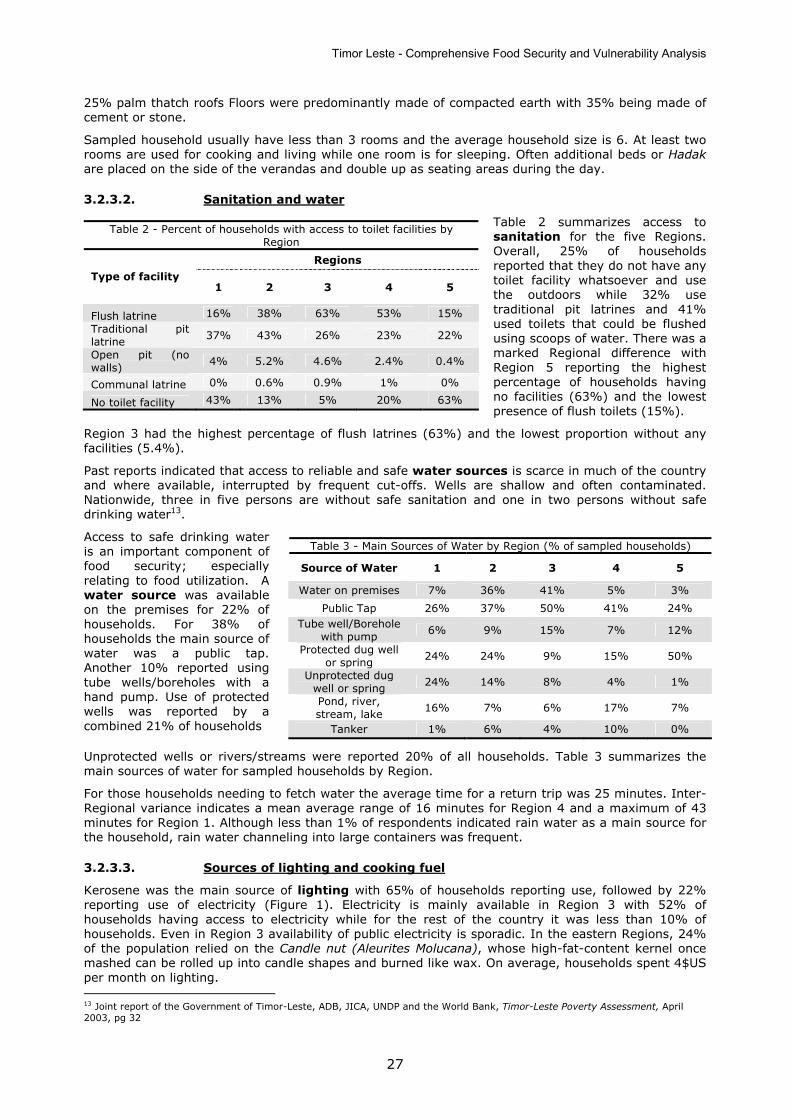
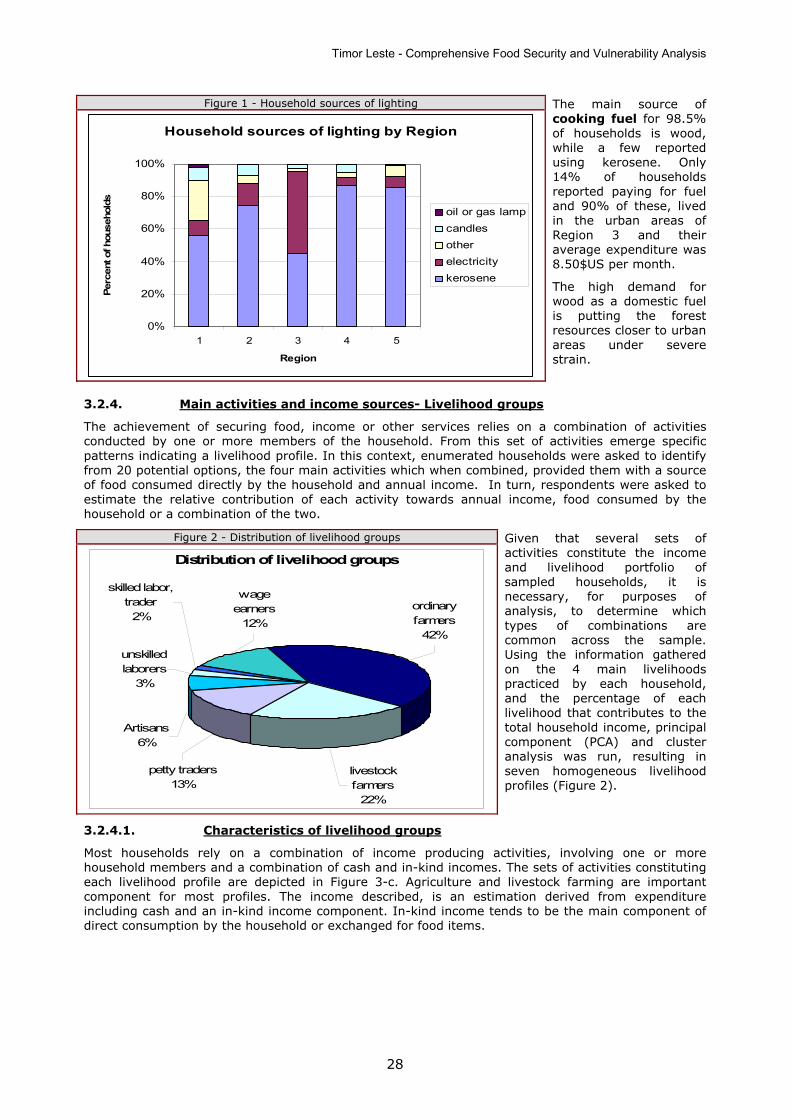
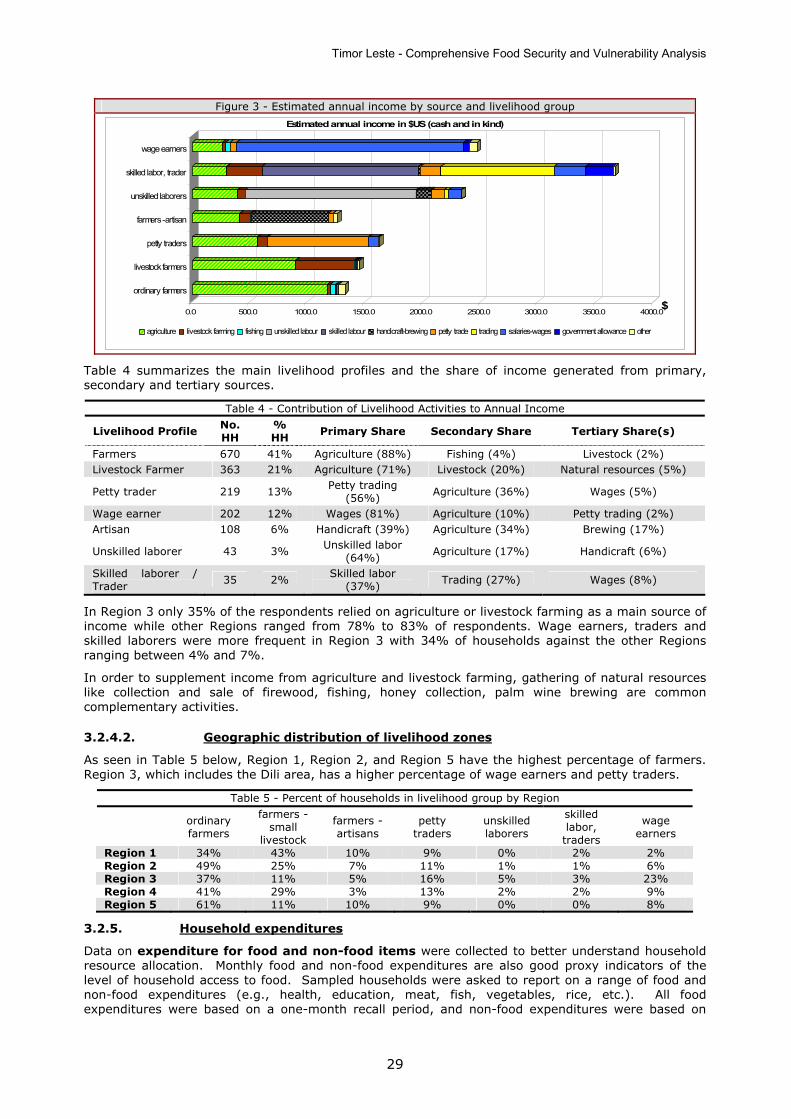
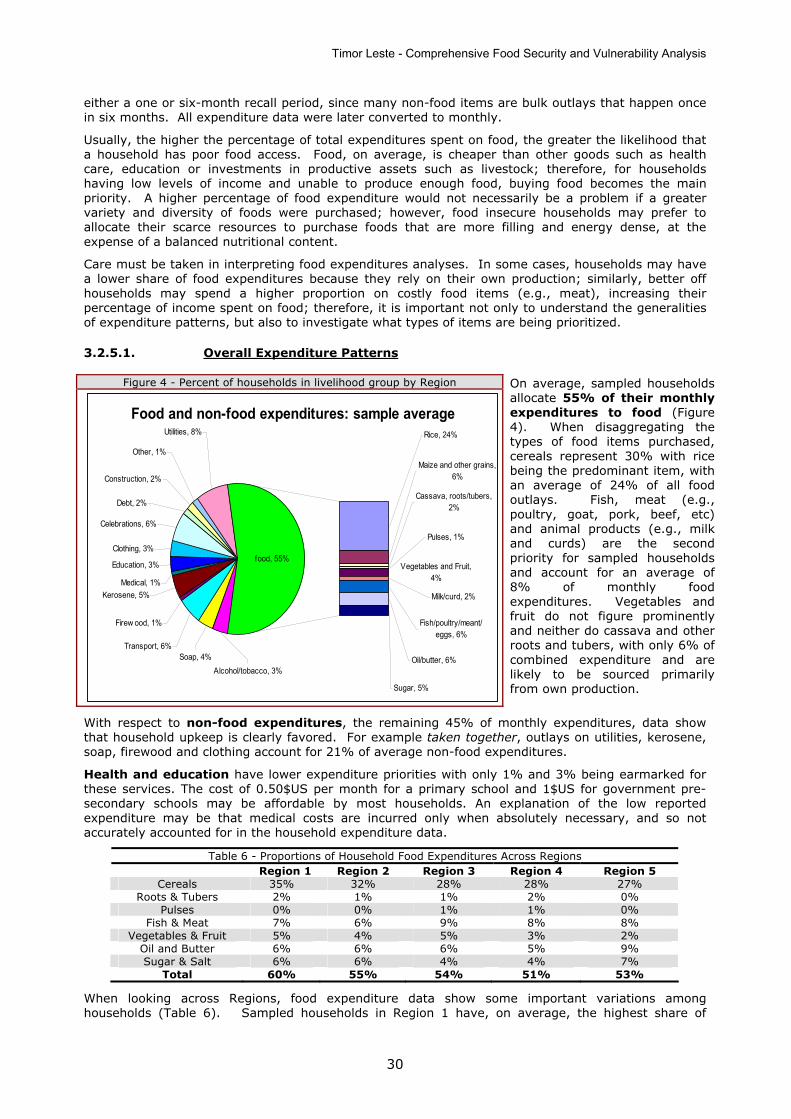
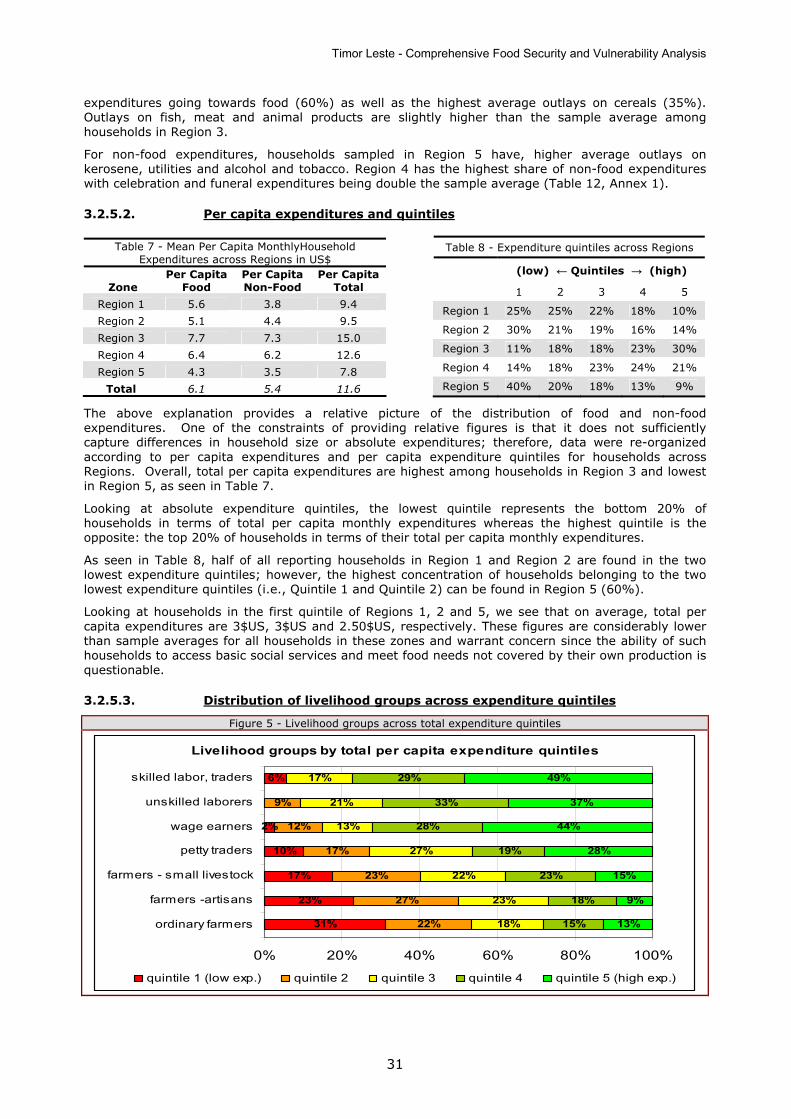
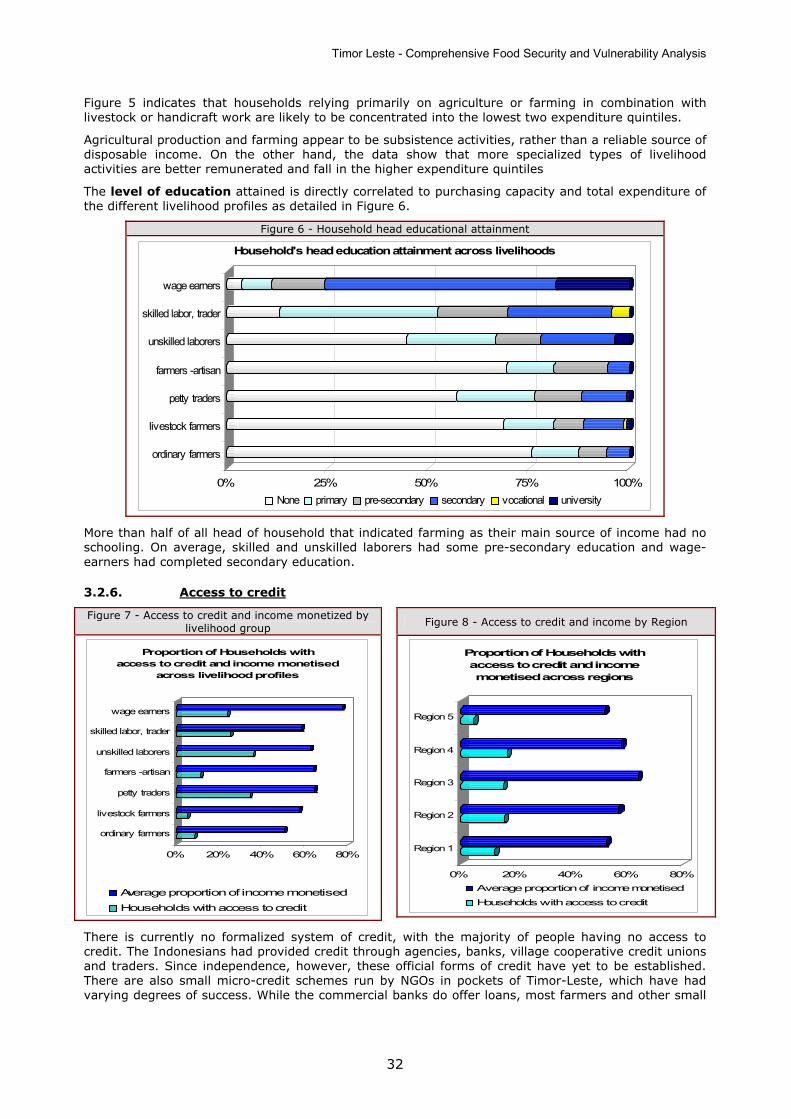
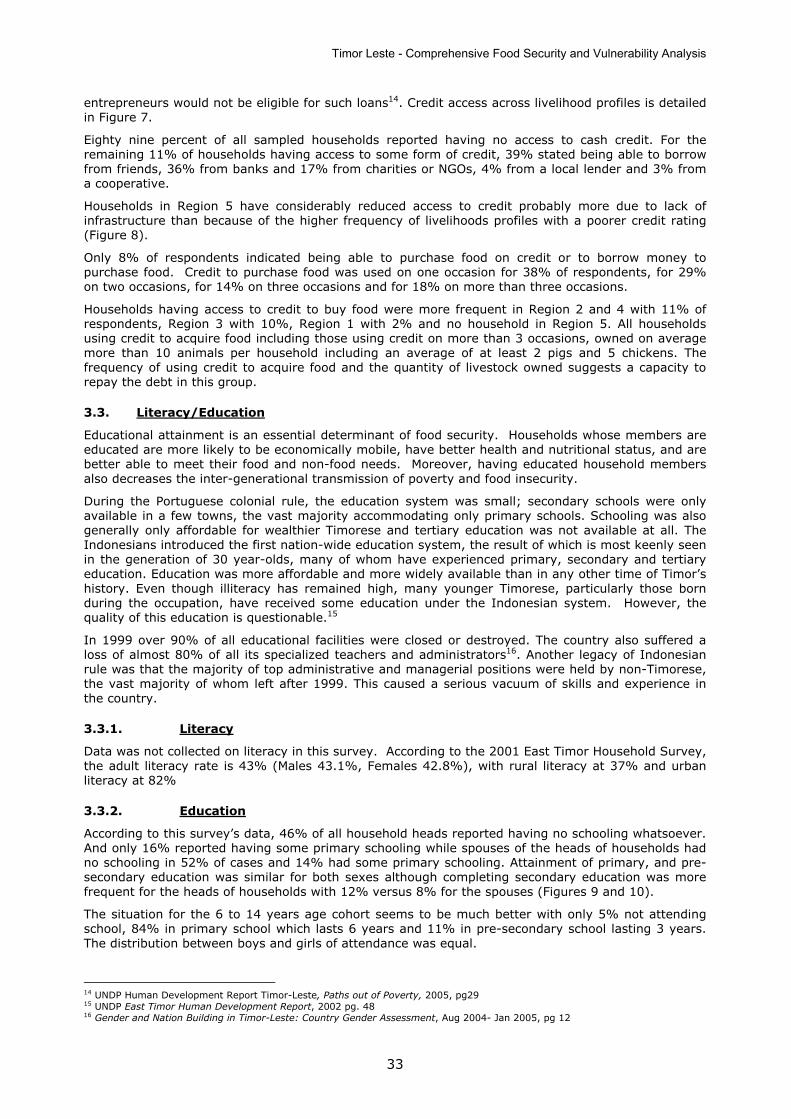
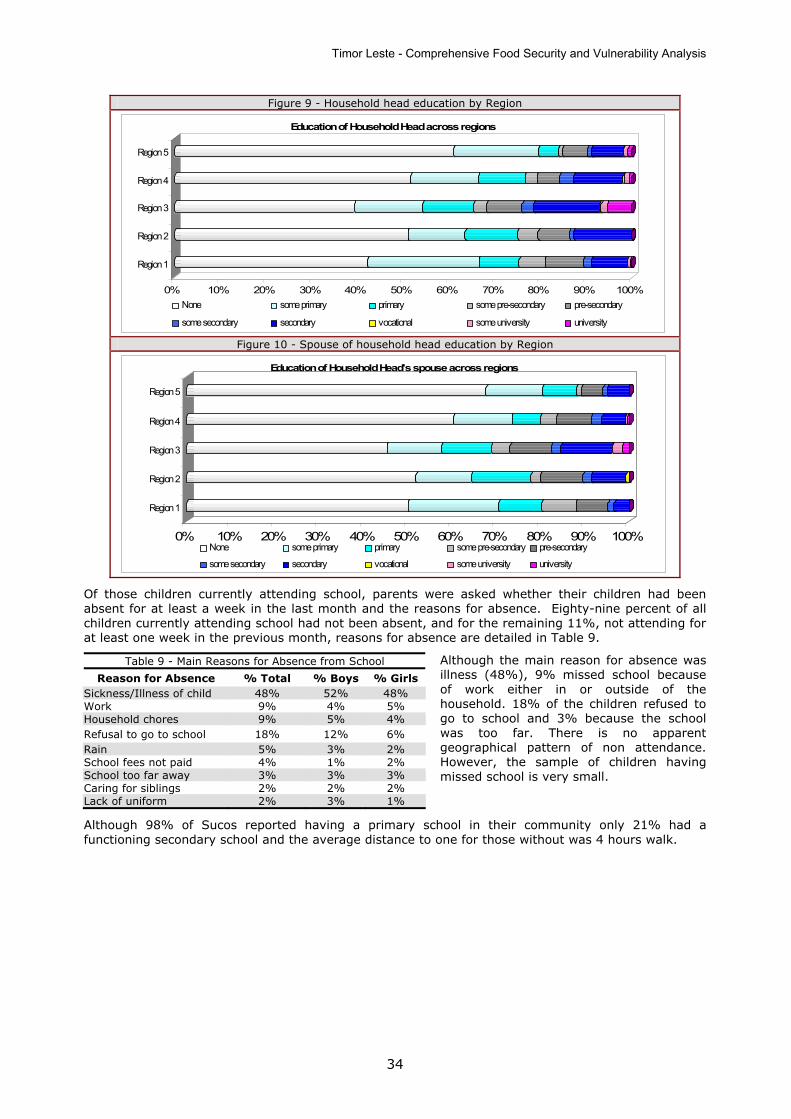
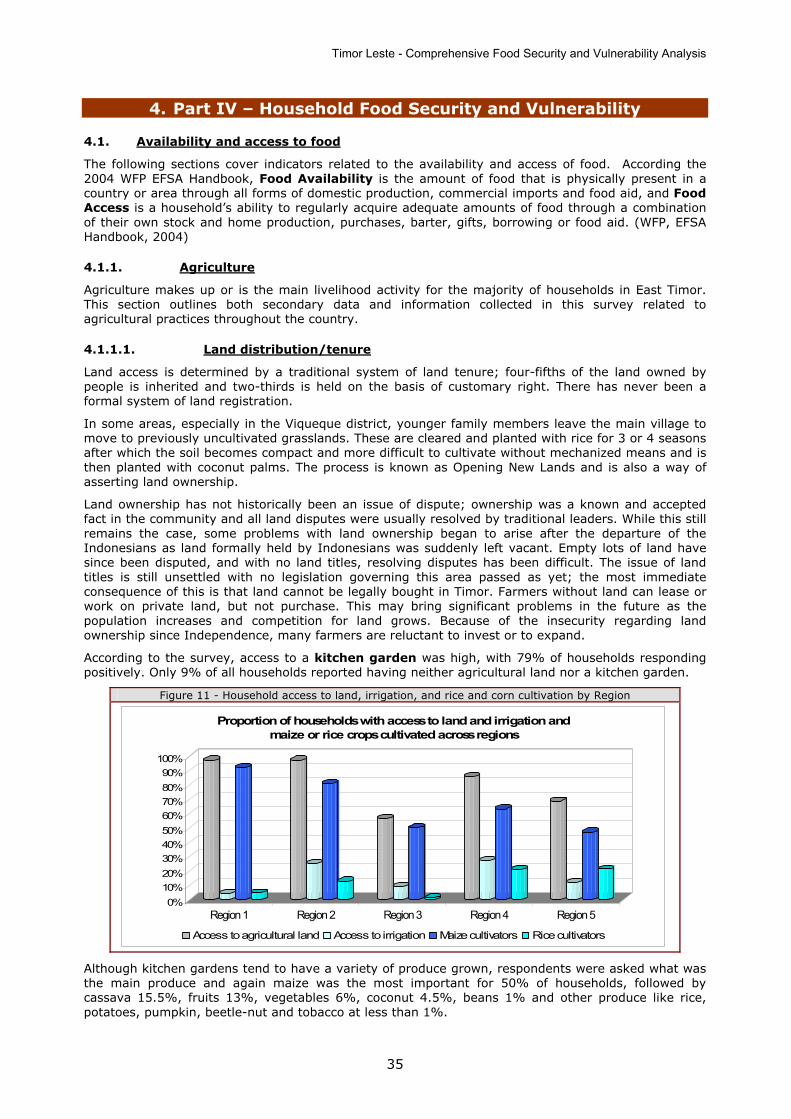
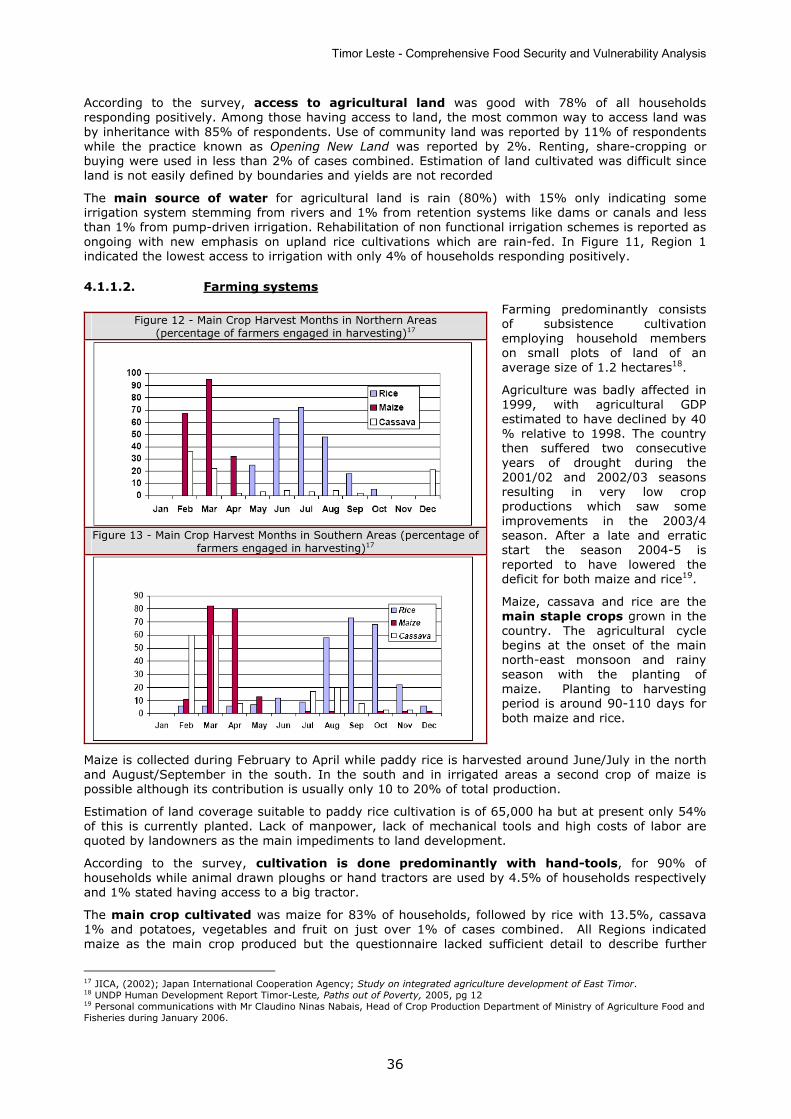
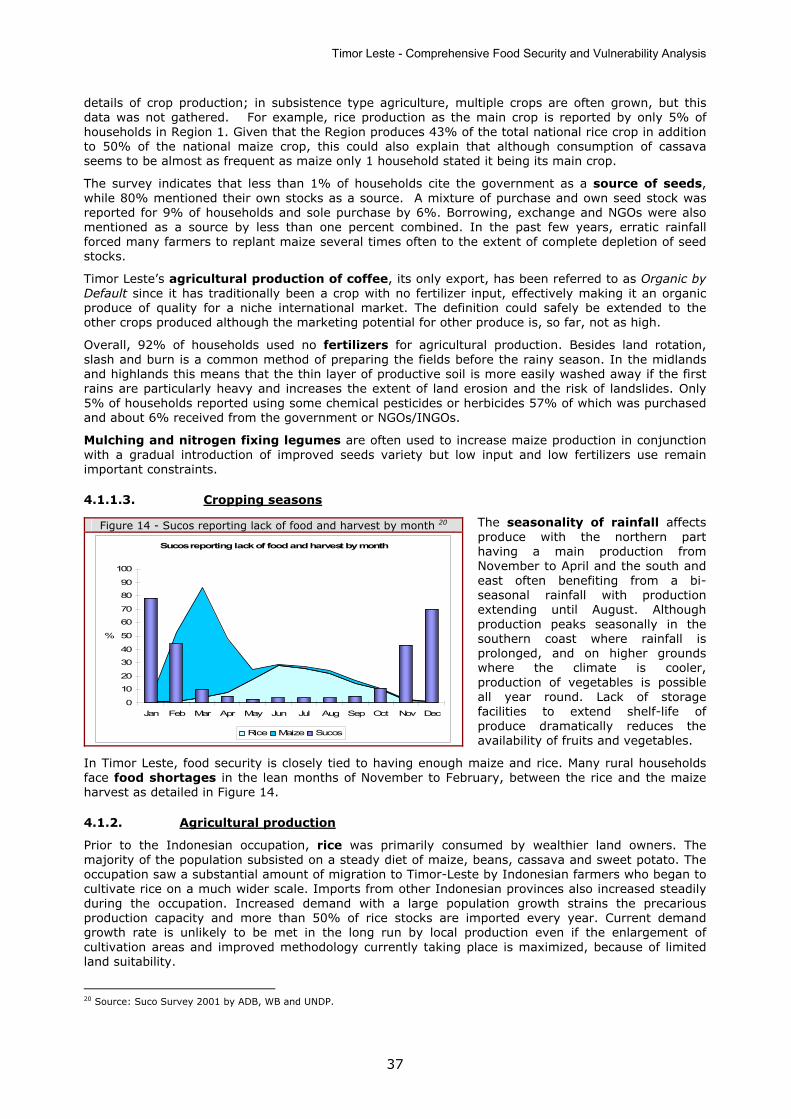
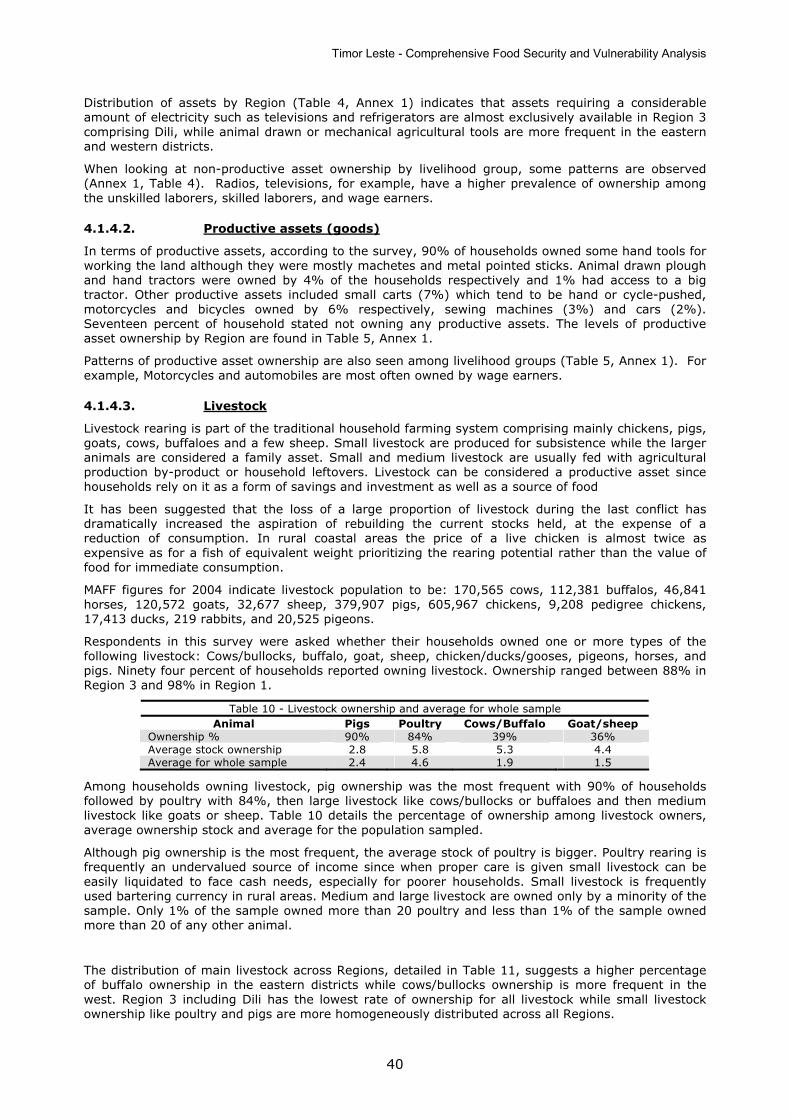
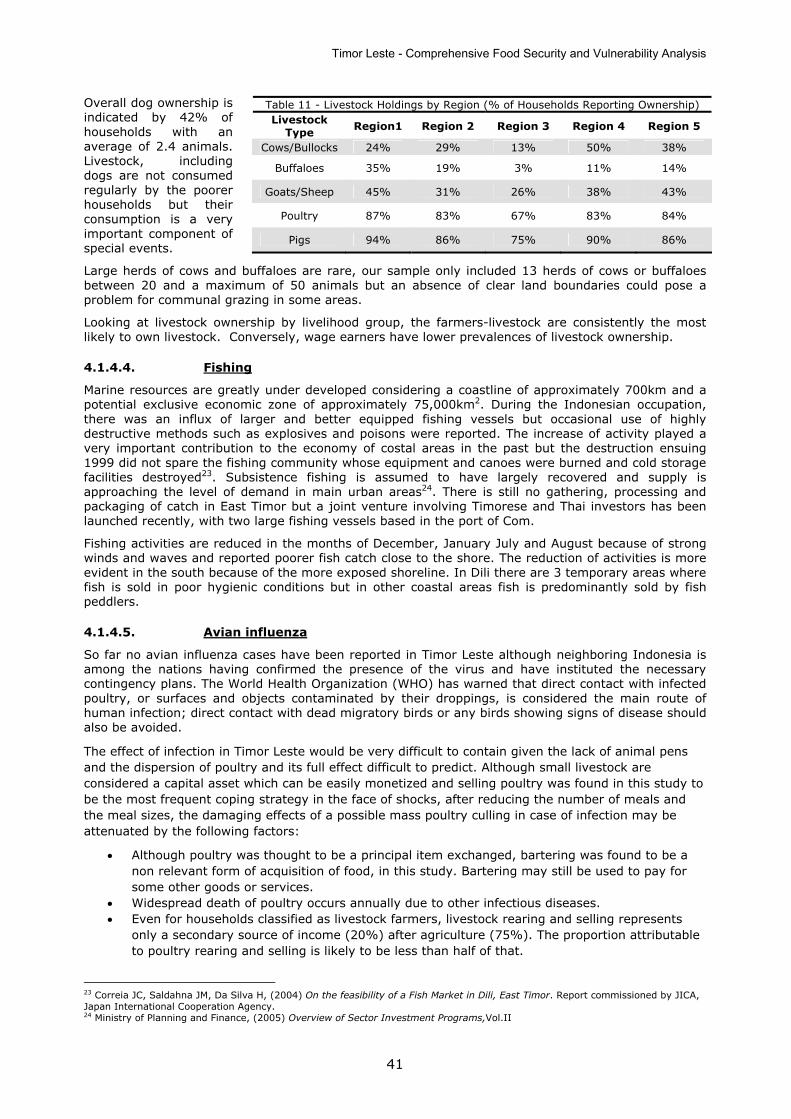
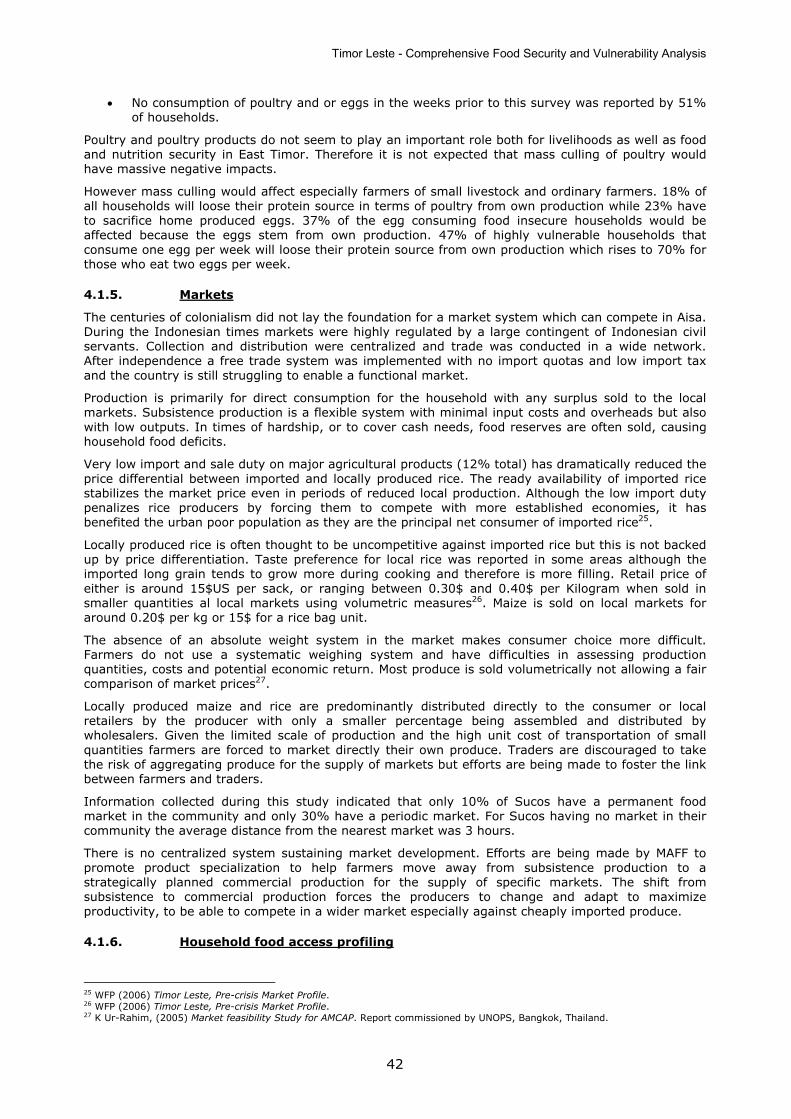
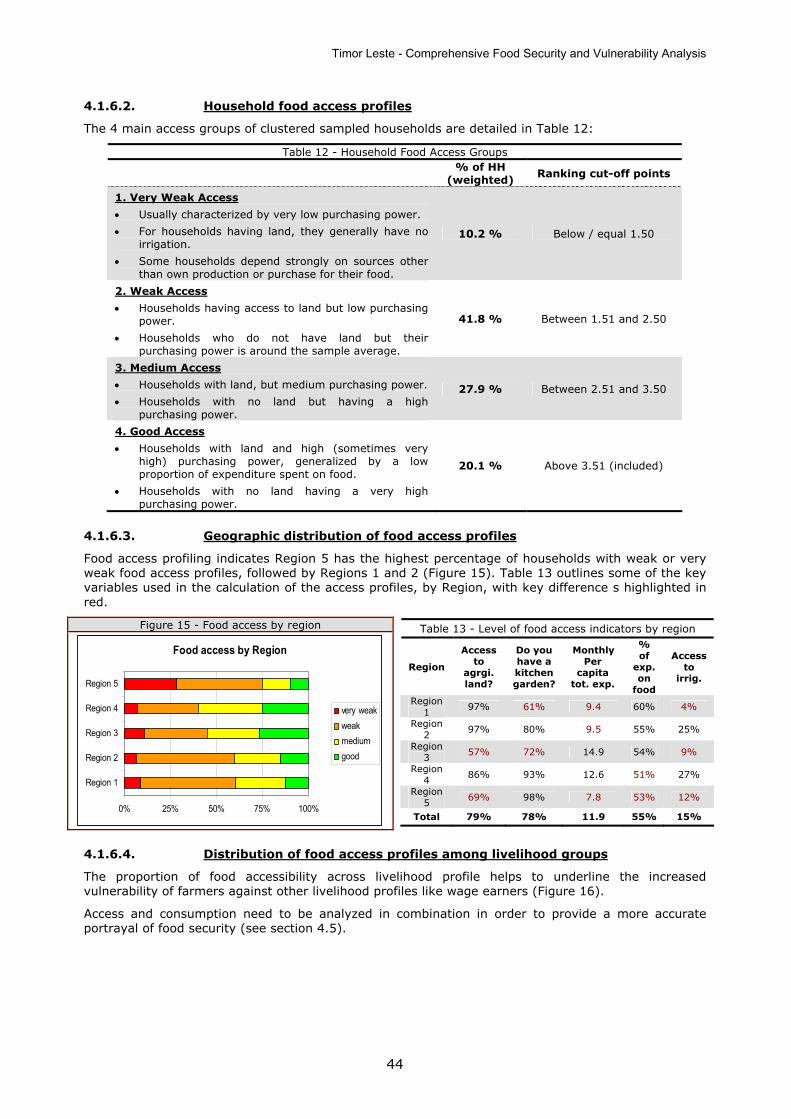
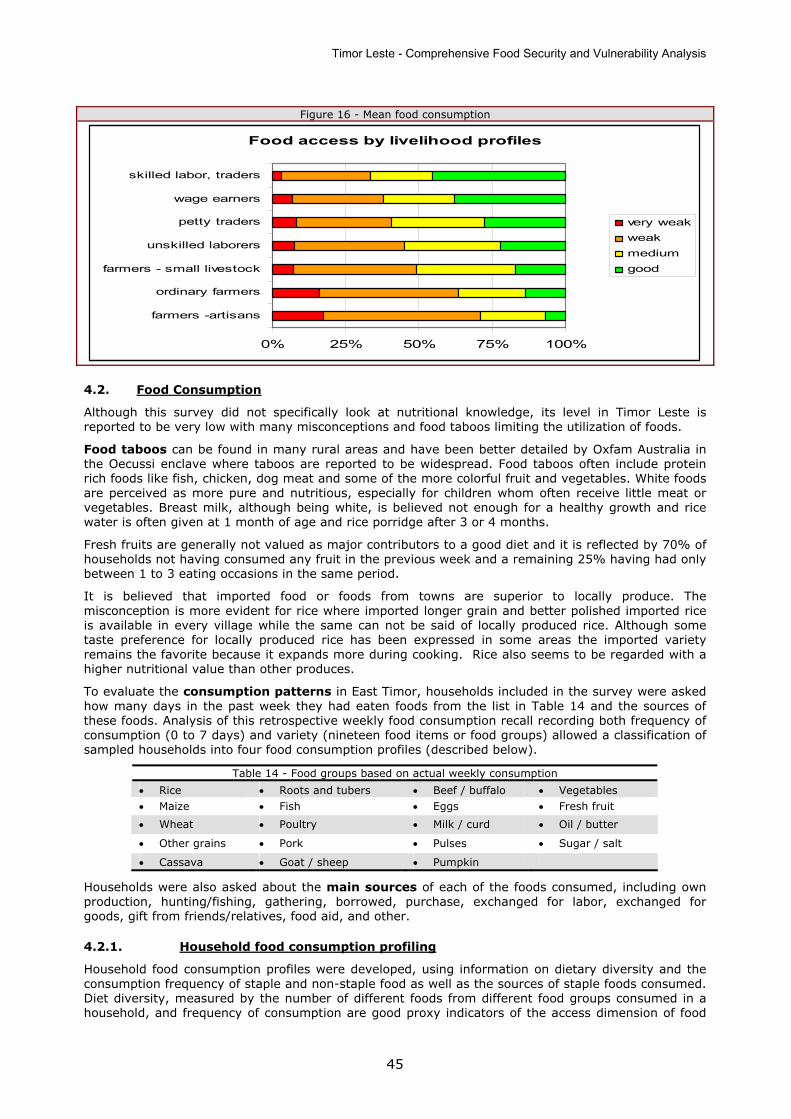
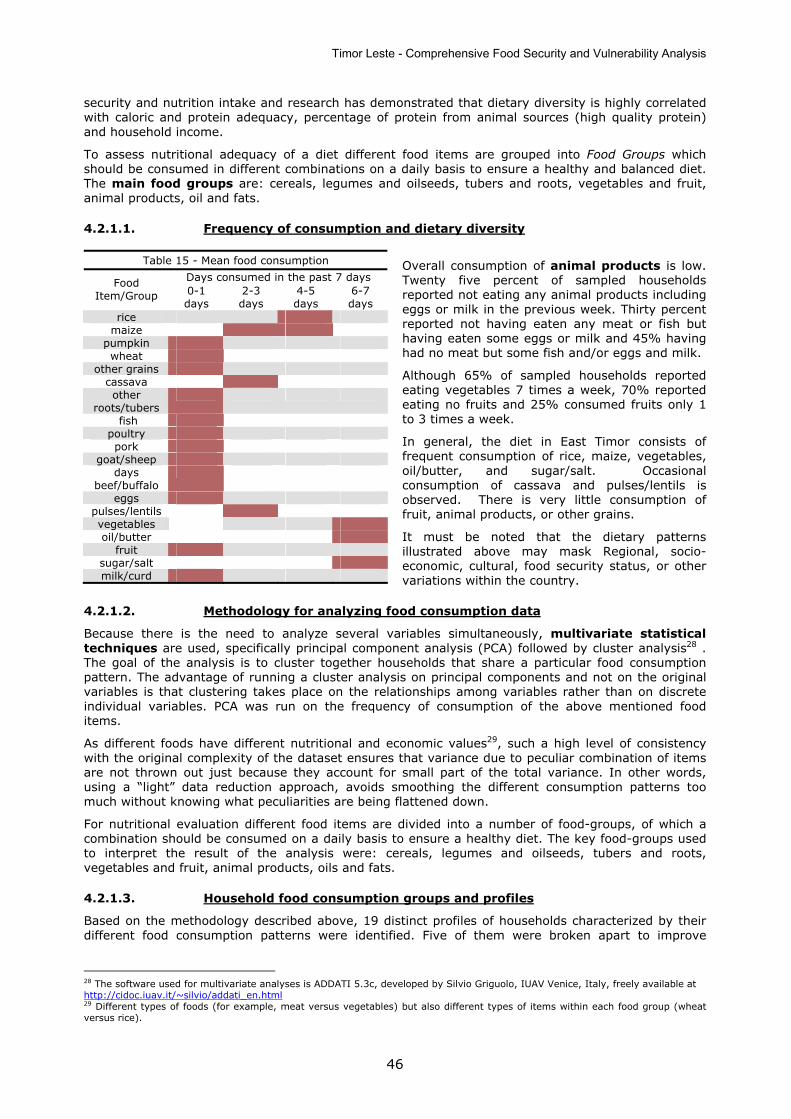
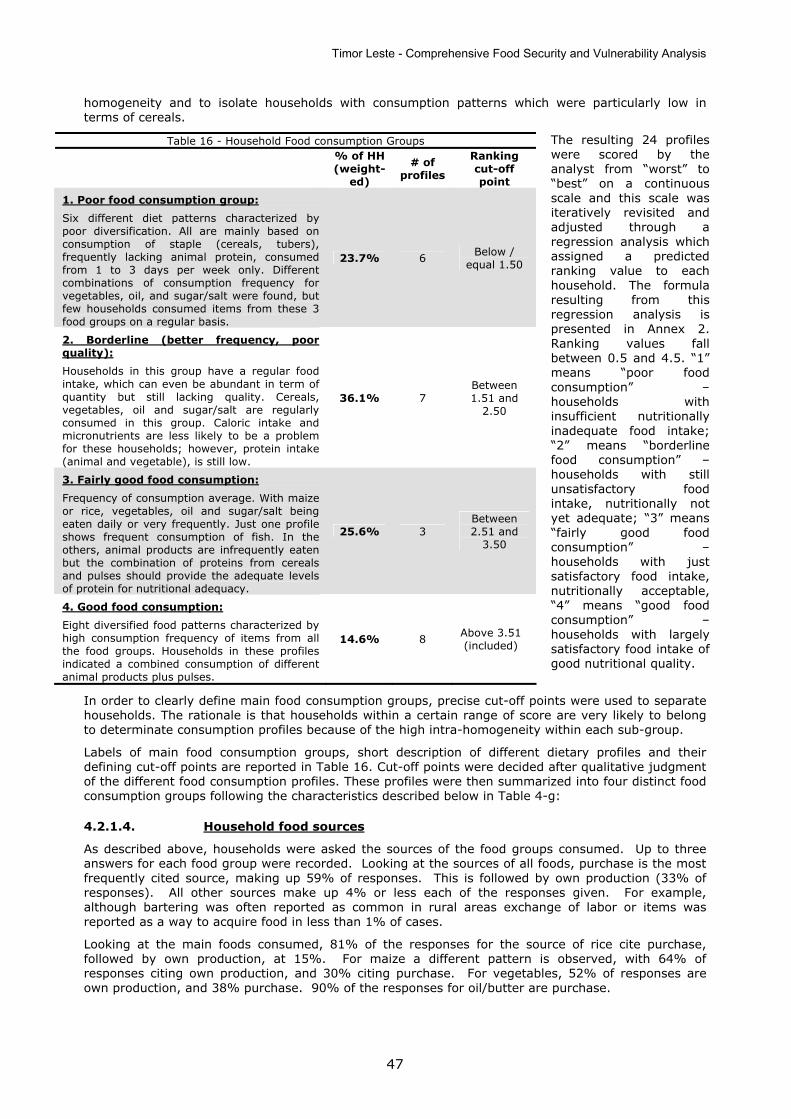
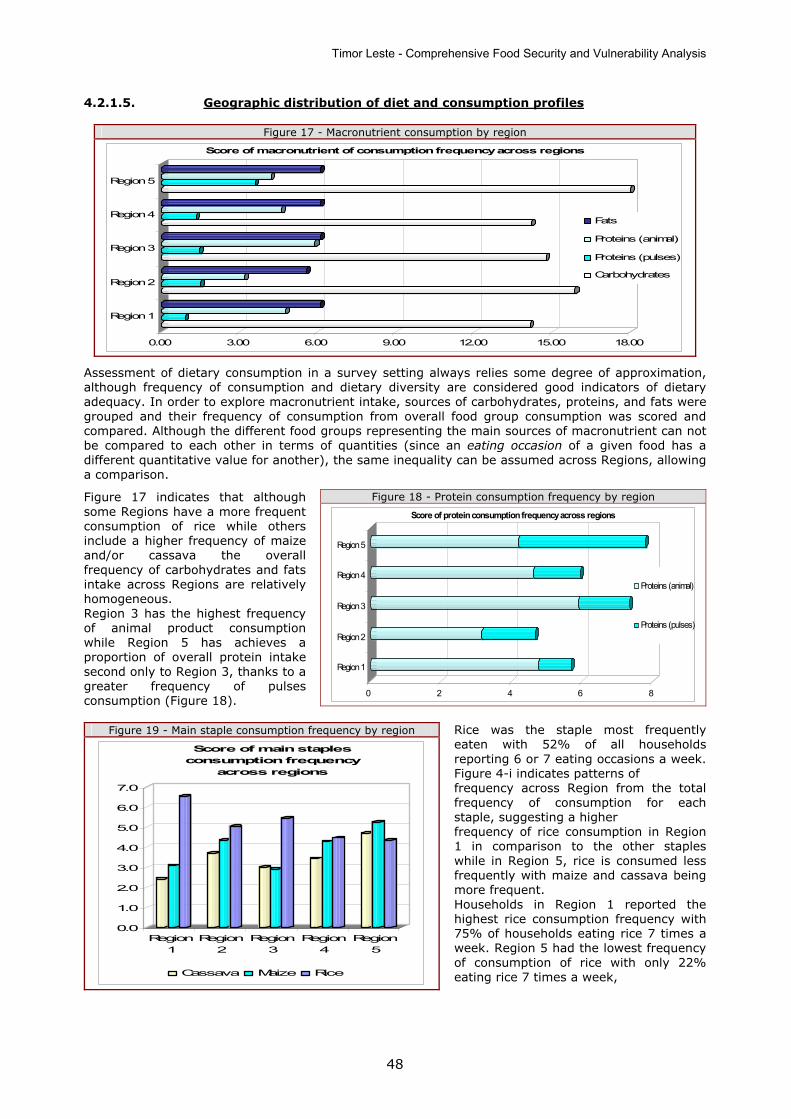
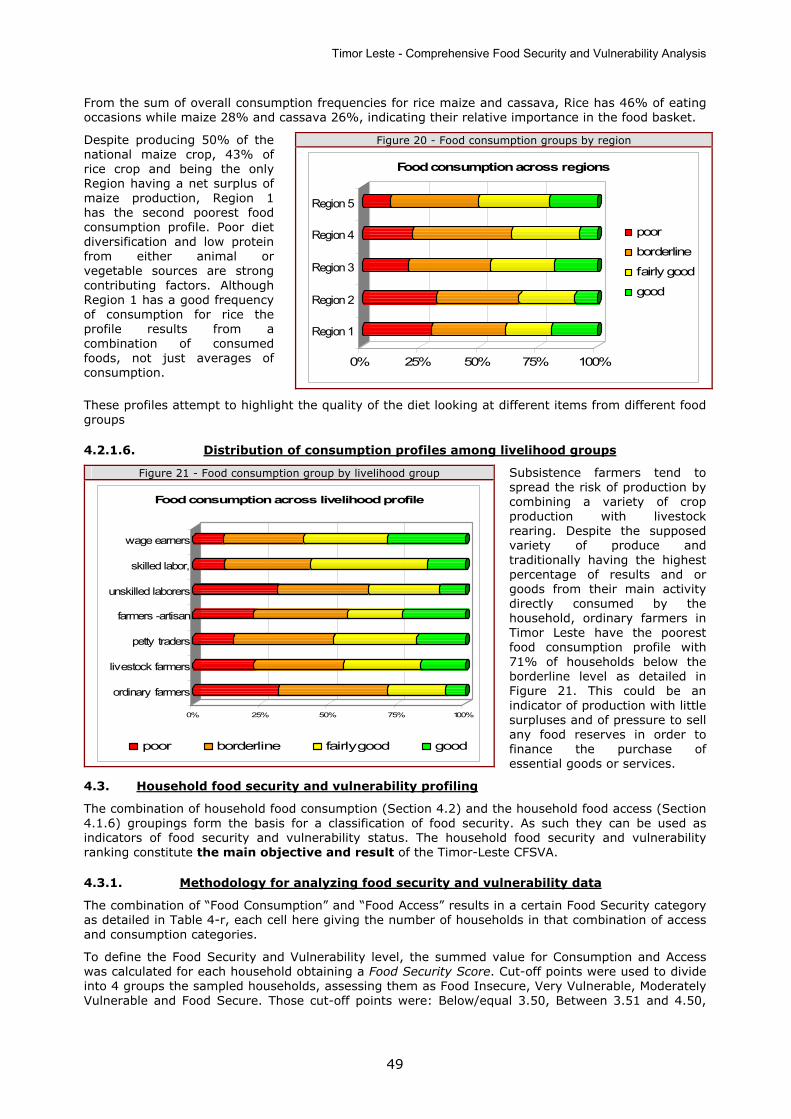
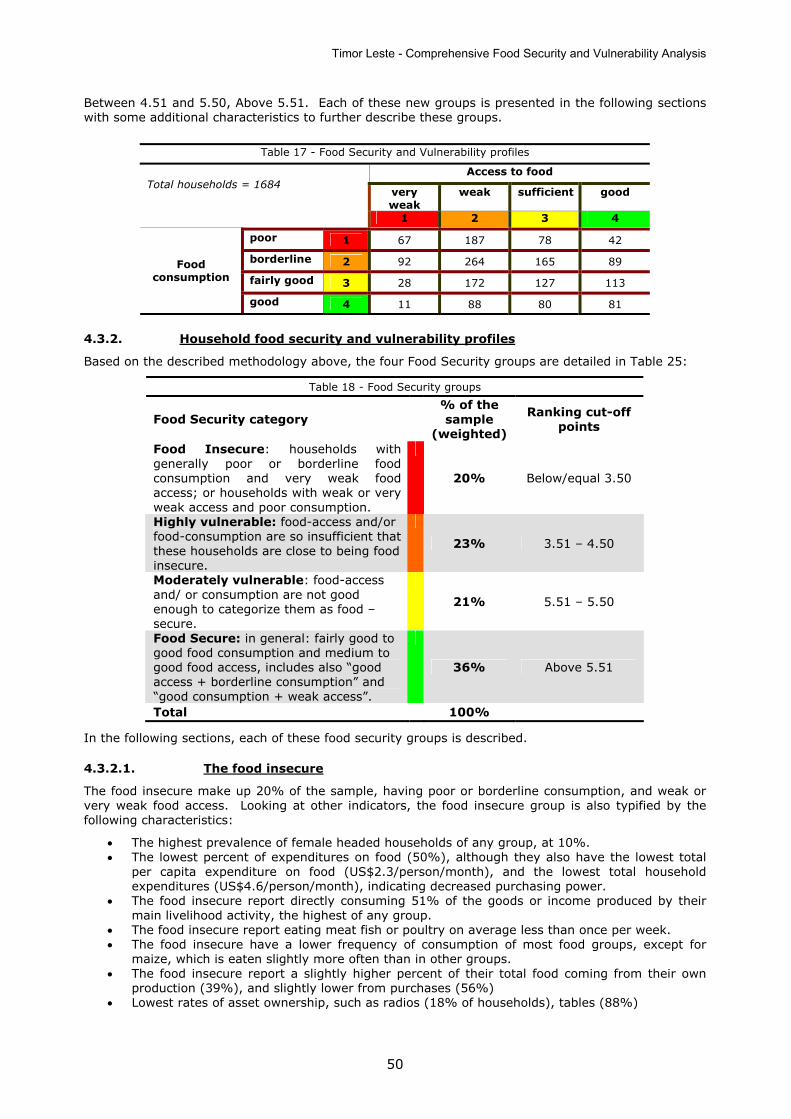
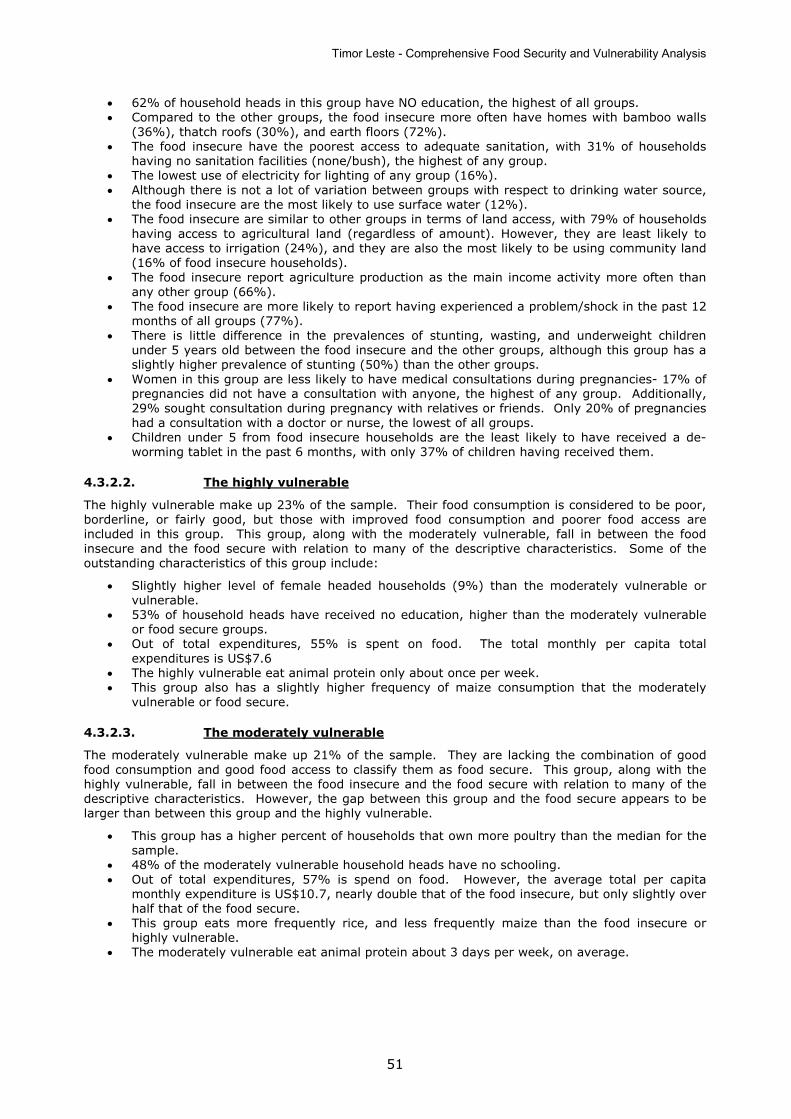
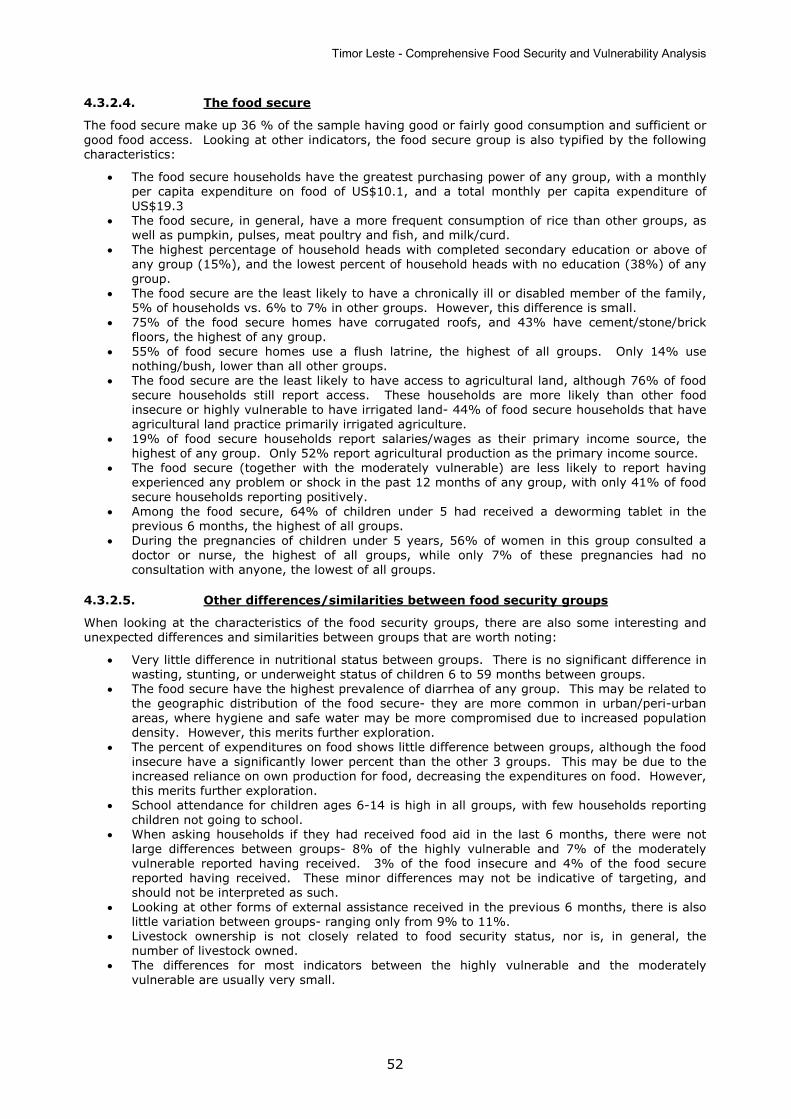
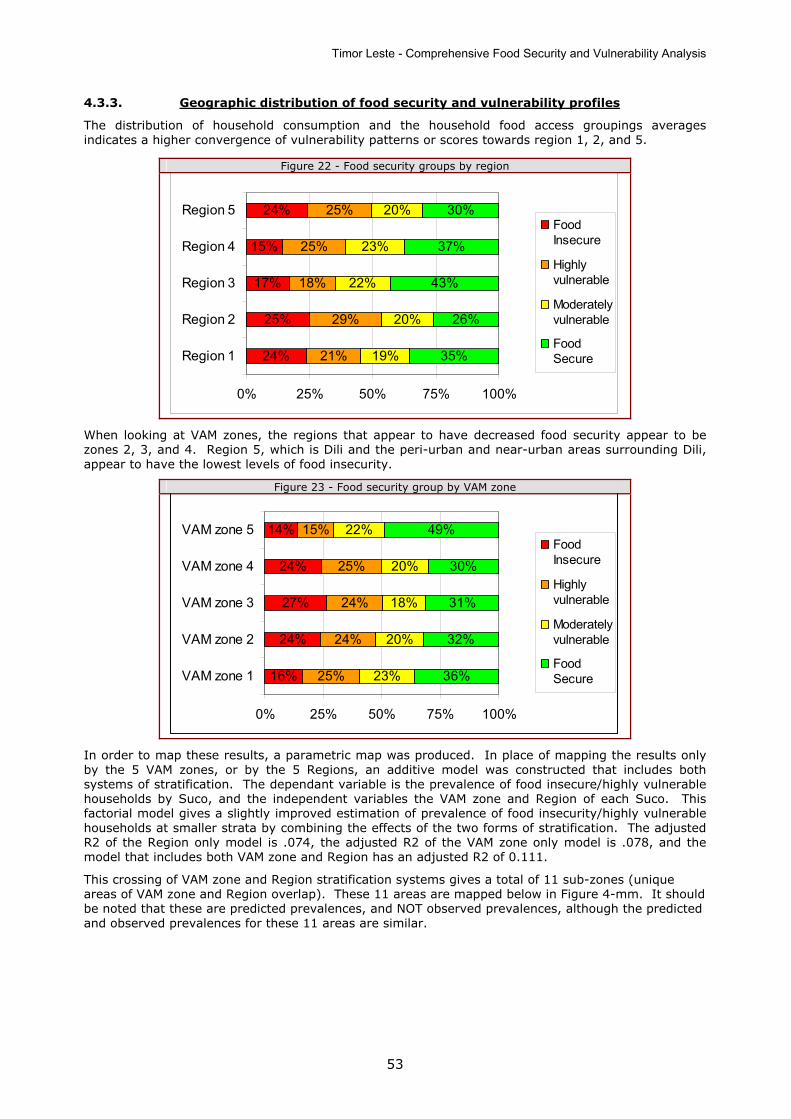
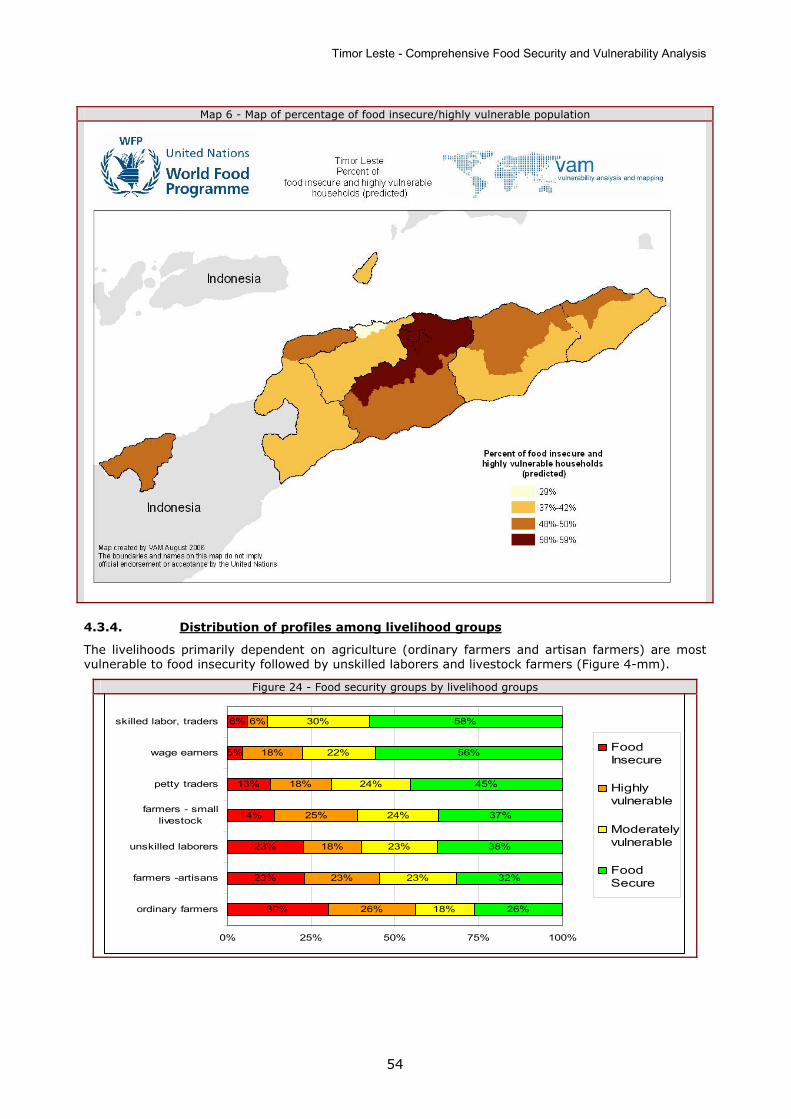
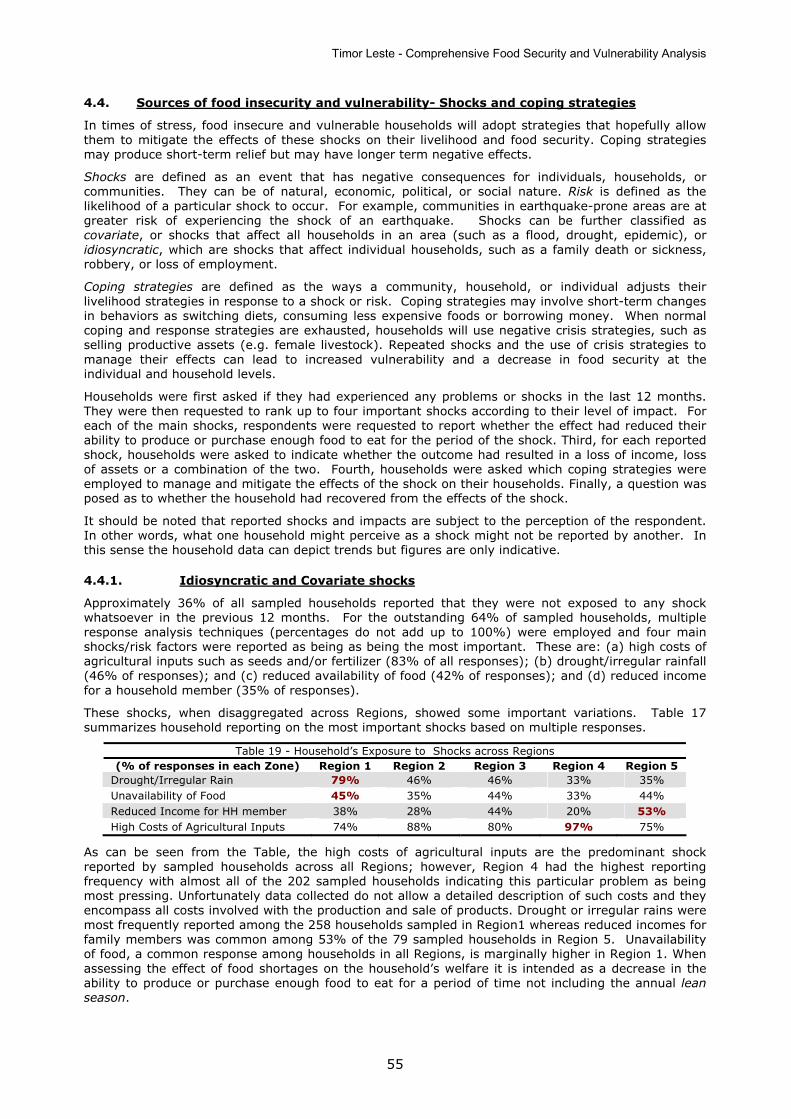
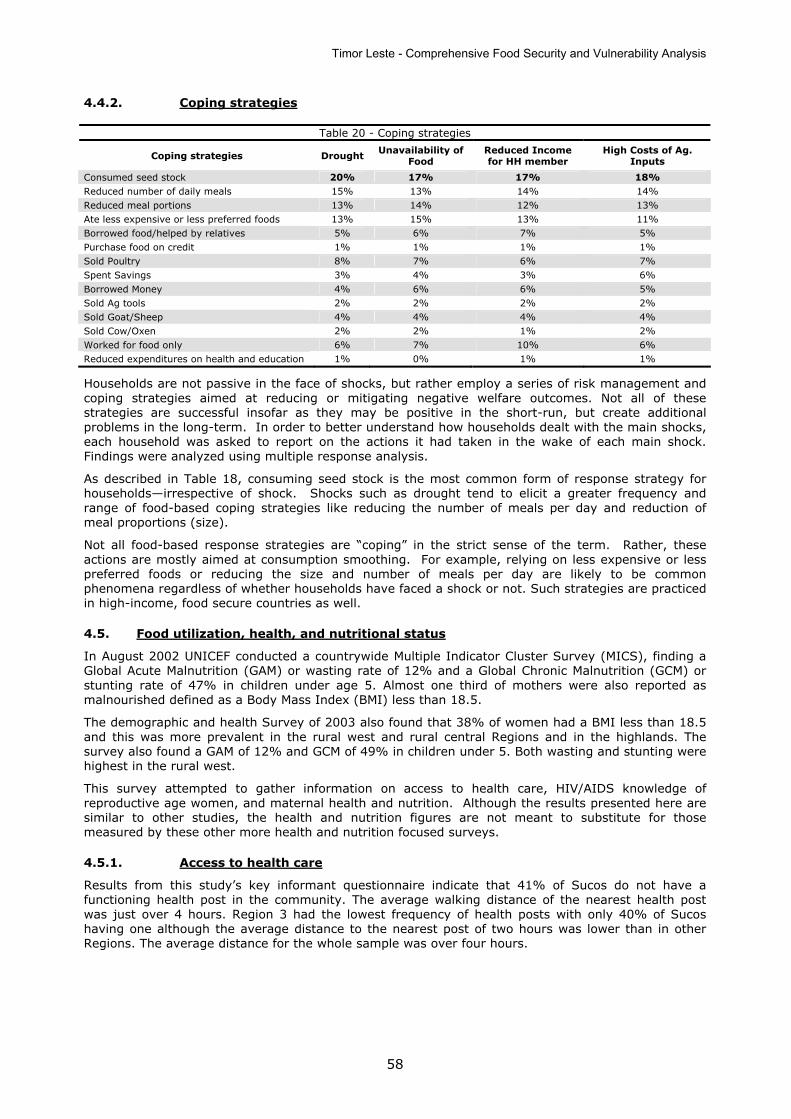
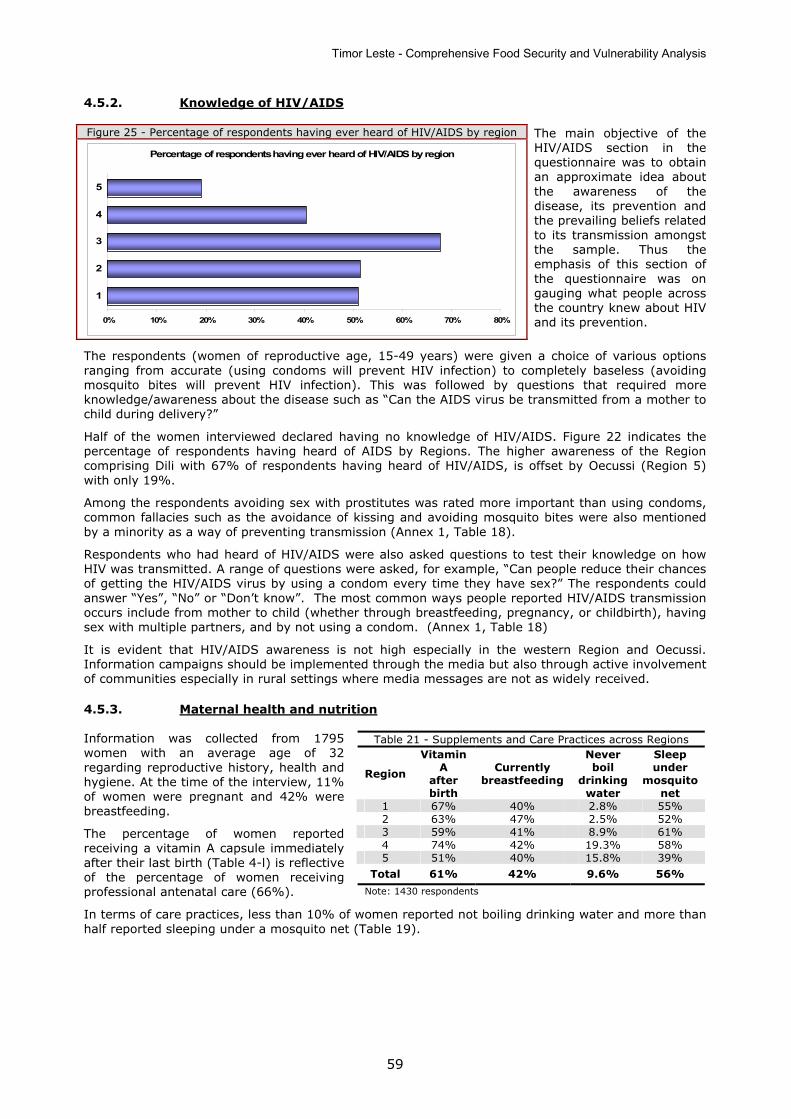
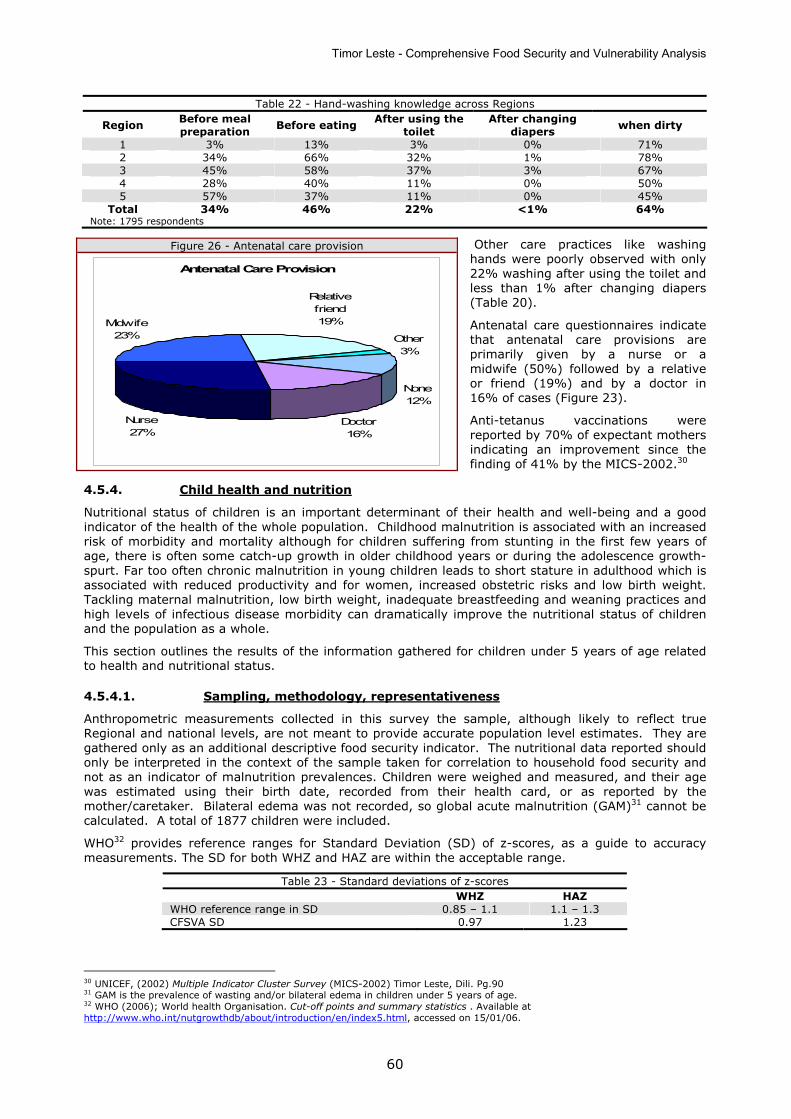
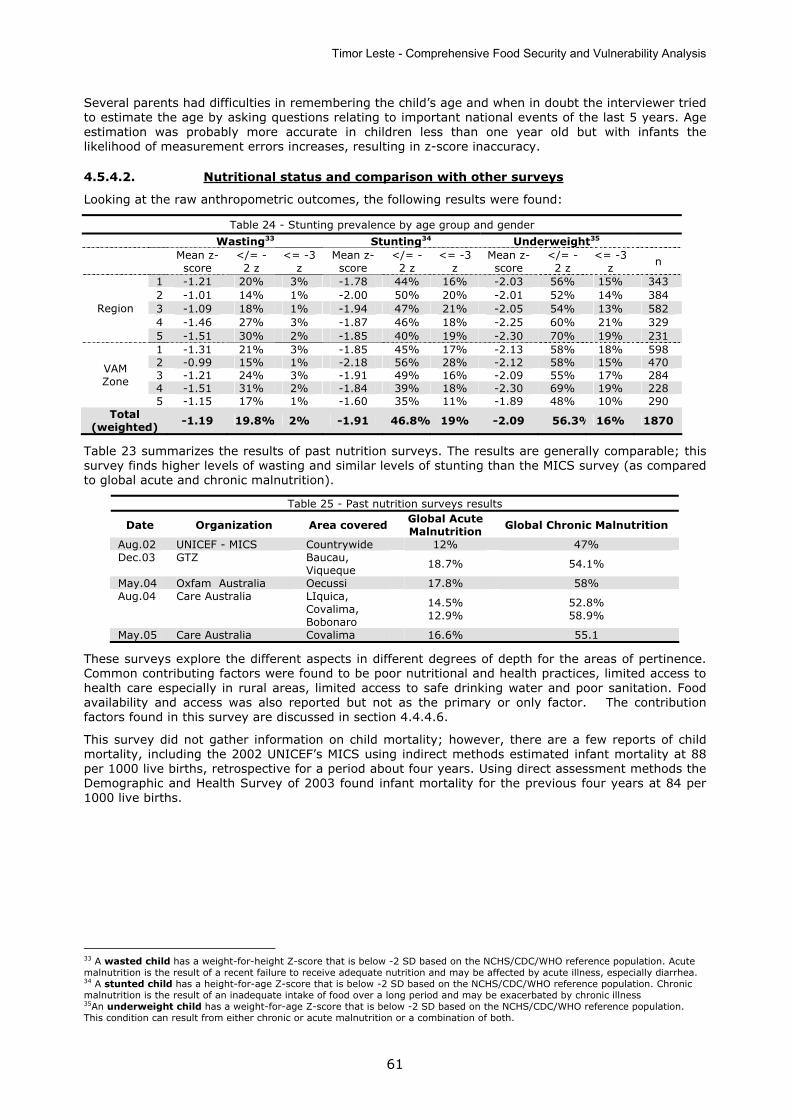
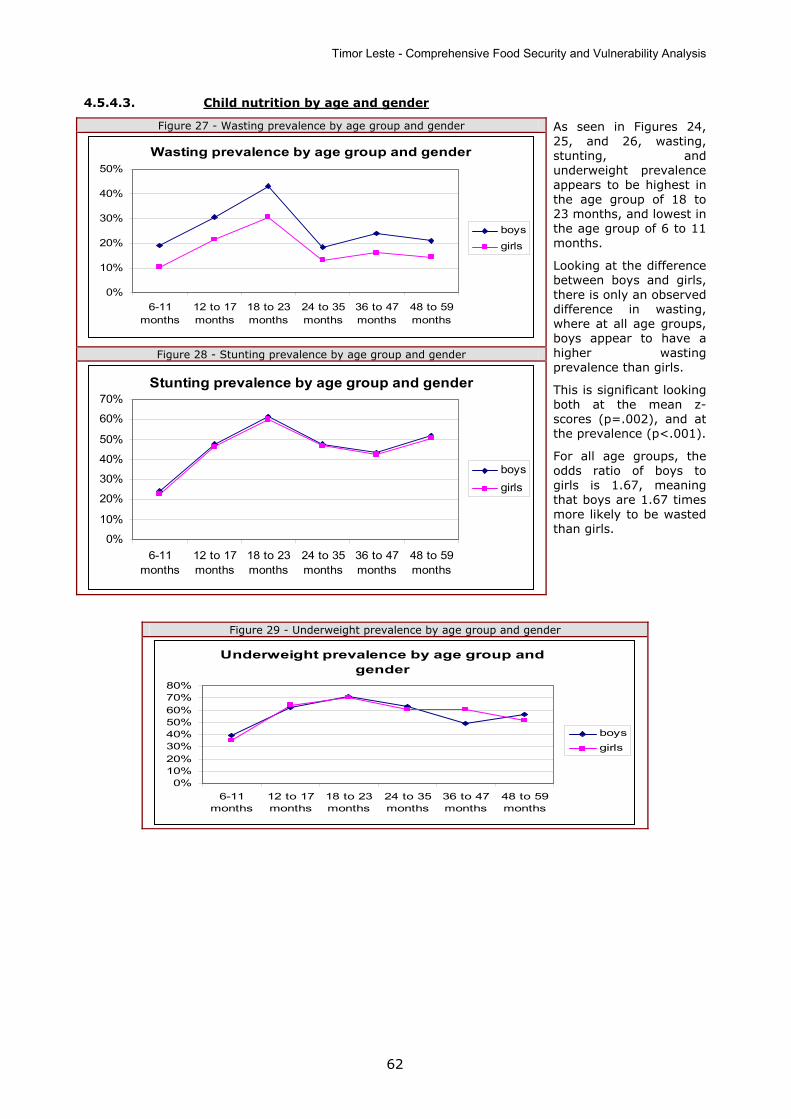
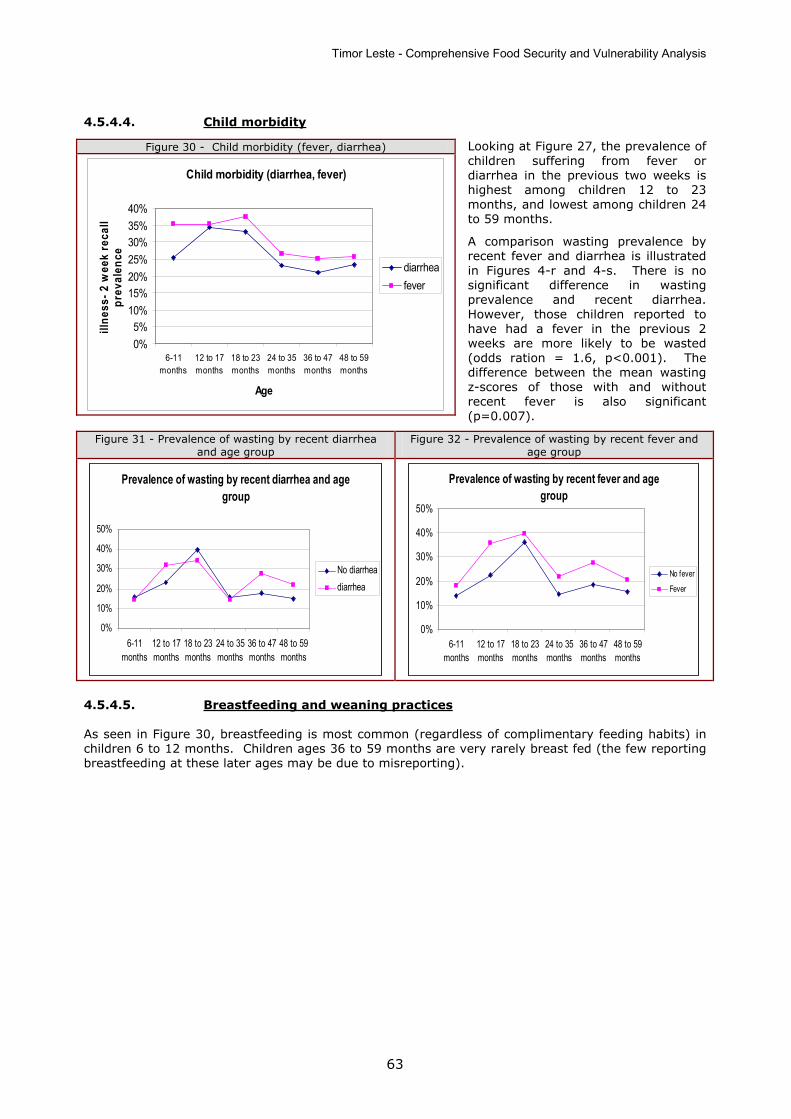
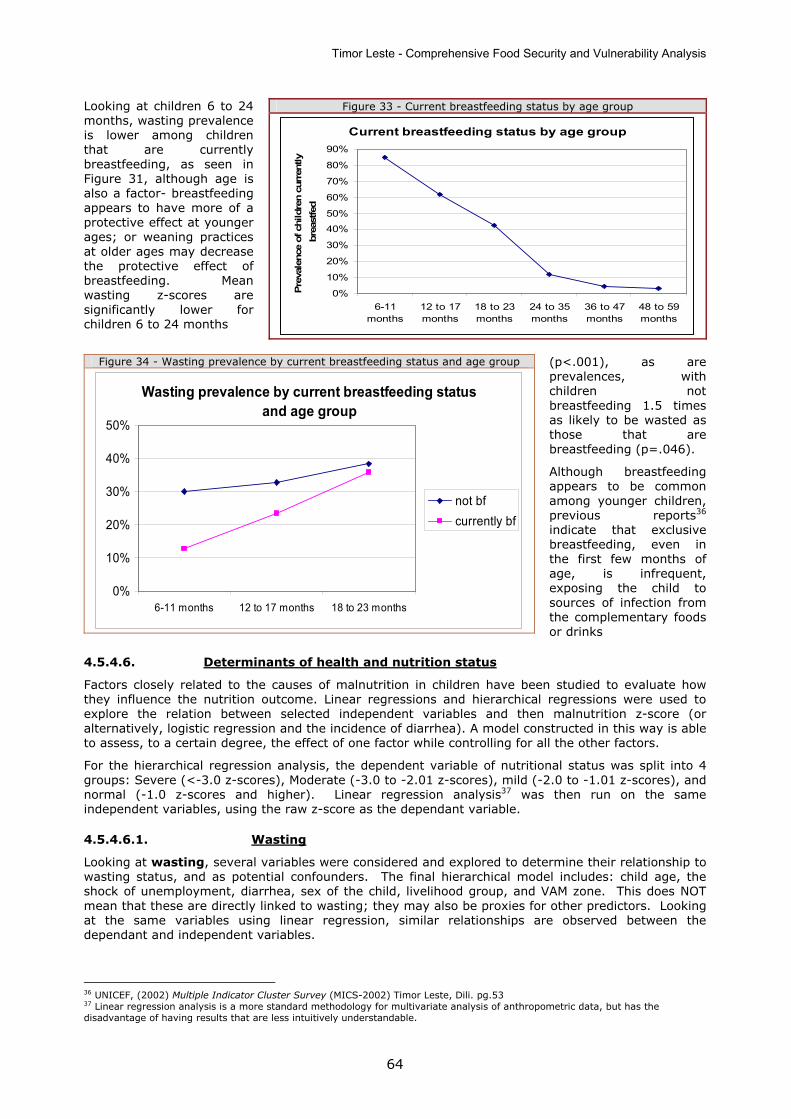
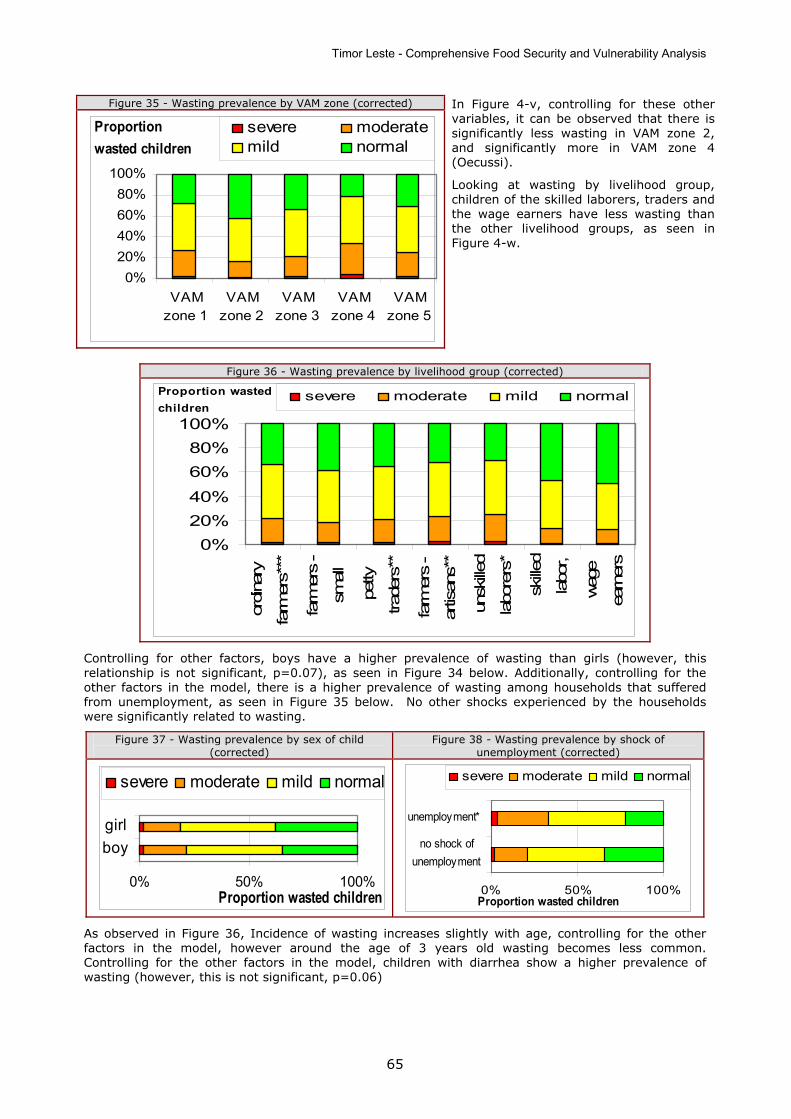
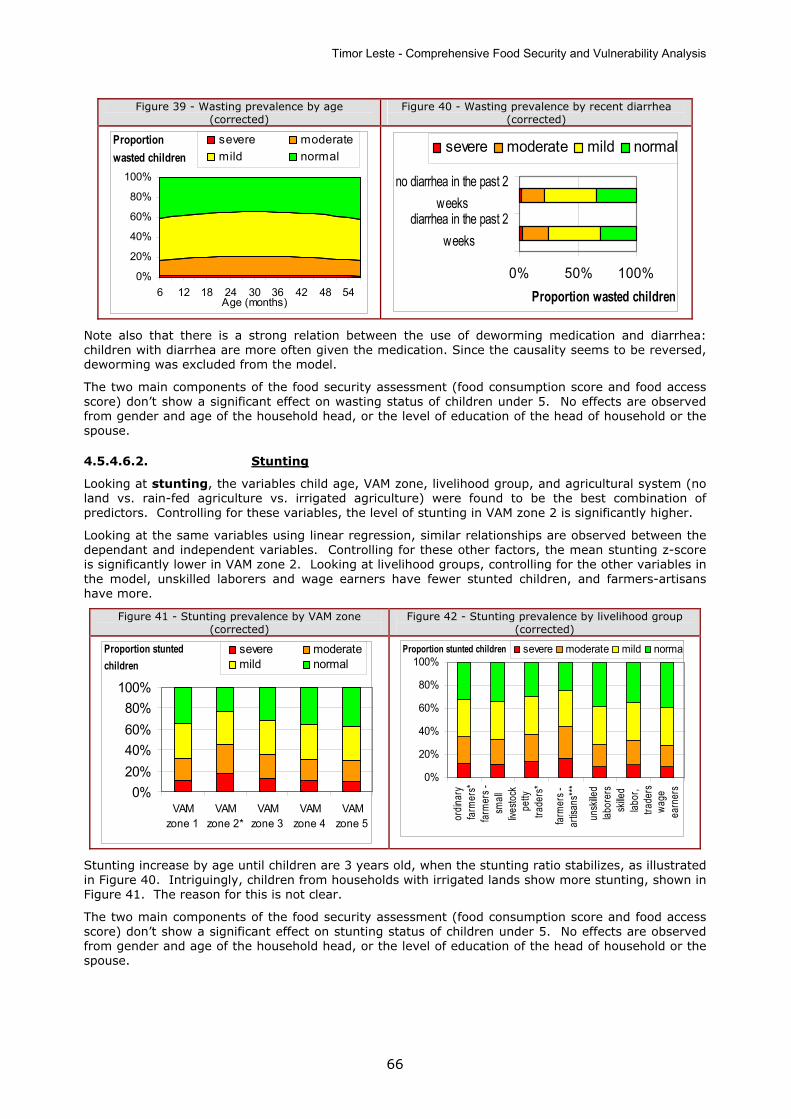
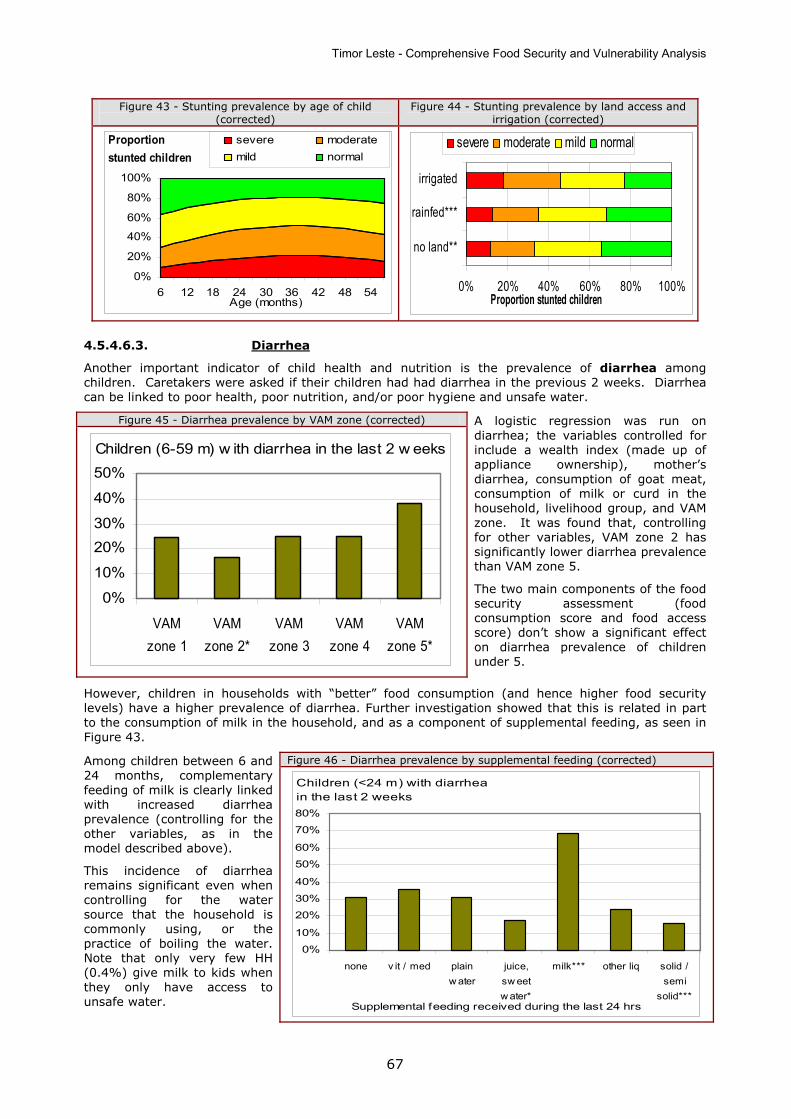
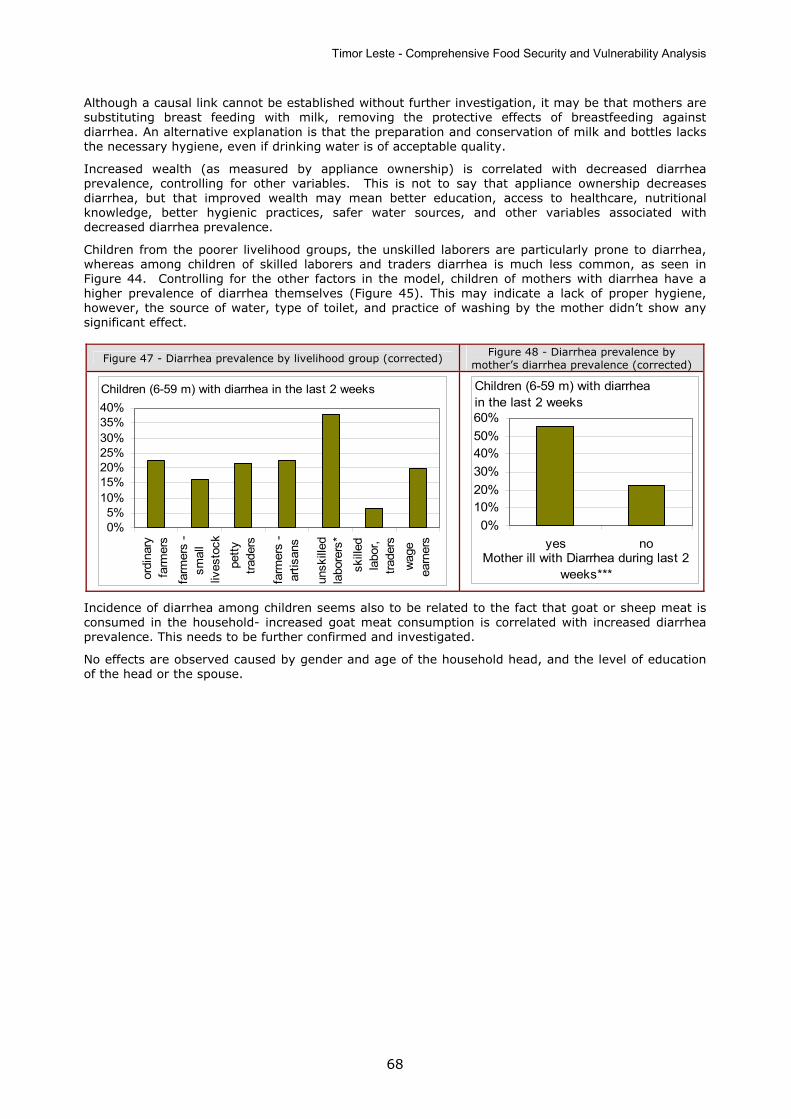
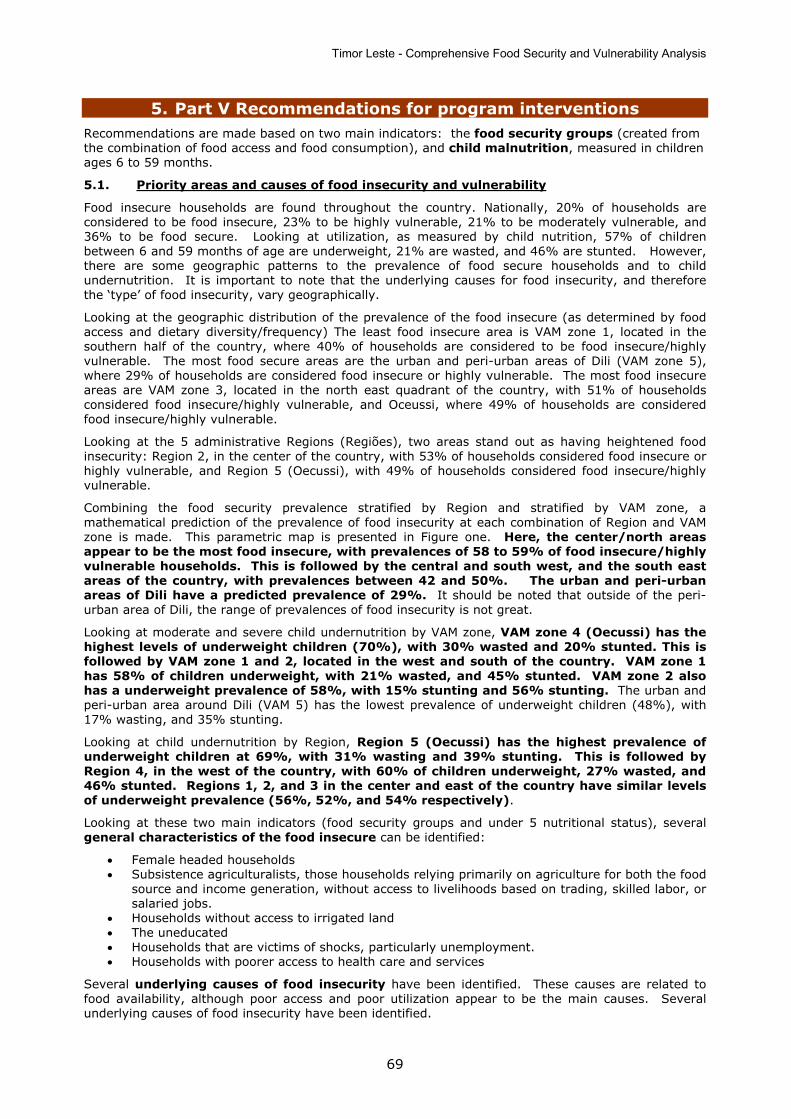
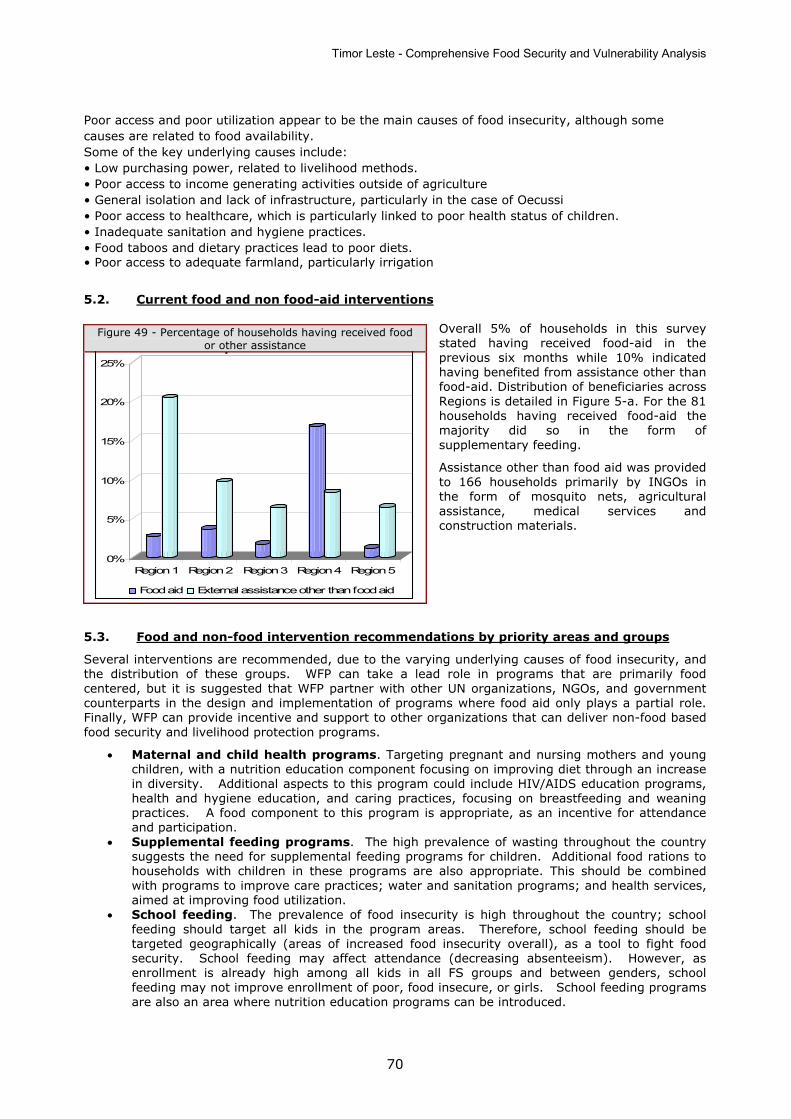
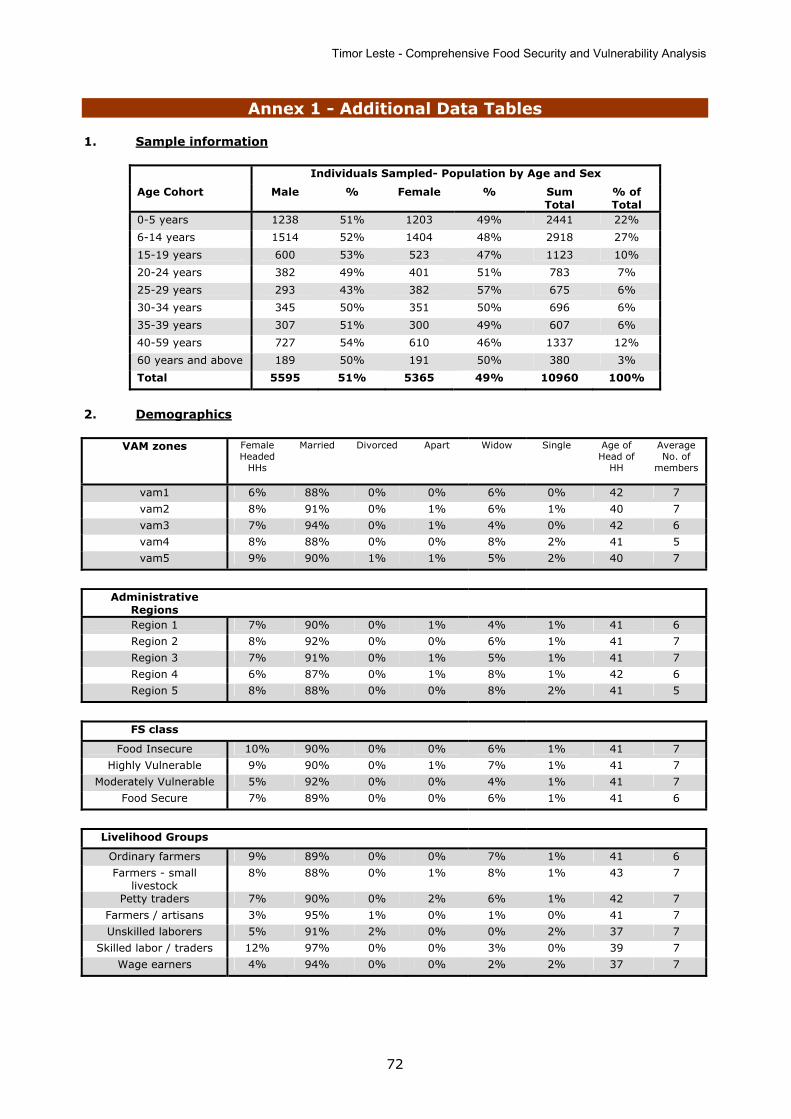
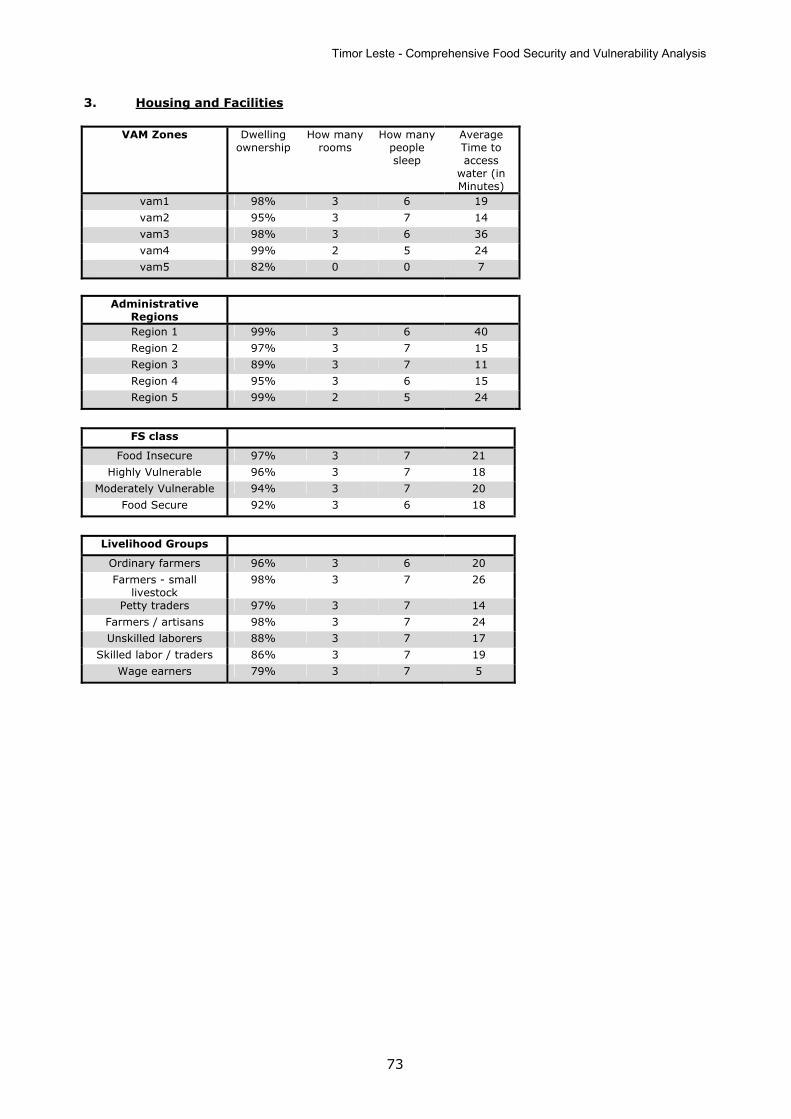
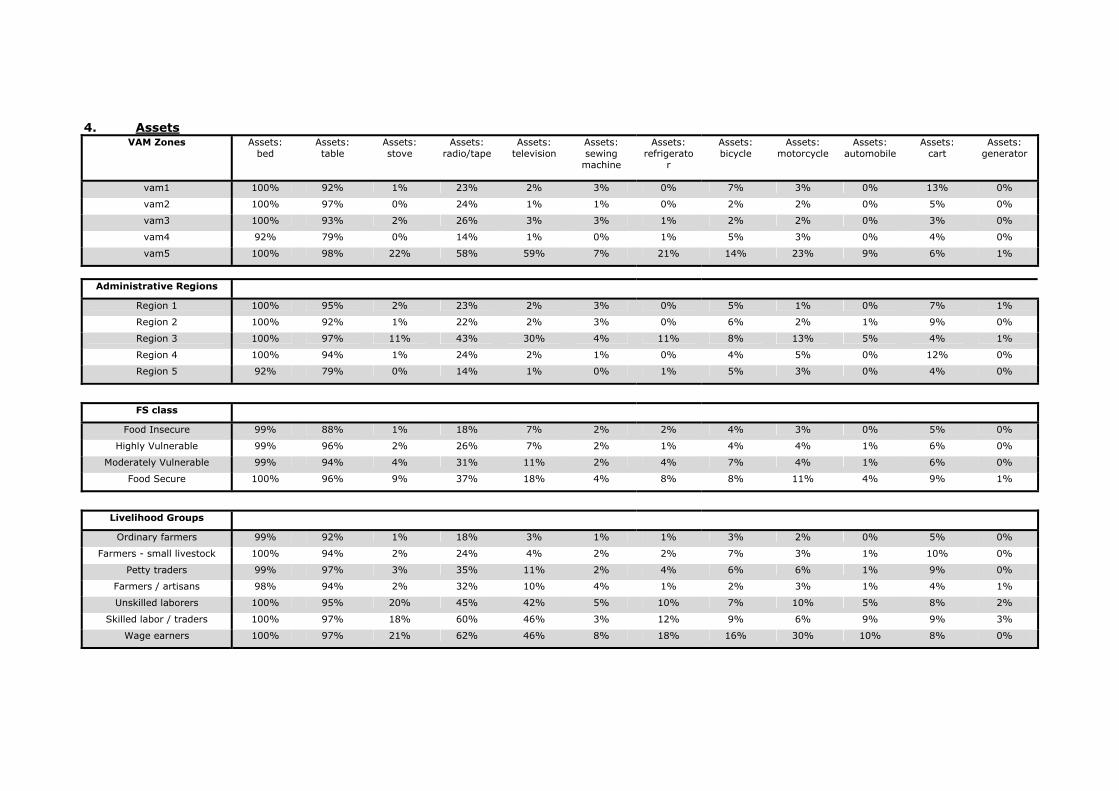
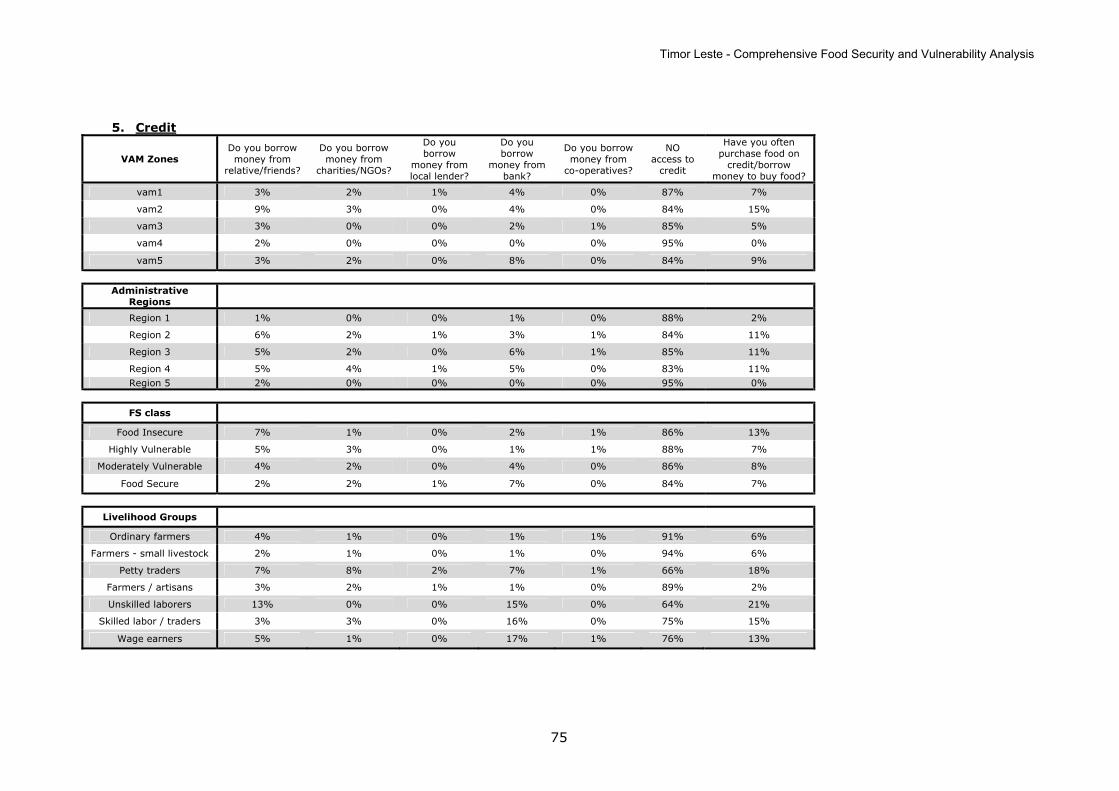
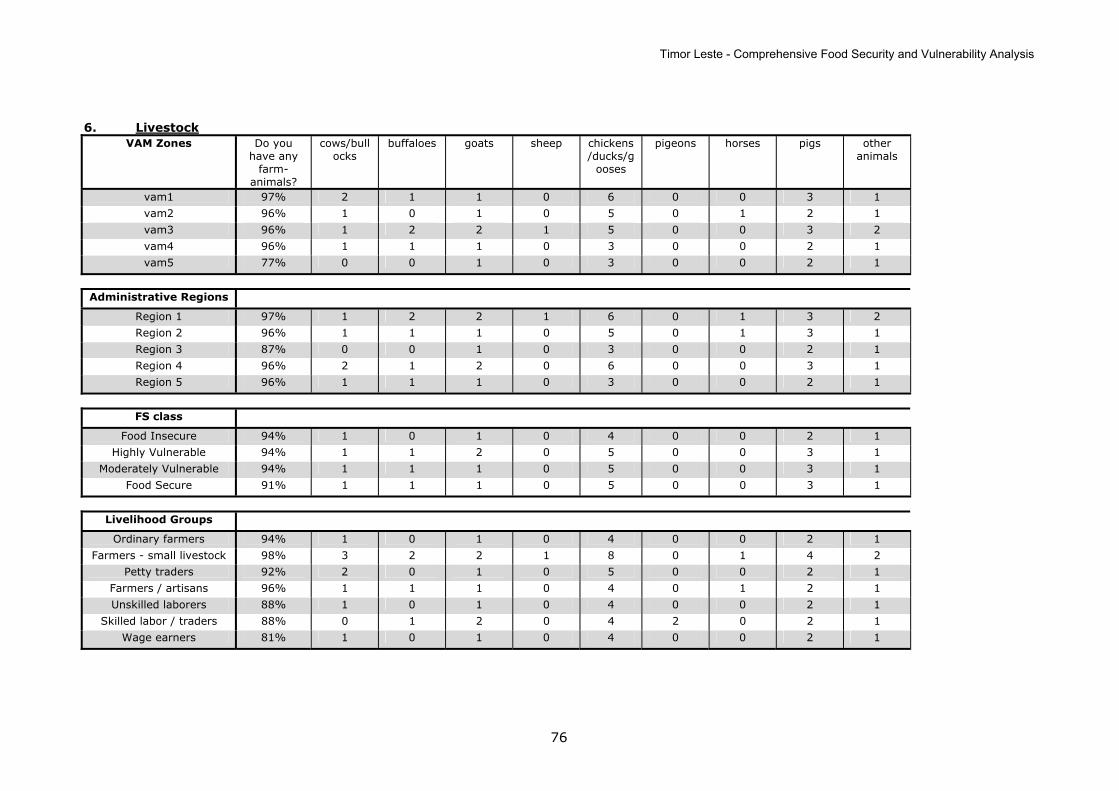
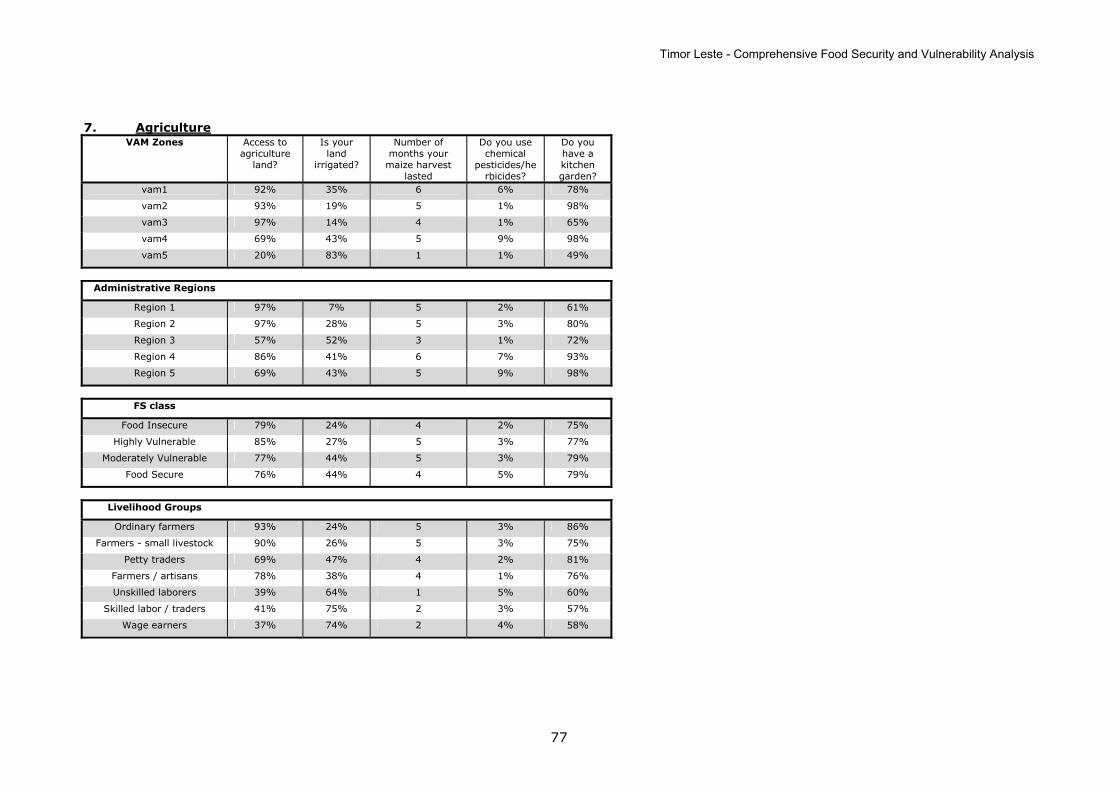
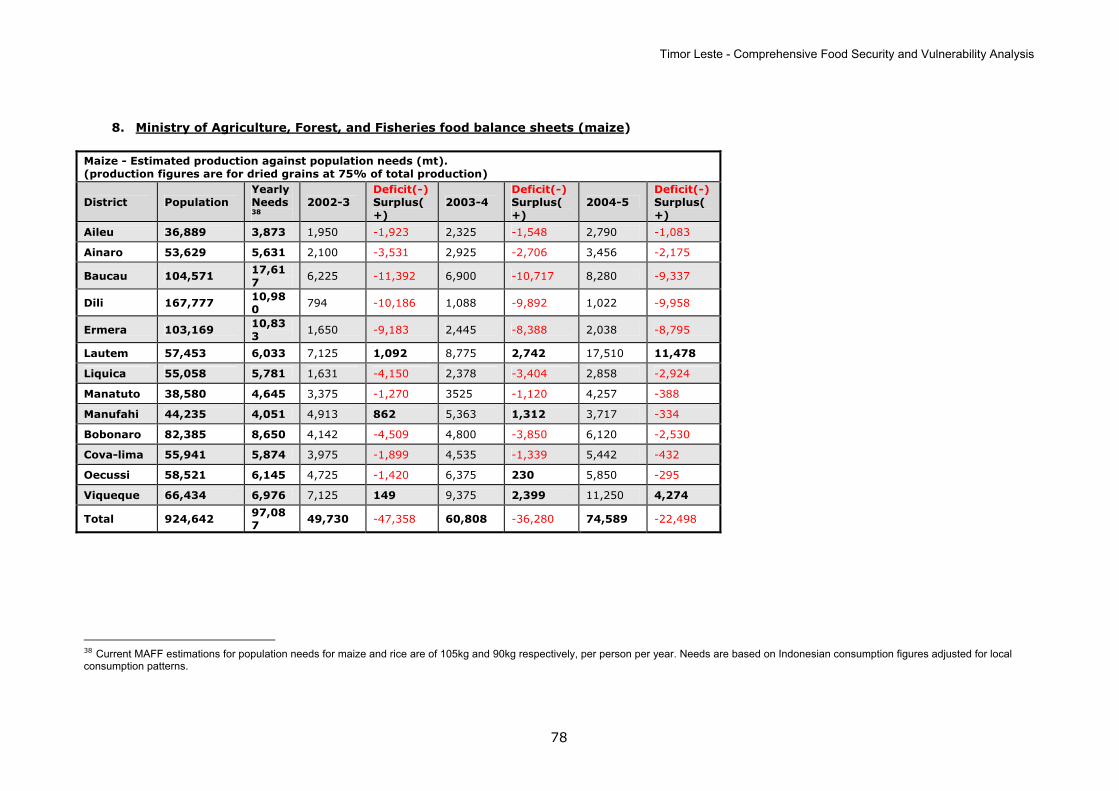
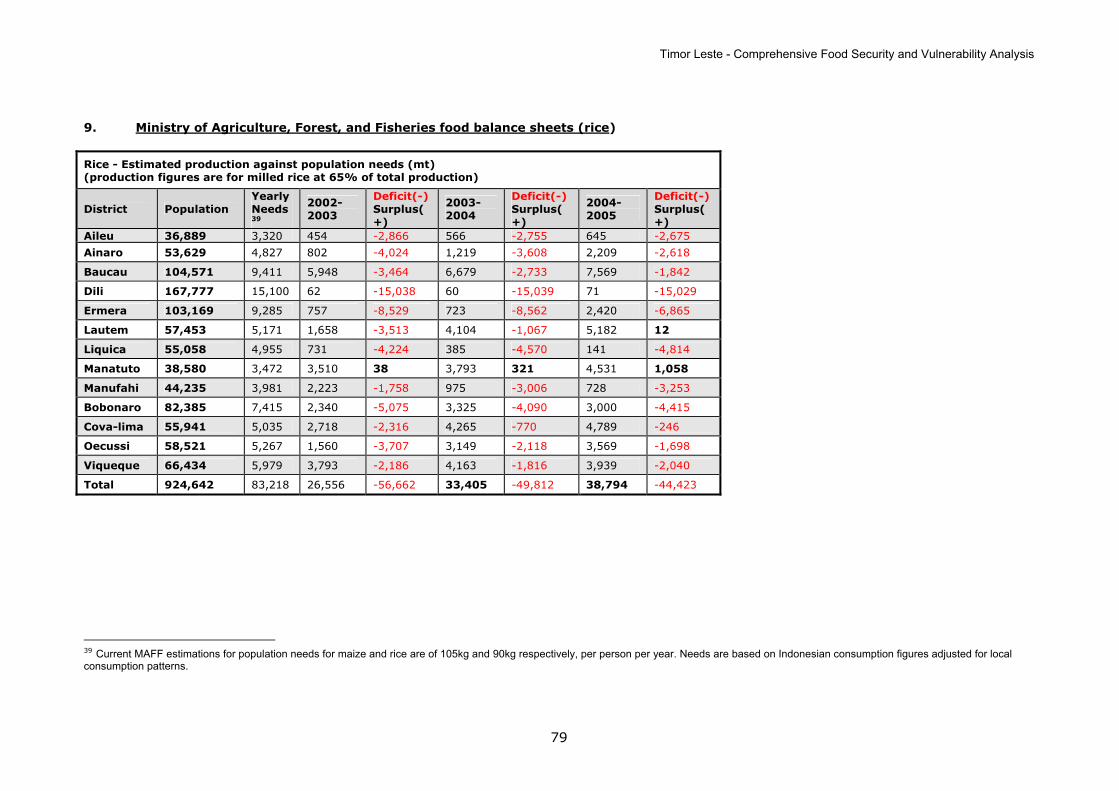
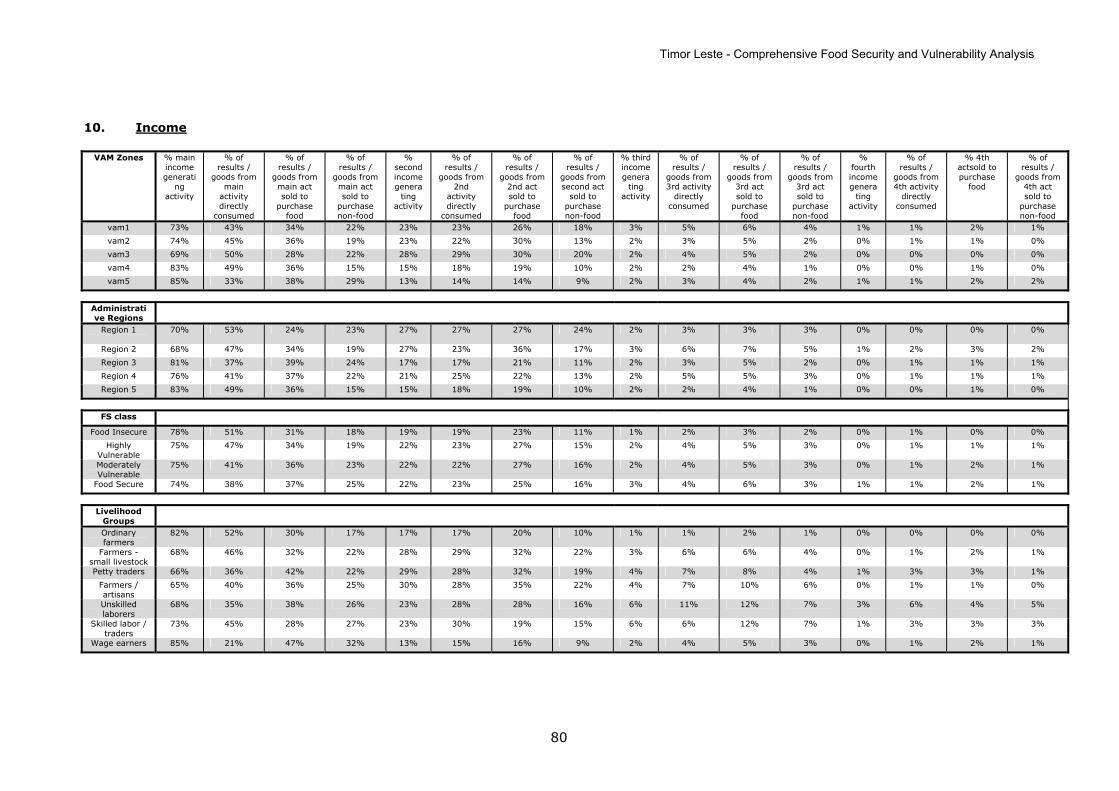
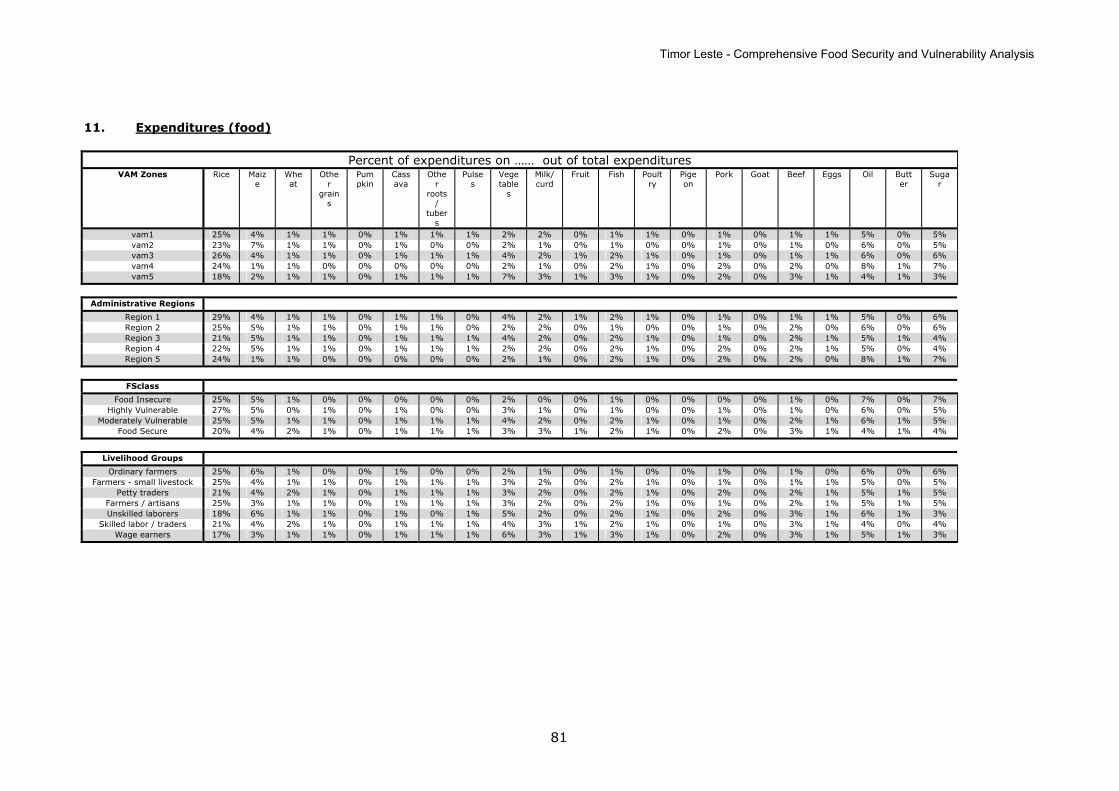
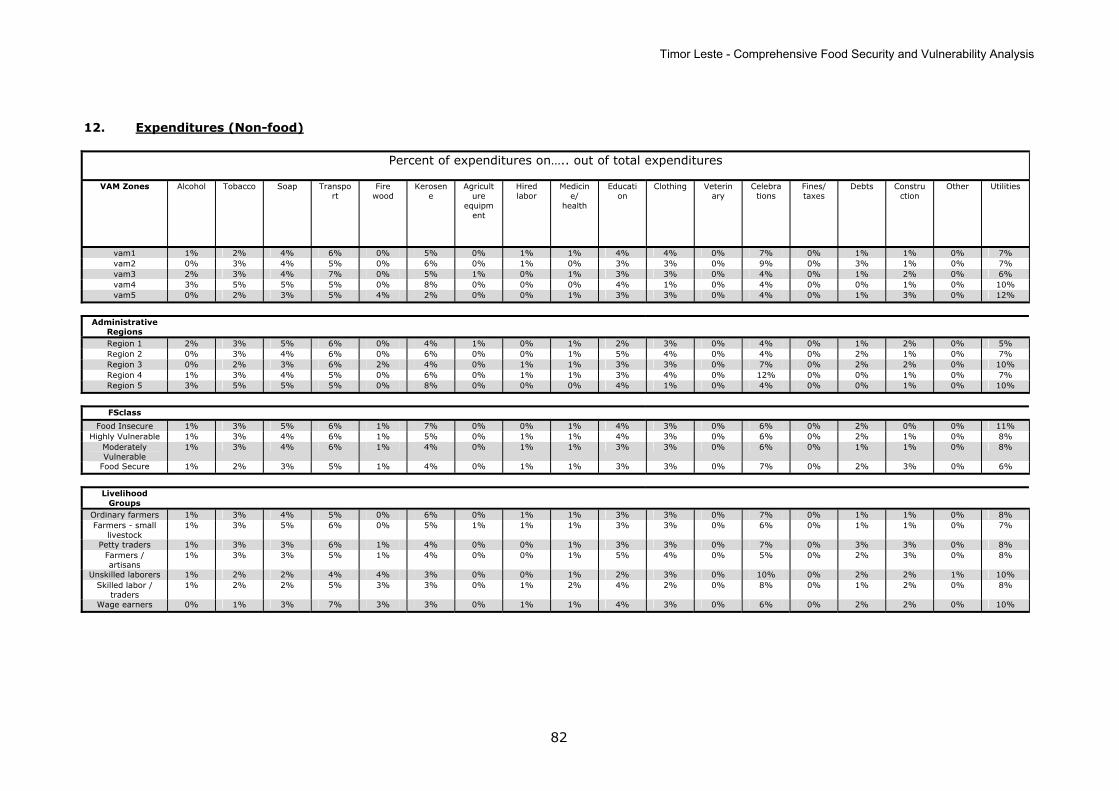
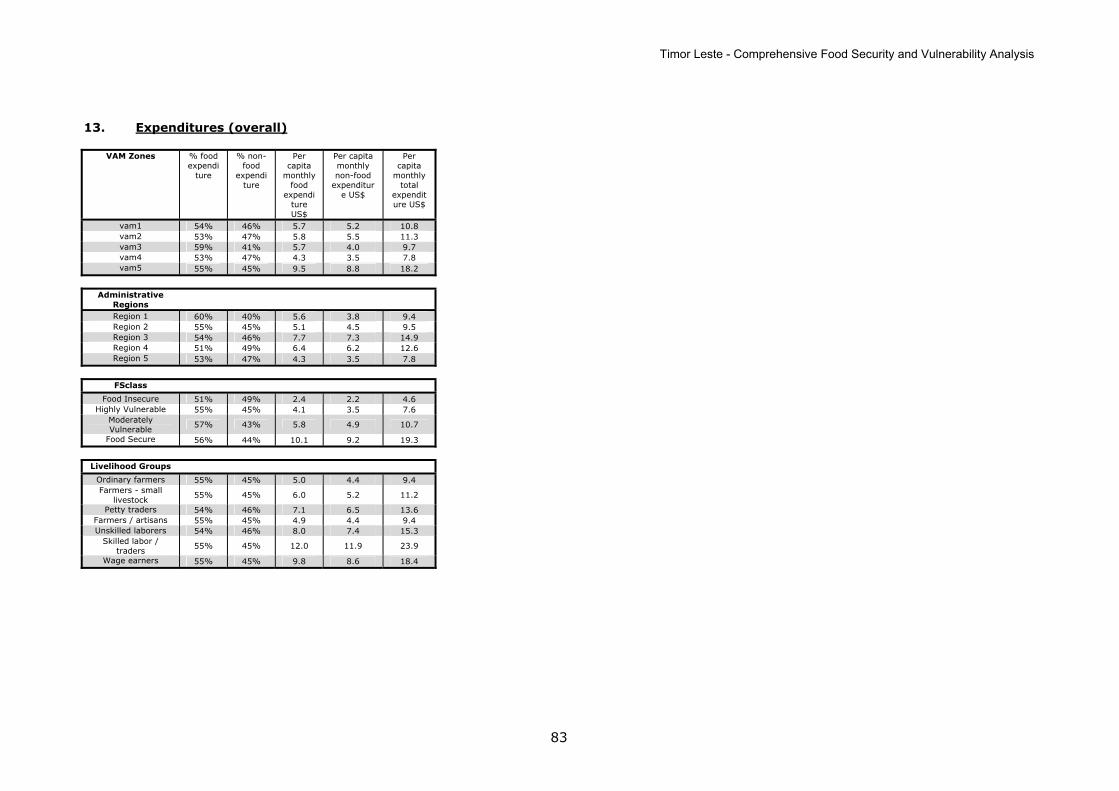
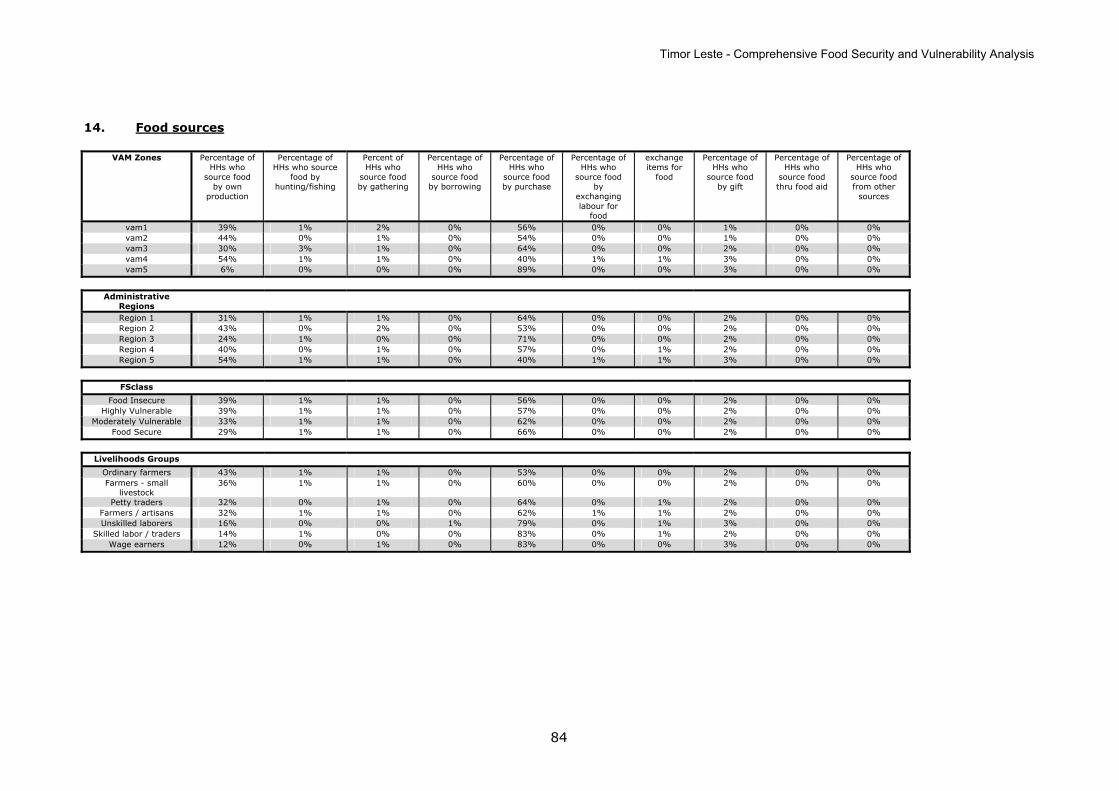
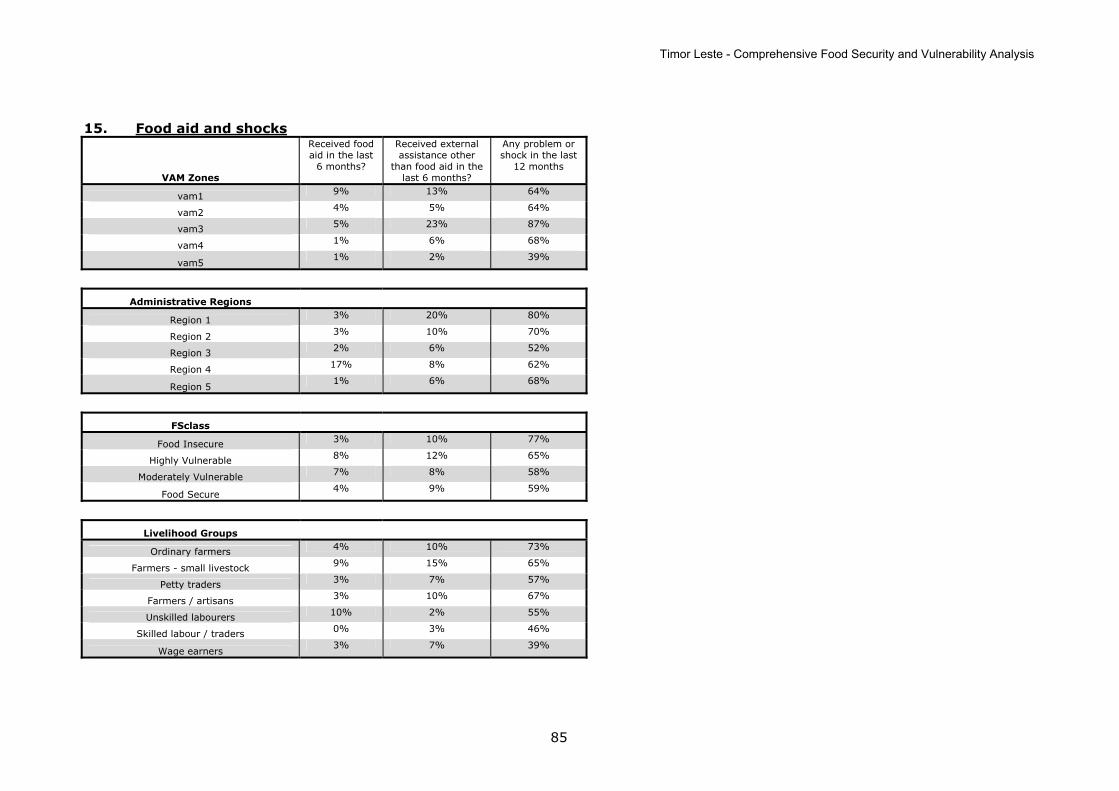
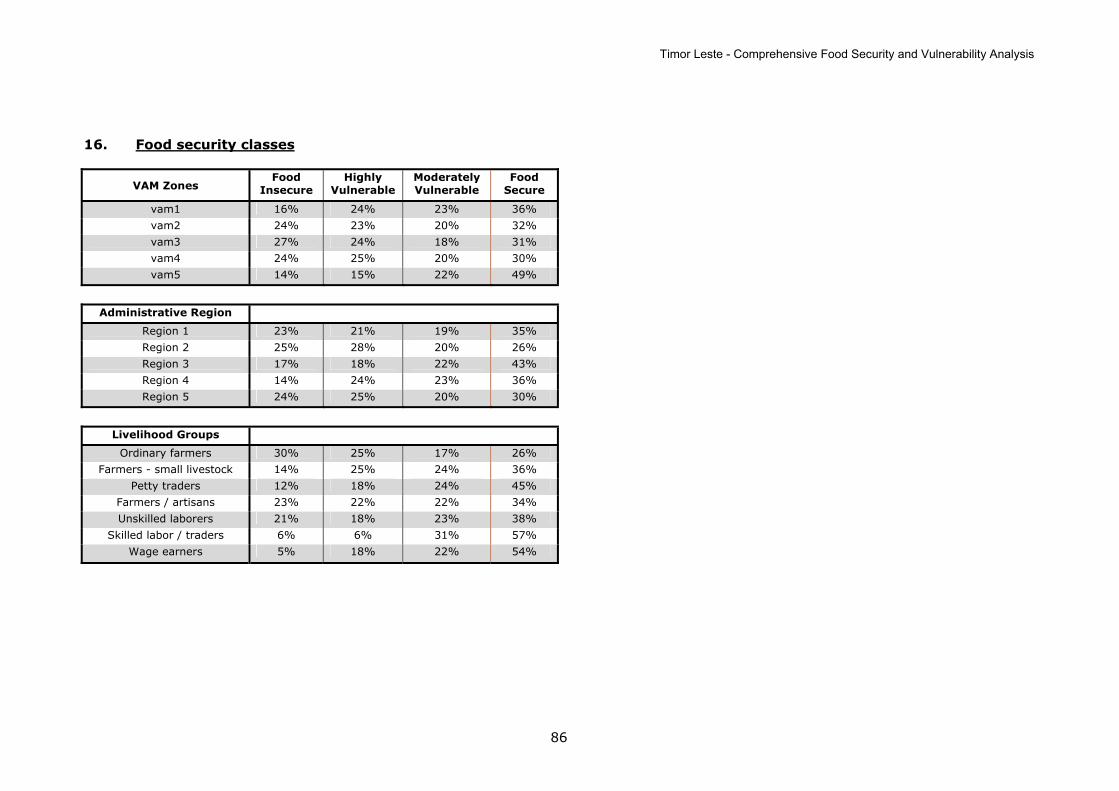
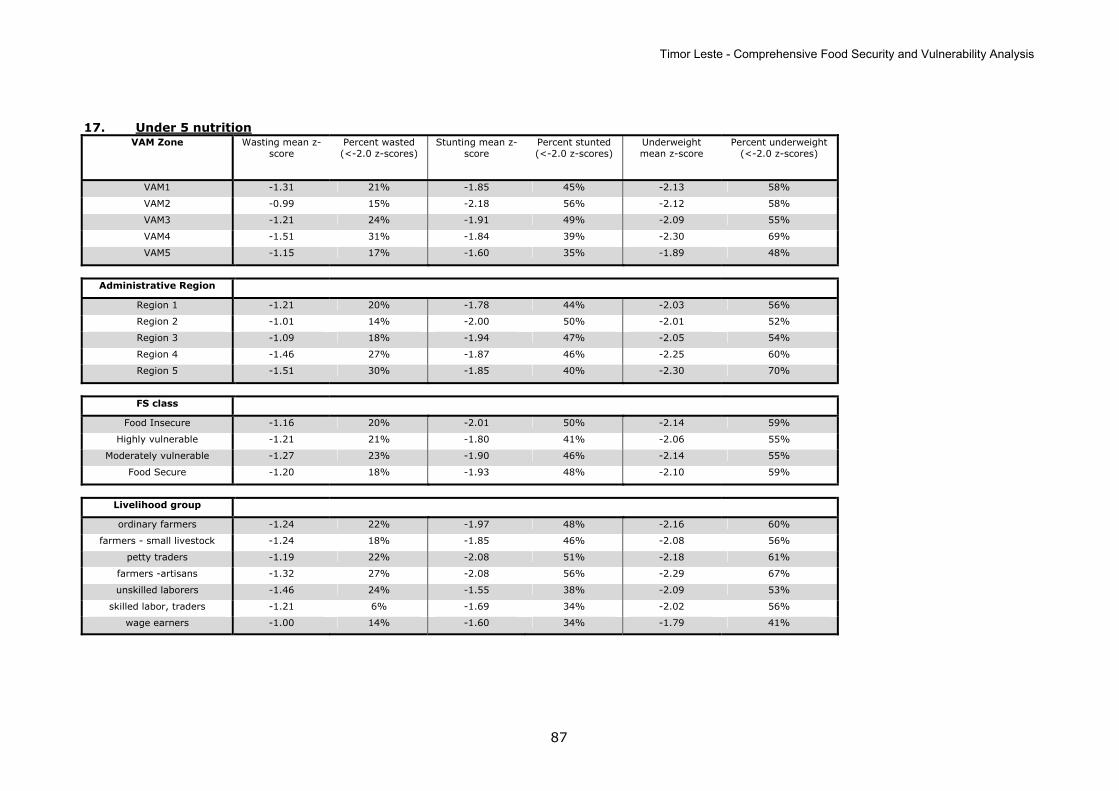
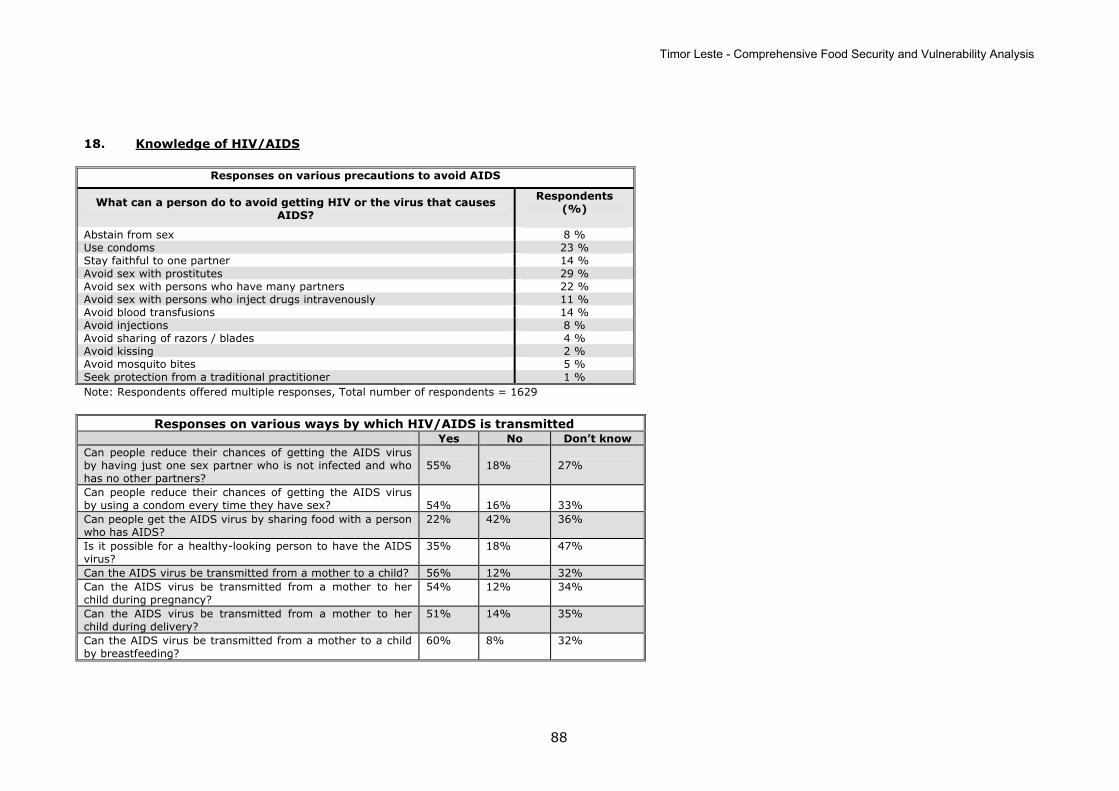
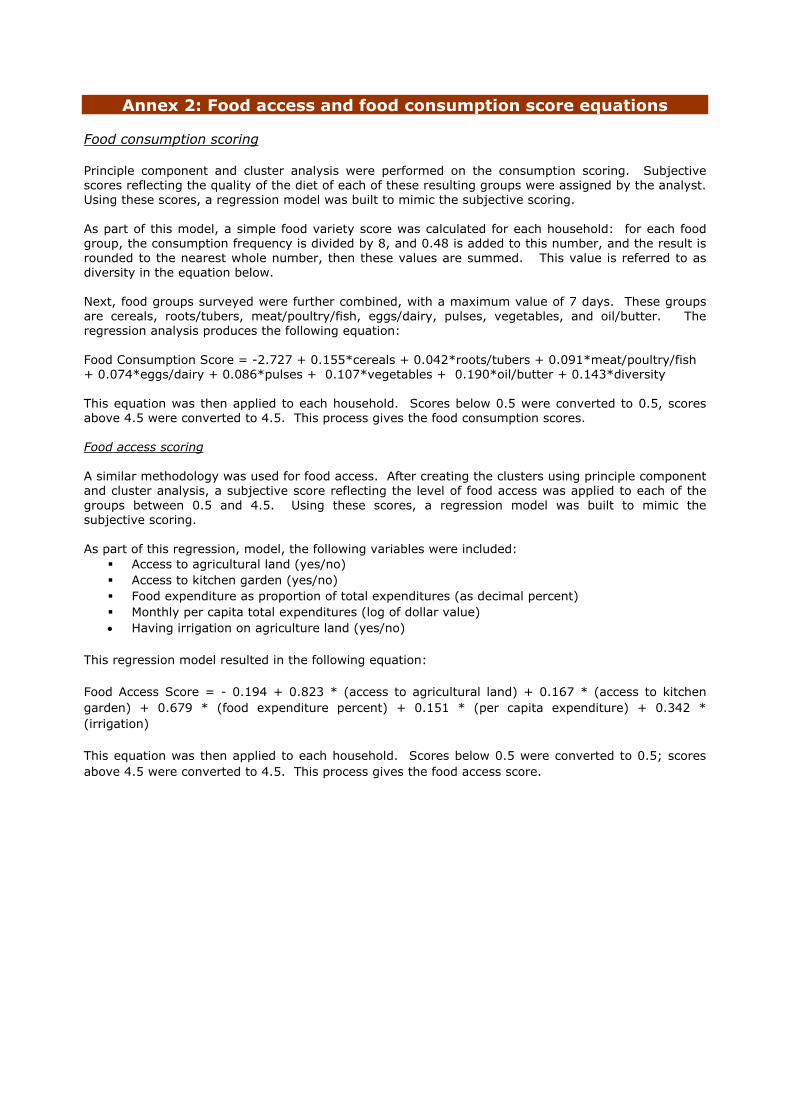
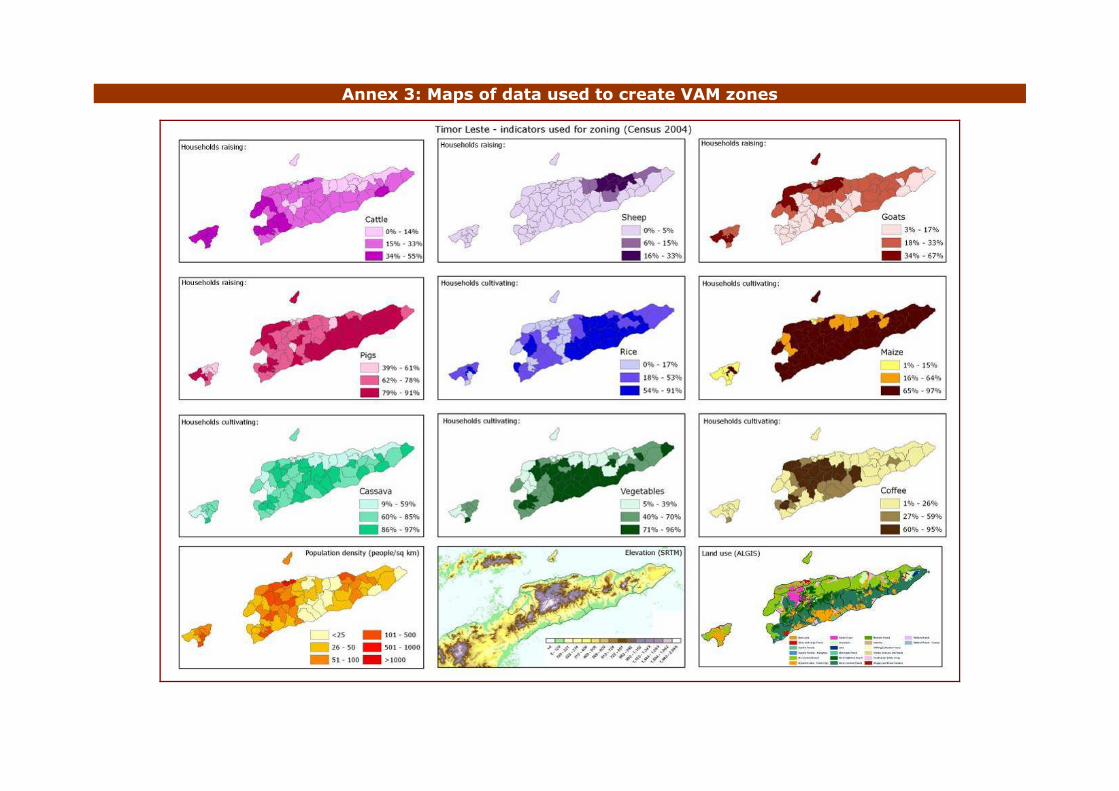


![[Document title] - Tourism Timor-Leste](https://static.documents.pub/doc/80x56/633fe93050b519f7ea0acbe2/document-title-tourism-timor-leste.jpg)


