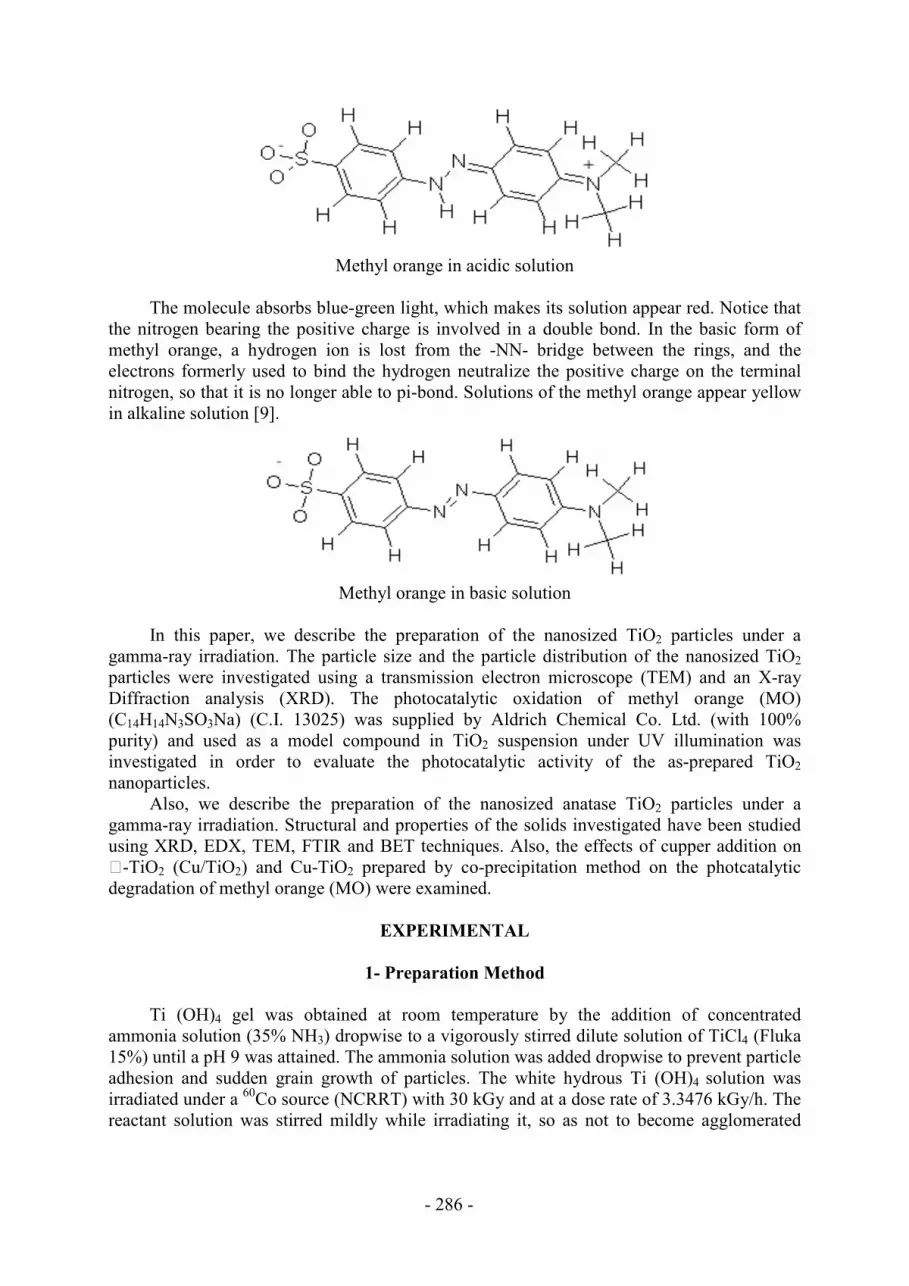
Date post: | 04-Dec-2023 |
Category: |
Documents |
Upload: | independent |
View: | 0 times |
Download: | 0 times |
- 285 -
2nd
International Conference on Energy Systems and Technologies
18 – 21 Feb. 2013, Cairo, Egypt
TiO2 ANATASE NANO-POWDER PREPARED BY A GAMMA
RAY IRRADIATION AND PHOTOCATALYTIC ACTIVITY
Radwa A. Elsalamony, Salwa A. Ghoneim
Egyptian Petroleum Research Institute, Cairo, Egypt, P.O. 11727
The activities of Cu/TiO2 prepared by a gamma-ray irradiation and Cu-doped TiO2 sample
prepared by a sol-gel method in photodegradation of methyl orange dye were examined.
Structural and properties of the solids investigated have been studied using XRD, EDX,
TEM, FTIR and BET techniques. The particles of the prepared TiO2 have high surface area
and an anatase phase structure. The remaining concentrations of 10 ppm MO at PH 1
reaches 0.13 and 2.25 ppm after 120 min under UV irradiation using 0.15g/L of Cu/TiO2
and Cu-TiO2 catalysts respectively.
INTRODUCTION
Textile azo dyes are pollutants of high environmental impact, because of their
widespread use and their potential to form toxic aromatic amines. These dyes represent
approximately 50% of worldwide production [1]. They are also an important source of
pollution since 20% of synthetic dyes are lost in waste stream during industrial processes [2].
Their release in the aquatic ecosystem causes a dramatic consequence such as aesthetic
pollution, toxicity and perturbations in aquatic life. As international environmental standards
are becoming more stringent [3], there is a need for developing treatment methods that are
more effective in eliminating dyes from waste stream at its source. The application of
titanium dioxide (TiO2) as a heterogeneous photocatalystis attracting considerable attention
for an water purification and remediation due to its physical and chemical stability, low cost,
non-toxicity [4]. TiO2, particularly in an anatase form, can be used as a photocatalyst under
ultra violet light, i.e. less than 380 nm [5]. After TiO2 absorbs UV light, it forms an electron
(e-) and a positive hole (h
+). Also, h
+ can oxidize ·OH and H2O conglutinated on the surface
of TiO2 [6]. Moreover, a free radical has a strong oxidation ability and can decompose various
organic substances (e.g. formaldehyde, benzene, dye and VOCs), into a benign substance:
CO2, H2O, OH free radical has no selectivity to a reactant, so it has a crucial effect on a
photocatalyst, mean that an electron has a strong deoxidizing ability [7]. For a strong
oxidation, a photocatalyst can implement the function of anti-bacteria by destroying a cell
membrane [5]. Methyl orange is an intensely colored compound used in dyeing and printing
textiles. It is also known as C.I. Acid Orange 52, C.I. 13025, Helianthine B, Orange III, Gold
orange, and ropaeolin D [8] pH-related color changes result from changes in the way electrons
are confined in a molecule when hydrogen ions are attached or detached. Here is the structure
of methyl orange in acidic solution:
- 286 -
Methyl orange in acidic solution
The molecule absorbs blue-green light, which makes its solution appear red. Notice that
the nitrogen bearing the positive charge is involved in a double bond. In the basic form of
methyl orange, a hydrogen ion is lost from the -NN- bridge between the rings, and the
electrons formerly used to bind the hydrogen neutralize the positive charge on the terminal
nitrogen, so that it is no longer able to pi-bond. Solutions of the methyl orange appear yellow
in alkaline solution [9].
Methyl orange in basic solution
In this paper, we describe the preparation of the nanosized TiO2 particles under a
gamma-ray irradiation. The particle size and the particle distribution of the nanosized TiO2
particles were investigated using a transmission electron microscope (TEM) and an X-ray
Diffraction analysis (XRD). The photocatalytic oxidation of methyl orange (MO)
(C14H14N3SO3Na) (C.I. 13025) was supplied by Aldrich Chemical Co. Ltd. (with 100%
purity) and used as a model compound in TiO2 suspension under UV illumination was
investigated in order to evaluate the photocatalytic activity of the as-prepared TiO2
nanoparticles.
Also, we describe the preparation of the nanosized anatase TiO2 particles under a
gamma-ray irradiation. Structural and properties of the solids investigated have been studied
using XRD, EDX, TEM, FTIR and BET techniques. Also, the effects of cupper addition on
E-TiO2 (Cu/TiO2) and Cu-TiO2 prepared by co-precipitation method on the photcatalytic
degradation of methyl orange (MO) were examined.
EXPERIMENTAL
1- Preparation Method
Ti (OH)4 gel was obtained at room temperature by the addition of concentrated
ammonia solution (35% NH3) dropwise to a vigorously stirred dilute solution of TiCl4 (Fluka
15%) until a pH 9 was attained. The ammonia solution was added dropwise to prevent particle
adhesion and sudden grain growth of particles. The white hydrous Ti (OH)4 solution was
irradiated under a 60
Co source (NCRRT) with 30 kGy and at a dose rate of 3.3476 kGy/h. The
reactant solution was stirred mildly while irradiating it, so as not to become agglomerated
- 287 -
with each other. The particles were then washed rigorously and repeatedly with bidistilled
water to remove any remaining impurities. After the solvent was evaporated at 100°C for 24
h, the precipitates were dried at 300°C for 2 h to remove NH4Cl, and then calcined at 500°C
for 4 h to get titania TiO2. A 0.5% Cu/TiO2 was prepared by an impregnation the TiO2 carrier
using copper nitrate Cu (NO3).6H2O as a precursor for copper metal. A third sample was
prepared by a sol-gel method 0.5%Cu-TiO2.
Cu-doped TiO2 nanoparticles containing 0.5wt% Cu (II) ion dopant were synthesized
via a co-precipitation. Briefly, 6 mL ethanol solution of 0.5 M of Cu (NO3).6H2O was added
dropwise to TiCl4 solution under stirrering. The pH value of the reaction solution was
adjusted to ca. 9 by ammonia. Then the white and dense colloid was formed. The colloid was
stirred gently for 3h, and then washed rigorously and repeatedly with bidistilled water to
remove any remaining impurities After the solvent was evaporated at 100°C for 24 h, the
precipitates were dried at 300°C for 2 h to remove NH4Cl, and then calcined in an air stream
of 400°C for 4 h.
2- Experimental Procedure
The photoreactor was designed by us. The light source was a 254 nm UV lamp. A
general photocatalytic procedure was carried out as follows: methyl orange was chosen as the
model molecule; 0.15 g of the catalyst was suspended in the methyl orange solution (C0 =
0.01 g/L, 500 ml, PH 1) and the suspension was irradiated with UV lamp open to air. During
the process of the photocatalytic tests, the concentration of methyl orange was detected using
a visible spectrophotometer (JENWAY-6505) at λmax 458 nm.
3- Physical Characterization of the Catalysts
N2 physisorption was utilized to study the effect of the preparation and pretreatment
process on the TiO2 samples. Characteristics such as BET surface area, pore size, and pore
volume were examined. N2 physisorption studies were carried out in a NOVA Automated gas
sorption system Version 1.12. For each measurement, the sample was degassed at 250oC for
3–4 h, and then analyzed at 77 K (liquid N2 temperature). The surface areas and pore volumes
were determined using the BET (Brunauer–Emmett–Teller) method from the adsorption
branch in the relative pressure range of 0.05-0.35. The total pore volume of the samples was
calculated from the nitrogen uptake at P/Po = 0.95, using the BJH (Barrett–Joyner– Halenda)
method from the isothermal desorption data.
Total amount of acidity was estimated from weight loss measurements of adsorbed
pyridine using SETARAM Labsys TG-DSC16 equipment. After that, the samples were
analyzed by TGA.
XRD analysis was performed to determine the rutile and anatase concentrations. X-ray
powder diffraction (XRD) patterns were obtained with a PANalytical X'Pert PRO
diffractometer in reflection mode using Cu Kα radiation over the scan range of 2θ between 20
and 80 at 295 K, in order to identify the phase present.
Crystallite size (D) of the photocatalysts was calculated from the line broadening of X-
ray diffraction peak according to the Sherrer formula [10], as shown in Eq. (1):
, (1)
- 288 -
where K is the Sherrer constant (0.89), λ is the wavelength of the X-ray radiation (0.15418 nm
for Cu Kα), β is the full width at half maximum (FWHM) of the diffraction peak measured at
2θ, and θ is the diffraction angle.
FTIR were performed using Nicolet Is-10 model (USA) Infrared spectrophotometer
adopting KBr technique. For all samples, the KBr technique was carried out approximately in
a quantitative manner since the weight of sample and that of KBr, were always kept constant.
The topography and particle size of TiO2 was measured using JEOL transmission
electron microscopy (TEM) operating at an accelerating voltage of 120 kV. The structure
resolution of microscope is 0.2 nm. Prior to the analysis, the catalyst sample was ground into
powder (using mortar and pestle) and then ultrasonically dispersed in water and placed on a
carbon-coated copper grid. The sample was allowed to dry before TEM analysis.
RESULTS AND DISCUSSION
1- Characterization Results of Photocatalysts
The physicochemical properties of the nanocrystalline TiO2 photocatalysts synthesized
by the sol–gel process could be influenced by doses of γ- ray and the instant of irradiation,
namely sample A (calcined only), sample B (calcined then irradiated with 0.1 kGy), and
sample C (irradiated with 30 kGy during preparation).
1.1. N2 adsorption–desorption results
In order to verify the mesoporosity of the photocatalyst samples, the N2 adsorption–
desorption analysis is very powerful technique normally used. The N2 adsorption–desorption
isotherms of the synthesized TiO2 exhibits typical IUPAC type IV pattern as shown in Fig. 1.
γ-TiO2 tends to give Type H2 loops, often referred to as 'ink bottle' pores. Whereas; Cu-TiO2
catalyst show H3 hysteresis loop, it does not exhibit any limiting adsorption at high P/P°
values. It is often observed with aggregates of plate-like particles giving rise to slit-shaped
pores. The specific surface area and total pore volume of TiO2 are shown in Table 1.
Figure 1. N2 Adsorption-desorption isotherm of TiO2.
- 289 -
1.2. X-ray diffraction results
The crystallinity of the prepared samples was examined by XRD analysis, Fig. 2. A
single anatase phase TiO2 was formed for both irradiated and non-irradiated TiO2. The peaks
at 2θ values of 25.3, 30.8, 37.8, 48.1, 53.9, 54.3, 56.6, 70.2 and 75.1, 82.7 were identified by
comparing with literature data and confirm that the particles are polycrystalline with an
anatase structure [11]. All peaks are in good agreement with the standard spectrum (JCPDS
no 01-075-2246).
The presence of Cu2+
was hardly detected by XRD due to its low content. However, the
relative intensities of the anatase peak vary among samples. High TiO2 crystallinity was
obtained with the addition of 0.5wt% Cu+2
. The TiO2 without Cu2+
produced relatively small
diffraction peaks of anatase at 25°, in contrast to the patterns of the samples with Cu2+
.
Therefore, phase transformation was not fully achieved without Cu2+
, as the TiO2 retained
portions of the inactive amorphous phase.
Table 1. Textural and structural properties of TiO2 Catalysts.
SamplesSamplesSamplesSamples
Crystal size of Crystal size of Crystal size of Crystal size of
TiOTiOTiOTiO2222aaaa
((((nmnmnmnm))))
Specific surface Specific surface Specific surface Specific surface
areaareaareaareabbbb
((((mmmm2222////gggg))))
PoPoPoPore Radiusre Radiusre Radiusre Radius
Dv Dv Dv Dv ((((rrrr))))cccc
((((nmnmnmnm))))
Total pore Total pore Total pore Total pore
VolumeVolumeVolumeVolumecccc
((((cccccccc////gggg))))
Acidity Acidity Acidity Acidity
�mol�mol�mol�mol////gmgmgmgmdddd
TiOTiOTiOTiO2222 22.35 127.1 1.24 0.334 6055
CuCuCuCu////6----TiOTiOTiOTiO2222 16.91 115.8 1.13 0.324 6334
CuCuCuCu----TiOTiOTiOTiO2222 18.62 60.8 1.01 0.476 13343 a according to XRD analysis. b BET surface area calculated from the linear portion of the BET plot in the relative pressure range of p/p0 = 0.05–0.35. c Pore radius and total pore volume estimated using BJH method from the isothermal desorption data. d weight loss measurements of adsorbed pyridine using SETARAM Labsys TG-DSC16 equipment.
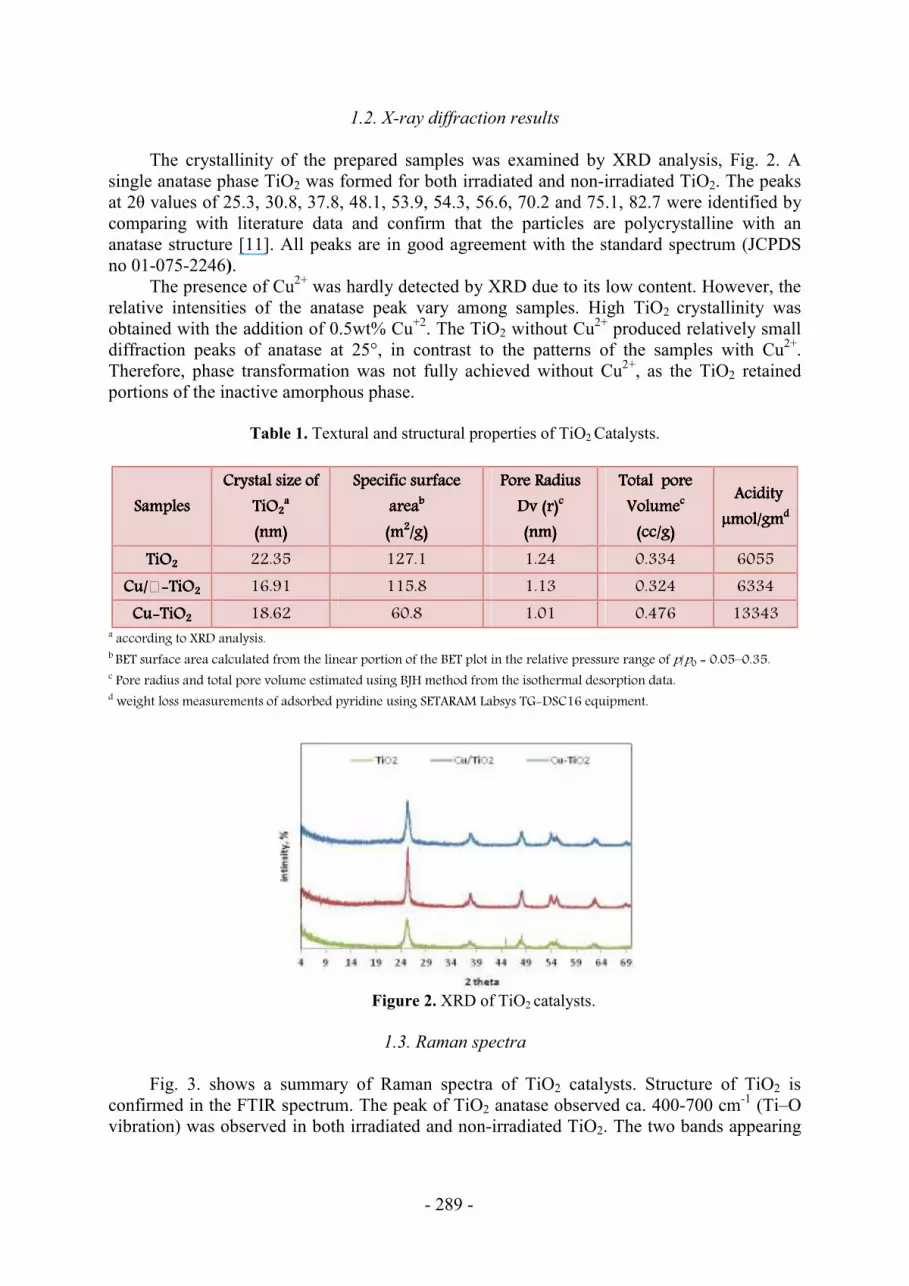
Figure 2. XRD of TiO2 catalysts.
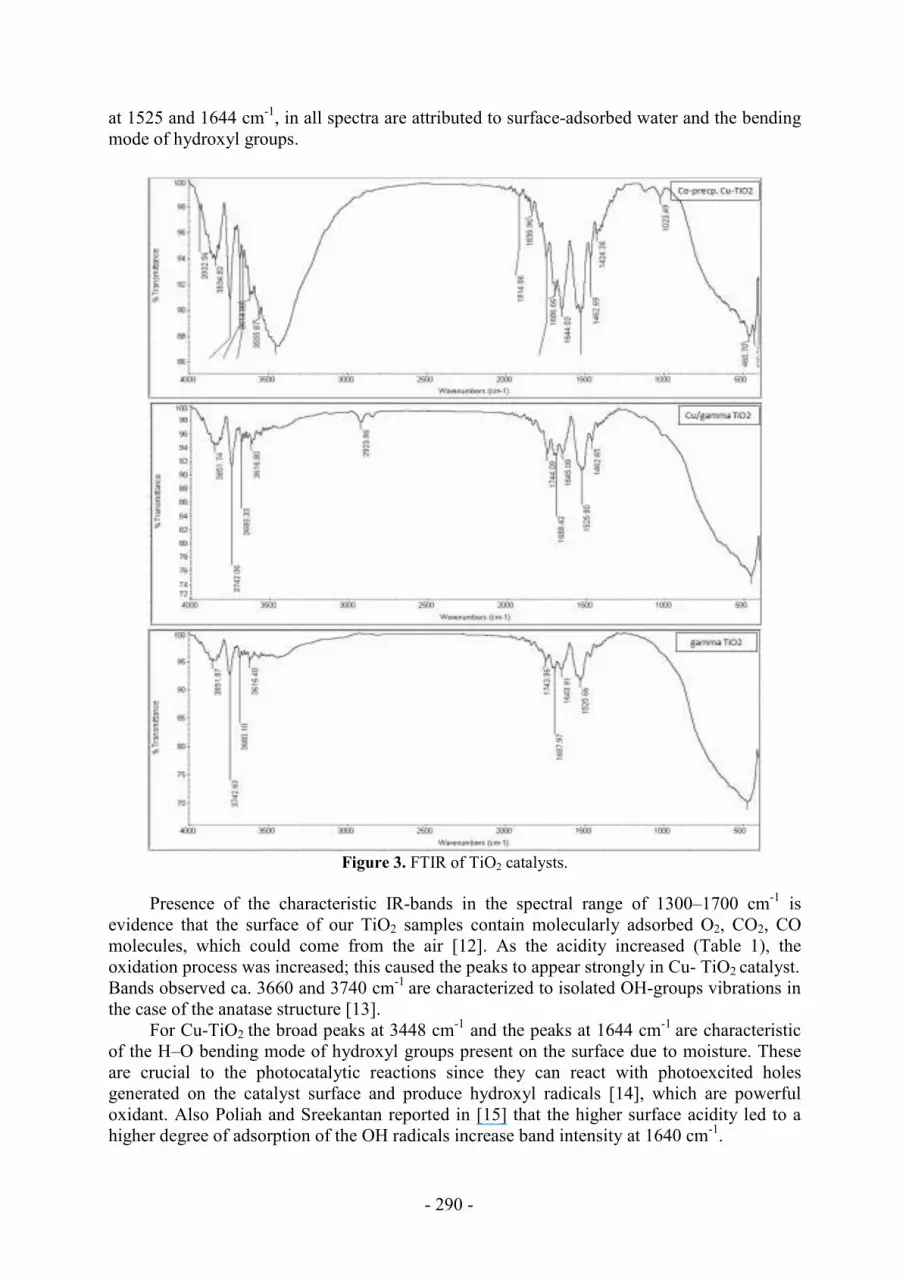
1.3. Raman spectra
Fig. 3. shows a summary of Raman spectra of TiO2 catalysts. Structure of TiO2 is
confirmed in the FTIR spectrum. The peak of TiO2 anatase observed ca. 400-700 cm-1
(Ti–O
vibration) was observed in both irradiated and non-irradiated TiO2. The two bands appearing
- 290 -
at 1525 and 1644 cm-1
, in all spectra are attributed to surface-adsorbed water and the bending
mode of hydroxyl groups.
Figure 3. FTIR of TiO2 catalysts.
Presence of the characteristic IR-bands in the spectral range of 1300–1700 cm-1
is
evidence that the surface of our TiO2 samples contain molecularly adsorbed O2, CO2, CO
molecules, which could come from the air [12]. As the acidity increased (Table 1), the
oxidation process was increased; this caused the peaks to appear strongly in Cu- TiO2 catalyst.
Bands observed ca. 3660 and 3740 cm-1
are characterized to isolated OH-groups vibrations in
the case of the anatase structure [13].
For Cu-TiO2 the broad peaks at 3448 cm-1
and the peaks at 1644 cm-1
are characteristic
of the H–O bending mode of hydroxyl groups present on the surface due to moisture. These
are crucial to the photocatalytic reactions since they can react with photoexcited holes
generated on the catalyst surface and produce hydroxyl radicals [14], which are powerful
oxidant. Also Poliah and Sreekantan reported in [15] that the higher surface acidity led to a
higher degree of adsorption of the OH radicals increase band intensity at 1640 cm-1
.
- 291 -
However; the high level of anatase hydration is probably also responsible for broad
absorption bands in the spectral range of 1023 cm-1
in Cu-TiO2 catalyst. The signals of copper
are not observed in the case of IR.
1.4. High Resolution Transmission Electron Microscopy (HRTEM)
The TEM images of Irradiated and non-irradiated TiO2 are shown in Fig. 4. They
showed regular round shaped particles. There was no significant difference between Cu+2
and
Ti+4
particles. The lattice distance was measured to be 0.246 nm according to the HRTEM
image, which could be undoubtedly assigned to the lattice facet of Cu2O (1 1 1). Some
amorphous phases covered the Cu2O lattice, which might be dispersed TiO2 on Cu2O.
Figure 4. TEM image of TiO2 catalysts.
2- Photocatalytic MO Degradation Results
Under neutral conditions (pH 7) the dye solutions were irradiated from the very
beginning of the experiment. There was no appreciable change in the dye concentration,
which indicated no photocatalytic oxidation of Methyl Orange occurred.
With pH 1.0, no appreciable change in the dye concentration noticed with γ-TiO2. The
photocatalytic activity of a nosized TiO2 particles was very low despite the large surface area
about 127m2/g may be due to its imperfect crystallization from the XRD pattern (Fig. 2)
accompanying with the fairly small crystallite size (Table 1) is considered to increase the
probability of the mutual e−/h
+ recombination at both surface and bulk traps. This also, was
- 292 -
finding decrease in the dye concentration was observed both with Cu/γ-TiO2 and Cu-TiO2
catalysts. The degradation % reached to 99, 93 using Cu/γ-TiO2 and Cu-TiO2 catalysts
respectively after 210 min under UV irradiation, Fig. 5. The high surface area and pore radius
of Cu/γ-TiO2 is responsible for its high photocatalytic activity. Since the PCD process is
affected by adsorption of the substrate on the catalyst the effect of surface area is important in
PCD. Robert and Weber [16] used sol-gel prepared TiO2 and prepared TiO2 with surface areas
of 162 m2g
-1 and 300m
2g
-1. The latter showed higher photoactivity as they have higher surface
areas. However; Cu-TiO2 has higher amount of OH radicals, as shown in FTIR spectrum,
which powerful photocatalytic activity of this catalyst. From the previous researches, it is
evident that the degradation of organic compounds proceeds through progressive attachment
of OH groups. Thus, those compounds, which facilitate the attachment of OH radical, will
degrade faster. The OH radicals can attack at different positions of the aromatic ring,
depending upon the directing effect of the original functional group [17].
a) b)
Figure 5. (a) The degradation % of methyl orange with time, and (b) the remaining
concentration of it after 210 min of UV irradiation.
CONCLUSION
The photocatalytic activity of titanium dioxide prepared by a gamma-ray irradiation was
investigated. The particles of the prepared TiO2 were very fine and had a narrow distribution.
The photocatalytic activity of the nanosized TiO2 and Cu/γ-TiO2 particles on the concentration
of the methyl orange with an increasing time of the UV irradiation were investigated. The
photocatalytic activity of gamma catalyst was compared with that of Cu-TiO2 catalyst. The
degradation percentage of the MO was reached 99 owing to the Cu/ɤ-TiO2. The photocatalytic
activity of a nosized TiO2 particles was very low despite the large surface area about 127 m2/g
of might its imperfect crystallization from the XRD pattern accompanying with the fairly
small crystallite size is considered to increase the probability of the mutual e−/h
+
recombination at both surface and bulk traps.
REFERENCES
[1] P. Rys and H. Zollinger, "Fundamentals of the Chemistry and Application of Dyes",
Wiley-Interscience, New York, (1992).
- 293 -
[2] H. Zollinger, eds., “Color Chemistry: Synthesis, Properties and Applications of Organic
Dyes and Pigments”, 2nd Revised Edition, VCH, (1991).
[3] ISO 14001, October (1996).
[4] Ren, W.J., Ai, Z.H. ,Jia, F.L., Zhang, L.Z., Fan, X.X., Zou, Z.G, “Low temperature
preparation and visible light photocatalytic activity of mesoporous carbon-doped
crystalline TiO2”. Appl.Catal. B—Environ. 69, 138–144, (2007).
[5] Kim, D.S., Han, S.J., Kwak, S.Y. "Synthesis and photocatalytic activityof mesoporous
TiO2 with the surface area, crystallite size, and pore size"; .J. Colloid Interface Sci. 316,
85–91, (2007).
[6] Maria, F., Valentina, G., Tiziano, M., Paolo, F., Mauro, G., "A high-frequency (95 GHz)
electron paramagnetic resonance study of B-doped TiO2 photocatalysts”. Inorg. Chim.
Acta 361, 3980–3987, (2008).
[7] Wu, Z.B., Gu, Z.L., Zhao, W.R., Wang, H.Q., “Photocatalytic oxidation of gaseous
benzene over nanosized TiO2 prepared by solvothermal method”. Chin. Sci. Bull. 52,
3061–3067, (2007).
[8] The Merck Index, 8th ed., Merck & Co., Rahway N. J. “The index gives the following
reference for details on the synthesis of methyl orange”, (1968).
[9] L. Gattermann, “Die Praxis des organischen Chemikers”, 40th ed., de Gruyter & Co.,
Berlin, pp 260-261, (1961).
[10] B.D. Cullity, “Elements of X-ray Diffraction”, Addison-Wesley Pub. Co, Reading, MA,
(1978).
[11] F. Rouquerol, J. Rouquerol, K. Sing, “Adsorption by Powders and Porous Solids:
Principles, Methodology and Applications”, Academic Press, San Diego, (1999).
[12] A.A. Davydov, “IR Spectroscopy in Oxides Surface Chemistry, Nauka”, Novosibirsk,
248 p., in Russian, (1984)
[13] P. Jackson, G. Parfitt, Trans. Farad. Soc. 67, 2469, (1971).
[14] Z. Ding, G.Q. Lu, P.F. Greenfield, J. Phys. Chem. B 104 , 4815, (2000).
[15] R. Poliah and S. Sreekantan, “Characterization and Photocatalytic Activity of Enhanced
Copper-Silica-Loaded Titania Prepared via HydrothermalMethod”; J. Nanomaterials 1-
5 (2011).
[16] D. Robert and J.V. Weber, Chem. Prod., 6, 335, (1998).
[17] D.S. Bhatkhande, V.G. Pangarkar, A.A.C.M. Beenackers, J. Chem. Technol. Biotechnol.,
77, 102 (2002).