Agriculture faces many challenges, suchas climate change, water shortages,labor shortages due to an agingurbanized population, and increasedsocietal concern about issues such as
animal welfare, food safety, and environmental im-pact. Humanity depends on agriculture and waterfor survival, so optimal, profitable, and sustainableuse of our land and water resources is critical. At
Australia’s Commonwealth Sci-entific and Industrial ResearchOrganization (CSIRO), we’re de-veloping a “smart farm” that ap-plies wireless sensor networktechnology to animal agricultureto address these requirements.We’ve created a pervasive, self-configuring network of cheap,
simple devices that learn about their environmentand seek to control it for beneficial purposes.
How sensors can helpThe agricultural practices brought to Australia
from Europe have turned out to be poorly suitedto a land with different seasonal patterns, hydro-logical and nutrient cycles, and geology. As in othercountries where the land has been overexploited,these practices have led to problems such as soilerosion, declining water quality, loss of biodiver-sity, and salinity. These problems are generallyinterlinked: Overgrazing in an inland region canlead to increased erosion. The increased sedimentrunoff can harm the distant Great Barrier Reef, orreduced water runoff can reduce the recharge of
underground aquifers. Sensor networks are a crit-ical tool for measuring and understanding the com-plex coupled dynamics of natural systems.
In the past, farming was a labor-intensive hu-man activity that involved tending plants and ani-mals on an almost individual basis. Modern agri-culture, in contrast, is highly mechanized andinvolves very large areas per farmer. For instance,in the UK, 200,000 farms disappeared between1966 and 1995, and 17,000 farmers and farm-workers left the land in 2003. In the US, between1950 and 1999, the number of farms decreasedby 64 percent. The global demographic shift infarm labor and reduced recruitment of youngerpeople has created an aging farming populationand looming labor shortage. The consolidationhas resulted in less personalized care and atten-tion to both animals and landscape. It has alsoachieved a major cost savings, but at the risk ofundesired situations arising and being overlookeduntil it’s too late—for instance, until the land isdegraded or disease outbreaks occur. Prevention,as always, is the best strategy. A sensor networkcan improve productivity by increasing situationalawareness of the state of the pasture and animals.
Animal production also requires controlling ani-mals’ locations—traditionally by using fences andmustering. Studies show that fence installation andmaintenance and mustering constitute approxi-mately 30 percent of the total cost of rearing an ani-mal.1 However, these expensive, static assets mightactually hinder rather than promote ideal land-management practices. Areas of marginal landbecome inaccessible because it’s not cost-effective
A large-scale, outdoor pervasive computing system uses static andanimal-borne nodes to measure the state of a complex systemcomprising climate, soil, pasture, and animals.
B U I L D I N G A S E N S O R - R I C H W O R L D
Tim Wark, Peter Corke, Pavan Sikka, Lasse Klingbeil, Ying Guo, Chris Crossman, Phil Valencia, Dave Swain, and Greg Bishop-HurleyCSIRO
APRIL–JUNE 2007 PERVASIVEcomputing 51
to fence and use it. Mustering in remoteareas is dangerous—undertaken by peo-ple on horseback or motorbikes or in heli-copters—and labor shortages are affect-ing this as well. Mobile sensor networknodes can monitor and influence animals’positions in the landscape. You can findmore details about our motivations andwork at www.sensornets.csiro.au.
Sensor network platformOutdoor sensor networks must be able
to tolerate harsh conditions to survivelong-term deployments. A key aspect ofour work has been developing a robusthardware platform for outdoor use. In-spired by the original Berkeley mote,we’ve developed three generations ofdevices since 2002: the Fleck-1, Fleck-2, and Fleck-3.
These devices incorporate numerousdesign features that make our platformideal for long-term outdoor deploy-ments: a Nordic radio with a range ofover 1 km that operates on the 433-MHz (Fleck-1 and Fleck-2) or 915-MHz(Fleck-3) band, an integral solar battery-charging circuit, and an extensive rangeof sensors and sensor interfaces. TheFleck-3 also incorporates a real-timeclock chip to reduce microcontrolleroverheads. Our software stack is basedon the TinyOS software stack with a cus-tom component for the radio.
We use this platform for both static andmobile nodes. Static nodes are based onthe Fleck-1,2 which consists of an Atmega128 microcontroller running at 8 MHz, aNordic NRF903 radio transceiver with abit rate of 76.8 Kbits per second, and anonboard temperature sensor. These nodesare connected to soil moisture sensors orcustom complementary metal oxide semi-conductor (CMOS) camera modules.
In a sunny environment such as Aus-tralia, solar energy is clearly the most abun-dant environmental energy source. Re-search groups are becoming increasinglyinterested in the use of solar energy, andnumerous recent platforms harness it.3,4
However, these platforms have typicallyonly been tested over short time periods.
We developed our Fleck-3 platformconcurrently with many of these plat-forms, and we’ve been one of the earli-est groups to exploit solar power for
long-term sensor network deployments.2
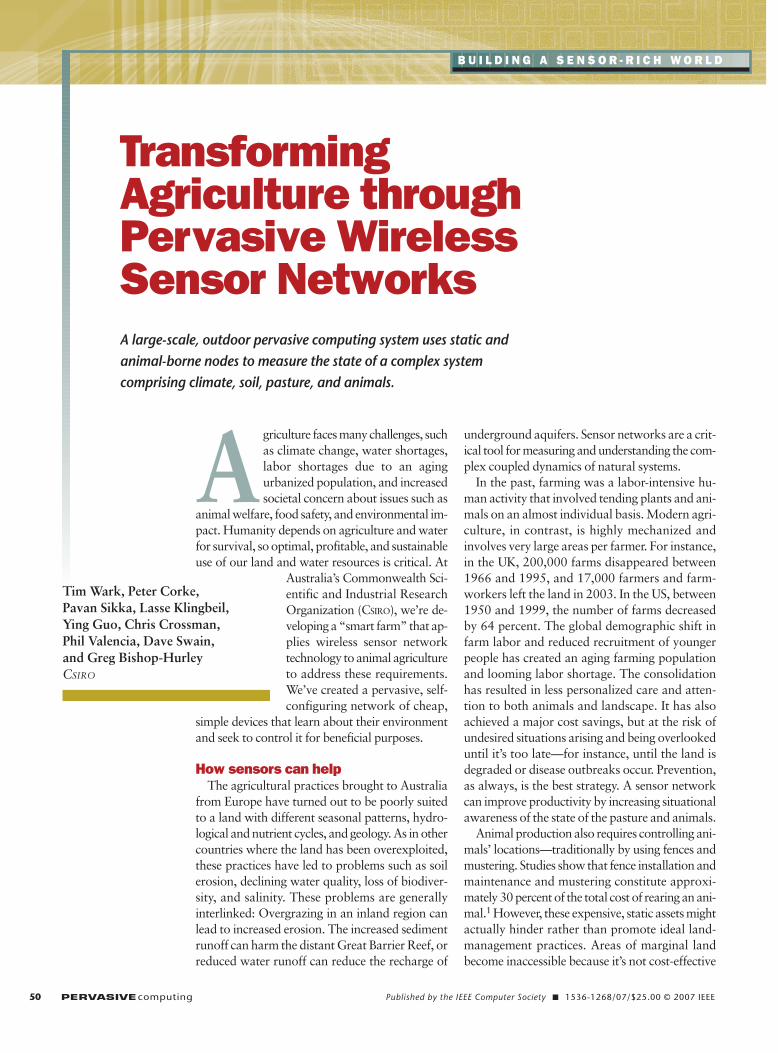
Figure 1a shows a typical (10,000 mm2)solar cell we’ve used in our deployments.Experiments have shown that these pan-els can generate from 80 to 400 kilo-joules of solar energy each month, anorder of magnitude more than our cur-rent applications require. Figure 1bshows a typical example of battery andsolar voltage and current, where the min-imum battery voltage (2.7 V) is wellabove the 1.1 V the Fleck requires.
180 181 182 183 184 185 186
2.6
2.8
3.0
Batte
ry v
olta
ge (V
)
180 181 182 183 184 185 1860
1
2
3
4
Sola
r vol
tage
(V)
180 181 182 183 184 185 1860
100
200
300
Sola
r cur
rent
(mA)
Days(b)
(a)
Figure 1. A solar-powered node showingenergy received and consumed over sixdays: (a) a typical solar cell generatesfrom 80 to 400 kilojoules of solar energymonthly, and (b) the solar and batteryvoltage and current is more thanadequate for our system.
The mobile node, the Fleck-2, is aFleck-1 base augmented by a variety ofmotion sensors. It contains an onboardtriaxial electronic compass coupled withthree orthogonally mounted accelerom-eters as well as an onboard GPS receiver.An 8-Mbit flash chip augmented by amultimedia card socket can support upto 512 Mbytes of onboard storage usingan MMC flash memory card. Newer-
generation static and mobile nodes(which we’re currently deploying) are allbased on the Fleck-3.
Sensor networks for pasture assessment
Knowing the state of pastures andcrop fields in a farm environment is cru-cial for farmers. As weather patternschange, crops mature, and cattle graze
pastures for food, farmers must decidewhen to irrigate pastures, apply fertil-izer, or move cattle to another pasture.Typically, a farmer relies on a combina-tion of experience, visual observation,and intuition as to when to make suchdecisions, but they will almost certainlybe far from optimal.
As such, the agricultural-research com-munity has become increasingly inter-ested in the use of sensor networks foragricultural monitoring and has under-taken numerous pilot projects. A crop-monitoring sensor network, Lofar Agro,5
assessed potato crop quality. Nodes mea-sured temperature and humidity, thenmultihopped the data back to a gateway.Carnegie Mellon University researchersdeveloped a small network for measur-ing the state of a plant nursery,6 with sen-sors measuring humidity and tempera-ture at various points in the nursery.
We have concurrently focused on sen-sor networks as a means for providing anew level of information about the stateof pastures. Our initial experiments haverevolved around the use of solar-poweredmoisture nodes and low-resolution cam-era nodes for pasture assessment. Giventhese two complementary informationsources, we can reach a new under-standing of the pasture’s underlying state.
Measuring soil moistureOur soil moisture nodes use commer-
cially available ECH2O capacitance-based sensors that measure the sur-rounding soil’s volumetric water content.These sensors generally don’t require cal-ibration and have an error of +/– 2 per-cent. The network automatically takesreadings, typically at one-minute inter-vals, from each node and sends themback. Data is aggregated at the base togive an up-to-date moisture profile forthe whole pasture.
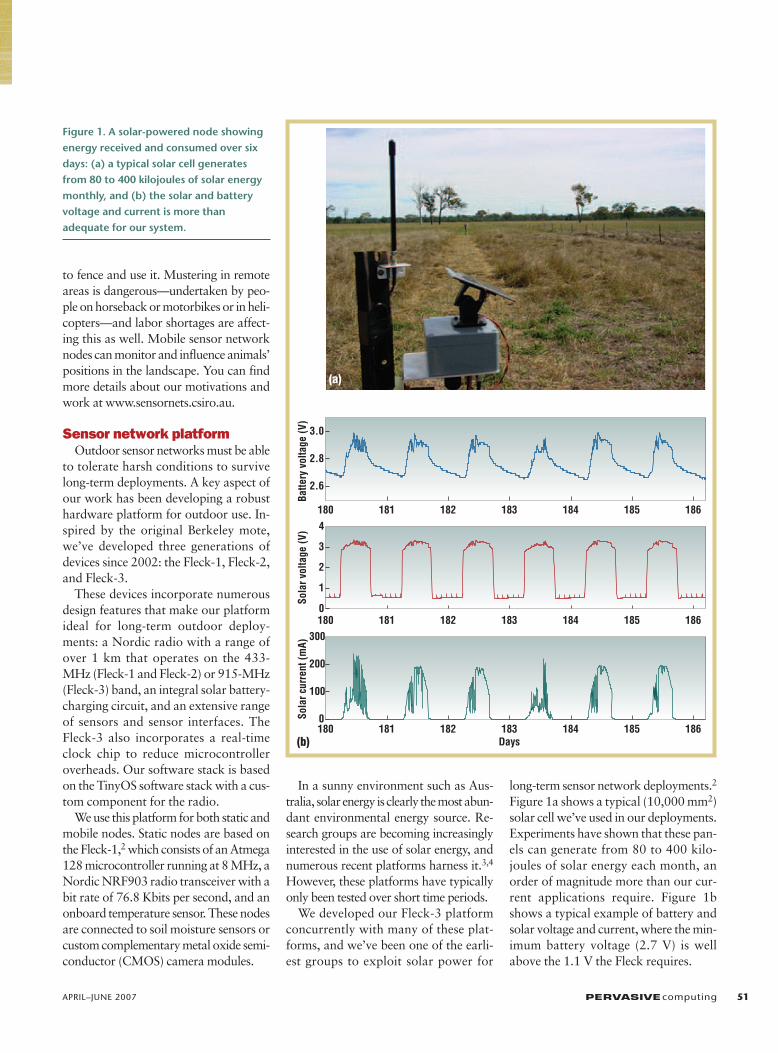
Figure 2 shows an example of datafrom a six-hectare pasture fitted with 16soil moisture nodes attached to wooden
52 PERVASIVEcomputing www.computer.org/pervasive
B U I L D I N G A S E N S O R - R I C H W O R L D
(b)
(a)
Figure 2. A color-coded contour plot of soil moisture. Blue regions indicate higher soilmoisture and red regions indicate lower moisture. Green dots indicate the sensornodes’ locations. See www.sensornets.csiro.au for live data.
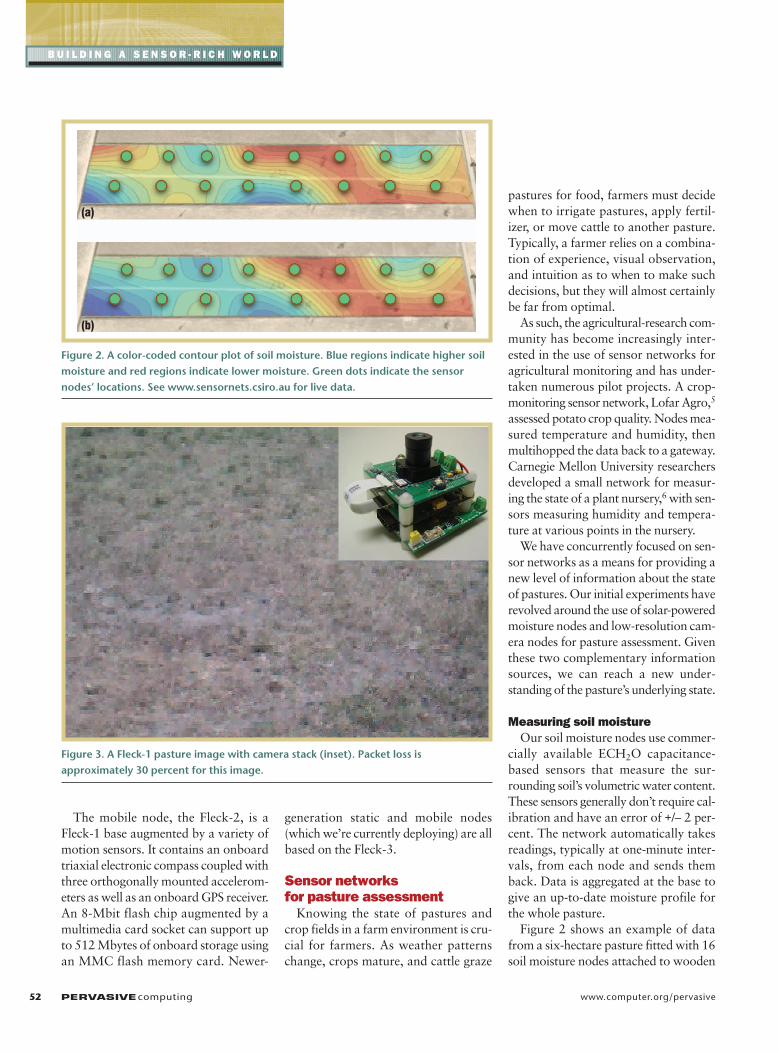
Figure 3. A Fleck-1 pasture image with camera stack (inset). Packet loss isapproximately 30 percent for this image.
posts mounted in the ground at equalintervals. Using a spline-interpolationtechnique over the individual moisturereadings from each node, we estimate thefunction describing the whole pasture’ssoil moisture profile. You can clearly seethe effects of irrigation at the pasture’sleft end (figure 2a is unirrigated, 2b is irri-gated), as well as natural variation acrossthe pasture. This is valuable input to apredictive pasture growth model.
Pasture camera nodesOther important parameters for farm-
ers include surface grass coverage or grassheight. We’re investigating the potentialfor completely self-contained, self-pow-ered camera nodes that can send imagesover our low-bandwidth networks. Theinset photo in figure 3 shows an exampleof our camera, which we created by stack-ing a Fleck-1 board with a custom-designed Texas Instruments DSP boardand a custom CMOS camera board. Youcan also connect a separate MMC boardto the stack for storing images.
The Fleck mainboard, DSP board,flash memory board, and camera boardwork together to take an image and storeit in local flash memory. A camera man-ager at the base preallocates time slotsfor each camera to send its image, whichis reconstructed at the base. A programat the base interpolates missing packets.
Figure 3 shows a typical pasture imagethat we can obtain. This image containsa useful amount of information aboutthe degree of grass coverage, grassheight, and greenness level. In this image,you can clearly see the change in thegreenness, which correlates well with theamount of soil moisture variation thatnodes are measuring in this same pas-ture. Ongoing work is investigatingimage-processing techniques that cantake place at the node to extract the pas-
ture’s parameters, making the informa-tion more compact to transmit. We canalso use cameras to observe cattle atwater troughs and gates.
Cattle sensor networksCattle are an integral part of this dy-
namic system. By better understandingcattle’s individual and herd behavior,grazing habits, and interactions with thesurrounding environment, farmers andanimal scientists can potentially select fordesirable qualities that were previouslyhard to measure or not fully understood.
One of the first major uses of wirelesssensor networks for animal monitoringwas in tracking zebras as part of theZebraNet project.7 In this system, ani-mal GPS position data, taken every fewminutes, was hopped in a peer-to-peerfashion to other animals when they camein range. Subject to the amount of stor-age space on each device, a user couldthen download historical position datafrom multiple animals by approachinga single zebra. Researchers have sinceproposed more sophisticated systems forad hoc routing of data through large net-works of mobile cattle nodes.8 However,this work is still at the simulation stage.
Systems such as ZebraNet have focusedon the transfer of historical position infor-mation between nodes. Our work in ani-mal sensor networks, however, has fo-cused on extracting information (such asbehavior states) that helps farmers under-stand how herds of cattle interact andgraze pastures. This can help solve theagricultural problem of finding betterways to use limited pasture resources.
Another unique focus, which we discussin more detail later, has been on the poten-tial for internode communication to pro-vide contact-log information (that is, a logof the number of times a pair of animalscome into proximity of each other) with-out needing position information. Animalresearchers can use this information todetermine characteristics such as cow-calfrelationships over time or trends in herdbehavior.
Collars and other hardwareTo attach sensor nodes to cattle, we
created custom collars for them to wear2
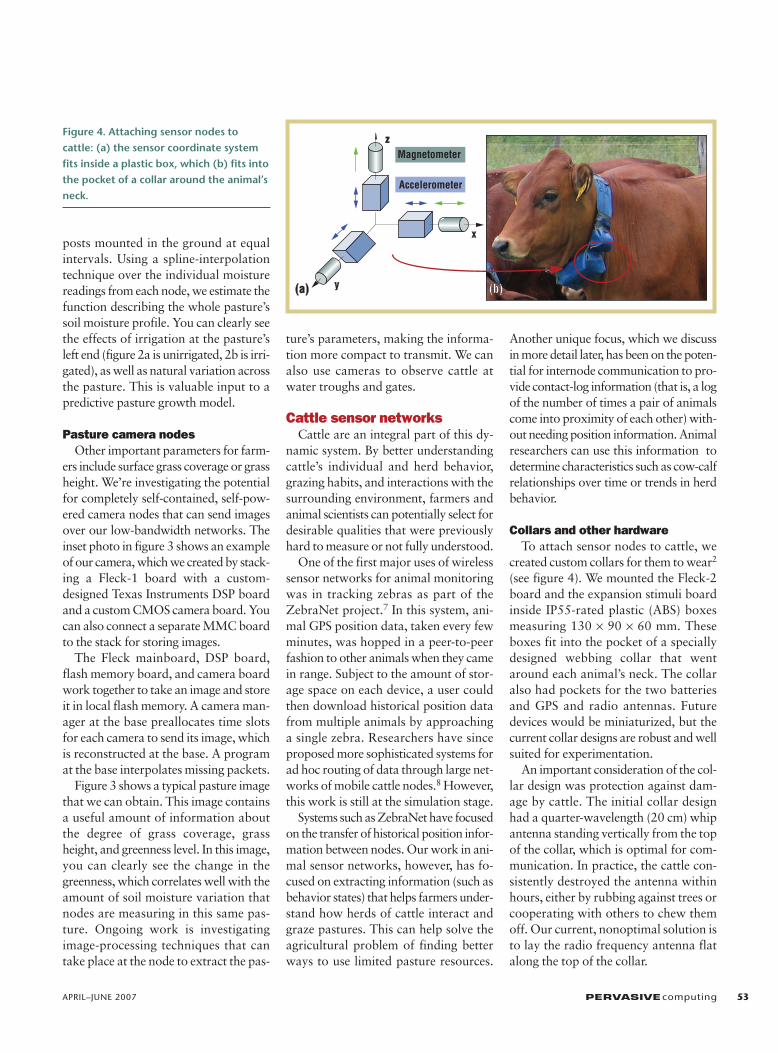
(see figure 4). We mounted the Fleck-2board and the expansion stimuli boardinside IP55-rated plastic (ABS) boxesmeasuring 130 � 90 � 60 mm. Theseboxes fit into the pocket of a speciallydesigned webbing collar that wentaround each animal’s neck. The collaralso had pockets for the two batteriesand GPS and radio antennas. Futuredevices would be miniaturized, but thecurrent collar designs are robust and wellsuited for experimentation.
An important consideration of the col-lar design was protection against dam-age by cattle. The initial collar designhad a quarter-wavelength (20 cm) whipantenna standing vertically from the topof the collar, which is optimal for com-munication. In practice, the cattle con-sistently destroyed the antenna withinhours, either by rubbing against trees orcooperating with others to chew themoff. Our current, nonoptimal solution isto lay the radio frequency antenna flatalong the top of the collar.
APRIL–JUNE 2007 PERVASIVEcomputing 53
zz
xx
yy(a)(a) (b)(b)
Magnetometer
Accelerometer
Figure 4. Attaching sensor nodes to cattle: (a) the sensor coordinate systemfits inside a plastic box, which (b) fits intothe pocket of a collar around the animal’sneck.
CommunicationWe’ve aimed to answer two main
questions regarding sensor networks:
1. Can we reliably send and receivepackets between mobile cattle nodes(for example, multihop routing ofbehavior states)?
2. Can we extract valuable informationfrom each node’s position and iner-
tial information so as to determineanimal and herd state?
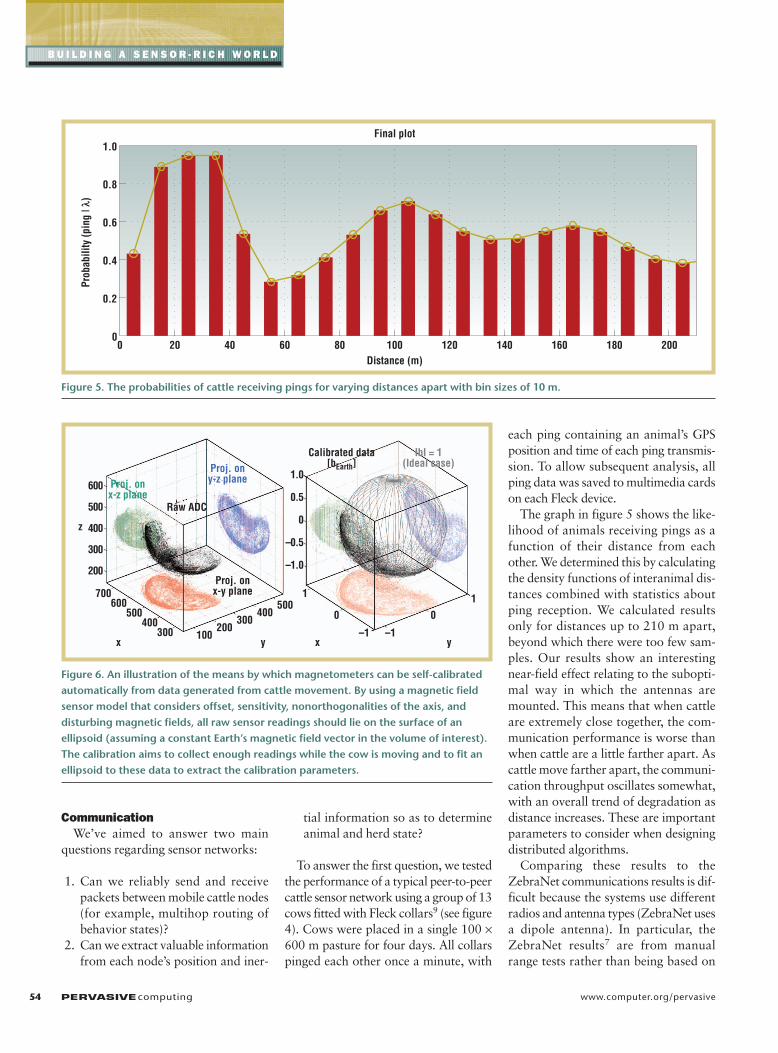
To answer the first question, we testedthe performance of a typical peer-to-peercattle sensor network using a group of 13cows fitted with Fleck collars9 (see figure4). Cows were placed in a single 100 �600 m pasture for four days. All collarspinged each other once a minute, with
each ping containing an animal’s GPSposition and time of each ping transmis-sion. To allow subsequent analysis, allping data was saved to multimedia cardson each Fleck device.
The graph in figure 5 shows the like-lihood of animals receiving pings as afunction of their distance from eachother. We determined this by calculatingthe density functions of interanimal dis-tances combined with statistics aboutping reception. We calculated resultsonly for distances up to 210 m apart,beyond which there were too few sam-ples. Our results show an interestingnear-field effect relating to the subopti-mal way in which the antennas aremounted. This means that when cattleare extremely close together, the com-munication performance is worse thanwhen cattle are a little farther apart. Ascattle move farther apart, the communi-cation throughput oscillates somewhat,with an overall trend of degradation asdistance increases. These are importantparameters to consider when designingdistributed algorithms.
Comparing these results to theZebraNet communications results is dif-ficult because the systems use differentradios and antenna types (ZebraNet usesa dipole antenna). In particular, theZebraNet results7 are from manualrange tests rather than being based on
54 PERVASIVEcomputing www.computer.org/pervasive
B U I L D I N G A S E N S O R - R I C H W O R L D
0 20 40 60 80 100 120 140 160 180 2000
0.2
0.4
0.6
0.8
1.0
Distance (m)
Prob
abili
ty (p
ing
| �)
Final plot
Figure 5. The probabilities of cattle receiving pings for varying distances apart with bin sizes of 10 m.
Calibrated data[bEarth]
z
1.0
0.5
0
–0.5
–1.0
600
500
400
300
200
IbI = 1(Ideal case)
1
0
–1
10
–1x y
Proj. ony-z plane
Proj. onx-y plane
Raw ADC
Proj. onx-z plane
700
500600
400300
500300
400200
100x y
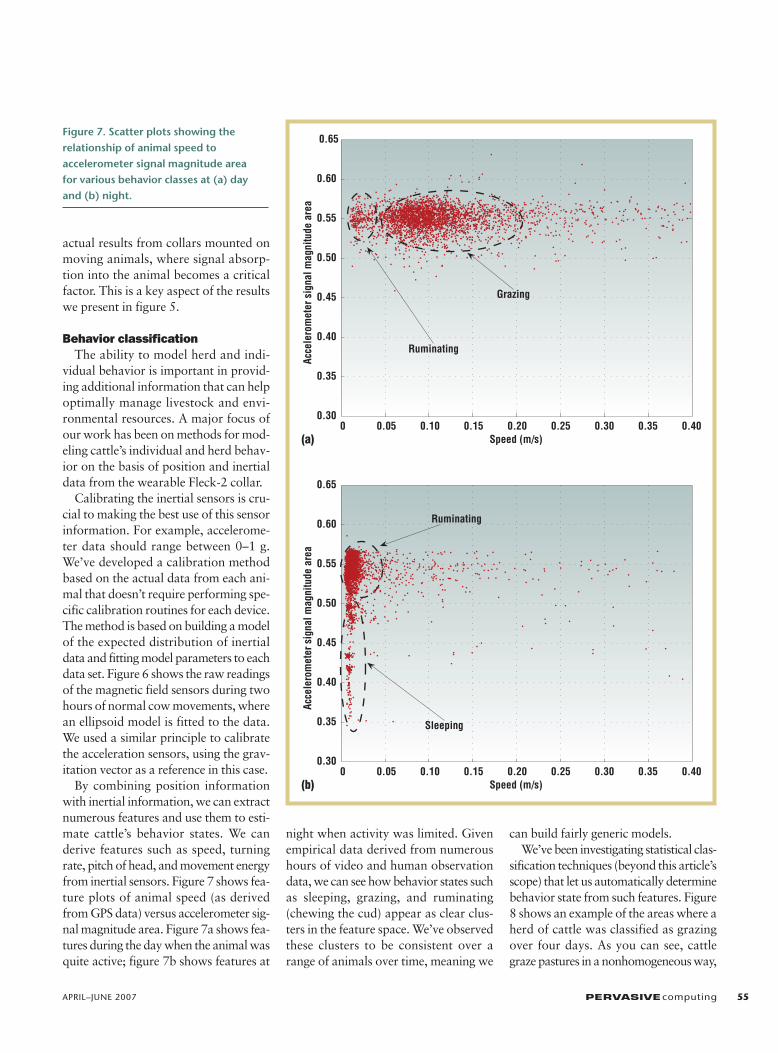
Figure 6. An illustration of the means by which magnetometers can be self-calibratedautomatically from data generated from cattle movement. By using a magnetic fieldsensor model that considers offset, sensitivity, nonorthogonalities of the axis, and disturbing magnetic fields, all raw sensor readings should lie on the surface of an ellipsoid (assuming a constant Earth’s magnetic field vector in the volume of interest).The calibration aims to collect enough readings while the cow is moving and to fit anellipsoid to these data to extract the calibration parameters.
actual results from collars mounted onmoving animals, where signal absorp-tion into the animal becomes a criticalfactor. This is a key aspect of the resultswe present in figure 5.
Behavior classificationThe ability to model herd and indi-
vidual behavior is important in provid-ing additional information that can helpoptimally manage livestock and envi-ronmental resources. A major focus ofour work has been on methods for mod-eling cattle’s individual and herd behav-ior on the basis of position and inertialdata from the wearable Fleck-2 collar.
Calibrating the inertial sensors is cru-cial to making the best use of this sensorinformation. For example, accelerome-ter data should range between 0–1 g.We’ve developed a calibration methodbased on the actual data from each ani-mal that doesn’t require performing spe-cific calibration routines for each device.The method is based on building a modelof the expected distribution of inertialdata and fitting model parameters to eachdata set. Figure 6 shows the raw readingsof the magnetic field sensors during twohours of normal cow movements, wherean ellipsoid model is fitted to the data.We used a similar principle to calibratethe acceleration sensors, using the grav-itation vector as a reference in this case.
By combining position informationwith inertial information, we can extractnumerous features and use them to esti-mate cattle’s behavior states. We canderive features such as speed, turningrate, pitch of head, and movement energyfrom inertial sensors. Figure 7 shows fea-ture plots of animal speed (as derivedfrom GPS data) versus accelerometer sig-nal magnitude area. Figure 7a shows fea-tures during the day when the animal wasquite active; figure 7b shows features at
night when activity was limited. Givenempirical data derived from numeroushours of video and human observationdata, we can see how behavior states suchas sleeping, grazing, and ruminating(chewing the cud) appear as clear clus-ters in the feature space. We’ve observedthese clusters to be consistent over arange of animals over time, meaning we
can build fairly generic models.We’ve been investigating statistical clas-
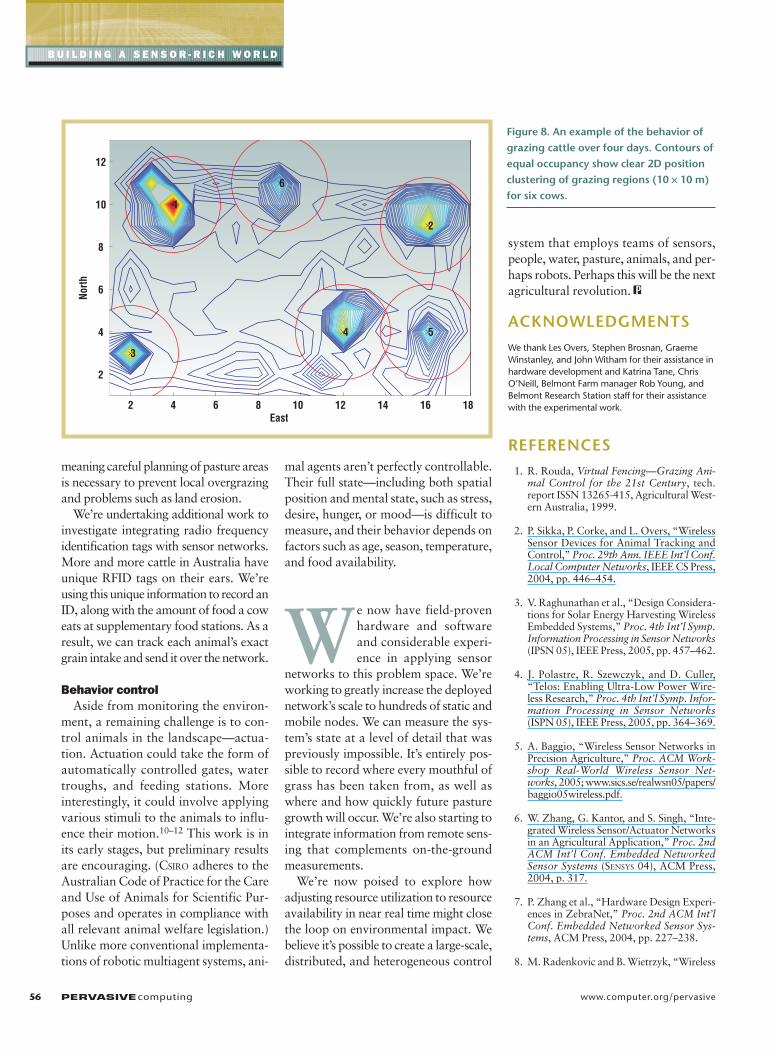
sification techniques (beyond this article’sscope) that let us automatically determinebehavior state from such features. Figure8 shows an example of the areas where aherd of cattle was classified as grazingover four days. As you can see, cattlegraze pastures in a nonhomogeneous way,
Figure 7. Scatter plots showing the relationship of animal speed toaccelerometer signal magnitude area for various behavior classes at (a) dayand (b) night.
meaning careful planning of pasture areasis necessary to prevent local overgrazingand problems such as land erosion.
We’re undertaking additional work toinvestigate integrating radio frequencyidentification tags with sensor networks.More and more cattle in Australia haveunique RFID tags on their ears. We’reusing this unique information to record anID, along with the amount of food a coweats at supplementary food stations. As aresult, we can track each animal’s exactgrain intake and send it over the network.
Behavior controlAside from monitoring the environ-
ment, a remaining challenge is to con-trol animals in the landscape—actua-tion. Actuation could take the form ofautomatically controlled gates, watertroughs, and feeding stations. Moreinterestingly, it could involve applyingvarious stimuli to the animals to influ-ence their motion.10–12 This work is inits early stages, but preliminary resultsare encouraging. (CSIRO adheres to theAustralian Code of Practice for the Careand Use of Animals for Scientific Pur-poses and operates in compliance withall relevant animal welfare legislation.)Unlike more conventional implementa-tions of robotic multiagent systems, ani-
mal agents aren’t perfectly controllable.Their full state—including both spatialposition and mental state, such as stress,desire, hunger, or mood—is difficult tomeasure, and their behavior depends onfactors such as age, season, temperature,and food availability.
We now have field-provenhardware and softwareand considerable experi-ence in applying sensor
networks to this problem space. We’reworking to greatly increase the deployednetwork’s scale to hundreds of static andmobile nodes. We can measure the sys-tem’s state at a level of detail that waspreviously impossible. It’s entirely pos-sible to record where every mouthful ofgrass has been taken from, as well aswhere and how quickly future pasturegrowth will occur. We’re also starting tointegrate information from remote sens-ing that complements on-the-groundmeasurements.
We’re now poised to explore howadjusting resource utilization to resourceavailability in near real time might closethe loop on environmental impact. Webelieve it’s possible to create a large-scale,distributed, and heterogeneous control
system that employs teams of sensors,people, water, pasture, animals, and per-haps robots. Perhaps this will be the nextagricultural revolution.
ACKNOWLEDGMENTSWe thank Les Overs, Stephen Brosnan, GraemeWinstanley, and John Witham for their assistance inhardware development and Katrina Tane, ChrisO’Neill, Belmont Farm manager Rob Young, andBelmont Research Station staff for their assistancewith the experimental work.
REFERENCES1. R. Rouda, Virtual Fencing—Grazing Ani-
mal Control for the 21st Century, tech.report ISSN 13265-415, Agricultural West-ern Australia, 1999.
2. P. Sikka, P. Corke, and L. Overs, “WirelessSensor Devices for Animal Tracking andControl,” Proc. 29th Ann. IEEE Int’l Conf.Local Computer Networks, IEEE CS Press,2004, pp. 446–454.
3. V. Raghunathan et al., “Design Considera-tions for Solar Energy Harvesting WirelessEmbedded Systems,” Proc. 4th Int’l Symp.Information Processing in Sensor Networks(IPSN 05), IEEE Press, 2005, pp. 457–462.
4. J. Polastre, R. Szewczyk, and D. Culler,“Telos: Enabling Ultra-Low Power Wire-less Research,” Proc. 4th Int’l Symp. Infor-mation Processing in Sensor Networks(ISPN 05), IEEE Press, 2005, pp. 364–369.
5. A. Baggio, “Wireless Sensor Networks inPrecision Agriculture,” Proc. ACM Work-shop Real-World Wireless Sensor Net-works, 2005; www.sics.se/realwsn05/papers/baggio05wireless.pdf.
6. W. Zhang, G. Kantor, and S. Singh, “Inte-grated Wireless Sensor/Actuator Networksin an Agricultural Application,” Proc. 2ndACM Int’l Conf. Embedded NetworkedSensor Systems (SENSYS 04), ACM Press,2004, p. 317.
7. P. Zhang et al., “Hardware Design Experi-ences in ZebraNet,” Proc. 2nd ACM Int’lConf. Embedded Networked Sensor Sys-tems, ACM Press, 2004, pp. 227–238.
8. M. Radenkovic and B. Wietrzyk, “Wireless
56 PERVASIVEcomputing www.computer.org/pervasive
B U I L D I N G A S E N S O R - R I C H W O R L D
1
2
3
4 5
6
East
North
2 4 6 8 10 12 14 16 18
2
4
6
8
10
12
Figure 8. An example of the behavior ofgrazing cattle over four days. Contours ofequal occupancy show clear 2D positionclustering of grazing regions (10 � 10 m)for six cows.
Mobile Ad-Hoc Sensor Networks for VeryLarge Scale Cattle Monitoring,” Proc. 6thInt’l Workshop Applications and Servicesin Wireless Networks (ASWN 06), 2006,pp. 47–58; www.wanrg.cs.nott.ac.uk/papers/ASWN-MR_BW.pdf.
9. P. Corke and P. Sikka, “Results from theFarm,” Proc. 3rd Workshop EmbeddedNetworked Sensors (EmNets 06), 2006, pp.46–50.
10. G.J. Bishop-Hurley et al., “Animal Con-trol—What Constitutes a Reliable Cue to Stop Animal Movement?” 59th Ann.Meeting and Trade Show, 2006, paper no.31.
11. G.J. Bishop-Hurley et al., “Virtual FencingApplications: Implementing and Testing anAutomated Cattle Control System,” Com-puters and Electronics in Agriculture, vol.56, 2007, pp. 14–22.
12. Z.Butler et al., “From Robots to Animals:Virtual Fences for Controlling Cattle,” Int’lJ. Robotics Research, vol. 25, nos. 5–6,2006, pp. 485–508.
For more information on this or any other comput-ing topic, please visit our Digital Library at www.computer.org/publications/dlib.
APRIL–JUNE 2007 PERVASIVEcomputing 57
the AUTHORSTim Wark is a member of theresearch staff at the Auto-nomous Systems Laboratoryin Australia’s CommonwealthScientific and Industrial Re-search Organization’s Infor-mation and CommunicationTechnology Centre. His re-search interests are in distrib-
uted processing in wireless sensor networks, par-ticularly on agricultural applications. He receivedhis PhD in multimodal signal processing and pat-tern recognition from the Queensland Universityof Technology. Contact him at the CSIRO ICT Cen-tre, QCAT, 1 Technology Ct., Pullenvale, Queens-land, 4069, Australia; [email protected].
Peter Corke is the researchdirector of the AutonomousSystems Laboratory in Aus-tralia’s Commonwealth Scien-tific and Industrial ResearchOrganization’s Informationand Communication Technol-ogy Centre and an adjunctprofessor at the University of
Queensland. His research activities are in machinevision, vision-based robot control, field robotics,and sensor networks. He received his PhD from theUniversity of Melbourne. He’s a member of theeditorial board of the International Journal of Robot-ics Research and a founding editor of the Journal ofField Robotics. Contact him at the CSIRO ICT Centre,QCAT, 1 Technology Ct., Pullenvale, Queensland,4069, Australia; [email protected].
Pavan Sikka works on appli-cations of wireless sensor/actu-ator networks at Australia’sCommonwealth Scientific andIndustrial Research Organiza-tion. He received his PhD incomputer science from theUniversity of Alberta, Canada.Contact him at the CSIRO ICT
Lasse Klingbeil is a postdoc-toral fellow at the Autono-mous Systems Laboratory inAustralia’s CommonwealthScientific and IndustrialResearch Organization’sInformation and Communi-cation Technology Centre.His research interests are in
localization, activity recognition, and monitor-ing humans and animals using sensor networks.He received his Dr.rer.nat in experimental phy-sics from the University of Bonn, Germany. Con-tact him at the CSIRO ICT Centre, QCAT, 1 Tech-nology Ct., Pullenvale, Queensland, 4069,Australia; [email protected].
Ying Guo is a research scien-tist at the Autonomous Sys-tems Laboratory in Australia’sCommonwealth Scientificand Industrial Research Orga-nization’s Information andCommunication TechnologyCentre. Her research interestsare in machine-leaning tech-
niques and multiagent system design. She re-ceived her PhD in machine learning from theAustralian National University. Contact her at theCSIRO ICT Centre, Locked Bag 17, North Ryde,New South Wales, 1670, Australia; [email protected].
Chris Crossman is an embed-ded software engineer at theAutonomous Systems Labora-tory in Australia’s Common-wealth Scientific and Indus-trial Research Organization’sInformation and Communica-tion Technology Centre. He’sworking on autonomous vir-
tual fencing for livestock and outdoor wireless sen-sor networks. He received his bachelor’s degree incomputer systems engineering from the Univer-sity of Queensland. Contact him at the CSIRO ICTCentre, QCAT, 1 Technology Ct., Pullenvale,Queensland, 4069, Australia; [email protected].
Phil Valencia is a researchengineer in the AutonomousSystems Laboratory in Aus-tralia’s Commonwealth Scien-tific and Industrial ResearchOrganization’s Informationand Communication Tech-nology Centre and is workingon his PhD in complex sys-
tems science. His research interests are in environ-mental sensor networks. He received a doubledegree (BEng/BIT) from the Queensland Univer-sity of Technology. Contact him at the CSIRO ICTCentre, QCAT, 1 Technology CT., Pullenvale,Queensland, 4069, Australia; [email protected].
Dave Swain is group leaderof the Livestock Systems re-search group at the J.M. Ren-del Laboratory in Rockhamp-ton, Australia. His researchinterests are in grazing sys-tems, with a particular interestin developing modeling andexperimental methods to ex-
plore selection behavior within spatially con-strained environments. He received his PhDfrom the University of Wales, Swansea. Contacthim at CSIRO Livestock Industries, J.M. Rendel Lab-oratory, Ibis Ave., Rockhampton, Queensland,4701, Australia; [email protected].
Greg Bishop-Hurley is aresearch scientist in the Live-stock Systems group at theJ.M. Rendel Laboratory inRockhampton, Australia, andis working on understandingthe behavior of beef cattle inextensive grazing systemsusing wireless sensors. He
received his PhD in pastoral agronomy fromMassey University, New Zealand. Contact him atCSIRO Livestock Industries, J.M. Rendel Laboratory,Ibis Ave., Rockhampton, Queensland, 4701, Aus-tralia; [email protected].