Tree mortality patterns following prescribed firesin a mixed conifer forest
Leda Kobziar, Jason Moghaddas, and Scott L. Stephens
Abstract: During the late fall of 2002 we administered three burns in mixed conifer forest sites in the north-central Si-erra Nevada. Eight months later we measured fire-induced injury and mortality in 1300 trees. Using logistic regression,an array of crown scorch, stem damage, fuels, and fire-behavior variables were examined for their influence on treemortality. In Douglas-fir (Pseudotsuga menziesii (Mirb.) Franco), white fir (Abies concolor (Gord. & Glend.) Lindl.),and incense cedar (Calocedrus decurrens (Torr.) Florin), smaller trees with greater total crown damage had higher mor-tality rates. Smaller stem diameters and denser canopies predicted mortality best in ponderosa pine (Pinus ponderosaDougl. ex P. Laws. & C. Laws). Duff consumption and bark char severity increased model discrimination for white firand incense cedar and California black oak (Quercus kelloggii Newberry), respectively. In tanoak (Lithocarpus densiflorus(Hook. & Arn.) Rehd.), greater total crown damage in shorter trees resulted in higher mortality rates. Along with treediameter and consumption of large (>7.6 cm diameter at breast height, DBH) rotten downed woody debris, fire inten-sity was a significant predictor of overall tree mortality for all species. Mortality patterns for white fir in relation tocrown damage were similar among sites, while those for incense cedar were not, which suggests that species in repli-cated sites responded differently to similar burns. Our results demonstrate actual fire-behavior data incorporated intomortality models, and can be used to design prescribed burns for targeted reduction of tree density in mixed coniferforests.
Résumé : À la fin de l’automne 2002, nous avons réalisé trois brûlages dirigés sur des stations forestières mixtes deconifères dans la région centre-nord de la Sierra Nevada. Huit mois plus tard, nous avons mesuré les blessures et lamortalité induite par le feu sur 1300 arbres. Par le biais d’une régression logistique, nous avons étudié la mortalité desarbres en fonction d’une gamme de variables comprenant le roussissement de la cime, les dommages à la tige, lescombustibles et le comportement du feu. Pour le douglas vert (Pseudotsuga menziesii (Mirb.) Franco), le sapin argenté(Abies concolor (Gord. & Glend.) Lindl.) et le cèdre à rayons (Calocedrus decurrens (Torr.) Florin), les plus petits ar-bres ayant la plus grande quantité de dommages cumulés à la cime étaient associés à une mortalité élevée. La mortalitédu pin ponderosa (Pinus ponderosa Dougl. ex P. Laws. & C. Laws) était fortement associée aux petits diamètres et àdes canopées denses. La consommation de litière et la sévérité de la carbonisation de l’écorce ont respectivementaugmenté le pouvoir discriminant du modèle pour le sapin argenté, le cèdre à rayons et le chêne noir de Californie(Quercus kelloggii Newberry). Dans le cas du chêne à tan (Lithocarpus densiflorus (Hook. & Arn.) Rehd.), les plusforts taux de mortalité ont été observés sur les plus petits arbres ayant la plus grande quantité de dommages cumulés àla cime. Avec le diamètre des arbres et la consommation des gros (>7,6 cm) débris ligneux décomposés au sol,l’intensité du feu était un prédicteur significatif de la mortalité des arbres et ce, pour toutes les espèces. Les patrons demortalité en fonction des dommages à la cime étaient semblables peu importe la station pour le sapin argenté, mais pasdans le cas du cèdre à rayons, ce qui suggère que les espèces ont réagi différemment à des brûlages similaires selon lastation. Nos résultats démontrent que des données réelles de comportement du feu peuvent être introduites dans les mo-dèles de mortalité et peuvent être utilisées pour planifier des brûlages dirigés avec une réduction ciblée de la densitédes arbres dans les forêts mixtes de conifères.
[Traduit par la Rédaction] Kobziar et al. 3238
Introduction
Fuel-reduction treatments are one of the highest prioritiesin the management of western United States forests today.With over 10 million hectares of coniferous forests in mod-erate or high fire hazard condition classes (National WildfireCoordinating Group 2001), the National Fire Plan (US De-partment of Agriculture and US Department of the Interior2000) and Healthy Forest Restoration Act (United StatesCongress 2003) have encouraged expedient action to de-crease fuel loads in fire-prone coniferous forests (Stephensand Ruth 2005).
Prescribed fire is one of numerous fuel-reduction tech-niques and has been employed to reduce wildfire severity for
Received 31 October 2005. Accepted 20 June 2006.Published on the NRC Research Press Web site athttp://cjfr.nrc.ca on 23 February 2007.
L. Kobziar.1 School of Forest Resources andConservation/School of Natural Resources and Environment,University of Florida, 134 Newins-Ziegler Hall, Gainesville,FL 32611-0410, USA.J. Moghaddas, and S.L. Stephens. Division of EcosystemScience, Department of Environmental Science, Policy, andManagement, 137 Mulford Hall, University of California,Berkeley, CA 94720-3114, USA.
nearly a century in the northern Sierra Nevada (Biswell1989). In fire-suppressed, fire-adapted ecosystems, fuel re-duction is often an integral component of landscape-level re-integration of historical fire regimes (Covington et al. 1997).Fire’s various ecological roles have propelled its applicationin restoration projects in mixed conifer and ponderosa pine(Pinus ponderosa Dougl. ex P. Laws. & C. Laws) forests ofthe western USA (Covington et al. 1997; Stephens andMoghaddas 2005a). Whether lightning-ignited, experimen-tal, or prescribed, fire can influence soil physical and chemi-cal properties, vegetative species composition and structure,and wildlife habitat (Whelan 1995). Its ultimate role in anyecosystem depends on the frequency, intensity, seasonality,severity, and type of fire, which can be influenced by otherdisturbance types and climate.
Like other fuel-reduction methods, such as thinning orchipping of understory vegetation and woody material, theapplication of fire is primarily intended to produce foreststands with specific structures known to mitigate fire sever-ity in the case of an ignition (Brown et al. 2004; Agee andSkinner 2005). Unlike those of other fuel-reduction treat-ments, the actual effects of prescribed fires on trees are in-fluenced by factors that can extend beyond the manager’scontrol. Fire behavior can vary in relation to fine-scale dif-ferences in topography, fuel loads or moisture, or even shiftsin relative humidity. Although prescribed burns are adminis-tered within a range of acceptable weather and fuel-moistureconditions, the stochastic nature of fire imbues the predic-tion of its effects with complexity. Often, analyses ofpostfire tree mortality are based on opportunistic studieslacking pretreatment data or replication (e.g., Peterson andArbaugh 1986, 1989; Regelbrugge and Conard 1993;McHugh and Kolb 2003), which can result in ambiguity inmodeling and statistical analyses (van Mantgem et al. 2001).Agee and Skinner (2005) note that examining the impact ofcrown fire in dry forests of the western USA is nearly im-possible under controlled conditions, even with pretreatmentdata. Statistically based quantification of the roles played byfire behavior, individual tree species morphology, and fueldistribution and consumption in tree mortality can help man-agers design prescribed burns for optimal fuel diminutionand targeted reduction of tree density.
In contrast to unpredictable wildfire events, prescribedburning provides the opportunity for pre- and post-fire mea-sures of site features and severity as indicated by fuel con-sumption, as well as direct measures of fire behavior. In thesouthern Sierra Nevada Mountains of California, duff con-sumption proved significant in predicting tree mortality fol-lowing prescribed fire (Stephens and Finney 2002). Litter,duff, and large (>7.6 cm DBH) fuels often comprise the larg-est single fuel fraction in natural stands (Finney and Martin1993), and their loads and consumption have been related toroot damage and tree injury (Ryan and Frandsen 1991;Swezy and Agee 1991). Consumption of ground fuels is alsolikely to influence tree mortality, as it indicates the durationof burning and the amount of heat transferred from a fire totree boles and roots (Ryan 1982).
Direct measures of fire behavior have seldom been used inmodeling postfire tree mortality, in large part because of thechallenge of quantifying fire characteristics during flame-front passage (van Wangtendonk 1983; Finney and Martin
1993). In-situ measures of flame length can be used to com-pute fireline intensity (Byram 1959), a unit that describes therate of heat release over an area of flaming front (kW·m–1).This aspect of fire behavior is relevant to tree mortality in itsdirect relationship to the height of convective crown scorchon conifers (van Wagner 1973) and to the presence of anyvegetation susceptible to convective heating injury (Finneyand Martin 1993). Increases in both flame length and firelineintensity were associated with increased tree mortality inprescribed underburning in the northwestern USA(Reinhardt and Ryan 1988). Flame lengths alone were usedto model mortality following a prescribed fire in theunderstory of a mixed conifer forest in the Sierra Nevada(van Wagtendonk 1983). In a southeastern Canadian borealforest, authors equilibrated postwildfire bole char heightwith flame height and then length, concluding that logisticregression models using both tree morphology and fire-behavior indicators outperformed those relying on intrinsictree sensitivity only (Hely et al. 2003).
Tree features such as radial growth, stem diameter, crownposition, or bark thickness have been used to model survivalfollowing fire in the western USA for certain conifer species(Ryan and Reinhardt 1988; Mutch and Parsons 1998;Stephens and Finney 2002; van Mantgem et al. 2003). Fol-lowing a southern Sierra Nevada mixed conifer prescribedburn, the subcanopy or intermediate classes had the highestpercent mortality across all species (Mutch and Parsons1998). The influence of tree stature or intrinsic characteris-tics on survival is largely reflective of species-specific differ-ences in bark thickness or bark insulative capacity or thepresence or absence of adventitious buds. Yet expected pat-terns are not always exemplified by the data. For example,DBH has not always proved a strong predictor of tree mor-tality in some mixed conifer stands containing such speciesas sugar pine (Pinus lambertiana Dougl.), ponderosa pine,California black oak (Quercus kelloggii Newberry), giant se-quoia (Sequoiadendron giganteum (Lindl.) Buchh.), andwhite fir (Abies concolor (Gord. & Glend.) Lindl.) (Swezyand Agee 1991; Mutch and Parsons 1998; Stephens andFinney 2002; van Mantgem et al. 2003). Experimental heatapplication to small mixed conifer stands yielded no signifi-cant difference between bark-related species resistance tocambial damage (van Mantgem and Schwartz 2003). Suchdiscrepancies support the need for highly controlled experi-ments on tree mortality patterns following fire.
Postfire tree survivorship has been most successfully mod-eled using measures of foliar damage, such as crown scorchheight or percentage of crown volume scorched (Peterson1985; Ryan and Reinhardt 1988; Peterson and Arbaugh1989; Stephens and Finney 2002). Some authors have usedtotal crown damage to model mortality, which takes con-sumption of foliage into account (McHugh and Kolb 2003).These measures quantify the effects of convective heat trans-fer following flaming or smoldering combustion, and oftenserve as proxies for fire behavior when direct data are un-available. The degree of scorch or crown damage a tree canwithstand varies with tree size, species, and site-specific fac-tors influencing fire behavior, such as fuel load and burningconditions (Stephens and Finney 2002; McHugh and Kolb2003). Discrepancies in some tree-injury-based mortalitymodels have led authors to emphasize the importance of
site-specific fire behavior and severity information in ex-plaining tree mortality (Ryan and Reinhardt 1988; McHughand Kolb 2003; van Mantgem and Schwartz 2003). More-over, a recent review of 21 postfire tree mortality studies inthe western USA highlighted the necessity for standardiza-tion of site and burn conditions, as well as replication in ex-perimental designs, to increase the quality of tree mortalityprediction research (Fowler and Sieg 2004).
In this study the application of prescribed fire for fuel re-duction in replicated stands is used to evaluate postfire treemortality. We explore mortality patterns in three north-central Sierra Nevada mixed conifer forest stands, as part ofthe National Fire and Fire Surrogate study (McIver andWeatherspoon 2006) in which a series of controlled empiri-cal experiments have been implemented to study the effectsof fuel treatments on tree mortality, vegetation structure, fuelloads, and a suite of other ecological variables at 13 loca-tions across the continental USA. Here we test the fuels, in-herent tree and tree-injury variables, and fire behavior andseverity measures for their capacity to predict postfire sur-vival in 1300 trees. Our objectives are to (i) determine whichtree-injury and morphological attributes best predict fire-induced mortality in seven mixed conifer forest species, (ii)examine the influence of fuel consumption and fire on tree-mortality prediction, and (iii) utilize the replicated study de-sign to evaluate variability in tree-mortality patterns amongthree prescribed burns. To our knowledge this is the firstreplicated study of the effects of fire on tree-mortality pat-terns, as well as the first study to incorporate fireline inten-sity from actual measures of flame height.
Study siteThe prescribed burning was conducted in three second-
growth mixed conifer forest sites (units 60, 340, and 400) inthe north-central Sierra Nevada at the University of Califor-nia Blodgett Forest Research Station (Blodgett Forest), ap-proximately 20 km east of Georgetown, California. Mixedconifer forests cover approximately 3.2 million ha (7.8%) ofCalifornia’s total land base (California Department of For-estry and Fire Protection 2003). The area of burn units 60,340, and 400 was 24, 17, and 18 ha, with, on average, 12%,27%, and 18% slope, respectively.
Blodgett Forest is located at 38°54′45′′N, 120°39′27′′W, be-tween 1100 and 1410 m above sea level, and encompassesan area of 1780 ha. Soils at Blodgett Forest are well-developed, well-drained Haploxeralfs (Alfisols) derived fromeither andesitic mudflow or granitic/granodiorite parent ma-terials (Hart et al. 1992). Soils are deep, weathered, sandyloams overlain by an organic forest floor horizon. Commonsoil depths range from 85 to 115 cm. Tree species growingon this substrate include sugar pine, ponderosa pine, whitefir, incense cedar (Calocedrus decurrens (Torr.) Florin),Douglas-fir (Pseudotsuga menziesii (Mirb.) Franco), Califor-nia black oak, tanoak (Lithocarpus densiflorus (Hook. &Arn.) Rehd.), and Pacific dogwood (Cornus nuttallii Audu-bon ex. Torr. & Gray). Because of site-specific edaphic andclimatic conditions, conifers at Blodgett Forest (excludingincense cedar) can grow to a height of 27–30 m in 50 years,resulting a Dunning (1942) site I classification.
The climate at Blodgett Forest is Mediterranean with asummer drought period that extends into the fall. Most pre-
cipitation, 160 cm on average (Stephens and Collins 2004),falls in winter and spring. Average temperatures in Januaryrange between 0 and 8 °C. Summer months are mild, withaverage August temperatures between 10 and 29 °C, with in-frequent summer precipitation from thunderstorms (averag-ing 4 cm over the summer months from 1960 to 2000)(Stephens and Collins 2004).
Fire was a common ecosystem process in the mixed coni-fer stands in Blodgett Forest before the policy of fire sup-pression began early in the 20th century. Between 1750 and1900, historical fire evaluated at the 3–5 ha spatial scale hada composite fire return interval range of 6–14 years (Stephensand Collins 2004). Forested areas at Blodgett Forest havebeen repeatedly harvested and subjected to fire suppressionfor the last 90 years, a management history common tomany forests in the Sierra Nevada and Cascade ranges ofCalifornia (Laudenslayer and Darr 1990; Stephens 2000)and elsewhere in the western USA (Graham et al. 2004).
Materials and methods
Vegetation measurementsVegetation was measured using twenty 0.04 ha circular
plots installed in each of the three treatment units (60 plotsin total). Individual plots were placed on a systematic 60 mgrid with a random starting point. Plot centers were perma-nently marked with a pipe, and three witness trees weretagged to facilitate plot relocation after treatments. Tree spe-cies, DBH, total height, height to live crown base, plot-levelpercent canopy cover, and crown position (dominant,codominant, intermediate, suppressed, or understory) wererecorded for all trees >10 cm DBH. Similar information wasalso recorded for all trees >1.37 m tall on a 0.004 ha nestedsubplot in each of the 20 plots. Canopy cover was measuredat 25 points on each 0.04 ha plot using a 5 m by 5 m grid us-ing a GRS densitometer (Geographic Resource Solutions™,Arcata, California) (Gill et al. 2000).
Fuel loads and distributionSurface and ground fuels were sampled with two random-
azimuth transects at each of the 60 plots using the line-intercept method (van Wagner 1968; Brown 1974). A totalof 120 fuel transects were installed. One hour time lag (0–0.64 cm) and 10 h time lag (0.64–2.54 cm) fuels were sam-pled from 0–2 m, 100 h time lag (2.54–7.62 cm) fuels from0–3 m, and 1000 h time lag (>7.62 cm) and larger fuels from0–11.3 m on each transect; 1000 h fuels were separated intosound (1000 h (S)) and rotten (1000 h (R)) categories. Duffand litter depths (cm) were measured at 0.3 and 0.9 m oneach transect. Fuel depth (cm) was measured at three pointsalong each transect.
Fuel transects were sampled prior to treatment (2001) and8 months after burning was completed (2003). At the time offuel remeasurement, windblown scorched needles were onthe ground, though their presence did not modify the dufflayer from its immediate postburn state. Surface- andground-fuel loads were calculated using appropriate equa-tions developed for California forests (van Wagtendonk et al.1996, 1998). Coefficients required to calculate all surface-and ground-fuel loads were arithmetically weighted by the
basal area fraction to produce accurate and precise estimatesof fuel loads (Stephens 2001).
Prescribed fire and resulting tree injuryThe three units were burned using strip head fires (Martin
and Dell 1978), one of the most common ignition patternsused to burn forests in the western USA. All prescribedburning was conducted during a short period prior to winterprecipitation (2–6 November 2002). The last rainfall had oc-curred in June 2002, meaning that the burns were conductedin what was still considered “fire season”. Prescribed-fireprescription parameters for temperature, relative humidity,and wind speed were 0–10 °C, >35%, and 0.0–5 km·h–1, re-spectively; each prescription was met, as shown in Table 1.There were no significant differences between unit weathervariables measured every 15 min using on-site HOBO®
weather-station data loggers (Table 1). Desired 10 h fuelstick moisture content was 7%–10%. Most active ignitionsoccurred at night between 1600 and 0900. This was pre-ferred because relative humidity, air temperature, windspeed, and fuel moisture were within predetermined levelsthat would produce the desired fire effects; fires were “held”during the day, with minimum active ignitions. Ignitionstook place on 1 November 2002 in unit 340, 3 November2002 in unit 400, and 5 November 2002 in unit 60 (Table 1).Temperatures, relative humidity, and wind speeds were simi-lar during ignition and burnout of treated units (Table 1),with residual smoldering being completely extinguishedacross all units by extensive rainfall beginning on 8 Novem-ber 2002. The dominant fire behavior was surface fires withoccasional torching of trees <25 cm DBH followed by ap-proximately 32–36 h of burnout of duff, stumps, and largerdiameter sound woody debris. In contrast to other mixed co-nifer forest systems, downed woody debris was sparse inthese stands (Stephens and Moghaddas 2005a), so that anybetween-stand differences in the longevity of smolderingcombustion is not believed to have complicated the interpre-tation of fire effects.
Scorch heights, percentage of crown volume scorched(PCVS), and initial mortality were assessed 3–5 months af-ter burn completion, between 14 January and 6 March 2003during periods when foliage was not covered with snow and
weather conditions allowed access to research plots. Coni-fers with no green foliage were considered dead during thepostburn scorch remeasurement period and during the sum-mer measurement period in 2003. Trees that were dead dur-ing the summer 2003 inventory period were considered deadfor this analysis. Other postfire tree-injury measurements,including bark char height and severity, were made in 2003,8 months after the prescribed burns. Rather than measuringthe percentage of crown length scorched, we used visual es-timates of PCVS, which has been shown to be a more accu-rate measure of fire damage (Peterson 1985) and has beensuccessfully used in mortality models (Ryan et al. 1988;Saveland and Neuenschwander 1990; Stephens and Finney2002). For each tree we recorded PCVS (including buds andfoliage killed but not consumed) and the maximum and op-posite-maximum crown scorch heights. Total crown damage(TCD) was calculated as PCVS plus the percentage of crownvolume consumed (McHugh and Kolb 2003). Crown volumeconsumption and hence TCD was assumed to be 100%where trees were incinerated, leaving no trace of foliage. Forblack oak, all foliage-related fire-injury data were omitted,as these deciduous trees had shed their leaves prior to theprescribed burns. Any black oak or tanoak trees withepicormic or adventitious sprouting were considered to belive, regardless of the degree of top kill.
To better isolate stem-related variables for modeling treemortality (van Mantgem and Schwartz 2003), we used bothdirect and indirect measures. Stem diameter can be viewedas a proxy for bark thickness and its resulting insulation ofthe inner cambium against injury (van Mantgem andSchwartz 2003). This indirect measure of tree resistance tofire damage is typically correlated with tree height (Yuancaiand Parresol 2001), which may confound its meaning. Wetherefore also used direct measures of stem damage, includ-ing bole char height, percentage of bole circumferencecharred, percentage of charring below DBH, and bole charseverity rating. Bole char severity was rated at maximumchar height, below 30.5 cm on the side of maximum char, atthe side opposite the maximum char height, and below30.5 cm on the side opposite maximum charring. Bole charseverity was defined as follows: 1 = bark black but not con-sumed, fissures not blackened; 2 = entire bark and fissures
*Within the time periods shown, active ignitions ceased between 0900 and 1600 daily; on 8 November 2002 rain extinguished all units, with no furtherburning.
†Data are for entire burn periods.‡Values are given as the average, with the range in parentheses.
Table 1. Weather data for prescribed burn treatments during November 2002 in three mixed conifer stands in Blodgett Forest, California.
blackened but not consumed; or 3 = entire bark and fissuresblackened, with significant consumption of bark evident(Ganz et al. 2003). Insects were not detected in the burnedunits before late May 2003, and no mortality was attributedto insect infestation when inventoried in 2004 (D. Stark, D.Wood, and A. Storer, personal communication, 2005).
Fire behaviorFive passive flame height sensors (Ryan 1981) were posi-
tioned in a regular circular pattern in each plot in all threeunits, totaling 300 sensors. Some sensors fell over during thefire, and after the burn, 86, 91, and 100 sensors were read inunits 60, 340, and 400, respectively. The passive flame heightsensors were composed of vertically suspended cotton strings.First, the strings were pressure-soaked in a 10% solution ofthe fire retardant diammonium phosphate (NH4)2PO4) in wa-ter (Ryan 1981; Finney and Martin 1992). Next, cotter pinswere attached at regular intervals to 3 m tall rebar rods,which were then pounded into the soil. Finally, the treatedstrings were hung so that they passed freely through the cot-ter pins and were weighted with paper clips to stabilize thestring vertically during flame passage (Ryan 1981).
Following the burns, five measurements of the string weredocumented, including (i) the length of the string that wasnot burned or singed by the fire, (ii) the length of completelycharred/consumed string, (iii) the length at which the stringsnapped when pulled, or the length of disintegration (Ryan1981), (iv) the length at which the string was completelyblackened, and (v) the length at which the fine fibers weresinged (Finney and Martin 1992).
Ryan (1981) found that the length of string charred to dis-integration correlated best with ocular estimates and photo-graphs of continuous flame heights. We used this measure inour calculations of flame length (L, m) from flame-heightdata from the passive sensors (H, m), using the followingequation:
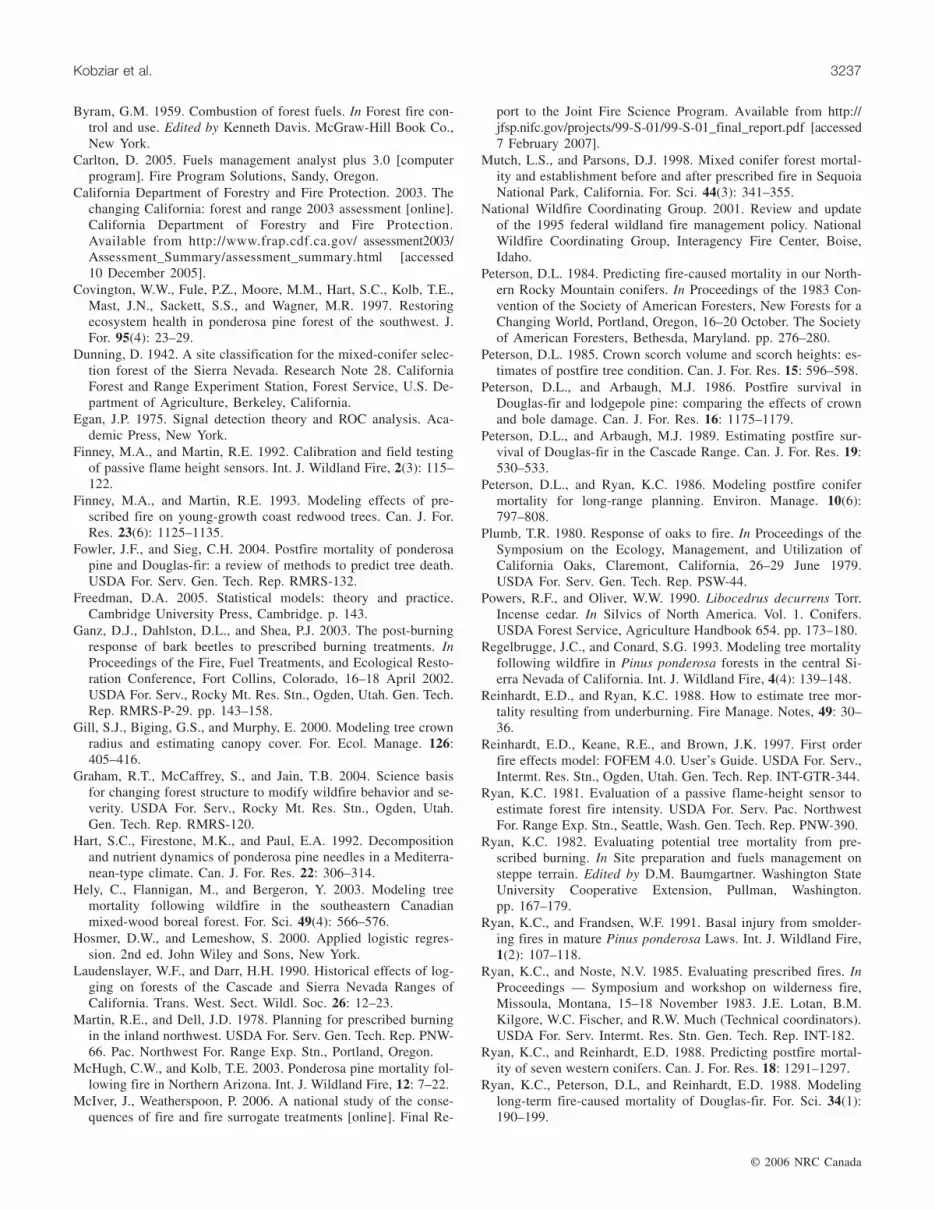
[1] L = {H[sin(90 – β)]}/[sin(θ – β)]
where β is the slope angle and θ is the angle of the flamefrom the horizontal (Fig. 1). Ocular estimates of flame angle
during the three burns were compared with photographedflame angles from Finney and Martin (1992) for prescribedfires, and a mean flame angle of 50° was used for the con-version in eq. 1.
Flame lengths are related to fireline intensity (I, kW·m–1)in the equation defined by Byram (1959) as
[2] I = 259.83L2.17
where L is flame length. This measure describes the rate ofheat release per unit length of flaming front (kW·m–1) and isassociated with fire-caused injuries in aboveground plants(van Wagner 1973). Mean fireline intensity was calculatedfor each plot within each unit using a plot average of mea-sured flame heights.
Data analysisThe JMP 5.1 Statistical Software package (Sall et al.
2001) and SPSS® Release 14.0 (SPSS Inc. 2005) were em-ployed for our data analyses. Logistic regression procedureshave been widely used to model the probability of fire-related tree mortality (Peterson and Ryan 1986; Ryan andReinhardt 1988; Regelbrugge and Conard 1993; Stephensand Finney 2002; McHugh and Kolb 2003; van Mantgem etal. 2003). This analysis is particularly useful for binary data,such as tree status classified as live or dead following fire,and does not require normally distributed variables. The lo-gistic regression model has the following form:
[3] Pm = 1/{1 + exp[–(β0 + β1X1 + … + βnXn)]}
where Pm is the probability of mortality, X1…Xn are inde-pendent variables, and β0 …βn are coefficients estimatedfrom mortality data.
Before testing variables for predictive capacity in the lo-gistic regression models, we screened both plot-level (can-opy cover, fuel loads and distribution, fuel consumption,flame lengths, fireline intensity), morphological (intrinsictree features such as the height to live crown ratio and DBH),and fire-related tree-injury data for significant pairs(Pearson’s product–moment correlation coefficient (r)) >0.50),which precluded their use in a single logistic regression
Fig. 1. Relationships between flame length, slope, and flame height, where β is the slope angle in degrees and θ is the flame tilt in de-grees (adapted from Ryan 1981).
model. All independent morphological and tree-injury vari-ables were tested for significant differences (Wilcoxon/Kruskal–Wallis rank sum test, p < 0.05) between live anddead trees within each species (Table 2).
Independent variables that were not significantly corre-lated were used for the logistic regression models. The ini-tial reverse-stepwise multiple logistic regression approachwas used to explore all the variables for possible predictivecapacity. After the most influential predictors were identi-fied, model coefficients were estimated using a maximumlikelihood fitting procedure (Bishop et al. 1975), and finalmodels only included significant covariates according to thegeneralized Wald statistic and the likelihood ratio test (p <0.05). Six outliers out of the 1300 trees measured were iden-tified using analysis of residuals in the various logistic re-gression models. Data for these trees were far outside therange of the other 1294, and as they were likely the result offield sampling errors, they were removed from the analysis.
Relative goodness of fit, or deviance (G2), was assessedusing a likelihood ratio test to compare the fitted model withone using only constants. Hosmer and Lemeshow’sgoodness-of-fit test (Hosmer and Lemeshow 2000) was usedto determine whether the model-predicted mortality valuesdiffered from observed mortality values, with p values >0.05indicating no difference. Classification accuracy based onthis test was calculated. We also employed the “lack-of-fit”test (JMP 5.1; Sall et al. 2001), which uses the pure-errornegative log-likelihood for every possible combination (i.e.,polynomials, crossed terms) of the regressor values in amodel to test whether any additional, more complex termsneed to be added.
Model discrimination was evaluated using receiver operat-ing characteristic (ROC) curve analysis (Saveland andNeuenschwander 1990). This curve is generated by plottingthe frequency of correct predictions or hits (i.e., trees pre-dicted and observed to be live) versus the frequency of falsealarms (i.e., trees predicted to be live but observed to bedead) as the decision criterion varies from 0 to 1 (Egan1975). This procedure has been used to assess the accuracyof the logistic regression model in other fire-mortality stud-ies (Ryan and Reinhardt 1988; Finney and Martin 1993;Regelbrugge and Conard 1993; Stephens and Finney 2002;McHugh and Kolb 2003; van Mantgem et al. 2003). Thearea under the ROC curve corresponds to the concordance ofa correct prediction and classification of observations. Amaximum value of 1.0 signifies no error in model predic-tion, while a value of 0.5 signifies the model’s inability tomake predictions that are better than chance occurrence(Saveland and Neuenschwander 1990). ROC values higherthan 0.70 are generally considered indicative of good modeldiscrimination (Hosmer and Lemeshow 2000). Values higherthan 0.90 indicate very high discrimination accuracy in thelogistic regression model.
Logistic regression analyses were preformed for each ofthe seven tree species, except dogwood for which there weretoo few individuals. For tanoak, sugar pine, ponderosa pine,Douglas-fir, and black oak, data were aggregated for thethree units, owing to insufficient trees in some units. Mortal-ity patterns in white fir and incense cedar were analyzed foreach unit individually, as well as for all units merged. Tocompare the separate unit models with the model for all
units merged, we used the deviance, G2. The difference be-tween the sum of G2 values for individual unit models andthe G2 value for the merged-units model is asymptoticallydistributed as χ2, and its significance can be tested on thatbasis to ascertain the similarity of the tree-mortality responseto a given variable among the units (Freedman 2005). To ex-amine patterns and influences of fire behavior, and to deter-mine entrance into regression equations (Wyant et al. 1986),we used two one-way ANOVAs on fire intensity betweenspecies and between live and dead trees for each unit. Toperform multiple comparisons between fire intensity in rela-tion to species composition and mortality, we used Tukey’shonestly significant difference (HSD) test (Zar 1999). Mor-tality models incorporating fireline intensity used plot-levelmean intensity values. These mean plot values were appliedto all trees within the corresponding 0.04 ha plots.
Results
Species’ characteristics and mortality ratesMean preburn stand values, including species composition
and percent basal area, percent canopy cover, average qua-dratic mean DBH, tree density, and tree heights, were simi-lar for the three units (data not shown; see Stephens andMoghaddas 2005b). Percent composition by basal area foreach species did not change significantly following the pre-scribed fire (Table 2). Of the independent variables used inthe mortality models, TCD, DBH, and tree height values dif-fered between live and dead trees of every species (Table 2).Live trees had larger diameters and were taller than mostdead trees. Bole char severity ratings at either maximumchar height or opposite this height were similar in live anddead trees for all species except incense cedar (Table 2).Bole char severity was relatively greater at the base of thetree opposite the maximum char height than at the highestbole scorch location (Table 2). Excluding Douglas-fir andblack oak, dead trees sustained over 90% TCD, on average.
Overall mortality was 30% in unit 60, 17% in unit 340,and 26% in unit 400. Mortality ranged between 3.2% and58% for individual tree species 8 months after the prescribedburn (Table 3). Sugar pine had the lowest overall mortalityrate, but was also the least represented in the units, with only2 dead of the total of 36 individuals (Table 3). Only one(dead) tanoak >75 cm DBH was observed in the units, ex-plaining the high percent mortality for that DBH class. Forall species other than black oak, mortality tended to decreasewith increasing DBH (Table 3). The highest overall mortal-ity rate was observed in tanoak and black oak, even thoughtop-killed but sprouting individuals were not included in thetally of dead trees.
Fire severity and intensity and influence of tree speciesWith few exceptions, ground (duff and litter) and surface
fuel loads and percent consumption in the three units weresimilar (Table 4). Unit 400 differed from unit 60 in 100 hfuel load and consumption of 1000 h fuels, while unit 340had lower 1000 h (S) fuel consumption (Table 4). The post-treatment inventory of woody debris included existing1000 h fuels that had not been completely consumed duringthe prescribed burn, as well as new coarse woody debris cre-ated by the downing of snags by the prescribed burn. Some
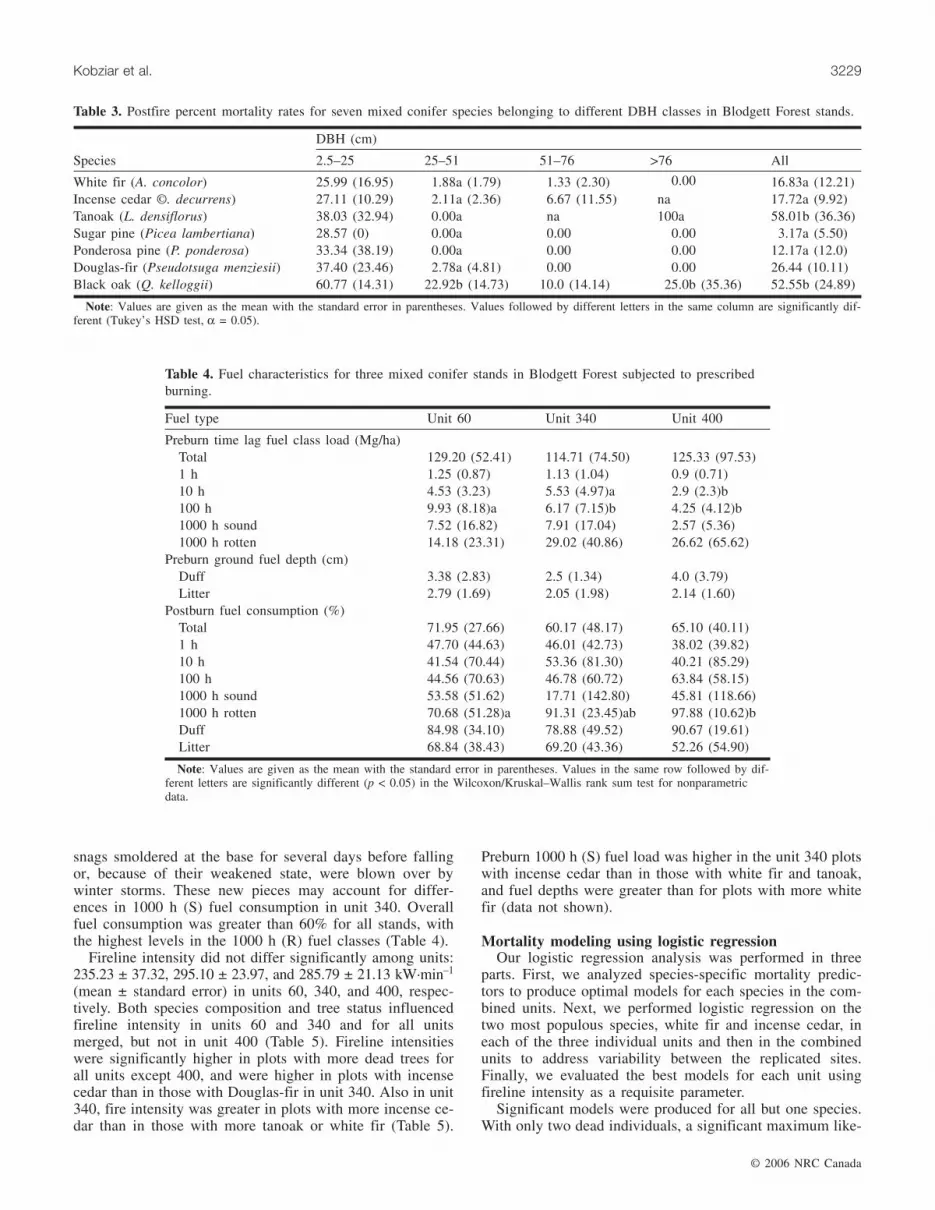
snags smoldered at the base for several days before fallingor, because of their weakened state, were blown over bywinter storms. These new pieces may account for differ-ences in 1000 h (S) fuel consumption in unit 340. Overallfuel consumption was greater than 60% for all stands, withthe highest levels in the 1000 h (R) fuel classes (Table 4).
Fireline intensity did not differ significantly among units:235.23 ± 37.32, 295.10 ± 23.97, and 285.79 ± 21.13 kW·min–1
(mean ± standard error) in units 60, 340, and 400, respec-tively. Both species composition and tree status influencedfireline intensity in units 60 and 340 and for all unitsmerged, but not in unit 400 (Table 5). Fireline intensitieswere significantly higher in plots with more dead trees forall units except 400, and were higher in plots with incensecedar than in those with Douglas-fir in unit 340. Also in unit340, fire intensity was greater in plots with more incense ce-dar than in those with more tanoak or white fir (Table 5).
Preburn 1000 h (S) fuel load was higher in the unit 340 plotswith incense cedar than in those with white fir and tanoak,and fuel depths were greater than for plots with more whitefir (data not shown).
Mortality modeling using logistic regressionOur logistic regression analysis was performed in three
parts. First, we analyzed species-specific mortality predic-tors to produce optimal models for each species in the com-bined units. Next, we performed logistic regression on thetwo most populous species, white fir and incense cedar, ineach of the three individual units and then in the combinedunits to address variability between the replicated sites.Finally, we evaluated the best models for each unit usingfireline intensity as a requisite parameter.
Significant models were produced for all but one species.With only two dead individuals, a significant maximum like-
Note: Values are given as the mean with the standard error in parentheses. Values followed by different letters in the same column are significantly dif-ferent (Tukey’s HSD test, α = 0.05).
Table 3. Postfire percent mortality rates for seven mixed conifer species belonging to different DBH classes in Blodgett Forest stands.
Fuel type Unit 60 Unit 340 Unit 400
Preburn time lag fuel class load (Mg/ha)Total 129.20 (52.41) 114.71 (74.50) 125.33 (97.53)1 h 1.25 (0.87) 1.13 (1.04) 0.9 (0.71)10 h 4.53 (3.23) 5.53 (4.97)a 2.9 (2.3)b100 h 9.93 (8.18)a 6.17 (7.15)b 4.25 (4.12)b1000 h sound 7.52 (16.82) 7.91 (17.04) 2.57 (5.36)1000 h rotten 14.18 (23.31) 29.02 (40.86) 26.62 (65.62)
Note: Values are given as the mean with the standard error in parentheses. Values in the same row followed by dif-ferent letters are significantly different (p < 0.05) in the Wilcoxon/Kruskal–Wallis rank sum test for nonparametricdata.
Table 4. Fuel characteristics for three mixed conifer stands in Blodgett Forest subjected to prescribedburning.
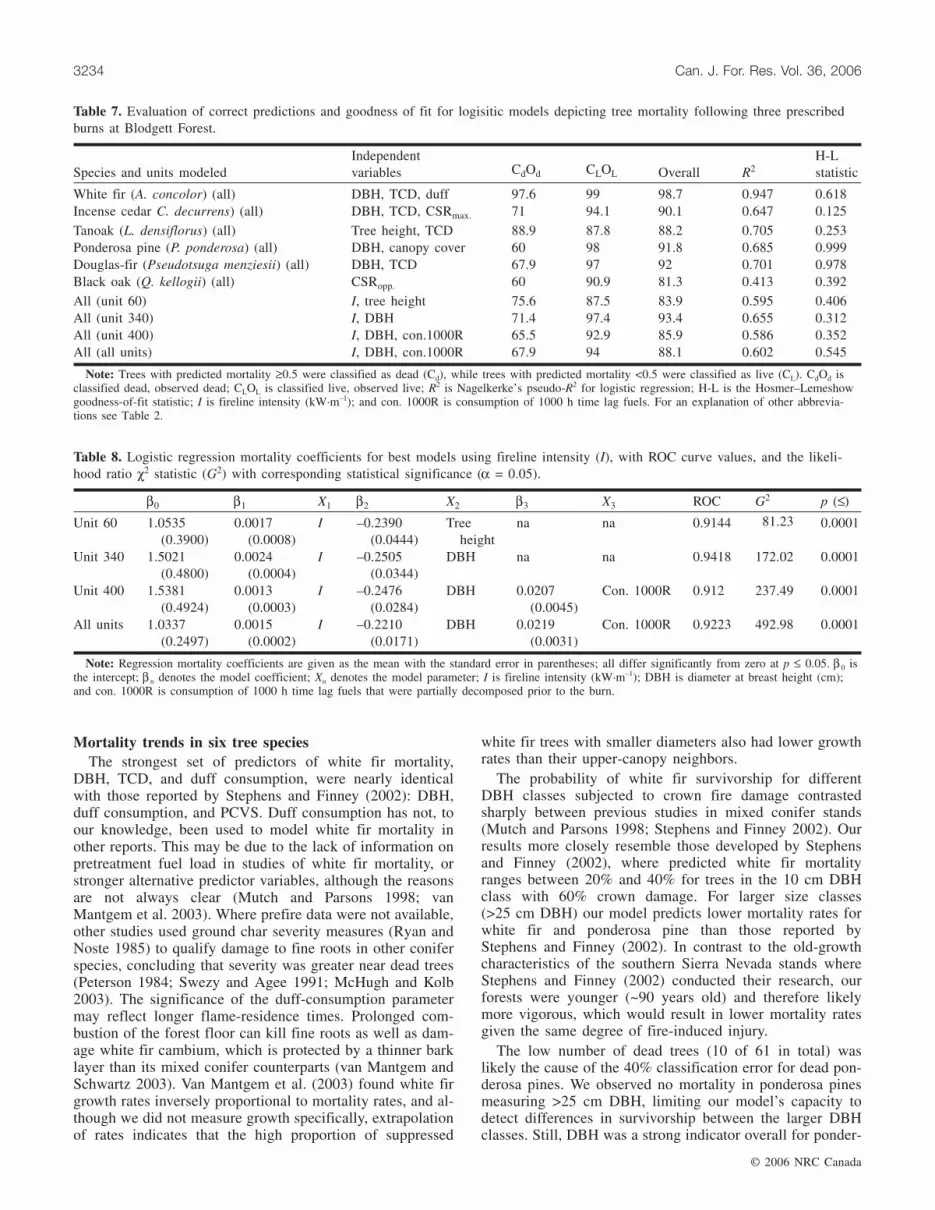
lihood estimate could not be obtained for sugar pine. Ac-cording to generalized Wald and likelihood ratio statistics,TCD was a consistently stronger variable in predicting mor-tality than either PCVS or percentage of crown volume con-sumed, and as these measures are correlated, we used onlythe strongest parameter in models where each was signifi-cant (McHugh and Kolb 2003). Optimal models for eachspecies based on G2, ROC, and the lack-of-fit test are shownin Table 6. Only tree and stand features yielded a significantmodel for ponderosa pine mortality, with predicted mortalityincreasing in plots where diameters were smaller and canopycover was more closed (Fig. 2). DBH was a significant inde-pendent variable in all species but tanoak, where theunivariate model based on TCD could only be improved bythe addition of tree height measurements (Table 6, Fig. 3).Predicted tree mortality increased with increasing TCD anddecreasing DBH in white fir (Fig. 4), Douglas-fir (Fig. 5),and incense cedar (Fig. 6).
The addition of duff consumption and bole char severityrating at the highest scorch location to the bivariate modelsbased on DBH and TCD for white fir and incense cedar, re-spectively, reduced lack of fit and increased model accuracy(ROC) (Table 6). All models were highly significant accordingto the likelihood ratio statistic (G2), and ROC values indi-cated very good overall model accuracy, while the lack-of-fittest showed that models could not be improved with the ad-dition of more complex regressor terms (p > 0.05). For allspecies other than tanoak, the models were better at predict-ing survivorship than mortality, notably in ponderosa pineand black oak (Table 7). Overall (net) classification correct-ness was high. H-L statistics were >0.05 for all models,demonstrating insignificant differences between predictedand observed tree status (Table 7).
Using replicated sites and fires for mortality analysis oftwo conifer species
Only incense cedar and white fir were populous enough tosupport a logistic regression analysis for each of the threeunits separately. For each unit and the two species, optimalmodels were univariate, based on TCD alone (data notshown). Each model produced a significant maximum likeli-hood estimate and demonstrated very high discrimination ac-curacy, with ROC values ranging from 0.90 to 0.99. Toassess the variability in the models between units, we alsoperformed the regression analysis on each species for allthree units merged, limiting the model again to the same andstrongest univariate predictor, TCD. We took the measure ofdeviance, G2, in the logistic regression analysis and com-pared it with the sum of G2 values for each separate unit(e.g., for incense cedar, G2 = 233.27 for the sum of units andG2 = 204.45 for the smaller model; for white fir, G2 =259.63 for the sum of units and G2 = 263.83 for the smallermodel). The difference was significant for incense cedar butnot for white fir (α = 0.05), implying that the sites were ac-tual replicates of the response to fire-induced crown damagefor white fir but not incense cedar.
Fireline intensity as a requisite variable in mortalityprediction
It is not surprising that although the ANOVA reportedoverall differences between mean fireline intensities for the
Fig. 2. Estimated mortality rates for ponderosa pine in relation to diameter at breast height (DBH) predicted by prefire canopy coverfollowing prescribed fire in three mixed conifer stands in Blodgett Forest, California. As actual canopy cover ranged from 60% to71%, all other associated mortality values are extrapolated.
Fig. 3. Estimated mortality rates for tanoak resulting from total crown damage (TCD) following prescribed fire in the three mixed co-nifer stands.
Fig. 4. Estimated mortality rates for white fir in different DBH classes resulting from TCD following prescribed fire in the three mixedconifer stands.
combined units and the different species in unit 60, Tukey’stest did not. In contrast to Student’s t test, Tukey’s test isconsidered conservative in its ability to detect differences ingroups of data (Zar 1999, p. 214). Because our ANOVAshowed the mean fireline intensity values for species in eachunit to be similar, we did not perform a species-specific lo-gistic regression using intensity. Instead we performed ourregression modeling on all species within each unit and onthe combined data set.
In concert with measures of tree morphology, fireline in-tensity proved to have a significant effect on predicted mor-tality when all trees were combined (Table 8), but generallyproduced models with lower ROC and G2 values than theoptimal-fit models for each species. Overall predicted treemortality increased with higher fireline intensity and smallertree diameters in units 340 and 400 (Table 8). In unit 60, treeheight was the only variable with a significant effect on tree-mortality prediction when intensity was incorporated intothe model (Table 8). The addition of a fire-severity variable,the consumption of 1000 h (R)) fuels, improved the modelsin unit 400 and for all units combined. The relationships be-tween mortality and intensity were similar between the units.ROC values for the models using fireline intensity indicated
very good model discrimination, and the H-L statistic wasinsignificant (Table 7).
Discussion
Our results confirm those from previous studies in demon-strating how both crown damage and tree diameter are im-portant indicators of coniferous species survival followingfire (Peterson and Arbaugh 1986; Ryan and Reinhardt 1988;Saveland and Neuenschwander 1990; Regelbrugge andConard 1993; Stephens and Finney 2002; McHugh and Kolb2003). A tree’s ability to survive fire is explained in part byits bark’s ability to protect it against vascular cambial dam-age (Peterson and Arbaugh 1986; Ryan et al. 1988; vanMantgem and Schwartz 2003; Bova and Dickinson 2005).The linear relationships between bark thickness and diame-ter for various species are well documented and have beenused as predictors in other works (Ryan and Reinhardt 1988;van Mantgem and Schwartz 2003). The significance of di-ameter in all of our conifer mortality models is seen in otherstudies of some of these species (Wyant et al. 1986;Regelbrugge and Conard 1993; Mutch and Parsons 1998;Stephens and Finney 2002).
Fig. 5. Estimated mortality rates for Douglas-fir in different DBH classes resulting from TCD following prescribed fire in the threemixed conifer stands.
Fig. 6. Estimated mortality rates for incense cedar in different DBH classes resulting from TCD following prescribed fire in threestands.
Mortality trends in six tree speciesThe strongest set of predictors of white fir mortality,
DBH, TCD, and duff consumption, were nearly identicalwith those reported by Stephens and Finney (2002): DBH,duff consumption, and PCVS. Duff consumption has not, toour knowledge, been used to model white fir mortality inother reports. This may be due to the lack of information onpretreatment fuel load in studies of white fir mortality, orstronger alternative predictor variables, although the reasonsare not always clear (Mutch and Parsons 1998; vanMantgem et al. 2003). Where prefire data were not available,other studies used ground char severity measures (Ryan andNoste 1985) to qualify damage to fine roots in other coniferspecies, concluding that severity was greater near dead trees(Peterson 1984; Swezy and Agee 1991; McHugh and Kolb2003). The significance of the duff-consumption parametermay reflect longer flame-residence times. Prolonged com-bustion of the forest floor can kill fine roots as well as dam-age white fir cambium, which is protected by a thinner barklayer than its mixed conifer counterparts (van Mantgem andSchwartz 2003). Van Mantgem et al. (2003) found white firgrowth rates inversely proportional to mortality rates, and al-though we did not measure growth specifically, extrapolationof rates indicates that the high proportion of suppressed
white fir trees with smaller diameters also had lower growthrates than their upper-canopy neighbors.
The probability of white fir survivorship for differentDBH classes subjected to crown fire damage contrastedsharply between previous studies in mixed conifer stands(Mutch and Parsons 1998; Stephens and Finney 2002). Ourresults more closely resemble those developed by Stephensand Finney (2002), where predicted white fir mortalityranges between 20% and 40% for trees in the 10 cm DBHclass with 60% crown damage. For larger size classes(>25 cm DBH) our model predicts lower mortality rates forwhite fir and ponderosa pine than those reported byStephens and Finney (2002). In contrast to the old-growthcharacteristics of the southern Sierra Nevada stands whereStephens and Finney (2002) conducted their research, ourforests were younger (~90 years old) and therefore likelymore vigorous, which would result in lower mortality ratesgiven the same degree of fire-induced injury.
The low number of dead trees (10 of 61 in total) waslikely the cause of the 40% classification error for dead pon-derosa pines. We observed no mortality in ponderosa pinesmeasuring >25 cm DBH, limiting our model’s capacity todetect differences in survivorship between the larger DBHclasses. Still, DBH was a strong indicator overall for ponder-
All (unit 60) I, tree height 75.6 87.5 83.9 0.595 0.406All (unit 340) I, DBH 71.4 97.4 93.4 0.655 0.312All (unit 400) I, DBH, con.1000R 65.5 92.9 85.9 0.586 0.352All (all units) I, DBH, con.1000R 67.9 94 88.1 0.602 0.545
Note: Trees with predicted mortality ≥0.5 were classified as dead (Cd), while trees with predicted mortality <0.5 were classified as live (CL). CdOd isclassified dead, observed dead; CLOL is classified live, observed live; R2 is Nagelkerke’s pseudo-R2 for logistic regression; H-L is the Hosmer–Lemeshowgoodness-of-fit statistic; I is fireline intensity (kW·m–1); and con. 1000R is consumption of 1000 h time lag fuels. For an explanation of other abbrevia-tions see Table 2.
Table 7. Evaluation of correct predictions and goodness of fit for logisitic models depicting tree mortality following three prescribedburns at Blodgett Forest.
β0 β1 X1 β2 X2 β3 X3 ROC G2 p (≤)
Unit 60 1.0535(0.3900)
0.0017(0.0008)
I –0.2390(0.0444)
Treeheight
na na 0.9144 81.23 0.0001
Unit 340 1.5021(0.4800)
0.0024(0.0004)
I –0.2505(0.0344)
DBH na na 0.9418 172.02 0.0001
Unit 400 1.5381(0.4924)
0.0013(0.0003)
I –0.2476(0.0284)
DBH 0.0207(0.0045)
Con. 1000R 0.912 237.49 0.0001
All units 1.0337(0.2497)
0.0015(0.0002)
I –0.2210(0.0171)
DBH 0.0219(0.0031)
Con. 1000R 0.9223 492.98 0.0001
Note: Regression mortality coefficients are given as the mean with the standard error in parentheses; all differ significantly from zero at p ≤ 0.05. β 0 isthe intercept; β n denotes the model coefficient; Xn denotes the model parameter; I is fireline intensity (kW·m–1); DBH is diameter at breast height (cm);and con. 1000R is consumption of 1000 h time lag fuels that were partially decomposed prior to the burn.
Table 8. Logistic regression mortality coefficients for best models using fireline intensity (I), with ROC curve values, and the likeli-hood ratio χ2 statistic (G2) with corresponding statistical significance (α = 0.05).
osa pine mortality (Wyant et al. 1986; Regelbrugge andConard 1993; Stephens and Finney 2002). That TCD wasnot significant in predicting this species’ survivorship maybe a function of its height and stature in the forest profile(Mutch and Parsons 1998). Pines were the tallest species inour sites and most were in the dominant or codominant can-opy stratum. Those that died as a result of crown damageand consumption were completely scorched, suppressed trees,which made regression modeling of mortality in relation toTCD largely inapplicable. Instead, local plot canopy coverproved to be a strong predictor. We are unaware of anyother study that has investigated how preburn canopy covercould affect postfire mortality trends. In our stands, highercanopy cover was concurrent with a higher proportion ofsuppressed and intermediate trees (r = 0.40, p < 0.005).Higher canopy cover could thereby reflect an increasedprobability of passive crown fire, with smaller trees helpingto initiate the movement of fire from surface fuels to the fewoverstory ponderosa pines that were scorched. These treessuffered one of two fates: in plots with high canopy cover,smaller trees were entirely scorched or incinerated, while alldominant or codominant trees survived their fire injuries.
In contrast to results reported in another analysis of mixedconifer forest mortality (Stephens and Finney 2002), ourdata supported a significant likelihood estimate for black oakmortality prediction, and we are unaware of any other studythat models tanoak survivorship following fire. Diameter didnot play a role in the mortality of the two angiosperms, animportant differentiating factor from the coniferous species.Overall mortality rates were higher in black oak and tanoakthan in the conifers, a trend depicted in two other studies ad-dressing black oak’s resistance to fire damage in mixed for-ests (Regelbrugge and Conard 1993; Hely et al. 2003).Regelbrugge and Conard (1993) found DBH to be a signifi-cant predictor of mortality in black oak, based on trees withhigher mean DBH and height than those in our study. Au-thors investigating the allometric relationship between stemsize and bark thickness in mixed conifer forest species foundthat differences in heat tolerance between species <20 cmDBH were slight, even in fire-resistant species (vanMantgem and Schwartz 2003). A significant DBH term inmortality models indicates differential resistance to cambialinjury, and is predicated on the assumption that the samplemodeled captures a significant range of DBH values and as-sociated bark-related heat tolerance. Mean DBH of blackoak and tanoak was 15 and 20 cm, respectively, and highlyskewed towards the smaller size classes, suggesting that dif-ferential resistance to heating was not yet exemplified by theindividuals in our sites.
While bark char severity ratings at maximum bole charheights did not play a significant role, the char severity rat-ing opposite the side of maximum char height produced astrong univariate model for black oak. This measure likelyindicates prolonged flame residence near the base of thetrees, resulting in a higher degree of stem necrosis and signi-fying a greater potential for girdling in black oaks becausetheir bark is thinner and denser than that of their coniferousassociates (Plumb 1980). This prolonged flame residence ex-plains the relatively greater bole charring at the base of thetree opposite the maximum char height when compared withcharring at the highest bole scorch position (Table 2). Bole
charring at maximum height was typically a result of a shortexposure to flames that reached their maximum height dur-ing flame-front passage. The char severity rating was alsoimportant for predicting mortality in incense cedar, one ofonly two species that showed differences in char severityratings between live and dead trees. In other reports, alterna-tive measures of bole damage, including stem scorch height(Stephens and Finney 2002) and char height (Regelbruggeand Conard 1993), were successful in modeling incense ce-dar mortality. The role played by each of these measures re-veals the susceptibility of smaller incense cedars to cambialdamage and girdling, in part because they had thinner barkand higher susceptibility to fire than their coniferous coun-terparts (Show 1915; Powers and Oliver 1990). In our sam-ple, incense cedars with DBH >25 cm were more likely tosurvive than die following any level of crown damage, whileprobabilities of mortality for those <25 cm DBH rosesteadily as TCD increased (Fig. 6).
Role of fire intensity in predicting tree mortalityAttempts to relate fire intensity to stem necrosis in two
eastern deciduous species proved unsatisfactory, but out-predicted flame-residence time alone when the two measureswere combined (Bova and Dickinson 2005). Similarly,fireline intensity by itself did not explain significant varia-tion in tree mortality in our study, but was a significant pre-dictor when paired with tree-morphology parameters such asDBH. In addition, including a term for the consumption oflarge downed woody fuels decreased the lack of fit and in-creased ROC and R2 values in unit 400 (where consumptionwas highest) as well as for all units merged. Large woodyfuels are considered less influential for fire behavior thansmaller fuels (van Wagtendonk 1983; Stephens 1998), butappear to be significant in terms of fire effects. If fire inten-sity and fuel continuity are high enough, and the moisturecontent of 1000 h fuels is low enough to result in their igni-tion, they are likely to increase overall flame-residence timesand the duration of heat pulses absorbed by nearby vegeta-tion and soils. Greater consumption of these fuels indicateslonger periods of either flaming or smoldering combustion,resulting in a greater degree of stem or fine-root damage inproximate trees.
Fire-behavior models such as BEHAVE (Burgan andRothermel 1984) or FOFEM (Reinhardt et al. 1997) yieldestimates of flame length that are used to generate expectedranges of fireline intensity prior to the implementation ofprescribed burning. Using these predictions along withDBH, our models would allow a researcher or manager toestimate tree mortality for each tree species and DBH classprior to burning. This contrasts with the majority of logisticregression models that rely on measures of postfire injuryfor predicting tree mortality. This work can be incorporatedinto existing fire-severity models, including Fire Manage-ment Analyst Plus™ (Carlton 2005), NEXUS (Scott 1999),and FOFEM (Reinhardt et al. 1997), to better estimate po-tential fire severity in similar mixed conifer forests.
Using replicates in tree-mortality modeling andprescribed burning
Replication of sites is one of the greatest challenges infire-effects research (van Mantgem et al. 2001). To compen-
sate for the statistical violations presented by lack of replica-tion, post-wildfire studies of fire effects can use similar,unburned reference sites, thereby controlling for backgroundenvironmental fluctuations (van Mantgem et al. 2001). Ex-perimental or closely managed prescribed burns allow forthe collection of prefire data and the approximation of repli-cated fire events, and provide opportunities for long-termmonitoring of fire effects. Where initial stand conditions aresimilar and stands are independent, prescribed burns can beadministered in such a manner that replication is achieved.
In this study, preburn inventories of stand structure andfuel distribution showed no significant differences betweenthe three stands, and in light of similar burning conditionsduring active ignitions and burnout (Table 1), the prescribedfires could be considered replicates. In addition, firing wasmodified on steeper slopes, with narrower strip-head firesbeing used to moderate fire intensities in these areas. As ex-pected, fire intensities were similar in all units (ANOVA, α >0.05), therefore we could examine the consistency of spe-cies’ responses to the effects of replicated fires. Our analysisof deviance in the postfire mortality models of the two bestrepresented species yielded mixed results. Variability in in-cense cedar mortality patterns was significantly higher be-tween units than within the combined units. This reveals adifferential response of incense cedar to similar burning sce-narios. The opposite was true for white fir, where mortalitypatterns in relation to TCD did not differ significantly be-tween units. Although overall species composition, density,canopy cover, mean DBH, and basal areas were similar inthe three sites, analysis at the individual species level un-veiled underlying differences. Incense cedar trees wereshorter and smaller and TCD was higher in unit 400(ANOVA, α = 0.05). This finding implies that the supposi-tion of similarity among sites at the stand level may not beapplicable to an analysis at the species level, and is sensitiveto the precision of the data that are used to designate thereplicates. Ideally, one could assess fireline intensity at eachtree’s location, to minimize the impact of highly localizedvariation in fire behavior and its resulting effects. Especiallywhen the stochastic nature of fire is taken into consideration,the quantification of replication depends on the scale atwhich a site’s components and processes are measured.
Conclusion
The ability to accurately model and interpret potential fireseverity is essential in planning and implementing successfultreatments of forest vegetation in western coniferous forests.This tenet holds true for treatments with a wide range ofgoals, including restoration of forest structure and process,commercial production of forest products, and managementof vast tracts of publicly owned land to meet sometimes con-flicting management objectives.
This work quantifies first-order fire effects, and will befollowed by other studies addressing tree mortality in rela-tion to insect activity and disease. The results of this workcan be incorporated into existing quantitative models tobetter predict fire severity across a wide range of speciescommon to the Sierra Nevada and Cascade Ranges of Cali-fornia. These results are best applied to sites that are similarin site class, age structure, species composition, and past
management history. Specifically, mixed conifer stands atBlodgett Forest are classified as Dunning site classes I andIa (Dunning 1942), with relatively young, even-aged standsthat were initiated in the early 20th century after intensiverailroad logging. Research stands had been thinned from be-low at least once in the past 20 years, retaining most domi-nant and codominant trees. We recognize that fire-inducedmortality might continue over the next 2–8 years (Ryan etal. 1988), potentially changing the species’ response patternsreported here. Longer term responses to the prescribed burnswill be monitored in hopes of addressing the effects theburns may have had on tree vigor and resistance to any addi-tional stressors.
Our analysis of replication of the prescribed burns re-vealed some limitations that are already largely accepted infire-effects studies. The importance of fine-scale factors indictating fire behavior and individual species’ responseslikely explain the discrepancy in mortality patterns betweenwhite fir and incense cedar that we found. A continuance ofattempts to standardize fire-effects research should help de-crease bias, improve comparability between studies, andwork towards a consensus on applicable statistics and essen-tial study-design criteria.
Acknowledgments
This is Contribution 102 of the National Fire and FireSurrogate (FFS) Project, funded by the US Joint Fire Sci-ence Program. We especially thank the University of Cali-fornia Blodgett Forest Research Station for their cooperationand support of the FFS study. We also thank the Universityof California at Berkeley FFS Research Team and all 2001–2004 summer field assistants for their dedicated work in im-plementing the FFS study. Thanks are extended to D.A.Freedman for guidance in the statistical analyses. Thanks arealso extended to the two anonymous reviewers, whose com-ments improved the quality of our manuscript.
References
Agee, J.K., and Skinner, C.N. 2005. Basic principles of fuel reduc-tion treatments. For. Ecol. Manage. 211: 83–96.
Bishop, Y.M., Fienberg, S.E., and Holland, P.W. 1975. Discretemultivariate analysis: theory and practice. Massachusetts Insti-tute of Technology Press, Cambridge, Massachusetts.
Biswell, H.H. 1989. Prescribed burning in California wildlandsvegetation management. University of California Press, Berke-ley, California.
Bova, A.S., and Dickinson, M.B. 2005. Linking surface-fire behav-ior, stem heating, and tissue necrosis. Can. J. For. Res. 35: 814–822.
Byram, G.M. 1959. Combustion of forest fuels. In Forest fire con-trol and use. Edited by Kenneth Davis. McGraw-Hill Book Co.,New York.
Carlton, D. 2005. Fuels management analyst plus 3.0 [computerprogram]. Fire Program Solutions, Sandy, Oregon.
California Department of Forestry and Fire Protection. 2003. Thechanging California: forest and range 2003 assessment [online].California Department of Forestry and Fire Protection.Available from http://www.frap.cdf.ca.gov/ assessment2003/Assessment_Summary/assessment_summary.html [accessed10 December 2005].
Covington, W.W., Fule, P.Z., Moore, M.M., Hart, S.C., Kolb, T.E.,Mast, J.N., Sackett, S.S., and Wagner, M.R. 1997. Restoringecosystem health in ponderosa pine forest of the southwest. J.For. 95(4): 23–29.
Dunning, D. 1942. A site classification for the mixed-conifer selec-tion forest of the Sierra Nevada. Research Note 28. CaliforniaForest and Range Experiment Station, Forest Service, U.S. De-partment of Agriculture, Berkeley, California.
Egan, J.P. 1975. Signal detection theory and ROC analysis. Aca-demic Press, New York.
Finney, M.A., and Martin, R.E. 1992. Calibration and field testingof passive flame height sensors. Int. J. Wildland Fire, 2(3): 115–122.
Finney, M.A., and Martin, R.E. 1993. Modeling effects of pre-scribed fire on young-growth coast redwood trees. Can. J. For.Res. 23(6): 1125–1135.
Fowler, J.F., and Sieg, C.H. 2004. Postfire mortality of ponderosapine and Douglas-fir: a review of methods to predict tree death.USDA For. Serv. Gen. Tech. Rep. RMRS-132.
Freedman, D.A. 2005. Statistical models: theory and practice.Cambridge University Press, Cambridge. p. 143.
Ganz, D.J., Dahlston, D.L., and Shea, P.J. 2003. The post-burningresponse of bark beetles to prescribed burning treatments. InProceedings of the Fire, Fuel Treatments, and Ecological Resto-ration Conference, Fort Collins, Colorado, 16–18 April 2002.USDA For. Serv., Rocky Mt. Res. Stn., Ogden, Utah. Gen. Tech.Rep. RMRS-P-29. pp. 143–158.
Gill, S.J., Biging, G.S., and Murphy, E. 2000. Modeling tree crownradius and estimating canopy cover. For. Ecol. Manage. 126:405–416.
Hart, S.C., Firestone, M.K., and Paul, E.A. 1992. Decompositionand nutrient dynamics of ponderosa pine needles in a Mediterra-nean-type climate. Can. J. For. Res. 22: 306–314.
Hely, C., Flannigan, M., and Bergeron, Y. 2003. Modeling treemortality following wildfire in the southeastern Canadianmixed-wood boreal forest. For. Sci. 49(4): 566–576.
Hosmer, D.W., and Lemeshow, S. 2000. Applied logistic regres-sion. 2nd ed. John Wiley and Sons, New York.
Laudenslayer, W.F., and Darr, H.H. 1990. Historical effects of log-ging on forests of the Cascade and Sierra Nevada Ranges ofCalifornia. Trans. West. Sect. Wildl. Soc. 26: 12–23.
Martin, R.E., and Dell, J.D. 1978. Planning for prescribed burningin the inland northwest. USDA For. Serv. Gen. Tech. Rep. PNW-66. Pac. Northwest For. Range Exp. Stn., Portland, Oregon.
McHugh, C.W., and Kolb, T.E. 2003. Ponderosa pine mortality fol-lowing fire in Northern Arizona. Int. J. Wildland Fire, 12: 7–22.
McIver, J., Weatherspoon, P. 2006. A national study of the conse-quences of fire and fire surrogate treatments [online]. Final Re-
port to the Joint Fire Science Program. Available from http://jfsp.nifc.gov/projects/99-S-01/99-S-01_final_report.pdf [accessed7 February 2007].
Mutch, L.S., and Parsons, D.J. 1998. Mixed conifer forest mortal-ity and establishment before and after prescribed fire in SequoiaNational Park, California. For. Sci. 44(3): 341–355.
National Wildfire Coordinating Group. 2001. Review and updateof the 1995 federal wildland fire management policy. NationalWildfire Coordinating Group, Interagency Fire Center, Boise,Idaho.
Peterson, D.L. 1984. Predicting fire-caused mortality in our North-ern Rocky Mountain conifers. In Proceedings of the 1983 Con-vention of the Society of American Foresters, New Forests for aChanging World, Portland, Oregon, 16–20 October. The Societyof American Foresters, Bethesda, Maryland. pp. 276–280.
Peterson, D.L. 1985. Crown scorch volume and scorch heights: es-timates of postfire tree condition. Can. J. For. Res. 15: 596–598.
Peterson, D.L., and Arbaugh, M.J. 1986. Postfire survival inDouglas-fir and lodgepole pine: comparing the effects of crownand bole damage. Can. J. For. Res. 16: 1175–1179.
Peterson, D.L., and Arbaugh, M.J. 1989. Estimating postfire sur-vival of Douglas-fir in the Cascade Range. Can. J. For. Res. 19:530–533.
Peterson, D.L., and Ryan, K.C. 1986. Modeling postfire conifermortality for long-range planning. Environ. Manage. 10(6):797–808.
Plumb, T.R. 1980. Response of oaks to fire. In Proceedings of theSymposium on the Ecology, Management, and Utilization ofCalifornia Oaks, Claremont, California, 26–29 June 1979.USDA For. Serv. Gen. Tech. Rep. PSW-44.
Powers, R.F., and Oliver, W.W. 1990. Libocedrus decurrens Torr.Incense cedar. In Silvics of North America. Vol. 1. Conifers.USDA Forest Service, Agriculture Handbook 654. pp. 173–180.
Regelbrugge, J.C., and Conard, S.G. 1993. Modeling tree mortalityfollowing wildfire in Pinus ponderosa forests in the central Si-erra Nevada of California. Int. J. Wildland Fire, 4(4): 139–148.
Reinhardt, E.D., and Ryan, K.C. 1988. How to estimate tree mor-tality resulting from underburning. Fire Manage. Notes, 49: 30–36.
Reinhardt, E.D., Keane, R.E., and Brown, J.K. 1997. First orderfire effects model: FOFEM 4.0. User’s Guide. USDA For. Serv.,Intermt. Res. Stn., Ogden, Utah. Gen. Tech. Rep. INT-GTR-344.
Ryan, K.C. 1981. Evaluation of a passive flame-height sensor toestimate forest fire intensity. USDA For. Serv. Pac. NorthwestFor. Range Exp. Stn., Seattle, Wash. Gen. Tech. Rep. PNW-390.
Ryan, K.C. 1982. Evaluating potential tree mortality from pre-scribed burning. In Site preparation and fuels management onsteppe terrain. Edited by D.M. Baumgartner. Washington StateUniversity Cooperative Extension, Pullman, Washington.pp. 167–179.
Ryan, K.C., and Frandsen, W.F. 1991. Basal injury from smolder-ing fires in mature Pinus ponderosa Laws. Int. J. Wildland Fire,1(2): 107–118.
Ryan, K.C., and Noste, N.V. 1985. Evaluating prescribed fires. InProceedings — Symposium and workshop on wilderness fire,Missoula, Montana, 15–18 November 1983. J.E. Lotan, B.M.Kilgore, W.C. Fischer, and R.W. Much (Technical coordinators).USDA For. Serv. Intermt. Res. Stn. Gen. Tech. Rep. INT-182.
Ryan, K.C., and Reinhardt, E.D. 1988. Predicting postfire mortal-ity of seven western conifers. Can. J. For. Res. 18: 1291–1297.
Ryan, K.C., Peterson, D.L, and Reinhardt, E.D. 1988. Modelinglong-term fire-caused mortality of Douglas-fir. For. Sci. 34(1):190–199.
Sall, J., Lehman, A., and Creighton, L. 2001. JMP start statistics.A guide to statistics and data analysis using JMP and JUMP INsoftware. 2nd ed. Duxbury, Pacific Grove, California.
Saveland, J.M., and Neuenschwander, L.F. 1990. A signal detec-tion framework to evaluate models of tree mortality followingfire damage. For. Sci. 36(1): 66–76.
Scott, J.H. 1999. NEXUS: a system for assessing crown fire haz-ard. Fire Manage. Notes, 59(2): 20–24.
Show, S.B. 1915. Light burning at Castle Rock. Proc. Soc. Am.For. 10(1): 426–433.
SPSS Inc. 2005. SPSS® for Windows. Release 14.0 [computer pro-gram]. SPSS Inc., Chicago, Illinois.
Stephens, S.L. 1998. Effects of fuels and silvicultural treatmentson potential fire behavior in mixed conifer forest of the SierraNevada, Calif. For. Ecol. Manage. 105: 21–34.
Stephens, S.L. 2000. Mixed conifer and upper montane foreststructure and uses in 1899 from the central and northern SierraNevada, Calif. Madrono, 47: 43–52.
Stephens, S.L. 2001. Fire history differences in adjacent Jeffreypine and upper montane forests in the eastern Sierra Nevada.Int. J. Wildland Fire, 10: 161–167.
Stephens, S.L., and Collins, B.C. 2004. Fire regimes of mixed co-nifer forests in the north-central Sierra Nevada at multiple spa-tial scales. Northwest Sci. 78: 12–23.
Stephens, S.L., and Finney, M.A. 2002. Prescribed fire mortality ofSierra Nevada mixed conifer tree species: effects of crown dam-age and forest floor combustion. For. Ecol. Manage. 162: 261–271.
Stephens, S.L., and Moghaddas, J.J. 2005a. Fuel treatment effectson snags and coarse woody debris in a Sierra Nevada mixed co-nifer forest. For. Ecol. Manage. 214(1): 53–64.
Stephens, S.L., and Moghaddas, J.J. 2005b. Experimental fueltreatment impacts on forest structure, potential fire behavior,and predicted tree mortality in a California mixed conifer forest.For. Ecol. Manage. 215: 21–36.
Stephens, S.L., and Ruth, L.W. 2005. Federal forest-fire policy inthe United States. Ecol. Appl. 15(2): 532–542.
Swezy, M.D., and Agee, J.K. 1991. Prescribed-fire effects on fine-root and tree mortality in old-growth ponderosa pine. Can. J.For. Res. 21: 626–634.
United States Congress. 2003. Healthy Forest restoration act. 1904[online]. United States Congress, Washington, D.C. Availablefrom http://frwebgate.access.gpo.gov/cgi-bin/getdoc. cgi?dbname =109_cong_bills&docid = f:h1904ih.txt.pdf [cited 15 October 2005].
USDA–USDI. 2000. A report to the President in response to thewildfires of 2000: USDA and USDI [online]. Available fromhttp://www.fs.fed.us/emc/hfi/president.pdf [cited 7 March 2005].
van Mantgem, P.J., and Schwartz, M. 2003. Bark heat resistance ofsmall trees in Californian mixed conifer forests: testing somemodel assumptions. For. Ecol. Manage. 178: 341–352.
van Mantgem, P.J., Schwartz, M., and Keifer, M. 2001. Monitoringfire effects for managed burns and wildfires: coming to termswith pseudoreplication. Nat. Areas J. 21(3): 266–273.
van Mantgem, P.J., Stephenson, N.L., Mutch, L.S., Johnson, V.G.,Esperanza, A.M., and Parsons, D.J. 2003. Growth rate predictsmortality of Abies concolor in both burned and unburned stands.Can. J. For. Res. 33: 1029–1038.
van Wagner, C.E. 1968. The line intercept method in forest fuelsampling. For. Sci. 14: 20–26.
van Wagner, C.E. 1973. Height of crown scorch in forest fires.Can. J. For. Res. 3: 373–378.
van Wagtendonk, J.W. 1983. Prescribed fire effects on forestunderstory mortality. In Proceedings of the 7th Conference ofFire and Forest Meteorology, Fort Collins, Colorado, 25–28April 1983. American Meteorological Society, Boston, Massa-chusetts. pp. 136–138.
van Wagtendonk, J.W., Benedict, J.M., and Sydoriak, W.M. 1996.Physical properties of woody fuel particles of Sierra Nevada co-nifers. Int. J. Wildland Fire, 6: 117–123.
van Wagtendonk, J.W., Benedict, J.M., and Sydoriak, W.M. 1998.Jfuel bed characteristics of Sierra Nevada conifers. West. J.Appl. For. 13: 1145–1157.
Whelan, R.J. 1995. The ecology of fire. Cambridge UniversityPress, Cambridge, UK.
Wyant, J.G., Omi, P.N., and Laven, R.D. 1986. Fire induced treemortality in a Colorado ponderosa pine / Douglas-fir stand. For.Sci. 32(1): 49–59.
Yuancai, L., and Parresol, B.R. 2001. Remarks on height-diametermodeling. USDA For. Serv. Res. Note SRS-IO.