Page 1
School of Business Law and Taxation
Using Tax and Regulatory Measures to Reform Choice and Usage of
Motor Vehicles for Personal Transportation in Australia for the
Sustainability of Oil
Prafula Pearce
This thesis is presented for the Degree of
Doctor of Philosophy
of
Curtin University
July 2012
Page 2
ii
DECLARATION
To the best of my knowledge and belief this thesis contains no material previously
published by any other person except where due acknowledgement has been made.
This thesis contains no material which has been accepted for the award of any other
degree or diploma in any university.
Signature: ………………………………………….
Date: ………………………...
Page 3
iii
ABSTRACT
This thesis has been motivated by the need to preserve the scarce oil resources used
by motorists for their personal transportation. The inquiry for this research was
whether the government of Australia bears some responsibility for influencing
Australian motorists’ choice and usage of motor vehicles, in order to reduce oil
consumption and preserve this scarce commodity, and whether this responsibility is
being achieved within the current regulatory and tax environment.
This qualitative research has been conducted by using interpretive description and
legal methodology. A tax policy solution has been suggested after investigating the
problem by deconstructing prior knowledge in three areas: the status of oil reserves;
the characteristics of motor vehicles that impact upon the consumption of oil; and the
tax and regulatory measures that have been adopted by other countries to influence
the choice and usage of passenger motor vehicles.
A critical examination of the various policy options for Australia was conducted to
suggest a solution for this identified problem and this thesis proposes that the best
option for Australia is to conduct a comprehensive reform of the motor vehicle taxes
and charges and introduce a Luxury Energy Tax (LET) system for motor vehicles
based on the precautionary principle and the polluter-pays principle.
The diagnosis of the problem and the design of a solution has been undertaken in this
thesis using a step-by-step approach as follows:
1. Investigate the reported data on Australian and global oil resources.
2. Explore the need to focus on reducing oil use by passenger motor
vehicles in Australia.
3. Explore the growth of passenger motor vehicle use, both globally and in
Australia.
4. Explore the design and choice of passenger motor vehicles in terms of
power and weight.
5. Investigate whether future car designs can resolve the oil problem.
6. Examine the current Australian regulatory and tax framework and its
failure to promote oil efficiency in passenger motor vehicles.
Page 4
iv
7. Examine the regulatory and fiscal policies implemented by other
countries to promote oil efficiency in passenger motor vehicles.
8. Explore specific studies on motor vehicle taxation undertaken by the
Netherlands, Norway and the State of Oregon in the USA.
9. Analyse the criteria to develop a framework for Australia to promote
energy-efficient passenger motor vehicles.
10. Design an interventional strategy for Australia, being a tax framework
for the Luxury Energy Tax (LET).
In order to design the LET criteria, it was necessary to examine the motor vehicle
characteristics that cause increased oil use and emissions and to ensure that these
characteristics are taken into consideration in the design of the LET. The
administration, operation and implementation of the LET system are explained in
detail in this thesis. The proposed LET is then evaluated in terms of various criteria
including its net revenue generation potential, the known criteria of a good tax and
the ability of the tax to change behaviour. It is proposed that the revenues from the
LET be directed towards building public transport infrastructure. The LET provides a
new policy approach directed at resolving the problem of how passenger motor
vehicles are perceived and reducing the demand for large and powerful motor
vehicles that consume and diminish the limited oil resources.
This thesis identifies the opportunities that could arise through the introduction of a
LET, including the design of a new micro-light LET motor vehicle and
modernisation of the public transport system. The message from this thesis is that a
new way of thinking is required regarding passenger vehicle transportation, and the
application of this new way of thinking might bring about benefits and opportunities.
This thesis also identifies that without a strong political will, these regulatory and
fiscal reforms would only end up as a window-dressing exercise.
Page 5
v
ACKNOWLEDGEMENTS
AND DEDICATION
The topic of sustainability and peak oil was introduced to me by my husband as we
were discussing a topic to present at a tax conference. We watched the number of
motor vehicles on the road and questioned our dependency on motor vehicles for
passenger transportation and whether it was necessary to drive such large and
powerful motor vehicles for personal transportation. As I researched more into the
topic, I realised that I had to do something more to make a difference and that
taxation could be the answer.
Professor Dale Pinto was present at the tax conference and encouraged me to
commence my PhD and agreed to supervise my thesis on the chosen topic. I thank
Dale for not only starting me on this journey, but also for his encouragement
throughout the journey and taking the time to read and comment on my work.
A search on people with interest on peak oil revealed Professor Peter Newman. I
attended a seminar presented by Professor Peter Newman and after listening to
Peter’s presentation on what life could be like without oil made me realise that there
was no turning back from this journey. Peter also agreed to supervise my thesis and I
thank Peter for being a source of my inspiration and guidance.
I am also grateful to the members and directors of the Applied Law and Policy
research group, for their encouragement and research support. I thank Professor
Glenton Barton, for supporting my leave applications from work, without which this
journey would have taken a lot longer.
The PhD journey can be a lonely endeavour. However I was fortunate to have my
husband Bob to walk with me through this journey, sharing his knowledge and
guiding me. I read my drafts to Bob and he would question my choices, so I could
refine them. He helped me see my path through a mire of documents. I had no
knowledge on motor vehicles and I thank Bob for having the patience to explain the
basics of motor mechanics. Without this background understanding of the workings
of a motor vehicle and the motor vehicle industry, I could not have brought the three
Page 6
vi
areas of sustainability of oil, tax policy and passenger motor vehicles together in this
thesis.
Finally, I acknowledge my late parents who taught me the love for life and
perseverance. If not for this strong foundation rooted in love and wisdom, I could not
have recognised the need to pursue on this journey to attempt to make a difference to
the needs of my grandchildren and the future generations. I also thank my daughter
Selina and grandchildren Joshua, Lucas and Jacob for their sacrifices whilst I
undertook this arduous journey.
This thesis is dedicated to my husband, Bob Pearce, our children and grandchildren,
and humanity in general.
This thesis is also dedicated to my late father and late mother for their endless love
and wisdom that have made me who I am.
Page 7
vii
TABLE OF CONTENTS
DECLARATION ........................................................................................................ ii
ABSTRACT ............................................................................................................... iii
ACKNOWLEDGEMENTS ....................................................................................... v
AND DEDICATION .................................................................................................. v
TABLE OF CONTENTS ......................................................................................... vii
LIST OF TABLES .................................................................................................. xiv
LIST OF FIGURES ............................................................................................... xvii
LIST OF ACRONYMS ........................................................................................ xviii
CHAPTER 1: INTRODUCTION ............................................................................. 1
1.1 Overview and Problem Definition ................................................................... 1
1.2 Research Background and Context .................................................................. 2
1.3 Research Questions and Research Objectives ................................................ 11
1.4 Research Design and Methods ....................................................................... 12
1.4.1 Research Framework .......................................................................... 12
1.4.2 Methodology....................................................................................... 14
a. Interpretive Description ............................................................... 14
b. Legal Research ............................................................................. 18
c. Methods and Techniques ............................................................. 19
d. Ethical Considerations ................................................................. 20
1.5 Coverage and Scope ....................................................................................... 21
1.6 Thesis Structure and Organisation ................................................................. 22
CHAPTER 2: SUSTAINABILITY OF OIL ...................................................... 26
2.1 Introduction .................................................................................................... 26
2.2 Global Oil Position ......................................................................................... 27
2.2.1 What is Oil? ........................................................................................ 27
2.2.2 An Assessment of Global Reserves and Evidence of a Near-Term
Peak in Oil Supply .............................................................................. 30
a. An Assessment of the Global Reserves of Oil ............................. 31
b. Peaking of Global Oil Production ................................................ 35
c. The Energy Watch Group (EWG) ............................................... 39
d. The US Joint Forces Command: The Joint Operating Environment
(JOE) Report 2010 .............................................................................. 40
e. The International Energy Agency (IEA) ...................................... 40
Page 8
viii
f. The UK Government Department of Energy & Climate Change 41
g. The UK Industry Taskforce on Peak Oil & Energy Security ...... 42
h. Global Witness ............................................................................. 43
i. Alternative View ........................................................................... 44
2.3 Implications of Peak Oil and the Oil Crisis: An International Perspective .... 45
2.4 Australian Oil Position ................................................................................... 48
2.5 Conclusion ...................................................................................................... 55
CHAPTER 3: ANALYSIS OF PASSENGER MOTOR VEHICLES —
GROWTH, USAGE, DESIGN AND CHOICE ........................ 56
3.1 Introduction .................................................................................................... 56
3.2 Growth of Passenger motor vehicles .............................................................. 56
3.3 Usage of Passenger motor vehicles for Transportation .................................. 60
3.4 Design and Choice of Passenger motor vehicles............................................ 62
3.5 Future Motor Vehicle Designs and their Limitations ..................................... 71
3.5.1 Biofuels for motor vehicles ................................................................ 76
a. Ethanol ......................................................................................... 77
b. Biodiesel ...................................................................................... 77
c. Hydrogen ...................................................................................... 78
3.6 Conclusion ...................................................................................................... 79
CHAPTER 4: ANALYSIS OF REGULATORY AND FISCAL MEASURES
IMPLEMENTED IN VARIOUS COUNTRIES THAT
IMPACT ON PASSENGER MOTOR VEHICLES ................. 80
4.1 Introduction .................................................................................................... 80
4.2 Fuel Economy and Greenhouse Gas (GHG) Emissions Standards for
Passenger motor vehicles ............................................................................... 82
4.2.1 Fuel Economy Standards in the USA ................................................. 84
4.2.2 Japanese Top Runner Program ........................................................... 91
4.2.3 Chinese Fuel Economy Standards ...................................................... 94
4.2.4 Fuel Economy Standards in Korea ..................................................... 98
4.2.5 Voluntary Standards in Canada .......................................................... 99
4.2.6 CO2 Standards in the EU .................................................................. 100
4.2.7 Lessons for Australia ........................................................................ 101
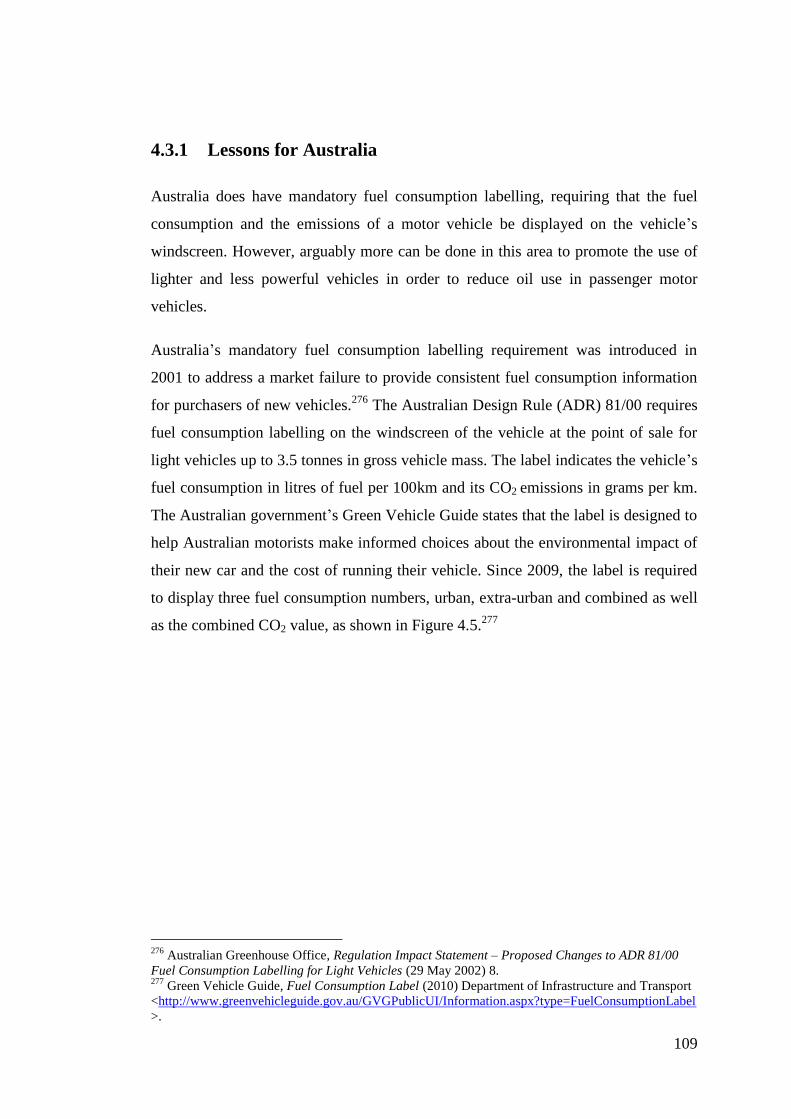
4.3 Consumer Awareness Programs ................................................................... 105
4.3.1 Lessons for Australia ........................................................................ 109
4.4 A Survey of Fiscal Measures Implemented in Various Countries ............... 111
Page 9
ix
4.4.1 Differential charges on purchase and use of motor vehicles ............ 111
a. Lessons for Australia ................................................................. 118
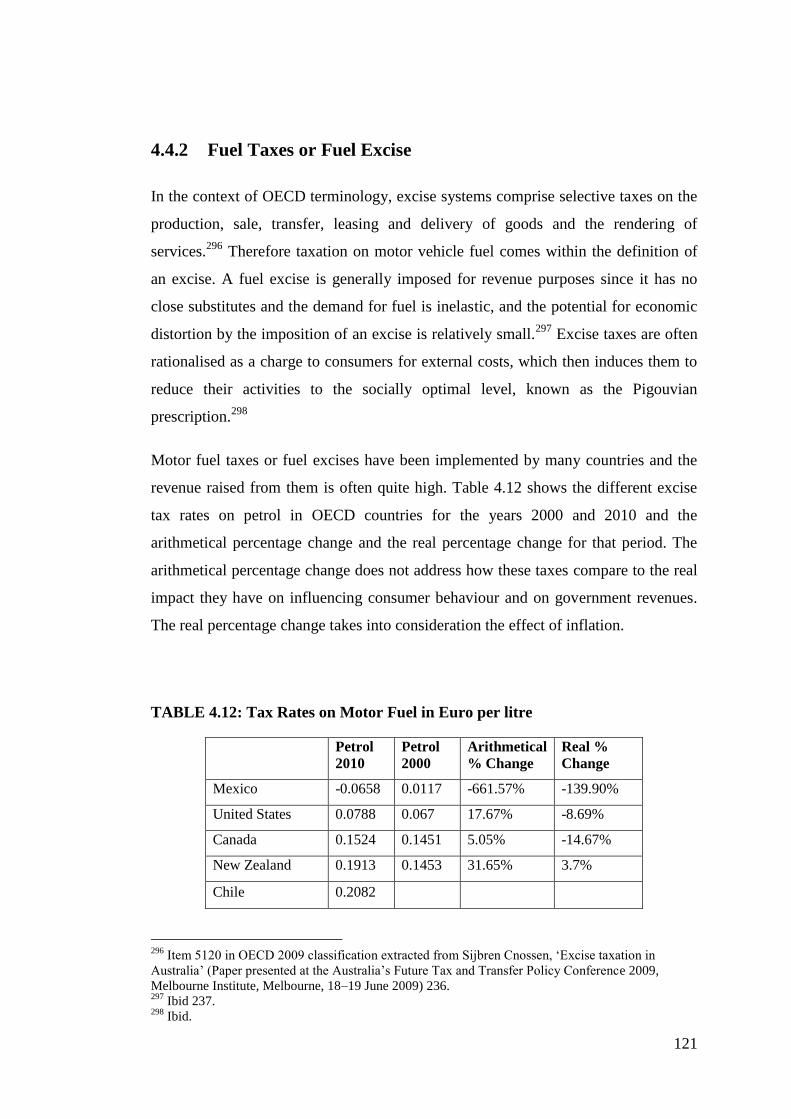
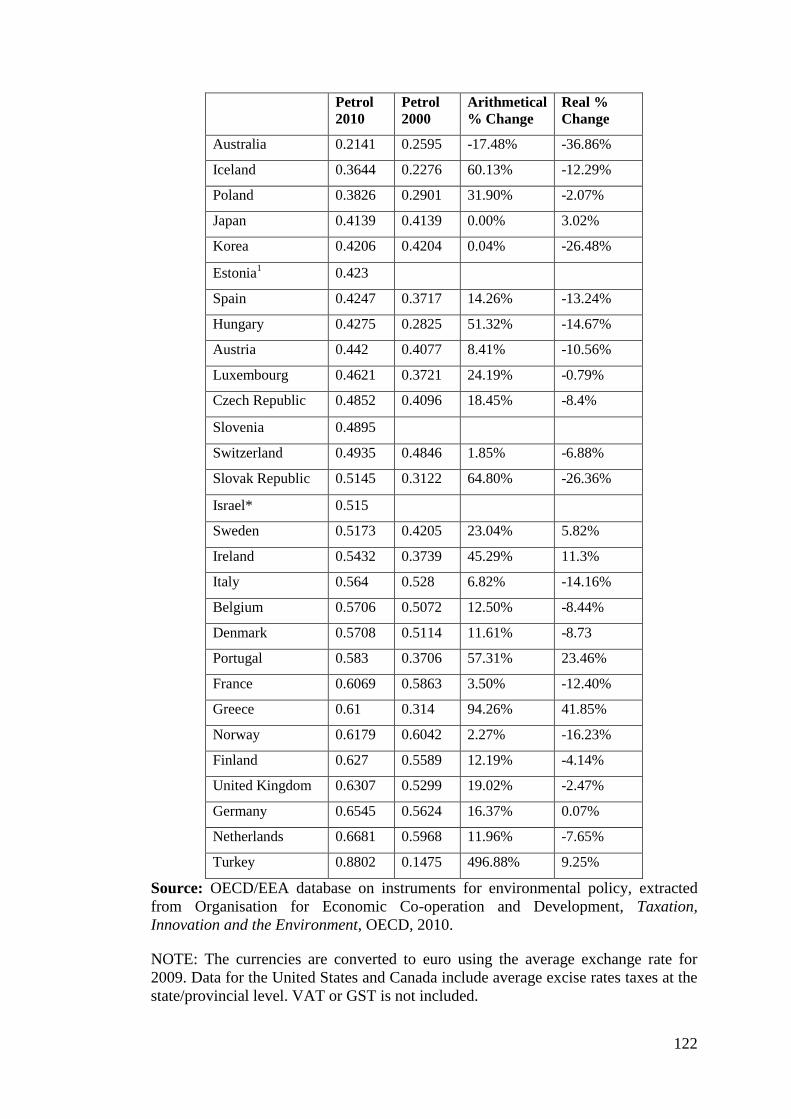
4.4.2 Fuel Taxes or Fuel Excise ................................................................ 121
a. Lessons for Australia ................................................................. 125
4.4.3 Income Tax Incentives ..................................................................... 127
a. Lessons for Australia ................................................................. 129
4.5 Demand Management Programs .................................................................. 132
4.5.1 Lessons for Australia ........................................................................ 139
4.6 Compulsory Inspection and Retiring of Motor Vehicles ............................. 140
4.7 Conclusion .................................................................................................... 142
CHAPTER 5: CASE STUDIES ......................................................................... 144
5.1 Introduction .................................................................................................. 144
5.2 Norway ......................................................................................................... 145
5.2.1 The History of Motor Vehicle Taxes in Norway .............................. 146
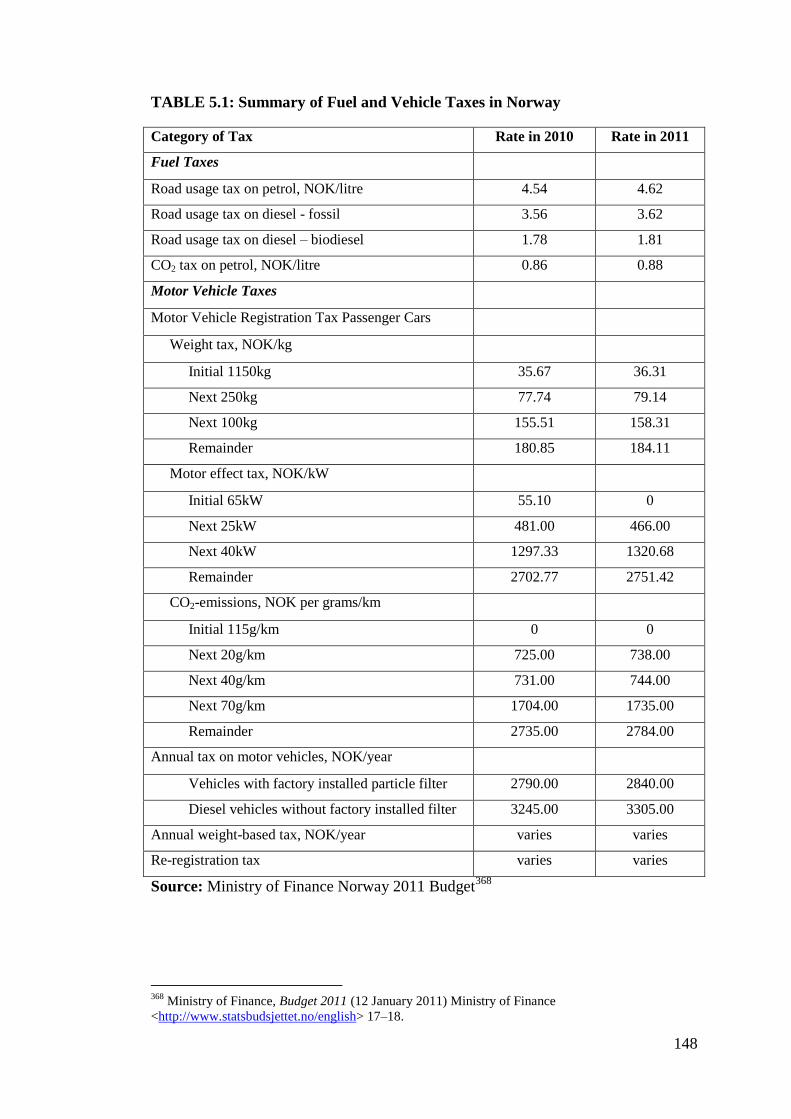
5.2.2 The Current Motor Vehicle Taxes in Norway .................................. 147
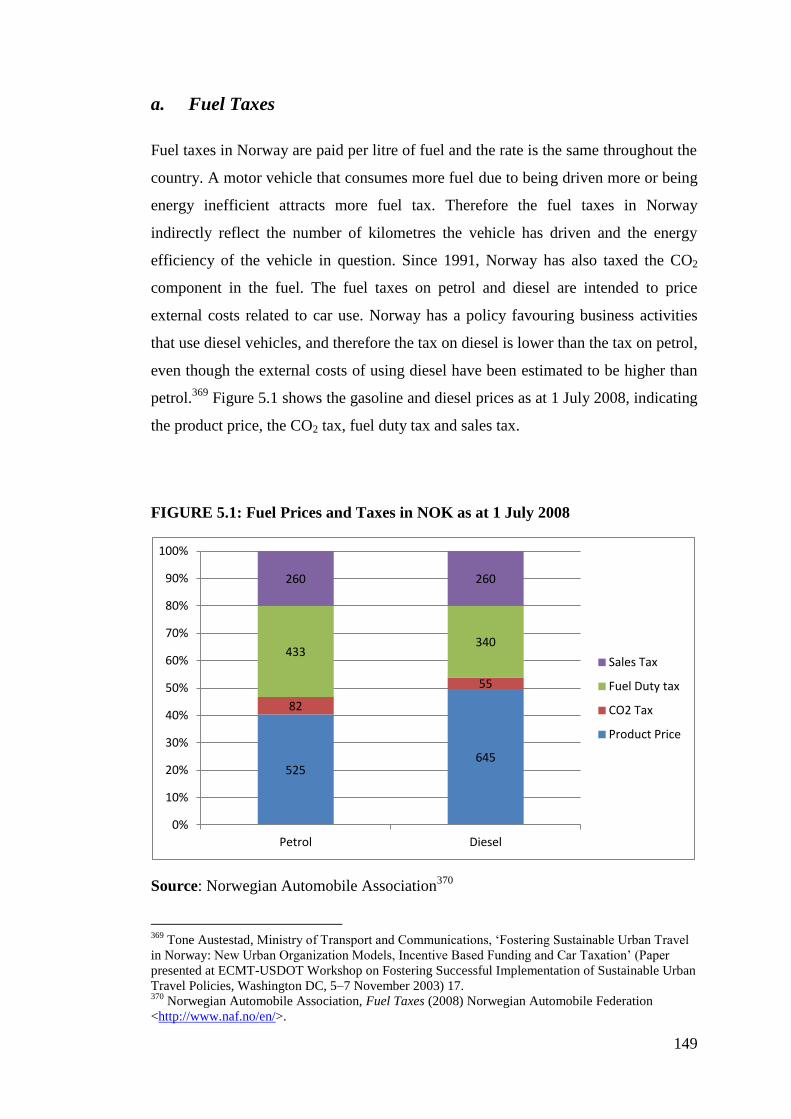
a. Fuel Taxes .................................................................................. 149
b. Vehicle Taxes ............................................................................ 150
c. The Purchase Tax ....................................................................... 150
d. Annual Taxes ............................................................................. 152
e. Norwegian Tolls ......................................................................... 153
5.2.3 Lessons for Australia ........................................................................ 154
5.3 The Netherlands ........................................................................................... 156
5.3.1 The Situation Prior to the Intended Kilometre Charge Regime ....... 157
5.3.2 The Abandoned Kilometre Charge System ...................................... 158
a. Equity and Fairness .................................................................... 162
b. Privacy ....................................................................................... 162
c. Technology and Operation Cost ................................................ 162
d. Public Viability .......................................................................... 163
5.3.3 Lessons for Australia ........................................................................ 165
5.4 Oregon .......................................................................................................... 168
5.4.1 Identification of the Oregon Problem with Fuel Taxes .................... 169
5.4.2 The Mission Statement and Formation of the Road User Fee Task
Force ................................................................................................. 172
5.4.3 Proceedings of the Road User Fee Task Force and the Mileage Fee
Concept – March 2003 ..................................................................... 173
Page 10
x
5.4.4 Strategy to Move the Mileage Fee Concept to the Design Framework:
Report to the 73rd
Oregon Legislative Assembly – June 2005. ........ 181
5.4.5 The Oregon Pilot Program................................................................ 187
5.4.6 ODOT’s Critical Analysis and Pathway to Implementation ............ 192
5.4.7 Lessons for Australia ........................................................................ 196
5.5 Conclusion .................................................................................................... 198
CHAPTER 6: RECOMMENDATION OF TAX FRAMEWORK FOR THE
LUXURY ENERGY TAX ......................................................... 200
6.1 Introduction .................................................................................................. 200
6.2 The Australian Problem Reiterated .............................................................. 200
6.3 Critical Examination of Some Policy Options for Australia ........................ 203
6.3.1 Maintaining the Status Quo .............................................................. 204
6.3.2 Replace the LCT in Australia with a Purchase Tax Similar to that in
Norway ............................................................................................. 206
6.3.3 Supplement Motor Vehicle Taxes in Australia with the Introduction of
a Kilometre/Mileage Tax as was Proposed in the Netherlands and
Oregon .............................................................................................. 209
6.3.4 Supplement Motor Vehicle Taxes in Australia with Mandatory Fuel
Economy/CO2 Standards .................................................................. 211
6.3.5 Comprehensive Reform of Motor Vehicle Taxes and Charges in
Australia and the Introduction of a LET System .............................. 215
6.4 THE LET SYSTEM ..................................................................................... 216
6.4.1 The Principles of the LET System.................................................... 216
a. The Precautionary Principle ....................................................... 217
b. The Polluter-Pays Principle ....................................................... 219
6.4.2 The Framework for the LET System ................................................ 220
a. The Weight of the Vehicle ......................................................... 220
b. The Size of the Engine or Engine Capacity ............................... 224
c. The Engine Power ...................................................................... 226
d. CO2 Emissions ........................................................................... 228
e. The Taxing Points ...................................................................... 229
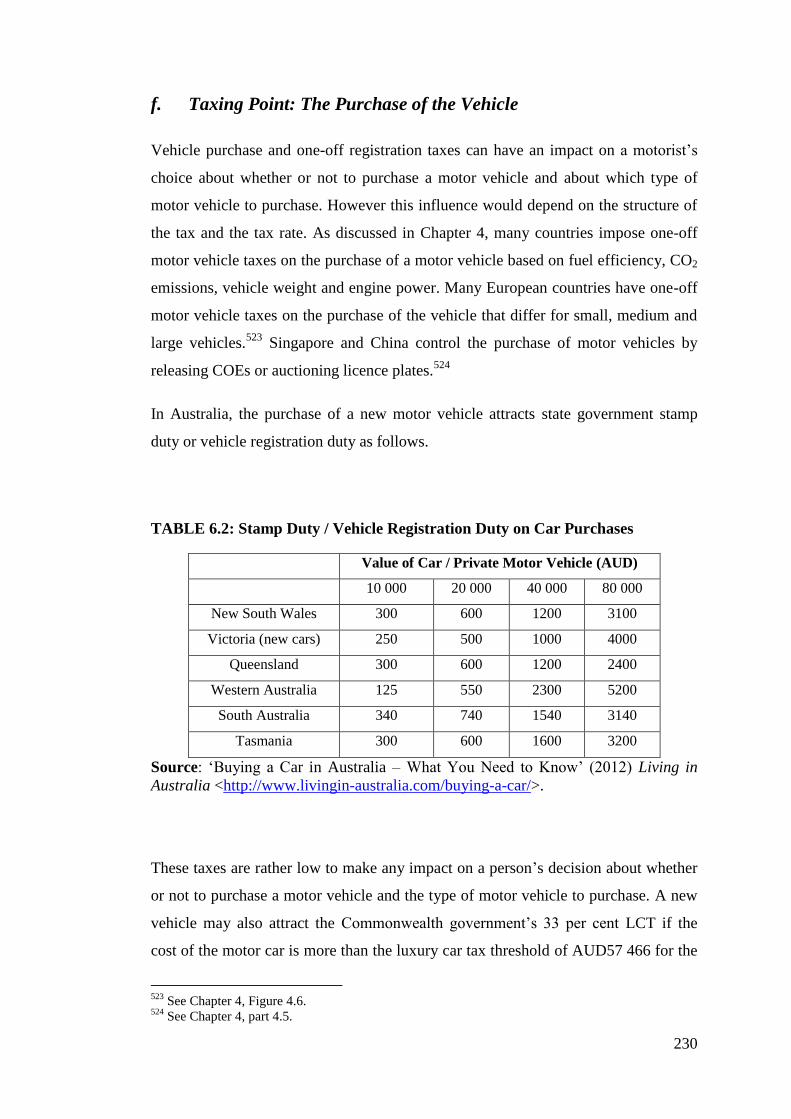
f. Taxing Point: The Purchase of the Vehicle ................................ 230
g. Taxing Point: The Annual Registration Tax .............................. 231
h. Taxing Point: The Fuelling of the Vehicle ................................ 233
i. Taxing Point: The Disposal of a Vehicle .................................... 234
j. Commonwealth or State Tax ...................................................... 235
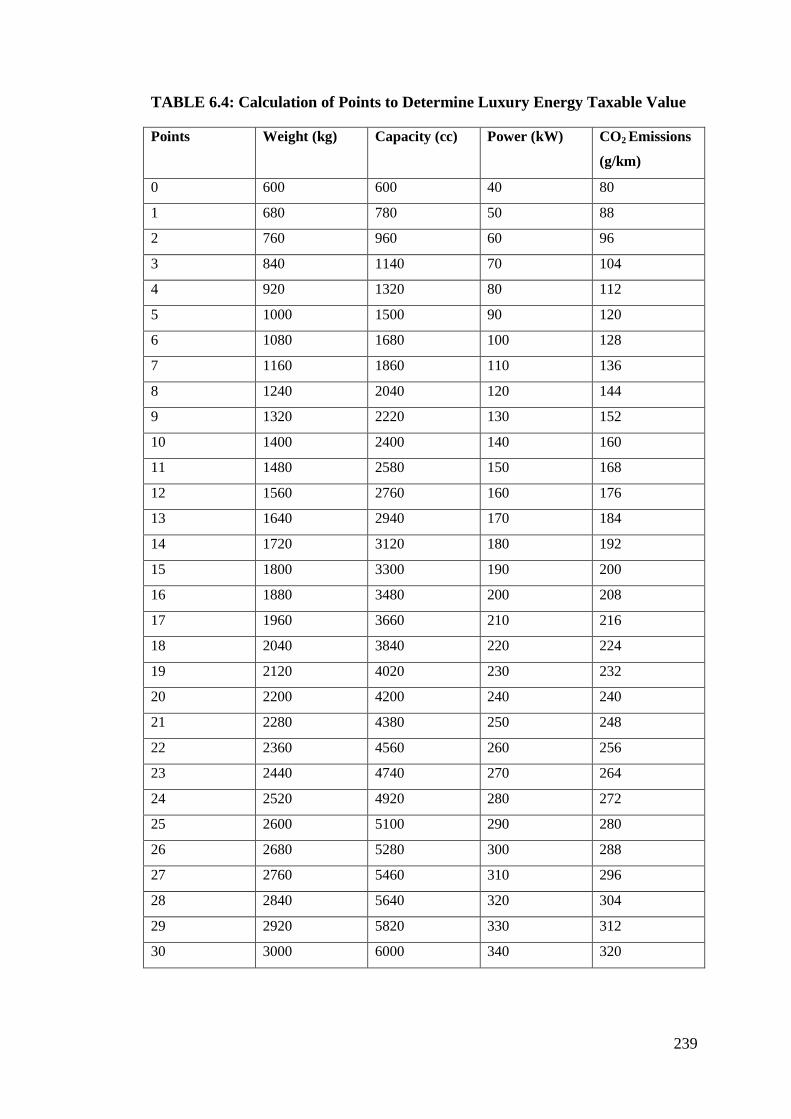
6.4.3 The Working Design of the LET System ......................................... 238
Page 11
xi
a. The LET Points .......................................................................... 238
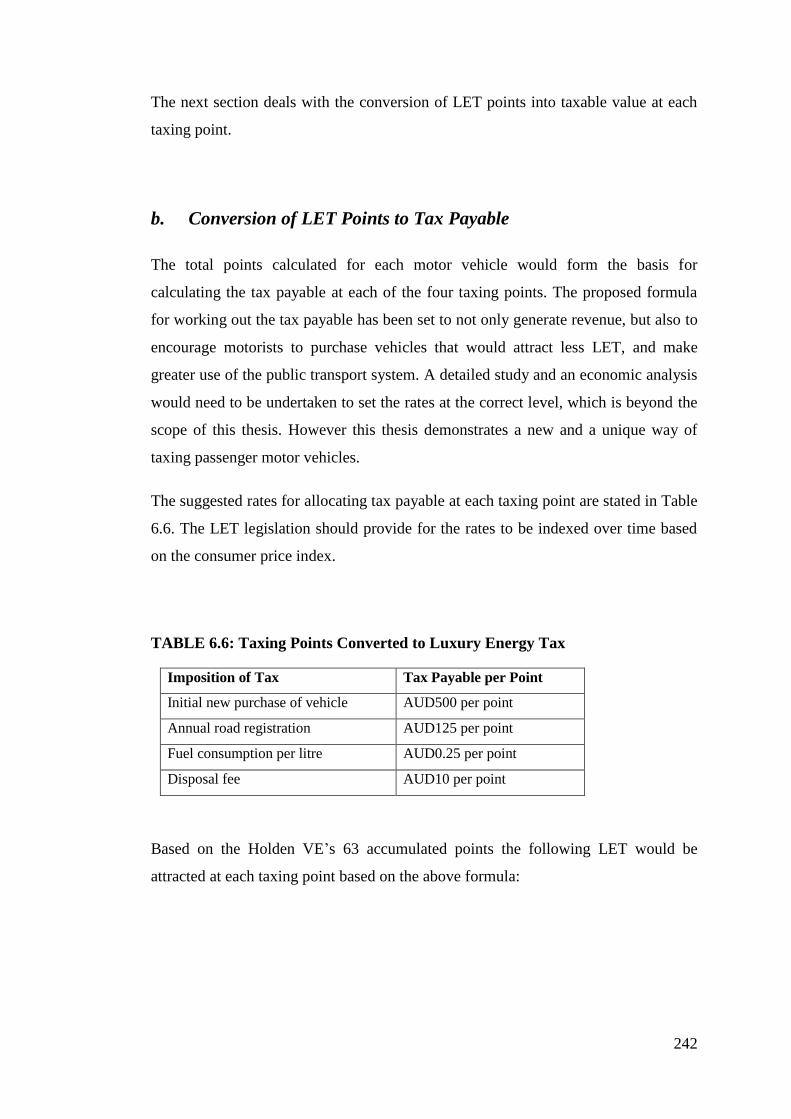
b. Conversion of LET Points to Tax Payable ................................ 242
c. The Discount .............................................................................. 243
6.4.4 The Administration and Operation of the LET Design Framework . 248
a. The Registration for LET ........................................................... 248
b. The Special Number Plate Design ............................................. 251
c. Application for Exemptions ....................................................... 251
d. The Administration of the Purchase LET .................................. 252
e. The Administration of the Fuel LET .......................................... 253
f. The Administration of the Annual Registration LET ................. 255
g. The Administration of the Disposal Fee LET ............................ 255
h. The Setting Up and Operation of the LET Department ............. 255
i. The Annual or Periodical Road Worthiness Test ....................... 256
j. LET Audits and Offences ........................................................... 256
k. The Responsibility of the Taxpayer ........................................... 257
6.4.5 The Implementation of the LET System .......................................... 257
a. Compliance and Administration Cost Study .............................. 258
b. Task Force and Pilot Study ........................................................ 260
6.5 Conclusion .................................................................................................... 261
CHAPTER 7: EVALUATION OF THE LET SYSTEM ................................ 263
7.1 Introduction .................................................................................................. 263
7.2 Net Revenue Generation Potential ............................................................... 263
7.2.1 LET Vehicles in Australia ................................................................ 264
7.2.2 Forecast of the Purchase LET Revenues .......................................... 267
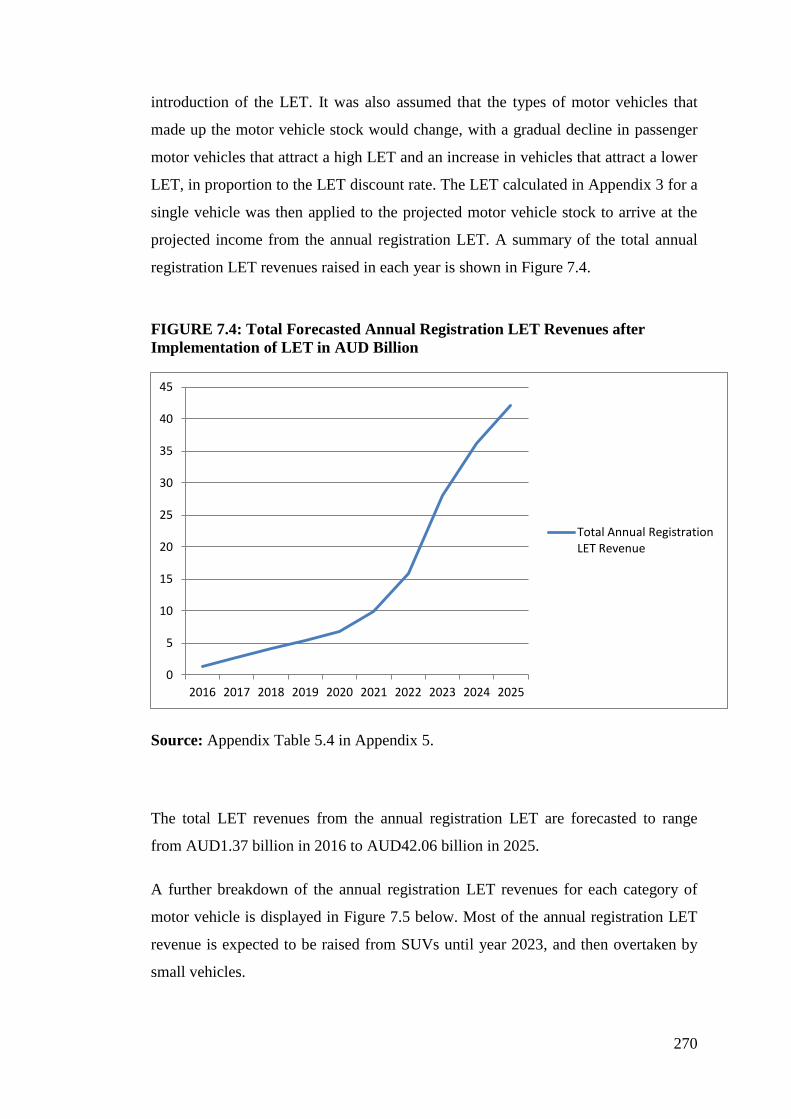
7.2.3 Forecast of Annual Registration LET Revenues .............................. 269
7.2.4 The Effect of Net Revenue Generation Potential ............................. 273
7.3 The Expected Saving in the Usage of Oil .................................................... 276
7.4 General Evaluation of LET .......................................................................... 277
7.5 Evaluation under the Principles of a Good Tax ........................................... 281
7.5.1 Equity ............................................................................................... 282
7.5.2 Certainty ........................................................................................... 285
7.5.3 Convenience ..................................................................................... 286
7.5.4 Economy ........................................................................................... 287
7.5.5 Required Intervention ....................................................................... 289
7.5.6 Price Elasticity .................................................................................. 289
Page 12
xii
7.5.7 Built in Escalator .............................................................................. 289
7.5.8 Use of Revenues Generated .............................................................. 290
7.6 The Desired Ability to Change Behaviour ................................................... 290
7.6.1 Individual Level Theories................................................................. 291
a. The Rational Choice Theory ...................................................... 291
b. Theory of Planned Behaviour (TPB) ......................................... 292
7.6.2 Interpersonal Behavioural Theories ................................................. 293
a. Triandis’ Theory of Interpersonal Behaviour ............................ 293
b. Social Learning Theory ............................................................. 293
7.6.3 Community Theories of Behaviour .................................................. 294
a. Social Capital Theory................................................................. 294
b. Diffusion of Innovation ............................................................. 294
7.7 Conclusion .................................................................................................... 296
CHAPTER 8: CONCLUSION AND RECOMMENDATIONS FOR
POSSIBLE FURTHER RESEARCH ...................................... 297
8.1 Introduction .................................................................................................. 297
8.2 Review of Key Findings and Policy Recommendations .............................. 298
8.2.1 The First Research Question ............................................................ 298
8.2.2 The Second Research Question ........................................................ 300
8.3 Desired Outcome of Policy Recommendations ........................................... 304
8.4 Contributions to Research ............................................................................ 306
8.5 Methodological Contributions ...................................................................... 307
8.6 Major Limitations ......................................................................................... 308
8.7 Suggestions For Future Research ................................................................. 308
8.8 Author’s Concluding Comments .................................................................. 309
BIBLIOGRAPHY .................................................................................................. 313
A Articles ...................................................................................................... 313
B Books ........................................................................................................ 322
C Book Chapters .......................................................................................... 324
D Cases ........................................................................................................ 327
E Legislation ................................................................................................ 327
F Conference Papers, Discussion Papers, Research Papers, Working Papers
.......................................................................................................... 328
G Reports ...................................................................................................... 341
H Newspaper Articles and Press Releases ................................................... 350
Page 13
xiii
I Parliamentary and Government Documents ............................................. 352
J Internet Sources ......................................................................................... 354
K Other ......................................................................................................... 362
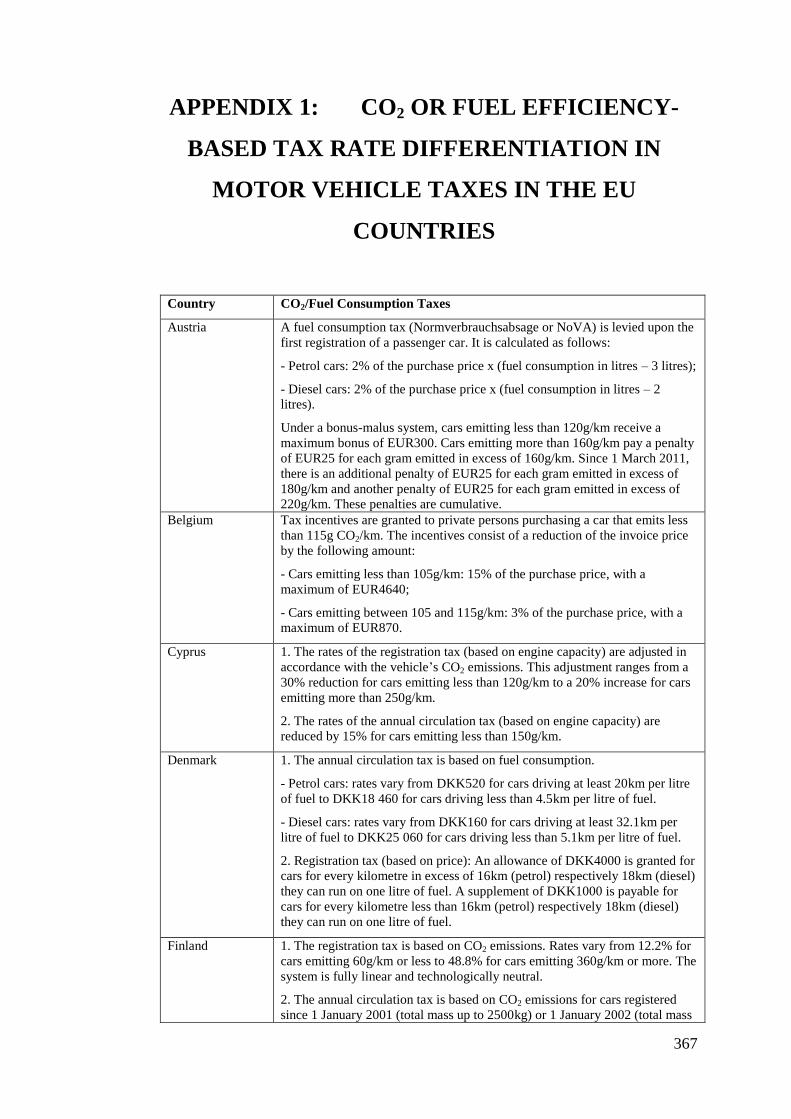
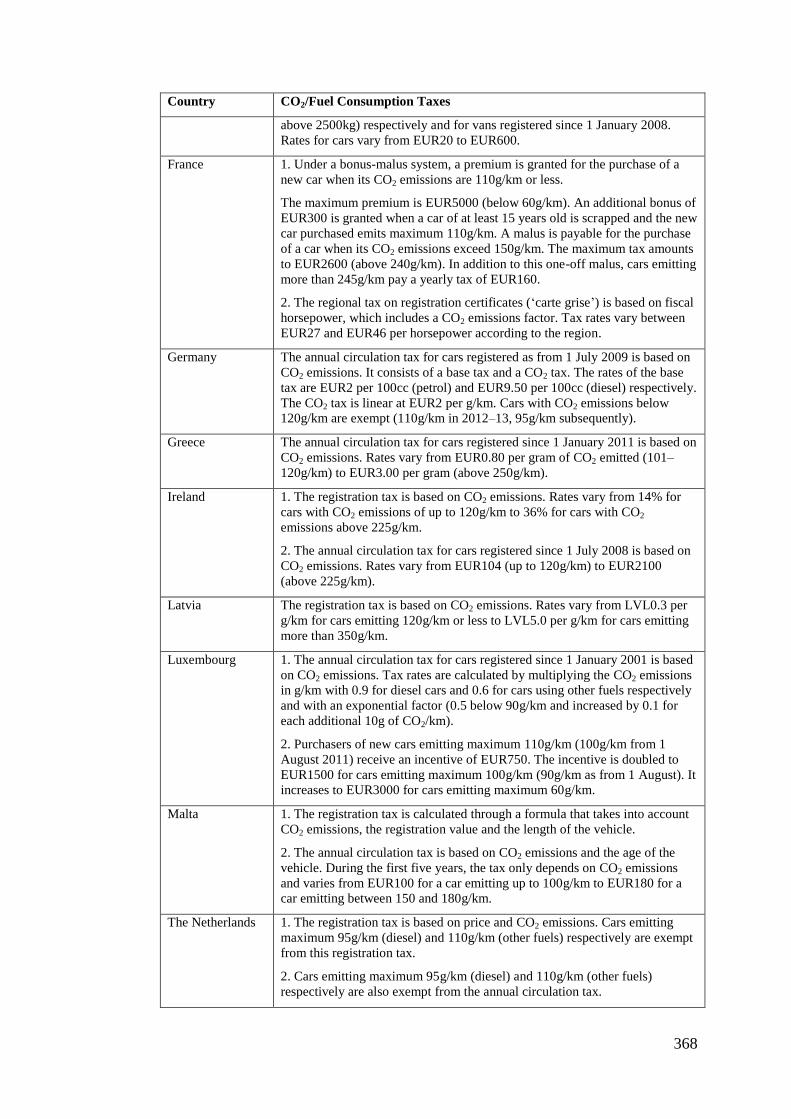
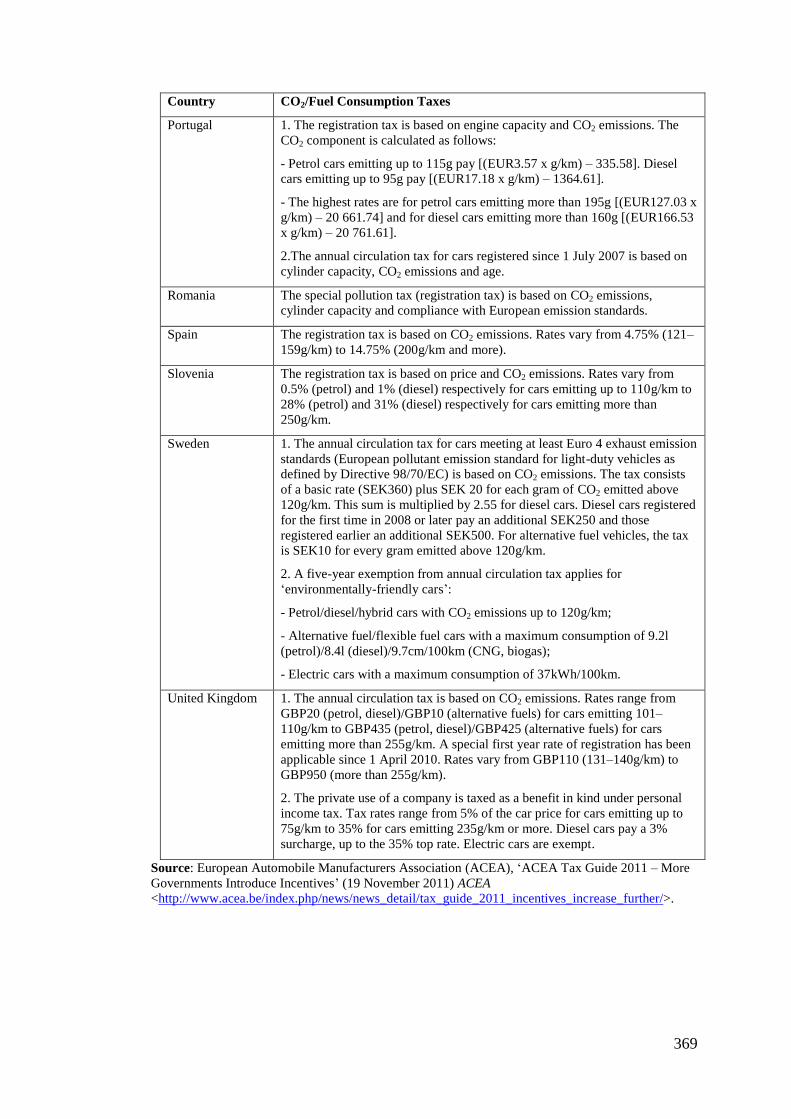
APPENDIX 1: CO2 OR FUEL EFFICIENCY-BASED TAX RATE
DIFFERENTIATION IN MOTOR VEHICLE TAXES IN THE
EU COUNTRIES ....................................................................... 367
APPENDIX 2: OREGON PILOT PROGRAM SURVEYS AND SUMMARY
OF THE RESULTS ................................................................... 370
APPENDIX 3: CHAPTER 7 METHODOLOGY TO CALCULATE THE LET
FOR AUSTRALIAN MOTOR VEHICLE CATEGORIES .. 374
APPENDIX 4: CHAPTER 7 METHODOLOGY TO FORECAST
REVENUES FROM PURCHASE LET ON PASSENGER
MOTOR VEHICLES ................................................................ 398
APPENDIX 5: CHAPTER 7 METHODOLOGY TO FORECAST
REVENUES FROM ANNUAL REGISTRATION LET ON
PASSENGER MOTOR VEHICLES ....................................... 405
APPENDIX 6: CHAPTER 7 METHODOLOGY TO FORECAST
REVENUES FROM FUEL LET ON PASSENGER MOTOR
VEHICLES ................................................................................. 410
APPENDIX 7: METHODOLOGY TO FORECAST NET REVENUES FROM
LET ............................................................................................. 417
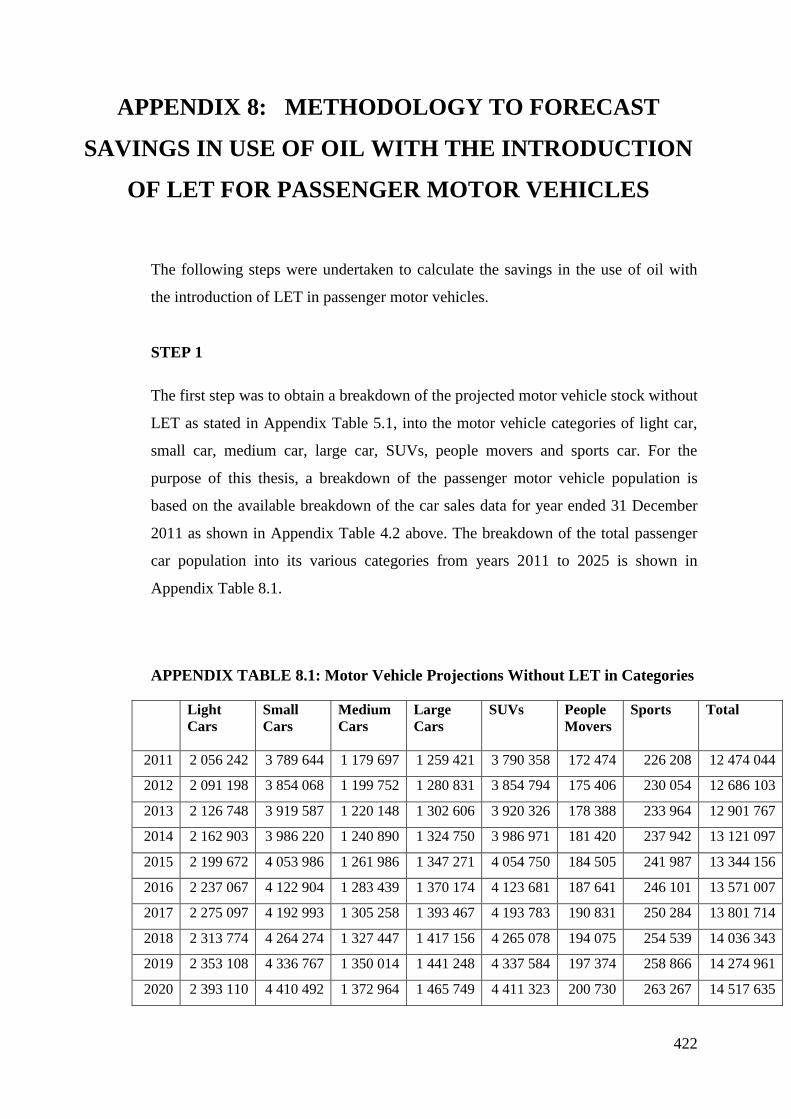
APPENDIX 8: METHODOLOGY TO FORECAST SAVINGS IN USE OF
OIL WITH THE INTRODUCTION OF LET FOR
PASSENGER MOTOR VEHICLES ....................................... 422
Page 14
xiv
LIST OF TABLES
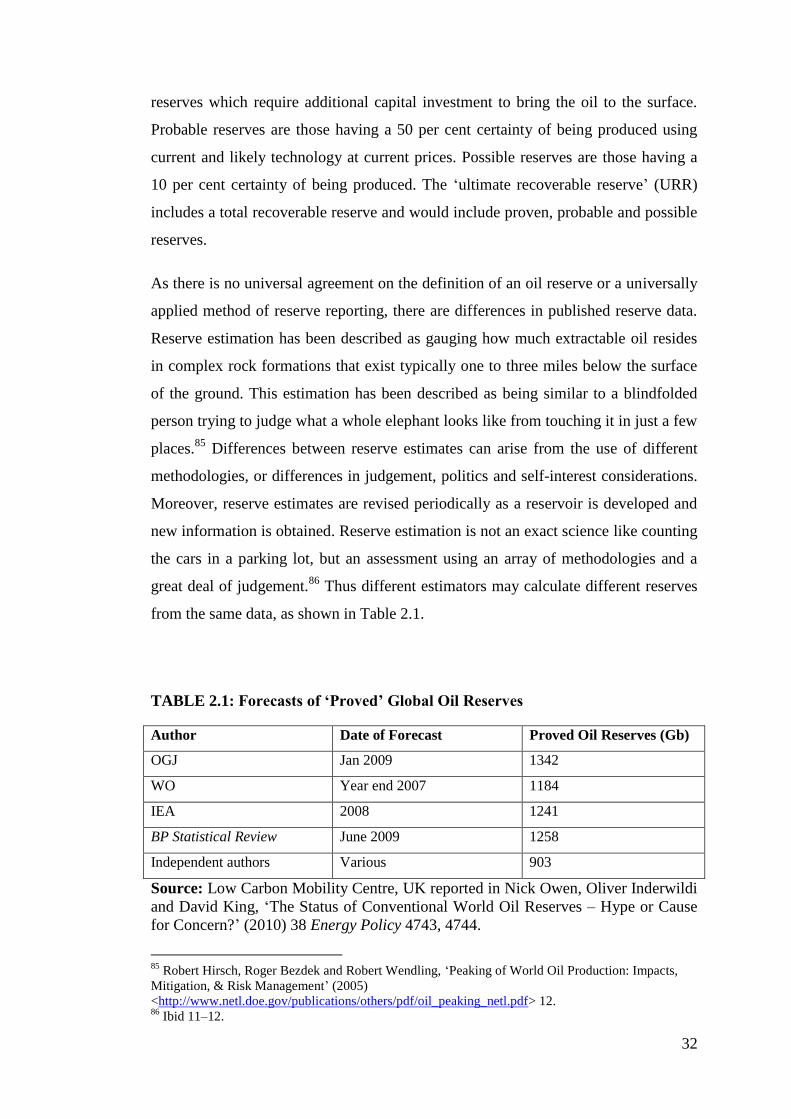
TABLE 2.1: Forecasts of ‘Proved’ Global Oil Reserves ........................................... 32
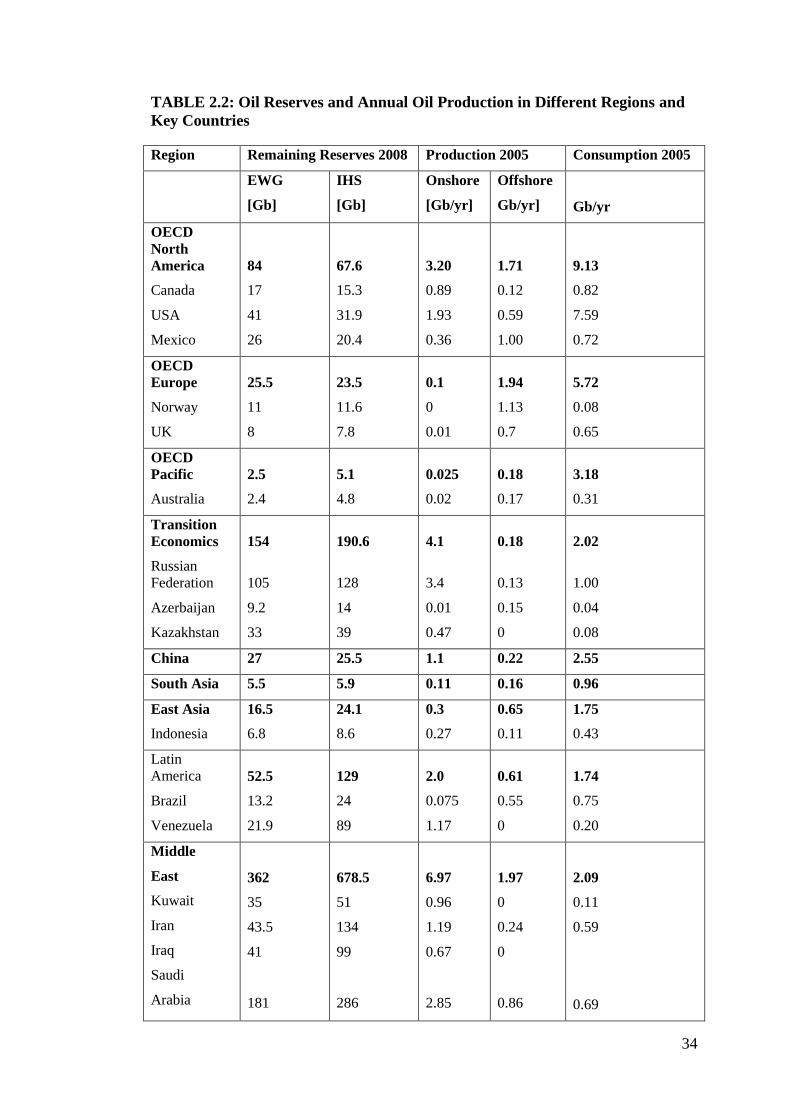
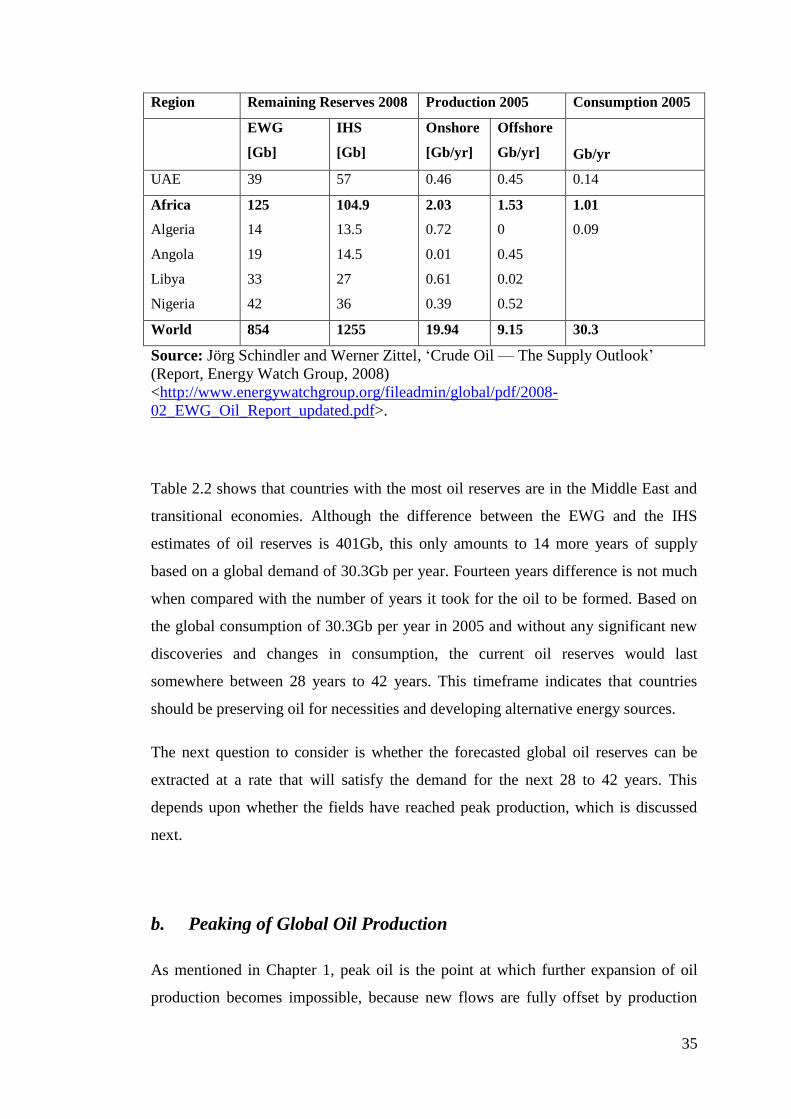
TABLE 2.2: Oil Reserves and Annual Oil Production in Different Regions and Key
Countries .................................................................................................................... 34
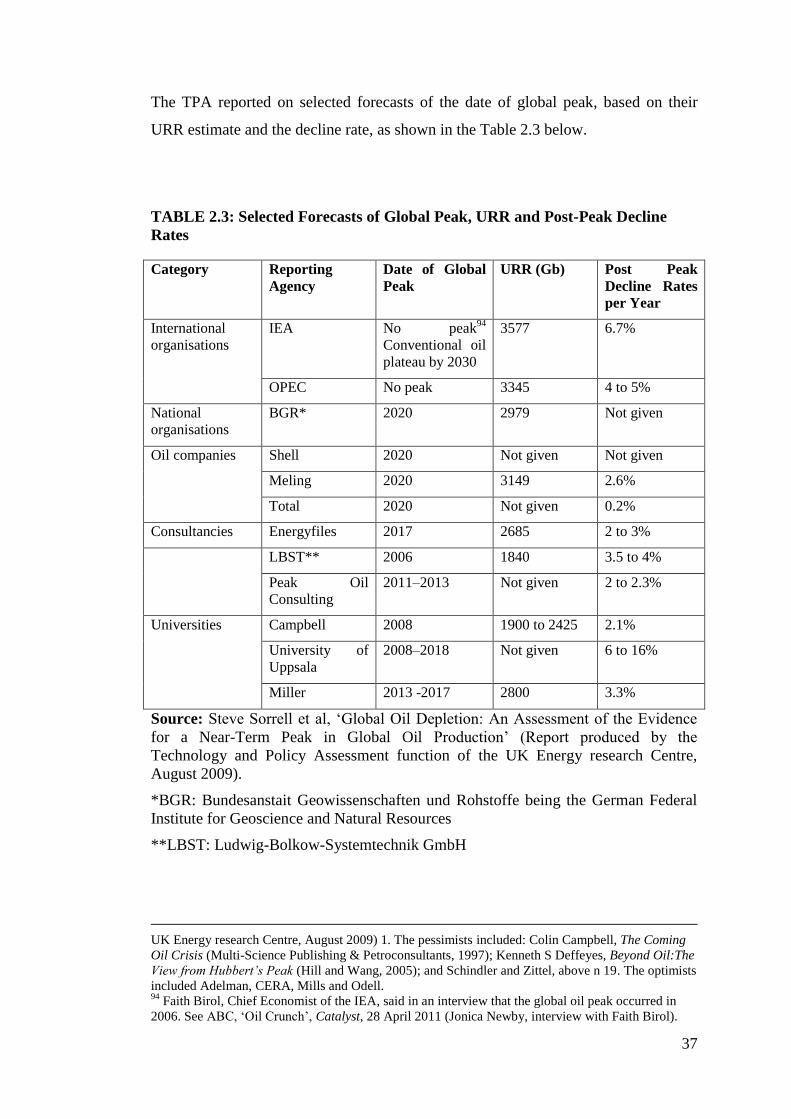
TABLE 2.3: Selected Forecasts of Global Peak, URR and Post-Peak Decline Rates37
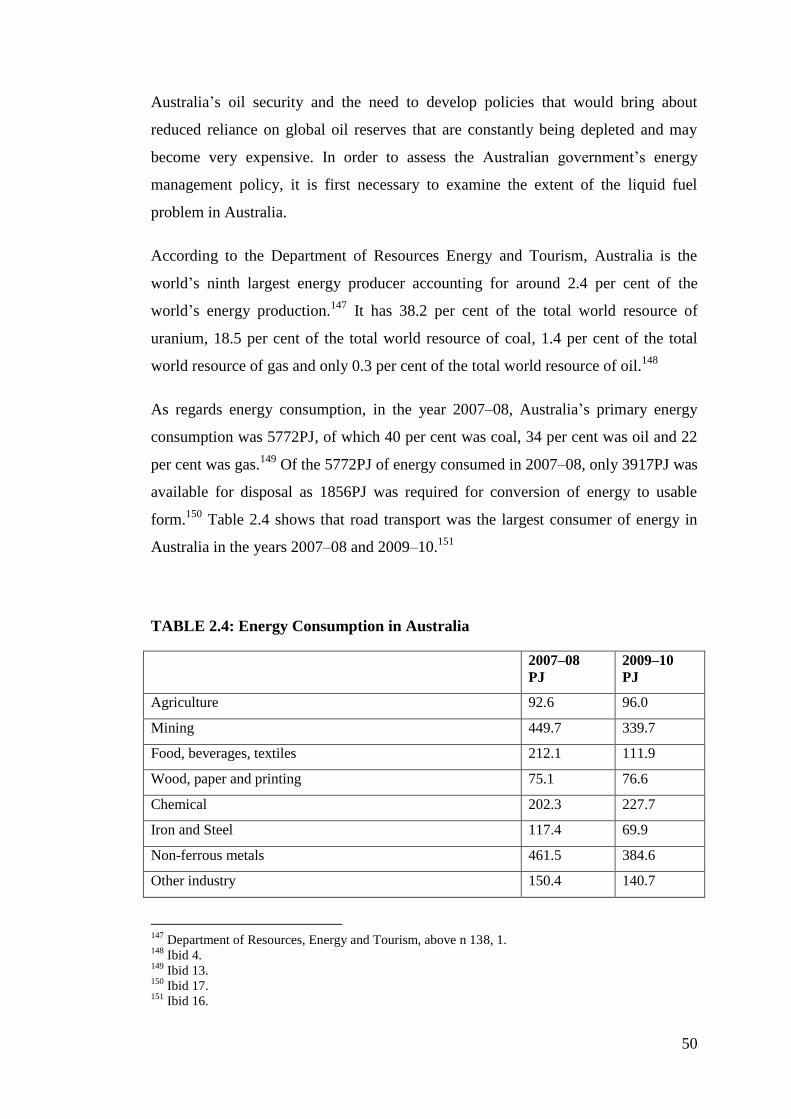
TABLE 2.4: Energy Consumption in Australia ......................................................... 50
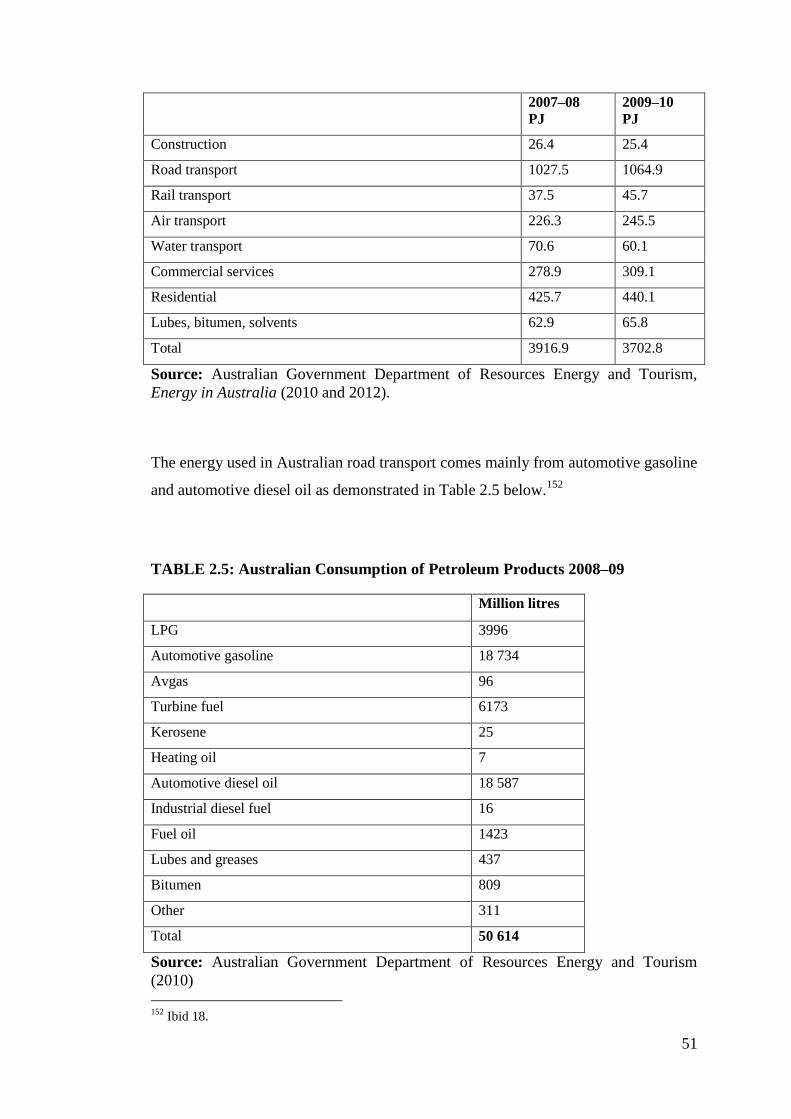
TABLE 2.5: Australian Consumption of Petroleum Products 2008–09 .................... 51
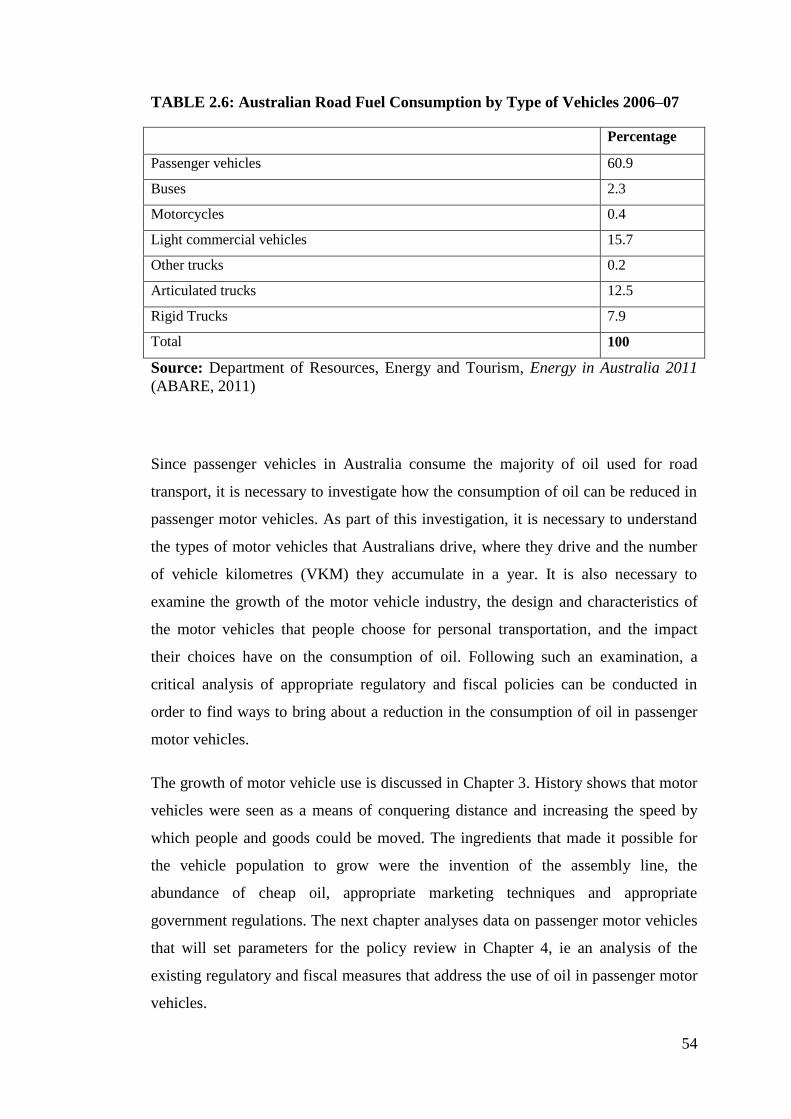
TABLE 2.6: Australian Road Fuel Consumption by Type of Vehicles 2006–07 ..... 54
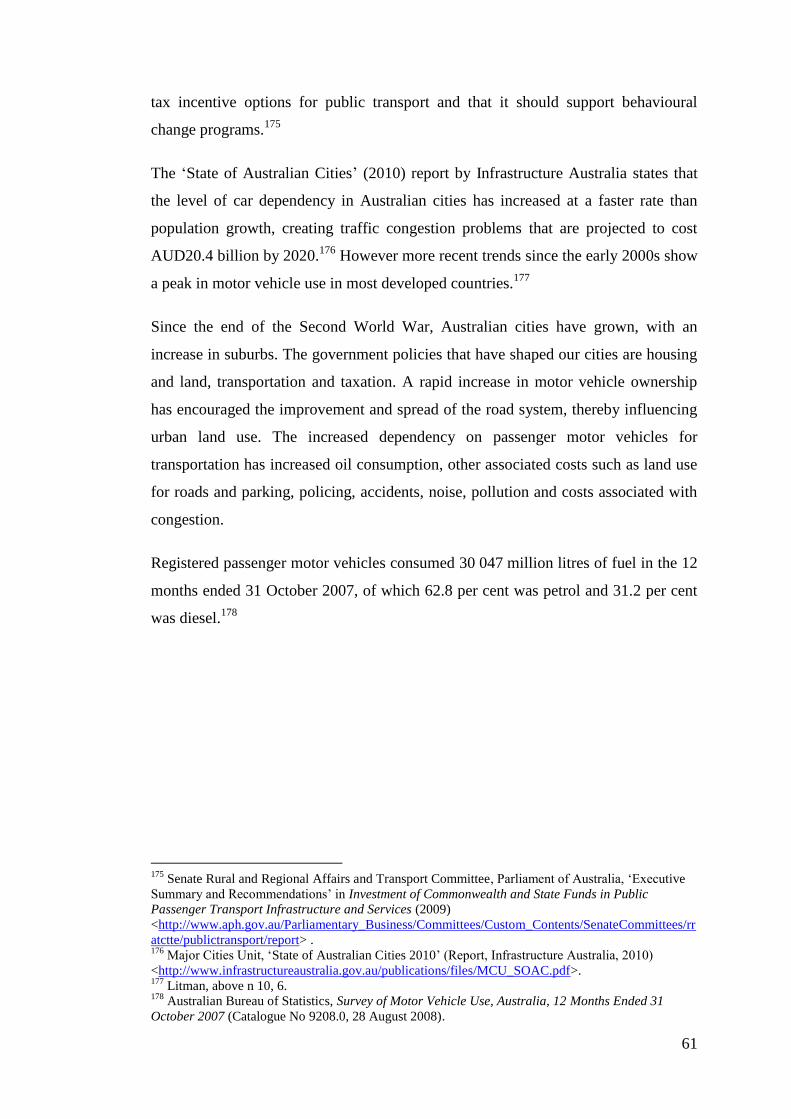
TABLE 3.1: Type of Fuel Used by Passenger Vehicles ............................................ 62
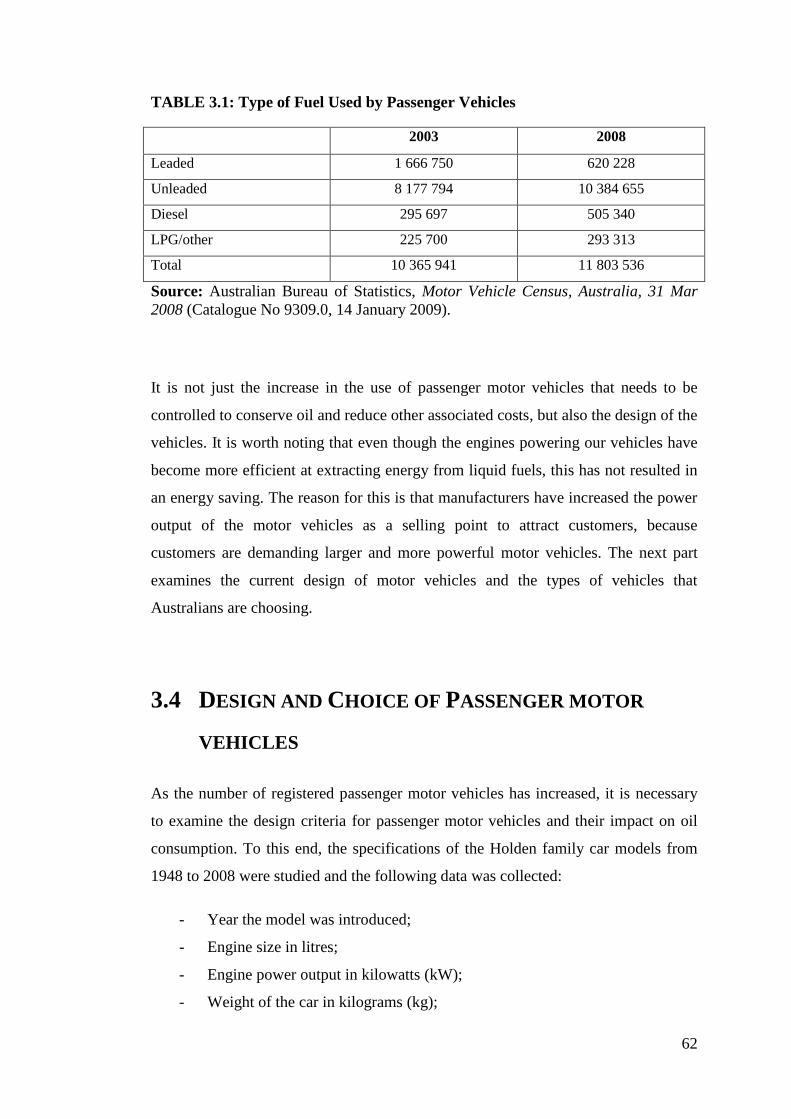
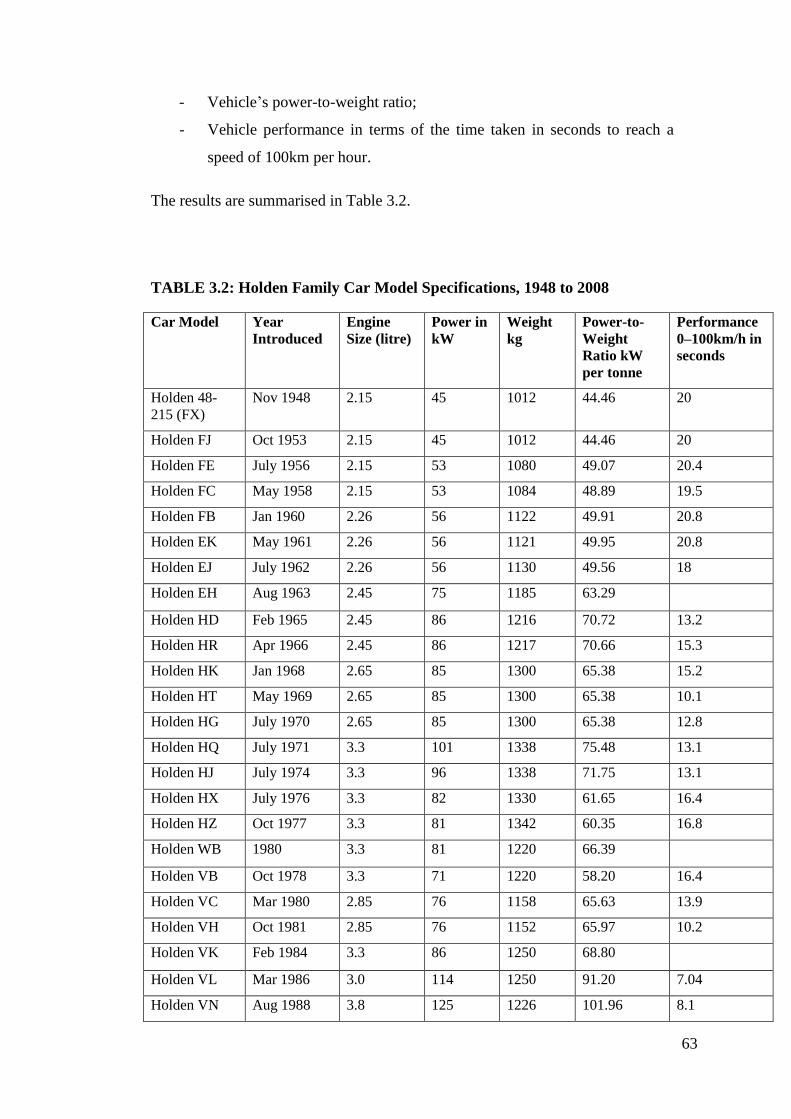
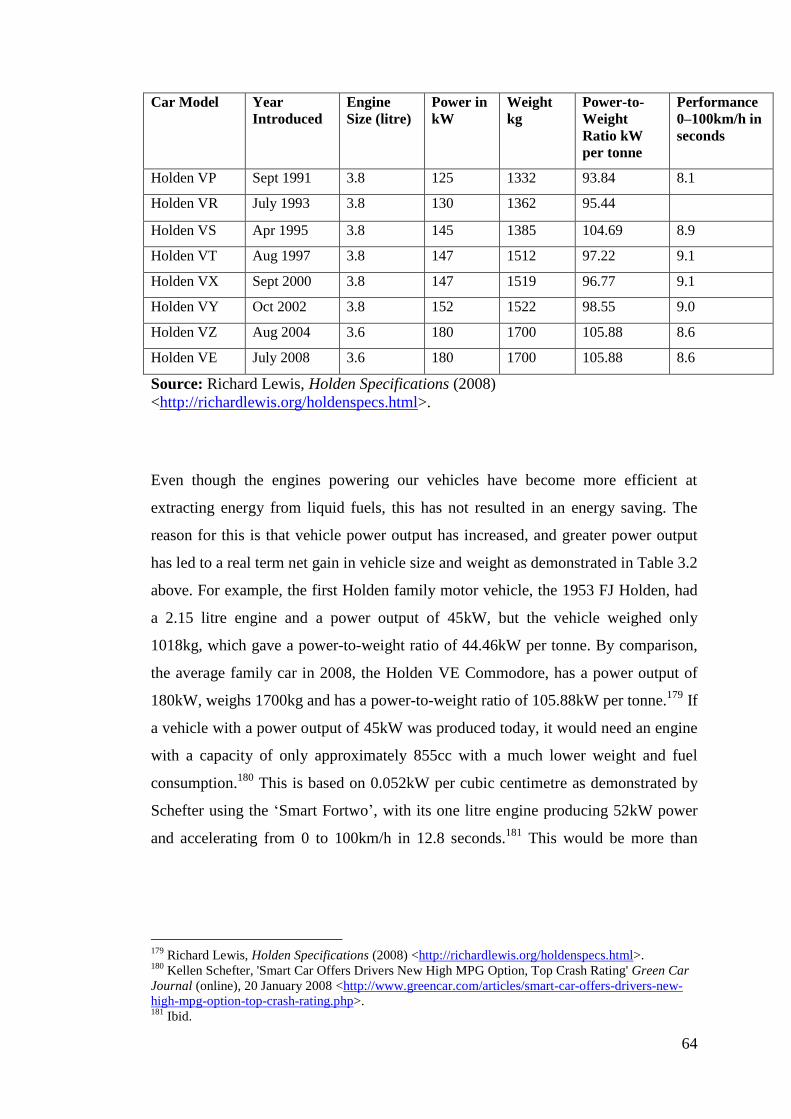
TABLE 3.2: Holden Family Car Model Specifications, 1948 to 2008 ...................... 63
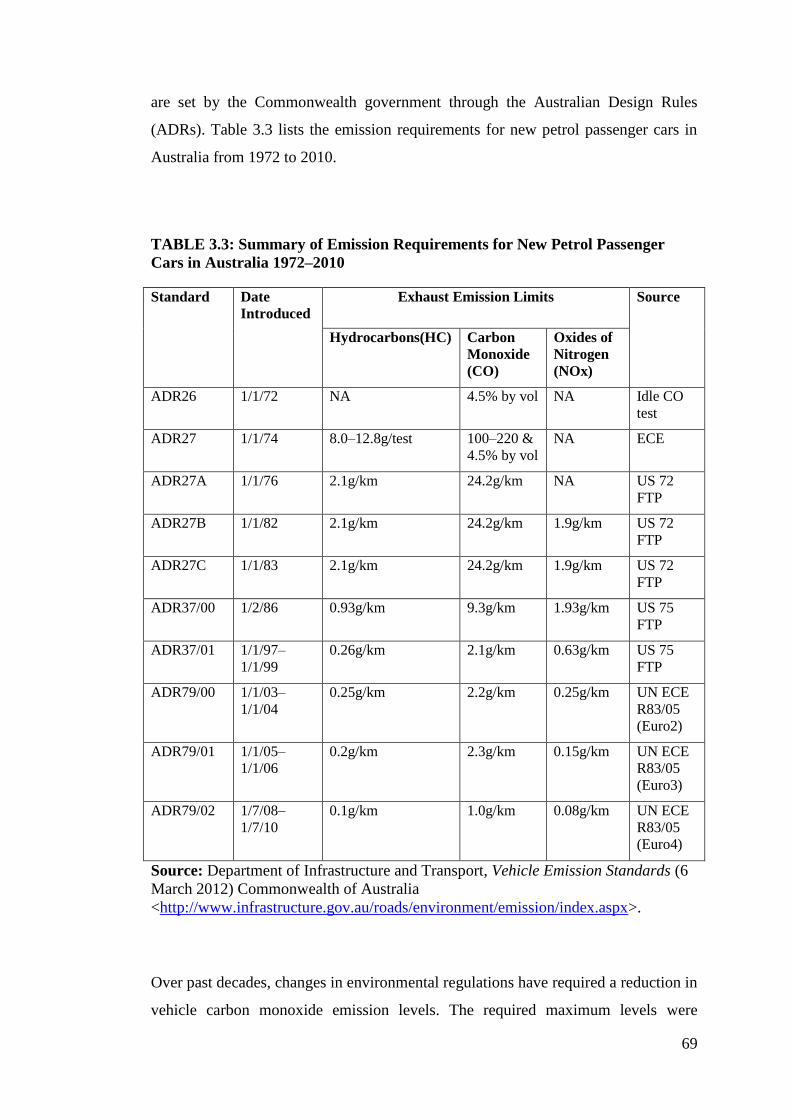
TABLE 3.3: Summary of Emission Requirements for New Petrol Passenger Cars in
Australia 1972–2010 .................................................................................................. 69
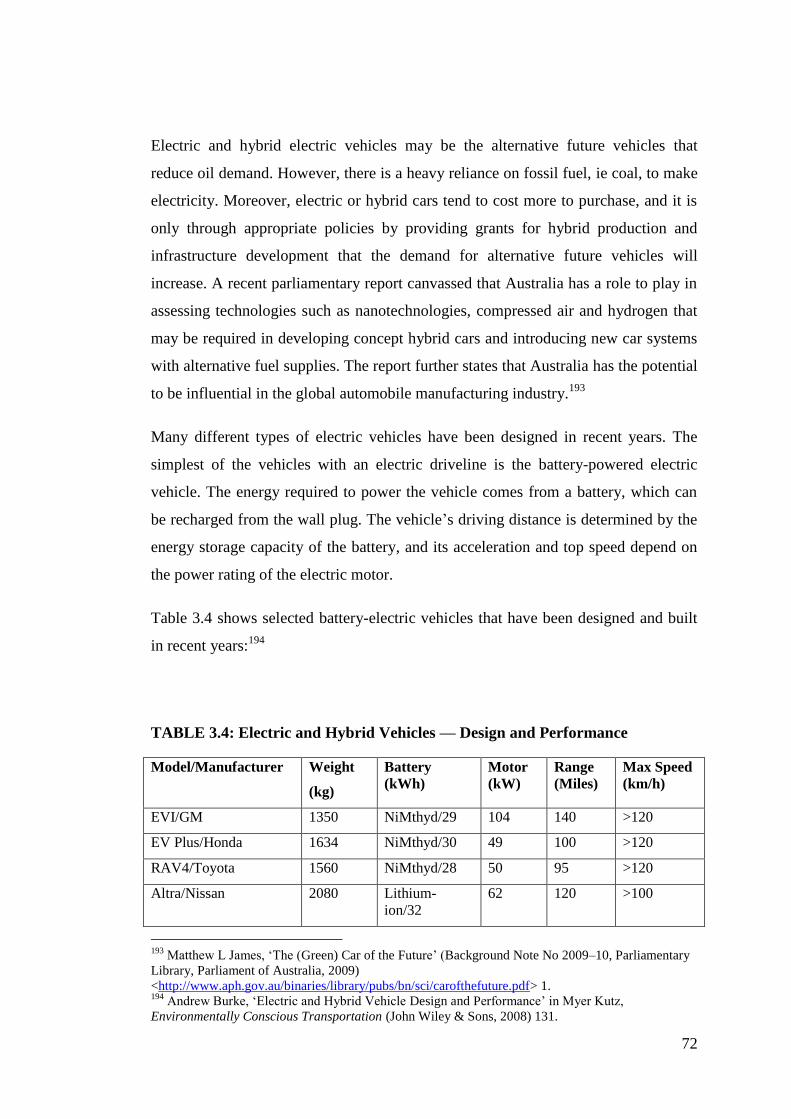
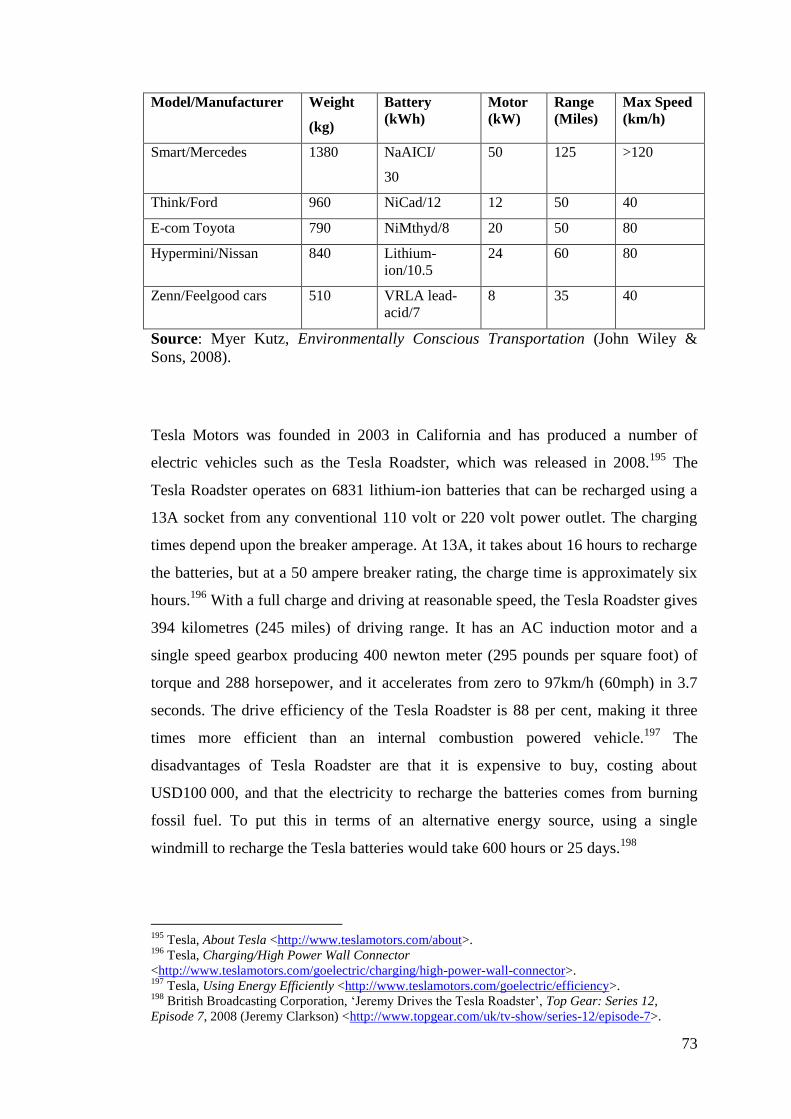
TABLE 3.4: Electric and Hybrid Vehicles — Design and Performance ................... 72
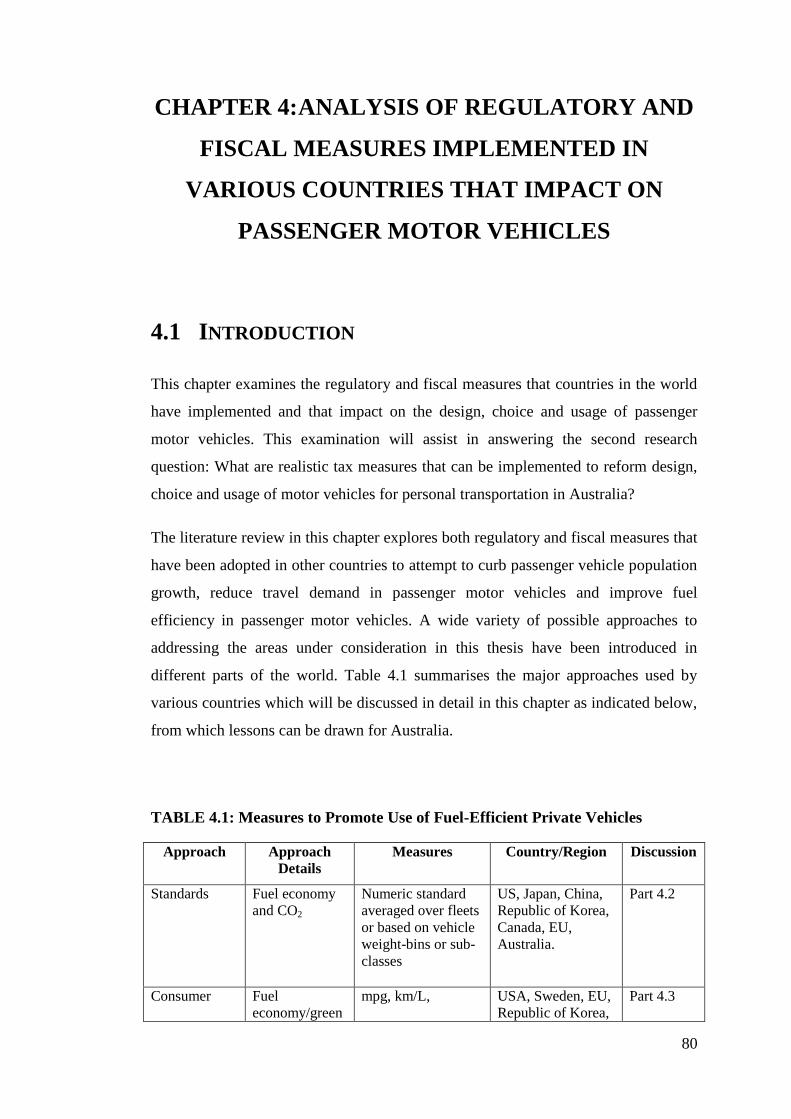
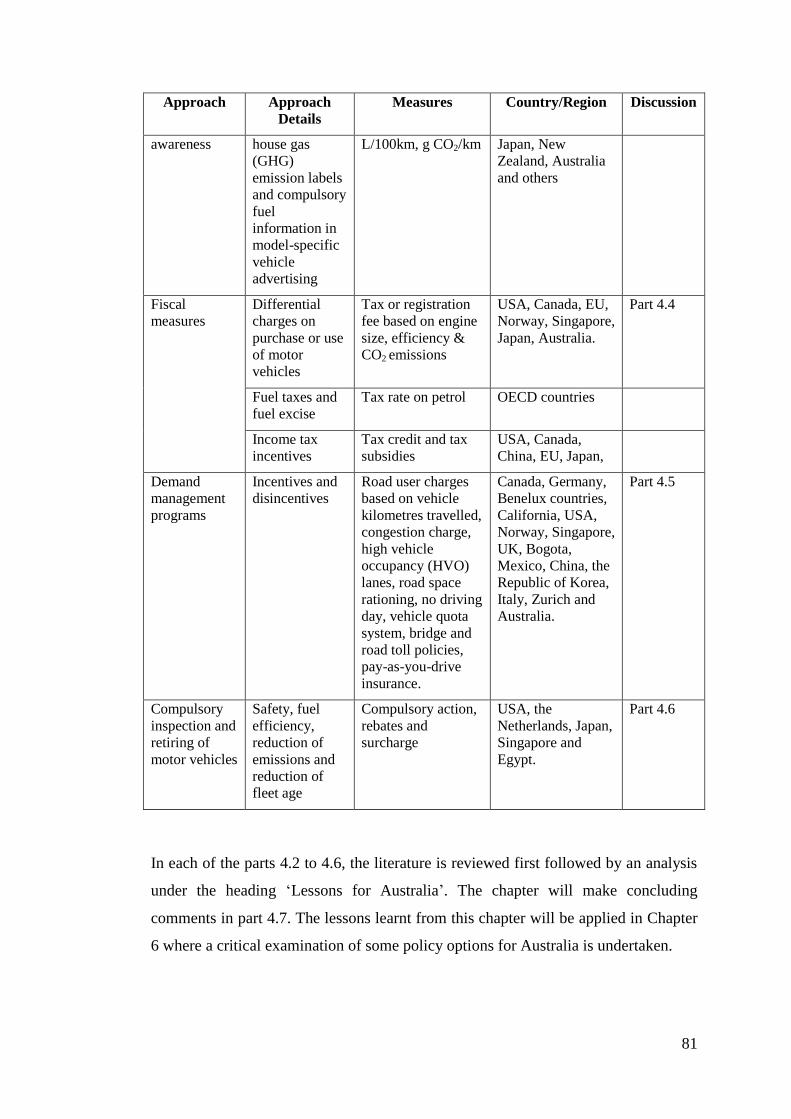
TABLE 4.1: Measures to Promote Use of Fuel-Efficient Private Vehicles .............. 80
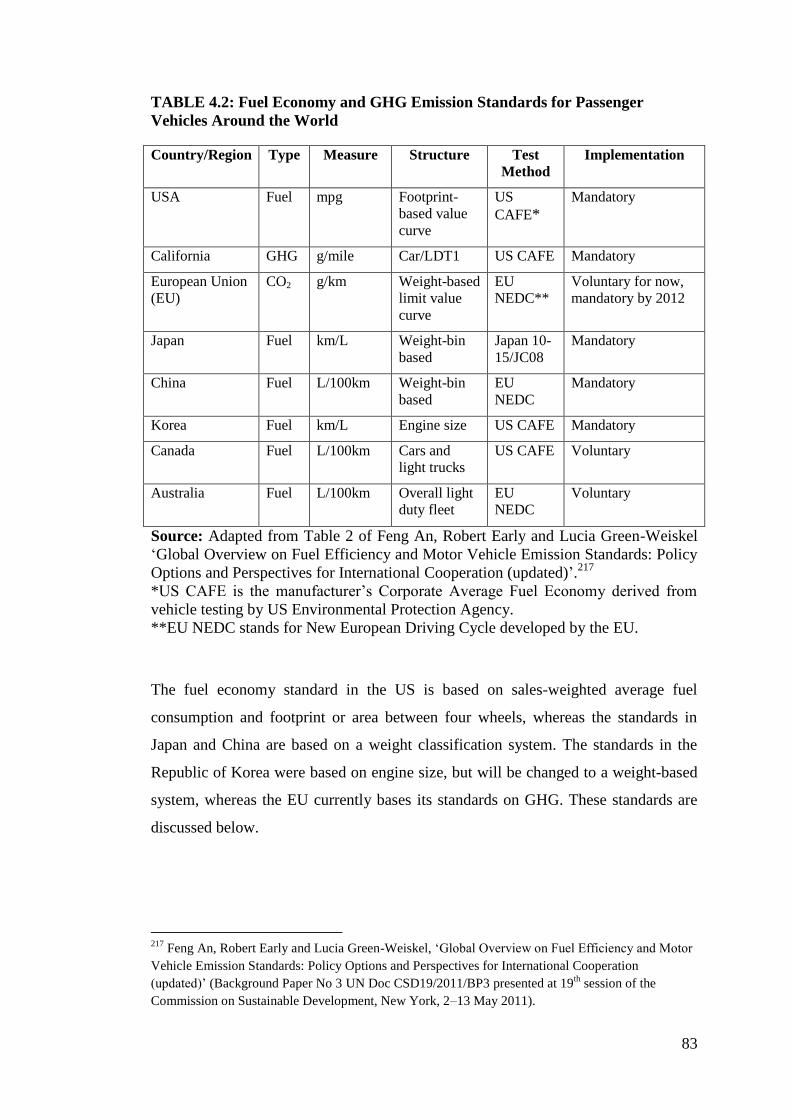
TABLE 4.2: Fuel Economy and GHG Emission Standards for Passenger Vehicles
Around the World ...................................................................................................... 83
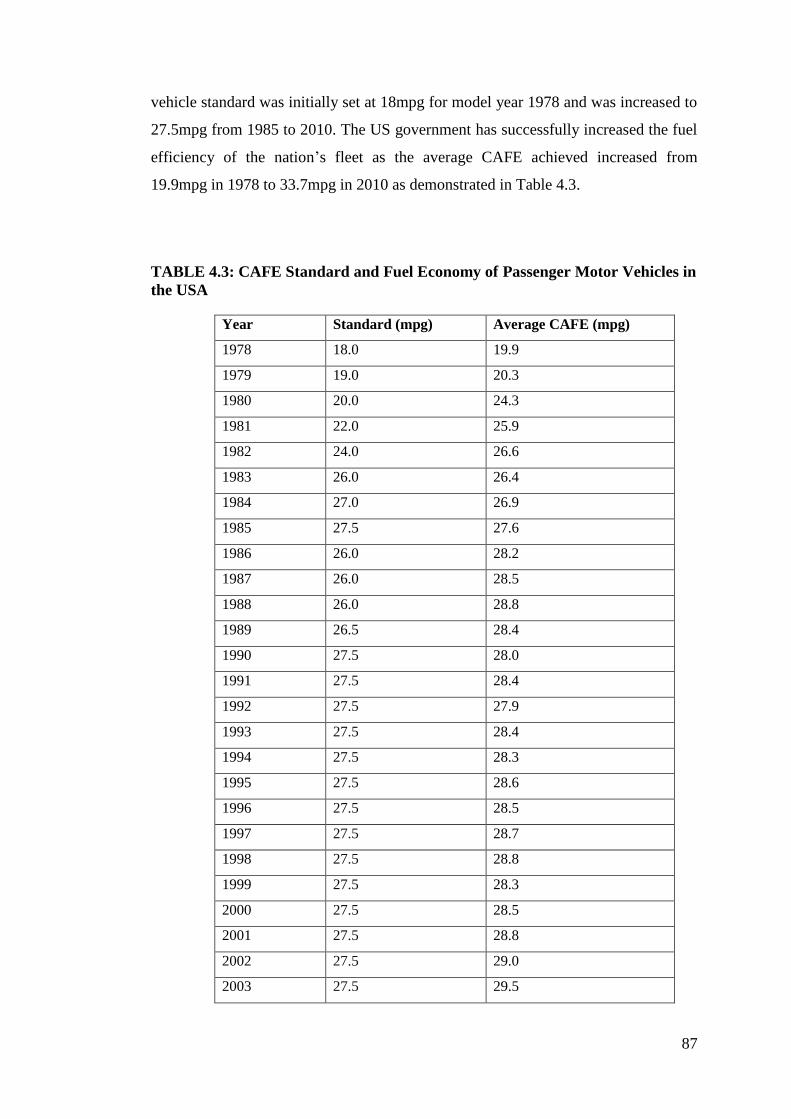
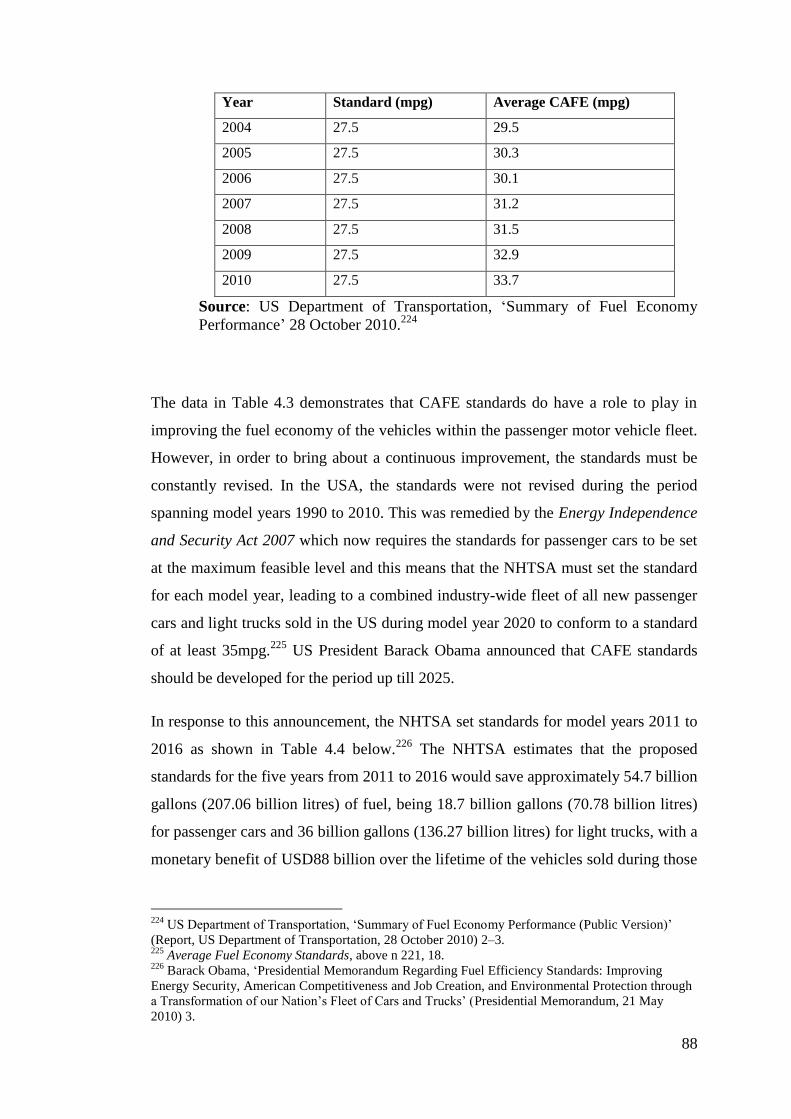
TABLE 4.3: CAFE Standard and Fuel Economy of Passenger Motor Vehicles in the
USA ............................................................................................................................ 87
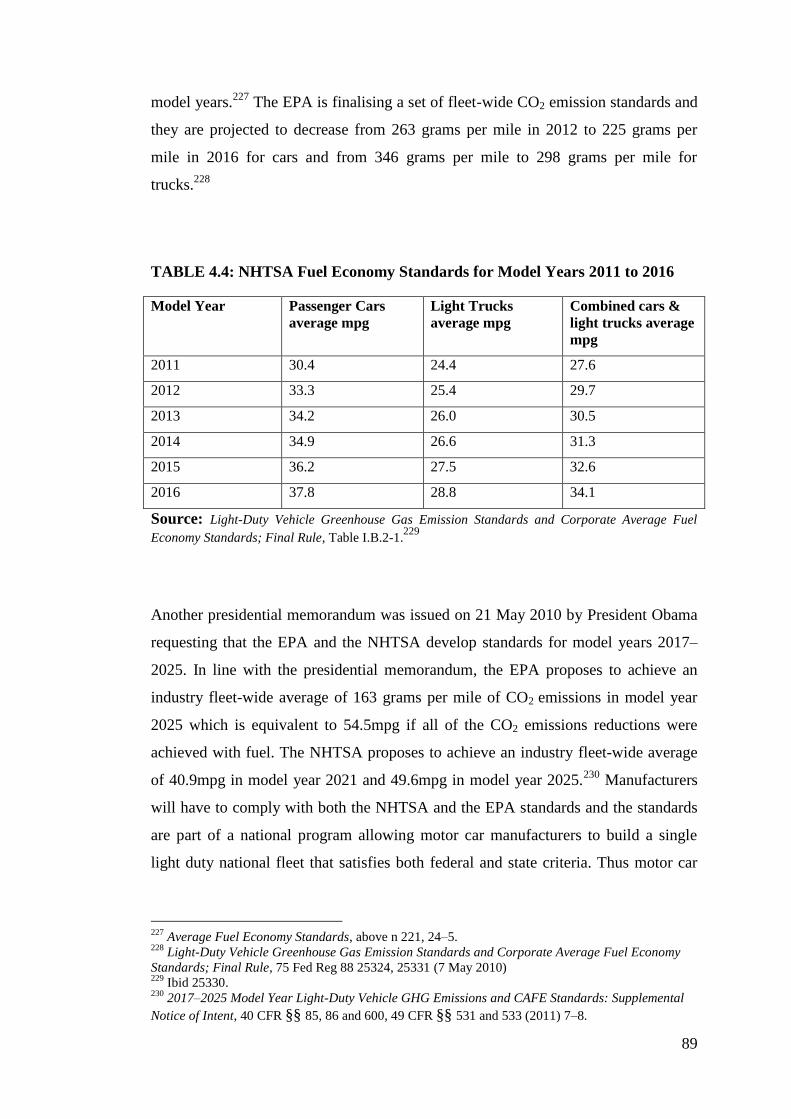
TABLE 4.4: NHTSA Fuel Economy Standards for Model Years 2011 to 2016 ....... 89
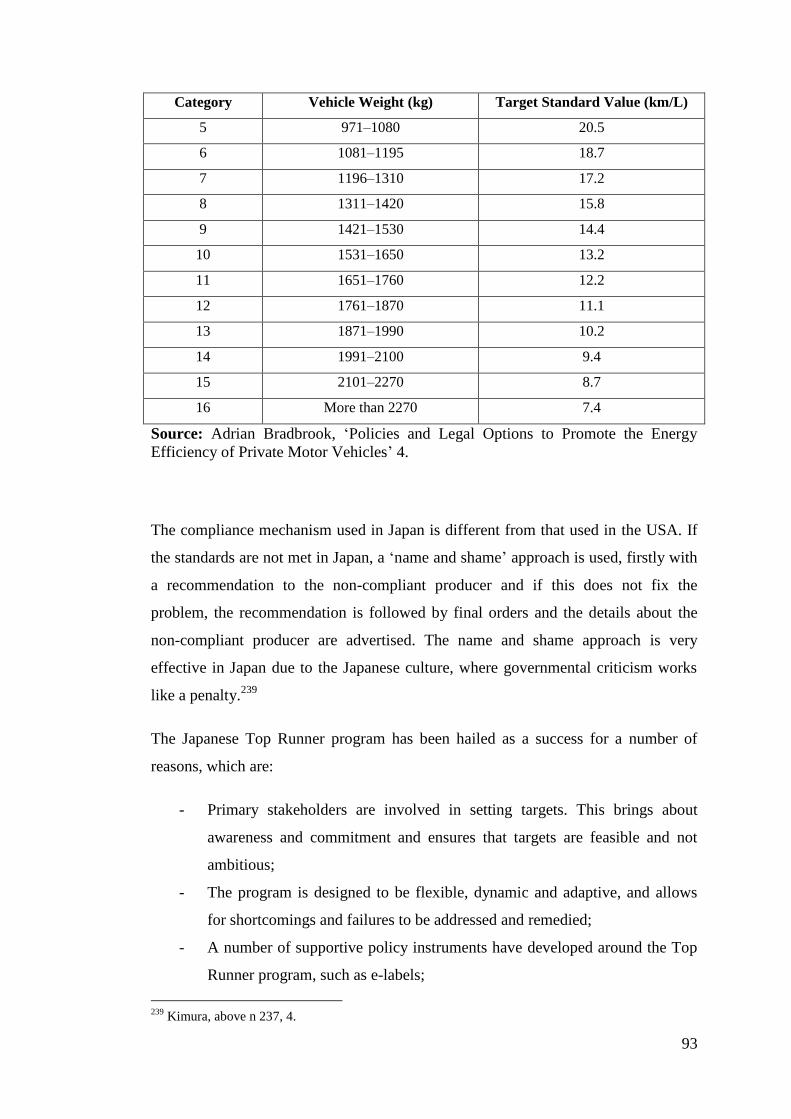
TABLE 4.5: 2015 Fuel Economy Standards for the Top Runner Program in Japan . 92
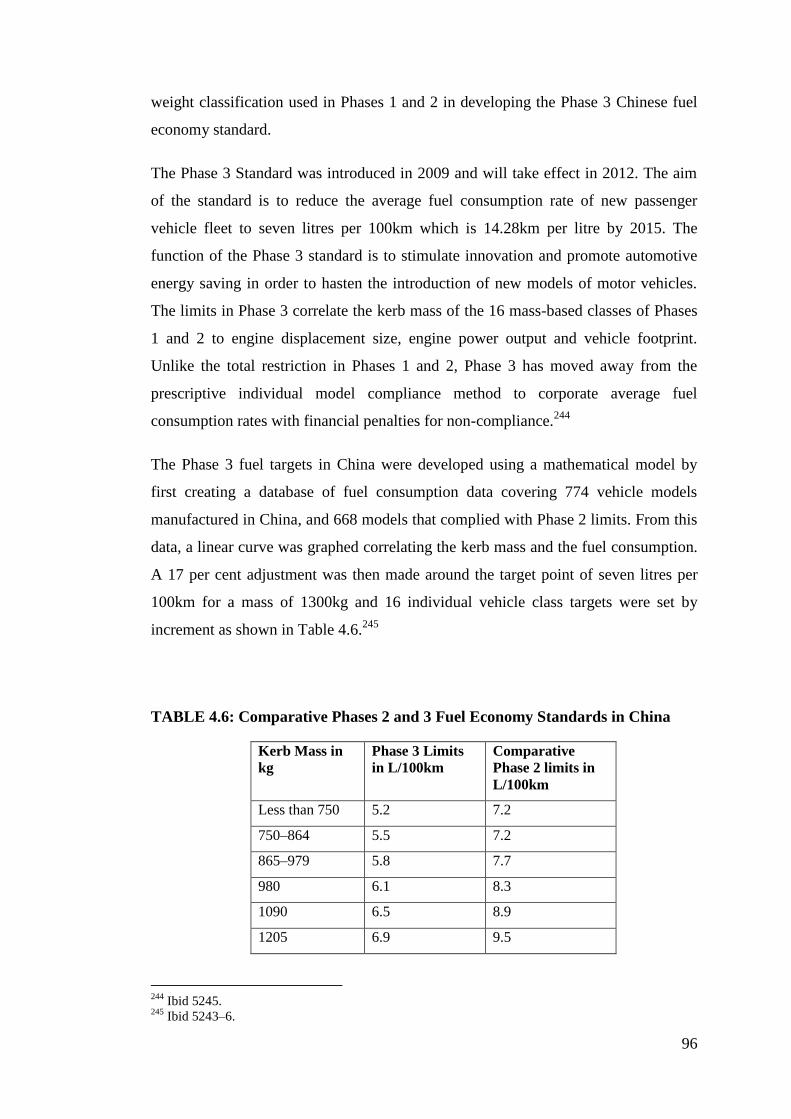
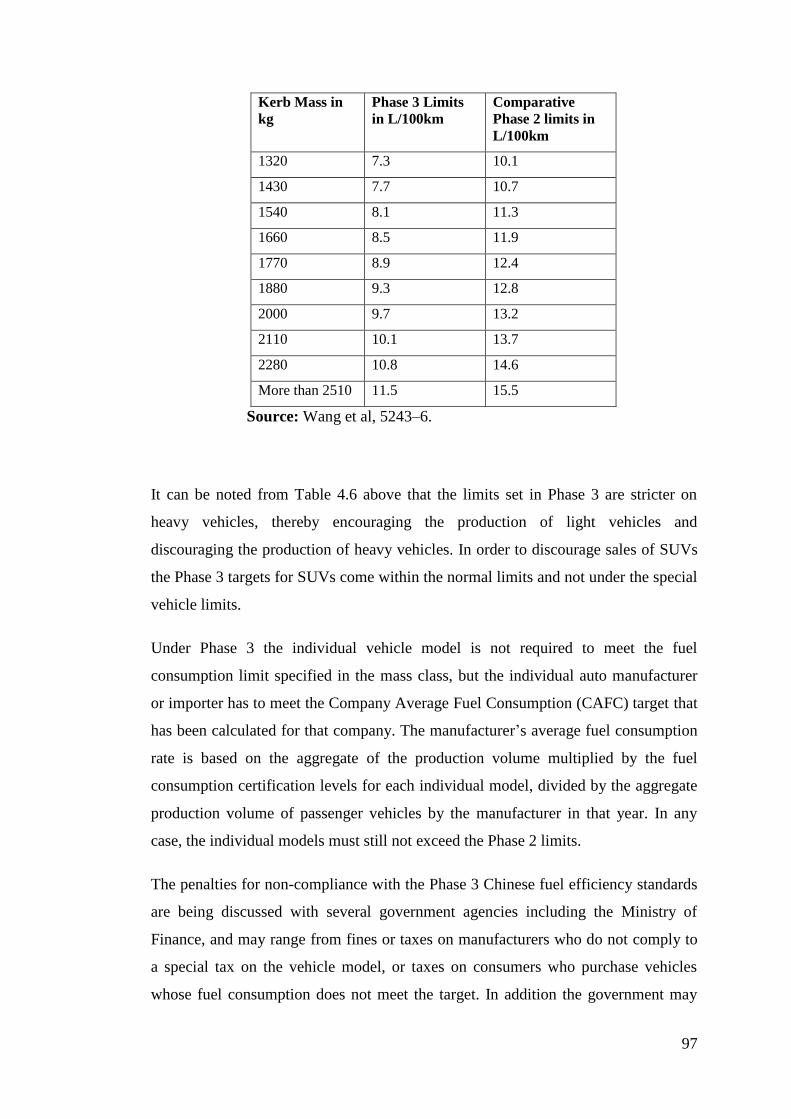
TABLE 4.6: Comparative Phases 2 and 3 Fuel Economy Standards in China.......... 96
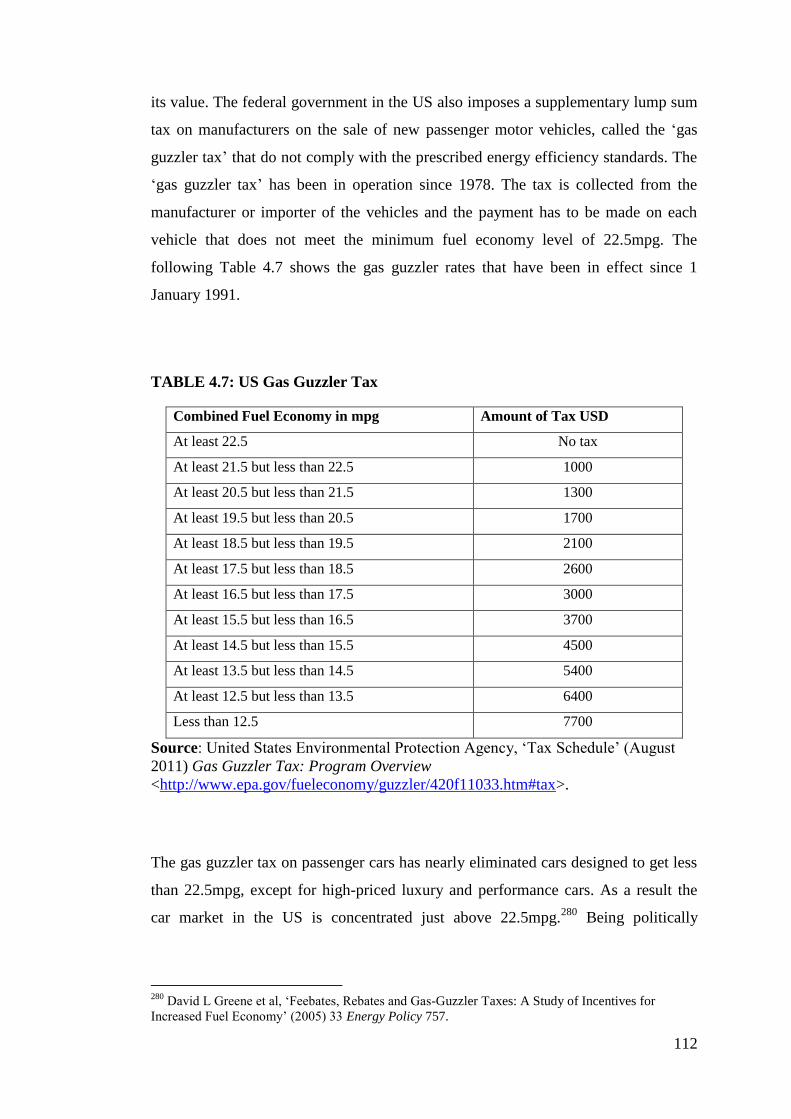
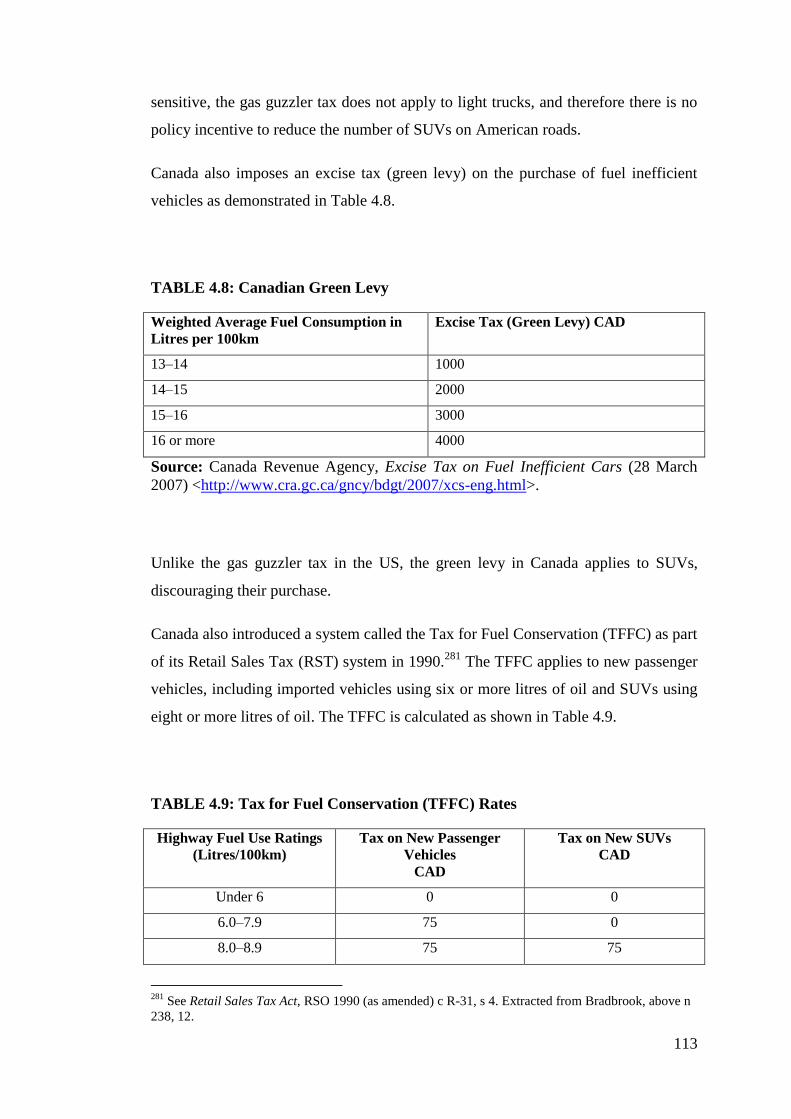
TABLE 4.7: US Gas Guzzler Tax ........................................................................... 112
TABLE 4.8: Canadian Green Levy .......................................................................... 113
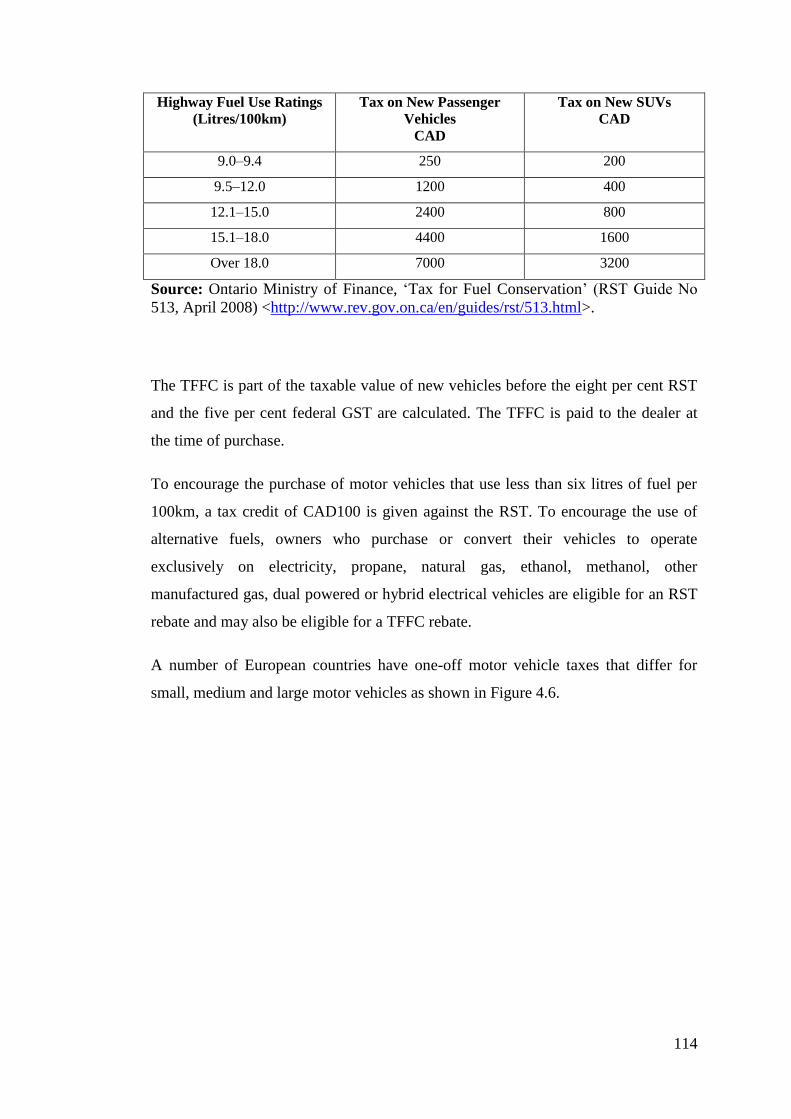
TABLE 4.9: Tax for Fuel Conservation (TFFC) Rates ........................................... 113
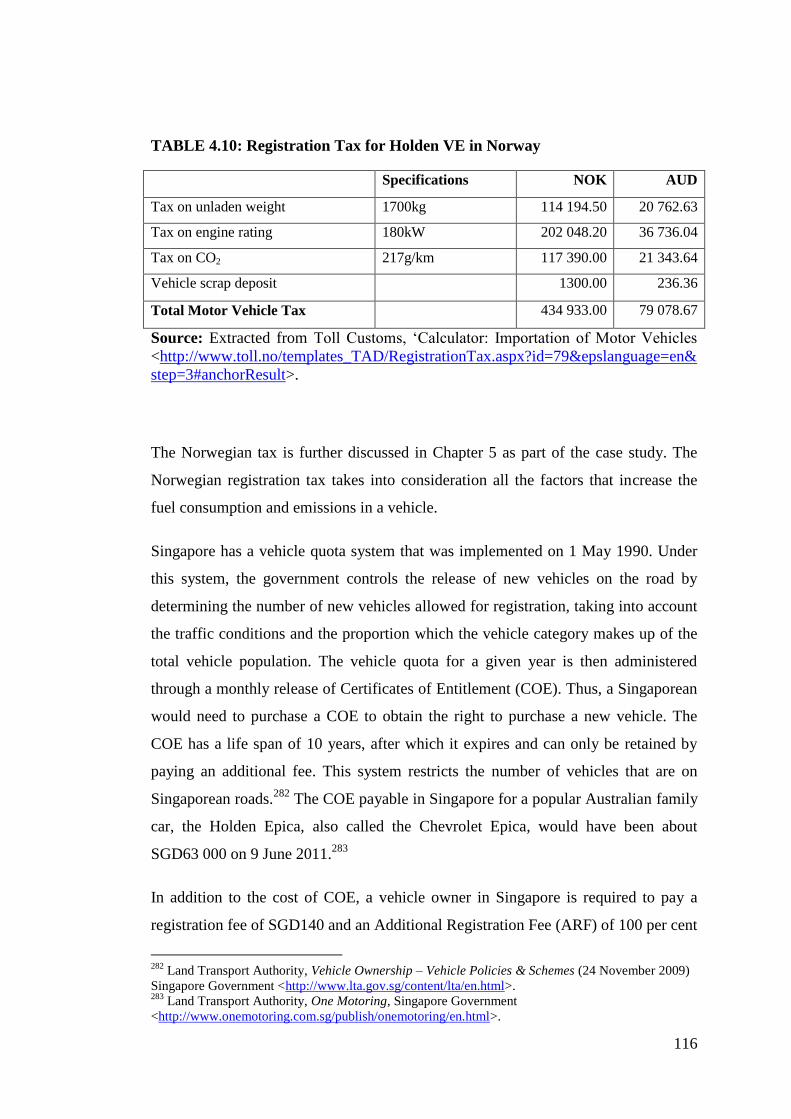
TABLE 4.10: Registration Tax for Holden VE in Norway ..................................... 116
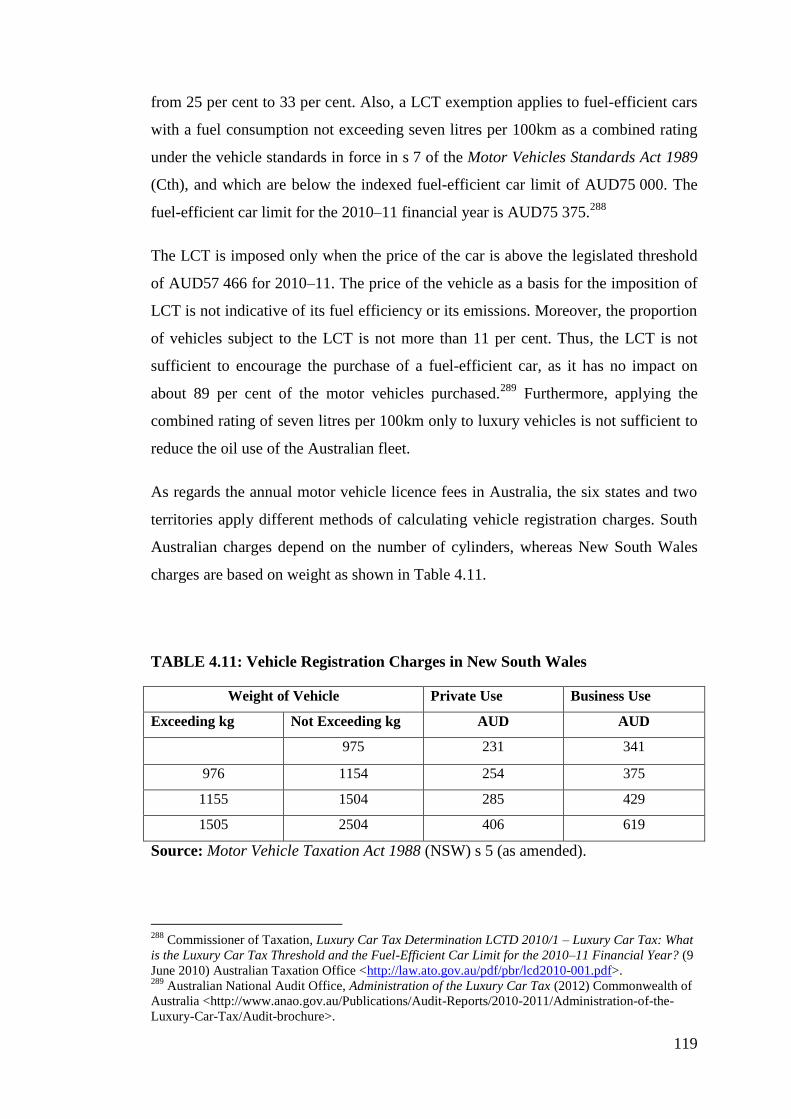
TABLE 4.11: Vehicle Registration Charges in New South Wales .......................... 119
TABLE 4.12: Tax Rates on Motor Fuel in Euro per litre ........................................ 121
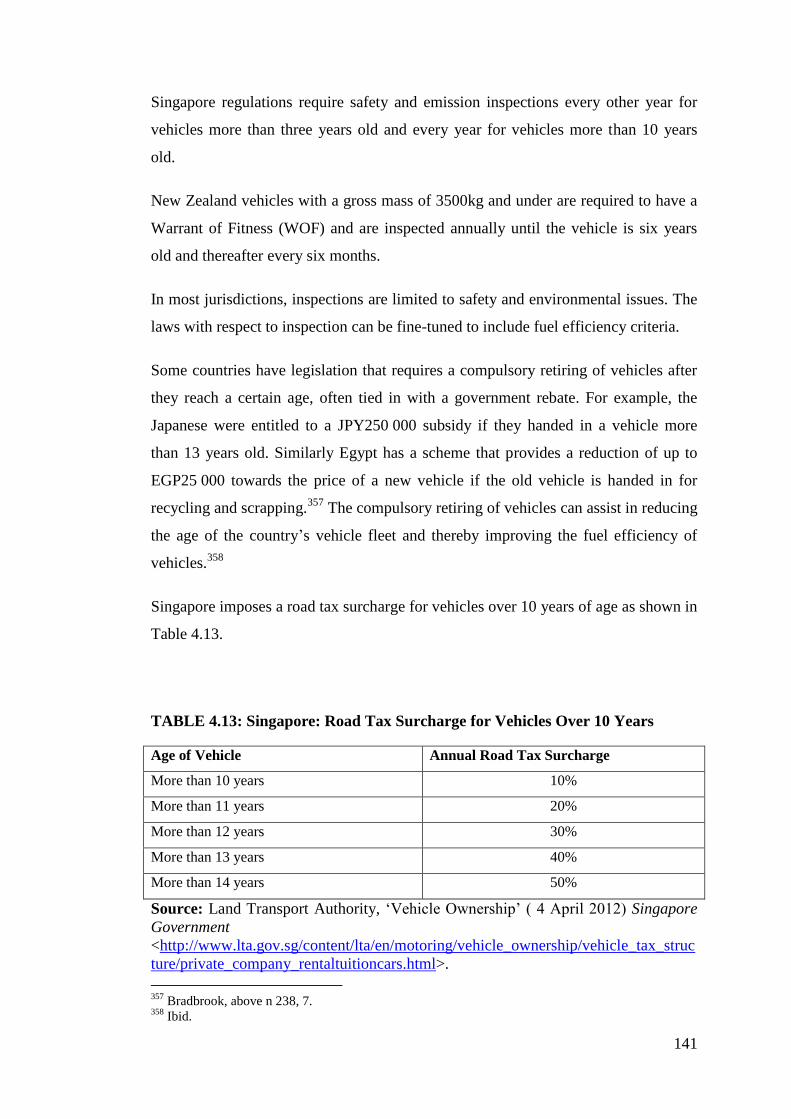
TABLE 4.13: Singapore: Road Tax Surcharge for Vehicles Over 10 Years........... 141
TABLE 5.1: Summary of Fuel and Vehicle Taxes in Norway ................................ 148
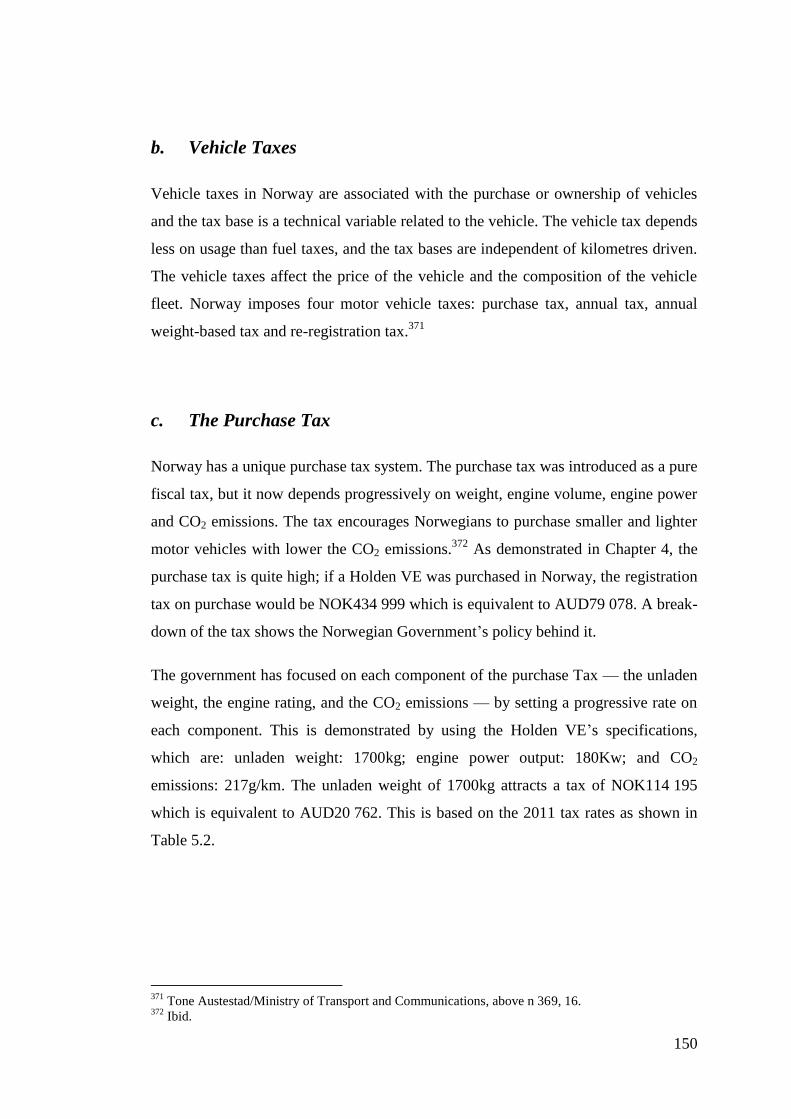
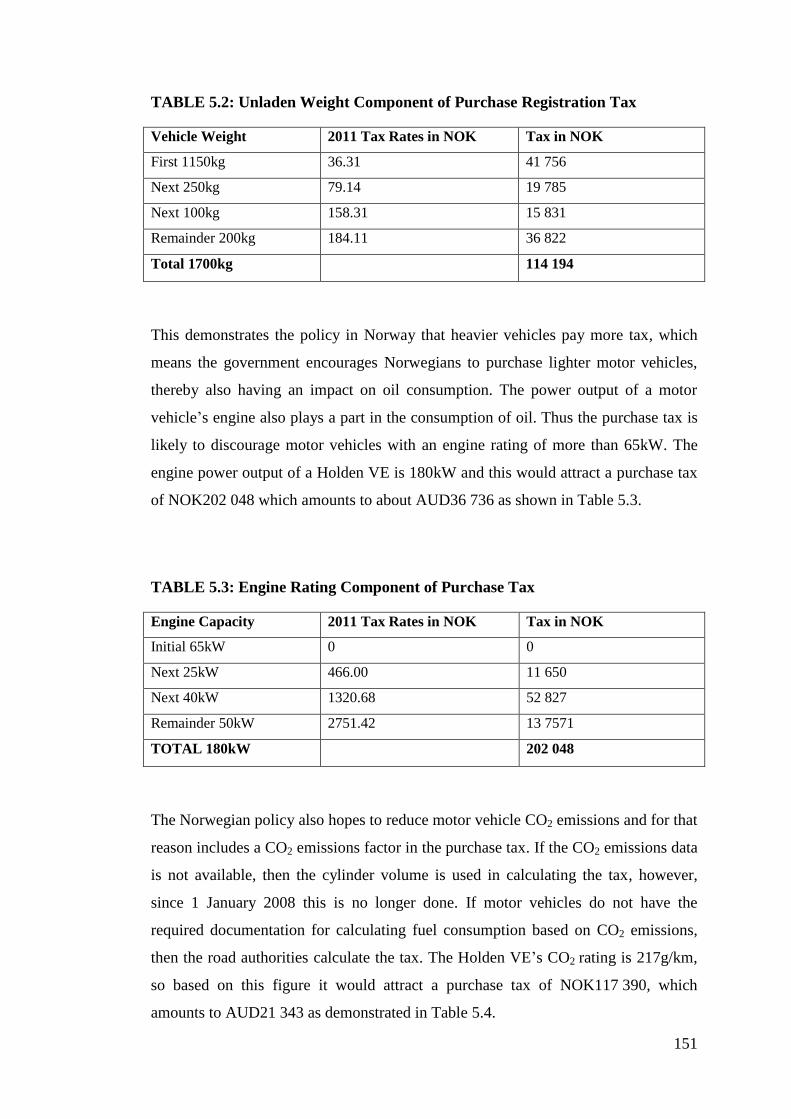
TABLE 5.2: Unladen Weight Component of Purchase Registration Tax ............... 151
TABLE 5.3: Engine Rating Component of Purchase Tax ....................................... 151
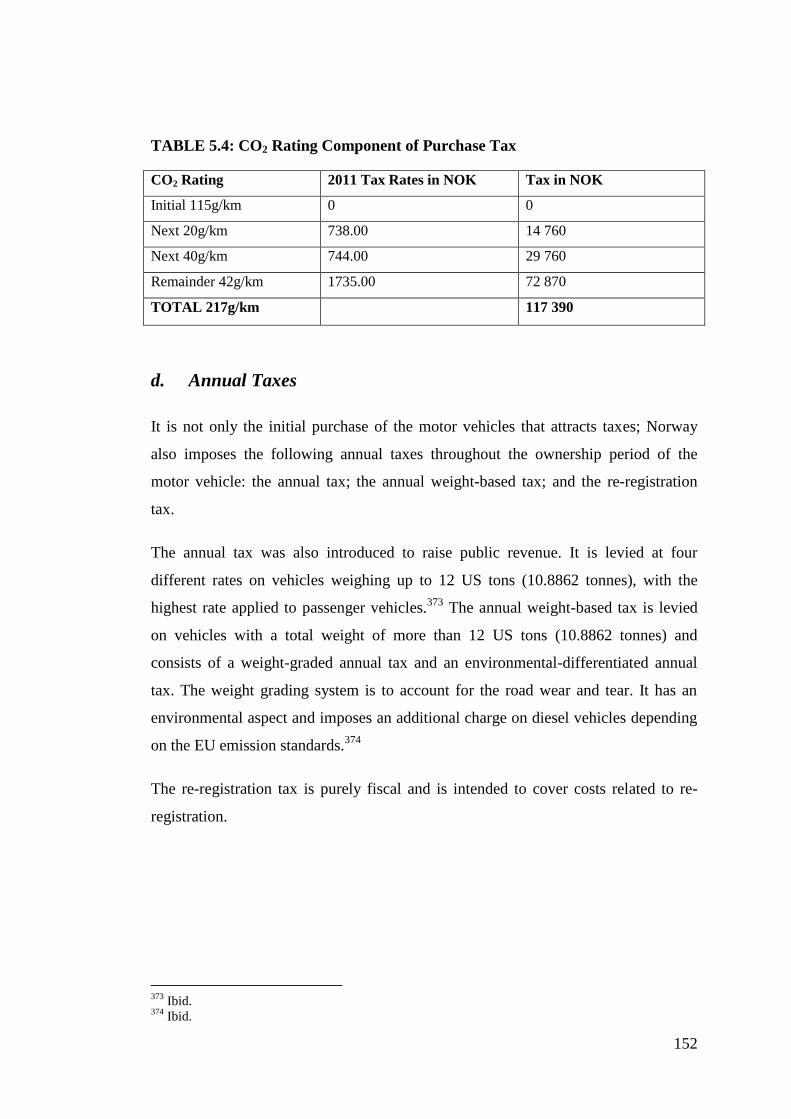
TABLE 5.4: CO2 Rating Component of Purchase Tax............................................ 152
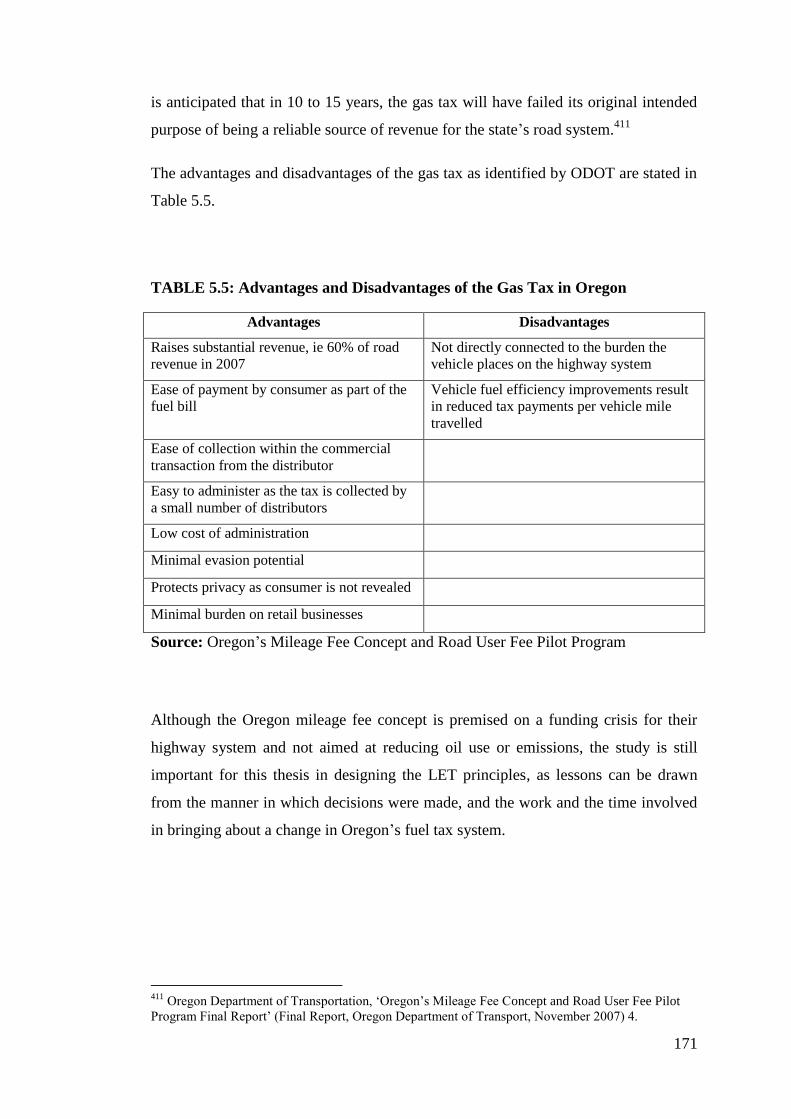
TABLE 5.5: Advantages and Disadvantages of the Gas Tax in Oregon ................. 171
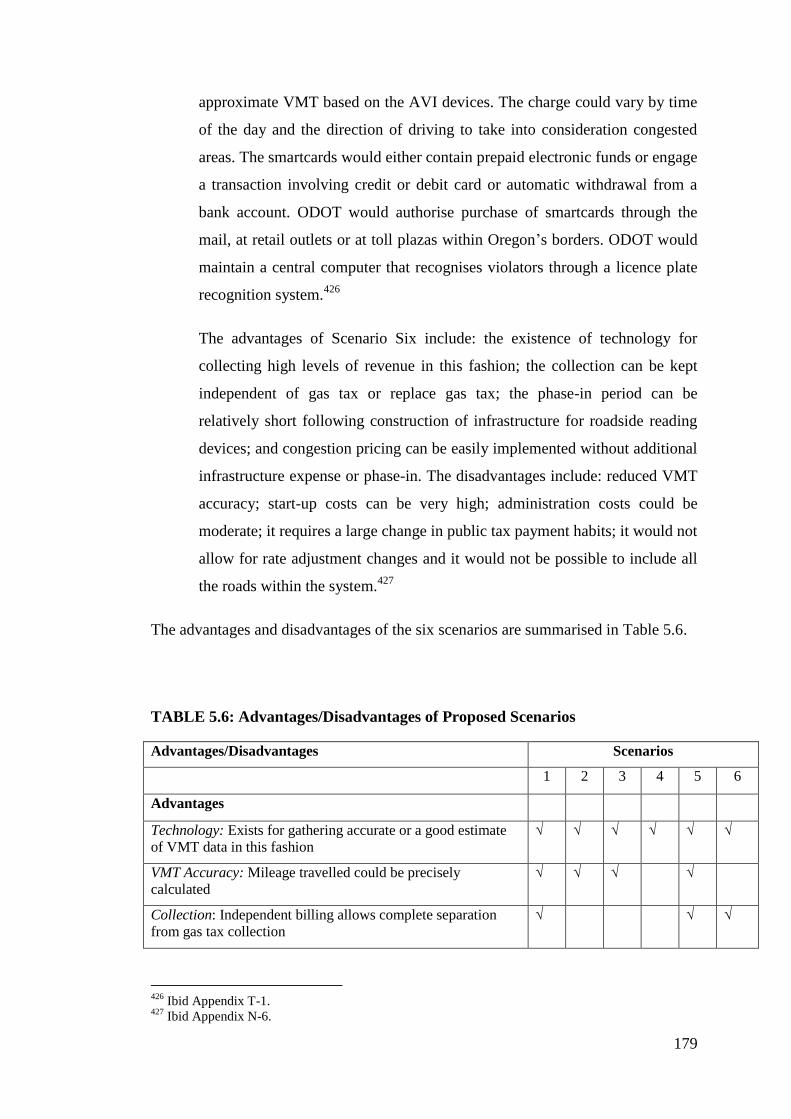
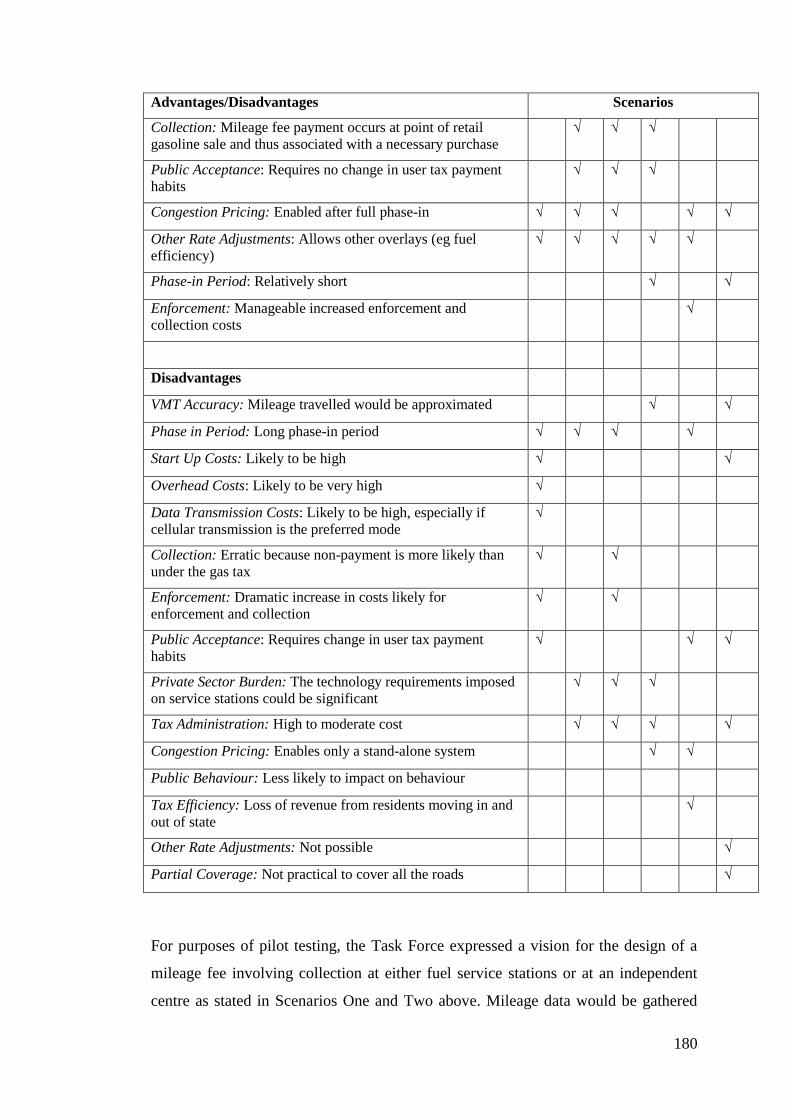
TABLE 5.6: Advantages/Disadvantages of Proposed Scenarios ............................. 179
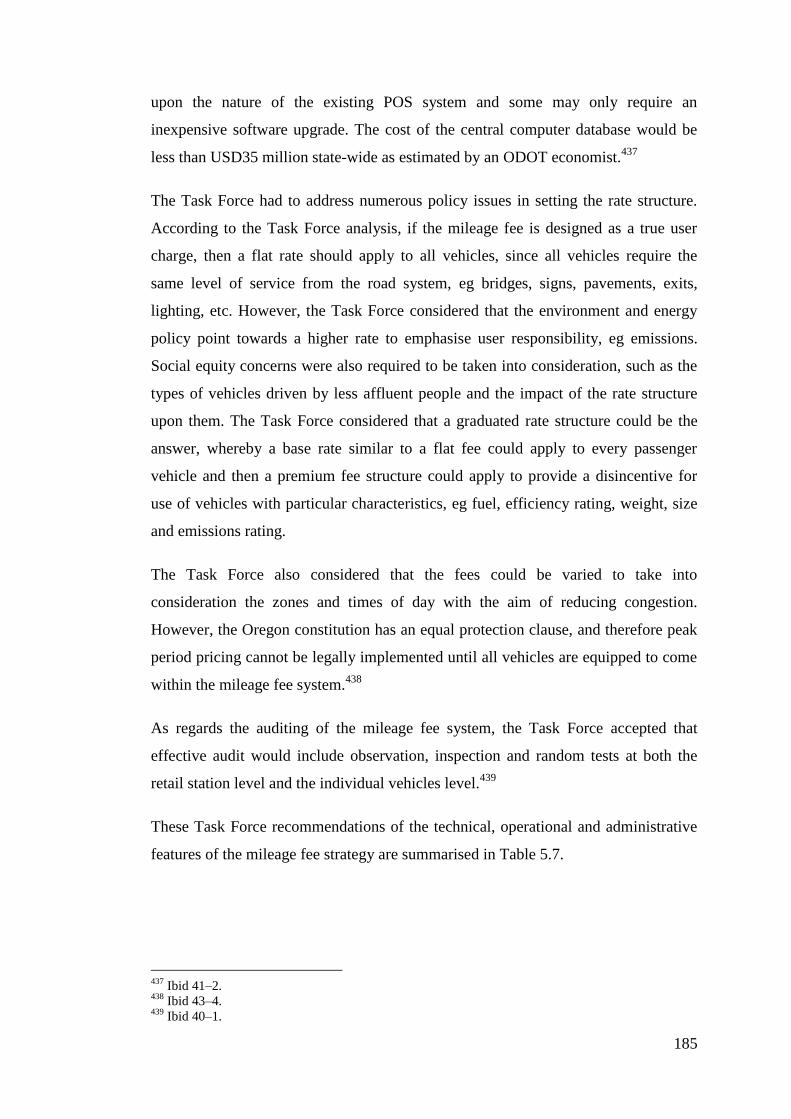
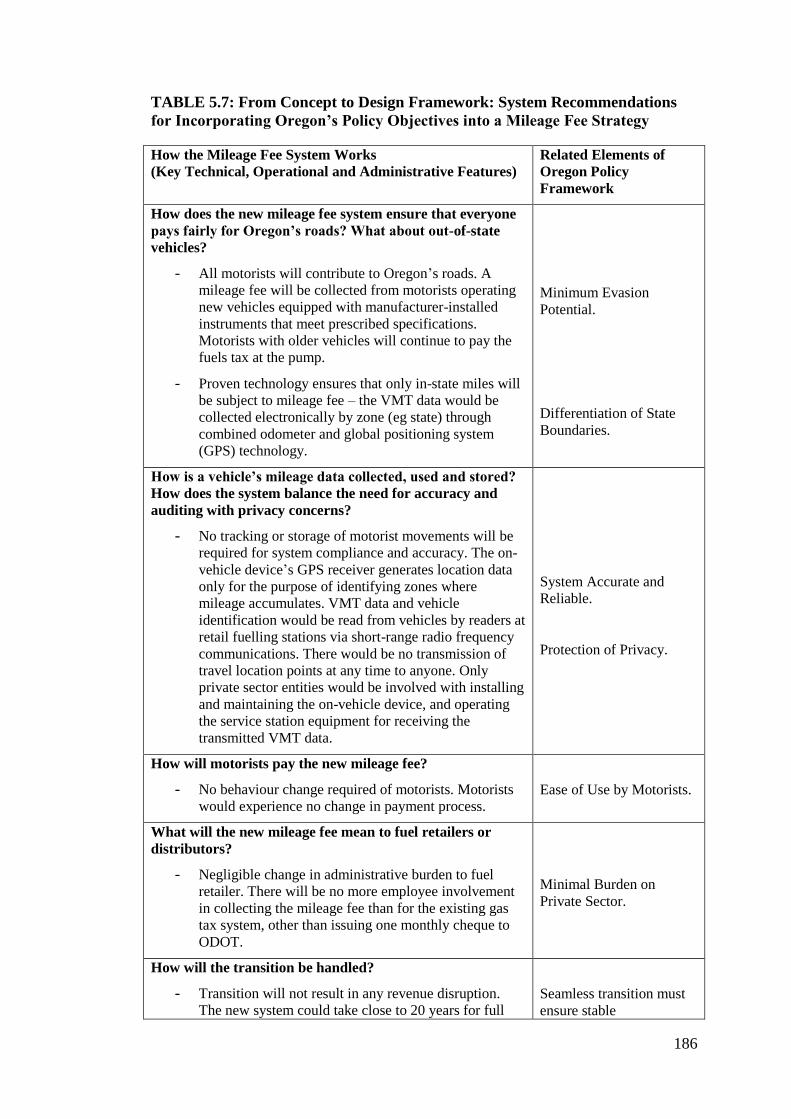
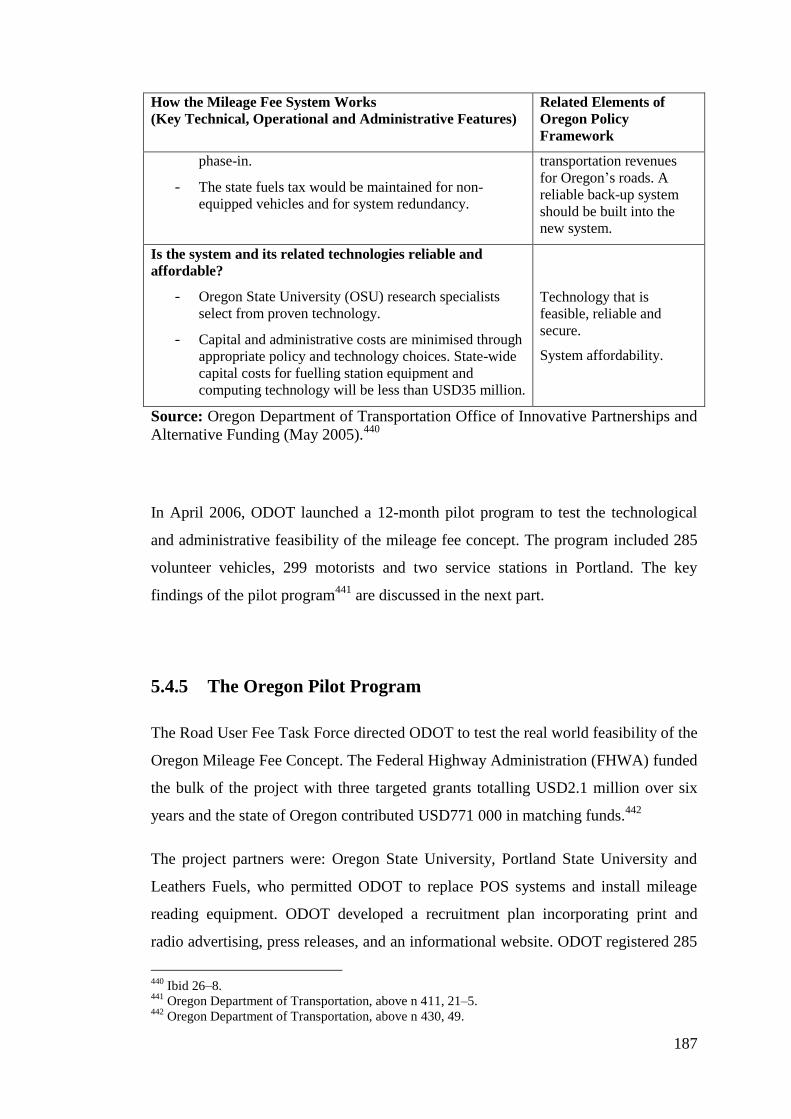
TABLE 5.7: From Concept to Design Framework: System Recommendations for
Incorporating Oregon’s Policy Objectives into a Mileage Fee Strategy.................. 186
Page 15
xv
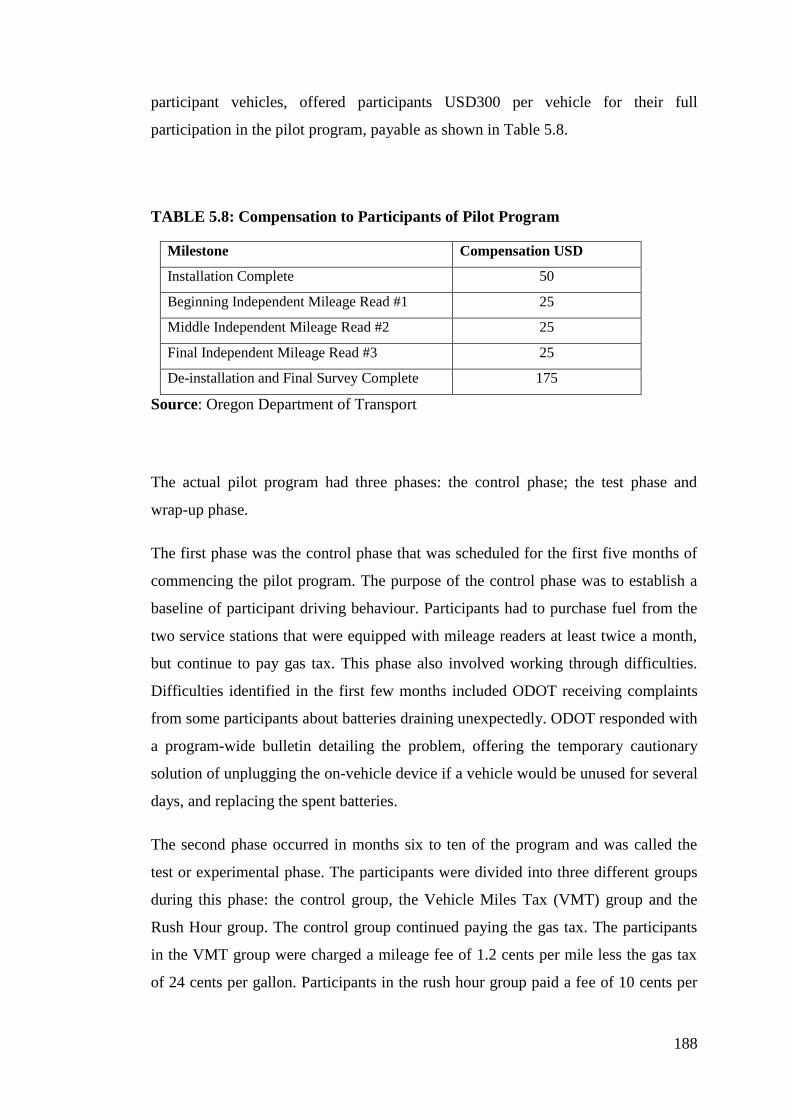
TABLE 5.8: Compensation to Participants of Pilot Program .................................. 188
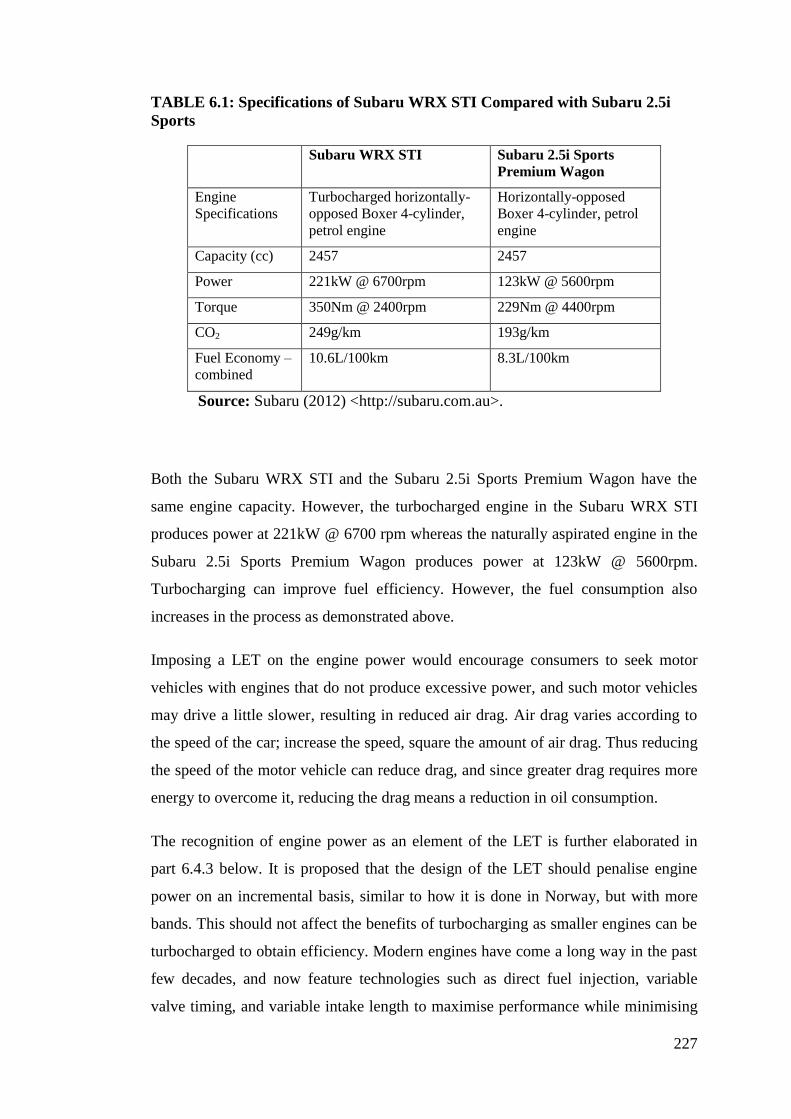
TABLE 6.1: Specifications of Subaru WRX STI Compared with Subaru 2.5i Sports
.................................................................................................................................. 227
TABLE 6.2: Stamp Duty / Vehicle Registration Duty on Car Purchases ................ 230
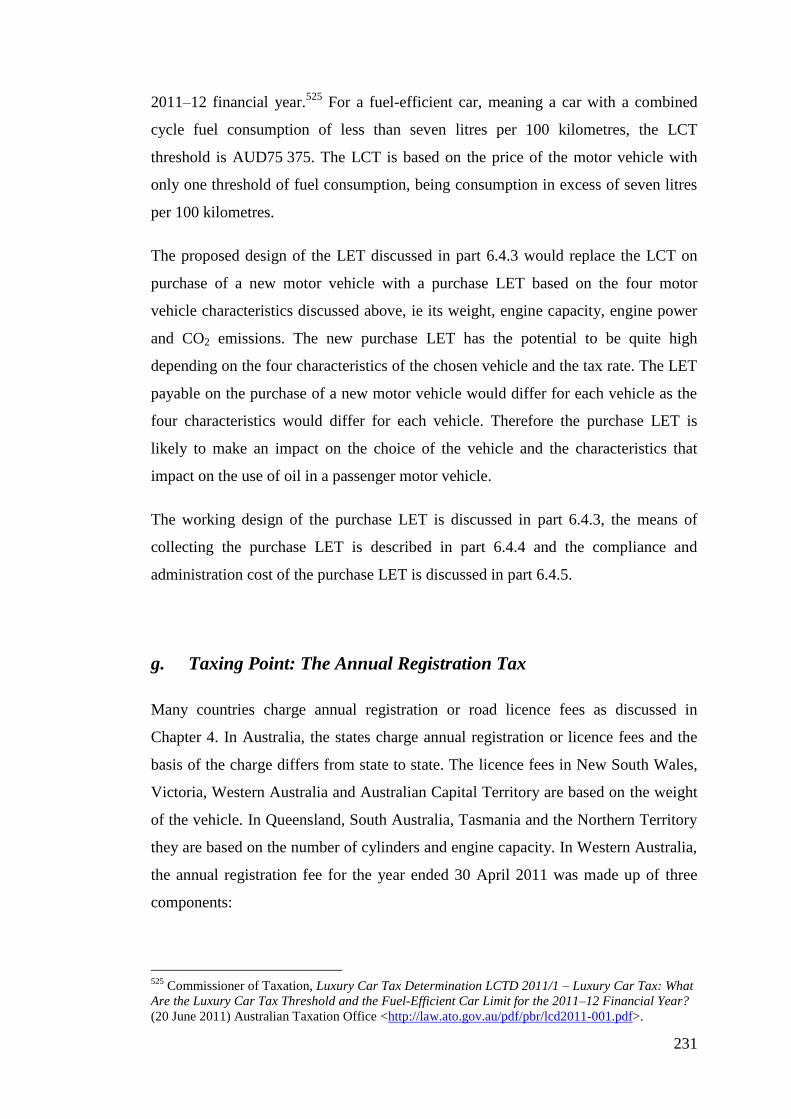
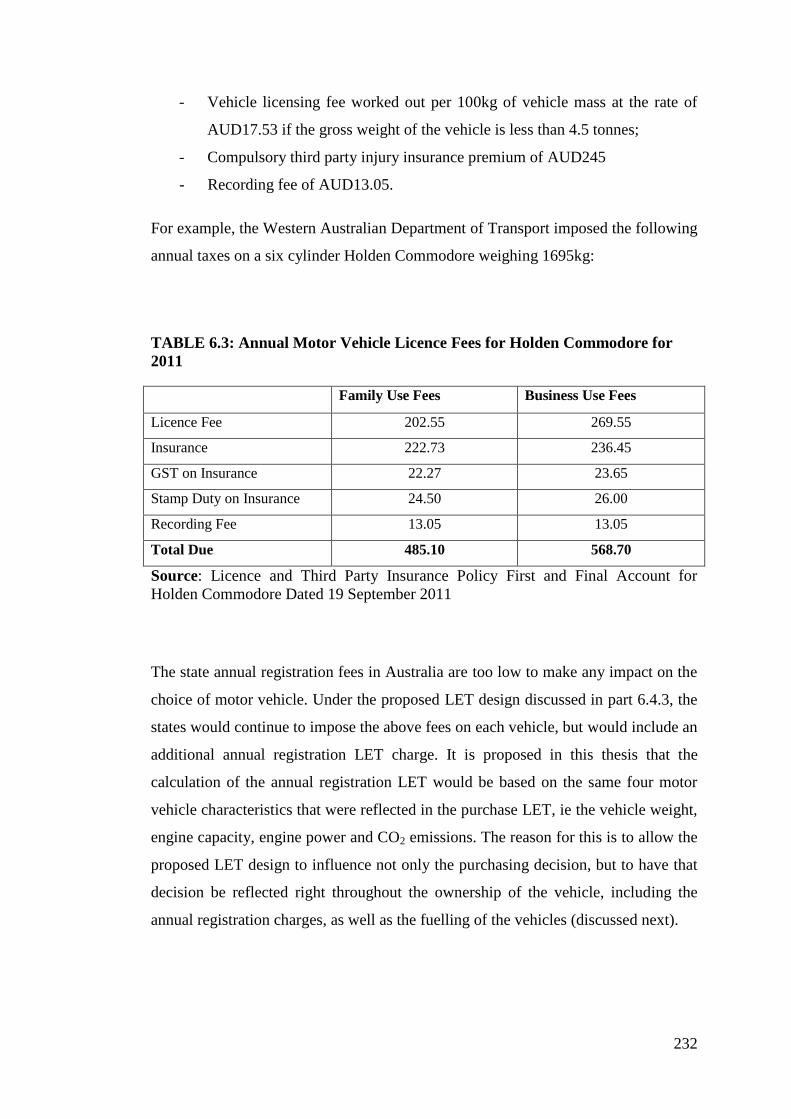
TABLE 6.3: Annual Motor Vehicle Licence Fees for Holden Commodore for 2011
.................................................................................................................................. 232
TABLE 6.4: Calculation of Points to Determine Luxury Energy Taxable Value ... 239
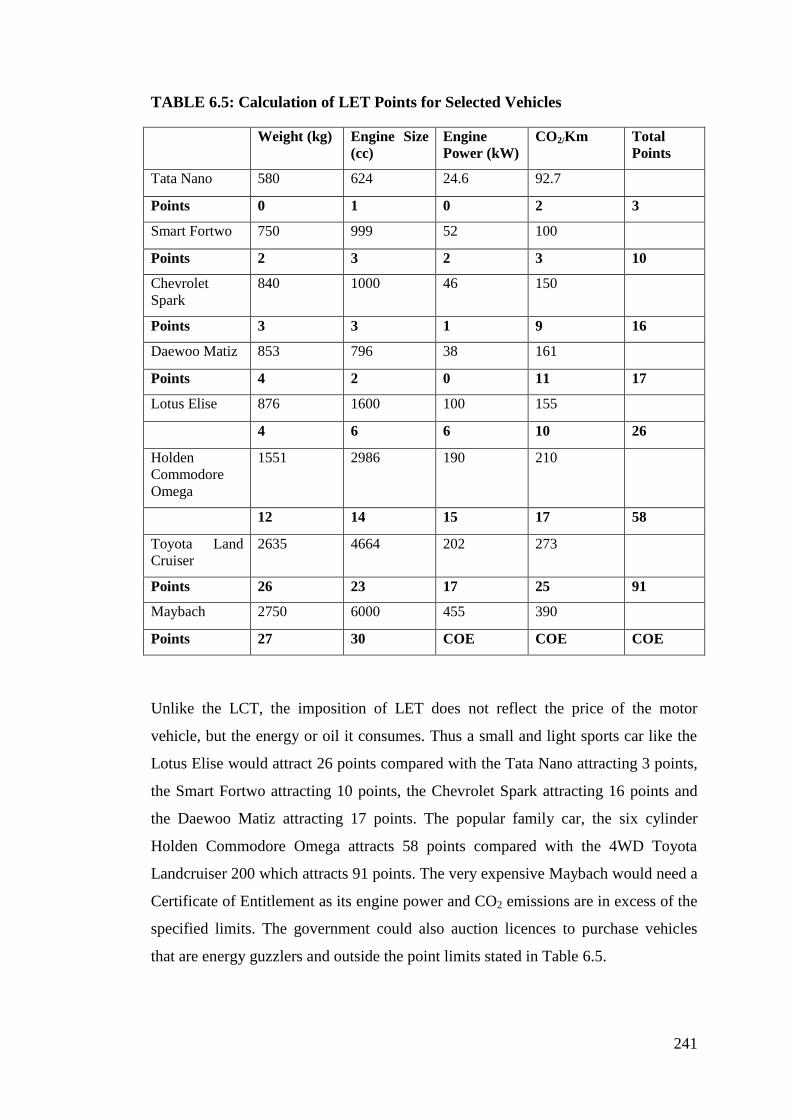
TABLE 6.5: Calculation of LET Points for Selected Vehicles ............................... 241
TABLE 6.6: Taxing Points Converted to Luxury Energy Tax ................................ 242
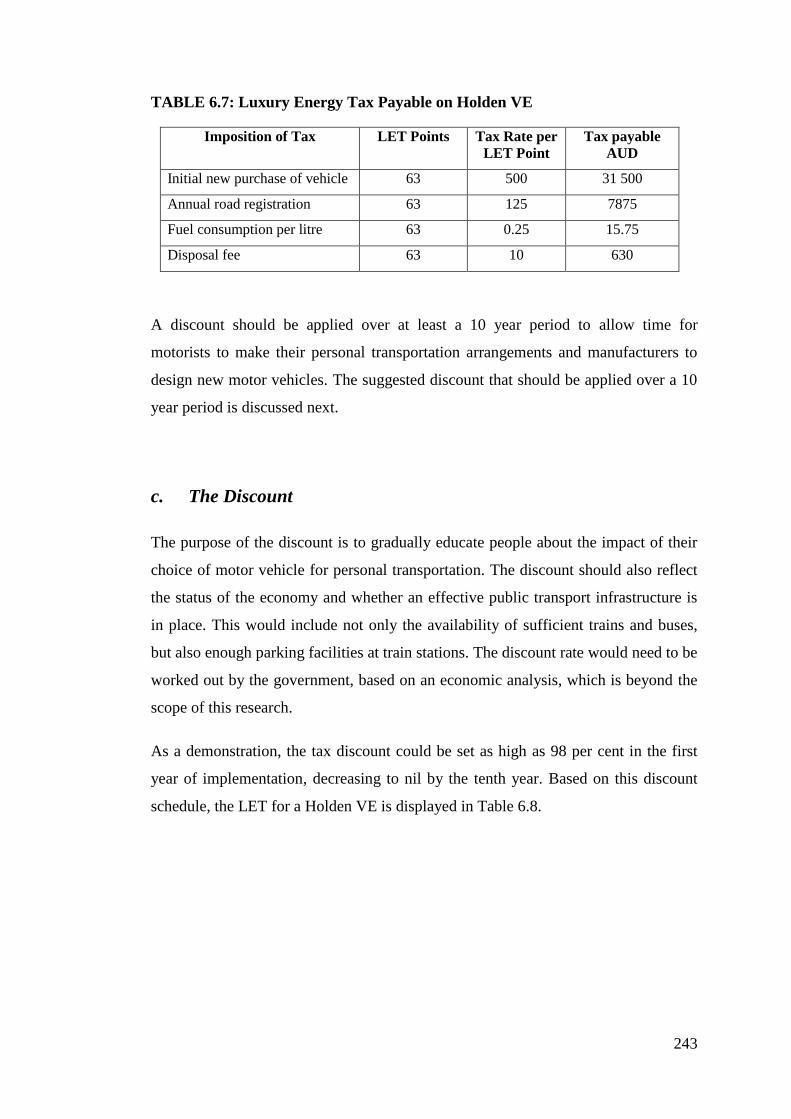
TABLE 6.7: Luxury Energy Tax Payable on Holden VE ....................................... 243
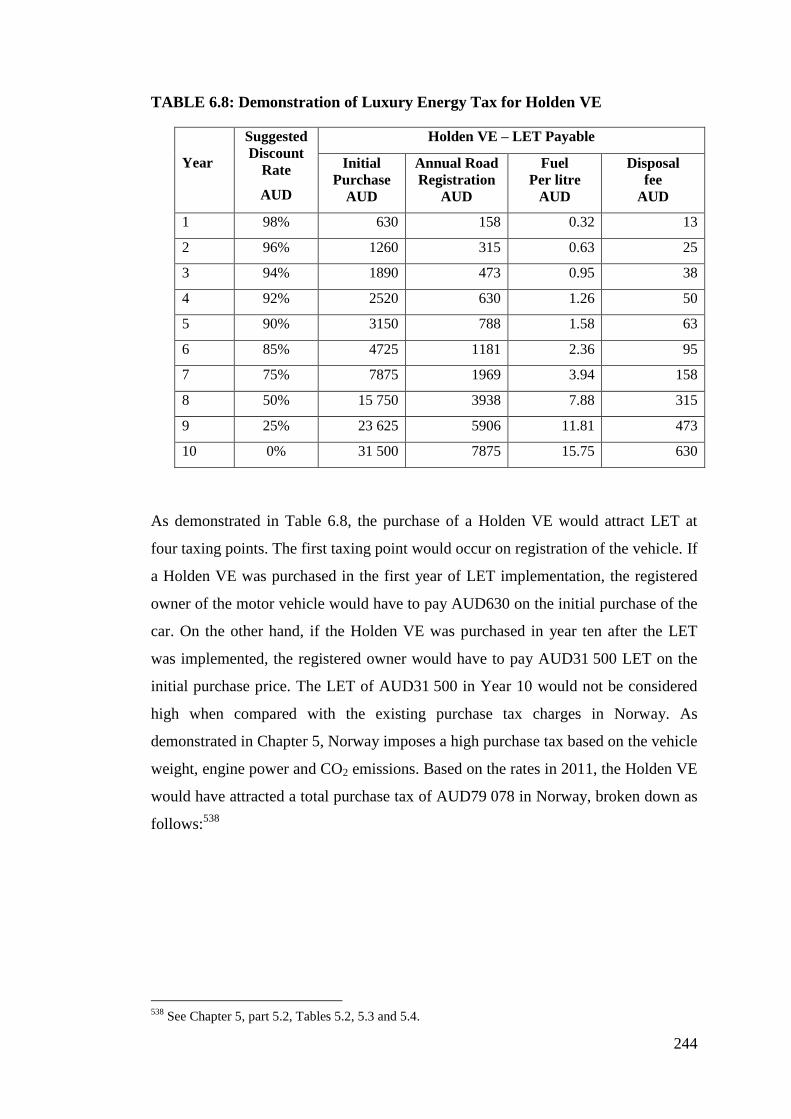
TABLE 6.8: Demonstration of Luxury Energy Tax for Holden VE ....................... 244
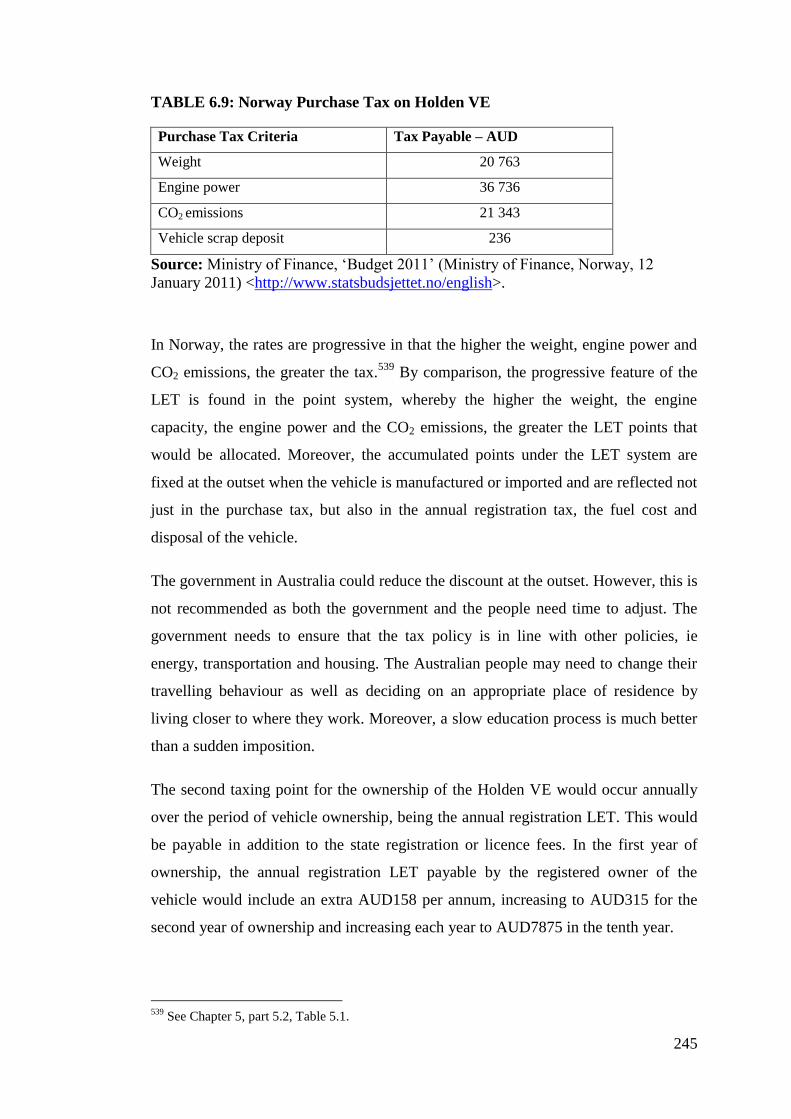
TABLE 6.9: Norway Purchase Tax on Holden VE ................................................. 245
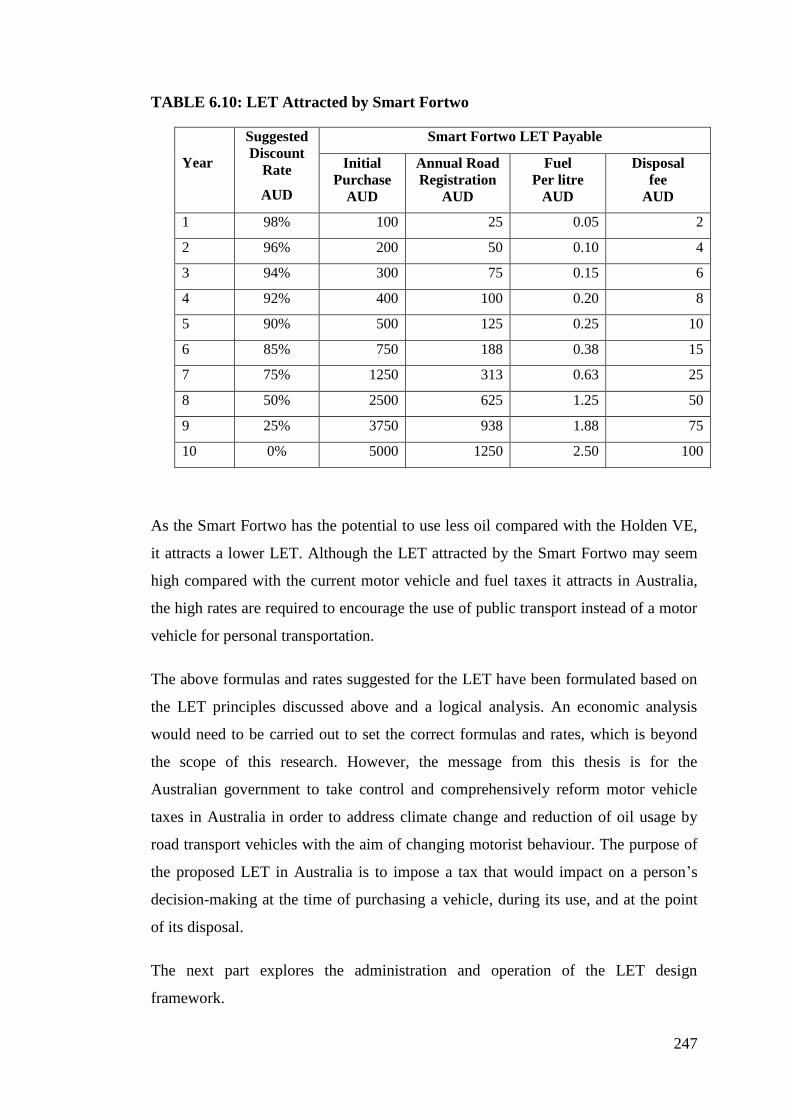
TABLE 6.10: LET Attracted by Smart Fortwo ....................................................... 247
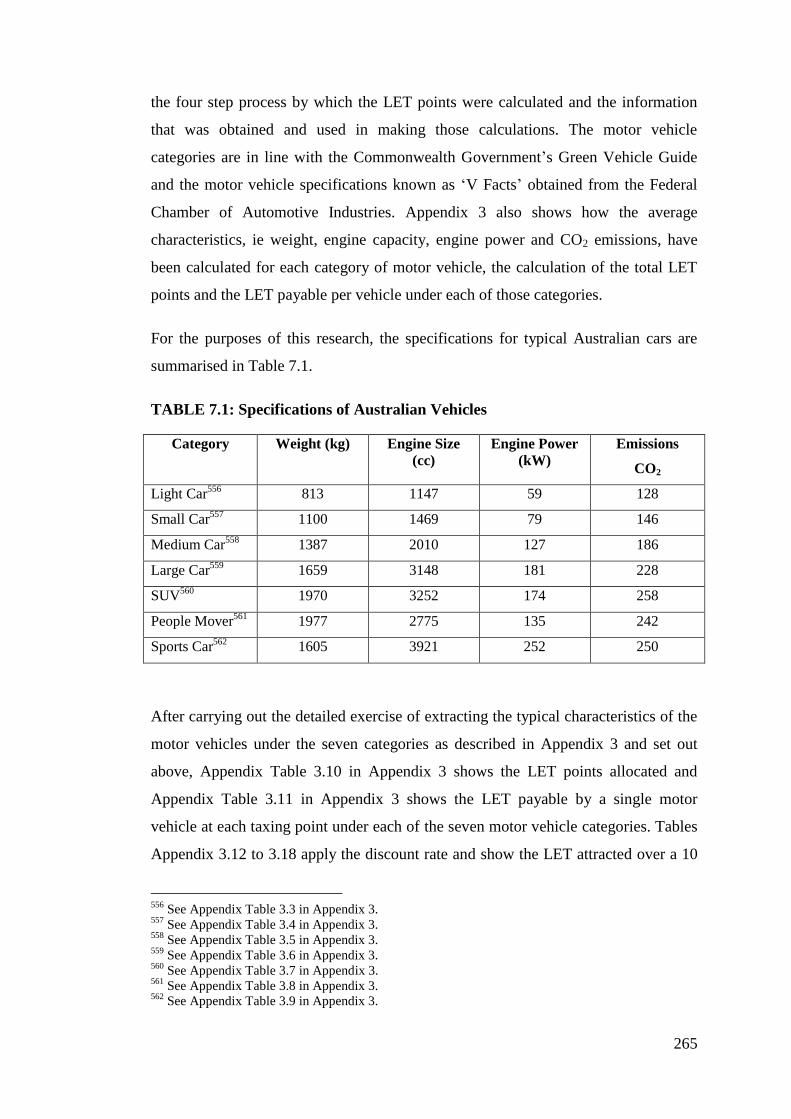
TABLE 7.1: Specifications of Australian Vehicles ................................................. 265
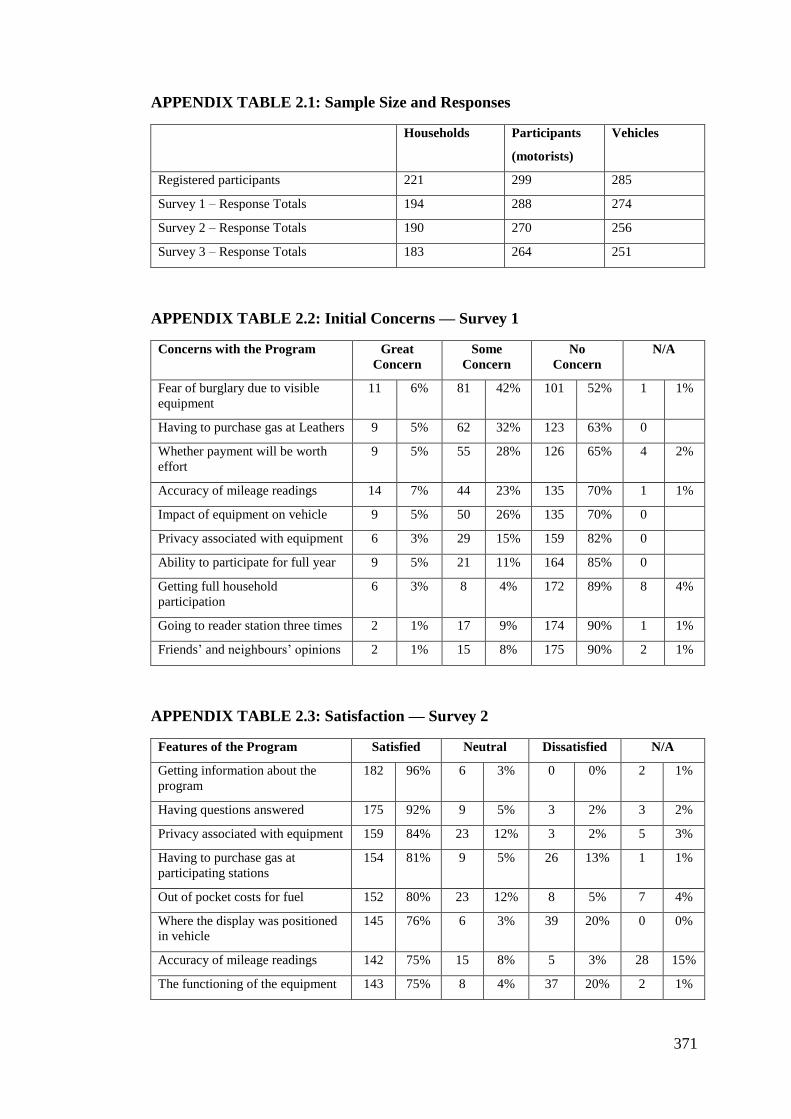
APPENDIX TABLE 2.1: Sample Size and Responses ........................................... 371
APPENDIX TABLE 2.2: Initial Concerns — Survey 1 .......................................... 371
APPENDIX TABLE 2.3: Satisfaction — Survey 2 ................................................. 371
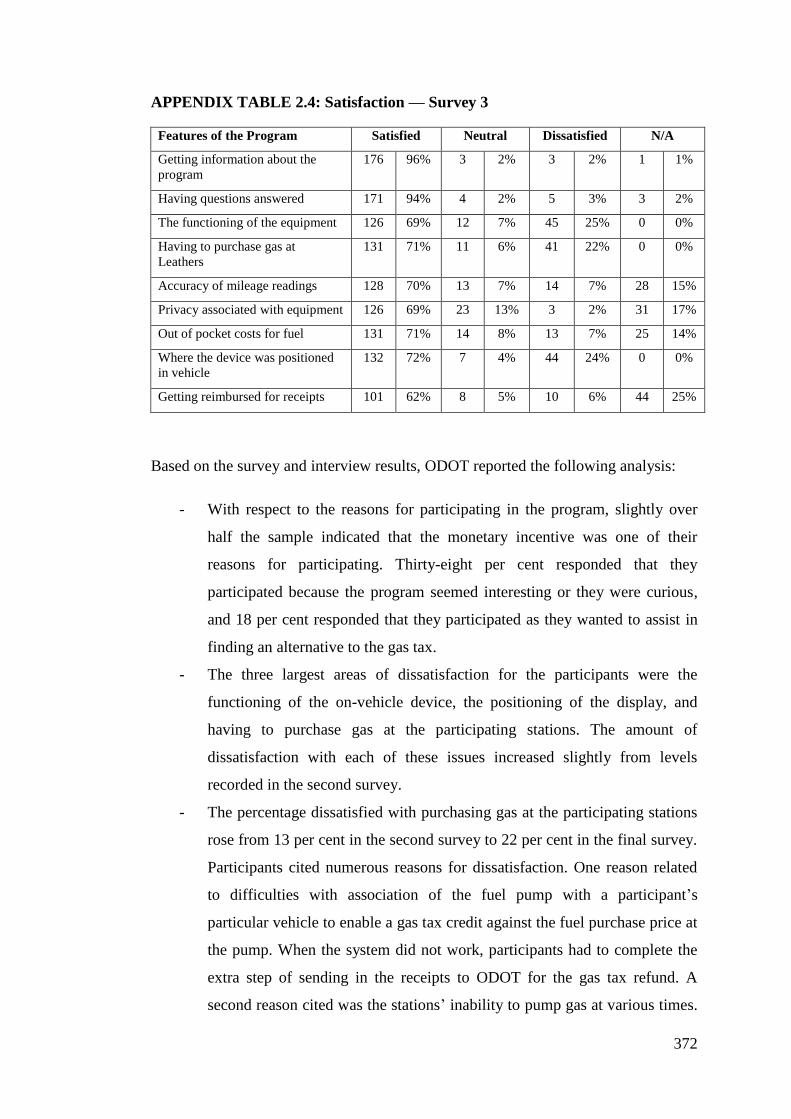
APPENDIX TABLE 2.4: Satisfaction — Survey 3 ................................................. 372
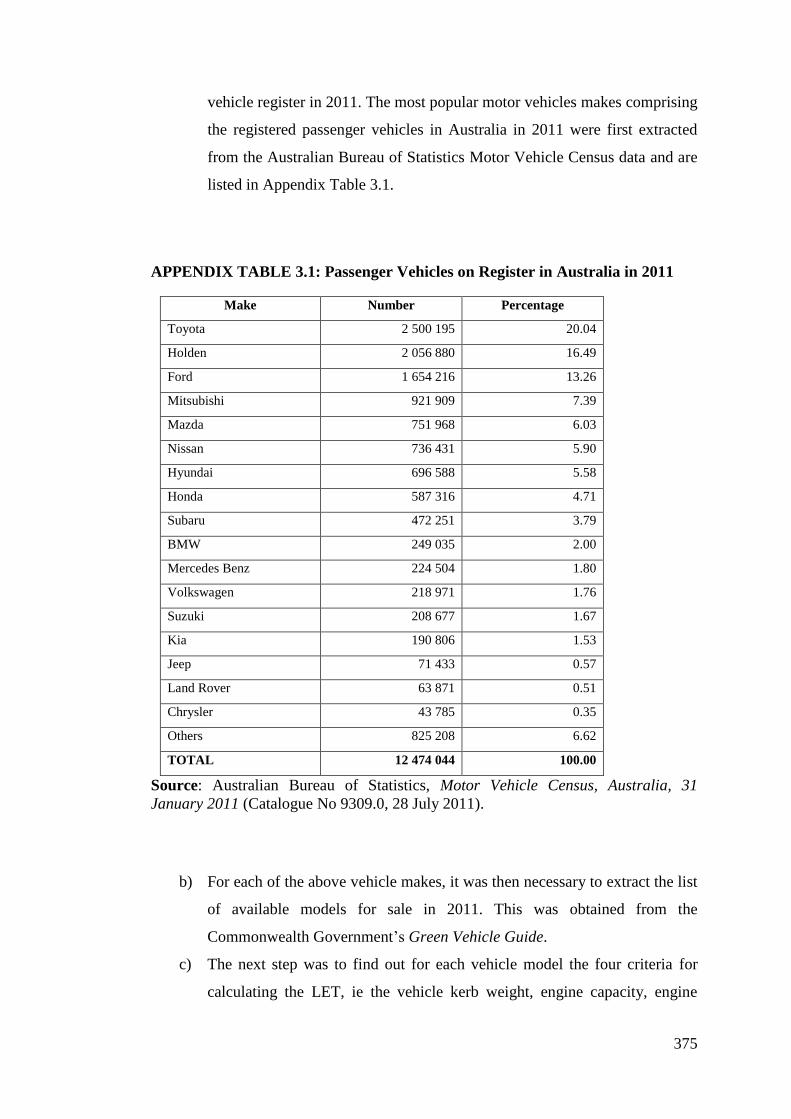
APPENDIX TABLE 3.1: Passenger Vehicles on Register in Australia in 2011 ..... 375
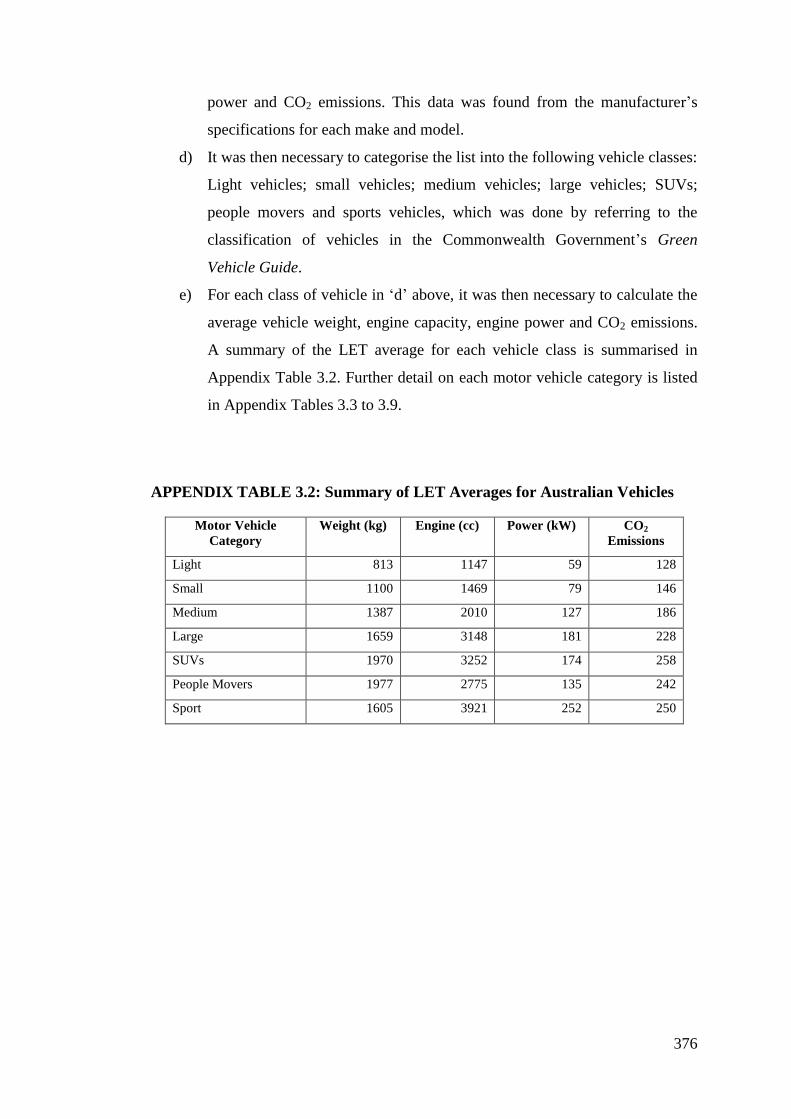
APPENDIX TABLE 3.2: Summary of LET Averages for Australian Vehicles ..... 376
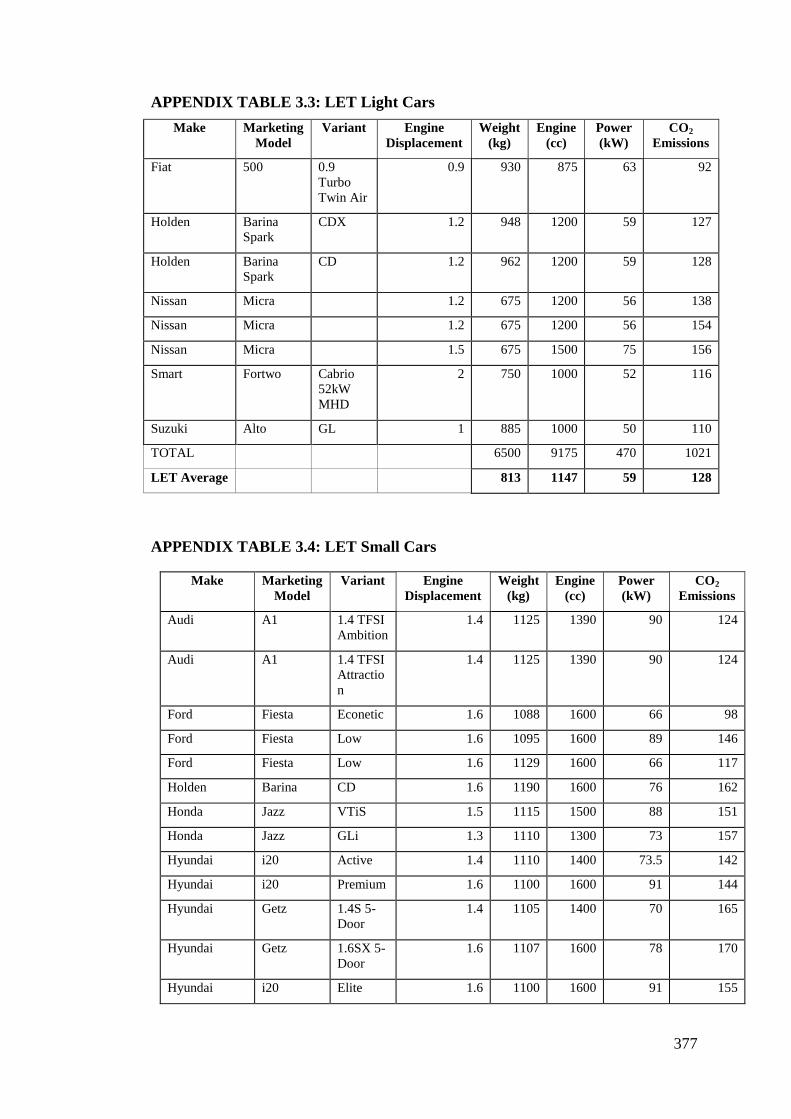
APPENDIX TABLE 3.3: LET Light Cars ............................................................... 377
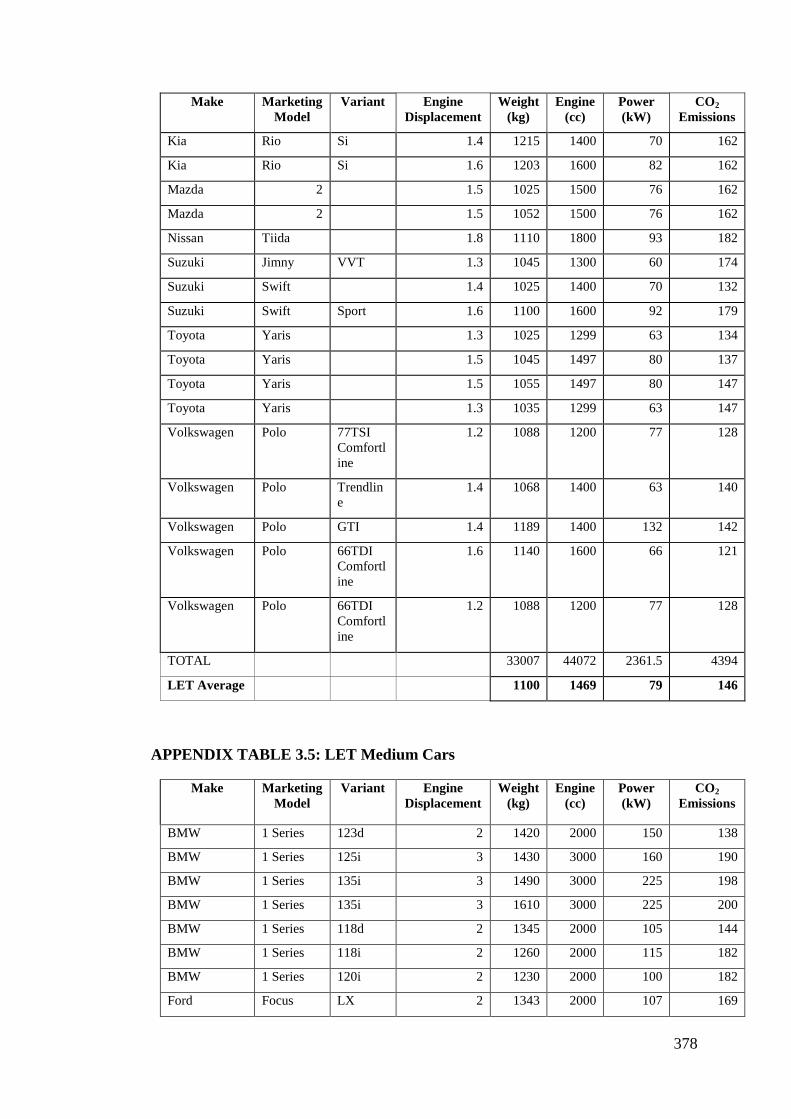
APPENDIX TABLE 3.4: LET Small Cars .............................................................. 377
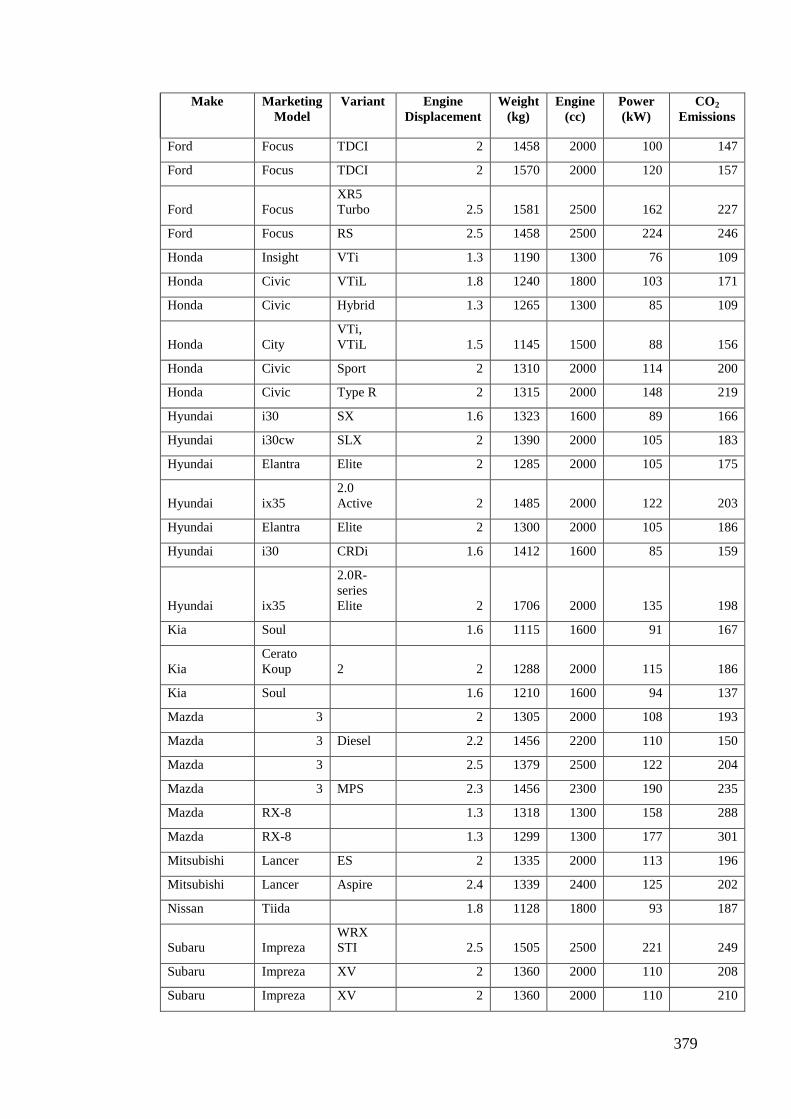
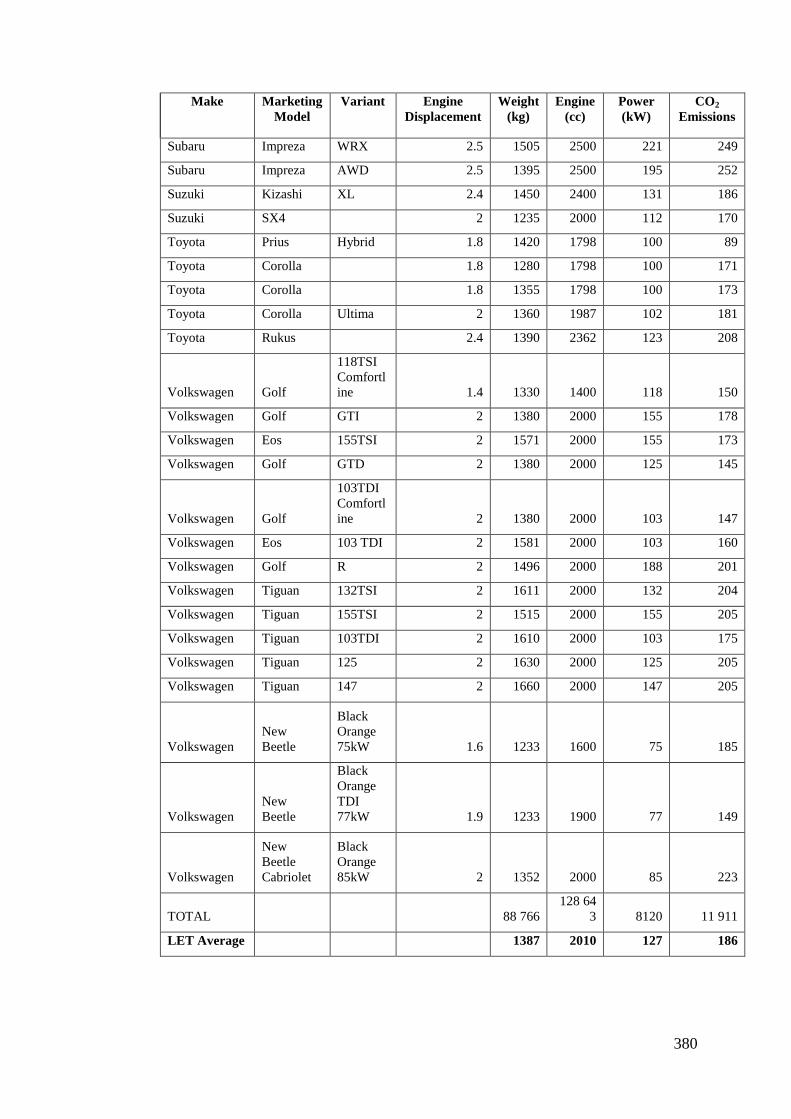
APPENDIX TABLE 3.5: LET Medium Cars .......................................................... 378
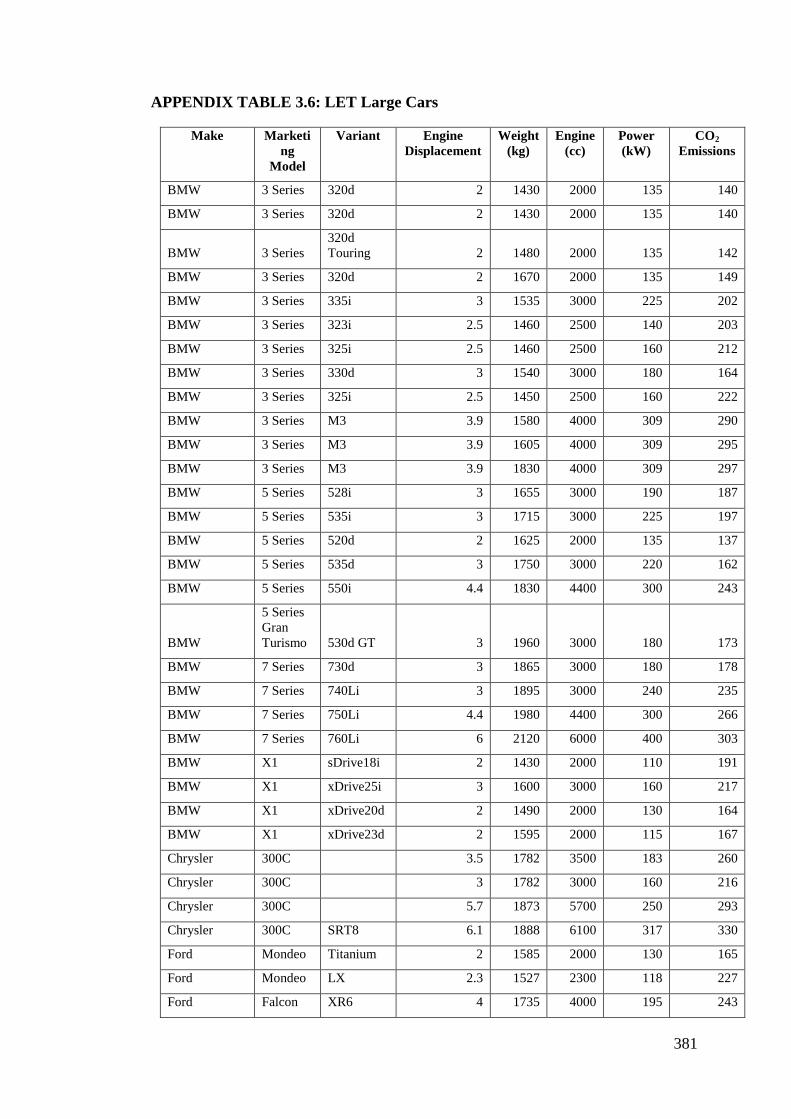
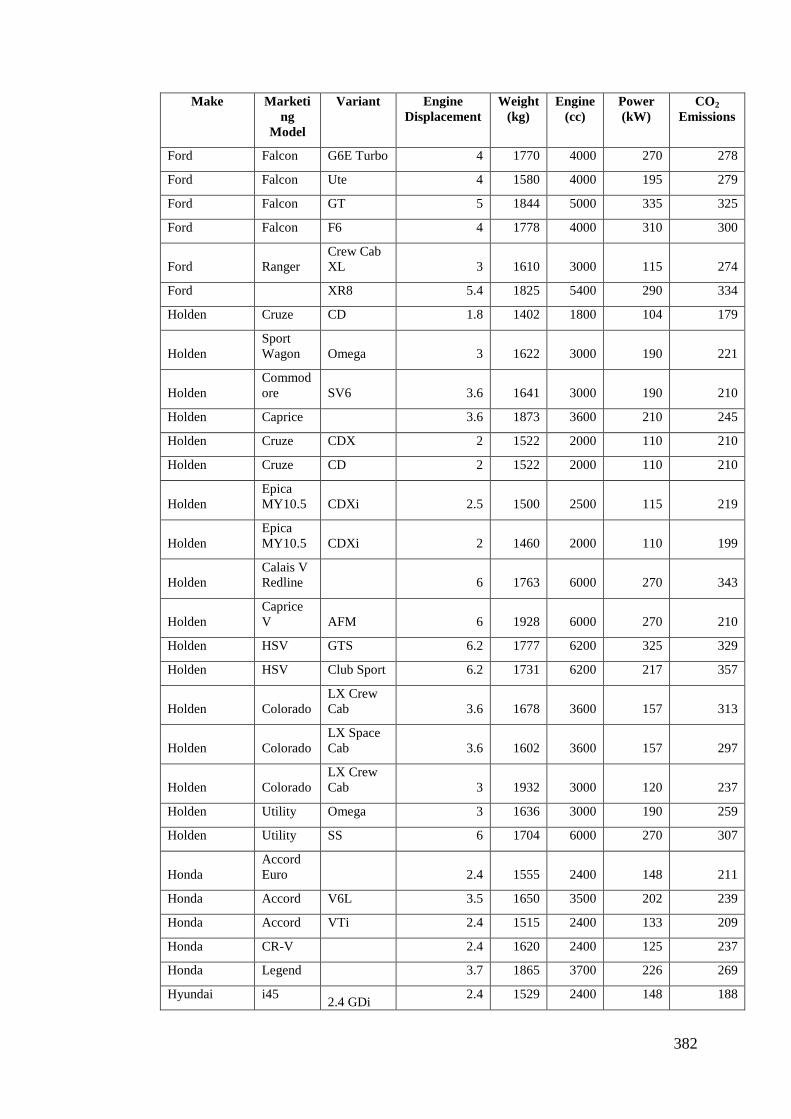
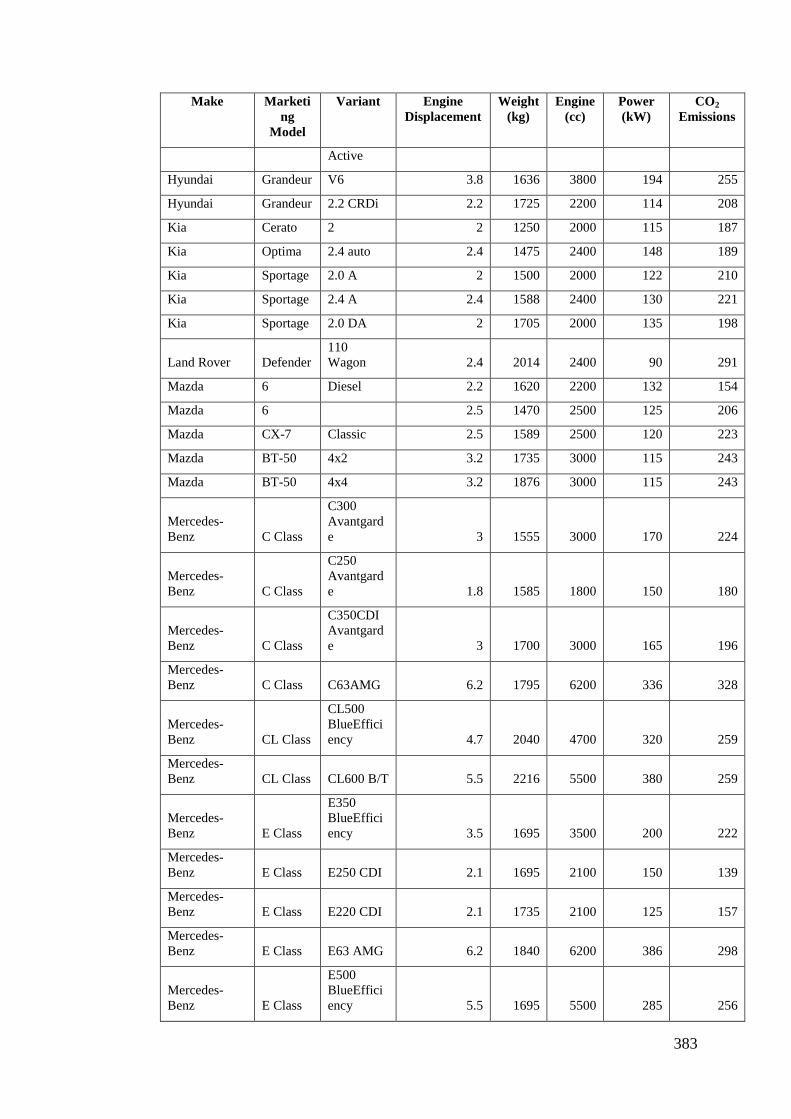
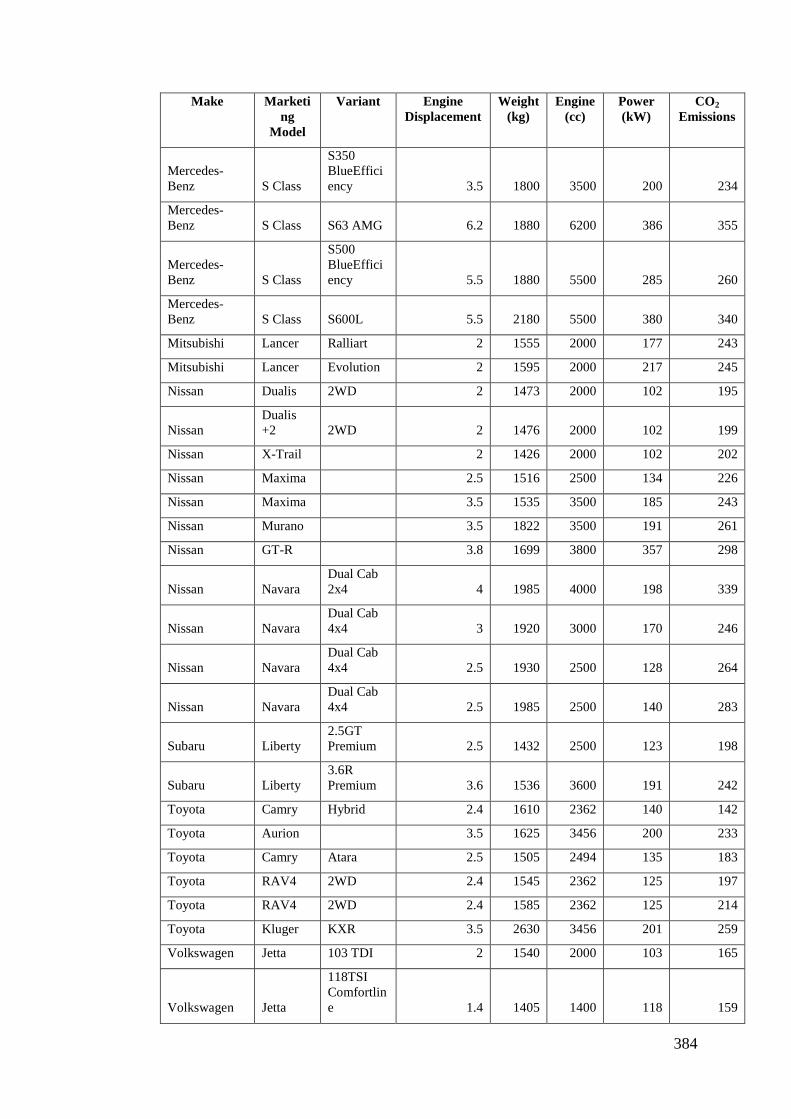
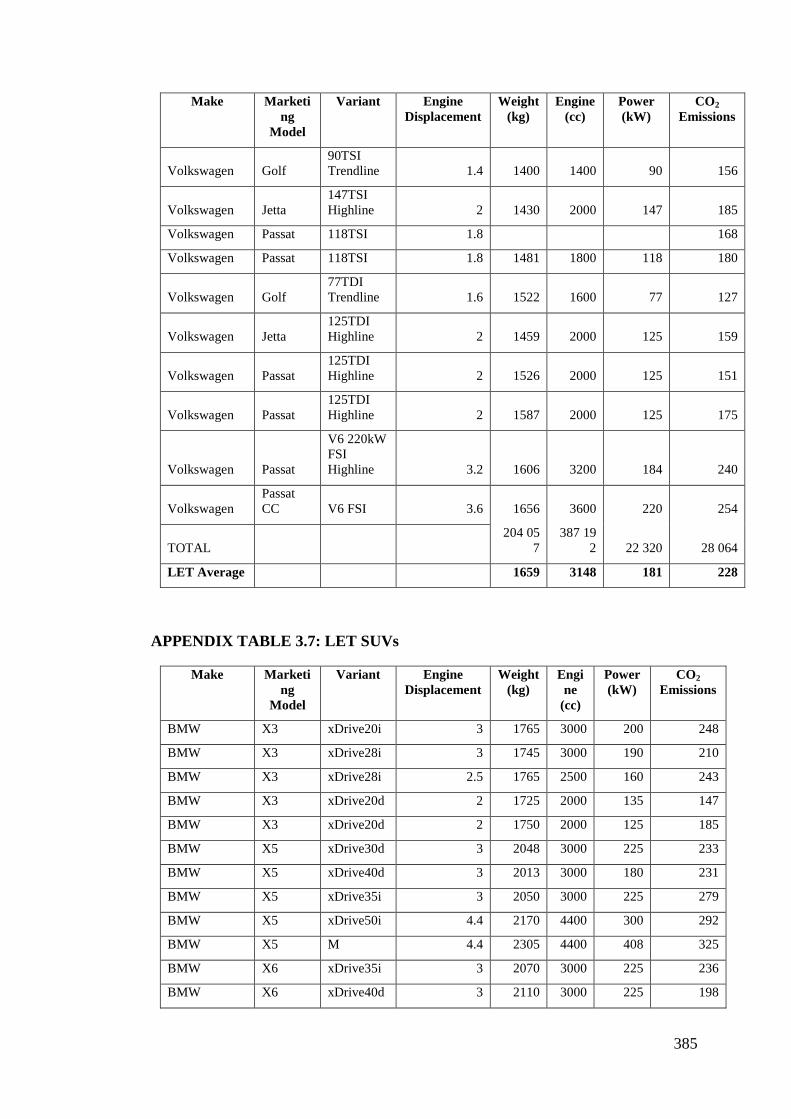
APPENDIX TABLE 3.6: LET Large Cars .............................................................. 381
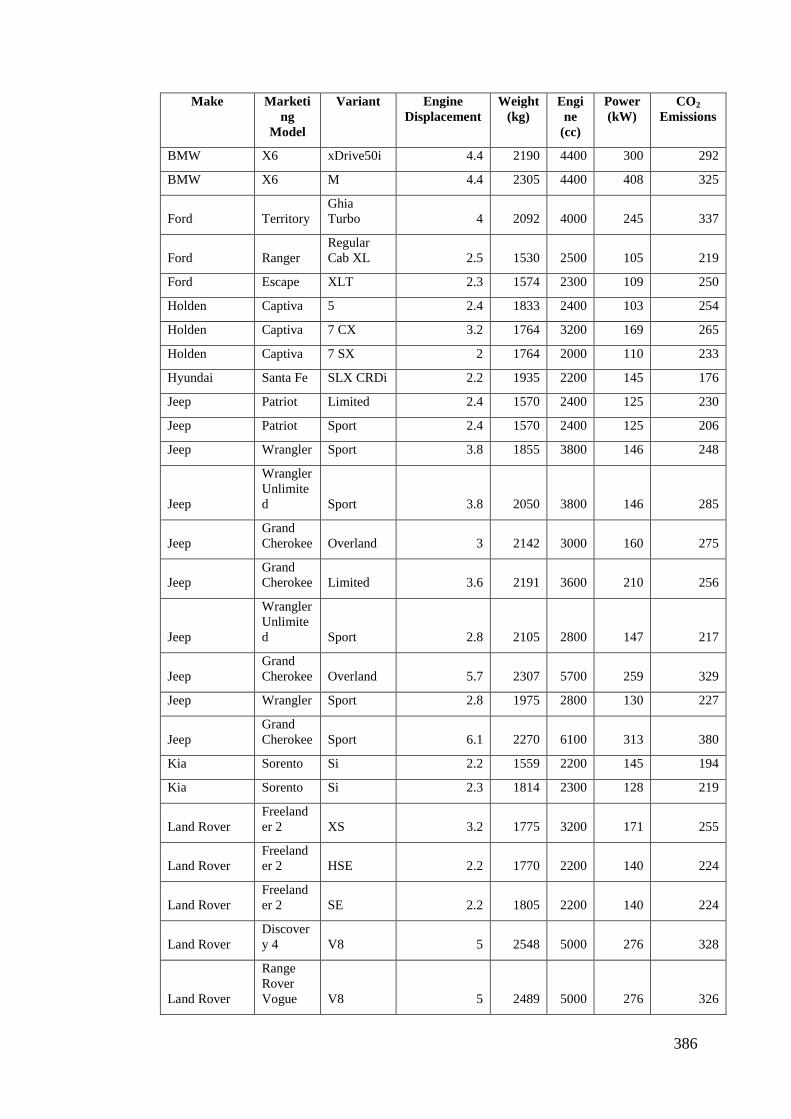
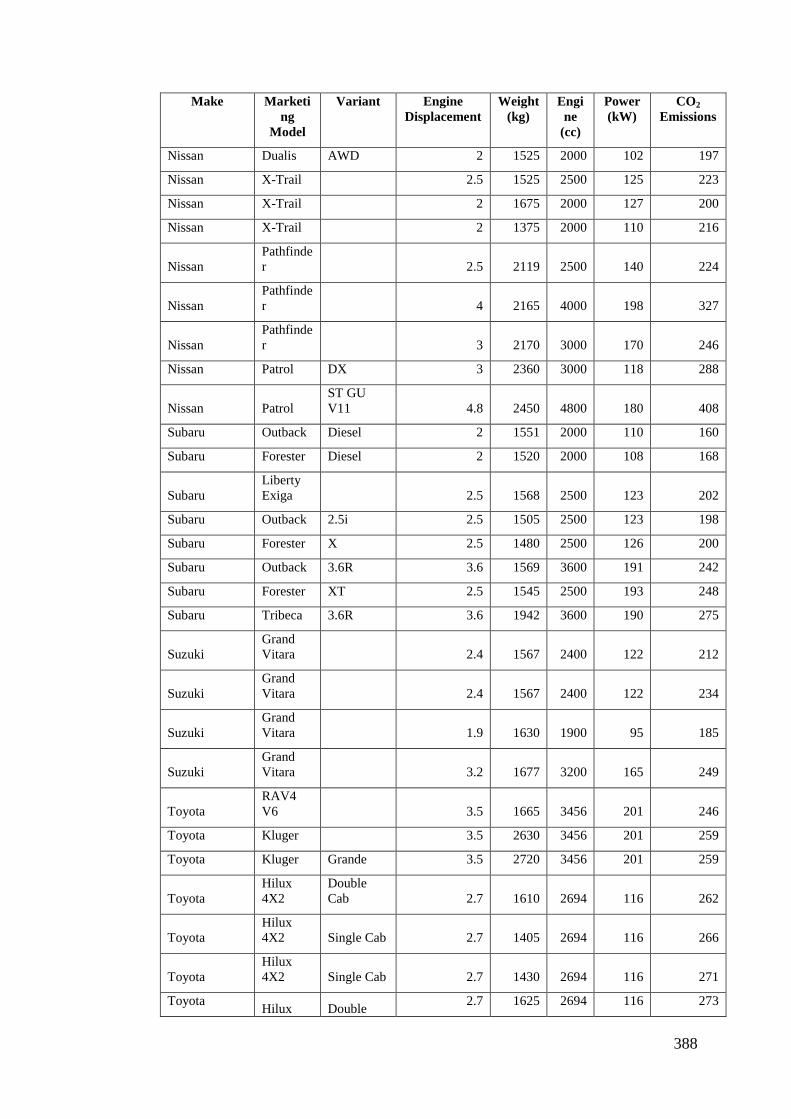
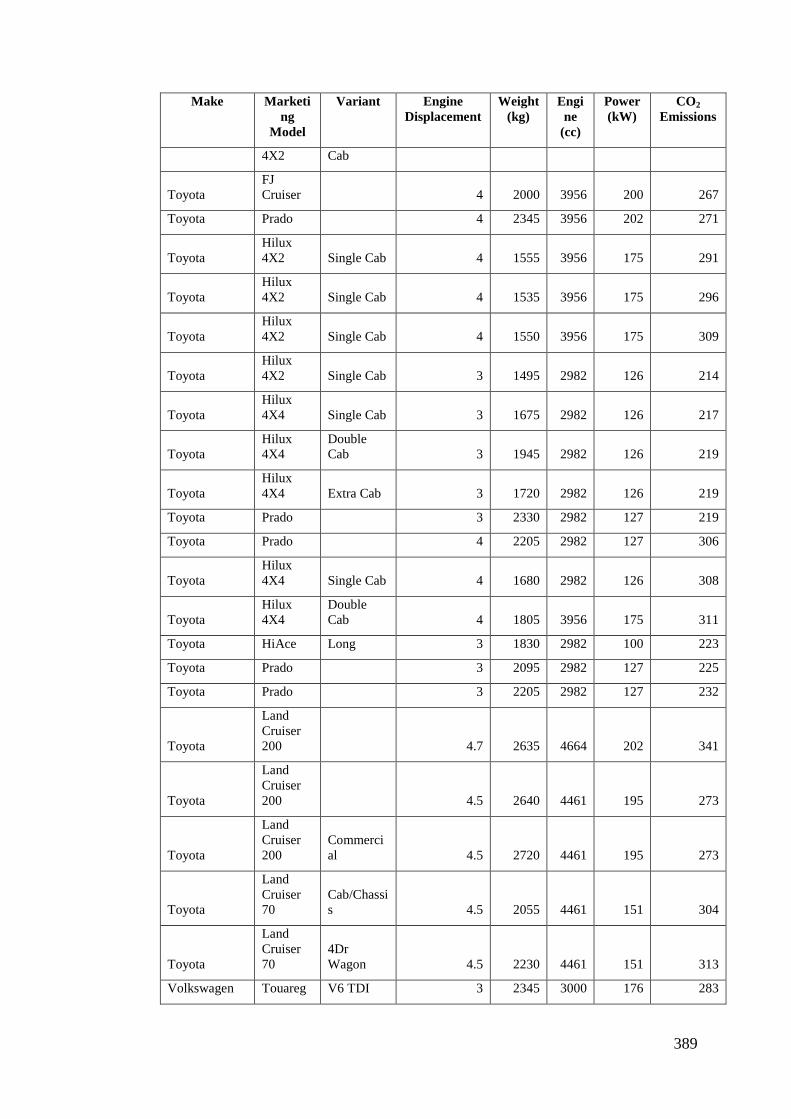
APPENDIX TABLE 3.7: LET SUVs ...................................................................... 385
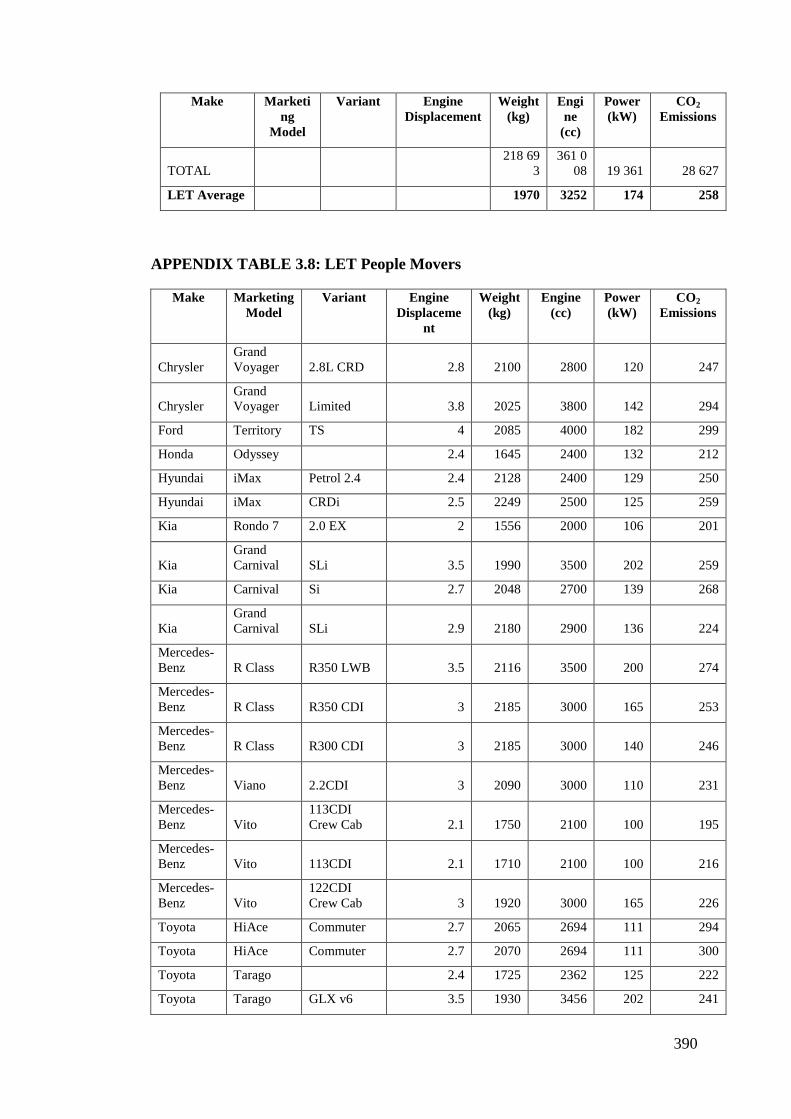
APPENDIX TABLE 3.8: LET People Movers ....................................................... 390
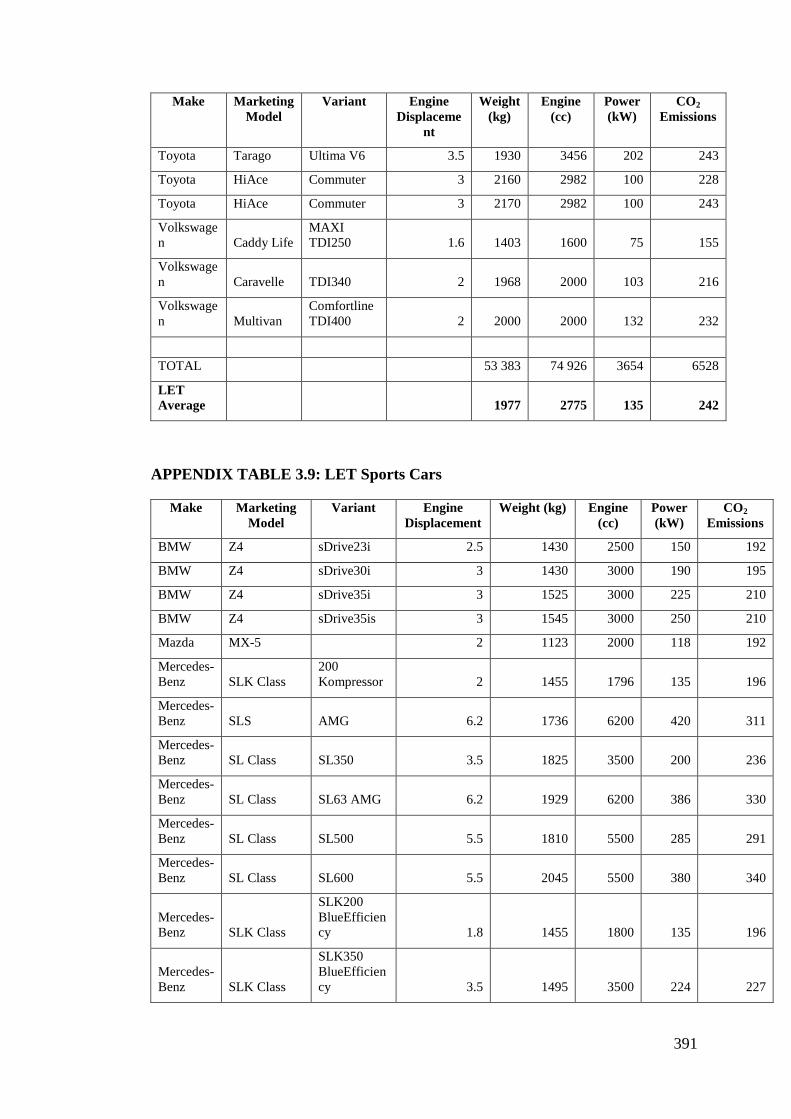
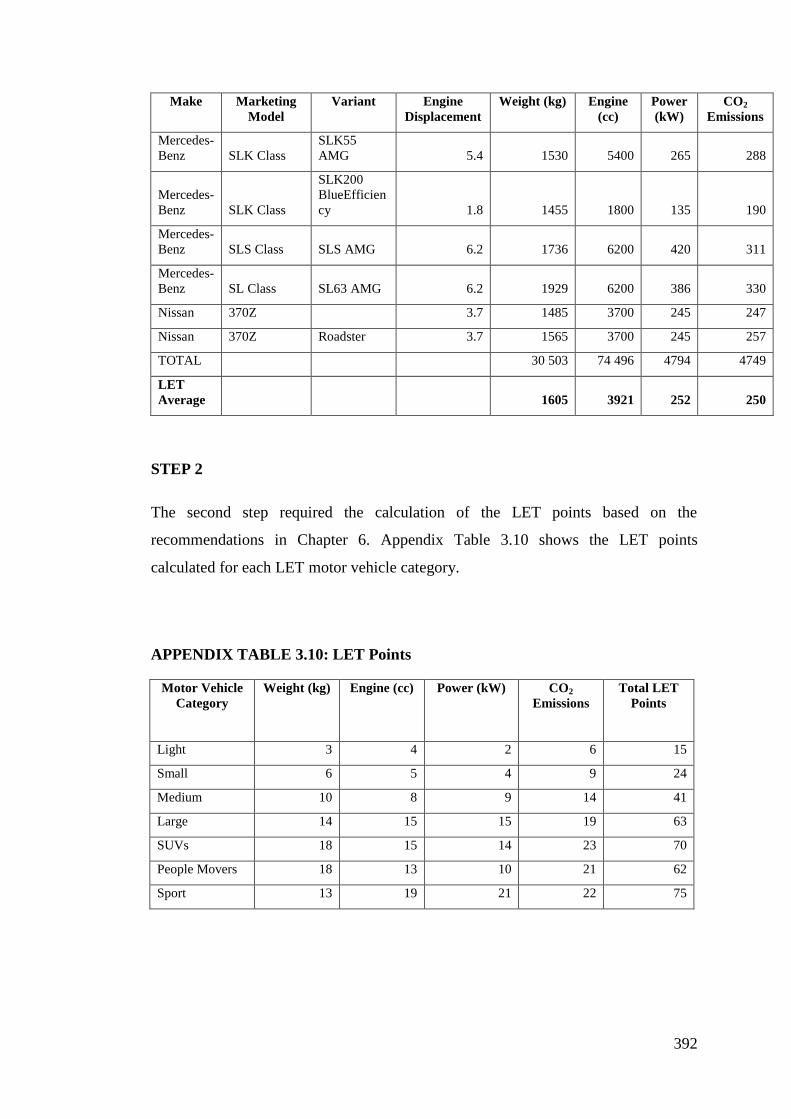
APPENDIX TABLE 3.9: LET Sports Cars ............................................................. 391
APPENDIX TABLE 3.10: LET Points .................................................................... 392
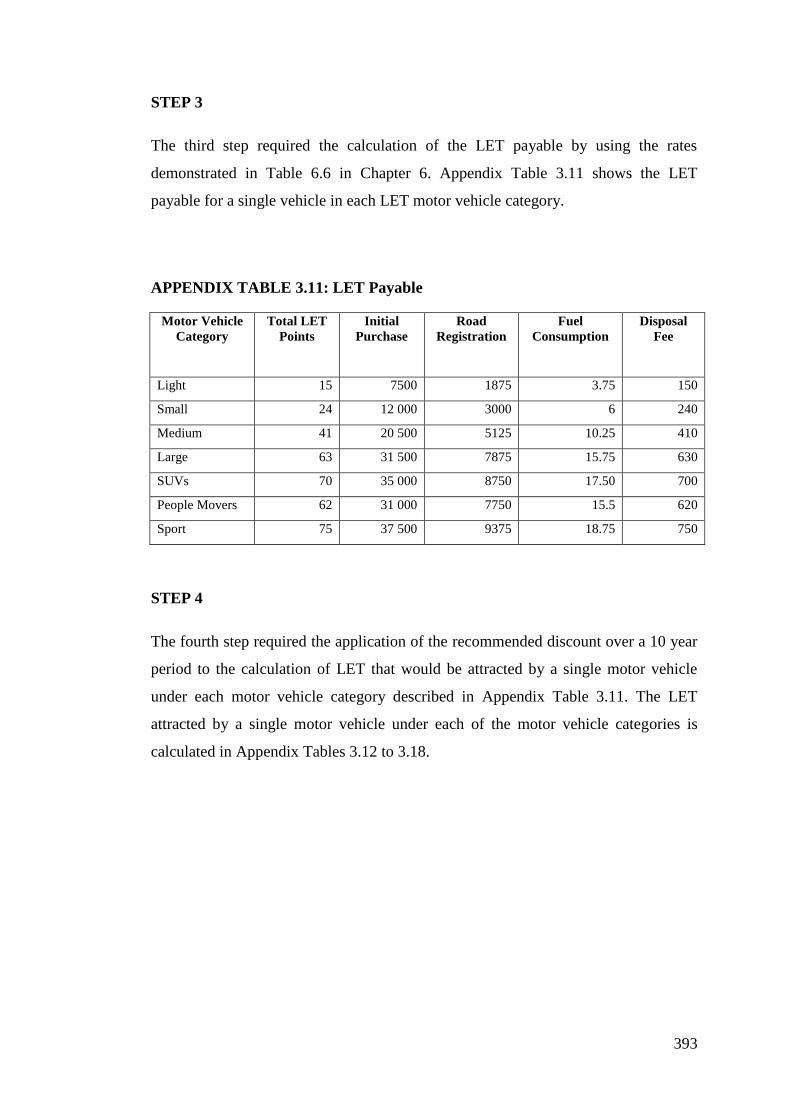
APPENDIX TABLE 3.11: LET Payable ................................................................. 393
APPENDIX TABLE 3.12: LET Attracted by Light Motor Vehicle ........................ 394
APPENDIX TABLE 3.13: LET Attracted by Small Motor Vehicle ....................... 394
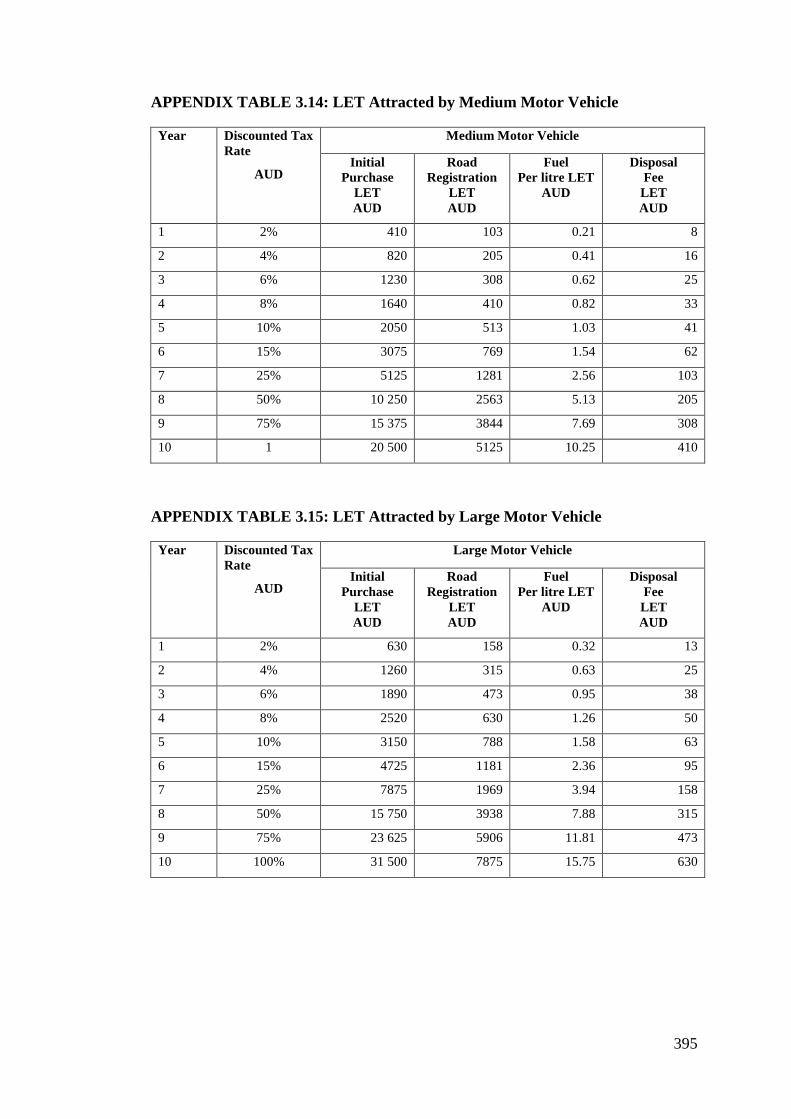
APPENDIX TABLE 3.14: LET Attracted by Medium Motor Vehicle ................... 395
APPENDIX TABLE 3.15: LET Attracted by Large Motor Vehicle ....................... 395
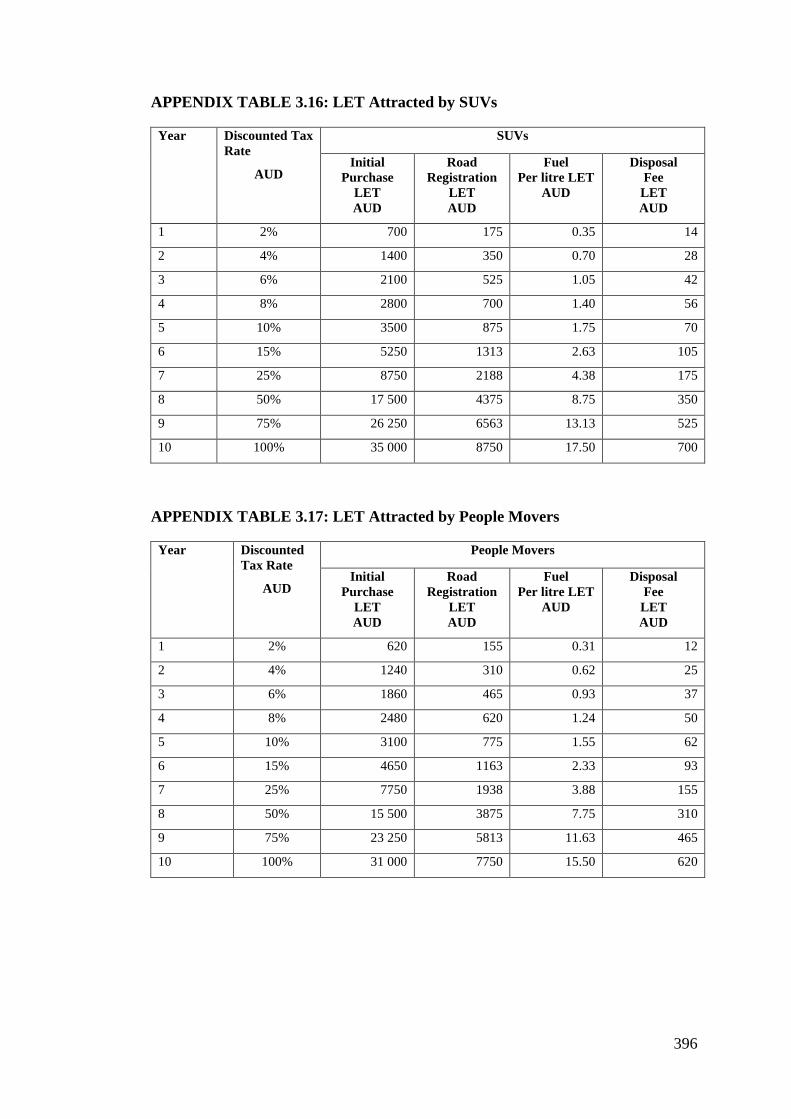
APPENDIX TABLE 3.16: LET Attracted by SUVs ............................................... 396
APPENDIX TABLE 3.17: LET Attracted by People Movers ................................. 396
Page 16
xvi
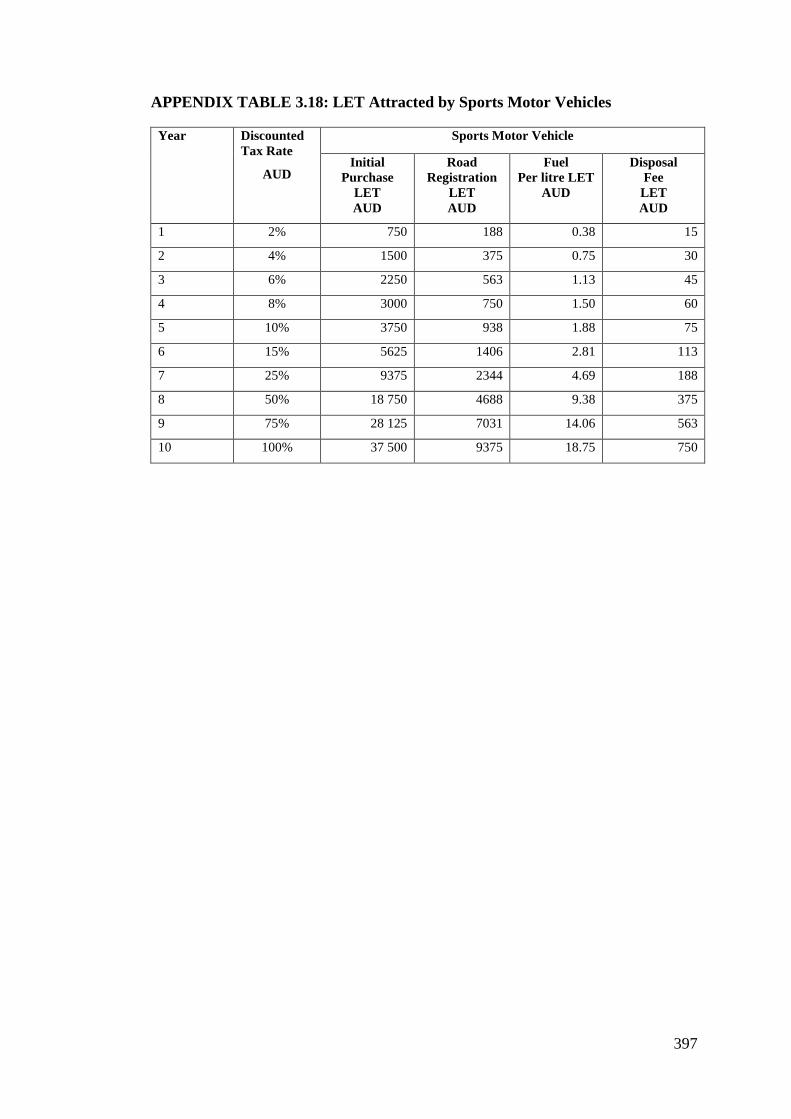
APPENDIX TABLE 3.18: LET Attracted by Sports Motor Vehicles .................... 397
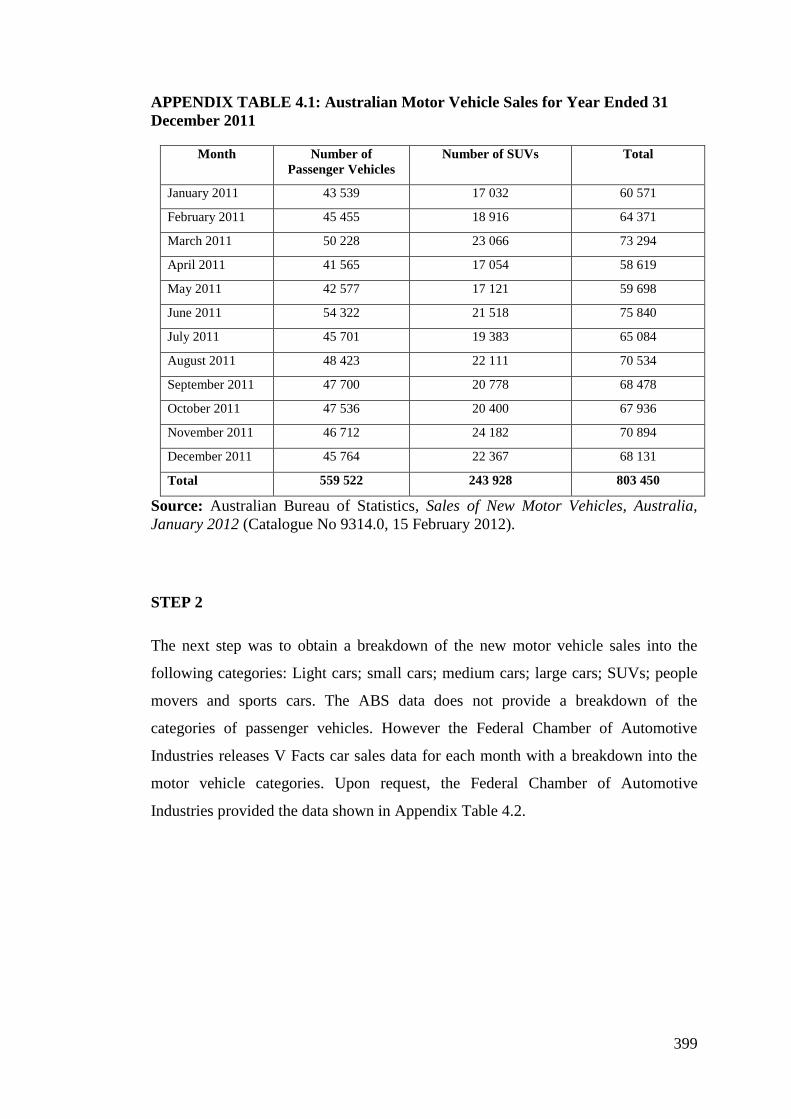
APPENDIX TABLE 4.1: Australian Motor Vehicle Sales for Year Ended 31
December 2011 ........................................................................................................ 399
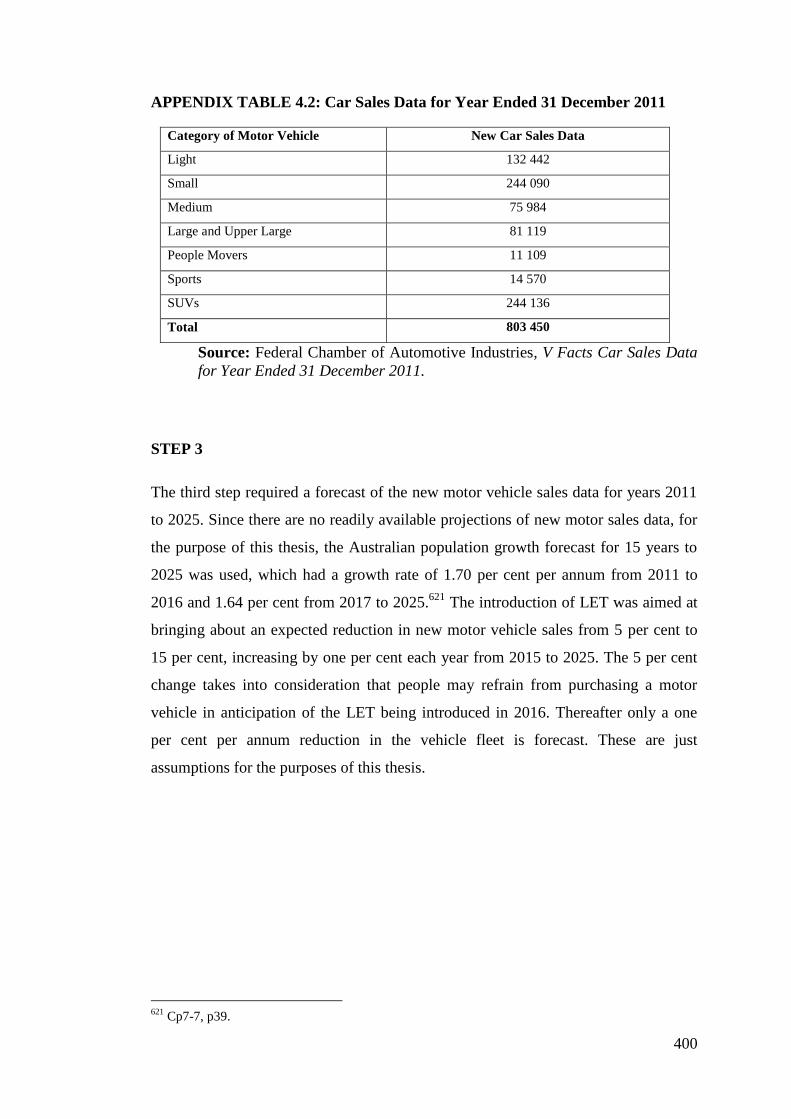
APPENDIX TABLE 4.2: Car Sales Data for Year Ended 31 December 2011 ....... 400
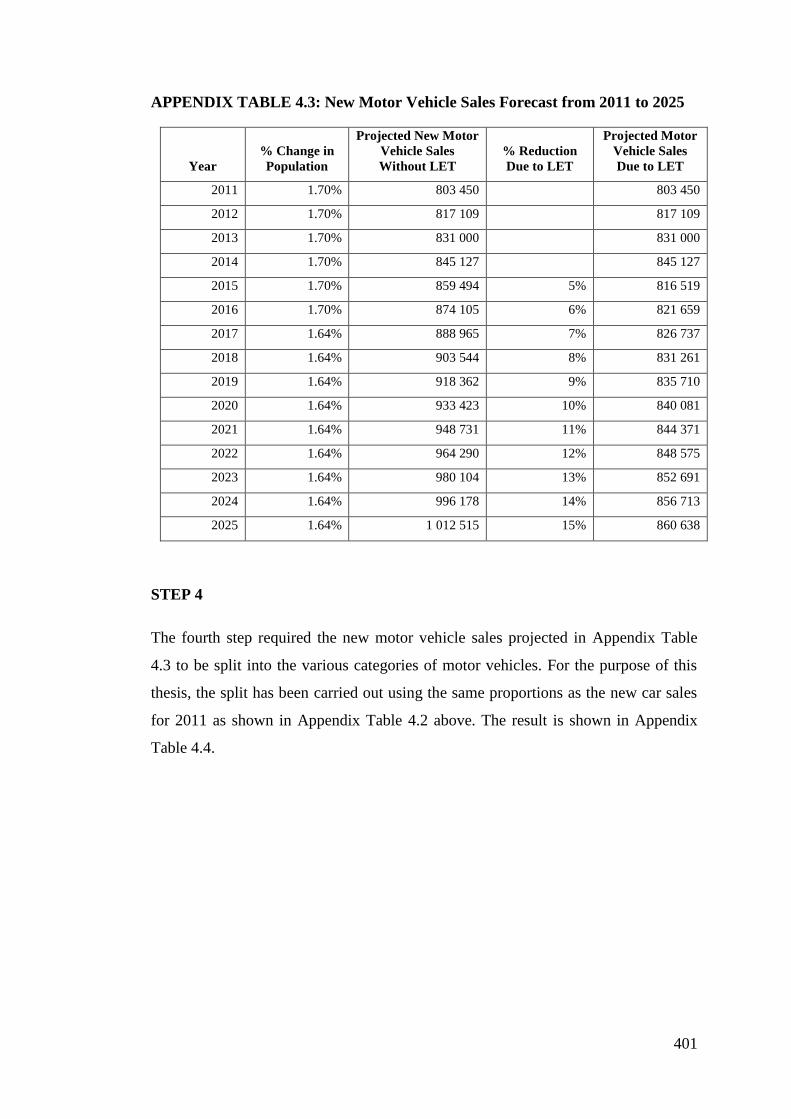
APPENDIX TABLE 4.3: New Motor Vehicle Sales Forecast from 2011 to 2025 . 401
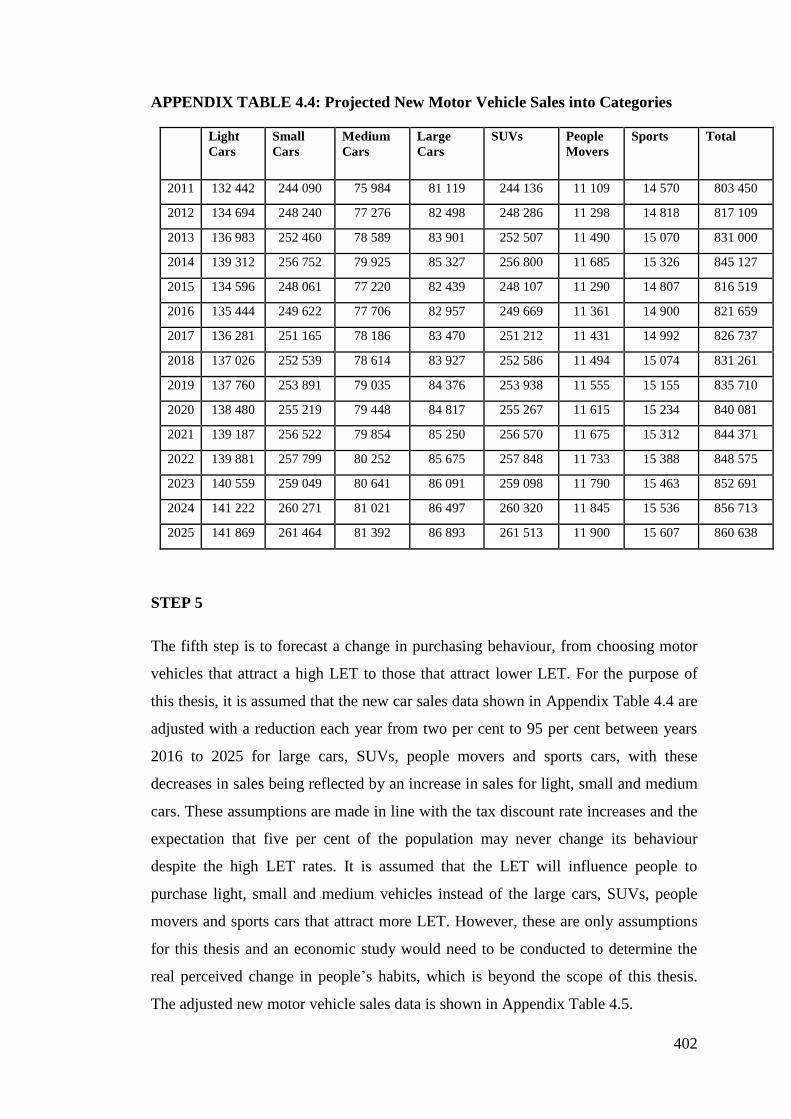
APPENDIX TABLE 4.4: Projected New Motor Vehicle Sales into Categories ..... 402
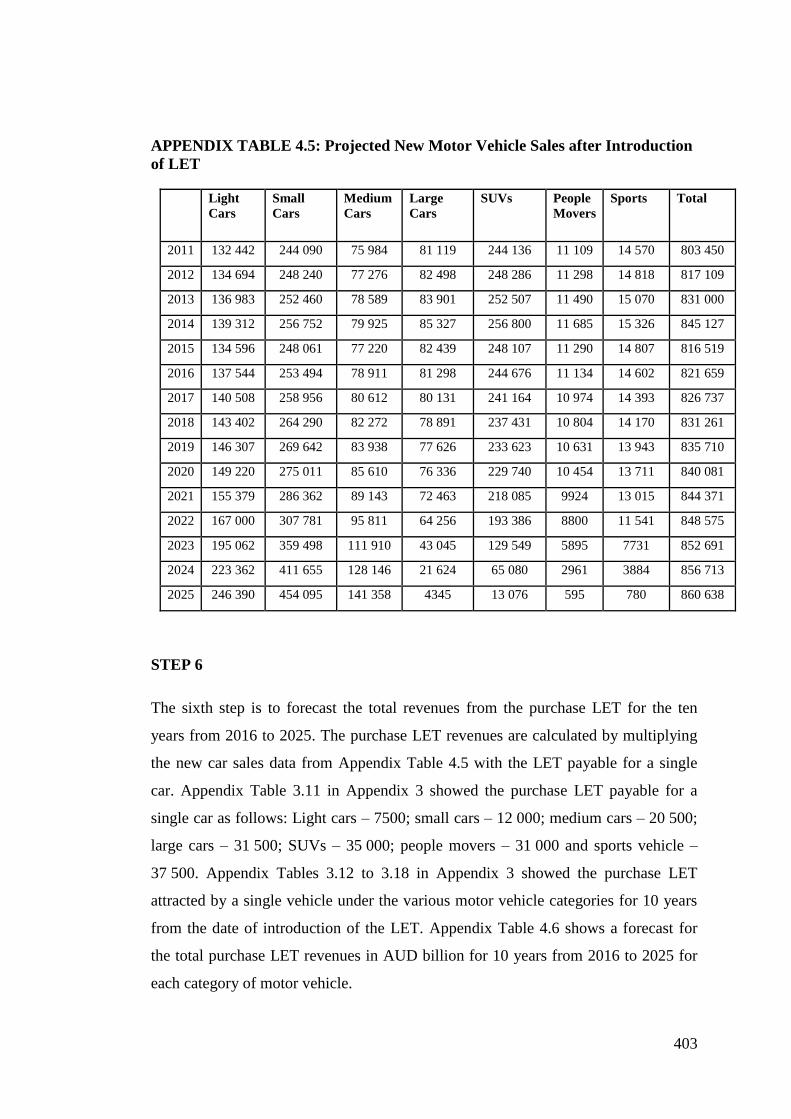
APPENDIX TABLE 4.5: Projected New Motor Vehicle Sales after Introduction of
LET .......................................................................................................................... 403
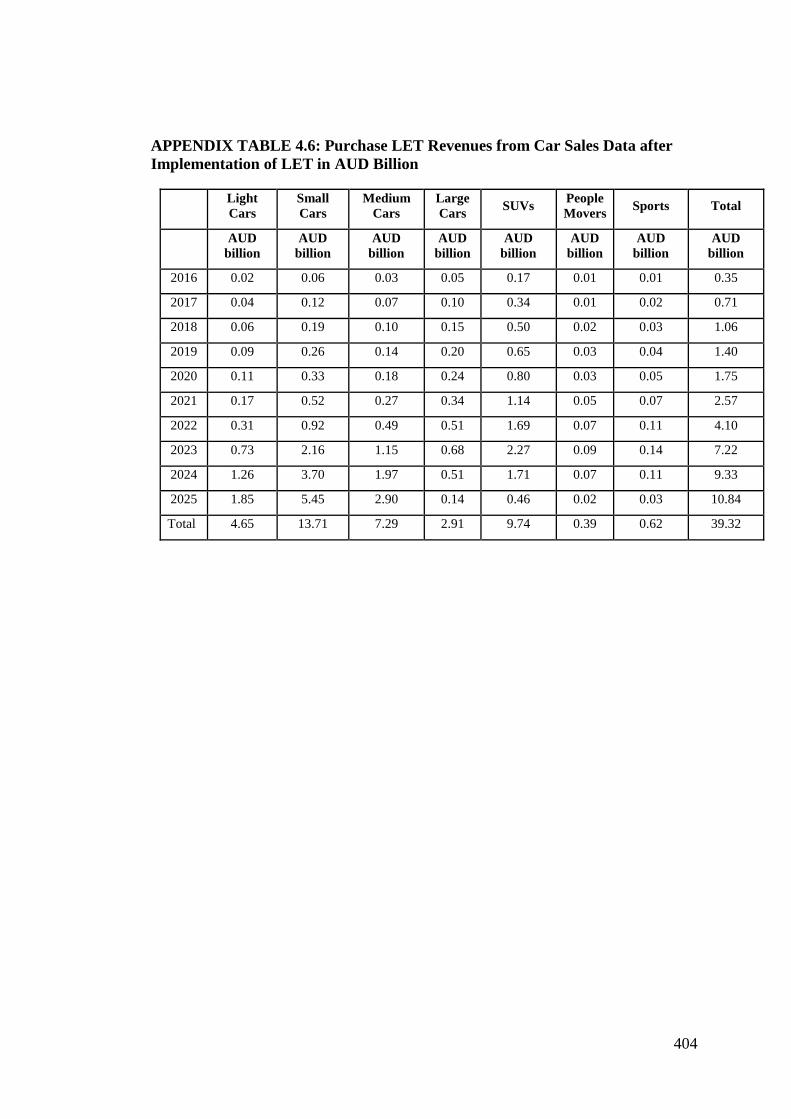
APPENDIX TABLE 4.6: Purchase LET Revenues from Car Sales Data after
Implementation of LET in AUD Billion .................................................................. 404
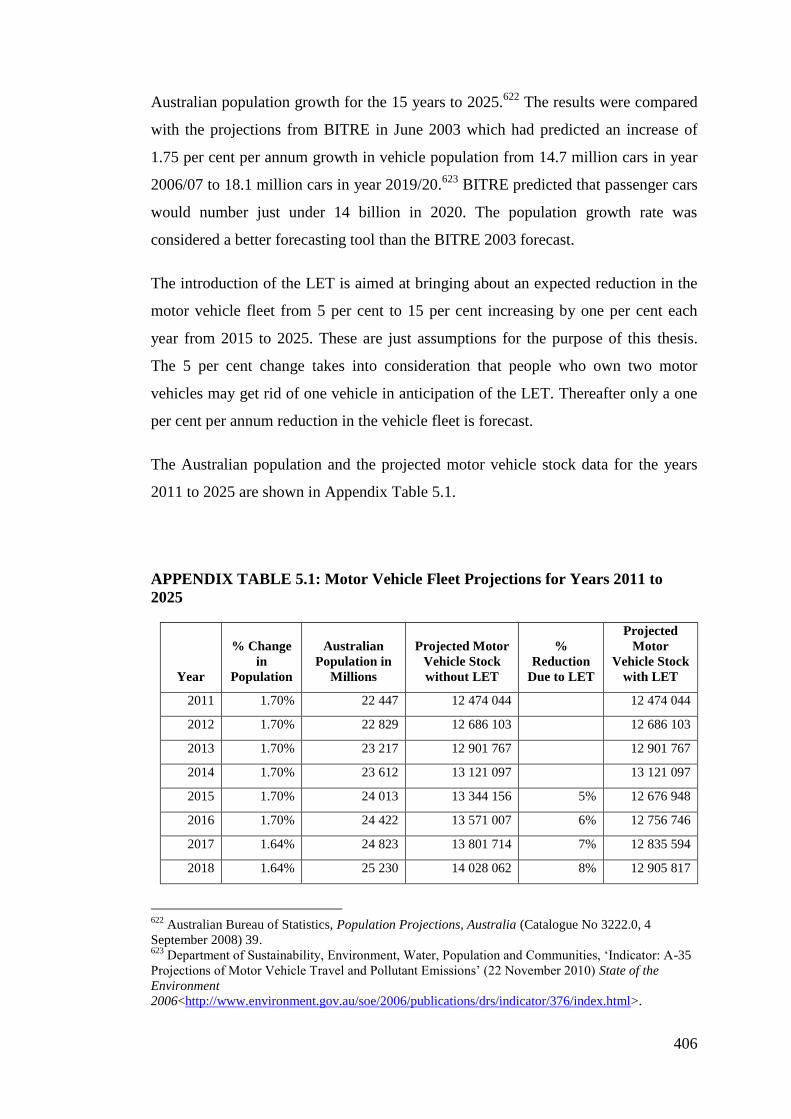
APPENDIX TABLE 5.1: Motor Vehicle Fleet Projections for Years 2011 to 2025
.................................................................................................................................. 406
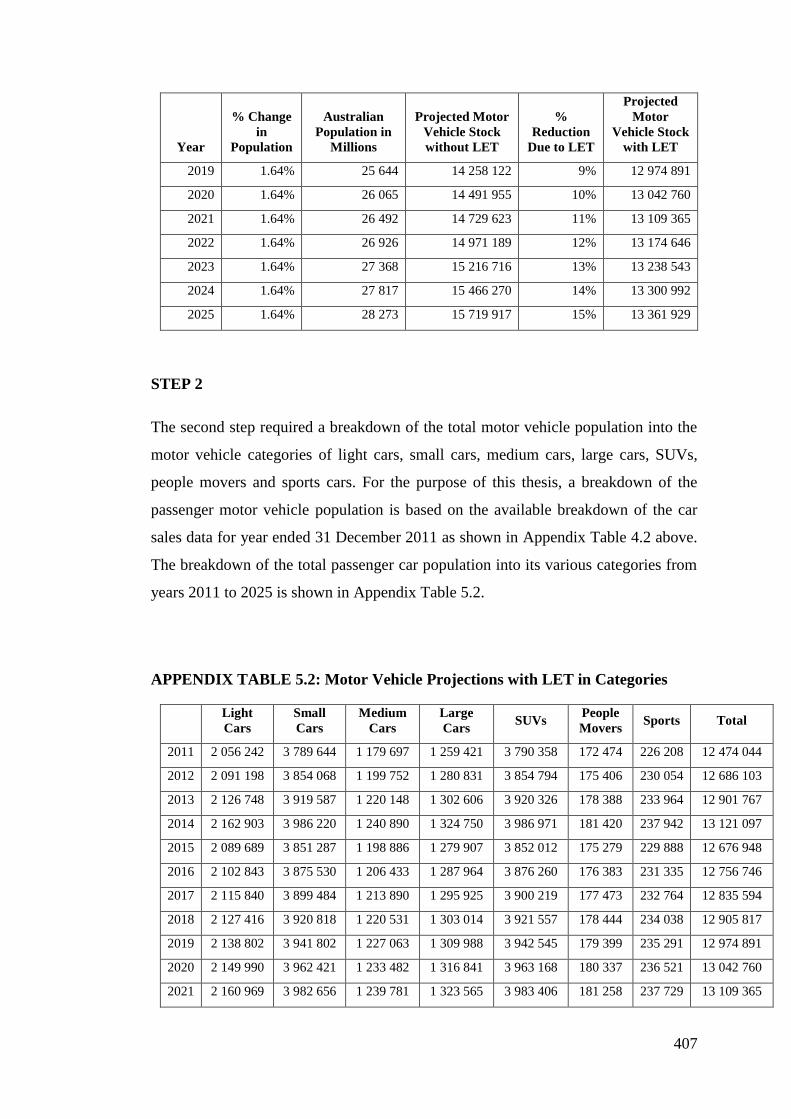
APPENDIX TABLE 5.2: Motor Vehicle Projections with LET in Categories ....... 407
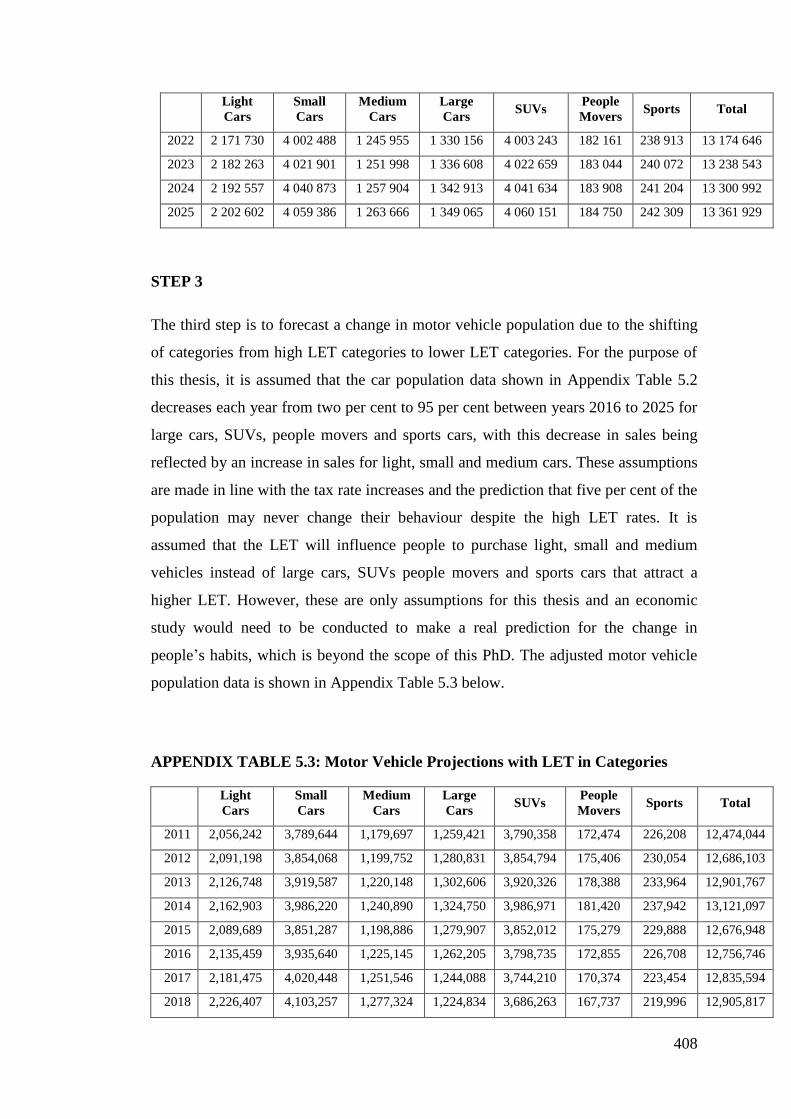
APPENDIX TABLE 5.3: Motor Vehicle Projections with LET in Categories ....... 408
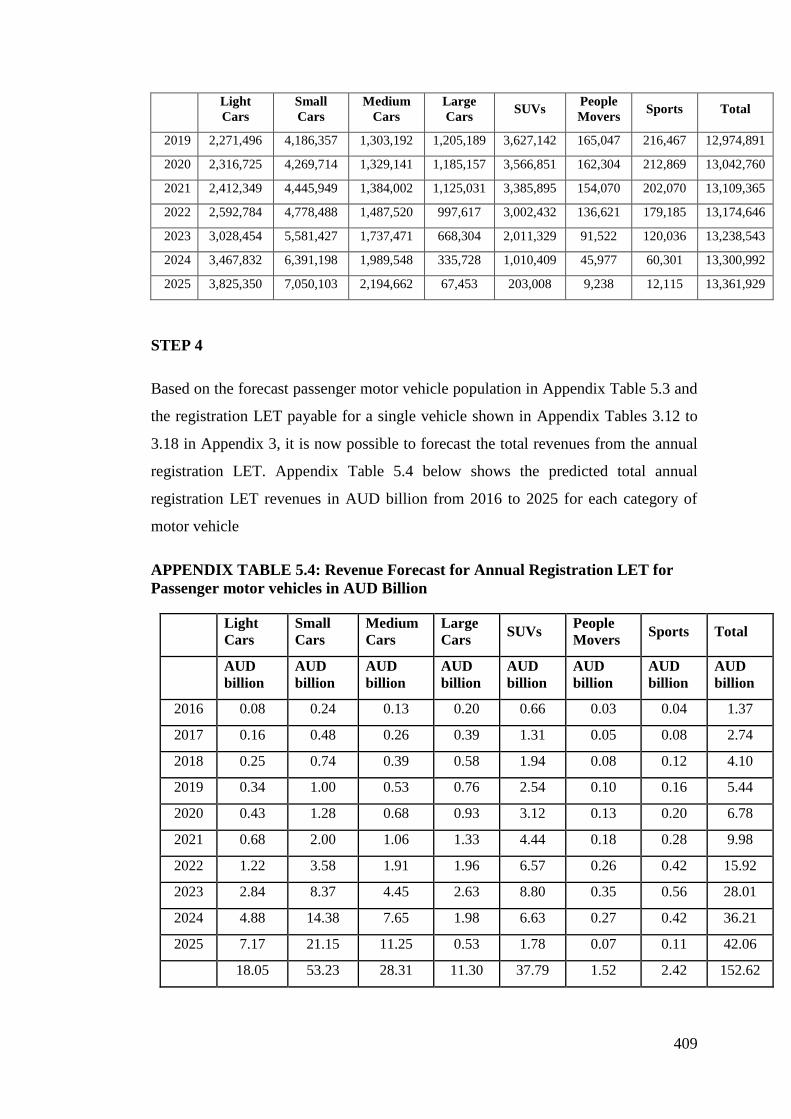
APPENDIX TABLE 5.4: Revenue Forecast for Annual Registration LET for
Passenger motor vehicles in AUD Billion ............................................................... 409
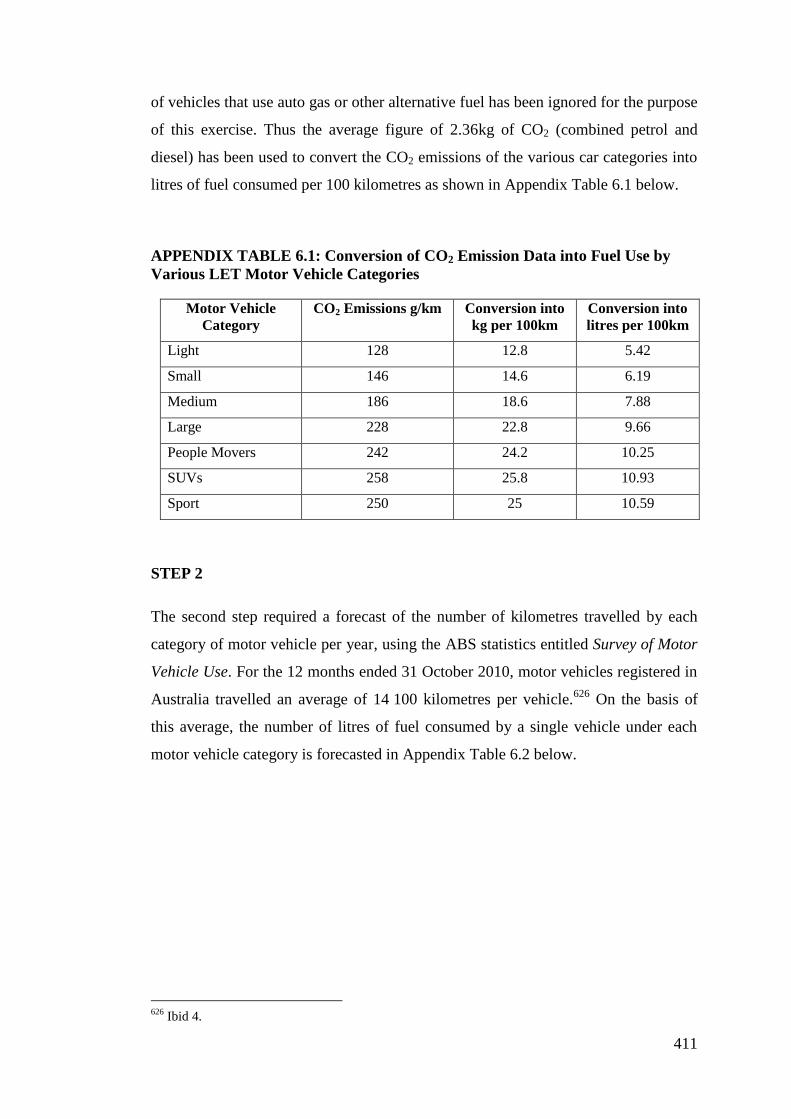
APPENDIX TABLE 6.1: Conversion of CO2 Emission Data into Fuel Use by
Various LET Motor Vehicle Categories .................................................................. 411
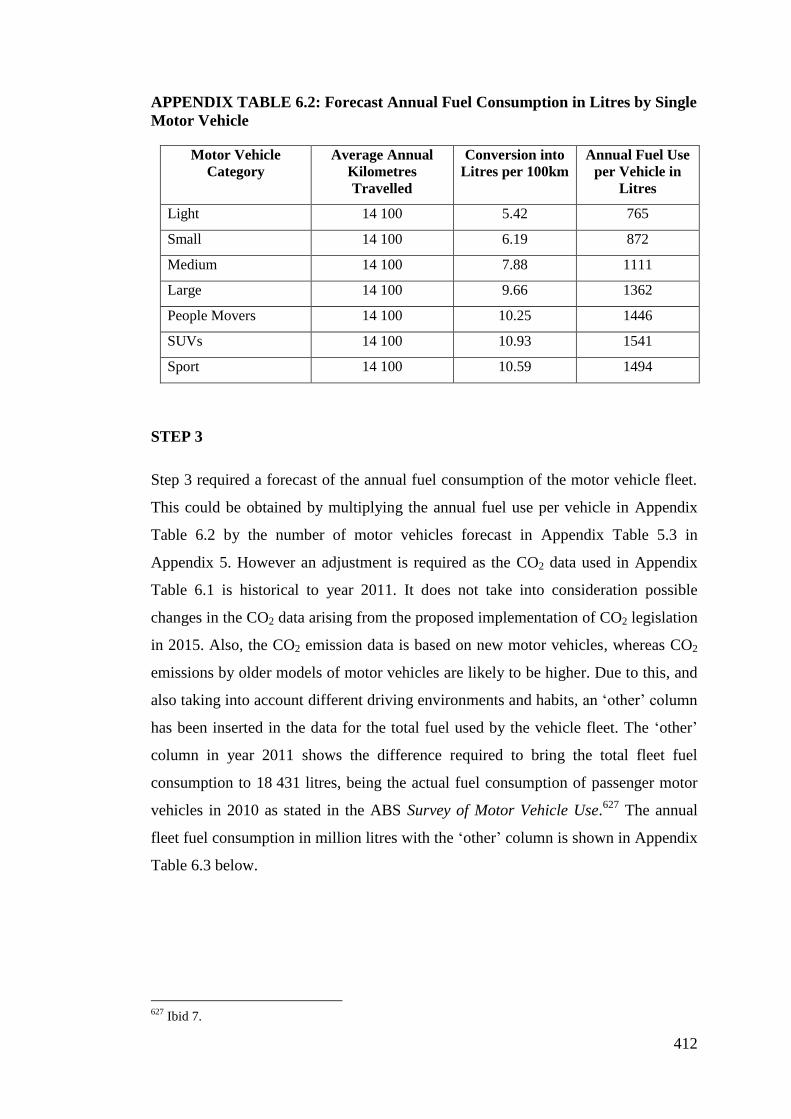
APPENDIX TABLE 6.2: Forecast Annual Fuel Consumption in Litres by Single
Motor Vehicle .......................................................................................................... 412
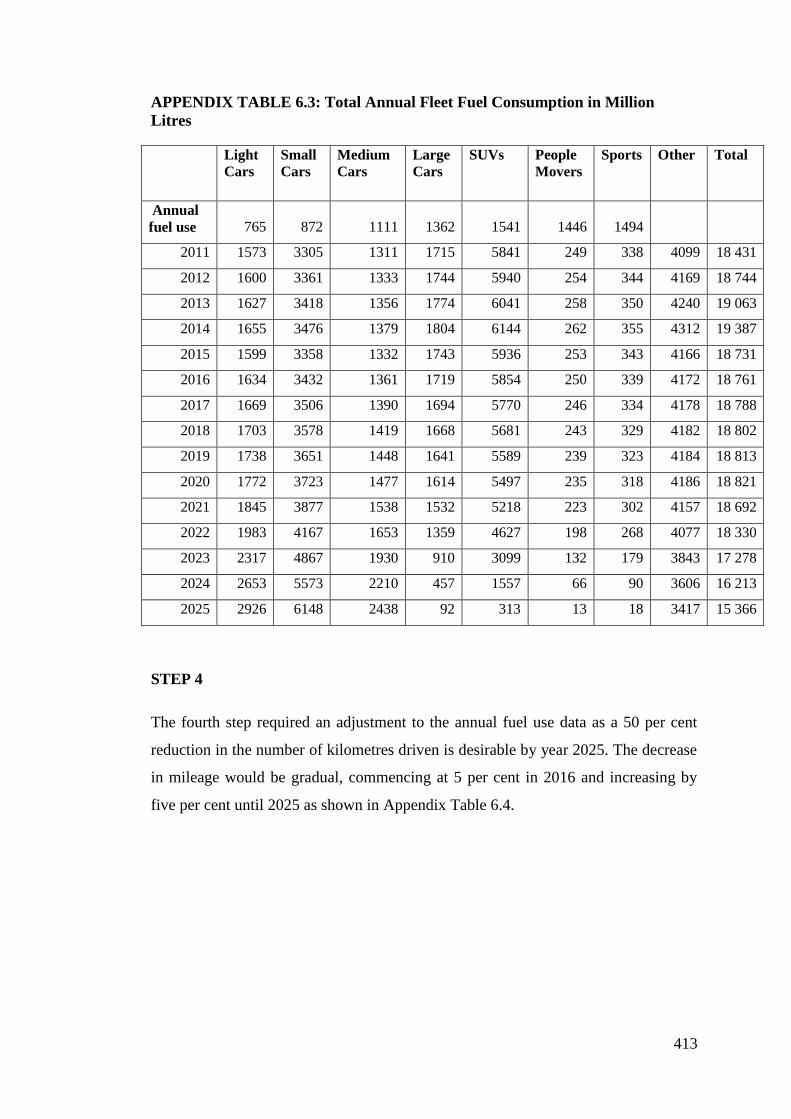
APPENDIX TABLE 6.3: Total Annual Fleet Fuel Consumption in Million Litres 413
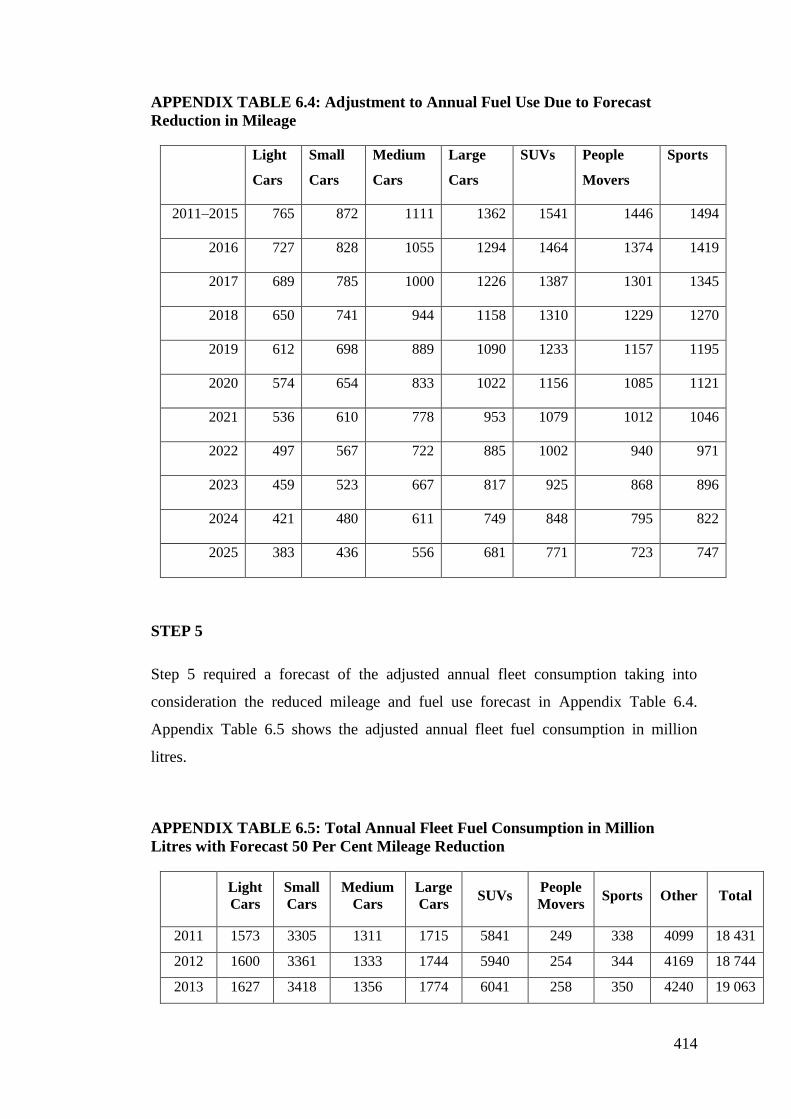
APPENDIX TABLE 6.4: Adjustment to Annual Fuel Use Due to Forecast Reduction
in Mileage................................................................................................................. 414
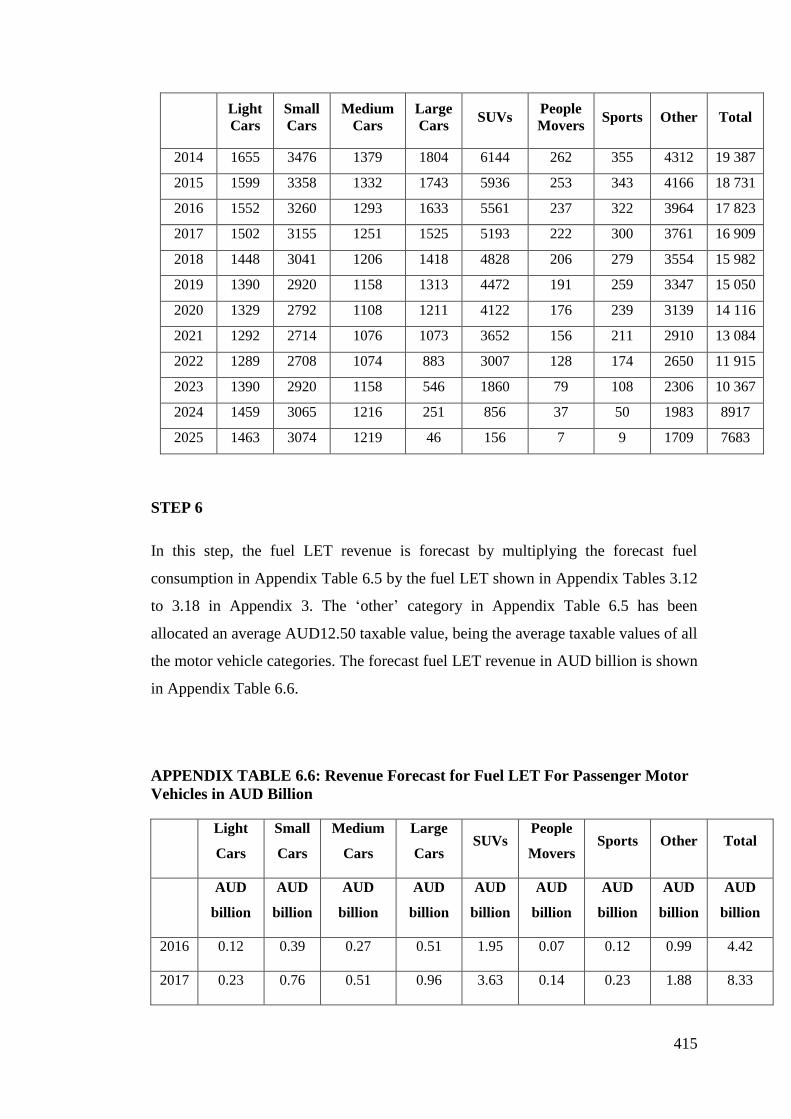
APPENDIX TABLE 6.5: Total Annual Fleet Fuel Consumption in Million Litres
with Forecast 50 Per Cent Mileage Reduction ......................................................... 414
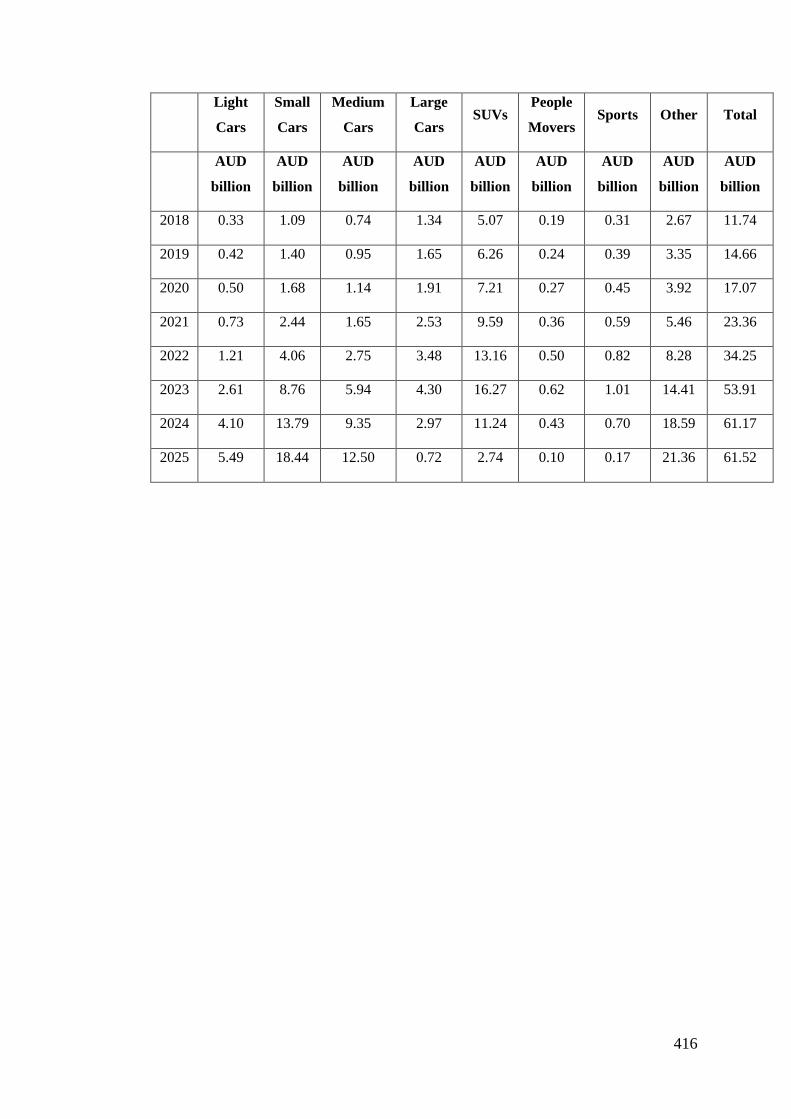
APPENDIX TABLE 6.6: Revenue Forecast for Fuel LET For Passenger Motor
Vehicles in AUD Billion .......................................................................................... 415
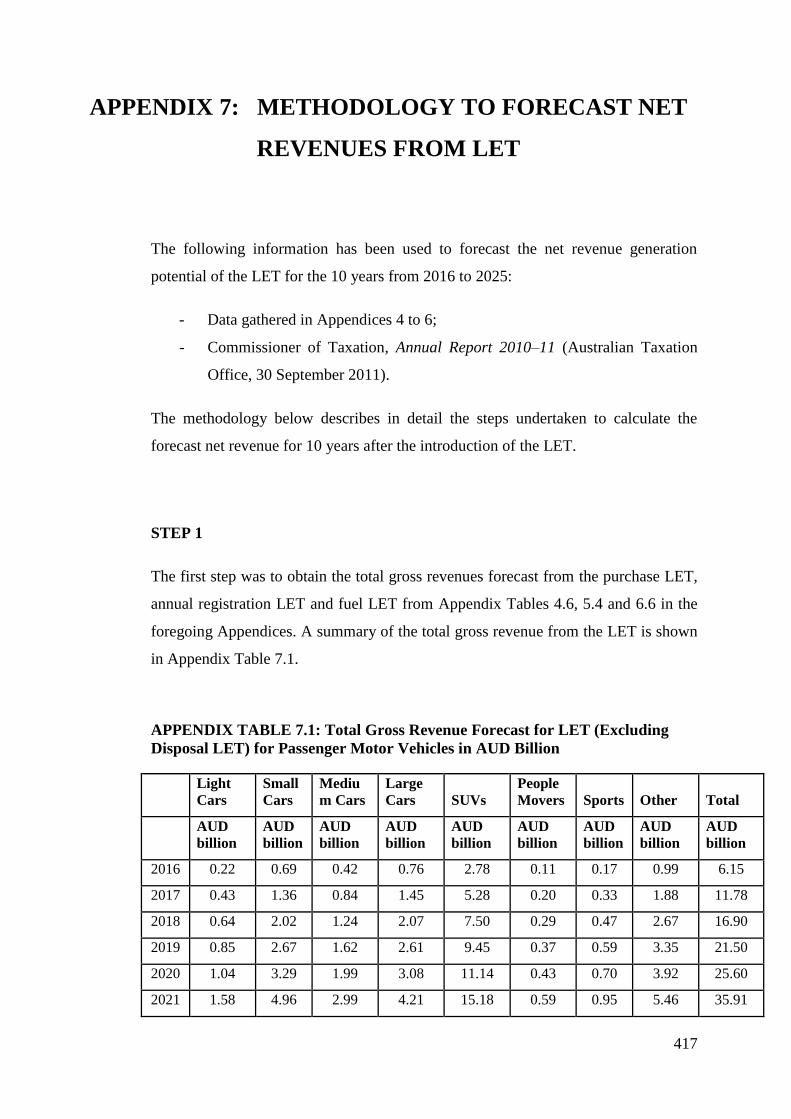
APPENDIX TABLE 7.1: Total Gross Revenue Forecast for LET (Excluding
Disposal LET) for Passenger Motor Vehicles in AUD Billion................................ 417
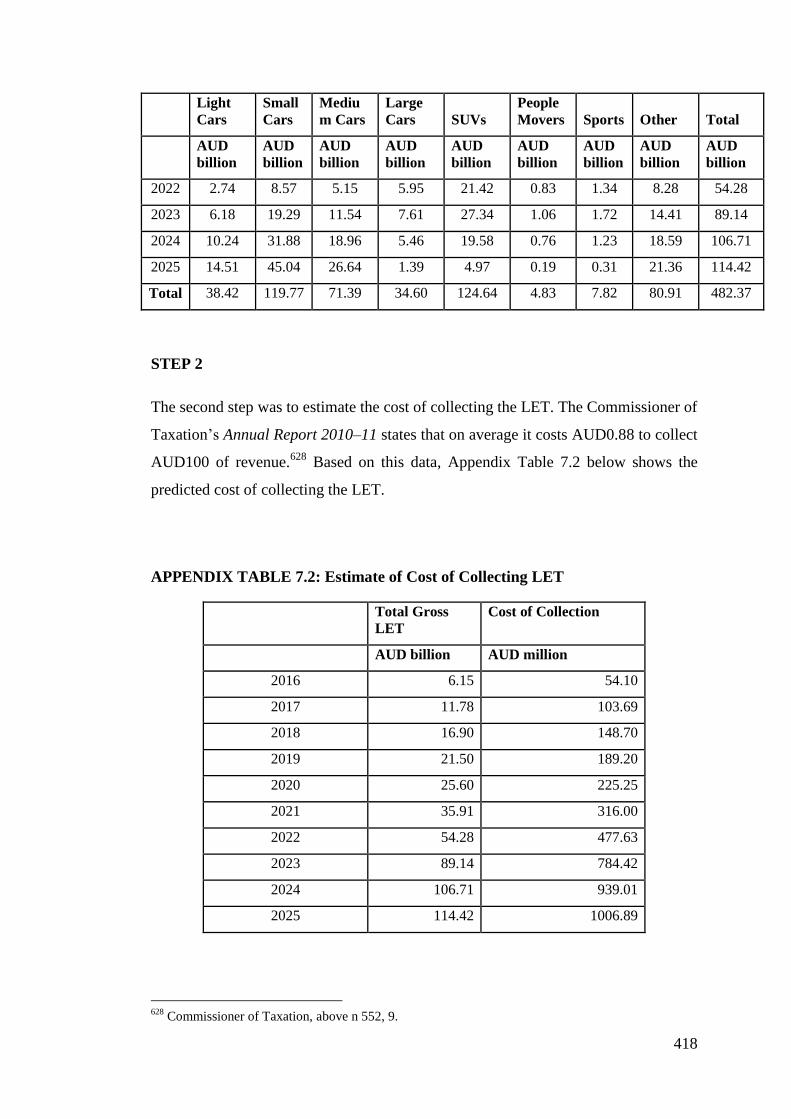
APPENDIX TABLE 7.2: Estimate of Cost of Collecting LET ............................... 418
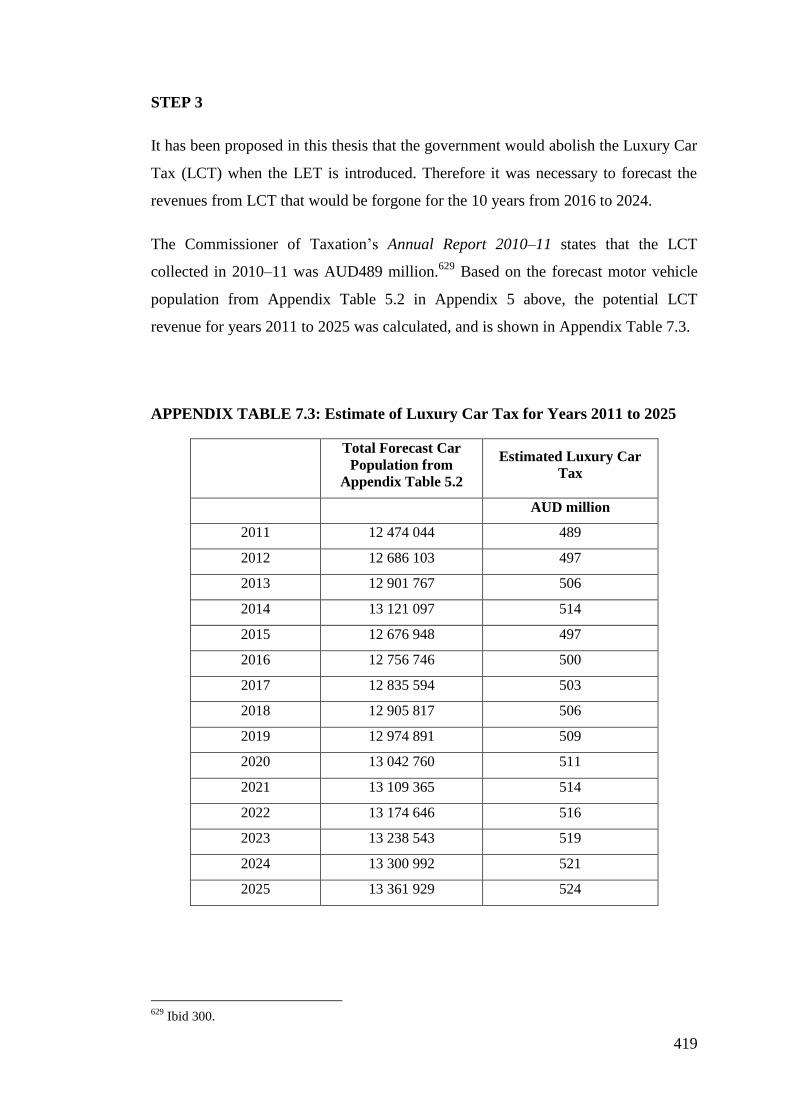
APPENDIX TABLE 7.3: Estimate of Luxury Car Tax for Years 2011 to 2025 ..... 419
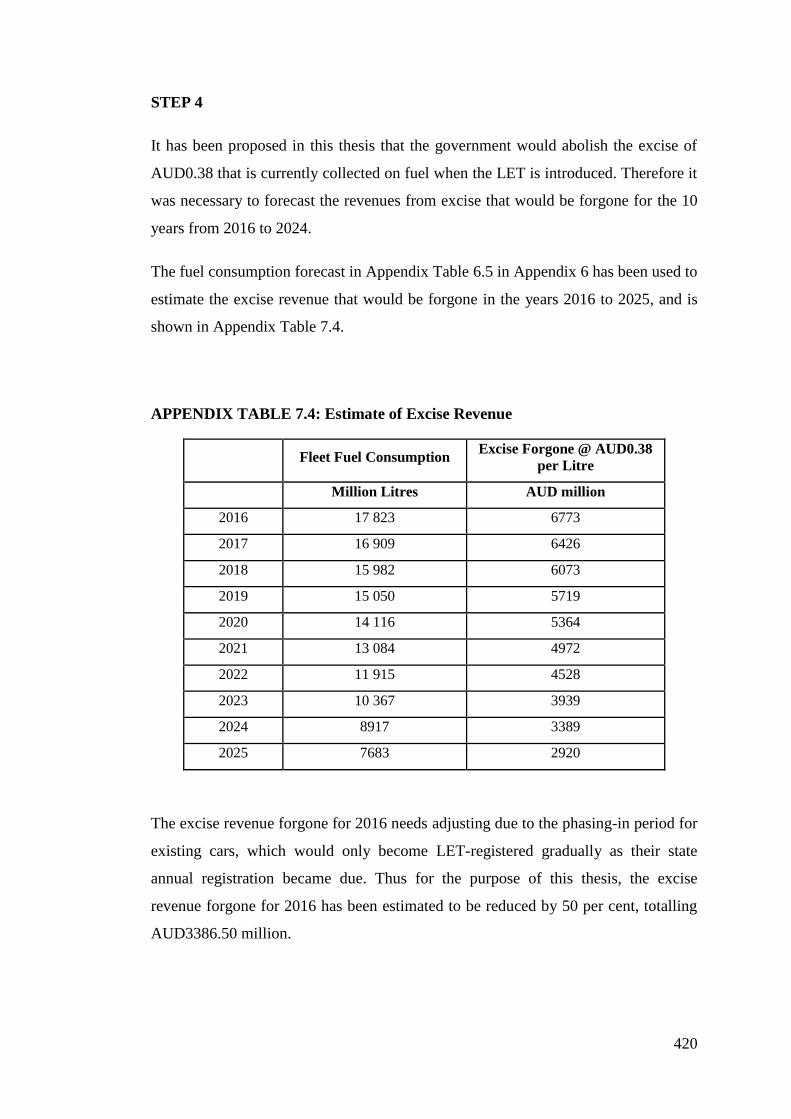
APPENDIX TABLE 7.4: Estimate of Excise Revenue ........................................... 420
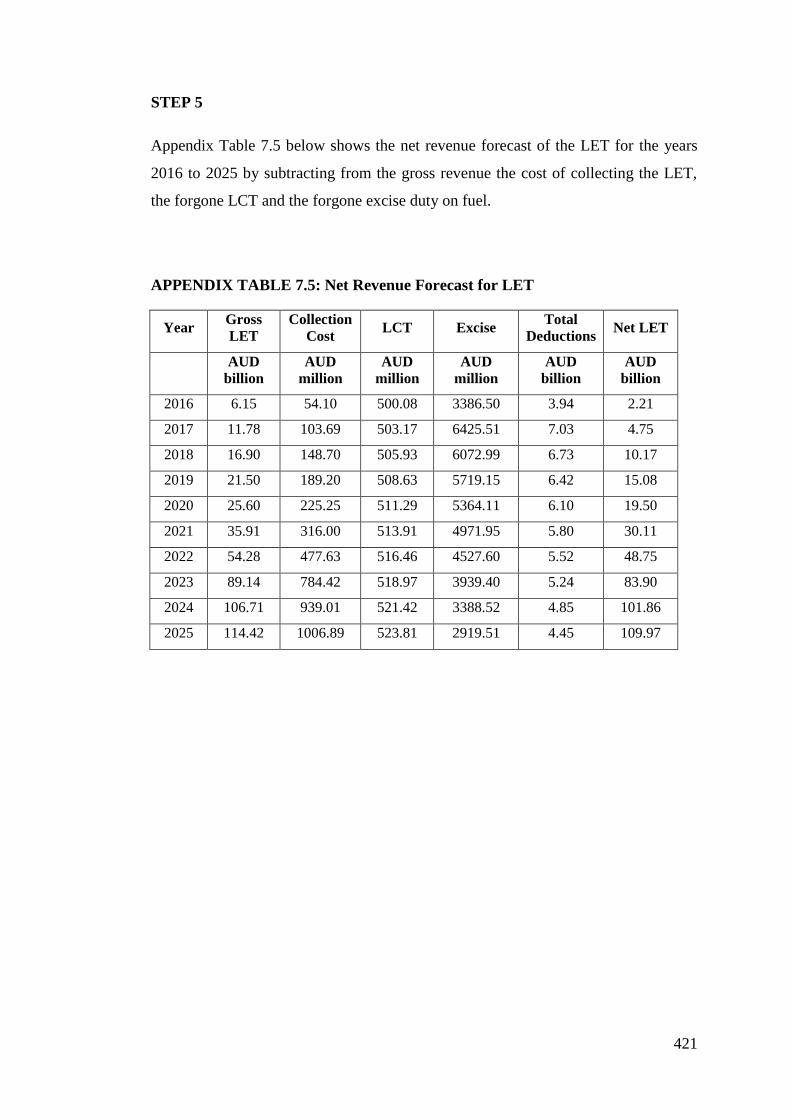
APPENDIX TABLE 7.5: Net Revenue Forecast for LET ....................................... 421
APPENDIX TABLE 8.1: Motor Vehicle Projections Without LET in Categories . 422
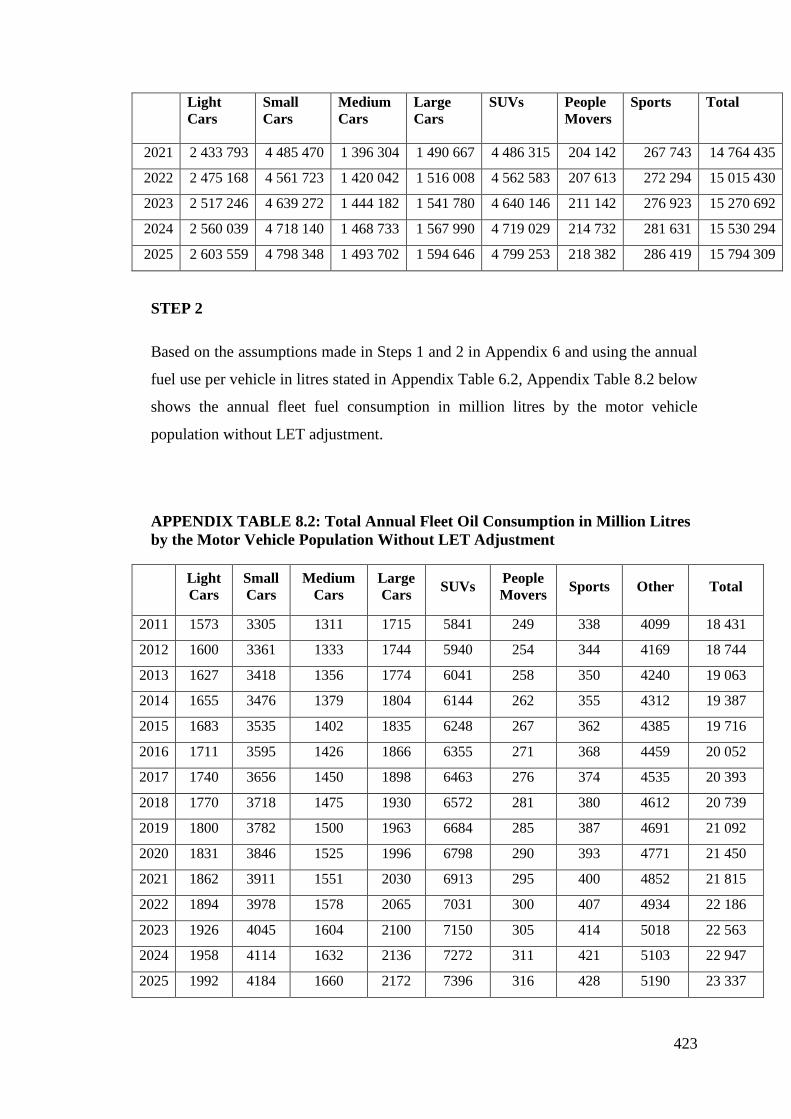
APPENDIX TABLE 8.2: Total Annual Fleet Oil Consumption in Million Litres by
the Motor Vehicle Population Without LET Adjustment ........................................ 423
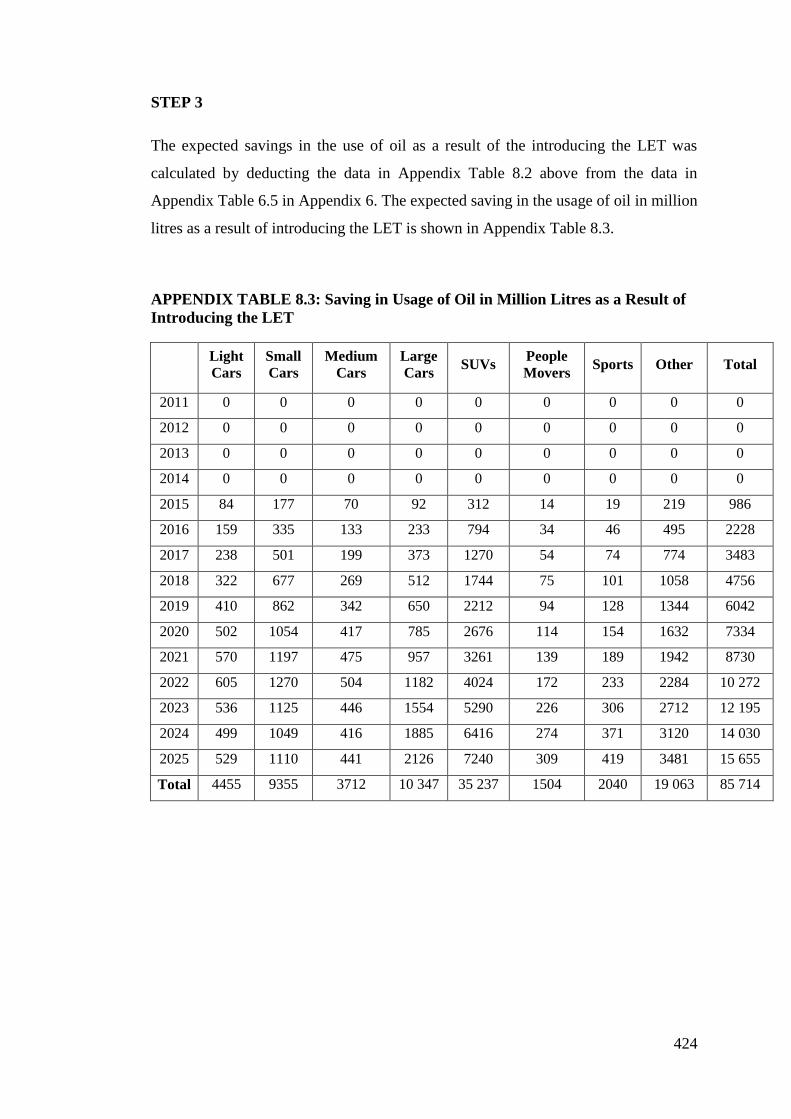
APPENDIX TABLE 8.3: Saving in Usage of Oil in Million Litres as a Result of
Introducing the LET ................................................................................................. 424
Page 17
xvii
LIST OF FIGURES
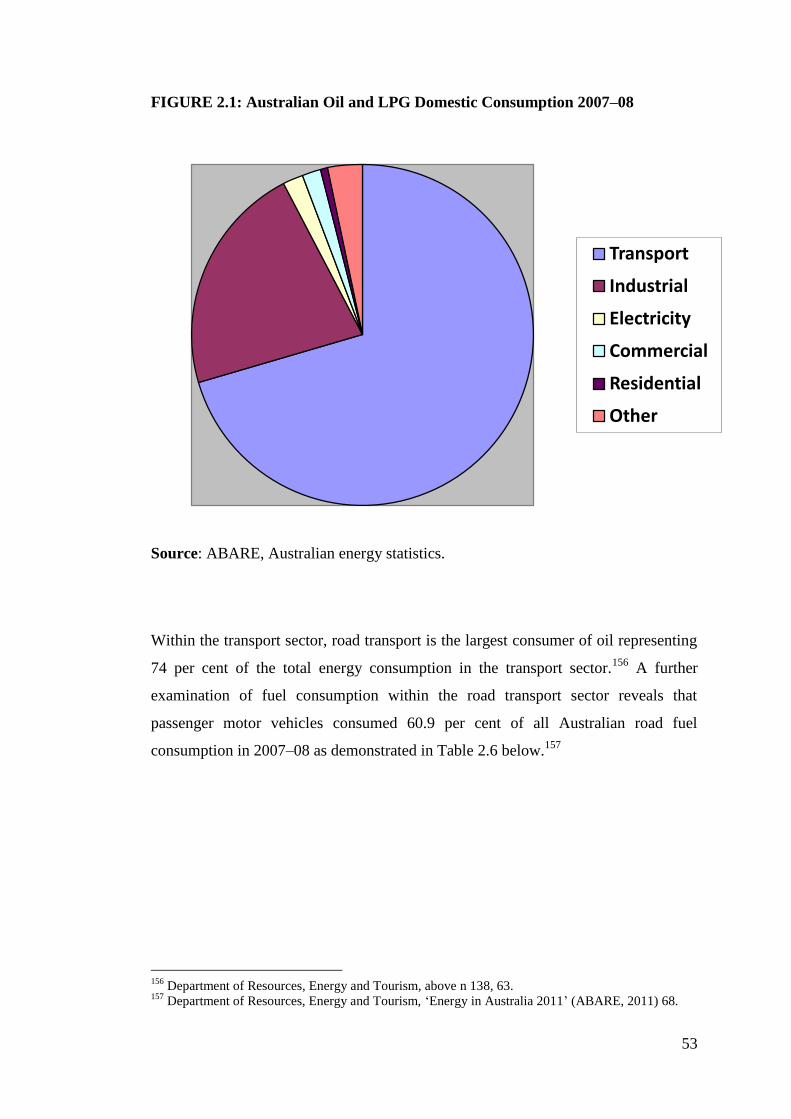
FIGURE 2.1: Australian Oil and LPG Domestic Consumption 2007–08 ................. 53
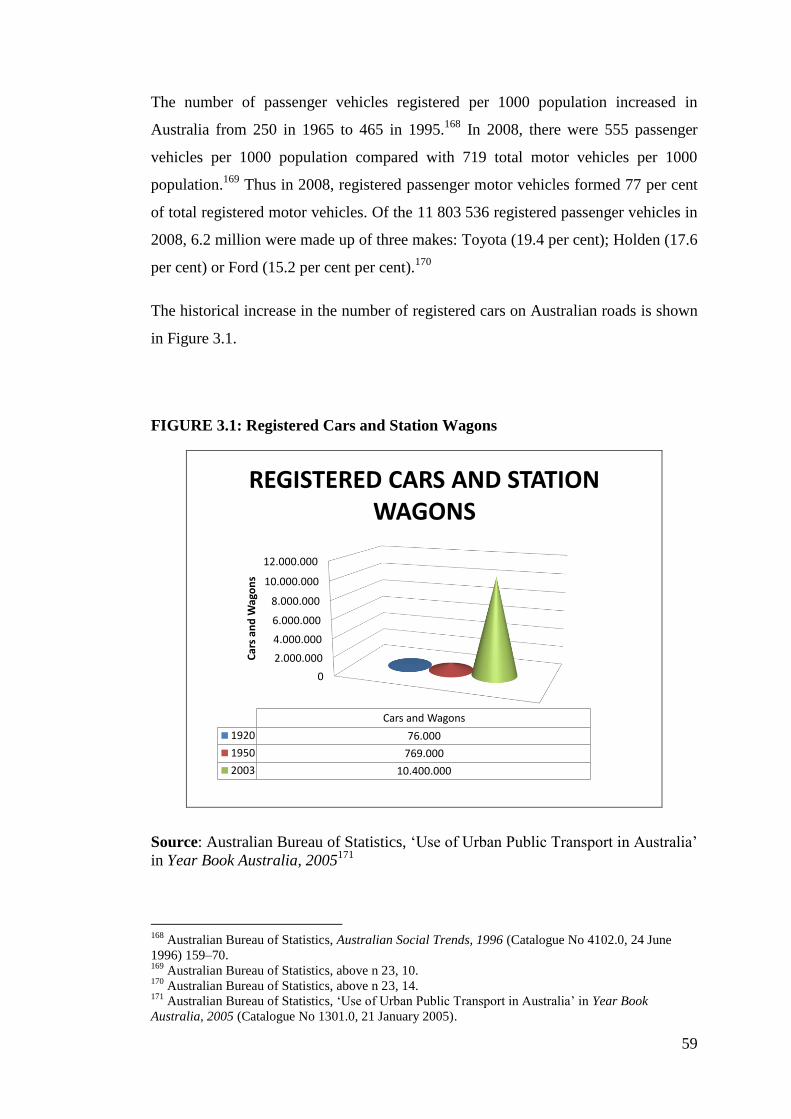
FIGURE 3.1: Registered Cars and Station Wagons .................................................. 59
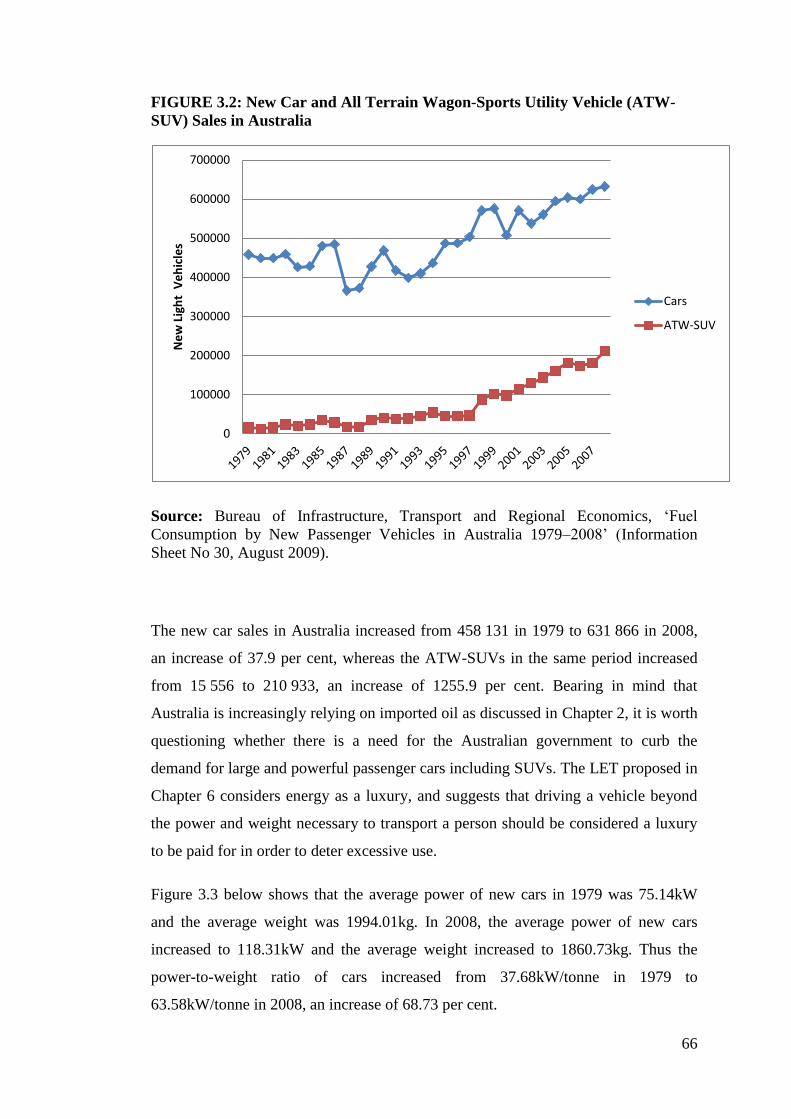
FIGURE 3.2: New Car and All Terrain Wagon-Sports Utility Vehicle (ATW-SUV)
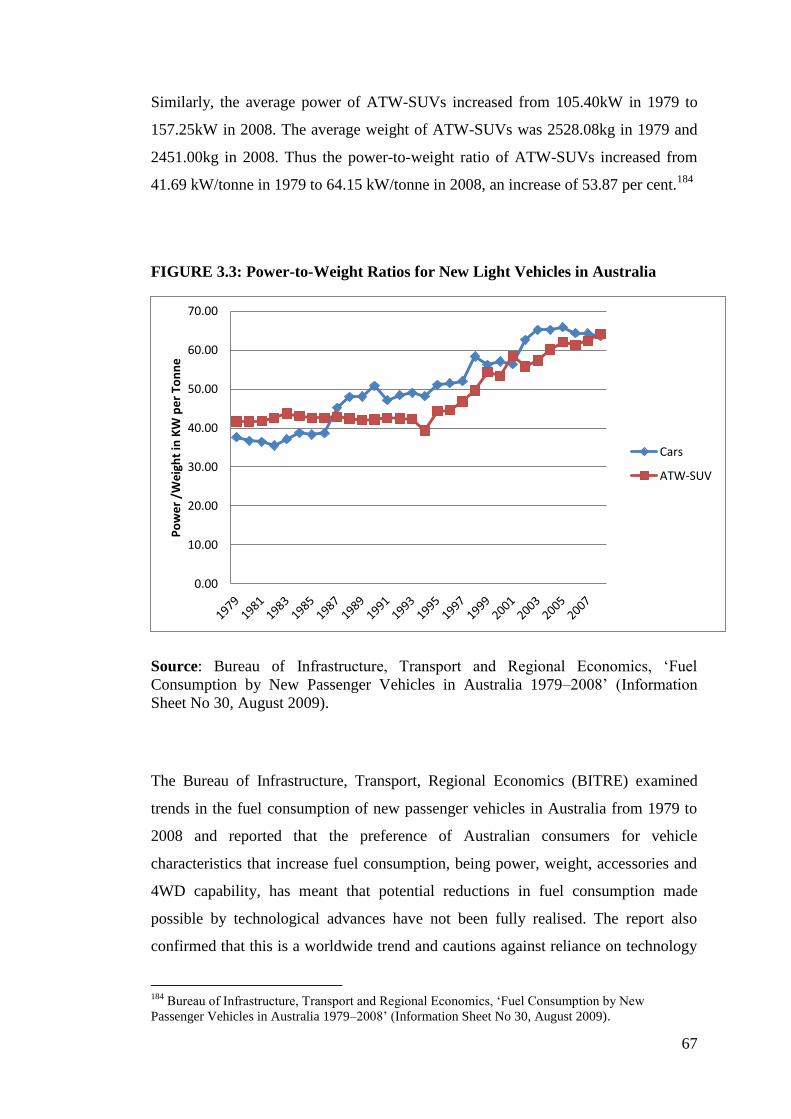
Sales in Australia........................................................................................................ 66
FIGURE 3.3: Power-to-Weight Ratios for New Light Vehicles in Australia ............ 67
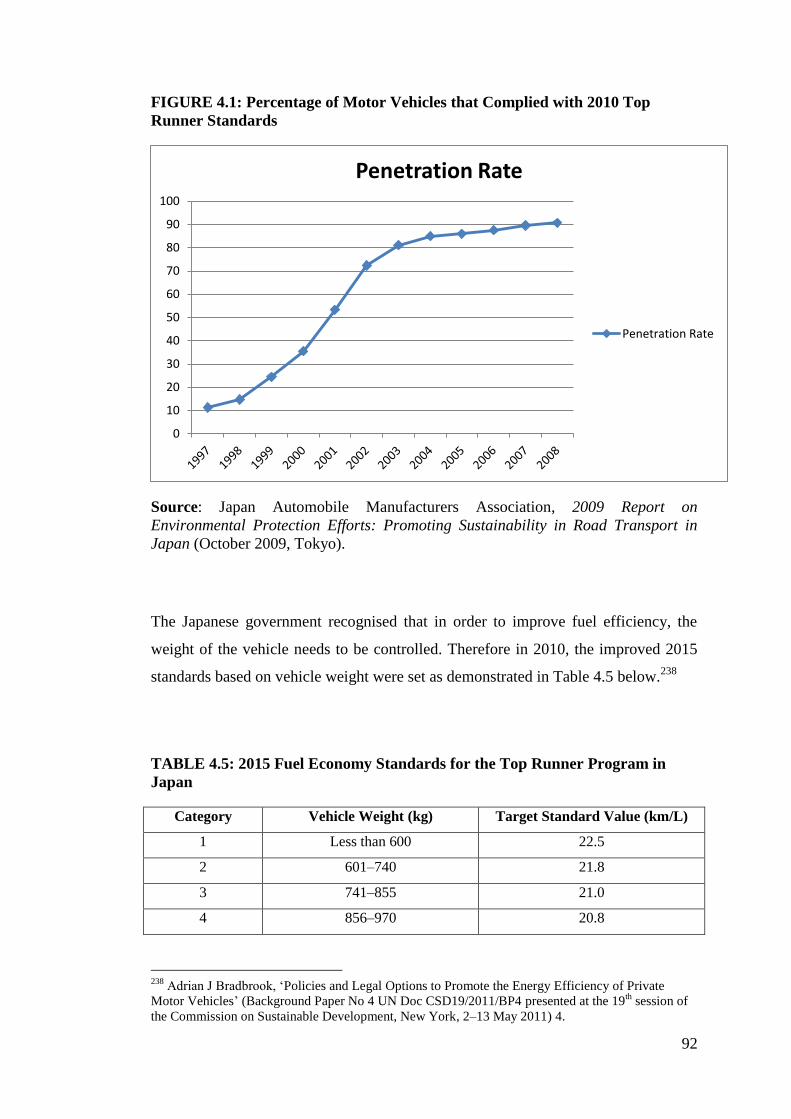
FIGURE 4.1: Percentage of Motor Vehicles that Complied with 2010 Top Runner
Standards .................................................................................................................... 92
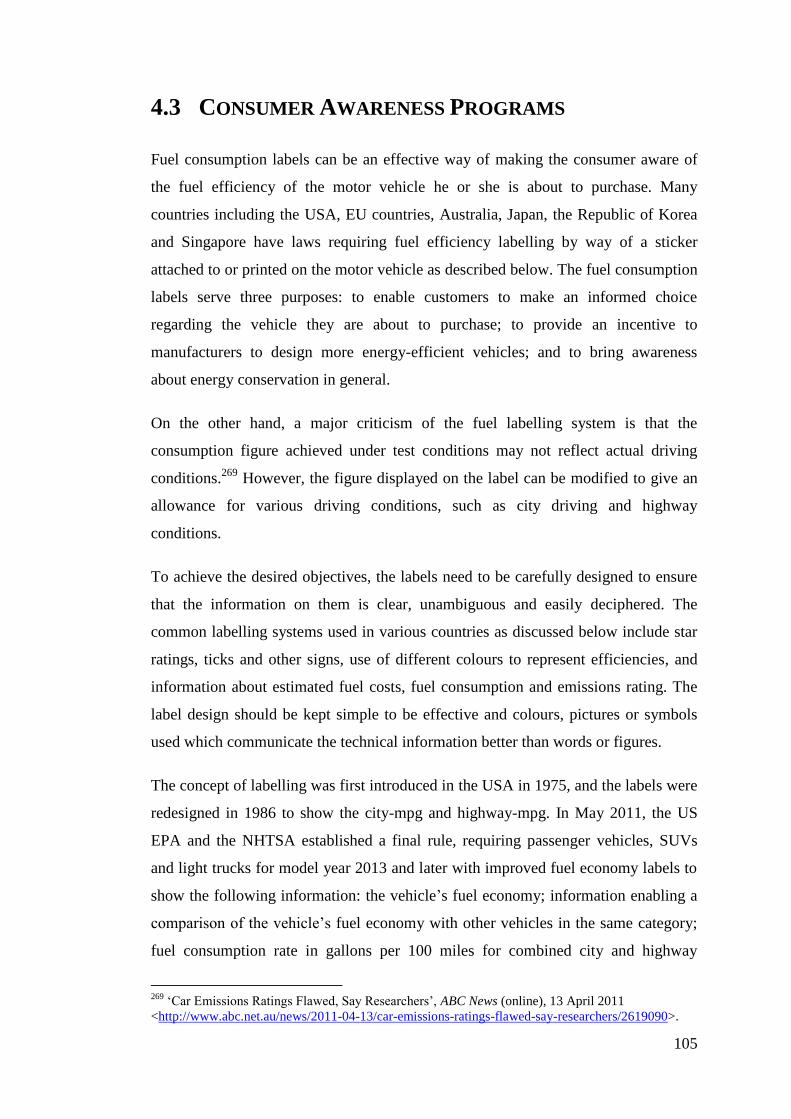
FIGURE 4.2: The US Fuel Economy and Environment Label for a Gasoline Vehicle
with Gas Guzzler Tax............................................................................................... 106
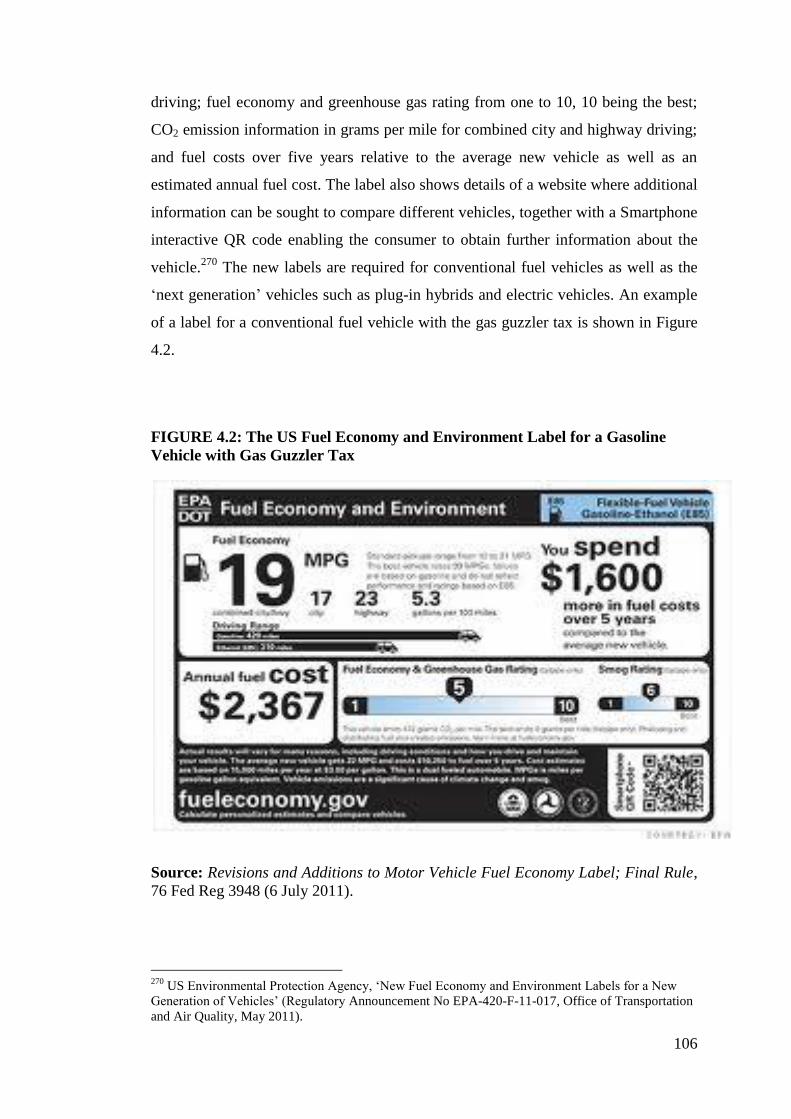
FIGURE 4.3: Japanese Motor Vehicle Label .......................................................... 108
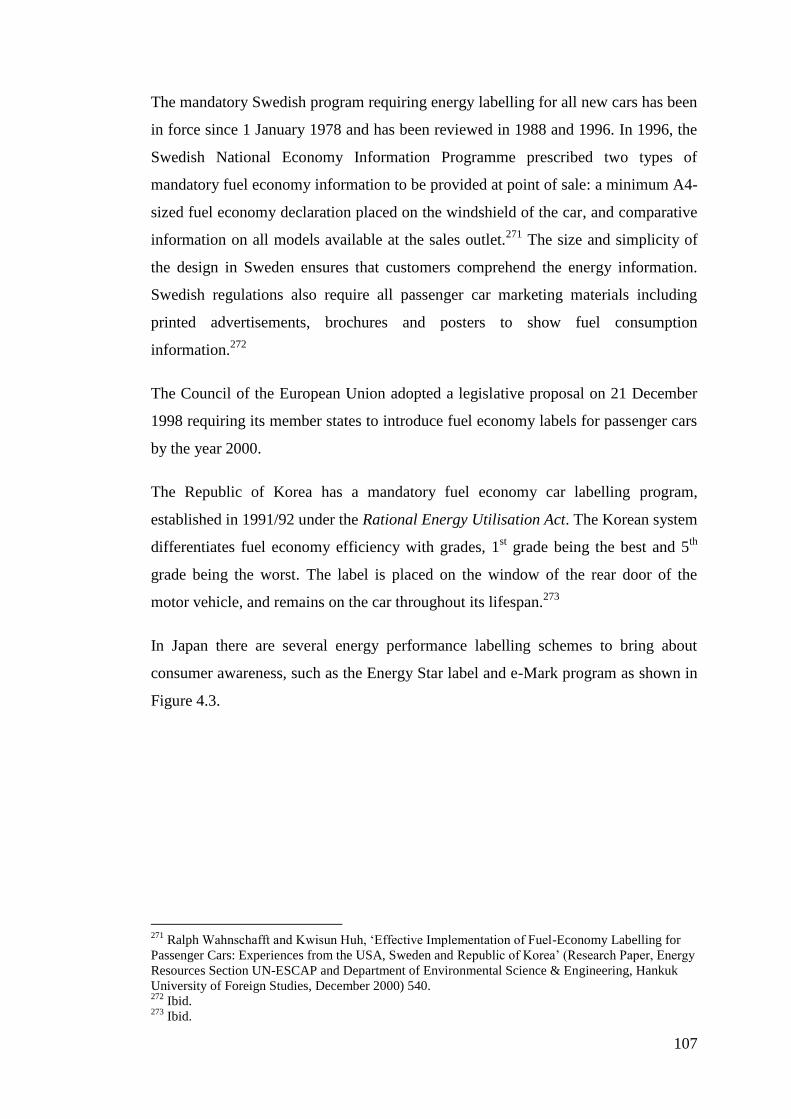
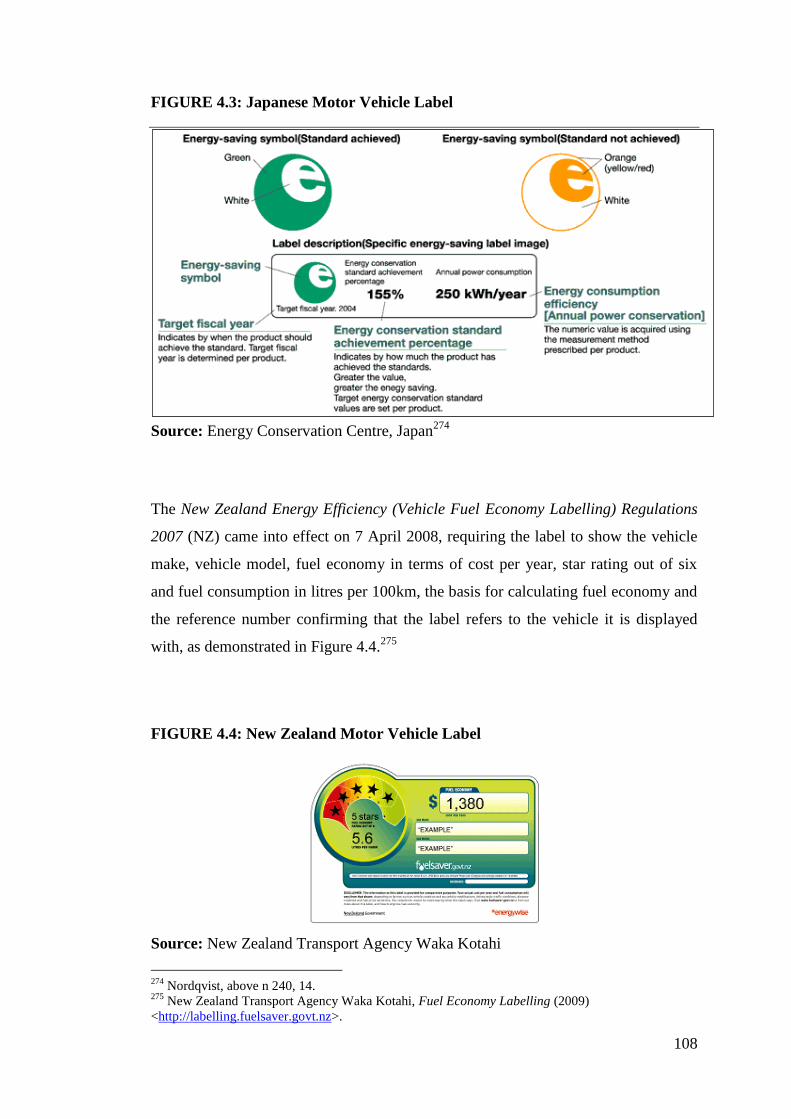
FIGURE 4.4: New Zealand Motor Vehicle Label ................................................... 108
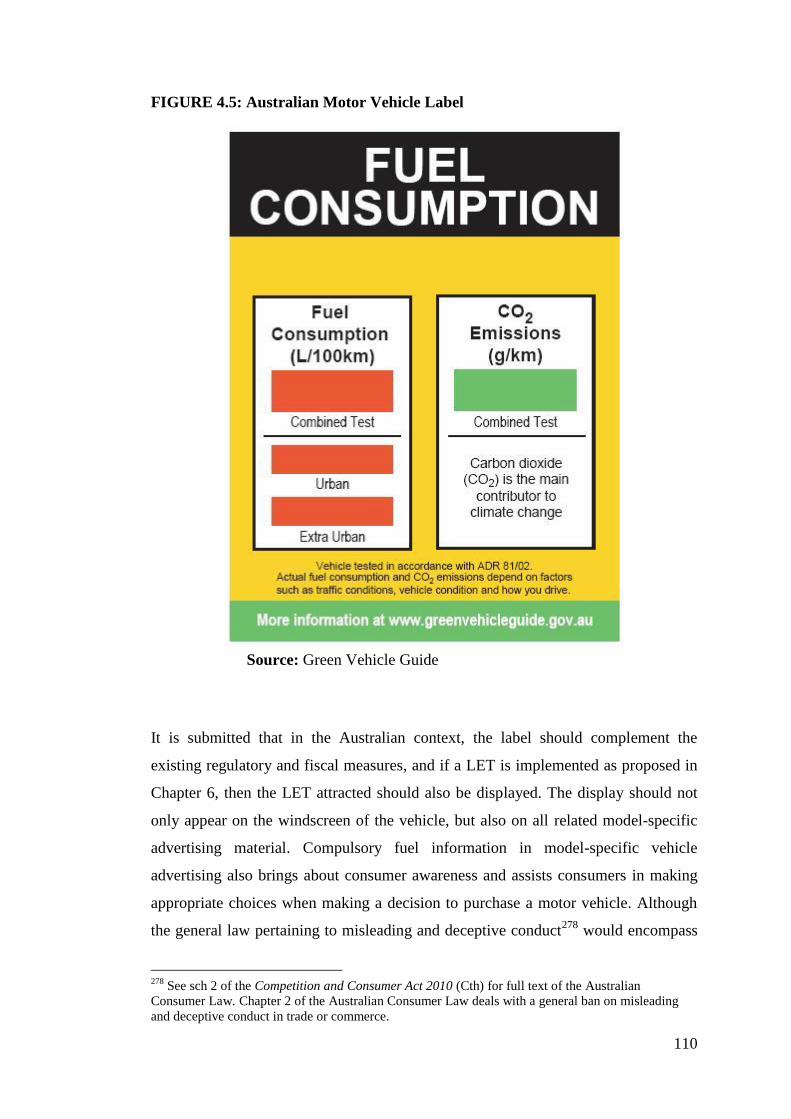
FIGURE 4.5: Australian Motor Vehicle Label ........................................................ 110
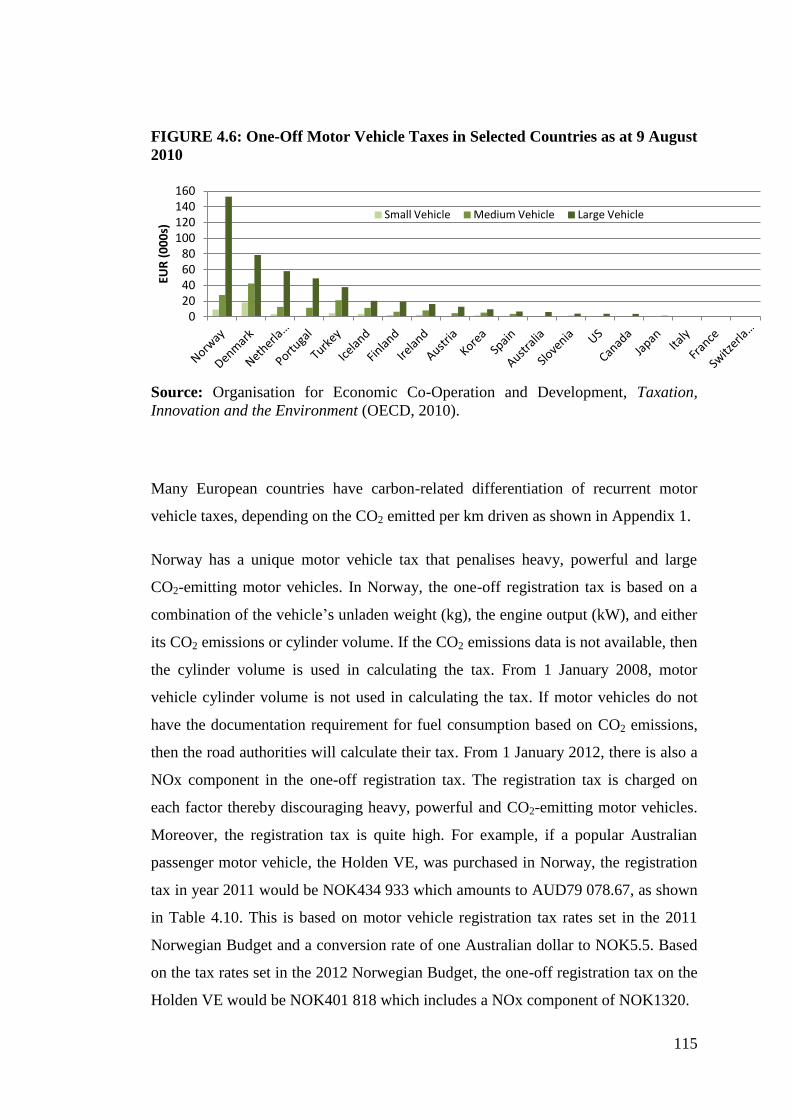
FIGURE 4.6: One-Off Motor Vehicle Taxes in Selected Countries as at 9 August
2010 .......................................................................................................................... 115
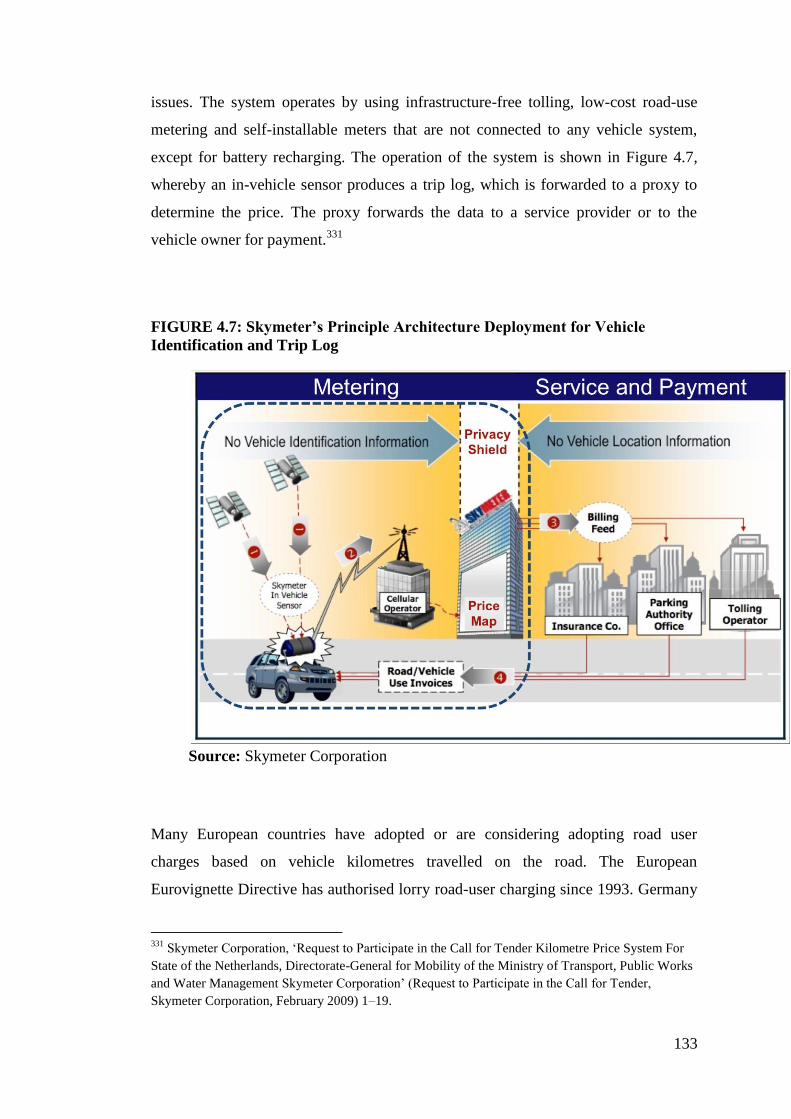
FIGURE 4.7: Skymeter’s Principle Architecture Deployment for Vehicle
Identification and Trip Log ...................................................................................... 133
FIGURE 5.1: Fuel Prices and Taxes in NOK as at 1 July 2008 .............................. 149
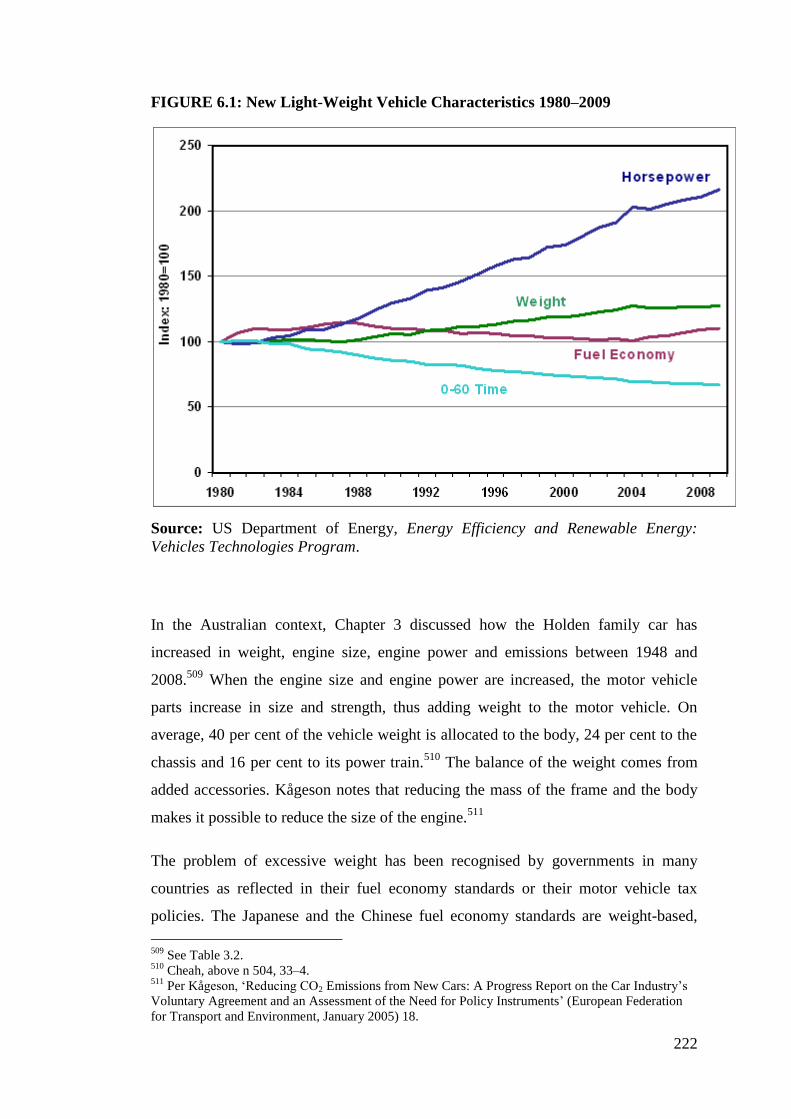
FIGURE 6.1: New Light-Weight Vehicle Characteristics 1980–2009 .................... 222
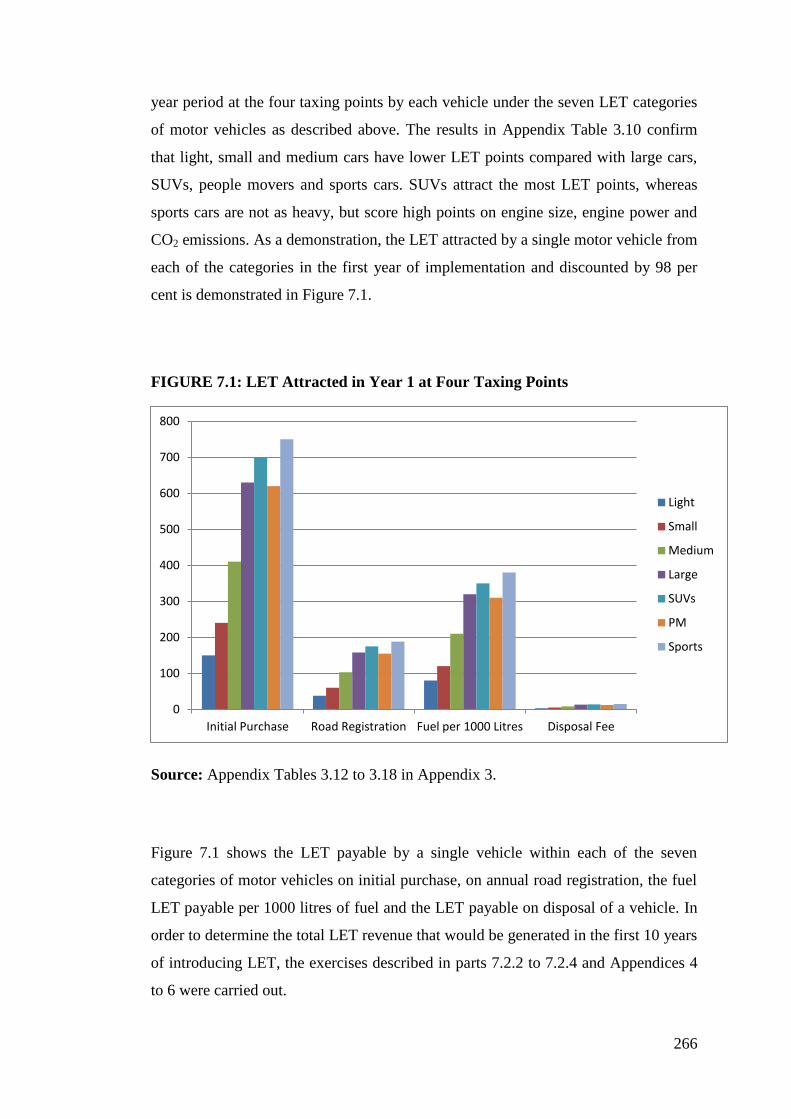
FIGURE 7.1: LET Attracted in Year 1 at Four Taxing Points ................................ 266
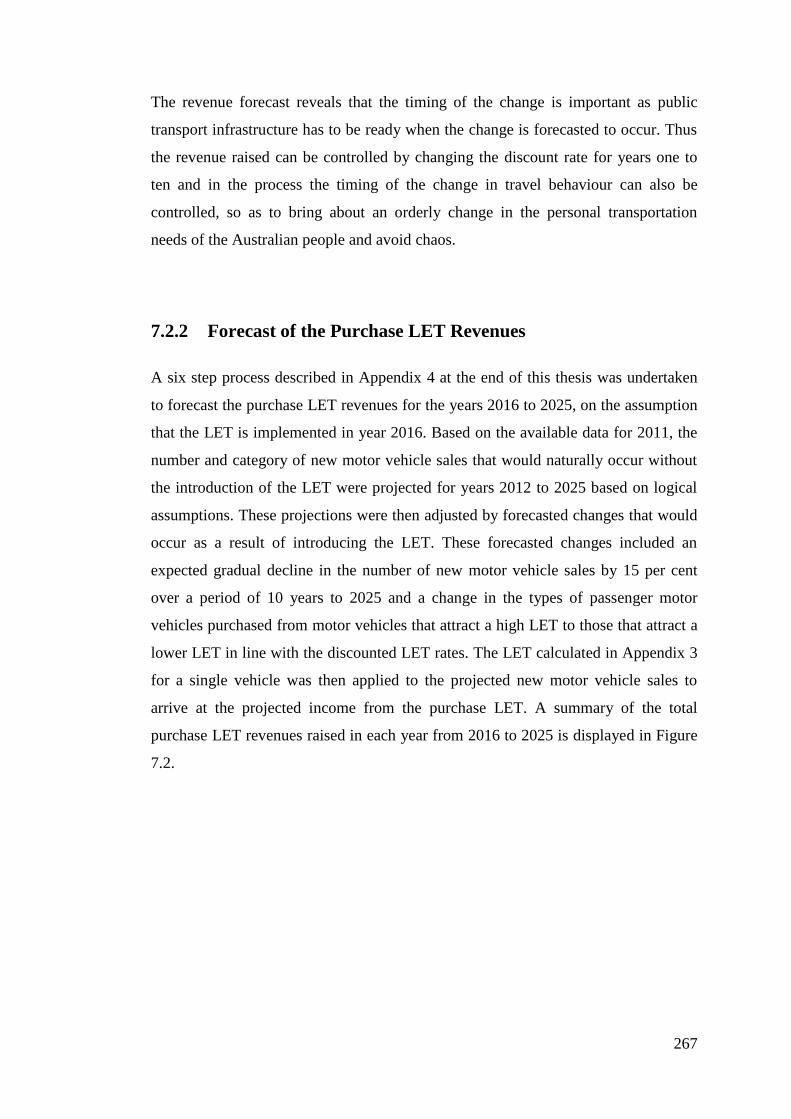
FIGURE 7.2: Total Purchase LET Revenues from Car Sales Data After
Implementation of LET in AUD Billion .................................................................. 268
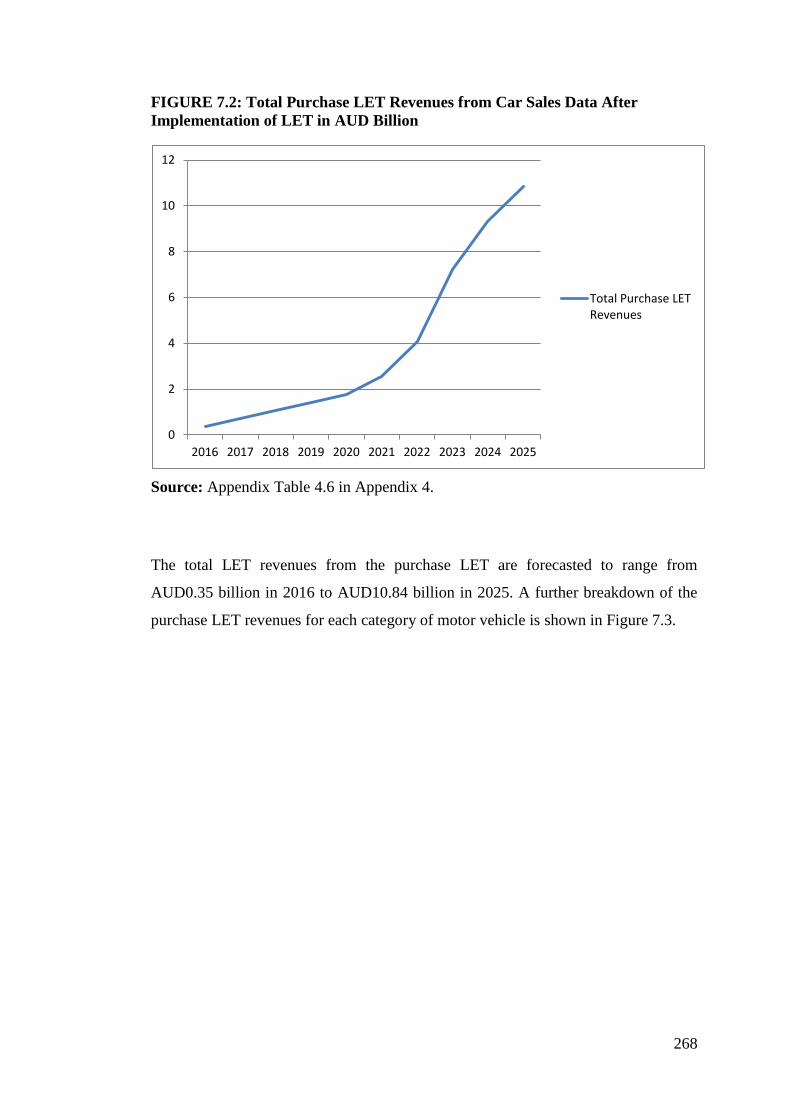
FIGURE 7.3: Purchase LET Revenues for Each Motor Vehicle Category after
Implementation of LET in AUD Billion .................................................................. 269
FIGURE 7.4: Total Forecasted Annual Registration LET Revenues after
Implementation of LET in AUD Billion .................................................................. 270
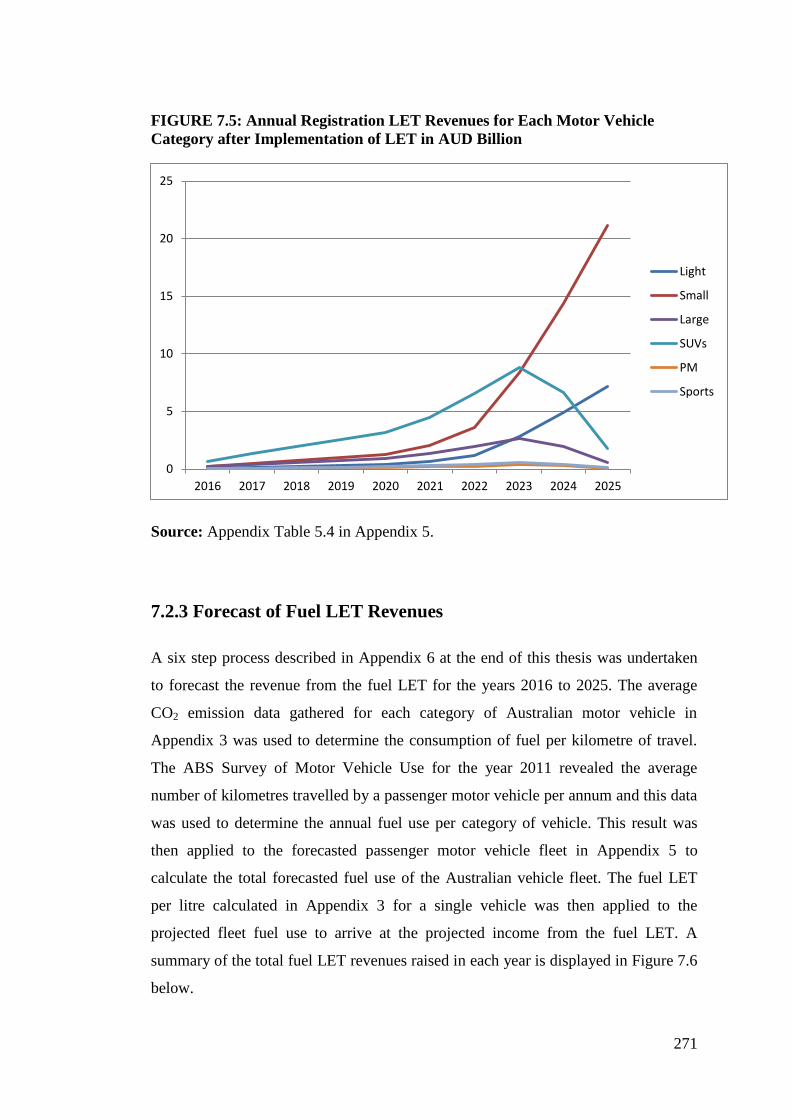
FIGURE 7.5: Annual Registration LET Revenues for Each Motor Vehicle Category
after Implementation of LET in AUD Billion ......................................................... 271
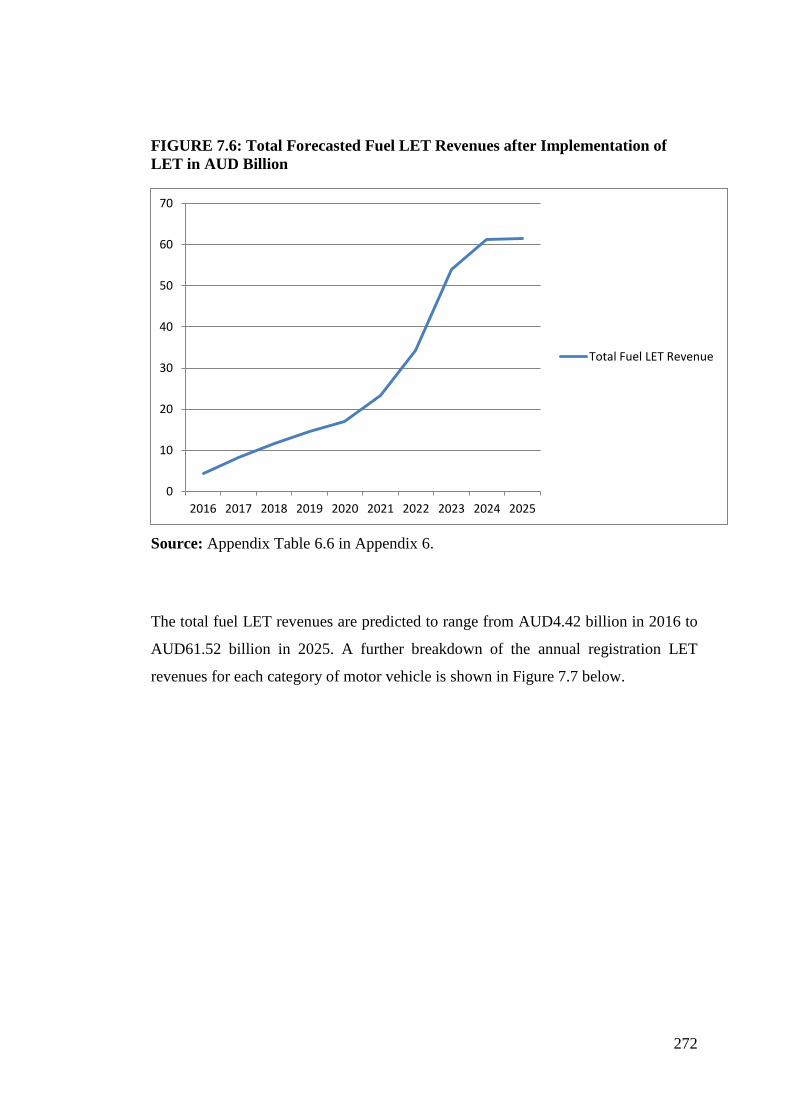
FIGURE 7.6: Total Forecasted Fuel LET Revenues after Implementation of LET in
AUD Billion ............................................................................................................. 272
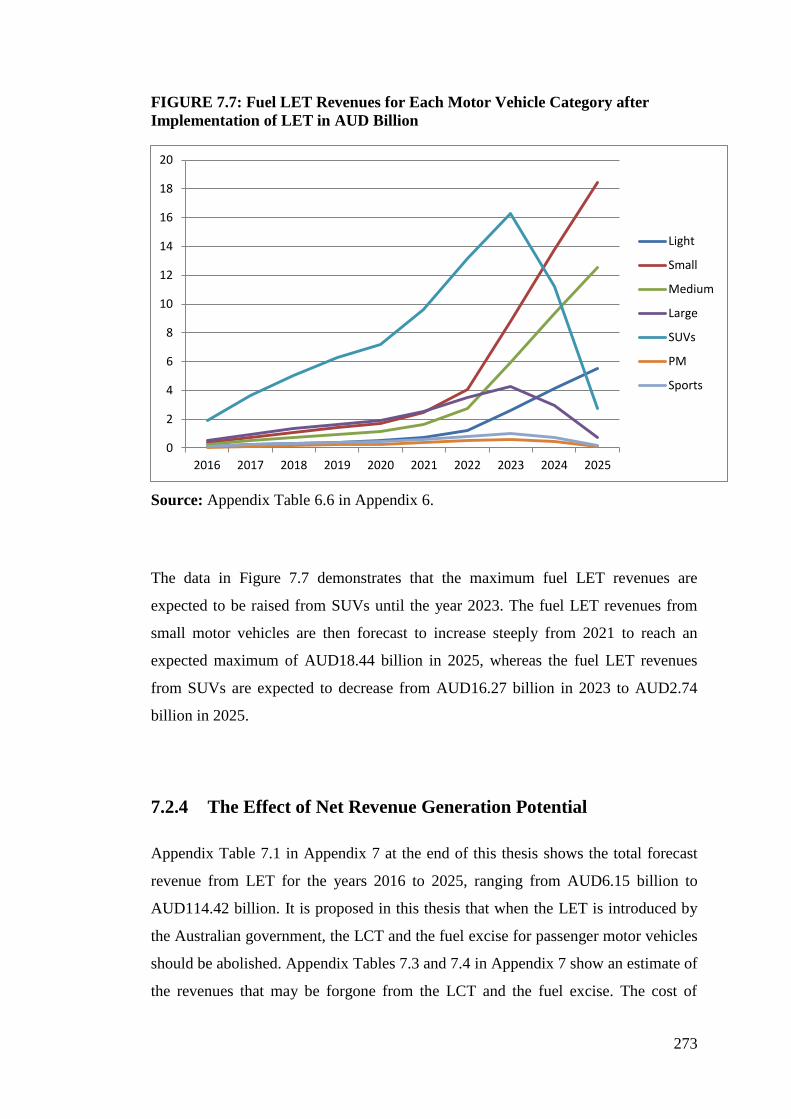
FIGURE 7.7: Fuel LET Revenues for Each Motor Vehicle Category after
Implementation of LET in AUD Billion .................................................................. 273
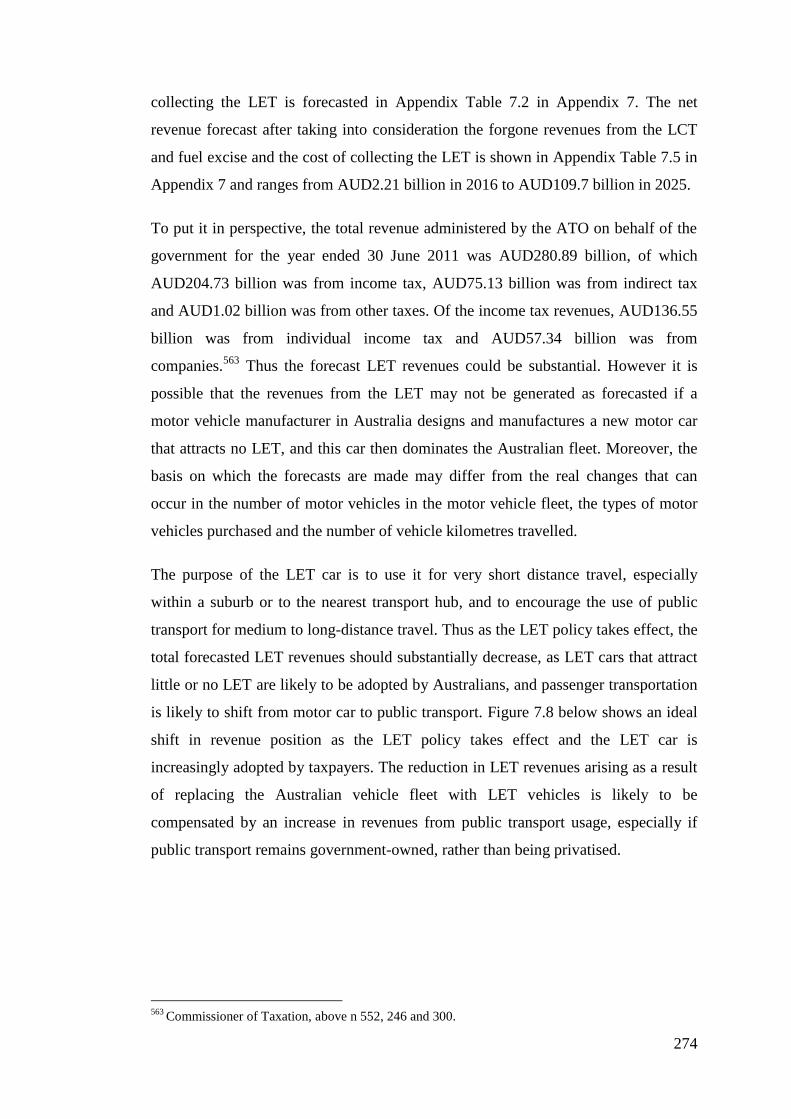
FIGURE 7.8: Forecasted Reduction in LET Revenues With the Adoption of an Ideal
LET Car .................................................................................................................... 275
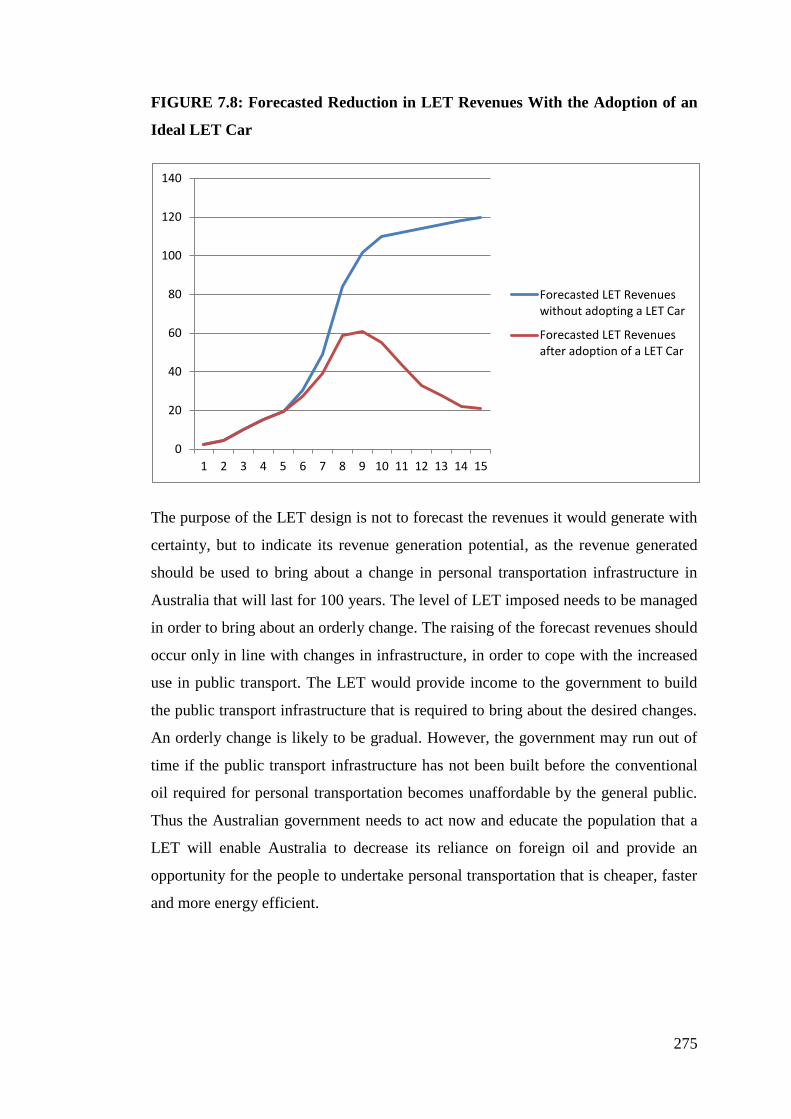
FIGURE 7.9: The Expected Percentage Savings in Oil with the Introduction of the
LET .......................................................................................................................... 276
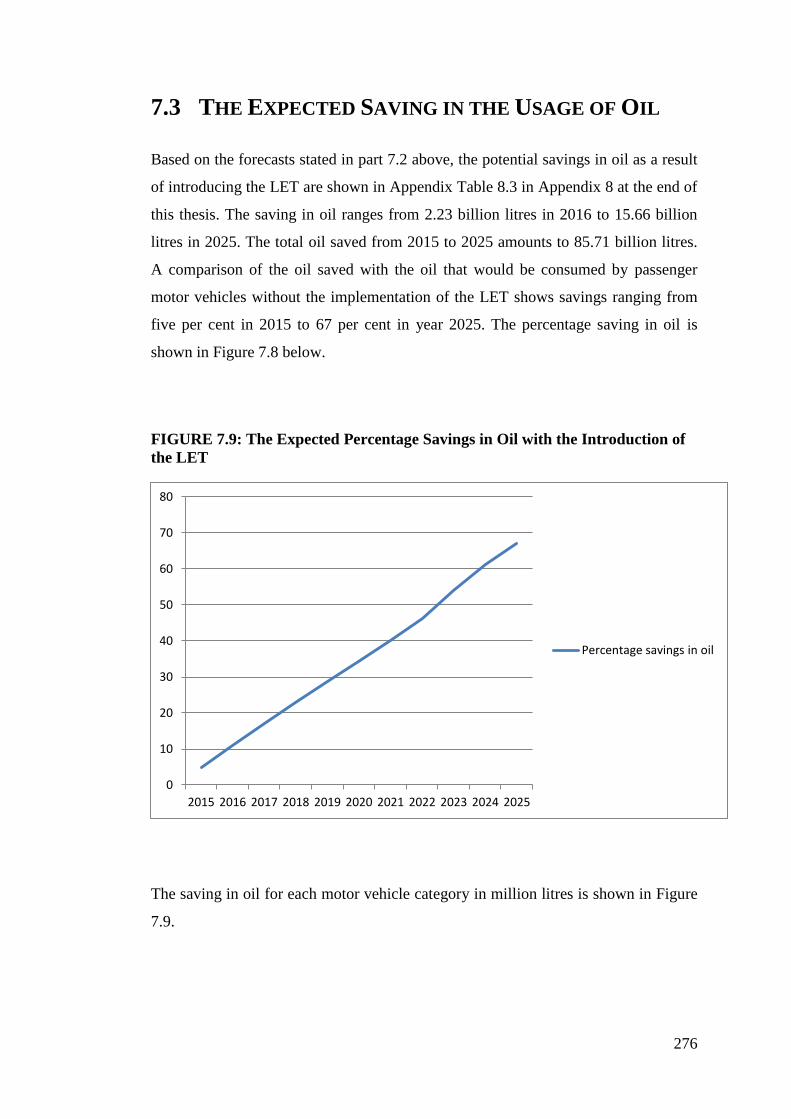
FIGURE 7.10: Savings in Fuel by Vehicle Category from 2015 to 2025 ............... 277
Page 18
xviii
LIST OF ACRONYMS
AASHTO American Association of State Highway and Transportation Officials
ACEA European Automobile Manufacturers’ Association
ADR Australian Design Rules
AID-EE Active Implementation of the European Directive on Energy
Efficiency
ANPR Automatic number plate recognition
API American Petroleum Institute
APK Algemene Periodieke Keuring
ARF Additional Registration Fee
ATO Australian Taxation Office
ATW-SUV All terrain wagon-sports utility vehicle
AVI Audio Video Interleave
BITRE Bureau of Infrastructure, Transport, Regional Economics
CAFC Company Average Fuel Consumption
CAFE Corporate Average Fuel Economy
CAT Compressed air technology
cc Cubic centimetres
CNG Compressed natural gas
COE Certificate of Entitlement
CSIRO Commonwealth Scientific and Industrial Research Organisation
DMV Department of Motor Vehicles
ECU Engine Control Unit
EIA Energy Information Administration
EPA Environmental Protection Agency
EROI Energy return on investment
ESD Ecologically sustainable development
ETAG Electronic Tag
EU European Union
EWG Energy Watch Group
FHWA Federal Highway Administration
GAO General Accounting Office
Gb Billion barrels
GHG Greenhouse gas
Page 19
xix
GM General Motors
GPS Global positioning system
GSM Global standard for mobile telephony
GST Goods and Services Tax
HVO High vehicle occupancy
IEA International Energy Agency
IHS Information Handling Services
JOE Joint Operating Environment
LCT Luxury Car Tax
LET Luxury Energy Tax
LNG Liquefied natural gas
LPG Liquefied petroleum gas
Mb Million barrels
Mbpd Million barrels per day
MOT Ministry of Transport
mpg Miles per gallon
NEDC New European driving cycle
NHTSA National Highway Traffic Safety Administration
NOC Network Operations Centre
NOx Nitrogen oxide
NPRA National Public Road Administration
OBD-II On-Board Diagnostics-II
OBPR Office of Best Practice Regulation
OBU Onboard unit
ODOT Oregon Department of Transport
OGJ Oil and Gas Journal
OPEC Organization of Petroleum Exporting Countries
OSU Oregon State University
PARF Preferential Additional Registration Fee
PJ Petajoule
PM People mover
PPP Polluter-pays principle
PSU Portland State University
RACQ Royal Automobile Club of Queensland
RIS Regulation Impact Statement
Page 20
xx
rpm Revolutions per minute
RST Retail Sales Tax
SUV Sports utility vehicle
TFFC Tax for Fuel Conservation
TPA Technology and Policy Assessment
TPB Theory of Planned Behaviour
URR Ultimate recoverable reserve
VKM Vehicle kilometres
VKT Vehicle kilometres travelled
VMRUF Vehicle mileage road user fee
VMT Vehicle miles travelled
VMTCAR Vehicle Miles Travelled Collected at Retail
WEO World Energy Outlook
WO World Oil
WOF Warrant of Fitness
Page 21
1
CHAPTER 1: INTRODUCTION
1.1 OVERVIEW AND PROBLEM DEFINITION
The world has a finite amount of oil resources and excessive use of a finite resource
will lead to rapid depletion, especially if it is non-renewable. Global oil resources are
non-renewable since the energy from oil cannot be recaptured after it has been used
up. It is a well-known fact that the oil that we are accustomed to using was formed
many millions of years ago.1 The scarcity of oil was initially highlighted by the peak
oil report by Hubert in the USA,2 followed by other government and international
agency reports as discussed in Chapter 2. The impact of the scarcity of oil can be
observed from the energy crisis of the 1970s when the Arab members of the
Organization of Petroleum Exporting Countries (OPEC) implemented an oil
embargo. The embargo led to a significant increase in the price of oil and the
governments of many countries imposed restrictions on motorists to economise on
oil use. Petrol rationing was introduced in many countries with the distribution of
ration books to motorists, leading to long queues at petrol stations.3
This thesis is motivated by the need to preserve the scarce oil resources used by
motorists for their personal transportation. Personal observations of motor vehicles
on Australian roads indicate a trend towards driving large and powerful motor
vehicles. Large four-wheel drive and sport utility vehicles are increasingly common
on Australian roads. Even normal motor cars appear to have increased in size when a
newer model of the same type of vehicle is compared with an older model. This has
brought about the inquiry in this thesis as to whether the government of Australia
bears some responsibility for influencing Australian motorists’ choice of motor
vehicles, in order to reduce oil consumption and preserve this scarce commodity, and
1 Geoscience Australia and ABARE, ‘Australian Energy Resource Assessment’ (Assessment and
Report, Australian Government Department of Resources, Energy and Tourism, 2010) Appendix F. 2 Clifford J Wirth, ‘Peak Oil: Alternatives, Renewables, and Impacts’ (2008)
<http://greatchange.org/ov-clifford,PeakOilAnalysisOctober6-2007.pdf> 5. 3 David Parish, ‘The 1973 – 1975 Energy Crisis and Its Impact on Transport’ (Report Number 09/107,
Royal Automobile Club Foundation for Motoring, October 2009).
Page 22
2
whether this responsibility is being achieved within the current regulatory and tax
environment.
The thesis first explores whether the use of available oil resources in Australia needs
to be curtailed, and if so, why oil use reduction should focus on passenger motor
vehicles. The answer to these questions defines the research problem requiring a
solution. The solution is explored by examining the current tax and regulatory
measures that are in place in Australia and determining whether the current measures
have an impact upon the choice and usage of motor vehicles for personal
transportation in Australia. It is argued in this thesis that the current tax and
regulatory measures, including motor vehicle taxation, road user charges, excise
taxes on fuel and motor vehicle regulations have not been designed with a focus on
sustainability of oil or emissions control, and there is a need in Australia for specific
tax measures to influence Australian people to firstly choose a personal
transportation vehicle that consumes less oil, and secondly to drive less. This thesis
proposes a framework within which specific tax measures can be implemented with
the aim of reducing the oil use for personal transportation vehicles.
1.2 RESEARCH BACKGROUND AND CONTEXT
Over the last century the demand for large and powerful passenger vehicles has
increased as they have become more than just a means of transportation. Passenger
motor vehicles are often chosen as a symbol of financial success and social status,
with little regard to their fuel consumption or emissions. From being a luxury in the
early part of the 20th
century, passenger motor vehicles have become a necessity in
Australia. However, if oil becomes scarcer, this necessity may once again become a
luxury, disrupting the living standards and lifestyle to which Australians are
accustomed, unless the Australian government takes responsibility in making
appropriate policy decisions.
In September 2008, the Australian Transport Council released a public discussion
paper entitled ‘Vehicle Fuel Efficiency: Potential Measures to Encourage the Uptake
Page 23
3
of More Fuel Efficient, Low Carbon Emission Vehicles’4 and noted that engine
technology in terms of fuel consumption per power output has improved
substantially and there has been an improvement in fuel efficiency in the new
passenger vehicle fleet. However the discussion paper states that ‘potential fuel
savings across the whole light vehicle fleet have been offset by increases in vehicle
power, size and weight, by the strong growth in sales of four wheel drive sports
utility vehicles (SUVs), and increases in the fuel consumption of light commercial
vehicles.’5 The same conclusion was also drawn by the Bureau of Infrastructure,
Transport, Regional Development and Local Government (BITRE) study of the
trends in new passenger vehicle fuel consumption in Australia from 1979 to 2008.6
Studies such as these show that there is a need to reduce the power and weight of
vehicles driven on Australian roads in order to conserve oil.
The trend towards driving heavy and powerful private vehicles comes at a
tremendous cost to our environment in terms of depleting the limited oil resources
and increasing emissions. This cost is not only borne by the people who drive
vehicles, but by all humankind. The internal combustion engine was invented with
the intention of conquering distance through increasing the speed by which people
and goods could be transported. However, it must be questioned whether such weight
and horsepower are necessary in a motor vehicle used to carry us from home to work
or from one place to another. And if people wish to drive motor vehicles with such
weight and power, then the next question is whether they should be deterred from
making this choice through government regulations or tax policy.
The dream of a passenger motor vehicle as we know it today commenced in 1896,
when Henry Ford constructed his first horseless carriage, a quadricycle. In 1903, he
proclaimed that he would build a car for the great multitude, and in October 1908, he
did so by producing the ‘Model T’. Henry Ford consequently revolutionised the
vehicle manufacturing process and by 1914, his Michigan plant could turn out a
complete chassis every 93 minutes, compared with 728 minutes previously. Later,
4 Australian Transport Council and Environment Protection and Heritage Council Fuel Efficiency
Working Group, ‘Vehicle Fuel Efficiency — Potential Measures to Encourage the Uptake of More
Fuel Efficient, Low Carbon Emission Vehicles’ (Public Discussion Paper, Commonwealth of
Australia, 2008). 5 Ibid 16.
6 Ibid 6–7.
Page 24
4
the use of a constantly-moving assembly line and subdivision of labour allowed the
production of Model T every 24 seconds.7 As a result of this innovation, vehicles
became affordable and facilitated greater mobility. Today, like other industrialised
nations, Australia is a major consumer of vehicles.
The vehicle industry influenced Australian urbanisation policy,8 and combined with
inadequate public transport systems, the use of motor vehicles for private
transportation dramatically increased from 100 cars per 1000 persons in 1945 to
almost 500 cars per 1000 persons in 1971. Correspondingly, both oil use and
emissions have increased, and it is now important to consider ways of reducing the
reliance on oil and curbing motor vehicle emissions. Although there has been a
recent trend towards increased public transport patronage and a consequent reduction
in car use, both in Australia and in other countries,9 a further increase in public
transport usage in Australian cities is required to overcome motor vehicle
dependence.10
The purpose of this research is to examine tax and other regulatory measures that the
Australian government could introduce in order to reduce motor vehicle oil
consumption by changing driver behaviour in the choice and usage of passenger
motor vehicles. Over the last two to three decades, the need for legislative
implementation of financial mechanisms to improve motor vehicle fuel efficiency in
Australia has been recognised due to the extreme dependence of Australian society
on motor vehicles for personal transportation. In their 1998 article, ‘Legislative
Implementation of Mechanisms to Improve Motor Vehicle Fuel Efficiency’
published in the Melbourne University Law Review, Adrian Bradbrook and
Alexandra Wawryk state that the Australian Government could introduce financial
and economic measures that would encourage vehicle manufacturers to produce
7 Mary Bellis, History of Transportation (2008) About.com: Inventors
<http://inventors.about.com/library/inventors/bl_history_of_transportation.htm>. 8 See Philip Laird et al, Back on Track: Rethinking Transport Policy in Australia and New Zealand
(University of New South Wales Press, 2001); see also Major Cities Unit, ‘Our Cities: The Challenge
of Change’ (Background and Research Paper, Department of Infrastructure and Transport, 2010) 17–
18. 9 Garry Glazebrook, ‘The Scope for Enhancing Public Transport in Australian Capital Cities’ (18 June
2008) International Transport Forum
<www.internationaltransportforum.org/2009/pdf/AUS_Glazebrook.pdf>. 10
Peter Newman, Jeff Kenworthy and Garry Glazebrook, ‘How to Create Exponential Decline in Car
Use in Australian Cities’ (2008) 45(3) Australian Planner 17. See also Todd Litman, ‘The Future Isn’t
What it Used to Be’ (2012) Victoria Transport Policy Institute <http://www.vtpi.org/future.pdf>.
Page 25
5
more fuel-efficient vehicles and to encourage the public to purchase such vehicles.11
The argument of this thesis is that the Australian government should introduce a new
motor vehicle taxation framework in the form of a ‘Luxury Energy Tax’ (LET), as a
partial response to the problem of oil scarcity in Australia.
There are two main reasons for the introduction of a LET. The first is that the earth
has a finite amount of known oil and extractions may already have reached peak
production. In 1956, US geologist M King Hubbert calculated that oil production in
the US ‘lower 48’ states would peak in 1971. Hubbert’s analysis proved correct,
coming to pass in 1970, one year earlier than he had suggested.12
After Hubbert, two
senior geologists, Colin Campbell and Jean Laherrère, published a paper titled ‘The
End of Cheap Oil’, stating that world oil fields could also peak, just as individual
fields.13
Peak oil is often misunderstood as the point at which oil runs out, however this is not
the case. Peak oil is the point where further expansion of oil production becomes
impossible, because new flows are fully offset by production declines or depletion.
When the oil field reaches maturity the production volumes decline. The cost of
extraction far outweighs the return on volumes of oil extracted and as a result the oil
field is abandoned.14
It is difficult to extract oil from a well in the second half of the
well’s life because pressures are lower, water contamination is more likely and the
remaining oil is found in increasingly hard to reach parts of the reservoir system.15
A number of reports by various governments and international agencies are discussed
in Chapter 2 and they indicate that many countries, including Australia, have already
reached peak production. The question of whether Australia has sufficient oil to meet
demand and whether it can rely on the supply of oil from other countries is also
discussed in Chapter 2, along with the reported estimated remaining proven reserves
11
Adrian Bradbrook and Alexandra Wawryk, ‘Legislative Implementation of Financial Mechanisms
to Improve Motor Vehicle Fuel efficiency’ (1998) 22(3) Melbourne Law Review 537. 12
Cutler Cleveland, Nuclear Energy and the Fossil Fuels (historical) (1 June 2010) Encyclopedia of
Earth <http://www.eoearth.org/article/Nuclear_Energy_and_the_Fossil_Fuels_(historical)>. Original
work is cited as Marion King Hubbert, ‘Nuclear Energy and the Fossil Fuels’ (Publication No 95,
Shell Development Company, Exploration and Production Research Division, 8 March 1956). 13
Colin J Campbell and Jean H Laherrère, ‘The End of Cheap Oil’ (1998) March Scientific American
79. 14
Global Witness, ‘Heads in the Sand? — Governments Ignore the Oil Supply Crunch and Threaten
the Climate’ (Report, Global Witness, 20 October 2009) 30. 15
Richard Gilbert, ‘Hamilton: The Electric City’ (2006) City of Hamilton
<http://richardgilbert.ca/Files/2006/Hamilton--Electric%20City%20(Web).pdf> 9.
Page 26
6
of oil forecast by various government and international agencies. The Australian
government considers that Australia has limited crude oil resources and only enough
to last 10 years.16
It also states that world oil reserves were estimated at some 1400
billion barrels17
at the end of 2008. This is equivalent to around 42 years of supply at
current production rates.18
The Energy Watch Group’s 2008 report estimates that the world oil proved reserves
amount to approximately 1255 billion barrels. The estimated world consumption in
2005 was 30.3 billion barrels, increasing every year.19
The Energy Information
Administration (EIA), a US government agency, has projected that oil will continue
to be a major source of energy in the coming decades, with consumption of about
118 million barrels per day by 2030, totalling about 43 billion barrels per year.20
This
could mean that within the next 30 to 50 years, there may not be enough supplies to
satisfy the demand for oil.
As already mentioned, the impact on life of an insufficient oil supply can be gleaned
by looking back at the time of the oil embargo in 1973 when OPEC stopped exports
of oil to the US and other western nations. The embargo produced chaos in many
countries and governments targeted motorists to reduce oil consumption, imposing
oil rationing and reduction in speed limits in order to conserve oil.21
This strongly
suggests that Australia should make changes to societal behaviour in order to
promote the recognition that oil is non-renewable and its supply is not guaranteed; its
use should be curtailed by implementing appropriate government policies.
It is submitted that the first place to start is by cutting down on passenger motor
vehicle oil use by encouraging people to drive less, and to drive lighter and less
powerful vehicles. This is the second reason for the need to introduce a LET in
Australia, and is further discussed in Chapter 3 of this research. In Australia, 34 per
16
Geoscience Australia and ABARE, above n 1, 4. 17
One barrel is equivalent to 42 US gallons or 159 litres. 18
Geoscience Australia and ABARE, above n 1, 41. 19
Jörg Schindler and Werner Zittel, ‘Crude Oil — The Supply Outlook’ (Report, Energy Watch
Group, 2008) <http://www.energywatchgroup.org/fileadmin/global/pdf/2008-
02_EWG_Oil_Report_updated.pdf>. 20
US Government Accountability Office, ‘Report to Congressional Requesters: Crude Oil:
Uncertainty about Future Oil Supply Makes it Important to Develop a Strategy for Addressing a Peak
and Decline in Oil Production’ (Report No GAO-07-283, 2007)
<http://www.gao.gov/new.items/d07283.pdf>. 21
David Parish, ‘The 1973–1975 Energy Crisis and its Impact on Transport’ (Report Number 09/107,
Royal Automobile Club Foundation for Motoring, October 2009) 4–6.
Page 27
7
cent of the national fuel energy consumption is from petroleum products and the
largest industry consumer of energy is transportation.22
Between 70 to 80 per cent of
the energy consumption by the transportation sector in Australia is related to road
transport vehicles, and passenger vehicles accounted for 77.2 per cent of all vehicles
registered in Australia at 31 March 2008.23
In Australia, there were 15.3 million motor vehicles registered at 31 March 2008, of
which 11.8 million were passenger vehicles. The average age of passenger vehicles
in Australia was 9.7 years at 31 March 2008.24
Thus more than a decade of planning
would be required to achieve a significant improvement in overall fuel efficiency.
This suggests that the introduction of laws and regulations such as a LET should
occur sooner rather than later.
The introduction of a LET will also assist in reducing greenhouse gas (GHG)
emissions. Many scientists are warning that without a reduction of GHG emissions, it
will be impossible to avoid irreparable damage to the planet’s habitability for human
civilisation. A climate crisis demands immediate action to sharply reduce carbon
dioxide emissions worldwide, in order to turn down the earth’s thermostat and avert
a catastrophe.25
Most developed countries have adopted the Kyoto recommendations
in reducing GHG emissions. By implementing the Kyoto recommendations,
Australia has accepted the challenge of reducing GHG emissions, and to achieve this,
the Australian government has recently introduced a carbon pricing mechanism in
the Clean Energy Act 2011 (Cth) and related legislation. However, fuels used for
personal transportation have been excluded from the mechanism.26
Thus the LET
proposed in this thesis aims to help reduce GHG emissions arising from the use of
transportation fuels in passenger motor vehicles.
22
Australian Bureau of Agricultural and Resource Economics and Sciences, ‘Energy in Australia
2010’ (Report, Department of Resources Energy and Tourism, 16 April 2010) 12–15. 23
Australian Bureau of Statistics, Motor Vehicle Census, Australia, 31 Mar 2009 (Catalogue No
9309.0, 31 March 2009). 24
Ibid. 25
Al Gore, ‘Former Vice President Gore Gives a Major Policy Address at the NYU School of Law’
(Speech delivered at New York University School of Law, New York, 18 September 2006) 26
Explanatory Memorandum, Clean Energy Bill 2011 (Cth) 12.
Page 28
8
The Australian government’s report on transport emission projections27
states that
passenger cars are the largest source of emissions in the transport sector, accounting
for almost half of the transport emissions in 2009. The increase in emissions
reportedly relates to total passenger vehicle kilometres travelled and the fuel
efficiency of the vehicle fleet.28
The report also states that the size and technology of
future new cars is highly uncertain, as it depends on consumer choices.29
In response
to these comments, the Australian government has revealed its intention to introduce
mandatory carbon dioxide emission standards that will apply to new light vehicles
from 2015, and a discussion paper was released in 2011 to elicit views from
interested parties on key issues that would need to be addressed in the development
of the standards.30
There are other reasons for introducing a LET, including enhancements to urban
amenity, encouragement of a more active lifestyle, health benefits arising from traffic
reduction, decreasing the incidence of automobile accidents, and economic benefits
arising from reduced car dependence, but this thesis will focus on oil scarcity. It will
be argued that it is necessary to consider a LET to change people’s behaviour and
their perception of large vehicles, and to encourage people to drive vehicles that use
less fuel and to drive less, thereby conserving oil and reducing emissions. The issue
of climate change is well covered in the literature and is a major focus of public
policy. However the looming global scarcity of oil is not so well covered. Thus this
thesis will focus on the rationale of oil scarcity as the basis for considering a LET on
vehicles.
There are two ways of dealing with change. One is through voluntary measures to
raise awareness, and improve availability of information and support for people to try
alternative modes of transportation instead of driving their vehicles. The other is a
strict compulsory approach, which could include appropriate tax measures. The
current approach adopted by the Australian government is the voluntary approach,
which is reflected in projects such as TravelSmart, in all states in Australia. For
27
Department of Climate Change and Energy Efficiency, ‘Transport Emission Projections 2010’
(Report, Commonwealth of Australia, 2010) 2. 28
Ibid 9. 29
Ibid 11. 30
Department of Infrastructure and Transport, ‘Light Vehicle CO2 Emission Standards for Australia:
Key Issues’ (Discussion Paper, Commonwealth of Australia, 2011).
Page 29
9
example, in Western Australia, TravelSmart Household is a personalised travel
service to help the community make better use of available travel options by
replacing car trips with walking, cycling or using public transport.31
This thesis explores why compulsory means such as taxation may be a more effective
tool to change the way personal transportation is perceived. The imposition of a
specific tax can also address the problematic issue of transport demand
management.32
As early as the 1920s, economists applied road pricing to deal with
the external costs of transportation, such as congestion, accidents, risk, noise and
emissions.33
Many countries use taxation as a means to address transport demand
management.
Singapore has a vehicle quota system that was implemented on 1 May 1990, and
which restricts the number of vehicles on Singaporean roads.34
The Dutch
government approved a plan to replace their transportation taxes with a system that
charges drivers based on how much they drive. With technology known as
Mobimiles, charges were to be tallied for each car and billed at regular intervals.35
In
2003, the Greater London Council in England introduced a congestion charge for
driving on certain roads in London.36
Since 2000, the Swiss government has required
all Swiss trucks to install an onboard unit (OBU) and imposes road usage fees using
GPS technology.
Taxation, combined with other regulatory rules, can be effective in changing
behaviour. An example is smoking, where the government is passing a message to
the community by banning smoking in public places and imposing excise duties on
31
Australian Greenhouse Office, TravelSmart Snapshots (2005) Department of the Environment and
Heritage <http://www.environment.gov.au/settlements/transport/publications/travelsmart-
snapshots.html>. 32
Transport demand management consists of a group of factors generating the total volume of travel
and includes the travel undertaken, the trip length, the mode used and vehicle occupancy. See Stephen
Potter, ‘Sustainability, Energy Conservation and Personal Transport’ in Warren J (ed), Managing
Transport Energy (Oxford University Press, 2007) 9. 33
See A C Pigou, The Economics of Welfare (Macmillan, 1920) in F H Knight, ‘Some Fallacies in the
Interpretation of Social Cost’ (1924) 38 Quarterly Journal of Economics 582. 34
Lew Yii Der and Leong Wai Yan, ‘Managing Congestion in Singapore — A Behavioural
Economics Perspective’ (2009) May Journeys17. 35
Ministry of Transport, Public Works and Water Management, ‘A Different Way of Paying for Road
Use Impacts on Traffic, Environment & Safety, Technology, Organisation, Enforcement and Costs
Management Summaries’ (Management Summaries, Ministry of Transport, Public Works and Water
Management, March 2005) 20. 36
Transport of London, Congestion Charge, How it Works
<http://www.tfl.gov.uk/roadusers/congestioncharging/6718.aspx>.
Page 30
10
cigarettes. By introducing the Clean Energy Act 2011 (Cth), the Australian
government is showing its support of behaviour-changing taxation, and economists
have urged governments to make more use of the taxation of ‘bads’, such as
pollution, traffic congestion and anti-social consumption, as opposed to ‘goods’.37
It
has been argued that if consumers can be convinced of the link between
environmental disaster and non-renewable energy sources, drivers of heavy and fuel-
guzzling vehicles will be shunned and fuel taxes will be viewed as an acceptable
‘evil’.38
This thesis submits that there is a need for a tax that will promote a change in driver
behaviour towards using lighter and less powerful vehicles, therefore reducing
emissions and reducing dependence on foreign oil. A specific motor vehicle tax
framework to reduce the consumption of oil may be an option, as canvassed by
Pigou.39
The introduction of a LET may influence people both to choose personal
transportation vehicles that consume less fuel, and to drive less. Most consumers
only change their behaviour when there is a financial incentive to do so.
In this thesis a case is made for the introduction of tax measures in order to lead to a
new way of thinking about oil management. The tax would relate to vehicles and
their use, and not where the vehicles are manufactured. A new way of thinking is
required as it takes millions of years for our planet to produce oil, but it takes an
instant to burn it, and once burnt, it is irrecoverable. The tax measures proposed in
this thesis are therefore evaluated not only for their revenue-raising capacity, but also
the savings in oil they can achieve. They are also evaluated for the potential for
change in human behaviour using theories such as the theory of planned behaviour,40
and are examined in light of the generally accepted tax policy principles first
enunciated by Adam Smith in 1776: that a tax should be certain and simple to
37
Alan Mitchell, ‘Trouble Taxing Bad Behaviour’, Australian Financial Review (Melbourne), 17
October 2011, 23. 38
Roberta F Mann and Mona L Hymel, ‘Getting Into the Act: Enticing the Consumer to Become
“Green” Through Tax Incentives’ (2006) 36 Environmental Law Reporter 10419. 39
Arthur C Pigou, The Economics of Welfare (Macmillan and Co, 1920) in John Freebairn,
‘Environmental Taxation and its Possible Application in Australia’ (Paper prepared for the Treasury,
Canberra, May 2009). 40
See Icek Ajzen, ‘The Theory of Planned Behavior’ (1991) 50 Organizational Behavior and Human
Decision Processes 179.
Page 31
11
understand, it should be convenient and economical to collect, and it and should take
into account the taxpayers’ ability to pay the tax.41
1.3 RESEARCH QUESTIONS AND RESEARCH
OBJECTIVES
The aim of this research is to establish that there is a need to change current
Australian policy in order to influence the choice of passenger motor vehicles
necessary to affect oil sustainability. Once this need is established, then the approach
adopted is to examine the tax policies and legal options used by other countries to
promote energy efficiency in passenger motor vehicles. The thesis proposes a tax
framework for Australia that not only takes into account the inbuilt factors in
vehicles which cause excessive fuel use, ie the weight, the engine capacity, the
power output and emissions produced, but also the distance driven.
The core research questions are:
1. Is there a need to reform the design, choice and usage of passenger motor
vehicles in Australia in order to sustain the limited oil resources?
2. What are the realistic tax measures that can be implemented and what
criteria should the design of tax framework take into account to reform the
choice and usage of motor vehicles for personal transportation in Australia
in order to reduce the consumption of oil?
To answer these questions, four objectives provide the framework for this thesis:
1. To investigate the reported Australian and global oil resources.
2. To explore the need to focus on reducing passenger motor vehicle oil use in
Australia.
41
Asprey Committee, Commonwealth of Australia, Full Report of the Commonwealth Committee on
Taxation (1975). Also see Peter D Groenewegen, Public Finance in Australia (Prentice-Hall of
Australia, 3rd
ed, 1984).
Page 32
12
3. To examine tax policies and legal options used by other countries that
promote passenger motor vehicle energy efficiency and influence the choice
of personal transportation.
4. To address the Australian tax policy reform and other regulatory reforms
required to reduce the use of oil in passenger motor vehicles and propose a
framework by utilising lessons learnt from other countries.
1.4 RESEARCH DESIGN AND METHODS
This part articulates the research design and methodology which has been adopted to
answer the research questions of the thesis.
1.4.1 Research Framework
The research framework or paradigm to answer the research questions and objectives
for this thesis is non-positivism or interpretivism using inductive legal reasoning.
A research framework or ‘paradigm’ as advocated by Guba and Lincoln is a system
of philosophical beliefs or worldviews that leads and governs an investigation or
individuals, respecting their position in the world and the range of possible
relationships to it and its parts.42
Therefore the research paradigm shapes the entire
research process and provides valuable directions, principles concerning the
approach, methods and techniques for conducting research within its philosophical
setting.43
The traditional view has been that the framework adopted reflects the
beliefs of the researcher in terms of ontology (how the researcher views the world)
and epistemology (the researcher’s belief of how knowledge is created).44
The literature on research methodology evidences extensive and constant debate
concerning the best approach for carrying out research. McKerchar notes that the
42
Egon Guba and Yvonna S Lincoln, ‘Competing Paradigms in Qualitative Research’ in Norman K
Denzin and Yvonna S Lincoln (eds), The Sage Handbook of Qualitative Research (Sage Publications,
2nd
ed, 1994) 163. 43
Ibid. 44
Margaret McKerchar, Design and Conduct of Research in Tax, Law and Accounting (Thomson
Reuters, 2010) 71.
Page 33
13
substantial body of existing literature on the design and conduct of research states
that two leading research paradigms are generally acknowledged by research
methodologists in social science and other disciplines. These are the positivist
paradigm and the interpretive or phenomenology paradigm.45
The positivist paradigm is rooted in natural science with an emphasis on
experimental scientific observation to explain and test cause and effect relationships
of an event. By contrast, the interpretive paradigm is founded on the humanities with
an emphasis on holistic and qualitative information to provide rich insights into
components of a social phenomenon.46
The interpretive theorist sees the social world
as possessing an uncertain ontological status and the truth is socially construed.47
Therefore, according to Hassard, the best way to understand the social world is from
the point of view of the investigated participant.48
The interpretive approach
endeavours to understand meanings of particular situations,49
and under this
approach, the researcher acquires a rich and empathetic understanding of social life
aspects and experiences.50
The research for this thesis falls within the interpretive paradigm, being socio-legal
research that is reform-oriented. Whilst positivism can provide the theoretical
underpinning for doctrinal legal research which is the ‘black letter law’ research,
McKerchar notes that the positivist paradigm is not appropriate for socio-legal
research which requires an understanding of people’s behaviour. The current
research is non-doctrinal about law and not a study in law, in that the law is sought to
provide a solution to a problem related to the sustainability of oil and people’s choice
of motor vehicles for personal transportation. The current study is broad and requires
both inductive and deductive reasoning to construe possible explanations and derive
45
Ibid 70. 46
Torsten Husen, ‘Research Paradigms in Education’ in John P Keeves (ed), Educational Research,
Methodology and Measurement: An International Handbook (Pergamon Press, 1988) 17. 47
Gregory Ticehurst and Anthony Veal, ‘Business Research Methods: A Managerial Approach’
(Pearson Education, 2000). 48
John Hassard, ‘Sociology and Organisation Theory: Positivism, Paradigms and Postmodernity’
(Cambridge University Press, 1993). 49
Thomas Schwandt, ‘Constructivist, Interpretivist Approaches to Human Inquiry’ in Norman K
Denzin and Yvonna S Lincoln (eds), The Sage Handbook of Qualitative Research (Sage Publications,
2nd
ed, 1994) 163. 50
John K Smith and Lous Heshusius, ‘Closing Down the Conversation: The End of the Quantitative-
Qualitative Debate Among Educational Inquiries’ (1986) 15(1) Educational Researcher 4.
Page 34
14
conclusions in order to resolve the research questions and the research objectives
stated above.
1.4.2 Methodology
The choice of research framework influences the choice of methodology.
Methodology is the middle ground between philosophical discussion on theoretical
frameworks and discussion on the methods. The methodology used for this research
is a combination of qualitative interpretative description and reform-oriented legal
research.
a. Interpretive Description
Interpretive description is a qualitative research approach developed by Sally Thorne,
Reimer Kirkham and MacDonald-Emes in 1997, and has been mainly used in
nursing science. Since interpretive description is a relatively new theoretical
framework, its foundation is discussed here with an explanation of why it is suitable
for this research.
The theoretical or philosophical underpinnings for interpretive description are firmly
aligned with interpretive naturalist orientations such as those delineated by Lincoln
and Guba, which include:
- There are multiple construed realities that can be studied only holistically.
Thus, reality is complex, contextual, construed and ultimately subjective.
- The inquirer and the ‘object’ of inquiry interact to influence one another;
indeed, the knower and known are inseparable.
- No a priori theory could possibly encompass the multiple realities that are
likely to be encountered; rather, the theory must emerge or be grounded in
the data.51
51
Sally Thorne, Sheryl Reimer Kirkham and Katherine O’Flynn-Magee, ‘The Analytic Challenge in
Interpretive Description’ (2004) 3(1) International Journal of Qualitative Methods 5.
Page 35
15
Interpretive description is an articulation of a qualitative approach to description with
an interpretive or explanatory flavour. It offers the potential to deconstruct the angle
of vision upon which prior knowledge has been erected to generate new insights that
shape new inquiries and applications.52
Thorne states that in interpretive description,
findings reflect an interpretive manoeuvre within which the researcher considers
what the pieces might mean, individually and in relation to one another, including the
sequence of presentation that the researcher uses that leads the eventual reader
toward a kind of knowing that was not possible prior to the study.53
The new
organised structures in themselves may not advance knowledge. However, when the
organising structures are given subjective interpretation and experience and they
reveal new possibilities in the relationship between subjective experience and
conceptual knowledge, then they will have achieved their essential purpose.54
The research in this thesis offers the potential for deconstructing prior knowledge in
three areas, these being the status of oil reserves; the characteristics of motor vehicles
that impact upon the consumption of oil; and the tax and regulatory measures which
may be adopted by countries to influence the choice of passenger motor vehicles.
These three areas when viewed independently do not create new knowledge.
However, putting the knowledge in these areas together gives rise to a new inquiry
and a need to investigate a solution through tax and regulatory reform.
The core elements of interpretive description are interpretation, analysis and
description. Interpretation is a process and a product of mulling over. According to
Wolcott, ‘When you emphasize description, you want your reader to see what you
saw. When you emphasize analysis, you want your reader to know what you know.
When you emphasize interpretation, you want your reader to understand what you
think you yourself have understood.’55
Interpretive description accomplishes all three
in different ratios and for different purposes. The decisions that the researcher makes
and the groundings to achieve that aim creates the foundation for the manner in
which the analytic process will transform data to become the written report.56
The
52
Sally Thorne, Interpretive Description (Left Coast Press, 2008) 35. 53
Ibid. 54
Ibid 175. 55
Harry F Wolcott, Transforming Qualitative Data: Description, Analysis, and Interpretation (Sage
Publications, 1992) 412. See Thorne, above n 52, 163. 56
Thorne, above n 52, 163.
Page 36
16
current research applies all three core elements of interpretive description in
answering the research questions and the research objectives.
Interpretive description requires working with data conceptually. Concepts are
mental devices for organising ideas so that the idea can be communicated to build
knowledge. There are four sequential cognitive processes that are required in
conceptualising data in interpretive description. These are: comprehending;
synthesising; theorising and recontextualising.57
A good thematic description or
summary can then show the reader how elements within the larger phenomenon can
be ordered and organised to reveal new ideas.58
The cognitive processes are applied
to this thesis as discussed under methods and techniques below.
Interpretive description is a meaning-making activity, directed towards the purpose
of rendering a new, enriched or expanded way of making sense of some problem or
issue. In order to retain its quality, it must retain that sense of direction throughout
the process so that the claims it has generated are consistent with the steps that
comprised the generation. This thesis aims to achieve the sense of direction
necessary to resolving the research questions.
Although interpretative description is new and has a health profession focus, it can
readily be adapted to the current research due to its focus on sustainability which is
also new and demands a new kind of methodology. Moreover, there are obvious
similarities between this research and the research conducted in the nursing
environment, although they are in two different fields. An example of health research
where interpretive description has been used is in health care communication issues
in multiple sclerosis, especially from the period of the onset of symptoms to the point
of diagnosis and treatment.59
Interpretive description was used to answer compelling,
complex and contextually embedded questions relevant to nursing practice. It
allowed the researcher to articulate a meaningful account of the knowledge with the
aim of providing a backdrop for assessment, planning and interventional strategies.60
The patterns and themes are ordered into a story or professional narrative in order to
57
Ibid 165–66. 58
Ibid 173. 59
Sally Thorne et al, ‘Health Care Communication Issues in Multiple Sclerosis: An Interpretive
Description’ (2004) 14(1) Qualitative Health Research 5. 60
Thorne, Kirkham and O’Flynn-Magee, above n 51, 6.
Page 37
17
influence the choices in the construction of the research product and taking into
consideration the needs of the audience.
Interpretive description is suitable for the current study as it assists in diagnosing not
a medical problem, but the problems arising from the limited supply of oil for
personal transportation. The research questions are aimed at identifying the
symptoms and consequences if no action is taken. Using interpretive description in
this study has made it possible to obtain a meaningful account of the knowledge of
oil resources, the impact of oil use on motor vehicles used for personal
transportation, and an assessment of the current regulatory and tax environment. This
knowledge has provided the backdrop for assessment, planning and interventional
strategies. The questions in the current study are quite complex and broad. The
diagnosis of the problem and design of the solution using interpretive description has
been a step-by-step approach as follows:
1. To investigate the reported Australian and global oil resources.
2. To explore the need to focus on reducing oil use by passenger motor
vehicles in Australia.
3. To explore the growth of passenger motor vehicle use, both globally and
in Australia.
4. To explore the design and choice of passenger motor vehicles in terms
of power and weight.
5. To investigate whether future car designs can resolve the oil problem.
6. To examine the current Australian regulatory and tax framework and its
deficiency in promoting oil efficiency in passenger motor vehicles.
7. To examine the regulatory and fiscal policies implemented by other
countries to promote oil efficiency in passenger motor vehicles.
8. To explore specific studies on motor vehicle taxation undertaken by the
Netherlands, Norway and Oregon.
9. To analyse the criteria to develop a framework for Australia to promote
energy-efficient passenger motor vehicles.
10. To design an interventional strategy for Australia, being a tax
framework for the Luxury Energy Tax (LET).
Page 38
18
b. Legal Research
In conjunction with interpretive description, legal research methodology has also
been employed for this study. McKerchar notes that there is increasing evidence
of researchers drawing from more than one paradigm or using more than one
strategy of inquiry from within the same methodology. This can assist
researchers who are driven by the purpose of the question and not necessarily
bound by any one paradigm.61
The Pearce Committee identified two typologies of legal research: doctrinal or
non-doctrinal, and further divided non-doctrinal research into reform-oriented
and theoretical research.62
Doctrinal research is based on the ‘black-letter’ or
literal analysis of legal rules and principles, relying on a deductive form of legal
reasoning. Non-doctrinal research is concerned with people, social values and
social institutions.63
The legal research employed for this thesis is non-doctrinal
as opposed to doctrinal research. Doctrinal research is not appropriate for this
research as its scope is usually narrow and excludes any policy or societal
implications, whereas this thesis is premised on the societal implications
associated with the sustainability of oil, the implications of peak oil and the oil
crisis from an international perspective, and the need to use motor vehicles for
personal transportation. This research is reform-oriented, identifies the gap in the
current laws in Australia and proposes a framework based on the desirable
characteristics of a tax structure, taking into consideration the legal options used
by other countries to promote energy efficiency of passenger motor vehicles and
influence the choice of personal transportation.
61
Margaret A McKerchar, ‘Philosophical Paradigms, Inquiry Strategies and Knowledge Claims:
Applying the Principles of Research Design and Conduct to Taxation’ (2008) 6(1) eJournal of Tax
Research 14. 62
Dennis Pearce, Enid Campbell and Don Harding, Australian Law Schools: A Discipline Assessment
for the Commonwealth Tertiary Education Commission (AGPS, 1987). See McKerchar, above n 61,
5. 63
McKerchar, above n 61, 13.
Page 39
19
c. Methods and Techniques
The epistemological foundation of interpretive description allows for the use of
established qualitative data collection and analysis. This research has used an
iterative process of collecting information mainly from published documents,
meaning that the collection and analysis of data has been rhythmic, intertwined and
repetitive and the interpretation is inductive.
The first step focused on establishing the existing knowledge, and was achieved by
gathering information within the context of the research purpose. Based on the scope
of the research questions, some primary source documents and mainly secondary
source documents were gathered. The primary source materials included those
relevant to the current laws of Australia, such as cases and legislation sourced from
the Australasian Legal Information Institute.64
The secondary source materials were
obtained from a variety of textbooks, scholarly journal articles, government reports,
institutional reports, records of discussions at round table conferences and
government statistics. Australian and foreign libraries, government organisations,
institutional organisations and research bodies were used to obtain the secondary
source documents. Documents from foreign countries such as the Netherlands and
Norway needed translation into English, which was done using the facility available
through Microsoft Word.
The next step was to sample and code the documents. Documents that were relevant
to the research questions were then grouped according to the question of inquiry.
The following step involved reading, analysing, interpreting and summarising. This
process was carried out methodically and in detail so that an interpretation of the
document could be summarised. Initial reflections were carried out on the key parts
of information in each document. The materials were worked through to identify
similarities and differences. Commonalities were established and differences were
grouped creating a basic level of generalisation. The generalisations were then linked
together, compared and analysed to extract the meaning and message in order to
answer each research question and draw conclusions. The researcher’s analytic
64
See Australasian Legal Information Institute (12 June 2012) <www.austlii.edu.au>.
Page 40
20
process was applied to bring out construed truths, and the data was then
recontextualised and the information converted into findings.
Opportunities for triangulating the data obtained from documents came largely
through round table conference reports, verbal advice and feedback from participants
of various conferences on environmental tax and transportation.
The methods and techniques used fall within both the interpretive description and the
legal methodology that has been adopted in this research. The usual range of data
collection methods that are not normally considered in ‘academic’ research is
encouraged by interpretive description. Thorne notes that this flexibility encourages
data and research to be looked at from a broader epistemological perspective and
asserts that ‘staying overlong in the microscopic view of the trees has the tendency to
blur one’s perspective on the forest, and so it becomes important to move in and out
of the detail.’65
Thorne further states that the data analysis needs to ‘trigger your
innate curiosity, and to follow the many lines of fascinating inquiry that your
inductive processes illuminate.’66
Interpretive description not only requires
immersion and intimate knowledge of the data, but a constant reflection on the data
is required to develop new insights that allow the redevelopment of responses.67
McKerchar also notes that collecting data sequentially allows the findings from
one strategy to inform another.68
This research identifies a problem in humanities
and recommends a solution through tax policy.
d. Ethical Considerations
This research has been conducted according to the Curtin University of
Technology ethical guidelines. The checklist found in the Form C Application for
Approval of Research with Low Risk (Ethical Requirements) Guidelines was
completed in order to identify any considerations that may arise and require
ethical approval. The conduct of this research did not require any ethical approval
65
Thorne, Kirkham and O’Flynn-Magee, above n 51, 14. 66
Thorne, above n 52, 155. 67
Thorne, Kirkham and O’Flynn-Magee, above n 51, 13. 68
McKerchar, above n 61, 15.
Page 41
21
from the Human Research Ethics Committee at Curtin University of Technology.
The research also satisfies the School of Business Law and Taxation guidelines
for conducting research.
1.5 COVERAGE AND SCOPE
The scope and coverage of this thesis extends to the need to change current
Australian tax policy measures in order to influence the way drivers choose their
motor vehicles for personal transportation, in order to address the issues of oil
sustainability and climate change. Climate change is only addressed to the extent that
a reduction in the use of oil has an effect on it. Climate change policy, including the
proposed carbon reduction scheme, is not examined in this research. Rather, the
research assesses whether the sustainability of oil is a factor that currently influences
the choice of motor vehicles for personal transportation in Australia and whether the
current regulatory and tax policy in Australia bear any influence on drivers who
make that choice.
The thesis does not explore other alternative ideas to reduce energy use, such as
tradeable energy quotas. The purpose of tradeable energy quotas is premised on fair
entitlement to energy by using a form of rationing system and simply and efficiently
measuring all emissions from energy use within a national economy. Thus tradeable
energy quotas target fuels and electricity. This thesis only deals with the
sustainability of oil used by motor vehicles for personal transportation and therefore
tradeable energy quotas have not been examined in this thesis.
The focus of this research is from a policy perspective and does not include
economic financial modelling within its scope. Further, this research only focuses on
personal transportation in passenger motor vehicles, ie a car designed to carry
passengers, and not commercial motor vehicles used for business or freight
transportation, for three reasons. Firstly, it can be argued that personal transportation
can be reduced without having a direct impact on the production of goods and
services. Secondly, businesses are likely to pass on their costs and therefore are less
likely to change their behaviour. Thirdly, between 70 and 80 per cent of the energy
Page 42
22
consumption by the transportation sector in Australia is related to road transport
vehicles, and passenger vehicles accounted for 77.2 per cent of all vehicles registered
in Australia at 31 March 2008.69
1.6 THESIS STRUCTURE AND ORGANISATION
This thesis comprises eight chapters within the context of the core research questions
and objectives. The core research questions are:
1 Is there a need to reform the design, choice and usage of passenger motor
vehicles in Australia in order to sustain the limited oil resources?
2 What are the realistic tax measures that can be implemented and what
criteria should the design of a tax framework take into account to reform the
choice and usage of motor vehicles for personal transportation in Australia
in order to reduce oil consumption?
To answer these questions, four objectives provide the framework for this thesis:
1. To investigate the reported Australian and global oil resources.
2. To explore the need to focus on reducing the use of oil in passenger motor
vehicles in Australia.
3. To examine tax policies and legal options used by other countries that
promote passenger motor vehicle energy efficiency and influence the choice
of personal transportation.
4. To address the Australian tax policy reform and other regulatory reforms
required to reduce the use of oil in passenger motor vehicles and propose a
framework by utilising lessons learnt from other countries.
Chapter 1 presents the rationale for the research and defines the research problem.
The chapter articulates and justifies the research paradigm, the methodology and the
data collection methods and techniques used for this thesis, together with any ethical
considerations. It also identifies the purpose and scope of the research.
69
Australian Bureau of Statistics, above n 23.
Page 43
23
Chapter 2 provides an analysis within which part of the first research question is
framed, ie the sustainability of oil and the implications of peak oil and the oil crisis
from an international perspective. This chapter deals with the first research objective:
To investigate the reported Australian and global oil resources by examining reported
data on known or proven oil reserves, the rate of depletion and evidence of a peak in
oil supply, from both the Australian and global perspectives. The concerns of the
global community and implications of peak oil are also stated in order to assess the
need to reduce the use of oil in passenger motor vehicles.
Chapter 3 also provides an analysis within which part of the first research question
and the second research objective are framed, ie the need to reform the choice and
usage of passenger motor vehicles in Australia. This chapter explores the growth of
motor vehicle use, both globally and in Australia, and the reliance on motor vehicles
for personal transportation. It also examines the design and choice of motor vehicles
used for personal transportation to determine whether this is sustainable or a change
is required. Future motor vehicle designs and their limitations are also discussed in
this chapter.
Chapter 4 addresses the third research objective: To examine tax policies and legal
options used by other countries that promote passenger motor vehicle energy
efficiency and influence the choice of personal transportation. The review pertaining
to the role of the law in providing regulatory and fiscal measures to reduce the use of
oil in passenger motor vehicles also prepares the answer for the second research
question: What are the realistic tax measures that can be implemented and what
criteria should the design of a tax framework take into account to reform the choice
and usage of motor vehicles for personal transportation in Australia in order to
reduce oil consumption?
This chapter examines the fuel economy standards, consumer awareness programs,
fiscal measures and demand management programs that have been implemented in
various countries around the world. It provides the background literature against
which the need to change current tax and regulatory arrangements in Australia is
examined, in order to impact on the design, choice and usage of motor vehicles in
Australia to reduce oil consumption.
Page 44
24
In order to satisfy the fourth research objective of addressing the Australian tax
policy reform and other regulatory reforms required to reduce the use of oil in
passenger motor vehicles and propose a framework for an all-encompassing LET
design in Chapter 6, a case study of the motor vehicle taxes and road user charges
proposed or implemented in the following selected countries is undertaken in
Chapter 5: Norway; the Netherlands; and the United States of America (specifically,
the state of Oregon). These countries were chosen as they have conducted
parliamentary-approved studies that involve innovative ways of taxing their motor
vehicles and road user charges. Examining the innovative thinking applied in these
studies enables lessons to be drawn for Australia in bringing about a change in motor
vehicle taxation in order to reduce oil consumption and change the perception of a
passenger motor vehicle used for transportation.
Chapter 6 draws lessons from the findings presented in Chapters 2 to 5, and explores
the various policy options that Australia can adopt and their likely outcomes. This
thesis proposes that in addition to setting the fuel economy and CO2 emission
standards, the Australian government should regulate consumer preferences for
passenger motor vehicle transportation through appropriately designed motor vehicle
taxes such as the LET. Chapter 6 proposes a LET framework that answers the second
research question: What criteria should the design of a tax framework take into
account to reform the choice and usage of motor vehicles for personal transportation
in Australia in order to reduce oil consumption? The LET framework is then
explored in this chapter in terms of core environmental tax principles, in particular
the ‘Precautionary Principle’ and the ‘Polluter Pay Principle’, and its design,
operation, administration and implementation.
The LET system described in Chapter 6 is evaluated in Chapter 7 under the
following categories: The net revenue generation potential; the expected savings in
the usage of oil as a result of implementing the LET; general evaluation in terms of
collection, fee calculation, technology, cost of state-wide implementation, auditing,
fee rate structure, phase-in-period, systemic precision, adaptability to congestion
pricing, public acceptance, convenience and protection of privacy; the known criteria
of a good tax; and the ability of the LET to change behaviour. In order to evaluate
the net revenue generation potential and the savings in oil usage, a detailed exercise
Page 45
25
is undertaken in this chapter by examining the current Australian passenger motor
vehicle fleet, extracting the characteristics of the motor vehicles that impact on the
consumption of oil and forecasting the change in the fleet as a result of implementing
the LET.
Chapter 8 provides conclusions, identifies problems associated with the introduction
of the proposed framework of a LET, discusses the limitations of the research and
suggests areas for further possible research.
Page 46
26
CHAPTER 2: SUSTAINABILITY OF OIL
2.1 INTRODUCTION
This chapter provides the background and context within which the aim and
objectives of this thesis are framed, ie the sustainability of oil and the choice and
usage of motor vehicles for personal transportation. This chapter addresses the first
two research objectives stated in part 1.3, which are as follows:
OBJECTIVE (i): To investigate the reported Australian and global oil resources.
OBJECTIVE (ii): To explore the need to focus on reducing the use of oil in
passenger motor vehicles in Australia.
This chapter also addresses the first core research question stated in part 1.3 which is
to determine whether there is a need to reform the choice and usage of passenger
motor vehicles in Australia. The main reason is the sustainability of oil and
Australia’s increasing reliance on imported oil.
Australia’s need for oil cannot be studied in isolation. This is due to the fact that if
Australia does not have enough oil for its own needs, it will need to import oil from
another country. Whether another country will be able to supply Australia with the
required oil can only be ascertained by examining the global supply and demand for
oil.
The global oil position is explored in part 2.2 by examining reported data on known
or proven global oil reserves, the rate of depletion and evidence of a peak in oil
supply. The concerns of the global community are also summarised from reports
produced by various government and international organisations.
Part 2.3 analyses the implications of peak oil and the global oil crisis gathered from
global evidence and points to a need for government action.
Page 47
27
Part 2.4 explores the Australian position on oil and the extent of its reliance on
imported oil. An analysis of Australian government reports indicates that passenger
vehicles consume the majority of oil in Australia and from this an inference can be
drawn that there is a need to focus on reducing the use of oil in passenger motor
vehicles.
2.2 GLOBAL OIL POSITION
Before examining the global oil position it is necessary to first understand the
terminologies used in the global literature concerning oil.
2.2.1 What is Oil?
Oil is a liquid fossil fuel which scientists believe was formed between 100 and 300
million years ago during the Palaeozoic and Mesozoic era by natural processes.70
It is
thought to have been formed from living organisms that died millions of years ago,
and through heat and pressure were turned into oil and gas, trapped within source
rocks.71
Oil that took so long to form can be used up in an instant in driving a
passenger motor vehicle, and once used, it is irrecoverable.
The discovery of oil can be traced back to 1846 when Dr Abraham Gesner managed
to extract oil and other petroleum products, including kerosene, from albertite rocks.
In the 1850s Ignacy Lukasiewich found a way to distil seep oil into products, and
constructed the first real oil refinery. However the modern oil era began in Oil Creek
in Pennsylvania with boreholes sunk by Colonel Drake. By the 1880s, Standard Oil
controlled nearly all of America’s refining capacity.
Before examining the various ways oils are defined, it is important to understand the
oil supply chain. The oil supply chain starts with exploration. Using reflection
seismic technology, geoscientists identify areas where hydrocarbons may be trapped
70
Geoscience Australia and ABARE, above n 1, 344. 71
US Energy Information Administration, Oil (Petroleum)
<http://www.eia.gov/kids/energy.cfm?page=oil_home-basics>.
Page 48
28
in suitable rocks. Once these areas are located, then drilling is carried out to test
whether the structure contains both oil and gas. If the area contains an economically
recoverable resource, then a decision is made on whether to proceed with the
development and production phase. The development phase involves the
construction of infrastructure including wells, production facilities, processing
facilities, and storage and transportation facilities. The production phase includes
extracting oil from the reservoir and removing impurities.72
Oil is generally classified as conventional or unconventional. Conventional oil is
crude oil that is technically producible from reservoirs through a well bore, and
excludes mined deposits (tar sands and oil shales) and created liquids (gas-to-liquids
and coal oil).73
Crude oil is a naturally occurring liquid consisting mainly of
hydrocarbons derived from the thermal and chemical alteration of organic matter
buried in sedimentary basins. Crude oils vary in appearance, chemical composition
and viscosity. Light crude oils have low density and viscosity whereas heavy crude
oils have high density and viscosity.74
Conventional crude oil is crude oil with a viscosity above 17° API,75
heavy oil with
viscosity between 10° and 17° API, all deep sea oil at any depth, polar oil, and
condensate. Non-conventional oil is natural gas liquid, extra heavy oil below 10°
API, synthetic crude oil, bitumen from tar sands and oil shale. Conventional oil is
typically the highest quality light oil which flows from the reservoirs with
comparative ease, whereas unconventional oils are heavy and require greater capital
and energy to recover them.
Condensate is a liquid mixture of heavier hydrocarbons found in oil fields with
associated gas. It is gas in the reservoir, but condenses to form a liquid when
produced and brought to the surface.76
72
Geoscience Australia and ABARE, above n 1, 45. 73
John Wood, Gary Long and David Morehouse, ‘Long-Term World Oil Supply Scenarios: The
Future Is Neither Bleak or Rosy as Some Assert’ (Report prepared for US Energy Information
Administration, 2004) <www.eia.doe.gov>. 74
Geoscience Australia and ABARE, above n 1, 43. 75
Degrees API is the specific gravity or density of oil expressed in terms of a scale devised by the
American Petroleum Institute. 76
Geoscience Australia and ABARE, above n 1, 43.
Page 49
29
Liquefied petroleum gas (LPG) is a mixture of lighter hydrocarbons and is normally
a gas at the surface. It is usually stored and transported as a liquid under pressure.
LPG has lower energy content per volume than condensate and crude oils.77
Crude oil and condensate are not used in their raw or unprocessed form. Rather, they
are processed in a refinery to produce refined petroleum products used as fuels, such
as LPG, gasoline for aviation and automotives, automotive diesel oil, industrial
diesel oil, fuel oil and kerosene, and refined products for non-fuel applications such
as bitumen.78
Oil is typically measured on a volumetric basis in either barrels or cubic metres. One
barrel is equivalent to 42 US gallons or 159 litres. One million barrels is abbreviated
Mb and one billion barrels is abbreviated Gb. One million barrels per day is
abbreviated Mbpd.
In examining oil production data, it is necessary to understand the difference between
‘oil resources’ and ‘oil reserves’. The term ‘resource’ describes the amount of oil in
the ground while ‘reserve’ describes the amount of oil expected to be extracted. A
large reserve of oil does not mean that it is possible to increase the flow rate to
satisfy an increase in demand. The physical, chemical and geological attributes of a
field become the limiting factors for extraction from a resource. When a resource
reaches its peak of production,79
the extraction reaches a phase where regardless of
additional expenditure and effort, the volume of output declines.80
The next section
carries out an assessment of reported data to ascertain the global reserve of oil and
evidence of a near-term peak in oil supply.
In this thesis, ‘oil’ refers to conventional crude oil as described above, including the
refined petroleum products extracted from conventional crude oil.
77
Ibid. 78
Ibid. 79
See discussion on peak oil in the section titled ‘Peaking of Global Oil Production’. 80
Global Witness, above n 14, 24.
Page 50
30
2.2.2 An Assessment of Global Reserves and Evidence of a Near-
Term Peak in Oil Supply
The process by which oil is made in source rocks and its extraction from oil fields is
well understood by geologists. Therefore the areas with potential hydrocarbon
accumulations are well known and there are unlikely to be huge surprises in the
future as the world has already been sufficiently explored.81
In November 2010, the European Union energy expert Guenther Oettinger expressed
a fear that the global consumption of oil is going to increase and confirmed that the
global availability of oil had already peaked.82
It is necessary to examine the global
position of oil, as Australia does not have enough oil for its own needs, and relies on
oil imported from other countries. Whether other countries will continue to be able to
supply Australia with the required oil can only be ascertained by examining the
global supply and demand for oil.
On the supply side, reports from various government organisations and international
agencies provide data on global reserve estimates. These reserves have to be
extracted from the ground and the extraction rate depends upon whether the oil fields
have reached their peak, hence the term ‘peak oil’. An analysis of the studies and
reports below indicates that there is no uniform estimate of the global oil reserve. In
addition, some studies forecast a near-term peak and subsequent terminal decline in
the production of conventional oil, whereas others argue that liquid fuel production
will be sufficient to meet global demand well into the 21st century. Despite the
differences in the forecasts of global reserves and the peak oil position as
summarised below, the commentaries and views of various government reports,
business leaders and industry experts indicate that the era of cheap oil is almost over,
and any forecasts that delay the peak beyond 2030 are based upon optimistic
assumptions.
81
Schindler and Zittel, above n 19, 20. 82
C Dunmore, ‘Global Oil Availability has Peaked - EU Energy Chief’, Reuters (online), 10
November 2010 <http://www.reuters.com/article/idUSBRU01112520101110> .
Page 51
31
A literature review carried out by the Low Carbon Mobility Centre at Oxford
University in the UK reveals three sources for oil reserve data:83
1. Data available in the public domain originates from surveys conducted by
Oil and Gas Journal (OGJ), World Oil (WO) and the OPEC Secretariat. The
data from these sources is not subject to independent audits and has been
reported to give more optimistic estimates in comparison with independent
parties that assess reporting methodology.
2. Information agencies such as the International Energy Agency (IEA),
Energy Information Administration (EIA) and BP Statistical Review
reproduce data referred from reporting agencies, with small amendments.
3. Independent authors and academic institutions such as Uppsala University
also report oil data, sometimes purchased from scouting companies such as
the Information Handling Services (IHS) who sell data on individual fields;
independent authors consider this data to be the most accurate.
a. An Assessment of the Global Reserves of Oil
In order to determine the quantity of the world’s oil reserves, it is necessary to
examine the definition of reserves. Although a distinction was made above between
the terms oil resource and oil reserve, there is no universal definition of oil reserves
and the concept of oil reserves is generally not well understood. In general, ‘oil
reserve’ can be defined as an estimate of the amount of oil in a reservoir that can be
extracted at an assumed cost. There are three categories of reserves: proven, probable
and possible reserves.84
Proven oil reserves are those which are producible using current technology at
current prices and having a 90 per cent certainty of being produced. Proven reserves
are further sub-divided into ‘proven developed’ and ‘proven undeveloped’ reserves.
Proven developed reserves can be produced from existing wells with minimal
additional investment or operating expense, compared with proven undeveloped
83
Nick Owen, Oliver Inderwildi and David King, ‘The Status of Conventional World Oil Reserves —
Hype or Cause for Concern?’ (2010) 38 Energy Policy 4743. 84
Schindler and Zittel, above n 19, 25.
Page 52
32
reserves which require additional capital investment to bring the oil to the surface.
Probable reserves are those having a 50 per cent certainty of being produced using
current and likely technology at current prices. Possible reserves are those having a
10 per cent certainty of being produced. The ‘ultimate recoverable reserve’ (URR)
includes a total recoverable reserve and would include proven, probable and possible
reserves.
As there is no universal agreement on the definition of an oil reserve or a universally
applied method of reserve reporting, there are differences in published reserve data.
Reserve estimation has been described as gauging how much extractable oil resides
in complex rock formations that exist typically one to three miles below the surface
of the ground. This estimation has been described as being similar to a blindfolded
person trying to judge what a whole elephant looks like from touching it in just a few
places.85
Differences between reserve estimates can arise from the use of different
methodologies, or differences in judgement, politics and self-interest considerations.
Moreover, reserve estimates are revised periodically as a reservoir is developed and
new information is obtained. Reserve estimation is not an exact science like counting
the cars in a parking lot, but an assessment using an array of methodologies and a
great deal of judgement.86
Thus different estimators may calculate different reserves
from the same data, as shown in Table 2.1.
TABLE 2.1: Forecasts of ‘Proved’ Global Oil Reserves
Author Date of Forecast Proved Oil Reserves (Gb)
OGJ Jan 2009 1342
WO Year end 2007 1184
IEA 2008 1241
BP Statistical Review June 2009 1258
Independent authors Various 903
Source: Low Carbon Mobility Centre, UK reported in Nick Owen, Oliver Inderwildi
and David King, ‘The Status of Conventional World Oil Reserves – Hype or Cause
for Concern?’ (2010) 38 Energy Policy 4743, 4744.
85
Robert Hirsch, Roger Bezdek and Robert Wendling, ‘Peaking of World Oil Production: Impacts,
Mitigation, & Risk Management’ (2005)
<http://www.netl.doe.gov/publications/others/pdf/oil_peaking_netl.pdf> 12. 86
Ibid 11–12.
Page 53
33
The forecasts noted in Table 2.1 above from OGJ, WO and BP Statistical Review
include tar sands. It has been reported that if the tar sands were removed from the
above estimates, the OGJ reserve forecast would be 882Gb, the WO forecast would
be 892Gb and the BP Statistical Review forecast would be 830Gb.87
Other organisations such as the EIA and the Energy Watch Group (EWG) have also
reported on the status of the world’s oil reserves. The EIA belongs to the US
Department of Energy and it publishes many energy statistics, as well as annual
reports entitled ‘International Energy Outlook’. ‘International Energy Outlook 2010’
was released in July 2010 and presents international energy projections through to
2035. The report stated that as of January 2010, proved world oil reserves including
the Canadian oil sands, as reported by the Oil and Gas Journal, were estimated at
1354Gb, of which 56 per cent are located in the Middle East.88
Peak Oil experts have
asserted that the Middle East exporting countries artificially raised estimates of their
reserves even though there were no new discoveries, on the basis that the reserves
were previously underreported for financial and political reasons.89
The EWG is an international network of scientists and parliamentarians, initiated by
a member of German Parliament, in collaboration with other parliamentarians from
both Germany and abroad. A report titled ‘Crude Oil – The Supply Outlook’ was
released by the EWG in 2008 on the future availability of crude oil up to 2030. The
methodology used was the proved plus probable discoveries and production patterns.
The report stated that the peak of discoveries took place in the 1960s,90
and that the
current reserves amounted to 854Gb. By comparison, the industry database IHS
estimated that the remaining world oil supplies were 1255Gb. Table 2.2 shows the oil
reserves, production and consumption reported by the EWG and IHS.
87
Owen, Inderwildi and King, above n 83, 4747. 88
Energy Information Administration, ‘International Energy Outlook’ (Report No DOE/EIA-
0484(2010), Energy Information Administration, 27 July 2010)
<http://www.eia.gov/forecasts/archive/ieo10/index.html> 37. 89
Schindler and Zittel, above n 19, 30. 90
Schindler and Zittel, above n 19, 7.
Page 54
34
TABLE 2.2: Oil Reserves and Annual Oil Production in Different Regions and
Key Countries
Region Remaining Reserves 2008 Production 2005 Consumption 2005
EWG
[Gb]
IHS
[Gb]
Onshore
[Gb/yr]
Offshore
Gb/yr]
Gb/yr
OECD
North
America
Canada
USA
Mexico
84
17
41
26
67.6
15.3
31.9
20.4
3.20
0.89
1.93
0.36
1.71
0.12
0.59
1.00
9.13
0.82
7.59
0.72
OECD
Europe
Norway
UK
25.5
11
8
23.5
11.6
7.8
0.1
0
0.01
1.94
1.13
0.7
5.72
0.08
0.65
OECD
Pacific
Australia
2.5
2.4
5.1
4.8
0.025
0.02
0.18
0.17
3.18
0.31
Transition
Economics
Russian
Federation
Azerbaijan
Kazakhstan
154
105
9.2
33
190.6
128
14
39
4.1
3.4
0.01
0.47
0.18
0.13
0.15
0
2.02
1.00
0.04
0.08
China 27 25.5 1.1 0.22 2.55
South Asia 5.5 5.9 0.11 0.16 0.96
East Asia
Indonesia
16.5
6.8
24.1
8.6
0.3
0.27
0.65
0.11
1.75
0.43
Latin
America
Brazil
Venezuela
52.5
13.2
21.9
129
24
89
2.0
0.075
1.17
0.61
0.55
0
1.74
0.75
0.20
Middle
East
Kuwait
Iran
Iraq
Saudi
Arabia
362
35
43.5
41
181
678.5
51
134
99
286
6.97
0.96
1.19
0.67
2.85
1.97
0
0.24
0
0.86
2.09
0.11
0.59
0.69
Page 55
35
Region Remaining Reserves 2008 Production 2005 Consumption 2005
EWG
[Gb]
IHS
[Gb]
Onshore
[Gb/yr]
Offshore
Gb/yr]
Gb/yr
UAE 39 57 0.46 0.45 0.14
Africa
Algeria
Angola
Libya
Nigeria
125
14
19
33
42
104.9
13.5
14.5
27
36
2.03
0.72
0.01
0.61
0.39
1.53
0
0.45
0.02
0.52
1.01
0.09
World 854 1255 19.94 9.15 30.3
Source: Jörg Schindler and Werner Zittel, ‘Crude Oil — The Supply Outlook’
(Report, Energy Watch Group, 2008)
<http://www.energywatchgroup.org/fileadmin/global/pdf/2008-
02_EWG_Oil_Report_updated.pdf>.
Table 2.2 shows that countries with the most oil reserves are in the Middle East and
transitional economies. Although the difference between the EWG and the IHS
estimates of oil reserves is 401Gb, this only amounts to 14 more years of supply
based on a global demand of 30.3Gb per year. Fourteen years difference is not much
when compared with the number of years it took for the oil to be formed. Based on
the global consumption of 30.3Gb per year in 2005 and without any significant new
discoveries and changes in consumption, the current oil reserves would last
somewhere between 28 years to 42 years. This timeframe indicates that countries
should be preserving oil for necessities and developing alternative energy sources.
The next question to consider is whether the forecasted global oil reserves can be
extracted at a rate that will satisfy the demand for the next 28 to 42 years. This
depends upon whether the fields have reached peak production, which is discussed
next.
b. Peaking of Global Oil Production
As mentioned in Chapter 1, peak oil is the point at which further expansion of oil
production becomes impossible, because new flows are fully offset by production
Page 56
36
declines or depletion. In a typical production profile for a single field, production
rises quickly to a peak and then subsides at a depletion rate which varies from field
to field. Peak production is typically established when 25 to 30 per cent of the
reserves are extracted. The last 25 to 30 per cent of the reserves are extremely
difficult to extract, so the reserve position at peak is not very comforting.91
In short, peaking means that the rate of world oil production cannot increase. It
means that production will decrease with time after peaking occurs.92
Global oil will
have reached peak when all new projects coming on stream fail to offset the annual
decline from older fields. The timing of the global peak is normally judged by taking
into consideration shrinking discoveries, the rate of depletion, the adequacy of
investment and the rate of global demand.
Hubbert published his peak oil analysis in 1956 when he indicated that the US
conventional oil production would resemble a bell-shaped curve, reaching a peak and
then declining. Hubbert’s theory proved remarkably accurate and is called the peak
oil theory. It has been widely accepted as a technique for assessing production
volumes as the production rate starts to decline before reserves approach their peak.
Using Hubbert’s theory of peak oil, the global peak can be ascertained as the point at
which about 50 per cent of the world’s URRs have been consumed. Thus, peak oil
can be estimated by examining the known quantities of URR and the volume of oil
consumed so far.
A report produced in 2009 by the Technology and Policy Assessment (TPA) function
of the UK Energy Research Centre, entitled ‘Global Oil Depletion: An Assessment
of the Evidence for a Near-Term Peak in Global Oil Production’ states that the
depletion of oil resources and the peak oil debate is contentious, whereby the
pessimists forecast an imminent peak, and the optimists believe that rising prices will
stimulate new discoveries and new methods of recovery, and therefore there will be
sufficient oil to meet global demand well into the 21st century.
93
91
Industry Taskforce on Peak Oil & Energy Security, ‘The Oil Crunch: A Wake-Up Call for the UK
Economy’ (Second report of the UK Industry Taskforce on Peak Oil & Energy Security (ITPOES), 10
February 2010) 11. 92
Hirsch, Bezdek and Wendling, above n 85, 12. 93
Steve Sorrell et al, ‘Global Oil Depletion: An Assessment of the Evidence for a Near-Term Peak in
Global Oil Production’ (Report produced by the Technology and Policy Assessment function of the
Page 57
37
The TPA reported on selected forecasts of the date of global peak, based on their
URR estimate and the decline rate, as shown in the Table 2.3 below.
TABLE 2.3: Selected Forecasts of Global Peak, URR and Post-Peak Decline
Rates
Category Reporting
Agency Date of Global
Peak URR (Gb) Post Peak
Decline Rates
per Year
International
organisations IEA No peak
94
Conventional oil
plateau by 2030
3577 6.7%
OPEC No peak 3345 4 to 5%
National
organisations BGR* 2020 2979 Not given
Oil companies Shell 2020 Not given Not given
Meling 2020 3149 2.6%
Total 2020 Not given 0.2%
Consultancies Energyfiles 2017 2685 2 to 3%
LBST** 2006 1840 3.5 to 4%
Peak Oil
Consulting 2011–2013 Not given 2 to 2.3%
Universities Campbell 2008 1900 to 2425 2.1%
University of
Uppsala 2008–2018 Not given 6 to 16%
Miller 2013 -2017 2800 3.3%
Source: Steve Sorrell et al, ‘Global Oil Depletion: An Assessment of the Evidence
for a Near-Term Peak in Global Oil Production’ (Report produced by the
Technology and Policy Assessment function of the UK Energy research Centre,
August 2009).
*BGR: Bundesanstait Geowissenschaften und Rohstoffe being the German Federal
Institute for Geoscience and Natural Resources
**LBST: Ludwig-Bolkow-Systemtechnik GmbH
UK Energy research Centre, August 2009) 1. The pessimists included: Colin Campbell, The Coming
Oil Crisis (Multi-Science Publishing & Petroconsultants, 1997); Kenneth S Deffeyes, Beyond Oil:The
View from Hubbert’s Peak (Hill and Wang, 2005); and Schindler and Zittel, above n 19. The optimists
included Adelman, CERA, Mills and Odell. 94
Faith Birol, Chief Economist of the IEA, said in an interview that the global oil peak occurred in
2006. See ABC, ‘Oil Crunch’, Catalyst, 28 April 2011 (Jonica Newby, interview with Faith Birol).
Page 58
38
In summary, the TPA Report’s findings are as follows:
- Global cumulative production of conventional oil stood at 1128Gb in 2007,
with annual production of 29.5Gb. Since 1995, global production has grown
at an average of 1.5 per cent per year, with 60 per cent of cumulative
production occurring since 1980.95
- Most of the world’s conventional oil was discovered between 1946 and
1980 and since that time annual production has exceeded annual
discoveries.
- Although there are around 70 000 producing oil fields in the world,
approximately 25 fields account for a quarter of global production, 100
fields account for half of production and up to 500 fields account for two-
thirds of cumulative discoveries. Most of these ‘giant’ fields are relatively
old, most of the rest will begin to decline within the next decade or so and
few new giant fields are expected to be found. The remaining reserves at
these fields, their future production profiles and the potential for enhanced
recovery and reserve growth are therefore of critical importance.96
- The oil industry must continually invest to replace the decline in production
from existing fields. The production-weighted global average rate of decline
from post-peak fields is at least 6.5 per cent per year, while the
corresponding rate of decline from all currently-producing fields is at least 4
per cent per year. This implies that at least 3Mbd of new capacity must be
added each year, simply to maintain production at current levels.97
- More than two-thirds of current crude oil production capacity may need to
be replaced by 2030, simply to prevent production from falling.98
- Estimates of the global URR for conventional oil vary widely in their
definitions, methods, assumptions and results. Contemporary estimates now
fall within the range 2000–4300Gb, compared to cumulative production
through to 2007 of 1128Gb.99
- For a wide range of assumptions about the global URR and the shape of the
future production cycle, a peak in production can be estimated to occur
95
Steve Sorrell et al, above n 93, 170. 96
Ibid 168. 97
Ibid. 98
Ibid 169. 99
Ibid 137.
Page 59
39
before 2031. In most models, increasing the global URR by a billion barrels
delays the peak by only a few days. Delaying the peak beyond 2030 requires
optimistic assumptions about the size of the recoverable resource and the
rate at which it is developed.100
- Forecasts that delay the peak of conventional oil production until after 2030
rest upon several assumptions that are at best optimistic and at worst
implausible.101
- A peak in conventional oil supply will only be associated with a peak in
liquid fuels supply if ‘non-conventional’ sources are unable to substitute in a
sufficiently timely fashion.
- The risk of a peak in conventional oil production deserves urgent and
serious consideration.102
There are many national and international reports that show concern about the global
oil position and advocate that governments of each country should take policy action
to reduce the demand for oil, especially in the transportation sector, as summarised
below.
c. The Energy Watch Group (EWG)
The Energy Watch Group’s report, ‘Crude Oil – The Supply Outlook 2008’,
concluded that the world oil production peaked in 2006 and that by 2020 and 2030
the global oil supply will be dramatically lower. This will create a supply gap which
will not be satisfied by other forms of energy.103
100
Ibid. 101
Ibid 165. 102
Ibid 171. 103
Schindler and Zittel, above n 19, 16.
Page 60
40
d. The US Joint Forces Command: The Joint Operating
Environment (JOE) Report 2010
The US Joint Forces Command’s ‘Joint Operating Environment’ (JOE) is an
independent report and does not constitute the US government policy. It has a
military and security focus as opposed to emerging opportunities. The report claims
that oil and gas will make up 60 per cent of the global energy mix in the 2030s. The
central problem in the coming decade will not be a shortage of oil reserves, but a
shortage of refining capacity. By 2030, the demand for oil will increase to
118Mbpd.104
The report states that in order to meet the rising demand, OPEC will
have to increase its output from 30Mbpd to at least 50Mbpd and no OPEC nations
except Saudi Arabia are investing in new technologies and recovery methods to
achieve such a growth.105
The US JOE report also states that a severe energy crunch is inevitable without a
massive expansion of production and refining capacity. The effect of the supply
crunch would result in reduction of growth for both developing and developed
countries and could lead to harsh economic adjustments.106
By 2012, surplus oil
production capacity could disappear and by 2015, the shortfall in output could be
about 10Mbpd.107
e. The International Energy Agency (IEA)
The World Energy Outlook (WEO) 2010 produced by the IEA focused on climate
change and emphasised the removal of fossil-fuel consumption subsidies which
totalled USD312 billion in 2009. The report claimed that the removal of these
subsidies would make a big contribution to energy security and environmental goals,
and confirmed that fossil fuels, in particular oil, coal and natural gas will remain the
dominant energy sources in 2035. The report also stated that emerging economies led
104
US Joint Forces Command, ‘The Joint Operating Environment (JOE)’ (Distribution Statement, 18
February 2010) 24. 105
Ibid 26. 106
Ibid 28. 107
Ibid 29.
Page 61
41
by China and India will drive global demand higher, mainly due to rising use of
transport fuel.108
For the first time, the WEO 2010 report projected that crude oil output would reach
an undulating plateau of around 68 to 69Mbpd and may not regain its all-time peak
of 70Mbpd in 2006. The report states that global oil production will peak one day.
The IEA 450 Scenario projections predict peak oil production at 86Mbpd just before
2020. The message from the report is that if governments act vigorously to
encourage more efficient use of oil and the development of alternatives, this may
reduce the demand for oil and the peak would not be caused by a resource constraint.
However, if governments do not act, then demand will continue to increase and
supply costs of oil will rise, leading to vulnerability to supply disruptions. The report
also stated that unconventional oil is abundant, but more costly.109
The IEA reports were contradicted by their chief economist, Faith Birol, in an
interview reported on the ABC television program Catalyst, on the oil crunch
reported on 28 April 2011. Dr Birol said in that interview, ‘When we look at the oil
markets the news is not very bright. We think that the crude oil production has
already peaked in 2006.’110
f. The UK Government Department of Energy & Climate Change
In August 2009, the UK Government Department of Energy & Climate Change
released a report entitled ‘Energy Security: A National Challenge in a Changing
World’. The report is referred to as the ‘Wicks Report’, as Malcolm Wick, MP for
Croydon, was appointed by the UK Prime Minister as a special representative on
international energy.
The report states that despite the promising outlook for new technologies to provide
more of the world’s energy needs, the demand for fossil fuel is likely to grow over
the next decade and remain a significant part of the global energy mix in the longer
term. There are clear risks that global supply will not be able to satisfy the demand,
108
International Energy Agency, ‘World Energy Outlook 2010’ (OECD/IEA 2010) 4. 109
Ibid 4-7. 110
ABC, above n 94.
Page 62
42
one reason being that many resource-rich countries restrict the involvement of
foreign companies in producing oil, which may result in lack of sufficient investment
to increase production. This no doubt will have an impact on the price of oil.111
The report states that in order to support the UK’s energy security, the approach
should be to first minimise energy use, diversify the energy mix and then take action
to minimise residual risks arising from the UK’s continual use of oil and gas and
growing import dependence.112
The UK government sees energy security as physical
security, ie avoiding involuntary disruption of supply, price security, and geopolitical
security, ie dependence on particular nations.113
The UK government report projects a growth in the world population from 6.5
billion in 2009 to 8.2 billion by 2030, with 35 per cent of this growth coming from
China and India. The demand for cars in emerging countries and the difficulty in
replacing oil for transport use with alternatives means that oil will remain the largest
fuel in the global fuel mix. Around three quarters of the projected increase in demand
for oil worldwide is expected to come from the transport sector. The report notes that
the transport sector is least responsive to price changes in the short term, ie the
demand is inelastic.114
The Wicks report states that a future increase in global demand for oil is likely to be
met by the Organisation of Petroleum Exporting Countries (OPEC). However, oil
production has already peaked in most non-OPEC countries and the production in
OPEC countries will peak before 2030.115
g. The UK Industry Taskforce on Peak Oil & Energy Security
The UK Industry Taskforce on Peak Oil & Energy Security also released a report in
February 2010 entitled ‘The Oil Crunch: A Wake-Up Call for the UK Economy’.
Their message to the government and businesses is clear, which is to act now. The
111
Malcolm Wicks, ‘Energy Security: A National Challenge in a Changing World’ (Report for the
Department of Energy and Climate, 2009) 3–4. 112
Ibid 6. 113
Ibid 8. 114
Ibid 27. 115
Ibid 29.
Page 63
43
message is that there will be an oil crunch in the next five years and as the world
reaches maximum oil extraction rates, ie peak oil, the era of cheap oil is over. The
UK government should set coherent policies to help the UK adapt, as virtually every
sector of the UK economy is still dependent on oil. The transport sector is dependent
on fossil fuels and older combustion technologies.116
h. Global Witness
Global Witness is an international non-governmental organisation established in
1993. One of the goals of Global Witness is to expose corrupt exploitation of natural
resources. In October 2009, Global Witness produced a report titled ‘Heads in the
Sand? — Governments Ignore the Oil Supply Crunch and Threaten the Climate’,
which provides an overview of the energy crisis and explores the problems with
securing sufficient oil supply for the growing demand, declining discovery rate,
insufficient new projects and oil field depletion. The report states that governments
and multi-lateral and international agencies have failed to recognise the scale of the
global oil crunch and most governments are unprepared for the consequences. There
is concern about the lack of international discussion about the nature and scale of the
problem. The report also states that the oil supply is not assured as generally
presumed, and criticises the IEA for holding an overconfident view that future supply
will meet growing demand. It also says that the IEA’s view is based on the
understanding that a massive investment of up to USD450 billion annually for the
next 22 years will ensure the supply. However the report claims that it is not possible
for the world to spend its way to an oil supply solution.117
The main recommendation of the Global Witness report is for individual
governments to officially recognise the scale and imminence of an oil crunch.
Individual governments have an overwhelming responsibility to their present and
future citizens to take urgent action. Finally, the report states that business-as-usual is
not possible and therefore a radically increased pace of change is required.118
116
Industry Taskforce on Peak Oil & Energy Security, above n 91, 4. 117
Global Witness, above n 14, 5. 118
Ibid 53.
Page 64
44
The Global Witness report lists the countries where oil production has peaked as
follows: Argentina, Australia, Brunei, Columbia, Congo-Brazzaville, Denmark,
Egypt, Gabon, Indonesia, Mexico, Norway, Oman, Papua New Guinea, Peru,
Romania, Syria, Trinidad & Tobago, Tunisia, United Kingdom, USA, Uzbekistan,
Vietnam and Yemen. Countries where oil production has peaked for political reasons
include Iran, Nigeria and Venezuela. Countries on a production plateau are Algeria,
Ecuador, India, Iraq, Malaysia and Russia. Iraq’s output has stagnated, but with
stability and investment, it could be increased. The key countries that the world is
relying on for oil are Angola, Azerbaijan, Brazil, Canada, China, Kazakhstan,
Kuwait, Libya, Qatar/UAE, and Saudi Arabia.119
i. Alternative View
Although the majority of the national and international reports show concern about
the global oil position, there are some economists who believe that the world will
never run out of oil as the reduction in the supply of oil will also shift or reduce the
demand and therefore there will always be oil in the ground. People will adjust their
behaviour by using unconventional oil or other energy sources.120
Unconventional oil can be recovered through a variety of processes, for example
deep water oil extraction and production from tar sands. However the cost of oil
recovery using these processes is more costly than conventional oil. Synthetic crude
oil can also be extracted from oil shale and synthetic diesel can be produced from gas
or coal. However the energy returned from energy invested (EROI) by using these
technologies is relatively low.
Despite this alternative view, it should be noted that concern about peak oil centres
around the amount of cheap energy that has been available from oil. The EROI from
conventional oil is high, and life without cheap energy will have ramifications. The
next part explores the implications of reduced energy as a result of peak oil and the
oil crisis.
119
Ibid 32. 120
Mike Moffatt, Peak Oil – Are Economists Collectively Stupid? (2012) About.com Economics
<http://economics.about.com/od/theoilsupply/a/stupideconomist.htm>.
Page 65
45
2.3 IMPLICATIONS OF PEAK OIL AND THE OIL
CRISIS: AN INTERNATIONAL PERSPECTIVE
The implications of peak oil and the oil crisis predicted by the international
community strongly suggests that action is required to reduce demand by adopting
behaviour change programs and diversify liquid fuel mix by implementing
alternative energy carriers where appropriate.121
However, exploration takes time,
and the implementation of new technologies takes even longer. Some critics argue
that higher oil prices will have no effect on the economy since price mechanisms will
cause a smooth transition to alternative energy resources such as coal, natural gas or
nuclear. Hirsh has examined the possibility of switching to alternative sources of fuel
and he concludes that the non-renewable energy alternatives will also be subject to
peak at some time in the future. On the other hand, renewable energy alternatives
from the sun or wind require energy storage which will add further costs compared
with the EROI for oil.122
Adapting behaviour in order to reduce the demand for oil, and implementing
alternative energy sources takes time. History has demonstrated that humans are slow
to change. If we examine American history and the abolition of the slave trade, the
southern US states were plunged into a deep crisis and it took a century for the
southern states to recover and catch up with the northern states. By comparison,
developing alternative energy technologies is likely to be even harder under the more
challenging circumstances of a global energy crunch. It is likely that when oil
becomes scarce, there may be slow and painful processes of social and technological
adjustments that could last for a century or more. The unavoidable consequence
could be famine, disease, and mass exodus. Countries that are likely to survive better
are those that are prepared to adapt to community-based values and a return to a
subsistence lifestyle.123
121
Owen, Inderwildi and King, above n 83, 4743–49. 122
Ugo Bardi, ‘Peak Oil: The Four Stages of a New Idea’ (2009) 34 Energy 323. 123
Jorg Friedrichs, ‘Global Energy Crunch: How Different Parts of the World Would React to a Peak
Oil Scenario’ (2010) 38 Energy Policy 4562.
Page 66
46
Although it cannot be predicted with certainty when the production of oil will peak,
the peaking of oil will cause a unique challenge. Massive mitigation more than a
decade before peaking is required to prevent disruption to life as we know it today. It
has been noted that previous energy transitions were gradual and evolutionary,
whereas oil peaking will be abrupt and revolutionary.124
In order to prevent economic
and social chaos, this thesis argues that government intervention will be required,
especially with regard to passenger transportation.
It has been reported in the US that from the time oil peaking occurs or is recognised,
it may take as long as 15 years until on-road fleet fuel efficiency is achieved in a
realistic manner and only aggressive vehicle fuel efficiency standards legislation may
reduce consumption of fuel.125
This thesis argues that in addition to fuel efficiency
standards, taxation may be required as a tool to effectively reduce the consumption
of oil in passenger motor vehicles.
Dr Robert Falkner from the London School of Economics has recently reported that
the transport sector in the UK is most exposed to the effects of global oil supply
constraints and price shocks, as the transport sector is highly dependent on petrol,
diesel and kerosene.126
This is equally true for Australia as the vulnerability of the
transport sector has important knock-on effects throughout the economy due to the
wide range of businesses relying on a highly integrated transport system. Many
businesses have frequent deliveries of stock with just-in-time business models. About
95 per cent of all products in shops are delivered using oil. Oil is essential for the
production of pharmaceuticals and agrochemicals. About 99 per cent of food
production uses oil.127
The Global Witness report states that the ramifications of a global oil shortage are
likely to affect almost every aspect of life, and if not handled properly, it could
become a multidimensional problem affecting economic growth, social progress and
political security around the world.128
124
Hirsch, Bezdek and Wendling, above n 85, 64. 125
Ibid 76. 126
Industry Taskforce on Peak Oil & Energy Security, above n 91, 27. 127
Global Witness, above n 14, 13. 128
See for example discussions in New Scientist: Debora MacKenzie, ‘Why the Demise of
Civilisation may be Inevitable’ (2008) 2650 New Scientist 32; Debora MacKenzie, ‘Will a Pandemic
Page 67
47
The economic impact of an oil supply crunch is likely to be far reaching and
complex. Energy expert Robert Hirsch analysed the relationship between GDP and
oil use on a global basis and his analysis shows that the global GDP to oil use ratio
stands at approximately 0.6 to 0.8 to 1. This means that for every one per cent loss of
available oil supply, global GDP could fall by 0.6 to 0.8 per cent.129
The oil supply crunch is likely to have an impact on world population which is
forecast to increase to 8 billion by the 2030s. Of this increase, 95 per cent will occur
in developing countries.130
The Australian population is expected to increase from
21.6 million in 2008 to 28.5 million by 2030.131
Population growth affects the size
and pattern of energy demand, as an increase in population requires an increase in
energy use. Oil provides the energy needed to grow and distribute food, which has an
impact on the rate of mortality as food is made available where needed. In 18th
century Europe, food was only transported about 15 kilometres.132
Today, motor
vehicles and trains transport food within a country and aeroplanes can transport fresh
food around the world.
The question the world faces is no longer whether to reduce energy consumption, but
how. The answer lies with the policymakers, whether they choose to manage energy
intelligently or not. Transport systems requiring energy intensive vehicles will
wither, impacting on energy-dependent food systems with possible consequences in
terms of unemployment and even famine. However if policymakers manage the
energy downturn intelligently, an acceptable quality of life could be maintained.133
In addition, private citizens should be encouraged through government policies to
adjust their lifestyles, and governments should provide support for oil conservation
Bring Down Civilisation?’ (2008) 2650 New Scientist 28; ‘Countdown to Crisis: Eight Days that
Shook Britain,’ BBC News Online, 14th September 2000
<http://news.bbc.co.uk/2/hi/uk_news/924574.stm>, from Global Witness, above n 14, 13. Also see
Clint Smith, ‘The Next Oil Shock’ (New Zealand, Parliamentary Library Research Paper, October
2010). 129
Global Witness, above n 14, 18. 130
US Joint Forces Command, above n 104, 12. 131
See Australian Bureau of Statistics, Population Projections, Australia (Catalogue No 3222.0, 4
September 2008) and Australian Bureau of Statistics, Australian Demographic Statistics (Catalogue
No 3101.0, March 2009), reported in Geoscience Australia and ABARE, above n 1, 26. 132
Graham Zable, Population and Energy (2002) Minnesotans For Sustainability
<http://www.mnforsustain.org/pop_population_and_energy_zable.g.htm>. 133
Richard Heinberg, ‘Searching for A Miracle “Net Energy” Limits & The Fate of Industrial Society’
(A Joint Project of the International Forum on Globalization and the Post Carbon Institute, September
2009) 65.
Page 68
48
measures that help them do so. The scale of the problem is likely to be immense and
some degree of international coordination and cooperation will also likely be
required. Peak oil presents many challenges to modern society, but with a strong
commitment from governments, countries can prepare for the eventual end of the oil
age.134
Having examined the global position, the next section explores Australia’s energy
position and the need to focus on passenger motor vehicles in order to maintain
Australia’s energy security, particularly for oil.
2.4 AUSTRALIAN OIL POSITION
Similar to the global position, Australia’s oil resources are in decline with remaining
crude oil resources estimated at 1 January 2009 to be 8414 petajoules (PJ)135
which is
equivalent to 1431Mb. This includes 6950PJ of economic demonstrated resources
and 1464PJ of sub-economic demonstrated resources.136
Australia also has 16 170PJ
or 2750Mb of condensate and 6210PJ or 1475Mb of LPG.137
The economic
demonstrated resources have further declined during the course of writing this thesis
to 5685PJ at 31 December 2010.138
The reason for this is that Australia’s crude oil
resources are being depleted at a faster rate than they are being replenished by
discovery. As a result, Australia is increasingly relying on imports to meet its
demand for crude oil.139
Crude oil exploration in Australia has not repeated the early
success of the 1960s when the first offshore exploration discovered the giant
Gippsland Basin.140
134
Jonah Ralston, Peak Oil: The Eventual End of the Oil Age (Directed Research Project, Master of
Arts in International Affairs, Washington University in St. Louis, 2008) 25. 135
One joule is defined as the amount of work done by a force of one Newton moving an object
through a distance of one meter. One joule is the equivalent of one watt of power dissipated for one
second. One petajoule is the heat energy content of about 43 000 tonnes of coal or 29 million litres of
petrol. 136
Geoscience Australia and ABARE, above n 1, 51. 137
Ibid 4. 138
Department of Resources, Energy and Tourism, ‘Energy in Australia 2012’ (ABARE, Canberra,
2012) 11. 139
Geoscience Australia and ABARE, above n 1, 20. 140
Ibid 41.
Page 69
49
Australia’s crude oil production was equivalent to 69 per cent of refinery feedstock
in 2007–08 and imported 31 per cent of its crude oil requirement. In 2008–09,
Australia imported 24 303 million litres of refinery feedstock (crude oil and
condensate) and exported 16 588 million litres of refinery feedstock.141
Australia also
imported 18 276 million litres of refined petroleum products in 2008–09 and
exported 1134 million litres of refined petroleum products in the same year. In terms
of the value of Australian trade in petroleum in 2008–09, Australia exported
AUD8755 million of crude oil and other refinery feedstock and imported AUD14
721 million of crude oil and other refinery feedstock in that same year.142
In terms of
refined products, in 2008–09, Australia exported AUD785 million of refined
products and imported AUD15 297 million of refined products in that same year.143
The majority of Australia’s crude oil and condensate comes from the Carnarvon
Basin in north-west Australia and the Gippsland Basin in the Bass Strait. The
production from the Carnarvon Basin currently accounts for 63 per cent of
Australia’s production of crude oil, condensate and LPG, whereas the Gippsland
Basin accounts for 20 per cent of the production of crude oil, condensate and LPG.144
Australia’s net imports of oil and oil products represented 45 per cent of
consumption in 2007–08.145
Australia’s primary oil production peaked in 2000–01 at
1546PJ (276Mb) and has been declining at five per cent per year to 1059PJ or
187Mb per year in 2007–08.
In Australia, the total conventional oil production (including crude oil, condensate
and LPG) is increasingly from offshore oilfields with deeper oil accumulations and
fields that contain smaller reserves compared with those developed in the past. It
should be noted that oilfields that are located offshore generally reach peak
production in a shorter time than reserves that are located onshore. Moreover, the
production costs of offshore fields are greater than onshore fields.146
Since Australia does not produce enough oil for its own use and has to rely on
imported oil from other countries, the government of Australia needs to question
141
Australian Bureau of Agricultural and Resource Economics and Sciences, above n 22, 53–4. 142
Ibid 55. 143
Ibid. 144
Ibid 51. 145
Geoscience Australia and ABARE, above n 1, 42. 146
Geoscience Australia and ABARE, above n 1, 72.
Page 70
50
Australia’s oil security and the need to develop policies that would bring about
reduced reliance on global oil reserves that are constantly being depleted and may
become very expensive. In order to assess the Australian government’s energy
management policy, it is first necessary to examine the extent of the liquid fuel
problem in Australia.
According to the Department of Resources Energy and Tourism, Australia is the
world’s ninth largest energy producer accounting for around 2.4 per cent of the
world’s energy production.147
It has 38.2 per cent of the total world resource of
uranium, 18.5 per cent of the total world resource of coal, 1.4 per cent of the total
world resource of gas and only 0.3 per cent of the total world resource of oil.148
As regards energy consumption, in the year 2007–08, Australia’s primary energy
consumption was 5772PJ, of which 40 per cent was coal, 34 per cent was oil and 22
per cent was gas.149
Of the 5772PJ of energy consumed in 2007–08, only 3917PJ was
available for disposal as 1856PJ was required for conversion of energy to usable
form.150
Table 2.4 shows that road transport was the largest consumer of energy in
Australia in the years 2007–08 and 2009–10.151
TABLE 2.4: Energy Consumption in Australia
2007–08 PJ
2009–10 PJ
Agriculture 92.6 96.0
Mining 449.7 339.7
Food, beverages, textiles 212.1 111.9
Wood, paper and printing 75.1 76.6
Chemical 202.3 227.7
Iron and Steel 117.4 69.9
Non-ferrous metals 461.5 384.6
Other industry 150.4 140.7
147
Department of Resources, Energy and Tourism, above n 138, 1. 148
Ibid 4. 149
Ibid 13. 150
Ibid 17. 151
Ibid 16.
Page 71
51
2007–08 PJ
2009–10 PJ
Construction 26.4 25.4
Road transport 1027.5 1064.9
Rail transport 37.5 45.7
Air transport 226.3 245.5
Water transport 70.6 60.1
Commercial services 278.9 309.1
Residential 425.7 440.1
Lubes, bitumen, solvents 62.9 65.8
Total 3916.9 3702.8
Source: Australian Government Department of Resources Energy and Tourism,
Energy in Australia (2010 and 2012).
The energy used in Australian road transport comes mainly from automotive gasoline
and automotive diesel oil as demonstrated in Table 2.5 below.152
TABLE 2.5: Australian Consumption of Petroleum Products 2008–09
Million litres
LPG 3996
Automotive gasoline 18 734
Avgas 96
Turbine fuel 6173
Kerosene 25
Heating oil 7
Automotive diesel oil 18 587
Industrial diesel fuel 16
Fuel oil 1423
Lubes and greases 437
Bitumen 809
Other 311
Total 50 614
Source: Australian Government Department of Resources Energy and Tourism
(2010)
152
Ibid 18.
Page 72
52
Of the consumption of 50 614 million litres of petroleum products, 78 per cent or
39 546 million litres came from the petroleum refining industry in Australia.
However, the Australian refineries consumed 38 808 million litres of crude oil and
condensate, of which 80 per cent was imported.153
This is partly because the
Australian crude oil is generally light and getting lighter and the Australian refineries
require the heavier crude oils. This means that Australia is very dependent on
imported crude and petroleum products (oil). In 2010–11, Australia imported 31 768
million litres of crude oil and over 16 000 million litres of refined transport fuels.154
In terms of oil consumption, the transport sector is the largest consumer of oil
products in Australia. In 2007–08, the transport sector accounted for around 70 per
cent of the total use of oil, compared with 50 per cent in the 1970s as shown in
Figure 2.1 below.155
153
Ibid 57. 154
Department of Resources, Energy and Tourism, ‘Strategic Framework for Alternative Transport
Fuels’ (December 2011) 16. 155
Geoscience Australia and ABARE, above n 1, 63.
Page 73
53
FIGURE 2.1: Australian Oil and LPG Domestic Consumption 2007–08
Source: ABARE, Australian energy statistics.
Within the transport sector, road transport is the largest consumer of oil representing
74 per cent of the total energy consumption in the transport sector.156
A further
examination of fuel consumption within the road transport sector reveals that
passenger motor vehicles consumed 60.9 per cent of all Australian road fuel
consumption in 2007–08 as demonstrated in Table 2.6 below.157
156
Department of Resources, Energy and Tourism, above n 138, 63. 157
Department of Resources, Energy and Tourism, ‘Energy in Australia 2011’ (ABARE, 2011) 68.
Transport
Industrial
Electricity
Commercial
Residential
Other
Page 74
54
TABLE 2.6: Australian Road Fuel Consumption by Type of Vehicles 2006–07
Percentage
Passenger vehicles 60.9
Buses 2.3
Motorcycles 0.4
Light commercial vehicles 15.7
Other trucks 0.2
Articulated trucks 12.5
Rigid Trucks 7.9
Total 100
Source: Department of Resources, Energy and Tourism, Energy in Australia 2011
(ABARE, 2011)
Since passenger vehicles in Australia consume the majority of oil used for road
transport, it is necessary to investigate how the consumption of oil can be reduced in
passenger motor vehicles. As part of this investigation, it is necessary to understand
the types of motor vehicles that Australians drive, where they drive and the number
of vehicle kilometres (VKM) they accumulate in a year. It is also necessary to
examine the growth of the motor vehicle industry, the design and characteristics of
the motor vehicles that people choose for personal transportation, and the impact
their choices have on the consumption of oil. Following such an examination, a
critical analysis of appropriate regulatory and fiscal policies can be conducted in
order to find ways to bring about a reduction in the consumption of oil in passenger
motor vehicles.
The growth of motor vehicle use is discussed in Chapter 3. History shows that motor
vehicles were seen as a means of conquering distance and increasing the speed by
which people and goods could be moved. The ingredients that made it possible for
the vehicle population to grow were the invention of the assembly line, the
abundance of cheap oil, appropriate marketing techniques and appropriate
government regulations. The next chapter analyses data on passenger motor vehicles
that will set parameters for the policy review in Chapter 4, ie an analysis of the
existing regulatory and fiscal measures that address the use of oil in passenger motor
vehicles.
Page 75
55
2.5 CONCLUSION
This chapter addressed the first research question and the first two research
objectives stated in part 1.3.
The first objective was the investigation of the reported Australian and global oil
resources. The investigation reveals that the countries with the most oil reserves are
in the Middle East and transitional economies, ie the Russian Federation. The oil
position is well summarised in the reports, for instance that a peak in production can
be expected to occur before 2031; increasing the global URR by a billion barrels
delays the peak by only a few days, and delaying the peak beyond 2030 requires
optimistic assumptions about the size of the recoverable resource and the rate at
which it is developed. Many organisations have forecast global peak oil to occur
before 2020. Peak oil does not mean oil running out, but a point where further
expansion of oil production becomes impossible, because new flows are fully offset
by production declines or depletion. Many national and international reports show
concern about the global oil position and advocate that governments should take
policy action to reduce the demand for oil, especially in the transportation sector.
This chapter also addressed the second research objective, to explore whether there is
a need to focus on reducing the use of oil in passenger motor vehicles in Australia.
Australian government reports indicate that Australia’s oil resources are in decline as
crude oil resources are being depleted at a faster rate than they are being replenished
by discovery, and as a result, Australia is increasingly relying on imported oil. Since
passenger vehicles in Australia consume the most oil, that is the focus of
investigation for this research. Chapter 3 analyses passenger motor vehicles in terms
of their growth in number and size, driver usage and choice, and dependency on oil.
Chapter 3 also explores future car designs and their limitations.
Page 76
56
CHAPTER 3: ANALYSIS OF PASSENGER
MOTOR VEHICLES — GROWTH, USAGE,
DESIGN AND CHOICE
3.1 INTRODUCTION
This chapter addresses the second research objective: To explore the need to focus on
reducing the use of oil in passenger motor vehicles in Australia. An analysis of
passenger motor vehicles is undertaken in this chapter in terms of their growth in
number and size, their usage and design, their choice by motorists, and their impact
on the consumption of oil.
Part 3.2 explores the increase in passenger motor vehicles, both globally and in
Australia, and illustrates how the passenger motor vehicle industry has grown over
the last 100 years. Australians mainly rely on passenger motor vehicles for
transportation and this is examined in part 3.3. Part 3.4 explores the design and
choice of passenger motor vehicles and addresses the question of whether a large and
powerful passenger vehicle is necessary when a smaller, lighter vehicle can provide
the necessary transportation with reduced oil consumption. Part 3.5 investigates
whether future car designs can resolve the oil problem, followed by a conclusion in
part 3.6.
3.2 GROWTH OF PASSENGER MOTOR VEHICLES
The growth of the motor vehicle industry over the last 100 years has been dependent
upon the plentiful supply of oil, a resource which has taken millions of years to form.
The history of motor vehicles dates back to 1886 when Karl Benz invented the first
gasoline motor vehicle and fitted it with a four-stroke engine.158
Henry Ford
158
Jean-Pierre Bardou et al, The Motor Vehicle Revolution: The Impact of an Industry (James M Laux
trans, University of North Carolina Press, 1982) [trans of: La Révolution Automobile (first published
1977)] 5.
Page 77
57
revolutionised the motor industry in the United States in 1908 by introducing a low-
priced model ‘T’. The model T was very successful, with 15 458 781 cars having
been produced after ten years. The success of the model T was due to its simple,
sturdy design and a high power-to-weight ratio, which meant that drivers could
obtain power without pushing the engine to its limit.159
The year 1908 marked the
founding of General Motors (GM) as the holding company for many merged firms in
the car industry.
Manufacturers in the 1900s were keen to reduce the weight of cars in order to
increase their performance, and began using special steels for crucial parts such as
gears and valves. These steel alloys contained carbon, nickel, chromium, tungsten
and manganese. The focus on new production methods led to larger volumes of cars
being produced. There was a shift in focus from sale to production. Ford’s invention
of a constant moving assembly line between 1907 and 1909 was a major
evolutionary step in the mass production of cars. By April 1914, the constant moving
assembly line reduced the time required for chassis assembly from 840 minutes to 93
minutes. The increased production output due to the assembly line meant that the
price of cars was reduced. This put pressure on other manufacturers around the
world, especially in Europe.
By 1914, the first phase of the motor vehicle revolution was complete. The First
World War did not halt the growth of car manufacturing. In 1914, America produced
548 139 passenger cars, and by 1917, there was an increase of over 218 per cent in
production to 1 745 792 cars.160
The heaviest demand was for lower priced cars, and
in 1916 the price of the Model T dropped to USD360. In 1918, manufacturers
improved their cars by installing heaters and closing up the bodies. The four-wheel
hydraulic brakes were also introduced in 1918.161
In the early years, cars were
considered a luxury and there was resistance to them due to the fear of motor
vehicles running into horses and people. In October 1917, the War Industries Board
in the United States classified car manufacturing as a ‘non-essential’ industry, and in
1918 the US imposed a luxury tax on cars. Similar taxes were also imposed by
159
Ibid 54. 160
Ibid 84. 161
Ibid 88.
Page 78
58
Britain. However, this did not deter the demand for cars and their production. By
1920, there was a total of 8 132 000 registered cars in the US.162
The growth pattern of motor vehicle manufacturing in Australia was similar to that in
America and Europe. Australia commenced the manufacturing of cars in 1897, when
the first petrol car was invented by Harry Tarrant in Melbourne. Tarrant was later
joined by Howard Lewis, a bicycle maker, and together they produced another car
with a six horsepower engine. This car became known as the Tarrant,163
and over the
years it underwent a number of design improvements and adjustments using both
Australian-made and imported components.164
Locally designed engines, gearboxes
and rear axles were combined with imported radiators, magnetos and carburettors.165
Australia was already importing cars in the early 1900s from the UK and America.
By 1917, 15 000 cars were imported into Australia, of which 10 000 were Model T
Fords and 2300 Dodges, 1500 Buicks and 1200 others.166
In order to protect local
manufacturing, the Australian government introduced customs duty on imported
vehicle bodies. In 1913 about 2000 car bodies were produced locally and 4900
imported.
The demand for vehicles increased after the First World War, as better roads were
constructed and vehicles became more reliable. In 1920–21, there was one vehicle to
55 people. By 1929–30, there was one vehicle to 11 people. The Second World War
brought a shortage of petrol which was rationed for civilian use. Imports were
restricted during the Second World War and greater reliance was placed on the local
car industry.167
The first Australian Holden was manufactured in 1948 and became a
popular family car, followed by Ford, Chrysler and Volkswagen. The Japanese cars
came onto the scene in the 1960s, and the large American cars and expensive
European cars could not compete with the Japanese as the Japanese cars were
cheaper, simpler and reliable.
162
Ibid 90. 163
An automobile engine produced by Tarrant Motor & Engineering Co and dating back to 1908 is
housed in the Powerhouse Museum in Sydney, Australia. 164
Sir Brian Inglis, ‘Transport’ in Technology in Australia 1788–1988 (Australian Academy of
Technological Sciences and Engineering using the Web Academic Resource Publisher, revised 2001),
479. 165
Ibid. 166
Ibid 480. 167
Ibid 485.
Page 79
59
The number of passenger vehicles registered per 1000 population increased in
Australia from 250 in 1965 to 465 in 1995.168
In 2008, there were 555 passenger
vehicles per 1000 population compared with 719 total motor vehicles per 1000
population.169
Thus in 2008, registered passenger motor vehicles formed 77 per cent
of total registered motor vehicles. Of the 11 803 536 registered passenger vehicles in
2008, 6.2 million were made up of three makes: Toyota (19.4 per cent); Holden (17.6
per cent) or Ford (15.2 per cent per cent).170
The historical increase in the number of registered cars on Australian roads is shown
in Figure 3.1.
FIGURE 3.1: Registered Cars and Station Wagons
REGISTERED CARS AND STATION WAGONS
0
2.000.000
4.000.000
6.000.000
8.000.000
10.000.000
12.000.000
Car
s an
d W
ago
ns
Cars and Wagons
1920 76.000
1950 769.000
2003 10.400.000
Source: Australian Bureau of Statistics, ‘Use of Urban Public Transport in Australia’
in Year Book Australia, 2005171
168
Australian Bureau of Statistics, Australian Social Trends, 1996 (Catalogue No 4102.0, 24 June
1996) 159–70. 169
Australian Bureau of Statistics, above n 23, 10. 170
Australian Bureau of Statistics, above n 23, 14. 171
Australian Bureau of Statistics, ‘Use of Urban Public Transport in Australia’ in Year Book
Australia, 2005 (Catalogue No 1301.0, 21 January 2005).
Page 80
60
Not only did the number of passenger vehicles increase, but Australians also
increasingly began relying on passenger motor vehicles as their main means of
transport, as discussed in the next part.
3.3 USAGE OF PASSENGER MOTOR VEHICLES FOR
TRANSPORTATION
Australians increasingly began relying on passenger motor vehicles for
transportation. In 1995, private road vehicles represented 93 per cent of city
passenger transport.172
In March 2009, 92 per cent of Australian households kept at
least one registered motor vehicle at home. The proportion of households with two or
more registered vehicles increased from 51 per cent in 2006 to 56 per cent in 2009.173
In 2009, 80 per cent of people in Australia used private motor vehicles to travel to
work or full-time study, 14 per cent took public transport, four per cent walked and
two per cent cycled. Ninety-four per cent of people who used a private motor vehicle
to travel to work or full-time study did so as a driver or rider and only six per cent
travelled as a passenger. The most common reasons for Australians not using public
transport are: lack of service at right or convenient time; convenience, comfort and
privacy; travel time too long; and own vehicle needed.174
A Senate inquiry on the investment of Commonwealth and State funds in public
passenger transport infrastructure and services reported in August 2009 that
metropolitan travel passenger-kilometres consist of about 85–90 per cent by car, 10
per cent by public transport and the rest by cycling and walking. The most prominent
comment in the submissions was the need for improvements to public transport
service and for encouragement of public transport use. A number of
recommendations were made which included that the government should investigate
172
Ibid. 173
Australian Bureau of Statistics, Year Book Australia, 2009–10 (Catalogue No 1301.0, 4 June 2010)
84. 174
Ibid 85.
Page 81
61
tax incentive options for public transport and that it should support behavioural
change programs.175
The ‘State of Australian Cities’ (2010) report by Infrastructure Australia states that
the level of car dependency in Australian cities has increased at a faster rate than
population growth, creating traffic congestion problems that are projected to cost
AUD20.4 billion by 2020.176
However more recent trends since the early 2000s show
a peak in motor vehicle use in most developed countries.177
Since the end of the Second World War, Australian cities have grown, with an
increase in suburbs. The government policies that have shaped our cities are housing
and land, transportation and taxation. A rapid increase in motor vehicle ownership
has encouraged the improvement and spread of the road system, thereby influencing
urban land use. The increased dependency on passenger motor vehicles for
transportation has increased oil consumption, other associated costs such as land use
for roads and parking, policing, accidents, noise, pollution and costs associated with
congestion.
Registered passenger motor vehicles consumed 30 047 million litres of fuel in the 12
months ended 31 October 2007, of which 62.8 per cent was petrol and 31.2 per cent
was diesel.178
175
Senate Rural and Regional Affairs and Transport Committee, Parliament of Australia, ‘Executive
Summary and Recommendations’ in Investment of Commonwealth and State Funds in Public
Passenger Transport Infrastructure and Services (2009)
<http://www.aph.gov.au/Parliamentary_Business/Committees/Custom_Contents/SenateCommittees/rr
atctte/publictransport/report> . 176
Major Cities Unit, ‘State of Australian Cities 2010’ (Report, Infrastructure Australia, 2010)
<http://www.infrastructureaustralia.gov.au/publications/files/MCU_SOAC.pdf>. 177
Litman, above n 10, 6. 178
Australian Bureau of Statistics, Survey of Motor Vehicle Use, Australia, 12 Months Ended 31
October 2007 (Catalogue No 9208.0, 28 August 2008).
Page 82
62
TABLE 3.1: Type of Fuel Used by Passenger Vehicles
2003 2008
Leaded 1 666 750 620 228
Unleaded 8 177 794 10 384 655
Diesel 295 697 505 340
LPG/other 225 700 293 313
Total 10 365 941 11 803 536
Source: Australian Bureau of Statistics, Motor Vehicle Census, Australia, 31 Mar
2008 (Catalogue No 9309.0, 14 January 2009).
It is not just the increase in the use of passenger motor vehicles that needs to be
controlled to conserve oil and reduce other associated costs, but also the design of the
vehicles. It is worth noting that even though the engines powering our vehicles have
become more efficient at extracting energy from liquid fuels, this has not resulted in
an energy saving. The reason for this is that manufacturers have increased the power
output of the motor vehicles as a selling point to attract customers, because
customers are demanding larger and more powerful motor vehicles. The next part
examines the current design of motor vehicles and the types of vehicles that
Australians are choosing.
3.4 DESIGN AND CHOICE OF PASSENGER MOTOR
VEHICLES
As the number of registered passenger motor vehicles has increased, it is necessary
to examine the design criteria for passenger motor vehicles and their impact on oil
consumption. To this end, the specifications of the Holden family car models from
1948 to 2008 were studied and the following data was collected:
- Year the model was introduced;
- Engine size in litres;
- Engine power output in kilowatts (kW);
- Weight of the car in kilograms (kg);
Page 83
63
- Vehicle’s power-to-weight ratio;
- Vehicle performance in terms of the time taken in seconds to reach a
speed of 100km per hour.
The results are summarised in Table 3.2.
TABLE 3.2: Holden Family Car Model Specifications, 1948 to 2008
Car Model Year
Introduced Engine
Size (litre) Power in
kW Weight
kg Power-to-
Weight
Ratio kW
per tonne
Performance
0–100km/h in
seconds
Holden 48-
215 (FX) Nov 1948 2.15 45 1012 44.46 20
Holden FJ Oct 1953 2.15 45 1012 44.46 20
Holden FE July 1956 2.15 53 1080 49.07 20.4
Holden FC May 1958 2.15 53 1084 48.89 19.5
Holden FB Jan 1960 2.26 56 1122 49.91 20.8
Holden EK May 1961 2.26 56 1121 49.95 20.8
Holden EJ July 1962 2.26 56 1130 49.56 18
Holden EH Aug 1963 2.45 75 1185 63.29
Holden HD Feb 1965 2.45 86 1216 70.72 13.2
Holden HR Apr 1966 2.45 86 1217 70.66 15.3
Holden HK Jan 1968 2.65 85 1300 65.38 15.2
Holden HT May 1969 2.65 85 1300 65.38 10.1
Holden HG July 1970 2.65 85 1300 65.38 12.8
Holden HQ July 1971 3.3 101 1338 75.48 13.1
Holden HJ July 1974 3.3 96 1338 71.75 13.1
Holden HX July 1976 3.3 82 1330 61.65 16.4
Holden HZ Oct 1977 3.3 81 1342 60.35 16.8
Holden WB 1980 3.3 81 1220 66.39
Holden VB Oct 1978 3.3 71 1220 58.20 16.4
Holden VC Mar 1980 2.85 76 1158 65.63 13.9
Holden VH Oct 1981 2.85 76 1152 65.97 10.2
Holden VK Feb 1984 3.3 86 1250 68.80
Holden VL Mar 1986 3.0 114 1250 91.20 7.04
Holden VN Aug 1988 3.8 125 1226 101.96 8.1
Page 84
64
Car Model Year
Introduced Engine
Size (litre) Power in
kW Weight
kg Power-to-
Weight
Ratio kW
per tonne
Performance
0–100km/h in
seconds
Holden VP Sept 1991 3.8 125 1332 93.84 8.1
Holden VR July 1993 3.8 130 1362 95.44
Holden VS Apr 1995 3.8 145 1385 104.69 8.9
Holden VT Aug 1997 3.8 147 1512 97.22 9.1
Holden VX Sept 2000 3.8 147 1519 96.77 9.1
Holden VY Oct 2002 3.8 152 1522 98.55 9.0
Holden VZ Aug 2004 3.6 180 1700 105.88 8.6
Holden VE July 2008 3.6 180 1700 105.88 8.6
Source: Richard Lewis, Holden Specifications (2008)
<http://richardlewis.org/holdenspecs.html>.
Even though the engines powering our vehicles have become more efficient at
extracting energy from liquid fuels, this has not resulted in an energy saving. The
reason for this is that vehicle power output has increased, and greater power output
has led to a real term net gain in vehicle size and weight as demonstrated in Table 3.2
above. For example, the first Holden family motor vehicle, the 1953 FJ Holden, had
a 2.15 litre engine and a power output of 45kW, but the vehicle weighed only
1018kg, which gave a power-to-weight ratio of 44.46kW per tonne. By comparison,
the average family car in 2008, the Holden VE Commodore, has a power output of
180kW, weighs 1700kg and has a power-to-weight ratio of 105.88kW per tonne.179
If
a vehicle with a power output of 45kW was produced today, it would need an engine
with a capacity of only approximately 855cc with a much lower weight and fuel
consumption.180
This is based on 0.052kW per cubic centimetre as demonstrated by
Schefter using the ‘Smart Fortwo’, with its one litre engine producing 52kW power
and accelerating from 0 to 100km/h in 12.8 seconds.181
This would be more than
179
Richard Lewis, Holden Specifications (2008) <http://richardlewis.org/holdenspecs.html>. 180
Kellen Schefter, 'Smart Car Offers Drivers New High MPG Option, Top Crash Rating' Green Car
Journal (online), 20 January 2008 <http://www.greencar.com/articles/smart-car-offers-drivers-new-
high-mpg-option-top-crash-rating.php>. 181
Ibid.
Page 85
65
adequate to drive on most roads as it almost matches the performance requirement of
0–100km/h in 10 seconds for general duty patrol and high performance vehicles.182
Various reports have noted that there has been no real gain in average fuel efficiency
over the last few decades. In September 2008, the Australian Transport Council
released a public discussion paper and noted that:
The average fuel consumption of all light vehicles has hardly changed over
the last decade. Engine technology in terms of fuel consumption per power
output has improved substantially due to a number of reasons such as higher
compression ratios and fuel injected Otto engines and as a result there has
been an improvement in fuel efficiency in the new passenger vehicle fleet.
However, potential fuel savings across the whole light vehicle fleet have
been offset by increases in vehicle power, size and weight and by the strong
growth in sales of four wheel drive sports utility vehicles (SUVs), and
increases in the fuel consumption of light commercial vehicles.183
This is demonstrated in Figures 3.2 and 3.3.
182
Australasian Centre for Policing Research, National Specifications for General Duty Patrol &
High Performance Vehicles (National Police Research Unit, Payneham, 6th
revision, 2006). 183
Australian Transport Council and Environment Protection and Heritage Council Fuel Efficiency
Working Group, above n 4, 16.
Page 86
66
FIGURE 3.2: New Car and All Terrain Wagon-Sports Utility Vehicle (ATW-
SUV) Sales in Australia
Source: Bureau of Infrastructure, Transport and Regional Economics, ‘Fuel
Consumption by New Passenger Vehicles in Australia 1979–2008’ (Information
Sheet No 30, August 2009).
The new car sales in Australia increased from 458 131 in 1979 to 631 866 in 2008,
an increase of 37.9 per cent, whereas the ATW-SUVs in the same period increased
from 15 556 to 210 933, an increase of 1255.9 per cent. Bearing in mind that
Australia is increasingly relying on imported oil as discussed in Chapter 2, it is worth
questioning whether there is a need for the Australian government to curb the
demand for large and powerful passenger cars including SUVs. The LET proposed in
Chapter 6 considers energy as a luxury, and suggests that driving a vehicle beyond
the power and weight necessary to transport a person should be considered a luxury
to be paid for in order to deter excessive use.
Figure 3.3 below shows that the average power of new cars in 1979 was 75.14kW
and the average weight was 1994.01kg. In 2008, the average power of new cars
increased to 118.31kW and the average weight increased to 1860.73kg. Thus the
power-to-weight ratio of cars increased from 37.68kW/tonne in 1979 to
63.58kW/tonne in 2008, an increase of 68.73 per cent.
0
100000
200000
300000
400000
500000
600000
700000
Ne
w L
igh
t V
eh
icle
s
Cars
ATW-SUV
Page 87
67
Similarly, the average power of ATW-SUVs increased from 105.40kW in 1979 to
157.25kW in 2008. The average weight of ATW-SUVs was 2528.08kg in 1979 and
2451.00kg in 2008. Thus the power-to-weight ratio of ATW-SUVs increased from
41.69 kW/tonne in 1979 to 64.15 kW/tonne in 2008, an increase of 53.87 per cent.184
FIGURE 3.3: Power-to-Weight Ratios for New Light Vehicles in Australia
Source: Bureau of Infrastructure, Transport and Regional Economics, ‘Fuel
Consumption by New Passenger Vehicles in Australia 1979–2008’ (Information
Sheet No 30, August 2009).
The Bureau of Infrastructure, Transport, Regional Economics (BITRE) examined
trends in the fuel consumption of new passenger vehicles in Australia from 1979 to
2008 and reported that the preference of Australian consumers for vehicle
characteristics that increase fuel consumption, being power, weight, accessories and
4WD capability, has meant that potential reductions in fuel consumption made
possible by technological advances have not been fully realised. The report also
confirmed that this is a worldwide trend and cautions against reliance on technology
184
Bureau of Infrastructure, Transport and Regional Economics, ‘Fuel Consumption by New
Passenger Vehicles in Australia 1979–2008’ (Information Sheet No 30, August 2009).
0.00
10.00
20.00
30.00
40.00
50.00
60.00
70.00
Po
we
r /W
eig
ht
in K
W p
er
Ton
ne
Cars
ATW-SUV
Page 88
68
alone to deliver reductions in fuel use.185
This indicates that the choice of extra
power and weight should be discouraged through appropriate government policies.
Studies undertaken by Van den Brink and Van Wee186
on European vehicles indicate
that any energy efficiency achieved by enabling vehicles to do more mileage with
less fuel has been directed toward increasing the power and weight of vehicles rather
than reducing their fuel use. The study on new passenger vehicles in the Netherlands
showed that between 1985 and 1997 the average weight of new passenger cars
increased by 20 per cent, or about 190kg, and without this increase in weight, the
average new passenger car would have been 12 per cent more fuel efficient.187
The
reason for the increase in weight was that successive models of cars got larger, and
this was partly due to competition between car manufacturers, but also due to
demand from customers. Motor vehicle advertisements emphasising the importance
of space, speed, and acceleration discourage consumers from choosing smaller,
lighter and less powerful models.188
The new models also tend to have a greater
cylinder capacity. From 1985 to 1995, the cylinder capacity of the average new car
sold in the Netherlands increased from 1475 to 1640cc.189
The increase in weight of a motor vehicle can be attributed to the actual increase in
its size together with an increase in safety standards, extra insulation materials and
conveniences such as air conditioning and electric windows. The Netherlands study
also showed that the increase in weight directly affects specific fuel consumption in
two ways, firstly through acceleration resistance, where energy is needed to
accelerate the vehicle, and secondly through rolling resistance. The study concluded
that an extra 100kg of weight leads to a seven to eight per cent increase in fuel
consumption.190
It is also interesting to note that a substantial increase in motor vehicle power was the
indirect result of technological improvements required in order to comply to changes
in laws on vehicle emission standards. In Australia, the vehicle emission standards
185
Ibid 10. 186
Robert M M van den Brink and Bert van Wee, ‘Why Has Car-Fleet Specific Fuel Consumption
Not Shown Any Decrease Since 1990? Quantitative Analysis of Dutch Passenger Car-Fleet Specific
Fuel Consumption’ (2001) 6 Transportation Research Part D 75. 187
Ibid 84. 188
Ibid 84–5. 189
Ibid 86. 190
Ibid 83.
Page 89
69
are set by the Commonwealth government through the Australian Design Rules
(ADRs). Table 3.3 lists the emission requirements for new petrol passenger cars in
Australia from 1972 to 2010.
TABLE 3.3: Summary of Emission Requirements for New Petrol Passenger
Cars in Australia 1972–2010
Standard Date
Introduced Exhaust Emission Limits Source
Hydrocarbons(HC) Carbon
Monoxide
(CO)
Oxides of
Nitrogen
(NOx)
ADR26 1/1/72 NA 4.5% by vol NA Idle CO
test
ADR27 1/1/74 8.0–12.8g/test 100–220 &
4.5% by vol NA ECE
ADR27A 1/1/76 2.1g/km 24.2g/km NA US 72
FTP
ADR27B 1/1/82 2.1g/km 24.2g/km 1.9g/km US 72
FTP
ADR27C 1/1/83 2.1g/km 24.2g/km 1.9g/km US 72
FTP
ADR37/00 1/2/86 0.93g/km 9.3g/km 1.93g/km US 75
FTP
ADR37/01 1/1/97–
1/1/99 0.26g/km 2.1g/km 0.63g/km US 75
FTP
ADR79/00 1/1/03–
1/1/04 0.25g/km 2.2g/km 0.25g/km UN ECE
R83/05
(Euro2)
ADR79/01 1/1/05–
1/1/06 0.2g/km 2.3g/km 0.15g/km UN ECE
R83/05
(Euro3)
ADR79/02 1/7/08–
1/7/10 0.1g/km 1.0g/km 0.08g/km UN ECE
R83/05
(Euro4)
Source: Department of Infrastructure and Transport, Vehicle Emission Standards (6
March 2012) Commonwealth of Australia
<http://www.infrastructure.gov.au/roads/environment/emission/index.aspx>.
Over past decades, changes in environmental regulations have required a reduction in
vehicle carbon monoxide emission levels. The required maximum levels were
Page 90
70
24.2g/km in July 1976 (ADR 27A), decreasing to 9.3g/km from 1986 for new
passenger vehicles (ADR 37-00) and 2.1g/km for new models (ADR 37-01) from
1997 and for all new passenger vehicles from 1998. These have been further reduced
to 1.0g/km from 2008. The removal of lead from petrol since 1986 and the
installation of catalytic converters (ADR 37-00; Australian Standard 2877) has
assisted in reducing environmental air pollution from exhaust emissions. The
catalytic converter transforms carbon monoxide and other pollutants into the by-
products carbon dioxide and water, reducing emissions and increasing performance.
It reduces NOx emissions, unburned hydrocarbons and carbon monoxide.
Performance is enhanced via an oxygen sensor mounted in the catalytic converter
that conveys to the engine computer how much oxygen is in the exhaust, so that the
engine computer can adjust the air-to-fuel ratio, making sure that the engine is
running at close to the stoichiometric point.191
With the introduction of emission laws, motor manufacturers began installing
microprocessors in vehicle Engine Control Units (ECU) that regulate the air/fuel
mixture so that the catalytic converter can remove most of the pollution from the
exhaust. The ECU collects data and performs millions of calculations each second to
decide the best spark timing and determine how long the fuel injector is open, thus
obtaining the lowest emissions and the best mileage.
A motor vehicle fuel system that provides an incorrect fuel intake creates high levels
of emissions. In order to keep up with emission and fuel efficiency laws, the fuel
system used in modern cars has been changed over the years. The throttle body fuel
injection systems have been replaced by multi-port fuel injection systems, which
have a fuel injector for each cylinder so that the correct amount of fuel is delivered at
the intake valve, thereby increasing the engine performance.
The increase in performance and power brought about by these technological
advances has been eroded by the motor vehicle manufacturers providing consumers
with larger and heavier vehicles. Larger and heavier motor vehicles require more
energy to get them moving and this means an increase in oil consumption. A New
South Wales study on the change in car fleet characteristics from 1990 to 2000
191
Karim Nice and Charles W Bryant, How Catalytic Converters Work (2011) How Stuff Works
<http://auto.howstuffworks.com/catalytic-converter2.htm>.
Page 91
71
showed that car size increased by 27 per cent, the kilometres travelled increased by
23.5 per cent and the fuel efficiency improved by only four per cent.192
From the analysis so far, it can be concluded that Australians are mainly relying on
passenger motor vehicles to transport themselves and they are increasingly
purchasing heavier and more powerful vehicles that consume more fuel, when a
smaller car could also meet their needs. If oil is becoming scarcer, the first place
where oil consumption should be curtailed is where it will have the least impact on
the Australian lifestyle. It is argued in this thesis that a behaviour change is required
in regard to both the choice of motor vehicle type and the use of motor vehicles and
alternative modes of transport. Critics may argue that if oil becomes scarce,
conventional motor vehicles will be replaced by electric and hybrid motor vehicles,
or motor vehicles using alternative fuels.
The next part explores whether future car designs could help reduce oil consumption.
3.5 FUTURE MOTOR VEHICLE DESIGNS AND THEIR
LIMITATIONS
The main problem with current motor vehicle design is its reliance on a plentiful
supply of oil. The fact that oil is non-renewable means that one day motor vehicles
will need to be redesigned to run on alternative energy sources. Some alternative
sources may impact on other resources such as water, land and agriculture, upon
which our population relies for survival. Attempts have been made in the past to use
different fuel sources for motor vehicles. In 1901, Ferdinand Porsche invented the
‘mixed’ gas-electric hybrid car. The American Baker Motor Vehicle Company sold
thousands of electric cars from 1899 to 1915. These electric cars could reach speeds
of 23 kilometres per hour (km/h). In 1990, General Motors (GM) introduced its ‘EV’
two-seater electric car that could reach a speed of 120km/h and could accelerate from
zero to 90km/h in less than seven seconds. However, GM only built 1000 of these
cars.
192
Environment Protection Authority, Clean Cars for NSW (Environment Protection Authority,
revised ed, 2003) 3.
Page 92
72
Electric and hybrid electric vehicles may be the alternative future vehicles that
reduce oil demand. However, there is a heavy reliance on fossil fuel, ie coal, to make
electricity. Moreover, electric or hybrid cars tend to cost more to purchase, and it is
only through appropriate policies by providing grants for hybrid production and
infrastructure development that the demand for alternative future vehicles will
increase. A recent parliamentary report canvassed that Australia has a role to play in
assessing technologies such as nanotechnologies, compressed air and hydrogen that
may be required in developing concept hybrid cars and introducing new car systems
with alternative fuel supplies. The report further states that Australia has the potential
to be influential in the global automobile manufacturing industry.193
Many different types of electric vehicles have been designed in recent years. The
simplest of the vehicles with an electric driveline is the battery-powered electric
vehicle. The energy required to power the vehicle comes from a battery, which can
be recharged from the wall plug. The vehicle’s driving distance is determined by the
energy storage capacity of the battery, and its acceleration and top speed depend on
the power rating of the electric motor.
Table 3.4 shows selected battery-electric vehicles that have been designed and built
in recent years:194
TABLE 3.4: Electric and Hybrid Vehicles — Design and Performance
Model/Manufacturer Weight
(kg)
Battery
(kWh) Motor
(kW) Range
(Miles) Max Speed
(km/h)
EVI/GM 1350 NiMthyd/29 104 140 >120
EV Plus/Honda 1634 NiMthyd/30 49 100 >120
RAV4/Toyota 1560 NiMthyd/28 50 95 >120
Altra/Nissan 2080 Lithium-
ion/32 62 120 >100
193
Matthew L James, ‘The (Green) Car of the Future’ (Background Note No 2009–10, Parliamentary
Library, Parliament of Australia, 2009)
<http://www.aph.gov.au/binaries/library/pubs/bn/sci/carofthefuture.pdf> 1. 194
Andrew Burke, ‘Electric and Hybrid Vehicle Design and Performance’ in Myer Kutz,
Environmentally Conscious Transportation (John Wiley & Sons, 2008) 131.
Page 93
73
Model/Manufacturer Weight
(kg)
Battery
(kWh) Motor
(kW) Range
(Miles) Max Speed
(km/h)
Smart/Mercedes 1380 NaAICI/
30
50 125 >120
Think/Ford 960 NiCad/12 12 50 40
E-com Toyota 790 NiMthyd/8 20 50 80
Hypermini/Nissan 840 Lithium-
ion/10.5 24 60 80
Zenn/Feelgood cars 510 VRLA lead-
acid/7 8 35 40
Source: Myer Kutz, Environmentally Conscious Transportation (John Wiley &
Sons, 2008).
Tesla Motors was founded in 2003 in California and has produced a number of
electric vehicles such as the Tesla Roadster, which was released in 2008.195
The
Tesla Roadster operates on 6831 lithium-ion batteries that can be recharged using a
13A socket from any conventional 110 volt or 220 volt power outlet. The charging
times depend upon the breaker amperage. At 13A, it takes about 16 hours to recharge
the batteries, but at a 50 ampere breaker rating, the charge time is approximately six
hours.196
With a full charge and driving at reasonable speed, the Tesla Roadster gives
394 kilometres (245 miles) of driving range. It has an AC induction motor and a
single speed gearbox producing 400 newton meter (295 pounds per square foot) of
torque and 288 horsepower, and it accelerates from zero to 97km/h (60mph) in 3.7
seconds. The drive efficiency of the Tesla Roadster is 88 per cent, making it three
times more efficient than an internal combustion powered vehicle.197
The
disadvantages of Tesla Roadster are that it is expensive to buy, costing about
USD100 000, and that the electricity to recharge the batteries comes from burning
fossil fuel. To put this in terms of an alternative energy source, using a single
windmill to recharge the Tesla batteries would take 600 hours or 25 days.198
195
Tesla, About Tesla <http://www.teslamotors.com/about>. 196
Tesla, Charging/High Power Wall Connector
<http://www.teslamotors.com/goelectric/charging/high-power-wall-connector>. 197
Tesla, Using Energy Efficiently <http://www.teslamotors.com/goelectric/efficiency>. 198
British Broadcasting Corporation, ‘Jeremy Drives the Tesla Roadster’, Top Gear: Series 12,
Episode 7, 2008 (Jeremy Clarkson) <http://www.topgear.com/uk/tv-show/series-12/episode-7>.
Page 94
74
A new type of lithium-ion battery that uses nanophosphate maybe soon be marketed
by Norwegian company ‘Think’. These batteries are made from specialised electrode
materials using nanotechnology, and should be able to provide up to 15 years of daily
charging cycles of about four hours each. They are being developed by A123
systems and will be used in the new GM Chevy Volt.199
For plug-in electric motor vehicles to be successful, they would require an
infrastructure of electric recharge grids. An organisation called Better Place is
building electric recharge grids in many countries including Israel, Denmark,
Australia and California.200
In Australia, Better Place announced the launch of
Network Operations Centre (NOC) which will manage the intelligent systems,
software and assets for the Better Place electric vehicle recharge network.201
Another type of vehicle that is becoming common is the hybrid electric vehicle. Here
the electricity is generated on board the vehicle from liquid or gaseous fuel and the
electric motor provides the torque to propel the vehicle. In a parallel hybrid vehicle,
the engine is connected directly to the wheels, whereas in a series hybrid vehicle, the
engine is connected to a generator. In a charge-sustaining hybrid vehicle, the energy
storage battery is charged off the engine and only requires a low charge, whereas in a
plug-in hybrid vehicle, the battery is charged off the wall plug. The charge-sustaining
hybrid vehicles operate in a similar manner to the conventional internal combustion
engine. The development of plug-in hybrids is at an early stage and may become
important in the future. The plug-in hybrid significantly replaces oil with
electricity.202
The Toyota hybrid technology appears to be the most advanced.203
More hybrids have now come on the market, with Lexus announcing its GS 450h
hybrid sedan in March 2006, followed by the RX400h 4WD in September 2006. GM
brought in the Chevrolet Silverado and the GMC Sierra. A Hungarian hybrid, the
Solo, was also introduced in June 2008.204
Holden has also announced its electric
Volt, which will come onto the market as a four passenger extended range electric
vehicle. It uses electricity as its primary power source and petrol as its secondary
199
Kevin Bullis, ‘An Electrifying Startup’ (2008) 111(3) Technology Review 68. 200
James, above n 193, 12. 201
Better Place Australia <http://australia.betterplace.com/>. 202
Burke, above n 194, 131. 203
See Toyota Motor Corporation, How Hybrid Works <http://www.toyota.com.au/hybrid-synergy-
drive/hybrid-technology/how-hybrid-works>. 204
James, above n 193, 9.
Page 95
75
power source. The energy in the Volt is stored in a 16kWh lithium-ion battery pack
which can drive 64km without using any oil.205
Hydrogen fuel cell vehicles are also being designed, where the fuel cell is an
electrochemical device that converts hydrogen directly to electricity with only water
and vapour as emissions.206
The Honda FCX Clarity is one such motor vehicle which
has its own electricity generating centre on board, using the hydrogen fuel cell. The
compressed hydrogen is converted into electricity that drives the electric motor,
producing 136 horsepower and reaching a speed of 160km/h (100mph). It can go
from zero to 97km/h (60mph) in nine seconds. The advantage of using hydrogen is
that it is renewable.207
However, the chemical and atomic properties of hydrogen are
such that it is difficult to separate hydrogen atoms out of the molecules in which it
exists, and a substantial amount of power is required to do so. To obtain two grams
of hydrogen and 16 grams of oxygen by electrolysis of 18 grams of water, an
equivalent of 68 300 calories of electrical energy is required. Thus 100kWh of
electricity is required to produce 18kWh of electricity or energy available in one
pound of hydrogen gas.208
Compressed air cars are also being developed by a French company Motor
Development International, based on the French compressed air technology
(CAT).209
It works on four cycles. Firstly, outside air is drawn into the combustion
chamber and compressed to 400°C. Cold air is then injected to cause an explosive
stroke of the piston which is then exhausted.210
This technology is also being
developed by an Indian company Tata Motors, which has operations in the UK,
South Korea, Thailand and Spain. Deakin University in Australia designed a car that
runs on compressed air as part of the Ford Global Challenge to design a Model T for
the 21st century, and was a joint winner with Aachen University in Germany. Ford
pronounced the Deakin design simple, lightweight, practical, compelling and low
205
Holden, Holden Volt – Coming Soon <http://www.holden.com.au/pages/volt-coming-soon>. 206
Burke, above n 194, 132. 207
British Broadcasting Corporation, above n 198. 208
C Johnson, Hydrogen as a Fuel for Automobiles and Other Vehicles (2003) <http://mb-
soft.com/public2/hydrogen.html>. 209
CAT volution, MDI OneCAT CAV @ the 2008 NY Auto Show – Questions and Answers (21 March
2008) You Tube <http://www.youtube.com/watch?v=rldgXhLW0h0&feature=player_embedded>.
Also see <http://www.mdi.lu/eng/affiche_eng.php?page=communique3>. 210
James, above n 193, 18.
Page 96
76
cost, saying that it could be retailed for under AUD9000.211
The Ford WS Fiesta
Econetic is lightweight and therefore boasts a fuel economy of 3.7 litres per 100km,
but does not match the AUD9000 price tag as pronounced by the Ford Global
Challenge.
Volkswagen presented its L1 concept car at the Frankfurt International Motor Show
in September 2009, driven by a new high-tech TDI and E-motor engine. With a
carbon fibre body, the car weighs 380kg and can drive at a maximum speed of
160km/h. The L1 consumes 1.49 litres of diesel per 100km and is a small car at
3.813 metres long, 1.143 metres high and 1.2 metres wide. It has an aerodynamic
design using the glider concept where driver and passenger sit one behind another,
and it employs Formula 1 racing and airplane construction techniques. Volkswagen
targeted release date for the vehicle is in 2013.212
It should be noted that mass production and marketing of motor vehicles using new
technologies is in its infancy and may take many years to become viable. The reason
for this is that the technologies must be first developed to be feasible at an affordable
cost. They must compete with conventional technology, and the cost of the batteries
and fuel cell technologies is still high.213
In short, although the future car designs
may be the solution for a reduced reliance on oil, they are not the solution for today.
Government policies need to focus on reducing the use of oil in the existing vehicles
with internal combustion engines, and encourage the purchase of vehicles with
alternative energy sources. In this respect, the next part examines whether biofuels
can replace the use of oil in the currently available motor vehicles.
3.5.1 Biofuels for motor vehicles
Biofuels may become an alternative source of energy for motor vehicles when oil
becomes very expensive. Biofuels are made from renewable materials such as plants
211
Deakin Research Services Division, T2 proves a winner in Global Challenge (October 2008)
<http://www.gsdm.com.au/newsletters/deakin/Oct08/t2.html>. 212
Volkswagen International, ‘Breakthrough for the 1-Litre Car: Volkswagen Presents the Most Fuel-
Efficient Automobile in the World’ (Press Release, 15 September 2009). 213
Burke, above n 194, 187.
Page 97
77
and organic waste. Common biofuels that may become popular in the future are
ethanol, biodiesel and hydrogen.
a. Ethanol
Ethanol was used by Nikolaus Otto in 1876 when he invented the four-stroke engine.
Even the Model T ran partly on ethanol. However oil became cheaper than ethanol
and took over as a motor fuel. Ethanol can be produced from sucrose and starch, by
the fermentation of crops into ethanol. There are a number of methods of making
ethanol using the sugars or the starch, and new methods of making ethanol from
plant fibres are being investigated as they would yield twice the amount of ethanol.
Ethanol can be used in spark-ignition engines as a pure fuel or blended with oil.
Vehicles manufactured after 1990 may use E10 ethanol, which has 10 per cent
ethanol by volume. Since ethanol has poor cold-start properties, vehicles that run on
blends greater than E85, ie containing up to 85 per cent ethanol, require an oil
reservoir for cold starts. Some problems with ethanol include water separating oil
from the ethanol, causing poor engine performance. Also, ethanol is hygroscopic and
can be corrosive to common metals used in fuel systems and cause plastics to
deteriorate. Ethanol contains less energy than oil, with 1.5 gallons of ethanol
necessary to match the energy of one gallon of oil.214
The problem with using ethanol as a fuel supply is the reliance on production of
crops with sucrose and starch. This brings about problems relating to the use of land
and water required for human sustenance, and the need to feed the world’s growing
population rather than to use these resources to produce transportation fuel.
b. Biodiesel
Another biofuel that is increasingly being used for transportation is biodiesel.
Biodiesel or vegetable oil was first used in engines developed by Rudolf Diesel. It
214
Aaron Smith, C Granda and M Holtzapple, ‘Biofuels for Transportation’ in Myer Kutz,
Environmentally Conscious Transportation (John Wiley & Sons, 2008) 215.
Page 98
78
can be used in diesel engines without modification and in fact extends the life of the
engines. The advantages of biodiesel are that it produces lower emissions, is
biodegradable, non-toxic and has a higher flash point. Rapeseed is the primary crop
used for biodiesel in Europe, whereas soybean is used in the USA. Biodiesel is a
well-developed biofuel. Pure biodiesel yields 12 per cent less energy per kilogram
than conventional diesel but seven per cent higher combustion efficiency. It has a
higher cloud point than conventional diesel and is therefore less tolerant to cold
temperatures. Since biodiesel contains 10 per cent oxygen by mass, it burns cleaner
than conventional diesel and it is safer to transport. However it can produce greater
nitrogen oxide (NOx) emissions. Biodiesel can be stored in the same containers as
normal diesel. The future of biodiesel depends upon the vegetable oil production
capacity. Algae have potential as a source of biodiesel,215
however, this research is
still in its infancy.
c. Hydrogen
Hydrogen is an energy carrier rather than an energy source. Hydrogen is molecularly
bound in many organic and inorganic compounds. To produce hydrogen, water,
biomass and hydrocarbons are required. However, it takes energy to produce
hydrogen and there are various methods of doing so. The cost of producing hydrogen
is the biggest barrier to moving towards a hydrogen economy. Hydrogen needs to be
pure and would require new standards for storage, delivery, infrastructure and end-
use. About 0.45kg of hydrogen has the equivalent energy of approximately 3.1
gallons of oil. The internal combustion engines that use hydrogen are 20 per cent
more efficient. It is the cleanest fuel on the planet with zero emissions, however this
depends on how the hydrogen is produced. The distribution and storage of hydrogen
is very expensive. Storage is expensive because hydrogen is very low in volumetric
density and increasing the density requires energy. Because hydrogen burns rapidly,
there are also safety issues to consider. For hydrogen to become a widespread source
215
Ibid 224–34.
Page 99
79
of fuel, it must be economical and practical to produce. Currently it is very expensive
to produce and store.216
3.6 CONCLUSION
This chapter addressed the second research objective of the thesis which is whether
there is a need to focus on reducing the use of oil in passenger motor vehicles. It also
addressed the second research question: To what extent does the growth, usage,
design and choice of motor vehicles have an impact on the consumption of oil?
The growth of the motor vehicle industry over the last 100 years has depended on the
plentiful supply of oil. Australians rely on passenger motor vehicles for their
transportation and have been choosing large and powerful passenger motor vehicles
which consume more oil. This dependence on oil has the potential to become a
problem as discussed in Chapter 2. Future cars may resolve the problem, but this is
not likely to occur in the near future as discussed in this chapter.
Since passenger motor vehicles consume the most oil in Australia, and larger and
more powerful motor vehicles are increasingly being demanded by Australians, this
leads to the logical conclusion that the increased size and usage of these vehicles
needs to be controlled by appropriate government policies. If oil is becoming scarce,
the first place where oil consumption should be curtailed is where this would have
the least impact on the lifestyle we are accustomed to. The oil should be preserved
for other necessities, such as the production of food, plastics and pharmaceuticals,
and to develop other sources of energy.
The next chapter explores existing regulatory and fiscal measures implemented by
various countries that impact on passenger motor vehicles, so that lessons can be
learnt that help in designing a tax framework to control the growth, choice and usage
of passenger motor vehicles and reduce the use of oil.
216
Ibid 234–50.
Page 100
80
CHAPTER 4: ANALYSIS OF REGULATORY AND
FISCAL MEASURES IMPLEMENTED IN
VARIOUS COUNTRIES THAT IMPACT ON
PASSENGER MOTOR VEHICLES
4.1 INTRODUCTION
This chapter examines the regulatory and fiscal measures that countries in the world
have implemented and that impact on the design, choice and usage of passenger
motor vehicles. This examination will assist in answering the second research
question: What are realistic tax measures that can be implemented to reform design,
choice and usage of motor vehicles for personal transportation in Australia?
The literature review in this chapter explores both regulatory and fiscal measures that
have been adopted in other countries to attempt to curb passenger vehicle population
growth, reduce travel demand in passenger motor vehicles and improve fuel
efficiency in passenger motor vehicles. A wide variety of possible approaches to
addressing the areas under consideration in this thesis have been introduced in
different parts of the world. Table 4.1 summarises the major approaches used by
various countries which will be discussed in detail in this chapter as indicated below,
from which lessons can be drawn for Australia.
TABLE 4.1: Measures to Promote Use of Fuel-Efficient Private Vehicles
Approach Approach
Details Measures Country/Region Discussion
Standards Fuel economy
and CO2 Numeric standard
averaged over fleets
or based on vehicle
weight-bins or sub-
classes
US, Japan, China,
Republic of Korea,
Canada, EU,
Australia.
Part 4.2
Consumer Fuel
economy/green
mpg, km/L, USA, Sweden, EU,
Republic of Korea,
Part 4.3
Page 101
81
Approach Approach
Details Measures Country/Region Discussion
awareness house gas
(GHG)
emission labels
and compulsory
fuel
information in
model-specific
vehicle
advertising
L/100km, g CO2/km Japan, New
Zealand, Australia
and others
Fiscal
measures
Differential
charges on
purchase or use
of motor
vehicles
Tax or registration
fee based on engine
size, efficiency &
CO2 emissions
USA, Canada, EU,
Norway, Singapore,
Japan, Australia.
Part 4.4
Fuel taxes and
fuel excise Tax rate on petrol OECD countries
Income tax
incentives Tax credit and tax
subsidies USA, Canada,
China, EU, Japan,
Demand
management
programs
Incentives and
disincentives Road user charges
based on vehicle
kilometres travelled,
congestion charge,
high vehicle
occupancy (HVO)
lanes, road space
rationing, no driving
day, vehicle quota
system, bridge and
road toll policies,
pay-as-you-drive
insurance.
Canada, Germany,
Benelux countries,
California, USA,
Norway, Singapore,
UK, Bogota,
Mexico, China, the
Republic of Korea,
Italy, Zurich and
Australia.
Part 4.5
Compulsory
inspection and
retiring of
motor vehicles
Safety, fuel
efficiency,
reduction of
emissions and
reduction of
fleet age
Compulsory action,
rebates and
surcharge
USA, the
Netherlands, Japan,
Singapore and
Egypt.
Part 4.6
In each of the parts 4.2 to 4.6, the literature is reviewed first followed by an analysis
under the heading ‘Lessons for Australia’. The chapter will make concluding
comments in part 4.7. The lessons learnt from this chapter will be applied in Chapter
6 where a critical examination of some policy options for Australia is undertaken.
Page 102
82
4.2 FUEL ECONOMY AND GREENHOUSE GAS (GHG)
EMISSIONS STANDARDS FOR PASSENGER MOTOR
VEHICLES
Fuel economy and GHG emission standards are currently the main policy option
being increasingly adopted by many countries in order to reduce the fuel
consumption and emissions of their motor vehicle fleet. This thesis explores the
impact of this policy in bringing about a reduction in fuel consumption. This part
first explains in detail the policy behind the setting of the standards in various
countries and then, under ‘Lessons for Australia’, explores the impact of these
standards in bringing about a behaviour change favouring personal vehicles that
consume less oil.
A fuel economy standard is normally set by a country’s regulatory authority with the
aim of improving the fuel economy of motor vehicles, raising awareness of the fuel
economy of motor vehicles sold to consumers, and allowing consumers to make
better-informed purchasing decisions based on the fuel efficiency of motor vehicles.
The standards indirectly persuade consumers to choose fuel-efficient or emission-
efficient vehicles by imposing regulations on the manufacturers and importers of
motor vehicles. It is questioned in this thesis whether this indirect method of
persuasion is sufficient.
Fuel economy and GHG or CO2 emission standards have been implemented in some
countries as a regulatory measure to improve motor vehicle fuel efficiency and
emissions. The adoption of these standards varies in stringency, form and structure
and how fuel economy and emissions are measured. Some countries have set
mandatory standards whereas other countries such as Australia rely on voluntary
commitment from the automotive industry. Table 4.2 shows the various countries
and regions that have implemented fuel economy and GHG or CO2 emission
standards.
Page 103
83
TABLE 4.2: Fuel Economy and GHG Emission Standards for Passenger
Vehicles Around the World
Country/Region Type Measure Structure Test
Method Implementation
USA Fuel mpg Footprint-
based value
curve
US
CAFE* Mandatory
California GHG g/mile Car/LDT1 US CAFE Mandatory
European Union
(EU) CO2 g/km Weight-based
limit value
curve
EU
NEDC** Voluntary for now,
mandatory by 2012
Japan Fuel km/L Weight-bin
based Japan 10-
15/JC08 Mandatory
China Fuel L/100km Weight-bin
based EU
NEDC Mandatory
Korea Fuel km/L Engine size US CAFE Mandatory
Canada Fuel L/100km Cars and
light trucks US CAFE Voluntary
Australia Fuel L/100km Overall light
duty fleet EU
NEDC Voluntary
Source: Adapted from Table 2 of Feng An, Robert Early and Lucia Green-Weiskel
‘Global Overview on Fuel Efficiency and Motor Vehicle Emission Standards: Policy
Options and Perspectives for International Cooperation (updated)’.217
*US CAFE is the manufacturer’s Corporate Average Fuel Economy derived from
vehicle testing by US Environmental Protection Agency.
**EU NEDC stands for New European Driving Cycle developed by the EU.
The fuel economy standard in the US is based on sales-weighted average fuel
consumption and footprint or area between four wheels, whereas the standards in
Japan and China are based on a weight classification system. The standards in the
Republic of Korea were based on engine size, but will be changed to a weight-based
system, whereas the EU currently bases its standards on GHG. These standards are
discussed below.
217
Feng An, Robert Early and Lucia Green-Weiskel, ‘Global Overview on Fuel Efficiency and Motor
Vehicle Emission Standards: Policy Options and Perspectives for International Cooperation
(updated)’ (Background Paper No 3 UN Doc CSD19/2011/BP3 presented at 19th
session of the
Commission on Sustainable Development, New York, 2–13 May 2011).
Page 104
84
4.2.1 Fuel Economy Standards in the USA
The United States of America has had mandatory Corporate Average Fuel Economy
(CAFE) standards in place since 1975 for passenger cars and light trucks sold by
manufacturers. It was the dependence on foreign oil in the wake of the oil embargo
that led the US Congress to pass the Energy Policy and Conservation Act 1975 that
requires each manufacturer in the US to separately meet the CAFE standards for each
of its fleets, ie the domestic fleet and the imported fleet.218
The CAFE standards are based on the sales-weighted corporate average fuel
economy for passenger motor vehicles and the vehicle footprint. For passenger cars
and light-duty trucks built in model years 2012 to 2016, the standards are expressed
as a mathematical function depending on vehicle footprint and set in a curve so that
the burden of compliance is distributed across all vehicles and all manufacturers. The
footprint is determined by multiplying the vehicle’s wheelbase by its average track
width. Whether the manufacturer has met the standard is determined by computing
the sales-weighted average, being the harmonic average of the targets applicable to
each of the manufacturer’s cars and light trucks. Thus each manufacturer’s
compliance will depend upon the mix of vehicles sold.
A formula is used to calculate the manufacturers’ CAFE as a sales-weighted CAFE
based on production volume of passenger cars manufactured for sale in a model year.
The fuel economy is expressed in terms of ‘miles per gallon’ (mpg). The CAFE
applicable to each manufacturer must exceed the CAFE target set for the model year.
To understand the impact of CAFE standards in the US, it is important to analyse the
policy criteria behind the setting of the target standards for each model year. The
CAFE standards in the US are set by the Secretary of the Department of Transport
through the National Highway Traffic Safety Administration (NHTSA) and the
Environmental Protection Agency (EPA). In setting the CAFE standards, Congress
218
National Highway Traffic Safety Administration, CAFE Overview – Frequently Asked Questions
(3 March 2005) US Department of Transport
<http://lobby.la.psu.edu/_107th/126_CAFE_Standards_2/Agency_Activities/NHTSA/NHTSA_Cafe_
Overview_FAQ.htm>.
Page 105
85
directed that the following four factors must be considered by the NHTSA in
determining the ‘maximum feasible’ fuel economy level:
1. Technological feasibility: This requires the NHTSA to consider whether
particular methods of improving fuel economy will be available for
commercial application in the model year for which a standard is being
established.
2. Economic practicability: This requires the NHTSA’s consideration of
whether the implementation of projected fuel economy improvements is
within the economic capability of the industry.
3. The effect of other federal motor vehicle standards on fuel economy: This
requires an analysis of the unavoidable adverse effects on fuel economy of
compliance with emission, safety, noise, or damageability standards.
4. The need of the nation to conserve energy: This requires consideration of
the consumer cost, national balance of payments, environmental and foreign
policy implications of the nation’s need for large quantities of oil, especially
imported oil.219
It is questioned in this thesis and explored further in Chapter 6 whether the fourth
factor stated above is being achieved in terms of bringing about an overall reduction
in the use of oil by passenger motor vehicles.
In the US, the EPA is also now required to address an additional factor in setting the
standards, which are emissions. The requirement for this factor arises from s 202
(a)(1) of the Clean Air Act and confirmed in the US Supreme Court in the case of
Massachusetts v Environmental Protection Agency.220
This case was brought by 12
states and several cities of the United States against the EPA to force the EPA to
regulate carbon dioxide and other greenhouse gases as pollutants.
The US President also issued a memorandum on 26 January 2009 stating that the
CAFE standard for model year 2011 and beyond needed to take into consideration
the requirements of the Energy Independence and Security Act 2007 as well as the
decision in Massachusetts v Environmental Protection Agency. In setting the
219
Center for Auto Safety v NHTSA, 793 F 2d 1322 (Ct App, Dist of Columbia Circuit, 1986) 147,
footnote 12. 220
Massachusetts v Environmental Protection Agency, 549 US 497 (2007).
Page 106
86
standards for model year 2012 and beyond, the NHTSA will also address the issues
of energy independence, energy security and climate change, in addition to the
financial health of the industry, technologies for reducing fuel consumption and fuel
prices.
Another factor that the CAFE standards need to consider is the vehicle footprint. The
Energy Independence and Security Act 2007 mandated that the standard assign
higher fuel economy targets to smaller vehicles and lower ones to larger vehicles.221
The footprint is calculated by multiplying the track width by the wheelbase. The
track width is the distance between the centrelines of the right and left wheels,
whereas the wheelbase is the distance between the centres of the front and rear
axles.222
The question to consider is why the US has changed to a footprint-based
standard. According to the NHTSA, there are four advantages to a system that relies
on footprint-based targets.
1. The footprint-based system accounts for size differences in manufacturers’
product mixes.
2. The footprint-based system reduces incentives for manufacturers to pursue
unsafe practices by downsizing and down-weighting and thereby increasing
the propensity for the vehicle to roll over.
3. The footprint-based system is more equitable as the manufacturer has to
comply with the potential fuel economy of the actual fleet, thereby
spreading the cost burden of the fuel economy more broadly across the
industry.
4. The footprint-based system is more market-oriented and satisfies consumer
choice rather than force manufacturers to make vehicles not demanded by
the public, but solely for the purposes of CAFE compliance.223
The next question to address is whether the CAFE standards do have an effect on
improving the fuel economy of passenger motor vehicles. In the US, the passenger
221
Average Fuel Economy Standards Passenger Cars and Light Trucks Model Year 2011, 49 CFR §§
523, 531, 533, 534, 536 and 537 (2011) 18. 222
Ryoichi Komiyama, ‘Overview of CAFE Standards and the Estimation of Petroleum Saving
Potentials by Japanese Automobiles in the United States’ (Report, IEEJ, May 2008) 15. 223
US Department of Transportation, ‘Final Environmental Assessment: National Highway Traffic
Safety Administration Corporate Average Fuel Economy (CAFE) Standards’ (Assessment Report,
Department of Transportation, 29 March 2006) 10.
Page 107
87
vehicle standard was initially set at 18mpg for model year 1978 and was increased to
27.5mpg from 1985 to 2010. The US government has successfully increased the fuel
efficiency of the nation’s fleet as the average CAFE achieved increased from
19.9mpg in 1978 to 33.7mpg in 2010 as demonstrated in Table 4.3.
TABLE 4.3: CAFE Standard and Fuel Economy of Passenger Motor Vehicles in
the USA
Year Standard (mpg) Average CAFE (mpg)
1978 18.0 19.9
1979 19.0 20.3
1980 20.0 24.3
1981 22.0 25.9
1982 24.0 26.6
1983 26.0 26.4
1984 27.0 26.9
1985 27.5 27.6
1986 26.0 28.2
1987 26.0 28.5
1988 26.0 28.8
1989 26.5 28.4
1990 27.5 28.0
1991 27.5 28.4
1992 27.5 27.9
1993 27.5 28.4
1994 27.5 28.3
1995 27.5 28.6
1996 27.5 28.5
1997 27.5 28.7
1998 27.5 28.8
1999 27.5 28.3
2000 27.5 28.5
2001 27.5 28.8
2002 27.5 29.0
2003 27.5 29.5
Page 108
88
Year Standard (mpg) Average CAFE (mpg)
2004 27.5 29.5
2005 27.5 30.3
2006 27.5 30.1
2007 27.5 31.2
2008 27.5 31.5
2009 27.5 32.9
2010 27.5 33.7
Source: US Department of Transportation, ‘Summary of Fuel Economy
Performance’ 28 October 2010.224
The data in Table 4.3 demonstrates that CAFE standards do have a role to play in
improving the fuel economy of the vehicles within the passenger motor vehicle fleet.
However, in order to bring about a continuous improvement, the standards must be
constantly revised. In the USA, the standards were not revised during the period
spanning model years 1990 to 2010. This was remedied by the Energy Independence
and Security Act 2007 which now requires the standards for passenger cars to be set
at the maximum feasible level and this means that the NHTSA must set the standard
for each model year, leading to a combined industry-wide fleet of all new passenger
cars and light trucks sold in the US during model year 2020 to conform to a standard
of at least 35mpg.225
US President Barack Obama announced that CAFE standards
should be developed for the period up till 2025.
In response to this announcement, the NHTSA set standards for model years 2011 to
2016 as shown in Table 4.4 below.226
The NHTSA estimates that the proposed
standards for the five years from 2011 to 2016 would save approximately 54.7 billion
gallons (207.06 billion litres) of fuel, being 18.7 billion gallons (70.78 billion litres)
for passenger cars and 36 billion gallons (136.27 billion litres) for light trucks, with a
monetary benefit of USD88 billion over the lifetime of the vehicles sold during those
224
US Department of Transportation, ‘Summary of Fuel Economy Performance (Public Version)’
(Report, US Department of Transportation, 28 October 2010) 2–3. 225
Average Fuel Economy Standards, above n 221, 18. 226
Barack Obama, ‘Presidential Memorandum Regarding Fuel Efficiency Standards: Improving
Energy Security, American Competitiveness and Job Creation, and Environmental Protection through
a Transformation of our Nation’s Fleet of Cars and Trucks’ (Presidential Memorandum, 21 May
2010) 3.
Page 109
89
model years.227
The EPA is finalising a set of fleet-wide CO2 emission standards and
they are projected to decrease from 263 grams per mile in 2012 to 225 grams per
mile in 2016 for cars and from 346 grams per mile to 298 grams per mile for
trucks.228
TABLE 4.4: NHTSA Fuel Economy Standards for Model Years 2011 to 2016
Model Year Passenger Cars
average mpg Light Trucks
average mpg Combined cars &
light trucks average
mpg
2011 30.4 24.4 27.6
2012 33.3 25.4 29.7
2013 34.2 26.0 30.5
2014 34.9 26.6 31.3
2015 36.2 27.5 32.6
2016 37.8 28.8 34.1
Source: Light-Duty Vehicle Greenhouse Gas Emission Standards and Corporate Average Fuel
Economy Standards; Final Rule, Table I.B.2-1.229
Another presidential memorandum was issued on 21 May 2010 by President Obama
requesting that the EPA and the NHTSA develop standards for model years 2017–
2025. In line with the presidential memorandum, the EPA proposes to achieve an
industry fleet-wide average of 163 grams per mile of CO2 emissions in model year
2025 which is equivalent to 54.5mpg if all of the CO2 emissions reductions were
achieved with fuel. The NHTSA proposes to achieve an industry fleet-wide average
of 40.9mpg in model year 2021 and 49.6mpg in model year 2025.230
Manufacturers
will have to comply with both the NHTSA and the EPA standards and the standards
are part of a national program allowing motor car manufacturers to build a single
light duty national fleet that satisfies both federal and state criteria. Thus motor car
227
Average Fuel Economy Standards, above n 221, 24–5. 228
Light-Duty Vehicle Greenhouse Gas Emission Standards and Corporate Average Fuel Economy
Standards; Final Rule, 75 Fed Reg 88 25324, 25331 (7 May 2010) 229
Ibid 25330. 230
2017–2025 Model Year Light-Duty Vehicle GHG Emissions and CAFE Standards: Supplemental
Notice of Intent, 40 CFR §§ 85, 86 and 600, 49 CFR §§ 531 and 533 (2011) 7–8.
Page 110
90
manufacturers will not have to build different cars to comply with different state
laws.
It should be noted that the overarching goal of setting annual standards is to preserve
energy, particularly the energy from oil. According to the NHTSA, the need to
reduce oil consumption is more crucial today than in the late 1970s.231
Compliance
with the fuel economy standard can be judged from the penalties it imposes for non-
compliance. US manufacturers are liable to a penalty for non-compliance with the set
standard, which is then published on the NHTSA website. The penalty is calculated
using the following formula:
USD5.50 / ((CAFE target –specific CAFE for a given manufacturer) / 10) x sales
volume in a given model year.232
If a US manufacturer exceeds the established standard, the manufacturer earns
credits which can be banked and can be carried back for three years or carried
forward for three years.233
This has been increased to five years carry forward under
the Energy Independence and Security Act 2007.234
Currently, US CAFE credits cannot be transferred between manufacturers or between
fleets. However, credits earned after model year 2012 will be tradeable.235
Tradeable
credits enable motor car manufacturers who find it difficult to comply with the
standard to purchase credits from another manufacturer which has exceeded the fuel
economy standard and obtained credits. It has been argued that tradeable credits are a
better incentive to a complying manufacturer to further improve the fuel economy of
its vehicles as the credits can be sold to other manufacturers.236
231
Average Fuel Economy Standards, above n 221, 604. 232
Komiyama, above n 222, 18. 233
Ibid. 234
Average Fuel Economy Standards, above n 221, 19. 235
Ibid 25. 236
Carolyn Fischer, ‘Comparing Flexibility Mechanisms for Fuel Economy Standards’ (2008) 36(8)
Energy Policy 3116, 3117–18.
Page 111
91
4.2.2 Japanese Top Runner Program
Similarly to the USA, Japan introduced motor vehicle standards to preserve energy
through its Top Runner Program, introduced in 1998. The set-up of the Japanese fuel
economy standard is different from that in the US, however. The Top Runner
Program operates by setting energy efficiency targets for selected products including
the improvement of energy efficiency in passenger motor vehicles. The program
started with nine products in 1998, one of which was passenger motor vehicles. By
2009, the program had expanded to include 21 products.237
Since motor vehicles
mainly run on oil, the Japanese motor vehicle standards have been set to preserve oil-
based energy.
The Top Runner Program requires producers to comply with the weighted average
energy efficiency of the products they sell in the target year by achieving the
requisite standard. The target year set in 1998 for passenger motor vehicles was 2010
and the target required was an average 15.1km per litre. This was achieved in 2005,
five years ahead of the target year. The success story for passenger motor vehicles
can be seen from the increase in the percentage of passenger motor vehicles that
complied with the 2010 Top Runner Standards from 1997 to 2008, as shown in
Figure 4.1 below, although not all fuel efficiency can be attributed to the Top Runner
Standards.
237
Osamu Kimura, ‘Japanese Top Runner Approach for Energy Efficiency Standards’ (SERC
Discussion Paper No SERC09035, Socio-Economic Research Centre, 2010) 1.
Page 112
92
FIGURE 4.1: Percentage of Motor Vehicles that Complied with 2010 Top
Runner Standards
Source: Japan Automobile Manufacturers Association, 2009 Report on
Environmental Protection Efforts: Promoting Sustainability in Road Transport in
Japan (October 2009, Tokyo).
The Japanese government recognised that in order to improve fuel efficiency, the
weight of the vehicle needs to be controlled. Therefore in 2010, the improved 2015
standards based on vehicle weight were set as demonstrated in Table 4.5 below.238
TABLE 4.5: 2015 Fuel Economy Standards for the Top Runner Program in
Japan
Category Vehicle Weight (kg) Target Standard Value (km/L)
1 Less than 600 22.5
2 601–740 21.8
3 741–855 21.0
4 856–970 20.8
238
Adrian J Bradbrook, ‘Policies and Legal Options to Promote the Energy Efficiency of Private
Motor Vehicles’ (Background Paper No 4 UN Doc CSD19/2011/BP4 presented at the 19th session of
the Commission on Sustainable Development, New York, 2–13 May 2011) 4.
0
10
20
30
40
50
60
70
80
90
100
Penetration Rate
Penetration Rate
Page 113
93
Category Vehicle Weight (kg) Target Standard Value (km/L)
5 971–1080 20.5
6 1081–1195 18.7
7 1196–1310 17.2
8 1311–1420 15.8
9 1421–1530 14.4
10 1531–1650 13.2
11 1651–1760 12.2
12 1761–1870 11.1
13 1871–1990 10.2
14 1991–2100 9.4
15 2101–2270 8.7
16 More than 2270 7.4
Source: Adrian Bradbrook, ‘Policies and Legal Options to Promote the Energy
Efficiency of Private Motor Vehicles’ 4.
The compliance mechanism used in Japan is different from that used in the USA. If
the standards are not met in Japan, a ‘name and shame’ approach is used, firstly with
a recommendation to the non-compliant producer and if this does not fix the
problem, the recommendation is followed by final orders and the details about the
non-compliant producer are advertised. The name and shame approach is very
effective in Japan due to the Japanese culture, where governmental criticism works
like a penalty.239
The Japanese Top Runner program has been hailed as a success for a number of
reasons, which are:
- Primary stakeholders are involved in setting targets. This brings about
awareness and commitment and ensures that targets are feasible and not
ambitious;
- The program is designed to be flexible, dynamic and adaptive, and allows
for shortcomings and failures to be addressed and remedied;
- A number of supportive policy instruments have developed around the Top
Runner program, such as e-labels;
239
Kimura, above n 237, 4.
Page 114
94
- The Top Runner program allows manufacturers who perform well at the
start of the cycle to become free-riders; and
- The name and shame sanctions are effective deterrents in Japan.240
The most common criticism of the Top Runner program is that it only encourages
incremental technical improvements, and innovations do not receive incentives under
the scheme.241
4.2.3 Chinese Fuel Economy Standards
China has joined the USA and Japan in setting mandatory fuel consumption
standards for its passenger motor vehicles. China’s motivation for vehicle fuel
economy standards is also oil, as China has oil security concerns associated with
rapid vehicle population growth and the promotion of China’s economic growth with
a strong motor vehicle industry. Until the 1990s only nine car models were made and
sold in China and the Chinese government’s aim is to also use the national fuel
economy standard to push domestic motor vehicle manufacturers to improve their
products and overall competitiveness.242
In September 2004, China adopted its Phase 1 mandatory national fuel consumption
standard for Chinese passenger vehicles. Phase 1 limits took effect on 1 July 2005.
The standard limits were revised in Phase 2 which came into effect on 1 January
2008.
The standards in Phases 1 and 2 specified the fuel consumption limits for 16 different
passenger vehicle classes according to vehicle kerb mass. This shows that the
Chinese government also recognises the need to control the weight of the country’s
motor vehicle fleet in order to bring about fuel efficiency. The vehicles in heavier
classes were required to meet stricter limits than vehicles in lighter classes, in order
240
Joakim Nordqvist, ‘Evaluation of Japan’s Top Runner Programme Within the Framework of the
AID-EE Project’ (Report, AID-EE, 2 July 2006) 28. The Active Implementation of the European
Directive on Energy Efficiency (AID-EE) project commenced in February 2005 to successfully
implement the Energy End-Use Efficiency and Energy Services Directive of the European Parliament
and the Council. See <http://www.aid-ee.org/aid_ee.htm>. 241
Ibid 29. 242
Hongyan H Oliver et al, ‘China’s Fuel Economy Standards for Passenger Vehicles: Rationale,
Policy Process, and Impacts’ (2009) 37(11) Energy Policy 4720.
Page 115
95
to encourage the Chinese to purchase lighter vehicles. Vehicles with automatic
transmission or three or more rows of seats and SUVs with four-wheel drive (special
vehicles) were allocated a slightly higher limit.243
The standards in Phases 1 and 2 were based on a strict compliance method. Vehicles
that did not meet the consumption limit standards were prohibited from production.
Chinese motor manufacturers prepared themselves to comply with these standards by
eliminating high fuel consumption technologies such as three gear transmissions and
two valve engines and by introducing new efficient technologies such as variable
valves, overhead camshaft and multi-gear ratio transmissions.
The standards set in Phases 1 and 2 were successful in eliminating over 800
domestically produced vehicle models that did not comply with the standards.
However, since the standards in Phases 1 and 2 did not apply to imported vehicles,
there was an increase in vehicles being imported into China, especially large luxury
sedans and SUVs. In 2008, China imported 409 769 vehicles, an increase of 30.4 per
cent over the 2007 figures. Another problem with the standards in Phases 1 and 2
was that they were based on the mass of vehicles produced without any restriction on
the mass of the motor vehicles that the consumers could purchase, so the standards
did not deter the Chinese from purchasing large, sporty and luxury vehicles. The
average kerb mass in 2002 was 1230kg and it increased to 1356kg in 2006, giving
rise to 6.8 per cent extra fuel consumption. The incidence of motor vehicles with a
capacity of less than one litre decreased from 16.8 per cent in 2005 to 2.7 per cent in
2008.
The Chinese government realised that the level of fuel consumption by Chinese
vehicles was higher than those in the EU, the US and Japan by about 10 per cent and
that these countries intended to use high fuel efficiency as a measure to maintain
competitiveness in the automotive industry. In addition, China’s increasing reliance
on imported oil, importing 52 per cent of its total oil consumption in 2008, and the
growth of the Chinese vehicle population, has led to the Chinese government
approving the Phase 3 fuel consumption standard for passenger vehicles. The
Chinese government incorporated some of the US CAFE principles together with the
243
Zhao Wang et al, ‘New Fuel Consumption Standards for Chinese Passenger Vehicles and Their
Effects on Reductions of Oil Use and CO2 Emissions of the Chinese Passenger Vehicle Fleet’ (2010)
38(9) Energy Policy 5242.
Page 116
96
weight classification used in Phases 1 and 2 in developing the Phase 3 Chinese fuel
economy standard.
The Phase 3 Standard was introduced in 2009 and will take effect in 2012. The aim
of the standard is to reduce the average fuel consumption rate of new passenger
vehicle fleet to seven litres per 100km which is 14.28km per litre by 2015. The
function of the Phase 3 standard is to stimulate innovation and promote automotive
energy saving in order to hasten the introduction of new models of motor vehicles.
The limits in Phase 3 correlate the kerb mass of the 16 mass-based classes of Phases
1 and 2 to engine displacement size, engine power output and vehicle footprint.
Unlike the total restriction in Phases 1 and 2, Phase 3 has moved away from the
prescriptive individual model compliance method to corporate average fuel
consumption rates with financial penalties for non-compliance.244
The Phase 3 fuel targets in China were developed using a mathematical model by
first creating a database of fuel consumption data covering 774 vehicle models
manufactured in China, and 668 models that complied with Phase 2 limits. From this
data, a linear curve was graphed correlating the kerb mass and the fuel consumption.
A 17 per cent adjustment was then made around the target point of seven litres per
100km for a mass of 1300kg and 16 individual vehicle class targets were set by
increment as shown in Table 4.6.245
TABLE 4.6: Comparative Phases 2 and 3 Fuel Economy Standards in China
Kerb Mass in
kg Phase 3 Limits
in L/100km Comparative
Phase 2 limits in
L/100km
Less than 750 5.2 7.2
750–864 5.5 7.2
865–979 5.8 7.7
980 6.1 8.3
1090 6.5 8.9
1205 6.9 9.5
244
Ibid 5245. 245
Ibid 5243–6.
Page 117
97
Kerb Mass in
kg Phase 3 Limits
in L/100km Comparative
Phase 2 limits in
L/100km
1320 7.3 10.1
1430 7.7 10.7
1540 8.1 11.3
1660 8.5 11.9
1770 8.9 12.4
1880 9.3 12.8
2000 9.7 13.2
2110 10.1 13.7
2280 10.8 14.6
More than 2510 11.5 15.5
Source: Wang et al, 5243–6.
It can be noted from Table 4.6 above that the limits set in Phase 3 are stricter on
heavy vehicles, thereby encouraging the production of light vehicles and
discouraging the production of heavy vehicles. In order to discourage sales of SUVs
the Phase 3 targets for SUVs come within the normal limits and not under the special
vehicle limits.
Under Phase 3 the individual vehicle model is not required to meet the fuel
consumption limit specified in the mass class, but the individual auto manufacturer
or importer has to meet the Company Average Fuel Consumption (CAFC) target that
has been calculated for that company. The manufacturer’s average fuel consumption
rate is based on the aggregate of the production volume multiplied by the fuel
consumption certification levels for each individual model, divided by the aggregate
production volume of passenger vehicles by the manufacturer in that year. In any
case, the individual models must still not exceed the Phase 2 limits.
The penalties for non-compliance with the Phase 3 Chinese fuel efficiency standards
are being discussed with several government agencies including the Ministry of
Finance, and may range from fines or taxes on manufacturers who do not comply to
a special tax on the vehicle model, or taxes on consumers who purchase vehicles
whose fuel consumption does not meet the target. In addition the government may
Page 118
98
use the name and shame approach by announcing the names of manufacturers that do
not comply.
The intent of the Phase 3 requirements is to encourage manufacturers to produce a
variety of vehicles. Thus manufacturers who usually produce heavy model vehicles
will have to start producing light model vehicles in order to comply with the Phase 3
standards. The overall objective of Phase 3 is also to control Chinese motor vehicle
fuel consumption and CO2 emissions. Based on certain assumptions such as vehicles
driving 10 000km a year, the cumulative reduction in fuel use is likely to be 333Mb
from 2012–2020.246
China’s Phase 3 fuel economy standards are likely to be
implemented in 2012 with full compliance required by 2015, and it is anticipated that
discussions for China’s Phase 4 fuel economy standards will commence thereafter.
Phase 4 standards are likely to become effective in 2016 with full compliance
required by 2020.247
It can be concluded that the Chinese government has refined its
motor vehicle fuel economy standards and has incorporated the principles from the
US CAFE standard and the Japanese Top Runner motor vehicle fuel economy
standard.
4.2.4 Fuel Economy Standards in Korea
The Republic of Korea, being the fifth largest car manufacturer, introduced fuel
economy standards in January 2006 as the government realised that other countries
around the world were imposing stringent fuel economy standards. However, the
standards were based on engine capacity, as a vehicle with a higher engine capacity
is likely to be more powerful and heavier and therefore consume more fuel. The
Korean program requires car manufacturers to meet an average fuel economy
standard by 2011 of 12.4km per litre for vehicles with engines of less than 1500cc
and 9.6km per litre for vehicles with engines over 1500cc.248
The average fuel
efficiency criteria from 2012 are 14.5km per litre for vehicles with engines of 1600cc
or less and 11.2km per litre with engines over 1600cc. The manufacturer’s average
246
Ibid 5249. 247
General Motors, ‘Mobile Emissions & Fuel Economy’ (December 2011) General Motors
Sustainability Report <http://www.gmsustainability.com>. 248
International Energy Agency, Energy Policies of IEA Countries: The Republic of Korea 2006
Review (OECD/IEA, 2006) 65.
Page 119
99
fuel efficiency is required to correspond to the limit set by the government, and is
calculated by dividing the sum of fuel efficiencies of passenger cars sold during the
previous year by each car manufacturer with the quantity sold. The name and shame
approach is also used in Korea whereby the manufacturers and importers who do not
comply are issued an order of improvement, but no penalties are assigned with the
orders.249
The Korean government has indicated new fuel economy standards from model year
2012 requiring local car manufacturers to manufacture vehicles that on average can
travel 17km or more per litre of fuel and emit less than 140g of greenhouse gases per
kilometre travelled. The new standards will be weight-based and use the US CAFE
combined cycle for testing.250
It is anticipated that the new standard will be flexible
with a phase-in approach and carry-forward credits. It is proposed that credits be
granted for including tyre pressure monitoring systems and low rolling resistance
tyres. Gears and shift indicators and eco-innovations will also receive credits.251
4.2.5 Voluntary Standards in Canada
Since 1978, Canada has had only voluntary motor vehicle fuel economy
consumption standards, whereby vehicle manufacturers are committed to meeting a
progressively stringent annual CAFC limit for new motor vehicles sold in Canada.
The standards are similar to the US CAFE standards, and approximately 98 per cent
of total vehicles sold in Canada meet these standards.252
Although the standards are
strictly ‘voluntary’ in Canada, the national government enacted legislation similar to
that in the US, which it stated that it would immediately invoke if the manufacturers
did not ‘voluntarily’ comply. In April 2010, Canada issued regulations to implement
249
Ibid 66. 250
Tony Lewis, South Korea: More Realistic Fuel Economy Standards from 2012 (29 November
2011) Just-Auto <http://www.just-auto.com/news/more-realistic-fuel-economy-standards-from-
2012_id117514.aspx>. 251
International Council on Clean Transportation, Global Light-Duty Vehicles: Fuel Economy and
Greenhouse Gas Emission Standards (April 2011)
<http://www.theicct.org/info/documents/PVstds_update_apr2011.pdf> 2. 252
Michael Hart, ‘Potholes and Paperwork: Improving Cross-Border Integration and Regulation of the
Automotive Industry’ (C D Howe Institute Commentary No 286, April 2009) 7.
Page 120
100
limits on emissions from passenger cars and light trucks from model year 2011 to
2016 based on the US footprint structure.253
4.2.6 CO2 Standards in the EU
The EU has promoted voluntary CO2 standards until 2009. However, as it became
apparent that automakers were not going to comply with the voluntary standards, the
EU has made the compliance mandatory as of 2012. The EU standards are based on a
weight-based limit value curve.254
The target set by the EU was 140g of CO2 per km
for 2008–09 which is equivalent to 17.2–19.0km per litre. The EU target that is now
under consideration for 2012 is 120g CO2 per km which is equivalent to fuel
economy of 20.1–22.2km per litre.255
The EU CO2 regulation would require each motor vehicle manufacturer to obtain an
individual annual target based on the average mass of all its new cars registered in
the EU in a particular year, and 65 per cent of those cars would need to have
emissions below the target in year 2012, 75 per cent in 2013, 80 per cent in 2014 and
100 per cent in 2015. A limit curve based on vehicle mass would be set so that the
fleet average of 130g of CO2 per km is achieved for the EU as a whole.
Manufacturers could form a pool to meet the requirements, if they so wished.
The EU’s objective is to reduce CO2 emissions from light duty vehicles. The aim is
for the emissions to be under 130g of CO2 per km by 2015 and 95g/km by 2020. The
130g standard will be phased in between 2012 and 2015.256
In conclusion it can be said that fuel economy standards are set in order to improve
the fuel efficiency of the motor vehicle fleet in a country by encouraging
technological advances and controlling the size, weight or fuel efficiency of motor
vehicles that are manufactured or sold in a country with the aim of reducing vehicle
oil consumption and CO2 emissions. Tighter regulations are now being accepted by
253
‘Canada, US Unite on Car Emission Standards’, CBC News (online), 1 April 2010
<http://www.cbc.ca/news/politics/story/2010/04/01/vehicle-emissions-ottawa-washington.html>. 254
Feng, Early and Green-Weiskel, above n 217, 4. 255
International Energy Agency, above n 248, 66. 256
European Commission, Reducing CO2 Emissions from Passenger Cars (1 August 2011)
<http://ec.europa.eu/clima/policies/transport/vehicles/cars/faq_en.htm>.
Page 121
101
automakers as an advantage to increasing their market share, and the governments
also see them as sources of economic growth and employment. For example, after
China’s fuel economy standard was adopted in 2005, China’s first plug-in hybrid
model appeared. Soon after the Obama administration announced the new national
fuel economy standards target of 35.5mpg by 2016, the Tesla-Toyota joint venture
was launched. Car manufacturers and importers need clear signals from the
government and therefore standards should be predictable more than a decade into
the future.257
The next part analyses the lessons that Australia can learn and explores
whether there is place for a mandatory fuel economy standard in Australia.
4.2.7 Lessons for Australia
Australia does not currently have a mandatory fuel consumption target, but has a
voluntary target which has been established by the Federal Chamber of Automotive
Industries. In March 2003, the voluntary target was aimed at improving consumption
for new petrol passenger vehicles to an average of 6.8 litres per 100km by 2020. In
2005, an average CO2 emissions target for vehicles under 3.5 tonnes of gross mass
was set at 222g/km by 2010.258
The current Labor government in Australia has
indicated that it will set a mandatory standard for a national fleet-wide target for
average CO2 emissions of 190g/km by 2015 and 155g/km by 2024.259
A CO2-based
standard will only correlate with fuel consumption, if the vehicle fleet is mainly
homogeneous from a fuelling perspective.260
However, if the fuelling market
diversifies, or technology develops to capture the CO2 emissions, then a regulation
based on CO2 would have no bearing on reducing the use of oil in motor vehicles.
A key issue discussion paper was released by the Australian government in August
2011 to obtain views from interested parties on the key issues that would need to be
257
Drew Kodjak et al, ‘The Regulatory Engine: How Smart Policy Drives Vehicle Innovations’
(Research Paper No 02, International Council on Clean Transportation, January 2011) 9. 258
Federal Chamber of Automotive Industries ‘National Average Carbon Emission (NACE) Fact
Sheet’ <http://www.fcai.com.au/library/nace.pdf>. 259
N Martin, ‘Emission Standards for Cars – Julia Gillard and Labor – Let’s Move Australia Forward’
(Fact Sheet, Australian Labor Party, 24 July 2010) <http://www.alp.org.au/getattachment/97cd68c5-
087f-4ff8-b1d5-ee2aadae31c9/emission-standards-for-cars/>. 260
Hui He and Anup Bandivadekar, A Review and Comparative Analysis of Fiscal Policies Associated
with New Passenger Vehicle CO2 Emissions (International Council on Clean Transportation, 2011) 5.
Page 122
102
addressed to develop the standards. The key issues identified in the discussion paper
were:
- Whether the emission targets should involve only one setting or should be
set in stages;
- The appropriate reference or base year against which the assessment of
improvements is measured;
- The reasonable target for Australia taking into consideration the business as
usual scenario;
- The costs and benefits that the mandatory standards would deliver;
- Whether there should be a single target for the whole light vehicle fleet or
whether it should be split between light passenger vehicles and light
commercial vehicles;
- How to calculate the target for each motor vehicle model and its variants
and the methodology for setting the manufacturer’s targets;
- The appropriate regulatory model for implementing the standards;
- Identifying the specific data requirements in order for the standards to work;
- Whether the current data set published as VFACTS are adequate and
appropriate;
- Amendments that may be required to the Motor Vehicles Standards Act or
other legislation or legal framework that would be required;
- The entities that would be responsible for reporting performance;
- Whether credit banking and trading should be permitted; and
- The appropriate sanctions for non-compliance.261
Submissions were obtained from interested parties from which the Department of
Infrastructure and Transport will develop a Regulatory Impact Statement for public
scrutiny and comment. The Department of Infrastructure and Transport will also
present a set of recommendations to the Australian government on the mandatory
standards for Australia.
If the Australian government is going to set a mandatory fuel economy standard for
its motor vehicle fleet, then it is submitted that it should draw lessons from other
countries in developing the standard. Australia is not a major motor vehicle
261
Department of Infrastructure and Transport, above n 30, 9–25.
Page 123
103
manufacturer on the world stage. However, that does not mean that it should not
aspire to develop its motor vehicle industry. A mandatory fuel economy standard in
Australia might assist in reducing the average fuel consumption of the Australian
fleet if it is applied to both manufacturers and importers of motor vehicles.
From the literature review above, standards based on vehicle weight and footprint
combined with corporate average sales are likely to be most effective in reducing the
fuel consumption of the national fleet of vehicles. However, standards do not have a
controlling impact on the growth of the national motor vehicle fleet. This is because
the standards apply to the average fleet. Thus if increased sales of larger motor
vehicles are offset by increased sales of smaller motor vehicles, the fleet average
may be satisfied, but the overall fleet fuel consumption may not necessarily be
reduced, as the overall fleet size has increased. Therefore, it is argued that setting a
mandatory fuel economy standard should not be the sole strategy for reducing fuel
consumption in the motor vehicle fleet in Australia, but should be combined with
appropriate fiscal measures.
Other problems with the standards include: tension between the government and the
motor vehicle industry;262
vehicle safety potentially being compromised by
standards;263
manufacturers exercising ‘policy gaming’ in order to overcome the
standards set by the government; and the efficiency gained from the standards giving
rise to an increase in fuel use called the rebound effect.264
These are further discussed
in Chapter 6 under part 6.3.4 of this thesis.
A study conducted by Austin and Dinan on US passenger vehicles using an
empirically rich simulation model and cost estimates for anticipated fuel economy
technologies states that taxes on fuel are more efficient than increases in fuel
economy standards.265
The study estimated that a 3.8mpg increase in standards
would reduce oil consumption by 10 per cent over 14 years, whereas an increase in
gasoline tax would produce greater immediate savings by encouraging people to
262
See Fischer, above n 236, 3118. 263
Energy Efficiency and Renewable Energy, Vehicle Technologies Program, Fact #630: Fuel
Economy vs Weight and Performance (5 July 2010) US Department of Energy
<http://www1.eere.energy.gov/vehiclesandfuels/facts/2010_fotw630.html>. 264
Fischer, above n 236, 3116. 265
David Austin and Terry Dinan, ‘Clearing the Air: The Costs and Consequences of Higher CAFE
Standards and Increased Gasoline Taxes’ (2005) 50 Journal of Environmental Economics and
Management 562.
Page 124
104
drive less, and eventually to choose more fuel-efficient vehicles.266
The study also
estimated that a gasoline tax of 30 cents per gallon would save the same discounted
quantity of oil as a 3.8mpg increase in standards.267
For these reasons and other reasons explored further in Chapter 6, this thesis argues
that a fuel economy standard should not be solely relied upon as a policy mechanism
to change consumer behaviour by encouraging the choice of an appropriate motor
vehicle for personal transportation that minimises oil consumption and reduces CO2
emissions. This is supported by comments made by the NHTSA in setting CAFE
standards in the USA. The NHTSA stated that the price of vehicles should reflect the
value that the consumer places on the fuel economy attribute of his or her vehicle.
However, it is not clear according to the NHTSA that consumers have the
information or inclination to value the impact of fuel economy in their purchasing
decisions. Consumers have no direct incentive to value benefits not included in the
purchase price or the price of fuel, such as energy security and global climate
change.268
It is argued in this thesis that setting a mandatory fuel economy and GHG standard in
Australia is a way forward in regulating the types of motor vehicles that are going to
be sold to the Australian public. However, setting a fuel economy standard may not
be sufficient to address the problem of reducing the consumption of oil in passenger
motor vehicles in Australia. If a mandatory standard is going to be set in Australia, it
should not only take into consideration the factors considered by the USA, Japan,
China and Korea in setting their standards, especially the power and weight of a
vehicle, but the standard should be accompanied by an appropriate tax such as the
LET proposed in Chapter 6.
The next part examines the fuel consumption labelling requirements of various
countries in the world and analyses the impact the labelling requirements can have in
reducing oil consumption in passenger motor vehicles.
266
Ibid 562. 267
Ibid 576. 268
Average Fuel Economy Standards, above n 221, 606.
Page 125
105
4.3 CONSUMER AWARENESS PROGRAMS
Fuel consumption labels can be an effective way of making the consumer aware of
the fuel efficiency of the motor vehicle he or she is about to purchase. Many
countries including the USA, EU countries, Australia, Japan, the Republic of Korea
and Singapore have laws requiring fuel efficiency labelling by way of a sticker
attached to or printed on the motor vehicle as described below. The fuel consumption
labels serve three purposes: to enable customers to make an informed choice
regarding the vehicle they are about to purchase; to provide an incentive to
manufacturers to design more energy-efficient vehicles; and to bring awareness
about energy conservation in general.
On the other hand, a major criticism of the fuel labelling system is that the
consumption figure achieved under test conditions may not reflect actual driving
conditions.269
However, the figure displayed on the label can be modified to give an
allowance for various driving conditions, such as city driving and highway
conditions.
To achieve the desired objectives, the labels need to be carefully designed to ensure
that the information on them is clear, unambiguous and easily deciphered. The
common labelling systems used in various countries as discussed below include star
ratings, ticks and other signs, use of different colours to represent efficiencies, and
information about estimated fuel costs, fuel consumption and emissions rating. The
label design should be kept simple to be effective and colours, pictures or symbols
used which communicate the technical information better than words or figures.
The concept of labelling was first introduced in the USA in 1975, and the labels were
redesigned in 1986 to show the city-mpg and highway-mpg. In May 2011, the US
EPA and the NHTSA established a final rule, requiring passenger vehicles, SUVs
and light trucks for model year 2013 and later with improved fuel economy labels to
show the following information: the vehicle’s fuel economy; information enabling a
comparison of the vehicle’s fuel economy with other vehicles in the same category;
fuel consumption rate in gallons per 100 miles for combined city and highway
269
‘Car Emissions Ratings Flawed, Say Researchers’, ABC News (online), 13 April 2011
<http://www.abc.net.au/news/2011-04-13/car-emissions-ratings-flawed-say-researchers/2619090>.
Page 126
106
driving; fuel economy and greenhouse gas rating from one to 10, 10 being the best;
CO2 emission information in grams per mile for combined city and highway driving;
and fuel costs over five years relative to the average new vehicle as well as an
estimated annual fuel cost. The label also shows details of a website where additional
information can be sought to compare different vehicles, together with a Smartphone
interactive QR code enabling the consumer to obtain further information about the
vehicle.270
The new labels are required for conventional fuel vehicles as well as the
‘next generation’ vehicles such as plug-in hybrids and electric vehicles. An example
of a label for a conventional fuel vehicle with the gas guzzler tax is shown in Figure
4.2.
FIGURE 4.2: The US Fuel Economy and Environment Label for a Gasoline
Vehicle with Gas Guzzler Tax
Source: Revisions and Additions to Motor Vehicle Fuel Economy Label; Final Rule,
76 Fed Reg 3948 (6 July 2011).
270
US Environmental Protection Agency, ‘New Fuel Economy and Environment Labels for a New
Generation of Vehicles’ (Regulatory Announcement No EPA-420-F-11-017, Office of Transportation
and Air Quality, May 2011).
Page 127
107
The mandatory Swedish program requiring energy labelling for all new cars has been
in force since 1 January 1978 and has been reviewed in 1988 and 1996. In 1996, the
Swedish National Economy Information Programme prescribed two types of
mandatory fuel economy information to be provided at point of sale: a minimum A4-
sized fuel economy declaration placed on the windshield of the car, and comparative
information on all models available at the sales outlet.271
The size and simplicity of
the design in Sweden ensures that customers comprehend the energy information.
Swedish regulations also require all passenger car marketing materials including
printed advertisements, brochures and posters to show fuel consumption
information.272
The Council of the European Union adopted a legislative proposal on 21 December
1998 requiring its member states to introduce fuel economy labels for passenger cars
by the year 2000.
The Republic of Korea has a mandatory fuel economy car labelling program,
established in 1991/92 under the Rational Energy Utilisation Act. The Korean system
differentiates fuel economy efficiency with grades, 1st grade being the best and 5
th
grade being the worst. The label is placed on the window of the rear door of the
motor vehicle, and remains on the car throughout its lifespan.273
In Japan there are several energy performance labelling schemes to bring about
consumer awareness, such as the Energy Star label and e-Mark program as shown in
Figure 4.3.
271
Ralph Wahnschafft and Kwisun Huh, ‘Effective Implementation of Fuel-Economy Labelling for
Passenger Cars: Experiences from the USA, Sweden and Republic of Korea’ (Research Paper, Energy
Resources Section UN-ESCAP and Department of Environmental Science & Engineering, Hankuk
University of Foreign Studies, December 2000) 540. 272
Ibid. 273
Ibid.
Page 128
108
FIGURE 4.3: Japanese Motor Vehicle Label
Source: Energy Conservation Centre, Japan
274
The New Zealand Energy Efficiency (Vehicle Fuel Economy Labelling) Regulations
2007 (NZ) came into effect on 7 April 2008, requiring the label to show the vehicle
make, vehicle model, fuel economy in terms of cost per year, star rating out of six
and fuel consumption in litres per 100km, the basis for calculating fuel economy and
the reference number confirming that the label refers to the vehicle it is displayed
with, as demonstrated in Figure 4.4.275
FIGURE 4.4: New Zealand Motor Vehicle Label
Source: New Zealand Transport Agency Waka Kotahi
274
Nordqvist, above n 240, 14. 275
New Zealand Transport Agency Waka Kotahi, Fuel Economy Labelling (2009)
<http://labelling.fuelsaver.govt.nz>.
Page 129
109
4.3.1 Lessons for Australia
Australia does have mandatory fuel consumption labelling, requiring that the fuel
consumption and the emissions of a motor vehicle be displayed on the vehicle’s
windscreen. However, arguably more can be done in this area to promote the use of
lighter and less powerful vehicles in order to reduce oil use in passenger motor
vehicles.
Australia’s mandatory fuel consumption labelling requirement was introduced in
2001 to address a market failure to provide consistent fuel consumption information
for purchasers of new vehicles.276
The Australian Design Rule (ADR) 81/00 requires
fuel consumption labelling on the windscreen of the vehicle at the point of sale for
light vehicles up to 3.5 tonnes in gross vehicle mass. The label indicates the vehicle’s
fuel consumption in litres of fuel per 100km and its CO2 emissions in grams per km.
The Australian government’s Green Vehicle Guide states that the label is designed to
help Australian motorists make informed choices about the environmental impact of
their new car and the cost of running their vehicle. Since 2009, the label is required
to display three fuel consumption numbers, urban, extra-urban and combined as well
as the combined CO2 value, as shown in Figure 4.5.277
276
Australian Greenhouse Office, Regulation Impact Statement – Proposed Changes to ADR 81/00
Fuel Consumption Labelling for Light Vehicles (29 May 2002) 8. 277
Green Vehicle Guide, Fuel Consumption Label (2010) Department of Infrastructure and Transport
<http://www.greenvehicleguide.gov.au/GVGPublicUI/Information.aspx?type=FuelConsumptionLabel
>.
Page 130
110
FIGURE 4.5: Australian Motor Vehicle Label
Source: Green Vehicle Guide
It is submitted that in the Australian context, the label should complement the
existing regulatory and fiscal measures, and if a LET is implemented as proposed in
Chapter 6, then the LET attracted should also be displayed. The display should not
only appear on the windscreen of the vehicle, but also on all related model-specific
advertising material. Compulsory fuel information in model-specific vehicle
advertising also brings about consumer awareness and assists consumers in making
appropriate choices when making a decision to purchase a motor vehicle. Although
the general law pertaining to misleading and deceptive conduct278
would encompass
278
See sch 2 of the Competition and Consumer Act 2010 (Cth) for full text of the Australian
Consumer Law. Chapter 2 of the Australian Consumer Law deals with a general ban on misleading
and deceptive conduct in trade or commerce.
Page 131
111
misleading fuel information in model-specific vehicle advertising, it may be better
for the law to prescribe the type of information that should be released when
advertising a specific model of a motor vehicle. Not many countries have enacted
such specific laws. The Republic of Korea enacted the Rational Energy Utilisation
Act requiring the manufacturer or importer of motor vehicles to include energy
consumption efficiency when the motor car is advertised.
The next part explores the fiscal measures in place in various countries around the
world.
4.4 A SURVEY OF FISCAL MEASURES IMPLEMENTED
IN VARIOUS COUNTRIES
Many countries have implemented a variety of fiscal measures not only to raise
revenue, but to influence the purchase of a fuel-efficient vehicle and to reduce the
vehicle kilometres travelled (VKT) or CO2 emissions. Unlike the fuel economy
standards, fiscal measures generally do not have any direct bearing on the
manufacturer or importer of the motor vehicles, except through satisfying consumer
demand on the part of the customers who may be affected by fiscal measures. The
fiscal measures adopted by various countries and discussed below include:
Differential charges on the purchase and use of motor vehicles, fuel taxes and fuel
excise and income tax incentives.
4.4.1 Differential charges on purchase and use of motor vehicles
It is common for countries to use differential one-off registration and annual motor
vehicle charges based on the type of vehicle, its weight, the engine capacity, its CO2
emissions or whether the vehicle is used for business or private purposes.279
In the US, various states impose differential charges on the purchase or use of a
motor vehicle based on a flat fee, the weight of the vehicle, the age of the vehicle or
279
Bradbrook, above n 238, 13.
Page 132
112
its value. The federal government in the US also imposes a supplementary lump sum
tax on manufacturers on the sale of new passenger motor vehicles, called the ‘gas
guzzler tax’ that do not comply with the prescribed energy efficiency standards. The
‘gas guzzler tax’ has been in operation since 1978. The tax is collected from the
manufacturer or importer of the vehicles and the payment has to be made on each
vehicle that does not meet the minimum fuel economy level of 22.5mpg. The
following Table 4.7 shows the gas guzzler rates that have been in effect since 1
January 1991.
TABLE 4.7: US Gas Guzzler Tax
Combined Fuel Economy in mpg Amount of Tax USD
At least 22.5 No tax
At least 21.5 but less than 22.5 1000
At least 20.5 but less than 21.5 1300
At least 19.5 but less than 20.5 1700
At least 18.5 but less than 19.5 2100
At least 17.5 but less than 18.5 2600
At least 16.5 but less than 17.5 3000
At least 15.5 but less than 16.5 3700
At least 14.5 but less than 15.5 4500
At least 13.5 but less than 14.5 5400
At least 12.5 but less than 13.5 6400
Less than 12.5 7700
Source: United States Environmental Protection Agency, ‘Tax Schedule’ (August
2011) Gas Guzzler Tax: Program Overview
<http://www.epa.gov/fueleconomy/guzzler/420f11033.htm#tax>.
The gas guzzler tax on passenger cars has nearly eliminated cars designed to get less
than 22.5mpg, except for high-priced luxury and performance cars. As a result the
car market in the US is concentrated just above 22.5mpg.280
Being politically
280
David L Greene et al, ‘Feebates, Rebates and Gas-Guzzler Taxes: A Study of Incentives for
Increased Fuel Economy’ (2005) 33 Energy Policy 757.
Page 133
113
sensitive, the gas guzzler tax does not apply to light trucks, and therefore there is no
policy incentive to reduce the number of SUVs on American roads.
Canada also imposes an excise tax (green levy) on the purchase of fuel inefficient
vehicles as demonstrated in Table 4.8.
TABLE 4.8: Canadian Green Levy
Weighted Average Fuel Consumption in
Litres per 100km Excise Tax (Green Levy) CAD
13–14 1000
14–15 2000
15–16 3000
16 or more 4000
Source: Canada Revenue Agency, Excise Tax on Fuel Inefficient Cars (28 March
2007) <http://www.cra.gc.ca/gncy/bdgt/2007/xcs-eng.html>.
Unlike the gas guzzler tax in the US, the green levy in Canada applies to SUVs,
discouraging their purchase.
Canada also introduced a system called the Tax for Fuel Conservation (TFFC) as part
of its Retail Sales Tax (RST) system in 1990.281
The TFFC applies to new passenger
vehicles, including imported vehicles using six or more litres of oil and SUVs using
eight or more litres of oil. The TFFC is calculated as shown in Table 4.9.
TABLE 4.9: Tax for Fuel Conservation (TFFC) Rates
Highway Fuel Use Ratings
(Litres/100km) Tax on New Passenger
Vehicles
CAD
Tax on New SUVs
CAD
Under 6 0 0
6.0–7.9 75 0
8.0–8.9 75 75
281
See Retail Sales Tax Act, RSO 1990 (as amended) c R-31, s 4. Extracted from Bradbrook, above n
238, 12.
Page 134
114
Highway Fuel Use Ratings
(Litres/100km) Tax on New Passenger
Vehicles
CAD
Tax on New SUVs
CAD
9.0–9.4 250 200
9.5–12.0 1200 400
12.1–15.0 2400 800
15.1–18.0 4400 1600
Over 18.0 7000 3200
Source: Ontario Ministry of Finance, ‘Tax for Fuel Conservation’ (RST Guide No
513, April 2008) <http://www.rev.gov.on.ca/en/guides/rst/513.html>.
The TFFC is part of the taxable value of new vehicles before the eight per cent RST
and the five per cent federal GST are calculated. The TFFC is paid to the dealer at
the time of purchase.
To encourage the purchase of motor vehicles that use less than six litres of fuel per
100km, a tax credit of CAD100 is given against the RST. To encourage the use of
alternative fuels, owners who purchase or convert their vehicles to operate
exclusively on electricity, propane, natural gas, ethanol, methanol, other
manufactured gas, dual powered or hybrid electrical vehicles are eligible for an RST
rebate and may also be eligible for a TFFC rebate.
A number of European countries have one-off motor vehicle taxes that differ for
small, medium and large motor vehicles as shown in Figure 4.6.
Page 135
115
FIGURE 4.6: One-Off Motor Vehicle Taxes in Selected Countries as at 9 August
2010
Source: Organisation for Economic Co-Operation and Development, Taxation,
Innovation and the Environment (OECD, 2010).
Many European countries have carbon-related differentiation of recurrent motor
vehicle taxes, depending on the CO2 emitted per km driven as shown in Appendix 1.
Norway has a unique motor vehicle tax that penalises heavy, powerful and large
CO2-emitting motor vehicles. In Norway, the one-off registration tax is based on a
combination of the vehicle’s unladen weight (kg), the engine output (kW), and either
its CO2 emissions or cylinder volume. If the CO2 emissions data is not available, then
the cylinder volume is used in calculating the tax. From 1 January 2008, motor
vehicle cylinder volume is not used in calculating the tax. If motor vehicles do not
have the documentation requirement for fuel consumption based on CO2 emissions,
then the road authorities will calculate their tax. From 1 January 2012, there is also a
NOx component in the one-off registration tax. The registration tax is charged on
each factor thereby discouraging heavy, powerful and CO2-emitting motor vehicles.
Moreover, the registration tax is quite high. For example, if a popular Australian
passenger motor vehicle, the Holden VE, was purchased in Norway, the registration
tax in year 2011 would be NOK434 933 which amounts to AUD79 078.67, as shown
in Table 4.10. This is based on motor vehicle registration tax rates set in the 2011
Norwegian Budget and a conversion rate of one Australian dollar to NOK5.5. Based
on the tax rates set in the 2012 Norwegian Budget, the one-off registration tax on the
Holden VE would be NOK401 818 which includes a NOx component of NOK1320.
0 20 40 60 80
100 120 140 160
EUR
(0
00
s) Small Vehicle Medium Vehicle Large Vehicle
Page 136
116
TABLE 4.10: Registration Tax for Holden VE in Norway
Specifications NOK AUD
Tax on unladen weight 1700kg 114 194.50 20 762.63
Tax on engine rating 180kW 202 048.20 36 736.04
Tax on CO2 217g/km 117 390.00 21 343.64
Vehicle scrap deposit 1300.00 236.36
Total Motor Vehicle Tax 434 933.00 79 078.67
Source: Extracted from Toll Customs, ‘Calculator: Importation of Motor Vehicles
<http://www.toll.no/templates_TAD/RegistrationTax.aspx?id=79&epslanguage=en&
step=3#anchorResult>.
The Norwegian tax is further discussed in Chapter 5 as part of the case study. The
Norwegian registration tax takes into consideration all the factors that increase the
fuel consumption and emissions in a vehicle.
Singapore has a vehicle quota system that was implemented on 1 May 1990. Under
this system, the government controls the release of new vehicles on the road by
determining the number of new vehicles allowed for registration, taking into account
the traffic conditions and the proportion which the vehicle category makes up of the
total vehicle population. The vehicle quota for a given year is then administered
through a monthly release of Certificates of Entitlement (COE). Thus, a Singaporean
would need to purchase a COE to obtain the right to purchase a new vehicle. The
COE has a life span of 10 years, after which it expires and can only be retained by
paying an additional fee. This system restricts the number of vehicles that are on
Singaporean roads.282
The COE payable in Singapore for a popular Australian family
car, the Holden Epica, also called the Chevrolet Epica, would have been about
SGD63 000 on 9 June 2011.283
In addition to the cost of COE, a vehicle owner in Singapore is required to pay a
registration fee of SGD140 and an Additional Registration Fee (ARF) of 100 per cent
282
Land Transport Authority, Vehicle Ownership – Vehicle Policies & Schemes (24 November 2009)
Singapore Government <http://www.lta.gov.sg/content/lta/en.html>. 283
Land Transport Authority, One Motoring, Singapore Government
<http://www.onemotoring.com.sg/publish/onemotoring/en.html>.
Page 137
117
of the vehicle’s open market value when the vehicle is purchased. An annual road tax
is also payable and the amount of road tax is based on the engine capacity of the
vehicle. A road tax surcharge also applies for vehicles that are more than 10 years
old. To encourage motor vehicles to be scrapped or exported before they are 10 years
old, a ‘Preferential Additional Registration Fee’ rebate ranging from 75 per cent to
50 per cent of the ARF is granted.284
Singapore introduced the Green Vehicle Rebate scheme in 2001, and up until
December 2011, electric, hybrid and gas-powered vehicles were eligible for a rebate
of 40 per cent on the national vehicle registration fee. Since 2011, only electric
vehicles are eligible for a rebate of five per cent of the ARF.
Japan has two acquisition taxes and two taxes during ownership of motor vehicles.
On acquisition of a motor vehicle, the Japanese have to pay an acquisition tax and a
consumption tax. The acquisition tax applies to both new and used motor vehicles
and is based on five per cent of the purchase price, unless the price is less than
JPY500 000, in which case it is exempted. The consumption tax of five per cent is
also based on the purchase price of the motor vehicle. During ownership, the
Japanese pay a tonnage tax and the automobile tax. An annual tonnage tax is
assessed according to vehicle weight at each vehicle inspection, with a rate of
JPY5000 (Approximately AUD59 based on an exchange rate of 85.3497) per 0.5
tonne per year. The tonnage tax is in addition to the annual automobile tax based on
the engine capacity, ranging from JPY29 500 (about AUD345) per year for a
passenger car up to 1000cc to JPY111 000 (approximately AUD1300) for a
passenger car over 6000cc.285
Thus the Japanese discourage the use of heavy and
powerful motor vehicles.
Many OECD countries have been changing the manner in which they charge motor
vehicle taxes, and they incorporate the fuel efficiency, CO2 emissions per kilometre,
engine power and weight of the vehicle. As demonstrated above, Norway has a high
one-off tax as they take into account all the factors — CO2 emissions, vehicle weight
and engine power — in calculating the tax. Denmark has higher taxes for small and
284
Land Transport Authority, Vehicle Ownership – Vehicle Tax Structure, Singapore Government
<http://www.lta.gov.sg/content/lta/en.html>. 285
Japan Automobile Manufacturers Association, ‘The Motor Industry of Japan 2010’ (Report, Japan
Automobile Manufacturers Association, May 2010) 43.
Page 138
118
medium-sized vehicles in comparison with other European countries.286
In
conclusion, one-off and recurrent motor vehicle taxes are a major source of revenue
for most governments, but if they are set sufficiently high and measured against
appropriate criteria, they can also play a role in affecting levels of motor vehicle
ownership and the composition of the national fleet of vehicles.
a. Lessons for Australia
In Australia, the taxes and duties payable on the purchase of a vehicle include the
Goods and Services Tax (GST), stamp duty and Luxury Car Tax (LCT). Annual
motor vehicle licence fees are also payable in order to be able to use the vehicle on
the roads.
The GST is a standard 10 per cent payable on the cost of the vehicle and has no
bearing on the oil consumption of the vehicle. Stamp duty is imposed by the states
and territories where the new vehicles are registered for the first time, or when
registration is being transferred to another person. The amount of the duty is based
on the dutiable value of the motor vehicles and the rate varies with each state or
territory. The stamp duty has an impact on the price of the vehicles but no bearing on
the oil consumption of the vehicle.
In Australia, the LCT can impact on the price of the vehicles. The LCT was first
introduced in Australia on 1 July 2000 when the GST was introduced and the
wholesale sales tax was abolished. The tax applies to vehicles whose GST-inclusive
value exceeds the indexed threshold of AUD57 466 for 2010–11. The LCT applies to
both domestically produced and imported vehicles.287
The purpose of the LCT was
not necessarily to curb excessive oil consumption but to protect the local car industry
in Australia.
In an effort to have an impact on choice of motor vehicle, the federal government
made recent amendments to the LCT in the Tax Laws Amendment (Luxury Car Tax)
Act 2008 (Cth) which came into effect on 1 July 2008 increasing the rate of LCT
286
Organisation for Economic Co-Operation and Development, Taxation, Innovation and the
Environment (OECD, 2010) 41. 287
Tax Laws Amendment (Luxury Car Tax) Act 2008 (Cth)
Page 139
119
from 25 per cent to 33 per cent. Also, a LCT exemption applies to fuel-efficient cars
with a fuel consumption not exceeding seven litres per 100km as a combined rating
under the vehicle standards in force in s 7 of the Motor Vehicles Standards Act 1989
(Cth), and which are below the indexed fuel-efficient car limit of AUD75 000. The
fuel-efficient car limit for the 2010–11 financial year is AUD75 375.288
The LCT is imposed only when the price of the car is above the legislated threshold
of AUD57 466 for 2010–11. The price of the vehicle as a basis for the imposition of
LCT is not indicative of its fuel efficiency or its emissions. Moreover, the proportion
of vehicles subject to the LCT is not more than 11 per cent. Thus, the LCT is not
sufficient to encourage the purchase of a fuel-efficient car, as it has no impact on
about 89 per cent of the motor vehicles purchased.289
Furthermore, applying the
combined rating of seven litres per 100km only to luxury vehicles is not sufficient to
reduce the oil use of the Australian fleet.
As regards the annual motor vehicle licence fees in Australia, the six states and two
territories apply different methods of calculating vehicle registration charges. South
Australian charges depend on the number of cylinders, whereas New South Wales
charges are based on weight as shown in Table 4.11.
TABLE 4.11: Vehicle Registration Charges in New South Wales
Weight of Vehicle Private Use Business Use
Exceeding kg Not Exceeding kg AUD AUD
975 231 341
976 1154 254 375
1155 1504 285 429
1505 2504 406 619
Source: Motor Vehicle Taxation Act 1988 (NSW) s 5 (as amended).
288
Commissioner of Taxation, Luxury Car Tax Determination LCTD 2010/1 – Luxury Car Tax: What
is the Luxury Car Tax Threshold and the Fuel-Efficient Car Limit for the 2010–11 Financial Year? (9
June 2010) Australian Taxation Office <http://law.ato.gov.au/pdf/pbr/lcd2010-001.pdf>. 289
Australian National Audit Office, Administration of the Luxury Car Tax (2012) Commonwealth of
Australia <http://www.anao.gov.au/Publications/Audit-Reports/2010-2011/Administration-of-the-
Luxury-Car-Tax/Audit-brochure>.
Page 140
120
In Western Australia, the vehicle licence fee for light vehicles weighing less than
4500kg is AUD17.02 per 100kg, plus a recording fee and a prescribed flat fee.290
The
Northern Territory and Victorian charges are based on engine size.291
The differential
charges on the use of motor vehicles in Australia have little influence on the
purchase and use of motor vehicles as the charges are either not high enough or the
basis on which they are imposed has no impact on the use of oil in motor vehicles.
The need for a tax to change behaviour, to drive less in more fuel-efficient motor
vehicles, was recognised by the Australian government and referred to the review of
Australia’s future tax system commonly known as the ‘Henry Tax Review’.292
Around 1500 formal submissions were received, and included in the key messages
from the submissions was that taxes on the purchase of motor vehicles should
promote fuel efficiency.293
The Henry Tax Review also made recommendations to
the Australian government to abolish the LCT and to replace vehicle registration
taxes with more efficient road user charges.294
It also criticised the imposition of
stamp duty on motor vehicles on the basis that it dissuades people from turning over
their vehicles and thereby increases the age of the national fleet of vehicles.295
The LET discussed in Chapter 6 takes into consideration how countries use
differential one-off registration and annual motor vehicle charges based on the type
of a vehicle, its weight, the engine capacity, its CO2 emissions (especially Norway),
as well as some of the recommendations from the Henry Review, and proposes a
differential charge on the purchase and use of motor vehicles that has the potential to
change consumer behaviour in favour of smaller and lighter vehicles with reduced
CO2 emissions. The next section explores fuel taxes and fuel excise.
290
Department of Transport, Schedule of Licensing Fees and Charges (July 2010) Government of
Western Australia <http://www.transport.wa.gov.au/licensing/566.asp> 5. 291
Northern Territory Transport Group, Vehicle Registration (March 2012) Northern Territory
Government <http://www.transport.nt.gov.au/mvr/registration>; VicRoads, Registration (18 May
2012) State Government Victoria <http://www.vicroads.vic.gov.au/Home/Registration/>. 292
Australian Treasury, ‘Architecture of Australia’s Tax and Transfer System’ (Report,
Commonwealth of Australia, August 2008)
<http://taxreview.treasury.gov.au/content/downloads/report/Architecture_of_Australias_Tax_and_Tra
nsfer_System_Revised.pdf> (Henry Tax Review). 293
Commonwealth of Australia, ‘Chapter E: Enhancing Social and Market Outcomes’ in Australia’s
Future Tax System: Final Report – Detailed Analysis (Final Report, 2 May 2010)
<http://taxreview.treasury.gov.au/content/FinalReport.aspx?doc=html/Publications/Papers/Final_Repo
rt_Part_2/Chapter_e.htm>. 294
Ibid. 295
Acil Tasman, ‘Henry Tax Review: An Overview of Issues for Motorists’ (Report, Australian
Automobile Association, May 2010) 9.
Page 141
121
4.4.2 Fuel Taxes or Fuel Excise
In the context of OECD terminology, excise systems comprise selective taxes on the
production, sale, transfer, leasing and delivery of goods and the rendering of
services.296
Therefore taxation on motor vehicle fuel comes within the definition of
an excise. A fuel excise is generally imposed for revenue purposes since it has no
close substitutes and the demand for fuel is inelastic, and the potential for economic
distortion by the imposition of an excise is relatively small.297
Excise taxes are often
rationalised as a charge to consumers for external costs, which then induces them to
reduce their activities to the socially optimal level, known as the Pigouvian
prescription.298
Motor fuel taxes or fuel excises have been implemented by many countries and the
revenue raised from them is often quite high. Table 4.12 shows the different excise
tax rates on petrol in OECD countries for the years 2000 and 2010 and the
arithmetical percentage change and the real percentage change for that period. The
arithmetical percentage change does not address how these taxes compare to the real
impact they have on influencing consumer behaviour and on government revenues.
The real percentage change takes into consideration the effect of inflation.
TABLE 4.12: Tax Rates on Motor Fuel in Euro per litre
Petrol
2010 Petrol
2000 Arithmetical
% Change Real %
Change
Mexico -0.0658 0.0117 -661.57% -139.90%
United States 0.0788 0.067 17.67% -8.69%
Canada 0.1524 0.1451 5.05% -14.67%
New Zealand 0.1913 0.1453 31.65% 3.7%
Chile 0.2082
296
Item 5120 in OECD 2009 classification extracted from Sijbren Cnossen, ‘Excise taxation in
Australia’ (Paper presented at the Australia’s Future Tax and Transfer Policy Conference 2009,
Melbourne Institute, Melbourne, 18–19 June 2009) 236. 297
Ibid 237. 298
Ibid.
Page 142
122
Petrol
2010 Petrol
2000 Arithmetical
% Change Real %
Change
Australia 0.2141 0.2595 -17.48% -36.86%
Iceland 0.3644 0.2276 60.13% -12.29%
Poland 0.3826 0.2901 31.90% -2.07%
Japan 0.4139 0.4139 0.00% 3.02%
Korea 0.4206 0.4204 0.04% -26.48%
Estonia1 0.423
Spain 0.4247 0.3717 14.26% -13.24%
Hungary 0.4275 0.2825 51.32% -14.67%
Austria 0.442 0.4077 8.41% -10.56%
Luxembourg 0.4621 0.3721 24.19% -0.79%
Czech Republic 0.4852 0.4096 18.45% -8.4%
Slovenia 0.4895
Switzerland 0.4935 0.4846 1.85% -6.88%
Slovak Republic 0.5145 0.3122 64.80% -26.36%
Israel* 0.515
Sweden 0.5173 0.4205 23.04% 5.82%
Ireland 0.5432 0.3739 45.29% 11.3%
Italy 0.564 0.528 6.82% -14.16%
Belgium 0.5706 0.5072 12.50% -8.44%
Denmark 0.5708 0.5114 11.61% -8.73
Portugal 0.583 0.3706 57.31% 23.46%
France 0.6069 0.5863 3.50% -12.40%
Greece 0.61 0.314 94.26% 41.85%
Norway 0.6179 0.6042 2.27% -16.23%
Finland 0.627 0.5589 12.19% -4.14%
United Kingdom 0.6307 0.5299 19.02% -2.47%
Germany 0.6545 0.5624 16.37% 0.07%
Netherlands 0.6681 0.5968 11.96% -7.65%
Turkey 0.8802 0.1475 496.88% 9.25%
Source: OECD/EEA database on instruments for environmental policy, extracted
from Organisation for Economic Co-operation and Development, Taxation,
Innovation and the Environment, OECD, 2010.
NOTE: The currencies are converted to euro using the average exchange rate for
2009. Data for the United States and Canada include average excise rates taxes at the
state/provincial level. VAT or GST is not included.
Page 143
123
From Table 4.12 it can be observed that Mexico has an effective negative excise tax
rate due to high international crude prices in 2009 and the Mexican government
heavily subsidising motor fuel as Mexico is one of the top ten oil producers in the
world. On the other extreme, Turkey has the highest tax rate on petrol among OECD
countries. The impact of this is that Turkey’s economy is less dependent on personal
vehicles than other OECD countries. In 2005, Turkey had only 117 vehicles per 1000
people compared with the OECD average of 607 vehicles per 1000 people. Since
petrol is taxed at a much higher rate than diesel or LPG, the number of vehicles that
shifted to LPG increased from 800 000 to 1.8 million between 2003 and 2007 and
thus the petrol use declined significantly. A case study on Turkey suggests that fuel
taxes and fuel excise can have an important impact on consumer behaviour.299
Although the real rate of motor fuel tax is declining in most OECD countries, motor
fuel tax is a major source of revenue for many governments around the world. The
UK pump price of petrol and diesel has a higher tax component than any other EU
country. In April 2007, fuel tax formed 67 per cent of the pump price of a litre of
unleaded fuel in the UK, compared with the 25 EU countries’ average of 57 per
cent.300
Many countries are conducting studies on reforming their road transport taxes. The
2008 Mirrlees Fullerton study in the UK on environmental taxation noted that an
optimal system of road transport taxes would precisely target the taxes against the
various externalities involved and that fuel taxation should correct environmental and
road damage costs.301
In the US, the federal tax on petrol is USD0.184 per gallon and has not been raised
since 1993. US legislators have been unwilling to raise the tax rate on motor fuels as
the price of petrol is already high without adding on the extra tax. On the other hand,
the costs of building and repairing roads have risen. Over the last 30 years the US has
added very little capacity to its road network, while vehicle miles travelled (VMT)
299
OECD, above n 286, 38. 300
Don Fullerton, Andrew Leicester and Stephen Smith, ‘Environmental Taxes: Paper Written for the
Mirrlees Review “Reforming the Tax System for the 21st Century”’ (22 March 2007) Institute for
Fiscal Studies <http://www.ifs.org.uk/mirrleesreview/reports/conference_drafts/environment.pdf> 37. 301
Ibid 35–8.
Page 144
124
rose 95 per cent between 1980 and 2008, increasing congestion. It is anticipated that
revenues from motor fuel taxes in the US will continue to decline due to further
improvements in fuel economy arising from stricter CAFE standards. Thus there is a
push in the US to replace the tax on motor fuel with a user fee to fund transportation
and infrastructure.302
The reason why many countries are considering replacing fuel taxation with a
kilometre-based user fee structure is that the kilometre fee addresses the three main
criticisms of the fuel tax: that the kilometre-based user fees are based on distance
driven and not the amount of fuel purchased and consumed; the revenue base is not
diminished by increased fuel efficiency of the motor vehicle fleet; and they capture
miles driven by vehicles that do not use traditional fuel.303
A special 2006 research report by the US Committee for the Study of the Long-Term
Viability of Fuel Taxes for Transportation Finance concluded that fuel taxes may
become less reliable revenue sources for transportation programs in the future. The
committee concluded that although the present highway finance system can remain
viable for some time, travellers and the public would benefit greatly from a transition
to a fee structure that more directly charges vehicle operators for their actual use of
the roads.304
The Oregon Road User Fee Pilot Program Report commented that the fuel tax-
generated revenue is eroding and is likely to fail in its original intended purpose as a
reliable source of revenue for the state’s road system. The Report identified the
advantages of the fuel tax as: raises substantial revenue; ease of payment by
consumer; ease of collection; easy to administer; and low cost of administration.
However the disadvantages identified included disconnection to the highway system
and revenue erosion. The Oregon Task Force created a mileage fee concept by
emulating positive attributes of the fuel tax collection and designing the collection of
mileage fees at the fuel pump; it thus raises fewer enforcement issues because access
302
Keith Crane, Nicholas Burger and Martin Wachs, ‘The Option of an Oil Tax to Fund
Transportation and Infrastructure’ (Occasional Paper, RAND, 2011) 45. 303
Richard T Baker, Ginger Goodin and Lindsay Taylor, ‘Mileage‐Based User Fees — Defining a
Path toward Implementation (Phase 2): An Assessment of Institutional Issues’ (Final Report,
University Transportation Center for Mobility, November 2009) 12. 304
Committee for the Study of the Long-Term Viability of Fuel Taxes for Transportation Finance,
Transportation Research Board of the National Academies, ‘The Fuel Tax and Alternatives for
Transportation Funding’ (Special Report 285, Transportation Research Board, 2006) 3.
Page 145
125
to fuel can be conditional upon payment of the mileage charge. Although designed to
replace the fuel tax, the platform employed by the Oregon Task Force is
tremendously flexible and can easily accommodate country and city options or
congestion pricing without photographic or tolling style infrastructure.305
This is
further discussed in the Chapter 5 case study.
The European study on kilometre fees is not aimed at replacing the fuel tax, but is
more focused on congestion taxes and road user charges. The European concept is
further discussed below under Demand Management Programs and in Chapter 5 with
the Netherlands case study.
a. Lessons for Australia
Table 4.12 shows that the Australian fuel tax rate has declined over the 10 years to
2010. As part of its A New Tax System reforms, the Howard government reduced
excise on petrol and diesel by 6.656 cents per litre on 1 July 2000 in order to
compensate for the introduction of the GST. The Australian government further
reduced the excise by 1.5 cents on 2 March 2001. This brought the total reduction in
excise to 8.156 cents. The excise rates in Australia are not indexed to the consumer
price index and the excise rate has remained at 38.143 cents per litre, with the result
that the real excise rate has decreased over the last 10 years to 2010.
The main reason that Australia imposes excise on petrol is to raise revenue. For
every litre of petrol or diesel, whether imported from overseas or produced in
Australia, an excise of AUD0.3814 cents per litre is imposed. The question to
address is whether an increase in fuel excise is likely to affect the consumption of oil
in passenger motor vehicles in Australia. It has been noted in various studies that the
consumption of fuel is inelastic. The reason for this is that people have a need to
drive. It is difficult to reduce demand for fuel without changing behaviour, for
example, buying a fuel-efficient vehicle, using more public transport, or driving less.
Moreover, there is no readily available substitute for oil which can be used without
305
James M Whitty, ‘Oregon’s Mileage Fee Concept and Road User Fee Pilot Program’ (Final
Report, Oregon Department of Transportation, November 2007)
<http://www.oregon.gov/ODOT/HWY/RUFPP/docs/RUFPP_finalreport.pdf>.
Page 146
126
making major alterations to the current design of vehicles. The same argument
applies if the price of fuel increases as a result of the Australian government
introducing an emission trading scheme or a carbon tax.
The Senate Select Committee on Fuel and Energy conducted an inquiry on the
impact of the Carbon Pollution Reduction Scheme on consumers and revealed
arguments from organisations such as the Commonwealth Scientific and Industrial
Research Organisation (CSIRO), Caltex Australia and the Royal Automobile Club of
Queensland (RACQ) acknowledging that local and international research confirm
that fuel use is quite inelastic, so an increase in fuel price will reduce the demand for
fuel only slightly. The RACQ argued that in the short term, car fuel use declines
about 1.5 per cent with any 10 per cent concurrent increases in the price of fuel.
Caltex Australia commented that the price of fuel does little to change motorists’
consumption behaviour.306
The Bureau of Infrastructure, Transport and Regional
Economics also confirmed in their ‘Briefing Document – 1’ that in the short term, car
fuel use declines about 1.5 per cent with a 10 per cent increase in the petrol price.307
The Henry Tax Review suggested that fuel tax as a source of general government
revenue should be phased out and transport-specific taxes should be imposed only
where they improve social and market outcomes. The Henry Tax Review has
proposed that fuel excise could serve as a distant second best option to collecting the
variable part of the two-part (fixed price component and variable price component)
road user charge. The Henry Review further stated that if fuel excise is kept for the
variable pricing component of a road user charge, then the anomalies in the fuel
excise system need to be remedied and the fuel tax needs to tax all energy sources on
an energy-content basis.308
The Australian fuel excise has been reviewed in the proposed LET in Chapter 6. The
next part explores the income tax incentives.
306
Senate Select Committee on Fuel and Energy, Parliament of Australia, The CPRS: Economic Cost
Without Environmental Benefit – Interim Report (May 2009) 185. 307
David Gargett and Afzal Hossain, ‘How Do Fuel Use and Emissions Respond to Price Changes?’
(Briefing Report No 1, Bureau of Infrastructure, Transport, Regional Development and Local
Government, 2008) 2. 308
Acil Tasman, above n 295, 9.
Page 147
127
4.4.3 Income Tax Incentives
Many countries support the introduction of fiscal incentives for fuel efficiency, as tax
measures are considered an important tool in shaping consumer demand in favour of
fuel-efficient vehicles. Many countries also grant tax incentives to produce motor
vehicles that do not rely on oil, ie electric motor vehicles or those driven on biofuels.
Some countries grant income tax incentives to produce biofuels.
The American Recovery and Reinvestment Act 2009 provides credits of between
USD2500 and USD7500 for qualified plug-in electric drive vehicles purchased after
31 December 2009. To qualify for the credit, the vehicles must be newly purchased,
have four wheels or more, have a gross weight rating of less than 14 000 pounds and
draw propulsion from a battery with at least four kilowatt hours that can be recharged
from an external source of electricity.309
In the US, tax incentives have been
available for electric and clean fuel vehicles since 1975 and these incentives have
been amended over the years. For example, the 2005 Energy Tax Incentives Act
added the ‘Alternative Technology Vehicles’ credit for qualified fuel cell vehicles,
alternative fuel vehicles, qualified hybrid vehicles, advanced lean-burn technology
motor vehicles and alternative fuel vehicle refuelling property.310
Tax incentives
have also been provided for ethanol production in the US since 1978 to reduce
dependence on foreign oil, according to the Energy Tax Act of 1978.311
In the US, the
first major tax incentive was an exemption of ethanol from motor fuel excise tax. The
US federal law now grants three income tax credits, ranging from USD0.10 to
USD0.60, designed to encourage ethanol use by making ethanol prices competitive
with petroleum-based fuels.312
A credit of USD0.10 per gallon is granted to small
producers if production exceeds a certain threshold, and is limited to a cap of 15
million gallons of production unless the fuel is produced from cellulosic sources.313
309
Internal Revenue Service, ‘Energy Provisions of the American Recovery and Reinvestment Act of
2009’ (Fact Sheet No FS-2009-10, US Department of the Treasury, 10 April 2009)
<http://www.irs.gov/newsroom/article/0,,id=206871,00.html/>. 310
Mona Hymel, ‘The United States’ Experience with Energy-Based Tax Incentives: The Evidence
Supporting Tax Incentives for Renewable Energy’ (Discussion Paper No 06-21, Arizona Legal
Studies, 2006) 15. 311
Mona L Hymel, ‘Moonshine to Motorfuel: Tax Incentives for Fuel Ethanol’ (Discussion Paper No
08-29, Arizona Legal Studies, 2008) 2. 312
Ibid 3. 313
Ibid 7.
Page 148
128
The US also grants a credit of up to 50 per cent of the cost of refuelling equipment
capped at USD50 000.314
In April 2009, the State of Colorado enacted legislation HB09-1331, allowing a tax
credit of up to USD6000 for any alternative fuel or hybrid-powered vehicle. Starting
with financial year 2009–10, HB09-1331 has changed the rebate scheme by
classifying seven categories of vehicles and a percentage ranging from zero to 85 per
cent of the purchase price with a cap to any one entity of USD350 000 per fiscal
year.315
Other American states that have established incentives and tax exemptions for
electric vehicles include California, Arizona, the District of Columbia, Florida,
Georgia, Hawaii, Illinois, Louisiana, Montana, New Jersey, Oklahoma, Oregon,
South Carolina, Tennessee, Utah and Washington.316
Effective from 1 July 2010, Ontario, a province in Canada, has enacted an incentive
ranging from CAD5000 to CAD8500 towards the purchase or lease of a new plug-in
hybrid electric or battery electric vehicle. The value of the incentive is based on the
vehicle’s battery capacity from 4kW to 17kW.317
This is part of the Ontario
government’s vision to have one out of every 20 vehicles driven in Ontario be
electrically powered by 2020.
The Chinese government has implemented a subsidy program in five of its cities,
Shanghai, Changchun, Shenzhen, Hangzhou and Hefei, whereby buyers of pure
electric vehicles would be entitled to a subsidy of CNY60 000 and CNY50 000 for
plug-in hybrid cars.318
As of April 2010, 17 EU Member States levied passenger car taxes partially or
totally based on the car’s carbon emissions or fuel consumption or a combination of
the two. These states include Austria, Belgium, Cyprus, Denmark, Finland, France,
314
Ibid 19. 315
‘Concerning Incentives for Efficient Motor Vehicles’ (Colorado Legislative Council Staff Fiscal
Note No HB09-1331, 20 April 2009) 3. 316
Alternative Fuels & Advanced Vehicles Data Center, All Federal & State Incentives & Laws: All
Incentives and Laws Sorted by Type (15 June 2011) US Department of Energy
<http://www.afdc.energy.gov/afdc/laws/matrix/tech>. 317
Ontario Ministry of Transportation, Electric Vehicle Incentive Program (July 2012)
<http://www.mto.gov.on.ca/english/dandv/vehicle/electric/electric-vehicles.shtml>. 318
Fang Yang, 'China's Annual Output of Electric Vehicles to Hit 1 mln by 2020', English.News.cn
(online), 16 Oct 2010 <http://news.xinhuanet.com/english2010/china/2010-10/16/c_13560296.htm>.
Page 149
129
Germany, Ireland, Luxembourg, Malta, the Netherlands, Portugal, Romania, Spain,
Sweden and the United Kingdom. All western European countries except Italy and
Luxembourg have incentives for electrically chargeable vehicles. The tax incentives
mainly consist of tax reductions, exemptions and bonus payments for the buyers of
electric cars.319
In Japan, alternative-energy and next generation vehicles are either exempt from the
tonnage tax and the automobile tax or subject to a reduction of the tax, based on
certain criteria.
a. Lessons for Australia
Although many governments are providing incentives to encourage the use of
alternative fuel or electric motor vehicles, the uptake of alternative fuel vehicles
remains low. The reasons for this are that the price of petrol is still relatively low,
there is a lack of infrastructure for refuelling motor vehicles with alternative fuels or
electricity, and the extra costs that go with purchasing alternative fuel and electric
vehicles.
The question is whether providing tax incentives is a better means of changing driver
habits in order to reduce passenger motor vehicle oil consumption, as opposed to
imposing taxation to curb undesirable behaviour. Studies in the US on the impact of
oil and gas tax incentives to promote the conservation of oil indicate that tax
incentives substantially increased the rate of return for the petroleum industry, but
have not resulted in the conservation of oil and gas reserves, nor decreased the US
security concerns associated with foreign imports. According to the General
Accounting Office (GAO), a better approach to increasing US energy security would
have been to develop alternatives, increase fuel efficiency in transportation, and
319
European Automobile Manufacturers’ Association, 2011 The Automobile Industry Pocket Guide
(September 2011) ACEA
<http://www.acea.be/images/uploads/files/20110921_Pocket_Guide_3rd_edition.pdf>; European
Automobile Manufacturers’ Association, Overview of Purchase and Tax Incentives for Electric
Vehicles in the EU (Report, 29 March 2012) ACEA
<http://www.acea.be/images/uploads/files/Electric_vehicles_overview.pdf>.
Page 150
130
continue the development of the Strategic Petroleum Reserve.320
A study conducted
by the EIA on the provision of tax credits for nonconventional fuels concluded that
the tax credits had no impact in terms of reducing the dependence on fossil fuels or
foreign imports.321
It has been stated that lowering the cost of petroleum
consumption in the US through tax incentives has had the effect of encouraging
waste, not conservation.322
The GAO has also stated that while incentives may
encourage more efficient fossil fuel consumption, alternative fuel use has not
resulted in lower fossil fuel consumption or reduced dependence on the car.323
Tax incentives, if properly designed, do have a role to play in improving energy
efficiency. A 2001 study by the American Council for Efficient Economy outlined
eight principles for designing energy efficiency tax incentives, being that the tax
incentives should:
- Encourage development of advanced technologies;
- Establish clear performance criteria;
- Be substantial;
- Choose technologies where first cost is a major barrier;
- Be flexible as to who receives the credit;
- Complement other policy initiatives;
- Select priorities, but offer incentives in a variety of areas to increase
likelihood of success; and
- Allow sufficient time before phasing out the incentives.324
The Australian government promotes the use of alternative fuels in passenger motor
vehicles and provides a grant of 38.143 cents per litre under the Energy Grants
(Cleaner Fuels) Scheme Act 2004 (Cth), where the biodiesel and ethanol meet the
relevant quality standard under the Fuel Quality Standards Act 2000 (Cth). The
320
US General Accounting Office, ‘Tax Policy Additional Petroleum Production Tax Incentives Are
of Questionable Merit’ (Report to the Chairman, Subcommittee on Energy and Power, Committee on
Energy and Commerce, House of Representatives, July 1990)
<http://www.gao.gov/assets/150/149358.pdf> 39. 321
Energy Information Administration, ‘Analysis of Five Selected Tax Provisions of the Conference
Energy Bill of 2003’ (Service Report No SR/OIAF/2004-01, February 2004)
<ftp://ftp.eia.doe.gov/service/sroiaf(2004)01.pdf> 2. 322
Hymel, above n 310, 76. 323
US General Accounting Office, ‘Tax Policy Effects of the Alcohol Fuels Tax Incentives’ (Report
to the Chairman, Subcommittee on Energy and Power, Committee on Energy and Commerce, House
of Representatives, March 2007) http://www.gao.gov/archive/1997/gg97041.pdf> 6. 324
Mann and Hymel, above n 38, 10422.
Page 151
131
Australian government has enacted legislation into Parliament to extend this grant
until 2021.325
By providing these grants, the excise and excise-equivalent customs
duty imposed on manufacturers and importers is reduced to nil. Under the new laws
implemented in 2011, liquefied petroleum gas (LPG) for transport use will be subject
to fuel tax at the rate of 12.5 cents per litre and liquefied natural gas (LNG) and
compressed natural gas (CNG) for transport use will be subject to fuel tax at the rate
of 26.13 cents per kg. The application for these taxes will be phased in over the
period 1 December 2011 and 1 July 2015.326
The current Labor government supports a work program to ensure Australia’s energy
markets are ready to support the potential large-scale adoption of electric vehicles
and related technologies. In order to address the barriers to the uptake of electric
vehicles, the Gillard government, through the Ministerial Council on Energy and the
Australian Energy Market Commission, will consider issues such as metering
requirements, technical and safety standards, network protection and the adequacy of
current network infrastructure.327
The problem with electric cars is that Australia is
still reliant on fossil fuel to make electricity and insufficient electricity is produced in
Australia using renewable resources to satisfy the increase in its demand for electric
cars. Moreover, oil is required for production of electric cars and their batteries and
the depletion of oil will increase the cost of electric cars. Thus the tax incentives
should complement other policy initiatives, ie tax imposition to bring about a
reduction in oil consumption by passenger motor vehicles, which are currently the
largest consumers of oil.
325
Treasury, ‘Fuel Tax Legislation Amendment (Clean Energy) Bill 2011, Excise Tariff Legislation
Amendment (Clean Energy) Bill 2011, Customs Tariff Amendment (Clean Energy) Bill 2011 —
Commentary on Provisions’ (28 July 2011)
<http://www.climatechange.gov.au/government/submissions/clean-energy-legislative-
package/~/media/publications/clean-energy-legislation/Commentary-on-Clean-Energy-Fuel-Tax-
Arrangements-PDF.pdf> 4. 326
Explanatory Memorandum, Taxation of Alternative Fuels Legislation Amendment Bill 2011 (Cth)
9. 327
Martin, above n 259.
Page 152
132
4.5 DEMAND MANAGEMENT PROGRAMS
Demand management programs are designed to reduce the demand for driving a
motor vehicle, which should result in reduced oil use and a reduction in other costs
that cannot be accurately measured, such as lost time and effect on health due to
traffic congestion. Many countries have enacted a wide variety of laws and
regulations pertaining to demand management programs at the local, state or national
government level in order to reduce the need for and amount of private vehicle use,
some of which are discussed below.
The majority of the demand management programs hinge on road pricing. Efficient
road pricing can be achieved by changing the structure of taxes and charges from
fixed and blunt measures to more variable ones levied at the point of sale. There is
enough knowledge on the monetary values of external costs to reform road pricing.
Efficient pricing can increase the cost of car use in congested urban areas and make
public transport a more viable option. Road pricing measures are effective in
changing people’s behaviour and travel patterns.328
Many governments around the world are realising that government revenues from
motor fuel taxes and excise may fall due to a reduction in driving resulting from
increased fuel costs and an increase in alternative fuel-based vehicles such as plug-in
hybrids and electric drive vehicles. As a result, there is increasing debate in many
countries over nation-wide road pricing based on distance travelled.329
Technology is available to design demand management programs that are more
variable and priced at the point of sale. An in-vehicle device with access to the
vehicle data bus and powered through a single standard connector has been available
since 1996 and capable of communicating information to a ‘back office’ for
processing and calculating fees.330
An example of such technology is developed by
the Canadian firm Skymeter Corporation, removing critical barriers to the use of
road-use charging, and paying particular attention to reliability, cost and privacy
328
André de Palma, Robin Lindsey and Esko Niskanen, ‘Policy Insights from the Urban Road Pricing
Case Studies’ (2006) 13 Transport Policy 149. 329
Max Donath et al, ‘Technology Enabling Near-Term Nationwide Implementation of
Distance Based Road User Fees’ (Report No CTS 09-20, Intelligent Transportation Systems Institute
Center for Transportation Studies University of Minnesota, June 2011) 1. 330
Ibid 2.
Page 153
133
issues. The system operates by using infrastructure-free tolling, low-cost road-use
metering and self-installable meters that are not connected to any vehicle system,
except for battery recharging. The operation of the system is shown in Figure 4.7,
whereby an in-vehicle sensor produces a trip log, which is forwarded to a proxy to
determine the price. The proxy forwards the data to a service provider or to the
vehicle owner for payment.331
FIGURE 4.7: Skymeter’s Principle Architecture Deployment for Vehicle
Identification and Trip Log
Source: Skymeter Corporation
Many European countries have adopted or are considering adopting road user
charges based on vehicle kilometres travelled on the road. The European
Eurovignette Directive has authorised lorry road-user charging since 1993. Germany
331
Skymeter Corporation, ‘Request to Participate in the Call for Tender Kilometre Price System For
State of the Netherlands, Directorate-General for Mobility of the Ministry of Transport, Public Works
and Water Management Skymeter Corporation’ (Request to Participate in the Call for Tender,
Skymeter Corporation, February 2009) 1–19.
Page 154
134
was the first country in Europe to introduce a lorry road-user charging scheme,
followed by Denmark and the Benelux countries (Belgium, the Netherlands and
Luxembourg) on 1 January 1995. Sweden joined in 1997. The European Directives
were amended in 1999 and again in 2006. The framework conditions allowed tolls to
be levied according to the distance travelled and the type of vehicles and to scale the
user charges according to the duration of the use made of the infrastructure as well as
the vehicle emissions produced. The Directive only authorises the tolls and user
charges to be imposed on vehicles weighing over 12 tonnes, using motorways or
multi-lane roads similar to motorways as well as bridges, tunnels and mountain
passes. However, from 2012 Eurovignette will apply to vehicles of 3.5 tonnes or
more.332
In April 2010, the German ‘Agency for the Environment’ recommended the
comprehensive introduction of VMT-based charging of cars on all roads and not just
lorries on certain roads. In September 2010, the Vice-President of the German
Research Society on roads and transport stated that the traditional tax financing of
roads is no longer appropriate and recommended an urgent shift from fixed tax-based
financing to a user-based financing. The VMT-based charges for heavy goods
vehicles have been implemented in the Czech Republic, France, Poland, Portugal and
Slovakia.333
The Dutch National Traffic Transport Plan was going to replace the existing motor
vehicle tax, vehicle purchase tax for passenger cars and motor cycles and the heavy
motor vehicle tax by a charge per kilometre driven tax on all vehicles.334
Under the
new tax, different vehicle types would have had different base rates, determined by
CO2 emissions or weight. Higher charges would have been levied during rush hour
and for travelling on congested roads. Also, bigger cars emitting more carbon
dioxide would have been assessed at a higher rate, while smaller cars would have
paid less. The proceeds from this new tax were not expected to exceed the combined
cost of the older taxes and were earmarked to go directly to the Infrastructure Fund to
332
Louise Butcher, ‘Roads: Lorry Road User Charging’ (House of Commons Library Note No
SN/BT/588, 6 September 2010) 7. 333
Andreas Kossak Hamburg, ‘Road Pricing Updates 2010 from Germany to Europe’ (Paper
presented at Transport Research Board 90th Annual Conference, Washington, DC, 23–27 January
2011) 7–9. 334
Explanatory Memorandum, Rules for Charging a Pay-By-Use Price for Driving with Motor
Vehicle (Dutch Road Pricing Act).
Page 155
135
support the building of roads and railways.335
Due to a change in the government, the
Dutch National Traffic Transport Plan was not implemented. However the principles
of the abandoned Dutch Plan are discussed as part of the case study in Chapter 5.
It is not only the European countries that are at the forefront of transforming
transportation tax policies. The State of Oregon in the US is in the process of
developing a ‘Road User Fee’.336
Oregon’s Parliament has concerns about the
revenue from its existing fuel taxation, and in July 2001 it appointed a Task Force to
design a new revenue collection strategy for road usage. The mandated mission was
enacted in 2001 in US House Bill 3946 by the Oregon State Legislative Assembly,
the mission being: ‘To develop a revenue collection design, funded through user pay
methods, acceptable and visible to the public, that ensures a flow of revenue
sufficient to annually maintain, preserve and improve Oregon’s state, country and
city highway and road system.’337
The criteria used by the Task Force in designing the new system include: user pays;
local government control of revenue sources; revenue sufficiency to support highway
and road system; transparency; non-governmental burden; enforceability; and public
acceptance. The Task Force recommended a mileage fee accompanied by a
congestion charge. The Task Force recommended the switch from fuel taxation
collection to mileage fee collection using technology. Unlike the Netherlands model,
the Oregon study does not recommend using a centralised collection agency, but
rather fuel pump stations as collecting agents as part of the fuel purchase.338
The
principles of the Oregon Road User Fee are further discussed as part of the case
study in Chapter 5.
In January 2011, another state in the US, Texas, reported the results of an exploratory
study on vehicle mileage fees as a possible funding mechanism for meeting the
state’s long-term transportation needs, and identified challenges and opportunities for
335
Green Car Congress, Dutch Cabinet Approves Mileage Tax; In Effect in 2012 if Approved by
Parliament (14 November 2009) <http://www.greencarcongress.com/2009/11/dutch-cabinet-
approves-mileage-tax-in-effect-in-2012-if-approved-by-parliament.html>. 336
Whitty, above n 305. 337
Ibid 72. 338
Ibid 6.
Page 156
136
implementation of vehicle mileage fees.339
It can be concluded from these studies
that road user fees based upon vehicle mileage are likely to be the way of the future
for the design of demand management programs.
Another demand management program introduced in many countries is congestion
charges. Congestion charges are designed differently based on their goals, which are
mainly to reduce congestion, generate revenue or raise environmental quality and
safety. For example, in Singapore, the UK and the US, the main purpose of
introducing congestion charges is to reduce congestion, whereas in Norway, the
congestion charge was initially designed to generate revenue, but is now focused on
raising environmental quality and safety.340
Singapore was the first country to introduce congestion charging in 1976, whereby
drivers had to purchase a licence to enter a central zone during peak hours. The
system was modified in 1998 with electronic road pricing, and the fee is paid on
entering the zone, rather than representing a daily fee. Some Australian cities also
use the Electronic Tag (ETAG) which is a small device attached to vehicle
windscreens. When the vehicle passes tolling points, the tag transmits a signal to the
tolling equipment, which will acknowledge it and deduct an appropriate amount from
the toll account.
In 2003, the UK government introduced a congestion charge scheme called cordon
pricing in the city of London over a 22 square mile zone representing core shopping,
government, entertainment and business districts. London and Stockholm have
congestion charge schemes based on distance-based user charges.341
In Stockholm, a
congestion charging trial was performed from 3 January to 31 July 2006, the stated
purpose being to implement a tolling system to reduce congestion, increase
accessibility and improve the environment. The trial brought about a radical change
in the public attitude and resulted in a positive outcome at the referendum and
permanent implementation of the system in August 2007. The trial showed that a
single-cordon toll could affect traffic within a large area and not just close to the
339
Richard Baker and Ginger Goodin, ‘Exploratory Study: Vehicle Mileage Fees in Texas’ (Report
No FHWA/TX-11/0-6660-1,Texas Transportation Institute, January 2011) 1–91. 340
Govinda R Timilsina and Hari B Dulal, ‘Urban Road Transportation Externalities: Costs and
Choice of Policy Instruments’ (Research Paper, World Bank Research Observer, 3 June 2010) 8. 341
David A Hensher and Sean M Puckett, ‘Road User Charging: The Global Relevance of Recent
Developments in the United Kingdom’ (2005) 12 Transport Policy 377.
Page 157
137
zone limits. The congestion charge scheme in Stockholm was supplemented by a
public transport service which gave the public fast alternatives for travelling at peak
hours.342
Cordon pricing has also been introduced in Oslo and Trondheim.343
A
cordon-based scheme was implemented in Trondheim in 1991 and changed to a
zonal system in 1998. The scheme was implemented to finance infrastructure and
brought little change in the volume of traffic in the region. The scheme was scrapped
in 2005.344
In order to reduce congestion, the US introduced high vehicle occupancy (HVO)
lanes under the Federal-Aid Highway Program, whereby one lane is reserved for
private vehicles carrying at least two to three passengers.
Another method used to control congestion in Bogota, Columbia, has been road
space rationing, called ‘Pico y Placa’ which means peak and licence plate system.
Under this system, vehicles with their licence plate number ending in certain digits
are prohibited during peak hours.
Mexico introduced a ‘No Driving Day’ policy in November 1989 where driving was
prohibited on one day during the week.
The government of the Republic of Korea has a number of policies in place to reduce
the demand for private vehicle use. Government workers are required to leave their
cars at home on one day out of five.345
Italy has adopted a policy which bans private cars from entering city centres.
Similarly, some Swiss cities such as Zurich and Bern make it difficult for private
motor vehicles to enter city centres.
Another method used to reduce congestion is to control the vehicle population, such
as has been implemented in Singapore and China. The Singapore government
introduced a vehicle quota system in 1990, whereby motor vehicles can only be
purchased by acquiring a Certificate of Entitlement (COE). The COEs are obtained
342
Jonas Eliasson et al, ‘The Stockholm Congestion – Charging Trial 2006: Overview of Effects’
(2009) 43(3) Transportation Research Part A 240. 343
Anthony Ockwell and Phil Bullock, ‘The Role of Road Pricing in the Australian Policy Context’
(Paper presented at Australasian Transport Research Forum 2010, Canberra, Australia, 29 September
– 1 October 2010) 5. 344
Ibid 8. 345
International Energy Agency, above n 248, 67.
Page 158
138
by bidding, and the government controls the number of COEs that are released each
month. The COE has a life span of 10 years, after which it expires and can only be
retained by paying an additional fee.
China has also introduced a system of auctioning licence plates. Shanghai officially
started using auctions to issue licence plates in 1994. In 2011, Beijing commenced a
lottery system to tackle the city’s traffic problem, whereby applicants who qualify
are able to try their luck in a draw to obtain a licence plate.346
Bridge and road toll policies can play an important part in controlling traffic
congestion and can have an indirect effect on fuel consumption.347
The government
of the Republic of Korea has implemented pricing regimes for toll roads, parking lots
and insurance policies that encourage the purchase and use of smaller cars.348
Higher
tolls are being used in some countries to maintain the number of motor vehicles that
travel in a designated lane on the highway. In Atlanta, the Georgia Department of
Transport is constructing a high-occupancy toll lane that will run 16 miles along
Atlanta’s heavily-used highway. The express lane will cost from USD0.10 to
USD1.00 per mile to allow drivers to pay to avoid the traffic.349
Another incentive to encourage reduced driving is pay-as-you-drive insurance. In
California, regulations have been put into place providing for the insurance on motor
vehicles to be based on the vehicle’s actual mileage, or pay-as-you-drive coverage.
Under the regulations, the insurer could verify mileage by odometer readings,
automotive repair records or a technical device used to collect mileage data.350
A discussion paper brought out in 2008–09 in the US by the Brookings Institution,
entitled ‘Pay-As-You-Drive Auto Insurance: A Simple Way to reduce Driving-
Related Harms and Increase Equity’, states that the current lump sum pricing of
motor vehicle insurance is inefficient and inequitable. The paper compares the all-
346
China.org.cn, ‘210,000 Apply for Vehicle License Plates in Beijing’ (2 January 2011) CCTV News
<http://www.china.org.cn/video/2011-01/12/content_21720642.htm>. 347
Bradbrook, above n 238, 10. 348
International Energy Agency, above n 248, 67. 349
Mike Billips 'Congestion Pricing in Atlanta' TIME Magazine (online), 23 January 2011
<http://www.time.com/time/specials/packages/article/0,28804,2026474_2026675_2032830,00.html>. 350
California Department of Insurance, ‘Insurance Commissioner Poizner Sets Framework For
Environmentally-Friendly Automobile Insurance, Increased Options For Consumers’ (Press Release,
27 August 2008) <http://www.insurance.ca.gov/0400-news/0100-press-releases/0070-
2008/release089-08.cfm>.
Page 159
139
you-can-drive insurance to all-you-can-eat restaurants which encourages a person to
eat more. The paper states that pay-as-you-drive insurance provides an incentive to
drive less, but notes that the cost of monitoring the mileage is the biggest hurdle to
widespread implementation of pay-as-you-drive insurance.351
The paper estimated
that driving would decline by eight per cent in the US, benefitting the nation about
USD50 to 60 billion a year by reducing driving-related harm.352
Pay-as-you-drive insurance is being offered by some insurance companies in
Australia, such as Pay-As-You-Drive (Real Insurance).353
A minimum premium is
paid and the insured then purchases a comprehensive cover based on kilometres they
want to drive. If all of the kilometres are used up, the insurance cover reverts to a
Third Party policy. On the other hand, if the kilometres purchased are not used up,
they get transferred into the next year. The premium for the insurance is not based on
kilometres measured by a GPS device, but on customers reporting their odometer
readings and pre-paying for kilometres of travel. At the time of a claim, the odometer
reading is verified to ensure the customers are within their purchased kilometre
range.354
4.5.1 Lessons for Australia
In Australia, apart from toll roads and limited pay-as-you-drive insurance, there is no
control or pricing over the distance driven in motor vehicles, so long as one is
prepared to meet the vehicle acquisition and running costs. In other words, Australia
does not have any demand management programs other than toll roads in some of the
cities and limited pay-as-you-drive insurance.
There is a need for the Australian government to set a policy for a demand
management program that is compatible across the whole of Australia, with a focus
on reducing VKT, thereby reducing the consumption of oil and other associated costs
to society. Australia should learn from the experiences of other countries that are
351
Jason E Bordoff and Pascal J Noel, ‘Pay-As-You-Drive Auto Insurance: A Simple Way to Reduce
Driving-Related Harms and Increase Equity’ (Discussion Paper, Brooking Institution, 2008) 2 and 16. 352
Ibid 2. 353
See <http://www.payasyoudrive.com.au>. 354
See <http://www.payasyoudrive.com.au/howitworks/paydworld.aspx>.
Page 160
140
now using technology in the design of their demand management programs. The
LET discussed in Chapter 6 incorporates demand management as part of the
comprehensive reform of motor vehicle taxes and charges in Australia. The next part
explores the reasons why countries have implemented compulsory inspection and
retiring of motor vehicles.
4.6 COMPULSORY INSPECTION AND RETIRING OF
MOTOR VEHICLES
Many countries have legislation requiring compulsory inspection of vehicles and
retiring of vehicles after a fixed period of time.
In the US, the Clean Air Act (1990)355
requires the metropolitan areas of each State
to implement vehicle emission inspection programs, known as the ‘I/M’ programs, in
order to reduce emissions from on-road motor vehicles.
The Periodic Vehicle Inspection called the Algemene Periodieke Keuring (APK) was
also introduced in Netherlands during the 1980s. The periodic vehicle inspection of
cars is commonly known as the Ministry of Transport test (MOT). EU Directive
77/143 EEC set the framework for the MOT in 1977, and this was amended in
Directive 2009/40/EC, effective from 6 May 2009, requiring annual inspections for
passenger vehicles with more than eight seats excluding the driver’s seat and an
inspection every two years after the first four years after purchase for passenger
vehicles with not more than eight seats excluding the driver’s seat. MOT is focused
on the safety aspects of the motor vehicle and exhaust emissions.356
The Japanese motor vehicle inspection program is called ‘Shaken’ and requires
inspection of passenger vehicles over 250cc in the first three years after purchase and
then every two years to ensure that the vehicles meet the regulations and are safe.
355
Clean Air Act 42 USC §7401 et seq. (1970). The Clean Air Act is a United States federal law
enacted by the United States Congress to control air pollution at a national level. It was passed in 1963
and amended in 1970 and 1990. 356
SWOV Institute for Road Safety Research Netherlands, ‘SWOV Fact Sheet – Periodic Vehicle
Inspection of Cars (MOT)’ (Fact Sheet, SWOV, September 2009).
Page 161
141
Singapore regulations require safety and emission inspections every other year for
vehicles more than three years old and every year for vehicles more than 10 years
old.
New Zealand vehicles with a gross mass of 3500kg and under are required to have a
Warrant of Fitness (WOF) and are inspected annually until the vehicle is six years
old and thereafter every six months.
In most jurisdictions, inspections are limited to safety and environmental issues. The
laws with respect to inspection can be fine-tuned to include fuel efficiency criteria.
Some countries have legislation that requires a compulsory retiring of vehicles after
they reach a certain age, often tied in with a government rebate. For example, the
Japanese were entitled to a JPY250 000 subsidy if they handed in a vehicle more
than 13 years old. Similarly Egypt has a scheme that provides a reduction of up to
EGP25 000 towards the price of a new vehicle if the old vehicle is handed in for
recycling and scrapping.357
The compulsory retiring of vehicles can assist in reducing
the age of the country’s vehicle fleet and thereby improving the fuel efficiency of
vehicles.358
Singapore imposes a road tax surcharge for vehicles over 10 years of age as shown in
Table 4.13.
TABLE 4.13: Singapore: Road Tax Surcharge for Vehicles Over 10 Years
Age of Vehicle Annual Road Tax Surcharge
More than 10 years 10%
More than 11 years 20%
More than 12 years 30%
More than 13 years 40%
More than 14 years 50%
Source: Land Transport Authority, ‘Vehicle Ownership’ ( 4 April 2012) Singapore
Government
<http://www.lta.gov.sg/content/lta/en/motoring/vehicle_ownership/vehicle_tax_struc
ture/private_company_rentaltuitioncars.html>.
357
Bradbrook, above n 238, 7. 358
Ibid.
Page 162
142
The Australian rules on vehicle inspection are different for each state, with vehicle
inspections occurring mainly on registration, if cited for safety faults by police, if
previously written off and re-registered, if transferred from interstate or if re-
registered after a previous registration had expired.
There is a need for the Australian government to set a policy on vehicle retirement or
inspection, so that the vehicle fleet in Australia remains fuel-efficient and safe. Once
again, the policy on vehicle retirement and inspection can be combined with a LET,
as discussed in Chapter 6.
4.7 CONCLUSION
This chapter addressed the third research objective of the thesis which is to examine
tax policies and legislative options used by other countries that promote energy
efficiency of passenger motor vehicles and influence the choice of passenger
transportation. This chapter also provides information that addresses the second
research question: What are realistic tax measures that can be implemented to reform
design, choice and usage of motor vehicles for personal transportation in Australia?
This is further explored in Chapter 6 of this thesis.
It is submitted in this thesis that a multiple-pronged approach is required in Australia
through the use of regulatory and fiscal measures to reduce passenger motor vehicle
oil use, and that these measures should be directed at both the manufacturers and the
consumers. The reason for this is that it is not clear whether the manufacturers are
simply supplying the consumer demand for large and powerful vehicles, or acting as
the catalyst that drives the consumer demand. In reality it may be a mixture of both.
Whether it is the manufacturers or the consumers, the government in Australia has a
vital role to play in enacting legislation and regulations to control the consumption of
oil in passenger motor vehicles. Moreover, the law should impose obligations on all
parties — manufacturers, importers and consumers — in order to reduce the use of
oil in passenger motor vehicles.
Page 163
143
The Henry Tax Review in Australia commented that the current transport taxes in
Australia are unlikely to meet Australia’s future transport challenges. The Report to
the Treasurer stated that the existing structure of fuel tax, annual registration and
other road-related taxes is primarily designed to raise revenue. These taxes more than
cover the direct costs of providing road infrastructure, but are not capable of
providing specific prices that vary according to location or time of use. The Report
also outlined as a principle for road transport taxes that transport-specific taxes
should only be imposed where they improve the way that people, businesses and
governments make decisions.359
The current taxation arrangements in Australia pertaining to passenger motor
vehicles and fuel should be reformed from just being revenue raisers by
incorporating principles that encourage behaviour change leading to a reduction in
the use of oil in passenger motor vehicles. These principles should also be reflected
in the setting of fuel economy standards and consumer awareness programs. The
government of Australia should lead its people by making appropriate policy
decisions and not just seek to raise revenue from its people.
Taking into consideration the regulatory and fiscal measures and the demand
management programs implemented in various countries as discussed in this chapter,
Chapter 6 addresses the fourth research objective stated in Chapter 1, ie the
Australian tax policy reform and other regulatory reforms required to reduce the use
of oil in passenger motor vehicles by utilising the lessons learnt from other countries.
To assist in addressing the tax policy reforms in Australia, a detailed analysis of
innovative tax reform exercises conducted in three jurisdictions, Norway, the
Netherlands and the State of Oregon, is undertaken in Chapter 5.
359
Commonwealth of Australia, above n 293.
Page 164
144
CHAPTER 5: CASE STUDIES
5.1 INTRODUCTION
As stated before, Australia needs to reduce the consumption of oil in passenger
motor vehicles. This thesis explores various options for achieving this in Chapter 6
and proposes a framework for the design of the LET that aims to influence a person
in choosing an appropriate motor vehicle for his or her personal transportation needs,
while taking into consideration the vehicle’s potential environmental impact. A case
study of the motor vehicle taxes proposed or implemented in Norway, the
Netherlands and the State of Oregon in the US was carried out to assist in developing
the criteria for motor vehicle tax reform proposals and designing the LET for
Australia.
These jurisdictions were chosen as they have either enacted unique motor vehicle or
fuel taxation regimes or conducted parliamentary approved studies that involve
innovative ways of taxing their motor vehicles and road user charges. The existence
of motor vehicle tax studies sanctioned and funded by parliaments shows that these
jurisdictions recognise the need to change the current way of taxing motor vehicles
or road user charges, be it to influence consumer choices or just collect revenues.
Although some of the studies, for example in the Netherlands, have been drawn out
over a number of years resulting in the introduction of a bill into parliament, a lack of
political will has resulted in an abandonment of their road user charge policy.
However, lessons can be learnt for Australia from the innovative thinking applied in
the studies conducted in these places, with the aim of bringing about change in motor
vehicle taxation in order to reduce oil consumption and change the perception of
passenger motor vehicles used for personal transportation.
Following this brief introduction, part 5.2 explores the motor vehicle taxation system
in Norway. The studies undertaken in the Netherlands and Oregon are discussed in
parts 5.3 and 5.4, followed by a short conclusion in part 5.5.
Page 165
145
5.2 NORWAY
Norway was chosen as a case study because its government has implemented a
unique motor vehicle taxation system. Norway’s Government has long experience
with environmental tax policy pertaining to the reduction of the use of oil in motor
vehicles. Although Norway is an oil exporter, the Norwegian policy has been to
reduce its own oil consumption. The New York Times reported in 2005 that no other
major oil exporter has attempted to reduce its own fuel consumption with as much
zeal as Norway. The political will in Norway is to keep the oil prices high in order to
reduce consumption, and not succumb to critics like the Norwegian Automobile
Association who have often called for a cut in the price of expensive gasoline. A
radio announcer with the Norwegian Broadcasting Corporation, Torgald Sorli, has
been quoted as saying that ‘those critics are but voices in the wilderness ... We
Norwegians are resigned to expensive gasoline. There is no political will to change
the system.’360
The Norwegian policies and Norway’s strong political commitment
have resulted in the country having one of the lowest car ownership rates in Europe,
with more fuel-efficient Volkswagens and Peugeots on its roads compared with the
big sports utility vehicles.361
Norway has an area of 323 759km2 and in 2009 it had a population of 4 828 726
inhabitants with a passenger car population of 2 244 000 and 64 014 million
kilometres of passenger-km by road. Compared with other European countries,
Norway has the lowest number of passenger cars. Reported statistics reveal that at
the end of 2003, there were 45 million passenger vehicles in Germany, 34.3 million
in Italy, and only 1.89 million in Norway. During the period 1990 to 2003, the rate of
increase of passenger cars, calculated per number of inhabitants, was the lowest in
the Nordic countries, when compared with other European countries. Norway has a
very low proportion of cars that are new, ie one to two years old,362
and its transport
infrastructure (roads, railways and airports) is also low compared with other
European countries. In January 2005, Norway had 92 500 kilometres of public roads,
360
Simon Romero, ‘Oil-Rich Norway is Taxing on Cars’ The New York Times (online), 30 April 2011
http://www.nytimes.com/2005/04/29/business/worldbusiness/29iht-norway.html. 361
Ibid. 362
Frode Brunvoll and Jan Monsrud, ‘Transport and Communication: Transport’ (Report No 2008/03,
Statistics Norway, 12 April 2006) <http://www.ssb.no/transport_en/>.
Page 166
146
74 400 kilometres of private roads and only 200 kilometres of motorways, the least
among the Nordic countries.363
5.2.1 The History of Motor Vehicle Taxes in Norway
The history of Norway’s motor vehicle taxation shows that, as early as 1959, it
introduced a kilometre taxation system on diesel powered cars and trailers weighing
over 2000kg. The tax rates were based on the distance covered and the weight of the
vehicle. The rates increased regressively up to a certain weight and then increased
progressively thereafter. In 1992, the rates ranged from NOK0.17 per kilometre for
passenger vehicles and small delivery vans weighing under 2000kg to NOK1.58 per
kilometre for heavier trucks. The kilometre tax was levied on vehicles of all
nationalities, except Germany, France, Spain and Italy, with whom Norway had a
bilateral treaty. In 1987, the Norwegian Government set up a working group to
consider the discontinuance of the kilometre tax and to examine alternative taxation
systems as the Norwegian transport companies were put at a disadvantage by
Norway having to relinquish its requirement for certain other countries to pay
kilometre tax. On the basis of the recommendations from the working group on the
discontinuance of the kilometre tax, the Norwegian Government proposed to replace
the kilometre tax effective from 1 January 1993 with an additional tax on diesel plus
a weight-graduated annual tax on heavier vehicles, even though the kilometre tax
was preferred by the Green Commission.364
The Norwegian Government commissioned several inquiries on the correct level of
road user taxation. The Green Tax Commission was organised by the Norwegian
Government in 1989 and the Commission examined the principles for imposing road
user taxes. In the final report to the Minister of Finance in 1992, the Commission’s
report argued that environmental taxation should include a kilometre tax based upon
the distance travelled as well as vehicle characteristics, and preferred a kilometre tax
363
Ibid. 364
Cavelle Creightney, ‘Road User Taxation in Selected OECD Countries’ (SSATP Working Paper
No 3, Sub–Saharan Africa Transport Policy Program, World Bank and Economic Commission for
Africa, August 1993) 80.
Page 167
147
and a fuel tax.365
The principles upon which these recommendations were made
included:
- The kilometre tax was felt to be the best instrument for charging several
types of environmental costs since it was based upon the distance travelled
as well as vehicle characteristics;
- Fuel taxes were more appropriate where the environmental problems varied
with fuel consumption;
- Fuel taxes became less appropriate where environmental damage varied
with time and space;
- Fuel taxes became less effective in recovering costs when the discharge per
consumed unit of fuel varied among different types of vehicles;
- Fuel taxes did not provide incentives for choosing more environmentally-
friendly vehicles;
- To provide incentives for environmentally-friendly vehicles, fuel taxes
should be combined with other instruments such as a differentiation of fixed
road use according to vehicle characteristics.366
In spite of the recommendations by the Green Tax Commission that the kilometre tax
was the best instrument for charging environmental costs, Norway abandoned it as
part of the EC harmonisation of commercial vehicle taxes. The kilometre tax in
Norway was an attempt to improve the link between road use and road taxes, to act
as an explicit tariff for roads, and to promote efficiency by presenting users with the
costs of road use.367
5.2.2 The Current Motor Vehicle Taxes in Norway
Norway has implemented two main categories of transport taxes: fuel and vehicle
taxes as summarised in Table 5.1.
365
Ibid 78. 366
Ibid 83. 367
Ibid.
Page 168
148
TABLE 5.1: Summary of Fuel and Vehicle Taxes in Norway
Category of Tax Rate in 2010 Rate in 2011
Fuel Taxes
Road usage tax on petrol, NOK/litre 4.54 4.62
Road usage tax on diesel - fossil 3.56 3.62
Road usage tax on diesel – biodiesel 1.78 1.81
CO2 tax on petrol, NOK/litre 0.86 0.88
Motor Vehicle Taxes
Motor Vehicle Registration Tax Passenger Cars
Weight tax, NOK/kg
Initial 1150kg 35.67 36.31
Next 250kg 77.74 79.14
Next 100kg 155.51 158.31
Remainder 180.85 184.11
Motor effect tax, NOK/kW
Initial 65kW 55.10 0
Next 25kW 481.00 466.00
Next 40kW 1297.33 1320.68
Remainder 2702.77 2751.42
CO2-emissions, NOK per grams/km
Initial 115g/km 0 0
Next 20g/km 725.00 738.00
Next 40g/km 731.00 744.00
Next 70g/km 1704.00 1735.00
Remainder 2735.00 2784.00
Annual tax on motor vehicles, NOK/year
Vehicles with factory installed particle filter 2790.00 2840.00
Diesel vehicles without factory installed filter 3245.00 3305.00
Annual weight-based tax, NOK/year varies varies
Re-registration tax varies varies
Source: Ministry of Finance Norway 2011 Budget368
368
Ministry of Finance, Budget 2011 (12 January 2011) Ministry of Finance
<http://www.statsbudsjettet.no/english> 17–18.
Page 169
149
a. Fuel Taxes
Fuel taxes in Norway are paid per litre of fuel and the rate is the same throughout the
country. A motor vehicle that consumes more fuel due to being driven more or being
energy inefficient attracts more fuel tax. Therefore the fuel taxes in Norway
indirectly reflect the number of kilometres the vehicle has driven and the energy
efficiency of the vehicle in question. Since 1991, Norway has also taxed the CO2
component in the fuel. The fuel taxes on petrol and diesel are intended to price
external costs related to car use. Norway has a policy favouring business activities
that use diesel vehicles, and therefore the tax on diesel is lower than the tax on petrol,
even though the external costs of using diesel have been estimated to be higher than
petrol.369
Figure 5.1 shows the gasoline and diesel prices as at 1 July 2008, indicating
the product price, the CO2 tax, fuel duty tax and sales tax.
FIGURE 5.1: Fuel Prices and Taxes in NOK as at 1 July 2008
Source: Norwegian Automobile Association370
369
Tone Austestad, Ministry of Transport and Communications, ‘Fostering Sustainable Urban Travel
in Norway: New Urban Organization Models, Incentive Based Funding and Car Taxation’ (Paper
presented at ECMT-USDOT Workshop on Fostering Successful Implementation of Sustainable Urban
Travel Policies, Washington DC, 5–7 November 2003) 17. 370
Norwegian Automobile Association, Fuel Taxes (2008) Norwegian Automobile Federation
<http://www.naf.no/en/>.
525 645
82
55
433 340
260 260
0%
10%
20%
30%
40%
50%
60%
70%
80%
90%
100%
Petrol Diesel
Sales Tax
Fuel Duty tax
CO2 Tax
Product Price
Page 170
150
b. Vehicle Taxes
Vehicle taxes in Norway are associated with the purchase or ownership of vehicles
and the tax base is a technical variable related to the vehicle. The vehicle tax depends
less on usage than fuel taxes, and the tax bases are independent of kilometres driven.
The vehicle taxes affect the price of the vehicle and the composition of the vehicle
fleet. Norway imposes four motor vehicle taxes: purchase tax, annual tax, annual
weight-based tax and re-registration tax.371
c. The Purchase Tax
Norway has a unique purchase tax system. The purchase tax was introduced as a pure
fiscal tax, but it now depends progressively on weight, engine volume, engine power
and CO2 emissions. The tax encourages Norwegians to purchase smaller and lighter
motor vehicles with lower the CO2 emissions.372
As demonstrated in Chapter 4, the
purchase tax is quite high; if a Holden VE was purchased in Norway, the registration
tax on purchase would be NOK434 999 which is equivalent to AUD79 078. A break-
down of the tax shows the Norwegian Government’s policy behind it.
The government has focused on each component of the purchase Tax — the unladen
weight, the engine rating, and the CO2 emissions — by setting a progressive rate on
each component. This is demonstrated by using the Holden VE’s specifications,
which are: unladen weight: 1700kg; engine power output: 180Kw; and CO2
emissions: 217g/km. The unladen weight of 1700kg attracts a tax of NOK114 195
which is equivalent to AUD20 762. This is based on the 2011 tax rates as shown in
Table 5.2.
371
Tone Austestad/Ministry of Transport and Communications, above n 369, 16. 372
Ibid.
Page 171
151
TABLE 5.2: Unladen Weight Component of Purchase Registration Tax
Vehicle Weight 2011 Tax Rates in NOK Tax in NOK
First 1150kg 36.31 41 756
Next 250kg 79.14 19 785
Next 100kg 158.31 15 831
Remainder 200kg 184.11 36 822
Total 1700kg 114 194
This demonstrates the policy in Norway that heavier vehicles pay more tax, which
means the government encourages Norwegians to purchase lighter motor vehicles,
thereby also having an impact on oil consumption. The power output of a motor
vehicle’s engine also plays a part in the consumption of oil. Thus the purchase tax is
likely to discourage motor vehicles with an engine rating of more than 65kW. The
engine power output of a Holden VE is 180kW and this would attract a purchase tax
of NOK202 048 which amounts to about AUD36 736 as shown in Table 5.3.
TABLE 5.3: Engine Rating Component of Purchase Tax
Engine Capacity 2011 Tax Rates in NOK Tax in NOK
Initial 65kW 0 0
Next 25kW 466.00 11 650
Next 40kW 1320.68 52 827
Remainder 50kW 2751.42 13 7571
TOTAL 180kW 202 048
The Norwegian policy also hopes to reduce motor vehicle CO2 emissions and for that
reason includes a CO2 emissions factor in the purchase tax. If the CO2 emissions data
is not available, then the cylinder volume is used in calculating the tax, however,
since 1 January 2008 this is no longer done. If motor vehicles do not have the
required documentation for calculating fuel consumption based on CO2 emissions,
then the road authorities calculate the tax. The Holden VE’s CO2 rating is 217g/km,
so based on this figure it would attract a purchase tax of NOK117 390, which
amounts to AUD21 343 as demonstrated in Table 5.4.
Page 172
152
TABLE 5.4: CO2 Rating Component of Purchase Tax
CO2 Rating 2011 Tax Rates in NOK Tax in NOK
Initial 115g/km 0 0
Next 20g/km 738.00 14 760
Next 40g/km 744.00 29 760
Remainder 42g/km 1735.00 72 870
TOTAL 217g/km 117 390
d. Annual Taxes
It is not only the initial purchase of the motor vehicles that attracts taxes; Norway
also imposes the following annual taxes throughout the ownership period of the
motor vehicle: the annual tax; the annual weight-based tax; and the re-registration
tax.
The annual tax was also introduced to raise public revenue. It is levied at four
different rates on vehicles weighing up to 12 US tons (10.8862 tonnes), with the
highest rate applied to passenger vehicles.373
The annual weight-based tax is levied
on vehicles with a total weight of more than 12 US tons (10.8862 tonnes) and
consists of a weight-graded annual tax and an environmental-differentiated annual
tax. The weight grading system is to account for the road wear and tear. It has an
environmental aspect and imposes an additional charge on diesel vehicles depending
on the EU emission standards.374
The re-registration tax is purely fiscal and is intended to cover costs related to re-
registration.
373
Ibid. 374
Ibid.
Page 173
153
e. Norwegian Tolls
In addition to fuel and motor vehicle taxes, Norway also uses tolls as a financial
instrument to fund their main road projects. There are rings in three major cities,
Oslo, Trondheim and Bergen. Due to Norway’s topography, road-building is a very
expensive exercise. Norway has a number of fjord crossings and tunnel projects with
substantial construction costs, and toll financing supplements the government
constrained funding, enabling projects to be implemented earlier than would be the
case if they relied on government funding alone.375
Thus the toll systems in major Norwegian cities have been used as a solution to the
infrastructure crisis that prevailed in the 1980s. Since the 1980s, tolls have emerged
almost everywhere in Norway, in the cities, on inner-urban roads and on trunk roads
serving smaller communities.376
In January 1986, the first toll ring was opened in
Bergen, the second-largest city in Norway. The experience from the Bergen ring
made way for the Oslo ring in 1990 and the Trondheim ring in 1992.377
Norway’s toll system has been successful due to its organisational framework, and
lessons can be drawn from this. The framework involves the local community, local
authorities and private interests, as well as the government through the Ministry of
Transport. Projects commence with local initiative, but the National Public Road
Administration (NPRA) is responsible for the planning, construction, maintenance
and building of roads and toll collection facilities. A two-step political process is
followed in the planning process, ie the principal acceptance of toll financing and the
approval of the financing scheme by the Norwegian parliament.378
Toll financing is
usually a mixture of private and public funding and loan capital, where local
authorities guarantee the loans. A non-profit limited liability company is then
responsible for the toll collections. The Ministry of Transport, Public Works and
Water Management establishes the operating regulations, including the toll charges
and discounts. Usually the local authorities affected by the road construction control
the toll company as owners.
375
James Odeck and Svein Bråthen, ‘Toll Financing in Norway: The Success, the Failures and
Perspectives for the Future’ (2002) 9 Transport Policy 254. 376
Ibid. 377
James Odeck and Svein Bråthen, ‘On Public Attitudes Toward Implementation of Toll Roads –
The Case of Oslo Toll Ring’ (1997) 4(2) Transport Policy 73. 378
Odeck and Bråthen, above n 375, 254.
Page 174
154
Since the toll projects commence with local initiatives and are used to finance the toll
construction costs, public attitudes towards the toll payments are positive. Moreover,
the tollbooths have been removed in certain areas after the roads are paid for. This
strong connection between user payments and perceived benefits increases public
confidence. In most other countries, tolls are used for traffic demand management
purposes and the attitude towards the payment of tolls is negative. It has been argued
that the reason for public resistance against road pricing schemes may be that people
expect to be charged for things they wish to acquire and not the things they want to
avoid, ie congestion.379
Since the Norwegians are used to the toll system, the question that is being debated is
whether the current toll rings in the congested Norwegian cities should be
transformed to resolve environmental problems such as congestion. Congestion
imposes a major social cost on society, and it has been argued that the current tolls
should be transformed into a congestion pricing scheme in order to improve the
environment. Surveys carried out in Norway indicate a latent positive attitude
towards using toll rings for traffic regulation purposes, eg congestion pricing.380
It
has been said that remarkable economic benefits may be gained by converting the
cordon toll systems for road financing into congestion pricing schemes. This can
succeed with sufficient public involvement and the establishment of an
organisational framework.381
5.2.3 Lessons for Australia
Many lessons can be learnt from the case study on Norway’s motor vehicle taxation
system. Norway’s government has recognised that although it currently has sufficient
oil resources to export them, oil resources are not unlimited and therefore it has
shaped its policies influencing environmental choices, especially in the reduction of
motor vehicle oil consumption and CO2 emissions. This recognition should be an
important consideration for the Australian government in reforming its passenger
motor vehicle taxation policies.
379
Ibid 256. 380
Odeck and Bråthen, above n 377, 78. 381
Odeck and Bråthen, above n 375, 260.
Page 175
155
Norway’s government has shown political will in implementing its policies and
fighting off criticism from organisations such as the Norwegian Automobile
Association. Its fuel taxes and the motor vehicle taxes are among the highest in
Europe and the effect of these taxes has been the lowest car ownership rates in
Europe. Such a political will is also required in Australia in order to bring about the
hard reforms highlighted in this thesis.
The Australian government should heed the foresight of the Norwegian government
and its long history of funding studies on the imposition of appropriate road user
charges. Since 1959, the Norwegian government has recognised the need for a user
pays system to cover external marginal costs, namely road maintenance, congestion,
capacity, accident and environment and had introduced the kilometre tax system for
diesel-powered motor vehicles and trailers weighing over 2000kg. This policy
indicates that the government was targeting consumer choice regarding the amount
of road driving they undertake. Fuel taxes in Norway are quite high to deter
unnecessary driving. There is also a small CO2 component and a further NOx
component added in 2012 in Norwegian fuel taxes, in order to educate the public
about the environmental harm caused by excessive fuel use.
Norway’s policy on purchase and ownership of vehicles is directed towards
encouraging the purchase of small, light, compact vehicles as opposed to large-
engined sport utility vehicles. The purchase tax prompts Norwegians to consider the
vehicle weight, engine power and CO2 emissions, as tax rates increase on a sliding
scale corresponding to an increase in each of these factors. Moreover, the purchase
taxes are quite high, influencing Norwegian motorists in their motor vehicle purchase
decisions. These factors have an impact on oil consumption and CO2 emissions, as
Norwegians are encouraged to choose vehicles that consume less oil and emit less
CO2. Norway’s annual weight-based tax also discourages ownership of heavy
vehicles that consume more fuel. The Australian motor vehicle taxation policy needs
to be based on similarly defined principles, rather than just being used for raising
revenue.
Norway’s unique motor vehicle taxes, ie the fuel tax, purchase taxes and annual
ownership taxes are uniform throughout the country and not based on states or
provinces. This removes any complexity in bringing about changes to the system.
Page 176
156
Similarly, Australia’s federal and state taxes relating to passenger motor vehicles
need to be considered together in order for reforms to be effective.
The organisational design of Norway’s toll system is also unique as it commences
with a local initiative and the toll payments are classified as perceived benefits. A
positive public attitude has allowed the Norwegian government to overcome its
topography problem by extensively using tolls to finance the expensive exercise of
building roads. This is an important lesson for Australia as public acceptance is the
key to successful reforms.
The main drawback of the Norwegian system is that although the unique purchase
tax discourages the purchase of heavy and powerful motor vehicles, the same
characteristics are not reflected in the fuel tax. The fuel tax does not directly reflect
the motor vehicle characteristics recognised in the purchase tax, as the fuel price is
the same for all vehicles. There is therefore no incentive for owners of heavy and
powerful motor vehicles to reduce the number of kilometres they drive in those
vehicles; the fuel tax does not impose a penalty for using a heavier, more powerful
vehicle that emits more CO2. If government policy were to focus on preserving the
limited global oil resource by encouraging the purchase and use of small and light
motor vehicles, then the factors that the Norwegian Government has included in the
purchase tax should also be reflected in the other costs throughout the ownership of
the vehicle, ie in the fuel costs, annual registration charges and the costs of vehicle
disposal.
5.3 THE NETHERLANDS
The Netherlands has been chosen as a case study following the Dutch cabinet’s
attempt to introduce new and unique principles for road pricing in the Netherlands
not implemented anywhere else. The principles involved were:
- The motorist pays for using the car instead of owning the car;
- The charges occur for use of the car throughout the Netherlands, even if
driving does not occur on roads;
Page 177
157
- A basic rate per kilometre is set, differentiated according to environmental
characteristics (CO2) in consultation with the stakeholders;
- A rush-hour surcharge applies for busy times and places;
- The system uses satellite technology;
- Fixed motor taxes abolished, ie motor vehicle tax, provincial surcharges and
purchase tax; and
- The revenue from the road pricing goes to the Infrastructure Fund for road
maintenance and construction of new roads and improving public
transport.382
5.3.1 The Situation Prior to the Intended Kilometre Charge
Regime
With the increasing number of motor vehicles on Dutch roads, the Dutch government
has been concerned about mobility and congestion and wished to implement a
national road pricing network where charges would vary by driving distance,
location and environmental factors, such as emissions and vehicle size.383
The
mission of the government was to replace the existing transportation taxes and fees
with a new national road pricing program that covered 134 000 kilometres of roads
and over eight million vehicles, with the resulting revenue to support the economy.
The scheme would help minimise road congestion, address environmental concerns
and result in a more equitable distribution of costs.384
In 2001, the Dutch government initiated the process to convert fixed government
charges on motor vehicles to a payment per kilometre charge. The Dutch Cabinet
notified the Lower House of Parliament of its position on kilometre charges
(Parliament Documents II 27 455, no 6).385
A progress report on the pay per
kilometre charge together with the Kilometre Charge Bill was sent to the Council of
382
Ministerie van Verkeer en Waterstaat, ‘Road Pricing in the Netherlands: Lessons Learned’
(Presentation, 21 April 2010) 7. 383
Petrouschka Werther, ‘Kilometer Pricing in the Netherlands’ (Project Notes, Ministry of Transport,
Public Works and Water Management, 2009). 384
Ibid. 385
Ministry of Transport, Public Works and Water Management, ‘Pay Per Kilometre Progress Report’
(Dutch National Traffic and Transport Plan (Nationaal Verkeers- en Vervoersplan), November 2001).
Page 178
158
State in 2002. Seven years later in November 2009 the Cabinet in the Netherlands
decided to introduce the kilometre charge, with charges of three euro cents per
kilometre in 2012, rising to 6.7 cents in 2018.386
However, the Bill required the
approval of the Dutch Parliament before it could be implemented and this did not
occur.
Prior to 2002, there were three components in the Dutch system for taxing motor
vehicles:
1. A fixed charge on new cars referred to as BPM (45 per cent of net price less
deduction depending on type of fuel);
2. An annual charge for every car owner referred to as MRB (depending on the
weight of vehicle, to be paid each quarter);
3. Fuel tax (the only variable component depending on the use of the vehicle).
Similarly to Norway, Dutch motor vehicle taxes are premised on charging principles.
The existing vehicle taxes in the Netherlands consist of eight charging principles,
aimed at achieving fiscal and non-fiscal objectives. The principles are: weight, fuel
type, emissions, quantity of fuel, fuel consumption, catalogue price, type of vehicle
and province. The proposed new kilometre charge system in the Netherlands was
premised on the use of motor vehicles instead of ownership, and encompassed only
six charging principles, being distances, weight, fuel type, vehicle type, emissions
and province.387
5.3.2 The Abandoned Kilometre Charge System
The Dutch government intended to abolish fixed motor taxes, ie motor vehicle tax,
provincial surcharges and the purchase tax, and replace these taxes with a basic rate
per kilometre of driving. There was room for this rate to be differentiated according
to environmental characteristics (CO2) and a rush hour surcharge for certain roads at
busy times. Thus, two extra charging principles could be added to the new system –
time and place. The payment was intended to capture the cost of driving throughout
386
Ibid. 387
Ibid 3.
Page 179
159
the Netherlands, even if the driving did not occur on the roads in the Netherlands.
The revenue from road pricing was intended to go the Infrastructure Fund to be used
for the maintenance of infrastructure, new road construction and improvements to
public transport. The system was meant to operate using satellite technology, in-
vehicle tolling and GPS to locate vehicles on the road network.388
The Dutch government expected to implement a national road pricing program that
covered 134 000 kilometres of roads and over 8 million vehicles and that would
support the economy, minimise road congestion, address environmental concerns and
result in a more equitable distribution of costs. The new system was meant to be
revenue-neutral by replacing existing transportation taxes and fees, and it was
expected to bring about a reduction of as much as 60 per cent of travel times during
congested periods.389
There were a number of criteria that the kilometre charge had to satisfy, which were:
- The support of the people, organisations and the politicians. This was
intended to be achieved through consultation and collaboration.
- The protection of road user privacy. This could be achieved by ensuring that
only the information necessary for the collection of the kilometre charge
was transmitted.
- The technological design to be reliable, fraud-proof and manageable at
acceptable cost levels.
- The income to central government to remain the same. Thus the kilometre
charge system was intended to be revenue-neutral.
- The replacement of fixed vehicle taxes, the euro vignette390
and proportion
of duties to be the primary objective, and differentiation of charges based on
place and time to be secondary objectives.
- A goal of positive contribution to road safety.
- The development of open standards for the design of the mobimeter,391
whereby various suppliers could produce and market them, thereby
enhancing its technological development.
388
Ministerie van Verkeer en Waterstaat, above n 382, 9. 389
Werther, above n 383, 1. 390
The euro vignette is a charge for driving on motorways for trucks of 12 tonnes and more.
Page 180
160
- The effective and efficient management of the overall traffic infrastructure
network on a permanent basis.
- Goods transport to be included in the system and comply with European
regulations.
- Parliamentary approval by implementing legislation, giving the kilometre
charge system a legal framework.392
The kilometre charge system would operate by making the licence holder of the
vehicle liable for the payment of the kilometre tax, by requiring the licence holder to
periodically declare the number of kilometres driven by the vehicle. To achieve this,
it was intended that a special meter, called the mobimeter, would be fitted to the
vehicle.393
The operation of the kilometre charge system required a new technical system to be
developed for registering the number of kilometres driven. The 2001 Mobimeter
report indicated that the various technical components to develop the kilometre
charge system were already available on the market. The Dutch Cabinet gave
approval for the development of the kilometre charge system that required the
following:
- Policy development to determine rates and specifications for the
development of equipment such as the mobimeter.
- The submission of the declaration by the registered holder, requiring the
measurement of the kilometres driven, the calculation of the amount payable
and transmission to the service provider.
- Development of rules for enforcement and supervision of the system.
- Development of equipment and software to enable the provision of
additional services.
- Supervision of market action, privacy and implementation.
The development of a mobimeter was an essential step in the development of the
kilometre charge system. The specified requirements of the mobimeter were that it
391
The mobimeter was intended to be an onboard vehicle unit fitted in the motor vehicle to record the
mileage driven by the vehicle. 392
Ministry of Transport, Public Works and Water Management, above n 385, 2. 393
Ibid 3.
Page 181
161
should not only collect the data for the kilometre charge, but the data collected must
be stored and transmitted in a tamper-proof manner. The mobimeter should also
calculate the charge to be paid. This would require the seller of the mobimeter to
program into the mobimeter the rates for the locations where the kilometres were to
be driven. Possible solutions included roadside beacons or the use of a global
positioning system (GPS). The mobimeter would have to identify the road section
where the vehicle had travelled and match the applicable rate to that route.
The mobimeter was intended to be secure and protect the privacy of the individual.
The data gathered in the mobimeter was to be stored in a tamper-proof charge card
installed in the mobimeter, similar to a SIM card in a mobile telephone. The system
would operate by not allowing the vehicle to be driven without the mobimeter
registering the trip on the charge card. The information recorded on the charge card
also had to be tamper-proof to prevent fraud. The requirement was for the charge
card to be developed in such a way that information, once recorded, could not be
altered or deleted. To protect the privacy of the driver, it was necessary that the
mobimeter only communicate through secure protocols with parties outside the
vehicle.
From a motorist’s perspective, the only task would have been for the driver to check
that the mobimeter was functioning properly before the commencement of the
journey, and to report a malfunctioning mobimeter to the service provider. The driver
would not be aware of the calculations carried out inside the mobimeter, but would
have been able to see at a glance the kilometre charge incurred for the journey. The
mobimeter would have been required to automatically transmit information to the tax
department periodically, eg once a month or after every 1000 kilometres driven. The
registered holder would have received an overview of the kilometres driven and the
associated kilometre charges. The details about each journey were to be kept securely
in the mobimeter and not revealed to the service provider. This would have enabled
the registered holder of the vehicle to check the assessment against the detailed
information contained within the mobimeter, and if necessary appeal the charges
imposed by the taxation office. Additional services provided to the driver by the
service provider were to be separately invoiced to the registered holder.
Page 182
162
The following issues were taken into consideration in designing the pay per
kilometre system.394
a. Equity and Fairness
The key objective of the new system was to address the insufficient link between the
costs and benefits to road users under the existing taxes based on vehicle purchase.
Direct charges improve equity across users of the road network by charging those
users who create congestion, and motivate investments. Under the new system,
charges were intended to vary by vehicle type, allowing environmental costs to be
recouped directly from polluting users.
b. Privacy
The use of onboard units (OBUs) such as the mobimeter through the GPS system
highlighted concerns about privacy issues. The protection of the driver’s privacy is
an issue of importance throughout Europe. The European Union has issued Directive
95/46/EC for issues relating to the protection of individuals with regard to the
processing of personal data and the free movement of such data. The functional
requirement of the charging system had to comply with this directive.
c. Technology and Operation Cost
The kilometre program initiated an aggressive investigation of system design and
costs that took advantage of extensive industry knowledge throughout Europe. The
Dutch government required that the implementation costs of the kilometre charge
system be lower than EUR3 billion and operating costs to be not more than five per
cent of implementation cost. For the system to be credible, the invoices generated
through the system were required to be at least 99 per cent accurate. The system was
meant to be scalable and flexible to support state-wide implementation of a
394
Werther , above n 383, 1.
Page 183
163
multidimensional tariff structure, with technical trials scheduled to aid in the
development of final system specifications.
d. Public Viability
Successful implementation of the system was premised on public viability with
large-scale consultation with citizens and the private sector so as to extract the best
information upon which to base key policy and design decisions. The Dutch Cabinet
made decisions on how to implement the kilometre charge and the parties that would
be responsible for undertaking the various tasks. The Government identified three
clusters of tasks: Government tasks which belonged in the public domain; tasks to be
subcontracted; and private tasks.395
The Cabinet decided that the kilometre charge was a form of taxation and therefore
the Minister of Finance was required to be responsible for the collection of the tax.
However the development and implementation phase would have been the joint
responsibility of the Minister of Finance and the Minister of Transport, Public Works
and Water Management. These ministers would have been responsible for
supervising market action, privacy and performance of private service providers. The
government would direct the process, but market contribution was considered
essential.396
Tasks that could be subcontracted included the processing of declarations, sending
out bills and carrying out the frontline settlement of customer reactions. These tasks
were intended to be undertaken by service providers who would have been
authorised and made responsible for developing and implementing reliable and safe
communication through the mobimeter, using secure communication channels. The
service providers would have been allowed to also factor in additional services such
as traffic information, route selection, safety and breakdown services, weather
conditions, road works, accidents, entertainment, business services such as dictating
e-mails and instant messages, convenience services such as reserving and paying for
parking or providing any information sought, eg where is the nearest pizza store.
395
Ministry of Transport, Public Works and Water Management, above n 385, 10. 396
Ibid 10–11.
Page 184
164
These services would have acted as attraction points to lure customers, since each
citizen would have been free to use the service provider of his or her choice.397
Private tasks were meant to involve the production, distribution and installation of
certified mobimeters. These mobimeters were required to be developed within an
open standard, which had the potential to become an international standard, similar
to the Global Standard for Mobile Telephony (GSM). Private entrepreneurs would
have developed the mobimeters, tested them and obtained certification.398
The implementation of the kilometre charge would only have been undertaken after
thorough testing and trials. Alternatively, a full rehearsal would have been conducted
using a number of volunteers in order to test the whole system.
A market orientation was conducted to determine the feasibility, risks, willingness to
participate and conditions of participation amongst 30 potential suppliers of one or
more components of the kilometre charge system. The market orientation in the
Netherlands demonstrated a positive response concerning the feasibility of the
kilometre charge system and the provision of additional services. However, the
companies were seeking strong government commitment before investing in any
supplies related to the kilometre charge system. The companies were not willing to
bear the development risk alone.399
The cost of the kilometre charge project was estimated to be EUR5.6 billion, made
up of an estimated EUR3.8 billion for implementing an OBU such as the mobimeter
in each vehicle and EUR1.8 billion for establishing communication between the
OBU and back office.
Conclusions derived from traffic studies in the short and long term indicated that the
outcome of the new kilometre charge system would have been a decrease in the
number of vehicle kilometres driven by seven to ten per cent, resulting in reduced
congestion. This is because heavy road users would have been required to pay more
under the new kilometre charge system. The number of vehicle hours per 24-hour
period was likely to fall between 20 and 25 per cent, leading to a positive effect on
397
Ibid 15. 398
Ibid 12. 399
Ibid 17.
Page 185
165
safety and the quality of the living environment. Accident risk and emissions,
particularly CO2 and NOx, were predicted to fall by ten per cent. There would also
have been a reduction of noise nuisance by 0.5DBA per 24 hour period. However the
size of the vehicle fleet was unlikely to change.400
After nine years of effort in consultation, design and testing of the kilometre system,
it was abandoned. On 11 March 2010, the new government of the Netherlands
declared that the mobility project was controversial and therefore the project should
be abandoned. However, lessons can still be drawn from the Dutch study on the
kilometre charge system. The Ministry of Infrastructure and the Environment pointed
out the elements necessary in order to successfully implement the kilometre charge
project:
- Societal support is the key driver to the success of the project;
- It is imperative to weigh up political ambition versus realistic planning;
- The planning process needs to be thought through, ie whether it should it be
parallel or serial;
- It is necessary to think backwards, ie the last step first – exploitation,
expansion, testing, building and developing;
- It is necessary to incorporate corresponding stakeholders to carry out tasks;
- Define the basic principles for paying for use, revenue neutrality and
refunding the revenues to the infrastructure fund; and
- Focus on the communication strategy with a clear message about why the
system is necessary.401
5.3.3 Lessons for Australia
The first lesson that can be drawn from the Dutch case study is problem recognition.
The problem of the unsustainability of passenger motor vehicles needs to be
recognised, and it is recognition of the problem that will provide the drive to seek
solutions. The seven year Dutch study involved innovative thinking on the part of the
Dutch government and recognised the need to change the current policy pertaining to
400
Ibid 6. 401
Ministerie van Verkeer en Waterstaat, above n 382, 12.
Page 186
166
the taxation of motor vehicles. The government of the Netherlands recognised that
there is a problem with sustaining the current number of motor vehicles on Dutch
roads, and intended to use taxation as a tool to influence the Dutch people in
changing their travel behaviour. The purpose of changing over to the kilometre
charge system was to minimise road congestion and address environmental concerns.
The system was expected to bring about a reduction of 60 per cent in travel time,
which would mean a reduction in fuel consumption and other social costs, including
the use of oil in passenger motor vehicles.
The Dutch policy was premised on the principle that increasing motoring costs per
kilometre mitigates road traffic growth and thereby reduces congestion. Moreover,
the pricing policy was intended to raise additional revenue that could be used to build
additional infrastructure that would further assist in reducing congestion. Similarly,
revenues generated from Australian motor vehicle taxation reform can also be set
aside for much-needed improvements to the public transport infrastructure.
In the Netherlands, the effect of paying more per kilometre was an expected decrease
in both commuter and leisure travel, and over time commuters would seek work and
leisure activities closer to home. The kilometre charge was also expected to lead to
reduced car journeys and an increase in the use of other modes of transport such as
the rail.402
The indirect effect of the Dutch policy would have been upon the consumption of oil,
especially by including vehicle weight in the charging principles. In addition,
improvements in public transport would have led to a reduction in driving, further
reducing the use of oil in motor vehicles.
The proposed Dutch kilometre charge system also had a number of shortcomings. It
required the licence holder of the vehicle to become responsible for the payment of
the kilometre tax by way of an invoice. The licence holder would receive a periodical
bill, similar to a utility bill. This would have brought about a public outcry.
Moreover, unpaid invoices would have given rise to enforcement proceedings,
thereby imposing high costs of administration. In addition, the task of sending out
bills and carrying out the front line settlement were intended to be undertaken by
402
Ministry of Transport, Public Works and Water Management, above n 35, 5.
Page 187
167
service providers, and the service providers would have been reluctant to invest in
such a business without a guarantee of returns. The design of the new LET system in
Australia in Chapter 6 should avoid these shortcomings.
The kilometre charge system was premised on the development of the mobimeter,
and it was left in the hands of the market to develop a business model. This may not
have successfully occurred without government commitment, as entrepreneurs would
have been unwilling to bear the development risks alone. The mobimeter was
expected to operate under open standards similar to the GSM and these standards
were expected to be developed by the market. Setting standards such as the GSM
involves a commitment of time, effort and money into research and development,
and there would be a time lag of several years between research and system
development. There would be disagreements amongst entrepreneurs in the criteria for
the framework of such standards, leading to problems finding a consensus.
The design of the kilometre system in the Netherlands did not have any provisions
for charging foreign vehicles for using Dutch roads, as it would not be possible to
expect foreign vehicles to have a mobimeter installed.
The Dutch study identified three clusters of tasks – government tasks, subcontracted
tasks and private tasks – and that it would cost EUR5.6 billion for the project.
However, the study did not identify how the funding for the full system in operation
would be obtained, including the means of paying for the use of the system, revenue
neutrality and refunding the revenues to the infrastructure fund. Thus the lesson for
Australia is to ensure that appropriate impact studies are conducted as part of the
reform process.
Effective reform requires involvement of all interested parties. The Dutch study did
not mention the involvement of motor vehicle manufacturers who were likely to have
a vested interest in developing accessories for their vehicles, however, it indicated
the involvement of new players in developing information technology, tax collection
and designing the network. The new players from the market would only show a
commitment to be involved if there was a financial incentive to do so.
The abandoned kilometre charge system in the Netherlands only focused on the user
pays principle with regard to driving the vehicle. It had no focus on influencing the
Page 188
168
choice of vehicle in order to reduce oil consumption. and thus had no provisions for
influencing the types of motor vehicles to be driven on Dutch roads. A
comprehensive reform is likely to bring about a better policy outcome than patched-
up reforms. Therefore the lesson for Australia is to examine comprehensively the
motor vehicle taxation regime in order to draw up the principles for reform.
Although the kilometre charge system was not implemented in the Netherlands,
many lessons can be learnt from the study for Australia, including the fact that
without a strong political will, long-term planning in the area of motor vehicle
taxation and road user charges, although necessary, may not be achievable.
5.4 OREGON
The state of Oregon in the United States has played a leading role in igniting a
national debate on the future of transportation funding in the 21st century. There is a
current debate in the United States about the need to supplement or replace the
current fuels tax that funds federal and state roads. The Executive Director of the
American Association of State Highway and Transportation Officials (AASHTO)
testified on behalf of the Departments of Transportation from the 50 American states
at the National Surface Transportation Policy and Revenue Study Commission in
March 2007 that the federal highway program in the United States faces a funding
crisis and a large increase in gasoline tax rates would be required to sustain the
program.403
He also commented that the Oregon study on the mileage-based fee
system could be an alternative means of resolving the funding crisis, and urged
congress to fund additional pilots and studies so that by 2021 enough research has
been conducted on how a Vehicle Miles Travelled user fee can best be configured to
supplement or replace the cents per gallon fuels tax by 2025. He emphasised that it
would be desirable if consensus could be reached between the states and the federal
403
National Surface Transportation Policy Revenue Study Commission, ‘Improving the Performance
of the Surface Transportation System: Revenue Options’ (Testimony of John Horsley, Executive
Director American Association of State Highway and Transportation Officials, 19 March 2007) 2–6.
Page 189
169
government about which system to adopt, so that US motorists will only have to
adjust to one approach at the pump.404
This part examines the alternative approach taken in the Oregon study, so that
lessons can be drawn for Australia in designing the LET. It is divided into seven
parts. Part one identifies the problem Oregon faces with its fuel taxes. To find
solutions to the problem, Oregon’s Legislative Assembly appointed a Road User Fee
Task Force and mandated it with the mission ‘to develop a design for revenue
collection for Oregon’s roads and highways that will replace the current system for
revenue collection.’405
This is discussed in part 5.4.2. Part 5.4.3 explores the Road
User Fee Task Force proceedings with a detailed discussion of the mileage fee
concept. Part 5.4.4 examines the strategy to move the mileage fee concept to the
design framework. The results of Oregon’s Road User Fee pilot program are
discussed in part 5.4.5 followed by critical analysis and pathway to implementation
of the program in part 5.4.6. Finally, part 5.4.7 draws out lessons for Australia.
5.4.1 Identification of the Oregon Problem with Fuel Taxes
The fuel sold in Oregon attracts both federal and state gas taxes; the current rate is
48.4 cents per gallon, being 30 cents for the state tax and 18.4 cents for the federal
tax. The state gas tax rate for Oregon was 24 cents a gallon from 1993 until 2009,
when it was increased by six cents to 30 cents per gallon. The federal gas tax rate
was last raised in 1993 and is not indexed to inflation. The problem Oregon is faced
with is that with no voter support to increase the fuel tax, it is viewed as a declining
revenue source to fund Oregon’s road system.
The report of the National Surface Transportation Infrastructure Financing
Commission established by US Congress states that from 1980 to 2006, the total
number of miles travelled by motor vehicles increased by 97 per cent, whereas the
total number of highway lane miles grew by only 4.4 per cent over the same
404
Ibid 10. 405
House Bill 3946, 2001 (71st Oregon Legislative Assembly) s 2 (2).
Page 190
170
period.406
The Commission’s report states that the federal Highway Trust Fund faces
a near-term insolvency crisis, and the problem will worsen with reduced federal
motor fuel tax revenues.407
The Commission recommended a transition from a fuel
tax-based system to one based more directly on use of the highway system measured
by miles driven.408
The Oregon highway system has also not grown quickly enough to meet the needs of
Oregon’s motoring population. In 1960, Oregonians drove 4.9 billion miles on
18 478 lane miles of the state highway system. Forty years later, in 2000,
Oregonians’ driving has quadrupled to 20.5 billion miles, but the number of lane
miles in the state highway system has increased by only 4 percent, to 19 200 lane
miles.409
Oregon fuel tax revenue is expected to decline further as Oregonians are likely to
have a reduced need for fuel due to a number of reasons: increase in the hybrid
electric vehicle population; increase in price of oil as more expensive oil extraction
technologies are employed; or a shift into the use of alternative fuels.410
It is this
problem, together with the fact that a long lead time is necessary to bring about any
change, that has provided the state of Oregon with the impetus to investigate a new
revenue system for road funding.
In 2001, Oregon commenced a government-backed study into replacing Oregon’s
gas tax with a mileage tax. The final report of Oregon’s Mileage Fee Concept and the
Road User Fee Pilot Program was released by the Oregon Department of Transport
(ODOT) in November 2007. The report states that the current gas tax system in
Oregon has the inherent flaw of not having a direct nexus to road use. Oregon’s
Constitution mandates this nexus to determine the funding allocation for its roads. It
406
National Surface Transportation Infrastructure Financing Commission, ‘Paying Our Way: A New
Framework for Transportation Finance’ (Executive Summary Report, 21 February 2009)
<http://financecommission.dot.gov> 1. 407
Ibid 2. 408
Ibid 12. 409
Oregon Department of Transportation, ‘Road User Fee Task Force Report to the 72nd Oregon
Legislative Assembly On Possible Alternatives to the Current System of Taxing Highway Use
through Motor Vehicle Fuel Taxes’ (Report, March 2003) 13. 410
Ibid 15.
Page 191
171
is anticipated that in 10 to 15 years, the gas tax will have failed its original intended
purpose of being a reliable source of revenue for the state’s road system.411
The advantages and disadvantages of the gas tax as identified by ODOT are stated in
Table 5.5.
TABLE 5.5: Advantages and Disadvantages of the Gas Tax in Oregon
Advantages Disadvantages
Raises substantial revenue, ie 60% of road
revenue in 2007 Not directly connected to the burden the
vehicle places on the highway system
Ease of payment by consumer as part of the
fuel bill Vehicle fuel efficiency improvements result
in reduced tax payments per vehicle mile
travelled
Ease of collection within the commercial
transaction from the distributor
Easy to administer as the tax is collected by
a small number of distributors
Low cost of administration
Minimal evasion potential
Protects privacy as consumer is not revealed
Minimal burden on retail businesses
Source: Oregon’s Mileage Fee Concept and Road User Fee Pilot Program
Although the Oregon mileage fee concept is premised on a funding crisis for their
highway system and not aimed at reducing oil use or emissions, the study is still
important for this thesis in designing the LET principles, as lessons can be drawn
from the manner in which decisions were made, and the work and the time involved
in bringing about a change in Oregon’s fuel tax system.
411
Oregon Department of Transportation, ‘Oregon’s Mileage Fee Concept and Road User Fee Pilot
Program Final Report’ (Final Report, Oregon Department of Transport, November 2007) 4.
Page 192
172
5.4.2 The Mission Statement and Formation of the Road User Fee
Task Force
The Oregon Legislative Assembly enacted a House Bill to create a Task Force to
conduct the mileage fee study. The aim of the Task Force was to develop and design
a revenue collection system for Oregon’s roads and highways, being an alternative to
motor fuel taxes, on the basis that an efficient transport system is critical for
Oregon’s quality of life and the revenues available for highways and local roads are
inadequate to preserve and maintain existing infrastructure, reduce congestion and
improve service. The current gas tax in Oregon is anticipated to become a less
effective mechanism for meeting its long-term revenue needs as cars become more
fuel efficient and alternative sources of fuel are identified, and there is no direct
relationship between the gas tax and the use of roads and highways.412
The Task Force in Oregon had the approval of its government. It comprised 12
members who were appointed for a term of four years as follows: two members
appointed from the House of Representatives and appointed by the Speaker of the
House of Representatives; another two members from the Senate, appointed by the
President of the Senate; four members appointed by the Governor, the Speaker and
the President acting jointly from representatives of the telecommunications industry,
the highway user group, the Oregon transportation research community and the
national research and policy-making bodies; one member to be an elected city
official; one member to be an elected county official and two members from the
Oregon Transport Commission.413
The purpose of the Task Force as stated by the Oregon Legislative Assembly was to
study alternatives to the current taxation of highway use through motor vehicle fuel
taxes. The Task Force was commissioned to gather public comments and make
recommendations to the Department of Transportation and the Transport
Commission on the design, evaluation and implementation of pilot programs. It was
required to report to the Legislative Assembly on its work at each regular session.
412
Alternatives to Motor Vehicle Fuel Taxes, 71st Oregon Legislative Assembly – 2001 Regular
Session, House Bill 3946 (March 2003) Appendix A, 1. 413
Ibid 2.
Page 193
173
Any official action by the Task Force required the approval of the majority of the
Task Force members.
5.4.3 Proceedings of the Road User Fee Task Force and the
Mileage Fee Concept – March 2003
The proceedings of the of the Road User Fee Task Force mileage fee concept,
including the criteria to develop the mileage fee concept, the issues in designing the
mileage fee concept and the various options or scenarios in collecting the fee, are
examined in detail in this part, as they highlight the areas that would need to be
examined in developing the LET concept in Chapter 6.
The Road User Fee Task Force held eight meetings from 30 November 2001 to 15
November 2002. During these meetings, the Task Force adopted a public outreach
process and received comments from a number of stakeholders.414
The Task Force
released its first report to the 72nd
Oregon Legislative Assembly in March 2003. The
report described a new vision of the mileage fee concept being a distance-travelled
charge based on the amount a vehicle owner/operator uses the road system, and
recommended the criteria for developing the mileage fee concept including the
critical issues to be resolved in designing the mileage fee. The Task Force
commissioned research consultants from the Oregon State University (OSU) and
Portland State University (PSU) to develop scenarios for collection of the mileage
fee.
The Task Force recommended that the configuration of a mileage fee should be
developed according to the following criteria:
- Accuracy: The configuration of any mileage fee mechanism should facilitate
accurate determination of distance travelled.
- Reliability, Security and Technological Feasibility: The technology used
for a mileage fee must be reliable, secure and technologically feasible.
- Minimal Evasion Potential: The configuration of any mileage fee
mechanism should allow minimal opportunities for evasion or fraud.
414
Oregon Department of Transportation, above n 409, 19.
Page 194
174
- No Charge for Mileage outside Oregon: The mileage fee should be state-
based and not apply to mileage travelled by Oregonians outside the borders of
Oregon.
- Minimal Burden on Private Sector: The capital expenditures and the costs
of collection for a mileage fee should minimally burden the private sector.
- Retrofitting Affordability: Any retrofitting of new technology into older
vehicles should be affordable.
- Seamless Transition: Transition to a mileage fee should be essentially
seamless, with no more than an incidental loss of fuel tax revenue.
- Privacy: Oregonians must be assured that the technology used for any
mileage fee is not used to violate the level of privacy expected by the general
public.
- Cost of Administration: Operating costs for administration of a mileage fee
should not be a substantial percentage of the revenue raised.415
It should be noted that such criteria will need to be examined for the LET in Chapter
6.
The Task Force recognised that several issues had to be resolved in designing a
mileage fee.416
Similar issues will also arise for the LET and will need to be resolved.
- The technology: The technology supporting the mileage fee must perform
the following functions: Calculation of mileage travelled only within Oregon;
data storage; data transmission; data processing and calculation of fee owed.
According to the Task Force, the GPS device and the Audio Video Interleave
(AVI) with odometer tag device, both combined with radio frequency
mileage data transmission, offer the most functional and reliable technology
upon which to base a mileage fee. The data recorded by the technology needs
to be weighed against privacy. The Task Force recommended that only the
summary mileage data should be transmitted and not the data on continuous
vehicle locations, in order to provide a technological safeguard to
Oregonians.
415
Ibid 27. 416
Ibid 28.
Page 195
175
- The expense of retrofitting: The technology choice must be viewed in
relation to its cost. The Task Force recognised that retrofitting GPS devices
into every Oregon passenger vehicle was cost prohibitive over a short time
frame and although the retrofitting of AVI devices is affordable, the AVI
devices have a limited application. The Task Force concluded that retrofitting
of odometer tag devices is more affordable than GPS.
- Phasing: The Task Force recommended that the mileage fee only apply to
new or newly registered vehicles. This would entail a long phase-in period of
about 20 years as a practical necessity. This implies that during the phase-in
period, it would be necessary to retain both the fuel tax and the mileage fee.
However, the owner or operator of a passenger motor vehicle in Oregon
should not be assessed on both a fuel tax and a mileage fee without receiving
a credit for one of them.
- Public versus Private Administration: The Task Force recommended a
private fee collection mechanism as more likely to be cost effective and
administratively efficient.
The aim of the Task Force was to come up with alternatives to gradually replace the
current fuel tax system. Under the current fuel tax system, payments to the revenue
authorities for the tax do not occur at the retail service station level but rather at the
first point of wholesale distribution in the state (ie ‘at the rack’). Retail stations then
reimburse the gasoline distributor, and the motorists in turn reimburse the retail
stations. The current fuel tax system and the new mileage fee system would be
required to operate together during the phase-in period, but without a duplication of
charges. This was taken into consideration in the six mileage fee collection scenarios
that were developed by research consultants from the Oregon State University (OSU)
and Portland State University (PSU), each scenario being differentiated by mode of
fee collection and payment as discussed below.
- Scenario One: Under this scenario, actual mileage data would be uploaded to
a central data and fee collection centre for fee calculation and monthly
billings to owners of passenger vehicles using Oregon’s road system. The
user receives credit for gas tax paid.417
The cost of an electronic odometer in
417
Ibid Appendix O, 1.
Page 196
176
the form of a GPS was estimated to be about USD500 compared with
USD125 if an odometer tag is used.
The main advantages of Scenario One are: technology exists for the accurate
gathering of VMT data; the mileage travelled could be precisely calculated;
independent billing allows complete separation from gas tax collection; and it
is possible to phase in congestion tax or other rate adjustments. The
disadvantages include: a long phase-in period; high start-up, overhead and
data transmission costs; erratic fee collection leading to increased collection
costs and a moderate change in user tax payment habits.418
- Scenario Two: Under this scenario, mileage fee application would occur at
the point of sale at the service station, whereby the service station would
collect the user fee. However, the gas tax would continue to be collected at
the distributor level. Actual mileage data would be uploaded to the service
station’s computer for fee calculation and payment. All operators of vehicles
containing an electronic odometer would be charged a fee based on vehicle
miles travelled since last fuelling. The user would receive a credit for
estimated fuel tax paid. Mileage data collection would occur via electronic
odometer, either GPS or odometer tag technology. The transmission of
summary mileage data (and not vehicle location movements) would occur by
radio frequency to local readers at the service station.
The main advantages of Scenario Two are: technology exists for accurate
gathering of VMT data; the mileage travelled could be precisely calculated;
gas tax would continue to be collected at the distributor level whereas
mileage fee payment would occur at point of retail gasoline sale and is thus
associated with a necessary purchase; it requires no change in user tax
payment habits; and it is possible to phase in congestion tax or other rate
adjustments. The disadvantages include: a long phase-in period; high tax
administration costs; possible public confusion and a high technological
burden on service stations.419
418
Ibid Appendix N, 1. 419
Ibid Appendix N, 2.
Page 197
177
- Scenario Three: Under this scenario, both the mileage fee and gas tax
charges would occur at the point of sale at the service station. Actual mileage
data is uploaded to service stations for fee calculation and payment. Switch at
gas pump (electronic or manual) determines which user pays mileage fee and
which user pays gas tax. Under this scenario, the incidence of gasoline sale
tax is shifted from the distributor level to service station level. Service
stations would charge the gas tax only to those taxpayers not subject to the
mileage fee.420
The main advantages of Scenario Three are: technology exists for accurate
gathering of VMT data; the mileage travelled could be precisely calculated;
mileage fee payment occurs at point of retail gasoline sale and is thus
associated with a necessary purchase; it requires no change in user tax
payment habits; and it is possible to phase in congestion tax or other rate
adjustments. The disadvantages include: a long phase-in period; high tax
administration, collection and enforcement costs as service station collects
both the mileage tax and the gas tax resulting in a high technological burden
on service stations.421
- Scenario Four: This scenario is the same as Scenario Two, except that the
mileage data is estimated as a function of the amount of gasoline purchased
and the EPA fuel efficiency rating for the vehicle. Under this scenario, the
actual recording of mileage is not relevant. The user would receive credit for
the gasoline tax paid. Gasoline stations would forward the fees collected to
the Highway Fund minus an administrative charge. The incidence of gasoline
taxation would remain at distributor level. The service station would apply a
credit for gas tax paid against the mileage fee before forwarding the net
amount to the Highway Fund. If gas tax paid exceeded the assessed mileage
fee for any transaction, there would be no rebate of any portion of the gas tax
paid.422
The advantages under Scenario Four include: low cost of retrofitting vehicles
with technology to gather estimates of VMT data; short phase-in period;
420
Ibid Appendix Q, 1. 421
Ibid Appendix N-3. 422
Ibid Appendix R-1.
Page 198
178
mileage fee payment occurs at point of retail gasoline sale and is thus
associated with a necessary purchase; no change in user tax payment habits;
and it is possible to phase in congestion tax or other rate adjustments. The
disadvantages of Scenario Four include: low VMT accuracy; high tax
administration costs; increased consumer confusion; no integration of
congestion pricing; and significant technological requirements on service
stations.423
- Scenario Five: Under this scenario, mileage data is uploaded to the
Department of Motor Vehicles (DMV) locations for fee calculation and
payment as a condition of registering passenger vehicles. User receives credit
for gas tax paid. DMV would forward fees to Highway Fund.424
The advantages of Scenario Five were identified as follows: technology exists
for accurate gathering of VMT data; the mileage travelled could be precisely
calculated; mileage fee payment occurs at DMV locations as a condition of
registration renewal and not integrated with the gas tax collection, thus
resulting in less consumer confusion; manageable increased enforcement and
collection costs; and it is possible to phase in congestion tax or other rate
adjustments. The disadvantages include: high phase-in period; there might be
a loss of revenue to the state during the phase in period if registration fee
payment schedule is maintained at two to four years. Residents moving into
and out of state might avoid mileage fee payment; it requires a small change
in user tax payment habits and the mileage fee assessed might not be charged
in ‘real time’ (ie monthly) if registration fee payment schedule is maintained
at two to four years and thus less likely to impact user behaviour.425
- Scenario Six: This scenario involves a state-wide spot tolling system through
electronic onboard devices. All passenger vehicles would be equipped with
inexpensive automatic vehicle identification devices. The 7500 mile state
highway system would be equipped with approximately 2000 roadside
reading gantries and an optical recognition system. Drivers of passenger cars
would be required to display smartcards to pay for the toll that reflect
423
Ibid Appendix N-4. 424
Ibid Appendix S-1. 425
Ibid Appendix N-4.
Page 199
179
approximate VMT based on the AVI devices. The charge could vary by time
of the day and the direction of driving to take into consideration congested
areas. The smartcards would either contain prepaid electronic funds or engage
a transaction involving credit or debit card or automatic withdrawal from a
bank account. ODOT would authorise purchase of smartcards through the
mail, at retail outlets or at toll plazas within Oregon’s borders. ODOT would
maintain a central computer that recognises violators through a licence plate
recognition system.426
The advantages of Scenario Six include: the existence of technology for
collecting high levels of revenue in this fashion; the collection can be kept
independent of gas tax or replace gas tax; the phase-in period can be
relatively short following construction of infrastructure for roadside reading
devices; and congestion pricing can be easily implemented without additional
infrastructure expense or phase-in. The disadvantages include: reduced VMT
accuracy; start-up costs can be very high; administration costs could be
moderate; it requires a large change in public tax payment habits; it would not
allow for rate adjustment changes and it would not be possible to include all
the roads within the system.427
The advantages and disadvantages of the six scenarios are summarised in Table 5.6.
TABLE 5.6: Advantages/Disadvantages of Proposed Scenarios
Advantages/Disadvantages Scenarios
1 2 3 4 5 6
Advantages
Technology: Exists for gathering accurate or a good estimate
of VMT data in this fashion √ √ √ √ √ √
VMT Accuracy: Mileage travelled could be precisely
calculated √ √ √ √
Collection: Independent billing allows complete separation
from gas tax collection √ √ √
426
Ibid Appendix T-1. 427
Ibid Appendix N-6.
Page 200
180
Advantages/Disadvantages Scenarios
Collection: Mileage fee payment occurs at point of retail
gasoline sale and thus associated with a necessary purchase √ √ √
Public Acceptance: Requires no change in user tax payment
habits √ √ √
Congestion Pricing: Enabled after full phase-in √ √ √ √ √
Other Rate Adjustments: Allows other overlays (eg fuel
efficiency) √ √ √ √ √
Phase-in Period: Relatively short √ √
Enforcement: Manageable increased enforcement and
collection costs √
Disadvantages
VMT Accuracy: Mileage travelled would be approximated √ √
Phase in Period: Long phase-in period √ √ √ √
Start Up Costs: Likely to be high √ √
Overhead Costs: Likely to be very high √
Data Transmission Costs: Likely to be high, especially if
cellular transmission is the preferred mode √
Collection: Erratic because non-payment is more likely than
under the gas tax √ √
Enforcement: Dramatic increase in costs likely for
enforcement and collection √ √
Public Acceptance: Requires change in user tax payment
habits √ √ √
Private Sector Burden: The technology requirements imposed
on service stations could be significant √ √ √
Tax Administration: High to moderate cost √ √ √ √
Congestion Pricing: Enables only a stand-alone system √ √
Public Behaviour: Less likely to impact on behaviour
Tax Efficiency: Loss of revenue from residents moving in and
out of state √
Other Rate Adjustments: Not possible √
Partial Coverage: Not practical to cover all the roads √
For purposes of pilot testing, the Task Force expressed a vision for the design of a
mileage fee involving collection at either fuel service stations or at an independent
centre as stated in Scenarios One and Two above. Mileage data would be gathered
Page 201
181
through an ‘electronic odometer’ such as a GPS or odometer tag. The mileage data
from the electronic odometer would be uploaded to data readers via radio frequency
transmission and forwarded to a computer for fee billing. The rate applied would be
approximately 1.22 cents per mile driven, which is roughly equivalent to the current
state fuel tax on gasoline.428
The vision would require all new vehicles to be fitted with electronic odometers with
no retrofitting required for existing vehicles. Thus a long phase-in period of about 20
years would be necessary for the state to operate both the fuel tax and the mileage fee
system. Motorists’ privacy would be protected by a design for the data transmission
technology that would eliminate any possibility that their movements could be
transmitted.429
From 2003 to 2005, the Task Force further developed the mileage fee and congestion
pricing concepts of the new revenue system. The transformation from concept to
design framework was reported to the 73rd
Oregon Legislative Assembly in 2005.430
This is discussed in the next part.
5.4.4 Strategy to Move the Mileage Fee Concept to the Design
Framework: Report to the 73rd
Oregon Legislative Assembly
– June 2005.
The Task Force made recommendations on the design framework of the mileage fee
system based upon the already determined policy objectives as discussed in 5.4.3
above.
The Task Force recommended that the mileage fee should be collected by the service
stations since the ODOT requirement specified that the system developed should not
require any additional actions on the part of motorists relative to what occurs
currently. Under the Task Force recommendation, the motorist will purchase fuel as
428
Oregon Department of Transportation, above n 409, 2. 429
Ibid. 430
Oregon Department of Transportation, ‘Oregon’s Mileage Fee Concept and Road User Fee Pilot
Program Report to the 73rd Oregon Legislative Assembly’ (Report On Proposed Alternatives to the
Current System of Taxing Highway Use through Motor Vehicle Fuel Taxes, June 2005) 1–55.
Page 202
182
they currently do. Those motorists with non-equipped vehicles will pay their state
gasoline tax at the pump as they currently do. Those vehicles that are equipped for
the mileage fee will be exposed to an electronic calculation whereby state gasoline
tax is deducted and mileage fee is added to the price of fuel.431
The problem that the Task Force encountered was how the service stations would be
able to account to ODOT the mileage fee collected from the owners of equipped
vehicles, less the gas tax credited to those vehicle owners, without imposing an
administrative obligation on the service station. To solve this problem, the Task
Force developed an administrative system called Vehicle Miles Travelled Collected
at Retail (VMTCAR). Under the VMTCAR system, the gasoline tax reimbursement
from the retail station to the distributor at the point of distribution will remain the
same. The only change will involve the information submitted to ODOT. The service
station would need to provide the following information to ODOT:
- Amount of fuel purchased by customers at the station subject to VMT
charges for a given period;
- The amount of mileage fees paid by mileage fee payers during the same
period.
The service station retailer would not remit to ODOT the total mileage fee paid by
the customer since the service station retailer has already reimbursed the distributor
the gasoline tax and the distributor has already paid the gas tax to ODOT. The only
amount the retailer would remit to ODOT is the difference between the prepaid gas
tax and the mileage fee. This amount would be calculated by ODOT from the
information provided to ODOT by the service station retailer, as stated above. ODOT
would invoice the retailers monthly if the mileage fee collected is greater than the
prepaid gas tax, but if refunds are owing to the retailer, than ODOT would pay the
retailer on a weekly basis.432
The next issue for the Task Force was how the service station would calculate the
mileage fee. ODOT required the system to indicate to the user the amount spent on
431
Ibid 35–8. 432
Ibid.
Page 203
183
fuel and the amount of mileage fee paid. Two possible electronic scenarios for
calculating the fee at fuelling stations were proposed.433
The first was a one-way communication from the vehicle’s device to a host computer
located at the service station through a wireless data reader that would read the stored
mileage. The host computer would also request the prior paid zone mileage
information from a central computer at ODOT and then compute the VMT fee. The
host computer would then direct the service station’s POS system to incorporate the
proper fee into the fuel purchase transaction in lieu of the gas tax, and transfer the
new latest ‘paid for’ zone mileage to the central ODOT computer for updating. The
vehicle’s mileage data is not updated in the one-way communication system.
The second scenario was a two-way communication from and to the vehicle’s device.
Wireless data readers at or near a fuel dispenser would read two mileage readings
from the motor vehicle device, ie the total Oregon VMT and the paid-for Oregon
VMT and pass it onto the host computer at the service station to calculate the
difference between the two mileage readings. This data would be made available at
the service station’s POS and included in the purchase transaction. After completing
the transaction, the vehicle’s total paid for mileage data is updated via the two-way
communication system.
Under the system recommended by the Task Force, the vehicles would need to be
fitted with a device that calculates the mileage. This device had to be examined from
the point of view of the cost and privacy issues. The service station would also need
to be fitted with mileage fee collection technology and a database at the ODOT level
to receive mileage information.
The Task Force recommended that the device to be fitted in the motor vehicle would
use hybrid technology by applying the best attributes of odometer-based technology
and GPS receiver-based technology. The hybrid technology uses the odometer’s
speed sensor to measure miles travelled and a GPS receiver to indicate which zone
the vehicle is travelling in and thus which zone ‘odometer’ should accumulate the
433
Ibid 34–5.
Page 204
184
mileage. This technology would satisfy the ODOT requirement that the mileage data
(VMT) collection within predefined geographic zones be accurate.434
Another requirement from ODOT was that the motor vehicle device must protect the
privacy of Oregon’s citizens and not track drivers to a greater degree than the
existing payment systems required. The Task Force examined the privacy concern
arising from the use of the GPS technology that the Government may use the mileage
fee system to track motorists’ movements. The Task Force noted that the GPS
receiver recommended by ODOT and the Oregon State University (OSU) School of
Engineering has the ability to generate location and time data, but cannot transmit
this information wirelessly or save a large amount of this data. Therefore the Task
Force intended to use the GPS receiver to only answer questions with a simple ‘Yes’
or ‘No’, the questions being, ‘Is the vehicle travelling in Oregon?’ and ‘Is the vehicle
travelling in a smaller jurisdictional area such as the city?’ The Task Force would not
use the device to save the location data or transmit the data to another entity, and the
privacy of Oregon’s citizens would thereby be protected.435
The data collected from the vehicle device had to be accurately transmitted to the
service station. According to the Task Force, the mileage fee system requires the
installation of the mileage fee collection technology at the service station and a
central computer and database at the ODOT level. The Task Force proposed using
short-range radio frequency for transmission of mileage data. As part of its overall
and integrated set of privacy protection, the Task Force wanted to avoid systems with
broad transmission range capabilities, such as cellular, that would enable tracking of
vehicular movements. The OSU researchers reported that the maximum range for
radio frequency technology was 300 feet but expected to refine this technology so
that transmission would be limited to the particular reader aligned with the fuelling
pump, thus preventing data theft.436
As regards the cost of state-wide implementation, according to the Task Force, the
estimated cost of the on-vehicle prototype would be less than USD250. All service
stations would require mileage data readers to be installed at an approximate cost of
USD290 per pump. The cost of the mileage fee collection technology would depend
434
Ibid 32–3. 435
Ibid 30–1. 436
Ibid 33–4.
Page 205
185
upon the nature of the existing POS system and some may only require an
inexpensive software upgrade. The cost of the central computer database would be
less than USD35 million state-wide as estimated by an ODOT economist.437
The Task Force had to address numerous policy issues in setting the rate structure.
According to the Task Force analysis, if the mileage fee is designed as a true user
charge, then a flat rate should apply to all vehicles, since all vehicles require the
same level of service from the road system, eg bridges, signs, pavements, exits,
lighting, etc. However, the Task Force considered that the environment and energy
policy point towards a higher rate to emphasise user responsibility, eg emissions.
Social equity concerns were also required to be taken into consideration, such as the
types of vehicles driven by less affluent people and the impact of the rate structure
upon them. The Task Force considered that a graduated rate structure could be the
answer, whereby a base rate similar to a flat fee could apply to every passenger
vehicle and then a premium fee structure could apply to provide a disincentive for
use of vehicles with particular characteristics, eg fuel, efficiency rating, weight, size
and emissions rating.
The Task Force also considered that the fees could be varied to take into
consideration the zones and times of day with the aim of reducing congestion.
However, the Oregon constitution has an equal protection clause, and therefore peak
period pricing cannot be legally implemented until all vehicles are equipped to come
within the mileage fee system.438
As regards the auditing of the mileage fee system, the Task Force accepted that
effective audit would include observation, inspection and random tests at both the
retail station level and the individual vehicles level.439
These Task Force recommendations of the technical, operational and administrative
features of the mileage fee strategy are summarised in Table 5.7.
437
Ibid 41–2. 438
Ibid 43–4. 439
Ibid 40–1.
Page 206
186
TABLE 5.7: From Concept to Design Framework: System Recommendations
for Incorporating Oregon’s Policy Objectives into a Mileage Fee Strategy
How the Mileage Fee System Works
(Key Technical, Operational and Administrative Features) Related Elements of
Oregon Policy
Framework
How does the new mileage fee system ensure that everyone
pays fairly for Oregon’s roads? What about out-of-state
vehicles?
- All motorists will contribute to Oregon’s roads. A
mileage fee will be collected from motorists operating
new vehicles equipped with manufacturer-installed
instruments that meet prescribed specifications.
Motorists with older vehicles will continue to pay the
fuels tax at the pump.
- Proven technology ensures that only in-state miles will
be subject to mileage fee – the VMT data would be
collected electronically by zone (eg state) through
combined odometer and global positioning system
(GPS) technology.
Minimum Evasion
Potential.
Differentiation of State
Boundaries.
How is a vehicle’s mileage data collected, used and stored?
How does the system balance the need for accuracy and
auditing with privacy concerns?
- No tracking or storage of motorist movements will be
required for system compliance and accuracy. The on-
vehicle device’s GPS receiver generates location data
only for the purpose of identifying zones where
mileage accumulates. VMT data and vehicle
identification would be read from vehicles by readers at
retail fuelling stations via short-range radio frequency
communications. There would be no transmission of
travel location points at any time to anyone. Only
private sector entities would be involved with installing
and maintaining the on-vehicle device, and operating
the service station equipment for receiving the
transmitted VMT data.
System Accurate and
Reliable.
Protection of Privacy.
How will motorists pay the new mileage fee?
- No behaviour change required of motorists. Motorists
would experience no change in payment process.
Ease of Use by Motorists.
What will the new mileage fee mean to fuel retailers or
distributors?
- Negligible change in administrative burden to fuel
retailer. There will be no more employee involvement
in collecting the mileage fee than for the existing gas
tax system, other than issuing one monthly cheque to
ODOT.
Minimal Burden on
Private Sector.
How will the transition be handled?
- Transition will not result in any revenue disruption.
The new system could take close to 20 years for full
Seamless transition must
ensure stable
Page 207
187
How the Mileage Fee System Works
(Key Technical, Operational and Administrative Features) Related Elements of
Oregon Policy
Framework
phase-in.
- The state fuels tax would be maintained for non-
equipped vehicles and for system redundancy.
transportation revenues
for Oregon’s roads. A
reliable back-up system
should be built into the
new system.
Is the system and its related technologies reliable and
affordable?
- Oregon State University (OSU) research specialists
select from proven technology.
- Capital and administrative costs are minimised through
appropriate policy and technology choices. State-wide
capital costs for fuelling station equipment and
computing technology will be less than USD35 million.
Technology that is
feasible, reliable and
secure.
System affordability.
Source: Oregon Department of Transportation Office of Innovative Partnerships and
Alternative Funding (May 2005).440
In April 2006, ODOT launched a 12-month pilot program to test the technological
and administrative feasibility of the mileage fee concept. The program included 285
volunteer vehicles, 299 motorists and two service stations in Portland. The key
findings of the pilot program441
are discussed in the next part.
5.4.5 The Oregon Pilot Program
The Road User Fee Task Force directed ODOT to test the real world feasibility of the
Oregon Mileage Fee Concept. The Federal Highway Administration (FHWA) funded
the bulk of the project with three targeted grants totalling USD2.1 million over six
years and the state of Oregon contributed USD771 000 in matching funds.442
The project partners were: Oregon State University, Portland State University and
Leathers Fuels, who permitted ODOT to replace POS systems and install mileage
reading equipment. ODOT developed a recruitment plan incorporating print and
radio advertising, press releases, and an informational website. ODOT registered 285
440
Ibid 26–8. 441
Oregon Department of Transportation, above n 411, 21–5. 442
Oregon Department of Transportation, above n 430, 49.
Page 208
188
participant vehicles, offered participants USD300 per vehicle for their full
participation in the pilot program, payable as shown in Table 5.8.
TABLE 5.8: Compensation to Participants of Pilot Program
Milestone Compensation USD
Installation Complete 50
Beginning Independent Mileage Read #1 25
Middle Independent Mileage Read #2 25
Final Independent Mileage Read #3 25
De-installation and Final Survey Complete 175
Source: Oregon Department of Transport
The actual pilot program had three phases: the control phase; the test phase and
wrap-up phase.
The first phase was the control phase that was scheduled for the first five months of
commencing the pilot program. The purpose of the control phase was to establish a
baseline of participant driving behaviour. Participants had to purchase fuel from the
two service stations that were equipped with mileage readers at least twice a month,
but continue to pay gas tax. This phase also involved working through difficulties.
Difficulties identified in the first few months included ODOT receiving complaints
from some participants about batteries draining unexpectedly. ODOT responded with
a program-wide bulletin detailing the problem, offering the temporary cautionary
solution of unplugging the on-vehicle device if a vehicle would be unused for several
days, and replacing the spent batteries.
The second phase occurred in months six to ten of the program and was called the
test or experimental phase. The participants were divided into three different groups
during this phase: the control group, the Vehicle Miles Tax (VMT) group and the
Rush Hour group. The control group continued paying the gas tax. The participants
in the VMT group were charged a mileage fee of 1.2 cents per mile less the gas tax
of 24 cents per gallon. Participants in the rush hour group paid a fee of 10 cents per
Page 209
189
mile for driving during the rush hours of 7–9AM and 4–6PM Monday through to
Friday, excluding holidays within the Portland metropolitan area.
The participating motorists did not actually pay the mileage fee or rush hour fee at
the pump during the field test, regardless of group. Instead, ODOT charged the
mileage fee or rush hour fee to an endowment account. Based on the driving history
during the control phase, ODOT established individual endowment accounts to pay
for the fees, so that the endowment account would equal zero at the conclusion of the
field test.
ODOT notified participants of their endowment balances every few weeks, giving
them information that could help them modify their driving habits in order to reduce
the mileage fee charged to their account balance and maximise their reward at the
completion of the pilot program. Any endowment balance remaining at the end was
granted to the participant, thus providing an economic incentive that was intended to
mimic real-life incentives to save money by driving more consciously.
The final stage of the pilot program was the field test wrap up. ODOT held a pizza
party to thank those participants who had completed the field test. Approximately
one-fifth of the final 260 participants attended, giving both ODOT and motorists a
chance to discuss one-on-one the successes and difficulties of the pilot program.
The pilot program results were evaluated using criteria established by ODOT, being
administration, cost, net revenue generation potential, hardware and software,
systemic precision, evasion potential, usefulness for phasing and partial
implementation, adaptability to congestion pricing and public acceptance. Some of
these evaluation criteria have been used in Chapter 7 of this thesis against which the
LET has been evaluated.
As regards administration of the mileage fee, the pilot program successfully
demonstrated that the mileage fee could be implemented alongside and integrated
with the gas tax collection system.443
The pilot program demonstrated that the mileage fee differential collected at the
service stations involves the addition of a fairly inexpensive automated transaction
443
Oregon Department of Transportation, above n 411, 26–31.
Page 210
190
recording using VMTCAR and this automated system would greatly minimise the
administrative burden to the state and the service stations.444
The mileage fee system would satisfy its potential to generate revenue for road
funding as the revenue would not be eroded with an increase in electric and
alternative fuel vehicles or improvement in fuel efficiency of the vehicle fleet.445
As regards the hardware and software evaluation, there was a three per cent or 18
days of malfunction of technology between the two service stations, where the
mileage fee transactions could not be calculated due to a variety of component
failures including: problems with POS system, lost power, not knowing that the cable
or equipment were accidentally disconnected, DSL communications problems and
OSU web-server downtime. There were two main types of on-vehicle devices used in
the field test to collect the mileage data. One device used speed data from the
vehicles’ On-Board Diagnostics-II (OBD-II) port. The second device used a GPS
receiver to compute mileage from vehicle position data derived after sufficient GPS
satellite signal acquisition. Overall accuracy of the on-vehicle devices was on
average within two per cent and this was considered very high. However the on-
vehicle devices retrofitted into participating vehicles created some difficulties during
the pilot program. Sixty-eight participants reported that the on-vehicle devices
drained their car batteries. In the pilot program the participant motorists were
occasionally charged the gas tax instead of the mileage fee. However, it was noted
that although the vehicle-to-pump association was not sufficiently reliable, once the
association was successfully made, the system was completely reliable in
downloading the mileage information from the on-vehicle device.446
The pilot program demonstrated that the mileage fee could be calculated and
collected with sufficient precision. The evasion potential was noted to be minimal.
The system was ideally suited for phasing and partial implementation and was
adaptable to congestion pricing.447
444
Ibid 31–3. 445
Ibid 33. 446
Ibid 35–6. 447
Ibid 33–9.
Page 211
191
An evaluation against public acceptance showed that the public would accept the
implementation of the on-vehicle devices as the cost was embedded in the purchase
price of the vehicle. As regards the convenience of the mileage fee system, the pilot
program results showed that participants believed the mileage fee system to be
convenient and the statistics were as follows:
- 71 per cent of the participants were satisfied with the requirements;
- 25 per cent of respondents had problems with equipment function;
- Six per cent needed reimbursement when the experimental prototype
equipment failed; and
- 91 per cent of the participants agreed to keep the equipment and stay with
the same fee structure if the program was extended to include all service
stations.
It was noted that participants on both the motorists and service station side were
sceptical at first about the mileage fee. Concerns included:
- worry about damage to vehicles from equipment installation;
- lack of knowledge about the mileage fee;
- mistrust of the technology; and
- doubts about its utility and overall acceptance.
Participant concerns about protection of personal information during the course of
the study started low and satisfaction with privacy safeguards remained high
throughout the project. At the study wrap-up discussion it was noted that participants
expressed an understanding of the fairness of the mileage fee system and that the
more one drives, the more one pays. As regards transparency, it was noted that
participants found the receipts from the service stations provided a second check on
mileage recorded, and provided a detailed breakdown (in certain experimental
groups) of charges per zone and time. The on-vehicle mileage screen provided a real
time alert for when a vehicle changed zones. Participants knew ahead of time what
the fee rates were for each of the zones. Seventy per cent of motorists were satisfied
with the accuracy of the equipment, and of those who were not, 14 percent could
Page 212
192
readily compare the accuracy of the pilot technology’s mileage count against their
car’s own odometer to provide an easy check to ensure the system’s accuracy.448
As part of the pilot program, participants agreed to take part in three surveys. The
owner and managers of the service stations agreed to be interviewed regarding their
experiences with the program. Three surveys were conducted at the beginning,
midpoint and end of the field test and they provided ODOT with an insight into the
experience of the participant motorists. The results of these surveys are stated in
Appendix 2 of this thesis.
The next part explores ODOT’s critical analysis of the motorist and station operator
response-behaviour and the pathway to implementation of Oregon’s mileage fee
concept.
5.4.6 ODOT’s Critical Analysis and Pathway to Implementation
ODOT was able to conduct a limited analysis of participant behaviour. Surveys and
interviews provided ODOT with direct information on how volunteers perceived the
technology and their changes in travel behaviour. This information provides useful
insights into behaviour change that could occur from the implementation of a LET.
ODOT’s behavioural research objectives for the pilot program included the
following:
1. Determine whether switching from the gas tax to a mileage fee would cause
motorists to change their driving behaviour; and
2. Determine whether motorists would change their behaviour in response to
differential pricing associated with congestion.449
The answers to both the objectives were found to be in the affirmative. On the first
objective it was noted that the VMT group showed a surprising 12 per cent reduction
in total miles or more than three miles per day. The price per mile for the VMT
group was set to approximate the gas tax, so little change in behaviour was
448
Ibid 39–40. 449
Ibid 41.
Page 213
193
anticipated for this group. Surprisingly, however, 10 of the households in the VMT
group reported that someone in the household started taking the train, took up biking,
or began walking to save money through the program. Comments in the surveys and
in a focus group session indicate that some of the participants in the VMT group did
indeed reduce their driving based on more awareness of the number of short trips
being taken and the number of miles driven.450
On the second objective it was noted that the reduction in total miles for the rush
hour group was even larger than the reduction for the VMT group and, as expected,
this group also reduced the number of peak miles driven. ODOT and the research
team had initial concerns that the lower off-peak charge would encourage rush hour
motorists simply to shift into the ‘shoulders’ of the peak periods. Not only did this
not happen, but notably, the reduction in peak miles was accompanied by further
reductions in off-peak miles. Twelve of the 84 households in the rush hour group
reported that someone in the household began using alternative transportation modes
to save money. Twenty-six also reported that someone in the household changed
either the time or distance of travel to save money. Mostly this was by avoiding
driving in the congestion zone during rush hour. This occurred in 23 households,
although four households reported grouping errands or consolidating trips and one
reported using a carpool.451
The overall conclusion of the surveys as reported by ODOT was that although there
were a few glitches, the system worked well. A major purpose of the survey effort
was to identify problems that could be corrected. Several issues with the on-vehicle
devices were noted by the participants, though most were pilot-specific issues that
would not affect real world program deployment. It was noted that the service station
owners and operators would require substantial improvements in several areas, the
most important being the creation of a POS system. Owing to the practical
limitations only one POS system could be used for the pilot program. It was also
noted that if the system were mandated state-wide, additional costs for new fuel
pumps with the required communication capabilities would have to be addressed in
some cases, but most station owners should already be equipped with the appropriate
fuel pumps. However, costs associated with accommodating the mileage fee system,
450
Ibid 41–9. 451
Ibid 41–9.
Page 214
194
such as re-establishing coordination with internal accounting systems would have to
be addressed.
The key findings of Oregon’s mileage-fee-concept and the road user fee pilot
program were:452
1. The concept is viable by using existing technologies in new ways and with
91 per cent of the participant program agreeing to continue paying the
mileage fee instead of the gas tax if the program were extended state-wide.
2. The payment of the mileage fee as part of the fuel bill at the petrol station is
comparative to the gas tax when it comes to processing and administration
fees.
3. The mileage fee can be phased, in taking into consideration the expense of
retrofitting vehicles with mileage-calculating equipment.
4. The new point-of-sale system can easily be integrated with the current gas
tax collection by the State.
5. The mileage fee concept can support congestion and zone-oriented pricing.
The pilot program revealed a 22 per cent decline in driving during peak
periods.
6. Privacy is protected whereby the only centrally stored data needed to access
mileage fees were vehicle identification, zone mileage and amount of fuel
purchased.
7. The system would place minimal burden on gas businesses as the
administration is easily automated.
8. On-vehicle engineering and penalties would ensure minimal tampering with
the on-vehicle device.
9. The cost of implementation and administration is likely to be low, with
service stations required to install mileage reading equipment, and operating
costs including communications of the mileage information with a central
database in order to calculate mileage fees and modifications to the station’s
point of sale system.
The next step would occur within the next 10 years, and involves additional
development and testing, working with technology firms and motor vehicle
452
Ibid vii.
Page 215
195
manufacturers to refine on-vehicle technology and incorporate home fuelling and
multi-state integration of the system.453
The Final Report also noted the following timeline for broad scale implementation:
- Necessary technology refinements for the on-vehicle devices and fuel pump
collections, as well as revenue systems integration, may take up to five
years to complete development after allocation of sufficient funding;
- Without the lead of the US Department of Transport or the State of
California, industry acceptance, manufacturing integration and service
station installations may take over 10 years;
- Without effective and consistent messaging by officeholders and other
policymakers across the nation, the experience of disasters may be
necessary for the public to accept the change to per-mile charges;
- In the absence of a large, widely-supported effort, broad scale
implementation might be feasible in 10 to 12 years, on a phased basis; and
- If only new vehicles are fitted with the required technology, then complete
implementation would occur over a 30 to 35 year period, from start to
finish.
These timelines indicate the time it could take to reform the motor vehicle taxation
system in Australia with the proposed implementation of the LET. The objective of
the Oregon project was to trigger a national debate on the future of transportation
funding in the 21st century and ODOT succeeded in this task. The Oregon
representatives learnt that other states faced the same problems as Oregon and
demonstrated a genuine interest in the Oregon approach. Oregon’s pilot program has
often been cited by American state departments of transportation as a key case study
to match the states’ infrastructure needs against revenues.454
Alabama researchers
used Oregon’s program as their proxy model for their state road funding and finance
option called the vehicle mileage road user fee (VMRUF). While ultimately
recommending short term fixes, Alabama researchers recommended additional study
453
Ibid. 454
Caroline Lundquist Noblet et al, ‘Sustainable Transportation Funding for Maine’s Future’
(Research Report in response to Transportation Research Problem and Statement, Maine Department
of Transport, 20 January 2006)
<http://mcspolicycenter.umaine.edu/files/pdf/SustainableTransportationFunding01-06.pdf> 15.
Page 216
196
of the per-mile charge and opined that implementation of such a system ‘should be
given great attention by government officials, financial analysts and the public,
because it has the best potential for the future.’455
The Oregon example has also been
considered in other countries such as the Netherlands, Switzerland and the UK.456
5.4.7 Lessons for Australia
Government commitment is the first essential step required to initiate reform. Even
though the Oregon project is supported by their Legislative Assembly, it takes time
to investigate and develop a new system. The Road User Fee Task Force in Oregon
had to investigate 28 different potential revenue sources to design the central feature
of the new system. The Task Force recommended that the new revenue collection
system that would replace the fuel tax should be based on road use, directly
connecting to the burden each user of the road places on the road system. Thus the
amount paid by the road user would be classified as a fee for service, rather than
general taxation unrelated to use. According to the Task Force, the new system also
paves the way to price congestion and manage traffic during peak periods by creating
multiple zones.457
Another lesson for Australia is that developing a new concept would require the
involvement of many organisations, including research institutions. In Oregon, six
mileage fee collection scenarios were developed by research consultants from
Oregon State University and Portland State University.
A lesson that could be learnt for Australia from the Oregon study is that a well-
defined pilot study can assist in ironing out implementation problems and increasing
public acceptance by taking uncertainty out of the proposals. In Oregon, the Road
User Fee Task Force recommended that ODOT should conduct a pilot program to
study two strategies in the Oregon Mileage Fee Concept. These two strategies were:
455
Virginia P Sisiopiku et al, ‘Alternative Financing Sources for Alabama Highways’ (UTCA Report
Number 05114, August 2006) <http://utca.eng.ua.edu/files/2011/08/05114fnl.pdf>. 456
Stephen Potter, Graham Parkhurst and Ben Lane, ‘European Perspectives on a New Fiscal
Framework for Transport’, in Reggiani A, Schintler L (eds), Methods and Models in Transport and
Telecommunications: Cross Atlantic Perspectives (2005) 9. 457
Oregon Department of Transportation , above n 411, v.
Page 217
197
Study the feasibility of replacing the gas tax with a mileage-based fee that is
collected at fuelling stations; and study the feasibility of using this system to collect
congestion charges. ODOT launched a 12-month pilot program in April 2006,
involving 285 volunteer vehicles, 299 motorists and two service stations in Portland,
Oregon.458
An important step in designing a new system is to draw up a set of defined criteria
within which the system should be designed. The Task Force in Oregon identified
eight principles as the criteria for designing the new revenue system to implement the
gas tax. These criteria were:459
- User payment to directly relate to use of road infrastructure and services;
- The revenue to remain within the local government control;
- The ability to collect sufficient revenue required to replace the gas tax;
- The payment under the new system to be transparent to the public;
- There should not be substantial burden on taxpayers or private entities to
collect fees and data;
- The system must be readily enforceable with minimum evasion;
- The new system should be capable of supporting the entire highway and
road system;
- The new system should be acceptable to the public.
The Oregon case study gives an insight into the factors that would need to be taken
into consideration in designing the new LET system in Australia. However, the
Oregon study is only applicable to the state of Oregon and not the whole country.
There does not appear to be coordination between federal and state policies
pertaining to energy and infrastructure.
The situation that initiated the Oregon study was insufficient and declining revenue
from the current gas tax to support Oregon’s road system. The mileage tax proposed
in Oregon certainly addresses this problem. The problem is also premised on the fact
that the Oregon fuel tax revenue is expected to decline further as Oregonians are
likely to have a reduced need for fuel due to an increase in the hybrid electric vehicle
population, increase in the price of oil as more expensive oil extraction technologies
458
Ibid vi. 459
Ibid 2.
Page 218
198
are employed, or a shift into the use of alternative fuels. Although the problem of
reduced oil supply is anticipated, the mileage tax does not directly address this
problem. The mileage tax certainly encourages a reduction in the kilometres driven
and also encourages the use of public transport. However, the kilometre charge has
no bearing on the types of motor vehicles on the roads and the amount of fuel they
consume or the emissions they produce. The motor vehicle fuel consumption
problem in the US is being addressed by the federal government through regulations,
ie CAFE standards, as discussed in Chapter 4. A better result could be achieved by
synchronising federal and state policies. A lack of a truly national energy policy has
become apparent in the recent campaign for the presidential election to be held on 6
November 2012. Media reports in the US indicate that a national energy policy is
difficult to achieve in the US due to the fear of losing votes.460
It is argued in this thesis that an effective approach for Australia is for the Australian
government to first identify the problem. The problem identified for Australia in this
thesis is to reform motor vehicle taxes on passenger motor vehicles in order to reduce
the use of oil. The problem should then be resolved on a national basis and this may
require changing both state and federal laws. A combined Australian reform is
required, impacting on both state and federal laws on purchase of the vehicle, annual
road use, fuelling and the disposal of the vehicle.
5.5 CONCLUSION
Important lessons have been drawn from the case studies in Norway, the Netherlands
and Oregon that will assist in designing the tax framework for the LET in Chapter 6.
The study in Norway points towards political commitment to a system that impacts
on the purchase of motor vehicles based on the weight, engine power and CO2
emissions. The failed project in the Netherlands shows the recognition of a problem
with the existing taxation regime pertaining to road use, but the lack of political will
can hinder the successful implementation of the required changes. The Oregon study
460
Kent Moors, Who is to Blame When the Next Energy Crisis Hits (24 February 2012) Oil & Energy
Investor <http://oilandenergyinvestor.com/2012/02/the-other-elephant-in-the-room/>.
Page 219
199
gives an insight into the principles and protocol required to implement a new road
pricing system. A successful policy change requires long-term planning, clear
objectives and realistic foresight of costs and consequences.
Lessons from these three case studies and the review of global policies in Chapter 4
have provided enough information to examine in the next chapter the choices
available to Australia to resolve the problems identified in Chapters One, Two and
Three of this thesis.
Page 220
200
CHAPTER 6: RECOMMENDATION OF TAX
FRAMEWORK FOR THE LUXURY ENERGY
TAX
6.1 INTRODUCTION
This chapter draws on the lessons from the findings presented in Chapters 2 to 5, and
proposes a luxury energy tax (LET) framework that answers the second research
question: What criteria should the design of a tax framework take into account to
reform the choice and usage of motor vehicles for personal transportation in
Australia in order to reduce oil consumption?
This chapter is divided into five parts. Following this introduction, part 6.2 reiterates
the problem that needs to be resolved, followed by a critical examination of some of
the policy options for Australia in part 6.3, with reference to the materials discussed
in Chapters 2 to 5. Part 6.4 then outlines a five-part proposal for the LET system,
addressing the core environmental tax principles, the framework, the design, the
operation and administration and the implementation of the LET. This is followed by
a short conclusion in part 6.5.
6.2 THE AUSTRALIAN PROBLEM REITERATED
The problem that needs to be resolved commenced over 200 years ago with the
invention of the internal combustion engine in 1807 by Francois Isaac de Rivaz, the
discovery of oil in 1846 by Dr Abraham Gesner,461
the invention of the first petrol
motor vehicle in 1886 by Karl Benz and the invention of the constant moving
assembly line in 1907 by Henry Ford.
461
See discussion in Chapter 2. The discovery of oil can be traced back to 1846 when Dr Abraham
Gesner managed to extract oil and other petroleum products, including kerosene from albertite rocks.
In the 1850s Ignacy Lukasiewich achieved a way to distil seep oil into products. He constructed the
first real oil refinery.
Page 221
201
A rapid increase in motor vehicle ownership as discussed in Chapter 3 of this thesis
has encouraged the improvement and spread of the road system, thereby influencing
urban land use and bringing about ancillary problems such as the use of valuable
land for road building, and the extra costs associated with road lighting and road
policing. The increased road use by motor vehicles also increases accidents,
congestion, pollution and many other indirect costs to the public, the courts and
health systems.
Not only has the abundant supply of oil impacted on the increase in the number of
motor vehicles and influenced the shape and size of our cities, but we have also come
to rely on oil in many products we need in our daily lives. Many governments and
international organisations have recognised this, as discussed in Chapter 2. Even in
Australia, the Chartered Institute of Transport voiced its concerns in 1998, as
follows:
A shrinking supply of cheap oil will characterise the next century and
confront us with one of the greatest transformations of human affairs.
The signs are already there. Risks of chaos, disorder and conflict will
arise unless we face up to this great challenge and make the difficult
decisions essential to the future wellbeing of us all. These decisions
must be based on the care of people and of the environment if we are
to proceed down the path of constructive change.462
It is important to recognise that the era of cheap oil is over and it is the Australian
government’s responsibility to educate the people of Australia that oil is a valuable
commodity and should be used wisely. The best place to start this education process
is where the wasteful use of oil is the greatest and where a policy change can ensure
the next 100 years of sustainable living. The greatest wastage of oil is from motor
vehicles used for personal transportation. Motor vehicles have become larger,
heavier and more powerful as illustrated by the model creep of the Holden family car
described in Chapter 3 of this thesis.
Ignoring the other indirect costs, passenger motor vehicles used for personal
transportation are considered expensive in terms of energy use. Buses and trains are
462
Laird et al, above n 8, 87.
Page 222
202
far more energy efficient than a personal passenger motor vehicle. Newman and
Kenworthy note that a fully loaded electric train is five times more energy efficient
than a car.463
Even the weight allocation per passenger of a personal passenger motor
vehicle can be far greater than for a train, bus or even an aeroplane. Compared with
aeroplanes, trains or buses where the weight allocation per passenger is 300 to
350kg, motor vehicles weighing between 1000 and 2500kg are often used by one or
two passengers at a time on a journey. The Airbus A340-600 aircraft has an
operating empty weight of 130 200kg and can carry between 295 and 440
passengers, resulting in a weight allocation per passenger of between 295 and
441kg.464
Transperth ‘A series’ two-car trains weigh 94 000kg and each car has the
capacity to carry 72 seated and 82 standing passengers. This results in a weight
allocation of 305kg per passenger. A natural gas bus weighs 18 000kg and is licensed
to carry 59 passengers, resulting in an allocation of 305kg per passenger. In order to
obtain an average of 300kg per passenger for a passenger motor vehicle that carries
four passengers, the motor vehicle should not weigh more than 1200kg. However, an
average family car, the Holden VE introduced in July 2008, weighs 1700kg and the
Toyota Land Cruiser 200 GLX weighs 2635kg.465
In order to reduce the use of oil in passenger motor vehicles, it is necessary to shift
the focus from motor vehicles being a symbol of financial success and social status
to being simply a means of transportation. James Sallee in his recent study on the
taxation of fuel economy notes there is a strong relationship between wealth and
ownership of personal vehicles.466
The basic question to address is whether we as a
society can afford to waste our precious oil resource by allowing passenger motor
vehicles weighing 2640kg467
to carry between 100 and 400kg of passenger weight.
The question to also ask is whether Australians who drive energy-guzzling motor
vehicles for personal transportation know the impact of their choice on the depletion
of oil and the future ramifications. An effective way to educate Australians about
choosing suitable motor vehicles for personal transportation is through an
463
Ibid 85. 464
Airbus, A340-600 Global Performer (March 2012)
<http://www.airbus.com/aircraftfamilies/passengeraircraft/a340family/a340-600/>. 465
Toyota, Land Cruiser 200 Specifications <http://www.toyota.com.au/landcruiser-
200/specifications/gxl-petrol?WT.ac=VH_LC200_RangeSpecs_GXL_Specs>. 466
James M Sallee, ‘The Taxation of Fuel Economy’ in Jeffrey R Brown (ed), Tax Policy and the
Economy (National Bureau of Economic Research, 2011) vol 25, 2. 467
Based on the weight of Toyota Land Cruiser. See Toyota, above n 465.
Page 223
203
appropriate motor vehicle taxation policy. The Australian Institute of Engineers
recommended in their report on sustainable transport that taxation and fiscal policy
instruments should encourage sustainable transport.468
It is important for the Australian government to act whilst there is still time to do so.
If the Australian population were suddenly prevented from driving their motor
vehicles due to a lack of oil, as happened during the 1970s oil embargo, how would
the cities cope with the transportation needs of the people? It is submitted in this
thesis that a new policy approach is needed in Australia that would steer the
Australian population towards energy-efficient passenger transportation. This would
require a change of behaviour in favour of the use of smaller and lighter vehicles
accompanied by an increase in the choice and usage of public transport. The ideal
goal is to minimise the oil used in passenger transportation by encouraging walking
and cycling for very short trips. For short, medium and long trips to major centres,
public transport should be encouraged and cars actively discouraged. The new policy
approach proposed in this thesis is the introduction of a LET that would encourage
the choice of a smaller, lighter motor vehicle that use less oil and emits less CO2. The
LET would also encourage a reduction in the use of motor vehicles for personal
transportation. Moreover, the revenues raised from the LET could assist the
government in improving and expanding public transport services.
Before exploring the principles of the LET, the next part critically examines the
potential effects of Australia adopting some policy options that have been proposed
or implemented by other countries.
6.3 CRITICAL EXAMINATION OF SOME POLICY
OPTIONS FOR AUSTRALIA
Taking into consideration why other countries around the world are changing their
transportation tax policies as discussed in Chapter 4, and the case studies undertaken
in Chapter 5 on the proposed motor vehicle tax reforms in Oregon, the failed reform
in the Netherlands and the unique motor vehicle system in Norway, this part
468
Laird et al, above n 8, 88.
Page 224
204
critically explores some policy options for reform in Australia. This may be viewed
as a continuum with maintenance of the status quo at one end and the introduction of
a LET at the other. These options are now considered in more detail.
6.3.1 Maintaining the Status Quo
If the Australian government does nothing to change the current taxes and charges
relating to passenger motor vehicles in Australia and the oil resources dwindle as
predicted in Chapter 2, then there may not be sufficient time to carry out the
necessary reforms in an orderly manner, with the possible result being the same sort
of chaos experienced in the 1970s during the time of the oil embargo.
In Australia, both the Commonwealth and the states impose a variety of taxes
relating to passenger motor vehicles, as discussed under ‘Lessons for Australia’ in
parts 4.4.1 and 4.4.2. The Commonwealth government levies the luxury car tax
(LCT), import tariffs on passenger motor vehicles and fuel excise on petrol and
diesel that are uniform throughout the whole of Australia. The states impose taxes on
vehicle purchase, transfer of ownership and annual motor vehicle registration fees,
and these taxes vary from state to state. It is submitted that the current motor vehicle
taxes in Australia are not based on the environmental tax principles which will be
discussed in part 6.4.1, being the precautionary principle and the polluter-pays
principle. It is also submitted that the existing motor vehicle taxes are not sufficiently
high to impact on motorists’ choice of motor vehicle and have little impact on the
sustainability of oil as they were mainly designed with the specific objective of
raising revenue. The existing motor vehicle taxes have not halted the increase in
demand for larger cars including ATW-SUVs as discussed in part 3.4.
The problem with existing motor vehicle taxes is that they do not discourage the
common attributes that cause excessive oil usage in a passenger motor vehicle, being
the weight of a vehicle, the size of the engine or engine capacity and the engine
power as discussed under ‘The Framework of the LET System’ in part 6.4.2 below.
Although some state taxes are based on these characteristics — for example, New
South Wales and Western Australian annual registration charges are based on
Page 225
205
weight, South Australian charges depend on the number of cylinders and the
Northern Territory and Victorian charges are based on the engine size — these taxes
have a very low impact on a person’s choice of passenger motor vehicle.
Furthermore, these taxes are not imposed at the time of making a vehicle purchase.
In order to influence the purchase of a motor vehicle in a way that has an impact on
the use of oil, a tax based on these characteristics should be imposed at more than
one taxing point, ranging from the time of purchasing the vehicle to the disposal of
the motor vehicle. The Commonwealth government in Australia does impose the
LCT at the time the vehicle is purchased, but the tax is based on the purchase price
and not the characteristics of the motor vehicle that cause excessive oil use or
emissions. Also, the current fuel excise imposed by the Commonwealth government
is not sufficiently high to influence motorists’ choice and usage of passenger motor
vehicles. It is submitted that the fuel excise should be based on the common
attributes that cause excessive oil usage in a motor vehicle, being the vehicle weight,
the size of the engine or engine capacity and the engine power, and be part of the
comprehensive motor vehicle tax reform.
The proposal to reform Australia’s motor vehicle taxes is in line with
recommendations made by the Henry Tax Review, which noted that the existing road
transport taxes in Australia are not appropriate to meet Australia’s future transport
challenges, and that transport taxes should be designed to correct market failures in
the transport sector.469
In this respect, this thesis proposes that priority should be
given to the reduction of oil usage in passenger motor vehicles and this could be best
achieved if there was a harmonious relationship between the Australian energy,
transportation and tax policies in order to promote the choice of passenger vehicles
that consume less fuel or use cleaner fuels, encourage a reduction in the use of
vehicles, and lead to a reduction in congestion. Instead of having a variety of taxes
with no specific objectives other than raising revenue, a comprehensive tax on motor
vehicles should be introduced that targets the attributes of a motor vehicle that cause
excessive oil use.
By carrying out an orderly reform of passenger motor vehicle taxes, the government
of Australia can educate its people to seek motor vehicles that consume less oil. It is
469
Commonwealth of Australia, Australia’s Future Tax System: Final Report (2 May 2010)
<http://taxreview.treasury.gov.au/content/Content.aspx?doc=html/pubs_reports.htm>.
Page 226
206
argued that this can be achieved by reforming the current motor vehicle taxes in
Australia and introducing a more targeted tax such as the LET discussed in parts
6.3.5 and 6.4. The extra revenues collected as a result of this tax reform can be
utilised in building sufficient infrastructure for public transport, as better public
transport is likely to be demanded as the LET policy takes effect.
Employing motor vehicle tax reform to reduce oil use in passenger motor vehicles is
necessary, as the Australian government has predicted that the demand for oil in
motor vehicles used for personal transportation will not change at least until 2035.470
Thus it is submitted in this thesis that maintaining the status quo is not an option that
the Australian government should follow as it may take 15 to 20 years or even longer
to successfully implement all the necessary motor vehicle tax reforms. To change the
perception of the passenger motor vehicle from being a status symbol to a basic
means of transportation will require time, both to educate the community and to
influence manufacturers to make and sell appropriate motor vehicles. It will also take
time to enhance the public transport system infrastructure and capacity so that it can
cope with the proposed changes.
The possibility of simply increasing the current passenger motor vehicle taxes and
charges in Australia without changing the structure of the taxation system is also not
recommended in this thesis, as only a comprehensive reform of motor vehicle taxes
is likely to effect a lasting change. The next part explores the impact of moving one
step away from maintaining the status quo, by replacing the LCT in Australia with a
purchase tax similar to that in Norway.
6.3.2 Replace the LCT in Australia with a Purchase Tax Similar to
that in Norway
If the Australian government maintains the status quo but only replaces its LCT with
a comprehensive purchase tax similar to that in Norway, then the ‘Lessons for
Australia’ discussed in part 5.2.3 would apply. The Norwegian government’s
purchase tax is quite high with progressive rates of tax imposed on three components
470
Department of Resources, Energy and Tourism, ‘Draft Energy White Paper: Strengthening the
Foundations for Australia’s Energy Future’ (Commonwealth of Australia, December 2011) 31.
Page 227
207
of a motor vehicle, ie the weight, engine power and CO2 emissions, as discussed in
part 5.2.2. The purchase tax in Norway does not include the engine capacity, and as
this factor can also cause excessive oil use in a motor vehicle, it should be included
in the purchase tax calculation. Omitting this factor from the purchase tax could
leave room for policy gaming by motor vehicle manufacturers. Therefore it is
proposed that if the LCT were to be replaced by a purchase tax in Australia, then the
purchase tax would have to be high enough to make an impact and would need to
include motor vehicle characteristics such as vehicle weight, engine capacity, engine
power and CO2 emissions. Moreover, the rate should increase on a sliding scale as
each of these factors increases, in order to satisfy the environmental tax polluter-pays
principle discussed in part 6.4.1.
The disadvantage of this action for Australia would be that the purchase tax would
only focus on the purchase of the motor vehicle and not its use. The fuel excise in
Australia is not high enough to discourage the use of motor vehicles for personal
transportation. Increasing fuel cost by simply increasing the fuel excise is inelastic
and therefore may not be very effective in the short run. It is therefore argued in this
thesis that a comprehensive tax reform for passenger motor vehicles through the LET
is a much better option, where common attributes that cause excessive oil usage in a
motor vehicle, being vehicle weight, engine size or engine capacity and engine
power, are included in taxes imposed at the time of purchase, annual registration,
fuel excise and disposal of the vehicle. Although CO2 emissions do not have an
impact on oil use, they are included in the LET to support broader environmental
objectives. The need for a comprehensive motor vehicle tax reform was
demonstrated in 2006 by a Norwegian study on the alteration of the car taxation
system in Norway as part of its government’s plan to include the CO2 component in
the purchase tax. Interviews were carried out as part of this study and the
interviewees pointed out that a single change in the basis for calculating the non-
recurrent fee (purchase tax) is rather a small but necessary step in a long process and
is not regarded as a sufficient measure on its own. The interviewees expressed that
the revision of the motor car taxation system in Norway should be integrated in a
larger package of policy instruments that affect the purchase, ownership and use of
Page 228
208
cars.471
One of the interviewees, the Director of the ‘Car-Importers National
Association’ (Bilimportorenes Landsforening) expected the new car tax system in
Norway to be comprehensive, saying in an interview:
It would be really nice if we now made the system comprehensive.
We are world champions in patching. It is always these improvised
solutions. To make the system comprehensive, we must reconsider all
the elements in the car taxation system and ask ourselves what we can
do if we want more environmentally friendly cars, safer cars, faster
replacement of the car fleet and so on. We have to do something about
these taxes simultaneously.472
Similarly another interviewee, Karstein Farstad from the ‘Norwegian Automobile
Association’ (Norges Automobil-Forbund) said that a full reconsideration of the tax
system was necessary, encompassing a comprehensive evaluation of the purchase,
ownership and the use of cars as part of Norway’s motor vehicle tax reform.473
Although replacing the LCT in Australia with a comprehensive purchase tax would
be a step in the right direction, it is submitted in this thesis that it is better for
Australia to examine all the components of the motor vehicle taxation system and
reconsider not only the purchase, but also the use of the vehicle. This is discussed
under the LET in part 6.4.
The next part explores the option of introducing a kilometre tax in Australia, similar
to the proposed kilometre/mileage tax in the Netherlands and Oregon.
471
Erlend Andre Tveiten Hermansen, Governing a Technological System: The Alteration of the Car
Taxation System in Norway (Masters Thesis, University of Oslo, 2006) 46. 472
Ibid 41. 473
Ibid 42.
Page 229
209
6.3.3 Supplement Motor Vehicle Taxes in Australia with the
Introduction of a Kilometre/Mileage Tax as was Proposed in
the Netherlands and Oregon
If Australia supplements its current motor vehicle taxes with the introduction of a
kilometre tax, it will see similar advantages to those discussed in Chapter 5 in
relation to the Dutch and Oregon studies, in particular under ‘Lessons for Australia’
(parts 5.3.3 and 5.4.7). As discussed in those parts, having to pay more per kilometre
travelled is likely to bring about a decrease in commuter and leisure travel and an
increase in work and leisure activities closer to home. It is also likely to lead to a
reduction in car journeys and an increase in the use of public transport, thereby
reducing congestion and other indirect car-related costs.
The kilometre fee, if implemented should only be imposed on private passenger
vehicles and not on commercial vehicles. Commercial vehicles should be treated
differently from private passenger vehicles as commercial vehicles are often chosen
to satisfy a need rather than being purchased for prestige or a display of wealth.
Secondly, businesses pass on their costs to consumers where possible and thus the
increased cost to a business from a kilometre tax on commercial vehicles is unlikely
to have much impact.
The main disadvantages of a kilometre tax system include: the cost of infrastructure
required to collect the kilometre fee; privacy issues; difficulty in collecting the tax;
no direct relevance to use of oil in the choice of a motor vehicle; and its regressive
nature if the same rate applies to all vehicles, large and small. A kilometre tax system
might be set up as a revenue raiser rather than having its roots in environmental tax
principles such as those discussed later in part 6.4.1.
As regards the infrastructure for collecting the kilometre fee, the Dutch study
proposed the development and use of a mobimeter for collecting and transmitting the
data to the tax department. However, the study emphasised the need to protect
taxpayer privacy in data collection, especially with respect to the details of
commuting routes. The development of the mobimeter was left in the hands of the
market.
Page 230
210
The mileage fee technology recommended by the Oregon Task Force was a GPS
receiver fitted to each motor vehicle and an odometer tag device to calculate and
collect the mileage data and transmit the data to fuel stations using a radio frequency
mileage data transmission device. Under the Oregon concept, the service station
would account for the mileage fee to ODOT using the ‘VMTCAR’ administrative
system. The Oregon study also emphasised the protection of privacy so that only
limited location details relating to the mileage information collected through the GPS
receiver would be transmitted to the government or another entity.474
A disadvantage of introducing a kilometre fee system in Australia is the time it
would take to develop the necessary technologies for calculating and collecting the
kilometre fee. Cost, accuracy and privacy issues would also need to be taken into
account.
Another consideration is that a kilometre fee system has no direct relevance in
promoting the choice of motor vehicle characteristics that lead to reduced oil
consumption, such as vehicle weight, engine capacity and engine power. The
kilometre fee system has also no direct relevance in promoting motor vehicles that
emit less CO2. The kilometre charge is based on the kilometres driven and has no
bearing on the types of passenger motor vehicles on the roads, the amount of fuel
they consume or the emissions they produce. A kilometre fee system that does not
differentiate between the cost per kilometre for large and small cars will not
encourage the purchase of a smaller, lighter and less powerful motor vehicle, and
may even end up penalising small car owners. It could be argued, therefore, that a
kilometre fee system would not be considered an effective means of encouraging the
choice and usage of motor vehicles that consume less oil. A more comprehensive
motor vehicle tax reform is required in Australia, as suggested in part 6.4, with the
introduction of a LET aiming to cause motorists to change their behaviour in terms
of both choosing an appropriate vehicle and the way they drive. The proposed LET
design discussed in part 6.4 will not be as costly to implement as the kilometre fee
system and will not have the same privacy concerns.
The next part explores the option of supplementing motor vehicle taxes in Australia
with mandatory fuel economy/CO2 standards.
474
See discussion in part 5.4 in Chapter 5 of this thesis.
Page 231
211
6.3.4 Supplement Motor Vehicle Taxes in Australia with
Mandatory Fuel Economy/CO2 Standards
The current Australian government as part of its election commitment of 24 July
2010 intends to introduce mandatory CO2 emission standards that will apply to new
light vehicles as from 2015 and that will form part of its Clean Energy Future
Plan.475
This part explores why the Australian government’s intention to implement
CO2 standards for light motor vehicles needs to be supplemented by a comprehensive
motor vehicle tax reform in order to resolve the problems identified in part 6.2
above. Since the amount of CO2 a car emits is directly related to the amount of fuel it
consumes, the problems associated with fuel economy standards such as the CAFE
standards in the US discussed in part 4.2 under ‘Lessons for Australia’ would also
apply to the proposed CO2 standards in Australia.476
The Australian government’s election commitment was to set a target for new light
vehicles at 190g CO2/km by 2015 and 155g CO2/km by 2024. Accordingly, in
August 2011 the government released a discussion paper entitled ‘Light Vehicle CO2
Emission Standards for Australia’ in order to obtain views from interested parties on
the emission targets to be established under the proposed standards and the most
appropriate regulatory framework for implementing the standards.477
The discussion
paper states that light vehicles, which comprise passenger vehicles, SUVs and light
commercial vehicles, are responsible for 64 per cent of Australia’s transport
emissions and between nine and ten per cent of total emissions, and mandatory CO2
standards will therefore contribute to the reduction of CO2 in the light vehicle fleet.
This is particularly the case since the Australian government has decided to
permanently exclude transport fuels for light vehicles from the recently implemented
carbon tax legislation.478
The setting of these standards should bring about
technological benefits for the Australian vehicle fleet, however, many studies have
475
Department of Infrastructure and Transport, above n 30, 1. 476
Under the EU standardised test procedure, a petrol car that emits 130g of CO2 per kilometre would
consume approximately 5.6 litres of petrol per 100 kilometres. See Transport & Environment,
Briefing Car CO2 Standards: FAQ (December 2011) <www.transportenvironment.org/cars-and-co2>. 477
Department of Infrastructure and Transport, above n 30, 9. 478
Ibid 3.
Page 232
212
pointed out that the standards should be complemented with direct tax measures to
make the resulting vehicles more attractive to potential purchasers.479
Steven Plotkin examined the fuel economy and carbon standards for light vehicles in
his discussion paper prepared for the OECD Joint Research Transport Centre in 2007
and he states that there is strong opposition to fuel economy standards from motor
vehicle manufacturers, motor vehicle unions, motor vehicle enthusiasts and the
economics community generally due to the limitations of the standards and their
impact on oil use, public safety, consumer choice, vehicle markets and the
economy.480
Austin and Dinan argue that fuel economy standards are economically inefficient and
have costs to consumers and producers that greatly exceed their benefits. Studies
undertaken by Austin and Dinan in 2005 and Jacobsen in 2010 estimate CAFE
standards cost two to three times more per gallon conserved compared with an
increase in fuel tax.481
Another possible problem with the fuel economy standard is the rebound effect
caused when greater fuel economy lowers the cost of driving, leading to an increase
in the vehicle miles travelled (VMT).482
This causes increased external costs, such as
air pollution, congestion, accidents and other costs associated with increased road
use.483
The problem with the fuel economy/CO2 standards is that they apply directly to
motor vehicle manufacturers or importers and not the consumers. The aim of these
businesses is to maximise profits. The normal ethos of any business is to identify the
need, supply the need and make a profit. If a government regulation incurs a cost on
the business, the business would want to minimise the cost in order to maximise their
profit. Thus a mandatory fuel economy standard arguably creates a tension between
479
Steven E Plotkin, ‘Fuel Economy Policy for Australia: Policies that Complement Fuel Economy
Standards’ (Paper presented at 50 By 50 Global Fuel Economy Initiative, Improving Fuel Economy in
Australia, Melbourne, 2 March 2011) 171. 480
Stephen E Plotkin, ‘Examining Fuel Economy and Carbon Standards for Light Vehicles’ in
International Transport Forum Round Tables, The Cost and Effectiveness of Policies to Reduce
Vehicle Emissions (OECD Publishing, 1st ed, 2009) 5.
481 Soren Anderson et al, ‘Automobile Fuel Economy Standards: Impacts, Efficiency and Alternatives’
(Discussion Paper No RFF DP 10-45, Resources for the Future, October 2010) 13. 482
Fischer, above n 236, 3116. 483
Plotkin, above n 480, 5.
Page 233
213
the government and the motor vehicle industry. This is evident in the USA where
each manufacturer must meet the requirement for each of its fleets, even though it is
more expensive for that manufacturer to do so. Thus manufacturers have to sell
enough small vehicles to ensure they comply with the fleet average requirement, and
in order to do this, some manufacturers end up selling smaller vehicles at little or no
profit.484
As a result, these small motor vehicles may need to be manufactured
cheaply and this may have consequences for the safety and durability of the vehicle.
Manufacturers often use ‘policy gaming’ to overcome the standards set by
government. According to a US study undertaken by James Sallee, motor vehicle
manufacturers often take advantage of the fuel economy standard by making small
changes such as redesigning vehicles and relabelling a passenger car as a light truck
in order to improve the tax treatment by achieving a generous regulatory
classification. Under the fuel economy standards for cars and trucks in the US, large
cars are taxed and small trucks are subsidised. This classification may have
contributed to the rising use of minivans and SUVs as family cars, as they qualify as
trucks.485
This is known as policy gaming whereby the business carries out an action
that improves the tax status or complies with the regulation, but has little or no
impact on improving the overall fuel economy. Another example of policy gaming is
the practice of manufacturers increasing their motor vehicle range strategically to
comply with the standards. For example, the small Fiats are now being sold under the
Ferrari badge. According to the US National Traffic Highway Safety Administration,
motor vehicle manufacturers practice policy gaming with costly technologies such as
cylinder deactivation, turbo-charging, engine downsizing, conversion to dual-clutch
transmissions and start-stop engine technology, and other modifications such as
weight reductions without causing deterioration in power, acceleration or other
attributes.486
Policy gaming also occurs if the fuel economy standards are not uniform, but have an
incremental scale or a notch. Motor vehicle manufacturers boost fuel economy
around an incremental notch by modifying the vehicle in the short term to improve
its fuel economy, for example by light-weighting, where vehicle parts are substituted
484
Fischer, above n 236, 3118. 485
Anderson et al, above n 481, 6–8. 486
Ibid 10.
Page 234
214
to reduce weight; engine recalibration, where the engine is reprogrammed to operate
in a different gear at certain speeds; use of low-friction lubricants; modification of
tyres; or small aerodynamic changes such as the addition of a spoiler, side skirts, air
dam reshaping or the installation of belly pants that smooth air flow by covering
parts underneath the vehicle.487
Fuel economy standards may also not reduce the overall oil use in a country’s motor
vehicle fleet as the motor vehicle fleet may in fact increase, since there is no cap on
the number of motor vehicles on the road. The standards normally require the
manufacturer or the importer to maintain average fuel consumption. Thus increased
sales of larger motor vehicles have to be balanced by a greater increase in sales of
smaller vehicles in order to maintain the manufacturer or importer’s average. Since
there is no cap on the number of motor vehicles on the road, the overall oil
consumption of the motor vehicle fleet may in fact increase.
Other shortcomings of fuel economy/CO2 standards are that they only affect new
cars. On the other hand if fuel taxes are increased, the increased fuel prices affect all
motor vehicles, new and used.488
Moreover, the standards are set when the motor
vehicle is new and its fuel economy is at its peak. The vehicle fuel economy may
deteriorate due to wear and tear of tyres, poor engine maintenance, driving style and
the speed at which the motor vehicle is driven. To overcome these problems, Sallee
states that a Pigouvian tax can be a more efficient policy option.489
Fuel economy standards have not succeeded in stopping the model creep or the
demand for SUVs. Plotkin notes that in the US over the past 20 years, fuel efficiency
technologies have been applied to the vehicle fleet, however the potential to improve
fuel economy has been cancelled by other changes in vehicle attributes desired by
vehicle buyers, especially higher performance, larger size and increased weight due
to the larger vehicle size and increase in luxury and safety equipment. Plotkin states
that the new fuel economy standards may constrain the trend towards larger, heavier
and more powerful vehicles, but vehicle manufacturers (through vehicle advertising
and design decisions) and the government through its ability to influence the public
487
James Sallee and Joel Slemrod, ‘Car Notches: Strategic Automaker Responses to Fuel Economy
Policy’ (EI @ Haas Working Paper No WP-212, Energy Institute at Haas, December 2010) 9. 488
Sallee, above n 466, 13. 489
Ibid 2–3.
Page 235
215
have a strong role to play.490
Anderson et al also confirm this in their discussion
paper on automobile fuel economy standards, stating that CAFE may have improved
engine efficiency during the last two decades; however, motor car manufacturers
have sacrificed potential improvements in fuel economy to make bigger, more
powerful vehicles, probably in response to consumer preferences.491
Taking into consideration the arguments raised above, it is submitted that the
Australian government should focus its policies on consumers and not just
manufacturers and importers of motor vehicles, regulating consumer preferences
for passenger motor vehicle transportation through appropriately designed motor
vehicle taxes such as the LET. The public’s perception of the motor vehicle as a
means of transportation and the energy or oil use associated with it can best be
influenced by imposing appropriate taxes. The fuel economy/CO2 route is an indirect
way of influencing consumers, whereas a direct tax on consumers would influence
both the consumers and the motor vehicle manufacturers. If, as a result of the LET,
consumers choose appropriate motor vehicles based on characteristics that result in
less oil consumption, the motor vehicle manufacturers would supply that demand in
order to make a profit. Manufacturers have the capacity to build such motor vehicles,
however the government has to initiate that drive through the proposed LET system
as discussed below.
6.3.5 Comprehensive Reform of Motor Vehicle Taxes and Charges
in Australia and the Introduction of a LET System
A comprehensive reform of all motor vehicle taxes in Australia is suggested in this
thesis to resolve the problems described in part 6.2 above. The next part of this thesis
proposes a new LET system for passenger motor vehicles in Australia and explains
how it would function, and how the current taxes and charges relating to passenger
motor vehicles can be reformed.
The proposed LET system can be designed with the aim of influencing the purchase
of an appropriate passenger vehicle, its use and its disposal. The proposed LET is
490
Plotkin, above n 480, 30. 491
Anderson et al, above n 481, 8.
Page 236
216
also aimed at influencing the design of future passenger motor vehicles. If consumers
demand appropriate motor vehicles as a result of the introduction of the LET as well
as the new fuel economy/CO2 standards set by the Australian government, motor
vehicle manufacturers will supply that demand, thereby creating a new motor vehicle
industry, which could potentially expand to an international market. The creation of
new jobs for Australians could thus be an indirect impact of the LET.
The proposed LET is aimed at providing revenues to the government that could be
used to improve public transport infrastructure and create an efficient public
transport system that would be suitable for the next 100 years. This would both meet
the expected increased demand for public transport resulting from the introduction of
the LET, and create job opportunities for Australians.
As the LET policy takes effect, ownership and use of motor vehicles for personal
transportation should decline, resulting in a corresponding decline in government
revenues. However, the increased income from the improved public transport system
should then supplement the government’s loss of LET revenue (if the government
has not privatised the public transport system).
The next part explains the details of the proposed LET system.
6.4 THE LET SYSTEM
The proposed LET system is discussed in five parts. Part 6.4.1 explains the core
environmental tax principles upon which the LET is based. Part 6.4.2 explains the
framework for the LET followed in part 6.4.3 by the design of the LET system. Part
6.4.4 explores the operation and administration of the LET design framework
followed in part 6.4.5 by implementation of the LET system.
6.4.1 The Principles of the LET System
The main principle of the proposed LET is to reduce oil consumption by passenger
motor vehicles in Australia and reduce CO2 emissions. The proposed LET is an
Page 237
217
environmental tax based on two underlying principles that are commonly used by
policymakers, which are:
- The precautionary principle; and
- The polluter-pays principle.492
a. The Precautionary Principle
The origin of the precautionary principle traces back to the German concept of
‘Vorsorgeprinzip’, which literally means ‘foresight principle’. The precautionary
principle is now widely used in international environmental law and received strong
endorsement in the Rio Declaration on Environment and Development, adopted in
1992 by the United Nations Conference on Environment and Development in Rio de
Janeiro.493
The precautionary principle has been described as a decision-making approach which
ensures that, even without conclusive scientific proof, a substance or activity that
poses a threat to the environment should be curbed.494
The principle, both in its
conceptual core and its practical implications, is preventative and provides the
philosophical authority to make decisions in the face of uncertainty. It is symbolic of
the need for change in human behaviour towards sustainability, and in this thesis, the
emphasis is on change in behaviour for the sustainability of oil, by using tax
measures to reform the choice and usage of motor vehicles for personal
transportation. The proposed LET is an environmental tax developed by applying the
precautionary principle with the aim of preventing the depletion of oil that is required
492
There are many prestigious books and refereed articles published on the precautionary principle
and the polluter-pays principle, for example, see: Sharon Beder, Environmental Principles and
Policies (University of New South Wales Press, 2006); Nicolas de Sadeleer, Environmental Principles
From Political Slogans to Legal Rules (Oxford University Press, 2005); Richard Moules,
Environmental Judicial Review (Hart Publishing, 2011); J F de Carvalho, Sonia Seger P Mercedes
and Ildo L Sauer, ‘Precautionary Principle, Economic and Energy Systems and Social Equity’ (2010)
38(10) Energy Policy 5399; Peter Dorman, ‘Evolving Knowledge and the Precautionary Principle’
(2005) 53(2) Ecological Economics 169; Katie Steele, ‘The Precautionary Principle: A New Approach
to Public Decision-Making’ (2006) 5(1) Law, Probability and Risk 19. 493
Paul L Stein, ‘Are Decision-Makers Too Cautious With The Precautionary Principle?’ (Paper
presented at the Land and Environment Court of New South Wales Annual Conference, Blue
Mountains, 14–15 October 1999) 3. 494
Ibid 5.
Page 238
218
for transportation and other needs, and reducing Australia’s dependence on foreign
oil.
The precautionary principle does not provide guidance as to how the government
should make its policy choices between environment and economic values, but lack
of scientific certainty should not be used as a reason for postponing measures. The
precautionary principle requires policies to be considered in the broader context of
ecologically sustainable development (ESD). ESD was defined in the 1987
Brundtland Report of the World Commission of Environment and Development as
having to ‘[meet] the needs of the present without compromising the ability of future
generations to meet their own needs.’495
The question as to whether the Australian oil
position requires any action under the precautionary principle can be answered by
examining the Australian government’s statement on the matter in the Draft Energy
White Paper that was released in December 2011. This paper states that:
- Australia is increasingly dependent on foreign oil and therefore needs to halt
the demand for liquid fuel that has steadily risen over the past decade and is
projected to grow at a rate of 1.2 per cent a year over the long term;496
- Australia’s liquid fuel demand will increasingly be met by imports of crude
and refined products and Australian refineries will source around 80 per
cent of crude oil needs from overseas;497
- The transport sector is the largest final consumer of liquid fuels, accounting
for around three-quarters of Australia’s final use;498
and
- Oil will remain the primary energy source for the transport sector to 2035
and changing policies and technologies could result in a demand-induced
peak in global production after 2020. The risk of major supply disruptions
remains an unknown, but ever-present factor.499
495
Gro Harlem Brundtland, Our Common Future (World Commission on Environment and
Development, 1987) <http://www.earthsummit2012.org/about-us/historical-documents/92-our-
common-future> (The Brundtland Report). Also see John Drexhage and Deborah Murphy,
‘Sustainable Development: From Brundtland to Rio 2012’ (Background Paper prepared for
consideration by High Level Panel on Global Sustainability at its first meeting, United Nations
Headquarters, 19 September 2010). 496
Department of Resources, Energy and Tourism, above n 470, 113. 497
Ibid 111. 498
Ibid 113. 499
Ibid 31.
Page 239
219
The precautionary principle therefore implies that there is a responsibility on the part
of the Australian government to intervene and protect the public from harm where
scientific investigation discovers a plausible risk. As discussed in Chapter 2, many
organisation and government reports indicate the status of Australian and global oil
reserves and confirm the need to reduce oil consumption. By applying the
precautionary principle, the Australian government bears the responsibility for
reducing the wastage of oil. The word ‘precaution’ is defined in the Shorter Oxford
English Dictionary as a measure taken beforehand to ward off an evil. The evil that
needs to be warded off is an abrupt halt in the oil supply and the consequences of a
lack of preparation for a life without oil, especially for the personal transportation
needs of the Australian people. Using the precautionary principle, the Australian
government needs to educate and prepare its people for life without cheap, abundant
oil. This thesis proposes that the first step in achieving this purpose is the
introduction of the LET.
b. The Polluter-Pays Principle
The polluter-pays principle (PPP) was first advocated by the OECD Council on
Guiding Principles concerning International Economic Aspects of Environmental
Policies as: ‘The principle to be used for allocating costs of pollution prevention and
control measures to encourage rational use of scarce environmental resources and to
avoid distortions in international trade and investment.’ It then went on to elaborate:
‘This principle means that the polluter should bear the expenses of carrying out the
above-mentioned measures decided by public authorities to ensure that the
environment is in an acceptable state.’500
The PPP is today one of the fundamental
principles of the environmental policy of the European Community and at the
international level.
An environmental tax designed using the PPP allocates the cost to the polluter, and
can be set at a level that covers the cost of the defined pollution. However, a higher
500
Organisation for Economic Co-operation and Development, Recommendation of the Council on
Guiding Principles concerning International Economic Aspects of Environmental Policies, C(72)128
(26 May 1972).
Page 240
220
rate could also be set, not just to cover the cost of the defined pollution, but to
achieve a desired behaviour change.501
It is proposed that the LET should adopt the PPP by imposing taxes on motorists who
purchase or use passenger motor vehicles that are energy guzzlers, in order to
provide an incentive to modify their behaviour. The suggested rates for the LET
should not only cover the cost of the defined pollution, but should be set at a rate that
motivates behaviour change.
Based on the above principles, the next section explores the criteria for shaping the
framework of the LET.
6.4.2 The Framework for the LET System
Similar to Oregon, the configuration of the LET system should be developed
according to set criteria. It is proposed that the framework of the LET system should
reflect the common attributes of a motor vehicle that cause excessive oil usage,
which are: the weight of the vehicle; the size of the engine or engine capacity; and
the engine power. The LET should also reflect the CO2 emissions, as discussed
below.502
a. The Weight of the Vehicle
The weight of a vehicle reflects the energy required in moving that vehicle. This is
because a vehicle’s power at the wheels is required to overcome the force of inertia
to accelerate from zero to the desired speed or from one speed to a higher one,
overcome the forces of air drag and tyre friction, and overcome the force of gravity
when climbing a grade. Plotkin notes that the weight of a motor vehicle affects two
of the three primary sources of energy use in driving and therefore weight reduction
501
See Janet E Milne, ‘Environmental Taxation: Why Theory Matters – Critical Issues in
Environmental Taxation’ in Janet E Milne et al (eds), Critical Issues in Environmental Taxation:
International and Comparative Perspectives (Richmond Law & Tax, 2003) vol 1, 2–3. See also,
Anuschka Bakker, Tax and the Environment: A World of Possibilities (IBFD, 2009) 7–10. 502
These criteria are similar to those implemented in Norway as discussed in the case study in Chapter
5 of this thesis.
Page 241
221
is an excellent way to reduce the energy needed by a vehicle. He states that the
weight of the vehicle affects the inertia required in accelerating the car as well as the
rolling resistance from tyre friction.503
Cheah states that every 100kg of weight
reduction will yield a 0.39L/100 kilometre reduction in fuel consumption for the
current average gasoline car in the US.504
She states that as a general rule of thumb,
for every 10 per cent reduction in vehicle weight, the fuel consumption of vehicles is
reduced by five to seven per cent.505
Plotkin also states in his discussion paper that if
a vehicle designer achieves a weight reduction of 10 per cent and maintains constant
performance by using a slightly smaller engine, fuel economy will be improved by
about six to seven per cent, measured by the standard EPA fuel economy test, which
assumes that 55 per cent of driving is in the city and 45 per cent on the highway.506
In the US, the average weight of passenger motor vehicles has been steadily
increasing at a rate of 1.2 per cent per annum over the past two decades, levelling off
at 1730kg in 2009. Data released by the US Environmental Protection Agency show
that the only occasion in the past four decades where the vehicle weight decreased
significantly was in the late 1970s in response to the oil crisis and the introduction of
the CAFE program.507
The Australian position is very similar to that of the US, if not
worse.
The question to ask is what has caused the average vehicle weight to increase and
how can the vehicle weight be reduced? The US Department of Energy states that the
increase in vehicle weight has been primarily caused by an increase in vehicle size as
well as reinforced structures and added safety equipment.508
The US new light
vehicle characteristics from 1980 to 2009 are shown in Figure 6.1.
503
Plotkin, above n 480, 38. 504
Lynette W Cheah, Cars on a Diet: The Material and Energy Impacts of Passenger Vehicle Weight
Reduction in the US (Thesis, Doctor of Philosophy in Engineering Systems, Massachusetts Institute of
Technology, September 2010) 32. 505
Ibid 13. 506
Plotkin, above n 480, 38. 507
Environmental Protection Agency, ‘Light-Duty Automotive Technology, Carbon Dioxide
Emissions, and Fuel Economy Trends: 1975 through 2009’ (Technical Report, EPA420-R-09-014, US
Environmental Protection Agency, November 2009) 14. 508
Energy Efficiency and Renewable Energy, above n 263.
Page 242
222
FIGURE 6.1: New Light-Weight Vehicle Characteristics 1980–2009
Source: US Department of Energy, Energy Efficiency and Renewable Energy:
Vehicles Technologies Program.
In the Australian context, Chapter 3 discussed how the Holden family car has
increased in weight, engine size, engine power and emissions between 1948 and
2008.509
When the engine size and engine power are increased, the motor vehicle
parts increase in size and strength, thus adding weight to the motor vehicle. On
average, 40 per cent of the vehicle weight is allocated to the body, 24 per cent to the
chassis and 16 per cent to its power train.510
The balance of the weight comes from
added accessories. Kågeson notes that reducing the mass of the frame and the body
makes it possible to reduce the size of the engine.511
The problem of excessive weight has been recognised by governments in many
countries as reflected in their fuel economy standards or their motor vehicle tax
policies. The Japanese and the Chinese fuel economy standards are weight-based,
509
See Table 3.2. 510
Cheah, above n 504, 33–4. 511
Per Kågeson, ‘Reducing CO2 Emissions from New Cars: A Progress Report on the Car Industry’s
Voluntary Agreement and an Assessment of the Need for Policy Instruments’ (European Federation
for Transport and Environment, January 2005) 18.
Page 243
223
discouraging excessive weight. The US Department of Energy’s Vehicle
Technologies Program has established the ambitious goal of reducing the weight of
the vehicle structure and subsystems by 50 per cent by 2015.512 The motor vehicle
tax structure in Norway emphasises weight, as discussed in Chapter 5. The LET
should also recognise that weight is directly related to a motor vehicle’s energy or oil
use, and the assessment for the LET should allocate a greater rate for a heavier motor
vehicle, compared with a lighter motor vehicle. By recognising the vehicle weight as
one of the characteristics in the design of the LET, users will have a choice between
purchasing and using lighter motor vehicles or paying the tax.
Basing the LET on vehicle weight would also encourage manufacturers to build
lighter vehicles. Cheah states that reductions in vehicle weight can be achieved by
replacing heavy materials with lighter materials such as high-strength steel,
aluminium or magnesium, and by vehicle redesign and vehicle downsizing. She
states that creative redesign can be employed by motor vehicle manufacturers to
reduce vehicle size and weight whilst maintaining the same interior space. Another
way of reducing weight is to consolidate, eliminate or downsize parts or remove
some optional content from the motor vehicle.513
Many critics argue that a reduction in vehicle weight may jeopardise the safety of a
motor vehicle. Plotkin argues that this is not so and quotes studies by Van Auken and
Zellner in 2003 showing that reducing the average weight of the light duty vehicle
fleet would actually lead to improved safety if average vehicle size measured by
wheelbase and track width remained unchanged. Plotkin also quotes Ross and
Wenzel’s 2002 study which concluded that vehicle design plays a more critical role
in vehicle safety than weight. Their study also concluded that pick-ups and SUVs are
about twice as dangerous as cars to the vehicles that they collide with because of
their high bumpers and rigid frames.514
More recently, Cheah has argued that it is
possible to design and build small vehicles with safety standards similar to larger
vehicles by reinforcing the structural stiffness of the vehicle at critical points and
512
Plotkin, above n 480, 12; Also see US Department of Energy, Vehicle Technologies Program:
Goals, Strategies, and Top Accomplishments (December 2010)
<http://www1.eere.energy.gov/vehiclesandfuels/pdfs/pir/vtp_goals-strategies-accomp.pdf>. 513
Cheah, above n 504, 33–4. 514
Plotkin, above n 480, 8.
Page 244
224
introducing crumple zones to absorb energy in case of a collision.515
Kågeson noted
American data stating that SUVs are nearly three times more likely to kill drivers of
other vehicles than other mid-sized cars. This is due to their stiff frames and their
height. Occupants of SUVs are also more likely than car occupants to die in a
rollover. The death rate in crashes per million SUVs on the road is six per cent higher
than the death rate per million in cars.516
The recognition of weight as an element of the LET design is further discussed in
part 6.4.3 below. The design of the tax should penalise weight on an incremental
basis, similar to the Norwegian system, but with more bands in order to reduce
policy gaming around a notch and to satisfy the environmental tax principles, in
particular the PPP. The LET design illustrated in part 6.4.3 has 30 bands of weight
ranging from 600kg to 3000kg. A vehicle weighing more than 3000kg should require
special approval or a certificate of entitlement similar to the situation in Singapore.
In this way, consumers have the choice between purchasing and using a lighter
vehicle which does not attract LET, or a slightly heavier vehicle that does attract
some LET, or a very heavy vehicle that attracts a large amount of LET or requires
special approval.
b. The Size of the Engine or Engine Capacity
Engines with greater capacities are usually more powerful and provide greater torque
at lower revolutions per minute (rpm). A bigger engine will also weigh more,
creating more rolling resistance. Therefore an engine that is larger in cubic
centimetres has the capacity to increase power and in the process consume more oil.
Engine capacity refers to the swept volume by the pistons of the engine’s cylinder.
The engine cylinder sits at the core of the engine and is the space in which the piston
moves up and down, working as a stopper that compresses air and fuel to make
mechanical energy. Thus a two litre engine capacity means that an engine has the
capacity for two litres of compressed air and fuel mixture to fill the cylinders if all
515
Cheah, above n 504, 45. 516
Kågeson, above n 511, 36.
Page 245
225
the pistons are at the bottom of the cylinders. If a two litre engine has four cylinders,
then each cylinder has a half-litre capacity. More cylinders mean a greater potential
to produce power and in the process more fuel can be consumed. In Australia, the
engine capacity is measured in cubic centimetres (cc).
Motor vehicle manufacturers often use a large engine capacity as a marketing point
to sell more vehicles, in that a model with a larger engine capacity is more powerful
and has the capacity to reduce time at take-off when accelerating from zero to 100
kilometres per hour. The Holden family car in 1948 had a 2.15 litre engine and it
took 20 seconds to accelerate from zero to 100 kilometres. However, the Holden
family car now has a 3.6 litre engine and takes only 8.6 seconds to accelerate from
zero to 100 kilometres.517
The question is whether a large engine capacity is
necessary if motor vehicles are viewed simply as a means of transportation and
whether this desire for a rapid take-off speed comes at a high cost in terms of fuel
efficiency.
Plotkin explains this concept by stating that petrol engines are most efficient at high
loads, in that petrol engines are most efficient when the power demanded of them is a
substantial fraction of their maximum power. A large engine would accelerate faster
at take-off but consume a substantial amount of fuel or oil. This power is not
required during normal driving and would therefore pay a large penalty on fuel.518
This is because of the volume of combustible mixture introduced into the cylinders.
The engine requires a richer mixture of around four parts of air to one part of fuel by
weight when starting the vehicle from cold, compared with about 14 parts of air to
one part of fuel by weight during normal driving.
Plotkin states that a small engine that uses its substantial power most of the time with
a facility to artificially boost its power when required is better than a large engine
that only uses its substantial power on take-off.519
The design of the LET recognising engine capacity as a characteristic of the tax is
further elaborated in part 6.4.3 below. It is proposed that the design of the LET
should penalise the engine capacity on an incremental basis. The LET design
517
See discussion in Chapter 3 of this thesis. 518
Plotkin, above n 480, 39. 519
Ibid.
Page 246
226
illustrated in part 6.4.3 has 30 bands of engine capacity ranging from 600cc to
6000cc. A vehicle with more than 6000cc of engine capacity should require special
approval or a certificate of entitlement similar to the system in Singapore. In this
way, consumers have the choice between purchasing a car with a 600cc engine
which does not attract LET, or car with a slightly bigger engine capacity that does
attract some LET, or a car with a very large engine capacity that attracts a large
amount of LET.
c. The Engine Power
The design of the LET should also take into consideration the power generated by a
motor vehicle since engine weight, engine capacity and engine power are interrelated
and if one of the factors is omitted from a tax scheme, it can encourage policy
gaming. A smaller motor vehicle engine can be made to produce more power in a
number of ways such as forced air induction. For example, the Subaru Impreza WRX
with its two litre engine capacity produces more power than a Ford Falcon with a
four litre engine capacity by the addition of a turbocharger. A turbocharger increases
the amount of airflow into the engine cylinders. This allows an increased amount of
fuel to be burnt, thereby producing more power. However, this increases the fuel
consumption as demonstrated in Table 6.1 where the Subaru WRX STI is compared
with the Subaru 2.5i Sports Premium Wagon.
Page 247
227
TABLE 6.1: Specifications of Subaru WRX STI Compared with Subaru 2.5i
Sports
Subaru WRX STI Subaru 2.5i Sports
Premium Wagon
Engine
Specifications Turbocharged horizontally-
opposed Boxer 4-cylinder,
petrol engine
Horizontally-opposed
Boxer 4-cylinder, petrol
engine
Capacity (cc) 2457 2457
Power 221kW @ 6700rpm 123kW @ 5600rpm
Torque 350Nm @ 2400rpm 229Nm @ 4400rpm
CO2 249g/km 193g/km
Fuel Economy –
combined 10.6L/100km 8.3L/100km
Source: Subaru (2012) <http://subaru.com.au>.
Both the Subaru WRX STI and the Subaru 2.5i Sports Premium Wagon have the
same engine capacity. However, the turbocharged engine in the Subaru WRX STI
produces power at 221kW @ 6700 rpm whereas the naturally aspirated engine in the
Subaru 2.5i Sports Premium Wagon produces power at 123kW @ 5600rpm.
Turbocharging can improve fuel efficiency. However, the fuel consumption also
increases in the process as demonstrated above.
Imposing a LET on the engine power would encourage consumers to seek motor
vehicles with engines that do not produce excessive power, and such motor vehicles
may drive a little slower, resulting in reduced air drag. Air drag varies according to
the speed of the car; increase the speed, square the amount of air drag. Thus reducing
the speed of the motor vehicle can reduce drag, and since greater drag requires more
energy to overcome it, reducing the drag means a reduction in oil consumption.
The recognition of engine power as an element of the LET is further elaborated in
part 6.4.3 below. It is proposed that the design of the LET should penalise engine
power on an incremental basis, similar to how it is done in Norway, but with more
bands. This should not affect the benefits of turbocharging as smaller engines can be
turbocharged to obtain efficiency. Modern engines have come a long way in the past
few decades, and now feature technologies such as direct fuel injection, variable
valve timing, and variable intake length to maximise performance while minimising
Page 248
228
fuel consumption and emissions output. Modern engines can have higher
compression ratios which minimises the need for a substantial amount of boost to
make reasonable power.520
The LET design illustrated in part 6.4.3 recognises this, and allows for 30 bands of
engine power ranging from 40kW to 340kW. A vehicle with more than 340kW
would require special approval or a certificate of entitlement. In this way, consumers
have the choice between purchasing a vehicle that does not attract LET, or a vehicle
with a more powerful engine that attracts more LET.
d. CO2 Emissions
In addition to the three characteristics of weight, engine capacity and engine power,
the LET should also discourage passenger motor vehicles with high CO2 emissions.
A study undertaken in 2002 by the European Commission’s Directorate-General for
Environment on fiscal measures to reduce CO2 emissions in new passenger cars
concluded that a CO2 component in car taxation systems with significantly
progressive tax rates could provide a solid incentive for consumers to choose a car
with low CO2 emissions. The report concluded that the more progressive the curve,
the larger its effects would be.521
As discussed in Chapter 5, the taxation system in Norway has a CO2 component as
part of its purchase tax. The rates of tax in Norway are on a sliding scale with no tax
being attracted for CO2 emissions of 115g/km and the rate increasing with increasing
emissions thereafter. Many European countries impose motor vehicle taxes based on
CO2 emissions.522
The LET design recognising CO2 emissions as an element of the tax is further
elaborated in part 6.4.3 below. It is proposed that the design of the tax should
penalise CO2 emissions on an incremental basis. The illustration of the LET design
520
Kurt, Huge Growth in Turbocharged Cars Expected (8 February 2011) TopSpeed
<http://www.topspeed.com/cars/car-news/huge-growth-in-turbocharged-cars-expected-
ar113421.html>. 521
European Commission’s Directorate-General for Environment ‘Fiscal Measures to Reduce CO2
Emissions from New Passenger Cars: Main Report’ (Final Report, January 2002) 114. 522
See Appendix 1.
Page 249
229
in part 6.4.3 shows 30 bands of CO2 emissions ranging from 80g/km to 320g/km. A
vehicle emitting more than 320g/km would require special approval or a certificate
of entitlement similar to the requirement in Singapore. In this way, consumers would
have the choice to purchase a car that emits less CO2/km and pay a lower LET.
e. The Taxing Points
The LET should be a comprehensive tax in order for it to have an impact on
influencing people to make appropriate choices of passenger motor vehicles for
personal travel, thereby reducing oil consumption.
Norway’s car taxation system does this to a limited extent in its design of the
purchase tax as discussed in Chapter 5. Norway’s motor vehicle tax system would
have been more comprehensive if the same thinking as for the purchase tax had been
applied to other taxing points, ie the annual registration and fuel excise, although
Norway does have a separate annual weight-based tax. The proposed design of the
LET system in Australia should encompass the four characteristics of the motor
vehicle, being its weight, engine capacity, engine power and CO2 emissions, and to
make the system comprehensive, the same characteristics should be taxed at four
taxing points being:
- the purchase of the vehicle;
- the annual registration;
- the fuelling of the vehicle; and
- the disposal of the vehicle.
Including the same motor vehicle characteristics at each of the proposed taxing
points makes the LET system comprehensive, and the impact of purchasing a
particular motor vehicle is reflected throughout the ownership of the vehicle. The
reason for imposing the LET at each of the taxing points is discussed further below.
Page 250
230
f. Taxing Point: The Purchase of the Vehicle
Vehicle purchase and one-off registration taxes can have an impact on a motorist’s
choice about whether or not to purchase a motor vehicle and about which type of
motor vehicle to purchase. However this influence would depend on the structure of
the tax and the tax rate. As discussed in Chapter 4, many countries impose one-off
motor vehicle taxes on the purchase of a motor vehicle based on fuel efficiency, CO2
emissions, vehicle weight and engine power. Many European countries have one-off
motor vehicle taxes on the purchase of the vehicle that differ for small, medium and
large vehicles.523
Singapore and China control the purchase of motor vehicles by
releasing COEs or auctioning licence plates.524
In Australia, the purchase of a new motor vehicle attracts state government stamp
duty or vehicle registration duty as follows.
TABLE 6.2: Stamp Duty / Vehicle Registration Duty on Car Purchases
Value of Car / Private Motor Vehicle (AUD)
10 000 20 000 40 000 80 000
New South Wales 300 600 1200 3100
Victoria (new cars) 250 500 1000 4000
Queensland 300 600 1200 2400
Western Australia 125 550 2300 5200
South Australia 340 740 1540 3140
Tasmania 300 600 1600 3200
Source: ‘Buying a Car in Australia – What You Need to Know’ (2012) Living in
Australia <http://www.livingin-australia.com/buying-a-car/>.
These taxes are rather low to make any impact on a person’s decision about whether
or not to purchase a motor vehicle and the type of motor vehicle to purchase. A new
vehicle may also attract the Commonwealth government’s 33 per cent LCT if the
cost of the motor car is more than the luxury car tax threshold of AUD57 466 for the
523
See Chapter 4, Figure 4.6. 524
See Chapter 4, part 4.5.
Page 251
231
2011–12 financial year.525
For a fuel-efficient car, meaning a car with a combined
cycle fuel consumption of less than seven litres per 100 kilometres, the LCT
threshold is AUD75 375. The LCT is based on the price of the motor vehicle with
only one threshold of fuel consumption, being consumption in excess of seven litres
per 100 kilometres.
The proposed design of the LET discussed in part 6.4.3 would replace the LCT on
purchase of a new motor vehicle with a purchase LET based on the four motor
vehicle characteristics discussed above, ie its weight, engine capacity, engine power
and CO2 emissions. The new purchase LET has the potential to be quite high
depending on the four characteristics of the chosen vehicle and the tax rate. The LET
payable on the purchase of a new motor vehicle would differ for each vehicle as the
four characteristics would differ for each vehicle. Therefore the purchase LET is
likely to make an impact on the choice of the vehicle and the characteristics that
impact on the use of oil in a passenger motor vehicle.
The working design of the purchase LET is discussed in part 6.4.3, the means of
collecting the purchase LET is described in part 6.4.4 and the compliance and
administration cost of the purchase LET is discussed in part 6.4.5.
g. Taxing Point: The Annual Registration Tax
Many countries charge annual registration or road licence fees as discussed in
Chapter 4. In Australia, the states charge annual registration or licence fees and the
basis of the charge differs from state to state. The licence fees in New South Wales,
Victoria, Western Australia and Australian Capital Territory are based on the weight
of the vehicle. In Queensland, South Australia, Tasmania and the Northern Territory
they are based on the number of cylinders and engine capacity. In Western Australia,
the annual registration fee for the year ended 30 April 2011 was made up of three
components:
525
Commissioner of Taxation, Luxury Car Tax Determination LCTD 2011/1 – Luxury Car Tax: What
Are the Luxury Car Tax Threshold and the Fuel-Efficient Car Limit for the 2011–12 Financial Year?
(20 June 2011) Australian Taxation Office <http://law.ato.gov.au/pdf/pbr/lcd2011-001.pdf>.
Page 252
232
- Vehicle licensing fee worked out per 100kg of vehicle mass at the rate of
AUD17.53 if the gross weight of the vehicle is less than 4.5 tonnes;
- Compulsory third party injury insurance premium of AUD245
- Recording fee of AUD13.05.
For example, the Western Australian Department of Transport imposed the following
annual taxes on a six cylinder Holden Commodore weighing 1695kg:
TABLE 6.3: Annual Motor Vehicle Licence Fees for Holden Commodore for
2011
Family Use Fees Business Use Fees
Licence Fee 202.55 269.55
Insurance 222.73 236.45
GST on Insurance 22.27 23.65
Stamp Duty on Insurance 24.50 26.00
Recording Fee 13.05 13.05
Total Due 485.10 568.70
Source: Licence and Third Party Insurance Policy First and Final Account for
Holden Commodore Dated 19 September 2011
The state annual registration fees in Australia are too low to make any impact on the
choice of motor vehicle. Under the proposed LET design discussed in part 6.4.3, the
states would continue to impose the above fees on each vehicle, but would include an
additional annual registration LET charge. It is proposed in this thesis that the
calculation of the annual registration LET would be based on the same four motor
vehicle characteristics that were reflected in the purchase LET, ie the vehicle weight,
engine capacity, engine power and CO2 emissions. The reason for this is to allow the
proposed LET design to influence not only the purchasing decision, but to have that
decision be reflected right throughout the ownership of the vehicle, including the
annual registration charges, as well as the fuelling of the vehicles (discussed next).
Page 253
233
The working design of the annual registration LET is discussed in part 6.4.3, the
collection of the annual registration LET is outlined in part 6.4.4 and the compliance
and administration cost of the annual registration LET is discussed in part 6.4.5.
h. Taxing Point: The Fuelling of the Vehicle
Many countries including Australia charge excise duty on the fuel used in running
vehicles. The current fuel excise rate in Australia is 38.143 cents per litre. As
discussed in Chapter 4, the excise on petrol in Australia has in fact decreased by
36.86 per cent in the ten years to 2010.526
In order to bring about a reduction in the use of motor vehicles for personal
transportation, it is necessary to increase the rate of fuel excise. The proposed LET
design discussed in part 6.4.3 sets the excise rate based on the four motor vehicle
characteristics, being weight, engine capacity, engine power and CO2 emissions.
Thus each motor vehicle attracts a different excise rate depending on the four
characteristics of that motor vehicle. In this way, the decision to purchase a particular
motor vehicle is reflected in the ongoing use of the vehicle, including the price of
fuelling that vehicle.
Since oil is considered a luxury, a person who chooses to drive a motor vehicle that
has the potential to use more oil should have to pay for fuel at a higher rate, the aim
being to deter motorists from choosing such motor vehicles. The reasoning behind
this concept is that a person who chooses to drive a large and heavy motor vehicle
that consumes more oil is depleting the oil resources faster and thereby taking away
from future generations the opportunity to access energy from oil. Imposing a higher
tax rate for such vehicles does not deny motorists the choice of such vehicles, but
makes them aware of the implications of that choice through their hip pocket. High
fuelling costs would certainly act to deter a person from choosing such a motor
vehicle, and may even encourage someone to use public transport instead of using a
passenger motor vehicle.
526
See Chapter 4, part 4.4.2, Table 4.12.
Page 254
234
The working design of the fuel LET is discussed in part 6.4.3, the collection of the
fuel LET is described in part 6.4.4 and the compliance and administration cost of the
fuel LET is discussed in part 6.4.5.
i. Taxing Point: The Disposal of a Vehicle
The reason for including the disposal of the vehicle as a taxing point under the LET
is to extend the consideration of motor vehicle characteristics to the point of disposal
and the energy required for that disposal. A disposal fee would promote car designs
that both attract lower disposal fees and have a longer existence.
Motor cars should be built to last for a reasonable time. Buses last for at least 20
years.527
Even aircraft used on long flights have a lifespan of at least 20 years or
longer; some 747s last 25 to 30 years.528
If aircraft that are exposed to extreme
weather conditions are built to last at least 20 years, the question to ask is whether we
are being extravagant in terms of energy usage by scrapping motor vehicles within
10 years. If motor vehicles were built to last, manufacturers might be inclined to use
more expensive, energy-efficient materials in building the vehicle, for example,
aluminium chassis and fibre glass bodies. Thus the cost of the vehicle would not
increase over its lifespan.
Some may argue that building motor vehicles for increased longevity could destroy
the Australian motor car industry, leading to loss of jobs. This does not have to be so,
as the Australian government can encourage production of a new motor vehicle that
satisfies the LET design criteria and that requires minimum repairs and is built to
last. The government can also create employment by building on the public transport
infrastructure and creating an efficient public transport system that is patronised by a
greater number of people.529
Passenger motor cars should be seen as a means of transportation, rather than as a
mark of prestige and wealth. If this display of wealth comes at a cost to society in
527
Sustainable Energy Association of Australia, ‘Submission: Public Transport Plan 2031’
(Sustainable Energy Association of Australia, October 2011) 5. 528
Rebecca Maksel, ‘What Determines an Airplane’s Lifespan?’ Air & Space Smithsonian Magazine
(online), 1 March 2008 <http://www.airspacemag.com/need-to-know/NEED-lifecycles.html>. 529
Laird et al, above n 8, 137.
Page 255
235
terms of the depletion of our limited oil resource, then the Australian government
should discourage the purchase and use of those types of vehicle by introducing the
LET.
Before exploring the working design of a comprehensive LET system, the next
section discusses the level of government in Australia that should ideally impose the
LET and the constitutional justification of its power to do so.
j. Commonwealth or State Tax
Some of the current motor vehicle taxes in Australia such as the annual registration
taxes are imposed by the states, whereas others such as the LCT and fuel excises are
imposed by the federal government. Therefore it is important to establish the level of
government that can and that should impose and collect the LET at the four taxing
points discussed above, and how the revenues from the LET should be dealt with.
In order to determine which level of government can and should impose the LET, it
is necessary to consult the Australian Constitution. Section 51(ii) of the Constitution
allows the Commonwealth to impose taxation, and since this power is a concurrent
power, the states can also legislate and impose taxation. However the states cannot
impose excise, as s 90 of the Constitution gives exclusive power to the
Commonwealth to impose duties of customs and excise. The High Court of Australia
in the case of Ha v New South Wales530
confirmed that duties of excise are taxes on
the production, manufacture, sale or distribution of goods, that is, taxes on some step
taken in dealing with goods.531
The first of the four taxing points is the purchase LET, which is to be imposed on the
purchase of a passenger motor vehicle. Under the definition of the duties of excise
established in the abovementioned High Court decision, the purchase LET would be
considered to be an excise as it is a tax on the sale of a car. Therefore only the
Commonwealth government would be able to impose the purchase LET.
530
(1997) 189 CLR 465; 97 ATC 4674. 531
(1997) 189 CLR 465; 97 ATC 4674, 4679 and 4684 (per Brennan CJ, McHugh, Gummow and
Kirby JJ). See Patricia Sampathy, ‘Section 90 of the Constitution and Victorian Stamp Duty on
Dealings in Goods’ (2002) 4(1) Journal of Australian Taxation 133.
Page 256
236
The annual registration LET is not intended to be a licence and insurance fee like the
current licence and insurance fees imposed by the states, but is intended to be a tax
on the ownership and use of that motor vehicle. For this reason, it would be classified
as an excise as it is a tax on the possession of a good, and therefore only the
Commonwealth government would be allowed to impose the annual registration
LET.
Similarly to the current fuel excise, the fuel LET will also be an excise and therefore
only the Commonwealth government will have the constitutional right to impose it.
Finally, the disposal LET is a tax to be charged on disposal of the passenger motor
vehicle. Since it is not a tax on the service of disposal, but a tax on the disposal of the
vehicle itself, it will be classified as an excise under the interpretation provided by
the High Court of Australia in the case of Ha v New South Wales.532
From the above, it is apparent that only the Commonwealth government would have
the constitutional right to enact the LET legislation. Moreover, since the desire is for
the proposed LET to be a comprehensive tax with the same rules applicable to the
whole country, a Commonwealth tax would be more suitable. Although the
leadership of the Commonwealth government is required for implementation of the
LET, liaison with state and local governments will be necessary as the LET revenues
should be earmarked for the improvement of public transport infrastructure ahead of
the anticipated decrease in reliance on imported oil. Transportation involves all three
levels of government as well as private sector operators, as roads and railway can be
owned and operated by the Commonwealth government, state governments, local
governments or privately owned corporations. It may be necessary to set up a
commission that deals with the distribution of the LET revenues on a need basis and
with the goal of preparing the country for energy-efficient and modern 21st century
passenger transportation.
The distribution of the LET revenues would require further investigation that is
beyond this PhD as it involves Commonwealth and state relationships and may
require an intergovernmental agreement. The distribution of the LET revenues
should not follow ‘The Intergovernmental Agreement on the Reform of
532
97 ATC 4674.
Page 257
237
Commonwealth-State Financial Relations’533
that was entered into when GST was
introduced in Australia. Under the GST intergovernmental agreement, the
Commonwealth government collects the GST and these revenues are then distributed
to the states and territories, and even allow the states and territories to be involved in
setting the GST rate. The LET intergovernmental agreement, if entered into, should
deal with the states giving up their right to collect the stamp duty on purchase of a
passenger motor vehicle and the state entitlement to funding for public transport
infrastructure projects. The LET intergovernmental agreement should be different
from the GST intergovernmental agreement as the backdrop of the GST
intergovernmental agreement was a decade of vertical fiscal imbalance,534
whereas
the backdrop of the intergovernmental agreement for the LET revenues is preparation
of public transport infrastructure for the LET objectives to operate effectively.
Despite this difference, there is also an overlap due to the concept of horizontal fiscal
equalisation535
under which the states receive funding from the federal government
from the pool of GST revenues to provide for the states’ services and associated
infrastructure. Therefore the Commonwealth and the state governments would need
to work together as the LET should be considered a major national tax reform similar
to the GST536
and the LET applies to a large cross-section of the population linked by
the common cause of reducing oil use in passenger motor vehicles.
Since the LET is proposed to be a Commonwealth tax, the collection of the LET at
the four taxing points should be the responsibility of the Australian Taxation Office
(ATO). However, the ATO may need to rely on state Departments of Transport and
independent fuel stations in setting up revenue collection mechanisms. This is further
discussed in part 6.4.4, which covers the administration of the LET.
The next part explores the working design of a comprehensive Commonwealth LET
system.
533
A New Tax System (Commonwealth-State Financial Arrangements) Act 1999 (Cth) sch 2. 534
Peter Edmundsen, ‘Intergovernmental Agreements and the Battle over GST Revenue’ (Paper
presented at the 2006 Constitutional Law Conference and Dinner, Art Gallery of New South Wales,
24 February 2006) <http://www.gtcentre.unsw.edu.au/events/2006-constitutional-law-conference-and-
dinner>. 535
See Commonwealth of Australia, ‘GST Distribution Review’ (Interim Report, March 2012) 1. 536
State Government of Victoria, ‘GST Distribution Review’ (Victorian Supplementary Submission,
March 2012) 5.
Page 258
238
6.4.3 The Working Design of the LET System
This thesis proposes an innovative design for a LET system that could replace some
of the current motor vehicle and fuel taxes in Australia relating to passenger motor
vehicles. The comprehensive LET design structure involves an allocation of points
for each of the four motor vehicle characteristics. The points are progressive, as seen
in Table 6.4, which displays 30 progressive points for each of the characteristics. The
progressive points are set in accordance with the polluter-pays principle discussed
earlier. The points are calculated separately for each characteristic and then added up
to reach the total points. Thus a motor vehicle that is light in weight, but has a
powerful engine, ie a typical sports car, would attract only a few points on weight,
but more points on power and CO2 emissions as each of these factors are individually
important in reducing oil consumption and CO2 emissions. Also, to prevent policy
gaming, it is necessary to include all four characteristics of the motor vehicle within
the LET, ie its weight, engine capacity, engine power and CO2 emissions.
The LET system would then operate by allocating the tax rate per number of LET
points at each taxing point. The LET payable can be discounted over a 10 year period
so that the introduction of LET is slowly phased in. The phasing-in of LET over a 10
year period will also allow manufacturers, importers and purchasers of motor
vehicles to plan ahead. The proposed LET operating system is discussed in detail
below.
a. The LET Points
Sets of suggested points for each of the four motor vehicle characteristics are stated
in Table 6.4. Each characteristic is independently analysed to determine the point
allocation for that characteristic.
Page 259
239
TABLE 6.4: Calculation of Points to Determine Luxury Energy Taxable Value
Points Weight (kg) Capacity (cc) Power (kW) CO2 Emissions
(g/km)
0 600 600 40 80
1 680 780 50 88
2 760 960 60 96
3 840 1140 70 104
4 920 1320 80 112
5 1000 1500 90 120
6 1080 1680 100 128
7 1160 1860 110 136
8 1240 2040 120 144
9 1320 2220 130 152
10 1400 2400 140 160
11 1480 2580 150 168
12 1560 2760 160 176
13 1640 2940 170 184
14 1720 3120 180 192
15 1800 3300 190 200
16 1880 3480 200 208
17 1960 3660 210 216
18 2040 3840 220 224
19 2120 4020 230 232
20 2200 4200 240 240
21 2280 4380 250 248
22 2360 4560 260 256
23 2440 4740 270 264
24 2520 4920 280 272
25 2600 5100 290 280
26 2680 5280 300 288
27 2760 5460 310 296
28 2840 5640 320 304
29 2920 5820 330 312
30 3000 6000 340 320
Page 260
240
The system works by ascertaining the points for each characteristic separately and
then adding the points for all the four characteristics to form the total points for each
motor vehicle. For example, the Holden VE would attract a total of 63 points as
follows:
- Weight: 1700kg – would attract 14 points;
- Capacity: 3600cc – would attract 17 points;
- Power: 180kW – would attract 14 points; and
- CO2 emissions: 217g/km – would attract 18 points.
The total of 63 points for a Holden VE would then be used to calculate the tax
payable at each taxing point by applying the tax rate.
The suggested points for the LET system have not been set in a vacuum. They are set
in order to influence the owner and end user of the motor vehicle as well the motor
vehicle manufacturer and importer to promote motor vehicles that are close to 600kg
in weight, with an engine size of 600cc, producing 40kW and emitting 80g C02/km.
Such a motor vehicle would not attract any LET. It is possible for an Australian
motor vehicle manufacturer to manufacture such a vehicle by using appropriate
lightweight materials, reducing the size of the motor vehicle and incorporating an
aerodynamic design that reduces wind and rolling resistance. An example of such
innovation can be observed in some concept cars and the Lotus Elise with its 69.5kg
extruded aluminium chassis. However the Elise is powered as a sports car with a
100kW engine.537
If such a vehicle was designed with a less powerful engine, it
could easily achieve a low level of LET points. Table 6.5 shows the specifications of
some small motor cars that would attract low LET points, and indicates that it is
possible to have lower LET points for both cheaper motor vehicles like the Tata
Nano and the Chevrolet Spark as well as more expensive vehicles such as the Lotus
Elise.
537
Lotus Elise, Chronology of Chassis Development (1995) Sands Mechanical Museum
<http://www.sandsmuseum.com/cars/elise/thecar/chassis/index.html>.
Page 261
241
TABLE 6.5: Calculation of LET Points for Selected Vehicles
Weight (kg) Engine Size
(cc) Engine
Power (kW) CO2/Km Total
Points
Tata Nano 580 624 24.6 92.7
Points 0 1 0 2 3
Smart Fortwo 750 999 52 100
Points 2 3 2 3 10
Chevrolet
Spark 840 1000 46 150
Points 3 3 1 9 16
Daewoo Matiz 853 796 38 161
Points 4 2 0 11 17
Lotus Elise 876 1600 100 155
4 6 6 10 26
Holden
Commodore
Omega
1551 2986 190 210
12 14 15 17 58
Toyota Land
Cruiser 2635 4664 202 273
Points 26 23 17 25 91
Maybach 2750 6000 455 390
Points 27 30 COE COE COE
Unlike the LCT, the imposition of LET does not reflect the price of the motor
vehicle, but the energy or oil it consumes. Thus a small and light sports car like the
Lotus Elise would attract 26 points compared with the Tata Nano attracting 3 points,
the Smart Fortwo attracting 10 points, the Chevrolet Spark attracting 16 points and
the Daewoo Matiz attracting 17 points. The popular family car, the six cylinder
Holden Commodore Omega attracts 58 points compared with the 4WD Toyota
Landcruiser 200 which attracts 91 points. The very expensive Maybach would need a
Certificate of Entitlement as its engine power and CO2 emissions are in excess of the
specified limits. The government could also auction licences to purchase vehicles
that are energy guzzlers and outside the point limits stated in Table 6.5.
Page 262
242
The next section deals with the conversion of LET points into taxable value at each
taxing point.
b. Conversion of LET Points to Tax Payable
The total points calculated for each motor vehicle would form the basis for
calculating the tax payable at each of the four taxing points. The proposed formula
for working out the tax payable has been set to not only generate revenue, but also to
encourage motorists to purchase vehicles that would attract less LET, and make
greater use of the public transport system. A detailed study and an economic analysis
would need to be undertaken to set the rates at the correct level, which is beyond the
scope of this thesis. However this thesis demonstrates a new and a unique way of
taxing passenger motor vehicles.
The suggested rates for allocating tax payable at each taxing point are stated in Table
6.6. The LET legislation should provide for the rates to be indexed over time based
on the consumer price index.
TABLE 6.6: Taxing Points Converted to Luxury Energy Tax
Imposition of Tax Tax Payable per Point
Initial new purchase of vehicle AUD500 per point
Annual road registration AUD125 per point
Fuel consumption per litre AUD0.25 per point
Disposal fee AUD10 per point
Based on the Holden VE’s 63 accumulated points the following LET would be
attracted at each taxing point based on the above formula:
Page 263
243
TABLE 6.7: Luxury Energy Tax Payable on Holden VE
Imposition of Tax LET Points Tax Rate per
LET Point
Tax payable
AUD
Initial new purchase of vehicle 63 500 31 500
Annual road registration 63 125 7875
Fuel consumption per litre 63 0.25 15.75
Disposal fee 63 10 630
A discount should be applied over at least a 10 year period to allow time for
motorists to make their personal transportation arrangements and manufacturers to
design new motor vehicles. The suggested discount that should be applied over a 10
year period is discussed next.
c. The Discount
The purpose of the discount is to gradually educate people about the impact of their
choice of motor vehicle for personal transportation. The discount should also reflect
the status of the economy and whether an effective public transport infrastructure is
in place. This would include not only the availability of sufficient trains and buses,
but also enough parking facilities at train stations. The discount rate would need to be
worked out by the government, based on an economic analysis, which is beyond the
scope of this research.
As a demonstration, the tax discount could be set as high as 98 per cent in the first
year of implementation, decreasing to nil by the tenth year. Based on this discount
schedule, the LET for a Holden VE is displayed in Table 6.8.
Page 264
244
TABLE 6.8: Demonstration of Luxury Energy Tax for Holden VE
Year
Suggested
Discount
Rate
AUD
Holden VE – LET Payable
Initial
Purchase
AUD
Annual Road
Registration
AUD
Fuel
Per litre
AUD
Disposal
fee
AUD
1 98% 630 158 0.32 13
2 96% 1260 315 0.63 25
3 94% 1890 473 0.95 38
4 92% 2520 630 1.26 50
5 90% 3150 788 1.58 63
6 85% 4725 1181 2.36 95
7 75% 7875 1969 3.94 158
8 50% 15 750 3938 7.88 315
9 25% 23 625 5906 11.81 473
10 0% 31 500 7875 15.75 630
As demonstrated in Table 6.8, the purchase of a Holden VE would attract LET at
four taxing points. The first taxing point would occur on registration of the vehicle. If
a Holden VE was purchased in the first year of LET implementation, the registered
owner of the motor vehicle would have to pay AUD630 on the initial purchase of the
car. On the other hand, if the Holden VE was purchased in year ten after the LET
was implemented, the registered owner would have to pay AUD31 500 LET on the
initial purchase price. The LET of AUD31 500 in Year 10 would not be considered
high when compared with the existing purchase tax charges in Norway. As
demonstrated in Chapter 5, Norway imposes a high purchase tax based on the vehicle
weight, engine power and CO2 emissions. Based on the rates in 2011, the Holden VE
would have attracted a total purchase tax of AUD79 078 in Norway, broken down as
follows:538
538
See Chapter 5, part 5.2, Tables 5.2, 5.3 and 5.4.
Page 265
245
TABLE 6.9: Norway Purchase Tax on Holden VE
Purchase Tax Criteria Tax Payable – AUD
Weight 20 763
Engine power 36 736
CO2 emissions 21 343
Vehicle scrap deposit 236
Source: Ministry of Finance, ‘Budget 2011’ (Ministry of Finance, Norway, 12
January 2011) <http://www.statsbudsjettet.no/english>.
In Norway, the rates are progressive in that the higher the weight, engine power and
CO2 emissions, the greater the tax.539
By comparison, the progressive feature of the
LET is found in the point system, whereby the higher the weight, the engine
capacity, the engine power and the CO2 emissions, the greater the LET points that
would be allocated. Moreover, the accumulated points under the LET system are
fixed at the outset when the vehicle is manufactured or imported and are reflected not
just in the purchase tax, but also in the annual registration tax, the fuel cost and
disposal of the vehicle.
The government in Australia could reduce the discount at the outset. However, this is
not recommended as both the government and the people need time to adjust. The
government needs to ensure that the tax policy is in line with other policies, ie
energy, transportation and housing. The Australian people may need to change their
travelling behaviour as well as deciding on an appropriate place of residence by
living closer to where they work. Moreover, a slow education process is much better
than a sudden imposition.
The second taxing point for the ownership of the Holden VE would occur annually
over the period of vehicle ownership, being the annual registration LET. This would
be payable in addition to the state registration or licence fees. In the first year of
ownership, the annual registration LET payable by the registered owner of the
vehicle would include an extra AUD158 per annum, increasing to AUD315 for the
second year of ownership and increasing each year to AUD7875 in the tenth year.
539
See Chapter 5, part 5.2, Table 5.1.
Page 266
246
The third taxing point for the ownership of the Holden VE would occur every time it
is refuelled at the petrol station. Instead of paying excise at the rate of AUD0.38, it
would attract an excise of AUD0.32 in the first year, increasing to AUD0.63 in the
second year and increasing each year to AUD15.75 in the tenth year. Although the
rate of AUD15.75 per litre of oil for the Holden VE may currently seem excessive, it
needs to be observed from the perspective of the future availability of global oil
supplies and the growth, usage, design and choice of current motor vehicles as
discussed in Chapters 2 and 3 of this thesis. A high excise rate on fuel can be avoided
by choosing a motor vehicle that attracts fewer LET points.
A unique feature of the LET system is in the cost of fuelling a motor vehicle as a
different fuel rate would apply to each motor vehicle depending on the number of
points accumulated for that vehicle. It is an alternative to the kilometre fee and can
be calculated and collected relatively easily without impacting on the privacy of the
driver. This tax would be collected at the pump in a manner similar to that described
in the Oregon pilot study. This is further discussed with relation to LET
administration in part 6.4.4.
The fourth taxing point for the ownership of the Holden VE would occur on its
disposal. The disposal fee attracted would be AUD13 in the first year, increasing to
AUD25 in the second year and increasing each year to AUD630 in the tenth year.
This would encourage consumers to purchase motor cars that are low on disposal
charges and to keep the motor vehicles as long as possible to avoid paying the
disposal fee.
By comparison to the Holden VE, the Smart Fortwo attracts 10 LET points. The LET
payable for the Smart Fortwo is shown in Table 6.10.
Page 267
247
TABLE 6.10: LET Attracted by Smart Fortwo
Year
Suggested
Discount
Rate
AUD
Smart Fortwo LET Payable
Initial
Purchase
AUD
Annual Road
Registration
AUD
Fuel
Per litre
AUD
Disposal
fee
AUD
1 98% 100 25 0.05 2
2 96% 200 50 0.10 4
3 94% 300 75 0.15 6
4 92% 400 100 0.20 8
5 90% 500 125 0.25 10
6 85% 750 188 0.38 15
7 75% 1250 313 0.63 25
8 50% 2500 625 1.25 50
9 25% 3750 938 1.88 75
10 0% 5000 1250 2.50 100
As the Smart Fortwo has the potential to use less oil compared with the Holden VE,
it attracts a lower LET. Although the LET attracted by the Smart Fortwo may seem
high compared with the current motor vehicle and fuel taxes it attracts in Australia,
the high rates are required to encourage the use of public transport instead of a motor
vehicle for personal transportation.
The above formulas and rates suggested for the LET have been formulated based on
the LET principles discussed above and a logical analysis. An economic analysis
would need to be carried out to set the correct formulas and rates, which is beyond
the scope of this research. However, the message from this thesis is for the
Australian government to take control and comprehensively reform motor vehicle
taxes in Australia in order to address climate change and reduction of oil usage by
road transport vehicles with the aim of changing motorist behaviour. The purpose of
the proposed LET in Australia is to impose a tax that would impact on a person’s
decision-making at the time of purchasing a vehicle, during its use, and at the point
of its disposal.
The next part explores the administration and operation of the LET design
framework.
Page 268
248
6.4.4 The Administration and Operation of the LET Design
Framework
The administration and operation of the LET design framework encompass a range
of aspects, which are discussed below. The compliance and administration cost of the
LET design framework are discussed in part 6.4.5.
a. The Registration for LET
Although the LET design should allow for a phasing-in period for existing vehicles,
it is proposed in this thesis that all passenger vehicles would need to become
registered for LET. However, the purchase LET would only apply to the purchase of
new passenger vehicles in Australia and the purchase of used passenger vehicles that
are road registered in Australia for the first time. All passenger motor vehicles should
be liable for assessments of the annual registration LET, the LET fuel excise and the
LET disposal fee.
The definition of a passenger motor vehicle for the purposes of the LET legislation
could be adopted from the OECD Glossary of Statistical Terms that defines a
passenger car as a road motor vehicle, other than a motor cycle, intended for the
carriage of passengers and designed to seat no more than nine persons (including the
driver).540
The LET legislation would need to provide for the correct measurement and
quantification of the motor vehicle characteristics, ie weight, engine size, engine
power and CO2 emissions. It is recommended that this occurs at the same time that
the vehicle is fitted with the compliance plate. Under the current Australian laws,
before a road vehicle can be registered for the first time in Australia, it must meet the
requirements of the Motor Vehicle Standards Act 1989 (Cth). The Act requires all
new and used imported vehicles to meet the Australian Design Rules (ADRs) and be
540
Organisation for Economic Co-Operation and Development, Glossary of Statistical Terms —
Passenger Car (14 March 2002) OECD Statistical Portal <http://www.oecd-
ilibrary.org/economics/oecd-glossary-of-statistical-terms_9789264055087-en>.
Page 269
249
fitted with a compliance plate. This is known as the vehicle certification process,541
and it is recommended that this would be the appropriate stage at which the vehicle
should be correctly measured and quantified for LET purposes, and its correct
weight, engine capacity, engine power and CO2 emissions certified and recorded on
the compliance plate.
It is also recommended that the motor vehicle owner registers the motor vehicle for
the LET. LET registration of a passenger motor vehicle should occur at the same
time as the motor vehicle is licensed and the number plate is obtained. Under the
existing system, the motor vehicle road licence and number plate are obtained by
completing a form and sending it with the appropriate fee to the state Department of
Transport.542
This form would need to be amended to include details of the motor
vehicle, ie its weight, engine capacity, engine power and CO2 emissions, so that the
motor vehicle could also be registered for LET.
LET registrations can be administered by the state Department of Transport working
together with the Australian Taxation Office (ATO). One way is for the Department
of Transport to calculate the LET points and the purchase tax payable before the
department releases the number plate and the road licence, and then inform the ATO
of the LET registration details. Alternatively, the Department of Transport can
forward the details of the motor vehicle and the registered owner to the Australian
Taxation Office (ATO), which would then calculate the LET points and the purchase
tax. The ATO would then collect the purchase tax from the registered owner and
inform the Department of Transport of the calculated LET points. Under this
alternative, the Department of Transport should only release the motor vehicle
registration and number plate to the registered owner after receiving confirmation
from the ATO that the purchase tax has been paid.
It is proposed that the motor vehicle number plate be designed to display the LET
points, such that the registration number and the LET points can be read and
recognised using appropriate vehicle recognition technology as discussed below.
541
Department of Infrastructure and Transport, Vehicle Certification in Australia (December 2008)
Commonwealth of Australia
<http://www.infrastructure.gov.au/roads/motor/standards/certification/index.aspx>. 542
Department of Transport, Application to Licence a Vehicle Form MR17 (19 December 2011)
Government of Western Australia
<http://www.transport.wa.gov.au/mediaFiles/LBU_F_VL_MR17_LicenceVehicle.pdf>.
Page 270
250
Existing vehicles that have already been road registered before the implementation of
the LET legislation would also need to be registered for LET. Their registration can
be phased in by the Department of Transport when their annual registration comes up
for renewal. The Department of Transport should send a form to the registered owner
confirming the details of the LET registration and issue the registered owner of the
vehicle with the special number plate. If details such as the CO2 emissions are not
available for that motor vehicle, the Department of Transport should apply a standard
statutory rate, or permit the registered owner to obtain certified data through
appropriate inspection agents.
The Department of Transport would need to synchronise with the ATO the details of
the motor vehicle that has been registered for LET, the details of the registered owner
and the purchase LET payable. It is also proposed that the ATO issue the registered
owner with at least two debit cards that the registered owner may use to pay the fuel
LET. If a person other than the registered owner is using the motor vehicle, then the
registered owner and the new user of the motor vehicle would need to complete a
form notifying the Department of Transport and the ATO of the person responsible
for the LET.
Since the LET only applies to passenger motor vehicles, it is proposed that certain
passenger vehicles that are fitted to be used for specific businesses could apply for an
exemption from the ATO. If an exemption for the LET has been obtained from the
ATO, then this should be recognised in the special number plate issued by the
Department of Transport.
Commercial motor vehicles are not liable for the payment of LET. However, motor
vehicles that are not designed to carry passengers or carry less than nine passengers
should also be required to register for LET and obtain a commercial LET
classification. This is required to prevent policy gaming, ie using commercial
vehicles as private passenger vehicles.
Page 271
251
b. The Special Number Plate Design
The special number plate forms an important part of the LET administration. The
number plate, issued by the state Department of Transport, should include the motor
vehicle registration number, followed by the number of LET points that the vehicle
attracts, ranging from 000 to 120 (a maximum of 30 LET points for each of the four
categories). An example of a number plate could be: 1ABC 123 – 078. In this case,
the vehicle registration number is ‘1ABC 123’ and the ‘078’ represents the total LET
points. A passenger motor vehicle which is exempt from LET would show 000 as the
LET points allocated for that vehicle. A commercial vehicle could have the prefix
‘C’ before ‘000’ to indicate that it is a commercial vehicle.
The LET points are openly displayed on the number plate in order to educate the
public about the LET points attracted by different makes and models of motor
vehicles. The display of LET points on the number plate would also influence
manufacturers and importers of motor vehicles to promote motor vehicles that attract
the least amount of LET points.
The number plate with the display of the LET points also forms the basis for
collecting the fuel tax as discussed below. Therefore, to prevent fraudulent activity
such as transferring the number plate from one motor vehicle to another in order to
reduce the fuel LET, it is important that once the number plate is affixed to the motor
vehicle, it cannot be removed without special approval. To ensure that the number
plate has not been tampered with, the number plate should display an intact
Department of Transport seal. Number plate seals could be checked and certified
when motor vehicles go for periodical roadworthiness checks. The unauthorised
breaking of the seal should be an offence under the LET legislation. Accidental
damage to the seal should be reported to the state Department of Transport or their
authorised agents, and a replacement obtained for a fee.
c. Application for Exemptions
All passenger motor vehicles should be registered for LET within one year of the
LET legislation being implemented. The intention of the legislation is to impose a
Page 272
252
LET on all passenger motor vehicles as defined, whether those vehicles are used for
personal or business use. Passenger motor vehicles that are designed and used for
carrying goods for genuine business purposes could be eligible for a LET exemption.
Exemptions from the LET should only be granted after the vehicle has been
examined, as blanket exemptions can give rise to policy gaming ie large trucks being
used as passenger motor vehicles. Such business vehicles should also be subject to
criteria regarding size requirements, but this is not dealt with here as the focus of this
thesis is on passenger motor vehicles. There is, however, a need to reform the
taxation of passenger vehicles used for business and commercial motor vehicles in
the future. It is recommended that LET registration be applicable for all commercial
vehicles, but that these vehicles obtain a commercial classification and attract ‘000’
LET points.
Other exemptions or concessions could be made for specially designed vehicles
required for pensioners, schools or disabled people. Alternatively, part of the LET
revenues could be set aside to cushion the impact of the LET on the socially
disadvantaged.
Exemptions should not be granted for passenger motor vehicles using alternative
fuels or electricity, as reduced energy use should be encouraged even for these
vehicles. An electric motor vehicle may accumulate LET points only on its weight
and power. Since an electric vehicle would not require fuel from a petrol station, it
would only attract the purchase LET, the annual registration LET and the disposal
LET. Further work is required to design a LET for electric vehicles.
d. The Administration of the Purchase LET
It is recommended that the purchase LET be imposed on all passenger motor vehicles
that are road registered in Australia for the first time after the implementation of the
LET legislation, unless the registered owner of the vehicle has obtained an
exemption from the ATO. The purchase LET would need to be paid by the registered
owner of the passenger motor vehicle to the state Department of Transport or the
ATO before the motor vehicle can be road registered and the number plate issued.
Page 273
253
e. The Administration of the Fuel LET
It is proposed in this thesis that the fuel LET should be calculated and collected at the
service station. In order to do this, service stations would need to be fitted with a
special number plate recognition technology system, and install a LET debit card
POS terminal at each fuel pump that is capable of collecting the LET.
The suggested procedure for collection of the fuel LET would commence when a
motor vehicle drives into a service station for fuelling, and its number plate,
including the LET points, is read by the special number plate recognition technology
system. The motorist must have a LET debit card with a prepaid LET balance on it,
and commences the fuelling by swiping the card at the pump’s LET debit card POS
terminal. The information on the number plate and the debit card must synchronise in
order for the transaction to proceed. The LET rate is displayed, together with the
balance on the card. This informs the motorist of the number of litres of fuel that can
be pumped into the tank. The debit card is updated as the fuel is being pumped into
the motor vehicle, and when there is no more LET credit left on the card, the pump
stops supplying the fuel. The fuel pump LET debit card POS terminals have the
facility for topping up the debit cards. Under this system, the LET collected goes
directly to the ATO. A receipt of the LET paid could be printed on demand in a
similar manner to a bank’s ATM.
Once the fuelling is complete, the person pays for the fuel only at the service station
POS. Under this system, the service station’s employees have no involvement in the
calculation and collection of the LET.
Companies that hire out motor cars or large organisations that have many drivers
driving passenger motor vehicles should be able to issue temporary debit cards with
the authority of the ATO.
The suggested fuel LET collection system relies on the special number plate
recognition technology. Since every vehicle has a unique number plate, no expensive
tags or transmitters need to be fitted in order for the system to recognise the vehicle.
Number plate recognition technology can identify a vehicle by capturing an image of
Page 274
254
the number plate, and the imaging sensor can recognise a number plate the moment it
enters its field of view. The sensor can take more than one image per vehicle. The
image is processed, the number plate is extracted from the image and the digits are
separated and recognised. The details can be stored and sent to third party systems, ie
the LET debit card POS terminals.
Businesses could be invited to set up an approved number plate recognition system
for use by service stations. There are a few Australian companies that already
specialise in this area. For example, a company called ‘Sensor Dynamics’ specialises
in automatic number plate recognition (ANPR) solutions. They already have a
system called ‘The Vyper Forecourt ANPR System’ aimed at retail service station
owners who want to deter customers from driving off without paying.543
Such a
system could be modified for the purpose of collecting the fuel LET.
There are also many global companies that specialise in ANPR solutions. The
European Dacoll Group has the NDI Recognition Systems that provide global ANPR
design, software, cameras and hardware. This company already provides the ANPR
systems to the UK law enforcement community.544
Another global company is
INEX/ZAMIR that has been supplying ANPR technology for over 15 years.545
ANPR technology is already being used in Australia by the police and local councils,
such as the City of Melbourne which commenced using it in July 2011 to capture
parking offences. The system records vehicle registration details and locations and
identifies those vehicles that have overstayed their parking limit. An alert is sent to
the parking officer’s hand-held device.546
Businesses could also be invited to set up the LET debit card POS terminals for LET
collection at each service station pump. There are a few Australian companies that
already specialise in this area. For example, Integrated Technology Services has the
capacity to tailor a system to suit the specific needs of both the ATO and the
taxpayers under the LET legislation. Other global corporations include Diebold,
543
Sensor Dynamics, Forecourt Service Station ANPR Solutions <www.sensordynamics.com.au>. 544
NDI Recognition Systems UK, Overview (2012) <http://ndi-rs.com/ukrs/company_overview>. 545
See INEX/ZAMIR (2010) <http://www.inexzamir.com/>. 546
City of Melbourne, Licence Plate Recognition (28 April 2012)
<http://www.melbourne.vic.gov.au/ParkingTransportandRoads/Parking/Pages/LicensePlateRecognitio
n.aspx>.
Page 275
255
Euronet Worldwide, Fujitsu Frontech Limited, Hitachi-Omron Terminal Solutions,
NCR Corporation, Triton Systems, VeriFone Holdings, Wellington Technologies and
Wincor Nixdorf, and global corporations that can provide multifunction ATMs for
outdoor installations.547
f. The Administration of the Annual Registration LET
It is proposed in this thesis that the annual registration LET is calculated together
with the state licence and third party insurance policy by the state Department of
Transport, as discussed above. Since the annual registration LET charges belong to
the federal government, the annual registration LET could be collected by the state
Department of Transport and then periodically handed over to the ATO.
Alternatively, the annual registration LET could be separately calculated by the LET
Department of the ATO and invoiced to the registered owner, with one of the
possible payment methods being the LET debit card.
g. The Administration of the Disposal Fee LET
A disposal fee could be calculated and collected from the registered owner either by
the state Department of Transport or the ATO before the vehicle is deregistered.
h. The Setting Up and Operation of the LET Department
It is proposed that the LET legislation implements the LET system. The LET should
be a Commonwealth tax and the government would need to set up a central LET
Department in Canberra and sub-departments in each state and territory. The LET
Department of the ATO should liaise closely with the state Departments of
Transport, with free information exchange between the two bodies concerning the
LET.
547
See ATM Marketplace (2012) <http://www.atmmarketplace.com/>.
Page 276
256
The LET departments should be responsible for appointing authorised LET Agents to
conduct tasks such as the annual or periodical road worthiness test and audits.
i. The Annual or Periodical Road Worthiness Test
It is proposed that passenger motor vehicles should be required under the LET
legislation to be inspected annually or periodically. The checks should include:
- Whether the motor vehicle has gone through any modifications that affect
its weight, engine capacity, engine power or CO2 emissions;
- Whether the number plate seal is intact or broken; and
- The odometer reading to calculate the number of kilometres the motor
vehicle has driven since the previous reading.
The inspection should be conducted by authorised LET agents at appropriate LET
centres. Alternatively, the current motor vehicle inspection centres at the Department
of Transport could be used by having a LET representative present at each of the
centres.
j. LET Audits and Offences
In order to increase compliance levels, the LET legislation needs to be enforced, and
the fear of a LET audit could deter non-compliance. LET audits could be of two
types, general and specific. The general audit could include an overall mileage check
to determine whether the fuel purchased for use in one vehicle is being siphoned off
and used elsewhere. The debit card records should indicate the number of litres of
fuel purchased for that vehicle, along with an indication of the range of kilometres
that the motor vehicle could have driven, taking into consideration city and urban
driving and the driving style. The general audit test should be able to match the
information from the debit card with the mileage information obtained from the
annual road worthiness test. If there is a large variance from the expected data, then
the auditor should seek further tests and explanations from the registered owner.
Page 277
257
Various specific audits should also be conducted on the operation of the service
station to ensure that the fuel sales from that service station match the LET collected
by the ATO. Specific audits should include a random examination of the ANPR
videos to check that the make and model of motor vehicles correspond with the
number plates.
The legislation should spell out offences and penalties under the LET legislation.
Offences could include having incorrect information on the LET forms, tampering
with number plates, and the siphoning of fuel. The aim of the system is not to be 100
per cent foolproof, but to ensure that the fear of committing an offence and the
consequent severe penalties act as deterrents from committing offences under the
Act.
k. The Responsibility of the Taxpayer
The responsibility of the taxpayer would involve the correct completion of the LET
forms, the appropriate payment of LET under the LET legislation, and ensuring that
appropriate annual checks and reporting requirements are complied with, such as
when the motor vehicle is modified or the seal on the number plate is broken.
6.4.5 The Implementation of the LET System
The first step in the implementation process is a commitment from the Australian
government that the motor vehicle tax policy needs a comprehensive review and that
the way forward is through the implementation of the LET system. The Australian
government bears the responsibility for this under the precautionary principle
discussed in part 6.4.1 above. Once the government takes on the responsibility to
bring about a change, the normal consultative and legislative process would need to
be followed. This would include widespread consultation, awareness campaigns and
various government-authorised pilot studies similar to the Oregon pilot study. A
compliance and administration cost study would need to be undertaken as part of the
implementation process.
Page 278
258
a. Compliance and Administration Cost Study
LET compliance costs would be those expenses incurred by individuals and
organisations in meeting the requirements of the LET legislation. LET administration
costs are those costs that the taxation authorities incur in administering the taxation
system.
Compliance costs in the taxation literature include: taxpayer’s own labour, unpaid
helper and internal staff costs; costs of external advisers; incidental or overhead
costs; psychic costs associated with the worry of complying with taxation obligations
and social welfare costs which distorts taxpayer behaviour as a consequence of the
existence of the LET.548
Compliance costs can be divided into social and taxpayer compliance costs. Social
compliance costs refer to the costs incurred by the entire economy, whereas taxpayer
compliance costs are those incurred by the taxpayer. It is also necessary to consider
the start-up costs of introducing the new LET, which can include design, drafting and
enactment; administration and compliance.
The design, drafting and enactment costs normally refer to the costs incurred by
society leading up to the enactment of the LET legislation. This would include costs
incurred by all stakeholders in discussing, debating, promoting and opposing the tax,
and these costs are difficult to quantify.549
The compliance cost of implementing the LET refers to the costs incurred by the
economy in its preparation to comply with the LET legislation. For the LET,
compliance costs affect all motor vehicle owners as well as various government
departments and some businesses such as fuelling stations. The administration costs
of implementing the LET refer to the start-up costs incurred by the ATO and other
government bodies such as the Licensing offices of the state Departments of
548
See Cedric Sandford, Michael Godwin and Peter Hardwick, Administrative and Compliance Costs
of Taxation (Fiscal Publications, 1989). 549
Binh Tran-Nam, ‘The Implementation Costs of the GST in Australia: Concepts, Preliminary
Estimates and Implications’ (2000) 3 Journal of Australian Taxation 331.
Page 279
259
Transport. The start-up compliance and administrative costs of the LET would
include:
- Learning about the LET and the new procedures;
- Measuring and quantifying motor vehicles for LET compliance;
- Registering motor vehicles for LET;
- Purchasing and installing number plate recognition technology at service
stations;
- Purchasing and installing the LET debit card POS terminals at each fuelling
pump;
- Installation of special number plate design;
- Set-up and operation of the LET Department;
- Training LET agents for annual and periodical road worthiness testing;
- Training LET auditors;
- Setting up procedures and forms at the ATO and state Departments of
Transport; and
- Training LET staff at the ATO and the state Departments of Transport.
Compliance costs can be minimised by getting things right the first time and this can
be achieved by a comprehensive education and training program.550
However, start-
up compliance costs are difficult to quantify since the implementation and build-up
period may be long and therefore not fully captured or accounted for. This is evident
in the various forecasts of the business start-up compliance costs for the GST,
ranging from AUD1.02 billion to AUD14.05 billion.551
Recurrent LET compliance costs would include the annual or periodical road
worthiness test and the time taken to top up the debit card. The ATO would also
incur recurrent LET collection costs in terms of staffing the LET Department and the
state Departments of Transport, setting up tax collection systems within the
departments, maintaining the LET debit card POS terminals and audit and legal costs
of prosecution for non-compliance of the LET legislation. The Commissioner of
550
Cedric Sandford, ‘Minimising the Compliance Costs of a GST’ in C Evans and A Greenbaum
(eds), Tax Administration – Facing the Challenges of the Future (1998) 130. 551
Binh, above n 549, 337–40.
Page 280
260
Taxation Annual Report 2010–11552
states that on average it costs AUD0.88 to
collect AUD100 of revenue and this has been used to forecast the LET revenues in
Chapter 7.553
The calculation of start-up and recurrent compliance costs for the LET requires a
detailed exercise which is beyond the scope of this research. However it is
recommended that a compliance cost study be undertaken as part of the LET
implementation process. In addition, a Regulation Impact Statement (RIS) will also
be required as soon as the administrative decision is made by the government that
LET regulations are necessary and the regulations are likely to have an impact on the
business or the non-profit sectors. Since the LET would have an impact on motor
vehicle manufacturers and fuel stations, an RIS would need to be prepared by policy
officers. The primary role of the RIS is to improve government decision-making
processes and it is normally prepared after stakeholder consultation has been carried
out. The Office of Best Practice Regulation (OBPR) is in charge of assessing and
reporting on compliance with best practice regulation requirements. The OBPR is an
independent arm of the Department of Finance and Deregulation.
The RIS for the LET would be required to set out: the problem or issues which gives
rise to the need for action; the desired objectives; the options, both regulatory and
non-regulatory that may constitute viable means of achieving the desired objectives;
an assessment of the impact, being costs, benefits and risks to consumers, business,
government and the community; a consultation statement; a recommended option
and a strategy to implement and review the preferred option.554
b. Task Force and Pilot Study
It is recommended that the Australian government should first set up a Task Force
similar to the Oregon Task Force to commence consultation with various government
departments such as the Department of Infrastructure and Transport, the Treasury,
552
Commissioner of Taxation, ‘Annual Report 2010–11’ (Australian Taxation Office, 30 September
2011) 9. 553
See Appendix Table 7.2. 554
Department of Finance and Deregulation, Australian Government RIS (25 June 2010)
Commonwealth of Australia <http://www.finance.gov.au/obpr/ris/gov-ris.html>.
Page 281
261
the Department of Environment and Resource Management and the Department of
Sustainability, Environment, Water, Population and Communities. The Task Force
should comprise representatives from each of the government departments, the
transport industry, the motor vehicle industry, the oil industry, academics, banks and
the business community. The Task Force should be given the primary responsibility
for the detailed work involved in developing and recommending the LET system
after carrying out detailed consultation with key stakeholders and the public. The
Task Force should elicit views from interested parties on key issues that would need
to be addressed in the development of the LET system by releasing discussion papers
and holding conferences similar to the Ralph Review and the Henry Review,
including on how the revenues from the LET would be dealt with under the
federal/state relationship.
After the consultation process, the government should authorise pilot studies to be
conducted, similar to the Oregon pilot study. The consultation process and the pilot
study would form part of the public education process and this could take many
years. The Oregon Road User Fee Task Force was set up in 2001 and the final report
of Oregon’s Mileage Fee Concept and Road User Fee Pilot Program was only
released in November 2007. The timeline for the implementation of the LET system
is dependent upon the commitment of resources and the political will. As stated in
the Oregon Report, if a country can send a man to the moon with less than a decade
of planning, then Australia should be able to find a way to implement the LET
system in a much shorter period of time.555
6.5 CONCLUSION
The LET system described in this Chapter gives consumers the choice of purchasing
and using a motor vehicle that either attracts no points, or attracts a large number of
points. By undertaking to implement the LET system in Australia, the Australian
government would be taking responsibility for persuading people to use passenger
motor vehicles that consume less oil. This is similar to the government passing
carbon tax legislation to control the carbon release into the environment.
555
Whitty, above n 305, 68.
Page 282
262
Under the recommended formulas for calculating and discounting the LET, each
LET point in the first year would only attract a LET of AUD10 on the initial
purchase, AUD2.50 every year on registration, 0.5 cents per litre excise on fuel and
only AUD0.20 disposal fee. After five years of implementing the LET, each LET
point would attract AUD50 on initial purchase, AUD12.50 every year on
registration, 2.50 cents excise per litre on fuel and AUD1 disposal fee. In the tenth
year after implementation of the LET, each LET point would attract AUD500 on
initial purchase, AUD125 every year on annual registration, 25 cents excise per litre
on fuel and AUD10 disposal fee. Thus the LET payable would be more if a person
chooses to purchase and use a motor vehicle that attracts more LET points, as
demonstrated in this chapter by the comparison between a Holden VE that attracts 63
LET points and a Smart Fortwo that attracts only 10 LET points. The maximum
number of LET points that can be attracted under the system are 120.
An evaluation of the LET system is undertaken in Chapter 7 in terms of the revenues
it can generate in Australia, the oil use it can save, tax collection, fee calculation,
technology, cost of state-wide implementation, auditing, fee rate structure, the phase-
in period, systemic precision, adaptability to congestion pricing, public acceptance,
convenience, privacy and protection of personal details, the criteria of a good tax,
and its potential to change motorist behaviour with regard to the choice and usage of
passenger motor vehicles.
Page 283
263
CHAPTER 7: EVALUATION OF THE LET
SYSTEM
7.1 INTRODUCTION
The LET system described in Chapter 6 is evaluated in this chapter under five
categories:
- The net revenue generation potential of the LET;
- The expected savings in oil usage as a result of implementing the LET;
- General matters relating to collection, fee calculation, technology, cost of
state-wide implementation, auditing, fee rate structure, phase-in period,
systemic precision, adaptability to congestion pricing, public acceptance,
convenience and protection of privacy;
- The LET assessed under the known criteria of a good tax; and
- The LET’s ability to change behaviour.
7.2 NET REVENUE GENERATION POTENTIAL
An exercise has been carried out as part of this thesis to measure the net revenue
generation potential of the LET. The LET rates stated in Table 6.6 have been used to
forecast the net revenue. They have not been indexed over the period of the forecast
as it is proposed that the rates will not change for the first 10 years. The discount
factor as stated in Table 6.8 has been taken into consideration over the 10 year
period, ranging from 98 percent in year one to nil discount in year 10. This exercise
demonstrates the ability of the LET to raise sufficient revenue to build the public
transport infrastructure that would be required as a result of the change in travel
behaviour that is anticipated after implementation of the LET.
In order to forecast the LET revenues, it was first necessary to categorise the current
Australian motor vehicle fleet into the following categories: light cars, small cars,
Page 284
264
medium cars, large cars, SUVs, people movers (PM) and sports cars, so that the LET
taxable value and the tax payable can be calculated for a vehicle falling within each
of those categories. Part 7.2.1 describes how this exercise was carried out.
The next three parts 7.2.2 to 7.2.4 explain how the revenue forecasts are made under
each category of the LET, ie the purchase LET, the annual registration LET and the
fuel excise LET. The revenues from the disposal LET are likely to be small and are
therefore ignored for the purpose of this exercise. The revenues have been forecasted
by using year 2011 data as the starting point and years 2011 to 2015 as years before
implementation of the LET. Years 2016 to 2025 are then treated as the first 10 years
after implementation of the LET for which the revenues have been forecasted. These
dates would change depending on the will of the government and acceptance of the
LET system by the people. However, the data provides an insight into the revenue
generation potential of the LET and how the revenues can be utilised in building an
infrastructure for passenger transportation in Australia.
The total revenue forecast for the LET excluding the disposal LET for passenger
motor vehicles from years 2016 to 2025 is expected to range from AUD2.21 billion
in 2016 to AUD109.97 billion in year 2025 as shown in Appendix Table 7.5 in
Appendix 7 at the end of the thesis. However, the forecast revenue could decrease to
about AUD20 billion per annum by 2025 if an ideal LET car were to be increasingly
adopted by the Australian population as shown in Figure 7.8 in Part 7.2.4.
7.2.1 LET Vehicles in Australia
The LET system as described in Chapter 6 operates by allocating LET points to each
vehicle category on the basis of weight, engine size, engine capacity and CO2
emissions. A rate is then applied at each taxing point to convert the LET points into
LET payable. It is not possible to accurately forecast the LET points for every single
motor vehicle in Australia. However a general revenue forecast has been achieved by
examining the Australian motor vehicle fleet and extracting the LET points under the
following six categories of motor vehicles: light cars, small cars, medium cars, large
cars, SUVs, PMs and sports cars. Appendix 3 at the end of this thesis shows in detail
Page 285
265
the four step process by which the LET points were calculated and the information
that was obtained and used in making those calculations. The motor vehicle
categories are in line with the Commonwealth Government’s Green Vehicle Guide
and the motor vehicle specifications known as ‘V Facts’ obtained from the Federal
Chamber of Automotive Industries. Appendix 3 also shows how the average
characteristics, ie weight, engine capacity, engine power and CO2 emissions, have
been calculated for each category of motor vehicle, the calculation of the total LET
points and the LET payable per vehicle under each of those categories.
For the purposes of this research, the specifications for typical Australian cars are
summarised in Table 7.1.
TABLE 7.1: Specifications of Australian Vehicles
Category Weight (kg) Engine Size
(cc)
Engine Power
(kW)
Emissions
CO2
Light Car556
813 1147 59 128
Small Car557
1100 1469 79 146
Medium Car558
1387 2010 127 186
Large Car559
1659 3148 181 228
SUV560
1970 3252 174 258
People Mover561
1977 2775 135 242
Sports Car562
1605 3921 252 250
After carrying out the detailed exercise of extracting the typical characteristics of the
motor vehicles under the seven categories as described in Appendix 3 and set out
above, Appendix Table 3.10 in Appendix 3 shows the LET points allocated and
Appendix Table 3.11 in Appendix 3 shows the LET payable by a single motor
vehicle at each taxing point under each of the seven motor vehicle categories. Tables
Appendix 3.12 to 3.18 apply the discount rate and show the LET attracted over a 10
556
See Appendix Table 3.3 in Appendix 3. 557
See Appendix Table 3.4 in Appendix 3. 558
See Appendix Table 3.5 in Appendix 3. 559
See Appendix Table 3.6 in Appendix 3. 560
See Appendix Table 3.7 in Appendix 3. 561
See Appendix Table 3.8 in Appendix 3. 562
See Appendix Table 3.9 in Appendix 3.
Page 286
266
year period at the four taxing points by each vehicle under the seven LET categories
of motor vehicles as described above. The results in Appendix Table 3.10 confirm
that light, small and medium cars have lower LET points compared with large cars,
SUVs, people movers and sports cars. SUVs attract the most LET points, whereas
sports cars are not as heavy, but score high points on engine size, engine power and
CO2 emissions. As a demonstration, the LET attracted by a single motor vehicle from
each of the categories in the first year of implementation and discounted by 98 per
cent is demonstrated in Figure 7.1.
FIGURE 7.1: LET Attracted in Year 1 at Four Taxing Points
Source: Appendix Tables 3.12 to 3.18 in Appendix 3.
Figure 7.1 shows the LET payable by a single vehicle within each of the seven
categories of motor vehicles on initial purchase, on annual road registration, the fuel
LET payable per 1000 litres of fuel and the LET payable on disposal of a vehicle. In
order to determine the total LET revenue that would be generated in the first 10 years
of introducing LET, the exercises described in parts 7.2.2 to 7.2.4 and Appendices 4
to 6 were carried out.
0
100
200
300
400
500
600
700
800
Initial Purchase Road Registration Fuel per 1000 Litres Disposal Fee
Light
Small
Medium
Large
SUVs
PM
Sports
Page 287
267
The revenue forecast reveals that the timing of the change is important as public
transport infrastructure has to be ready when the change is forecasted to occur. Thus
the revenue raised can be controlled by changing the discount rate for years one to
ten and in the process the timing of the change in travel behaviour can also be
controlled, so as to bring about an orderly change in the personal transportation
needs of the Australian people and avoid chaos.
7.2.2 Forecast of the Purchase LET Revenues
A six step process described in Appendix 4 at the end of this thesis was undertaken
to forecast the purchase LET revenues for the years 2016 to 2025, on the assumption
that the LET is implemented in year 2016. Based on the available data for 2011, the
number and category of new motor vehicle sales that would naturally occur without
the introduction of the LET were projected for years 2012 to 2025 based on logical
assumptions. These projections were then adjusted by forecasted changes that would
occur as a result of introducing the LET. These forecasted changes included an
expected gradual decline in the number of new motor vehicle sales by 15 per cent
over a period of 10 years to 2025 and a change in the types of passenger motor
vehicles purchased from motor vehicles that attract a high LET to those that attract a
lower LET in line with the discounted LET rates. The LET calculated in Appendix 3
for a single vehicle was then applied to the projected new motor vehicle sales to
arrive at the projected income from the purchase LET. A summary of the total
purchase LET revenues raised in each year from 2016 to 2025 is displayed in Figure
7.2.
Page 288
268
FIGURE 7.2: Total Purchase LET Revenues from Car Sales Data After
Implementation of LET in AUD Billion
Source: Appendix Table 4.6 in Appendix 4.
The total LET revenues from the purchase LET are forecasted to range from
AUD0.35 billion in 2016 to AUD10.84 billion in 2025. A further breakdown of the
purchase LET revenues for each category of motor vehicle is shown in Figure 7.3.
0
2
4
6
8
10
12
2016 2017 2018 2019 2020 2021 2022 2023 2024 2025
Total Purchase LET Revenues
Page 289
269
FIGURE 7.3: Purchase LET Revenues for Each Motor Vehicle Category after
Implementation of LET in AUD Billion
Source: Appendix Table 4.6 in Appendix 4.
It can be observed from Figure 7.3 that the revenues from large cars, SUVs, PMs and
sports cars are expected to decline as the policy takes effect, whereas the revenues
from light, small and medium cars are expected to increase.
7.2.3 Forecast of Annual Registration LET Revenues
A four step process described in Appendix 5 at the end of this thesis was undertaken
to forecast the annual registration LET for the years 2016 to 2025. Based on the
available data for 2011, the numbers and categories of the Australian passenger
motor vehicle fleet for 2012 to 2025 were first projected based on logical
assumptions. These projections were then adjusted to take into consideration the
changes that may occur as a result of the introduction of the LET. For the purpose of
the adjustments, it was assumed that there would be an expected gradual decline in
the number of passenger motor vehicle stock of 15 per cent by 2025 as a result of the
0
1
2
3
4
5
6
2016 2017 2018 2019 2020 2021 2022 2023 2024 2025
Light
Small
Medium
Large
SUVs
PM
Sports
Page 290
270
introduction of the LET. It was also assumed that the types of motor vehicles that
made up the motor vehicle stock would change, with a gradual decline in passenger
motor vehicles that attract a high LET and an increase in vehicles that attract a lower
LET, in proportion to the LET discount rate. The LET calculated in Appendix 3 for a
single vehicle was then applied to the projected motor vehicle stock to arrive at the
projected income from the annual registration LET. A summary of the total annual
registration LET revenues raised in each year is shown in Figure 7.4.
FIGURE 7.4: Total Forecasted Annual Registration LET Revenues after
Implementation of LET in AUD Billion
Source: Appendix Table 5.4 in Appendix 5.
The total LET revenues from the annual registration LET are forecasted to range
from AUD1.37 billion in 2016 to AUD42.06 billion in 2025.
A further breakdown of the annual registration LET revenues for each category of
motor vehicle is displayed in Figure 7.5 below. Most of the annual registration LET
revenue is expected to be raised from SUVs until year 2023, and then overtaken by
small vehicles.
0
5
10
15
20
25
30
35
40
45
2016 2017 2018 2019 2020 2021 2022 2023 2024 2025
Total Annual Registration LET Revenue
Page 291
271
FIGURE 7.5: Annual Registration LET Revenues for Each Motor Vehicle
Category after Implementation of LET in AUD Billion
Source: Appendix Table 5.4 in Appendix 5.
7.2.3 Forecast of Fuel LET Revenues
A six step process described in Appendix 6 at the end of this thesis was undertaken
to forecast the revenue from the fuel LET for the years 2016 to 2025. The average
CO2 emission data gathered for each category of Australian motor vehicle in
Appendix 3 was used to determine the consumption of fuel per kilometre of travel.
The ABS Survey of Motor Vehicle Use for the year 2011 revealed the average
number of kilometres travelled by a passenger motor vehicle per annum and this data
was used to determine the annual fuel use per category of vehicle. This result was
then applied to the forecasted passenger motor vehicle fleet in Appendix 5 to
calculate the total forecasted fuel use of the Australian vehicle fleet. The fuel LET
per litre calculated in Appendix 3 for a single vehicle was then applied to the
projected fleet fuel use to arrive at the projected income from the fuel LET. A
summary of the total fuel LET revenues raised in each year is displayed in Figure 7.6
below.
0
5
10
15
20
25
2016 2017 2018 2019 2020 2021 2022 2023 2024 2025
Light
Small
Large
SUVs
PM
Sports
Page 292
272
FIGURE 7.6: Total Forecasted Fuel LET Revenues after Implementation of
LET in AUD Billion
Source: Appendix Table 6.6 in Appendix 6.
The total fuel LET revenues are predicted to range from AUD4.42 billion in 2016 to
AUD61.52 billion in 2025. A further breakdown of the annual registration LET
revenues for each category of motor vehicle is shown in Figure 7.7 below.
0
10
20
30
40
50
60
70
2016 2017 2018 2019 2020 2021 2022 2023 2024 2025
Total Fuel LET Revenue
Page 293
273
FIGURE 7.7: Fuel LET Revenues for Each Motor Vehicle Category after
Implementation of LET in AUD Billion
Source: Appendix Table 6.6 in Appendix 6.
The data in Figure 7.7 demonstrates that the maximum fuel LET revenues are
expected to be raised from SUVs until the year 2023. The fuel LET revenues from
small motor vehicles are then forecast to increase steeply from 2021 to reach an
expected maximum of AUD18.44 billion in 2025, whereas the fuel LET revenues
from SUVs are expected to decrease from AUD16.27 billion in 2023 to AUD2.74
billion in 2025.
7.2.4 The Effect of Net Revenue Generation Potential
Appendix Table 7.1 in Appendix 7 at the end of this thesis shows the total forecast
revenue from LET for the years 2016 to 2025, ranging from AUD6.15 billion to
AUD114.42 billion. It is proposed in this thesis that when the LET is introduced by
the Australian government, the LCT and the fuel excise for passenger motor vehicles
should be abolished. Appendix Tables 7.3 and 7.4 in Appendix 7 show an estimate of
the revenues that may be forgone from the LCT and the fuel excise. The cost of
0
2
4
6
8
10
12
14
16
18
20
2016 2017 2018 2019 2020 2021 2022 2023 2024 2025
Light
Small
Medium
Large
SUVs
PM
Sports
Page 294
274
collecting the LET is forecasted in Appendix Table 7.2 in Appendix 7. The net
revenue forecast after taking into consideration the forgone revenues from the LCT
and fuel excise and the cost of collecting the LET is shown in Appendix Table 7.5 in
Appendix 7 and ranges from AUD2.21 billion in 2016 to AUD109.7 billion in 2025.
To put it in perspective, the total revenue administered by the ATO on behalf of the
government for the year ended 30 June 2011 was AUD280.89 billion, of which
AUD204.73 billion was from income tax, AUD75.13 billion was from indirect tax
and AUD1.02 billion was from other taxes. Of the income tax revenues, AUD136.55
billion was from individual income tax and AUD57.34 billion was from
companies.563
Thus the forecast LET revenues could be substantial. However it is
possible that the revenues from the LET may not be generated as forecasted if a
motor vehicle manufacturer in Australia designs and manufactures a new motor car
that attracts no LET, and this car then dominates the Australian fleet. Moreover, the
basis on which the forecasts are made may differ from the real changes that can
occur in the number of motor vehicles in the motor vehicle fleet, the types of motor
vehicles purchased and the number of vehicle kilometres travelled.
The purpose of the LET car is to use it for very short distance travel, especially
within a suburb or to the nearest transport hub, and to encourage the use of public
transport for medium to long-distance travel. Thus as the LET policy takes effect, the
total forecasted LET revenues should substantially decrease, as LET cars that attract
little or no LET are likely to be adopted by Australians, and passenger transportation
is likely to shift from motor car to public transport. Figure 7.8 below shows an ideal
shift in revenue position as the LET policy takes effect and the LET car is
increasingly adopted by taxpayers. The reduction in LET revenues arising as a result
of replacing the Australian vehicle fleet with LET vehicles is likely to be
compensated by an increase in revenues from public transport usage, especially if
public transport remains government-owned, rather than being privatised.
563
Commissioner of Taxation, above n 552, 246 and 300.
Page 295
275
FIGURE 7.8: Forecasted Reduction in LET Revenues With the Adoption of an
Ideal LET Car
The purpose of the LET design is not to forecast the revenues it would generate with
certainty, but to indicate its revenue generation potential, as the revenue generated
should be used to bring about a change in personal transportation infrastructure in
Australia that will last for 100 years. The level of LET imposed needs to be managed
in order to bring about an orderly change. The raising of the forecast revenues should
occur only in line with changes in infrastructure, in order to cope with the increased
use in public transport. The LET would provide income to the government to build
the public transport infrastructure that is required to bring about the desired changes.
An orderly change is likely to be gradual. However, the government may run out of
time if the public transport infrastructure has not been built before the conventional
oil required for personal transportation becomes unaffordable by the general public.
Thus the Australian government needs to act now and educate the population that a
LET will enable Australia to decrease its reliance on foreign oil and provide an
opportunity for the people to undertake personal transportation that is cheaper, faster
and more energy efficient.
0
20
40
60
80
100
120
140
1 2 3 4 5 6 7 8 9 10 11 12 13 14 15
Forecasted LET Revenues without adopting a LET Car
Forecasted LET Revenues after adoption of a LET Car
Page 296
276
7.3 THE EXPECTED SAVING IN THE USAGE OF OIL
Based on the forecasts stated in part 7.2 above, the potential savings in oil as a result
of introducing the LET are shown in Appendix Table 8.3 in Appendix 8 at the end of
this thesis. The saving in oil ranges from 2.23 billion litres in 2016 to 15.66 billion
litres in 2025. The total oil saved from 2015 to 2025 amounts to 85.71 billion litres.
A comparison of the oil saved with the oil that would be consumed by passenger
motor vehicles without the implementation of the LET shows savings ranging from
five per cent in 2015 to 67 per cent in year 2025. The percentage saving in oil is
shown in Figure 7.8 below.
FIGURE 7.9: The Expected Percentage Savings in Oil with the Introduction of
the LET
The saving in oil for each motor vehicle category in million litres is shown in Figure
7.9.
0
10
20
30
40
50
60
70
80
2015 2016 2017 2018 2019 2020 2021 2022 2023 2024 2025
Percentage savings in oil
Page 297
277
FIGURE 7.10: Savings in Fuel by Vehicle Category from 2015 to 2025
Source: Appendix Table 8.3 in Appendix 8.
Figure 7.9 demonstrates that the greatest total savings in oil from 2015 to 2025 is
from SUVs, representing 41 per cent of the total savings. The ‘other’ category in
Figure 7.9 represents driving habits from all vehicle categories as discussed in Step 3
under Appendix 6.
The reduction in CO2 resulting from the savings in oil can be estimated by using the
conversion rate of one litre of oil emitting 2.36kg of CO2 as stated in Step 1 of
Appendix 6. Thus 85.71 billion litres of oil would save 202 million tonnes of CO2
emissions from passenger motor vehicles to year 2025. This is a significant reduction
in emissions.
7.4 GENERAL EVALUATION OF LET
A general evaluation of the LET is carried out in this part in terms of collection, fee
calculation, technology, cost of state-wide implementation, auditing, fee rate
structure, phase-in period, systemic precision, adaptability to congestion pricing,
0
5000
10000
15000
20000
25000
30000
35000
40000
Savings in usage of oil in million litres
Light
Small
Medium
Large
SUVs
PM
Sports
Others
Page 298
278
public acceptance, convenience and protection of privacy. This exercise is similar to
the evaluation of the mileage fee under the Oregon study discussed in Chapter 5 of
this thesis.
Based on the proposals made in Chapter 6, the purchase LET would be collected
either directly by the ATO or indirectly via the state Departments of Transport. The
fuel LET would be collected directly by the ATO through machines similar to ATMs
set up at fuel pumps, with payment being made using prepaid debit cards. The annual
registration LET would be collected by the state Departments of Transport along
with state licensing fees. The disposal LET would also be collected by the state
Departments of Transport. There will obviously be an initial compliance cost in
setting up the collection systems as discussed in Part 6.4.5. However, the benefits
derived from implementing the LET would far outweigh these costs, the benefits
being not only the expected saving of oil and a decreased reliance on imported oil,
but the preparedness of the public transport infrastructure to accommodate the
increased demand when oil becomes expensive.
In terms of the fee calculation, the accumulation of LET points determines the
amount of LET payable at each taxing point. The points are assigned at the time the
motor vehicle is first registered for LET as discussed under part 6.4.4 above. Once
the points are allocated, the amount of LET payable is only a mathematical formula.
The technology required for the LET system to operate is mainly the number plate
recognition technology, the LET debit card POS terminals similar to ‘Pay at the
pump’ systems, and the use of debit cards. These technologies are already advanced
and are commercially available as demonstrated in Chapter 6 above. The adoption of
this technology at each fuel pump at a service station would involve a cost. However,
the cost is unlikely to outweigh the potential benefits to be derived from the LET
system, as already discussed in this thesis.
The fee rate structure is based on the four characteristics of a motor vehicle that can
affect the consumption of oil, ie vehicle weight, engine size, engine power and CO2
emissions. The fee rate structure does not take into consideration a person’s ability to
pay the tax. However, these considerations can be addressed through the social
security system and by providing tax rebates as discussed in part 7.5 below.
Page 299
279
The phase-in period needs to be aligned with the time it would take to educate the
public of the benefits of the LET system and setting up the administration of the
system. A five year time frame has been estimated. Since the LET system is
comprehensive and only requires the abolition of the LCT and fuel excises on
passenger motor vehicles, the phase-in period of the full operation of the LET system
could be relatively short. The annual registration LET would take at least a year to
implement as its collection is proposed to be in line with licence fee renewals.
As regards systemic precision, the error rate is likely to be low as the LET
calculation and collection would be precise. Any error in allocating the LET points is
likely to be minimal under the vehicle certification process as discussed in part 6.4.4
above. The likelihood of error in the number plates issued by the Department of
Transport is also likely to be low. Errors in using number plate recognition
technology and the LET debit card POS terminals at the fuel pumps are also likely to
be low. Thus it can be concluded that the LET system is likely to have a high
systemic precision.
The audit of the LET system is discussed under 6.4.4 above where both general and
specific audits are recommended. The fear of audits and the imposition of penalties
would prevent abuse of the LET system. The aim of the system is not to be 100 per
cent foolproof, but the system would deter LET avoidance.
The LET system can be adapted to congestion pricing by using the example of the
Oregon mileage fee system as discussed in Chapter 5 above. Alternatively, a system
similar to the Singapore congestion pricing system could be used whereby the
number plate of the vehicle passing through the congested street is recognised and
the congestion fee charged to the debit card already issued to the registered owner of
the vehicle under the LET system. The congestion charges imposed could also be
aligned to the LET points, thereby discouraging fuel guzzling passenger vehicles on
congested roads.
Acceptance by the public would very much depend upon the education process. The
public acceptance of the Norway toll system is high due to the public involvement in
the organisational structure as discussed in part 5.2.2 above. The Norwegian study
demonstrated that public confidence increases where there is a strong connection
Page 300
280
between user payments and perceived benefits. Thus the benefits of the LET system
need to be demonstrated to the public in order for the system to be accepted by the
public. The reasons for setting up the LET system were explored in Chapters 2, 3 and
4 of this thesis. The scarcity of oil and Australia’s dependence on foreign oil together
with passenger motor vehicles being the largest consumer of oil are the core catalysts
that call for a change in the way passenger transportation is undertaken in Australia.
The suggested LET would assist in bringing about this change, in terms of providing
the necessary funds for the government to improve the public transport infrastructure
and a change in the type of passenger motor vehicles that are purchased and used for
personal transportation.
As regards convenience, the owners and users of passenger motor vehicles do not
have to undertake tasks that are onerous. The LET collection at each taxing point
would be fairly automated and therefore the LET can be said to be reasonably
convenient.
The LET system is unlikely to invade the privacy of an individual. Unlike the
kilometre/mileage system discussed in Chapter 5 for the Netherlands and Oregon,
where the information about where the motor vehicle has been driven instigates
privacy concerns as to how that information could be gathered and used by
government organisations, the LET system only displays publicly the LET points
attracted by the vehicle. This does not affect the privacy of the owner or user of the
vehicle. In fact the display of the LET points act as an advertisement of the number
of LET points attracted by that make and model and would amount to an educational
exercise, rather than an infringement of privacy.
In conclusion, a general evaluation of the LET in terms of collection, fee calculation,
technology, cost of state-wide implementation, auditing, fee rate structure, phase-in
period, systemic precision, adaptability to congestion pricing, public acceptance,
convenience and protection of privacy appears to be positive. In the next part, the
LET is evaluated using Adam Smith’s criteria of a good tax.
Page 301
281
7.5 EVALUATION UNDER THE PRINCIPLES OF A GOOD
TAX
The design of a good tax system should not only achieve its vision or purpose, but
should also strive to achieve the criteria for an efficient tax. One way to assess the
recommended LET is to assess it against a ‘checklist’ of desirable properties. The
checklist of desirable properties can be drawn from the most famous canons of
taxation set out by Adam Smith in The Wealth of Nations published in 1776.564
Adam Smith’s criteria of a good tax are:
(i) The subjects of every state ought to contribute towards the support of the
government, as nearly as possible, in proportion to their respective abilities
...
(ii) The tax which the individual is bound to pay ought to be certain and not
arbitrary ...
(iii) Every tax ought to be levied at the time, or in the manner, in which it is
most likely to be convenient for the contributor to pay it.
(iv) Every tax ought to be so contrived as to take out of the pockets as little
as possible, over and above that which it brings into the public treasury of
the state.565
Mark Hinnells and Stephen Potter have built upon Adam Smith’s criteria of a good
tax and explored the principles of a good environmental tax, stating that taxes must
not only be ‘good taxes’ in the conventional sense of the word but must be good
taxes in a strictly environmental sense.566
The LET is evaluated below based upon a checklist of criteria drawn from Adam
Smith’s criteria of a good tax and Hinnells’ and Potter’s idea of a good
environmental tax. Although the LET is evaluated using the commonly-used general
principles, it has been noted by Clinton Alley and Duncan Bentley that the general
principles should be interpreted within the perceived purpose or vision of the tax
564
Adam Smith, An Inquiry into the Nature and Causes of the Wealth of Nations (Oxford University
Press, selected ed, 1993) 450, extracted from Clinton Alley and Duncan Bentley, ‘A Remodelling of
Adam Smith’s Tax Design Principles’ (2005) 20 Australian Tax Forum 579, 586. 565
James Mirrlees et al, Dimensions of Tax Design: The Mirrlees Review (Oxford University Press,
April 2010) 22. 566
Mark Hinnells and Stephen Potter, ‘Don’t Tax More, Tax Different! A Tax Paradigm for
Sustainability’ (Paper No 20, Centre for Reform, 2001) 6.
Page 302
282
system. Taxation, being the compulsory extraction of money by the government for
which the taxpayer receives nothing directly in return, can have three purposes: to
provide revenue for government expenditure; to act as an instrument to achieve
economic aims set by the government; and to redistribute income on a socially
acceptable basis.567
The vision for the LET encompasses the three purposes stated: to
provide revenues to the government for efficient public transport systems that will be
required for passenger transportation when oil becomes expensive; to act as an
instrument to change behaviour in the choice and usage of passenger motor vehicles;
and to preserve the scarce oil resource so that it is available for use on a socially
acceptable basis for current and future generations.
The LET is first evaluated under the four principles of an ideal tax system laid down
by Adam Smith, being equity, certainty, convenience and economy.
7.5.1 Equity
Under the Adam Smith’s criteria of equity, the subjects of every state ought to
contribute towards the support of the government, as nearly as possible in proportion
to their respective abilities. The question is whether equity is always measured in
proportion to the revenue which the subjects respectively enjoy under the protection
of the state. Equity or fairness is often classified as horizontal equity or vertical
equity. Horizontal equity means people in the same situation should be equally
treated. In other words, like taxpayers are taxed alike. Vertical equity means
taxpayers in different situations are differently treated. The Asprey Report from the
Taxation Review Committee in 1975 reflected on various interpretations of this
principle. One way of viewing this principle is the ‘benefit’ approach, ie the tax
payment should equate the benefits individuals are estimated to receive from
government-provided goods and services. However, the Asprey Report stated that
the benefit approach would be hard to apply as it is difficult to measure the benefits
one derives from government-provided goods and services. Another approach is the
‘ability to pay’ approach where tax is viewed as a ‘sacrifice’ levied upon a private
economic ‘wellbeing’ and the ‘sacrifice’ and the ‘wellbeing’ need to be measured in
567
Alley and Bentley, above n 564, 582–83.
Page 303
283
money terms. Thus an individual’s wellbeing is often measured in terms of his or her
income. However the Asprey Report identifies a number of problems including the
meaning of ‘income’ and whether the unit of tax should be an individual or a family
and whether income should be measured over one year or one’s lifetime.568
Further
complications from the equity perspective occur in figuring out who actually pays
the tax, in that the statutory or legal incidence shows who receives the tax bill,
whereas economic incidence shows who bears the tax burden.
The literature in this field identifies a debate of the meaning of the phrase ‘ability to
pay’ under Adam Smith’s criteria. The question is whether the ‘ability to pay’
equates to the income or wealth of a person and consumption taxes are prone to
breaching the ‘ability to pay’ principle because they are in proportion to consumption
rather than the revenue they enjoy under the protection of the state.569
Often a tax is
accepted by the electorate if the benefits of the tax outweigh its regressive nature. An
example of such a tax in Australia is the Goods and Services Tax (GST).570
Taxes are
labelled as regressive when they are a decreasing proportion of income as income
rises.
Traditionally energy taxes have been labelled as strongly regressive, as early studies
have ignored the indirect and long-term effects of environmental taxes. However
later studies indicate that when the purpose of the environmental tax is to change
behaviour over a long period, and the tax burden is measured over a longer period
and includes both direct and indirect impacts that include the energy to produce
energy and non-energy products, the regressivity is less.571
An environmental tax such as the LET may be considered regressive if measured in
terms of a person’s income as the tax is based on consumption criteria, ie the choice
and use of a motor vehicle. However, a person has the choice to avoid the tax by
choosing an appropriate LET vehicle or using public transport. It could be argued
that a person has the ability to pay if they have the ability to consume more oil in
their choice of a passenger motor vehicle. Under this interpretation, the LET would
568
Asprey Committee, above n 41, 3.7–3.15. 569
For good debate on the literature, see Alley and Bentley, above n 564. 570
Ibid, 601. 571
Jeff Hamond, Hardy Merriman and Gary Wolff, ‘Equity and Distributional Issues in the Design of
Environmental Tax Reform’ (1999) Redefining Progress 1.
Page 304
284
not be considered to be regressive. Moreover, the design of the LET can take into
consideration certain special circumstances such as remote locations, disabilities,
certain specific occupations and non-availability of public transport systems that may
require dispensation to satisfy the criteria of equity. The design of the LET can in
fact work in a progressive manner if the LET revenues are utilised in providing
sufficient and frequent public transport facilities. Thus the LET collected from
people with more ability to pay can be used to subsidise the public transport for
people with less ability to pay.
In addition to equity in the traditional sense, the concept of intergenerational equity
becomes relevant to the sustainability of the oil resource. The Brundtland
Commission defined intergenerational equity in terms of sustainable development as:
‘development that meets the needs of the present without compromising the ability of
the future generations to meet their own needs.’572
Sharon Beder argues that there are
two ways of looking at how to ensure that future generations can supply their needs.
One is a weak sustainability argument and the other is a strong sustainability
argument. Under the weak sustainability argument, the view is that future
generations will be adequately compensated for any loss of environmental amenity
by having alternative sources of wealth creation. Under the preferred strong
sustainability argument, the loss of environmental amenity cannot be replaced by
human-made wealth and the future generation should not inherit a degraded
environment.573
Pearce et al argue that there are various reasons why the strong
sustainability argument is preferred, being lack of substitutes, uncertainty as to
whether substitutes can replace the degraded environmental asset, and that reversing
the damage may be impossible or it may take centuries to repair.574
As regards oil, considering that it took millions of years for oil to be formed and that
we are now accustomed to using oil in every aspect of our lives and there is
uncertainty about finding a substitute for oil, the strong sustainability argument
implies that oil should be considered a luxury and should be preserved for future
generations and not wasted. Weiss argues that resource consumption can increase the
572
Brundtland, above n 495. 573
Sharon Beder, ‘Costing the Earth: Equity, Sustainable Development and Environmental
Economics’ (2000) 4 New Zealand Journal of Environmental Law 227, 228. 574
David Pearce, Anil Markandya and Edward Barbier, Blueprint for a Green Economy (Earthscan,
1989), ch 2 in Beder, above n 573, 228.
Page 305
285
real prices of those resources for future generations.575
The imposition of a LET
supports the intergenerational equity argument by reducing the consumption of oil in
passenger motor vehicles so that the ability of future generations to meet their need
for the oil resource is not compromised.
7.5.2 Certainty
Under Adam Smith’s criteria, the requirement of certainty refers to the time of
payment, the manner of payment and the quantity to be paid and these criteria ought
to be clear and plain to the contributor and to every other person.576
A tax that is
certain will improve the taxpayer’s understanding of his or her obligations and
thereby increase the level of confidence a taxpayer will have in their compliance.577
A simple tax is likely to be certain. A tax is called simple if the administration and
compliance costs are less and these costs are likely to be less if the assessor and the
assessed can establish with certainty what is due.578
The Asprey Report mentions two
aspects of simplicity. Firstly it states that a simple tax is one that requires the
taxpayer to perform fewer operations for the administrators to make the assessment
and the taxpayer to ascertain the liability. Secondly, a simple tax is one that has
fewer collection points, ie ‘the sheikdom that can raise all it requires (and maybe
much more) from a single tax on a single oil company has what is unquestionably the
simplest tax system of all.’579
The LET system as described in Chapter 6 satisfies the criteria of certainty as the
rules clearly specify when the LET has to be paid, how it is to be paid and how the
amount to be paid is to be determined. Moreover, the LET collection does not require
complex tasks on the part of the taxpayer. Form-filling and using prepaid debit cards
would not be classified as complex tasks. Since the LET is similar to the GST and is
imposed on all registered owners of motor vehicles, it would not be classified as
575
Edith Brown Weiss, ‘In Fairness to Future Generations’ (1990) 32(3) Environment 9, in Beder,
above n 573, 229. 576
See Alley and Bentley, above n 564, 608. 577
American Institute of Certified Public Accountants, ‘Guiding Principles of Good Tax Policy: A
Framework for Evaluating Tax Proposals’ (Tax Policy Concept Statement, March 2001) 7. 578
Asprey Committee, above n 41, 3.7–3.20. 579
Ibid 3.21–3.22.
Page 306
286
simple under the second aspect of simplicity mentioned under the Asprey Report.580
The imposition of the LET directly on registered motor vehicle owners should not be
compromised for the sake of reducing collection points as it is necessary to impose
the LET directly on the registered owner of the motor vehicles to bring about
behavioural changes.
Certainty also refers to the degree of certainty with which the tax authority can
accurately predict the incidence of tax and the certainty with which the revenue
authorities can predict the revenue that will be raised in a particular year.581
The
revenue authorities can certainly identify the taxpayer under the LET as the taxpayer
is the registered owner of the passenger motor vehicle. Although the LET behaviour
change cannot be predicted with certainty, the revenues generated from the LET, if
earmarked for public transport infrastructure, will not affect the government’s
general revenue. It should also be noted that the decline in LET revenues is likely to
be compensated by an increase in revenues from the use of public transport. It should
also be noted that if the LET is not introduced and the price of oil becomes
unaffordable and people consequently demand public transport, this would not only
bring about a drastic reduction in the collection of existing fuel excise, but could also
result in chaos arising from an overburdened public transport system. By introducing
the LET, there is a positive degree of certainty that the LET revenues are available to
prepare for the increased demand on public transport systems when oil becomes
unaffordable.
7.5.3 Convenience
Under the Adam Smith criteria on convenience, a tax should be due at a time or in a
manner that is most convenient for the taxpayer. Convenience of payment assists in
keeping compliance levels high. A convenient tax would be one that is assessed at
the time of purchase when the person has a choice of purchasing the item or not.
580
Ibid. 581
Alley and Bentley, above n 564, 609.
Page 307
287
Another example of a convenient tax payment is for the tax to be collected along
with some other existing payment, thereby using an existing collection point.582
The LET would satisfy the criteria of convenience at the four collection points. The
purchase LET is collected at the time of purchasing the vehicle, and the registered
owner has a choice of whether or not to buy the vehicle and pay the purchase LET.
The annual registration LET is also convenient as it is collected together with the
existing state annual licence fees. The fuel LET is convenient as it is paid via prepaid
debit card at the time of purchasing fuel. The disposal LET is convenient as it is paid
at the time the number plate is returned to the Department of Transport.
The more difficult it is to pay a tax, more likely that it will not be paid. A system that
has high compliance costs is likely to have reduced convenience. The compliance
cost of the LET is discussed in part 6.4.5. As stated in that section, the start-up
compliance costs of the LET includes learning about the LET procedures, including
the use of the prepaid debit card and completing forms to register the motor vehicle
for the LET. There could also be costs incurred if there is a dispute relating to the
LET points allocated to a motor vehicle. The recurrent compliance costs for the LET
would include the annual or periodical road worthiness test and the time it would
take to top up the debit card. The proposed design of the LET does not provide for
the taxpayer to keep transaction records or prepare a LET return. Therefore taxpayers
are unlikely to incur the costs of an accountant or a tax preparer. However further
compliance costs could arise if there is a difficulty in paying LET due to the failure
of the prepaid debit card system. In this case, alternative procedures would need to
be put in place, such as being able to extract temporary debit cards from convenient
debit card outlets.
7.5.4 Economy
The economy criterion under the Adam Smith principle is that ‘Every tax ought to be
so contrived as to take out of pockets of the people as little as possible, over and
582
Ibid 610; American Institute of Certified Public Accountants, above n 577, 8.
Page 308
288
above that which brings into the public treasury of the State’.583
This means that the
cost of collection should be kept to a minimum. A tax that is administratively
efficient would yield to the government the largest possible proportion of the money
collected from the taxpayer. A tax that is complex increases the cost of
administration and compliance.
The administration cost of the LET is discussed in part 6.4.5. The implementation of
a new tax such as the LET would involve initial costs in setting up the LET
Departments in each state, the tax collection systems and procedures within the LET
Departments and the state Departments of Transport, all staff costs including
training, designing forms and software, and purchasing and installing equipment
such as the LET debit card POS terminals and the number plate recognition
technology. The recurrent costs include accounting for the LET collections, auditing,
maintenance of the LET debit card POS terminals and the automated number plate
recognition systems, updating software to calculate the LET owed, accounting for
revenues received, and identifying and prosecuting LET evaders. The fact that
administrative costs are incurred does not obviate the need for implementing the LET
for the purpose of changing motorist behaviour and reducing oil consumption in
passenger motor vehicles.
In addition to administrative efficiency, economic efficiency is also desired of a good
tax. This requires a tax to be neutral, in that considerations of tax liability do not
influence the manner in which a person conducts his or her affairs. However, taxes
are sometimes deliberately designed to change behaviour. Environmental taxes are
often designed to tackle spillovers or externalities. The purpose of the LET is to
change behaviour and therefore it will not satisfy the criteria of neutrality.
The LET is also explored under Mark Hinnells and Stephen Potter’s criteria of a
good environmental tax in the following section.
583
Alley and Bentley, above n 564, 611.
Page 309
289
7.5.5 Required Intervention
A ‘good environmental tax’ is one where the environmental intervention is justified.
The intervention should be weighed against the costs to society of an environmental
impact and this should be judged using the precautionary principle and not
epidemiological evidence.584
The precautionary principle for the LET was discussed
under Chapter 6, part 6.4.1. The intervention through LET is justified on the basis
that Australia imports around 80 per cent of the crude oil which is the primary energy
source for the transport sector. The uncertainty of global oil supply justifies
intervention through the LET by curbing the wastage of oil in fuel guzzling
passenger vehicles.
7.5.6 Price Elasticity
Price elasticity of the commodity needs to be taken into consideration in setting the
price of the product. A tax would only bring about a change if it is set high enough to
be equal to or exceed the costs of change or the cost of damage. Hinnells and Potter
state that price elasticity will depend upon the alternative technologies available and
the ease of adoption of alternative modes of behaviour.585
The LET is likely to bring
about a change as it is not preventing the use of a passenger motor vehicle, but it is
aimed at directing people to make appropriate choices based on the motor vehicle’s
oil consumption characteristics. The Australian government needs to ensure that the
introduction of the LET and the LET rates are synchronised with the availability of
alternative modes of public transport.
7.5.7 Built in Escalator
Hinnells and Potter state that it is better that an environmental tax is taxed earlier and
lower to give a long term signal for change, since evolution is more manageable than
revolution. Tax rates should be amended in light of the behavioural response to a
584
Hinnells and Potter, above n 566, 6. 585
Ibid.
Page 310
290
price change.586
The LET proposed in Chapter 6 has a built in escalator with a five
year educational period before implementation of the LET and five years of a highly
discounted rate, from 98 per cent discount in the first year to a 90 per cent discount
in year five. The discount is then reduced to 85 per in the sixth year, 75 per cent in
the seventh year, 50 per cent in the eighth year, 25 per cent in the ninth year and no
discount in the tenth year. The proposed discounted rates for the LET should be
adjusted in light of the behavioural response and the government’s ability to provide
alternative transport choices via the public transport network.
7.5.8 Use of Revenues Generated
The revenues collected from the environmental tax should be recycled into
investments that reduce resource consumption.587
It has been proposed in this thesis
that the revenue from the LET should be used by the government in building or
enhancing a public transport system that is time and energy efficient.
7.6 THE DESIRED ABILITY TO CHANGE BEHAVIOUR
There are a wide range of theories of behaviour change that can help to evaluate the
LET’s desired ability to change behaviour. According to research carried out by Lane
and Potter in exploring consumer attitudes towards purchasing cleaner vehicles, both
situational and psychological factors influence car purchasing behaviour. The
situational factors include economic and regulatory environments, vehicle
performance and existing fuel and road infrastructure. The psychological factors
include attitudes, lifestyle, personality and self image.588
Social and psychological
models or theories can assist in pointing out the important issues that may need to be
586
Ibid. 587
Ibid. 588
Ben Lane and Stephen Potter, ‘The Adoption of Cleaner Vehicles in the UK: Exploring the
Consumer Attitude — Action Gap’ (2007) 15(11–12) Journal of Cleaner Production 1086.
Page 311
291
dealt with in order to result in behaviour change.589
Some of the recognised theories
of behaviour change against which the LET is evaluated are:
- Individual level theories;
- Interpersonal behavioural theories; and
- Community theories of behaviour.
7.6.1 Individual Level Theories
Individual theories focus on the influences and processes involved in individual
decision-making.
a. The Rational Choice Theory
The rational choice theory views people as rational economic actors who make
decisions by assessing costs and benefits in order to maximise their welfare, and
policy instruments such as the LET would lead individuals to modify their
behaviour.590
Anable, Lane and Kelay argue that the textbook rational choice theory
tends to neglect the wider social, infrastructural and psychological factors such as
peer pressure.591
Applying the rational choice theory from a textbook perspective of
individuals being rational economic actors, the LET is likely to influence individual
behaviours by encouraging motorists to choose a motor vehicle that attracts less LET
points, as the LET imposes extra costs on a consumer.
589
Elizabeth Ampt, David Engwicht and Sinclair Knight Merz ‘A Personal Responsibility Perspective
to Behaviour Change’ (Paper presented at the 30th Australasian Transport Research Forum,
Melbourne, Australia, 25–27 September 2007) 1. 590
Jillian Anable, Ben Lane and Tanika Kelay, ‘An Evidence Base Review of Public Attitudes to
Climate Change and Transport Behaviour’ (Working Paper No PPRO 004/006/006, UK Department
for Transport, 2006) 66. 591
Ibid 67.
Page 312
292
b. Theory of Planned Behaviour (TPB)
Ajzen’s TPB states that a particular behaviour is caused by a person’s intention and
the intention is influenced by the person’s attitude, subjective and social norm and
controlled beliefs. The central factor in the TPB is the individual’s intention to carry
out the particular behaviour.592
Thus a person may have a wide range of motives or
beliefs relating to their choice and usage of a motor vehicle for personal
transportation.
Lane and Potter’s research indicates that environmental issues play little part in the
decision-making process to purchase a car. Their research points to a two stage
decision-making process. Firstly the model decision is made on the capability and the
purchase price of the vehicle. Then the consumer conducts a more sophisticated
consideration of factors such as running costs, fuel economy, performance, safety,
styling, image, brand and reliability.593
The beliefs central to the TPB are behavioural beliefs, normative beliefs and control
beliefs. Behavioural beliefs relate to the consequences of certain actions. Normative
beliefs relate to perceived expectations of others, and control beliefs refer to how
feasible it is to perform a particular behaviour.594
Although general attitudes and specific behaviours are complex, the LET would form
part of the perceived behavioural control in bringing about the desired change in
behaviour. The LET would become part of a factor that would require consideration
in the decision about the type of passenger motor vehicle to purchase and use. This is
likely to occur due to the design of the LET, whereby the LET is imposed not only at
the purchase level, but throughout the ownership of the passenger vehicle, ie at the
registration level, the fuelling of the vehicle and the disposal of the vehicle.
592
Ajzen, above n 40. 593
Lane and Potter, above n 588, 1089. 594
Ajzen, above n 40.
Page 313
293
7.6.2 Interpersonal Behavioural Theories
Interpersonal behavioural theories state that people change not only because of
personal characteristics, but also because of interactions with people around them.595
a. Triandis’ Theory of Interpersonal Behaviour
According to Triandis, a person’s behaviour is a function partly of what the person
intends, partly out of the person’s habitual responses and partly out of situational
constraints and conditions under which the person operates. The person’s intentions
in turn are influenced by social, normative and affective factors as well as by rational
deliberations.596
The LET would become a situational constraint and condition under
which a person would be required to operate and this constraint or condition is likely
to influence a person’s decision on the type of motor vehicle that they choose to
purchase and use for personal transportation.
b. Social Learning Theory
Bandura’s social learning theory states that in addition to using their own skills,
competency and experience, people learn by observing peers and model their
behaviour on what their peers are doing.597
This theory focuses on the self-efficacy
which increases people’s confidence in their ability to take action. The design of the
LET registration system displaying the LET points on the motor vehicle’s number
plate is likely to influence social learning, and social learning is a powerful tool to
use in bringing about an effective change.
595
Ampt, Engwicht and Sinclair Knight Merz, above n 589, 2. 596
Anable, Lane and Kelay, above n 590, 73. 597
Ibid 74.
Page 314
294
7.6.3 Community Theories of Behaviour
Community theories of behaviour are based on understanding how groups,
organisations, social institutions and communities function.
a. Social Capital Theory
Social capital has been defined as the connections and relationships among and
between individuals.598
Halpern states that these relationships consist of networks,
norms, relationships, values and informal sanctions that shape the quantity and
cooperative quality of a society’s social interaction.599
Social capital can assist in
explaining policy outcomes as it hinges on how people look around them for
guidance on how to behave based on trust and participation.
The introduction of the LET is likely to demonstrate a demand for an ideal LET
passenger vehicle that attracts the lowest number of LET points. When the demand
for such a vehicle becomes apparent and a new motor vehicle design that is
influenced by the LET emerges, the social capital theory would then work to increase
the popularity of such a vehicle, especially if the new vehicle proves to be affordable,
reliable and a fuel-efficient means of passenger transportation.
b. Diffusion of Innovation
The Diffusion of innovation theory states that new products, behaviours and ideas
diffuse through a social network or through the media over time and spread within a
society or from one society to another.600
This theory may have an impact on the
acceptance of the LET system as the LET number plates are advertised through the
social networks and media over time. Lane and Potter’s research on the adoption of
cleaner vehicles in the UK indicates that private car buyers seek or collect
598
Robert D Putnam, ‘Bowling Alone: America’s Declining Social Capital’ (1995) 6.1 Journal of
Democracy 67. 599
Anable, Lane and Kelay, above n 590, 76. 600
Everett M Rogers, Arvind Singhal and Margaret M Quinlan, ‘Diffusion of Innovation’ in Don
Stacks and Michael Salwen (eds) An Integrated Approach to Communication Theory and Research
(Lawrence Erlbaum Associates, 1996) 409.
Page 315
295
information from a wide range of sources. These include manufacturers’ brochures,
the internet, car magazines, sales staff, consumer guides, family and friends,
television programs and radio and newspaper advertising.601
These sources of
information should be used in promoting the LET and desirable LET vehicles.
The diffusion of innovation theory may also have an effect on the innovative design
of the new LET vehicle for passenger transportation. Five perceived characteristics
of an innovation affect its rate of adoption. These are: relative advantage over
existing products; compatibility with existing ideas and products; complexity to
understand and use; whether the innovation can be tried out on a limited basis; and
how visible adopting the innovation is to others.602
Lane and Potter suggested a series of ‘hotspot’ factors that influence the adoption of
alternative innovations, being: the high purchase price resulting in a long payback
period; products designed for easy and convenient use and not requiring users to
adapt to technical requirements; a lack of systems integration between products and
systems such as fuelling infrastructure and the life of an electric battery; and
recognising that some people like to openly display their different choice, for
example a highly observable eco-product sign.603
Thus the new LET vehicle would need to take into consideration these factors if it is
to be readily accepted by people.
Although these suggested theories are well tested, it is a difficult task to predict
behavioural change. Lane and Potter note that links between consumer values,
knowledge, beliefs, attitudes, intentions and behaviour are not simple
determinants.604
There are many other theories that deal with human motivation,
thought and action which are beyond the scope of this research. However, the
imposition of a LET that is substantial enough and imposed at more than one taxing
point is likely to affect behaviour around the choice and usage of motor vehicles for
personal transportation, resulting in reduced oil usage.
601
Lane and Potter, above n 588, 1089. 602
Ibid 1087. 603
Ibid 1089–90. 604
Ibid 1087.
Page 316
296
7.7 CONCLUSION
This chapter explored the revenue generation capability of the LET system that was
discussed in Chapter 6. The computations in Appendices 3 to 8 at the end of this
thesis show that the LET has the potential to raise sufficient revenue to provide the
Australian government with the funds to build the public transport infrastructure that
will assist people to make changes relating to personal transportation that are likely
to be triggered by the implementation of the LET. Based on various assumptions
stated in Appendices 3 to 8, the LET has the potential to bring about a total saving of
85.71 billion litres of oil from 2015 to 2025 and this would result in reduction of 202
million tonnes of CO2 emissions from passenger motor vehicles to year 2025.
An analysis of the evaluation of the LET carried out in this chapter shows that the
LET has sound characteristics in terms of collection, fee calculation, technology, cost
of state-wide implementation, auditing, fee rate structure, phase-in period, systemic
precision, adaptability to congestion pricing, public acceptance, convenience and
protection of privacy. The LET also conforms to the notion of a good tax under the
principles discussed in this chapter and has the potential to be a good environmental
tax with its desired ability to change motorist behaviour around the choice and usage
of motor vehicles for personal transportation, and thus reduce oil consumption.
Page 317
297
CHAPTER 8: CONCLUSION AND
RECOMMENDATIONS FOR POSSIBLE
FURTHER RESEARCH
8.1 INTRODUCTION
This chapter presents the conclusions on the key findings relating to the basic inquiry
and research questions for this thesis as identified in Chapter 1, and the proposed
policy recommendations. The basic inquiry of this thesis was whether the
government of Australia bears responsibility for influencing Australian motorists’
choice of motor vehicles in order to reduce oil consumption so as to preserve this
scarce commodity, and whether this responsibility is being achieved within the
current regulatory and tax environment. The core research questions identified in
Chapter 1 were:
1. Is there a need to reform the design, choice and usage of passenger motor
vehicles in Australia in order to sustain the limited oil resources?
2. What are the realistic tax measures that can be implemented and what
criteria should the design of tax framework take into account to reform the
choice and usage of motor vehicles for personal transportation in Australia
in order to reduce the consumption of oil?
The following sections review the key findings and policy recommendations in
relation to the research questions, and present the desired outcomes of the policy
recommendations. This is followed by a discussion of the contributions made to
research and methodology, the major limitations of the research, and some
suggestions for future research, and finally, some concluding remarks.
Page 318
298
8.2 REVIEW OF KEY FINDINGS AND POLICY
RECOMMENDATIONS
To answer the research questions, it was first necessary to examine why and how the
research problem has arisen. The problem was examined in Chapters Two and Three
of this thesis and is briefly reiterated in the following part.
8.2.1 The First Research Question
The core underlying problem is the availability of oil and the dependence on foreign
oil. The first reality is that the oil resource is finite and oil is a non-renewable source
of energy. Once the energy from oil is used up, it cannot be recaptured. The facts
stated in Chapter 2 of this thesis demonstrate that we will never know for certain
when oil will completely run out and exactly how large the existing Australian and
global oil reserves are. However, the Australian government’s recent Draft White
Paper released in December 2011 indicates that in 2010, Australia had only 10 years
of economic demonstrated oil reserves605
and that Australia is heavily dependent on
imports of both refined petroleum products and crude oil to meet its liquid fuel
demand.606
To determine whether Australia can rely on global oil reserves, it was necessary to
carry out an assessment of the global oil position. Various government and
independent agency reports were examined in Chapter 2 and these reports show
concern about the global oil position and advocate that the governments of each
country should take policy action to reduce the demand for oil.
The next question that was addressed in this thesis was why the availability of oil is
important.607
Lack of oil supply can lead to social and economic chaos and the
ramifications of life without oil could include famine, disease and mass exodus. We
as a society have become accustomed to using oil in every aspect of our lives,
ranging from plastics to pharmaceuticals and all forms of transportation. Oil has
605
Department of Resources, Energy and Tourism, above n 470, 14. 606
Ibid, xxvi. 607
See Chapter 2, part 2.3.
Page 319
299
transformed our cities with the growth of the motor vehicle industry and has even
influenced our land release policies and how our homes are designed. Homes with
two or three car garages are now a norm rather than an exception.
The first step in resolving any problem is to recognise that there is a looming
problem. In this thesis it was recognised that Australia imports about 80 per cent of
the crude oil and the oil products it requires. It was also established that the transport
sector accounts for about 70 percent of the total use of oil. A further examination of
fuel consumption within the road transport sector revealed that passenger motor
vehicles consumed the most, ie 60.9 per cent in 2007–08. Moreover, Australians are
increasingly using private motor vehicles for personal transportation, and the use of
public transportation system has been declining. Thus the problem recognised in this
thesis was that Australians are heavily dependent on oil for their passenger motor
vehicles. This led to the first inquiry for this thesis, to examine the motor vehicles
that Australians drive in order to assess whether a change in government policy can
influence the design, choice and usage of passenger motor vehicles in Australia in
order to sustain the limited oil resources and reduce reliance on foreign oil.608
A review of passenger motor vehicles was undertaken in Chapter 3, where it was
demonstrated that technological advances in motor vehicles have been eroded by
model creep with increased power-to-weight ratios. This led to the question of
whether we need two tonnes or more of metal in a passenger motor vehicle to carry a
few hundred kilograms of passenger body weight, especially when Australian and
global supplies of oil are uncertain. The logical conclusion was that passenger motor
vehicle transportation needs to be examined by the Australian government and the
growth and usage of these vehicles needs to be controlled by appropriate government
policies.
Future motor vehicle designs and alternative biofuels were also examined in Chapter
3 and the conclusion drawn is that mass production and marketing of motor vehicles
using new technologies is in its infancy and may take many years to have an impact.
Therefore, Australian government policies need to focus on reducing the use of oil in
existing vehicles with internal combustion engines that are available today, thereby
answering the first research question of this thesis with the confirmation that there is
608
See discussion in Chapter 2, part 2.4.
Page 320
300
a need for the Australian government to reform the design, choice and usage of
passenger motor vehicles in Australia in order to sustain the limited oil resources.
The next question was to address the reform criteria by examining the regulatory and
fiscal reforms undertaken in other countries. This is briefly reiterated in the next part.
8.2.2 The Second Research Question
In examining the regulatory reforms undertaken by other countries, it became
apparent that some countries such as the US have recognised the problem of
dependence on foreign oil in their motor vehicle use after the oil embargo was
imposed in the 1970s by the Arab members of OPEC. The US government has tried
to curb the oil consumption of its motor vehicle fleet by imposing mandatory fuel
economy standards, ie the CAFE standards, since 1975. These standards have
succeeded in increasing the fuel efficiency of the nation’s fleet. However, the
demand for large and powerful vehicles such as SUVs remains. The US government
has therefore proposed more stringent standards to reduce fuel use and CO2
emissions in its motor vehicle fleet for model years 2017 to 2025. Many problems
with these standards have been identified in this thesis, such as the tendency for the
standards to create tension between the government, the consumers and the motor
vehicle industry, the inability to effect a reduction in the total number of motor
vehicles on the road, the rebound effect, and an increase in policy gaming by
manufacturers and importers to circumvent the standards imposed upon them. Thus it
is proposed in this thesis that although the Australian government intends to
implement mandatory CO2 standards for passenger motor vehicles by 2015, the
mandatory standards should be accompanied by a reform of Australia’s motor
vehicle taxes that influences end users in their passenger motor vehicle choices.609
This thesis then addressed the second research question regarding the realistic tax
measures that can be implemented and the choice of criteria to design a tax
framework that would be suitable to reform the choice and usage of motor vehicles
for personal transportation in Australia in order to reduce oil consumption. To
answer this research question, Chapter 4 examined the fiscal measures implemented
609
See a discussion in Chapter 4, part 4.2.
Page 321
301
by various countries around the world.610
It was observed that many countries impose
one-off and recurrent taxes directly or indirectly on registered owners of motor
vehicles, and that these taxes, if they are set sufficiently high and use appropriate
criteria, can play a role in affecting levels of motor vehicle ownership and the
composition of the national fleet of vehicles.
It was also observed that many countries impose fuel taxes or fuel excise in order
raise general revenues for the country or for road maintenance, however for political
reasons, many countries have been unable to increase their fuel excise rates. This has
created a road funding problem resulting in a desire to replace the declining fuel
excise with kilometre-based user fee and congestion charges. Other travel demand
management policies that can assist in improving social and market outcomes
include road tolls, extra parking charges, pay-as-you-drive insurance policies,
charges for the use of an express lane, leaving cars at home one day in a week and
the banning of private cars in the city. Many countries provide income tax incentives
or subsidies to encourage consumer demand for fuel-efficient or lower CO2-emitting
motor vehicles, especially for hybrid or plug-in electric vehicles. In spite of these
incentives, the uptake of alternative fuel vehicles remains low. The reason for this is
the excessive cost of these vehicles, insufficient battery range and lack of alternative
fuel infrastructure.
This thesis also examined the current position of the Australian motor vehicle
taxes.611
Except for the LCT which provides for a higher threshold for motor vehicles
whose fuel consumption does not exceed seven litres per 100km, the existing taxes
and charges in Australia have little influence on the purchase and use of motor
vehicles as the charges are not high enough or the basis on which they are imposed
has no impact on the use of oil in motor vehicles. The Henry Tax Review suggested
that fuel tax as a source of general government revenue should be phased out and
transport-specific taxes should be imposed only where they improve social and
market outcomes.
It was concluded in this thesis that the current taxation arrangements in Australia
pertaining to passenger motor vehicles and fuel should be reformed from being just
610
See the discussion on fiscal measures in Chapter 4, part 4.4. 611
See Chapter 4, part 4.4 under Lessons for Australia.
Page 322
302
revenue raisers to incorporating the principle of a reduction in oil use in passenger
motor vehicles. A fitting method of addressing tax policy reform in Australia was to
draw lessons from appropriate case studies. The three jurisdictions chosen for the
case studies were Norway, the Netherlands and the state of Oregon in the US as these
places have either enacted unique motor vehicle or fuel taxation regimes or have
conducted parliamentary-approved studies that involve innovative ways of taxing
their motor vehicles and road user charges.
Lessons were drawn from Norway’s unique motor vehicle purchase tax system
which is based on the vehicle’s weight, engine capacity and CO2 emissions.612
The
case study in the Netherlands reveals that the Dutch were prepared to make
significant amendments to their motor vehicle taxation system to bring about a
change in behaviour. The Oregon case study revealed a unique method of collecting
the mileage fee, ie at the fuel station when the motor vehicle is being refuelled.
Lessons were also drawn from the criteria set for the mileage fee concept in Oregon
and how these criteria were tested and evaluated in a 12 month pilot program. The
Oregon project has successfully triggered a national debate on the future of
transportation funding in the 21st century.
613
The lessons learnt from these case studies were then used to address the criteria for
designing a tax framework to reform the choice and usage of motor vehicles for
personal transportation in Australia in order to reduce the consumption of oil.
First a critical examination of the various policy options for Australia was conducted
to resolve this identified problem.614
The critical examination revealed that the best
option for Australia is to conduct a comprehensive reform of the motor vehicle taxes
and charges in Australia and introduce a LET system based on the precautionary
principle and the polluter-pays principle.615
In order to design the LET criteria, it was necessary to examine the motor vehicle
characteristics that cause extra oil use and emissions, and to ensure that these
characteristics are taken into consideration in the design of the LET, by allocating
612
See Chapter 5, part 5.2.3. 613
See a discussion of the Oregon study in Chapter 5, part 5.4. 614
See Chapter 6, part 6.3. 615
See Chapter 6, part 6.4.1.
Page 323
303
progressive LET points on the vehicle weight, engine capacity, engine power and
CO2 emissions.616
The accumulated LET points were then proposed to be taxed at
four taxing points being: the purchase of the vehicle; annual registration; fuelling;
and the disposal of the vehicle, by applying a set rate at each taxing point.
The administration, operation and implementation of the LET system are explained
in detail in the thesis.617
The LET is proposed to be a Commonwealth tax, but parts
of the LET would be collected and administered by the states. It is also proposed that
some existing Commonwealth taxes, such as the LCT and fuel excise for passenger
motor vehicles, be abolished.
A detailed exercise was undertaken to evaluate the LET in terms of its revenue
generation potential.618
On the assumption that the LET is introduced in 2016, the net
revenue forecast after taking into consideration the forgone revenues from the LCT
and fuel excise and the cost of collecting the LET are forecasted to range from
AUD2.21 billion in 2016 to AUD109.7 billion in 2025. The forecast saving in oil as
a result of implementing the LET ranges from 2.23 billion litres in 2016 to 15.66
billion litres in 2025, resulting in a total saving in oil of 85.71 billion litres for the ten
years from 2015 to 2025. The percentage oil savings from passenger motor vehicles
is forecast to be five per cent in 2015 to 67 per cent in 2025.
The LET was then evaluated against set criteria, including the criteria of a good tax
based on the most famous canons of a good tax set out by Adam Smith.619
The LET
has the potential not only to be a good tax, but also a good environmental tax with its
goal of changing motorist behaviour regarding the choice and usage of motor
vehicles for personal transportation, and reducing oil use, as discussed in this thesis.
In conclusion, this thesis has answered the basic inquiry and the core research
questions set out in Chapter 1, confirming that the Australian government does bear a
responsibility for influencing Australian motorists’ choice of motor vehicles in order
to reduce oil consumption so as to preserve this scarce commodity, and that this
responsibility is not being achieved within the current regulatory and tax
616
See Chapter 6, part 6.4.2. 617
See Chapter 6, part 6.4.3. 618
See Chapter 7, part 7.2. 619
See Chapter 7, parts 7.4 and 7.5.
Page 324
304
environment. This thesis explored the tax and regulatory measures that can be
implemented in Australia and proposed a framework for the LET that is likely to
achieve the desired aim of changing motorist behaviour in the choice and usage of
passenger motor vehicles. The next part explains the likely desired outcome of policy
recommendations arising from the LET.
8.3 DESIRED OUTCOME OF POLICY
RECOMMENDATIONS
This thesis has highlighted the problem of how people have become accustomed to
life with an available supply of oil to the point that they seem to believe it will be
available forever, even though it may become a little more expensive. Oil as we
know it today was only discovered in 1846 and 40 years later in 1886, Karl Benz
invented the first gasoline motor vehicle. Since then, the global demand for oil has
been continuously rising with the increase in the motor vehicle population, especially
in countries such as India and China. Thus it is quite conceivable that the supply of
affordable oil will diminish in the next 28 to 42 years. If this forecast is correct, then
reforms such as the LET should be implemented sooner rather than later. If this
forecast is incorrect and affordable oil does not diminish for the next 100 years, it is
still worth considering reforms to preserve oil for necessities, as 100 years is not a
long time when compared with the number of years that life on earth has been in
existence and the number of years it has taken for oil to form.
The Australian population is particularly vulnerable to diminishing oil supplies as
our cities are spread out and most people are accustomed to using motor vehicles for
personal transportation. It is therefore necessary for the Australian government to
take the lead and prepare the people to rely less on imported oil. The imposition of
the LET could be the catalyst to bring about this change. It is likely to bring about a
reaction, and if the LET is introduced with sufficient education and involvement of
the people, the change can be controlled, rather than being volatile.
The LET is likely to force people to choose motor vehicle characteristics that attract
less LET or no LET at all. These characteristics are the vehicle weight, engine
Page 325
305
capacity, engine power and CO2 emissions. Since the LET points are expected to be
demonstrated on the number plate, the demand for motor vehicles with less LET
points will increase. It is hoped that the LET will inspire motor vehicle
manufacturers to redesign passenger motor vehicles. The desire is for the LET to
bring about a change in the Australian motor vehicle fleet to one which consumes
less oil. However, the LET approach is to bring about this change directly through
customer demand, rather than indirectly through regulations where customers are
indirectly persuaded by motor vehicle manufacturers and importers.
An anticipated desired outcome of the LET is a newly-designed Australian micro-
light motor vehicle that weighs 600kg, has a 600cc engine, 40kW of engine power
and emits no more than 80g/km of CO2. It should be possible for a motor vehicle
manufacturer to design an affordable motor vehicle with these specifications. With
appropriate light materials and aerodynamics, it is possible to produce a light and
safe motor vehicle, and with mass production the cost can be kept affordable. Similar
to an aeroplane, such a motor vehicle should be built to have a longer lifespan,
allowing the cost of the vehicle to be spread out over more years. The motor vehicle
design should take into consideration that as most families in Australia have more
than one vehicle, the new generation vehicles should also offer two-seater cars that
are not necessarily sports cars. The study of motor vehicle models in Chapter 7
indicates that most two-seater car models are sports cars with high engine power.
The LET should highlight the design efficiency of the motor vehicle, and the notion
that a motor vehicle is required as an efficient means of transportation, and not as a
luxury item or a status symbol.
The current design of Australian cities and the suburbs within the cities is such that
the need for passenger motor vehicles continues to exist. The LET does not take
away the need to own a motor vehicle, but it encourages the purchase of a motor
vehicle that consumes less oil. The ideal situation that may be achieved through the
LET is for people to own a micro-light car that allows them to drive short distances
including to the nearest transport hub. The use of public transport is encouraged for
medium to long-distance travel and a micro-light car for local area travel.
In order to encourage the use of public transport, the income generated from the LET
should be used by the Australian government to build sufficient and attractive public
Page 326
306
transport infrastructure and to cushion the impact of the tax on certain parts of the
community, eg pensioners, disabled people and those who require special need
vehicles. Many changes can be made to the public transport system to make it more
attractive, such as extra car parking spaces near train stations. The income from the
LET could be used to build multi-storeyed automated car parks, and as technology
develops, these car parks could have robotic car lifts installed. Taking away the stress
of parking would encourage the use of public transport. Prepaid reserved seats could
be introduced in trains, which may help change the image of travelling in trains. In
any case, more trains and buses and punctual service would enhance public transport
use.
A desired outcome of the LET is to bring about a change in the perception of
passenger motor vehicle transportation. The LET should not be used by the
government to just raise revenue, ie as a cash cow, as this would crush society. The
LET needs to be managed well, in that the imposition of the LET needs to coincide
with the development of the public transport infrastructure, otherwise it is likely to
cause anarchy. The design of the LET should take into consideration that
dispensation may be required for people living in country areas with little or no
public transport, large families, poor people and job and transport-specific vehicles.
The government should implement the LET, but allow life to continue with minimal
disruption.
The desired revenues forecast for the LET in Chapter 7 are just academic. The real
objective of the LET is to monitor change taking place. The LET rate and timing of
the discounted rate should take into consideration the manufacture of new micro-
light cars, improvements to public transport infrastructure and social change taking
place. It is emphasised in this thesis that for Australians to survive with expensive or
no oil, change is important and the LET can assist in bringing about this change.
8.4 CONTRIBUTIONS TO RESEARCH
A vast quantity of research has been undertaken with regard to using fuel economy
or CO2 standards to bring about a behavioural change that will reduce fuel
Page 327
307
consumption in motor vehicles. Many countries are also focusing on demand
management programs such as user-pay charges per kilometre driven and congestion
charges. The present research has explored and gained a deeper understanding of
how taxation can be used as a tool to change behaviour in the choice and usage of
motor vehicles in order to reduce oil consumption. As a result, the current research
findings and the developed LET framework provide new contributions to and
implications for how the Australian government can bring about a change in the way
passenger motor vehicle transportation is perceived in Australia.
The LET provides a new policy approach directed at resolving the global problem of
how passenger motor vehicles are perceived and reducing the demand for large and
powerful motor vehicles that consume and diminish the limited oil resources.
Australia could become the pioneer in this area and may even benefit from a new
motor vehicle industry for the manufacturing of new generation micro-light motor
vehicles that could be exported to other countries. The LET would also generate the
revenues required to build a better public transport infrastructure, and prepare the
Australian cities for the next generation.
8.5 METHODOLOGICAL CONTRIBUTIONS
This thesis has been a pioneer in combining two methodologies, being interpretive
description and legal methodology. Moreover, the interpretive description
methodology has been used outside nursing science, for which it was first developed.
The interpretive description methodology has permitted an examination of three
different areas of investigation, being the position of oil resources, the position of
passenger motor vehicles, and legal regulations and tax policy. The combination of
these three areas has permitted a moral inquiry into whether the government of
Australia bears a responsibility towards influencing Australian motorists’ choice of
motor vehicles in order to reduce oil consumption and preserve this scarce
commodity, and whether this responsibility is being achieved within the current
regulatory and tax environment. The legal methodology has permitted the
investigation and formulation of tax policy proposals. The legal tax policy solution
could not be suggested without probing into the problem. Therefore the combination
Page 328
308
of interpretive description and legal methodology has been an appropriate and ideal
combination for this thesis.
8.6 MAJOR LIMITATIONS
A limitation of this research has been lack of experts in all of the three fields
together, and therefore the research has not relied on expert interviews, but on a wide
range of collateral documentary source material from each separate field that has
contributed to the breadth of the inquiry. Documentary sources included government
reports, refereed journal articles, industry reports, reports from representative world
organisations, government legislation, research studies, books, media reports and
general literature.
Another limitation has been that it has not been possible to test the policy
recommendation made by this thesis, being the proposed LET. A pilot study similar
to the one undertaken in Oregon could have been used to test the recommendations.
However, such a study would have required a large amount of funding, the
involvement of many organisations and a large time commitment. Moreover, a pilot
study at this stage would have been considered to be too preliminary. It is hoped that
this thesis ignites a debate in this area which persuades the government to take an
active role in shaping the motor vehicle tax policy.
8.7 SUGGESTIONS FOR FUTURE RESEARCH
Within the Australian context, future recommendations for research would include
gathering enough government and industry support and funding to conduct a pilot
study of the operation of the LET. Future research also needs to be conducted in
other areas where a policy change is required and recommended, ie commercial
vehicles, recreational vehicles, alternative fuel vehicles including electric vehicles,
zoning of land, house designs, public transport and city planning.
Page 329
309
Within an international context, future research could include determining the
willingness of nations to enter into an agreement of policy options to reduce the use
of oil. This could be similar to the Kyoto agreement to reduce greenhouse gas
emissions.
8.8 AUTHOR’S CONCLUDING COMMENTS
We as a society have a strong affinity to motor vehicles and we are increasingly
dependent on oil. In this context, seeking behaviour change by the use of persuasive
methods is unlikely to succeed in bringing about a lasting change, and therefore
regulatory and fiscal reforms are required. However, without a strong political will,
these regulatory and fiscal reforms would only end up as a window-dressing
exercise. It is hoped that the Australian government does not wait for oil shortages to
occur before taking the steps to bring about the recommended policy reform. If there
is a constriction in the oil supply and Australia is not ready to embrace it, the
government may face challenging problems pertaining to the personal transportation
needs of the Australian people. Without preparedness, the government could be faced
with the problem of transporting people to work and children to school, as well as
delivering goods and services. The people of Australia will look to the government
for answers when they cannot afford the oil for their passenger motor vehicles.
Therefore the government needs to not only foresee these future problems, but to
also have contemplated solutions to them.
The Australian government needs to see the big picture of over 100 years into the
future in reforming its motor vehicle taxation system and realise that a future without
change looks bleak and that life without oil would need substantial adjustments.
However, these adjustments do not have to be all doom and gloom; they could bring
about future opportunities for people, for businesses and for the country as a whole.
The government need to set the scene by demonstrating to the people the full range
of benefits arising from this reform, which could include the potential to create new
jobs, create new markets, reduce imports and benefit the country as a whole.
Page 330
310
An opportunity arising from the introduction of the LET could be the introduction to
small micro-light motor vehicles. The LET could be used as a catalyst to inspire
motor vehicle manufacturers to design and manufacture new generation micro-light
motor vehicles that are suitable for driving short distances. This could be a
tremendous opportunity for Australian car manufacturers with potential sales to
replace some of the 16 million cars in Australia. The LET would set the
manufacturing parameters for the types of cars that are going to be demanded by the
consumers in Australia.
The introduction of the LET could also provide the opportunity to redesign and
modernise the Australian public transport infrastructure. Many changes can be made,
for example, if micro-light cars are encouraged for local area travel and public
transport is encouraged for medium to long-distance travel, then car parking at the
transport hubs will need to be changed.
Multi-storeyed or underground car parks may be required to cater for the increase in
need for parking. Car parks could be automated or even robotised for convenience,
including a provision for reserved and prepaid parking spots. Many countries in the
world are introducing smart car parking stations with computer controlled parking
levels, where the driver enters the car park and the car is automatically parked using
automated conveyor belts and lifts. When the driver returns and requests the car via
the parking meter, the car is automatically brought back to the driver. A very good
example of such a car park is in Wolfburg, Germany, where a 10 level car park is
fully automated with six entry and exit lanes.620
A rapid public transport system would enhance its usability. An increase in light
trains may be necessary to join one suburb to another, and there could be an
opportunity to install a limited number of high speed trains like the trains used in
China, Japan and some European cities. The public transport system can be
modernised with a range of different services instead of one type of service that fits
all. There could be a provision where a person could pay extra to reserve a seat in a
particular suburban train. In this way the person is assured of a seat, and the train
service can be converted from cattle class to jet class.
620
See demonstration of an automated car park at
http://www.youtube.com/watch?v=UrCmPWCgCRQ&feature=related.
Page 331
311
With the increased use of train travel, another business opportunity could be a pre-
booked micro-light car at the end of the journey to take the person from the train
station to the place of work.
A new way of thinking could transform the public transport system into a luxury
system that caters to the individual’s desire to demonstrate a level of prestige, in
much the same way that the need to drive a large and powerful motor vehicle is
doing today. As well as saving oil, there are many other benefits to having a well
organised and efficient transport system, such as reduced stress, and increased
productivity, as work can be undertaken whilst travelling, including the conduct of
meetings. This is possible especially in this day and age where computing and phone
technology allow communication whilst travelling.
Other potential opportunities arising through the introduction of the LET include
suburb redesign and centralised living. The message from this thesis is that a new
way of thinking is required in passenger vehicle transportation, and this new way of
thinking can bring about benefits and opportunities. The LET should not be seen as a
bitter pill, but as a new opportunity arising from a necessity, that should be
embraced. Just as we had to embrace the age of electronic commerce, and we are
embracing the changes required to control CO2 emissions in the carbon tax
legislation, we can certainly embrace changes to reduce the consumption of oil in
passenger motor vehicles by implementing the LET.
A direct result of implementing the LET would be the savings in oil and reduction in
emissions, as forecast in Chapter 7 of this thesis. Reduced reliance on oil would
mean reduced imports for Australia, resulting in a strengthened Australian economy.
The benefits of reduced emissions are well known and would certainly be welcomed
by the global community. In addition to the direct benefits, the LET could trigger
some positive indirect benefits with foresight and planning.
The concluding thought is that a new way of thinking is required, as it takes millions
of years for our planet to produce oil, but it takes only an instant to burn it, and once
burnt, it is not recoverable. Therefore the Australian government should take the
responsibility to implement appropriate taxation policies such as the proposed LET,
in order to promote the efficient movement of people and goods with the least
Page 332
312
consumption of oil. If oil that has taken millions of years to form is used up within
one to two centuries, what will happen to the needs of future generations in the
centuries to come?
Page 333
313
BIBLIOGRAPHY
A Articles
Aftabuzzaman, Md and Ehsan Mazloumi, ‘Achieving Sustainable Urban Transport
Mobility in Post Peak Oil Era’ (2011) 18(5) Transport Policy 695
Ajzen, Icek, ‘The Theory of Planned Behavior’ (1991) 50 Organizational Behavior
and Human Decision Processes 179
Aleklett, Kjell, Michael Hook, Kristofer Jakobsson, Michael Lardelli, Simon
Snowden and Bengt Soderbergh, ‘The Peak of the Oil Age – Analyzing the World Oil
Production Reference Scenario in the World Energy Outlook 2008’ (2010) 38 Energy
Policy 1398
Alley, Clinton and Duncan Bentley, ‘A Remodelling of Adam Smith’s Tax Design
Principles’ (2005) 20 Australian Tax Forum 579
Anderson, Soren and James Sallee, ‘Using Loopholes to Reveal the Marginal Cost of
Regulation: The Case of Fuel-Economy Standards’ (2011) 101(4) American
Economic Review 1375
Austin, David and Terry Dinan, ‘Clearing the Air: The Costs and Consequences of
Higher CAFE Standards and Increased Gasoline Taxes’ (2005) 50 Journal of
Environmental Economics and Management 562
Balaban, Oded and Alexander Tsatskin, ‘The Paradox of Oil Reserve Forecasts: The
Political Implications of Predicting Oil Reserves and Oil Consumption’ (2010) 38
Energy Policy 1340
Bamberg, Sebastian, Satoshi Fujii, Margareta Friman and Tommy Garling,
‘Behaviour Theory and Soft Transport Policy Measures’ (2011) 18 Transport Policy
228
Bardi, Ugo, ‘Peak Oil: The Four Stages of a New Idea’ (2009) 34 Energy 323
Beder, Sharon, ‘Costing the Earth: Equity, Sustainable Development and
Environmental Economics’ (2000) 4 New Zealand Journal of Environmental Law
227
Bentley, Roger and Godfrey Boyle, ‘Global Oil Production: Forecasts and
Methodologies’ (2008) 35 Environment and Planning B: Planning and Design 609
Bradbrook, Adrian and Alexandra Wawryk, ‘Legislative Implementation of
Financial Mechanisms to Improve Motor Vehicle Fuel efficiency’ (1998) 22(3)
Melbourne Law Review 537
Brink, Robert M M van den and Bert van Wee, ‘Why Has Car-Fleet Specific Fuel
Consumption Not Shown Any Decrease Since 1990? Quantitative Analysis of Dutch
Page 334
314
Passenger Car-Fleet Specific Fuel Consumption’ (2001) 6 Transportation Research
Part D 75
Bristow, Abigail L, Marcus Enoch, Lian Zhang, Clare Greensmith, Norman James
and Stephen Porter, ‘Kickstarting Growth in Bus Patronage: Targeting Support at the
Margins’ (2008) 16 Journal of Transport Geography 408
Bullis, Kevin, ‘An Electrifying Startup’ (2008) 111(3) Technology Review 68
Campbell, Colin J, ‘Petroleum and People’ (2002) 24(2) Open Geography Journal
193
Campbell, Colin J and Jean H Laherrère, ‘The End of Cheap Oil’ (1998) March
Scientific American 79
Carvalho, J F de, Sonia Seger P Mercedes and Ildo L Sauer, ‘Precautionary Principle,
Economic and Energy Systems and Social Equity’ (2010) 38(10) Energy Policy 5399
Cheah, Lynette and John Heywood, ‘Meeting US Passenger Vehicle Fuel Economy
Standards in 2016 and Beyond’ (2011) 39 Energy Policy 454
Chester, Mikhail V and Arpad Horvath, ‘Environmental Assessment of Passenger
Transportation Should Include Infrastructure and Supply Chains’ (2009) 4
Environmental Research Letter 1
Clarke, Harry, ‘Conserving Biodiversity in the Face of Climate Change’ (2007) 14
Agenda 157
Clarke, Harry and Andrew Hawkins, ‘Economic Framework for Melbourne Traffic
Planning’ (2006) 13 Agenda 63
Clerides, Sofronis and Theodoros Zachariadis, ‘The Effect of Standards and Fuel
Prices on Automobile Fuel Economy: An International Analysis’ (2008) 30 Energy
Policy 2657
Curtis, Carey and Reena Tiwari, ‘Transitioning Urban Arterial Roads to Activity
Corridors’ (2008) 13 URBAN DESIGN International 105
Dargay, Joyce, ‘Personal Transport Choice’ (2008) 2 OECD Journal: General
Papers 59
Dill, Jennifer and Asha Weinstein, ‘How to Pay for Transportation? A Survey of
Public Preferences in California’ (2007) 14 Transport Policy 346
Dobes, Leo, ‘Getting Real about Adapting to Climate Change: Using “Real Options”
to Address the Uncertainties’ (2008) 15 Agenda 55
Dorman, Peter, ‘Evolving Knowledge and the Precautionary Principle’ (2005) 53(2)
Ecological Economics 169
Duncan, Richard C, ‘The Olduvai Theory Energy, Population, and Industrial
Civilization’ (2005–2006) Winter Social Contract 1
Page 335
315
Editorial, ‘The Science of Climate Change’ (2001) 292 Science 1261
Eliasson, Jonas, Lars Hultkrantz, Lena Nerhagen and Lena Smidfelt Rosqvist, ‘The
Stockholm Congestion-Charging Trial 2006: Overview of Effects’ (2009) 43(3)
Transportation Research Part A 240
England, Richard W, ‘Motor Fuel Taxation, Energy Conservation, and Economic
Development: A Regional Approach’ (2007) 61 Ecological Economics 409
Enoch, Marcus and Stephen Potter ‘Encouraging the Commercial Sector to Help
Employees to Change Their Travel Behaviour’ (2003) 10 Transport Policy 51
Eoma, Jiyong and Lee Schipper, ‘Trends in Passenger Transport Energy Use in South
Korea’ (2010) 38 Energy Policy 3598
Fairey, Philip, ‘Drilling, Alternative Fuels and Efficiency: Can the United States
Wean Itself from Imported Oil?’ (2009) 37 Energy Policy 1249
Farrell, A E and A R Brandt, ‘Risks of the Oil Transition’ (2006) 1 Environmental
Research Letter 1
Fischer, Carolyn, ‘Comparing Flexibility Mechanisms for Fuel Economy Standards’
(2008) 36(8) Energy Policy 3116
Freebairn, John, ‘Some Sectoral and Global Distributional Issues in Greenhouse Gas
Policy Design’ (2008) 15 Agenda 13
Friedrichs, Jorg, ‘Global Energy Crunch: How Different Parts of the World Would
React to a Peak Oil Scenario’ (2010) 38 Energy Policy 4562
Gallagher, Brian, ‘Peak Oil Analyzed with a Logistic Function and Idealized Hubbert
Curve’ (2011) Energy Policy 790
Gallo, Mariano, ‘A Fuel Surcharge Policy for Reducing Road Traffic Greenhouse
Gas Emissions’ (2011) 18 Transport Policy 413
Gehlert, Tina, Christiane Kramer, Otto Anker Nielsen and Bernhard Schlag, ‘Socio
Economic Differences in Public Acceptability and Car Use Adaptation Towards
Urban Road Pricing’ (2011) 18 Transport Policy 685
Gonzalez, George A, ‘An Eco-Marxist Analysis of Oil Depletion via Urban Sprawl’
(2006) 15 Environmental Politics 515
Goulding, Charles, Jacob Goldman and Raymond Kumar, ‘Energy Tax Aspects of
Car Dealerships’ (2009) 10 Corporate Business Taxation Monthly 12
Greene, David L, Philip D Patterson, Margaret Singh and Jia Li, ‘Feebates, Rebates
and Gas-Guzzler Taxes: A Study of Incentives for Increased Fuel Economy’ (2005)
33 Energy Policy 757
Gudmundsson, Henrik, Eva Ericsson, Muriel Beser Hugosson and Lena Smidfelt
Rosqvist, ‘Framing the Role of Decision Support in the Case of Stockholm
Page 336
316
Congestion Charging Trial’ (2009) 43 Transportation Research Part A 258
Hamond, Jeff, Hardy Merriman and Gary Wolff, ‘Equity and Distributional Issues in
the Design of Environmental Tax Reform’ (1999) Redefining Progress 1
Hensher, David A and Sean M Puckett, ‘Road User Charging: The Global Relevance
of Recent Developments in the United Kingdom’ (2005) 12 Transport Policy 377
Hook, Mikael, Ugo Bardi, Lianyong Feng and Xiongqi Pang, ‘Development of Oil
Formation Theories and their Importance for Peak Oil’ (2010) 27 Marine and
Petroleum Geology 1995
Hunter, Tina, ‘It’s Time: Petroleum Policy Change for Sustainable Development in
the Australian Offshore Upstream Petroleum Sector’ (2009) Journal of Applied Law
and Policy 31
Hymel, Kent M, Kenneth A Small and Kurt Van Dender, ‘Induced Demand and
Rebound Effects in Road Transport’ (2010) 44 Transportation Research Part B 1220
Ieromonachou, Petros, Marcus Enoch and Stephen Potter, ‘Adapting Strategic Niche
Management for Evaluating Radical Transport Policies – the Case of Durham Road
Access Charging Scheme’ (2004) 2 International Journal of Transport Management
75
Ieromonachou, Petros, Stephen Potter and J P Warren, ‘Evaluation of the
Implementation Process of Urban Road Pricing Schemes in the United Kingdom and
Italy’ (2006) 32 European Transport 49
James, Simon and Alison Edwards, ‘Developing Tax Policy in a Complex and
Changing World’ (2008) 38 Economic Analysis and Policy 35
Johnson, Kenneth C, ‘Notes and Comments: Circumventing the Weight-Versus-
Footprint Tradeoffs in Vehicle Fuel Economy Regulation’ (2010) 15 Transportation
Research Part D 503
Jotzo, Frank, ‘Climate Policy: Where To and How?’ (2007) 14 Agenda 17
Kasipillai, Jeyapalan and Pikkay Chan, ‘Travel Demand Management: Lessons for
Malaysia’ (2008) 11 Journal of Public Transportation 41
Kaufmann, Robert, ‘The Role of Market Fundamentals and Speculation in Recent
Price Changes for Crude Oil’ (2011) 39 Energy Policy 105
Kaufmann, Robert K and Laura D Shiers, ‘Analysis — Alternatives to Conventional
Crude Oil: When, How Quickly, and Market Driven?’ (2008) 67 Ecological
Economics 405
Knight, F H, ‘Some Fallacies in the Interpretation of Social Cost’ (1924) 38
Quarterly Journal of Economics 582
Kottenhoff, Karl and Karin Brundell Freij, ‘The Role of Public Transport for
Feasibility and Acceptability of Congestion Charging – The Case of Stockholm’
Page 337
317
(2009) 43 Transportation Research Part A 297
Krumdieck, Susan, Shannon Page and Andre Dantas, ‘Urban Form and Long-Term
Fuel Supply Decline: A Method to Investigate the Peak Oil Risks to Essential
Activities’ (2010) Transportation Research Part A 306
Lane, Ben and Stephen Potter, ‘The Adoption of Cleaner Vehicles in the UK:
Exploring the Consumer Attitude – Action Gap’ (2007) 15(11–12) Journal of
Cleaner Production 1085
Lauridsen, Henning, ‘The Impacts of Road Tolling: A Review of Norwegian
Experience’ (2011) 18 Transport Policy 85
Leigh, James, ‘Beyond Peak Oil in Post Globalization Civilization Clash’ (2008) 1
Open Geography Journal 15
Lemoine, D M, D M Kammen and A E Farrell, ‘An Innovation and Policy Agenda
for Commercially Competitive Plug-In Hybrid Electric Vehicles’ (2008) 3
Environmental Research Letter 1
Lew Yii Der and Leong Wai Yan, ‘Managing Congestion in Singapore — A
Behavioural Economics Perspective’ (2009) May Journeys 17
MacKenzie, Debora, ‘Why the Demise of Civilisation may be Inevitable’ (2008)
2650 New Scientist 32
MacKenzie, Debora, ‘Will a Pandemic Bring Down Civilisation?’ (2008) 2650 New
Scientist 28
Mahlia, T M I, R Saidur, L A Memon, N W M Zulkifli and H H Masjuki ‘A Review
on Fuel Economy Standard for Motor Vehicles with the Implementation Possibilities
in Malaysia’ (2010) 14 Renewable and Sustainable Energy Reviews 3092
Malone, Daniel P, ‘Electric Vehicles and the Need For A More Intelligent
Regulatory Grid’ Automotive Industries (Online), February 2011 <http://www.ai-
online.com/Adv/Previous/show_issue.php?id=3946>
Mann, Roberta F and Mona L Hymel, ‘Getting Into the Act: Enticing the Consumer
to Become “Green” Through Tax Incentives’ (2006) 36 Environmental Law Reporter
10419
Mason, Arthur, ‘Images of the Energy Future’ (2006) 1 Environmental Research
Letter 1
Massaro, Dominic, ‘Back to the Future: Retrospective Review of Leon Festinger’s
“A Theory of Cognitive Dissonance”’ (1997) 110(1) American Journal of
Psychology 127
McGregor-Lowndes, Myles and Denise Conroy, ‘The GST Regulation Impact
Statement and Nonprofit Organisations’ (2002) 5(3) Journal of Australian Taxation
413
Page 338
318
McKerchar, Margaret A, ‘Philosophical Paradigms, Inquiry Strategies and
Knowledge Claims: Applying the Principles of Research Design and Conduct to
Taxation’ (2008) 6(1) eJournal of Tax Research 14
McMullen, B Starr, Lei Zhang and Kyle Nakahara, ‘Distributional Impacts of
Changing from a Gasoline Tax to a Vehicle-Miletax for Light Vehicles: A Case Study
of Oregon’ (2010) 17 Transport Policy 359
Miller, Richard, ‘Future Oil Supply: The Changing Stance of the International
Energy Agency’ (2011) 39(3) Energy Policy 1569
Moeller, Joergen Oerstroem, ‘Conventional Economic Theory — A Critique
Highlighting Flaws in American Style Capitalism’ (2011) 56(1) Singapore Economic
Review 1
Moriarty, Patrick and Damon Honnery, ‘Viewpoint — What Energy Levels Can the
Earth Sustain?’ (2009) 37 Energy Policy 2469
Muthukrishnan, Subhashini, ‘Vehicle Ownership and Usage Charges’ (2010) 17
Transport Policy 398
Newman, Peter, ‘Beyond Peak Oil: Will Our Cities Collapse?’ (2007) 14(2) Journal
of Urban Technology 15
Newman, Peter and Jeff Kenworthy, ‘“Peak Car Use”: Understanding the Demise of
Automobile Dependence’ (2011) 17(2) World Transport Policy and Practice 31
Newman, Peter, Jeff Kenworthy and Garry Glazebrook, ‘How to Create Exponential
Decline in Car Use in Australian Cities’ (2008) 45(3) Australian Planner 17
Odeck, James and Svein Bråthen, ‘On Public Attitudes Toward Implementation of
Toll Roads – The Case of Oslo Toll Ring’ (1997) 4(2) Transport Policy 73
Odeck, James and Svein Bråthen, ‘Toll Financing in Norway: The Success, the
Failures and Perspectives for the Future’ (2002) 9 Transport Policy 254
Odeck, James and Svein Bråthen, ‘Travel Demand Elasticities and Users Attitudes:
A Case Study of Norwegian Toll Projects’ (2008) 42 Transportation Research Part
A 77
Odeck, James and Anne Kjerkreit, ‘Evidence on Users’ Attitudes Towards Road
User Charges — A Cross-Sectional Survey of Six Norwegian Toll Schemes’ (2010)
17 Transport Policy 349
Oliver, Hongyan H, Kelly Sims Gallagher, Donglian Tian and Jinhua Zhang,
‘China’s Fuel Economy Standards for Passenger Vehicles: Rationale, Policy Process,
and Impacts’ (2009) 37(11) Energy Policy 4720
Oreskes, Naomi, ‘The Scientific Consensus on Climate Change’ (2004) 306(5702)
Science 1686
Owen, Nick, Oliver Inderwildi and David King, ‘The Status of Conventional World
Page 339
319
Oil Reserves — Hype or Cause for Concern?’ (2010) 38 Energy Policy 4743
Palma, André de, Edoardo Marcucci, Esko Niskanen and Bernhard Wieland,
‘Introduction Road Pricing: Is It Needed, Is It Possible, Is It Inevitable?’ (2005) 31
European Transport 1
Palma, André de, Robin Lindsey and Esko Niskanen, ‘Policy Insights from the Urban
Road Pricing Case Studies’ (2006) 13 Transport Policy 149
Parry, Ian W H, Margaret Walls and Winston Harrington, ‘Automobile Externalities
and Policies’ (2007) XLV Journal of Economic Literature 373
Potter, S, J P Warren and Petros Ieromonachou, ‘A Strategic Niche Analysis of Urban
Road Pricing in the UK and Norway’ (2007) 7(1) European Journal of Transport and
Infrastructure Research 15
Potter, Stephen and Marcus Enoch, ‘Regulating Transport’s Environmental Impacts
in A Deregulating World’ (1997) 2 Transportation Research Part D: Transport and
Environment 271
Potter, Stephen, Marcus Enoch, Tom Rye, Collin Black and Barry Ubbels, ‘Tax
Treatment of Employer Commuting Support: An International Review’ (2006) 26
Transport Reviews 221
Potter, Stephen and Graham Parkhurst, ‘Transport Policy and Transport Tax Reform’
(2005) Public Money and Management 171
Potter, Stephen and Martin J Skinner, ‘On Transport Integration: A Contribution to
Better Understanding’ (2000) 32 Futures 275
Prochaska, James and Carlo DiClemente, ‘Stages and Processes of Self-Change of
Smoking: Toward An Integrative Model of Change’ (1983) 51(3) Journal of
Consulting and Clinical Psychology 390
Punj, Girish and Richard Staelin, ‘A Model of Consumer Information Search
Behavior for New Automobiles’ (1983) 9(4) Journal of Consumer Research 366
Putnam, Robert D, ‘Bowling Alone: America’s Declining Social Capital’ (1995) 6(1)
Journal of Democracy 65
Rajagopal, D, S E Sexton, D Roland-Holst and D Zilberman, ‘Challenge of Biofuel:
Filling the Tank Without Emptying the Stomach?’ (2007) Environmental Research
Letter 1
Reynolds, C and M Kandlikar, ‘How Hybrid-Electric Vehicles Are Different from
Conventional Vehicles: The Effect of Weight and Power on Fuel Consumption’
(2007) 2 Environmental Research Letter 1
Rodrigues-Neto, Jose A, ‘Climate Change Policy: A Theorist’s Plea to Take Heed of
Game Theory and Ambiguity Aversion’ (2008) 15(2) Agenda 85
Rouwendal, Jan and Erik T Verhoef, ‘Basic Economic Principles of Road Pricing:
Page 340
320
From Theory to Applications’ (2006) 13 Transport Policy 106
Sælen, Håkon and Steffen Kallbekken, ‘A Choice Experiment on Fuel Taxation and
Earmarking in Norway’ (2011) 70(11) Ecological Economics 2181
Sampathy, Patricia, ‘Section 90 of the Constitution and Victorian Stamp Duty on
Dealings in Goods’ (2002) 4(1) Journal of Australian Taxation 133
Santos, Georgina, Hannah Behrendt, Laura Maconi, Tara Shirvani and Alexander
Teytelboym, ‘Part I: Externalities and Economic Policies in Road Transport’ (2010)
28 Research in Transportation Economics 2
Schade, Jens and Bernhard Schlag, ‘Acceptability of Urban Transport Pricing
Strategies’ (2003) 6 Transportation Research Part F 45
Schipper, Lee, ‘Automobile Use, Fuel Economy and CO2 Emissions in Industrialized
Countries: Encouraging Trends Through 2008?’ (2011) 18 Transport Policy 358
Schipper, Lee, ‘Moving Forwards with Fuel Economy Standards’ (2009) 34 ACCESS
11
Schipper, Lee and Lew Fulton, ‘Making Urban Transit Systems Sustainable Around
the World: Many Birds with One Bus?’ (2002) 1791 Transportation Research Record
44
Schuitema, Geertje and Linda Steg, ‘The Role of Revenue Use in the Acceptability
of Transport Pricing Policies’ (2008) 11 Transportation Research Part F 221
Sentenac-Chemin, Elodie, ‘Is the Price Effect on Fuel Consumption Symmetric?
Some Evidence from an Empirical Study’ (2012) 41 Energy Policy 59
Serret, Ysé and Ida Ferrara, ‘Conclusions and Policy Implications’ (2008) 2 OECD
Journal: General Papers 181
Shapiro, Matthew D and Joel Slemrod, ‘Consumer Response to the Timing of
Income: Evidence from a Change in Tax Withholding’ (1995) 85(1) American
Economic Review 274
Shiau, Ching-Shin Norman, Jeremy J Michalek and Chris T Hendrickson, ‘A
Structural Analysis of Vehicle Design Responses to Corporate Average Fuel
Economy Policy’ (2009) 43 Transportation Research Part A 814
Simon, Herbert, ‘A Behavioral Model of Rational Choice’ (1955) 69(1) Quarterly
Journal of Economics 99
Smith, John K and Lous Heshusius, ‘Closing Down the Conversation: The End of the
Quantitative-Qualitative Debate Among Educational Inquiries’ (1986) 15(1)
Educational Researcher 4
Sorrell, Steve, Jamie Speirs, Roger Bentley, Adam Brandt and Richard Miller,
‘Global Oil Depletion: A Review of the Evidence’ (2010) 38 Energy Policy 5290
Page 341
321
Sperling, Daniel and Deborah Gordon, ‘Advanced Passenger Transport
Technologies’ (2008) 33 Annual Review of Environment and Resources 63
Srinivasan, Narasimhan and Brian Ratchford, ‘An Empirical Test of a Model of
External Search for Automobiles’ (1991) 18(2) Journal of Consumer Research 233
Steele, Katie, ‘The Precautionary Principle: A New Approach to Public Decision-
Making’ (2006) 5(1) Law, Probability and Risk 19
Tam, Mei Lam and William H K Lam, ‘Using Automatic Vehicle Identification and
Global Positioning System Data for Travel Time Estimation in Hong Kong’ (2007) 7
Journal of the East Asia Society for Transportation Studies 165
Tan, S Y and Graham C, ‘Medicine in Stamps Ivan Petrovich Pavlov (1849–1936):
Conditioned Reflexes’ (2010) 51(1) Singapore Medical Journal 1
Thorne, Sally, Andrea Con, Liza McGuinness, Gladys McPherson and Susan R
Harris, ‘Health Care Communication Issues in Multiple Sclerosis: An Interpretive
Description’ (2004) 14(1) Qualitative Health Research 5
Thorne, Sally, Sheryl Reimer Kirkham and Katherine O’Flynn-Magee, ‘The Analytic
Challenge in Interpretive Description’ (2004) 3(1) International Journal of
Qualitative Methods 5
Tran-Nam, Binh, ‘The Implementation Costs of the GST in Australia: Concepts,
Preliminary Estimates and Implications’ (2000) 3 Journal of Australian Taxation 331
Tran-Nam, Binh and John Glover, ‘The GST Recurrent Compliance Costs/Benefits
of Small Business in Australia: A Case Study Approach’ (2005) 1(2) Journal of the
Australasian Tax Teachers Association 237
Tversky, Amos and Daniel Kahneman, ‘Judgement Under Uncertainty: Heuristics
and Biases’ (1974) 185 Science 1124
Ubbels, Barry, Piet Rietveld and Paul Peeters, ‘Environmental Effects of a Kilometre
Charge in Road Transport: An Investigation for the Netherlands’ (2002) 7
Transportation Research Part D 255
Vanderschuren, M J W A, T E Lane and J J Wakeford, ‘Can the South African
Transport System Surmount Reduced Crude Oil Availability?’ (2010) 38 Energy
Policy 6092
Wagner, David Vance, Feng An, Cheng Wang, ‘Structure and Impacts of Fuel
Economy Standards for Passenger Cars in China’ (2009) 37 Energy Policy 3803
Wang, Zhao, Yuefu Jin, Michael Wang and Wu Wei, ‘New Fuel Consumption
Standards for Chinese Passenger Vehicles and Their Effects on Reductions of Oil
Use and CO2 Emissions of the Chinese Passenger Vehicle Fleet’ (2010) 38(9) Energy
Policy 5242
Weiss, Edith Brown, ‘In Fairness to Future Generations’ (1990) 32(3) Environment 9
Page 342
322
Weitzman, Martin L, ‘On Modelling and Interpreting the Economics of Catastrophic
Climate Change’ (2009) XCI Review of Economics and Statistics 1
Winslott-Hiselius, Lena, ‘The Development of Public Attitudes Towards the
Stockholm Congestion Trial’ (2009) 43 Transportation Research Part A 269
Yan, Xiaoyu and Roy J Crookes, ‘Energy Demand and Emissions from Road
Transportation Vehicles in China’ (2010) 36 Energy and Combustion Science 651
Zalik, Anna, ‘Oil “Futures”: Shell’s Scenarios and the Social Constitution of the
Global Oil Market’ (2010) 41(4) Geoforum 553
Zhang, Qingyun, Tian Weili, Zheng Yingyue, Zhang Lili ‘Fuel Consumption from
Vehicles of China until 2030 in Energy Scenarios’ (2010) 38 Energy Policy 6860
B Books
Australasian Centre for Policing Research, National Specifications for General Duty
Patrol & High Performance Vehicles (National Police Research Unit, Payneham, 6th
revision, 2006)
Austroads, Feasibility Study: Heavy Vehicle Charging in Australia (Austroads, 2011)
Bakker, Anuschka, Tax and the Environment: A World of Possibilities (IBFD, 2009)
Bardou, Jean-Pierre, Jean-Jacques Chanaron, James M Laux and Patrick Fridenson,
The Motor Vehicle Revolution: The Impact of an Industry (James M Laux trans,
University of North Carolina Press, 1982) [trans of: La Révolution Automobile (first
published 1977)]
Beder, Sharon, Environmental Principles and Policies (University of New South
Wales Press, 2006)
Bureau of Infrastructure, Transport and Regional Economics, Australian
Infrastructure Statistics Yearbook 2011 (Bureau of Infrastructure, Transport and
Regional Economics, Canberra, 2011)
Campbell, Colin, The Coming Oil Crisis (Multi-Science Publishing &
Petroconsultants, 1997)
Committee on the Effectiveness and Impact of Corporate Average Fuel Economy
(CAFE) Standards, National Research Council, Effectiveness and Impact of
Corporate Average Fuel Economy (CAFE) Standards (National Academies Press,
2002)
Deffeyes, Kenneth S, Beyond Oil: The View from Hubbert’s Peak (Hill and Wang,
2005)
Eddington, Sir Rod, The Eddington Transport Study: The Case for Action: Sir Rod
Eddington’s Advice to Government (Department for Transport, 2006)
Page 343
323
Environment Protection Authority, Clean Cars for NSW (Environment Protection
Authority, revised ed, 2003)
Groenewegen, Peter D, Public Finance in Australia (Prentice-Hall of Australia, 3rd
ed, 1984)
Hassard, John, ‘Sociology and Organisation Theory: Positivism, Paradigms and
Postmodernity’ (Cambridge University Press, 1993)
Hayes, Richard (ed), Thoreau’s Legacy: American Stories about Global Warming
(Union of Concerned Scientists with Penguin Books, 2009)
Hui He and Anup Bandivadekar, A Review and Comparative Analysis of Fiscal
Policies Associated with New Passenger Vehicle CO2 Emissions (International
Council on Clean Transportation, 2011)
International Energy Agency, Energy Policies of IEA Countries: The Republic of
Korea 2006 Review (OECD/IEA, 2006)
International Transport Forum Round Tables, The Cost and Effectiveness of Policies
to Reduce Vehicle Emissions (OECD Publishing, 1st ed, 2009)
Kutz, Myer, Environmentally Conscious Transportation (John Wiley & Sons, 2008)
Laird, Philip, Peter Newman, Jeff Kenworthy and Mark Bachels, Back on Track:
Rethinking Transport Policy in Australia and New Zealand (University of New South
Wales Press, 2001)
McKerchar, Margaret, Design and Conduct of Research in Tax, Law and Accounting
(Thomson Reuters, 2010)
Mirrlees, James, Stuart Adam, Timothy Besley, Richard Blundell, Stephen Bond,
Robert Chote, Malcolm Gammie, Paul Johnson, Gareth Myles, and James Poterba,
Dimensions of Tax Design: The Mirrlees Review (Oxford University Press, April
2010)
Moules, Richard, Environmental Judicial Review (Hart Publishing, 2011)
Murphy, Joseph (ed), Governing Technology for Sustainability (Earthscan, 2007)
Organisation for Economic Co-operation and Development, Globalisation, Transport
and the Environment (OECD, 2010)
Organisation for Economic Co-operation and Development, Taxation, Innovation
and the Environment (OECD, 2010)
Pearce, David, Anil Markandya and Edward Barbier, Blueprint for a Green Economy
(Earthscan, 1989)
Pearce, Dennis, Enid Campbell and Don Harding, Australian Law Schools: A
Discipline Assessment for the Commonwealth Tertiary Education Commission
(AGPS, 1987)
Page 344
324
Pigou, A C, The Economics of Welfare (Macmillan, 1920)
Productivity Commission, Promoting Better Environmental Outcome: Roundtable
Proceedings (Productivity Commission, 2009)
Sadeleer, Nicolas de, Environmental Principles From Political Slogans to Legal
Rules (Oxford University Press, 2005)
Sandford, Cedric, Michael Godwin and Peter Hardwick, Administrative and
Compliance Costs of Taxation (Fiscal Publications, 1989)
Smith, Adam, An Inquiry into the Nature and Causes of the Wealth of Nations
(Oxford University Press, selected ed, 1993)
Thorne, Sally, Interpretive Description (Left Coast Press, 2008)
Ticehurst, Gregory and Anthony Veal, ‘Business Research Methods: A Managerial
Approach’ (Pearson Education, 2000)
Wolcott, Harry F, Transforming Qualitative Data: Description, Analysis, and
Interpretation (Sage Publications, 1992)
C Book Chapters
Banks, Gary, ‘Introduction’ in Productivity Commission, Promoting Better
Environmental Outcomes Roundtable Proceedings (Productivity Commission, 2009)
1
Bradbrook, Adrian, ‘Alternative Legal Measures to Improve the Fuel Efficiency of
Motor Vehicles’ in United Nations, Energy Efficiency: Compendium of Energy
Conservation Legislation in Countries of the Asia and Pacific Region (1999)
Burke, Andrew, ‘Electric and Hybrid Vehicle Design and Performance’ in Myer
Kutz, Environmentally Conscious Transportation (John Wiley & Sons, 2008) 131
Cheah, Lynette, Christopher Evans, Anup Bandivadekar and John Heywood, ‘Factor
of Two: Halving the Fuel Consumption of New US Automobiles by 2035’ in D
Sperling and J S Cannon (eds), Reducing Climate Impacts in the Transportation
Sector (Springer, 2008)
Devine-Wright, Patrick, ‘Energy Citizenship: Psychological Aspects of Evolution in
Sustainable Energy Technologies’ in Joseph Murphy (ed), Governing Technology for
Sustainability (Earthscan, 2007) 63
Foxon, Tim, ‘The Rationale for Policy Interventions from an Innovation Systems
Perspective’ in Joseph Murphy (ed), Governing Technology for Sustainability
(Earthscan, 2007) 129
Greszler, Anthony, ‘Heavy Duty Vehicle Fleet Technologies for Reducing Carbon
Dioxide: An Industry Perspective’ in D Sperling and J S Cannon (eds), Reducing
Page 345
325
Climate Impacts in the Transportation Sector (Springer, 2008)
Guba, Egon and Yvonna S Lincoln, ‘Competing Paradigms in Qualitative Research’
in Norman K Denzin and Yvonna S Lincoln (eds), The Sage Handbook of Qualitative
Research (Sage Publications, 2nd
ed, 1994) 163
Harrington, Winston, ‘The Design of Effective Regulations in Transport’ in
International Transport Forum Round Tables, The Cost and Effectiveness of Policies
to Reduce Vehicle Emissions (OECD Publishing, 1st ed, 2009) 119
Husen, Torsten, ‘Research Paradigms in Education’ in John P Keeves (ed),
Educational Research, Methodology and Measurement: An International Handbook
(Pergamon Press, 1988) 17
Inglis, Sir Brian, ‘Transport’ in Technology in Australia 1788–1988 (Australian
Academy of Technological Sciences and Engineering using the Web Academic
Resource Publisher, revised 2001), 433
International Transport Forum Round Tables, ‘Summary of Discussions’ in ITF
Round Tables, Port Competition and Hinterland Connections (OECD Publishing,
2009) 7
McDonald, Seonaidh, Panayiota Alevizou, Caroline Oates, Kumju Hwang and
William Young, ‘Decoding Governance: A Study of Purchase Processes for
Sustainable Technologies’ in Joseph Murphy (ed), Governing Technology for
Sustainability (Earthscan, 2007) 25
Milne, Janet E, ‘Environmental Taxation: Why Theory Matters – Critical Issues in
Environmental Taxation’ in Janet E Milne, Kurt Deketelaere, Larry Kreiser and Hope
Ashiabor (eds), Critical Issues in Environmental Taxation: International and
Comparative Perspectives (Richmond Law and Tax, 2003) vol 1
Murphy, Joseph, ‘Governing Technology for Sustainability’ in Joseph Murphy (ed),
Governing Technology for Sustainability (Earthscan, 2007) 203
Murphy, Joseph, ‘Sustainability: Understanding People, Technology and
Governance’ in Joseph Murphy (ed), Governing Technology for Sustainability
(Earthscan, 2007) 3
Organisation for Economic Co-operation and Development, ‘Infrastructure
Investment: Links to Growth and the Role of Public Policy’ in Economic Policy
Reforms: Going for Growth (OECD, 2009) 163
Plotkin, Stephen, ‘Examining Fuel Economy and Carbon Standards for Light
Vehicles’ in International Transport Forum Round Tables, The Cost and Effectiveness
of Policies to Reduce Vehicle Emissions (OECD Publishing, 1st ed, 2009) 39
Potter, Stephen, ‘Sustainability, Energy Conservation and Personal Transport’ in
Warren J (ed), Managing Transport Energy (Oxford University Press, 2007) 9
Potter, Stephen, ‘Transport Demand Management and Purchase, Circulation and Fuel
Taxation’ in Stephen Ison and Tom Rye (eds), Implementation and Effectiveness of
Page 346
326
Transport Demand Management Measures: An International Perspective (Ashgate,
2008)
Potter, Stephen, Graham Parkhurst and Ben Lane, ‘European Perspectives on a New
Fiscal Framework for Transport’ in A Reggiani and L Schintler (eds), Methods and
Models in Transport and Telecommunications: Cross Atlantic Perspectives (Springer,
2005) 9
Productivity Commission, ‘Sessions 1–4 General Discussion’ in Productivity
Commission, Promoting Better Environmental Outcomes Roundtable Proceedings
(Productivity Commission, 2009) 53–207
Raux, Charles, ‘How Should Transport Emissions be Reduced? Potential for
Emissions Trading System’ in International Transport Forum Round Tables, The Cost
and Effectiveness of Policies to Reduce Vehicle Emissions (OECD Publishing, 1st ed,
2009) 75
Rogers, Everett M, Arvind Singhal and Margaret M Quinlan, ‘Diffusion of
Innovation’ in Don Stacks and Michael Salwen (eds), An Integrated Approach to
Communication Theory and Research (Lawrence Erlbaum Associates, 1996) 409
Roy, Robin, Sally Caird and Stephen Potter, ‘People Centred Eco-Design: Consumer
Adoption and Use of Low and Zero Carbon Products and Systems’ in Joseph Murphy
(ed), Governing Technology for Sustainability (Earthscan, 2007) 41
Sallee, James M, ‘The Taxation of Fuel Economy’ in Jeffrey R Brown (ed), Tax
Policy and the Economy (National Bureau of Economic Research, 2011) vol 25, 2
Sandford, Cedric, ‘Minimising the Compliance Costs of a GST’ in C Evans and A
Greenbaum (eds), Tax Administration – Facing the Challenges of the Future (1998)
130
Sauter, Raphael and Jim Watson, ‘Micro-Generation: A Disruptive Innovation for the
UK Energy System?’ in Joseph Murphy (ed), Governing Technology for
Sustainability (Earthscan, 2007) 110
Schwandt, Thomas, ‘Constructivist, Interpretivist Approaches to Human Inquiry’ in
Norman K Denzin and Yvonna S Lincoln (eds), The Sage Handbook of Qualitative
Research (Sage Publications, 2nd
ed, 1994) 163
Slater, Rachel, ‘Local Governance of Public Services: The Role of Partnerships in
Sustainable Waste Management’, in Joseph Murphy (ed), Governing Technology for
Sustainability (Earthscan, 2007) 151
Smith, Aaron, C Granda and M Holtzapple, ‘Biofuels for Transportation’ in Myer
Kutz, Environmentally Conscious Transportation (John Wiley & Sons, 2008) 215
Smith, Adrian, ‘Governance Lessons from Green Niches: The Case of Eco-Housing’
in Joseph Murphy (ed), Governing Technology for Sustainability (Earthscan, 2007)
89
‘Summary for Policymakers’ in S Solomon, D Qin, M Manning, Z Chen, M Marquis,
Page 347
327
K B Averyt, M Tignor and H L Miller (eds), Climate Change 2007: The Physical
Science Basis. Contribution of Working Group I to the Fourth Assessment Report of
the Intergovernmental Panel on Climate Change (Cambridge University Press, 2007)
Toke, David, ‘Wind Power, Governance and Networks’ in Joseph Murphy (ed),
Governing Technology for Sustainability (Earthscan, 2007) 168
Winskel, Mark, ‘Multi-Level Governance and Energy Policy: Renewable Energy in
Scotland’ in Joseph Murphy (ed), Governing Technology for Sustainability
(Earthscan, 2007) 182
D Cases
Center for Auto Safety v NHTSA, 793 F 2d 1322 (Ct App, Dist of Columbia Circuit,
1986)
Ha v New South Wales (1997) 189 CLR 465
Massachusetts v Environmental Protection Agency, 549 US 497 (2007)
E Legislation
2017–2025 Model Year Light-Duty Vehicle GHG Emissions and CAFE Standards:
Supplemental Notice of Intent, 40 CFR §§ 85, 86 and 600, 49 CFR §§ 531 and 533
(2011) [USA]
A New Tax System (Commonwealth-State Financial Arrangements) Act 1999 (Cth)
Alternatives to Motor Vehicle Fuel Taxes, 71st Oregon Legislative Assembly – 2001
Regular Session, House Bill 3946 (March 2003)
American Recovery and Reinvestment Act 2009, Pub L No 111-5 [USA]
Average Fuel Economy Standards Passenger Cars and Light Trucks Model Year
2011, 49 CFR §§ 523, 531, 533, 534, 536 and 537 (2011) [USA]
Clean Air Act 42 USC §7401 et seq (1970) [USA]
Clean Energy Act 2011 (Cth)
Competition and Consumer Act 2010 (Cth)
Energy Grants (Cleaner Fuels) Scheme Act 2004 (Cth)
Energy Tax Act of 1978, Pub L No 95-618, 92 Stat 3174 [USA]
Energy Tax Incentives Act of 2005 [USA]
Explanatory Memorandum, Clean Energy Bill 2011 (Cth)
Page 348
328
Explanatory Memorandum, Rules for Charging a Pay-By-Use Price for Driving with
Motor Vehicle (Dutch Road Pricing Act)
Explanatory Memorandum, Taxation of Alternative Fuels Legislation Amendment
Bill 2011 (Cth)
Energy Independence and Security Act 2007 42 USC 17001 [USA]
Energy Policy and Conservation Act 1975 [USA]
Fuel Quality Standards Act 2000 (Cth)
Light-Duty Vehicle Greenhouse Gas Emission Standards and Corporate Average
Fuel Economy Standards; Final Rule, 75 Fed Reg 88 25324 (7 May 2010) [USA]
Motor Vehicles Standards Act 1989 (Cth)
Motor Vehicle Taxation Act 1988 (NSW)
New Zealand Energy Efficiency (Vehicle Fuel Economy Labelling) Regulations 2007
(NZ)
Rational Energy Utilisation Act [Republic of Korea]
Retail Sales Tax Act, RSO 1990 (as amended) c R-31 [Canada]
Revisions and Additions to Motor Vehicle Fuel Economy Label; Final Rule, 76 Fed
Reg 3948 (6 July 2011) [USA]
Tax Laws Amendment (Luxury Car Tax) Act 2008 (Cth)
F Conference Papers, Discussion Papers, Research Papers, Working Papers
Ahring, Birgitte, ‘Sustainable Biofuels for the Transport Sector’ (Discussion Paper
No 2007-4, OECD/ITF, 2007)
American Institute of Certified Public Accountants, ‘Guiding Principles of Good Tax
Policy: A Framework for Evaluating Tax Proposals’ (Tax Policy Concept Statement,
March 2001)
Ampt, Elizabeth, David Engwicht and Sinclair Knight Merz ‘A Personal
Responsibility Perspective to Behaviour Change’ (Paper presented at the 30th
Australasian Transport Research Forum, Melbourne, Australia, 25–27 September
2007)
An, Feng, Robert Earley and Lucia Green-Weiskel, ‘Global Overview on Fuel
Efficiency and Motor Vehicle Emission Standards: Policy Options and Perspectives
for International Cooperation (updated)’ (Background Paper No 3 UN Doc
CSD19/2011/BP3 presented at 19th
session of the Commission on Sustainable
Development, New York, 2–13 May 2011)
Page 349
329
Anable, Jillian, Ben Lane and Tanika Kelay, ‘An Evidence Base Review of Public
Attitudes to Climate Change and Transport Behaviour’ (Working Paper No PPRO
004/006/006, UK Department for Transport, 2006)
Anable, Jillian, Paige Mitchell and Russell Layberry, ‘Getting the Genie Back in the
Bottle: Limiting Speed to Reduce Carbon Emissions and Accelerate the Shift to Low
Carbon Vehicles’ (Paper presented at the LowCVP Conference, Westminster, United
Kingdom, 15 June 2006)
Anderson, Soren, Ian Parry, James M Sallee and Carolyn Fischer, ‘Automobile Fuel
Economy Standards: Impacts, Efficiency and Alternatives’ (Discussion Paper No
RFF DP 10-45, Resources for the Future, October 2010)
Austestad, Tone, Ministry of Transport and Communications, ‘Fostering Sustainable
Urban Travel in Norway: New Urban Organization Models, Incentive Based Funding
and Car Taxation’ (Paper presented at ECMT-USDOT Workshop on Fostering
Successful Implementation of Sustainable Urban Travel Policies, Washington DC, 5–
7 November 2003)
Australian Government, ‘Tax Reform: Next Steps for Australia’ (Tax Forum
Discussion Paper, Commonwealth of Australia, 2011)
Baker, Richard T, Ginger Goodin and Lindsay Taylor, ‘Mileage‐Based User Fees —
Defining a Path toward Implementation (Phase 2): An Assessment of Institutional
Issues’ (Final Report, University Transportation Center for Mobility, November
2009)
Birn, Kevin and Paul Khanna, ‘A Discussion Paper on the Oil Sands: Challenges and
Opportunities’ (Discussion paper, Natural Resources Canada, 2010)
Bordoff, Jason E and Pascal J Noel, ‘Pay-As-You-Drive Auto Insurance: A Simple
Way to Reduce Driving-Related Harms and Increase Equity’ (Discussion Paper,
Brooking Institution, 2008)
Boxer, Keith and Leila O’Sullivan ‘Green Badge Parking Permit (GBPP) Project’
(Paper presented at the LowCVP Conference, Westminster, United Kingdom, 15 June
2006)
Braathen, Nils Axel, ‘Carbon-Related Taxation in OECD Countries, and Interactions
Between Cap-and-Trade System and Other Policy Instruments’ (Paper presented at
the 11th
Global Conference on Environmental Taxation, Bangkok, 3–5 November
2010)
Braathen, Nils Axel, ‘Incentives for CO2 Emission Reductions in Current Motor
Vehicle Taxes’ (Working Paper No ENV/EPOC/WPNEP/T(2009)2/FINAL,
Environment Policy Committee OECD, 3 September 2009)
Bradbrook, Adrian J, ‘Policies and Legal Options to Promote the Energy Efficiency
of Private Motor Vehicles’ (Background Paper No 4, UN Doc CSD19/2011/BP4
presented at the 19th
session of the Commission on Sustainable Development, New
York, 2–13 May 2011)
Page 350
330
Brennan, Geoffrey, ‘Reflections for Public Policy: A Drawing Together and Drawing
Apart. Comments on Proceedings’ (Paper presented at Productivity Commission
Roundtable: Promoting Better Environmental Outcomes, Canberra, 19–20 August
2008) 195
Brog, Werner and Ian Kerr, ‘Issues in Measuring Travel Behaviour Change’ (Paper
presented at 8th International Conference on Survey Methods in Transport, Annecy,
France, 25–31 May 2008)
Brunckhorst, David J, ‘On Common Ground: Designing Strategic Spatial
Governance to Advance Integrated Natural Resource Management and
Environmental Outcomes’ (Paper presented at Productivity Commission Roundtable:
Promoting Better Environmental Outcomes, Canberra, 19–20 August 2008) 85
Buchan, Arlene, ‘Letting Markets Work for the Environment’ (Paper presented at
Productivity Commission Roundtable: Promoting Better Environmental Outcomes,
Canberra, 19–20 August 2008) 41
Bureau of Infrastructure, Transport and Regional Economics, ‘Greenhouse Gas
Emissions from Australian Transport: Projections to 2020’ (Working Paper No 73,
Bureau of Infrastructure, Transport and Regional Economics, December 2009)
Bureau of Infrastructure, Transport and Regional Economics, ‘Moving Urban
Australia: Can Congestion Charging Unclog our Roads?’ (Working Paper No 74,
Department of Infrastructure, Transport, Regional Development and Local
Government, Canberra, 2008)
Bureau of Transport Economics, ‘Reducing Greenhouse Gas Emissions in Transport:
Some Tax Policy Options’ (Working Paper No 3, Bureau of Transport Economics,
October 1991)
Bureau of Transport Economics, ‘Traffic Congestion and Road User Charges in
Australian Capital Cities’ (Report No 92, Commonwealth of Australia, 1996)
Caltex Australia, ‘Submission to the Senate Select Committee Inquiry on Fuel and
Energy’ (31 July 2009)
Carling, Robert, ‘State Taxation and Fiscal Federalism: A Blueprint for Further
Reform’ (Policy Monograph 73, Centre For Independent Studies, 2006)
Casgrove, David, Bureau of Infrastructure, Transport and Regional Economics,
‘Long-term Emission Trends for Australian Transport’ (Paper presented at 31st
Australasian Transport Research Forum, Gold Coast, 2–3 October 2008)
Cervero, Robert, ‘Accessible Cities and Regions: A Framework for Sustainable
Transport and Urbanism in the 21st Century’ (Working Paper No UCB-ITS-VWP-
2005-3, UC Berkeley Center for Future Urban Transport, 2005)
Cervero, Robert, ‘Transit Transformations: Private Financing and Sustainable
Urbanism in Hong Kong and Tokyo’ (Working Paper, Pacific Basin Research Center,
2008)
Page 351
331
Clarke, Harry and David Prentice, ‘A Conceptual Framework for the Reform of
Taxes Related to Roads and Transport’ (Paper prepared for the Treasury, Canberra,
June 2009)
Cnossen, Sijbren, ‘Excise Taxation in Australia’ (Paper presented at the Australia’s
Future Tax and Transfer Policy Conference 2009, Melbourne Institute, Melbourne,
18–19 June 2009)
Collins, Drew, ‘Threats to Effective Environmental Policy in Australia’ (Paper
presented at Productivity Commission Roundtable: Promoting Better Environmental
Outcomes, Canberra, 19–20 August 2008) 29
Corpuz, Grace, ‘Public Transport or Private Vehicle: Factors that Impact on Mode
Choice’ (Paper presented at the 30th Australasian Transport Research Forum,
Melbourne, Australia, 25–27 September 2007)
Council of Australian Governments, ‘COAG Road Reform Plan: Evaluation of
Options – DRAFT’ (Discussion Paper, COAG Road Reform Plan, 26 July 2011)
Council of Australian Governments, ‘COAG Road Reform Plan: Feasibility Study
and Local Government Consultation Paper’ (Consultation Paper, COAG Road
Reform Plan, 1 March 2011)
Council of Australian Governments, ‘COAG Road Reform Plan: Funding and
Implementation Issues Paper’ (Discussion Paper, COAG Road Reform Plan, 13 April
2011)
Council of Australian Governments, ‘COAG Road Reform Plan: Preliminary
Findings Consultation Paper’ (Consultation Paper, COAG Road Reform Plan, 27
June 2011)
Council of Australian Governments, ‘COAG Road Reform Plan: Use of Heavy
Vehicle Data Sets: Opportunities for Improvement Under Direct Charging
Arrangements’ (Project Information Sheet, COAG Road Reform Plan)
Council of Australian Governments, ‘Evaluation Framework Reference Guide’
(Discussion Paper, COAG Road Reform Plan, July 2010)
Council of Australian Governments, ‘Policy Framework Reference Guide’
(Discussion Paper, COAG Road Reform Plan, July 2010)
Council of Australian Governments, ‘Report for Review of Incremental Pricing
Trials’ (Report, GHD, May 2011)
Cousins, Steven, ‘New Dashboard Instruments Inform CO2 Policies for New
Vehicles’ (Paper presented at the LowCVP Conference, Westminster, United
Kingdom, 15 June 2006)
Craik, Wendy and James Cleaver, ‘Institutions and Incentives for Promoting Better
Policies and Outcomes: Challenges of Achieving Environmental Outcomes that
Require Coordination Across Multiple Jurisdictions’ (Paper presented at Productivity
Commission Roundtable: Promoting Better Environmental Outcomes, Canberra, 19–
Page 352
332
20 August 2008) 149
Crane, Keith, Nicholas Burger and Martin Wachs, ‘The Option of an Oil Tax to Fund
Transportation and Infrastructure’ (Occasional Paper, RAND, 2011)
Creightney, Cavelle, ‘Road User Taxation in Selected OECD Countries’ (SSATP
Working Paper No 3, Sub–Saharan Africa Transport Policy Program, World Bank
and Economic Commission for Africa, August 1993)
Dantas, André, Susan Krumdieck and Shannon Page, ‘Energy Risk to Activity
Systems as a Function of Urban Form’ (Research Report 311, Land Transport New
Zealand, 2007)
Davis, Lucas W and Lutz Kilian, ‘Estimating the Effect of a Gasoline Tax on Carbon
Emissions’ (Working Paper No 14685, National Bureau of Economic Research,
January 2009)
Denniss, Richard, ‘Implementing Policies to Increase the Sustainability of Transport
in Australia’ (Paper presented at Western Australia: Beyond Oil? Perth, 21 February
2003)
Department of Infrastructure and Transport, ‘Light Vehicle CO2 Emission Standards
for Australia: Key Issues’ (Discussion Paper, Commonwealth of Australia, 2011)
Department of Resources, Energy and Tourism, ‘Draft Energy White Paper 2011:
Strengthening the Foundations for Australia’s Energy Future’ (Commonwealth of
Australia, December 2011)
Dirkis, Michael, ‘A Taxing Climate: The Taxation Aspects of the CPRS’ (Paper
presented at the School of Business Law and Taxation Symposium, Curtin University
of Technology, Perth, 2009)
Dix, Michele, ‘The Central London Congestion Charging Scheme — From
Conception to Implementation’ (Paper prepared for the second seminar of the
IMPRINT-EUROPE Thematic Network: Implementing Reform on Transport Pricing:
Identifying Mode-Specific Issues, Brussels, 14–15 May 2002)
Doornbosch, Richard and Ronald Steenblik, ‘Biofuels: Is the Cure Worse Than The
Disease?’ (Working Paper No SG/SD/RT(2007)3/REV1, OECD, 2007)
Drexhage, John and Deborah Murphy, ‘Sustainable Development: From Brundtland
to Rio 2012’ (Background Paper prepared for consideration by High Level Panel on
Global Sustainability at its first meeting, United Nations Headquarters, 19 September
2010)
Duff, David G, ‘Tax Policy and Global Warming’ (University of Toronto Law and
Economics Research Paper No 03-04, University of Toronto, 2003)
Earley, Robert, Liping Kang, Feng An and Lucia Green-Weiskel, ‘Electric Vehicles
in the Context of Sustainable Development in China’ (Background Paper No 9, UN
Doc CSD19/2011/BP9 presented at 19th
session of the Commission on Sustainable
Development, New York, 2–13 May 2011)
Page 353
333
ECON-Economics Analysis Center, ‘Economic Growth and Transport Growth in the
Netherlands’ (ECON-Note No 78/99, ECON-Economics Analysis Center, 27
February 2004)
Eddington, Sir Rod, ‘Investing in Transport: East West Link Needs Assessment’
(Recommendation Paper Addressed to The Hon John Brumby MP, Melbourne, 2008)
Edmundsen, Peter, ‘Intergovernmental Agreements and the Battle over GST
Revenue’ (Paper presented at the 2006 Constitutional Law Conference and Dinner,
Art Gallery of New South Wales, 24 February 2006)
<http://www.gtcentre.unsw.edu.au/events/2006-constitutional-law-conference-and-
dinner>
Enoch, Marcus, Stephen Potter, Graham Parkhurst and Mark Smith, ‘Why Do
Demand Responsive Systems Fail?’ (Paper for the 85th Annual Meeting of the
Transport Research Board, 2006)
Environment Directorate and Directorate for Financial, Fiscal and Enterprise Affairs,
‘Environmental Taxes in OECD Countries: A Survey’ (OECD Environment
Monographs No 71, OECD, 1993)
Ergas, Henry, ‘New Policies Create a New Politics: Issues of Institutional Design in
Climate Change Policy’ (Paper presented at Productivity Commission Roundtable:
Promoting Better Environmental Outcomes, Canberra, 19–20 August 2008) 165
Evans, Chris and Binh Tran-Nam, ‘The Compliance and Administrative Costs of the
TVM: What are the Implications?’ (Paper presented at TVM Consultative
Conference, ATAX, Sydney, 23–24 July 2001)
Fabian, Bert, ‘Vehicle Fuel Economy Standards in the ASEAN: Need for
Harmonized Approach’ (Paper presented at 5th UNCRD EST Forum Bangkok,
Thailand, 23–25 August 2010)
Fergusson, Malcolm, Ian Skinner and Eleanor Mackay, ‘A Feebate Scheme for the
UK’ (Paper presented at the LowCVP Conference, Westminster, United Kingdom, 15
June 2006)
Freebairn, John, ‘Allocation of and Investment in the Environment’ (Paper presented
at Productivity Commission Roundtable: Promoting Better Environmental
Outcomes, Canberra, 19–20 August 2008) 13
Freebairn, John, ‘Environmental Taxation and its Possible Application in Australia’
(Paper presented at the Melbourne Institute – Australia’s Future Tax and Transfer
Policy Conference, University of Melbourne, 18–19 June 2009)
Froggatt, Antony and Glada Lahn, ‘Sustainable Energy Security: Strategic Risks and
Opportunities for Business’ (White Paper, Chatham House-Lloyd’s 360° Risk
Insight, June 2010)
Fuel Efficiency Working Group, ‘Final Report’ (Australian Transport Council and the
Environment Protection and Heritage Council, March 2009)
Page 354
334
Fuel Efficiency Working Group, ‘Vehicle Fuel Efficiency—Potential Measures to
Encourage the Uptake of More Fuel Efficient, Low Carbon Emission Vehicles’
(Public Discussion Paper, Commonwealth of Australia, 2008)
Fullerton, Don, Andrew Leicester and Stephen Smith, ‘Environmental Taxes: Paper
Written for the Mirrlees Review “Reforming the Tax System for the 21st Century”’
(22 March 2007) Institute for Fiscal Studies
<http://www.ifs.org.uk/mirrleesreview/reports/conference_drafts/environment.pdf>
Glazebrook, Garry, ‘The Scope for Enhancing Public Transport in Australian Capital
Cities’ (18 June 2008) International Transport Forum
<www.internationaltransportforum.org/2009/pdf/AUS_Glazebrook.pdf>
Grayling, Tony, Tim Gibbs and Ben Castle, ‘Tailpipe Trading: How to Include Road
Transport in the EU Emissions Trading Scheme (EU ETS)’ (Paper presented at the
LowCVP Conference, Westminster, United Kingdom, 15 June 2006)
Greene, David L, ‘Fiscal Incentives for GHG Mitigation: Feebates’ (Paper presented
at Climate Change Mitigation: The Importance of Passenger Vehicle Efficiency,
Mexico City, 8–9 March 2010)
Hamburg, Andreas Kossak, ‘Road Pricing Updates 2010 from Germany to Europe’
(Paper presented at Transport Research Board 90th Annual Conference, Washington,
DC, 23–27 January 2011)
Hargroves, Karlson and Ernst Ulrich Weiszäcker, ‘Technology and Policy Opions for
Making Transport Systems More Sustainable’ (Background Paper No 2, UN Doc
CSD19/2011/BP2 presented at the 19th
session of the Commission on Sustainable
Development, New York, 2–13 May 2011)
Hart, Michael, ‘Potholes and Paperwork: Improving Cross-Border Integration and
Regulation of the Automotive Industry’ (C D Howe Institute Commentary No 286,
April 2009) 7
Heady, Christopher, ‘Directions in Overseas Tax Policy’ (Paper presented at the
Australia’s Future Tax and Transfer Policy Conference 2009, Melbourne Institute,
Melbourne, 18–19 June 2009)
Henry, Ken, ‘Changing Taxes for Changing Times’ (Keynote speaker at the
Australasian Tax Teachers Association (ATTA) Conference, Sydney, 20–22 January
2010)
Hinnells, Mark and Stephen Potter, ‘Don’t Tax More, Tax Different! A Tax Paradigm
for Sustainability’ (Paper No 20, Centre for Reform, 2001)
Hubbert, Marion King, ‘Nuclear Energy and the Fossil Fuels’ (Publication No 95,
Shell Development Company, Exploration and Production Research Division, 8
March 1956)
Hymel, Mona L, ‘Americans and their “Wheels”: A Tax Policy for Sustainable
Mobility’ (Discussion Paper No 06-15, Arizona Legal Studies, 2006)
Page 355
335
Hymel, Mona L, ‘Globalisation, Environmental Justice, and Sustainable
Development: The Case of Oil’ (Discussion Paper No 06-38, Arizona Legal Studies,
2006)
Hymel, Mona L, ‘Moonshine to Motorfuel: Tax Incentives for Fuel Ethanol’
(Discussion Paper No 08-29, Arizona Legal Studies, 2008)
Hymel, Mona L, ‘The United States’ Experience with Energy-Based Tax Incentives:
The Evidence Supporting Tax Incentives for Renewable Energy’ (Discussion Paper
No 06-21, Arizona Legal Studies, 2006)
Hymel, Mona L,’Trading Greenbacks for Green Behavior: Oregon and the City of
Portland’s Environmental Incentives’ (Discussion Paper No 06-44, Arizona Legal
Studies, 2006)
Ieromonachou, Petros, James Warren and Stephen Potter, ‘Supporting Policy
Packages: The Future of Road Pricing in the UK?’ (Paper presented at Kuhmo Nectar
Conference, University of Urbino, Italy, 9–13 July 2007)
Infrastructure Partnerships Australia, ‘Urban Transport Challenge: A Discussion
Paper on a Role for Road Pricing in the Australian Context’ (Discussion Paper,
Infrastructure Partnership Australia, April 2010)
International Transport Forum, ‘Transport for Society: 2011 Annual Summit:
Background Paper’ (International Transport Forum, 2011)
Jacobsen, Mark, ‘Evaluating US Fuel Economy Standards In a Model with Producer
and Household Heterogeneity’ (Working Paper No 08-10, University of California,
San Diego, September 2010)
James, Simon and Alison Edwards, ‘The Importance of Behavioral Economics in Tax
Research and Tax Reform: The Issues of Tax Compliance and Tax Simplification’
(Paper presented at the Conference of the Society for the Advancement of Behavioral
Economics, New York University, 15–18 May 2007)
Johnson, Paul and Nick Stern, ‘Commentary on Fullerton, Leicester, Smith,
“Environmental Taxes”’ (2008) The Institute for Fiscal Studies
<http://www.ifs.org.uk/mirrleesreview/commentaries/johnson_stern.pdf>
Joint Transport Research Centre of the OECD and the International Transport Forum,
‘Transport Outlook 2008 Focusing on CO2 Emissions from Road Vehicles’
(Discussion Paper No 2008-13, OECD/ITF, 2008)
Kerr, Suzi and Marianna Kennedy, ‘Greenhouse Gases and Nutrients: The
Interactions Between Concurrent New Zealand Trading Systems’ (Paper presented at
Productivity Commission Roundtable: Promoting Better Environmental Outcomes,
Canberra, 19–20 August 2008) 103
Kilsby, David, ‘“Securing Australia’s Energy Future”: Comments on Energy White
Paper’ (2004) <http://www.kilsby.com.au/archive/p08041.pdf>
Kim, David S and J David Porter, ‘Technology Development and System Integration
Page 356
336
for a Vehicle Miles Traveled Based Revenue Collection System Prototype’ (Working
Paper No OR 97310, Oregon Department of Transportation Road User Fee Task
Force, May 2004)
Kimura, Osamu, ‘Japanese Top Runner Approach for Energy Efficiency Standards’
(SERC Discussion Paper No SERC09035, Socio-Economic Research Centre, 2010)
Klier, Thomas and Joshua Linn, ‘New Vehicle Characteristics and the Cost of the
Corporate Average Fuel Economy Standard’ (Draft Working Paper No WP 2008-13,
Federal Reserve Bank of Chicago, November 2008)
Kodjak, Drew, Anup Bandivadekar, John German and Nicholas Lutsey, ‘The
Regulatory Engine: How Smart Policy Drives Vehicle Innovations’ (Research Paper
No 02, International Council on Clean Transportation, January 2011)
Krumdieck, Susan, ‘The First Rule and Why it Would Work’ (Paper presented at the
Energy, Transport and Sustainability Symposium, Wellington, New Zealand, 26–27
June 2008)
Krumdieck, Susan, Andre Dantas, Shannon Page, Jean-Paul Thull and Montira
Watcharasukarn, ‘Travel Demand and Behaviour Change with Increasing Fuel Price
as a Function of Income for a Particular Geographic and Activity Cohort’ (Research
Paper, Department of Mechanical Engineering, University of Canterbury)
Lane, Ben, Stephen Potter and James Warren, ‘Taxing Cars with Attitude’ (Paper
presented at the LowCVP Conference, Westminster, United Kingdom, 15 June 2006)
Libecap, Gary D, ‘Promoting Better Environmental Outcomes through Property
Rights and Markets: Opportunities and Limits’ (Paper presented at Productivity
Commission Roundtable: Promoting Better Environmental Outcomes, Canberra, 19–
20 August 2008) 57
Litman, Todd, ‘Appropriate Response to Rising Fuel Prices Citizens Should
Demand, “Raise My Prices Now!”‘ (Research Paper, Victoria Transport Policy
Institute, 1 March 2011)
Litman, Todd, ‘Changing Vehicle Travel Price Sensitivities: The Rebounding
Rebound Effect’ (Research Paper, Victoria Transport Policy Institute, 8 June 2011)
Litman, Todd, ‘Efficient Vehicles Versus Efficient Transportation: Comparing
Transportation Energy Conservation Strategies’ (Research Paper, Victoria Transport
Policy Institute, 26 August 2009)
Litman, Todd, ‘Pay-As-You-Drive Vehicle Insurance in British Columbia’ (Research
Paper, Pacific Institute for Climate Solutions, May 2011)
Litman, Todd, ‘The Future Isn’t What it Used to Be’ (2012) Victoria Transport
Policy Institute <http://www.vtpi.org/future.pdf>
Litman, Todd, ‘Transportation Land Valuation: Evaluating Policies and Practices that
Affect the Amount of Land Devoted to Transportation Facilities’ (Research Paper,
Victoria Transport Policy Institute, 9 May 2011)
Page 357
337
LowCVP ‘Low Carbon Road Transport Challenge: Proposals to Reduce Road
Transport CO2 Emissions in the UK to Help Mitigate Climate Change’ (Paper
presented at the LowCVP Conference, Westminster, United Kingdom, 15 June 2006)
Mæhlum, Sverre, ‘Vehicle Tax Incentives in Norway’ (Paper presented at the IEA
Workshop, 22–23 November 2010)
Major Cities Unit, ‘Our Cities: The Challenge of Change’ (Background and Research
Paper, Department of Infrastructure and Transport, 2010)
Marks, Robert, ‘Macro-Economic Effects of the Import Parity Pricing of Oil’ (Paper
presented at the Tenth Conference of Economists, Canberra, 1981)
McKibbin, Warwick, ‘Lessons for Climate Policy from Monetary History’ (Paper
presented at Productivity Commission Roundtable: Promoting Better Environmental
Outcomes, Canberra, 19–20 August 2008) 213
Meiklejohn, David, ‘Addressing Oil Vulnerability Through Travel Behaviour
Change’ (Paper presented at the 29th Australasian Transport Research Forum, Gold
Coast, Australia, 27–29 September 2006)
Metschies, Gerhard, ‘Adam Smith and the Principles of Sustainable Road Policy’
(2001) Financial and Institutional Reform of Road Conservation in Latin America
and the Caribbean <http://www.zietlow.com/docs/adamsmith.pdf>
Midgley, Peter, ‘Bicycle-Sharing Schemes: Enhancing Sustainable Mobility in Urban
Areas’ (Background Paper No 8, UN Doc CSD19/2011/BP8 presented at 19th
session
of the Commission on Sustainable Development, New York, 2–13 May 2011)
Ministerial Taskforce, ‘An Economic Framework for an Efficient Transportation
Marketplace: Issues Paper’ (Ministerial Taskforce, 2 December 2008)
Moriarty, Patrick and Damon Honnery, ‘Australian Car Travel: An Uncertain Future’
(Paper presented at the 30th
Australasian Transport Research Forum, Melbourne, 25–
27 September 2007)
National Transport Commission, ‘Road Freight Demand Elasticities Stage 2’ (Final
Report, National Transport Commission, 23 May 2011)
Newman, Peter, ‘Why Do We Need a Good Public Transport System?’ (Research
Paper, Curtin University Sustainability Policy (CUSP) Institute)
Noblet, Caroline Lundquist, Gregory M Gould, Jonathan Rubin, Daniel Innis and
Charles Morris ‘Sustainable Transportation Funding for Maine’s Future’ (Research
Report in response to Transportation Research Problem and Statement, Maine
Department of Transport, 20 January 2006)
<http://mcspolicycenter.umaine.edu/files/pdf/SustainableTransportationFunding01-
06.pdf>
Ockwell, Anthony and Phil Bullock, ‘The Role of Road Pricing in the Australian
Policy Context’ (Paper presented at Australasian Transport Research Forum 2010,
Canberra, Australia, 29 September – 1 October 2010)
Page 358
338
Onoda, Takao, ‘Review of International Policies for Vehicle Fuel Efficiency’
(Information Paper, OECD/IEA, August 2008)
Pannell, David, ‘Environmental Policy for Environmental Outcomes’ (Paper
presented at Productivity Commission Roundtable: Promoting Better Environmental
Outcomes, Canberra, 19–20 August 2008) 115
Parker, Alan A, ‘Cutting Transport Fuel Use: The Priorities for Climate Change and
Uncertain Future Oil Prices’ (Paper presented at the 30th
Australasian Transport
Research Forum, Melbourne, Australia, 25–27 September 2007)
Patterson, Peter, ‘A Competitive Response to Climate Change’ (Policy Paper,
Institute of Directors, 2007)
Pink, Brian, Australian Statistician, Australia’s Environment: Issues and Trends 2007
(Catalogue No 4613.0, Australian Bureau of Statistics, 11 January 2008) <Australian
Bureau of Statistics <www.abs.gov.au>
Plotkin, Steven E, ‘Fuel Economy Policy for Australia: Policies that Complement
Fuel Economy Standards’ (Paper presented at 50 By 50 Global Fuel Economy
Initiative, Improving Fuel Economy in Australia, Melbourne, 2 March 2011)
Potter, Stephen, ‘Exploring Rail Futures Using Scenarios: Experience and Potential’
(Paper presented at Universities Transport Study Group Conference, University of
Leeds, January 2007)
Potter, Stephen, ‘Exploring Strategic Approaches Towards a Sustainable Transport
System’ (Paper presented at International Conference and Annual Meeting of the
Chinese Institute of Transportation, Taipei, 4–6 December 2007)
Potter, Stephen, ‘Travelling Light: The Roles of Behavioural Change and Technical
Innovation in Achieving Sustainable Transport’ (Keynote paper for the 2006 Shell
Ecomarathon, 2006)
Potter, Stephen, Barry Ubbels, Paul Peeters and Graham Parkhurst, ‘Adapting the
Dutch “Mobility Explorer” Program to Investigate Possible Car Taxation Futures for
the UK’ (Paper presented at the University Transport Studies Group Annual
Conference, Newcastle, 5–7 January 2004)
Proost, Stef, ‘A Full Account of the Costs and Benefits of Reducing CO2 Emissions
in Transport’ (Discussion Paper No 2008-3, OECD/ITF, 2008)
Quiggin, John, ‘Untangling the Web of Commonwealth/State/Local Government
Funding — What Did Your GST Buy?’ (Research Paper, School of Political Science
and International Studies, University of Queensland, May 2005)
Rabinowitz, Robert, ‘Using Carbon Markets to Encourage the Uptake of Low
Carbon Vehicles’ (Paper presented at the LowCVP Conference, Westminster, United
Kingdom, 15 June 2006)
Riedel, Johann, Robin Roy, Stephen Potter, ‘Design and Market Position – Mapping
the Market with the MADRID Market Map’ (Paper presented at the International
Page 359
339
Product Development Management Conference, Hamburg, Germany, 30 June – 1
July 2008)
Riedy, Christopher, ‘Subsidies that Encourage Fossil Fuel Use in Australia’ (Working
Paper CR2003/01, Institute for Sustainable Futures, January 2003)
Road User Fee Task Force, ‘A Testing Scenario Vision for a Mileage Fee’
(Discussion Paper, Road User Fee Task Force, 12 February 2003)
Roth, Gabriel J, ‘Paying for Parking’ (Hobart Paper No 33, The Institute of
Economic Affairs, 1965)
Roy, Rana, ‘The Scope for CO2-Based Differentiation in Motor Vehicle Taxes in
Equilibrium and in the Context of the Current Global Recession’ (Working Paper No
ENV/EPOC/WPNEP/T(2009)1/FINAL, Environment Policy Committee OECD, 9
October 2009)
Sallee, James and Joel Slemrod, ‘Car Notches: Strategic Automaker Responses to
Fuel Economy Policy’ (EI @ Haas Working Paper No WP-212, Energy Institute at
Haas, December 2010)
Sandmo, Agnar, ‘Commentary on Fullerton, Leicester, Smith, “Environmental
Taxes”’ (2008) The Institute for Fiscal Studies
<http://www.ifs.org.uk/mirrleesreview/commentaries/sandmo.pdf>
Shanjun Li, Joshua Linn and Erich Muehlegger, ‘Gasoline Taxes and Consumer
Behavior’ (Research Paper, March 2011)
Skutento, David, David Cosgrove and David Mitchell, Survey of Motor Vehicle Use –
An Investigation into Coherence (Research Paper No 9208.0.55.005, Australian
Bureau of Statistics, 8 September 2006)
Small, Kenneth A, ‘Energy Policies for Automobile Transportation: A Comparison
Using the National Energy Modeling System’ (Backgrounder, Resources for the
Future, June 2010)
Small, Kenneth A and Kurt Van Dender, ‘Fuel Efficiency and Motor Vehicle Travel:
The Declining Rebound Effect’ (Working Paper No 05-06-03, Department of
Economics, University of California, 10 April 2006)
Small, Kenneth and Kurt Van Dender, ‘Long Run Trends in Transport Demand, Fuel
Price Elasticities and Implications of the Oil Outlook for Transport Policy’
(Discussion Paper No 2007-16, Joint Transport Research Centre, December 2007)
Smith, Clint, ‘The Next Oil Shock’ (Research Paper No 2010/04, Parliamentary
Library, New Zealand Parliament, October 2010)
Stavins, Robert N, ‘Getting Serious About Global Climate Change: Post-Kyoto
International Climate Policy Architecture’ (Paper presented at Productivity
Commission Roundtable: Promoting Better Environmental Outcomes, Canberra, 19–
20 August 2008) 133
Page 360
340
Stein, Paul L, ‘Are Decision-Makers Too Cautious With The Precautionary
Principle?’ (Paper presented at the Land and Environment Court of New South Wales
Annual Conference, Blue Mountains, 14–15 October 1999)
Still, Ben, ‘Transport Impact on Land Use: Potential Methods and Their Relevance to
Strategic Planning’ (Paper presented at The European Transport Conference, 1
January 1997)
Timilsina, Govinda R and Hari B Dulal, ‘Fiscal Policy Instruments for Reducing
Congestion and Atmospheric Emissions in the Transport Sector: A Review’ (Policy
Research Working Paper No WPS 4652, World Bank Development Research Group
Sustainable Rural and Urban Development Team, 1 June 2008)
Timilsina, Govinda R and Hari B Dulal, ‘Urban Road Transportation Externalities:
Costs and Choice of Policy Instruments’ (Research Paper, World Bank Research
Observer, 3 June 2010)
Toleman, Roger and Geoff Rose, ‘A Pathway to Sustainable Transport’ (Paper
presented at the 30th
Australasian Transport Research Forum, Melbourne, Australia,
25–27 September 2007)
Trebeck, David, John Landels and Kevin Hughes, ‘Fuel Taxation Inquiry Issues
Paper’ (Commonwealth of Australia, 18 August 2001)
Trewin, Dennis, Australian Statistician, Developments in New Motor Vehicle
Statistics (Catalogue No 9313.0, Australian Bureau of Statistics, 19 December 2001)
Veitch, Alex, ‘Options for Carbon Regulation of the European Car Industry’ (Paper
presented at the LowCVP Conference, Westminster, United Kingdom, 15 June 2006)
Wahnschafft, Ralph and Kwisun Huh, ‘Effective Implementation of Fuel-Economy
Labelling for Passenger Cars: Experiences from the USA, Sweden and Republic of
Korea’ (Research Paper, Energy Resources Section UN-ESCAP and Department of
Environmental Science and Engineering, Hankuk University of Foreign Studies,
December 2000)
Wal, S Y van der, ‘Evolutionary Change in Automotive Technology: Long Term
Developments, Artefacts, Producers and Consumers’ (Research Paper, Eindhoven
Centre for Innovation Studies, October 2007)
Waller, Mike, ‘Oil Vulnerability Strategy/Action Plan for Queensland: Research
Paper’ (Report to the Minister for Sustainability, Climate Change and Innovation,
September 2009)
Watcharasukarn, Montira, Susan Krumdieck, Andre Dantas and Richard Green, ‘A
Game-Based Survey for Core Travel Demand and Fuel Price Adaptability
Assessment’ (Transportation Research Board Annual Meeting 2009 Paper #09-2389,
Transportation Research Board, 2009)
Watcharasukarn, Montira, Susan Krumdieck, Andre Dantas and Richard Green,
‘Transport Behaviour Assessment for Adaptability’ (Paper presented at Energy,
Transport and Sustainability Symposium, 26–27 June 2008)
Page 361
341
Webb, Richard, ‘Crude Oil Excise and Royalties’ (Research Note No 29, 2000-01,
Parliamentary Library, Parliament of Australia, 22 May 2001)
Weisbrod, Glen E and Brian Baird Alstadt, ‘Progress and Challenges in the
Application of Economic Analysis for Transport Policy and Decision Making’
(Discussion Paper No 2007-14, OECD/ITF, 2007)
Werther, Petrouschka, ‘Kilometer Pricing in the Netherlands’ (Project Notes,
Ministry of Transport, Public Works and Water Management, 2009)
Whiteford, Peter, ‘Transfer Issues and Directions for Reform: Australian Transfer
Policy in Comparative Perspective’ (Paper presented at the Australia’s Future Tax
and Transfer Policy Conference, Melbourne, 18–19 June 2009)
Yacobucci, Brent D and Robert Bamberger, ‘Automobile and Light Truck Fuel
Economy: The CAFE Standards’ (CRS Report for Congress Order Code RL33413,
Congressional Research Services, Congress of the United State of America, 2007)
G Reports
An, Feng, Deborah Gordon, Hui He, Drew Kodjak, and Daniel Rutherford,
‘Passenger Vehicle Greenhouse Gas and Fuel Economy Standards: A Global Update’
(Report, International Council on Clean Transportation, July 2007)
An, Feng and Amanda Sauer, ‘Comparison of Passenger Vehicle Fuel Economy and
Greenhouse Gas Emission Standards Around the World’ (Report, Pew Center on
Global Climate Change, December 2004)
Acil Tasman, ‘Henry Tax Review: An Overview of Issues for Motorists’ (Report,
Australian Automobile Association, May 2010)
Andersen, Mikael Skou, Niels Dengsøe and Anders Branth Pedersen, ‘An Evaluation
of the Impact of Green Taxes in the Nordic Countries’ (Report No TemaNord
2000:561, Centre for Social Research on the Environment, May 2000)
Australian Bureau of Agricultural and Resource Economics and Sciences, ‘Energy in
Australia 2010’ (Report, Department of Resources Energy and Tourism, 16 April
2010)
Australian Bureau of Statistics, Australian Demographic Statistics (Catalogue No
3101.0, March 2009)
Australian Bureau of Statistics, Australian Social Trends, 1996 (Catalogue No
4102.0, 24 June 1996)
Australian Bureau of Statistics, Household Expenditure Survey, Australia: Detailed
Expenditure Items 2003–04 (Catalogue No 6535.0.55.001, 11 August 2005)
Australian Bureau of Statistics, Motor Vehicle Census, Australia, 31 Mar 2008
(Catalogue No 9309.0, 14 January 2009)
Page 362
342
Australian Bureau of Statistics, Motor Vehicle Census, Australia, 31 Mar 2009
(Catalogue No 9309.0, 17 November 2009)
Australian Bureau of Statistics, Motor Vehicle Census, Australia, 31 January 2011
(Catalogue No 9309.0, 28 July 2011)
Australian Bureau of Statistics, Population Projections, Australia (Catalogue No
3222.0, 4 September 2008)
Australian Bureau of Statistics, Sales of New Motor Vehicles, Australia, January
2012 (Catalogue No 9314.0, 15 February 2012)
Australian Bureau of Statistics, Sales of New Motor Vehicles, Australia, April 2012
(Catalogue No 9314.0, 15 May 2012)
Australian Bureau of Statistics, Survey of Motor Vehicle Use, Australia, 12 Months
Ended 31 October 2007 (Catalogue No 9208.0, 28 August 2008)
Australian Bureau of Statistics, Survey of Motor Vehicle Use, Australia, 12 Months
Ended 31 October 2010 (Catalogue No 9208.0, 23 August 2011)
Australian Bureau of Statistics, ‘Use of Urban Public Transport in Australia’ in Year
Book Australia, 2005 (Catalogue No 1301.0, 21 January 2005)
Australian National Audit Office, ‘Administration of the Luxury Car Tax —
Performance Audit Report’ (Performance Audit Report No 45 2010–11, Australian
National Audit Office, 2011)
Australian Treasury, ‘Architecture of Australia’s Tax and Transfer System’ (Report,
Commonwealth of Australia, August 2008)
<http://taxreview.treasury.gov.au/content/downloads/report/Architecture_of_Australi
as_Tax_and_Transfer_System_Revised.pdf> (Henry Tax Review)
Automobile Evaluation Standard Subcommittee, Energy Efficiency Standards
Subcommittee of the Advisory Committee for Natural Resources and Energy and
Automobile Fuel Efficiency Standards Subcommittee, Automobile Transport
Section, Land Transport Division of the Council for Transport Policy, ‘Final Report
of Joint Meeting between the Automobile Evaluation Standards Subcommittee,
Energy Efficiency Standards Subcommittee of the Advisory Committee for Natural
Resources and Energy and the Automobile Fuel Efficiency Standards Subcommittee,
Automobile Transport Section, Land Transport Division of the Council for
Transport: Policy Concerning Revisions of Evaluation Standards for Manufacturers
with Regard to Improvement of Automobile Energy Consumption Efficiency’
(Working Papers, Council for Transport Policy, February 2007)
Baker, Richard and Ginger Goodin, ‘Exploratory Study: Vehicle Mileage Fees in
Texas’ (Report No FHWA/TX-11/0-6660-1,Texas Transportation Institute, January
2011)
Bertini, Robert L, Kerri Sullivan, Karen Karavanic, Hau Hagedorn and Dean Deeter,
‘Data Transmission Options for VMT Data and Fee Collection Centers’ (Report No
FHWA-OR-VP-03-06, Oregon Department of Transportation Research Group,
Page 363
343
November 2002)
Besseling, Paul, Karst Geurs, Hans Hilbers, Rik Lebouille and Mark Thissen ‘Effects
of Converting the Purchase Tax on Cars to a Kilometre-based Charge’ (Bureau for
Economic Policy Analysis Document, Bureau for Economic Policy Analysis, May
2008)
Booz Allen Hamilton, ‘International Approaches to Tackling Transport Congestion
Paper 3 (Final): Financial and Taxation Measures’ (Report No A5022/WP/WP3,
Victorian Competition and Efficiency Commission, April 2006)
Bristow, Abigail, Marcus Enoch, Lian Zhang, Clare Greensmith, Norman James and
Stephen Potter, ‘Improving Public Transport Research — Monitoring Kickstart
Schemes (UG589): Final Report’ (Final Report commissioned jointly by Department
for Transport and Scottish Executive, 2007)
Brundtland, Gro Harlem, Our Common Future (World Commission on Environment
and Development, 1987) <http://www.earthsummit2012.org/about-us/historical-
documents/92-our-common-future>
Brunvoll, Frode and Jan Monsrud, ‘Transport and Communication: Transport’
(Report No 2008/03, Statistics Norway, 12 April 2006)
<http://www.ssb.no/transport_en/>
Centre for Strategic Economic Studies, Energy Research Institute and National
Development and Reform Commission, ‘Identifying Policies and Implementation
Strategies for Improving Energy Efficiency — Case Study 1: High Fuel Efficiency
Motor Vehicles’ (Report, Australian Department of Climate Change, May 2011)
City of Portland Peak Oil Task Force, ‘Descending the Oil Peak: Navigating the
Transition from Oil and Natural Gas’ (2007) City of Portland
<http://www.portlandonline.com/bps/index.cfm?a=145732&c=42894>
Commissioner of Taxation, ‘Annual Report 2010–11’ (Australian Taxation Office, 30
September 2011)
Committee for the Study of the Long-Term Viability of Fuel Taxes for Transportation
Finance, Transportation Research Board of the National Academies, ‘The Fuel Tax
and Alternatives for Transportation Funding’ (Special Report 285, Transportation
Research Board, 2006)
Commonwealth of Australia, ‘Chapter E: Enhancing Social and Market Outcomes’ (2
May 2010) Australia’s Future Tax System: Final Report – Detailed Analysis
<http://taxreview.treasury.gov.au/content/FinalReport.aspx?doc=html/Publications/P
apers/Final_Report_Part_2/Chapter_e.htm>
Deighton, Carole and Rebecca Luther, ‘Pre-Driver Education: A Critical Review of
the Literature on Attitude Change and Development, Good Practice in Pre-Driver
Education and Programme Effectiveness’ (UK Department for Transport, 2007)
Department of Climate Change and Energy Efficiency, ‘Transport Emissions
Projections 2010’ (Report, Commonwealth of Australia, 2010)
Page 364
344
Department of Industrial and Manufacturing Engineering, Oregon State University,
‘Technology Development and System Integration for a Vehicle Miles Traveled
Based Revenue Collection System Prototype Test Result’ (Oregon Department of
Transportation, 31 May 2004)
Department of Infrastructure, Energy and Resources, ‘Strategically Important
Transportation Data’ (Australian Transport Council Strategic Research and
Technology Working Group Report to Support the National Policy Framework,
Department of Infrastructure, Energy and Resources, 2009)
Department of Resources, Energy and Tourism, ‘Energy in Australia 2009’ (ABARE,
Canberra, 2009)
Department of Resources, Energy and Tourism, ‘Energy in Australia 2010’ (ABARE,
Canberra, 2010)
Department of Resources, Energy and Tourism, ‘Energy in Australia 2011’ (ABARE,
2011)
Department of Resources, Energy and Tourism, ‘Energy in Australia 2012’ (ABARE,
Canberra, 2012)
Department of Resources, Energy and Tourism, ‘Strategic Framework for Alternative
Transport Fuels’ (December 2011)
Department of Sustainability, Environment, Water, Population and Communities,
‘Indicator: A-35 Projections of Motor Vehicle Travel and Pollutant Emissions’ (22
November 2010) State of the Environment 2006
<http://www.environment.gov.au/soe/2006/publications/drs/indicator/376/index.html
>
Department of Treasury, ‘Overview of State Taxes and Royalties’ (Report,
Government of Western Australia, December 2011)
Donath, Max, Alec Gorjestani, Craig Shankwitz, Richard Hoglund, Edmund Arpin V,
Pi-Ming Cheng, Arvind Menon and Bryan Newstrom, ‘Technology Enabling Near-
Term Nationwide Implementation of Distance Based Road User Fees’ (Report No
CTS 09-20, Intelligent Transportation Systems Institute Center for Transportation
Studies, University of Minnesota, June 2011)
Eads, George, ‘50 by 50: Prospects and Progress’ (Report, Global Fuel Economy
Initiative)
Energy Information Administration, ‘Analysis of Five Selected Tax Provisions of the
Conference Energy Bill of 2003’ (Service Report No SR/OIAF/2004-01, February
2004) <ftp://ftp.eia.doe.gov/service/sroiaf(2004)01.pdf>
Energy Information Administration, ‘International Energy Outlook 2007’ (Report No
DOE/EIA-0484(2007), Energy Information Administration, 25 June 2008)
<http://www.eia.gov/forecasts/archive/ieo07/index.html>
Energy Information Administration, ‘International Energy Outlook 2010’ (Report No
Page 365
345
DOE/EIA-0484(2010), Energy Information Administration, 27 July 2010)
<http://www.eia.gov/forecasts/archive/ieo10/index.html>
Energy Information Administration, ‘International Energy Outlook 2011’ (Report No
DOE/EIA-0484(2011), Energy Information Administration, 19 September 2011)
<http://www.eia.gov/forecasts/ieo/index.cfm>
Enoch, Marcus, Stephen Potter, Graham Parkhurst and Mark Smith, ‘INTERMODE:
Innovations in Demand Responsive Transport’ (UK Department for Transport and
Greater Manchester Passenger Transport Executive, 2004)
Environmental Protection Agency, ‘Light-Duty Automotive Technology, Carbon
Dioxide Emissions, and Fuel Economy Trends: 1975 through 2009’ (Technical
Report, EPA420-R-09-014, US Environmental Protection Agency, November 2009)
Essen, H P van, B H Boon, A Schroten, M Otten, M Maibach, C Schreyer, C Doll, P
Jochem, M Bak and B Pawlowska ‘Internalisation Measures and Policy for the
External Cost of Transport’ (Report, CE Delft, June 2008)
European Automobile Manufacturers’ Association (ACEA), ‘Overview of CO2 Based
Motor Vehicle Taxes in the EU’ (Report, ACEA: European Automobile
Manufacturers’ Association, 14 March 2011)
European Automobile Manufacturers’ Association (ACEA), ‘Overview of Purchase
and Tax Incentives for Electric Vehicles in the EU’ (Report, 29 March 2012) ACEA
<http://www.acea.be/images/uploads/files/Electric_vehicles_overview.pdf>
European Commission’s Directorate-General for Environment ‘Fiscal Measures to
Reduce CO2 Emissions from New Passenger Cars: Main Report’ (Final Report,
January 2002)
Gargett, David and Afzal Hossain, ‘How Do Fuel Use and Emissions Respond to
Price Changes?’ (Briefing Report No 1, Bureau of Infrastructure, Transport, Regional
Development and Local Government, 2008)
Garnaut Climate Change Review, ‘TravelSmart and LivingSmart Case Study —
Western Australia’ (Report, Garnaut Climate Change Review, 2008)
General Motors, ‘Mobile Emissions & Fuel Economy’ (December 2011) General
Motors Sustainability Report <http://www.gmsustainability.com>
General Motors, ‘Sustainability In Motion’ (December 2011) General Motors
Sustainability Report
<http://www.gmsustainability.com/_reportBuilderImages/GeneralMotorsSustainabilit
yReportPDF.pdf>
Geoscience Australia and ABARE, ‘Australian Energy Resource Assessment’
(Assessment and Report, Australian Government Department of Resources, Energy
and Tourism, 2010)
Gilbert, Richard, ‘Hamilton: The Electric City’ (2006) City of Hamilton
<http://richardgilbert.ca/Files/2006/Hamilton--Electric%20City%20(Web).pdf>
Page 366
346
Global Fuel Initiative, ‘50 by 50 Global Fuel Initiative’ (Report, Global Fuel
Economy Initiative)
Global Witness, ‘Heads in the Sand? — Governments Ignore the Oil Supply Crunch
and Threaten the Climate’ (Report, Global Witness, 20 October 2009)
Goldberg, David, Lawrence Frank, Barbara McCann, Jim Chapman and Sarah
Kavage, ‘New Data for A New Era: A Summary of the SMARTRAQ Findings’
(Report, SMARTRAQ, 2007)
Guo, Zhan, Asha Weinstein Agrawal, Jennifer Dill, Megan Quirk and Melissa Reese,
‘The Intersection of Urban Form and Mileage Fees: Findings from the Oregon Road
User Fee Pilot Program’ (Report No 10-04, Mineta Transportation Institute, March
2011
Heinberg, Richard, ‘Searching for A Miracle “Net Energy” Limits & The Fate of
Industrial Society’ (False Solution Series No 4, International Forum on Globalization
and the Post Carbon Institute, September 2009)
Helms, Hinrich, Udo Lambrecht and Ulrich Hopfner, ‘Energy Savings by Light-
Weighting’ (Report, Institute for Energy and Environmental Research, January 2003)
Hirsch, Robert, Roger Bezdek and Robert Wendling, ‘Peaking of World Oil
Production: Impacts, Mitigation, & Risk Management’ (2005)
<http://www.netl.doe.gov/publications/others/pdf/oil_peaking_netl.pdf>
Industry Taskforce on Peak Oil and Energy Security, ‘The Oil Crunch: A Wake-Up
Call for the UK Economy’ (Second report of the UK Industry Taskforce on Peak Oil
and Energy Security (ITPOES), 10 February 2010)
Intergovernmental Panel on Climate Change, ‘IPCC Fourth Assessment Report:
Climate Change 2007’ (2007)
<http://www.ipcc.ch/publications_and_data/publications_and_data_reports.shtml>
International Energy Agency, ‘World Energy Outlook 2009’ (OECD/IEA, 2009)
International Energy Agency, ‘World Energy Outlook 2010’ (OECD/IEA, 2010)
International Energy Agency, ‘World Energy Outlook 2011’ (OECD/IEA, 2011)
International Energy Agency, ‘Worldwide Trends in Energy Use and Efficiency: Key
Insights from IEA Indicator Analysis’ (OECD/IEA, 2008)
International Transport Forum, ‘Key Transport Statistics: 2010 Data’ (International
Transport Forum, 2011)
Japan Automobile Manufacturers Association, ‘2009 Report on Environmental
Protection Efforts: Promoting Sustainability in Road Transport in Japan’ (October
2009, Tokyo)
Japan Automobile Manufacturers Association, ‘The Motor Industry of Japan 2010’
(Report, Japan Automobile Manufacturers Association, May 2010)
Page 367
347
Kågeson, Per, ‘Reducing CO2 Emissions from New Cars: A Progress Report on the
Car Industry’s Voluntary Agreement and an Assessment of the Need for Policy
Instruments’ (European Federation for Transport and Environment, January 2005)
Kim, David S and J David Porter, ‘Technology Development and System Integration
for a Vehicle Miles Traveled Based Revenue Collection System Prototype Final
Report’ (Final Report , Oregon Department of Transportation, May 2004)
Kim, David S, David Porter and Robin Wurl, ‘Technology Evaluation for
Implementation of VMT Based Revenue Collection Systems Final Report’ (Final
Report, Oregon Department of Transportation, November 2002)
Komiyama, Ryoichi, ‘Overview of CAFE Standards and the Estimation of Petroleum
Saving Potentials by Japanese Automobiles in the United States’ (Report, IEEJ, May
2008)
Lord Stern, ‘Stern Review: Economics of Climate Change’ (January 2007) Cabinet
Office – HM Treasury <www.hm-treasury.gov.uk/stern_review_report.htm>
MacKenzie, James, Roger Dower and Donald Chen, ‘The Going Rate: What It
Really Costs to Drive’ (Report, World Resources Institute, June 1992)
<http://archive.wri.org/publication_detail.cfm?pubid=2559>
Major Cities Unit, ‘State of Australian Cities 2010’ (Report, Infrastructure Australia,
2010)
<http://www.infrastructureaustralia.gov.au/publications/files/MCU_SOAC.pdf>
Ministry of Transport, Public Works and Water Management, ‘A Different Way of
Paying for Road Use Impacts on Traffic, Environment and Safety, Technology,
Organisation, Enforcement and Costs Management Summaries’ (Management
Summaries, Ministry of Transport, Public Works and Water Management, March
2005)
Ministry of Transport, Public Works and Water Management, ‘Pay Per Kilometre
Progress Report’ (Dutch National Traffic and Transport Plan (Nationaal Verkeers- en
Vervoersplan), November 2001)
National Surface Transportation Infrastructure Financing Commission, ‘Paying Our
Way: A New Framework for Transportation Finance’ (Executive Summary Report,
21 February 2009) <http://financecommission.dot.gov >
New South Wales Treasury, ‘Submission to Tax Design Review Panel: Improvements
to Process for Considering Legislative Changes to the GST Base’ (Submission to the
Tax Design Review Panel, 17 April 2008)
Nordqvist, Joakim, ‘Evaluation of Japan’s Top Runner Programme Within the
Framework of the AID-EE Project’ (Report, AID-EE, 2 July 2006)
Oregon Department of Transportation, ‘Oregon’s Mileage Fee Concept and Road
User Fee Pilot Program Final Report’ (Report, Oregon Department of Transport,
November 2007)
Page 368
348
Oregon Department of Transportation, ‘Oregon’s Mileage Fee Concept and Road
User Fee Pilot Program Report to the 73rd Oregon Legislative Assembly’ (Report On
Proposed Alternatives to the Current System of Taxing Highway Use through Motor
Vehicle Fuel Taxes, June 2005)
Oregon Department of Transportation, ‘Road User Fee Task Force Report to the
72nd Oregon Legislative Assembly On Possible Alternatives to the Current System
of Taxing Highway Use through Motor Vehicle Fuel Taxes’ (Report, March 2003)
Organisation for Economic Co-operation and Development, Recommendation of the
Council on Guiding Principles concerning International Economic Aspects of
Environmental Policies, C(72)128 (26 May 1972)
Organisation for Economic Co-operation and Development, ‘Strategies to Reduce
Greenhouse Gas Emissions from Road Transport: Analytical Methods’ (Report,
OECD, 2002)
Parish, David, ‘The 1973–1975 Energy Crisis and its Impact on Transport’ (Report
Number 09/107, Royal Automobile Club Foundation for Motoring, October 2009)
Potter, Stephen, Graham Parkhurst, Ben Lane, Barry Ubbels and Paul Peeters,
‘Taxation Futures for Sustainable Mobility: Final Report to the ESRC’ (Open
University, March 2004)
Public Transport Users Association, ‘A Tax System for Sustainable Transport:
Submission to the Review of Australia’s Future Tax System’ Review of Australia’s
Future Tax System, 22 October 2008)
Rufolo, Anthony M, Robert L Bertini and Thomas Kimpel, ‘Alternatives to the
Motor Fuel Tax Final Report’ (Final Report No SR 561, Oregon Department of
Transportation Research Group, December 2001)
Rufolo, Anthony M, Peter Stiffler, Hau Hagedorn and Dean Deeter, ‘Institutional
Options for VMT Data and Fee Collection Centres’ (Report, Oregon Department of
Transportation, November 2002)
Schindler, Jörg and Werner Zittel, ‘Crude Oil—The Supply Outlook’ (Report, Energy
Watch Group, 2008) <http://www.energywatchgroup.org/fileadmin/global/pdf/2008-
02_EWG_Oil_Report_updated.pdf>
Schipper, Lee, Reena Tiwari, Jake Schapper, Daniel Hills and Andrew Wilkinson,
‘Moving Cooler Sustainable Transport Matter’ (Round Table Report, Curtin
University, 9 August 2010)
Select Committee on Pricing of Petroleum Products, Parliament of Western
Australia, ‘Getting a Fair Deal for Western Australian Motorists’ (2000)
Shulock, Chuck, Ed Pike, Alan Lloyd and Robert Rose, ‘Vehicle Electrification
Policy Study Task 1 Report: Technology Status’ (Report, The International Council
on Clean Transportation, February 2011)
Shulock, Chuck, Ed Pike, Alan Lloyd and Robert Rose, ‘Vehicle Electrification
Page 369
349
Policy Study Task 2 Report: Metrics’ (Report, The International Council on Clean
Transportation, February 2011)
Shulock, Chuck, Ed Pike, Alan Lloyd and Robert Rose, ‘Vehicle Electrification
Policy Study Task 4 Report: Complementary Policies’ (Report, The International
Council on Clean Transportation, February 2011)
Sisiopiku, Virginia P, Johnnie C Waid, Tarek Rizk, Robert McLeod and Walter
Robbins, ‘Alternative Financing Sources for Alabama Highways’ (UTCA Report
Number 05114, August 2006) <http://utca.eng.ua.edu/files/2011/08/05114fnl.pdf>
Sorrell, Steve, Jamie Speirs, Roger Bentley, Adam Brandt and Richard Miller,
‘Global Oil Depletion: An Assessment of the Evidence for a Near-Term Peak in
Global Oil Production’ (Report produced by the Technology and Policy Assessment
function of the UK Energy research Centre, August 2009)
Tax Design Review Panel, ‘Better Tax Design and Implementation: A Report to the
Assistant Treasurer and Minister for Competition Policy and Consumer Affairs’
(Treasury, 30 April 2008)
<http://archive.treasury.gov.au/documents/1342/PDF/tax_design_review_panel_repo
rt.pdf>
Thoresen, Thorolf, ‘Australia’s New Car Fleet: Fuel Consumption Trade-Offs 1985–
2005’ (Research Report No ARR 371, ARRB Group Ltd, May 2008)
Transport and Mobility Leuven, ‘TREMOVE Service Contract for the Further
Development and Application of the Transport and Environmental TREMOVE
Model Lot 1 (Improvement of the Data Set and Model Structure)’ (Final Report to
Directorate General Environment European Commission, Belgium, 9 July 2007)
UN Environment Programme, ‘Overview of the Republic of Korea’s National
Strategy for Green Growth’ (Report, UN Environment Programme, April 2010)
US Joint Forces Command, ‘The Joint Operating Environment (JOE)’ (Distribution
Statement, 18 February 2010)
UN Secretary-General, ‘Policy Options and Actions for Expediting Progress in
Implementation: Transport-Report of the Secretary General’ (Item 3 of the
Provisional Agenda, UN Doc E/CN.17/2011/4, 19th
Session of the Commission on
Sustainable Development, 17 December 2010)
UN Secretary-General, ‘Review of Progress Achieved in Implementation of Agenda
21 and the Johannesburg Plan of Implementation: Transport-Report of the Secretary
General’ (Item 3 of the provisional Agenda, UN Doc E/CN.17/2010/4, 18th
Session
of the Commission on Sustainable Development, 18 February 2010)
US Department of Transportation, ‘Final Environmental Assessment: National
Highway Traffic Safety Administration Corporate Average Fuel Economy (CAFE)
Standards’ (Assessment Report, Department of Transportation, 29 March 2006)
US Department of Transportation, ‘Summary of Fuel Economy Performance (Public
Version)’ (Report, US Department of Transportation, 28 October 2010)
Page 370
350
US General Accounting Office, ‘Tax Policy Additional Petroleum Production Tax
Incentives Are of Questionable Merit’ (Report to the Chairman, Subcommittee on
Energy and Power, Committee on Energy and Commerce, House of Representatives,
July 1990) <http://www.gao.gov/assets/150/149358.pdf>
US General Accounting Office, ‘Tax Policy Effects of the Alcohol Fuels Tax
Incentives’ (Report to the Chairman, Subcommittee on Energy and Power,
Committee on Energy and Commerce, House of Representatives, March 2007)
http://www.gao.gov/archive/1997/gg97041.pdf>
US Government Accountability Office, ‘Report to Congressional Requesters: Crude
Oil: Uncertainty about Future Oil Supply Makes it Important to Develop a Strategy
for Addressing a Peak and Decline in Oil Production’ (Report No GAO-07-283,
2007) <http://www.gao.gov/new.items/d07283.pdf>
Vågane, Liva and Arne Rideng, ‘Summary: Transport Volumes in Norway 1946–
2009’ (TØI report 1090/2010, Institute of Transport Economics, 2010)
Western Australian Government, ‘Western Australian Government Submission to the
Review of Australia’s Future Tax System’, Review of Australia’s Future Tax System,
4 June 2009
Whitty, James M, ‘Oregon’s Mileage Fee Concept and Road User Fee Pilot Program’
(Final Report, Oregon Department of Transportation, November 2007)
<http://www.oregon.gov/ODOT/HWY/RUFPP/docs/RUFPP_finalreport.pdf>
Wicks, Malcolm, ‘Energy Security: A National Challenge in a Changing World’
(Report for the Department of Energy and Climate, 2009)
Wirth, Clifford J, ‘Peak Oil: Alternatives, Renewables, and Impacts’ (2008)
<http://greatchange.org/ov-clifford,PeakOilAnalysisOctober6-2007.pdf>
Wood, John, Gary Long and David Morehouse, ‘Long-Term World Oil Supply
Scenarios: The Future Is Neither Bleak or Rosy as Some Assert’ (Report prepared for
US Energy Information Administration, 2004) <www.eia.doe.gov>
H Newspaper Articles and Press Releases
AP/AFP, ‘China Now Second Largest Vehicle Market’, China Daily (online), 12
January 2007 <http://www.chinadaily.com.cn/china/2007-
01/12/content_782036.htm>
Billips, Mike, ‘Congestion Pricing in Atlanta’ TIME Magazine (online), 23 January
2011
<http://www.time.com/time/specials/packages/article/0,28804,2026474_2026675_20
32830,00.html>
Carples, James M, ‘James M Carples of ALAM Draws Comparison Between
Attitude of This and European Country’, New York Times (New York), 28 February
1909
Page 371
351
California Department of Insurance, ‘Insurance Commissioner Poizner Sets
Framework For Environmentally-Friendly Automobile Insurance, Increased Options
For Consumers’ (Press Release, 27 August 2008)
<http://www.insurance.ca.gov/0400-news/0100-press-releases/0070-
2008/release089-08.cfm>
‘Canada, US Unite on Car Emission Standards’, CBC News (online), 1 April 2010
<http://www.cbc.ca/news/politics/story/2010/04/01/vehicle-emissions-ottawa-
washington.html>
‘Car Emissions Ratings Flawed, Say Researchers’, ABC News (online), 13 April
2011 <http://www.abc.net.au/news/2011-04-13/car-emissions-ratings-flawed-say-
researchers/2619090>
China.org.cn, ‘210 000 Apply for Vehicle License Plates in Beijing’ (2 January 2011)
CCTV News <http://www.china.org.cn/video/2011-01/12/content_21720642.htm>
Chote, Robert, Don Fullerton, Andrew Leicester and Stephen Smith, ‘Don’t Expect
Much Extra Revenue from Green Taxes, Says Study Prepared for the Mirrlees
Review’ (Press Release, July 2008)
Cohen, Adam, ‘Should the Government Need a Search Warrant to Track Your Car
with GPS?’ TIME (online), 5 July 2011
<http://www.time.com/time/nation/article/0,8599,2081372,00.html#ixzz1REqgyO35
>
‘Countdown to Crisis: Eight Days that Shook Britain,’ BBC News Online, 14th
September 2000 <http://news.bbc.co.uk/2/hi/uk_news/924574.stm>
Dunmore C, ‘Global Oil Availability has Peaked – EU Energy Chief’, Reuters
(online), 10 November 2010
<http://www.reuters.com/article/idUSBRU01112520101110>
Fang Yang, ‘China’s Annual Output of Electric Vehicles to Hit 1 mln by 2020’,
English.News.cn (online), 16 Oct 2010
<http://news.xinhuanet.com/english2010/china/2010-10/16/c_13560296.htm>
Garnaut, Ross, ‘The New Australian Resource Rent Tax’ The Australian (Sydney),
21 May 2010
Glaskin, Max, ‘US Vehicle Efficiency Hardly Changed Since Model T’, New
Scientist (online), 23 July 2009 <http://www.newscientist.com/article/dn17506-us-
vehicle-efficiency-hardly-changed-since-model-t.html>
House of Representatives Standing Committee on Economics, ‘Report Tabled on the
Taxation of Alternative Fuels Bills’ (Media Release, Wednesday 1 June 2011)
Internal Revenue Service, ‘Energy Provisions of the American Recovery and
Reinvestment Act of 2009’ (Fact Sheet No FS-2009-10, US Department of the
Treasury, 10 April 2009)
<http://www.irs.gov/newsroom/article/0,,id=206871,00.html/>
Page 372
352
Maksel, Rebecca, ‘What Determines an Airplane’s Lifespan?’ Air & Space
Smithsonian Magazine (online), 1 March 2008 <http://www.airspacemag.com/need-
to-know/NEED-lifecycles.html>
Manning, Paddy, ‘Peak Oil: It’s Closer Than You Think’ Sydney Morning Herald
(online), 30 April 2011 <http://www.smh.com.au/business/peak-oil-its-closer-than-
you-think-20110429-1e0gt.html>
Mitchell, Alan, ‘Trouble Taxing Bad Behaviour’, Australian Financial Review
(Melbourne), 17 October 2011, 23
Paul, Annie Murphy, ‘Herd Mentality’ TIME Magazine (online), 9 April 2011
<http://www.time.com/time/magazine/article/0,9171,2061234,00.html#ixzz1J4MXu
qqC>
Romero, Simon, ‘Oil-Rich Norway is Taxing on Cars’ The New York Times (online),
30 April 2011 http://www.nytimes.com/2005/04/29/business/worldbusiness/29iht-
norway.html
Schefter, Kellen, ‘Smart Car Offers Drivers New High MPG Option, Top Crash
Rating’, Green Car Journal (online), 20 January 2008
<http://www.greencar.com/articles/smart-car-offers-drivers-new-high-mpg-option-
top-crash-rating.php>
Simmons, Matthew, ‘The Real Oil Shock’ TIME Magazine (online), 14 November
2007 <http://www.time.com/time/magazine/article/0,9171,1106299,00.html>
Swan, Wayne and Greg Combet, ‘Clean Energy Future Draft Legislation Released’
(Joint Media Release, GC 234/11, 28 July 2011)
Volkswagen International, ‘Breakthrough for the 1-Litre Car: Volkswagen Presents
the Most Fuel-Efficient Automobile in the World’ (Press Release, 15 September
2009)
I Parliamentary and Government Documents
Asprey Committee, Commonwealth of Australia, Full Report of the Commonwealth
Committee on Taxation (1975)
Australian Greenhouse Office, ‘Regulation Impact Statement – Proposed Changes to
ADR 81/00 Fuel Consumption Labelling for Light Vehicles’ (29 May 2002)
Australian National Audit Office, Administration of the Luxury Car Tax (2012)
Commonwealth of Australia <http://www.anao.gov.au/Publications/Audit-
Reports/2010-2011/Administration-of-the-Luxury-Car-Tax/Audit-brochure>
Butcher, Louise, ‘Roads: Lorry Road User Charging’ (House of Commons Library
Note No SN/BT/588, 6 September 2010)
Commissioner of Taxation, Luxury Car Tax Determination LCTD 2010/1 – Luxury
Page 373
353
Car Tax: What is the Luxury Car Tax Threshold and the Fuel-Efficient Car Limit for
the 2010–11 Financial Year? (9 June 2010) Australian Taxation Office
<http://law.ato.gov.au/pdf/pbr/lcd2010-001.pdf>
Commissioner of Taxation, Luxury Car Tax Determination LCTD 2011/1 – Luxury
Car Tax: What Are the Luxury Car Tax Threshold and the Fuel-Efficient Car Limit
for the 2011–12 Financial Year? (20 June 2011) Australian Taxation Office
<http://law.ato.gov.au/pdf/pbr/lcd2011-001.pdf>
Commonwealth of Australia, Australia’s Future Tax System: Final Report (2 May
2010)
<http://taxreview.treasury.gov.au/content/Content.aspx?doc=html/pubs_reports.htm>
Commonwealth of Australia, ‘GST Distribution Review’ (Interim Report, March
2012)
‘Concerning Incentives for Efficient Motor Vehicles’ (Colorado Legislative Council
Staff Fiscal Note No HB09-1331, 20 April 2009)
Department of Infrastructure, Transport Regional Development and Local
Government, ‘Draft Regulation Impact Statement for Review of Euro 5/6 Light
Vehicle Emissions Standards’ (December 2009)
EPA and NHTSA, ‘Fuel Economy Labels in EPA and DOT Final Rulemaking’
(Revisions and Additions to Motor Vehicle Fuel Economy Label, 24 May 2011)
James, Matthew L, ‘The (Green) Car of the Future’ (Background Note No 2009-10,
Parliamentary Library, Parliament of Australia, 2009)
<http://www.aph.gov.au/binaries/library/pubs/bn/sci/carofthefuture.pdf>
Obama, Barack, ‘Presidential Memorandum Regarding Fuel Efficiency Standards:
Improving Energy Security, American Competitiveness and Job Creation, and
Environmental Protection through a Transformation of our Nation’s Fleet of Cars and
Trucks’ (Presidential Memorandum, 21 May 2010)
Senate Rural and Regional Affairs and Transport Committee, Parliament of Australia,
‘Executive Summary and Recommendations’ in Investment of Commonwealth and
State Funds in Public Passenger Transport Infrastructure and Services (2009)
<http://www.aph.gov.au/Parliamentary_Business/Committees/Custom_Contents/Sen
ateCommittees/rratctte/publictransport/report>
Senate Select Committee on Fuel and Energy, Parliament of Australia, The CPRS:
Economic Cost Without Environmental Benefit – Interim Report (May 2009)
Smith, Stewart, ‘Oil Supply and Petrol Prices’ (Briefing Paper No 10/08,
Parliamentary Library, Parliament of New South Wales, September 2008)
State Government of Victoria, ‘GST Distribution Review’ (Victorian Supplementary
Submission, March 2012)
Transport Committee, Taxes and Charges on Road Users, House of Commons,
Transport Committee Sixth Report, Session 2008–09 (2009)
Page 374
354
<http://www.publications.parliament.uk/pa/cm200809/cmselect/cmtran/103/10302.ht
m>
Treasury, ‘Fuel Tax Legislation Amendment (Clean Energy) Bill 2011, Excise Tariff
Legislation Amendment (Clean Energy) Bill 2011, Customs Tariff Amendment
(Clean Energy) Bill 2011 — Commentary on Provisions’ (28 July 2011)
<http://www.climatechange.gov.au/government/submissions/clean-energy-
legislative-package/~/media/publications/clean-energy-legislation/Commentary-on-
Clean-Energy-Fuel-Tax-Arrangements-PDF.pdf>
US Environmental Protection Agency, ‘EPA and NHTSA Propose Changes to the
Motor Vehicle Fuel Economy Label’ (Regulatory Announcement No EPA-420-F-10-
048, Office of Transportation and Air Quality, August 2010)
US Environmental Protection Agency, ‘EPA and NHTSA Propose First-Ever
Program to Reduce Greenhouse Gas Emissions and Improve Fuel Efficiency of
Medium- and Heavy-Duty Vehicles’ (Regulatory Announcement No EPA-420-F-10-
038, Office of Transportation and Air Quality, May 2010)
US Environmental Protection Agency, ‘EPA and NHTSA to Propose Greenhouse Gas
and Fuel Efficiency Standards for Heavy-Duty Trucks; Begin Process for Further
Light-Duty Standards’ (Regulatory Announcement No EPA-420-F-10-048, Office of
Transportation and Air Quality, August 2010)
US Environmental Protection Agency, ‘EPA Will Propose Historic Greenhouse Gas
Emissions Standards for Light-Duty Vehicles’ (Regulatory Announcement No EPA-
420-F-09-028, Office of Transportation and Air Quality, May 2009)
US Environmental Protection Agency, ‘New Fuel Economy and Environment Labels
for a New Generation of Vehicles’ (Regulatory Announcement No EPA-420-F-11-
017, Office of Transportation and Air Quality, May 2011)
US Environmental Protection Agency, ‘NHTSA and EPA Issue a Supplemental
Notice in the Process for Setting Future Greenhouse Gas and Fuel Economy
Standards for Passenger Cars and Light Trucks’ (Regulatory Announcement NoEPA-
420-F-09-028, Office of Transportation and Air Quality, May 2009)
J Internet Sources
Advancing Science Serving Society, AAAS Board Statement on Climate Change
(2006) <http://www.aaas.org/climate/>
Airbus, A340-600 Global Performer (March 2012)
<http://www.airbus.com/aircraftfamilies/passengeraircraft/a340family/a340-600/>
Alternative Fuels & Advanced Vehicles Data Center, All Federal & State Incentives
& Laws: All Incentives and Laws Sorted by Type (15 June 2011) US Department of
Energy <http://www.afdc.energy.gov/afdc/laws/matrix/tech>
American Meteorological Society, Climate Change (2007)
Page 375
355
<http://www.ametsoc.org/policy/2007climatechange.html>
ATM Marketplace (2012) <http://www.atmmarketplace.com/>
Australasian Legal Information Institute (12 June 2012) <www.austlii.edu.au>
Bamberger, Robert, Automobile and Light Truck Fuel Economy: The CAFE
Standards (25 September 2002) Almanac of Policy Issues
<http://www.policyalmanac.org>
Bellis, Mary, History of Transportation (2008) About.com: Inventors
<http://inventors.about.com/library/inventors/bl_history_of_transportation.htm>
Better Place Australia <http://australia.betterplace.com/>
Buying a Car in Australia – What You Need to Know (2012) Living in Australia
<http://www.livingin-australia.com/buying-a-car/>
Caltex Australia, How Pricing is Determined (2009)
<http://www.caltex.com.au/LatestNews/FuelPricing/Pages/default.aspx>
Canada Revenue Agency, Excise Tax on Fuel Inefficient Cars (28 March 2007)
<http://www.cra.gc.ca/gncy/bdgt/2007/xcs-eng.html>
CAT volution, MDI OneCAT CAV @ the 2008 NY Auto Show – Questions and
Answers (21 March 2008) YouTube
<http://www.youtube.com/watch?v=rldgXhLW0h0&feature=player_embedded>
City of Melbourne, Licence Plate Recognition (28 April 2012)
<http://www.melbourne.vic.gov.au/ParkingTransportandRoads/Parking/Pages/Licens
ePlateRecognition.aspx>
Cleveland, Cutler, Nuclear Energy and the Fossil Fuels (historical) (1 June 2010)
The Encyclopedia of Earth
<http://www.eoearth.org/article/Nuclear_Energy_and_the_Fossil_Fuels_(historical)>
Cohen, Dave, Does the Peak Oil ‘Myth’ Just Fall Down? — Our Response to CERA
(4 February 2007) The Oildrum
<http://www.theoildrum.com/story/2006/11/15/83857/186>
Deakin Research Services Division, T2 proves a winner in Global Challenge
(October 2008) <http://www.gsdm.com.au/newsletters/deakin/Oct08/t2.html>
Department of Finance and Deregulation, Australian Government RIS (25 June 2010)
Commonwealth of Australia <http://www.finance.gov.au/obpr/ris/gov-ris.html>
Department of Infrastructure and Transport, General Information — Emissions and
ADRs (28 April 2011) Commonwealth of Australia
<http://www.infrastructure.gov.au/roads/environment/emission/index.aspx>
Department of Infrastructure and Transport, Summary of Emission Requirements for
New Petrol Passenger Cars In Australia 1972–2010 (28 April 2011) Commonwealth
Page 376
356
of Australia
<http://www.infrastructure.gov.au/roads/environment/files/Emission_Standards_for_
Petrol_Cars_1972_2018.pdf>
Department of Infrastructure and Transport, Vehicle Certification in Australia
(December 2008) Commonwealth of Australia
<http://www.infrastructure.gov.au/roads/motor/standards/certification/index.aspx>
Department of Infrastructure and Transport, Vehicle Emission Standards (6 March
2012) Commonwealth of Australia
<http://www.infrastructure.gov.au/roads/environment/emission/index.aspx>
Department of Sustainability, Environment, Water, Population and Communities,
Emissions From Different Fuels (24 October 2008) Commonwealth of Australia
<http://www.environment.gov.au/settlements/transport/fuelguide/environment.html>
Department of Transport, Application to Licence a Vehicle Form MR17 (19
December 2011) Government of Western Australia
<http://www.transport.wa.gov.au/mediaFiles/LBU_F_VL_MR17_LicenceVehicle.pd
f>
Department of Transport, Schedule of Licensing Fees and Charges (July 2010)
Government of Western Australia
<http://www.transport.wa.gov.au/licensing/566.asp>
DesLauriers, Michael J, US Govt Sponsored Peak Oil Report Draws Disturbing
Conclusions (29 July 2005) Resource Investor
<http://www.resourceinvestor.com/2005/07/29/us-govt-sponsored-peak-oil-report-
draws-disturbing>
Ekins, Paul, An Introduction to the ESRC New Opportunities Programme
Environment and Human Behavior (2003) Environment and Human Behaviour: An
ESRC New Opportunities Programme
<http://www.psi.org.uk/ehb/introduction.html>
Ekwurzel, B, Findings of the IPCC Fourth Assessment Report Climate Change
Impacts (2007) Union of Concerned Scientists
<http://www.ucsusa.org/global_warming/science_and_impacts/science/findings-of-
the-ipcc-fourth.html>
Energy Bulletin, Peak Oil Primer (2009)
<http://www.energybulletin.net/primer.php>
Energy Efficiency and Renewable Energy, Vehicle Technologies Program, Fact
#630: Fuel Economy vs Weight and Performance (5 July 2010) US Department of
Energy <http://www1.eere.energy.gov/vehiclesandfuels/facts/2010_fotw630.html>
Energy Information Administration, Australia Energy Data, Statistics and Analysis
— Oil, Gas, Electricity, Coal (October 2011)
<http://www.eia.gov/cabs/Australia/Full.html>
Energy Information Administration, Oil (Petroleum)
Page 377
357
<http://www.eia.gov/kids/energy.cfm?page=oil_home-basics>
European Automobile Manufacturers’ Association (ACEA), 2011 The Automobile
Industry Pocket Guide (September 2011) ACEA
<http://www.acea.be/images/uploads/files/20110921_Pocket_Guide_3rd_edition.pdf
>
European Automobile Manufacturers’ Association (ACEA), ACEA Tax Guide 2011
— More Governments Introduce Incentives (19 November 2011) ACEA
<http://www.acea.be/index.php/news/news_detail/tax_guide_2011_incentives_increa
se_further/>
European Commission, Reducing CO2 Emissions from Passenger Cars (1 August
2011) <http://ec.europa.eu/clima/policies/transport/vehicles/cars/faq_en.htm>
European Commission, Road Vehicles (23 February 2012) Transport and
Environment <http://ec.europa.eu/environment/air/transport/road.htm>
Forum for Stable Currencies, The ‘Stick’ of Green Taxation v the ‘Carrot’ of Green
Funding Environmental Economics from a Mathematical Perspective (17 May 2007)
Forum for Stable Currencies
<http://www.forumforstablecurrencies.org.uk/documents/Stick-v-Carrot.pdf>
G8, Joint Science Academies’ Statement: Global Response to Climate Change (7
June 2005) <http://royalsociety.org/policy/publications/2005/global-response-
climate-change/>
Garnaut, Ross, The Garnaut Climate Change Review (2008)
<www.cambridge.edu.au>
Green Car Congress, Dutch Cabinet Approves Mileage Tax; In Effect in 2012 if
Approved by Parliament (14 November 2009)
<http://www.greencarcongress.com/2009/11/dutch-cabinet-approves-mileage-tax-in-
effect-in-2012-if-approved-by-parliament.html>
Green Vehicle Guide, Fuel Consumption Label (2010) Department of Infrastructure
and Transport
<http://www.greenvehicleguide.gov.au/GVGPublicUI/Information.aspx?type=FuelC
onsumptionLabel>
History of Green Taxes in Norway (4 August 2011) Ministry of Finance
<http://www.regjeringen.no/nb/dep/fin/tema/skatter_og_avgifter/The-history-of-
green-taxes-in-Norway.html?id=418097>
Holden Announces Ethanol Partnership With Victorian Government And Leading
Companies (1 March 2011) The Motor Report
<http://www.themotorreport.com.au/50055/holden-announces-ethanol-partnership-
with-victorian-government-and-leading-companies>
Holden, Holden Volt – Coming Soon <http://www.holden.com.au/pages/volt-coming-
soon>
Page 378
358
Ieromonachou, Petros, Stephen Potter and J P Warren, Norway’s Urban Toll Rings:
Evolving Towards Congestion Charging? (2004) Open University: Department of
Design and Innovation <http://design.open.ac.uk/potter/documents/NorwayTP.pdf>
Industry Canada, Fuel Economy Standards <http://www.ic.gc.ca/eic/site/auto-
auto.nsf/eng/am01206.html>
INEX/ZAMIR (2010) <http://www.inexzamir.com/>
Institute of Public Affairs, Facts (2008) <www.ipa.org.au>
International Council on Clean Transportation, Global Light-Duty Vehicles: Fuel
Economy and Greenhouse Gas Emission Standards (April 2011)
<http://www.theicct.org/info/documents/PVstds_update_apr2011.pdf>
John, Gary, TravelSmart Ten Years On (2006) Department for Planning and
Infrastructure <http://www.transport.wa.gov.au/AT_TS_P_tenyearson.pdf>
Johnson, C, Hydrogen as a Fuel for Automobiles and Other Vehicles (2003)
<http://mb-soft.com/public2/hydrogen.html>
Kurt, Huge Growth in Turbocharged Cars Expected (8 February 2011) TopSpeed
<http://www.topspeed.com/cars/car-news/huge-growth-in-turbocharged-cars-
expected-ar113421.html>
Land Transport Authority, One Motoring, Singapore Government
<http://www.onemotoring.com.sg/publish/onemotoring/en.html>
Land Transport Authority, Vehicle Ownership – Vehicle Policies & Schemes (24
November 2009) Singapore Government <http://www.lta.gov.sg/content/lta/en.html>
Land Transport Authority, Vehicle Ownership – Vehicle Tax Structure, Singapore
Government <http://www.lta.gov.sg/content/lta/en.html>
Lewis, Richard, Holden Specifications (2008)
<http://richardlewis.org/holdenspecs.html>
Lewis, Tony, South Korea: More Realistic Fuel Economy Standards from 2012 (29
November 2011) Just-Auto <http://www.just-auto.com/news/more-realistic-fuel-
economy-standards-from-2012_id117514.aspx>
Lotus Elise, Chronology of Chassis Development (1995) Sands Mechanical Museum
<http://www.sandsmuseum.com/cars/elise/thecar/chassis/index.html>
McLennan, W, Australian Statistician, Directory of Transport Statistics (2000)
Australian Bureau of Statistics <www.abs.gov.au>
Ministry of Finance, Budget 2011 (12 January 2011) Ministry of Finance
<http://www.statsbudsjettet.no/english>
Moffatt, Mike, Peak Oil – Are Economists Collectively Stupid? (2012) About.com
Economics <http://economics.about.com/od/theoilsupply/a/stupideconomist.htm>
Page 379
359
Moors, Kent, Who is to Blame When the Next Energy Crisis Hits (24 February 2012)
Oil & Energy Investor <http://oilandenergyinvestor.com/2012/02/the-other-elephant-
in-the-room/>
National Academy of Sciences, Understanding and Responding to Climate Change:
Highlights of National Academies Reports (2005) <http://www.nap.edu>
National Highway Traffic Safety Administration, CAFE Overview – Frequently
Asked Questions (3 March 2005) US Department of Transport
<http://lobby.la.psu.edu/_107th/126_CAFE_Standards_2/Agency_Activities/NHTS
A/NHTSA_Cafe_Overview_FAQ.htm>
National Highway Traffic Safety Administration, CAFE Standards: NHTSA Rules,
US Department of Transport <http://www.nhtsa.gov>
NDI Recognition Systems UK, Overview (2012) <http://ndi-
rs.com/ukrs/company_overview>
New Zealand Transport Agency Waka Kotahi, Fuel Economy Labelling (2009)
<http://labelling.fuelsaver.govt.nz>
Nice, Karim and Charles W Bryant, How Catalytic Converters Work (2011) How
Stuff Works <http://auto.howstuffworks.com/catalytic-converter2.htm>
Northern Territory Transport Group, Vehicle Registration (March 2012) Northern
Territory Government <http://www.transport.nt.gov.au/mvr/registration>
Norwegian Automobile Association, Fuel Taxes (2008) Norwegian Automobile
Federation <http://www.naf.no/en/>
Oregon Department of Transportation, Road User Fee Pilot Program: Frequently
Asked Questions (20 September 2006) Oregon Government
<http://www.oregon.gov/ODOT/HWY/RUFPP/mileage_faq.shtml>
Organisation for Economic Co-Operation and Development, Environment: Private
Vehicle Ownership (2009) OECD Regions at a Glance
<http://fiordiliji.sourceoecd.org/pdf/regionsataglance2009/042009011e-05-06.pdf>
Organisation for Economic Co-Operation and Development, Glossary of Statistical
Terms – Passenger Car (14 March 2002) OECD Statistical Portal <http://www.oecd-
ilibrary.org/economics/oecd-glossary-of-statistical-terms_9789264055087-en>
Ontario Ministry of Finance, Tax for Fuel Conservation (RST Guide No 513, April
2008) <http://www.rev.gov.on.ca/en/guides/rst/513.html>
Ontario Ministry of Transportation, Electric Vehicle Incentive Program (July 2012)
<http://www.mto.gov.on.ca/english/dandv/vehicle/electric/electric-vehicles.shtml>
Parumog, Michelle and Surya Raj Acharya, Road Transport Taxation and Charging
Trends and Strategies in East Asia (2007) Eastern Asia Society for Transportation
Studies <http://www.easts.info/publications/journal_proceedings/online.html>
Page 380
360
Potter, Stephen, Transport Energy and Emissions: Urban Public Transport (2003)
Open University: Open Research Online <http://oro.open.ac.uk/4378/>
Public Transport Users Association, Common Urban Myths About Transport(27
January 2006) <http://www.ptua.org.au/myths/energy.shtml>
Real Pay As You Drive Insurance <http://www.payasyoudrive.com.au>
Road Transport Authority, Vehicle Standards Information (November 2007) New
South Wales Government <www.rta.nsw.gov.au>
Sensor Dynamics, Forecourt Service Station ANPR Solutions
<http://www.sensordynamics.com.au/>
Subaru (2012) <http://subaru.com.au/>
Tesla, About Tesla <http://www.teslamotors.com/about>
Tesla, Charging/High Power Wall Connector
<http://www.teslamotors.com/goelectric/charging/high-power-wall-connector>
Tesla, Using Energy Efficiently <http://www.teslamotors.com/goelectric/efficiency>
Toll Customs, Calculator: Importation of Motor Vehicles
<http://www.toll.no/templates_TAD/RegistrationTax.aspx?id=79&epslanguage=en&
step=3#anchorResult>
Toyota, Land Cruiser 200 Specifications <http://www.toyota.com.au/landcruiser-
200/specifications/gxl-petrol?WT.ac=VH_LC200_RangeSpecs_GXL_Specs>
Toyota Motor Corporation, How Hybrid Works <http://www.toyota.com.au/hybrid-
synergy-drive/hybrid-technology/how-hybrid-works>
Transport & Environment, Briefing Car CO2 Standards: FAQ (December 2011)
<www.transportenvironment.org/cars-and-co2>
Transport of London, Congestion Charge, How it Works
<http://www.tfl.gov.uk/roadusers/congestioncharging/6718.aspx>
UK Department for Transport, How to Reduce Costs and Carbon Emissions from
Business Related Transport (2009) Department of Transport
<http://webarchive.nationalarchives.gov.uk/20090605214743/http://www.dft.gov.uk/
pgr/sustainable/businessrelatedtransport>
UK Department for Transport, Reduce the Environmental Impact of Your Business
Transport (2009) Department of Transport
<http://www.businesslink.gov.uk/bdotg/action/printguide?r.l1=1079068363&r.lc=en
&r.l3=1080531485&r.l2=1079363666&topicId=1080531485#>
UN Energy, Sustainable Bioenergy: A Framework for Decision Makers (2007) FAO
<ftp://ftp.fao.org/docrep/fao/010/a1094e/a1094e00.pdf>
Page 381
361
Union of Concerned Scientists, Climate 2030: A National Blueprint for a Clean
Energy Economy (2009) <http://www.ucsusa.org/>
Union of Concerned Scientists, Climate Change in Pennsylvania Impacts and
Solutions for the Keystone State (2008) <http://www.climatechoices.org/pa>
Union of Concerned Scientists, Common Sense on Climate Change Practical
Solutions to Global Warming (2004) <http://www.ucsusa.org/>
Union of Concerned Scientists, Global Warming (2008)
<http://www.ucsusa.org/global_warming/>
Union of Concerned Scientists, Ten Personal Solutions to Global Warming (2006)
<http://www.ucsusa.org/global_warming/what_you_can_do/ten-personal-solutions-
to.html>
Union of Concerned Scientists, US Scientists and Economists’ Call for Swift and
Deep Cuts in Greenhouse Gas Emissions (11 March 2010)
<www.ucsusa.org/climateletter>
US Environmental Protection Agency, Tax Schedule (August 2011) Gas Guzzler
Tax: Program Overview
<http://www.epa.gov/fueleconomy/guzzler/420f11033.htm#tax>
Vehicle Technologies Program, Goals, Strategies, and Top Accomplishments
(December 2010) Department of Energy
<http://www1.eere.energy.gov/vehiclesandfuels/pdfs/pir/vtp_goals-strategies-
accomp.pdf>
VicRoads, Registration (18 May 2012) State Government Victoria
<http://www.vicroads.vic.gov.au/Home/Registration/>
Victoria Transport Policy Institute, Carbon Taxes: A Special Tax on the Carbon
Content of Fuels (2009) TDM Encyclopedia <http://www.vtpi.org/tdm/tdm130.htm>
Victoria Transport Policy Institute, Change Management: Developing Support for
Innovation (16 February 2010) Victoria Transport Policy Institute
<http://www.vtpi.org/tdm/tdm114.htm>
Victoria Transport Policy Institute, Distance-Based Pricing: Mileage-Based
Insurance, Registration and Taxes (2008) TDM Encyclopedia
<http://www.vtpi.org/tdm/tdm10.htm>
Victoria Transport Policy Institute, Fuel Taxes: Increasing Fuel Taxes and Fees
(2009) TDM Encyclopedia <http://www.vtpi.org/tdm/tdm17.htm>
Victoria Transport Policy Institute, Intelligent Transportation Systems: Information
Technologies to Improve Transportation System Efficiency (2008) TDM
Encyclopedia <http://www.vtpi.org/tdm/tdm101.htm>
Victoria Transport Policy Institute, Multi-Modal Navigation Tools: Improving User
Information For Walking, Cycling and Public Transit (2009) TDM Encyclopedia
Page 382
362
<http://www.vtpi.org/tdm/tdm113.htm>
Victoria Transport Policy Institute, Pay-As-You-Drive Vehicle Insurance Converting
Vehicle Insurance Premiums into Use-Based Charges (2008) TDM Encyclopedia
<http://www.vtpi.org/tdm/tdm79.htm>
Victoria Transport Policy Institute, Road Pricing: Congestion Pricing, Value Pricing,
Toll Roads and HOT Lanes (2008) TDM Encyclopedia
<http://www.vtpi.org/tdm/tdm35.htm>
Victoria Transport Policy Institute, Road Space Reallocation: Roadway Design and
Management To Support Transportation Alternatives (2008) TDM Encyclopedia
<http://www.vtpi.org/tdm/tdm56.htm>
Victoria Transport Policy Institute, Transportation Management Associations (2008)
TDM Encyclopedia <http://www.vtpi.org/tdm/tdm44.htm>
Victoria Transport Policy Institute, Vehicle Restrictions Limiting Automobile Travel
at Certain Times and Places (2008) TDM Encyclopedia
<http://www.vtpi.org/tdm/tdm33.htm>
Volkswagen International, Breakthrough for the 1-Litre Car: Volkswagen Presents
the Most Fuel-Efficient Automobile in the World (24 September 2009) Volkswagen
AG
<http://www.volkswagenme.com:80/region/me/en/news_and_events/news/0.html>
Zable, Graham, Population and Energy (2002) Minnesotans For Sustainability
<http://www.mnforsustain.org/pop_population_and_energy_zable.g.htm>
K Other
ABC, ‘Oil Crunch’, Catalyst, 28 April 2011 (Jonica Newby, interview with Faith
Birol)
An, Feng, ‘Carbon Taxes: The Chinese Fuel Economy Standards for Passenger
Vehicles: How it Works, the Targets, the Effects’ (Presentation made at European-
Asian Policy Workshop on Cars, Climate and Energy, Berlin, 19 July 2006)
<http://www.duh.de/uploads/media/Feng_An_APECC_03.pdf>
Australian Greenhouse Office, TravelSmart Snapshots (2005) Department of the
Environment and Heritage
<http://www.environment.gov.au/settlements/transport/publications/travelsmart-
snapshots.html>
British Broadcasting Corporation, ‘Jeremy Drives the Tesla Roadster’, Top Gear:
Series 12, Episode 7, 2008 (Jeremy Clarkson) <http://www.topgear.com/uk/tv-
show/series-12/episode-7>
Bureau of Infrastructure, Transport and Regional Economics, ‘Fuel Consumption by
New Passenger Vehicles in Australia 1979–2008’ (Information Sheet No 30, August
Page 383
363
2009)
Bureau of Transport Economics, ‘Alternative Fuels in Australian Transport’
(Information Paper No 39, Bureau of Transport and Communications Economics,
May 1994)
Carmody, Tony, ‘Public Road-Related Expenditure and Revenue in Australia: 2005
Update’ (Information Sheet LS24, Bureau of Transport and Regional Economics,
2005)
Carmody, Tony, ‘Public Road-Related Expenditure and Revenue in Australia: 2006
Update ‘ (Information Sheet LS25, Bureau of Transport and Regional Economics,
2006)
Cheah, Lynette W, Cars on a Diet: The Material and Energy Impacts of Passenger
Vehicle Weight Reduction in the US (Thesis, Doctor of Philosophy in Engineering
Systems, Massachusetts Institute of Technology, September 2010)
Cregan Mark, David Gargett and David Cosgrove, ‘Fuel Consumption by New
Passenger Vehicles in Australia’ (Information Sheet No 18, Bureau of Transport and
Regional Economics, 2002)
Curwood, Steve, Interview with Gernot Wagner (Living on Earth, US National
Public Radio’s Environmental News Show, 13 July 2001)
Department of Industrial and Manufacturing Engineering, Oregon State University,
‘Technology Development and System Integration for a Vehicle Miles Traveled
Based Revenue Collection System Prototype’ (Central Database Documentation
Version 1.4, Oregon Department of Transportation, 28 May 2004)
Department of Industrial and Manufacturing Engineering, Oregon State University,
‘Technology Development and System Integration for a Vehicle Miles Traveled
Based Revenue Collection System Prototype Project Status Update/Demonstration
for the Road User Fee Task Force’ (Presentation, Oregon Department of
Transportation, 14 May 2004)
Dimopoulos, Nick, ‘Working Together for Better Urban Transport’ (Presentation
made at Future City Transport Summit, Melbourne, 20 July 2009)
<http://www.ntc.gov.au/filemedia/News/FutureCityTransportSummit09pres.pdf>
Directive 95/46/EC of the European Parliament and of the Council of 24 October
1995 on the Protection of Individuals with Regard to the Processing of Personal
Data and on the Free Movement of Such Data [1995] OJ L 281
Federal Chamber of Automotive Industries ‘National Average Carbon Emission
(NACE) Fact Sheet’ <http://www.fcai.com.au/library/nace.pdf>
Ford, Mark, ‘Mileage Fee Pilot Project Plan’ (Presentation, Oregon Department of
Transportation, 14 May 2004)
Gore, Al, ‘Former Vice President Gore Gives a Major Policy Address at the NYU
School of Law’ (Speech delivered at New York University School of Law, New
Page 384
364
York, 18 September 2006)
Hermansen, Erlend Andre Tveiten, Governing a Technological System: The
Alteration of the Car Taxation System in Norway (Masters Thesis, University of
Oslo, 2006)
Hook, Michael, Coal and Oil: The Dark Monarchs of Global Economy (PhD Thesis,
Uppsala University, 2010)
Hubbert, Marion King, ‘Nuclear Energy and the Fossil Fuels’ (Publication No 95,
Shell Development Company, Exploration and Production Research Division, 8
March 1956)
Hymel, Mona L and Arthur W Andrews, Climate Change Management in the United
States Post Bush (University of Technology Sydney, 2009)
Imholt, Betsy and Joe Brookhouse, ‘Pilot Status Update Before the Road User Fee
Task Force’ (Presentation, Oregon Department of Transportation, 19 November
2004)
International Energy Agency, ‘World Energy Outlook 2011 Factsheet: How Will
Global Energy Markets Evolve to 2035?’ (OECD/IEA, 2011)
Klure, Justin, ‘Hydrogen Fuel Development: Oregon’s Perspective’ (Presentation,
Oregon Department of Energy, 19 November 2004)
Kobe, Gerry, Interview with Gary Rogers, (Interview in Automotive Industries, May
2002)
Letter from Jill Pearson to Road User Fee Pilot Project Volunteers, 25 October 2006
Letter from Jill Pearson to Road User Fee Pilot Program Volunteers, 3 January 2007
Letter from Quintin Hess to Jim Whitty, 8 October 2002
Letter from the Minister of Movement and Water State to the President of the House
of Commons, 30 November 2007
Letter from the Minister of Movement and Water State and of Finances to the
President of the House of Commons of the Staten Generaal, 6 June 2001
Martin, N, ‘Emission Standards for Cars – Julia Gillard and Labor – Let’s Move
Australia Forward’ (Fact Sheet, Australian Labor Party, 24 July 2010)
<http://www.alp.org.au/getattachment/97cd68c5-087f-4ff8-b1d5-
ee2aadae31c9/emission-standards-for-cars/>
Memo from Quintin Hess to Jim Whitty, 1 July 2002
Ministerie van Verkeer en Waterstaat, ‘Road Pricing in the Netherlands: Lessons
Learned’ (Presentation, 21 April 2010)
National Surface Transportation Policy Revenue Study Commission, ‘Improving the
Page 385
365
Performance of the Surface Transportation System: Revenue Options’ (Testimony of
John Horsley, Executive Director American Association of State Highway and
Transportation Officials, 19 March 2007)
Office of Energy Efficiency and Renewable Energy, ‘Just the Basics: Diesel Engine’
(Information Sheets, US Department of Energy, 2003)
Office of Innovative Partnerships and Alternative Funding, ‘The Oregon Mileage Fee
Concept: Discoveries 2003–2004’ (Presentation, Office of Innovative Partnerships
and Alternative Funding)
Oregon Department of Transportation, ‘Participant Manual Road User Fee Pilot
Program’ (Oregon Department of Transportation, 29 March 2006)
Oregon Department of Transportation, ‘Volunteer Update Oregon Department of
Transportation 1 May 2006’ (Volunteer Update, 1 May 2006, 10 May 2006, 19 June
2006 and 6 February 2007)
Ralston, Jonah, Peak Oil: The Eventual End of the Oil Age (Directed Research
Project, Master of Arts in International Affairs, Washington University in St Louis,
2008)
Road User Fee Task Force, ‘A Brief Description of RUFTF’s Work to Date’
(Presentation, Oregon Department of Transportation)
Road User Fee Task Force, ‘Frequently Asked Questions with Answers (January 28,
2003)
Road User Fee Task Force, ‘Pilot Test Configuration’ (Presentation, Oregon
Department of Transportation)
Road User Fee Task Force, ‘RUTF Pilot Project’ (Presentation, Oregon Department
of Transportation)
Ruta, Giovanni, ‘The Social Cost of Transport’ (Training module for the
Environmental Economics and Development Policy Course, World Bank, July 15–
26, 2002)
Schott, Jeffrey J, ‘KORUS FTA 2.0: Assessing the Changes’ (Policy Brief No PB10-
28, Peterson Institute for International Economics, December 2010)
Skymeter Corporation, ‘Request to Participate in the Call for Tender Kilometre Price
System For State of the Netherlands, Directorate-General for Mobility of the
Ministry of Transport, Public Works and Water Management Skymeter Corporation’
(Request to Participate in the Call for Tender, Skymeter Corporation, February 2009)
Stoianoff, Natalie, ‘Climate Change & Fiscal Policy: Introduction’ (University of
Technology Sydney, 2009)
Stuart, Jan, ‘The Big Oil Picture: We’re Not Running Out, But That Doesn’t Mean
We’ll Have Enough’ (Presentation, Macquarie Commodities Research, September
2009)
Page 386
366
Sustainable Energy Association of Australia, ‘Submission: Public Transport Plan
2031’ (Sustainable Energy Association of Australia, October 2011)
SWOV Institute for Road Safety Research Netherlands, ‘SWOV Fact Sheet –
Periodic Vehicle Inspection of Cars (MOT)’ (Fact Sheet, SWOV, September 2009)
Transport and Mobility Leuven, ‘TREMOVE Model Description’ (14 December
2007) TREMOVE
<http://www.tremove.org/documentation/TREMOVE_Short_Description.pdf>
Every reasonable effort has been made to acknowledge the owners of copyright
material. I would be pleased to hear from any copyright owner who has been
omitted or incorrectly acknowledged.
Page 387
367
APPENDIX 1: CO2 OR FUEL EFFICIENCY-
BASED TAX RATE DIFFERENTIATION IN
MOTOR VEHICLE TAXES IN THE EU
COUNTRIES
Country CO2/Fuel Consumption Taxes
Austria A fuel consumption tax (Normverbrauchsabsage or NoVA) is levied upon the
first registration of a passenger car. It is calculated as follows:
- Petrol cars: 2% of the purchase price x (fuel consumption in litres – 3 litres);
- Diesel cars: 2% of the purchase price x (fuel consumption in litres – 2
litres).
Under a bonus-malus system, cars emitting less than 120g/km receive a
maximum bonus of EUR300. Cars emitting more than 160g/km pay a penalty
of EUR25 for each gram emitted in excess of 160g/km. Since 1 March 2011,
there is an additional penalty of EUR25 for each gram emitted in excess of
180g/km and another penalty of EUR25 for each gram emitted in excess of
220g/km. These penalties are cumulative.
Belgium Tax incentives are granted to private persons purchasing a car that emits less
than 115g CO2/km. The incentives consist of a reduction of the invoice price
by the following amount:
- Cars emitting less than 105g/km: 15% of the purchase price, with a
maximum of EUR4640;
- Cars emitting between 105 and 115g/km: 3% of the purchase price, with a
maximum of EUR870.
Cyprus 1. The rates of the registration tax (based on engine capacity) are adjusted in
accordance with the vehicle’s CO2 emissions. This adjustment ranges from a
30% reduction for cars emitting less than 120g/km to a 20% increase for cars
emitting more than 250g/km.
2. The rates of the annual circulation tax (based on engine capacity) are
reduced by 15% for cars emitting less than 150g/km.
Denmark 1. The annual circulation tax is based on fuel consumption.
- Petrol cars: rates vary from DKK520 for cars driving at least 20km per litre
of fuel to DKK18 460 for cars driving less than 4.5km per litre of fuel.
- Diesel cars: rates vary from DKK160 for cars driving at least 32.1km per
litre of fuel to DKK25 060 for cars driving less than 5.1km per litre of fuel.
2. Registration tax (based on price): An allowance of DKK4000 is granted for
cars for every kilometre in excess of 16km (petrol) respectively 18km (diesel)
they can run on one litre of fuel. A supplement of DKK1000 is payable for
cars for every kilometre less than 16km (petrol) respectively 18km (diesel)
they can run on one litre of fuel.
Finland 1. The registration tax is based on CO2 emissions. Rates vary from 12.2% for
cars emitting 60g/km or less to 48.8% for cars emitting 360g/km or more. The
system is fully linear and technologically neutral.
2. The annual circulation tax is based on CO2 emissions for cars registered
since 1 January 2001 (total mass up to 2500kg) or 1 January 2002 (total mass
Page 388
368
Country CO2/Fuel Consumption Taxes
above 2500kg) respectively and for vans registered since 1 January 2008.
Rates for cars vary from EUR20 to EUR600.
France 1. Under a bonus-malus system, a premium is granted for the purchase of a
new car when its CO2 emissions are 110g/km or less.
The maximum premium is EUR5000 (below 60g/km). An additional bonus of
EUR300 is granted when a car of at least 15 years old is scrapped and the new
car purchased emits maximum 110g/km. A malus is payable for the purchase
of a car when its CO2 emissions exceed 150g/km. The maximum tax amounts
to EUR2600 (above 240g/km). In addition to this one-off malus, cars emitting
more than 245g/km pay a yearly tax of EUR160.
2. The regional tax on registration certificates (‘carte grise’) is based on fiscal
horsepower, which includes a CO2 emissions factor. Tax rates vary between
EUR27 and EUR46 per horsepower according to the region.
Germany The annual circulation tax for cars registered as from 1 July 2009 is based on
CO2 emissions. It consists of a base tax and a CO2 tax. The rates of the base
tax are EUR2 per 100cc (petrol) and EUR9.50 per 100cc (diesel) respectively.
The CO2 tax is linear at EUR2 per g/km. Cars with CO2 emissions below
120g/km are exempt (110g/km in 2012–13, 95g/km subsequently).
Greece The annual circulation tax for cars registered since 1 January 2011 is based on
CO2 emissions. Rates vary from EUR0.80 per gram of CO2 emitted (101–
120g/km) to EUR3.00 per gram (above 250g/km).
Ireland 1. The registration tax is based on CO2 emissions. Rates vary from 14% for
cars with CO2 emissions of up to 120g/km to 36% for cars with CO2
emissions above 225g/km.
2. The annual circulation tax for cars registered since 1 July 2008 is based on
CO2 emissions. Rates vary from EUR104 (up to 120g/km) to EUR2100
(above 225g/km).
Latvia The registration tax is based on CO2 emissions. Rates vary from LVL0.3 per
g/km for cars emitting 120g/km or less to LVL5.0 per g/km for cars emitting
more than 350g/km.
Luxembourg 1. The annual circulation tax for cars registered since 1 January 2001 is based
on CO2 emissions. Tax rates are calculated by multiplying the CO2 emissions
in g/km with 0.9 for diesel cars and 0.6 for cars using other fuels respectively
and with an exponential factor (0.5 below 90g/km and increased by 0.1 for
each additional 10g of CO2/km).
2. Purchasers of new cars emitting maximum 110g/km (100g/km from 1
August 2011) receive an incentive of EUR750. The incentive is doubled to
EUR1500 for cars emitting maximum 100g/km (90g/km as from 1 August). It
increases to EUR3000 for cars emitting maximum 60g/km.
Malta 1. The registration tax is calculated through a formula that takes into account
CO2 emissions, the registration value and the length of the vehicle.
2. The annual circulation tax is based on CO2 emissions and the age of the
vehicle. During the first five years, the tax only depends on CO2 emissions
and varies from EUR100 for a car emitting up to 100g/km to EUR180 for a
car emitting between 150 and 180g/km.
The Netherlands 1. The registration tax is based on price and CO2 emissions. Cars emitting
maximum 95g/km (diesel) and 110g/km (other fuels) respectively are exempt
from this registration tax.
2. Cars emitting maximum 95g/km (diesel) and 110g/km (other fuels)
respectively are also exempt from the annual circulation tax.
Page 389
369
Country CO2/Fuel Consumption Taxes
Portugal 1. The registration tax is based on engine capacity and CO2 emissions. The
CO2 component is calculated as follows:
- Petrol cars emitting up to 115g pay [(EUR3.57 x g/km) – 335.58]. Diesel
cars emitting up to 95g pay [(EUR17.18 x g/km) – 1364.61].
- The highest rates are for petrol cars emitting more than 195g [(EUR127.03 x
g/km) – 20 661.74] and for diesel cars emitting more than 160g [(EUR166.53
x g/km) – 20 761.61].
2.The annual circulation tax for cars registered since 1 July 2007 is based on
cylinder capacity, CO2 emissions and age.
Romania The special pollution tax (registration tax) is based on CO2 emissions,
cylinder capacity and compliance with European emission standards.
Spain The registration tax is based on CO2 emissions. Rates vary from 4.75% (121–
159g/km) to 14.75% (200g/km and more).
Slovenia The registration tax is based on price and CO2 emissions. Rates vary from
0.5% (petrol) and 1% (diesel) respectively for cars emitting up to 110g/km to
28% (petrol) and 31% (diesel) respectively for cars emitting more than
250g/km.
Sweden 1. The annual circulation tax for cars meeting at least Euro 4 exhaust emission
standards (European pollutant emission standard for light-duty vehicles as
defined by Directive 98/70/EC) is based on CO2 emissions. The tax consists
of a basic rate (SEK360) plus SEK 20 for each gram of CO2 emitted above
120g/km. This sum is multiplied by 2.55 for diesel cars. Diesel cars registered
for the first time in 2008 or later pay an additional SEK250 and those
registered earlier an additional SEK500. For alternative fuel vehicles, the tax
is SEK10 for every gram emitted above 120g/km.
2. A five-year exemption from annual circulation tax applies for
‘environmentally-friendly cars’:
- Petrol/diesel/hybrid cars with CO2 emissions up to 120g/km;
- Alternative fuel/flexible fuel cars with a maximum consumption of 9.2l
(petrol)/8.4l (diesel)/9.7cm/100km (CNG, biogas);
- Electric cars with a maximum consumption of 37kWh/100km.
United Kingdom 1. The annual circulation tax is based on CO2 emissions. Rates range from
GBP20 (petrol, diesel)/GBP10 (alternative fuels) for cars emitting 101–
110g/km to GBP435 (petrol, diesel)/GBP425 (alternative fuels) for cars
emitting more than 255g/km. A special first year rate of registration has been
applicable since 1 April 2010. Rates vary from GBP110 (131–140g/km) to
GBP950 (more than 255g/km).
2. The private use of a company is taxed as a benefit in kind under personal
income tax. Tax rates range from 5% of the car price for cars emitting up to
75g/km to 35% for cars emitting 235g/km or more. Diesel cars pay a 3%
surcharge, up to the 35% top rate. Electric cars are exempt.
Source: European Automobile Manufacturers Association (ACEA), ‘ACEA Tax Guide 2011 – More
Governments Introduce Incentives’ (19 November 2011) ACEA
<http://www.acea.be/index.php/news/news_detail/tax_guide_2011_incentives_increase_further/>.
Page 390
370
APPENDIX 2: OREGON PILOT PROGRAM
SURVEYS AND SUMMARY OF THE RESULTS
As part of the pilot program, participants agreed to take part in three surveys. The
owners and managers of the service stations agreed to be interviewed regarding their
experience with the program.
Three surveys were conducted at the beginning, midpoint and end of the field test
and they provide ODOT with an insight into the experience of the participant
motorists.
Survey 1 was conducted on 20–29 June 2006 and the survey focus was:
- Reasons for participating;
- Understanding of the pilot program;
- Installation and early operational experience with on-vehicle device;
- Travel patterns and attitudes.
Survey 2 was conducted between 25 October and 8 November 2006, and the survey
focus was:
- Experience with equipment;
- Experience with pilot program features;
- Travel patterns and attitudes.
Survey 3 was conducted between 15 March and 10 April 2007 and the survey focus
was:
- Behaviour changes;
- Experience with equipment;
- Experience with pilot program features;
- Travel patterns and attitudes.
The results of the survey reported by ODOT are stated in the following four tables.
Page 391
371
APPENDIX TABLE 2.1: Sample Size and Responses
Households Participants
(motorists)
Vehicles
Registered participants 221 299 285
Survey 1 – Response Totals 194 288 274
Survey 2 – Response Totals 190 270 256
Survey 3 – Response Totals 183 264 251
APPENDIX TABLE 2.2: Initial Concerns — Survey 1
Concerns with the Program Great
Concern
Some
Concern
No
Concern
N/A
Fear of burglary due to visible
equipment
11 6% 81 42% 101 52% 1 1%
Having to purchase gas at Leathers 9 5% 62 32% 123 63% 0
Whether payment will be worth
effort
9 5% 55 28% 126 65% 4 2%
Accuracy of mileage readings 14 7% 44 23% 135 70% 1 1%
Impact of equipment on vehicle 9 5% 50 26% 135 70% 0
Privacy associated with equipment 6 3% 29 15% 159 82% 0
Ability to participate for full year 9 5% 21 11% 164 85% 0
Getting full household
participation
6 3% 8 4% 172 89% 8 4%
Going to reader station three times 2 1% 17 9% 174 90% 1 1%
Friends’ and neighbours’ opinions 2 1% 15 8% 175 90% 2 1%
APPENDIX TABLE 2.3: Satisfaction — Survey 2
Features of the Program Satisfied Neutral Dissatisfied N/A
Getting information about the
program
182 96% 6 3% 0 0% 2 1%
Having questions answered 175 92% 9 5% 3 2% 3 2%
Privacy associated with equipment 159 84% 23 12% 3 2% 5 3%
Having to purchase gas at
participating stations
154 81% 9 5% 26 13% 1 1%
Out of pocket costs for fuel 152 80% 23 12% 8 5% 7 4%
Where the display was positioned
in vehicle
145 76% 6 3% 39 20% 0 0%
Accuracy of mileage readings 142 75% 15 8% 5 3% 28 15%
The functioning of the equipment 143 75% 8 4% 37 20% 2 1%
Page 392
372
APPENDIX TABLE 2.4: Satisfaction — Survey 3
Features of the Program Satisfied Neutral Dissatisfied N/A
Getting information about the
program
176 96% 3 2% 3 2% 1 1%
Having questions answered 171 94% 4 2% 5 3% 3 2%
The functioning of the equipment 126 69% 12 7% 45 25% 0 0%
Having to purchase gas at
Leathers
131 71% 11 6% 41 22% 0 0%
Accuracy of mileage readings 128 70% 13 7% 14 7% 28 15%
Privacy associated with equipment 126 69% 23 13% 3 2% 31 17%
Out of pocket costs for fuel 131 71% 14 8% 13 7% 25 14%
Where the device was positioned
in vehicle
132 72% 7 4% 44 24% 0 0%
Getting reimbursed for receipts 101 62% 8 5% 10 6% 44 25%
Based on the survey and interview results, ODOT reported the following analysis:
- With respect to the reasons for participating in the program, slightly over
half the sample indicated that the monetary incentive was one of their
reasons for participating. Thirty-eight per cent responded that they
participated because the program seemed interesting or they were curious,
and 18 per cent responded that they participated as they wanted to assist in
finding an alternative to the gas tax.
- The three largest areas of dissatisfaction for the participants were the
functioning of the on-vehicle device, the positioning of the display, and
having to purchase gas at the participating stations. The amount of
dissatisfaction with each of these issues increased slightly from levels
recorded in the second survey.
- The percentage dissatisfied with purchasing gas at the participating stations
rose from 13 per cent in the second survey to 22 per cent in the final survey.
Participants cited numerous reasons for dissatisfaction. One reason related
to difficulties with association of the fuel pump with a participant’s
particular vehicle to enable a gas tax credit against the fuel purchase price at
the pump. When the system did not work, participants had to complete the
extra step of sending in the receipts to ODOT for the gas tax refund. A
second reason cited was the stations’ inability to pump gas at various times.
Page 393
373
A third reason cited by 14 people (seven per cent) was dissatisfaction with
the accuracy of the mileage readings. Though this was an increase compared
to the three per cent of dissatisfied respondents in the second survey this
represents only half of those who thought there might be accuracy problems
at the beginning of the pilot program.
- Behaviour changes in the rush hour group were expected, and some were
observed. Twelve of the 84 households in the rush hour group reported that
someone in the household began using alternative transportation modes to
save money. Twenty-six also reported that someone in the household
changed either the time or distance of travel to save money. Mostly this was
by avoiding driving in the congestion zone during rush hour. This occurred
in 23 households, although four households reported grouping errands or
consolidating trips and one reported using a carpool.
- The price per mile for the VMT group was set to approximate the gas tax, so
little change in behaviour was anticipated for this group. Surprisingly,
however, 10 of the households in the VMT group reported that someone in
the household started taking the train, took up biking, or began walking to
save money through the program. This may be attributable to an increase in
attentiveness owing to ready viewing of the display and simply participating
in the pilot program itself.
- Ninety-one per cent of the participants agreed when they were asked, ‘If the
program were changed so that participants could go to any local service
station, would you have been willing to keep the equipment in your vehicle
and stay with the same fee payment and refund of the gas tax?’ Taking into
consideration that the pilot program did not perfectly mimic a real world
implementation situation as the households did not actually have to pay the
mileage fee this result indicates a strong willingness to accept the new
system once people have become familiar with it.
Page 394
374
APPENDIX 3: CHAPTER 7 METHODOLOGY
TO CALCULATE THE LET FOR AUSTRALIAN
MOTOR VEHICLE CATEGORIES
The following available information has been used in this exercise to calculate the
LET for the following categories of Australian motor vehicles: Light cars; small cars;
medium cars; large cars; SUVs; people movers and sports cars:
- Australian Bureau of Statistics, Motor Vehicle Census, Australia, 31
January 2011 (Catalogue No 1304.3)
- Australian Bureau of Statistics, Sales of New Motor Vehicles, Australia,
January 2012 (Catalogue No 9314.0)
- Australian Bureau of Statistics, Survey of Motor Vehicle Use, Australia, 12
Months Ended 31 October 2010 (Catalogue No 9208.0)
- Federal Chamber of Automotive Industries, V Facts Car Sales Data for
Year Ended 31 December 2011
- The Australian government’s Green Vehicle Guide, offering detailed criteria
for small cars, medium cars, large cars, people movers, SUVs and sport
cars.
The methodology below describes in detail the steps undertaken to calculate the LET
for Australian motor vehicles, in order to be able to forecast government revenues.
STEP 1
The first step was to obtain the LET characteristics of the following categories of
LET cars: Light car; small car; medium car; large car; people mover; SUV and sports
car, and calculate the average LET for each LET characteristic. The following steps
were undertaken for this exercise:
a) It was first necessary to extract the motor vehicle LET characteristics being:
vehicle weight; engine capacity; engine power and CO2 emissions of
Australia’s top 90 per cent of passenger motor vehicle makes on the motor
Page 395
375
vehicle register in 2011. The most popular motor vehicles makes comprising
the registered passenger vehicles in Australia in 2011 were first extracted
from the Australian Bureau of Statistics Motor Vehicle Census data and are
listed in Appendix Table 3.1.
APPENDIX TABLE 3.1: Passenger Vehicles on Register in Australia in 2011
Make Number Percentage
Toyota 2 500 195 20.04
Holden 2 056 880 16.49
Ford 1 654 216 13.26
Mitsubishi 921 909 7.39
Mazda 751 968 6.03
Nissan 736 431 5.90
Hyundai 696 588 5.58
Honda 587 316 4.71
Subaru 472 251 3.79
BMW 249 035 2.00
Mercedes Benz 224 504 1.80
Volkswagen 218 971 1.76
Suzuki 208 677 1.67
Kia 190 806 1.53
Jeep 71 433 0.57
Land Rover 63 871 0.51
Chrysler 43 785 0.35
Others 825 208 6.62
TOTAL 12 474 044 100.00
Source: Australian Bureau of Statistics, Motor Vehicle Census, Australia, 31
January 2011 (Catalogue No 9309.0, 28 July 2011).
b) For each of the above vehicle makes, it was then necessary to extract the list
of available models for sale in 2011. This was obtained from the
Commonwealth Government’s Green Vehicle Guide.
c) The next step was to find out for each vehicle model the four criteria for
calculating the LET, ie the vehicle kerb weight, engine capacity, engine
Page 396
376
power and CO2 emissions. This data was found from the manufacturer’s
specifications for each make and model.
d) It was then necessary to categorise the list into the following vehicle classes:
Light vehicles; small vehicles; medium vehicles; large vehicles; SUVs;
people movers and sports vehicles, which was done by referring to the
classification of vehicles in the Commonwealth Government’s Green
Vehicle Guide.
e) For each class of vehicle in ‘d’ above, it was then necessary to calculate the
average vehicle weight, engine capacity, engine power and CO2 emissions.
A summary of the LET average for each vehicle class is summarised in
Appendix Table 3.2. Further detail on each motor vehicle category is listed
in Appendix Tables 3.3 to 3.9.
APPENDIX TABLE 3.2: Summary of LET Averages for Australian Vehicles
Motor Vehicle
Category
Weight (kg) Engine (cc) Power (kW) CO2
Emissions
Light 813 1147 59 128
Small 1100 1469 79 146
Medium 1387 2010 127 186
Large 1659 3148 181 228
SUVs 1970 3252 174 258
People Movers 1977 2775 135 242
Sport 1605 3921 252 250
Page 397
377
APPENDIX TABLE 3.3: LET Light Cars
Make Marketing
Model
Variant Engine
Displacement
Weight
(kg)
Engine
(cc)
Power
(kW)
CO2
Emissions
Fiat 500 0.9
Turbo
Twin Air
0.9 930 875 63 92
Holden Barina
Spark
CDX 1.2 948 1200 59 127
Holden Barina
Spark
CD 1.2 962 1200 59 128
Nissan Micra 1.2 675 1200 56 138
Nissan Micra 1.2 675 1200 56 154
Nissan Micra 1.5 675 1500 75 156
Smart Fortwo Cabrio
52kW
MHD
2 750 1000 52 116
Suzuki Alto GL 1 885 1000 50 110
TOTAL 6500 9175 470 1021
LET Average 813 1147 59 128
APPENDIX TABLE 3.4: LET Small Cars
Make Marketing
Model
Variant Engine
Displacement
Weight
(kg)
Engine
(cc)
Power
(kW)
CO2
Emissions
Audi A1 1.4 TFSI
Ambition
1.4 1125 1390 90 124
Audi A1 1.4 TFSI
Attractio
n
1.4 1125 1390 90 124
Ford Fiesta Econetic 1.6 1088 1600 66 98
Ford Fiesta Low 1.6 1095 1600 89 146
Ford Fiesta Low 1.6 1129 1600 66 117
Holden Barina CD 1.6 1190 1600 76 162
Honda Jazz VTiS 1.5 1115 1500 88 151
Honda Jazz GLi 1.3 1110 1300 73 157
Hyundai i20 Active 1.4 1110 1400 73.5 142
Hyundai i20 Premium 1.6 1100 1600 91 144
Hyundai Getz 1.4S 5-
Door
1.4 1105 1400 70 165
Hyundai Getz 1.6SX 5-
Door
1.6 1107 1600 78 170
Hyundai i20 Elite 1.6 1100 1600 91 155
Page 398
378
Make Marketing
Model
Variant Engine
Displacement
Weight
(kg)
Engine
(cc)
Power
(kW)
CO2
Emissions
Kia Rio Si 1.4 1215 1400 70 162
Kia Rio Si 1.6 1203 1600 82 162
Mazda 2 1.5 1025 1500 76 162
Mazda 2 1.5 1052 1500 76 162
Nissan Tiida 1.8 1110 1800 93 182
Suzuki Jimny VVT 1.3 1045 1300 60 174
Suzuki Swift 1.4 1025 1400 70 132
Suzuki Swift Sport 1.6 1100 1600 92 179
Toyota Yaris 1.3 1025 1299 63 134
Toyota Yaris 1.5 1045 1497 80 137
Toyota Yaris 1.5 1055 1497 80 147
Toyota Yaris 1.3 1035 1299 63 147
Volkswagen Polo 77TSI
Comfortl
ine
1.2 1088 1200 77 128
Volkswagen Polo Trendlin
e
1.4 1068 1400 63 140
Volkswagen Polo GTI 1.4 1189 1400 132 142
Volkswagen Polo 66TDI
Comfortl
ine
1.6 1140 1600 66 121
Volkswagen Polo 66TDI
Comfortl
ine
1.2 1088 1200 77 128
TOTAL 33007 44072 2361.5 4394
LET Average 1100 1469 79 146
APPENDIX TABLE 3.5: LET Medium Cars
Make Marketing
Model
Variant Engine
Displacement
Weight
(kg)
Engine
(cc)
Power
(kW)
CO2
Emissions
BMW 1 Series 123d 2 1420 2000 150 138
BMW 1 Series 125i 3 1430 3000 160 190
BMW 1 Series 135i 3 1490 3000 225 198
BMW 1 Series 135i 3 1610 3000 225 200
BMW 1 Series 118d 2 1345 2000 105 144
BMW 1 Series 118i 2 1260 2000 115 182
BMW 1 Series 120i 2 1230 2000 100 182
Ford Focus LX 2 1343 2000 107 169
Page 399
379
Make Marketing
Model
Variant Engine
Displacement
Weight
(kg)
Engine
(cc)
Power
(kW)
CO2
Emissions
Ford Focus TDCI 2 1458 2000 100 147
Ford Focus TDCI 2 1570 2000 120 157
Ford Focus
XR5
Turbo 2.5 1581 2500 162 227
Ford Focus RS 2.5 1458 2500 224 246
Honda Insight VTi 1.3 1190 1300 76 109
Honda Civic VTiL 1.8 1240 1800 103 171
Honda Civic Hybrid 1.3 1265 1300 85 109
Honda City
VTi,
VTiL 1.5 1145 1500 88 156
Honda Civic Sport 2 1310 2000 114 200
Honda Civic Type R 2 1315 2000 148 219
Hyundai i30 SX 1.6 1323 1600 89 166
Hyundai i30cw SLX 2 1390 2000 105 183
Hyundai Elantra Elite 2 1285 2000 105 175
Hyundai ix35
2.0
Active 2 1485 2000 122 203
Hyundai Elantra Elite 2 1300 2000 105 186
Hyundai i30 CRDi 1.6 1412 1600 85 159
Hyundai ix35
2.0R-
series
Elite 2 1706 2000 135 198
Kia Soul 1.6 1115 1600 91 167
Kia
Cerato
Koup 2 2 1288 2000 115 186
Kia Soul 1.6 1210 1600 94 137
Mazda 3 2 1305 2000 108 193
Mazda 3 Diesel 2.2 1456 2200 110 150
Mazda 3 2.5 1379 2500 122 204
Mazda 3 MPS 2.3 1456 2300 190 235
Mazda RX-8 1.3 1318 1300 158 288
Mazda RX-8 1.3 1299 1300 177 301
Mitsubishi Lancer ES 2 1335 2000 113 196
Mitsubishi Lancer Aspire 2.4 1339 2400 125 202
Nissan Tiida 1.8 1128 1800 93 187
Subaru Impreza
WRX
STI 2.5 1505 2500 221 249
Subaru Impreza XV 2 1360 2000 110 208
Subaru Impreza XV 2 1360 2000 110 210
Page 400
380
Make Marketing
Model
Variant Engine
Displacement
Weight
(kg)
Engine
(cc)
Power
(kW)
CO2
Emissions
Subaru Impreza WRX 2.5 1505 2500 221 249
Subaru Impreza AWD 2.5 1395 2500 195 252
Suzuki Kizashi XL 2.4 1450 2400 131 186
Suzuki SX4 2 1235 2000 112 170
Toyota Prius Hybrid 1.8 1420 1798 100 89
Toyota Corolla 1.8 1280 1798 100 171
Toyota Corolla 1.8 1355 1798 100 173
Toyota Corolla Ultima 2 1360 1987 102 181
Toyota Rukus 2.4 1390 2362 123 208
Volkswagen Golf
118TSI
Comfortl
ine 1.4 1330 1400 118 150
Volkswagen Golf GTI 2 1380 2000 155 178
Volkswagen Eos 155TSI 2 1571 2000 155 173
Volkswagen Golf GTD 2 1380 2000 125 145
Volkswagen Golf
103TDI
Comfortl
ine 2 1380 2000 103 147
Volkswagen Eos 103 TDI 2 1581 2000 103 160
Volkswagen Golf R 2 1496 2000 188 201
Volkswagen Tiguan 132TSI 2 1611 2000 132 204
Volkswagen Tiguan 155TSI 2 1515 2000 155 205
Volkswagen Tiguan 103TDI 2 1610 2000 103 175
Volkswagen Tiguan 125 2 1630 2000 125 205
Volkswagen Tiguan 147 2 1660 2000 147 205
Volkswagen
New
Beetle
Black
Orange
75kW 1.6 1233 1600 75 185
Volkswagen
New
Beetle
Black
Orange
TDI
77kW 1.9 1233 1900 77 149
Volkswagen
New
Beetle
Cabriolet
Black
Orange
85kW 2 1352 2000 85 223
TOTAL
88 766
128 64
3 8120 11 911
LET Average
1387 2010 127 186
Page 401
381
APPENDIX TABLE 3.6: LET Large Cars
Make Marketi
ng
Model
Variant Engine
Displacement
Weight
(kg)
Engine
(cc)
Power
(kW)
CO2
Emissions
BMW 3 Series 320d 2 1430 2000 135 140
BMW 3 Series 320d 2 1430 2000 135 140
BMW 3 Series
320d
Touring 2 1480 2000 135 142
BMW 3 Series 320d 2 1670 2000 135 149
BMW 3 Series 335i 3 1535 3000 225 202
BMW 3 Series 323i 2.5 1460 2500 140 203
BMW 3 Series 325i 2.5 1460 2500 160 212
BMW 3 Series 330d 3 1540 3000 180 164
BMW 3 Series 325i 2.5 1450 2500 160 222
BMW 3 Series M3 3.9 1580 4000 309 290
BMW 3 Series M3 3.9 1605 4000 309 295
BMW 3 Series M3 3.9 1830 4000 309 297
BMW 5 Series 528i 3 1655 3000 190 187
BMW 5 Series 535i 3 1715 3000 225 197
BMW 5 Series 520d 2 1625 2000 135 137
BMW 5 Series 535d 3 1750 3000 220 162
BMW 5 Series 550i 4.4 1830 4400 300 243
BMW
5 Series
Gran
Turismo 530d GT 3 1960 3000 180 173
BMW 7 Series 730d 3 1865 3000 180 178
BMW 7 Series 740Li 3 1895 3000 240 235
BMW 7 Series 750Li 4.4 1980 4400 300 266
BMW 7 Series 760Li 6 2120 6000 400 303
BMW X1 sDrive18i 2 1430 2000 110 191
BMW X1 xDrive25i 3 1600 3000 160 217
BMW X1 xDrive20d 2 1490 2000 130 164
BMW X1 xDrive23d 2 1595 2000 115 167
Chrysler 300C 3.5 1782 3500 183 260
Chrysler 300C 3 1782 3000 160 216
Chrysler 300C 5.7 1873 5700 250 293
Chrysler 300C SRT8 6.1 1888 6100 317 330
Ford Mondeo Titanium 2 1585 2000 130 165
Ford Mondeo LX 2.3 1527 2300 118 227
Ford Falcon XR6 4 1735 4000 195 243
Page 402
382
Make Marketi
ng
Model
Variant Engine
Displacement
Weight
(kg)
Engine
(cc)
Power
(kW)
CO2
Emissions
Ford Falcon G6E Turbo 4 1770 4000 270 278
Ford Falcon Ute 4 1580 4000 195 279
Ford Falcon GT 5 1844 5000 335 325
Ford Falcon F6 4 1778 4000 310 300
Ford Ranger
Crew Cab
XL 3 1610 3000 115 274
Ford XR8 5.4 1825 5400 290 334
Holden Cruze CD 1.8 1402 1800 104 179
Holden
Sport
Wagon Omega 3 1622 3000 190 221
Holden
Commod
ore SV6 3.6 1641 3000 190 210
Holden Caprice 3.6 1873 3600 210 245
Holden Cruze CDX 2 1522 2000 110 210
Holden Cruze CD 2 1522 2000 110 210
Holden
Epica
MY10.5 CDXi 2.5 1500 2500 115 219
Holden
Epica
MY10.5 CDXi 2 1460 2000 110 199
Holden
Calais V
Redline 6 1763 6000 270 343
Holden
Caprice
V AFM 6 1928 6000 270 210
Holden HSV GTS 6.2 1777 6200 325 329
Holden HSV Club Sport 6.2 1731 6200 217 357
Holden Colorado
LX Crew
Cab 3.6 1678 3600 157 313
Holden Colorado
LX Space
Cab 3.6 1602 3600 157 297
Holden Colorado
LX Crew
Cab 3 1932 3000 120 237
Holden Utility Omega 3 1636 3000 190 259
Holden Utility SS 6 1704 6000 270 307
Honda
Accord
Euro 2.4 1555 2400 148 211
Honda Accord V6L 3.5 1650 3500 202 239
Honda Accord VTi 2.4 1515 2400 133 209
Honda CR-V 2.4 1620 2400 125 237
Honda Legend 3.7 1865 3700 226 269
Hyundai i45 2.4 GDi
2.4 1529 2400 148 188
Page 403
383
Make Marketi
ng
Model
Variant Engine
Displacement
Weight
(kg)
Engine
(cc)
Power
(kW)
CO2
Emissions
Active
Hyundai Grandeur V6 3.8 1636 3800 194 255
Hyundai Grandeur 2.2 CRDi 2.2 1725 2200 114 208
Kia Cerato 2 2 1250 2000 115 187
Kia Optima 2.4 auto 2.4 1475 2400 148 189
Kia Sportage 2.0 A 2 1500 2000 122 210
Kia Sportage 2.4 A 2.4 1588 2400 130 221
Kia Sportage 2.0 DA 2 1705 2000 135 198
Land Rover Defender
110
Wagon 2.4 2014 2400 90 291
Mazda 6 Diesel 2.2 1620 2200 132 154
Mazda 6 2.5 1470 2500 125 206
Mazda CX-7 Classic 2.5 1589 2500 120 223
Mazda BT-50 4x2 3.2 1735 3000 115 243
Mazda BT-50 4x4 3.2 1876 3000 115 243
Mercedes-
Benz C Class
C300
Avantgard
e 3 1555 3000 170 224
Mercedes-
Benz C Class
C250
Avantgard
e 1.8 1585 1800 150 180
Mercedes-
Benz C Class
C350CDI
Avantgard
e 3 1700 3000 165 196
Mercedes-
Benz C Class C63AMG 6.2 1795 6200 336 328
Mercedes-
Benz CL Class
CL500
BlueEffici
ency 4.7 2040 4700 320 259
Mercedes-
Benz CL Class CL600 B/T 5.5 2216 5500 380 259
Mercedes-
Benz E Class
E350
BlueEffici
ency 3.5 1695 3500 200 222
Mercedes-
Benz E Class E250 CDI 2.1 1695 2100 150 139
Mercedes-
Benz E Class E220 CDI 2.1 1735 2100 125 157
Mercedes-
Benz E Class E63 AMG 6.2 1840 6200 386 298
Mercedes-
Benz E Class
E500
BlueEffici
ency 5.5 1695 5500 285 256
Page 404
384
Make Marketi
ng
Model
Variant Engine
Displacement
Weight
(kg)
Engine
(cc)
Power
(kW)
CO2
Emissions
Mercedes-
Benz S Class
S350
BlueEffici
ency 3.5 1800 3500 200 234
Mercedes-
Benz S Class S63 AMG 6.2 1880 6200 386 355
Mercedes-
Benz S Class
S500
BlueEffici
ency 5.5 1880 5500 285 260
Mercedes-
Benz S Class S600L 5.5 2180 5500 380 340
Mitsubishi Lancer Ralliart 2 1555 2000 177 243
Mitsubishi Lancer Evolution 2 1595 2000 217 245
Nissan Dualis 2WD 2 1473 2000 102 195
Nissan
Dualis
+2 2WD 2 1476 2000 102 199
Nissan X-Trail 2 1426 2000 102 202
Nissan Maxima 2.5 1516 2500 134 226
Nissan Maxima 3.5 1535 3500 185 243
Nissan Murano 3.5 1822 3500 191 261
Nissan GT-R 3.8 1699 3800 357 298
Nissan Navara
Dual Cab
2x4 4 1985 4000 198 339
Nissan Navara
Dual Cab
4x4 3 1920 3000 170 246
Nissan Navara
Dual Cab
4x4 2.5 1930 2500 128 264
Nissan Navara
Dual Cab
4x4 2.5 1985 2500 140 283
Subaru Liberty
2.5GT
Premium 2.5 1432 2500 123 198
Subaru Liberty
3.6R
Premium 3.6 1536 3600 191 242
Toyota Camry Hybrid 2.4 1610 2362 140 142
Toyota Aurion 3.5 1625 3456 200 233
Toyota Camry Atara 2.5 1505 2494 135 183
Toyota RAV4 2WD 2.4 1545 2362 125 197
Toyota RAV4 2WD 2.4 1585 2362 125 214
Toyota Kluger KXR 3.5 2630 3456 201 259
Volkswagen Jetta 103 TDI 2 1540 2000 103 165
Volkswagen Jetta
118TSI
Comfortlin
e 1.4 1405 1400 118 159
Page 405
385
Make Marketi
ng
Model
Variant Engine
Displacement
Weight
(kg)
Engine
(cc)
Power
(kW)
CO2
Emissions
Volkswagen Golf
90TSI
Trendline 1.4 1400 1400 90 156
Volkswagen Jetta
147TSI
Highline 2 1430 2000 147 185
Volkswagen Passat 118TSI 1.8 168
Volkswagen Passat 118TSI 1.8 1481 1800 118 180
Volkswagen Golf
77TDI
Trendline 1.6 1522 1600 77 127
Volkswagen Jetta
125TDI
Highline 2 1459 2000 125 159
Volkswagen Passat
125TDI
Highline 2 1526 2000 125 151
Volkswagen Passat
125TDI
Highline 2 1587 2000 125 175
Volkswagen Passat
V6 220kW
FSI
Highline 3.2 1606 3200 184 240
Volkswagen
Passat
CC V6 FSI 3.6 1656 3600 220 254
TOTAL
204 05
7
387 19
2 22 320 28 064
LET Average
1659 3148 181 228
APPENDIX TABLE 3.7: LET SUVs
Make Marketi
ng
Model
Variant Engine
Displacement
Weight
(kg)
Engi
ne
(cc)
Power
(kW)
CO2
Emissions
BMW X3 xDrive20i 3 1765 3000 200 248
BMW X3 xDrive28i 3 1745 3000 190 210
BMW X3 xDrive28i 2.5 1765 2500 160 243
BMW X3 xDrive20d 2 1725 2000 135 147
BMW X3 xDrive20d 2 1750 2000 125 185
BMW X5 xDrive30d 3 2048 3000 225 233
BMW X5 xDrive40d 3 2013 3000 180 231
BMW X5 xDrive35i 3 2050 3000 225 279
BMW X5 xDrive50i 4.4 2170 4400 300 292
BMW X5 M 4.4 2305 4400 408 325
BMW X6 xDrive35i 3 2070 3000 225 236
BMW X6 xDrive40d 3 2110 3000 225 198
Page 406
386
Make Marketi
ng
Model
Variant Engine
Displacement
Weight
(kg)
Engi
ne
(cc)
Power
(kW)
CO2
Emissions
BMW X6 xDrive50i 4.4 2190 4400 300 292
BMW X6 M 4.4 2305 4400 408 325
Ford Territory
Ghia
Turbo 4 2092 4000 245 337
Ford Ranger
Regular
Cab XL 2.5 1530 2500 105 219
Ford Escape XLT 2.3 1574 2300 109 250
Holden Captiva 5 2.4 1833 2400 103 254
Holden Captiva 7 CX 3.2 1764 3200 169 265
Holden Captiva 7 SX 2 1764 2000 110 233
Hyundai Santa Fe SLX CRDi 2.2 1935 2200 145 176
Jeep Patriot Limited 2.4 1570 2400 125 230
Jeep Patriot Sport 2.4 1570 2400 125 206
Jeep Wrangler Sport 3.8 1855 3800 146 248
Jeep
Wrangler
Unlimite
d Sport 3.8 2050 3800 146 285
Jeep
Grand
Cherokee Overland 3 2142 3000 160 275
Jeep
Grand
Cherokee Limited 3.6 2191 3600 210 256
Jeep
Wrangler
Unlimite
d Sport 2.8 2105 2800 147 217
Jeep
Grand
Cherokee Overland 5.7 2307 5700 259 329
Jeep Wrangler Sport 2.8 1975 2800 130 227
Jeep
Grand
Cherokee Sport 6.1 2270 6100 313 380
Kia Sorento Si 2.2 1559 2200 145 194
Kia Sorento Si 2.3 1814 2300 128 219
Land Rover
Freeland
er 2 XS 3.2 1775 3200 171 255
Land Rover
Freeland
er 2 HSE 2.2 1770 2200 140 224
Land Rover
Freeland
er 2 SE 2.2 1805 2200 140 224
Land Rover
Discover
y 4 V8 5 2548 5000 276 328
Land Rover
Range
Rover
Vogue V8 5 2489 5000 276 326
Page 407
387
Make Marketi
ng
Model
Variant Engine
Displacement
Weight
(kg)
Engi
ne
(cc)
Power
(kW)
CO2
Emissions
Land Rover
Range
Rover
Sport TDV6 3 2535 3000 180 243
Land Rover
Discover
y 4
SDV6 3.0
SE 3 2583 3000 180 244
Land Rover
Range
Rover
Vogue TDV8 4.4 2710 4400 230 253
Land Rover
Range
Rover
Sport
Supercharg
ed 5 2590 5000 375 327
Land Rover
Discover
y 4 TDV6 2.7 2486 2700 140 275
Mazda CX-7 Diesel 2.2 1928 2200 127 202
Mazda CX-9 3.7 2041 3700 204 309
Mazda CX-7 Sports 2.3 1761 2300 175 273
Mercedes-
Benz G Class G55 AMG 5.4 2471 5400 373 372
Mercedes-
Benz G Class
G350
BlueTec 3 2458 3000 155 295
Mercedes-
Benz GL Class GL500 5.5 2370 5500 285 322
Mercedes-
Benz GL Class GL350CDI 3 2375 3000 165 254
Mercedes-
Benz M Class ML350 3.5 2060 3500 200 279
Mercedes-
Benz M Class ML500 5.5 2185 5500 285 306
Mercedes-
Benz M Class
ML300
CDI 3 2185 3000 140 254
Mercedes-
Benz M Class
ML350
CDI 3 2110 3000 165 254
Mercedes-
Benz M Class
ML63
AMG 6.2 2310 6200 375 392
Mitsubishi
Outlande
r LS 2.4 1560 2400 125 227
Mitsubishi
Outlande
r LS 2.4 1560 2400 125 222
Mitsubishi
Outlande
r VR 3 1603 3000 169 247
Mitsubishi Pajero Exceed 3.2 2205 3200 147 243
Mitsubishi Pajero Exceed 3.8 2085 3800 184 322
Mitsubishi
Challeng
er LS 2.5 2059 2500 113 259
Page 408
388
Make Marketi
ng
Model
Variant Engine
Displacement
Weight
(kg)
Engi
ne
(cc)
Power
(kW)
CO2
Emissions
Nissan Dualis AWD 2 1525 2000 102 197
Nissan X-Trail 2.5 1525 2500 125 223
Nissan X-Trail 2 1675 2000 127 200
Nissan X-Trail 2 1375 2000 110 216
Nissan
Pathfinde
r 2.5 2119 2500 140 224
Nissan
Pathfinde
r 4 2165 4000 198 327
Nissan
Pathfinde
r 3 2170 3000 170 246
Nissan Patrol DX 3 2360 3000 118 288
Nissan Patrol
ST GU
V11 4.8 2450 4800 180 408
Subaru Outback Diesel 2 1551 2000 110 160
Subaru Forester Diesel 2 1520 2000 108 168
Subaru
Liberty
Exiga 2.5 1568 2500 123 202
Subaru Outback 2.5i 2.5 1505 2500 123 198
Subaru Forester X 2.5 1480 2500 126 200
Subaru Outback 3.6R 3.6 1569 3600 191 242
Subaru Forester XT 2.5 1545 2500 193 248
Subaru Tribeca 3.6R 3.6 1942 3600 190 275
Suzuki
Grand
Vitara 2.4 1567 2400 122 212
Suzuki
Grand
Vitara 2.4 1567 2400 122 234
Suzuki
Grand
Vitara 1.9 1630 1900 95 185
Suzuki
Grand
Vitara 3.2 1677 3200 165 249
Toyota
RAV4
V6 3.5 1665 3456 201 246
Toyota Kluger 3.5 2630 3456 201 259
Toyota Kluger Grande 3.5 2720 3456 201 259
Toyota
Hilux
4X2
Double
Cab 2.7 1610 2694 116 262
Toyota
Hilux
4X2 Single Cab 2.7 1405 2694 116 266
Toyota
Hilux
4X2 Single Cab 2.7 1430 2694 116 271
Toyota Hilux Double
2.7 1625 2694 116 273
Page 409
389
Make Marketi
ng
Model
Variant Engine
Displacement
Weight
(kg)
Engi
ne
(cc)
Power
(kW)
CO2
Emissions
4X2 Cab
Toyota
FJ
Cruiser 4 2000 3956 200 267
Toyota Prado 4 2345 3956 202 271
Toyota
Hilux
4X2 Single Cab 4 1555 3956 175 291
Toyota
Hilux
4X2 Single Cab 4 1535 3956 175 296
Toyota
Hilux
4X2 Single Cab 4 1550 3956 175 309
Toyota
Hilux
4X2 Single Cab 3 1495 2982 126 214
Toyota
Hilux
4X4 Single Cab 3 1675 2982 126 217
Toyota
Hilux
4X4
Double
Cab 3 1945 2982 126 219
Toyota
Hilux
4X4 Extra Cab 3 1720 2982 126 219
Toyota Prado 3 2330 2982 127 219
Toyota Prado 4 2205 2982 127 306
Toyota
Hilux
4X4 Single Cab 4 1680 2982 126 308
Toyota
Hilux
4X4
Double
Cab 4 1805 3956 175 311
Toyota HiAce Long 3 1830 2982 100 223
Toyota Prado 3 2095 2982 127 225
Toyota Prado 3 2205 2982 127 232
Toyota
Land
Cruiser
200 4.7 2635 4664 202 341
Toyota
Land
Cruiser
200 4.5 2640 4461 195 273
Toyota
Land
Cruiser
200
Commerci
al 4.5 2720 4461 195 273
Toyota
Land
Cruiser
70
Cab/Chassi
s 4.5 2055 4461 151 304
Toyota
Land
Cruiser
70
4Dr
Wagon 4.5 2230 4461 151 313
Volkswagen Touareg V6 TDI 3 2345 3000 176 283
Page 410
390
Make Marketi
ng
Model
Variant Engine
Displacement
Weight
(kg)
Engi
ne
(cc)
Power
(kW)
CO2
Emissions
TOTAL
218 69
3
361 0
08 19 361 28 627
LET Average
1970 3252 174 258
APPENDIX TABLE 3.8: LET People Movers
Make Marketing
Model
Variant Engine
Displaceme
nt
Weight
(kg)
Engine
(cc)
Power
(kW)
CO2
Emissions
Chrysler
Grand
Voyager 2.8L CRD 2.8 2100 2800 120 247
Chrysler
Grand
Voyager Limited 3.8 2025 3800 142 294
Ford Territory TS 4 2085 4000 182 299
Honda Odyssey 2.4 1645 2400 132 212
Hyundai iMax Petrol 2.4 2.4 2128 2400 129 250
Hyundai iMax CRDi 2.5 2249 2500 125 259
Kia Rondo 7 2.0 EX 2 1556 2000 106 201
Kia
Grand
Carnival SLi 3.5 1990 3500 202 259
Kia Carnival Si 2.7 2048 2700 139 268
Kia
Grand
Carnival SLi 2.9 2180 2900 136 224
Mercedes-
Benz R Class R350 LWB 3.5 2116 3500 200 274
Mercedes-
Benz R Class R350 CDI 3 2185 3000 165 253
Mercedes-
Benz R Class R300 CDI 3 2185 3000 140 246
Mercedes-
Benz Viano 2.2CDI 3 2090 3000 110 231
Mercedes-
Benz Vito
113CDI
Crew Cab 2.1 1750 2100 100 195
Mercedes-
Benz Vito 113CDI 2.1 1710 2100 100 216
Mercedes-
Benz Vito
122CDI
Crew Cab 3 1920 3000 165 226
Toyota HiAce Commuter 2.7 2065 2694 111 294
Toyota HiAce Commuter 2.7 2070 2694 111 300
Toyota Tarago 2.4 1725 2362 125 222
Toyota Tarago GLX v6 3.5 1930 3456 202 241
Page 411
391
Make Marketing
Model
Variant Engine
Displaceme
nt
Weight
(kg)
Engine
(cc)
Power
(kW)
CO2
Emissions
Toyota Tarago Ultima V6 3.5 1930 3456 202 243
Toyota HiAce Commuter 3 2160 2982 100 228
Toyota HiAce Commuter 3 2170 2982 100 243
Volkswage
n Caddy Life
MAXI
TDI250 1.6 1403 1600 75 155
Volkswage
n Caravelle TDI340 2 1968 2000 103 216
Volkswage
n Multivan
Comfortline
TDI400 2 2000 2000 132 232
TOTAL
53 383 74 926 3654 6528
LET
Average
1977 2775 135 242
APPENDIX TABLE 3.9: LET Sports Cars
Make Marketing
Model
Variant Engine
Displacement
Weight (kg) Engine
(cc)
Power
(kW)
CO2
Emissions
BMW Z4 sDrive23i 2.5 1430 2500 150 192
BMW Z4 sDrive30i 3 1430 3000 190 195
BMW Z4 sDrive35i 3 1525 3000 225 210
BMW Z4 sDrive35is 3 1545 3000 250 210
Mazda MX-5 2 1123 2000 118 192
Mercedes-
Benz SLK Class
200
Kompressor 2 1455 1796 135 196
Mercedes-
Benz SLS AMG 6.2 1736 6200 420 311
Mercedes-
Benz SL Class SL350 3.5 1825 3500 200 236
Mercedes-
Benz SL Class SL63 AMG 6.2 1929 6200 386 330
Mercedes-
Benz SL Class SL500 5.5 1810 5500 285 291
Mercedes-
Benz SL Class SL600 5.5 2045 5500 380 340
Mercedes-
Benz SLK Class
SLK200
BlueEfficien
cy 1.8 1455 1800 135 196
Mercedes-
Benz SLK Class
SLK350
BlueEfficien
cy 3.5 1495 3500 224 227
Page 412
392
Make Marketing
Model
Variant Engine
Displacement
Weight (kg) Engine
(cc)
Power
(kW)
CO2
Emissions
Mercedes-
Benz SLK Class
SLK55
AMG 5.4 1530 5400 265 288
Mercedes-
Benz SLK Class
SLK200
BlueEfficien
cy 1.8 1455 1800 135 190
Mercedes-
Benz SLS Class SLS AMG 6.2 1736 6200 420 311
Mercedes-
Benz SL Class SL63 AMG 6.2 1929 6200 386 330
Nissan 370Z 3.7 1485 3700 245 247
Nissan 370Z Roadster 3.7 1565 3700 245 257
TOTAL
30 503 74 496 4794 4749
LET
Average
1605 3921 252 250
STEP 2
The second step required the calculation of the LET points based on the
recommendations in Chapter 6. Appendix Table 3.10 shows the LET points
calculated for each LET motor vehicle category.
APPENDIX TABLE 3.10: LET Points
Motor Vehicle
Category
Weight (kg) Engine (cc) Power (kW) CO2
Emissions
Total LET
Points
Light 3 4 2 6 15
Small 6 5 4 9 24
Medium 10 8 9 14 41
Large 14 15 15 19 63
SUVs 18 15 14 23 70
People Movers 18 13 10 21 62
Sport 13 19 21 22 75
Page 413
393
STEP 3
The third step required the calculation of the LET payable by using the rates
demonstrated in Table 6.6 in Chapter 6. Appendix Table 3.11 shows the LET
payable for a single vehicle in each LET motor vehicle category.
APPENDIX TABLE 3.11: LET Payable
Motor Vehicle
Category
Total LET
Points
Initial
Purchase
Road
Registration
Fuel
Consumption
Disposal
Fee
Light 15 7500 1875 3.75 150
Small 24 12 000 3000 6 240
Medium 41 20 500 5125 10.25 410
Large 63 31 500 7875 15.75 630
SUVs 70 35 000 8750 17.50 700
People Movers 62 31 000 7750 15.5 620
Sport 75 37 500 9375 18.75 750
STEP 4
The fourth step required the application of the recommended discount over a 10 year
period to the calculation of LET that would be attracted by a single motor vehicle
under each motor vehicle category described in Appendix Table 3.11. The LET
attracted by a single motor vehicle under each of the motor vehicle categories is
calculated in Appendix Tables 3.12 to 3.18.
Page 414
394
APPENDIX TABLE 3.12: LET Attracted by Light Motor Vehicle
Year Discounted
Tax Rate
AUD
Light Motor Vehicle
Initial
Purchase
LET
AUD
Road
Registration
LET
AUD
Fuel
Per litre LET
AUD
Disposal
Fee
LET
AUD
1 2% 150 38 0.08 3
2 4% 300 75 0.15 6
3 6% 450 113 0.23 9
4 8% 600 150 0.30 12
5 10% 750 188 0.38 15
6 15% 1125 281 0.56 23
7 25% 1875 469 0.94 38
8 50% 3750 938 1.88 75
9 75% 5625 1406 2.81 113
10 100% 7500 1875 3.75 150
APPENDIX TABLE 3.13: LET Attracted by Small Motor Vehicle
Year Discounted Tax
Rate
AUD
Small Motor Vehicle
Initial
Purchase
LET
AUD
Road
Registration
LET
AUD
Fuel
Per litre LET
AUD
Disposal
Fee
LET
AUD
1 2% 240 60 0.12 5
2 4% 480 120 0.24 10
3 6% 720 180 0.36 14
4 8% 960 240 0.48 19
5 10% 1200 300 0.60 24
6 15% 1800 450 0.90 36
7 25% 3000 750 1.50 60
8 50% 6000 1500 3.00 120
9 75% 9000 2250 4.50 180
10 100% 12 000 3000 6.00 240
Page 415
395
APPENDIX TABLE 3.14: LET Attracted by Medium Motor Vehicle
Year Discounted Tax
Rate
AUD
Medium Motor Vehicle
Initial
Purchase
LET
AUD
Road
Registration
LET
AUD
Fuel
Per litre LET
AUD
Disposal
Fee
LET
AUD
1 2% 410 103 0.21 8
2 4% 820 205 0.41 16
3 6% 1230 308 0.62 25
4 8% 1640 410 0.82 33
5 10% 2050 513 1.03 41
6 15% 3075 769 1.54 62
7 25% 5125 1281 2.56 103
8 50% 10 250 2563 5.13 205
9 75% 15 375 3844 7.69 308
10 1 20 500 5125 10.25 410
APPENDIX TABLE 3.15: LET Attracted by Large Motor Vehicle
Year Discounted Tax
Rate
AUD
Large Motor Vehicle
Initial
Purchase
LET
AUD
Road
Registration
LET
AUD
Fuel
Per litre LET
AUD
Disposal
Fee
LET
AUD
1 2% 630 158 0.32 13
2 4% 1260 315 0.63 25
3 6% 1890 473 0.95 38
4 8% 2520 630 1.26 50
5 10% 3150 788 1.58 63
6 15% 4725 1181 2.36 95
7 25% 7875 1969 3.94 158
8 50% 15 750 3938 7.88 315
9 75% 23 625 5906 11.81 473
10 100% 31 500 7875 15.75 630
Page 416
396
APPENDIX TABLE 3.16: LET Attracted by SUVs
Year Discounted Tax
Rate
AUD
SUVs
Initial
Purchase
LET
AUD
Road
Registration
LET
AUD
Fuel
Per litre LET
AUD
Disposal
Fee
LET
AUD
1 2% 700 175 0.35 14
2 4% 1400 350 0.70 28
3 6% 2100 525 1.05 42
4 8% 2800 700 1.40 56
5 10% 3500 875 1.75 70
6 15% 5250 1313 2.63 105
7 25% 8750 2188 4.38 175
8 50% 17 500 4375 8.75 350
9 75% 26 250 6563 13.13 525
10 100% 35 000 8750 17.50 700
APPENDIX TABLE 3.17: LET Attracted by People Movers
Year Discounted
Tax Rate
AUD
People Movers
Initial
Purchase
LET
AUD
Road
Registration
LET
AUD
Fuel
Per litre LET
AUD
Disposal
Fee
LET
AUD
1 2% 620 155 0.31 12
2 4% 1240 310 0.62 25
3 6% 1860 465 0.93 37
4 8% 2480 620 1.24 50
5 10% 3100 775 1.55 62
6 15% 4650 1163 2.33 93
7 25% 7750 1938 3.88 155
8 50% 15 500 3875 7.75 310
9 75% 23 250 5813 11.63 465
10 100% 31 000 7750 15.50 620
Page 417
397
APPENDIX TABLE 3.18: LET Attracted by Sports Motor Vehicles
Year Discounted
Tax Rate
AUD
Sports Motor Vehicle
Initial
Purchase
LET
AUD
Road
Registration
LET
AUD
Fuel
Per litre LET
AUD
Disposal
Fee
LET
AUD
1 2% 750 188 0.38 15
2 4% 1500 375 0.75 30
3 6% 2250 563 1.13 45
4 8% 3000 750 1.50 60
5 10% 3750 938 1.88 75
6 15% 5625 1406 2.81 113
7 25% 9375 2344 4.69 188
8 50% 18 750 4688 9.38 375
9 75% 28 125 7031 14.06 563
10 100% 37 500 9375 18.75 750
Page 418
398
APPENDIX 4: CHAPTER 7 METHODOLOGY TO
FORECAST REVENUES FROM PURCHASE LET ON
PASSENGER MOTOR VEHICLES
The following available information has been used in this exercise to forecast the
purchase LET revenues for the following categories of Australian motor vehicles:
Light cars; small cars; medium cars; large cars; SUVs; people movers and sports cars
for 10 years from 2016 to 2025:
- Australian Bureau of Statistics, Population Projections,
Australia,(Catalogue No 3222.0, 4 September 2008)
- Australian Bureau of Statistics, Motor Vehicle Census, Australia, 31
January 2011 (Catalogue No 9309.0, 28 July 2011)
- Australian Bureau of Statistics, Sales of New Motor Vehicles, Australia,
January 2012 (Catalogue No 9314.0, 15 February 2012)
- Australian Bureau of Statistics, Survey of Motor Vehicle Use, Australia, 12
Months Ended 31 October 2010 (Catalogue No 9208.0, 23 August 2011)
- Federal Chamber of Automotive Industries, V Facts Car Sales Data for
Year Ended 31 December 2011
The methodology below describes in detail the steps undertaken to calculate the
purchase LET for Australian motor vehicles for 10 years after the introduction of the
LET.
STEP 1
The first step was to obtain the number of new vehicles purchased by Australians in
any one year. The information on the number of new motor vehicles sold in Australia
was obtained from the ABS publication 9314. The data from that publication for the
year ended 31 December 2011 is displayed in Appendix Table 4.1.
Page 419
399
APPENDIX TABLE 4.1: Australian Motor Vehicle Sales for Year Ended 31
December 2011
Month Number of
Passenger Vehicles
Number of SUVs Total
January 2011 43 539 17 032 60 571
February 2011 45 455 18 916 64 371
March 2011 50 228 23 066 73 294
April 2011 41 565 17 054 58 619
May 2011 42 577 17 121 59 698
June 2011 54 322 21 518 75 840
July 2011 45 701 19 383 65 084
August 2011 48 423 22 111 70 534
September 2011 47 700 20 778 68 478
October 2011 47 536 20 400 67 936
November 2011 46 712 24 182 70 894
December 2011 45 764 22 367 68 131
Total 559 522 243 928 803 450
Source: Australian Bureau of Statistics, Sales of New Motor Vehicles, Australia,
January 2012 (Catalogue No 9314.0, 15 February 2012).
STEP 2
The next step was to obtain a breakdown of the new motor vehicle sales into the
following categories: Light cars; small cars; medium cars; large cars; SUVs; people
movers and sports cars. The ABS data does not provide a breakdown of the
categories of passenger vehicles. However the Federal Chamber of Automotive
Industries releases V Facts car sales data for each month with a breakdown into the
motor vehicle categories. Upon request, the Federal Chamber of Automotive
Industries provided the data shown in Appendix Table 4.2.
Page 420
400
APPENDIX TABLE 4.2: Car Sales Data for Year Ended 31 December 2011
Category of Motor Vehicle New Car Sales Data
Light 132 442
Small 244 090
Medium 75 984
Large and Upper Large 81 119
People Movers 11 109
Sports 14 570
SUVs 244 136
Total 803 450
Source: Federal Chamber of Automotive Industries, V Facts Car Sales Data
for Year Ended 31 December 2011.
STEP 3
The third step required a forecast of the new motor vehicle sales data for years 2011
to 2025. Since there are no readily available projections of new motor sales data, for
the purpose of this thesis, the Australian population growth forecast for 15 years to
2025 was used, which had a growth rate of 1.70 per cent per annum from 2011 to
2016 and 1.64 per cent from 2017 to 2025.621
The introduction of LET was aimed at
bringing about an expected reduction in new motor vehicle sales from 5 per cent to
15 per cent, increasing by one per cent each year from 2015 to 2025. The 5 per cent
change takes into consideration that people may refrain from purchasing a motor
vehicle in anticipation of the LET being introduced in 2016. Thereafter only a one
per cent per annum reduction in the vehicle fleet is forecast. These are just
assumptions for the purposes of this thesis.
621
Cp7-7, p39.
Page 421
401
APPENDIX TABLE 4.3: New Motor Vehicle Sales Forecast from 2011 to 2025
Year
% Change in
Population
Projected New Motor
Vehicle Sales
Without LET
% Reduction
Due to LET
Projected Motor
Vehicle Sales
Due to LET
2011 1.70% 803 450
803 450
2012 1.70% 817 109
817 109
2013 1.70% 831 000
831 000
2014 1.70% 845 127
845 127
2015 1.70% 859 494 5% 816 519
2016 1.70% 874 105 6% 821 659
2017 1.64% 888 965 7% 826 737
2018 1.64% 903 544 8% 831 261
2019 1.64% 918 362 9% 835 710
2020 1.64% 933 423 10% 840 081
2021 1.64% 948 731 11% 844 371
2022 1.64% 964 290 12% 848 575
2023 1.64% 980 104 13% 852 691
2024 1.64% 996 178 14% 856 713
2025 1.64% 1 012 515 15% 860 638
STEP 4
The fourth step required the new motor vehicle sales projected in Appendix Table
4.3 to be split into the various categories of motor vehicles. For the purpose of this
thesis, the split has been carried out using the same proportions as the new car sales
for 2011 as shown in Appendix Table 4.2 above. The result is shown in Appendix
Table 4.4.
Page 422
402
APPENDIX TABLE 4.4: Projected New Motor Vehicle Sales into Categories
Light
Cars
Small
Cars
Medium
Cars
Large
Cars
SUVs People
Movers
Sports Total
2011 132 442 244 090 75 984 81 119 244 136 11 109 14 570 803 450
2012 134 694 248 240 77 276 82 498 248 286 11 298 14 818 817 109
2013 136 983 252 460 78 589 83 901 252 507 11 490 15 070 831 000
2014 139 312 256 752 79 925 85 327 256 800 11 685 15 326 845 127
2015 134 596 248 061 77 220 82 439 248 107 11 290 14 807 816 519
2016 135 444 249 622 77 706 82 957 249 669 11 361 14 900 821 659
2017 136 281 251 165 78 186 83 470 251 212 11 431 14 992 826 737
2018 137 026 252 539 78 614 83 927 252 586 11 494 15 074 831 261
2019 137 760 253 891 79 035 84 376 253 938 11 555 15 155 835 710
2020 138 480 255 219 79 448 84 817 255 267 11 615 15 234 840 081
2021 139 187 256 522 79 854 85 250 256 570 11 675 15 312 844 371
2022 139 881 257 799 80 252 85 675 257 848 11 733 15 388 848 575
2023 140 559 259 049 80 641 86 091 259 098 11 790 15 463 852 691
2024 141 222 260 271 81 021 86 497 260 320 11 845 15 536 856 713
2025 141 869 261 464 81 392 86 893 261 513 11 900 15 607 860 638
STEP 5
The fifth step is to forecast a change in purchasing behaviour, from choosing motor
vehicles that attract a high LET to those that attract lower LET. For the purpose of
this thesis, it is assumed that the new car sales data shown in Appendix Table 4.4 are
adjusted with a reduction each year from two per cent to 95 per cent between years
2016 to 2025 for large cars, SUVs, people movers and sports cars, with these
decreases in sales being reflected by an increase in sales for light, small and medium
cars. These assumptions are made in line with the tax discount rate increases and the
expectation that five per cent of the population may never change its behaviour
despite the high LET rates. It is assumed that the LET will influence people to
purchase light, small and medium vehicles instead of the large cars, SUVs, people
movers and sports cars that attract more LET. However, these are only assumptions
for this thesis and an economic study would need to be conducted to determine the
real perceived change in people’s habits, which is beyond the scope of this thesis.
The adjusted new motor vehicle sales data is shown in Appendix Table 4.5.
Page 423
403
APPENDIX TABLE 4.5: Projected New Motor Vehicle Sales after Introduction
of LET
Light
Cars
Small
Cars
Medium
Cars
Large
Cars
SUVs People
Movers
Sports Total
2011 132 442 244 090 75 984 81 119 244 136 11 109 14 570 803 450
2012 134 694 248 240 77 276 82 498 248 286 11 298 14 818 817 109
2013 136 983 252 460 78 589 83 901 252 507 11 490 15 070 831 000
2014 139 312 256 752 79 925 85 327 256 800 11 685 15 326 845 127
2015 134 596 248 061 77 220 82 439 248 107 11 290 14 807 816 519
2016 137 544 253 494 78 911 81 298 244 676 11 134 14 602 821 659
2017 140 508 258 956 80 612 80 131 241 164 10 974 14 393 826 737
2018 143 402 264 290 82 272 78 891 237 431 10 804 14 170 831 261
2019 146 307 269 642 83 938 77 626 233 623 10 631 13 943 835 710
2020 149 220 275 011 85 610 76 336 229 740 10 454 13 711 840 081
2021 155 379 286 362 89 143 72 463 218 085 9924 13 015 844 371
2022 167 000 307 781 95 811 64 256 193 386 8800 11 541 848 575
2023 195 062 359 498 111 910 43 045 129 549 5895 7731 852 691
2024 223 362 411 655 128 146 21 624 65 080 2961 3884 856 713
2025 246 390 454 095 141 358 4345 13 076 595 780 860 638
STEP 6
The sixth step is to forecast the total revenues from the purchase LET for the ten
years from 2016 to 2025. The purchase LET revenues are calculated by multiplying
the new car sales data from Appendix Table 4.5 with the LET payable for a single
car. Appendix Table 3.11 in Appendix 3 showed the purchase LET payable for a
single car as follows: Light cars – 7500; small cars – 12 000; medium cars – 20 500;
large cars – 31 500; SUVs – 35 000; people movers – 31 000 and sports vehicle –
37 500. Appendix Tables 3.12 to 3.18 in Appendix 3 showed the purchase LET
attracted by a single vehicle under the various motor vehicle categories for 10 years
from the date of introduction of the LET. Appendix Table 4.6 shows a forecast for
the total purchase LET revenues in AUD billion for 10 years from 2016 to 2025 for
each category of motor vehicle.
Page 424
404
APPENDIX TABLE 4.6: Purchase LET Revenues from Car Sales Data after
Implementation of LET in AUD Billion
Light
Cars
Small
Cars
Medium
Cars
Large
Cars SUVs
People
Movers Sports Total
AUD
billion
AUD
billion
AUD
billion
AUD
billion
AUD
billion
AUD
billion
AUD
billion
AUD
billion
2016 0.02 0.06 0.03 0.05 0.17 0.01 0.01 0.35
2017 0.04 0.12 0.07 0.10 0.34 0.01 0.02 0.71
2018 0.06 0.19 0.10 0.15 0.50 0.02 0.03 1.06
2019 0.09 0.26 0.14 0.20 0.65 0.03 0.04 1.40
2020 0.11 0.33 0.18 0.24 0.80 0.03 0.05 1.75
2021 0.17 0.52 0.27 0.34 1.14 0.05 0.07 2.57
2022 0.31 0.92 0.49 0.51 1.69 0.07 0.11 4.10
2023 0.73 2.16 1.15 0.68 2.27 0.09 0.14 7.22
2024 1.26 3.70 1.97 0.51 1.71 0.07 0.11 9.33
2025 1.85 5.45 2.90 0.14 0.46 0.02 0.03 10.84
Total 4.65 13.71 7.29 2.91 9.74 0.39 0.62 39.32
Page 425
405
APPENDIX 5: CHAPTER 7 METHODOLOGY TO
FORECAST REVENUES FROM ANNUAL
REGISTRATION LET ON PASSENGER MOTOR
VEHICLES
The following available information has been used in this exercise to forecast the
annual registration LET revenues for the following categories of Australian motor
vehicles: Light cars; small cars; medium cars; large cars; SUVs; people movers and
sports cars for 10 years from 2016 to 2025:
- Australian Bureau of Statistics, Population Projections, Australia
(Catalogue No 3222.0, 4 September 2008)
- Australian Bureau of Statistics, Motor Vehicle Census, Australia, 31
January 2011 (Catalogue No 9309.0, 28 July 2011)
- Australian Bureau of Statistics, Sales of New Motor Vehicles, Australia,
January 2012 (Catalogue No 9314.0, 15 February 2012)
- Australian Bureau of Statistics, Survey of Motor Vehicle Use, Australia, 12
Months Ended 31 October 2010 (Catalogue No 9208.0, 23 August 2011)
- Federal Chamber of Automotive Industries, V Facts Car Sales Data for
Year Ended 31 December 2011.
The methodology below describes in detail the steps undertaken to calculate the
annual LET for Australian motor vehicles for 10 years after the introduction of the
LET.
STEP 1
The first step was to forecast the total motor vehicle population for each year from
2011 to 2025. The total passenger motor vehicle population in 2011 is stated in
Appendix Table 3.1 of Appendix 3, numbering 12 474 044. The motor vehicle
population growth was forecast using the same percentage increases as the projected
Page 426
406
Australian population growth for the 15 years to 2025.622
The results were compared
with the projections from BITRE in June 2003 which had predicted an increase of
1.75 per cent per annum growth in vehicle population from 14.7 million cars in year
2006/07 to 18.1 million cars in year 2019/20.623
BITRE predicted that passenger cars
would number just under 14 billion in 2020. The population growth rate was
considered a better forecasting tool than the BITRE 2003 forecast.
The introduction of the LET is aimed at bringing about an expected reduction in the
motor vehicle fleet from 5 per cent to 15 per cent increasing by one per cent each
year from 2015 to 2025. These are just assumptions for the purpose of this thesis.
The 5 per cent change takes into consideration that people who own two motor
vehicles may get rid of one vehicle in anticipation of the LET. Thereafter only a one
per cent per annum reduction in the vehicle fleet is forecast.
The Australian population and the projected motor vehicle stock data for the years
2011 to 2025 are shown in Appendix Table 5.1.
APPENDIX TABLE 5.1: Motor Vehicle Fleet Projections for Years 2011 to
2025
Year
% Change
in
Population
Australian
Population in
Millions
Projected Motor
Vehicle Stock
without LET
%
Reduction
Due to LET
Projected
Motor
Vehicle Stock
with LET
2011 1.70% 22 447 12 474 044
12 474 044
2012 1.70% 22 829 12 686 103
12 686 103
2013 1.70% 23 217 12 901 767
12 901 767
2014 1.70% 23 612 13 121 097
13 121 097
2015 1.70% 24 013 13 344 156 5% 12 676 948
2016 1.70% 24 422 13 571 007 6% 12 756 746
2017 1.64% 24 823 13 801 714 7% 12 835 594
2018 1.64% 25 230 14 028 062 8% 12 905 817
622
Australian Bureau of Statistics, Population Projections, Australia (Catalogue No 3222.0, 4
September 2008) 39. 623
Department of Sustainability, Environment, Water, Population and Communities, ‘Indicator: A-35
Projections of Motor Vehicle Travel and Pollutant Emissions’ (22 November 2010) State of the
Environment
2006<http://www.environment.gov.au/soe/2006/publications/drs/indicator/376/index.html>.
Page 427
407
Year
% Change
in
Population
Australian
Population in
Millions
Projected Motor
Vehicle Stock
without LET
%
Reduction
Due to LET
Projected
Motor
Vehicle Stock
with LET
2019 1.64% 25 644 14 258 122 9% 12 974 891
2020 1.64% 26 065 14 491 955 10% 13 042 760
2021 1.64% 26 492 14 729 623 11% 13 109 365
2022 1.64% 26 926 14 971 189 12% 13 174 646
2023 1.64% 27 368 15 216 716 13% 13 238 543
2024 1.64% 27 817 15 466 270 14% 13 300 992
2025 1.64% 28 273 15 719 917 15% 13 361 929
STEP 2
The second step required a breakdown of the total motor vehicle population into the
motor vehicle categories of light cars, small cars, medium cars, large cars, SUVs,
people movers and sports cars. For the purpose of this thesis, a breakdown of the
passenger motor vehicle population is based on the available breakdown of the car
sales data for year ended 31 December 2011 as shown in Appendix Table 4.2 above.
The breakdown of the total passenger car population into its various categories from
years 2011 to 2025 is shown in Appendix Table 5.2.
APPENDIX TABLE 5.2: Motor Vehicle Projections with LET in Categories
Light
Cars
Small
Cars
Medium
Cars
Large
Cars SUVs
People
Movers Sports Total
2011 2 056 242 3 789 644 1 179 697 1 259 421 3 790 358 172 474 226 208 12 474 044
2012 2 091 198 3 854 068 1 199 752 1 280 831 3 854 794 175 406 230 054 12 686 103
2013 2 126 748 3 919 587 1 220 148 1 302 606 3 920 326 178 388 233 964 12 901 767
2014 2 162 903 3 986 220 1 240 890 1 324 750 3 986 971 181 420 237 942 13 121 097
2015 2 089 689 3 851 287 1 198 886 1 279 907 3 852 012 175 279 229 888 12 676 948
2016 2 102 843 3 875 530 1 206 433 1 287 964 3 876 260 176 383 231 335 12 756 746
2017 2 115 840 3 899 484 1 213 890 1 295 925 3 900 219 177 473 232 764 12 835 594
2018 2 127 416 3 920 818 1 220 531 1 303 014 3 921 557 178 444 234 038 12 905 817
2019 2 138 802 3 941 802 1 227 063 1 309 988 3 942 545 179 399 235 291 12 974 891
2020 2 149 990 3 962 421 1 233 482 1 316 841 3 963 168 180 337 236 521 13 042 760
2021 2 160 969 3 982 656 1 239 781 1 323 565 3 983 406 181 258 237 729 13 109 365
Page 428
408
Light
Cars
Small
Cars
Medium
Cars
Large
Cars SUVs
People
Movers Sports Total
2022 2 171 730 4 002 488 1 245 955 1 330 156 4 003 243 182 161 238 913 13 174 646
2023 2 182 263 4 021 901 1 251 998 1 336 608 4 022 659 183 044 240 072 13 238 543
2024 2 192 557 4 040 873 1 257 904 1 342 913 4 041 634 183 908 241 204 13 300 992
2025 2 202 602 4 059 386 1 263 666 1 349 065 4 060 151 184 750 242 309 13 361 929
STEP 3
The third step is to forecast a change in motor vehicle population due to the shifting
of categories from high LET categories to lower LET categories. For the purpose of
this thesis, it is assumed that the car population data shown in Appendix Table 5.2
decreases each year from two per cent to 95 per cent between years 2016 to 2025 for
large cars, SUVs, people movers and sports cars, with this decrease in sales being
reflected by an increase in sales for light, small and medium cars. These assumptions
are made in line with the tax rate increases and the prediction that five per cent of the
population may never change their behaviour despite the high LET rates. It is
assumed that the LET will influence people to purchase light, small and medium
vehicles instead of large cars, SUVs people movers and sports cars that attract a
higher LET. However, these are only assumptions for this thesis and an economic
study would need to be conducted to make a real prediction for the change in
people’s habits, which is beyond the scope of this PhD. The adjusted motor vehicle
population data is shown in Appendix Table 5.3 below.
APPENDIX TABLE 5.3: Motor Vehicle Projections with LET in Categories
Light
Cars
Small
Cars
Medium
Cars
Large
Cars SUVs
People
Movers Sports Total
2011 2,056,242 3,789,644 1,179,697 1,259,421 3,790,358 172,474 226,208 12,474,044
2012 2,091,198 3,854,068 1,199,752 1,280,831 3,854,794 175,406 230,054 12,686,103
2013 2,126,748 3,919,587 1,220,148 1,302,606 3,920,326 178,388 233,964 12,901,767
2014 2,162,903 3,986,220 1,240,890 1,324,750 3,986,971 181,420 237,942 13,121,097
2015 2,089,689 3,851,287 1,198,886 1,279,907 3,852,012 175,279 229,888 12,676,948
2016 2,135,459 3,935,640 1,225,145 1,262,205 3,798,735 172,855 226,708 12,756,746
2017 2,181,475 4,020,448 1,251,546 1,244,088 3,744,210 170,374 223,454 12,835,594
2018 2,226,407 4,103,257 1,277,324 1,224,834 3,686,263 167,737 219,996 12,905,817
Page 429
409
Light
Cars
Small
Cars
Medium
Cars
Large
Cars SUVs
People
Movers Sports Total
2019 2,271,496 4,186,357 1,303,192 1,205,189 3,627,142 165,047 216,467 12,974,891
2020 2,316,725 4,269,714 1,329,141 1,185,157 3,566,851 162,304 212,869 13,042,760
2021 2,412,349 4,445,949 1,384,002 1,125,031 3,385,895 154,070 202,070 13,109,365
2022 2,592,784 4,778,488 1,487,520 997,617 3,002,432 136,621 179,185 13,174,646
2023 3,028,454 5,581,427 1,737,471 668,304 2,011,329 91,522 120,036 13,238,543
2024 3,467,832 6,391,198 1,989,548 335,728 1,010,409 45,977 60,301 13,300,992
2025 3,825,350 7,050,103 2,194,662 67,453 203,008 9,238 12,115 13,361,929
STEP 4
Based on the forecast passenger motor vehicle population in Appendix Table 5.3 and
the registration LET payable for a single vehicle shown in Appendix Tables 3.12 to
3.18 in Appendix 3, it is now possible to forecast the total revenues from the annual
registration LET. Appendix Table 5.4 below shows the predicted total annual
registration LET revenues in AUD billion from 2016 to 2025 for each category of
motor vehicle
APPENDIX TABLE 5.4: Revenue Forecast for Annual Registration LET for
Passenger motor vehicles in AUD Billion
Light
Cars Small
Cars Medium
Cars Large
Cars SUVs
People
Movers Sports Total
AUD
billion AUD
billion AUD
billion AUD
billion AUD
billion AUD
billion AUD
billion AUD
billion
2016 0.08 0.24 0.13 0.20 0.66 0.03 0.04 1.37
2017 0.16 0.48 0.26 0.39 1.31 0.05 0.08 2.74
2018 0.25 0.74 0.39 0.58 1.94 0.08 0.12 4.10
2019 0.34 1.00 0.53 0.76 2.54 0.10 0.16 5.44
2020 0.43 1.28 0.68 0.93 3.12 0.13 0.20 6.78
2021 0.68 2.00 1.06 1.33 4.44 0.18 0.28 9.98
2022 1.22 3.58 1.91 1.96 6.57 0.26 0.42 15.92
2023 2.84 8.37 4.45 2.63 8.80 0.35 0.56 28.01
2024 4.88 14.38 7.65 1.98 6.63 0.27 0.42 36.21
2025 7.17 21.15 11.25 0.53 1.78 0.07 0.11 42.06
18.05 53.23 28.31 11.30 37.79 1.52 2.42 152.62
Page 430
410
APPENDIX 6: CHAPTER 7 METHODOLOGY TO
FORECAST REVENUES FROM FUEL LET ON
PASSENGER MOTOR VEHICLES
Information from the following sources has been used in this exercise to forecast the
fuel LET revenues for the following categories of Australian motor vehicles: Light
cars; small cars; medium cars; large cars; SUVs; people movers and sports cars for
the 10 years from 2016 to 2025:
- Department of Sustainability, Environment, Water, Population and
Community, Emissions from Different Fuels;
- Australian Bureau of Statistics, Survey of Motor Vehicle Use, Australia, 12
Months Ended 31 October 2010 (Catalogue No 9208.0, 23 August 2011).
The methodology below describes in detail the steps undertaken to calculate the fuel
LET for Australian motor vehicles for 10 years after the introduction of the LET.
STEP 1
The first step required a forecast of annual fuel use per LET vehicle category. The
CO2 emission data gathered under each category in Appendix Tables 3.2 to 3.9 in
Appendix 3 has been used to calculate the number of litres of fuel used per 100
kilometres by those vehicles. The Department of Sustainability, Environment, Water,
Population and Community data shows that the use of one litre of petrol emits 2.3kg
of CO2 and one litre of diesel emits 2.7kg of CO2.624
The Survey of Motor Vehicle
Use states that 84.1 per cent of passenger motor vehicles use petrol.625
It is assumed
that the remaining 15.9 per cent of the vehicles use diesel, and the small percentage
624
Department of Sustainability, Environment, Water, Population and Communities, Emissions From
Different Fuels (24 October 2008) Commonwealth of Australia
<http://www.environment.gov.au/settlements/transport/fuelguide/environment.html>. 625
Australian Bureau of Statistics, Survey of Motor Vehicle Use, Australia, 12 Months Ended 31
October 2010 (Catalogue No 9208.0, 23 August 2011).
Page 431
411
of vehicles that use auto gas or other alternative fuel has been ignored for the purpose
of this exercise. Thus the average figure of 2.36kg of CO2 (combined petrol and
diesel) has been used to convert the CO2 emissions of the various car categories into
litres of fuel consumed per 100 kilometres as shown in Appendix Table 6.1 below.
APPENDIX TABLE 6.1: Conversion of CO2 Emission Data into Fuel Use by
Various LET Motor Vehicle Categories
Motor Vehicle
Category CO2 Emissions g/km Conversion into
kg per 100km Conversion into
litres per 100km
Light 128 12.8 5.42
Small 146 14.6 6.19
Medium 186 18.6 7.88
Large 228 22.8 9.66
People Movers 242 24.2 10.25
SUVs 258 25.8 10.93
Sport 250 25 10.59
STEP 2
The second step required a forecast of the number of kilometres travelled by each
category of motor vehicle per year, using the ABS statistics entitled Survey of Motor
Vehicle Use. For the 12 months ended 31 October 2010, motor vehicles registered in
Australia travelled an average of 14 100 kilometres per vehicle.626
On the basis of
this average, the number of litres of fuel consumed by a single vehicle under each
motor vehicle category is forecasted in Appendix Table 6.2 below.
626
Ibid 4.
Page 432
412
APPENDIX TABLE 6.2: Forecast Annual Fuel Consumption in Litres by Single
Motor Vehicle
Motor Vehicle
Category Average Annual
Kilometres
Travelled
Conversion into
Litres per 100km Annual Fuel Use
per Vehicle in
Litres
Light 14 100 5.42 765
Small 14 100 6.19 872
Medium 14 100 7.88 1111
Large 14 100 9.66 1362
People Movers 14 100 10.25 1446
SUVs 14 100 10.93 1541
Sport 14 100 10.59 1494
STEP 3
Step 3 required a forecast of the annual fuel consumption of the motor vehicle fleet.
This could be obtained by multiplying the annual fuel use per vehicle in Appendix
Table 6.2 by the number of motor vehicles forecast in Appendix Table 5.3 in
Appendix 5. However an adjustment is required as the CO2 data used in Appendix
Table 6.1 is historical to year 2011. It does not take into consideration possible
changes in the CO2 data arising from the proposed implementation of CO2 legislation
in 2015. Also, the CO2 emission data is based on new motor vehicles, whereas CO2
emissions by older models of motor vehicles are likely to be higher. Due to this, and
also taking into account different driving environments and habits, an ‘other’ column
has been inserted in the data for the total fuel used by the vehicle fleet. The ‘other’
column in year 2011 shows the difference required to bring the total fleet fuel
consumption to 18 431 litres, being the actual fuel consumption of passenger motor
vehicles in 2010 as stated in the ABS Survey of Motor Vehicle Use.627
The annual
fleet fuel consumption in million litres with the ‘other’ column is shown in Appendix
Table 6.3 below.
627
Ibid 7.
Page 433
413
APPENDIX TABLE 6.3: Total Annual Fleet Fuel Consumption in Million
Litres
Light
Cars Small
Cars Medium
Cars Large
Cars SUVs People
Movers Sports Other Total
Annual
fuel use 765 872 1111 1362 1541 1446 1494
2011 1573 3305 1311 1715 5841 249 338 4099 18 431
2012 1600 3361 1333 1744 5940 254 344 4169 18 744
2013 1627 3418 1356 1774 6041 258 350 4240 19 063
2014 1655 3476 1379 1804 6144 262 355 4312 19 387
2015 1599 3358 1332 1743 5936 253 343 4166 18 731
2016 1634 3432 1361 1719 5854 250 339 4172 18 761
2017 1669 3506 1390 1694 5770 246 334 4178 18 788
2018 1703 3578 1419 1668 5681 243 329 4182 18 802
2019 1738 3651 1448 1641 5589 239 323 4184 18 813
2020 1772 3723 1477 1614 5497 235 318 4186 18 821
2021 1845 3877 1538 1532 5218 223 302 4157 18 692
2022 1983 4167 1653 1359 4627 198 268 4077 18 330
2023 2317 4867 1930 910 3099 132 179 3843 17 278
2024 2653 5573 2210 457 1557 66 90 3606 16 213
2025 2926 6148 2438 92 313 13 18 3417 15 366
STEP 4
The fourth step required an adjustment to the annual fuel use data as a 50 per cent
reduction in the number of kilometres driven is desirable by year 2025. The decrease
in mileage would be gradual, commencing at 5 per cent in 2016 and increasing by
five per cent until 2025 as shown in Appendix Table 6.4.
Page 434
414
APPENDIX TABLE 6.4: Adjustment to Annual Fuel Use Due to Forecast
Reduction in Mileage
Light
Cars
Small
Cars
Medium
Cars
Large
Cars
SUVs People
Movers
Sports
2011–2015 765 872 1111 1362 1541 1446 1494
2016 727 828 1055 1294 1464 1374 1419
2017 689 785 1000 1226 1387 1301 1345
2018 650 741 944 1158 1310 1229 1270
2019 612 698 889 1090 1233 1157 1195
2020 574 654 833 1022 1156 1085 1121
2021 536 610 778 953 1079 1012 1046
2022 497 567 722 885 1002 940 971
2023 459 523 667 817 925 868 896
2024 421 480 611 749 848 795 822
2025 383 436 556 681 771 723 747
STEP 5
Step 5 required a forecast of the adjusted annual fleet consumption taking into
consideration the reduced mileage and fuel use forecast in Appendix Table 6.4.
Appendix Table 6.5 shows the adjusted annual fleet fuel consumption in million
litres.
APPENDIX TABLE 6.5: Total Annual Fleet Fuel Consumption in Million
Litres with Forecast 50 Per Cent Mileage Reduction
Light
Cars Small
Cars Medium
Cars Large
Cars SUVs
People
Movers Sports Other Total
2011 1573 3305 1311 1715 5841 249 338 4099 18 431
2012 1600 3361 1333 1744 5940 254 344 4169 18 744
2013 1627 3418 1356 1774 6041 258 350 4240 19 063
Page 435
415
Light
Cars Small
Cars Medium
Cars Large
Cars SUVs
People
Movers Sports Other Total
2014 1655 3476 1379 1804 6144 262 355 4312 19 387
2015 1599 3358 1332 1743 5936 253 343 4166 18 731
2016 1552 3260 1293 1633 5561 237 322 3964 17 823
2017 1502 3155 1251 1525 5193 222 300 3761 16 909
2018 1448 3041 1206 1418 4828 206 279 3554 15 982
2019 1390 2920 1158 1313 4472 191 259 3347 15 050
2020 1329 2792 1108 1211 4122 176 239 3139 14 116
2021 1292 2714 1076 1073 3652 156 211 2910 13 084
2022 1289 2708 1074 883 3007 128 174 2650 11 915
2023 1390 2920 1158 546 1860 79 108 2306 10 367
2024 1459 3065 1216 251 856 37 50 1983 8917
2025 1463 3074 1219 46 156 7 9 1709 7683
STEP 6
In this step, the fuel LET revenue is forecast by multiplying the forecast fuel
consumption in Appendix Table 6.5 by the fuel LET shown in Appendix Tables 3.12
to 3.18 in Appendix 3. The ‘other’ category in Appendix Table 6.5 has been
allocated an average AUD12.50 taxable value, being the average taxable values of all
the motor vehicle categories. The forecast fuel LET revenue in AUD billion is shown
in Appendix Table 6.6.
APPENDIX TABLE 6.6: Revenue Forecast for Fuel LET For Passenger Motor
Vehicles in AUD Billion
Light
Cars
Small
Cars
Medium
Cars
Large
Cars SUVs
People
Movers Sports Other Total
AUD
billion
AUD
billion
AUD
billion
AUD
billion
AUD
billion
AUD
billion
AUD
billion
AUD
billion
AUD
billion
2016 0.12 0.39 0.27 0.51 1.95 0.07 0.12 0.99 4.42
2017 0.23 0.76 0.51 0.96 3.63 0.14 0.23 1.88 8.33
Page 436
416
Light
Cars
Small
Cars
Medium
Cars
Large
Cars SUVs
People
Movers Sports Other Total
AUD
billion
AUD
billion
AUD
billion
AUD
billion
AUD
billion
AUD
billion
AUD
billion
AUD
billion
AUD
billion
2018 0.33 1.09 0.74 1.34 5.07 0.19 0.31 2.67 11.74
2019 0.42 1.40 0.95 1.65 6.26 0.24 0.39 3.35 14.66
2020 0.50 1.68 1.14 1.91 7.21 0.27 0.45 3.92 17.07
2021 0.73 2.44 1.65 2.53 9.59 0.36 0.59 5.46 23.36
2022 1.21 4.06 2.75 3.48 13.16 0.50 0.82 8.28 34.25
2023 2.61 8.76 5.94 4.30 16.27 0.62 1.01 14.41 53.91
2024 4.10 13.79 9.35 2.97 11.24 0.43 0.70 18.59 61.17
2025 5.49 18.44 12.50 0.72 2.74 0.10 0.17 21.36 61.52
Page 437
417
APPENDIX 7: METHODOLOGY TO FORECAST NET
REVENUES FROM LET
The following information has been used to forecast the net revenue generation
potential of the LET for the 10 years from 2016 to 2025:
- Data gathered in Appendices 4 to 6;
- Commissioner of Taxation, Annual Report 2010–11 (Australian Taxation
Office, 30 September 2011).
The methodology below describes in detail the steps undertaken to calculate the
forecast net revenue for 10 years after the introduction of the LET.
STEP 1
The first step was to obtain the total gross revenues forecast from the purchase LET,
annual registration LET and fuel LET from Appendix Tables 4.6, 5.4 and 6.6 in the
foregoing Appendices. A summary of the total gross revenue from the LET is shown
in Appendix Table 7.1.
APPENDIX TABLE 7.1: Total Gross Revenue Forecast for LET (Excluding
Disposal LET) for Passenger Motor Vehicles in AUD Billion
Light
Cars Small
Cars Mediu
m Cars Large
Cars SUVs People
Movers Sports Other Total
AUD
billion AUD
billion AUD
billion AUD
billion AUD
billion AUD
billion AUD
billion AUD
billion AUD
billion
2016 0.22 0.69 0.42 0.76 2.78 0.11 0.17 0.99 6.15
2017 0.43 1.36 0.84 1.45 5.28 0.20 0.33 1.88 11.78
2018 0.64 2.02 1.24 2.07 7.50 0.29 0.47 2.67 16.90
2019 0.85 2.67 1.62 2.61 9.45 0.37 0.59 3.35 21.50
2020 1.04 3.29 1.99 3.08 11.14 0.43 0.70 3.92 25.60
2021 1.58 4.96 2.99 4.21 15.18 0.59 0.95 5.46 35.91
Page 438
418
Light
Cars Small
Cars Mediu
m Cars Large
Cars SUVs People
Movers Sports Other Total
AUD
billion AUD
billion AUD
billion AUD
billion AUD
billion AUD
billion AUD
billion AUD
billion AUD
billion
2022 2.74 8.57 5.15 5.95 21.42 0.83 1.34 8.28 54.28
2023 6.18 19.29 11.54 7.61 27.34 1.06 1.72 14.41 89.14
2024 10.24 31.88 18.96 5.46 19.58 0.76 1.23 18.59 106.71
2025 14.51 45.04 26.64 1.39 4.97 0.19 0.31 21.36 114.42
Total 38.42 119.77 71.39 34.60 124.64 4.83 7.82 80.91 482.37
STEP 2
The second step was to estimate the cost of collecting the LET. The Commissioner of
Taxation’s Annual Report 2010–11 states that on average it costs AUD0.88 to collect
AUD100 of revenue.628
Based on this data, Appendix Table 7.2 below shows the
predicted cost of collecting the LET.
APPENDIX TABLE 7.2: Estimate of Cost of Collecting LET
Total Gross
LET Cost of Collection
AUD billion AUD million
2016 6.15 54.10
2017 11.78 103.69
2018 16.90 148.70
2019 21.50 189.20
2020 25.60 225.25
2021 35.91 316.00
2022 54.28 477.63
2023 89.14 784.42
2024 106.71 939.01
2025 114.42 1006.89
628
Commissioner of Taxation, above n 552, 9.
Page 439
419
STEP 3
It has been proposed in this thesis that the government would abolish the Luxury Car
Tax (LCT) when the LET is introduced. Therefore it was necessary to forecast the
revenues from LCT that would be forgone for the 10 years from 2016 to 2024.
The Commissioner of Taxation’s Annual Report 2010–11 states that the LCT
collected in 2010–11 was AUD489 million.629
Based on the forecast motor vehicle
population from Appendix Table 5.2 in Appendix 5 above, the potential LCT
revenue for years 2011 to 2025 was calculated, and is shown in Appendix Table 7.3.
APPENDIX TABLE 7.3: Estimate of Luxury Car Tax for Years 2011 to 2025
Total Forecast Car
Population from
Appendix Table 5.2
Estimated Luxury Car
Tax
AUD million
2011 12 474 044 489
2012 12 686 103 497
2013 12 901 767 506
2014 13 121 097 514
2015 12 676 948 497
2016 12 756 746 500
2017 12 835 594 503
2018 12 905 817 506
2019 12 974 891 509
2020 13 042 760 511
2021 13 109 365 514
2022 13 174 646 516
2023 13 238 543 519
2024 13 300 992 521
2025 13 361 929 524
629
Ibid 300.
Page 440
420
STEP 4
It has been proposed in this thesis that the government would abolish the excise of
AUD0.38 that is currently collected on fuel when the LET is introduced. Therefore it
was necessary to forecast the revenues from excise that would be forgone for the 10
years from 2016 to 2024.
The fuel consumption forecast in Appendix Table 6.5 in Appendix 6 has been used to
estimate the excise revenue that would be forgone in the years 2016 to 2025, and is
shown in Appendix Table 7.4.
APPENDIX TABLE 7.4: Estimate of Excise Revenue
Fleet Fuel Consumption
Excise Forgone @ AUD0.38
per Litre
Million Litres AUD million
2016 17 823 6773
2017 16 909 6426
2018 15 982 6073
2019 15 050 5719
2020 14 116 5364
2021 13 084 4972
2022 11 915 4528
2023 10 367 3939
2024 8917 3389
2025 7683 2920
The excise revenue forgone for 2016 needs adjusting due to the phasing-in period for
existing cars, which would only become LET-registered gradually as their state
annual registration became due. Thus for the purpose of this thesis, the excise
revenue forgone for 2016 has been estimated to be reduced by 50 per cent, totalling
AUD3386.50 million.
Page 441
421
STEP 5
Appendix Table 7.5 below shows the net revenue forecast of the LET for the years
2016 to 2025 by subtracting from the gross revenue the cost of collecting the LET,
the forgone LCT and the forgone excise duty on fuel.
APPENDIX TABLE 7.5: Net Revenue Forecast for LET
Year Gross
LET Collection
Cost LCT Excise
Total
Deductions Net LET
AUD
billion AUD
million AUD
million AUD
million AUD
billion AUD
billion
2016 6.15 54.10 500.08 3386.50 3.94 2.21
2017 11.78 103.69 503.17 6425.51 7.03 4.75
2018 16.90 148.70 505.93 6072.99 6.73 10.17
2019 21.50 189.20 508.63 5719.15 6.42 15.08
2020 25.60 225.25 511.29 5364.11 6.10 19.50
2021 35.91 316.00 513.91 4971.95 5.80 30.11
2022 54.28 477.63 516.46 4527.60 5.52 48.75
2023 89.14 784.42 518.97 3939.40 5.24 83.90
2024 106.71 939.01 521.42 3388.52 4.85 101.86
2025 114.42 1006.89 523.81 2919.51 4.45 109.97
Page 442
422
APPENDIX 8: METHODOLOGY TO FORECAST
SAVINGS IN USE OF OIL WITH THE INTRODUCTION
OF LET FOR PASSENGER MOTOR VEHICLES
The following steps were undertaken to calculate the savings in the use of oil with
the introduction of LET in passenger motor vehicles.
STEP 1
The first step was to obtain a breakdown of the projected motor vehicle stock without
LET as stated in Appendix Table 5.1, into the motor vehicle categories of light car,
small car, medium car, large car, SUVs, people movers and sports car. For the
purpose of this thesis, a breakdown of the passenger motor vehicle population is
based on the available breakdown of the car sales data for year ended 31 December
2011 as shown in Appendix Table 4.2 above. The breakdown of the total passenger
car population into its various categories from years 2011 to 2025 is shown in
Appendix Table 8.1.
APPENDIX TABLE 8.1: Motor Vehicle Projections Without LET in Categories
Light
Cars Small
Cars Medium
Cars Large
Cars SUVs People
Movers Sports Total
2011 2 056 242 3 789 644 1 179 697 1 259 421 3 790 358 172 474 226 208 12 474 044
2012 2 091 198 3 854 068 1 199 752 1 280 831 3 854 794 175 406 230 054 12 686 103
2013 2 126 748 3 919 587 1 220 148 1 302 606 3 920 326 178 388 233 964 12 901 767
2014 2 162 903 3 986 220 1 240 890 1 324 750 3 986 971 181 420 237 942 13 121 097
2015 2 199 672 4 053 986 1 261 986 1 347 271 4 054 750 184 505 241 987 13 344 156
2016 2 237 067 4 122 904 1 283 439 1 370 174 4 123 681 187 641 246 101 13 571 007
2017 2 275 097 4 192 993 1 305 258 1 393 467 4 193 783 190 831 250 284 13 801 714
2018 2 313 774 4 264 274 1 327 447 1 417 156 4 265 078 194 075 254 539 14 036 343
2019 2 353 108 4 336 767 1 350 014 1 441 248 4 337 584 197 374 258 866 14 274 961
2020 2 393 110 4 410 492 1 372 964 1 465 749 4 411 323 200 730 263 267 14 517 635
Page 443
423
Light
Cars Small
Cars Medium
Cars Large
Cars SUVs People
Movers Sports Total
2021 2 433 793 4 485 470 1 396 304 1 490 667 4 486 315 204 142 267 743 14 764 435
2022 2 475 168 4 561 723 1 420 042 1 516 008 4 562 583 207 613 272 294 15 015 430
2023 2 517 246 4 639 272 1 444 182 1 541 780 4 640 146 211 142 276 923 15 270 692
2024 2 560 039 4 718 140 1 468 733 1 567 990 4 719 029 214 732 281 631 15 530 294
2025 2 603 559 4 798 348 1 493 702 1 594 646 4 799 253 218 382 286 419 15 794 309
STEP 2
Based on the assumptions made in Steps 1 and 2 in Appendix 6 and using the annual
fuel use per vehicle in litres stated in Appendix Table 6.2, Appendix Table 8.2 below
shows the annual fleet fuel consumption in million litres by the motor vehicle
population without LET adjustment.
APPENDIX TABLE 8.2: Total Annual Fleet Oil Consumption in Million Litres
by the Motor Vehicle Population Without LET Adjustment
Light
Cars Small
Cars Medium
Cars Large
Cars SUVs
People
Movers Sports Other Total
2011 1573 3305 1311 1715 5841 249 338 4099 18 431
2012 1600 3361 1333 1744 5940 254 344 4169 18 744
2013 1627 3418 1356 1774 6041 258 350 4240 19 063
2014 1655 3476 1379 1804 6144 262 355 4312 19 387
2015 1683 3535 1402 1835 6248 267 362 4385 19 716
2016 1711 3595 1426 1866 6355 271 368 4459 20 052
2017 1740 3656 1450 1898 6463 276 374 4535 20 393
2018 1770 3718 1475 1930 6572 281 380 4612 20 739
2019 1800 3782 1500 1963 6684 285 387 4691 21 092
2020 1831 3846 1525 1996 6798 290 393 4771 21 450
2021 1862 3911 1551 2030 6913 295 400 4852 21 815
2022 1894 3978 1578 2065 7031 300 407 4934 22 186
2023 1926 4045 1604 2100 7150 305 414 5018 22 563
2024 1958 4114 1632 2136 7272 311 421 5103 22 947
2025 1992 4184 1660 2172 7396 316 428 5190 23 337
Page 444
424
STEP 3
The expected savings in the use of oil as a result of the introducing the LET was
calculated by deducting the data in Appendix Table 8.2 above from the data in
Appendix Table 6.5 in Appendix 6. The expected saving in the usage of oil in million
litres as a result of introducing the LET is shown in Appendix Table 8.3.
APPENDIX TABLE 8.3: Saving in Usage of Oil in Million Litres as a Result of
Introducing the LET
Light
Cars Small
Cars Medium
Cars Large
Cars SUVs
People
Movers Sports Other Total
2011 0 0 0 0 0 0 0 0 0
2012 0 0 0 0 0 0 0 0 0
2013 0 0 0 0 0 0 0 0 0
2014 0 0 0 0 0 0 0 0 0
2015 84 177 70 92 312 14 19 219 986
2016 159 335 133 233 794 34 46 495 2228
2017 238 501 199 373 1270 54 74 774 3483
2018 322 677 269 512 1744 75 101 1058 4756
2019 410 862 342 650 2212 94 128 1344 6042
2020 502 1054 417 785 2676 114 154 1632 7334
2021 570 1197 475 957 3261 139 189 1942 8730
2022 605 1270 504 1182 4024 172 233 2284 10 272
2023 536 1125 446 1554 5290 226 306 2712 12 195
2024 499 1049 416 1885 6416 274 371 3120 14 030
2025 529 1110 441 2126 7240 309 419 3481 15 655
Total 4455 9355 3712 10 347 35 237 1504 2040 19 063 85 714