Viscoelastic Properties of Inert Solid Rocket PropellantsExposed to a Shock WaveSarah A. Bentil,*[a] William J. Jackson,[a] Christopher Williams,[b] and Timothy C. Miller*[b]
Abstract: Inert solid rocket propellant samples were sub-jected to dynamic inflation experiments, to characterize theviscoelastic response at high strain rates. An oxyacetylene-driven shock tube created the shock wave, which was usedto dynamically pressurize the surface of the samples duringthe inflation experiments. Two high-speed cameras cap-tured the deforming samples, which were speckled tomeasure the full-field surface displacements using the digi-tal image correlation (DIC) algorithm. An inverse finite ele-ment analysis (iFEA) was used to calibrate parameters of ageneralized Maxwell model (i. e. Prony series), which wasused to characterize the propellants’ viscoelastic responseto shock wave exposure. The viscoelastic parameters cali-
brated using a Prony series with one Maxwell branch pro-vided a better fit with the out-of-plane displacement datafrom DIC. At least 50% of the energy dissipated, within theinert solid rocket propellant, occurred within 5 ms followingshock wave exposure. The softening phenomenon, due todebonding of the particles embedded in the inert solidrocket propellant, occurred since there was a decrease ininstantaneous elastic modulus with increased strain rate.The results of this study will add to the limited knowledgeof the linear viscoelastic behavior of inert HTPB propellantat high strain rates and may improve the predictive capa-bilities of health-monitoring sensors that assess the solidrocket propellant’s structural integrity.
Solid rocket propellants are energetic materials used as fuelin military applications to generate thrust for tactical orstrategic rockets and missiles or generate gas in commercialapplications (e.g. inflation of automobile airbags) [1,2, 3, 4].The solid rocket propellants are comprised of a high-vol-ume fraction (60%–75%) of microscopic solid oxidizer par-ticles that are bonded to an elastomeric matrix such as hy-droxyl-terminated polybutadiene (HTPB), but contain otherchemical ingredients such as fuel, plasticizer, and stabilizer[2,5, 6, 7]. Since the matrix is elastomeric, HTPB is classifiedas a viscoelastic material; meaning that the stress responseis strain-rate and temperature-dependent [3, 8, 9]. The ballis-tic performance of HTPB propellant is improved by increas-ing the volume fraction of the particulates, with a decreasein structural integrity as the trade-off [5, 10]. The decreasedstructural integrity is attributed to the creation of an irregu-lar network structure in the elastomeric matrix, due to in-creasing the volume fraction of the solid oxidizer particles[1]. Structural integrity is further compromised when theHTPB propellant is mechanically loaded multiaxially, duringstorage and/or the ignition and firing process of the solidrocket propellant [5,8, 11]. Mechanical loading causes inter-facial debonding (i. e. dewetting) of the particles that arebonded to the matrix, which leads to damage of the solidrocket propellant [12,13]. The damage manifests as cracksin the HTPB propellant, which affects the ballistic perform-ance of the solid rocket propellant and the structural in-
tegrity of the solid rocket motor [14]. In the case of solidrocket motors that experience bullet impact damage orfragment impact damage, this debonding takes place underhigh strain rate conditions, but conventional test methodsdo not allow for equivalent strain rates in the laboratory. Asa result, designing health-monitoring sensors that canquantify the structural integrity of the solid rocket propel-lants would be invaluable [15]. However, the predictive ca-pabilities of the health-monitoring sensors require addi-tional research into the viscoelastic behavior of the solidrocket propellant at high strain rates [9,16] using non-
[a] S. A. Bentil, W. J. JacksonDepartment of Mechanical EngineeringIowa State University2529 Union DriveAmes, IA 50011, U.S.A*e-mail: [email protected]: https://www.me.iastate.edu/sbentil/
conventional test methods such as dynamic inflation ex-periments using a shock tube as done by Bentil et al. [17].
Stress level, temperature, strain rate, and repeated load-ing are all factors that have been reported to influencedewetting of the viscoelastic HTPB propellant [6,9, 16,18].These factors were determined by first constructing thestress-strain relations for HTPB propellant, using commercialmechanical servohydraulic machines. HTPB propellant sam-ples were clamped into the mechanical servohydraulic ma-chines before uniaxial tensile experiments. The uniaxial ten-sile experiments, performed at strain rates less than 102 s� 1,showed that both aging and increased cross-linking den-sities caused a decrease in the mechanical properties[19,20]. HTPB propellant samples were thermally aged inthe study by Du et al. [19] and chemically aged in the studyby Gligorijević et al. [20], to induce damage due to dewet-ting.
Stress-strain relations for HTPB propellant samples sub-jected to very high strain rates (>103 s� 1) have been ob-tained using the split-Hopkinson pressure bar (i. e. Kolskybar) [21], even though these strain rates exceed the ignitionrates (i. e. 1 m/s–6 m/s) of the solid rocket propellant [16]. Inthe Kolsky bar experiments, the stress-strain response ofelastomers (e.g. HTPB propellant) under compressive load-ing can be measured as a function of strain rates that rangefrom 102 s� 1–104 s� 1 [22]. However, the literature is lackinghigh strain rate experiments of HTPB propellant under ten-sile loading, at rates that exceed the ignition rates. Thus,hindering the ability to completely characterize the me-chanical behavior of HTPB propellant [16], which would beinvaluable for increased confidence in the reliability of pre-dicting the solid propellant’s structural integrity [9]. Un-fortunately, a commercially available mechanical testingmachine that can construct the tensile stress-strain curvesof soft materials, at high rates, does not exist [23,24]. Thus,making the complete characterization of HTPB propellant’sdynamic mechanical behavior challenging. As a solution tothe lack of a commercially available mechanical testing ma-chine, this study combines an oxyacetylene-driven shocktube apparatus with the digital image correlation (DIC)method and inverse finite element analysis (iFEA) to charac-terize the viscoelastic behavior of inert HTPB propellant athigh strain rates on the order of 104 s� 1. The inert HTPB pro-pellant samples were subjected to bending, using dynamicinflation, which produces both tensile and compressiveloads for improved characterization of the high strain rateresponse.
Digital image correlation is a non-contact optical meth-od that has been widely applied in many areas of scienceand engineering for over 30 years [25,26,27]. Contactlessmeasurements of soft deformable materials are importantsince minor disturbances on the material surface, due tostrain gauge attachment, can influence the mechanical be-havior [17,28,29,30]. DIC is capable of quantifying bothsmall and large deformation of soft materials at strain ratesthat range from quasistatic (10� 6 s� 1–100 s� 1) to shock wave
(106 s� 1–108 s� 1) [17,31–38]. As a result, the DIC techniquewas applied in this study to measure the three-dimensional(3D) full-field surface displacement of inert solid rocket pro-pellants at high strain rates. The results from DIC were usedto validate the iFEA.
Inverse finite element analysis has been applied in theliterature to calibrate constitutive model parameters de-scribing the mechanical properties of viscoelastic materials[39,40]. During the iFEA, a comparison is made betweenthe output from an experiment and simulated output fol-lowing finite element simulations of the experiment. Amatch between the output implies that the mechanicalproperties of the material have been found. In this study,the iFEA was applied to determine the linear viscoelasticproperties of inert solid rocket propellant samples exposedto a shock wave during a dynamic inflation experiment.Specifically, a comparison of calibrated constants using aProny series, with either one, two, or three Maxwell branch-es, was considered for the linear viscoelastic model of theinert solid rocket propellant. A Prony series is generallyused in the literature to model the linear viscoelastic behav-ior of HTPB propellants [9].
2 Experimental Section
2.1 Sample Preparation
Inert solid rocket propellants, which were a simulant of thepolymer matrix binder hydroxyl-terminated polybutadiene(HTPB) formulation, were fabricated for this study. Ammoni-um sulfate was used as the inert ingredient and served asthe substitute for the oxidizer. The percent filler by volumefor the inert propellant was 80%, which is comparable witha real solid rocket propellant. A bimodal size distribution,similar to the energetic formulation, was used. The materialwas mixed in a one-gallon small-clearance batch mixer andwas then vacuum cast into a large block. The block wasthen cured for approximately seven days at 60 °C.
Eight (8) solid rocket propellant samples were cut fromthe inert HTPB propellant block, using a horizontal millingmachine and a band saw. Initially, 12.7-mm (0.5-in.) thickslabs were roughly cut from the block using the band saw.The length and width of the slab were 188-mm (7.4-in.) and176-mm (7-in.), respectively. Opposite faces were then mil-led flat and parallel, using a fly cutter revolving at1000 rpm. Approximately 1-mm (0.04-in.) of material wasremoved each time, until thin rectangles with a thickness of5-mm (0.2-in.) was obtained. The rectangular HTPB propel-lant samples were shipped from Edwards Air Force Base toIowa State University, for dynamic inflation experiments us-ing the oxyacetylene-driven shock tube.
Prior to shock tube experiments, the rectangular HTPBpropellant samples were cut into a circular plate (i. e. disc-shaped) geometry having a diameter of 152.4-mm (6-in.)with a thickness of 5-mm (0.2-in.). The diameter of the HTPB
Research Article S. A. Bentil, W. J. Jackson, C. Williams, T. C. Miller
propellant sample matched the outer diameter of the annu-li used to clamp and attach the sample to the end of theoxyacetylene-driven shock tube. The inner diameter of theannuli plate was 7.44 cm (2.93-in.). The thickness of theHTPB propellant sample was chosen to facilitate character-ization of the viscoelastic properties, due to shock wave ex-posure, using concepts from plate bending theory.
2.2 Shock Tube Experiments
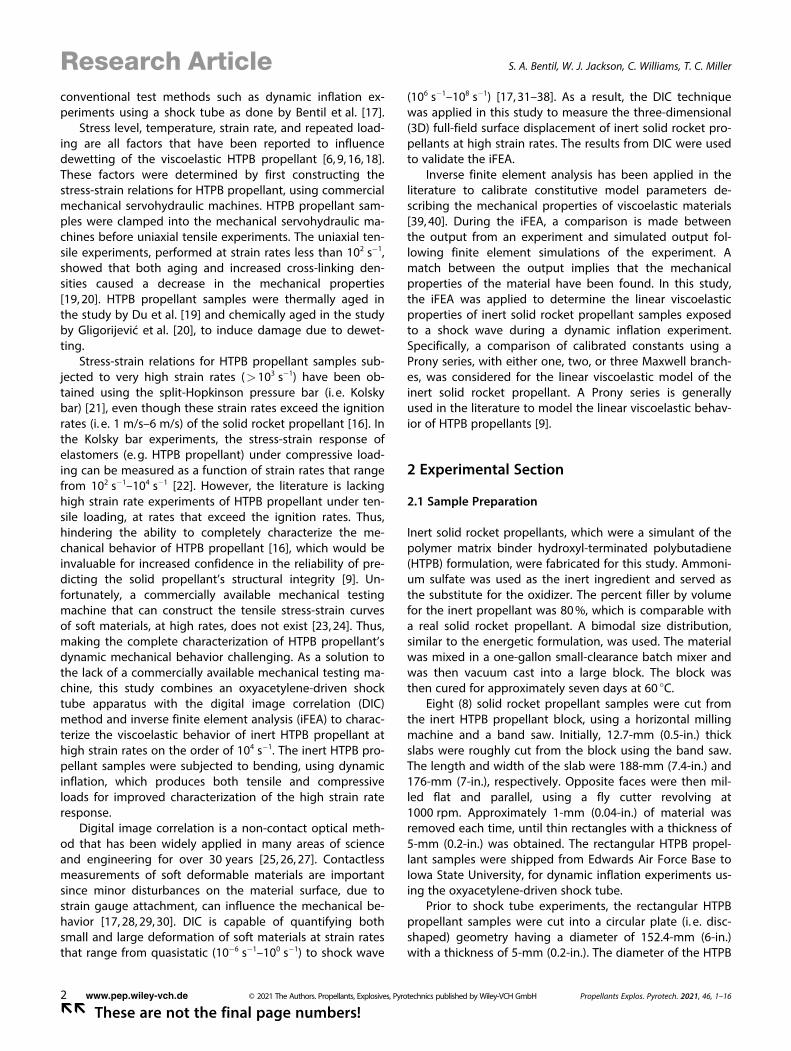
An oxyacetylene-driven shock tube, with a 7.62 cm (3-in.)inner diameter, was used to conduct the dynamic inflationexperiments (Figure 1). A 25.4 μm (1-mil) thick Mylar dia-phragm was used to separate the shock tube’s 30.48 cm (1-ft) driver and 457.2 cm (15-ft) driven section. Rupturing theMylar diaphragm, by igniting the oxyacetylene in the driversection, created a propagating shock wave through the
driven section. The shock tube’s driven section was in-strumented with three (3) high frequency integrated circuitpiezoelectric (ICP) pressure transducers (PCB Piezotronics,Model 102B15), to measure the speed of the shock waveand capture its pressure-time characteristics as a function ofoxyacetylene volume in the driver section. A range of shockwave pressures was considered by varying the volume ofoxyacetylene in the driver section, to study the influence onthe material response.
Pressure transducers were placed 152.4 cm (5-ft) apartfrom each other. The input signals from the three pressuretransducers were conditioned using a signal conditioner(PCB Piezotronics, Model 482C16), before being measuredby an oscilloscope (Tektronix, MDO3024). Following dia-phragm rupture, the oscilloscope was triggered to begin re-cording the pressure transducer signals when the shockwave reached pressure transducer 3. Initiation of pressurerecording corresponded to when the time in this study wasset to zero. Recorded pressure transducer data continuedfor either 70 ms, 140 ms, or 180 ms at a sampling rate of100 kS/s, 50 kS/s, or 50 kS/s, respectively. Decreasing thesampling rate did not affect the resolution of the pressurewaveform. The range of pressure-time signal duration wasincreased incrementally to facilitate investigation into thelong-term deformation behavior of inert HTPB propellant.
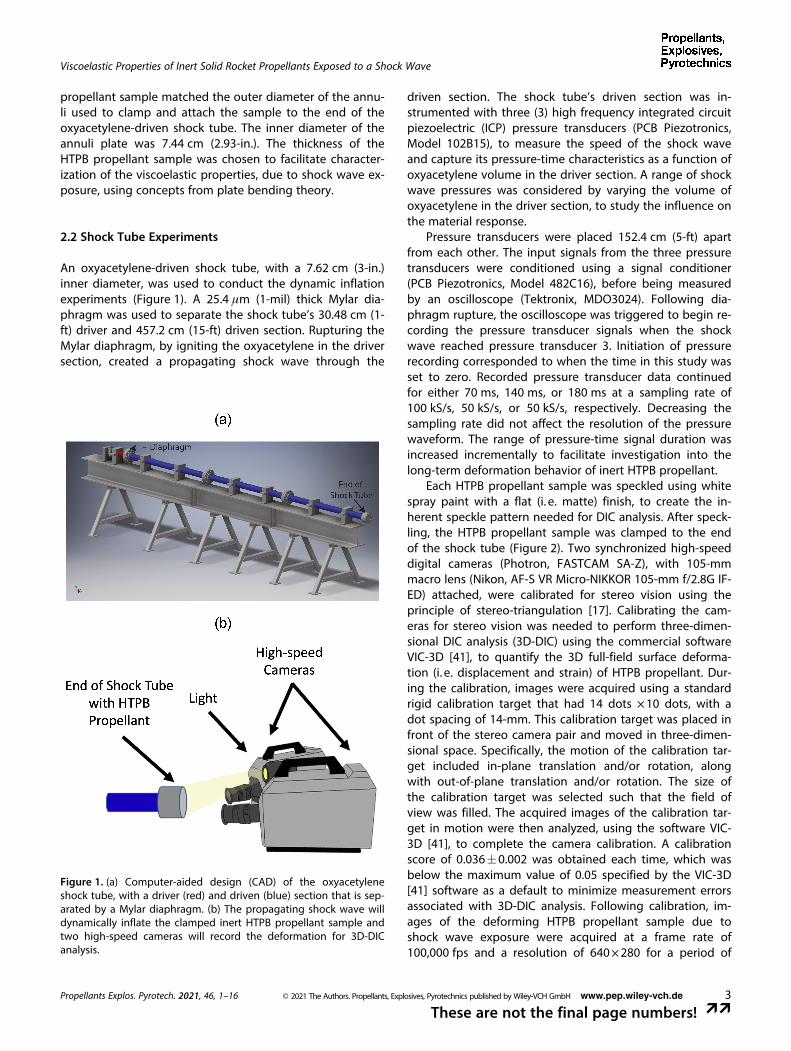
Each HTPB propellant sample was speckled using whitespray paint with a flat (i. e. matte) finish, to create the in-herent speckle pattern needed for DIC analysis. After speck-ling, the HTPB propellant sample was clamped to the endof the shock tube (Figure 2). Two synchronized high-speeddigital cameras (Photron, FASTCAM SA-Z), with 105-mmmacro lens (Nikon, AF-S VR Micro-NIKKOR 105-mm f/2.8G IF-ED) attached, were calibrated for stereo vision using theprinciple of stereo-triangulation [17]. Calibrating the cam-eras for stereo vision was needed to perform three-dimen-sional DIC analysis (3D-DIC) using the commercial softwareVIC-3D [41], to quantify the 3D full-field surface deforma-tion (i. e. displacement and strain) of HTPB propellant. Dur-ing the calibration, images were acquired using a standardrigid calibration target that had 14 dots ×10 dots, with adot spacing of 14-mm. This calibration target was placed infront of the stereo camera pair and moved in three-dimen-sional space. Specifically, the motion of the calibration tar-get included in-plane translation and/or rotation, alongwith out-of-plane translation and/or rotation. The size ofthe calibration target was selected such that the field ofview was filled. The acquired images of the calibration tar-get in motion were then analyzed, using the software VIC-3D [41], to complete the camera calibration. A calibrationscore of 0.036�0.002 was obtained each time, which wasbelow the maximum value of 0.05 specified by the VIC-3D[41] software as a default to minimize measurement errorsassociated with 3D-DIC analysis. Following calibration, im-ages of the deforming HTPB propellant sample due toshock wave exposure were acquired at a frame rate of100,000 fps and a resolution of 640×280 for a period of
Figure 1. (a) Computer-aided design (CAD) of the oxyacetyleneshock tube, with a driver (red) and driven (blue) section that is sep-arated by a Mylar diaphragm. (b) The propagating shock wave willdynamically inflate the clamped inert HTPB propellant sample andtwo high-speed cameras will record the deformation for 3D-DICanalysis.
Viscoelastic Properties of Inert Solid Rocket Propellants Exposed to a Shock Wave
250 ms. The spatial resolution for images acquired duringthe oxyacetylene-driven shock tube experiments was 3 pix-els/mm. Recordings of the deforming inert HTPB propellantsample, by the high-speed cameras, were synchronizedwith the pressure transducer signals from the oscilloscopeusing a voltage trigger box (RW Electronics, Sound TriggerBox) that had the acoustical inputs switched off. Specifi-cally, the high-speed cameras were triggered to recordwhen the shock wave first reached pressure transducer 3.All dynamic inflation experiments were conducted at roomtemperature (21 °C).
During the 3D-DIC analysis, VIC-3D’s default subset sizeand step size of 29 pixels and 7 were applied, respectively.A preliminary study found that the lowest projection errorof less than 10% was generated if using VIC-3D’s defaultsettings. Subsets of speckles were analyzed in VIC-3D, toobtain measurements of the out-of-plane displacement W.
The measurements of W were used to validate the opti-mized viscoelastic properties for the inert HTPB propellantsamples exposed to a shock wave. Since the inert HTPB pro-pellant samples were dynamically inflated using a shockwave, the samples were therefore subjected to bendingloading. Thus, during inflation, the speckled surface (Fig-ure 2b) of the inert HTPB propellant sample was in tensionwhile the unspeckled surface (i. e. opposite face of the disc-shaped sample) was under compression.
2.3 Inverse Finite Element Analysis (iFEA) to ExtractMechanical Properties
The iFEA was used to calibrate the linear viscoelastic prop-erties of the disc-shaped HTPB propellant samples. Figure 3shows the methodology for the iFEA, which required cou-pling the commercially available software MATLAB [42] andABAQUS Explicit [43]. MATLAB’s genetic algorithm function(i. e. ga) was used to perform the optimization of the con-stitutive model parameters. The ga function uses one of thefollowing four criteria, to determine when to stop the solv-er: (i) the maximum number of generations is reached (de-fault is 100 times the number of parameters/variables), (ii) ifthere is no change in the best fitness value for some timegiven in seconds (stall time limit), (iii) if there is no changein the best fitness value for some number of generations(maximum stall generations), or (iv) if the maximum timelimit (in seconds) specified by the user is reached. The bestfitness value was defined using the sum of the squared esti-mate of error (SSE), which is the sum of the squares of theresidual. The residual is the difference between the out-of-plane displacement W at the apex obtained using iFEA and3D-DIC (Equation 1).
SSE ¼XNp
n¼1WiFEA tnð Þ � W3D� DIC tnð Þ½ �2 (1)
where: n is a sampled point in time, which represents eachframe from the acquired images of the deforming HTPBpropellant sample. Np is the total number of sampled pointsin time. WiFEA tnð Þ and W3D� DIC tnð Þ represent the out-of-planedisplacement of the HTPB propellant sample’s apex at thetime tn, which is predicted by the iFEA and measured by3D-DIC, respectively. WiFEA, at the apex of the sample in theiFEA, is dependent upon the estimated parameters of a Pro-ny series describing the linear viscoelastic response of theHTPB propellant material.
Figure 4 shows the boundary and loading conditions,along with the mesh applied to the disc-shaped HTPB pro-pellant samples during the iFEA. The diameter of the sam-ples (in the iFEA) was equivalent to the inner diameter ofthe annuli, which was used to clamp the HTPB propellantsample during the dynamic inflation experiments. The HTPBpropellant sample was modeled as a deformable solid in 3Dmodeling space, using solid (or continuum) second-ordertetrahedron elements for the mesh. Since both material
Figure 2. (a) Experimental setup to facilitate 3D-DIC analysis of theclamped disc-shaped HTPB propellant sample subjected to dynam-ic inflation. Pressure transducer 3 and the clamped sample are15.24-cm (6-in.) apart. (b) Disc-shaped HTPB propellant sample thatwas clamped when viewed from the front and side. The white dotson the surface (front view) are the speckles.
Research Article S. A. Bentil, W. J. Jackson, C. Williams, T. C. Miller
nonlinearity (i. e. large deformations) and geometric non-linearity (large displacements) are expected during the iFEA,the option NLGEOM was activated in ABAQUS to avoid con-vergence issues. A mesh convergence study was conductedto select the appropriate mesh size, which consisted of3,724 elements.
A generalized Maxwell model (Figure 5), with either one(1), two (2), or three (3) Maxwell branches in parallel, wasused to determine which linear viscoelastic constitutivemodel could best capture the behavior of the inert HTPBpropellant exposed to a shock wave. The Maxwell branchconsists of a spring and dashpot in series. A Prony series, inthe time t domain, is used to mathematically represent the
generalized Maxwell model using the relaxation modulusE(t).
Equation 2 defines the relaxation modulus E tð Þ usingthe Prony series [44].
E tð Þ ¼ E0 �XN
i¼1Ei 1 � e�
tti
� �, (2)
where: E0 ¼ E1 þPN
i¼1 Ei is the instantaneous elastic mod-ulus and E1 is the long-term (or equilibrium) elastic mod-ulus. The relaxation time ti is obtained through the follow-ing relation: ti ¼
hi
E0, where hi is the viscosity of the dashpot
in Figure 5. N represents the number of Maxwell branchesin the Prony series, and t is time.
Figure 3. Flowchart illustrating the iFEA methodology. MATLAB was used for the optimization using the built-in genetic algorithm functionga.
Figure 4. (a) Fixed boundary conditions (red) were applied around the circumference of the disc-shaped sample, to prevent translation in alldirections. (b) The reflected pressure load, from pressure transducer 3 (Figure 2a), was applied on the circular cross-sectional area (red) ofthe sample shown in the inset. The red tick marks denote the 25 ms time frame considered during the iFEA. (c) A 10-node modified quad-ratic tetrahedral mesh was used.
Viscoelastic Properties of Inert Solid Rocket Propellants Exposed to a Shock Wave
E tð Þ contains parameters (i. e. E and t) that need to beoptimized, to characterize the linear viscoelastic behavior ofHTPB propellant using the generalized Maxwell models inFigure 5. However, implementation of E tð Þ in the iFEA re-quires expression of the Prony series expansion (Equation 2)using both the shear relaxation modulus (Equation 3) andbulk relaxation modulus (Equation 4) [45]. As a result, thelinear viscoelastic response of HTPB propellant was charac-terized using the following parameters: E0, n0, g, k, and t.
G tð Þ ¼ G0 1 �XN
i¼1gi 1 � e�
tti
� �h i, (3)
where: G0 ¼E0
2 1þn0ð Þ is the instantaneous shear modulus, gi
is the shear relaxation modulus ratio, and ti is the relaxationtime. n0 is the instantaneous Poisson’s ratio. N representsthe number of Maxwell branches in the Prony series, and tis time.
K tð Þ ¼ K0 1 �XN
i¼1ki 1 � e�
tti
� �h i, (4)
where: K0 ¼E0
3 1� 2n0ð Þ is the instantaneous bulk modulus, ki isthe bulk modulus ratio, and ti is the relaxation time. n0 isthe instantaneous Poisson’s ratio. N represents the numberof Maxwell branches in the Prony series, and t is time.
An isotropic response and the Boltzmann superpositionprinciple were assumed for the linear viscoelastic HTPB pro-pellant material, to obtain the constitutive relation describ-ing the state of 3D stress and strain. This constitutive rela-
tion is defined using the decomposition of the 3D stress s¼
and strain e¼
tensors into their volumetric (i. e. hydrostatic)and deviatoric parts. Equation 5 is the constitutive relationfor the volumetric state of stress, while Equation 6 describesthe deviatoric state of stress for HTPB propellant. In apply-ing the equations for stress, the assumption is that thestresses at one point in the HTPB propellant material de-pend only on the strains at that same point.
svol tð Þ ¼ K tð Þevol 0ð Þ þZ t
0K t � t
0� � devol t0� �
dt0dt0
, (5)
where: svol and evol are the volumetric stress and strain, re-spectively. t0 is the time at which the deformation is im-posed and K tð Þ is the bulk relaxation modulus defined inEquation 4.
s¼
dev tð Þ ¼ G tð Þe¼
dev 0ð Þ þZ t
0G t � t
0� � de¼
dev t0� �
dt0dt0
, (6)
where: s¼
dev and e¼
dev are the deviatoric stress and strain ten-sors, respectively. G tð Þ is the shear relaxation modulus de-fined in Equation 3.
3 Results and Discussion
3.1 Experiments: Dynamic Inflation
The oxyacetylene-driven shock tube was used to performthe dynamic inflation experiments by first sandwichingeach inert HTPB propellant sample in between two annuliplates, before clamping to the end of the shock tube. Ta-ble 1 provides the density for each inert HTPB propellantsample, the maximum reflected shock wave amplitude thatwas applied on each sample’s surface, along with the corre-sponding shock wave speed, strain rate, and projection er-ror from 3D-DIC analysis. Each sample’s density was calcu-lated using the mass of the sample and the equation forthe volume of a disc (i. e. cylinder). Reflected shock wavepressures, with a maximum amplitude below 313 kPa didnot cause the HTPB propellant sample to pop out of the an-nuli plates. To study the influence of variable pressures onthe material response, one of the samples (IP_3) was ex-posed to a lower reflected pressure. This lower pressure re-sulted in a wave speed that was subsonic. The supple-mentary material contains images and videos of HTPB
Figure 5. Schematic of the generalized Maxwell model with (a) one Maxwell branch, (b) two Maxwell branches, and (c) three Maxwellbranches. The springs E describe the elastic effects and the dashpots η captures the viscous effects. ɛ and σ are the strain and stress,respectively.
Research Article S. A. Bentil, W. J. Jackson, C. Williams, T. C. Miller
propellant samples that popped out of the annulus, due toa reflected shock wave pressure above 313 kPa. The shockwave speed was calculated using the distance betweenpressure transducers 2 and 3 and the time interval for theshock wave to travel between these two transducers. Thestrain rates reported in Table 1 and elsewhere in this manu-script were calculated by dividing the shock wave speed bythe thickness of the propellant. This strain rate can be con-sidered as a normalized loading rate applied on the inertHTPB propellant material. From the 3D–DIC analysis, the in-plane strain rates for the inert HTPB propellant materialwere calculated using the in-plane displacements and theapplied frame rate. The in-plane strain rate ranges for the x-direction (exx
dt ), y-direction (eyydt ), and xy-direction (exy
dt ) were asfollows: exx
dt ¼ 215=s � 1098=s, eyydt ¼ 296=s � 1151=s, and
exydt ¼ 141=s � 496=s. The xy-direction is the shear case.
Figure 6 compares the time history for out-of-plane dis-placement, obtained from the eight HTPB propellant sam-ples following 3D-DIC analysis. The maximum out-of-planedisplacement for IP_2 was highest since the reflected shock
wave pressure was the highest. IP_3 had the lowest max-imum out-of-plane displacement since the reflected shockwave pressure was the lowest. Additionally, the density ofIP_3 was lower than the other samples, which influencedthe waveform for the time history of the out-of-plane dis-placement.
Figure 7 compares the results of DIC and pressure trans-ducer data, for the eight HTPB propellant samples. Duringthe 3D-DIC experiments, the duration of the images ac-quired was longer than the duration of the pressure trans-ducer data captured by the oscilloscope. As a result, the du-ration of W in Figure 7 was decreased to match themaximum duration of the pressure waveform, to facilitatecomparison. Additionally, the pressure waveforms in Fig-ure 7 were smoothed using a moving average to minimizenoise.
3.2 iFEA: Dynamic Inflation
Three representative samples were considered for the iFEAto facilitate a comparison of the calibrated constants as afunction of reflected shock wave pressures (Table 1) thatwere classified in this study as low (IP_3), high (IP_2), andbetween low and high (IP_1). IP 4–IP_6 were all in the cat-egory between low and high reflected shock wave pres-sures and were not considered to avoid redundancy. Thesearch space used during the iFEA for the instantaneouselastic modulus E0 and relaxation time ti was 1×10⁶ Pa–5×10⁷ Pa and 0 s–0.01 s, respectively. A search space of 0–0.99was used for the shear relaxation modulus ratio gi and bulkmodulus ratio ki. The criteria used by the ga function, tostop the solver once the Prony series parameters were opti-mized, was when the average relative change in the penaltyfitness value SSE was less than 1×10� 6 over 50 generations(i. e. the default setting for the maximum stall generations).
Table 1. Inert HTPB propellant material and shock wave properties, along with the projection error from 3D-DIC analysis. “IP” means “inertHTPB propellant”. *Density and reflected pressure of IP_3 was lower than the other samples and the wave speed was subsonic.
Figure 6. Out-of-plane displacement W at the apex from DIC, forthe eight inert HTPB propellant samples. “IP” means “inert HTPBpropellant”.
Viscoelastic Properties of Inert Solid Rocket Propellants Exposed to a Shock Wave
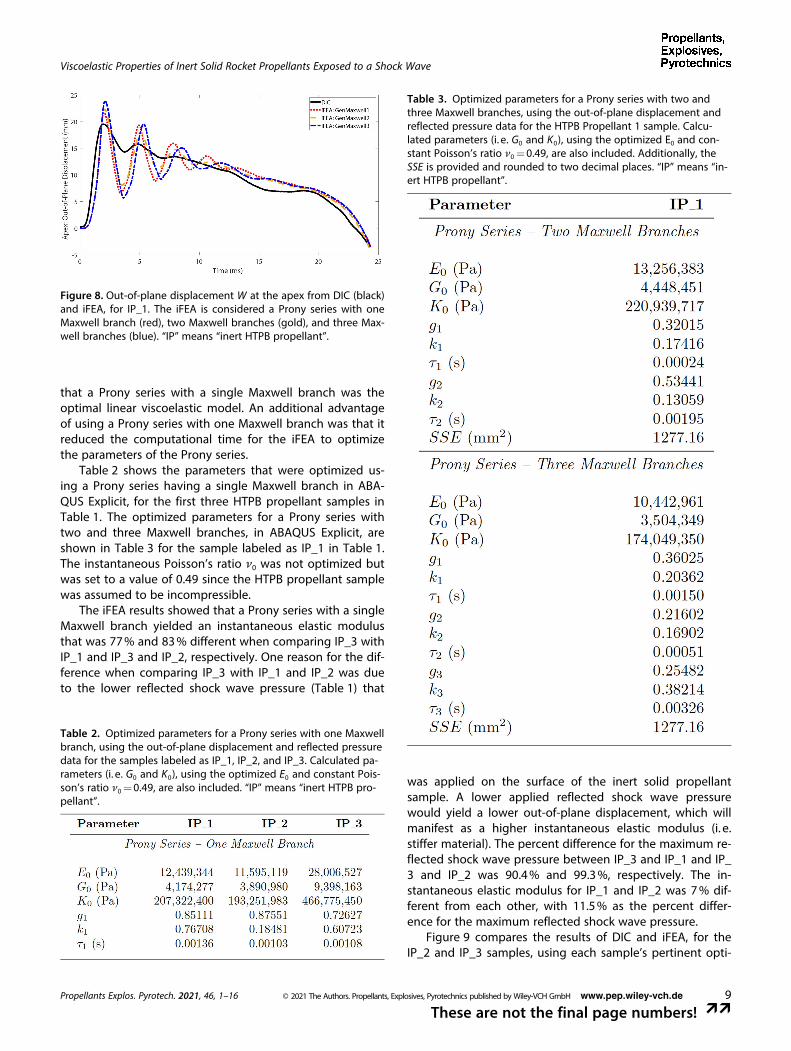
Figure 8 compares the results of DIC and iFEA, for theIP_1 sample, using the optimized parameters from the line-ar viscoelastic constitutive models. The Prony series with asingle Maxwell branch was better suited at capturing thelinear viscoelastic behavior of HTPB propellant exposed to ashock wave. This is because the SSE for a Prony series withone Maxwell branch was the lowest when compared withthe SSE for two and three Maxwell branches. The percent
difference for SSE between one and two Maxwell branches,one and three Maxwell branches, and two and three Max-well branches were 6.35×10� 8 %, 4.04×10� 9 %, and 5.94×10� 8 %, respectively. Furthermore, the first three peaks ofthe out-of-plane displacement time history using one Max-well branch (red curve) occurred around the same time asthe initial three peaks from the DIC experiments (blackcurve) in Figure 8. Matching the initial three peaks implied
Figure 7. Out-of-plane displacement W at the apex from DIC (black) and pressure (red) for (a) IP_1, (b) IP_2, (c) IP_3, (d) IP_4, (e) IP_5, (f) IP_6, (g) IP_7, and (h) IP_8. “IP” means “inert HTPB propellant”.
Research Article S. A. Bentil, W. J. Jackson, C. Williams, T. C. Miller
that a Prony series with a single Maxwell branch was theoptimal linear viscoelastic model. An additional advantageof using a Prony series with one Maxwell branch was that itreduced the computational time for the iFEA to optimizethe parameters of the Prony series.
Table 2 shows the parameters that were optimized us-ing a Prony series having a single Maxwell branch in ABA-QUS Explicit, for the first three HTPB propellant samples inTable 1. The optimized parameters for a Prony series withtwo and three Maxwell branches, in ABAQUS Explicit, areshown in Table 3 for the sample labeled as IP_1 in Table 1.The instantaneous Poisson’s ratio ν0 was not optimized butwas set to a value of 0.49 since the HTPB propellant samplewas assumed to be incompressible.
The iFEA results showed that a Prony series with a singleMaxwell branch yielded an instantaneous elastic modulusthat was 77% and 83% different when comparing IP_3 withIP_1 and IP_3 and IP_2, respectively. One reason for the dif-ference when comparing IP_3 with IP_1 and IP_2 was dueto the lower reflected shock wave pressure (Table 1) that
was applied on the surface of the inert solid propellantsample. A lower applied reflected shock wave pressurewould yield a lower out-of-plane displacement, which willmanifest as a higher instantaneous elastic modulus (i. e.stiffer material). The percent difference for the maximum re-flected shock wave pressure between IP_3 and IP_1 and IP_3 and IP_2 was 90.4% and 99.3%, respectively. The in-stantaneous elastic modulus for IP_1 and IP_2 was 7% dif-ferent from each other, with 11.5% as the percent differ-ence for the maximum reflected shock wave pressure.
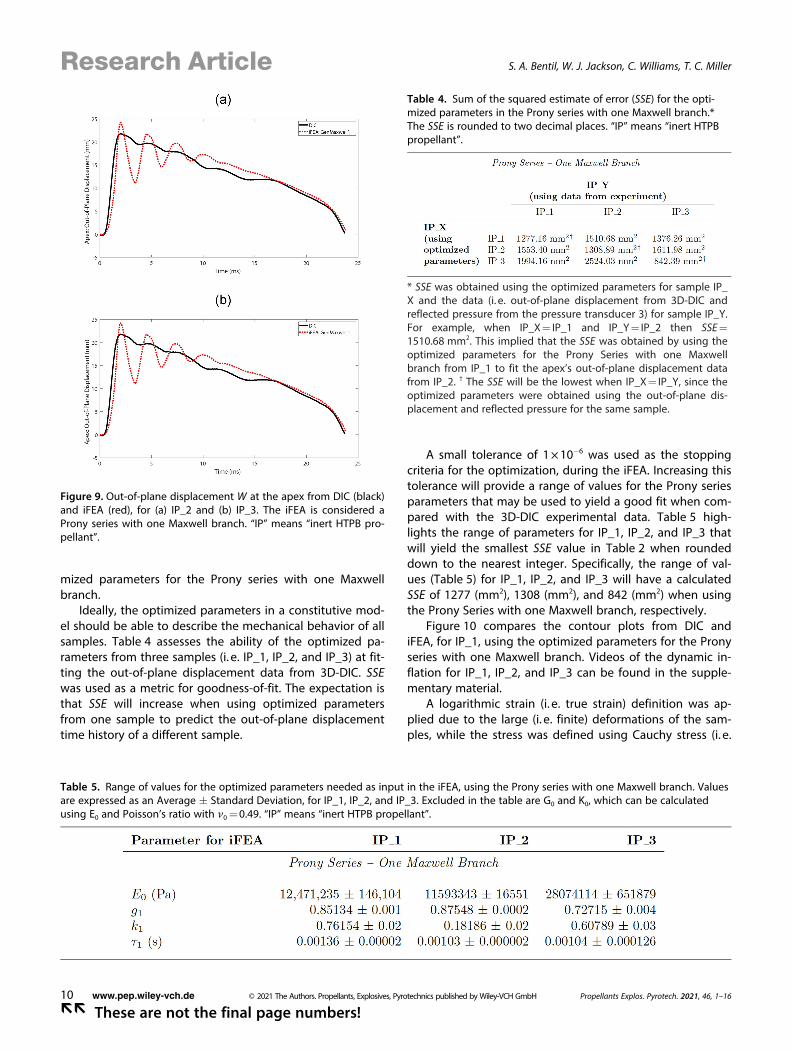
Figure 9 compares the results of DIC and iFEA, for theIP_2 and IP_3 samples, using each sample’s pertinent opti-
Figure 8. Out-of-plane displacement W at the apex from DIC (black)and iFEA, for IP_1. The iFEA is considered a Prony series with oneMaxwell branch (red), two Maxwell branches (gold), and three Max-well branches (blue). “IP” means “inert HTPB propellant”.
Table 2. Optimized parameters for a Prony series with one Maxwellbranch, using the out-of-plane displacement and reflected pressuredata for the samples labeled as IP_1, IP_2, and IP_3. Calculated pa-rameters (i. e. G0 and K0), using the optimized E0 and constant Pois-son’s ratio n0 =0.49, are also included. “IP” means “inert HTPB pro-pellant”.
Table 3. Optimized parameters for a Prony series with two andthree Maxwell branches, using the out-of-plane displacement andreflected pressure data for the HTPB Propellant 1 sample. Calcu-lated parameters (i. e. G0 and K0), using the optimized E0 and con-stant Poisson’s ratio n0 =0.49, are also included. Additionally, theSSE is provided and rounded to two decimal places. “IP” means “in-ert HTPB propellant”.
Viscoelastic Properties of Inert Solid Rocket Propellants Exposed to a Shock Wave
mized parameters for the Prony series with one Maxwellbranch.
Ideally, the optimized parameters in a constitutive mod-el should be able to describe the mechanical behavior of allsamples. Table 4 assesses the ability of the optimized pa-rameters from three samples (i. e. IP_1, IP_2, and IP_3) at fit-ting the out-of-plane displacement data from 3D-DIC. SSEwas used as a metric for goodness-of-fit. The expectation isthat SSE will increase when using optimized parametersfrom one sample to predict the out-of-plane displacementtime history of a different sample.
A small tolerance of 1×10� 6 was used as the stoppingcriteria for the optimization, during the iFEA. Increasing thistolerance will provide a range of values for the Prony seriesparameters that may be used to yield a good fit when com-pared with the 3D-DIC experimental data. Table 5 high-lights the range of parameters for IP_1, IP_2, and IP_3 thatwill yield the smallest SSE value in Table 2 when roundeddown to the nearest integer. Specifically, the range of val-ues (Table 5) for IP_1, IP_2, and IP_3 will have a calculatedSSE of 1277 (mm2), 1308 (mm2), and 842 (mm2) when usingthe Prony Series with one Maxwell branch, respectively.
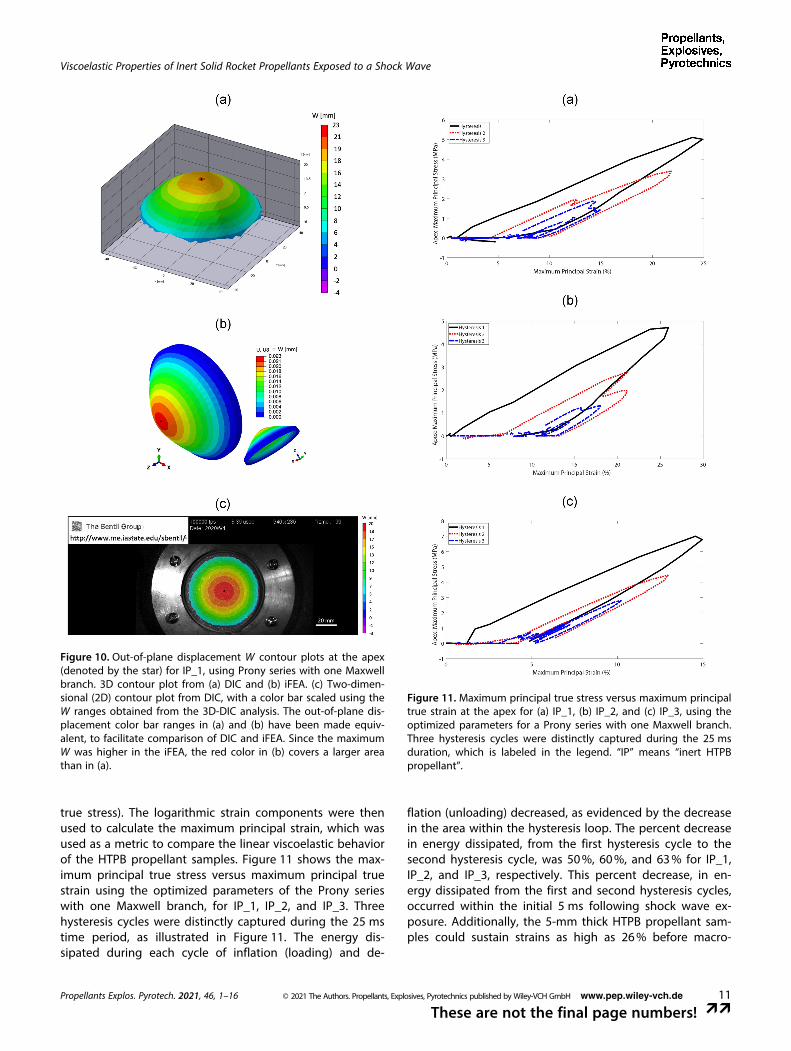
Figure 10 compares the contour plots from DIC andiFEA, for IP_1, using the optimized parameters for the Pronyseries with one Maxwell branch. Videos of the dynamic in-flation for IP_1, IP_2, and IP_3 can be found in the supple-mentary material.
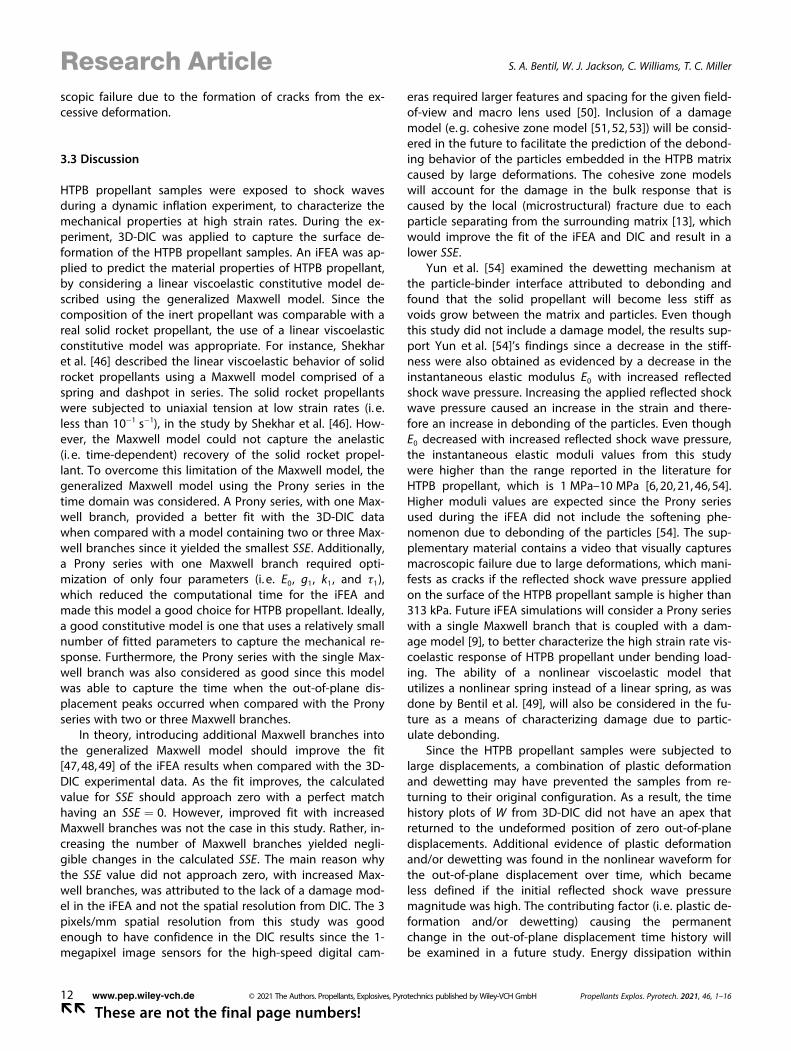
A logarithmic strain (i. e. true strain) definition was ap-plied due to the large (i. e. finite) deformations of the sam-ples, while the stress was defined using Cauchy stress (i. e.
Figure 9. Out-of-plane displacement W at the apex from DIC (black)and iFEA (red), for (a) IP_2 and (b) IP_3. The iFEA is considered aProny series with one Maxwell branch. “IP” means “inert HTPB pro-pellant”.
Table 4. Sum of the squared estimate of error (SSE) for the opti-mized parameters in the Prony series with one Maxwell branch.*The SSE is rounded to two decimal places. “IP” means “inert HTPBpropellant”.
* SSE was obtained using the optimized parameters for sample IP_X and the data (i. e. out-of-plane displacement from 3D-DIC andreflected pressure from the pressure transducer 3) for sample IP_Y.For example, when IP_X= IP_1 and IP_Y= IP_2 then SSE=
1510.68 mm2. This implied that the SSE was obtained by using theoptimized parameters for the Prony Series with one Maxwellbranch from IP_1 to fit the apex’s out-of-plane displacement datafrom IP_2. † The SSE will be the lowest when IP_X= IP_Y, since theoptimized parameters were obtained using the out-of-plane dis-placement and reflected pressure for the same sample.
Table 5. Range of values for the optimized parameters needed as input in the iFEA, using the Prony series with one Maxwell branch. Valuesare expressed as an Average � Standard Deviation, for IP_1, IP_2, and IP_3. Excluded in the table are G0 and K0, which can be calculatedusing E0 and Poisson’s ratio with n0 =0.49. “IP” means “inert HTPB propellant”.
Research Article S. A. Bentil, W. J. Jackson, C. Williams, T. C. Miller
true stress). The logarithmic strain components were thenused to calculate the maximum principal strain, which wasused as a metric to compare the linear viscoelastic behaviorof the HTPB propellant samples. Figure 11 shows the max-imum principal true stress versus maximum principal truestrain using the optimized parameters of the Prony serieswith one Maxwell branch, for IP_1, IP_2, and IP_3. Threehysteresis cycles were distinctly captured during the 25 mstime period, as illustrated in Figure 11. The energy dis-sipated during each cycle of inflation (loading) and de-
flation (unloading) decreased, as evidenced by the decreasein the area within the hysteresis loop. The percent decreasein energy dissipated, from the first hysteresis cycle to thesecond hysteresis cycle, was 50%, 60%, and 63% for IP_1,IP_2, and IP_3, respectively. This percent decrease, in en-ergy dissipated from the first and second hysteresis cycles,occurred within the initial 5 ms following shock wave ex-posure. Additionally, the 5-mm thick HTPB propellant sam-ples could sustain strains as high as 26% before macro-
Figure 10. Out-of-plane displacement W contour plots at the apex(denoted by the star) for IP_1, using Prony series with one Maxwellbranch. 3D contour plot from (a) DIC and (b) iFEA. (c) Two-dimen-sional (2D) contour plot from DIC, with a color bar scaled using theW ranges obtained from the 3D-DIC analysis. The out-of-plane dis-placement color bar ranges in (a) and (b) have been made equiv-alent, to facilitate comparison of DIC and iFEA. Since the maximumW was higher in the iFEA, the red color in (b) covers a larger areathan in (a).
Figure 11. Maximum principal true stress versus maximum principaltrue strain at the apex for (a) IP_1, (b) IP_2, and (c) IP_3, using theoptimized parameters for a Prony series with one Maxwell branch.Three hysteresis cycles were distinctly captured during the 25 msduration, which is labeled in the legend. “IP” means “inert HTPBpropellant”.
Viscoelastic Properties of Inert Solid Rocket Propellants Exposed to a Shock Wave
scopic failure due to the formation of cracks from the ex-cessive deformation.
3.3 Discussion
HTPB propellant samples were exposed to shock wavesduring a dynamic inflation experiment, to characterize themechanical properties at high strain rates. During the ex-periment, 3D-DIC was applied to capture the surface de-formation of the HTPB propellant samples. An iFEA was ap-plied to predict the material properties of HTPB propellant,by considering a linear viscoelastic constitutive model de-scribed using the generalized Maxwell model. Since thecomposition of the inert propellant was comparable with areal solid rocket propellant, the use of a linear viscoelasticconstitutive model was appropriate. For instance, Shekharet al. [46] described the linear viscoelastic behavior of solidrocket propellants using a Maxwell model comprised of aspring and dashpot in series. The solid rocket propellantswere subjected to uniaxial tension at low strain rates (i. e.less than 10� 1 s� 1), in the study by Shekhar et al. [46]. How-ever, the Maxwell model could not capture the anelastic(i. e. time-dependent) recovery of the solid rocket propel-lant. To overcome this limitation of the Maxwell model, thegeneralized Maxwell model using the Prony series in thetime domain was considered. A Prony series, with one Max-well branch, provided a better fit with the 3D-DIC datawhen compared with a model containing two or three Max-well branches since it yielded the smallest SSE. Additionally,a Prony series with one Maxwell branch required opti-mization of only four parameters (i. e. E0, g1, k1, and t1),which reduced the computational time for the iFEA andmade this model a good choice for HTPB propellant. Ideally,a good constitutive model is one that uses a relatively smallnumber of fitted parameters to capture the mechanical re-sponse. Furthermore, the Prony series with the single Max-well branch was also considered as good since this modelwas able to capture the time when the out-of-plane dis-placement peaks occurred when compared with the Pronyseries with two or three Maxwell branches.
In theory, introducing additional Maxwell branches intothe generalized Maxwell model should improve the fit[47,48,49] of the iFEA results when compared with the 3D-DIC experimental data. As the fit improves, the calculatedvalue for SSE should approach zero with a perfect matchhaving an SSE ¼ 0. However, improved fit with increasedMaxwell branches was not the case in this study. Rather, in-creasing the number of Maxwell branches yielded negli-gible changes in the calculated SSE. The main reason whythe SSE value did not approach zero, with increased Max-well branches, was attributed to the lack of a damage mod-el in the iFEA and not the spatial resolution from DIC. The 3pixels/mm spatial resolution from this study was goodenough to have confidence in the DIC results since the 1-megapixel image sensors for the high-speed digital cam-
eras required larger features and spacing for the given field-of-view and macro lens used [50]. Inclusion of a damagemodel (e.g. cohesive zone model [51,52,53]) will be consid-ered in the future to facilitate the prediction of the debond-ing behavior of the particles embedded in the HTPB matrixcaused by large deformations. The cohesive zone modelswill account for the damage in the bulk response that iscaused by the local (microstructural) fracture due to eachparticle separating from the surrounding matrix [13], whichwould improve the fit of the iFEA and DIC and result in alower SSE.
Yun et al. [54] examined the dewetting mechanism atthe particle-binder interface attributed to debonding andfound that the solid propellant will become less stiff asvoids grow between the matrix and particles. Even thoughthis study did not include a damage model, the results sup-port Yun et al. [54]’s findings since a decrease in the stiff-ness were also obtained as evidenced by a decrease in theinstantaneous elastic modulus E0 with increased reflectedshock wave pressure. Increasing the applied reflected shockwave pressure caused an increase in the strain and there-fore an increase in debonding of the particles. Even thoughE0 decreased with increased reflected shock wave pressure,the instantaneous elastic moduli values from this studywere higher than the range reported in the literature forHTPB propellant, which is 1 MPa–10 MPa [6,20,21,46,54].Higher moduli values are expected since the Prony seriesused during the iFEA did not include the softening phe-nomenon due to debonding of the particles [54]. The sup-plementary material contains a video that visually capturesmacroscopic failure due to large deformations, which mani-fests as cracks if the reflected shock wave pressure appliedon the surface of the HTPB propellant sample is higher than313 kPa. Future iFEA simulations will consider a Prony serieswith a single Maxwell branch that is coupled with a dam-age model [9], to better characterize the high strain rate vis-coelastic response of HTPB propellant under bending load-ing. The ability of a nonlinear viscoelastic model thatutilizes a nonlinear spring instead of a linear spring, as wasdone by Bentil et al. [49], will also be considered in the fu-ture as a means of characterizing damage due to partic-ulate debonding.
Since the HTPB propellant samples were subjected tolarge displacements, a combination of plastic deformationand dewetting may have prevented the samples from re-turning to their original configuration. As a result, the timehistory plots of W from 3D-DIC did not have an apex thatreturned to the undeformed position of zero out-of-planedisplacements. Additional evidence of plastic deformationand/or dewetting was found in the nonlinear waveform forthe out-of-plane displacement over time, which becameless defined if the initial reflected shock wave pressuremagnitude was high. The contributing factor (i. e. plastic de-formation and/or dewetting) causing the permanentchange in the out-of-plane displacement time history willbe examined in a future study. Energy dissipation within
Research Article S. A. Bentil, W. J. Jackson, C. Williams, T. C. Miller
the first 5 ms following shock wave exposure contributed tothe complex deformation time histories obtained from thedynamic inflation experiments.
Limitations of this study, which influenced the reportedparameters for the Prony series, were attributed to the ex-perimental setup and also the error from the 3D-DIC meas-urements. For instance, since inert HTPB propellant is a vis-coelastic material, the mechanical behavior is strain ratedependent. Thus, the reported values for the optimizedProny series parameters pertain to 5-mm thick inert HTPBpropellant samples subjected to high strain rates on the or-der of 104 s� 1. Additionally, the experiments were con-ducted on an inert solid propellant using ammonium sul-fate in place of the oxidizer ammonium perchlorate. Futuredynamic inflation experiments using solid propellants withoxidizers are needed, for comparison of the linear viscoe-lastic behavior as a function of oxidizer.
The time history for the shock wave pressures that weremeasured by the pressure transducers was repeatable.However, the results presented are dependent upon theapplied shock wave pressures on the surface of the inertHTPB propellant sample. For instance, the oxyacetylene-driven shock tube in this study produced shock wave pres-sures and also negative pressures, which both influencedthe out-of-plane displacement behavior of the solid propel-lant. Negative pressure caused the HTPB propellant sampleto inflate inside the shock tube, while the reflected shockwave pressure caused inflation outside of the shock tube.Therefore, dynamic inflation experiments using a shocktube that is not capable of generating negative pressuresmay influence the linear viscoelastic behavior by reducingdebonding since there would be an absence of an addi-tional tensile strain caused by the negative pressure phase.
During 3D-DIC analysis, the projection error was used asa metric to quantify the correlation accuracy (i. e. displace-ment measurement error). Factors that influence the projec-tion error were optics (e.g. depth of field, lens focus, light-ing, etc.) and the subset and step size. The default subsetand step size values in VIC-3D generated an average projec-tion error and standard deviation of 6.7�0.08%, across alleight HTPB propellant samples. Decreasing the projectionerror would require increasing the depth of field to mini-mize blurred images caused by large deformations. Sinceoptics influence, the calibration score, recalibrating thecameras using the rigid calibration target would also influ-ence the projection error. However, the calibration score forthis study was better than the suggested value of 0.05 bythe VIC-3D [41] software. Thus, recalibrating is not expectedto significantly decrease the projection error.
4 Conclusion
This study is one of the first to report the linear viscoelasticand tensile behavior of inert solid propellants with strainrates on the order of 104 s� 1. Additionally, this study has
provided data quantifying how well a generalized Maxwellmodel could describe the deformation of inert propellantsexposed to shock waves. The experimental results pre-sented will add to the limited knowledge of solid propel-lants at high strain rates, which may aid in improving thepredictive capabilities of health-monitoring sensors and in-form future work involving the development of a moreelaborate constitutive model that can capture the complexmicromechanics of the propellant through the inclusion ofcohesive zone models. As such, the presented findings maybe used to validate models that can assess the solid rocketpropellant’s structural integrity.
Acknowledgments
This research was supported in part by the Air Force Research Lab-oratory’s Aerospace Systems Directorate, through the Air Force Of-fice of Scientific Research Summer Faculty Fellowship Program ®,Contract Numbers FA8750-15-3-6003 and FA9550-15-0001.
Data Availability Statement
The data that support the findings of this study are avail-able from the corresponding author, Sarah A. Bentil, uponreasonable request.
References
[1] B. P. Mason, C. M. Roland, Solid propellants, Rubber Chemistry –Technology 2019, 92, 1–24.
[2] L. T. DeLuca, Highlights of Solid Rocket Propulsion History, inChemical Rocket Propulsion: A Comprehensive Survey of En-ergetic Materials (Eds.: L.T. De Luca, T. Shimada, V.P. Sinditskii,M. Calabro), Springer International Publishing, Cham, 2017, pp.1015–1032.
[3] H. Shekhar, D. K. Kankane, Viscoelastic Characterization of Dif-ferent Solid Rocket Propellants Using the Maxwell Spring-Dashpot Model, Central European Journal of Energetic Materials2012, 9, 189–199.
[4] T. Cheng, Review of novel energetic polymers – binders – highenergy propellant ingredients for the new space race, DesMonomers Polym 2019, 22, 54–65.
[5] T. C. Miller, Damage – Dilatometry for Solid Propellants withDigital Image Correlation, Propellants, Explosives, Pyrotechnics2019, 44, 234–245.
[6] S. Ozupek, E. B. Becker, Constitutive Equations for Solid Propel-lants, J. Eng. Mater. Technol 1997, 119, 125–132.
[7] S. Chaturvedi, P. N. Dave, Solid propellants: AP/HTPB compo-site propellants, Arabian Journal of Chemistry 2019, 12, 2061–2068.
[8] H. Ma, Z.-B. Shen, D.-K. Li, A Viscoelastic Constitutive Model ofComposite Propellant Considering Dewetting – Strain-Rate –its Implementation, Propellants, Explosives, Pyrotechnics 2019,44, 759–768.
[9] Z. Wang, H. Qiang, G. Wang, Q. Huang, Tensile mechanicalproperties – constitutive model for HTPB propellant at low
Viscoelastic Properties of Inert Solid Rocket Propellants Exposed to a Shock Wave
temperature – high strain rate, Journal of Applied Polymer Sci-ence 2015, 132, DOI https://doi.org/10.1002/app.42104.
[10] G. D. Kosiba, R. R. Wixom, M. A. Oehlschlaeger, High-FidelityMicrostructural Characterization – Performance Modeling ofAluminized Composite Propellant, Propellants, Explosives, Py-rotechnics 2017, 42, 1387–1395.
[11] A. Q. Le, L. Z. Sun, T. C. Miller, Detectability of Delaminations inSolid Rocket Motors with Embedded Stress Sensors, Journal ofPropulsion – Power 2013, 29, 299–304.
[12] W. M. Adel, L. Guo-Zhu, Analysis of Mechanical Properties forAP/HTPB Solid Propellant under Different Loading Conditions,International Journal of Aerospace – Mechanical Engineering2017, 11, 1915–1919.
[13] H. Zhang, M. Liu, Y. Miao, H. Wang, T. Chen, X. Fan, H. Chang,Dynamic Mechanical Response – Damage Mechanism of HTPBPropellant under Impact Loading, Materials (Basel) 2020, 13,DOI 10.3390/ma13133031.
[14] D. Liu, L. Sun, T. C. Miller, Defect Diagnosis in Solid Rocket Mo-tors Using Sensors – Deep Learning Networks, AIAA Journal2020, 59, 276–281.
[15] Q. Le Anhduong, L. Z. Sun, C. Miller Timothy, Health Monitor-ing – Diagnosis of Solid Rocket Motors with Bore Cracks, Jour-nal of Aerospace Engineering 2016, 29, 04015058.
[16] R. Jeremic, Some Aspects of Time-Temperature SuperpositionPrinciple Applied for Predicting Mechanical Properties of SolidRocket Propellants, Propellants, Explosives, Pyrotechnics 1999,24, 221–223.
[17] S. Bentil, K. Ramesh, T. Nguyen, A Dynamic Inflation Test forSoft Materials, Exp.Mech. 2016, 56, 759.
[18] X. Chen, J. Lai, X. Chang, Y. Zhang, L. Zhang, C. Wang, Com-pressive mechanical properties of HTPB propellant at low tem-peratures – high strain rates, Results in Physics 2017, 7, 4079–4084.
[19] Y. Du, J. Zheng, C. Xiong, Cross-linking density – aging con-stitutive model of HTPB coating under prestrain thermal accel-erated aging, Defence Technology 2019, DOI 10.1016/j.dt.2019.07.007.
[20] N. Gligorijević, S. Živković, S. Subotić, B. Pavković, M. Nikolić, S.Kozomara, V. Rodić, Mechanical properties of HTPB compositepropellants in the initial period of service life, Scientific Techni-cal Review 2014, 64, 8–16.
[21] J. L. Jordan, D. Montaigne, P. Gould, C. Neel, G. Sunny, C. Mo-lek, High Strain Rate – Shock Properties of Hydroxyl-Termi-nated Polybutadiene (HTPB) with Varying Amounts of Plasti-cizer, J. dynamic behavior mater. 2016, 2, 91–100.
[22] M. S. Chaudhry, A. Czekanski, FE Analysis of Critical Testing Pa-rameters in Kolsky Bar Experiments for Elastomers at HighStrain Rate, Materials (Basel) 2019, 12, DOI 10.3390/ma12233817.
[23] J. E. Field, S. M. Walley, W. G. Proud, H. T. Goldrein, C. R. Siviour,Review of experimental techniques for high rate deformationand shock studies, International Journal of Impact Engineering2004, 30, 725–775.
[24] K. T. Ramesh, High Rates and Impact Experiments, in SpringerHandbook of Experimental Solid Mechanics (Ed.: W.N. SharpeJr.), Springer, New York, 2008, pp. 929–960.
[25] M. Hokka, N. Mirow, H. Nagel, M. Irqsusi, S. Vogt, V.-T. Kuokka-la, In-vivo deformation measurements of the human heart by3D Digital Image Correlation, J Biomech 2015, 48, 2217–2220.
[26] M. Sutton, C. Mingqi, W. Peters, Y. Chao, S. McNeill, Applicationof an optimized digital correlation method to planar deforma-tion analysis, Image and Vision Computing 1986, 4, 143–150.
[27] M. A. Sutton, J. J. Orteu, H. Schreier, Image Correlation forShape, Motion and Deformation Measurements: Basic Con-
cepts,Theory and Applications, Image Correlation for Shape,Motion and Deformation Measurements: Basic Concepts,Theoryand Applications, Springer US, 2009.
[28] A. Ajovalasit, B. Zuccarello, Local Reinforcement Effect of aStrain Gauge Installation on Low Modulus Materials, The Jour-nal of Strain Analysis for Engineering Design 2005, 40, 643–653.
[29] E. Alay, M. Skotak, A. Misistia, N. Chandra, Dynamic loads onhuman and animal surrogates at different test locations incompressed-gas-driven shock tubes, Shock Waves 2018, 28,51–62.
[30] T. C. Miller, Poisson’s Ratio Extrapolation from Digital ImageCorrelation Experiments, Poisson’s Ratio Extrapolation from Dig-ital Image Correlation Experiments, AIR FORCE RESEARCH LABEDWARDS AFB CA ROCKET PROPULSION DIV, 2013.
[31] B. L. Boyce, J. M. Grazier, R. E. Jones, T. D. Nguyen, Full-field de-formation of bovine cornea under constrained inflation con-ditions, Biomaterials 2008, 29, 3896–3904.
[32] S. L. Evans, C. A. Holt, Measuring the mechanical properties ofhuman skin in vivo using digital image correlation and finiteelement modelling, The Journal of Strain Analysis for Engineer-ing Design 2009, 44, 337–345.
[33] V. Libertiaux, F. Pascon, S. Cescotto, Experimental verificationof brain tissue incompressibility using digital image correla-tion, J Mech Behav Biomed Mater 2011, 4, 1177–1185.
[34] G. Lionello, L. Cristofolini, A practical approach to optimizingthe preparation of speckle patterns for digital-image correla-tion, Measurement Science and Technology 2014, 25, 107001.
[35] K. M. Myers, B. Coudrillier, B. L. Boyce, T. D. Nguyen, The in-flation response of the posterior bovine sclera, Acta Bio-materialia 2010, 6, 4327–4335.
[36] M. Palanca, G. Tozzi, L. Cristofolini, The use of digital imagecorrelation in the biomechanical area: a review, InternationalBiomechanics 2016, 3, 1–21.
[37] G. Subhash, Q. Liu, D. F. Moore, P. G. Ifju, M. A. Haile, Concen-tration Dependence of Tensile Behavior in Agarose Gel UsingDigital Image Correlation, Exp Mech 2011, 51, 255–262.
[38] D. Zhang, D. D. Arola, Applications of digital image correlationto biological tissues, J Biomed Opt 2004, 9, 691–699.
[39] M. Hosseini-Farid, M. Ramzanpour, M. Ziejewski, G. Karami, Acompressible hyper-viscoelastic material constitutive modelfor human brain tissue and the identification of its parameters,International Journal of Non-Linear Mechanics 2019, 116, 147–154.
[40] M. Kauer, V. Vuskovic, J. Dual, G. Szekely, M. Bajka, Inverse fi-nite element characterization of soft tissues, Med Image Anal2002, 6, 275–287.
[41] VIC-3D, VIC-3D digital image correlation (version 8.0.8), VIC-3DDigital Image Correlation (Version 8.0.8), Correlated Solutions,Inc., Irmo, South Carolina, 2018.
[44] R. Michalczyk, Implementation of generalized viscoelastic ma-terial model in ABAQUS code, Logistyka 2011.
[45] K. E. Keenan, S. Pal, D. P. Lindsey, T. F. Besier, G. S. Beaupre, Aviscoelastic constitutive model can accurately represent entirecreep indentation tests of human patella cartilage, J Appl Bio-mech 2013, 29, 292–302.
[46] H. Shekhar, A. D. Sahasrabudhe, Maxwell Fluid Model for Gen-eration of Stress–Strain Curves of Viscoelastic Solid Rocket Pro-pellants, Propellants, Explosives, Pyrotechnics 2010, 35, 321–325.
[47] B. Babaei, A. Davarian, K. M. Pryse, E. L. Elson, G. M. Genin, Effi-cient and optimized identification of generalized Maxwell vis-
Research Article S. A. Bentil, W. J. Jackson, C. Williams, T. C. Miller
coelastic relaxation spectra, J Mech Behav Biomed Mater 2015,55, 32–41.
[48] S. A. Bentil, R. B. Dupaix, Simulations of hydrogel-coated neuralmicroelectrodes to assess biocompatibility improvement usingstrain as a metric for micromotion, Biomed. Phys. Eng. Express2018, 4, 035036.
[49] S. A. Bentil, R. B. Dupaix, Exploring the mechanical behavior ofdegrading swine neural tissue at low strain rates via the frac-tional Zener constitutive model, Journal Of The Mechanical Be-havior Of Biomedical Materials 2014, 30, 83.
[50] E. M. C. Jones, M. A. Iadicola (Eds.), International Digital ImageCorrelation Society: A Good Practices Guide for Digital ImageCorrelation, “International Digital Image Correlation Society: AGood Practices Guide for Digital Image Correlation,” can befound under https://doi.org/10.32720/idics/gpg.ed1, 2018.
[51] B. Han, Y. Ju, C. Zhou, Simulation of crack propagation in HTPBpropellant using cohesive zone model, Engineering FailureAnalysis 2012, 26, 304–317.
[52] D. J. Walters, D. J. Luscher, J. D. Yeager, B. M. Patterson, Cohe-sive finite element modeling of the delamination of HTPBbinder and HMX crystals under tensile loading, InternationalJournal of Mechanical Sciences 2018, 140, 151–162.
[53] R. Hu, C. Prakash, V. Tomar, M. Harr, I. E. Gunduz, C. Oskay, Ex-perimentally-validated mesoscale modeling of the coupledmechanical–thermal response of AP–HTPB energetic materialunder dynamic loading, Int J Fract 2017, 203, 277–298.
[54] K.-S. Yun, J.-B. Park, G.-D. Jung, S.-K. Youn, Viscoelastic con-stitutive modeling of solid propellant with damage, Interna-tional Journal of Solids and Structures 2016, 80, 118–127.
Manuscript received: February 19, 2021Revised manuscript received: May 11, 2021
Version of record online: ■■■, ■■■■
Viscoelastic Properties of Inert Solid Rocket Propellants Exposed to a Shock Wave