31
Volumetric and Sedimentation Survey of LAKE CHEROKEE April 2015 Survey January 2016
| Date post: | 27-Feb-2023 |
| Category: |
Documents |
| Upload: | khangminh22 |
| View: | 0 times |
| Download: | 0 times |

Volumetric and Sedimentation Survey
of LAKE CHEROKEE
April 2015 Survey
January 2016

Texas Water Development Board Bech Bruun, Chairman | Kathleen Jackson, Member | Peter Lake, Member
Kevin Patteson, Executive Administrator
Prepared for:
City of Longview
With Support Provided by:
U.S. Army Corps of Engineers, Fort Worth District
Authorization for use or reproduction of any original material contained in this publication, i.e. not obtained from other sources, is freely granted. The Board would appreciate acknowledgement.
This report was prepared by staff of the Surface Water Resources Division:
Jason J. Kemp, Manager Holly Holmquist
Khan Iqbal Bianca D. Whitaker
Michael Vielleux, P.E. Nathan Leber
Published and distributed by the
P.O. Box 13231, Austin, TX 78711-3231

Executive summary
In January 2015, the Texas Water Development Board (TWDB) entered into agreement
with the U.S. Army Corps of Engineers, Fort Worth District, to perform a volumetric and
sedimentation survey of Lake Cherokee. The City of Longview provided 50% of the funding for
this survey, while the U.S. Army Corps of Engineers, Fort Worth District, provided the remaining
50% of the funding through their Planning Assistance to States Program. Surveying was
performed using a multi-frequency (208 kHz, 50 kHz, and 24 kHz), sub-bottom profiling depth
sounder. In addition, sediment core samples were collected in select locations and correlated with
the multi-frequency depth sounder signal returns to estimate sediment accumulation thicknesses
and sedimentation rates.
Cherokee Dam and Lake Cherokee are located on Cherokee Bayou, approximately 12
miles southeast of Longview, in southeastern Gregg and northeastern Rusk Counties, Texas. The
conservation pool elevation of Lake Cherokee is 280.0 feet above mean sea level (NGVD29).
TWDB collected bathymetric data for Lake Cherokee between March 31, 2015, and April 14,
2015. The daily average water surface elevations during the survey ranged between 279.80 and
280.38 feet above mean sea level (NGVD29).
The 2015 TWDB volumetric survey indicates that Lake Cherokee has a total
reservoir capacity of 44,475 acre-feet and encompasses 3,749 acres at conservation pool
elevation (280.0 feet above mean sea level, NGVD29). Previous capacity estimates include the
original design estimate of 62,400 acre-feet by the Cherokee Water Company, a recalculated
original design estimate by the U.S. Soil Conservation Service in 1960 of 49,295 acre-feet, a 1960
U.S. Soil Conservation Service survey estimate of 46,705 acre-feet, and volumes obtained from
two TWDB surveys in 1996 and 2003. Both prior TWDB volumetric surveys were re-evaluated
using current processing procedures resulting in updated capacity estimates of 42,314 acre-feet
and 44,440 acre-feet, respectively.
Based on two methods for estimating sedimentation rates, the 2015 TWDB
sedimentation survey estimates Lake Cherokee to have an average loss of capacity between
41 and 72 acre-feet per year since impoundment due to sedimentation below conservation
pool elevation (280.0 feet NGVD29). Sediment accumulation varies throughout the reservoir and
appears to be greater in natural depressions or low lying areas of the flood plain. TWDB
recommends that a similar methodology be used to resurvey Lake Cherokee in 10 years or after a
major flood event.
Table of Contents
Introduction ........................................................................................................................... 1 Lake Cherokee general information ................................................................................... 1 Volumetric and sedimentation survey of Lake Cherokee ................................................. 3
Datum .................................................................................................................................. 3 TWDB bathymetric and sedimentation data collection ...................................................... 4
Data processing ..................................................................................................................... 5 Model boundaries ................................................................................................................ 5 Triangulated Irregular Network model ............................................................................... 6 Spatial interpolation of reservoir bathymetry ...................................................................... 6 Area, volume, and contour calculation ................................................................................ 9 Analysis of sediment data from Lake Cherokee ............................................................... 13
Survey results ...................................................................................................................... 19 Volumetric survey ............................................................................................................. 19 Sedimentation survey ........................................................................................................ 20
Recommendations ............................................................................................................... 21 TWDB contact information ............................................................................................... 21 References ............................................................................................................................ 22
List of Tables
Table 1: Pertinent data for Cherokee Dam and Lake Cherokee Table 2: Sediment core sampling analysis data – Lake Cherokee Table 3: Current and previous survey capacity and surface area data Table 4: Capacity loss comparisons for Lake Cherokee
List of Figures
Figure 1: Location of Lake Cherokee Figure 2: Data collected during 2015 TWDB Lake Cherokee survey Figure 3: Anisotropic spatial interpolation of Lake Cherokee Figure 4: Elevation relief map Figure 5: Depth ranges map Figure 6: 2-foot contour map Figure 7: Sediment core sample CH-3 from Lake Cherokee Figure 8: Comparison of sediment core CH-3 with acoustic signal returns Figure 9: Cross-section of data collected during 2015 survey Figure 10: Sediment thicknesses throughout Lake Cherokee
Appendices
Appendix A: Lake Cherokee 2015 capacity table Appendix B: Lake Cherokee 2015 area table Appendix C: Lake Cherokee 2015 capacity curve Appendix D: Lake Cherokee 2015 area curve
Note: References to brand names throughout this report do not imply endorsement by the Texas Water Development Board
1
Introduction
The Hydrographic Survey Program of the Texas Water Development Board
(TWDB) was authorized by the 72nd Texas State Legislature in 1991. Section 15.804 of the
Texas Water Code authorizes TWDB to perform surveys to determine reservoir storage
capacity, sedimentation levels, rates of sedimentation, and projected water supply
availability.
In January 2015, the Texas Water Development Board (TWDB) entered into
agreement with the U.S. Army Corps of Engineers, Fort Worth District, to perform a
volumetric and sedimentation survey of Lake Cherokee. The City of Longview provided
50% of the funding for this survey, while the U.S. Army Corps of Engineers, Fort Worth
District, provided the remaining 50% of the funding through their Planning Assistance to
States Program (TWDB, 2015). This report describes the methods used to conduct the
volumetric and sedimentation survey, including data collection and processing techniques.
This report serves as the final contract deliverable from TWDB to the City of Longview
and the U.S. Army Corps of Engineers, Fort Worth District, and contains as deliverables:
(1) a shaded relief plot of the reservoir bottom [Figure 4], (2) a bottom contour map [Figure
6], (3) an estimate of sediment accumulation and location [Figure 10], and (4) an elevation-
area-capacity table of the reservoir acceptable to the Texas Commission on Environmental
Quality [Appendix A, B].
Lake Cherokee general information
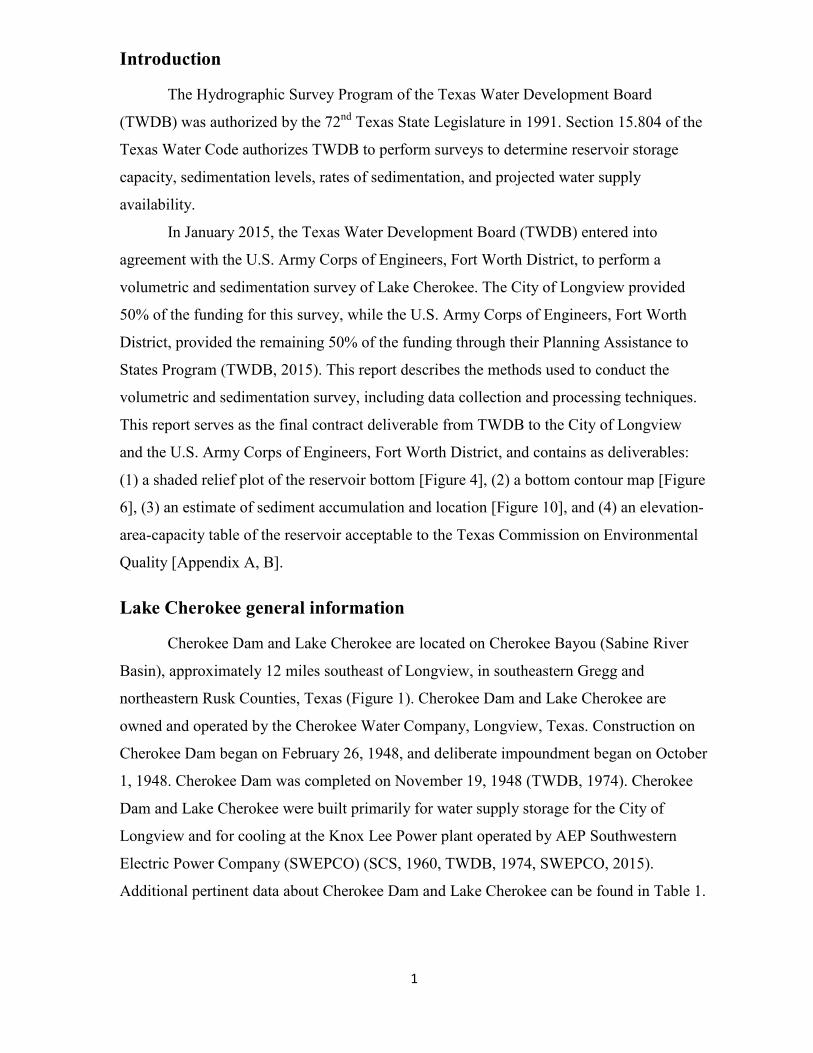
Cherokee Dam and Lake Cherokee are located on Cherokee Bayou (Sabine River
Basin), approximately 12 miles southeast of Longview, in southeastern Gregg and
northeastern Rusk Counties, Texas (Figure 1). Cherokee Dam and Lake Cherokee are
owned and operated by the Cherokee Water Company, Longview, Texas. Construction on
Cherokee Dam began on February 26, 1948, and deliberate impoundment began on October
1, 1948. Cherokee Dam was completed on November 19, 1948 (TWDB, 1974). Cherokee
Dam and Lake Cherokee were built primarily for water supply storage for the City of
Longview and for cooling at the Knox Lee Power plant operated by AEP Southwestern
Electric Power Company (SWEPCO) (SCS, 1960, TWDB, 1974, SWEPCO, 2015).
Additional pertinent data about Cherokee Dam and Lake Cherokee can be found in Table 1.
2
Water rights for Lake Cherokee have been appropriated to the City of Longview
through Certificate of Adjudication No. 05-4642. The complete certificate is on file in the
Information Resources Division of the Texas Commission on Environmental Quality.
Figure 1. Location of Lake Cherokee
3
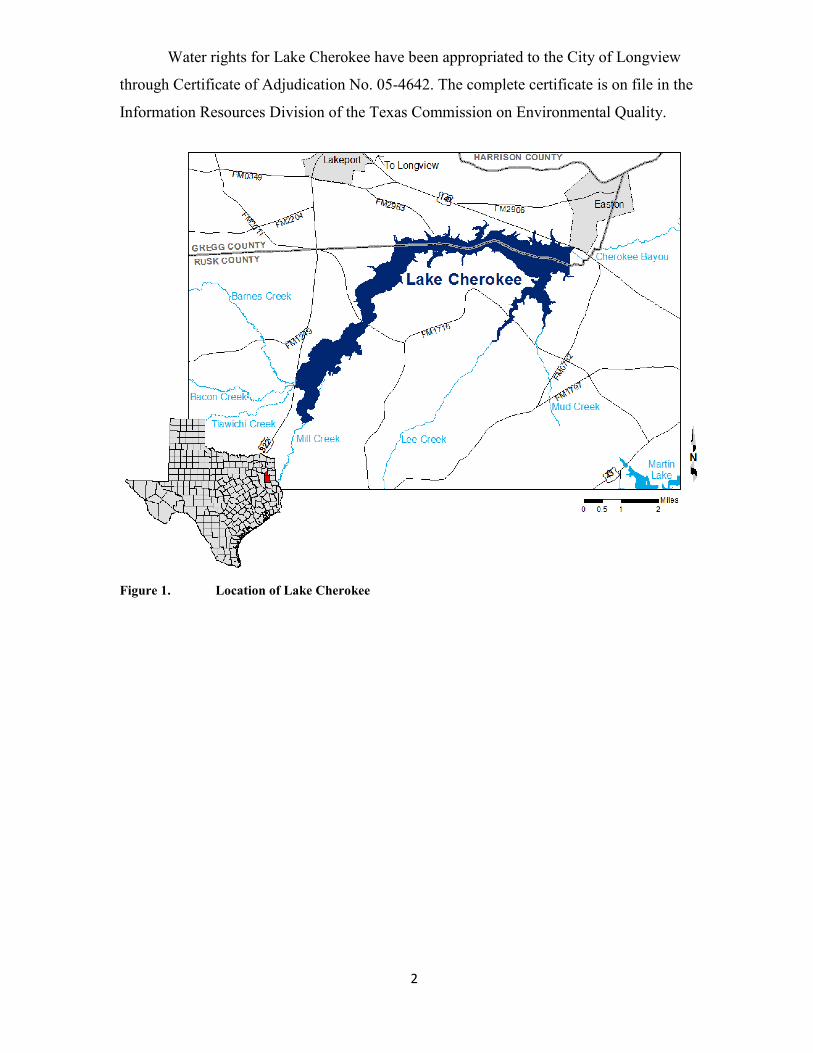
Table 1. Pertinent data for Cherokee Dam and Lake Cherokee Owner Cherokee Water Company, Longview, Texas Engineer (design) Powell and Powell Location of dam
On Cherokee Bayou approximately 8 miles upstream from its confluence with the Sabine River, in Gregg and Rusk Counties, 12 miles southeast of the city of Longview.
Drainage area 158 square miles Dam Type Earthfill Length (including spillways) 4,000 feet Maximum height 45 feet Top width 20 feet Top elevation 295.0 feet above mean sea level Spillway (emergency)
Type Cut in natural ground Crest elevation 287.7 feet above mean sea level Crest length 160 feet
Location Near right end of dam Spillway (service)
Type Uncontrolled concrete structure Crest elevation 280.0 feet above mean sea level Crest length 828± feet
Location Left end of dam Outlet works
Type Concrete pipe, 18-inch diameter Invert elevation 260.0 feet above mean sea level
Control Gate valve operated from a tower Reservoir data (Based on 2015 TWDB survey) Elevation Capacity Area Feature (feet NGVD29a) (acre-feet) (acres) Top of dam 295.0 N/A N/A
Top of design flood pool 291.0 N/A N/A Crest of emergency spillway 287.7 N/A N/A Crest of service spillway 280.0 44,475 3,749 Invert of 18-inch outlet 260.0 4,382 846 Source: (SCS, 1960, TWDB, 1974) a NGVD29 = National Geodetic Vertical Datum 1929
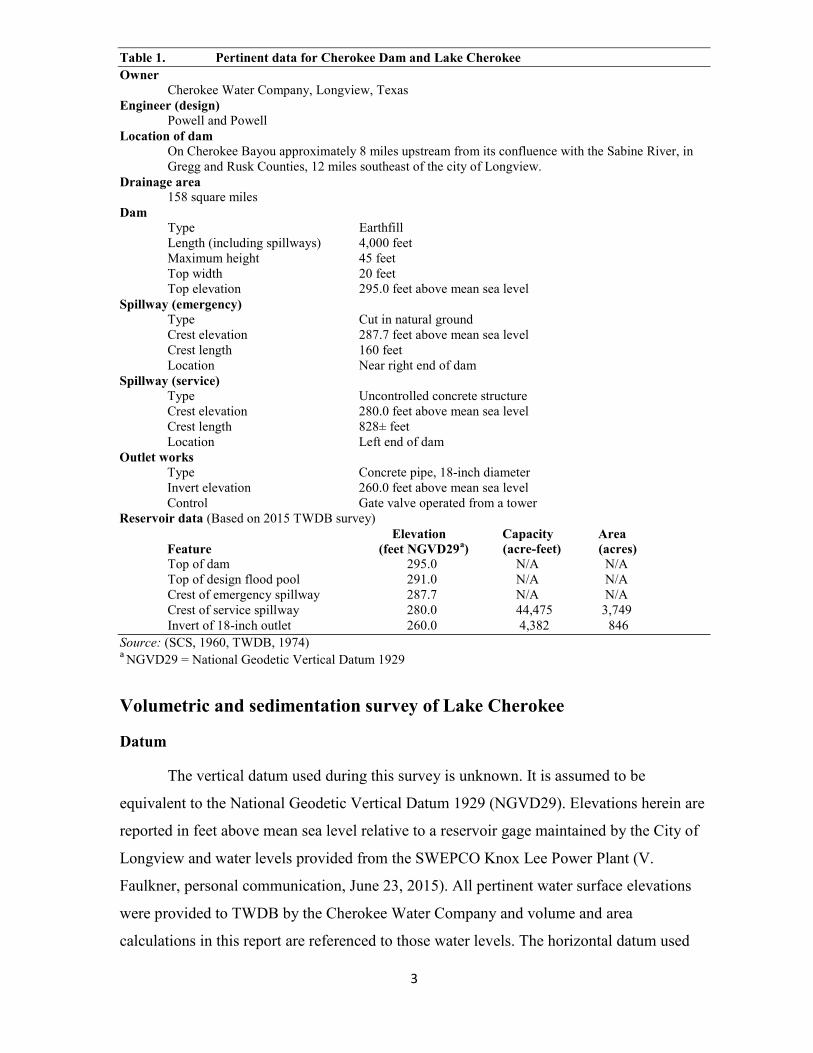
Volumetric and sedimentation survey of Lake Cherokee
Datum
The vertical datum used during this survey is unknown. It is assumed to be
equivalent to the National Geodetic Vertical Datum 1929 (NGVD29). Elevations herein are
reported in feet above mean sea level relative to a reservoir gage maintained by the City of
Longview and water levels provided from the SWEPCO Knox Lee Power Plant (V.
Faulkner, personal communication, June 23, 2015). All pertinent water surface elevations
were provided to TWDB by the Cherokee Water Company and volume and area
calculations in this report are referenced to those water levels. The horizontal datum used
4
for this report is North American Datum 1983 (NAD83), and the horizontal coordinate
system is State Plane Texas North Central Zone (feet).
TWDB bathymetric and sedimentation data collection
TWDB collected bathymetric data for Lake Cherokee between March 31, 2015, and
April 14, 2015. The daily average water surface elevations during the survey ranged
between 279.80 and 280.38 feet above mean sea level (NGVD29) (V. Faulkner, personal
communication, June 23, 2015). For data collection, TWDB used a Specialty Devices, Inc.
(SDI), single-beam, multi-frequency (208 kHz, 50 kHz, and 24 kHz) sub-bottom profiling
depth sounder integrated with differential global positioning system (DGPS) equipment.
Data was collected along pre-planned survey lines oriented perpendicular to the assumed
location of the original river channels and spaced approximately 500 feet apart. Many of the
same survey lines were also used by TWDB during the 2003 and 1996 surveys. The depth
sounder was calibrated daily using a velocity profiler to measure the speed of sound in the
water column and a weighted tape or stadia rod for depth reading verification. Figure 2
shows where data collection occurred during the 2015 TWDB survey.
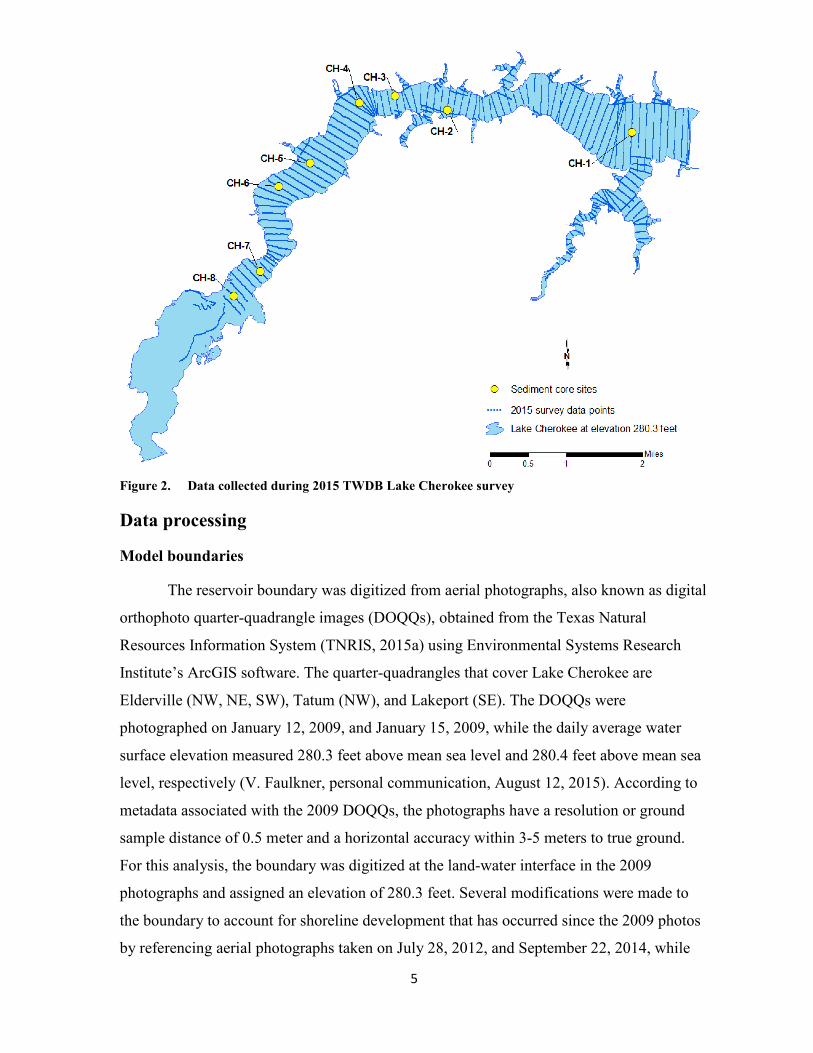
All sounding data was collected and reviewed before sediment core sampling sites
were selected. Sediment core samples are collected at regularly spaced intervals within the
reservoir, or at locations where interpretation of the acoustic display would be difficult
without site-specific sediment core data. After analyzing the sounding data, TWDB selected
eight locations to collect sediment core samples (Figure 2). The sediment core samples
were collected on June 4, 2015, with a custom-coring boat and SDI VibeCore system.
Several of the cores sites were the same as those cored during the 2003 survey.
Sediment cores are collected in 3-inch diameter aluminum tubes. Analysis of the
acoustic data collected during the bathymetric survey assists in determining the depth of
penetration the tube must be driven during sediment sampling. The goal is to collect a
sediment core sample extending from the current reservoir-bottom surface, through the
accumulated sediment, and to the pre-impoundment surface. After retrieving the sample, a
stadia rod is inserted into the top of the aluminum tubes to assist in locating the top of the
sediment in the tube. This identifies the location of the layer corresponding to the current
reservoir-bottom surface. The aluminum tube is cut to this level, capped, and transported
back to TWDB headquarters for further analysis. During this time, some settling of the
upper layer can occur.
5
Figure 2. Data collected during 2015 TWDB Lake Cherokee survey
Data processing
Model boundaries
The reservoir boundary was digitized from aerial photographs, also known as digital
orthophoto quarter-quadrangle images (DOQQs), obtained from the Texas Natural
Resources Information System (TNRIS, 2015a) using Environmental Systems Research
Institute’s ArcGIS software. The quarter-quadrangles that cover Lake Cherokee are
Elderville (NW, NE, SW), Tatum (NW), and Lakeport (SE). The DOQQs were
photographed on January 12, 2009, and January 15, 2009, while the daily average water
surface elevation measured 280.3 feet above mean sea level and 280.4 feet above mean sea
level, respectively (V. Faulkner, personal communication, August 12, 2015). According to
metadata associated with the 2009 DOQQs, the photographs have a resolution or ground
sample distance of 0.5 meter and a horizontal accuracy within 3-5 meters to true ground.
For this analysis, the boundary was digitized at the land-water interface in the 2009
photographs and assigned an elevation of 280.3 feet. Several modifications were made to
the boundary to account for shoreline development that has occurred since the 2009 photos
by referencing aerial photographs taken on July 28, 2012, and September 22, 2014, while
6
the daily average water surface elevation measured 278.5 feet above mean sea level and
277.7 feet above mean sea level, respectively (V. Faulkner, personal communication, June
23, 2015). According to metadata associated with the 2012 and 2014 DOQQs, the
photographs have a resolution or ground sample distance of 1.0-meters and a horizontal
accuracy within ±6 meters to true ground (TNRIS, 2015b, USDA, 2015).
Triangulated Irregular Network model
Following completion of data collection, the raw data files collected by TWDB
were edited to remove data anomalies. DepthPic©, software developed by SDI, Inc., was
used to display, interpret, and edit the multi-frequency data by manually removing data
anomalies in the current bottom surface and manually digitizing the reservoir-bottom
surface at the time of initial impoundment (i.e. pre-impoundment surface). For processing
outside of DepthPic©, an in-house software package, HydroTools, was used to identify the
current reservoir-bottom surface, pre-impoundment surface, sediment thickness at each
sounding location, and output the data into a single file. The water surface elevation at the
time of each sounding was used to convert each sounding depth to a corresponding
reservoir-bottom elevation. This survey point dataset was then preconditioned by inserting a
uniform grid of artificial survey points between the actual survey lines. Bathymetric
elevations at these artificial points were determined using an anisotropic spatial
interpolation algorithm described in the next section. This technique creates a high
resolution, uniform grid of interpolated bathymetric elevation points throughout a majority
of the reservoir (McEwen et al., 2014a). Finally, the point file resulting from spatial
interpolation was used in conjunction with sounding and boundary data to create volumetric
and sediment Triangulated Irregular Network (TIN) models utilizing the 3D Analyst
Extension of ArcGIS. The 3D Analyst algorithm uses Delaunay’s criteria for triangulation
to create a grid composed of triangles from non-uniformly spaced points, including the
boundary vertices (ESRI, 1995).
Spatial interpolation of reservoir bathymetry
Isotropic spatial interpolation techniques such as the Delaunay triangulation used by
the 3D Analyst extension of ArcGIS are, in many instances, unable to suitably interpolate
bathymetries between survey lines common to reservoir surveys. Reservoirs and stream
channels are anisotropic morphological features where bathymetry at any particular location
is more similar to upstream and downstream locations than to transverse locations.
7
Interpolation schemes that do not consider this anisotropy lead to the creation of several
types of artifacts in the final representation of the reservoir bottom surface and hence to
errors in volume. These include: artificially-curved contour lines extending into the
reservoir where the reservoir walls are steep or the reservoir is relatively narrow;
intermittent representation of submerged stream channel connectivity; and oscillations of
contour lines in between survey lines. These artifacts reduce the accuracy of the resulting
volumetric and sediment TIN models in areas between actual survey data.
To improve the accuracy of bathymetric representation between survey lines,
TWDB developed various anisotropic spatial interpolation techniques. Generally, the
directionality of interpolation at different locations of a reservoir can be determined from
external data sources. A basic assumption is that the reservoir profile in the vicinity of a
particular location has upstream and downstream similarity. In addition, the sinuosity and
directionality of submerged stream channels can be determined by directly examining the
survey data, or more robustly by examining scanned USGS 7.5 minute quadrangle maps
(known as digital raster graphics) and hypsography files (the vector format of USGS 7.5
minute quadrangle map contours), when available. Using the survey data, polygons are
created to partition the reservoir into segments with centerlines defining directionality of
interpolation within each segment. For surveys with similar spatial coverage, these
interpolation definition files are in principle independent of the survey data and could be
applied to past and future survey data of the same reservoir. In practice, however, minor
revisions of the interpolation definition files may be needed to account for differences in
spatial coverage and boundary conditions between surveys. Using the interpolation
definition files and survey data, the current reservoir-bottom elevation, pre-impoundment
elevation, and sediment thickness are calculated for each point in the high resolution
uniform grid of artificial survey points. The reservoir boundary, artificial survey points
grid, and survey data points are used to create volumetric and sediment TIN models
representing the reservoir bathymetry and sediment accumulation throughout the reservoir.
Specific details of this interpolation technique can be found in the HydroTools manual
(McEwen et al., 2014a) and in McEwen et al., 2014b.
In areas inaccessible to survey data collection, such as small coves and shallow
upstream areas of the reservoir, linear interpolation is used for volumetric and sediment
accumulation estimations. The linear interpolation follows a linear definition file linking the
survey points file to the lake boundary file (McEwen et al., 2014a). Without linearly
8
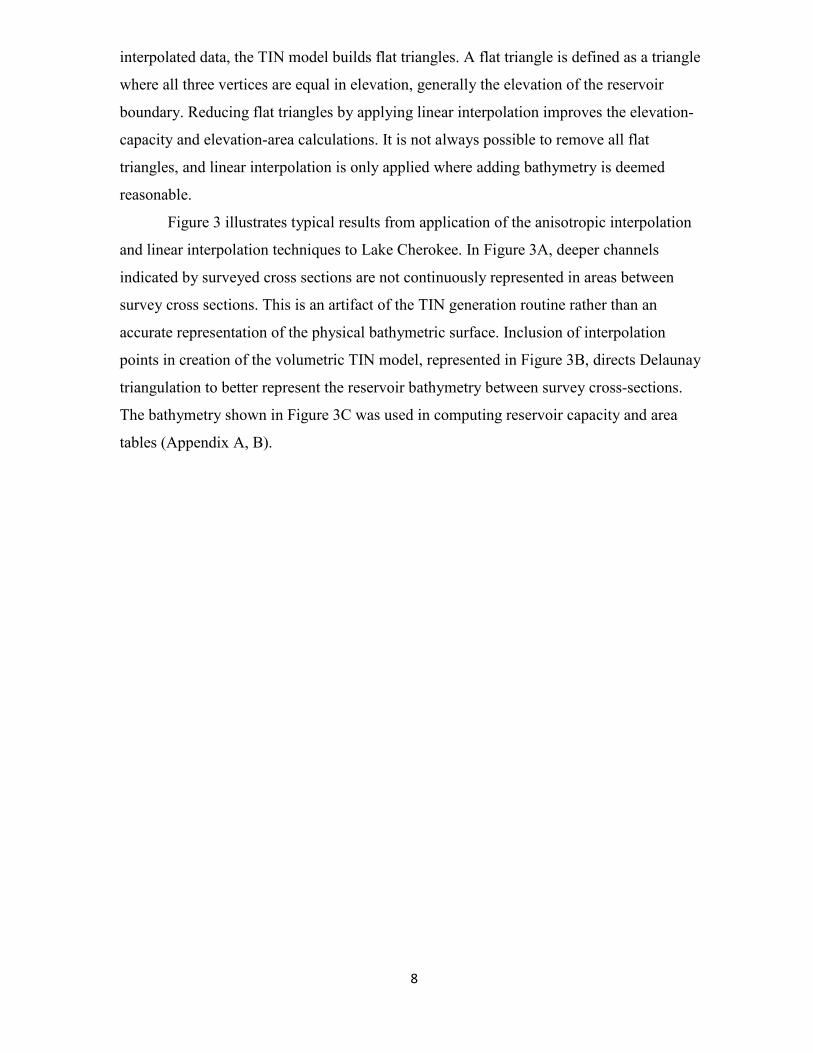
interpolated data, the TIN model builds flat triangles. A flat triangle is defined as a triangle
where all three vertices are equal in elevation, generally the elevation of the reservoir
boundary. Reducing flat triangles by applying linear interpolation improves the elevation-
capacity and elevation-area calculations. It is not always possible to remove all flat
triangles, and linear interpolation is only applied where adding bathymetry is deemed
reasonable.
Figure 3 illustrates typical results from application of the anisotropic interpolation
and linear interpolation techniques to Lake Cherokee. In Figure 3A, deeper channels
indicated by surveyed cross sections are not continuously represented in areas between
survey cross sections. This is an artifact of the TIN generation routine rather than an
accurate representation of the physical bathymetric surface. Inclusion of interpolation
points in creation of the volumetric TIN model, represented in Figure 3B, directs Delaunay
triangulation to better represent the reservoir bathymetry between survey cross-sections.
The bathymetry shown in Figure 3C was used in computing reservoir capacity and area
tables (Appendix A, B).
9
Figure 3. Anisotropic spatial interpolation and linear interpolation of Lake Cherokee sounding data -
A) bathymetric contours without interpolated points, B) sounding points (black) and interpolated points (red), C) bathymetric contours with the interpolated points
Area, volume, and contour calculation
Using ArcInfo software and the volumetric TIN model, volumes and areas were
calculated for the entire reservoir at 0.1-foot intervals, from 246.7 to 280.3 feet. While
linear interpolation was used to estimate the topography in areas that were inaccessible by
boat or too shallow for the instruments to work properly, development of anomalous “flat
triangles”, that is triangles whose three vertices all have the same elevation, in the TIN
model are unavoidable. The flat triangles in turn lead to anomalous calculations of surface
area and volume at the boundary elevation 280.3 feet. To eliminate the effects of the flat
triangles on area and volume calculations, areas between elevations 279.5 feet and 280.3
feet were linearly interpolated between the computed values, and volumes above elevation
279.5 feet were calculated based on the corrected areas. The elevation-capacity table and
elevation-area table, updated for 2015, are presented in Appendices A and B, respectively.
The capacity curve is presented in Appendix C, and the area curve is presented in Appendix

10
D. However, due to the inaccessibility of the upper reaches, and the increasing uncertainty
in the elevation-area-capacity relationship as the elevation approaches 280.3 feet, the tables
and curves are only provided up to conservation pool elevation, 280.0 feet.
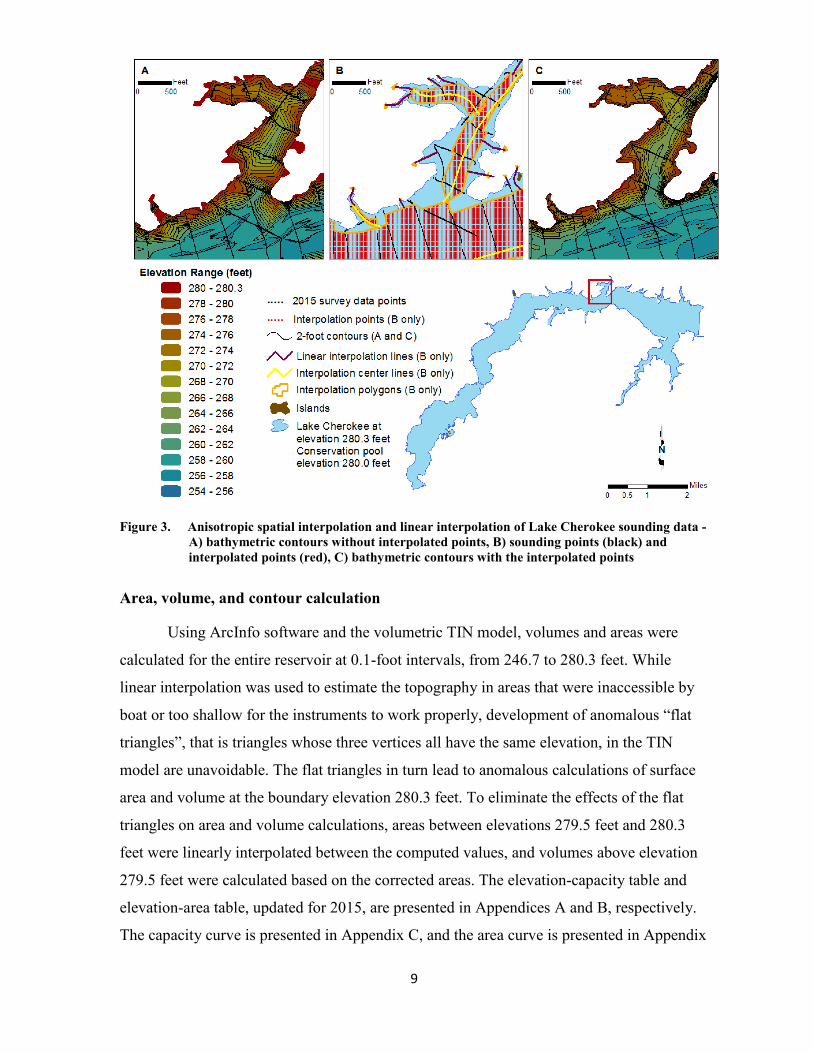
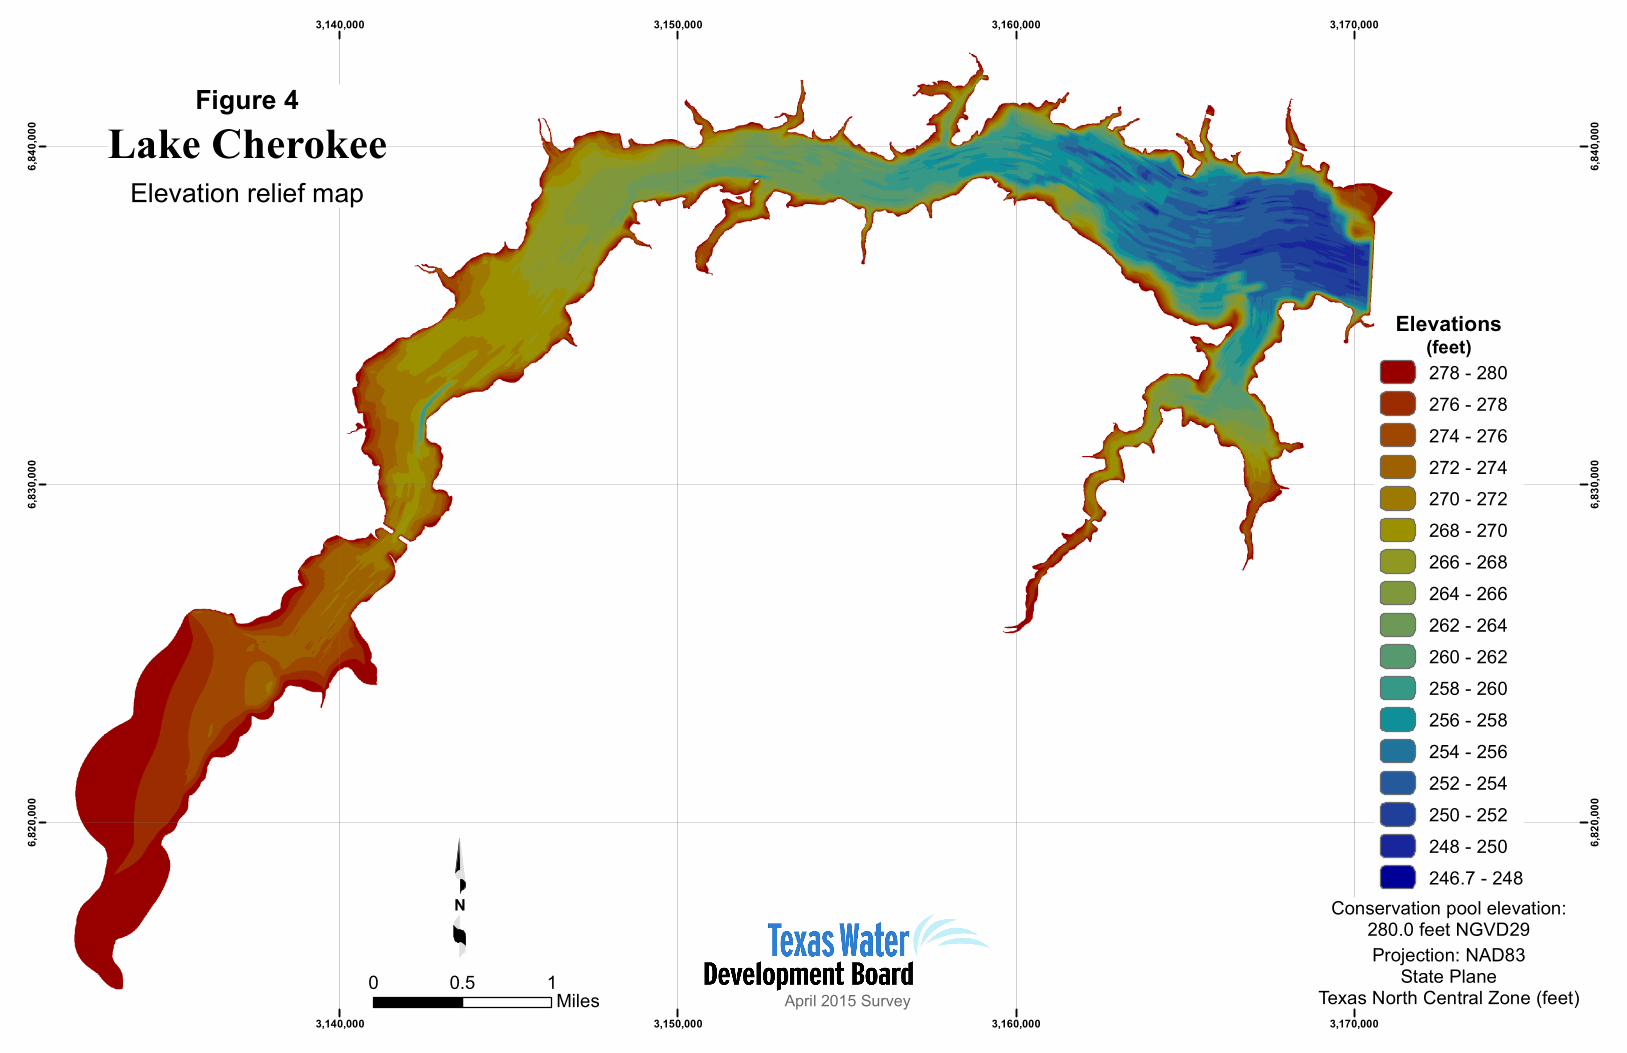
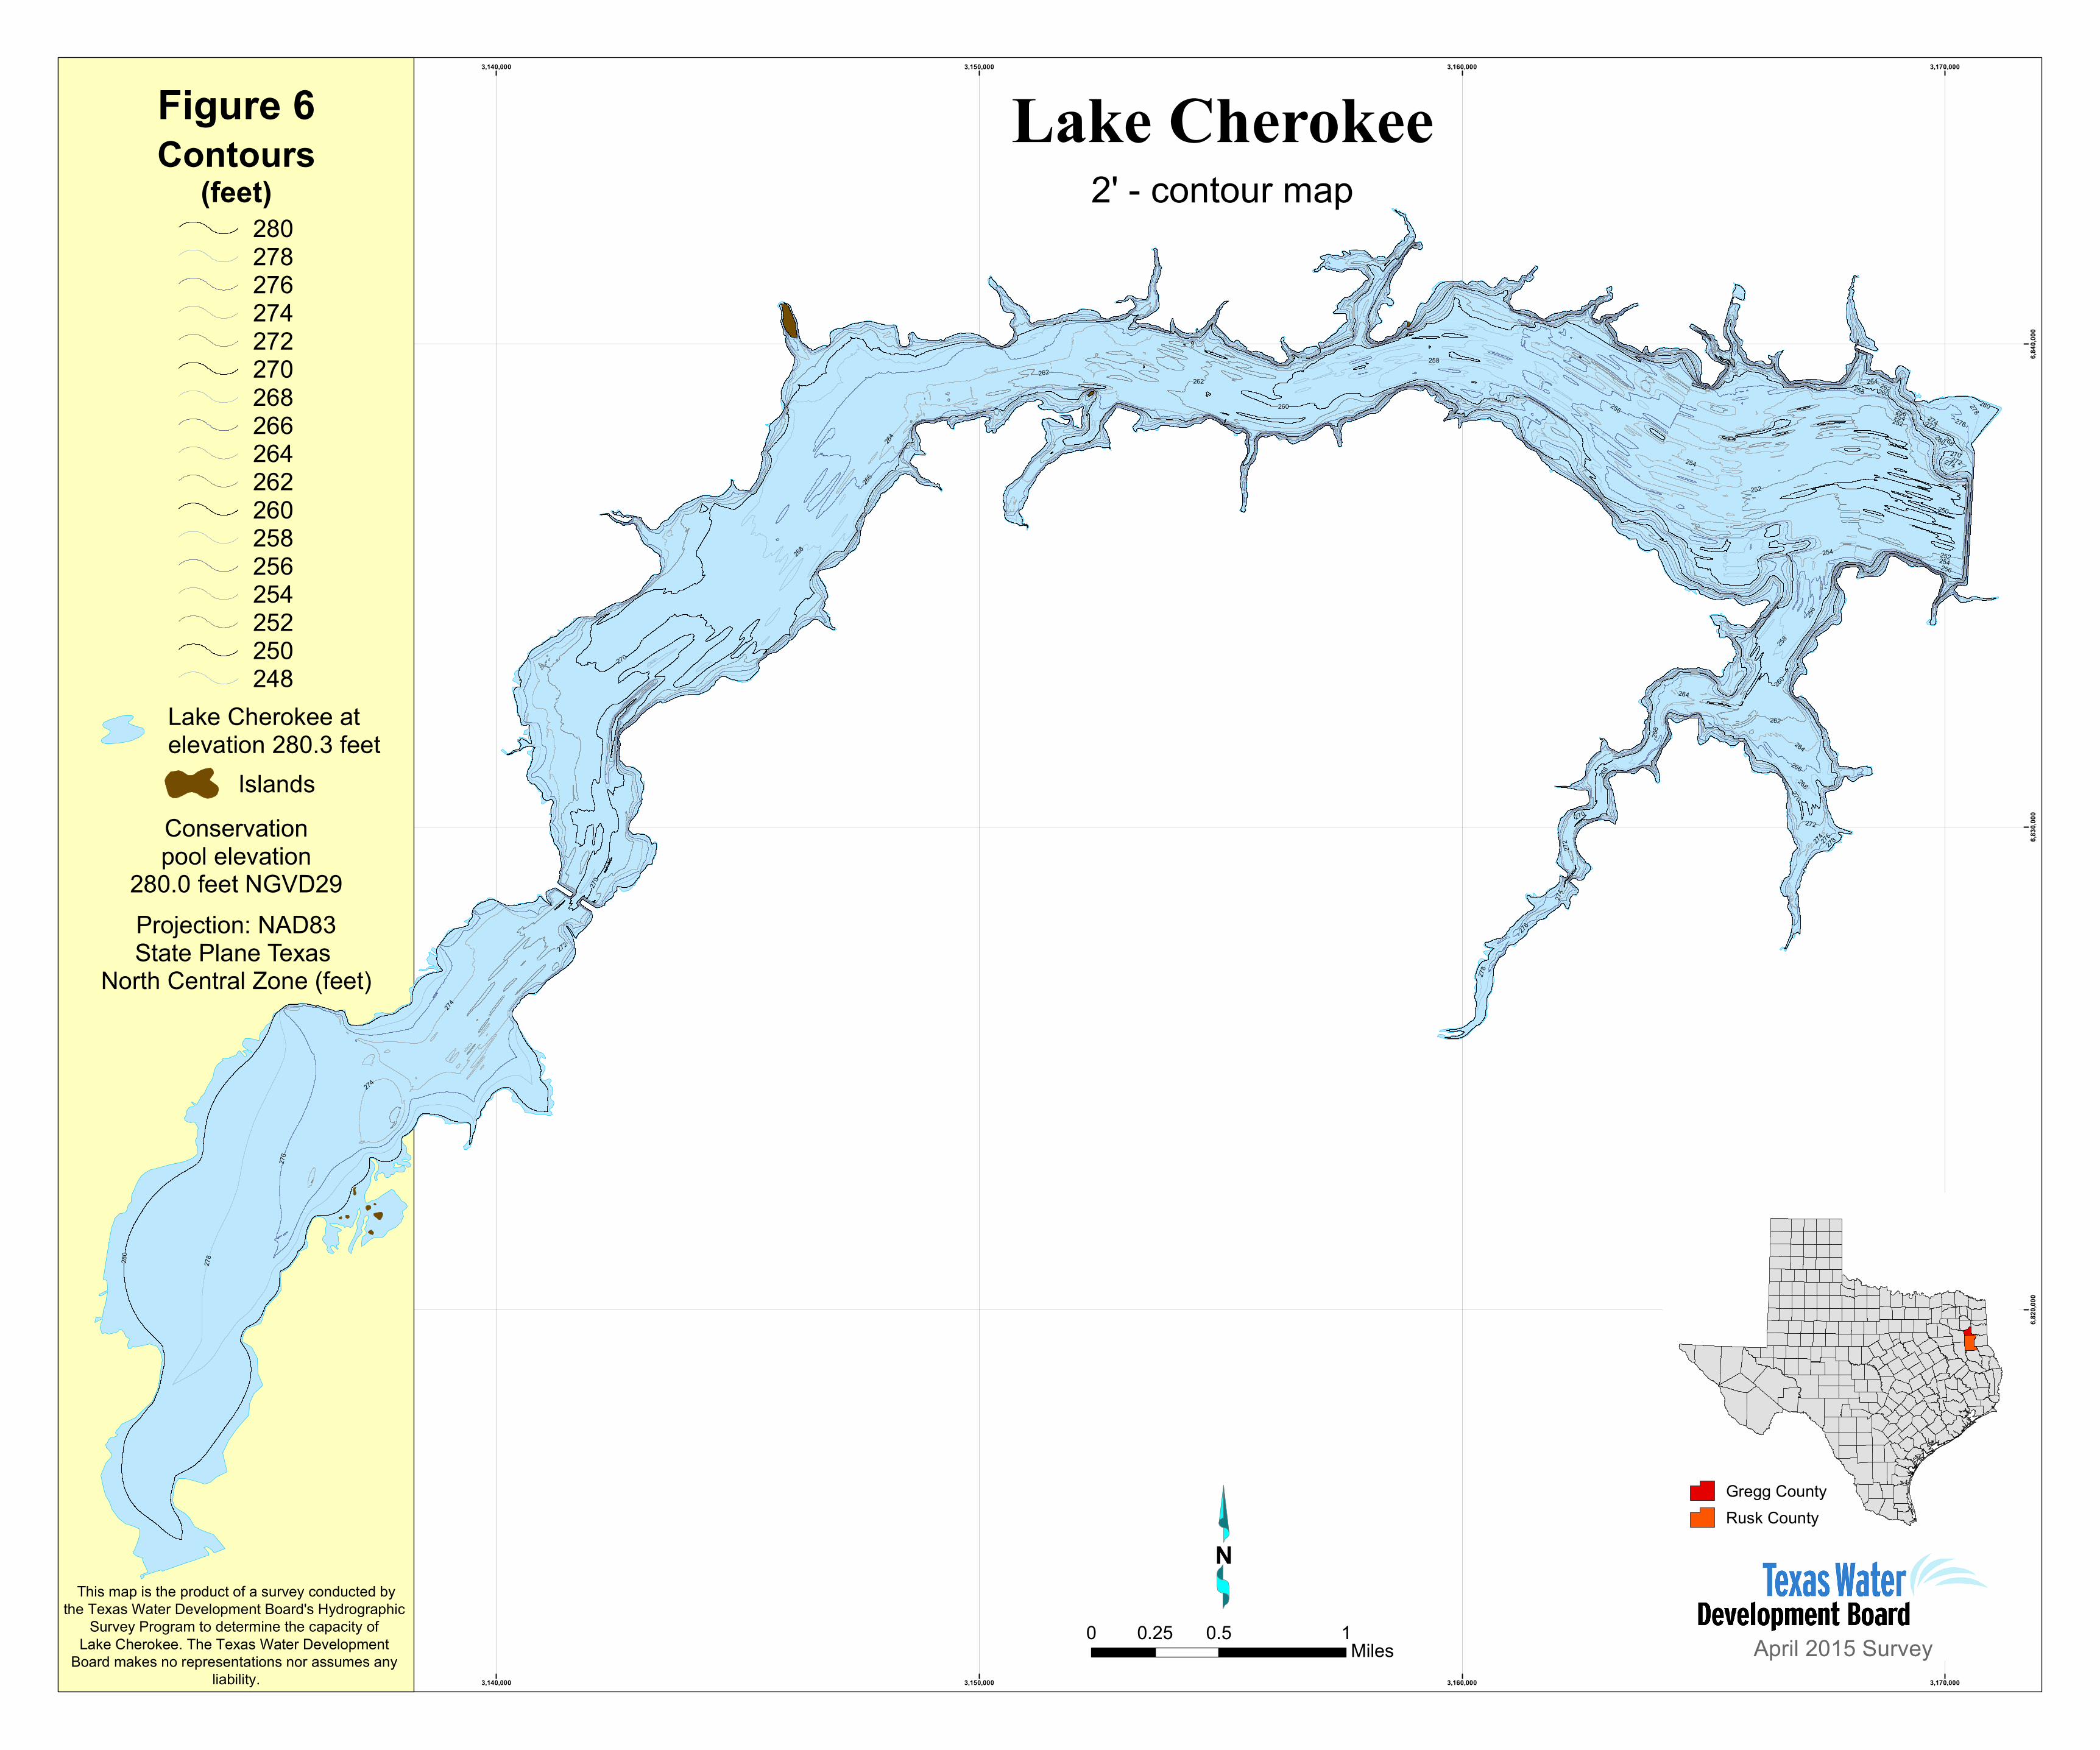
The volumetric TIN model was converted to a raster representation using a cell size
of 1 foot by 1 foot. The raster data was then used to produce: an elevation relief map
(Figure 4), representing the topography of the reservoir bottom; a depth range map (Figure
5), showing shaded depth ranges for Lake Cherokee; and a 2-foot contour map (Figure 6 -
attached).
3,140,000
3,140,000
3,150,000
3,150,000
3,160,000
3,160,000
3,170,000
3,170,000
6,820
,000
6,820
,000
6,830
,000
6,830
,000
6,840
,000
6,840
,000
N
0 0.5 1Miles
Elevations(feet)278 - 280276 - 278274 - 276272 - 274270 - 272268 - 270266 - 268264 - 266262 - 264260 - 262258 - 260256 - 258254 - 256252 - 254250 - 252248 - 250246.7 - 248
Conservation pool elevation:280.0 feet NGVD29Projection: NAD83
State PlaneTexas North Central Zone (feet)
Figure 4
Elevation relief mapLake Cherokee
April 2015 Survey
3,140,000
3,140,000
3,150,000
3,150,000
3,160,000
3,160,000
3,170,000
3,170,000
6,820
,000
6,820
,000
6,830
,000
6,830
,000
6,840
,000
6,840
,000
N
0 0.5 1Miles
Depth ranges(feet)
0 - 5'5 - 10'10 - 15'15 - 20'20 - 25'25 - 30'30 - 35'> 35'
Conservation pool elevation:280.0 feet NGVD29Projection: NAD83
State PlaneTexas North Central Zone (feet)
280.0-foot contour
Figure 5
Depth ranges mapLake Cherokee
April 2015 Survey
13
Analysis of sediment data from Lake Cherokee
Sedimentation in Lake Cherokee was determined by analyzing the acoustic signal
returns of all three depth sounder frequencies in the DepthPic© software. The 208 kHz
signal was analyzed to determine the current bathymetric surface of the reservoir, while all
three frequencies, 208 kHz, 50 kHz, and 24 kHz, were analyzed to determine the reservoir
bathymetric surface at the time of initial impoundment (i.e. pre-impoundment surface).
Sediment core samples collected in the reservoir were used to assist in identifying the
location of the pre-impoundment surface in the acoustic signals. The difference between the
current surface and the pre-impoundment surface yields a sediment thickness value at each
sounding location.
Analysis of the sediment core samples was conducted at TWDB headquarters in
Austin. Each sample was split longitudinally and analyzed to identify the location of the
pre-impoundment surface. The pre-impoundment surface is identified within the sediment
core sample by one or more of the following methods: (1) a visual examination of the
sediment core for terrestrial materials, such as leaf litter, tree bark, twigs, intact roots, etc.,
concentrations of which tend to occur on or just below the pre-impoundment surface; (2)
changes in texture from well sorted, relatively fine-grained sediment to poorly sorted
mixtures of coarse and fine-grained materials; and (3) variations in the physical properties
of the sediment, particularly sediment water content and penetration resistance with depth
(Van Metre et al., 2004). The total sample length, sediment thickness, and the pre-
impoundment thickness were recorded. Physical characteristics of the sediment core,
including Munsell soil color, texture, relative water content, and presence of organic
materials, were also recorded (Table 2).
14
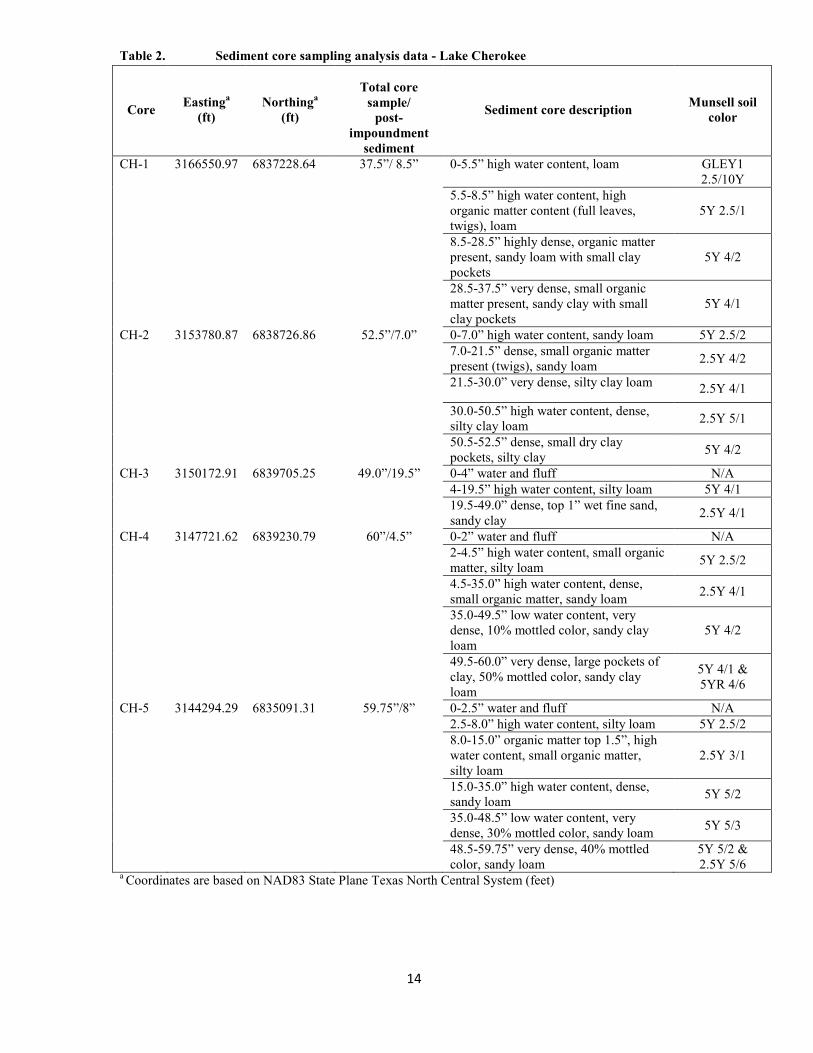
Table 2. Sediment core sampling analysis data - Lake Cherokee
Core Eastinga (ft)
Northinga (ft)
Total core sample/
post-impoundment
sediment
Sediment core description Munsell soil color
CH-1 3166550.97 6837228.64 37.5”/ 8.5” 0-5.5” high water content, loam GLEY1 2.5/10Y
5.5-8.5” high water content, high organic matter content (full leaves, twigs), loam
5Y 2.5/1
8.5-28.5” highly dense, organic matter present, sandy loam with small clay pockets
5Y 4/2
28.5-37.5” very dense, small organic matter present, sandy clay with small clay pockets
5Y 4/1
CH-2 3153780.87 6838726.86 52.5”/7.0” 0-7.0” high water content, sandy loam 5Y 2.5/2 7.0-21.5” dense, small organic matter present (twigs), sandy loam 2.5Y 4/2
21.5-30.0” very dense, silty clay loam 2.5Y 4/1
30.0-50.5” high water content, dense, silty clay loam 2.5Y 5/1
50.5-52.5” dense, small dry clay pockets, silty clay 5Y 4/2
CH-3 3150172.91 6839705.25 49.0”/19.5” 0-4” water and fluff N/A 4-19.5” high water content, silty loam 5Y 4/1 19.5-49.0” dense, top 1” wet fine sand,
sandy clay 2.5Y 4/1
CH-4 3147721.62 6839230.79 60”/4.5” 0-2” water and fluff N/A 2-4.5” high water content, small organic matter, silty loam 5Y 2.5/2
4.5-35.0” high water content, dense, small organic matter, sandy loam 2.5Y 4/1
35.0-49.5” low water content, very dense, 10% mottled color, sandy clay loam
5Y 4/2
49.5-60.0” very dense, large pockets of clay, 50% mottled color, sandy clay loam
5Y 4/1 & 5YR 4/6
CH-5 3144294.29 6835091.31 59.75”/8” 0-2.5” water and fluff N/A 2.5-8.0” high water content, silty loam 5Y 2.5/2 8.0-15.0” organic matter top 1.5”, high water content, small organic matter, silty loam
2.5Y 3/1
15.0-35.0” high water content, dense, sandy loam 5Y 5/2
35.0-48.5” low water content, very dense, 30% mottled color, sandy loam 5Y 5/3
48.5-59.75” very dense, 40% mottled color, sandy loam
5Y 5/2 & 2.5Y 5/6
a Coordinates are based on NAD83 State Plane Texas North Central System (feet)
15
Table 2 (continued). Sediment core sampling analysis data - Lake Cherokee
Core Eastinga (ft)
Northinga (ft)
Total core sample/
post-impoundment
sediment
Sediment core description Munsell soil color
CH-6 3142122.24 6833456.59 28”/12” 0-4.0” water and fluff N/A 4.0-12.0” high water content, silty loam 5Y 2.5/2 12.0-28.0” very dense, some organic matter present, sandy clay loam 5Y 4/1
CH-7 3140864.23 6827602.04 48”/16.5” 0-6.0” water and fluff N/A 6.0-16.5” high water content, silty loam 5Y 2.5/2 16.5-26.5” dense, organic matter present
top 4”, silty clay loam 5Y 4/1
26.5-48.0” very dense, 30% mottled color, clay 5Y 4/2
CH-8 3139017.75 6825869.59 20.5”/8.5” 0-2.0” water and fluff N/A 2.0-4.5” high water content, small
organics present, silty loam 5Y 2.5/2
4.5-8.5” high water content, heavy/ coarse organic matter, sandy loam 5Y 3/1
8.5-20.5” very dense, coarse organic matter in lower 3” (roots, twigs), medium clay pockets, clay loam
5Y 4/1
a Coordinates are based on NAD83 State Plane Texas North Central System (feet)
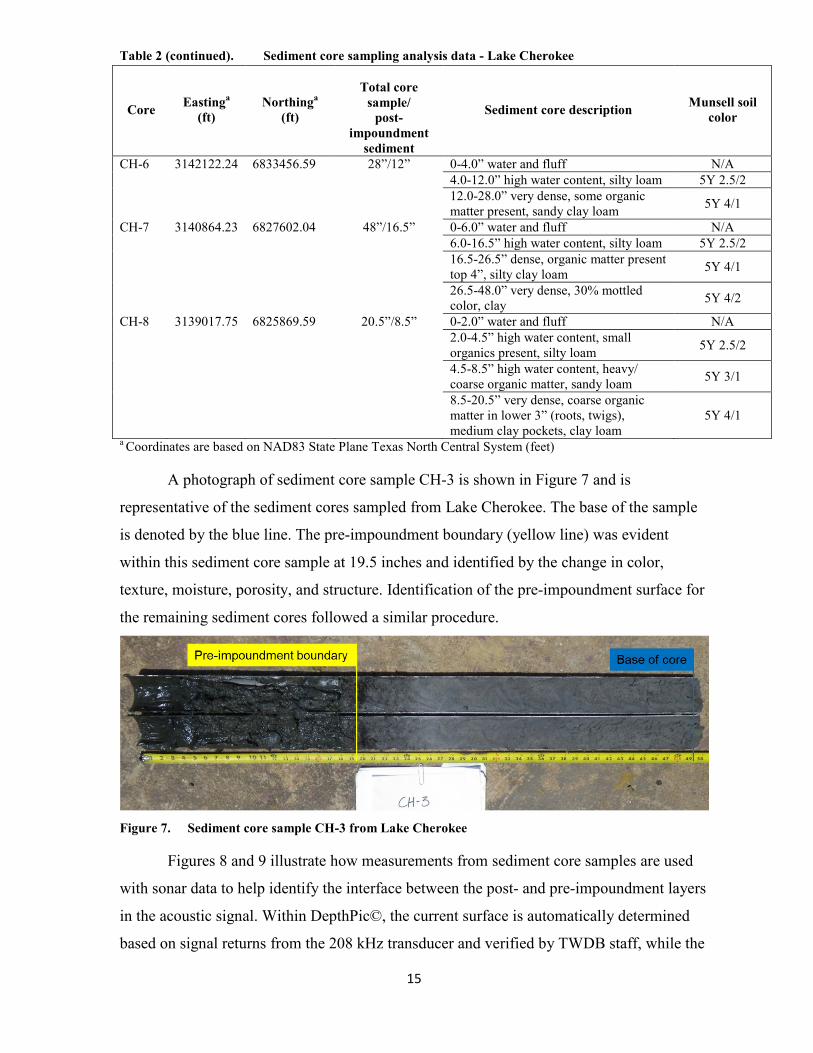
A photograph of sediment core sample CH-3 is shown in Figure 7 and is
representative of the sediment cores sampled from Lake Cherokee. The base of the sample
is denoted by the blue line. The pre-impoundment boundary (yellow line) was evident
within this sediment core sample at 19.5 inches and identified by the change in color,
texture, moisture, porosity, and structure. Identification of the pre-impoundment surface for
the remaining sediment cores followed a similar procedure.
Figure 7. Sediment core sample CH-3 from Lake Cherokee
Figures 8 and 9 illustrate how measurements from sediment core samples are used
with sonar data to help identify the interface between the post- and pre-impoundment layers
in the acoustic signal. Within DepthPic©, the current surface is automatically determined
based on signal returns from the 208 kHz transducer and verified by TWDB staff, while the
16
pre-impoundment surface must be determined visually. The pre-impoundment surface is
first identified along cross-sections for which sediment core samples have been collected.
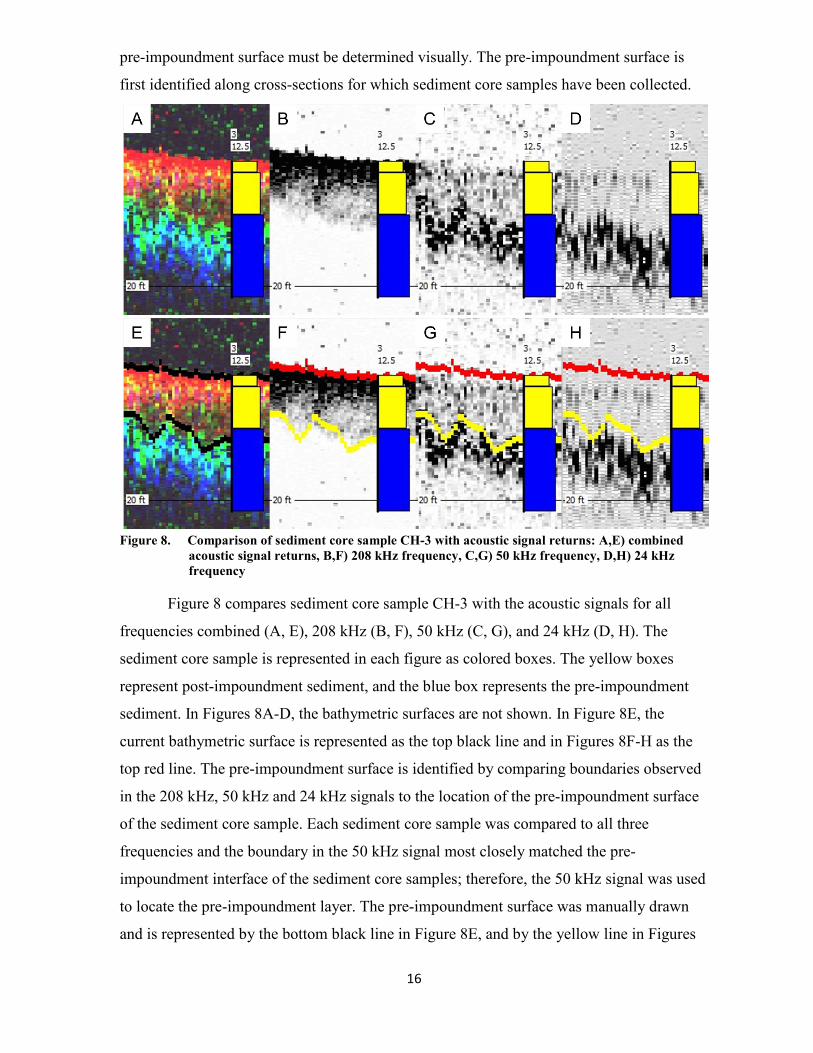
Figure 8. Comparison of sediment core sample CH-3 with acoustic signal returns: A,E) combined
acoustic signal returns, B,F) 208 kHz frequency, C,G) 50 kHz frequency, D,H) 24 kHz frequency
Figure 8 compares sediment core sample CH-3 with the acoustic signals for all
frequencies combined (A, E), 208 kHz (B, F), 50 kHz (C, G), and 24 kHz (D, H). The
sediment core sample is represented in each figure as colored boxes. The yellow boxes
represent post-impoundment sediment, and the blue box represents the pre-impoundment
sediment. In Figures 8A-D, the bathymetric surfaces are not shown. In Figure 8E, the
current bathymetric surface is represented as the top black line and in Figures 8F-H as the
top red line. The pre-impoundment surface is identified by comparing boundaries observed
in the 208 kHz, 50 kHz and 24 kHz signals to the location of the pre-impoundment surface
of the sediment core sample. Each sediment core sample was compared to all three
frequencies and the boundary in the 50 kHz signal most closely matched the pre-
impoundment interface of the sediment core samples; therefore, the 50 kHz signal was used
to locate the pre-impoundment layer. The pre-impoundment surface was manually drawn
and is represented by the bottom black line in Figure 8E, and by the yellow line in Figures
17
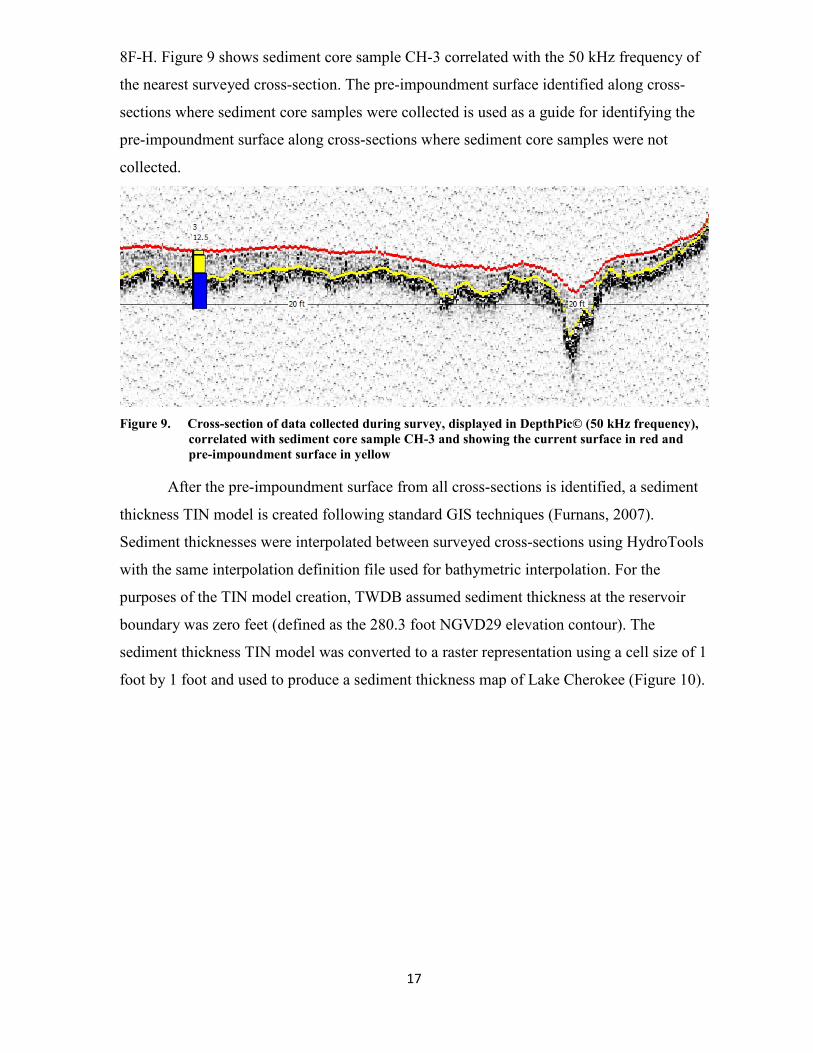
8F-H. Figure 9 shows sediment core sample CH-3 correlated with the 50 kHz frequency of
the nearest surveyed cross-section. The pre-impoundment surface identified along cross-
sections where sediment core samples were collected is used as a guide for identifying the
pre-impoundment surface along cross-sections where sediment core samples were not
collected.
Figure 9. Cross-section of data collected during survey, displayed in DepthPic© (50 kHz frequency),
correlated with sediment core sample CH-3 and showing the current surface in red and pre-impoundment surface in yellow
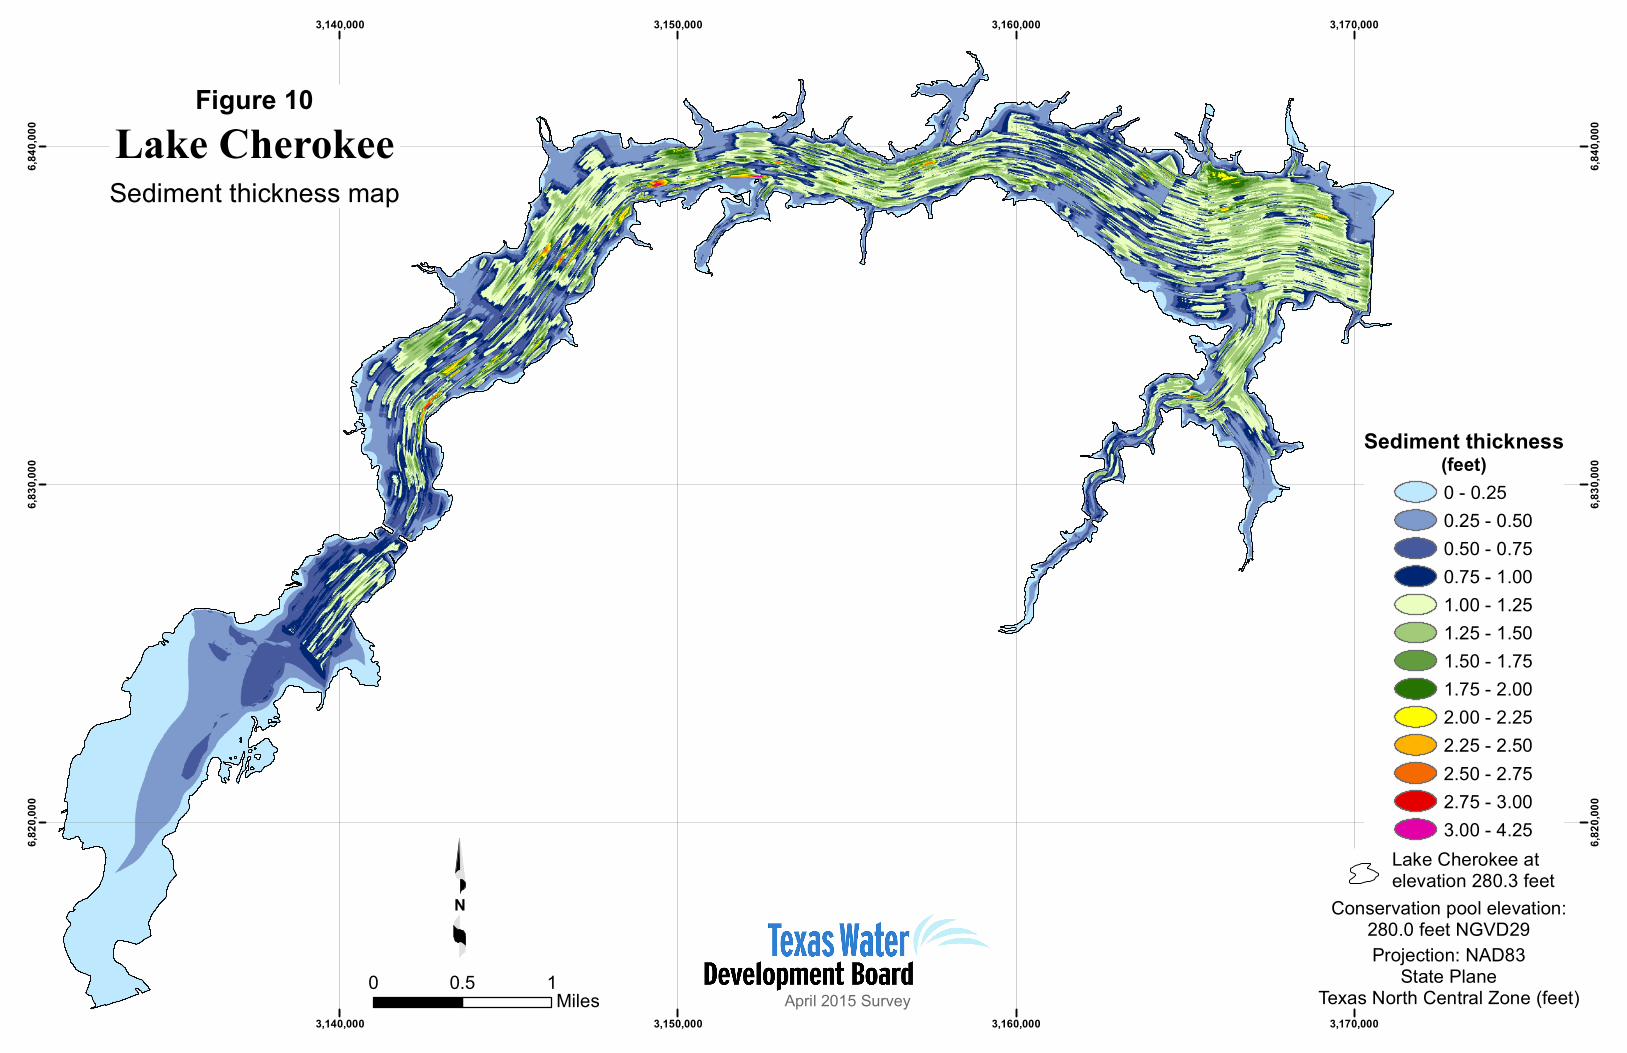
After the pre-impoundment surface from all cross-sections is identified, a sediment
thickness TIN model is created following standard GIS techniques (Furnans, 2007).
Sediment thicknesses were interpolated between surveyed cross-sections using HydroTools
with the same interpolation definition file used for bathymetric interpolation. For the
purposes of the TIN model creation, TWDB assumed sediment thickness at the reservoir
boundary was zero feet (defined as the 280.3 foot NGVD29 elevation contour). The
sediment thickness TIN model was converted to a raster representation using a cell size of 1
foot by 1 foot and used to produce a sediment thickness map of Lake Cherokee (Figure 10).
3,140,000
3,140,000
3,150,000
3,150,000
3,160,000
3,160,000
3,170,000
3,170,000
6,820
,000
6,820
,000
6,830
,000
6,830
,000
6,840
,000
6,840
,000
N
0 0.5 1Miles
Figure 10
Sediment thickness mapLake Cherokee
Sediment thickness(feet)0 - 0.250.25 - 0.500.50 - 0.750.75 - 1.001.00 - 1.251.25 - 1.501.50 - 1.751.75 - 2.002.00 - 2.252.25 - 2.502.50 - 2.752.75 - 3.003.00 - 4.25
Conservation pool elevation:280.0 feet NGVD29Projection: NAD83
State PlaneTexas North Central Zone (feet)
Lake Cherokee atelevation 280.3 feet
April 2015 Survey
19
Survey results
Volumetric survey
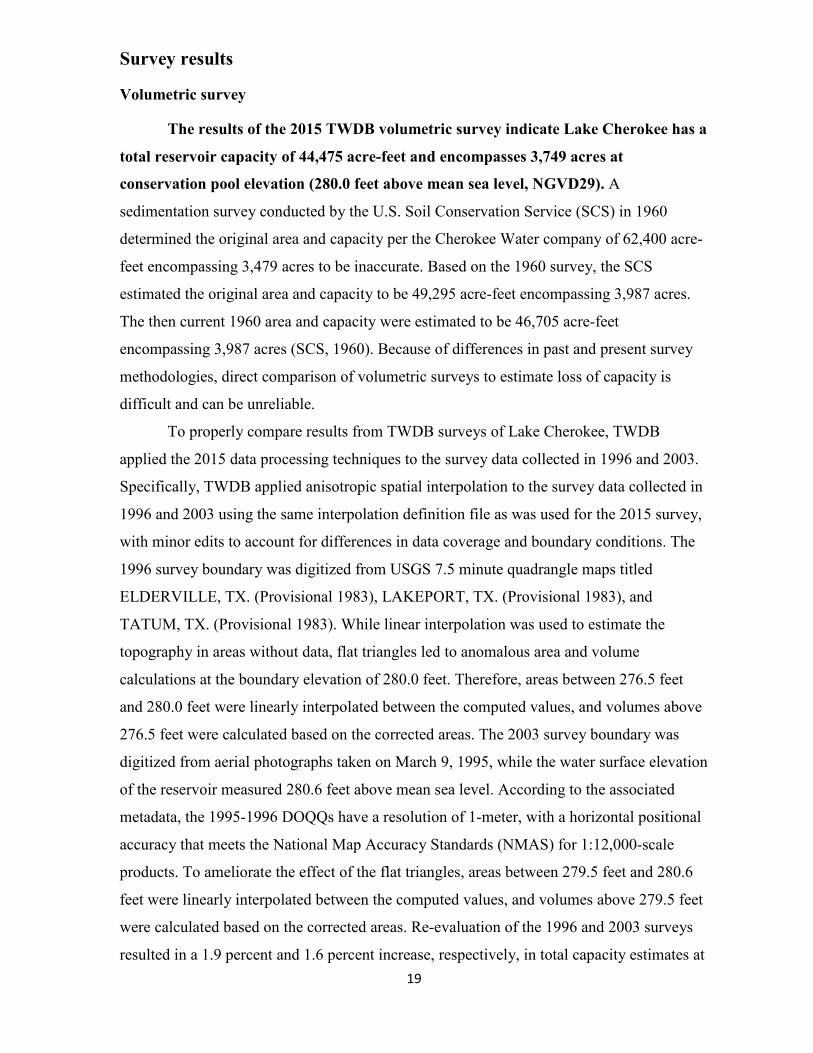
The results of the 2015 TWDB volumetric survey indicate Lake Cherokee has a
total reservoir capacity of 44,475 acre-feet and encompasses 3,749 acres at
conservation pool elevation (280.0 feet above mean sea level, NGVD29). A
sedimentation survey conducted by the U.S. Soil Conservation Service (SCS) in 1960
determined the original area and capacity per the Cherokee Water company of 62,400 acre-
feet encompassing 3,479 acres to be inaccurate. Based on the 1960 survey, the SCS
estimated the original area and capacity to be 49,295 acre-feet encompassing 3,987 acres.
The then current 1960 area and capacity were estimated to be 46,705 acre-feet
encompassing 3,987 acres (SCS, 1960). Because of differences in past and present survey
methodologies, direct comparison of volumetric surveys to estimate loss of capacity is
difficult and can be unreliable.
To properly compare results from TWDB surveys of Lake Cherokee, TWDB
applied the 2015 data processing techniques to the survey data collected in 1996 and 2003.
Specifically, TWDB applied anisotropic spatial interpolation to the survey data collected in
1996 and 2003 using the same interpolation definition file as was used for the 2015 survey,
with minor edits to account for differences in data coverage and boundary conditions. The
1996 survey boundary was digitized from USGS 7.5 minute quadrangle maps titled
ELDERVILLE, TX. (Provisional 1983), LAKEPORT, TX. (Provisional 1983), and
TATUM, TX. (Provisional 1983). While linear interpolation was used to estimate the
topography in areas without data, flat triangles led to anomalous area and volume
calculations at the boundary elevation of 280.0 feet. Therefore, areas between 276.5 feet
and 280.0 feet were linearly interpolated between the computed values, and volumes above
276.5 feet were calculated based on the corrected areas. The 2003 survey boundary was
digitized from aerial photographs taken on March 9, 1995, while the water surface elevation
of the reservoir measured 280.6 feet above mean sea level. According to the associated
metadata, the 1995-1996 DOQQs have a resolution of 1-meter, with a horizontal positional
accuracy that meets the National Map Accuracy Standards (NMAS) for 1:12,000-scale
products. To ameliorate the effect of the flat triangles, areas between 279.5 feet and 280.6
feet were linearly interpolated between the computed values, and volumes above 279.5 feet
were calculated based on the corrected areas. Re-evaluation of the 1996 and 2003 surveys
resulted in a 1.9 percent and 1.6 percent increase, respectively, in total capacity estimates at
20
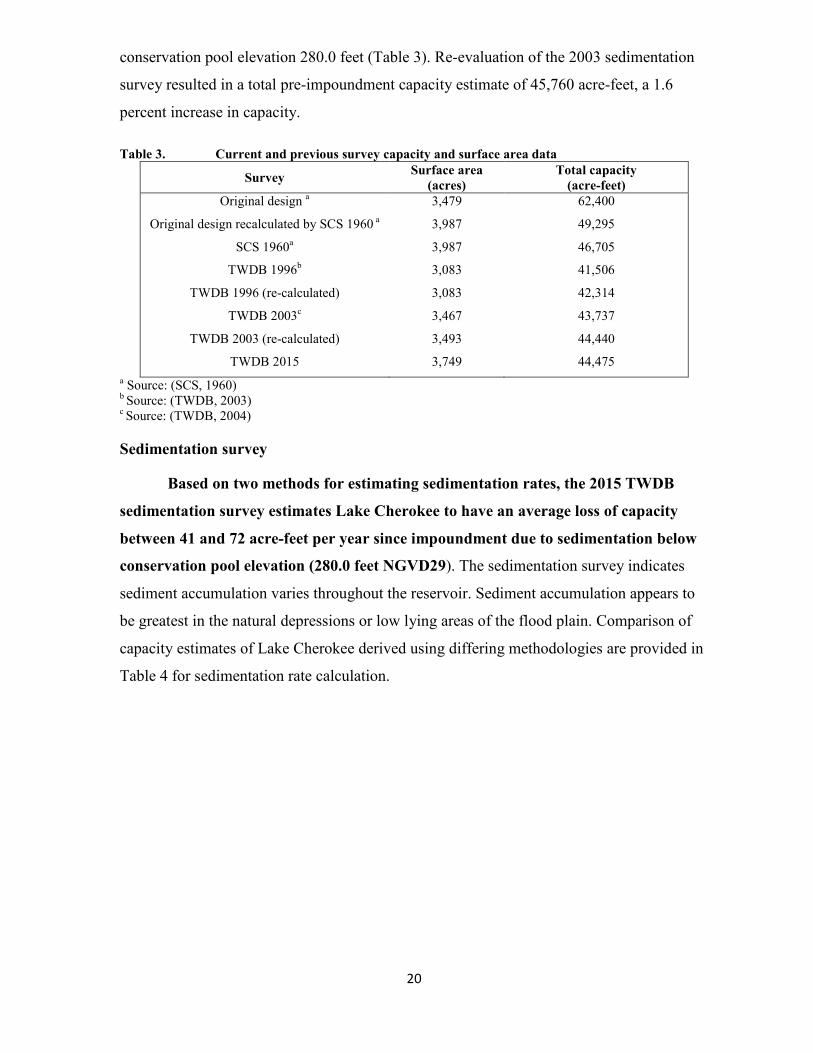
conservation pool elevation 280.0 feet (Table 3). Re-evaluation of the 2003 sedimentation
survey resulted in a total pre-impoundment capacity estimate of 45,760 acre-feet, a 1.6
percent increase in capacity.
Table 3. Current and previous survey capacity and surface area data
Survey Surface area (acres)
Total capacity (acre-feet)
Original design a 3,479 62,400
Original design recalculated by SCS 1960 a 3,987 49,295
SCS 1960a 3,987 46,705
TWDB 1996b 3,083 41,506
TWDB 1996 (re-calculated) 3,083 42,314
TWDB 2003c 3,467 43,737
TWDB 2003 (re-calculated) 3,493 44,440
TWDB 2015 3,749 44,475 a Source: (SCS, 1960) b Source: (TWDB, 2003) c Source: (TWDB, 2004)
Sedimentation survey
Based on two methods for estimating sedimentation rates, the 2015 TWDB
sedimentation survey estimates Lake Cherokee to have an average loss of capacity
between 41 and 72 acre-feet per year since impoundment due to sedimentation below
conservation pool elevation (280.0 feet NGVD29). The sedimentation survey indicates
sediment accumulation varies throughout the reservoir. Sediment accumulation appears to
be greatest in the natural depressions or low lying areas of the flood plain. Comparison of
capacity estimates of Lake Cherokee derived using differing methodologies are provided in
Table 4 for sedimentation rate calculation.
21
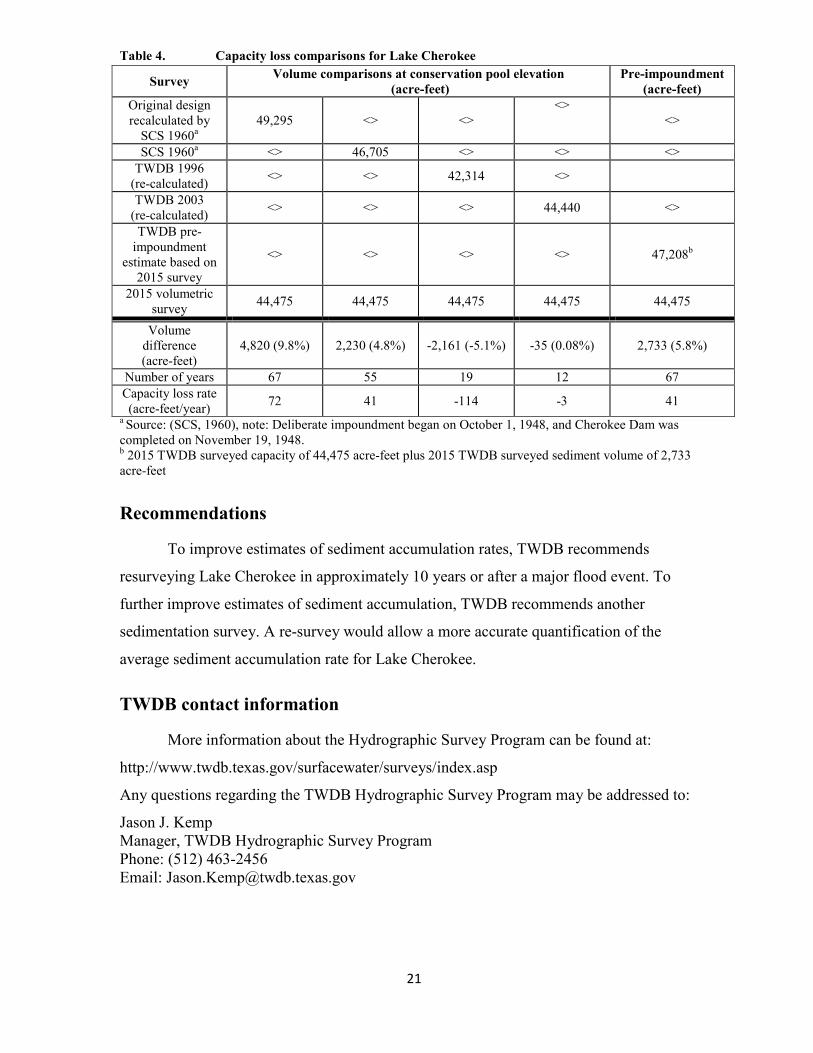
Table 4. Capacity loss comparisons for Lake Cherokee
Survey Volume comparisons at conservation pool elevation (acre-feet)
Pre-impoundment (acre-feet)
Original design recalculated by
SCS 1960a 49,295 <> <>
<> <>
SCS 1960a <> 46,705 <> <> <> TWDB 1996
(re-calculated) <> <> 42,314 <>
TWDB 2003 (re-calculated) <> <> <> 44,440 <>
TWDB pre-impoundment
estimate based on 2015 survey
<> <> <> <> 47,208b
2015 volumetric survey 44,475 44,475 44,475 44,475 44,475
Volume difference (acre-feet)
4,820 (9.8%) 2,230 (4.8%) -2,161 (-5.1%) -35 (0.08%) 2,733 (5.8%)
Number of years 67 55 19 12 67 Capacity loss rate (acre-feet/year) 72 41 -114 -3 41
a Source: (SCS, 1960), note: Deliberate impoundment began on October 1, 1948, and Cherokee Dam was completed on November 19, 1948. b 2015 TWDB surveyed capacity of 44,475 acre-feet plus 2015 TWDB surveyed sediment volume of 2,733 acre-feet
Recommendations
To improve estimates of sediment accumulation rates, TWDB recommends
resurveying Lake Cherokee in approximately 10 years or after a major flood event. To
further improve estimates of sediment accumulation, TWDB recommends another
sedimentation survey. A re-survey would allow a more accurate quantification of the
average sediment accumulation rate for Lake Cherokee.
TWDB contact information
More information about the Hydrographic Survey Program can be found at:
http://www.twdb.texas.gov/surfacewater/surveys/index.asp
Any questions regarding the TWDB Hydrographic Survey Program may be addressed to:
Jason J. Kemp Manager, TWDB Hydrographic Survey Program Phone: (512) 463-2456 Email: [email protected]

22
References ESRI (Environmental Systems Research Institute), 1995, ARC/INFO Surface Modeling and
Display, TIN Users Guide, ESRI, 380 New York Street, Redlands, CA 92373.
Furnans, J., Austin, B., 2007, Hydrographic survey methods for determining reservoir volume, Environmental Modeling & Software, doi:10.1016/j.envsoft.2007.05.011.
McEwen, T., Brock, N., Kemp, J., Pothina, D. & Weyant, H., 2014a, HydroTools User’s Manual, Texas Water Development Board.
McEwen, T., Pothina, D. & Negusse, S., 2014b, Improving efficiency and repeatability of lake volume estimates using Python, submitted, Proceedings of the 10th Python for Scientific Computing Conference (SciPy 2014).
SCS (U.S. Soil Conservation Service), 1960, Report on Sedimentation of Lake Cherokee, Gregg and Rusk Counties, Texas, April 4 – May 13, 1060.
SWEPCO (Southwestern Electric Power Company), 2015, History, https://www.swepco.com/info/facts/History.aspx, accessed August 2015.
TNRIS (Texas Natural Resources Information System), 2015a, http://www.tnris.org/, accessed March 2015.
TNRIS (Texas Natural Resources Information System), 2015b, http://tnris.org/news/2015- 01-09/naip-2014-statewide-aerial-available/, accessed August 2015.
TWDB (Texas Water Development Board), 1974, Cherokee Dam and Lake Cherokee, Report 126, Engineering Data on Dams and Reservoirs in Texas, Part I.
TWDB (Texas Water Development Board), 2003, Volumetric and Sediment Survey of Lake Cherokee, http://www.twdb.texas.gov/hydro_survey/Cherokee/1996-10/Cherokee1996_FinalReport.pdf.
TWDB (Texas Water Development Board), 2004, Volumetric Survey Report of Lake Cherokee, http://www.twdb.texas.gov/hydro_survey/Cherokee/2003-11/Cherokee2003_FinalReport.pdf.
TWDB (Texas Water Development Board), 2015, Contract No. R1548011795 with U.S. Army Corps of Engineers, Fort Worth District.
USDA (US Department of Agriculture), 2011, National Agricultural Imagery Program (NAIP) Information Sheet, February 2015, http://www.fsa.usda.gov/Internet/FSA_File/naip_info_sheet_2015.pdf, accessed August 2015.
Van Metre, P.C., Wilson, J.T., Fuller, C.C., Callender, Edward, and Mahler, B.J., 2004, Collection, analysis, and age-dating of sediment cores from 56 U.S. lakes and reservoirs sampled by the U.S. Geological Survey, 1992-2001: U.S. Geological Survey Scientific Investigations Report 2004-5184, United States Geological Survey, 180p.
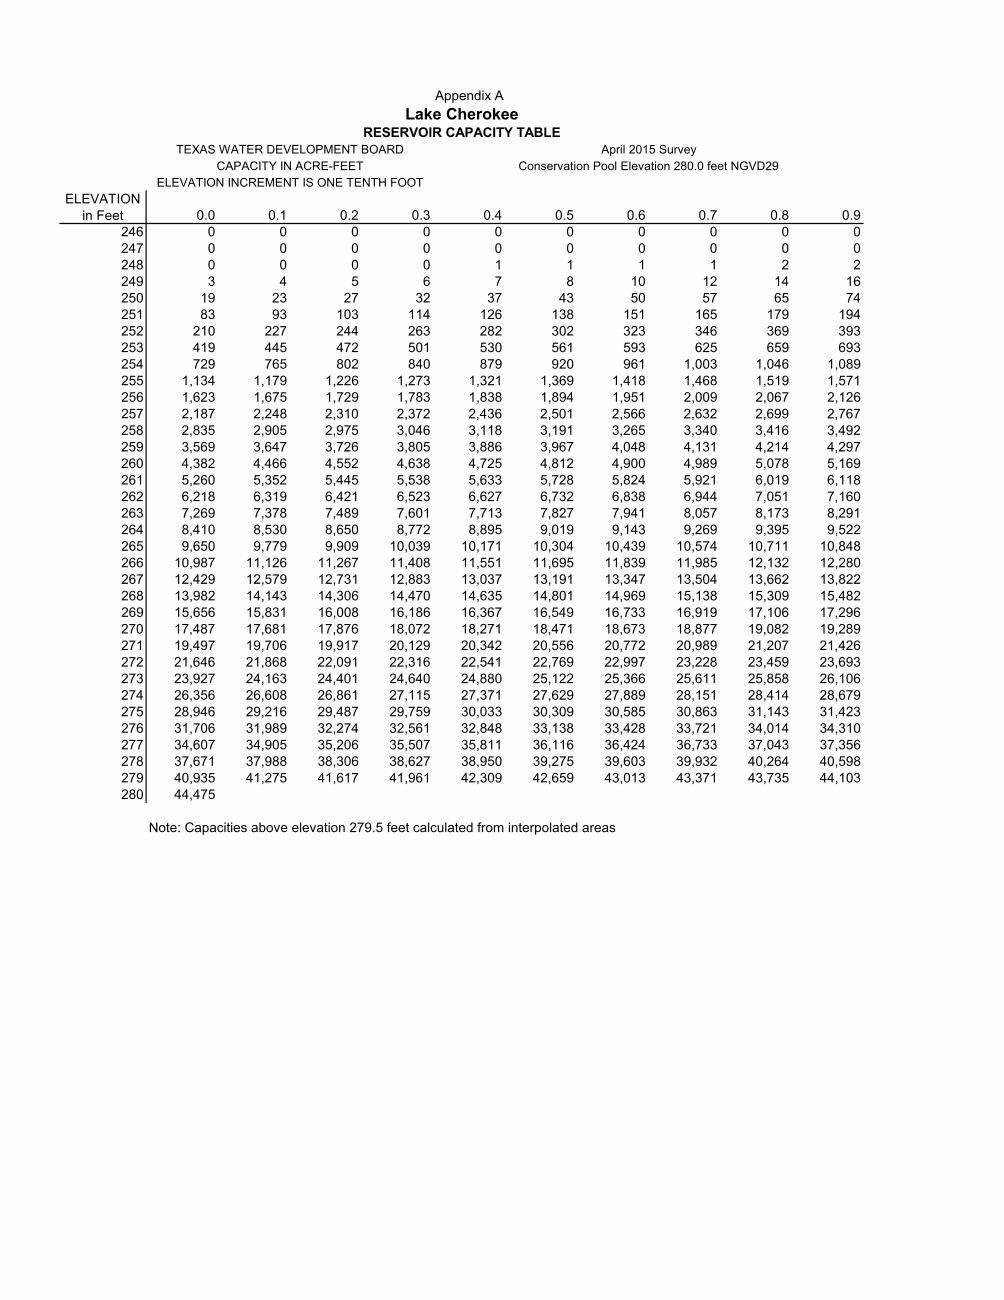
ELEVATION in Feet 0.0 0.1 0.2 0.3 0.4 0.5 0.6 0.7 0.8 0.9
246 0 0 0 0 0 0 0 0 0 0247 0 0 0 0 0 0 0 0 0 0248 0 0 0 0 1 1 1 1 2 2249 3 4 5 6 7 8 10 12 14 16250 19 23 27 32 37 43 50 57 65 74251 83 93 103 114 126 138 151 165 179 194252 210 227 244 263 282 302 323 346 369 393253 419 445 472 501 530 561 593 625 659 693254 729 765 802 840 879 920 961 1,003 1,046 1,089255 1,134 1,179 1,226 1,273 1,321 1,369 1,418 1,468 1,519 1,571256 1,623 1,675 1,729 1,783 1,838 1,894 1,951 2,009 2,067 2,126257 2,187 2,248 2,310 2,372 2,436 2,501 2,566 2,632 2,699 2,767258 2,835 2,905 2,975 3,046 3,118 3,191 3,265 3,340 3,416 3,492259 3,569 3,647 3,726 3,805 3,886 3,967 4,048 4,131 4,214 4,297260 4,382 4,466 4,552 4,638 4,725 4,812 4,900 4,989 5,078 5,169261 5,260 5,352 5,445 5,538 5,633 5,728 5,824 5,921 6,019 6,118262 6,218 6,319 6,421 6,523 6,627 6,732 6,838 6,944 7,051 7,160263 7,269 7,378 7,489 7,601 7,713 7,827 7,941 8,057 8,173 8,291264 8,410 8,530 8,650 8,772 8,895 9,019 9,143 9,269 9,395 9,522265 9,650 9,779 9,909 10,039 10,171 10,304 10,439 10,574 10,711 10,848266 10,987 11,126 11,267 11,408 11,551 11,695 11,839 11,985 12,132 12,280267 12,429 12,579 12,731 12,883 13,037 13,191 13,347 13,504 13,662 13,822268 13,982 14,143 14,306 14,470 14,635 14,801 14,969 15,138 15,309 15,482269 15,656 15,831 16,008 16,186 16,367 16,549 16,733 16,919 17,106 17,296270 17,487 17,681 17,876 18,072 18,271 18,471 18,673 18,877 19,082 19,289271 19,497 19,706 19,917 20,129 20,342 20,556 20,772 20,989 21,207 21,426272 21,646 21,868 22,091 22,316 22,541 22,769 22,997 23,228 23,459 23,693273 23,927 24,163 24,401 24,640 24,880 25,122 25,366 25,611 25,858 26,106274 26,356 26,608 26,861 27,115 27,371 27,629 27,889 28,151 28,414 28,679275 28,946 29,216 29,487 29,759 30,033 30,309 30,585 30,863 31,143 31,423276 31,706 31,989 32,274 32,561 32,848 33,138 33,428 33,721 34,014 34,310277 34,607 34,905 35,206 35,507 35,811 36,116 36,424 36,733 37,043 37,356278 37,671 37,988 38,306 38,627 38,950 39,275 39,603 39,932 40,264 40,598279 40,935 41,275 41,617 41,961 42,309 42,659 43,013 43,371 43,735 44,103280 44,475
Note: Capacities above elevation 279.5 feet calculated from interpolated areas
ELEVATION INCREMENT IS ONE TENTH FOOT
Appendix ALake Cherokee
RESERVOIR CAPACITY TABLETEXAS WATER DEVELOPMENT BOARD April 2015 Survey
CAPACITY IN ACRE-FEET Conservation Pool Elevation 280.0 feet NGVD29
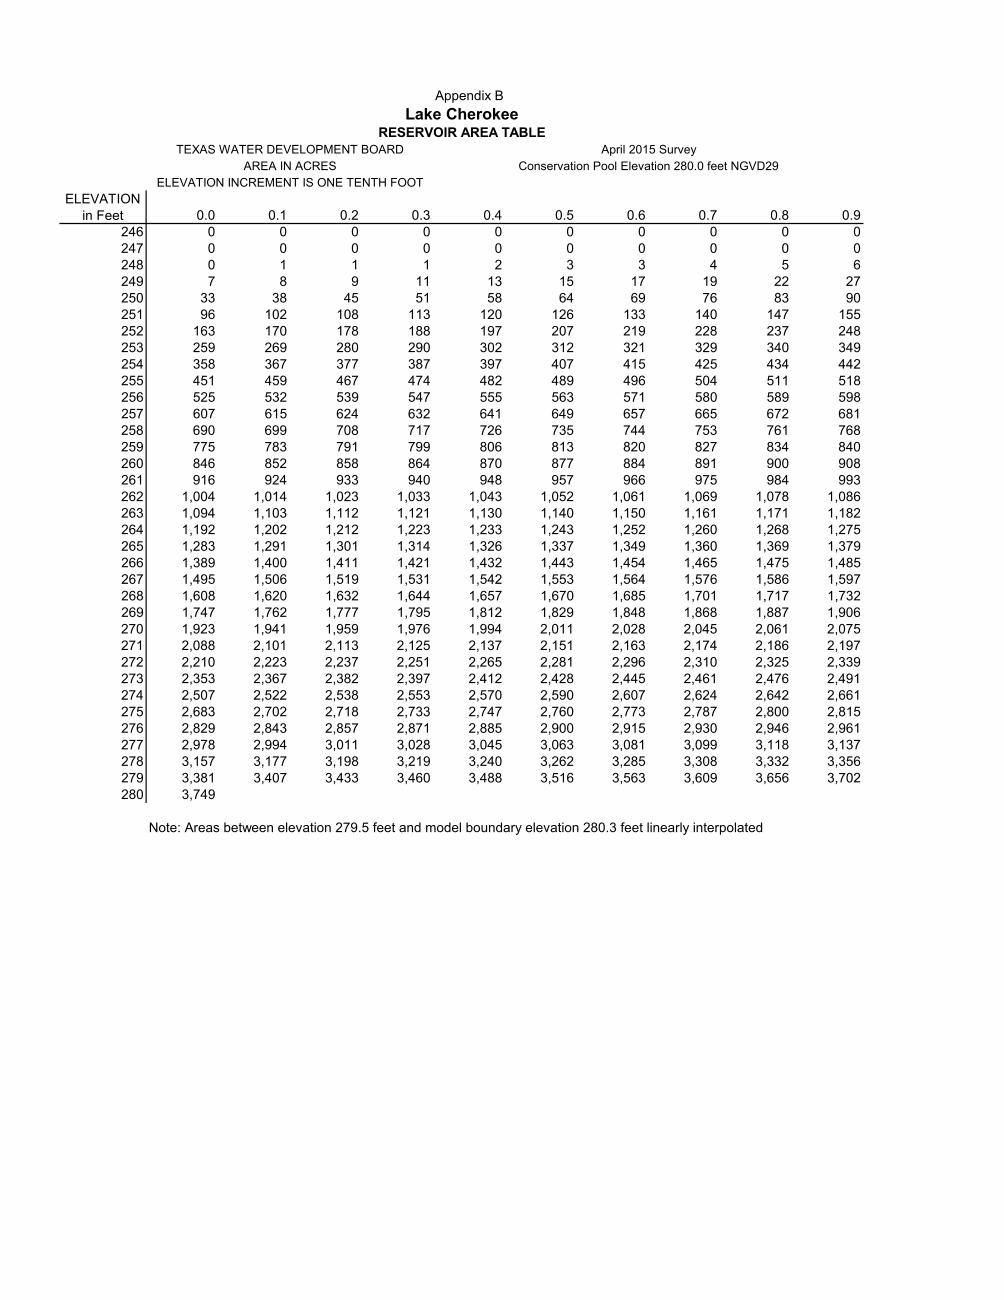
ELEVATION in Feet 0.0 0.1 0.2 0.3 0.4 0.5 0.6 0.7 0.8 0.9
246 0 0 0 0 0 0 0 0 0 0247 0 0 0 0 0 0 0 0 0 0248 0 1 1 1 2 3 3 4 5 6249 7 8 9 11 13 15 17 19 22 27250 33 38 45 51 58 64 69 76 83 90251 96 102 108 113 120 126 133 140 147 155252 163 170 178 188 197 207 219 228 237 248253 259 269 280 290 302 312 321 329 340 349254 358 367 377 387 397 407 415 425 434 442255 451 459 467 474 482 489 496 504 511 518256 525 532 539 547 555 563 571 580 589 598257 607 615 624 632 641 649 657 665 672 681258 690 699 708 717 726 735 744 753 761 768259 775 783 791 799 806 813 820 827 834 840260 846 852 858 864 870 877 884 891 900 908261 916 924 933 940 948 957 966 975 984 993262 1,004 1,014 1,023 1,033 1,043 1,052 1,061 1,069 1,078 1,086263 1,094 1,103 1,112 1,121 1,130 1,140 1,150 1,161 1,171 1,182264 1,192 1,202 1,212 1,223 1,233 1,243 1,252 1,260 1,268 1,275265 1,283 1,291 1,301 1,314 1,326 1,337 1,349 1,360 1,369 1,379266 1,389 1,400 1,411 1,421 1,432 1,443 1,454 1,465 1,475 1,485267 1,495 1,506 1,519 1,531 1,542 1,553 1,564 1,576 1,586 1,597268 1,608 1,620 1,632 1,644 1,657 1,670 1,685 1,701 1,717 1,732269 1,747 1,762 1,777 1,795 1,812 1,829 1,848 1,868 1,887 1,906270 1,923 1,941 1,959 1,976 1,994 2,011 2,028 2,045 2,061 2,075271 2,088 2,101 2,113 2,125 2,137 2,151 2,163 2,174 2,186 2,197272 2,210 2,223 2,237 2,251 2,265 2,281 2,296 2,310 2,325 2,339273 2,353 2,367 2,382 2,397 2,412 2,428 2,445 2,461 2,476 2,491274 2,507 2,522 2,538 2,553 2,570 2,590 2,607 2,624 2,642 2,661275 2,683 2,702 2,718 2,733 2,747 2,760 2,773 2,787 2,800 2,815276 2,829 2,843 2,857 2,871 2,885 2,900 2,915 2,930 2,946 2,961277 2,978 2,994 3,011 3,028 3,045 3,063 3,081 3,099 3,118 3,137278 3,157 3,177 3,198 3,219 3,240 3,262 3,285 3,308 3,332 3,356279 3,381 3,407 3,433 3,460 3,488 3,516 3,563 3,609 3,656 3,702280 3,749
Note: Areas between elevation 279.5 feet and model boundary elevation 280.3 feet linearly interpolated
ELEVATION INCREMENT IS ONE TENTH FOOT
Appendix BLake Cherokee
RESERVOIR AREA TABLETEXAS WATER DEVELOPMENT BOARD April 2015 Survey
AREA IN ACRES Conservation Pool Elevation 280.0 feet NGVD29
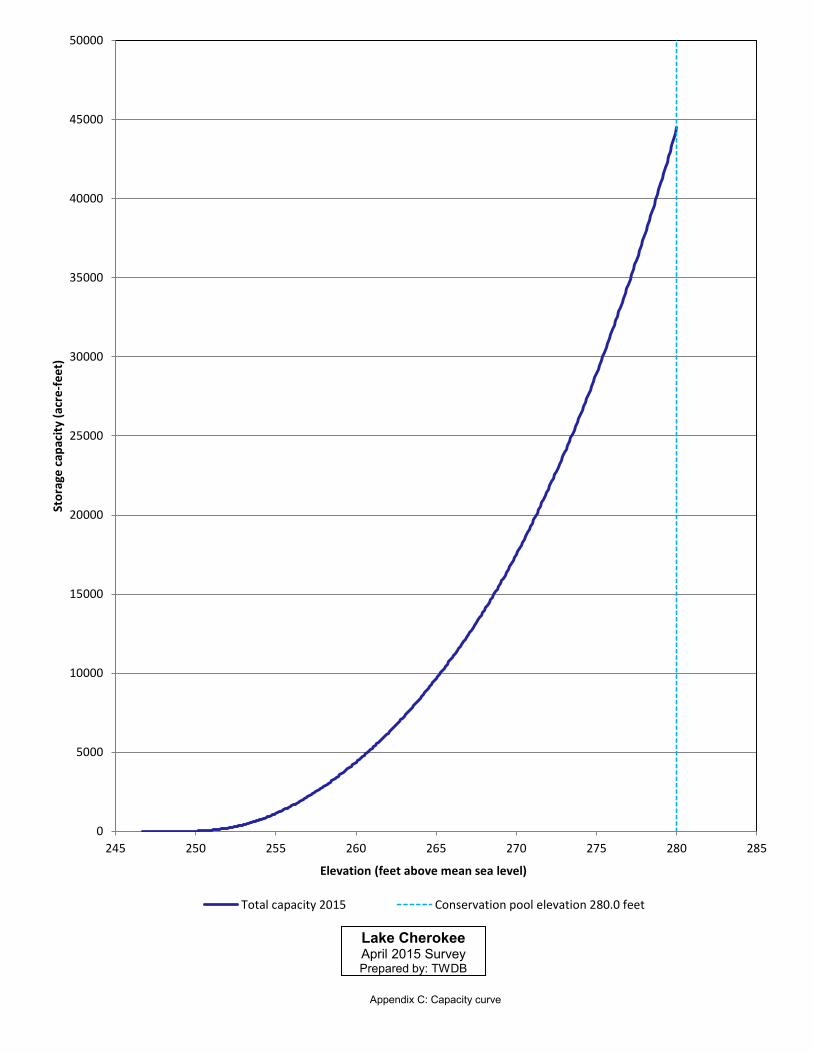
0
5000
10000
15000
20000
25000
30000
35000
40000
45000
50000
245 250 255 260 265 270 275 280 285
Stor
age
capa
city
(acr
e-fe
et)
Elevation (feet above mean sea level)
Total capacity 2015 Conservation pool elevation 280.0 feet
Lake Cherokee April 2015 Survey Prepared by: TWDB
Appendix C: Capacity curve
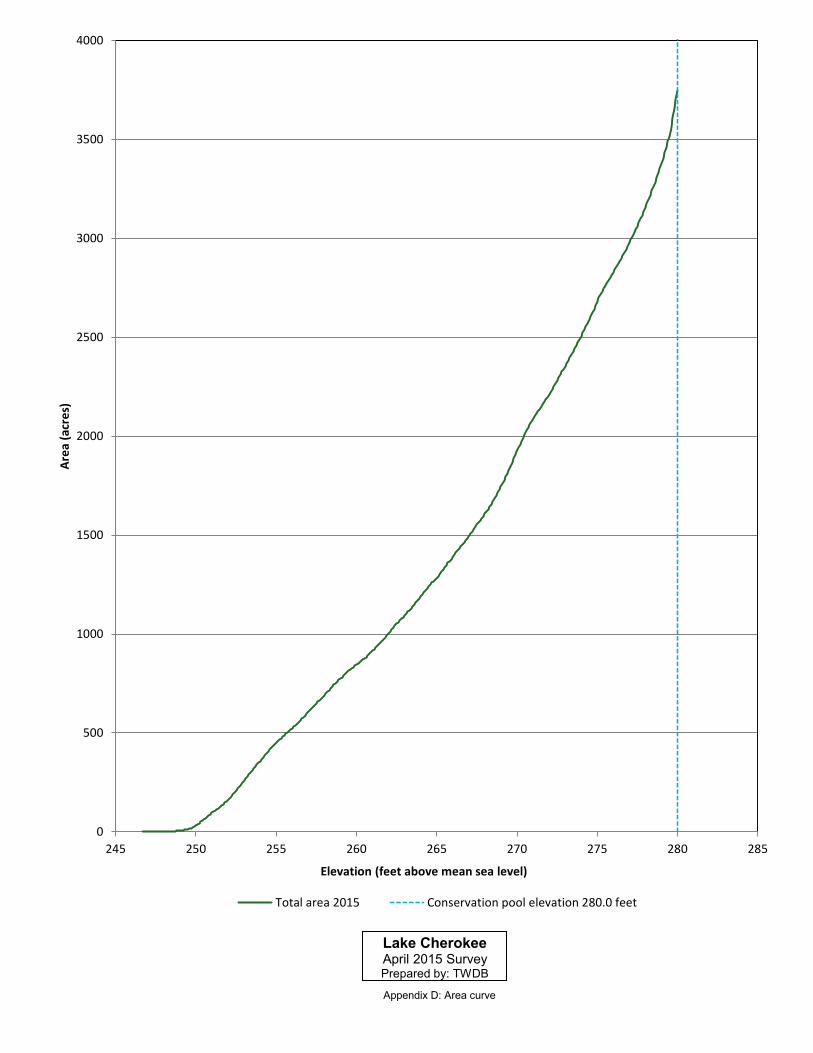
0
500
1000
1500
2000
2500
3000
3500
4000
245 250 255 260 265 270 275 280 285
Area
(acr
es)
Elevation (feet above mean sea level)
Total area 2015 Conservation pool elevation 280.0 feet
Lake Cherokee April 2015 Survey Prepared by: TWDB
Appendix D: Area curve
3,140,000
3,140,000
3,150,000
3,150,000
3,160,000
3,160,000
3,170,000
3,170,000
6,820
,000
6,820
,000
6,830
,000
6,830
,000
6,840
,000
6,840
,000
252
254
256
258
260
262
264
266268270
272
274276278
264
266
268
270
272
278
276
274
254
256
258
260
262262
280278
276
264
266
268
270
270
272
280
278
276
274
274
274272
270272274
252254256
250
268
266
264 262260258
256254252
Figure 6
This map is the product of a survey conducted bythe Texas Water Development Board's Hydrographic
Survey Program to determine the capacity of Lake Cherokee. The Texas Water Development
Board makes no representations nor assumes any liability.
Projection: NAD83State Plane Texas
North Central Zone (feet)
Contours(feet)
N
0 0.5 10.25Miles
IslandsConservationpool elevation
280.0 feet NGVD29
April 2015 Survey
Lake Cherokee2' - contour map
280278276274272270268266264262260258256254252250248
Lake Cherokee atelevation 280.3 feet
Gregg CountyRusk County


