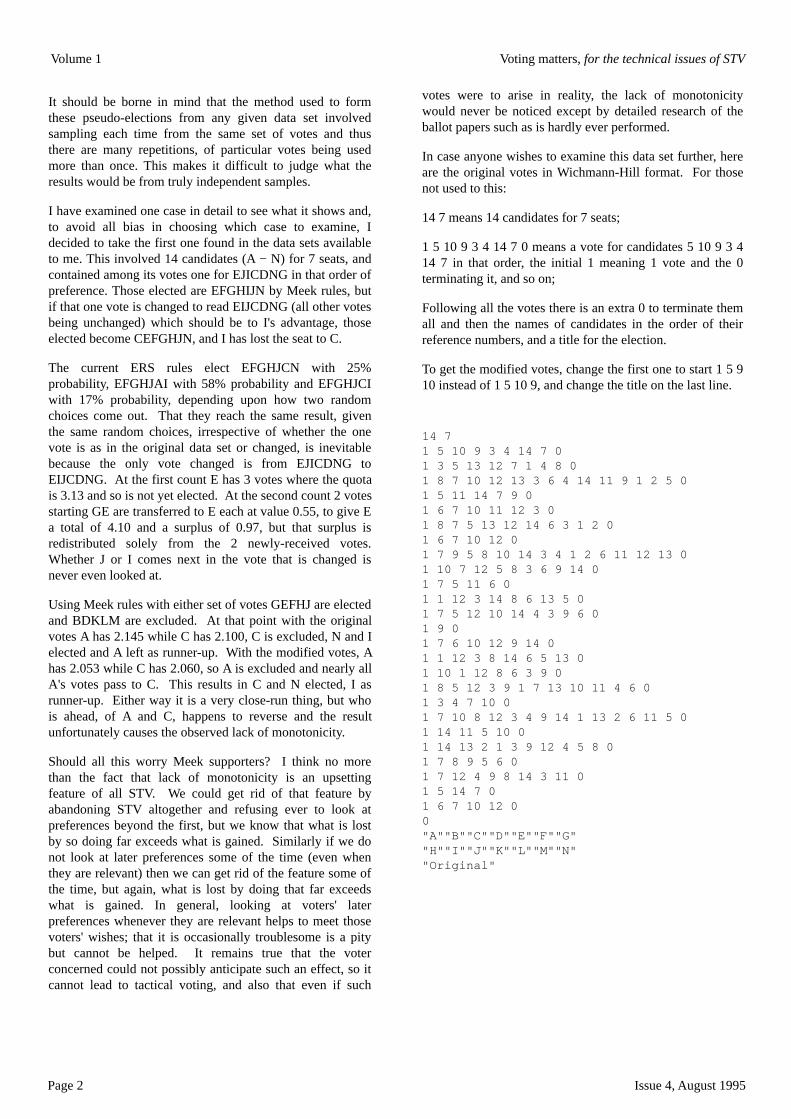
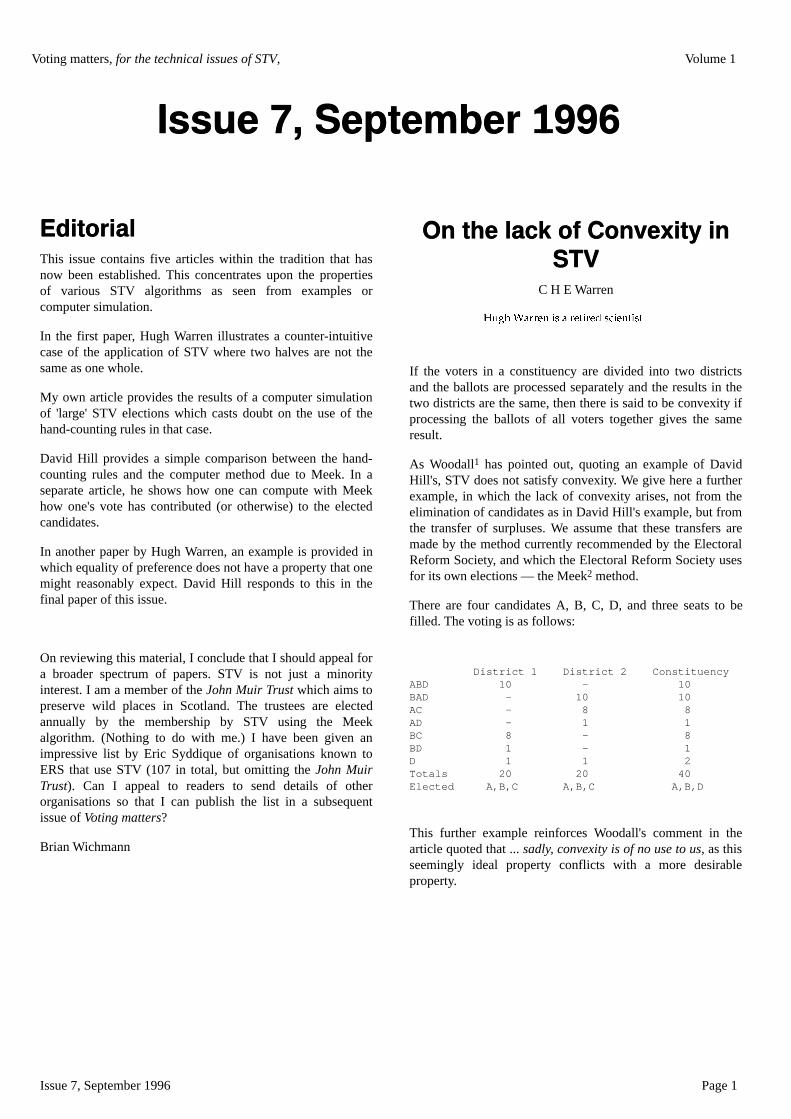
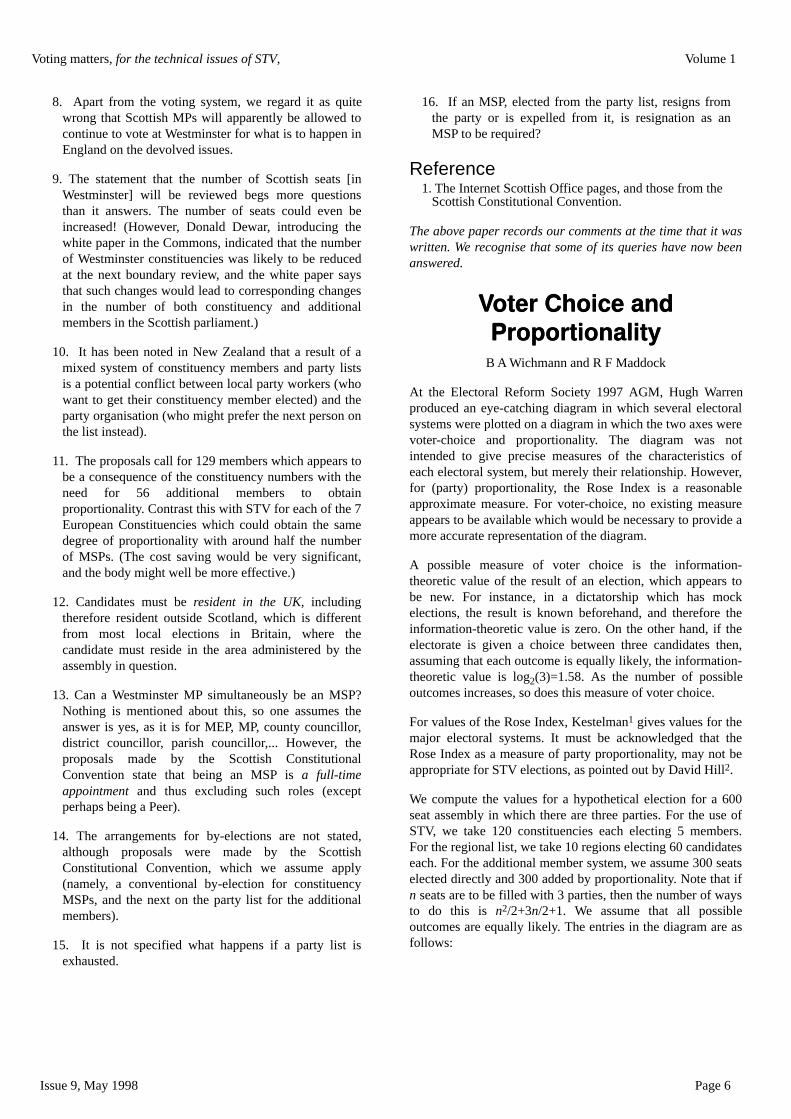
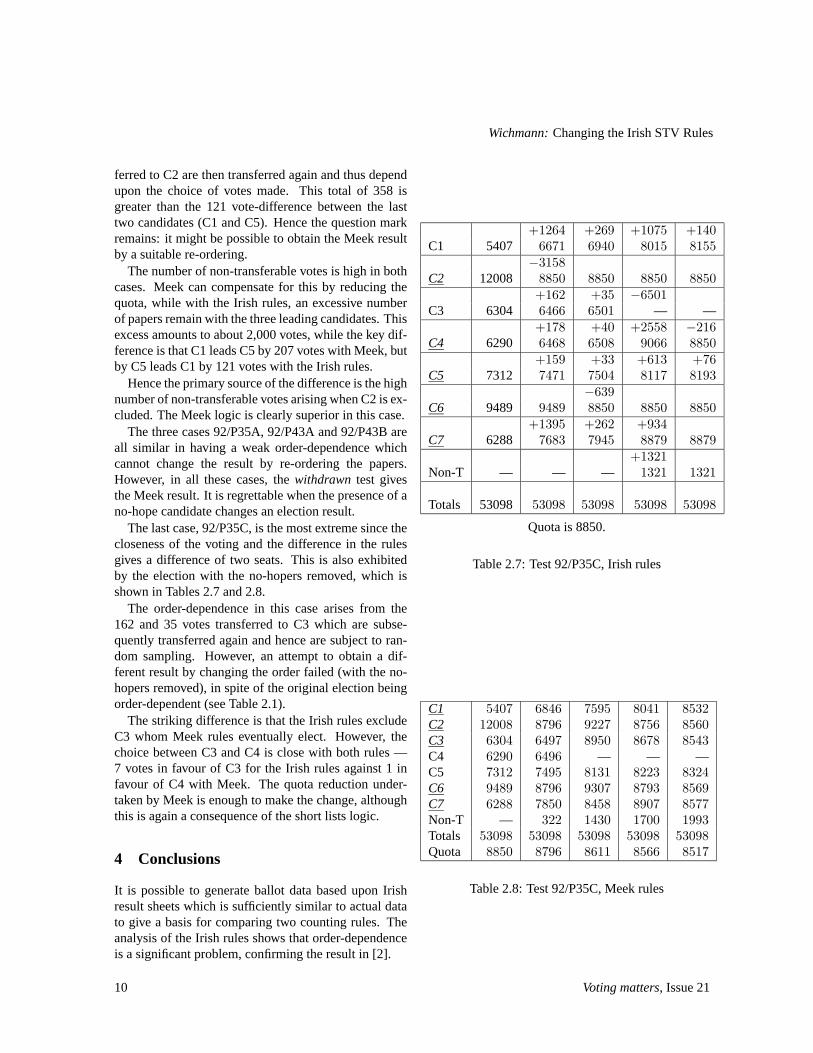
V o t i n g m a t t e r s for the technical issues of STV The Electoral Reform Society Volume 1, Issues 1-10 March 1994 - March 1999 All correspondence regarding Voting matters should be addressed to: B A Wichmann, The Editor, Voting matters, The Electoral Reform Society, 6 Chancel Street, London, SE1 0UU. Readers are reminded that views expressed in Voting matters by contributors do not necessarily reflect those of the Electoral Reform Society. To aid production, the Editor would welcome contributions on IBM-PC discs, with a printed copy as well. E d i t o r i a l In recent years Representation has tended to shy away from articles of a technical nature and restrict itself to the non- technical. While there may be some advantages in this course of action, it has left those with technical things to say on voting systems without a suitable outlet for their ideas and arguments. The members of the Electoral Reform Society's Technical Committee, and others, have been unhappy about this. Hence this new venture, which it is intended to circulate to those Society members who request it. In this first issue, we reprint some earlier articles that deserve a wider circulation. Those by B L Meek, originally published over 20 years ago in French, have been available in English only as a typed and duplicated version containing many errors. These are classic papers which have led to much discussion in recent years. Whether one agrees with Meek's conclusions or not, it cannot be denied that those who argue about his method need to know what he did actually say. The article by D R Woodall was also printed with an error originally and this reprint includes the necessary correction. Although Woodall's method is basically the same as Meek's, it was entirely independently derived and it is interesting to see his different approach. The article by C H E Warren has not been published before. It is a slightly rewritten version of a paper first submitted in 1983, but not then accepted. Warren's method is similar in spirit to the other two, but differs in the way it performs. Each of the two counting methods has an advantage over the other in some circumstances so, although a majority of the ERS Technical Committee prefer the Meek/ Woodall formulation, the Warren alternative is worth bearing in mind. The final paper discusses the differences. I D Hill Chairman, ERS Technical Committee A N e w A p p r o a c h t o t h e S i n g l e T r a n s f e r a b l e V o t e Paper I: Equality of Treatment of voters and a feedback mechanism for vote counting. With some differences in presentation, the paper was originally published in French in Mathématiques et Sciences Humaines, No 25, pp13-23, 1969. Issue 1, March 1994 Page 1
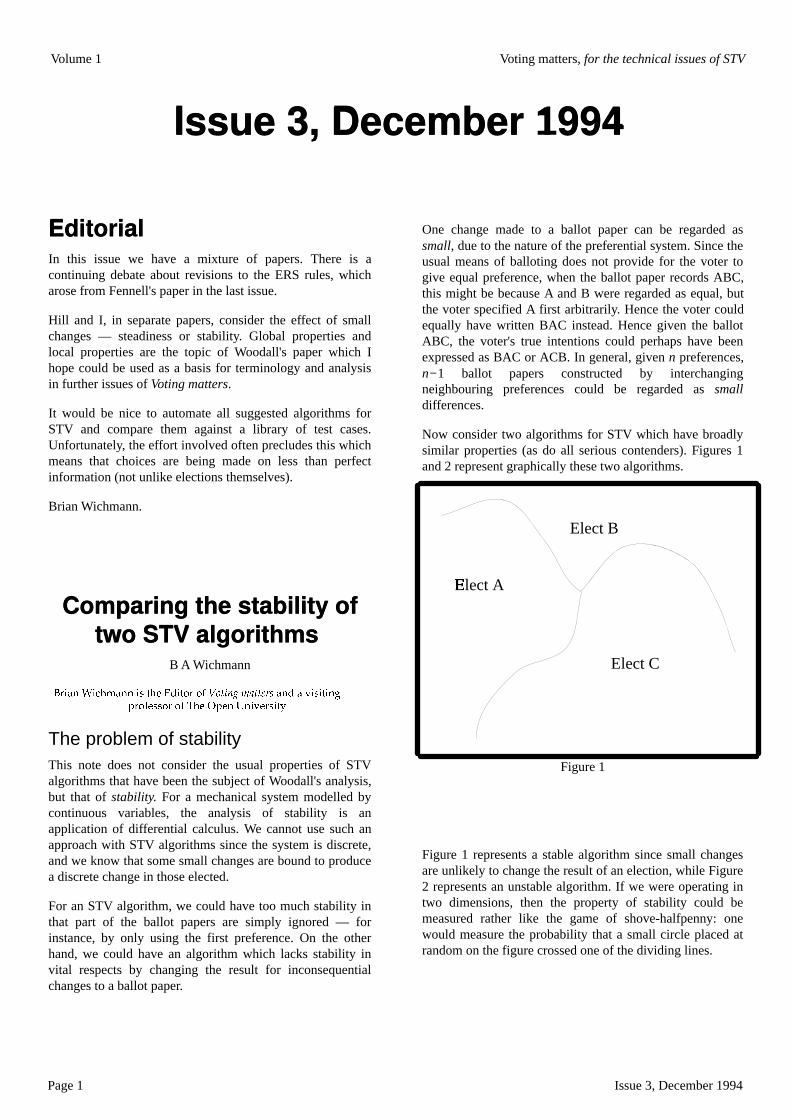
Transcript
Voting mattersfor the technical issues of STV
The Electoral Reform Society
Volume 1, Issues 1-10 March 1994 - March 1999
All correspondence regarding Voting matters should beaddressed to:
B A Wichmann, The Editor, Voting matters, The Electoral ReformSociety, 6 Chancel Street, London, SE1 0UU.
Readers are reminded that views expressed in Voting matters bycontributors do not necessarily reflect those of the ElectoralReform Society.
To aid production, the Editor would welcome contributions onIBM-PC discs, with a printed copy as well.
EditorialIn recent years Representation has tended to shy away fromarticles of a technical nature and restrict itself to the non-technical. While there may be some advantages in this courseof action, it has left those with technical things to say onvoting systems without a suitable outlet for their ideas andarguments. The members of the Electoral Reform Society'sTechnical Committee, and others, have been unhappy aboutthis. Hence this new venture, which it is intended to circulateto those Society members who request it.
In this first issue, we reprint some earlier articles that deservea wider circulation. Those by B L Meek, originally publishedover 20 years ago in French, have been available in Englishonly as a typed and duplicated version containing many errors.These are classic papers which have led to much discussion inrecent years. Whether one agrees with Meek's conclusions ornot, it cannot be denied that those who argue about his methodneed to know what he did actually say.
The article by D R Woodall was also printed with an errororiginally and this reprint includes the necessary correction.Although Woodall's method is basically the same as Meek's, itwas entirely independently derived and it is interesting to seehis different approach.
The article by C H E Warren has not been published before. It is aslightly rewritten version of a paper first submitted in 1983, but notthen accepted. Warren's method is similar in spirit to the other two,but differs in the way it performs. Each of the two counting methodshas an advantage over the other in some circumstances so, althougha majority of the ERS Technical Committee prefer the Meek/Woodall formulation, the Warren alternative is worth bearing inmind. The final paper discusses the differences.
I D Hill
Chairman, ERS Technical Committee
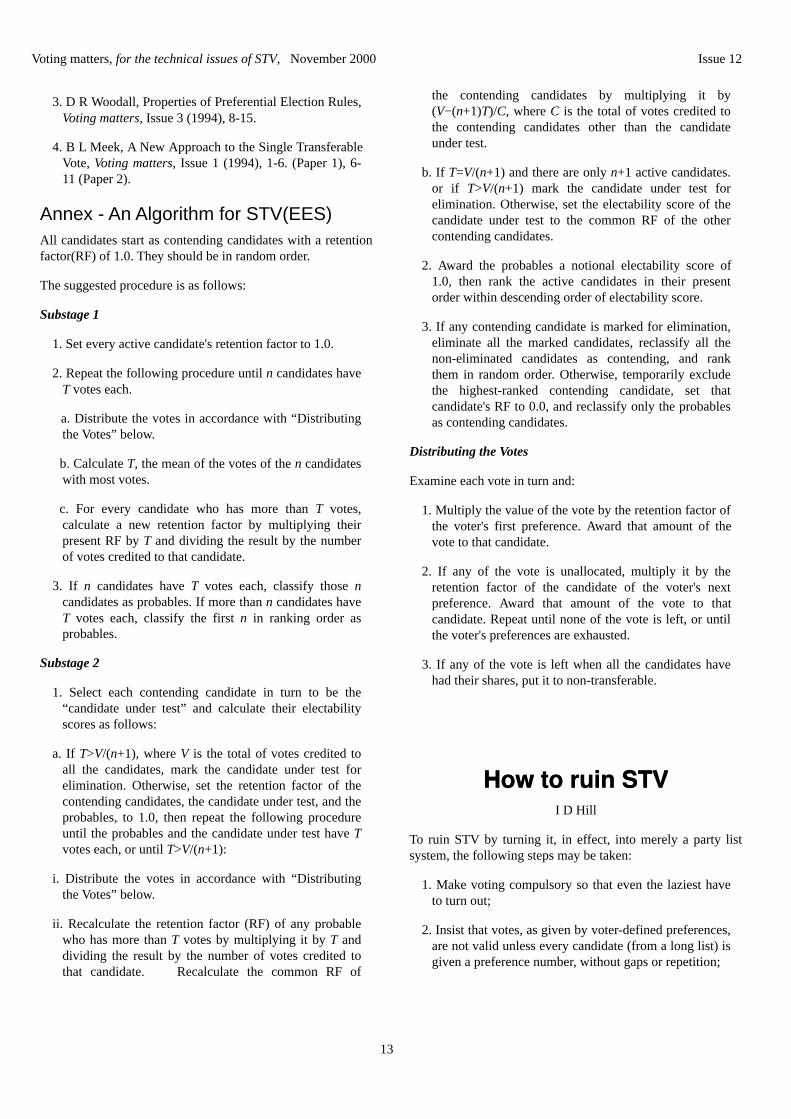
A New Approach to theSingle Transferable Vote
Paper I: Equality of Treatment of votersand a feedback mechanism for votecounting.
With some differences in presentation, the paper wasoriginally published in French in Mathématiques etSciences Humaines, No 25, pp13-23, 1969.
Issue 1, March 1994 Page 1
AbstractIt is shown that none of the counting methods so far used insingle transferable vote elections satisfies the criterion thatall votes should, as far as possible, be taken equally intoaccount. A feedback method of counting is described whichdoes satisfy this criterion within the general limitationsimposed by the STV system. This counting method, thoughvery laborious for manual counting, would be feasible inautomated elections.
1. IntroductionWhile the preferential voting system known as the SingleTransferable Vote (STV)1 has been criticised on variousgrounds, the following advantages claimed for it do notseem to have been seriously challenged:
(A) The number of ‘wasted’ votes in an election (i.e,which do not contribute to the election of anycandidate) is kept to a minimum.
(B) As far as possible the opinions of each voter aretaken equally into account.
(C) There is no incentive for a voter to vote in any wayother than according to his actual preference.
It is the purpose of this and a subsequent paper to consider(A), (B) and (C) from a decision-theoretic viewpoint, withina single constituency; it will be shown that (A), (B) and (C)in fact do not hold in present STV procedures, but may bemade to hold, within certain overall limitations, byappropriate modification of the counting method.
2. The wasted voteAn essential feature of an STV election is the ‘quota’ . Ifthere are s vacancies to be filled, the quota q is the smallestnumber such that, if s candidates have q votes each, it is notpossible for an (s+1)th candidate to have as many as qvotes. Thus if the total votes are T, then T−sq < q, butT−s(q−1) > q−1, whence q = [1+T/(s+1)], where the squarebrackets denote ‘ integer part of ’ .
Candidates with more than q votes are elected, and havetheir surplus votes transferred according to the nextpreferences marked; if there are no such candidates, thebottom candidate is eliminated and all his votes sotransferred. Repeated application of these rules ensures thatat the end of the count s candidates have at least q voteseach and so the total wasted vote w satisfies w < T/(s+1).
Given s and T, it is clear from the definition of q thatcondition (A) is satisfied provided the next preference ateach transfer is always given. It is possible for the aboveinequality, and hence condition (A), to be violated, if w isincreased by the addition of votes which are non-
transferable because no next preference has been indicated.In this paper we shall assume that this does not occur; it willbe shown in a second paper that it is possible still to satisfy(A) in such cases by modifying the definition of q.
3. Equality of treatmentThe discussion of condition (A) shows that, in general,there will be some wasted votes, except in the trivial caseswhen s ≥ T. It is therefore not possible under STV toguarantee that all votes will be taken equally into account(e.g. votes with first preferences for runner-up candidates),although all are taken indirectly into account whencalculating the quota.2
Within this obvious limitation, attempts have been made toeliminate possible sources of inequity of treatment byvarious modifications of the counting rules. Such sourcesinclude:
(i) the choice of which votes to transfer from the totalfor a candidate who has exceeded the quota
(ii) errors introduced by taking whole-number approx-imations to fractions of totals for transfer −particularly in elections with small total vote
(iii) calculation of the proportion for transfer from anelected candidate on the basis of the last batch ofvotes transferred to him, and not on his total vote.
The common way of overcoming difficulties (i) and (ii) isto use the variant of STV known as the Senate Rules. Eachvote is divided into K parts (usually K = 100 or 1000) andeach part treated as a separate vote (of value 1/K) withidentical preference listings.
Difficulty (i) is overcome by transferring the appropriateproportion of each divided vote, while the method clearlyreduces the errors involved in (ii) by the factor 1/K. IfK=10n this is simply working to n decimal places. The valueof K has only to be increased until the errors are too smallto affect the result of the election.3 The method isequivalent to transferring the whole vote at an appropriatelyreduced value, and it is this interpretation we shall use fromnow on.
Difficulty (iii) is slightly more technical, and warrantsfurther explanation. Suppose at some stage a candidate hasobtained x (<q) votes. By transfer from another (elected oreliminated) candidate he now acquires a further y votes,where x+y > q. His surplus is now z=x+y−q. It wouldappear that his x+y votes should now be transferred, withvalue reduced by the factor z/(x+y).
It is, however, common practice for only the y votes to betransferred, with value reduced by the factor z/y. The reasonfor adopting this procedure is simply the practical one, in a
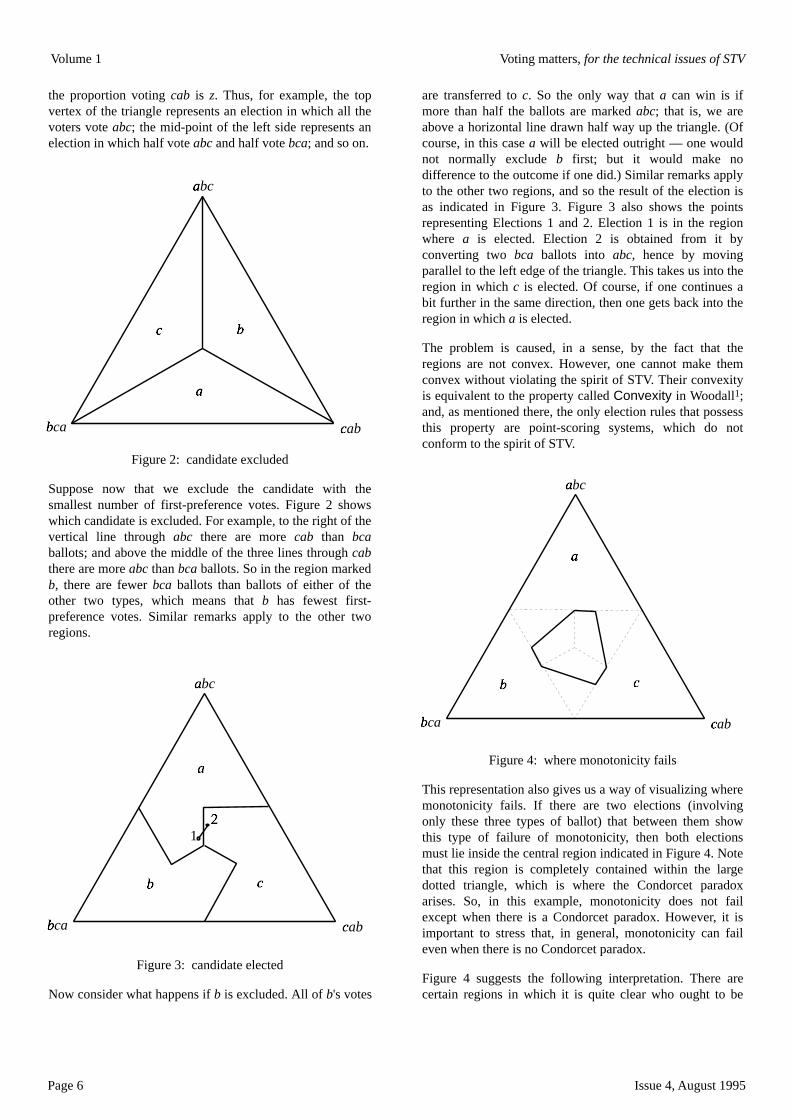
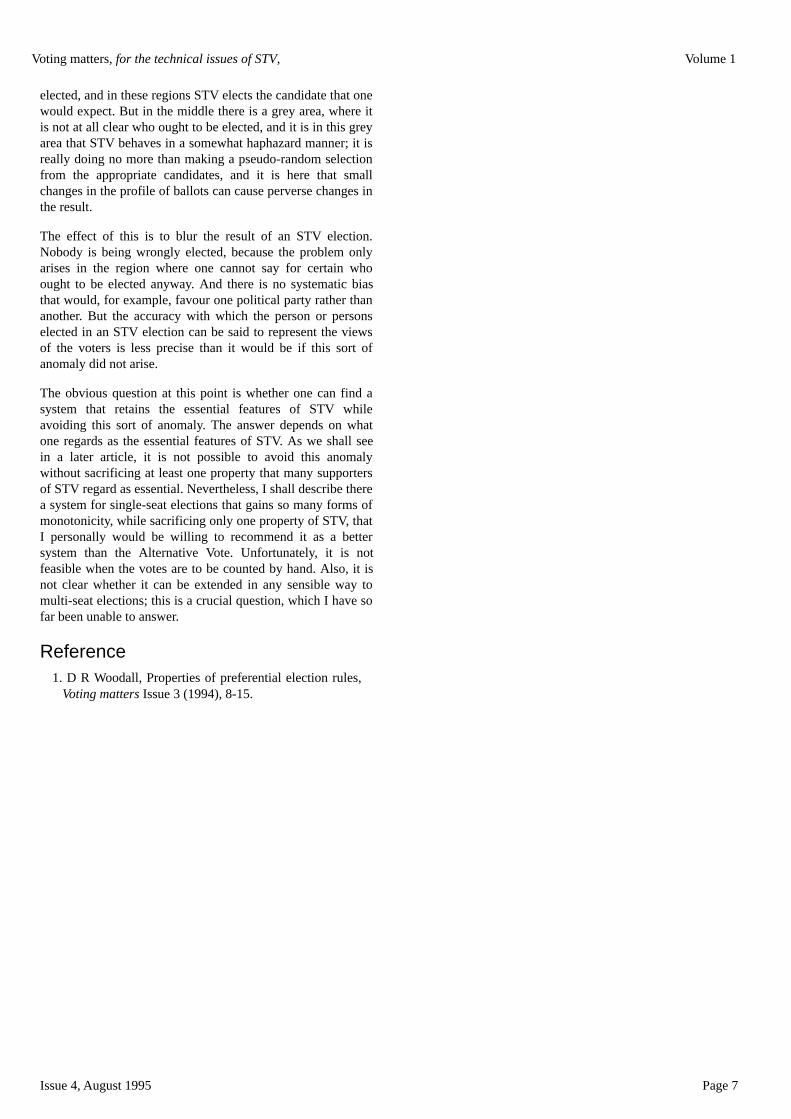
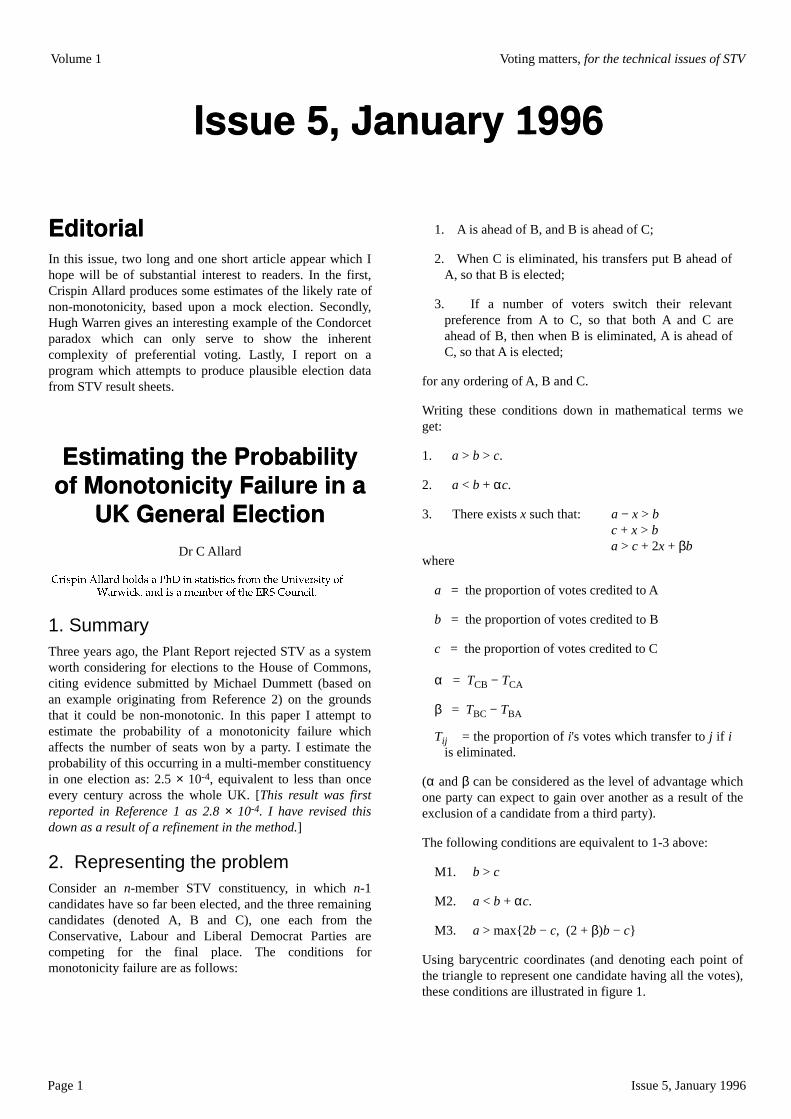
Volume 1 Voting matters, for the technical issues of STV
Page 2 Issue 1, March 1994
manual count, of reducing as much as possible the rescrutinyof ballots for later preferences. However, neither this nor theargument that ‘ the difference is unlikely to affect the result’are particularly relevant to a decision-theoretic discussion,though we shall return to the practicability problem later.
Of more importance here is the argument ‘ in STV a vote onlycounts for one candidate at a time, and should count for thefirst preference where possible’ . If accepted, this would ofcourse also render difficulties (i) and (ii) irrelevant, and theSenate Rules unnecessary; the first part of it is in factsometimes used as a ‘proof ’ that STV satisfies condition (B).But even without the Senate Rules the statement is false;however the surplus votes are chosen for transfer, it is theexistence of the untransferred votes which makes thetransferred votes surplus. A vote not only counts directly forone candidate; it can indirectly affect the progress of thecount, the pattern of transfers, and ultimately the election ornon-election of other candidates.4
It is this fact which is at the root of the failure of STV tosatisfy condition (B).
In the specific situation described above, the candidateachieves election not only because of the accession of the ynew votes, but because of the existence of the x previousvotes; hence for condition (B) to be satisfied, all x+y votesshould be transferred at the appropriate reduced value.
However, there is yet a fourth difficulty, one which does notseem to have been recognised hitherto.
(iv) In determining the next preference to which a vote isto be transferred, elected as well as eliminatedcandidates are ignored.
Let us suppose that of y votes to be transferred, y/2 aremarked next to go to candidate A, and y/2 to candidate B. Letus further suppose that A has already been elected; under STVthe y/2 votes which would otherwise go to him aretransferred to the next candidate marked (assumed C in everycase) provided that that candidate is not also already elected.Thus y/2 go to B, and y/2 to C. The inequities are plain; thevotes for A which enabled the y/2 to go to C rather than Ahad no say in their destination, while C obtains these votes atthe same value as B receives his. Suppose these y votes wereoriginally first-preference votes for a candidate D, noweliminated; those who voted for A next and then C at leasthave had their second choice elected, while those who votednext for B have not − yet these votes go, under STV, to both Band C at full value.
In section 6 we shall describe a counting mechanism whichovercomes all these difficulties.
4. Making the most of one's voteAny system which contains wasted votes contains at leastsome element of incentive to vote in other than his preferredway; the case for (C) in STV is that it is difficult for a voter tobe sure (rightly or wrongly) that his vote will be wasted, bothbecause the number of wasted votes is relatively small, andbecause the wasted votes are those for the non-elected butnon-eliminated candidates − i.e. of the stronger, not theweaker, runners-up. However, it is also possible for voters totake advantage of the features of STV described in section 3,provided they are sufficiently well informed, by voting in asophisticated manner. This is most easily shown by anexample:
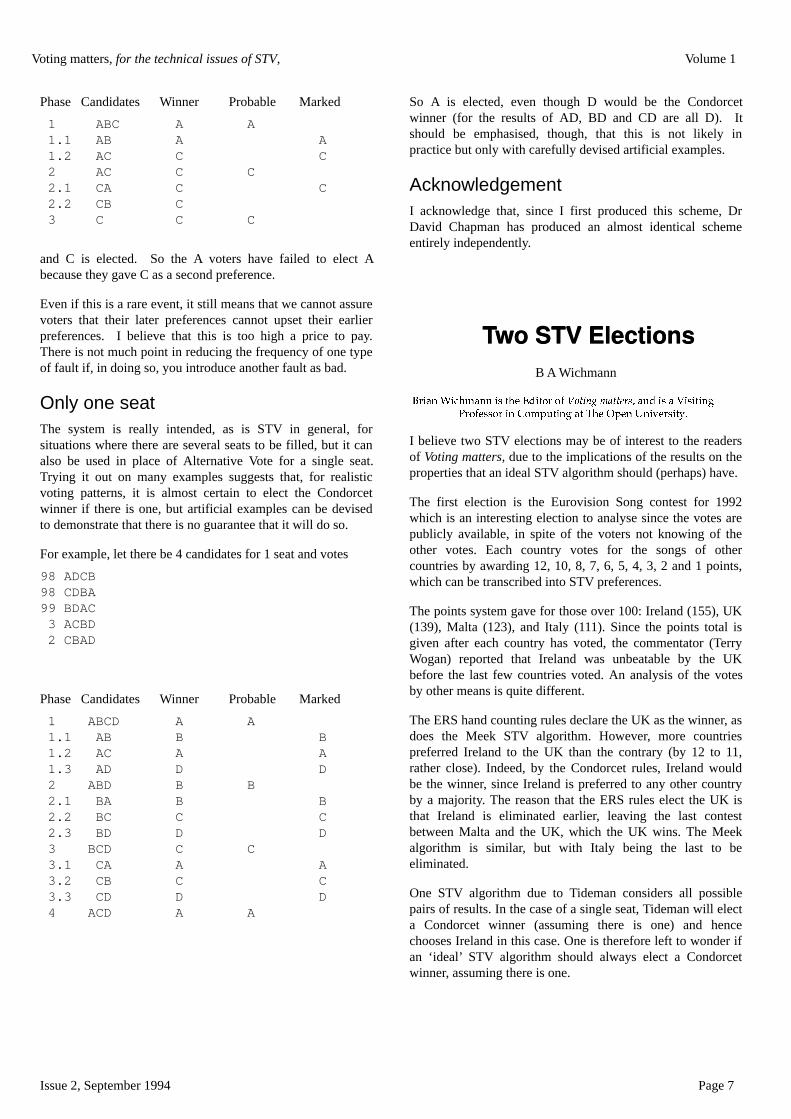
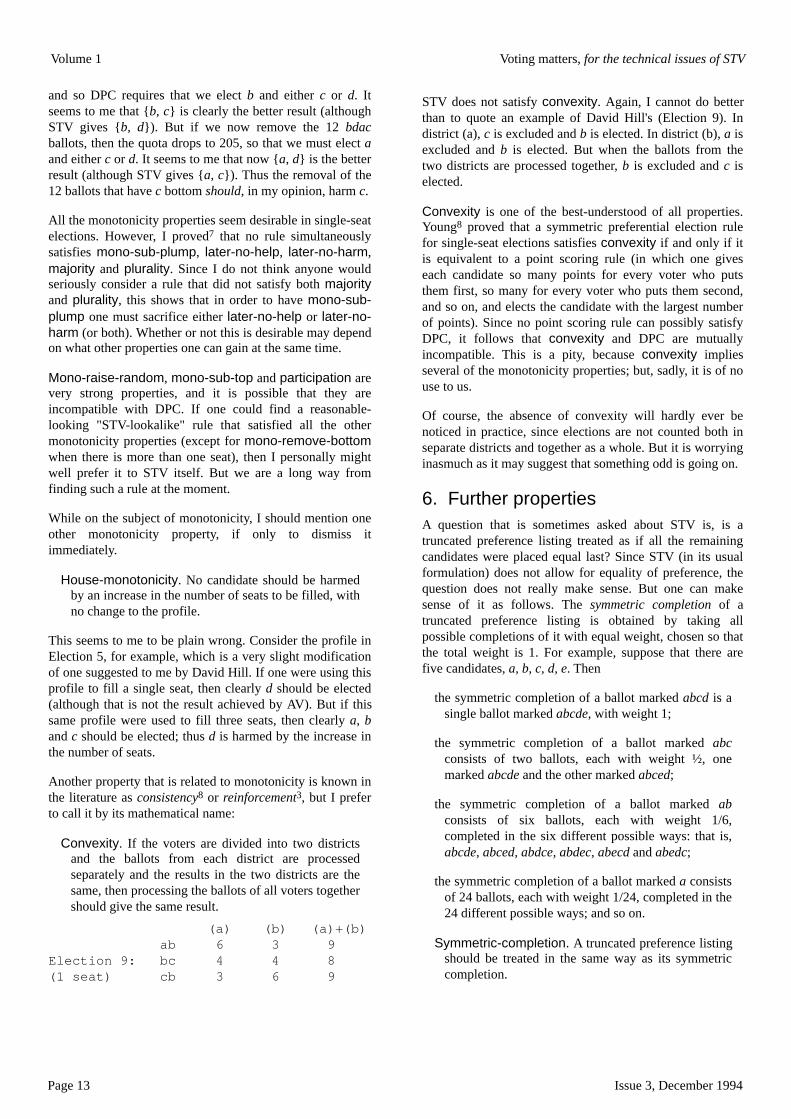
Let T=3599, s=3, q=900, and the unsophisticated first-preference votes for the six candidates A, B, ... F be asfollows:
A B C D E F
1020 890 880 589 200 20
In this case the 120 surplus votes of A divide 60 to B, 20 to C,40 to D and the elected candidates are A, B and C.
Suppose there are 170 voters who above voted A, D, C ... It isknown that the second-preference votes of F will go to C, andof E to D. Then the sophisticated way for these 170 to vote isF, A, D, C,... in order to prevent A from being elected on thefirst count.
A B C D E F
850 890 880 589 200 190
On the elimination of F, his original 20 votes go to C, and the170 sophisticated votes return to A. However, the 120 surplusis now taken entirely from this batch (see (iii) in section 3)and goes to D. C having no surplus, E must be eliminated andD is elected.
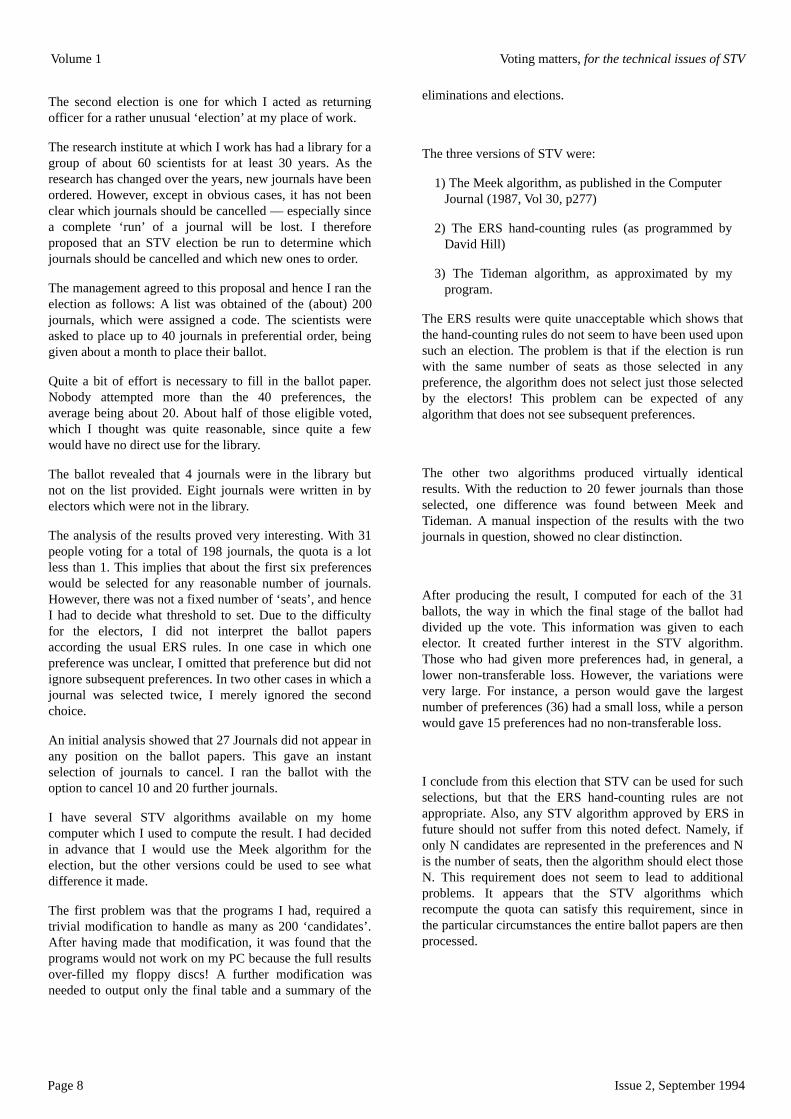
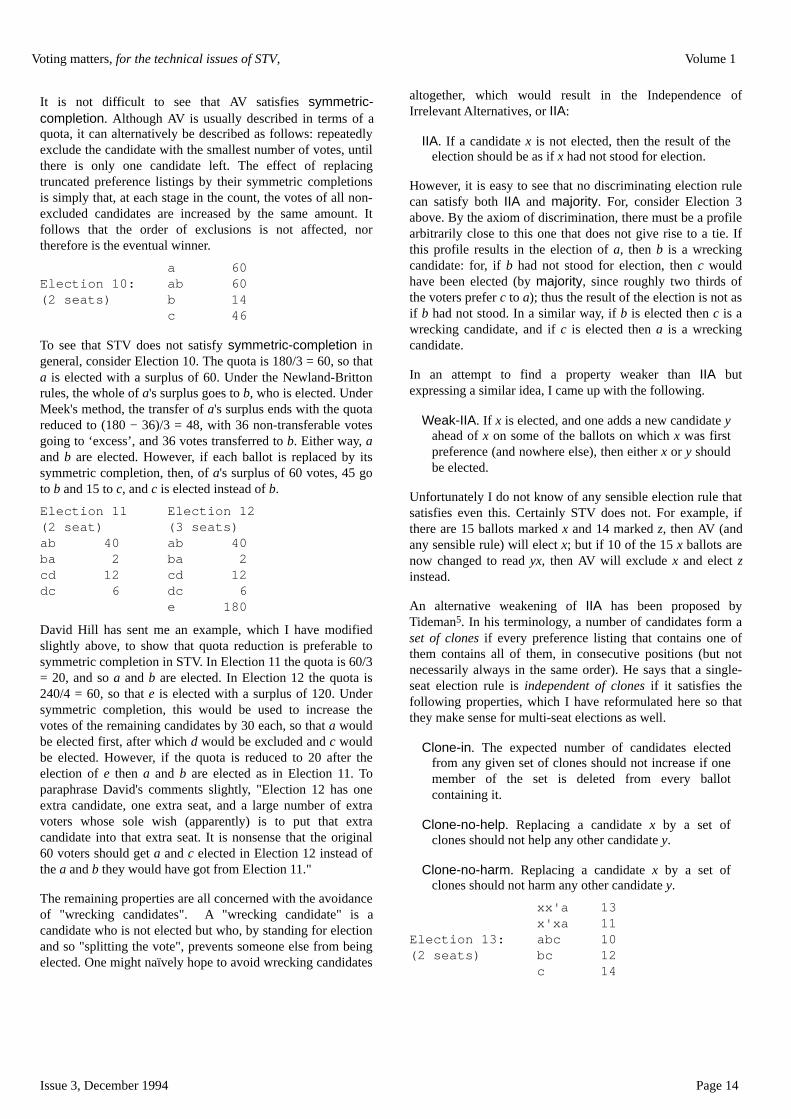
A different type of sophisticated voting is given below:
T=239, s=2, q=80.
Unsophisticated case: C and A elected:
C,A,B... C,B,A... B,A.... A,B.....
120 80 31 8
Sophisticated case: C and B elected:
C,A,B... C,B,A... E,B,A... B,A.... A,B.....
120 50 30 31 8
Voting matters, for the technical issues of STV, Volume 1
Issue 1, March 1994 Page 3
It seems to be a new result that sophisticated voting ispossible in STV, though it is well-known that it can occur inother voting systems and considerable work has been doneon decision processes using a games-theoretic approach.Black5 in his discussion of STV does mention the possibilityof ‘an organised minority (perverting) the use of the system’but only in connection with a candidate with just the quotaon first preferences who is rated last by the rest of theelectorate. STV supporters would claim that if a candidatecan obtain a quota this ipso facto entitles him to be elected,particularly if he gets the quota on first preferences, and it iscertainly difficult to understand what Black means by‘pervert’ in this context.
5. Other considerationsAt this point we shall mention some other aspects of STV,mainly in order to define the limitations of the presentdiscussion. Proper treatment of the points raised in thissection are well outside the scope of the present work, and isthe subject of a projected further, more general paper.
The conditions (A), (B), (C) discussed so far were chosensimply because they seem to be specific to STV amongconstituency-type systems in parliamentary elections.However, other conditions could be applied, notably thosespecified by Arrow in his General Possibility Theorem.6
As STV elections are multi-vacancy, the preferencesbetween candidates listed by the voters do not as they standrepresent an ordering of independent alternatives, and soArrow's analysis is not directly applicable. The deductionfrom the voter’s ordering of candidates of his ordering of theactual independent alternatives (the possible subsets of theset of all candidates who might actually be elected) is by nomeans straightforward. Nevertheless, at some stage of thecount the process reduces to electing one candidate to oneremaining vacancy, and so the consequences of the theorem,and the Condorcet paradox, cannot be escaped. Using thealternatives as they stand, even though they are notindependent, STV clearly satisfies Arrow's conditions 1, 4,and 5. The condition 3 of independence of irrelevantalternatives is not satisfied, nor is condition 2 (the positiveassociation of social and individual values). This can beseen from the above analysis.
A related point, and probably the strongest decision-theoretic argument against STV, is the fact that a candidatemay be everyone's second choice but not be elected. Thisdifficulty is not overcome by the feedback method, and itdoes not seem to the author to be possible to do so whileretaining a system which would be recognisably a ‘single’transferable vote.
Virtually all other discussion of STV, both for and against,seem to have been about political and not decision-theoreticconsiderations.
For example, Black5 does discuss STV from what he termsthe ‘statical’ point of view, but although he does expresssome disquiet about the ‘heterogeneity’ involved in STV(basically, that some votes count for first preferences, othersfor second or later preferences), he does not go into theproblem in detail and concludes ‘ in spite of thosedrawbacks (STV) has merits ... it is not difficult to see whymany people, regarding it purely as a statical system,(Black's italics) should hold (it) in esteem’ . The italicisedphrase is to introduce other, ‘dynamical’ arguments againstSTV.7 Black does not discuss the conditions mentionedhere; though the germ of the idea of inequity is contained inthe word ‘heterogeneity’ ; in fact as section 3 shows, theheterogeneity which worries him is more apparent than real,and the feedback method described in section 6 eliminateswhat there is. Nor − oddly − does the ‘everyone's secondchoice’ problem, even though this is closely connected withthe doubts mentioned at the end of the last section.
6. The feedback processOne of the criticisms of STV which is often made is that itsrules are too complicated, and are not derived fromprinciples which can be simply stated. The above discussionshows that this is not surprising; the rules are in many caseslittle more than rules of thumb, designed for practicalconvenience rather than theoretic merit. The feedbackprocess, however, is derived from simply-stated principles:
Principle 1. If a candidate is eliminated, all ballots aretreated as if that candidate had never stood. 8
Principle 2. If a candidate has achieved the quota, heretains a fixed proportion of every vote received, andtransfers the remainder to the next non-eliminatedcandidate, the retained total equalling the quota.
Principle 1 is the one which leads to the feedbackmechanism. For, suppose a voter marks his ballot A, B, C,..and A is eliminated, the ballot, by Principle 1, ishenceforward treated as if it read B, C,.. on the assumptionthat if A had not stood at all, the voter would have orderedthe other candidates as before and B would have been firstpreference9. But suppose that B has at an earlier countreached the quota. Then this ballot must now be treated asan original first preference for B; that is, according toPrinciple 2, the same proportion of this vote must beretained by B as for the others, passing the rest to C (insteadof the whole vote going to C as in previous methods).However, this will mean that the total retained by B is nowgreater than the quota. Thus the proportion of B's votes tobe retained must be recalculated, and will in fact drop − inother words we must go back to the beginning, with A noweliminated. This is the feedback process.
Note that the proportion of each of B's votes to betransferred is increased by this accession of support; B's
Volume 1 Voting matters, for the technical issues of STV
Page 4 Issue 1, March 1994
supporters have a say in the transfer of the extra surplus, sinceit is their existence which has made it surplus. All support forB is now treated equally, being divided proportionately toleave him with exactly the quota.
Consider now the effect of Principle 2. The transfer of B'svote may lead to another candidate, D, being elected. Allvotes, new and old, for D, have now to be divided, leaving Dwith the quota and distributing the rest to the next non-eliminated candidate. Some ballots may have B, anotherelected candidate, as next candidate. Under previous rules,only continuing (i.e. non-eliminated and non-elected)candidates can receive transfers. Now these votes are regardedas extra support for B: he takes the proportion allotted him byD, retains the proportion that he keeps of all he receives, andtransfers the rest − now the third marked candidate. Formerlythe third candidate would get all of the proportion transferredby D (see (iv) section 3).
It can be seen that B will once more have more than the quotaif he does not again reduce the proportion which he retains.However, the increased proportion transferred may in part goto D who will therefore have to reduce the proportion heretains. This will react back on B, and it is clear that we havean infinite regression. However, it is also clear that theproportions for transfer do not increase without limit, therebeing only a finite total surplus available from B and D, whomust each retain a quota. The problem is in fact a math-ematical one of determining the proportions to be retained byeach which will leave them both with a quota, taking intoaccount the extent of mutual support. If pB is the proportion Btransfers, and pD that which D transfers, supporters of both Band D have their votes transferred to third preferences at valuepBpD. Those putting B first have 1−pB retained by him andpB(1−pD) retained by D; those putting D first have 1−pDretained by him and pD(1−pB) retained by B.
We now, as examples, give the formulae for the proportionsfor transfer in the cases of 1, 2, 3 and 4 elected candidates:
One candidate
t1(1−p1)=q
This is the same formula as before, except that t1 nowcontains all effective first-preference votes for the candidate,including those obtained from eliminated candidates, who byPrinciple 1 are now ignored. The proportion p1 is recalculatedevery time t1 is increased by the elimination of a candidate.
Two candidates
The first elected candidate has t1 first preference votes, ofwhich t12 have the second elected candidate as secondpreference. Hence p1t12 are passed on to that candidate.Similarly p2t21 are received from the second candidate. Thus
(t1+p2t21)(1−p1)=q
(t2+p1t12)(1−p2)=q
Three candidates
The votes received by candidate 1 are now his first-preferencet1, second-preference p2t21 from candidate 2 and p3t31 fromcandidate 3, and third-preference p2(p3t321) from candidate 3(1st), 2 (2nd) and p3(p2t231) from candidate 2 (1st), 3(2nd).
Thus:
[ t1+p2t21+p3t31+p2p3(t321+t231)] (1−p1)=q
Two similar formulae hold, obtained by cyclic permutation ofthe suffices.
where Σ' indicates summation over all permutations of (234);there are three similar formulae.
The extension to any number of candidates is straightforward.It should be noted:
(i) The formulae for n candidates may be reduced to those forn−1 candidates by eliminating the nth equation and puttingpn=0 in the others;
(ii) Full recursion is not necessary on the elimination of acandidate if none of the totals or subtotals in the formulae inuse at that stage are changed as a result.
7. Calculating the proportionsIt can be seen that one of the difficulties involved in thefeedback process arises from the need to calculate theproportions for transfer. However, a simple iterative procedureenables this to be done to any required accuracy. We shall takeas the simplest example the position with two electedcandidates, where the equations to be solved are, as above:
(t1+p2t21)(1−p1)=q (1)
(t2+p1t12)(1−p2)=q (2)
In these equations only the pi are unknown. Suppose we guessa value of p2 which is too low; then (1−p1) will be too large inequation (1), that is p1 will also be too small. If we substitutethis in equation (2) it will similarly give a value of p2 which is
Voting matters, for the technical issues of STV, Volume 1
Issue 1, March 1994 Page 5
too low.
The total vote for the two candidates is t1+t2; for them bothto be elected t1+t2 ≥ 2q. Suppose the strict inequality holds;in a non-trivial case t12, t21 are both non-zero. Further, atleast one of t1, t2 is greater than q; assume it is t1. If we putp2=0 in (1) we can solve for p1, giving a value p1>0. This p1is the proportion to be transferred if candidate 1 were theonly elected candidate; thus t2+p1t12 ≥ q or candidate 2would not be elected. If the equality holds, candidate 2 onlyjust gets the quota and so p2=0 from equation (2); thus theequations are solved.
If the strict inequality holds, we get a value of p2 > 0 whichis too small. Substituting in (1) increases the coefficient of(1−p1) and hence increases p1; the new value of p1 isincreased (but is still too low). Substitution in (2) givessimilarly an increased, but too low, value of p2. Thus theiterative process gives monotonically increasing sequencesof values p1, p2 bounded above, which hence tend to limitswhich are the solutions of the equations. A cycle ofiterations which leads to two successive sets of values thesame to the given accuracy is taken as the approximatesolution required. Note that the approximate values may beslightly smaller than the exact ones, but this is exactly whatwe want; otherwise too much of the support for thecandidate concerned would be transferred and he would beleft with less than the quota. The process can also be easilyshown to work in the limiting case, t1+t2=2q.
It is clear that the success of this iterative procedure dependson the fact that all the quantities in the totals (thecoefficients of (1−pi) in each equation) are non-negative,and that therefore it will work for any number of equationsprovided they are solved cyclically in order of election −this condition being necessary to avoid getting negativevalues of pi. Since the counting process can only increasethe totals of support for elected candidates, it is also clearthat the pi for those candidates can only increase as thecount progresses;10 thus it is safe to take as starting valuesof the pi the ones obtained at a previous stage, putting pi=0initially for newly-elected candidates only (in which case, asmentioned above, the equations reduce to the ones at theprevious stage and hence will yield, at the beginning of theiteration, the same answers).
It can be shown fairly simply that the convergence rate ofthe iterative process is likely to be unsatisfactory only whenboth of the following conditions hold; that all the pi aresmall, and the cross-totals tij etc, are as large as possible.This would not cause difficulty even on the rare occasionson which all these conditions were satisfied, since theoccurrence of slow convergence can be detected in advanceand allowed for, while at a later stage in the count some atleast of the pi are likely to rise sufficiently to accelerate tothe true convergence satisfactorily.
8. ConclusionsIt is obvious even from the above example that the feedbackprocess is a much more laborious method of arriving at aresult than any at present in use; in a full-scale election withthousands of ballots to scrutinise, it would be very lengthyindeed. However, even the present methods are sufficientlylengthy to make it worthwhile using computers to help inthe counting,11 and if this is done, then complex countingmethods are no problem.
It may be argued that the actual results of any electionwould be different so infrequently that the additionalcomplication is unnecessary. This is a matter for conjecture,or preferably, for further investigation. However, themethod has been tried out in two cases, once using figuresobtained by a quasi-random process, and once in an actualSTV election. In both, there were differences in thecandidates elected.12 Particularly since STV supporters laysuch emphasis on the criterion of equality of treatment(condition (B)), it would seem worthwhile in automatedcounting to adopt the feedback method.
To sum up, the feedback method does satisfy the criterion,subject to the limitations imposed by the basic STV system− i.e. the theoretical minimum of wasted votes, and theelimination of candidates. There is one further limitation notso far discussed, imposed by the voters themselves if theytake advantage of the possibility allowed by STV of listingonly some of the candidates in preference order. Theextension of the feedback method to cover this is dealt within Paper II; it turns out that the extension also, as a bonus,allows voters to express their views much more accuratelythan under previous STV methods.13
References and Notes1. For a complete description of STV see E Lakeman
and J Lambert: Voting in Democracies (Faber andFaber 1955). (The current edition in 1994 is ELakeman: How Democracies Vote (4th edition, Faberand Faber 1974).)
2. This is nevertheless more than can be said for somecommon voting systems, such as the simple majoritysystem.
3. This cannot, of course, cope with the case of exactequality, where some other method has to be used, ifonly drawing of lots.
4. To argue, in connection with a transferable system,that a vote should where possible not be transferable,seems inconsistent, particularly in view of the strongarguments put forward by STV supporters against thesingle non-transferable vote system, where an electormay choose only one from a list of candidates eventhough more than one are to be elected. See Lakeman
Volume 1 Voting matters, for the technical issues of STV
Page 6 Issue 1, March 1994
and Lambert, op, cit.1
5. Duncan Black: Theory of Committees and Elections(2nd edition, Cambridge, 1963, pp 80-83).
6. K Arrow: Social Choice and Individual Values (2ndedition, Wiley 1962).
7. The case for the other side may be found in Lakemanand Lambert, op cit 1.
8. The similarity of this principle to Arrow's condition ofindependence of irrelevant alternatives is obvious.However, the interdependence of the alternatives heremeans that the condition is not in fact satisfied.
9. This innocent-looking assumption is open to majorcriticism. Full discussion is outside the scope of thispaper; it is hoped to include this in the projected moregeneral paper mentioned in section 5.
10. Clearly Arrow's condition 2, the positive associationof individual and social values, is now satisfied by thenon-independent alternatives.
11. For a feasibility study in general terms, see P Deanand B L Meek: the Automation of Voting Systems;Paper I; Analysis (Data and Control Systems, January1967, p16); Paper II; Implementation (Data andControl Systems, February 1967, p22), and B L Meek:Electronic Voting by 1975? (Data Systems, July 1967,p12) − the date in the last source referring to the UK.For a description of the actual use of computers in STVelections in the United States, see Walter L Pragnell:Computers and Conventions (The Living Church, 20thAugust 1967, p12).
12. For obvious reasons the work on the actual electioncannot be made public!
13. These papers are the result of a problem posed byMiss Enid Lakeman, Director of the Electoral ReformSociety, London; the author wishes to thank her for herencouragement in the progress of the work. Thanksare due also to Professor W B Bonnor, Mr RobertCassen, Mr Peter Dean, Mr Michael Steed andProfessor Gordon Tullock for valuable discussions,correspondence and advice.
The original version of this paper was dated 21 March1968 and was published in French in Mathématiques etSciences Humaines No 29, pp 33-39, 1970. This note,and note 8 in its present form, have been added in thisreprint.
AbstractThe feedback counting method used for Single TransferableVote elections, developed in an earlier paper, is extended tocover situations in which there are non-transferable votes. It isshown that present counting methods, on the other hand, maynot satisfy the condition that the number of wasted votes bekept to a minimum in such situations. The extension of themethod to permit voters to give equal preferences tocandidates is also described.
1. IntroductionIn an earlier paper1 (hereafter referred to as Paper I) theSingle Transferable Vote (STV) system of voting wasconsidered from the point of view of certain conditions, themain one being that as far as possible the opinions of allvoters are taken equally into account; it was shown thatpresent STV counting methods do not satisfy this condition. A'feedback' counting mechanism was suggested which wouldovercome this problem. In Paper I, however, we confinedourselves only to the cases where, whenever a vote isrescrutinised for transfer, a next preference is always given. Inthis paper we shall show how the feedback method can beextended to cope with situations where no such preference isavailable. We shall here adopt the reverse procedure to PaperI; we shall consider the application of the feedbackmechanism to these cases first, and only then discuss presentcounting methods in the light of the conditions.
2. Rules for vote-castingEven within the same voting system major differences can bemade simply by changing the rules governing what constitutesa valid ballot. For example, in a multiple-vacancy election bysimple majority where each voter has one independent votefor each vacancy, the result can be totally different if the voteris forced to use all of his votes (in effect to vote against hisfavourite candidates) instead of using only some.2 In STV theequivalent requirement would be that all candidates should belisted in preference order. However, in the simple-majoritycase distortions can arise in that some votes may not begenuine, having only been added in order to make up thecorrect number; in STV a voter may only wish to express hispreferences for a few candidates, being indifferent to theremainder. Normal STV practice is in fact to accept as valid
Voting matters, for the technical issues of STV, Volume 1
Issue 1, March 1994 Page 7
any ballot showing a unique first preference; thereafter thevoter may, optionally, give further preferences for as manyor as few of the remaining candidates as he wishes. In STVthe feedback mechanism could be applied as it standssimply by declaring as invalid any votes which do not givepreferences for all candidates or (relaxing this somewhat)declaring invalid during the progress of the count any voteencountered for which a next preference is required but notavailable, and then restarting the count. However, it wouldclearly be more satisfactory not to impose additionalrestrictions on the voter if this can be avoided.
3. Extension of the feedback methodWe recall here the two principles of the feedbackmechanism stated in Paper I:
Principle 1. If a candidate is eliminated, all ballots aretreated as if that candidate had never stood.
Principle 2. If a candidate has achieved the quota, heretains a fixed proportion of every vote received, andtransfers the remainder to the next non-eliminatedcandidate, the retained total equalling the quota.
Since transfers are only made from eliminated or electedcandidates, non-transferability only arises when all themarked candidates are eliminated or elected. The simplestcase to consider is that when all the marked candidates areeliminated. By Principle 1, such a ballot has to be treated asif those candidates had never stood; and hence as if theballot is invalid. This implies that the total T of valid ballotsis reduced; this in turn implies that, on the elimination ofany candidate, if non-transferable ballots occur the feedbackshould include the recalculation of the quota, using thereduced value of T.
The case of a ballot with marked candidates who are electedis less straightforward. Suppose an elected candidate Creceives a total x of votes with no further preferencesmarked on them (any marked eliminated candidates can, byPrinciple 1, be ignored). By Principle 2, C must pass on afixed proportion p of these, as all other, votes and retain therest as part of his quota. The difficulty arises because it isnot clear to whom these votes should be transferred.
If the difficulty were to be avoided by increasing theproportion transferred of votes for which a next preferenceis marked, to enable all x votes to be retained by C, thiswould clearly reintroduce inequities of the kind Principle 2was designed to eliminate. Not to transfer the proportion atall would mean leaving C with more than the quota (see alsosection 4). The two possible ways of strictly obeyingPrinciple 2 are
(a) to divide the otherwise non-transferable proportionequally between the remaining (i.e. unmarked anduneliminated) candidates; or
(b) to subtract this quantity from the total T of votescast, and recalculate the quota with the new value.
Method (a) is based on the view that the voter regards theunmarked candidates as of equal merit, which is why he hasnot given preferences. The second method is based on theview that the voter's action is a partial abstention; he has notsufficient knowledge of these candidates to judge betweenthem, and prefers to leave the choice to the other voters. Itshould be noted that the two methods are not equivalent; inthe first the totals of the unmarked candidates, in particularthe non-eliminated ones, are raised equally, whereas in thesecond the quota increases the proportions transferred fromthe elected candidates, and the increase in the votes of non-elected candidates will vary according to these values.
For the moment we shall resolve the (apparent) dilemma bymaking the (apparently) arbitrary decision to adopt thesecond method. The prima facie case for this is that ingeneral some unmarked candidates will be electedcandidates, and hence the adoption of the first method willin any case involve the recalculation of the quota. However,the real justification will appear in section 6, when it will beshown that the dilemma need not, in fact, exist at all.
4. Current STV practiceCurrent STV procedure in dealing with non-transferablevotes involves different rules in different circumstances.The main rules are
(i) If a vote is not transferable from an eliminatedcandidate, it is set aside; such votes play no furtherpart in the count.
(ii) If the number of votes non-transferable from anelected candidate is not greater than the quota, thosevotes are included in the quota and only thetransferable votes determine the distribution of thesurplus. If the number is greater than the quota, thenthe transferable votes are transferred (at unreducedvalue), the difference between the non-transferablevotes and the quota increasing the non-transferabletotal.
In Paper I we considered STV from the point of view ofthree conditions. Condition (C) we shall discuss later; theothers were
(A) The number of wasted votes in an election (i.e.which do not contribute to the election of anycandidate) is kept to a minimum.
(B) As far as possible the opinions of each voter aretaken equally into account.
It is clear at once that, when there are non-transferablevotes, condition (B) cannot be satisfied even by the
Volume 1 Voting matters, for the technical issues of STV
Page 8 Issue 1, March 1994
feedback counting method unless recalculation of the quota isincluded, for otherwise candidates at a later stage of the count,when a number of non-transferable votes have accumulated,need less that the original quota to be elected. Indeed, if asmany as q votes become non-transferable, it is impossible forthe last elected candidate to achieve a full quota.
We saw in Paper I that condition (A) is satisfied when thereare no non-transferable votes. When votes do become non-transferable these have to be added to the 'wasted' total W, andthe formula in Paper I becomes
W < T/(S + 1) + T0
where T0 is the non-transferable total. However, this isderived from a quota calculated on the total T and not on thetotal available vote T ' = T – T0. Thus with recalculation of thequota we have
W ' < T '/(S + 1) + T0 = W – T0 /(S + 1) < W
i.e. condition (A) is violated unless the quota is recalculated3.
It is clear that rule (ii) above is an attempt to satisfy condition(A), but it only does so at the cost of violating condition (B);for example, if a candidate E is elected with q + x votes, q ofwhich are non-transferable, the x remaining votes will betransferred at unreduced value to the next preference eventhough their earlier preference for E has been satisfied.Further, the present rule that votes cannot be transferred to anelected candidate (see Paper I) means that both by rule (i) andby rule (ii) many whole votes may be declared completelynon-transferable, thus swelling T0 and W above, whereas thefeedback method allows each vote to count partly for theelected candidates marked and only a fraction becomes non-transferable.
Thus, on two grounds, current STV counting methods violatecondition (A). It could perhaps be argued that the feedbackmethod cannot satisfy condition (A) unless method (a) ratherthan method (b) of section 3 is used when dealing withunmarked candidates. We shall discuss this point in section 6.
5. Recalculating the quotaIt can be seen that in recalculating the quota and having toapply it in retrospect to candidates already elected, the samedifficulties occur as in the simple feedback situation, withoutnon-transferable votes, described in Paper I. We consider firstthe case of an elected candidate. If some of his votes are non-transferable, the appropriate proportion is subtracted from thetotal vote, and the quota recalculated. The reduction in thequota makes more of the elected candidate's votes surplus,which increases the proportion for transfer; this increases thenon-transferable proportion to be subtracted from the total,which further reduces the quota, and so on. The equations tobe solved are
q = [(T – p1t10)/(S + 1) + 1] (1)
t1(1 – p1) = q (2)
where, as in Paper I, S is the number of vacancies, T is thetotal votes (now ignoring any which mark only eliminatedcandidates), t1 the total for the elected candidate, p1 theproportion he transfers, t10 the total vote for the candidate nottransferable to others, and q is the quota.
These two equations can be solved easily for p1 and q byequating the expressions for q; however, if there is more thanone elected candidate the iterative method of finding the pi,described in Paper I, will be needed, and it is convenient todiscuss the extension of the iterative process to include therecalculation of the quota in terms of the simplest case, above.Equation (1) with p1 = 0 gives the original value of q.Equation (2) then gives a first value of p1 > 0 . Substitution ofthis value in (1) gives a new value of q smaller than before;use of the new q in (2) gives a larger p1, and so on. Thus wehave a monotone increasing sequence of values for p1,bounded above by 1, and a monotone decreasing sequence ofvalues of q bounded below by 0; these sequences musttherefore tend to limits which are the solutions to theequations. The convergence rate is satisfactory; simpleanalysis shows that the errors are multiplied in each cycle by afactor which is at most 1/(S + 1).
The process is extended to the case of n elected candidates byadding to the equations in Paper I the equation
q = [Tn /(S + 1) + 1]
which must be evaluated for q first in each iterative cycle. Tn = Tn(p1,p2,....,pn) is the total available for transfer in eachcase; for n = 1, 2, 3 it is given by
T1 = T – p1t10
T2 = T – { p1t10 + p2t20 + p1p2(t120 + t210)}
T3 = T – { Σ1piti0 + Σ2 pipjtij0 + Σ3 p1p2p3 t(123)0}
In these formulae tij...k0 is the total transferable fromcandidate i to candidate j, to ..., to candidate k but not further;Σ1denotes summing over i; Σ2 denotes summing over all i, j,i /= j; Σ3 denotes summing over all permutations of (123).
The reader will easily derive equivalent formulae for highervalues of n; putting pn = 0 in the expression for Tn gives theexpression for Tn-1.
6. Equal preferencesIn section 2 we discussed briefly the effect of differentvalidity rules on otherwise identical voting systems. The usualSTV counting procedures depend on the existence at each
Voting matters, for the technical issues of STV, Volume 1
Issue 1, March 1994 Page 9
stage of a unique next preference, the only deviationallowed being, as we have seen, that the absence of furtherpreferences does not make the vote as a whole invalid. It isstandard practice to accept as valid a vote with a unique firstpreference, and to accept further preferences provided oneand only one is marked at each stage; if no, or more thanone, next preference is given at any point, all markings atand past this point are ignored.
For the simplest form of STV counting, involving thephysical transfer of ballot papers from pile to pile, the needfor a unique next preference is obvious. However, with thefeedback method such a restriction is no longer necessary,and indeed it is not necessary even with Senate Rulescounting. A vote can be marked A1, B1, C2, ... with A and Bas equal first preferences and credited at 0.5 each to A andB. If A is elected or eliminated the 0.5 is transferred atreduced or full value to the next preference − which ofcourse is B and not C. In effect, such a vote is equivalent totwo normal STV votes, of value 0.5 each, marked A,B,C...and B,A,C... respectively. Similarly, if A, B, C are allmarked equal first, this is equivalent to 6 (= 3!) votes ofvalue 1/6 each, marked A,B,C...; A,C,B...; B,A,C...;B,C,A...; C,A,B...; and C,B,A... . It is easy to see that thiscan be extended to equal preferences at any stage, and thatK equal preferences correspond to K! possible orderings ofthe candidates concerned, each sharing 1/K! of the value atthat stage.
Such an extension of the validity rules enables us to resolvethe dilemma between the methods (a) and (b) in section 3 ofdealing with non-transferable votes. A voter who, at acertain stage, wishes his vote, if transferred, to be sharedequally between the remaining candidates, can simply markthose candidates as equal (i.e. last) preferences. Thus thedilemma does not after all exist; both of the methods can beused, and the voter himself can determine which is to beused for his own ballot by the way that he marks it; failureto rank a candidate indicates a genuine (partial) abstention.
This extension of the validity rules also enables condition(C) of Paper I to be satisfied more closely. The conditionwas:
(C) There is no incentive for a voter to vote in any wayother than according to his actual preference.
Here we are interpreting this condition in a particular waynot discussed in Paper I: the STV voting rules not merelyencourage but force a voter to vote other than according tohis preference in the restricted sense that, e.g. if he rates twocandidates as equal first he is not allowed to voteaccordingly, but must assign a preference order betweenthem which may well be arbitrary. In view of the importanceof first preferences in STV, this is undesirable. A voter issimilarly forced to make an unreal ordering of candidates towhich he is indifferent if, for example, he has listed his realpreferences but wishes to give the lowest ranking to a
candidate he particularly dislikes. This kind of voting isvery common.
Permitting equal preferences thus gives much greaterflexibility to the voter to express his ordering of thecandidates, and is thus a desirable reform whether thefeedback method is used for counting or the Senate Rulesretained.4
7. Concluding remarksTwo distinct problems arise in the development of a votingsystem; the information with regard to the choices which isrequired from each voter, and the way in which thisinformation is to be processed to arrive at "the socialchoice".
The first problem is mainly outside the scope of thesepapers, but has been touched on in the last section. It is abasic assumption of STV that the individual preferenceorderings of each voter is sufficient information5 to obtainthe social ordering, and the voting rule extensions describedabove follow naturally from this principle, and indeed bringSTV more closely into line, in a certain sense, with thework of Arrow.6
The possible development of (preferential, transferable)voting systems which use further relevant information is thesubject of continuing work.8
The second problem is the classical problem of decisiontheory. Assuming the basic STV structure, these papershave shown that the feedback method of counting is neededto satisfy the declared aims of STV as a decision-makingprocedure more consistently.
This improvement can be made without causing any moredifficulty to the voter, and allows the counting procedure tobe described by two simple principles instead of by acollection of rules, some of which are rules of thumb.
The disadvantage of the method is the need for manyrepetitive calculations, which for reasons of sheerpracticality rules it out for manual counting except when thenumbers of vacancies, candidates and votes are small.However, as pointed out in Paper I, an STV count is alreadya sufficiently tedious process for it to be worthwhile to use acomputer, and the additions to the feedback methoddescribed in this paper would be simple to add to thecomputer program.
As E G Cluff has pointed out,7 one advantage of electionautomation is that one is not restricted in the choice ofvoting system to what is practically feasible in a manualcount. The feedback method can lead to different resultsfrom the Senate Rules in non-trivial cases, and is therefore achoice to be considered when the automation of STVelections is being implemented.
Volume 1 Voting matters, for the technical issues of STV
Page 10 Issue 1, March 1994
References and notes 1 B L Meek, A new approach to the Single Transferable
Vote I: Equality of treatment of voters and a feedbackmechanism for vote counting, Mathématiques etSciences Humaines No 25, pp 13-23, 1969.
2 It can in fact lead to the defeat of a candidate who isfirst choice of a majority of the electorate. It isdepressing to note that a public election in England washeld under precisely these rules as recently as 1964.
3 This kind of inequity can be found most often inelections with large numbers of candidates andvacancies − e.g. for society committees − and can leadto disillusion with STV as a voting system which haslittle relation to its merits or demerits.
4 The possibility of a voter sharing his first preferenceother than equally between a number of candidateswould take us too far afield, into the realm of multipletransferable voting systems − the subject of continuingwork on more general preferential voting systems. InSTV the task of the voter is in comparison astraightforward one, in some ways made easier byallowing equal preferences.
5 And, indeed, necessary information!
6 K Arrow, Social choice and individual values, 2nd edn,Wiley 1962. For what is meant by "in a certain sense"see Paper I.
7 See B L Meek, Electronic voting by 1975?, DataSystems July 1967, p 12.
8 See also note 4. This further work was later published(in English) as: B L Meek, A transferable voting systemincluding intensity of preference, Mathématiques etSciences Humaines No 50, pp 23-29, 1975.
Computer counting in STVelections
D R Woodall, Department of Mathematics, University ofNottingham.
Reprinted [with minor corrections] from Representation23 (1983), 4-6.
The Single Transferable Vote is by far and away the fairestform of electoral system. Nevertheless, when the counting inSTV elections is carried out by hand, rather arbitrary
decisions have to be made in order to simplify the count, andthese introduce anomalies. Although small in comparison withanomalies present in other electoral systems, these anomaliesmay affect the result, and are certainly annoying to the purist.
The biggest anomaly is caused by the decision, always made,not to transfer votes to candidates who have already reachedthe quota of votes necessary for election. This means that theway in which a given voter's vote will be assigned maydepend on the order in which candidates are declared electedor eliminated during the counting, and it can lead to thefollowing form of tactical voting by those who understand thesystem. If it is possible to identify a candidate W who is sureto be eliminated early (say, the Cambridge University RavingLoony Party candidate), then a voter can increase the effect ofhis genuine second choice by putting W first. For example, iftwo voters both want A as first choice and B as second, and Ahappens to be declared elected on the first count, then thevoter who lists his choices as 'A B ...' will have (say) one thirdof his vote transferred to B, whereas the one who lists hischoices as 'W A B ...' will have all of his vote transferred to B,since A will already have been declared elected by the time Wis eliminated. Since one aim of an electoral system should beto discourage tactical voting, this seems to me to be a seriousdrawback.
If, on the other hand, one agrees that surpluses will betransferred to candidates who have already reached the quota,then one has to do something to avoid the never-endingtransfer of progressively smaller surpluses between twocandidates. Whatever strategy one adopts, it is bound tointroduce other anomalies, albeit smaller than the one alreadydescribed.
If the counting is carried out by computer, however, no sucharbitrary decisions are necessary, as the never-ending transfercan be carried out to completion, or at least until the surplusesremaining to be transferred are less than (say) a millionth of avote. The resulting procedure is described in the nextparagraph in a different way. It is comparatively simple inconcept, and the undoubtedly long calculations are all safelyhidden inside the computer.
The counting is divided into rounds, in each of which onecandidate is eliminated. In each round of the elimination, ascaling factor is assigned to each candidate, representing theproportion that will actually be credited to him out of thevotes potentially available to him, in such a way that:
1) a candidate who has already been eliminated in aprevious round is assigned scaling factor 0, so that novotes will be credited to him in the current round;
2) a candidate whose fate is undecided at the end of thecurrent round is assigned scaling factor 1, so that all thevotes potentially available to him are credited to him;and
Voting matters, for the technical issues of STV, Volume 1
Issue 1, March 1994 Page 11
3) a candidate who by the end of the current round hasat least the quota of votes necessary for election (andso is certain to be elected) is assigned a scaling factorless than or equal to 1 so that the number of votescredited to him is brought down exactly to the quota.
The candidate with the smallest number of votes is theneliminated, and the process is repeated until the number ofcandidates remaining is equal to the number of places to befilled.
For example, suppose that, in a given round of the counting,candidates A and B are certain of election and have scalingfactors of two thirds and three quarters respectively, andcandidates C, D and E have already been eliminated inprevious rounds, whereas the fates of the remainingcandidates remain undecided. Then a voter who lists thecandidates in the order C, A, D, B, E, F will, in the currentround, have none of his vote assigned to C. The whole of hisvote will be passed down to A, who will retain two thirds ofit. The remaining third of his vote will be passed over D anddown to B, who will retain three quarters of it (that is, onequarter of a vote). The twelfth of a vote that is stillunassigned will be passed over E and down to F, who willretain all of it.
The calculation of the scaling factors, which would beprohibitively long to do by hand, could be carried out quiteeasily by computer. However, once the computer had donethe work, it would be possible to check by hand that thecomputer was correct; certainly this would take no longerthan carrying out the whole count by hand as at present.
(This situation is not unusual in mathematics. Suppose, forexample, that you were asked to find a number x between 1and 2, accurate to seven places of decimals, such that (say)
x5 + x4 – 4x3 – 3x2 + 3x + 1 = 0.
You would find it very tedious to do so by hand, even withthe aid of a pocket calculator. Suppose, however, that acomputer were to do the work and tell you that the answer is1.6825071; then it would take you only a few minutes tocheck that the computer was correct.)
The size of computer required would depend on the size ofthe electorate, on the number of places to be filled and, to alesser extent, on the number of candidates. In the case of anelection with both a very large electorate and a large numberof places, it might even be impossible to carry out thecalculations in a reasonable time with the present generationof computers.
However, for parliamentary elections, there would be noproblem: the calculations could be done quite easily even ona mini-computer.
Since proposing the above method, I have learnt that it isnot new; a differently worded but exactly equivalent method
was proposed by Brian Meek in 1969.1,2 I hope it will bepossible to agree that, whenever computer counting is usedin STV elections, this method should be used.
References1 B L Meek, Une nouvelle approche du scrutin
transférable, Mathématics et Sciences Humaines 25(1969), 13-23.
2 B L Meek, Une nouvelle approche du scrutintransférable (fin), Mathématics et Sciences Humaines29 (1970), 33-39.
IntroductionWhatever criticisms may be levelled against First-Past-The-Post as a system of voting, at least the system has the meritthat, although the count may be conducted in many ways,all ways give the same result. The Single Transferable Voteis demonstrably a better system of voting, but the systemhas the disadvantage that the result depends upon how thecounting is conducted.
Counts have been done in many ways, and in some peculiarways by some well-meaning, but unversed, enthusiasts forSTV. One of the commonest methods of conducting thecount, and indeed the method that the Electoral ReformSociety uses, is that given by Newland and Britton.1 Theirpaper tells one how to conduct a count by their method, butnot why they make many of the arbitrary decisions that theydo. Woodall2 has suggested that they are made forexpediency − to simplify the count − and he goes on topropose another method, which he advocates whenevercomputer counting is used. As Woodall points out, hismethod would be prohibitively long with human counting.As Woodall also states, a differently worded but an exactlyequivalent method to his had been proposed by Meek in1969.3,4
The object of this paper is, first, to consider some of theprinciples that are felt to be important in deciding upon amethod for conducting the count, and then to go on andpropose a method that meets these principles.
PrinciplesThe first principle of the STV system is that election is byquota. A candidate is deemed elected when the voteassigned to him attains a given quota. The quota is chosenas the minimum vote which will not allow more than the
Volume 1 Voting matters, for the technical issues of STV
Page 12 Issue 1, March 1994
required number of candidates to be elected. This is the Droopquota, and is the total valid vote divided by one more than thenumber of candidates to be elected.
The second principle concerns the transference of a voter'svote to the preferences later than his first preference. Thevoter needs to be assured that his later preferences will in noway upset the voter's earlier preferences. Equally a voter'slater preferences should not be considered unless, in regard toeach earlier preference candidate, either the voter has borne anequal share with other voters who have voted for thatcandidate in giving him the necessary quota, or that earlierpreference candidate has been eliminated. The way in whichNewland and Britton conduct a count does not meet thisprinciple.
The third principle concerns the elimination of candidates.Unfortunately no-one appears to have proposed a principle inthis regard. So what is usually done is that, when no candidatehas a surplus above the quota, in order to allow the count tocontinue, the candidate whose vote is least is eliminated.
MethodIf, after counting the first preference votes, the votes for oneor more candidates exceed the quota, then the essential featureof the method proposed here is that these candidates areallowed to retain only part of the vote that had been expressedfor them such as will give each candidate just the necessaryquota. The part of the vote that the candidate retains is calledthe 'amount retained'. The voters who have voted for one ofthese candidates, for whom the amount retained is x1, say,then have an amount remaining of (1–x1), which is thentransferred to the voters' expressed second preferences. If anexpressed second preference has an amount retained of x2,say, and if x1+x2 is less than unity, then the voter still has anamount remaining of (1–x1–x2), which is then transferred tothe expressed third preference, and so on. Proceeding in thisway, the end of the first stage of the count is reached whensome candidates have just the quota, whereas the remainderhave varying amounts of vote less than the quota.
The candidate whose vote at the end of the first stage is leastis eliminated. This means that, wherever his name appears ona ballot paper, it is 'passed over', and, in effect, all the laterpreferences are 'moved up one'. Elimination of a candidatewill usually cause the votes for some other candidates toexceed the quota. The amount to be retained by eachcandidate is then reduced to such lower value as will giveeach candidate just the necessary quota. Voters who havevoted for these candidates with reduced amount retained willthen find that they have more vote remaining for transferenceto later preferences. Proceeding in this way, at the end of eachstage of the count, some candidates will have just the quota,whereas the remainder will have varying amounts of vote lessthan the quota.
Eventually the number of non-eliminated candidates will bereduced to one more than the number to be elected. When theamounts to be retained are now recalculated so as to reduceeach candidate's vote to the necessary quota, all candidateswill have just the quota, so the one candidate who has anamount retained of just 1 is the one eliminated. The remainingcandidates are deemed elected.
If at any stage a ballot paper does not contain sufficientpreferences for transference to be made, then the balance ofvote is ascribed 'non-transferable', and the quota isrecalculated excluding the non-transferable vote.
The main question that the proposed method of conductingthe count poses is: how does one decide upon the amount tobe retained by each candidate at each stage? From what hasbeen said, the amounts retained have to be such that, when thecount is made, each candidate to whom an amount to beretained of less than 1 has been assigned achieves just a quota.The problem of finding the amounts retained, and theassociated quota, is a mathematical one which is relativelystraightforward, even if protracted, but which a computer canhelp to solve. Here we are concerned only with the principle,not with precisely how the task be done. However, it is notnecessary for everyone to know how to assign the amountsretained. As Woodall2 has exemplarily pointed out, it is onlynecessary for anyone to be able to check that the assignedamounts retained do in fact achieve the desired result.
References1 R A Newland and F S Britton, How to conduct an
election by the Single Transferable Vote, secondedition, Electoral Reform Society of Great Britain andIreland (1976).
2 D R Woodall, Computer counting in STV elections,Representation, Vol.23, No.90 (1982), 4-6.
3 B L Meek, Une nouvelle approche du scrutintransférable, Mathématics et Sciences Humaines 25(1969), 13-23.
4 B L Meek, Une nouvelle approche du scrutintransférable (fin), Mathématics et Sciences Humaines29 (1970), 33-39.
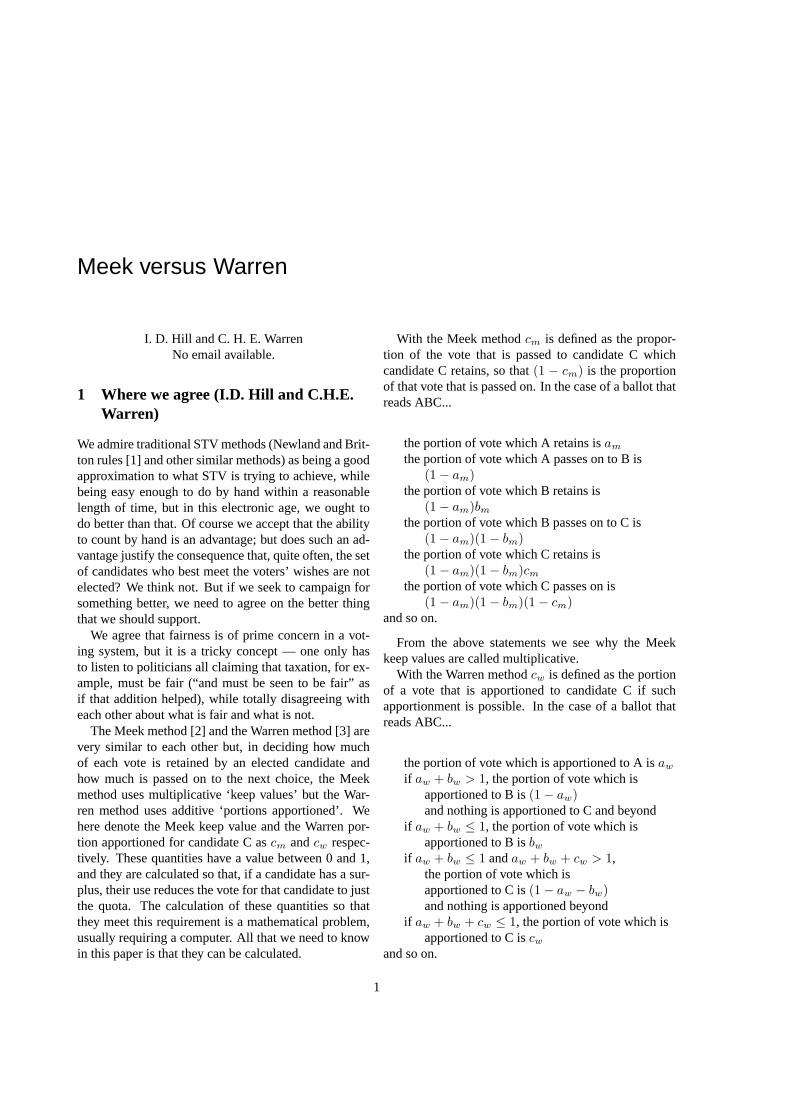
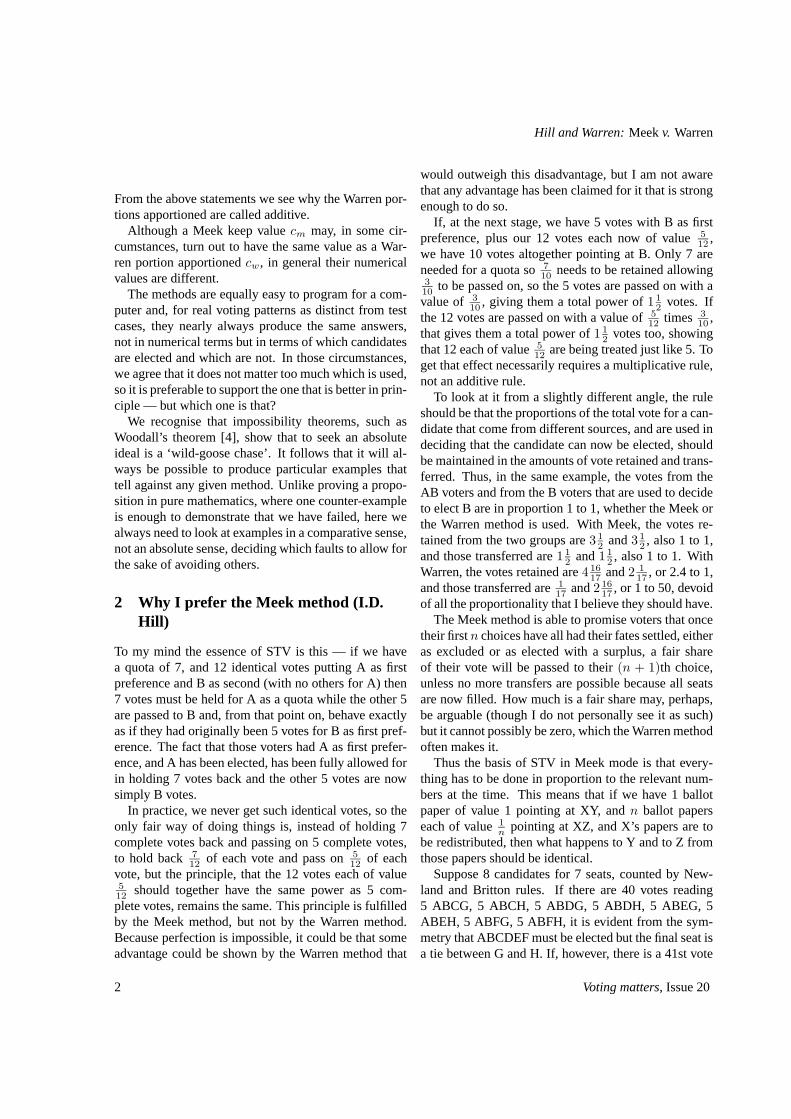
The Meek system and the Warren system for counting an STVelection are very similar, but whereas the fractions of a vote
Voting matters, for the technical issues of STV, Volume 1
Issue 1, March 1994 Page 13
retained by successive elected candidates are multiplicativeunder Meek, they are additive under Warren. For example, ifcandidate A is keeping 1/2 of everything received andcandidate B is keeping 1/3, a vote reading AB... will, underMeek, give 1/2 of a vote to A and 1/6 of a vote to B (i.e. 1/3of the remaining 1/2), leaving 1/3 of a vote to be passed onfurther. With those same fractions under Warren, a similarvote will give 1/2 of a vote to A and 1/3 of a vote to B,leaving 1/6 of a vote to be passed on further. (It should benoted, though, that in any actual case the fractions will notusually be the same under the two systems). The Warrensystem will often lead to the situation where not enoughvote remains for the fraction required; in such a case all thatremains is taken and nothing remains to go any further.
There is no difference in the ease of writing a computerprogram to satisfy the one system or the other; the choicecan be made solely on which is regarded as better inprinciple. It should also be reported that in real examples ofSTV elections, as distinct from artificially constructedexamples, no case has yet been found where the two elect adifferent set of candidates, so the difference for real lifeseems to be slight.
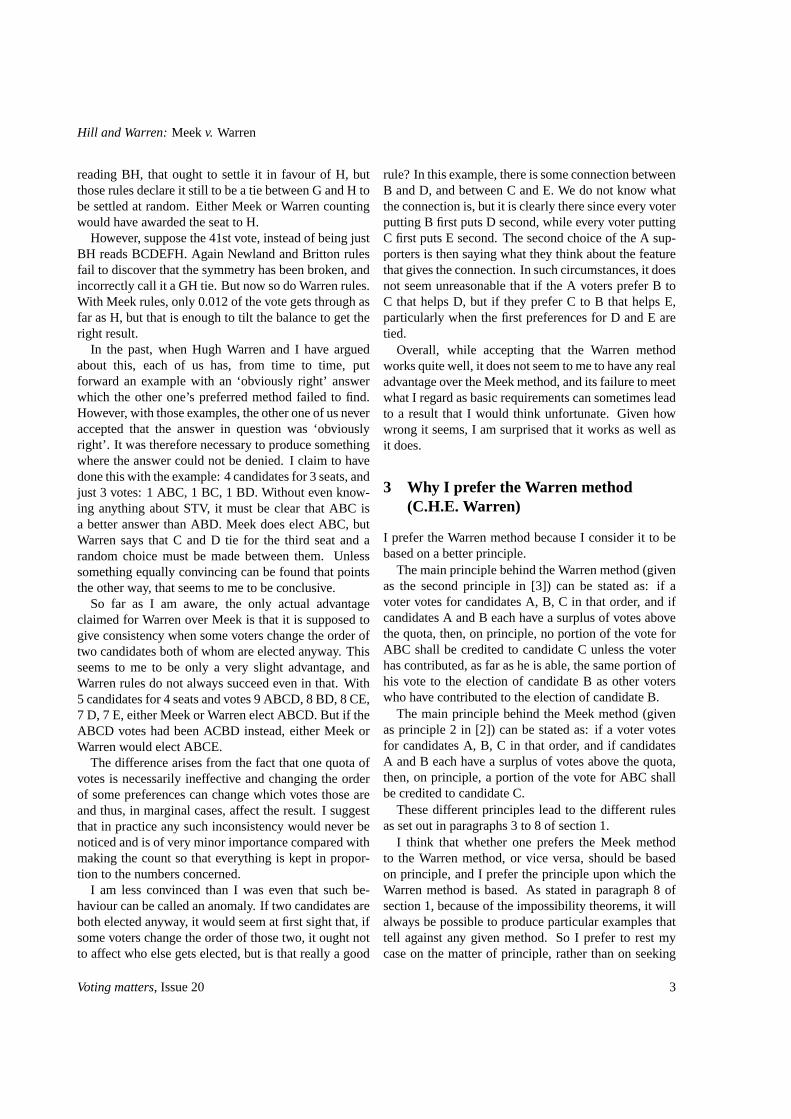
There has been much argument over which system is to bepreferred. In the end, we have settled on a particularexample which demonstrates that each system can be said tosuffer from a difficulty that the other one solves. It musttherefore be a matter of judgement which difficulty isregarded as the more serious, rather than a firm decision ofone always being better than the other.
The Meek rationale is that all transfers from a surplusshould be in proportion to the 'votes-worth' put into thatsurplus. Thus 5 identical votes, each of current value 1/5,should have the identical effect to that of 1 complete votefor the same preferences. The Warren rationale is that novoter should be allowed to influence the election of anadditional candidate until having contributed as much as anyother voter to the election of each candidate who has alreadybeen elected and is named earlier in the voter's preferences.Thus the 5, each of value 1/5, are to be treated as 5, not asthe equivalent of 1.
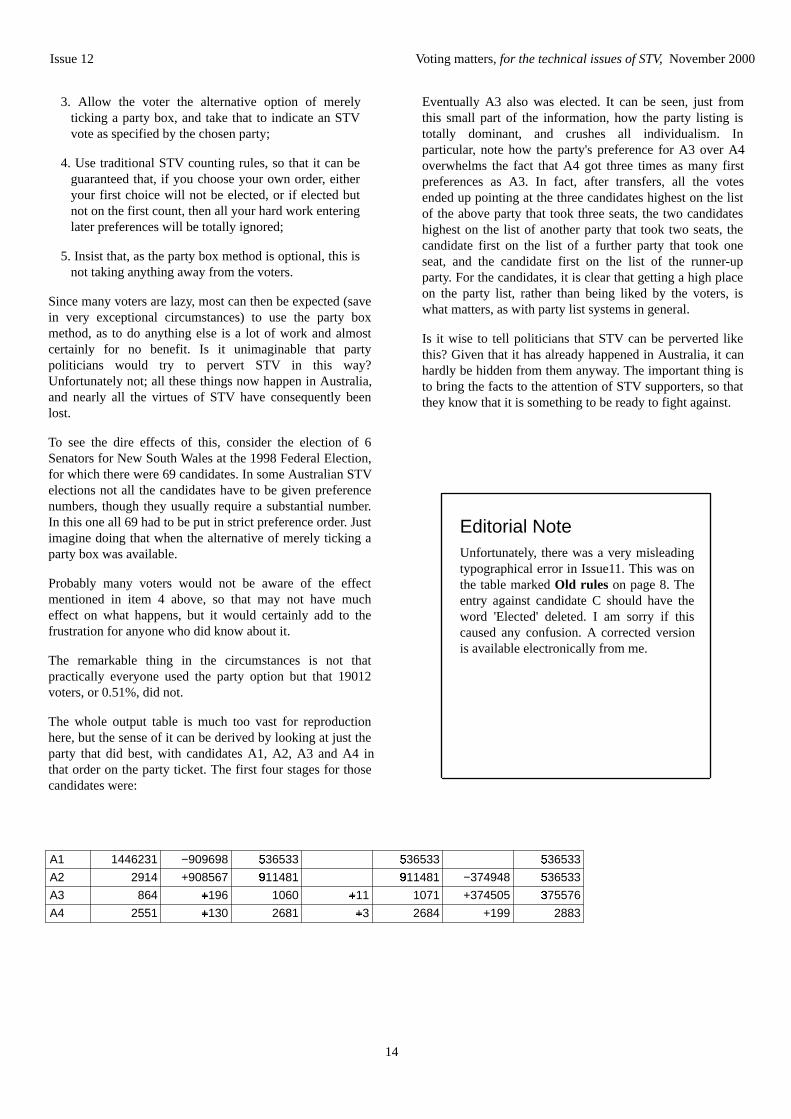
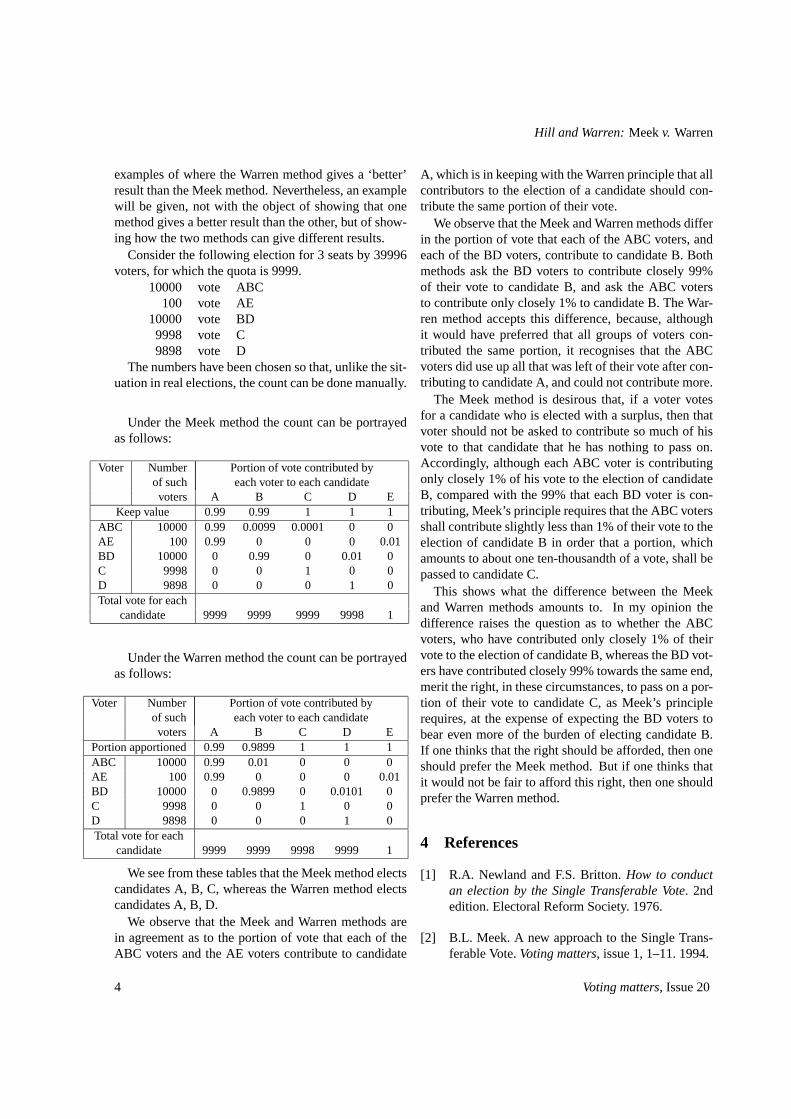
The example that shows the differences has 5 candidates for3 seats and 32 votes, leading to a quota of 8.0. The votesare:
12 ABC, 12 BE, 7 C, 1 D.
Meek supporters can point out the Warren anomaly that Aand B each had a substantial surplus on the first count, yetthe 12 ABC votes are given by the Warren system entirely toA and B and, in consequence, C fails to get the 1 extra voteneeded for election and E takes the third seat. Under Meek,C easily beats E.
Warren supporters can point out the Meek anomaly that if
the 12 ABC voters had voted BAC instead, the Meeksystem would have behaved exactly like the Warren system,and E would have beaten C. It seems illogical that thechoice of C or E should depend upon the ordering by those12 voters as ABC or BAC when A and B were both electedanyway.
Deciding between the two systems must therefore remain amatter of personal preference.
It may be of interest to see exactly how each of the twosystems would treat this example. Each would note that Aand B are both elected on the first count, each having 12first preferences for a quota of 8.
The Meek system would calculate that A needs to keep 2/3of everything received whereas B needs to keep 1/2, thesefractions being derived so that each of A and B keepsexactly a quota. The 12 ABC votes would be allocated as2/3 of 12 = 8 to A, 1/2 of the remaining 4 = 2 to B, theremaining 2 to C. The 12 BE votes would be allocated as1/2 of 12 = 6 to B, the remaining 6 to E. At the next countthe current votes would therefore be A 8, B 8, C 9, D 1, E 6.The third seat is thus assigned to C and no more needs to bedone.
The Warren system would calculate that A's amountretained needs to be 2/3 and B's 1/3, again derived such that(under the different counting method) each of A and Bkeeps exactly a quota. The 12 ABC votes would beallocated as 2/3 of 12 = 8 to A, 1/3 of 12 = 4 to B. The 12BE votes would be allocated as 1/3 of 12 = 4 to B, theremaining 8 to E. At the next count the current votes wouldtherefore be A 8, B 8, C 7, D 1, E 8. The third seat is thusassigned to E and no more needs to be done.
Volume 1 Voting matters, for the technical issues of STV
Page 14 Issue 1, March 1994
EditorialVoting matters is concerned with the implementation of theSingle Transferable Vote. However, STV is merely onemethod of analysing ballot papers in which preferential votingis used. In consequence, other methods of analysis couldprovide some insight into STV. In this issue, one particularproblem of STV is highlighted, namely that of the eliminationof a popular candidate with few first-preference votes. DavidHill and Simon Gazeley provide algorithms to ‘overcome’ thisproblem and discuss the consequences. Due to theimpossibility of satisfying apparently simple requirements,Douglas Woodall has shown that overcoming the aboveproblem is bound to introduce other anomalies.
The problem with current STV systemsA feature of STV which is not shared by other preferentialvoting systems is election on attaining a certain number ofvotes (the ‘quota’ ). If the number of candidates who have aquota of first preference votes is insufficient to fill all theseats being contested, those which are left are filled bycandidates whose quotas contain votes which have beentransferred from other candidates. These transfers take twoforms: of surpluses above the quota for election fromcandidates who are already elected, and of all the votespreviously standing to the credit of candidates who have beenexcluded in accordance with the rules.
When it is necessary to withdraw a candidate from contention,all versions of STV currently in use exclude the one who hasfewest votes at that time. It is contended that theconsequences of this rule in conventional STV formulationscan be haphazard and therefore unjust in their effect. Considerthe following count:
AD 35 BD 33 CD 32
There are here 3 separate and substantial majorities: againstA, against B and against C. The only thing that all the votersagree on is that D is preferable to two out of the other threecandidates; yet STV excludes D first, however many seats arebeing contested. Unfairness and anomalies such as this arisebecause candidates are excluded before the full extent of thesupport available to them has been investigated. Even thoughevery ballot-paper may have the same candidate marked asthe next available preference, that candidate will not survive ifthey do not have enough votes now.
An even more serious consequence of the ‘exclude the lowest’rule is that it is possible for voters to assist their favouredcandidates by withholding support rather than giving it.Consider the following election for one seat:
AC 13 BC 8 CA 9
Having been excluded, B's votes go to C, who now has anabsolute majority and gets the seat. But suppose that two ofA's supporters had voted BC instead:
AC 11 BC 10 CA 9
Now C is excluded first and A gets the seat.
Is it possible, then, to remove this anomaly withoutintroducing another? The answer, unfortunately, is ‘no’ .Woodall1 proposed that every count under any reasonableelectoral system should have the following four properties:
1. Increased support, for a candidate who wouldotherwise have been elected, should not prevent theirelection;
Voting matters, for the technical issues of STV, Volume 1
Issue 2, September 1994 Page 1
Issue 2, September 1994
2. a. Later preferences should not count against earlierpreferences;
b. Later preferences should not count towards earlierpreferences;
3. If no second preferences are expressed, and there isa candidate who has more first-preference votes thanany other candidate, that candidate should be elected;
4. If the number of ballots marked X first, Y secondplus the number marked Y first, X second is morethan half the total number of ballots, then at least oneof X and Y should be elected.
He then proved that no such system can be devised.
We have already noted that current STV systems can (butusually do not) fail on Woodall's first property; this is thefailure that in Dummett's2 eyes precludes consideration ofSTV as a possible option for public elections in the UK. Asno system can have all four properties, a price for havingone has always to be paid in terms of lacking at least oneother. Under the system proposed below, some counts (butby no means all) may fail to have Woodall's first or secondproperty, but all will have the other two. Whether the priceis worth paying is a question to which no definitive answercan be given: it is ultimately a matter of personal preference.
STV by successive selection (SS) The object of exclusion in current STV formulas is torelease votes from one candidate to be transferred to othersso that one or more of them will get a quota. STV(SS)retains the transfer of votes from candidates who are not yetelected, but differs from present STV systems in that nocandidate is permanently withdrawn from contention. Whenit becomes necessary to release a candidate's votes, thatcandidate is ‘suspended’ (withdrawn temporarily) afterbeing identified as the one whose election to the next vacantseat would be least appropriate.
Manual STV systems need to keep within reasonablebounds both the time taken to count an election and thescope for human error and this need can give rise toanomalies. Meek3 and Warren4 have devised schemeswithout these anomalies for distributing votes which wouldbe impracticable using manual methods. STV(SS) isdesigned (but not yet programmed) to be run on a computerusing either of these schemes, but only one should be usedin any one election.
In addition to Woodall's four properties, every count under areasonable system would have the property that of a set of dor more candidates to which d Droop quotas of voters aresolidly committed, more than (d-1) should be elected; if theset contains fewer than d candidates, all of them should beelected. According to Dummett, a group of voters are
‘solidly committed’ to a set of candidates if every voter inthe group prefers all candidates within the set to anycandidate outside it. STV(SS) and other STV formulasachieve proper representation of sets of candidates bywithdrawing from contention candidates who have less thana quota of votes and by transferring surplus votes fromthose candidates who have more than a quota.
The principle underlying STV(SS)STV(SS) is predicated on the proposition that when nosurpluses remain to be transferred, there is only onecandidate (barring ties) who is the most appropriateoccupant of the next seat. Appropriateness depends amongother things on who has been elected already: if CandidateX is the ‘most appropriate’ and Candidate Y is the ‘nextmost appropriate’ at any given point, it does not followwhen X is elected that Y is now the ‘most appropriate’ . Thenext candidate to be elected is the one who can command aquota and for whose election the other non-electedcandidates need to sacrifice the smallest proportion of theirvotes.
Under STV(SS), each non-elected candidate in turn is testedto see what proportion of the votes of the other non-electedcandidates have to be passed on in addition to the surplusesof the elected candidates to give them the quota. Of thosewho can command a quota, the candidate who requires thesmallest proportion of the others' votes is the ‘mostappropriate’ to be elected next. The process is bestillustrated by an example. Consider the following votes forone seat:
A 49 BC 26 CB 25
No candidate has a quota, but instead of excluding thelowest we test each candidate in turn to see which is the‘best buy’ . Let us test A first. The quota is 50 and B and Chave 51 votes between them; we therefore change theirKeep Values (KVs: see the Annex for further details) from1.0 to 50/51 (0.9804). At the second distribution the voteslook like this:
A 49. 0000 B 25. 9708 C 25. 0096
The new total of votes is 99.9804, making the quota49.9902. A still has not got the quota, so the countproceeds. The final distribution looks like this:
A 49. 0000 B 24. 8216 C 24. 1784
Volume 1 Voting matters, for the technical issues of STV
Page 2 Issue 2, September 1994
At this point, we record the fact that the common KV of B andC is 0.8020. If we now test B, we find that the final commonKV of A and C is 0.5152; when we test C the common KV ofA and B is 0.5050.
At first sight, A seems the obvious choice to get the seat:however, if A were to be successful, Woodall's fourth propertywould be lacking. No candidate should be elected who cannotcommand a Droop quota of the votes which are active at thetime of their election. If we remove C from contention (C is‘ least appropriate’ as the other candidates had to give up thegreatest proportion of their own votes to secure C's quota) andredistribute C's votes, B now secures a Droop quota and iselected.
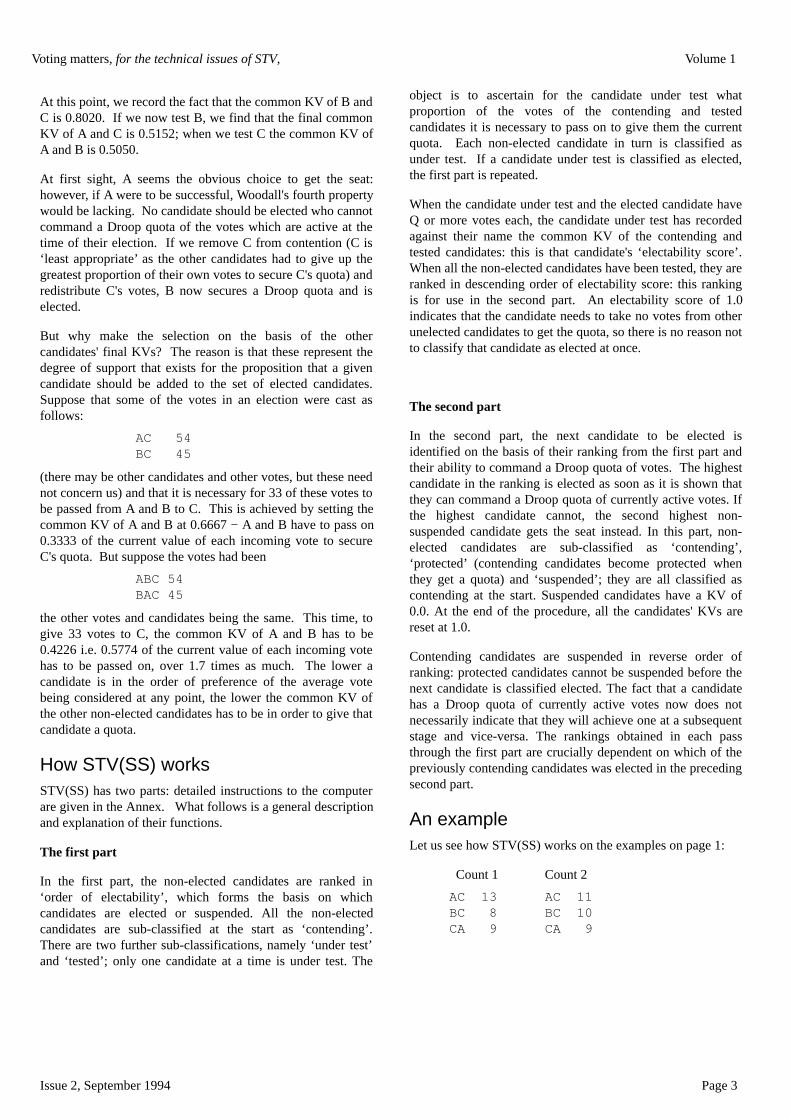
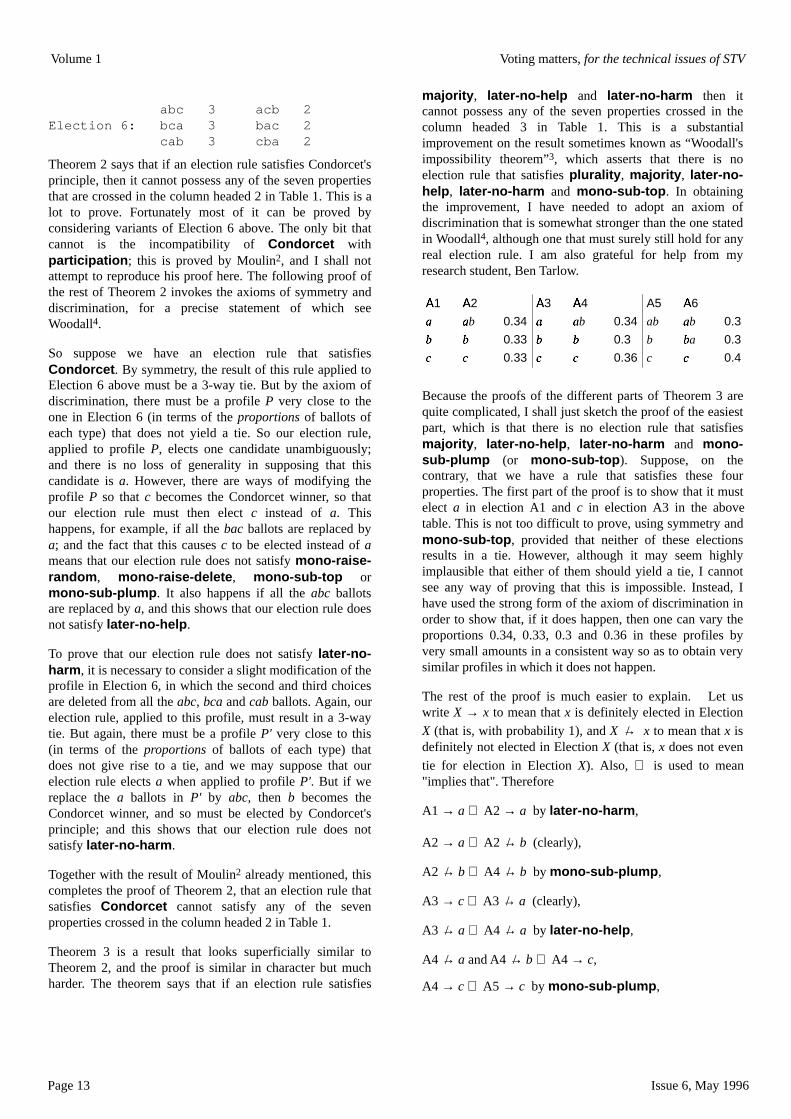
But why make the selection on the basis of the othercandidates' final KVs? The reason is that these represent thedegree of support that exists for the proposition that a givencandidate should be added to the set of elected candidates.Suppose that some of the votes in an election were cast asfollows:
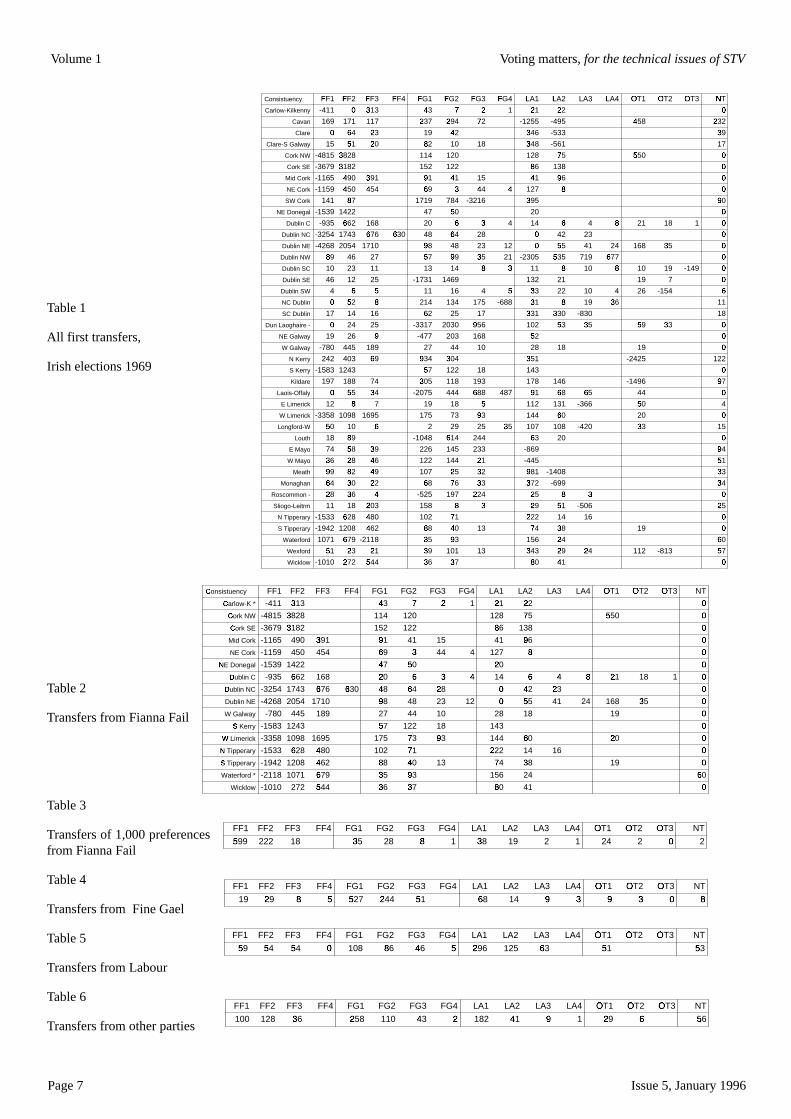
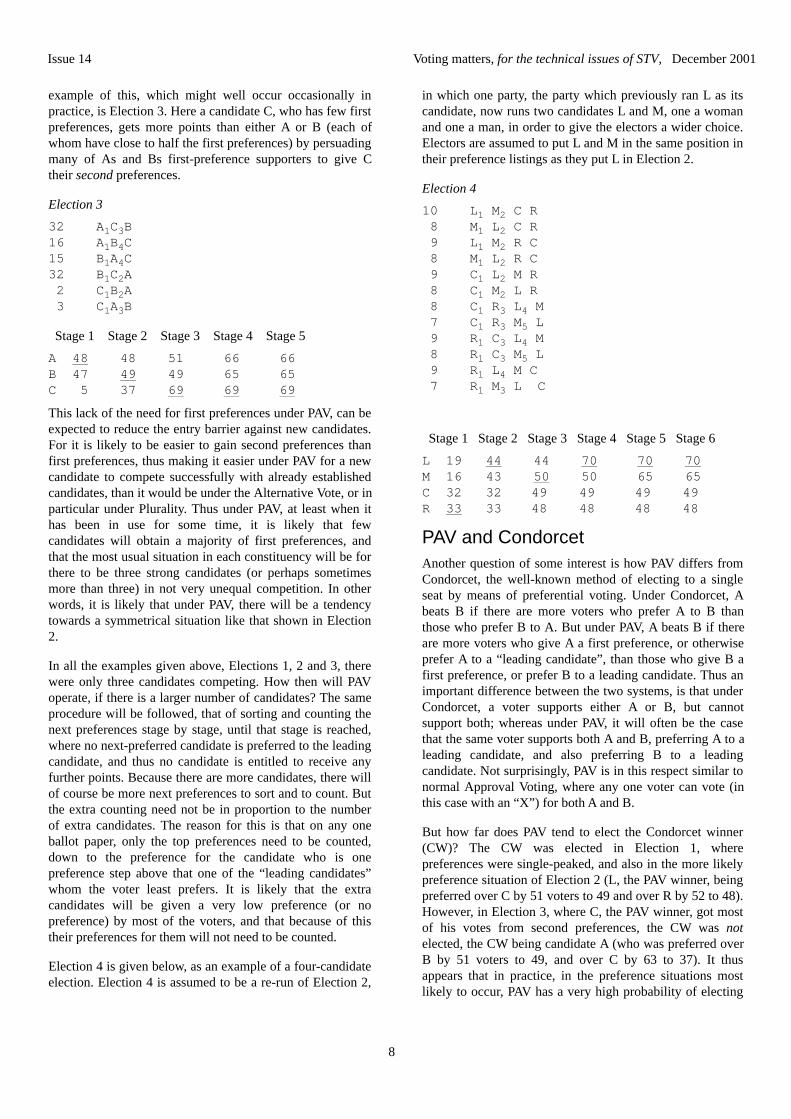
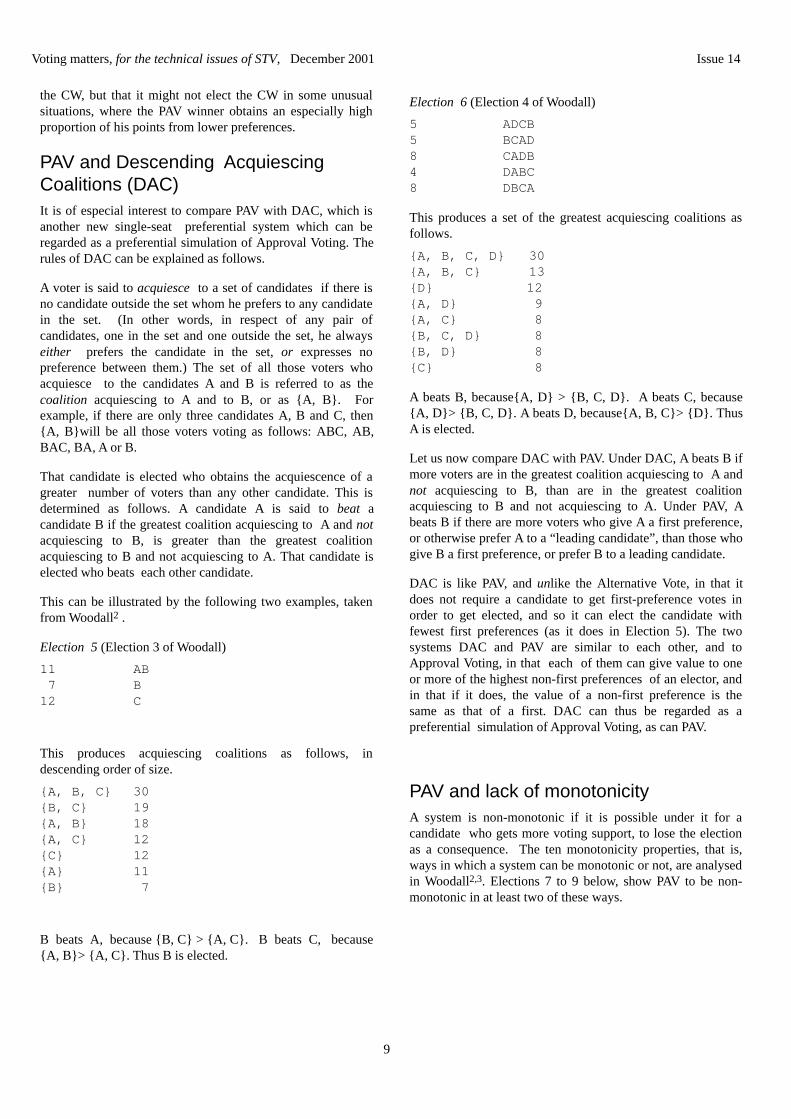
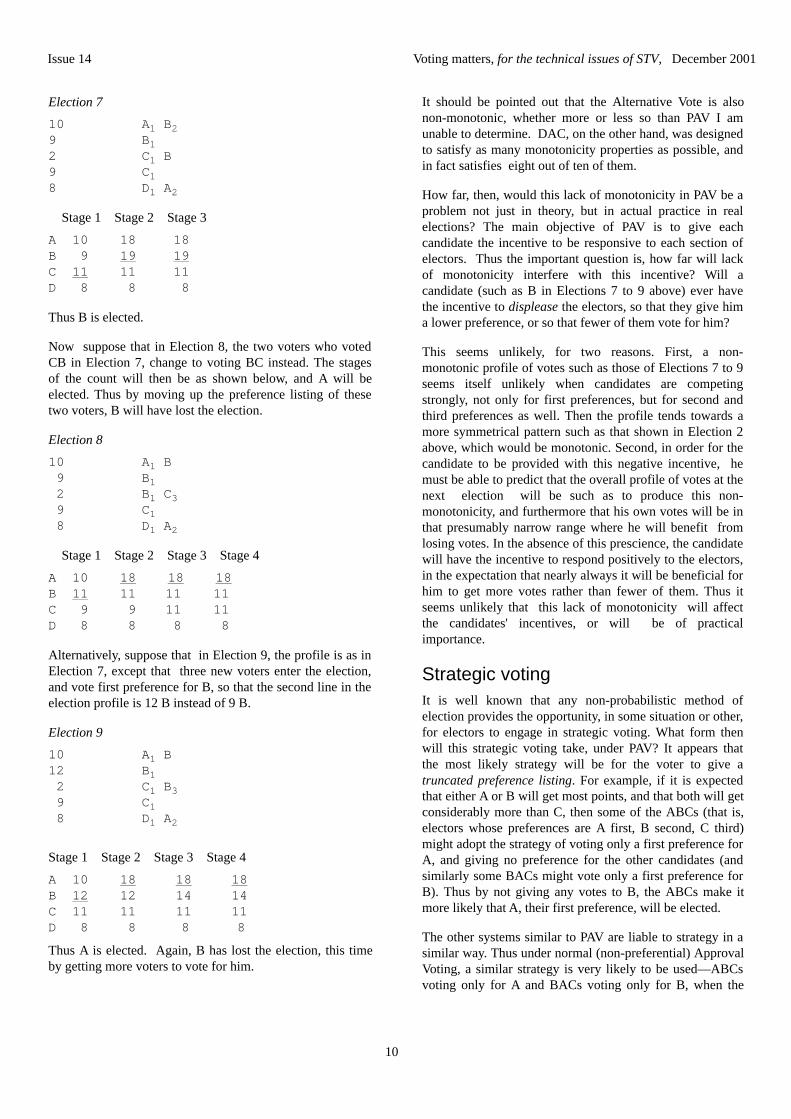
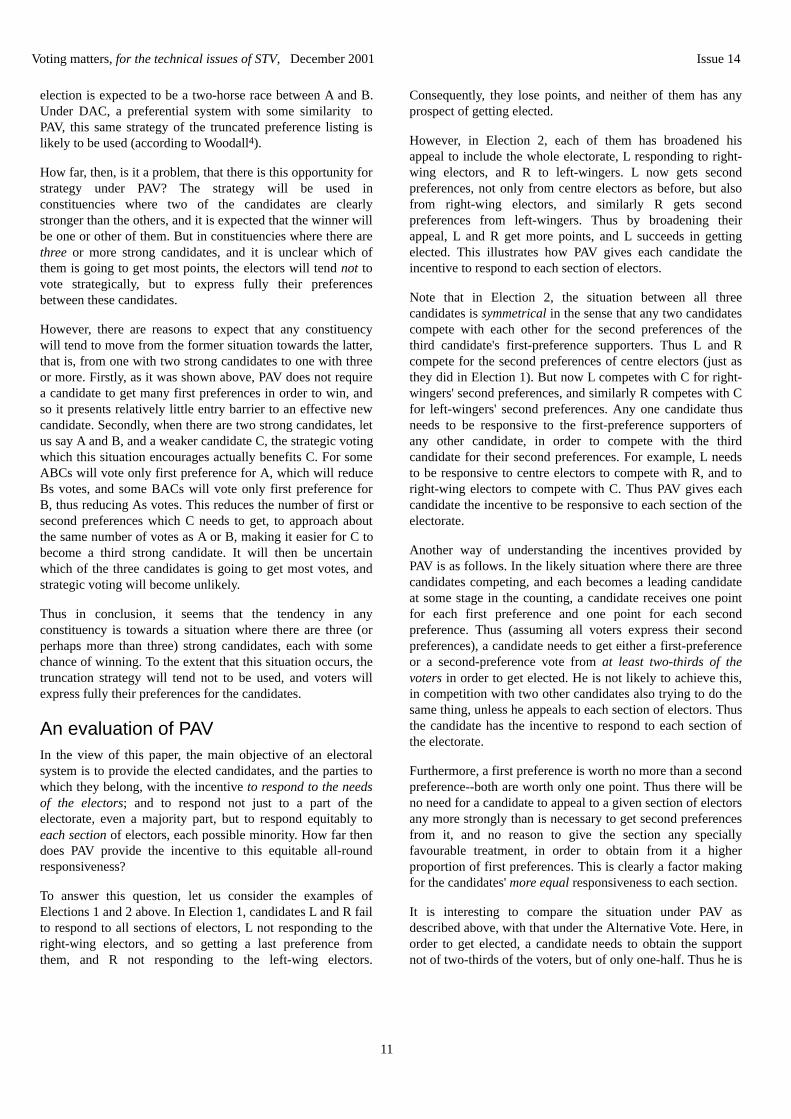
AC 54 BC 45
(there may be other candidates and other votes, but these neednot concern us) and that it is necessary for 33 of these votes tobe passed from A and B to C. This is achieved by setting thecommon KV of A and B at 0.6667 − A and B have to pass on0.3333 of the current value of each incoming vote to secureC's quota. But suppose the votes had been
ABC 54 BAC 45
the other votes and candidates being the same. This time, togive 33 votes to C, the common KV of A and B has to be0.4226 i.e. 0.5774 of the current value of each incoming votehas to be passed on, over 1.7 times as much. The lower acandidate is in the order of preference of the average votebeing considered at any point, the lower the common KV ofthe other non-elected candidates has to be in order to give thatcandidate a quota.
How STV(SS) worksSTV(SS) has two parts: detailed instructions to the computerare given in the Annex. What follows is a general descriptionand explanation of their functions.
The first part
In the first part, the non-elected candidates are ranked in‘order of electability’ , which forms the basis on whichcandidates are elected or suspended. All the non-electedcandidates are sub-classified at the start as ‘contending’ .There are two further sub-classifications, namely ‘under test’and ‘ tested’ ; only one candidate at a time is under test. The
object is to ascertain for the candidate under test whatproportion of the votes of the contending and testedcandidates it is necessary to pass on to give them the currentquota. Each non-elected candidate in turn is classified asunder test. If a candidate under test is classified as elected,the first part is repeated.
When the candidate under test and the elected candidate haveQ or more votes each, the candidate under test has recordedagainst their name the common KV of the contending andtested candidates: this is that candidate's ‘electability score’ .When all the non-elected candidates have been tested, they areranked in descending order of electability score: this rankingis for use in the second part. An electability score of 1.0indicates that the candidate needs to take no votes from otherunelected candidates to get the quota, so there is no reason notto classify that candidate as elected at once.
The second part
In the second part, the next candidate to be elected isidentified on the basis of their ranking from the first part andtheir ability to command a Droop quota of votes. The highestcandidate in the ranking is elected as soon as it is shown thatthey can command a Droop quota of currently active votes. Ifthe highest candidate cannot, the second highest non-suspended candidate gets the seat instead. In this part, non-elected candidates are sub-classified as ‘contending’ ,‘protected’ (contending candidates become protected whenthey get a quota) and ‘suspended’ ; they are all classified ascontending at the start. Suspended candidates have a KV of0.0. At the end of the procedure, all the candidates' KVs arereset at 1.0.
Contending candidates are suspended in reverse order ofranking: protected candidates cannot be suspended before thenext candidate is classified elected. The fact that a candidatehas a Droop quota of currently active votes now does notnecessarily indicate that they will achieve one at a subsequentstage and vice-versa. The rankings obtained in each passthrough the first part are crucially dependent on which of thepreviously contending candidates was elected in the precedingsecond part.
An exampleLet us see how STV(SS) works on the examples on page 1:
Count 1 Count 2
AC 13 AC 11 BC 8 BC 10 CA 9 CA 9
Voting matters, for the technical issues of STV, Volume 1
Issue 2, September 1994 Page 3
In Count 1, the ranking is A (the common KV of the othertwo candidates would be 0.7962), C (0.7143) and B(0.2023), so B is suspended first and C gets the seat. TheCount 2 ranking is C (0.7143), A (0.6311) and B (0.2929); Bis once more the first to be suspended so C again gets theseat.
ConclusionAs specified above, the system appears to be long-winded:there are possible short-cuts, but these would obscureessentials and have been excluded.
STV(SS) is a logical system which is submitted as acontribution to the continuing debate on what thecharacteristics of the best possible system might be.Refinements are necessary (for instance, a way of breakingties has to be devised), but there is here the basis for adebate.
References1 D R Woodall, An Impossibility Theorem for Electoral
2 Michael Dummett, Towards a More RepresentativeVoting System: The Plant Report, New Left Review(1992) pp 98-113
3 i. B L Meek, Une nouvelle approche du scrutintransférable, Mathématiques et Sciences Humaines,No. 25, pp 13-23 (1969)
ii. B L Meek, Une nouvelle approche du scrutintransférable (fin), Mathématiques et SciencesHumaines, No. 29, pp 33-39 (1970).
4 C H E Warren, Counting in STV Elections, Votingmatters, No. 1, pp 12-13 (March 1994)
Annex
STV(SS) — Detailed InstructionsThe first part
1. If there is any candidate for whom no voter has expressedany preference at all, treat every such candidate as havingwithdrawn. If fewer than (N+1) candidates remain, end thecount; otherwise, set the ranking of every remainingcandidate to equal first.
2. Classify every non-elected candidate as contending andrepeat the following procedure until there are no contendingcandidates left:
a. Set every candidate's KV at 1.0 and select acontending candidate to be the candidate under test.
b. Examine each ballot-paper in turn and distribute thevalue of the vote in accordance with the voter'spreferences and the KVs of the candidates as follows:
Either i. The Meek Formulation. Offer the vote to each
candidate for whom the voter has voted inorder of preference expressed. Multiply thefraction of the vote which has not yet beenallocated by the KV of the candidate towhom it is being offered, and allocate thatproportion of the vote to that candidate. Anypart of the vote left over after all thecandidates for whom the voter has votedhave received their share is non-transferable.
or ii. The Warren Formulation. Offer the vote to
each candidate for whom the voter hasvoted in order of preference expressed.Award to each candidate in turn a fraction ofthe vote equal to that candidate's KV; if thefraction of the vote remaining is less thanthe KV of the current candidate, award allthat is left to that candidate. Any part of thevote left over after all the candidates forwhom the voter has voted have receivedtheir share is non-transferable.
c. Calculate the quota according to the formulaQ=V/(N+1), where V is the total number of votescredited to all the candidates and N is the number ofseats being contested.
d. If the elected candidates and the candidate under testhave at least Q votes each, go to Step e. Otherwise,calculate new KVs for all the candidates as follows:
i. For all the elected candidates and the candidateunder test, multiply the current KV by Q and dividethe result by that candidate's current total of votes.
ii. Multiply the common KV of the contending can-didates and the tested candidates by (V–(E+1)Q)/T,where E is the number of candidates elected so farand T is the total of the votes credited to thecontending and tested candidates.
If any new KV exceeds 1.0, reset it at 1.0. Go to Stepb.
e. Record the common KV of the contending and testedcandidates against the name of the current candidateunder test; let this be that candidate's ‘electabilityscore’ . Classify that candidate as tested.
3. If no tested candidate has an electability score of 1.0,rank the tested candidates in their existing order withindescending order of electability score and go to Step 5.Otherwise, classify as elected every tested candidate whose
Volume 1 Voting matters, for the technical issues of STV
Page 4 Issue 2, September 1994
electability score is 1.0.
4. If there are N elected candidates, end the count. Otherwise,go to Step 2.
The second part
5. Classify every non-elected candidate as contending and setevery candidate's KV to 1.0. Repeat the following procedureuntil either the highest-ranked contending or protectedcandidate and the elected candidates have Q or more voteseach, or there are only N non-suspended candidates.
a. Examine each ballot-paper in turn and distribute thevalue of the vote in accordance with the voter'spreferences and the KVs of the candidates as follows:
Either i. The Meek Formulation. Offer the vote to each
candidate for whom the voter has voted inorder of preference expressed. Multiply thefraction of the vote which has not yet beenallocated by the KV of the candidate to whomit is being offered, and allocate that proportionof the vote to that candidate. Any part of thevote left over after all the candidates forwhom the voter has voted have received theirshare is non-transferable.
or ii. The Warren Formulation. Offer the vote to each
candidate for whom the voter has voted inorder of preference expressed. Award to eachcandidate in turn a fraction of the vote equalto that candidate's KV; if the fraction of thevote remaining is less than the KV of thecurrent candidate, award all that is left to thatcandidate. Any part of the vote left over afterall the candidates for whom the voter hasvoted have received their share is non-transferable.
b. Calculate the quota according to the formulaQ=V/(N+1), where V is the total number of votescredited to all the candidates and N is the number ofseats being contested. Classify any contendingcandidate with Q or more votes as ‘protected’ .
c. If any candidate has more than Q votes, calculate a newKV for each such candidate by multiplying their presentKV by Q and dividing the result by their present total ofvotes. Otherwise, suspend the contending candidatewho is ranked lowest.
6. Classify as elected the highest-ranked contending orprotected candidate.
7. If N candidates are elected, end the count: otherwise, go toStep 2.
The Meek system for counting an STV election overcomesmost of the troubles encountered in using older systemsdesigned for counting by hand, but the problem of prematureexclusion remains. Premature exclusion of a candidate occurswhen someone is the lowest because hidden behind anotherwho, in the end, is also not going to succeed. If A, who wouldotherwise have been elected, fails because B stood and waselected instead, it is bad luck for A but there is nothingdisturbing about it in principle. If, however, A fails because Bstood, but then B does not get in either, that is disturbing.
Exclusion of the lowest candidate, when an exclusion isnecessary, is the trouble. After all, if the so-called first pastthe post is not necessarily the right person to elect, thenneither is the last past the post necessarily the right one toexclude. Is there some other way of handling things thatwould do better? What is needed is a mechanism to discoverinitially which candidates have some hope of election andwhich have virtually none, and to get rid of the ‘no-hopers’ atthe start of the count. Others cannot then suffer from theirpresence.
Let the election be to fill k seats from n candidates, and let m= n − k. Sequential STV then consists of a number of main-phases and sub-phases, each being an STV election for k seatsbut with varying selections of candidates. The STV electionsare preferably conducted using Meek-style counting but otherrules could be used.
Main-phase 1. All n candidates, but instead of dividing intoelected and excluded, divide them into probables and othersrespectively. Set all n candidates to unmarked.
Sub-phase 1.1. The k probables plus any other one candidate.Set the winners to marked.
Sub-phase 1.2. The same k probables plus any other onecandidate not yet tested. Set any unmarked winners tomarked.
etc.
Sub-phase 1.m. The same k probables plus the last candidatenot yet tested. Set any unmarked winners to marked.
If at any sub-phase there is a tie that has to be settled usingrandom selection, then all k + 1 of the candidates involved areset to marked.
Voting matters, for the technical issues of STV, Volume 1
Issue 2, September 1994 Page 5
Main-phase 2. All marked candidates, dividing intoprobables and others. If the resulting set of probables is thesame as a previous set, those candidates are elected and theprocess finishes. Otherwise reset all n candidates tounmarked and continue.
Sub-phases 2.1 - 2.m. As 1.1 - 1.m but using the newprobables.
Main-phase 3. As main-phase 2.
etc. etc.
It may be noted that anyone getting a quota of firstpreferences on the original count is, in fact, certain to beelected in the end, but to be classified for the time being asprobable does no harm.
The process must terminate because there is only a finitenumber of sets of k that can be formed from n. Usually itwill terminate with two successive main-phases showing thesame set of k probables. In that case the result is firmlyestablished. If, however, the two showing the same set arenot successive it will mean that the system is cycling inCondorcet-paradox style. In that case it may be that a betterrule could be devised than taking the first set to occur twicebut it has to be recognised that a totally satisfactory answeris impossible.
Each candidate is given a fair chance by being tested againsteach new set of probables and since each sub-phase consistsof only k + 1 candidates for k seats, exclusion is nevernecessary during the sub-phases so the ‘exclude the lowest’rule is not operative there.
ExampleWith 5 candidates for 2 seats, suppose the votes
It is evident that E is a strong candidate, in that if any one ofA, B, C or D were to withdraw, E would be the first elected.Yet under simple STV the first action is to exclude E, and Band C are elected. Under sequential STV we find
Phase Candidates Winners Probables Marked 1 ABCDE BC BC 1. 1 BCA BC BC 1. 2 BCD BC 1. 3 BCE BE E 2 BCE BE BE 2. 1 BEA BE BE 2. 2 BEC BE 2. 3 BED BE 3 BE BE BE
B and E are consequently elected. It will be noted thatsome elections may be repeats of ones already done (main-phase 2 and sub-phase 2.2 in the above example are bothrepeats of sub-phase 1.3). The result may of course merelybe copied down without actually repeating any calculations.
Should it be used?If any scheme is to be adopted to get rid of (or at least toease) the problem of premature exclusion, I believe that thisis about as good as can be devised. Yet, after muchconsideration, I do not recommend it for general use,because it breaks the rule, which simple STV always obeys,that a voter's later preferences ought not to interfere withthat voter's earlier preferences.
The following example to demonstrate this trouble isderived from those that Douglas Woodall devised to provehis ‘ impossibility’ theorem. Let there be 3 candidates for 1seat and votes
25 A 17 BC 16 C
Phase Candidates Winner Probable Marked
1 ABC A A 1. 1 AB A A 1. 2 AC C C 2 AC C C 2. 1 CA C C 2. 2 CB B B 3 BC B B 3. 1 BA A A 3. 2 BC B B 4 AB A A
So A is elected. But if the A voters had put in C as a secondpreference, we get
25 AC 17 BC 16 C
Volume 1 Voting matters, for the technical issues of STV
Page 6 Issue 2, September 1994
Phase Candidates Winner Probable Marked
1 ABC A A 1. 1 AB A A 1. 2 AC C C 2 AC C C 2. 1 CA C C 2. 2 CB C 3 C C C
and C is elected. So the A voters have failed to elect Abecause they gave C as a second preference.
Even if this is a rare event, it still means that we cannot assurevoters that their later preferences cannot upset their earlierpreferences. I believe that this is too high a price to pay.There is not much point in reducing the frequency of one typeof fault if, in doing so, you introduce another fault as bad.
Only one seatThe system is really intended, as is STV in general, forsituations where there are several seats to be filled, but it canalso be used in place of Alternative Vote for a single seat.Trying it out on many examples suggests that, for realisticvoting patterns, it is almost certain to elect the Condorcetwinner if there is one, but artificial examples can be devisedto demonstrate that there is no guarantee that it will do so.
For example, let there be 4 candidates for 1 seat and votes
98 ADCB98 CDBA99 BDAC 3 ACBD 2 CBAD
Phase Candidates Winner Probable Marked
1 ABCD A A 1. 1 AB B B 1. 2 AC A A 1. 3 AD D D 2 ABD B B 2. 1 BA B B 2. 2 BC C C 2. 3 BD D D 3 BCD C C 3. 1 CA A A 3. 2 CB C C 3. 3 CD D D 4 ACD A A
So A is elected, even though D would be the Condorcetwinner (for the results of AD, BD and CD are all D). Itshould be emphasised, though, that this is not likely inpractice but only with carefully devised artificial examples.
AcknowledgementI acknowledge that, since I first produced this scheme, DrDavid Chapman has produced an almost identical schemeentirely independently.
I believe two STV elections may be of interest to the readersof Voting matters, due to the implications of the results on theproperties that an ideal STV algorithm should (perhaps) have.
The first election is the Eurovision Song contest for 1992which is an interesting election to analyse since the votes arepublicly available, in spite of the voters not knowing of theother votes. Each country votes for the songs of othercountries by awarding 12, 10, 8, 7, 6, 5, 4, 3, 2 and 1 points,which can be transcribed into STV preferences.
The points system gave for those over 100: Ireland (155), UK(139), Malta (123), and Italy (111). Since the points total isgiven after each country has voted, the commentator (TerryWogan) reported that Ireland was unbeatable by the UKbefore the last few countries voted. An analysis of the votesby other means is quite different.
The ERS hand counting rules declare the UK as the winner, asdoes the Meek STV algorithm. However, more countriespreferred Ireland to the UK than the contrary (by 12 to 11,rather close). Indeed, by the Condorcet rules, Ireland wouldbe the winner, since Ireland is preferred to any other countryby a majority. The reason that the ERS rules elect the UK isthat Ireland is eliminated earlier, leaving the last contestbetween Malta and the UK, which the UK wins. The Meekalgorithm is similar, but with Italy being the last to beeliminated.
One STV algorithm due to Tideman considers all possiblepairs of results. In the case of a single seat, Tideman will electa Condorcet winner (assuming there is one) and hencechooses Ireland in this case. One is therefore left to wonder ifan ‘ ideal’ STV algorithm should always elect a Condorcetwinner, assuming there is one.
Voting matters, for the technical issues of STV, Volume 1
Issue 2, September 1994 Page 7
The second election is one for which I acted as returningofficer for a rather unusual ‘election’ at my place of work.
The research institute at which I work has had a library for agroup of about 60 scientists for at least 30 years. As theresearch has changed over the years, new journals have beenordered. However, except in obvious cases, it has not beenclear which journals should be cancelled — especially sincea complete ‘ run’ of a journal will be lost. I thereforeproposed that an STV election be run to determine whichjournals should be cancelled and which new ones to order.
The management agreed to this proposal and hence I ran theelection as follows: A list was obtained of the (about) 200journals, which were assigned a code. The scientists wereasked to place up to 40 journals in preferential order, beinggiven about a month to place their ballot.
Quite a bit of effort is necessary to fill in the ballot paper.Nobody attempted more than the 40 preferences, theaverage being about 20. About half of those eligible voted,which I thought was quite reasonable, since quite a fewwould have no direct use for the library.
The ballot revealed that 4 journals were in the library butnot on the list provided. Eight journals were written in byelectors which were not in the library.
The analysis of the results proved very interesting. With 31people voting for a total of 198 journals, the quota is a lotless than 1. This implies that about the first six preferenceswould be selected for any reasonable number of journals.However, there was not a fixed number of ‘seats’ , and henceI had to decide what threshold to set. Due to the difficultyfor the electors, I did not interpret the ballot papersaccording the usual ERS rules. In one case in which onepreference was unclear, I omitted that preference but did notignore subsequent preferences. In two other cases in which ajournal was selected twice, I merely ignored the secondchoice.
An initial analysis showed that 27 Journals did not appear inany position on the ballot papers. This gave an instantselection of journals to cancel. I ran the ballot with theoption to cancel 10 and 20 further journals.
I have several STV algorithms available on my homecomputer which I used to compute the result. I had decidedin advance that I would use the Meek algorithm for theelection, but the other versions could be used to see whatdifference it made.
The first problem was that the programs I had, required atrivial modification to handle as many as 200 ‘candidates’ .After having made that modification, it was found that theprograms would not work on my PC because the full resultsover-filled my floppy discs! A further modification wasneeded to output only the final table and a summary of the
eliminations and elections.
The three versions of STV were:
1) The Meek algorithm, as published in the Computer Journal (1987, Vol 30, p277)
2) The ERS hand-counting rules (as programmed byDavid Hill)
3) The Tideman algorithm, as approximated by myprogram.
The ERS results were quite unacceptable which shows thatthe hand-counting rules do not seem to have been used uponsuch an election. The problem is that if the election is runwith the same number of seats as those selected in anypreference, the algorithm does not select just those selectedby the electors! This problem can be expected of anyalgorithm that does not see subsequent preferences.
The other two algorithms produced virtually identicalresults. With the reduction to 20 fewer journals than thoseselected, one difference was found between Meek andTideman. A manual inspection of the results with the twojournals in question, showed no clear distinction.
After producing the result, I computed for each of the 31ballots, the way in which the final stage of the ballot haddivided up the vote. This information was given to eachelector. It created further interest in the STV algorithm.Those who had given more preferences had, in general, alower non-transferable loss. However, the variations werevery large. For instance, a person would gave the largestnumber of preferences (36) had a small loss, while a personwould gave 15 preferences had no non-transferable loss.
I conclude from this election that STV can be used for suchselections, but that the ERS hand-counting rules are notappropriate. Also, any STV algorithm approved by ERS infuture should not suffer from this noted defect. Namely, ifonly N candidates are represented in the preferences and Nis the number of seats, then the algorithm should elect thoseN. This requirement does not seem to lead to additionalproblems. It appears that the STV algorithms whichrecompute the quota can satisfy this requirement, since inthe particular circumstances the entire ballot papers are thenprocessed.
Volume 1 Voting matters, for the technical issues of STV
Page 8 Issue 2, September 1994
An STV DatabaseB A Wichmann
Since we know that no single algorithm for STV can have allthe properties one might like, it appears that some statisticalanalysis may be needed to select an optimal algorithm. Peopledo not vote at random and therefore any effective analysismust take into account voting patterns. For instance, if votersalways voted strictly along party lines, proportionalrepresentation among such parties would be an importantfactor.
Collections of ballot papers from real elections would beuseful for any practical analysis. There is a de facto standardfor the representation of ballot papers in a computer, being theform used by the Meek algorithm. Hence collection of suchdata is practical and useful. Both David Hill, NicholasTideman and myself had such collections, accumulatedinformally over several years. I have now put this collectioninto a consistent framework so that the material can beprovided to anybody who would like it — merely post afloppy disc to me, and I can return the disc with this data.
The data available has been classified in a number of ways asfollows:
Real: Data here is that from real elections, with thepossible exception that a statistical sample of the totalballot papers would be acceptable. The reason for this isthat it presents a means of providing ‘ real’ data withoutproviding the total information. There are potentialdangers in analysis of real data, since an alternativealgorithm could elect a different person, giving rise toconcerns about the election itself, rather than theprinciples involved. Another reason for accepting asubset of all the votes is that this is all that may befeasible for a large election. Obviously, this data isprovided in a form which precludes the identification ofthe election involved. There are currently 46 data sets inthis class.
Mock: This is data from genuine elections, except that noposition or office is at stake. Mock elections are oftenused to educate people into the principle of STV. Thereare currently 2 sets in this class.
Semi: Elections in this class are not genuine elections,but are clearly related to real elections. Examples in thisclass are ‘ballot’ papers derived from published STVelections (from Northern Ireland), elections from theEurovision Song Contest and elections in which therewas no fixed number of ‘seats’ . There are currently 21data sets in this class.
Test: Data in this class are not derived from any election
but have been constructed to demonstrate the differencebetween some algorithms, show a bug in a computeralgorithm, or some similar purpose. There are currently129 in this class.
I would very much welcome additional data, especially fromreal elections in which some ‘party’ aspect is involved. Thedata can be provided in a form in which the origin cannot betraced. I have analysed an Irish election to produce a singledata set in the Semi class, but this is very time consuming andhas to make a number of assumptions to produce anythinglike the actual ballot papers. Hence real data is much superior.
Is a feedback method ofcalculating the quota really
The March issue of Voting matters reprinted papers by B LMeek, 1,2 D R Woodall 3 and C H E Warren.4 In this paper Iwill propose that their feedback method of calculating thequota is not necessary. To do this I will consider some of thebasic principles of the Single Transferable Vote (STV) system.
One problem identified5 is that if a candidate is elected anyfurther preferences for that candidate are passed over. Thequestion to be considered is ‘are elected candidates continuingin the election or should they be considered as no longeravailable to receive votes’?
In other words is the purpose of a vote in the SingleTransferable Vote system to try to elect candidates in the orderthe voter wishes or to place candidates in popularity order andhave this order respected whatever the outcome of the roundsof the count? I suggest that it is the former. Once a candidatehas been elected he has achieved the aim of participation inthe election and, henceforth should take no further part in theelection. Under these circumstances the manual countingmethod is satisfactory.
We will take a voting paper that shows preferences A,B,C,Dand assume that B was elected on the first round. The transferof B's surplus elects A on the second round. The question nowarises on our paper, should the transfer of A's surplus go to Bor C. Let us assume that our voter had future vision whendeciding the preferences and knew that B would be elected in
Voting matters, for the technical issues of STV, Volume 1
Issue 2, September 1994 Page 9
the first round; would our voter put B as the secondpreference? I suggest that anyone so gifted would select thepreferences A,C,D thus maximising the transfers to thecandidates they wished to see elected. Of course thisforesight is not available to voters so to cover allpossibilities the voter will elect to keep to the originalselection knowing that the counting system will not wasteany part of a vote by transferring it to a candidate alreadyelected.
In practice few voters would take the risk of excluding acandidate on the grounds that they are certain to be elected.If too many did then B would not be elected. Voters can beexpected to behave in a rational fashion and vote for thecandidates of their choice in the order they wish. When acandidate has been elected they have achieved the aim ofboth the candidate and the voter. The voter will now wishany surplus votes to be concentrated on the unelectedchoices.
Another problem identified by Meek6 is how to treatunmarked candidates. He suggests that they should beconsidered either as being of equal merit, or that the voterwishes to leave the ordering of these candidates to others.Meek ignores the third possibility that the voter does notwish these candidates to have any part of the vote. Theomission of the third alternative in Meek's paper is possiblydue to the voting instructions that take a form similar to‘place the candidates in order until you can no longerdifferentiate between them’ . If the instructions werechanged to a form similar to ‘place the candidates in orderuntil you no longer wish the remaining candidates to haveyour vote’ it would be clear how the voter requiredunmarked candidates to be treated. Under thesecircumstances the manual counting method is satisfactory.
If STV is to be used in local or parliamentary electionsmany voters will only want to vote for their particular party.They will not wish any proportion of their vote to go tocandidates of a party with an opposing view to theirs. Ifvotes are apportioned to all non-selected candidates, voterswill have no way of ensuring that they do not vote forcandidates of a party whose policies they cannot agree with.
The other problem foreseen by Meek7 that I will consider isthe possibility of voters indicating the same preference fortwo or more candidates. He suggests that this should beallowed and the counting system modified to accommodateit. The Electoral Reform Society (ERS) supports the SingleTransferable Vote system, not the Transferable Multi-vote ofUnity Value System. This second system may exist but it isnot that supported by the Society and therefore should notbe considered. The Single Transferable Vote system requiresvoters to cast a single vote, all or part of which may betransferred. That a multiple vote may have unitary value isirrelevant, it is a single vote which must be utilised.
D R Woodall8 raises a different problem, that of the tacticalvoter. He postulates a situation where there are severalSensible Party candidates, say A,B,C and one Silly Partycandidate, W. The tactical voter decides that W will beexcluded and in order to maximise the transfer of votes afterthe first round he will vote W,A,B,C rather than A,B,Cwhich is the real preference. The problem for the tacticalvoter comes when several voters take the same line. Assumein this election that the quota is 200. If 201 voters votetactically and put W first then W will be elected reducingthe vacancies available for Sensible Party candidates. Inthese circumstances the tactical voters will be as silly as W'sparty. The only way to avoid this is to place preferences inthe order the voter wishes the candidates to be elected andnot to attempt to vote tactically.
One of the main advantages of STV is that attempts to votetactically are likely to end in a result that will not suit thetactical voter. The situation above could happen irrespectiveof the number of candidates or the size of the quota. Theonly safe way for voters to use their vote successfully is tovote according to preference.
The three works printed in the March issue of Votingmatters may be mathematically rigorous but are theyrequired? My contention is that if the basic principles of theSingle Transferable Vote system are carefully consideredthen the feedback method of counting is unnecessary. Themanual method used to date is satisfactory to ensure thecorrect result.
There is one further matter to be considered. If the feedbackmethod is to be used, the constant recalculations necessarywill require computers to be used. It is recognised in thepapers supporting the method that it is too laborious to usehand counting. While the ERS has voted to use bothcomputer and manual counting for its internal elections, Idoubt if a system which cannot reasonably be counted byhand will be accepted by the general public. Computers arequick but they rely on the integrity of their programming.Computer technology is not yet at a state where incorrectprogramming, whether by accident or intent, will always beexposed. While it is not possible to say that the currentlyaccepted Newland/Britton hand counting rules will alwaysproduce the correct result, they will produce a satisfactoryresult. I can see no reason to change the current system ofcounting.
References1. B L Meek, A New Approach to the Single
Transferable Vote, Paper I, Voting matters, March1994.
2. B L Meek, A New Approach to the SingleTransferable Vote, Paper II, Voting matters, March1994.
Volume 1 Voting matters, for the technical issues of STV
Page 10 Issue 2, September 1994
3. D R Woodall, Computer Counting in STV Elections,Voting matters, March 1994.
4. C H E Warren, Counting in STV Elections, Votingmatters, March 1994.
5. As 1, section 3, item (iv).
6. As 2, section 3, penultimate paragraph.
7. As 2, section 6.8. As 3, second paragraph.
8. As 3, second paragraph.
Voting matters, for the technical issues of STV, Volume 1
Issue 2, September 1994 Page 11
EditorialIn this issue we have a mixture of papers. There is acontinuing debate about revisions to the ERS rules, whicharose from Fennell's paper in the last issue.
Hill and I, in separate papers, consider the effect of smallchanges — steadiness or stability. Global properties andlocal properties are the topic of Woodall's paper which Ihope could be used as a basis for terminology and analysisin further issues of Voting matters.
It would be nice to automate all suggested algorithms forSTV and compare them against a library of test cases.Unfortunately, the effort involved often precludes this whichmeans that choices are being made on less than perfectinformation (not unlike elections themselves).
The problem of stabilityThis note does not consider the usual properties of STValgorithms that have been the subject of Woodall's analysis,but that of stability. For a mechanical system modelled bycontinuous variables, the analysis of stability is anapplication of differential calculus. We cannot use such anapproach with STV algorithms since the system is discrete,and we know that some small changes are bound to producea discrete change in those elected.
For an STV algorithm, we could have too much stability inthat part of the ballot papers are simply ignored — forinstance, by only using the first preference. On the otherhand, we could have an algorithm which lacks stability invital respects by changing the result for inconsequentialchanges to a ballot paper.
One change made to a ballot paper can be regarded assmall, due to the nature of the preferential system. Since theusual means of balloting does not provide for the voter togive equal preference, when the ballot paper records ABC,this might be because A and B were regarded as equal, butthe voter specified A first arbitrarily. Hence the voter couldequally have written BAC instead. Hence given the ballotABC, the voter's true intentions could perhaps have beenexpressed as BAC or ACB. In general, given n preferences,n−1 ballot papers constructed by interchangingneighbouring preferences could be regarded as smalldifferences.
Now consider two algorithms for STV which have broadlysimilar properties (as do all serious contenders). Figures 1and 2 represent graphically these two algorithms.
Figure 1
Figure 1 represents a stable algorithm since small changesare unlikely to change the result of an election, while Figure2 represents an unstable algorithm. If we were operating intwo dimensions, then the property of stability could bemeasured rather like the game of shove-halfpenny: onewould measure the probability that a small circle placed atrandom on the figure crossed one of the dividing lines.
Volume 1 Voting matters, for the technical issues of STV
Page 1 Issue 3, December 1994
Issue 3, December 1994
Elect A:
Elect B
Elect C
Figure 2
In the case of STV algorithms, we do not have a simple two-dimensional system, and hence the figures are a crudediagrammatic representation. To measure the probabilities wemust conduct a suitably controlled experiment. Fortunately,we can use a computer to aid this process so that we canperform the equivalent of shove-halfpenny sufficiently oftento obtain results which are likely to be meaningful.
The experimental methodWe now specify the experimental method to compare the ERShand counting rules versus the Meek algorithm. (Any twoalgorithms could be chosen, but this seems the mostinteresting pair.)
We select an actual election for which the ballot papers areavailable. We also choose a number, about 20, which is thenumber of ballot papers from the full set that is to be selectedat random. (We return to the choice of this number n later.)
From each real election, we derive 100 mini-elections byrandomly selecting n ballot papers. The experimental methodis to analyse the effect of making small changes to these mini-elections. The analysis is as follows. Firstly, we compute theresult of the two algorithms from the mini-election. (Theresult need not be the same for the two algorithms, nor thesame as for the full election.) We now consider all thepossible similar mini-elections derived by making one smallchange to one of the ballot papers. (This is potentiallyhundreds of elections — hence the computer.) This particularmini-election is on the edge if a specific criterion is met, sayat least one of the small changes produces a different result.
The choice of n is important. If n is very small (say 1), then itis clear that the mini-election will not be representative of thereal election. On the other hand, if n is large (say the fullelection), then the computation of the ‘edge’ becomes toolarge, and also the number of possible mini-elections becomestoo small (in this case only 1). Care must be taken over thespecific criterion for being on the edge. If one takessomething like the ERS council elections (i.e., several posts tofill with no parties, so that small changes are likely to make adifference to the outcome), with the criterion that any smallchange resulting in a difference implies being on the edge,then there is a danger that all mini-elections are on the edge!
For the 100 random mini-elections we perform a differentanalysis in each of the three experiments given here. If onecould assume statistical independence, then it would be asimple matter to undertake a χ2 test to see if the result issignificant. Unfortunately, we do not have elections with alarge enough number of ballot papers to ensure theindependence, and therefore we must be content with a non-statistical treatment.
The programs and test dataTwo programs have been written, one for using the ERSalgorithm and the other the Meek version. Apart from theSTV algorithm in use, both work in an identical fashion. Theyread 100 mini-elections in the conventional format. Firstly, theresult is computed for this election, then every possible smallchange is made, and for each such change, the number ofchanges to those elected is recorded.
The number of changes to those elected for one small changeis usually 0 (no change), but is sometimes 1, rarely 2 and veryrarely 3. Hence for each ballot paper in the mini-election, n−1integers are output, representing the number of changesarising from each of the n−1 possible interchanges of adjacentpreferences, where n is the number of preferences marked onthe ballot paper. This implies that the output is of similarlength to the input — an important consideration, since ifcomplete results were printed for each election resultcomputed, hundreds of pages of material would be produced.
The analysis is most easily seen by considering an example. Amini-election from election R038 is as follows:
Voting matters, for the technical issues of STV, Volume 1
Issue 3, December 1994 Page 2
Elect A;
Elect B
Elect C
1 8 10 13 11 17 01 9 5 6 17 01 11 10 5 17 9 01 6 4 15 14 16 8 1 01 6 14 16 1 2 4 13 12 8 15 01 13 4 15 12 8 00" A. 1 " " B. 2 " " C. 3 " " D. 4 "" E. 5 " " F. 6 " " G. 7 " " H. 8 "" I . 9 " " J. 10 " " K. 11 " " L. 12 "" M. 13 " " N. 14 " " O. 15 " " P. 16 "" Q. 17 "" 1R038: H3H "
The above data is for an election with 17 candidates for 5seats, in which the first ballot paper selects candidate 11 (K)as the first preference, then 9 and lastly 10. The names ofthe candidates are the letters A-Q, a convention usedthroughout.
The program computes the effect of making all possibleinterchanges of adjacent preferences, which for Meek gives:
The first line gives the result (with Meek) for this mini-election, where +F- L means F is elected and L is excluded,etc. (The v1 and 68 are not relevant.) Then, starting with thelast ballot paper and working back towards the beginning,the number of differences to the result is printed for eachpossible interchange. Hence the last ballot paper has fourpossible interchanges, the first one giving no difference, butthe last three each making a single difference. So in thiscase, interchanging the first two preferences makes nodifference, but interchanging the 2nd and 3rd preferencesdoes change the result by one candidate. The 'm' relates tothe third experiment and is explained later.
One other program is needed which selects n ballot papersat random from a real election, and repeats this 100 times.This program is fast and straightforward.
For the main election data, six real elections have beenchosen from the data already available (see Voting matters,Issue 2). The statistics from these elections are as follows:
Unfortunately, none of the elections in the data base arefrom elections involving parties, and so such electionscould not be selected for this study.
We can now summarise the results obtained by example.For election R017, 100 mini-elections are computed byselecting 15 ballot papers from the actual 479. For each ofthese mini-elections, we compute what difference (if any)would be made by a single transposition of a preference.This is repeated for each possible transposition, which inthis case, involves the analysis of 4585 elections!
Experiment 1We now consider the issue raised initially — that of the‘size’ of the edge dividing the line between differentelection results. We therefore need to devise a criterion forbeing on the ‘edge’ , and compare the results for the sixelections with the two algorithms.
This table means, for instance, that for the 100 mini-elections derived from R006, 74 are on the ‘edge’ for ERSand 65 for Meek — which implies that there were 26 or 35elections for which no change was made by anytranspositions. Hence a very high proportion of the mini-elections are on the ‘edge’ , over three quarters in almost allcases. However, even the most optimistic assumption showsthat there is not much difference between the twoalgorithms.
We now change the criterion for being on the edge so that alower proportion are on the edge.
Criterion: More than three transpositions make a change
Volume 1 Voting matters, for the technical issues of STV
We again conclude that there is not much difference betweenthe two algorithms.
We need to look at aspects other than the actual size of theedge to see significant differences.
Experiment 2In this experiment, conducted with the programs and data asbefore, we look at properties of the edges rather than theiractual magnitude.
Given a mini-election which is on the edge, then we know atleast some transpositions of the preferences will change theresult. It is therefore natural to ask which specifictranspositions can change the result. Clearly, it is more likelythat transposing the first two preferences will alter the result,but what about the subsequent transpositions? We thereforeanalyse the number of times a transposition makes a change,against the position of the transposition (pi ).
In the table above, for each of the six elections, the number oftimes a transposition makes (at least) one change to the resultis tabulated against the preference position for all the 100mini-elections. The difference between ERS and Meek is nowobvious. The number of changes for the first preferencebetween the two algorithms is similar and is surely notsignificant. However, in all subsequent preferences, manymore changes arise from Meek than from ERS.
In examining the subsequent preferences, there is no naturalscale to work to, since a change in preference n is more
significant if there are n candidates than 2n candidates. Thenumber of seats is also relevant to this scale. Hence inanalysing the table above, both the number of candidates andseats must be considered.
We can add up the results from each election for thosepositions beyond the number of seats (s) for each election,giving the following results:
Position s +1 s+2 s+3 >s+3
ERS 61 21 15 11Meek 530 364 293 596r at i o 8. 7 17 19 54
Hence we conclude that transposing preferences beyond thenumber of seats has virtually no effect with ERS as comparedwith Meek.
Experiment 3In a paper in this issue of Voting matters, Woodall defines theproperty mono-raise. For the elections analysed by theexperiments undertaken here, we can determine the extent towhich a weaker property than mono-raise is violated. Sinceour analysis determines the effect of a single interchange inthe preferences, given a preference pair A,B which is replacedby B,A, the raising of the order of B should not disadvantageB. This implies that if the election with A,B elects B, then thatwith B,A should also elect B. If this condition is not satisfied,then mono-raise is violated, and is marked by 'm' in theoutput files.
We can now compare the violation rate for ERS and Meek,which is as follows:
Hence there is no question that Meek violates mono-raisemuch more than ERS. This is likely to be due to the increasedsensitivity of Meek to the effects of late preferences.
ConclusionsThe analysis undertaken in this paper has led to the followingconclusions:
1. There is no evidence that the ERS and Meekalgorithms are any different with respect to the size ofthe boundary between the election of differentcandidates.
Voting matters, for the technical issues of STV, Volume 1
Issue 3, December 1994 Page 4
2. Making small changes by transposing preferenceslater than the number of seats makes virtually nodifference with ERS but a substantial difference withthe Meek algorithm.
3. Meek violates mono-raise much more than ERS.
Point 2 indicates that the Meek algorithm is much moresensitive to the voter's wishes than ERS, and moreover thissensitivity is not at the expense of making the algorithm lessstable. However, the fact that Meek violates mono-raise somuch more than ERS might question the extra sensitivity ofMeek. It would appear that an ideal algorithm would havethe sensitivity of Meek, but would only violate mono-raisewith the same frequency as ERS. I suspect that it is actuallythe extra sensitivity of Meek that gives rise to the mono-raise violations, so that the best of Meek and ERS is notpossible.
It appears that the results presented here have somelimitations. Firstly, the mini-elections necessarily have asmall number of ballot papers and so the results need notapply to larger elections. Secondly, a consequence of thesmall number of ballot papers is that in many cases, randomchoices are made by both the ERS and Meek algorithms.
The comparative steadinesstest of electoral methods
In comparing one electoral method with another it is usefulto examine their comparative steadiness. It should be notedthat it is only a comparative test and does not give a"goodness" score for any individual method on its own butonly for one method relative to another. Nor does the factthat any method comes out as the better of the two by thistest indicate that it is necessarily better in any other way.
To use it, first run each method for the same number of seatsand the same given set of votes and see whether they bothelect the same candidates. If they do, this test is notapplicable. Otherwise, see whether there is one or morecandidate whom neither method elects. If there is no suchcandidate, again the test is not applicable. In particular, thetest can never be applicable if the number of candidates isonly 1 greater than the number of seats, but the fact that it isoften not applicable does not destroy its value in those caseswhere it does apply.
If the test is applicable, then treat all candidates who failedto be elected by either method as withdrawn, and re-runeach method. If each method continues to elect the samecandidates as before, then there is nothing to choosebetween them on this test for this particular set of votes. If,however, one method makes no change in whom it electswhile the other makes a change, then the no-change methodgains a point in comparison with the other.
For example, if there are 5 candidates for 3 seats, and thevotes are:
51 ABC 44 ABD 5 EABD
the current ERS rules will elect A, B and D whereas theMeek rules will elect A, B and C. They agree that E is notelected, so the comparative steadiness test treats E as havingwithdrawn and re-runs the election. Now the Meek rulesstill elect A, B and C, but the ERS rules switch to electingA, B and C too. Meek therefore shows greater steadinessfor this particular set of votes.
While such artificial elections are important as illustrations,what most matters is which rules are steadier for realelections. Taking the 57 real elections that I have available,I find the test to be applicable for only 10 of them. In 4 ofthose, these two systems are both steady, neither changingits result when the relevant candidates are withdrawn. Inthe other 6, however, the Meek system remains steady butthe ERS system changes. By this test, the Meek systemseems to be superior, so far as the evidence goes, though afew more results in the same direction would help to makemore certain that the difference is not just a chance effect.
It should be noted, of course, that discovering a lack ofsteadiness must not be used to change the result of a realelection, which must always be in accordance with the rulesas laid down for that election. The test is only for researchpurposes, not to interfere with a result.
Editorial Note: It is possible to apply the steadiness testeven when an election gives the same result. This can bedone by selecting random ballot papers from the election inthe manner of the mini-elections in the previous paper. Withthe 100 mini-elections from the real election R006, 17 ofthese elect different candidates so that the steadiness testcan be applied. Of these 17, none were steady for the ERSrules, while 13 were steady according to Meek. One mini-election could not be considered since a random choice wasmade. For the remaining 3 mini-elections, neither weresteady, and in one case, the removal of the no-hopecandidates causes the two algorithms to interchange theresults!
Volume 1 Voting matters, for the technical issues of STV
I was surprised to see the existing manual system defended byR J C Fennel as being beyond reproach.
The basic flaw in the manual method is that it allows for theelection of candidates receiving less than the quota. This has ledto Tasmania requiring at least 7 preferences, combined with arotated ballot paper since 1973. Even in our own elections someare elected with 4 fewer votes when there are 8 non-transferablevotes.
There is a refinement which could easily be introduced inmanual elections. This is that when the stage is reached whensome candidate(s) fail to reach the quota, a recount takes placewith only those remaining taking part. This means that votespreviously wasted on candidates with no chance can theninfluence the result by being allotted to a lower preference for acandidate previously elected. The result will then bedemonstrably fair. Taking an actual mock election in the Solentarea in 1989 as an example, in which there were 20 candidatesfor 5 seats. The manual result gave a lead of 4.88 to the lastelected — although short of the quota. The Meek systemelected the runner-up instead by a margin of 2.01 votes. If afurther 5 counts has been added the manual system would havecome to a similar result, but by an even larger margin of 7.42.The new result is demonstrably fair — with the last candidatehaving 2.53 over the quota.
Sometimes the unfair result is even obvious to the public. Sucha case occurred in Cork East in 1954. The two Fine Gaelcandidates received 153 more votes than the two Fianna Failcandidates (1162 non-transferable) yet Fianna Fail won 2 of the3 seats. Such results discredit the whole system.
The current mechanised system is quite unsuitable for smallelections. For instance, with 9 votes and 18 candidates for 3seats it proceeds to eliminate 7 candidates with 1 votecompletely at random. It is quite clear that a different order ofexclusion would give a different result. Personally I favour apoints method based upon the preferences expressed whichwould give some form of ranking order to be used instead ofthe random method.
R J C Fennell's article, in Voting matters issue 2, raises anumber of matters that deserve reply.
Taking a voting paper naming ABCD in order of preference,where B has been elected on the first count and A is elected onthe second count as a result of transfers from B, he askswhether that paper's surplus should go to B or to C. Heappears to have failed to notice that, in the current ERS rules,it is totally immaterial whether the vote is taken as if it wereACD instead of ABCD, because that paper's surplus does notgo anywhere. The voter's second and subsequent preferencesare completely ignored, the whole paper remains with A,while only the new votes that A has received are redistributed.
Let us look instead at the point that he was trying to make.Suppose, in that same election, that C was also elected on thefirst count, and we have a paper naming BACD. That paperwill pass from B to A and will be further redistributed, at asuitable value. Should it go to the next choice C, or jumpover C straight to D as currently happens? He suggests thatsuch a voter with future vision would not have put C into thelist, so it is right to jump to D. But all voters ought to betreated alike, and therefore, if we are to treat one as if futurevision existed, we must do so to all others too, and mostvoters would wish to change their votes if they knew whatwas going to happen; nobody would vote for the runner-up, ofcourse. But such a change would make sense only if nobodyelse changes; if we treat everybody as though allowing themto change, the assumed future vision would collapse, noindividual could then know how to change and the wholesystem would become wildly unstable. There is only onesatisfactory way out, and that is to treat each vote in strictaccordance with what it says, and not by what we assume thatit might have said if only the voter had known what wouldhappen.
Transferring to a candidate who has already been elected, asin Meek-style STV, does not waste votes, as is suggested,because the same size surplus is passed on in any case. Thechange is only to whether the surplus is taken fairly, from allrelevant groups in proportion to their current totals of votes,or unfairly in some other way. To change the example,suppose that there are 100 AC votes and 10 BAD votes in asituation where the quota is 77. A is elected on the first countgiving 77 to stay with A for quota, 23 to be transferred to C.
Voting matters, for the technical issues of STV, Volume 1
Issue 3, December 1994 Page 6
If, later on, B is excluded then in current ERS rules the 10all pass to D. The Meek alternative is that only 3 pass to D,while 7 more of the original ACs pass to C. The twomethods are
ERS 100 vot es 77 st ay wi t h A 23 go t o Cf ur t her 10 vot es 10 go t o D Meek 100 vot es 70 st ay wi t h A 30 go t o Cf ur t her 10 vot es 7 st ay wi t h A 3 go t o D
In either case 77 have been kept and 33 redistributed, but Ido not see how anyone could claim that the first method issatisfactory if we are able to operate the second. The articlesuggests that the voters ‘will wish any surplus votes to beconcentrated on the unelected choices’ . That is to say thatthe BAD voters would like the first alternative. Of coursethey would; that is not in dispute. But it is not fair to the ACvoters to allow it.
The next point addressed by Fennell is the treatment of‘short lists’ , that is to say votes that would be transferred ifthey had a next choice, but do not show one. He mentionsthe two possible treatments discussed in detail by Meek, butsays that Meek's papers ignore a third possibility, and it isevident that he is thinking of something like the current ERSrule. He is wrong to say that Meek ignored this; his papersaid ‘ If the difficulty were to be avoided by increasing theproportion transferred of votes for which a next preferenceis marked, to enable all x votes to be retained by C, thiswould clearly reintroduce inequities of the kind Principle 2was designed to eliminate’ . I agree with Meek that thispossibility does not deserve any more discussion than that,but many people have failed to see that this method is wrongin principle, and a far greater quantity of writing has goneinto it in the last few years than can be reproduced here. Ican well see that people might take the wrong decision onthis at a first quick glance, but the number who continue todo so even after thought and discussion is quiteextraordinary.
I disagree with Meek that the voters should be given thechoice between the two methods he discusses in detail. Thiswould have to mean explaining to them the different effectsof each, a task that I would not wish on anyone. Meekpoints out that the two can give different results; usuallythey do not but, in the few cases we know of where they do,to give the relevant surplus to ‘non-transferable’ and reducethe quota to compensate is always the preferable option.
Fennell suggests that these voters may not wish othercandidates to have any part of the vote. I agree with that —indeed I insist that, whatever those voters wish, we have noright to assume what their wishes are, but only to obey whattheir ballot papers say, namely that if they become entitledto a further choice they wish to abstain from making one. Itis true that, in the current ERS (and most other) rules, theballot papers are not physically transferred to any other
candidate, but what matters is not what is done with piecesof paper, but the effect of the rule. Consider the simplecase, with 4 candidates for 2 seats, and votes
40 AB 17 CD 3 DC
The quota, in current ERS rules, is 20. So 20 votes go to Aand A's surplus of 20 goes to B, and A and B are elected, butthe situation is ‘on a knife-edge’ for, if D were to withdrawbefore the count, A and C would be elected. Now with aknife-edge situation any relevant change in one directionmust settle the matter, and it is certainly a relevant change ifhalf B's support is lost, to give
20 AB 20 A 17 CD 3 DC
Yet the current ERS rules take no notice whatever, but stillgive 20 to A and 20 to B.
It is sometimes argued that if the AB voters had had pre-vision, they would have gone straight to B but, as arguedabove, we cannot allow that without allowing pre-vision toother voters too. Given pre-vision, the DC voters wouldhave voted for C. Given pre-vision, the A plumpers need nothave bothered to vote at all. The only fair thing to do is totake what the ballot papers actually say, and everything inproportion to the numbers involved. That means that halfA's surplus must go to B, and half to non-transferable,which gives C the second seat.
Provided that the quota can be changed to allow for thenon-transferables, as in Meek's method, it can be shown thatthis does not waste any extra votes at all. What one methodwastes in non-transferable, the other wastes on leavingmore votes with elected candidates than they now need tobe sure of election. With hand-counting methods, wheretrue quota-reduction is not practicable, it could be the casethat the present rule does more good than harm, but I knowof no evidence to support such a view.
Turning to the discussion of whether voters should beallowed to express equality of preference if they wish,rather than a strict ordering, I cannot agree that it ought notto be considered. It is undoubtedly the case that the absenceof this feature is regarded by many as a major disadvantageof STV. There are some difficulties of implementing it, andit would complicate the instructions to voters. I believe thatit is something that we ought to consider introducing oneday, but that there are more important things to be donefirst.
Volume 1 Voting matters, for the technical issues of STV
Page 7 Issue 3, December 1994
Fennell then discusses the ‘Silly Party candidate’ method oftactical voting discussed in Woodall's paper. He is right, ofcourse, that trying to utilise it may be to the voter'sdisadvantage if a wrong guess is made, and would certainly betroublesome if too many voters tried to do it. It is a badfeature though that it should be possible at all. Furthermore itis not necessary for there to be a silly party candidate ortactical voters for the effect to occur. It always happens tothose voters who put as first preference the first candidate tobe excluded, no matter how sincere their choice, causing adistortion that should be avoided if possible.
Fennell is correct that it is not practicable, save for very smallelections, to use methods such as those proposed withoutdoing the count by computer but, in this electronic age, canthat really be an adequate reason for putting up with second-best results? He queries whether computer-generated resultswould be trusted and this is certainly something to whichattention has to be given. There are two distinct ways in whichthings might go wrong. The first is in the input of the datafrom the ballot papers, but this could be subject to repetition ifa recount is requested.
The second possibility of error is in the program to calculatethe results but, in a public election it could be arranged that,once the data input has been agreed as correct, each candidatewould be given a copy of the data on floppy disc. Each partywould have its own program, each independently written fromthe rules specified in the Act of Parliament, and its owncomputer near at hand. Within a few minutes each could havechecked that the official result is agreed. Such a systemwould lead to much greater protection against errors thananything that could be done with hand-counted STV.
The article concluded that ‘ the currently accepted Newland/Britton hand counting rules ... will produce a satisfactoryresult. I can see no reason to change the current system ofcounting’ . What is meant by a satisfactory result? Incomparing the results of real elections by hand-counted rulesand by Meek rules the result is different more often than not,and all the indications are that the result is not merelydifferent but better, in more accurately representing the voters'wishes. Now that the ability exists to do something better thancan be done by hand, it would be absurd to try to exist in thepast. Does it not matter to the Electoral Reform Society (orothers) whether we get the best result or not?
1. IntroductionI have often been struck—and never more than in the lastyear—by how much the types of argument used by thesupporters of the Single Transferable Vote (STV) differ fromthose used by its opponents. When it comes to the details ofthe count, the supporters of STV almost invariably try todefend its procedures directly, on the grounds that they followcertain principles, or that they do with each vote exactly whatthe voter would want done with it, if the voter were able to bepresent at the count and to express an opinion. Unfortunately,there is no guarantee that adopting sensible procedures, ateach stage of the count, will lead to a system with sensibleproperties, and the opponents of STV often emphasize its lessdesirable properties. In particular, it is now well known thatSTV is not monotonic: that is, that increased support, for acandidate who would otherwise have been elected, canprevent that candidate from being elected. It was ostensiblybecause of this and related anomalies that the Plant Reportrejected STV.
Properties of electoral systems can be thought of as"performance indicators", and like any other performanceindicators they need to be used with care. If one chooses a setof performance indicators in advance, it may well be possibleto manufacture a high score on those indicators in an artificialway, which does not represent good performance in any realsense. Nevertheless, it seems to me that the Electoral ReformSociety needs to pay more attention to properties if it is not tobe sidelined in the electoral debate. In particular, sincedifferent desirable properties often turn out to be mutuallyincompatible, it is important to discover which sets ofproperties can hold simultaneously in an electoral system.Only then will it be possible to decide whether there areelectoral systems that retain what is essential in STV whileavoiding some of the pitfalls.
The purpose of this article is to introduce a long list oftechnical properties that an election rule may or may not have,to invent snappy descriptive names for them all, and todiscuss them with special reference to STV. Except whereotherwise indicated, statements made about STV applyequally well to the Newland-Britton and Meek versions of
Voting matters, for the technical issues of STV, Volume 1
Issue 3, December 1994 Page 8
STV. In a later article I hope to address the question ofmonotonicity in more detail.
2. Notation and terminologyAs is usual in the Social Choice literature, I shall use lower-case letters a, b, c,... to denote candidates (or choices). Eachvoter casts a ballot containing a preference listing of thecandidates, which is written as (for example) abc, to denotethat the voter places a first, b second and c third, with nofourth choice being expressed. A preference listing iscomplete if all candidates are included in it and truncated ifsome are left out. (A preference listing that leaves out justone candidate will be treated by most election rules,including STV, as if it were complete; but one should notcall it complete, since some election rules may not treat it assuch.) A profile is a set of preference listings, such as mightrepresent the ballots cast in an election. Profiles may berepresented in either of the forms shown for Elections 1 and2 below, indicating either the proportion, or the absolutenumber, of ballots of each type cast.
The term outcome will be used in the sense of "possibleoutcome" (assuming there are no ties). Thus in an election tofill two seats from four candidates a, b, c, d, there are sixoutcomes, corresponding to the six possible ways ofchoosing the two candidates to be elected: { a, b} , { a, c} ,{ a, d} , { b, c} , { b, d} and { c, d} .
El ect i on 1 El ect i on 2 ( 1 seat ) ( 2 seat s)ab 0. 17 a 9 ea 4ac 0. 16 b 9 eb 4bac 0. 33 c 10 f c 1cb 0. 34 d 10 f d 1 f e 6
An election rule is usually thought of as a method that,given a profile, chooses a corresponding outcome—or, inthe event of a tie, chooses two or more outcomes, one ofwhich must then be selected in some other way (such as bytossing a coin). However, this description is not quiteadequate to deal with the complexities of ties. ConsiderElection 1 above, with the votes counted by STV (or, rather,by the Alternative Vote (AV), which is the rule to whichSTV reduces in a single-seat election). No candidate reachesthe quota of 0.5, and there is an initial tie for exclusionbetween a and b. If b is excluded then a is immediatelyelected, whereas if a is excluded then b and c tie forelection. Thus a is elected with probability ½, and b and care elected with probability ¼ each.
A similar situation arises in Election 2, again under STV.There are 54 votes cast, so the quota is 18, and there is aninitial tie for exclusion between e and f. If e is excluded thenf, c and d must also be excluded, and a and b are elected;whereas, if f is excluded, then a and b must also beexcluded, and then e is elected and c and d tie for second
place. Thus the outcome { a, b} is chosen with probability½, and the outcomes { c, e} and { d, e} are chosen withprobability ¼ each.
Because of examples like these, I define a (preferential)election rule to be a procedure that, given a profile,associates a corresponding non-negative probability witheach outcome, in such a way that the probabilitiesassociated with all possible outcomes add up to 1. The"normal" situation is that all the outcomes are givenprobability 0 except for one, which has probability 1(meaning that that outcome is chosen unequivocally). Ifanything else happens, then we say that the result is a tiebetween all the outcomes that have non-zero probability.
3. AxiomsThere are so many properties that an election rule mayhave, that it is useful to categorize them in some way. Fourin particular seem sufficiently basic to deserve to be calledaxioms. The first is more or less implicit in the abovedefinition of an election rule; but it has a name, and so forcompleteness I include it here.
Anonymity. The result should depend only on the number ofballots of each possible type in the profile (and not, forexample, on the order in which they are cast, or onextraneous information such as the heights of thecandidates).
Neutrality. If some permutation is applied to the names ofall the candidates on all the ballots in the profile, then thesame permutation should be applied to the result. Forexample, since STV is neutral, if a is replaced by c and c bya on every ballot in Election 2 above, then STV wouldchoose { b, c} with probability ½ and { a, e} and { d, e} withprobability ¼ each. One consequence of neutrality is that atie in a single-seat election cannot be resolved simply byelecting the first in alphabetical order among the tiedcandidates.
A rule that is both anonymous and neutral is calledsymmetric.
Homogeneity. The result should depend only on theproportion of ballots of each possible type. In particular, ifevery ballot is replicated the same number of times, then theresult should not change. It is this property that enables usto describe profiles as in Election 1 above, showing theproportion, rather than the absolute number, of ballots ofeach type cast.
Discrimination. If a particular profile P0 gives rise to a tie,then it should be possible to find a profile P that does notgive rise to a tie and in which the proportion of ballots ofeach type differs from its value in P0 by an arbitrarily smallamount. This rules out, for example, the following methodof electing one candidate from three: elect the candidate
Volume 1 Voting matters, for the technical issues of STV
Page 9 Issue 3, December 1994
who beats both of the others in pairwise comparisons, if thereis such a candidate, and otherwise declare the result a three-way tie. For in that case, not only would the profile inElection 3 below give rise to a tie, but anything at all close toit would also give a tie, contrary to the axiom ofdiscrimination.
abc 1/ 3El ect i on 3: bca 1/ 3( 1 seat ) cab 1/ 3
A proper election rule is one that satisfies the above fouraxioms; that is, one that is anonymous, neutral, homogeneousand discriminating. The term "axiom" is used rather freely inthe literature as a synonym for "property", but I shall restrictits use to these four, which I regard as genuinely axiomatic, inthe sense that I am not interested in any rule that does notsatisfy them.
A word of warning is needed about homogeneity. In anypractical election where the count is carried out by computer,there will be a limit to the number of decimal places that thecomputer can hold accurately. Thus there are bound to besituations in which two numbers that are not really equal areregarded as equal by the computer program, because theybecome equal when rounded to the appropriate number ofdecimal places. In this case, if every ballot were replicated thesame, sufficiently large, number of times, then the differencebetween the two numbers of votes would become significant,and the computer might give a different result. However, thisis a minor problem, introduced by the practical need to roundnumbers; the axiom of homogeneity should be applied to theunderlying theoretical rule, with no rounding.
With this interpretation, STV is a proper election rule.
4. Global or absolute propertiesIt is convenient to divide properties into global or absoluteproperties on the one hand, and local or relative properties onthe other. The former say something about the result ofapplying an election rule to a single profile, whereas the lattersay something about how the result should (or should not)change when certain changes are made to the profile. Not allproperties fall unambiguously into one of these two classes,but sufficiently many do for the distinction to be useful.
The most important single property of STV is what I call theDroop proportionality criterion or DPC. Recall that if v votesare cast in an election to fill s seats, then the quantity v/(s + 1)is called the Droop quota.
DPC. If, for some whole numbers k and m satisfying0 < k ≤ m, more than k Droop quotas of voters put the samem candidates (not necessarily in the same order) as the topm candidates in their preference listings, then at least k ofthose m candidates should be elected. (In the event of a tie,this should be interpreted as saying that every outcome that
is chosen with non-zero probability should include at leastk of these m candidates.)
In statements of properties, the word "should" indicates thatthe property says that something should happen, notnecessarily that I personally agree. However, in this case Icertainly do: DPC seems to me to be a sine qua non for a fairelection rule. I suggest that any system that satisfies DPCdeserves to be called a quota-preferential system and to beregarded as a system of proportional representation (withineach constituency)—an STV-lookalike. Conversely, I assumethat no member of the Electoral Reform Society will besatisfied with anything that does not satisfy DPC.
The property to which DPC reduces in a single-seat electionshould hold (as a consequence of DPC) even in a multi-seatelection, and it deserves a special name.
Majority. If more than half the voters put the same set ofcandidates (not necessarily in the same order) at the topof their preference listings, then at least one of thosecandidates should be elected.
The following rather weak property was formulated withsingle-seat elections in mind, but it makes sense also formulti-seat elections and, again, it clearly holds for STV.
Plurality. If some candidate a has strictly fewer votes intotal than some other candidate b has first-preferencevotes, then a should not have greater probability than bof being elected.
The next property has been suggested to me by BrianWichmann in the light of his experiences reported in the lastissue of Voting matters6.
No-support. A candidate who receives no support at all(that is, who is not listed by any voters in theirpreference listings) should not be elected unless everycandidate who receives some support is also elected.
This is not satisfied by STV with the Newland-Britton rules.For example, if x receives no support at all, and the onlysupport that y receives is on ballots marked ay, where areaches the quota as a result of transfers from othercandidates, then x and y will both be recorded throughout ashaving no votes (since the ay ballots are not re-examinedwhen a reaches the quota), and so y is as likely to be excludedas x. It seems that no-support is satisfied by Meek's versionof STV, although I do not have a formal proof of this.
The remaining three global properties consist of Condorcet'sprinciple, which was proposed by M. J. A. N. Caritat, Marquisde Condorcet (1743-1794), and two modern strengthenings ofit. We say that a voter, ballot or preference listing prefers a tob if he, she or it lists a above (before) b, or lists a but not b.Let p(a, b) denote the number of voters who prefer a to b. We
Voting matters, for the technical issues of STV, Volume 1
Issue 3, December 1994 Page 10
say that a beats b (in pairwise comparisons) if p(a, b) >p(b, a); that is, if the number of voters who prefer a to b isgreater than the number who prefer b to a. We say that a tieswith b (in pairwise comparisons) if p(a, b) = p(b, a). ACondorcet winner is a candidate who beats every othercandidate in pairwise comparisons. A Condorcet non-loseris a candidate who beats or ties with every other candidatein pairwise comparisons; note that if there is more than oneCondorcet non-loser then all the Condorcet non-losers musttie with each other.
Note that there need not be a Condorcet winner, or even aCondorcet non-loser. In the profile shown in Election 3above, a beats b, b beats c and c beats a, all by the samemargin of 2/3 to 1/3. This is the so-called Condorcetparadox or paradox of voting: even though each voterprovides a linear ordering of the candidates, the result whenthe votes are totalled can be a cyclical ordering. TheCondorcet top tier is the smallest nonempty set ofcandidates such that every candidate in that set beats everycandidate (if any) outside that set. In Election 3, theCondorcet top tier consists of all three candidates. If there isa Condorcet winner, then the Condorcet top tier consists justof the Condorcet winner. If there is a Condorcet non-loser,then the Condorcet top tier contains all the Condorcet non-losers, but it may possibly contain other candidates as well.
Condorcet's principle and the two strengthenings of it givenbelow were formulated originally for single-seat elections inwhich every voter provides a complete preference listing;but I have reworded them here so that they make sense(although they are not necessarily sensible) for allpreferential elections.
Condorcet1. If there is a Condorcet winner, then theCondorcet winner should be elected.
Smith-Condorcet4. At least one candidate from theCondorcet top tier should be elected.
Exclusive-Condorcet (see Fishburn2). If there is aCondorcet non-loser, then at least one Condorcet non-loser should be elected.
Note that Smith-Condorcet and exclusive-Condorcetboth imply Condorcet, and Smith-Condorcet also impliesmajority. Smith-Condorcet seems a very natural extensionof Condorcet. Exclusive-Condorcet is also very natural,but it is of much less importance since it differs fromCondorcet only when there is a "tie" for first place underpairwise comparisons, and that will not happen very often.
El ect i on 4 El ect i on 5( 1 seat ) ( 2 seat s)abc 0. 30 ad 0. 36bac 0. 25 bd 0. 34cab 0. 15 cd 0. 30cba 0. 30
STV does not satisfy Condorcet, and so it certainly doesnot satisfy either of the above two extensions of it. This canbe seen in Election 4 above. Under STV (AV), b is excludedand a is elected. However, b is the Condorcet winner,beating both a and c by the same margin of 0.55 to 0.45.This example highlights a fundamental difference inphilosophy between STV and Condorcet-based rules.Loosely speaking, STV tries to keep votes near the tops ofthe ballots. Thus the preferences of the cba voters for b overa will not even be considered under STV until c isexcluded, which means that in this example they are notconsidered at all, since b is excluded before c. In contrast,Condorcet's principle requires that, right from the outset, thepreferences of the cba voters for b over a should be givenequal weight with the similar preferences of the bac voters.However, despite this difference in philosophy, Condorcetand majority are not actually incompatible in single-seatelections: if one wishes, one can use AV (or any othersystem of one's choice) to select a candidate from theCondorcet top tier. Any such rule clearly satisfies Smith-Condorcet, and hence satisfies both majority andCondorcet, although it is a moot point whether it is reallyany better than AV on its own. In multi-seat elections,Condorcet is undesirable, in my opinion, because it isincompatible with DPC, as shown by Election 5 above.Here the quota is 0.33
. , and so DPC requires that a and b
should be elected, whereas d is the Condorcet winner.
5. Local or relative properties: monotonicity
Local or relative properties are concerned with whathappens when a profile is changed in some way. We shallsay that a candidate is helped or harmed by a change in theprofile if the result is, respectively, to increase or todecrease the probability of that candidate being elected.
As we saw in Election 4, under STV the later preferenceson a ballot are not even considered until the fates of allcandidates of earlier preference have been decided. Thus avoter can be certain that adding extra preferences to his orher preference listing can neither help nor harm anycandidate already listed. Supporters of STV usually regardthis as a very important property, although it has to be saidthat not everyone agrees; the property has been described(by Michael Dummett, in a letter to Robert Newland) as"quite unreasonable", and (by an anonymous referee) as"unpalatable". There are really two properties here, whichwe can state as follows.
Later-no-help. Adding a later preference to a ballotshould not help any candidate already listed.
Later-no-harm. Adding a later preference to a ballotshould not harm any candidate already listed.
We come now to the different versions of monotonicity. Thebasic theme is that a candidate x should not be harmed by a
Volume 1 Voting matters, for the technical issues of STV
Page 11 Issue 3, December 1994
change in the profile that appears to give more support to x;but one gets different flavours of monotonicity if one specifiesdifferent ways in which the profile might be changed.
Monotonicity. A candidate x should not be harmed if:
(mono-raise) x is raised on some ballots withoutchanging the orders of the other candidates;
(mono-raise-delete) x is raised on some ballots and allcandidates now below x on those ballots are deletedfrom them;
(mono-raise-random) x is raised on some ballots andthe positions now below x on those ballots are filled (orleft vacant) in any way that results in a valid ballot;
(mono-append) x is added at the end of some ballotsthat did not previously contain x;
(mono-sub-plump) some ballots that do not have x topare replaced by ballots that have x top with no secondchoice;
(mono-sub-top) some ballots that do not have x top arereplaced by ballots that have x top (and are otherwisearbitrary);
(mono-add-plump) further ballots are added that have xtop with no second choice;
(mono-add-top) further ballots are added that have x top(and are otherwise arbitrary);
(mono-remove-bottom) some ballots are removed, allof which have x bottom, below all other candidates.
There is also the following property, which is not strictly aform of monotonicity but is very close to it. It is an extensionto multi-seat elections of a property proposed by Moulin3 forsingle-seat elections.
Participation. The addition of a further ballot should not,for any positive whole number k, reduce the probabilitythat at least one candidate is elected out of the first kcandidates listed on that ballot.
These properties are not all independent. For example,
mono-raise-random implies both mono-raise andmono-raise-delete;
mono-raise and later-no-help together imply mono-raise-delete;
mono-raise-delete and later-no-harm together implymono-raise-random;
mono-sub-top implies mono-sub-plump;
mono-sub-plump and later-no-harm together implymono-sub-top;
mono-append and mono-raise-delete together implymono-sub-plump;
mono-append and mono-raise-random together implymono-sub-top;
mono-add-top implies mono-add-plump;
mono-add-plump and later-no-harm together implymono-add-top;
participation implies mono-add-top.
Moreover, in single-seat elections,
participation implies mono-remove-bottom.
Also, if truncated preference listings are not allowed, thenmono-raise-random implies mono-sub-top.
ab 10 El ect i on 6: bca 8 ( 1 seat ) ca 7
STV satisfies mono-append but none of the other properties,although in single-seat elections AV satisfies mono-add-plumpand mono-add-top. To see that AV does not satisfy mono-raise, mono-raise-delete, mono-raise-random, mono-sub-plump, mono-sub-top or mono-remove-bottom, consider itseffect in Election 6 above. As it stands, c is excluded and a iselected. But if two of the bca ballots are removed, or replacedby a or by abc or by anything else starting with a, then b isexcluded and c is elected instead of a.
El ect i on 7 El ect i on 8 ( 2 seat s) ( 2 seat s) ab 30 ac 207 ac 90 bd 198 bd 59 bdac 12 cb 51 cd 105 d 70 dc 105
To see that STV does not satisfy mono-add-plump or mono-add-top, consider Election 7. The quota is 300/3 = 100, sothat a is elected with a surplus of 20. This is divided 5 to b, 15to c, and so b has 64 votes to c's 66, b is excluded, and d iselected. Suppose now that we add a further 24 ballots with dtop. The quota is now 324/3 = 108, so that a's surplus is nowonly 12. This is divided 3 to b, 9 to c, and so b has 62 votes toc's 60, c is excluded, and b is elected instead of d.
Although all the monotonicity properties look attractive, I donot think that mono-remove-bottom is desirable in multi-seat elections. Consider Election 8. The quota is 627/3 = 209,
Voting matters, for the technical issues of STV, Volume 1
Issue 3, December 1994 Page 12
and so DPC requires that we elect b and either c or d. Itseems to me that { b, c} is clearly the better result (althoughSTV gives { b, d} ). But if we now remove the 12 bdacballots, then the quota drops to 205, so that we must elect aand either c or d. It seems to me that now { a, d} is the betterresult (although STV gives { a, c} ). Thus the removal of the12 ballots that have c bottom should, in my opinion, harm c.
All the monotonicity properties seem desirable in single-seatelections. However, I proved7 that no rule simultaneouslysatisfies mono-sub-plump, later-no-help, later-no-harm,majority and plurality. Since I do not think anyone wouldseriously consider a rule that did not satisfy both majorityand plurality, this shows that in order to have mono-sub-plump one must sacrifice either later-no-help or later-no-harm (or both). Whether or not this is desirable may dependon what other properties one can gain at the same time.
Mono-raise-random, mono-sub-top and participation arevery strong properties, and it is possible that they areincompatible with DPC. If one could find a reasonable-looking "STV-lookalike" rule that satisfied all the othermonotonicity properties (except for mono-remove-bottomwhen there is more than one seat), then I personally mightwell prefer it to STV itself. But we are a long way fromfinding such a rule at the moment.
While on the subject of monotonicity, I should mention oneother monotonicity property, if only to dismiss itimmediately.
House-monotonicity. No candidate should be harmedby an increase in the number of seats to be filled, withno change to the profile.
This seems to me to be plain wrong. Consider the profile inElection 5, for example, which is a very slight modificationof one suggested to me by David Hill. If one were using thisprofile to fill a single seat, then clearly d should be elected(although that is not the result achieved by AV). But if thissame profile were used to fill three seats, then clearly a, band c should be elected; thus d is harmed by the increase inthe number of seats.
Another property that is related to monotonicity is known inthe literature as consistency8 or reinforcement3, but I preferto call it by its mathematical name:
Convexity. If the voters are divided into two districtsand the ballots from each district are processedseparately and the results in the two districts are thesame, then processing the ballots of all voters togethershould give the same result.
( a) ( b) ( a) +( b) ab 6 3 9El ect i on 9: bc 4 4 8( 1 seat ) cb 3 6 9
STV does not satisfy convexity. Again, I cannot do betterthan to quote an example of David Hill's (Election 9). Indistrict (a), c is excluded and b is elected. In district (b), a isexcluded and b is elected. But when the ballots from thetwo districts are processed together, b is excluded and c iselected.
Convexity is one of the best-understood of all properties.Young8 proved that a symmetric preferential election rulefor single-seat elections satisfies convexity if and only if itis equivalent to a point scoring rule (in which one giveseach candidate so many points for every voter who putsthem first, so many for every voter who puts them second,and so on, and elects the candidate with the largest numberof points). Since no point scoring rule can possibly satisfyDPC, it follows that convexity and DPC are mutuallyincompatible. This is a pity, because convexity impliesseveral of the monotonicity properties; but, sadly, it is of nouse to us.
Of course, the absence of convexity will hardly ever benoticed in practice, since elections are not counted both inseparate districts and together as a whole. But it is worryinginasmuch as it may suggest that something odd is going on.
6. Further propertiesA question that is sometimes asked about STV is, is atruncated preference listing treated as if all the remainingcandidates were placed equal last? Since STV (in its usualformulation) does not allow for equality of preference, thequestion does not really make sense. But one can makesense of it as follows. The symmetric completion of atruncated preference listing is obtained by taking allpossible completions of it with equal weight, chosen so thatthe total weight is 1. For example, suppose that there arefive candidates, a, b, c, d, e. Then
the symmetric completion of a ballot marked abcd is asingle ballot marked abcde, with weight 1;
the symmetric completion of a ballot marked abcconsists of two ballots, each with weight ½, onemarked abcde and the other marked abced;
the symmetric completion of a ballot marked abconsists of six ballots, each with weight 1/6,completed in the six different possible ways: that is,abcde, abced, abdce, abdec, abecd and abedc;
the symmetric completion of a ballot marked a consistsof 24 ballots, each with weight 1/24, completed in the24 different possible ways; and so on.
Symmetric-completion. A truncated preference listingshould be treated in the same way as its symmetriccompletion.
Volume 1 Voting matters, for the technical issues of STV
Page 13 Issue 3, December 1994
It is not difficult to see that AV satisfies symmetric-completion. Although AV is usually described in terms of aquota, it can alternatively be described as follows: repeatedlyexclude the candidate with the smallest number of votes, untilthere is only one candidate left. The effect of replacingtruncated preference listings by their symmetric completionsis simply that, at each stage in the count, the votes of all non-excluded candidates are increased by the same amount. Itfollows that the order of exclusions is not affected, northerefore is the eventual winner.
a 60El ect i on 10: ab 60( 2 seat s) b 14 c 46
To see that STV does not satisfy symmetric-completion ingeneral, consider Election 10. The quota is 180/3 = 60, so thata is elected with a surplus of 60. Under the Newland-Brittonrules, the whole of a's surplus goes to b, who is elected. UnderMeek's method, the transfer of a's surplus ends with the quotareduced to (180 − 36)/3 = 48, with 36 non-transferable votesgoing to ‘excess’ , and 36 votes transferred to b. Either way, aand b are elected. However, if each ballot is replaced by itssymmetric completion, then, of a's surplus of 60 votes, 45 goto b and 15 to c, and c is elected instead of b.
El ect i on 11 El ect i on 12( 2 seat ) ( 3 seat s)ab 40 ab 40ba 2 ba 2cd 12 cd 12dc 6 dc 6 e 180
David Hill has sent me an example, which I have modifiedslightly above, to show that quota reduction is preferable tosymmetric completion in STV. In Election 11 the quota is 60/3= 20, and so a and b are elected. In Election 12 the quota is240/4 = 60, so that e is elected with a surplus of 120. Undersymmetric completion, this would be used to increase thevotes of the remaining candidates by 30 each, so that a wouldbe elected first, after which d would be excluded and c wouldbe elected. However, if the quota is reduced to 20 after theelection of e then a and b are elected as in Election 11. Toparaphrase David's comments slightly, "Election 12 has oneextra candidate, one extra seat, and a large number of extravoters whose sole wish (apparently) is to put that extracandidate into that extra seat. It is nonsense that the original60 voters should get a and c elected in Election 12 instead ofthe a and b they would have got from Election 11."
The remaining properties are all concerned with the avoidanceof "wrecking candidates". A "wrecking candidate" is acandidate who is not elected but who, by standing for electionand so "splitting the vote", prevents someone else from beingelected. One might naïvely hope to avoid wrecking candidates
altogether, which would result in the Independence ofIrrelevant Alternatives, or IIA:
IIA. If a candidate x is not elected, then the result of theelection should be as if x had not stood for election.
However, it is easy to see that no discriminating election rulecan satisfy both IIA and majority. For, consider Election 3above. By the axiom of discrimination, there must be a profilearbitrarily close to this one that does not give rise to a tie. Ifthis profile results in the election of a, then b is a wreckingcandidate: for, if b had not stood for election, then c wouldhave been elected (by majority, since roughly two thirds ofthe voters prefer c to a); thus the result of the election is not asif b had not stood. In a similar way, if b is elected then c is awrecking candidate, and if c is elected then a is a wreckingcandidate.
In an attempt to find a property weaker than IIA butexpressing a similar idea, I came up with the following.
Weak-IIA. If x is elected, and one adds a new candidate yahead of x on some of the ballots on which x was firstpreference (and nowhere else), then either x or y shouldbe elected.
Unfortunately I do not know of any sensible election rule thatsatisfies even this. Certainly STV does not. For example, ifthere are 15 ballots marked x and 14 marked z, then AV (andany sensible rule) will elect x; but if 10 of the 15 x ballots arenow changed to read yx, then AV will exclude x and elect zinstead.
An alternative weakening of IIA has been proposed byTideman5. In his terminology, a number of candidates form aset of clones if every preference listing that contains one ofthem contains all of them, in consecutive positions (but notnecessarily always in the same order). He says that a single-seat election rule is independent of clones if it satisfies thefollowing properties, which I have reformulated here so thatthey make sense for multi-seat elections as well.
Clone-in. The expected number of candidates electedfrom any given set of clones should not increase if onemember of the set is deleted from every ballotcontaining it.
Clone-no-help. Replacing a candidate x by a set ofclones should not help any other candidate y.
Clone-no-harm. Replacing a candidate x by a set ofclones should not harm any other candidate y.
xx ' a 13 x ' xa 11El ect i on 13: abc 10( 2 seat s) bc 12 c 14
Voting matters, for the technical issues of STV, Volume 1
Issue 3, December 1994 Page 14
It is not difficult to see that AV satisfies all the cloneproperties. I am fairly sure that STV also satisfies clone-inin multi-seat elections, although I do not have a formalproof of this. To see that STV does not satisfy the other twoclone properties, consider Election 13. The quota is 60/3 =20. Nobody having reached the quota, a is excluded and b iselected; then x' is excluded and x is elected. However, if theclones x and x' are replaced by a single candidate x, then xhas 24 votes initially and so is elected, and the surplus of 4votes goes to a; therefore b is excluded, and c is electedinstead of b. So replacing x by a pair of clones helps b andharms c.
Clone-no-harm is actually incompatible with DPC. To seethis, note that if only two candidates stand in a 2-seatelection, where the voting is (say) x 70, y 30, then both mustbe elected. But if x is replaced by a pair of clones and thevoting is now xx' 35, x'x 35, y 30, then DPC requires that xand x' should both be elected. This suggests that clone-no-harm is not a desirable property for multi-seatelections—and Tideman never suggested that it was. Butclone-in and clone-no-help both look sensible to me, evenfor multi-seat elections.
References1. Marquis de Condorcet, Essai sur l'Application de
l'Analyse à la Probabilité des Décisions Rendues à laPluralité des Voix, Paris, 1785.
2. P. C. Fishburn, Condorcet social choice functions,SIAM Journal on Applied Mathematics 33 (1977),469-489.
3. H. Moulin, Condorcet's principle implies the no showparadox, Journal of Economic Theory 45 (1988), 53-64.
4. J. H. Smith, Aggregation of preferences with variableelectorate, Econometrica 41 (1973), 1027-1041.
5. T. N. Tideman, Independence of clones as a criterionfor voting rules, Social Choice and Welfare 4 (1987),185-206.
6. B. A. Wichmann, Two STV Elections, Voting matters(The Electoral Reform Society) 2 (1994), 7-9.
7. D. R. Woodall, An impossibility theorem for electoralsystems, Discrete Mathematics 66 (1987), 209-211.
8. H. P. Young, Social choice scoring functions, SIAMJournal on Applied Mathematics 28 (1975), 824-838.
Volume 1 Voting matters, for the technical issues of STV
Page 15 Issue 3, December 1994
EditorialReaders will have noticed that there has been a significantdelay in the appearance of this issue. The reason is verysimple — a lack of sufficient material. Also, in reading thisissue, you will see many familiar names amongst the authors.The conclusion is that we need a wider base for the authorshipthan we have currently. Hence could I ask all readers to ensurethat friends with similar interests subscribe to Voting matters?
In the last paper in this issue, Douglas Woodall usesbarycentric coordinates to present the analysis of electionresults with three candidates. Unfortunately, this elegantmethod of presentation is regarded by the media as toocomplex for general use. In consequence, in the recent three-way by-election, the comparison between the previous generalelection and the by-election was hard to understand. Perhapsthis is an advantage to the three party managers who could allclaim a ‘victory’ .
In my previous article [Issue 3, page 6] I took the Solent mockelection of 1989 to show that electing 5 candidates from afield of 20 gave a different result to choosing 5 from the last6.
It occurred to me that a computer used in a progressiveelimination (19 from 20, then 18 from 19 and so on) couldgive a different result. Dr Hill proved this to be the case,though he did not favour this method.
Whereas all systems elected candidate Nos 1, 7, 9 and 18; thenormal manual method elected No 2, but electing 5 from thelast 6 preferred No 20. The progressive elimination finallyelected No 19 with No 14 as the runner-up. An examination ofthe first 5 preferences on each ballot paper revealed that No19 came 2nd (60), No 20 - 6th (45), No 14 - 7th (37), andNo 2 - 8th (34).
This demonstrates that a candidate with considerablesecondary support can easily lose out in such an election. No19 was originally 9th to be eliminated, and No 14 was 13th togo out, being less than a vote behind his running mate - No 2.
Taking only the top 8 based on the first 5 preferencesproduced that same result as the progressive eliminationprocess.
In Voting matters issue 3, B A Wichmann reported that, usingdata sampled from real voting patterns, ‘Meek violates mono-raise much more than ERS’ . Is this something that Meeksupporters should worry about?
We know: (1) that all electoral systems have to suffer fromsome anomaly or other; (2) that STV's anomaly is that it canfail on monotonicity i.e. a change of vote in a candidate'sfavour can cause that candidate's defeat; (3) that traditionalrules do not even look at a voter's second or subsequentpreferences if the first preference is elected later than the firstcount. So the way to make Meek run into an anomaly wheretraditional rules do not is to find a case where monotonicitytrouble occurs among the preferences that such rules ignore.
Although the numbers of such violations reported are indeedconsiderably greater for Meek, it should be remembered thatthese arise from examining many thousands of pseudo-elections, and the proportions of occasions are small. Forexample, the greatest number of Meek violations found was141 from a data set called R038, but that number comes from12421 comparisons of one pseudo-election with another.Furthermore each of these pseudo-elections has only 20voters, which is very few for electing to 5 places from 17candidates. So the degree of trouble should not beexaggerated, but nevertheless 141 Meek violations werefound and no ERS violations in comparisons derived fromthat particular data set.
Voting matters, for the technical issues of STV, Volume 1
Issue 4, August 1995 Page 1
Issue 4, August 1995
It should be borne in mind that the method used to formthese pseudo-elections from any given data set involvedsampling each time from the same set of votes and thusthere are many repetitions, of particular votes being usedmore than once. This makes it difficult to judge what theresults would be from truly independent samples.
I have examined one case in detail to see what it shows and,to avoid all bias in choosing which case to examine, Idecided to take the first one found in the data sets availableto me. This involved 14 candidates (A − N) for 7 seats, andcontained among its votes one for EJICDNG in that order ofpreference. Those elected are EFGHIJN by Meek rules, butif that one vote is changed to read EIJCDNG (all other votesbeing unchanged) which should be to I's advantage, thoseelected become CEFGHJN, and I has lost the seat to C.
The current ERS rules elect EFGHJCN with 25%probability, EFGHJAI with 58% probability and EFGHJCIwith 17% probability, depending upon how two randomchoices come out. That they reach the same result, giventhe same random choices, irrespective of whether the onevote is as in the original data set or changed, is inevitablebecause the only vote changed is from EJICDNG toEIJCDNG. At the first count E has 3 votes where the quotais 3.13 and so is not yet elected. At the second count 2 votesstarting GE are transferred to E each at value 0.55, to give Ea total of 4.10 and a surplus of 0.97, but that surplus isredistributed solely from the 2 newly-received votes.Whether J or I comes next in the vote that is changed isnever even looked at.
Using Meek rules with either set of votes GEFHJ are electedand BDKLM are excluded. At that point with the originalvotes A has 2.145 while C has 2.100, C is excluded, N and Ielected and A left as runner-up. With the modified votes, Ahas 2.053 while C has 2.060, so A is excluded and nearly allA's votes pass to C. This results in C and N elected, I asrunner-up. Either way it is a very close-run thing, but whois ahead, of A and C, happens to reverse and the resultunfortunately causes the observed lack of monotonicity.
Should all this worry Meek supporters? I think no morethan the fact that lack of monotonicity is an upsettingfeature of all STV. We could get rid of that feature byabandoning STV altogether and refusing ever to look atpreferences beyond the first, but we know that what is lostby so doing far exceeds what is gained. Similarly if we donot look at later preferences some of the time (even whenthey are relevant) then we can get rid of the feature some ofthe time, but again, what is lost by doing that far exceedswhat is gained. In general, looking at voters' laterpreferences whenever they are relevant helps to meet thosevoters' wishes; that it is occasionally troublesome is a pitybut cannot be helped. It remains true that the voterconcerned could not possibly anticipate such an effect, so itcannot lead to tactical voting, and also that even if such
votes were to arise in reality, the lack of monotonicitywould never be noticed except by detailed research of theballot papers such as is hardly ever performed.
In case anyone wishes to examine this data set further, hereare the original votes in Wichmann-Hill format. For thosenot used to this:
14 7 means 14 candidates for 7 seats;
1 5 10 9 3 4 14 7 0 means a vote for candidates 5 10 9 3 414 7 in that order, the initial 1 meaning 1 vote and the 0terminating it, and so on;
Following all the votes there is an extra 0 to terminate themall and then the names of candidates in the order of theirreference numbers, and a title for the election.
To get the modified votes, change the first one to start 1 5 910 instead of 1 5 10 9, and change the title on the last line.
Volume 1 Voting matters, for the technical issues of STV
Page 2 Issue 4, August 1995
Trying to find a winning setof candidates
I D Hill
In Voting matters issue 2, I introduced the idea of SequentialSTV and came to the conclusion that it should not berecommended for general use. But there remains somethingvery attractive in trying to find a set of candidates, of the rightsize for the number to be elected, such that if an STV electionwere conducted with that set plus any other one candidate, allother candidates being treated as withdrawn, that set wouldalways be the winners.
We know from Condorcet's paradox that in the one-seat case,where the set is of size 1, there may not be any winner whofulfils the criterion, but at least if we can find such a winner,the result is unique.
In the multi-seat case, we can still get results where no setsatisfies the criterion. For an example, consider 4 candidatesfor 2 seats and votes 1 AB, 1 BC, 1 CD, 1 DA. If we chooseAB to test we find that ABD leads to AD as winners; testingAD we find that ACD leads to CD; testing CD we find BCDleads to BC; testing BC we find that ABC leads to AB. Soround in circles we go.
But now things are far worse for, even where a set to satisfythe criterion is found, it may not be unique. Again consider 4candidates for 2 seats and votes 6 A, 6 B, 5 C, 5 D, 4 DA, 4DB, 4 CA, 4 CB, 4 BC, 4 BD, 4 AC, 4 AD. If we choose ABas potential winners, we find that ABC elects AB and ABDelects AB, which would seem to confirm the choice; but if wechoose CD we find that ACD elects CD and BCD elects CD,so that choice is also confirmed. Looking at the votes we cansee that AB is, in fact, the better choice, but merely to findany set that fulfils the criterion is not adequate.
Can we then say that, having found a potential winning set,we need only look at disjoint sets to see if there are anyothers? Again things are not as easy as that. Consider 6candidates for 4 seats, with the same votes as in the lastexample, with the addition of 20 E, 20 F. Then if we chooseABEF as potential winners, we find that ABCEF elects ABEFand ABDEF elects ABEF, seeming to confirm the choice; butif we choose CDEF we find that ACDEF elects CDEF andBCDEF elects CDEF, so that choice is also confirmed, and thesets are not disjoint as they both contain E and F.
It is clear therefore that there cannot be a universally bestalgorithm. For everyday practical use, I believe that simpleSTV by Meek's method should remain the algorithm ofchoice.
Voting patternsThe additional information provided by preferential votingmeans that it is difficult to characterise voter behaviour. Forinstance, one cannot state that a voter supports party A merelybecause his first preference is for party A. The totalinformation provided in a preferential ballot is very muchlarger than in X voting, although the result sheet onlyprovides a small fraction of this information.
An obvious question to raise is if the information provided ina ballot can somehow be simplified to provide the essentialcontent. In this paper, a simple model is proposed whichappears to provide the essential information from apreferential ballot.
An exampleThe principle behind the model is most easily understood bymeans of an example. The model does not depend upon thenumber of seats to be filled (indeed, should this value alter thevoting patterns?).
Hence we consider the case with four candidates: Albert,Bernard, Clare and Diana, with the votes cast as follows:
20 AB 15 CDA 4 ADC 1 B
From this data, we compute the number of each pair ofpreferences, adding both the starting position and aterminating position. For instance, the number of times thepreference for A is followed by B is 20, and the number oftimes the starting position is ‘ followed by’ A is 20+4=24. Thecomplete table is therefore:
A B C D es 24 1 15 0 -A - 20 0 4 15B 0 - 0 0 21C 0 0 - 15 4D 15 0 4 - 0
Obviously, a preference for X cannot be followed by X,resulting in the diagonal of dashes. The entry under s- ecould represent the invalid votes.
Voting matters, for the technical issues of STV, Volume 1
Issue 4, August 1995 Page 3
Having now computed this table, we can use it tocharacterise voting behaviour. For instance, 24 out of 40, or60% of voters gave A as their first preference. More thanthis, we can use the table to compute ballot papers havingthe same statistical properties. For example, if the firstpreference was A, then the second row of the table showsthat the subsequent preference should be B, D or e in theproportions of 20:4:15. Due to the fortunately large numberof zeros in the table, we can easily compute the distributionof all the possible ballot papers which can be constructedthis way. Putting these in reducing frequency of occurrencewe have:
The figures in brackets are the frequencies from the originaldata — which can be seen to be quite different.
A number of points arise from this example:
1. The computation of the frequencies needs to take intoaccount the valid preferences. For instance, thefrequency of the ballots starting AD is 0.6×4/39 =6.1%; the next preference can only be C, since theother option in the table is A which is invalid.
2. The large percentage that plump for A is due to thecombination of the large percentage having A as thefirst preference, and the large percentage having A asthe last preference, even though plumping for A doesnot occur in the original ballot. One would not expectthis to occur in practice.
3. In this example, the table seems to be larger than theoriginal ballot papers in information content. Exactlythe opposite would occur with real elections withhundreds or more ballot papers.
4. Note that the number of occurrences of A in theballot papers is the sum of the column A and also thesum of row A (which are therefore equal).
5. It is clear that the ballot papers constructed this waydo not have the same distribution of the number ofpreferences as the original data. However, the meannumber of preferences is similar, but smaller (2.19 forthe computed data, 2.45 for the original). Clearly,when all ballot papers give a complete set ofpreferences, the computed data will rarely, butsometimes, give plumping.
6. If the voters voted strictly according to sex (A,B orC,D), then this characteristic would be preserved by
the model. Similarly, the model does characteriseparty voting patterns.
The conclusion so far is that the model characterises someaspects of voter behaviour, but does not mirror otheraspects. However, from the point of view of preferentialvoting systems, we need to know if the characterizationinfluences the results obtained by a variety of STValgorithms. The property can be checked by comparing setsof ballot papers constructed by the above process againstthose produced by random selection of ballot papers fromthe original data.
We take the ballot papers from a real election which was toselect 7 candidates from 14, being election R33 from theSTV database. From this data, which consists of 194 ballotpapers, we select 100 elections of 25 votes by a) producingrandom subsets of the actual ballots, or by b) the processdescribed above.
For each of the 200 elections we determine 4 properties asfollows:
1. Determine if the Condorcet top tier consists solely ofthe candidate G. This was a property of the actualelection.
2. Determine if the Meek algorithm elects candidate C.This was a property of the actual election.
3. Determine if the ERS hand counting rules electscandidate N. This was a property of the actualelection.
4. Determine if Tideman's algorithm elects candidate E.This was not a property of the actual election.Unfortunately, computing the result from thisalgorithm can be very slow, and hence the result wasdetermined for 50 elections rather than the 100 for theother three cases.
The results can be summarised by the following table:
I believe that the four properties above are sufficientlyindependent, and the elections themselves independentenough to undertake the χ-squared test to see if the two setsof elections could be regarded as having come from thesame population. Passing this test would indicate that thestatistical construction process is effective in providing‘election’ data for research purposes.
The statistical testing is best done as a separate 2 × 2 tabletest of each line. The first line, for example, gives the table
Volume 1 Voting matters, for the technical issues of STV
Page 4 Issue 4, August 1995
Condor cet Anal ysi s ( G) ot herSubset 75 25 100Pr ocess 67 33 100 ————————————————— 142 58 200
The four tables give P = 0.28, 0.31, 0.26 and 0.29respectively, using a two-tailed test. So, so far as this testgoes, these show no significant differences in the twomethods.
AcknowledgementDr David Hill provided the statistical analysis above.
Here is a fairly typical example of the way in whichmonotonicity can fail with STV (or, as in this case, AV).Consider the pair of single-seat elections below. In Election 1,no candidate has reached the quota of 15, and so c, thecandidate with the smallest number of first-preference votes,is excluded. All c's votes are transferred to a, and so a iselected. However, just before the result is announced, it isdiscovered that two of the ballots placed in the pile labelledbca are not in fact marked bca at all, but abc, so that the truesituation is as in Election 2. Naturally a is delighted with thisincreased support. But now b has the smallest number of first-preference votes, and so, when the count is redone, b isexcluded instead of c. All b's votes go to c, and so c is electedinstead of a. So the effect of this increased support for a is tocause a not to be elected.
El ect i on 1 El ect i on 2abc 11 13bca 10 8cab 9 9Excl uded c bEl ect ed a c
This is the sort of anomaly that has caused some people toreject the whole idea of STV. The question I want to discusshere is, how serious is it really? Certainly nobody is going topretend that it is desirable; but is it really as bad as somepeople have been making out?
The first thing to notice is that nobody has been wronglyelected. One might object that it cannot possibly be the case
that a is the right person to elect in Election 1 and that c is theright person to elect in Election 2, in which a clearly has moresupport. But it does not really make sense to talk about "theright person to elect" in these elections. In Election 1, forexample, there are 19 voters who prefer c to a, and only 11who prefer a to c, so that c seems a better candidate to electthan a. But then there are 21 voters who prefer b to c, andonly 9 who prefer c to b, and so b seems a better candidate toelect than c. But then again, there are 20 voters who prefer ato b, and only 10 who prefer b to a, and so a seems a bettercandidate to elect than b. Whichever candidate you choose toelect, someone else can claim to be better! (Of course, this isjust an example of the famous Condorcet paradox.) In thissituation one should not talk about which is the rightcandidate to elect, but, rather, about which candidates it wouldbe permissible to elect. It seems to me that in either of theseelections it would be perfectly permissible to elect any one ofthe three candidates. In this situation STV really does no morethan make a somewhat arbitrary selection from among thepermissible candidates. It is certainly unfortunate that itchooses a in Election 1 and c in Election 2, where a clearlyhas more support; but it is in the nature of such processes thatthis sort of thing will happen.
Figure 1
Let us examine more closely what is going on here. Becausethere are only three different types of ballot present, we canrepresent the situation diagrammatically, using what areknown as barycentric coordinates in a triangle. Suppose wedraw an equilateral triangle of unit height (Figure 1). If we puta point inside the triangle and drop perpendiculars from it, oflengths x, y and z, to the three sides of the triangle, then it iseasy to prove that x + y + z = 1, the height of the triangle. Soif we label the three corners of the triangle with the threedifferent types of ballot, as in Figure 1, then we can use thepoint depicted to represent an election in which the proportionof voters voting abc is x, the proportion voting bca is y, and
Voting matters, for the technical issues of STV, Volume 1
Issue 4, August 1995 Page 5
abc>
bca?
cab@
xA
yBzC
the proportion voting cab is z. Thus, for example, the topvertex of the triangle represents an election in which all thevoters vote abc; the mid-point of the left side represents anelection in which half vote abc and half vote bca; and so on.
Figure 2: candidate excluded
Suppose now that we exclude the candidate with thesmallest number of first-preference votes. Figure 2 showswhich candidate is excluded. For example, to the right of thevertical line through abc there are more cab than bcaballots; and above the middle of the three lines through cabthere are more abc than bca ballots. So in the region markedb, there are fewer bca ballots than ballots of either of theother two types, which means that b has fewest first-preference votes. Similar remarks apply to the other tworegions.
Figure 3: candidate elected
Now consider what happens if b is excluded. All of b's votes
are transferred to c. So the only way that a can win is ifmore than half the ballots are marked abc; that is, we areabove a horizontal line drawn half way up the triangle. (Ofcourse, in this case a will be elected outright — one wouldnot normally exclude b first; but it would make nodifference to the outcome if one did.) Similar remarks applyto the other two regions, and so the result of the election isas indicated in Figure 3. Figure 3 also shows the pointsrepresenting Elections 1 and 2. Election 1 is in the regionwhere a is elected. Election 2 is obtained from it byconverting two bca ballots into abc, hence by movingparallel to the left edge of the triangle. This takes us into theregion in which c is elected. Of course, if one continues abit further in the same direction, then one gets back into theregion in which a is elected.
The problem is caused, in a sense, by the fact that theregions are not convex. However, one cannot make themconvex without violating the spirit of STV. Their convexityis equivalent to the property called Convexity in Woodall1;and, as mentioned there, the only election rules that possessthis property are point-scoring systems, which do notconform to the spirit of STV.
Figure 4: where monotonicity fails
This representation also gives us a way of visualizing wheremonotonicity fails. If there are two elections (involvingonly these three types of ballot) that between them showthis type of failure of monotonicity, then both electionsmust lie inside the central region indicated in Figure 4. Notethat this region is completely contained within the largedotted triangle, which is where the Condorcet paradoxarises. So, in this example, monotonicity does not failexcept when there is a Condorcet paradox. However, it isimportant to stress that, in general, monotonicity can faileven when there is no Condorcet paradox.
Figure 4 suggests the following interpretation. There arecertain regions in which it is quite clear who ought to be
Volume 1 Voting matters, for the technical issues of STV
Page 6 Issue 4, August 1995
abcD
bcaE
cabF
aD
cF bE
abcG
bcaH
cabI
bH
cI
aG
12
J
abcK
bcaL
cabM
bL cM
aK
elected, and in these regions STV elects the candidate that onewould expect. But in the middle there is a grey area, where itis not at all clear who ought to be elected, and it is in this greyarea that STV behaves in a somewhat haphazard manner; it isreally doing no more than making a pseudo-random selectionfrom the appropriate candidates, and it is here that smallchanges in the profile of ballots can cause perverse changes inthe result.
The effect of this is to blur the result of an STV election.Nobody is being wrongly elected, because the problem onlyarises in the region where one cannot say for certain whoought to be elected anyway. And there is no systematic biasthat would, for example, favour one political party rather thananother. But the accuracy with which the person or personselected in an STV election can be said to represent the viewsof the voters is less precise than it would be if this sort ofanomaly did not arise.
The obvious question at this point is whether one can find asystem that retains the essential features of STV whileavoiding this sort of anomaly. The answer depends on whatone regards as the essential features of STV. As we shall seein a later article, it is not possible to avoid this anomalywithout sacrificing at least one property that many supportersof STV regard as essential. Nevertheless, I shall describe therea system for single-seat elections that gains so many forms ofmonotonicity, while sacrificing only one property of STV, thatI personally would be willing to recommend it as a bettersystem than the Alternative Vote. Unfortunately, it is notfeasible when the votes are to be counted by hand. Also, it isnot clear whether it can be extended in any sensible way tomulti-seat elections; this is a crucial question, which I have sofar been unable to answer.
Reference1. D R Woodall, Properties of preferential election rules,
Voting matters Issue 3 (1994), 8-15.
Voting matters, for the technical issues of STV, Volume 1
Issue 4, August 1995 Page 7
EditorialIn this issue, two long and one short article appear which Ihope will be of substantial interest to readers. In the first,Crispin Allard produces some estimates of the likely rate ofnon-monotonicity, based upon a mock election. Secondly,Hugh Warren gives an interesting example of the Condorcetparadox which can only serve to show the inherentcomplexity of preferential voting. Lastly, I report on aprogram which attempts to produce plausible election datafrom STV result sheets.
Estimating the Probabilityof Monotonicity Failure in a
1. SummaryThree years ago, the Plant Report rejected STV as a systemworth considering for elections to the House of Commons,citing evidence submitted by Michael Dummett (based onan example originating from Reference 2) on the groundsthat it could be non-monotonic. In this paper I attempt toestimate the probability of a monotonicity failure whichaffects the number of seats won by a party. I estimate theprobability of this occurring in a multi-member constituencyin one election as: 2.5 × 10⁻⁴, equivalent to less than onceevery century across the whole UK. [This result was firstreported in Reference 1 as 2.8 × 10⁻⁴. I have revised thisdown as a result of a refinement in the method.]
2. Representing the problemConsider an n-member STV constituency, in which n-1candidates have so far been elected, and the three remainingcandidates (denoted A, B and C), one each from theConservative, Labour and Liberal Democrat Parties arecompeting for the final place. The conditions formonotonicity failure are as follows:
1. A is ahead of B, and B is ahead of C;
2. When C is eliminated, his transfers put B ahead ofA, so that B is elected;
3. If a number of voters switch their relevantpreference from A to C, so that both A and C areahead of B, then when B is eliminated, A is ahead ofC, so that A is elected;
for any ordering of A, B and C.
Writing these conditions down in mathematical terms weget:
1. a > b > c.
2. a < b + αc.
3. There exists x such that: a − x > b c + x > b a > c + 2x + βbwhere
a = the proportion of votes credited to A
b = the proportion of votes credited to B
c = the proportion of votes credited to C
α = TCB − TCA
β = TBC − TBA
Tij = the proportion of i's votes which transfer to j if iis eliminated.
(α and β can be considered as the level of advantage whichone party can expect to gain over another as a result of theexclusion of a candidate from a third party).
The following conditions are equivalent to 1-3 above:
M1. b > c
M2. a < b + αc.
M3. a > max{ 2b − c, (2 + β)b − c}
Using barycentric coordinates (and denoting each point ofthe triangle to represent one candidate having all the votes),these conditions are illustrated in figure 1.
Volume 1 Voting matters, for the technical issues of STV
Page 1 Issue 5, January 1996
Issue 5, January 1996
Figure 1
Thus, if we assume a uniform distribution, the probability ofthis type of monotonicity failure is the ratio of the area of thesmall triangle (either PQR or STR, whichever is the smaller)to the area of the large one (ABC). To see why we must takethe smaller triangle, note that to satisfy condition M3, a pointin Figure 1 must be below both the lines:
a = (2 + β)b − c and a = 2b − c .
Note that if β > α, conditions M1-M3 cannot simultaneouslybe satisfied, so in this case we define: Area (STR) = 0.
Switching to Cartesian coordinates,
x = c + b/2
y = √3 b/2
the areas of the three triangles are found to be:
Area(ABC) = √3/4
Area(PQR) =
Area(STR) =
= 0 otherwise
So if we let p be the probability of monotonicity failure, wecan find its value as follows:
else p=0
Or, by substituting,
γ = max{ α, β, 0}
δ = max{ min{ α, β} , 0}
we obtain a single equation for p:
(P1)
3. Estimating the transfer patternsClearly we need to know the likely pattern of transfersbetween candidates from different parties, which requiresaccess to the ballot papers of a typical British electoratevoting by STV for real political parties. Last year an ERS/MORI exit poll of 3,983 London voters was conducted duringthe European Parliament elections, in which they were askedto cast preferential votes in two multi-member constituencies.The results form by far the best available data on the likelybehaviour of British voters in an election conducted by STV.
Details of the poll may be found in Reference 3, whichincludes tables of terminal transfers (transfers of votes from acandidate whose party has no further candidates left who arestill eligible to receive votes). Unfortunately, there is noterminal data from Conservative candidates, since noneoccurred in the count of the mock vote, so this data cannot beused.
Instead I try to consider all the possible transfers of voteswhich could have taken place. For each of the twoconstituencies (London North and London South), and forevery ordered triple of candidates (Conservative, Labour, LibDem), the following data extracted from the poll results isused.
The number of votes which would transfer to the Labourcandidate (if the Conservative were to be eliminated leavingonly the Labour and Lib Dem candidates); the number whichwould transfer to the Lib Dem candidate in suchcircumstances; and the number which would be non-transferable.
Voting matters, for the technical issues of STV, Volume 1
Issue 5, January 1996 Page 2
B
CAN
b=c
yO
xP
b=1Q
c=1Ra=1
a=b+ cS
a=2b-cSa=(2+ )b - cβ
T
αU
P Q
TSV
R
αW
(3 + α)(1 + α)X
2
12√3
(3 + α)(1 + α)X
2Y
(α−β)X
√3Z
4(3+β)[ 2
Y if\
α > β]
α]
9(3 + α)(1 + α)^
2
α > 0 ≥ β ⇒ ] p =_
(3 + α)(1 + α)X
2Y
α > β > 0 ⇒ ] p =_ (α−β)X
(3+β)X 2
Y
(3 + γ)(1 + γ)X
2
p =_ (γ−δ)X
(3+δ)X 2
This data is repeated for the each of the Labour and LibDem candidates being eliminated, providing 840 data sets(sadly not independent!) on which to base the estimate oftransfer patterns, and hence estimate p. The number of datasets arises from 216 ordered triples in London North (6-seater), 64 in London South (4-seater), and three data setsfor each ordered triple.
4. MethodIn outline, I employ the following method (using an Excelspreadsheet):
i) For each data set (representing the potential transfersfrom one candidate from one party to two candidatesfrom the other parties), the proportions Tij of votestransferred to each of the surviving candidates arecalculated.
ii) These proportions are then adjusted using thefollowing approximate shrinkage equation:
where:
T 'ij represents the shrunken estimate of theproportion of i's votes which transfer to j if i iseliminated.
T--ij is the weighted sample mean of Tij based onexclusions of candidates from the same party in aparticular constituency.
s is the sample variance of Tij.
n is the size of the data set (the number of firstpreferences credited to the excluded candidate).
t = 0.0004
Note that this is based on a two-stage hierarchicalmodel, in which (for a given constituency and party)there is a party mean value of Tij, with variance0.0004, about which the candidates' Tij values aredistributed.
iii) Based on the values of T 'ij, γ, δ and p are calculated,using the above definitions and equation P1.
iv) For each ordered triple of candidates, the threevalues of p (one for each potential elimination) aresummed to allow for all the possible ways in whichmonotonicity might fail, giving a total probability P.
v) For each constituency, a weighted mean of theprobabilities is calculated.
vi) Finally a weighted mean of the probabilities for thetwo constituencies is taken to produce the result:
ε(P) = 2.5 × 10⁻⁴.
So, if the UK is divided into 138 multi-memberconstituencies, as proposed in Reference 4, and assuming anaverage of one General Election every four years, we wouldexpect one instance of final-stage monotonicity failureaffecting party standing under STV roughly every 115years.
5. Justifying the approachThe problem of estimating the probability of monotonicityfailure under STV is complicated, involving politicalconsiderations and statistical judgement as well as puremathematics. So inevitably I have had to make a number ofassumptions and simplifications. I will now attempt toidentify all the potential objections to my approach andanswer some of the possible criticisms.
5.1 Only monotonicity failure affecting parties isconsidered.
It is almost certainly true that the probability of affectingindividual candidates within a party is much greater. For astart, far more voters are prepared to transfer within a partythan between parties. This is supported if we look at ERSCouncil Elections (which are like elections betweencandidates of the same party since all support electoralreform), where potential instances have been observed.
Nevertheless, given that STV is the only system which evenattempts to represent intra-party opinion, any minor‘ imperfection’ in this respect is irrelevant to the choice of anelectoral system. And it is certainly the case that most of theopponents of STV are far more concerned with partyrepresentation.
Finally, it is a necessary simplification since intra-partytransfer patterns are notoriously unpredictable and difficultto model.
5.2 The model only covers three parties and final-stagetransfers.
Of course, earlier stages and a greater number of partiesallow more opportunities for monotonicity failure.However, I claim that the probability of this making adifference to the final result is tiny compared to the figure Ihave calculated above.
To see this, consider the diagram in figure 1. The effect isonly possible when there are three candidates with verysimilar votes (Q is the geometric centre). Thus, if there are
Volume 1 Voting matters, for the technical issues of STV
Page 3 Issue 5, January 1996
T ij =/t + n/s
`T +nTij ij /s
`/t
`
1'
four candidates competing for the final place, a candidate who‘benefits’ in the penultimate stage is still very unlikely tobenefit in terms of election (and one who ‘ loses’ probablywould not have been elected anyway).
If there are four candidates competing for two places, withthree in danger of elimination, then the fourth may bediscounted (as a certainty), and we are back to the originalproblem. Only in the case where there are four or morecandidates all with similar votes might a relevant situationarise; it is reasonable to ignore such nth order terms.
5.3 The method assumes a Uniform (prior) distribution ofvotes between the three parties.
This assumes that the three parties each have the samemarginal distribution. In a one-member constituency this ishighly unlikely, but in a multi-member constituency therelevant distribution to consider is the remainder, once n-1seats have been ‘allocated’ , and the appropriate number ofquotas deducted from each party's vote.
Therefore, in order for the assumption to be reasonable, all weneed is to have across the country three parties capable ofachieving proportions of votes over a range of at least onequota. This would typically be achieved by a party receiving10% or more of the national (or regional) vote.
A similar principle is at work behind the Wichmann-Hillpseudo-random generator, where the sum of a number ofvariables is known to tend to normality, but the fractional partof the sum remains rectangular. There is room here forsomeone to conduct a proper analysis, which I am confidentwould uphold my assumption.
5.4 The results are based on an opinion poll conducted onlyin London.
This represents probably the biggest area of doubt about theresult and, since this is the best data available so far, there isno way of avoiding it. The STV ballot paper was constructedby listing (nearly) all candidates in each of the Euro-constituencies represented. Since this was an election forMEPs, recognition of most individual candidates must havebeen relatively low.
However, we can only speculate on how voters would react ina General election conducted by STV, and it is by no meansobvious that voting patterns would be substantially different.The same applies to the London factor. While the relativepositions of the parties would vary across the country, there isno reason to suppose that the nature of voting patterns wouldbe any different.
5.5 Why has shrinkage been applied in this way?
Shrinkage is one of the results of Bayesian analysis which has
been accepted by non-Bayesian statisticians as representing atrue effect which does not appear in more traditional models. Ihave judged that a hierarchical model is relevant to thissituation, so we must take account of shrinkage. A referencewill be given in the next issue of Voting matters to provide anexplanation of shrinkage for non-statisticians.[Not produced?]
If the charge is that I have not defined a full Bayesianhierarchical model, with detailed multivariate priordistributions etc., then I plead guilty. This was donedeliberately to avoid specifying prior distributions whichmight obscure the argument. The value of t is arbitrary but, Ibelieve, reasonable. A little sensitivity analysis shows that itdoes not affect the final result by more than a tenth.
5.6 The weightings used in the final calculation do not allowfor some votes having a greater effect.
Rather than try to work out what effect the voting patternsmight have had in this particular election, I wanted to gain anestimate of overall voting patterns. This means consideringboth first and last place candidates, since in differentconstituencies each party will have somewhere between 0 and5 ‘safe’ seats, so the candidate involved in a three-way battlecould be anyone between the first and sixth most popular inthat party.
The best way to cope with such uncertainty is to assign equalweightings to each elector.
6. ConclusionsUsing the best data available and using reasonableassumptions I have estimated the probability thatmonotonicity failure would arise in a UK General Electionconducted by STV. That probability turns out to be extremelysmall. In political terms it may as well be zero. Opponents ofSTV will need to come up with better reasons if they wish toreject it out of hand.
AcknowledgementsI am grateful to Professor Shaun Bowler of the University ofCalifornia at Riverside for his help in supplying data from theERS/MORI poll, and to Richard Wainwright and others fortheir encouragement and interest in this research.
References1. Crispin Allard, ‘Lack of Monotonicity - Revisited’ ,
Representation 33:2 (1995), pp48-50.
2. G. Doron and R. Kronick, American Journal ofPolitical Science 21, pp303-311.
Voting matters, for the technical issues of STV, Volume 1
Issue 5, January 1996 Page 4
3. Shaun Bowler and David M. Farrell, ‘A British PRElection: Testing STV with London's Voters’ ,Representation 32:120 (1994/5), pp90-3.
4. Robert A. Newland, Electing the United KingdomParliament, 3rd Edition (ERS, 1992).
Appendix: Summary StatisticsBelow is a table showing the transfer trends in North andSouth London. The transfers are weighted means, expressedas percentages of the respective first preference votes. Theadvantages (corresponding to α or β) are given afteradjusting for shrinkage. See section 4 for a full explanation.Each party is shown with the number of first preferencevotes cast in the poll for candidates of that party.
Of the 3,983 voters polled, 3,013 expressed a valid firstpreference for a candidate from one of the three mainparties, of whom 1,778 were from North London and 1,235from South London. The overall probabilities ofmonotonicity failure were found to be 0.00013 in NorthLondon and 0.00043 in South London, giving a (weighted)mean of 0.00025 and a sample variance of 2 × 10⁻⁸.
An example showing thatCondorcet infringes aprecept of preferential
voting systemsC H E Warren
a b c d e f g g h i j k f l h l m h g n o p d h q r s t n b i u j v w
It is one of the precepts of preferential voting systems that alater preference should neither help nor harm an earlierpreference. The purpose of this paper is to show that theCondorcet system of preferential voting infringes thisprecept.
Consider an election for one seat in which there are 3candidates:
A is a Catholic Conservative White
B is a Protestant Labour White
C is a Catholic Labour Asian
There are 99 voters:
17 want Labour, they prefer a White to an Asian, and theyare indifferent as to sect, so they vote BC.
16 want Labour, they prefer an Asian to a White, and theyare indifferent as to sect, so they vote CB.
15 want a Catholic, they prefer Labour to Conservativeand they are indifferent as to race, so they vote CA.
17 want a Catholic, they prefer Conservative to Labour,and they are indifferent as to race, so they vote AC.
16 want a White, they prefer Conservative to Labour, andthey are indifferent as to sect, so they vote AB.
15 want a White, they prefer Labour to Conservative, andthey are indifferent as to sect, so they vote BA.
1, whom we shall call Voter X, wants primarily aConservative, and wants also an Asian and a Protestant,so is undecided whether to vote AC or AB, but settles forAC.
1, whom we shall call Voter Y, wants primarily aProtestant, and wants also a Conservative and an Asian,so is undecided whether to vote BA or BC, but settles forBA.
1, whom we shall call Voter Z, wants primarily an Asian,and wants also a Protestant and a Conservative, so isundecided whether to vote CB or CA, but settles for CB.
Volume 1 Voting matters, for the technical issues of STV
Page 5 Issue 5, January 1996
%Transfers Advantage
Votes Con Lab LD NT Mean High Low
North LondonCon:512 - 2.4 5.1
x92.6
yAdvantage(LD-Lab) 2.7 9.7
y-9.8
Lab:1049 1.4 - 8.1z
90.5y
Advantage(LD-Con) 6.7{
22.5 -5.7
LD:217 4.8 11.3 - 83.9z
Advantage(Lab-Con) 6.5{
20.6 -8.6
South London|
Con:400 - 3.0}
11.6 85.4z
Advantage(LD-Lab) 8.6z
23.2 -8.9
Lab:598 1.9 - 13.9 84.2z
Advantage(LD-Con) 12.0 21.2 3.8}
LD:237 7.7 12.5 - 79.9
Advantage(Lab-Con) 4.8 18.3 -13.0
Accordingly the votes are as follows:
AB 16AC 18BA 16BC 17CA 15CB 17
The Condorcet method for the election yields the followingresults:
C beats B by 50-49
A beats C by 50-49
B beats A by 50-49
Accordingly we see that Condorcet produces a paradox.
(Incidentally, the Single Transferable Vote, which amounts tothe commonly called Alternative Vote in this case, would‘exclude the lowest’ , C, and hence would elect B.)
If the paradox is resolved by electing A, then, if instead ofvoting AC Voter X had voted AB, Candidate B would havebeaten Candidate C, and accordingly by the Condorcetmethod Candidate B would have been elected. Thereforechanging the second preference of Voter X from C to B worksto the detriment of his first preference A.
If the paradox is resolved by electing B, then, if instead ofvoting BA Voter Y had voted BC, Candidate C would havebeaten Candidate A, and accordingly by the Condorcetmethod Candidate C would have been elected. Thereforechanging the second preference of Voter Y from A to C worksto the detriment of his first preference B.
If the paradox is resolved by electing C, then, if instead ofvoting CB Voter Z had voted CA, Candidate A would havebeaten Candidate B, and accordingly by the Condorcetmethod Candidate A would have been elected. Thereforechanging the second preference of Voter Z from B to A worksto the detriment of his first preference C.
Therefore, no matter how the paradox is resolved, the preceptthat a later preference should not harm an earlier preference isinfringed.
Producing plausible partyelection data
B A Wichmann
The STV database lacks any data from public elections whichinvolves political parties1. This is hardly surprising due to the
legal constraints on public election data. However, from thepoint of view of election studies, this omission is veryunfortunate. Statistical studies of real election data areimportant, since we know that desirable logical propertiescannot be universally satisfied.
For public elections, the only information available is that ofthe result sheet. Unfortunately, this information is very muchless than that contained in the ballot data itself. Only a fewpreferences expressed by votes are actually exercised in thecounting process and therefore can be reconstructed from theresult sheet. It is possible to produce minimal ballot paperswhich will give the same effect as the result sheet, but suchballot data is very unlike the (unknown) ballot data itself. Incontrast, we are here attempting to produce ballot data whichappears similar to the actual data, so that our constructed datacan be used instead of the real data.
In this study, we are using the Irish election data for the years1969 and 1973, since this is available in a convenient bookformat which is easy to process, see Knight and Baxter-Moore3. The first election in the book, is that for Carlow-Kilkenny. For this, we have:
It might therefore appear that we have a hopeless task sincethe result sheet contains a thousand times less informationthan that of the (missing) election data.
However, we established2 that if we can provide a matrixgiving the probabilities of A being followed by B (for allcandidates A, B), then election data can be constructed whichappears to have the statistical properties one would expect, atleast as far as the election results are concerned with the usualSTV algorithms. Hence if we can produce an estimate for theA-B probabilities, we can construct plausible data.
Taking the result sheets for all the Irish elections for 1969, wecan study just the first transfers made. These transfers are notrestricted in the potential choice that can be made by theelector, and therefore can provide a basis for the probabilitieswe wish to estimate. To compare one constituency withanother, we label the candidates FF1, FF2,.. for Fianna Fail inorder of the first preferences, and similar for Fine Gael (FG1,etc), Labour (LA1, etc) and others (OT1, etc). (Fortunately,this is exactly the order listed in 3) We only need to considerthe three main parties since they account for around 97% ofthe first preference votes. However, the ‘other’ candidatesmust be taken into account with transfers, and hence appear asa notional party.
Voting matters, for the technical issues of STV, Volume 1
Issue 5, January 1996 Page 6
Information content
Result 9 bits
Result sheet 800 bits
Election data 800,000 bits
Volume 1 Voting matters, for the technical issues of STV
Table 1 gives the first transfers for all* the 1969 Irishelections. The candidates are labelled as above and NT (forNon-Transferable). A blank in the relevant columns indicatesno such candidate. Others are listed in the order given inKnight and Baxter-Moore3.
Table 2 shows the transfer from Fianna Fail alone. The staragainst the Waterford entry represents a change from theoriginal. In this case alone, the FF transfer was byelimination; but we wish to put under FF1 the candidate fromwhich transfers were made, which implies permuting thecolumns as shown. Again, the star against the Carlow-Kilkenny entry represents a change from the original. Here,the candidate FF2 already had the quota, and therefore wasnot eligible for transfers (or rather any such transfer wouldhave been ignored) and hence the transfer to FF3 is regardedas being for FF2, being the next available FF candidate.
The columns can now be added up to see what the averagetransfers are. (The total transfers are 33,549, but we expressthis as votes transferred per thousand.) This result is shown inTable 3, where FF1 here represents the first Fianna Failcandidate to which transfers could be made. As expected, thisindicates weak cross-party voting and that the most popularperson within a party is that based on first-preference votes.
Tables 4, 5 and 6 give the corresponding transfers of 1,000votes from Fine Gael, Labour and the other partiesrespectively.
Hence we now have estimates for our A-B probabilities,although these figures are very crude for the followingreasons:
1. The tables show large variations between con-stituencies.
2. Comparing constituencies with different numbers ofcandidates for each party is dubious.
3. Grouping all other candidates into a notional party isclearly dubious also.
Nevertheless, we now have some estimates that are probablyas good as we can get in the circumstances.
The next process is to use the above estimates for providingdefault transfer probabilities in those cases in which the resultsheet does not provide this information.
For each of the Irish elections for 1969, we compute thetransfer probabilities that can be found from the result sheet.For the other values, we use our estimates. This then allowsfor plausible ballot data to be computed by program.
The computer program does need to reduce the ballot datato manageable proportions. For Carlow-Kilkenny in 1969,there were 46,073 ballot papers. If we constructed thisnumber of ballot papers individually by program, we wouldhave a 750K bytes data file — too big to process rapidly.We can reduce the data file to a more manageable size byhaving piles of identical papers, which all the computeralgorithms can handle rapidly. The program uses piles of500, 100, 50, 10, 5 and 1 paper(s), adjusted so that thecorrect number of total ballot papers is produced, and thefirst preference counts are the same as the result sheet. Thedata file is now reduced to about 11K bytes.
The program also attempts one further adjustment. Theballot papers match the first preferences and the total votescast exactly, but the match to subsequent transfers is onlysimilar in terms of the proportion of the occurrence of A-B'sin the papers. To obtain a better, but not identical fit, theprogram computes many examples using different seeds forthe random number generator, and selects the best example.Determining the fit between a ballot paper set and the resultsheet is not straightforward. To undertake the comparisonproperly would require a computer version of the Irish STVrules which was not available. Instead, the ERS rules wereused, which has a number of differences from the Irishversion. The most obvious difference is rounding the votesto whole numbers (single ballot papers are transferred),rather than one hundredths; but this makes little differencein this case with over 10,000 votes cast in each election.
To summarise, the program takes as input:
1. The transfers between parties deduced from a set ofelections.
2. The result sheet from a specific election from thatset, giving the party affiliation of each candidate.
3. Seeds for the random number generator, and anumber of trials from which to select the ballot setwith the best fit.
From this, the program outputs a set of ballot papers givinga ‘good’ fit to the specified election. Note that by changingthe seeds for the random number generator, slightlydifferent sets of ballot papers will be produced.
This program was then used to construct plausible ballotsets for the 1969 and 1973 Irish elections. The elections in1973 were regarded as distinct from 1969, so that the sameprocess as illustrated above was used to construct anothertable of transfers per thousand votes between parties.
Voting matters, for the technical issues of STV, Volume 1
Issue 5, January 1996 Page 8
-------* Donegal-Leitrim is excluded since this has the Speaker ofthe Dail elected unopposed, so comparisons are difficult.
A summary of the results from analysing the election dataappears below. The meaning of the entries in the table are asfollows:
Dn On my home computer, I have nine different STV-like algorithms. Listed here is the number ofalgorithms giving a different result from the actualIrish election. A result of D0 is not printed.
Cn A Condorcet ranking is computed from the electiondata. From this, the lowest-ranked candidate is foundwho was elected. Cn is the number of un-electedcandidates ranked at least as high as that candidate.
Pn From the Condorcet ranking, a Condorcet paradox isevident. Pn indicates the number of candidatesinvolved in the paradox. The plus sign indicates thatthe paradox involves both elected and un-electedcandidates. (Note that a Condorcet paradox involvingthe ‘ top’ candidate is undoubtedly a problem whenelecting a single candidate, but not necessarily inother cases.)
IEM Of the nine STV algorithms that were used toanalyse the data, two are of special interest: Meek andthe ERS hand-counting rules. Of the three when theIrish result is compared, the odd-one-out is noted (bya single letter). (Note that in the single case of DublinSW for 1969, all three algorithms gave a differentresult, so there was not an ‘odd-one-out’ .)
The method of construction implies that it would be unwiseto assume that there was an actual Condorcet paradox forSouth West Cork, since this property is dependent in partupon the data which has been added by statistical means.However, it would be reasonable to suppose that thefraction of elections in Ireland having a Condorcet paradoxis about one third, and about a quarter have a paradoxinvolving elected and unelected candidates.
In many cases, the election result is clearly marginalbetween two candidates, and hence differences between theSTV algorithms is not surprising.
Two elections stand out as being very different. For DublinSouth West for 1969, all three main algorithms gave adifferent result. After the top candidate, the next six were ina Condorcet paradox. It seems clear that this seat is apotential example of non-monotonicity. I have been unableto determine if this is so, since I do not know of anycomputationally feasible way of determining the property.As an exercise for the readers, I have reproduced the resultsheet, together with the fit my program produces, to allowothers to determine if non-monotonicity occurs. I have beenable to simplify the data by reducing the number of pilessubstantially, and also reduced the number of votes by afactor of ten, but this still does not provide an easy way ofdetermining this vital property. David Hill has commentedon this by noting that perhaps the property is not soimportant if it is impractical to determine its validity for aspecific election.
The other unusual result is that for Longford-Westmeath for1973. This is the only case in which there were two sets ofcandidates involved in Condorcet paradoxes in one election.
There is only a weak correlation between those electionshaving C≠0 and those having D≠0. There is somecorrelation between the C's and P's, which is hardlysurprising due to the underlying dependence uponCondorcet. A Condorcet paradox involving both elected andunelected candidates is no guarantee that any of the STValgorithms will produce a different result as can be seenfrom Dublin North Central for 1973.
All the computer data produced in this study is availablefrom me on request.
AcknowledgementThis work would not have been possible without theexcellent work of J Knight and N Baxter-Moore intabulating and presenting the results of the 1969 and 1973Irish elections.
Volume 1 Voting matters, for the technical issues of STV
Page 9 Issue 5, January 1996
Consistuency Result 69 Result 73
Carlow-Kilkenny C1£
P3+ D2 P5
Cavan C1£
D2 P3
Clare D6 C2£
M C1£
P4+
Clare-S Galway C1£
D2 C1£
Cork NW D3 C3£
P4+ D2 C1£
Cork SE D2 D2 C1£
Mid Cork D2 C1£
NE Cork D6 C1£
M¤
D7 C1£
M¤
SW Cork D1 C2£
P3+ D1 C2£
P4+
NE Donegal D1
Dublin C C1£
Dublin NC D1 C1£
C2£
P5+
Dublin NE C2£
D2 C2£
P3
Dublin NW C1£
P5+ C1£
Dublin SC D1 C4£
D8 C1£
M¤
Dublin SE C1£
D8 C1£
M¤
Dublin SW D9 C3£
P6+ ME C2£
P4+
NC Dublin C1£
P3+
SC Dublin D1 D1 C1£
Dun Laoghaire - D2
NE Galway C1£
W Galway D3 C1£
M
N Kerry D6 C2£
P5+ I
S Kerry C1£
P4+ C1£
Kildare C1£
Laois-Offaly D6 C1£
P4+ M D3 C1£
E
E Limerick C1£
C1£
W Limerick D1
Longford-W D1 C4£
D8 C4£
P3,3+ M¤
Louth D1 P3
E Mayo C1£
P4+ D1 C1£
W Mayo C1£
Meath D1 C1£
C1£
P3+
Monaghan D2 C1£
D8 C2£
M¤
Roscommon - P3
Sliogo-Leitrm C1£
N Tipperary C1£
D3 C1£
P3+
S Tipperary C2£
Waterford D7 C1£
P3+ I D2 C2£
P5+
Wexford C3£
P5+
Wicklow D9 C2£
I
References1 B A Wichmann. An STV Database. Voting matters,
issue 2, p9.
2 B A Wichmann. A simple model of voter behaviour.Voting matters, issue 4, pp3-5.
3 J Knight and N Baxter-Moore. Republic of Ireland:The General Elections of 1969 and 1973. The ArthurMcDougall Fund. London. 1973.
Appendix The table below is the Irish result sheet as from Knight andBaxter-Moore, except that additionally the results computedby the program from the plausible data are shown in italics.
The actual event elected FF1, LA1, LA2 and FF2. The ERSrules with the plausible data elected FF1, LA1, LA2 and FG1,while the Meek algorithm with the plausible data elected FF1,LA1, LA2 and FG2.
There is a single Condorcet winner in LA1, but the set ofcandidates FF1, FF2, FG1, FG2, LA2 and OT1 are in aCondorcet paradox with the plausible data
.
Voting matters, for the technical issues of STV, Volume 1
Issue 5, January 1996 Page 10
Candidate Stage I Stage II Stage III Stage IV Stage V Stage VI Stage VII Stage VIII Stage IX Stage X Stage XI Stage XIIDowling
EditorialA survey has been conducted of the readership of Votingmatters which has resulted in a number of changes; thesechanges are reported on page 9. I have written individually toall those that took the trouble to write to ERS. Please writeagain if you have further suggestions, and especially if youhave material for potential inclusion.
This issue contains five articles. The first is a republication ofa further article by Brian Meek. Readers should take note ofthe preface which points out the very different nature of thisarticle from the other two that Voting matters has republished.The second article contains a description of mine of a two-tierform of STV. I am not advocating this, since it appears to beinferior to standard STV.
The third article is a very detailed analysis of the degree ofrepresentativity in Irish STV elections by Philip Kestelman.Please note the use of the term magnitude to mean the numberof seats in a multi-seat election.
Douglas Woodall's article is a very detailed analysis of therules that could be used for single-seat elections. Theimportance of this work in my view is that of questioning thedesirability of the property that later preferences should notharm or help earlier ones. Whatever your own views are, Ihope you will note the consequences of the variousimpossibility theorems which shows that, even with just oneseat, conflicting properties abound. This article does define alarge number of terms but I hope readers will find theexplanation of those terms adequate.
The last article is by David Hill which analyses the resultswhich have previously been reported in Replaying the 1992General Election. This paper illustrates the difficulties inproducing accurate predictions for an STV election when only9,614 ballot papers are available for all of the UK.
Brian Wichmann
A transferable votingsystem including intensity
of preferenceB L Meek
Ä g j f i Å h h Æ j k i n Ç f p p d h t n l È b p j i c t h i p g h É Ê j i c Ë k t n v v h c hÌ n i Í n i É s p g f i Í É Ì n i Í n i e t Î r Î Ì s w Ï d j k f g p j u v h Ç f k
n g j c j i f v v Ð È b m v j k d h Í j i Ñ Ò Ó Ô Õ Ö Ò Ó × Ø Ù Ú Û Ú Ó Ü Ý × Ú Þ Ý Ú Ûß Ù Ö Ò × Þ Ú Û É à á É â n ã ä à å æ ã È È Î á ç Î å w
Preface to this republicationAfter I wrote the two papers describing what has sincebecome known as ‘Meek's method’ — published (inFrench) in Mathématiques et Sciences Humaines in 1969and 1970, and republished in English in Voting mattersNo.1 — I went on to write a third paper, which the samejournal published (in English!) in 1975. Some people havebeen aware of the existence of this third paper, and this ledto a request that it too be republished in Voting matters. Ihave no objection to this being done, but it is important tostress that its status is quite different from the other two.
The first two papers present my analysis of STV counting,and how it can be made as accurate as possible. Themethod totally accepts the basis of STV as it is, and doesnot alter or challenge its fundamental assumptions at all. (Itdoes seem to challenge some people's own assumptionsabout STV, but that's not the same thing at all!) As such,‘Meek's method’ was always intended as a practical methodfor conducting an STV count, albeit an expensive one atthat time — far less so now, of course. Years later, DavidHill, Brian Wichmann and Douglas Woodall demonstratedbeyond question that it is a practical method, and earned myeternal gratitude for so doing.
This third paper does not have that status at all. It is in factno more than an academic exercise, exploring an issuewhich arises from time to time in the literature onaggregation of individual preferences. It demonstrates thata method of taking account of intensity of preference ispossible. This is very far from advancing it as a practicalmethod for implementing an election.
I have never regarded it as a practical method. I do notadvocate its adoption, and I shall be very annoyed if anyoneattempts to present it as (say) ‘Meek's proposal’ orotherwise imply that I advocate its use. It should not even
Volume 1 Voting matters, for the technical issues of STV
Page 1 Issue 6, May 1996
Issue 6, May 1996
Note in this reprinting
Brian Meek died in 1997: see end of thisissue, page 17.
be linked to ‘Meek's method’ (e.g. by alleging it is anextension to my method), at least without very carefulqualification. The reason is that ‘Meek's method’ is STV,whereas the process described in this paper is not STV. (It iscertainly not a ‘single’ transferable vote, for a start.) The waythat votes are cast and interpreted is quite different from STV.
To be sure, the vote counting shares some similarities, but thatis only because the same logic that led to the invention ofSTV and to the Meek method has been applied to theaggregation process. The individual votes being aggregatedare, however, not STV votes. The consequence is that theresult can end up very far from STV, as the paper itself clearlyshows.
So the paper should be read for what it is, a mathematicaldemonstration that individual preferences can be fairlyaggregated while still taking intensity of preference intoaccount, and not as a suggested practical method forconducting elections. If that is done, there should be nomisunderstandings. A voting system, derived from the STV(Single Transferable Vote), is described which includesintensity of preference while avoiding difficulties due to inter-personal comparison of utilities. It is shown that this systemallows the voters some control over the method used toaggregate their preferences.
IntroductionThis paper describes a voting procedure with a number ofinteresting properties. Chief among these are the inclusion ofintensity of preference in a non-controversial manner — i.e. ina way which avoids the difficulty of inter-personalcomparison of utilities — and that in various limiting casesthe procedure is equivalent to well-known voting systemssuch as simple majority, the single transferable vote, thesingle non-transferable vote, etc. The paper first describes thevoting procedure, then looks at the properties mentioned, andfinally shows that the procedure offers a partial solution to theproblem of determining which voting procedure to use insome decision situation.
The procedureAny voting procedure consists of two parts — that of votecasting, and that of vote counting. In this case the votecasting procedure for the elector is to assign weights to thedifferent candidates to indicate the order and strength of hispreferences between them. It is a basic assumption thatstrength of preference is transitive, e.g. that if a voter thinksthat he prefers A twice as much as B, and B three times asmuch as C, then he prefers A six times as much as C and canexpress his preferences by assigning weights to A, B, and C inthe ratio 6:3:1.
The vote counting procedure begins by normalising all theweights wij which the ith voter gives to the jth candidate, sothat
c being the number of candidates. This is the key, as we shallsee later, to the avoidance of troubles due to inter-personalcomparison of utilities, since it ensures that as far as possibleeach voter has an equal say in the voting procedure.
The count proceeds by summing all the weights for all thecandidates, i.e. calculating
v being the number of voters. Thereafter the count proceedsmuch in the same way as in the single transferable vote, asmodified by the proposals in two earlier papers1,2. An STV-type quota is calculated according to the formula
where s is the number of seats to be filled and
is the total vote, and the brackets indicate that the integral partis to be taken. q is the minimum number such that, if scandidates have that number, any other candidate must haveless than that number.
(In practice it is likely that working will be to fractions ofvotes — say three decimal places, in which case the "+1" inthe formula for q is replaced by "+0.001", or equivalently theweights wij are normalised to sum to 1000 for each voter andthe formula for q is unaltered.)
The count may proceed by one of two steps. If no Wj exceedsq, i.e. no candidate has reached the quota, then the candidatewith lowest Wj, say candidate x, is eliminated. All the wij arethen renormalised with all wix made equal to zero. Theprinciple adopted is that if a candidate is eliminated the countproceeds as if that candidate had never stood; the assumptionis that the elimination of a candidate does not alter the voter'srelative preferences between the remaining candidates. (It isof course quite possible to take issue with this assumption.)
If, however, a candidate, say y, has Wy greater than q, anotherrenormalisation takes place so that Wy is reduced to q. This
Voting matters, for the technical issues of STV, Volume 1
Issue 6, May 1996 Page 2
= 1, alliwè ijj=1
éj=c
é
Σ
for all j,ê
wë iji=1
ìi=v
ìΣW =j
í
q = W + 1îs+1ï[ ]
Wjð
j=1ñ
j=cñ
ΣW =
means that all wiy are reduced by the factor q/Wy, and all wij,j≠y, are increased by the factor (1 + wiyq/Wy)/(1 − wiy). Bythis means the weights allocated by each voter i are adjustedin a quite natural way, so that those supporting y give himno more support than is necessary to ensure his election.
Counting continues by the application of one or other ofthese rules until the requisite number s of candidates areelected. Once elected and allocated the quota q the weightsfor that candidate are of course not included in therecalculation. This makes the procedure somewhat simplerthan in the modified form of STV described in [1].However, if all of a voter's choices — i.e. those candidateshe has allotted a positive weight — are eliminated, the quotaq has to be recalculated as in [2] so that this undistributablevote is not included; similarly, when all a voter's choiceshave been elected and allotted recalculated weights, theresidue is non-distributable and also must be subtractedfrom W. Recalculation of the quota does of course implyrecalculation of the weights of elected candidates, and aniterative procedure as described in [2] can be used to obtainthe new q and wiy to any desired accuracy.
Intensity of preferenceWhen expressed crudely in the form “ It is of more benefit tome to have A rather than B than it is for you to have B ratherthan A” , inter-personal comparison of utilities is patentlyinvidious. Nevertheless in actual voting situations intensityof preference is often taken into account. If A and B want togo to a museum when C wants to go to the funfair, thecollective choice is frequently the funfair, without any senseof dictatorship or lack of democracy, simply because allknow that C's preference is much the most intense.
Lest this be regarded as too trivial an example, it is often thecase in committee that the collective choice for chairman isX, even though a majority prefer Y, simply because asubstantial minority strongly object to Y. Any theory ofvoting which does not allow for intensity of preference iscertainly incomplete, and any voting system which does notpermit its expression cannot be wholly satisfactory.
The present system is based on two principles: that the onlyperson who can gauge the intensity of his preferences is thevoter himself; and that as far as possible each voter shouldcontribute equally in the choice of those elected. In a multi-vacancy election (s > 1) there is more than just a singlechoice involved, and so it makes sense to allow a voter toexpress his preference intensities by contributing all hisvoting power to the choice of one candidate, or to share thispower between the choices of different candidates. Ofcourse, it is possible to regard an s-vacancy election as asingle choice from the nCs possible combinations of scandidates out of n elected, but this view invalidates theassumption that elimination of a candidate does not alter thevoter's relative preferences. This is because eachcombination is independent; a voter may rank candidates
individually A, B, C, D in that order, but rate them in pairsAB, BD, CD, BC, .... since he thinks A will only worksatisfactorily in combination with B. This kind of multipleelection is essentially the election of a team of s people,rather than s individuals. STV, and the present system, isconcerned with choosing a set of s independent individualsfrom a larger set of c candidates. An STV vote is a vote forone individual (the first choice) and only subsidiarily and inspecial circumstances for lower choices. The presentsystem enables the voter to have a say in all the s choices ifhe wishes, but his share in the whole decision processremains the same, up to the wastage involved innontransferable votes or those given to unelected candidateswho remain when the s winners have been chosen.
Equivalence to other voting systems(a) STV
Let 1 > ε > 0. Let the voters order their choices 1−ε, ε−ε2,ε2−ε3,..... εc-2−εc-1, εc-1. Then the closer ε is to 0 the closerthe actual voting process becomes equivalent to STV. Forexample, suppose there are 5 candidates and ε = 0.01. Avoter's choice will be in the proportions 0.99, 0.0099,0.000099, 0.00000099, 0.00000001, counting 99% for hisfirst choice. If his first choice is eliminated, the four lowervotes remain, and total 0.01. These have to be renormalisedto add up to 1, and so are multiplied by 100 to give 0.99,0.0099, 0.000099, 0.000001. A similar argument applies tovotes transferred from elected candidates.
(b) Single non-transferable vote
This, trivially, is when the voter gives 1 to his first choiceand 0 to all the others.
(c) Simple majority with multiple vote
Here the voter gives 1/s to each of s candidates, or perhaps1/k to each of k candidates, k < s. These are special cases ofgiving α to k candidates and β to c−k candidates, whereαk+β(c−k) = 1 giving a weighting between a more preferredand a less preferred group.
(d) Cumulative vote
In this case the voter gives α1, α2, .... αk, to k candidatesrespectively, such that
For an exact analogy to the cumulative vote each α i must bea multiple of 1/s.
Volume 1 Voting matters, for the technical issues of STV
Page 3 Issue 6, May1996
= 1α ii=1
i=k
Σ
The choice of voting procedureSuch a voting system would require a more than usualsophistication on the part of the voter. This being so, one canconsider a further sophistication. The choice of votingprocedure is one of immense importance in the democraticprocess, and no system is wholly stable wherein a substantialminority is dissatisfied with the voting procedure in currentuse. The required consensus may either be achieved throughignorance or habit, or by general agreement that a system isfair even though another may be advantageous to many,perhaps even a majority. In situations where there isawareness of and controversy about the different properties ofvoting systems, the present system offers a possible way outof deadlock. For, if most voters use the system in one of theways described in the last section, then the election will belargely determined according to that voting procedure.Looking at it from the point of view of parties, each party canurge the voters to use the method they favour of filling in theballot forms. However, it is a weakness in this area thatvoting systems are so often argued about in terms of fairnessto parties or candidates, seldom in terms of fairness to voters.The present system, whose main fault is its complexity, hasthe virtue of that fault in that each voter can specify asprecisely as he wishes the way his vote is to be counted,without this being imposed by others on him or on others byhim. Most voting systems allow some such flexibility; thevirtue of this system is the much greater precision with whichthe sophisticated voter can specify his wishes, without hisbeing able by strategic voting to exercise more influence onthe final result than is implied by his actual possession of avote.
Concluding remarksDespite the scope for manipulation which the system offers, itis clearly derived from and shares the principles of the STVsystem, particularly with the concept of the quota and thetransferability of votes above the quota. One of the chiefobjections to STV is that it does not guarantee the election ofa Condorcet winner, e.g. when one candidate is everyone'ssecond choice. While the present system does not guaranteethe election of such a candidate (this is obvious, since asshown earlier the system can approach arbitrarily closely toSTV), it does render it more likely, and will ensure it providedthat the weights given to the candidate are large enough i.e. ifthe candidate is considered a good enough substitute for theirfirst choice by a sufficient number of electors. The price thatone has to pay for this improvement to STV is the greatercomplexity, particularly for the voter.
Bibliography1. B L Meek, Une nouvelle approche du scrutin
transférable I: égalite de traitement des électeurs ettechnique à rétroaction utilisée pour le depouillementdes votes, Mathématiques et Sciences Humaines, 25,1969, pp 13-23. Reproduced in Voting matters, Issue 1,pp1-6.
2. B L Meek, Une nouvelle approche du scrutintransférable II: le problème des votes non-transférablesMathématiques et Sciences Humaines, 29, 1970, pp 33-39. Reproduced in Voting matters, Issue 1, pp7-11.
A form of STV with single-member constituencies
B A Wichmann
ò ó ô õ ö ÷ ô ø ù ú õ ö ö ô û ü ù ý ý þ ô ü ÿ ó ÿ � � � � � � � � � � � �
One over-riding concern that appears in the Plant report is thedesire to retain single-member constituencies in any reform ofthe electoral system for the House of Commons. A naturalquestion is if STV can be adapted in some way to retainsingle-member constituencies, but avoiding the non-proportionality of the Alternative Vote (AV). This paperpresents such an adaptation.
The basic idea is to use a two-tier system in a similar mannerto the German system by having single-memberconstituencies augmented by members elected in a moreproportional manner. The second tier is a group ofconstituencies which, for convenience, we call a county. Theelectors provide two ‘votes’ by giving the usual preferences tothe candidates in their constituency and then also providing apreference vote to all the candidates in their county.
The election proceeds in two stages, firstly each constituencyis considered individually using STV (which degenerates toAV). However those votes which have not been used to elect acandidate here are forwarded to the county vote (or secondstage). The county vote first eliminates those candidatesalready elected at the first stage, and then uses STV to fill thecounty seats.
The main parameters of this voting system are the number ofsingle-member constituencies used to form a county, and thenumber of seats available at the county level. It appears thatabout 5 (or more) constituencies should be grouped into a
Voting matters, for the technical issues of STV, Volume 1
Issue 6, May 1996 Page 4
county in order to provide reasonable proportionality andthat the number of county seats should be not less than 2 forthe same reason.
This system is quite different from conventional STV for anumber of reasons:
1. This system, like FPTP has safe seats, whereas STVhas no such equivalent. For instance, in the Irishelections, almost every constituency has a Fianna Failor Fine Gael candidate who is not elected. My reasonfor concluding this is that I believe that the mainparties, even for safe seats, would not propose morethan one candidate since this would appear to presenta divided party.
2. The elector's ability to select within a party isrestricted. If you are a Conservative party supporter ina safe Conservative constituency with a malecandidate, you could not select a woman candidate(given the restriction noted above of a singlecandidate). On the other hand, if you were in a Labourconstituency, your vote would be wasted, allowingyou to select a woman candidate from the county listas your first preference.
3. Minority interests would be represented at the countylevel. These interests would be accumulated as wastedvotes and hence would have a good chance ofrepresentation, depending upon the number of countyseats.
Of course, the advantage of this system is that there is noreliance upon the ordering of a party list which is outsidedirect voter control.
There are some technical details to resolve. I have based myproposal on the use of the Meek algorithm for STV,although this is not strictly essential. However, it is clearlyimportant to compute the fraction of each vote which iswasted (from the first stage) in order to conduct the secondstage. This is straightforward since for each voter whocontributes to the elected candidate, the percentage wastedis simply the percentage of votes above the quota. Thisimplies that about ½ of the votes would go forward to thesecond stage. This might imply that about half of the seatsshould be at county level, but a smaller number is probablysatisfactory.
My belief is that this proposal would be quite easy toimplement, at least using the Meek algorithm. However,since we have no similar system, it does not seem possibleto construct realistic data with which to do any serious studyof its suitability.
Is STV a form of PR?P Kestelman
� ù ô ô � � ý û ü ý ú õ ö ô û � ý ý ö ÿ ö ú ý õ û � ó ô ö � ý ý ø ü ÿ ó õ ó ý � ó ý û ý ö ü õ ü ô � ô ü � � õ ö þ � ÿ ó � û ô ö ü ù ý õ ó ý õ ÿ � � õ ú ô � � õ ö ö ô ö �
IntroductionIn my view, Single Transferable Voting (STV) is the bestelectoral principle: whether electing one representative byAlternative Voting (AV), or several representatives by multi-member STV. The Collins English dictionary succinctlydefines proportional representation (PR) as “ representationby parties in an elective body in proportion to the votes theywin” .
The 1937 Irish Constitution prescribes that both the Presidentand parliamentary deputies (TDs) shall be elected “on thesystem of proportional representation by means of the singletransferable vote” . Of course, PR is not an electoral system;but a principle, to which different elections approximate towidely varying degrees.
Accordingly, the basic question is whether STV achieves PR;and if so, how far? To answer this question, we need someoverall measure of electoral representativity (‘pro-portionality’ ); of which the simplest is the Rose Index12. Forreasons which will become apparent, I have renamed the RoseIndex, Party Total Representativity (PTR).
PartyTable 1 demonstrates the calculation of PTR, for the 1994European Parliamentary Election in the Irish Republic.Notice that the total over-representation of all over-represented party votes (+23.7% of first preferences) isequal and opposite to the total under-representation of allunder-represented party votes (−23.7%). This overalldeviation is the Loosemore-Hanby Index (LHI) of partydisproportionality10, — “ the most widely used measure ofdisproportionality”9.
Thus LHI measures the total under-representation of allunder-represented party-voters. Complementing LHI is theRose Index, PTR = 100.0 − 23.7 = 76.3% of first preferencevotes. For comparison, in the 1994 European ParliamentaryElection in Britain (First-Past-the-Post), PTR = 70.4%. Thislow British PTR (definitely not PR) approximated the IrishPTR (76.3%); and the corresponding STV final count PTR(81.7%) was little higher.
Cole3 over-estimated final count PTR by excluding non-transferable votes. Moreover, non-transferable votes areunder-counted by conventional STV proportionating DroopQuota surplus votes among transferable next preferences(ie. continuing candidates only11). Besides, “using later-stage figures overstates the proportionality of STV”6.
Volume 1 Voting matters, for the technical issues of STV
Page 5 Issue 6, May 1996
In the first four European Parliamentary elections (1979-94),the Irish PTR ranged from 76.3% to 87.0% of STV firstpreferences; hardly more representative than the British PTR,ranging from 70.4% to 78.6%. In the 1990 Irish PresidentialElection, PTR increased from 38.9% of first preferences to51.9% of final preferences yet nobody regards AV as PR!
Indeed, none of the foregoing STV elections has achievedanything like PR. However, in the last six Irish generalelections (1981-92), PTR has ranged from 90.1% to 96.9% offirst preferences, as may be seen in Table 2.
Apparently, multi-member STV is only ‘semi-proportional’ .More remarkably, three and five member STV constituenciesmediated comparable representativity. This refutes thewidespread belief that “political science research establishesconclusively that PR electoral districts must elect at least fourMPs before they deliver proportional outcomes”5. Indeed,four member STV constituencies proved invariably lessrepresentative than either three or five member constituencies,although the differences were small.
CumbencyBogdanor1 observed that STV advocates prefer to secure“proportional representation of opinion ... which cuts acrossparty lines. But since they do not give a clear operationaldefinition enabling one to measure ‘proportionality ofopinion’ , it becomes difficult to offer any evaluation of theirclaim” . Nonetheless, published election results provide someusable, non-party data for each candidate, includingCumbency: that is, whether incumbent (immediately previousrepresentative) or non-incumbent (‘excumbent’ ).
Analogously to party, consider the relationship betweencumbency first preferences and seats. Instead of PTR,incumbent and excumbent candidates are treated asrepresenting two different parties; and Cumbency TotalRepresentativity (CTR) is calculated, as in Table 3.
Such low CTRs arise from incumbents invariably over-representing their first preferences (high incumbent S%−V%).Notice the distinction between this finding and theunsurprisingly, greater electability of incumbent candidates(high incumbent S%−C%, where C% is the fraction ofincumbent candidates).
Of course, incumbents are far more likely than excumbentcandidates to be men. Hence the importance of disentanglingcumbency from gender.
GenderAt the 1992 Irish General Election, 19% of candidates werewomen: 8% of incumbents and 24% of excumbent candidates.Among elected candidates (TDs), only 12% were women: 8%of incumbents, and 23% of excumbent TDs. Thus allowing forcumbency, TDs fairly represented candidates by gender.
What of the relationship between votes and seats, by gender(electoral representativity proper)? In 1992, voters cast 13%of their first preferences for women candidates: slightlyunder-represented by women TDs (12%).
Voting matters, for the technical issues of STV, Volume 1
Issue 6, May 1996 Page 6
Table 1: Party Representativity analysis of the EuropeanParliamentary Election, Irish Republic 1994.
Party Votes (V%) Seats Deviation (S%-V%)
first�
final�
(S%) first�
final�
Total 100.0 100.0 100.0 0.0 0.0
Fianna Fáil 35.0 37.4 46.7 +11.7 + 9.3
Fine Gael 24.3 30.8 26.7 + 2.4 - 4.1
Labour 11.0 4.2 6.7 - 4.3 + 2.5
Green 7.9 8.9 13.3 + 5.4 + 4.4
Cox (Munster) 2.5 4.6 6.7 + 4.2 + 2.1
Others/Non-transferable�
19.4 14.2 0.0 -19.4 -14.2
Over-represented 69.6 93.3 +23.7
55.1 73.3 +18.3
Under-represented 30.4 6.7 -23.7
44.9 26.7 -18.3
Source: Irish Times, 14 June 1994.
Source: Dáil Éireann4
District magnitude
Date All 3 4 5
1981 94.2 95.4 89.8 94.7
1982 (Feb) 96.6 97.4 95.6 95.8
1982 (Nov) 95.8 97.4 92.8 95.3
1987 90.1 89.5 89.1 89.9
1989 92.9 94.0 91.1 92.2
1992 91.8 90.2 89.5 91.5
Table 2: Party Total Representativity by districtmagnitude in Irish Republic general elections.
Table 3: Cumbency Total Representativity by districtmagnitude for Irish Republic general elections
District magnitude
Date All 3 4 5
1981 86.2 85.0 83.8 88.6
1982 (Feb) 85.0 77.9 92.6 83.0
1982 (Nov) 83.7 72.6 87.0 87.3
1987 81.6 80.2 79.9 83.8
1989 87.9 96.2 82.2 86.9
1992 85.4 76.7 90.4 86.3
Source: Dáil Éireann4
As with cumbency, we could calculate a Gender TotalRepresentativity (GTR) for each election and districtmagnitude. However, because there are only two genders(non-transferable!), and so few women candidates (andhence votes for women), it seems more illuminating toaggregate the previous five general elections (1981-89); andto calculate Gender Representativity Ratios (GRRs).
GRR is the ratio of female seats per vote to male seats pervote (first preference). Table 4 gives GRR, by districtmagnitude and cumbency.
In 1981-89 overall, first preferences for women candidateswere slightly under-represented (GRR = 0.94). However,allowing for cumbency, women TDs slightly over-represented their first preferences (excumbent GRR = 1.07).
Of particular interest, three member STV constituenciesover-represented votes for women by 20% (GRR = 1.20);leaving them under-represented in five memberconstituencies by 20% (GRR = 0.80) overall. Amongexcumbent candidates in three member constituencies, firstpreferences for women were over-represented even morespectacularly; only 5% of votes electing 10% of the TDs(GRR = 2.26). By contrast, in five member constituencies,15% of the voters for excumbent candidates preferredwomen, represented by 14% of the TDs (GRR = 0.89).
Alphabetic biasIt is widely believed that candidates appearing high onballot-forms enjoy some electoral advantage. On Irishgeneral election ballot-forms, candidates' names are listed insurname-alphabetic order. Voters' preferences for (lessfamiliar) excumbent candidates may well be morevulnerable to ‘Positional Voting Bias’14.
Notice that we are interested here in three distinctrelationships: between candidates and votes (firstpreferences): between candidates and seats; and betweenvotes and seats (electoral representativity proper).Aggregating five Irish general elections (1981-89), Table 5confirms that higher placed excumbent candidates attracteddisproportionately more first preferences (V%/C%decreasing, from 1.18 for A-C surnames, to 0.89 for N-Zsurnames).
Consequently, excumbent TDs over-represented candidateswith A-C surnames by 20% (S%/C% = 1.20); under-representing those with K-M surnames by 20% (S%/C% =0.80). However, notice something else: excumbentcandidates with L-P forenames were even more over-represented (S%/C% = 1.32); leaving those with Q-Zforenames even more under-represented (S%/C% = 0.60).All the more remarkable, considering that forenames are notordered alphabetically on ballot-forms; and perhaps voters'preferences for surnames were not positional, after all!
Relating excumbent first preferences to seats (electoralrepresentativity proper), D-J surnames and L-P forenameswere over-represented (by 12% and 24%, respectively);while K-M surnames and Q-Z forenames were under-represented (by 16% and 32%, respectively). How shouldwe compare surname with forename representativitiesoverall?
We could treat every single name-initial letter of thealphabet like a party (N=22), and calculate both SurnameTotal Representativity (STR) and Forename TotalRepresentativity (FTR). Aggregating five Irish generalelections again gives Table 6, comparing STR with FTR bydistrict magnitude and cumbency.
Volume 1 Voting matters, for the technical issues of STV
Page 7 Issue 6, May 1996
Table 4: Gender Representativity Ratio by districtmagnitude in Irish Republic general elections 1981-89
District magnitude
Cumbency All 3 4 5
All 0.94 1.20 1.04 0.80
Incumbent 1.10 1.01 1.19 1.02
Excumbent 1.07 2.26 0.98 0.89
Source: Dáil Éireann4
Table 5: Excumbent Candidate Surname/ForenameRepresentativity Index Irish Republic general elections1981-89
Initial Vote/ Seat/ Seat/
Name letter Candidate Candidate Vote
=V%/C% =S%/C% =S%/V%
A-C 1.18 1.20 1.02
Surname D-J 0.99 1.12 1.12
K-M 0.96 0.80 0.84
N-Z 0.89 0.91 1.01
A-E 0.95 0.95 1.01
Forename F-K 1.08 1.02 0.94
L-P 1.06 1.32 1.24
Q-Z 0.88 0.60 0.68
Source: Dáil Éireann4
Table 6: Excumbent Candidate Surname/Forename TotalRepresentativity Index by district magnitude in IrishRepublic general elections 1981-89
District magnitude
Cumbency All 3 4 5
All 95.5/94.8 93.3/91.7 91.8/89.7 93.1/95.6
Incumbent 97.1/96.4 96.0/95.3 94.4/93.4 96.1/97.2
Excumbent 90.7/88.6 75.3/80.8 83.8/85.0 85.2/88.1
Source: Dáil Éireann4
Overall, first preferences for surnames and forenames wererepresented with comparable fidelity (STR = 95.5%: FTR =94.8%); again, with little difference by district magnitude.Among excumbent candidates, TDs represented surnamesslightly more faithfully than forenames (STR = 90.7%: FTR =88.6%) overall; by district magnitude, somewhat less.Altogether a muddy picture, without obvious implications forordering candidates' names on ballot forms (surname —alphabetical or random).
ConclusionsConsidering the quantitative notion of PR, the measurementof electoral representativity remains curiously neglected. Thesimplest measure of overall party disproportionality, theLoosemore-Hanby Index (LHI), complements the Rose Index,or Party Total Representativity (PTR). Indeed, PTR may beconstrued as the degree to which any given election — from anational aggregate down to a single member constituency —achieves PR (rarely 100%).
Single member STV (Alternative Voting) hardly mediates PR,even at the national level (as in Australia2). In the fourEuropean Parliamentary elections in the Irish Republic, evenmulti-member STV has only achieved PTRs ranging from76% to 87%: scarcely more representative than First-Past-the-Post in Britain: ranging from 70% to 79%.
However, the last six Irish general elections (1981-92) haveproved considerably more representative, PTR ranging from90% to 97%. Thus multi-member STV alone mediates quasi-PR15; requiring a few additional members to guarantee PR(eg. final count best losers: ‘STV-plus’ , as in Malta7).
More remarkably, Irish three and five member STVconstituencies have proved comparably representative. That isgood news for voters, oppressed by the lengthy ballot-formscharacterising larger STV constituencies (perhaps listing 20names). It is equally good news for reformers, dismayed at theprospect of anonymously vast STV constituencies, electing asmany as seven MPs (eg. representing all three Londonboroughs of Greenwich, Lewisham and Southwark13).
The concept of Total Representativity proves a most versatiletool, even beyond party considerations. In respect ofcumbency, multi-member STV remains invariably non-PR;with Cumbency Total Representativity ranging from 82% to88%. On the other hand, first preferences for womencandidates have been represented near-proportionally; withan aggregate female-to-male S%/V% ratio of 0.94 overall.Nonetheless, three member STV constituencies over-represented votes for women, under-represented in fivemember constituencies.
Aggregating five Irish general elections also confirmed thatexcumbent candidates listed higher on ballot-forms tended toattract disproportionately more first preferences; thereby over-representing candidates with A-C surnames, and under-representing K-M surnames(S%/C%). Yet TDs over/under-represented candidates with L-P/Q-Z forenames even moresteeply. Moreover, first preferences for both surnames andforenames were represented with comparable fidelity. It maynot be so important to randomise ballot-forms after all:another relief for preferential voters accustomed to alphabeticorder!
At best therefore, in mediating party first preferences (themain consideration), multi-member STV alone is not quite aform of PR. Nonetheless, in national parliamentary elections,Irish STV has proved far more representative than BritishFPP. That conclusion may be brought even closer to home, bycalculating another measure (perhaps user-friendlier thanPTR).
Under both AV and FPP, around half of all voters electcandidates; whereas under multi-member STV, nearly 90% ofvoters elect at least one representative of their preferred party.In Irish general elections, this Constituency-Represented PartyVote-fraction (CRPV) has also proved conspicuously invariantwith district magnitude, as shown in Table 7.
Maximising each CRPV, multi-member STV minimises vote-wastage. Thus quantifying STV's principal virtue, CRPVshould allay the concern over STV — apart from itscomplexity — expressed by the Plant Working Party onElectoral Systems8. Of course, STV enjoys other virtues!
References1. V Bogdanor. Introduction, in Democracy and
Elections, edited by V Bogdanor and D Butler. 1983. pp1-19.
2. V Bogdanor. What is Proportional Representation?1984.
Voting matters, for the technical issues of STV, Volume 1
Issue 6, May 1996 Page 8
Table 7: Constituency-Represented Party Vote-fractionby district size for Irish Republic General Elections1981-89
Date District size
All 3�
4 5
1981 90.8�
91.3�
86.9�
93.0�
1982 (Feb) 92.6�
94.0�
91.3�
92.8�
1982 (Nov) 92.3�
94.6�
89.4�
93.4�
1987 83.6�
85.3�
81.0�
84.8�
1989 87.3�
90.9�
84.9�
86.7�
1992 86.7�
85.7�
84.9�
88.7�
Source: Dáil Éireann4
3. P Cole. Measuring Proportionality and Presenting theEvidence, Representation, Vol 30, pp 66-67, 1992.
4. Dáil Éireann. Election Results and Transfer of Votesin General Election. June 1981 - November 1992.
5. P Dunleavy, et al. Replaying the 1992 GeneralElection. 1992.
6. M Gallagher. The Political Consequences of theElectoral System in the Republic of Ireland, ElectoralStudies, Vol 5, pp 253-275, 1986.
7. S Howe. The Maltese General Election of 1987.Electoral Studies, Vol 6, pp 235-247, 1987.
8. Labour Party. Second Interim Report of the WorkingParty on Electoral Systems. 1992.
9. A Lijphart. Electoral Systems and Party Systems.1994.
10. J Loosemore and V Hanby. The Theoretical Limitsof Maximum Distortion: Some Analytic Expressionsfor Electoral Systems. British Journal of PoliticalScience, Vol 1, pp 467-477. 1971.
11. P McKee. The Republic of Ireland, in Democracyand Elections, edited by V Bogdanor and D Butler.1983. pp 167-189.
12. T Mackie and R Rose. The International Almanac ofElectoral History (3rd edition). 1991.
13. R A Newland. Electing the United KingdomParliament (3rd edition). 1992.
14. C Robson and B Walsh. The Importance ofPositional Voting Bias in the Irish General Election of1973. Political Studies, Vol 22, pp 191-203. 1974.
15. R Taagepera and M S Shugart. Seats and Votes.1989.
Monotonicity and Single-Seat Election Rules
D R Woodall
� ÿ � � õ û ÷ ÿ ÿ þ õ ô û � ý õ þ ý ó ô ö � � ó ý � õ ü ù ý ú õ ü ô ø û õ ü� ÿ ü ü ô ö � ù õ ú ö ô � ý ó û ô ü � !
1. IntroductionThis article investigates the monotonicity properties ofpreferential election rules for filling a single seat. Section 2lists the properties of interest, which form a subset of thoseintroduced in Woodall4. Section 3 describes several knownelection rules and two new ones (QLTD and DAC), whoseproperties are tabulated in Table 1. Section 4 describes anumber of impossibility theorems, which are alsorepresented symbolically in Table 1. These theorems saythat certain combinations of properties cannot holdsimultaneously, because the properties in question aremutually incompatible. In Section 5 I attempt to summarizethe current state of knowledge and indicate what remains tobe done.
Throughout this article I consider only the single-seat case.This does not reduce the force of the impossibility theoremsin Section 4. We are interested in universal election rules,which will work for filling any number of seats. If certainproperties are mutually incompatible even in the single-seatcase — that is, there is not even a single-seat election rulewith all these properties — then it is almost inconceivablethat there will be an election rule with all these propertiesthat works for any other number of seats, and there certainlycannot exist a universal election rule with them all. So, inpractice, an impossibility theorem for single-seat electionrules is as good as one that considers multi-seat elections aswell. But in the case of the examples in Section 3,considering only single-seat elections is a real limitation,and I have resorted to it only because I have found themulti-seat case too hard to handle. There are many electionrules that possess properties in the single-seat case that theydo not possess in the multi-seat case, and there are manysingle-seat election rules that cannot apparently be extendedto multi-seat elections in any sensible way, and so the multi-seat case is much harder to analyze.
I think the most important problems facing mathematicianswho are interested in STV are, first, to discover whichmonotonicity properties are compatible with DPC (theDroop Proportionality Criterion)4, or with majority (theproperty that DPC reduces to in single-seat elections—seeSection 2 below); and then to find an election rule thatsatisfies DPC and as many monotonicity properties aspossible. In the case of single-seat elections, I have found arule (DAC) that satisfies majority and many monotonicityproperties, which I would be prepared to recommend as
Volume 1 Voting matters, for the technical issues of STV
Page 9 Issue 6, May 1996
Changes to Voting matters, as recommended by the TechnicalCommittee of the ERS are as follows:
1. You can see that a subtitle now appears. The reason forthis is that some readers did not appreciate the technicalnature of the publication.
2. As Editor, I will try to avoid excessively technicaljargon. I will attempt to ensure that terms likemonotonicity are explained (even though that has beendefined in a previous issue).
3. The main publication of ERS, Representation, is beingasked to reproduce the contents list of our issues, sothat those interested will be aware of Voting matters.
preferable to the Alternative Vote (AV). Admittedly it fails tosatisfy one important property of AV, that later preferencesshould not count against earlier preferences, but in return forthis it gains five properties that AV does not possess.However, at the moment I have not been able to extend DACin any sensible way to multi-seat elections, and I do not knowwhether this will prove to be possible, or whether it will benecessary to start afresh with a new idea.
2. The propertiesThese properties were all introduced in Woodall4, where theywere discussed in more detail, and so I shall only state thembriefly here. Of the seven global or absolute propertiesmentioned there, three are of interest to us now:
Plurality. If some candidate x has strictly fewer votes intotal than some other candidate y has first-preferencevotes, then x should not have greater probability than yof being elected.
Majority. If more than half the voters put the same set ofcandidates (not necessarily in the same order) at the topof their preference listings, then at least one of thosecandidates should be elected.
Condorcet. If there is a Condorcet winner (that is, acandidate who would beat every other candidate inpairwise comparisons), then the Condorcet winnershould be elected.
Of these three properties, majority is by far and away themost important. Plurality is also important, but it is muchless likely to be violated: every reasonable electoral systemseems to satisfy it, whereas many systems proposed oractually used, such as first-past-the-post, point-scoringsystems and approval voting, fail majority. Condorcet is avery attractive property, but, as we shall see in Section 4, itleads to problems with monotonicity. My aim is to find asystem that satisfies majority and as many of themonotonicity properties as possible.
Among the local or relative properties introduced in Woodall4
we shall consider seven of the nine versions of monotonicity,together with participation, later-no-help and later-no-harm. The remaining two versions of monotonicity, mono-append and mono-add-plump, are omitted because theyhold for all the election rules discussed in Section 3 and donot feature in any of the impossibility theorems in Section 4.
Monotonicity. A candidate x should not be harmed if:
(mono-raise) x is raised on some ballots withoutchanging the orders of the other candidates;
(mono-raise-delete) x is raised on some ballots and allcandidates now below x on those ballots are deletedfrom them;
(mono-raise-random) x is raised on some ballots andthe positions now below x on those ballots are filled (orleft vacant) in any way that results in a valid ballot;
(mono-sub-plump) some ballots that do not have x topare replaced by ballots that have x top with no secondchoice;
(mono-sub-top) some ballots that do not have x top arereplaced by ballots that have x top (and are otherwisearbitrary);
(mono-add-top) further ballots are added that have xtop (and are otherwise arbitrary);
(mono-remove-bottom) some ballots are removed, allof which have x bottom, below all other candidates.
Participation. The addition of a further ballot should not, forany positive whole number k, reduce the probability that atleast one candidate is elected out of the first k candidateslisted on that ballot.
Later-no-help. Adding a later preference to a ballot shouldnot help any candidate already listed.
Later-no-harm. Adding a later preference to a ballot shouldnot harm any candidate already listed.
3. Examples of election rulesFirst-Preference Plurality (FPP), or First-Past-the-Post, electsthe candidate with the largest number of first-preferencevotes. This rule behaves extremely well with regard to all thelocal properties (although it satisfies later-no-harm only ifsecond and subsequent preferences are ignored totally, and arenot used to separate ties). However, it does not satisfymajority or Condorcet: in Election 1 below, FPP elects c,but majority requires that a or b should be elected, and a is theCondorcet winner.
ab 30El ect i on 1: ba 25 c 45
Point Scoring (PS) methods are those where each candidate isgiven a certain number of points for every voter who puts themfirst, a certain (smaller) number for every voter who puts themsecond, and so on, and the candidate with the largest total numberof points is elected. These methods have very similar propertiesto FPP, although later preferences can now count against earlierpreferences, so that later-no-harm fails, and mono-raise-random and mono-sub-top also fail in most cases. To see thatPS systems do not satisfy majority or Condorcet, suppose thatjust over half the voters list three candidates in the order abc, andjust under half list them in the order bca. Then both majorityand Condorcet require that a should be elected, but any PSmethod will choose b.
Voting matters, for the technical issues of STV, Volume 1
Issue 6, May 1996 Page 10
The Alternative Vote (AV) was discussed at length inWoodall4 and so I shall content myself here with tabulatingits properties in Table 1. Unlike FPP and PS, it satisfies theall-important majority property, but it behaves rather badlywith respect to monotonicity.
There are many known election rules that satisfyCondorcet's principle; for example, nine such rules arediscussed by Fishburn1. In the present context (looking for amore monotonic substitute for AV) we are really onlyinterested in rules that satisfy majority. Among such rules,the one with the largest number of other properties seems tobe one that is not among the nine considered by Fishburn,namely to use a point scoring method to select a candidatefrom the Condorcet top tier. This method is described asC−PS in Table 1. It satisfies all three of the global propertiesthat we are considering, but it behaves badly with respect tothe local properties.
My first serious attempt to find a rule that would rival AVresulted in what I call Quota-Limited Trickle-Down(QLTD). Although this has now been superseded by DAC, Idescribe it here because it is simpler. One starts by creditingevery candidate with all their first-preference votes. If nocandidate exceeds the quota (of half the number of votescast), then one gradually adds in the second-preferencevotes, then the third-preference votes, and so on, until somecandidate reaches the quota. For example, it may be that ifone credits every candidate with all their first-preferencevotes, all their second-preference votes and 0.53 times theirnumber of third-preference votes, then exactly onecandidate is brought up to the quota; that candidate is thendeclared elected.
abcdef 12 cabdef 11El ect i on 2: bcadef 10 def 27
It is easy to see that this rule satisfies majority. At first Ithought it satisfied all the most important monotonicityproperties as well. However, I now realize that it failsmono-add-top. This can be seen from Election 2 above.Here the quota is 30, and if one gives every candidate alltheir first and second-preference votes, plus 0.7 of theirthird-preference votes, then a gets 30 votes, b 29.7, c 29.4,d 27, e 27 and f 18.9; thus a is elected. However, if one addssix extra ballots marked ad, then the quota goes up to 33,but now d reaches the quota on first and second preferencesalone: the count is d 33, a 29, b 22, c 21, e 27 and f zero. InElection 2 itself, a is behind d (by 23 to 27) on the basis offirst and second-preference votes, but a overtakes d whenthe third-preference votes are added in. Adding six extra adballots increases a's and d's first and second-preferencevotes by the same amount, and this causes d to reach thequota: a would again overtake d if the third-preferencevotes were added in, but this does not happen because theelection has already ended.
El ect i on 3 Acqui esci ng Coal i t i onsab 11 { a, b, c} 30 { c} 12b 7 { b, c} 19 { a} 11c 12 { a, b} 18 { b} 7 { a, c} 12
My most recent attempt to find a substitute for AV hasresulted in what I call the method of DescendingAcquiescing Coalitions, or DAC, which is the first election
Volume 1 Voting matters, for the technical issues of STV
Page 11 Issue 6, May 1996
Table 1
Properties of Impossibility
specific election rules theorems
FPP PS AV C-PS QLTD"
DAC 1 2 3#
Plurality √$
√$
√ √$
√ √$
•Majority × × √ √
$√ √
$•
Condorcet × × × √$
× × • •Mono-raise √
$√$
× √$
√ √$
×Mono-add-top √
$√$
√ × × √$
×Mono-remove-bottom √
$√$
× × √ √$
×Participation √
$√$
× × × √$
× ×Mono-raise-random √
$× × × × × × ×
Mono-sub-top √$
× × × × × × ×Mono-raise-delete √
$√$
× × √ √$
× ×Mono-sub-plump √
$√$
× × √ √$
× ×Later-no-help √
$√$
√ × √ √$
× •Later-no-harm √
$× √ × × × × •
The thick box delimits those properties that make sense even if truncated preferencelistings are not allowed. The top three properties are global while the others are local or
relative.
rule that I am really happy with. The coalition acquiescing toany set of candidates comprises all voters who have notindicated that they prefer any candidate not in that set to anycandidate in that set. For example, in Election 3 above, thereare 19 voters who acquiesce to b and c, namely, the 7 whovoted b and the 12 who voted c; none of them actually votedfor both b and c, but none of them have said that they prefer ato either of these candidates, and so they are said to acquiesceto this set of two candidates. Similarly, the 18 voters whoacquiesce to a and b comprise the 11 who voted ab and the 7who voted b. The 12 voters who acquiesce to a and c areexactly the same as those who acquiesce to c, namely, the 12 cvoters. And so on.
In DAC, one first lists the sizes of all the acquiescingcoalitions in decreasing order, as I have done above, and thenworks down the list from the top, eliminating candidates untilonly one is left. The largest acquiescing coalition alwayscontains every voter, since every voter acquiesces to the set ofall candidates; this does not help towards deciding who shouldbe eliminated. In the above example, the next largestacquiescing coalition comprises 19 voters, for { b, c} ; the factthat a is not included in this set means that a is the firstcandidate to be eliminated. The next acquiescing coalitioncomprises 18 voters, for { a, b} . Since c is not included in thisset, c is next to be eliminated. This leaves only one candidatenot eliminated, namely b, and so b is declared elected. (Notethat AV would exclude b first and then elect c in thisexample.)
El ect i on 4 Lar gest Acqui esci ng Coal i t i onsadcb 5 { a, b, c, d} 30 { a, c} 8bcad 5 { a, b, c} 13 { b, c, d} 8cabd 8 { d} 12 { b, d} 8dabc 4 { a, d} 9 { c} 8dbca 8
Sometimes several candidates can be eliminated at once. Forexample, in Election 4, the largest acquiescing coalition notcontaining all voters comprises 13 voters, for { a, b, c} ; thus dis the first candidate to be eliminated. The next largestacquiescing coalition is for { d} , and so it appears that a, b andc should all be eliminated at once, leaving no candidateremaining uneliminated. In this case one simply ignores thiscoalition: it does not help in distinguishing between theremaining three candidates. The next coalition is for { a, d} ,and this causes b and c to be eliminated, so that a is elected.
El ect i on 5 Lar gest Acqui esci ng Coal i t i onsacbd 6 { a, b, c, d} 25adbc 3 { a, b, c} 14adcb 3 { a} 12bcad 4 { a, c} 10cabd 4 { a, d} 6dbca 5
It is not difficult to see that DAC satisfies majority, since ifmore than half the voters put the same set of candidates (invarious orders) at the top of their preference listings, then
every other candidate will be eliminated before any candidatein that set. With slightly more difficulty, it can be proved thatDAC satisfies all the other properties ticked in Table 1.However, it does not satisfy mono-raise-random ormono-sub-top: if two of the four dabc ballots in Election 4were replaced by acbd then c would be elected instead of a.Also, it does not satisfy Condorcet: in Election 5, DACelects a, but c is the Condorcet winner. And it does not satisfylater-no-harm: if the seven b voters in Election 3 had votedbc instead, then c would have been elected instead of b. Weshall see in the next section that there cannot exist anyelection rule satisfying Condorcet or later-no-harm aswell as all the properties of DAC; but it is not clear whetherthere is any rule that satisfies mono-raise-random ormono-sub-top as well as everything that DAC does.
4. Impossibility theoremsOf the three theorems summarized symbolically in Table 1,the one of greatest interest in the present context is Theorem3. However, it is also the most difficult to prove, and so I shalldiscuss the two simpler theorems first.
Theorem 1 says that if plurality and Condorcet hold thenmono-add-top cannot hold; that is, there is no election rulethat satisfies all three of these properties. This is easily seenby considering Election 3. Which candidate would such a ruleelect? Since c has more first-preference votes than a has votesin total, a cannot be elected, by plurality. But adding two baballots would make a the Condorcet winner, and so b cannotbe elected, by Condorcet and mono-add-top. Andsimilarly c cannot be elected, because adding five cb ballotswould make b the Condorcet winner. Thus, whichevercandidate was elected, at least one of the three propertieswould be violated! (Of course, our rule could declare theresult of Election 3 to be a tie; but this would lead to acontradiction in a similar way.)
It seems that most of the Condorcet-based propertiesdiscussed in the Social Choice literature would in fact elect ain Election 3, and so violate plurality (whereas AV elects cand DAC elects b). How seriously one regards the failure ofplurality depends on how one interprets truncated preferencelistings, and that in turn may depend on the rubric on theballot paper. If the 12 c voters are merely expressingindifference between a and b and not hostility to them, and socan be treated in exactly the same way as if half of them votedcab and half voted cba, then the violation is not too serious.But if, by plumping for c, these voters are not just saying thatthey prefer c to a, but that they want c and definitely do notwant a (or b), and if the seven b voters also definitely do notwant a (or c), then it is clear that c has more support than aand so a should not be elected.
Voting matters, for the technical issues of STV, Volume 1
Issue 6, May 1996 Page 12
abc 3 acb 2El ect i on 6: bca 3 bac 2 cab 3 cba 2
Theorem 2 says that if an election rule satisfies Condorcet'sprinciple, then it cannot possess any of the seven propertiesthat are crossed in the column headed 2 in Table 1. This is alot to prove. Fortunately most of it can be proved byconsidering variants of Election 6 above. The only bit thatcannot is the incompatibility of Condorcet withparticipation; this is proved by Moulin2, and I shall notattempt to reproduce his proof here. The following proof ofthe rest of Theorem 2 invokes the axioms of symmetry anddiscrimination, for a precise statement of which seeWoodall4.
So suppose we have an election rule that satisfiesCondorcet. By symmetry, the result of this rule applied toElection 6 above must be a 3-way tie. But by the axiom ofdiscrimination, there must be a profile P very close to theone in Election 6 (in terms of the proportions of ballots ofeach type) that does not yield a tie. So our election rule,applied to profile P, elects one candidate unambiguously;and there is no loss of generality in supposing that thiscandidate is a. However, there are ways of modifying theprofile P so that c becomes the Condorcet winner, so thatour election rule must then elect c instead of a. Thishappens, for example, if all the bac ballots are replaced bya; and the fact that this causes c to be elected instead of ameans that our election rule does not satisfy mono-raise-random, mono-raise-delete, mono-sub-top ormono-sub-plump. It also happens if all the abc ballotsare replaced by a, and this shows that our election rule doesnot satisfy later-no-help.
To prove that our election rule does not satisfy later-no-harm, it is necessary to consider a slight modification of theprofile in Election 6, in which the second and third choicesare deleted from all the abc, bca and cab ballots. Again, ourelection rule, applied to this profile, must result in a 3-waytie. But again, there must be a profile P' very close to this(in terms of the proportions of ballots of each type) thatdoes not give rise to a tie, and we may suppose that ourelection rule elects a when applied to profile P'. But if wereplace the a ballots in P' by abc, then b becomes theCondorcet winner, and so must be elected by Condorcet'sprinciple; and this shows that our election rule does notsatisfy later-no-harm.
Together with the result of Moulin2 already mentioned, thiscompletes the proof of Theorem 2, that an election rule thatsatisfies Condorcet cannot satisfy any of the sevenproperties crossed in the column headed 2 in Table 1.
Theorem 3 is a result that looks superficially similar toTheorem 2, and the proof is similar in character but muchharder. The theorem says that if an election rule satisfies
majority, later-no-help and later-no-harm then itcannot possess any of the seven properties crossed in thecolumn headed 3 in Table 1. This is a substantialimprovement on the result sometimes known as “Woodall'simpossibility theorem”3, which asserts that there is noelection rule that satisfies plurality, majority, later-no-help, later-no-harm and mono-sub-top. In obtainingthe improvement, I have needed to adopt an axiom ofdiscrimination that is somewhat stronger than the one statedin Woodall4, although one that must surely still hold for anyreal election rule. I am also grateful for help from myresearch student, Ben Tarlow.
Because the proofs of the different parts of Theorem 3 arequite complicated, I shall just sketch the proof of the easiestpart, which is that there is no election rule that satisfiesmajority, later-no-help, later-no-harm and mono-sub-plump (or mono-sub-top). Suppose, on thecontrary, that we have a rule that satisfies these fourproperties. The first part of the proof is to show that it mustelect a in election A1 and c in election A3 in the abovetable. This is not too difficult to prove, using symmetry andmono-sub-top, provided that neither of these electionsresults in a tie. However, although it may seem highlyimplausible that either of them should yield a tie, I cannotsee any way of proving that this is impossible. Instead, Ihave used the strong form of the axiom of discrimination inorder to show that, if it does happen, then one can vary theproportions 0.34, 0.33, 0.3 and 0.36 in these profiles byvery small amounts in a consistent way so as to obtain verysimilar profiles in which it does not happen.
The rest of the proof is much easier to explain. Let uswrite X → x to mean that x is definitely elected in ElectionX (that is, with probability 1), and X /→ x to mean that x isdefinitely not elected in Election X (that is, x does not even
tie for election in Election X). Also, ⇒ is used to mean"implies that". Therefore
A1 → a ⇒ A2 → a by later-no-harm,
A2 → a ⇒ A2 /→ b (clearly),
A2 /→ b ⇒ A4 /→ b by mono-sub-plump,
A3 → c ⇒ A3 /→ a (clearly),
A3 /→ a ⇒ A4 /→ a by later-no-help,
A4 /→ a and A4 /→ b ⇒ A4 → c,
A4 → c ⇒ A5 → c by mono-sub-plump,
Volume 1 Voting matters, for the technical issues of STV
Page 13 Issue 6, May 1996
A1%
A2%
A3%
A4%
A5 A6%
a& ab& 0.34 a& ab& 0.34 ab ab& 0.3
b'
b'
0.33 b'
b'
0.3 b ba'
0.3
c( c( 0.33 c( c( 0.36 c c( 0.4
A5 → c ⇒ A5 /→ b (clearly),
A5 /→ b ⇒ A6 /→ b by later-no-help.
However, majority requires that A6 should result in theelection of either a or b, and the axiom of symmetry thereforerequires that a and b should tie for election in A6, each withprobability ½. This contradiction shows that there can be noelection rule satisfying the four properties described.
The details of this proof, and the proof of the rest of Theorem3, can be found in Woodall5, which is not yet published but isavailable from the author at the Department of Mathematics,University Park, Nottingham, NG7 2RD, [email protected] .
5. ConclusionsIn attempting to find a single-seat preferential election rulethat satisfies majority and is generally monotonic, I havecome up with only one rule, DAC, that I would be prepared torecommend as preferable to the Alternative Vote, and thenonly when the count is carried out by computer. DAC is muchmore complicated than AV, and I have not given great thoughtto how one would implement it on a computer, but I do notthink there would be any great difficulty unless the number ofcandidates was unrealistically large. DAC admittedly fails tosatisfy one important property of AV, that later preferencesshould not count against earlier preferences, but in return forthis it gains five monotonicity properties that AV does notpossess, including the very strong participation property,and so I would regard it as preferable.
However, DAC only works for filling a single seat, and I havenot so far found any sensible way of extending it to multi-seatelections. The major remaining problem seems to me to be tofind a multi-seat preferential election rule that satisfies theDroop Proportionality Criterion and is generally monotonic. Itis not clear whether one can do this by modifying DAC, orwhether it will be necessary to start afresh with a new idea.
From the mathematical point of view, there is still a great dealof work to be done on single-seat elections. The generalproblem is to determine which sets of the properties listed inTable 1 are mutually compatible. The examples discussed inSection 3 and the impossibility theorems in Section 4 givesome answers. For example, Theorems 2 and 3 show that bothFPP and AV possess maximal compatible sets of theseproperties, and that moreover these are the only two maximalcompatible sets of properties that include both later-no-helpand later-no-harm. Surprisingly, I have not been able toprove that the properties possessed by DAC form a maximalcompatible set; Theorems 2 and 3 show that one cannot addeither Condorcet or later-no-harm to these properties, butI cannot prove that one cannot add mono-raise-random ormono-sub-top (although this seems unlikely, since these
last two are extremely strong properties, which hardly anyelection rules seem to possess). Another problem of this typeis to determine whether there is any rule that satisfiesmajority, Condorcet and either mono-add-top or mono-remove-bottom. While problems of this type may seem tohave little direct relevance to STV, the ideas generated byattempts to solve them may turn out to be more relevant thanat first appears, and in any case we cannot afford to know lessabout such questions than our opponents do.
References1. P C Fishburn, Condorcet social choice functions, SIAM
Journal on Applied Mathematics 33 (1977), 469-489.
2. H Moulin, Condorcet's principle implies the no showparadox, Journal of Economic Theory 45 (1988), 53-64.
3. D R Woodall, An impossibility theorem for electoralsystems, Discrete Mathematics 66 (1987), 209-211.
4. D R Woodall, Properties of preferential election rules,Voting matters Issue 3 (1994), 8-15.
5. D R Woodall, Monotonic single-seat preferentialelection rules, submitted.
Some comments onReplaying the 1992 general
electionI D Hill
� õ � ô þ ) ô ô û * ù õ ô ó ú õ ö ÿ � ü ù ý + � , - ý ø ù ö ô ø õ * ÿ ú ú ô ü ü ý ý
At the time of the 1992 general election, Patrick Dunleavy,Helen Margetts and Stuart Weir conducted research designedto indicate how Britain would have voted under alternativeforms of voting. Their report 1,2 states that the result “poses aproblem for STV advocates” in that the allocation of seats isfar from proportional by first preferences and severelydisadvantages the Conservatives. They are very forthright intheir claims that the study shows what would actually havehappened. A subsequent letter3 hoped that the ElectoralReform Society would “address the problems for STV thatour ... study identified” . It is, of course, not possible fully toaddress such problems without the data, and I am grateful tothe authors for letting me have a copy.
In the comments that follow, I have concentrated entirely onthe STV part of the document, ignoring the work that theyalso did on Alternative Vote, Additional Member, and List PRsystems.
Voting matters, for the technical issues of STV, Volume 1
Issue 6, May 1996 Page 14
The data were obtained from a sample of 9614 peopleacross 13 regions of the UK (excluding Northern Ireland).The sampling and interviewing was done by ICM, usingtheir professional experience of getting a representativesample within each region. The interviewees were given aballot paper of 17 candidates, in sections by party, theirnames being those of actual candidates in the generalelection in that region. They always consisted of 4 eachfrom the 3 main parties, plus 5 others who included thenationalist parties in Scotland and Wales. Within thispattern, the aim was to give a mix of well-known and lesser-known, of men and women, etc.
The country was divided into 5-member constituencies sofar as possible, but with some 4-member ones, bycombining the actual single-member constituencies withineach region. There were 133 such constituencies,consistently misquoted as 123 in their reports.
Much trouble was taken to get representative samples, butfor analysis the regional results were reweighted for eachmulti-member constituency “ to produce distinctive localprofiles” . I do not doubt that this was done with goodintentions but, so far as I can see, the anomalous results that“pose a problem for STV advocates” result almost entirelyfrom this reweighting.
My analysis has necessarily had to be slightly incompletebecause of some missing files. I am told that somecomputer discs have become unreadable and these files aregoing to be difficult to retrieve, so it seems better to goahead with reporting what I can without them. Thosemissing concern all four of their East Anglianconstituencies, 5.4% of the total data, and three of theGreater London ones (those that they call Richmond andKingston, Hillingdon, and Central London). We can derivethe regional Greater London results, from the otherconstituencies in the region, but not the reweighting for eachof these three missing constituencies.
Of the available files, there are some that show trouble inthe data in that some spurious figure zeros appear, that leadmuch of the data to be ignored by my STV computerprogram that was used. Luckily only one of these instancesleads to a different result by political party from what theyfound, but there are also four others not suffering from thisparticular trouble, where the results by party seem to havebeen incorrectly reported. For the reweighting of the data,the authors say that “ the 1992 general election resultsprovide a complete picture of people's first preferences” sothey use those to reweight the voting patterns. Even if thisactually gave an improvement, I completely disagree withthe beliefs behind it. A very important reason for wantingelectoral reform is that election results at present do notshow people's true preferences. Common observationshows that vast numbers of people vote tactically, not forwhat they would most like to see but for candidates who,
they think, have some chance of success, and trying to keepout the party they most dislike. The squeeze of the thirdcandidate in by-elections is notorious and a similar effect ingeneral elections, to a lesser extent, certainly exists.Whether a better electoral system would make much changein voters' stated preferences or not we simply do not know;until we try the real thing the evidence is not available.
Having done the reweighting, for better or for worse, theyreport (in their Table 11):
Con Lab L/ D ot her sPur e pr opor t i onal i t y 273 222 114 25STV 256 250 102 26
and this is what they say that STV supporters have toponder. If we do the analysis by what appear to be theoriginal data for each region, without such reweighting, itmeans using the same voting pattern for every multi-member constituency within the region, which is a crudemodel and often unrealistic but is probably the best that canbe done with the data available. The results (with someassumptions for missing files) are:
Con Lab L/ D ot her sPur e pr opor t i onal i t y 273 222 114 25STV 274 230 108 22
I think that it is they who have some pondering to do.
I cannot see how the numerical values of their reweightingwere derived, but my requests for clarification have notbeen successful. If, as I believe, it was intended to bring thefirst preferences, by party, closer to the general electionvotes, it does not seem to have done so. The results are inthe large table.
If anything the results after reweighting seem further fromthe general election results than do the raw ones, andcertainly the Conservatives have been marked down.
It might be claimed that it is the individual multi-memberconstituency figures that matter rather than these overallones, so I have looked at one constituency in detail to seewhether that improves the picture. I chose to do this for myhome constituency which, in their scheme, would be thecombination of the present constituencies of Herts SW,Herts W, Hertsmere, Watford and St Albans. As an exampleof their reweighting, in this constituency every vote in theraw data with a Conservative first preference has beentreated as 98 identical votes, every vote with a Labour firstpreference as 121 identical votes, every vote with a LiberalDemocrat first preference as 87 identical votes and everyother vote as 94 identical votes.
For this constituency I find:
Con Lab L/ D ot herGener al el ect i on 53. 3% 25. 1% 20. 3% 1. 3%STV ( r aw) 52. 7% 23. 0% 20. 0% 4. 3%STV ( r ewei ght ed) 51. 2% 27. 6% 17. 3% 4. 0%
Volume 1 Voting matters, for the technical issues of STV
Page 15 Issue 6, May 1996
Apart from slightly reducing the others figure, which is fartoo big nevertheless, has the reweighting helped? I doubt it.
I am well aware that it is much easier to criticize such a studythan to perform one, but it does seem to me that a betterscheme would have been to take their 9614 interviews equallyfrom each of their 133 multi-member constituencies, i.e. about72 per constituency, and then use the results in raw form. Itmight be argued that 72 votes are not many for electing to 5seats, but that is all you get with a total of 9614. You do notget any more actual information by using the same figuresmany times with reweighting.
The authors also comment on “some apparently extraordinaryresults — as with the election of 5 Green MPs in the southeast region” , and that only 2 of the 5 would survive if Meekrules were used (I make it only 1 of the 5 actually). Ininterpreting this we need to remember that it is the same set ofvotes being analysed over and over again, and the identicalperson as Green candidate, merely with different reweightingfor each constituency in the region. That may have been thebest that could be done in the circumstances, but I wish theywould not claim that this is what would actually happen inpractice. Again it is the reweighting that has produced theodd effect — no Green is elected if the original, unmodified,observations are used.
They seem to think it a disadvantage of STV that it can reactwith different results when the votes change only slightly. Ithink it an advantage that most constituencies becomemarginal for their final seat. At present it is only the marginal
constituencies that have any real effect on who wins a generalelection. Under STV nearly every voter can feel that it isworth voting as it could make a difference.
They also make a point of the fact that “STV is onlycontingently proportional” if comparing seats with firstpreferences by party. So it should be. It often helps to explaina point such as this by using an exaggerated example. Torepeat one that I have used elsewhere, if we have 9 candidatesfor 3 seats, A1, A2 and A3 from party A; B1, B2 and B3 fromparty B; C1, C2 and C3 from party C and the votes are
20 A1 B1 20 A1 C1
a party-based proportional system would have to elect A1, A2and A3 as all first preferences were for party A, whereas STVwill elect A1, B1 and C1 and appear to do badly if one insistson comparing seats with first preferences by party, but it hasdone what the voters have asked for, and that should be theaim of an electoral system.
What is more their data show that, of all interviewees whoselected at least two preferences with each of their first twofrom the three main parties, only 79% of them chose the sameparty for both choices. If this is nothing like what wouldhappen in practice, then the exercise cannot be quoted asmeaningful in this respect. Their report claims strongly thattheir figures do represent what would happen in practice, butthey cannot have it both ways; if they are right in that, thenthe authors' wish to see party proportionality by firstpreferences is not shared by the electorate. I believe that thewishes of the electors are what matter.
Voting matters, for the technical issues of STV, Volume 1
Issue 6, May 1996 Page 16
General election.
STV (raw figures)/
STV (after reweighting)/
Region Con0
Lab L/D other1 Con0
Lab L/D other1 Con0
Lab L/D other1
East Anglia 48.7 37.12
12.7 1.5 - - - - - - - -
East Midlands 48.93
35.22
14.8 1.1 46.53
39.22
12.0 2.34
46.33
39.52
12.0 2.34
Greater London.
45.2 35.12
18.0 1.7 41.0 37.12
18.1 3.82
40.3 39.55
16.0 4.2
North West 39.42
45.13
14.2 1.3 37.62
46.33
13.9 2.14
36.72
47.33
13.8 2.24
Northern 29.6 55.16
15.2 0.27
26.0 56.86
15.2 2.0 26.1 56.86
15.1 2.0
South East/
54.66
20.4 23.7 1.2 52.76
23.0 20.0 4.3 52.76
23.3 19.8 4.3
South West/
48.13
17.2 32.82
1.9 49.33
21.74
24.84
4.13
49.23
21.94
24.84
4.13
West Midlands 49.4 34.12
15.7 0.77
45.2 40.5 10.7 3.62
44.3 41.6 10.4 3.72
Yorks & Humber8
37.52
45.73
15.5 1.3 39.02
44.23
12.8 4.13
38.32
45.03
12.5 4.23
Highlands 38.02
11.0 20.14
30.92
23.24
28.04
17.4 31.42
22.04
28.54
18.9 30.52
Strathclyde/
19.8 49.9 7.8 22.5 24.1 47.2 5.26
23.5 23.3 48.0 5.26
23.6
East Central Scotland 29.94
34.12
14.8 21.24
28.04
36.02
18.3 17.7 28.44
35.22
18.7 17.6
Wales 26.0 50.86
11.8 11.4 32.02
43.7 13.1 11.2 31.12
44.1 13.2 11.6
Percentage share of votes by region
East Anglia missing, italic figures approximate due to missing files
My overall conclusion is that it has been claimed that STVadvocates have some problems to deal with, but in fact it isthe authors of the study who need to deal first with theproblems that they have created.
References1. P Dunleavy, H Margetts and S Weir. Replaying the
1992 general election (LSE Public Policy papernumber 3), 1992.
2. P Dunleavy, H Margetts and S Weir. Proportionalrepresentation in action: a report on simulated PRelections in 1992. Representation, vol 31, issue 113,pages 14-18.
3. S Weir. Letter to the editor. Representation, vol 32,issue 117, page 20.
Brian Lawrence Meek, M.Sc, FRAS, C.Eng, FBCS.1934 - 1997.
Brian Meek died on 12 July 1997. He was a member of theElectoral Reform Society for many years, and in the annalsof the Single Transferable Vote his name will surely beimmortal. Alongside the three pioneers Hill, Andrae andHare, the other great names are Droop, Gregory and Meek.Various others have made improvements from time to time.This is not intended as any disparagement of them — fine-tuning of the system is not to be despised; it all helps if welldone. It was Meek though who re-thought the system fromscratch for the age of the computer and put it upon a propermathematical basis. It should be recorded that a major partof the Meek system was also devised, quite independently,by Douglas Woodall a little later.
It is a pity that, although Meek's system is simpler inprinciple and easier to understand than other versions ofSTV, it is too long-winded if tried by hand. A computer isnecessary, and since not everyone is willing to usecomputers for counting all elections, it will be necessary fora number of years yet to keep the approximate methods,suitable for hand-counting, available too. However, for anyorganisation that is willing always to use computers for itselections it would be madness to continue with approximatemethods when Meek's method is available.
We have lost a man who did something really great in thisfield. One day that fact will be common knowledge for allproponents of STV.
I.D. Hill
Volume 1 Voting matters, for the technical issues of STV
Page 17 Issue 6, May 1996
Added in this reprinting
EditorialThis issue contains five articles within the tradition that hasnow been established. This concentrates upon the propertiesof various STV algorithms as seen from examples orcomputer simulation.
In the first paper, Hugh Warren illustrates a counter-intuitivecase of the application of STV where two halves are not thesame as one whole.
My own article provides the results of a computer simulationof 'large' STV elections which casts doubt on the use of thehand-counting rules in that case.
David Hill provides a simple comparison between the hand-counting rules and the computer method due to Meek. In aseparate article, he shows how one can compute with Meekhow one's vote has contributed (or otherwise) to the electedcandidates.
In another paper by Hugh Warren, an example is provided inwhich equality of preference does not have a property that onemight reasonably expect. David Hill responds to this in thefinal paper of this issue.
On reviewing this material, I conclude that I should appeal fora broader spectrum of papers. STV is not just a minorityinterest. I am a member of the John Muir Trust which aims topreserve wild places in Scotland. The trustees are electedannually by the membership by STV using the Meekalgorithm. (Nothing to do with me.) I have been given animpressive list by Eric Syddique of organisations known toERS that use STV (107 in total, but omitting the John MuirTrust). Can I appeal to readers to send details of otherorganisations so that I can publish the list in a subsequentissue of Voting matters?
Brian Wichmann
On the lack of Convexity inSTV
C H E Warren
9 : ; < = > ? ? @ A B C > ? @ D B ? @ E C F B @ A D B C D
If the voters in a constituency are divided into two districtsand the ballots are processed separately and the results in thetwo districts are the same, then there is said to be convexity ifprocessing the ballots of all voters together gives the sameresult.
As Woodall1 has pointed out, quoting an example of DavidHill's, STV does not satisfy convexity. We give here a furtherexample, in which the lack of convexity arises, not from theelimination of candidates as in David Hill's example, but fromthe transfer of surpluses. We assume that these transfers aremade by the method currently recommended by the ElectoralReform Society, and which the Electoral Reform Society usesfor its own elections — the Meek2 method.
There are four candidates A, B, C, D, and three seats to befilled. The voting is as follows:
Di st r i ct 1 Di st r i ct 2 Const i t uencyABD 10 - 10BAD - 10 10AC - 8 8AD - 1 1BC 8 - 8BD 1 - 1D 1 1 2Tot al s 20 20 40El ect ed A, B, C A, B, C A, B, D
This further example reinforces Woodall's comment in thearticle quoted that ... sadly, convexity is of no use to us, as thisseemingly ideal property conflicts with a more desirableproperty.
Voting matters, for the technical issues of STV, Volume 1
Issue 7, September 1996 Page 1
Issue 7, September 1996
References1 D R Woodall, Properties of Preferential Election
2 B L Meek, A new approach to the Single TransferableVote, reproduced in Voting matters, Issue 1, pp 1-10,March 1994.
Large elections bycomputer
B A Wichmann
IntroductionBy a large election, in this article we mean elections inwhich there are a large number of candidates, say over 100.Such an election was reported in reference 1, in which theperiodicals to be retained in a library were to be decided. Inthat case, the Meek algorithm was used4, but on re-runningthe same data with the Newland-Britton (ERS) rules5, adisturbing fact was noted. Towards the end of the count,none of the remaining candidates were credited with anyvotes at all, so that the last few ‘seats’ were filled at randomfrom the remaining candidates. This was quiteinappropriate, since the number of journals that receivedsome support in the votes was more than enough to fill allthe places. Hence Woodall has defined the property No-support in reference 2 to cover this issue.
In this paper, we are concerned not with the limiting case ofthe ERS rules electing candidates without support, but withother large elections in which some candidates are electeddespite having less than half the quota. In such situations, itmight appear that the ERS rules might elect the ‘wrong’person. Unfortunately, it is not easy to devise a means ofdetermining the ‘ right’ choice. Here we use random ballotpapers with some characteristics of a real election.
UKCCThe United Kingdom Central Council for Nursing, Mid-wifery and Health Visiting (UKCC) election is the largestone conducted by Electoral Reform Ballot Services Ltd (atleast, using STV). It is possible that other such electionscould arise of this type if multi-national organisationsundertake employee-council elections to satisfy the ‘SocialChapter’ .
The data from the last UKCC election is impressive: 129candidates for 7 seats with 62,216 ballot papers. Theelection is conducted to the ERS rules assisted byRosenstiel's program.
Mr Wadsworth of ERBS has kindly given me theinformation above and also a print-out from the Rosenstielprogram which gives for the seven elected candidates:
Fi r st St age Vot es Pr ef er ence when whenCandi dat e Vot es/ el ect ed el ect ed/ Quot a Quot aA 112. 8% 1 100. 0%B 17. 3% 122 47. 7%C 19. 8% 121 53. 2%D 21. 0% 121 50. 5%E 16. 0% 123 34. 9%F 11. 1% 123 36. 4%G 11. 0% 123 42. 6%
The concern here is that since one candidate was elected ononly about one third of the votes that had to be retained bythe most popular candidate, can one be sure the correctchoice was made? The result of that particular election isnot being questioned, but the choice of algorithm forelections of this type.
Computer processingSince the computer programs to conduct elections are notused for the large public elections, there is no experience inusing these programs for very large elections. As notedabove, Rosenstiel's program was used for UKCC, but thisprogram is for assisting a manual count, and could not beused for the Meek algorithm (for instance). Although theprograms for the ERS rules (by I D Hill) or that for Meekdo not have hard limits, it is not immediately obvious thatthey could be used for elections as large as that for UKCC.
To determine the feasibility of using these programs on aPC (personal computer) for elections like UKCC, a programwas written to construct a large number of random ballotpapers. Of course, real ballot papers were not available, andeven if they were, the data preparation problem would beformidable.
At this point, a major problem arose. Both Meek and theERS computer programs allow for the storage of thecomplete set of preferences. If this information is written totemporary disc storage, then the programs will run quiteslowly. However, the total storage for UKCC-like electionsis around 8Mbytes, which is only just within the reach ofcurrent PCs. The obvious solution was to undertakemodifications to both programs to take advantage of the factthat only a small fraction of the total possible number ofpreferences would be specified. In fact, the modification toMeek was very easy and undertaken, but that for ERS(which is much more complex in computer terms) was toodifficult. In any case, both programs were successfully runwith random data on my home computer.
Volume 1 Voting matters, for the technical issues of STV
Page 2 Issue 7, September 1996
The conclusion from this study was that running the Meek orERS rules on a modern PC would be possible for largeelections. However, program modifications would bedesirable to ensure that the programs kept within systemlimits. It was also observed that both programs producedresult files which were excessive in size (and too big to printwith convenience). With the preferences kept in main store,the time both programs took to execute was limited by thespeed of processing; moreover, it was linear in the number ofballot papers. The time taken for the programs on my homecomputer was about 500 seconds per 10,000 papers for Meekand about ten times faster than that for the ERS rules. Thesetimes are clearly minor compared with the data preparationoverheads in undertaking such counts.
Random UKCC-like dataHaving determined that it is feasible to undertake UKCC-likeelections on a computer with either Meek or the ERS rules,we now wish to see if there is a significant risk of eitheralgorithm producing the ‘wrong’ result.
For this part of the study we use simulated data with only1,000 papers, rather than the 62,000 that were actuallyrecorded for UKCC. The reason for this reduction is to saveon the computer time required, since many elections must beanalysed (in fact, 100 elections were used). However, to havea realistic chance of determining the effect of using eitheralgorithm, it is clear that the ballot papers must adhere tosome of the characteristics of the real data.
The method used to construct the papers was to use a randomnumber generator, but to use some of the characteristics of theUKCC election to determine the distribution functions used.The two major parameters are the popularity of eachcandidate and the length of each ballot paper. We can estimatethe popularity of each candidate in the real election by meansof their (known) number of first preference votes. Hence thepopularities of the candidates in the simulated elected wereadjusted so that the leading candidate had more than the quotaof first-preference votes, candidates numbered 2 to 20 hadreducing popularity of 95% of the previous candidate, and theremaining candidates had a constant popularity of 95% of the20th candidate. The reason for this constant tail is that if the95% rule was carried on, it was observed that the lowercandidates had virtually no votes at all.
The distribution of the length of preferences chosen was asfollows: For those expressing a single preference: 8.0% of thepapers; for two preferences, 8.7%; for 3: 9.4%; for 4: 10.1%;for 5: 10.9%; for 6: 11.6%, for 7: 12.3%, and for 8 to 11preferences: 7.2%. This distribution increases linearly to 7,the number of candidates then drops to a constant amount.
We can now compare a randomly produced set of papers withthose above from UKCC. In this case with random ballots, the
quota becomes 1000/8=125, instead of 62216/8=7777 for thereal election. The table entries below and for the comparativetable for UKCC are expressed in proportion to the quota togive directly comparable data.
Fi r st St age Vot es Pr ef er ence when whenCandi dat e Vot es/ el ect ed el ect ed/ Quot a Quot aA 129. 6% 1 100. 0%B 16. 8% 119 53. 3%C 10. 4% 121 46. 1%D 13. 6% 121 46. 9%E 12. 0% 121 45. 3%F 8. 8% 121 44. 1%G 9. 6% 121 42. 2%
The pattern is clearly similar. We need not be concerned aboutminor differences, since the study is of elections of thisgeneral type. To generate each set of ballot papers merelyrequires as input the three integer seeds for the randomnumber generator. In consequence, all the data presented herewhich is based upon a set of 100 elections can be recomputedfrom 300 integers. The seeds for the election in the abovetable were 1, 1 and 18.
Comparative tests: Meek versus ERSWe now have the ability to generate large election data andprocess the results with two algorithms: Meek and the ERSrules. The remaining problem is to determine characteristicsof the results which would decide between the two. In fact,four different tests were applied as follows:
Non-transferables: In this test, the number of non-transferable votes of each algorithm are compared. The‘better’ algorithm is the one which gives the lower figure.
Condorcet: In this test, we take those elections producedin which the two algorithms elected different candidates.We then compare the first candidate elected by Meekwho was not elected by ERS with the first candidateelected by ERS who was not elected by Meek. Thecomparison is by Condorcet. Since there is no correlationbetween the votes for different candidates, the winningalgorithm for this test is the one which has the highernumber of Condorcet winners.
No-hopers: In this test, we eliminate the candidates withno realistic hope of being elected, namely the candidatesnumbered 21-129, so there are 20 candidates. Again,since there is no correlation between the votes ofdifferent candidates, the winning algorithm for this test isthe one for whom this change makes the least difference.In other words, one is expecting the removal of the no-hope candidates to make no difference.
Voting matters, for the technical issues of STV, Volume 1
Issue 7, September 1996 Page 3
Steadiness: This test is that specified by I D Hill inreference 3. The test is applied when there is only onepair of candidates elected differently by Meek andERS. The election is then re-run with only 8candidates. The winner is the algorithm for which thismakes the least difference to the result.
At this point, the author thinks that readers should reflectupon the tests above. If the results are against your favouritealgorithm, will you be convinced that your algorithm shouldnot be used for such elections?
We now consider the results of each of these tests:
Non-transferables: There is a consistent pattern withthe number of non-transferable votes with eachalgorithm which can be summarised as follows:
Meek 559.0 (±18.8); ERS 482.6 (±13.7); Meek/ERS1.159 (±0.031); where the range represents twostandard deviations. Hence Meek consistently gives16% more non-transferable votes.
Condorcet: Out of the 100 elections constructed withthe random ballot papers, 30 produced a differentresult. Hence for these 30, the Condorcet test could beapplied. The results were that for 24 cases, Meekelected the Condorcet winner, and for 6 cases, ERSelected the Condorcet winner.
No-hopers: In this test, we wish to know if theelimination of the no-hope candidates changed thosethat were elected. For Meek no change occurred forany of the 29 cases examined, but there were changesfor all but three cases with ERS. Hence Meek is aclear winner here.
Steadiness: This test is applied to the 29 cases in whichthere was one difference between the two algorithms.To pass the test, the result of the election with justeight candidates must be the same as for the fullelection. Meek passes the test for all of the 29 cases,and ERS 6 times (and failed 23 times). Again, Meekis the clear winner of this test.
The above analysis understates the differences between thetwo algorithms. Of the 29 cases that can be compared forsteadiness, the following table indicates how the resultscompared in 20 cases:
Meek El ect s ERS El ect s129 candi dat es [ S] +A [ S] +B20 candi dat es [ S] +A [ S] +A8 candi dat es [ S] +A [ S] +A
Here [ S] represents a set of six candidates and A and B aredifferent candidates not in the set [ S] . In other words, ERSreverts to the Meek result when the no-hope candidates areremoved, and this reversion is retained when only 8
candidates are considered. This is clearly strong evidencethat the full election using the ERS rules produces the‘wrong’ result.
ConclusionsThe study indicates that it is feasible to use computeralgorithms such as Meek on a PC for elections as large asthat for UKCC (although the data preparation problem hasnot been considered). Furthermore, a comparison betweenMeek and ERS shows that Meek is superior except for thenumber of non-transferable votes. The increased number ofnon-transferable votes is clearly secondary to producing the‘correct’ result, and from that perspective, the Meekalgorithm appears to be superior. The fact that randompapers from no-hope candidates can change the result isstrong evidence against the ERS rules.
Of course, this study only relates to elections with a largenumber of candidates. It can hardly be considered acriticism of Newland and Britton, since it is doubtfulwhether they ever conducted an election of the sizeconsidered here. [Added in this printing: See Issue 8, page3].
AcknowledgementsI should like to thank Joe Wadsworth of ERBS forproviding me with a summary of the UKCC election result‘sheet’ . Also, David Hill and Douglas Woodall providedmany comments on a draft of this paper which I hope hasresulted in a clearer presentation here.
References1. B A Wichmann. Two STV Elections. Voting matters,
Issue 2, pp7-9, September 1994.
2. D R Woodall. Properties of Preferential ElectionRules. Voting matters, Issue 3. pp8-15, December1994.
3. I D Hill. The comparative steadiness test of electoralmethods. Voting matters, Issue 3, p5, December 1994.
4. B L Meek. A New Approach to the SingleTransferable Vote. Reprinted in Voting matters, Issue1, pp1-10, March 1994.
5. R A Newland and F S Britton. How to conduct anelection by the Single Transferable Vote, secondedition, ERS, 1976.
Volume 1 Voting matters, for the technical issues of STV
Page 4 Issuee 7, September 1996
Meek style STV − a simpleintroduction
I D Hill
G A D B H ? @ F @ A D H I J K > L B E 9 B H H M > C N < > B ? O > A P Q D < @ R S T U @ F < A B F > HN P O O B D D @ @
For its 1996 Council election, ERS used the Meek countingrules, instead of the Newland and Britton rules that aresuitable for counting by hand. Now that there is sufficientavailability of computers, I believe that ERS owes it to itselfand to its members to use the best rules of which we areaware.
However many people seem to be muddled as to what thisinvolves and some seem to be sadly misinformed. It istherefore desirable to have available a simple listing of whatis the same and what is different in these systems.
It needs to be said clearly that there is no intention ofabandoning STV. The system adopted (taking its name fromB L Meek who first proposed it) retains all the essentialfeatures and aims of STV, but uses the power of moderncomputers to get a closer realisation of the voters' wishes,better meeting all the traditional STV virtues.
Some of the main changes were mentioned by RobertNewland in Comparative Electoral Systems, section 7.8(c).He wrote that these further refinements ‘which would belikely rarely to change the result of an election but whichgreatly lengthen the count, are not recommended’ . At thetime, that was probably a reasonable judgement butinformation gained since then has shown it to be untrue thatthe result would rarely change, whereas lengthening the countis unimportant when counting is by computer where, eitherway, the counting time is trivial compared with the effortneeded to input the data.
Meek style STV - what is the same?1. Each voter votes by listing some or all of the
candidates in order of preference.
2. Each voter is treated as having one vote, which isassigned initially to that voter's first-preferencecandidate.
3. A quota is calculated, as the minimum number of votesneeded by a candidate to secure election.
4. If a candidate receives a quota of votes or more, thenthat candidate is elected, and any surplus votes (overthe quota) are transferred to other candidates inaccordance with the later preferences expressed by therelevant voters.
5. If, at any stage of the count, no surplus remains to betransferred, but not all seats are yet filled, then thecandidate who currently has fewest votes is excluded.Votes assigned to that candidate are then transferred toother candidates in accordance with the laterpreferences of the relevant voters.
Meek style STV - what is different?6. All surpluses are transferred simultaneously instead of
in a particular order.
7. Surpluses are taken, in due proportion, from allrelevant votes, not only from those most recentlyreceived.
8. To make that work properly it is necessary to givevotes to already-elected candidates and not "leap frog"over them. This does not waste votes as the samenumber are transferred away again, but now in dueproportion to all relevant votes.
9. Whenever a candidate is excluded, the count behavesas if that candidate had never existed (except thatanyone previously excluded cannot be reinstated).
10. Whenever any votes become non-transferable, thequota is re-calculated, based on active votes only. Thislower quota then applies not only for future election ofcandidates, but also to already-elected candidatesgiving them all new surpluses.
11. No candidate is ever elected without reaching thecurrent quota.
12. For surpluses, every relevant vote goes to the voter'snext choice, at fractional value. If there is no nextchoice, the fraction becomes non-transferable.
13. At an exclusion all the relevant votes are dealt with atonce. There is no doing one little bit at a time.
14. The only disadvantage is that it is too tedious to do byhand, but has to be by computer.
Examples 1. A very simple, though artificial, example of thesuperiority of the Meek method is seen in 4 candidates for 3seats. If there are only 5 voters and the votes are: 2 ABC, 2ABD, 1 BC it is obvious to anyone, whether knowinganything of STV or not, that the right solution must be to electA, B and C, as the Meek method does, yet traditional hand-counting rules elect A and B but declare the third seat to be atie between C and D.
2. In a real election held recently, I shall call 4 of the
Voting matters, for the technical issues of STV, Volume 1
Issue 7, September 1996 Page 5
candidates A, B, C and D of whom at the last stage, A and Bhad each been elected with a surplus, C had been excludedand D was still continuing, to be either the last elected or therunner-up. Four of the votes gave preferences as ABCD,ACBD, CABD and ABD. As C had been excluded, thesebecame identical votes, each now having A as firstpreference, B as second and D as third. The Meek methodwould have treated them identically, but the rules actually inuse gave D wildly different portions of these votes, asfollows:
Vot e Rul es as used Meek r ul es Por t i on of vot e assi gned t o Por t i on of vot e assi gned t o
A B C D A B C DABCD 0. 72 0. 28 - - 0. 471 0. 285 - 0. 244ACBD 0. 72 - - 0. 28 0. 471 0. 285 - 0. 244CABD - - - 1. 00 0. 471 0. 285 - 0. 244ABD 0. 72 0. 28 - - 0. 471 0. 285 - 0. 244
The variation between all of the vote going to D, and noneof it doing so, is really startling.
How was my vote used?I D Hill
If an election has been conducted by STV using Meekcounting, and the final keep values have been published (asI think that they should be), any voters who remember theirpreference orders can work out how their votes were used,as follows.
Suppose you voted for Bodkins as first preference, forEdkins as second preference, etc., where their final keepvalues were published as 0.310, 0.772, etc., as shown in thetable below. The first thing to do is to make such a tablewith the order of preference that you actually used for thereal candidates and fill in their published final keep valuesin column (3).
Always start with 1.000 as the first item, one line aboveyour first candidate, in column (6), and then in each row inturn, fill in columns (4), (5) and (6) using the rules shown.
When an excluded candidate appears, such as Atkins above,the keep value is 0.000, so no part of the vote is kept. Whena candidate was either the runner-up or the last to be elected,
such as Firkins, the keep value is 1.000, so that candidatekeeps everything received and later preferences get nothing.
Column (5) tells how the vote was used. 0.310 of it went tohelp elect Bodkins, 0.533 of it went to help elect Edkins,0.110 of it went to help elect Dawkins and the remaining0.047 went to Firkins and, if Firkins was runner-up, wasunused.
I have been asked by someone who has seen the above toproduce something similar for traditional-style STV (and, inparticular, for Newland and Britton rules, second edition).Having had a look at the problem, I have concluded that, foranyone who really understands what is going on, theinformation can be derived from the result sheet in an adhoc way, but that it is not possible to do anything as general,or as simple, as the above.
This should be offered as an exercise for those who thinkthe traditional rules simpler than the Meek rules. Let themdo it. I do not deny, of course, that the traditional rules areless long-winded for making a hand-count, but in everyother way, in principle and in practice, the Meek rules aremuch the simpler.
STV and Equality ofPreference
C H E Warren
The Single Transferable Vote is a preferential votingsystem, in which the voter has to list the candidates in theorder in which he prefers them.
One of the questions which is asked is whether a votershould be permitted to express an equality of preferencebetween two candidates whom the voter assesses as equal inhis judgement. My view is that the expression of equality ofpreference should be permitted in principle, although ofcourse it would complicate both the voting and thesubsequent count.
If a voter does express an equality of preference betweentwo candidates A and B, then it is assumed that this istantamount to his expressing two half-votes with non-equalpreferences, one half-vote for A followed by B, and theother half-vote for B followed by A, but the half-votesotherwise identical.
However, Bernard Black is concerned that, if equality ofpreference is permitted, a voter may see neither of his equalpreferences elected, whereas if the voter had given one ofhis two a clear preference then at least he would have gotthat one elected.
Volume 1 Voting matters, for the technical issues of STV
Page 6 Issue 7, September 1996
Preference Candidate Final keep Previous vote Vote kept Vote
value remaining remaining
(1) (2) (3) (4) (5) (6)
previous (6) (3) × (4) (4)−(5)
1.000
1 Bodkins 0.310 1.000 0.310 0.690
2 Edkins 0.772 0.690 0.533 0.157
3 Atkins 0.000 0.157 0.000 0.157
4 Dawkins 0.702 0.157 0.110 0.047
5 Firkins 1.000 0.047 0.047 0.000
6 Gaskins 0.570
7 Catkins 0.978
The following example of an election for 3 seats from 6candidates by 30 voters, for which the quota is 7.5,exemplifies Black's concern. 29 of the voters vote as follows:
1 AB 1 BA 9 CAB 1 CEF 9 DBA 1 DEF 3 EF 4 F
The thirtieth voter is undecided between A and B. If thisthirtieth voter votes AB, or votes BA or expresses an equalityof preference between A and B, then the votes after thesurpluses of C and D have been transferred are:
AB BA ½AB + ½BA A 4. 25 A 3. 25 A 3. 75 B 3. 25 B 4. 25 B 3. 75 C 7. 5 C 7. 5 C 7. 5 D 7. 5 D 7. 5 D 7. 5 E 3. 5 E 3. 5 E 3. 5 F 4 F 4 F 4
We see that if the voter gives a clear preference for either A orB, then that one gets elected, because the other one is noweliminated and his votes then transferred to the preferred one.However, if the voter expresses equality of preference, then Eis now eliminated, and E's votes then transferred to F who iselected, so that neither A nor B is elected. Hence Black'sconcern is justified.
The main benefit that is likely to arise from permittingequality of preference, as Douglas Woodall has said, is not forvoters who are undecided between their top preferences, butfor voters who want to put certain candidates as their bottompreferences, below a whole lot of candidates whom they donot know much about, but for whom being able to giveequality of preference would be ideal.
David Hill has shown, in an unpublished paper, that, in a realelection, this middle group of candidates whom the voter doesnot know much about is more likely to be of relevance withMeek1 counting than with Warren2 counting, because withWarren counting the count does not extend down to thismiddle group of candidates.
References1 B L Meek. A new approach to the Single Transferable
Vote. Reproduced in Voting matters, Issue 1, pp1-10.March 1994.
2 C H E Warren. Counting in STV Elections. Votingmatters, Issue 1, pp12-13. March 1994.
Equality of preference − analternative view
I D Hill
In the preceding paper1, Hugh Warren states 'Hence Black'sconcern is justified', but the example from which he derivesthis opinion is not convincing. It really concerns the questionof how a tie is to be resolved, since in each of his three casesthe AB supporters have 7.5 votes and the EF supporters have7.5 votes. This makes it critically dependent on using aversion of STV in which the quota is defined to give precisely7.5 as in Newland and Britton, second edition2 and not 7.5plus a minimal amount as in most versions of STV, such asNewland and Britton, first edition3, for example. It alsodepends on the rule that anyone reaching the quota is to bedeemed elected at once even though some other candidatecould catch up if the process were continued.
I am not objecting to those features, but if we are prepared tobase conclusions on examples that depend critically on them,it is easy enough to construct one that points to the oppositeconclusion. Consider 4 candidates for 3 seats with an oddnumber, n, of voters who support A and B, and an equalnumber, n, who support C and D. The quota will be n/2 and ifthe AB party do not use equality, no matter how they arrangetheir votes between saying AB and saying BA, one of theircandidates will have more than a quota, and the other lessthan a quota, on the first count. If the CD party all put C andD as equal first, each of their candidates will have exactly aquota on the first count and consequently either ACD or BCDwill be elected.
It follows that Black's concern is not justified. In theseextreme cases use of equality could either harm or help and itis not possible to know which. In reality such extreme casesrarely, if ever, occur. What would normally happen if equalitywere used would be for one of the two candidates to go out(either as excluded or elected) at some stage and then therelevant part of the vote would be transferred to the othercandidate, so nothing would be lost.
References1. C H E Warren. STV and Equality of Preference. Voting
matters, Issue 7, p6, September 1996.
2. R A Newland and F S Britton. How to conduct anelection by the Single Transferable Vote, secondedition, ERS, 1976.
3. R A Newland and F S Britton. How to conduct anelection by the Single Transferable Vote, first edition,ERS, 1973.
Voting matters, for the technical issues of STV, Volume 1
Issue 7, September 1996 Page 7
EditorialIn this issue, a new format is being used, but without anychange to the content or type of material being published.
It is hoped that future issues of Voting matters will be madeavailable via the Internet. However, printed copies willcontinue to be made which can be ordered from ERS. Dueto some limitations of the most straightforward means ofproducing material on the World Wide Web, the printedcopies will be the master ones, and presentation on the Webmay have some defects.
The first article which lists those organisations known to useSTV is an example of material which should be available onthe Web anyway. Given this, then updating the list can moreeasily be undertaken.
As before, I am concerned about the lack of variety in theauthors of material. Electronic publication could easilyencourage contributions from other countries.
Brian Wichmann.
Volume 1 Voting matters, for the technical issues of STV
Page 1 Issue 8, May 1997
Issue 8, May 1997
Organisations using STVThe following is an alphabetical list of organisations known touse STV in the UK or the Republic of Ireland. In the interestsof brevity, local organisations are not always included.
3M plcAberdeen University SRCAdlerian Society of the UKAllied DunbarAmnesty InternationalAssociation for Jewish YouthAssociation of Municipal EngineersAssociation of University Teachers (AUT)Association of Teachers & Lecturers (ATL)Association of Logic ProgrammingAutomobile AssociationAvon CosmeticsBar CouncilBardsey Island TrustBass plcBeechlawn SchoolBirmingham Labour GroupBirmingham UniversityBow GroupBritish Airports AuthorityBritish Dental AssociationBritish Psychological SocietyBritish Association of Colliery ManagementBritish Association of DermatologistsBritish Association of CounsellingBritish Computer SocietyBritish CouncilBritish Humanist AssociationBritish Medical AssociationBritish Mensa LtdBritish Union of Anti-VivisectionBrittle Bone SocietyBUPA plcCambridge University Student UnionCampaign for Homosexual EqualityCardiff Union ServicesCeltic Film and TV AssociationChurch of EnglandChurch of WalesCity Literary InstituteCommittee of Vice Chancellors & PrincipalsConsumers' AssociationCoopers & LybrandCrosslinksDerbyshire E. R. GroupDrake & Scull Engineering LtdDu Pont UK LtdEastern ElectricityEast Midlands ElectricityEngineering CouncilElectronic Data SystemsExpress Newspapers Pension LtdFaculty of Public Health MedicineFamily Law Bar AssociationGateshead & South Tyneside LMCGeneral Dental CouncilGeneral Medical CouncilGilberd SchoolGlasgow Caledonian UniversityGouldensGreater Manchester PoliceGreater London Unison
Guild of Hospital PharmacistsHeadmasters' ConferenceHoechst UK LtdICL plcImperial TobaccoInstitute of the Motor IndustryInstitute of Chartered Accountants Institute of Civil EngineersInstitute of Electrical EngineersInstitute of LinguistsInstitute of Management Services Institute of Mechanical EngineersInstitute of Public RelationsInternational Association of Teachers of English as a
Foreign LanguageJohn Muir TrustKing's College London Students' UnionLeeds University UnionLewisham & Kent Islamic CentreLondon Borough of SuttonLondon Electricity plcLondon School of Economics Students' UnionLiberal Democratic PartyLibertyLogica plcManweb plcMercury CommunicationsMethodist ConferenceMidland Bank plcMountain Bothies AssociationNational Association of Teachers in Further & Higher
Education (NATHE)National Citizens' Advice BureauxNational Federation of Housing AssociationsNational Freight ConsortiumNational Grid plcNational Westminster GroupNational PowerNational Union of JournalistsNational Union of MineworkersNational Union of Rail, Maritime & Transport Workers
(RMT)National Union of StudentsNational Union of TeachersNeural Computing Applications ForumNews International Newspapers LtdNortheast Fife D.C.Northern Electric plcNorthern SinfoniaNorweb plcPensions Management InstitutePensions TrustPharmaceutical Society of Great BritainPowergenPrice WaterhouseProfessional Association of TeachersPrudential AssuranceRoyal College of General PractitionersRoyal College of MidwivesRoyal College of NursingRoyal College of PathologistsRoyal Statistical SocietyRoyal Town Planning InstituteScottish NuclearSecondary Heads AssociationShantiniketan Centre, SouthallShell UKSeeBoard plcSmith & Nephew plcSolicitors Family Law Association
Voting matters, for the technical issues of STV, Volume 1
Issue 8, May 1997 Page 2
South Oxfordshire D.C.Stoneham Housing AssociationSouthern Electricity plcSouth East Electricity plcSouth Wales Electricity plcSouth West Electricity plcTelegraph NewspapersTotal Oil LtdTheatrical Management AssociationUK Central Council for Nursing, Midwifery and Health
Visiting (UKCC)UK Council for Graduate EducationUniversity of BristolUniversity of Wales Swansea Students' UnionUniversity of Ulster Students' UnionUnion of Democratic MineworkersUnion of UEA StudentsYorkshire Housing AssociationYorkshire WaterZionist Federation of Great Britain
The various companies named above will not be using STVto elect their Boards of Directors which are usually Yes/Noballots, but to elect Pension Fund Trustees. The accountancypartnerships of Coopers & Lybrand and Price Waterhouseuse it to elect their Executive partners. These particularelections are unique in that, apart from partners retiringduring the year, all partners are automatically candidates.
Quotation MarksDear Sir,
There are one or two matters I would like to comment upon.
In his article Large Elections by Computer, Dr Wichmannsays there is strong evidence that the traditional method ofSTV counting produces the 'wrong' result. I would suggestthat even with the use of quotation marks this is anunfortunate comment. The result is surely correct within therules which have been used, and to suggest otherwise is toimply that there is something inaccurate, or wrong, with thecount. It might lead to defeated candidates thinking theywere defeated as a result of some procedural error by theReturning Officer, which would not be the case. It would bewiser to say that the election result might be different. I donot think we would wish to appear to cast doubts upon ourown ballot organisation to count an election by STV.
The real problem with elections of this kind is theproportion of candidates to the number of places to be filled.In the UKCC example there were over 18 times morecandidates than the 7 places to be filled. 129 candidatesappears to offer those voting the widest possible choice, butthe choice is unreal. Unfortunately few of the voters havesufficient knowledge about the candidates to be able to putmore that a small number of candidates in preferential order.The candidates are allowed to provide information aboutthemselves but there is still a great deal of information toread. One answer might be to re-examine the nominationprocess, with a view to there being more assentors to thenominations. The organisation may, of course, not wish to
do this because it might create an unreasonable hurdle tonomination.
Dr Wichmann is under a misapprehension when he says Itcan hardly be considered a criticism of Newland andBritton, since it is doubtful whether they ever conducted anelection of the size considered here. Major Britton and MrNewland were closely involved with drafting the electoralarrangements for the UKCC and took a very close interestin the first two elections at Chancel Street to see how thecounts went. The report of the first UKCC election recordsthat 441 candidates were nominated and that 61,715 peoplevoted. Therefore it would appear that there has been adecline in the number of candidates nominated. I can recallboth Major Britton and Mr Newland being somewhatconcerned at the number of candidates nominated for thefirst election, but thought the number would decline when itwas realised that most of those nominated had no real hopeof being elected. At the first two elections no candidateachieved the quota, the whole election consisting ofexclusions, candidates being elected with a reduced quotientas votes became non-transferable. It was not until the thirdor fourth UKCC election that I recall being told that for thevery first time a candidate had attained the quota during thecount. My recollection is that Major Britton and MrNewland would probably have recommended that thenomination procedure be amended if the number ofcandidates had not declined to a more manageable numberfor the voters.
E M Syddique, ERS
A replyI owe readers an apology if they were under anymisapprehension on the use of the quotation marks. Ofcourse, there was no implication that the rules were notcorrectly applied; indeed the simulations I made assumedthat. It is also worth noting that since I used artificial ballotpapers, the implications for any specific election (like thelast UKCC one) are unclear.
I cannot apologise to Major Britton and Mr Newland for notrealising their involvement in the early UKCC electionswhich were even bigger than the one I analysed.
I believe that a major contributory factor to the results Iobtained was that not only was one candidate elected withthe quota, but that the others were elected with very muchless than the quota. The re-computation of the quotaundertaken by the Meek method therefore makes a biggerdifference than would typically be the case.
Lastly, it seems to me that an advantage of STV should bethat many candidates can compete. Hence introducingbarriers to nominations seems against the spirit of STV.
B A Wichmann.
Volume 1 Voting matters, for the technical issues of STV
Page 3 Issue 8, May 1997
Are non-transferables bad?I D Hill
Brian Wichmann1 put forward four different tests of whetherone vote-counting algorithm had done better than another andinvited readers, before reading on, to consider whether theywould regard failure on each test as a serious matter.
I did not cheat, but made the requested consideration beforereading on. I concluded that I accepted his tests calledCondorcet, No-hopers and Steadiness but I totally rejected histest called Non-transferables. I then found, not much to mysurprise, that he had found Meek's method to be a clearwinner (on his particular data) on the three tests that Iaccepted as valid, while Newland and Britton (2nd edition)rules had done ‘better’ on the Non-transferables test which Ihad rejected, so I think it important to explain just why I hadrejected it.
My view is that everything should always be in accordancewith what the votes say, in proportion to their numbers and, ifsome votes, in whole or in part, are entitled to transfer and donot indicate a wish to be transferred anywhere, then it ismorally wrong not to make them non-transferable, in whole orin part as the case may be.
That being so we cannot say which of two methods is betteron the basis of the number of non-transferables, until weknow the cause of the difference. If method 1 shows morethan method 2, we must ask whether this is due to method 1making some votes non-transferable unnecessarily, or tomethod 2 failing to make votes non-transferable when theyshould be. With methods of which we know nothing exceptthe outcome of this particular test, we can really say no morethan that.
In the actual case, however, we do know the methods in detailand are aware that Meek's method never makes anything non-transferable except when it is right to do so. It follows that, ifthe Newland and Britton rules get a smaller number, it is theythat are failing to do the right thing.
Reference1. B A Wichmann. Large elections by computer. Voting
matters, 1996, issue 7, 2-4.
Some Council ElectionsB A Wichmann
IntroductionThis paper is an analysis of some Council elections basedupon computer simulation in a similar manner to two previouspapers 1,2. The analysis starts with (five) result sheets, sincethey are the publicly available record of the elections. Thefirst stage consists of using a computer program to produce aset of ballot papers which reproduces the result sheet (or getsvery close to that). The second stage consists of running anumber of experiments based upon elections which select arandom subset of the ballot papers. The third stage is a furtheranalysis of the results.
This paper is concerned with STV elections in which there areno ‘party’ affiliations. Hence the voting patterns are differentfrom those which applied in the Irish elections analysed in thefirst reference. The identity of the actual council electionsused for this study is not stated here, since this is irrelevantand could detract from the conclusions which are thought tobe relevant for all elections for several seats in which there areno parties involved.
Constructing ballot papersGiven a result sheet, then it is possible to construct a set ofpapers which would produce the same results. In producingsuch a set by hand, the obvious method is to work forwardstage by stage. However if no transfers occur from candidateA (say), such a method will give preferences that, if Aappears, stop at that point. In other words, preferences that arenot required to produce the results as given in the result sheetare not given. Clearly, the voter will not necessarily do this,and more significantly, other algorithms may use subsequentpreferences. Hence a more general means is required ofproducing ballot papers.
The program used in this study works as follows. Theprogram computes transfer rates from A to B if candidate Awas eliminated or had a surplus to transfer (and B wasavailable for transfers). If no such transfer occurred, then anestimate is used based upon the first preferences for B.
Ballot papers are now constructed using a random numbergenerator with an exact match for the first preferences. Thisset is then used as the starting point of an iterative process,working stage by stage, to obtain a very close fit to the actualresult sheet. The program cannot necessarily obtain a perfectmatch when transfers of surpluses are involved. Experimentsshowed that the starting position which was dependent uponthe seeds for the random number generator did not have alarge effect on the accuracy of the final fit to the actualelection.
Voting matters, for the technical issues of STV, Volume 1
Issue 8, May 1997 Page 4
An exampleTo give a fuller explanation of the method of constructingballot papers from a result sheet, we give a simple example.Consider an election in which the votes for electing onecandidate from 4 was:
10 AB5 BCD6 BAD6 CDA1 C8 DAB
The result sheet from these ballot papers using Newland-Britton is:
St age 1 St age 2 St age 3A 10 10 0B 11 11 21C 7 0 0D 8 14 14Non- T 0 1 1
Since we are concerned with a council election withoutparties, we consider each candidate in the same way. We canjudge the overall popularity of each candidate from the firstpreference votes. We now construct a matrix to represent theprobability of X being followed by Y in any preference (Xcould clearly be the last preference given, so Y is allowed tobe the Non-Transferable option). For instance, givencandidate D, then the preference specified after D isassumed to be A, B or C in the ratio 10:11:7 (since these arethe ratios of the votes on the first preferences).
We can make a better estimate of the transfer probabilities,since we do have a limited amount of information from theresult sheet. In this case, for stage 2 in which C iseliminated, we know that the next preferences were either Dor non-transferable in the ratio 6:1, respectively. Hence, wecan adjust our matrix accordingly. For stage 3, in which A iseliminated, the transfers were entirely to B, but the paperscould have had a preference to C which would have beenignored. This clearly reflects the adjustments made to thematrix. The final matrix, based upon one hundredths of avote, in this case becomes:
TOFROM NT A B C D STRT - 278 306 194 222 A 0 - 1000 194 222 B 0 278 - 194 222 C 143 278 306 - 857 D 0 278 306 194 -
The program now computes a trial set of ballot papers withan exact match on the first preferences, but using a pseudo-random number generator and the above matrix to producethe remaining preferences. Finally, adjustments are made tothe papers to obtain a better match to the result sheet. The
root mean square error is computed over the entries in theresult sheet, which gives 0 in this case for the 3×5 entries,since we have a perfect match.
The ballot papers produced in this case (which dependsupon the seeds used for the random-number generator)were:
There are clearly many differences between the initial ballotpapers and the above. However, since there are 64 ways ofvoting, it is quite unlikely that 10 ballot papers would beidentical as with the initial papers (and in this sense, thefinal set must be regarded as more likely than the startingset). The construction method in this case gives very fewpapers with incomplete preferences, since the result sheethad few non-transferables.
Five real electionsThe results of running the program for the five elections aregiven in Table 1. The result sheets were from theapplication of Newland-Britton3. A very close fit wasobtained in all cases. The entry Next gives the difference inthe number of votes between the last candidate elected andthe next highest. This figure is also divided by the numberof votes to give a numeric indication of how close thechoice of the last elected candidate is. For election B, theresult was very close since this difference was a mere 14votes (from 8739, ie 0.16%). In performing both Newland-Britton and Meek upon the ballot papers constructed by theprogram, only one result was obtained which was differentfrom the actual result. For election B, Meek produced aresult different from the actual election, but this is hardlysurprising, due to the closeness of the final candidateelected.
The experimentThe experiment concerns the influence of candidates withno realistic hope of being elected upon the result. With theUKCC analysis2, it was observed that such no-hopers had abigger influence with Newland-Britton rules than with
Volume 1 Voting matters, for the technical issues of STV
Page 5 Issue 8, May 1997
Meek. In this case, 100 elections were run by selecting 200ballot papers at random (repeated five times for each actualelection). For these 100 elections, both Newland-Britton andMeek were run. The second row in Table 2 gives the numberof times out of the 100 that the results from Newland-Brittonand Meek were different. For the 500 elections the result wasdifferent for 88 cases, which implies that 4% of the candidateswere treated differently.
The first row in Table 2 gives the number of candidates whichwere never elected in any of the 100 elections, called no-hopers. It would seem that this is not an unreasonabledefinition of those that have no chance of election, since weknow that the number of first-preference votes is not always agood indication.
The 88 elections in which Newland-Britton/Meek gave adifferent result were now re-run with the no-hoperseliminated. The results of this are recorded in Table 2 in therows with indented titles. In all but one case, the differencebetween the two algorithms was just one candidate. However,the result of the re-runs is somewhat confusing except for thesimple case in which the elimination of the no-hopers makesno difference. The results in the table are classified as follows:
No change. In this case, the elimination makes nodifference and hence these cases are not supportive ofeither Newland-Britton or Meek.
Revert to Meek. In this case, the result from Meek doesnot change, but that for Newland-Britton changes tothat of Meek. Such a case is taken as supporting the useof Meek.
Revert to Newland-Britton. This is the exact opposite ofthe previous case and is taken as supporting the use ofNewland-Britton.
Meek unchanged. In this case, the result for Meek doesnot change, but that for Newland-Britton does (but notto that of Meek). This case is regarded as supporting theuse of Meek.
Both change. In this case, both change to a differentresult. This is obviously not supportive of eitheralgorithm.
Invert both. In this case, the results of both algorithmschange to the previous result of the other one! Clearlynot indicative of either Newland-Britton or Meek.
Other. None of the above, and again not supportive ofeither algorithm.
The overall count from the above classification is that 56cases are neutral, 27 support Meek and 5 support Newland-Britton.
ConclusionsIn appears that realistic ballot papers can be computed fromthe result sheets. However, it is difficult to validate thisprocess, since at the moment, actual ballot papers are notavailable from real elections of any size. I would like toappeal for such ballot papers, perhaps in computer format,since such papers could be made available without revealingthe source which surely would be satisfactory once the periodof elected candidates had finished. All the election dataobtained so far is for small elections for which the studyabove could not be applied.
The first result from this study is that Newland-Britton andMeek produce a different result for about 4% of the seats. Theobserved rate for the Irish elections in 1969 was 2.8% (3 outof 143) and for 1973 was 4.9% (7 out of 143). The differencebetween 1969 and 1973 is due to a decline in the party votingand hence is consistent with a figure of 4% given in this study.
Does a difference of 4% matter between two STV algorithms?Obviously, it is reasonable to say this is insignificant against adifference of around 30% when STV is compared to First PastThe Post. On the other hand, for the Electoral Reform Society,it is surely unsatisfactory to have such differences.Unfortunately, resolving this issue, as we are all aware, is noteasy.
Voting matters, for the technical issues of STV, Volume 1
The remaining result is that Meek has more indicative casesin its support than Newland-Britton by about 5 to 1 in theabove experiment. Does this matter? Surely, a keyadvantage of STV is that candidates can enter withoutupsetting the result if they have no realistic chance of beingelected. Providing other hurdles for candidates seemsagainst the spirit of democracy.
References1. B A Wichmann. Producing plausible party election
data. Voting matters, Issue 5. pp6-9. January 1996.
2. B A Wichmann. Large elections by computer. Votingmatters, Issue 7. pp2-4. September 1996.
3. R A Newland and F S Britton, How to conduct anelection by the Single Transferable Vote, secondedition, ERS 1976.
4. B L Meek, A new approach to the Single TransferableVote, reproduced in Voting matters, Issue 1, pp1-10,March 1994.
Measuring proportionality I D Hill
When you can measure what you are speaking about andexpress it in numbers, you know something about it, butwhen you cannot measure it, when you cannot express it innumbers, your knowledge is of a meagre and unsatisfactorykind. Lord Kelvin.
It is important to consider what the problem actually is, andsolve it as well as you can, even if only approximately,rather than invent a substitute problem that can be solvedexactly but is irrelevant. Anon.
I agree with the first of those quotations but I agree muchmore strongly with the second one. As Philip Kestelmanpoints out in a recent article1, if we are to talk ofproportional representation, and to claim that one aim ofSTV is to achieve it, it is desirable that we should havesome idea of how to measure it and thus be able to detectthe extent to which one system or another is able to achieveit.
Many indices have been proposed for the purpose, of whichKestelman prefers the Rose index, or Party TotalRepresentativity (PTR) as he renames it. While differentlyformulated, the various indices all seem to have similareffects, usually placing different elections in the same orderof merit even if the numbers that they assign are verydifferent. They mostly depend, in one way or another, onthe differences between percentages of votes by party andpercentages of seats by party. It seems a little odd when
considering a multiplicative type of thing, likeproportionality, to use an additive type of measure, but thisdoes overcome some difficulties that might otherwise arisewhen parties get zero seats.
A correlation measureThere is an additional measure that is rather different fromall these, mentioned by Douglas Woodall2 as having beenproposed by Dr J E G Farina and depending on the cosineof an angle in multi-dimensional space. This is not aconcept with which the general public would feel easily athome, but the measure does turn out to be closelyassociated with the statistical measure known as thecorrelation coefficient, and many people seem to feel happythat they know what correlation means (even if, in fact, theydo not). However the ordinary correlation will not do,because it measures whether points tend to be groupedaround a straight line, but not all straight lines giveproportionality.
For example with votes of 200, 400 and 600 and theproportional 2, 4 and 6 seats we get a correlation of 1.0, butthe non-proportional 3, 4 and 5 seats equally get 1.0 asthose points also fall on a straight line. To get a suitablemeasure we also need to include the same numbers overagain, but negated. Thus 200, 400, 600, −200, −400, −600with 2, 4, 6, −2, −4, −6 gives a correlation of 1.0 as before,but 200, 400, 600, −200, −400, −600 with 3, 4, 5, −3, −4,−5 gives only 0.983 demonstrating a less good fit.
The fatal flawIf going for any of these measures, I like the last one best,but they all have one fatal flaw — they depend only uponparty representation and only upon first preference votes. Itis possible to use them upon features other than formalpolitical parties if there is enough information available onthose other features, which usually there is not. Kestelmandoes so, but this is rarely done, while how to extend them todeal with anything other than first preferences does noteven seem to be discussed. They therefore, to my mind, fallwithin the terms of the second quotation in my heading, asthe substitute problem that is irrelevant.
It is true that, in many elections, voting is mainly in termsof party, and that most people's party allegiances will bedetectable in terms of their first-preference votes, but Iobject to those who say that all we need to know about anelectorate is to be found in those things. I much morestrongly object to any suggestion that voters ought not tovote cross-party if they wish, or even should not be allowedto do so.
It often helps discussion to look at an exaggerated case,even though it is far removed from what normally happensin practice. An example that I have used before concerns 9candidates: A1, A2 and A3 from party A; B1, B2 and B3
Volume 1 Voting matters, for the technical issues of STV
Page 7 Issue 8, May 1997
from party B; C1, C2 and C3 from party C. The election isfor 3 seats and the votes are, say,
50% A1 B150% A1 C1
If a system elects A1, A2 and A3 the above measures will allsay that it has done well — with 100% of the votes for partyA and 100% of the seats for party A. Yet nobody actuallyvoted for A2 or A3 at any level of preference. From thatelection STV would elect A1, B1 and C1, the candidateswhom the voters mentioned, yet such measures will all saythat it has done badly. While I believe that a measure ofproportionality, if we can find a suitable one, would be a goodthing I am not prepared to accept as useful any measure thatcannot deal sensibly with that case.
Minor parties and independents A further difficulty with all these measures occurs if there area number of minor parties (and/or independent candidates),none of which get enough votes to be entitled to a seat. Ifeach of them is put into the formula as a separate entity, youget one answer, but if you put them together as “others” youmay get a very different answer because that number of votesfor a single party would have been worth a seat (or more).Such minor parties are likely to be so divergent that to electany one of their candidates to represent all their voters wouldbe quite unsatisfactory.
STV's proportionalitySTV's proportionality comes from what Woodall 3 calls DPCfor “Droop proportionality criterion” . This says that if, forsome whole numbers k and m (where k is greater than 0 and mis greater than or equal to k), more than k Droop quotas ofvoters put the same m candidates (not necessarily in the sameorder) as their top m preferences, then at least k of those mcandidates will be elected. In particular this must lead toproportionality by party (except for one Droop quotanecessarily unrepresented) if voters decide to vote solely byparty. Anti-STVites may argue that this is not altogetherrelevant because people may not vote like that, but theycannot have it both ways — if voters are not concerned solelywith party, and do not vote solely by party, then measures thatassume that only party matters must be wrong.
The STV argument is that it will behave proportionately, asdefined above, so long as voters do vote solely by one thing,whether that is party or not, but if (as is usual) voters have amixture of aims and motives it will adjust itself to match whatthey do want to a reasonable degree. Looking at how it workssuggests that it must do so, but I know of no way of provingit. What I find obnoxious is to find those who oppose itsaying that it cannot be guaranteed to do so, and thereforewanting instead some system that does not even attempt it.
Furthermore STV gives the voters freedom to show their truewishes, major party, minor party, independents, sole party orcross-party, by sex or race or religion or colour of socks, orwhatever they wish, whether others think that a sensible wayof choosing or not. Even if it did not give a reasonable degreeof proportionality as well, it would be worth it for thatfreedom and choice. Party proportionality is a bonus, not thebe-all-and-end-all. It may be that “when you cannot express itin numbers, your knowledge is of a meagre and unsatisfactorykind” but can we measure love, or aesthetic pleasure, orscientific curiosity? Perhaps there would be some advantagesif we could measure them, but our inability to do so does notin the least affect our conviction that they are things worthhaving. Let us continue to seek a useful measure, but not bebound by imperfect ones.
First-preference measures unsatisfactory
Even within strictly party voting, the first-preferencemeasures are unsatisfactory. Consider a 5-seater constituencyand several candidates from each of Right, Left and Far-leftparties. Suppose that all voters vote first for all the candidatesof their favoured parties, but Left and Far-left then put theother of those on the ends of their lists. If the first preferencesare 48% Right, 43% Left, 9% Far-left, all the measures willsay that 3, 2, 0 is a more proportional result than 2, 3, 0. YetSTV will elect 2, 3, 0 and that is the genuinely best result,because there were more left-wing than right-wing voters.There is no escape by comparing with final preferences, afterredistribution, instead of first preferences. That is merely toclaim that STV has done well by comparing it with itself. Our opponents may sometimes be dim, but I doubt whetherthey are dim enough to fall for that one.
ConclusionI remain of the opinion that a measure of proportionality isvery much desired if we can find a suitable one, but we knowof none, and an unsuitable one may be worse than useless. What do others think?
References1. P Kestelman. Is STV a form of PR? Voting matters,
1996, issue 6, 5-9.
2. D R Woodall. How proportional is proportionalrepresentation? Mathematical intelligencer, 1986, 8,36-46.
3. D R Woodall. Properties of preferential election rules.Voting matters, 1994, issue 3, 8-15.
Voting matters, for the technical issues of STV, Volume 1
Issue 8, May 1997 Page 8
EditorialI must apologise for the absence of an issue since May1997,but this has been due to a lack of material. There is no doubtthat the primary reason for this lack has been the May 1997elections and the consequences in terms of the politicaldebate on voting reform which has engaged many potentialcontributors.
The first article by David Hill considers the vexed questionof constraints. After producing an elegant possible solutionto the problem, he advocates that constraints should not beused. It seems to me that constraints can be used, but onlymodestly. For instance, if a Council is to be elected having atreasurer who must be a qualified accountant, then aconstraint is better than having a separate election. Also, fornational bodies, it is difficult to get young people electedsince they are not as well-known which again seems to meto be reasonable grounds for a constraint. What do othersthink?
The second paper was prepared to submit to the ScottishOffice as a result of the paper giving the proposed electoralsystem for the Scottish Parliament. This has obviously beenpartly overtaken by events.
The third paper on voter choice and proportionality wasprepared as a result of the ERS AGM, and has beensubmitted to the Electoral Commission.
The last two papers consider a topical issue: how to prepare anordered list of candidates given preferential voting. In thiscase, the Liberal Democrats and the Green Party have decidedupon different methods which are specified in these twopapers. The one point of agreement, which is also supported byothers, is that the method of ordering a list given by Newlandand Britton should not be used for this purpose! In both thesecond and third edition of Newland and Britton's book, theysuggest that the order of election within the STV stages shouldbe used to order the candidates (see section 2.5).
For the tenth issue, I plan to produce a combined index of allthe issues to that date. I also hope to produce a volumecontaining all these issues in one binding, hopefully with goodreproductive quality. The intent is to provide a moreconvenient permanent record.
I also plan to provide Internet access to Voting matters via theUK Citizens On-Line Democracy, which has been agreed byERS. This Internet site provides discussion groups and otherinformal material on democratic issues. UKCOD has alsocollected comments on the Government proposals for aFreedom of Information Bill (ht t p: / /f oi . democr acy. or g. uk/ ). I believe that providingaccess to Voting matters by this means will encourage furtherinternational contributions. The printed version will be theauthoritative one, since it is not possible to control layoutprecisely on the Internet, nor can references be guaranteed toremain valid over a long time-frame. The Internet version mayalso be delayed by the conversion effort required.
Brian Wichmann
Volume 1 Voting matters, for the technical issues of STV
Page 1 Issue 9, May 1998
Issue 9, May 1998
STV with constraintsI D Hill
K > L B E 9 B H H B C D < @ > : D < P ? P Q D < @ F P O f : D @ ? f ? P ; ? > O F @ ? D B Q B @ E Q P ?: C @ B A D < @ N < : ? F < P Q R A ; H > A E @ H @ F D B P A C g
IntroductionElections sometimes include constraints such as, for example,saying that those elected must include at least a given numberof each sex. How is it to be done?
The traditional way is set out, for example, in the ERS bookletby Grey and Fitzgerald, that preceded the later rules byNewland and Britton. I have sometimes heard their methodreferred to rather rudely as “ the naïve rules” . Basically theyare the same as those in the Church of England's 1981regulations and say: (1) that if a point is reached in the countwhere a specified maximum number of candidates of theconstrained type has been elected, then any other candidate ofthat type must be excluded as soon as possible; (2) that if apoint is reached where the number unexcluded of theconstrained type equals a specified minimum, then any suchcandidate not yet elected must be guarded, such that whenchoosing a candidate for exclusion at any later point, thelowest non-guarded one must be chosen.
Multiple constraintsGrey and Fitzgerald make no mention of the possibility ofmore than one constraint or how such is to be handled. TheChurch of England's 1981 regulations, however, specified thatthe same rules should be applied to each constraintindependently. It was pointed out that this could lead totrouble because two constraints may interfere with each other.The example used was: suppose there are 3 seats to be filled,and one constraint requires at least 2 women, while anotherrequires at least 2 black people. If the available candidates are2 black men, 2 white women and 1 black woman, where no-one has a quota and the last-named has fewest votes, shewould be excluded by looking at each constraint separately,whereas that exclusion makes it impossible for the constraintsto be met. It might be objected that such requirements areunlikely but: (a) regulations must allow for all possibilities;(b) however unlikely for a complete election, such a thingcould easily arise at a late stage of something larger.
In consequence, the Church of England's 1990 regulationsgave no specific rule for handling multiple constraints but leftit to the presiding officer to do as seemed right at the time.
An alternative for a single constraintAn alternative approach has been devised by Colin Rosenstieland colleagues for use by the Liberal Democrats in theirinternal elections, where STV is to be used with a constrainton the minimum number of each sex to be elected. Theirmethod is (a) to run STV with the correct number of seats andno constraints. If more of one sex are found to be required,then (b) to rerun with more and more seats until it is foundwhich extra candidates of that sex to elect, and (c) to rerunwith fewer and fewer seats until it is found which candidatesof the other sex to exclude. There are some difficulties, buton the whole this seems at first glance to be an elegantsolution for a single constraint, though it is not feasible unlessthe count is to be by computer and it is not easy to see how itcould cope with more than one constraint. It should be noted,however, that it is incompatible with any promise to votersthat their later preferences cannot upset their earlier ones.
Although attractive at first sight, I have now come to theopinion that this method is wrong in principle. Indeed thisopinion relates to any scheme that starts with ordinary STVand says that, if that produces a result that meets theconstraints, it should be accepted. Such a method is alwayswrong. This opinion may seem odd; does it mean that there issomething wrong with ordinary STV? Yes, of course there is.We know well that a perfect electoral method is impossible.The main fault with ordinary STV lies in its “exclude thelowest” rule, which can lead to unjustified exclusion onoccasions. The justification of the rule is that it seems to beimpossible to find a better one without violating the promisethat a voter's later choices cannot upset that voter's earlierchoices. It is generally thought to be better to accept the faultthan to violate that.
Excluding the lowest is on the grounds that we must excludesomeone and that candidate looks, on current evidence, theleast likely to succeed. But if we have a constraint that makesit totally impossible for some other candidate to succeed, it isplain daft not to exclude that candidate first.
A simple example can explain the point clearly. Suppose 4candidates for 2 seats. A and B are men, C and D are women.The votes are:
19 ABD. 8 CD. . 3 DC. .
giving a quota of 10. A is elected at once and passes hissurplus to B, but with no further surplus someone must beexcluded and, without constraints, it is most sensible toexclude D, who looks the least likely to succeed, and make afair fight between B and C for the second seat, which C wins.
Voting matters, for the technical issues of STV, Volume 1
Issue 9, May 1998 Page 2
Suppose, however, that there is a constraint to say that 1man and 1 woman must be elected. A and C, as by plainSTV, are 1 man and 1 woman, but the reasoning by whichthey were chosen is now quite inadmissible. It cannot besaid that D “ looks the least likely to succeed” because, nomatter what happens, it is absolutely certain that B cannotsucceed and a fair fight between B and C is impossible. Theremaining seat must go to a woman and a fair fight betweenC and D is what is necessary. Excluding B, D beats C.
So, by plain STV, A and C are elected, 1 man and 1 woman.Yet, with the constraint of 1 man and 1 woman, it is right toelect A and D instead. This may seem remarkable, but ifthere is any flaw in the logic I should like to hear of it. Theconclusion must be that the title “naïve method” has beenwrongly ascribed.
Tackling multiple constraintsHow then should multiple constraints be tackled? I believethat the traditional way for a single constraint is right but itneeds to be extended to deal with multiple constraints assuch, not with each single constraint independently. This isnot easy, but if people will introduce multiple constraints,the difficulties are their fault.
The Grey and Fitzgerald rules must be extended to say thatwhenever a situation is reached such that certain candidatesmust be elected, or must fail to be elected, if all constraintsare to be met then the appropriate action is required. Itshould be noted that such situations can be met even beforevote counting starts, and it may even be that no solution ispossible. Regulations need to deal with such cases.
It is superficially attractive to look at each possible set ofcandidates that could be elected and enquire of each setwhether it meets all the constraints, classifying each set aspositive or negative. At every stage, each set ruled out asinconsistent with those now elected or excluded would bereclassified as negative, any candidate appearing in everypositive set would be marked as “guarded” (i.e. not to beexcluded, but still to receive votes until reaching a quota),while any candidate appearing in no positive set would be atonce excluded. However, if thoughtlessly implemented, thisscheme could easily lead to a combinatorial explosion. Forexample to elect 20 candidates out of 40, there would beover 10,000,000,000 sets and if a computer could examine1000 sets per second to classify them, it would take over 4years merely to go through them once.
A more practicable scheme is to note that the candidates canbe grouped according to which constraint features theypossess. Usually there are many identical in such respectsand looking at them individually is not necessary but only atthe number in each group. With that simplification it hasbeen found possible to implement a solution, but it remainssufficiently complicated that to try to do it without computer
help is inadvisable. By hand and eye it is all too easy tomiss the vital moment when constraints need to be applied,and if missed, disaster can ensue later.
A (disguised) real electionAn example of this can be seen in an election that actuallyoccurred though, for obvious reasons, I shall disguise it. Ishall also simplify it a little.
Suppose an election in which there are 28 candidates for 14seats. The candidates, with two-letter code-names for thegroups are
4 Engl i sh men ( EM) 7 Engl i sh women ( EW)11 Scot t i sh men ( SM) 3 Scot t i sh women ( SW) 2 Wel sh men ( WM) 1 Wel sh woman ( WW)
Constraints say that those elected have to be 7 English, 6Scottish, 1 Welsh and additionally 7 men, 7 women.
Suppose that the first to be elected is a Welsh man. Anyonewould at once see that the other Welsh man and the Welshwoman cannot now succeed so it is right to exclude them atonce to let their supporters move elsewhere.
Suppose that the next to be elected are 2 English men and 2English women, and that the next step after that is toexclude a Scottish woman. How many people would noticethat this is a critical point, where everything will go wronglater unless constraints are applied? I think that few peoplewould; without careful analysis it is hard to notice.
The point is that only 2 Scottish women remain, we have toelect 6 Scottish altogether, and have elected none as yet.Therefore we must elect at least 4 Scottish men. But we arerestricted to 7 men in total and we have already elected 3. Itfollows that we must elect exactly 4 Scottish men, and thatmeans that the 2 remaining Scottish women must now beguarded, and that the 2 remaining English men must beexcluded as soon as possible, as they cannot now succeedwithout upsetting the constraints.
If such an election has to be carried out by hand, the bestway is to prepare in advance, preferably with a computer tohelp, a list of all the possible ways, by groups not byindividuals, in which a conformant result could be obtained.This can be done as soon as the candidates are known, whenthere is time to devote to it before the count. In the presentinstance, there are 8 possibilities:
Volume 1 Voting matters, for the technical issues of STV
With such a list at hand during the count, its lines can bedeleted as soon as they become impossible. Thus as soon asthe first to be elected is found to be a Welsh man, any linewith WM set to 0 goes out, leaving just
EM EW SM SW WM WW 0 7 6 0 1 0 1 6 5 1 1 0 2 5 4 2 1 0 3 4 3 3 1 0
The election of 2 English men and 2 English women leavesjust
EM EW SM SW WM WW 2 5 4 2 1 0 3 4 3 3 1 0
and the second of these becomes untenable when only 2Scottish women remain. Knowing that the first line is nowthe only way to meet the constraints shows the stepsnecessary much more clearly than could be seen without it.With a bit of practice, to follow such a list, as an indication ofthe interaction of the constraints with the STV count, becomesa little easier. However, it can never be really easy.
In case anyone should suggest that such a complicatedexample is implausible, I should repeat that it did actuallyoccur except that I have disguised it and simplified it.
ConclusionsI believe that the approach given above is the best way, withinSTV, to implement constraints but that they should not beemployed unless it cannot be avoided.
The mechanisms of STV are already designed to give voterswhat they want, so far as possible, in proportion to theirnumbers. It should be for the voters to decide what they want,not for anyone else to tell them what they ought to want.
The magazine Punch in 1845 included “Advice to personsabout to marry — Don't” . My advice on constraints is similar.
Comments on the ScottishElectoral proposalsI D Hill, R F Maddock and B A Wichmann
N P h B A F B E @ A D > H H I J > H H D < ? @ @ > : D < P ? C < > L @ i @ @ A O @ O i @ ? C P Q D < @j ? B D B C < T D > A E > ? E C k A C D B D : D B P A f ? P ; ? > O O B A ; H > A ; : > ; @
C D > A E > ? E C F P O O B D D @ @ > D L > ? B P : C D B O @ C g
It is clear than the proposal (made in July by the Government1
in advance of the September 1997 Referendum) is anincomplete draft. Nevertheless, it seems appropriate to list thelogical problems which are in this draft, since it is unclearhow a complete proposal would rectify the flaws. In somecases, aspects which are undefined could be resolved bytaking the proposals made at the Scottish ConstitutionalConvention, but this is something to be submitted to areferendum to authorise a constitutional change. No matterhow worthy that body, it would be absurd to regard itsproposals as being in any way definitive for such a purpose.
Why admit the existence of parties?Although the existence of parties is a key aspect of theproposals, we feel bound to query this for the reasons below.
1. To formally acknowledge the existence of politicalparties is not currently part of the UK electoralframework. Surely such a significant step should bejustified by showing that the general objectives canonly be satisfied by this step.
2. Who is to be entitled to register a party? How are thenames of such parties to be resolved to avoidconfusion? Several names could cause confusion: TheNew Labour Party or The Tory Party or even justLiberal.
3. The proposal appears to suggest that the statedobjective is to attain proportionality of partyrepresentation within the Scottish Parliament. However,the UK already accepts that proportionality can beattained without formal recognition of parties by meansof the Single Transferable Voting system used for theNorthern Ireland European Elections.
4. The proposal has several logical flaws, most of whicharise from the party identification (see below).
The whole process appears to have been designed to give asmuch power as possible to party organisations and as little aspossible to the electorate, making a mockery of whatdemocracy should be.
Voting matters, for the technical issues of STV, Volume 1
Issue 9, May 1998 Page 4
On the other hand, the recent case of the Literal Democratsindicates that standardized party labels have some benefits.
Can one have independent MSPs?It is clear that independent MSPs could not be elected fromthe Party lists, but for the constituency MSPs this appears tobe possible. After all, we have such an MP for Westminsterand therefore the question is not academic. The basic rightfor anyone to seek election should not be unreasonablyrestricted and therefore one must assume that those seekingelection as a constituency MSP need not have a partyaffiliation.
Can a 'rejected' MSP be elected?This can happen under the German system and results in theelectorate being very sceptical about elections. This happensas follows:
A candidate who is seeking re-election is both aconstituency candidate and is on a party list. If the candidatefails to obtain election for the constituency, the person cannevertheless be elected via the party list. If the personconcerned was overtly unpopular and lost by a significantswing, then to be subsequently elected is perverse.
No electoral system should give rise to anomalies as grossas the above, since it can seriously damage the electoralprocess in the eyes of the electorate. (However, we knowthat 'perfection' is not possible for electoral systems whichimplies that minor anomalies cannot be avoided.)
One party list or many?It is not clear if there is a single party list for each party, orone for each European Constituency. Note that the rulesappear to allow for a party which is already over-represented to obtain additional seats due to being under-represented within one European Constituency (thusincreasing the lack of proportionality).
Better proportionality would be obtained for a single listallocated on the basis of the entire Scottish vote. If the aimis to elect on the basis of European Constituencies, then whynot STV for each such constituency?
Some problemsA list is made here of the main flaws that we have noticed.We cannot guarantee that the list is complete.
1. Who specifies the party lists? In practice, a goodfraction of the MSPs are not determined by theelectorate but by those who draw up the lists. Inconsequence, it is most important that the mechanismfor producing these lists should be well-defined (oreven an explicit statement that the party organisations
determine the list by means of their own choosing). Ifthe list is specified by the party organisations withoutany electoral process, then it is clear that this aspect isless democratic than any other mechanism currentlyin use within the UK.
2. When are the party lists published, and by whom? Isthe list on the ballot paper? Surely the lists have to bepublished by the returning officers, but whatrestriction, if any, is placed upon the lists? (One couldallow 'cross-benchers' to appear, as in the Lords. Weassume that the lists are published before pollingday!) The Scottish Constitutional Conventionproposals appear to suggest that the list is just that,with no 'party' as such, which leaves open how partiesare linked to constituency MSP's to determine thenumber of additional members.
3. Can a (previously) sitting MSP also be on a partylist? If this is allowed, then the German problemarises, as noted above. In consequence, it seems bestto exclude this. Obviously, if an MSP is elected as aconstituency member, then one must assume that his/her name is deleted from the party list. This mightpresent a practical problem if the MSP appeared on adifferent list from his/her own EuropeanConstituency.
4. What duplicates can appear on the party lists? If aperson could appear on the party list for more thanone European constituency, then logical problemsarise due to the coupling of the voting between theEuropean Constituencies. In particular, the resultwould depend upon the order in which the EuropeanConstituencies were considered.
5. The dependence of the proposals on the EuropeanConstituencies seems odd since the government hasindicated its intention that the next European election,which will occur before the elections to the Scottishparliament, will use a regional list system, and thusthe current European constituencies will no longerexist. The white paper does say that if the Europeanconstituencies are changed the boundary commissionwill make "appropriate arrangements for the ScottishParliament".
6. A popular MSP could stand as an 'independent' sothat his/her seat would not count for his/her party,thus increasing their additional members by one.
7. In a somewhat similar position to the last problem, aparty could have a different label for its constituencycandidates than for its party list. This would make theparty list label appear under-represented (no seats),thus being eligible for additional members.
Volume 1 Voting matters, for the technical issues of STV
Page 5 Issue 9, May 1998
8. Apart from the voting system, we regard it as quitewrong that Scottish MPs will apparently be allowed tocontinue to vote at Westminster for what is to happen inEngland on the devolved issues.
9. The statement that the number of Scottish seats [inWestminster] will be reviewed begs more questionsthan it answers. The number of seats could even beincreased! (However, Donald Dewar, introducing thewhite paper in the Commons, indicated that the numberof Westminster constituencies was likely to be reducedat the next boundary review, and the white paper saysthat such changes would lead to corresponding changesin the number of both constituency and additionalmembers in the Scottish parliament.)
10. It has been noted in New Zealand that a result of amixed system of constituency members and party listsis a potential conflict between local party workers (whowant to get their constituency member elected) and theparty organisation (who might prefer the next person onthe list instead).
11. The proposals call for 129 members which appears tobe a consequence of the constituency numbers with theneed for 56 additional members to obtainproportionality. Contrast this with STV for each of the 7European Constituencies which could obtain the samedegree of proportionality with around half the numberof MSPs. (The cost saving would be very significant,and the body might well be more effective.)
12. Candidates must be resident in the UK, includingtherefore resident outside Scotland, which is differentfrom most local elections in Britain, where thecandidate must reside in the area administered by theassembly in question.
13. Can a Westminster MP simultaneously be an MSP?Nothing is mentioned about this, so one assumes theanswer is yes, as it is for MEP, MP, county councillor,district councillor, parish councillor,... However, theproposals made by the Scottish ConstitutionalConvention state that being an MSP is a full-timeappointment and thus excluding such roles (exceptperhaps being a Peer).
14. The arrangements for by-elections are not stated,although proposals were made by the ScottishConstitutional Convention, which we assume apply(namely, a conventional by-election for constituencyMSPs, and the next on the party list for the additionalmembers).
15. It is not specified what happens if a party list isexhausted.
16. If an MSP, elected from the party list, resigns fromthe party or is expelled from it, is resignation as anMSP to be required?
Reference1. The Internet Scottish Office pages, and those from the
Scottish Constitutional Convention.
The above paper records our comments at the time that it waswritten. We recognise that some of its queries have now beenanswered.
Voter Choice andProportionality
B A Wichmann and R F Maddock
At the Electoral Reform Society 1997 AGM, Hugh Warrenproduced an eye-catching diagram in which several electoralsystems were plotted on a diagram in which the two axes werevoter-choice and proportionality. The diagram was notintended to give precise measures of the characteristics ofeach electoral system, but merely their relationship. However,for (party) proportionality, the Rose Index is a reasonableapproximate measure. For voter-choice, no existing measureappears to be available which would be necessary to provide amore accurate representation of the diagram.
A possible measure of voter choice is the information-theoretic value of the result of an election, which appears tobe new. For instance, in a dictatorship which has mockelections, the result is known beforehand, and therefore theinformation-theoretic value is zero. On the other hand, if theelectorate is given a choice between three candidates then,assuming that each outcome is equally likely, the information-theoretic value is log2(3)=1.58. As the number of possibleoutcomes increases, so does this measure of voter choice.
For values of the Rose Index, Kestelman1 gives values for themajor electoral systems. It must be acknowledged that theRose Index as a measure of party proportionality, may not beappropriate for STV elections, as pointed out by David Hill2.
We compute the values for a hypothetical election for a 600seat assembly in which there are three parties. For the use ofSTV, we take 120 constituencies each electing 5 members.For the regional list, we take 10 regions electing 60 candidateseach. For the additional member system, we assume 300 seatselected directly and 300 added by proportionality. Note that ifn seats are to be filled with 3 parties, then the number of waysto do this is n2/2+3n/2+1. We assume that all possibleoutcomes are equally likely. The entries in the diagram are asfollows:
Voting matters, for the technical issues of STV, Volume 1
Issue 9, May 1998 Page 6
First Past The Post (FPTP): Rose Index 70% (UK),voter choice is 600 log2(3)=951.
Alternative Vote (AV): Rose Index 72% (Australia),voter choice is 600 log2(3)=951.
Single Transferable Vote (STV): Rose Index 92%(Ireland), voter choice is 120 log2(5C15)=1386. (Weare assuming each party has five candidates andtherefore could theoretically obtain all five seats;hence the number of possibilities is the number ofways of selecting 5 from 15.)
Additional Member System (AMS): Rose Index 98%(estimated), voter choice
300 log2(3)+log2(3002/2 +3×300/2+1)=491.
Party List (PL): Rose Index 98% (estimated), voterchoice is log2(6002/2+3×600/2+1)=17.5.
Regional party Lists (RL): Rose Index 98%(estimated), voter choice is 10 log2(602/2+3×60/2+1)=109.
It is important to note that this diagram will change if theunderlying assumptions are changed, for instance, if thenumber of parties was increased from 3 to 4. An alternativeway to compute voter choice values would be to take intoaccount the probability of the various outcomes, based uponappropriate statistical data. This was considered initially butrejected due to the difficulty of the calculation and theproblems in finding appropriate statistical data. If the votingsystem was changed, then one can only guess at the futurestatistical data. (The diagram here has the x-axis reflectedfrom Hugh Warren's version so that the Rose Index isincreasing.)
The conclusion from this diagram is hardly unexpected:party lists do not give voter choice, and FPTP/AV do notgive party proportionality, while STV can claim, to areasonable degree, to provide both.
References1. P Kestelman. Is STV a form of PR? Voting matters.
Issue 6. p5-9.
2. I D Hill. Measuring proportionality. Voting matters.Issue 8. p7-8.
Producing a Party Listusing STV
C Rosenstiel
N P H B A S P C @ A C D B @ H B C > O @ O i @ ? P Q D < @ N P : A F B H P Q R S T > A E D < @> : D < P ? P Q > F P O f : D @ ? f ? P ; ? > O Q P ? T U l g
With some of the current proposals for electoral reform,parties will be required to produce a list from whomcandidates will be elected in order from the top. STV can beused to construct the ordered list, given a preferential ballotof all party members.
The conventional use of STV to elect n members givesmembers of equal status, since the order in which STVelects does not necessarily determine the strength of theirsupport. Repeated use of STV elections can be used todetermine an order as follows:
Given a total list of 10 (say), then the first step is todetermine those on the list (without an ordering) by runningan STV election with all the candidates and 10 seats to fill.The next step is to run an STV election for 9 seats with 10candidates being those previously elected (using the sameballot papers). The eliminated candidate is then placed laston the list. Next, an STV election if run with the remaining9 candidates with 8 seats to determine the next lowestcandidate, and so on.
Volume 1 Voting matters, for the technical issues of STV
Page 7 Issue 9, May 1998
Rose Index of proportionalitym
Voter Choice
1,000
0n
75% 100%
STV
AVFPTP
AMSo
RLPL
50%p
This process might sound tedious, since so many STVelections are run, but if a computer is used, it isstraightforward. Note that the above process will not work inreverse, i.e. selecting the top candidate first. The reason forthis is that when electing two candidates, it can happen thatneither of those elected is the previously selected ‘ top’candidate.
Two elections were taken in which there was more than tencandidates to which we have applied the algorithm above toorder the top 10 candidates. The results obtained were asfollows:
El ect i on 1 El ect i on 2Thi s al gor i t hm : ABCDEFGHI J ABCDEFGHI JOr der of el ect i on : CABDEFGHJI CBAFEHDGI J
As expected, it can be seen that the order of election does notgive the same result as successive elimination. Hence thisalgorithm is recommended in producing party lists.
Editorial comment
It has been suggested to me that if the Meek method is used,then just one election would suffice (to determine the order ofthe 10 candidates). Their order can be found from theretention factor in the final table of the election results — thesmallest retention factor implying the strongest candidatesince that candidate required the smallest proportion of thevotes retained to get the quota. These values do give ameasure of their relative support, unlike the order of election.In the elections above the Meek results were:
El ect i on 1 El ect i on 2Meek ' keep' f act or : ABCDEFGJHI ABCEFDHGI J
This would appear to indicate that the methods of ordering ofthe candidates produce a similar result. In practice, bothmethods would need to use a computer and hence there seemsto be little to choose between them.
Ordered List SelectionJ Otten
q P C @ f < r D D @ A B C D < @ s ? @ @ A t > ? D I t P H B F I N P h P ? E B A > D P ? g
RationaleThe electoral system to be used for the next EuropeanElections requires ordered lists of candidates from each party.It was felt that the advice in the ERS booklet 1 that If an orderis desired, this is provided by the order of election (2.5) wasinadequate — it would effectively lead to a First Past the Postcontest for the top place on the list.
Were we to know in advance that we would win, say, n seatsin a region, then it would be straightforward to use STV toselect n candidates from the potential candidates and put them
in the top n places in our list. If we don't know n in advance(which we don't!) then we can perform this operation forevery possible n, i.e. from 1 up to the number of seatsavailable in the region, and attempt to construct a list whosetop n candidates are those victorious in the nth selectionballot. (There is really only 1 ballot — the division into nballots is notional.)
This ideal solution fails when a candidate elected for onevalue of n is not elected for a larger n. In such cases either theSTV result for a smaller n must constrain that for the larger(top-down) or vice versa (bottom up). Reasoning that theGreen Party would be unlikely to win large numbers of seatsin any region, we opted for top-down.
AlgorithmEach count is conducted by ERS rules 1 with the followingalterations. We start with the count for the first place (n=1)and work down.
5.1.6 Calculate the quota
Divide the total valid vote by one more than the ordinalnumber of the count. Eg for the third count, divide the totalvalid vote by 4. If the result is not exact, round up to thenearest 0.01.
5.2.5 Excluding Candidates
Do not exclude any candidate in one count if they havealready been elected to the list in an earlier count. This mayintroduce distortions to the results of later counts, but isnecessary to preserve the integrity of the earlier counts.
If a count is proceeding identically to an earlier count, and anexclusion by lot is required, then the result of the earlier lotshould be taken as read. Otherwise the lot must be recast. (cf5.6.3)
5.3.3 and 5.4.2
For the purpose of these rules (i.e. receiving transfers), acandidate elected in a previous count (not stage) should betreated as a continuing candidate for purpose of receivingtransfers during the count, until they are deemed electedagain.
5.5.2 Completion of the Count
For the purpose of this rule, any candidate elected to the list ina previous count shall be deemed elected. Therefore the countmay stop as soon as a single candidate is deemed elected, whowas not elected in a previous count. In exceptionalcircumstances it is possible that two candidates, notpreviously elected may exceed the quota in the same stage.Only one may be elected. Resolve as follows (in order ofpriority):
Voting matters, for the technical issues of STV, Volume 1
Issue 9, May 1998 Page 8
1. If more than one value of papers is transferred duringthat stage, and only one candidate is elected as aresult of the transfer of an earlier (i.e. higher valued)batch, then that candidate is deemed elected.
2. If both exceed the quota during the transfer of thesame batch, then elect the one with the higher vote.
3. According to 5.6.2
4. By lot.
Other deviationsMy apologies to the Electoral Reform Society for these, butthey do seem to be popular in some quarters.
Where regional parties have agreed to adopt gender balanceconstraints, then the usual constraint rules shall be used.This usually means excluding all the candidates of aparticular sex at the beginning of an even-numbered count.
Each region was free to determine its own gender balanceformula. For example one region might require a list of halfmen and half women with no constraints on position, andanother region might require that the top two candidateswere a man and a woman with no constraints on the othercandidates. Whatever formula was chosen, this was appliedwithin the system by excluding any ineligible candidates atthe beginning of a round. Hence the top place on each listwould be open to both sexes, and subsequent places wouldonly be constrained in the event of an imbalance. Notablythe London region decided not to impose a gender balanceformula, and the top three candidates are all women.
On each ballot form there is a notional candidate called “Re-Open Nominations” (who is of indeterminate sex). If Re-Open Nominations is elected to the list, then there must be afresh election for that place and lower places on the list.This is a distortion of STV which could be used by amajority to deny minority representation, although there isno evidence of this happening. STV, rightly in my view,omits this sort of negative voting, but it is popular in the realworld outside public elections, such as in student unions.
ConclusionsAlthough the justification for starting at the top of the listand working down, as opposed to starting at the bottom oreven in the middle, is not particularly strong, this system is areasonable solution to the question of seeking an orderedlist. In particular it ensures that however MEPs are electedin any region from the party, they are as proportionallyrepresentative of the range of opinion in the party as theirnumber allows.
Reference1. R A Newland and F S Britton. How to conduct an
election by the Single Transferable Vote. ERS 3rdEdition. 1997.
Volume 1 Voting matters, for the technical issues of STV
Page 9 Issue 9, May 1998
EditorialThe publication of the Jenkins Commission report haspresented ERS with a dilemma. The role of STV is minimaland on any reasonable measure, the degree of voter choice isnot on the same scale that STV would provide. However, thereport in my mind raises a technical challenge. If one acceptsas a political imperative that 80% of the seats must be fromsingle-member constituencies, can one devise a scheme withan increased voter choice which is simple to understand?
I certainly believe that this is possible. Moreover, I think thatone should accept the significant support for First Past ThePost (FPTP).
The Jenkins proposal of having two votes seems to me to bebasically flawed since it then requires a mathematicaladjustment to correct the mis-representation from the singlemember constituencies. Why not have just one vote, whicheither elects your chosen candidate for the single-memberconstituency or is transferred to the ‘county’ vote?
With an additional 20% to be elected at the ‘county’ level, andSTV being the electoral mechanism, one needs about 15single member constituencies to be merged into counties.These counties would therefore elect three members, givinguseful voter-choice and good proportionality.
What would such a scheme look like from the point of viewof the voter? The single-member voting would retain FPTPand hence would correspond to the existing system apart froma 20% increase in the size of these constituencies.
This implies that votes which would undeniably be ‘wasted’under the present system would now be transferred to thecounty vote. Here the voter has a bigger choice, but moredifficult decisions to make. With perhaps 12-20 candidates torank in order to elect 3 people, the situation would be verysimilar to that of the voter in the Irish Republic. The keydifference is that this STV vote would only apply to thosevoters who did not select a winning candidate at the single-member constituency level. Surely this scheme would end theneed for strategic voting. The use of the Alternative Vote, asproposed by Jenkins, would therefore be unnecessary.
If voter choice is to mean anything at all, surely the votermust be able to choose between candidates of the same party.By having STV with three seats, such a choice would beeffective. Increasing the size of the STV areas would havesome advantages in terms of proportionality, but wouldprobably give a ballot paper that was too cumbersome(compared with current practice).
Brian Wichmann.
Voting matters, for the technical issues of STV, Volume 1
Issue 10, March 1999 Page 1
Issue 10, March 1999
The Handsomely SupportedCandidate Ploy
C H E Warren
9 : ; < = > ? ? @ A B C > ? @ D B ? @ E O > D < @ O > D B F B > A
There is an electorate of 1400, who have to elect candidatesto fill 6 seats, so clearly the quota is 200. The electorate ismade up of 418 members of the Labour Party and 982members of the Conservative Party. Labour should,therefore, get 2 seats, and the Conservatives 4.
The Conservatives put up 5 candidates — L, A, B, Z and Y.Candidate L is the Party Leader, and is handsomelysupported because of his ability to hold the party together,despite its Europhile and Europhobe wings. Candidates A, Bare on the Europhile wing, and Candidates Z, Y on theEurophobe wing. If all the Conservatives voted sincerelytheir voting pattern would be as follows:
503 LAB479 LZY
Whether the count is done by Newland & Britton1, Meek2
or Warren3, 4 Conservatives would be elected — L, A, Zand B. Not surprisingly the Europhiles get one more seatthan the Europhobes because they are the slightly largerfaction. 182 Conservative votes would be ‘wasted’ , aswould 18 Labour votes, thereby making up a quota of 200votes in total which are perforce ‘wasted’ in any STVelection.
However, the Europhobe Conservatives adopt theHandsomely Supported Candidate Ploy. Above everythingelse they want to see their leader, Candidate L, elected. Butthey argue that their support of 479 voters should be enoughto ensure that Candidate L is elected if they insincerely givehim their second preference only, even if those Europhilesare even more insincere and don't give Candidate L apreference at all!
In practice the Europhiles vote sincerely, so the votingpattern turns out to be:
503 LAB479 ZLY
If the count is done by Newland & Britton or Meek, theEurophobes' ploy pays off, because the 4 Conservativeselected are L, A, Z, Y. So, by their ploy, the Europhobeshave ‘captured’ the fourth Conservative seat for theEurophobes.
Of course one can not guarantee that one will always gainan advantage by adopting the ploy, but it is always worthtrying on, for one can not lose provided it is done prudently,
as in the example here, by not relegating a handsomelysupported candidate to a preference where one has not thesupport to get him elected no matter what other voters do.
The Handsomely Supported Candidate Ploy, if practised bya group, can lead to a discernible gain, as just demonstrated.However, the principle, that one can gain an advantage bynot giving one's first preference to a handsomely supportedcandidate, holds even for voters voting individually.
Consider an election for nine seats by 100 voters, so thequota is 10, in which the voting pattern is as follows:
39 H. . .19 M. . .41 . . . . 1 HM. . .
H is clearly a handsomely supported candidate, and M amoderately supported candidate. These two candidates donot figure in the voting pattern other than in the placesshown.
If the count is done by Meek the individual voter HM... willhave 0.37025 of a vote to pass on to his third preferenceafter H and M have retained just the votes necessary toattain the quota.
However, if the individual voter decides not to give his firstpreference to the handsomely supported candidate H, whowould be his sincere first preference, but instead to voteMH..., then he finds that he has 0.37342 of a vote to pass onto his third preference.
It is the principle that is salient from this example — thatone can get more out of one's single vote by not givingone's first preference to a handsomely supported candidate.
References1. R A Newland and F S Britton. How to conduct an
election by the Single Transferable Vote. ERS 3rdEdition. 1997.
2. B L Meek, A new approach to the SingleTransferable Vote, reproduced in Voting matters,Issue 1, pp1-11, March 1994.
3 C H E Warren. Counting in STV Elections. Votingmatters, Issue 1, pp12-13. March 1994.
Volume 1 Voting matters, for the technical issues of STV
Page 2 Issue 10, March 1999
An example of orderingelected candidates
C H E Warren
Colin Rosenstiel has proposed that elected candidates can beordered by successive elimination1. In an unpublished note ofthe same date (May 1998), Eric Syddique has proposedessentially the same method. However, in Newland &Britton2, the method proposed is to take the order of election.The purpose of this paper is to show that these two methodscan produce very different results.
Consider the following election of 4 candidates from 7contenders by 600 voters, for which the voting profile is:
50 AC 70 AD115 BED100 CD115 D 65 ED 50 FCD 35 GBED
Since the quota is 120, we obtain the following result sheetfrom the ascription of the Newland & Britton principles,avoiding the rounding errors which the practical applicationof their method as given by them introduces.
Hence the order of election is A, B, C and then D.
With the Rosenstiel/Syddique method of successiveelimination, with E, F and G eliminated the votes are:
120 A150 B150 C180 D
B, C and D are selected and A is placed fourth and eliminatedhenceforth. The votes are then:
150 B200 C250 D
C, D are selected, and B is placed third and eliminatedhenceforth. The votes are then:
200 C400 D
C is now placed second and D first. To summarise, the orderis D, C, B and then A.
Hence the two methods produce ordering which is exactly theopposite of each other.
References1. C Rosenstiel. Producing a Party List using STV. Voting
matters, Issue 9, pp7-8, May 1998.
2. R A Newland and F S Britton. How to conduct anelection by the Single Transferable Vote. ERS 3rdEdition. 1997.
STV with constraintsEarl Kitchener
Hill1 describes a useful way of dealing with constraints, butthen says that “ It should be for the voters to decide what theywant, not for anyone else to tell them what they ought towant” . If, as is normally the case, the rules for elections havebeen set by the voters, there is no-one else, because it is thevoters themselves who have decided in advance that theywant, say, at least one new member and at least one sittingmember. I feel that the ERS should encourage the use ofconstraints, so that we can learn whether they turn out to behelpful.
When voting is on party lines, it may be desirable to‘entrench’ the rules by only allowing them to be changed bymore than a simple majority. This is because a party in powercan often find alterations whose only merit is that they wouldfavour it. In some cases this would force constraints onunwilling voters.
Reference1. I D Hill. STV with constraints, Voting matters, Issue 9,pp2-4, May 1998.
Voting matters, for the technical issues of STV, Volume 1
Issue 10, March 1999 Page 3
A 120 120 120 120 120
B 115 +35u 150 -30 120 120 120
Cv
100 100 100 +50u 150 -30 120
D 115 115 115 115 +30u 145
E 65w
65w
+30u 95x
95x
95x
F 50y
50y
50y
-50 0z
0z
G{
35|
-35 0z
0z
0z
0z
Response by I D HillI am grateful to Lord Kitchener for his courtesy in lettingme see his paper in advance and for having no objection tomy putting a reply in the same issue.
Although it is true that constraints would sometimes havebeen set by the voters themselves, it is by no means alwaysso. For example, some Church of England elections aresubject to constraints that have been set by Act ofParliament. Even where the voters have set them, it willusually be an earlier set of voters who have done so,constraints being set in the bye-laws of the organisation andcontinuing to exist for many years; the actual voters have noopportunity to alter them at the time of an election.
There is much to be said in favour of rules specifying that atleast a certain number of people of particular types must beamong those nominated as candidates, but it should be forthe voters to decide whether they wish to elect them or not.As soon as they are forced to elect some, the whole electioncan become distorted by that fact. So I stick to my point ofview that, in general, constraints within STV are a bad thingand should be avoided if at all possible. If there is noavoiding their use, the method employed should be as in myarticle.
A problem for Andrae andHareI D Hill
K > L B E 9 B H H } C ; ? @ > D h ; ? @ > D h ; ? @ > D h ; ? > A E Q > D < @ ? B C D < @ U < P O > C= ? B ; < D 9 B H H O @ A D B P A @ E B A D < B C > ? D B F H @ g
With any form of STV there is a question about the best wayto transfer surpluses when they arise. Some people seem tothink that provided the right number are taken, and no voteis specifically misused, it does not much matter how it isdone. Others claim that such conditions are not sufficient,and that methods should be used that correctly interpret thewishes of the relevant voters as a whole.
The argument turns up interestingly in a fascinating book, tobe found in the McDougall Library Andrae andProportional Representation by Poul Andrae, son of CarlAndrae who introduced STV to Danish elections in 1855.The book is partly a complaint that Thomas Hare gets all thecredit for the invention of STV and his father very little.Hare first suggested STV in 1857, whereas Andrae actuallyintroduced it in 1855. The complaint appears to be justifiedand it looks as though perhaps Hare himself did not reallywant to know about Andrae, but it is always dangerous tojudge something like this after hearing argument from oneside only. The author of the book is evidently totallyunaware of what Thomas Wright Hill did in 1819.
Andrae's system was simply to shuffle the voting papersand then count them just once, allocating each to its earliestpreference who had not already attained a quota, and finallyelect all those with a quota, plus the highest of those withless, to give the right number to fill the seats. There was nosystem of exclusions, with redistribution of those votes.Hare's earliest versions were somewhat similar to this.
On the question of how to redistribute a surplus, there is inthe book a problem that was put to Andrae, of a case whereit was said that his system could give an absurd answer.Andrae, in reply, points out that one of the rules of hissystem is that the voting papers are to be thoroughlyshuffled before counting and, if that rule is obeyed, theprobability that they are counted in the particular order onwhich the absurd result depends is so small that it can beignored. In this he is correct (and he calculates theprobability correctly too).
However the problem was also put to Hare, and Hare's replyis to try to justify the absurd answer as reasonable. I wonderwhether any STV supporter nowadays would agree withHare.
The problem concerns 5 candidates for 3 seats, and votes:
299 ABD200 ACB101 ACE
Hare and Andrae agree that the quota should be 600/3 = 200and for present purposes let us not dispute that, even thoughwe think that Droop's quota is preferable. The problem says:suppose the votes are counted in the order as given, usingAndrae's system. Then, of the first 299, 200 go to A and 99to B, the next 200 all go to C (leap-frogging A) and the final101 to E (leap-frogging both A and C). As the system doesnot use exclusions, the final seat is awarded to E, because101 exceeds 99 even though nowhere near a quota.
Andrae's correct reply is that, even in the unlikely event ofsuch votes being made, the probability merely that all the299 come out before any of the 200 is 1/q where q is anumber of 117 digits, without even taking account of thefact that all those have to come before the final 101. This iscertainly a remote enough probability to be ignored.
He does not mention that a similarly silly answer couldresult from
2 ABD2 ACB2 ACE
where the probability is as high as 1/90, but I feel sure thathe would have said that his system was designed for bigelections, not such tiny ones, though to my mind a goodsystem ought to work sensibly for any size of election.
Volume 1 Voting matters, for the technical issues of STV
Page 4 Issue 10, March 1999
Hare, however, according to the book, wrote
I am willing ... to adopt the result, which I believe isperfectly reconcilable with the principle that is at thefoundation of this method of voting, and alsoreconcilable with justice. The object is to give theelector the means of voting for the candidate who mostperfectly attains his ideal of what a legislator should be,but it does not contemplate giving him the choice ofmore than one ...
The primary purpose of giving the voter the opportunityof adding to his paper the second, third, or other namesfor one of whom his vote is to be taken on thecontingency of the name at the head not requiring it, isnot to add greater weight to his vote, but to prevent itfrom being thrown away or lost owing to a greaternumber of voters than is necessary placing the samepopular candidate at the head of their papers ...
Thus the first 200 voters, whose voting papers areappropriated to A, have no ground of complaint(because of the non-election of B), for their votes havebeen attended with entire success ... Still less have thesecond 200 voters, whose votes were appropriated to C,any reason to complain, for they also have not onlyelected a favourite candidate of their own, but, equallywith the first 200, they are gratified by the triumphantsuccess of A. The 99 voters for B have also the lattersatisfaction, and if they failed to return their nextfavourite candidate, it is simply because 101 are morethan 99.
I should have to change my mind about supporting STV, ifthat were good STV reasoning, but I do not accept that it is. Iagree that it is right to allow each voter just the one vote, butif 299 say AB whereas 301 say AC, to pass A's surplus as 301to C and only 99 to B, instead of dividing it out in proportionto the voters' wishes, is grotesque.
It is extraordinary that Hare thinks it just and reasonable toelect E even though the total number of voters mentioning Eat any level of preference is far less than a Droop quota. Anymodern STV system would take the quota as 600/4 = 150,elect A with a surplus of 450 to be divided almost equallybetween B and C, who then each have more than a quota andall seats are filled.
Even if the votes had been merely
200 ACB101 ACE
to elect ACE rather than ACB would be obviously absurd.With the additional 299 ABD votes it becomes even more so.Does any reader think that Hare was talking sense?
A review of the ERS97 rulesB A Wichmann
Recently, I was asked to interpret the Newland and Britton 3rdedition rules1 (referenced as ERS97) with some specificexamples and therefore read the rules carefully for the firsttime. I think I was largely successful in interpreting the rulescorrectly, but was surprised at a number of features of theirpresentation.
Over the last 20 years, I have been involved with thespecification of programming languages for the InternationalStandardization Organization (ISO). The requirements hereare again for precision and clarity. ISO have adopted draftingrules for standards which I think are very helpful and are notfar removed from the style of the presentation of section 5 ofERS97. There are a number of detailed differences in which Iprefer the ISO approach. These differences are as follows:
1. Separation of normative (requirements of the standard)and non-normative text. In ISO, the model electionwould be a non-normative annex. In fact only sections 5and 6 are normative.
2. In ISO, defined terms would appear before the maintext. In ERS97, the Glossary in section 6 appears aftertheir usage in section 5.
3. In ISO, notes are non-normative and laid out in amanner to make this clear. The note in 5.6.2 in ERS97is clearly normative (and uses shall, as in ISOstandards).
It seems to me that the adoption of the ISO drafting ruleswould be a worthwhile undertaking if any revision of the ruleswas contemplated. Indeed, I see no reason why a suitablerevision should not be proposed to ISO as a standard, since itwould allow other organisations (in any country) to use it byreference. Currently, many organisations contain rules forSTV in their constitution which is unsatisfactory when therules themselves are very old — a method of reference wouldbe useful in such contexts.
My major and perhaps controversial comments on the rulesarise from my desire to see it formulated more closely as analgorithm, rather than as a description. In trying to interpretthe rules, one is necessarily performing a function like that ofexecuting a computer program. Since the main purpose of therules is surely to aid Returning Officers, then the computerprogram approach is helpful. Of course, I am not suggestingthat computer terminology should be used, but merely that thestyle should allow for conversion into a program in anobvious manner.
Voting matters, for the technical issues of STV, Volume 1
Issue 10, March 1999 Page 5
My specific points arising from the above computerperspective, and from other analysis are as follows:
1. There is no provision for conducting a count with theaid of a computer or by an entirely automatic process.Since computer programs of both types are routinelyused for this purpose, this is a major fault. Note thatthe Church of England rules2 make specific provisionfor this, including the certification of appropriateprograms by ERS. Breaking ties by lot needs adifferent wording allowing for the use of a pseudo-random number generator.
2. I think the wording associated with checking andrecords should be separated by being in a paragraphafter the corresponding actions. (This is notstraightforward as some paragraphs are a mixture.)
3. As I see it, only those paragraphs which are neededfor reference purposes need be numbered. This wouldreduce the apparent complexity of the rules.Currently, the whole of section 5 needs to be read todetermine what use is made of each part of the rules.
4. Section 5.5 (completion of the count) is notreferenced at all, since it is invoked when appropriateconditions are satisfied. This is not algorithmic in theconventional sense, indeed, in computer terms couldbe seen as ‘ interrupt-driven’ . I think this sectionshould be used explicitly.
5. The calculation of the quota and the recording oftransfers appears to give the impression ofundertaking computations to one hundredth of thevote. However, this is not achieved, since thataccuracy requires that the transfer values arecomputed to a greater accuracy. Indeed, if p votes aretransferred, then there is a truncation error of at mostp/100, which implies that transfer values should becomputed to about (number of digits in total votes)+1digits. I do not believe that an arithmetic approx-imation which can lose a whole vote is acceptablesince the voter could reasonably equate the loss to his/her vote. Unfortunately, the rules depend upon(number of papers)×(transfer value) in hundredths ofa vote, so it is difficult to increase the accuracywithout complexities elsewhere. Hence I concludethat this problem is inherent in this type of rule andcould be seen as a defect in ERS97.
6. The rules mention coloured forms, but the colouringis not apparent in the copy of the forms in theexample — the solution is to print the ‘beige/blue/green/white/pink/yellow’ on the forms, so thatphotocopying them retains the information (or so theycan be photocopied onto the correct colour paper).
7. Not all uses of the defined terms appear in bold inthe rules. I would suggest that the uses of a definedterm uses a different font (say, italic).
8. Paragraphs used in more than one place should begiven a name and referenced by name (as with thesections 5.3 and 5.4).
9. A batch is a set of bundles each having the sametransfer value, not a type of bundle as given in 6.1.
10. The definition of stage of the count is ambiguous,or perhaps depends upon the layout to parse.
11. The definition of transfer value should have‘deemed elected’ rather than ‘elected’ .
12. The statement that for small elections counting slipsare not required should be made once at the start,rather than each time slips are mentioned.
13. The second sentence of 5.6.4 is confusing. Surelythe point is that an auditable record of the countshould be kept? If all recording forms are optional,then why are counting slips specifically mentioned in5.1.3, 5.3.12 and 5.4.3?
14. The term ‘ formally excluded’ (in 5.5.2) clearlymeans exclusion without the application of the rulesassociated with exclusion, although this is notexplicitly stated.
I have attempted to reformulate the rules along the lines thatISO would use, but I do not regard the result as at allsatisfactory. My attempts were based upon a minimalchange to the wording, but it appears that a more radicalapproach is needed.
A few issues have been noted by others that I should alsoadd for completeness:
a) Conventional practice appears to be that the transfervalues are not included in the result sheet. I do notlike this, since the values are hard to reconstruct andare available.
b) The handling of withdrawn candidates is notmentioned in section 5 of ERS97, although it issurely a possibility with all elections (and is noted insection 2.2).
c) A minor ambiguity has been noted in the rules. (Ihope to report fully on this in the next issue of Votingmatters.)
Volume 1 Voting matters, for the technical issues of STV
Page 6 Issue 10, March 1999
ConclusionsIs any ‘ improvement’ to the wording needed? I think the rulesshould be readily usable just from the booklet. In this regard,the model election and examples given are very helpful.However, they do not cover all the situations that can arise.Moreover, for the model election, the actual papers are notincluded (not unreasonable for 785 voters, but this means thatthis single long example cannot be re-worked completely bythe reader). Also, the explanations given are not alwaysadequate. For instance, in Section 8.2 it is said that, becausethe surplus could change the order of the last two, it ‘must betransferred’ , without any hint being given that it is required tolook at whether the next two or more to go out are definite, inwhich case it must not be transferred. In the particularinstance the action taken is correct, but that is not the point.How to decide that it is correct is not fully stated as it shouldbe3.
Of course, the fact that ERS runs courses in conducting anSTV election is very helpful as is the large number of peoplethat have had such training and can pass on their skills toothers.
Hence I conclude that improving the wording is not that vital,but it would be a shame not to consider the ISO approach if arevision was produced in the future.
References1. R A Newland and F S Britton. How to conduct an
election by the Single Transferable Vote. ERS 3rdEdition. 1997.
2. Church of England, General Synod. Regulations for theconduct of elections by the method of the singletransferable vote. GS930. 1990.
3. I D Hill. Private communication.
Quantifying Representativity P Kestelman
t < B H B f ~ @ C D @ H O > A B C � @ @ A P A O @ > C : ? B A ; @ H @ F D P ? > H? @ f ? @ C @ A D > D B L B D I J > A E M P ? � C B A Q > O B H I f H > A A B A ; g
IntroductionWhat is a Proportional Representation (PR) electoral system?Seriously begging that question, Gallagher (1991: 49) arguedthat “Each method of PR minimizes disproportionalityaccording to the way it defines disproportionality, and thuseach in effect generates its own measure of dis-proportionality” .
However, Gallagher overlooked Single Transferable Voting(STV); an omission repaired by Hill (1997), invoking a‘Droop proportionality criterion’ (DPC: Woodall, 1994: 10):“ If, for some whole numbers k and m (where k is greater than0 and m is greater than or equal to k), more than k Droopquotas of voters put the same m candidates (not necessarily inthe same order) as their top m preferences, then at least k ofthose m candidates will be elected. In particular this must leadto proportionality by party (except for one Droop quotanecessarily unrepresented) if voters decide to vote solely byparty” .
Thus defined, PR systems include Alternative Voting (AV:k=1); though over half the voters may be unrepresented!According to the 1937 Irish Constitution, not onlyparliamentary deputies (multi-member STV), but also thePresident (AV), shall be elected “on the system ofproportional representation by means of the singletransferable vote” .
Yet nobody regards AV as a PR electoral system. In fairness toWoodall (1994: 10), “Any system that satisfies DPC deserves... to be regarded as a system of proportional representation(within each constituency)” . At that level, Hill's “exaggeratedcase” (three-member STV) is persuasive; howeverdisproportional to Party First Preferences. Nonetheless,constituency level ‘PR’ (including AV) is not enough for PRas normally construed.
Hill (1992) reasoned that, if voters vote solely by party, eachnominating sufficient candidates, “ then STV will producesplendid proportionality, ... , while any discrepancy due tofractions of quotas can be expected to even out over a numberof multi-member constituencies” . Indeed, the main politicalquestion is how faithfully total seats reflect Party FirstPreferences overall (regionally and/or nationally).
Voting matters, for the technical issues of STV, Volume 1
Issue 10, March 1999 Page 7
Party Total RepresentativityIn parliamentary elections, the simplest measure of totaldisproportionality is the overall deviation between over-represented Party Seat-fractions and Vote-fractions: theLoosemore-Hanby Index (LHI),
LHI = ½ Σ ABS ( S% - V% ),
where S% = Party Seat-fraction (percent); V% = Party Vote-fraction (percent); and Σ ABS = Sum of magnitudes (over all parties).
LHI complements the Rose Index of Proportionality (RIP);for which I prefer the more explicit term, Party TotalRepresentativity (PTR).
Table 1 below demonstrates the calculation of PTR =100%-LHI for the 1997 Irish General Election, whichproved unprecedentedly disproportional to Party FirstPreferences.
Table 1: STV Party (First Preference) Votes and Seats:Numbers, Fractions and Deviations: General Election,Irish Republic, 1997
* Loosemore-Hanby Index (LHI) = 12.9 percent =Overall deviation between over-represented PartySeat-fractions and Vote-fractions: complementingParty Total Representativity (PTR) = 87.1 percent. Source: Dáil Éireann (1998).
The Independent Commission on the Voting System(Jenkins, 1998: 47) gave a 1997 Irish General Election LHIof only 9.8 percent (their DV or ‘deviation from pro-portionality’ : Dunleavy et al, 1997: 10). However, the twomain parties (Fianna Fáil and Fine Gael) alone received11.6 percent more Seats than Votes (First Preferences); andexact LHI=12.9 per cent (Table 1). LHI (and hence PTR)are often miscalculated.
Other MeasuresMcBride (1997: 9) invoked “O'Leary's index ofproportionality” : the ratio of each party's Seat-fraction to itsFirst Preference Vote-fraction (S%/V%). However, theproblem is how to combine such party-specific ratios (ordeviations, S% - V%: see Table 1 above) into some measureof overall disproportionality. O'Leary (1979: 100) favouredthe Rae Index of Disproportionality (RID), measuring partyaverage disproportionality (contrast LHI above):
RID = 1/N Σ ABS ( S% - V% ),
where N = Number of parties exceeding 0.5 percent of votes.
The palpable arbitrariness of this average disproportionalityper party (why not a cutoff-point of 0.1 percent, or 5.0 per-cent of votes, for that matter?) may be redeemed somewhatby defining N as the ‘effective number of parties’ (Laaksoand Taagepera, 1979):
N1 = 1 / Π PP or N2 = 1 / Σ P2,
where P = Party Vote-fraction or Seat-fraction; and Π = Product (over all parties).
Taagepera and Shugart (1989: 260) preferred N2 onpractical grounds; though (entropy-based) N1 enjoyed“equally good conceptual credentials” .
Gallagher (1991) argued that RID was “ too sensitive to thenumber of parties” ; to which LHI was “much tooinsensitive” . Accordingly, he proposed a “ least squaresindex” : the Gallagher Index of Disproportionality,
GID = (½Σ ( S% - V% )2)½.
Nevertheless, Gallagher (1991: 47) considered “probablythe soundest of all the measures” the Sainte-Laguë Index,
SLI = Σ ( S% - V% )2 / V% = (Σ S%2 / V%) - 100 %.
Unfortunately, SLI ranges theoretically from zero toinfinity; which Gallagher acknowledged was “ less easilyinterpreted” than LHI or GID (ranging 0 - 100 percent).Thus in the 1997 Irish Presidential Election, AV First CountLHI = 55 percent (complementing PTR = 45 percent:President McAleese's First Preference Vote-fraction: Table 2below); whereas SLI = 121 percent!
Volume 1 Voting matters, for the technical issues of STV
Page 8 Issue 10, March 1999
Party Number Fraction (%) Deviation
(Constituency) Votes Seats Votes Seats
(V) (S) (V%) (S%) (S%-V%)
Total 1,788,985 166 100.0 100.0 0.0
Fianna Fáil 703,682 77 39.3 46.4 +7.1
Fine Gael 499,936 54 27.9 32.5 +4.6
Labour 186,044 17 10.4 10.2 -0.2
Progressive Democrats 83,765 4 4.7 2.4 -2.3
Green 49,323 2 2.8 1.2 -1.6
Sinn Féin 45,614 1 2.5 0.6 -1.9
Democratic Left 44,901 4 2.5 2.4 -0.1
Socialist 12,445 1 0.7 0.6 -0.1
Lowry (Tipperary N) 11,638 1 0.7 0.6 -0.0
Blaney (Donegal NE) 7,484 1 0.4 0.6 +0.2
Healy-Rae (Kerry S) 7,220 1 0.4 0.6 +0.2
Gildea (Donegal SW) 5,592 1 0.3 0.6 +0.3
Fox (Wicklow) 5,590 1 0.3 0.6 +0.3
Gregory (Dublin C) 5,261 1 0.3 0.6 +0.3
Unrepresented 120,490 0 6.7 0.0 -6.7
Over-represented 1,234,765 136 69.0 81.9 +12.9*
Under-represented 554,220 30 31.0 18.1 -12.9
Table 2: AV Party Vote-fractions, Seat-fractions andDeviations, by Count: Presidential Election, IrishRepublic, 1997
† Final Count LHI = 44.4 percent: PTR = 55.6 percent. Source: Irish Times, 1 November 1997.
Lijphart (1994: 60) preferred GID as steering “A middlecourse between the Rae and Loosemore-Hanby indices. Itskey feature is that it registers a few large deviations muchmore strongly than a lot of small ones” ; and contrasted twohypothetical elections (abstracted in Table 3 below).
Without defining any ‘Lijphart Proportionality Criterion’ ,he maintained that Election 1 was “highly disproportional”(GID = LHI = 5.0 percent); whereas Election 2 was “highlyproportional” (GID = 2.2 percent; but LHI = 5.0 percent).Ironically, his intuitively “much more proportional” Election 2yielded the higher SLI, considered by Gallagher (1991: 49)“ the standard measure of disproportionality” !
Woodall (1986: 45) preferred the Farina Index,
FI = cos-1 ( Σ S% V% / [ Σ S%2 Σ V%2 ]½ ).
FI is the angle between two multi-dimensional vectors, whosecoordinates are Party Seat-fractions and Vote-fractions:theoretically ranging between 90° (cos FI=0) and zero degrees(parallel vectors: exact PR). As a fraction of a right angle, FID= FI/90°; so ranging 0 - 100 percent (instead of 0 - 90°).
In Table 3, FID (like RID and GID) evaluates Election 1 asmore disproportional than Election 2. However, as Hill (1997)recognised, FID also poses problems of interpretation;remaining a far cry from the pristine simplicity of LHI.
Hill (1997) reproached PTR and other measures (their “ fatalflaw”) as confined to Party First Preferences. Nonetheless, heacknowledged that the concept of Total Representativity maybe generalised (e.g. from Party to ‘Cumbency’ , Gender andName: Kestelman, 1996); and extended beyond the STV FirstCount. Yet he regarded Final Count PTR as merely comparingSTV with itself!
Table 3: Five Measures of Overall Disproportionality:Two Hypothetical Elections
*As defined in the text above.
Minor / Micro-Parties As Hill (1997) implied, minor parties and independents(‘microparties’ — representing nobody but themselves) mayneed disaggregating before calculating overall measures ofdisproportionality. Exact LHI necessitates disaggregating thevotes for every represented party (and elected independent)from unrepresented parties; as in Table 1 above. SLI may alsobe calculated without disaggregating unrepresented parties.
On the other hand, exact GID requires disaggregating evenunrepresented party votes. Moreover, in evaluating a few largedeviations (S% - V%) as more disproportional than manysmall deviations, with the same total deviation (and henceLHI), GID implies that, the more fissiparously people vote,the more they deserve to be under-represented. In contrast,LHI consistently measures the total under-representation(Σ S%-V%) of all under-represented voters.
ConclusionsGallagher (1991: 33-34) lamented that “There is remarkablylittle discussion of what exactly we mean by proportionalityand how we should measure it ... how do we decide which iscloser to perfect proportionality?” — when comparingdifferent elections. Notice already two different senses of theterm ‘proportionality’ here! Hence my preference for the term‘representativity’ for measures admitting matters of degree tothe relationship between votes and seats.
Voting matters, for the technical issues of STV, Volume 1
Gallagher (1991: 46) reported that, at 82 national electionsin 23 countries (1979-89), LHI, GID and SLI (but not RID)proved impressively correlated with each other: so whycomplicate matters? Besides, measuring averagedisproportionality (RID) necessitates counting parties — arather moveable feast — and there seems little virtue inquantifying some hybrid between the distinct concepts oftotal and average disproportionality.
There remains legitimate scope for debating the relativemerits of STV first or final preference representativity, innational aggregate or constituency average, respecting partyor other considerations. In evaluating the representativitymediated by different electoral systems, no measure isperfect.
A generation after its introduction (Loosemore and Hanby,1971), LHI survives relatively unscathed. I remainpeculiarly susceptible to the complement (PTR) of thatsimplest LHI; doubting whether more complex measures ofoverall disproportionality would materially affect electoralcomparisons (for example, STV representativity by DistrictMagnitude: Kestelman, 1996).
References1. Dáil Éireann (1998): 28th Dáil General election, June
1997. Election Results and Transfer of Votes. TheStationery Office, Dublin.
2. Dunleavy, P et al (1997): Making Votes Count.Replaying the 1990s General Elections underalternative electoral systems. Democratic Audit,Colchester.
3. Gallagher, M (1991): ‘Proportionality, Dis-proportionality and Electoral Systems’ : ElectoralStudies 10, 33-51.
4. Hill, I D (1992): ‘STV and Party Proportionality:Another View’ : Representation 31: 113, 19.
5. Hill, I D (1997): ‘Measuring proportionality’ : Votingmatters 8, 7-8.
6. Jenkins, R (1998): The Report of the IndependentCommission on the Voting System. Cm 4090-I. TheStationery Office, London.
7. Kestelman, P (1996): ‘ Is STV a form of PR?’ : Votingmatters 6, 5-9.
8. Laakso, M and Taagepera, R (1979): '"Effective"Number of Parties: A Measure with Application toWest Europe': Comparative Political Studies 12, 3-27.
9. Lijphart, A (1994): Electoral Systems and PartySystems. Oxford University Press.
10. Loosemore, J and Hanby, V (1971): ‘TheTheoretical Limits of Maximum Distortion: SomeAnalytic Expressions for Electoral Systems’ : BritishJournal of Political Science 1, 467-477.
11. McBride, J P (1997): ‘Positive Aspects of PR-STVfor the Irish Political System’ : Representation 34:1,7-12.
12. O'Leary, C (1979): Irish Elections, 1918-1977:Parties, Voters and Proportional Representation. Gilland Macmillan, Dublin.
13. Taagepera, R and Shugart, M S (1989): Seats andVotes. Yale University Press, New Haven.
14. Woodall, D R (1986): ‘How Proportional isProportional Representation?’ : Mathematicalintelligencer 8:4, 36-46.
15. Woodall, D R (1994): ‘Properties of PreferentialElection Rules’ : Voting matters 3, 8-15.
Volume 1 Voting matters, for the technical issues of STV
Page 10 Issue 10, March 1999
1
Voting mattersfor the technical issues of STV
The Electoral Reform Society
Issue 11 April 2000
All correspondence regarding Voting matters should beaddressed to:
B A Wichmann, The Editor, Voting matters, The Electoral ReformSociety, 6 Chancel Street, London, SE1 0UU.
Readers are reminded that views expressed in Voting matters bycontributors do not necessarily reflect those of the ElectoralReform Society.
To aid production, the Editor would welcome contributions onIBM-PC discs (with a printed copy as well) or [email protected].
EditorialThis publication has now entered the Internet age! Futureissues will appear on the ERS Web site (http://www.electoral-form.org.uk). Those who have no access to the Internet and donot wish to do so, need not be concerned, since a printed copywill continue to the available from ERS as before.
As Editor, I will ensure that those without Internet access areat no disadvantage. On the other hand, I would be happy toreceive articles by e-mail to [email protected] should be in standard formats, such as HTML or PDF(and also RTF), rather than in proprietary word-processorformats.
Although the ERS Web site will have the current issue, therewill be some delay in conversion and checking before it willbe available there. Hence the printed copy should be availablefirst, and that version should be regarded as the authoritativesource (due to conversion and presentation problems withHTML).
I hope to arrange for all the back issues to be available on theInternet via a suitable Archive site. I have prepared a‘combined’ issue for all of Issues 1-10, which is availablefrom me in electronic format (HTML and PDF).Unfortunately, since this combined issue amount to 112 pages,it has not been possible for it to be professionally printed,since the cost is excessive for the likely sales.
The delay in this issue indicates the continuing problem of thelack of material from a small authorship. I am hoping thatexposure of the material to international access via theInternet will encourage other parties to contribute in thefuture.
In the first article, Hugh Warren suggests a way of mergingSTV with FPTP, at least as far as the ballot itself isconcerned. Could this encourage STV counting? Commentsare welcome.
Philip Kestelman provides another article on proportionalitywith reference to the Jenkin's proposals.
Earl Kitchener makes a suggestion that Borda scores shouldbe used to break tie rather than relying on a random choice (atleast in the first instance).
My own article on checking two STV computer programs hasproved controversial due to the issue of quota-reductionwhich is one of the new features in the 1997 edition of theERS hand-counting rules. This issue is explained in thefollowing article by David Hill; and Colin Rosenstiel, as co-author of the new rules, provides a response. Readers shouldjudge for themselves whether a revision to the rules isrequired to ensure that no ambiguity exists.
Brian Wichmann.
Incorporating X-voting intoPreference voting by STV
1. IntroductionOne of the thing said by many people, particularly by thosewho have used the X-voting system for many years, and byjournalists, is that preference voting by STV is difficult tounderstand. However much advocates of preference votingby STV may find this view unjustified, and itself difficult tounderstand, they must accept that it is a view that isexpressed, and no doubt genuinely held by a lot of people.
The purpose of this paper is to make the point that, insteadof trying to win over the X-voting enthusiasts to the STVway of voting, consideration should be given to allowing theX-voting enthusiasts into the preference voting by STVsystem.
2. The Basic IdeaThe basic idea is that, in addition to those who wish to votein the STV way by showing preferences 1, 2, 3, .. in therecognized way, those who wish to vote by putting an Xagainst the candidates they wish to see elected should beallowed to do so, provided of course that they do not put anX against more candidates than the number to be elected.
3. Interpretation of the Ballot PaperWith some ballot papers marked in the STV way bypreferences 1, 2, 3,.. and some marked by an X against anumber of candidates, the way in which it is suggested thatthe two may be accommodated is to treat the X votes asequal preference for a first preference candidate.
The allowing of equal preferences in the STV system is amatter which has been talked about in the past, but usuallyruled out on the grounds that it would make an alreadycomplicated system more complicated. However, to allowequality of preference to be exercised on the first preferenceonly should not lead to seriously greater complexity.
4. The countThe count is not of course a matter with which the votershave to concern themselves, provided that they can beassured that it is being done in a fair way.
If there are, say, 10 candidates to be elected, then at the firststage of the count, each candidate will have a number ofvotes of value 1 from the preference votes, and a number ofvotes of value 0.1 from the X-votes.
From this point onwards the count can proceed just as if itwere a regular STV count, except that, of course, whensurpluses have to be transferred, it will only be thepreference votes for which the amount retained will bereduced, thereby allowing some of the vote to be transferredto the next preference.
5. ConclusionThe advocates of preference voting by STV have beentrying for over 100 years to beat the advocates of X-voting.There is an adage which says If you can't beat them, jointhem. What is proposed here is not so much a case ofjoining them as incorporating them.
It is possible that, in the course of time, the X-voters willsee that their interests could be better served by goingacross to preference voting, but the proposal is not to tryand force STV on them.
Editorial CommentThe above proposal effectively merges the voting methodsof First Past The Post and STV, so that the user can choosewhich method to employ. However, given that an STV-stylecount is to be undertaken, it seems logical to make anextension to Warren's proposal as follows: Allow the voterto place any number of X's on the ballot paper. Each Xcounts as a first-preference value of 1/n, where n is thenumber of X's. With this proposal, an election for a singlecandidate in which the voter judges two candidates as ofequal merit and no others of interest, two X's can be used,counting as 0.5 for each. More significantly, in my ownexperience for some elections, one can have, say, 6 seats tofill, but one has knowledge of only, say 3 candidates. Underconventional X-voting (and Warren's proposal) one couldplace 3 X's and loose half of ones voting power. Under thissuggestion, 1/3 of a vote would go to each candidate andthere would be no loss of voting power.
2
Issue 11 Voting matters, for the technical issues of STV, April 2000
AV-plus, PR and
Essential AMS
Philip Kestelman
NomenclatureMuch like Proportional Representation (PR), SingleTransferable Voting (STV) is not an electoral system but aprinciple. There are various forms of STV: single-memberSTV, better known as Alternative Voting (AV); and multi-member STV, using various counting procedures (withpotentially different results).
In October 1998, the Independent Commission on the VotingSystem (ICVS) recommended AV-plus for electing 659 UKMPs: mostly in around 543 AV constituencies, with 15-20percent compensatory MPs, in 80 relatively small Top-upareas (electing 4 - 11 total MPs per area, including one or twoAdditional Members). Compensating parties under-represented by Constituency MPs (AV), d’Hondt allocation ofTop-up MPs would render total MPs semi-proportional toSecond / Party Votes, with choice of candidate within party(Open List PR4).
Is AV-plus a form of PR? Is AV-plus an Additional MemberSystem (AMS)? Indeed, is AV-plus a form of multi-memberSTV? Answers to all three questions depend on what youmean by PR, AMS and STV, respectively!
Proportional RepresentationRitchie (Tribune, 11 June 1999) has argued that
“The Jenkins Committee’s recommendations have much torecommend them, but there is little more chance of themdelivering a proportional result than there is under the presentsystem”.
His introduction of a probabilistic element is welcome: herecomparing AV-plus with so-called ‘First-Past-the-Post’ (FPP).
Jenkins4 estimated that, in the 1997 UK General Election(FPP), AV-plus would have reduced the “DV score” from21 percent to 13.2 percent. Measuring Deviation fromProportionality, DV = Loosemore-Hanby Index = LHI8. LHIsof 4 - 8 percent represent practically “ full proportionality” ;and for AV-plus, Jenkins4 claimed only ‘broadproportionality’ .
Compare other d’Hondt systems. In the May 1999 ScottishParliamentary Election (FPP-plus: seven Top-up MSPs perRegion × 8 = 56 / 129 = 43 percent), the Second / Party VoteLHI was 10.5 percent. Ironically, total MSPs proved morerepresentative of First / FPP Votes (LHI = 5.4 percent)! In theMay 1999 Welsh Assembly Election (FPP-plus: four Top-upMWAs per Region × 5 = 20 / 60 = 33 percent), the Party VoteLHI was 11.2 percent (Guardian, 8 May 1999).
In Britain, the June 1999 European Parliamentary ElectionLHI reached 14.1 percent (Closed List PR: 84 MEPs: 4 - 11per Region: Guardian, 15 June 1999): ‘broad proportionality’ .Such pure d’Hondt seat allocation favours larger parties,proving considerably less representative than LargestRemainder (which would have yielded LHI = 6.1 percent).
Over the last 10 Irish general elections (multi-member STV,1969-97), aggregate First Count LHI averaged 7.0 percent(ranging 3.4 - 12.9 percent between elections: from ‘ full PR’down to ‘broad PR’ in 1997). Between three- and five-member STV constituencies (averaging 7.0 and 7.4 percent,respectively), LHIs differed insignificantly7. In the June 1998Northern Ireland Assembly Election (six-member STV), FirstPreference LHI was 6.6 percent (Irish Times, 29 June 1998).
Additional Member SystemsNow used in Germany, New Zealand, Scotland and Wales,FPP-plus is frequently referred to misleadingly as the AMS.Thus Bogdanor2:
“ the additional member system is, conceptually, a ‘closed’ listsystem ... it combines many of the faults of the first-past-the-post system with many of the defects of list systems ofproportional representation” .
Confusingly, Bogdanor was alluding to “a variant of theGerman system”, recommended by the Hansard SocietyCommission on Electoral Reform: FPP without separate partyvoting, topped-up regionally with FPP ‘best losers’ (25% ofall MPs1).
At the 1994 German General Election, 328 Constituency MPswere elected by FPP (First Votes); d’Hondt allocating 328Top-up MPs, in 16 Regions, according to Second Votes(Closed List PR9). However, Second Votes may indicatevoters' second preference parties5; as suspected in the 1999Scottish and Welsh elections (Times, 8 May 1999):
“All electors then had a second vote. This should have beenused to indicate their favourite political party. There iswidespread confusion on this point and the fear that somepeople thought that they were being asked for their secondpreference” .
Voting separately for constituency MPs and parties — OneVoter Two votes — may well encourage tactical (insincere)
3
Voting matters, for the technical issues of STV, April 2000 Issue 11
voting. Especially in areas safe for the most-favoured party,a Second Vote for that party would elect no Top-up MP (andthus be wasted); and it would be more rational to vote for aless-favoured party, against a least-favoured party4.
The average area represented by a German MP under FPP-plus in 1994 was over 20 times that of 656 FPPconstituencies. In contrast, the mean area covered by eachMP under AV-plus, with two Top-up MPs per area, would beonly three times that of 659 FPP constituencies — just likethree-member STV!
STV-plusIt is not widely realised that, in Malta since 1987, five-member STV has operated with a conditional AMS6. At the1981 General Election, the Nationalist Party received anabsolute majority of First Preferences (50.9 percent), but aminority of STV seats (31 / 65 = 47.7 percent).
Public outrage forced a constitutional amendment,guaranteeing a bare parliamentary majority to a partyexceeding half of all STV First Preferences. At the 1987Maltese General Election, the Nationalists won the samemajority of First Preferences (50.9 percent), and minority ofSTV seats (47.7 percent); and therefore received fouradditional seats (totalling 35 / 69 = 50.7 percent of all MPs).
The 1992 General Election required no compensatory seats.Yet at the 1996 General Election − with fine impartiality −the Maltese Labour Party won 50.7 percent of FirstPreferences, but only 47.7 percent of STV seats!Accordingly, for a bare parliamentary majority, Labourreceived four additional seats (again totalling 50.7 percentof all MPs).
These few compensatory seats (4 / 69 = six percent) wereoccupied by STV Final Count ‘best losers’ : runners-up forthe party under-represented by STV alone. Thus AdditionalMembers both stood for election and retained theirconstituency links.
The Maltese AMS (STV-plus) neatly solved an acutepolitical problem. Incidentally, Malta remains a two-partypolity, despite the opportunities for party fragmentationafforded by multi-member STV.
In the June 1998 Northern Ireland Assembly Election, theSocial Democratic and Labour Party won more STV FirstPreferences than the Ulster Unionist Party (177,963 /172,225 votes); but fewer Members (24 / 28 seats). Thatowed little to vote-transfers (Irish Times, 26 June 1998):even SDLP final ‘preferences’ exceeded those for the UUP(191,091 / 185,560 votes). The SDLP deserved fiveAdditional Members (29 / 28 total seats proportionatingSDLP to UUP).
STV-plus could well be generalised to British conditions;
and would remedy the corruption of Party VoteManagement — a form of tactical voting which disfiguresIrish STV3. Party Vote Management involves a party’ssupporters spreading their First Preferences evenly amongits candidates: intended to keep them in the STV count foras long as possible (hoovering up stray transfers). Inaddition, each party nominates one more candidate than itexpects seats; avoiding premature elimination throughspreading its votes too thinly (‘over-nomination’ ).
Proportionating total (Constituency + Compensatory) seatsto Party First Preferences, STV-plus could also reconcile themain parties (fearing the spectacle of disunity) to multi-member STV's wider choice of candidate. With each party'scandidates competing for the voters’ affections, their FirstPreferences would complement each other in determiningparliamentary party strengths under STV-plus. AV-pluscould be redeemed likewise.
Essential AMSAV-plus clarifies that AMS is not essentially FPP or ClosedParty Lists. Both STV-plus (e.g. Malta), and the HansardSociety Commission variant of the German AMS, show thatseparate voting for Constituency Members and Parties isequally inessential. Anxious to avoid “all traces of a partylist” , the Hansard Society Commission recommended thatall candidates should stand in constituency elections1.
Likewise, the ICVS stressed “open as opposed to closedlists for Top-up members” : Second / Party Votes offering achoice of candidate4. However, with three candidates permajor party, preferential (rank-ordered, numbered) SecondVotes are clearly better than categorical (single choice,X-marked) voting.
In that case, why not simply integrate First / AV withSecond / Party votes: semi-proportionating total (AV + Top-up) MPs to AV First Preferences; with AV Final Count ‘bestlosers’ as Top-up MPs? Aiming to maximise AV FirstPreferences (and hence total MPs), each party wouldbecome highly motivated to nominate more than onecandidate per constituency.
Thus could an improved AV-plus increase voter choice, bothwithin and between parties. With a transferable choice ofcandidate within party, Party First Preferences are mostsincere.
The ICVS argued that separating Constituency from Partyvotes would liberate voters from unwanted candidates ofpreferred parties; and that transmuting Constituency ‘bestlosers’ into Top-up winners would be hard to explain4. Validagainst FPP-plus, both objections are much attenuated bymore than one AV candidate per Constituency Party.
One Voter One Vote could then become far less wastefulthan One Voter Two Votes. In both Scottish and Welsh
4
Issue 11 Voting matters, for the technical issues of STV, April 2000
elections, around half of both First and Second votes electednobody (Guardian, 8 May 1999).
Moreover, the ICVS version of AV-plus (switching betweenpreferential and categorical voting) is even more complicatedfor voters than multi-member STV. Indeed, it has been argued— rather cruelly — that its very complexity would favour thatnext step!
ConclusionsICVS-proposed AV-plus is an Additional Member System(AMS), mediating semi-PR (‘broad proportionality’ ). AMS isconfined neither to FPP-plus nor to separate Constituency andParty List voting.
AV-plus would be simplified by integrating Constituency withParty voting, each party nominating more than one AVcandidate per constituency; rendering total MPs semi-proportional to First Preferences; and exploiting the rich cropof Final Count ‘best losers’ as Top-up MPs. AV-plus couldthus achieve much towards multi-member STV (which mayalso benefit from some mild topping-up: STV-plus).
It remains unclear why the Scottish Parliament includes moreTop-up Members (43%) than the Welsh Assembly (33%):both more than the ICVS-proposed House of Commons (15-20%). With 20−25 percent Top-up MPs, AV-plus wouldincrease Party Representativity (‘proportionality’ ).
In the end, parties must nominate parliamentary candidates;while the voter’s predicament is paramount. With preferentialvoting in fairly small Top-up areas, AV-plus essentially placesPR on a human scale. Commitment to that principle need notrule out debate on technical improvements (short of multi-member STV) before the Referendum.
References1. Blake R (1976): The Report of the Hansard Society
Commission on Electoral Reform. Hansard Society forParliamentary Government, London.
3. Gallagher M (1993): ‘The Election of the 27th Dáil’ inGallagher M and Laver M eds: How Ireland Voted1992. PSAI Press, Limerick.
4. Jenkins R (1998): The Report of the IndependentCommission on the Voting System. Cm 4090-I. TheStationery Office, London.
5. Jesse E (1988): ‘Split-voting in the Federal Republic ofGermany: An Analysis of the Federal Elections from1953 to 1987’ : Electoral Studies 7, 109-124.
6. Keesing's (1987 and 1996): Record of World Events33, 35214 and 42, 41340.
7. Kestelman P (1996): Is STV a form of PR?, Votingmatters, Issue 6, 5-9.
8. Kestelman P (1999): Quantifying Representativity,Voting matters, Issue 10, 7-10.
9. Mackie T and Rose R (1997): A Decade of ElectionResults: Updating the International Almanac. Centre forthe Study of Public Policy, Strathclyde University,Glasgow.
Tie-Breaking in STVEarl Kitchener
It is a fundamental principle of STV that later preferencesshould not affect the fate of earlier ones; this encouragessincere voting, but means that some arbitrary or randomchoice must be made to break ties, which can giveunreasonable results.
An extreme case can arise where there is one seat and theelectors are the same as the candidates; for example, if apartnership is electing a senior partner. Each candidate mayput himself first, and all, except candidate A, put A second.Under most present rules, one candidate then has to beexcluded at random, and it may be A. There is no way ofgetting over this unreasonable result without looking at laterpreferences, and the system of Borda scores is probably asgood as any; with N candidates, N-1 points are allotted to afirst preference, N-2 to a second, and so on. If it were desiredto increase the importance of early preferences, the intervalbetween values could be increased for early preferences. Tiesin this system would be very rare, and it could be used tobreak ties in the normal STV counting.
In the above example no candidate or voter could reasonablyobject to the result, but in a real election, reported by Hill1,with four candidates for one place, the voting was:
A B C 1 B A D 1 A C D B 1 B C A 1
The quota is two, which both A and B have. Under theproposed system A, with nine, beats B's eight. The secondvoter may complain that his second preference, for A, enabledA to beat his first preference. If the second voter had known inadvance how the others were going to vote, he would not haveput A second; but it is not unusual in small STV elections fora voter to find that if he had known the other voters' intentions
5
Voting matters, for the technical issues of STV, April 2000 Issue 11
he would have voted differently. He has got his secondpreference in, so has not much to complain about. In view ofthe uncertainty of voting intentions it is doubtful whetherthe proposed rule would lead to insincere voting, and itwould avoid the possibility of A being unreasonablyexcluded in the first example. It has the virtue of satisfyingWoodall's “No support” property2, that no candidate who isnot listed by any voter should be elected unless everycandidate who receives some support is elected.
Hill has described a Sequential STV system3 which deals ina more general way with the problem of prematureexclusion of a candidate with few first preferences, butmany other early ones; Hill does not recommend it, becauseof the breach of the rule against looking at later preferences.The present proposal, being confined to tie-breaking, mightbe less likely to lead to insincere voting, which is the main(and perhaps the only) objection to looking at laterpreferences.
References1. I D Hill, ERS Document TC 95/13, September 1995.
2. D R Woodall, Properties of Preferential ElectionRules. Voting matters, Issue 3 (1994), p10
3. l D Hill, Sequential STV. Voting matters, Issue 2(1994), pp5-7
Checking two STVprograms
B A Wichmann
Last year, I received a request from the Electoral ReformBallot Services to ‘validate’ the computer software that theyuse to perform elections for their customers. Before thatwork was finished, I had another request from ERS itself tore-certify the program used to perform elections in theChurch of England. Since there was a substantial overlapbetween both of these activities, these are reported together.
The checking undertaken was merely to ensure that theelection results reported were as required by the respectiverules. Hence many issues which might be of interest werenot examined, such as: the user-friendliness, speed andmemory requirements, number of satisfied users, maturity ofthe program, etc. In fact, the two programs which weretested are very different: David Hill's program is a completesystem for data entry and edit, counting and presentation ofthe results and has been available for some years. Incontrast, Keith Edkins' program is solely a countingprogram and is a recent development.
ERBS's requirements were identified as mainly to check aprogram that implements the ERS rules that were publishedin 19971 (ERS97). However, their requirements aresignificant in terms of the capacity required, amounting tothe ability to handle up to 350 candidates and up to 250,000votes. In principle, modern computers have no inherentdifficulty in handling elections of that size, provide thesoftware is designed appropriately.
If software is to be shown to be reliable, then a largenumber of test cases need to be run, or an alternative meansneeds to be devised to show logically that all the relevantfunctionality is correctly implemented. In performing thefirst certification of the Church of England rules in 1990,the technique adopted was to ensure that all the code inDavid Hill's counting engine was executed, and that theelection results obtained were correct (checked by EricSyddique). It was not thought that the same technique couldbe applied effectively for the ERBS validation, so the use ofmany tests was used instead.
If high reliability is to be demonstrated then severalhundred tests should be run (corresponding to some years ofuse by ERBS). This immediately gives a difficult problem— how can one be assured that the result produced by thecomputer is correct? Initially an attempt was made todetermine a small number of tests which performs all therelevant functionality which would then make manualchecking feasible. However, the individual actions inERS97 are quite numerous and difficult to identify — forinstance, the result sheet does not state many specificactions undertaken during a count. Hence it seemed that thebest means for undertaking the checking was to comparetwo programs for the ERS97 rules which were available.
Comparing two programs to increase reliability is notwidely regarded2, but in this case, the two programs wereknown to have very different internal workings and werequite independently developed. Hence it was thought thatthe comparison would be effective.
Unless comparisons can be made automatically by program,the number of tests will be limited to a level which wouldnot give the assurance needed. Hence to facilitate suchcomparison and to avoid the need for the STV programs toproduce elaborate printing, an output format was designedthat could be input into a spreadsheet for printing. Thisformat is logically just the conventional Result Sheet, butspecified so that mechanical checks, such as those on rowand column arithmetic, can be made. I am grateful to bothauthors that they amended their programs to produce thisoutput since the testing would have been very tediouswithout that. Two small differences were located betweenthe programs but an analysis showed that neither couldchange the result. Finally, the comparisons were automatedwhich resulted in a successful validation of Keith Edkins'program.
6
Issue 11 Voting matters, for the technical issues of STV, April 2000
No formal validation was undertaken of David Hill's programfor these rules, but, of course, the same results were obtained.The program is not designed to handle ERBS's very largeelections. It currently has 50 as its maximum number ofcandidates. ERBS would also wish for Colin Rosenstiel'sinterpretation of the quota reduction rules to be applied, butthis has not been implemented, as explained in David Hill'sarticle3.
A number of issues arose from the validation as follows:
Quota reduction
A logical problem has been noted by David Hill in ERS97which arises when the quota is reduced before any candidateis elected. This issue is defined and discussed in a separatearticle in this issue3. The consequences for this validation wasthat no comparison was possible when this situation arosesince David Hill's program does not produce a result, due tothe uncertainty in the meaning of the rules. The problem canbe regarded as serious, since around 25% of those tests whichare based upon real elections involved quota reduction. Idecided that I could not formally sign my validation report,since, in my opinion, the meaning of the rules was sufficientlyuncertain in this respect. Subsequent to undertaking this work,an analysis showed that the problem could only arise whentransfers occurred after quota reduction. For instance, thiscannot happen when there is only one seat. An analysis of myelection data suggests that the quota reduction problemactually arises in about 12% of real elections. Readers candecide for themselves the significance of this problem fromthe two articles about quota reduction in this issue3,8.
New data base
The data base of election data described in Voting matters4 hasbeen substantially enhanced as a result of both validations.This data is now available on a CD-ROM. In order tofacilitate the collection of data from real elections, a programhas been written, available as a MS-DOS/Windows program,which produces an anonymous version of election data bytaking a statistical sample. Anybody can therefore add data tothe collection without concern for the confidentiality of thesource. (The data base contains the results for each electionfor the two rules being considered here, and also for the Meekrules.)
Capacity tests
In order to check that large elections could be handled, aprogram was written to generate large test data together withthe results in result sheet format. This technique showed thatthese large tests can indeed be handled by any modern PC.
Tie-breaks
If an election requires the use of a tie-break, then a computerprogram makes a random choice. When comparing twoprograms, such a tie-break can result in two valid, butdifferent results. This made the validation awkward, sinceeither that election had to be ignored, or one of the programshad to be re-run with the option taken by the other programenforced. In most such elections the results were notcompared, and as a result, a small difference between the twoprograms was not detected. The proposal to resolve tie-breaksby Borda scores would largely avoid this problem7.
Church of England validationSince the objective here was to revalidate David Hill'sprogram, little would be gained in repeating the activityundertaken for the first validation. There were two changes tothe Church's specification: a small change to rectify theLichfield anomaly (which influences the main counting logic,see below), and the much larger change to add the handling ofconstraints. The logic used to handle constraints is specified inVoting matters5.
The testing of the main counting logic relied upon theprevious testing and the clearance of the Lichfield anomaly.Also, all the tests run were checked for the correctness of therow and column arithmetic. Hence the main effort was inchecking the constraint handling.
The new Church of England rules (GS1327)6 merely specifythe actions to be taken during the count using the concept ofcandidates which are doomed or guarded. A doomedcandidate is one that cannot be elected if a conformant resultis to be obtained. A guarded candidate is one that must beelected if a conformant result is to be obtained. GS1327 doesnot specify the forms that the constraint might take, althoughit is understood that David Hill's program provides directsupport for the constraints that are actually used by theChurch. The program requires that every candidate is amember of one and only one constraint group. The constraintsthemselves specify the maximum and minimum number in aset of constraint groups.
A concern was that it might be possible to specify someconstraints which would cause the program to compute for aneffectively unbounded length of time. This does not seempossible, basically because the constraints are linear.However, a test was devised which produced a very largetable of potential solutions which caused the program toproduce a message that insufficient computer storage wasavailable. David Hill has subsequently modified his programto use a file for the table within the counting process whichnow handles even this case.
7
Voting matters, for the technical issues of STV, April 2000 Issue 11
Although the program provides direct support for only oneform of constraint, indirect support is provided for a muchlarger range of constraints. As an example, suppose that theconstraint groups are Scottish, English and Welsh. Aconstraint that is not directly support would be that thenumber of English elected is greater than the number ofScottish elected. However, the indirect method was capableof handling this case.
The approach to testing constraints was to take someelections from the data base (which are like real elections)and add constraints and then check for a conformant result.It was thought that 13 tests adequately covered theimplementation of the constraint logic. It appears that thereleased program handles constraints which are very muchmore complex that would arise with Church of Englandcounts.
Lichfield anomaly
A problem arose with the use of previous rules whichresulted in the change to the rules even when constraints arenot being used. This is called the Lichfield anomaly after thediocese where it arose. A simple test case (based upon anexample from David Hill) would be to elect 2 from 5 withthe following voting pattern:
20 AC13 B12 C 2 DB 1 EB
Under the old rules, even though exclusions were one at atime, A's surplus redistribution would be deferred, because itcould not change who were the bottom two. Under the newrules it is not deferred because it could change who is thebottom one.
Old rules
A 20 20 El ect edB 13 +1 14 +2 16 El ect edC 12 12 El ect edD 2 2 −2 0E 1 −1 0
New rules
A 20 −4 16 El ect edB 13C 12 +4 16 El ect edD 2E 1
A large election
The original certification of David Hill's program did notcover (as it really should have done) the data preparationside. Hence this time, an effort was made to use and test theinput logic of the program. A large election was input, both
by use of a text editor, and by use of David Hill's programwith all the checking options enabled. The conclusion fromthis was that double-entry should be used in almost allcircumstances, since several data entry errors wouldotherwise be undetected. On the other hand, the programbehaved perfectly. (A few points were noted on the userinterface, which has resulted in some improvements to thereleased version.)
ConclusionsSuitable techniques can be used to check STV software. Theresults have revealed some defects in the programsinvolved, which, of course, have been removed. However,in fairness to the authors, it is unclear if any of these defectswould have remained undetected. Hence the main gain isadditional confidence in the software and a reduced risk thatsuch a program would fail during an actual count.
Copies of the full report on both validations are availablefrom the author. Electronic copies are available by mailing arequest to [email protected].
References1. R A Newland and F S Britton. How to conduct an
election by the Single Transferable Vote. 3rd Edition,ERS. 1997.
2. J C Knight and N G Leveson. An experimentalevaluation of the assumption of independence inmultiversion programming. IEEE Trans. SoftwareEng. Volume 12, No 1. 1986.
3. I D Hill. Quota Reduction in hand-counting STVrules. Voting matters, Issue 11 pp8-9.
4. B A Wichmann. An STV Database. Voting matters,Issue 2. p9. 1994.
5. I D Hill. STV with constraints. Voting matters, Issue9 pp2-4.
6. GS1327: General Synod, Single Transferable Voteregulations 1990 and 1998. (Obtainable from ChurchHouse Bookshop, Great Smith Street, London SW1P3BN.)
7. Earl Kitchener. Tie-breaking in STV. Voting matters,Issue 11 p5.
8. C Rosenstiel. The problem of surpluses when thequota is reduced. Voting matters. Issue 11 p10.
8
Issue 11 Voting matters, for the technical issues of STV, April 2000
Quota reduction in hand-counting STV rules
I D Hill
The 1997 ERS rules for STV1 include a rule for reducing thequota if some votes become non-transferable before anyonehas been deemed elected. In general, such a rule is to bewelcomed, as the smaller the quota can legitimately be madethe better.
However, in attempting to implement this rule in my STVcomputer program I ran into difficulties of interpretation. Itmay be that the circumstances that cause such difficultywould rarely arise in practice, but that is irrelevant. Rules,and programs derived from them, have to work in allcircumstances. I wished to know whether the difficulties werereal, or whether I was being over-fussy in imagining them, soI consulted a number of people, chosen as beingknowledgeable in STV, and asked for their views on what therules required with each of four examples. Their replies weresufficiently varied as to show that there is a real problem.
The rules in question are:
5.3.1 If a surplus arises at the first stage, select forexamination all the papers which the candidate hasreceived.
5.3.2 If a surplus arises at a later stage, because of thetransfer of another surplus or the exclusion of acandidate or candidates, select only the last receivedbatch of papers, which gave rise to the surplus.
With minor changes of wording those two rules are as in theprevious edition, but we now also have:
5.4.8 If any papers have become non-transferable beforeany candidate has been deemed elected, recalculate thequota as in paragraph 5.1.6, ignoring the non-transferable vote.
The first three examples were as shown below. The fourthwas somewhat different as it did not do what was intendedand it is better here to show the intended case instead of theunintended one.
El ect i on 1 El ect i on 2 El ect i on 3 El ect i on 4 17 AB. . 14 AB. . 17 AB. . 12 AB. . 11 BC. . 11 BC. . 11 BC. . 11 BC. . 10 CD. . 10 CD. . 10 CD. . 10 CD. . 10 DA. . 10 DA. . 9 DA. . 10 DA. . 6 E( pl ump) 6 E( pl ump) 6 E( pl ump) 6 E( pl ump) 3 EAC. . 1 EAC. . 5 FAD. .
In each of these there are 2 seats to be filled and 54 votes. Ineach case the initial quota is 54/3 = 18. In each case 6 votesbecome non-transferable before any candidate is deemed
elected, so the quota is reduced to 48/3 = 16. In each casecandidate A now has over a quota of votes. How do the rulesrequire A's surplus to be dealt with?
As a result of the exercise, it seems clear to me that trying toimplement these rules would not be sensible until they havebeen amended for, even in the simplest cases, elections 1 and2, it is not absolutely clear where A's surplus should go, sinceit cannot really be said that the papers concerned ‘gave rise tothe surplus’ . In election 3 there was much disagreement abouthow much goes to C and how much (if any) to B. If expertsdisagree, to the extent that was observed, on what the rulesmean, what hope is there for an ordinary returning officer?
In election 4 the ‘gave rise to the surplus’ wording is evenmore far-fetched than in the other cases, and my own view isthat this case is not catered for in the rules.
I am grateful for an additional case that was suggested to melater by one of those whom I had consulted:
El ect i on 5 14 AB. . 11 BC. . 10 CD. . 10 DA. . 3 E ( pl ump) 6 EAC. .
I would probably have got this one wrong, as my first reactionon seeing it was ‘No problem here’ , because A has already gotmore than the original quota by the time it is known that anyvotes have become non-transferable, so quota reductionwould not apply, but not so. Although exceeding the quota, Ais not actually deemed elected (para 5.4.9) until after thequota reduction has been made (para 5.4.8).
My own view is that, in principle, the right way to do suchquota reduction is to re-start the election after the reduction,with the equivalent of a new Stage 1, treating all excludedcandidates as if withdrawn, but the wording of the currentrules does not seem to support that. For the moment what iswanted is the publication of a clarifying amendment to therules, so that users can know how to proceed. This issue canbe resolved only by a properly authorised statement from theERS Council.
Reference1. Newland R A and Britton F S. How to conduct an
election by the Single Transferable Vote. 3rd edition.Electoral Reform Society. 1997.
9
Voting matters, for the technical issues of STV, April 2000 Issue 11
The problem of surpluses when the quota is reduced
Colin Rosenstiel
Normally a candidate elected with a quota receives ballotpapers at the stage at which their votes first exceed thequota. Since the changes to the rules made in 1997 it is nowpossible for a candidate to be elected with a surplus at astage where they receive no ballot papers. If the quota isreduced at the same stage from a larger number than thecandidate's current vote to a figure below that vote they canbe declared elected with a surplus. It has of course beenpossible for a candidate to be elected without a surplus at astage where they receive no ballot papers since theintroduction of the second edition of the rules in 1976.
The candidate's surplus does not then arise from papersreceived at that stage, the rule heretofore. However theprinciple remains that their surplus is derived only from thelast-received parcel of papers, their first preferences if nopapers have been received since then. The rules in detailsay:
5.3 Transfer of a surplus
5.3.1 If a surplus arises at the first stage, select forexamination all the papers which the candidate hasreceived.
5.3.2 If a surplus arises at a later stage, because of thetransfer of another surplus or the exclusion of acandidate or candidates, select only the last receivedbatch of papers, which gave rise to the surplus.
Any difficulty in interpreting this wording is because of thepossibility of different interpretations of the term ‘arises’ .The candidate declared elected due to the quota beingreduced may not have received any papers at the stage inquestion. I would therefore maintain that only perversitycould lead to the conclusion that the word ‘arises’ couldrefer to any other stage than the one at which the paperswere received and that the most recently received parcel ofpapers should be the ones used to transfer the surplus as hasalways been the case.
It is also possible for the papers forming a surplus to beworth less than the value of the surplus. This is again notnew, in terms of transferable papers, and is to be treated inthe same way — no paper may be transferred at a highervalue than it had when received by the candidate with thesurplus.
In his article Dr Hill1 gives a number of examples which heclaims there are difficulties over interpretation of the rulesquoted above. He doesn't explain what the difficulties are. If
the precise wording above is not applicable (which I argueabove is not the case anyway) what rules does he imagineare to be followed?
There is also a problem about the importance of thissupposed difficulty. The figure of 12% of cases ismentioned by the Dr Wichmann2, though withoutsupporting evidence. His original claim was for 25% ofcases but it turns out that half were AV elections where nosurplus can ever be transferred!
Bear in mind that the disputed cases require (a) a reducedquota (b) a surplus arising at a stage where the electedcandidate receives no papers (c) that surplus to betransferred. Since the rule came in I have counted manyelections. Just three had reduced quotas. In no cases did asurplus arise at a stage where a candidate received no votes,let alone such a surplus requiring to be transferred.
References 1. I D Hill. Quota reduction in hand-counting STV rules.Voting matters. Issue 11. p9.
2. B A Wichmann. Checking two STV programs. Votingmatters. Issue 11. pp6-8.
Brian Wichmann respondsColin Rosenstiel correctly quotes my article which onreflection might be confusing. The 25% refers to thoseelections in which, logically, quota reduction takes place.The 12% refers to those elections in which subsequenttransfers take place. Nobody knows what fraction of the12% are truly ‘ambiguous’ in the sense raised by DavidHill. I would regard any significant percentage as quiteunacceptable, since surely STV should be no less certainthat First Past The Post. To avoid any problems, I wouldsuggest that the Council of the ERS formally accepts asmall wording change proposed by Colin Rosenstiel in aletter to David Hill dated 8th November 1998.
10
Issue 11 Voting matters, for the technical issues of STV, April 2000
1
Voting mattersfor the technical issues of STV
The Electoral Reform Society
Issue 12 November 2000
All correspondence regarding Voting matters should beaddressed to:
B A Wichmann, The Editor, Voting matters, The Electoral ReformSociety, 6 Chancel Street, London, SE1 0UU.
Readers are reminded that views expressed in Voting matters bycontributors do not necessarily reflect those of the ElectoralReform Society.
To aid production, the Editor would welcome contributions onIBM-PC discs (with a printed copy as well) or [email protected].
EditorialIssue 9 of Voting matters contained two articles on the vexedquestion of ordering candidates when preferential voting isused. In the first article here Joe Otten returns to this questionin the light of some problems noted in the previous‘solutions’ .
In the next two articles, David Hill questions the suggestionsmade in two different articles that appeared in Issue 11. Asoften happens in this area, a suggestion which seems fineinitially, may have subtle difficulties — at least as far aspeople other than the author are concerned!
My own article for this issue considers the effect of numericalaccuracy of STV when using the Meek algorithm. Unlike thehand-counting rules, the algorithm itself does not define theaccuracy that should be used, although omitting thisinformation is the convention with numerical algorithms.
Bob Jones questions what one wants from an electoral systemand considers the use of Decision Analysis to make sense ofthe conflicting requirements. Readers are invited to make theirown contribution. The editor hopes that, given sufficientresponse, a further article might be appropriate which shouldprovide a view from the entire readership of Voting matters.
A major article is provided by Simon Gazeley in which a newalgorithm is proposed for a computer-based STV count. As isto be expected with such an algorithm, it will take asignificant effort to validate. No doubt, if a program isproduced to implement it, some ambiguities will be noted.Given an implementation, then comparisons should bestraightforward. It appears that the algorithm is essentiallymore complex than, say Meek — but does that matter?
David Hill provides a third article which is surely a warningto all who advocate STV. We have no ‘standard’ for STV andin some Australian elections, the rules do not appear to givethe benefits which one would expect.
Recently, an Internet group has been formed on STV. Aseditor, I will keep a watching brief on this, both to reportmaterial in Voting matters and also to encourage others towrite articles. As is usual with Internet traffic, it is ratherinformal and not suitable for direct publication.
A combined issue for Volume 1 of Voting matters has beenprepared. Unfortunately, it is not economic to print it, but it isavailable from me in the electronic format PDF which can beprinted easily on most modern computers.
1. Problems with methods advocatedin Voting Matters 9
I was struck by a comment by Hill1 that Rosenstiel'salternative method to the use of constraints violated theprinciple that later preferences should not be allowed tocount against earlier ones (I will refer to this as ‘ theprinciple’ in this paper). This was because the methodinvolved running repeated counts on the same vote profile,and thus a later preference may have its effect in one countwhen the fate of earlier preferences was still to be decided ina later count.
I realised that the same criticism could be levelled at themethod I advocated for selecting an ordered list2 (in thiscase of candidates for a party to offer at a EuropeanParliament election conducted using a list system). It couldalso be levelled at the similar system proposed byRosenstiel3. In each case multiple counts were used, and theresult of one count could affect the result of another — bythe use of a constraint in my case, or by overriding it in theother.
Example 1:
AC 2AD 10BC 10C 8DC 6
This gives the following results:
Vacancies Results
1 C 2 AC 3 ABC
Both methods give the Result: CABD.
Suppose Rosenstiel's method was used, and those voting BCchanged their vote to BDC, example 1 gives
Vacancies Results
1 C 2 AC 3 ABD
Now, C gets last place, and B and D are tied for third. Thetie is broken by looking at first preferences, so D is third.
Then there is a similar tie for second between A and B, so Bis second. Result ABDC. Voters have improved the positionof B by changing later preferences.
My method would still give the order CABD with example2, but would violate the principle given a similar example.
Wichmann4 suggests using the Meek keep factor fordetermining the ordering, and this case is not soimmediately obvious, since only one count is held. TheMeek algorithm does not allow later preferences toinfluence whether earlier preferences may be elected.However later preferences may affect the size of the keepfactor for elected candidates, and so if this is used to orderthe candidates, the principle is violated. Electing 3, thisgives ABCD in example 1 and ABDC in example 2.
2. Using the Orange Book methodThe Orange Book simply suggests that if an order isrequired, the order in which candidates are elected duringthe count should be used. This seems, on face value, to beinadequate for selecting a long list of candidates, since thecontest for the significant top places would be rather similarto a First Past the Post election, with a few candidates abovethe quota being given positions dependent only on thenumbers of first preferences received. Newland himself,author of the early editions of the Orange Book, indicates inhis Comparative Electoral Systems why he thinks thismethod is wrong, advocating a top-down method.
The method appears to rest on the assumption that it is thedetermination of the whole membership of the list that is theprimary purpose of the election. That is not the case. Thepurpose is that however many seats the party wins, thepeople thus elected are those who were selected by an STVballot with the appropriate number of vacancies. Thus in theGreen Party, where no more than 1 seat was won in anyregion, the top of the list should be the AV winner (asindeed they were, since the Green Party used a top-downmethod.) The Liberal Democrats won 2 seats in someregions, so there the appropriate selection would be that ofthe top two candidates by an STV election with 2 vacancies.
The problem is that the number of seats that a party will winis unknown at the time of selection. However, it may bereasonable to guess at that number. The order of election(orange book method) would give the order of thecandidates elected in the selection ballot, and the reverseorder of exclusion could determine the order of latercandidates. If a party wins 1 more or fewer seats, thedistortion might not be that great.
This does not seem entirely satisfactory, but I cannot seehow better can be done without abandoning the principle.
2
Issue 12 Voting matters, for the technical issues of STV, November 2000
3. Abandoning the PrincipleA great many articles in Voting matters have discussed theprinciple. Some have suggested that it might be relaxed, forexample to allow Borda scores to be used to break ties5.Personally I think the only strong argument against Condorcetstyle election rules is that they violate the principle. Thereforeif the principle must be lost, we may as well look at laterpreferences more freely and use an election rule more inkeeping with Condorcet principles, and do better than any ofthe methods advocated in Voting matters 9.
It seems to me that a great many voters would welcome asubstantial benefit to a second or third preference at theexpense of a small risk to a first preference. STV does seem torest on the assumption that the strength of a voter's support fortheir first preference is such that other considerations areoverridden. While I don't think this assumption is true for verymany voters (except perhaps for die-hard party loyalists), it isright for STV to make it. It is right because it makes the taskof voting much easier. The voter does not need to assess howhis or her use of later preferences might affect the fate of anearlier one. The principle encourages voters to indicate theirtrue preferences.
Nonetheless, if the price of the principle is reducing a contestto near equivalence to First Past the Post, I believe that priceis too high. I suggest the next question is how may we reapthe benefits of the information the principle denied us. In theone vacancy election, systems which violate the principle maybenefit by being able to guarantee the election of theCondorcet winner if there is one. I seek now to generalise thisbenefit to the election of an ordered list.
4. Generalising Condorcet principles to multiple vacanciesHill6 describes the complexity that can arise when trying togeneralise the concept of a Condorcet top-tier to a multiplevacancy election. However, if we are considering a listselection then we are not simply looking for a subset of all thecandidates, but adding them one at a time to a list. Thissimplifies the problem somewhat. Also for the purposes ofsimplicity I shall refer to Condorcet to mean any single-winner rule satisfying the Condorcet Criterion. The manner inwhich cycles should be resolved is not a significant concernhere; nor is whether Meek or ERS97 rules are used, althoughcomputer counting will be necessary.
The method which follows builds an ordered list from the topdown. It, like Condorcet, does not use exclusions at all, butconsiders at every stage, all possible pairs of candidates forthe next position to see if one beats all the others. Like STV,votes are retained by elected candidates so they have less orno influence on later positions.
The top position is elected by Condorcet (call this candidateP).
For every pair, X and Y of other candidates, we mustdetermine which is preferred to the other for the second place.We calculate the result of an STV election between P, X and Yfor 2 places (other candidates being withdrawn). Thiscalculation determines whether X is preferred to Y or viceversa. We read off the support for X and Y after any surplusfor P has been redistributed and this completes one element inthe Condorcet result square. (Normally it is only of interestwhich of X or Y is elected in this election. However themagnitude of the difference in support will be relevant if acycle-breaking method needs to be employed.) Thecalculation is repeated for all other pairs of candidates, notincluding P (or at least for as many pairs as are necessary todetermine the winner). Call the candidate thus elected toposition 2 Q.
We need to repeat this exercise for position 3, 4, 5, etc, andwe now have more than one elected candidate. Each time weperform an STV count including all the elected candidates,PQR..., and a pair of unelected candidates X and Y, and noothers, giving one element of the Condorcet result square asbefore. We then repeat this for every pair of unelectedcandidates, and add our new Condorcet-style winner to thelist.
Applied to Example 1, the result tables look like this:
A B C DA +2 - 12 +6B - 2 - 6 - 6C +12 +6 +4D - 6 +6 - 4
Position 2: (3 STV counts with 3 candidates, C and twoothers)
AvB: C has a surplus of 2, which is non-transferable - A 12, B10
AvD: C has a surplus of 6, which is non-transferable - A 12, D6
BvD: C has no surplus - B 10, D 16
A B DA +2 +6B - 2 - 6D - 6 +6
A is elected to position 2
3
Voting matters, for the technical issues of STV, November 2000 Issue 12
Position 3: (1 STV count with all candidates)
BvD: A has a surplus of 3, which goes 0.5 to C and 2.5 toD - B 10, D 8.5
B DB +1. 5D - 1. 5
B is elected to position 3
Result: CABD
Changing the 10 votes from BC to BDC as before (example2) creates a cycle:
Position 1:
A B C DA +2 - 12 - 4B - 2 - 6 - 6C +12 +6 - 16D +4 +6 +16
D is the Condorcet Winner and is elected to position 1.
Position 2:
AvB: - A 12, B 10
AvC: - A 12, C 8 (D is guarded, so A is not elected)
BvC: D has a surplus of 4 which goes to C (strictly 3.96with ERS97) - B 10, C 14
A B CA +2 +4B - 2 - 4C - 4 +4
A is elected to position 2
Position 3:
BvC: - B 10, C 8.5 (C and D are guarded, so B is notelected)
B CB +1. 5C - 1. 5
A is elected to position 3.
Result: DABC
D and C have swapped places, as is reasonable given thechange of votes from BC to BDC.
Instead of using a usual cycle-breaking rule, an alternativewould be to combine the election for the position inquestion with the following one, elect two, and then go backto the first, where there are now only 2 candidates to choosefrom, so there can be no cycle. (This would be a normal
STV election for the top two. Alternatively we couldconsider every possible triple, but this may lead to furthercycles.)
This procedure is a synthesis of STV and Condorcet. Ateach position a Condorcet-winner is added to the list, oncevotes cast for already-elected candidates have beendiscounted (reduced in value) in the manner of STV. It isnot vulnerable to the exclusion of potential winners withfew first preferences.
It could also form the basis for a synthesis of STV andCondorcet for unordered elections, although this would be asolution looking for a problem as regular STV is availablehere. Seeking to elect n candidates we could apply the STVrule to every subset of n+1 of the candidates and see whichn were able to beat off any individual challenger. As Hill6
says, the subset of n with this property may not exist, ormay not be unique. However the generalised Condorcetmethod above could be adapted in such cases to arbitratebetween competing sets of candidates, or to provide a resultwhere there appears to be none.
5. Summary of examples Ex 1 Ex 2Repeated count rules:Rosenst i el / Bot t om Up Over r i di ng ( R) :
CABD ABDCOt t en / Top Down Const r ai ned ( O) :
CABD CABDTop Down Over r i di ng ( TDO) :
CABD CABDBot t om Up Const r ai ned ( BUC) : CABD ABDC One count rules:Wi chmann Meek ( 2 pl aces) ( WM2) :
ABCD ABDCGeneralised Condorcet rule:Gener al i sed Condor cet ( GC) :
CABD DABC
I have not described the last two repeated count rules —they are hybrids of the Rosenstiel and Otten rules, whichmight be called Bottom Up Overriding and Top DownConstrained respectively. It is worth noting that BUC, likeGC, does not use exclusions, (candidates already allocated
4
Issue 12 Voting matters, for the technical issues of STV, November 2000
to lower positions are withdrawn before the start of the nextcount) but with different results.
What are the best results? CABD seems to be a clear favouritefor example 1. With example 2, the elementary conflict is thatif the electorate were to be represented by one person, the bestperson (from an AV point of view) would be C, and if it wereto be three, the best people would be A, B and D. Rules whichtake greater care over the top end of the list (O, TDO, WM2,OB1) therefore place C highly and those which concentrate onthe bottom (WM3, R, BUC, OB3) place C low. Notably WM3and OB3 place C low even in example 1.
We have, it seems, not entirely escaped from the considerationin point 2, of needing to know what position on the list is thecrucial one. If it is believed that a particular position on thelist, say 4th, is the key one, an STV count for 4 winners couldbe followed by BUC to fill the top 3 and O to fill the positionsfrom 5 down (or R and TDO respectively).
As to be expected GC succeeds in finding the Condorcetwinner D in Example 2, who is not found by any of the othermethods. Obviously this is an example of my choosing, and Ihave no doubt that other examples may show GC generatinginferior results.
6. ConclusionsI have described three broad approaches to ordered listselection, all of which are unsatisfactory. The methods usedby the Green Party and Liberal Democrats violate theprinciple, but fail to take advantage of the information thisreleases. The Generalised Condorcet method uses thisinformation but also violates the principle. The orange bookmethod, used as described here, may lead to a severelydistorted result if the guess is wrong.
While the methods described in 1, appear for the moment tobe the most practical solution to the question of ordering, thefact that counts for differing numbers of candidates frequentlyproduce inconsistent results undermines their credibility.
A significant source of these inconsistencies is changes inearly exclusions or the order of exclusions and in whichparcel of papers elects a candidate, resulting from the higheror lower quota. (Meek should be less vulnerable to two ofthese effects.) While my generalised Condorcet methodconceals any comparable inconsistencies that might bepresent, the fact that it eliminates exclusions altogether, meansthat it should be robust against exclusion-related effects.
The disadvantages are greater complexity and probably amore frequent violation of the principle that later preferencesshould not count against earlier ones. It will also requireconsiderably more computer time than the alternatives, whichmay be an issue with a very large election, particularly ifMeek is used. It would not be desirable to adopt a rule that
then had to be abandoned for very large elections.
I do not at this point advocate that a generalised Condorcetmethod is adopted. However, I think the idea has its merits,and I do believe the question of ordering demands furtherconsideration. While a single rule may not be appropriate forall circumstances, it should be possible to narrow the fieldsomewhat from that in section 5.
References1. I D Hill. STV with Constraints, Voting Matters 9, pp2-
3. C Rosenstiel. Producing a Party List using STV.Voting Matters 9, pp7-8, 1998.
4. B A Wichmann. Editorial Comment on 3, Votingmatters, 9, p8, 1998.
5. Lord Kitchener, Tie-Breaking in STV, Voting Matters11, pp5-6, 2000.
6. I D Hill, Trying to find a winning set of candidates.Voting matters, 4, p3. 1995.
Tie-breaking in STVI D Hill
Earl Kitchener1 puts forward a scheme for using Borda scoresfor tie-breaking within STV. In general Borda scores are not asensible way of conducting elections, but for this one purposeit will seem preferable to many people, to use something thattakes note of the wishes of the voters, rather than a resort torandomness. The question is whether any such scheme wouldcause more trouble than it is worth.
We need to remember that ties rarely occur except in the caseof very small elections, but it is just those very small oneswhere voters can see what is happening, and where the effectof later preferences upsetting earlier ones may be mosttroublesome.
In the real case quoted by Kitchener, there were 4 candidatesfor 1 seat. The 4 candidates were also the voters but noteveryone voted for themselves. The votes were
ABC 1BAD 1ACDB 1BCA 1
5
Voting matters, for the technical issues of STV, November 2000 Issue 12
giving an AB tie for first place whether judged byAlternative Vote or by Condorcet. Using Borda scores astie-breaker, A is elected, but this is solely because of a thirdpreference for A against a fourth preference for B.
Now Voter 2 has a right to be cross about that. He put A assecond choice meaning, according to all the bestexplanations of STV, “ If B is out of the running, then I wishto support A” but B was not out of the running at that point.
Suppose there were the same set-up the following year.Voter 2 is likely to decide to plump because putting in asecond preference the previous year was to hisdisadvantage. But Voter 1 may realise this and decide thathe must plump too to counteract Voter 2's plumping — thenVoters 3 and 4 will need to think about their strategies.
Whether anyone decides to plump or not is not really theissue. What matters is that tactical considerations have beenallowed in, where STV (in its AV version in this case) issupposed to be free of them.
It may seem a pity to decide it at random, but such lookingat the votes only decides it on the grounds that Voter 3preferred D to B whereas Voter 4 preferred A to D. Is thatreally relevant when D is clearly out of it anyway?
My own conclusion is that to look at later votes in suchcircumstances, by Borda scores or any other method, is nota good thing to do, but I recognise that it is a matter ofjudgement, not of a clear right and wrong.
Reference1. Earl Kitchener, Tie-breaking in STV. Voting matters,
Issue 11, p5, 2000
Mixing X-voting andpreference voting
I.D. Hill
Hugh Warren1 puts forward a plan to incorporate X-votinginto an STV election, so that those who prefer it are notforced into STV against their will. The aim is very sensiblebut, as he says, the voters must “be assured that it is beingdone in a fair way” . As Hamlet said: “ay, there's the rub” .Is it possible to find a way that actually is fair and, equallynecessary, will be accepted as fair by those concerned?
The Warren suggestion is to treat Xs as equal firstpreferences, treating each X as worth 1/m where there are mplaces to be filled. Now suppose, as he does, that m = 10. Iftwo voters each plump for a single candidate, one using anX and the other using a 1 in marking the paper, would it beregarded as fair for the second of those to be treated asworth 10 times as much as the first? Surely not.
In an editorial footnote, Brian Wichmann suggests analternative formulation, treating each X as worth 1/n wheren is the number of Xs marked on the paper. That wouldsolve the above difficulty, but only at the expense ofintroducing a new one.
Suppose two candidates get X-votes only, one getting 20 Xseach of value 0.5, because those voters used two Xs each,the other getting 40 Xs each of value 0.2, because thosevoters used five Xs each. The first then has a total votevalue of 10, the second a total vote value of 8. So if one ofthe two is elected it will be the one getting 20 Xs, not theone getting 40 Xs. Would X-voters regard that as fair? Iam quite sure that they would not. It is just this sort ofsituation that I presume that the Warren formulation wascarefully designed to avoid.
Is there any way of doing it that everyone would think fairin all cases? I doubt it.
Reference1. C H E Warren. Incorporating X-voting into
Preference voting by STV. Voting matters, Issue 11,p2. 2000.
The computationalaccuracy using the Meek
algorithmB A Wichmann
IntroductionThe Meek algorithm1 is specified without regard to theaccuracy of the computation (with the exception of theconvergence criterion, which is not relevant to this paper).The formulation in Pascal uses the type real which istraditionally floating point, but this could have varyingaccuracy or even be replaced by a rational arithmeticpackage of unbounded precision. A natural question to askis what computational accuracy is required to ensure thatthe ‘correct’ candidates are elected, ie, the same candidatesas if infinite precision was used. We demonstrate byexamples, that there are cases in which very high precisionis required.
An exampleIf a candidate A has first preference votes which only justexceed the quota, then those who have given A as their firstpreference will have only a small fraction of their votepassed on to their subsequent preference. Moreover, if mostof A's subsequent preferences are for B (say) and just one
6
Issue 12 Voting matters, for the technical issues of STV, November 2000
for C, then the fraction going to C can be made smaller still.
The above leads to the following example in which 3 seats areto be filled:
333 AX333 AY333 AZ333 BX333 BY333 BZ667 X667 Y667 Z 1 ABX 1 ABY 2 BAX
The total number of votes is 4003, which gives an initialquota of 1000.75. Since A and B each have 1001 firstpreference votes, there is a surplus to transfer after theirelection of a quarter of a vote. This implies that the weightassociated with A and B is roughly (1−1/4000). This furtherimplies that the vote ABX makes a contribution to X ofroughly 1/16,000,000th of a vote.
After the election of A and B, one of X, Y or Z must beeliminated. In the cases above, it is clear this should be Z,since that candidate has no contribution from the last threevotes, but X and Y do. However, if the implementation ofMeek only recorded millionths of a vote, then the last threecandidates would be regarded as equal, in which case, a tie-break would occur.
For this test, we are only concerned as to what happens at thethird stage. If a tie-break occurs, we know that theimplementation does not have the accuracy necessary tocompute the same result that would arise from infiniteaccuracy.
The above example illustrates that the accuracy required togive the same result as with infinite precision is unboundedeven with six candidates (since we can just use more votes toincrease the accuracy needed). However, the same techniquecan be employed with more candidates to increase theaccuracy without increasing the number of votes. Forinstance, with 69 candidates and less than 1,000 votes, onecan produce an example requiring 127 decimal places! Thefull details of this are available from the author.
ConclusionsThere are somewhat bizarre voting patterns in which theaccuracy required by the Meek algorithm is high, if the sameresult is to be obtained as that which would result frominfinite precision.
One cannot expect the accuracy provided by an actualimplementation to be high enough to guarantee the sameresult as that from infinite precision. (The highest availableaccuracy that is easily provided on a modern computer is 17decimal places.)
The examples used here involved only the first two stages of acount. However, an important property of the Meek algorithmis that there is no accumulation of rounding error from onestage to the next, since the state is just the (discrete) record ofthose elected and eliminated. The weights are not reallyrelevant since they only provide a starting point for the nextiterative step.
One could gauge the impact of computational accuracy if oneknew the rate at which ties arose which are not due to analgebraic tie. If such a computational tie arose with mydatabase of around 370 elections, then it should be detected.In work which involved comparing two implementations ofMeek(using all these 370 elections), it is likely that oneimplementation would report a tie-break when the otherimplementation did not. Such an occurrence did not arise.
Hence the overall conclusion is that the accuracy of theexisting implementation of 64-bits is sufficient in practice, butnot theoretically if the requirement is to produce the sameresult as that given by infinite precision.
Reference1. I D Hill, B A Wichmann and D R Woodall. Algorithm
123 — Single Transferable Vote by Meek's method.Computer Journal. 1986.
IntroductionDecision Analysis is a method by which comparisons betweendifferent courses of action may be evaluated in order to obtaina desired end product. In the field of electoral reform the endproduct is the best electoral system, and the means ofevaluating different systems is by comparing how well theymeasure up to desirable features of such systems.
The idea of applying Decision Analysis to electoral systemswas first suggested by Tony Cooper, chairman of DERG,inthe late 1980s and initially the performance of a system
7
Voting matters, for the technical issues of STV, November 2000 Issue 12
against each feature was evaluated as excellent, good, fairlygood and poor. More recently the evaluation has beencarried out numerically with scores being given up to amaximum of 10.
As well as this scoring procedure, it was realised that certainfeatures were of greater importance than others, andweighting factors (WF) were therefore applied to eachfeature. For example, proportionality is considered to bevery important and is thus given a WF of 3 , the relevantfeature score being multiplied by WF. On the other handease of counting is not of great importance as the returningofficer and his or her staff will have been trained to dealwith the relevant system. In this case the weighting factor(WF) is taken as 1.
Notation for systems1. Single Member Constituencies
FPTP(SM): First-past-the-post.
AV(SM): Alternative Vote.
2. Multi-Member Constituencies
PL(MM): Party List based on the whole country (as inIsrael).
PLRC(MM): Party List based upon regions using aclosed list.
PLRO(MM): Party List based on regions with an openlist.
STV(MM): Single Transferable Vote.
3. Hybrid Systems
AMS(HY): Additional Member System as used inGermany and in differing forms for the ScottishParliament and Welsh Assembly.
AV+(HY): AV(SM) with a top-up as proposed by LordJenkins for Westminster.
AV+50(HY): Similar to AV+(HY) but having equalnumbers of local and regional members.
Notation for FeaturesPRO-R: How proportional is the result within a region?
(A region is visualised as, say, ten adjacent single-member constituencies).
PRO-N: How proportional is the total election result?
CHO-P: Is there a choice within a party as well asacross party lines?
ONECM: Is there one class of elected members?
EASV: How easy is the system for the voter?
EASC: How easy is it to conduct the count?
EASBC: Does the system ease the task of determiningconstituency boundaries?
EW&E: Does the system encourage women andpersons of ethnic minorities to stand for election?
LOC: How closely is the elected member linked to hisor her constituency?
PLOC: How easily can a voter contact an electedmember of their own political persuasion?
My Decision Table1. Weighting factors
The weighting factors I have chosen for the features aboveare:
8
Issue 12 Voting matters, for the technical issues of STV, November 2000
Feature
System PRO-R PRO-N CHO-P ONECM EASV EASC EASBC EW&E LOC PLOC Total Ranking
The figures in parentheses are obtained by multiplying thescore (out of 10) by the weighting factor WF, thus obtaining aweighted score. The total (weighted) score is the sum of theweighted scores for each feature of a system. The figurespresented in the table gives my own judgement of the featuresfor each system.
ConclusionsOn this basis STV appears to be the best system. This,however, is something I have believed for the last 20 years orso. Maybe I have been subconsciously biased!
The scoring and weighting reflects my personal opinions andfeelings. Small differences in scoring and, particularly inWFs, can easily change the above conclusions and I would begrateful for other opinions.
STV with Elimination byElectability Scores
Simon Gazeley
1. IntroductionIt is widely thought among students of electoral reform that acandidate in a single-seat election who can beat every other inCondorcet pairwise comparisons is the most representativepossible of the expressed views of that electorate. Thisproposition can be disputed, but for present purposes I shallregard it as axiomatic. The Condorcet principle can beextended to cover elections for n seats when n>1; one way ofachieving this is to conduct mini-elections by STV to select nout of every possible set of n+1 candidates, and to elect the setof n candidates that wins the largest number of these mini-elections.
There are two problems with this extended form ofCondorcet. One is that, when two or more seats are beingcontested, it is not practicable for any but the smallestelections: 15 candidates contesting 5 seats would give rise to5005 contests; 27 candidates standing for the 15 seats on theCouncil of the Electoral Reform Society would give rise to13,037,895 contests. Confronted with the result sheet of suchan election, the electorate would find it difficult to understandhow the winning candidates won and, perhaps moreimportantly, how the losing candidates lost. The other
problem is that there could be more than one set of ncandidates (whether n>1 or n=1) which gain the equal greatestnumber of victories. We would have to provide some kind oftie-breaker.
I believe that we can achieve the effect of Condorcet for oneor more seats without these practical difficulties. Indeed,David Hill1 has suggested one such scheme which selects setsof n candidates and tests each set against the other candidatesone at a time. He admits that his scheme can elect a candidateother than the Condorcet winner in an election for one seat: Ibelieve that the system propounded here will always elect theCondorcet winner, if there is one.
2. A Brief Digression on ProportionalityWoodall2 has proved that no system can be devised which hasall the following properties:
1. Increased support, for a candidate who wouldotherwise have been elected, should not prevent theirelection.
2. a. Later preferences should not count against earlierpreferences.
b. Later preferences should not count towards earlierpreferences.
3. If no second preferences are expressed, and there is acandidate who has more first-preference votes that anyother candidate, then that candidate should be elected.
4. If the number of ballots marked X first, Y second, plusthe number marked Y first, X second, is more than halfthe number of ballots, then at least one of X and Yshould be elected.
Given that preferential voting is desirable, few would considerany system which lacks either of properties 3 or 4 to beacceptable. Woodall later3 extended 4, dubbing it the “DroopProportionality Criterion” (DPC), which he stated thus:
If, for some whole numbers K and L satisfying 0<K≤L, morethan K Droop quotas of voters put the same L candidates (notnecessarily in the same order) as the top L candidates in theirpreference listings, then at least K of those L candidatesshould be elected.
A voter who puts those L candidates (in any order) as the topcandidates in order of preference is said to be “stronglycommitted” to that set of L candidates. We will refer to a setof candidates to whom one set of voters is strongly committedas a “DPC set” .
Under any of the rules in current use, the elimination ofcandidates in an STV election makes votes available to other
9
Voting matters, for the technical issues of STV, November 2000 Issue 12
candidates in the DPC sets to which they belong. Nocandidate who has a quota at the relevant stage iseliminated, and, with insignificant exceptions, eliminationsare made one at a time. This ensures that the result of anSTV count is consistent with the Droop ProportionalityCriterion. STV with Elimination by Electability Scores(STV(EES)) shares this characteristic.
3. The aim of STV(EES)Conventional STV (whether by Meek's method4 or one ofthe manual methods) is directed towards identifying with aslittle ado as possible the candidates who should get theseats: election takes precedence over elimination. Theproblem with this approach is that only as many of eachvoter's preferences are examined as are necessary to awardthe quota to sufficient candidates within the rules. Forexample, the second and subsequent preferences of thevoters whose first preference was cast for the eventualrunner-up are not even examined.
On the other hand, the aim of STV(EES) is to identify thosecandidates who certainly should not be elected. It does so bytaking account of all the preferences of every voter; in somecircumstances, this feature will cause the system to fail onWoodall's second property. To identify candidates forelimination, it calculates “electability scores” (see below)for the candidates: as new electability scores are calculatedat successive stages, these form the basis for the eliminationof candidates one by one until only sufficient are left to fillthe available seats. These remaining candidates are elected.
STV(EES) differs in another way from conventional STV.As we are identifying candidates for elimination, notelection, we do not have to use the Droop quota, and in factits use can lead to perverse results. Instead, we calculate the“ threshold” , which any of the other candidates must be ableto attain in order to survive.
4. How STV(EES) worksSTV(EES) is based on Meek's method, the most significantfeature of which in this context is that votes are transferredin strict order of the voter's preference, regardless ofwhether the receiving candidates already have a quota ofvotes or not. In STV(EES), all candidates start as“contending” candidates. We then calculate the “electabilityscore” (see below) of each contending candidate in turn, andcandidates are withdrawn on the basis of those electabilityscores.
A stage of STV(EES) culminates in the withdrawal, eithertemporary or permanent, of a candidate. It consists of twosubstages: the first establishes the threshold of votes which acandidate must be capable of achieving in order to survive;the second is to test whether the candidates who start withless than the threshold can in fact achieve it. At the end ofthe second sub-stage, one of these candidates is withdrawn
from contention. This withdrawal takes one of two forms:the candidate is either “eliminated” , which means that (s)hetakes no further part in the count, and is treated from thatpoint on as though (s)he had withdrawn before it started; oris “ temporarily excluded” , which means that (s)he iswithdrawn for the time being, but comes back in after thenext elimination.
Before explaining how to calculate electability scores, wemust define the “ retention factor” , which Meek calls the“proportion retained” . In a Meek count, a point will bereached when a candidate has more than the quota. Clearly,that candidate should get less of the incoming votes in thenext iteration of the count than were credited this time; andin successive iterations, the proportion of each incomingvote that stays with that candidate will diminish. Thetendency will be for each new total of votes credited to thatcandidate to be closer to the quota than the last. To achievethis, an incoming whole vote or fraction of a vote ismultiplied by an amount m where 0<m<1; the result of thismultiplication is the fraction of that vote which is creditedto that candidate. This amount m is known as the retentionfactor. Retention factors start with a value of 1.0, and thosefor the candidates with more than the quota are re-calculated at every iteration; thus retention factors willdiminish as the count progresses. The Droop quota is alsore-calculated at every iteration on the basis of the votescredited to candidates, ignoring those which have becomenon-transferable.
In an STV(EES) election, the first sub-stage of each stage isthe calculation of the threshold. It does this by calculatingthe mean of the votes of the n candidates who have the mostvotes. Surpluses over the mean are transferred, then a newmean is calculated. This process of distributing the votes,calculating the mean, and transferring surpluses is repeateduntil the first n candidates have the same number of votes.The top n candidates are then known collectively as the“probables” , and their common total of votes is thethreshold (T). The value of T remains fixed throughout thesecond substage, which is the calculation of the contendingcandidates' electability scores. Let C be the contendingcandidate whose electability score we are calculating (the“candidate under test” ), and let all the contendingcandidates other than C have a common retention factor ofc. C's own retention factor remains at 1.0. In successiveiterations, c and the retention factors of the probables arerecalculated until the votes credited to all the probables areequal to the threshold and C either has the threshold or hasless than the threshold while no other contending candidatehas any votes at all. At this point, c is declared to be C'selectability score. The electability scores of the remainingcontending candidates are calculated in like fashion. Thesmaller C's electability score, the greater the number ofvotes that have had to be transferred from contendingcandidates other than C in order to ensure that C and theprobables get their thresholds.
10
Issue 12 Voting matters, for the technical issues of STV, November 2000
If the votes credited to the candidate under test and thecontending candidates have a collective total of less than T,this indicates that the probables had a Droop quota of voteseach when that candidate's electability score was beingcalculated. In that case, that contending candidate iseliminated, and all the non-eliminated candidates are re-classified as contending. On the other hand, if all thecontending candidates' electability scores are at least 0.0, theone with the highest electability score is temporarilyexcluded, and only the existing probables are re-classified ascontending. The new set of contending candidates proceeds tothe next stage.
Stage succeeds stage until there are only n candidates whohave not been eliminated, and those final candidates areelected. Note that at any stage when there are only n+1“active” candidates (ie, candidates who have not beeneliminated or temporarily excluded), one of them is certain tobe eliminated. We therefore know that candidates will beeliminated until only n active candidates survive; thus anSTV(EES) election must come to an end.
STV(EES) aims to identify a set of n candidates which canscore at least as many victories in Condorcet mini-elections asevery other. This means, for every eliminated candidate X,that there must be no set of n candidates including X whichcan score more victories in Condorcet mini-elections thanevery set of n not including X. We know at any given stagethat every probable is better supported at that stage than X,and that every temporarily excluded candidate was bettersupported than X at the time of their temporary exclusion.Any DPC set to which X belongs has more members than canbe elected by the number of voters that support it, and everyother member of that DPC set is better supported than X. Wecan therefore be confident, though not certain, that there is noset of n candidates including X that can score more victoriesin Condorcet mini-elections than every set of n not includingX. We can, however, state with certainty that in a count forone seat, the Condorcet winner (if there is one) will win. Thisis because, by definition, the Condorcet winner will win acontest with any one other candidate: and since no candidateis eliminated unless n other candidates have a Droop quota ofvotes each, the Condorcet winner cannot be eliminated.
5. An IllustrationSix candidates are contesting two seats, and votes are:
After sub-stage 1.1, A and C are probables, and the threshold(the number of votes held by both A and C when transfers arecomplete) is 3436. At sub-stage 1.2, electability scores are:
B 0. 1319D 0. 4125E 0. 2860F 0. 3478
This means that if D, E, and F had a common retention factorof 0.1319, A, B, and C would have 3436 votes each whensurpluses have been transferred; if B, E, and F had a commonretention factor of 0.4125, A, C, and D would have 3436 voteseach when surpluses have been transferred, and so on. As Dhas the largest electability score at this stage, we act on thepresumption that D has a better chance of being elected thanB, E, or F, and so we ensure by temporary exclusion that Ddoes not run the risk of being eliminated at substage 1.2. Notethat this presumption is like the presumption of innocence in acriminal trial: the process tests it and may very well overturnit.
Again, A and C are probables and the threshold is 3436. At0.7608, E's electability score is higher than B's or F's, so E istemporarily excluded at substage 2.2. Effective votes are now:
At substage 3.1, A and F are probables, and the threshold is4016.9493, more than the current Droop quota. As neither Bnor C can get that many votes if the other is temporarilywithdrawn, we can eliminate both. D and E are nowreclassified as contending, making effective votes:
Voting matters, for the technical issues of STV, November 2000 Issue 12
At substage 4.1, A and D are probables, and the threshold is3696.7554. At substage 4.2, E's electability score is 0.4741and F's is 0.3385, so E is temporarily excluded. Active votesare now:
At substage 5.1, A and F are probables, and the threshold is4309.9757, more than the current Droop quota. D cannot getthat many votes and therefore is eliminated. E now comesback in, and active votes are:
At substage 6.1, the threshold is 5040.5, more than thecurrent Droop quota, and A and E are probables. There is noprospect that F can attain the threshold, so we eliminate F. Aand E are the only active candidates left, so they are elected.
6. DiscussionThe example above is unusual in that there are two discreteDPC sets, ABC and DEF, supported respectively by 7106and 4894 voters. The result is consistent with the DroopProportionality Criterion in that each set contributes onewinning candidate. In fact, an exhaustive Condorcet countproduces a three-way tie for first place between AD, AE,and AF. This results from a paradox whereby AD wins theADE contest, AE wins the AEF contest, and AF wins theADF contest. Any of these outcomes is as valid as either ofthe others. It is noteworthy that STV(EES) does not “hangup” on a Condorcet paradox.
If there are too few DPC sets with sufficient support to“soak up” all n seats being contested, can the system stillproduce a reasonable outcome? Let there be 4 candidatescontesting 2 seats with votes:
ABCD 41BCDA 30CDAB 25DABC 24 === 120
The results of an exhaustive Condorcet count are:
Contest Winners
ABC ABABD ADACD ACBCD BC
We have a paradox in that AB wins the ABC contest, butAD wins the ABD contest and AC wins the ACD contest;there is also a four-way tie. As A starts with a quota of firstpreferences, A must be one of the winning candidates, butwhich of the other three should take the second seat?
Under STV(EES), A and B are probables, and the initialthreshold is 35.5. At stage 1, the electability scores of C andD are respectively 0.5625 and 0.54, so C is temporarilyexcluded. At stage 2, A and D win the ABD contest, and Bis eliminated. At stage 3, A, C, and D remain in the contest,so A and C are elected.
How can the elimination of B and D be justified? Part of theanswer is that D was in only one winning set in theexhaustive Condorcet count, whereas the other candidateswere in at least two. But is there any objective reason whyB rather than C should be eliminated? Here we mustconfess that the system may be said to be perverse: 95voters prefer B to C, but only 25 prefer C to B. In defenceof this outcome, we can say that set AC is one of the jointCondorcet winners, so it meets the aim of STV(EES); andthat when a tie is the result of a paradox, it will be arbitraryto some extent. But I would still have preferred AB to bethe winning set in this case.
I submit that STV(EES) will in most cases (perhaps all)give a result that is compatible with an exhaustiveCondorcet count: and that even if it does not, the result willstill be defensible.
AcknowledgementI am grateful to David Hill, Hugh Warren, and BrianWichmann, whose queries, comments, suggestions, andadvice have made this paper very much better than it wouldotherwise have been. My deep gratitude is due also to theindependent referee, who not only made many suggestionsbut also pointed out a fatal flaw in an earlier version of thesystem.
References1. I D Hill, Sequential STV, Voting matters, Issue 2
(1994), 5-7.
2. D R Woodall, An impossibility theorem for electoralsystems, Discrete Mathematics, 66, (1987) 209-211.
12
Issue 12 Voting matters, for the technical issues of STV, November 2000
3. D R Woodall, Properties of Preferential Election Rules,Voting matters, Issue 3 (1994), 8-15.
4. B L Meek, A New Approach to the Single TransferableVote, Voting matters, Issue 1 (1994), 1-6. (Paper 1), 6-11 (Paper 2).
Annex - An Algorithm for STV(EES)All candidates start as contending candidates with a retentionfactor(RF) of 1.0. They should be in random order.
The suggested procedure is as follows:
Substage 1
1. Set every active candidate's retention factor to 1.0.
2. Repeat the following procedure until n candidates haveT votes each.
a. Distribute the votes in accordance with “Distributingthe Votes” below.
b. Calculate T, the mean of the votes of the n candidateswith most votes.
c. For every candidate who has more than T votes,calculate a new retention factor by multiplying theirpresent RF by T and dividing the result by the numberof votes credited to that candidate.
3. If n candidates have T votes each, classify those ncandidates as probables. If more than n candidates haveT votes each, classify the first n in ranking order asprobables.
Substage 2
1. Select each contending candidate in turn to be the“candidate under test” and calculate their electabilityscores as follows:
a. If T>V/(n+1), where V is the total of votes credited toall the candidates, mark the candidate under test forelimination. Otherwise, set the retention factor of thecontending candidates, the candidate under test, and theprobables, to 1.0, then repeat the following procedureuntil the probables and the candidate under test have Tvotes each, or until T>V/(n+1):
i. Distribute the votes in accordance with “Distributingthe Votes” below.
ii. Recalculate the retention factor (RF) of any probablewho has more than T votes by multiplying it by T anddividing the result by the number of votes credited tothat candidate. Recalculate the common RF of
the contending candidates by multiplying it by(V−(n+1)T)/C, where C is the total of votes credited tothe contending candidates other than the candidateunder test.
b. If T=V/(n+1) and there are only n+1 active candidates.or if T>V/(n+1) mark the candidate under test forelimination. Otherwise, set the electability score of thecandidate under test to the common RF of the othercontending candidates.
2. Award the probables a notional electability score of1.0, then rank the active candidates in their presentorder within descending order of electability score.
3. If any contending candidate is marked for elimination,eliminate all the marked candidates, reclassify all thenon-eliminated candidates as contending, and rankthem in random order. Otherwise, temporarily excludethe highest-ranked contending candidate, set thatcandidate's RF to 0.0, and reclassify only the probablesas contending candidates.
Distributing the Votes
Examine each vote in turn and:
1. Multiply the value of the vote by the retention factor ofthe voter's first preference. Award that amount of thevote to that candidate.
2. If any of the vote is unallocated, multiply it by theretention factor of the candidate of the voter's nextpreference. Award that amount of the vote to thatcandidate. Repeat until none of the vote is left, or untilthe voter's preferences are exhausted.
3. If any of the vote is left when all the candidates havehad their shares, put it to non-transferable.
How to ruin STVI D Hill
To ruin STV by turning it, in effect, into merely a party listsystem, the following steps may be taken:
1. Make voting compulsory so that even the laziest haveto turn out;
2. Insist that votes, as given by voter-defined preferences,are not valid unless every candidate (from a long list) isgiven a preference number, without gaps or repetition;
13
Voting matters, for the technical issues of STV, November 2000 Issue 12
3. Allow the voter the alternative option of merelyticking a party box, and take that to indicate an STVvote as specified by the chosen party;
4. Use traditional STV counting rules, so that it can beguaranteed that, if you choose your own order, eitheryour first choice will not be elected, or if elected butnot on the first count, then all your hard work enteringlater preferences will be totally ignored;
5. Insist that, as the party box method is optional, this isnot taking anything away from the voters.
Since many voters are lazy, most can then be expected (savein very exceptional circumstances) to use the party boxmethod, as to do anything else is a lot of work and almostcertainly for no benefit. Is it unimaginable that partypoliticians would try to pervert STV in this way?Unfortunately not; all these things now happen in Australia,and nearly all the virtues of STV have consequently beenlost.
To see the dire effects of this, consider the election of 6Senators for New South Wales at the 1998 Federal Election,for which there were 69 candidates. In some Australian STVelections not all the candidates have to be given preferencenumbers, though they usually require a substantial number.In this one all 69 had to be put in strict preference order. Justimagine doing that when the alternative of merely ticking aparty box was available.
Probably many voters would not be aware of the effectmentioned in item 4 above, so that may not have mucheffect on what happens, but it would certainly add to thefrustration for anyone who did know about it.
The remarkable thing in the circumstances is not thatpractically everyone used the party option but that 19012voters, or 0.51%, did not.
The whole output table is much too vast for reproductionhere, but the sense of it can be derived by looking at just theparty that did best, with candidates A1, A2, A3 and A4 inthat order on the party ticket. The first four stages for thosecandidates were:
Eventually A3 also was elected. It can be seen, just fromthis small part of the information, how the party listing istotally dominant, and crushes all individualism. Inparticular, note how the party's preference for A3 over A4overwhelms the fact that A4 got three times as many firstpreferences as A3. In fact, after transfers, all the votesended up pointing at the three candidates highest on the listof the above party that took three seats, the two candidateshighest on the list of another party that took two seats, thecandidate first on the list of a further party that took oneseat, and the candidate first on the list of the runner-upparty. For the candidates, it is clear that getting a high placeon the party list, rather than being liked by the voters, iswhat matters, as with party list systems in general.
Is it wise to tell politicians that STV can be perverted likethis? Given that it has already happened in Australia, it canhardly be hidden from them anyway. The important thing isto bring the facts to the attention of STV supporters, so thatthey know that it is something to be ready to fight against.
14
Issue 12 Voting matters, for the technical issues of STV, November 2000
Editorial NoteUnfortunately, there was a very misleadingtypographical error in Issue11. This was onthe table marked Old rules on page 8. Theentry against candidate C should have theword 'Elected' deleted. I am sorry if thiscaused any confusion. A corrected versionis available electronically from me.
A1 1446231 −909698 536533"
536533"
536533"
A2 2914 +908567 911481#
911481#
−374948 536533"
A3 864 +196$ 1060 +11$ 1071 +374505 375576%
A4 2551 +130$ 2681 +3$ 2684 +199 2883
1
Voting mattersfor the technical issues of STV
The Electoral Reform Society
Issue 13 April 2001
All correspondence regarding Voting matters should beaddressed to:
B A Wichmann, The Editor, Voting matters, The Electoral ReformSociety, 6 Chancel Street, London, SE1 0UU.
Readers are reminded that views expressed in Voting matters bycontributors do not necessarily reflect those of the ElectoralReform Society.
To aid production, the Editor would welcome contributions onIBM-PC discs (with a printed copy as well) or [email protected].
EditorialAs the political debate intensifies prior to a General Election,the search for a better technical understanding continues here.
Hugh Warren responds to remarks made about his suggestionfor merging X voting with STV.
The issue of undertaking recounts with STV is very unclear.Even with computer counts, ensuring that there are no errorswhatsoever in the data input is unrealistic. My own paperprovides details of a computer system designed to detect if anSTV election is close enough to justify a recount.
Joe Otten provides details of an algorithm for handling STVelections with complex constraints. Even though suchconstraints override the voters' intentions, it seems that severalelections are of this type and hence there is a demand for suchan implementation.
David Hill provides an analysis of STV when equality ofpreference is permitted. It seems that there are problems inthis area, so the fact that conventional STV does not provideequality is not necessarily a disadvantage.
Lastly, I provide a paper concerned with the transparency ofSTV. The conclusion is to call for the partial disclosure of thevotes so that anybody can perform an effective check on thecounting process. Comments on this and all the other papersare welcome!
CD-ROM PublicationWith the support of the McDougall Trust, I am collectingelectoral material with the aim of publishing it in CD-ROMformat. It is intended, for example, that the publication willinclude all of Voting matters. (As a separate exercise, backissues of the journal Representation may be made availableon CD ROM as well.) The main emphasis will be on thecollation of election data, especially that involving STV orpreferential voting. If you have or know of material whichyou think could be suitable, please contact me. A keyadvatange of the CD ROM media is that well over 5,000pages can be placed on one disc.
Brian Wichmann
The principal objects of the McDougall Trust (TheArthur McDougall Fund) are to advance knowledge ofand research into representative democracy, its forms,functions and development and associated institutions.The Trust is governed by a High Court Scheme issuedin 1959 which states its charitable purposes as being ‘ toadvance knowledge of and encourage the study of andresearch in: political or economic science and functionsof government and the services provided to thecommunity by public and voluntary organisations: andmethods of election of and the selection of andgovernment of representative organisations whethernational, civic, commercial, industrial or social.’
Mixing X-Voting andPreference Voting
C H E Warren
In my paper on incorporating X-voting into preferencevoting by STV1, without saying so I had treated it asaxiomatic that a method of mixing X-voting and preferencevoting should reduce to either X-voting or preference votingby STV should all the voters be of one sort.
In a comment at the end of my paper, the Editor suggestedan alternative formulation which, sadly, would not reduce toX-voting as it is always practised should all the voters be X-voters. The Editor's formulation would not therefore satisfythe axiom mentioned above.
The answer to the question at the end of David Hill's paper2
“ Is there a way of doing it that everyone would think fair inall cases?” is surely “No” .
There are the hardliners on both sides — those who thinkthat anything other than X-voting is not fair, and those whothink that anything other than preference voting by STV,which I imagine includes David Hill, is not fair.
The most that one can hope for, then, is not a way of doingit that everyone would think fair, but a way that a majorityof considered opinion would think fair.
The major response that I have had to my paper1 so far isthat “ it is a good idea” .
References1. C H E Warren. Incorporating X-voting into
Preference voting by STV. Voting matters, Issue 11,p2, 2000.
2. I D Hill. Mixing X-voting and preference voting.Voting matters, Issue 12, p6 , 2000.
Recounts with STVB A Wichmann
IntroductionWith Westminster elections, if a result is sufficiently close, arecount is undertaken to reduce the risk of an incorrectresult being declared. Of course, with First Past The Post, asimple measure of the closeness of the result is possible, sothat the criteria for a recount can be easily given. (Avirtually identical problem has arisen with the US electionsin Florida in which obsolete technology is employed!)
With STV, recounts are very rarely undertaken due to theproblems that this would give. In Newland and Brittonrules1, both first and second edition, there was aninstruction, at the end of each stage “Ascertain thatcandidates and/or their agents are content” and a recount ofthe stage could be called for if not. The difficulty with thisis that it may not become evident that an early stage needschecking until a later one has occurred, and the only surestrategy for candidates was always to ask for a recountafter every stage. In the latest edition of the rules, thosewords have, in any case, been omitted.
However, when the count is conducted by computer, thecomputer itself can be used to assess the need for a‘ recount’ . The article is not concerned with the actualprocess of undertaking a recount (merely running thecounting program again would be pointless), but withproviding a tool to assess the risks of an incorrect resultbeing obtained due to a typing error when the papers areentered manually.
This article describes a set of computer programs,developed for Electoral Reform Ballot Services, whichassesses the need for a recount.
The conceptAt first, I thought that the problem was too difficult toundertake, since if a change is made to even one ballotpaper, it is hard (in general) to predict any change of result.However, given a computer program that can undertake acount in a matter of minutes (if not seconds) then analternative method is available which does not require anyanalysis of the result of changes in specific papers.
The stages are as follows:
1. A simple model is produced of the manual data entryprocess, together with the likely data entry errors.
2. From the data entry error analysis, a computerprogram is produced which simulates such errors.
3. The above computer program is used to construct ahundred (or more) copies of the original election datawith simulated errors.
4. The simulated elections are counted by program andthe results compared with the original results to see ifan incorrect result is likely.
This process can be made effective since the speed ofmodern computers allows a hundred of more copies of anelection to be counted in a reasonable time. (It is surelysufficient for an overnight batch computer run to producethe result — although for smaller elections, a result shouldbe obtained in a few minutes. Examples so far have onlytaken about an hour to run.)
2
Issue 13 Voting matters, for the technical issues of STV, April 2001
The systemThe system consists of two programs: one which producescopies of the original election with data errors added, andanother which analyses the results from all the elections.Provision is made to handle the Meek rules2 or the ERS97rules1. In addition, a batch execution run is produced to callthe relevant election counting program on all the simulatedelections.
The data entry model is essentially one of key depressionsusing ballot papers in which the voter adds preferencenumbers. Since typing errors have known patterns, areasonable guess can be made of the potential errors in termsof those errors. However, it is difficult to accurately calibratethe rate of errors. Such errors are naturally rare, say 1 in 5,000characters, but at this rate one would need to double-checkmany thousands of characters to obtain a good estimate of theerror rate. In addition, the computer entry programs used forballot entry already include some checks and hence the errorsimulation program ensures that these checks will be passed.Also, the staff of ERBS are naturally familiar with therequirements and appear to take special care with the firstpreference (not actually allowed for in the current program).There is some evidence that the staff at ERBS may realise atthe end of the ballot paper that they are ‘out-of-step’ andhence go back to correct an error. In view of the above, thereis clearly some doubt as to the accuracy of the model of dataerrors, but the statistical nature of the problem makes somedoubt inevitable.
After some experimentation, the data error rate was set at onekey depression per 6,000 characters. However, if the errorwould then be detected by the STV program, such as arisingfrom a repeated preference, the corresponding change is notmade.
ResultsThis can be illustrated by an example taken from a realelection (which has been made anonymous).
Data error analysis program, version 1.01Basic data of original election: Title: R048: STV Selection Example 1 To elect 10 from 29 candidates. Number of valid votes: 944 Count according to Meek rules
Data used to simulate input errors to count: Key errors taken as 1 in 6000 key depressions. Duplication and removal of papers taken as 1 in 6000 papers. Number of simulated elections produced: 100 Seeds were initially: 16215, 15062 and 7213 and finally: 17693, 15003 and 25920
Some statistics from the generated election data: Average number of commas added for each election: 1 Average number of commas deleted for each election: 1 Average number of interchanges for each election: 2 Average number of papers deleted for each election: 0 Average number of papers duplicated for each election: 0 Average number of papers changed for each election: 4 Average number of papers changed at preference: 1 is 1
Candidates elected in the original election and allsimulated ones: Jane BENNETT Robert BROWNING Joan CRAWFORD Francis DRAKE Mary-Ann EVANS Kate GREENAWAY John MASEFIELD Alfred TENNYSON Sybil THORNDIKE
Candidates not elected in the original election orany of the simulated ones: James BOSWELL Emily BRONTE George BYRON Eric COATES Ella FITZGERALD Stella GIBBONS Graham GREENE Sherlock HOLMES Samuel JOHNSON John KEATS Alice LIDDELL Harold PINTER Walter RALEIGH Margaret RUTHERFORD Will SHAKESPEARE Percy SHELLEY John WESLEY Virginia WOOLF
The program records the known details of the election whichincludes the type of count used: Meek in this case. Then thestatistics are recorded on the simulated elections. Firstly, thereis the key depression error rate used, then the seeds used forthe pseudo-random generator so that the process can be re-runif required. Then a summary is produced of the changes madeto the papers. Note that one of the changes is that of repeatingand duplicating a paper (both changes are needed to reflectthe checks made on the total number of papers). The commasindicate moving onto the next preference. Note that of nearly1,000 papers, typically one change is made to the firstpreference position.
Of course, the changes that will be of most interest are thoserelating to the election of the candidates. The first two lists arethe candidates which are always elected or always excluded— there should be no doubt about the status of these.
3
Voting matters, for the technical issues of STV, April 2001 Issue 13
The last table indicates the position with those candidateswhose status varied in the 101 elections performed (1original and 100 simulated).
The number of such candidates is two. In the case of ClaraBow, she was elected in the original election and also in98% of the simulated ones, ie in two cases she was notelected. The case with Benjamin Franklin is exactly theopposite. However, merely knowing that percentage is notwhat is required. We need an estimate of the probability ofan incorrect result, which is the likely value of thepercentage in the long run, that is if infinitely manysimulated elections were used. This long-term value isestimated to lie between 93% and 100% (to a 95%probability).
In this particular case the result is not seriously in doubt.However if the percentage range included the 50% figure,then it is proposed that this would be sufficient to require arecount.
ConclusionsThe method proposed here appears to be an effective meansof determining if a recount should be undertaken for an STVelection. However, the technique does depend upon astatistical model of the nature of the data preparation errorswhich is always going to be hard to produce.
The method can be applied to assess the impact of dataerrors arising from mechanically produced data, assumingthe data error rate is high enough to warrant its use.
I am grateful to David Hill who provided some Pascal codewhich gives the 95% probability ranges — a vital part of thesystem.
References1. R A Newland and F S Britton. How to conduct an
election by Single Transferable Vote. ERS, 1973,1976 and 1997.
2. I D Hill, B A Wichmann and D R Woodall. Algorithm123 — Single Transferable Vote by Meek's method.Computer Journal. 1987.
The problemDavid Hill writes in Voting matters1 that the handling ofconstraints should be undertaken by marking as doomedcandidates who cannot be elected if a conformant result isto be obtained, and marking as guarded those candidateswho must be elected for a conformant result. A doomedcandidate is eliminated immediately so that the nextpreference can be taken into account, while guardedcandidates await attaining a quota (if that is possible).However, where multiple constraints are to be applied, thenHill states we should list all the possible ways that theconstraints might be met, so that we can tell when it isnecessary to guard or doom continuing candidates. If youare unfamiliar with these details, I recommend readingHill's article first.
In this paper we consider the situation with two independentsets of constraints, such as nationality and gender. A groupof candidates are those sharing the same constrainingcharacteristics. While I agree that Hill's method works, andthat simpler methods do not, there is a problem when thenumbers of candidates and groups of candidates becomelarge. For instance, suppose there are 20 candidates to beelected from 30 groups, with 2 candidates in each group,there would be astronomic number of cases (≈330), of whichmaybe only half can be ruled out by the constraints. Such alist of possibilities would take far too long to calculate on afast computer with efficient code, and occupy an excessiveamount of storage. This is clearly not feasible. It mightappear that such complexity of constraints should not arisein practice — unfortunately it has arisen which hasprompted the approach given here.
A worked ExampleWe re-work Hill's example which is that of 14 to be elected,where must be 7 English, 6 Scottish and 1 Welsh, andadditionally 7 Men and 7 Women. We refer to each of theseby the initial letter with the nationality first. In this example,there are 8 possibilities listed:
4
Issue 13 Voting matters, for the technical issues of STV, April 2001
Number of other candidates: 2 Original Result Simulated Result(95% conf. limits) Name Elected Elected 98% ( 93% to 100%) Clara BOW Not Elected Not Elected 98% ( 93% to 100%) Benjamin FRANKLIN
Each time an election or exclusion causes one or more ofthese results to become impossible, we cross it out. We canthen see when it is necessary to guard or doom candidates.
This problem requires a solution that does not involve listingevery combination since the size of the list rises exponentiallywith the number of groups. I believe this is possible if wededuce and keep track of every constraint as it applies toevery group. In Hill's example this is possible. At the crucialpoint he argues that “ ...only 2 Scottish women remain, wehave to elect 6 Scottish altogether and have elected none asyet. Therefore we must elect at least 4 Scottish men. But weare restricted to 7 men in total and we have already elected 3.It follows that we must elect exactly 4 Scottish men, and thatmeans that the remaining 2 Scottish women must be guarded,and that the 2 English men must be excluded as soon aspossible,...”
This argument is sound, and does not itself rely on anexhaustive listing of all the possible combinations. I propose aprocedure which implements this sort of logic in a way thatcan be automated and performed at the start of the count andafter every election and exclusion.
The way I propose to represent this is as in the following grid.
A row (of 4 lines) corresponds to each gender constraint and acolumn to each nationality constraint. A cell, with 4 entries,Elected, Min, Max, Cands, corresponds to a candidate groupor to a row or column total or to the grand total. The grid hasbeen initialized with the numbers of candidates in each group,and the various totals required by the constraints (as from
Hill's example). Of course, we have none elected in this initialtable, the constraints are as given before, and the newinformation is that concerning the candidates.
The basic method is to repeatedly apply five rules to a tableuntil a stable condition is produced which essentially providesa bounding box which must enclose any conformant solution.We need to apply these rules initially (to confirm that asolution is possible) and at each election and elimination.Each rule is triggered by a condition which should be satisfiedby a conformant solution.
1. In each group we require: Elected ≤ Min ≤ Max ≤Cands. Rule — increase Min or decrease Max. If as aresult of applying the rules Min > Max then noconformant result is possible (there is no bounding box)and we do not regard this as a settled state.
2. In each group, the Min must be possible — i.e. it mustbe possible for this few to be elected, even if the currentminimum is elected from the row/column, and themaxima elected from each other group in that row/column. Rule — increase Min.
3. Like 2, for maxima — in each group, it must bepossible for this many to be elected, even if the currentmaximum is elected from the row/column, and theminimum elected from each other group in the row/column. Rule — decrease Max.
4. The row/column minimum must be at least the sum ofthe minima of the items in the row/column. Rule —increase Min.
5. The row/column maximum must be no more than thesum of the maxima of the items in the row/column.Rule — decrease Max.
Hence if any of the conditions required is violated, we applythe associated rule until a settled state is reached.
Once the grid is in a settled state, and if in any cell Elected =Max then continuing candidates in that cell are doomed. If inany cell Min = Cands then all continuing candidates in thatcell are guarded.
I hope it is clear that each of these rules is a logical necessity,as is its Rule when it applies. What is not so clear is thatfollowing these rules is sufficient to ensure that candidates arealways doomed or guarded as necessary.
To see what is going on, let us apply the above now before westart counting the votes, as we need to in order to ensure thatthere is a conformant result and to identify any candidateswhich may be initially guarded or doomed.
5
Voting matters, for the technical issues of STV, April 2001 Issue 13
English Scottish Welsh Total
Men Elected 0 0 0 0
Min 0 0 0 7
Max 7 6 1 7
Cands 4 11 2 17
Women Elected 0 0 0 0
Min 0 0 0 7
Max 7 6 1 7
Cands 7 3 1 11
Total Elected 0 0 0 0
Min 7 6 1 14
Max 7 6 1 14
Cands 11 14 3 28
a) By 1, Max English Men must be reduced from 7 to 4because there are not enough candidates. Similarly,Max Scottish Women must be reduced from 6 to 3.
b) By 2, Min Scottish Men = 2. There are at most 5non-Scottish men, and we need 7 men altogether.
c) Similarly by 2, Min English Women = 3. Since MinEnglish + Max English Men = 7.
d) By 2, Min Scottish Men = 3. Since Min ScottishMen + Max Scottish Women = 6.
This is a settled state, so we conclude that a conformantresult is possible, and we can start counting the votes. Thefirst event is the election of a Welsh man, which we mark asa 1 in the space referring to the number of Welsh menelected. This requires the following alterations:
a) By 1, Min Welsh Men = 1.
b) By 3, Max Welsh Women = 0.
c) By 2, Min English Women = 4.
d) By 3, Max English Men = 3.
This is a settled state. We now have 2 cells where Elected =Max, so the continuing candidates in those cells, a WelshMan and the Welsh Woman are doomed. The doomed
candidates are removed from the grid by reducing theCands entry.
The next events are — the election of 2 English Men and 2English Women, and the exclusion of a Scottish Woman.We would in practice update the grid after each of these 5events, but for the purpose of this example, we will do it inone go.
a) By 1, Min English Men = 2, due to the election.
b) By 1, Max Scottish Women = 2.
This completes the actions directly as a result of theelections, but now we must continue to give a settled state
c) By 2, Max Scottish Men = 4.
d) By 2, Min English Women = 5.
e) By 3, Max English Men = 2.
f) By 2, Min Scottish Men = 4.
g) By 2, Min Scottish Women = 2.
h) By 3, Max English Women = 5.
At this point, the grid is in a settled state, and we knowprecisely how many are in each group, so the constraintsproblem has been solved. Elected = Max for English Men,
6
Issue 13 Voting matters, for the technical issues of STV, April 2001
English Scottish Welsh Total
Men Elected 0 0 0 0
Min 0 3 0 7
Max 4 6 1 7
Cands 4 11 2 17
Women Elected 0 0 0 0
Min 3 0 0 7
Max 7 3 1 7
Cands 7 3 1 11
Total Elected 0 0 0 0
Min 7 6 1 14
Max 7 6 1 14
Cands 11 14 3 28
English Scottish Welsh Total
Men Elected 0 0 1 0
Min 0 3 1 7
Max 3 6 1 7
Cands 4 11 2 17
Women Elected 0 0 0 0
Min 4 0 0 7
Max 7 3 0 7
Cands 7 3 1 11
Total Elected 0 0 1 1
Min 7 6 1 14
Max 7 6 1 14
Cands 11 14 3 28
English Scottish Welsh Total
Men Elected 2 0 1 3
Min 2 3 1 7
Max 3 6 1 7
Cands 4 11 1 17
Women Elected 2 0 0 2
Min 4 0 0 7
Max 7 2 0 7
Cands 7 2 0 9
Total Elected 4 0 1 5
Min 7 6 1 14
Max 7 6 1 14
Cands 11 13 1 25
English Scottish Welsh Total
Men Elected 2 0 1 3
Min 2 4 1 7
Max 2 4 1 7
Cands 2 11 1 16
Women Elected 2 0 0 2
Min 5 2 0 7
Max 5 2 0 7
Cands 7 2 0 9
Total Elected 4 0 1 5
Min 7 6 1 14
Max 7 6 1 14
Cands 11 13 1 25
so the 2 continuing English Men must be doomed, and Min =Cands for the Scottish Women, so these must both beguarded. The count will continue to determine which of theEnglish Women and which of the Scottish Men are elected.
All I have demonstrated here is that this method achieves thesame result in this case as Hill's method. However, I hope thatit is clear how it works and why it should therefore work forall 2-dimensional constraints problems.
Rules 4 and 5 were not needed as none of the Row total orColumn total Min and Max could be altered. This was becausethe constraints were of the rigid “must equal 7” variety ratherthan the more flexible “must be between 5 and 9” variety.
Constraints and the STV rulesGiven the logic above for handling constraints, then this mustbe integrated into an STV system which would use a specificrule set in the unconstrained case. We consider this with threesets of rules: The Church of England rules2 (a hand-countingsystem which makes provision for constraints), the currentERS rules3 (hand-counting with no provision for constraints)and Meek4 (computer-counting with no provision forconstraints).
The logic above, using guarded and doomed, depends uponelecting and excluding candidates one at a time. None of thethree sets satisfy this, and in consequence, the integration ofthese STV rules with the constraint logic is non-trivial. Theaddition is naturally simplest with the Church rules, since theyhave been written with that intent. However, the rulesthemselves are without constraints and a separate sectiongives a series of amendments to the rules which are to beapplied in the case of constraints. The wording of the specialsection is reasonably straightforward since elections andexclusions take place one at a time.
Consider the following situations:
i) Suppose A is excluded, and this causes C and D to bedoomed. The Church rules just exclude A at this stage, andthen exclude C and D at the next stage. It seems possible toexclude all three together, but this surely makes no difference.
ii) Suppose A and B are to be excluded (with A having fewervotes than B), and the exclusion of A causes B to be guarded,and C and D to be doomed. This then is essentially the samecase as above.
iii) Suppose A and B are to be excluded (with A having fewervotes than B), and the exclusion of A causes C and D to bedoomed, but does not affect the status of B. It is clear that Cand D should be excluded before B, since transfers from Cand D could spare B from exclusion.
This last case shows the importance of exclusions being
undertaken one at a time. This implies that the rules in ERSfor multiple exclusions should be changed to handleconstraints. Indeed, whatever method is used to handleconstraints, the serialization of elections and exclusions isneeded.
With Meek, the published algorithm only allows singleexclusions, but the version implemented by I D Hill allows fora single exclusion and multiple elections at one stage. Boththe elections and the exclusion need to be serialized to applythe constraints logic.
With all the rules, if two candidates achieve the quota at thesame stage, then the election of one could cause the other tobe doomed. Hence, if this is a tie, the tie-breaking logic wouldneed to be applied to produce a result, even though this wasnot necessary without constraints.
ConclusionsThe logic for handling constraints which was first specified byDavid Hill can be implemented in a manner that does notinvolve the use of large lists. This can be combined with theconventional STV rules, provided changes are made to electand exclude candidates one by one.
Our illustration here was with an example having twoindependent types of constraint and therefore requiring two-dimensional tables. However, the same logic can be appliedwith higher dimensions if required.
With larger problems, the size and number of dimensions, andhence the computational requirements, will increase inproportion, not suffering the combinatorial explosion that thelisting of all possible combinations does.
Software has been written to implement this procedure andsuccessfully tested on a 4×16×9×3 hypercube.
References1. I D Hill. STV with constraints. Voting matters, Issue 9
pp2-4. 1998.
2. GS1327: General Synod, Single Transferable Voteregulations 1990 and 1998. (Obtainable from ChurchHouse Bookshop, Great Smith Street, London SW1P3BN.)
3. R A Newland and F S Britton. How to conduct anelection by Single Transferable Vote. ERS, 1997.
4. I D Hill, B A Wichmann and D R Woodall. Algorithm123 — Single Transferable Vote by Meek's method.Computer Journal. 1986.
7
Voting matters, for the technical issues of STV, April 2001 Issue 13
Difficulties with equalityof preference
I D Hill
One of the things that some people do not like about STV isthe fact that voters have to give a strict order of preferenceof those candidates whom they mention, where they wouldsometimes prefer to be allowed to express equality. Evenwhere they are clear about the ordering of their first fewpreferences, and their last few, they may well wish toseparate out their middle candidates from their high onesand their low ones without ordering those middle ones.
Instructions to votersDifficulties arise in deciding how such equality is to bespecified. Suppose candidate A is first preference, then Band C equal, followed by D. Some voters will wish to markthose first four candidates as 1, 2, 2, 3. Others will insistthat logic requires 1, 2, 2, 4, while still others may want touse 1, 2½, 2½, 4. What is allowed has to be specified andmade not too difficult to follow.
One way out of such difficulties is to say that any numbersthe user may wish can be used, but only their order will betaken into account. But if such freedom is to be allowed tothose who use equality, it must in fairness also be allowed tothose not using equality. This disables some useful tests thatcan be made for correctness of data input to a computer file.Furthermore suppose someone uses 0; is this to be regardedas better than 1? Then suppose that there are 17 candidatesin total and that one voter marks four candidates as 1, 2, 3, 4while another marks four candidates as 1, 2, 3, 17. Did theyboth really mean the same thing? I doubt it.
Such difficulties are not fatal, but they need careful thought,and they may complicate the instructions to voters. If theylead to less secure input of data to the computer because ofthe checks that can no longer be made, that also matters.
Counting the votesThere are other difficulties though in how to count suchvotes. The basic idea is as set out by Brian Meek1, that avote for A(BC)D, where the brackets indicate equality ofpreference for B and C, should be treated as half a votereading ABCD and half a vote reading ACBD, and similarlywith equalities of more than two candidates. This needscareful handling to avoid a “combinatorial explosion” ifequality of large numbers of candidates is allowed.
However there is a difficulty of principle, rather than merelyof the mechanics of the operation, that arises if voterschoose to mention all candidates and to put two or more ofthem in equal last place. Meek's paper mentioned this
possibility with approval, as allowing voters the option ofindicating all remaining candidates as equal, as analternative to not mentioning them at all. It is the one pointin Meek's STV papers where I have to disagree with him,for allowing that option would mean having to explain tovoters how to choose which method to use and what theirdifferent effects could be; not a task that I would wish onanyone. Or alternatively, just not to mention it, leavingvoters uninformed about what they are doing.
The trouble is that there are two important principles incounting votes that are here in conflict:
1. that a vote should be interpreted in accordance withwhat is actually written on it, and in no other way;
2. that votes of identical meaning should be treatedidentically.
Now, with five candidates, for example, if one voter marksABC as the first three preferences and stops there, whileanother voter marks ABC(DE), the strict interpretation ofhow to handle the two votes, once the fate of A, B and Chas been settled, is different, but their meaning, in terms ofpreferences, is identical. If voters had been asked to expressdegrees of preference in some way, perhaps those twothings might not be thought identical, but all that they havebeen asked for is an order of preference, and I cannot seehow those two orders could possibly be thought different.This difficulty does not arise where equality is not allowed,since it so happens that two votes ABCD and ABCDE aretreated identically by STV in any case, if those five are theonly candidates.
There are three options: (1) to treat them differently eventhough their meanings are identical; (2) to treat both votesas if they had been ABC(DE); (3) to treat both votes as ifthey had been ABC. Of these I believe the third option to bethe most satisfactory, in that there are cases where anabstention gives a better result than an equality of allremaining candidates, but I know of no case where theopposite can be claimed. (See Woodall's discussion of“symmetrical completion”2). I have therefore adopted thisapproach in my STV computer program.
The difference comes out very clearly in the results of anactual election, that used my program and allowed equality.Some voters, believe it or not, put all the candidates (notmerely enough to fill all seats) as equal first choice. Theprogram did not blink an eyelid but put those votes at onceinto non-transferable, treating them merely as a new way ofabstaining. Surely this is right, rather than the alternative ofdiluting the meaningful votes with this useless information.
Having decided on option (3) then, there arises yet anotherproblem. One of the two fundamental principles on whichthe Meek system is based is “ If a candidate is eliminated, allballots are treated as if that candidate had never stood” .
8
Issue 13 Voting matters, for the technical issues of STV, April 2001
Suppose then that we have 5 candidates and someone hasvoted AB(CD). The (CD) equality has to be included as theseare not last places; it is important to the voter's wishes that Cand D, though not differentiated from each other, are bothpreferred to the unmentioned E.
If E is now excluded, we must behave as if E had never been acandidate. With E gone, all four remaining candidates arementioned and, in accordance with the option adopted above,the AB(CD) vote must now be treated as AB. Any part of thevote that was previously awarded equally to C and D nowbecomes non-transferable instead. This still treats themequally, of course, but it can have the odd effect thatsomebody's vote may go down in the course of the count,whereas normally votes can only go up until the candidate iselected or excluded. This is certainly an extra complicationthat one has to be ready to explain if it occurs.
Overall, my conclusion is that, although allowing equality hassome advantages, and it can be implemented, thecomplications may be too many to be worth it. On the otherhand, those bodies that have actually used it report nodifficulties, and say that the facility is strongly valued by asignificant number of electors.
References1. B L Meek, A new approach to the single transferable
vote, paper II. Voting matters, issue 1, 7-11.
2. D R Woodall, Properties of preferential election rules.Voting matters, issue 3, 8-15. (Elections 11 and 12 onpage 14).
Is STV transparent?B A Wichmann
IntroductionThe problem with the issue of transparency is to decide whatit means. Even then, to be useful, we need something whichcan be measured, at the very least in an informal sense. Istransparency just a matter of assurance? In which case this canbe assisted by auditing, such as is used in the ISO 9000quality management standard. I think not, since we surelyaccept that we need to trust those performing the electioncount. Even with a witnessed count, such as in public
elections, we still need to trust those handling the ballot asany conjurer can testify. Even given that trust, we expectevidence that the count has been conducted according to therelevant rules.
Use of computersEven if the election rules are such as to permit a manualcount, it is quite likely that an STV count will be conductedusing a computer. Hence we now have to question the validityand evidence for such a computer-based operation.
The public perception of computers is mixed. Few check thearithmetic in their bank statements — so surely we shouldaccept such arithmetic when it can be checked by hand. Onthe other hand, the very complex calculations in weatherforecasting cannot be checked, and we all know that theresults are far from perfect. Fortunately, an STV count isnearer to a bank statement than to weather forecasting andhence public trust is not unreasonable.
An interesting analogy to trusting a computer-based count isthat of safety-critical software which must be trusted. Therecent problems in the railway industry, specifically passing asignal at red, is being tackled by the automatic train protectionsystem which uses computers to stop the train. Indeed, on theDocklands Light Railway, the problem has been solved byhaving no drivers! In other words, we trust computers to bemore reliable than people, at least when the situations arewell-defined.
Nevertheless, there is something comforting about seeingpiles of ballot papers building up against each candidatewhich is lost when machine counting takes place. For thosewitnessing a manual count, it is comforting because it is easierto place trust in people you can see. The experience in Floridais a warning that machine counting can be flawed unlesssufficient controls are exercised.
ComplexityIt cannot be denied that the counting process of First Past ThePost (FPTP) is simple. This, in itself, is a substantial aid totransparency. Hence the simpler the rules, the easier it is todemonstrate beyond reasonable doubt, that the rules havebeen applied. Indeed, transparency might be a euphemism forto understand rather than anything associated withverification and auditing.
All the different STV rules must be regarded as complex. Thenature of the complexity is different in the hand-countingvariety compared with the machine-based versions like Meek.If rules designed for manual counting are used, butimplemented using a computer, then the issue of transparencyis different — since one must be concerned with thecorrectness of the software.
9
Voting matters, for the technical issues of STV, April 2001 Issue 13
B C D E E F = < G ? E H D 7 7 8 C C F I J K L A I J M J N
Proponents of a specific rule are likely to claim it is simple— not unreasonable if they know it well. The fact is that wehave no widely accepted measure of complexity and hencewe cannot use complexity as a means of quantifyingtransparency.
Criteria for TransparencyThe main approach is to demonstrate traceability from theballot papers through to the election result. The actualpapers themselves are of no concern (in this article) andhence it is assumed that they can be (or have been)transcribed without error. There is no doubt that FPTP is100% transparent.
We now consider three examples of STV from the point ofview of transparency.
ERS97, by hand
We are assuming that ERS97 is followed to the letter2.Hence we have a defined result sheet. Hence the questionarises as to whether this information provides completetraceability. It does not since the following information ismissing:
1. The transfers at substages are merged and just thetotal transferred listed.
2. The quota is listed only once, and hence if quotareduction takes place, one assumes that only the finalquota is listed. Hence it will not be clear that quotareduction has taken place.
3. When a tie-break is required, there is no indication asto how this should be recorded (if at all).
4. In ERS97, a tie can be broken on the basis of (thefirst difference of) a substage result, but these resultsare not recorded on the result sheet.
Church of England, by computer
The Church of England regulations3 do not specify in detailthe form of the result sheet, but a pro-forma result sheet isprovided by Church House. This is similar to the ERS97result sheet and therefore does not list substages as above.
Items 2 and 4 of the previous case do not apply to theChurch of England rules, and therefore the remaining issueis the manner for recording tie-breaks.
However, all the computer programs that conduct STVcounts provide substantial detail on the actions performed— much greater than the typical result sheet. This includesthe resolution of any tie-break. Hence one has a reasonabledegree of transparency if the fullest form of computer outputis available.
On the question of checking the computer software, theChurch of England rules are relatively easy to program andthe corresponding checking of the software is alsomanageable (at least without the facility of constraintswhich is not considered here).
Meek, by computer
The issues here are quite different from those with the twoprevious cases with hand-counting rules. The algorithm isdefined1, and hence the correctness of the software isrelatively simple to address.
The problem is that at each stage, a computation is requiredwhich needs at least a Spreadsheet to handle with ease.Moreover, without any other information than the votes andkeep values for each candidate at each stage, it is notpossible (in general) to determine the preferences whichgave the observed result. In other words, we have losttraceability to the actual ballot papers. (A similar situationarises with multiple exclusions with ERS972, but it is not socommon.)
Other issuesTwo questions a voter could reasonably ask needconsideration:
What happened to my vote? In the case of hand-countingrules, a detailed knowledge of the rules is required as wellas the result sheet. The rules are devised so that relativelyfew of the preferences given are used — this is deliberate tominimise the actual work involved in a count. Hence, inmost cases, it is simple to trace the position of the paperamongst the piles of papers within the count. For theChurch of England rules which does not allow multipleexclusions, it is more straightforward to trace your vote. Itis even simpler with Meek5, since at each stage, all thepapers are re-considered. The formula using the keep valuesfor each candidate gives the fraction of the paper going toeach candidate. If issues of security could be resolved, avoter could interrogate the voting system to validate andtrace his/her vote.
What if I changed my vote? This is similar to the lastquestion except that if the change was sufficient to alter thedecisions on election and elimination, then the subsequentstages would be in doubt. The uncertainty arises becausepreferences may then be inspected which were neverexamined before — and hence cannot be determined fromthe result sheet.
The Data Protection Acts of 1984 and 1999 imply that thecandidates have some rights of access to the informationabout them contained in the preferential ballots. The 1984Act is reasonably straightforward to follow and my viewwas that the candidate should be told, if a request is made,of the number of votes he/she attained in each preference
10
Issue 13 Voting matters, for the technical issues of STV, April 2001
position, assuming the data was held on a computer.
The 1999 Act is much more complex and very hard foranybody other than a trained lawyer to interpret. It does covermanual as well as computer counts. As I understand it, ERBShas never been asked for information under the Act nor hasconcluded what information should be disclosed.
ConclusionsThe transparency of STV is nowhere near that of FPTP,regardless of the voting rules in use. Currently, it is not reallypossible for a voter to obtain the same level of understandingfor an STV ballot as for FPTP. This is a serious loss, since inmany cases, the impact of a single vote with STV couldchange the result and the voter should be aware of this. (Ofcourse, this loss is more than compensated by the additionalinformation STV uses.)
I conclude that the above should be rectified by two changesto current practice:
Preferences should be published if they contribute to thecount.
This is not complete publication of the ballot papers. My ownexperience suggests that complete publication might allowsome individual papers to be identified which would becontrary to the overriding need for a secret ballot. For the lastremaining candidate, say, only the initial preference isinspected, and hence all that would be stated would be thetotal number of first preferences attained. Similarly, manypapers differing in some preferences would be groupedtogether, since the differences were not used in the ballot.
It has been suggested to me that full publication would bepossible for large elections in which the identification of asingle paper would be more difficult. I have rejected this sinceit would imply an arbitrary decision as to when an election islarge. Moreover, for large ballots, the published summary ofthe papers would be small compared with the total, and hencewould not be an excessive requirement.
Full publication would also allow candidates to try other STVrules which would not necessarily encourage acceptance ofthe declared results. For some (small) elections, the summaryproposed here for publication would be the complete datafrom the ballot papers. However, in this situation, it may wellbe possible to derive that information directly from the resultsheet anyway, so formal publication could not be regarded assacrificing ballot secrecy.
In the case of the Meek rules, the removal of the unseenpreferences is undertaken as follows (where KV is the KeepValue of a candidate):
1. Remove all preferences for withdrawn candidates
2. For each eliminated candidate A, compute at the pointof elimination, the set X of candidates having KV=1.0(must be continuing or elected candidates). Remove allpreferences for A that appear after any candidate withinX (in each paper).
3. For those candidates B for which KV=1.0 at the end ofthe count, eliminate all preferences after B. (Hence afirst preference for B will have only a first preference.)
Similar logic can be produced to remove unseen preferencesfor the hand-counting rules.
Joe Otten made an interesting comment about a witnessedcount. If you could not go in person, could you provide yourown copy of a vote-count program to observe the count? Ithink not, since it would provide terrible problems if theresults did not agree, and the returning officer could not beexpected to ensure that the provided program only undertookappropriate actions. (David Hill4 made a similar point that thedata should be available for people to run their own program.)
Internet facilities should be available for voters todetermine what happened to their vote.
This would be simple to provide and can be made secure bymeans of a Java applet that runs on the voter's computer.
Assuming that the used preferences are available in anelectronic format, then anybody would be able to re-run theelection count with suitable software. This is surely astransparent as possible. The Internet facility would allowvoters to understand the impact of their vote without having tobe an expert in the particular STV rules in use.
AcknowledgementsThe author received very detailed comments on an earlierdraft of this paper from: David Hill, Michael Hodge, JoeOtten, Steve Todd and Joe Wadsworth. I have tried to takethese comments into account, while not necessarily acceptingall of them.
References1. I D Hill, B A Wichmann and D R Woodall. Algorithm
123 — Single Transferable Vote by Meek's method.Computer Journal. Vol 30, pp277, 1987.
2. R A Newland and F S Britton. How to conduct anelection by the Single Transferable Vote. ERS 3rdEdition. 1997.
3. Church of England, General Synod. Regulations for theconduct of elections by the method of the singletransferable vote. GS1327. 1990 and 1998.
11
Voting matters, for the technical issues of STV, April 2001 Issue 13
4. I D Hill. Are better STV rules worthwhile? Votingmatters 3, Page 8. December 1994.
5. I D Hill. How was my vote used? Voting matters 7,Page 7. September 1996.
12
Issue 13 Voting matters, for the technical issues of STV, April 2001
1
Voting mattersfor the technical issues of STV
The Electoral Reform Society
Issue 14 December 2001
All correspondence regarding Voting matters should beaddressed to:
B A Wichmann, The Editor, Voting matters, The Electoral ReformSociety, 6 Chancel Street, London, SE1 0UU.
Readers are reminded that views expressed in Voting matters bycontributors do not necessarily reflect those of the ElectoralReform Society.
To aid production, the Editor would welcome contributions onIBM-PC discs (with a printed copy as well) or [email protected].
EditorialReaders will no doubt be pleased to know that New Zealandhas passed legislation to use STV in area Health Boardelections and also in some local elections. Some may besurprised that the legislation specifies the use of the Meekalgorithm and hence means that a computer count will beundertaken. Although these elections will not be until 2004,work is in progress to ensure that appropriate software isavailable and fully meets the requirements. I hope thatdevelopments can reported via Voting matters.
In a separate move, the Republic of Ireland is considering theuse of computers to undertake its counts, although in this case,the rules are those in the Irish constitution which weredesigned for a manual count.
In the first article in this issue Simon Gazeley reports a meansof undertaking a manual count which avoids the need to electcandidates with less that the quota of votes. Comments on thelogic of this proposal or its feasibility would be welcome.
In the second article, I report on the observed differences inthose elected with the current ERS rules compared with theMeek algorithm — somewhat topical in view of the NewZealand decision (although it was motivated by preparing anelection data-based for publication on the McDougall TrustCD-ROM).
In the third article, David Chapman makes a proposal forelecting one candidate which is described as preferentialapproval voting. The counting method seems straightforwardto undertake manually and yet claims some of the benefits ofthe more complex algorithms.
In the last article Bob Jones reports on the questionnairewhich was circulated with Issue 12. Unfortunately, thenumber of responses was rather small and hence it is difficultto deduce much from the replies. The Decision Analysis tablethat Bob produced can be recommended as a means ofencouraging people to think more deeply about the issuesinvolved.
McDougall Trust CD-ROMThe CD-ROM, mentioned in the last editorial, should beavailable early in 2002. Hence if you have material thatwould be suitable, or know the source of such material, pleaselet me know. Election data from the UK, Ireland and Maltawill be included.
The CD will contain an acknowledgement to the manyreferees would have aided in this publication and especially toDr David Hill who has proof-read all 14 issues.
Brian Wichmann.
STV with SymmetricCompletion
Simon Gazeley
Meek's1 formula for STV differs from manual systems insignificant ways which have been explained by Hill2. Thesedifferences make Meek more acceptable to many thanmanual STV, but it means that a computer is necessary forany but the very simplest Meek counts. I believe it ispossible to improve manual STV without either losing theability to do it manually, or introducing some unintendedunacceptable effect. The current ERS rules3 are taken as astarting point in formulating the changes proposed, and willbe referred to as N-B.
When a candidate has a surplus, N-B transfers the “parcel”of votes which gave rise to that surplus — ie, the voteswhich that candidate received most recently. Note that theballot-papers will all be of the same value, which can be 1.0or less. The papers in the parcel are sub-divided intotransferable votes (those on which a subsequent preferencehas been expressed for a candidate who is not yet elected oreliminated), and non-transferable (those on which all thecandidates for whom a preference has been expressed areeither elected or eliminated). If the total of transferablevotes at their present value is less than or equal to thesurplus, they are all transferred at that value to the voters'next preferences, and sufficient of the non-transferable votesare left with the elected candidate to preserve thatcandidate's quota with no surplus; any non-transferablevotes over and above the quota are put to the non-transferable pile. If the total of transferable votes is greaterthan the surplus, a new value is calculated for eachtransferable vote such that when all of them are transferredat that value, their total value is equal to the surplus, and theelected candidate is left with the quota.
This procedure in effect shares out the non-transferablevotes among the continuing candidates in the proportions ofthe transferable votes, and can give a result which I considerperverse. Consider the following count for two seats,adapted from one devised by David Hill:
Case 1A 60AB 60CD 51DC 9
The quota is 60, so A gets the first seat. N-B ignores the 60voters who expressed no preference after A. It transfers the60 AB votes at full value to B, who now gets the other seat.On the other hand, Meek transfers all the votes credited toA, in this case at a value of 0.5. Thus B gets 30 of the AB
votes, while 30 of the A votes go to non-transferable. Thenew total of effective votes is now 150, making the newquota 50. C, with 51 votes, has attained this new quota andgets the second seat.
Now suppose that the 60 A voters had in fact expressedsecond preferences, three for C, the rest for B. Votes wouldbe:
Case 2AB 117AC 3CD 51DC 9
In Case 2, the N-B count is identical to the Meek count. Agets the first seat, but this time all the votes credited to A aretransferred at a value of 0.5, leaving A with 60. B gets 58.5of the transferred votes and C gets 1.5, increasing C's totalto 52.5. Now, nobody other than A has the quota, so weeliminate D. C's total of votes now goes up to 61.5, morethan the quota, so C gets the second seat. Comparing Cases1 and 2, we see that the additional 57 votes on which thesecond preference is for B are counteracted under N-B byjust three voters whose second preference is for C.
Owing to the habit of many voters of not castingpreferences for all candidates, the total number of votescredited to candidates tends to decline as the countproceeds. This is countered in some rules by requiring thevoters to cast preferences for all candidates, forcing them toregister preferences they do not feel and perhaps cannotjustify. This means that in N-B counts, the final candidatesto be elected often have less than a quota. As the quota ishigher in these cases than it needs to be, the opportunity islost to transfer as many surplus votes as could have beentransferred if the quota had been lower from the beginningbut still attainable by only as many candidates as there areseats. In a Meek count, the quota is recalculated at everystage to take account of the votes which become non-transferable and all surpluses over each successive value ofthe quota are transferred. Thus, the only criterion forelection in a Meek count is attainment of the quota.
It is reasonable to presume that a voter who does not rankall the candidates is indifferent to the fates of the candidatesleft unranked, and therefore does not wish the vote tofavour any of the unranked candidates over the others. Asthe example above clearly shows, N-B can give second andsubsequent preferences more votes than the voters arepresumed to have intended them to receive. Note that the Avoters have no right to feel aggrieved; if they had wanted tocast further preferences, they were perfectly entitled to doso. However, the CD voters are certainly entitled to protestthat the 60 A votes were treated by N-B in effect as ABvotes, thus denying the second seat to C.
In a manual count, the option of reducing the quota as inMeek is not available, as the count would have to be
2
Issue 14 Voting matters, for the technical issues of STV, December 2001
restarted at every change of the quota. The other option is toshare among the continuing candidates the votes which wouldotherwise have been non-transferable, treating them as if theyhad in fact been cast as equal lowest preferences for thecandidates concerned. Following Woodall4, I shall call this“symmetric completion” . To those who are against symmetriccompletion on the grounds that it is never justified to awardany part of a vote to a candidate for whom no preference hasbeen expressed, my response is that symmetric completiontreats all short votes alike and does not give too much weightto surplus votes on transfer. In both these respects, it issuperior in my view to N-B.
With symmetric completion, the numbers of votes credited tothe continuing candidates will usually be greater than theywould have been under N-B, especially at the later stages.This means that there will be a tendency for more surpluses tobe available for transfer, and therefore for more voters'preferences to be taken into account. Applying symmetriccompletion to Case 1 above, we get at the first stage
A 120C 51D 9
The quota is 60, and A is elected. A's votes are all transferredat a value of 0.5 to next preferences: the 60 AB votes go to B,who now has (60 × 0.5) = 30 votes, and the 60 A votes goequally to B, C, and D, who each get (20 × 0.5) = 10 votes.Votes are now:
A 60B 40C 61D 19
and C gets the second seat.
Implementing STV with symmetric completion (STV-SC)would entail some changes to the N-B procedure. This is bestillustrated by an example. Six candidates are contesting threeseats, with votes:
The quota is 250. As no candidate has the quota, F, withfewest votes, is eliminated. As in N-B, the 85 FBDC votesare transferred to B. Although STV-SC puts the 21 F ballot-papers to the non-transferable pile, it does not put the 21 Fvotes to non-transferable, as all votes in STV-SC aretransferred. Instead, we call these 21 votes on which nofurther preferences are expressed “dividend votes” , becausethey are divided equally among the continuing candidates, inthis case 21/5=4.2 to each. The number of dividend votes iscalculated as the difference between the total of votescurrently credited to candidates and the original total of validballot-papers; a running total is kept against each candidate'sname of the number of dividend votes (s)he has received, andthe stage at which they were gained. Effective votes at stage2 are:
A 129.20B 273.20C 202.20D 210.20E 185.20
Now, the sum of A's votes and B's surplus is less than thevotes credited to E, the candidate in last-but-one place. Under N-B rules, and therefore under STV-SC rules, thetransfer of B's surplus is deferred, and we eliminate A at once.The 66 AEFB votes go to E, the 59 A papers to non-transferable. The total of votes credited to the candidates isnow 936.80; the 63.2 dividend votes are awarded equally toC, D, and E, 21.06 to each. Votes are now:
B 273.20C 223.26D 231.26E 272.26
We now transfer B's surplus, as that is the larger. The mostrecent parcel received by B contains the 85 transferred FBDCvotes, plus A's share of the 21 dividend F votes, making 89.2in all. We now transfer the 85 FBDC votes to D and the 4.2 Fvotes to C and D @ 23.2/89.2=0.26. As this boosts D's totalabove the quota, we end the count.
The only criterion for election in STV-SC, as in Meek, isattainment of the quota. To cater for rounding errors intransferred votes, the number of dividend votes is recalculatedat each stage as the difference between the original total (inthis case, 1000) and the total of the votes credited tocandidates after all transferable votes have been transferred;the number of dividend votes awarded to each continuingcandidate is truncated if necessary to two decimal places. Asthe total of the votes credited to the candidates is the sameafter each stage as it was after the previous one (exceptperhaps for rounding error), surpluses can arise at any point,giving the voters concerned a greater opportunity than underconventional N-B to influence the subsequent course of theelection.
3
Voting matters, for the technical issues of STV, December 2001 Issue 14
Should symmetric completion be imported into Meek? Theanswer is emphatically no. Woodall4, using an exampleprovided by David Hill, has shown that quota reduction inMeek is preferable to symmetric completion, even thoughMeek himself was equivocal on the point. The purpose ofthis paper has been to show that, given the practicalconstraints of a manual count, symmetric completion candeal with a problem that may arise in N-B without ingeneral substituting one that is as bad or worse.
References1. B. L. Meek, A New Approach to the Single
2. I. D. Hill, Meek style STV — a simple introduction,Voting matters. Issue 7 (1996), 5-6.
3. Robert A. Newland & Frank S. Britton, How toConduct an Election by the Single Transferable Vote,Electoral Reform Society, 3rd Edition, 1997.
4. D. R. Woodall, Properties of Preferential ElectoralSystems, Voting matters. Issue 3 (1994), 8-15.
Do the differences matter?Brian Wichmann
IntroductionIn preparing material for a CD-ROM which contains ballotdata1, I have revised and extended the data which makes itfeasible to undertake meaningful comparisons between thedifferent STV counting rules.
It is naturally regrettable that the counting rules do indeedproduce different results, that is, elect different candidates.This is to be expected, especially when comparing the Meekalgorithm with the hand counting rules. Approximationsmust be made to provide a feasible manual process, so if itis required that a witnessed count be undertaken (and hencethe moving of ballot papers between piles for eachcandidate) then a manual counting rule is required.
Unfortunately, real election data is hard to collect due to theconfidentiality that usually applies to such data. However, acomputer program has been written to produce such dataanonymously by a random process which would notinvalidate statistical tests on the anonymous data. This hasresulted in a few more data sets from which a comparisoncan be made.
The two counting algorithms being compared here areMeek2 and ERS 973.
Data selection and comparisonThe total election data contains many examples used to testcounting software which is not representative of real ballotdata. However, 188 ballot sets have been identified asappropriate in three classes, as follows:
R001-R060. Data from real elections. This includes afew in which a random selection has been made fromthe total in the real election.
M001-M091. This data has been constructed fromresult sheets in such a way as to reflect real ballotdata. In particular, the ones constructed fromelections in the Irish Republic has been adjusted toreflect the observed transfers between the parties.
S001-S019, S021-S038. This set is constructed fromdata such as the Eurovision Song Contest, in whichpreferential voting could have been applied.
When a count is conducted, if a random choice has to bemade, it is hard to conclude that a real difference hasoccurred. In fact, 29 of the above elections produced adifferent result, but in 10 of these a random choice wasmade and hence we ignore these.
We are therefore left with 19 differences out of 188elections, ie 10.1% different. (I could have omitted those forelecting one person, but I did not. These are mainly the thirdclass above in which no difference was observed.)
4
Issue 14 Voting matters, for the technical issues of STV, December 2001
Case�
Votes�
Candidates�
Seats�
Non-transferables Difference
(Meek-ERS97)/Votes
M005 27,757 7 3 -0.23% 1 (0.57%)
M010 38,410 9 4 1.83% 1 (0.71%)
M019 29,193 13 4 -1.06% 1 (*)
M028 44,454 13 5 -0.76% 1 (0.05%)
M051 39,991 10 4 0.13% 1 (0.45%)
M059 35,038 11 4 -0.13% 1 (0.58%)
M060 25,553 9 3 -0.96% 1 (0.33%)
M066 24,825 9 3 -1.79% 1 (*)
M070 44,914 13 5 -0.54% 1 (0.03%)
M073 36,407 8 4 0.16% 1 (1.01%)
M078 27,881 8 3 -0.07% 1 (0.38%)
R004 42 10 5 0.12% 1 (2.50%)
R005 58 8 7 3.79% 1 (0.40%)
R033 211 14 7 -2.61% 2
R040 257 20 15 0.07% 1 (*)
R045 2,908 12 5 5.95% 1 (0.83%)
R046 853 10 9 13.69% 1 (0.09%)
R048 944 29 10 0.04% 1 (0.15%)
R059 1,147 10 6 -0.40% 1 (0.03%)
In the table, the last entry records the number of seats whoseoccupancy changed and, in brackets, the number of votes lessthan the quota which the Meek algorithm recorded against thecandidate which ERS97 elected (expressed as a percentage ofthe total number of votes). Hence for M005, the lastremaining candidate which the Meek algorithm did noteliminate was the one elected by ERS97 and had 6358.85votes against a quota of 6517.76 (6517.76-6358.85=158.91votes = 0.57% of 27,757). The star indicates that theremaining candidate in the Meek count was not the oneelected by ERS97 and hence the two counts diverged at anearlier point — not just the last stage. Of course, in the onecase in which two seats differed, it is not possible to provide asimple numerical difference.
It can be seen from the table that the differences aresignificant and large in some cases. In five cases (M070,R004, R005, R046 and R048) the differences are small andperhaps could be regarded as acceptable. The total number ofseats in these 19 elections is 106 with 20 differences andhence a discrepancy in those elected of 18.8%, or 2.1%difference if all the elections are considered.
The difference in the handling of non-transferables betweenthe two algorithms is a matter of controversy. To indicatewhether the number of non-transferables is a factor, thedifference that the two algorithms give in the number of non-transferables is expressed as a percentage of the total votes. Inthe case of R046, ERS97 has a very much lower number ofnon-transferables which surely has a key effect on the result.However, in general, the pattern is not so clear.
It could be that the method of constructing the Mddd data(first class above) produces results which would not be typicalof real elections. However, the table clearly shows that theRddd (real elections, second class) examples show similardifferences.
ConclusionsI conclude that unless it is essential to have a manual,witnessed count, the Meek rules should be used for STVcounting. The approximations introduced to enable a manualcount produces too many differences for the hand countingrules to be used otherwise.
Any of the data upon which this paper is based can beprovided to interested parties.
References1. See Editorial, Voting matters, Issue 13. April 2001.
2 I D Hill, B A Wichmann and D R Woodall. Algorithm123 — Single Transferable Vote by Meek's method.Computer Journal. Vol 30, pp277-281, 1987.
3. R A Newland and F S Britton. How to conduct anelection by the Single Transferable Vote. ERS 3rdEdition. 1997.
IntroductionThis paper puts forward a new method for electing, by use ofpreferential voting, a candidate to fill a single seat. It isproposed as an improvement on the normally used single-seatelectoral systems such as Plurality (as used for theWestminster Parliament), Second Ballot (previously used inFrance) or Alternative Vote (used in Australia). The newsystem is similar in its working to Approval Voting (thesystem proposed in 1982 by Brams and Fishburn1). However,it achieves this effect by means of preferential voting insteadof the simple X voting of the latter system. It is thereforecalled Preferential Approval Voting, or PAV for short.
The advantage claimed for PAV is one of equity, that ascompared with other systems, it gives candidates and parties astronger incentive to be equally responsive to the differentsections of the electorate. Also, PAV appears to be a highlypracticable method of election. It is not complicated to count,having about the same level of complication as the AlternativeVote, and it could easily be counted by hand, not needing tobe counted by computer, however large is the number ofcandidates.
PAV can best be explained by means of its relation toApproval Voting. The procedure of Approval Voting is simplythis: the electors vote (non-preferentially) for as manycandidates as they like, for one or for more than one, and thecandidate who gets most votes is elected. PAV simulates thisprocedure by use of preferential voting (that is, voting wherethe elector votes by marking the candidates in order ofpreference, 1 for a first preference, 2 for a second preference,and so on, for as many candidates as he wishes).
Now under Approval Voting, the voter will always vote for thecandidate whom he most prefers. But under whatcircumstances will he vote further down his preferenceordering, voting in addition for his next-preferred candidate,or for several of the next-preferred candidates? It seems likelythat he will do so if he expects that a candidate whom he verymuch less prefers has some chance of being elected, and if hethinks that voting for the next-preferred candidate orcandidates will reduce this chance. For example, a voter
5
Voting matters, for the technical issues of STV, December 2001 Issue 14
whose first preference is Labour, second is LiberalDemocrat, and third is Conservative, will always vote forthe Labour candidate, and might vote for the LiberalDemocrat in addition, if he thinks that the Conservative hasa significant chance of winning.
PAV approximately simulates this voting behaviour, by useof the preference orderings provided by the voters. ThusPAV always counts the voter as voting for his first-preferredcandidate. PAV counts him as voting for his next-preferredcandidate when the latter is preferred to the leadingcandidate, that one who so far in the counting has obtainedmost votes. In other words, this leading candidate is treatedas one who has a significant chance of being elected, andtherefore voters are assumed to vote for the candidates theyprefer to him.
The rules of PAVHere are the full rules of PAV. The electors vote by puttingthe candidates in order of preference. “Points” are assignedto candidates, according to the preferences for them, and thecandidate with most points is elected. For this purpose, thecounting of the votes proceeds in stages, as follows.
The first stage. In respect of each ballot paper, a point isgiven to the candidate marked as first preference on thatpaper. The points of each candidate are counted, and theleading candidate is found (that is, the candidate who hasmost points). If there is a tie between two or morecandidates, one of them is selected by lot to be the leadingcandidate.
Any further stage. Those ballot papers are considered, inrespect of which a point has not so far been given to theleading candidate of the previous stage. In respect of eachsuch ballot paper, a point is given to the candidate next-preferred to the last candidate to receive a point, providedthis next-preferred candidate is preferred to the leadingcandidate of the previous stage. The leading candidate (whowill possibly be a new one) is then found, that is, thecandidate who has obtained most points up to and includingthe current stage.
These further stages are repeated, each one giving morepoints to the candidates, until the final stage is reached, atwhich none of the electors' next preferred candidates ispreferred to the leading candidate, so that no candidate isentitled to receive any further point. At this final stage, thecandidate who has most points is elected.
It will be seen that the method of counting the votes forPAV, is somewhat similar to that for the Alternative Vote.Under both PAV and AV, the first stage is to count the firstpreferences on all ballot papers. In each later stage, the nextpreferences are counted on a limited number of the ballotpapers, until the winning candidate is found.
A preferential system which bears some resemblance toPAV is that of Descending Acquiescing Coalitions (DAC).DAC is a new preferential election method for filling asingle seat, which was recently proposed by Woodall2,3, asan improvement on the Alternative Vote (which is discussedmore fully below). DAC resembles PAV in that both can beregarded as a preferential simulation of Approval Voting.However, Woodall2 admits DAC is “much more comp-licated than [the Alternative Vote]” , and would be likely torequire a computer to carry out the counting. Thus it is clearthat PAV will be much simpler than DAC (see below).
The effects of PAVIn order to illustrate the working of PAV, and to demonstratethe properties of the system, let us consider some numericalexamples. We first consider Election 1, where the electors'preferences are single-peaked, that is, preferences are basedon some dimension (such as that of left-to-right positions inpolicy), on which each voter has his own most-preferredpoint, and on which he prefers any other point less, thefurther it is from his most-preferred point.
(The notation used to describe the election is explained asfollows. The first lines show the voters' preference listingsof the candidates. Thus in the top line, 35 voters rank Lfirst, C second, and R third. The subscripts against some ofthe candidates in a preference listing, show in what stagepoints are given to the candidate. Thus in the third line, 16points are given to C in the first stage, and 16 points aregiven to R in the second stage. After the preference listings,each column shows the total points which have beenobtained by each candidate by the specified stage. Thus bystage 2, L has obtained 35 points, C 65, and R 49. Thegreatest total of points, that of C, is shown in underlined, Cbeing the leading candidate at stage 2.)
Election 1
35 L1C R16 C1L R16 C1R2L33 R1C2L
Stage 1 Stage 2 Stage 3
L 35 35 35 C 32 65 65R 33 49 49
In stage 1, each candidate gets one point for each firstpreference. L is the leading candidate, getting most points.In stage 2, candidate C (who is the next preference of the 33first-preference supporters of R, and who is preferred bythem to L, the leading candidate of the previous stage)therefore gets 33 more points. Similarly, R gets 16 morepoints, by being preferred to L by 16 first-preferencesupporters of C. C, now having most points, becomes thenew leading candidate. In stage 3, none of the next-
6
Issue 14 Voting matters, for the technical issues of STV, December 2001
preferred candidates is preferred to C, the leading candidate ofthe previous stage, and so no candidate gets any more points.Thus C, having most points in the final stage, is elected.
We can use the results of Election 1 to illustrate how PAVdeals with incomplete preference listings, that is, ballot paperswhich do not express a preference for all the candidates. Itmakes no difference whether or not a last preference isexpressed by the voter. For example, if the 33 voters votingRCL voted RC instead, this would not alter the result, sincewe would still know, for stage 2, that they preferred C to L,the leading candidate, so that C would still get 33 extra points.However, it does make a difference if a non-last preference isnot expressed. For example, if the 33 voters voted just R, thatis, first preference for R, with no preference given for anyother candidate, then C would get no extra points in stage 2,since no preference for C over L would have been expressed.
But let us return to the original results of Election 1 as shownabove. In this situation of single-peaked preferences, PAV haselected the centre candidate in the left-to-right dimension. Thiscandidate elected by PAV is also the so-called Condorcetwinner, that is, the candidate who beats each other candidate,always being preferred to the other candidate by a majority ofvoters. (C is preferred over L by 65 voters to 35 and over R by67 to 33.) Note that PAV achieves this result (that is, of electingthe centre candidate or Condorcet winner) despite the fact thatC has fewest first preferences, which would prevent C frombeing elected under the Alternative Vote, that form ofpreferential system which is most commonly used for electingto one seat.
However, if PAV is actually in use for a series of elections, thenit is unlikely that the electors' preferences between thecandidates will remain single-peaked. For candidates L and Rwill surely come to realise that under PAV, their respectiveextremist positions are going to lose them election afterelection, and so they will adjust their appeals to give themselvesa better chance of winning. Thus L will appeal to thesupporters of R, to persuade more of them to change theirpreference listing to RLC instead of RCL, and R will appeal tosupporters of L to get them to change to LRC. The pattern ofthe electors' preferences will then no longer be single-peaked,but will tend towards what might be called a symmetricalpattern, where there is about the same number of voters witheach possible preference listing (that is, in this case, one-sixthLCR, one-sixth LRC, and so on). Thus a typical election mightbe something like Election 2.
Election 2
18 L1C4R17 L1R3C17 C1L4R15 C1R2L17 R1C2L16 R1L3C
Stage 1 Stage 2 Stage 3 Stage 4 Stage 5
L 35 35 51 68 68C 32 49 49 67 67R 33 48 65 65 65
Thus by broadening their appeal, L and R have got morepoints, and L has succeeded in getting elected. L now getssecond preferences, not only from first-preference supportersof C as before, but also from the first-preference supporters ofR, and similarly R now gets second preferences from the first-preference supporters of L. This illustrates how PAV gives acandidate or party the incentive to appeal to, and to beresponsive to, all sections of electors.
Election 2 can be used to illustrate the general strategy bywhich a candidate will seek to win under PAV. A candidatewins by getting a point from the most voters. A candidate Cgets a point from any one voter V either if C gets V's firstpreference, or otherwise if C is preferred by V to that one ofthe leading candidates who is least preferred by V. Thus inElection 2, L gets a point not only from the 18 LCRs and 17LRCs, but also from the 17 CLRs and the 16 RLCs.
This has implications for a candidate's general strategy. Hewill be primarily concerned to persuade voters to prefer himover their least preferred leading candidate. Once they do this,he will not seek to persuade them to give him a still higherpreference (that is, a first preference in Election 2), since thiswill tend to be difficult to achieve, and in any case it will notbring him any more points. Thus when there are three leadingcandidates, as in Election 2, each one will direct his appealprimarily at those electors who have tended to give him lastpreference, and in general, each candidate will be seeking toget second preferences rather than first preferences.
Further properties of PAVPAV has the same property as does the Alternative Vote, andalso DAC, that a candidate who gets an absolute majority offirst preferences is necessarily elected. This can be simplyshown as follows. Suppose A has the first preferences of morethan half the voters. Thus A is the leading candidate at the firststage, with a point from more than half the voters. At thesecond stage, the best that any other candidate can do is to geta point from every voter who did not vote first preference forA, that is, he must get points from less than half the voters.Thus A, with a point from more than half the voters, must bethe leading candidate at the second stage. By a similarargument, A must be the leading candidate at the next stage,and at any stage after that. Thus A must be elected.
However, PAV is unlike the Alternative Vote in that thecandidate with fewest first preferences can be elected, as wasthe case in the single-peaked example of Election 1 above.Indeed, PAV can enable a candidate to get elected who hasvery few or even no first preferences. A non-single-peaked
7
Voting matters, for the technical issues of STV, December 2001 Issue 14
example of this, which might well occur occasionally inpractice, is Election 3. Here a candidate C, who has few firstpreferences, gets more points than either A or B (each ofwhom have close to half the first preferences) by persuadingmany of As and Bs first-preference supporters to give Ctheir second preferences.
Election 3
32 A1C3B16 A1B4C15 B1A4C32 B1C2A 2 C1B2A 3 C1A3B
Stage 1 Stage 2 Stage 3 Stage 4 Stage 5
A 48 48 51 66 66B 47 49 49 65 65C 5 37 69 69 69
This lack of the need for first preferences under PAV, can beexpected to reduce the entry barrier against new candidates.For it is likely to be easier to gain second preferences thanfirst preferences, thus making it easier under PAV for a newcandidate to compete successfully with already establishedcandidates, than it would be under the Alternative Vote, or inparticular under Plurality. Thus under PAV, at least when ithas been in use for some time, it is likely that fewcandidates will obtain a majority of first preferences, andthat the most usual situation in each constituency will be forthere to be three strong candidates (or perhaps sometimesmore than three) in not very unequal competition. In otherwords, it is likely that under PAV, there will be a tendencytowards a symmetrical situation like that shown in Election2.
In all the examples given above, Elections 1, 2 and 3, therewere only three candidates competing. How then will PAVoperate, if there is a larger number of candidates? The sameprocedure will be followed, that of sorting and counting thenext preferences stage by stage, until that stage is reached,where no next-preferred candidate is preferred to the leadingcandidate, and thus no candidate is entitled to receive anyfurther points. Because there are more candidates, there willof course be more next preferences to sort and to count. Butthe extra counting need not be in proportion to the numberof extra candidates. The reason for this is that on any oneballot paper, only the top preferences need to be counted,down to the preference for the candidate who is onepreference step above that one of the “ leading candidates”whom the voter least prefers. It is likely that the extracandidates will be given a very low preference (or nopreference) by most of the voters, and that because of thistheir preferences for them will not need to be counted.
Election 4 is given below, as an example of a four-candidateelection. Election 4 is assumed to be a re-run of Election 2,
in which one party, the party which previously ran L as itscandidate, now runs two candidates L and M, one a womanand one a man, in order to give the electors a wider choice.Electors are assumed to put L and M in the same position intheir preference listings as they put L in Election 2.
Election 4
10 L1 M2 C R 8 M1 L2 C R 9 L1 M2 R C 8 M1 L2 R C 9 C1 L2 M R 8 C1 M2 L R 8 C1 R3 L4 M 7 C1 R3 M5 L 9 R1 C3 L4 M 8 R1 C3 M5 L 9 R1 L4 M C 7 R1 M3 L C
PAV and CondorcetAnother question of some interest is how PAV differs fromCondorcet, the well-known method of electing to a singleseat by means of preferential voting. Under Condorcet, Abeats B if there are more voters who prefer A to B thanthose who prefer B to A. But under PAV, A beats B if thereare more voters who give A a first preference, or otherwiseprefer A to a “ leading candidate” , than those who give B afirst preference, or prefer B to a leading candidate. Thus animportant difference between the two systems, is that underCondorcet, a voter supports either A or B, but cannotsupport both; whereas under PAV, it will often be the casethat the same voter supports both A and B, preferring A to aleading candidate, and also preferring B to a leadingcandidate. Not surprisingly, PAV is in this respect similar tonormal Approval Voting, where any one voter can vote (inthis case with an “X”) for both A and B.
But how far does PAV tend to elect the Condorcet winner(CW)? The CW was elected in Election 1, wherepreferences were single-peaked, and also in the more likelypreference situation of Election 2 (L, the PAV winner, beingpreferred over C by 51 voters to 49 and over R by 52 to 48).However, in Election 3, where C, the PAV winner, got mostof his votes from second preferences, the CW was notelected, the CW being candidate A (who was preferred overB by 51 voters to 49, and over C by 63 to 37). It thusappears that in practice, in the preference situations mostlikely to occur, PAV has a very high probability of electing
8
Issue 14 Voting matters, for the technical issues of STV, December 2001
the CW, but that it might not elect the CW in some unusualsituations, where the PAV winner obtains an especially highproportion of his points from lower preferences.
PAV and Descending AcquiescingCoalitions (DAC)It is of especial interest to compare PAV with DAC, which isanother new single-seat preferential system which can beregarded as a preferential simulation of Approval Voting. Therules of DAC can be explained as follows.
A voter is said to acquiesce to a set of candidates if there isno candidate outside the set whom he prefers to any candidatein the set. (In other words, in respect of any pair ofcandidates, one in the set and one outside the set, he alwayseither prefers the candidate in the set, or expresses nopreference between them.) The set of all those voters whoacquiesce to the candidates A and B is referred to as thecoalition acquiescing to A and to B, or as { A, B} . Forexample, if there are only three candidates A, B and C, then{ A, B} will be all those voters voting as follows: ABC, AB,BAC, BA, A or B.
That candidate is elected who obtains the acquiescence of agreater number of voters than any other candidate. This isdetermined as follows. A candidate A is said to beat acandidate B if the greatest coalition acquiescing to A and notacquiescing to B, is greater than the greatest coalitionacquiescing to B and not acquiescing to A. That candidate iselected who beats each other candidate.
This can be illustrated by the following two examples, takenfrom Woodall2 .
Election 5 (Election 3 of Woodall)
11 AB 7 B12 C
This produces acquiescing coalitions as follows, indescending order of size.
A beats B, because{ A, D} > { B, C, D} . A beats C, because{ A, D} > { B, C, D} . A beats D, because{ A, B, C} > { D} . ThusA is elected.
Let us now compare DAC with PAV. Under DAC, A beats B ifmore voters are in the greatest coalition acquiescing to A andnot acquiescing to B, than are in the greatest coalitionacquiescing to B and not acquiescing to A. Under PAV, Abeats B if there are more voters who give A a first preference,or otherwise prefer A to a “ leading candidate” , than those whogive B a first preference, or prefer B to a leading candidate.
DAC is like PAV, and unlike the Alternative Vote, in that itdoes not require a candidate to get first-preference votes inorder to get elected, and so it can elect the candidate withfewest first preferences (as it does in Election 5). The twosystems DAC and PAV are similar to each other, and toApproval Voting, in that each of them can give value to oneor more of the highest non-first preferences of an elector, andin that if it does, the value of a non-first preference is thesame as that of a first. DAC can thus be regarded as apreferential simulation of Approval Voting, as can PAV.
PAV and lack of monotonicityA system is non-monotonic if it is possible under it for acandidate who gets more voting support, to lose the electionas a consequence. The ten monotonicity properties, that is,ways in which a system can be monotonic or not, are analysedin Woodall2,3. Elections 7 to 9 below, show PAV to be non-monotonic in at least two of these ways.
9
Voting matters, for the technical issues of STV, December 2001 Issue 14
Election 7
10 A1 B29 B1 2 C1 B 9 C1 8 D1 A2
Stage 1 Stage 2 Stage 3
A 10 18 18B 9 19 19C 11 11 11D 8 8 8
Thus B is elected.
Now suppose that in Election 8, the two voters who votedCB in Election 7, change to voting BC instead. The stagesof the count will then be as shown below, and A will beelected. Thus by moving up the preference listing of thesetwo voters, B will have lost the election.
Election 8
10 A1 B 9 B1 2 B1 C3 9 C1 8 D1 A2
Stage 1 Stage 2 Stage 3 Stage 4
A 10 18 18 18B 11 11 11 11C 9 9 11 11D 8 8 8 8
Alternatively, suppose that in Election 9, the profile is as inElection 7, except that three new voters enter the election,and vote first preference for B, so that the second line in theelection profile is 12 B instead of 9 B.
Election 9
10 A1 B12 B1 2 C1 B3 9 C1 8 D1 A2
Stage 1 Stage 2 Stage 3 Stage 4
A 10 18 18 18B 12 12 14 14C 11 11 11 11D 8 8 8 8
Thus A is elected. Again, B has lost the election, this timeby getting more voters to vote for him.
It should be pointed out that the Alternative Vote is alsonon-monotonic, whether more or less so than PAV I amunable to determine. DAC, on the other hand, was designedto satisfy as many monotonicity properties as possible, andin fact satisfies eight out of ten of them.
How far, then, would this lack of monotonicity in PAV be aproblem not just in theory, but in actual practice in realelections? The main objective of PAV is to give eachcandidate the incentive to be responsive to each section ofelectors. Thus the important question is, how far will lackof monotonicity interfere with this incentive? Will acandidate (such as B in Elections 7 to 9 above) ever havethe incentive to displease the electors, so that they give hima lower preference, or so that fewer of them vote for him?
This seems unlikely, for two reasons. First, a non-monotonic profile of votes such as those of Elections 7 to 9seems itself unlikely when candidates are competingstrongly, not only for first preferences, but for second andthird preferences as well. Then the profile tends towards amore symmetrical pattern such as that shown in Election 2above, which would be monotonic. Second, in order for thecandidate to be provided with this negative incentive, hemust be able to predict that the overall profile of votes at thenext election will be such as to produce this non-monotonicity, and furthermore that his own votes will be inthat presumably narrow range where he will benefit fromlosing votes. In the absence of this prescience, the candidatewill have the incentive to respond positively to the electors,in the expectation that nearly always it will be beneficial forhim to get more votes rather than fewer of them. Thus itseems unlikely that this lack of monotonicity will affectthe candidates' incentives, or will be of practicalimportance.
Strategic votingIt is well known that any non-probabilistic method ofelection provides the opportunity, in some situation or other,for electors to engage in strategic voting. What form thenwill this strategic voting take, under PAV? It appears thatthe most likely strategy will be for the voter to give atruncated preference listing. For example, if it is expectedthat either A or B will get most points, and that both will getconsiderably more than C, then some of the ABCs (that is,electors whose preferences are A first, B second, C third)might adopt the strategy of voting only a first preference forA, and giving no preference for the other candidates (andsimilarly some BACs might vote only a first preference forB). Thus by not giving any votes to B, the ABCs make itmore likely that A, their first preference, will be elected.
The other systems similar to PAV are liable to strategy in asimilar way. Thus under normal (non-preferential) ApprovalVoting, a similar strategy is very likely to be used—ABCsvoting only for A and BACs voting only for B, when the
10
Issue 14 Voting matters, for the technical issues of STV, December 2001
election is expected to be a two-horse race between A and B.Under DAC, a preferential system with some similarity toPAV, this same strategy of the truncated preference listing islikely to be used (according to Woodall4).
How far, then, is it a problem, that there is this opportunity forstrategy under PAV? The strategy will be used inconstituencies where two of the candidates are clearlystronger than the others, and it is expected that the winner willbe one or other of them. But in constituencies where there arethree or more strong candidates, and it is unclear which ofthem is going to get most points, the electors will tend not tovote strategically, but to express fully their preferencesbetween these candidates.
However, there are reasons to expect that any constituencywill tend to move from the former situation towards the latter,that is, from one with two strong candidates to one with threeor more. Firstly, as it was shown above, PAV does not requirea candidate to get many first preferences in order to win, andso it presents relatively little entry barrier to an effective newcandidate. Secondly, when there are two strong candidates, letus say A and B, and a weaker candidate C, the strategic votingwhich this situation encourages actually benefits C. For someABCs will vote only first preference for A, which will reduceBs votes, and some BACs will vote only first preference forB, thus reducing As votes. This reduces the number of first orsecond preferences which C needs to get, to approach aboutthe same number of votes as A or B, making it easier for C tobecome a third strong candidate. It will then be uncertainwhich of the three candidates is going to get most votes, andstrategic voting will become unlikely.
Thus in conclusion, it seems that the tendency in anyconstituency is towards a situation where there are three (orperhaps more than three) strong candidates, each with somechance of winning. To the extent that this situation occurs, thetruncation strategy will tend not to be used, and voters willexpress fully their preferences for the candidates.
An evaluation of PAVIn the view of this paper, the main objective of an electoralsystem is to provide the elected candidates, and the parties towhich they belong, with the incentive to respond to the needsof the electors; and to respond not just to a part of theelectorate, even a majority part, but to respond equitably toeach section of electors, each possible minority. How far thendoes PAV provide the incentive to this equitable all-roundresponsiveness?
To answer this question, let us consider the examples ofElections 1 and 2 above. In Election 1, candidates L and R failto respond to all sections of electors, L not responding to theright-wing electors, and so getting a last preference fromthem, and R not responding to the left-wing electors.
Consequently, they lose points, and neither of them has anyprospect of getting elected.
However, in Election 2, each of them has broadened hisappeal to include the whole electorate, L responding to right-wing electors, and R to left-wingers. L now gets secondpreferences, not only from centre electors as before, but alsofrom right-wing electors, and similarly R gets secondpreferences from left-wingers. Thus by broadening theirappeal, L and R get more points, and L succeeds in gettingelected. This illustrates how PAV gives each candidate theincentive to respond to each section of electors.
Note that in Election 2, the situation between all threecandidates is symmetrical in the sense that any two candidatescompete with each other for the second preferences of thethird candidate's first-preference supporters. Thus L and Rcompete for the second preferences of centre electors (just asthey did in Election 1). But now L competes with C for right-wingers' second preferences, and similarly R competes with Cfor left-wingers' second preferences. Any one candidate thusneeds to be responsive to the first-preference supporters ofany other candidate, in order to compete with the thirdcandidate for their second preferences. For example, L needsto be responsive to centre electors to compete with R, and toright-wing electors to compete with C. Thus PAV gives eachcandidate the incentive to be responsive to each section of theelectorate.
Another way of understanding the incentives provided byPAV is as follows. In the likely situation where there are threecandidates competing, and each becomes a leading candidateat some stage in the counting, a candidate receives one pointfor each first preference and one point for each secondpreference. Thus (assuming all voters express their secondpreferences), a candidate needs to get either a first-preferenceor a second-preference vote from at least two-thirds of thevoters in order to get elected. He is not likely to achieve this,in competition with two other candidates also trying to do thesame thing, unless he appeals to each section of electors. Thusthe candidate has the incentive to respond to each section ofthe electorate.
Furthermore, a first preference is worth no more than a secondpreference--both are worth only one point. Thus there will beno need for a candidate to appeal to a given section of electorsany more strongly than is necessary to get second preferencesfrom it, and no reason to give the section any speciallyfavourable treatment, in order to obtain from it a higherproportion of first preferences. This is clearly a factor makingfor the candidates' more equal responsiveness to each section.
It is interesting to compare the situation under PAV asdescribed above, with that under the Alternative Vote. Here, inorder to get elected, a candidate needs to obtain the supportnot of two-thirds of the voters, but of only one-half. Thus he is
11
Voting matters, for the technical issues of STV, December 2001 Issue 14
likely to appeal less widely. Further, each candidate muststrive for first preferences, since the candidate with fewestfirst preferences will be excluded. This seems likely tocreate an incentive for a candidate to favour some sectionsof electors over others, in order to get first preferences fromthem.
To illustrate this, let us consider an example with threecandidates, A, B and C, where it is expected that C will beexcluded, and that it will be a close finish between A and B.Each of A and B will have his core supporters, to whom heis strongly responsive, in order to obtain first preferencesfrom them. Also, each of A and B will be stronglyresponsive to those voters giving first preference to C, inorder to compete with the other candidate for these voters'second preferences. But A will tend to be unresponsive tothe core supporters of B, because of the difficulty ofpersuading them to switch from first preference for B to firstpreference for A. Similarly, B will tend to be unresponsiveto the core supporters of A. Thus the Alternative Vote, byforcing candidates to strive for first preferences, makes fortheir unequal responsiveness to the different sections ofelectors. In comparison, PAV, which makes no requirementfor first preferences, will give candidates the incentive torespond more equally to each different section of electors.
PAV in the UKIf PAV were introduced in the UK for the WestminsterParliament, the present single-member constituencies wouldbe retained. The only difference for the electors would bethat they would vote by putting candidates in order ofpreference, instead of X-voting for only one candidate.
What then would be the effect on the parties' shares ofseats? The present Plurality system, which essentially givesa seat to the candidate with most first preferences,discriminates strongly against the Liberal Democrats, whohave third most first preferences. However, under PAV, theywould be likely to get many more seats than now, sincethere seems no reason why they should not get about asmany second preferences as either of the other two majorparties. Thus it seems likely that the three major partieswould be more equal in their seats than they are now, andthat no one party would get a majority; so that a coalitiongovernment would need to be formed, by some two of them.
The point of most interest, and the main advantage claimedfor the new system, is that it would give parties theincentive to change their policies to be more inclusive, moreequitably responsive to the different sections of theelectorate. For example, the Conservative Party currentlytends to be unresponsive to strong Labour supporters, sinceunder the present Plurality system few of them could bepersuaded to switch to voting for the Conservatives. Butunder PAV, the Conservative Party would become moreresponsive to them, in order to compete with the LiberalDemocrats for their second preferences. Similarly, the
Conservatives would become more responsive to strongLiberal Democrat supporters, in order to compete for theirsecond preferences with Labour. Thus the three majorparties would tend to converge in policy, towards a policymore equally responsive to each section of electors; and as aresult of this convergence, a coalition government formedby any two of them would be likely to be stable, andacceptable to all sections of the electorate.
Other uses of PAVPAV could be used with advantage, instead of the Two-Ballot System, for the election by popular vote of individualoffice-holders, such as the president of France, the presidentof Russia, or the prime minister of Israel. The advantage ofPAV for this purpose, can be explained as follows. Underthe Two-Ballot System, the usual rule is that if there aremore than two candidates on the first ballot, and no-onegets a majority of the votes, then the two strongestcandidates go forward to the second ballot, where one ofthem must get a majority. Thus a moderate or centrecandidate, who is widely acceptable to the electorate, andwho could win in the second ballot if he got there, may wellfail to get elected, because he gets too few votes on the firstballot. But as was explained above, under PAV there is norequirement to get first preferences (corresponding to first-ballot votes in the Two-Ballot System), and a candidate canbe elected just as well by second as by first preferences.Thus this moderate or centre candidate, with few firstpreferences but many second preferences, is likely to getelected under PAV, where he would not be elected under theTwo-Ballot System.
For similar reasons, it might be desirable to use PAV forpurposes such as the following: the election of a president,or of a chairman, by the members of a legislature; theelection of the party leader by the party membership, or bythe party's MPs.
PAV could also be used for a multi-option referendum, toenable the electorate to choose one option out of three ormore. This can be justified as follows.
In the usual type of referendum, electors choose betweentwo options, these options being some proposed action, letus say A, and the status quo S. Proposers will be concernedto find an A which will get a majority over S, and in doingso they may come up with an A which is very harmful to theminority, while perhaps only marginally beneficial to manypeople in the majority. Thus the two-option referendummight lead to very unequal treatment of different sections ofthe electorate, and to division and conflict.
However, if a PAV-using multi-option referendum isintroduced, a compromise option C is likely to be proposed,one which is better than A for S preferrers and some Apreferrers, and better than S for other A preferrers. Thusthere will be three options on the ballot paper, A, S and C,
12
Issue 14 Voting matters, for the technical issues of STV, December 2001
for the electors to place in order of preference. Since C willhave many second preferences, it is likely that C will beadopted. This illustrates how a PAV-using multi-optionreferendum tends to improve the outcome, reducing the riskthat any section of the electors will be severely harmed.
References1. S J Brams and P C Fishburn, Approval Voting, 1982.
2. D R Woodall, Monotonicity and Single-Seat ElectionRules, Voting Matters, Issue 6 (May 1996), 9 - 14.
3. D R Woodall, Monotonicity of Single-SeatPreferential Election Rules, Discrete AppliedMathematics, 77 (1997), 81 - 98.
4. D R Woodall, private communication, 3 July 1996.
IntroductionAn article describing the application of Decision Analysis tochoice of “best” electoral system was given in Issue 12 ofVoting matters. Readers were invited to complete their ownversion of the Analysis Table supplied. The present articlegives an analysis of the responses received.
Not surprisingly, in view of the readership of Voting mattersnearly all favoured STV. It was therefore decided to invite awider population to respond. This was just before the GeneralElection on June 7th and candidates from the local “JenkinsAV+” area were contacted. The area consists of the presentconstituencies of Cheltenham, Gloucester, Tewkesbury,Stroud, Cotswold, and Forest of Dean. Responses from some20 candidates was sparse so other political and non-politicalpeople were contacted.
A total of 14 responses was received.
Method of averagingFor each FEATURE (of a voting system) the average valuefrom respondents was evaluated. These features are plotted inFigure 1 in the order giving the most liked feature first. In thatorder, the features are:
PRO-N: How proportional is the national result?
EASYV: How easy is the system for the voter to use?
PRO-R: How proportional is the result within a region?(A region is visualised as, say, 10 of the presentneighbouring constituencies.)
LOC: Local link — How closely are MPs linked to anarea?
EW&E: Does the system encourage women and peoplefrom ethnic minorities to stand for election?
CHO-MP: Is there a choice within a party as well asacross party lines?
PLOC: How easily can constituents contact an MP oftheir preferred political persuasion?
ONECMP: Is there one class of MP? (Some systems haveregional as well as local MPs)
EASYC: How easy is the process of counting?
EASYBC: How easy is the task of the BoundaryCommission?
STAB: Stability of government. STAB really asks thequestion “ Is the government likely to complete itsnormal period of office?” Critics of PR sometimes sayit results in “weak” coalition government. This hassome validity with Party Lists, particularly when basedon the whole country as in Israel. Experience inGermany since 1945 with AMS, and in Eire since 1922with STV are to the contrary.
It should be noted that the Voting matters article used a rangeof weighing factors from 0 to 3, whereas from March 2001 arange from 0 to 10 was in use. Furthermore the additionalFEATURE of STAB was not considered as it did not appear inthe original Voting matters article.
For each voting system, a similar plot is produced in Figure 2.Here the systems in reducing order of preference are:
STV: Single Transferable vote.
PLRO: Party List based upon a region and using openlists.
PLRC: Party List based upon a region and using closedlists.
AV50: Similar to AV+, but having a 50% top-up element.
PL: Party List.
AV+: The proposal made by Lord Jenkins.
13
Voting matters, for the technical issues of STV, December 2001 Issue 14
AMS: Additional Member System as used in Germanysince 1945 and in differing forms for the ScottishParliament and the Welsh Assembly.
AV: Alternative vote.
FPTP: First Past the Post (as used in Westminster).
Readers who would like to fill in their own questionnaire canobtain a copy from the Editor by writing to ERS orelectronically by e-mailing [email protected].
14
Issue 14 Voting matters, for the technical issues of STV, December 2001
EASYC
Minimum
Average
Maximum
PRO-N EASYV PRO-R LOC EW&E CHO-MP'
PLOC ONECMP(
EASYBC
10)
0*
Figure 1: Features
Minimum
Average
Maximum
STV PLRO PLRC AV50 PL AV+ AMS AV FPTP
700
0
Figure 2: Systems
1
Voting mattersfor the technical issues of STV
The Electoral Reform Society
Issue 15 June 2002
All correspondence regarding Voting matters should beaddressed to:
B A Wichmann, The Editor, Voting matters, The Electoral ReformSociety, 6 Chancel Street, London, SE1 0UU.
Readers are reminded that views expressed in Voting matters bycontributors do not necessarily reflect those of the ElectoralReform Society.
To aid production, the Editor would welcome contributions onIBM-PC discs (with a printed copy as well) or [email protected].
EditorialOn the 17th May 2002, the Dáil constituencies of Meath,Dublin North and Dublin West used an experimental systemfor electronic voting. It is expected that this system will beused exclusively for local and national elections in the IrishRepublic in the near future.
Of course, the three constituencies used the same electoralrules as in the other 40 — essentially a hand-counting systemwhich has at least one ‘problem’ in that the result can dependupon the order in which papers are transferred on a surplus.Examination of such issues has traditionally always beenhampered by the lack of complete information of all thepreferences expressed by the voters.
We now have a significant step forward for electoral studiessince the Irish electronic voting results includes the completedata input to the electronic counting software. One canreasonably expect future issues of Voting matters to analysethis data.
The first paper in this issue is indeed an analysis of Irishelection data, but only uses the result sheets. Philip Kestelmanshows statistically significant bias according to the alphabeticposition (on the ballot paper). I might add that even a casualinspection of the full data mentioned above shows a tendencyfor the final few preferences to be in strictly ascending ordescending order.
In the second paper, Eivind Stensholt considers the problemwhen additional support for a candidate results in thatotherwise elected candidate not being elected. This propertyof non-monotonicity applies even to the case of electing asingle candidate, as shown in this paper. On the other hand,the paper indicates that it is relatively rare.
In the third paper, Markus Schulze considers an algorithm forelecting candidates with preference voting proposed byProfessor Sir Michael Dummett. Sir Michael has chosen notto respond to the criticisms made.
In the last paper, David Hill and Simon Gazeley produce anew STV-like algorithm which merges the ideas of Condorcetand STV. The advantage of this algorithm is to avoid theproperty of all conventional STV algorithms of prematureexclusion, such as for a universal second-choice candidate.On the other hand, this method has the disadvantage of laterpreferences could possibly upset earlier ones in rare cases.
McDougall Trust: STV Resources CD
A proof copy was prepared in February, but the publicationdate has not yet been agreed.
Brian Wichmann.
Positional Voting BiasRevisitedPhilip Kestelman
IntroductionIt is widely supposed that candidates appearing high onballot-forms enjoy a considerable electoral advantage. In ahighly influential paper on the 1973 General Election to theIrish Dáil, by multi-member Single Transferable Voting(STV), Robson and Walsh (1974) observed that Deputies(TDs) over-represented candidates with A-C surnames.Compared to randomly sampled Irish electors, “The under-representation of M-O names among politicians is verystriking” .
Proportionality conventionally measures the relationshipbetween numbers of Party votes and seats (regardless ofcandidates). Despite a probable age bias, we are hardlyconcerned that seats considerably over-represent firstpreferences for incumbent candidates; let alone thatincumbents are far more likely to be elected than‘excumbents’ (non-incumbents).
On the other hand, we are concerned not only that seatsshould proportionally represent votes for women candidates,but also that seats should be proportional to womencandidates, in the interests of Parliament representingsociety. In respect of ballot-form position, we are primarilyconcerned with the relationship between numbers ofcandidates and seats (regardless of votes), by surnameinitial, when candidates are listed surname-alphabetically onballot-forms.
ElectabilityThis article mainly evaluates positional voting bias in thelast 12 general elections in the Irish Republic (1961-97).Electability is quantified in terms of an Electability Index(S%/C%): the ratio of a seat-fraction (S%) to a candidate-fraction (C%); and of a Relative Electability Ratio: the ratiobetween specified Electability Indices.
Aggregating all 12 elections (Total S/C = 1,875/4,594),Upper/Lower half surname A-J/K-Z Electability Indiceswere 1.11/0.88, with a statistically highly significantRelative Electability Ratio of 1.26 (P<0.001). Bycomparison, alphabetically Upper/Lower half forenameA–L/M–Z Electability Indices were 1.01/0.99, with aninsignificant Relative Electability Ratio of 1.01 (P > 0.05).
CumbencyIn 1961-97, most incumbent candidates (S/C = 1,404/1,687= 83 percent) were re-elected; whereas few excumbents(471/2,907 = 16 percent) were elected, rendering them more
susceptible to alphabetic disproportionality. Surname A-J/K-Z Electability Indices (S%/C%) were 1.01/0.98 forincumbents, and 1.15/0.86 for excumbents, with RelativeElectability Ratios of 1.03 (P>0.05) and 1.34 (P<0.05),respectively.
The last 12 Irish general elections have consistently over-represented excumbent candidates with A-C surnames;under-representing those with K-M surnames (overall S%/C%, 1.27 and 0.81: Table A). Even combining the 12elections into three quartets leaves considerable variabilityin both forename and surname Electability Indices.
Table A: Excumbent Electability Index, by Electionsand Forename/Surname initial letter: Irish Republic,1961-97 (12 general elections: Dáil Éireann, 1962-98).
* P < 0.05
In 1961-73, excumbent forename and surname alphabeticbiases were equally convincing (P<0.05); but insignificantsubsequently. Ironically in 1973, the Relative ElectabilityRatio for A-L / M-Z forenames (2.76) exceeded that for A-J/ K-Z surnames (1.57)! The pitfalls of generalising from asingle election are manifest.
District MagnitudeSurname disproportionality was virtually confined to four-and five-member STV constituencies: only three-memberconstituencies returned TDs more-or-less faithfullyreflecting excumbent surnames (Table B). Magnitude-specific surname A-J/K-Z Relative Electability Ratiosproved statistically insignificant, but much closer to unity inthree-member constituencies (1.25, 0.89 and 0.72) than infour-member constituencies (1.62, 1.36 and 1.51), or infive-member constituencies (2.05, 1.77 and 1.42), in1961–73, 1977–82 and 1987–97, respectively.
2
Issue 15 Voting matters, for the technical issues of STV, June 2002
Name Elections: Electability Index (S% / C%)
Initial letter 1961-97 1961-73 1977-82 1987-97
A-F 1.04 1.34 1.11 0.88
Forename G-L 1.08 1.08 0.98 1.16
M-P 1.02 0.82 1.14 1.08
Q-Z 0.82 0.84 0.72 0.85
Ratio (A-L/M-Z) 1.14 1.42* 1.10 1.01
A-C 1.27 1.38 1.19 1.24
Surname D-J 1.04 1.04 1.06 1.04
K-M 0.81 0.73 0.84 0.83
N-Z 0.92 0.91 0.91 0.94
Ratio (A-J/K-Z) 1.34* 1.47* 1.29 1.27
Table B: Excumbent Electability Index, by DistrictMagnitude (seats per constituency) and Surname initialletter: Irish Republic, 1961-97 (12 general elections:Dáil Éireann, 1962-98).
*P < 0.05 +Including a few two-member constituencies.
District Canditude and PositionInterestingly, the 1961-97 aggregate, excumbent RelativeElectability Ratio by surname (A-J/K-Z) proved identical withthat by ballot-form position (Upper/Lower = 1.34: P<0.05).Like the surname A-J/K-Z Relative Electability Ratio withdistrict magnitude (the number of seats per constituency), thepositional Upper/Lower Relative Electability Ratio increasedwith district ‘canditude’ (the number of candidates perconstituency: Table C).
Table C: Excumbent Electability Index, by DistrictCanditude (candidates per constituency) and Ballot-form Position: Irish Republic, 1961-97 (12 generalelections: Dáil Éireann, 1962-98).
* P < 0.05 +Excluding odd-Canditude mid-candidates.
Party PolicyBoth main political parties in the Irish Republic (Fianna Fáiland Fine Gael) have staunchly denied over-nominatingcandidates appearing high on ballot-forms9. Table D analysesthe surname-alphabetic distribution of FF and FG excumbentcandidates, compared with other (non-FF + FG) excumbents,in terms of a Relative Nomination Index, over time.
Table D: Two Main Party Excumbent RelativeNomination Index, by Elections and Surname initialletter: Irish Republic, 1961-97 (12 general elections:Dáil Éireann, 1962-98).
*** P < 0.001
Evidently since 1977, both main parties have greatly over-nominated A-C surname candidates (and/or other parties haveunder-nominated them); with the honours evenly dividedbetween Fianna Fáil and Fine Gael. Relative to thepublication of Robson and Walsh (1974), the timing may nothave been entirely coincidental!
ElectorateRobson and Walsh (1974) observed that the alphabeticdistribution of surname initial letters differed insignificantlybetween randomly sampled Irish electors and excumbentcandidates at the 1973 Irish General Election. Presumablynowadays, the surname initials of electors are rather betterrepresented by excumbent, non-FF + FG candidates; andTable E compares overall seat-fractions, by surname initial,with excumbent, non-FF + FG candidate-fractions.
This Surname Concentration Index (Total S%/Excumbent,non-FF + FG C%) highlights Dáil Éireann over-representingA-C surnames in the Irish electorate; while under-representingK-M surnames. Despite the lower surname A-J/K-ZConcentration Ratio since 1987 (1.35), A-C surname electorsremain over twice as likely as K-M surname electors tobecome TDs.
Voting matters, for the technical issues of STV, June 2002 Issue 15
Surname Magnitude: Electability Index (S% / C%)
Initial letter Total+ 3 4 5
A-C 1.27 1.10 1.51 1.21
D-J 1.04 0.87 0.98 1.28
K-M 0.81 1.05 0.66 0.73
N-Z 0.92 0.98 0.96 0.79
Ratio (A-J/K-Z) 1.34* 0.96 1.51 1.64
Ballot-form Canditude: Electability Index (S% / C%)
Position+ Total 4-8 9-11 12-21
Top 1.30 1.22 1.26 1.41
Upper-middle 0.98 0.86 1.06 1.01
Lower-middle 0.90 1.15 0.91 0.76
Bottom 0.83 0.83 0.81 0.86
Ratio (Upper/Lower) 1.34* 1.13 1.37 1.49
Elections: Relative Nomination Index
Surname (Fianna Fáil +Fine Gael C%/ Other C%)
Initial letter 1961-97 1961-73 1977-82 1987-97
A-C 1.46 1.07 1.63 1.57
D-J 0.96 1.02 1.13 0.84
K-M 0.92 1.09 0.79 0.87
N-Z 0.81 0.85 0.69 0.92
Ratio (A-J/K-Z) 1.35*** 1.08 1.82*** 1.25
Elections: Surname Concentration Index
Surname (Total S% /Excumbent, non-Fianna Fáil +Fine Gael C%)
Initial letter 1961-97 1961-73 1977-82 1987-97
A-C 1.65 1.56 1.66 1.58
D-J 1.01 1.13 1.13 0.91
K-M 0.70 0.76 0.63 0.73
N-Z 0.85 0.68 0.85 0.99
Ratio (A-J/K-Z) 1.65*** 1.85*** 1.86*** 1.35**
Other STV ElectionsCompared to the last 12 Irish general elections, with a totalsurname A-J/K-Z Relative Electability Ratio of 1.26(P<0.001), the last five European elections in the IrishRepublic (1979-99: Total S/C = 75/234) have yielded ahigher but statistically insignificant surname A-J/K-ZRelative Electability Ratio of 1.37 (P > 0.05) 5 .
On the other hand, the last five Irish Local Elections(1979–99: Total S/C = 4,918/10,250) disclosed a lowersurname A-J/K-Z Relative Electability Ratio of 1.12(P<0.001)3. Perhaps better acquainted with localgovernment candidates, voters discriminate moreindividually; numbering their preferences regardless ofalphabetical order.
At the 1973 Assembly Election in Northern Ireland, Robsonand Walsh (1974) attributed eight out of 78 Seats topositional voting bias. Yet at the 1998 Northern IrelandAssembly Election (Total S/C = 108/296), the surname A-J/K-Z Relative Electability Ratio fell below unity(0.87: P>0.05)4. Certainly, parties are more sharplydifferentiated in Northern Ireland than in the Irish Republic.
DiscussionUsing forenames as controls, surname-alphabeticelectability valuably measures voters’ lack of discriminationbetween candidates within parties. Neither voters nor theIrish electoral system (STV) can be reproached for anypositional voting bias.
However, Dáil Éireann remains surname-alphabetocratic,over-representing candidates with A-C surnames, whileunder-representing excumbents (non-incumbents) with K-Msurnames (Table A: compare Table E): especially inconstituencies with over three seats (Table B), and/or overeight candidates (Table C).
Perhaps aware of Robson and Walsh (1974), Ireland’s twomain parties (Fianna Fáil and Fine Gael) have apparentlyover-nominated A-C excumbents (notably since 1977:Table D). However, thus acting on the belief of increasedelectability may itself increase A-C surname over-representation: aggregating the last 12 Irish generalelections (1961-97), excumbent S%/C% for FF + FG (1.67)was considerably higher than for other parties (0.43).
Reassuringly, aggregating all 12 general elections (1961-1997), the excumbent Surname Relative Electability Ratio(S/C ratio: A-J/K-Z=1.34 overall) proved significantlyhigher for FF+FG (1.28: P<0.05) than for the othercandidates (1.03: P>0.05). however, it remains unclearwhether the two main parties have benefited from A-C over-nomination.
Darcy and McAllister (1990) found “no evidence forposition advantage for political parties in any election” .Their review concluded that positional voting bias may beeliminated by removing its causes: notably, compulsoryvoting; completion of all preferences; and ballot-forms notindicating candidates’ Party affiliation (as in Ireland before19657).
On the strength of the 1973 Irish General Election, Robsonand Walsh (1974) advocated randomising the order ofcandidates on ballot-forms. Citing Robson and Walsh(1974), Sinnott8 suggested that the problem could “easily beeliminated by arranging the names in a number of differentrandomised orders on different sets of ballot papers” .
At the Dublin High Court in 1986, Mr Justice Murphyaccepted that candidates with surname initials high in thealphabet were over-represented but, noting that alphabeticorder helped voters to find candidates, he found itconstitutional9. Indeed, the voter’s predicament isparamount; and to avoid the palpable frustrations ofrandomised ballot-forms in locating preferred candidates, areasonable compromise might be to print half the ballot-forms in surname-alphabetic order, with the other half in thereverse order — if positional voting bias really matters.
AcknowledgementI am indebted to David Hill for statistical advice. Statisticalsignificance was calculated by combining election-specific,one-tailed exact two-by-two table probabilities6.
References1. Dáil Éireann (1962-98): Election Results and
Transfer of Votes in General Election: October 1961— June 1997. Stationery Office, Dublin.
2. Darcy R and McAllister I (1990): Ballot PositionEffects: Electoral Studies 9, 5-17.
3. Department of the Environment and LocalGovernment (1980-2000): Local Elections, 1979-99.Stationery Office, Dublin.
4. Chief Electoral Officer for Northern Ireland (1998): The New Northern Ireland Assembly Election 25June 1998. Belfast.
5. European Parliament Office in Ireland/Department ofthe Environment and Local Government (1980-2000): European Parliament Election Results,Ireland, 1979-99.
6. Fisher R A (1970): Statistical Methods for ResearchWorkers, 14th Edition. Hafner Publishing Company,New York (pages 99-101).
4
Issue 15 Voting matters, for the technical issues of STV, June 2002
7. Robson C and Walsh B (1974): The Importance ofPositional Voting Bias in the Irish General Election of1973: Political Studies 10, 191-203.
8. Sinnott R (1999): The Electoral System: in Coakley Jand Gallagher M eds: Politics in the Republic of Ireland(Third Edition). Routledge, London (page 124).
9. Trench B et al (1987): The Alphabet Advantage: inMagill Book of Irish Politics: Election February 87(page 23).
Nonmonotonicity in AVE Stensholt
Eivind Stensholt is from the Norwegian School of Economicsand Business Administration
IntroductionNonmonotonicity arises with STV when apparent additionalsupport for a candidate, A, at the expense of anothercandidate, C, causes a third candidate, B, to be elected.Without the additional support, A would be elected. Thus theadditional support actually costs A the election. Thisunfortunate property in the standard variations of STV islinked to the elimination of candidates in the countingprocess6, and it is unavoidable unless some compromise ismade with the principle that a voter' s later preferences cannotinfluence the fate of the voter' s earlier preferences.
How frequently will it happen that a candidate is not elected,but might have been elected if some of his or her support hadgone to another candidate instead? That depends on the voters'behaviour. Based on standard assumptions on the distributionof voter preference, modified by empirical evidence of voterbehaviour, the frequency is estimated for elections in which 1candidate is elected from 3. This is the Alternative Vote (AV),a single-seat version of STV.
It is also shown how the nonmonotonicity is related to theCondorcet paradox in which one majority prefers B to A,another majority prefers A to C, and a third majority prefers Cto B. In all elections considered, each voter is assumed to givea complete preference list.
For example, consider an election (from a simulation with10000 voters) with
475 ABC3719 ACB 390 CAB2110 CBA 41 BCA3265 BAC
No candidate has 50% of the first preference votes. C, withonly 2500 first preference votes is eliminated, and finally Bdefeats A with 5416 votes to 4584. However, if x of theACB-voters vote “strategically” CAB instead, the electionmay turn out differently. Then the profile is
If x > 806, C with 2500+x overtakes B with 3306, and ifx<888, A is still ahead of B with 4194−x to 3306. Thus, with806 < x < 888, B gets eliminated, and finally A defeats C with7459−x votes to 2541+x.
The example also shows the Condorcet paradox of cyclicmajorities. In pair-wise encounters A defeats C with 7459−x to2541+x, C defeats B with 6219 votes to 3781, and B defeats Awith 5416 votes to 4584. However, in real elections with 3candidates cyclic majorities become very rare as the numberof voters increases. One indicator of unrealism is that thecyclic order ABCA receives only 475+390+41+x = 906+xvotes while ACBA receives 3719+2110+3265−x = 9094−xvotes. In real elections the votes are distributed in the 6categories in a more harmonious way.
If nonmonotonicity occurs in a real election, the scenario ismost likely that there is a plurality winner, A (with the largestnumber of first preference votes), another Condorcet winner,B (who defeats each other candidate in pair-wise encounters),and a third candidate, C (who is last in first preference votes).Such an example, from the same simulation, is
2996 ABC1122 ACB 875 CAB2046 CBA1431 BCA1530 BAC
Here C is eliminated and B wins the AV-election. If x votersswitch from ACB to CAB, and 40 < x < 648, then B iseliminated and A wins. It turns out that if AV is modified andA declared winner in the few cases like this, nonmonotonicityis eliminated. Instead, however, another principle will beviolated: B may win by a suitable vote transfer from BAC toBCA.
3-candidate elections may be classified according to how wellthe “electoral cake model” in Stensholt5 may be fitted; thefigure on page 7 shows a good fit. The model may be fittedquite well to most real elections. When simulated elections areclassified, election P is considered more “realistic” thanelection Q if the model fits P better than Q. When better fit,i.e. more “realism”, is demanded, the frequency of the
5
Voting matters, for the technical issues of STV, June 2002 Issue 15
Condorcet paradox will approach 0. Nonmonotonicity,however, occurs in about 0.90% of all simulated “realistic”elections. Two real elections (37 candidates, 63 voters) and(14 candidates, 115 voters) have been checked, withnonmonotonicity in, respectively, 0.66% and 1.10% of thecandidate triples.
A description of nonmonotonicity bymeans of inequalitiesA possible preference distribution P in an election with 3candidates, A, B, and C (a profile in the social choicevernacular), consists of a sequence of 6 non-negativenumbers.
P = (p q r s t u),
These are the numbers (absolute or relative) of voters withpreference ranking respectively: ABC, ACB, CAB, CBA,BCA, BAC.
If x of the ABC-voters and y of the ACB-voters change tovote CAB, there is a new profile Q:
Q = (p−x q−y r+x+y s t u).
Nonmonotonicity occurs if B is AV-winner in P and A in Qdespite the natural expectation that the candidate A isweaker in Q than in P. The story is told in 9 inequalities.
r+s+t+u > p+q (1)
p+q+r+s > t+u (2)
p+q > r+s (3)
t+u > r+s (4)
s+t+u > p+q+r (5)
p+q+t+u−(x+y) > r+s+(x+y) (6)
r+s + (x+y) > t+u (7)
p+q−(x+y) > t+u (8)
u+p+q−(x+y) > r+s+t + (x+y) (9)
A translation to non-mathematical language links theinequalities to the AV rules. (1, 2): In P, neither A nor B have50% of the first preference votes. (3, 4): In P, C has thelowest number of first preference votes. (5): In P, B winsover A (after elimination of C). (6): In Q, C does not reach50% first preference votes. (7): In Q, C passes B in firstpreference votes. (8): In Q, A keeps more first preferencevotes than B. (9): In Q, A wins over C (after elimination ofB).
However, the mathematical version (1-9) is easier toanalyse. Write (7, 8, 9) equivalently as
Thus numbers x and y satisfying (7, 8, 9) exist if and only if(11) and (12) hold:
p+q+r+s > 2t+2u (11)
p+q+r+s > 3t+u (12)
Moreover, (1), (2), (3), and (6) are redundant because of (5),(11), (4 and 8), and (9), respectively. Therefore the p+qsupporters of candidate A can turn defeat in P to victory inQ if and only if (4, 5, 11, 12) all hold. Then x+y of themvote “strategically” CAB, with x+y as in (10).
A profile where a candidate may be helped by being rankedlower in some ballots without any other change in anyballot will be called a nonmonotonic profile for the electionmethod considered. In discussing various election rules, it isalso useful to have an “absolute” definition: A profile isthen nonmonotonic if it is so for AV. A monotonic electionmethod is one without nonmonotonic profiles. AV, and theusual STV-variations are nonmonotonic because of theelimination rules. By the criteria (4, 5, 11, 12)
p+q> t+u > r+s (13)
Thus, in P, A is plurality winner (first past the post), while Bbeats A and A beats C in pair-wise comparisons by (5) and(9). This we will call nonmonotonicity of type ABC. Thereare six types of nonmonotonic profiles: ABC, ACB, CAB,CBA, BCA, and BAC.
Connection to the Condorcet paradox;a geometric descriptionThe Condorcet paradox occurs together with ABC-typenonmonotonicity when also C beats B in pair-wisecomparison, i.e.
q+r+s > t+u+p (14)
Otherwise B is the Condorcet winner, i.e. B defeats eachopponent in a pair-wise contest. The strategic voting of thex+y voters who honestly support A is then designed to takethe AV victory away from Condorcet winner B to pluralitywinner A. Define E, F, G, H, K as functions of the profile:
E=−r−s+t+u
F=−p−q−r+s+t+u
G= p+q+r+s−2t−2u (15)
H= p+q+r+s−3t−u
K=−p+q+r+s−t−u
When all possible profiles are standardized, e.g. top+q+r+s+t+u=12, as in the table below, they form a 5-dimensional simplex with 6 corners — a higher dimensionalanalogue of the familiar 3-dimensional simplex(tetrahedron) with 4 corners and 4 triangular sides.
6
Issue 15 Voting matters, for the technical issues of STV, June 2002
By (4, 5, 11, 12) the nonmonotonic profiles of ABC-type forma convex subset S of this simplex, given by
E > 0, F > 0, G > 0, H > 0 (16)
The Condorcet paradox occurs if K > 0 too. The profiles inthe table are the corners of the closure of S and have non-negative E, F, G, H.
In the right hand column, ε = ε(P) is a continuous function ofthe profile P, defined in Stensholt5. By its definition, 0 < ε <3√3/4π ≈ 0.4135. Generally ε is well below 0.01 in profilesfrom real elections with many voters. Any profile P satisfying(16) may be written as
with non-negative kj and k01 + k02 + k03 +... + kl6 = 1.
To a profile P = (p q r s t u) we may assign a twin profile P* =(q p r s t u). Thus P**=P and Pi* = Pi+8, i=1, 2,.., 8. If P is anonmonotonicity profile of type ABC, so is P* . With P as in(17), then
Thus the profile 0.5 [P + P* ], midway between P and P*, willnever give the Condorcet paradox, but it is on the borderline ifand only if k07 = k08 = kl5 = kl6 = 0 Somewhere between 1/3and 2/3 along the line segment from P to P* , K = 0. From theK-column in Table 1 it is clear that, with many voters,somewhere between 33% and 50% of all nonmonotonicityprofiles also have a Condorcet cycle. However, they are notall equally likely to occur in real elections.
Simulation and realityOne million random 3-candidate profiles were generated withuniform probability in the simplex. The distribution is knownas the Impartial Anonymous Culture (IAC). The IAC alsodepends on the number of voters, but the simulationcorresponds to the limit case of infinitely many voters.Actually about 100 voters would give quite similar results.
In 3621 of the IAC-generated profiles were E>0, F>0, G>0,H>0. As there are six nonmonotonicity types, about6×0.3621% ≈ 2.17% of the profiles are nonmonotonic.Among these 3621, 1602, i.e. ≈ 44.24% also had K>0,indicating a Condorcet cycle in the profile: A beats C beats Bbeats A. For comparison, 6.25% of all IAC-profiles have aCondorcet cycle 2,5.
In real elections the cycle frequency is much lower. That isdue to a structure in the profiles, which may come from thevoters having some common perception of the “politicallandscape” although they have placed themselves in differentpositions and rank the candidates accordingly 5.
Imagine that the voters are distributed with uniform density ina circular disc, that candidates A, B and C are among them,and that a voter ranks the candidates according to theirdistance from the voter' s position. In a pair-wise comparisonbetween A and B, B wins if and only if B is closer than A tothe circle centre. A and B divide the voters between them withthe mid-normal to the line segment AB as dividing line.Similarly the mid-normals for BC and AC divide the disc. Thethree candidates split the “voter cake” in six pieces by threestraight cuts through one common point, each piece getting anarea proportional to the number of votes with thecorresponding ranking of the candidates. In a model like this,the Condorcet paradox can never occur except in a degenerateform with all cuts through the circle center, and p=s, q=t, r=u.
Empirically, the electoral cake model fits reasonably well for3-candidate profiles from real elections with a large numberof voters. That is why the Condorcet paradox is rare. Thefunction ε(P) measures the deviation of P from the model. Forthe examples in the introduction,
7
Voting matters, for the technical issues of STV, June 2002 Issue 15
Figure giving the profile (2996 1122 0875 2046 1431 1530)which fits well with the “electoral cake” model.
A
B
C
2996
1530
1431
2046
875
1122
Profile p q r s t u E F G H K 100εP01 4 0 2 2 2 2 0 0 0 0 –4 5.61
Among the simulation profiles with small ε(P), about 0.15%were nonmonotonic of ABC-type. This suggests an estimateof 0.90% for the probability for nonmonotonicity in acandidate triple in real elections with many voters.
In an election with 63 voters and 37 candidates at theauthor' s institution, 51 of the 37×36×35/6 = 7770 tripleswere nonmonotonic, a fraction of 0.66%. In these 51 triples,the Condorcet paradox occurred only 7 times, i.e. much lessthan the 44.24% in the full IAC-simulation. In anotherelection in the same place, with 115 voters and 14candidates there were 4 nonmonotonicity triples out of14×13×12/6 = 364, i.e. 1.10% and the Condorcet paradoxoccurred in none of them. Comparison with the simulationrequires some caution since the triple profiles in an electionwith many candidates cannot be assumed stochasticallyindependent.
ConclusionIn an election with 3 candidates, A, B and C, let A beplurality winner. In the vast majority of elections, there willalso be a unique Condorcet winner. If A also happens to beCondorcet winner, A wins the AV-election. That cannot bevery controversial.
So assume B is Condorcet winner, which means that B winsif A or C is eliminated. B may win with very few firstpreference votes in the ballots, but electing B means thatthere are no “wasted votes”. The “plurality ideology” mayalso be modified to avoid wasting votes by eliminating B;then the supporters of B are allowed to influence the choicebetween A and C. An election method that always eliminatesa Condorcet winner who is not also a plurality winner, mayseem strange. However, it would, arguably, be a democraticimprovement of the plurality method that is in wide usetoday. It preserves the “plurality ideology” as well aspossible, preferring to let centre voters decide between“right” and “left” rather than filling an assembly with centrepoliticians.
AV can be seen as a compromise between the “pluralityideology” and the “Condorcet ideology”. There are twopossibilities.
(I) If B has the smallest support in terms of firstpreference votes, i.e. p+q > r+s > t+u, then B iseliminated.
(II) If B is number 2 in terms of first preference votes,i.e. p+q > t+u > r+s, then B is the AV-winner.
Nonmonotonicity occurs in (II) if A has a number of surplusfirst preference votes that could be transferred to C in a waythat benefits A. Such transfer is not a part of AV, but this canbe remedied in the spirit of STV if the transfer rule isextended. When (16) holds, let the necessary number ofsurplus votes be transferred from voter categories ABC andACB to CAB if this lets C become number 2 in terms offirst preference votes, and still lets A win against C afterelimination of B. This transfer of first preference votes fromA to C involves only voters who prefer A to B (categoriesABC, ACB, CAB), and it may be implemented in thecounting process when it helps A to win instead of B.
An obvious argument against such a procedure is that itoccasionally may violate the cherished principle that mysecond preference should never hurt my first preference. Tosee this, consider first standard AV. Then C is eliminatedafter examination of first preferences only. The secondpreferences of C' s supporters become available, and eitherA (plurality winner) wins or B (Condorcet winner if oneexists) wins. Among the conditions in (16) for an extratransfer of votes from A to C, the three first only involvefirst preference votes: p+q, r+s, t+u. The inequality H > 0requires information about t and u, i.e. about the secondpreferences of B' s supporters. This allows for strategicvoting on behalf of B. Let z voters move from BAC toBCA. Then according to (15) the requirement H > 0 issharpened to
p+q+r+s−3t−u−2z>0.
The strategy is to break this condition, which is achieved ifand only if
p+q+r+s−3t−u ≤ 2z ≤ 2u
Such strategy is possible if and only if
p+q+r+s+t+u ≤ 4(t+u),
i.e. if and only if B has at least 25% of the first preferencevotes. This will, however, always be the case when the extratransfer rule is invoked, because by (1) A has less than 50%of the first preference votes and by (4) B has more firstpreference votes than C. AV with extra transfer violates theprinciple exactly when standard AV violates monotonicity.
In 3-candidate elections, voters may be offered one of twoguarantees:
1) You can never hurt a candidate by an upwards move;
2) You can never hurt a candidate by a change in thesubsequent ranking.
In about 99% of the elections, the profile is monotonic.Then AV and AV with extra transfer satisfy both 1) and 2),as no extra transfer is done. In the remaining cases, standard
8
Issue 15 Voting matters, for the technical issues of STV, June 2002
AV picks the Condorcet winner and violates 1) but not 2),while AV with extra transfer picks the plurality winner andviolates 2) but not 1). Which of the two guarantees is thenmost important?
With more candidates, it becomes more complicated to studynonmonotonicity in AV. With 5 candidates, A, B, C, D, and E,there are 10 triples, and each candidate takes part in 6 triples:
After all but 3 candidates are eliminated, there is a final triple,say {A,B,C}. If AV is adopted in more than 600constituencies, as in a Westminster election, there willgenerally be some with nonmonotonicity in {A,B,C}. Howbad will criticism from frustrated supporters of a non-electedplurality winner in such cases be for people' s trust in standardAV?
If A, B and C are much stronger than all other candidates, itmay be enough to implement the extra vote transfer in{A,B,C} in order to cope with most nonmonotonic profiles.Nonmonotonicity is reduced, at a price: How bad willcriticism from frustrated supporters of a non-electedCondorcet winner in such cases be for people' s trust in AVwith extra transfer?
The purpose of elimination is to find the opponent for A in thefinal pair, so B or C must be eliminated. The extended transferrule only adjusts the border between elimination of B andelimination of C. Is an election of B due to honest firstpriority from A' s supporters more tolerable than election of Adue to honest subsequent ranking from B' s supporters?
Can we achieve monotonicity with more than 3 candidates, ata reasonable price? Perhaps a recursive idea may work.Assume that the set of profiles S with n candidates has beensubdivided into n subsets S = Sl ∪ S2 ∪ ... ∪ Sn, so thatcandidate i wins with profile in Si and that this electionmethod is monotonic. With n+1 candidates left, eliminate Zwith the lowest number of first preference votes. If that leadsto a profile in SY and X ≠ Y, then allow an extra transfer offirst votes from X to Z or even to more candidates in order toeliminate another candidate and obtain an n-candidate profilei Sx. The possibility of saving more candidates than Z fromelimination by an extra transfer raises the question of whetherX is uniquely defined.
A more radical measure is to count in each triple separately,implementing the extra transfer. “Triple-AV” then gives acandidate one point for a triple victory, and achievesmonotonicity. It is similar to Copeland' s method1,3,4, whichgives one point for each victory in a pair-wise comparison andavoids Condorcet cycles. On the other hand, the price formonotonicity with triple-AV may well be too high in terms ofviolations of the principle.
An axiomatic study of election theory reveals some basicimpossibilities. Certain combinations of nice propertiescannot be realized simultaneously in one election method. Toachieve monotonicity, one must sacrifice the principle. On theother hand, only in the few cases where (16) holds, will triple-AV find another triple winner than standard AV.
Three papers in Voting matters6,7,8 deal with nonmonotonicityand related problems. One theme is the axiomaticunderstanding of election methods: which combinations ofdesirable properties are theoretically incompatible? That kindof knowledge is important for everyone concerned with “howto choose how to choose”. An axiomatic approach, however,needs a clearly formulated and manageable conceptual frame.As part of this frame, it must be clearly stated what kind ofpreference relations the voters are allowed to express. Onemay restrict ballots to be complete, or to conform to a linearlisting of the alternatives (single-peak condition), etc. Withinthis frame the axiomatic investigator must take into accountall possible profiles without any extra screening againstunrealistic profiles. Even a highly concocted profile may be acounter-example that kills a hypothesis; lack of realism is noobjection if the profile formally is within the axiomatic frame.According to Stensholt5 a bound on the function ε(P) of the 3-candidate profile P is useful to screen off most of theunrealistic profiles generated in a simulation. However, acriterion like ε(P) < 0.01 does not seem suitable for axiomatictreatment. Axiomatics must be followed up by otherapproaches, e.g. comparisons of election methods onsimulated and empirical data.
AcknowledgementsIt is a pleasure to recognize the many exchanges with theeditor and the comments of an anonymous referee. The latterled to a complete rewriting of the conclusion section, wherehowever, there still are viewpoints for which the author daresnot presume full agreement.
References1. A.H. Copeland, A “reasonable” social welfare function,
Seminar on Mathematics in Social Sciences, University ofMichigan, 1951.
2. W. Gehrlein and P.C. Fishburn, Probabilities for electionoutcomes for large electorates, J. Econom. Theory, 19,(1978) pp. 38-49
Markus Schulze is a physicist and mathematician fromGermany
In two books1,2, in his submission to the JenkinsCommission3, and at a number of conferences, MichaelDummett has promoted a preferential voting method whereone successively searches for solid coalitions of increasingnumbers of candidates and where, when one has found sucha solid coalition, one declares the candidates with the bestBorda scores elected. Dummett calls his method “QuotaPreference Score” (QPS) or “Quota Borda System” (QBS).He writes that his method “has never been in use, but wasvoted the best at a conference on electoral reform held inBelfast with representatives of all parties” 3. In his bookVoting Procedures, he describes this method as follows(where v is the number of voters, S is the number of seats,
� is the number of candidates, and the “preference score” is
the Borda score) [1, pp. 284-286]:
The assessment will proceed by stages, all but the last ofwhich may be called “qualifying stages”: it will of courseterminate as soon as all S seats have been filled. We mayfirst describe the assessment process for the case when S is2 or 3. At stage 1, the tellers will determine whether there areany candidates listed first by more than 1/(S+1) of the totalnumber v of voters: if so, they immediately qualify forelection. If seats remain to be filled, the preference scores ofall candidates not qualifying at stage 1 will then becalculated. At stage 2, the ballot papers will be scrutinized tosee if there is any pair of candidates, neither of whomqualified at stage 1, to whom more than v/(S+1) voters aresolidly committed: if so, that member of the pair with thehigher preference score now qualifies for election. If seatsremain to be filled, the tellers will proceed to stage 3, atwhich they will consider sets of three candidates, none ofwhom has already qualified. If more than v/(S+1) voters aresolidly committed to any such trio, that one with the highestpreference score qualifies for election. In general, at thequalifying stage i, the tellers determine whether, for any setof i candidates none of whom has so far qualified, there aremore than v/(S+1) voters solidly committed to thosecandidates; if so, the member of the set with the highestpreference score qualifies for election at stage i. If there still
remain seats to be filled after all the qualifying stages havebeen completed, they will be filled at the final stage by thosecandidates having the highest preference scores out ofthose who have not yet qualified. ( . . . )
When S = 4, however, it may be thought that a body ofvoters, amounting to more than two-fifths of the electorateand solidly committed to two or more candidates, is entitledto 2 of the 4 seats. To achieve this, the assessment processmust be made a little more complex. Stage 1 will proceed asbefore, and, at stage 2, the same operation must be carriedout as described above. Before proceeding to stage 3,however, the tellers must also consider every pair ofcandidates of whom one qualified at stage 1 and the otherdid not: if more than 2·v/(S+1) voters are solidly committedto such a pair, that one who did not qualify at stage 1qualifies at stage 2. (Note that, if more than 2·v/(S+1) votersare solidly committed to two candidates, one of them mustqualify at stage 1.) Likewise, at each qualifying stage i, thetellers must ask, of every set of i candidates of whom atmost one has already qualified, whether more than 2·v/(S+1)voters are solidly committed to those candidates. If so, andnone of them has previously qualified, the two with thehighest preference scores will now qualify; if one of themqualified at an earlier stage, that one, of the rest, who hasthe highest preference score will qualify at stage i. ( . . . )
In general, at stage i, the tellers must ask, of each set ofvoters solidly committed to i candidates, what multiple ofv/(S+1) members it contains, up to i·v/(S+1). If it containsmore than v/(S+1) voters, at least one of the i candidates willqualify for election; if it contains more than 2·v/(S+1), at leasttwo will qualify; if 3 ≤ i and it contains more than 3·v/(S+1), atleast three will; and so on, up to the case in which it containsmore than i·v/(S+1) voters, when all i candidates will qualify.
This description of QBS seems unnecessarily long. Usually,Dummett offers a significantly shorter description. Forexample, in his submission to the Jenkins Commission hewrites3:
The scruntineers can first mark as elected any candidateranked highest by a sufficiently large minority (one-sixth ofthe voters in a five-member constituency, etc.). Then, havingcalculated the Borda counts of all remaining candidates,they can discover whether any set of from two to fivecandidates receives solid support from a sufficiently largeminority: if so, that candidate in the set with the highestBorda count is marked as to be elected. The remainingseats will be filled by the candidates most generallyacceptable to the electorate as a whole, i.e. those with thehighest Borda counts.
In my opinion, a problem of the shorter description is thatreaders could mistakenly believe that the order in which thesolid coalitions are considered at each stage and thequestion at which stages the different candidates havequalified were unimportant. However, example 1demonstrates that they are decisive.
10
Issue 15 Voting matters, for the technical issues of STV, June 2002
The Borda scores are 243 for candidate A, 250 for candidateB, 227 for candidate C, 251 for candidate D, and 29 forcandidate E. Table 1 lists all solid coalitions. At stage 1, nocandidate qualifies for election. At stage 2, it is observed thatmore than v/(S+1) voters are solidly committed to thecandidates A and B and that more than v/(S+1) voters aresolidly committed to the candidates A and C. When one usesonly the short description of QBS, then one could mistakenlybelieve that there are two different possibilities how toproceed resulting in two different sets of winners. First:When one starts with the set A and B, candidate B qualifiesfor election because he has a better Borda score thancandidate A. Then one has to consider the set A and C;candidate A qualifies for election because he has a betterBorda score than candidate C. As no seats remain to be filled,QBS terminates and the candidates A and B are the winners.Second: When one starts with the set A and C, candidate Aqualifies for election because he has a better Borda score thancandidate C. Then one has to consider the set A and B;however, as this set has already won one seat no additionalcandidate qualifies at stage 2. At stage 3, one observes that
more than v/(S+1) voters are solidly committed to thecandidates A, B and D; however, as this set has already wonone seat no additional candidate qualifies at stage 3. At stage4, one observes that more than 2·v/(S+1) voters are solidlycommitted to the candidates A, B, C and D; as candidate Dhas the best Borda score candidate D qualifies for election. Asno seats remain to be filled, QBS terminates and thecandidates A and D are the winners.
However, the long description in “Voting Procedures” statesclearly that when one has to decide how many additional seatsa given solid coalition gets at a given stage then one has toconsider as already qualified only those candidates who havealready qualified at strictly earlier stages. In example 1, when
one starts with the set A and C, candidate A qualifies forelection because he has a better Borda score than candidate C.Then one has to consider the set A and B; as none of thesecandidates has already qualified at a strictly earlier stage,candidate B qualifies for election because he has a betterBorda score than candidate A.
In short, to guarantee that the result doesn' t depend on theorder in which the solid coalitions are considered at a givenstage, it is important that one looks only at those candidateswho have qualified at strictly earlier stages. For example,suppose, at stage 10, one finds a set of 10 candidates such thatmore than 5·v/(S+1) voters, but not more than 6·v/(S+1)voters, are solidly committed to these 10 candidates. Supposethat already 4 of these 10 candidates have qualified at stages1-9. Then that candidate of this set who has the best Bordascore of all those candidates of this set who did not qualify atstages 1-9 qualifies at stage 10 even if this set has already wonadditional seats at stage 10.
At first sight, it isn' t clear whether the QBS winners can becalculated in a polynomial runtime since there are 2� possiblesets of candidates. However, a set of candidates has to betaken into consideration only when at least one voter iscommitted to this set. In so far as at each of the � stages therecannot be more than v sets of candidates such that at least onevoter is committed to this set, one has to take not more thanv·� sets of candidates into consideration to calculate the QBSwinners. Therefore, a polynomial runtime is guaranteed.
When not each voter ranks all candidates, then Dummett' sintention is met best when in each stage i those voters whodon' t strictly prefer all the candidates of some set of icandidates to every other candidate are allocated to no solidcoalition.
Nicolaus Tideman writes about QBS [4]:
To avoid sequential eliminations, Michael Dummett suggesteda procedure in which a search would be made for solidcoalitions of a size that deserved representation, and whensuch a coalition was found, an option (or options) that thecoalition supported would be selected. If the solid coalitionsupported more than one option, the option (or options) withthe greatest “preference score” (Borda count) would beselected. Preference scores would also be used to determinewhich options would fill any positions not filled by optionssupported by solid coalitions. I find Dummett's suggestionunsatisfying. Suppose there are voters who would bemembers of a solid coalition except that they included an“extraneous” option, which is quickly eliminated, among theirtop choices. These voters' nearly solid support for the coalitioncounts for nothing, which seems to me inappropriate.
At first sight, it isn' t clear whether Tideman' s criticism isfeasible. It is imaginable that whenever there are “voters whowould be members of a solid coalition except that theyincluded an ‘extraneous’ option” there is also an STV method
11
Voting matters, for the technical issues of STV, June 2002 Issue 15
Table 1: Solid Coalitions in Example 1
one candidate two candidates three candidates four candidates
(i.e. a method where surpluses of elected candidates aretransferred according to certain criteria to the next availablepreference and where, when seats remain to be filled,candidates are eliminated according to certain criteria andtheir votes are transferred to the next available preference)where this “nearly solid support for the coalition counts fornothing”. If this is the case, then it is not appropriate tocriticize QBS for ignoring this “nearly solid support”.However, example 2 demonstrates that there are reallysituations where the QBS winners differ from the STVwinners independently of the STV method used.
Example 2 (v = 100; S = 3; � = 5):
40 ACDBE. 39 BCDAE. 11 DABEC. 10 DBAEC.
The Borda scores are 252 for candidate A, 248 for candidateB, 237 for candidate C, 242 for candidate D, and 21 forcandidate E. Table 2 lists all solid coalitions. At stage 1, thecandidates A and B qualify for election because bothcandidates are preferred to every other candidate by morethan v/(S+1) voters each. At stage 2, it is observed that morethan v/(S+1) voters are solidly committed to the candidatesA and C and that more than v/(S+1) voters are solidlycommitted to the candidates B and C; but as both sets ofcandidates have already won one seat each, no additionalcandidate qualifies for election at stage 2. At stage 3, it isobserved that more than v/(S+1) voters are solidlycommitted to the candidates A, C, and D and that more thanv/(S+1) voters are solidly committed to the candidates B, C,and D; but as both sets of candidates have already won oneseat each, no additional candidate qualifies for election atstage 3. At stage 4, it is observed that more than 3·v/(S+1)voters are solidly committed to the candidates A, B, C, andD; as this set has already won 2 seats, candidate D, thecandidate with the best Borda score of all those candidates
who haven' t yet qualified, qualifies for election. As no seatsremain to be filled, QBS terminates and the candidates A, B,and D are the winners. However, STV methods necessarilychoose the candidates A, B, and C because, independentlyof how surpluses are transferred, candidate C alwaysreaches the quota. In my opinion, example 2 questionswhether compliance with proportionality for solid coalitions
is sufficient for being a proportional preferential votingmethod.
Dummett' s justification for his method is his claim that,unlike traditional STV methods, QBS is less “quasi-chaotic”. He writes 3:
The defect of STV is that it is quasi-chaotic, in the sense thata small change in the preferences of just a few voters canhave a great effect on the final outcome. This is because itmay affect which candidate is eliminated at an early stage,and thus which votes are redistributed, this then affecting allsubsequent stages of the assessment process.
However, in my opinion, example 3 demonstrates that alsoQBS is “quasi-chaotic”. This is because a small change inthe preferences can affect which candidate qualifies at anearly stage, this then affecting all subsequent stages of theassessment process.
The Borda scores are 142 for candidate A, 216 for candidateB, 215 for candidate C, 204 for candidate D, and 223 forcandidate E. Table 3 lists all solid coalitions. At stage1, candidate D qualifies for election because more thanv/(S+1) voters strictly prefer candidate D to every othercandidate. At stage 2, it is observed that more than v/(S+1)
voters are solidly committed to the candidates C and D; butas this set of candidates has already won one seat, noadditional candidate of this set qualifies for election at stage2. At stage 3, it is observed that more than v/(S+1) votersare solidly committed to the candidates A, B, and C; asnone of these candidates has already qualified, candidate B,the candidate with the best Borda score, qualifies for
12
Issue 15 Voting matters, for the technical issues of STV, June 2002
Table 2: Solid Coalitions in Example 2
one candidate two candidates three candidates four candidates
election. As no seats remain to be filled, QBS terminates andthe candidates B and D are the winners.
When a single DEBCA ballot is changed to BDECA, theBorda scores are 142 for candidate A, 218 for candidate B,215 for candidate C, 203 for candidate D, and 222 forcandidate E. Table 4 lists all solid coalitions for this modifiedexample. At stage 1, no candidate qualifies for election. Atstage 2, it is observed that more than v/(S+1) voters are solidlycommitted to the candidates C and D; as candidate C has abetter Borda score, candidate C qualifies for election. At stage3, it is observed that more than v/(S+1) voters are solidlycommitted to the candidates A, B, and C; but as this set ofcandidates has already won one seat, no additional candidateof this set qualifies for election at stage 3. At stage 4, it is
observed that more than v/(S+1) voters are solidly committedto the candidates A, B, C, and E and that more than v/(S+1)voters are solidly committed to the candidates B, C, D, and E;but as both sets have already won one seat each, no additionalcandidates qualify for election at stage 4. At stage 5, candidateE qualifies for election because he has the best Borda score ofall candidates who have not already qualified. Thus, byranking candidate B higher candidate B is changed from awinner to a loser. By changing a single ballot the QBSwinners are changed from the candidates B and D to thecandidates C and E.
References1. Michael Dummett, Voting Procedures, Clarendon
Press, Oxford, 1984
2. Michael Dummett, Principles of Electoral Reform,Oxford University Press, 1997
3. Michael Dummett, Submission to the IndependentCommission on Electoral Reform, 3rd July 1998
4. T. Nicolaus Tideman, Collective Decisions and Voting(draft), 1993
Sequential STV - a newversion
I.D. Hill and Simon Gazeley
In Issue 2 of Voting matters, a system was reported calledSequential STV 1, designed to overcome, at least to someextent, the problem of premature exclusion of a candidate,which occurs when the one who has the fewest votes at thetime is excluded, though due to receive many transfers later ifonly that exclusion had not taken place. That system has nowbeen improved and we report here on the new version. Oneparticular result of the improvement is that, in the case of asingle seat, it is now certain to find the Condorcet winner ifthere is one.
The aim is to find a set of candidates of size n, where n is thenumber of seats to be filled, such that any set of n+1candidates consisting of those n and 1 more, will result in theelection of those n when an STV election is performed. Whenn=1 this reduces, of course, to the Condorcet rule. In a smallelection, or when n=1, it would be relatively easy and quick todo a complete analysis to find if there is such a set. Thechallenge is to find a way of doing so that will work in areasonable time in large elections, where such a completeanalysis would be impracticable. We recognise that themeanings of ‘a reasonable time’ and ‘ impracticable’ are opento dispute, and that what is practicable will change ascomputers continue to get faster.
In the old version of Sequential STV, an initial STV countdivided the candidates into probables and others, but theothers were regarded as ‘ in a heap’ and all of equal status.Consequently, if a challenger was successful, it would havebeen contrary to the axioms of anonymity and neutrality2 tomake a change of probables until all the others had beentested too, and that could lead to more than one challenger inthe next main stage. In the new version the others are not putin a heap but in a queue, where the order depends upon thevoting pattern. It is then fair to implement any change ofprobables at once, and the division of the method into mainstages and sub-stages is no longer necessary.
How it works − the easy partAn initial STV count is made but instead of dividing intothose elected and not elected, it classifies those who wouldhave been elected as probables, and puts the others into aqueue, in the reverse order of their exclusion in that initialcount, except that the runner-up is moved to last place as it isalready known that an initial challenge by that candidate willnot succeed. Having found the probables and the order of thequeue, further rounds each consist of n+1 candidates, the n
13
Voting matters, for the technical issues of STV, June 2002 Issue 15
Table 4: Solid Coalitions in the modified Example 3
one candidate two candidates three candidates four candidates
probables plus the head of the queue as challenger, for the nseats.
It should be noted that, apart from the initial count, which isonly to get things started, all counts are of n+1 candidatesfor n seats, so the ‘exclude the lowest’ rule, which is theleast satisfactory feature of STV, is not used.
If the challenger is not successful, the probables areunchanged for the next round and the challenger moves tothe end of the queue, but a successful challenger at oncebecomes a probable, while the beaten candidate is put to theend of the queue. The queue therefore changes its order astime goes on but its order always depends upon the votes.
The reordering of the queue during the count, by putting anylosing candidate to the end of the queue, is to make sure thatit cannot ever get into a state where, say, a set X areprobables, A, B and C are all near the top of the queue andX+A beats X+B beats X+C beats X+A, while D is furtherdown and X+D has not been tested. Putting losingcandidates to the end means that D must head the queue atsome point before A, B and C come round again.
This continues until either we get a complete run throughthe queue without any challenger succeeding, in which casewe have a solution of the type that we are seeking, or we fallinto a Condorcet-style loop. In the latter case, we have toenter the more difficult part, set out below, but it should beemphasised that in real elections, as distinct from speciallydevised test cases, that rarely happens.
How it works − the more difficult partTo decide that a loop has been found, a set that has beenseen before must recur as the probables. If the queue is inthe same order as before then a loop is certain and actionmust be taken at once. If, however, a set recurs but thequeue is in a different order, it is conceivable thoughunlikely that something different, that breaks the loop, couldhappen. So, in that case, a second chance is given and thecounting continues but, if the same set recurs yet again, aloop is assumed and action taken.
In either event the action is the same, to exclude allcandidates who have never been a probable since the lastrestart (which means the start where no actual restart hasoccurred) and then restart from the beginning except that theexisting probables and queue are retained instead of theinitial STV count.
If there is no candidate who can be excluded, then a specialprocedure is used, in which any candidate who has alwaysbeen a probable since the last restart is classified as acertainty and any other remaining candidate as a contender.From each possible set of n+1 candidates that includes allthe certainties, an election for n seats is conducted. Since, atthis point, most of the original candidates will be either
excluded or certainties, there is no need to fear anastronomical number of tests needing to be made.
At the end of each test, the one candidate who has notreached the quota is assigned a fractional value calculatedby dividing that candidate' s votes by the quota. When allthe tests have been done, the average of these fractions iscalculated for each candidate. Additionally candidates areawarded one point for each contest in which they did reachthe quota. It is these complete points that mainly decide,the average fraction being really only a tie-breaker.
The contender with the highest score is then reclassified asa certainty and, if the number of certainties is less than thenumber of seats, the special procedure is repeated with onecontender fewer and one seat fewer to fill.
While this process may look complicated, it should beremembered that, on most occasions, only the part called‘the easy part’ above is used, while the complications areused to sort out a Condorcet paradox if it occurs.
ProgrammingWhere loops occur it will often be found that a particular setof candidates is being tested more than once. Storingresults and accessing them as necessary would obviously bemuch quicker than repeating the same STV count manytimes. However, since most voting patterns do not havesuch loops, such storing of results would usually beunproductive extra work. For the present, the system hasbeen programmed with repetition rather than storing.
The name ‘Sequential STV’From now on the name Sequential STV will be used tomean this new version.
A random versionThe initial STV count, to choose the initial probables and todetermine the initial order of the queue, turns out to be notvery important, in that an alternative version that selects theinitial probables at random, and orders the initial queue atrandom, nearly always reaches the same eventual answer. Itis fun to watch it getting from an initial nonsense selectionto end up at the correct solution, but this version should notbe used in practice because of rare cases where it can get adifferent result from that given by starting with an STVcount and, where this is so, we suspect that it would usuallybe a less good result.
An example of such a rare case has been given previously3
with a fictitious set of votes, having 4 candidates for 2places, in which testing ABC elects AB and testing ABDelects AB, yet testing ACD elects CD and testing BCDelects CD. In that example, Sequential STV elects AB(which is, in fact, the better choice) whereas the random
14
Issue 15 Voting matters, for the technical issues of STV, June 2002
version has a 50-50 chance of finding either AB or CD. Suchan example seems unlikely ever to occur in reality but the factthat it is possible means that it is better to guard against it bynot using the random version.
ExamplesWith 5 candidates for 2 seats, consider the voting pattern
This evidently makes E a very much stronger candidate, for ifany one of A, B, C or D had not stood, E would have been thefirst elected, but plain STV takes no notice, electing BC justas before. Sequential STV chooses BC as probables but thentests BCD, where BC stay as probables and D goes to the endof the queue, followed by BCE where BE become the newprobables and C goes to the end of the queue. It then testsBEA and BED, BE winning each time. There is no need totest BEC again as that result is already known, so BE areelected.
Real voting patternsIn 43 real elections held on file, the sequential method merelyconfirmed the original result in 38 of them, and replaced just1 candidate in 3 more of them. In only 2 cases were loopsfound, making it necessary to do more than the easy part ofthe method.
TimingsSome timings were made on an 11-year old PC with a 386chip. In a real election with 10 candidates for 6 seats and 841voters, simple STV took 11 seconds. Sequential STV madeno change in those elected and took 23 seconds.
In a much more difficult case with 30 candidates for 15 seatsand 563 voters, simple STV took 1 minute 6 seconds.Sequential STV found 1 candidate to be definitely replacedand 3 others who were in a loop for the final seat. It took atotal of 18 minutes 30 seconds.
Should it be used?With this new version, should it be recommended for practicaluse? That depends upon whether the user is willing toabandon the principle that it should be impossible for a voterto upset earlier preferences by using later preferences. Manypeople regard that principle as very important, but reducingthe frequency of premature exclusions is important too. Weknow that it is impossible to devise a perfect scheme, and it isall a question of which faults are the most important to avoid.
In considering this, we need to take into account, among otherthings, that the true aim of an election should not be solely tomatch seats as well as possible to votes, but to match seats tothe voters’ wishes. Since we do not know the wishes we mustuse the votes as a substitute, but that makes it essential thatthe votes should match the wishes as far as possible. That, inturn, makes it desirable that the voters should not be temptedto vote tactically.
They would not be so tempted if they felt confident that laterpreferences were as likely to help earlier ones as to harmthem, and if they could not predict the effect one way or theother. At present, we see no reason to doubt that theserequirements are met.
All things considered, we believe that Sequential STV isworthy of serious consideration.
Comparison with STV(EES) and withCPO-STV?STV(EES) 4 was designed to meet much the same aims asSequential STV, and also has the same disadvantage that laterpreferences can upset earlier ones. A comparison of the twowould be interesting. As at present defined, however,STV(EES) is so slow that a comparison is not easy. For anelectoral method to be slow should not be considered toomuch of a disadvantage for real elections if it can be shown toget better results, but it is certainly a disadvantage for researchpurposes where a large number of counts of different datamay be required within a reasonable time.
15
Voting matters, for the technical issues of STV, June 2002 Issue 15
Using the examples above, STV(EES) elects BC from thefirst but BE from the second, just as Sequential STV does.
In the example given in section 6 of reference 4, AC wereelected by STV(EES), which was not wrong as there was aparadox in the votes, but the paper admitted that ‘I wouldstill have preferred AB to be the winning set in this case’, soit may be worth noting that Sequential STV does indeedelect AB.
CPO-STV 5, 6 was designed to search for an outcome that isglobally optimum rather than merely locally stable. Again acomparison would be interesting.
AcknowledgementsWe are grateful to Douglas Woodall and Nic Tideman forhelpful comments on earlier versions of this paper.
References1. I.D. Hill, Sequential STV. Voting matters, issue 2, 5-
3. I.D. Hill, Trying to find a winning set of candidates. Voting matters, issue 4, 3. 1995.
4. Simon Gazeley, STV with elimination by electabilityscores. Voting matters, issue 12, 9-13. 2000.
5. T. Nicolaus Tideman, The single transferable vote.Journal of Economic Perspectives, 9, 27-38. 1995.
6. T. Nicolaus Tideman, Better voting methods throughtechnology: the refinement-manageability trade-off inthe single transferable vote. Public Choice, 103, 13-34. 2000.
16
Issue 15 Voting matters, for the technical issues of STV, June 2002
1
Voting mattersfor the technical issues of STV
The Electoral Reform Society
Issue 16 February 2003
All correspondence regarding Voting matters should beaddressed to:
B A Wichmann, The Editor, Voting matters, The Electoral ReformSociety, 6 Chancel Street, London, SE1 0UU.
Readers are reminded that views expressed in Voting matters bycontributors do not necessarily reflect those of the ElectoralReform Society.
To aid production, the Editor would welcome contributions onIBM-PC discs (with a printed copy as well) or [email protected].
EditorialThe year 2002 has seen significant advances with thetechnology of STV, from opposite sides of the world.
In the Republic of Ireland, plans for the introduction ofelectronic voting (in the polling booth, not at this stage, viathe Internet) have advanced to a key stage. Suitabletechnology has been developed for the polling stations andsoftware has been written to undertake the count. ERBS wascontracted to test the counting software to ensure it adhered tothe rules which are identical to the hand-counting ones. On the17th May, the Dáil elections were held in which threeconstituencies were handled electronically as an experiment,while the others were handled by the traditional manualmeans. The software validation was completed in time underthe direction of Joe Wadsworth using a program for the Irishrules written by Joe Otten and with the editor running over400 tests, some specially written for the occasion. I am glad toreport that the counting went smoothly on the day.
The Irish election data for the three constituencies (Meath,Dublin North and Dublin West) was placed on the Internetwith the full results of the count. To my knowledge, this is thefirst time over 2,000 STV votes (ie, the full set of preferencesgiven by each voter) has been made publicly available. It isnow possible to analyse this data. It is immediately clear, evenby a manual inspection that many final preferences are inballot paper order.
The developments with STV in New Zealand have beencontinuing throughout 2002 and are reported in the finalarticle in this issue by Stephen Todd.
Other articles in this issue includes a note by Peter Deanshowing how the actual administration of STV has changedover the years in Tasmania (even without the impact ofcomputers). David Hill also considers a disturbing example ofchanges to the preferences on ballot papers which are notvisible to the traditional rules.
Eivind Stensholt presents a rather technical article about theimplementation of Meek STV rules when equality ofpreference is permitted. (Does the observed ballot-paperordering with the Irish election indicate that equality ofpreference should be allowed?)
The remaining article is a short one by myself about thevexed question of proportionality.
Welcome to the McDougall TrustThis issue is the last one under the ERS banner. Followingdiscussions between ERS and the Trust, Voting matters isbeing transferred to the Trust for publication for the timebeing. At this point, no significant changes are envisaged.
Brian Wichmann.
STV in TasmaniaP Dean
Peter Dean has been involved with ERS for many years.
In his article in Voting matters1, Philip Kestelman raises theissue of positional voting bias. In Tasmania, there has been acontinuous process of changing some details of the STVvoting system to make it fairer. The problem of positionalvoting bias was addressed in 1979 and first used in 1980.
A summary of STV in Tasmania from Newman2 is asfollows:
1897 First experimental use of STV.
1903 Women given the vote.
1909 First state-wide election by STV.
1917 By-elections and vacancies filled by a recount ofthe original ballots. First used in 1922.
1921 Women allowed to stand as candidates.
1922 Deposit lost if less than 20% of the quota ifexcluded or at the end of the count.
1930 Compulsory vote, previously 63-67% turnout, upto 82% in 1928.
1941 Grouping by party labels.
1954 Parliamentary term reduced from 5 to 3 years.
1955 Speaker to be chosen from party with the lowerstatewide vote.
1957 Assembly of 35 instead of 30 to overcomepotential deadlock.
1972 Term changed to 5 years, and 4 years thereafter.
1973 Voters required to make 7 choices instead of 3.Previously 90% of electors restricted their choice to asingle party. Franchise reduced to 18.
1976 Draw for ballot position, and position within partylist.
1980 first use of rotated ballot. The printer must issueequal numbers of papers showing different names inthe favoured position, starting with the first namealphabetically. Thus with a columnar ballot paper 2, 8,3 and 7 members in the 4 columns, 16 differentprintings are made.
A 1957 Select committee reported that it provided theTasmanian elector with a wider freedom of choice, and a
more effective vote than any other method of Parliamentaryelection in the world.
References1. P Kestelman. Positional Voting Bias Revised. Voting
matters, Issue 15, pp 2-5. June 2002.
2. Terry Newman. Hare-Clark in Tasmania. JointLibrary Committee of the Parliament of Tasmania,Parliament House. Hobart. 1992.
Implementing a suggestionof Meek's
E Stensholt
Eivind Stensholt is from the Norwegian School of Economicsand Business Administration
IntroductionIn preferential elections voters are often assumed to havelinear rankings, i.e. they rank all candidates without ties.Here the topic is STV elections where only a “completeorder” is required, which means that a voter must give eachcandidate a rank, but may declare equal preference. Hencein a 10-candidate election a voter V may rank
PQ(ABCDE)RST
which, in Hill's notation1, means that A, B, C, D, E sharethird to seventh rank.
At an iterative step in an algorithm for Meek's method acandidate P has a certain current retention factor: 1-p,which is a positive number less than or equal to 1. Voter Vstarts on top of his list, offers P his full vote, for which 1-pis retained and offers Q p votes, has p(1-q) retained and hasw = pq votes when coming to the set of equal preferences{ A, B, C, D, E} .
Meek2 suggested to count as if there were 5! = 120“minivoters” , each with a weight of w/120 votes, with oneminivoter for each possible way to split up the { A, B, C, D,E} into 5 singleton classes. With n candidates ranked equal,there are n! possible linear rankings, and the work soonbecomes too much even for computers if each minivoter isconsidered separately. However, the counting can besystematized, so that the necessary work grows as n2. Thusthere need not be a “combinatorial explosion” , but thealgorithm does not otherwise relate to Hill's discussion ofhow to cope with equality of preference.
2
Issue 16 Voting matters, for the technical issues of STV, February 2003
A count with five candidates equalOne minivoter ranks ABCDE, and contributes
we see that the factor (x+d) involves first 3 multiplications oftwo real numbers with d as a factor and then 3 additions oftwo real numbers to get the coefficients of x3, x2, and x.Multiplying (x+a)(x+b) needs one multiplication and oneaddition, and (x+a)(x+b)(x+c) is calculated with two more ofeach. Hence Q(E,x) requires 1+2+3 = 6 multiplications and1+2+3 = 6 additions. Moreover, the contribution formulacontains 6 multiplications, 4 additions, and 1 subtraction.
The general caseIn general, consider n candidates, C1, ..., Cn, with retentionfactors 1-p(1), ... , 1-p(n). Consider the polynomials
for i from 1 to n. Clearly B(0) = 1 while the other B(k) dependon i. They are the elementary symmetric polynomials in thep(j) where j ≠ i. The multiplication of n - 1 factors of type[x + p(j)] involves 1 + 2 + 3 + ... + (n-2) = (n-1)(n-2)/2multiplications of two real numbers and equally manyadditions.
Suppose the candidates C1, ..., Cn form an equal preferenceset for voter V, who has weight w left after contributing to thehigher ranked candidates. The contribution from V tocandidate Ci, i.e. the votes to Ci from n! minivoters, is givenby the contribution formula Rev(i) =
where the K(n-1,t) are determined as follows: There are n!minivoters, with weight w/(n!) each. Among them, (n-1)! havecandidate Ci as number t+1. The t candidates ranked ahead ofCi can be permuted in t! ways. The n-t-1 candidates rankedafter Ci can be permuted in (n-t-1)! ways. Thus t!(n-t-1)! ofthe (n-1)! minivoters have the same t candidates ahead of Ciand they offer the same support to candidate Ci. The totalrevenue collected by Ci from these (n-1)! minivoters ist!(n-t-1)! B(t) [1-p(i)]w/(n!). Thus K(n-1,t) = t!(n-t-1)! /(n!),i.e.
K(n,t) = t!(n-t)! /((n+1)!).
For the use of the contribution formula, it is practical totabulate the coefficients K(n-1,t).
If each Q(Ci,x) is calculated as a product with n-1 factors, ifrom 1 to n, the total requirement is n(n-1)(n-2)/2multiplications of two real numbers and n(n-1)(n-2)/2additions. Thus the work grows with the third power of n.Here we leave out the n+1 multiplications and n-1 additionsand 1 subtraction that must be performed each time thecontribution formula is used.
However, with n>5 one may reduce the work by firstcalculating Q(x) =
[x+p(1)][x+p(2)] ... [x+p(n)] =
A(0)xn + A(1)xn-1 + A(2)xn-2 + ... +A(n)
by means of n(n-1)/2 multiplications and n(n-1)/2 additions,and then for each i perform the division with [x+p(i)]:
A(0)xn+A(1)xn-1+A(2)xn-2 +...+ A(n) =
[B(0)xn-1+B(1)xn-2+B(2)xn-3 +...+B(n-1)][p(i)+x]
leads to A(0) = B(0) = 1 and
3
Voting matters, for the technical issues of STV, February 2003 Issue 16
The division with [x+p(i)] requires n-1 multiplications withp(i) as a factor and n-1 subtractions. All the divisions for ifrom 1 to n require n(n-1) multiplications and n(n-1)subtractions. Thus it is enough to perform 3n(n-1)/2multiplications and 3n(n-1)/2 additions/subtractions insteadof n(n-1)(n-2)/2 of each.
There are of course also n(n+1) multiplications and n2
additions/subtractions associated with the use of thecontribution formula for n candidates, and so we arrive atn(5n-1)/2 multiplications and n(5n-3)/2 additions/subtractions.
Further small savings are obviously possible, e.g. bykeeping Q(Cn,x) as an intermediate result from thecalculation of Q(x) instead of dividing Q(x) by [x+p(n)], butthey do perhaps not justify the extra programming.
A program for calculating thecontributionsHere is a Maple routine for calculating the contribution froma voter with weight 1 to each candidate in an equalpreference set of n candidates 1, 2, ... , n, with givenretention factors. The total number of candidates is denotedby C.
Set n = number of candidates ranked equally by the voter:
> n:=9;
n := 9
Set p(i) for candidates 1, 2, ... , n, so that 1-p(i) is thecurrent retention factor for candidate i.
As an example we use these equidistant values for the p(i).
The routine consists of a "preparation" and twoinstructions. The preparation is used only once per run ofthe election program. It sets the coefficients K(i,j) = j!(i-j)!/(i+1)! by first calculating the binomial coefficients " i -choose - j " = i!/(j!(i-j)!).
Preparation. Set the table of constants. Let C be the totalnumber of candidates:
> C:=20: for i from 0 to C-1 do K(i,0):=1.0; od: for j from 1 to C-1 do K(0,j):=0.0; od: for i from 1 to C-1 do for j from 1 to C-1 do K(i,j):=K(i-1,j-1)+K(i-1,j); od: od: for i from 1 to C-1 do for j from 0 to i do K(i,j):=1.0/((i+1)*K(i,j)); od: od:
Instruction 1. Calculate the polynomial of degree n:
> A(0):=1.0: B(0):=1.0: for j from 1 to n do A(j):=0.0; od:for j from 1 to n do for i from 0 to j-1 do A(j-i):= A(j-i-1)*p(j) + A(j-i); od; od;
Instruction 2. Calculate the polynomial of degree n-1 forcandidate s and simultaneously set Rev(s) = the revenue forcandidate s, s=1, 2, ..., n:
> for s from 1 to n do Pr:=K(n-1,0): q:=p(s): for j from 1 to n-1 do B(j) := A(j)-B(j-1)*q;Pr:=Pr+B(j)*K(n-1,j); od: Rev(s):=Pr*(1-q); od:
Another instruction shows the revenue Rev(s) collected bycandidate s from all n! "minivoters" :
The voter keeps p(1) p(2) ... p(n) = 0.036516911963.
What happens in the example above?Consider 9 candidates sharing ranks 1 to 9 in a vote, andassume the retention factors are as above. The preparationhas calculated a table including (K(8,0), ..., K(8,8)) =
AcknowledgementThe author is grateful to two referees for suggestions thathave made the presentation clearer.
References1. I D Hill, Difficulties with equality of preference,
Voting matters, Issue 13, April 2001, pp8-9.
2. B L Meek, Une nouvelle approche du scrutintransferable (fin), Mathématiques et sciences humaines,9 no.29 pp 33-39. 1970
3. B L Meek, A new approach to the Single TransferableVote, Voting matters, Issue 1, March 1994, pp1-11.
What would a differentmethod have done?
I D Hill
Following an election, the question is often raised of what theresult would have been had a different electoral method beenused. In general, no reply can be given to this question notonly because sufficiently detailed information is not availableon the votes, but also because voters can be expected tobehave differently if a different system is used.
In comparing one STV system with another, however, ratherthan totally different systems, it seems unlikely that therewould be very much difference in how voters behave, and areasonable reply is possible provided that the full votingpattern is divulged. It is very welcome that it has beendivulged for the three constituencies counted by computer inthe recent general election in Eire. Such openness is to becommended. Too often, though, the full voting pattern isregarded as confidential, and the only information is a resultsheet, which is quite insufficient for the purpose.
As an example, the question might be whether the result ofthe 2002 ERS Council election would have been different hadthe Meek system been used. Working solely from the resultsheet (the only information available) I have constructed avoting pattern in which some votes have the character #inserted within their preferences. Before running such data ona computer the # characters have to be replaced, either by anumber representing a candidate, or by a space which is thenignored by the STV program.
If the # characters are all replaced by a space, and ERS97rules used, the actual result sheet is reproduced. If Meek rulesare used the same candidates are elected, following a similarorder of events.
However, if the # characters are all replaced by the numberthat represents any one of the defeated candidates, and ERS97rules used, the same result sheet appears, identical in everyparticular, but if Meek rules are used, that defeated candidateis elected, at the expense, of course, of one of those who wasactually successful.
There is no suggestion that this artificial voting pattern isanything like the true one. I am absolutely sure that it is not,but it is somewhat remarkable that it is possible to devise sucha voting pattern with no effect at all on the ERS97 resultsheet. The fact that it is possible shows the extent to whichthe information available is totally inadequate to answer thequestion. I believe it to be impossible to do the reverse,leaving the Meek result unchanged while varying the ERS97result.
The artificial voting pattern can be supplied on request.
What sort of proportionality?I D Hill
In pure mathematics proportionality is a well-defined concept,but that is because we can always go into fractions whenevernecessary. For proportionality within voting systems we arerestricted to whole numbers in those elected for each party(using “party” in the general sense of any relevant grouping ofthe candidates, not only in the sense of a formal politicalparty). Under such circumstances it is in many cases not at all
5
Voting matters, for the technical issues of STV, February 2003 Issue 16
easy to say whether one result is more nearly proportionalthan another. This is particularly so where some parties,quite correctly, get zero seats, while none get zero votes.
I agree with Philip Kestelman1 that none of the measuresthat he discusses is perfect. I agree also that thecomparative answers that they produce are so similar that, ifusing any, we might as well settle on one of them. But as Ihave said before2 they are all fundamentally flawed inbasing their calculations on first-preference votes only, andthis can be very misleading, particularly where there is asubstantial amount of cross-party voting for successivepreferences.
However there is an additional point to be considered, evenwhere first preferences do give full information on partypopularity, there being no cross-party voting at all. Undersuch circumstances it could be the rule that if n is theminimum value, across parties, of votes per seat, then anyparty with at least n votes must get at least 1 seat, any partywith at least 2n votes must get at least 2 seats, any partywith at least 3n votes must get at least 3 seats, and so on.Given the restriction to whole numbers, and that someparties may get zero seats, what could be more proportionalthan that? Yet none of the measures that Kestelmanconsiders meets that rule.
For simplicity, consider the case of only 2 parties and only 2seats to be filled. Suppose the votes are 70 for party A and30 for party B. We can at once rule out the option of givingboth seats to party B, but is it better to give both to A or oneto each?
Suppose we allot them as 1 to each. Then n = 30 / 1 soparty A with more than 2n votes must get at least 2 seats andthe rule is violated. Suppose we allot them as both to partyA. Then n = 70 / 2 and the rule is satisfied for party B doesnot reach 35 to be worth a seat. Yet every one of themeasures that Kestelman considers says that 1 to each is abetter answer than both to party A. To my mind that showsall those measures to be unsatisfactory. I regret that I do notknow of a better alternative, but to do without a measure ispreferable to using a defective one.
If anyone doubts that both to party A is the better answer, letthem assume that there had been only 3 candidates andvotes 36 A1 A2, 34 A2 A1, 30 B. The measures all say thatto elect A1 and B, or even A2 and B, is preferable to A1 andA2, which is surely nonsense.
However, I am grateful to Philip Kestelman for thesuggestion that we might, perhaps, say that to elect A1 andB is more party-representative, while to elect A1 and A2 ismore candidate-representative. There might be somethingin that.
References1. P Kestelman, Quantifying representativity. Voting
matters, Issue 10, 7-10. 1999.
2. I D Hill, Measuring proportionality. Voting matters,Issue 8, 7-8. 1997.
Proportionality RevisitedB A Wichmann
IntroductionThe issue of proportionality in the last article1, raised twoproblems in my mind which are addressed here.
A flawConsider the hypothetical case of an STV election in theUK, in which there is a United Kingdom IndependenceParty (UKIP) candidate together with a Tory candidate. ATory voter who is on the Europhobic wing of the partycould well decide to give his/her first preference to theUKIP candidate. On the other hand, if the Tory candidatewas also Europhobic, then the voter would surely place his/her first preference with the Tory. In other words, the firstpreference votes for the Tory and UKIP cannot reasonablybe analysed in isolation.
Of course, this issue is not specific to the Tory party — thesame problem could arise with a Socialist Party candidatestanding against a New or Old Labour candidate.
I conclude from this that an analysis of party support basedupon first preferences alone is doomed to failure.
GranularityIn this section, we set aside the flaw noted above, andanalyse the issue of proportionality from just one point ofview: the granularity imposed by the size of theconstituencies. If a constituency elects 4 members, then it isclear that strict proportionality could only be obtained ifeach party had a multiple of 25% of the first preferencevotes. Obviously, there will always be a mismatch betweenthe first preference votes and the proportion of candidateselected.
As an example, we consider the 1997 Irish Generalelection2. The 166 seats for the Dáil are from 41constituencies having 3, 4 or 5 seats each. In this analysis,we consider three categories for the first preference votes:those of Fianna Fáil (FF), those for Fine Gael (FG) and theothers. It can reasonably be said that the ‘others’ does notrepresent a party, but if strict proportionality is obtained forFF and FG, then the others as a single group will also be
6
Issue 16 Voting matters, for the technical issues of STV, February 2003
represented proportionally. We return to this problem later.
Kestelman3 considers several measures of proportionality.Here, we consider some of those measures as applied to eachindividual constituency and compare this with the actualresult. The measures used here are the Loosemore-HanbyIndex, Gallagher Index of Disproportionality, Sainte-LaguëIndex and the Farina Index (all taken from the above paper).
Given a specific index, then one can determine the number ofseats for each party which would give the closest fit withrespect to that index. In fact, all the indices give the sameresult with one exception: the Sainte-Laguë Index gives adifferent result for the Dublin Central constituency. Ignoringthis isolated value we have the table as follows:
The content of the table is best explained by taking an entry:say Waterford, with 4 seats. The Actual and Best entries givethe seats in the order (FF, FG, Other). The Best entry is
computed according to all the indices apart from the isolatedresult already noted. The Fit% figures are calculated from theformula:
Fit% =√(∑(S%-V%)2 ), which is related to the Gallagherindex.
The last column gives the comparison between the actual andbest entries in seats. For Waterford, a single change in theactual result by a FF seat becoming an Other seat wouldproduce the ‘best’ result.
One can see from this result that 18 constituencies wouldremain unchanged if they gave the best fit to first preferenceproportionality. The major difference is that the two majorparties have gained over the others — the best fit giving 56seats in the Dáil for ‘others’ against the actual number of 35.
Two constituencies are different from the others. In the case ofCork North-Central, a two seat change is needed from theactual result to get the best fit. The reason for this is a highlevel of transfers from the other candidates to the two majorparties. The case of Donegal North-East is special because thedifference in the actual and best does not involve an increasein the ‘other’ seats. The reason for this was a significanttransfer from FG to FF in the actual election when an FGcandidate was still available for transfers.
As would be expected, there is a wide variation in the Fitentries. Also, the Fit values decrease with increasedconstituency seats: an average of 15.7% for 3-seats, 12.8% for4-seats and 10.7% for 5-seats.
The under-representation of the Other group is to be expectedas many of those candidates are excluded early in the countwith many transfers to the major parties (as well as to non-transferables). This effect clearly indicates the dubious natureof grouping all the parties other than the major two into one.
The conclusion from this analysis seems to be that there islittle loss in proportionality due to the natural granularity ofthe STV system. The lack of proportionality compared to thefirst preferences is caused by the vote transfers. There is acapital T in STV.
In addition to the above analysis of granularity, the same datareveals a very close correlation between the indices used. Thisis gratifying, since they are clearly supposed to be measuringthe same property. However, the correlations can berepresented approximately in a graph as follows in which theindices are indicated by their initials and the distance betweenthem increases with a lack of correlation. From this it appearsthat the Loosemore-Hanby Index is centrally placed whichreinforces Kestelman' s support for that index.
7
Voting matters, for the technical issues of STV, February 2003 Issue 16
Constituency Actual Best Fit (%) Comparison
Carlow-Kilkenny (2,2,1) (2,2,1) 13.998 =
Cavan-Monaghan (2,2,1) (2,2,1) 8.850 =
Clare (3,1,0) (2,1,1) 7.452 FF to Other
Cork East (2,2,0) (2,1,1) 16.773 FG to Other
Cork North-Central (3,2,0) (2,1,2) 12.473 Two changes
Cork North-West (2,1,0) (2,1,0) 24.912 =
Cork South-Central (3,2,0) (2,2,1) 11.923 FF to Other
Cork South-West (1,2,0) (1,1,1) 20.608 FG to Other
Donegal North-East (2,0,1) (1,1,1) 17.801 FF to FG
Donegal South-West (1,1,1) (1,1,1) 12.710 =
Dublin Central (2,1,1) (2,0,2) 17.771 FG to Other
Dublin North (2,1,1) (1,1,2) 16.756 FF to Other
Dublin North-Central (2,1,1) (2,1,1) 4.487 =
Dublin North-East (2,1,1) (2,1,1) 19.113 =
Dublin North-West (2,0,2) (2,1,1) 15.808 FG to Other
Dublin South (2,2,1) (2,1,2) 11.999 FG to Other
Dublin South-Central (2,1,1) (1,1,2) 13.301 FF to Other
Dublin South-East (1,1,2) (1,1,2) 4.042 =
Dublin South-West (2,1,2) (1,1,3) 12.192 FF to Other
Dublin West (2,1,1) (1,1,2) 11.492 FF to Other
Dun Laoghaire (2,2,1) (1,2,2) 11.226 FF to Other
Galway East (2,2,0) (2,1,1) 7.923 FG to Other
Galway West (2,1,2) (2,1,2) 10.324 =
Kerry North (1,1,1) (1,1,1) 19.729 =
Kerry South (1,0,2) (1,0,2) 18.479 =
Kildare North (1,1,1) (1,1,1) 9.214 =
Kildare South (1,1,1) (1,1,1) 8.464 =
Laoighis-Offaly (3,2,0) (3,1,1) 13.281 FG to Other
Limerick East (2,1,2) (2,1,2) 9.015 =
Limerick West (1,2,0) (1,1,1) 4.945 FG to Other
Longford-Roscommon (2,2,0) (2,1,1) 15.181 FG to Other
Louth (2,1,1) (2,1,1) 12.575 =
Mayo (2,3,0) (2,3,0) 14.288 =
Meath (3,2,0) (2,2,1) 3.803 FF to Other
Sligo-Leitrim (2,2,0) (2,1,1) 15.211 FG to Other
Tipperary North (2,0,1) (1,0,2) 24.890 FF to Other
Tipperary South (1,1,1) (1,1,1) 11.361 =
Waterford (2,1,1) (1,1,2) 14.951 FF to Other
Westmeath (1,1,1) (1,1,1) 15.218 =
Wexford (2,2,1) (2,2,1) 3.036 =
Wicklow (2,1,2) (1,1,3) 13.758 FF to Other
Correlation graph
References1. I D Hill, What sort of proportionality? Voting
matters, Issue 16, pp5-6. 2003
2. 28th Dáil General Election, June 1997, ElectionResults and Transfer of Votes. The Stationery Office,Dublin 1998.
3. P Kestelman, Quantifying Representativity. Votingmatters. Issue 10. pp7-10. March 1999.
STV in New ZealandS W Todd
Stephen Todd is a member of the Electoral Reform Coalitionand has advocated STV in New Zealand for many years
In May 2001, the New Zealand Parliament enacted theLocal Electoral Act 2001. At section 3 of the Act, it is statedthat its purpose “is to modernise the law governing theconduct of local elections and polls ...” including, to “allowdiversity (through local decision-making) in relation to ...the particular electoral system to be used for local electionsand polls[.]”
Section 5 of the Act defines “electoral system” as “... any ofthe following electoral systems that are prescribed for use atan election or poll:
(a) the system commonly known as First Past The Post:
(b) the system commonly known as Single TransferableVoting (STV) using Meek' s method of countingvotes[.]”
As a result of this legislation, New Zealand becomes thefirst country in the world to adopt STV by Meek' s methodfor use in public elections. Indeed, although local authoritieshave the choice of switching to STV if they or their electors
want it, the Act, at section 150, amends the New ZealandPublic Health and Disability Act 2000, to make itmandatory for the seven elected members of the country' stwenty-one district health boards to be elected by STV.
It will come as no surprise to learn that the road to STVbecoming a reality in New Zealand was not an easy one. In1994, on behalf of the Electoral Reform Coalition, Iprepared a draft bill for the Deputy Leader of theOpposition (Labour Party), the Hon David Caygill, MP.After consulting the Electoral Reform Society in the UK, Iincorporated the Northern Ireland rules in the relevantSchedule of the bill. Mr Caygill took the bill to asubsequent meeting of the Labour caucus, which agreedthat it should be accepted as a private member' s bill.
At that point it became the responsibility of the oppositionspokesperson on Local Government, Richard Northey, MP.He placed it in the fortnightly ballot of members' bills inOctober 1994, and it was drawn from that ballot thefollowing April. Mr Northey introduced the bill (LocalElections (Single Transferable Vote Option) Bill) into theHouse of Representatives on 19 July 1995.
Ten of 78 submissions on the bill were heard by theElectoral Law select committee, in November 1995. On 31July 1996, the committee established a subcommittee,comprising Richard Northey (Chairperson) and Hon. DavidCaygill, to consider the bill. Advice was received fromofficials in the Department of Internal Affairs, and thesubcommittee reported its findings to the committee on 21August 1996. The bill was reported back to Parliament inearly September, just as Parliament was dissolved so thatNew Zealand' s first MMP election could be held (on 12October). The bill was held over for consideration by thenew Parliament.
Part of the “advice [...] received from officials” was toabandon the Northern Ireland rules on the ground that theydid not treat all votes equally, particularly with regard tothose votes given for successful candidates that were not inthe actual parcel of votes that put a candidate up over thequota. Such inequality in the treatment of votes was seen asunfair.
Furthermore, knowing that computer technology wasincreasingly being used in local elections, the committeewanted counting rules that were more compatible with theuse of such technology.
Unfortunately, the rules written to replace the NorthernIreland rules in the Report copy of the bill were logicallyunsound. The main problem was that the word “votes”, asused in the rewritten rules, did not always mean the samething. Sometimes it referred to transferable papers andother times to the value of those papers. In undertaking therewrite, the authors overlooked the fact that, regardless ofwhether hand-counting rules are carried out by hand or by
8
Issue 16 Voting matters, for the technical issues of STV, February 2003
GID
LHI
FI
SLI
computer, it is voting papers that are being transferred,sometimes at full value, sometimes at a reduced transfervalue, rather than votes. A number of consequential errorsarising from this and other misunderstandings, rendered therules inoperable.
The rule pertaining to the calculation of the transfer value wasa case in point. In the case of the transfer of a surplusresulting from a previous transfer of votes, the transfer valueof the votes transferred [was to] be “the result of dividing thesurplus by the total number of votes transferred in thatprevious transfer to the candidate from whom the surplus istransferred.”
A transfer value is calculated by dividing the surplus by thenumber of transferable papers, not by the sum of the value ofthose papers and non-transferable papers, i.e. total votes.Under normal hand-counting rules, for example, an electedcandidate may obtain the quota upon receiving a batch of 280voting papers, each having a transfer value of 0.35 — a totalof 98 votes. If this candidate now has a surplus of 60 votesand only 240 of the 280 papers last received are transferable,then they would be transferred at a transfer value of 0.25.
The above-mentioned rule, however, states that the transfervalue shall be calculated by dividing the surplus of 60 votesby the 98 votes transferred at the previous transfer, whichcomes to 0.612244... If this transfer value (0.61?) were thenapplied to the 240 transferable papers (although there wasnothing to say it should be), a total of 146.40 votes would betransferred instead of 60, and the total number of non-transferable votes would be increased unnecessarily by 24.40!
Not only was there no direction as to how many decimalplaces the transfer value was to be taken to, but it was veryobvious that the votes would not sum to the correct totals.Something had to be done.
The Electoral Law Committee of the new Parliament calledfor submissions on the Report copy of the bill, to be receivedby 30 October 1997.
During the course of my efforts to make sense of the re-written counting rules, I realised quite suddenly that whatofficials had been attempting to do, was to replace theNorthern Ireland rules with Meek-equivalent rules, unawarethat Meek' s method of counting votes had already beeninvented, and subsequently perfected.
Consequently, in the Electoral Reform Coalition' s submission,we recommended to the committee that the counting rules bereplaced by Meek' s method. Our efforts were all to no avail,however, with the bill being lost following a tied vote (4-4) incommittee in May 1998.
That month, I set to work drafting a completely new bill, thistime for opposition Green Party MP, Rod Donald, in which I
incorporated Meek' s method of counting votes. TheExplanatory Note to the bill explained that Meek' s methodwas a significant improvement over the various hand-countingrules, and why; that it treated all votes equally; and that aMeek count had to be carried out by computer.
The draft was completed in December 1998 and sent out tointerested parties for comment. Reaction from the localgovernment sector was generally unsupportive, but twoprominent political scientists with a particular interest in localgovernment agreed that Meek' s method was an improvementover hand-counting rules.
The local government sector was resisting the STV optionbecause local returning officers (now called electoral officers)were terrified at the thought of having to learn how to conducta complicated hand-count of votes. They imagined dozens ofpeople constantly shuffling thousands of pieces of paper fromone pile to another over several days. In these cost-conscioustimes, when the public demands instant results, they simplydidn' t want to know about it.
Although sector representatives indicated continuedresistance, this new bill happened to coincide with a push bythe sector to have the local electoral legislation completely re-written and up-dated.
In June 1999, I was invited to attend a workshop on matterspertaining to the administration and conduct of local electionsto give a presentation on Meek' s method. Soon after, perhapsrealising that their main objection to STV (fear of hand-counts) need not be a relevant consideration, and that the issueof STV was not going to go away, sector representativesdecided to include provision for an STV option in their list ofproposed improvements to the legislation.
A year later, in July 2000, Rod Donald' s bill was drawn out inthe fortnightly ballot of members' bills and given its firstreading. At this time, the newly-elected Labour-ledgovernment decided that seven of the 11 members of the 21district health boards (DHBs) that it intended to set up toreplace the structure put in place by the previous government,would be elected by STV.
A significant reason for this decision was to ensure that theMaori population would have the means to ensure they wererepresented on these boards by people they helped to elect, ifthat was what they wanted. The legislation stipulates that atleast two of the 11 positions must be filled by Maori, soenabling Maori to elect Maori members would enable, in mostcases, the four appointed positions to be filled having regardto criteria other than ethnicity.
The government, which generally relied on the Green Partyfor its majority, and needing the support of the Greens toensure the Local Electoral Bill would be enacted during thefirst half of 2001, agreed to include provisions for local
9
Voting matters, for the technical issues of STV, February 2003 Issue 16
authorities to adopt STV in that bill. In turn, Rod Donaldallowed his bill to lapse in select committee.
At this point, late-July 2000, a decision needed to be madeas to which of the several forms of STV would be includedin the Local Electoral Bill. Relevant officials in theDepartment of Internal Affairs consulted well-knownpolitical scientists, and with myself, and reduced the choiceto four — Tasmania' s Hare-Clark rules, Northern Ireland' s“senatorial” rules, the “original” STV rules, as used in theRepublic of Ireland, and Meek' s method.
In September 2000, a paper was submitted to Cabinetrecommending that Meek' s method be accepted as the formof STV best suited for New Zealand. Meek was “preferredto the hand counting forms of STV because it bestcontributes to effective and fair representation, and publicconfidence and understanding of local elections.”
Two factors which contributed to this recommendationbeing made were that writing a computer program toimplement Meek' s method would be far morestraightforward than if one of the forms of hand-countingrules were adopted, and because Meek' s method reduces thenumber of “wasted” votes to an absolute minimum, andensures all successful candidates achieve the required quotafor election.
Furthermore, officials “noted that in 1996, the Electoral LawCommittee proposed that Richard Northey' s STV OptionBill be amended from the senatorial rules to a form thatreflected the intent of the Meek rules, in order to remove thenecessary arbitrariness generated by hand counting.”
As alluded to in the first paragraph above, the LocalElectoral Act provides for local authorities to resolve tochange to STV, or to hold a poll on the electoral system, andalso for electors to demand a poll be held on the electoralsystem.
In August and September 2002, eight (out of a total of 86)local authorities resolved to adopt STV to elect theircouncils and community boards (if any) in October 2004. Afurther two councils (Wellington and Whangarei) resolvedto hold a poll of electors, on 30 November and 5 December,respectively. Wellington voted narrowly to adopt STV;Whangarei voted by a margin of almost 2 to 1 to retain thefirst-past-the-post (FPTP) system.
Since then, the Opotiki District Council, which was one ofthe eight local authorities to resolve to change to STV, andthe Masterton District Council, which resolved to stay withFPTP, have further resolved to hold a poll of electors.
At the time of writing (January 2003), there have been 10successful poll demands, with possibly a handful more bythe end of February. All polls must be held no later than 21May 2003, the results of which are binding on the councils
concerned for the next two triennial general elections of thecountry' s local authorities (9 October 2004 and 13 October2007).
10
Issue 16 Voting matters, for the technical issues of STV, February 2003
Voting matters
for the technical issues of STV
published by
The McDougall Trust
Issue 17 October 2003
About the McDougall Trust (reg. charity no. 212151)
The McDougall Trust is a charitable trust formed in 1948. The charity’s purposes asstated in its governing scheme of 1959 are to advance knowledge of and encouragethe study of and research into:
� political or economic science and functions of government and the services pro-vided to the community by public and voluntary organisations; and
� methods of election of and the selection and government of representative organ-isations whether national, civic, commercial, industrial or social.
The Trust’s work includes the maintenance and development of the Lakeman Libraryfor Electoral Studies, a unique research resource, the production and publication ofRepresentation: The Journal of Representative Democracy, and, of course, this pub-lication Voting matters, that examines the technical issues of the single transferablevote and related electoral systems.For further information on the Trust, please contact:
For futher information on this publication, please contact B A Wichmann, the Editorat the above address or by email at: [email protected]
Editorial
This is the first issue under the auspices of the Mc-Dougall Trust. The Editor has taken the opportunityof this change to make a number of stylistic changes.These are mainly as follows:
� Use of the LATEX typesetting system so that, if theywish, authors can submit material in a format thatcan be directly typeset.
� Starting papers on a new page so that individualpapers can be handled more easily.
This issue also has a slight departure in having twopapers which are more mathematical in nature than isusual. It has been decided that the Editor should en-sure that the main points of such papers are intelligibleto non-mathematical readers by placing an appropriatesummary here.
There are four papers in this issue:
� D R Woodall: QPQ, a quota-preferential STV-likeelection rule,
� J Otten: Fuller Disclosure than Intended,
� M Schulze: A New Monotonic and Clone-Independent Single-Winner Election Method and
� J Gilmour: Calculation of Transfer Values — Pro-posal for STV-PR Rules for Local GovernmentElections in Scotland.
In Douglas Woodall’s paper he defines a new way ofcounting preferential votes which is analogous to con-ventional STV. To understand the counting process, it isprobably best to work through the examples in the pa-per with the general definition in mind. It is clear thatundertaking this form of counting without a computer isviable. Hence the interest here would be to see if QPQhas any appeal to those who think it inappropriate to usecomputers to count an election. The main mathematicsin Woodall’s paper is to show that QPQ has several de-sirable properties — hence this part can be skipped andthe results taken on trust.
The paper of Joe Otten arose from a resolution put tothe ERS AGM requesting that the full election data ofthe preferences specified should be available for STVelections. (Such disclosure was available for the threeIrish constituencies for which electronic voting was em-ployed in the June 2002 elections.) The paper explains
a potential danger from full disclosure with a proposedresolution.
Markus Schulze in his paper considers the questionof electing just one person, which would be the Alter-native Vote (AV) with STV. Many would consider thatAV is inappropriate since it does not necessarily electthe Condorcet winner (if there is one). The paper startsfrom the position of electing the Condorcet winner butwith the objective of ensuring as many desirable prop-erties are satisfied as possible. The proof that certainproperties are satisfied involves some logical analysiswhich I hope most readers can follow.
James Gilmour’s paper has arisen as a result of the re-cent consultation process for the introduction of STV inScottish local elections. Here, he shows by analysis andexample that the calculation of the transfer values canbe improved by using more precision in the calculationthan is often the case.
Readers are reminded that views expressed inVoting matters by contributors do not neces-sarily reflect those of the McDougall Trust orits trustees.
Olli Salmi, in a posting to an Election Methods list [6],has suggested a new quota-preferential election rule,which is developed slightly further in this article, andwhich is remarkably similar to the Single TransferableVote (STV) in its effects. I shall call it QPQ, for Quota-Preferential by Quotient. Both in its properties and inthe results it gives, it seems to be more like Meek’s ver-sion of STV [2] than the traditional version [3]. This issurprising since: (i) in marked contrast with STV, thequota in QPQ is used only as a criterion for election,and not in the transfer of surplus votes; (ii) QPQ, unlikeMeek’s method, involves no iterative processes, and sothe votes can be counted by hand; and (iii) QPQ derivesfrom the European continental tradition of party list sys-tems (specifically, d’Hondt’s rule), which is usually re-garded as quite different from STV. I do not imaginethat anyone who is already using STV will see any rea-son to switch to QPQ; but people who are already usingd’Hondt’s rule may feel that QPQ is a natural progres-sion of it, and so more acceptable than STV.
D’Hondt’s rule for allocating seats to parties wasproposed by the Belgian lawyer Victor d’Hondt [1] in1882. The seats are allocated to the parties one by one.At each stage, a party with � votes and (currently) �seats is assigned the quotient � ������� � , and the nextseat is allocated to the party with the largest quotient.This continues until all seats have been filled.
Many variations of this rule were subsequently pro-posed, in which the divisor
��� � is replaced by someother function of � . However, the next contribution ofrelevance to us is an adaptation of d’Hondt’s rule towork with STV-type preferential ballots. This adapta-tion has been part of Sweden’s Elections Act for many
years; we will call it the d’Hondt–Phragmen method,since it is based on a method proposed by the Swedishmathematician Lars Edvard Phragmen [4, 5] in 1895.The seats are again allocated one by one, only this timeto candidates rather than parties; at each stage, the nextseat is allocated to the candidate with the largest quo-tient (calculated as explained below). In the event thatthe voters effectively vote for disjoint party lists (e.g.,if every ballot is marked for abcd, efg or hijkl), thenthe d’Hondt–Phragmen method gives exactly the sameresult as d’Hondt’s rule. However, it was introduced inthe Swedish Elections Act as a means of allocating seatswithin a party, at a time when voters were allowed to ex-press a choice of candidates within the party. It does notguarantee to represent minorities proportionally.
Salmi’s contribution has been to introduce a quotainto Phragmen’s method. In this version, which he callsthe d’Hondt–Phragmen method with quota, the candi-date with the largest quotient will get the next seat if,and only if, this quotient is larger than the quota; oth-erwise, the candidate with the smallest quotient is ex-cluded, and the quotients are recalculated. In this re-spect it is like STV. However, unlike in STV, this is theonly way in which the quota is used; it is not used intransferring votes. QPQ, as described here, differs fromSalmi’s original version only in that the quota is definedslightly differently, and the count is preferably restartedafter every exclusion.
Both the d’Hondt–Phragmen method (with or with-out quota), and QPQ, can be described in terms ofgroups of voters rather than individuals, and this is nat-urally how one thinks when processing piles of ballotsby hand. But it seems to me that they are easier to un-derstand when rewritten in terms of individual ballotsrather than groups, and they are described here in thisform. From now on, � denotes the total number of seatsto be filled.
1
Woodall: QPQ, an STV-like election rule
2 The details of QPQ
2.1. The count is divided into a sequence of stages. Atthe start of each stage, each candidate is in one of threestates, designated as elected, excluded and hopeful.At the start of the first stage, every candidate is hopeful.In each stage, either one hopeful candidate is reclassi-fied as elected, or one hopeful candidate is reclassifiedas excluded.2.2. At the start of each stage, each ballot is deemedto have elected some fractional number of candidates,in such a way that the sum of these fractional numbersover all ballots is equal to the number of candidates whoare currently classed as elected. At the start of the firststage, every ballot has elected 0 candidates.
2.3. At the start of each stage, the quotients of allthe hopeful candidates are calculated, as follows. Theballots contributing to a particular hopeful candidate� are those ballots on which � is the topmost hopefulcandidate. The quotient assigned to � is defined to be����� � � � � � ��� � , where � � is the number of ballots con-tributing to � , and
� � is the sum of all the fractional num-bers of candidates that those ballots have so far elected.
2.4. A ballot is active if it includes the name of ahopeful candidate (and is a valid ballot), and inactiveotherwise. The quota is defined to be �� � � � � �� � � ,where ��� is the number of active ballots, � is the to-tal number of seats to be filled, and
���is the sum of
the fractional numbers of candidates that are deemed tohave been elected by all the inactive ballots.2.5a. If � is the candidate with the highest quotient, andthat quotient is greater than the quota, then � is declaredelected. In this case each of the � � ballots contributingto � is now deemed to have elected
� � ��� candidates intotal (regardless of how many candidates it had electedbefore � ’s election); no change is made to the number ofcandidates elected by other ballots. (Since these � � bal-lots collectively had previously elected
� � candidates,and they have now elected � � � � � � � ��� � candidates,the sum of the fractional numbers of candidates electedby all voters has increased by 1.) If all � seats have nowbeen filled, then the count ends; otherwise it proceedsto the next stage, from paragraph 2.3.2.5b. If no candidate has a quotient greater than thequota, then the candidate with the smallest quotient isdeclared excluded. No change is made to the numberof candidates elected by any ballot. If all but � can-didates are now excluded, then all remaining hopefulcandidates are declared elected and the count ends; oth-
erwise the count proceeds to the next stage, from para-graph 2.3.
The details of the calculations of the quotients andquota may become clearer from a study of Election 2 inthe next section.
The specification above contains two stopping condi-tions, in paragraphs 2.5a and 2.5b. These are includedfor convenience, to shorten the count. However, theyare not necessary; they could be replaced by a singlerule to the effect that the count ends when there are nohopeful candidates left. We shall see below (in Propo-sitions 5 and 6) that, left to its own devices in this way,QPQ will elect exactly � candidates. It shares this prop-erty with Meek-STV but not with conventional STV,in which the stopping condition of paragaph 2.5b isneeded in order to ensure that enough candidates areelected.
The most important proportionality property pos-sessed by STV is what I call the Droop proportional-ity criterion: if more than � Droop quotas of voters aresolidly committed to the same set of ����� candidates,then at least � of those � candidates should be elected.(Here the Droop quota is the total number of valid bal-lots divided by one more than the number of seats tobe filled, and a voter is solidly committed to a set of �candidates if the voter lists those candidates, in someorder, as the top � candidates on their ballot.) We shallsee in Proposition 7 that QPQ also satisfies the Droopproportionality criterion.
We shall see in Proposition 4 that if two candidates �and � are elected in successive stages, first � and then � ,with no exclusion taking place between them, then � ’squotient at the time of � ’s election is no greater than� ’s quotient at the time of � ’s election. (Thus withthe d’Hondt–Phragmen method, which is essentially thesame as QPQ but with no quota and no exclusions, eachcandidate elected has a quotient that is no greater thanthat of the previous candidate elected.)
This is not necessarily true, however, if an exclusionoccurs between the elections of � and � . Consider thefollowing election.
Election 1 (3 seats)
16 ��� , 12 � , 12 � , 12 � , 8 ��� .There are 60 votes, and so the quota is �� ��� � ���
.The initial quotients are the numbers of first-preferencevotes; � , with a quotient of 16, exceeds the quota and iselected. Now � ’s quotient becomes
� � � � �� � � �!�,
and this is the only quotient to change, so that no other
2 Voting matters, Issue 17
Woodall: QPQ, an STV-like election rule
candidate reaches the quota. Thus � is excluded. Now� ’s quotient becomes
��� � � �� ��� � � ���, and so �
is elected with a quotient that is larger than � ’s was atthe time of � ’s election. This means that each of the ���ballots was deemed to have elected ���� of a candidateafter � ’s election, but only ���� of a candidate after � ’selection. This conveys the impression that these ballotshave elected a negative proportion of � , or else (perhapsworse) that the � and ��� ballots are being treated as hav-ing elected part of � .
To avoid this, it is proposed here that the count shouldbe restarted from scratch after each exclusion. We shallsee below, in Proposition 8, that if � is the first can-didate to be excluded, and the count is then restartedwith � ’s name deleted from all ballots, then all the can-didates who were elected before � ’s exclusion will beelected again (although not necessarily first or in thesame order). With this variant of the method, the countis divided into rounds, each of which apart from the lastends with an exclusion; the last round involves the elec-tion of � candidates in � successive stages, with no inter-vening exclusions. Now no ballot can ever be regardedas contributing a negative amount to any candidate, or apositive amount to a candidate not explicitly mentionedon it.
With Meek’s method, a voter can tell from the resultsheet exactly how their vote has been divided betweenthe candidates mentioned on their ballot, and thereforehow much they have contributed to the election of eachcandidate. QPQ does not explicitly divide votes be-tween candidates; but with the multi-round version justdescribed, as with the d’Hondt–Phragmen method it-self, a voter can tell from the result sheet what pro-portion of each candidate they have elected; and mul-tiplying these proportions by the final quota could beregarded as indicating how much of their vote has goneto each candidate, implicitly if not explicitly. For exam-ple, suppose candidates � and � are elected with quo-tients (at the time of election) ��� ��� , candidate � ishopeful to the end, and the final quota is . Then avoter whose ballot (after the deletion of any excludedcandidates) reads � � � has elected
� � �� of � ,� � ��� � � ���
of � , and was able to contribute� � � � �� towards the
election of � (which, however, was insufficient to get �elected). And a voter whose ballot reads � � � or � � � haselected
� � � � of � , nothing of � , and was again able tocontribute
� � � � � � towards the election of � . Thefact that the � � � and � � � voters make the same contri-bution to � is a property that is shared with Meek-STVbut not with conventional STV.
3 Examples
The first of these examples is intended to clarify themethod of calculation of the quotients and quota.
There are 100 votes, and so the initial quota is� � � ��� � �
. The initial quotients are the numbers of first-preference votes; � ’s quotient of 35 is the largest,and exceeds the quota, and so � is elected. Each ofthe 35 ballots that has � in first place is deemed tohave elected ���� of � ; 5 of these plump for � andnow become inactive, 15 have � in second place, and15 have � in second place. So the quota now be-comes
exceeds the quota, and so � is elected. Each of the 40ballots that contributed to � ’s election is deemed to haveelected �� � of a candidate in total; 10 of these plumpfor � and now become inactive, and the remaining 30have � in the place after � . So the quota now becomes��� � � � � � ��� � ���� ���� � ��
��� ��, and � ’s quotient
becomes� � � ������� � ��� � � � ���� � � �� �
� � � � . Now� is elected. We can set out the count as follows.Election 2
We have already mentioned that QPQ satisfies theDroop proportionality criterion, which is one importanttest of proportionality. The next two elections provideanother test of proportionality. In both of these thereare two parties, one with candidates �&% �% � and the otherwith candidates ��% �'%�( . The voters vote strictly alongparty lines. However, the � � � -party voters all put � first,� second and � third, whereas the def -party voters areevenly divided among the three candidates. In Election3, the ��� � party has just over half the votes, and so weexpect it to gain 3 of the 5 seats, whereas in Election 4 ithas just under half the votes, and so we expect it to gainonly 2 seats. We shall see that this is what happens.
In each case there are 600 votes, and so the quota is� �� � � � � � � . In Election 3, after the election of� , � and � the � � � ballots become inactive, and, sincethese ballots are electing 3 seats, the quota reduces to � � � � � � � � �
We see that in each case the result is the one expectedby proportionality. This is the same result as is obtainedusing STV (using the Droop quota—but not if the Harequota is used).
In a single-seat election, QPQ and STV both reduceto the Alternative Vote. It is not clear how many seatsand candidates are needed for QPQ to give a differ-ent result from Meek-STV, but here is an example withthree seats and five candidates.
Election 5 (3 seats)
12 � � � � , 11 � , 7 � � � , 8 � � � , 9 � � � .
There are 47 votes, and so the quota (in STV or QPQ)is� ��� � � � �� . STV elects � with a surplus of �� of
a vote, which goes to � . No other candidate exceedsthe quota, and so � , having the smallest vote, is ex-cluded. Now � is elected with a surplus of
� �� votes,which all goes to � , causing � to be elected. In QPQ,each candidate’s initial quotient is their number of first-preference votes. So � is elected, and � ’s quotient thenbecomes
���� �� � � � �� . The candidate with thesmallest quotient is now � , and so � is excluded. If theelection is not restarted at this point, � now has a quo-tient of 17 and is elected, and this gives � a quotient of���� � � � � � ��� � ��
so that � is elected. If theelection is restarted after � ’s exclusion, then � is electedfirst, and then there is a tie between � and � for the sec-ond place; whichever gets it, the other will get the third
place. So in all cases the results are: STV: �&% ��% � ; QPQ:�&% � % � .
4 Proofs
In this section we will use the term single-round QPQto refer to the version where one does not restart thecount after an exclusion, and multi-round QPQ to referto the version where one does. In the event that no ex-clusion occurs, both methods proceed identically, beingthen equivalent to the d’Hondt–Phragmen method. ‘Acount in which no exclusions occur’ could refer to thispossibility, in which exclusions are absent by chance,but it covers also the final round of a multi-round QPQcount, which is guaranteed to be free of exclusions; thisfinal round is again equivalent to d’Hondt–Phragmen,although applied to ballots from which some candidatesmay already have been deleted.
It will be helpful to start by recalling some simpleinequalities.
Proposition 1. If ��%�� %�� %�� are positive real numberssuch that � � ����� � �&% then
�� �
� � �� � � �
���
(1.1)
If % in addition %������ , then
� ��� �� �
���
(1.2)
Proof. Since the denominators are all positive, theconclusions are equivalent to the inequalities � � � �� �� � � � � �� ,
� � � � ������ � � � � , and� � �� ����
� � � � . These all follow from the hypothesis, whichis that �!�!���"� . #
Proposition 2. During a multi-round QPQ count % thequota never increases.
Proof. To obtain a contradiction, suppose that thequota does increase at some stage, and consider the firststage at which this happens. Let the quota at the startof this stage be � � � ����� � � � � , where ��� is thenumber of active ballots at the start of this stage, and� �
is the sum of the fractional numbers of candidatesthat are deemed to have been elected by all the inactiveballots at the start of this stage. For each active ballotthat becomes inactive in this stage, the effect is to sub-tract 1 from � � and add
�to� �
, where�
is the fractionalnumber of candidates that that ballot has elected. This
4 Voting matters, Issue 17
Woodall: QPQ, an STV-like election rule
number�
is either 0 or� � � , where � is the quotient pos-
sessed by some already-elected candidate at the time oftheir election. In order for this candidate to have beenelected, necessarily � was greater than the quota at thattime, which we are supposing was at least . Thus inall cases
� � � � . It follows that if � ballots becomeinactive in the current stage, then the effect is to subtract� from � � and add a number � � � � to
� �. Let �
bethe quota at the end of the current stage. If � � � thenclearly � � . If � �� � then � � � � , so that (1.2)gives
� � ������� � � � � �� ����� � �� � � � �
This contradicts the supposition that the quota increasesin the current stage, and this contradiction proves theresult. #
Proposition 3. In any QPQ count % if � is elected withquotient � � , and � is a hopeful candidate whose quo-tients at the start and end of the stage in which � iselected are � � and � �� respectively, then � � � � �� � � � .Proof. Clearly � � � ��� , since otherwise � would nothave been elected in this stage. Suppose there are �ballots that contribute to � at the start of this stage andto � at the end of this stage, and let � � � � � � , so that� � � � � � � � � . Then, after � ’s election, each of these �candidates is deemed to have elected
� � � � candidates,so that collectively they have elected � candidates. Ifat the start of the current stage there were � � ballotscontributing to � , which collectively had already elected� � candidates, then
Proposition 4. In a QPQ count in which no exclusionsoccur, each candidate to be elected has a quotient
�at
the time of election that is no larger than the quotient�at the time of election of the previous candidate to be
elected.
Proof. If candidates � and � are elected in successivestages, with quotients � � and � �� respectively, and if � ’squotient at the start of the stage in which � is elected is� � , then � � � � �� � � � by Proposition 3. In particular,� �� � ��� , which is all we have to prove. #
Proposition 5. Even if the stopping condition in para-graph 2.5a is deleted % it is not possible for more than �candidates to be elected by any form of QPQ
�single-
round or multi-round .Proof. Suppose it is. Consider the stage in which the� � � � th candidate, � , is elected. At the start of thisstage, let the quota be ; let there be � � ballots con-tributing to � , and suppose these � � ballots collectivelyare currently electing
� � candidates; let there be ��� bal-lots contributing to other hopeful candidates, which arecurrently electing
�� candidates; let the number of active
ballots be � � � � � � � � ; and let the number of candidatesbeing elected by the inactive ballots be
� � � � � � � � .As in the proof of Proposition 2, every ballot has electedat most
� � candidates, and so�� � � � � . Thus
������ � ���� � �� � � � � � � ���� � � � � �
�%
and, by (1.2), � ’s quotient ��� satisfies
����� � �� � � � �� � � � ��� ������ � � � � �
� ��� � � � ���� � � � � �
�� �
This shows that � cannot be elected in the current stage,and this contradiction shows that at most � candidatesare elected in total. #
Proposition 6. Even if the stopping condition in para-graph 2.5b is deleted % at least � candidates must beelected by any form of QPQ
�single-round or multi-
round .Proof. Suppose this is not true, and consider the stagein which the number of nonexcluded candidates firstfalls below � . Suppose that at the start of this stage thereare � elected candidates and (therefore) � � hopefulcandidates. Since no hopeful candidate has a quotientgreater than the quota,
� � � � � � � � (1.3)
for every hopeful candidate � , where is the quota,� � is the number of ballots contributing to � , and
� �is the number of candidates that these ballots collec-tively have elected, all measured at the start of the cur-rent stage. Now, the sum of the � � numbers � � is� � , the number of active ballots, and the sum of the� � numbers
� � is the number of candidates electedby all the active ballots, which is � � � , where
� �is the
number of candidates elected by the inactive ballots. So
This contradiction shows that at least one of the � �hopeful candidates must have a quotient greater than thequota , and so be elected in the current stage. Thiscontradicts the supposition that the number of nonex-cluded candidates falls in the current stage, and thiscontradiction proves the result. #
Propositions 5 and 6 together show that, left to itsown devices, QPQ will always elect the right number ofcandidates; the only stopping condition required is thatthe election must terminate when there are no hopefulcandidates left.
Proposition 7. Every form of QPQ satisfies the Droopproportionality criterion � if more than � Droop quotasof voters are solidly committed to the same set of � � �candidates % then at least � of those � candidates must beelected.
Proof. The argument is rather similar to the proof ofthe previous proposition. Let
�be the set of � candi-
dates in question. In view of Proposition 5, we mayassume that the stopping condition in paragraph 2.5a isdeleted, so that the count cannot end because we haveelected too many candidates outside
�. Thus if Propo-
sition 7 is not true then there must come a point in someelection at which the number of nonexcluded candidatesin
�falls below � . Consider the stage in which this hap-
pens. Suppose that at the start of this stage there are �elected candidates and (therefore) � � hopeful candi-dates in
�. Since no hopeful candidate has a quotient
greater than the quota , (1.3) holds for all these � �hopeful candidates. Since the quota at the start of thecount was equal to the Droop quota, and, by Proposi-tion 2, the quota never increases, the number of ballotssolidly committed to
�is greater than �� , and so the
sum of the � � numbers � � is greater than � . More-over, none of these ballots can have contributed to elect-ing any candidate outside
�, and so the sum of the � �
numbers� � is at most � . So summing (1.3) over all � �
This contradiction shows that at least one of the hopefulcandidates in
�must have a quotient that is greater than
, and so the number of nonexcluded candidates in�
cannot fall in the current stage. This contradiction inturn proves the result. #
Proposition 8. Suppose that in the first � stages of aQPQ count candidates � � %
� � � % ��� are elected�in that
order with quotients � � %� ��� % � � respectively, and in the� � � � th stage candidate � is excluded. Suppose that
the count is restarted with � ’s name deleted from everyballot. Then % in the new count % candidates � � %
��� � % ���will all be elected before any exclusions take place % andeach candidate � will have quotient at least � at thetime of their election.
Proof. Suppose that in the first count the quota at thetime of � ’s election is , so that � , for each � .The deletion of � cannot decrease any candidate’s initialquotient, nor increase the quota, and so at the start ofthe new count � � has quotient at least � � and the quotais at most � . Since, by Propositions 2 and 3, the elec-tion of other candidates cannot increase the quota nordecrease � � ’s quotient, � � will have a quotient greaterthan the quota as long as � � remains hopeful. Thus � �will eventually be elected, before any exclusions takeplace, with a quotient that is at least � � .
In order to obtain a contradiction, suppose that theconclusion of the Proposition does not hold for all thesevalues of � , and consider the smallest value of � forwhich it fails to hold. Then � �
, since we have justseen that the conclusion holds for � � . Consider the firstpoint at which � � % � � %
� ��� % � � � are all elected, and let��� be the last of these candidates to be elected; ��� may,but need not, be � � � . Since the conclusion holds forall of � � % � � %
� ��� % � � � , we know that ��� had quotient atleast � � at the time of election. By Proposition 4 appliedto the first count and then to the new count, � � � � ,and every candidate elected so far in the new count hasbeen elected with a quotient that is at least � � and henceat least � . So if � has already been elected in the newcount then the conclusion of the Proposition holds for� . Since we are supposing that this is not the case, itmust be that � has not yet been elected. We will con-sider � ’s quotient and the quota at the start of the nextstage, immediately following the election of ��� .
In the first count, � was elected with quotient � �� � � � � � , where � is the number of ballots that con-tributed to � after � �� � ’s election, and
� is the frac-tional number of candidates that these ballots had sofar elected. These � ballots are the ones on whichno candidate other than � � %
� � � % ��� � is preferred to � ,6 Voting matters, Issue 17
Woodall: QPQ, an STV-like election rule
and so they again contribute to � at this point in thenew count. So in the new count, � now has quotient
�� � � � � � � ������� �� � �� � , where � � is the numberof ballots contributing to � at this point that did notcontribute to � at the time of � ’s election in the firstcount, and
�� and�� � are the fractional numbers of candi-
dates elected by the original � contributors and the new� � contributors at this point in the new count. Each ofthese � � � � ballots is deemed to have elected either 0candidates or a number of candidates of the form
� � �� ,where
�� is the smallest quotient of any elected candi-date listed above �� on that ballot. For all the ballotsof this second type,
�� � � � � � ; thus�� � � � � � � and
� � � �� � � � . Moreover, for each of the original �� ballotsthat is of this second type, the number
�� for that ballotis the smallest of a new set of quotients, each of whichis at least as large as the corresponding quotient in theoriginal count, so that if the ballot was electing
� � � can-didates at the time of � ’s election in the original countthen
�� � � and� � �� � � � � ; thus
�� � � . It follows from(1.1) that
�� � � � � �� � �� � �� � �� � � �� � � � �� � �
� � � � � � � (1.4)
Now let us consider the quota. Let � be the number ofvalid ballots. In the first count, the quota at the time of� ’s election was � � �� � � � � � � � � � , where � �is the number of inactive ballots at the time of � ’s elec-tion, and
� �is the fractional number of candidates that
these ballots have elected. These � � inactive ballots arethe ones that contain the name of no candidates otherthan � � %
��� � % ��� � , and so they are again inactive at thispoint in the new count. So in the new count, the quotaat this point is
� � � � � � � �� � � � � � �� � �� �� ,where � �� is the number of ballots that were active atthe time of � ’s election in the first count but are inac-tive at this point in the new count, and
�� �and
�� ��are the
fractional numbers of candidates elected by the origi-nal and the new inactive ballots at this point in the newcount. By the same argument we used in the previousparagraph to prove that
�� � � , we can now deduce that�� � � � �
. Moreover, by Propositions 2 and 4 and thecriterion for election in paragraph 2.5a, every candidateelected so far has been elected with a quotient that isgreater than the current quota
� , so that � ’s current quotient is greater than the cur-rent quota. Since, by Propositions 2 and 3, the elec-tion of other candidates cannot increase the quota nordecrease � ’s quotient, � will have a quotient greaterthan the quota as long as � remains hopeful. Thus � will eventually be elected, before any exclusions takeplace, with a quotient that is at least � . This contradictsthe supposition that the conclusion of the Propositionfailed to hold for � , and this contradiction completesthe proof of the Proposition. #
5 References
[1] V. d’Hondt, Systeme Pratique et Raisonne deRepresentation Proportionelle [A Practical andRational System for Proportional Representation],Librairie C. Muquardt, Brussels, 1882.
[2] I. D. Hill, B. A. Wichmann and D. R. Woodall,Algorithm 123, Single transferable vote by Meek’smethod, The Computer Journal 30 (1987) 277–281.
[3] R. A. Newland and F. S. Britton, How to Conductan Election by the Single Transferable Vote, Elec-toral Reform Society of Great Britain and Ireland,London, 1972; 2nd ed. 1976.
[4] E. Phragmen, Proportionella val [Proportional elec-tions], Svenska Sporsmal 25, Stockholm, 1895.
[5] E. Phragmen, Till fragan om en proportionell val-metod [On the question of a proportional electionmethod], Statsvetenskaplig Tidskrift 2 (1899), 87–95.
[6] O. Salmi, RE: [EM] D’Hondt without lists,http://groups.yahoo.com/group/election-methods-list/message/10068.
The full disclosure of preferences in the case of an STVelection carries one danger of abuse. That is the poten-tial for a unique preference list to identify a particularvoter. Suppose there are 10 candidates in an election.Then there are
� � ��
��
�
� � ��
��
��
� �� � �� � � � possible complete preference lists as well
as a number of incomplete lists. In an electorate of afew tens or hundreds of thousands, it is obvious that thevast majority of the possible preference lists will not beused.
Of the preference lists that are used, they will gen-erally follow some sort of pattern, such as the candi-dates of one party, followed by the candidates of an-other party, etc. It will therefore be fairly easy to createa large number of different preference lists that favoura particular candidate (with first preferences), and aremost unlikely to be used by any voter.
2 The problem
The full disclosure of preference data facilitates the fol-lowing fraud: The fraudster bribes or coerces a largenumber of voters to vote according to an exact prefer-ence list that is provided, and is different for each voter.The preference lists provided will be different unlikelysequences, such as the preferred candidate followed byalternate liberals and fascists or conservatives and com-munists.
Disclosure of the full preference data will then dis-close, with a high probability, the voting behaviour ofthe bribed voters. There may be some false positives,but there will be no false negatives — i.e. if a prefer-ence list is missing then it is certain that a bribed voterwelched.
3 The solution
One solution has been proposed — that of anonymis-ing the preference data in a similar way to how censusdata is anonymised. Changes are made to the individ-ual records in such a way as to minimise changes thatresult to any statistical aggregates an analyst might beinterested in. The problem with this is that the statis-tical analysis of preference data is in such infancy thatit is not clear what aggregates should be preserved, orhow they might be preserved.
My preferred solution is that prior to disclosure, pref-erence lists should be aggregated by censoring lowerpreferences until there are at least, say, 3 instances ofevery preference list to be published. So for example,if there are 10 votes of ABCDEFG then that fact canbe published. If there is 1 vote of BCDEFGA, 1 ofBCDEFAG and 1 of BCDEGAF then the fact that therewere 3 votes of BCDExxx would be published. Thiswould mean that no single individual’s vote would beidentifiably disclosed.
8
A New Monotonic and Clone-Independent Single-WinnerElection Method
Markus Schulze has studied mathematicsand physics at the Technische UniversitatBerlin.
1 Introduction
In 1997, I proposed to a large number of people whoare interested in mathematical aspects of election meth-ods a new method that satisfies Pareto, monotonicity,resolvability, independence of clones, reversal symme-try, Smith-IIA, and Schwartz. This method immediatelyattracted a lot of attention and very many enthusiasticsupporters. Today, this method is promoted e.g. by Di-ana Galletly [1], Mathew Goldstein [2], Jobst Heitzig[3], Raul Miller, Mike Ossipoff [4], Russ Paielli, Nor-man Petry, Manoj Srivastava, and Anthony Towns andit is analyzed e.g. in the websites of Blake Cretney[5], Steve Eppley [6], Eric Gorr [7], and Rob LeGrand[8]. Today, this method is taught e.g. by James E. Falkof George Washington University and Thomas K. Yanof Cornell University [9]. In January 2003, the boardof Software in the Public Interest (SPI) adopted thismethod unanimously [10]. In June 2003, the DEBIANProject adopted this method with 144 against 16 votes[11, 12]. Therefore, a more detailed motivation and ex-planation of the method is overdue.
There has been some debate about an appropri-ate name for the method. Some people suggestednames like “Beatpath Method”, “Beatpath Winner”,“Path Voting”, “Schwartz Sequential Dropping” (SSD)or “Cloneproof Schwartz Sequential Dropping” (CSSDor CpSSD). However, I prefer the name “Schulzemethod”, not because of academic arrogance, but be-cause the other names do not refer to the method it-self but to specific heuristics for implementing it, and so
may mislead readers into believing that no other methodfor implementing it is possible. In my opinion, althoughit is advantageous to have an intuitive and convincingheuristic, in the end only the properties of the methodare relevant.
I have already found some implementations of mymethod in the internet. Unfortunately, most implemen-tations that I have seen were inefficient because the pro-grammers have not understood the Floyd algorithm sothat the implementations had a runtime of
� ��� � al-though the winners of this method can be calculated ina runtime of
� ��� � , where�
is the number of candi-dates.
It is presumed that each voter casts at least a par-tial ranking of all candidates. That means: It is pre-sumed that for each voter V the relation “voter V strictlyprefers candidate A to candidate B” is irreflexive, asym-metric, and transitive on the set of candidates. But it isnot presumed that each voter casts a complete ranking.That means: It is not presumed that this relation is alsolinear.
Suppose that d[X,Y] is the number of voters whostrictly prefer candidate X to candidate Y. Then theSmith set is the smallest non-empty set of candidateswith d[A,B] d[B,A] for each candidate A of this setand each candidate B outside this set. Smith-IIA (whereIIA means Independence from Irrelevant Alternatives)says that adding a candidate who is not in the new Smithset should not change the probability that a given and al-ready running candidate is elected. Smith-IIA impliesthe majority criterion for solid coalitions and the Con-dorcet criterion. Unfortunately, compliance with theCondorcet criterion implies violation of other desiredcriteria like participation [13], later-no-harm, and later-no-help [14].
A chain from candidate A to candidate B is an or-dered set of candidates C(1),. . . ,C(n) with the following
9
Schulze: Single-winner election method
three properties:
1. C(1) is identical to A.
2. C(n) is identical to B.
3. d[C(i),C(i+1)] d[C(i+1),C(i)] 0 for each i =1,. . . ,(n 1).
A Schwartz winner is a candidate A who has chainsat least to every other candidate B who has a chain tocandidate A. The Schwartz set is the set of all Schwartzwinners. Schwartz says that the winner must be aSchwartz winner.
In section 2, the Schulze method is defined. In sec-tion 3, well-definedness of this method is proven. Insection 4, I present an implementation with a runtimeof
� ��� � . In section 5, I prove that this method sat-isfies Pareto, monotonicity, resolvability, independenceof clones, and reversal symmetry. From the definitionof the Schulze method, it is clear that this method meetsSmith-IIA and Schwartz.
Another election method that satisfies Pareto, mono-tonicity, resolvability, independence of clones, rever-sal symmetry, Schwartz, and Smith-IIA is Tideman’sRanked Pairs method [15, 16]. However, appendix Ademonstrates that the proposed method is not identicalwith the Ranked Pairs method. Appendix B demon-strates that the proposed method can violate the par-ticipation criterion in a very drastic manner. A spe-cial provision of the implementation used by SPI andDEBIAN is described in appendix C. Appendix D ex-plains how the proposed method can be interpreted asa method where successively the weakest pairwise de-feats are “eliminated.” Appendix E presents a concreteexample where the proposed method does not find aunique winner.
2 Definition of the Schulze Method
Stage 1: Suppose that d[A,B] is the number of voterswho strictly prefer candidate A to candidate B.
A path from candidate A to candidate B is an or-dered set of candidates C(1),. . . ,C(n) with the fol-lowing two properties:
1. C(1) is identical to A.
2. C(n) is identical to B.
The strength of the path C(1),. . . ,C(n) ismin � d[C(i),C(i+1)] d[C(i+1),C(i)] � i =1,. . . ,(n 1) � .
Thus a chain from candidate A to candidate B, asdefined in the introduction, is simply a path withpositive strength.
p[A,B] := max � min � d[C(i),C(i+1)] d[C(i+1),C(i)] � i = 1,. . . ,(n 1) ��� C(1),. . . ,C(n)is a path from candidate A to candidate B � .In other words: p[A,B] is the strength of thestrongest path from candidate A to candidate B.
Candidate A is a potential winner if and only ifp[A,B] � p[B,A] for every other candidate B.
When p[A,B] p[B,A], then we say: “CandidateA disqualifies candidate B”.
Stage 2: If there is only one potential winner, then thispotential winner is the unique winner. If thereis more than one potential winner, then a Tie-Breaking Ranking of the Candidates (TBRC) iscalculated as follows:
1. Pick a random ballot and use its rankings;consider ties as unsorted with regard to eachother.
2. Continue picking ballots randomly fromthose that have not yet been picked. Whenyou find one that orders previously unsortedcandidates, use the ballot to sort them. Donot change the order of the already sorted.
3. If you go through all ballots, and some can-didates are still not sorted, order them ran-domly.
The winner is that potential winner who is rankedhighest in this TBRC.
3 Well-Definedness
On first view, it is not clear whether the Schulze methodis well defined. It seems to be possible that candidatesdisqualify each other in such a manner that there is nocandidate A with p[A,B] � p[B,A] for every other can-didate B. However, the following proof demonstratesthat path defeats are transitive. That means: When can-didate A disqualifies candidate B and when candidate Bdisqualifies candidate C, then also candidate A disqual-ifies candidate C.
Claim: ( p[A,B] p[B,A] and p[B,C] p[C,B] ) �p[A,C] p[C,A].
The following statements are valid:(3) min � p[A,B]; p[B,C] ��� p[A,C].(4) min � p[A,C]; p[C,B] ��� p[A,B].(5) min � p[B,A]; p[A,C] ��� p[B,C].(6) min � p[B,C]; p[C,A] ��� p[B,A].(7) min � p[C,A]; p[A,B] ��� p[C,B].(8) min � p[C,B]; p[B,A] ��� p[C,A].
For example: If min � p[A,B]; p[B,C] � was strictlylarger than p[A,C], then this would be a contradictionto the definition of p[A,C] since there would be a routefrom candidate A to candidate C via candidate B with astrength of more than p[A,C]; and if this route was notitself a path (because it passed through some candidatesmore than once) then some subset of its links wouldform a path from candidate A to candidate C with astrength of more than p[A,C].
Case 1: Suppose(9a) p[A,B] � p[B,C].Combining (2) and (9a) gives:(10a) p[A,B] p[C,B].Combining (7) and (10a) gives:(11a) p[C,A] � p[C,B].Combining (3) and (9a) gives:(12a) p[B,C] � p[A,C].Combining (11a), (2), and (12a) gives:(13a) p[C,A] � p[C,B] � p[B,C] � p[A,C].
Case 2: Suppose(9b) p[A,B] � p[B,C].Combining (1) and (9b) gives:(10b) p[B,C] p[B,A].Combining (6) and (10b) gives:(11b) p[C,A] � p[B,A].Combining (3) and (9b) gives:(12b) p[A,B] � p[A,C].Combining (11b), (1), and (12b) gives:(13b) p[C,A] � p[B,A] � p[A,B] � p[A,C].
Therefore, the relation defined by p[A,B] p[B,A]is transitive.
4 Implementation
The strength of the strongest path p[i,j] from candidatei to candidate j can be calculated with the Floyd algo-rithm [17]. The runtime to calculate the strengths of allpaths is
� ��� � . It cannot be said frequently enough
that the order of the indices in the triple-loop of theFloyd algorithm is not irrelevant.
Input: d[i,j] with i�� j is the number of voters who
strictly prefer candidate i to candidate j.Output: “w[i] = true” means that candidate i is a po-
tential winner. “w[i] = false” means that candidate i isnot a potential winner.
for i := 1 to�
dofor j := 1 to
�do
if ( i�� j ) then
p[i,j] := d[i,j] d[j,i] ;
for i := 1 to�
dofor j := 1 to
�do
if ( i�� j ) then
for k := 1 to�
doif ( i
�� k ) thenif ( j
�� k ) then�s := min � p[j,i], p[i,k] � ;if ( p[j,k] � s ) then
p[j,k] := s ;�
for i := 1 to�
do�w[i] := true ;for j := 1 to
�do
if ( i�� j ) then
if ( p[j,i] p[i,j] ) thenw[i] := false ;
�
5 Properties
5.1 Pareto
Pareto says that when no voter strictly prefers candidateB to candidate A and at least one voter strictly preferscandidate A to candidate B then candidate B must notbe elected.
The Schulze method meets Pareto.Proof: Suppose no voter strictly prefers candidate B
to candidate A and at least one voter strictly prefers can-didate A to candidate B. Then d[A,B] 0 and d[B,A]= 0.
Voting matters, Issue 17 11
Schulze: Single-winner election method
Case 1: If BA is already the strongest path from can-didate B to candidate A, then p[B,A] = d[B,A] d[A,B] � 0. Therefore, candidate A disqualifiescandidate B because p[A,B] � d[A,B] d[B,A] 0, so that p[A,B] p[B,A].
Case 2: Suppose that B,C(1),. . . ,C(n),A is thestrongest path from candidate B to candidate A.As every voter who strictly prefers candidate Bto candidate C(1) also necessarily strictly preferscandidate A to candidate C(1), we get d[A,C(1)]� d[B,C(1)]. As every voter who strictly preferscandidate C(1) to candidate A also necessarilystrictly prefers candidate C(1) to candidate B, weget d[C(1),B] � d[C(1),A]. Therefore, d[A,C(1)] d[C(1),A] � d[B,C(1)] d[C(1),B]. For thesame reason, we get d[C(n),B] d[B,C(n)] �d[C(n),A] d[A,C(n)]. Therefore, the pathA,C(1),. . . ,C(n),B is at least as strong as the pathB,C(1),. . . ,C(n),A. In so far as B,C(1),. . . ,C(n),Ais the strongest path from candidate B to candidateA by presumption, we get p[A,B] � p[B,A].
Suppose that candidate B is a potential winner.Then also candidate A is a potential winner.
Proof: Suppose that B,C(1),. . . ,C(n),X is thestrongest path from candidate B to candidate X.Then, A,C(1),...,C(n),X is a path, but not nec-essarily the strongest path, from candidate Ato candidate X with at least the same strengthbecause d[A,C(1)] d[C(1),A] � d[B,C(1)] d[C(1),B]. Therefore, p[A,X] � p[B,X] for ev-ery candidate X other than candidate A or can-didate B. Suppose that X,C(1),. . . ,C(n),A is thestrongest path from candidate X to candidate A.Then, X,C(1),...,C(n),B is a path, but not neces-sarily the strongest path, from candidate X to can-didate B with at least the same strength becaused[C(n),B] d[B,C(n)] � d[C(n),A] d[A,C(n)].Therefore, p[X,B] � p[X,A] for every candidateX other than candidate A or candidate B.
Since candidate B is a potential winner, p[B,X]� p[X,B] for every other candidate X. Withp[A,X] � p[B,X], p[B,X] � p[X,B], and p[X,B] �p[X,A], we get p[A,X] � p[X,A] for every othercandidate X. Therefore, also candidate A is a po-tential winner.
Therefore, when no voter strictly prefers candi-date B to candidate A and at least one voter strictlyprefers candidate A to candidate B then when can-didate B is a potential winner also candidate A is
a potential winner. Therefore, candidate B cannotbe elected at stage 1 of the Schulze method. Can-didate B cannot be elected at stage 2, either, sincecandidate A is necessarily ranked above candidateB in the TBRC.
5.2 Monotonicity
Monotonicity says that when some voters rank candi-date A higher without changing the order in which theyrank the other candidates relatively to each other thenthe probability that candidate A is elected must not de-crease.
The Schulze method meets monotonicity.Proof: Suppose candidate A was a potential winner.
Then p ����� [A,B] � p ����� [B,A] for every other candidateB.
Part 1: Suppose some voters rank candidate A higherwithout changing the order in which they rank theother candidates. Then d ��� [A,X] � d ����� [A,X]and d ��� [X,A] � d ����� [X,A] for every other can-didate X. d ��� [X,Y] = d ����� [X,Y] when neithercandidate X nor candidate Y is identical to can-didate A. Therefore d ��� [A,X] d ��� [X,A] �d ����� [A,X] d ����� [X,A] for every other candidateX. And d ���� [X,Y] d ��� [Y,X] = d ����� [X,Y] d ����� [Y,X] when neither candidate X nor candidateY is identical to candidate A. For every candi-date B other than candidate A the value p[A,B]can only increase but not decrease with d[A,X] d[X,A] since only AX but not XA can be in thestrongest path from candidate A to candidate Band the value p[B,A] can only decrease but not in-crease with d[A,X] d[X,A] since only XA butnot AX can be in the strongest path from candi-date B to candidate A. Therefore p ��� [A,B] �p ����� [A,B] and p ��� [B,A] � p ����� [B,A]. Thereforep ��� [A,B] � p ��� [B,A] so that candidate A isstill a potential winner.
Part 2: Suppose that candidate E is not identical tocandidate A. It remains to be proven that whencandidate E was not a potential winner before thenhe is still not a potential winner. Suppose that can-didate E was not a potential winner. Then theremust have been a candidate F other than candidateE with
(1) p ����� [F,E] p ����� [E,F].
Then, of course, also p ��� [F,E] p ��� [E,F]is valid unless XA was a weakest link in the
12 Voting matters, Issue 17
Schulze: Single-winner election method
strongest path from candidate F to candidate Eand/or AY was the weakest link in the strongestpath from candidate E to candidate F. Without lossof generality, we can presume that candidate F isnot identical to candidate A and that
(2) p ����� [A,E] = p ����� [E,A]
because otherwise with p ����� [A,E] p ����� [E,A] wewould immediately get p ��� [A,E] p ���� [E,A](because of the considerations in Part 1) so thatwe would immediately get that candidate E is stillnot a potential winner. Since candidate A was apotential winner, we get
(3) p ����� [A,F] � p ����� [F,A].
The following statements are valid for the samereason as in section 3:
(4) min � p ����� [A,E]; p ����� [E,F] ��� p ����� [A,F].(5) min � p ����� [A,F]; p ����� [F,E] ��� p ����� [A,E].(6) min � p ����� [E,A]; p ����� [A,F] � � p ����� [E,F].(7) min � p ����� [E,F]; p ����� [F,A] ��� p ����� [E,A].(8) min � p ����� [F,A]; p ����� [A,E] ��� p ����� [F,E].(9) min � p ����� [F,E]; p ����� [E,A] � � p ����� [F,A].
Case 1: Suppose XA was a weakest link in thestrongest path from candidate F to candidate E.Then
(10a) p ����� [F,E] = p ����� [F,A] and(11a) p ����� [A,E] � p ����� [F,E].Now (3), (10a), and (1) give(12a) p ����� [A,F] � p ����� [F,A] = p ����� [F,E] p ����� [E,F],while (2), (11a), and (1) give(13a) p ����� [E,A] = p ����� [A,E] � p ����� [F,E] p ����� [E,F].But (12a) and (13a) together contradict (6).
Case 2: Suppose AY was the weakest link in thestrongest path from candidate E to candidate F.Then
(10b) p ����� [E,F] = p ����� [A,F] and(11b) p ����� [E,A] p ����� [E,F].Now (11b), (10b), and (3) give(12b) p ����� [E,A] p ����� [E,F] = p ����� [A,F] �p ����� [F,A],while (1), (10b), and (3) give(13b) p ����� [F,E] p ����� [E,F] = p ����� [A,F] �p ����� [F,A].But (12b) and (13b) together contradict (9).
Conclusion: When some voters rank candidate Ahigher without changing the order in which they rank
the other candidates relatively to each other, then (a)when candidate A was a potential winner candidate Ais still a potential winner and (b) every other candidateE who was not a potential winner is still not a poten-tial winner and (c) candidate A can only increase inthe TBRC while the positions of the other candidatesare not changed relatively to each other. Therefore, theprobability that candidate A is elected cannot decrease.
5.3 Resolvability
Resolvability says that at least in those cases in whichthere are no pairwise ties and there are no pairwise de-feats of equal strength the winner must be unique.
The Schulze method meets resolvability.Proof: Suppose that there is no unique winner. Sup-
pose that candidate A and candidate B are potential win-ners. Then:
(1) p[A,B] = p[B,A].Suppose that there are no pairwise ties and that there
are no pairwise defeats of equal strength. Then p[A,B]= p[B,A] means that the weakest link in the strongestpath from candidate A to candidate B and the weakestlink in the strongest path from candidate B to candidateA must be the same link, say CD. Then this situationlooks as follows:
A
D
B
C
p[D,A] p[D,B]
p[B,C]p[A,C]
d[C,D]-d[D,C]
As the weakest link of the strongest path from candi-date B to candidate A is CD, we get:(2) p[D,A] p[B,A].As the weakest link of the strongest path from candidateA to candidate B is CD, we get:(3) p[A,D] = p[A,B].With (2), (1), and (3) we get:(4) p[D,A] p[B,A] = p[A,B] = p[A,D] which con-tradicts the presumption that candidate A is a potentialwinner.
5.4 Independence of Clones
An election method is independent of clones if the fol-lowing holds:
Voting matters, Issue 17 13
Schulze: Single-winner election method
Suppose that candidate D and candidate E are twodifferent candidates.
1. Suppose (a) that there is at least one voter whoeither strictly prefers candidate D to candidate Eor strictly prefers candidate E to candidate D or (b)that candidate D is elected with zero probability.
2. Suppose that candidate D is replaced by a set ofcandidates D(1),...,D(m) in such a manner that forevery candidate D(i) in this set, for every candi-date F outside this set, and for every voter V thefollowing two statements are valid:
a) V strictly preferred D to F � V strictlyprefers D(i) to F.
b) V strictly preferred F to D � V strictlyprefers F to D(i).
Then the probability that candidate E is elected mustnot change.
The Schulze method is independent of clones.Proof: Suppose that candidate D is replaced by a set
of candidates D(1),. . . ,D(m) in the manner describedabove. Then d ��� [A,D(i)] = d ����� [A,D] for every can-didate A outside the set D(1),. . . ,D(m) and for every i =1,. . . ,m. And d ��� [D(i),B] = d ����� [D,B] for every can-didate B outside the set D(1),. . . ,D(m) and for every i =1,. . . ,m.
(1) Case 1: Suppose that the strongest pathC(1),. . . ,C(n) from candidate A to candidate B did notcontain candidate D. Then C(1),. . . ,C(n) is still a pathfrom candidate A to candidate B with the same strength.Therefore: p ��� [A,B] � p ����� [A,B].
Case 2: Suppose that the strongest path C(1),. . . ,C(n)from candidate A to candidate B contained candidateD. Then C(1),. . . ,C(n) with D replaced by an arbitrar-ily chosen candidate D(i) is still a path from candidateA to candidate B with the same strength. Therefore:p ��� [A,B] � p ����� [A,B].
(2) Case 1: Suppose that the strongest pathC(1),. . . ,C(n) from candidate A to candidate B doesnot contain candidates of the set D(1),. . . ,D(m). ThenC(1),. . . ,C(n) was a path from candidate A to candi-date B with the same strength. Therefore: p ����� [A,B]� p ��� [A,B].
Case 2: Suppose that the strongest path C(1),. . . ,C(n)from candidate A to candidate B contains some can-didates of the set D(1),. . . ,D(m). Then C(1),. . . ,C(n)where the part of this path from the first occurrence of acandidate of the set D(1),. . . ,D(m) to the last occurrenceof a candidate of the set D(1),. . . ,D(m) is replaced by
candidate D was a path from candidate A to candidateB with at least the same strength. Therefore: p ����� [A,B]� p ���� [A,B].
With (1) and (2), we get: p ��� [A,B] = p ����� [A,B].When we set A � D in (1) and (2), we get:
p ���� [D(i),B] = p ����� [D,B] for every candidate B outsidethe set D(1),. . . ,D(m) and for every i = 1,. . . ,m.
When we set B � D in (1) and (2), we get:p ���� [A,D(i)] = p ����� [A,D] for every candidate A outsidethe set D(1),. . . ,D(m) and for every i = 1,. . . ,m.
Suppose candidate A, who is not identical to can-didate D, was a potential winner, then p ����� [A,B] �p ����� [B,A] for every other candidate B; because of theabove considerations we get p ��� [A,B] � p ��� [B,A]for every other candidate B; therefore, candidate A isstill a potential winner. Suppose candidate B, who isnot identical to candidate D, was not a potential win-ner, then p ����� [B,A] � p ����� [A,B] for at least one othercandidate A; because of the above considerations weget p ���� [B,A] � p ���� [A,B] for at least this other can-didate A; therefore, candidate B is still not a potentialwinner.
Presumption 1 in the definition of independence ofclones guarantees that at least in those situations inwhich the TBRC has to be used to choose from thecandidates D(1),. . . ,D(m),E (a) candidate E is rankedabove each of the candidates D(1),...,D(m) when he wasoriginally ranked above candidate D. (b) candidate Eis ranked below each of the candidates D(1),. . . ,D(m)when he was originally ranked below candidate D.Therefore, replacing candidate D by a set of candidatesD(1),. . . ,D(m) can neither change whether candidate Eis a potential winner nor, when the TBRC has to beused, where this candidate is ranked in the TBRC.
5.5 Reversal Symmetry
Reversal symmetry says that when candidate A is theunique winner then when the individual preferences ofeach voter are inverted then candidate A must not beelected.
The Schulze method meets reversal symmetry.Proof: Suppose candidate A was the unique winner.
Then there must have been at least one other candidateB with p ����� [A,B] p ����� [B,A]. (Since the relation de-fined by p[X,Y] p[Y,X] is transitive there must havebeen at least one candidate B other than candidate Awith p[B,E] � p[E,B] for every candidate E other thancandidate A or candidate B. Since candidate A wasthe unique winner and since no candidate other than
14 Voting matters, Issue 17
Schulze: Single-winner election method
candidate A has disqualified candidate B, candidate Amust have disqualified candidate B, i.e. p ����� [A,B] p ����� [B,A].)
When the individual preferences of each voter are in-verted then d ��� [Y,X] = d ����� [X,Y] for each pair XY ofcandidates. When C(1),. . . ,C(n) was a path from candi-date X to candidate Y of strength Z then C(n),. . . ,C(1)is a path from candidate Y to candidate X of strength Z.Therefore, p ��� [Y,X] = p ����� [X,Y] for each pair XY ofcandidates. Therefore, p ��� [B,A] p ��� [A,B] so thatcandidate B disqualifies candidate A.
[13] Herve Moulin, Condorcet’s Principle Implies theNo Show Paradox, Journal of Economic Theory,vol. 45, p. 53-64, 1988
[14] Douglas R. Woodall, Monotonicity of single-seatpreferential election rules, Discrete Applied Math-ematics, vol. 77, p. 81-98, 1997
[15] T. Nicolaus Tideman, Independence of Clones asa Criterion for Voting Rules, Social Choice andWelfare, vol. 4, p. 185-206, 1987
[16] Thomas M. Zavist, T. Nicolaus Tideman, Com-plete Independence of Clones in the Ranked PairsRule, Social Choice and Welfare, vol. 6, p. 167-173, 1989
[17] Robert W. Floyd, Algorithm 97 (Shortest Path),Communications of the ACM, vol. 5, p. 345-350,1962
[18] Joaquın Perez, The Strong No Show Paradoxesare a common flaw in Condorcet voting corre-spondences, Social Choice and Welfare, vol. 18,p. 601-616, 2001
[19] M.J.A.N. de Condorcet, Essai sur l’application del’analyse a la probabilite des decisions renduesa la pluralite des voix, Imprimerie Royale, Paris,1785
[20] Peyton Young, Condorcet’s Theory of Voting,American Political Science Review, vol. 82, p.1231-1244, 1988
[21] Clarence G. Hoag, George H. Hallett, Propor-tional Representation, MacMillan Company, NewYork, 1926
A Tideman’s Ranked Pairs Method
Tideman’s Ranked Pairs method [15, 16] is very similarto my method in so far as both methods meet Pareto,monotonicity, resolvability, independence of clones, re-versal symmetry, Schwartz and Smith-IIA. However,the following example demonstrates that these methodsare not identical.
Example:
3 ACDB5 ADBC4 BACD5 BCDA2 CADB5 CDAB2 DABC4 DBAC
The matrix d[i,j] of pairwise defeats looks as follows:A B C D
A — 17 18 14B 13 — 20 9C 12 10 — 19D 16 21 11 —
The matrix p[i,j] of the path strengths looks as fol-lows:
A B C DA — 6 6 6B 2 — 10 8C 2 8 — 8D 2 12 10 —
Voting matters, Issue 17 15
Schulze: Single-winner election method
Candidate A is the unique Schulze winner becausecandidate A is the unique candidate with p[A,X] �p[X,A] for every other candidate X.
Tideman suggests to take successively the strongestpairwise defeat and to lock it if it does not create a di-rected cycle with already locked pairwise defeats or toskip it if it would create a directed cycle with alreadylocked pairwise defeats. The winner of the RankedPairs method is that candidate X who wins each pair-wise comparison which is locked and in which candi-date X is involved.
Tideman’s Ranked Pairs method locks D B. Thenit locks B C. Then it skips C D since it would createa directed cycle with the already locked defeats D Band B C. Then it locks A C. Then it locks A B.Then it locks D A. Thus, the Ranked Pairs winner iscandidate D.
B The Participation Criterion
The participation criterion says that adding a set ofidentical ballots on which candidate A is strictly pre-ferred to candidate B should not change the winner fromcandidate A to candidate B. Moulin [13] proved that theCondorcet criterion and the participation criterion areincompatible. Perez [18] demonstrated that most Con-dorcet methods can violate the participation criterion ina very drastic manner. That means: It can happen thatadding a set of identical ballots on which candidate A isstrictly preferred to every other candidate changes thewinner from candidate A to another candidate or thatadding a set of identical ballots on which every othercandidate is strictly preferred to candidate B changesthe winner from another candidate to candidate B. Thefollowing example demonstrates that also the Schulzemethod can violate the participation criterion in a verydrastic manner. (The basic idea for this example camefrom Blake Cretney.)
The matrix d[i,j] of pairwise defeats looks as follows:
A B C D E FA — 40 30 30 30 24B 20 — 34 30 30 38C 30 26 — 36 22 30D 30 30 24 — 42 30E 30 30 38 18 — 32F 36 22 30 30 28 —
The matrix p[i,j] of the path strengths looks as fol-lows:
A B C D E FA — 20 8 8 8 16B 12 — 8 8 8 16C 4 4 — 12 12 4D 4 4 16 — 24 4E 4 4 16 12 — 4F 12 12 8 8 8 —
Candidate A is the unique winner since he is the onlycandidate with p[A,X] � p[X,A] for every other candi-date X. However, when 3 AEFCBD ballots are addedthen the matrix d[i,j] of pairwise defeats looks as fol-lows:
A B C D E FA — 43 33 33 33 27B 20 — 34 33 30 38C 30 29 — 39 22 30D 30 30 24 — 42 30E 30 33 41 21 — 35F 36 25 33 33 28 —
The matrix p[i,j] of the path strengths looks as fol-lows:
A B C D E FA — 23 5 5 5 13B 9 — 5 5 5 13C 7 7 — 15 15 7D 7 7 19 — 21 7E 7 7 19 15 — 7F 9 9 5 5 5 —
Now, candidate D is the unique winner since he is theonly candidate with p[D,X] � p[X,D] for every othercandidate X. Thus the 3 AEFCBD voters change thewinner from candidate A to candidate D.
16 Voting matters, Issue 17
Schulze: Single-winner election method
C A Special Provision of theImplementation used by SPI andDEBIAN
There has been some debate about how to measure thestrength of a pairwise defeat when it is presumed that onthe one side each voter has a sincere complete rankingof all candidates, but on the other side some voters voteonly a partial ranking because of strategical considera-tions. I suggest that then the strength of a pairwise de-feat should be measured primarily by the absolute num-ber of votes for the winner of this pairwise defeat andsecondarily by the margin of this pairwise defeat. Thepurpose of this provision is to give an additional incen-tive to the voters to give different preferences to can-didates to which the voters would have given the samepreference because of strategical considerations other-wise.
The resulting version of this method is used by SPIand DEBIAN because (a) here the number of candidatesis usually very small and the voters are usually well-informed about the different candidates so that it can bepresumed that each voter has a sincere complete rank-ing of all candidates and (b) here the number of votersis usually very small and the voters are usually well-informed about the opinions of the other voters so thatthe incentive to cast only a partial ranking because ofstrategical considerations is large.
The resulting version still satisfies Pareto, mono-tonicity, resolvability, independence of clones, reversalsymmetry, Smith-IIA, and Schwartz. When each votercasts a complete ranking then this version is identicalto the version defined in section 2. I suggest that in thegeneral case the version as defined in section 2 shouldbe used. Only in situations similar to the above de-scribed situation in SPI and DEBIAN, the version asdefined in this appendix should be used.
When the strength of a pairwise defeat is measuredprimarily by p1 (= the absolute number of votes for thewinner of this pairwise defeat) and secondarily by p2(= the margin of this pairwise defeat), then a possibleimplementation looks as follows:
Input: d[i,j] with i�� j is the number of voters who
strictly prefer candidate i to candidate j.Output: “w[i] = true” means that candidate i is a po-
tential winner. “w[i] = false” means that candidate i isnot a potential winner.
for i := 1 to�
dofor j := 1 to
�do
if ( i�� j ) then
�p2[i,j] := d[i,j] d[j,i] ;if ( d[i,j] d[j,i] ) then
p1[i,j] := d[i,j] ;if ( d[i,j] � d[j,i] ) then
p1[i,j] := � ;�
for i := 1 to�
dofor j := 1 to
�do
if ( i�� j ) then
for k := 1 to�
doif ( i
�� k ) thenif ( j
�� k ) then�s := min � p1[j,i], p1[i,k] � ;t := min � p2[j,i], p2[i,k] � ;if ( ( p1[j,k] � s ) or ( ( p1[j,k] = s ) and
( p2[j,k] � t ) ) ) then�p1[j,k] := s ;p2[j,k] := t ;�
�
for i := 1 to�
do�w[i] := true ;for j := 1 to
�do
if ( i�� j ) then
if ( ( p1[j,i] p1[i,j] ) or ( ( p1[j,i] = p1[i,j] ) and( p2[j,i] p2[i,j] ) ) ) then
w[i] := false ;�
D The Schwartz Set Heuristic
Another way of looking at the proposed method is tointerpret it as a method where successively the weakestpairwise defeats are “eliminated”. The formulation ofthis method then becomes very similar to Condorcet’soriginal wordings.
Condorcet writes [19] p. 126: “Create an opin-ion of those
� ���-� � propositions that win most of
the votes. If this opinion is one of the���
possiblethen consider as elected that subject to which this opin-ion agrees with its preference. If this opinion is one
Voting matters, Issue 17 17
Schulze: Single-winner election method
of the� �������� � � ��� � � ����� impossible opinions then
eliminate of this impossible opinion successively thosepropositions that have a smaller plurality and accept theresulting opinion of the remaining propositions.”
In short, Condorcet suggests that the weakest pair-wise defeats should be eliminated successively until theremaining pairwise defeats form a ranking of the candi-dates. The problem with Condorcet’s proposal is that itis not quite clear what it means to “eliminate” a pairwisedefeat (especially in so far as when one successivelyeliminates the weakest pairwise defeat that is in a di-rected cycle of not yet eliminated pairwise defeats untilthere are no directed cycles of non-eliminated pairwisedefeats any more then the remaining pairwise defeatsusually do not complete to a unique ranking [20]). It isclear what it means when a candidate is “eliminated”;this candidate is treated as if he has never stood. Butwhat does it mean when the pairwise defeat A B is“eliminated” although candidate A and candidate B arestill potential winners?
A possible interpretation would be to say that the“elimination” of a pairwise defeat is its replacing by apairwise tie. However, when this interpretation is beingused then the Smith set, as defined in the Introduction,can only grow but not shrink at each stage. But whenthe Schwartz set, as defined in the Introduction, is beingused, then the number of candidates decreases continu-ously. With the concept of the Schwartz set the Schulzemethod can be described in a very concise manner:
Step 1: Calculate the Schwartz set and eliminate allthose candidates who are not in the Schwartz set.Eliminated candidates stay eliminated.If there is still more than one candidate andthere are still pairwise comparisons between non-eliminated candidates that are not pairwise ties: Goto Step 2.If there is still more than one candidate, but all pair-wise comparisons between non-eliminated candi-dates are pairwise ties, then all remaining candi-dates are potential winners: Go to Step 3.If there is only one candidate, then this candidateis the unique winner.
Step 2: The weakest pairwise defeat between two non-eliminated candidates is replaced by a pairwise tie.Pairwise comparisons that have been replaced bypairwise ties stay replaced by pairwise ties.In the version in section 4, the weakest pairwisedefeat is that defeat where � d[i,j] d[j,i] � is mini-mal.
In the version in appendix C, the weakest pairwisedefeat is that defeat where the number of votes forthe winner of this pairwise defeat is minimal or—if there is more than one pairwise defeat wherethe number of votes for the winner is minimal—of all those pairwise defeats where the number ofvotes for the winner is minimal that pairwise de-feat where the number of votes for the loser of thispairwise defeat is maximal.If the weakest pairwise defeat between non-eliminated candidates is not unique, then all weak-est pairwise defeats between non-eliminated candi-dates are replaced by pairwise ties simultaneously.Go to Step 1.
Step 3: The TBRC is calculated as described in sec-tion 2. The winner is that potential winner who isranked highest in this TBRC.
E An Example without a Unique Winner
Example [21], p. 502:
3 ABCD2 DABC2 DBCA2 CBDA
The matrix d[i,j] of pairwise defeats looks as follows:A B C D
A — 5 5 3B 4 — 7 5C 4 2 — 5D 6 4 4 —
The matrix p[i,j] of the path strengths looks as fol-lows:
A B C DA — 1 1 1B 1 — 5 1C 1 1 — 1D 3 1 1 —
Candidate X is a potential winner if and only ifp[X,Y] � p[Y,X] for every other candidate Y. There-fore, candidate B and candidate D are potential winners.
When the Schwartz set heuristic is being used then atthe first stage the Schwartz set is calculated. The pair-wise defeats are A B, A C, B C, B D, C D, and D A. Hence, the Schwartz set is: A, B, C,and D. At the second stage, the weakest pairwise de-feat that is not a pairwise tie between candidates whohave not yet been eliminated is replaced by a pairwise
18 Voting matters, Issue 17
Schulze: Single-winner election method
tie. The weakest pairwise defeats are A B, A C, B D, and C D each with a strength of 5:4. All thesepairwise defeats are replaced by pairwise ties simulta-neously. The remaining pairwise defeats are B C andD A. Hence, the new Schwartz set is: B and D. Sincethere are now no pairwise defeats between candidateswho have not yet been eliminated, the algorithm stopsand candidate B and candidate D are the winners.
Since 5 voters strictly prefer candidate B to candi-date D and 4 voters strictly prefer candidate D to candi-date B, candidate B is ranked higher than candidate Din the TBRC with a probability of 5/9 and candidate Dis ranked higher than candidate B in the TBRC with aprobability of 4/9. Therefore, the winner of the Schulzemethod is candidate B with a probability of 5/9 and can-didate D with a probability of 4/9.
Voting matters, Issue 17 19
Calculation of Transfer Values — Proposal for STV-PRRules for Local Government Elections in Scotland
The Local Governance (Scotland) Bill [1] will makeprovision for future local government elections in Scot-land to be by the Single Transferable Vote. Those re-sponsible for drafting the legislation have indicated thatthey do not intend simply to copy the legislation usedfor the comparable STV elections in Northern Ireland.They believe they can express some points in the count-ing procedure more clearly. Thus we have a “painless”opportunity to consider some other changes that mightusefully be incorporated at the same time. I suggest oneof these should be the calculation of transfer values.
2 Precision of calculation
Some discussion in the Election Methods web group[2] prompted me to look in some depth at the calcu-lation of transfer values in STV-PR. The discussion wasstarted by a reference to Wichmann’s review [3] of theERS97 Rules [4]. Wichmann made a number of pointsabout transfer values, starting with what I would call“apparent precision”, but going into the arithmetical re-alities of the truncated calculations adopted in ERS97and other sets of rules based on Newland and Britton1972 [5], including those currently used in NorthernIreland. Wichmann’s proposal to give results with anactual accuracy of 0.01 votes was to compute transfervalues to [(number of digits in total votes) + 1].
Another member of the EM web group drew atten-tion to the procedures of the Australian Electoral Com-mission [6]. The AEC calculates transfer values to eightdecimal places and then truncates as shown in the exam-ple on their website. This requirement to calculate to
eight decimal places is not specified in any Australianlegislation, but only in the AEC’s internal working doc-uments [7]. The relevant law [8] makes no reference tothe accuracy or precision for any of the STV calcula-tions. The AEC adopted eight decimal places becausethat was the limit of the desktop calculators available atthe time they framed that working rule [7].
The AEC example shows that while they calculatethe transfer value of a ballot paper to eight decimalplaces (8dp) and then use that 8dp result to calculatethe transfer values of the votes being transferred, theytruncate the candidates’ transferred votes to integer val-ues. They do not show decimal parts of a vote anywhereon their result sheets. This truncation to integer valuesmight seem perverse, but does not result in the loss ofsignificant numbers of votes.
In the AEC example there is a surplus of 992,137votes carried on 1,518,178 papers, of which one candi-date receives 1,513,870 papers. The AEC calculationshows an 8dp truncated transfer value of 0.65350505for each paper. This results in a candidate integer trun-cated transfer vote of 989,321. The “full” calculationwith the 8dp transfer value would have been 989321.69,so they have lost only 0.69 of a vote by integer trunca-tion. This amounts to only 0.000131% of the quota.Had the transfer value been calculated to 15dp (limitof numerical precision for Microsoft Excel 2002), theloss by integer truncation of the votes transferred wouldhave been only 0.700215653, amounting to 0.000133%of the quota.
In contrast, using the ERS/NI rules and calculatingthe same example to only two decimal places and thentruncating, gives a transfer value of 0.65, and a can-didate transfer vote of 984,015.50. In this case therewould be a loss of 5,306.20 votes from the “true” trans-fer value, amounting to 1.01% of the quota.
20
Gilmour: Calculation of transfer values
3 Examples from elections
For practical examples I have looked at the immedi-ately available results from the Australian Federal Sen-ate elections in 1998 [9] and the Northern Ireland As-sembly elections of 1998 [10]. To make sure there wereno complications in the calculations, I looked only atseparate transfers arising from the surpluses of candi-dates whose first preference votes exceeded the quota,i.e. who were elected at stage 1. The relevant figures arein the Tables 1 and 2. In the Australian results they show“non-transferable votes” separately for “exhausted bal-lots” and for “lost by fraction”, ie due to truncation.
The losses arising from truncation are expressed aspercentages of the quotas for the relevant elections be-cause this offers the most valid basis for comparisonsamong the different elections. The results are sorted inascending order by the size of these percentages. Thelosses in the Australian transfers range from 0.0043%to 0.032%. In only six of those 14 transfers did the lossexceed 0.01% of the quota. The losses in the NorthernIreland transfers range from 0.10% to 1.36%. In five ofthose 23 transfers the loss exceeded 1.0% of the quota.
The size of the loss in any individual transfer willdepend on just how the calculation tumbles out as thatwill determine the size of the fraction truncated. For ex-ample, in the Newry and Armagh election the transfervalue was 0.43 (excluding 222 exhausted papers), lead-ing to a loss of 0.0077245 votes on every one of the13,360 papers actually transferred. In the Australianelections the losses are increased by the large num-bers of candidates who stand and to whom transfers aremade.
4 Proposal for change
It now seems clear to me that when the STV rules wereformalised for Newland and Britton and the NorthernIreland STV regulations in 1972, there was a confusionof two objectives. It is illogical to calculate transfer val-ues to only two decimal places if candidates’ votes areto be recorded to of 0.01 of a vote. This approach wasprobably taken because the ‘Senatorial Rules’ [11], de-vised to remove the element of chance when selectingfull value ballot papers for the transfer of surpluses, hadgiven each valid ballot paper a value of one hundredbefore any calculations were done.
For public elections, with large numbers of electors,there is no intrinsic merit in recording candidates’ voteswith a precision greater than one vote, provided thatdoes not result in the loss of significant numbers ofvotes. For elections with small numbers of electors(quota less than 100), there may be a benefit in record-ing candidates’ votes with greater precision, perhaps to0.01 of a vote. Whatever level of precision is requiredin the recorded vote, calculating transfer values of ballotpapers to only two places of decimals is not consistentwith that reported precision. There may be a theoreticalcase for varying the numbers of decimal places in thecalculation according the magnitude of the numbers ofvotes, but the practical approach of the AEC has beenshown to give very satisfactory results.
The AEC adopted eight decimal places for the calcu-lation of transfer values because that was the capacity ofthe desktop calculators available at the time. Most cur-rently available electronic calculators (hand-held anddesktop models) display eight decimal digits, i.e. itis possible to enter ‘12345678’ but not ‘123456789’.However, when a division to obtain a transfer valueis made on such a calculator, the result does not con-tain eight decimal places, but only seven. Thus, to usethe example from the AEC website, (surplus = 992137;transferable papers = 1518178), an 8-digit electroniccalculator would display a result of 0.6535050 and notthe 0.65350505 quoted. It would be possible to obtaineight significant figures on such a calculator by scal-ing the calculation, eg 992137 / 151817.8 or 9921370 /1518178. The transfer value would then be displayed as‘6.5350505’. However, there would an additional riskof mistakes being made if calculations were scaled inthis way and the increase in precision would be verysmall.
Taking a practical approach, I would recommend thattransfer values should be calculated to 7 decimal places,reflecting the capacity of the commonly available elec-tronic calculators. If the calculation loss is minimisedin this way, there is then no need to record decimal frac-tions of votes for each candidate on the result sheet.The loss that would be incurred in discarding the frac-tional values when summing the votes for each candi-date is very small compared to the calculation loss. Thiswould greatly simplify the presentation of STV-PR re-sult sheets for public elections.
Voting matters, Issue 17 21
Gilmour: Calculation of transfer values
Table 1 Australian Federal Senate Elections 1998Non-transferable Votes arising on Transfer of Surpluses from First Preferences of Candidates elected at Stage 1
State Total Quota Candidate Candidate’s Surplus Candidates Exhausted Lost by LbF asVote F P Vote receiving Ballots Fraction Percentage
Table 2 Northern Ireland Assembly Elections 1998Non-transferable Votes arising on Transfer of Surpluses from First Preferences of Candidates elected at Stage 1
State Total Quota Candidate Candidate’s Surplus Candidates Non- NTV asVote F P Vote receiving transferable Percentage
5 Benefits in local government electionsin Scotland
The numbers of electors in the constituencies in boththe Australian Federal Senate elections and the North-ern Ireland Assembly elections are considerably largerthan those likely in the multi-member wards for localgovernment elections in Scotland. It is, therefore, use-ful to make an assessment of the potential effects ofchanging the precision of calculation of transfer valuesfrom 2dp to 7dp using local data.
For this example I have used Glasgow City Councilwhich has an electorate of 453,552 and 79 councillors.I have examined two possible implementations of STV-PR: nine 8-member wards plus one 7-member ward;and nineteen 4-member wards plus one 3-member ward(Table 3). I have assumed there would be equal numbersof electors per councillor in all wards and a turnout of50%. I have also assumed that the Labour Party wouldget 47.58% of the first preference votes (= city-wideaverage in the 2003 FPTP council elections), that 75%of those first preference votes would be for the party’sleading candidate in the ward and that all those paperswould be transferable. For the calculation with 7dp Ihave also truncated the transferred votes to integer val-ues as I recommend above. The results in Table 3 showthat the effect of truncating the calculation of transfervalues at 2dp could be considerable even in the smaller4-member wards. The losses when the calculation istruncated at 7dp are negligible.
Table 3 Comparison of Effects of CalculatingTransfer Values to 2dp and 7dp
Transfer value 2dp 0.68 0.43Transferred votes 2dp 5,571.92 1,761.71Votes lost by truncation at 2dp 70.08 38.29Votes lost as percentage of quota 2.75% 1.67%
Transfer value 7dp 0.6885525 0.4393458Transferred votes 7dp 5641 1,799Votes lost by truncation at 7dp 1 1Votes lost as percentage of quota 0.039% 0.044%
The actual loss in transfer value due to truncating thecalculation at 2dp compared to truncating at 7dp canvary from 0.0000000 to 0.0099999. The general effectcan be assessed by considering only the loss that occursin the third decimal place. The results in Table 4 havebeen calculated using the same two example wards asabove. The ten potential losses all have equal probabil-ities of occurrence. The loss due to truncation at 2dp inthe 8-member ward will exceed 1% of the quota in sixcases out of ten and will exceed 2% in three cases out often. Even in the smaller ward, the loss due to this trun-cation will exceed 1% of the quota in four cases out often. These losses are substantial and could be avoidedby a simple change to the rules for STV-PR elections.
Table 4 Loss of Votes due to Truncationof Transfer Value before 3dp
[1] Draft Local Governance (Scotland) Bill:Consultation. October 2003.http://www.scotland.gov.uk/consultations/localgov/dlgsc-00.asp
[2] Election Methods web group.http://electorama.com/modules.php?op=modload&name=News&file=article&sid=3&mode=thread&order=0&thold=0
[3] B A Wichmann (1999). A review of the ERS97rules. Voting Matters, Issue 10, 5-7
[4] R A Newland and F S Britton (1997). How toconduct an election by the single transferablevote. Electoral Reform Society, London. 1997ISBN 0 903291 18 5.
Voting matters, Issue 17 23
Gilmour: Calculation of transfer values
[5] R A Newland and F S Britton (1972). How toconduct an election by the single transferablevote. Electoral Reform Society, London. 1973ISBN 903291 02 9.
[6] Australian Electoral Commission Info Centre.Counting the votes: Senate.http://www.aec.gov.au/ content/what/voting/count senate.htm
[7] G Newman (2003) Director, Research Section,Australian Electoral Commission. Personalcommunication.
[8] Commonwealth Electoral Act 1918 Section 273.Scrutiny of votes in Senate elections.http://scaleplus.law.gov.au/html/pasteact/0/57/0/PA003460.htm
[9] Australian Election Archive: Federal Election of3 October 1998. http://psephos.adam-carr.net/countries/a/australia/index1998.shtml
[10] UK Election Results: Northern Ireland Assembly1998 — Full STV results.http://www.election.demon.co.uk/niassembly.html
[11] British Statutory Rules and Orders No. 727. 1921.
24 Voting matters, Issue 17
Voting matters
for the technical issues of STV
published by
The McDougall Trust
Issue 18 June 2004
About the McDougall Trust (reg. charity no. 212151)
The McDougall Trust is a charitable trust formed in 1948. The charity’s purposes asstated in its governing scheme of 1959 are to advance knowledge of and encouragethe study of and research into:
• political or economic science and functions of government and the services pro-vided to the community by public and voluntary organisations; and
• methods of election of and the selection and government of representative organ-isations whether national, civic, commercial, industrial or social.
The Trust’s work includes the maintenance and development of the Lakeman Libraryfor Electoral Studies, a unique research resource, the production and publication ofRepresentation: The Journal of Representative Democracy, and, of course, this pub-lication Voting matters, that examines the technical issues of the single transferablevote and related electoral systems.For further information on the Trust, please contact:
For further information on this publication, please contact B A Wichmann, the Editorat the above address or by email at: [email protected]
Editorial
I would strongly recommend to all readers that the In-terim Report of the Commission on Electronic Voting,issued by the Irish Government, is studied closely. ThisCommission, was formed on the 1st March and re-quired to report by 1st May, on the suitability of thesystem chosen for use in elections in Ireland. Theyrecommended that the chosen system should not beused for the local/European elections to be held on 11thJune. The Commission’s Report can be downloaded at:http://www.cev.ie/htm/report/download report.htm
To avoid any confusion, I need to declare an inter-est in this report, since I worked with Joe Wadsworthof Electoral Reform Services in testing the counting en-gine of the official software. Our work was not finisheduntil the end of March, which was only 5 weeks beforethe Commission reported.
Some aspects of their report are of particular interesthere:
• The desirability of removing random selection inthe counting process;
• Problems associated with full disclosure of the bal-lot data (discussed further in this issue);
• Some shortcomings with regard to secrecy;
• The need for a Voter Verifiable Audit Trial.
A Voter Verifiable Audit Trial might work by hav-ing a printer attached to the electronic voting machinewhich printed out the filled-in paper after it had beenrecorded electronically. The voter would then checkthis, and place the paper in a conventional ballot box.Hence the ballot box papers can be used as a (manual)check against the computer count.
Technically, such a scheme has a number of prob-lems. Firstly, printers are less reliable than a purelyelectronic device; should the printer jam, the electionofficials might inadvertently see a ballot paper. Sec-ondly, the conventional record would presumably beused for a recount; however, a manual recount is likelyto be less reliable than the initial electronic count. Theprocess whereby the printed papers are used needs to bevery carefully considered.
There is no doubt that the undertaking of a manualcount is one that the public feels gives confidence in thedemocratic process. What, therefore, needs to be doneto gain the same confidence in an electronic count? The
Irish report gives some insight into this important issue.Is it necessary to have a Voter Verifiable Audit Trial,it spite of the problems noted above? Since the IrishGovernment is still planning to use electronic voting,we will soon be able to see how these issues are beingaddressed.
Returning to Voting matters, there are 6 papers in thisissue:
• I. D. Hill: What is meant by ‘monotonic’? What ismeant by ‘AV’?
• M. Schulze: Free riding.
• I. D. Hill: An odd feature in a real STV election.
• I. D. Hill: Full disclosure of data.
• B. A. Wichmann: A note on the use of preferences.
• J. C. O’Neill: Tie-Breaking with the Single Trans-ferable Vote.
David Hill highlights the problem of the meaning ofterms and even abbreviations. As Editor, I am alwaysconcerned about this, since the terminology in commonuse varies substantially, especially now that papers areauthored from outside the UK/Ireland.
Markus Schulze raises the interesting and importantquestion of the extent to which strategic voting is usedin STV elections. Two forms of strategic voting areanalysed, which in one case, can be identified from USballot data in which voters can write-in a candidate.Fortunately for STV, the analysis gives no evidence ofstrategic voting in the analysable case.
The next three article are all about the use of prefer-ences. David Hill first provides an example in which asingle paper with a large number of preferences has acrucial effect. His subsequent papers respond to an ear-lier Voting matters paper on full disclosure. In my ownarticle, I consider the actual use made of the preferencesspecified by the voter, and how this information couldbe altered to avoid any undesirable consequences of fulldisclosure.
In the final article, Jeff O’Neill analyses the vari-ous ways in which ties are broken which results in aproposal to change the tie-breaking logic in the currentElectoral Reform Society rules.
Readers are reminded that views expressed inVoting matters by contributors do not neces-sarily reflect those of the McDougall Trust orits trustees.
Voting matters, Issue 18 i
What is meant by ‘monotonic’? What is meant by ‘AV’?
I. D. HillNo email available.
It is said that, during the 1939-1945 war, WinstonChurchill and President Roosevelt had a disagreementwhen Churchill wished to table a document and Roo-sevelt did not wish it to be tabled. It turned out thatthey both wanted the same thing: that to the British,tabling a document means putting it on the table for dis-cussion; whereas to the Americans, it means putting itin a drawer and forgetting it. Such confusion, caused bylanguage difficulties, can be serious.
1 Monotonic
Schulze [1] explains a method for single seat electionsthat finds the Condorcet winner if there is one, and hasa strategy for choosing a winner where there is a Con-dorcet paradox. He claims that the method is “mono-tonic and clone-independent”.
The main purpose of this note is to warn others whomay have been misled, as I was myself at first, by thatclaim. The trouble lies in definitions, because I am toldthat his usage of ‘monotonic’ is as normally used in thesocial choice literature, but it is a much narrower def-inition than is often taken as the meaning in electoralreform literature.
He gives an example where his method certainly vio-lates the condition that Woodall [2] calls mono-add-top:“A candidate x should not be harmed if further ballotsare added that have x top (and are otherwise arbitrary)”,but Schulze is only claiming to meet mono-raise: “Acandidate x should not be harmed if x is raised on someballots without changing the orders of the other candi-dates”.
I am not seeking to cast any blame. If that usageof the word is widely employed, he is fully entitled tofollow it, but a clash of definitions may cause misunder-standing if we do not take great care.
2 AV
Brams and Fishburn [3] give an example of the use of asystem called Approval Voting, and they use AV as anabbreviation for it. In this country AV has been used formany years to mean the system called Alternative Vote.
Approval Voting is a system in which a voter usesX-voting for as many candidates as desired, even whenthere is only one seat to fill. The winner is the one whogets the most Xs. Alternative Vote is what STV reducesto in the single-seat case, voting by preference number,with eliminative counting.
It is not my purpose in this note to examine the rela-tive merits, or lack of merits, of these two systems, butonly to warn that they are very different, and that thename AV is, unfortunately, being used for both of them.Again, this may cause misunderstanding if we do nottake great care.
3 References
[1] Schulze M. A new monotonic and clone-independent single-winner election method. Vot-ing matters, 17, 9-19. 2003.
The fact that more and more communities that use pro-portional representation by the single transferable vote(STV) change from manual count to computer countgives us today the possibility to check hypotheses thathave been made in the past about possible voting be-haviours. In this paper, I use the ballot data of the 1999and the 2001 City Council elections and School Com-mittee elections in Cambridge, Massachusetts, to esti-mate the number of voters who use a voting behaviourthat has been predicted e.g. by Woodall [1] and Tide-man [2].
2 Woodall Free Riding
Woodall free riding is a useful strategy only for thoseSTV methods where votes of eliminated candidatescannot be transferred to already elected candidates andtherefore jump directly to the next highest ranked hope-ful (i.e. neither yet elected nor yet eliminated) candi-date. A Woodall free rider is a voter who gives his firstpreference to a candidate who is believed by this voterto be eliminated early in the count even with this voter’sfirst preference. With this strategy this voter assures thathe does not waste his vote for a candidate who is electedalready during the transfer of the initial surpluses.
Woodall writes [1]:
“The biggest anomaly is caused by the de-cision, always made, not to transfer votesto candidates who have already reached thequota of votes necessary for election. Thismeans that the way in which a given voter’svote will be assigned may depend on the or-der in which candidates are declared elected
or eliminated during the counting, and it canlead to the following form of tactical votingby those who understand the system. If itis possible to identify a candidate W who issure to be eliminated early (say, the Cam-bridge University Raving Loony Party can-didate), then a voter can increase the effectof his genuine second choice by putting Wfirst. For example, if two voters both want Aas first choice and B as second, and A hap-pens to be declared elected on the first count,then the voter who lists his choices as ‘A B...’will have (say) one third of his vote trans-ferred to B, whereas the one who lists hischoices as ‘W A B...’ will have all of his votetransferred to B, since A will already havebeen declared elected by the time W is elim-inated. Since one aim of an electoral systemshould be to discourage tactical voting, thisseems to me to be a serious drawback.”
However, Woodall free riding can be prevented byrestarting the STV count with the remaining candidateswhenever a candidate has been eliminated. Actually,the Meek method [3] and the Warren method [4] do this.Therefore, Woodall [1] and Tideman [2] suggest thatone of these methods should be used.
A good test for Woodall free riding is an STV elec-tion with write-in options (i.e. with the possibility forthe voters to vote for any person by writing this person’sname on the ballot). The City Council and the SchoolCommittee of Cambridge, Massachusetts, are electedby an STV method that is vulnerable to Woodall freeriding and that has write-in options. In the elections tothe 9 seats of the City Council, the voter can vote forup to 9 write-ins. In the elections to the 6 seats of theSchool Committee, the voter can vote for up to 6 write-ins. Here the optimal Woodall free riding strategy is togive one’s first preference to a completely unimportantwrite-in.
Table 2.1: Potential write-in Woodall free riders in the1999 and the 2001 elections to the City Council and theSchool Committee of Cambridge, Massachusetts
In table 2, row “1” contains the numbers of vot-ers in the 1999 City Council elections (column “CC1999”), in the 1999 School Committee elections (col-umn “SC 1999”), in the 2001 City Council elections(column “CC 2001”), and in the 2001 School Commit-tee elections (column “SC 2001”) in Cambridge, Mas-sachusetts. Row “2” contains the numbers of voterswho cast a first preference for a write-in. Row “3” con-tains the numbers of voters who have to be subtractedfrom row “2” because they cast preferences only forwrite-ins and who are therefore obviously not Woodallfree riders. Furthermore, those voters who do not castat least a valid second and a valid third preference haveto be subtracted (row “4”) because these voters cannotbe Woodall free riders. Therefore, row “5” contains thenumbers of voters who could be write-in Woodall freeriders.
In all four elections, the number of voters who couldbe write-in Woodall free riders is about 0.1%. When weinvestigate these voters in greater detail we observe: Ofthe 19 potential write-in Woodall free riders in the 1999City Council elections, only 2 cast a second preferencefor Galluccio. Of the 17 potential write-in Woodall freeriders in the 1999 School Committee elections, only 2cast a second preference for Turkel. Of the 18 potentialwrite-in Woodall free riders in the 2001 City Councilelections, only 5 cast a second preference for Galluccio,2 for Davis, and one for Murphy. Of the 17 potentialwrite-in Woodall free riders in the 2001 School Com-mittee elections, only 4 cast a second preference forTurkel, one for Fantini, and none for Grassi. Therefore,also these voters seem to be not Woodall free ridersbecause otherwise super-proportionally many of thesevoters would have cast a second preference for a candi-date who reached the quota before candidates had to beeliminated. See table 2.2.
Suppose V is the number of voters. Suppose V1(A)is the number of voters who cast a valid first preference
for candidate A. Suppose V2(A) is the number of voterswho cast a valid first preference for candidate A and atleast also a valid second preference. Suppose V(A,B)is the number of voters who cast a valid first preferencefor candidate A, a valid second preference for candidateB, and at least also a valid third preference.
Woodall free riding is a useful strategy only whenone has at least a sincere first and a sincere second pref-erence. A given voter can be a Woodall free rider onlywhen he casts at least a valid first, a valid second, anda valid third preference. When a given voter whose sin-cere first preference is candidate B uses Woodall freeriding then V2(B) decreases and for some other candi-date A, who is eliminated early in the count, V(A,B) in-creases. Therefore, another good test for Woodall freeriding is to calculate V(A,B) for each pair of candidates.If (1) V(A,B)/V1(A) is large compared to V2(B)/V and(2) V(A,B)/V1(A) decreases with increasing V1(A) forthose pairs of candidates where candidate A is elimi-nated early in the count and candidate B is elected be-fore candidates have to be eliminated then this is evi-dence that voters use Woodall free riding.
Table 2.2 contains V2(B)/V for each candidate Bwho is elected before candidates have to be eliminated.Tables 2.3 to 2.6 contain V(A,B) for each pair of can-didates A and B where candidate B is elected beforecandidates have to be eliminated. Column “V1(A)”contains the numbers of voters who cast a valid firstpreference for the candidate in column “candidate A”.The column “Galluccio” (resp. “Turkel”, resp. “Davis”,etc.) contains the numbers of voters of column “V1(A)”who cast a valid second preference for Galluccio (resp.Turkel, resp. Davis, etc.) and cast at least also a validthird preference.
In tables 2.3 to 2.6, V(A,B)/V1(A) rather increasesthan decreases with increasing V1(A). Also the predic-tion that V(A,B)/V1(A) is large compared to V2(B)/Vis not fulfilled. This is surprising because in so far asWoodall free riding certainly is a useful strategy onewould expect that at least some voters use this strategy.A possible explanation why voters do not use Woodallfree riding is that they fear that when too many votersgive their first preference to candidate A because theybelieve that he is eliminated early in the count then itcould happen that candidate A gets so many votes thathe is elected [2, 5, 6]. But this can only explain whyV(A,B)/V1(A) does not decrease so fast with increas-ing V1(A); this cannot explain why V(A,B)/V1(A) in-creases with increasing V1(A). A possible explanationwhy V(A,B)/V1(A) increases with increasing V1(A) is
Voting matters, Issue 18 3
Schulze: Free riding
that voters are confronted with two problems:
1. It is a useful strategy not to waste one’s vote byvoting for a candidate B who is elected even with-out one’s vote. However, when too many votersuse Woodall free riding and cast a first preferencefor candidate A because they believe that he iseliminated early in the count even with one’s votethen it could happen that candidate A gets so manyvotes that he is elected.
2. It is a useful strategy not to vote for a candidateA who is believed to be eliminated with a greatprobability even with one’s vote, because other-wise there is the danger that there are not accept-able candidates anymore to whom this voter couldtransfer his vote when candidate A is eliminated.
Because of problem 2 only those voters who can-not identify themselves with any of the stronger candi-dates vote for candidates who are believed to be elimi-nated with a great probability; therefore, V(A,B)/V1(A)is low for low V1(A) for those candidates B who areelected before candidates have to be eliminated; there-fore, V(A,B)/V1(A) rather increases than decreaseswith increasing V1(A).
3 Hylland Free Riding
Problem 1 can be circumvented by using Hylland freeriding instead of Woodall free riding. Hylland writes[7]:
“Both for groups and for individual voters itcould be advantageous not to vote for a can-didate who is considered certain of winningelection, even if that candidate is one’s firstchoice. Suppose that my true first and sec-ond choices are A and B, I am sure A willget many more first preferences than neededfor election, but I find B’s chances uncertain.If I list A as the first preference on my ballot,its weight is reduced before it reaches B. If Iomit A, B gets a vote with full weight.”
In short, a Hylland free rider is a voter who omits inhis individual ranking completely all those candidateswho are certain to be elected. Of course, when too manyvoters use Hylland free riding then it can happen that thecandidate with the cast first preference is elected whilethe candidate with the sincere first preference is elimi-nated. However, when a voter uses Hylland free riding
then the candidate with the cast first preference is oneof this voter’s favorite candidates while when this voteruses Woodall free riding then the candidate with the castfirst preference is a candidate who this voter does notwant to be elected.
Problem 2 can be circumvented by voting only forthose candidates who are believed to be in the race untilthe final count. In so far as a candidate will be in thefinal count when he has more than V/(S+2) first pref-erences, where V is the number of voters and S is thenumber of seats, it is a useful strategy to cast one’s firstpreference only for one of those candidates who are be-lieved to get between V/(S+2) and V/(S+1) first prefer-ences.
This voting behaviour could best be observed inCanada because here the city councils were elected fora one year term and in a single city-wide district so thatthe voters had very precise information about the sup-port of the different candidates. A consequence of thisvoting behaviour was that usually almost all first prefer-ences were concentrated on S+1 almost equally strongcandidates [8, 9, 10]. Johnston [9] writes that one of themain criticisms of STV was that it was “one of the mostcommon features of PR in Canadian municipal elec-tions” that “the final count closely mirrored the resultsof the first count”. And Pilon [10] writes that the mainproblem of STV in Canada was that it “did not seemto make much difference in the results. After days ofcounting, eliminating candidates, and transferring frac-tions of support from one aspirant to another, there waslittle difference between the first choice results and thefinal tally.”
4 Summary
Free riding is a very serious problem of STV. The twofree riding strategies that have been predicted in the lit-erature are Woodall free riding [1, 2] and Hylland freeriding [7]. It is not possible to extract the number ofHylland free riders simply from the ballot data. Butwith additional assumptions it is possible to extract thenumber of Woodall free riders.
I used the ballot data of the 1999 and the 2001 CityCouncil elections and School Committee elections inCambridge, Massachusetts, to estimate the number ofvoters who use Woodall free riding. I could not findany evidence at all that voters use this strategy. Possibleexplanations why voters do not use this strategy are:
4 Voting matters, Issue 18
Schulze: Free riding
1. When too many voters cast a first preference forcandidate A, not because he is their sincere firstpreference but because they believe that he willbe eliminated early in the count, it could happenthat this candidate gets so many votes that he iselected [2, 5, 6].
2. It is not useful to vote for a candidate A whois eliminated with a great probability, because itcould happen that there are not acceptable candi-dates anymore to whom this voter could transferhis vote when candidate A is eliminated.
3. When a voter considers his second favorite can-didate to be only slightly worse than his favoritecandidate then Hylland free riding [7] is less dan-gerous than Woodall free riding in so far as a back-fire is less severe under Hylland free riding thanunder Woodall free riding.
4. The political organizations have not yet found asimple way to use Woodall free riding on a largerscale to increase their numbers of seats. There-fore, the voters are usually not pointed to thisstrategic problem.
5 References
[1] Douglas R. Woodall, Computer counting in STVelections, REPRESENTATION, vol. 23, pp. 4-6,1983 {reprinted in VOTING MATTERS, issue 1,1994}
[2] T. Nicolaus Tideman, Daniel Richardson, Bet-ter voting methods through technology: Therefinement-manageability trade-off in the singletransferable vote, PUBLIC CHOICE, vol. 103, pp.13-34, 2000
[3] Brian L. Meek, Une nouvelle approache duscrutin transferable, MATHEMATIQUES ET SCI-ENCES HUMAINES, vol. 25, pp. 13-23, 1969{reprinted in VOTING MATTERS, issue 1, 1994}
[4] C. H. E. Warren, Counting in STV Elections, VOT-ING MATTERS, issue 1, 1994
[5] R. J. C. Fennell, Is a feedback method of calcu-lating the quota really necessary?, VOTING MAT-TERS, issue 2, 1994
[6] I. D. Hill, Are better STV rules worthwhile? – Areply to R.J.C. Fennell, VOTING MATTERS, issue3, 1994
[7] Aanund Hylland, Proportional Representationwithout Party Lists, pp. 126-153, RATIONALITY
AND INSTITUTIONS, eds. Raino Malnes and ArildUnderdal, Scandinavian University Press, Oslo,1992
[8] Joseph P. Harris, Practical Workings of Propor-tional Representation in the United States andCanada, NATIONAL MUNICIPAL REVIEW, vol.19, pp. 337-383, 1930
[9] J. Paul Johnston, Miriam Koene, Learning His-tory’s Lessons Anew: The Use of STV in Cana-dian Municipal Elections, pp. 205-247, ELEC-TIONS IN AUSTRALIA, IRELAND, AND MALTA
UNDER THE SINGLE TRANSFERABLE VOTE, eds.Shaun Bowler and Bernard Grofman, Universityof Michigan Press, Ann Arbor, 2000
[10] Dennis M. Pilon, The Drive for Proportional Rep-resentation in British Columbia, 1917-23, SimonFraser University, Vancouver, 1994
Voting matters, Issue 18 5
Schulze: Free riding
Election Candidate B V V1(B) V1(B)/V V2(B) V2(B)/V1999 City Council Anthony D. Galluccio 18,613 2,705 14.5% 2,515 13.5%
1999 School Committee Alice L. Turkel 17,796 2,617 14.7% 2,360 13.3%2001 City Council Henrietta Davis 17,125 1,713 10.0% 1,645 9.6%2001 City Council Brian Murphy 17,125 1,716 10.0% 1,627 9.5%2001 City Council Anthony D. Galluccio 17,125 3,230 18.9% 2,947 17.2%
2001 School Committee Joseph G. Grassi 16,488 2,135 12.9% 1,728 10.5%2001 School Committee Alfred B. Fantini 16,488 2,854 17.3% 2,353 14.3%2001 School Committee Alice L. Turkel 16,488 2,862 17.4% 2,484 15.1%
Table 2.2: V2 (B)/V for each candidate B who is elected before candidates have to be eliminated
Candidate A V1(A) Anthony D. GalluccioCharles O. Christenson 28 2 (7.1%)
Daejanna P. Wormwood-Malone 28 0 (0.0%)William C. Jones 31 2 (6.5%)
Alan Kingfish Nidle 40 0 (0.0%)Vincent Lawrence Dixon 44 3 (6.8%)
Jeffrey Jay Chase 102 10 (9.8%)Dorothy M. Giacobbe 109 22 (20.2%)James M. Williamson 128 2 (1.6%)
Alan C. Price 1,873 41 (2.2%) 71 (3.8%) 319 (17.0%) 431 (23.0%)Joseph G. Grassi 2,135 — 698 (32.7%) 94 (4.4%)Alfred B. Fantini 2,854 942 (33.0%) — 158 (5.5%)Alice L. Turkel 2,862 97 (3.4%) 133 (4.6%) —
Table 2.6: Potential Woodall free riders in the 2001 School Committee elections in Cambridge, Massachusetts
8 Voting matters, Issue 18
An odd feature in a real STV election
I. D. HillNo email available.
Although artificial data can be extremely useful inclearly demonstrating difficulties in election rules, thereis also much to be said in favour of looking at real data,particularly where anything odd appears to have hap-pened.
A few years ago, there were 23 candidates in an elec-tion for 15 seats, and there were 539 votes. The candi-dates’ names have here been coded as A, B, C, etc.
One voter gave preferences, in order, as: M D L R IJ C T B E H A O U F etc. Using Newland and Britton(second edition) rules [1], the last candidate elected wasF and the runner-up was V. Amazingly, if that one voterhad put V instead of F as 15th preference, V would havebeen elected and F runner-up. In other words, the elec-tion result depended upon that one voter’s 15th prefer-ence.
There is, of course, nothing wrong with a 15thpreference being taken into account. If all previous 14preferences have been excluded it is right that the 15thpreference comes through with a value of 1.0 as if ithad been a 1st preference. In this case, though, it camethrough with a value of 1.0 even though 10 of the ear-lier preferences were elected. Of those 10, 8 had beenelected before that vote reached them and, in accor-dance with the rules, were “leap-frogged”. The other2, J and T are more remarkable; in each case the vote inquestion was among those that triggered their electionand, being part of the last parcel received, was due tobe transferred with a transfer value. For both of them,however, there were enough non-transferable votes inthe parcel that the transfer value came out as 1.0.
When the final transfer was made, V had 30.31 votes,and F had 30.51, so the additional 1.0 was enough tosway the result. The vote had not had to make any con-tribution to electing the 10 elected candidates namedearlier by the voter.
If Meek rules [2] had been used, that 15th prefer-ence would still have been reached, but F would havebeen ahead of V by almost 4 votes and the value at-tached to the particular vote, because it would have hadto contribute a fair share to electing the earlier 10 can-didates, would have been only 0.000000905 and wouldthus have made no difference.
It is pleasing that, as it happened, the correct resultwas reached by the actual count, but it could so easilyhave been the wrong one.
It has sometimes been suggested that messing aboutwith such small fractions of votes, which make no dif-ference to the result, is not worth while. There are twoanswers to that suggestion. The first is that, if the logicof the Meek method is accepted, then either we can fol-low that logic through, even if it does result in such“messing about with small fractions”, which is easy, orwe can put in special rules to stop it doing so, whichis much more difficult. We should need to consider notonly what special rules to adopt in such cases, but alsohow to determine when to use them. Obviously it makessense to do the easy, and correct, thing.
The second answer is that there are cases where sucha very small difference can change the answer, so itwould be wrong to ignore a 15th preference. If thecontest between V and F had reached an exact tie fromall the other relevant votes, then the result should, ofcourse, have been settled by what that 15th preferencewas.
1 References
[1] R A Newland and F S Britton. How to conductan election by the Single Transferable Vote. 2ndedition. Electoral Reform Society. 1976.
[2] I. D. Hill, B. A. Wichmann and D. R. Woodall.Algorithm 123 — Single Transferable Vote byMeek’s method. Computer Journal Vol 30, pp271-281. 1987.
9
Full disclosure of data
I. D. HillNo email available.
The objection to full disclosure made by Otten [1] isvalid, but seems to me to be of only minor importance.Considering the huge advantages of disclosure, in giv-ing transparency and allowing anyone who wishes tocheck the result of the counting, it would be a great pityif Otten’s point were allowed to prevail over it.
Disclosure does not in itself give complete trans-parency of the electoral process, because it takes asgiven the list of votes and their preferences, but in deal-ing fully with the second part of the process, the count-ing of the votes, it is nevertheless of great merit.
Otten’s “preferred solution” — to suppress later pref-erences until there are at least three votes of every pub-lished pattern — would undoubtedly be better than notpublishing the data at all, but it is a very poor thingcompared with full disclosure and would, in many in-stances, lead to the suppression of the very informationthat would be of importance.
Taking as an example the election reported on in thepreceding paper (Hill [2]), the original votes, which had531 different preference patterns from the 539 votes,would have been reduced to only 96 different patterns,and these would not have shown the vital informationthat led to the allocation of the final seat. Indeed the 16votes that put candidate M first would have been shownas just 13 M . . . and 3 M R . . . The voter whose 15thpreference was vital would not have had even a secondpreference shown.
In an election where political parties were important,it would seem likely that the loss of information wouldbe less severe. Even in the given case, the fact that therewere 7 votes starting Q P O S E F H A D J M C B R, andanother 3 also starting Q P O S E F, still comes through,indicating obvious collusion between voters (which isnot illegal, or even immoral, if that is what they wish todo).
Implementing the Otten procedure is not straightfor-ward, as it is not sufficiently defined. For example, therewere 2 votes starting W U A I D, 1 starting W U A I O,1 starting W U A E. Should these be shown as 4 of WU A . . . , or as 3 W U A I . . . leaving the other 1 to go inwith W . . . ? It is not self-evident.
There are many things in life that could be so muchsimpler if only we could trust everybody, and did notneed to bother about fraudsters, but we always needto consider whether a particular fraud is likely, andwhether procedures to stop it are doing more harm thangood. My personal view is that Otten’s suggestionwould be doing so.
1 References
[1] Otten J. Fuller disclosure than intended. Votingmatters, Issue 17, p8. 2003.
[2] Hill I.D. An odd feature in a real STV election.Voting matters, Issue 18, p9. 2004.
With STV, the voter is encouraged to specify as manypreferences as may be needed to reflect his/her wishes.The number of preferences actually used within thecount is quite a different matter which is the main sub-ject of this note.
For the three Irish constituencies for which a trialwas undertaken in 2002 of electronic voting, we havefull disclosure of the preferences specified by the vot-ers. This provides an opportunity to analyse the use ofpreferences in a large public election in some depth.
Joe Otten has stated reservations about the full dis-closure of preferential voting data on the grounds that itcould allow bribery to take place even though the votingis secret [1]. The issue has also been raised by the IrishCommission on Electronic Voting [3].
Here, we consider how the voter’s preferences areused and propose alternative solutions to the problemof disclosure.
2 The use of the voter’s preferences
It is clear that any preference listed after a continuingcandidate cannot be used at that stage of the count. Toinspect such a preference would contravene one of theprinciples of STV. A particular example of this is thatthose voters who gave their first preference for a can-didate who is still a continuing candidate at the end ofthe count, will not have anything other than their firstpreference used.
As an example of how preferences are used, considerthe 2002 Dail election for the Meath constituency forwhich we have full election data. There were 14 can-didates for 5 seats (the candidate names have been ab-
breviated to give only the gender and position in thetables). The election stages were as follows:
Hence the continuing candidate is M12.Now consider an actual voter whose preferences
were as follows:
M9 M8 M7 M10 M12 M11 M14 F3 F13 M1 M4 M2 M6 M5
Consulting the actions of the stages above, it is clearthat the preferences for M10 and all those after M12were never used. In other words, the voter could just aswell have voted: M9, M8, M7, M12. The other prefer-ences were invisible.
To understand the use of the preferences in more de-tail, we look at the result sheet in Table 5.1. At thesecond stage, the surplus of M4 is transferred. To dothis, all of the 11,534 votes for M4 are inspected andthe number whose second preference is given is found,together with the proportion for each of the remaining13 candidates. Since 853 votes must be transferred toreduce M4 to the quota, an integer is computed for eachcandidate giving the correct proportion and total. Asan example of a transfer, only one vote is transferredto M11 and that vote is selected at random from thosegiving M11 as the second preference. This implies that10,681 votes are inspected for their subsequent prefer-ence and a further 853 votes are used in the subsequentstages.
11
Wichmann: The use of preferences
Hence we have two uses of preferences with the Irishrules: those used directly to attempt to elect a candidateand those used indirectly to determine which papers toselect at random to transfer. For the Meath election, thenumber of preferences used directly are those for thefirst preference (the total vote of 64,081) plus the num-ber of those in the table with a + sign but ignoring thosein the non-transferable row. The indirect use, whichonly arises from a transfer of surplus is therefore onlyfrom M4, i.e, the 10,681 mentioned above.
In contrast to this, the Meek method uses all the vis-ible preferences. Our sample ballot paper above hadfour visible preferences M9, M8, M7 and finally M12.In fact, the Irish rules would use all these preferences.
We can now compute the use of the preferences forthe three Irish constituencies, expressed as an averageper vote:
Dublin North 1.33 0.01 2.12 4.98Dublin West 1.26 0.25 2.11 4.43Average of 3 1.26 0.14 2.07 4.68
Hence, as a percentage of all the preferences given,the direct use with the Irish rules is 27%, indirect usageis 3%, while Meek uses 44%.
3 Full disclosure?
We can now see that relatively few preferences are actu-ally used in a count. If the voter specifies a large numberof preferences, then it is unusual for them all to be used.For an example of a large number of preferences whichwere used, see [2].
We now have a means of providing an approxima-tion to full disclosure which would nevertheless allowthe voter to check the actual count: remove some (orall) of the invisible preferences. For long preferencelists, like the one shown above, it would usually be thecase that many preferences would be invisible. Hencethis strategy of providing full disclosure only of the vis-ible preferences would effectively prohibit the potentialproblem identified by Joe Otten.
Note that the identification of the invisible prefer-ences depends upon the order of the exclusions andelections which in turn depends upon the particularcounting rules being used. Hence, if data were pro-vided with only the visible preferences, then running
that data using a different counting rule would not nec-essarily give the same result as using the actual data.
4 Conclusions
Since many preferences are not used in a count, it ispossible to disclose all the used preferences and removeall or part of the unused preferences to avoid any po-tential breach of confidentiality. The referee made twoadditional points: it is possible to add invisible prefer-ences as well as removing them; and that any change tothe data implies that a check is not an exact check.
5 References
[1] J Otten. Fuller Disclosure than Intended. Votingmatters. Issue 17. p 8. 2003.
[2] I D Hill. What would a different method havedone? Voting matters. Issue 16. p 5. 2003.
[3] Interim Report of the Commission on Elec-tronic Voting on the Secrecy, Accuracy andTesting of the chosen Electronic Voting System.http://www.cev.ie/htm/report/download report.htm
In tallying the single-transferable vote (STV), ties canoccur for several different reasons. With the ERS97rules [1] for implementing STV, ties can occur whenchoosing a surplus to transfer (5.2.3), when choosing acandidate to eliminate (5.2.5), and when choosing win-ners (5.6.2). To illustrate, Table 6.1 shows an exampletally with the ERS97 rules. At stage 4, we need to elim-inate the candidate with the fewest number of votes, butboth C and D are tied for last place.
When ties occur, they need to be broken. One couldsimply break the tie by lot. However, since there is otherinformation available in an STV count, one can use thisinformation to break the tie. The following are four pos-sible tie-breaking rules.
1. Forwards Tie-Breaking: Choose the candidate whohas the most [least] votes at the first stage or at the ear-liest point in the count where they had unequal votes.
2. Backwards Tie-Breaking: Choose the candidate whohas the most [least] votes at the previous stage or atthe latest point in the count where they had unequalvotes.
3. Borda Tie-Breaking: Choose the candidate with thehighest [lowest] Borda score. See [2].
4. Coombs Tie-Breaking: Choose the candidate with thefewest [most] last place votes.
It is possible that after applying one of these tie-breaking rules that the candidates would still be tied.Because of this, it is useful to distinguish between“weak ties” and “strong ties.” A weak tie occurs whencandidates have the same number of votes at a givenstage. A strong tie occurs when candidates are still tied
after applying a tie-breaking rule, such as one of thefour listed above. A strong tie would be broken by lot.1
The ERS97 rules use forwards tie-breaking. Thepurpose of this paper is twofold. First, to show thatbackwards tie-breaking is a better solution and to sug-gest that the ERS97 rules be changed to use backwardstie-breaking instead. Second, to show that substage to-tals should not be used when breaking ties.
2 Backwards or Forwards Tie-Breaking
In breaking a tie, the ERS97 rules state that one mustchoose “the candidate who had the greatest vote [orfewest votes] at the first stage or at the earliest pointin the count, after the transfer of a batch of papers,where they had unequal votes.” This is forwards tie-breaking and is used when choosing a surplus to transfer(5.2.3), when choosing a candidate to eliminate (5.2.5),and when choosing winners (5.6.2).
The difference between backwards and forwards tie-breaking will be illustrated with the example in Ta-ble 6.1. In this example, we have to eliminate one can-didate at stage 4 and there is a weak tie between candi-dates C and D. Thus, tie-breaking needs to be used todetermine which candidate is to be eliminated. UnderERS97 rules, we break the tie by using forwards tie-breaking. To do this we first look to the counts at stage1. We see that D has one more vote than C at stage 1.Thus, candidate C is eliminated.2
Another alternative is to use backwards tie-breaking.To do this, we look at the previous stage to break ties,and if necessary to preceding stages. Looking at the
1Of course one could use another tie-breaking rule if the firsttie-breaking rule results in a tie, but this will not be considered here.Borda and Coombs tie-breaking are just presented as available alter-natives and will not be discussed further.
2If C and D had been tied at stage 1, then we would have lookedto subsequent stages. If C and D had been tied at all stages, then wewould have had a strong tie which would have been broken by lot.
14
O’Neill: Tie-Breaking
preceding stage, we see that C is ahead of D at stage 3.Thus, D would be eliminated.
One problem with forwards tie-breaking is that itlooks at the stages in an order that is not sequential.In order to determine the candidate to be eliminatedat stage 4, we would look at the stages in the follow-ing order: 4 1 2 3. Intuitively, this is undesirable. Itmakes more sense to look at the stages in sequential or-der. Since one must look first to the current stage, thereis only one sequential ordering: 4 3 2 1. This is whatbackwards tie-breaking would do.
A more important problem, is that forwards tie-breaking does not use the most relevant information tobreak the tie. The most relevant information to breaka tie is the previous stage and not all the way back tothe very first stage. By immediately looking to the firststage to break the tie, the ERS97 rules allow the tie-breaking to be influenced by candidates eliminated veryearly in the process and also by surpluses yet to be trans-ferred. Instead, if we look to the previous stage to breaka tie, candidates eliminated early on in the process willhave no influence in breaking the tie. In addition, it al-lows for surpluses to be transferred which gives a moreaccurate picture of candidate strength.
In Table 6.1, candidate C has more support than can-didate D at stage 3. At this point, the surplus of A hasalready been transferred and candidate F has alreadybeen eliminated. Thus, stage 3 is a better measure thanis stage 1 as to which candidate should be eliminated atstage 4.
Other implementations of the single transferable voteuse backwards tie-breaking instead of forwards tie-breaking: Cambridge, MA STV [3], rules advocated bythe Center for Voting and Democracy [4], and rules ad-vocated by the Proportional Representation Society ofAustralia [5].
3 Elimination of Winning Candidates
An incidental problem related to using forwards tie-breaking is that the ERS97 rules can sometimes elim-inate a winning candidate. Consider an example where31 voters elect one candidate with the following ballots:
Table 6.2 shows the results of the tally with ERS97rules.
At stage 3 of the count, we need to eliminate one ormore candidates and candidates B and C are tied withthe fewest votes. According to rule 5.2.5(b), both Band C are to be eliminated. However, if instead the tiebetween B and C was broken by lot, then the other can-didate would go on to win the election! In this sce-nario, suppose candidate C was eliminated by lot atstage three. Then B would be tied with A at stage 4,each with 10 votes. Forwards tie-breaking would beused to break the tie. Candidate A has the fewest votesat stage 1 and would then be eliminated. B would thenreceive all of A’s votes and beat F 20 to 11 in the finalstage.
Thus, the ERS97 rules are over-aggressive in elim-inating candidates. This is a clear flaw in the ERS97rules. This flaw arises from the interaction of rule5.2.5(b) and forwards tie-breaking. This flaw could befixed in two ways: (1) by changing rule 5.2.5(b), or(2) by using backwards tie-breaking instead of forwardstie-breaking. Since there are already other good reasonsfor using backwards tie-breaking, the obvious choice is(2).
If backwards tie-breaking were used instead, thenboth candidates B and C could properly be eliminatedat stage 3. If just C were eliminated and B received allof C’s votes, then there would again be a tie at stage 4.However, with backwards tie-breaking, B would neces-sarily have fewer votes than A at the previous stage andwould immediately be eliminated.
Backwards tie-breaking would fix this flaw generally,and not just in this specific example. This flaw occursunder specific conditions:3 (1) a candidate needs to beeliminated and two candidates are tied for last place,(2) the sum of the votes of these two candidates is equalto the candidate with the next fewest number of votes,and (3) after eliminating one of these candidates therewould be a subsequent tie with this third candidate.Under these conditions rule 5.2.5(b) requires that thetwo candidates in last place be eliminated simultane-ously. As described above, with forwards tie-breakinga winning candidate could be improperly eliminated.However, with backwards tie-breaking, both of theselast-place candidates cannot win and can thus be prop-erly eliminated. The two last-place candidates are guar-anteed to lose the second tie because they necessarily
3These conditions could be generalized to the case where morethan two candidates are tied for last place.
Voting matters, Issue 18 15
O’Neill: Tie-Breaking
have fewer votes at the previous stage (but they do notnecessarily have fewer votes at the first stage).
4 Use of Substages to Break Ties
The word “substage” is not used anywhere in theERS97 rules, but this terminology is used by people fa-miliar with the rules. Substages can occur when trans-ferring votes from eliminated candidates. Table 6.3shows an example using ballots from the test T143where 60 voters are electing two candidates. At stage3, candidate F is being eliminated. Candidate F has bal-lots with transfer value 1.00 and ballots with transfervalue 0.25 (from the surplus of A). These ballots will betransferred in two substages constituting two differentbatches. The first substage transfers ballots with value1.00 and the second transfers ballots with value 0.25.
In stage 4 of this example, we need to eliminate acandidate and candidates C and D are tied for last place.Hence, we need to use forwards tie-breaking. WithERS97 rules, substages must be considered when do-ing forwards tie-breaking. Candidates C and D are alsotied at stage 1 and stage 2, but candidate D is aheadof candidate C at the substage between stages 2 and 3.Thus, candidate C is eliminated.
The problem is that substages are not a good metricfor breaking ties. In the example in Table 6.3, eithercandidate C or D must be eliminated at stage 4. Can-didates C and D are tied at stages 4, 1, and 2. Candi-date C is ahead at stage 3, but candidate C is eliminatedanyway! The reason that C is eliminated is that D hasmore votes at an intermediary point where only someof candidate F’s votes have been transferred. This inter-mediate point is well-defined but completely arbitraryin terms of fairness. There is no reason to make someof F’s votes more important than others. Whether onecandidate is ahead of another at this intermediary pointis not relevant to which candidate should be eliminated.What is relevant, is what the counts are at each stage ofthe count, that is after a candidate has been completelyeliminated.
5 Conclusions
The ERS97 rules should be changed so that backwardstie-breaking is used instead of forwards tie-breaking. Inaddition, substage totals should not be considered whenbreaking ties.
6 Acknowledgments
The author would like to thank David Gamble, BrianWichmann, and an anonymous reviewer for their valu-able suggestions regarding this paper.
7 References
[1] R A Newland and F S Britton. How to conduct anelection by the Single Transferable Vote. ERS 3rdEdition. 1997. See http://www.electoral-reform.org.uk/votingsystems/stvrules.htm.
[2] Earl Kitchener, Tie-Breaking in STV. Votingmatters. Issue 11, April 2000.
[3] Massachusetts General Laws, Chapter 54A,Section 9(k).
[4] Choice Voting. The Center for Voting andDemocracy. Seehttp://www.fairvote.org/library/statutes/choice voting.htm
[5] Rules of the Proportional Representation Societyof Australia for conducting elections by thequota-preferential method. 2001. Seehttp://www.prsa.org.au/rule1977.htm
Table 6.3: ERS97 rules with substage tie-breaking.Sixty voters are electing two candidates.
Voting matters, Issue 18 17
ISSN 1745-6231
Voting matters
for the technical issues of STV
published by
The McDougall Trust
Issue 19 November 2004
About the McDougall Trust (reg. charity no. 212151)
The McDougall Trust is a charitable trust formed in 1948. The charity’s purposes asstated in its governing scheme of 1959 are to advance knowledge of and encouragethe study of and research into:
• political or economic science and functions of government and the services pro-vided to the community by public and voluntary organisations; and
• methods of election of and the selection and government of representative organ-isations whether national, civic, commercial, industrial or social.
The Trust’s work includes the maintenance and development of the Lakeman Libraryfor Electoral Studies, a unique research resource, the production and publication ofRepresentation: The Journal of Representative Democracy, and, of course, this pub-lication Voting matters, that examines the technical issues of the single transferablevote and related electoral systems.For further information on the Trust, please contact:
For further information on this publication, please contact B A Wichmann, the Editorat the above address or by email at: [email protected]
Editorial
Report by Steve Todd
On 9 October this year, New Zealand held a numberof STV elections using the Meek counting rules. Sev-eral problems arose which delayed the final declara-tion of the results. It appears that the main problemconcerned reconciling the number of voting papers thatwere scanned into the database with the number thatwere subsequently sent to the STV calculator.
The realisation that discrepancies were occurring ledthe local councils and district health boards (DHBs) af-fected, to call in the Auditor-General’s office to auditthe entire process. While the computer error was dis-covered and fixed within a few days, the auditing pro-cess meant that it took four weeks to complete all thevote-counting. In contrast, the program which actuallyperformed the count, i.e. the STV calculator, appearedto operate without mishap.
A lesser, but equally frustrating, problem was that theICR technology used to process the ballot papers wasunable to read (with a high level of confidence) a con-siderably higher percentage of the scanned documentsthan was expected. This led to much more human inter-vention than was expected, with a consequent increasein the time taken to process the votes.
The Justice and Electoral select committee of NewZealand’s parliament intend to conduct an inquiry intowhat went wrong. A focus of the inquiry will likelybe on why the two Auckland-based companies con-tracted to process the STV votes in the northern part ofthe country, did so seemingly without a hitch, and in atimely manner, while the Christchurch and Wellingtoncompanies contracted to conduct the remaining STVelections (in respect of 7 of 10 councils and 18 of 21DHBs) did not.
There has not yet been a full explanation of theproblems encountered, but there is a suggestion thatthe computer systems used by the Christchurch andWellington companies may not have been completelycompatible.
There were also widespread claims of voter confu-sion (said to have been caused by having FPTP and STVelections on the same A3-size voting documents), lead-ing to many Informal (Invalid) votes (errors) and blankvotes (non-participation) being cast, that the select com-mittee will no doubt inquire into.
Informal votes in council areas using STV appear tohave been no more than usual — 1.08% in Wellington
and 1.49% in Dunedin, for example. However, in the re-maining 64 council areas, that used FPTP, the Informalrate in respect of their DHB elections was up as high as10 to 12%.
A likely explanation for this will be poor voting-document design. There was no bold distinction be-tween FPTP and “tick-voting” for the mayoral andcouncil ward elections, and STV and voting by num-bering the candidates in the DHB elections. In fact, ap-parently due to printing restrictions, the DHB electionswere set out under the name of the city or district coun-cils they were associated with! This means that somevoters (who did not read the voting instructions care-fully) carried on tick-voting into the DHB election —more than one tick for the candidates and the vote wasinformal.
On the brighter side, the actual ballot data is likely tobe made available in respect of most, perhaps all, STVelections and hence it will be possible to ‘check’ thecounts by re-running them.
Voting matters
There are 3 papers in this issue:
• B. A. Wichmann: Tie Breaking in STV. This paperconsiders a method of handling ties when a com-puter is used by considering all possible outcomes.It is an unfortunate fact that breaking a tie by a ran-dom choice gives an impression that the outcomemight be random when this is rarely the case.
• J. Green-Armytage: Cardinal-weighted pairwisecomparison. This paper considers the electionof a single candidate by adding information to aCondorcet-style count on the strength of the pref-erences for candidates.
• B. A. Wichmann: A Working Paper on Full Dis-closure. This paper attempts to put together majorconcerns about this issue which have been raisedin previous issues of Voting matters. The paperwas written before the New Zealand election databecame available and hence does not mention this.
Readers are reminded that views expressed inVoting matters by contributors do not neces-sarily reflect those of the McDougall Trust orits trustees.
Given any specific counting rule, it is necessary to in-troduce some words to cover the situation in which a tieoccurs. However, such ties are only a practical concernfor small elections. For instance, it has been reportedthat a tie has never occurred with the rules used in theIrish Republic.
Probably the most common form of a tie is when thetwo smallest first preference votes are the same. Un-less both candidates can be excluded, a choice mustbe made, although in very many cases, the candidateselected will be the same.
This note proposes that when a computer is used toundertake a count, all the possible choices should beexamined and that the result is produced by computingthe probability of election of the candidates.
2 Ties in practice
It is clear that the propensity to produce a tie will de-pend largely on the number of votes. However, someestimate can be obtained from a collection of electiondata that has recently been revised [1]. The data baseconsists of over 700 ‘elections’, but for this paper weexclude artificial test cases. The figures obtained fromthe other cases, which are like real elections, with threecounting rules ([4, 2, 7]) are as in the table on page 4.
Hence, although with the Church of England rules,only 59 out of 299 involved a tie-break, the averagenumber of tie-breaks in those 59 was actually 9.9. Theaverage number of votes in those 59 cases was 102,while the average for the remaining 240 cases was12,900. It is important to note that Meek only has tieson an exclusion of a candidate, while the hand-counting
rules also have ties on the choice of the candidate whosesurplus is to be transferred.
For reasons not relevant to this note, the number ofcases run with each rule is different. (Larger cases haveonly been run with Meek.) It is clear that a small num-ber of votes increases the risk of a tie. Also, given thata tie occurs, the Meek algorithm has only half the riskof a subsequent tie arising, almost certainly due to thehigher precision of the calculation.
3 The special case of ties with the Meekalgorithm
Brian Meek’s original proposal rests upon the solutionof certain algebraic equations. The algorithm given in[7] provides an iterative solution of those equations.The mathematical nature of the equations implies thatthere is substantial freedom in handling exclusions,since, once a candidate is excluded, it is as if the can-didate had never entered the contest. Hence it is notnecessary for two implementations of Meek to handleexclusions in the same way — the same candidates willbe elected. (In contrast, the hand counting rules needto be specific on exclusions since it affects the result;ERS97 insists on as many as allowable, while CofE in-sists on only one at a time.)
As an example, David Hill’s implementation of Meekin comparison with my own has revealed differences.We both exclude together all those candidates havingno first preferences. David Hill also excludes the next-lowest candidate also (assuming it is safe to do so),while I do not. I will exclude more than one candi-date at a time when it is safe to do so, while David Hillsticks to one at a time. Hence both our implementa-tions report a random choice has been made when it iscertainly possible to avoid this. Such reporting is un-desirable since it might give the impression that thoseelected have been chosen at random, when this is notthe case. Both of us have introduced a tie-breaking rule
1
Wichmann: Tie Breaking
similar to that in many hand-counting rules based uponthe votes in previous stages (but in opposition to thatadvocated in [5]).
Two other aspects are relevant to the Meek algorithm.The cases reported in [6] indicate that an implementa-tion can report a tie even though in mathematical terms,one candidate is ahead (but by too small an amount tobe computed). This situation is not thought to arise inpractice. Perhaps somewhat more disturbing is that analgebraic tie can be computed differently, giving onecandidate ahead of another. Two implementations ofMeek with such a case can even break the actual tie byrounding in different directions. However, since there isa real tie, breaking it by the rounding in the implemen-tation, is not so bad.
4 Results of the proposed method
The only practical method to implement this proposal isto modify software that already implements an existingcounting rule. Since I have my own implementation ofMeek, I have modified this to analyse all choices whena tie occurs.
The modification works by executing the algorithmonce for every possible choice when the rules requirea ‘random’ choice. For my version of Meek, I haveprovided an option to remove the first-difference ruleso that when this rule would otherwise be invoked, arandom choice is made1.
As an example, consider a real (simple) election,R033, having four candidates (A1. . . A4) for one seat.At the first stage, A2 and A3 have the smallest numberof votes: if A2 is excluded, then A1 is elected; if A3 isexcluded, then there is a tie between A2 and A4 for thenext exclusion. These two alternatives also result in A1being elected. So the final result is:
Probability from 5 choices from 3 passes.Candidate Excluded? ProbabilityA1 no 1A2 yes 0A3 yes 0A4 yes 0
We now know that the election of A1 is not depen-dent upon the random choices made. The computation
1The first-difference rule is a method of breaking a tie by exam-ining the votes in all previous stages, starting at the first stage andselecting the one which has the fewest votes at the first stage at whichthere is a difference. Of course, if the earlier stages give no difference,then a random method must be used to break the tie.
involved three election runs. The middle column indi-cates that the candidates A2, A3 and A4 were all se-lected in one of the runs for random exclusion.
A more complex example is given by R009, electing2 from 14 candidates with 43 votes. Here, the final tablereads:
Probability from 1364 choices from 264 passes.Candidate Excluded? ProbabilityA1 no 1/ 4A2 yes 0A3 yes 0A4 yes 0A5 no 0A6 yes 0A7 yes 0A8 yes 0A9 no 1A10 yes 0A11 no 3/ 4A12 yes 0A13 yes 0A14 no 0
Here we see that only the candidates A1, A5, A9,A11 and A14 were never subject to random exclusion.Nevertheless, A5 and A14 were never elected.
However, the above result was using the variant ofMeek without the first-difference rule. If the first-difference rule had been applied, then A1 would nothave been elected in any circumstances. Note that inthis case, a large number of passes had to be made dueto many of the stages resulting in a tie. Hence this tech-nique is only really possible due to the speed of moderncomputers.
Given the above election, then there are two possi-ble uses of the outcome: firstly to elect the most proba-bly candidates (A9 and A11), or secondly, to randomlyselect between A1 and A11 according to the specifiedpossibilities. Since in this paper we are attempting toreduce the random element, we choose the first option.
From the database, 55 cases were selected which cor-respond reasonably closely to real elections. The re-sults are in the table on page 5. The entry ‘Random’gives the number of random choices made with the NewZealand version of Meek which has the first-differencerule. The last three entries are from running the newprogram. The ‘Probs.’ column includes the probabili-ties of election of those candidates who are involved inties and have nonzero probability of election.
2 Voting matters, Issue 19
Wichmann: Tie Breaking
The three examples with approximate results fromthe new program took too long to run to completion.Here, the tabulated results are based upon the first fewthousand cases executed. The majority ran very quicklyand only those with 10,000 or more passes took longerthan a minute or two. The case R038 was exceptional inhaving probabilities of 29/168, 11/35, 29/60, 431/840,431/1680, 437/1680 and 1 (and none were repeated).
If one was only concerned with the Meek algorithm,then the program could probably be made substantiallyfaster since the ties only arise with an exclusion andMeek is indifferent to the order of the exclusions in thesense that excluding A then B is the same as exclud-ing B then A; this situation will typically be the casewhen A and B tie on the fewest number of votes. Theapproach here is a general one that could be applied toany counting rule. It also seemed easier to program thegeneral method presented here.
From the 49 cases which were run to completion, allbut 7 reported than the random choice had no effectupon the result.
Election R102 is typical of the situation in which alarge number of random choices are made. In fact, 28exclusions are made before an election. This impliesthat for all these initial stages, the votes are integers.Given the small size of the election, ties are very com-mon. Unfortunately, this implies that the number ofchoices is too large to compute them all. However, ex-perimenting with removing those candidates who areexcluded early, gives the result shown in the last col-umn.
Followers of the Eurovision Song Contest might liketo know that although the official scoring system gave atie in 1991 between Sweden and France, with Swedenbeing judged the winner on the basis of having moresecond (preference) votes, this system gives Sweden aprobability of election of 71/288 and hence France theclear winner with a probability of 217/288. Accordingto this system, the UK would have won in 1992 witha probability of 5/6, while the official result declaredIreland as the winner which had a probability of only1/12.
5 Conclusions
It seems that the provision of this program raises moreproblems than it solves. If one is prepared to ignore the14% of cases which question the validity of the randomchoice, then one can continue the current practice with
a clear conscience. On the other hand, when a randomchoice was made in a real election, it would surely bewelcome to show that the result was not in question.However, using this program for that purpose might notgive a clear answer when only a fraction of all the possi-bilities could be executed in a reasonable time (as withthe three cases in the table). Of course, in those cases,numerous random choices could be tried, but the objecthere is to avoid such arbitrariness.
When a candidate has been subject to a random ex-clusion in an election, he/she could naturally feel ag-grieved. One solution to that would be to undertake are-count without randomly excluding that candidate. Ifthis were undertaken by computer, the number of re-counts would be less than the number of candidates andhence very much less than all possibilities which areconsidered above.
Currently, almost all STV counting rules introducesome rules, like the first-difference rule ([2, 4]) or Bordascores [3], to reduce the need for a random choice to bemade. An alternative would be to simplify the countingrules by omitting these provisions, but to use a programlike the one presented here to produce a result which isvery likely to have no random element.
6 References
[1] B. A. Wichmann. A Guide to an STV data base.July 2004. (Available from the author.)
[2] R. A. Newland and F. S. Britton. How to con-duct an election by the Single TransferableVote. ERS 3rd Edition. 1997. See http://www.
[3] Earl Kitchener, Tie-Breaking in STV. Voting mat-ters. Issue 11, April 2000.
[4] GS1327: General Synod, Single TransferableVote regulations 1990 and 1998. (Obtainable fromChurch House Bookshop, Great Smith Street,London SW1P 3BN.)
[5] J. C. O’Neill: Tie-Breaking with the Single Trans-ferable Vote. Voting matters Issue 18. pp 14-17.2004.
[6] B. A. Wichmann. The computational accuracy us-ing the Meek algorithm. Voting matters Issue 12.pp6-7. November 2000.
Voting matters, Issue 19 3
Wichmann: Tie Breaking
[7] I. D. Hill, B. A. Wichmann and D. R. Woodall.Algorithm 123 — Single Transferable Vote byMeek’s method. Computer Journal. Vol 30,pp277-281, 1987.
Rule Ties Ties Average votes Average votesper case with ties without ties
CofE 59 from 299 9.9 102 12900ERS97 55 from 154 7.1 81 2438Meek 62 from 587 3.3 12692 44180
James Green-Armytage graduated fromAntioch College in April of 2004. He isconsidering a graduate program for an eco-nomics PhD.
1 Introduction
This paper introduces a new voting method namedcardinal-weighted pairwise comparison, or cardinalpairwise for short. It is based on Condorcet’s methodof pairwise comparison, but in addition to asking vot-ers to rank the candidates in order of preference, thismethod also asks them to rate the candidates, for ex-ample on a scale from 0 to 100. The ordinal rankinginformation is still used to decide the winner and loserof each pairwise comparison, but the cardinal rating in-formation is used to decide the relative strength of thepairwise victories/defeats, which determines how ma-jority rule cycles are resolved if they occur.
Sections 2 through 4 are primarily concerned withdefinition, and sections 5 through 7 are primarily con-cerned with analysis and justification. In sections 2, 3and 4, I define some key terms, define the cardinal pair-wise method, and give an example computation. In sec-tion 5, I argue that pairwise methods in general are su-perior to other voting methods when the goal is major-ity rule. In sections 6 and 7, I discuss the advantages ofcardinal pairwise over other pairwise methods, whichare as follows: First, it takes into account the relativepriority of each pairwise preference to each voter. Sec-ond, it may greatly reduce the vulnerability to strategicmanipulation that is troublesome for pairwise methods.
2 Preliminary definitions
Pairwise comparison, pairwise defeat, pairwise tie:A pairwise comparison uses ranked ballots tosimulate head-to-head contests between differentcandidates. Given two candidates A and B, thereis a pairwise defeat of B by A if and only if A isranked above B on more ballots than B is rankedabove A. If the number of A>B ballots is equalto the number of B>A ballots, then there is apairwise tie between A and B.
> and = symbols: I use these in two slightly differentways. For example, “A>B” can mean that an in-dividual voter or a specific set of voters ranks Aabove B, and it can also mean that A has a pair-wise victory over B. “A=B” can signify an equalranking of A and B, or a pairwise tie between Aand B. The meaning will be made clear by the con-text.
Condorcet winner, Condorcet-efficiency, Condorcetcriterion: A Condorcet winner, also called a‘dominant candidate,’ is a candidate that wins allof its pairwise comparisons. If a voting methodalways elects a Condorcet winner when oneexists, the method is Condorcet-efficient, andpasses the Condorcet criterion.
Strong Condorcet winner: A Condorcet winnerwhose pairwise victories are each supported bymore than one half of the ballots.
Majority rule cycle: A circular series of pairwise de-feats (e.g. A beats B, B beats C, C beats A) thatleaves no single candidate unbeaten.
Condorcet completion method: A voting method thatchooses the Condorcet winner when one exists,and is also decisive when there is no Condorcetwinner. The following four methods (minimax,ranked pairs, river, and beatpath) are Condorcetcompletion methods.
6
Green-Armytage: Cardinal pairwise
Minimax method: The winner is a candidate whosestrongest pairwise loss (if any) is the least strongcompared to other candidates’ strongest losses.Equivalent to a method that drops the weakestpairwise defeat until one candidate is undefeated.
Ranked pairs method: Defeats are considered in de-scending order of strength. They are locked inplace unless they make a cycle with already-locked defeats, in which case they are skipped.The winner will be a candidate who is undefeatedafter all the defeats have been considered. SeeTideman [11].
River method: Similar to ranked pairs, except that itdoes not lock more than one defeat against thesame candidate; once the first has been locked,any others are skipped. See Heitzig [3].
Beatpath method: A beatpath is a series of pairwisedefeats that form a path from one candidate to an-other. For example, if A beats B, and B beats C,then there is a beatpath from A to C. The strengthof a beatpath is defined as the strength of its weak-est component defeat. If the strongest beatpathfrom X to Y is stronger than the strongest beat-path from Y to X, then X has a beatpath win overY. The winner of the beatpath method will be acandidate such that no other candidate has a beat-path win against it. See Schulze [8].
Ordinal pairwise: A shorthand term that I will use torefer to versions of the minimax, ranked pairs,river, and beatpath methods that only use ordinalrankings, and measure defeat strength in terms ofa sheer number of votes, whether the number ofvotes in agreement with a defeat, or the marginbetween the number of votes in agreement and thenumber of votes in disagreement.
Minimal dominant set: The smallest set of candidatessuch that every candidate within the set has a pair-wise victory over every candidate outside the set.See Schwartz [10]. The ranked pairs, river, andbeatpath methods always choose from the mini-mal dominant set, whereas the minimax methoddoes not.
Resolvability: A voting method is resolvable if theprobability that a random solution will be neededto produce a winner approaches zero as the num-ber of voters approaches infinity.
Mutual majority criterion: If there is a single major-ity of the voters who rank every candidate in a set
S1 over every candidate outside S1, then the win-ner should always be a member of S1.
3 Definition of the cardinal-weightedpairwise comparison method
3.1 Ballot
1. Voters rank the candidates. Equal rankings areallowed.
2. Voters rate the candidates, e.g. on a scale from 0to 100. Equal ratings are allowed. If you give onecandidate a higher rating than another, then youmust also give the higher-rated candidate a higherranking.
3.2 Tally
1. Determine the direction of the pairwise defeats byusing the rankings for a standard pairwise com-parison tally.
2. Determine the strength of the pairwise defeats byfinding the weighted magnitude as follows. Sup-pose that candidate A pairwise beats candidate B,and we want to know the strength of the defeat.For each voter who ranks A over B, and only forvoters who rank A over B, subtract their rating ofB from their rating of A, to get the rating differ-ential. The sum of these individual winning ratingdifferentials is the total weighted magnitude of thedefeat. (Note that voters who rank B over A do notcontribute to the weighted magnitude of the A>Bdefeat; hence it is never negative.)
3. Now that the direction of the pairwise defeats havebeen determined (in step 1) and the strength of thedefeats have been determined (in step 2), you canchoose from a variety of Condorcet completionmethods to determine the winner. I recommendthe ranked pairs, beatpath, and river methods.
3.3 Optional, additional provisions
These additional provisions are not an essential part ofthe cardinal-weighted pairwise method, but they mayprove helpful.
1. Maximizing in scale provision: [1] Once a mini-mal dominant set has been established by the pair-wise tally in step 2, it may be a good idea to max-
Voting matters, Issue 19 7
Green-Armytage: Cardinal pairwise
imize the voters’ rating differentials in scale be-tween the candidates in the set. That is, to changethe ratings on each ballot so that the highest-rated minimal dominant set candidate is at 100,the lowest-rated minimal dominant set candidateis at 0, and the rating differentials between theminimal dominant set candidates retain their orig-inal ratios. (For example, 50,20,10 would become100,25,0.) The benefit of this provision is that vot-ers will have equal ballot weight with regard tothe resolution of the majority rule cycle in partic-ular. Therefore, voters will not have an incentiveagainst investing priority in preference gaps thatare relatively unlikely to fall within the minimaldominant set.
2. Blank rating option: This allows voters to giveone or more candidates a blank rating, such thatif I give some candidate a blank rating, my ballotwill still affect the direction of pairwise defeatsconcerning that candidate, but it will not add tothe weighted magnitude of such defeats.
Another possible way to deal with candidates thatvoters leave unrated is to determine their ratingsusing a default formula. For example, a candidateranked in first place could be given a default rat-ing of 100, a candidate ranked in last place couldbe given a default rating of 0, and remaining de-fault ratings could be spaced evenly within theconstraints imposed by surrounding ratings.
4 An example computation
The notation in the first line below is used to indicatethat 26 voters rank the candidates in the order Right >LeftB > LeftA, and assign the three candidates ratingsof 100, 10, and 0, respectively.
4.1 Example
26: Right > LeftB > LeftA (100,10,0)22: Right > LeftA > LeftB (100,10,0)26: LeftB > LeftA > Right (100,90,0)1: LeftB > Right > LeftA (100,50,0)21: LeftA > LeftB > Right (100,90,0)4: LeftA > Right > LeftB (100,50,0)Direction of defeats (using ranking information):Right > LeftB : 52-48LeftA > Right: 51-49LeftB > LeftA: 53-47
Weighted magnitude of defeats (using rating informa-tion): Right > LeftB :
Completion by cardinal-weighted pairwise withranked pairs or river: Consider the defeats in the or-der of descending weighted magnitude.4740: Right > LeftB keep4640: LeftA > Right keep620: LeftB > LeftA skip (would cause a cycle,Right>LeftB>LeftA>Right)Kept defeats produce ordering LeftA>Right>LeftB ;LeftA wins.
Completion by cardinal-weighted pairwise withbeatpath: The strength of a beatpath is defined by thedefeat along that path with the lowest weighted magni-tude.beatpath Right → LeftB : 4740beatpath LeftB → Right: 620beatpath LeftA → Right: 4640beatpath Right → LeftA: 620beatpath LeftA → LeftB : 4640beatpath LeftB → LeftA: 620Complete ordering is LeftA>Right>LeftB ; LeftA wins.
5 Why majoritarian election methodsshould be Condorcet-efficient
The Condorcet criterion (along with the minimal domi-nant set, which is a generalization of the same principle)seems to be the most authentic definition of majorityrule that is available to us. If there is one candidate whois preferred by some majority over every other candi-date individually, it seems inappropriate to call anyoneelse a majority winner. For example, if candidate Ais a Condorcet winner, and a non-Condorcet-efficientmethod elects candidate B, a majority will prefer A toB. If there was an election just between these two can-didates, A should be expected to win that election.
Condorcet efficiency has important practical benefits.First, Condorcet-efficient methods tend toward the po-litical center, which should promote compromise ratherthan polarization. Second, when a strong Condorcet
8 Voting matters, Issue 19
Green-Armytage: Cardinal pairwise
winner exists with respect to voters’ sincere prefer-ences, and another method chooses someone else, theresult is unstable in that a majority could have achieveda mutually preferable result if some of them had voteddifferently.
Condorcet-efficient methods minimize the incentivefor the compromising strategy, which is insincerelyranking an option higher in order to decrease the proba-bility that a less-preferred option will win. For example,if my sincere preferences are R>S>T, a compromisingstrategy would be to vote S>R>T or R=S>T, raising S’sranking in order to decrease T’s chances of winning.(The drawback is that this often decreases R’s chancesof winning as well.) All resolvable voting methods thatsatisfy the mutual majority criterion have a compromis-ing incentive when there is a majority rule cycle. Butunlike other methods, such as single-winner STV, vot-ers in Condorcet-efficient methods never have an in-centive to use the compromising strategy when thereis a Condorcet winner [9]. This is an important prop-erty because, in the absence of a majority rule cycle, itallows me to vote my R>S preference without worry-ing that it will undermine my S>T preference. This isa more complete way of curtailing the “lesser of twoevils” problem, that is, decreasing the extent to whichvoters have to worry about earlier choices drawing sup-port away from later choices. Thus, Condorcet-efficientmethods allow more candidates to participate on anequal basis, which should lead in turn to substantiallyhigher levels of responsiveness and accountability.
6 Preference priority and defeat strength
Most Condorcet-efficient methods that have been pro-posed so far limit voter input to ordinal rankings.Hence, voters can express preferences between candi-dates, but they cannot express the relative priority oftheir preferences. If I worship my first three choices,but detest my fourth and fifth choices, I cannot expressthis on my ballot, and it is not taken into account whenthe winner is decided.
Ordinal pairwise methods measure defeat strength interms of a sheer number of ballots. The cardinal pair-wise method extends the sensitivity of the process byfactoring in a measure of how much priority the votersassign to each ranking. The goal is that the weakest de-feat in a majority rule cycle should be the one that hasthe lowest overall combination of these two factors: 1)the number of voters in agreement with the defeat; 2)
the relative priority of the defeat to those voters whoagree with it.
It seems almost axiomatic that, when faced with amajority rule cycle, one should drop the defeat(s) in thecycle that are of least importance to the voters. The re-maining question is how to define the priority of eachdefeat to each voter, and how to aggregate these in-dividual priorities. The answer that cardinal pairwisegives to this question is relatively simple. For thosewho agree with a defeat, we look at the rating differ-ential they express between the two candidates beingcompared. Then we take the sum of these winning rat-ing differentials to find the overall strength of the defeat.
The idea is that the voters will rate the candidatessuch that the rating differential between each pair ofcandidates will reflect the relative priority of their pref-erence between those candidates. The fact that eachvoter is constrained to the same range of ratings (e.g.0 to 100) assures that everyone has essentially the samevoting “power.” The point here is not to do interper-sonal comparison of utilities, but rather to allow votersto prioritize their own preferences relative to one an-other, using a fluid and simple high-resolution scale.
When learning the cardinal pairwise method, onemay wonder why it only looks at the rating differen-tials of those who agree with a particular defeat, ratherthan subtracting the losing rating differentials from thewinning rating differentials. To begin with, I will saythat I am more interested in dropping the defeats thatare of least importance to the voters overall, rather thanthe defeats that are the closest in terms of the strengthof preference on either side. That is, if there is one pair-wise comparison that voters on both sides consider tobe a very high priority, I think that it is especially im-portant not to reverse this defeat. Such high-priority de-feats should be regarded as crucial within the election,and the cardinal aspect of the method should be used todefend them rather than to undermine them.
In this way, looking at only the winning rating dif-ferentials greatly improves the stability of the cardinalpairwise method. Because the defeats that voters placethe highest priority on are the most difficult to reverse,the cardinal pairwise method is unusually resistant tostrategic manipulation. This point will be explored ingreater detail in the next section.
Voting matters, Issue 19 9
Green-Armytage: Cardinal pairwise
7 Strategic manipulation
Although Condorcet-efficient methods minimize the in-centive for use of the compromising strategy, they arevulnerable to the burying strategy. This strategy en-tails insincerely ranking an option lower in order toincrease the probability that a more-preferred optionwill win. For example, if my sincere preferences areR>S>T, a burying strategy would be to vote R>T>S orR>S=T, lowering S’s ranking in order to increase R’schances of winning. (The drawback is that this oftenincreases T’s chances of winning as well.)
Imagine that with respect to voters’ sincere prefer-ences in a three-candidate election, A pairwise beats Band C, while B pairwise beats C. A is a sincere Con-dorcet winner, but it is often possible for supporters ofcandidate B to gain an advantage by burying A underC, that is, by voting B>C>A instead of B>A>C. Thiscan create an insincere C>A defeat, which can causea majority rule cycle such that the A>B defeat is theweakest of the three, so that B wins. In this way, it isoften possible to overrule a genuine defeat with a fakedefeat.
The burying strategy may have the potential to causesubstantial trouble in elections that use a Condorcet-efficient method. Some have cited this as a reasonnot to adopt Condorcet-efficient methods. (Monroe[5]; Richie and Bouricus [6]) Unfortunately, Condorcet-efficient methods cannot be completely invulnerable tothe burying strategy, which follows from the fact thatCondorcet-efficiency is incompatible with the later-no-help criterion [12]. However, cardinal pairwise may beable to make this vulnerability much less severe.
There are many reasons to think that cardinal pair-wise will be more resistant to strategy than most otherCondorcet-efficient methods. First, it should tend toprevent the most flagrant strategic incursions. Sec-ond, it should tend to balance strategic incentive againststrategic ability, so that those who are most interestedin changing the result via strategic incursion tend to bethose who are least able to do so. Third, it should min-imize strategic barriers against the entry of new candi-dates. Fourth, it should create the possibility of more-stable counterstrategies than those that are available inordinal pairwise.
7.1 Flagrant strategic incursions
I define a flagrant strategic incursion as one that causesa very high-priority defeat to be overruled by a false
defeat. Take example 7.1 below. Sincere votes:46: A>B>C (100,10,0)44: B>A>C (100,10,0)5: C>A>B (100,50,0)5: C>B>A (100,50,0)
A is a Condorcet winner. Clearly, the primary contestis between A and B, as C is the last choice of 90% of thevoters. However, using ordinal pairwise, the B>A>Cvoters can change the winner to B by voting B>C>A.This is a very flagrant incursion.
In cardinal pairwise, however, this particular type offlagrant incursion does not work. The weighted mag-nitude of the C>A defeat is 4490, and no defeat witha magnitude greater than 33331/3 can be dropped as aresult of a three candidate cycle (assuming 100 votersand a 0-100 rating scale).
With larger cycles (four candidates and above, e.g.A>B>C>D>A), the 33331/3 limit does not apply, butoverruling a high-magnitude defeat is still very diffi-cult. Let’s say that there is a candidate B, who ispairwise-beaten by a candidate A. In order for B towin, there must be a chain of defeats from B to A(e.g. B>C>D>A), such that every defeat along thatchain has a weighted magnitude that is at least equalto the A>B defeat. The minority who prefer B to A willhave a limited amount of weight to distribute along theB>C>D>A chain. A given point of weight can count to-wards two defeats in this four-candidate chain (e.g. theone-point gap in the vote B>D>C>A (1,1,0,0) countstowards the B>C and D>A defeats), but it cannot counttowards more than two.
Cardinal pairwise, unlike ordinal pairwise, does notallow a voter to apply the maximum weight to all oftheir pairwise preferences. This scarcity of weight pro-duces excellent anti-strategic effects, by placing a limiton the extent to which a strategizing group of voters canbuild up the weight of multiple pairwise defeats at thesame time in order to manipulate the overall result.
In general, flagrant incursions are much less likely tobe successful in cardinal pairwise than in ordinal pair-wise, because the difficulty of overruling an A>B defeatincreases as more voters assign a higher priority to theA>B defeat. I hope that my definition of a flagrant in-cursion can be seen to have value, and that it can beagreed upon that relatively high-priority defeats shouldbe harder to overrule. Consider that when a defeat of Aover B is given a very high priority, we can generallyexpect B to be very different from A (in the eyes of thevoters), relative to differences with the other candidatesin the election. In order to quantify this difference, we
10 Voting matters, Issue 19
Green-Armytage: Cardinal pairwise
can look at both the average A>B rating differential andthe average B>A rating differential for individual vot-ers.
I think it is crucial that we make it as difficult as pos-sible for strategic voters to alter an election result insuch a way that the actual winner is considered by thevoters to be extremely different from all of the mem-bers of the sincere minimal dominant set. Consider howseriously it would undermine the legitimacy of the vot-ing system, if it was found that partisan supporters hadpulled off a successful burying strategy which won theelection for a candidate who was the ideological polaropposite of the sincere Condorcet winner. Ordinal pair-wise unfortunately cannot offer much protection againstthis disturbing possibility, but cardinal pairwise can.
7.2 Strategic incentive and strategic ability
There are impossibility theorems that show that strate-gic manipulation cannot be completely avoided in anyreasonable election method (Gibbard [2]; Satterthwaite[7]; Hylland [4]), but I’m not aware of a theorem thatsays that we can’t find a method that distributes strategicability in roughly inverse proportion to strategic incen-tive.
Let’s assume that the intensity of difference that avoter perceives between two candidates tends to belargely independent of their ranking of those candi-dates, and that the average rating differentials on eitherside of a defeat will tend to be strongly correlated withone another.
Let’s say that there is a candidate A who pairwisebeats candidate B. If the incentive for the B>A votersto help B by burying A is particularly strong–that is, ifthey assign a very high priority to their B>A ranking–then we can expect the A>B voters to assign a high pri-ority to their A>B ranking as well, which will makethe A>B defeat very hard to overrule. So, a group ofvoters’ ability to achieve a successful burying strategygenerally tends to be smaller in cases where that grouphas a larger incentive to engage in that strategy.
Conversely, if A and B are considered to be moresimilar candidates, such that there are low average rat-ing differentials on both sides of the defeat, then it maybe more feasible for the B>A voters to help B by bury-ing A, but they would have less to gain by doing so, andmore to lose should the strategy backfire.
In example 4.1 above, LeftB and LeftA can be consid-ered to be relatively similar candidates, in that there isa low average rating differential placed on the compar-ison between them, going in both directions. If onlyLeftA and Right were candidates, LeftA would proba-bly win, since he has a pairwise win over Right. In car-dinal pairwise, the entry of LeftB does not change thisresult. However, the winner changes to Right in ordinalpairwise, which defines Right’s 49-51 pairwise loss asthe weakest in the cycle. In general, it is much harderin cardinal pairwise for the entry of a new, non-winningcandidate to do harm to a similar candidate. The rea-son for this is that if the new candidate beats the similarcandidate, but does not win, this defeat will be relativelyweak, and hence likely to be overruled in the event of acycle.
In ordinal pairwise, a voter who would otherwisesupport a potentially-entering candidate might havesome anxiety that this candidate could hurt a similarcandidate whom that voter also supports. Because thepotentially-entering candidate’s support base may feelambivalent about his presence in the race, entry of thecandidate may not occur. Thus, the method retains acertain strategic barrier to entry of new candidates. Car-dinal pairwise minimizes this barrier to entry, in that theentry of a new candidate is extremely unlikely to affectthe result in opposition to the will of his would-be sup-porters.
7.4 Stable counterstrategies
If several voters try to coordinate a strategic incursion,and other voters learn about this and consider it to beundesirable, they may attempt to coordinate a counter-strategy, in order to make the initial strategy unsuccess-ful. One hopes that counterstrategy will rarely or neverbe needed, but it is nevertheless to the credit of cardi-nal pairwise that it provides for somewhat more-stablecounterstrategies than ordinal pairwise. Actually, thismay be important in preventing strategic incursion fromachieving a critical mass in the first place.
Example 7.2: Some votes are strategically altered28: A>B>C (100,60,0)23: C>A>B (100,40,0)17: B>A>C (100,60,0)22: C>B>A (100,40,0)
Voting matters, Issue 19 11
Green-Armytage: Cardinal pairwise
10: B>C>A (100,100,0) these 10 votes are strategicallyaltered from a sincere ordering of B>A>C
Pairwise comparisons, followed by weighted magni-tudes:A > B: 51-49 C > A: 55-45 B > C: 55-45A > B: 2040 C > A: 4580 B > C: 3380Candidate A was a sincere Condorcet winner, but Bwins instead using both ordinal and cardinal pairwise,as a result of the B>A>C voters’ burying strategy.
There are two basic counterstrategy replies to theburying strategy: the compromising counterstrategy,and the deterrent/burying counterstrategy.
In ordinal pairwise, the compromising counter-strategy would entail the C>A>B voters weakening orreversing the defeat against A by voting C=A>B. In car-dinal pairwise, a similar effect could be gained by vot-ing C>A>B (100,100,0). Both counterstrategies can re-turn the victory to candidate A. The cardinal pairwisecounterstrategy is more stable than the ordinal pairwisecounterstrategy, in that it does not risk a change in thewinner of the A-C pairwise comparison. This makes ita less perilous choice for the C>A>B voters.
The deterrent/burying counterstrategy would en-tail the A>B>C voters weakening or reversing B’s de-feat of C, such that the B>A>C voters’ burying of Acould only backfire by electing C. In ordinal pairwise,this would require some A>B>C voters to equalizeor reverse their B>C preference, thus voting A>B=Cor A>C>B. In cardinal pairwise, it is possible for theA>B>C voters to get a similar deterrent effect by vot-ing A>B>C (100,0,0).
With the deterrent/burying counterstrategy in gen-eral, the counterstrategizers are unlikely to know forsure whether the original strategizers will carry out theirincursion or not, until the votes have already been cast.Therefore it is important to have an effective counter-strategy that they can use without severely destabilizingthe result, in case the original strategy is not carried outand the counterstrategy punishment is undeserved. Inthis respect, the cardinal pairwise version of the coun-terstrategy is preferable, in that it does not alter the di-rection of any pairwise defeats, and therefore will notinterfere with the identification of a Condorcet winner.
Of course, the existence of more-stable counterstrate-gies in cardinal pairwise does not mean that strategywill never be a problem. However, it suggests to methat the threat of a strategic incursion, should it arise, isless likely to spiral out of control.
8 Conclusion
I believe that voting methods aiming for majority ruleshould be Condorcet-efficient, and that Condorcet-efficient methods should be improved in two ways.One, they should take the relative priority of voters’pairwise preferences into account; two, they should bemore resistant to the burying strategy. I find it serendip-itous that the same principle can achieve both benefitssimultaneously.
I find both of these potential improvements quitesignificant, but perhaps the strategic issue is the morepressing of the two, as I suspect that the burying strat-egy could prove to be a serious problem for Condorcet-efficient methods in contentious elections. It is impor-tant to have a method that, in addition to recognizing aCondorcet winner when one is clearly expressed, worksto protect sincere Condorcet winners from being ob-scured by strategic incursion. I believe that cardinal-weighted pairwise accomplishes this to an unusual de-gree.
So, I do not intend cardinal-weighted pairwise as afrivolous academic exercise or a mathematical curios-ity. I intend it as a realistic proposal, and one that I sin-cerely prefer over other existing proposals. I recognizethat it adds an extra layer of complexity, but I feel thatthe benefits of more-meaningful cyclic resolution andreduced strategic vulnerability far outweigh the cost.
9 Acknowledgments
I thank Nicolaus Tideman, Jobst Heitzig, Chris Ben-ham, and Markus Schulze for their helpful commentson earlier versions of this paper. I am also grateful tomany participants of the election methods discussionlist for their insight and support.
10 References
[1] Benham, C. (2004) Personal correspondence.June 8.
[2] Gibbard, A. (1973) Manipulation of votingschemes: A General Result. Econometrica 41:587-601.
[3] Heitzig, J. (2004) River method – updatedsummary. Discussion list entry. October 6.http://lists.electorama.com/pipermail/election-
methods-electorama.com/2004-October/013971.html
12 Voting matters, Issue 19
Green-Armytage: Cardinal pairwise
[4] Hylland, A. (1980) Strategy proofness of votingprocedures with lotteries as outcomes and infinitesets of strategies. University of Oslo.
[5] Monroe, B. (unpublished) Preferences, votes, andrepresentation: rethinking social choice theoryand democratic institutions. Unpublishedmanuscript. Excerpted athttp://accuratedemocracy.com/archive/condorcet/
Monroe/004004MonroeBurt.pdf
[6] Richie, R. and Bouricus, T. (2004) Draft of CVDanalysis about IRV vs. Condorcet voting.http://groups.yahoo.com/group/instantrunoff/message/1548
[7] Satterthwaite, M. (1975) Strategy-proofness andArrow’s conditions: Existence andcorrespondence theorems for voting proceduresand social welfare functions. Journal ofEconomic Theory 10: 187-217.
[8] Schulze, M. (2003) A new monotonic andclone-independent single-winner electionmethod. Voting matters 17: page 9-19
[9] Schulze, M. (2004) Compromising strategy inCondorcet. Two discussion list entries.September 19.http://lists.electorama.com/pipermail/election-
methods-electorama.com/2004-September/013908.html
http://lists.electorama.com/pipermail/election-
methods-electorama.com/2004-September/013906.html
[10] Schwartz, T. (1986) The Logic of CollectiveChoice. New York: Columbia University Press.Page 141.
[11] Tideman, T.N. (1987) Independence of clones asa criterion for voting rules. Social Choice andWelfare 4: 185-206.
[12] Woodall, D. (1997) Monotonicity of single-seatpreferential election rules. Discrete AppliedMathematics 77: 81-98.
This document considers the following problem: givenan election in which preferential voting is used andthe count is conducted by computer, what informa-tion should be disclosed? Running an election consistsof several stages, but here we are concerned with thecounting process only. This process must not only betrustworthy, but needs to be seen as such by the elec-torate.
With the manual count, the full result is typically de-clared by a result sheet which contains the great ma-jority of the information gathered during the countingprocess1. If a witnessed count is undertaken, which is,of course, the case with public elections, then all thecritical information that would be available to the wit-nesses appears in the result sheet. The same degree oftransparency is needed when a computer count is under-taken.
In the USA, under their Freedom of Information Act,full information of the ballot preferences is available forpublic elections. Of course, although this information isavailable, the identity of those who voted in a specificway is not available — ballot secrecy is maintained.
In the case of the experimental use of computers inthe Irish Dail elections in 2002, full information wasavailable for the three constituencies polled by votingmachines. It appears that the Republic has a similarFreedom of Information Act to the USA.
There are at least three different types of election inwhich the full disclosure questions arise: public elec-tions; private elections performed by an independent
1Practices vary in this area. Working calculations should be pub-lished but may not be. For some elections, the ballot boxes are openedindividually allowing a careful witness some information about therelative strengths of the candidate vote.
party; and lastly, private elections performed internally.All three types of election occur with the Single Trans-ferable Vote (and computer counting).
2 Data Protection Legislation
Public elections are typically covered by national laws,but private elections would also need to adhere to ap-propriate national laws. For the EU, this is largely thenational laws which enact the European Directive onData Protection. This gives data subjects the right toinformation held about them, and for those holding in-formation the need to register and control access to theinformation.
There are two cases to consider here: those relatingto the candidates in an election and those relating to avoter. Assuming that the voter is not specifically identi-fied, then, in effect, no information is held and thereforenothing needs to be disclosed.
For the candidate, it is clear that information is heldand therefore the candidate has a right to be told the in-formation held. For a preferential voting system, it hasbeen my opinion (based upon the 1984 Act, which wasstraightforward to follow), that the candidate should beinformed as to how many preferences were recordedagainst him/her at all the various levels. Of course,the number of first preferences would be available fromthe result sheet, but the other preferences may not be.Hence, with a computer count, there seems little doubtthat more information should be available to candidatesthan is provided in the result sheet.
The situation is rather more confused when one con-siders disclosure of more than the above. It is clearthat ballot secrecy is paramount and therefore disclo-sure may be limited by that need. The limitation issurely minimal since ballot secrecy has not been calledinto question in the USA, where full disclosure takesplace.
14
Wichmann:Full Disclosure
We consider secrecy in the next section and hence forthe moment, we note current practice.
For the 2002 Irish Dail elections, full disclosure tookplace. Some reservations have been expressed aboutthis in a recent Irish report [6]. Also, in the context ofpublic elections, Otten has pointed out a means of mak-ing bribery effective by the use of an unlikely sequenceof preferences [1]. It seems that this problem has notbeen raised in the USA.
In the case of an independent balloting organisationundertaking a count, it is not immediately clear who‘owns’ the ballot data. If it is the balloting organisation,then disclosure rests with them, otherwise it rests withtheir client.
Currently, Electoral Reform Services maintain thatfull disclosure is not possible even when the client re-quests it. I cannot understand this position and I am notalone in this.
3 Secrecy
Less that 150 years ago it was argued by some that se-cret voting was not desirable, but nowadays everyoneseems to accept that secrecy is paramount. Given that,then the question arises as to whether this imposes somerestrictions in applying the principle of full disclosure.
Secrecy has an important limitation. If the entireelectoral process is clothed in secrecy, then the valid-ity of the result will be open to question. Hence publicelections are open to substantial external scrutiny. Inour context, we are concerned with elections in whichthe count is undertaken by computer. It is far from clearhow the process of validating a count should be under-taken under such circumstances. Again, we are assum-ing that the other parts of the electoral system performthe intended function in a manner acceptable to the elec-torate. The integrity of the count was part of the concernin the report on the Irish system [6].
One means to overcome part of this problem is fulldisclosure. Then anybody can use the data to repeatthe count in order to confirm the result. (Countingsoftware is needed, but that is readily available for al-most all counting rules.) This is a stronger valida-tion method than the traditional method of a witnessedmanual count. When an STV manual count has beenchecked afterwards by using a computer, some errorsare almost always found — sometimes even affectingthe result!
Is ballot secrecy compatible with full disclosure?There are two possible problems: firstly, elections witha small number of votes, and secondly, the problem of along preference list which can act as a signature for thevoter.
3.1 An example — census data
It seems to me that there is a good analogy between theproblem here and that in handling census data. Com-plete disclosure occurs after 100 years. People can alsorequest their own data. However, substantial statisti-cal information is made available without restriction —a clear need for Government planning. The apparentconflict is overcome by grouping information into suffi-ciently large numbers so that an individual return cannotbe identified.
It is my understanding that the protocol that the Of-fice of National Statistics uses was agreed with theRoyal Statistical Society.
It is my contention that a similar protocol needs to beagreed for preferential election data.
4 Technical measures to ensure secrecy
It seems that there is no concern about the informationavailable from a result sheet. I have been informed of anexample in which the result sheet could be regarded asproblematic. This was for the 1999 North Tipperary lo-cal election in which a candidate got no first preferencevotes. One could envisage a situation in which sucha candidate was then hostile to his/her friends, family,employees, etc.
The preferences themselves can be revealed. Let ussay one is voting in an election in which your prefer-ences are A, B, C and finally D. It is not possible toexclude the possibility that the existence of such a vot-ing pattern will be evident from the result sheet. For anactual example in which a long preference list was evi-dent, see [2], which was evident due to full disclosure.
In practice, the percentage of preferences actuallyused in an election is quite small, so it is usual for longpreference lists to consist mainly of unused preferences(see [4]). It is therefore possible to provide a form ofdisclosure in which some of the preferences on the bal-lot papers are omitted or changed, but still provide datawhich confirms the result of the count. In other words,there is plenty of room to provide a form of disclosurewhich allows for count validation but nevertheless en-sures ballot secrecy.
Voting matters, Issue 19 15
Wichmann:Full Disclosure
The statistical analogy to the census data problemwould perhaps be to disclose a fraction of the ballot pa-pers. This is not a good method, since the data wouldthen not provide a means of validating the count. I havewritten a program myself to make a number of changesto ballot data so that both the election and the candidatescould not be identified. Unfortunately, such changesmake it impossible to perform some reasonable formsof analysis, like determining if there is an alphabeticbias in the voting data.
It is certainly true that if ballot data is provided onlyfor some forms of statistical research that a samplingmethod could be effective. Such a form of disclosurewould be of use, but only to a very limited audience.
I am unclear how small any election should be beforefull disclosure could not reasonably be undertaken. Iffull disclosure is not provided, then the issue of countvalidation remains.
Finally, it should be noted that once any public formof disclosure takes place, the use to which it is put is un-controlled. Here, we are not concerned with making in-formation available under some form of non-disclosureagreement that might restrict its use for research pur-poses.
5 Conclusions
From the above, I make the following conclusions:1. In the interests of openness and the validation of
computer counting, full disclosure should be thedefault.
2. Legal advice should be obtained on any caveats tofull disclosure as a result of the Data Protection Di-rective.
3. Technical measures should be agreed on howfull disclosure should be implemented, given theparamount importance of ballot secrecy.
4. Purists may well object to anything other than mak-ing the ballot data available without change, butdisclosure which is sufficient for count validationis surely required.
6 Postscript
Drafts of this paper have been sent to several peoplewho I know are interested in this subject. I have tried toreflect the views of those who commented on the drafts,but this has not always been possible. Those who pro-vided comments include: James Gilmour, Steve Todd,
Joe Otten, Colin Rosenstiel, Anthony Tuffin, JefferyO’Neill and David Hill.
David Hill was strongly of the view that no changeshould be made to the ballot preferences. I would pre-fer that, but think that it is better to have effective dis-closure (in which small changes are made), rather thanno disclosure which is the position with the majority ofSTV computer counts at the moment.
7 References
[1] Otten J. Fuller disclosure than intended. Votingmatters, Issue 17, p8. 2003.
[2] Hill I. D. An odd feature in a real STV election.Voting matters, Issue 18, p9. 2004.
[3] Hill I. D. Full disclosure of data. Voting matters,Issue 18, p10. 2004.
[4] Wichmann, B. A. A note on the use of preferences.Voting matters, Issue 18, p9. 2004.
[5] Hill I. D. What would a different method havedone? Voting matters. Issue 16. p5. 2003.
[6] Interim Report of the Commission on Elec-tronic Voting on the Secrecy, Accuracy andTesting of the chosen Electronic Voting System.http://www.cev.ie/htm/report/download report.htm
16 Voting matters, Issue 19
ISSN 1745-6231
Voting matters
for the technical issues of STV
published by
The McDougall Trust
Issue 20 June 2005
About the McDougall Trust (reg. charity no. 212151)
The McDougall Trust is a charitable trust formed in 1948. The charity’s purposes asstated in its governing scheme of 1959 are to advance knowledge of and encouragethe study of and research into:
• political or economic science and functions of government and the services pro-vided to the community by public and voluntary organisations; and
• methods of election of and the selection and government of representative organ-isations whether national, civic, commercial, industrial or social.
The Trust’s work includes the maintenance and development of the Lakeman Libraryfor Electoral Studies, a unique research resource, the production and publication ofRepresentation: The Journal of Representative Democracy, and, of course, this pub-lication Voting matters, that examines the technical issues of the single transferablevote and related electoral systems.For further information on the Trust, please contact:
For further information on this publication, please contact B A Wichmann, the Editorat the above address or by email at: [email protected]
Editorial
There are 4 papers in this issue:
• I. D. Hill and C. H. E. Warren: Meek versusWarren.
This article compares two computer-based STVcounting algorithms. Although the Meek versionseems to be the only version which is widely used,readers of Voting matters should surely appreciatethe differences and draw their own conclusions.
• I. D. Hill and Simon Gazeley: Sequential STV —a further modification.
This paper considers a variant of STV in whichlater preferences are used to exclude candidates.The modification described here has proved nec-essary due to two issues which are described in thepaper.
• Earl Kitchener: A new way to break STV ties in aspecial case.
This short paper considers one special case inwhich the proposal is surely non-controversial.This is followed by summary and moderated de-bate on breaking ties produced by the editor withassistance from those listed.
• P Kestelman. Apportionment and Proportionality:A Measured View.
The author’s abstract reads: Apportionment(allocating seats to multi-member constituenciesequitably) can illuminate proportionality (allo-cating seats to parties fairly) and its quantifi-cation. Sainte-Lague (Webster) is the fairestmethod of apportionment — and electoral prin-ciple. Several disproportionality measures havebeen proposed: among which the Loosemore-Hanby Index straightforwardly measures Partytotal over-representation. UK general elections(First-Past-the-Post) have clearly proved non-PR;and even nominally PR elections of British MEPsand Regional Assemblies have yielded only semi-PR (‘broad PR’). Allowing for vote transferability,multimember STV in Ireland has mediated full PR(despite low District Magnitude); while Alterna-tive Voting in Australia has arguably proved semi-PR.
The New Zealand STV elections
A Parliamentary investigation (Justice and ElectoralCommittee) is under way into the delays in producingthe results. It has not yet reported.
Steve Todd reported in the last issue that the ballotdata should be available. In fact, the electoral officerswere divided on the provision of this data so that com-plete data is only available for 15 of the 79 elections.(There were 81 STV elections, but two were not con-tested.) A table giving the availability of the data isavailable on http://stv.sourceforge.net/.
The British Columbia Referendum for STV
The Referendum produced a majority for STV, but notthe 60% to ensure that the necessary legislation will bepassed. It is unclear at this stage what will happen.
Readers are reminded that views expressed inVoting matters by contributors do not neces-sarily reflect those of the McDougall Trust orits trustees.
Voting matters, Issue 20 i
Meek versus Warren
I. D. Hill and C. H. E. WarrenNo email available.
1 Where we agree (I.D. Hill and C.H.E.Warren)
We admire traditional STV methods (Newland and Brit-ton rules [1] and other similar methods) as being a goodapproximation to what STV is trying to achieve, whilebeing easy enough to do by hand within a reasonablelength of time, but in this electronic age, we ought todo better than that. Of course we accept that the abilityto count by hand is an advantage; but does such an ad-vantage justify the consequence that, quite often, the setof candidates who best meet the voters’ wishes are notelected? We think not. But if we seek to campaign forsomething better, we need to agree on the better thingthat we should support.
We agree that fairness is of prime concern in a vot-ing system, but it is a tricky concept — one only hasto listen to politicians all claiming that taxation, for ex-ample, must be fair (“and must be seen to be fair” asif that addition helped), while totally disagreeing witheach other about what is fair and what is not.
The Meek method [2] and the Warren method [3] arevery similar to each other but, in deciding how muchof each vote is retained by an elected candidate andhow much is passed on to the next choice, the Meekmethod uses multiplicative ‘keep values’ but the War-ren method uses additive ‘portions apportioned’. Wehere denote the Meek keep value and the Warren por-tion apportioned for candidate C as cm and cw respec-tively. These quantities have a value between 0 and 1,and they are calculated so that, if a candidate has a sur-plus, their use reduces the vote for that candidate to justthe quota. The calculation of these quantities so thatthey meet this requirement is a mathematical problem,usually requiring a computer. All that we need to knowin this paper is that they can be calculated.
With the Meek method cm is defined as the propor-tion of the vote that is passed to candidate C whichcandidate C retains, so that (1 − cm) is the proportionof that vote that is passed on. In the case of a ballot thatreads ABC...
the portion of vote which A retains is am
the portion of vote which A passes on to B is(1 − am)
the portion of vote which B retains is(1 − am)bm
the portion of vote which B passes on to C is(1 − am)(1 − bm)
the portion of vote which C retains is(1 − am)(1 − bm)cm
the portion of vote which C passes on is(1 − am)(1 − bm)(1 − cm)
and so on.
From the above statements we see why the Meekkeep values are called multiplicative.
With the Warren method cw is defined as the portionof a vote that is apportioned to candidate C if suchapportionment is possible. In the case of a ballot thatreads ABC...
the portion of vote which is apportioned to A is aw
if aw + bw > 1, the portion of vote which isapportioned to B is (1 − aw)
and nothing is apportioned to C and beyondif aw + bw ≤ 1, the portion of vote which is
apportioned to B is bw
if aw + bw ≤ 1 and aw + bw + cw > 1,the portion of vote which isapportioned to C is (1 − aw − bw)
and nothing is apportioned beyondif aw + bw + cw ≤ 1, the portion of vote which is
apportioned to C is cw
and so on.
1
Hill and Warren: Meek v. Warren
From the above statements we see why the Warren por-tions apportioned are called additive.
Although a Meek keep value cm may, in some cir-cumstances, turn out to have the same value as a War-ren portion apportioned cw, in general their numericalvalues are different.
The methods are equally easy to program for a com-puter and, for real voting patterns as distinct from testcases, they nearly always produce the same answers,not in numerical terms but in terms of which candidatesare elected and which are not. In those circumstances,we agree that it does not matter too much which is used,so it is preferable to support the one that is better in prin-ciple — but which one is that?
We recognise that impossibility theorems, such asWoodall’s theorem [4], show that to seek an absoluteideal is a ‘wild-goose chase’. It follows that it will al-ways be possible to produce particular examples thattell against any given method. Unlike proving a propo-sition in pure mathematics, where one counter-exampleis enough to demonstrate that we have failed, here wealways need to look at examples in a comparative sense,not an absolute sense, deciding which faults to allow forthe sake of avoiding others.
2 Why I prefer the Meek method (I.D.Hill)
To my mind the essence of STV is this — if we havea quota of 7, and 12 identical votes putting A as firstpreference and B as second (with no others for A) then7 votes must be held for A as a quota while the other 5are passed to B and, from that point on, behave exactlyas if they had originally been 5 votes for B as first pref-erence. The fact that those voters had A as first prefer-ence, and A has been elected, has been fully allowed forin holding 7 votes back and the other 5 votes are nowsimply B votes.
In practice, we never get such identical votes, so theonly fair way of doing things is, instead of holding 7complete votes back and passing on 5 complete votes,to hold back 7
12 of each vote and pass on 512 of each
vote, but the principle, that the 12 votes each of value512 should together have the same power as 5 com-plete votes, remains the same. This principle is fulfilledby the Meek method, but not by the Warren method.Because perfection is impossible, it could be that someadvantage could be shown by the Warren method that
would outweigh this disadvantage, but I am not awarethat any advantage has been claimed for it that is strongenough to do so.
If, at the next stage, we have 5 votes with B as firstpreference, plus our 12 votes each now of value 5
12 ,we have 10 votes altogether pointing at B. Only 7 areneeded for a quota so 7
10 needs to be retained allowing310 to be passed on, so the 5 votes are passed on with avalue of 3
10 , giving them a total power of 112 votes. If
the 12 votes are passed on with a value of 512 times 3
10 ,that gives them a total power of 1
12 votes too, showing
that 12 each of value 512 are being treated just like 5. To
get that effect necessarily requires a multiplicative rule,not an additive rule.
To look at it from a slightly different angle, the ruleshould be that the proportions of the total vote for a can-didate that come from different sources, and are used indeciding that the candidate can now be elected, shouldbe maintained in the amounts of vote retained and trans-ferred. Thus, in the same example, the votes from theAB voters and from the B voters that are used to decideto elect B are in proportion 1 to 1, whether the Meek orthe Warren method is used. With Meek, the votes re-tained from the two groups are 3
12 and 3
12 , also 1 to 1,
and those transferred are 112 and 1
12 , also 1 to 1. With
Warren, the votes retained are 41617 and 2
117 , or 2.4 to 1,
and those transferred are 117 and 2
1617 , or 1 to 50, devoid
of all the proportionality that I believe they should have.The Meek method is able to promise voters that once
their first n choices have all had their fates settled, eitheras excluded or as elected with a surplus, a fair shareof their vote will be passed to their (n + 1)th choice,unless no more transfers are possible because all seatsare now filled. How much is a fair share may, perhaps,be arguable (though I do not personally see it as such)but it cannot possibly be zero, which the Warren methodoften makes it.
Thus the basis of STV in Meek mode is that every-thing has to be done in proportion to the relevant num-bers at the time. This means that if we have 1 ballotpaper of value 1 pointing at XY, and n ballot paperseach of value 1
npointing at XZ, and X’s papers are to
be redistributed, then what happens to Y and to Z fromthose papers should be identical.
Suppose 8 candidates for 7 seats, counted by New-land and Britton rules. If there are 40 votes reading5 ABCG, 5 ABCH, 5 ABDG, 5 ABDH, 5 ABEG, 5ABEH, 5 ABFG, 5 ABFH, it is evident from the sym-metry that ABCDEF must be elected but the final seat isa tie between G and H. If, however, there is a 41st vote
2 Voting matters, Issue 20
Hill and Warren: Meek v. Warren
reading BH, that ought to settle it in favour of H, butthose rules declare it still to be a tie between G and H tobe settled at random. Either Meek or Warren countingwould have awarded the seat to H.
However, suppose the 41st vote, instead of being justBH reads BCDEFH. Again Newland and Britton rulesfail to discover that the symmetry has been broken, andincorrectly call it a GH tie. But now so do Warren rules.With Meek rules, only 0.012 of the vote gets through asfar as H, but that is enough to tilt the balance to get theright result.
In the past, when Hugh Warren and I have arguedabout this, each of us has, from time to time, putforward an example with an ‘obviously right’ answerwhich the other one’s preferred method failed to find.However, with those examples, the other one of us neveraccepted that the answer in question was ‘obviouslyright’. It was therefore necessary to produce somethingwhere the answer could not be denied. I claim to havedone this with the example: 4 candidates for 3 seats, andjust 3 votes: 1 ABC, 1 BC, 1 BD. Without even know-ing anything about STV, it must be clear that ABC isa better answer than ABD. Meek does elect ABC, butWarren says that C and D tie for the third seat and arandom choice must be made between them. Unlesssomething equally convincing can be found that pointsthe other way, that seems to me to be conclusive.
So far as I am aware, the only actual advantageclaimed for Warren over Meek is that it is supposed togive consistency when some voters change the order oftwo candidates both of whom are elected anyway. Thisseems to me to be only a very slight advantage, andWarren rules do not always succeed even in that. With5 candidates for 4 seats and votes 9 ABCD, 8 BD, 8 CE,7 D, 7 E, either Meek or Warren elect ABCD. But if theABCD votes had been ACBD instead, either Meek orWarren would elect ABCE.
The difference arises from the fact that one quota ofvotes is necessarily ineffective and changing the orderof some preferences can change which votes those areand thus, in marginal cases, affect the result. I suggestthat in practice any such inconsistency would never benoticed and is of very minor importance compared withmaking the count so that everything is kept in propor-tion to the numbers concerned.
I am less convinced than I was even that such be-haviour can be called an anomaly. If two candidates areboth elected anyway, it would seem at first sight that, ifsome voters change the order of those two, it ought notto affect who else gets elected, but is that really a good
rule? In this example, there is some connection betweenB and D, and between C and E. We do not know whatthe connection is, but it is clearly there since every voterputting B first puts D second, while every voter puttingC first puts E second. The second choice of the A sup-porters is then saying what they think about the featurethat gives the connection. In such circumstances, it doesnot seem unreasonable that if the A voters prefer B toC that helps D, but if they prefer C to B that helps E,particularly when the first preferences for D and E aretied.
Overall, while accepting that the Warren methodworks quite well, it does not seem to me to have any realadvantage over the Meek method, and its failure to meetwhat I regard as basic requirements can sometimes leadto a result that I would think unfortunate. Given howwrong it seems, I am surprised that it works as well asit does.
3 Why I prefer the Warren method(C.H.E. Warren)
I prefer the Warren method because I consider it to bebased on a better principle.
The main principle behind the Warren method (givenas the second principle in [3]) can be stated as: if avoter votes for candidates A, B, C in that order, and ifcandidates A and B each have a surplus of votes abovethe quota, then, on principle, no portion of the vote forABC shall be credited to candidate C unless the voterhas contributed, as far as he is able, the same portion ofhis vote to the election of candidate B as other voterswho have contributed to the election of candidate B.
The main principle behind the Meek method (givenas principle 2 in [2]) can be stated as: if a voter votesfor candidates A, B, C in that order, and if candidatesA and B each have a surplus of votes above the quota,then, on principle, a portion of the vote for ABC shallbe credited to candidate C.
These different principles lead to the different rulesas set out in paragraphs 3 to 8 of section 1.
I think that whether one prefers the Meek methodto the Warren method, or vice versa, should be basedon principle, and I prefer the principle upon which theWarren method is based. As stated in paragraph 8 ofsection 1, because of the impossibility theorems, it willalways be possible to produce particular examples thattell against any given method. So I prefer to rest mycase on the matter of principle, rather than on seeking
Voting matters, Issue 20 3
Hill and Warren: Meek v. Warren
examples of where the Warren method gives a ‘better’result than the Meek method. Nevertheless, an examplewill be given, not with the object of showing that onemethod gives a better result than the other, but of show-ing how the two methods can give different results.
Consider the following election for 3 seats by 39996voters, for which the quota is 9999.
10000 vote ABC100 vote AE
10000 vote BD9998 vote C9898 vote D
The numbers have been chosen so that, unlike the sit-uation in real elections, the count can be done manually.
Under the Meek method the count can be portrayedas follows:
Voter Number Portion of vote contributed byof such each voter to each candidatevoters A B C D E
We see from these tables that the Meek method electscandidates A, B, C, whereas the Warren method electscandidates A, B, D.
We observe that the Meek and Warren methods arein agreement as to the portion of vote that each of theABC voters and the AE voters contribute to candidate
A, which is in keeping with the Warren principle that allcontributors to the election of a candidate should con-tribute the same portion of their vote.
We observe that the Meek and Warren methods differin the portion of vote that each of the ABC voters, andeach of the BD voters, contribute to candidate B. Bothmethods ask the BD voters to contribute closely 99%of their vote to candidate B, and ask the ABC votersto contribute only closely 1% to candidate B. The War-ren method accepts this difference, because, althoughit would have preferred that all groups of voters con-tributed the same portion, it recognises that the ABCvoters did use up all that was left of their vote after con-tributing to candidate A, and could not contribute more.
The Meek method is desirous that, if a voter votesfor a candidate who is elected with a surplus, then thatvoter should not be asked to contribute so much of hisvote to that candidate that he has nothing to pass on.Accordingly, although each ABC voter is contributingonly closely 1% of his vote to the election of candidateB, compared with the 99% that each BD voter is con-tributing, Meek’s principle requires that the ABC votersshall contribute slightly less than 1% of their vote to theelection of candidate B in order that a portion, whichamounts to about one ten-thousandth of a vote, shall bepassed to candidate C.
This shows what the difference between the Meekand Warren methods amounts to. In my opinion thedifference raises the question as to whether the ABCvoters, who have contributed only closely 1% of theirvote to the election of candidate B, whereas the BD vot-ers have contributed closely 99% towards the same end,merit the right, in these circumstances, to pass on a por-tion of their vote to candidate C, as Meek’s principlerequires, at the expense of expecting the BD voters tobear even more of the burden of electing candidate B.If one thinks that the right should be afforded, then oneshould prefer the Meek method. But if one thinks thatit would not be fair to afford this right, then one shouldprefer the Warren method.
4 References
[1] R.A. Newland and F.S. Britton. How to conductan election by the Single Transferable Vote. 2ndedition. Electoral Reform Society. 1976.
[2] B.L. Meek. A new approach to the Single Trans-ferable Vote. Voting matters, issue 1, 1–11. 1994.
We had hoped that our earlier paper [1] would be thefinal version of the Sequential STV system, but we havefound two examples since then that seem to call forfurther amendment.
The aim is to find a system that will be noticeably likeordinary STV but: (1) will correct unfairness, if any, tocandidates excluded by the reject-the-lowest rule; (2)will automatically reduce to Condorcet’s method ratherthan Alternative Vote when there is only a single seat.
It seeks to find a set of n candidates that observesDroop Proportionality [3], which we regard as an es-sential feature of any worthwhile voting system, and ispreferred by the largest majority of voters to any otherpossible set of n. Tideman’s CPO-STV [2] has similarobjectives. The successful set will usually be such thatany set of n+1 candidates, consisting of those n and1 more, will result in the election of those n when anSTV election is performed and in this case we refer tothe successful set as a Condorcet winning set.
In a small election, or when n=1, it would be rel-atively easy and quick to do a complete analysis, asCPO-STV does. The challenge is to find a way thatwill work in a reasonable time in large elections, wheresuch a complete analysis would be impracticable. Werecognise that the meanings of ‘a reasonable time’ and‘impracticable’ are open to dispute, and that what ispracticable will change as computers continue to getfaster. As Tideman and Richardson say “We are notyet at a point where computation cost can be ignoredcompletely”.
In cases where it is practicable to do a complete anal-ysis of all sets of n+1, n+2, etc., it might be possibleto find a solution that, in some sense, is preferable tothat produced by this system that (after an initial stage)
looks only at sets of n+1 and only at some of those. Wethink, however, that it would be hard to claim a severeinjustice to any non-elected candidate after this systemhad been used, and it does keep things within manage-able limits. It would be interesting to compare the per-formance of Sequential STV and CPO-STV, but this hasnot been done yet.
Of the two worrying examples, one showed thatthe system, as previously given, could fail to preserveDroop Proportionality, while the other showed that wewere a little over-optimistic in claiming that, if the spe-cial procedure to deal with a Condorcet paradox had tobe invoked, “most of the original candidates will be ei-ther excluded or certainties, [so] there is no need to fearan astronomical number of tests needing to be made”.This second example was highly artificial and the opti-mism was probably justified for any real voting patternthat is at all likely to occur, but even artificial patternsought not to cause trouble.
To cure the first of these troubles it is necessary, whenthe special procedure is used, to let it exclude just onecandidate before restarting the main method, instead ofcontinuing to use the special procedure. To cure thesecond, the special procedure has been much simpli-fied, to calculate a value for each continuing candidatebased upon Borda scores, and to exclude the one withthe lowest score. We emphasise that in real elections,as distinct from specially devised test cases, Condorcetloops rarely occur and so the special procedure is rarelycalled into use.
Borda scores on their own, as an electoral method,we regard as a very poor option. Those elected are fartoo dependent upon whether or not other (non-winning)candidates are standing, and the method is much tooopen to tactical voting; but as a method of helping tosort out a Condorcet paradox, they can be useful. Wherea paradox arises, we know that there cannot be a goodresult because, whoever is elected, it is possible to pointto some other option that a majority of the voters pre-
6
Hill and Gazeley: Sequential STV
ferred; so the best that can be done is to try for a not-too-bad result and, for this limited purpose, Borda scorescan serve.
2 Revised version of Sequential STV
All STV counts mentioned are made by Meek’smethod. It would be possible to use a similar systemwith some other version of STV but, since many countsare to be made using the same data, to try it other thanby computer would make little sense. If a computer isrequired in any case, Meek’s method is to be preferred.
An initial STV count is made of all candidates forn seats, but instead of dividing into those elected andthose not elected, it classifies those who would havebeen elected as probables, and puts the others into aqueue, in the reverse order of their exclusion in thatSTV count, except that the runner-up is moved to lastplace as it is already known that an initial challenge bythat candidate will not succeed. Having found the prob-ables and the order of the queue, further rounds eachconsist of n+1 candidates, the n probables plus the headof the queue as challenger, for the n seats. Should a tieoccur during these rounds, between a probable and achallenger, it is resolved by maintaining the current sit-uation; that is to say, the challenger has not succeeded.
If the challenger is not successful, the probables areunchanged for the next round and the challenger movesto the end of the queue, but a successful challenger atonce becomes a probable, while the beaten candidateloses probable status and is put to the end of the queue.The queue therefore changes its order as time goes onbut its order always depends upon the votes.
This continues until either we get a complete runthrough the queue without any challenger succeeding,in which case we have a solution of the type that we areseeking, or we fall into a Condorcet-style loop.
A loop may have been found if a set that has beenseen before recurs as the probables. If the queue is inthe same order as before then a loop is certain and actionis taken at once. If, however, a set recurs but the queueis in a different order, a second chance is given and thecounting continues but, if the same set recurs yet again,a loop is assumed and action taken.
In either event the action is the same, to excludeall candidates who have never been a probable sincethe last restart (which means the start where no actualrestart has occurred) and then to restart from the begin-
ning except that the existing probables and queue areretained instead of making a new initial STV count.
If there is no candidate who can be so excluded, thena special procedure is used, in which each continuingcandidate, other than any who has always been a proba-ble since the last restart, is classified as ‘at-risk’. Takingeach continuing candidate, a Borda score is calculated,as the sum over all votes of the number of continuingcandidates to whom the candidate in question is pre-ferred, taking all unmentioned continuing candidates asequal in last place. A continuing candidate who is notmentioned in a particular vote is given, for that vote,the average score that would have been attained by allthose unmentioned. In practice it can help to give 2points instead of 1 for each candidate beaten, becauseall scores, including any averages required, are thenwhole numbers.
The at-risk candidate with the lowest score (or a ran-dom choice from those with equal lowest score) is thenexcluded and the main method restarted from the be-ginning, except that the existing probables and queueorder are retained instead of making the initial STVcount. If the newly excluded candidate was one of thequeue, he or she is merely removed from the queue,but if the candidate was a probable, the candidate at thehead of the queue is reclassified as a probable and re-moved from the queue. Then a restart is made from thebeginning except that the existing probables and queueare retained instead of making a new initial STV count.
3 Proof of Droop Proportionalitycompliance
The ‘Droop proportionality criterion’ says that if, forsome whole numbers k and m (where k is greater than 0and m is greater than or equal to k), more than k Droopquotas of voters put the same m candidates (not nec-essarily in the same order) as their top m preferences,then at least k of those m candidates will be elected.
We know that a normal STV count is Droop Propor-tionality compliant so, in Sequential STV, for k and mdefined as above, at least k of the m will be probables atthe first count. If on a later count a challenger takes overas a probable then, because that was also the result of anSTV count, there will still be at least k of the m amongthe probables, even if the replaced candidate was one ofthe m. This ensures compliance if no paradox is found.
If a paradox is found, at least k of the m will havebeen probables at some time since the last restart, so
Voting matters, Issue 20 7
Hill and Gazeley: Sequential STV
excluding all who have not been probables must leaveat least k. If the special procedure, using Borda scores,is required, then if only k exist, k will have always beenprobables since the last restart, and so are not at risk ofexclusion, but if there are more than k, the exclusionof just one of them must leave at least k. This ensurescompliance where a paradox is found.
4 Examples
Example 1
This is the example that showed the old version of Se-quential STV to fail on Droop Proportionality. With 9candidates for 3 seats, votes are
41 votes (more than 2 quotas) have put ABCD, in someorder, as their first choices so, to satisfy Droop Propor-tionality, at least 2 of them must be elected. The oldversion elected DEF but the new version elects ADE.
Example 2
This is the example that showed the old version ofSequential STV not always to finish within a reasonabletime. With 40 candidates for 9 seats, votes are
This new version of Sequential STV terminates after835 STV counts, whereas the old version would, we es-timate, have required over 177,000 counts. We empha-sise again that the voting pattern is highly artificial —in a real election, with 40 candidates for 9 seats, morethan 60 counts would be very unusual.
Example 3: “Woodall’s torpedo”
With 6 candidates for 2 seats, votes are
11 AC 9 ADEF 10 BC9 BDEF 10 CA 10 CB
10 EFDA 11 FDEB
Sequential STV elects CD even though AB form theunique Condorcet winning set. Examining why thishappens, it is found that A and B are always elected bySTV from any set of 3 in which they are both present,but neither A nor B is ever elected if one of them isthere but not the other. Meanwhile C is always electedif present in a set of 3 except for the one set ABC. D, Eand F form a Condorcet loop. CD, CE or CF would bea second Condorcet winning set if the other two of D, Eand F were withdrawn.
Such a strange voting pattern is unlikely to arise inpractice. It shows that Sequential STV cannot be guar-anteed to find a Condorcet winning set even where oneexists but it does not shake our belief that SequentialSTV is a good system; it would be hard to deny that Cis a worthier winner than either A or B in this example.
5 Acknowledgements
We thank Douglas Woodall for devising example 3, andthe referee for useful comments on earlier versions ofthis paper.
6 References
[1] I.D. Hill and Simon Gazeley, Sequential STV —a new version. Voting matters, 15, 13–16. 2002.
[2] T. Nicolaus Tideman and Daniel Richardson,Better voting methods through technology: therefinement-manageability trade-off in the singletransferable vote. Public Choice, 103, 13–34.2000.
The simplest example of a particular type of tie hasthree votes, AB, BA, CA, for one place. The quota is1.5, and so, under the normal rules, one candidate isselected at random for exclusion, giving the chance ofelection as 2/3 for A and 1/3 for B. If it is B, A will bejustifiably aggrieved, and opponents of STV will arguethat a random choice has given a perverse result.
A general rule to cover cases of this type wouldbe to say that when all continuing candidates are tied(whether for exclusion or for election), they are all tobe excluded, but only for the current preferences, alllater preferences being unaltered. If voting is seen as aprocess of cutting off the top preference of each vote assoon as the fate, election or exclusion, of the candidateconcerned has been decided, and reducing the value ofthe vote in the case of election, then this proposal intro-duces a new type of exclusion in which the top candi-date is cut off in the normal way, but the candidate isnot removed from any other votes.
The above votes, but with two places to be filled, givean example of a tie for election. Under the normal rules,whichever candidate is elected first, each of the othertwo has an equal chance of second place. So each of thethree candidates has 2/3 of a chance of being elected.Under the proposals, A wins with 2 votes, B is electedwith 1, and C gets none.
A possible objection is that the proposal violates therule that later preferences must never be looked at untilthe fate of earlier ones has been decided, and there is adanger that it might discourage sincere voting, but thisseems unlikely, and is out-weighed by its advantages ifvoting is sincere.
If Borda’s method of counting votes is used for tie-breaking, this proposal would not be necessary; but it
has the advantage of being less of a departure from thepresent system.
This tie is very unlikely except in small elections, butit might well occur if partners are voting for a seniorpartner. If the proposal is considered too sweeping,it could be restricted to the case where the voters arethe same as the candidates, and they each vote first forthemselves. This would still give most of the benefits.
A powerful test of any proposed change to votecounting is, “Would it, compared with other rules, makeany voters or candidates justifiably aggrieved, or lead toinsincere voting?” This proposal gains on the first test,and only loses slightly on the second. Allowing par-ties to put up more candidates than they can hope to getin, and discouraging tactical voting, are also important,but not likely to be affected by changes in tie-breakingrules.
2 Editorial notes on tie breaking
The question of ties with STV has arisen severaltimes in Voting matters. The previous material can besummarised as follows:
• Earl Kitchener in Issue 11 of Voting matters advo-cates the use of Borda scores [1].
• David Hill in Issue 12 argues against the use ofBorda scores [2].
• Jeff O’Neill in Issue 18 notes that many rulesuse a first-difference rule, but he advocates a last-difference rule [3].
• Wichmann considers the use of computers in Issue19. Here, the suggestion is that no specific rule isneeded and that the computer can try all optionsand the result taken can be the most likely one [4].
• Earl Kitchener has returned to the subject with analternative proposal to Borda scores in a specialcase which appears above.
9
Earl Kitchener: A new way to break STV ties
2.1 Existing rules
The ERS rules [6] and the Church of England rules usethe first-difference method in an attempt to break a tie.
The Meek algorithm [7] uses a deterministic algo-rithm based upon a random number generator to breaka tie. No manual intervention is used. The New Zealandvariant uses a similar method.
When the Church of England rules are applied us-ing a computer, then the software must break the tieswithout manual intervention in a manner which is notdefined (by the rules).
For Ireland, the manual rules are being computer-ized and have been used for three trial constituencies in2002. Here, tie-breaking invokes a manual procedure,ie, the computer software does not break the tie.
A curiosity is that in the Irish rules if when allocatingsurplus remainders there is a tie of the fractional part,the surplus vote is given to the candidate with the largesttotal number of papers from that surplus; if that is alsotied then first difference is used.
It seems that a Condorcet comparison has been usedto resolve a strong tie between A and B (i.e. tie can’tbe broken by first/last difference) in very small manualcounts i.e. examine the papers to see how many timesA is ahead of B compared to vice versa.
2.2 Discussion
This section was produced as a result of an emaildebate; those contributing included: James Gilmour,David Hill, Michael Hodge, Joe Otten, Joe Wadsworthand Douglas Woodall.
A number of issues arise from tie-breaking:
Are tie-breaking rules needed? Surely better to havea rule than toss a coin?If a rule like first-difference, fails to break thetie, then drawing lots or some computer equiva-lent is needed unless we allow later preferencesto be looked at. But the disadvantages remainformidable as we are then unable to promise thatlater choices cannot upset earlier ones. These extratie-breaking rules complicate the counting process,since ties can arise in more than one way. It seemsthat just drawing lots would be adequate.If we are saying that for:
1 AB1 BA1 CA
fairness demands A is elected, the same wouldapply to
1000 AB1000 BA1000 CA
So what about999 AB
1000 BA1000 CA
Or even1000 AB1001 BA1000 CA
It seems that if the logic of looking at later pref-erences is sound and compelling, then they shouldbe considered in these later examples. They are allalmost identical with almost the same support forA, yet B wins with probability 1/3, 1 and 1/2 re-spectively. If the 1/3 should be 0, on the groundsof later preferences, perhaps the 1 or 1/2 should bereduced too?There seems nothing in the logic of the argumentthat limits it to ties. Why not judge all exclusionson the basis of ‘probability of election’ in somesense given an analysis of all later preferences, lim-ited only by a ‘probably-later-no-harm’ principledefined statistically?This would be a rival to STV, to be considered onits merits, without muddying the waters by intro-ducing features of it to STV for extremely marginalbenefits. The claim being made here is that wewant the Condorcet winner (or a similar result inthe multi-seat case) rather than the AV winner.The argument is quite separate from tie breakingas such, and Condorcet-type rules need paradoxbreakers as well as tie breakers. If anything of thesort is to be considered, then Sequential STV [8]could be the starting point.
If rules are used, what criteria are appropriate?There is significant opposition to using laterpreferences in breaking a tie, see [2], for instance.One can argue against this on the grounds thatit is hard to observe the difference between anytie-breaking logic and a random choice.There was significant support for using the last-difference rule as opposed to the first-differencerule. One correspondent wrote of the latter, “Itwould be a bit like requiring the Speaker, in theevent of a tied vote in the House, to cast his vote
10 Voting matters, Issue 20
Earl Kitchener: A new way to break STV ties
not in favour of the status quo, but in favour of theoutcome that more closely resembled the very ear-liest legislation ever passed on that question.” Butit can also be argued that any such rule is arbitraryand, if it is not necessary to change, it is necessarynot to change.The first-difference rule can have the effect of giv-ing preference to first-preference votes as opposedto transfers — this seems against the spirit of STV.With a computer, one can experiment with differ-ent procedures for breaking a tie. A reasonablecriterion would be the method that most reliablyresulted in the election of the candidates with thehighest probabilities of being elected from break-ing the ties in all the possible ways. The specialcase that Kitchener uses would always give the op-timal result, but it is unclear how often that specialcase arises.The use of Borda scores is not liked by the sup-porters for STV, but it is unclear if similar per-verse results could be obtained if Borda scoreswere introduced only to break ties.
The issue of voter satisfaction has been raised. Itcertainly seems unsatisfactory that all the existing ruleswill report a random choice for elections in which thechoice does not change the candidates elected. This isquite common with candidates with very low numbersof first-preferences. However, the following could beproposed to measure voter satisfaction in a tie-breakingrule:
• the method which maximizes the voters contribut-ing to those elected;Maximising voters seems to accord to the inclu-sive view of STV which allows voters to be addedto those supporting an already elected candidate asoccurs with the Meek rules.The conventional approach of the manual rules isexclusive in which voters are not added to the listof those supporting an already elected candidate.
• the method which minimizes the non-transferablevotes.The conventional practice with the manual rules isto minimise the non-transferable votes by consid-ering transferable votes first when transferring sur-plus. In contrast, the Meek rules do not do this.However there are those who would claim that anyproposal artificially to reduce non-transferables isimmoral, in that it distorts what the voters haveasked for.
[2] I. D. Hill. Tie-breaking in STV. Voting matters.Issue 12, pp 5–6. (seehttp://www.mcdougall.org.uk/VM/ISSUE12/P2.HTM)
[3] J. C. O’Neill. Tie-Breaking with the SingleTransferable Vote. Voting matters. Issue 18, pp14–17. (seehttp://www.mcdougall.org.uk/VM/ISSUE18/I18P6.PDF)
[4] B. A. Wichmann: Tie Breaking in STV. Votingmatters. Issue 19, pp 1–5. (seehttp://www.mcdougall.org.uk/VM/ISSUE19/I19P1.PDF)
[5] GS1327: General Synod, Single TransferableVote regulations 1990 and 1998. (Obtainablefrom Church House Bookshop, Great SmithStreet, London SW1P 3BN.)
[6] R. A. Newland and F. S. Britton. How to conductan election by the Single Transfer-able Vote. ERS 3rd Edition. 1997. (see http://www.
[7] I. D. Hill, B. A. Wichmann and D. R. Woodall.Algorithm 123 — Single Transferable Vote byMeek’s method. Computer Journal. Vol 30,pp277–281, 1987.
[8] I.D. Hill and Simon Gazeley. Sequential STV —a further modification. Voting matters, Issue 20,pp6–8.
Voting matters, Issue 20 11
Apportionment and Proportionality: A Measured View
P KestelmanNo email available.
1 Introduction
Collins (2003) English Dictionary defined ‘Propor-tional Representation’ (PR) as: “representation of par-ties in an elective body in proportion to the votes theywin”. Few elections translate every Party Vote-fractioninto the same Seat-fraction, thereby mediating exactPR; and raising the question of when to describe anelection as full PR, semi-PR (‘broad PR’) or non-PR.
According to Gallagher, Marsh and Mitchell [11],“Ireland uses the system of proportional representationby means of the single transferable vote (PR-STV) atparliamentary, local, and European Parliament elections(the president, too is elected by the single transferablevote)”. Presidential single-member STV is AlternativeVoting (AV), which also elects the Australian House ofRepresentatives.
Is AV therefore a PR electoral system? The Inde-pendent Commission on the Voting System [13] — theJenkins Report — maintained that AV alone “is ca-pable of substantially adding to [‘First-Past-the-Post’(FPP)] disproportionality”. The more recent Indepen-dent Commission on PR [12] affirmed that “AV can pro-duce a hugely disproportionate result”.
How should we compare the Party disproportionalityof different electoral systems? Which is the fairest —most proportional — electoral system? In other words,how should disproportionality — departure from exactPR — be quantified?
2 Apportionment
First consider the analogous question of the fairestmethod of apportionment. Collins (2003) English Dic-tionary defined ‘apportionment’ as: “U.S. government.the proportional distribution of the seats in a legislative
body, esp. the House of Representatives, on the basis ofpopulation”.
The USA has long wrestled with the problem ofthe most representative apportionment; trying variousmethods (Balinski and Young [1]). Table 4.1 gives theapportionment of 105 Seats among 15 States in the first(1791) House of Representatives, applying the mainfive Divisor methods. For the five most and least pop-ulous States, proportionality is measured as the ratiobetween their aggregate Seat-fractions and Population-fractions (S%/P%).
Adams, Dean and Hill yield the same apportion-ment: slightly under-representing the five most popu-lous States (S%/P% = 0.99); while over-representingthe five least populous States (S%/P% = 1.09). Thesemethods produce a Relative Bias of + 10 percent(Bottom/Top third S%/P% = 1.09/0.99 = 1.10).
On the other hand, Jefferson over-represents the topfive States (S%/P% = 1.02); and under-representsthe least populous States (S%/P% = 0.89): a Rela-tive Bias of – 13 percent (Bottom/Top third S%/P% =
0.89/1.02 = 0.87 = 1 − 0.13). With the lowest Rela-tive Bias ( – 2 percent), Webster yields the fairest 1791Apportionment.
Requiring at least one Seat per State usually over-represents the least populous States. Eliminating thatconstraint — so quantifying method-specific bias moreprecisely — Table 4.1 (bottom panel) gives the MeanBias for all 22 USA apportionments (1791–2000). TheWebster (Sainte-Lague) Method proved the least bi-ased overall (averaging 0.1 percent); whereas Adams(Smallest Divisor) and Jefferson (d’Hondt) were themost biased (over 20 percent).
3 Apportioning England
Nearer home, Table 4.2 apportions 71 MEPs betweenthe nine English Regions, applying the five Divisormethods to their 1999 Electorates. Adams and Dean co-
12
P Kestelman: Apportionment and Proportionality
incided but, despite identical Bottom/Top third RelativeBias, differed slightly from Hill and Webster. Whichapportionment is fairer?
The European Parliament (Representation) Act 2003prescribes that: “the ratio of electors to MEPs is asnearly as possible the same in each electoral region”. Intesting fairness, the Electoral Commission [7] accepteda measure that “involves calculating for each region thedifference between the number of electors per MEP forthat region and the overall number of electors per MEP,and adding up all these differences (having ignored mi-nus signs). The smaller this total is, the more equitablethe outcome”.
A little mathematical notation helps here. The over-all number of Electors per MEP, E/S =
∑
ER/SR,where
∑
(Sigma) denotes ‘Sum’ (over all Regions); ER
is the number of electors in a Region; and SR is the cor-responding number of seats. Each Regional deviation isthe absolute difference (that is, ignoring negative signs)between its ER/SR and E/S ; and
Total Deviation =∑ | E/S − ER/SR |
= E/S∑ | 1 − (ER/E)/(SR/S) |
= E/S∑ | 1 − ER%/SR% | ,
where ER % and SR % are the Regional Elector- andSeat- fractions (percent), respectively.
For any given apportionment, total Electors andSeats — and thus E/S — are fixed: hence RegionalMEP apportionment is required to minimise
∑ | 1 −ER%/SR% |. The UK statutory criterion implies theDean Method (Balinski and Young [1]).
Nonetheless, for the June 2004 European Elections,the Electoral Commission [7] recommended the Web-ster (Sainte-Lague) Method, making the ratio of MEPsto electors as nearly as possible the same in each Re-gion (beyond the statutory minimum of three MEPs).Based on December 2002 Regional electorates, Deanand Webster apportionments coincided.
We may therefore define a Dean Index =
∑ |1 − ER%/SR% |; and a Webster Index =
∑ |1 − SR%/ER% |. Table 4.2 (bottom panel) confirmsthat the Dean Method minimises the Dean Index; andthe Webster Method minimises the Webster Index.
4 Paradox and Proportionality
Overall measures of malapportionment (like the Deanand Webster indices defined above) are better than par-tial measures (like Bottom/Top third Relative Bias).
The Webster Method minimises total relative differ-ences between Regional Elector-fractions and Seat-fractions:
Webster Index =
∑ | 1 − SR%/ER% |=
∑ | ER% − SR% | /ER%.
Total absolute differences between Regional Elector-fractions and Seat-fractions are minimised by theHamilton Method (Largest Remainders: LR–Hare).
This Quota Method allocates to each Region the inte-ger part of its proportional entitlement (number of HareQuotas: one Hare Quota = National Electors/NationalSeats). Any residual seats are then allocated to the re-gions with the largest fractional parts (remainders) ofHare Quotas.
We may therefore define a Hamilton Index =
∑ |ER% − SR% | ; minimised by the Hamilton Method.Applied to all 22 USA apportionments (without seatminima), Hamilton averages a (Bottom/Top third) Rela-tive Bias of – 0.3 percent: differing insignificantly fromWebster ( – 0.1 percent).
Unlike Webster, the Hamilton Method of apportion-ment is vulnerable to paradox: notably the AlabamaParadox. The 1880 USA Census disclosed that, if to-tal House size were increased from 299 to 300 seats,then the Hamilton apportionment to Alabama wouldhave decreased from eight to seven seats (Balinski andYoung [1])!
That consideration excludes Hamilton as a methodof apportionment; though not necessarily for evaluatingmalapportionment. So how best to quantify malappor-tionment — or disproportionality?
5 Party Disproportionality
Gallagher [10] concluded that each PR method “mini-mizes disproportionality according to the way it definesdisproportionality”. However, Lijphart [14] argued thatLR-Hare (Hamilton) and Sainte-Lague (Webster) me-diate “inherently greater proportionality” than d’Hondt(Jefferson); thereby justifying proportionality measures“biased in favour of LR-Hare”.
LR-Hare minimises the Loosemore-Hanby Index(Loosemore and Hanby, [15]):
∑ | ER%−SR% |,as defined above. Halving the sum ensures that LHIranges 0–100 percent.
LHI is the ‘DV score’ mentioned by the IndependentCommission on the Voting System [13]; and as definedby the Independent Commission on PR [12]. LHI com-plements the Rose Proportionality Index (Mackie andRose, [16]) percent:
= 100− 12
∑ | VP %−SP % |= 100−LHI (percent).Table 4.3 illustrates the calculation of LHI and
RPI for the 2004 European Parliamentary Election inBritain. Over-represented and under-represented PartyTotal Deviations are necessarily equal and opposite(±14.7 percent in Table 4.3); and Party total over-representation is simply the Loosemore-Hanby Index(LHI = 14.7 percent).
6 Debate
As a measure of Party disproportionality, theLoosemore-Hanby Index (LHI) has been criti-cised on three main grounds: for violating Dalton’sTransfer Principle (Taagepera and Shugart [22]); forbeing vulnerable to paradox (Gallagher [10]); andfor exaggerating the disproportionality of PR systemsinvolving many parties (Lijphart [14]).
Dalton’s Transfer Principle states that transferringwealth from a richer to a poorer person decreases in-equality, decreasing any inequality index (Taageperaand Shugart [22]). However, transferring seats betweenover-represented parties (or between under-representedparties) leaves LHI unchanged.
Thus in the 2004 European Election in Britain (Table4.3), imagine the Conservatives (from 27 to 25 seats)losing two seats to Labour (from 19 to 21 seats). Thenboth Party deviations would converge (SP % − VP % =
from + 9.3 to + 6.6 percent, and from + 2.7 to + 5.4 per-cent, respectively); decreasing GhI (from 8.3 to 7.7 per-cent), leaving LHI unchanged (14.7 percent). However,Party total over-representation remains unchanged: sowhy should overall disproportionality change?
Minimised by LR-Hare (Hamilton), LHI is suscepti-ble to the paradoxes of that Quota method (Gallagher[10]). Because Sainte-Lague (Webster) is the least bi-ased Divisor method — and immune to paradox — Gal-lagher [10] recommended a Sainte-Lague Index “asthe standard measure of disproportionality”:
SLI (percent) =
∑
(VP % − SP %)2/VP %.
However, in a single-member constituency, if thewinner receives under half of all votes, then SLI ex-ceeds 100 percent (unlike LHI, which measures unrep-resented — wasted — votes).
Nowadays, Gallagher [10] is mainly cited for his‘Least Squares Index’:
GhI (percent)=√
12
∑
(VP % − SP %)2.
Also minimised by LR–Hare, GhI is subject to thesame paradoxes as LHI. Gallagher [10] saw GhI as “ahappy medium” between LHI and the Rae Index (Rae[18]):
RaI (percent) =
∑ | VP % − SP % | /N ,where N = Number of parties (VP % > 0.5 percent).
Thus RaI measures average deviation per Party;whereas LHI measures (half) Total Deviation. Yet whyhybridise such conceptually distinct measures in onemeasure (GhI)?
Taagepera and Grofman [21] have attributed the re-cent shift, from LHI towards GhI, “to sensitivity toparty system concentration”; based on the intuition ofLijphart [14] that a few large deviations (VP %− SP %)should be evaluated as more disproportional overallthan many small deviations with the same Total Devi-ation (and hence LHI). It remains unclear why largerParty deviations should be potentiated; and smaller onesattenuated.
For example, in the 2004 European Election inBritain, exact GhI was 8.3 percent. However, aggre-gating unrepresented parties (SP % = 0.0 percent: Ta-ble 4.3) increases GhI to 10.7 percent; leaving LHIunchanged (14.7 percent). In the process, Party totalunder-representation has not changed: so why shouldTotal Disproportionality change? Likewise, in single-member constituencies, GhI depends on the division ofvotes among losing candidates.
Monroe [17] proposed an inequity index rather simi-lar to GhI:
MrI(percent) =
√
∑
(VP % − SP %)2
1 +
∑
(VP %/100)2
LR-Hare also minimises MrI; which falls below 100percent for extreme disproportionality involving morethan two parties (like GhI, but unlike LHI).
Taagepera and Shugart [22] mentioned an electoralanalogue of the widespread Gini Inequality Index, withseveral examples; but without defining any Gini Dis-proportionality Index (GnI). It turns out that GnI (per-cent):
14 Voting matters, Issue 20
P Kestelman: Apportionment and Proportionality
=
∑ ∑ | (VP % × SQ%) − (SP % × VQ%) | /200
Thus GnI sums the absolute differences between theSP %/VP % ratios of every pair of parties, weighted bythe product of their vote-fractions (VP %/100). Thiscomplex GnI satisfies Dalton’s Transfer Principle; andaggregating unrepresented parties (SP % = 0.0 percent)leaves GnI unchanged (like LHI and SLI).
Taagepera and Grofman [21] evaluated 19 dispro-portionality indices against 12 criteria, sustaining fivemeasures: LHI; GhI; SLI (‘chi-square’); MrI; and GnI.Nonetheless, they overlooked both a Farina Index (FrI)and a Borooah Index (BrI).
Woodall [24] cited JEG Farina for a vector-basedmeasure of Party Total Disproportionality: the anglebetween two multidimensional vectors, whose coordi-nates are Party vote and seat numbers. Its fraction of aright angle defines a Farina Index, FrI (percent) =
arccos
[
∑
(SP % × VP %)
√
∑
SP %2 × ∑
VP %2
]
× 100/90◦
ranging 0–100 percent (instead of 0–90 degrees).Borooah [2] proposed an electoral analogue of the
Atkinson Inequality Index, depending on “society’saversion to inequality” (like Gini, originally measur-ing income inequality). Establishing national ‘SocietalAversion to Disproportionality’ seems arbitrary; whilea moderate value (SAD = 2) defines a Borooah Index,
BrI (percent) = 100 − 1/[∑
(SP %/100)2/VP %],ranging 0–100 percent.
7 Correlations
For 82 general elections in 23 countries (1979–89), Gal-lagher [10] reported high correlations between LHI,GhI and SLI. Graphing high correlations between LHI,GhI, SLI and FrI, Wichmann [23] noted that centralplacement reinforced LHI.
Table 4.4 gives the correlations between all seven in-dices in the last 44 UK general elections (1832–2005).Most notably, LHI proved very highly correlated withGnI; GhI with MrI; and SLI with BrI (R > 0.99). In-deed, LHI and GnI were highly correlated (R > 0.95)with all other measures of Party Total Disproportional-ity.
8 Proportionality Criteria
The Independent Commission on the Voting System[13] observed that “full proportionality ... is generallyconsidered to be achieved as fully as is normally prac-ticable if [LHI%] falls in the range of 4 to 8”. Moregenerously, we might allow LHI under 10 percent tocharacterise full PR. LHI ranging 10–15 percent couldthen encompass semi-PR (‘broad PR’); with LHI over15 percent constituting non-PR.
In UK general elections (FPP) since World War I,LHIs have ranged from 27 percent (1918); to only fourpercent (1951) — ironically, when the Conservativeswon fewer votes, but more seats, than Labour (Rallingsand Thrasher [19]). In the last nine general elections(1974–2005: Table 4.5), LHIs have ranged 15–24 per-cent, averaging 20 percent: clearly non-PR.
What of the nominally PR elections, introduced inBritain since 1997? In the 1999 and 2004 European Par-liamentary elections, Regional d’Hondt yielded LHIs of14.1–14.7 percent (between Party List votes and MEPs)nationwide: barely semi-PR. Likewise applied region-ally, either Sainte-Lague (LHI = 6.1–8.4 percent), orLR–Hare (LHI = 6.1–5.4 percent), would have medi-ated full PR. So the method used here can make a con-siderable difference.
In the 1999 and 2003 Scottish Parliament and Na-tional Assembly for Wales elections, between PartyList votes and Total (FPP Constituency + AdditionalRegional) seats, LHIs ranged 11–14 percent. The 2000and 2004 London Assembly elections (also FPP-plus,but with a five percent Party Vote Threshold) yieldedsimilar Party List LHIs of 14–15 percent. Thus allthree British Regional Assemblies remain semi-PR atbest (Independent Commission on PR [12]).
In contrast, both 1998 and 2003 Northern Ire-land Assembly elections (multi-member STV) medi-ated First Preference LHIs of only 6.0–6.4 percent: fullPR. Table 4.6 ranks UK national and regional electionLHIs over the past decade (1995–2005).
9 Vote Transferability and DistrictMagnitude
Transferable voting complicates evaluating the dispro-portionality of both AV and multi-member STV. FirstCount LHI is not the sole criterion; though FinalCount LHI over-estimates Party proportionality (Gal-lagher [9]). For comparing transferable voting with
Voting matters, Issue 20 15
P Kestelman: Apportionment and Proportionality
other electoral systems, averaging First and Final CountLHIs appears reasonable.
Under Alternative Voting (AV), in the last nine gen-eral elections in Australia (1983–2004), First CountLHI ranged 12–20 percent, averaging 16 percent (Table4.5): practically non-PR. Final Count LHI ranged 5–13percent, averaging eight percent (PR); while mean First+ Final Count LHI averaged 12 percent: semi-PR over-all (compare Table 4.6).
So much for empirical claims that AV “is capable ofsubstantially adding to [FPP] disproportionality” (Inde-pendent Commission on the Voting System, [13]). FPPvotes — involving tactical considerations — should notonly be compared with AV First Preferences.
Taagepera and Shugart [22] called AV ‘semi-PR’;and attributed any ‘semi-PR effect’ in multi-memberSTV elections to low District Magnitude (M = Num-ber of Seats per Constituency). As Gallagher [9] noted:“the smaller the constituency [M], the greater the po-tential for disproportionality”; and reported decreasingLHI with increasing STV District Magnitude in 16 Irishgeneral elections (1927–1973).
Table 4.7 gives national aggregate LHI, by DistrictMagnitude and Count, in the last 13 Irish general elec-tions (1961–2002). Between such low District Magni-tudes (M = 3–5), disproportionality might be expectedto fall steeply: so the relative insignificance of all LHIdifferences is remarkable.
Overall, First Count LHIs ranged 3–13 percent (aver-aging seven percent); Final Count LHIs ranged 1–7 per-cent (averaging three percent); and mean First + FinalCount LHI averaged only five percent (and 6–7 percentfor M = 3–5). Virtually regardless of District Magni-tude, multi-member STV mediates full PR.
10 Conclusions
Sainte-Lague (Webster) is the most equitable methodof apportionment — and the most proportional elec-toral principle. The d’Hondt (Jefferson) Method over-represents the most populous regions (and the mostpopular parties).
Not much has changed since Gallagher [10] lamented“surprisingly little discussion of what exactly we meanby proportionality and how we should measure it”.Certainly, Party disproportionality indices have pro-liferated; among which the Loosemore-Hanby Index(LHI) — straightforwardly measuring Party total over-representation — remains the most serviceable. More-
over, such absolute disproportionality is what matterspolitically [14, 21].
Continuing debate on the ‘best’ measure of dispro-portionality may distract attention from the main taskof evaluating the relative disproportionality of differ-ent electoral systems. Taagepera and Grofman [21]marginally preferred the Gallagher Index (GhI); allow-ing that its advantages over LHI were debatable.
LHI fails Dalton’s Transfer Principle; yet transfer-ring seats between over- (or under-) represented partiesshould arguably not change a measure of Total Dispro-portionality. LHI, GhI and MrI alike remain vulnera-ble to the paradoxes of the Largest Remainders (LR-Hare/Hamilton) Method.
The Sainte-Lague Index (SLI) is unsuitable for mea-suring Party Total Disproportionality. Fortunatelyhighly correlated with LHI, the Gini DisproportionalityIndex (GnI) is rather complicated to explain and calcu-late (virtually necessitating computerisation). Interest-ingly, Riedwyl and Steiner [20] traced the LHI conceptback to Gini (1914–15).
Settling for the most elementary LHI clearly demon-strates that, in recent UK general elections, FPP hasproved non-PR. Even nominally PR elections in Britainhave barely mediated semi-PR. Yet in both North-ern Ireland Assembly elections, multi-member SingleTransferable Voting has yielded full PR of Party FirstPreferences.
Allowing for vote transferability, STV has also me-diated full PR in recent Irish general elections; hardlyaffected by District Magnitude (between three and fiveseats per constituency). Likewise in Australia, Alterna-tive Voting has arguably proved semi-PR; and certainlyno more disproportional than First-Past-the-Post.
11 References
[1] Balinski, M. and Young, H. P. (2001): FairRepresentation. Meeting the Ideal of One Man,One Vote. Brookings Institution Press,Washington DC.
[2] Borooah, V. K. (2002): ‘The Proportionality ofElectoral Systems: Electoral Welfare andElectoral Inequality’: Economics and Politics 14,83–98.
[3] Chief Electoral Officer for Northern Ireland(1998): The New Northern Ireland AssemblyElection 25 June 1998: Election of 6 Members to
16 Voting matters, Issue 20
P Kestelman: Apportionment and Proportionality
each of the 18 (NI) Westminster Constituencies.Belfast.
[4] Dail Eireann (1962–2003): Election Results andTransfer of Votes in General Election: October1961 – May 2002. Stationery Office, Dublin.
[5] Electoral Commission (2001): Election 2001:The Official Results. London.
[6] Electoral Commission (2003a): Combination ofGibraltar with a European electoral region inEngland and Wales. Consultation paper, June2003.
[7] Electoral Commission (2003b): Distributionbetween electoral regions of UK MEPs.Recommendation, October 2003.
[9] Gallagher, M. (1986): ‘The PoliticalConsequences of the Electoral System in theRepublic of Ireland’: Electoral Studies 5, 253–75.
[10] Gallagher, M. (1991): ‘Proportionality,Disproportionality and Electoral Systems’:Electoral Studies 10, 33–51.
[11] Gallagher, M, Marsh, M. and Mitchell, P. eds(2003): How Ireland Voted 2002. PalgraveMacmillan, Basingstoke.
[12] Independent Commission on PR (2004):Changed Voting Changed Politics. Lessons ofBritain’s Experience of PR since 1997.Constitution Unit, School of Public Policy, UCL,London.
[13] Independent Commission on the Voting System(1998): The Report of the IndependentCommission on the Voting System. Cm 4090–I.The Stationery Office, London.
[14] Lijphart, A. (1994): Electoral Systems and PartySystems. Oxford University Press.
[15] Loosemore, J. and Hanby, V. (1971): ‘TheTheoretical Limits of Maximum Distortion:Some Analytic Expressions for ElectoralSystems’: British Journal of Political Science 1,467–77.
[16] Mackie, T. T. and Rose, R. (1991): TheInternational Almanac of Electoral History.Macmillan, Basingstoke.
[17] Monroe, B. L. (1994): ‘Disproportionality andMalapportionment: Measuring ElectoralInequity’: Electoral Studies 13, 132–49.
[18] Rae, D. (1967): The Political Consequences ofElectoral Laws. Yale University Press, NewHaven.
[19] Rallings, C. and Thrasher, M. eds (2000): BritishElectoral Facts 1832–1999. Ashgate, Aldershot.
[20] Riedwyl, H. and Steiner, J. (1995): ‘What isProportionality Anyhow?’: Comparative Politics27, 357–369.
[21] Taagepera, R and Grofman, B (2003): ‘Mappingthe Indices of Seats-Votes Disproportionality andInter-Election Volatility’: Party Politics 9,659–677.
[22] Taagepera, R. and Shugart, M. S. (1989): Seatsand Votes. The Effects and Determinants ofElectoral Systems. Yale University Press, NewHaven.
[23] Wichmann, B. A. (2003): ‘ProportionalityRevisited’: Voting matters Issue 16, 6–8.
[24] Woodall, D. R. (1986): ‘How Proportional isProportional Representation? The MathematicalIntelligencer 8 : 4, 36–46.
Voting matters, Issue 20 17
P Kestelman: Apportionment and Proportionality
Table 4.1: State Population, Seat Apportionment and Relative Bias
(Bottom/Top third most populous States), by Divisor Method: House of Representatives, USA: 1791Apportionment; and 1791–2000 Mean Bias (22 Apportionments, without seat minima).
State of Union Population Divisor Method: Number of Seats (S)(P ) Adams Dean Hill Webster Jefferson
1974–2005 Mean 20.1 1983–2004 Mean 16.1 8.0( First + Final ) ( 12.0 )
* AV Final Count: Two-Candidate Preferred (excluding few non-transferable votes: in Australia, valid votingnecessitates rank-ordering all AV preferences).
Data Sources: Rallings and Thrasher [19]; Electoral Commission [5]; and Australian Electoral Commission(personal communications, 1988–2005).
Table 4.6: Loosemore-Hanby Index
By Assembly, Electoral System and Election (Year): UK, 1995–2005.
Assembly Electoral System Year LHI, percentHouse of Commons (UK MPs) FPP 2001 22.1
* First to Final count (excluding non-transferable votes).
Data Sources: Chief Electoral Officer for Northern Ireland [3]; Electoral Commission [5]; Electoral Office forNorthern Ireland [8]; Rallings and Thrasher [19]; Guardian, 6 May 2000, 3 May 2003 and 7 May 2005; Times,
12 June 2004.
Voting matters, Issue 20 21
P Kestelman: Apportionment and Proportionality
Table 4.7: National Aggregate Loosemore-Hanby Index
By STV District Magnitude, Count and Election:Irish Republic, 1961–2002.
Election District Magnitude (Seats per STV Constituency):LHI, percent ( First to Final Count* )
Year (Month) Total 3 4 51961 8.4 to 3.4 9.4 to 4.5 10.7 to 7.1 9.7 to 4.71965 3.2 to 2.3 3.2 to 2.0 6.0 to 5.8 4.2 to 2.11969 7.1 to 4.5 7.3 to 4.6 7.5 to 4.5 4.3 to 2.01973 4.3 to 1.2 4.5 to 2.4 4.6 to 2.6 7.3 to 8.9
1977 7.4 to 4.1 7.3 to 6.0 9.7 to 4.1 8.5 to 1.11981 5.8 to 2.4 4.6 to 2.3 10.2 to 2.6 5.3 to 4.0
1982 (Feb) 3.4 to 1.9 2.6 to 2.0 4.4 to 2.8 4.2 to 1.11982 (Nov) 4.2 to 1.9 2.6 to 3.8 7.2 to 3.0 4.7 to 3.4
1987 9.9 to 1.3 10.5 to 7.3 10.9 to 2.8 10.1 to 2.21989 7.1 to 2.4 6.0 to 3.9 8.9 to 2.5 7.8 to 2.61992 8.2 to 3.7 9.8 to 3.6 10.5 to 5.6 8.5 to 3.91997 12.9 to 5.1 14.9 to 6.9 16.2 to 6.7 13.2 to 5.72002 12.6 to 6.6 15.8 to 10.4 14.2 to 6.3 11.4 to 5.6
1961–2002 Mean 7.3 to 3.1 7.6 to 4.6 9.3 to 4.3 7.6 to 3.6(First + Final) (5.2) (6.1) (6.8) (5.6)
* Final Count: Excluding non-transferable votes.
Data source: Dail Eireann (1962–2003).
22 Voting matters, Issue 20
ISSN 1745-6231
Voting matters
for the technical issues of STV
published by
The McDougall Trust
Issue 21 March 2006
About the McDougall Trust (reg. charity no. 212151)
The McDougall Trust is a charitable trust formed in 1948. Thecharity’s purposes asstated in its governing scheme of 1959 are to advance knowledge of and encouragethe study of and research into:
• political or economic science and functions of government and the services pro-vided to the community by public and voluntary organisations; and
• methods of election of and the selection and government of representative organ-isations whether national, civic, commercial, industrialor social.
The Trust’s work includes the maintenance and development of the Lakeman Libraryfor Electoral Studies, a unique research resource, the production and publication ofRepresentation: The Journal of Representative Democracy,and, of course, this pub-lication Voting matters, that examines the technical issues of the single transferablevote and related electoral systems.For further information on the Trust, please contact:
For further information on this publication, please contact B A Wichmann, the Editorat the above address or by email at:[email protected]
Editorial
The delay in producing this issue is due to the lack ofmaterial. An issue is produced when about 20 pages ofarticles are available.
There are 3 papers in this issue:
• Jeff O’Neill: Fast Algorithms for Counting RankedBallots.
Many years ago, the speed of undertaking a com-puter count was an issue. Computers are now fastenough for this not to be a serious concern. Thispaper shows that comparatively modest changes inthe way a program operates can make significantchanges to the speed of counting.
• Brian Wichmann:Changing the Irish STV Rules.
The Republic of Ireland has used STV since itsindependence, but used a counting rule in whichthe order of the ballot papers could potentiallychange the result, albeit rather infrequently. Thispaper considers a change to the Meek rules whichis assessed by means of computer simulation.
• Franz Ombler:Booklet position effects, and twonew statistics to gauge voter understanding of theneed to rank candidates in preferential elections.
The use of STV in New Zealand is a very wel-come development. The New Zealand electionsrandomised the order in which candidates werelisted in ballot papers for some elections, but not inan accompanying booklet given to all voters. Thispaper demonstrates effects of the booklet and pro-poses measures of voter understanding of the im-portance of ranking their chosen candidates.
We have an innovation with this issue which isactually some additional material under the headingInternet Resourceson the McDougall web site. Theadditional material is in the form of links to papers orreferences that are being used inVoting matterscontri-butions. Hypertext links are typically too long to han-dle easily by means of printing, and therefore presenta problem in producingVoting matters. There is alsoan additional hazard with such links as they can be re-moved or their position changed. The web site should
be able to record changes and record material that hasbeen lost.
Lastly, a report on electronic voting produced by theIrish Commission should be available shortly on theirweb site at:http://www.cev.ie/.
TV voting
There is an increasing use of popular voting associ-ated with TV programmes, which, unfortunately, doesnot include preferential voting. With a programme likeBBC’s Big Read, one wonders what the result wouldhave been. For instance, if one could (somehow) ar-range preferential voting in which is the voters had readthe books in their list, how wouldWar and Peacehavecompared withHarry Potter?
Readers are reminded that views expressed inVoting matters by contributors do not neces-sarily reflect those of the McDougall Trust orits trustees.
This paper shows how some vote-counting methodscan be implemented significantly faster by organizingranked-ballot data into a tree rather than a list. I willbegin by explaining how the tree data structure worksand then apply it to Meek’s method and Condorcet vot-ing.
2 Tree-Packed Ballots
The most basic way of storing ballots is in a list. Forexample, suppose Alice, Bob, and Cindy are candidatesand we have ten voters. The votes could be stored in alist, where each line corresponds to a ballot, and withineach line, the candidates are listed in order of prefer-ence. I call this raw or unpacked ballot data, and anexample is shown in Figure 1.1.
In this example, as is inevitable in any real elec-tion with ranked ballots, some voters will cast the exactsame ballot. Instead, one could store only one copy of
duplicate ballots along with the number of times the bal-lot occurred. I call this list-packed ballots. Figure 1.2shows the same ballots from Figure 1.1 packed into alist.
Many vote-counting methods can use list-packed bal-lots instead of raw ballots and save computations. Forexample IRV, ERS97 STV, and Meek’s method can alluse list-packed ballots but Cambridge and Irish STVcannot. The reason Cambridge and Irish STV cannotis that the outcome is dependent on the order of the bal-lots, and order information is lost with list-packed bal-lots.
The ballots, however, can be packed even moredensely into a tree, what I call tree-packed ballots. Fig-ure 1.3 shows the same ballots packed into a tree. Theroot of the tree lists the total number of ballots, whichis ten. From the root, branches go downward corre-sponding to the first-ranked candidates. The subse-quent nodes list the number of times that candidate wasranked first on a ballot. Note that these three num-bers add up to ten. The second level corresponds to thesecond-ranked candidates listed after the correspondingfirst-ranked candidates. Note that no candidate is everranked second after Bob. Further, note that four ballotshave Alice first, but only two ballots list a candidate sec-ond after Alice. This is because two of the four voterswho listed Alice first did not rank a candidate second.
For the three data structures, the size of the data struc-
ture corresponds to the number of entries, which is thenumber of times that candidate names are stored. Forexample, the size of the data structure in Figure 1.1 is15, the size of the data structure in Figure 1.2 is 10,and the size of the data structure in Figure 1.3 is 7 (theroot node isn’t counted). Table 1.3 shows the sizes ofthe three data structures for the ballots from eight elec-tions. B is the number of ballots, C is the number ofcandidates, and S is the number of seats to be filled.
List-packed ballots are 65% of the size of raw ballots.Tree-packed ballots are 45% of the size of list-packedballots and 29% of the size of raw ballots. I expectthe computation time of a particular implementation tobe roughly proportional to the size of the data struc-ture used. Thus, I expect the computation time withtree-packed ballots to be about 45% of the computationtime with list-packed ballots. The more complicateddata structures will also add some overhead that will in-crease the computation time to some extent.
Before presenting the details of implementing vote-counting methods with the different data structures, Iwill present the timing results with the different datastructures. The timing results should only be consid-ered in a rough sense since the efficiency of the par-ticular implementations may vary. All timing resultsare cumulative for the above eight elections and are inseconds. First, the times in seconds for loading, load-ing and list packing, and loading and tree-packing areshown in Table 1.1.
Next I compare the computation times for a numberof vote-counting methods using list-packed and tree-packed ballots. Because the relationship between rawand list-packed ballots is obvious, those times are not
Data Structure TimeLoad and No Packing 17.7Load and List Pack 26.7Load and Tree Pack 31.1
Table 1.1: Comparison of loading and packing times (inseconds).
Table 1.2: Timing of vote-counting methods with list-packed and tree-packed ballots (in seconds). The per-centages in parenthesis indicate the computation timeof the tree-packed implementation relative to the list-packed implementation.
compared in this paper.1 Further, only the slower meth-ods are implemented with tree-packed ballots becausethese are the only ones that are in need of improvement.The methods are single non-transferable vote (SNTV),instant runoff voting (IRV), Electoral Reform SocietySTV (ERS97 STV), STV rules proposed for BritishColumbia in 2005 (BC STV), Meek STV, Warren STV,and Condorcet.2 The computation times are shown inseconds in Table 1.2. The percentages in parenthesesindicate the computation time of the tree-packed imple-mentation relative to the list-packed implementation.
While we expected the computation times with tree-packed ballots to be 45% of the times for list-packedballots, they are much faster for Meek and Warren STV.Why this is so will be explained below.
1Implementing a particular method with raw or list-packed bal-lots uses nearly the same code. The code iterates over the raw ballotsor iterates over the list-packed ballots. The computation time is sim-ply proportional to the number of loop iterations. In contrast, withtree-packed ballots, the code needs to be rewritten from scratch as isdiscussed below.
2The timing for Condorcet is only for computing the pairwisecomparison matrix. Computing the Condorcet winner from the pair-wise comparison matrix is generally much faster than computing thepairwise computation matrix.
2 Voting matters, Issue 21
O’Neill: Fast Algorithms for Counting
3 Meek STV with Tree-Packed Ballots
I will now give the details of how to implement MeekSTV using tree-packed ballots. The process is very sim-ilar for Warren STV. A full description of Meek STV isbeyond the scope of this paper [1, 2, 3]. Instead, I willpresent the details most relevant to the fast implemen-tation.
In each stage of counting votes with Meek STV, allthe votes must be counted from scratch. This is distinctfrom other STV methods where some votes are simplytransferred from one candidate to another and a full re-count is not necessary at each round. With Meek STV,each candidate is assigned a fraction, f[c], where c de-notes the candidate. At the beginning of the count, allthe fractions are 1.0, and the fractions remain 1.0 aslong as a candidate is under the quota. When a candi-date has more than a quota, the fraction essentially dis-counts the value of that candidate’s votes to bring thecandidate back down to a quota. With a discount lessthan 1.0, the subsequently ranked candidates on a ballotwill receive a portion of the vote.
In each round of a Meek STV count, the fractions f[c]will be updated and the ballots recounted. The follow-ing is a segment of Python pseudo-code for countingballots for one round of a Meek count. Note that it useslist-packed ballots. The ith packed ballot is b.packed[i]and the corresponding weight of that packed ballot isb.weight[i].
# Iterate over all of the ballots.for i in range(nBallots):
# Each ballot is worth one vote.remainder = 1.0# Iterate over the candidates on this ballot.for c in b.packed[i]:
# If the candidate is already eliminated# then skip to the next candidate on the# ballot.if c in losers:
continue# This candidate gets a portion# of this ballot. For the first non-losing# candidate on the ballot, the remainder will# be 1.0. If the candidate is under quota,# then f[c] is also 1.0 and this candidate# gets all of the ballot. Otherwise the# candidate gets less than the full value,# and will share the ballot with# subsequently ranked candidates.count[c] += remainder * f[c] * b.weight[i]# Calculate how much of this ballot remains,# if any, to be counted for subsequently# ranked candidates.remainder *= 1 - f[c]# Stop if this ballot is used up.if remainder == 0:
break
This code can be rewritten to use tree-packed ballots.
The computations are exactly the same as before, theyare just done in a different order so that similar compu-tations can be done together. Consider the ten ballotspresented above. Alice is ranked first on four ballots.With list-packed ballots, it would take three loop itera-tions to count these three ballots, but with tree-packedballots all the first-place votes for Alice are counted atthe same time, thus saving computations.
The code is more complicated, because it involvesa depth-first traversal of the tree. The following showshow the nodes of the tree are accessed and also the orderof a depth-first traversal.
A convenient way to implement the depth-first traver-sal is to use a recursive subroutine. Note that the sub-routine calls itself by passing one branch of the tree,which is just a smaller tree, and possibly a diminishedvalue for the remainder.
def updateCountMeek(tree, remainder):# Iterate over the next possible candidates.for c in tree.nextCands():
# Copy the remainder for each iteration.rrr = remainder# Skip over losing candidates.if c not in losers:
# Count the votes as before but weight with# the tree-packed data instead of the# list-packed data.count[c] += rrr * f[c] * tree[c][n]# Calculate how much of this ballot remains,# if any, to be counted for subsequently# ranked candidates.rrr *= 1 - f[c]
# If there are any candidates ranked after# the current one and this ballot is not used# up, then recursively repeat this procedure.if tree[c].nextCands() != [] and rrr > 0:
updateCountMeek(tree[c], rrr)
The initial call to the subroutine uses the base of thetree, and as before, the initial value of the remainder is1.0
updateCountMeek(self.b.tree, 1.0)
Now that I have explained the fast algorithm, I canexplain why it works much faster than expected. Theunexpected speed increase arises from the fact that inany STV election, it is overwhelmingly the top choiceson the ballots that are counted. In the first round ofa Meek election, only the first-ranked candidates are
Voting matters, Issue 21 3
O’Neill: Fast Algorithms for Counting
counted. Consider the ballots for the Dublin North 2002election. With list-packed ballots, one needs to countthe 138,647 weighted ballots, but with tree-packed bal-lots, one needs to count only the twelve nodes of the treecorresponding to the first rankings of the twelve candi-dates. As the rounds progress, more and more nodes inthe tree will be needed for the count, but generally thiswill be far less than the total number of nodes in the treeand even further less than the number of list-packed bal-lots.
Readers who understand the differences betweenMeek STV and Warren STV will immediately realizewhy Warren STV is much faster than Meek STV withthe tree-packed ballots: Warren STV is less likely thanMeek STV to use lower-ranked choices on a ballot.
4 Condorcet with Tree-Packed Ballots
Tree-packed ballots can also be used to compute thepairwise comparison matrix in a Condorcet election.The pairwise comparison matrix, pMat[c][d], countsthe number of times that candidate c is ranked higherthan candidate d on the ballots. Computing the pairwisecomparison matrix is straightforward with list-packedballots:
# Iterate over all the ballots.for i in range(nBallots):
# Copy the list of candidates.remainingC = candidates[:]# Iterate over the candidates the ballot.for c in b.packed[i]:# Get list of lower-ranked candidates.remainingC.remove(c)# Iterate over all lower-ranked candidates.for d in remainingC:
# c is ranked higher than d.pMat[c][d] += b.weight[i]
This code can also be rewritten to use tree-packedballots. As before it involves the depth-first traversal ofthe tree.
def ComputePMat(tree, remainingC):# remainingC is a list of candidates not higher in# the ballot than the current candidate. Initially# it is a list of all the candidates.# Iterate over the next possible candidates.for c in tree.nextCands():# Copy the list of remaining candidates.rc = remainingC# Remove candidate from remaining list.rc.remove(c)for d in rc:
# Current candidate is ranked higher than# candidates in remaining list.pMat[c][d] += tree[c][n]
# Continue if more candidates.if tree[c].nextCands() != []:
ComputePMat(tree[c], rc)
# First call is with entire tree and list of all# candidates.ComputePMat(tree, allCands)
Computing the pairwise comparison matrix is fasterwith tree-packed ballots, but the improvement is notnearly as great as for Meek STV. The reason for thisis that computing the pairwise comparison matrix re-quires traversing the entire tree, thus the computationtimes are roughly proportional to the relative sizes ofthe data structures. The overhead involved with us-ing tree-packed ballots makes the implementation withtree-packed ballots a little slower than expected.
5 Conclusions
Using tree-packed ballots instead of other data struc-tures can greatly increase the speed of some vote-counting methods. Such speed improvements need tobe weighed against the time needed to create the tree-packed ballots and the cost of maintaining more com-plex code. Meek and Warren STV are approximatelyfive and ten times faster, respectively, with tree-packedballots than with list-packed ballots. Such enormousspeed improvements clearly outweigh the costs. In con-trast, with Condorcet voting, the time saved is aboutequal to the time required for tree-packing the ballotsso any benefits are minimal. Other methods, such asERS97 STV and BC STV, are so fast with list-packedballots that tree-packed ballots are clearly not benefi-cial.
My implementation of all of the vote counting meth-ods mentioned in this paper (and others) is available fordownload athttp://stv.sourceforge.net.
6 References
[1] Nicolaus Tideman,The Single Transferable Vote,Journal of Economic Perspectives, Vol. 9, No. 1,pp. 27-38 (1995).
[2] B. L. Meek,A New Approach to the Single Trans-ferable Vote, Voting matters, Issue 1, p. 1 (Mar.1994).
[3] I. D. Hill, B. A. Wichmann, and D. R. Woodall,Algorithm 123 – Single Transferable Vote byMeek’s Method, Computer Journal, Vol. 30, No.3, pp. 277-281 (1987).
4 Voting matters, Issue 21
O’Neill: Fast Algorithms for Counting
Election B/C/S Raw List TreeDublin North 2002 43,942/12/4 218,933 138,647 57,568
Dublin West 2002 29,988/9/3 132,726 69,860 23,730
Meath 2002 64,081/14/5 298,106 174,737 74,105
Cambridge 1999 City Council 18,777/29/9 106,585 90,816 47,813
Cambridge 2001 City Council 17,126/28/9 95,440 79,385 40,566
Cambridge 2001 School Committee 16,489/16/6 66,254 33,86012,907
Cambridge 2003 City Council 20,080/29/9 115,232 98,055 54,182
Cambridge 2003 School Committee 18,698/14/6 66,389 29,6379,764
Total 1,099,665 714,997 320,635
B/C/S = Ballots/Candidates/Seats
Table 1.3: Sizes of the three data structures for the eight elections. The size of a data structure is the number ofentries. See the text for more details.
For elections to the Dail, the Irish Government has beenusing a form of STV which has remained essentiallyunchanged since the state was formed, in spite of smalladjustments [1]. The counting rules have a significantflaw: they use a method of transferring surpluses thatmakes a random choice of the votes to be transferred[2]. Specifically, the rules require that the papers areplaced in a random order. When a transfer is under-taken, all the relevant papers are examined in order todetermine how many of them should be transferred toeach continuing candidate, but the actual papers chosenfor transfer depend on the random order. This methodcan affect the result if transferred papers are transferredagain later in the count.
With the advent of computer-based counting (whichis likely to be introduced shortly), the dependence uponthe (random) order of the papers will become appar-ent. In the case of the three constituencies for whichcomputer-based counting was used in 2002, the full bal-lot data was placed on the Internet (with the papers or-dered as for the official count). In those three cases, theresults were not order dependent, but order-dependenceis bound to arise at some stage in the future. If a candi-date could have been elected but was not, it is clear thata legal challenge to the result would be possible (espe-cially if, considering all possible random orders of thepapers, the aggrieved candidate was more likely to beelected than one of the candidates who actually was!).
This paper presents a study of the likely effect ofchanging the STV Rules for the Dail to use the Meekmethod [3]. As with all modern counting rules, theMeek method has no order-dependence.
2 A method for simulating Irish votingpatterns
For three Dail elections held in 2002 we have the com-plete ballot data as noted above. This implies that manyforms of analysis can be undertaken, for instance, theuse of preferences as below:
Constituency Average Average Average Seats/used (Meek) used (Irish) given Candidates
Dublin North 2.12 1.34 4.98 4/12Dublin West 2.11 1.49 4.43 3/9
Meath 1.98 1.43 4.65 5/14
Here we use the data in another way. A previouspaper [4] describes a way of generating simulated bal-lot data from a conventional STV result sheet using asimple statistical technique [5]. We wish to tailor thismethod to Irish voting patterns, which we can do bymaking the simulated ballot data more closely resem-ble the actual ballot data in the three Dail elections forwhich the latter are known. To that end, the followingchanges have been made to the method described in [4]:
1. a proportion of the papers with only one or twopreferences are ignored, since otherwise therewould be too many such papers;
2. an appropriate proportion is added of strict partyvotes — all the preferences being for one party;
3. additional votes are added in which the final pref-erences are in ballot paper (or reverse) order be-cause such are observed in the actual data. Thisis done by taking some of the generated paperswhich listed between a half and three quarters ofthe available candidates and inserting the remain-ing candidates;
4. for those candidates having a very small numberof first preference votes, there is an adjustment to
6
Wichmann:Changing the Irish STV Rules
ensure that the number of second preferences forthem is also low.
The best possible outcome would be if the generatedpapers looked as if they came from the same populationas the actual papers for the three constituencies. If fact,the results were as follows:
First preference test. This compares the distributionof first preferences for the actual and generatedpapers. The program construction should ensurethat this test passes.
First two preferences test.Each pair of candidates isconsidered and also each candidate singly whereno second preference is expressed. For the pairsthe order of the two candidates is disregarded,counts for AB and BA being put together. Thedistributions formed from the actual and generatedpapers are then compared. It is not very surpris-ing that this test fails because much of the neces-sary information about the relationships betweencandidates is missing in result sheets, and hencethe generator’s random selection will not producea good fit. For Dublin North, for instance, theLabour and Green Party candidates appear to havea common following giving a high count to paperscontaining these as the first two choices. The re-sult sheet for this election shows the high transfersat count 7 from the (elected) Green candidate toLabour, but does not show the reverse. In general,so many of the second preferences are unknownthat the test cannot be expected to perform well.
Length test. This test considers the distribution of thenumber of preferences specified. Those that spec-ify every candidate, and those that specify everycandidate except one, are merged as their mean-ings are regarded as identical. This test is notpassed, but does not fail so badly as to indicatea need to modify the program.
Rank test. This considers the ranking of the candidatesagainst the ballot paper order. It passes with oneof the three constituencies, and does not appear towarrant further program modification.
It is clear that the three available constituencies havedifferent statistical properties, not all of which can berelated to the differing numbers of seats (3, 4 and 5).Hence, the generator cannot be expected to obtain agood match for all of them. It is thought that any fur-ther change to the generator would be unlikely to makemuch improvement.
3 Generating data to match two Dailelections
For each of the constituencies for the 1992 and 1997Dail elections, the result sheet is used, together with thegenerator described in the previous section, to producethree (related) sets, making 246 in total. The total num-ber of candidates to be elected was 993. This ballot datacould then be processed using the Irish rules and Meek.The observed differences were in 17 constituencies, 16giving a difference of one candidate and one a differ-ence of two. Hence the differences were in 1.8% of thecandidates elected. (The difference in candidates was18/993, while that in constituencies was 17/246, but theformer is taken since that is the number which influ-ences the Dail.)
In all of the 17 constituencies, on completing thecount with both rules, there was only one continuingcandidate. In 13 of these, the set of those elected plusthe continuing candidate was the same — the differencebetween the two rules was in the choice of the last can-didate to elect.
We now need to consider ways of determining whatshould be the ‘correct’ result for these 17 cases. Twogeneral methods are considered:
Order-dependence.We need to consider whether theIrish count was influenced in the final outcome bythe order of the ballot papers. The papers wereinitially in random order and hence would not beexpected to favour a specific candidate.
In theory, it should be possible to compute theprobability of each possible outcome from the bal-lot papers. However, this seems rather difficultand hence the approach taken is to determine thetwo candidates whose position is different withthe two rules. A program is then used to re-orderthe papers to favour the Meek outcome. Then theIrish rules are applied to the re-ordered papers tosee if a different result is obtained. If a differentresult is produced, then it is clear that the papersare order-dependent, even if the probabilities ofthe different outcomes are not known. However,if the same result is produced, it is not possibleto be sure that there is no order-dependence in theresult, unless transferred surplus votes are not sub-sequently transferred again.
If the papers are order-dependent, then the Irishresult is certainly questionable. In all such cases,
Voting matters, Issue 21 7
Wichmann:Changing the Irish STV Rules
Test Seats Withdrawn test OrderCands. Result Depend.
reordering the papers can produce the Meek re-sult.
Withdraw no-hopers. All the candidates who wereneither elected nor a continuing candidate witheither rule can be considered as having no hopeof election. Under such circumstances, with STV,it is reasonable to assume that withdrawing theseno-hopers from the count would not change theresult. With the Meek rules, we know that thistestwill produce the same result, but the Irish re-sult is uncertain. In the 17 cases under considera-tion, when running the Irish rules (with the papersin the same order), the result is either as with theoriginal election, or else changes to the Meek re-sult, as indicated in the Table 2.1.
In Table 2.1, the 6 cases in which thewithdrawntestgives the Meek result and where there is also order-dependence, we regard as showing that the Meek resultis superior. This leaves another 11 cases to consider inmore depth.
The last four results in Table 2.1 arenot order-dependent because the votes transferred after a surplusare not subsequently transferred. It is instructive to con-sider the first one of these further. The first stages ofboth Meek and the Irish rules are to exclude the five no-hopers. Hence, after these exclusions, the votes for the
remaining five candidates are the same for both rules.(The stages are out of step as the Irish rules exclude twoin one stage, while Meek rules do not.) Thewithdrawntest shows that if the Irish rules were applied startingfrom this point, then the Meek result would have beenproduced. However, the two actual outcomes can besummarised in Table 2.2.
With the Irish rules, since the quota is calculated onceat the start, C8 is elected with 639 (8111-7472) morevotes than C5. The reduced quota with Meek meansthat many more of those people who voted first for C8had a fraction of their vote transferred to their next pref-erence. Moreover the 205 votes that were transferredfrom C8 all came from the excluded candidate C6. WithMeek, all the votes for C8 are considered and an appro-priate fraction retained while the rest of the votes arepassed to the next preference. In our opinion, Meek canbe seen to be fairer, although it requires more work toexamine each vote at each stage.
All the other three cases for 1997 are similar.We now consider the case 92/P24C in which thewith-
drawn test still produces the Irish result but we knowthat reordering the papers can produce the Meek result.Also, thewithdrawntest is very simple in that only onecandidate needs to be excluded. We give the result sheetfor each rule in Tables 2.3 and 2.4. The elected candi-dates are in italics and underlined.
Comparing these two result sheets reveals the keydifferences as follows:
1. at the second stage, the Irish rules transfer the sur-plus of C2, while Meek transfers the surpluses ofC1, C2 and C6. With the Irish rules, the surplus ofC6 is never transferred;
8 Voting matters, Issue 21
Wichmann:Changing the Irish STV Rules
−1463
C1 11156 11156 11156 9693
−7022
C2 16715 9693 9693 9693
+2668 −2051
C3 9076 11744 9693 9693
+1838 +402 +225
C4 6945 8783 9185 9410
+2516 +1076 +1238
C5 4532 7048 8124 9362
C6 9732 9732 9732 9732
+573
Non-T — — 573 573
Totals 58156 58156 58156 58156
Quota is 9693.
Table 2.3: Test 92/P24C, Irish rules
C1 11156 10692 9017
C2 16715 9732 9005
C3 9076 10832 9020
C4 6945 7983 8906
C5 4532 6142 9002
C6 9732 11121 9011
Non-T — 1654 4195
Totals 58156 58156 58156
Quota 9693 9417 8993
Table 2.4: Test 92/P24C, Meek rules
2. the quota reduction of 700 votes with Meek ismuch larger than the difference of only 48 votesbetween the last two candidates (C4 and C5) un-der the Irish rules;
3. the number of non-transferable votes is very muchlarger with Meek. The reason for this is that allvotes are treated the same way, while the Irishrules only transfer votes which have subsequentpreferences specified (given that there are suffi-cient votes to do this). Some people might seethis as a weakness of the Meek method, but foran opposing view, that it is a good feature of themethod, see [6]— this point is considered furtherlater.
+256 +827 +1047 +243
C1 4126 4382 5209 6256 6499
+191 +167 −5053
C2 4695 4886 5053 — —+1019 +208 +1120 −693
C3 6081 7100 7308 8428 7735
−1340
C4 9075 9075 7735 7735 7735
+172 +138 +820 +170
C5 5320 5492 5630 6450 6620
−1638
C6 9373 7735 7735 7735 7735
+2066 +280
Non-T — — — 2066 2346
Totals 38670 38670 38670 38670 38670
Quota is 7735.
Table 2.5: Test 92/P22A, Irish rules
C1 4126 5084 5821 6997
C2 4695 5008 — —C3 6081 7129 7985 7070
C4 9075 7649 8178 7040
C5 5320 5587 6291 6790
C6 9373 7650 8207 7059
Non-T — 563 2188 3714
Totals 38670 38670 38670 38670
Quota 7734 7621 7296 6991
Table 2.6: Test 92/P22A, Meek rules
With the possible exception of the issue of handlingof non-transferable papers, the Meek result cannot becriticized, while the obvious imperfections in the Irishrules gives cause to doubt the result.
We now consider case 92/P22A (92/P22B is essen-tially the same). Again, for simplicity, we consider thewithdrawn test rather than the full election. The tworesult sheets are presented in Tables 2.5 and 2.6.
It would be reasonable to ask why a further simplifi-cation could not be made by removing candidate C2,excluded by both rules. C2 is there as the continu-ing candidate with the Irish rules for the full election.Hence the candidate cannot be regarded as a no-hoper.
One can analyse the Irish results for evidence oforder-dependence. The 191 and then 167 votes trans-
Voting matters, Issue 21 9
Wichmann:Changing the Irish STV Rules
ferred to C2 are then transferred again and thus dependupon the choice of votes made. This total of 358 isgreater than the 121 vote-difference between the lasttwo candidates (C1 and C5). Hence the question markremains: it might be possible to obtain the Meek resultby a suitable re-ordering.
The number of non-transferable votes is high in bothcases. Meek can compensate for this by reducing thequota, while with the Irish rules, an excessive numberof papers remain with the three leading candidates. Thisexcess amounts to about 2,000 votes, while the key dif-ference is that C1 leads C5 by 207 votes with Meek, butby C5 leads C1 by 121 votes with the Irish rules.
Hence the primary source of the difference is the highnumber of non-transferable votes arising when C2 is ex-cluded. The Meek logic is clearly superior in this case.
The three cases 92/P35A, 92/P43A and 92/P43B areall similar in having a weak order-dependence whichcannot change the result by re-ordering the papers.However, in all these cases, thewithdrawn test givesthe Meek result. It is regrettable when the presence of ano-hope candidate changes an election result.
The last case, 92/P35C, is the most extreme since thecloseness of the voting and the difference in the rulesgives a difference of two seats. This is also exhibitedby the election with the no-hopers removed, which isshown in Tables 2.7 and 2.8.
The order-dependence in this case arises from the162 and 35 votes transferred to C3 which are subse-quently transferred again and hence are subject to ran-dom sampling. However, an attempt to obtain a dif-ferent result by changing the order failed (with the no-hopers removed), in spite of the original election beingorder-dependent (see Table 2.1).
The striking difference is that the Irish rules excludeC3 whom Meek rules eventually elect. However, thechoice between C3 and C4 is close with both rules —7 votes in favour of C3 for the Irish rules against 1 infavour of C4 with Meek. The quota reduction under-taken by Meek is enough to make the change, althoughthis is again a consequence of the short lists logic.
4 Conclusions
It is possible to generate ballot data based upon Irishresult sheets which is sufficiently similar to actual datato give a basis for comparing two counting rules. Theanalysis of the Irish rules shows that order-dependenceis a significant problem, confirming the result in [2].
+1264 +269 +1075 +140
C1 5407 6671 6940 8015 8155
−3158
C2 12008 8850 8850 8850 8850
+162 +35 −6501
C3 6304 6466 6501 — —+178 +40 +2558 −216
C4 6290 6468 6508 9066 8850
+159 +33 +613 +76
C5 7312 7471 7504 8117 8193
−639
C6 9489 9489 8850 8850 8850
+1395 +262 +934
C7 6288 7683 7945 8879 8879
+1321
Non-T — — — 1321 1321
Totals 53098 53098 53098 53098 53098
Quota is 8850.
Table 2.7: Test 92/P35C, Irish rules
C1 5407 6846 7595 8041 8532
C2 12008 8796 9227 8756 8560
C3 6304 6497 8950 8678 8543
C4 6290 6496 — — —C5 7312 7495 8131 8223 8324
C6 9489 8796 9307 8793 8569
C7 6288 7850 8458 8907 8577
Non-T — 322 1430 1700 1993
Totals 53098 53098 53098 53098 53098
Quota 8850 8796 8611 8566 8517
Table 2.8: Test 92/P35C, Meek rules
10 Voting matters, Issue 21
Wichmann:Changing the Irish STV Rules
The Meek counting rule overcomes the order-dependence, as do all the modern counting rules (suchas the Gregory rules used in Northern Ireland).
The analysis here shows that the property of Meekthat the exclusion of no-hope candidates is the same asif those candidates had never entered the election is alsoimportant. Surely the intervention of such candidatesshould not influence the result? Other commonly usedcounting rules do not have this property.
The analysis also reveals that Meek usually has amuch higher number of non-transferable papers thanthe Irish rules. It is the author’s view that Meek is cor-rect in this regard since every vote is handled in an iden-tical fashion, while in the Irish rules (as with most of thehand-counting rules), the logic is dependent upon theother votes. This can easily have the effect of totallyignoring the wishes of those votes which gave few pref-erences in the sense that no transfer to non-transferablesis undertaken. Whatever the reader might conclude onthis point, this is a smaller effect than those arising fromorder-dependence and the influence of no-hope candi-dates noted above.
Although the difference in those elected is quitesmall (1.8% of the candidates elected), such a differ-ence could be critical in the Dail. The two major partiesare frequently very nearly tied, so that the proportionof seats to them is critical in the formation of a Gov-ernment. An actual counting error of 1.8% would becorrectly regarded as quite unacceptable.
It might be maintained that the ‘complexity’ of usingthe Meek algorithm is not justified in view of the smalldifferences observed in this analysis. However, in Ire-land, when computers are being used, the complexity isnot what it seems. An implementation of the Irish rulesin Java amounts to around 2,000 lines of code [7], whilethe author’s implementation of Meek in Ada is less thanhalf that. There are a lot of exceptional cases in the Irishrules but virtually none in the Meek rules.
5 Acknowledgements
The paper is based upon a joint work with David Hill[8].
A significant fraction of this work would not havebeen possible without the ability to run a program ofJoe Otten that implements the Irish rules [1].
6 References
[1] Electoral Act 1992 as amended by the Electoral(Amendment) Act 2001. Republic of Ireland.
[2] M. Gallagher and A. R. Unwin. Electoral Dis-tortion under STV Random Sampling Procedures.B.J.Pol.S.Vol 16, pp243-268. 1986.
[3] I. D. Hill, B. A. Wichmann and D. R. Woodall.Algorithm 123 — Single Transferable Vote byMeek’s method. Computer Journal. Vol 30,pp277-281, 1987.
[4] B. A. Wichmann. Producing plausible party elec-tion data,Voting mattersIssue 5 pp. 6-10, January1996.
[5] B. A. Wichmann. A simple model of voter be-haviour, Voting matters. Issue 4. pp3-5. August1995.
[6] I D Hill. Are non-transferables bad?Voting mat-ters, Issue 8. p4. May 1997.
[7] Secrecy, Accuracy and Testing of the ChosenElectronic Voting System. Commission on Elec-tronic Voting (Ireland). December 2004. (Ap-pendix 2E gives details of the ‘CD’ implementa-tion — the author has been told this is 2,000 lines.)See: http://www.cev.ie/
[8] David Hill and Brian Wichmann. STV in the Re-public of Ireland. December 2003.
Voting matters, Issue 21 11
Booklet position effects, and two new statistics to gaugevoter understanding of the need to rank candidates inpreferential elections
In 2004 the Single Transferable Vote (STV) method re-placed plurality for the election of members of NewZealand’s District Health Boards (DHBs) [1]. Whilebeing unable to assess ballot position effects due to un-recorded random ordering of candidates’ names on eachballot paper this article demonstrates effects that maybe explained by the order of candidates’ names in anaccompanying booklet of the candidates’ profiles. Sucheffects undermine the intended benefits from randomlyordering candidates’ names on ballot papers, but proveuseful in questioning voter understanding of the needto rank candidates. Two new statistics are proposed tobetter gauge voter understanding of a preferential vot-ing method: the percentage of plurality style informalballots and a rank indifferent percentage.
2 The elections
Two elections are considered: the Canterbury DHBelection and the Otago DHB election. In both casesseven candidates were to be elected. Ballot papers weresent to voters by post. The ballots for the DHBs wereprinted with candidates’ names randomly ordered suchthat each ballot paper might be unique. An accompa-nying booklet with candidates’ profiles listed the can-didates alphabetically [2]. It seems likely that few can-didates for the elections were previously known to vot-ers and the election would seem relatively non-partisan.Voters were allowed to rank order any number of candi-dates and a ballot was deemed informal if there was no‘unique first preference’ indicated on the ballot [3].
2.1 Canterbury
The Canterbury DHB election was run alongside otherterritorial elections including those for the ChristchurchCity Council mayor, ward councillors and CanterburyRegional Council. These other elections continued touse plurality, so the voter had to contend with twomethods in their ballot papers. There were 29 candi-dates. Of 117,852 non-blank ballots, 8,986 (7.6%) weredeemed ‘informal’ and removed from the count. Ofthese, 7,579 (84.0% of informal votes, or 6.4% of to-tal votes) marked all of the candidates for whom theyvoted as a first preference (either with a tick, or by writ-ing ‘1’), presumably unaware of the need to rank candi-dates and thus voting as if it were a plurality election.
2.2 Otago
The Otago DHB election was run alongside territo-rial elections like those for Canterbury, but all elec-tions were conducted using STV. There were 26 candi-dates. Of 65,389 non-blank ballots, 3,016 (4.6%) weredeemed ‘informal’ and removed from the count. Ofthese, 1,315 (43.6% of informal votes, or 2.0% of totalvotes) marked candidates as if it were a plurality elec-tion.
As can be seen from the second-last row of Table 3.1,Canterbury DHB voters were over three times morelikely to waste their vote by treating the election as aplurality election (6.4% versus 2.0%). This is probablybecause the Otago DHB election voters were more fa-miliar with STV due to its use for all the elections on theOtago ballot papers. To better gauge voter understand-ing of preferential elections the percentage of pluralitystyle informal ballots could be reported alongside themore usually reported total number of informal ballots.
12
Ombler: Booklet position effects
Canterbury OtagoNumber of seats 7 7Candidates 29 26Non-blank ballots 117,852 65,389Formal ballots 108,866 62,373Informal ballots 8,986 (7.6%) 3,016 (4.6%)Informal ballots with multiple firstpreferences only (plurality-style) 7,579 (6.4%) 1,315 (2.0%)
Rank indifferent (see below) 5.1% 2.9%
Table 3.1: The Canterbury and Otago DHB elections
3 Ballot position effects
The voter burden of ordering the candidates is higherwhen the candidates are unfamiliar to voters, whenthere are so many candidates (29 for Canterbury, 26 forOtago), and where the district magnitude is high (seven)[4]. Furthermore, due to the lack of familiarity withcandidates, position effects are probably greater [4], andthese effects have greater consequences when voters arerequired to rank order candidates [5]. These effects mayalso be expected to be amplified by voters’ lack of expe-rience in rank ordering candidates, especially when theyhave to contend with multiple methods on their ballotpapers as in the Canterbury election.
Candidates’ names were randomly ordered duringballot paper printing, presumably to prevent ballot po-sition effects, that is, where the positions of the can-didates’ names on the ballot affect voters’ selectionor ranking of the candidates. Randomising candidatename order should certainly have reduced the effect of‘donkey votes’: ballots in which the voter ranked all thecandidates in the order in which they appeared on theballot. However, the number of donkey votes cannot beassessed due to the absence of information as to the or-der in which the candidates were listed on each ballotsheet. For the same reason, other ballot position effectscannot be assessed either.
4 ‘Booklet position effects’
Due to voters’ lack of familiarity with the candidatesmany voters would have relied heavily on the bookletof candidates’ profiles to draft their selections and rank-ings. The booklet listed the candidates alphabetically.We might call ensuing effects ‘booklet position effects’,which will dilute the intended benefits from randomlyordering the candidates’ names on ballot papers; indeedit is interesting to consider (although not demonstrated
here) whether booklet position effects may be greaterthan ballot position effects in elections in which vot-ers are less familiar with the candidates. Certainly, thecost-effectiveness of randomising ballot paper candi-date name order is questionable if the order of candi-dates’ profiles in an accompanying booklet is not alsorandomised.
Assigning the candidates numbers according to theirpositions in the booklet (alphabetically) helps comparethe rankings of candidates on each ballot with the orderin which they appear in the booklet. The real ballot ‘210 14 17 19 24 26’, where this voter has ranked candi-date number 2 first (that is, they wrote the number onebeside the candidate who appeared second in the book-let), candidate number 10 second and so on, may bedescribed as perfectly ordered as it lists the candidatesin the same order in which they appeared in the book-let. Similarly, ‘9 6 14 19 21 24 27’ seems near perfectlyordered.
Spearman’s rank correlation coefficient (rs) may beused to assess the correlation of two rankings. We canapply this to each ballot, finding thers of the rankingsof candidates in the ballot and the same ballot with can-didates re-ordered alphabetically. For example, thers
of the ballot ‘2 10 14 17 19 24 26’ with its ordered self(the same ballot) is exactly 1.0, showing a perfect pos-itive correlation; whilers for ‘9 6 14 19 21 24 27’ andits ordered self (‘6 9 14 19 21 24 27’) is 0.96.
The averagers of each formal ballot’s ranking ofcandidates with its ordered self is only 0.06 for Can-terbury and 0.03 for Otago, showing such weak posi-tive correlations that one might be tempted to infer anabsence of booklet position effects. This is likely todraw criticism that it proves nothing due to ‘failure torandomly assign groups of voters to different name or-ders’ [4]. Indeed it would be consistent with this bareanalysis to claim that position effects were present to alarge degree and that if the booklets had been printedrandomly that we would have seen a lower averagers.This might be true to some extent but we are unableto assess it properly due to the absence of informationabout the order of names on each ballot; however, evenwithout this information, booklet position effects can bedemonstrated.
If we assess the frequency of the various values ofrs for the ballots, we find inordinately high numbersof perfectly ordered and near perfectly ordered bal-lots. Figure 3.1 (the data for which is presented in Ta-ble 3.2) shows such an analysis of the 51,730 ballotsthat listed exactly seven candidates in the Canterbury
Voting matters, Issue 21 13
Ombler: Booklet position effects
election. In light grey is the exact distribution ofrs forN=7, as would be approximated by randomly orderingthese same ballots. Clearly there is a heavy tail on theright for the real ballots. Focussing on the rightmostbar, these 1,286 ballots (2.49%) are listed perfectly inorder, but the expected number of ballots to be foundin order for these 51,730 voters is only ten (0.02%) ifpreferences are randomly distributed.
Analyses of ballots listing other numbers of candi-dates (but more than 1) also find a notably higher thanexpected number of perfectly ordered ballots, 2,962more than expected in total (see Table 3.3).
The Otago DHB election shows a similar but lessprominent pattern (Figure 3.2). Given the similarity ofthe elections in other respects, this difference might bebest explained by the use of STV in all of the electionson the Otago ballot papers and therefore greater voterawareness and understanding of the method.
Booklet position effects are apparent, but there areother potential explanations. It is conceivable that somevoters are strongly biased towards candidates whosenames start with letters nearer the beginning of the al-phabet and admittedly booklet position effects cannotbe distinguished from alphabetic effects in this election[4]. It is also possible that a group of candidates mayactually be preferred in alphabetical order, perhaps bya small group of voters, perhaps following how-to-votecards with candidates ordered alphabetically. However,as discussed above, the Canterbury voters would havebeen less aware of STV, they were more than three timesmore likely than Otago voters to vote as if the electionwere being run as a plurality election, and the chartsshow a greater percentage of perfectly ordered ballotsfor the Canterbury election. I contend that the charts’heavy tails primarily demonstrate ignorance of, or in-difference towards, the ranking of candidates.
5 A measure of voter indifference toranking
Where booklet or ballot position order can be assessed itmay be worthwhile reporting a ‘rank indifferent’ statis-tic alongside the percentage of informal votes usuallyreported in elections. However, it isn’t easy to say howmany voters are rank indifferent.
Considering the Canterbury DHB election, it cer-tainly seems reasonable to assert that most of the 1,286voters who listed seven candidates in perfect order wererank indifferent: all but the ten expected, perhaps (refer
Table 3.3). It would also seem true of the remaining151 who listed more than seven candidates in perfectorder, as the probability of this occurring is so low. It isless compelling to argue that 38 of the 2,526 voters wholisted only two candidates in perfect order should alsocount, as the probability of this occurring by chance isso much greater. The appropriateness of this measurewould then depend on some aspects of the election: ifthe number of candidates is low or if there are few can-didates with popular support, sincere preferences are farmore likely to happen to accord with ballot or bookletposition and this may result in an inordinate number ofperfectly ordered or near perfectly ordered ballots.
One way to avoid this problem is to count the higherthan expected number of ordered ballots only when theprobability of this occurring is extremely low, below1% perhaps, which would only assess ballots listingfive or more candidates. The Canterbury DHB electionwould then have a statistic of 2%. However, this seemsconservative given the significantly more than expectednumber of near perfectly ordered ballots shown in thesecond-to-rightmost bar in Figure 3.1. Therefore onemight also consider those ballots with anrs, such that,say, less than 1% of ballots are to be expected to befound with thisrs or higher. The appropriate choice ofrs will then depend on the number of candidates in theballot.
Taking this approach encapsulates the above in whichwe ignored ballots with less than five candidates, aswith fewer than five candidates, there are fewer possi-ble values ofrs and the probability of finding orderedballots is greater than 1%. For example, where a ballotranks only two candidates, there are only two possiblearrangements resulting in anrs (with its ordered self)of either 1 or−1, and with a probability of 50% eitherway. With three candidates there are only four possi-ble values ofrs : −1,−0.5, 0.5 and 1, and the expectednumber of ballots having anrs of 1 is one in six (16.7%)[6]. For four candidates, the expected number of ballotswith anrs of 1 is 4%. It is not until we reach five candi-dates that the expected number of ballots with anrs of 1drops below 1%. For six candidates, the expected num-ber of ballots with anrs ≥ 0.94 (an rs of either 0.94or 1) is less than 1%, so we now count near perfectlyordered ballots as well as perfectly ordered ballots.
The appropriate values to use forrs are thus the crit-ical values to be found tabulated in textbooks. The ex-pected number of ballots can be calculated from theprobability of anrs greater than or equal to the criti-cal value: this might be assumed to be 1%, but it varies
14 Voting matters, Issue 21
Ombler: Booklet position effects
due to the discrete nature ofrs. Thus we also need tolook up the probability of this value ofrs and calculatethe number of ballots that may be expected to have thisrs if the ballots were randomly ordered. Critical val-ues for the number of candidates in the ballot from 5through 50 and the probabilities of finding these valuesare listed in Table 3.4.
Thus one can step through each ballot that ranks fiveor more candidates, correlating the ballot with its or-dered self, and counting those that are ‘highly ordered’,that is, those with anrs greater than the critical valuefor its number of candidates. One can then subtract theexpected number of highly ordered ballots, which canbe simply calculated by counting the number of ballotswith each number of candidates and multiplying this bythe probabilities listed in Table 3.4. Dividing this dif-ference by the total number of formal ballots providesan accessible statistic. This statistic may be interpretedas the percentage of voters that were almost certainlyrank indifferent. For the Canterbury DHB election thisis 3.8% and for the Otago DHB election it is 1.9%.
However, the probability of a voter being rank indif-ferent can be expected to be unrelated to the length ofthe ballot even though we cannot identify rank indif-ference in shorter ballots with confidence. This seemsreasonable when one considers that there is no rea-son to believe that voters who ranked fewer candidatesmight have had any greater understanding of STV thanthose who listed five or more candidates. Therefore, weshould really divide the difference by the number of for-mal ballots that listed five or more candidates. For theCanterbury DHB election the rank indifferent statisticis then 5.1% and for the Otago DHB election it is 2.9%(see Table 3.5 for working).
6 Conclusions
Booklet position effects should be considered when as-sessing the cost-effectiveness of randomising the orderof candidates’ names on the ballot paper, especially ifvoters are unfamiliar with the candidates or if the needto rank candidates might be poorly understood.
Two new statistics may be reported to better gaugevoter understanding of preferential voting: first, the per-centage of plurality-style informal ballots, that is, bal-lots in which the voter marked all of the candidates (forwhom they voted) with a tick or a ‘1’; and second, forelections where voters might be expected to rank or-der five or more candidates, the percentage of voters
that were almost certainly rank indifferent. However, ininterpreting the rank indifferent percentage one shouldbe wary of other potential causes of perfectly orderedor near perfectly ordered ballots such as how-to-votecards.
Voting matters, Issue 21 15
Ombler: Booklet position effects
2.38%2.49%
0.0%
0.5%
1.0%
1.5%
2.0%
2.5%
3.0%
3.5%
4.0%
-1.0
0-0
.93
-0.8
6-0
.79
-0.7
1-0
.64
-0.5
7-0
.50
-0.4
3-0
.36
-0.2
9-0
.21
-0.1
4-0
.07
0.00
0.07
0.14
0.21
0.29
0.36
0.43
0.50
0.57
0.64
0.71
0.79
0.86
0.93
1.00
Spearman's rank correlation coefficient of ballot wi th its ordered self
Per
cent
age
of b
allo
ts
%Exact distribution % Real ballots
Figure 3.1: Canterbury DHB: frequency of ballots for Spearman rank-order correlation coefficients of voters’ballots with their ballots ordered alphabetically, for ballots listing seven candidates.
1.23%
1.43%
0.0%
0.5%
1.0%
1.5%
2.0%
2.5%
3.0%
3.5%
4.0%
-1.0
0-0
.93
-0.8
6-0
.79
-0.7
1-0
.64
-0.5
7-0
.50
-0.4
3-0
.36
-0.2
9-0
.21
-0.1
4-0
.07
0.00
0.07
0.14
0.21
0.29
0.36
0.43
0.50
0.57
0.64
0.71
0.79
0.86
0.93
1.00
Spearman's rank correlation coefficient of ballot wi th its ordered self
Per
cent
age
of b
allo
ts
%Exact distribution % Real ballots
Figure 3.2: Otago DHB: frequency of ballots for Spearman rank-order correlation coefficients of voters’ ballotswith their ballots ordered alphabetically, for ballots listing seven candidates.
Table 3.2: Data for Figures 3.1 and 3.2: the numbers of ballots for each possible value ofrs and the exactdistribution (as would be approximated by randomly orderedballots) for ballots ranking seven candidates [7]
Table 3.5: Manual calculation of rank indifferent statistic
Further information and computer programs to automate the production of these statistics are available from theauthor on request.
20 Voting matters, Issue 21
Ombler: Booklet position effects
7 References
[1] Department of Internal Affairs, ‘STVInformation’, 2004, URL on web site.
[2] Personal communication with Christchurch CityCouncil, 13 April 2005.
[3] New Zealand Government, ‘Part 4 - Conduct ofElections and Polls using Single TransferableVoting Electoral System’,Local ElectoralAmendment Regulations 2002.
[4] Jon A. Krosnik, Joanne M. Miller, and Michael P.Tichy, ‘An unrecognized need for ballot reform’,in Ann N. Crigler, Marion R. Just, and Edward J.McCaffery (eds.),Rethinking the Vote : ThePolitics and Prospects of American ElectionReform(New York: Oxford University Press,2004), pp. 52, 53, 63.
[5] Susan Banducci, Michael Thrasher, ColinRallings and Jeffrey A. Karp, ‘Candidateappearance cues in low-information elections’,2003, Paper presented at the Annual Conferenceof the American Political Science Association(Philadelphia), URL on web site. p. 14.
[6] Sidney Siegel and N. John Castellan, Jr.,Nonparametric statistics for the behavioralsciences,second edition (New York:McGraw-Hill, 1988), pp. 242, 360-361.
[7] Mark van de Wiel, Computer programspearman.c for calculating the ‘Exactdistribution of Spearman’s rank statistic’,available from URL on web site.
Voting matters, Issue 21 21
ISSN 1745-6231
Voting matters
for the technical issues of STV
published by
The McDougall Trust
Issue 22 July 2006
About the McDougall Trust (reg. charity no. 212151)
The McDougall Trust is a charitable trust formed in 1948. Thecharity’s purposes asstated in its governing scheme of 1959 are to advance knowledge of and encouragethe study of and research into:
• political or economic science and functions of government and the services pro-vided to the community by public and voluntary organisations; and
• methods of election of and the selection and government of representative organ-isations whether national, civic, commercial, industrialor social.
The Trust’s work includes the maintenance and development of the Lakeman Libraryfor Electoral Studies, a unique research resource, the production and publication ofRepresentation: The Journal of Representative Democracy,and, of course, this pub-lication Voting matters, that examines the technical issues of the single transferablevote and related electoral systems.For further information on the Trust, please contact:
For further information on this publication, please contact B A Wichmann, the Editorat the above address or by email at:[email protected]
Editorial
There are five papers in this issue, the first three be-ing:
• Jonathan Lundell: Random tie-breaking inSTV.
AlthoughVoting mattershas had several papersabout tie-breaking, one can see that there is stillmore to be said on the matter.
• David Hill: Implementing STV by Meek’smethod.
David Hill has provided an implementation ofMeek’s method for many years. This imple-mentation has been taken as the ‘definition’ ofthe method for the New Zealand elections. Inthis paper, the details of this implementationare described and contrasted with that of theoriginalComputer Journalarticle.
• Robert Newland: Computerisation of STVcounts.
Although Robert Newland died in August1990, readers may well be surprised at the rel-evance of this paper for today. Up to his death,he was the leading technical expert on STVwithin ERS. This paper was located by DavidHill and since it was never published, print-ing it here seemed appropriate. It is hoped thatreaders will respond to the suggestions made.
The final two papers have a common theme: theform of STV proposed by British Columbia and nowbeing considered for the Scottish local elections tobe held next year.
• Jeff O’Neill: Comments on the STV Rules Pro-posed by British Columbia.
This paper presents the details of an implemen-tation of the British Columbia rules which hasbeen available on the Internet for some time. Itis a very simple version of STV in computerterms. Several issues arose from this workwhich are detailed in the paper.
• James Gilmour: Developing STV Rules formanual counting to give effect to the WeightedInclusive Gregory Method of transferring sur-pluses, with candidates’ votes recorded as in-teger values.
The paper is a complete contrast to the previ-ous one. Like the previous paper, the aim isto transfer surpluses by considering all papers,
not just the last batch that gave rise to the sur-plus. The contrast is in its presentation as amanual counting process and the provision ofthe conventional result sheet. One novelty is(at least within the UK) that the calculations areundertaken with high precision, but the resultsare presented as integers.
James Gilmour has produced a proposal andsent it to the Scottish Executive. This proposal,slightly modified, is now on the McDougallweb site. Hence the article provides the ratio-nale and background to the proposal.
It is hoped that the contrast between the two meth-ods above will clarify the choices to be made for theScottish elections. The final choice will be awaitedwith interest.
Two other items may be of interest to read-ers. Firstly, the final report on electronic votingin Ireland is due out shortly and will be found at:http://www.cev.ie/. Secondly, it has cometo my attention that the British Computer Societyelect their council by STV but do not provide a re-sult sheet to their electorate — only a list of thoseelected. Since the transfer of votes will not be vis-ible, this seems to me to be STV in name only. Doreaders have other examples of this?
Readers are reminded that views expressed inVoting matters by contributors do not neces-sarily reflect those of the McDougall Trust orits trustees.
The resolution of ties in STV elections is not a set-tled question. On the contrary, it remains a topic oflively discussion, with several papers published onthe subject in these pages; see Earl Kitchener’s note,“A new way to break STV ties in a special case” [1]for a summary.
Ties can arise in any STV election during exclu-sion. With some methods ties can arise at otherstages as well; Jeffrey O’Neill [2] lists the cases.
O’Neill also lists four tie-breaking methods. Twomethods use the first or last difference in priorrounds to break a tie, and two methods use laterpreferences—Borda scores or most (fewest) last-place preferences. Brian Wichmann [3] proposes toexamine all possible outcomes.
None of these tie-breaking methods is guaranteedto break a tie, since they can themselves result in atie, or in the case of [3] become so computation-ally expensive as to be impractical. These cases(strong ties) are typically broken randomly. Someelection methods, eg, the Algorithm 123 version ofMeek’s method [4], rely exclusively on random tie-breaking.
Objections to random tie-breaking fall into twocategories. One is a worry that voters and candi-dates will object to election decisions being made bychance instead of by voter preference. Thus Wich-mann [3]: “When a candidate has been subject to arandom exclusion in an election, he/she could nat-urally feel aggrieved.” Other objections adduce ex-amples in which it appears intuitively preferable tobreak a tie based on some measure of voter prefer-ence.
All STV election methods rely on random tie-breaking (or at least tie-breaking based on someconsideration other than voter preference) to breakstrong ties. (Ties in first-past-the-post elections are
often broken randomly as well, by coin toss, draw-ing straws, or drawing a high card.)
2 Prior-round tie-breaking
The rationale for forwards tie-breaking (usingO’Neill’s terminology) appears to be that it givesgreatest weight to first preferences. O’Neill [2]argues for backwards tie-breaking:
A more important problem, is that for-wards tie-breaking does not use the mostrelevant information to break the tie. Themost relevant information to break a tieis the previous stage and not all the wayback to the very first stage. By immedi-ately looking to the first stage to break thetie, the ERS97 rules allow the tie-breakingto be influenced by candidates eliminatedvery early in the process and also by sur-pluses yet to be transferred. Instead, if welook to the previous stage to break a tie,candidates eliminated early on in the pro-cess will have no influence in breaking thetie. In addition, it allows for surpluses tobe transferred which gives a more accu-rate picture of candidate strength.
Carrying O’Neill’s argument to its logical con-clusion, however, the “most relevant information”is not in any prior round, but rather in the currentround—and the current round declares a tie.
Prior-round tie-breaking encourages insincerevoting. Consider this election fragment, with twocandidates to exclude:
5 A4 B1 CB
Excluding C, we have:
1
Lundell: Random tie-breaking in STV
5 A5 B
and must now break the tie. Prior-round tie-breakingrequires that we exclude B, since A led B 5-4 in theprevious round. So voter CB, believing that the firstchoice (C) is likely to be excluded, is encouraged toinsincerely vote B (or BC) so as not to jeopardizeB’s chances in the event of an A–B tie.
Prior-round tie-breaking is especially trouble-some in the context of Meek rules, since it violatesMeek’s Principle 1: If a candidate is eliminated,all ballots are treated as if that candidate had neverstood. But if C had never stood, A and B would havebeen tied.
3 Later-preference tie-breaking
Kitchener [5] points out a problem case for randomtie-breaking:
An extreme case can arise where there isone seat and the electors are the same asthe candidates; for example, if a partner-ship is electing a senior partner. Each can-didate may put himself first, and all, ex-cept candidate A, put A second. Undermost present rules, one candidate then hasto be excluded at random, and it may beA. There is no way of getting over this un-reasonable result without looking at laterpreferences. . . .
The smallest such election:
1 A1 B A1 C A
Prior-round tie-breaking methods are of no helpin the first round, and a random choice excludes A,the consensus choice, one third of the time. Kitch-ener proposes to use Borda scores to break the tie;we must still randomly break a strong B-C tie, but Asurvives and is elected.
This case is related to a problem with STV in gen-eral, pointed out by Meek [6]. “A related point, andprobably the strongest decision-theoretic argumentagainst STV, is the fact that a candidate may be ev-eryone’s second choice but not be elected.”. . . and also related to the general problem of prema-ture exclusion.
Kitchener concedes that there is a problem withBorda tie-breaking, as there is with any tie-breakingmethod that relies on later preferences.
It is a fundamental principle of STV thatlater preferences should not affect the fateof earlier ones; this encourages sincerevoting, but means that some arbitrary orrandom choice must be made to break ties,which can give unreasonable results.
Responding to the Borda tie-breaking suggestion,David Hill [7] objects: “What matters is that tacticalconsiderations have been allowed in, where STV (inits AV version in this case) is supposed to be free ofthem.”
This point is crucial. In any election system, therules, including the method of breaking ties, mustof course be specified in advance. When we look atthe partnership election example above, we interpretthe ballots as the sincere expression of the voters,and so read the ballots as favoring A. But as bothHill and Kitchener observe, once later-preferencetie-breaking is introduced, we must expect insincerevoting. In the face of later-preference tie-breaking,B and C, to maximize their chances of winning (af-ter all, each is their own first choice) must resortto bullet voting (American English—one might saycharacteristically AmE—for plumping). The ballotswould then read,
1 A1 B1 C
. . . and we’re forced to resort to a random choice.This seems a shame, since it does appear from thepresumably sincere ballots in the initial profile thatboth B and C prefer A to the other. The partnersmight be well advised to adopt a special rule forbid-ding each to vote for herself. In that case, we wouldhave:
1 abstain2 A
. . . and A wins outright.
4 Random tie-breaking
An advantage claimed by Meek [6] for STV is that“There is no incentive for a voter to vote in any wayother than according to his actual preference.” Oneof Meek’s motivations for proposing a new STVmethod is to come closer to that ideal. LikewiseWarren [8], “It is one of the precepts of preferentialvoting systems that a later preference should neitherhelp nor harm an earlier preference.”
2 Voting matters, Issue 22
Lundell: Random tie-breaking in STV
Any election method relies for its properties onthe implicit assumption that voters will vote sin-cerely, that is, that their ballots will reflect, withinthe limitations of the specific method, their true pref-erences. Without sincere votes, any election methodfails to reflect the will of the electorate, on the prin-ciple of garbage in, garbage out. It is perverse to usetie-breaking methods that reintroduce incentives forvoters to vote insincerely. Hill and Gazeley [9]:
In considering this, we need to take intoaccount, among other things, that the trueaim of an election should not be solely tomatch seats as well as possible to votes,but to match seats to the voters’ wishes.Since we do not know the wishes wemust use the votes as a substitute, but thatmakes it essential that the votes shouldmatch the wishes as far as possible. That,in turn, makes it desirable that the votersshould not be tempted to vote tactically.
5 Voter psychology
One might counter that, except in small elections,the chances of a tie are sufficiently small that a voterought to ignore the possibility of a tie altogether andvote sincerely. This argument is problematic on twofronts. First, our methods should work with smallelections as well as large ones (and the line betweensmall and large elections is not well defined). Sec-ond, especially in a high-stakes election, the voter’sestimation of the risk associated with voting sin-cerely is likely to be wrong.
Computer security authority Bruce Schneier, in-terviewed inCSO Magazine[10], comments:
Why are people so lousy at estimating,evaluating and accepting risk?... Evalu-ating risk is one of the most basic func-tions of a brain and something hard-wiredinto every species possessing one. Ourown notions of risk are based on experi-ence, but also on emotion and intuition.The problem is that the risk analysis abil-ity that has served our species so well overthe millennia is being overtaxed by mod-ern society. Modern science and technol-ogy create things that cannot be explainedto the average person; hence, the aver-age person cannot evaluate the risks as-sociated with them. Modern mass com-munication perturbs the natural experien-tial process, magnifying spectacular but
rare risks and minimizing common butuninteresting risks. This kind of thingisn’t new—government agencies like the[US] FDA were established precisely be-cause the average person cannot intelli-gently evaluate the risks of food additivesand drugs—but it does have profound ef-fects on people’s security decisions. Theymake bad ones.
For our purposes, readtactical voting decisionsfor security decisions. Rational insincere voting isbad enough; insincere voting based on faulty infor-mation or poor tactics is even worse.
6 A note on weighting votes inlater-preference tie-breaking
Consider this election profile (BC rules, two to beelected, quota 10):
12 AB7 BC9 C2 D
A is elected, and D is excluded, leaving B and Ctied with nine votes each in the third round. If webreak the tie with Borda scores:
C is excluded, and B is elected as the last candi-date standing for the second seat.
Notice in particular that while B receives onlythe two transferable votes from the AB voters (aquota of 10 being retained by A, who is elected),B gets full credit for all 12 AB votes in the Bordatiebreaker.
I suggest that the AB voters, having elected A,must carry only the transferable weight of their votesin calculating the tie-breaking Borda score. Other-wise these votersdouble dip, not only electing A,but also participating disproportionately and deci-sively in the tie-breaking elimination of C and sub-sequent election of B.
If we calculate the Borda scores using the weightof transferable votes (that is, votes currently allo-cated to hopeful candidates), we have:
Voting matters, Issue 22 3
Lundell: Random tie-breaking in STV
A (elected)B 4+21 = 23C 14+27 = 41D (excluded)
Calculated with the vote weights that give rise tothe tie itself, the Borda score now breaks the tie toeliminate B, and C is elected.
The same argument applies to any method thatbreaks ties with later preferences. Votes committedto already-elected candidates should not be countedagain in breaking subsequent ties.
7 A better later-preferencetie-breaking method
The chief problem with STV tie-breaking withBorda scores is that it violates the principle of later-no-harm, and it does so in an especially egregiousway. Suppose that six candidates are in the running,that I have voted ABC, and that B and C are tied forelimination. The Borda scores for B and C pick upfour and three points, respectively, from my ballot.If the three points that my ballot contributes to C’sBorda score is the margin for C’s victory over B inthe Borda tiebreaker, then my later mention of C hasled directly to the defeat of B, even though I preferB to C.
Consider an alternative later-preferencetiebreaker. For the sake of simplicity, I willdescribe it for two-way ties, and then extend it ton-way ties. To break a tie, compare the ballotsthat prefer B to C to the number of ballots thatprefer C to B, weighted as described in the noteabove. Exclude the less-preferred candidate.Break strong ties randomly.
This method, like all later-preference methods,violates later-no-harm, but it preserves a propertythat I will call later-no-direct-harm. My ranking ofABC will not harm B’s chances in a BC tie. In thecase of a BC tie, my ballot will either have no ef-fect (the margin of B over C or vice versa withoutmy ballot is sufficient that my ballot makes no dif-ference), or it will cause the BC tie to be broken infavor of B, my preferred candidate in the tie (B andC are strongly tied without my ballot), or my bal-lot will convert a one-vote C advantage (without myballot) to a strong tie (with my ballot), giving B aneven chance in a random tiebreak.
That is, my ABC ballot either has no effect onbreaking a BC tie, or it benefits B.
By later-no-direct-harm, I mean that the fact thatI have ranked the later preferences BC will not harm
my favorite in the potential tie between B and C.Later-no-harm is not avoided; my ABC preferencecould break a tie in favor of B, and B could sub-sequently defeat my first preference, A, whereas Amight have prevailed had C won the BC tiebreaker.Any harm to A, however, will come indirectly, in alater round—and it would be rude for me to com-plain that the BC tie was broken on the basis of mypreference for B over C.
Generalizing to breaking ann-way tie for exclu-sion:
1. Find the first mention of any member of the tiedset of candidates on each ballot, and calculatethe total such mentions for each of the candi-dates, using the transferable weight of each bal-lot. Ignore ballots that do not mention at leastone tied candidate.
2. If all n candidates are still tied, exclude one tiedcandidate at random;finis.
3. Otherwise, remove from consideration for ex-clusion the candidate (or a random choice fromthe tied set of candidates) with the highestscore from step 1.
4. If only one candidate remains, exclude thatcandidate;finis.
5. Otherwise,n is now the remaining number oftied candidates (that is, less the reprieved can-didates from step 3); continue at step 1.
If the tie is for a winner rather than an exclusion,then remove from consideration the candidate withthe lowest rather than the highest score. This is sim-ply single-winner STV (AV or IRV) with weightedballots, and suggests an alternative to the proposedalgorithm for breaking a tie for exclusion: break ann-way tie for exclusion by counting an STV election(again with weighted ballots) withn candidates andn − 1 winners; exclude the single loser.
It’s worth noting that a similar procedure basedon lowest preferences (along the lines of Coombstie-breaking) does not satisfy the principle of later-no-direct-harm. For example, if candidates X, Y andZ are tied for exclusion and I have ranked those can-didates XYZ, it’s possible that my preference for Yover Z is decisive in favor of Y, and that Y but not Zbeats X in a head-to-head tiebreaker; thus my pref-erence for Y over Z decides the tiebreak in favor ofY over X, contrary to my preferences.
Likewise, Condorcet ranking is equivalent to theproposed method for two-way ties, but violateslater-no-direct-harm in the generaln-way-tie case.
4 Voting matters, Issue 22
Lundell: Random tie-breaking in STV
The proposed tie-breaking method—let’s call itweighted first preference—differs from prior-roundtie-breaking methods in that it considers the prefer-ences of all voters (suitably weighted), and not onlyvoters who have ranked the tied candidates first (af-ter elections and exclusions) in a prior round.
Hill and Gazeley [9] observe, in the context ofSequential STV:
With this new version, should it be recom-mended for practical use? That dependsupon whether the user is willing to aban-don the principle that it should be impossi-ble for a voter to upset earlier preferencesby using later preferences. Many peo-ple regard that principle as very important,but reducing the frequency of prematureexclusions is important too. We know thatit is impossible to devise a perfect scheme,and it is all a question of which faults arethe most important to avoid.
In considering this, we need to take intoaccount, among other things, that the trueaim of an election should not be solely tomatch seats as well as possible to votes,but to match seats to the voters’ wishes.Since we do not know the wishes wemust use the votes as a substitute, but thatmakes it essential that the votes shouldmatch the wishes as far as possible. That,in turn, makes it desirable that the votersshould not be tempted to vote tactically.
They would not be so tempted if they feltconfident that later preferences were aslikely to help earlier ones as to harm them,and if they could not predict the effect oneway or the other. At present, we see noreason to doubt that these requirementsare met.
The proposed method for breaking ties satisfiesthe same criteria: later preferences are as likely tohelp earlier ones as to harm them, and voters can-not predict the effect one way or the other. This isnot the case for other preference-based tie-breakingmethods discussed in these pages.
Whether this slight opening of the door to a vi-olation of later-no-harm is justified by the benefitof breaking ties non-randomly (in most cases) is, inDavid Hill’s words [7], a matter of judgment.
8 Summary
Arguments for various nonrandom tie-breaking im-plicitly assume sincere voters. But the introductionof those very methods undermines that crucial pre-condition, and without sincere voters the argumentsfail.
When O’Neill argues [2] that “forwards tie-breaking does not use the most relevant informationto break the tie,” and that later rounds reflect betterinformation, the logical conclusion of his argumentis that the most relevant information is not in a priorround at all, but rather in the current round that givesrise to the tie. That information is, simply, that thecandidates have equal support, by the means we’vechosen to measure that support.
Meek [6] drives this point further home with hisPrinciple 1: “If a candidate is eliminated, all bal-lots are treatedas if that candidate had never stood.”Prior-round tie-breaking typically, though not exclu-sively, depends on preferences for candidates whohave been excluded in the tie-breaking round. Toconsider those preferences violates Meek’s Princi-ple 1.
The encouragement of insincere voting is too higha price to pay for partially excluding chance fromSTV election methods. We should prefer randomtie-breaking in all cases.
If preferences must be considered in breakingties, then ties should be broken on the basis ofoverall earliest preferences, using transferable bal-lot weights.
9 References
[1] Earl Kitchener. A new way to break STV tiesin a special case.Voting matters. Issue 20, pp9–11.
[2] J C O’Neill. Tie-Breaking with the SingleTransferable Vote.Voting matters. Issue 18,pp 14–17.
[3] Brian Wichmann. Tie Breaking in STV.Voting matters. Issue 19, pp 1–5.
[4] I. D. Hill, B. A. Wichmann and D. R.Woodall. Algorithm 123—SingleTransferable Vote by Meek’s method.Computer Journal. Vol 30, pp 277–281, 1987.
Voting matters, Issue 22 5
Lundell: Random tie-breaking in STV
[5] Earl Kitchener. Tie-breaking in STV.Votingmatters. Issue 11, pp 5–6.
[6] B L Meek. A New Approach to the SingleTransferable Vote.Voting matters. Issue 1, pp1–7.
[7] I D Hill. Tie-breaking in STV.Voting matters.Issue 12, pp 5–6.
[8] C H E Warren. An example showing thatCondorcet infringes a precept of preferentialvoting systems.Voting matters. Issue 5, pp5–6.
[9] I D Hill and Simon Gazeley. Sequential STV -a new version.Voting matters. Issue 15, pp13–16.
[10] The Evolution of a Cryptographer,CSOMagazine, September 2003. Available fromthe McDougall web site.
At the time of the original implementation of STVby Meek’s method [1] we were feeling our way.Later thought has shown that, in some respects, thedetails can be improved while keeping the overallplan. Thus my own later implementation, as part ofa suite of programs to deal with the whole electionprocess rather than just the vote counting, and to in-clude other versions of STV as well as the Meekversion, made some changes from that original im-plementation. The aim of this paper is to describethose changes and the reasons for them.
My program is written in the Pascal computer lan-guage. While designed to be used under the MS-DOS operating system, it can also be easily accessedfrom Windows XP.
In [1] Woodall gave mathematical proof that theMeek formulation has a unique solution for anygiven voting pattern, and that the method necessar-ily converges upon that solution. Strictly speakingthat proof assumes infinite mathematical precision.In this paper I refer to that proof even though myimplementation has only finite precision. Providedthat the degree of precision is adequate, the approx-imation to Woodall’s proof will be close enough forpractical purposes.
2 Terminology
In [1] we used the term ‘weight’ for the fraction, ofeach vote or part of a vote received, that a candidateretains. This has now become known as the can-didate’s ‘keep value’, to be in accordance with thetraditional term ‘transfer value’.
We also used ‘excess’ for the amount of vote re-maining after all candidates mentioned in the voter’spreferences have received their shares. The moretraditional, but longer, term ‘non-transferable’ isnow used for this.
3 Arithmetic
In [1] the numbers of votes and the keep valueswere declared as ‘real’ variables in the computersense. These would be represented in the computerin floating-point form, which is necessarily only ap-proximate and there is no guarantee that exactly thesame approximations will be used on different com-puter systems. Given the robustness of the Meekmethod, it is highly improbable that a different can-didate would ever be elected because of this, exceptperhaps in the case of a tie, but it is thought wise toavoid even the possibility.
It is therefore better to make sure that the numbersare so represented that, although still approximatebecause only a finite number of decimal places isused, the results are necessarily identical on all com-puters. To achieve this, floating-point methods areavoided altogether, each ‘real’ number being repre-sented by a pair of integers, integer arithmetic oncomputers being exact.
Assuming 32-bit integers to be available, themaximum allowable integer is 2147483647 so to al-low 9 decimal places for the fractional part is safeand convenient. Thus a number such as 123.456, forexample, is represented as a pair of integers with 123as the value of its integral part and 456000000 asits fractional part. Adding or subtracting such num-bers is simple enough, the integral parts are addedor subtracted, and the fractional parts are addedor subtracted. If the resulting fractional part ex-ceeds 999999999, then 1000000000 is subtractedfrom it and 1 is added to the integral part. Simi-larly, if the resulting fractional part is negative, then1000000000 is added to it and 1 is subtracted fromthe integral part. There is no need to worry aboutthe whole number, rather than just its fractional part,ever being negative; that never happens within theMeek method.
Multiplication and division are not so simple, andspecial routines are necessary to enable them to beperformed with no risk of overflow.
In principle, a fixed number of significant figures
7
Hill: Implementing STV by Meek’s method
might be preferable to a fixed number of decimalplaces, but all that really matters is that the preci-sion should be great enough as to ensure that the useof more precision would be virtually certain not tochange the outcome. The fixed 9 decimal places un-doubtedly satisfies this and is convenient.
4 Quota definition
Meek’s formulation [2] used the integral part of1+T/(s+1), whereT is the total number of activevotes ands is the number of seats to be filled. Heobviously intended that the initial 1 of this formulashould be replaced by 1 in the last decimal placeused, when not working solely in integers. An al-ternative approach is that of the second edition ofNewland and Britton [3] in ignoring the initial 1 al-together if the calculation comes out exactly, whileadding extra rules to ensure that no more thans can-didates can be elected even in exceptional cases. In[1] we adopted the Newland and Britton approach(with the necessary extra rules) because the numberof decimal places that would be used by a floating-point implementation was unknown.
When working solely in integers, or to only 2 dec-imal places as in Newland and Britton rules, thereare advantages in their formulation, but those advan-tages are minimal where greater precision is used.For my implementation, therefore, I have includedthe addition of 0.000000001 to the quota, so that noextra rules are needed, while it is very hard to be-lieve that such a tiny increment will ever cause anydisadvantage.
5 Output
In [1], mainly because we were still feeling our wayat that time, more output was given than now seemssensible, producing two tables at each stage of the it-eration, one to say, in effect, “Where are we now?”,the other to say “What are we going to do about it?”There is really no need for any output for those iter-ations that do not elect or exclude any candidate, soimmediate output has been cut down to just show-ing the names of candidates elected or excluded asthose events occur, with storage in computer files ofenough information to allow various forms of tableto be easily produced when wanted.
There is also provision for an animated form ofoutput, showing coloured lines on the screen per-forming the transfers of votes. This is deliberatelyslowed down to make it easy to watch.
6 Ties
In the event of a tie, where a candidate must beexcluded and two or more are exactly equal in lastplace, [1] gave only a pseudo-random choice as thesolution. In my implementation, I was persuadedby ERS Technical Committee to include the tradi-tional ‘ahead at first difference’ criterion as a firsttie-breaker, with a pseudo-random choice only ifthat did not solve it.
Strictly speaking this is contrary to Meek’s statedprinciples on which his method is based, and wassomewhat against my will, but it is unreasonable toexpect to win every argument, and it does no realharm, particularly as ties hardly ever occur in realelections.
The pseudo-random method used is similar ex-cept that [1] calculated random numbers only if andwhen required. I have found it more convenient toassign such numbers to the candidates in the firstinstance and thus to have them already available ifwanted. However I change the assigned numbers ateach stage so that, if A is randomly preferred to Bon the odd stages, then B is preferred to A on theeven stages.
7 Election
In [1] candidates were not deemed elected until theend of an iteration. The keep values having con-verged, it was then considered whether any addi-tional candidate had achieved the quota. Furtherthought has shown that it is absolutely safe to electas soon as a candidate reaches the quota during theiterations and at once to start adjusting that candi-date’s keep value, along with those of any others al-ready elected. This follows from Woodall’s proof,given as part of [1], that if there is a feasible vec-tor, then there is a unique solution vector — see thatproof for the definitions of those terms.
8 Convergence
Both in [1] and my present implementation, theoverall plan consists of iterations within iterations,the outer iterations being the operations up to andincluding the exclusion of a candidate, the inner iter-ations being the successive adjustments of keep val-ues.
In [1] the inner iterations were taken as havingconverged when each elected candidate’s votes wereindividually close enough to the current quota. This
8 Voting matters, Issue 22
Hill: Implementing STV by Meek’s method
has been simplified to saying that the sum of the cur-rent surpluses of all the elected candidates must beno greater than 0.0001. It is almost certain in anycase that, if such a small sum of all surpluses is everreached, the lowest candidates are tied and furtheriterations would not separate them. Because of theshort-cut exclusion rule mentioned below, however,it hardly ever happens that iterations need to proceedso far.
9 Short-cut exclusion rule
During the iterations, if it is found that the lowestcandidate’s current votes plus the total surplus of theelected candidates is less than the current votes ofthe next lowest candidate, it is certain that, if the it-erations were continued all the way to convergence,that lowest candidate would necessarily still be thelowest and would have to be excluded. It is there-fore safe to exclude the candidate at once. The nextiterations will then start from a different point thanwould otherwise have been the case, but it followsfrom Woodall’s proof that the next solution vectorwill still be the same, so the eventual result must beunchanged.
To see that, in these circumstances, the lowestcandidate cannot catch up, it should be noted thatthe total number of votes remains unchanged and theeffect of reducing the keep values of elected candi-dates is to pass their surplus votes to other candi-dates or, possibly, to non-transferable. If all the sur-pluses are passed to the lowest candidate, that candi-date would necessarily, given the conditions, remainthe lowest. If some are passed to other candidatesthat is even worse for the lowest, even if some ofthose candidates become elected.
The only point that needs more thought is toconsider what happens if some surplus becomesnon-transferable, resulting in a reduction of thequota. Ifn votes become non-transferable, the ex-tra surplus created thereby ismn/(s + 1) wherem
is the number of elected candidates so far, ands isthe number of seats. We know thatm is less thans,because otherwise all seats are filled and the wholeelection is over. Thereforemn/(s+1) is less thann,which shows that the amount that could have goneto the lowest candidate has been reduced.
Similar arguments show that, if two or more low-est candidates have a total number of votes that, to-gether with the current surplus, is less than the votesof the candidate next above, it is safe to excludethem all at once, provided that enough would remainto fill all seats. I have not implemented this (except
in the special case where several lowest candidateshave zero votes) believing it to be simpler to explainwhat is going on if only one at a time is excluded.
With traditional style STV it is important thatrules are firmly laid down as to whether or not multi-ple exclusions are to be made, because it can changethe result. Thus, for example, Newland and Brit-ton rules [3] insist that multiple exclusions must bemade when possible, whereas Church of Englandrules [4] insist on only one at a time. With Meekrules, however, it is optional, as the result is neces-sarily the same either way. The fact that I excludeonly one at a time is not intended to suggest thatthere is anything wrong, within a Meek system, withmultiple exclusions if others wish to use them.
10 Equality of preference
Meek [2] suggested allowing voters to expressequality of preference where desired. In [1] this op-tion was not included. My program does includethe option but there are some difficulties involved,as explained in detail in [5]. I continue to hold theconclusion expressed there that “the complicationsmay be too many to be worth it ... [but] the facilityis strongly valued by a significant number of elec-tors”.
11 Constraints
Not proposed by Meek, the program also allowsconstraints, whereby a maximum number, or a min-imum number, may be laid down for certain cat-egories among those elected. I dislike such con-straints in principle [6], but they are necessary incertain circumstances in the Church of England [4]and, if the Church ever wished to update its proce-dures to use Meek-style STV, it would be necessaryto demonstrate that it could cope with this additionalcomplication.
At present the main thing for which constraintsmay be wanted is the filling of casual vacancies,where this is done by recounting the original voteswith the late occupier of the vacant seat withdrawn.The constraint that is then necessary is to disallowexclusion of any existing seat holder.
12 STV in New Zealand
Those working on the introduction of STV for cer-tain elections in New Zealand, having decided thatthe Meek rules were what they wanted, had my im-plementation available to them, and most of its de-
Voting matters, Issue 22 9
Hill: Implementing STV by Meek’s method
tails given above, such as the 9-decimal place work-ing, and the figure of 0.0001 for the total surplus toindicate convergence, have been incorporated intotheir Act of Parliament [7].
There is, of course, no objection to these detailshaving been used, but I hope that it will not become‘folklore’ that they must be used and that Meek hasnot been properly implemented otherwise.
13 Acknowledgements
I thank both the editor and the referee for sugges-tions that led to substantial improvements in this pa-per.
14 References
[1] I.D. Hill, B.A. Wichmann and D.R. Woodall.Algorithm 123 – Single Transferable Vote byMeek’s method.Computer Journal, 30,277-281, 1987.
[2] B.L. Meek. A new approach to the SingleTransferable Vote.Voting matters, Issue 1,1-11, 1994.
[3] R.A. Newland and F.S. Britton. How toconduct an election by the Single TransferableVote, 2nd edition. Electoral Reform Society,1976.
[4] GS1327: General Synod. Single TransferableVote regulations 1998.
[6] I.D. Hill. STV with constraints.Votingmatters, issue 9, 2-4, 1998.
[7] New Zealand Government. Local ElectoralRegulations 2001. Schedule 1A.
Editorial Postscript
I (Brian Wichmann) also have an implementation ofthe Meek algorithm, written in Ada 95. I have notmade this generally available for several reasons:firstly, it lacks any system for preparing the data andeven any adequate diagnostics on incorrect data (andhence is just a counting program); secondly the pro-gram has a number of extensions written to aid someinvestigations (typically reported inVoting matters);thirdly the program does not perform the arithmeticexactly correctly. There are a number of small dif-ferences between my Ada 95 version and the versionin this paper; ties are broken differently and I willexclude several candidates together having the samenumber of votes provided it is safe to do so.
In 2000, I did perform a check of the Meek imple-mentation described in this paper against the origi-nal version published in 1987 [1]. The report of thisvalidation can now be found on the McDougall web-site. One interesting finding was that a test (M135)was actually a tie between two candidates for exclu-sion. However, both programs performed slightlydifferent calculations in approximating the solutionin such a way that neither reported a tie and the dif-ferences in the rounding resulted in a different ex-clusion. This is not considered a fault as, wherethere is really a tie, either result is acceptable.
10 Voting matters, Issue 22
Computerisation of STV counts
Robert Newland(deceased)
This note, located by David Hill, appearsnot to have been published. It is datedFebruary 1983. It is unclear why it wasnot published. Since it raises many inter-esting issues, it is reproduced here. Read-ers may wish to comment on the propos-als. We hope to include their commentsin a subsequent issue ofVoting matters—Editor.
(1) It has often been suggested that STV countsshould be computerised to save time/money. I havealways regarded that view as unrealistic. Much ofthe time of any election count is taken up with pre-liminaries, such as envelope-slitting in postal bal-lots, unfolding voting papers, checking their au-thenticity, and, in public elections, reconciliation ofnumbers of papers issued.
With computerised counts, input would be time-consuming, whether by operators working in pairsto ensure accuracy, or whether by special equipmentreading special voting papers presented in succes-sion. Voting machines capable of accepting pref-erences seem an unlikely investment for infrequentpublic elections.
The time required for manual STV counts canbe exaggerated, while any saving in time/money incomputerised counts is doubtful or marginal. Unlessthere are other positive advantages to be gained fromthe computerisation of STV counts, it seems wrongto deprive candidates and others of the opportunityof witnessing manual counts.
(2) As Stephen Freeland said in his recent paper,COUNTING STV BY COMPUTER, “the exist-ing 1976 procedures for counting STV elections rep-resent a balance between technical refinement andspeed of counting”. Indeed, the 1976 procedures in-cluded improvements over earlier procedures bothin technical refinementand in speed of counting.The current (1976) procedures are probably the bestthat can be achieved in manual counts.
Although little can be said in favour of comput-erisation of STV counts if the objective is merelythe supposed saving of time/money, nevertheless,if computerisation is intended, the opportunity canbe taken of incorporating improved counting proce-dures into STV which are not practicable in manualcounts.
One minor improvement is obvious. It would beabsurd to write a computer program restricting thecalculation of quota,V/(N + 1), and of transfervalues, to two decimal places. Using more deci-mal places would, on occasion, lead to a different,better, result. Since the results of manual and com-puter counts would then no longer be comparable,it would be sensible to make other improvements toachieve even better, different, results.
(3) In my COMPARATIVE ELECTORALSYSTEMS where I was concerned primarily withthe comparison of systems employing manualcounts, I indicated briefly in section 7.8(c), Fur-ther Refinements, two areas of improvement notpracticable in manual counts, viz., (i) the re-commencement of counts from the beginning afterexclusions, and (ii) the transfer of voting papers tonext preferences even though already elected.
Stephen Freeland discusses the first of these in hispaper. Following exclusion, often some voting pa-pers are non-transferable. In consequence, towardsthe end of the count, candidates are elected withoutthe quota: votes are of unequal effect.
The remedy is to re-commence the count ab initioafter each exclusion. (A)
Non-transferable papers showing preferencesonly for excluded candidates would be discarded,and a new, lower, quota would be calculated. Even-tually all candidates would be elected on attainingthe same (lowest) quota: votes would be of equaleffect.
Non-transferable papers showing preferences foralready elected candidates would now be used tohelp elect those candidates: there would be fewernon-transferable papers.
Moreover, a well-known tactical voting ploy
11
Newland:Computerisation of STV counts
would be pre-empted. Suppose that in an electionwith quota 9, candidate A has 10 voting papers: 9AB, 1 AC. The count proceeds thus:
A 10 −1 9B - +0.9 0.9C - +0.1 0.1
Under current rules, the elector who voted AC canmaintain his support for A, but increase his supportten-fold for C by voting ZAC, where Z is not theelector’s genuine first choice, but is believed to havelittle or no support. The count proceeds:
A 9 9B - -C - +1 1Z 1 −1 -
There is an inherent danger that many such tacti-cal voters might elect Z unintentionally.
Such tactical voting is pre-empted if the count isre-commenced after the exclusion of Z:
A 9B -C -Z 1 excluded.
New start:
A 10 −1 9B - +0.9 0.9C - +0.1 0.1
(4) In manual counts, it is standard practice, intransferring a consequential surplus, only to exam-ine, and where appropriate transfer, those papers, allof one value, last received, which gave rise to thesurplus. It is sometimes suggested thatall the pa-pers of an elected candidate should be examined andwhere appropriate transferred, since they all con-tributed to the existence of the surplus. This is an ap-parently attractive argument, but such a procedure,by itself, is unsound.
Suppose that in an election with quota 8, candi-date A has 10 papers marked ABCD, B has 8 papers,and C has 7 papers. The count proceeds:
A 10 −2 8B 8 8C 7 +2 9 −1
It would clearly be unsound to examine and trans-fer any of the original 7 papers for C while the largernumber of 8 papers for B have no further effect onthe count. The 8 papers for B remain unexaminedbecause B had already attained the quota, and thesurplus of A was transferred, passing over B, directto C.
The remedy is to transfer voting papers to nextpreferences even if already elected, thereby enablingall voting papers of an elected candidate to be ex-amined when a consequential surplus is transferred.(B)
Electors would then be more equally represented.Suppose in an election with quota 10, preferences
for candidates A, B, C are shown on 30 voting pa-pers: 20 AB, 10 BC. The count proceeds under ex-isting rules thus:
A 20 −10 10B 10 10C - -NT - +10 10
But if the surplus of A is transferred to the nextpreference B, the count proceeds:
A 20 −10 10 10B 10 +10 20 −10 10C - - +10 10
The 30 electors with three quotas of votes havenow elected three representatives.
The practical difficulty with this desirable proce-dure is that if part of the surplus of a candidate A istransferred to a candidate B, who is already elected,or may thereby be elected, part of B’s surplus maybe transferred to A, and then part of A’s surplus toB, and so on indefinitely.
Brian Meek examined the problem in some de-tail in EQUALITY OF TREATMENT OF VOT-ERS AND A FEEDBACK MECHANISM FORVOTE COUNTING, papers published in 1969 and1970 inMathematiques et Sciences Humaines(En-glish language versions available).
Douglas Woodall also discusses the problemin COMPUTER COUNTING IN STV ELEC-TIONS in the current issue (Winter 1982-83 issue)of Representation.
To illustrate the effect of transferring votes be-tween elected candidates, suppose that in an electionwith quota 12, candidate A has 18 papers, and can-didate B has 10 papers. The papers for candidate Aare marked: in case (i) 18 ABC (ii) 15 ABC, 3 A
12 Voting matters, Issue 22
Newland:Computerisation of STV counts
(iii) 6 ABC, 12 A In each case the 10 papers for Bare marked BAD.
Under existing rules, except for non-transferabledifferences, the result in each case is the same. Theconsequential surplus of B is transferred entirely toC, and D receives nothing:
A 18 −6 12 12B 10 +6 16 −4 12C - - +4 4D - - -
If voting papers are transferred between A and Bhowever, D receives votes in each case; fewest votesin case (i) when most papers show a (third) prefer-ence for C; most votes in case (iii) when fewest pa-pers show a preference for C. In case (iii) the trans-fers soon terminate, but in the other two cases thereis a theoretically unending alternation of transfersas the votes credited to A and B gradually convergeto the quota. In practice, the calculations are termi-nated when a desired degree of accuracy is attained.
Details are appended. In case (iii) the transfersare worked out fully. In cases (i) and (ii) only theearly alternations are shown1.
It may be noted that I have followed principleswhich differ in some respects from both Meek andWoodall.
(5) If STV counts are to be computerised, it wouldbe foolish not to include remedy (A), since to re-commence the count after each exclusion requiresonly a little more computer time. If satisfactorycomputer programs can be devised, it would also beappropriate to include remedy (B), incorporating theprocedures as illustrated.
A manual STV count is already immensely supe-rior to any other method of election, votes being ofnearly equal effect. Remedies (A) and (B) are de-signed to treat voting papers equally, and to ensurethat votes are of exactly equal effect.
(6) This paper makes no suggestion to change theapparently obvious criterion of successively exclud-ing candidates with fewest votes. I know of no bettercriterion.
The procedures described above will ensure thatat most a quota of voters is not represented. Differ-ent criteria for exclusion would merely result in thenon-representation of a different quota of voters.
1These details have been omitted here because Newlandchanged his mind later. When the members of ERS TechnicalCommittee were arguing between three alternative ways of doingthe job: Newland, Meek and Warren, he had another look at itand switched to supporting the Meek method as better than whathe had proposed in this paper, so it is fairer to him to ignore hisproposed method.
Voting matters, Issue 22 13
Comments on the STV Rules Proposed by BritishColumbia
In May 2005, the Canadian province of BritishColumbia conducted a referendum to decidewhether to adopt the single transferable vote (STV)to elect the members of its legislative assembly. Al-though 57% of the electorate voted in favor of adopt-ing STV, the measure was not adopted as a supermajority of 60% was required for adoption. A Citi-zens’ Assembly drafted a proposed set of STV rules,which will henceforth be called BC-STV. Theserules are set forth in pages 17-20 of a Technical Re-port drafted by the Citizens’ Assembly [1] and arealso included as an appendix to this article.
The purpose of this article is to clarify the de-tails of the BC-STV implementation and providesome insight into the rationale underlying the rules.Much of the information presented in this article hasbeen gleaned from email conversations with JamesGilmour, Jonathan Lundell, Brian Wichmann, andJoe Wadsworth. I have implemented the BC-STVrules in the software package called OpenSTV.[6]
2 Unitary and Inclusive Philosophies
The primary difference between different STV rulesis in how surplus votes are transfered. The differ-ent methods for transferring surplus votes can begrouped into two different categories, what I callthe unitary and inclusive philosophies of transfer-ring surplus votes.
Before describing these two categories, a distinc-tion must be made between an initial surplus ofvotes and a secondary surplus of votes. An ini-tial surplus arises when a candidate has more thana quota of first choices, i.e., a surplus after the firststage of counting. A secondary surplus occurs whena candidate does not have an initial surplus but later
goes over the quota after receiving votes from otherelected or excluded candidates.
Consider an election where the quota is 100. Sup-pose candidate A has 140 votes after the first stageand thus an initial surplus of 40 votes. Suppose can-didate B has 90 votes after the first stage and 110votes after the second stage, after receiving 20 votesof A’s surplus. At the second stage, candidate B hasa secondary surplus of 10 votes.
Under the unitary philosophy of surplus transfers,only whole votes are transferred. With candidate A,40 of her votes transfered at full value, while theother votes remain with A at full value. Similarlywith candidate B, 10 votes are transferred at fullvalue. A common practice is to take these 10 votesfrom the 20 that B received during the second stage.
Under the inclusive philosophy of surplus trans-fers, a portion of each of a candidate’s votes is trans-ferred. With candidate A, each of her votes will betransferred to their second choices at a transfer valueof 40/140. The total value of the votes transferred is40. The transfer is inclusive because each of A’svotes takes part. With candidate B, the idea is thesame, except that one could (and should) accountfor the fact that some of the votes that B received inthe second stage could already have a value of lessthan one.1
Some STV rules can be clearly classified as exem-plifying one of these two philosophies, while othersemploy a hybrid of these two philosophies. I willnow consider several STV rules in addition to BC-STV: Cambridge STV (Massachusetts, USA), DailSTV (Ireland), Northern Ireland STV, Malta STV,Tasmania STV (Australia), Australian Capital Terri-tory or ACT STV, and Meek STV (New Zealand).
Cambridge and Dail STV are examples of the uni-tary philosophy. With Cambridge STV, the votes se-lected for transfer are chosen at random. With Dail
1Under a method used in Australia, all votes are treated thesame even if some of them were received at less than full value.In contrast, BC-STV appropriately weights the votes received atless than full value [4].
14
O’Neill: Comments on the British Columbia Rules
STV, the votes selected for transfer are chosen in amanner that proportionally represents the followingchoices on the ballots but does not seek to propor-tionally represent later choices on the ballots. Bothof these methods are ballot order dependent – theoutcome is not guaranteed to be the same if the votesare recounted with the ballots in a different order– a fact that some people find highly undesirable.David Robinson has proposed an interesting unitarySTV rule that is ballot order independent (or nearlyso).[5]
Northern Ireland, Malta, Tasmania, and ACTSTV employ a hybrid of the two philosophies andeach is an example of the long-established Gregorymethod of STV counting. The idea underlying thesemethods appears to be to exemplify the unitary phi-losophy to the extent possible but to also ensure thatthe rules are ballot order independent. With theserules, the method of surplus transfer is different foran initial surplus and a secondary surplus. An ini-tial surplus is transfered according to the inclusivephilosophy. While not impossible, it is difficult totransfer an initial surplus in a unitary fashion thatis also ballot order independent. The method fortransferring secondary surpluses is still hybrid, butmuch closer to being unitary. For secondary sur-pluses, only the last batch of received votes is con-sidered. This last batch could arrive from a previoustransfer of surplus votes or from the exclusion of acandidate. For example, consider candidate B fromabove. The last batch of votes has a total value of20 and the surplus is 10. Each of the votes in thislast batch is transfered to the next candidate on theballot with a transfer value of 10/20.2 The transfer isthus inclusive among the last batch but much moreunitary than a completely inclusive transfer.
BC-STV and Meek STV are examples of the in-clusive philosophy. For both initial and secondarysurpluses, a portion of each vote is transfered to itsnext choice. The primary difference between BC-STV and Meek STV is the following: with BC-STVvotes are transfered only to unexcluded candidateswith less than a quota while with Meek STV votesare transfered to all unexcluded candidates. MeekSTV is clearly a better method than BC-STV, butMeek STV requires a computer program to countthe votes while BC-STV can be counted by hand.
2For the sake of simplicity, I am assuming that each of thevotes has a valid next choice.
3 Provenance of the BC-STV Rules
Over the years, rules similar to the BC-STV ruleshave been considered in numerous places. The Pro-portional Representation Society of Australia urgedAustralia to replace an existing STV method with amethod similar to BC-STV[4]; Douglas Amy’s bookincludes a method similar to BC-STV[2]; and themodel statute on the website of the Center for Vot-ing and Democracy (a United States organization) issimilar to BC-STV. Rules similar to BC-STV ruleshave likely been independently derived numeroustimes, and I present two possible derivations.
Among people familiar with the different STVrules, Meek STV is generally regarded as the “best”set of rules for STV. The greatest difficulty withMeek STV is that it cannot be counted by hand. Themost obvious simplification to Meek STV to makeit hand countable is to not allow vote transfers toelected candidates. With this modification, MeekSTV becomes very similar to BC-STV.
The Gregory method is another well-knownmethod for counting STV elections, which has beenused for more than a century. As described above,for secondary surpluses with the Gregory methodonly the last received batch of votes is consid-ered. Some may regard this as unfair since the lastbatch of votes may be quite different from previousbatches of votes.[4] Intuitively, it seems desirable tochange the transfer of secondary surpluses so that allof the candidate’s votes are considered and not justthe last batch. With this modification, the Gregorymethod becomes very similar to BC-STV.
Farrell and McAllister used the term “weightedinclusive Gregory method” to refer to rules like theBC-STV rules, and the drafters of the BC-STV rulesalso used this terminology.3 While this terminologyis perhaps descriptively correct, I find it mislead-ing in that it overstates the relationship between theBC-STV and Gregory methods. Using only the lastbatch of votes in transferring secondary surpluses isa distinctive feature of the Gregory method. Withoutlast-batch transfers, the similarity with the Gregorymethod is mostly lost. The BC-STV rules could alsobe described as “hand-countable Meek” or “Meekwithout transfers to elected candidates.” A more ac-curate description of the BC-STV rules is simply“inclusive STV.”
3Farrell and McAllister appear to have coined thisterminology.[4]
Voting matters, Issue 22 15
O’Neill: Comments on the British Columbia Rules
4 Corrections to the BC-STV Rules
Several people have pointed out ambiguities and er-rors in the BC-STV rules. I believe that they are allstraightforward to address, and I will briefly do so.
First, the BC-STV rules necessarily entail compu-tations with fractions. The rules do not say if thesecomputations are to be performed exactly or throughprecisely-specified rounding techniques. While thisis an important detail, it is one that can easily be re-solved. In my implementation of the BC-STV rules,I round to eight decimal places to approximate anexact solution [6].
Second, there is one clear error in the rules, butthis error has a simple and obvious fix. In the ap-pendix, the underlined text has been added to fix thiserror.
Third, in two places, the rules need to be gen-eralized. First, in part 8 of “Counting procedurerules,” the rules acknowledge that it is possible forone candidate to be elected with less than a quotaof votes. In reality, it is possible that multiple can-didates could be elected with less than a quota ofvotes. One possible correction would be to deletethe second sentence in part 8 and replace it withthe following: “When the total number of electedand remaining candidates is equal to the number ofmembers to be elected, then all the remaining candi-dates are elected even if they have less than a quotaof votes.” Second, part 3 of “Provisions for tiedvotes” explains how a tie between two candidatesis to be broken, and this needs to be generalized tobreak a tie among three or more candidates.
Fourth, the BC-STV rules do not precisely spec-ify how to transfer surplus votes. Suppose that twocandidates have a surplus on the first count, that af-ter transferring the largest first-count surplus a thirdcandidate is elected, that after transferring the sec-ond first-count surplus a fourth candidate is elected,and that the fourth winner has a larger surplus thanthe third. The rules do not indicate which of thetwo remaining surpluses is to be transferred first.One could choose the largest surplus (that of thefourth winner) or the earliest surplus (that of the thethird winner). In accordance with common practice,I chose to always transfer the largest surplus.
5 Advantages and Disadvantages ofthe BC-STV Rules
I see four advantages of the BC-STV rules: (1) therules are very simple, (2) votes can be counted byhand, (3) the rules employ the inclusive philosophy,
and (4) the rules avoid the unfairness of transferringonly the last batch for secondary surpluses. Only thefourth advantage requires more explanation. Con-sider candidate B, described above. He received 90first place votes and later received 20 votes that hadbeen transfered as part of candidate A’s surplus. Itis quite possible that the latter 20 papers representquite different views than the first 90 papers, yetonly the latter 20 papers have further effect. Thishardly seems fair to the 90 voters who ranked Bfirst. Farrell and McAllister cite such a dispute aris-ing from an Australian election where the Gregorymethod was used.[4]
I see one main disadvantage of BC-STV rules.The outcome of the count is not continuous in thesense that changing only one vote can dramaticallyaffect the outcome. For example, consider the fol-lowing two sets of ballots for electing three candi-dates:
Set 1 Set 24501 ABC 4500 ABC2499 BD 2500 BD1200 C 1200 C1800 D 1800 D
The quota is 2500, and the two sets of ballots differby just one vote. I now count these ballots usingBC-STV rules.
With Set 1, candidate A is elected and has a sur-plus of 2001 votes. Since candidate B is second onall of these ballots and candidate B has less than aquota, candidate B receives all of these 2001 votes.Now B has a total of 4500 votes and a surplus of2000 votes. For these 4500 votes, 2001 rank C next(the ballots transfered from A) and 2499 rank Dnext. Thus,
2000
4500X2001 = 889.3
ballots of the surplus go to candidate C, and
2000
4500X2499 = 1110.7
ballots of the surplus go to candidate D. CandidateD is elected with 2910.7 votes and candidate C loseswith 2089.3 votes.
Now consider Set 2. Candidate A is elected andhas a surplus of 2000 votes. Since candidate B isalso elected, A’s surplus of 2000 votes goes directlyto candidate C. Thus, candidate C wins with 3200votes and candidate D loses with 1800 votes. Al-though there is only one different ballot in these twosets, the outcome differs by more than 1000 votes.
16 Voting matters, Issue 22
O’Neill: Comments on the British Columbia Rules
In comparison, with all of the other STV countingmethods mentioned in this paper, there is no suchdiscontinuity with these two sets of ballots. For ex-ample, let us count the two sets of ballots with theGregory method. With Set 1, A’s surplus of 2001votes goes to candidate B. B now has a surplus of2000 votes. Only votes from the last batch are fur-ther transfered, so 2000 votes are now transfered tocandidate C who wins with 3200 votes. With Set 2,A’s surplus of 2000 votes goes directly to candidateC who again wins with 3200 votes. Here, the changein one ballot produced a similarly small change inthe outcome.
6 Conclusions
In considering the relative merits of BC-STV andGregory methods, there is no clear winner. With theGregory method, one can argue that it is unfair to useonly the last batch of received votes in transferringsecondary surpluses. With BC-STV, the outcome isnot necessarily continuous with small changes in theballots. The clear solution to this conundrum is touse Meek STV, assuming that computer counts arepossible, which does not suffer from either of thesedisadvantages.
7 References
[1] Making Every Vote Count. The Case forElectoral Reform in British Columbia.Technical Report. December 2004. Availablevia McDougall web site.
[2] Douglas J. Amy,Behind the Ballot Box(2000).
[3] Center for Voting and Democracy. A SampleStatute for Choice Voting. Available viaMcDougall web site.
[4] David M. Farrell and Ian McAllister,The1983 Change in Surplus Vote TransferProcedures for the Australian Senate and itsConsequences for the Single TransferableVote, Australian Journal of Political Science38:479-491 (2003).
[5] Dave Robinson. Courageous STV.Description available via McDougall web site.
[6] OpenSTV – Software for computing theSingle Transferable Vote. Available athttp://stv.sourceforge.net.
Appendix: The Recommended BC-STVElectoral System
[Author’s note: James Gilmour pointed out a smallbut important error in the counting rules. This hasbeen fixed with the addition of the underlined text.I have also corrected the incorrect numbering in thesection “Provisions for tied votes.”]
This section describes the recommended BC-STVsystem. It provides guidelines to be used in draftinga new election act and in making changes to the cur-rent Electoral Boundaries Commission Act.
In addition to choosing an electoral systemthat incorporates its basic values, the Citizens’Assembly on Electoral Reform wanted a systemthat is open to public scrutiny and whose results canbe reviewed and validated. Consequently, BC-STVis designed to use paper ballots which are availablefor recount, if required.
General
1. BC-STV is a system of proportional represen-tation by the single transferable vote (STV)method.
2. The members of the Legislative Assembly ofBritish Columbia will be elected from multi-member electoral districts.
3. The number of members in each district willvary from two (2) to seven (7). Given thatachieving proportional electoral outcomes is aprimary reason for recommending BC-STV, us-ing larger rather than smaller numbers of mem-bers per district should always be preferredwhen drawing district boundaries. While somevery sparsely populated areas may require dis-tricts with as few as two members, the princi-ple of proportionality dictates that, in the mostdensely populated urban areas, districts shouldbe created at the upper end of the range.
4. The “Droop quota” will be the formula for cal-culating the number of votes required by a can-didate for election in a district. The quota for-mula is:
total number of validballots cast in the district
1 +number of members
to be elected
+ 1
Fractions are ignored.
Voting matters, Issue 22 17
O’Neill: Comments on the British Columbia Rules
5. The method of distributing surplus votes fromthose candidates with more than the minimumnumber of votes needed to be elected will bethe “Weighted Inclusive Gregory method” (seebelow, as well as Appendix: Glossary [Author’snote: the Glossary is not included.]).
The ballot paper
1. The ballot paper will display the names of allthe candidates contesting seats for a district.The names will be grouped according to partyaffiliation.
2. Candidates who do not indicate a party affili-ation, and candidates who do not indicate thatthey are running as an independent, will begrouped together.
3. Parties with only one candidate, and each candi-date running as an independent, will each havetheir own group.
4. Groupings with more than one candidate in adistrict will have the rank order of the candi-dates’ names rotated at random so that each can-didate has an equal chance of being placed inevery position within the grouping.
5. The rank order of groupings appearing on theballot will be rotated at random so that eachgrouping has an equal chance of being placedin every position on the ballot paper.
6. The ballot paper will not provide the option ofvoting for all the candidates of one group bymarking a party box (this is the so called “abovethe line” option used in some Australian elec-tions).
Valid ballots
1. Voters will indicate their preference for the can-didates listed on the ballot paper by putting thenumbers 1, 2, 3, 4, etc. next to candidates’names.
2. A ballot paper must include a first preferencefor the ballot to be counted as a valid ballot.The number of subsequent preferences markedon the ballot is at the discretion of the voter.
3. In the case of a ballot paper with gaps or repeti-tions in the sequence of numbers beyond a firstpreference, the preferences are valid up to thebreak in the sequence.
4. If a voter puts a mark next to only one candi-date’s name, and that mark makes the voter’sintention clear, the mark will be accepted as theexpression of a single preference for that can-didate and the ballot will be counted as a validballot.
Counting procedure rules
1. Once the total number of valid ballots is estab-lished in each multi-member district, the mini-mum number of votes required for a candidateto be elected is calculated using the Droop quotaformula.
2. All ballots are counted and each ballot is allo-cated as a vote to the candidate against whosename a first preference (i.e., “1”) is shown onthe ballot.
3. If a candidate(s) on the first count has a num-ber of first preference votes exactly equal to theminimum number of votes needed to be elected,then that candidate(s) is declared elected andthe counted ballot papers indicating that candi-date(s) as a first preference are put aside and theother preferences recorded on the ballots are notexamined.
4. If a candidate on the first count gains more thanthe minimum number of votes needed to beelected, the candidate is declared elected, andthe number of votes in excess of the numberof votes needed to be elected (the surplus) isrecorded. All of the elected candidate’s ballotsare then re-examined and assigned to candidatesnot yet elected according to the second prefer-ences marked on the ballots of those who gavea first preference vote to the elected candidate.These votes are allocated according to a “trans-fer value.” The formula for the transfer valueis:
surplus votes cast forthe elected candidate
total number of votes receivedby the elected candidate
5. If two or more candidates on the first countgain more than the minimum number of votesneeded to be elected, all of those candidatesare declared elected. The ballots of the can-didate with the largest number of first prefer-ence votes will be re-examined first and as-signed (at the transfer value) to candidates not
18 Voting matters, Issue 22
O’Neill: Comments on the British Columbia Rules
yet elected according to the second preferencesmarked on that candidate’s ballots, or the nextavailable preference, if the second preferencecandidate has already been elected. The ballotsof the other elected candidate(s) will then be re-examined and their surpluses distributed in or-der according to the number of first preferencevotes each candidate received.
6. If a candidate reaches more than the minimumnumber of votes needed to be elected as the con-sequence of a transfer of votes from an electedor excludedcandidate, the number of votes inexcess of the number of votes needed to beelected (the surplus) will be transferred to othercandidates. This transfer will be to the nextavailable preference shown on all of this can-didate’s ballots. These ballots now include 1)the candidate’s first preference ballots, and 2)the parcel(s) of ballots transferred to the candi-date from one or more elected or excludedcan-didates. The transfer value for the candidate’sfirst preference ballots is:
surplus votes cast forthe elected candidate
total number of votes receivedby the elected candidate
The transfer value for each parcel of ballotstransferred to the candidate from one or moreelected or excludedcandidates is:
surplus votes castfor the candidate
total number of votesreceived by the candidate
X
the transfer valueof the parcel ofballots receivedby the candidate
7. If no candidate has a number of votes equal toor greater than the minimum number of votesneeded to be elected, the candidate with thesmallest number of votes is excluded. All of thatcandidate’s ballots–both first preference ballotsand any parcel or parcels of ballots transferredfrom other candidates–are transferred to candi-dates who have not been elected or excluded ac-cording to the next available preference shownon the excluded candidate’s ballots. The ex-cluded candidate’s first preference ballots aretransferred to the second (or next available)preferences at full value. Ballots received frompreviously-elected (or excluded) candidates aretransferred at the transfer value at which the bal-lots were received.
8. Counting continues in the described sequence:the surplus of elected candidates is assigned un-til no more candidates are elected, then the bal-lots of excluded candidates are assigned untilanother candidate is elected. When all but oneof the candidates to be elected from the districthave been elected, and only two candidates re-main in the count, the candidate with the mostvotes is declared elected, even though the candi-date may not have reached the minimum num-ber of votes (the quota) needed to be elected.
9. If, during the transfer of preferences, a ballotpaper does not indicate an available preference,the ballot is put aside as “exhausted.” This canoccur because:
• the voter only indicated one, or a small numberof preferences;
• all the preferred candidates have already beenelected or excluded; or
• there are gaps or repetitions on the ballot in thesequence of numbering preferences.
Provisions for tied votes
1. Where two or more candidates have the samenumber of first preference votes at the end ofthe first count, and this number is more than theminimum number of votes necessary for elec-tion, then the candidate whose surplus is dis-tributed first will be decided by lot.
2. Where no candidate has a number of first pref-erence votes equal to or greater than the num-ber of votes necessary for election at the end ofthe first count, and two or more candidates havethe same number of first preference votes, thisnumber being the smallest number of first pref-erence votes gained by any candidate, then thecandidate who is excluded first will be decidedby lot.
3. If, at any stage of the count other than duringthe first count, two candidates have the samenumber of votes, the candidate who is declaredelected first, or who is not excluded will be:
a) the candidate with the larger number of votesin the previous or immediately next precedingcount where there is a difference in the votesbetween the two candidates; or
Voting matters, Issue 22 19
O’Neill: Comments on the British Columbia Rules
b) the candidate whose name is drawn by lot,where there is no difference in the number ofvotes between the candidates at any precedingcount.
By-elections
The single transferable vote method (preferen-tial voting) is to be used for by-elections wherea candidate is to be elected to fill a single casualvacancy in a district. The BC-STV method is to beused where candidates are to be elected to fill twoor more casual vacancies in a district.
20 Voting matters, Issue 22
Developing STV Rules for manual counting to giveeffect to the Weighted Inclusive Gregory Method oftransferring surpluses, with candidates’ votes recordedas integer values
The Local Governance (Scotland) Act 2004 [1]makes provision for councillors in Scotland to beelected by the single transferable vote (STV) fromwards returning either three or four councillors. Thefirst elections under these new provisions will beheld in May 2007. The Act does not specify anySTV counting rules, but requires Scottish Ministersto make such rules by order.
1 Proposal to use WIGM
When the Local Governance (Scotland) Bill [2] wasintroduced in the Scottish Parliament it includedmost (but not all) of the STV counting rules usedfor District Council elections in Northern Ireland[3]. Among those included were the provisions forthe transfer of surplus votes by the Gregory Method,applied only to the ‘last parcel’ of ballot papers fora consequential surplus [4]. During the Stage 1consideration of the Bill by the Local Governmentand Transport Committee of the Scottish Parliament,several MSPs questioned the use of the GregoryMethod and suggested that the ‘last parcel’ provi-sion treated some voters unfairly (eg see [5] at col380). The Committee also discussed the possibil-ities of using electronic counting which was attrac-tive because the elections for the Scottish Parliament(by a regional version of the Additional MemberSystem) would be held on the same day.
In their Report [6] on the Stage 1 consideration ofthe Bill, the Committee said, in relation to technicalissues surrounding the counting of votes:
“The Committee: Concludes that themethod set out in the Bill is the most appro-priate one for local government elections in
Scotland at this time, given the currentlyavailable counting technology;Believes that its preferred alternative, the‘weighted inclusive Gregory method’, is,theoretically, the most effective countingmethod as it ensures that the preferences ex-pressed by all voters are counted; but notesmanual counts using this system would beunrealistically time consuming; andRecommends that the ‘weighted inclusiveGregory method’ be introduced to replacethe system set out in the Bill when elec-tronic counting becomes available.”
Several technical amendments to the STV count-ing rules were discussed during the Stage 2 debateon the Bill, but the Gregory Method and the ‘lastparcel’ provision were retained for the transfer ofsurpluses. However, at the Stage 3 debate on theBill, on the floor of the Parliament Chamber, theScottish Executive Minister tabled amendments thathad the effect of removing all the detailed STVcounting rules, and these amendments were passed[7,8].
The second Newsletter of the 2007 ElectionsSteering Group [9] announced: “Scottish ExecutiveMinisters have agreed that work should go forwardon the possibility of introducing e-counting for the2007 local government elections.” The invitation totender for the provision of e-counting facilities wasissued in August 2005 [10]. (The award of this con-tract to DRS Data Services Ltd was announced inFebruary 2006 [11].)
The tender document issued to interested con-tractors [12] specified that the STV counting ruleswere to be based on the “Weighted Inclusive Gre-gory Method” (WIGM) of transferring surpluses.The tender document included a description of STV
21
Gilmour: Developing STV Rules for manual counting
rules incorporating WIGM, based on the incompleteand defective description given in the Technical Re-port of the British Columbia Citizens’ Assembly onElectoral Reform [13].
2 Definition of WIGM
The term “Weighted Inclusive Gregory Method” ap-pears to have been coined by Farrell and McAllister[14], where they give the following description ofthe procedure for determining the transfer value fora candidate’s surplus votes:
“For those votes that the candidate has receivedat full value, TV = s/v, where v is the candi-date’s total vote. For those votes that the candi-date has received from another candidate’s surplus,TV = (s/v)β, whereβ is the TV that was applied inthe transfer of the surplus votes to the previous can-didate.”
(The definitions of “TV” and “s” were given ear-lier in the paper: “TV” = transfer value; “s” = can-didate’s surplus.)
The Weighted Inclusive Gregory Method has notyet been implemented anywhere in the world and sothere is no working legislative language available.However, a legislative description of WIGM was in-cluded in the Electoral Legislation Amendment Bill2003 presented to the Legislative Assembly of theParliament of Western Australia [15]:
“Unless all the vacancies have been filled,the surplus votes (if any) of any candidateelected under clause 4, or elected subse-quently under this clause, shall be trans-ferred to the continuing candidates as fol-lows —(a) the number of surplus votes of theelected candidate shall be divided by thenumber of votes received by him and theresulting fraction shall be the surplus frac-tion;(b) in relation to any particular ballot papersfor surplus votes of the elected candidate,the surplus fraction shall be multiplied bythe transfer value at which those ballot pa-pers were transferred to the elected candi-date, or by one if they expressed first pref-erence votes for the elected candidate, andthe product shall be the continued transfervalue of those particular ballot papers;(c) the total number of ballot papers for sur-plus votes of the elected candidate that each
(i) express the next available preferencefor a particular continuing candidate; and(ii) have a particular continued transfervalue,
shall be multiplied by that transfer value,the number so obtained (disregarding anyfraction) shall be added to the number ofvotes of the continuing candidate and allthose ballot papers shall be transferred tothe continuing candidate,
and if on the completion of the transfer ofthe surplus votes of the elected candidate toa particular continuing candidate that can-didate has received a number of votes equalto or greater than the quota, that candidateshall be elected.”
(The Bill received a first and second reading, butwas withdrawn in November 2003 for reasons notrelated to the proposed change to the STV countingrules.)
This legislative description introduces the term“surplus fraction” for Farrell and McAllister’s cal-culated “s/v”, which is then applied to each parcelof ballot papers with a different current value, Far-rell and McAllister’s “β”, ie the “transfer value” atwhich those ballot papers were received by the can-didate with the current surplus. The Western Aus-tralian Bill used the term “continued transfer value”for the value at which the ballot papers would betransferred from the candidate with the current sur-plus. In UK STV rules we prefer the term “currentvalue” for whatever value a ballot paper may havewhen a calculation is made and “transfer value” forthe value at which the ballot paper will be trans-ferred to the next available preference.
3 Putting WIGM into UK legislation
The terminology of the Western Australia Bill ishelpful in that it distinguishes (and names) thetwo steps in the process of calculating correctlyweighted transfer values when a candidate has asurplus and all of that candidate’s ballot papersare transferred. This legislative language doesnot, however, provide ‘ballot-paper-by-ballot-paper’handling instructions of the kind usually found inUK rules for the conduct of STV counts (eg [3]). Itwas with this in mind that I prepared the detailedrules in the document that has been deposited on theMcDougall website [16]. That document has beenthrough several drafts and I am grateful to Brian
22 Voting matters, Issue 22
Gilmour: Developing STV Rules for manual counting
Wichmann, David Hill, John Curtice and the anony-mous Referee of this paper for corrections and help-ful comments. It has been made widely available tothose who are involved in the preparation of the sec-ondary legislation that will be required for the 2007elections.
Although the intent was that e-counting would beused for the 2007 elections, and the Local Govern-ment and Transport Committee of the Scottish Par-liament recommended the use of WIGM only if e-counting were to be introduced, there was nothingto indicate that manual counting by WIGM rulesshould not be undertaken if this were demanded ornecessary. A manual count by WIGM rules wouldtake longer than a manual count by (classical) Gre-gory Method rules because more ballot papers haveto be sorted and counted more times, but it wouldnot be impracticable for a public election as an ex-ceptional requirement. It seemed appropriate, there-fore, to devise first the WIGM rules for a manualcount. Once these had been determined as coher-ent and unambiguous, it would be a smaller task toadapt the manual rules for e-counting. As explainedin the preamble [16], the rules were written to fit intoa more comprehensive legislative document and fol-low the conventions of UK secondary legislation (eg[3]).
4 Consequential issues
The essential description of WIGM is quite simple,but its adoption raises several issues that affect otheraspects of the STV counting rules.
Because surpluses are to be spread across all theballot papers then held by the candidate from whomthe surplus is being transferred, each ballot paperwill, in most cases, carry forward a smaller votevalue. In the Northern Ireland rules [3], transfer val-ues are calculated to two decimal places and any re-mainder ignored. The votes transferred to succes-sive preferences are similarly calculated to two dec-imal places and the totals of votes credited to can-didates are shown to two decimal places on the re-sult sheet. If the WIGM calculations were similarlytruncated at two decimal places, substantial numbersof ballot papers would quickly have no recordablevalue. The precision of calculation must, therefore,be greater when WIGM rules are applied. To en-sure reproducibility no matter how the count is un-dertaken, it is necessary also to specify the precisionof each step of each calculation. As explained in thepreamble to the rules, the precision was set at sevendecimal places on pragmatic and practical grounds.
(The information about the precision of the transfervalue calculations in the STV elections to the Aus-tralian Federal Senate taken from the AEC websiteand given in an earlier paper [17] was incorrect [18].For those STV elections the precision is not limitedat all [19], but this has no consequences because ofthe ‘value averaging’ method that is used in thoserules to calculate transfer valuesde novofor eachsurplus.)
As noted in the document deposited on the Mc-Dougall website, these rules do not make any pro-vision to overcome the anomaly that arises withWIGM when votes are not transferred to alreadyelected candidates. This will be the subject of a sep-arate paper.
5 Integer vote values
It is a feature of the Australian STV rules that use an‘inclusive’ method of transferring surplus votes thatonly whole numbers of votes are credited to candi-dates when transfers are made [20]. The Common-wealth Electoral Act 1918 prescribes the flawed “In-clusive Gregory Method” and not the Weighted In-clusive Gregory Method, but the Western AustralianWIGM Bill [15] included the same provision (seesub-paragraph (c) in the text quoted above). This ap-proach has much to commend it, as it will simplifythe result sheet and so aid public comprehension. (Itwould probably be of benefit if it were adopted morewidely for STV counting rules.) Apart from its pre-sentational advantages, this approach avoids accept-ability problems that could arise in WIGM electionsfrom candidates being separated by minute fractionsof votes. With integer vote totals, candidates will ei-ther be separated by at least one vote or have thesame number of votes.
Of course, the fractional parts of the vote totalsthat are not transferred to the candidates cannot beignored; they must be accounted for properly. Thesefractional parts are shown separately on the Aus-tralian integer result sheets as ‘Lost by fraction’. Iprefer the term ‘Vote fraction not transferred’ be-cause it is more correctly descriptive and does notconvey the idea that any votes can be “lost”.
This truncation to an integer value is applied onlyto the total value of all the parcels and sub-parcelsbeing transferred to any one candidate; it is not ap-plied to the values of the individual parcels and sub-parcels before the candidate’s transferable total iscalculated. There is only one truncation for eachcandidate to whom votes are transferred in any one
Voting matters, Issue 22 23
Gilmour: Developing STV Rules for manual counting
stage. That way the ‘Vote fraction not transferred’ isminimised.
Note that when a multiple exclusion occurs, the‘Vote fraction not transferred’ can be negative. Thishappens when the sum of the values of the ballot pa-pers,including all the fractional parts , held by theexcluded candidates exceeds the sum of the integervotes credited to the excluded candidates. Thus pre-viously ‘non transferred’ votes can be brought backinto play. This is another reason for preferring aterm other than “lost”.
6 Non-transferable votes
When an ‘inclusive’ transfer of a surplus is effected,the transfer values are calculated taking into accountall the votes then credited to the elected candidateandall the ballot papers are transferred. Ballot pa-pers with no ‘next available preference’ are set asideas ‘non transferable’ and take with them as ‘non-transferable’ the proportionate share of the surplus.This approach is wholly consistent with the ‘inclu-sive’ concept that is given effect by the requirementto examine and transfer all parcels of ballot papersheld by the candidate with the surplus.
7 Deferred surpluses
It could be argued that the ‘inclusive approach’ thatunderlies WIGM would require the transfer ofallsurpluses, ie that there should be no provision to de-fer the transfer of any surplus, no matter how small.However, if there is to be any possibility of manualcounting, it would be best to retain the ‘deferred sur-plus’ provision so that the handling of large numbersof ballot papers of extremely small values could beavoided except when the votes on those ballot pa-pers would affect what has to happen next.
8 Sub-stages during exclusions
STV counting rules that use the Gregory Method oftransferring surpluses usually provide for sub-stagesduring exclusions, in which the transfer of a parcelof ballot papers of the same value constitutes a sub-stage. The transfer of first preference ballot papersbefore the transfer of other ballot papers of value1 vote also constitutes a separate sub-stage in theNorthern Ireland rules [3]. If any candidate attainsthe quota at the end of a sub-stage, that candidate is‘deemed elected’ and no further transfers are madeto that candidate. This is consistent with the ‘exclu-sive approach’ to STV that seeks to keep the voters
in discrete, ‘exclusive’ groups so far as possible. Al-though it is clearly not directly related to WIGM, thesub-stage approach to handling exclusions seems in-compatible with the ‘inclusive’ approach that under-lies WIGM. I have, therefore, made no provision forsub-stages during exclusions.
9 Publication of results
I have taken the opportunity to specify fully whatmust be published once an STV count has been com-pleted. This rectifies a deficiency in the NorthernIreland rules [3].
10 Casual vacancies
The suggested rules do not include any provisionsrelating to the filling of casual vacancies becausepolicy decisions on casual vacancies are requiredbefore the relevant election rules can be devised.Should it be decided that a by-election must be heldwhen a single vacancy occurs, I would commend theuse of the special purpose STV rules published bythe Electoral Reform Society [21]. I codified theserules in their present form in 1978, working underthe guidance of Frank Britton and Robert Newland.
11 ‘Inclusive’ and ‘exclusive’representation
A discussion of the ‘inclusive’ and ‘exclusive’ ap-proaches to proportional representation and STVcounting rules will be the subject of a separate paper.
12 References
[1] Local Governance (Scotland) Act 2004. RoyalAssent 29 July 2004. Available via theMcDougall web site.
[2] Local Governance (Scotland) Bill. Introduced21 November 2003. Available via theMcDougall web site.
[3] The Local Elections (Northern Ireland) Order1985. Statutory Instrument 1985 No. 454.
[4] Nanson, E. J. (1900) The real value of a voteand how to get it at the coming Federalelections. Melbourne, J. T. Picken. quoted by:McLean, I. (2002) Australian electoral reformand two concepts of representation. Availablevia the McDougall web site.
24 Voting matters, Issue 22
Gilmour: Developing STV Rules for manual counting
[5] Local Government and Transport CommitteeOfficial Report 9 December 2003. Availablevia the McDougall web site.
[6] Local Government and Transport Committee2nd Report 2004 (Session 2). Stage 1 Reporton the Local Governance (Scotland) BillVolume 1: Report. Available via theMcDougall web site.
[7] Local Governance (Scotland) Bill: MarshalledList of Amendments selected for Stage 3.Available via the McDougall web site.
[8] Scottish Parliament Official Report (Session2) 23 June 2004, Col. 9392
[9] Second Newsletter of the Local Elections2007 Steering Group – July 2005. Availablevia the McDougall web site.
[10] UK-Edinburgh: data capture services 2005/S171-170043 Contract Notice ScottishExecutive Tender for the Provision ofElectronic Counting Services for Elections.Available via the McDougall web site.
[11] UK-Edinburgh: data capture services 2006/S36-038769 Contract Award NoticeProvisionof Electronic Counting Services for Elections.Available via the McDougall web site.
[12] Scottish Executive (undated). Invitation toTender for the Provision of ElectronicCounting Facilities for Elections. ContractReference: QLC 17/1Schedule 2: Statementof Requirements and Appendixes D and E.
[13] Making Every Vote Count : the case forelectoral reform in British Columbia : theBritish Columbia Citizens’ Assembly onElectoral Reform technical report. December2004. Available via the McDougall web site.
[14] Farrell, D. M. and McAllister, I. (2003) The1983 Change in Surplus Vote TransferProcedures for the Australian Senate and itsConsequences for the Single TransferableVote.Australian Journal of Political Science,Vol. 38, 479–491.Available via theMcDougall web site.
[15] Western Australia: Electoral LegislationAmendment Bill 2003. Section 39. Availablevia the McDougall web site.
[16] Gilmour, J. (revised 1 July 2006) STV Rulesfor manual counting to give effect to theWeighted Inclusive Gregory Method oftransferring surpluses, with candidates’ votesrecorded as integer values. Available via theMcDougall web site.
[17] Gilmour, J. (2003) Calculation of TransferValues - Proposal for STV-PR Rules for LocalGovernment Elections in Scotland.Votingmatters, Issue 17, October 2003, 20-24
[18] Pugh, R. (March 2006) (personalcommunication) Australian ElectoralCommission, Research Section.
[19] Australian Electoral Commission (2006). TheSenate Voting System: Senate TheoryTraining. 7 June 2006, pp 40.
[20] Australia : Commonwealth Electoral Act1918 - Section 273: Scrutiny of votes inSenate elections : paragraph (9)(b). Availablevia the McDougall web site.
[21] Electoral Reform Society : Regulations forthe Election of One Person by means of theSingle Transferable Vote. Available via theMcDougall web site.
2 Editor, et al: Edited comments on Robert Newland’s suggestions 3
3 Brian Wichmann: Review— Machinery of Democracy 10
4 Jonathan Lundell: Review— Irish Commission on Electronic Voting 13
5 David Hill: Review—Collective Decisions and Voting 18
About the McDougall Trust (reg. charity no. 212151)
The McDougall Trust is a charitable trust formed in 1948. Thecharity’s purposes asstated in its governing scheme of 1959 are to advance knowledge of and encouragethe study of and research into:
• political or economic science and functions of governmentand the services pro-vided to the community by public and voluntary organisations; and
• methods of election of and the selection and government of representative organ-isations whether national, civic, commercial, industrialor social.
The Trust’s work includes the maintenance and development of the Lakeman Libraryfor Electoral Studies, a unique research resource, the production and publication ofRepresentation: The Journal of Representative Democracy,and, of course, this pub-lication Voting matters, that examines the technical issues of the single transferablevote and related electoral systems.For further information on the Trust, please contact:
For further information on this publication, please contact B A Wichmann, the Editorat the above address or by email at:[email protected]
CONTENTS
Editorial
There are 5 papers in this issue, all of which arecomments or reviews of other work:
• David Hill: Comments on Newland’s paper
Here, David Hill responds to some specifictechnical points in Newland’s paper.
• Edited comments on Robert Newland’s sugges-tions.
Robert Newland’s article, written in 1983 mademany suggestions which were thought to be anappropriate topic of a moderated email discus-sion. A heavily edited version of this discus-sion appears here. It points to a number of top-ics which could well be the subject of futurepapers inVoting matters.
• Brian Wichmann:Review of The Machinery ofDemocracy
The report reviewed here is one undertakenby leading experts in the US to show what isneeded to avoid some of the problems that oc-curred during the Presidential election of 2000.
Parts of this report are relevant to the use ofscanning machines for the Scottish local elec-tions to be held later this year. The US Freedomof Information Act ensures that electoral datais open to public scrutiny, whereas the positionin Scotland is uncertain at this point. This im-plies that the transparency of the Scottish STVelections might be less than those of NorthernIreland for which manual procedures are used.
• Jonathan Lundell:Review of the Second Reportof the Irish Commission on Electronic Voting
The Irish Commission has completed its workwith its second report. It is unclear at this stagewhat action the Government will take. This re-port has some similarities with the previouslymentioned US report which makes for someinteresting comparisons.
• David Hill: Review of Collective Decisions andVoting by Nicolaus Tideman
The book reviewed here is central to many ofthe issues covered inVoting matters, and hencethis review should be of interest to many of ourreaders.
Scotland
The final stages of the legal process for the localSTV elections in Scotland have been agreed. Thecounting method is based upon the Weighted Inclu-sive Gregory Method, but is as simple as it could bein computer terms. Hand counting using this logicis possible, but would take longer than current man-ual counts because of the need to examine all of theelected candidate’s papers when a surplus is trans-ferred. It is interesting to contrast this with the Meekmethod, which is more complex, since the quota isrecomputed and transfers are made to elected can-didates. In electoral terms, Meek has the advantagethat the intervention of a no-hope candidate cannotchange the choice of the elected candidates — a fail-ing of all the rules used for current hand-countingSTV methods.
The Order approved by the Scottish Parliamentat the end of January will require the ReturningOfficers to publish much fuller details about votesand transfers of votes at each stage of the countthan the corresponding legislation for STV electionsin Northern Ireland. However, the rules strangelyinclude a requirement to publish the numbers ofnon-transferable papers at each stage but not thenumbers of non-transferable votes. That vote isneeded because, with WIGM, the non-transferablepapers will have different values when they becomenon-transferable.
Because the ballot papers will be scanned andcounted electronically, there is a new requirementfor one copy of the electronic information so ob-tained to be kept for four years after the count, whilethe paper records need to be kept for only one year,as usual. However, it is most regrettable that the re-lease of any of the electronic information, even inanonymous form, is specifically prohibited. One rayof hope for a more enlightened approach is that theScottish Executive has given an undertaking to con-sult on this. I certainly hope that full preferentialdata will be made available because that would bein everyone’s best interest.
Readers are reminded that views expressed inVoting matters by contributors do not neces-sarily reflect those of the McDougall Trust orits trustees.
Like all work published posthumously, if there areany faults in this paper [1], the author should notbe blamed for them because, had he lived longer, hemight well have revised it, or even withdrawn it. Thepaper is important as showing Newland supportingsome of the main features of the Meek method. It isa pity that he did not support all of them, but his dis-agreement with the Meek method of handling shortvotes gets no mention here.
It is easy to agree with him that to think of savingtime or money, as a result of computer counting, isunrealistic, but he fails to mention other advantagesof counting by computer, even if the rules remainthose of hand-counting methods. These advantagesare that, given a correct computer program: (i) any-body can carry out an STV election without hav-ing to understand the rules; (ii) the results are muchmore likely to be correct, provided that due care istaken in converting the ballot paper information to acomputer file. Such evidence as is available sug-gests that STV hand-counts, even by experiencedstaff, usually have errors in them.
His saying that “It would be absurd to write acomputer program restricting the calculation ... totwo decimal places” is therefore not correct. Whereexisting systems require the two-decimal place re-striction, doing it by computer, for the sake of a cor-rect result within those rules, is worth while.
He says that “Using more decimal places would,on occasion, lead to a different, better, result”. Al-though the words “on occasion” need to be noticed,I take his meaning to be that on occasion there willbe a difference but, if there is, it will necessarily be adifference for the better. Whether that is so dependsupon how “better” is defined. In the hope of avoid-ing controversy, let us take it to mean, in the context
For this publication, see www.votingmatters.org.uk
of Newland’s paper, “more like the result that wouldhave been obtained by adopting remedies (A) and(B) of the paper”. Such work as I have done on itsuggests that merely more precision in the calcula-tions does not help to that end.
2 Remedies (A) and (B)
Newland’s “Remedy (A)” is to re-commence thecount ab initio after each exclusion; his “Remedy(B)” is to transfer voting papers to next preferenceseven if already elected. He says that “If STV countsare to be computerised, it would be foolish not to in-clude remedy (A)”. He appears not to have realisedthat to include (A) without (B) can be troublesome.I take it that he was thinking in terms of the rulesof Newland and Britton 2nd edition [2] and addingremedy (A) to those, so I shall do so in the followingexamples.
2.1 What is wrong with Remedy (A) on itsown
Example 1Suppose 8 candidates for 5 seats, with votes
25 ACDF..24 BCEF..7 D..5 E..2 F..6 G3 HBCWe get a quota of 12 and the count proceeds as:
Thus E was deemed elected in the first count, andhad a surplus transferred, but had to be unelectedand take back that surplus for the second count.Finally E fails to get even half a quota and loses. Itmight be said that there is no need to say that anyonehas been elected until the final result is known, butthen how can the surplus transfer be explained, forwithout it F would have been excluded first insteadof H?Example 2
Suppose 8 candidates for 5 seats, with votes25 ACDF..24 BCEH..7 D..5 E..2 F..6 G3 HBC
These are identical votes to example 1 except that24 BCEF.. has been changed to 24 BCEH..
Following through the election in a similar way,those elected are found to be ABCDE. Thus E suc-ceeds if those 24 vote BCEH but E fails if those24 vote BCEF. So their choice of a later preferencehas upset the fate of their earlier preference. Mymemory of Robert Newland says that he would havehated that.
3 Conclusions
We must always remember that it is mathematicallyimpossible to find a faultless system, so these faultsof remedy (A) on its own are not necessarily con-clusive, but they tell strongly against it. What wouldbe safe would be to restart after each exclusion,provided that no candidate had yet been deemedelected.
4 Acknowledgement
I thank the referee for some very helpful comments.
A moderated email discussion was held based uponthe questions raised by Robert Newland [1] about23 years ago, but only published in 2006. Thoseparticipating in the discussion were (in alphabeticalorder): Bernard Black (BB), James Gilmour (JG),David Hill (IDH), Michael Hodge (MH), Chris Jer-donek (CJ), Henry Kitchener (HK), Jonathan Lun-dell (JL), Michael Meadowcroft (MM), Joe Otten(JO), Colin Rosenstiel (CR), Markus Schulze (MS),Nicolaus Tideman (NT), and Paul Wilder (PW).
Although the discussion was initially concernedwith ten questions, it soon diverged into other, re-lated, topics. It was agreed that the editor shouldattempt to edit the material rather than relying uponusing only the original email text.
2 The questions and discussion
The questions and the discussion that arose fromeach are enumerated in the following sub-sections.Not surprisingly, some respondents said the ques-tions were wrong and answered a slightly differentpoint.
Questions raised in 1983 are not necessarily ap-propriate for today. A count in 1983 would proba-bly have needed a main-frame while today any officecomputer could do a count in a few seconds.
Direct input to a computer (DRE - Direct Record-ing Electronic voting) would not typically have beenenvisaged in 1983, nor was the capability to readballot papers using OCR as well developed — thequestions need to be phrased in a manner suitablefor today. On the other hand CR had a counting pro-gram working on a ZX81 in 1981.
For this publication, see www.votingmatters.org.uk
2.1 Does computerising STV counts savetime/money?
BB: This is of no consequence; the right result is allimportant. IDH: Not to any noticeable extent, unlessa recount is necessary to fill a casual vacancy or forsome other purpose. Then it is very substantial. (Apoint repeated by MH.)
JL: Probably. Certainly, if ballots are cast in acomputer-readable form (DRE or optical scan, say).Other considerations are probably more significant.
In particular, Newland’s comment that, “Votingmachines capable of accepting preferences seem anunlikely investment for infrequent public elections,”is probably wrong today, at least in the UnitedStates, where Federal law mandates machinery that,as a happy side effect, is capable of implementingSTV, given the requisite laws, programming and cer-tification.
On the other hand, the widespread practice of vot-ing by mail will continue to require voting machin-ery in which the primary ballot is paper. In mycounty (San Mateo, just south of San Francisco),more than half the ballots cast in the June primaryelection were cast by mail.
NT: This is an empirical question, so its final reso-lution will presumably be determined by experience.However, if voting is done on a computer screen, asseems increasingly likely, I cannot imagine how itcould happen that a computerised count would notsave time and money in elections with more than100 or so voters. Even if voting is not by com-puter, as long as voters produce scanable ballots, Iwould expect computer counting to save time andmoney. If the votes are made public, as I am in-clined to think they ought to be, then there will beprograms in the public domain to count them, so itwill be a good idea to use a computer to count them,to avoid consequential human errors in the countingprocess. The availability of such programs, alongwith the votes cast, will make it possible for any-one who wishes to do so to verify that the acceptedprogram elects the candidates that officials say are
3
Editor, et al: Edited comments on Robert Newland’s suggestions
elected.JG: As someone else has already suggested, this
question should now be answered by reference tothe data available from recent computerised countsin large scale elections. Modern high-speed scan-ning of paper ballots and intelligent OCR have al-most certainly changed this out of all recognitionsince Robert wrote his note in 1983.
CR: I agree that when we introduced full com-puter counting into Liberal Democrat elections itmade little difference in time and effort. However,from long experience it is now clear to me that wemade a considerable gain in accuracy because copy-ing ballot paper data are inherently simpler than in-terpreting preferences when making transfers.
2.2 How important is witnessing a manualcount?
BB: The opportunity to view the count should beavailable to candidates or their agents. IDH: Notvery. It can appear much more meaningful than itactually is, because witnesses can rarely see muchthat is really relevant. Having systems that actuallyget the right answer is much more important, butconvincing the public that it has been properly doneis vital.
MH: I regard it as vital that candidates (or theirrepresentatives) can witness counts, whether manualor computer.
JL: To digress slightly, California law requiresa manual count of 1% of the ballots (county bycounty) as a check on the automated count. Thisraises obvious problems for STV in general andcomputation-intensive STV methods in particular.
I witnessed a manual recount recently (city coun-cil, at large plurality election for three seats). I had alot more confidence in the result as a consequence ofseeing the count, even though the margin was verysmall. That is good, albeit somewhat subjective.
I agree with David Hill that, “Having systems thatactually get the right answer is much more impor-tant, but convincing the public that it has been prop-erly done is vital.” That is to say, a witnessed manualcount is but a means to an end.
NT: Fairly important, I would say.JG: I suspect this does not happen in most private
elections. It appears to be important in public elec-tions for two reasons; Firstly, it is the only meansby which candidates and their agents can have anyassurance that the ballot papers have been countedcorrectly; Secondly, it is the only means by whichcandidates and their agents can collect some infor-
mation about voting patterns that they consider use-ful for future campaigning.
Auditing
Apart from a witnessed count, another method togain confidence in the result are auditing proce-dures. There was a lengthy discussion on this whichis summarised below.
JL: Have reformers settled the question of the ex-tent to which STV algorithms should be replicable“by hand”? To me this question has primacy overquestions of representation and “inclusiveness” be-cause it is about trusting the validity of the tally it-self. Some answers may limit which algorithms canbe considered.
If proper procedures are followed, it seems to methat no replicability by hand is needed. In the UnitedStates there is a manual tally process for machinecounted elections that involves manually checkingthe ballots in 1% of precincts selected at random.(Whether this is implemented correctly in practiceis another matter.) It seems that no replicability byhand is needed if (1) the ballot rankings are publiclyand digitally released, and arranged by some group-ing (e.g. by precinct), (2) the digital data are man-ually checked against the physical ballots in somefraction of those groupings (e.g. 1% of them), and(3) the voting algorithm is fully specified to the pub-lic. This would be enough for any organization ormember of the public to verify the tally.
JO: It seems that no replicability by hand isneeded if (1) the ballot rankings are publicly anddigitally released, and arranged by some grouping(e.g. by precinct), (2) the digital data are manuallychecked against the physical ballots in some frac-tion of those groupings (e.g. 1% of them), and (3)the voting algorithm is fully specified to the public.
I agree that simplicity of the rules is important.Meek rules I find the simplest, other rules tendingonly to appear simple when details about the order inwhich things are done and so forth are glossed over.However while their simplicity is an advantage, theirimpracticality for hand-counting is not.
JG: With regard to transparency, so far as the im-minent (2007) elections in Scotland are concerned,you should remember that the conventional STV pa-per ballots will be scanned and the counting all donewithin a computer program. So the tally-men andtally-women will not be at all able to tally the pa-pers or the votes. Indeed, the STV (local govern-ment) and AMS (Scottish Parliament) ballot paperswill possibly be scanned together — the softwareseparates the votes.
4 Voting matters, Issue 23
Editor, et al: Edited comments on Robert Newland’s suggestions
If DRS stick with the scanning procedure theydemonstrated, andif the Scottish Executive allowthe publication of one of the very useful reports thatprogram produced, it will give the parties and othersa great deal of information about the STV prefer-ences, ballot box by ballot box. The report I havein mind shows the numbers of preferences at eachlevel (1, 2, 3, 4 etc) for each candidate. It doesnot show the patterns of transfers, but it does pro-vide very valuable information for the candidatesand their agents, and it does it painlessly. I havewritten to the Scottish Executive and to lots of oth-ers saying this isonepart of the open reporting weneed to have in the Scottish procedure.
PW: Transparency in procedures and countingmethods in all elections is important, but in publicelections it is crucial to maintaining confidence inand the legitimacy of those elected.
[There was a discussion about the US style of au-diting and its potential application to Scotland. Thishas not been included.]
2.3 Are the ERS76 rules the best for amanual count?
Respondents were given an opportunity to considerERS97 in their response.
BB: Neither. All possible improvements were notmade in the 97 version. IDH: Given that all manualcounts are only approximations, for reasons of prac-ticability, the ERS rules are probably almost as goodas can be got, though I am still waiting for a properdescription of the reduced quota feature of ERS97.
NT: The rules could probably be improved a little,here and there, but the improvements would not addmuch value to the existing rules. I would guess that98% or 99% of what could be achieved by the bestmanual-count rules could be achieved by the exist-ing rules. So the important thing is to get STV inuse, and then consider refinements.
JG: To answer this question you must first define“best”.
I would suggest there are six sets of rules thatcould be used for manual counts: Dail Eireann,Northern Ireland, ERS73 (not quite identical to theNI rules), ERS76, ERS97, and my version of WIGMSTV. (I exclude the Australian Federal Senate rulesbased on the Inclusive Gregory Method because thetransfer value averaging procedure in those rulesmeans that they do not comply with “one person,one vote” [3].)
Exclusive versus Inclusive rules
Farrell and McAllister [3] use the term “inclusive”to characterise a variant of STV which uses morevotes in a transfer thus ensuring that more voters areinvolved in the election of subsequent candidates.Hence one could characterise a rule as “exclusive”if it minimises the voters involved.
JG: I think it is important that any and all dis-cussions of computerisation of STV counts and ofthe counting procedures that computerisation mightmake practicable, should take fully into accountthe effects of the various procedures in relation tothe “exclusiveness” or “inclusiveness” of represen-tation. This essential context is missing from almostall these questions.
You may define “best” in terms of the “exclusive-ness” or “inclusiveness” of the procedures in differ-ent sets of STV rules; there is a diversity of viewson which is “best” in this respect. You may define“best” in terms of practicality; there is likely to beless diversity of view on that.
If maximum “exclusiveness” is your definition of“best”, you will choose the Dail Eireann rules. Ifany element of chance is completely unacceptable,you will exclude the Dail Eireann rules from any fur-ther consideration.
If maximum “inclusiveness” is your definition of“best”, you will choose my WIGM STV rules [4].If you want the maximum “exclusiveness” withoutany element of chance, you will choose the NI rulesor ERS73.
If you want to maximise the practicality youwould probably choose ERS76 or ERS97.
Interestingly, in revising ERS76 to ERS97 some“exclusive” features were dropped, but this does notappear to have been done with any conscious intentof making the rules more “inclusive”.
MM: Maybe some rules have defects, but the cru-cial difference with the rules for Dail Eireann elec-tions and for those in Northern Ireland, is that theyare already entrenched in law and have been usedsuccessfully in many elections.
CR: What about the Cambridge, Mass, ruleswhich could be described as more exclusive (I donot really buy the simple linear scale model of in-clusiveness/exclusiveness anyway because there areother, more political factors to weight various count-ing rules by).
Cambridge has no derived surpluses at all. If acandidate reaches the quota during a transfer theyare leapfrogged by further votes in that round. Theonly surpluses they have are first stage ones. Theyare randomly selected for transfer or not, see [8].
Voting matters, Issue 23 5
Editor, et al: Edited comments on Robert Newland’s suggestions
JG: The Dail Eireann rules have a principledstructure, which come at the “exclusive” end of thespectrum (called “exclusive” only because it is theopposite of the “inclusive” variants). The Cam-bridge, MA. rules certainly present a simplificationcompared with the Dail rules, but I don’t think theirarbitrary handling of what would otherwise be con-sequential surpluses in any way enhances the “ex-clusiveness” of the representation they deliver.
2.4 Given a computer count, shouldimproved counting procedures beused?
BB: Yes. IDH: Yes. It is absurd to be stuck with ap-proximations where they are unnecessary. NT: Yes.
MH: No, due to the desire to allow a manual countusing the same rules — the procedure adopted by theChurch of England.
JG: As noted above, the wording of this questionreveals the questioner’s prejudice and it presents nocontext for the assessment of “improved”.
2.5 Given a computer count, should morethan two decimal places be used?
BB: Yes. IDH: Yes, but merely that without otherchanges does not help much. NT: Yes.
JG: Before considering the number of decimalplaces that should be used for calculations withinSTV procedures, I would strongly recommend thatall STV counting rules for public elections shouldprescribe that when votes are transferred, candidatesshould be credited with only integer numbers ofvotes. That would greatly simplify the presentationof the results and would aid public understandingand acceptance. This, however, is not a matter of“rounding for presentation” - that way lies disas-ter. As in the Australian Federal Senate rules, thecandidates are credited with only the integer part ofthe total vote to be transferred and appropriate pro-cedures have to be specified to deal with the “votefractions not transferred”. I have not tried to applythis “integer only” approach to Meek STV, but it canbe applied to all other versions of STV rules, fromNorthern Ireland rules to my WIGM rules for man-ual counting. Dail Eireann STV is already integeronly.
Once the practicality of result sheet presentationhas been separated from internal calculation (byadopting integer transfers), determining the num-ber of decimal places to be used in calculations be-comes essentially an exercise in numerical analysis.We should certainly use more than 2 decimal places
because of the significant vote loss than can occurwith such truncation, as explained in my paper [5].Where the possibility of a manual count has to be re-tained alongside computerised counting, I have rec-ommended 7 decimal places for practical reasons as-sociated with the use of pocket electronic calculators[4].
2.6 Given a computer count, restart afteran exclusion?
BB: Yes. IDH: Yes, provided that other changes aremade to make it work properly. Merely to do thatwithout other changes is disastrous, see [9]. NT:Yes.
JG: I presume by this you mean “go back to thebeginning and start the count again as though theexcluded candidate had never stood”. This presum-ably reduces the total valid vote by the number ofvotes for the excluded candidate that are not trans-ferable (no next available preference) and so reducesthe quota for the “new” count. That could have allsorts of interesting effects.
2.7 Given a computer count, transfer toalready elected candidates?
BB: Yes. IDH: Yes.JL: The benefits of Meek’s method are com-
pelling, if we use computers for the count. How-ever, a manual count, or recount, or verification,becomes impossible, and while publication of theballots would make independent computer count-ing possible, there are significant ballot secrecy con-cerns associated with such publication.
Moreover, manual verification requires anotherstep prior to the (computerized) count, namely ver-ifying that the ballots in the ballot file representthe will of the individual voters. In California,that’s likely to mean examining a voter-verified pa-per copy of an electronic ballot, another area for bal-lot secrecy concerns, and one in which truncation ofunused preferences will not help (they are alreadyon the paper).
NT: Yes.JG: This is an illogical question because the de-
cision whether or not to transfer votes to alreadyelected candidates does not depend on computeri-sation, but on the STV procedures you are using. Itwould, of course, be impractical for public electionswithout the use of a computer, but that is a separateissue.
As Robert Newland showed in this 1983 note[2], it would be wrong to transfer votes to already
6 Voting matters, Issue 23
Editor, et al: Edited comments on Robert Newland’s suggestions
elected candidates if you are using the GregoryMethod of fractional transfers with last parcel only.Robert also showed that, to give coherent results,transfers to already elected candidates are requiredif you are transferring all ballot papers, as in WIGMand Meek.
Consideration of Meek
The use of the Meek algorithm arose several timeswithin the debate on the main questions, but the is-sues raised are collected here.
NT: To my mind, the answer to improving andsimplifying is the Meek rules. These rules have beenaround for nearly 40 years now. They eliminatesome limitations of the Newland-Britton rules thatare very distressing to voting theorists. They havea very straightforward explanation. It would gener-ally take too long to count by these rules by hand,but confirming a count by hand-calculator is rea-sonably straightforward, if rather time-consuming.The rules have been written into “legislation” by theRoyal Statistical Society (and in New Zealand law:Editor).
To make the Meek rules even more acceptable, Iwould propose that someone write a computer pro-gram with even more auditing than the present pro-gram. In particular, I would suggest that the pro-gram should produce an audit trail that shows theallocation of each vote at each stage of the count.
If you feel that the Meek rules are too compli-cated, then the rules now in use in Northern Ire-land (a slight variation on Newland-Britton) mightbe considered. Voting theorists will be concernedof the ease with which strategy can be employedagainst them.
CR: Interestingly, Robert Newland’s article, in afew short sentences, shows why Weighted InclusiveGregory treatment of surpluses is such a nonsense.
This discussion also needs to consider more polit-ical aspects of different STV variants. My main ob-jection to Meek (and implicitly to some of Robert’sideas) is that they reduce the effective value of votesof less well-informed voters, those who do not ex-press full preference lists. These voters are likelyto be politically skewed, with effects on party rep-resentation and on the acceptability of STV to ourpotential supporters.
JL: During a manual recount in California, wit-nesses must be permitted. They are generally rep-resentatives of the candidates. So, independent ofwhether a computer is making the primary count,ballots are visible to the (semi-) public during therecount. Is this an issue? Perhaps not; recounts are
expensive and rare, and as you say, could be imple-mented without any one person seeing the entire bal-lot.
With Meek’s method, though, a hand count is notpractical. So a “manual recount” must be replacedby some other process, presumably a manual verifi-cation of the ballot file, and then making the ballotfile available for an independent count, and it is notclear to me that truncation (say) could be part of ei-ther step.
I am not particularly concerned about the secrecyproblem at this step in the process. Again, just look-ing at the California process, there are secrecy is-sues already in a manual recount; a vote-seller could“prove” his ballot by casting a distinctive write-in inan irrelevant race. Worse, our vote-by-mail system,used by a large percentage of the electorate, is wideopen to both vote-selling and coercion. That is nota good thing, of course, but introducing STV is notgoing to make things appreciably worse.
On the other hand, jurisdictions with a strongercommitment to ballot secrecy are likely to have aproblem implementing STV, maintaining secrecy,and making counting transparent.
HK: Many voters will only know enough aboutthe candidates to put a few at the top of their list.There may be a ”party” in whom they have con-fidence, and who they would like to use to com-plete their paper. I have found this with the Friendsof the National Trust, and with the ERS SupportGroup. Adding Party Lists would eliminate, or atleast reduce, short votes, which would meet the ob-jection some people have to the way Meek treatsshort votes.
CR: My political concern, especially about Meekbut it could also apply to WIG, is that the votes ofpeople who express short preference lists can be de-valued. As it is expecting a lot of voters in masselections to have enough valid information to makeinformed preference choices for all candidates thiscould give some voters an advantage.
2.8 Given a computer count, should allcandidates be elected with the samenumber of votes?
BB: Yes. IDH: Yes, in principle, but it is not neces-sary in practice to do extra work to reach that, once itknown for certain which candidates are elected andwhich are not.
JL: I like the principle, but I am doubtful that it ispractical, if we mean to (say) reduce the quota untilall seats are filled at the original quota. If quotaq
Voting matters, Issue 23 7
Editor, et al: Edited comments on Robert Newland’s suggestions
fills one too few seats (without reducing the quota),and quotaq′ < q fills all the seats, is there a quotaq′′ betweenq andq
′ that also fills all the seats, butwith different winners?
In Green Party (California and US) internal STVelections, we require that a candidate reach the quotato be deemed elected, and leave seats empty if nec-essary, another way (not always appropriate or prac-tical) to answer this question in the affirmative.
MM: Clearly the search for improvements to theoperation of STV is on-going, and the advent of thecomputer opens up new possibilities, but the natureof STV and the relatively complex (for the averageelector) concept of the quota and redistribution ac-cording to preferences etc, lends itself to caricatureby its opponents.
It is interesting to note that the various arithmeti-cal formulae relating to the distribution of list seatsdoes not attract the same attack.
NT: Yes, provided that there is a restart after ex-clusions. The quota should be lowered as votes be-come non-transferable.
JG: It is difficult to imagine why anyone wouldwant to do this. It could be achieved only by a com-plex iterative procedure with an ever-diminishingquota and a series of transfers among the alreadyknown winners until all the winners were creditedwith an equal number of votes. The purpose of theelection is to identify the unique set of winners to filla stated number of seats. When you reach the stageat which you can do that (according to the rules youare using), there is little point in proceeding further.
If you are using a Droop quota and you have filledall the vacancies and there are some votes (less thanone quota) then credited to the runner-up, I can seeno useful purpose in transferring those votes, muchless any useful purpose in going on to equalise thenumbers of votes credited to each of the alreadyelected candidates.
CJ: I can see doing this in cases where a “count-back” may be used later on to fill a vacancy. In oneversion of countback, vacancies are filled with STVusing all votes that went to elect the vacating can-didate(s) in the last election or countback, togetherwith the exhausted votes. If candidate totals are notfirst equalized, then some voters will not have a fairsay in the countback result. For example, if onecandidate has a large surplus at the conclusion ofthe election and some other candidate vacates, thecountback would not be fair to the voters who havevotes in that pile with surplus. If the tally had contin-ued and surpluses cleared, a lot of those votes couldhave wound up in the exhausted pile (affecting theresult of the countback).
2.9 Given a computer count, should allpapers be considered for transfer of aconsequential surplus?
BB: Yes. IDH: Yes, allrelevantpapers.JL: Yes (Meek)NT: Yes.JG: Like several other questions, this question has
nothing to do with computer counting but everythingto do with the type of STV rules you are implement-ing. As Robert Newland has shown [2], for rulesthat are to be internally consistent, you must takeonly the last parcel for Dail Eireann, Northern Ire-land, ERS73, ERS76 and ERS97 rules. In contrast,for internal consistency in WIGM and Meek, youmust transfer all papers. So the real question is, onceagain, do you want “exclusive” or “inclusive” repre-sentation, and by how much?
2.10 Is excluding the lowest candidate thebest?
BB: Yes.IDH: If we stick to the principle that later prefer-
ences must not under any circumstances upset ear-lier ones, it appears to be the only sensible rule avail-able, though it is sometimes unsatisfactory. If weare prepared to abandon that absolute principle thenI believe “Sequential STV” to be better, see [10].
JL: Here we presumably mean lowest numberof first-place votes. I want to preserve later-no-help/harm, and so am reluctant to consider any butfirst-place votes, so: yes. I think so.
The attractions of Condorcet methods (for single-seat elections) and Sequential STV (otherwise) areundeniable, but the value of being able to uncondi-tionally assure the voter that subsequent preferenceswill not harm earlier ones is very valuable, not to begive up lightly.
NT: If exclusions are to be done one by one, I pre-fer a rule of excluding the candidate who would notbe elected if the number to be elected were one lessthan the total not excluded yet. This rule excludesat each stage the candidate with the least apparentclaim to inclusion with the others. This rule is notideal. Its weakness is apparent in the fact that if justone candidate is to be elected, the rule can excludea Condorcet winner. But even though the rule is notideal, it is an improvement on eliminating the candi-date with the fewest votes.
If a better exclusion rule is desired, then my rec-ommendation is to not exclude candidates one byone, but rather employ a rule that takes account of
8 Voting matters, Issue 23
Editor, et al: Edited comments on Robert Newland’s suggestions
the comparisons of all possible outcomes (sets ofelected candidates) with one another, see [6].
MS: An alternative STV method is also available[8].
JG: Here again, it depends on what you mean by“best”. Some of us like to give electors an absoluteguarantee that a later preference canneverharm anearlier preference. If you regard this as an impor-tant principle, to be upheld in all circumstances, youhave no option but to exclude the lowest candidate(or pair, or three, etc). Those who come from a so-cial choice background are concerned (or horrified)that a Condorcet winner could be excluded by thisprocedure and criticise STV for this effect. But ifyou once open the door to taking later preferencesinto account to decide the fate of earlier preferencesin any circumstances, you will have opened the doorto tactical voting in STV. In public elections, withlarge numbers of anonymous voters, tactical votingis impossible under the present “lowest candidateexclusion” rules and it would have very serious im-plications to make any change in that.
3 References
[1] R. Newland. Computerisation of STV counts.Voting mattersIssue 22, pp11-13.
[2] R. Newland. Consequential Surplus: Transferof the last parcel.RepresentationNo. 99, Vol25, summer 1985, pp 18-19.
[3] D. A. Farrell and I. McAllister. The 1983Change in Surplus Vote Transfer Proceduresfor the Australian Senate and itsConsequences for the Single TransferableVote.Australian Journal of Political Science,vol 38, No 3, November pp479-491. Availablevia the McDougall web site.
[4] J. Gilmour. Developing STV Rules formanual counting to give effect to theWeighted Inclusive Gregory Method oftransferring surpluses, with candidates’ votesrecorded as integer values.Voting matters.Issue 22. pp21-25.
[5] J. Gilmour. Calculation of Transfer Values —Proposal for STV-PR Rules for LocalGovernment Elections in Scotland.VotingmattersIssue 17, pp20-24.
[6] N Tideman and D. Richardson. “Better VotingMethods through Technology: TheRefinement-Manageability Trade-Off in theSingle Transferable Vote”,Public Choice103(2000) pp. 13-34.
[7] ELECTION OF CERTAIN CITY ANDTOWN OFFICERS BY PROPORTIONALREPRESENTATION OR PREFERENTIALVOTING. Massachusetts General Laws,Chapter 54A.http://www.cambridgema.gov/Election/mgls.html
[8] M Schultze. Free Riding and VoteManagement under ProportionalRepresentation by the Single TransferableVote.http://m-schulze.webhop.net/schulze2.pdf
[9] I. D. Hill. Comments on Newland’s paper.Voting matters. Issue 23, pp1-2.
[10] I. D. Hill and Simon Gazeley: Sequential STV— a further modification.Voting matters.Issue 20, pp6-8.
Voting matters, Issue 23 9
Review— The Machinery of Democracy, ProtectingElections in an Electronic World
The document being considered here [1] is a highlysignificant report which deserves careful study bythose nervous about the security aspect of usingcomputers for elections. The report is from a TaskForce with many experts with established reputa-tions in the field. Moreover, many others clearlyperformed studies for the Task Force, includingthe National Institute for Standards and Technology(NIST).
Equally important to the work were reviews andcomments made by those professionally responsiblefor elections across the USA — Registrars and Au-ditors.
There are important limitations to the study,namely that the only voting systems consideredwere ones available at the time, and that postal vot-ing was not considered. For the UK, this last re-striction is important, since a recent legal case hasindicated fundamental weaknesses in the UK postalvoting system [2].
Lastly, this report is specifically written to addressproblems in the US system, and hence its applicationto other jurisdictions is for readers to decide.
2 The context
The US has thousands of electoral jurisdictions —many more than one per state. The number of ju-risdictions that make their own decisions about vot-ing procedures and equipment is smaller, but runsinto hundreds. Hence the issues to be addressed arelarge and diverse due to the different technologiesused. The report divides the electronic voting sys-tems into three classes:
For this publication, see www.votingmatters.org.uk
DRE Direct Recording Electronic. A DRE ma-chine directly records the voter’s selections ineach contest, using a ballot that appears on adisplay screen. There are at least 9 types of ma-chine like this.
DRE w/VVPT A DRE with Voter-Verified PaperTrail captures a voter’s choice both internally inelectronic form, and contemporaneously on pa-per. There are at least 5 machines of this type.
PCOS Precinct Count Optical Scan. PCOS votingmachines allow voters to mark paper ballots,typically with pencils or pens, independent ofany machine. Voters then carry their sleevedballots to a scanner. At the scanner, they un-sleeve the ballot and insert into the scanner,which optically records the vote. There are atleast 3 systems of this type.
Note that all three types of voting systems needto be configured for a specific election. Undertakingthis task implies access to the machine that couldlead to security issues.
3 The methodology
Given the scale of the problem in the US, a method-ology was needed to provide a framework for thework and ensure that the result could be understoodwithout too much difficulty.
From existing electoral statistics from 10 states,an artificial state called Pennasota, was devised. The10 states were all marginal making them potentialtargets for an electronic attack. The main analysiswas for the Governor of Pennasota with the follow-ing voting pattern:Candidate Party Total Votes Percentage
of VotesTom Jefferson Dem-Rep 1,769,818 51.1Johnny Adams Federalists 1,689,650 48.8
In addition to the overall figures above, the split ofthe votes amongst the precincts and polling stationsand voting machines was produced.
10
Brian Wichmann:Review— Machinery of Democracy
The next stage of the methodology was to pro-duce a list of potential threats — 120 in all. These120 were then analysed to identify the most impor-tant ones. The key to this part of the analysis wasnoting how many people would be needed to under-take a successful attack. The main conclusion fromthis was that threats against individual polling sta-tions would be unlikely to be successful due to thenumber of stations needed to swing the Pennasotavote — 40,000 votes out of over 3 million.
There are two forms of analysis — one a genericone concerned with the nature of PC-based equip-ment, the other arising from the most important ofthe 120 identified threats.
Basing voting machines on PC technology hasobvious problems due to the known security issueswith both Windows and Linux. It seems that all theequipment considered use either of these two oper-ating systems. Personally, I consider this inappro-priate for polling station equipment since it wouldbe difficult to ensure adequate security both at thepolling stations and during storage and transport be-tween elections.
Of course, validation and checking is undertakenof voting machine software. However, it seems thisis limited to the software written for the purpose,rather than the entire system (which could be verylarge). This seems to imply that using the operat-ing system to subvert the voting machine softwareis a credible line of attack. This supports my owncontention that polling station machines should belike other embedded software systems — such as thesystems used to control the engine of modern cars.
Another generic issue to be faced with all theequipment is the need to customise it for a specificelection. For this purpose, ballot definition files areused. Hence an issue to be considered is whetherchanges to such a file could be undertaken with aview to changing the election result. Here the threatseems less credible.
3.1 Threat analysis
By way of illustration, we take the most credible at-tack on each of the three systems.
For theDRE system, this attack is a Trojan Horseinserted into the operating system. To remain unde-tected, it would probably have to be activated care-fully so that testing prior to the election would notreveal the Trojan Horse, nor would the limited vali-dation undertaken immediately prior to the election.To me, this attack seems very credible which is whyI believe such machines should have embedded soft-
ware and not rely upon a conventional operating sys-tem.
For theDRE w/VVPT system, a Trojan Horseagain seems to be the most credible form of at-tack. The difference here is that there is a muchmore complex task since a paper trail needs to beproduced as well. Since this paper record can bechecked by the voter it probably means that successwould depend upon the voter making no such check,which is usually the case. This threat seems muchless credible than the previous one.
For thePCOS systems, a memory card is usedto record the votes, and hence an attack on this iscredible, as is the Trojan Horse attack yet again.
As another example of this analysis, consider thesystem to be used in Scotland for this year’s localelections. Here, there are a small number of count-ing centres to which the ballot boxes are transported.Hence the security problem forPCOS-style ma-chines at these centres is much easier to manage thanhaving equipment at each polling station. Moreover,the process of transport and handling ballot boxes iswell established. Hence, although an attack is notimpossible it seems very much less credible than inthe US context.
4 Conclusions
A large number of recommendations arise from thestudy: for instance, that no use should be madeof wireless components due to the potential secu-rity threat. A feature of the analysis is the natureof counter-measures that would be effective againstspecific threats. Here, statistical analysis of resultscould reveal unusual voting patterns which could in-dicate an attack, or perhaps faults in equipment.
There is substantial evidence in this report that thevalidation, checking and counter-measures against asecurity threat were inadequate in practice. It seemsunlikely that all of the detailed recommendations inthe report could have been acted upon for the elec-tions in November 2006.
For the position in Scotland using scanning equip-ment, the key issue would be how many informedparticipants it would take to perform a successful at-tack.
For those with any direct responsibility for elec-tions involving electronic equipment, the reportshould be studied carefully — it is impossible tosummarise the 147 pages adequately here — in anycase, the key issues will depend upon the type ofsystem being used.
Voting matters, Issue 23 11
Brian Wichmann:Review— Machinery of Democracy
(Further reports have been issued by the BrennanCenter on Usability, Access and Cost of voting sys-tems — these are not reviewed here.)
5 References
[1] THE MACHINERY OF DEMOCRACY:PROTECTING ELECTIONS IN ANELECTRONIC WORLD. The BrennanCenter Task Force on Voting System Security.www.brennancenter.org, 28th June 2006. (Filedate 8th August 2006)
[2] Dominic Kennedy and Jill Sherman. Postalvoting is an invitation to fraud, says judge.Times23rd March 2005.http://www.timesonline.co.uk/article/0,,2-1537754,00.html
12 Voting matters, Issue 23
Review— Second Report of the Irish Commission onElectronic Voting
. . . the Commission concludes that it canrecommend the voting and counting equip-ment for use at elections in Ireland, subjectto further work it has also recommended,but that it is unable to recommend the elec-tion management software for such use.
So reads the conclusion of the Irish Commissionon Electronic Voting [1].
The government of Ireland chose an electronicvoting system for use beginning with the local andEuropean Parliamentary elections of 11 June 2004.Responding to public criticism, the government es-tablished the Independent Commission on Elec-tronic Voting and Counting at Elections in March2004 [2]. In April 2004, the Commission issued aninterim report recommending against using the cho-sen system for the 2004 elections, citing concernsover secrecy, accuracy and testing. The Commis-sion issued its First Report in December 2004, andits Second (and final) Report in July 2006; the Com-mission was dissolved in September 2006. Exceptfor a limited pilot test in 2002, the system has notbeen deployed.
In addition to recommending further work onthe voting equipment, and replacement of the elec-tion management software, the Commission recom-mended changes to the overall operation of the elec-tions system, including better physical security forthe machinery itself, and noted that more testing willbe required:
The testing of the system as a whole car-ried out to date, as well as the investigation,
For this publication, see www.votingmatters.org.uk
analysis and independent testing and certi-fication of its individual components, is in-sufficient to provide a secure basis for theuse of the system at elections in Ireland.There is thus a need for comprehensive, in-dependent and rigorous end-to-end testing,verification and certification by a single ac-credited body of the entire system as pro-posed for use in Ireland. While the Com-mission’s work has laid the foundations forthis process, more work will be required inthis area ([1] p8).
The Second Report runs to more than 350pages, not including much supplementary informa-tion available on the Commission’s website: pub-lic submissions, technical information on the chosensystem, and more. An adequate summary of the re-port is beyond the scope of this review, but the reportitself is quite readable; the interested reader woulddo well to begin with the report’s summary and con-clusions ([1] Part 7).
This review generally confirms the judgment ofthe Commission, but, based on additional informa-tion, questions the Commission’s conclusion thatthe chosen system can be made acceptable with fur-ther work.
2 The chosen system: hardware
The voter sees a series of up to five paper ballots be-hind transparent plastic. Each paper ballot lists up to14 candidates, and beside each candidate is a buttonand a numeric LED display. In an STV election, thevoter presses the candidate buttons in order of pref-erence, and the numeric displays reflect the prefer-ence order. When all preferences have been entered,the voter presses another button to record the ballotin a removable nonvolatile memory (Ballot Module)installed in the Voting Machine.
A small LCD screen provides feedback and in-structions to the voters. A cable connects the Vot-
13
Jonathan Lundell:Review— Irish Commission on Electronic Voting
ing Machine to a separate control unit, used by thepolling station staff to control the Voting Machineand monitor its operation.
After the close of voting, the Ballot Module isphysically transferred from the Voting Machine toa Programming and Reading Unit (PRU) connectedto a PC that runs software to read the ballot data andtransfer it to a CD for consolidation with ballot datafrom other machines to be counted.
(The PRU is also used before the election to writeinformation to the Ballot Module that the VotingMachine uses to configure itself, including a de-scription of the layout of the paper ballots affixedto the Voting Machine, with the names of the can-didates, which are also displayed to the voter on theLCD screen as voting buttons are pressed.)
The CDs containing ballot information are trans-ported to a central facility where they are read, ag-gregated, and counted ([1] Part 3.2).
3 The chosen system: software
The Voting Machine software, written in ANSI C,runs on the PRU as well as the Voting Machine.
The “Integrated Election Software” (IES) runson a “hardened” PC running Microsoft Windows2000. Written in Delphi, Borland’s Object Pascal,IES consists of modules for STV counting, electionmanagement, and management of the PRU. In addi-tion, IES uses several third-party tools and libraries,including the Microsoft Access database system.
The Voting Machine software comprises some25,000 lines of code, while IES approaches 100,000lines, of which some 40,000 lines are devoted to thecounting module ([1] Part 3.2).
4 Public comments
The Commission invited submissions from the pub-lic, and has published them on its website. Sub-missions were received from a variety of sources,including private individuals, opposition parties,voting-system advocacy groups, and the Irish Com-puter Society. Common to most of the submis-sions is an insistence on a voter-verifiable audit trail(VVAT).
5 Vendor comments
The Second Report includes an extensive responsefrom Nedap NV, the Dutch vendor of the chosen sys-tem. Nedap generally takes the position that the cho-sen system as supplied conforms to their contract,
and that it is trustworthy and secure. Nedap arguesthat a voter-verifiable paper audit trail (VVPAT) isnot just unnecessary but actually undesirable, andargues that an open-source voting system (ie, onein which the details of the hardware and softwareimplementations are made public) is undesirable aswell.
Nedap cites a paper by Selker and Goler [3] crit-icizing VVPAT. However, the paper in question ac-tually advocates VVAT but considers VVPAT infe-rior to alternative approaches to VVAT (Selker ad-vocates a voter-verified audio audit transcript trail(VVAATT) in which the voter verifies an audio tran-script of his or her choices; the audio transcript isrecorded for use in a possible audit [4]).
Nedap and their Irish branch, Powervote IrelandLTD, assert that the system has already been ade-quately tested:
The hardware and software of the VM, PRUand BM were analysed and tested by the ac-credited German “Physikalisch TechnischeBundesanstalt” who is the body that is ap-pointed by German law to analyse and testelectronic voting systems before they canbe deployed in Germany ([1] p290).
With respect to the Integrated Election Software,
The Integrated Election Software can be di-vided into 3 main sections:
1. Preparation and Administration
2. Programming and reading in ballot mod-ules
3. The Count
Sections 1 and 2 have been in use in othercountries for many years. Millions of voteshave been processed and counted withoutincident or challenge. These 2 crucial sec-tions are therefore very well proven in prac-tice and form part of the Irish version.
Unlike Sections 1 and 2, Section 3 was de-veloped specifically for Ireland. This wassubjected to extensive testing by the De-partment prior to its deployment at the Dailelection and the Nice referendum. IES is amature and stable design. Adaptations andenhancements are inevitable for each newcountry. Changes to electoral practices arecommon and require software which can be
14 Voting matters, Issue 23
Jonathan Lundell:Review— Irish Commission on Electronic Voting
readily adapted to meet these changing re-quirements in a very timely way. Each timea change is introduced requires testing to becarried out.
Once testing is completed satisfactorilythen that particular build number is not al-lowed to be changed and is issued for use([1] p362).
6 “We don’t trust voting computers”
Since the Commission’s Second Report was is-sued, the Dutch group “Wij vertrouwen stemcom-puters niet” (“We don’t trust voting computers”) hasdemonstrated the ability to compromise the Nedapvoting equipment used in the Netherlands [5]. Inresponse, the Dutch government has mandated se-curity changes to their voting machines in advanceof their November elections [6]. The Dutch votingequipment is essentially similar to Ireland’s chosensystem, and it’s likely that the chosen system hassimilar vulnerabilities.
7 Comparative assessment againstpaper voting
The Irish government added to the Commission’stasks a “comparative assessment of the security andaccuracy of the current system (ie, the paper-basedsystem) for voting at elections and referenda.” ([1]p147). The Commission found that the paper systemis “moderately superior overall” to the chosen sys-tem as it currently exists, but that if all the concernsof the Commission could be addressed, the chosensystem as improved would be superior to the papersystem.
Not addressed is the question of whether the po-tential benefits of the chosen system outweigh itscost of acquisition and ongoing overhead, as wellas the less tangible cost of the potential loss of con-fidence of Ireland’s voters in its elections, a conse-quence suggested by the public comments.
8 VVAT
A voter-verifiable audit trail (VVAT) is intended toprovide a means, independent of the integrity of thevoting machinery in use, 1) to determine whether theelection was accurately recorded and reported and 2)to provide an independent means of recounting theelection should the accuracy of the electronic votingmachinery be called into question.
A VVAT is typically accomplished by printing apaper record of each voter’s ballot in such a waythat the voter can verify that the paper record is cor-rect, while not permitting the voter to retain a copy(which would be contrary to the secrecy require-ment). The paper record is then used to spot-checkthe electronic results and, if necessary, to serve asthe basis of a recount.
Implementation of an effective VVPAT is nontriv-ial, requiring among other things that an adequateproportion of voters actually check the paper recordin detail, so that discrepancies are detected, and thata statistically adequate sample of paper ballots becounted to have good assurance that the electroniccount is correct. Selker [4] advocates a “voter-verifiable audio audit transcript trail” (VVAATT) in-stead of a paper trail, but this approach has draw-backs of its own, being more difficult to audit.
9 NIST Discussion Draft
In 2002, US federal legislation [7] effectively man-dated electronic voting equipment as a means of cor-recting election-systems deficiencies that came tolight in the 2000 US presidential election, as wellas of allowing more disabled voters to vote withoutassistance. The law charged the National Institute ofStandards and Technology (NIST) with assisting inthe development of technical guidelines for votingsystems. In November 2006, NIST issued a draftdocument concerned with the upcoming 2007 up-date of the US federal guidelines. The NIST draft isunequivocal in its opinion of electronic voting sys-tems without independent audit trails.
One conclusion drawn by NIST is that the lackof an independent audit capability in DRE [directrecord electronic] voting systems is one of the mainreasons behind continued questions about votingsystem security and diminished public confidence inelections. NIST does not know how to write testablerequirements to make DREs secure, and NIST’s rec-ommendation . . . is that the DRE in practical termscannot be made secure [8].
One of the central themes in the debate over vot-ing system approaches such as the DRE is whetherthe level of certainty in the DRE is still adequate toensure that the records have been recorded correctly.. . . Trust in an election outcome relies heavily upontrusting the correctness of the DRE’s software andupon trusting that the DRE software has not beenreplaced nor tampered with. But, assuring softwarecorrectness and security is very difficult and expen-sive, and techniques for doing this are still an open
Voting matters, Issue 23 15
Jonathan Lundell:Review— Irish Commission on Electronic Voting
research topic. . . . Simply put, the DRE architec-ture’s inability to provide for independent audits ofits electronic records makes it a poor choice for anenvironment in which detecting errors and fraud isimportant ([8] p7).
Are there ways to improve DREs so that they canbe made secure and fully auditable? NIST and theSTS do not know how to write testable requirementsto satisfy that the software in a DRE is correct. Theuse of COTS [commercial off-the-shelf] software inDREs causes additional problems; having, for ex-ample, a large opaque COTS operating system toevaluate in addition to the voting system softwareis not feasible ([8] p9).
(In the context of the chosen system, “COTS” in-cludes Microsoft Windows, the Microsoft Accessdatabase system, and the Borland Delphi softwaredevelopment environment.)
According to the NIST, 35 of 50 US states usevoter-verifiable paper records entirely, and another10 states use them on a county-by-county basis.Only five states now use DRE with no paper trailstatewide.
10 Commentary
My own background is in the design and manufac-ture of computer systems, and I find the Commis-sion’s conclusions on hardware and software qual-ity all too plausible, though the proprietary natureof the chosen system’s software makes it impossi-ble for me to independently verify the Commission’sconclusions.
The Commission suggests that the defects of thechosen system could be remedied, in part by com-pletely rewriting the IES election management andcounting software. It seems likely that the Com-mission, had its remit included a determination ofbest practices, would have seriously considered a re-quirement for a VVAT of some kind.
The Irish government’s selection of an electronicvoting system of any kind was in retrospect prema-ture. Such systems have received much attention re-cently, especially in the US, and the technology is influx. In any case, the Commission’s comparison ofthe chosen system with paper ballots does not makea compelling case for a change to electronic voting.
One of the difficulties in completely auditing thechosen system lies in being able to guarantee thatthe software running in binary form on each votingmachine, as well as the IES systems, correspondsexactly to the software examined in source form bythe auditors. It must be possible for a signed and
certified copy of the original source code to be com-piled independently into a signed and certified bi-nary copy of the code, and in turn to be able to guar-antee that the software running on the voting sys-tems is in fact a faithful copy of the certified binary.This is complicated by the fact that the IES is criti-cally dependent on third-party software such as Mi-crosoft Windows and the Microsoft Access databasesystem, as well as the Borland Delphi software de-velopment environment, none of which has been in-dependently audited.
While some of these difficulties can be mitigated,and others entirely corrected, it is impractical, if notimpossible, to be able to guarantee that any elec-tronic voting system is completely trustworthy and,as important, is seen to be trustworthy. The factthat a company with the resources of Microsoft hasnot been able to guarantee the security of its ownweb browser (let alone the entire Windows oper-ating system) despite years of effort and large in-centives, suggests that a fully secure and trustwor-thy electronic voting system may be an unattainablegoal, especially given the complexity of the overallsystem and the incentives for subverting it, makingan effective independent VVAT mandatory.
11 Options
The Irish government is left with several options formoving forward.
Adopt the Commission’s recommendations. Im-prove the voting machine and its software, improveprocedures during and between elections, and re-place the IES with alternative software that can meetthe Commission’s standards.
Adopt the Commission’s recommendations asabove, but require the vendor to provide a voter-verifiable audit trail (VVAT), and adopt appropriateprocedures for taking advantage of the VVAT.
Abandon the chosen system, begin a process todefine new criteria for a voting system, and thenidentify and acquire such a system.
Abandon the chosen system and continue to usethe existing paper-based system, perhaps with pro-cedural improvements, leaving open the option ofconsidering an electronic voting system at some fu-ture time.
The Sunday Business Post (Dublin) reports thatthe government is leaning toward option 1, es-timating the cost of complying with the Com-mission’s recommendations to be approximately�
500K, compared with a sunk cost of some� 60M.
The� 500K figure is disputed, however, and regard-
16 Voting matters, Issue 23
Jonathan Lundell:Review— Irish Commission on Electronic Voting
less of the cost of option 1, the cost of option 2would be substantially higher [9].
My advice? Choose option 4, and establish anew commission that would, with public partic-ipation, recommend improvements to the presentpaper-ballot system, monitor the experience and(dis)satisfaction of other users of electronic votingsystems, and develop criteria for the eventual selec-tion of a system for Ireland. The world of electronicvoting is evolving rapidly, and Ireland is in a fine po-sition to take advantage of the experience (includingthe bad experience) of others before taking such animportant step.
12 References
[1] Second Report of the Commission onElectronic Voting on the Secrecy, Accuracyand Testing of the Chosen Electronic VotingSystem. Independent Commission onElectronic Voting, July 2006, p7.http://www.cev.ie/htm/report/downloadsecond.htm
[2] Terms of Reference and the several Reports ofthe Commission are available athttp://www.cev.ie.
[3] Ted Selker & Jon Goler,SecurityVulnerabilities and Problems with VVPT,CalTech/MIT Voting Technology ProjectWhite Paper #16, April 2004. Available viathe McDougall web site.
[4] Ted Selker & Sharon Cohen,An ActiveApproach to Voting Verification, CalTech/MITVoting Technology Project White Paper #28,May 2005. Available via the McDougall website.
[5] Rop Gonggrijp et al,Nedap/GroenendaalES3B voting computer: a security analysis,the “We do not trust voting computers”foundation, October 2006. Available via theMcDougall web site.
[6] Aaron Gray-Block, “Fraud concerns overballot computers”, Expatica, 18 October 2006.Available via the McDougall web site.
[7] Help America Vote Act of 2002, United StatesPublic Law 107-252.http://www.fec.gov/hava/lawext.txt
[8] Requiring Software Independence in VVSG2007: STS Recommendations for the TGDC,William Burr, John Kelsey, Rene Peralta, John
Wack, National Institute of Standards andTechnology, November 2006, p4. Availablevia the McDougall web site.
[9] Adam Maguire, “Fine Gael accuses Ahern one-voting costs”, Sunday Business Post Online,29 October 2006.
Voting matters, Issue 23 17
Review— Collective Decisions and Voting by NicolausTideman
This is a very worthwhile book containing awealth of useful information.
I have seen it said that, when making a speech,it should be divided into three parts: (1) tell themwhat you are going to tell them; (2) tell it to them;(3) tell them what you have told them. This bookcertainly follows that plan, not only overall but alsowithin each chapter. It is divided into two parts —Collective Decisions, chapters 1 to 6, and Voting,chapters 7 to 16, before a short summing up in chap-ter 17. I feel that chapter 16 should really be in-cluded in part 1, rather than part 2. Chapters 1 to6 and 16 are really more suitable for review in eco-nomics journals rather than inVoting matters, and Ishall therefore concentrate here on chapters 7 to 15.
The book seems a little unbalanced in the degreeof mathematical knowledge expected of the reader,who is expected to cope happily with
∫
, with ! (inits mathematical usage), withln, with iff, etc., soit is surprising that
∏
and∑
, as multiplying andadding operators, apparently need explaining. Cer-tainly anyone who struggles with mathematical no-tation will have to skip some parts but could stillgain a lot from reading the surrounding plain text;it is unfortunate that those struggling to understandthe notation will run into some misprints, that willmake their understanding harder because they maynot recognise them as being misprints but suspectthat the fault is theirs.
I also found it unbalanced in having an 80 pagechapter discussing various rules for electing to asingle seat, yet only a 26 page chapter for the multi-seat case, which surely deserved more than that.
There are detailed discussions and proofs of howvoting cycles can arise, of Arrow’s theorem, andof the Gibbard-Satterthwaite theorem. It is usefulto have these together for reference. Even those
For this publication, see www.votingmatters.org.uk
who do not wish to go into the detail of the proofswill gain knowledge of the facts that it is impos-sible to have a voting system without unsatisfac-tory features, and impossible to have one that isimmune to strategic voting. Personally I find it apity that Woodall’s theorem [1] is not also given aplace. I have found Woodall rather than Arrow tobe the more convincing, both to myself and to ex-plain to others. However part of this preference isbecause Arrow deals with trying to form an overallranking of options whereas Woodall is more specif-ically about dividing candidates into those electedand those not elected. The book does deal with thatpoint, giving a variation of Arrow’s theorem to dealwith it.
I also regret that there is no mention, to go withGibbard-Satterthwaite, of the work of Bartholdi andOrlin [2] who show theoretically that STV is re-markably strategy-proof. This is certainly known inpractice by those who vote using it for multi-seatelections. Careful study of the votes after the eventmay sometimes show where strategic voting couldhave succeeded, but to know what to do, other thanvote honestly, at the time of voting, is virtually im-possible.
There is discussion of properties used to evaluatethe various proposed methods, under the headingsof Domain, Consistency, Responsiveness, Stabilityand Qualitative Attractiveness: 18 different proper-ties altogether. It would help in reading the book ifshort definitions of these properties were availableon a separate card that could be kept handy. Thenthose who, for example, do not know their Smithconsistency from their Schwartz consistency, or whowish to be reminded of exactly what is implied inthis context by Homogeneity, would find things eas-ier. I felt this in particular when finding a mention ofnon-negative responsiveness. Looking in the indexit was not there, so where is it to be found? I foundpositive responsiveness and had to make the obviousguess from that.
18
David Hill: Review—Collective Decisions and Voting
Many of the particular methods discussed for asingle seat elect the dominant option (often calledthe Condorcet winner) if there is one, while the dif-ferences between those methods apply only whenseeking to sort out whom to elect when, because ofcycles, there is no dominant option. It is a pity thatthe casual reader might not realise that, in real elec-tions, there usually is a dominant option, and muchof the detail of what to do when there is not is thenirrelevant. I have too often seen Condorcet votingdismissed as a useful method because this fact is notunderstood.
Among the methods discussed there is no mentionof Supplementary Vote, as now used in Britain toelect town mayors. Perhaps it is thought too silly todeserve serious discussion by adults. If so I agree,but it would be worth just a sentence or two to sayso.
Another reference that I should have liked to seeis to Moulin’s devastating work [3], showing thatany system that elects the dominant option if thereis one cannot also guarantee that turning out to voteat all is going to be helpful. It is unlikely in practicethat abstaining could be better, but the fact that it istheoretically possible is worrying.
In evaluating the methods the author uses bothtechnical considerations and, where preferences areused, a practical look at the voting patterns in a col-lection of real elections, mostly from the ERS, con-ducted by STV. In particular he uses these to eval-uate the frequency of cycles. It is recognised thatto take multi-seat elections and use the data as iffor a single seat may not always be realistic. Heis wrong in saying that in these elections voters areasked to rank all candidates. It is standard doctrinewithin ERS that voters should have total freedom torank as many or as few as they wish.
At the end of the long chapter on single-seatmethods, there are 5 pages headed “Summary”. Thisis surely the wrong heading; a summary should referbriefly to what the chapter has already said, not in-troduce new material. Yet here we find the author’srecommendations on the comparative value of themethods. These do not seem to me to concentrateenough on what I believe to be the main point toconsider — namely whether one wishes to preservea promise to voters that putting in later preferencescannot upset the chances of their earlier preferences,or whether one is willing to forego that promise so asto avoid the problems caused by successive elimina-tions. In the first case it is doubtful whether anythingbetter than Alternative Vote is available; in the sec-ond case it makes sense to go for electing the dom-inant option if there is one, while what to do in the
event of a cycle for top place, while it must be de-cided, is really a secondary matter as such cycles arerare.
The evaluations are mainly in objective termsof whether or not a method possesses each partic-ular property, but for the properties contained inthe Qualitative Attractiveness category the evalua-tions are necessarily subjective and it is easy to dis-agree with some of them. It is always difficult tofind names for such features that will not be mis-understood but, for example, under “ease of use”the author appears to be considering only the rela-tive difficulty of marking a cross against one candi-date compared with recording a preference rankingagainst all candidates, and not to take into accountthe different degree of strategic thinking that may beneeded for properly thought-out votes. Surely that isalso a considerable part of ease of use.
Turning to multi-seat elections the author iswrong in saying that “European systems of propor-tional representation of the party-list type all haveadded features to give voters some voice in the se-lection of representatives within parties”. Britishvoters in European Parliament elections are notgiven any such voice.
The main discussion in this section is of STV,mostly well done, but I find the eventual preferencefor Warren counting rather than Meek counting sur-prising. Taking the example given, carefully devisedso that Newland & Britton, Warren and Meek givethree different answers, there are 5 candidates (R,S, T, U, V) for 3 seats. Meek elects R, S, T whereWarren elects R, S, U. It is clear from this that, inthis case, V is just a nuisance candidate and a usefulcomparison can be made by treating V as withdrawn[4]. If that is done Warren switches to the Meek re-sult. Furthermore using the author’s own CPO-STVmethod, he finds that the Meek result is the dom-inant outcome. These facts are not in themselvesconclusive because they relate to only one exampleand it may well be possible to find another examplethat does the opposite. But I suggest that they areenough to call for further thinking from the author.His view seems to be only that “the Warren vari-ation ... accords with my conception of fairness”rather than any detailed technical analysis. Fairnessis a difficult concept and my own view of it pointsstrongly in the reverse direction.
In considering the problems caused by elimina-tions he includes a mention of a suggestion that Imade nearly 20 years ago and regards it as “tooadhoc to be satisfying”. So do I. But he ignores thefact that it was a very tentative suggestion that wassubsequently developed to become Sequential STV
Voting matters, Issue 23 19
David Hill: Review—Collective Decisions and Voting
[5]. I should love to see his views on that, even ifunfavourable, but it gets no mention.
In considering the refinement-comprehensibilitytrade-off, he appears to think that more refine-ment always leads to less comprehensibility. Whenmerely tinkering with rules in minor ways, this isusually correct, but when a major rethink occurs,such as the move from methods designed for hand-counting to the Meek method, I do not believe it tobe true at all. Meek is not only more refined butalso far more comprehensible. Those who promotehand-counting methods, and claim them to be easyto understand, usually pass over the messy details intheir descriptions of them. He also claims that theMeek rules are faster, which is not so in my expe-rience, but it is in any case unimportant. Comparedwith the time, trouble and expense of conducting anelection, what are a few extra seconds in calculatingthe result?
In the end he favours a hybrid system of allowingSTV preferences only for a maximum of perhaps 10or 12 candidates, followed by a party-list for the rest.I think that this is very inferior to STV throughoutand, to echo back his own words, is tooad hocto besatisfying.
On the whole the book is well set out and eas-ily readable, but I do dislike the modern custom ofputting footnotes at the end of the chapter, wherethey have to be searched for, rather than in theirproper footnote place.
But for all my criticisms, I should like to end byrepeating my first sentence and say again that thisis a very worthwhile book containing a wealth ofuseful information.
1 References
[1] D.R. Woodall (1987) An impossibilitytheorem for electoral systems.DiscreteMathematics, 66, 209-211.
[2] J.J. Bartholdi III and J.B. Orlin (1991) Singletransferable vote resists strategic voting.Social Choice and Welfare, 8, 341-354.
[3] H. Moulin (1988) Condorcet’s principleimplies the no show paradox.Journal ofEconomic Theory, 45, 53-64.
[4] I.D. Hill (1994) The comparative steadinesstest of electoral methods.Voting matters, issue3, 5.
[5] I.D. Hill and S. Gazeley (2005) SequentialSTV a further modification.Voting matters,issue 20, 6-8.
Collective Decisions and Votingby Nicolaus TidemanAshgate Publishing Ltd., Aldershot, 2006ISBN-13: 978-0-7546-4717-1ISBN-10: 0-7546-4717-X