This article appeared in a journal published by Elsevier. The attached copy is furnished to the author for internal non-commercial research and education use, including for instruction at the authors institution and sharing with colleagues. Other uses, including reproduction and distribution, or selling or licensing copies, or posting to personal, institutional or third party websites are prohibited. In most cases authors are permitted to post their version of the article (e.g. in Word or Tex form) to their personal website or institutional repository. Authors requiring further information regarding Elsevier’s archiving and manuscript policies are encouraged to visit: http://www.elsevier.com/authorsrights
Transcript
This article appeared in a journal published by Elsevier. The attachedcopy is furnished to the author for internal non-commercial researchand education use, including for instruction at the authors institution
and sharing with colleagues.
Other uses, including reproduction and distribution, or selling orlicensing copies, or posting to personal, institutional or third party
websites are prohibited.
In most cases authors are permitted to post their version of thearticle (e.g. in Word or Tex form) to their personal website orinstitutional repository. Authors requiring further information
regarding Elsevier’s archiving and manuscript policies areencouraged to visit:
jo ur nal home p ag e: www.elsev ier .com/ locate /eco lmodel
Was overfishing of predatory fish responsible for a lobster-inducedregime shift in the Benguela?
Laura K. Blameya,∗, Éva E. Plagányib,1, George M. Brancha
a Marine Research (MA-RE) Institute and Department of Biological Sciences, University of Cape Town, Private Bag X3, Rondebosch 7701, South Africab Department of Mathematics and Applied Mathematics, University of Cape Town, Private Bag X3, Rondebosch 7701, South Africa
a r t i c l e i n f o
Article history:Received 26 July 2013Received in revised form 4 November 2013Accepted 4 November 2013Available online 1 December 2013
The top-down effects of predators have been demonstrated for terrestrial, freshwater and marine systemsand their removal can cause a shift in ecosystem state. In many cases, the depletion of top-predatorsoccurred long before humans began monitoring these systems, but models can elucidate likely ecosystemchanges. In this paper we use a multispecies model to demonstrate that the abundance of predators caninduce different ecosystem states, emphasising the importance of sustainable harvesting. Our model isfounded on empirical data documenting a regime-shift that took place in the kelp-forest ecosystem alongthe south-west coast of South Africa following an ‘invasion’ by the West Coast rock lobster Jasus lalandiiin the early 1990s. Formerly dominated by herbivores and encrusting corallines, the ecosystem becamedominated by lobsters and macroalgae. A combination of illegal fishing of abalone Haliotis midae andthe lobster-induced extermination of the urchin Parechinus angulosus (which shelters juvenile abalone)depleted abalone stocks severely. In this currently over-fished ecosystem where predators of lobsters arescarce, the regime-shift appears irreversible. Using an intermediate complexity model of lobster, urchinand abalone relationships, we simulated the effects of predatory fish at various population levels onthe course of development of the currently lobster-dominated system. Our results indicate that currentlevels of fish biomass (<10% of the pristine population) would have been too small to significantly affectthe lobster population. However, at pristine levels of fish abundance (or even 50% less), the invasion oflobsters would have been controlled by linefish, and urchin and abalone populations would not havecollapsed. The effect of the lobster invasion had a greater influence on abalone abundance than illegalfishing, but together they severely depleted the abalone. Ecosystem effects of historical exploitation oftop predators are of central concern, and our ecosystem model indicates that depletion of linefish hadsevere consequences for lobsters, urchins and abalone, illustrating how overfishing of top predators mayprecipitate regime shifts, with profound socio-economic consequences.
Changes in the abundance of predators can powerfully influ-ence ecosystem structure, functioning and resilience (Frank et al.,2005; Beschta and Ripple, 2009; Ling et al., 2009; Estes et al., 2011),affecting both the prey species and having indirect ripple effects onthe rest of the ecosystem (e.g. Steneck, 1998; Jackson et al., 2001;Scheffer et al., 2005). Such top-down effects have been demon-strated for terrestrial, freshwater and marine systems (see Esteset al., 2011). In the marine realm, these top-down effects have often
been recorded in the coastal zone (e.g. Paine, 1974; Estes et al.,1998; Menge, 2000; Shears and Babcock, 2002; Steneck et al., 2002;Halpern et al., 2006; Barrett et al., 2009). However, only during thepast decade has top-down control become increasingly apparent inopen-ocean systems, as many top predators have been overfished(Worm and Myers, 2003; Frank et al., 2005; Baum and Worm, 2009).Acting simultaneously with human-induced climate-change, thisimplies that humans are exerting extreme modifications on bothtop-down and bottom-up forces (Scheffer et al., 2005; Ling et al.,2009), resulting in ecosystem shifts that are probably not eas-ily reversible (Frank et al., 2005). Often, the overexploitation andecological extinction of top predators occurred long before theintroduction of fisheries management and ecosystem monitoring(Jackson et al., 2001), so that it is impossible to rely on historicdata to assess whether ecosystem shifts took place or not, let aloneascribe responsibility to depletion of top predators. In this paper wefocus on a kelp-forest ecosystem in which considerable changes of
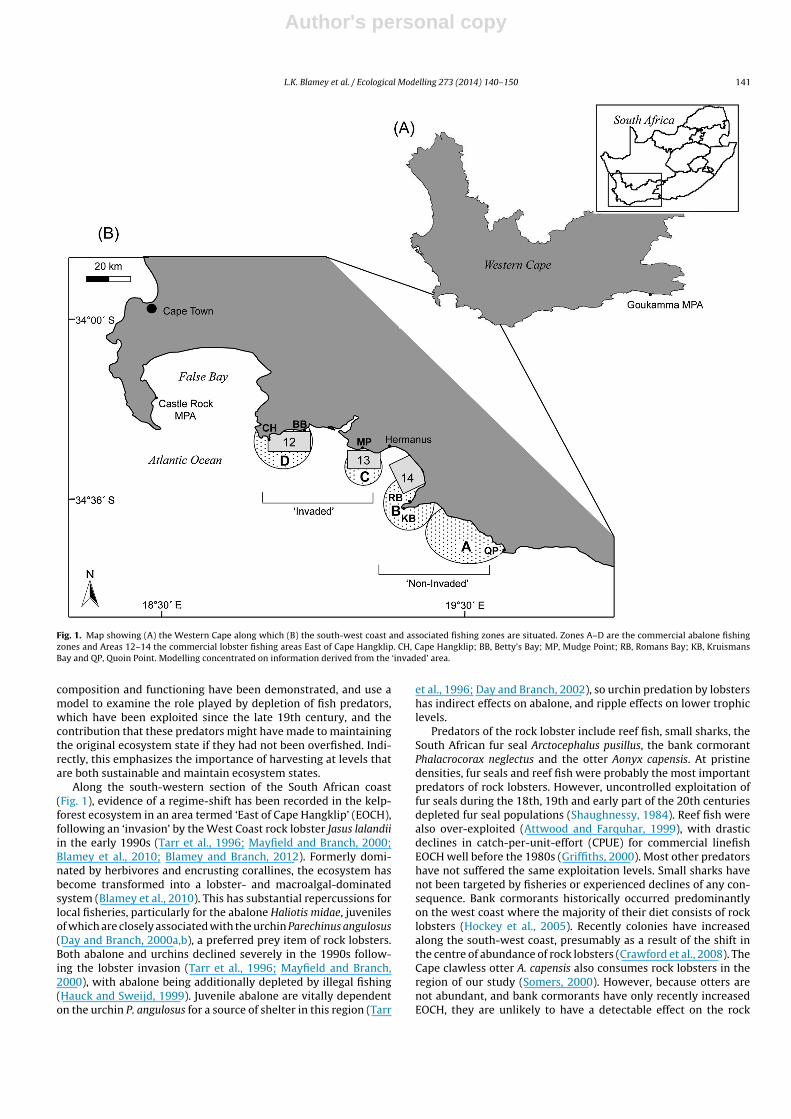
Fig. 1. Map showing (A) the Western Cape along which (B) the south-west coast and associated fishing zones are situated. Zones A–D are the commercial abalone fishingzones and Areas 12–14 the commercial lobster fishing areas East of Cape Hangklip. CH, Cape Hangklip; BB, Betty’s Bay; MP, Mudge Point; RB, Romans Bay; KB, KruismansBay and QP, Quoin Point. Modelling concentrated on information derived from the ‘invaded’ area.
composition and functioning have been demonstrated, and use amodel to examine the role played by depletion of fish predators,which have been exploited since the late 19th century, and thecontribution that these predators might have made to maintainingthe original ecosystem state if they had not been overfished. Indi-rectly, this emphasizes the importance of harvesting at levels thatare both sustainable and maintain ecosystem states.
Along the south-western section of the South African coast(Fig. 1), evidence of a regime-shift has been recorded in the kelp-forest ecosystem in an area termed ‘East of Cape Hangklip’ (EOCH),following an ‘invasion’ by the West Coast rock lobster Jasus lalandiiin the early 1990s (Tarr et al., 1996; Mayfield and Branch, 2000;Blamey et al., 2010; Blamey and Branch, 2012). Formerly domi-nated by herbivores and encrusting corallines, the ecosystem hasbecome transformed into a lobster- and macroalgal-dominatedsystem (Blamey et al., 2010). This has substantial repercussions forlocal fisheries, particularly for the abalone Haliotis midae, juvenilesof which are closely associated with the urchin Parechinus angulosus(Day and Branch, 2000a,b), a preferred prey item of rock lobsters.Both abalone and urchins declined severely in the 1990s follow-ing the lobster invasion (Tarr et al., 1996; Mayfield and Branch,2000), with abalone being additionally depleted by illegal fishing(Hauck and Sweijd, 1999). Juvenile abalone are vitally dependenton the urchin P. angulosus for a source of shelter in this region (Tarr
et al., 1996; Day and Branch, 2002), so urchin predation by lobstershas indirect effects on abalone, and ripple effects on lower trophiclevels.
Predators of the rock lobster include reef fish, small sharks, theSouth African fur seal Arctocephalus pusillus, the bank cormorantPhalacrocorax neglectus and the otter Aonyx capensis. At pristinedensities, fur seals and reef fish were probably the most importantpredators of rock lobsters. However, uncontrolled exploitation offur seals during the 18th, 19th and early part of the 20th centuriesdepleted fur seal populations (Shaughnessy, 1984). Reef fish werealso over-exploited (Attwood and Farquhar, 1999), with drasticdeclines in catch-per-unit-effort (CPUE) for commercial linefishEOCH well before the 1980s (Griffiths, 2000). Most other predatorshave not suffered the same exploitation levels. Small sharks havenot been targeted by fisheries or experienced declines of any con-sequence. Bank cormorants historically occurred predominantlyon the west coast where the majority of their diet consists of rocklobsters (Hockey et al., 2005). Recently colonies have increasedalong the south-west coast, presumably as a result of the shift inthe centre of abundance of rock lobsters (Crawford et al., 2008). TheCape clawless otter A. capensis also consumes rock lobsters in theregion of our study (Somers, 2000). However, because otters arenot abundant, and bank cormorants have only recently increasedEOCH, they are unlikely to have a detectable effect on the rock
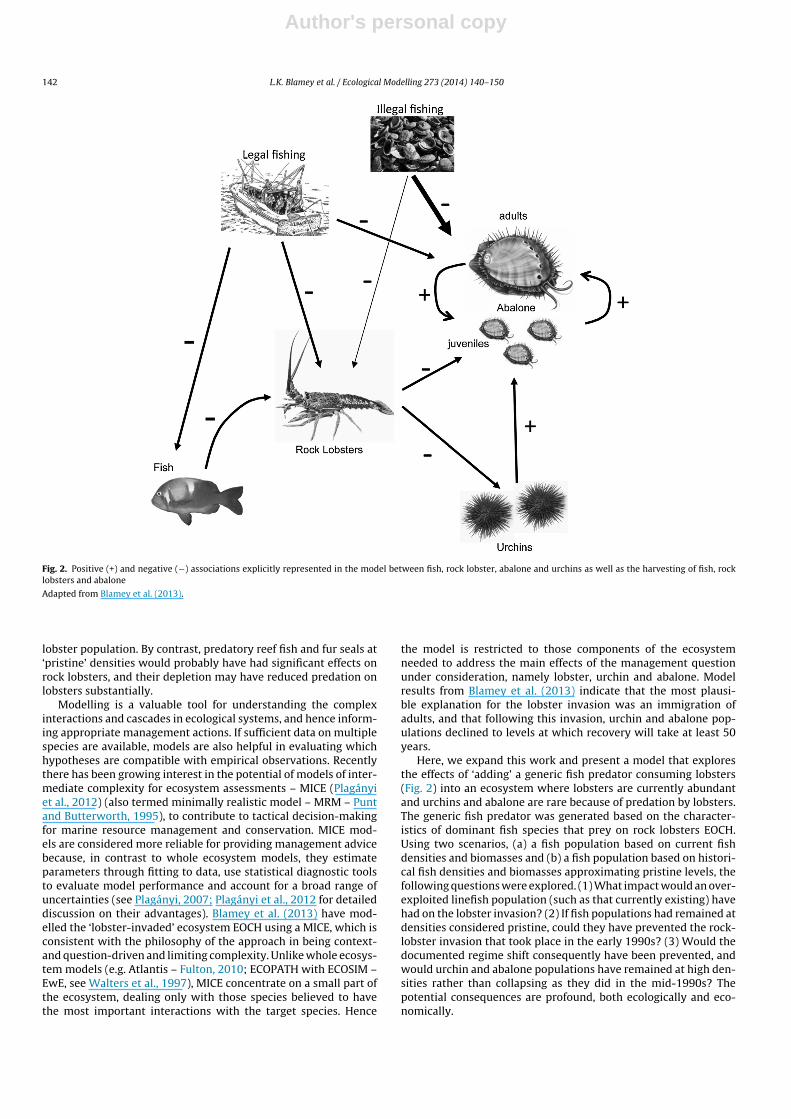
Fig. 2. Positive (+) and negative (−) associations explicitly represented in the model between fish, rock lobster, abalone and urchins as well as the harvesting of fish, rocklobsters and abalone
Adapted from Blamey et al. (2013).
lobster population. By contrast, predatory reef fish and fur seals at‘pristine’ densities would probably have had significant effects onrock lobsters, and their depletion may have reduced predation onlobsters substantially.
Modelling is a valuable tool for understanding the complexinteractions and cascades in ecological systems, and hence inform-ing appropriate management actions. If sufficient data on multiplespecies are available, models are also helpful in evaluating whichhypotheses are compatible with empirical observations. Recentlythere has been growing interest in the potential of models of inter-mediate complexity for ecosystem assessments – MICE (Plagányiet al., 2012) (also termed minimally realistic model – MRM – Puntand Butterworth, 1995), to contribute to tactical decision-makingfor marine resource management and conservation. MICE mod-els are considered more reliable for providing management advicebecause, in contrast to whole ecosystem models, they estimateparameters through fitting to data, use statistical diagnostic toolsto evaluate model performance and account for a broad range ofuncertainties (see Plagányi, 2007; Plagányi et al., 2012 for detaileddiscussion on their advantages). Blamey et al. (2013) have mod-elled the ‘lobster-invaded’ ecosystem EOCH using a MICE, which isconsistent with the philosophy of the approach in being context-and question-driven and limiting complexity. Unlike whole ecosys-tem models (e.g. Atlantis – Fulton, 2010; ECOPATH with ECOSIM –EwE, see Walters et al., 1997), MICE concentrate on a small part ofthe ecosystem, dealing only with those species believed to havethe most important interactions with the target species. Hence
the model is restricted to those components of the ecosystemneeded to address the main effects of the management questionunder consideration, namely lobster, urchin and abalone. Modelresults from Blamey et al. (2013) indicate that the most plausi-ble explanation for the lobster invasion was an immigration ofadults, and that following this invasion, urchin and abalone pop-ulations declined to levels at which recovery will take at least 50years.
Here, we expand this work and present a model that exploresthe effects of ‘adding’ a generic fish predator consuming lobsters(Fig. 2) into an ecosystem where lobsters are currently abundantand urchins and abalone are rare because of predation by lobsters.The generic fish predator was generated based on the character-istics of dominant fish species that prey on rock lobsters EOCH.Using two scenarios, (a) a fish population based on current fishdensities and biomasses and (b) a fish population based on histori-cal fish densities and biomasses approximating pristine levels, thefollowing questions were explored. (1) What impact would an over-exploited linefish population (such as that currently existing) havehad on the lobster invasion? (2) If fish populations had remained atdensities considered pristine, could they have prevented the rock-lobster invasion that took place in the early 1990s? (3) Would thedocumented regime shift consequently have been prevented, andwould urchin and abalone populations have remained at high den-sities rather than collapsing as they did in the mid-1990s? Thepotential consequences are profound, both ecologically and eco-nomically.
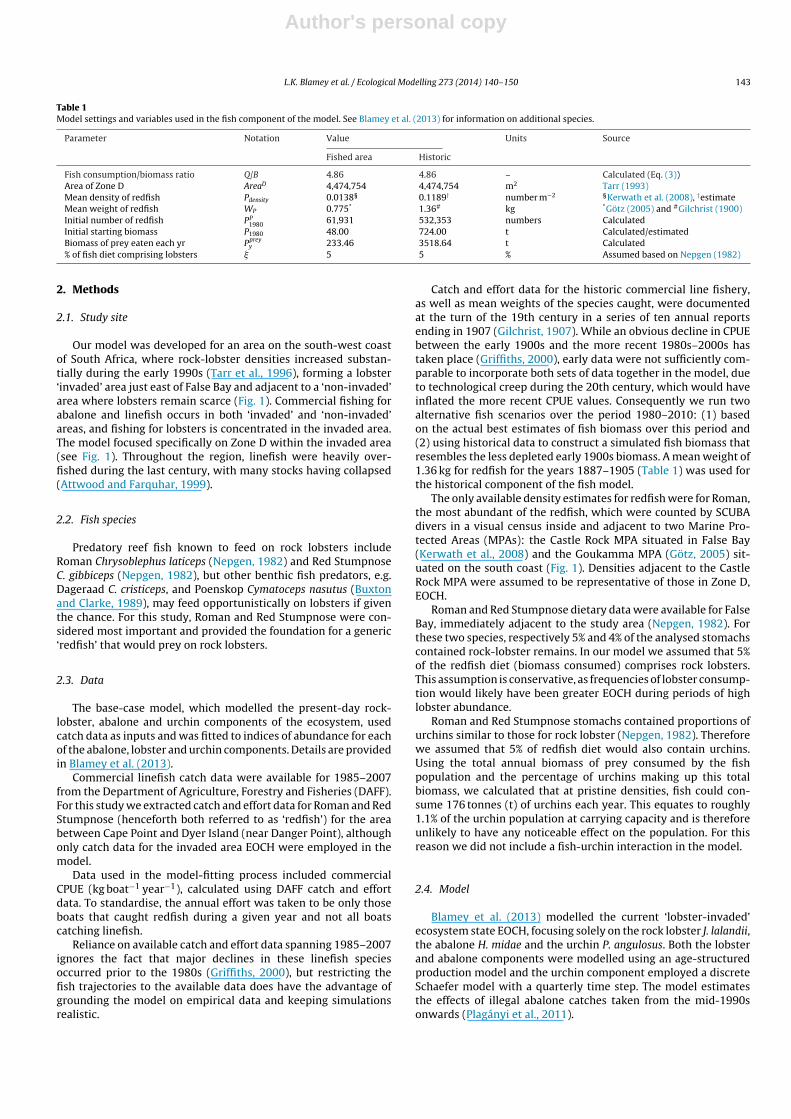
Table 1Model settings and variables used in the fish component of the model. See Blamey et al. (2013) for information on additional species.
Parameter Notation Value Units Source
Fished area Historic
Fish consumption/biomass ratio Q/B 4.86 4.86 – Calculated (Eq. (3))Area of Zone D AreaD 4,474,754 4,474,754 m2 Tarr (1993)Mean density of redfish Pdensity 0.0138§ 0.1189† number m−2 §Kerwath et al. (2008), †estimateMean weight of redfish WP 0.775* 1.36# kg *Götz (2005) and #Gilchrist (1900)Initial number of redfish PP
1980 61,931 532,353 numbers CalculatedInitial starting biomass P1980 48.00 724.00 t Calculated/estimatedBiomass of prey eaten each yr Pprey
y 233.46 3518.64 t Calculated% of fish diet comprising lobsters � 5 5 % Assumed based on Nepgen (1982)
2. Methods
2.1. Study site
Our model was developed for an area on the south-west coastof South Africa, where rock-lobster densities increased substan-tially during the early 1990s (Tarr et al., 1996), forming a lobster‘invaded’ area just east of False Bay and adjacent to a ‘non-invaded’area where lobsters remain scarce (Fig. 1). Commercial fishing forabalone and linefish occurs in both ‘invaded’ and ‘non-invaded’areas, and fishing for lobsters is concentrated in the invaded area.The model focused specifically on Zone D within the invaded area(see Fig. 1). Throughout the region, linefish were heavily over-fished during the last century, with many stocks having collapsed(Attwood and Farquhar, 1999).
2.2. Fish species
Predatory reef fish known to feed on rock lobsters includeRoman Chrysoblephus laticeps (Nepgen, 1982) and Red StumpnoseC. gibbiceps (Nepgen, 1982), but other benthic fish predators, e.g.Dageraad C. cristiceps, and Poenskop Cymatoceps nasutus (Buxtonand Clarke, 1989), may feed opportunistically on lobsters if giventhe chance. For this study, Roman and Red Stumpnose were con-sidered most important and provided the foundation for a generic‘redfish’ that would prey on rock lobsters.
2.3. Data
The base-case model, which modelled the present-day rock-lobster, abalone and urchin components of the ecosystem, usedcatch data as inputs and was fitted to indices of abundance for eachof the abalone, lobster and urchin components. Details are providedin Blamey et al. (2013).
Commercial linefish catch data were available for 1985–2007from the Department of Agriculture, Forestry and Fisheries (DAFF).For this study we extracted catch and effort data for Roman and RedStumpnose (henceforth both referred to as ‘redfish’) for the areabetween Cape Point and Dyer Island (near Danger Point), althoughonly catch data for the invaded area EOCH were employed in themodel.
Data used in the model-fitting process included commercialCPUE (kg boat−1 year−1), calculated using DAFF catch and effortdata. To standardise, the annual effort was taken to be only thoseboats that caught redfish during a given year and not all boatscatching linefish.
Reliance on available catch and effort data spanning 1985–2007ignores the fact that major declines in these linefish speciesoccurred prior to the 1980s (Griffiths, 2000), but restricting thefish trajectories to the available data does have the advantage ofgrounding the model on empirical data and keeping simulationsrealistic.
Catch and effort data for the historic commercial line fishery,as well as mean weights of the species caught, were documentedat the turn of the 19th century in a series of ten annual reportsending in 1907 (Gilchrist, 1907). While an obvious decline in CPUEbetween the early 1900s and the more recent 1980s–2000s hastaken place (Griffiths, 2000), early data were not sufficiently com-parable to incorporate both sets of data together in the model, dueto technological creep during the 20th century, which would haveinflated the more recent CPUE values. Consequently we run twoalternative fish scenarios over the period 1980–2010: (1) basedon the actual best estimates of fish biomass over this period and(2) using historical data to construct a simulated fish biomass thatresembles the less depleted early 1900s biomass. A mean weight of1.36 kg for redfish for the years 1887–1905 (Table 1) was used forthe historical component of the fish model.
The only available density estimates for redfish were for Roman,the most abundant of the redfish, which were counted by SCUBAdivers in a visual census inside and adjacent to two Marine Pro-tected Areas (MPAs): the Castle Rock MPA situated in False Bay(Kerwath et al., 2008) and the Goukamma MPA (Götz, 2005) sit-uated on the south coast (Fig. 1). Densities adjacent to the CastleRock MPA were assumed to be representative of those in Zone D,EOCH.
Roman and Red Stumpnose dietary data were available for FalseBay, immediately adjacent to the study area (Nepgen, 1982). Forthese two species, respectively 5% and 4% of the analysed stomachscontained rock-lobster remains. In our model we assumed that 5%of the redfish diet (biomass consumed) comprises rock lobsters.This assumption is conservative, as frequencies of lobster consump-tion would likely have been greater EOCH during periods of highlobster abundance.
Roman and Red Stumpnose stomachs contained proportions ofurchins similar to those for rock lobster (Nepgen, 1982). Thereforewe assumed that 5% of redfish diet would also contain urchins.Using the total annual biomass of prey consumed by the fishpopulation and the percentage of urchins making up this totalbiomass, we calculated that at pristine densities, fish could con-sume 176 tonnes (t) of urchins each year. This equates to roughly1.1% of the urchin population at carrying capacity and is thereforeunlikely to have any noticeable effect on the population. For thisreason we did not include a fish-urchin interaction in the model.
2.4. Model
Blamey et al. (2013) modelled the current ‘lobster-invaded’ecosystem state EOCH, focusing solely on the rock lobster J. lalandii,the abalone H. midae and the urchin P. angulosus. Both the lobsterand abalone components were modelled using an age-structuredproduction model and the urchin component employed a discreteSchaefer model with a quarterly time step. The model estimatesthe effects of illegal abalone catches taken from the mid-1990sonwards (Plagányi et al., 2011).
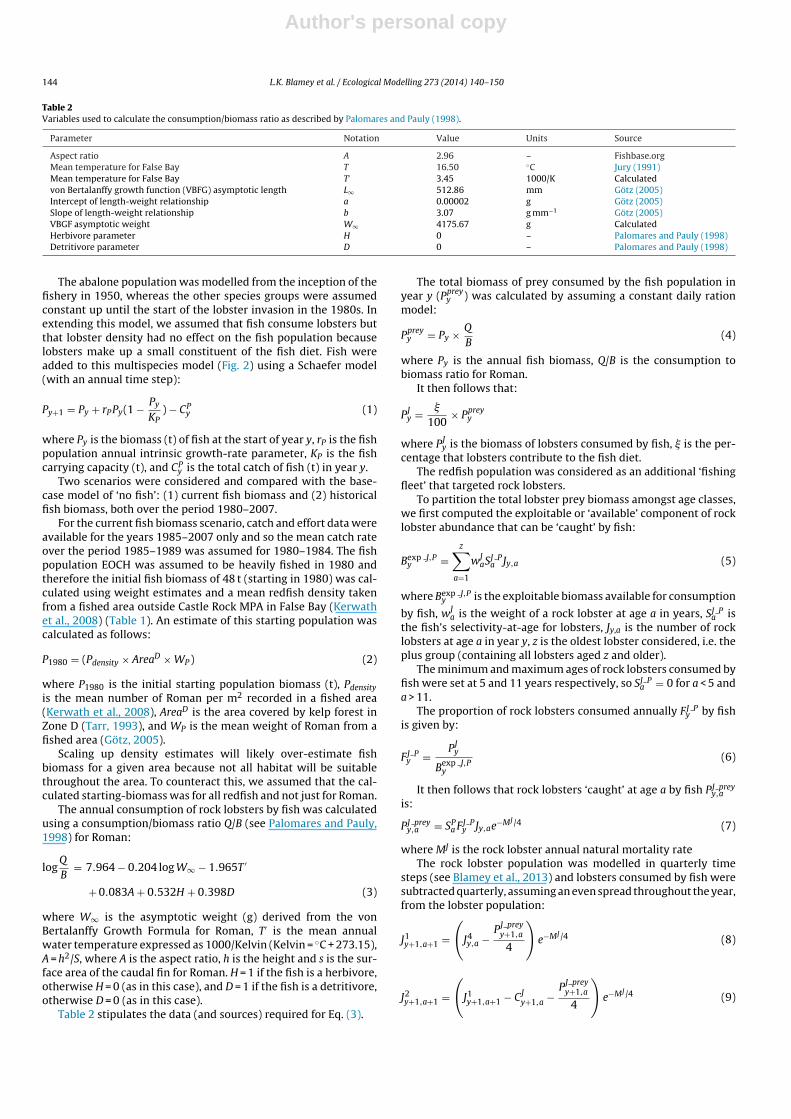
Table 2Variables used to calculate the consumption/biomass ratio as described by Palomares and Pauly (1998).
Parameter Notation Value Units Source
Aspect ratio A 2.96 – Fishbase.orgMean temperature for False Bay T 16.50 ◦C Jury (1991)Mean temperature for False Bay T′ 3.45 1000/K Calculatedvon Bertalanffy growth function (VBFG) asymptotic length L∞ 512.86 mm Götz (2005)Intercept of length-weight relationship a 0.00002 g Götz (2005)Slope of length-weight relationship b 3.07 g mm−1 Götz (2005)VBGF asymptotic weight W∞ 4175.67 g CalculatedHerbivore parameter H 0 – Palomares and Pauly (1998)Detritivore parameter D 0 – Palomares and Pauly (1998)
The abalone population was modelled from the inception of thefishery in 1950, whereas the other species groups were assumedconstant up until the start of the lobster invasion in the 1980s. Inextending this model, we assumed that fish consume lobsters butthat lobster density had no effect on the fish population becauselobsters make up a small constituent of the fish diet. Fish wereadded to this multispecies model (Fig. 2) using a Schaefer model(with an annual time step):
Py+1 = Py + rPPy(1 − Py
KP) − CP
y (1)
where Py is the biomass (t) of fish at the start of year y, rP is the fishpopulation annual intrinsic growth-rate parameter, KP is the fishcarrying capacity (t), and CP
y is the total catch of fish (t) in year y.Two scenarios were considered and compared with the base-
case model of ‘no fish’: (1) current fish biomass and (2) historicalfish biomass, both over the period 1980–2007.
For the current fish biomass scenario, catch and effort data wereavailable for the years 1985–2007 only and so the mean catch rateover the period 1985–1989 was assumed for 1980–1984. The fishpopulation EOCH was assumed to be heavily fished in 1980 andtherefore the initial fish biomass of 48 t (starting in 1980) was cal-culated using weight estimates and a mean redfish density takenfrom a fished area outside Castle Rock MPA in False Bay (Kerwathet al., 2008) (Table 1). An estimate of this starting population wascalculated as follows:
P1980 = (Pdensity × AreaD × WP) (2)
where P1980 is the initial starting population biomass (t), Pdensityis the mean number of Roman per m2 recorded in a fished area(Kerwath et al., 2008), AreaD is the area covered by kelp forest inZone D (Tarr, 1993), and WP is the mean weight of Roman from afished area (Götz, 2005).
Scaling up density estimates will likely over-estimate fishbiomass for a given area because not all habitat will be suitablethroughout the area. To counteract this, we assumed that the cal-culated starting-biomass was for all redfish and not just for Roman.
The annual consumption of rock lobsters by fish was calculatedusing a consumption/biomass ratio Q/B (see Palomares and Pauly,1998) for Roman:
logQ
B= 7.964 − 0.204 log W∞ − 1.965T ′
+ 0.083A + 0.532H + 0.398D (3)
where W∞ is the asymptotic weight (g) derived from the vonBertalanffy Growth Formula for Roman, T′ is the mean annualwater temperature expressed as 1000/Kelvin (Kelvin = ◦C + 273.15),A = h2/S, where A is the aspect ratio, h is the height and s is the sur-face area of the caudal fin for Roman. H = 1 if the fish is a herbivore,otherwise H = 0 (as in this case), and D = 1 if the fish is a detritivore,otherwise D = 0 (as in this case).
Table 2 stipulates the data (and sources) required for Eq. (3).
The total biomass of prey consumed by the fish population inyear y (Pprey
y ) was calculated by assuming a constant daily rationmodel:
Ppreyy = Py × Q
B(4)
where Py is the annual fish biomass, Q/B is the consumption tobiomass ratio for Roman.
It then follows that:
PJy = �
100× Pprey
y
where PJy is the biomass of lobsters consumed by fish, � is the per-
centage that lobsters contribute to the fish diet.The redfish population was considered as an additional ‘fishing
fleet’ that targeted rock lobsters.To partition the total lobster prey biomass amongst age classes,
we first computed the exploitable or ‘available’ component of rocklobster abundance that can be ‘caught’ by fish:
Bexp J,Py =
z∑a=1
wJaSJ P
a Jy,a (5)
where Bexp J,Py is the exploitable biomass available for consumption
by fish, wJa is the weight of a rock lobster at age a in years, SJ P
a isthe fish’s selectivity-at-age for lobsters, Jy,a is the number of rocklobsters at age a in year y, z is the oldest lobster considered, i.e. theplus group (containing all lobsters aged z and older).
The minimum and maximum ages of rock lobsters consumed byfish were set at 5 and 11 years respectively, so SJ P
a = 0 for a < 5 anda > 11.
The proportion of rock lobsters consumed annually FJ Py by fish
is given by:
FJ Py = PJ
y
Bexp J,Py
(6)
It then follows that rock lobsters ‘caught’ at age a by fish PJ preyy,a
is:
PJ preyy,a = SP
a FJ Py Jy,ae−MJ /4 (7)
where MJ is the rock lobster annual natural mortality rateThe rock lobster population was modelled in quarterly time
steps (see Blamey et al., 2013) and lobsters consumed by fish weresubtracted quarterly, assuming an even spread throughout the year,from the lobster population:
where Jqy,a is the number of rock lobsters in age class a during quar-
ter q of year y, CJy,a is the total fishery catch of rock lobsters from
age class a during year y, which is taken only in the second quarterof the year.
A Beverton–Holt stock-recruitment function was assumed forlobsters, and in Blamey et al. (2013) we outline other details of therock-lobster population model.
For the historical fish biomass scenario, we employed historicalfish data and assumed a starting biomass of 724 t, equivalent to theestimated fish carrying capacity, which is likely to have equated tothe pristine level. Using this starting biomass and an annual meancatch rate calculated from catch and effort data for 1897–1905, thehistorical fish population was modelled and its annual consump-tion of rock lobsters calculated.
The model was fitted to all available data to estimate themodel parameters, and we employed the estimates generating thesmallest Akaike information criterion (AIC) score. Various data con-tributed to the overall likelihood, and are described in Blameyet al. (2013), along with the relevant likelihood functions. New dataadded as part of the fish model include redfish CPUE data for theperiod 1985–2007. Equations used to fit these data to the modelare outlined below.
Abundance data
εsy = ln(Is
y) − (Isy) (12)
where Isy is the abundance index for year y and sector (species) s
and Isy = qsPy, which is the corresponding model estimated value,
where Py is the model value for fish biomass (given by Eq. (1)).The abundance data contribute to the negative of the log likeli-
hood as follows:
−ln L =∑
s
[∑y
ln �sy + (εs
y)2
2(�sy)2
](13)
The standard deviation �s of the residuals for the logarithm ofabundance series s was estimated in the fitting procedure by itsmaximum likelihood value:
�s =√
1ns
∑y
(ln Isy − ln Is
y)2
(14)
Table 3Sensitivity results for the model using intrinsic fish growth rates (rP) of 0.25 and0.35. KP = fish carrying capacity; p = number of estimated parameters; −ln L = the fishnegative log likelihood contribution; AIC = Akaike Information Criterion goodness offit test.
where ns is the number of data points for the abundance seriescorresponding to sector s.
The catchability co-efficient qs for the abundance index of sectors was estimated by its maximum likelihood value:
ln qs = 1ns
∑y
(ln Isy − ln Py) (15)
2.5. Sensitivity tests
Fish intrinsic growth rate rP was set at 0.3 in the ‘current’ fishmodel and sensitivity analyses were then conducted for rP = 0.25and rP = 0.35 (Table 3). The starting-biomass in the historical modelwas set at the ‘current’ model carrying capacity (KP). A sensitivityanalysis was then performed using a starting-biomass of KP 50%.
3. Results
An initial fish biomass of 48 t (starting in 1980) was calculatedusing density estimates (see Table 1). Based on this initial start-ing biomass and a fish intrinsic growth rate of 0.3, the modelestimated a fish carrying capacity KP of 724 t. Narrow confidenceintervals (715–732 t) were attached to this estimate, which ispartly a consequence of not accounting for all sources of uncer-tainty but, nonetheless, the estimate of KP is considered robust forthe simulations performed. A biomass of 724 t equates to roughly0.12 fish m−2, which is realistic if considered in terms of all redfish(Lechanteur and Griffiths, 2002).
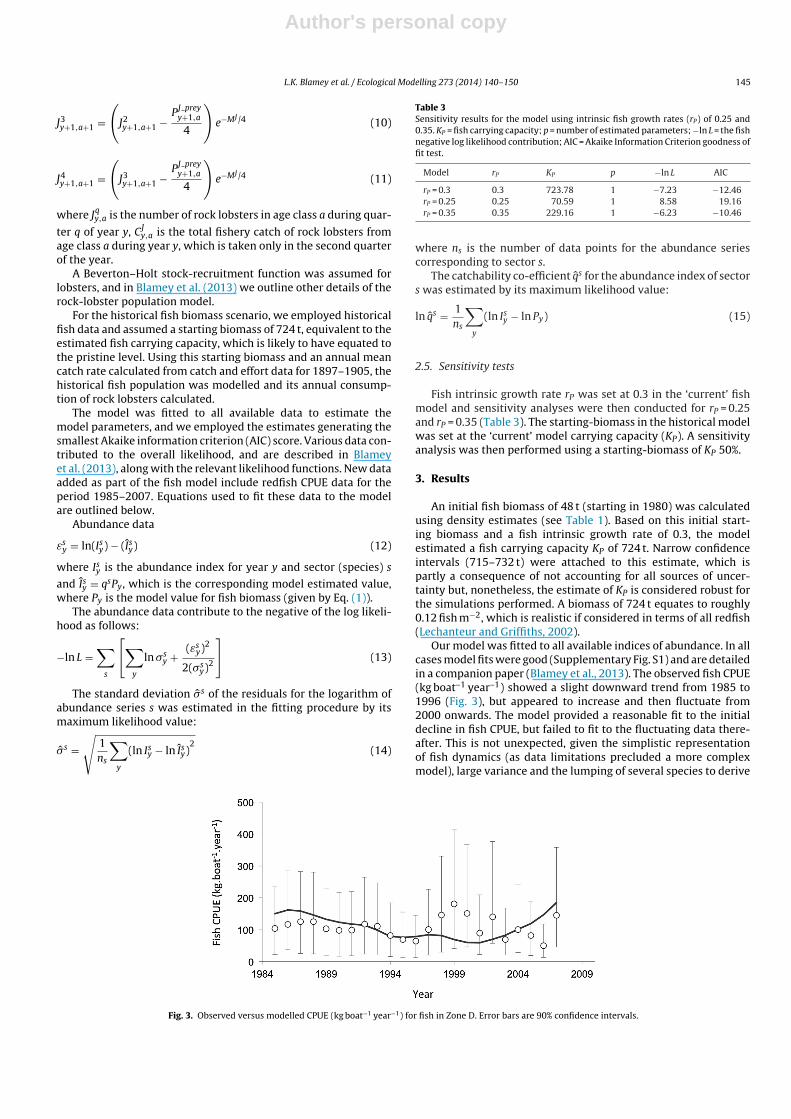
Our model was fitted to all available indices of abundance. In allcases model fits were good (Supplementary Fig. S1) and are detailedin a companion paper (Blamey et al., 2013). The observed fish CPUE(kg boat–1 year–1) showed a slight downward trend from 1985 to1996 (Fig. 3), but appeared to increase and then fluctuate from2000 onwards. The model provided a reasonable fit to the initialdecline in fish CPUE, but failed to fit to the fluctuating data there-after. This is not unexpected, given the simplistic representationof fish dynamics (as data limitations precluded a more complexmodel), large variance and the lumping of several species to derive
Fig. 3. Observed versus modelled CPUE (kg boat−1 year−1) for fish in Zone D. Error bars are 90% confidence intervals.
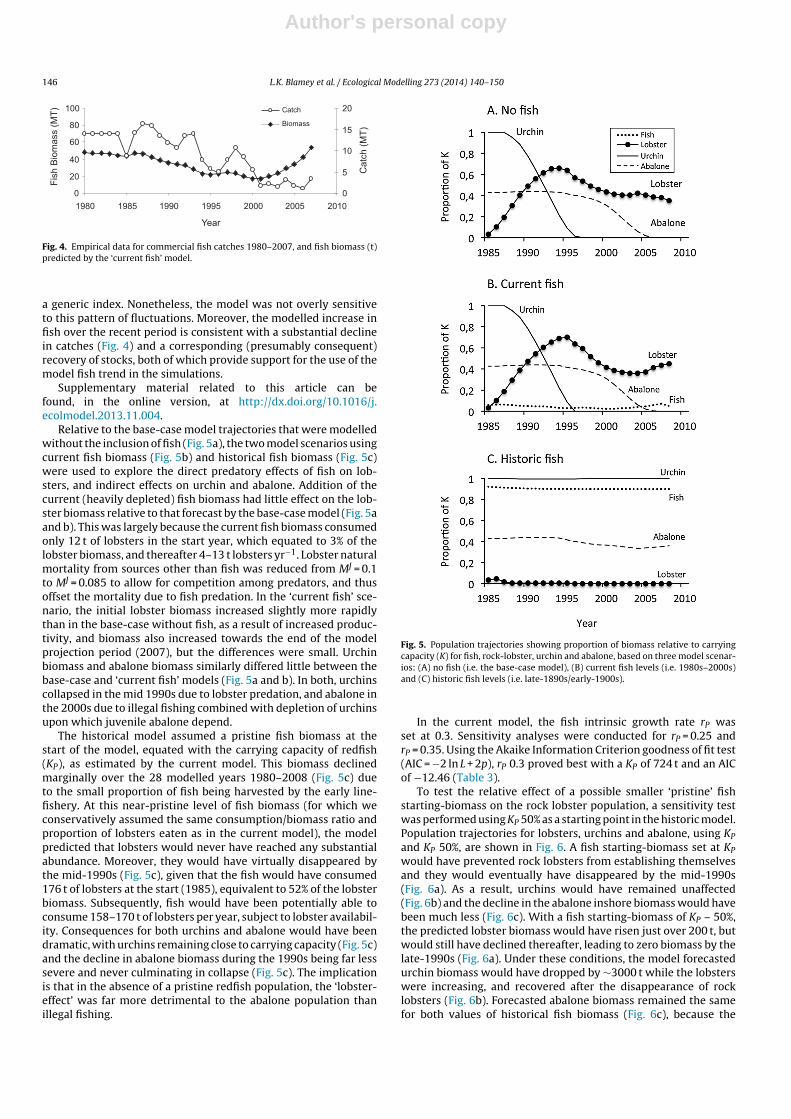
Fig. 4. Empirical data for commercial fish catches 1980–2007, and fish biomass (t)predicted by the ‘current fish’ model.
a generic index. Nonetheless, the model was not overly sensitiveto this pattern of fluctuations. Moreover, the modelled increase infish over the recent period is consistent with a substantial declinein catches (Fig. 4) and a corresponding (presumably consequent)recovery of stocks, both of which provide support for the use of themodel fish trend in the simulations.
Supplementary material related to this article can befound, in the online version, at http://dx.doi.org/10.1016/j.ecolmodel.2013.11.004.
Relative to the base-case model trajectories that were modelledwithout the inclusion of fish (Fig. 5a), the two model scenarios usingcurrent fish biomass (Fig. 5b) and historical fish biomass (Fig. 5c)were used to explore the direct predatory effects of fish on lob-sters, and indirect effects on urchin and abalone. Addition of thecurrent (heavily depleted) fish biomass had little effect on the lob-ster biomass relative to that forecast by the base-case model (Fig. 5aand b). This was largely because the current fish biomass consumedonly 12 t of lobsters in the start year, which equated to 3% of thelobster biomass, and thereafter 4–13 t lobsters yr−1. Lobster naturalmortality from sources other than fish was reduced from MJ = 0.1to MJ = 0.085 to allow for competition among predators, and thusoffset the mortality due to fish predation. In the ‘current fish’ sce-nario, the initial lobster biomass increased slightly more rapidlythan in the base-case without fish, as a result of increased produc-tivity, and biomass also increased towards the end of the modelprojection period (2007), but the differences were small. Urchinbiomass and abalone biomass similarly differed little between thebase-case and ‘current fish’ models (Fig. 5a and b). In both, urchinscollapsed in the mid 1990s due to lobster predation, and abalone inthe 2000s due to illegal fishing combined with depletion of urchinsupon which juvenile abalone depend.
The historical model assumed a pristine fish biomass at thestart of the model, equated with the carrying capacity of redfish(KP), as estimated by the current model. This biomass declinedmarginally over the 28 modelled years 1980–2008 (Fig. 5c) dueto the small proportion of fish being harvested by the early line-fishery. At this near-pristine level of fish biomass (for which weconservatively assumed the same consumption/biomass ratio andproportion of lobsters eaten as in the current model), the modelpredicted that lobsters would never have reached any substantialabundance. Moreover, they would have virtually disappeared bythe mid-1990s (Fig. 5c), given that the fish would have consumed176 t of lobsters at the start (1985), equivalent to 52% of the lobsterbiomass. Subsequently, fish would have been potentially able toconsume 158–170 t of lobsters per year, subject to lobster availabil-ity. Consequences for both urchins and abalone would have beendramatic, with urchins remaining close to carrying capacity (Fig. 5c)and the decline in abalone biomass during the 1990s being far lesssevere and never culminating in collapse (Fig. 5c). The implicationis that in the absence of a pristine redfish population, the ‘lobster-effect’ was far more detrimental to the abalone population thanillegal fishing.
Fig. 5. Population trajectories showing proportion of biomass relative to carryingcapacity (K) for fish, rock-lobster, urchin and abalone, based on three model scenar-ios: (A) no fish (i.e. the base-case model), (B) current fish levels (i.e. 1980s–2000s)and (C) historic fish levels (i.e. late-1890s/early-1900s).
In the current model, the fish intrinsic growth rate rP wasset at 0.3. Sensitivity analyses were conducted for rP = 0.25 andrP = 0.35. Using the Akaike Information Criterion goodness of fit test(AIC = −2 ln L + 2p), rP 0.3 proved best with a KP of 724 t and an AICof −12.46 (Table 3).
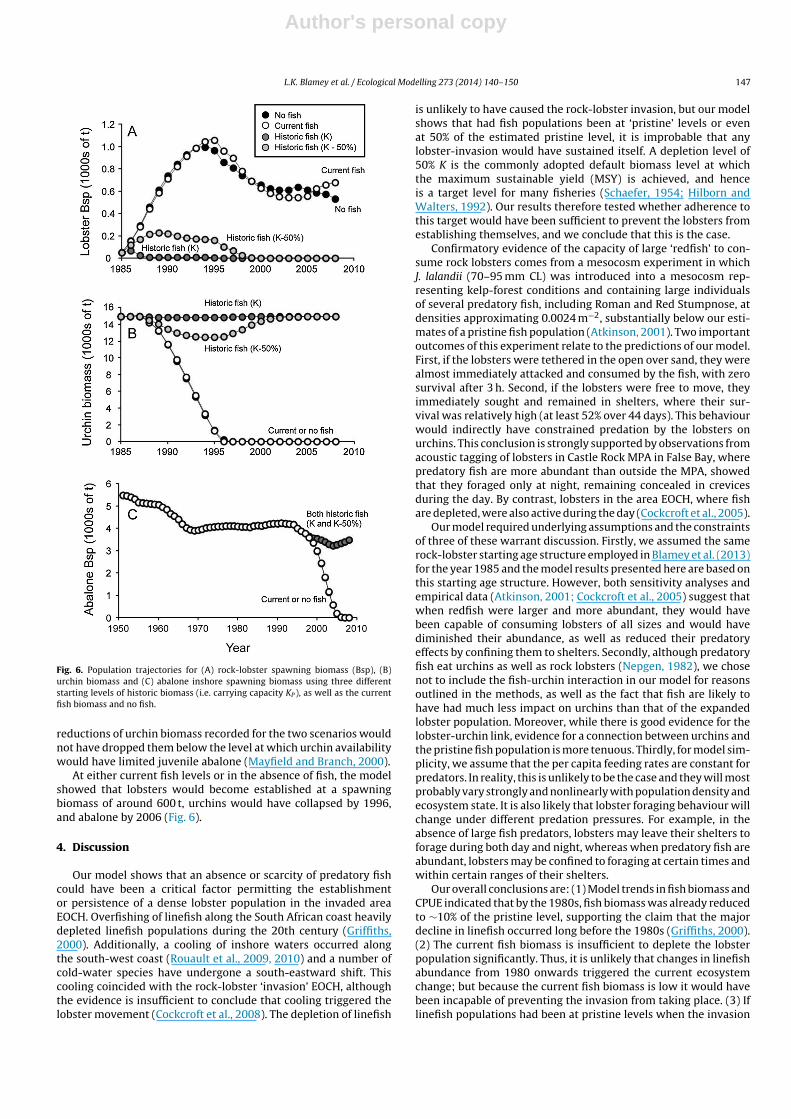
To test the relative effect of a possible smaller ‘pristine’ fishstarting-biomass on the rock lobster population, a sensitivity testwas performed using KP 50% as a starting point in the historic model.Population trajectories for lobsters, urchins and abalone, using KP
and KP 50%, are shown in Fig. 6. A fish starting-biomass set at KP
would have prevented rock lobsters from establishing themselvesand they would eventually have disappeared by the mid-1990s(Fig. 6a). As a result, urchins would have remained unaffected(Fig. 6b) and the decline in the abalone inshore biomass would havebeen much less (Fig. 6c). With a fish starting-biomass of KP – 50%,the predicted lobster biomass would have risen just over 200 t, butwould still have declined thereafter, leading to zero biomass by thelate-1990s (Fig. 6a). Under these conditions, the model forecastedurchin biomass would have dropped by ∼3000 t while the lobsterswere increasing, and recovered after the disappearance of rocklobsters (Fig. 6b). Forecasted abalone biomass remained the samefor both values of historical fish biomass (Fig. 6c), because the
Fig. 6. Population trajectories for (A) rock-lobster spawning biomass (Bsp), (B)urchin biomass and (C) abalone inshore spawning biomass using three differentstarting levels of historic biomass (i.e. carrying capacity KP ), as well as the currentfish biomass and no fish.
reductions of urchin biomass recorded for the two scenarios wouldnot have dropped them below the level at which urchin availabilitywould have limited juvenile abalone (Mayfield and Branch, 2000).
At either current fish levels or in the absence of fish, the modelshowed that lobsters would become established at a spawningbiomass of around 600 t, urchins would have collapsed by 1996,and abalone by 2006 (Fig. 6).
4. Discussion
Our model shows that an absence or scarcity of predatory fishcould have been a critical factor permitting the establishmentor persistence of a dense lobster population in the invaded areaEOCH. Overfishing of linefish along the South African coast heavilydepleted linefish populations during the 20th century (Griffiths,2000). Additionally, a cooling of inshore waters occurred alongthe south-west coast (Rouault et al., 2009, 2010) and a number ofcold-water species have undergone a south-eastward shift. Thiscooling coincided with the rock-lobster ‘invasion’ EOCH, althoughthe evidence is insufficient to conclude that cooling triggered thelobster movement (Cockcroft et al., 2008). The depletion of linefish
is unlikely to have caused the rock-lobster invasion, but our modelshows that had fish populations been at ‘pristine’ levels or evenat 50% of the estimated pristine level, it is improbable that anylobster-invasion would have sustained itself. A depletion level of50% K is the commonly adopted default biomass level at whichthe maximum sustainable yield (MSY) is achieved, and henceis a target level for many fisheries (Schaefer, 1954; Hilborn andWalters, 1992). Our results therefore tested whether adherence tothis target would have been sufficient to prevent the lobsters fromestablishing themselves, and we conclude that this is the case.
Confirmatory evidence of the capacity of large ‘redfish’ to con-sume rock lobsters comes from a mesocosm experiment in whichJ. lalandii (70–95 mm CL) was introduced into a mesocosm rep-resenting kelp-forest conditions and containing large individualsof several predatory fish, including Roman and Red Stumpnose, atdensities approximating 0.0024 m−2, substantially below our esti-mates of a pristine fish population (Atkinson, 2001). Two importantoutcomes of this experiment relate to the predictions of our model.First, if the lobsters were tethered in the open over sand, they werealmost immediately attacked and consumed by the fish, with zerosurvival after 3 h. Second, if the lobsters were free to move, theyimmediately sought and remained in shelters, where their sur-vival was relatively high (at least 52% over 44 days). This behaviourwould indirectly have constrained predation by the lobsters onurchins. This conclusion is strongly supported by observations fromacoustic tagging of lobsters in Castle Rock MPA in False Bay, wherepredatory fish are more abundant than outside the MPA, showedthat they foraged only at night, remaining concealed in crevicesduring the day. By contrast, lobsters in the area EOCH, where fishare depleted, were also active during the day (Cockcroft et al., 2005).
Our model required underlying assumptions and the constraintsof three of these warrant discussion. Firstly, we assumed the samerock-lobster starting age structure employed in Blamey et al. (2013)for the year 1985 and the model results presented here are based onthis starting age structure. However, both sensitivity analyses andempirical data (Atkinson, 2001; Cockcroft et al., 2005) suggest thatwhen redfish were larger and more abundant, they would havebeen capable of consuming lobsters of all sizes and would havediminished their abundance, as well as reduced their predatoryeffects by confining them to shelters. Secondly, although predatoryfish eat urchins as well as rock lobsters (Nepgen, 1982), we chosenot to include the fish-urchin interaction in our model for reasonsoutlined in the methods, as well as the fact that fish are likely tohave had much less impact on urchins than that of the expandedlobster population. Moreover, while there is good evidence for thelobster-urchin link, evidence for a connection between urchins andthe pristine fish population is more tenuous. Thirdly, for model sim-plicity, we assume that the per capita feeding rates are constant forpredators. In reality, this is unlikely to be the case and they will mostprobably vary strongly and nonlinearly with population density andecosystem state. It is also likely that lobster foraging behaviour willchange under different predation pressures. For example, in theabsence of large fish predators, lobsters may leave their shelters toforage during both day and night, whereas when predatory fish areabundant, lobsters may be confined to foraging at certain times andwithin certain ranges of their shelters.
Our overall conclusions are: (1) Model trends in fish biomass andCPUE indicated that by the 1980s, fish biomass was already reducedto ∼10% of the pristine level, supporting the claim that the majordecline in linefish occurred long before the 1980s (Griffiths, 2000).(2) The current fish biomass is insufficient to deplete the lobsterpopulation significantly. Thus, it is unlikely that changes in linefishabundance from 1980 onwards triggered the current ecosystemchange; but because the current fish biomass is low it would havebeen incapable of preventing the invasion from taking place. (3) Iflinefish populations had been at pristine levels when the invasion
took place, model outputs indicate that the lobsters would havebeen controlled by linefish and, consequently, urchin and abalonepopulations would not have collapsed. (4) The effects of preda-tion by lobsters had a greater influence on the abalone populationthan illegal fishing, but in combination they severely depleted theabalone stock, leading to a collapse EOCH. (5) Current redfish popu-lations were estimated to be <10% of the carrying capacity (pristinelevel). Even if the pristine biomass of fish was over-estimated, sen-sitivity analyses indicated that a biomass half that value would stillhave prevented lobsters from establishing high densities.
The top-down control by predators in the kelp-bed ecosystemwe examined is both direct and indirect. At pristine densities, toppredators such as fish and fur seals would likely have had a directnegative effect on lobsters and therefore indirect positive effects onurchins and abalone. However, through a combination of overfish-ing (removal of predatory fish) and an eastward shift of J. lalandii,rock lobsters became established at sufficient densities EOCH toexert (1) a bottom-up effect on Bank Cormorants, which haveincreased there following the increase in rock lobsters (Crawfordet al., 2008), (2) a direct predatory effect on urchins and otherherbivores, (3) an indirect positive effect on macroalgae followingdepletion of grazers (Blamey et al., 2010; Blamey and Branch, 2012)and (4) an indirect negative effect on juvenile abalone becauseof their dependence on urchins. Urchins not only provide juve-nile abalone with nourishment and protection (Day and Branch,2000a,b, 2002): they also facilitate encrusting corallines by pre-venting smothering by sediment build up, and encrusting corallinesare less abundant in lobster-invaded areas than in the non-invadedareas (Blamey and Branch, 2012). Moreover, large amounts of siltaccumulated on the lobster-invaded reefs (LKB personal observa-tion), similar to the increase in siltation recorded after experimentalremoval of urchins (Day and Branch, 2002). Encrusting corallinesfacilitate settlement of abalone recruits (Day and Branch, 2000a),but erect algae compete with them for space and they are vulner-able to smothering when grazers are depleted or silt accumulates.A combination of illegal fishing and the negative effect of rock lob-sters on urchins has therefore had severe negative impacts on theabalone population, resulting in a dwindling parent stock and prob-able recruitment failure (Blamey et al., 2013). In addition to alteringthe ecosystem structure and functioning, the synergistic effectsof top-predator removal and changing climate have almost cer-tainly reduced capacity of the ecosystem to return to its previousstate. Recovery of abalone and urchin populations is estimated totake 30–50 years, even assuming complete removal of lobsters anda sediment-free substratum, both of which are unlikely (Blameyet al., 2013).
Similar lobster-urchin-kelp interactions have been reportedelsewhere in the world (Lafferty, 2004; Babcock et al., 1999;Ling et al., 2009), although there are also numerous exampleswhere other predators regulate kelp/urchin ecosystem states. Forexample, in the north-eastern Pacific, the presence or absence ofsea otters determines whether the ecosystem is in a kelp-forestor urchin-barren state (Estes et al., 1998). In the north-westernAtlantic, the American lobster Homarus americanus, albeit quite dif-ferent from J. lalandii, is not as significant a predator of urchins aswas once thought. Instead, at least prior to over-exploitation, largepredatory fish are thought to have controlled urchin populations(Steneck et al., 2004). However, analogous to the South African sit-uation, the demise of large fish in the north Atlantic gave rise toa new apex predator: Atlantic rock crabs, which has subsequentlyled to a decline in urchins and an increase in kelp (see review inSteneck et al., 2013). In our system, we know that predatory fisheat urchins as well as lobsters (Nepgen, 1982), but little informa-tion exists on fish-urchin interactions compared to that of lobsterand urchins. It is also possible that there was a time lag betweenthese effects: a decline in fish may have led to increased urchin
abundance (although data do not exist to show this) and then someyears later, possibly as the result of an environmental perturbation,lobsters increased and found a niche devoid of predators, resultingin a decline in urchins and the subsequent ripple effects on abaloneand algae.
The effects of climate change on kelp forests have been reportedfor a number of regions around the globe and many of these studiesreport distributional shifts in species driven by changes in oceantemperature (e.g. Fernández, 2011; Bolton et al., 2012; Moy andChristie, 2012). Ling et al. (2009) report a shift in ecosystem stateoff the coast of Tasmania, and have linked this shift to changes inclimate (increased SST) as well as overfishing of predators (rocklobsters). In our study, we looked only at fishing as a driver forthe EOCH regime shift and did not include any physical drivers.Recent studies have shown that the coastal waters of the southernBenguela have cooled since the 1980s (Rouault et al., 2010) andmean upwelling and upwelling variability have increased (Blameyet al., 2012). Although this may explain the eastward shift in kelpreported by Bolton et al. (2012), the link to an eastward shift inrock lobster is less certain (Cockcroft et al., 2008). On the south-eastcoast of South Africa, coastal waters are warming, and tropical fishspecies are increasing at the expense of temperate species, consis-tent with a poleward shift in the geographic distributions of marinefish (Lloyd et al., 2012). Expansion of our model to include a climatedriver would be useful for teasing apart anthropogenic vs. climateeffects on the EOCH kelp ecosystem.
Our model could also be expanded to include other predatorsof rock lobsters. Fur seals are mainly piscivorous, but do eat rocklobsters. It has been estimated that annual consumption of rocklobsters in Namibia and South Africa by fur seals is 32,100 t (David,1987). Although this is considered an over-estimate, the data dosuggest that at high population levels, fur seals would have a neg-ative impact on lobster populations. Making predictions about thisis, however, complicated, as the direct negative effects of fur sealsmay be negated by potential indirect positive effects of fur sealsconsuming other prey such as fish that are themselves predators ofrock lobsters. Future work could also add encrusting corallines tothe model, as they could be linked to survival of abalone recruits,based on experimental work by Day and Branch (2000a). It wouldalso be useful to develop similar models for other kelp ecosystemsthat have undergone shifts analogous to the South African one, e.g.south-east Australia (Ling et al., 2009). More generally, it would bebeneficial to use focused models of intermediate complexity, fit-ted to empirical data, to better understand the drivers, ecosystemthresholds and tipping points involved in ecosystem shifts, and howmanagement might need to mitigate or adapt to future shifts (e.g.see Plagányi, 2013).
The ecosystem effects of historical exploitation of top predatorsare largely unknown and ecosystem models are an importantmeans of exploring the direct and indirect impacts, particularlybecause experimental tests of an appropriate magnitude arenot feasible. Although such models are rarely used in tacticaldecision-making and hence are mostly strategic (Plagányi et al.,2012), they can explore hypotheses related to ecosystem function-ing and associated changes. In the case of the ecosystem EOCH,both this model and its earlier version (Blamey et al., 2013) havesubstantially improved understanding of ecosystem shifts andassociated interactions. Specifically, the models uphold the con-clusion derived from temporal and spatial comparisons (Blameyet al., 2010; Blamey and Branch, 2012) that the lobster invasionled to an ecosystem regime shift. Our model also indicates that the‘lobster effect’ on abalone exceeds that of illegal fishing. But thegreatest insight gained from our current model is that overfishingpredatory fish would have had strong effects on lobster abundanceand was a likely contributory factor to the expansion of lobstersinto the invaded area. The social and commercial consequences
of the lobster invasion have been profound in terms of both acurtailment of a once-lucrative abalone fishery and the openingof a new lobster fishing-area EOCH (Mayfield and Branch, 2000;Hauck and Hector, 2003; Hauck, 2009; Raemaekers et al., 2011).
More generally, our results support the need to maintain fish-eries well above limit reference points, in the vicinity of maximumsustainable yield, and to account for the ecosystem effects offisheries (Garcia et al., 2003). Overfishing can have unintendedconsequences, reducing ecosystem resilience and precipitatingregime shifts, with associated biological, economic and social con-sequences. Protecting biodiversity is important in maintaining theresilience of ecosystems to external shocks and perturbations,which will become increasingly important under a future changingclimate. Past experience globally has demonstrated the difficultiesof predicting these shifts. Ecosystem modelling approaches, par-ticularly with rigorous fitting to data, can elucidate past changesas a platform for anticipating and countering future changes andregime shifts.
Acknowledgements
We gratefully acknowledge financial support from the Uni-versity of Cape Town, the National Research Foundation and theAndrew Mellon Foundation. We thank the Department of Agricul-ture, Forestry and Fisheries, and in particular A. Cockcroft, D. vanZyl, A. Mackenzie, R. Tarr and S. Kerwath, for making available dataon lobster, abalone and linefish abundances that were used in ourstudy. Thanks to A. Smith, M. Savina-Rolland, J. Estes and an anony-mous reviewer for their helpful comments on the manuscript.
References
Atkinson, L.J., 2001. Large and small-scale movement patterns of the West Coastrock lobster Jasus lalandii. University of Cape Town, pp. 100 (M.Sc. thesis).
Attwood, C., Farquhar, M., 1999. Collapse of linefish stocks between Cape Hangk-lip and Walker Bay, South Africa. South African Journal of Marine Science 21,415–432.
Barrett, N.S., Buxton, C.D., Edgar, G.J., 2009. Changes in invertebrate and macroalgalpopulations in Tasmanian marine reserves in the decade following protection.Journal of Experimental Marine Biology and Ecology 370, 104–119.
Baum, J.K., Worm, B., 2009. Cascading top-down effects of changing oceanic predatorabundances. Journal of Animal Ecology 78, 699–714.
Beschta, R.L., Ripple, W.J., 2009. Large predators and trophic cascades in terres-trial ecosystems of the western United States. Biological Conservation 142,2401–2414.
Blamey, L.K., Branch, G.M., 2012. Regime shift of a kelp-forest benthic communityinduced by an ‘invasion’ of the rock lobster Jasus lalandii. Journal of ExperimentalMarine Biology and Ecology 420–421, 33–47.
Blamey, L.K., Branch, G.M., Reaugh-Flower, K.E., 2010. Temporal changes in kelp-forest benthic communities following an invasion by the rock lobster Jasuslalandii. African Journal of Marine Science 32, 481–490.
Blamey, L.K., Howard, J.A.E., Agenbag Jarre, A., 2012. Regime-shifts in the southernBenguela shelf and inshore region. Progress in Oceanography 106, 80–95.
Blamey, L.K., Plagányi, É.E., Branch, G.M., 2013. Modelling a regime shift in akelp-forest ecosystem caused by a lobster range-expansion. Bulletin of MarineScience 89, 347–375.
Bolton, J.J., Anderson, R.J., Smit, A.J., Rothman, M.D., 2012. South African kelp movingeastwards? The discovery of Ecklonia maxima (Osbeck) Papenfuss at De HoopNature Reserve. African Journal of Marine Science 34, 147–151.
Buxton, C.D., Clarke, J.R., 1989. The growth of Cymatoceps nasutus (Teliostei: Spari-dae), with comments on diet and reproduction. South African Journal of MarineScience 8, 57–65.
Cockcroft, A.C., Kerwath, S., Wilke, C., 2005. Effectiveness of a radio-acoustic posi-tioning system tracking West Coast rock lobster Jasus lalandii – a preliminaryinvestigation. In: 6th International Crustacean Conference, Glasgow, Scotland,18–22 July, p. 237, Book of Abstracts.
Cockcroft, A.C., van Zyl, D., Hutchings, L., 2008. Large-scale changes in the spatialdistribution of South African West Coast rock lobsters: an overview. AfricanJournal of Marine Science 30, 149–159.
Crawford, R.J.M., Cockcroft, A.C., Dyer, B.M., Upfold, L., 2008. Divergent trends inbank cormorants Phalacrocorax neglectus breeding in South Africa’s WesternCape consistent with a distributional shift of rock lobsters Jasus lalandii. AfricanJournal of Marine Science 30, 161–166.
David, J.H.M., 1987. Diet of the South African fur seal (1974–1985) and an assessmentof competition with fisheries in southern Africa. South African Journal of MarineScience 5, 693–713.
Day, E.G., Branch, G.M., 2000a. Relationships between recruits of abalone Halio-tis midae, encrusting corallines and the sea urchin Parechinus angulosus. SouthAfrican Journal of Marine Science 22, 137–144.
Day, E.G., Branch, G.M., 2000b. Evidence for a positive relationship between juvenileabalone Haliotis midae and the sea urchin Parechinus angulosus in the south-western Cape, South Africa. South African Journal of Marine Science 22, 145–156.
Day, E.G., Branch, G.M., 2002. Effects of sea urchins (Parechinus angulosus) on recruitsand juveniles of abalone (Haliotis midae). Ecological Monographs 72, 133–149.
Fernández, C., 2011. The retreat of large brown seaweeds on the north coast of Spain:the case of Saccorhiza polyschides. European Journal of Phycology 46, 352–360.
Frank, K.T., Petrie, B., Choi, J.S., Leggett, W.C., 2005. Trophic cascades in a formerlycod-dominated ecosystem. Science 308, 1621–1623.
Fulton, E.A., 2010. Approaches to end-to-end ecosystem models. Journal of MarineSystems 81, 171–183.
Garcia, S.M., Zerbi, A., Aliaume, C., Do Chi, T., Lasserre, G., 2003. The ecosystemapproach to fisheries. Issues, terminology, principles, institutional foundations,implementation and outlook. FAO Fisheries Technical Paper 443, 71.
Gilchrist, J.D.F., 1900. Report of the Marine Biologist, Department of Agriculture,Cape of Good Hope, for the year 1899. Government Printer, Cape Town, 124 pp.
Gilchrist, J.D.F., 1907. Report of the Government Biologist, Department of Agricul-ture, Cape of Good Hope, for the year 1906. Government Printer, Cape Town, 44pp.
Götz, A., 2005. Assessment of the effect of Goukamma Marine Protected Area oncommunity structure and fishery dynamics. Rhodes University, 232 pp. (Ph.D.thesis).
Griffiths, M.H., 2000. Long-term trends in catch and effort of commercial linefishoff South Africa’s Cape Province: snapshots of the 20th century. South AfricanJournal of Marine Science 22, 81–110.
Halpern, B.S., Cottenie, K., Broitman, B.R., 2006. Strong top-down control in southernCalifornia kelp forest ecosystems. Science 312, 1230–1232.
Hauck, M., 2009. Crime, environment and power: revisiting the abalone fishery.South African Journal of Criminal Justice 22, 229–245.
Hauck, M., Sweijd, N.A., 1999. A case study of abalone poaching in South Africa and itsimpact on fisheries management. ICES Journal of Marine Science 56, 1024–1032.
Hauck, M., Hector, R., 2003. Towards abalone and rock-lobster co-management in theHangklip-Kleinmond area. In: Hauck, M., Sowman, M. (Eds.), Waves of Change.University of Cape Town Press, Cape Town, pp. 227–246.
Hilborn, R., Walters, C.J., 1992. Quantitative fisheries stock assessment: choice,dynamics, and uncertainty. Reviews in Fish Biology and Fisheries 2, 177–178.
Hockey, P.A.R., Dean, W.R.J., Ryan, P.G. (Eds.), 2005. Roberts Birds of Southern Africa.John Voelcker Bird Book Fund, Cape Town.
Jackson, J.B.C., Kirby, M.X., Berger, W.H., Bjorndal, K.A., Botsford, L.W., Bourque, B.J.,et al., 2001. Historical overfishing and the recent collapse of coastal ecosystems.Science 293, 629–638.
Jury, M., 1991. The weather of False Bay. Transactions of the Royal Society of SouthAfrica 47, 401–417.
Kerwath, S.E., Götz, A., Attwood, C.G., Sauer, W.H.H., 2008. The effect of marine pro-tected areas on an exploited population of sex-changing temperate reef fish: anindividual-based model. African Journal of Marine Science 30, 337–350.
Lafferty, K.D., 2004. Fishing for lobsters indirectly increases epidemics in sea urchins.Ecological Applications 14, 1566–1573.
Lechanteur, Y.A.R.G., Griffiths, C.L., 2002. Composition and seasonal variability of thesuprabenthic reef-fish assemblage in False Bay, South Africa. African Zoology 37,171–184.
Ling, S.D., Johnson, C.R., Frusher, S., Ridgway, K., 2009. Overfishing reducesresilience of kelp beds to climate-driven catastrophic phase shift. Proceedingof the National Academy of Science of the United States of America 106,22341–22345.
Lloyd, P., Plagányi, É.É., Weeks, S., Magno-Canto, T., Plagányi, G., 2012. Ocean warm-ing alters species abundance patterns and increases species richness in anAfrican sub-tropical reef-fish community. Fisheries Oceanography 21, 78–94.
Mayfield, S., Branch, G.M., 2000. Interrelations among rock lobsters, sea urchins andjuvenile abalone: implications for community management. Canadian Journalof Fisheries and Aquatic Sciences 57, 2175–2185.
Menge, B.A., 2000. Top-down and bottom-up community regulation in marine rockyintertidal habitats. Journal of Experimental Marine Biology and Ecology 250,257–289.
Moy, F.E., Christie, H., 2012. Large-scale shift from sugar kelp (Saccharina latissima)to ephemeral algae along the south and west coast of Norway. Marine BiologyResearch 8, 309–321.
Nepgen, C.S. DeV, 1982. Diet of predatory and reef fish in False Bay and possibleeffects of pelagic purse-seining on their food supply. Fisheries Bulletin of SouthAfrica 16, 75–93.
Paine, R.T., 1974. Intertidal community structure. Oecologia 15, 93–120.Palomares, M.L.D., Pauly, D., 1998. Predicting food consumption of fish populations
as functions of mortality, food type, morphometrics, temperature and salinity.Marine and Freshwater Research 49, 447–453.
Plagányi, É.E., 2007. Models for an Ecosystem Approach to Fisheries. FAO FisheriesTechnical Paper No. 477. FAO, Rome, 108 pp.
Plagányi, É., 2013. Fitting the puzzle–modelling species interactions in marineecosystems. Bulletin of Marine Science 89, 397–417.
Plagányi, É., Butterworth, D., Burgener, M., 2011. Illegal and unreported fishing onabalone – quantifying the extent using a fully integrated assessment model.Fisheries Research 107, 221–232.
Plagányi, É.E., Punt, A.E., Hillary, R., Morello, E.B., Thébaud, O., Hutton, T.,et al., 2012. Multispecies fisheries management and conservation: tacticalapplications using models of intermediate complexity. Fish and Fisheries,http://dx.doi.org/10.1111/j.1467-2979.2012.00488.x.
Punt, A.E., Butterworth, D.S., 1995. The effects of future consumption by the Capefur seal on catches and catch rates of the Cape hakes. 4. Modelling the biologi-cal interaction between Cape fur seals (Arctocephalus pusillus pusillus) and Capehakes (Merluccius capensis and M. paradoxus). South African Journal of MaineScience 16, 255–285.
Raemaekers, S., Hauck, M., Bürgener, M., Mackenzie, A., Maharaj, G., Plagányi, É.E.,et al., 2011. Review of the causes of the rise of the illegal South African abalonefishery and consequent closure of the rights-based fishery. Ocean and CoastalManagement 54, 433–445.
Rouault, M., Penven, P., Pohl, B., 2009. Warming in the Agulhas Cur-rent system since the 1980. Geophysical Research Letters 36, L12602,http://dx.doi.org/10.1029/2009GL037987.
Rouault, M., Pohl, B., Penven, P., 2010. Coastal oceanic climate change and variabilityfrom 1982 to 2009 around South Africa. African Journal of Marine Science 32,237–246.
Schaefer, M.B., 1954. Some aspects of the dynamics of populations, important forthe management of the commercial fisheries. Bulletin of the Inter-AmericanTropical Tuna Commission 1, 25–56.
Scheffer, M., Carpenter, S., de Young, B., 2005. Cascading effects of over-fishingmarine ecosystems. Trends in Ecology and Evolution 20, 579–581.
Shaughnessy, P.D., 1984. Historical population levels of seals and seabirds on islandsoff southern Africa, with special reference to Seal Island, False Bay. Investiga-tional Report of the Sea Fisheries Institute of South Africa 127, 1–61.
Shears, N.T., Babcock, R.C., 2002. Marine reserves demonstrate top-down control ofcommunity structure on temperate reefs. Oecologia 132, 131–142.
Somers, M.J., 2000. Seasonal variation in the diet of Cape clawless otters (Aonyxcapensis) in a marine habitat. African Zoology 35, 261–268.
Steneck, R.S., 1998. Human influences on coastal ecosystems: does overfishing createtrophic cascades? Trends in Ecology and Evolution 13, 429–430.
Steneck, R.S., Vavrinec, J., Leland, A.V., 2004. Accelerating trophic-level dysfunc-tion in kelp forest ecosystems of the western North Atlantic. Ecosystems 7,323–332.
Steneck, R.S., Leland, A., McNaught, D.C., Vavrinec, J., 2013. Ecosystem flips, locksand feedbacks: the lasting effects of fisheries on Maine’s kelp forest ecosystem.Bulletin of Marine Science 89, 31–55.
Tarr, R.J.Q., 1993. Stock assessment, and aspects of the biology of the South Africanabalone, Haliotis midae. University of Cape Town, 156 pp. (M.Sc. thesis).
Tarr, R.J.Q., Williams, P.V.G., Mackenzie, A.J., 1996. Abalone, sea urchins and rocklobster: a possible ecological shift that may affect traditional fisheries. SouthAfrican Journal of Marine Science 17, 319–323.
Walters, C.J., Pauly, D., Christensen, V., 1997. Structuring dynamic models ofexploited ecosystems from trophic mass-balanced assessments. Reviews in FishBiology and Fisheries 7, 139–172.
Worm, B., Myers, R.A., 2003. Meta-analysis of cod–shrimp interactions reveals top-down control in oceanic food webs. Ecology 84, 162–173.