Water Research 36 (2002) 1043–1055 Wastewater disinfection by ozone: main parameters for process design Pei Xu a , Marie-Laure Janex b , Philippe Savoye b , Arnaud Cockx c , Valentina Lazarova b, * a Laboratoire Hydrosciences, MSE, UMR no. 5569, Universit ! e Montpellier II, 34095 Montpellier cedex 5, France b Ondeo Services-CIRSEE, 38 Rue du Pr ! esident Wilson, 78230 Le Pecq, France c Laboratoire GPI, INSA, 135 avenue de Rangueil, 31077 Toulouse cedex 4, France Received 1 March 2000; accepted 30 May 2001 Abstract Wastewater disinfection by ozone was investigated at pilot scale on different wastewater effluents. Variations in operating conditions showed that a very low hydraulic retention time (2 min) was sufficient for efficient fecal coliform inactivation, provided a sufficient ozone dose was transferred to the effluent. Therefore, the transferred ozone dose appeared to be the critical parameter for the design of wastewater disinfection. As a consequence, the ‘‘Ct’’ approach commonly applied in drinking water treatment should not be used for wastewater ozonation. Design parameters of ozonation were proposed for two types of regulations, and for effluents of different qualities. It was demonstrated that only with an efficient filtration step one can meet stringent standards such as the California Title 22 criteria. In all cases, viruses were totally inactivated; consequently, viruses do not constitute a limiting factor in wastewater disinfection by ozone. The standard drinking water model failed to match the experimental data obtained on real wastewater effluents. A modified approach was successfully developed, based on the simultaneous consumption of ozone by the microorganisms and the organic matrix. r 2002 Elsevier Science Ltd. All rights reserved. Keywords: Wastewater disinfection; Ozone; Process design; Water quality; Wastewater reuse; Disinfection modelling 1. Introduction Wastewater reuse has become an attractive option for protecting the environment and extending available water resources. In the last few years, there has been a significant diversification of water reuse practices, such as green space and crop irrigation, recreational im- poundment, various urban uses including toilet flushing, industrial applications and water supply augmentation through groundwater or reservoir recharge [1,2]. The safe operation of water reuse systems depends on the reliability of wastewater disinfection, which is the most important treatment process for public health protec- tion. The health-related microbiological regulations [3] and the more recent impetus of producing virus-free effluents [4] require the development of highly effective advanced disinfection processes. Chlorination is still the most widely used means to inactivate pathogenic microorganisms in water and wastewater, but alterna- tive technologies have to be evaluated because of increasing concern over undesirable byproducts after chlorination and its inefficiency in eliminating some epidemic microorganisms at low chlorine doses [5,6]. Ozone has been proved to be one of the most effective disinfectants and is widely used to inactivate pathogens in drinking water, especially in Europe [7,8]. Design engineers in the US began to evaluate ozone for *Corresponding author. Tel.: +33-134-802-251; fax: +33- 130-536-207. E-mail address: [email protected](V. Lazarova). 0043-1354/02/$ -see front matter r 2002 Elsevier Science Ltd. All rights reserved. PII:S0043-1354(01)00298-6
Transcript
Water Research 36 (2002) 1043–1055
Wastewater disinfection by ozone: main parameters forprocess design
Pei Xua, Marie-Laure Janexb, Philippe Savoyeb, Arnaud Cockxc,Valentina Lazarovab,*
aLaboratoire Hydrosciences, MSE, UMR no. 5569, Universit !e Montpellier II, 34095 Montpellier cedex 5, FrancebOndeo Services-CIRSEE, 38 Rue du Pr !esident Wilson, 78230 Le Pecq, France
cLaboratoire GPI, INSA, 135 avenue de Rangueil, 31077 Toulouse cedex 4, France
Received 1 March 2000; accepted 30 May 2001
Abstract
Wastewater disinfection by ozone was investigated at pilot scale on different wastewater effluents. Variations inoperating conditions showed that a very low hydraulic retention time (2min) was sufficient for efficient fecal coliforminactivation, provided a sufficient ozone dose was transferred to the effluent. Therefore, the transferred ozone dose
appeared to be the critical parameter for the design of wastewater disinfection. As a consequence, the ‘‘Ct’’ approachcommonly applied in drinking water treatment should not be used for wastewater ozonation. Design parameters ofozonation were proposed for two types of regulations, and for effluents of different qualities. It was demonstrated that
only with an efficient filtration step one can meet stringent standards such as the California Title 22 criteria. In all cases,viruses were totally inactivated; consequently, viruses do not constitute a limiting factor in wastewater disinfection byozone.
The standard drinking water model failed to match the experimental data obtained on real wastewater effluents.A modified approach was successfully developed, based on the simultaneous consumption of ozone by themicroorganisms and the organic matrix. r 2002 Elsevier Science Ltd. All rights reserved.
Keywords: Wastewater disinfection; Ozone; Process design; Water quality; Wastewater reuse; Disinfection modelling
1. Introduction
Wastewater reuse has become an attractive option forprotecting the environment and extending available
water resources. In the last few years, there has been asignificant diversification of water reuse practices, suchas green space and crop irrigation, recreational im-
poundment, various urban uses including toilet flushing,industrial applications and water supply augmentationthrough groundwater or reservoir recharge [1,2]. Thesafe operation of water reuse systems depends on the
reliability of wastewater disinfection, which is the most
important treatment process for public health protec-tion. The health-related microbiological regulations [3]and the more recent impetus of producing virus-free
effluents [4] require the development of highly effectiveadvanced disinfection processes. Chlorination is still themost widely used means to inactivate pathogenic
microorganisms in water and wastewater, but alterna-tive technologies have to be evaluated because ofincreasing concern over undesirable byproducts afterchlorination and its inefficiency in eliminating some
epidemic microorganisms at low chlorine doses [5,6].Ozone has been proved to be one of the most effective
disinfectants and is widely used to inactivate pathogens
in drinking water, especially in Europe [7,8]. Designengineers in the US began to evaluate ozone for
0043-1354/02/$ -see front matter r 2002 Elsevier Science Ltd. All rights reserved.
PII: S 0 0 4 3 - 1 3 5 4 ( 0 1 ) 0 0 2 9 8 - 6
wastewater disinfection in the early 1970s. However,because of operational and maintenance problems that
appeared in the first generation of facilities, it has beenconsidered to be a less attractive alternative to chlorinethan UV disinfection. Also, many researchers initially
sought to achieve a measurable level of dissolved ozoneresidual in treated wastewater, which resulted in highozone dosages that were not economically feasible [9].Earlier studies pointed out the need for a thorough
investigation of wastewater ozone treatment in order topredict disinfection performance and design the disin-fection system for wastewater disinfection [10–12].
The present study investigates the main factors relatedto ozone disinfection performance, for the purpose offacilitating its design and application to wastewater
disinfection.
2. Materials and methods
Experiments were performed in a continuous-flowpilot plant with different types of effluents to evaluate
ozone disinfection performance on different targetmicroorganisms.
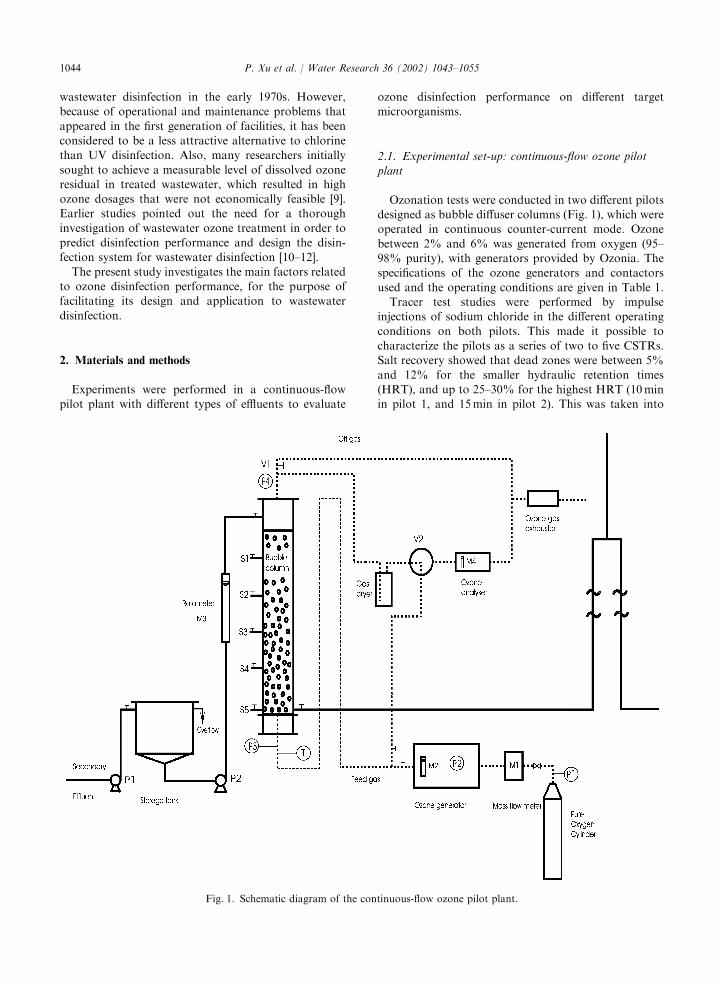
Ozonation tests were conducted in two different pilotsdesigned as bubble diffuser columns (Fig. 1), which wereoperated in continuous counter-current mode. Ozone
between 2% and 6% was generated from oxygen (95–98% purity), with generators provided by Ozonia. Thespecifications of the ozone generators and contactors
used and the operating conditions are given in Table 1.Tracer test studies were performed by impulse
injections of sodium chloride in the different operating
conditions on both pilots. This made it possible tocharacterize the pilots as a series of two to five CSTRs.Salt recovery showed that dead zones were between 5%
and 12% for the smaller hydraulic retention times(HRT), and up to 25–30% for the highest HRT (10minin pilot 1, and 15min in pilot 2). This was taken into
Fig. 1. Schematic diagram of the continuous-flow ozone pilot plant.
P. Xu et al. / Water Research 36 (2002) 1043–10551044
account to calculate real contact times when data were
expressed as a function of ‘‘Ct’’.The ozone concentrations in the influent gas and off-
gas were measured by UV absorbance monitors.Residual ozone concentration in water was analysed
by the indigo carmine method of [13], using HACH DR/2000 spectrophotometer. The mass transfer efficiency inthe columns was found to be consistently 55% and 30–
50%, respectively, in the pilots 1 and 2. In order tocompare the data, the transferred ozone dose (TOD)was used as a descriptive parameter throughout the
study. It is defined as follows:
TOD ¼ Qgas=Qliqð½O3�g in � ½O3�g outÞ; ð1Þ
where Qgas and Qliq are gas and water flow rates,
respectively, [O3]g in is the ozone concentration in thefeed gas to the column, [O3]g out is the ozone concentra-tion in the off-gas leaving the column. For a given set of
operating conditions, a time interval of three to fourtimes the mean hydraulic retention time was allowed toreach steady state and take samples. In order to study
the effect of post-contact without additional ozoneintroduction, water samples were taken from the outletof the column and were kept in a brown bottle withoutlight or air, to be analysed after a controlled contact
time.
2.2. Determination of ozone demand
The immediate ozone demand of the effluents, X ; wasevaluated from the plots of the ozone residual vs. thetransferred ozone dose during disinfection tests, accord-
ing to the method proposed by Roustan et al. [14]. Xrepresents the minimum dose to be transferred to getmeasurable ozone residual in the water. Mathematically,
the concept is represented by the following equations,where the ‘‘instantaneous’’ demand would correspond to
an infinite rate constant
d½O3�dt
¼KLað½O3�* � ½O3�Þ � kD½O3� if TOD > X ;
½O3� ¼ 0 andd½O3�dt
¼ 0 if TODoX ; ð2Þ
where KLa is the mass transfer coefficient; [O3]* is theequilibrium (maximum) concentration of dissolvedozone, [O3], corresponding to Henry’s law; kD is the
first order decay constant, in min�1. TOD is thetransferred ozone dose calculated by
TOD ¼Z t
0
KLað½O3�* � ½O3�Þ dt: ð3Þ
Eq. (2) can easily be solved in an open, completely mixed
reactor (CSTR with a contact time t) to estimate theozone concentration
½O3� ¼TOD� X
1þ kDt: ð4Þ
2.3. Wastewater characterisation
Effluents from three different wastewater treatmentplants (WWTP) were used for the studyFtwo second-ary effluents and one tertiary effluent. The secondarytreatment trains in Evry, France (48,000m3 d�1) and
Washington, UK (90,000m3 d�1) are similar: pretreat-ment, primary clarification, activated sludge (extendedaeration and high rate activated sludge, respectively),
secondary clarification and discharge. The tertiarytreatment train in Indianapolis, USA (300,000m3 d�1)consists of dual media filtration and chlorination after
primary clarification, and coupled bio-roughing andactivated sludge nitrification facilities. The effluent forpilot testing was taken after the tertiary filtration. The
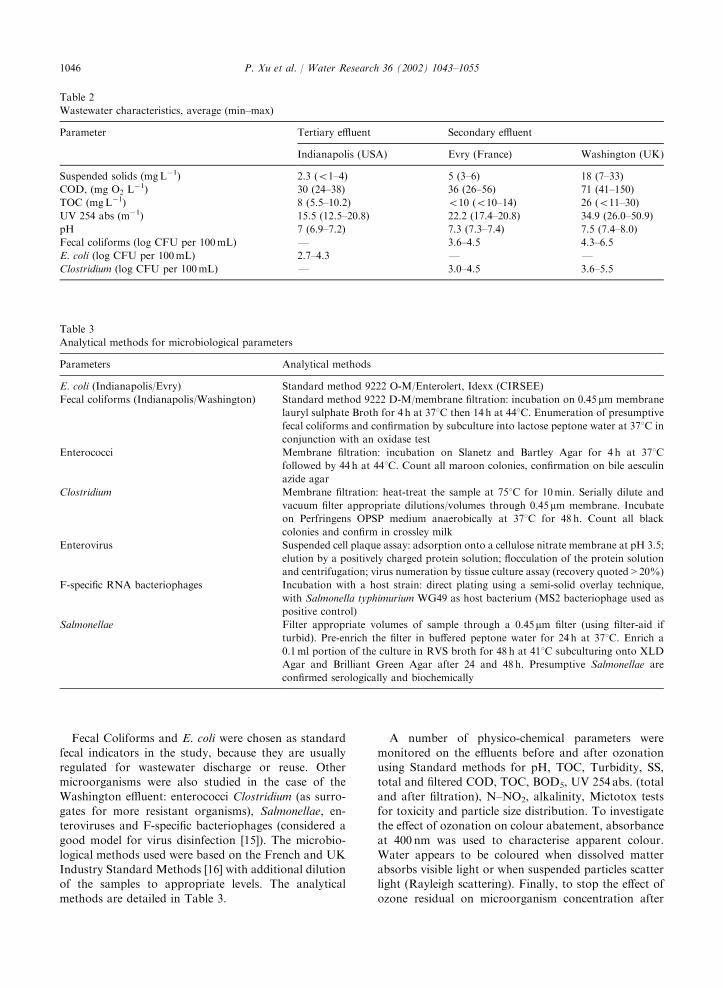
main characteristics of the effluents during the tests aregiven in Table 2.
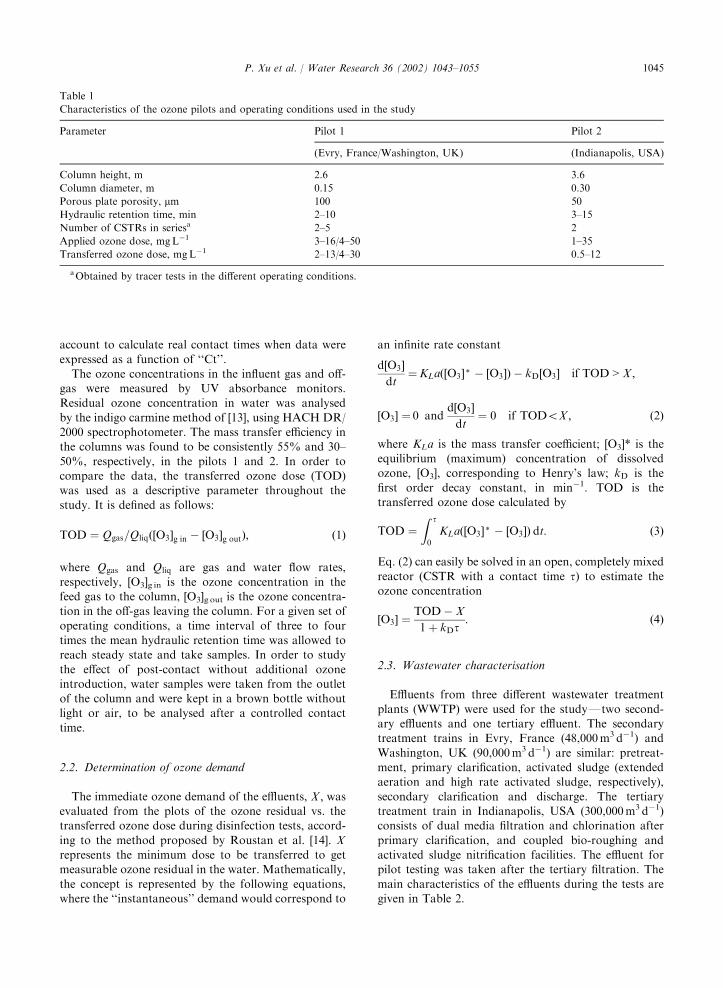
Table 1
Characteristics of the ozone pilots and operating conditions used in the study
Parameter Pilot 1 Pilot 2
(Evry, France/Washington, UK) (Indianapolis, USA)
Column height, m 2.6 3.6
Column diameter, m 0.15 0.30
Porous plate porosity, mm 100 50
Hydraulic retention time, min 2–10 3–15
Number of CSTRs in seriesa 2–5 2
Applied ozone dose, mgL�1 3–16/4–50 1–35
Transferred ozone dose, mgL�1 2–13/4–30 0.5–12
aObtained by tracer tests in the different operating conditions.
P. Xu et al. / Water Research 36 (2002) 1043–1055 1045
Fecal Coliforms and E. coli were chosen as standard
fecal indicators in the study, because they are usuallyregulated for wastewater discharge or reuse. Othermicroorganisms were also studied in the case of the
Washington effluent: enterococci Clostridium (as surro-gates for more resistant organisms), Salmonellae, en-teroviruses and F-specific bacteriophages (considered a
good model for virus disinfection [15]). The microbio-logical methods used were based on the French and UKIndustry Standard Methods [16] with additional dilutionof the samples to appropriate levels. The analytical
methods are detailed in Table 3.
A number of physico-chemical parameters were
monitored on the effluents before and after ozonationusing Standard methods for pH, TOC, Turbidity, SS,total and filtered COD, TOC, BOD5, UV 254 abs. (total
and after filtration), N–NO2, alkalinity, Mictotox testsfor toxicity and particle size distribution. To investigatethe effect of ozonation on colour abatement, absorbance
at 400 nm was used to characterise apparent colour.Water appears to be coloured when dissolved matterabsorbs visible light or when suspended particles scatterlight (Rayleigh scattering). Finally, to stop the effect of
ozone residual on microorganism concentration after
To investigate the influence of particles on disinfectionperformances, additional tests were run with the Evryeffluent after filtration (75 mm Arkal prefilter, followed
by a 10mm canvas filter), to lower the suspended solidsconcentration below 2mgL�1.
3. Results and discussion
3.1. Inactivation of fecal coliforms: impact ofoperating conditions and wastewater quality
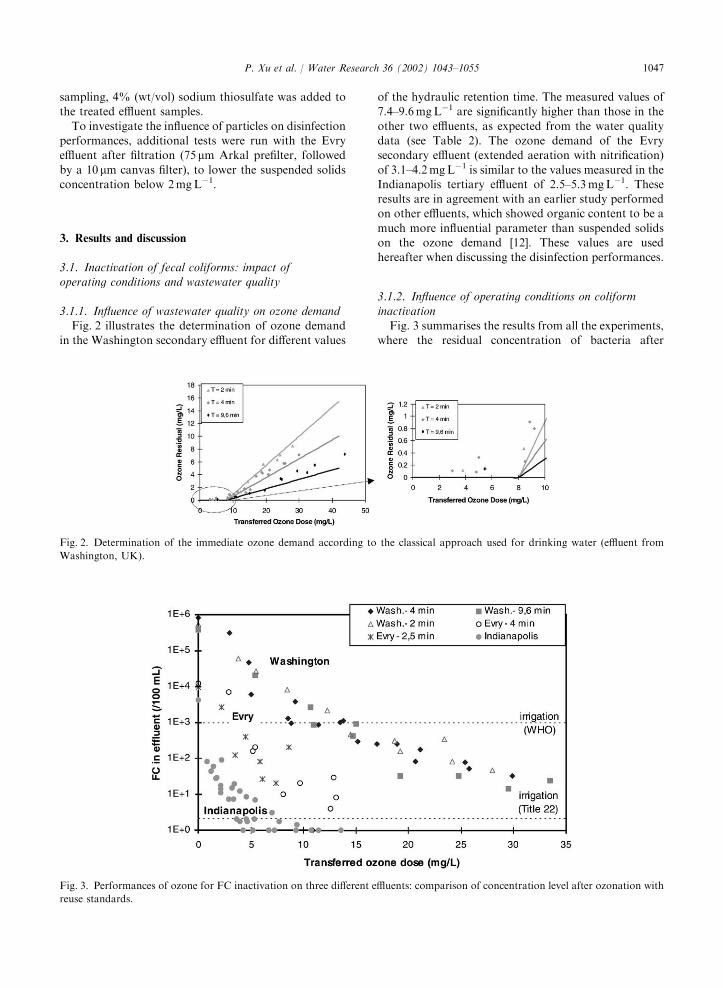
3.1.1. Influence of wastewater quality on ozone demandFig. 2 illustrates the determination of ozone demand
in the Washington secondary effluent for different values
of the hydraulic retention time. The measured values of7.4–9.6mgL�1 are significantly higher than those in the
other two effluents, as expected from the water qualitydata (see Table 2). The ozone demand of the Evrysecondary effluent (extended aeration with nitrification)
of 3.1–4.2mgL�1 is similar to the values measured in theIndianapolis tertiary effluent of 2.5–5.3mgL�1. Theseresults are in agreement with an earlier study performedon other effluents, which showed organic content to be a
much more influential parameter than suspended solidson the ozone demand [12]. These values are usedhereafter when discussing the disinfection performances.
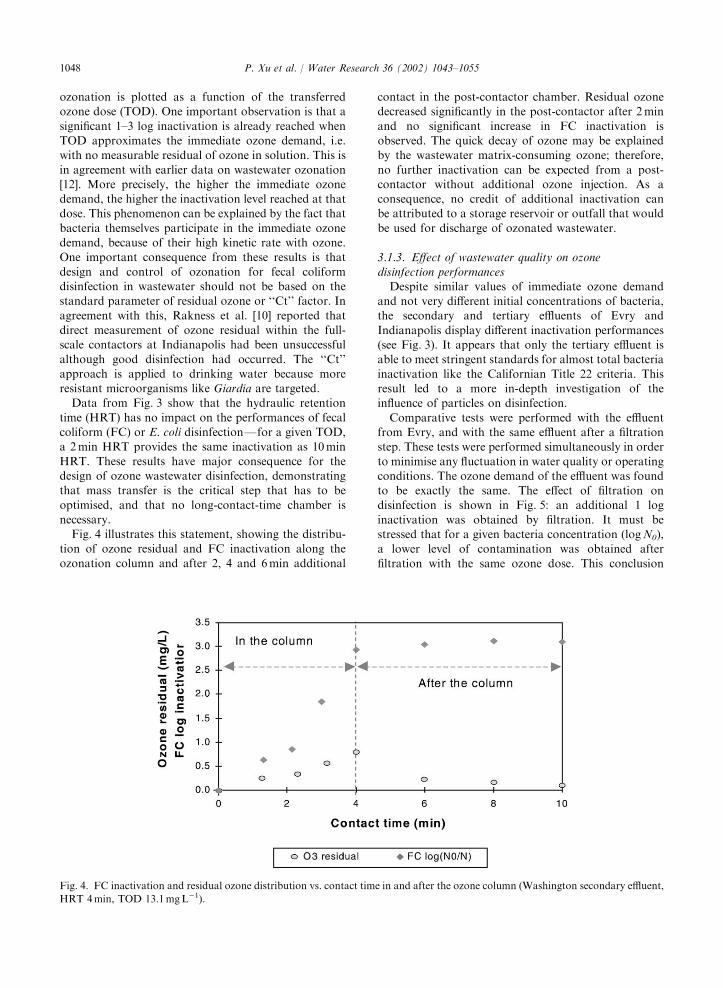
3.1.2. Influence of operating conditions on coliform
inactivationFig. 3 summarises the results from all the experiments,
where the residual concentration of bacteria after
Fig. 2. Determination of the immediate ozone demand according to the classical approach used for drinking water (effluent from
Washington, UK).
Fig. 3. Performances of ozone for FC inactivation on three different effluents: comparison of concentration level after ozonation with
reuse standards.
P. Xu et al. / Water Research 36 (2002) 1043–1055 1047
ozonation is plotted as a function of the transferredozone dose (TOD). One important observation is that a
significant 1–3 log inactivation is already reached whenTOD approximates the immediate ozone demand, i.e.with no measurable residual of ozone in solution. This is
in agreement with earlier data on wastewater ozonation[12]. More precisely, the higher the immediate ozonedemand, the higher the inactivation level reached at thatdose. This phenomenon can be explained by the fact that
bacteria themselves participate in the immediate ozonedemand, because of their high kinetic rate with ozone.One important consequence from these results is that
design and control of ozonation for fecal coliformdisinfection in wastewater should not be based on thestandard parameter of residual ozone or ‘‘Ct’’ factor. In
agreement with this, Rakness et al. [10] reported thatdirect measurement of ozone residual within the full-scale contactors at Indianapolis had been unsuccessful
although good disinfection had occurred. The ‘‘Ct’’approach is applied to drinking water because moreresistant microorganisms like Giardia are targeted.Data from Fig. 3 show that the hydraulic retention
time (HRT) has no impact on the performances of fecalcoliform (FC) or E. coli disinfectionFfor a given TOD,a 2min HRT provides the same inactivation as 10min
HRT. These results have major consequence for thedesign of ozone wastewater disinfection, demonstratingthat mass transfer is the critical step that has to be
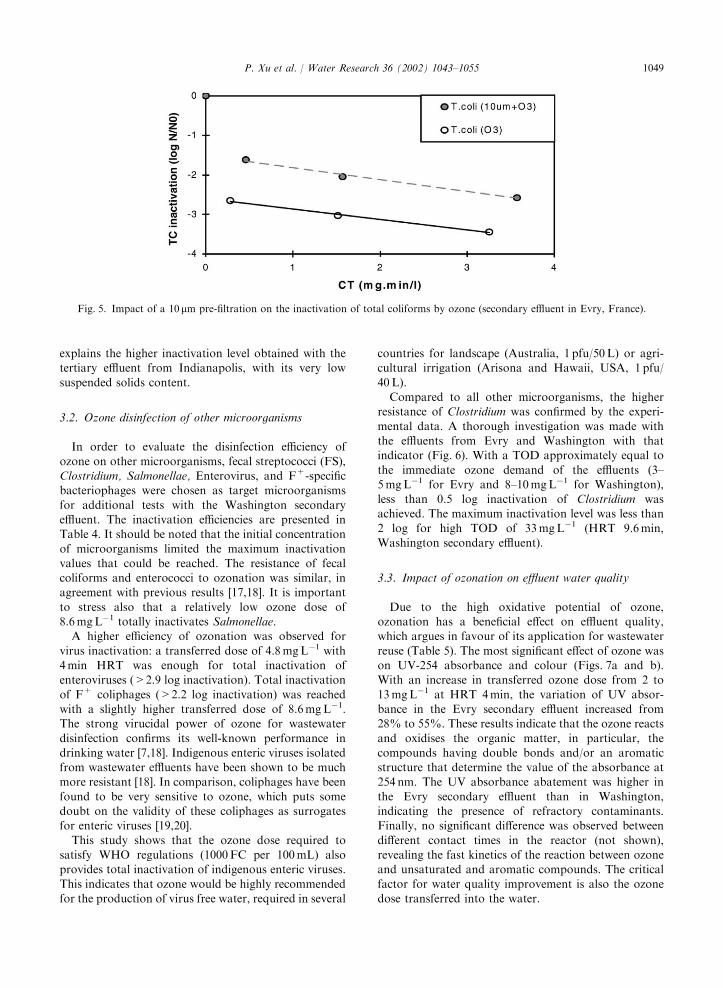
optimised, and that no long-contact-time chamber isnecessary.Fig. 4 illustrates this statement, showing the distribu-
tion of ozone residual and FC inactivation along the
ozonation column and after 2, 4 and 6min additional
contact in the post-contactor chamber. Residual ozonedecreased significantly in the post-contactor after 2min
and no significant increase in FC inactivation isobserved. The quick decay of ozone may be explainedby the wastewater matrix-consuming ozone; therefore,
no further inactivation can be expected from a post-contactor without additional ozone injection. As aconsequence, no credit of additional inactivation canbe attributed to a storage reservoir or outfall that would
be used for discharge of ozonated wastewater.
3.1.3. Effect of wastewater quality on ozone
disinfection performancesDespite similar values of immediate ozone demand
and not very different initial concentrations of bacteria,the secondary and tertiary effluents of Evry and
Indianapolis display different inactivation performances(see Fig. 3). It appears that only the tertiary effluent isable to meet stringent standards for almost total bacteria
inactivation like the Californian Title 22 criteria. Thisresult led to a more in-depth investigation of theinfluence of particles on disinfection.
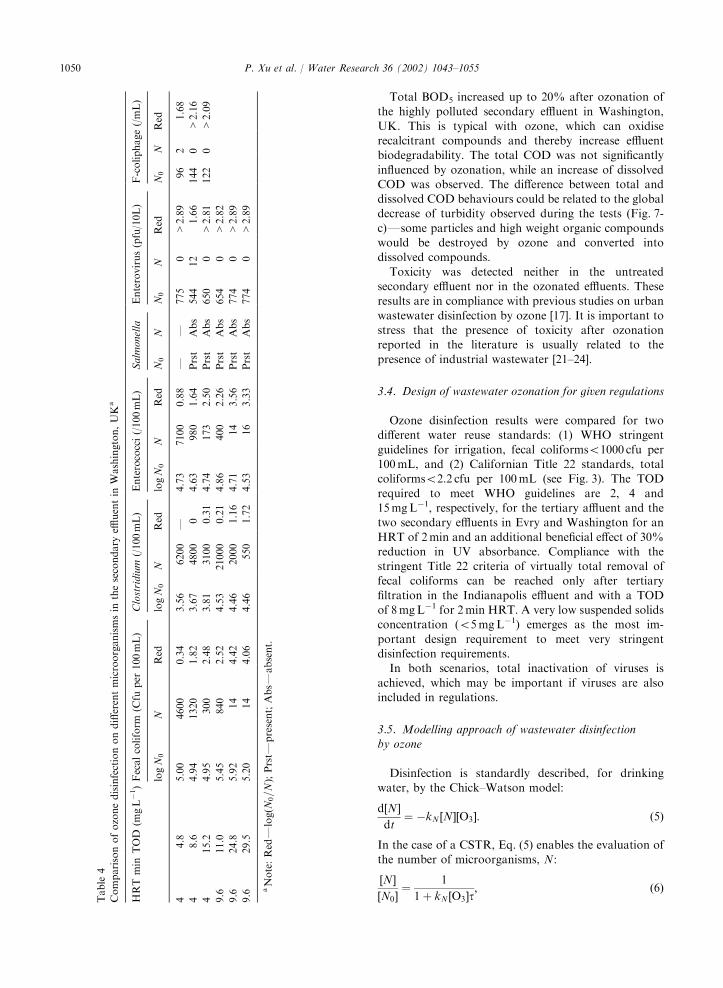
Comparative tests were performed with the effluentfrom Evry, and with the same effluent after a filtrationstep. These tests were performed simultaneously in order
to minimise any fluctuation in water quality or operatingconditions. The ozone demand of the effluent was foundto be exactly the same. The effect of filtration ondisinfection is shown in Fig. 5: an additional 1 log
inactivation was obtained by filtration. It must bestressed that for a given bacteria concentration (logN0),a lower level of contamination was obtained after
filtration with the same ozone dose. This conclusion
Fig. 4. FC inactivation and residual ozone distribution vs. contact time in and after the ozone column (Washington secondary effluent,
HRT 4min, TOD 13.1mgL�1).
P. Xu et al. / Water Research 36 (2002) 1043–10551048
explains the higher inactivation level obtained with thetertiary effluent from Indianapolis, with its very low
suspended solids content.
3.2. Ozone disinfection of other microorganisms
In order to evaluate the disinfection efficiency of
ozone on other microorganisms, fecal streptococci (FS),Clostridium, Salmonellae, Enterovirus, and F+-specificbacteriophages were chosen as target microorganisms
for additional tests with the Washington secondaryeffluent. The inactivation efficiencies are presented inTable 4. It should be noted that the initial concentration
of microorganisms limited the maximum inactivationvalues that could be reached. The resistance of fecalcoliforms and enterococci to ozonation was similar, inagreement with previous results [17,18]. It is important
to stress also that a relatively low ozone dose of8.6mgL�1 totally inactivates Salmonellae.A higher efficiency of ozonation was observed for
virus inactivation: a transferred dose of 4.8mgL�1 with4min HRT was enough for total inactivation ofenteroviruses (>2.9 log inactivation). Total inactivation
of F+ coliphages (>2.2 log inactivation) was reachedwith a slightly higher transferred dose of 8.6mgL�1.The strong virucidal power of ozone for wastewater
disinfection confirms its well-known performance indrinking water [7,18]. Indigenous enteric viruses isolatedfrom wastewater effluents have been shown to be muchmore resistant [18]. In comparison, coliphages have been
found to be very sensitive to ozone, which puts somedoubt on the validity of these coliphages as surrogatesfor enteric viruses [19,20].
This study shows that the ozone dose required tosatisfy WHO regulations (1000FC per 100mL) alsoprovides total inactivation of indigenous enteric viruses.
This indicates that ozone would be highly recommendedfor the production of virus free water, required in several
countries for landscape (Australia, 1 pfu/50L) or agri-cultural irrigation (Arisona and Hawaii, USA, 1 pfu/
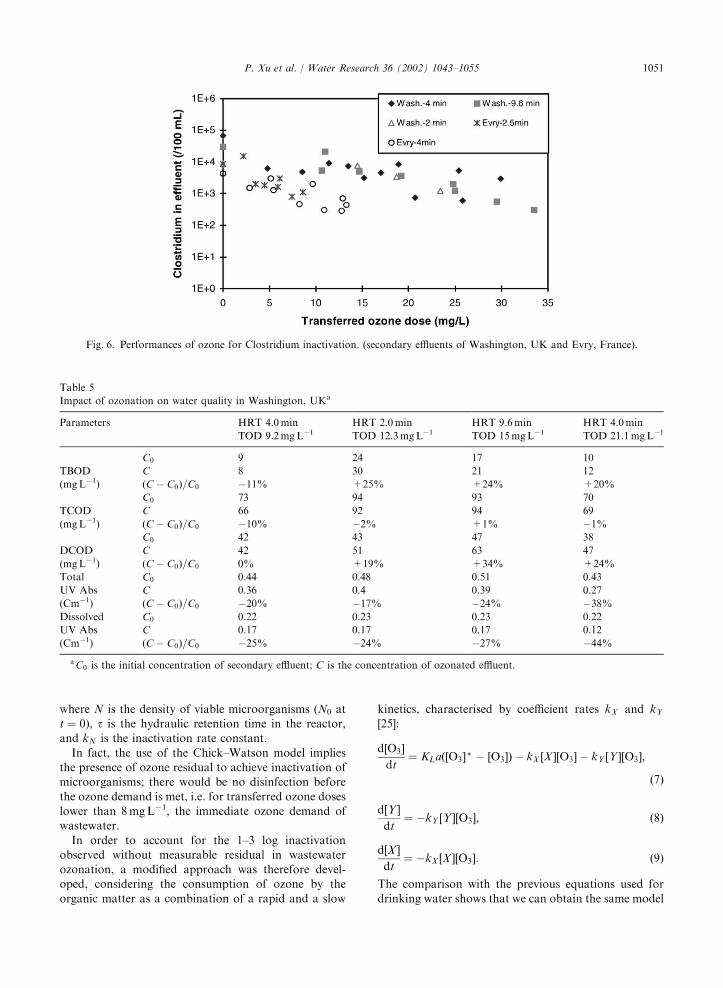
40L).Compared to all other microorganisms, the higher
resistance of Clostridium was confirmed by the experi-
mental data. A thorough investigation was made withthe effluents from Evry and Washington with thatindicator (Fig. 6). With a TOD approximately equal to
the immediate ozone demand of the effluents (3–5mgL�1 for Evry and 8–10mgL�1 for Washington),less than 0.5 log inactivation of Clostridium wasachieved. The maximum inactivation level was less than
2 log for high TOD of 33mgL�1 (HRT 9.6min,Washington secondary effluent).
3.3. Impact of ozonation on effluent water quality
Due to the high oxidative potential of ozone,ozonation has a beneficial effect on effluent quality,which argues in favour of its application for wastewater
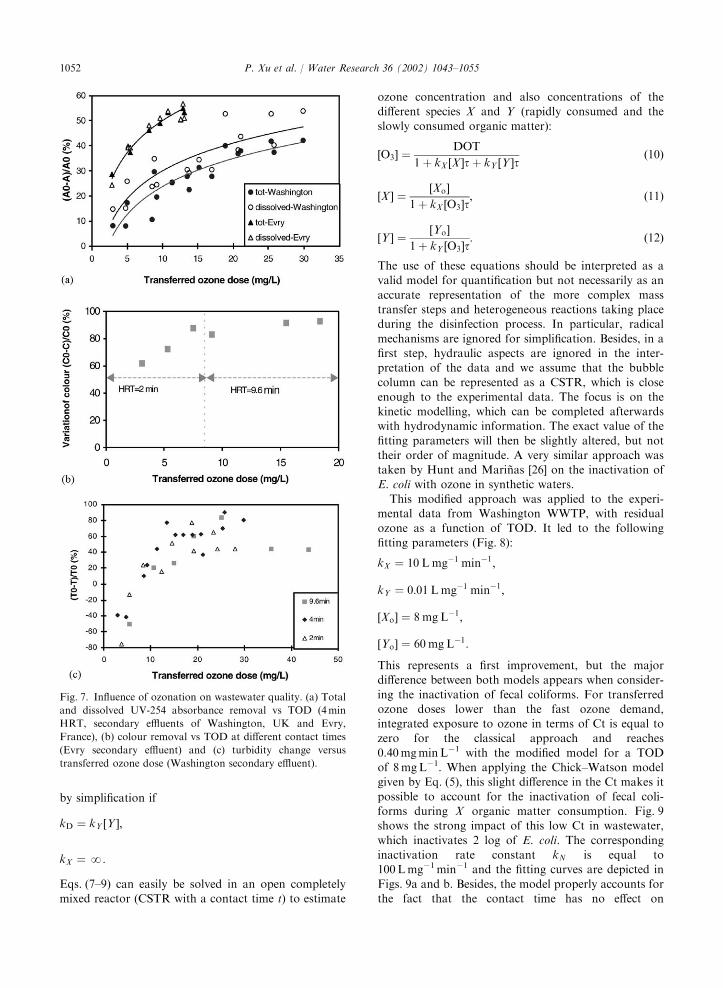
reuse (Table 5). The most significant effect of ozone wason UV-254 absorbance and colour (Figs. 7a and b).With an increase in transferred ozone dose from 2 to
13mgL�1 at HRT 4min, the variation of UV absor-bance in the Evry secondary effluent increased from28% to 55%. These results indicate that the ozone reacts
and oxidises the organic matter, in particular, thecompounds having double bonds and/or an aromaticstructure that determine the value of the absorbance at254 nm. The UV absorbance abatement was higher in
the Evry secondary effluent than in Washington,indicating the presence of refractory contaminants.Finally, no significant difference was observed between
different contact times in the reactor (not shown),revealing the fast kinetics of the reaction between ozoneand unsaturated and aromatic compounds. The critical
factor for water quality improvement is also the ozonedose transferred into the water.
Fig. 5. Impact of a 10 mm pre-filtration on the inactivation of total coliforms by ozone (secondary effluent in Evry, France).
P. Xu et al. / Water Research 36 (2002) 1043–1055 1049
Total BOD5 increased up to 20% after ozonation ofthe highly polluted secondary effluent in Washington,
UK. This is typical with ozone, which can oxidiserecalcitrant compounds and thereby increase effluentbiodegradability. The total COD was not significantly
influenced by ozonation, while an increase of dissolvedCOD was observed. The difference between total anddissolved COD behaviours could be related to the globaldecrease of turbidity observed during the tests (Fig. 7-
c)Fsome particles and high weight organic compoundswould be destroyed by ozone and converted intodissolved compounds.
Toxicity was detected neither in the untreatedsecondary effluent nor in the ozonated effluents. Theseresults are in compliance with previous studies on urban
wastewater disinfection by ozone [17]. It is important tostress that the presence of toxicity after ozonationreported in the literature is usually related to the
presence of industrial wastewater [21–24].
3.4. Design of wastewater ozonation for given regulations
Ozone disinfection results were compared for twodifferent water reuse standards: (1) WHO stringent
guidelines for irrigation, fecal coliformso1000 cfu per100mL, and (2) Californian Title 22 standards, totalcoliformso2.2 cfu per 100mL (see Fig. 3). The TOD
required to meet WHO guidelines are 2, 4 and15mgL�1, respectively, for the tertiary affluent and thetwo secondary effluents in Evry and Washington for an
HRT of 2min and an additional beneficial effect of 30%reduction in UV absorbance. Compliance with thestringent Title 22 criteria of virtually total removal offecal coliforms can be reached only after tertiary
filtration in the Indianapolis effluent and with a TODof 8mgL�1 for 2min HRT. A very low suspended solidsconcentration (o5mgL�1) emerges as the most im-
portant design requirement to meet very stringentdisinfection requirements.In both scenarios, total inactivation of viruses is
achieved, which may be important if viruses are alsoincluded in regulations.
3.5. Modelling approach of wastewater disinfectionby ozone
Disinfection is standardly described, for drinkingwater, by the Chick–Watson model:
d N½ �dt
¼ �kN ½N�½O3�: ð5Þ
In the case of a CSTR, Eq. (5) enables the evaluation ofthe number of microorganisms, N:
P. Xu et al. / Water Research 36 (2002) 1043–10551050
where N is the density of viable microorganisms (N0 att ¼ 0), t is the hydraulic retention time in the reactor,and kN is the inactivation rate constant.
In fact, the use of the Chick–Watson model impliesthe presence of ozone residual to achieve inactivation ofmicroorganisms; there would be no disinfection before
the ozone demand is met, i.e. for transferred ozone doseslower than 8mgL�1, the immediate ozone demand ofwastewater.
In order to account for the 1–3 log inactivationobserved without measurable residual in wastewaterozonation, a modified approach was therefore devel-oped, considering the consumption of ozone by the
organic matter as a combination of a rapid and a slow
kinetics, characterised by coefficient rates kX and kY[25]:
d½O3�dt
¼ KLað½O3�* � ½O3�Þ � kX ½X �½O3� � kY ½Y �½O3�;
ð7Þ
d Y½ �dt
¼ �kY ½Y �½O3�; ð8Þ
d X½ �dt
¼ �kX ½X �½O3�: ð9Þ
The comparison with the previous equations used fordrinking water shows that we can obtain the same model
Fig. 6. Performances of ozone for Clostridium inactivation. (secondary effluents of Washington, UK and Evry, France).
Table 5
Impact of ozonation on water quality in Washington, UKa
TOD 9.2mgL�1 TOD 12.3mgL�1 TOD 15mgL�1 TOD 21.1mgL�1
C0 9 24 17 10
TBOD C 8 30 21 12
(mgL�1) ðC � C0Þ=C0 �11% +25% +24% +20%
C0 73 94 93 70
TCOD C 66 92 94 69
(mgL�1) ðC � C0Þ=C0 �10% �2% +1% �1%
C0 42 43 47 38
DCOD C 42 51 63 47
(mgL�1) ðC � C0Þ=C0 0% +19% +34% +24%
Total C0 0.44 0.48 0.51 0.43
UV Abs C 0.36 0.4 0.39 0.27
(Cm�1) ðC � C0Þ=C0 �20% �17% �24% �38%
Dissolved C0 0.22 0.23 0.23 0.22
UV Abs C 0.17 0.17 0.17 0.12
(Cm�1) ðC � C0Þ=C0 �25% �24% �27% �44%
aC0 is the initial concentration of secondary effluent; C is the concentration of ozonated effluent.
P. Xu et al. / Water Research 36 (2002) 1043–1055 1051
by simplification if
kD ¼ kY ½Y �;
kX ¼ N:
Eqs. (7–9) can easily be solved in an open completelymixed reactor (CSTR with a contact time t) to estimate
ozone concentration and also concentrations of thedifferent species X and Y (rapidly consumed and the
slowly consumed organic matter):
½O3� ¼DOT
1þ kX ½X�tþ kY ½Y �tð10Þ
½X � ¼½Xo�
1þ kX ½O3�t; ð11Þ
½Y � ¼½Yo�
1þ kY ½O3�t: ð12Þ
The use of these equations should be interpreted as avalid model for quantification but not necessarily as an
accurate representation of the more complex masstransfer steps and heterogeneous reactions taking placeduring the disinfection process. In particular, radical
mechanisms are ignored for simplification. Besides, in afirst step, hydraulic aspects are ignored in the inter-pretation of the data and we assume that the bubble
column can be represented as a CSTR, which is closeenough to the experimental data. The focus is on thekinetic modelling, which can be completed afterwardswith hydrodynamic information. The exact value of the
fitting parameters will then be slightly altered, but nottheir order of magnitude. A very similar approach wastaken by Hunt and Mari *nas [26] on the inactivation of
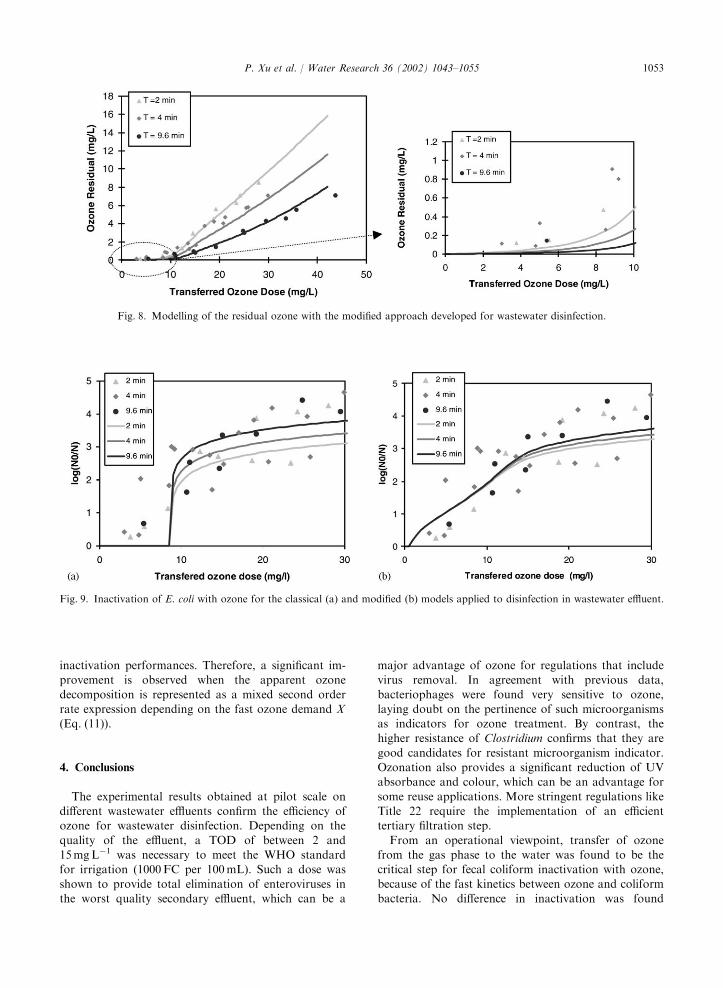
E. coli with ozone in synthetic waters.This modified approach was applied to the experi-
mental data from Washington WWTP, with residual
ozone as a function of TOD. It led to the followingfitting parameters (Fig. 8):
kX ¼ 10 Lmg�1 min�1;
kY ¼ 0:01 Lmg�1 min�1;
½Xo� ¼ 8 mg L�1;
½Yo� ¼ 60 mg L�1:
This represents a first improvement, but the majordifference between both models appears when consider-
ing the inactivation of fecal coliforms. For transferredozone doses lower than the fast ozone demand,integrated exposure to ozone in terms of Ct is equal tozero for the classical approach and reaches
0.40mgminL�1 with the modified model for a TODof 8mgL�1. When applying the Chick–Watson modelgiven by Eq. (5), this slight difference in the Ct makes it
possible to account for the inactivation of fecal coli-forms during X organic matter consumption. Fig. 9shows the strong impact of this low Ct in wastewater,
which inactivates 2 log of E. coli. The correspondinginactivation rate constant kN is equal to100Lmg�1min�1 and the fitting curves are depicted in
Figs. 9a and b. Besides, the model properly accounts forthe fact that the contact time has no effect on
Fig. 7. Influence of ozonation on wastewater quality. (a) Total
and dissolved UV-254 absorbance removal vs TOD (4min
HRT, secondary effluents of Washington, UK and Evry,
France), (b) colour removal vs TOD at different contact times
(Evry secondary effluent) and (c) turbidity change versus
P. Xu et al. / Water Research 36 (2002) 1043–10551052
inactivation performances. Therefore, a significant im-provement is observed when the apparent ozone
decomposition is represented as a mixed second orderrate expression depending on the fast ozone demand X(Eq. (11)).
4. Conclusions
The experimental results obtained at pilot scale ondifferent wastewater effluents confirm the efficiency ofozone for wastewater disinfection. Depending on the
quality of the effluent, a TOD of between 2 and15mgL�1 was necessary to meet the WHO standardfor irrigation (1000FC per 100mL). Such a dose was
shown to provide total elimination of enteroviruses inthe worst quality secondary effluent, which can be a
major advantage of ozone for regulations that includevirus removal. In agreement with previous data,
bacteriophages were found very sensitive to ozone,laying doubt on the pertinence of such microorganismsas indicators for ozone treatment. By contrast, thehigher resistance of Clostridium confirms that they are
good candidates for resistant microorganism indicator.Ozonation also provides a significant reduction of UVabsorbance and colour, which can be an advantage for
some reuse applications. More stringent regulations likeTitle 22 require the implementation of an efficienttertiary filtration step.
From an operational viewpoint, transfer of ozonefrom the gas phase to the water was found to be thecritical step for fecal coliform inactivation with ozone,because of the fast kinetics between ozone and coliform
bacteria. No difference in inactivation was found
Fig. 8. Modelling of the residual ozone with the modified approach developed for wastewater disinfection.
Fig. 9. Inactivation of E. coli with ozone for the classical (a) and modified (b) models applied to disinfection in wastewater effluent.
P. Xu et al. / Water Research 36 (2002) 1043–1055 1053
between 2 and 10min hydraulic retention time, for agiven ozone dose transferred to the effluent. As a
consequence, the ‘‘Ct’’ approach commonly applied indrinking water treatment should not be used for theozonation of wastewater. The new approach to waste-
water ozone contactor design must be based on shortcontact times and enhanced mass transfer. Further, nocredit of inactivation can be attributed to a storagereservoir or outfall that would be used for wastewater
discharge after ozonation, because of high ozone decayin an effluent matrix.Finally, a kinetic model was developed in order to
account for the 1–3 log inactivation of bacteria that wasobserved experimentally without a measurable concen-tration of ozone in the bulk solution. In fact, a
combination of the classic Chick–Watson disinfectionmodel and the ‘‘instantaneous demand’’ model used indrinking water was insufficient. The modified model was
based on the simultaneous consumption of ozone by themicroorganisms and by the organic matrix. Theapparent decomposition rate of dissolved ozone wasrepresented successfully by mixed second-order rate
equations.
Acknowledgements
The authors would like to thank Luc Burtin
(CIRSEE) for technical assistance, Ozonia for theprovision of an ozone generator, Evry and Washingtonwastewater treatment plants staff for field assistance,CIRSEE and Northumbian Water Group of Ondeo
Services for cooperation and lab analysis.
References
[1] Lazarova V. Role of water reuse in the integrated resources
management: costs, benefits and technological challenges
(R #ole de la r!eutilisation des eaux us!ees pour la gestion
int!egr!ee des ressources: co #uts, b!en!efices et d!efis technolo-
giques). Leau, Lindustrie, Les nuisances 1999;227:47–57.
[2] Lazarova V, Cirelli G, Jeffrey P, Salgot M, Icekson N,
Brissaud F. Enhancement of integrated water management
and water reuse in Europe and the Middle East. Water Sci