97


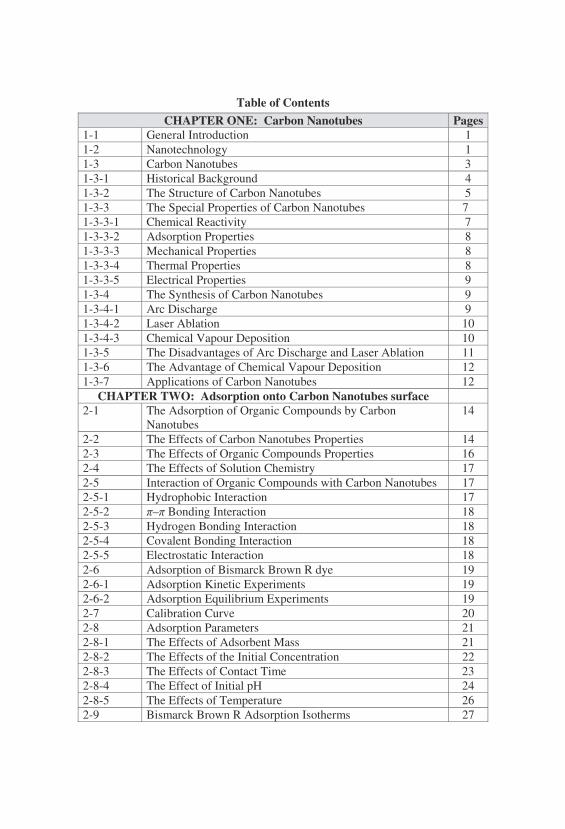
Table of Contents
CHAPTER ONE: Carbon Nanotubes Pages 1-1 General Introduction 1 1-2 Nanotechnology 1 1-3 Carbon Nanotubes 3 1-3-1 Historical Background 4 1-3-2 The Structure of Carbon Nanotubes 5 1-3-3 The Special Properties of Carbon Nanotubes 7 1-3-3-1 Chemical Reactivity 7 1-3-3-2 Adsorption Properties 8 1-3-3-3 Mechanical Properties 8 1-3-3-4 Thermal Properties 8 1-3-3-5 Electrical Properties 9 1-3-4 The Synthesis of Carbon Nanotubes 9 1-3-4-1 Arc Discharge 9 1-3-4-2 Laser Ablation 10 1-3-4-3 Chemical Vapour Deposition 10 1-3-5 The Disadvantages of Arc Discharge and Laser Ablation 11 1-3-6 The Advantage of Chemical Vapour Deposition 12 1-3-7 Applications of Carbon Nanotubes 12
CHAPTER TWO: Adsorption onto Carbon Nanotubes surface 2-1 The Adsorption of Organic Compounds by Carbon
Nanotubes 14
2-2 The Effects of Carbon Nanotubes Properties 14 2-3 The Effects of Organic Compounds Properties 16 2-4 The Effects of Solution Chemistry 17 2-5 Interaction of Organic Compounds with Carbon Nanotubes 17 2-5-1 Hydrophobic Interaction 17 2-5-2 �–� Bonding Interaction 18 2-5-3 Hydrogen Bonding Interaction 18 2-5-4 Covalent Bonding Interaction 18 2-5-5 Electrostatic Interaction 18 2-6 Adsorption of Bismarck Brown R dye 19 2-6-1 Adsorption Kinetic Experiments 19 2-6-2 Adsorption Equilibrium Experiments 19 2-7 Calibration Curve 20 2-8 Adsorption Parameters 21 2-8-1 The Effects of Adsorbent Mass 21 2-8-2 The Effects of the Initial Concentration 22 2-8-3 The Effects of Contact Time 23 2-8-4 The Effect of Initial pH 24 2-8-5 The Effects of Temperature 26 2-9 Bismarck Brown R Adsorption Isotherms 27
2-9-1 The Langmuir Isotherm 28 2-9-2 The Freundlich Isotherm 29 2-9-3 The Temkin Isotherm 30 2-10 Adsorption Kinetic Modeling 32 2-10-1 The Pseudo-First Order Kinetic Model 32 2-10-2 The Pseudo-Second Order Kinetic Model 33 2-10-3 The Intraparticle Diffusion Model 34 2-11 Thermodynamic Parameters 35
CHAPTER THREE: Multiwall Carbon Nanotubes/Titanium Dioxide Composites as a photocatalyst
3-1 Titanium Dioxide 39 3-2 Carbon Nanotubes Nanocomposites 42 3-3 Carbon Nanotubes/Titanium Dioxide Composite 42 3-4 Functionalizations of Carbon Nanotubes 43 3-4-1 Noncovalent Modification 43 3-4-2 Covalent Modification 44 3-5 Oxidation of Carbon Nanotubes 44 3-6 The Preparation of Multiwall Carbon Nanotubes/Titanium
Dioxide Composite 45
3-6-1 The Oxidation of Multiwall Carbon Nanotubes 45 3-6-2 Synthesis of the Composite 46 3-7 Characterizations of the Composites 47 3-7-1 Raman Spectroscopy 47 3-7-2 X-ray Diffraction Spectroscopy (XRD) 50 3-7-3 Fourier Transform Infrared Spectroscopy (FTIR) 53 3-7-4 UV-visible Reflectance Spectroscopy 55 3-7-5 Scanning Electron Microscopy 57 3-8 Photocatalytic Activity Experiments 59 3-9 Photocatalytic Reactions 63 3-10 The Mechanisms of Photocatalysis Enhancement in Carbon
Nanotubes/Titanium Dioxide Composites 65
References 68
List of Abbreviations and Symbols
Abs Absorbance BBR Bismarck brown R BET Burner emit taller BPA Biphenol A C Concentration CB Conduction band cm Centimeter CNTs Carbon nanotubes CVD Chemical vapour deposition °C Centigrade DMFE Direct methane fuel cell e-
CB Negative electron conduction band EE2 17a-ethinyl estrodiol Eg Energy gap Eq Equation et al Latin: et alii (English: and others) eV Electron volt g Gram GPa Gigapascal h+
VB Positive hole valance band K Kelvin kapp The apparent first order rate constant m Meter M Molar mA Milliampere mg Milligram min Minute mL Milliliter mW Milliwatt MWCNTs Multiwalled carbon nanotubes NHE Normal hydrogen electrode nm Nanometer NOM Natural organic matter P.C.D Photocatalytic decolorization pHzpc pH of Zero point charge R2 Correlation coefficient redox Oxidation reduction rpm Round per minute SEM Scanning electron microscopy SWCNTs Singlewalled carbon nanotubes T Absolute temperature UV Ultraviolet

Uv-vis Ultraviolet-visible VB Valance band W Watt W m-1 K-1 Watts per meter kelvin XRD X-ray diffraction � Wavelength
1
Chapter One Carbon Nanotubes
1-1 General Introduction
Nanotechnology represents one of new sciences that promises to provide a broad range of novel uses and enhanced technologies for several applications. A unique aspect of nanotechnology is the “vastly increased ratio of surface area to volume,” present in many nanoscale materials, which opens new possibilities in surface-based sciences [1]. Nanoscale materials have the potential to improve the environment, both through direct applications of these materials to detect, prevent, and remove pollutants, as well as indirectly by using nanotechnology to design cleaner industrial processes and create environmentally responsible products [2].
One of the main environmental pollutants is wastewater. Wastewater is the leftover water after industrial processes. This polluted water comes from the industry due to increasing population and industrial expansion, especially from the developed countries. One of the most important of these pollutants is dye, which is becoming a great concern to the environment and public health [3].
Carbon nanotubes (CNTs) are materials related to both graphite and fullerenes. The first experimental evidence of CNTs arose in 1991 [4] in the form of MWCNTs. CNTs have unique properties, such as high thermal and electrical conductivity, high strength, high stiffness, and special adsorption properties. The removal of organic and inorganic pollutants from wastewater by CNTs has been studied by several researchers. Much research has been done on the use of CNTs as composite materials because of their useful properties [5].
1-2 Nanotechnology
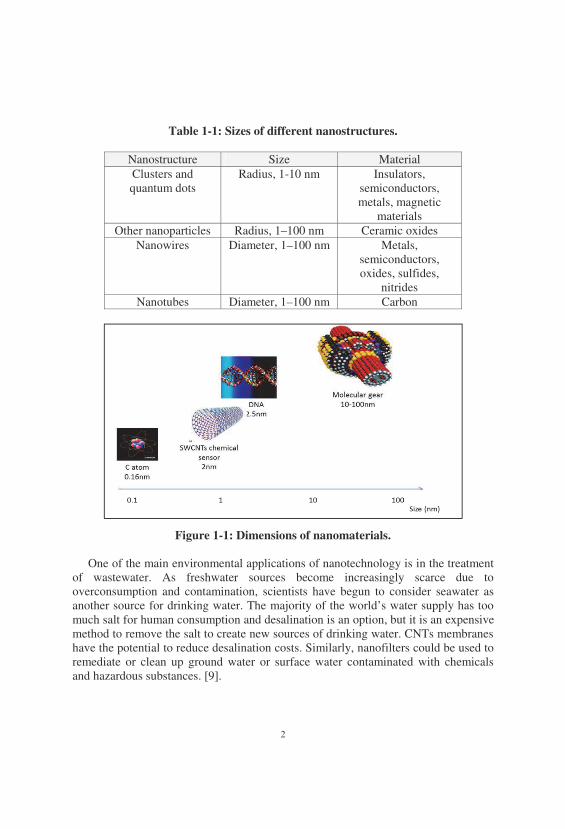
Nanotechnology is the study and control of matter at dimensions of roughly 1 to 100 nanometers (nm). Nanotechnology primarily deals with the synthesis, characterization, and applications of materials on a nanoscale. Nanomaterials exhibit novel and significantly changing chemical and physical properties due to their size and structure [6]. The physical and chemical properties of nanomaterials can differ significantly from those of the atomic-molecular, or of bulk materials of the same composition. By creating nanometer-scale structures, it is possible to control the fundamental properties of materials, such as their charge capacity, melting temperature, magnetic properties, and even their color, without changing the materials. Nanostructures constitute a bridge between molecules and infinite bulk systems. Nanostructures include clusters, quantum dots, nanoparticles, nanowires, and nanotubes [7]. Different nanostructures are shown in Table 1-1. These new properties of nanomaterials lead to enhanced catalysts, photoactivity, increased strength, and many other interesting characteristics [8]. Figure 1-1 shows the various dimensions of nanomaterials.
2
Table 1-1: Sizes of different nanostructures.
Nanostructure Size Material Clusters and quantum dots
Radius, 1-10 nm Insulators, semiconductors, metals, magnetic
materials Other nanoparticles Radius, 1–100 nm Ceramic oxides
Nanowires Diameter, 1–100 nm Metals, semiconductors, oxides, sulfides,
nitrides Nanotubes Diameter, 1–100 nm Carbon
Figure 1-1: Dimensions of nanomaterials.
One of the main environmental applications of nanotechnology is in the treatment of wastewater. As freshwater sources become increasingly scarce due to overconsumption and contamination, scientists have begun to consider seawater as another source for drinking water. The majority of the world’s water supply has too much salt for human consumption and desalination is an option, but it is an expensive method to remove the salt to create new sources of drinking water. CNTs membranes have the potential to reduce desalination costs. Similarly, nanofilters could be used to remediate or clean up ground water or surface water contaminated with chemicals and hazardous substances. [9].
3
1-3 Carbon Nanotubes (CNTs)
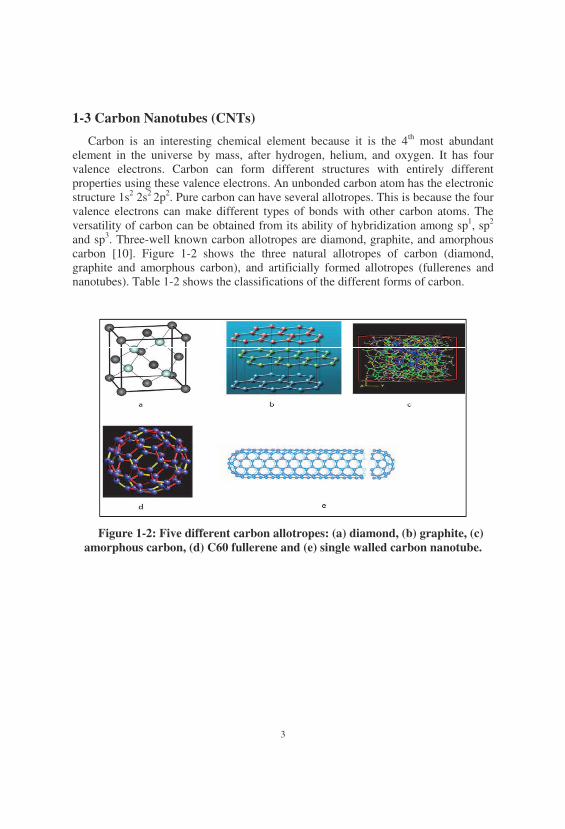
Carbon is an interesting chemical element because it is the 4th most abundant element in the universe by mass, after hydrogen, helium, and oxygen. It has four valence electrons. Carbon can form different structures with entirely different properties using these valence electrons. An unbonded carbon atom has the electronic structure 1s2 2s2 2p2. Pure carbon can have several allotropes. This is because the four valence electrons can make different types of bonds with other carbon atoms. The versatility of carbon can be obtained from its ability of hybridization among sp1, sp2 and sp3. Three-well known carbon allotropes are diamond, graphite, and amorphous carbon [10]. Figure 1-2 shows the three natural allotropes of carbon (diamond, graphite and amorphous carbon), and artificially formed allotropes (fullerenes and nanotubes). Table 1-2 shows the classifications of the different forms of carbon.
Figure 1-2: Five different carbon allotropes: (a) diamond, (b) graphite, (c)
amorphous carbon, (d) C60 fullerene and (e) single walled carbon nanotube.
4
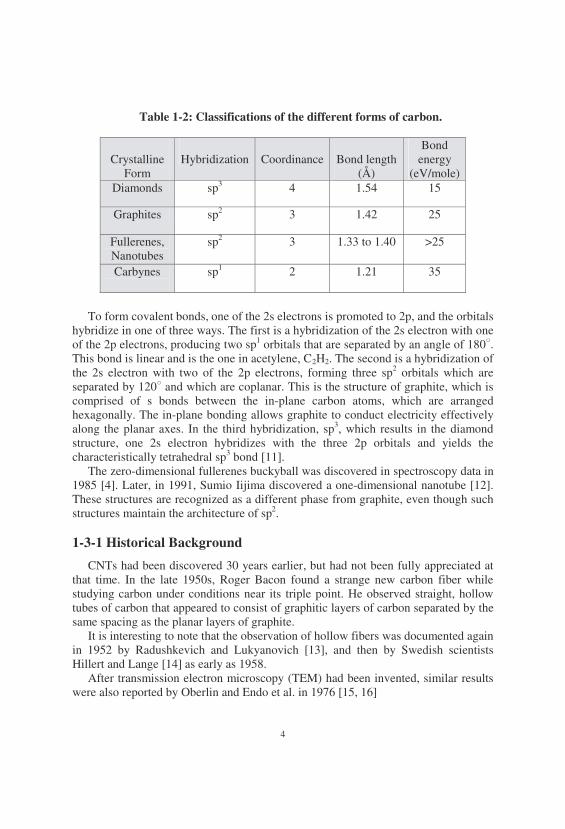
Table 1-2: Classifications of the different forms of carbon.
Crystalline Form
Hybridization
Coordinance
Bond length
(Å)
Bond energy
(eV/mole) Diamonds sp3 4 1.54 15
Graphites sp2 3 1.42 25
Fullerenes, Nanotubes
sp2 3
1.33 to 1.40
>25
Carbynes
sp1
2
1.21
35
To form covalent bonds, one of the 2s electrons is promoted to 2p, and the orbitals
hybridize in one of three ways. The first is a hybridization of the 2s electron with one of the 2p electrons, producing two sp1 orbitals that are separated by an angle of 180�. This bond is linear and is the one in acetylene, C2H2. The second is a hybridization of the 2s electron with two of the 2p electrons, forming three sp2 orbitals which are separated by 120� and which are coplanar. This is the structure of graphite, which is comprised of s bonds between the in-plane carbon atoms, which are arranged hexagonally. The in-plane bonding allows graphite to conduct electricity effectively along the planar axes. In the third hybridization, sp3, which results in the diamond structure, one 2s electron hybridizes with the three 2p orbitals and yields the characteristically tetrahedral sp3 bond [11].
The zero-dimensional fullerenes buckyball was discovered in spectroscopy data in 1985 [4]. Later, in 1991, Sumio Iijima discovered a one-dimensional nanotube [12]. These structures are recognized as a different phase from graphite, even though such structures maintain the architecture of sp2.
1-3-1 Historical Background
CNTs had been discovered 30 years earlier, but had not been fully appreciated at that time. In the late 1950s, Roger Bacon found a strange new carbon fiber while studying carbon under conditions near its triple point. He observed straight, hollow tubes of carbon that appeared to consist of graphitic layers of carbon separated by the same spacing as the planar layers of graphite.
It is interesting to note that the observation of hollow fibers was documented again in 1952 by Radushkevich and Lukyanovich [13], and then by Swedish scientists Hillert and Lange [14] as early as 1958.
After transmission electron microscopy (TEM) had been invented, similar results were also reported by Oberlin and Endo et al. in 1976 [15, 16]
5
In 1991, after the discovery and verification of the fullerenes, Sumio Iijima observed multiwall nanotubes formed in a carbon arc discharge. The first observation of the MWCNTs was credited to Iijima.
It was in 1993 that Iijima and Donald Bethune found SWCNTs known as buckytubes [17].
1-3-2 The Structure of Carbon Nanotubes
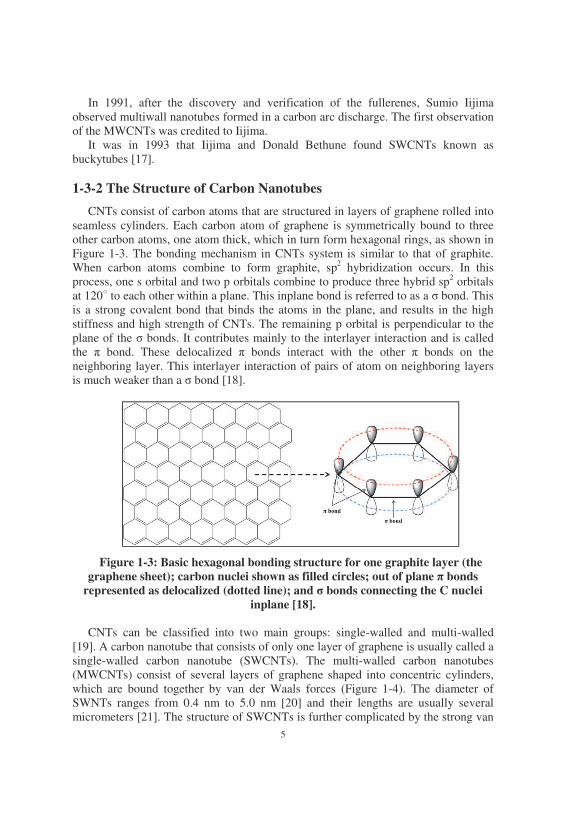
CNTs consist of carbon atoms that are structured in layers of graphene rolled into seamless cylinders. Each carbon atom of graphene is symmetrically bound to three other carbon atoms, one atom thick, which in turn form hexagonal rings, as shown in Figure 1-3. The bonding mechanism in CNTs system is similar to that of graphite. When carbon atoms combine to form graphite, sp2 hybridization occurs. In this process, one s orbital and two p orbitals combine to produce three hybrid sp2 orbitals at 120� to each other within a plane. This inplane bond is referred to as a � bond. This is a strong covalent bond that binds the atoms in the plane, and results in the high stiffness and high strength of CNTs. The remaining p orbital is perpendicular to the plane of the � bonds. It contributes mainly to the interlayer interaction and is called the � bond. These delocalized � bonds interact with the other � bonds on the neighboring layer. This interlayer interaction of pairs of atom on neighboring layers is much weaker than a � bond [18].
Figure 1-3: Basic hexagonal bonding structure for one graphite layer (the graphene sheet); carbon nuclei shown as filled circles; out of plane � bonds
represented as delocalized (dotted line); and � bonds connecting the C nuclei inplane [18].
CNTs can be classified into two main groups: single-walled and multi-walled
[19]. A carbon nanotube that consists of only one layer of graphene is usually called a single-walled carbon nanotube (SWCNTs). The multi-walled carbon nanotubes (MWCNTs) consist of several layers of graphene shaped into concentric cylinders, which are bound together by van der Waals forces (Figure 1-4). The diameter of SWNTs ranges from 0.4 nm to 5.0 nm [20] and their lengths are usually several micrometers [21]. The structure of SWCNTs is further complicated by the strong van
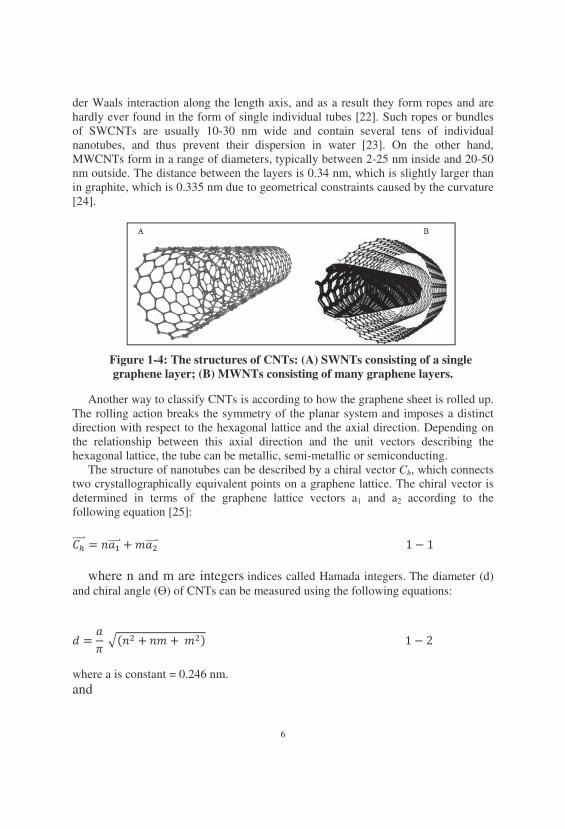
6
der Waals interaction along the length axis, and as a result they form ropes and are hardly ever found in the form of single individual tubes [22]. Such ropes or bundles of SWCNTs are usually 10-30 nm wide and contain several tens of individual nanotubes, and thus prevent their dispersion in water [23]. On the other hand, MWCNTs form in a range of diameters, typically between 2-25 nm inside and 20-50 nm outside. The distance between the layers is 0.34 nm, which is slightly larger than in graphite, which is 0.335 nm due to geometrical constraints caused by the curvature [24].
Figure 1-4: The structures of CNTs: (A) SWNTs consisting of a single graphene layer; (B) MWNTs consisting of many graphene layers.
Another way to classify CNTs is according to how the graphene sheet is rolled up.
The rolling action breaks the symmetry of the planar system and imposes a distinct direction with respect to the hexagonal lattice and the axial direction. Depending on the relationship between this axial direction and the unit vectors describing the hexagonal lattice, the tube can be metallic, semi-metallic or semiconducting.
The structure of nanotubes can be described by a chiral vector Ch, which connects two crystallographically equivalent points on a graphene lattice. The chiral vector is determined in terms of the graphene lattice vectors a1 and a2 according to the following equation [25]: ������� � �������� ������������������������������������������������������������������������������������������������������� �
where n and m are integers indices called Hamada integers. The diameter (d) and chiral angle (�) of CNTs can be measured using the following equations:
� ��
������ � �� � �������������������������������������������������������������������������������� ��
where a is constant = 0.246 nm. and
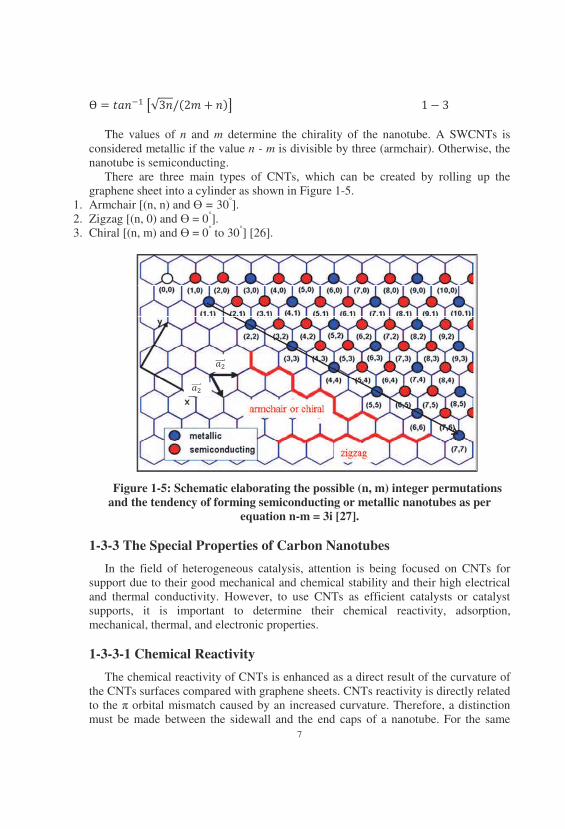
7
� � �������������� � ��������������������������������������������������������������������������� �
The values of n and m determine the chirality of the nanotube. A SWCNTs is considered metallic if the value n - m is divisible by three (armchair). Otherwise, the nanotube is semiconducting.
There are three main types of CNTs, which can be created by rolling up the graphene sheet into a cylinder as shown in Figure 1-5.
1. Armchair [(n, n) and � = 30°]. 2. Zigzag [(n, 0) and � = 0°]. 3. Chiral [(n, m) and � = 0° to 30°] [26].
Figure 1-5: Schematic elaborating the possible (n, m) integer permutations
and the tendency of forming semiconducting or metallic nanotubes as per equation n-m = 3i [27].
1-3-3 The Special Properties of Carbon Nanotubes
In the field of heterogeneous catalysis, attention is being focused on CNTs for support due to their good mechanical and chemical stability and their high electrical and thermal conductivity. However, to use CNTs as efficient catalysts or catalyst supports, it is important to determine their chemical reactivity, adsorption, mechanical, thermal, and electronic properties. 1-3-3-1 Chemical Reactivity
The chemical reactivity of CNTs is enhanced as a direct result of the curvature of the CNTs surfaces compared with graphene sheets. CNTs reactivity is directly related to the � orbital mismatch caused by an increased curvature. Therefore, a distinction must be made between the sidewall and the end caps of a nanotube. For the same
��������
�������
8
reason, a smaller nanotube diameter results in increased reactivity. CNTs are hydrophobic, and therefore they do not show wetting behavior for most aqueous solvents. The covalent chemical modification of either sidewalls or end caps has been shown to be possible [28, 29]. 1-3-3-2 Adsorption Properties
The interaction of CNTs with gases or any species adsorbed on their internal or external surface open up the possibility of using them for gas storage. It has been shown that the curvature of graphene sheets can result in a lower heat of adsorption compared with a planar graphitic surface. In fact, the rolling of the graphene sheet around itself to produce a tube causes a rehybridization of the carbon orbital, thus leading to a modification of the � density of the graphene sheet [30, 31]. 1-3-3-3 Mechanical Properties
CNTs have an extremely high Young’s modulus within a range of 1000-5000 GPa, which is approximately 5 times higher than steel, and they are very resistant to damage from physical forces. A comparative summary of various types of CNTs is listed in Table 1-3. Nanotubes as the whole are very flexible because of their great length. Therefore, these compounds are potentially suitable for applications in composite materials that need anisotropic properties [32, 33].
Table 1-3: Mechanical properties of carbon nanotubes in comparison to steel
[34].
CNTs types Young’s Modulus (GPa)
Tensile Strength (GPa)
MWCNTs 1200 150.0 SWCNTs 1054 75.0 Graphite 350 2.5
Steel 208 0.4 1-3-3-4 Thermal Properties
The thermal properties of CNTs display a wide range of behaviors, which are related both to their graphitic nature and their unique structure and size. CNTs have reported high thermal conductance, as high as 3000 W m-1 K-1 for single MWCNTs, surpassing that of diamond (2000 W m-1 K-1). The thermal conductivity of SWCNTs has been experimentally found to be as high as 200 to 6000 W m-1 K-1 at room temperature [35], but it has been theoretically predicted that the thermal conductivity of an individual ideal SWCNTs at room temperature could be as high as 6600 W m-1 K-1 [36]. The thermal conductance depends upon the quality of the CNTs and their diameter distribution [37].
9
1-3-3-5 Electrical Properties
There has been considerable practical interest in the conductivity of CNTs. Because of the symmetry and unique electronic structure of graphene, the structure of a nanotube strongly affects its electrical properties. Depending on their chiral vector, CNTs with a small diameter are either semiconducting or metallic. As previous discussed, a (n, m) nanotube is metallic when: n=m or (n-m) = 3i. Metallic CNTs can have an electrical current density 1000 times greater than metals such as silver and copper [38]. 1-3-4 The Synthesis of Carbon Nanotubes
There are various methods to prepare CNTs (CNTs) such as arc discharge, laser ablation, chemical vapor deposition, plasma enhanced chemical vapor deposition, alcohol catalytic chemical vapor deposition, vapor phase growth, aero gel-supported chemical vapor deposition, pulsed laser vaporization, and high-pressure carbon monoxide conversion method. The main methods to synthesis CNTs are:
1-3-4-1 Arc Discharge
The carbon arc discharge method, initially used for producing C60 fullerenes, is the most common and perhaps easiest way to produce CNTs, as it is relatively simple to carry out. However, it is a technique that produces a mixture of components and requires separating nanotubes from the soot and catalytic metals present in the crude product. This was the first method used to grow nanotubes by Ijima in 1991. In this method, an electric arc is struck between two pure graphite electrodes in an inert atmosphere, such as of helium or argon, separated by approximately 1 mm. Recent investigations have shown that it is also possible to create nanotubes using the arc method in liquid nitrogen [39]. A direct current of 50 to 100 A driven by approximately 20 V creates a high temperature discharge between the two electrodes, causing the graphite to evaporate. The discharge vaporizes one of the carbon rods and forms a small rod-shaped deposit on the other rod. Producing nanotubes in high yield depends on the uniformity of the plasma arc and the temperature of the deposit formed on the carbon electrode [40]. Figure 1-6 shows the principle of the electric arc discharge technique.
10
�������-����� ���������������������������������������� ����� 1-3-4-2 Laser Ablation
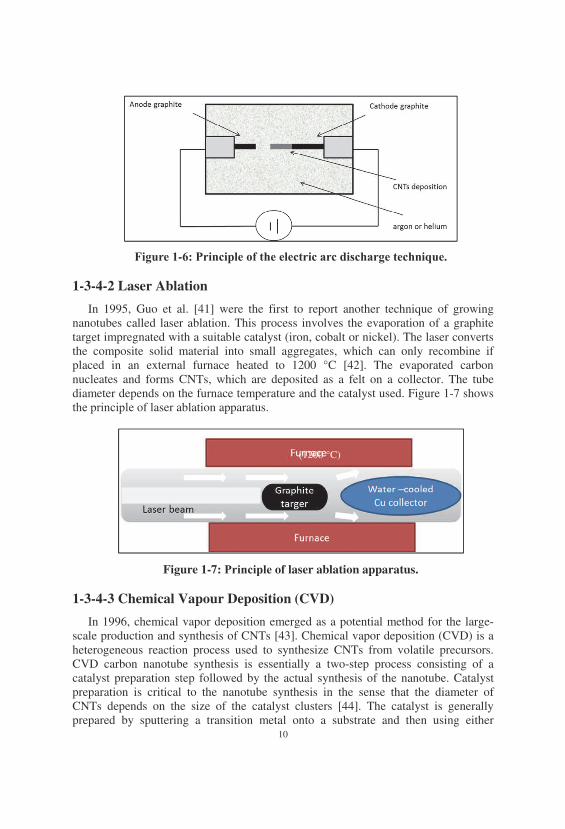
In 1995, Guo et al. [41] were the first to report another technique of growing nanotubes called laser ablation. This process involves the evaporation of a graphite target impregnated with a suitable catalyst (iron, cobalt or nickel). The laser converts the composite solid material into small aggregates, which can only recombine if placed in an external furnace heated to 1200 °C [42]. The evaporated carbon nucleates and forms CNTs, which are deposited as a felt on a collector. The tube diameter depends on the furnace temperature and the catalyst used. Figure 1-7 shows ������������of laser ablation apparatus.
Figure 1-7: ��� ������of laser ablation apparatus.
1-3-4-3 Chemical Vapour Deposition (CVD)
In 1996, chemical vapor deposition emerged as a potential method for the large-scale production and synthesis of CNTs [43]. Chemical vapor deposition (CVD) is a heterogeneous reaction process used to synthesize CNTs from volatile precursors. CVD carbon nanotube synthesis is essentially a two-step process consisting of a catalyst preparation step followed by the actual synthesis of the nanotube. Catalyst preparation is critical to the nanotube synthesis in the sense that the diameter of CNTs depends on the size of the catalyst clusters [44]. The catalyst is generally prepared by sputtering a transition metal onto a substrate and then using either
1200 °C)�
11
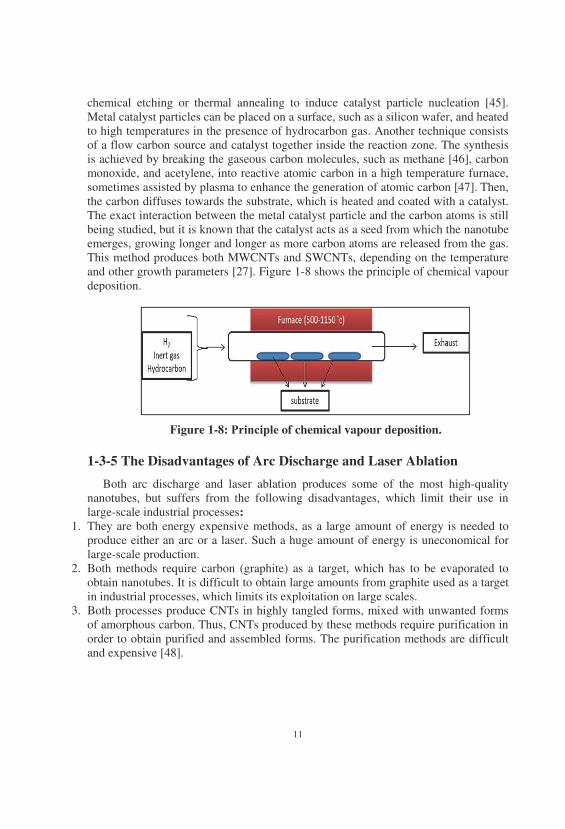
chemical etching or thermal annealing to induce catalyst particle nucleation [45]. Metal catalyst particles can be placed on a surface, such as a silicon wafer, and heated to high temperatures in the presence of hydrocarbon gas. Another technique consists of a flow carbon source and catalyst together inside the reaction zone. The synthesis is achieved by breaking the gaseous carbon molecules, such as methane [46], carbon monoxide, and acetylene, into reactive atomic carbon in a high temperature furnace, sometimes assisted by plasma to enhance the generation of atomic carbon [47]. Then, the carbon diffuses towards the substrate, which is heated and coated with a catalyst. The exact interaction between the metal catalyst particle and the carbon atoms is still being studied, but it is known that the catalyst acts as a seed from which the nanotube emerges, growing longer and longer as more carbon atoms are released from the gas. This method produces both MWCNTs and SWCNTs, depending on the temperature and other growth parameters [27]. Figure 1-8 shows the ��������of chemical vapour deposition.
Figure 1-8: ��� ������of chemical vapour deposition. 1-3-5 The Disadvantages of Arc Discharge and Laser Ablation
Both arc discharge and laser ablation produces some of the most high-quality nanotubes, but suffers from the following disadvantages, which limit their use in large-scale industrial processes:
1. They are both energy expensive methods, as a large amount of energy is needed to produce either an arc or a laser. Such a huge amount of energy is uneconomical for large-scale production.
2. Both methods require carbon (graphite) as a target, which has to be evaporated to obtain nanotubes. It is difficult to obtain large amounts from graphite used as a target in industrial processes, which limits its exploitation on large scales.
3. Both processes produce CNTs in highly tangled forms, mixed with unwanted forms of amorphous carbon. Thus, CNTs produced by these methods require purification in order to obtain purified and assembled forms. The purification methods are difficult and expensive [48].
12
1-3-6 The Advantages of Chemical Vapour Deposition
This method has many advantages: 1. As compared to arc discharge and laser ablation methods, CVD is a simple and
economic technique for synthesizing CNTs at low temperatures and ambient pressures.
2. The reaction is easy to control. The reaction process and reactor design are both simple.
3. Raw materials are abundant and readily available in the form of gases. 4. Due to the absence of expensive and difficult to produce targets or huge amounts of
energy needed, the process is cheap in terms of unit price. 5. In yield and purity, CVD beats the arc and laser methods [49].
1-3-7 Applications of Carbon Nanotubes
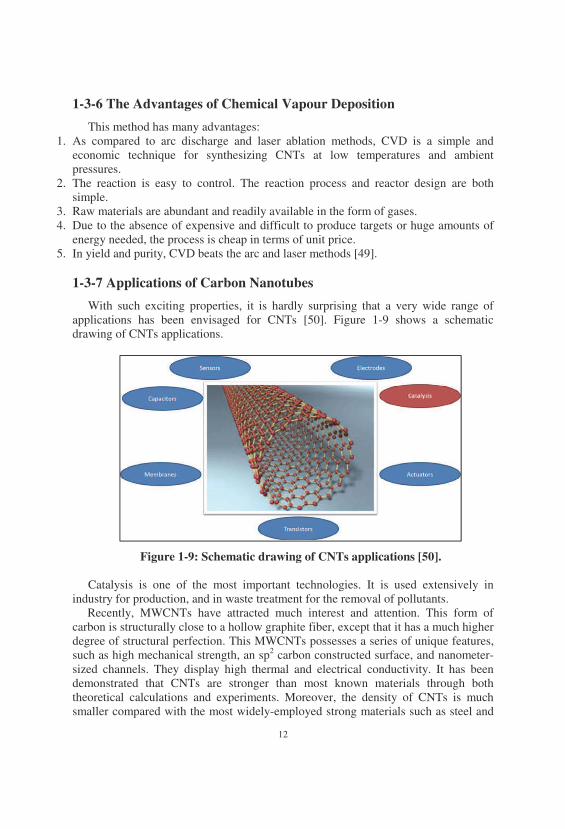
With such exciting properties, it is hardly surprising that a very wide range of applications has been envisaged for CNTs [50]. Figure 1-9 shows a schematic drawing of CNTs applications.
Figure 1-9: Schematic drawing of CNTs applications [50].
Catalysis is one of the most important technologies. It is used extensively in industry for production, and in waste treatment for the removal of pollutants.
Recently, MWCNTs have attracted much interest and attention. This form of carbon is structurally close to a hollow graphite fiber, except that it has a much higher degree of structural perfection. This MWCNTs possesses a series of unique features, such as high mechanical strength, an sp2 carbon constructed surface, and nanometer-sized channels. They display high thermal and electrical conductivity. It has been demonstrated that CNTs are stronger than most known materials through both theoretical calculations and experiments. Moreover, the density of CNTs is much smaller compared with the most widely-employed strong materials such as steel and

13
aluminum. The superior adsorption characteristics of CNTs over activated carbons for water and wastewater treatment have been reported. Long and Yang [51] observed the desorption energy of a dioxin adsorbed by CNTs as being three times higher than that activated carbon, and seven times higher than that by �-Al2O3.
14
Chapter Two Adsorption onto Carbon Nanotubes surface
2-1 The Adsorption of Organic Compounds by Carbon Nanotubes
Dyes have long been used in different types of industry such as dyeing, textiles, paper, plastics, leather, and cosmetics [52]. The color stuff discharged from these industries is hazardous and has an environmental impact. The presence of dyes in water is causing problems such as reducing oxygen levels; interfering with the penetration of sunlight; retarding photosynthesis; and interfering with gas solubility [53]. Various methods have been used to remove dyes from wastewaters such as chemical oxidation, biodegradation, electrocoagulation, photodegradation, solvent extraction, ultrafiltration, and adsorption [54]. The adsorption technique proved to be an effective and attractive process for removing dyes from aqueous solutions in terms of the initial costs, ease of operation, insensitivity to toxic substances, high efficiency, easy recovery, and simplicity of design [55]. Adsorption is a process that occurs when a gas or liquid solute accumulates on the surface of a solid, forming a molecular or atomic film. This accumulation is associated with three types of interaction among adsorbate - adsorbent - solvent: physical, chemical, and electrostatic interactions. These interactions are affected by the properties of adsorbents (surface area, pore size and distribution, and surface chemistry); by the nature of adsorbates (polarity, planarity, solubility, molecular size, and functional groups); and by the solution chemistry (adsorbate concentration, adsorbent mass, temperature, pH, and ionic strength). CNTs have already been widely studied for removing organic contaminants from aqueous solutions [56, 57].
2-2 The Effects of Carbon Nanotubes Properties
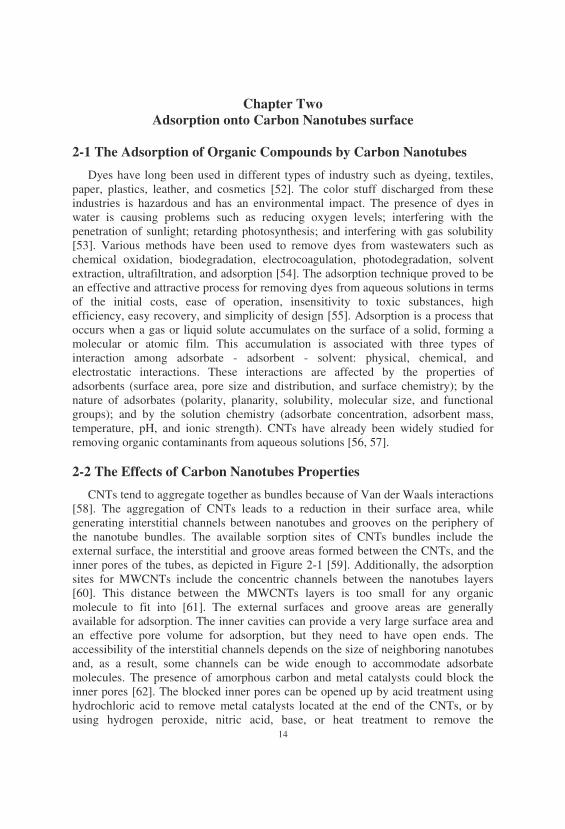
CNTs tend to aggregate together as bundles because of Van der Waals interactions [58]. The aggregation of CNTs leads to a reduction in their surface area, while generating interstitial channels between nanotubes and grooves on the periphery of the nanotube bundles. The available sorption sites of CNTs bundles include the external surface, the interstitial and groove areas formed between the CNTs, and the inner pores of the tubes, as depicted in Figure 2-1 [59]. Additionally, the adsorption sites for MWCNTs include the concentric channels between the nanotubes layers [60]. This distance between the MWCNTs layers is too small for any organic molecule to fit into [61]. The external surfaces and groove areas are generally available for adsorption. The inner cavities can provide a very large surface area and an effective pore volume for adsorption, but they need to have open ends. The accessibility of the interstitial channels depends on the size of neighboring nanotubes and, as a result, some channels can be wide enough to accommodate adsorbate molecules. The presence of amorphous carbon and metal catalysts could block the inner pores [62]. The blocked inner pores can be opened up by acid treatment using hydrochloric acid to remove metal catalysts located at the end of the CNTs, or by using hydrogen peroxide, nitric acid, base, or heat treatment to remove the
15
amorphous carbon [63, 64]. These purification treatments change the surface area and sometimes the surface chemistry of CNTs [65].
Figure 2-1: Schematic structure of CNTs bundles. CNTs possibly contain oxygen functional groups such as –OH, –C=O, and –
COOH, which could be introduced during synthetic procedures or purification processes by using strong acids for the removal of amorphous carbon and metal catalysts [66]. The functional groups can also be intentionally added by oxidation to functionalize the surfaces [67]. The presence of oxygen containing functional groups on the oxidized CNTs could change the adsorption properties of CNTs [68]. This change may be attributed to the decrease of available adsorption sites by blocking (using functional groups) of the inner cavities and interstitial channels of CNTs [69]. Functional groups can make CNTs more hydrophilic and suitable for the adsorption of relatively low molecular weight and polar compounds [70, 67], but they hardly affect hydrophobic organics [71]. In addition, previous studies have demonstrated that the oxygen functional groups depress the adsorption of organic compounds on CNTs [72] via competitive water adsorption and hydrogen bonding [73]. Figure 2-2 shows the effect of purification and functionalization on the adsorption ability of CNTs surfaces.
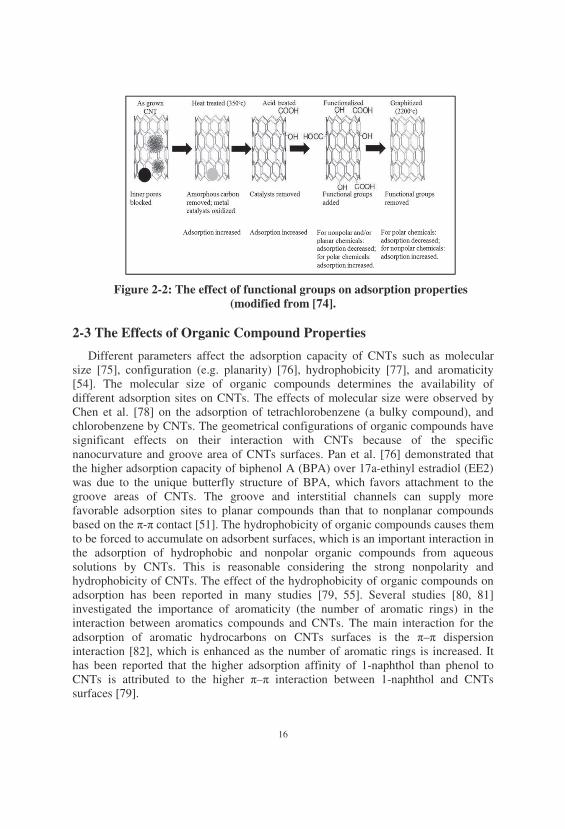
16
Figure 2-2: The effect of functional groups on adsorption properties (modified from [74].
2-3 The Effects of Organic Compound Properties
Different parameters affect the adsorption capacity of CNTs such as molecular size [75], configuration (e.g. planarity) [76], hydrophobicity [77], and aromaticity [54]. The molecular size of organic compounds determines the availability of different adsorption sites on CNTs. The effects of molecular size were observed by Chen et al. [78] on the adsorption of tetrachlorobenzene (a bulky compound), and chlorobenzene by CNTs. The geometrical configurations of organic compounds have significant effects on their interaction with CNTs because of the specific nanocurvature and groove area of CNTs surfaces. Pan et al. [76] demonstrated that the higher adsorption capacity of biphenol A (BPA) over 17a-ethinyl estradiol (EE2) was due to the unique butterfly structure of BPA, which favors attachment to the groove areas of CNTs. The groove and interstitial channels can supply more favorable adsorption sites to planar compounds than that to nonplanar compounds based on the �-� contact [51]. The hydrophobicity of organic compounds causes them to be forced to accumulate on adsorbent surfaces, which is an important interaction in the adsorption of hydrophobic and nonpolar organic compounds from aqueous solutions by CNTs. This is reasonable considering the strong nonpolarity and hydrophobicity of CNTs. The effect of the hydrophobicity of organic compounds on adsorption has been reported in many studies [79, 55]. Several studies [80, 81] investigated the importance of aromaticity (the number of aromatic rings) in the interaction between aromatics compounds and CNTs. The main interaction for the adsorption of aromatic hydrocarbons on CNTs surfaces is the �–� dispersion interaction [82], which is enhanced as the number of aromatic rings is increased. It has been reported that the higher adsorption affinity of 1-naphthol than phenol to CNTs is attributed to the higher �–� interaction between 1-naphthol and CNTs surfaces [79].
17
2-4 The Effects of Solution Chemistry
One of the main factors in solution chemistry is pH. The role of pH in adsorption mechanisms should be explained to understand the effect of pH on the adsorption of organic compounds. For ionizable organic compounds, an increase in pH leads to an enhanced dissociation of these compounds, increasing their hydrophilicity, ionization, and solubility, and thus decreasing their adsorption by CNTs [56]. In addition, increasing pH generally leads to an improved deprotonation of the oxygen groups on CNTs surfaces, as well as the production of water cluster on these groups, which prevents access to nanotube adsorption sites, thus decreasing adsorption [83, 84]. On the other hand, the enhanced dissociation of ionizable adsorbate functional groups may impede the formation of hydrogen bonds between functionalized CNTs surfaces and adsorbates. Furthermore, both the surface of CNTs and ionizable organic compounds might become more negatively charged as the pH increases, leading to an increase in electrostatic repulsion between adsorbates and CNTs [85]. This increased adsorption with increased pH has also been observed and attributed to enhanced �–� interactions.
The apparent pH influence on organic chemical adsorption depends on how the increase in attractive forces (e.g. �–� interactions) counteracts the increase of repulsive forces (e.g. charge repulsion), and/or the decline of certain attractive interactions (e.g. H–bond formation and hydrophobic interaction). Previous studies have demonstrated that the overall pH effect is dependent on the balance between all positive and negative interactions [84].
Ionic strength is another factor effect on the adsorption of organic compounds. The influence of ionic strength on the adsorption capacity of organic compounds by CNTs has been investigated by different studies [86]. 2-5 Interactions of Organic Compounds with Carbon Nanotubes
Numerous studies have been conducted to understand the adsorption mechanisms of organic compounds on CNTs [87, 77]. Five possible interactions including the hydrophobic effect, �–� bonds, hydrogen bonding interaction, covalent interaction, and electrostatic interactions have been observed for the adsorption of organic chemicals onto CNTs surfaces. 2-5-1 Hydrophobic Interaction
The surface of CNTs is hydrophobic, as can be observed by the preference of the adsorption of hydrocarbon (such as hexane, benzene, and cyclohexane) over alcohols (such as ethanol and 2-propanol) [88]. Therefore, hydrophobic interaction has been employed to explain the adsorption of organic chemicals by CNTs [89]. However, hydrophobic interaction alone is not enough to interpret the observed adsorption by CNTs [90].
18
2-5-2 �–� Bonding Interaction
�–� bonding interaction has been used to interpret the adsorption of organic compounds which have a C=C bond or a benzene ring on the CNTs surface because these organic molecules have � electrons to interact with the � electrons of the rings of graphene sheets on the CNTs surface through �–� electron coupling [91, 73].
2-5-3 Hydrogen Bonding Interaction
Hydrogen bonding interaction can occure when the organic compounds or CNTs have certain functional groups such as –COOH, –OH, and –NH2 [92]. Hydrogen bonding interaction can play an important role in adsorption. The –COOH, –OH, and –NH2 groups of organic compounds can act as hydrogen bonding donors and form hydrogen bonds with graphene sheets of CNTs, where the rings of graphene sheets of CNTs act as hydrogen bonding acceptors. Hydrogen bonds might also form between organic compounds and CNTs if CNTs contain –COOH and –OH groups on their surfaces as hydrogen bonding donors [93]. Moreover, functional groups of CNTs can also form hydrogen bonds with water molecules. This hydrogen bonding interaction is stronger than that between functional groups of CNTs and organic molecules, which results in the competitive adsorption of water with organic solutes [94]. 2-5-4 Covalent Bonding Interaction
Covalent bonding interaction may occur between CNTs and organic compounds if both the CNTs and compounds have functional groups such as –COOH, –OH, and –NH2 [95]. This covalent bond has been demonstrated by spectroscopic studies with infrared spectroscopy (IR), X-ray photoelectron spectroscopy (XPS), and nuclear magnetic resonance (NMR) techniques. The attachment of organic molecules to CNTs by a covalent bond is much stronger and can resist any desorption compare with the noncovalent bonding interactions (e.g. hydrophobic, �–� bonding, and hydrogen bonding interactions). Therefore, the covalent modification of CNTs has been widely used to form a variety of nanostructures with excellent physical and chemical properties [96]. The functionalization of CNTs with covalent modifications is usually accomplished by reactions such as carboxylation [97], fluorination [98], esterification [99], and composite formation [100]. 2-5-5 Electrostatic Interaction
Electrostatic interaction is related to the charge nature of both organic compounds and CNTs. Electrostatic attraction will take place if the CNTs and organic compounds have opposite charges. On the other hand, electrostatic repulsion will occur if both the CNTs and organic chemicals have the same charges. Electrostatic repulsion has been used to explain the decrease in the adsorption of natural organic matter (NOM) and phenolic compounds onto CNTs with an increase in solution pH. This is because the NOM and phenolic compounds can be dissociated to anions, and CNTs can be negatively charged as the pH increases. However, it is difficult to
19
separate the impact of this electrostatic interaction from the other interactions because the dissociation of organic compounds is constantly accompanied by a decrease in the hydrophobic effect and the hydrogen bonding interaction of organic compounds [101]. 2-6- Adsorption of Bismarck Brown R dye
The adsorption in this work was done to study the effect of experimental conditions on Bismarck brown R (BBR) dye adsorption and to determine the conditions that achieve the maximum amount of BBR removal. Isotherms, kinetics and thermodynamic evaluations were also conducted.
2-6-1 Adsorption Kinetic Experiments
For kinetic studies, solutions of (1, 3, 5, 7, and 10) ×10-5 M BBR, as the initial concentration, were treated with 25 mg of MWCNTs at a constant temperature of 298.15 K. The mixtures were then subjected to agitation using a shaker. In all cases, the working pH of solution was not controlled. Mixtures were taken from the shaker at appropriate time intervals (10, 20, 30, 40, 50, and 60 min), and the remaining concentration of the BBR solution was determined by a UV-visible spectrophotometer (PG instruments Ltd- Japan) at 459 nm.
2-6-2 Adsorption Equilibrium Experiments
For equilibrium studies, solutions of 5×10⁻⁵ M BBR, at the initial concentration, were treated with 25 mg of MWCNTs. The mixtures were agitated in a water bath shaker (Memmert GmbH Co KG, Germany) continuously for 60 min as the equilibrium time, and at different temperature and pH levels. After 60 min, the suspensions were filtered using a centrifuge, and the filtrates were analyzed for residual BBR concentration using UV-visible spectrophotometer at 459 nm.
The amount of BBR uptake by the MWCNTs in each flask was calculated using the mass balance equation:
� ����������
2-1
where qe is the amount of BBR adsorbed by the MWCNTs at equilibrium, C� and Ce are the initial and final dye concentrations (M), respectively, V is the volume of solution (L), and W is the adsorbent weight (g).
The percentage of dye removal (%) was calculated using the following equation:
��� ���� � � ��������
� ��� 2-2
where: Ct is the concentration of the BBR dye at time t.
20
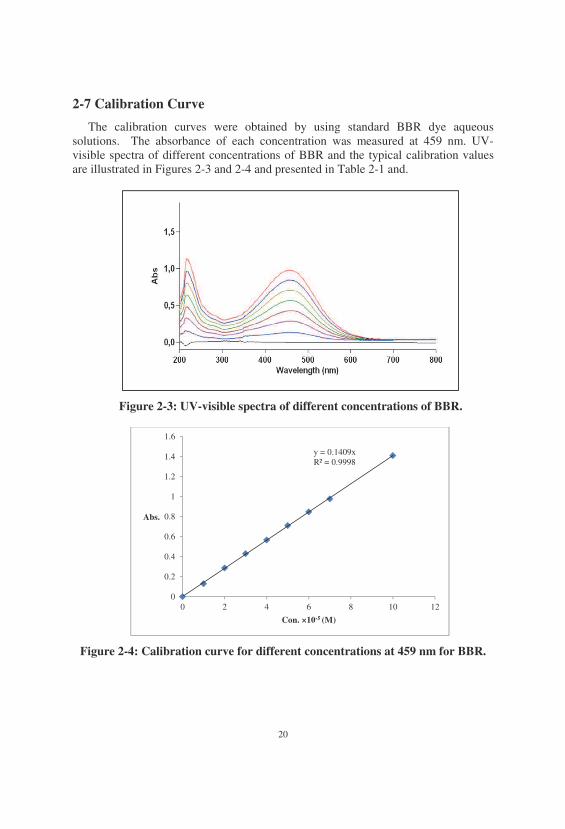
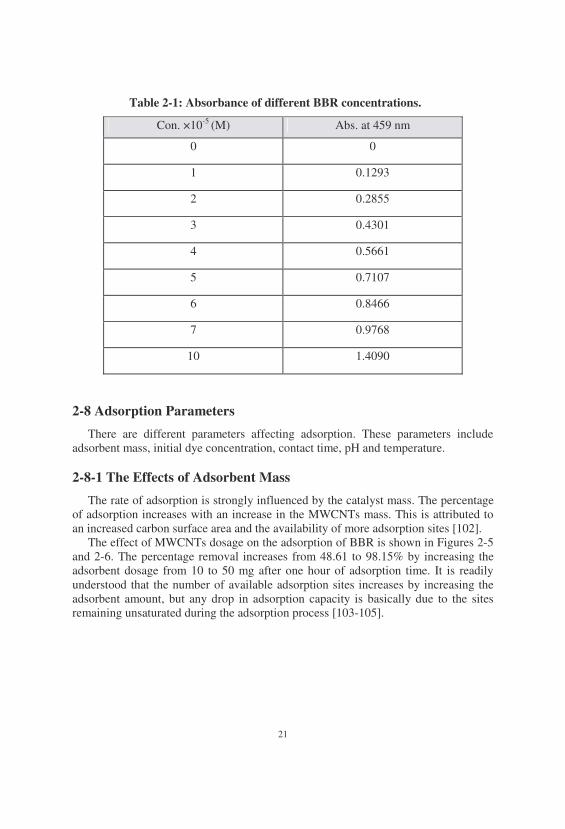
2-7 Calibration Curve
The calibration curves were obtained by using standard BBR dye aqueous solutions. The absorbance of each concentration was measured at 459 nm. UV-visible spectra of different concentrations of BBR and the typical calibration values are illustrated in Figures 2-3 and 2-4 and presented in Table 2-1 and.
Figure 2-3: UV-visible spectra of different concentrations of BBR.
Figure 2-4: Calibration curve for different concentrations at 459 nm for BBR.
y = 0.1409x R² = 0.9998
0
0.2
0.4
0.6
0.8
1
1.2
1.4
1.6
0 2 4 6 8 10 12
Abs.
Con. ×10-5�(M)
21
Table 2-1: Absorbance of different BBR concentrations.
Con. ×10-5 (M) Abs. at 459 nm
0 0
1 0.1293
2 0.2855
3 0.4301
4 0.5661
5 0.7107
6 0.8466
7 0.9768
10 1.4090
2-8 Adsorption Parameters
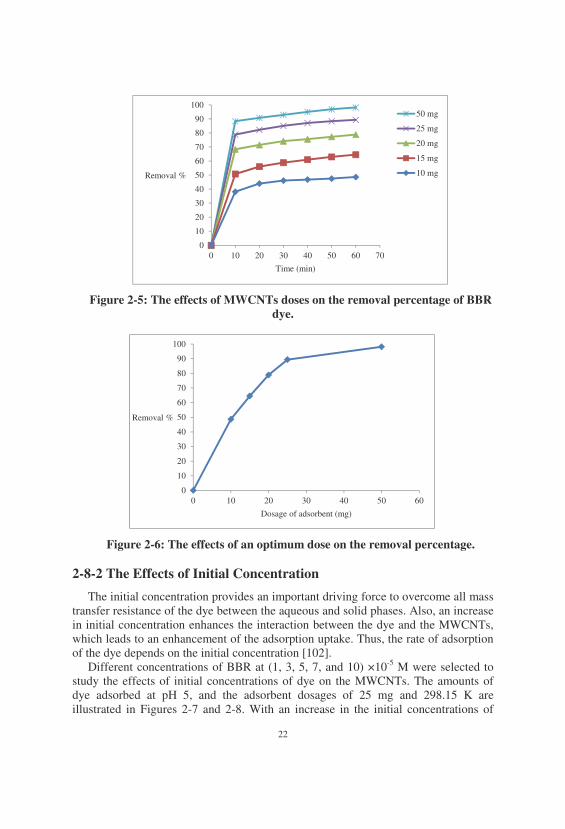
There are different parameters affecting adsorption. These parameters include adsorbent mass, initial dye concentration, contact time, pH and temperature. 2-8-1 The Effects of Adsorbent Mass
The rate of adsorption is strongly influenced by the catalyst mass. The percentage of adsorption increases with an increase in the MWCNTs mass. This is attributed to an increased carbon surface area and the availability of more adsorption sites [102].
The effect of MWCNTs dosage on the adsorption of BBR is shown in Figures 2-5 and 2-6. The percentage removal increases from 48.61 to 98.15% by increasing the adsorbent dosage from 10 to 50 mg after one hour of adsorption time. It is readily understood that the number of available adsorption sites increases by increasing the adsorbent amount, but any drop in adsorption capacity is basically due to the sites remaining unsaturated during the adsorption process [103-105].
22
Figure 2-5: The effects of MWCNTs doses on the removal percentage of BBR dye.
Figure 2-6: The effects of an optimum dose on the removal percentage.
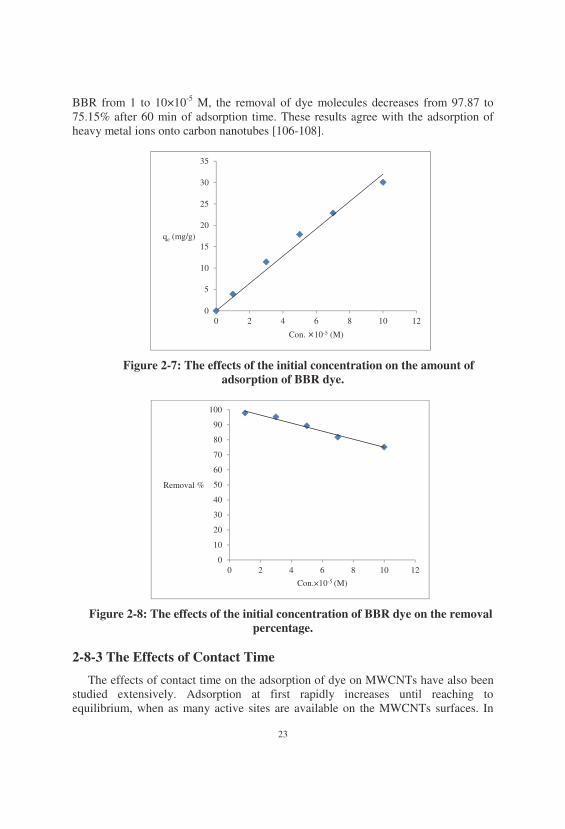
2-8-2 The Effects of Initial Concentration
The initial concentration provides an important driving force to overcome all mass transfer resistance of the dye between the aqueous and solid phases. Also, an increase in initial concentration enhances the interaction between the dye and the MWCNTs, which leads to an enhancement of the adsorption uptake. Thus, the rate of adsorption of the dye depends on the initial concentration [102].
Different concentrations of BBR at (1, 3, 5, 7, and 10) ×10-5 M were selected to study the effects of initial concentrations of dye on the MWCNTs. The amounts of dye adsorbed at pH 5, and the adsorbent dosages of 25 mg and 298.15 K are illustrated in Figures 2-7 and 2-8. With an increase in the initial concentrations of
0
10
20
30
40
50
60
70
80
90
100
0 10 20 30 40 50 60 70
Removal %
Time (min)
50 mg
25 mg
20 mg
15 mg
10 mg
0
10
20
30
40
50
60
70
80
90
100
0 10 20 30 40 50 60
Removal %
Dosage of adsorbent (mg)
23
BBR from 1 to 10×10-5 M, the removal of dye molecules decreases from 97.87 to 75.15% after 60 min of adsorption time. These results agree with the adsorption of heavy metal ions onto carbon nanotubes [106-108].
Figure 2-7: The effects of the initial concentration on the amount of adsorption of BBR dye.
Figure 2-8: The effects of the initial concentration of BBR dye on the removal percentage.
2-8-3 The Effects of Contact Time
The effects of contact time on the adsorption of dye on MWCNTs have also been studied extensively. Adsorption at first rapidly increases until reaching to equilibrium, when as many active sites are available on the MWCNTs surfaces. In
0
5
10
15
20
25
30
35
0 2 4 6 8 10 12
qe (mg/g)
Con. �10-5 (M)
0
10
20
30
40
50
60
70
80
90
100
0 2 4 6 8 10 12
Removal %
Con.×10-5 (M)
24
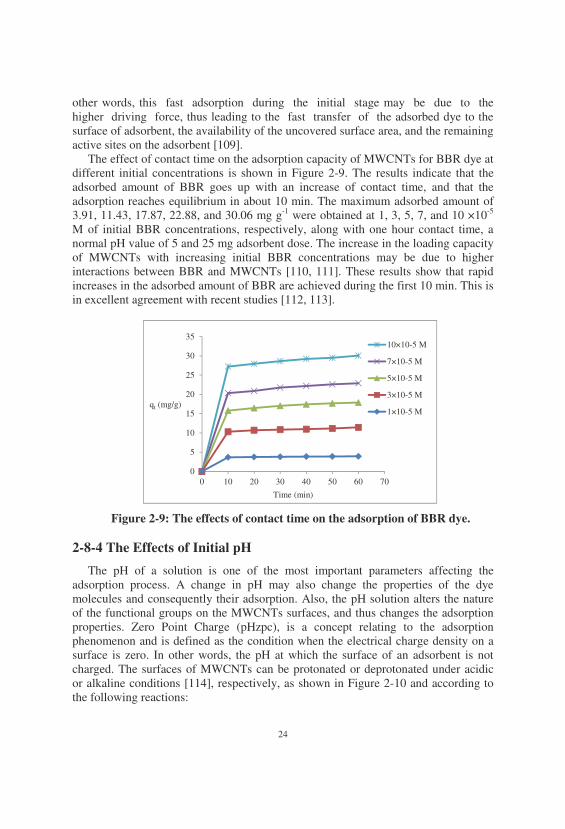
other words, this fast adsorption during the initial stage may be due to the higher driving force, thus leading to the fast transfer of the adsorbed dye to the surface of adsorbent, the availability of the uncovered surface area, and the remaining active sites on the adsorbent [109].
The effect of contact time on the adsorption capacity of MWCNTs for BBR dye at different initial concentrations is shown in Figure 2-9. The results indicate that the adsorbed amount of BBR goes up with an increase of contact time, and that the adsorption reaches equilibrium in about 10 min. The maximum adsorbed amount of 3.91, 11.43, 17.87, 22.88, and 30.06 mg g-1 were obtained at 1, 3, 5, 7, and 10 ×10-5 M of initial BBR concentrations, respectively, along with one hour contact time, a normal pH value of 5 and 25 mg adsorbent dose. The increase in the loading capacity of MWCNTs with increasing initial BBR concentrations may be due to higher interactions between BBR and MWCNTs [110, 111]. These results show that rapid increases in the adsorbed amount of BBR are achieved during the first 10 min. This is in excellent agreement with recent studies [112, 113].
Figure 2-9: The effects of contact time on the adsorption of BBR dye. 2-8-4 The Effects of Initial pH
The pH of a solution is one of the most important parameters affecting the adsorption process. A change in pH may also change the properties of the dye molecules and consequently their adsorption. Also, the pH solution alters the nature of the functional groups on the MWCNTs surfaces, and thus changes the adsorption properties. Zero Point Charge (pHzpc), is a concept relating to the adsorption phenomenon and is defined as the condition when the electrical charge density on a surface is zero. In other words, the pH at which the surface of an adsorbent is not charged. The surfaces of MWCNTs can be protonated or deprotonated under acidic or alkaline conditions [114], respectively, as shown in Figure 2-10 and according to the following reactions:
0
5
10
15
20
25
30
35
0 10 20 30 40 50 60 70
qt (mg/g)
Time (min)
10×10-5 M
7×10⁻⁵ M
5×10⁻⁵ M
3×10⁻⁵ M
1×10⁻⁵ M
25
2-3
2-4
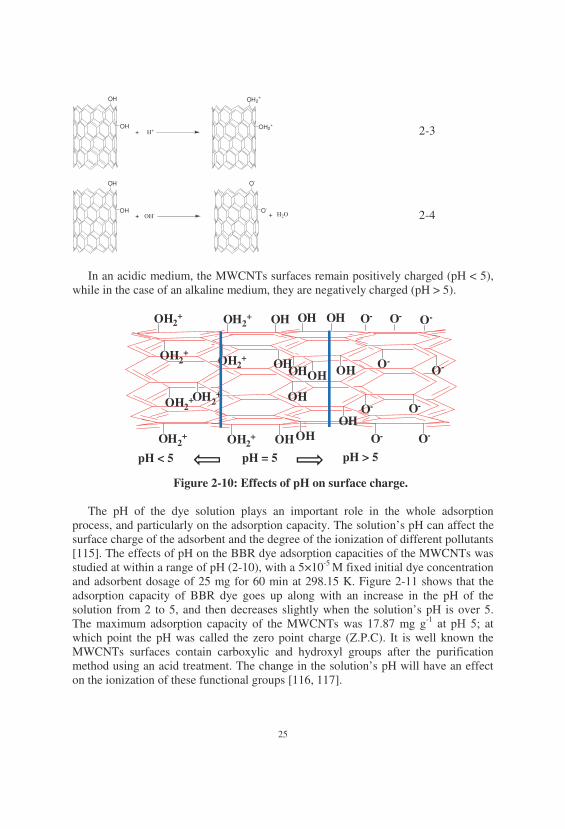
In an acidic medium, the MWCNTs surfaces remain positively charged (pH < 5),
while in the case of an alkaline medium, they are negatively charged (pH > 5).
O- O- O-
O-O-
O-O-
O- O-
OHOHOH
OH
OH
OHOH
OH
OH
OH2+OH2
+
OH2+
OH2+
OH2+
OH2+ OH2
+
OH2+
OHOH
Figure 2-10: Effects of pH on surface charge.
The pH of the dye solution plays an important role in the whole adsorption
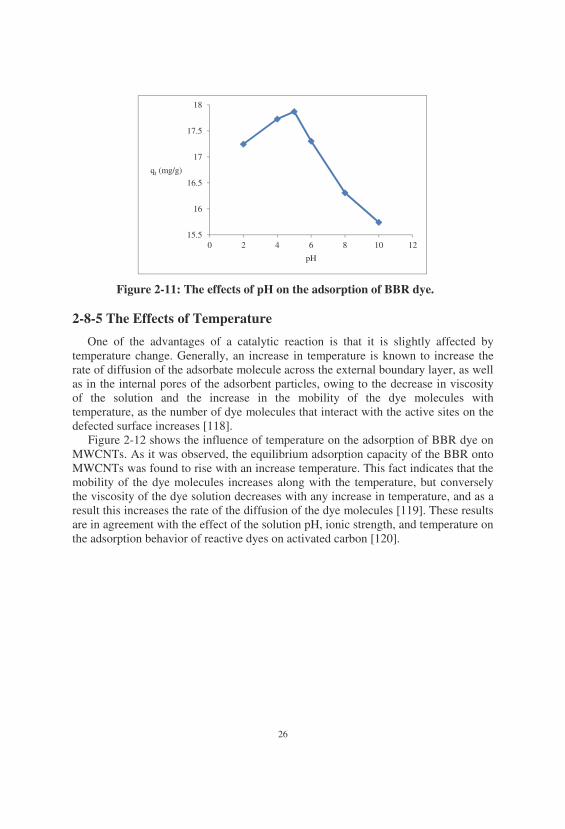
process, and particularly on the adsorption capacity. The solution’s pH can affect the surface charge of the adsorbent and the degree of the ionization of different pollutants [115]. The effects of pH on the BBR dye adsorption capacities of the MWCNTs was studied at within a range of pH (2-10), with a 5×10⁻⁵ M fixed initial dye concentration and adsorbent dosage of 25 mg for 60 min at 298.15 K. Figure 2-11 shows that the adsorption capacity of BBR dye goes up along with an increase in the pH of the solution from 2 to 5, and then decreases slightly when the solution’s pH is over 5. The maximum adsorption capacity of the MWCNTs was 17.87 mg g-1 �� ����� at which point the pH was called the zero point charge (Z.P.C). It is well known the MWCNTs surfaces contain carboxylic and hydroxyl groups after the purification method using an acid treatment. The change in the solution’s pH will have an effect on the ionization of these functional groups [116, 117].
OH
OH
OH2+
OH2+
+ H+
OH
OHOH-
O-
O-
+ H2O+
pH = 5 pH > 5 pH < 5
26
Figure 2-11: The effects of pH on the adsorption of BBR dye.
2-8-5 The Effects of Temperature
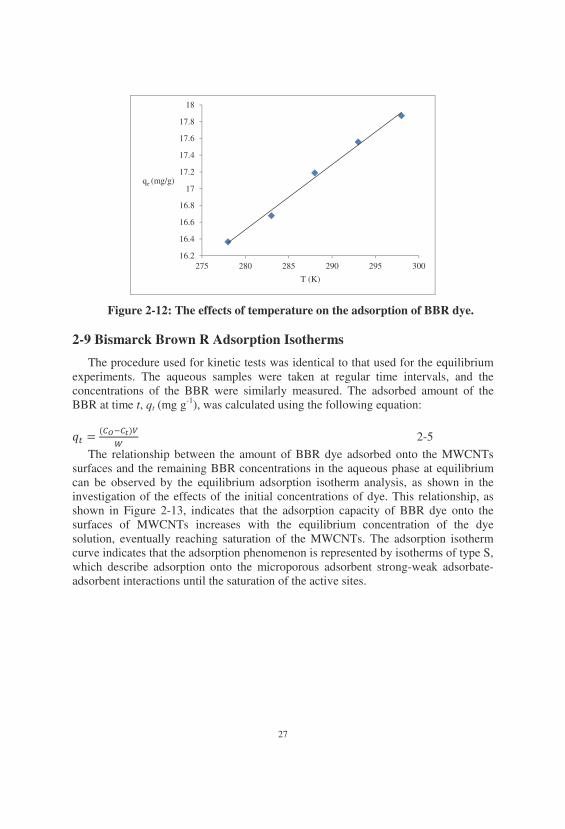
One of the advantages of a catalytic reaction is that it is slightly affected by temperature change. Generally, an increase in temperature is known to increase the rate of diffusion of the adsorbate molecule across the external boundary layer, as well as in the internal pores of the adsorbent particles, owing to the decrease in viscosity of the solution and the increase in the mobility of the dye molecules with temperature, as the number of dye molecules that interact with the active sites on the defected surface increases [118].
Figure 2-12 shows the influence of temperature on the adsorption of BBR dye on MWCNTs. As it was observed, the equilibrium adsorption capacity of the BBR onto MWCNTs was found to rise with an increase temperature. This fact indicates that the mobility of the dye molecules increases along with the temperature, but conversely the viscosity of the dye solution decreases with any increase in temperature, and as a result this increases the rate of the diffusion of the dye molecules [119]. These results are in agreement with the effect of the solution pH, ionic strength, and temperature on the adsorption behavior of reactive dyes on activated carbon [120].
15.5
16
16.5
17
17.5
18
0 2 4 6 8 10 12
qt (mg/g)
pH
27
Figure 2-12: The effects of temperature on the adsorption of BBR dye.
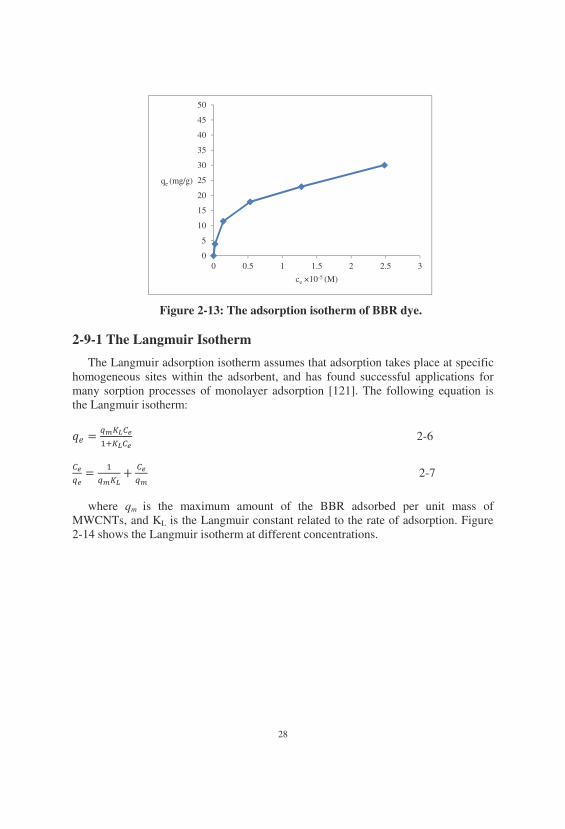
2-9 Bismarck Brown R Adsorption Isotherms
The procedure used for kinetic tests was identical to that used for the equilibrium experiments. The aqueous samples were taken at regular time intervals, and the concentrations of the BBR were similarly measured. The adsorbed amount of the BBR at time t, qt (mg g-1), was calculated using the following equation:
���������
2-5
The relationship between the amount of BBR dye adsorbed onto the MWCNTs surfaces and the remaining BBR concentrations in the aqueous phase at equilibrium can be observed by the equilibrium adsorption isotherm analysis, as shown in the investigation of the effects of the initial concentrations of dye. This relationship, as shown in Figure 2-13, indicates that the adsorption capacity of BBR dye onto the surfaces of MWCNTs increases with the equilibrium concentration of the dye solution, eventually reaching saturation of the MWCNTs. The adsorption isotherm curve indicates that the adsorption phenomenon is represented by isotherms of type S, which describe adsorption onto the microporous adsorbent strong-weak adsorbate-adsorbent interactions until the saturation of the active sites.
16.2
16.4
16.6
16.8
17
17.2
17.4
17.6
17.8
18
275 280 285 290 295 300
qe (mg/g)
T (K)
28
Figure 2-13: The adsorption isotherm of BBR dye.
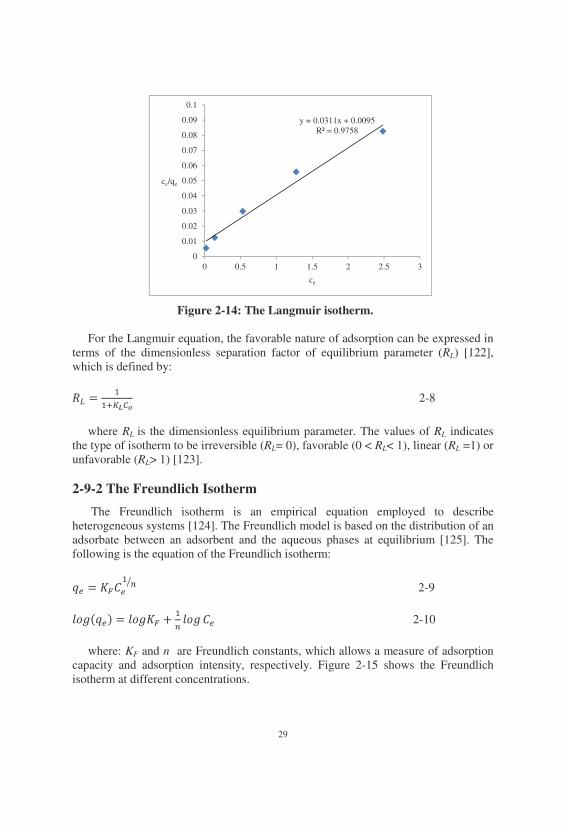
2-9-1 The Langmuir Isotherm
The Langmuir adsorption isotherm assumes that adsorption takes place at specific homogeneous sites within the adsorbent, and has found successful applications for many sorption processes of monolayer adsorption [121]. The following equation is the Langmuir isotherm:
� �������
� ���� 2-6
��
��� �
����� ��
�� 2-7
where qm is the maximum amount of the BBR adsorbed per unit mass of
MWCNTs, and KL is the Langmuir constant related to the rate of adsorption. Figure 2-14 shows the Langmuir isotherm at different concentrations.
0
5
10
15
20
25
30
35
40
45
50
0 0.5 1 1.5 2 2.5 3
qe (mg/g)
ce ×10-5 (M)
29
Figure 2-14: The Langmuir isotherm.
For the Langmuir equation, the favorable nature of adsorption can be expressed in terms of the dimensionless separation factor of equilibrium parameter (RL) [122], which is defined by:
� ��
� ���� 2-8
where RL is the dimensionless equilibrium parameter. The values of RL indicates
the type of isotherm to be irreversible (RL= 0), favorable (0 < RL< 1), linear (RL =1) or unfavorable (RL> 1) [123].
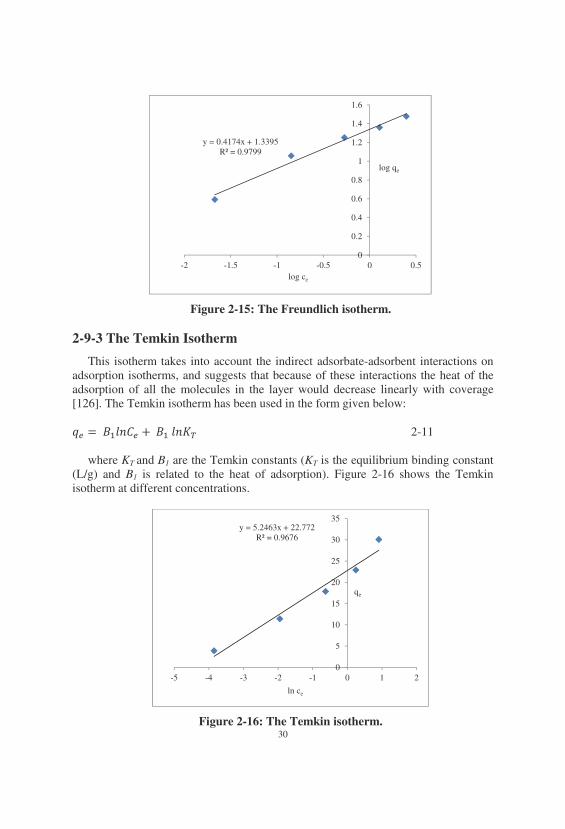
2-9-2 The Freundlich Isotherm
The Freundlich isotherm is an empirical equation employed to describe heterogeneous systems [124]. The Freundlich model is based on the distribution of an adsorbate between an adsorbent and the aqueous phases at equilibrium [125]. The following is the equation of the Freundlich isotherm:
� � ������ 2-9
������ � ����� ��
���� �� 2-10
where: KF and n are Freundlich constants, which allows a measure of adsorption
capacity and adsorption intensity, respectively. Figure 2-15 shows the Freundlich isotherm at different concentrations.
y = 0.0311x + 0.0095 R² = 0.9758
0
0.01
0.02
0.03
0.04
0.05
0.06
0.07
0.08
0.09
0.1
0 0.5 1 1.5 2 2.5 3
ce/qe
ce
30
Figure 2-15: The Freundlich isotherm.
2-9-3 The Temkin Isotherm
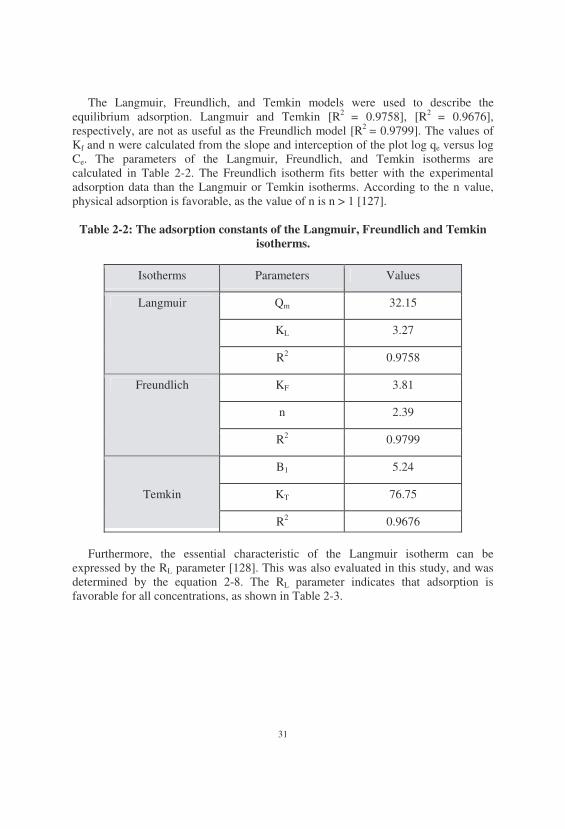
This isotherm takes into account the indirect adsorbate-adsorbent interactions on adsorption isotherms, and suggests that because of these interactions the heat of the adsorption of all the molecules in the layer would decrease linearly with coverage [126]. The Temkin isotherm has been used in the form given below:
� � ������� � �������� 2-11
where KT and B1 are the Temkin constants (KT is the equilibrium binding constant
(L/g) and B1 is related to the heat of adsorption). Figure 2-16 shows the Temkin isotherm at different concentrations.
Figure 2-16: The Temkin isotherm.
y = 0.4174x + 1.3395 R² = 0.9799
0
0.2
0.4
0.6
0.8
1
1.2
1.4
1.6
-2 -1.5 -1 -0.5 0 0.5
log qe
log ce
y = 5.2463x + 22.772 R² = 0.9676
0
5
10
15
20
25
30
35
-5 -4 -3 -2 -1 0 1 2
qe
ln ce
31
The Langmuir, Freundlich, and Temkin models were used to describe the equilibrium adsorption. Langmuir and Temkin [R2 = 0.9758], [R2 = 0.9676], respectively, are not as useful as the Freundlich model [R2 = 0.9799]. The values of Kf and n were calculated from the slope and interception of the plot log qe versus log Ce. The parameters of the Langmuir, Freundlich, and Temkin isotherms are calculated in Table 2-2. The Freundlich isotherm fits better with the experimental adsorption data than the Langmuir or Temkin isotherms. According to the n value, physical adsorption is favorable, as the value of n is n > 1 [127].
Table 2-2: The adsorption constants of the Langmuir, Freundlich and Temkin
isotherms.
Values Parameters Isotherms
32.15 Qm Langmuir
3.27 KL
0.9758 R2
3.81 KF Freundlich
2.39 n
0.9799 R2
5.24 B1
Temkin 76.75 KT
0.9676 R2
Furthermore, the essential characteristic of the Langmuir isotherm can be
expressed by the RL parameter [128]. This was also evaluated in this study, and was determined by the equation 2-8. The RL parameter indicates that adsorption is favorable for all concentrations, as shown in Table 2-3.
32
Table 2-3: The dimensionless separation factor for the adsorption of BBR on MWCNTs.
The fact that the Freundlich isotherm fits the experimental data very well may be
due to the heterogeneous distribution of active sites on the MWCNTs surfaces, since the Freundlich equation assumes that the surface of a catalyst is heterogeneous. 2-10 Adsorption Kinetic Modeling
Three kinetic models were used to determine the rate of the adsorption process. These kinetic models: pseudo-first order, pseudo-second order, and intraparticle diffusion models were used to analyze the kinetic data of the BBR adsorption onto the MWCNTs. These kinetic models were used to test the dynamic experimental data at 25 mg of MWCNTs; and the different initial concentrations of BBR were (1, 3, 5, 7 and 10) ×10-5 M at a normal pH of 5.
2-10-1 The Pseudo-First Order Kinetic Model
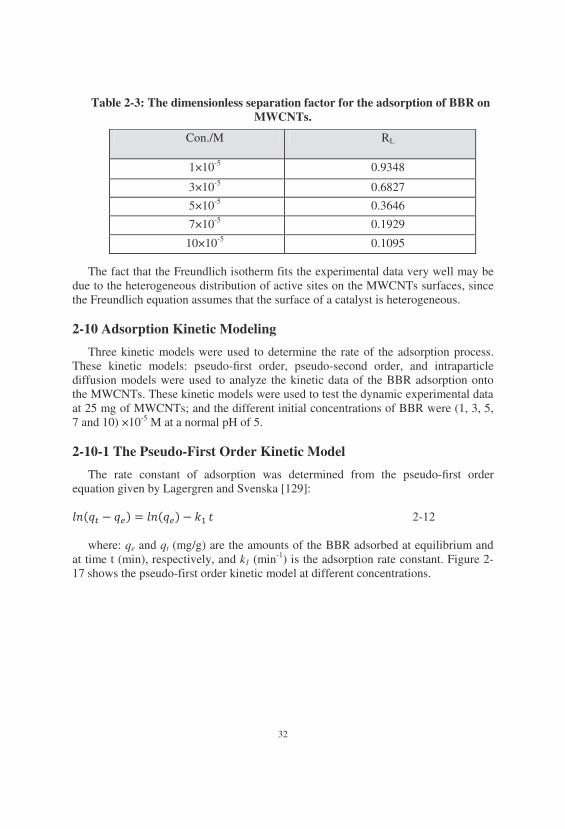
The rate constant of adsorption was determined from the pseudo-first order equation given by Lagergren and Svenska [129]:
��� � �� � ������ ���� 2-12
where: qe and qt (mg/g) are the amounts of the BBR adsorbed at equilibrium and
at time t (min), respectively, and k1 (min-1) is the adsorption rate constant. Figure 2-17 shows the pseudo-first order kinetic model at different concentrations.
Con./M RL
1×10⁻⁵ 0.9348
3×10⁻⁵ 0.6827
5×10⁻⁵ 0.3646
7×10⁻⁵ 0.1929
10×10-5 0.1095
33
Figure 2-17: The pseudo-first order kinetic model.
2-10-2 The Pseudo-Second Order Kinetic Model
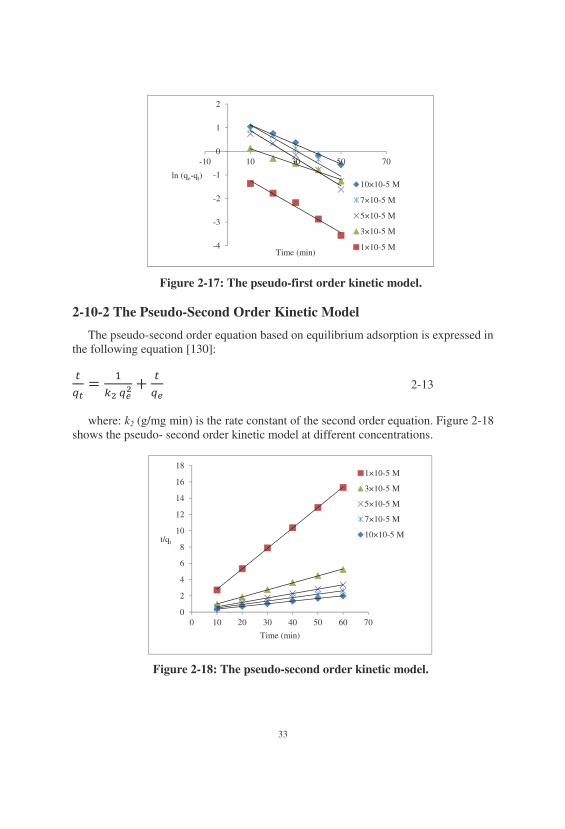
The pseudo-second order equation based on equilibrium adsorption is expressed in the following equation [130]:
��� �
���� �
�� 2-13
where: k2 (g/mg min) is the rate constant of the second order equation. Figure 2-18
shows the pseudo- second order kinetic model at different concentrations.
Figure 2-18: The pseudo-second order kinetic model.
-4
-3
-2
-1
0
1
2
-10 10 30 50 70
ln (qe-qt)
Time (min)
10×10-5 M
7×10⁻⁵ M
5×10⁻⁵ M
3×10⁻⁵ M
1×10⁻⁵ M
0
2
4
6
8
10
12
14
16
18
0 10 20 30 40 50 60 70
t/qt
Time (min)
1×10⁻⁵ M
3×10⁻⁵ M
5×10⁻⁵ M
7×10⁻⁵ M
10×10-5 M
34
2-10-3 The Intraparticle Diffusion Model
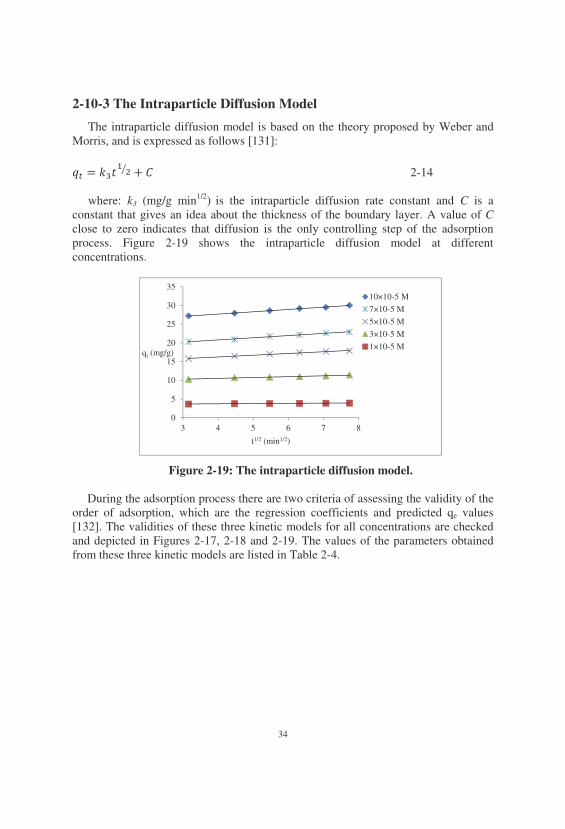
The intraparticle diffusion model is based on the theory proposed by Weber and Morris, and is expressed as follows [131]:
� ����� � � 2-14
where: k3 (mg/g min1/2) is the intraparticle diffusion rate constant and C is a
constant that gives an idea about the thickness of the boundary layer. A value of C close to zero indicates that diffusion is the only controlling step of the adsorption process. Figure 2-19 shows the intraparticle diffusion model at different concentrations.
Figure 2-19: The intraparticle diffusion model.
During the adsorption process there are two criteria of assessing the validity of the order of adsorption, which are the regression coefficients and predicted qe values [132]. The validities of these three kinetic models for all concentrations are checked and depicted in Figures 2-17, 2-18 and 2-19. The values of the parameters obtained from these three kinetic models are listed in Table 2-4.
0
5
10
15
20
25
30
35
3 4 5 6 7 8
qt (mg/g)
t1/2 (min1/2)
10×10-5 M
7×10⁻⁵ M
5×10⁻⁵ M
3×10⁻⁵ M
1×10⁻⁵ M
35
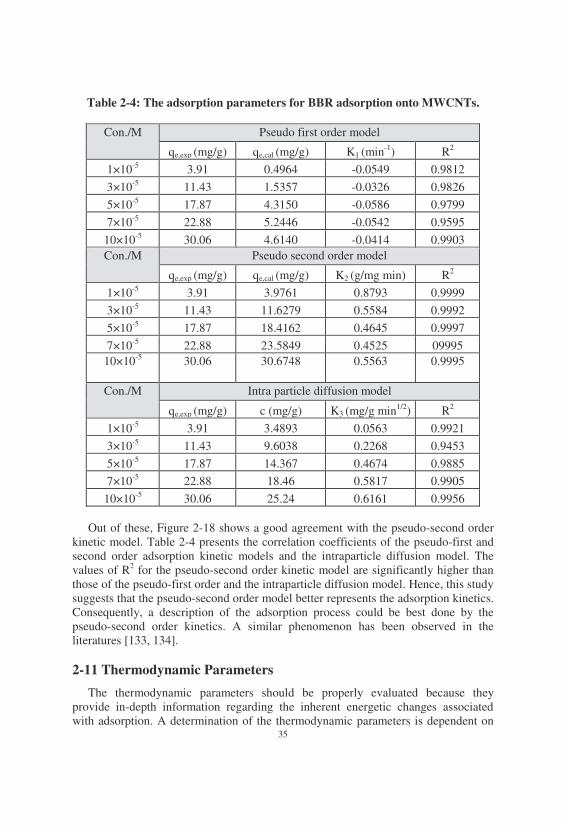
Table 2-4: The adsorption parameters for BBR adsorption onto MWCNTs.
Con./M Pseudo first order model
qe,exp (mg/g) qe,cal (mg/g) K1 (min-1) R2
1×10⁻⁵ 3.91 0.4964 -0.0549 0.9812
3×10⁻⁵ 11.43 1.5357 -0.0326 0.9826
5×10⁻⁵ 17.87 4.3150 -0.0586 0.9799
7×10⁻⁵ 22.88 5.2446 -0.0542 0.9595
10×10-5 30.06 4.6140 -0.0414 0.9903 Con./M Pseudo second order model
qe,exp (mg/g) qe,cal (mg/g) K2 (g/mg min) R2
1×10⁻⁵ 3.91 3.9761 0.8793 0.9999
3×10⁻⁵ 11.43 11.6279 0.5584 0.9992
5×10⁻⁵ 17.87 18.4162 0.4645 0.9997
7×10⁻⁵ 22.88 23.5849 0.4525 09995 10×10-5
30.06 30.6748
0.5563
0.9995
Con./M Intra particle diffusion model
qe,exp (mg/g) c (mg/g) K3 (mg/g min1/2) R2
1×10⁻⁵ 3.91 3.4893 0.0563 0.9921
3×10⁻⁵ 11.43 9.6038 0.2268 0.9453
5×10⁻⁵ 17.87 14.367 0.4674 0.9885
7×10⁻⁵ 22.88 18.46 0.5817 0.9905
10×10-5 30.06 25.24 0.6161 0.9956
Out of these, Figure 2-18 shows a good agreement with the pseudo-second order kinetic model. Table 2-4 presents the correlation coefficients of the pseudo-first and second order adsorption kinetic models and the intraparticle diffusion model. The values of R2 for the pseudo-second order kinetic model are significantly higher than those of the pseudo-first order and the intraparticle diffusion model. Hence, this study suggests that the pseudo-second order model better represents the adsorption kinetics. Consequently, a description of the adsorption process could be best done by the pseudo-second order kinetics. A similar phenomenon has been observed in the literatures [133, 134].
2-11 Thermodynamic Parameters
The thermodynamic parameters should be properly evaluated because they provide in-depth information regarding the inherent energetic changes associated with adsorption. A determination of the thermodynamic parameters is dependent on
36
the equilibrium adsorption constant, Kad. The thermodynamic parameters of the Gibbs energy change �G°, enthalpy change �H°, entropy change �S°, and activation energy Ea for the adsorption processes were calculated using the following equations:
��� � ��������� 2-15
��� � ���� ���� 2-16
������ � �����
���� ����
� 2-17
������ ��� � �� ��� � � ���
2-18
� � �� �����
2-19
where: R is the universal gas constant (8.314 J mol-1K-1), T is the absolute temperature in Kelvin, S* is the sticking probability, and � is the surface coverage. The sticking probability is a function of the adsorbate/adsorbent system under investigation; its value lies in the range 0<S*<1 for a preferable process, and is dependent on the temperature of the system [135]. Table 2-5 shows the different values of the sticking probability.
Table 2-5: The potential adsorption probability relationship between
adsorbate and adsorbent [135].
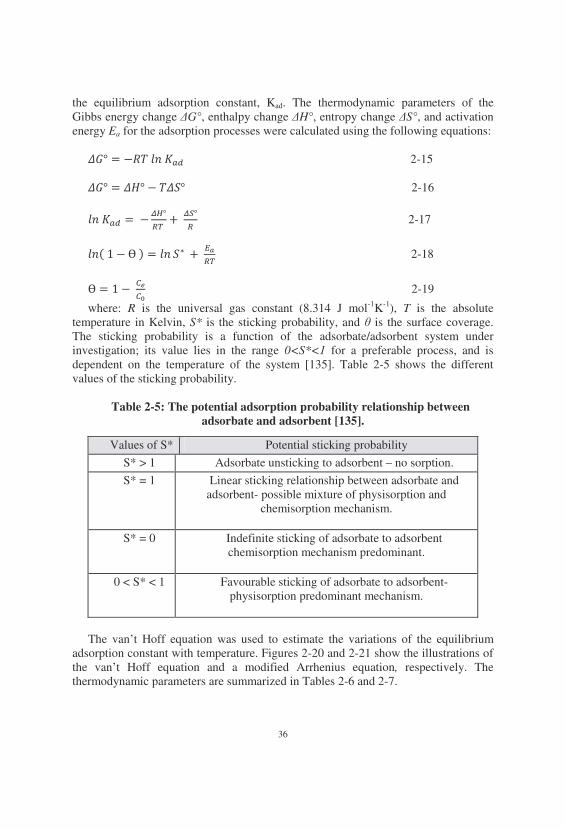
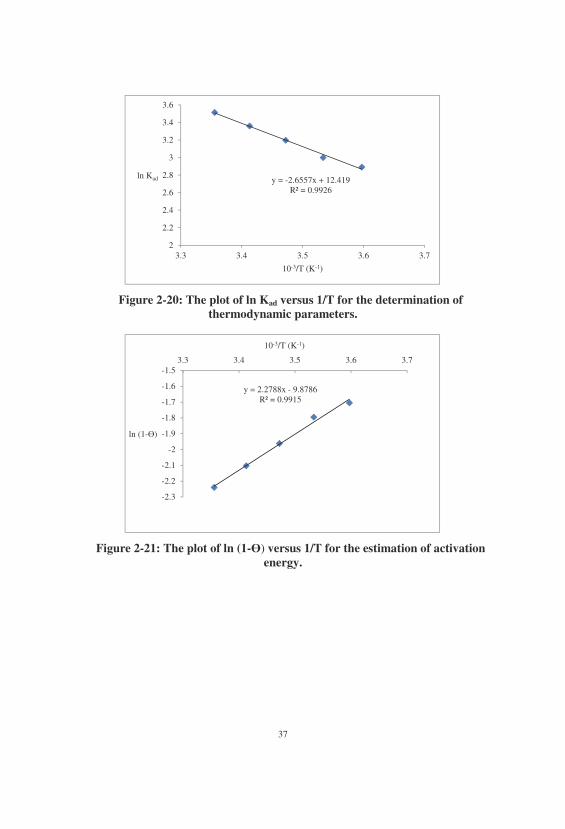
The van’t Hoff equation was used to estimate the variations of the equilibrium
adsorption constant with temperature. Figures 2-20 and 2-21 show the illustrations of the van’t Hoff equation and a modified Arrhenius equation, respectively. The thermodynamic parameters are summarized in Tables 2-6 and 2-7.
Values of S* Potential sticking probability
S* > 1 Adsorbate unsticking to adsorbent – no sorption.
S* = 1 Linear sticking relationship between adsorbate and adsorbent- possible mixture of physisorption and
chemisorption mechanism.
S* = 0 Indefinite sticking of adsorbate to adsorbent chemisorption mechanism predominant.
0 < S* < 1 Favourable sticking of adsorbate to adsorbent-
physisorption predominant mechanism.
37
Figure 2-20: The plot of ln Kad versus 1/T for the determination of thermodynamic parameters.
Figure 2-21: The plot of ln (1-�) versus 1/T for the estimation of activation energy.
y = -2.6557x + 12.419 R² = 0.9926
2
2.2
2.4
2.6
2.8
3
3.2
3.4
3.6
3.3 3.4 3.5 3.6 3.7
ln Kad
10-3/T (K-1)
y = 2.2788x - 9.8786 R² = 0.9915
-2.3
-2.2
-2.1
-2
-1.9
-1.8
-1.7
-1.6
-1.53.3 3.4 3.5 3.6 3.7
ln (1-�)
10-3/T (K-1)
38
Table 2-6: The thermodynamic parameters of the adsorption BBR onto MWCNTs.
Con./M
�G°/ k J mol-1 �H°/ k J
mol-1
Ea/kJ mol-1
S*
�S°/ J mol-1 K-1
5 °C 10 °C 15 °C 20 °C 25 °C
5×10⁻⁵ -6.68 -7.05 -7.65 -8.18 -8.70 22.08 18.94 0.00005 103.2
Table 2-7: The Gibbs energy change for different concentrations BBR at 25
°C.
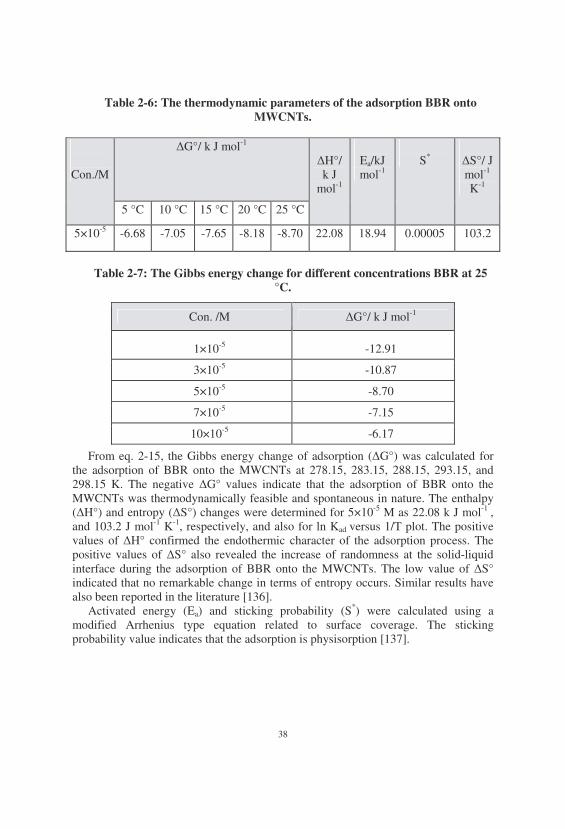
From eq. 2-15, the Gibbs energy change of adsorption (�G°) was calculated for the adsorption of BBR onto the MWCNTs at 278.15, 283.15, 288.15, 293.15, and 298.15 K. The negative �G° values indicate that the adsorption of BBR onto the MWCNTs was thermodynamically feasible and spontaneous in nature. The enthalpy (�H°) and entropy (�S°) changes were determined for 5×10⁻⁵ M as 22.08 k J mol-1 , and 103.2 J mol-1 K-1, respectively, and also for ln Kad versus 1/T plot. The positive values of �H° confirmed the endothermic character of the adsorption process. The positive values of �S° also revealed the increase of randomness at the solid-liquid interface during the adsorption of BBR onto the MWCNTs. The low value of �S° indicated that no remarkable change in terms of entropy occurs. Similar results have also been reported in the literature [136].
Activated energy (Ea) and sticking probability (S*) were calculated using a modified Arrhenius type equation related to surface coverage. The sticking probability value indicates that the adsorption is physisorption [137].
Con. /M �G°/ k J mol-1
1×10⁻⁵ -12.91
3×10⁻⁵ -10.87
5×10⁻⁵ -8.70
7×10⁻⁵ -7.15
10×10-5 -6.17
39
Chapter Three
Multiwall Carbon Nanotubes/Titanium Dioxide Composites as a photocatalyst
3-1 Titanium Dioxide
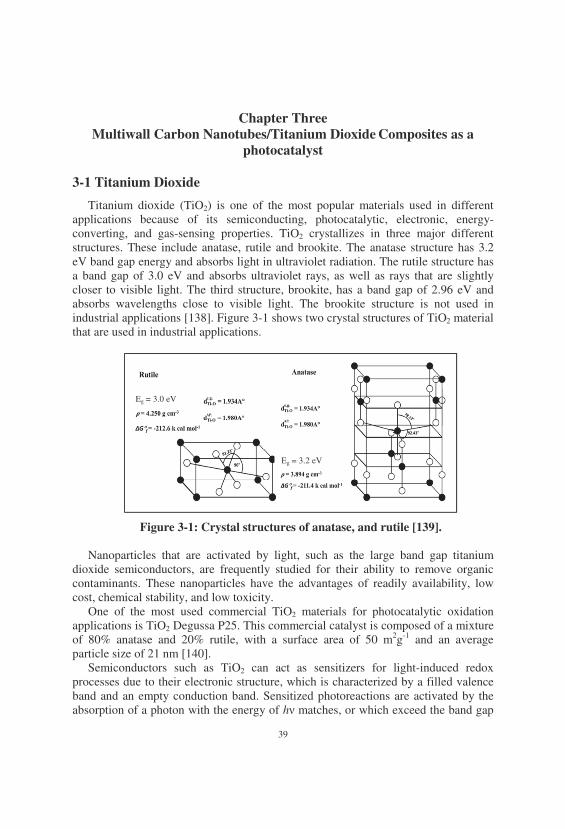
Titanium dioxide (TiO2) is one of the most popular materials used in different applications because of its semiconducting, photocatalytic, electronic, energy-converting, and gas-sensing properties. TiO2 crystallizes in three major different structures. These include anatase, rutile and brookite. The anatase structure has 3.2 eV band gap energy and absorbs light in ultraviolet radiation. The rutile structure has a band gap of 3.0 eV and absorbs ultraviolet rays, as well as rays that are slightly closer to visible light. The third structure, brookite, has a band gap of 2.96 eV and absorbs wavelengths close to visible light. The brookite structure is not used in industrial applications [138]. Figure 3-1 shows two crystal structures of TiO2 material that are used in industrial applications.
Figure 3-1: Crystal structures of anatase, and rutile [139]. Nanoparticles that are activated by light, such as the large band gap titanium
dioxide semiconductors, are frequently studied for their ability to remove organic contaminants. These nanoparticles have the advantages of readily availability, low cost, chemical stability, and low toxicity.
One of the most used commercial TiO2 materials for photocatalytic oxidation applications is TiO2 Degussa P25. This commercial catalyst is composed of a mixture of 80% anatase and 20% rutile, with a surface area of 50 m2g-1 and an average particle size of 21 nm [140].
Semiconductors such as TiO2 can act as sensitizers for light-induced redox processes due to their electronic structure, which is characterized by a filled valence band and an empty conduction band. Sensitized photoreactions are activated by the absorption of a photon with the energy of h� matches, or which exceed the band gap
Eg = 3.0 eV
Eg = 3.2 eV
40
energy (Eg) of the semiconductor catalyst. The absorption of photons leads to a charge separation due to the photoexcition of an electron (e−) from the valence band (VB) of the semiconductor catalyst to the conduction band (CB), thus generating a hole (h+) in the valence band. These electron-hole pairs have an oxidizing potential of 2.9 V vs. normal hydrogen electrode (NHE), which is enough to oxidize most pollutants.
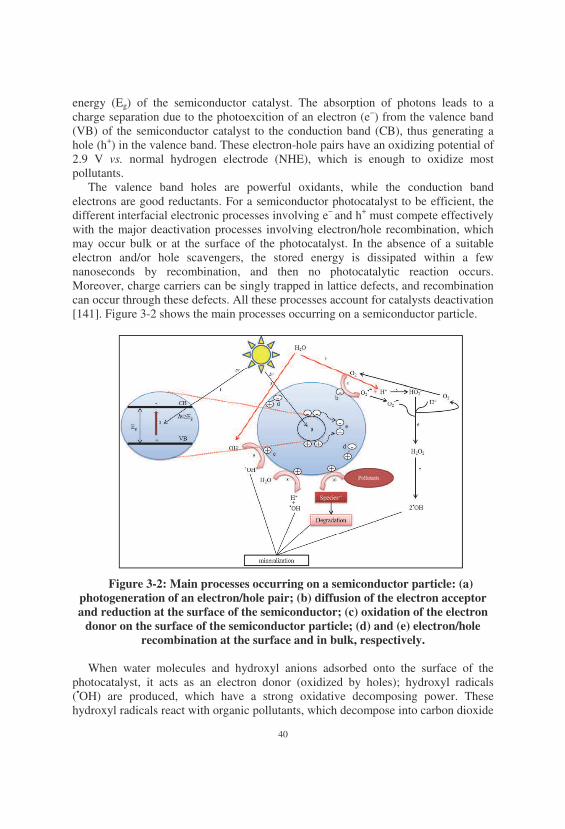
The valence band holes are powerful oxidants, while the conduction band electrons are good reductants. For a semiconductor photocatalyst to be efficient, the different interfacial electronic processes involving e− and h+ must compete effectively with the major deactivation processes involving electron/hole recombination, which may occur bulk or at the surface of the photocatalyst. In the absence of a suitable electron and/or hole scavengers, the stored energy is dissipated within a few nanoseconds by recombination, and then no photocatalytic reaction occurs. Moreover, charge carriers can be singly trapped in lattice defects, and recombination can occur through these defects. All these processes account for catalysts deactivation [141]. Figure 3-2 shows the main processes occurring on a semiconductor particle.
Figure 3-2: Main processes occurring on a semiconductor particle: (a) photogeneration of an electron/hole pair; (b) diffusion of the electron acceptor and reduction at the surface of the semiconductor; (c) oxidation of the electron
donor on the surface of the semiconductor particle; (d) and (e) electron/hole recombination at the surface and in bulk, respectively.
When water molecules and hydroxyl anions adsorbed onto the surface of the
photocatalyst, it acts as an electron donor (oxidized by holes); hydroxyl radicals (•OH) are produced, which have a strong oxidative decomposing power. These hydroxyl radicals react with organic pollutants, which decompose into carbon dioxide
41
and water. Also, organic pollutants can react directly with the positive holes, resulting in oxidative decomposition. At the same time, molecular oxygen adsorbed onto the surface of the semiconductor photocatalyst acts as an electron acceptor (reducted by an electron). This reduction reaction leads to form superoxide anions (O2
•-). The reduction of oxygen consumes electrons, reducing the rate of recombination with positive holes in the valence band. The overall process can be described by the following reactions:
TiO2 + hv � TiO2 (e
–CB + h+
VB) ������������������������������������������������������������������������������� 3-1 TiO2 (e
–CB + h+
VB) � e–CB + h+
VB �������������������������������������������������������������������������� 3-2 TiO2 (e
–CB + h+
VB) � TiO2 + hv ��������������������������������������������������������������������� 3-3 H2O � H+ + OH– �
�������������������������������������������������������������������������������������������������� 3-4 e–
CB + O2 � O2˙–
������������������������������������������������������������������������������������������������� 3-5
O2˙– + H+ � HO2
.������������������������������������������������������������������������������������������������������ 3-6
HO2˙ + O2˙– + H+
� H2O2 + O2 3-7 H2O2 � 2˙OH 3-8 h+
VB + H2O � ˙OH + H+ 3-9 h+
VB + OH– � ˙OH 3-10
Dye + TiO2 (h+
VB) � Dye+˙ + TiO2 3-11 ˙OH + Dye � Intermediate � Mineralization 3-12
As in the previous description, the semiconducting properties of TiO2 materials
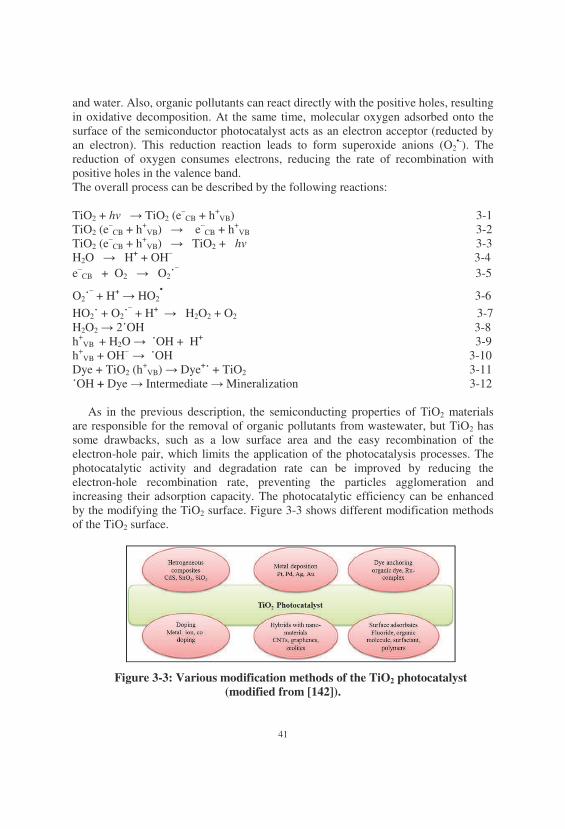
are responsible for the removal of organic pollutants from wastewater, but TiO2 has some drawbacks, such as a low surface area and the easy recombination of the electron-hole pair, which limits the application of the photocatalysis processes. The photocatalytic activity and degradation rate can be improved by reducing the electron-hole recombination rate, preventing the particles agglomeration and increasing their adsorption capacity. The photocatalytic efficiency can be enhanced by the modifying the TiO2 surface. Figure 3-3 shows different modification methods of the TiO2 surface.
Figure 3-3: Various modification methods of the TiO2 photocatalyst (modified from [142]).
42
3-2 Carbon Nanotubes Nanocomposites
A nanocomposite is defined as a material of more than one solid phase, where at least one of its dimensions is on a nanometer scale. The production of nanocomposites opens up an attractive route to obtain new compounds that can meet a broad range of applications.
The composites consist of different components; superior physical and chemical characteristics of these new materials can be achieved. Therefore, the development of nanoparticle-modified composites is currently one of the most explored areas in materials science [143].
A range of catalysts have been deposited onto the surfaces of MWCNTs. The most commonly reported have been metals, such as palladium, silver, gold, iron, aluminum, lead, nickel, ruthenium, and platinum. The production of nanoparticle metal/ MWCNTs heterostructures is both of fundamental and technological interest. Combining the unique properties of CNTs and nanoparticles, a new class of nanocomposites can be made to meet a broad range of advanced applications [144, 145]. Metals/MWCNTs can be used in fuel cell electrodes. MWCNTs supporting platinum promise to be an effective anode electrocatalyst in a direct methane fuel cells (DMFCs). Recently, much attention has been paid to the use of carbon nanotubes in polymer nanocomposite materials to harness their exceptional properties [146].
3-3 Carbon Nanotubes/Titanium Dioxide Composite
Carbonaceous materials/TiO2 composites have been shown to demonstrate similar photoelectrochemical enhancements to metal co-doped TiO2. In carbon/titanium dioxide composites, photocatalytic enhancement is generally attributed to electron capture by the carbon material and in the surface recombination rate. A red shift in the absorption wavelength of TiO2 has been observed for carbon/titanium dioxide composites due to the formation of Ti–C/Ti–O–C states [147]. In recent years, titanium dioxide nanoparticles supported on CNTs have been extensively studied and found to be an effective photocatalyst for the removal of hazardous organic chemicals from wastewater [148]. CNTs/TiO2 nanocomposites can be prepared by different methods, which fall into two basic classes. The first class involves the prior synthesis of TiO2 nanoparticles, which are thereafter connected to surface functionalized MWCNTs by either covalent or noncovalent interactions. The second class is a one-step method, which involves the direct deposition of TiO2 nanoparticles onto MWCNTs surfaces, and the in situ formation of nanoparticles through redox reactions or electrochemical deposition onto CNTs [149]. The important issues that must be considered to obtain heterostructures with enhanced TiO2 properties are the efficient chemical functionalization of CNTs, homogeneous dispersion in solvents, and good interconnectivity with TiO2. The effective utilization of CNTs in composite applications strongly depends on their ability to disperse homogeneously. Chemical modifications have become an important issue due to the poor solubility of CNTs in almost any solvent. The chemical modification of CNTs ensures the good dispersion
43
of nanotubes within a medium and enhances their interconnectivity with titanium dioxide [150, 151].
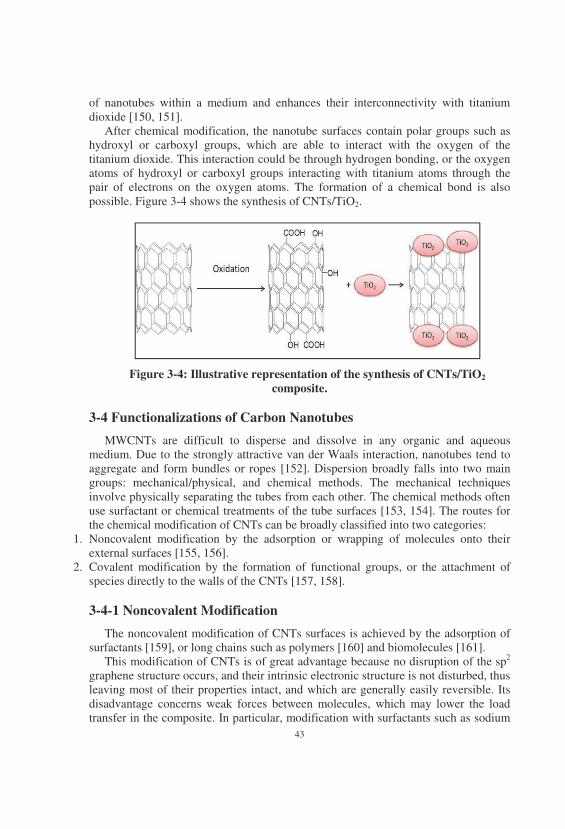
After chemical modification, the nanotube surfaces contain polar groups such as hydroxyl or carboxyl groups, which are able to interact with the oxygen of the titanium dioxide. This interaction could be through hydrogen bonding, or the oxygen atoms of hydroxyl or carboxyl groups interacting with titanium atoms through the pair of electrons on the oxygen atoms. The formation of a chemical bond is also possible. Figure 3-4 shows the synthesis of CNTs/TiO2.
Figure 3-4: Illustrative representation of the synthesis of CNTs/TiO2 composite.
3-4 Functionalizations of Carbon Nanotubes
MWCNTs are difficult to disperse and dissolve in any organic and aqueous medium. Due to the strongly attractive van der Waals interaction, nanotubes tend to aggregate and form bundles or ropes [152]. Dispersion broadly falls into two main groups: mechanical/physical, and chemical methods. The mechanical techniques involve physically separating the tubes from each other. The chemical methods often use surfactant or chemical treatments of the tube surfaces [153, 154]. The routes for the chemical modification of CNTs can be broadly classified into two categories:
1. Noncovalent modification by the adsorption or wrapping of molecules onto their external surfaces [155, 156].
2. Covalent modification by the formation of functional groups, or the attachment of species directly to the walls of the CNTs [157, 158]. 3-4-1 Noncovalent Modification
The noncovalent modification of CNTs surfaces is achieved by the adsorption of surfactants [159], or long chains such as polymers [160] and biomolecules [161].
This modification of CNTs is of great advantage because no disruption of the sp2 graphene structure occurs, and their intrinsic electronic structure is not disturbed, thus leaving most of their properties intact, and which are generally easily reversible. Its disadvantage concerns weak forces between molecules, which may lower the load transfer in the composite. In particular, modification with surfactants such as sodium
44
dodecyl sulphate (SDS) or biological polymers to yield water-soluble CNTs are of great importance to the potential biomedical applications of CNTs [162]. 3-4-2 Covalent Modification
A wide range of routes have been developed for the covalent functionalization of MWCNTs. The covalent functionalization of MWCNTs produces defects in the wall structure of the nanotubes. Covalent modification involves bond breaking across the surface of the MWCNTs, which disrupts the delocalized � electron systems and fractures the � bonds, leading to possible losses in the optical, mechanical, and electrical properties of the nanotubes [163].
The advantage of this type of modification is the improvement of the efficiency of the bonding between nanotubes and the host material [164].
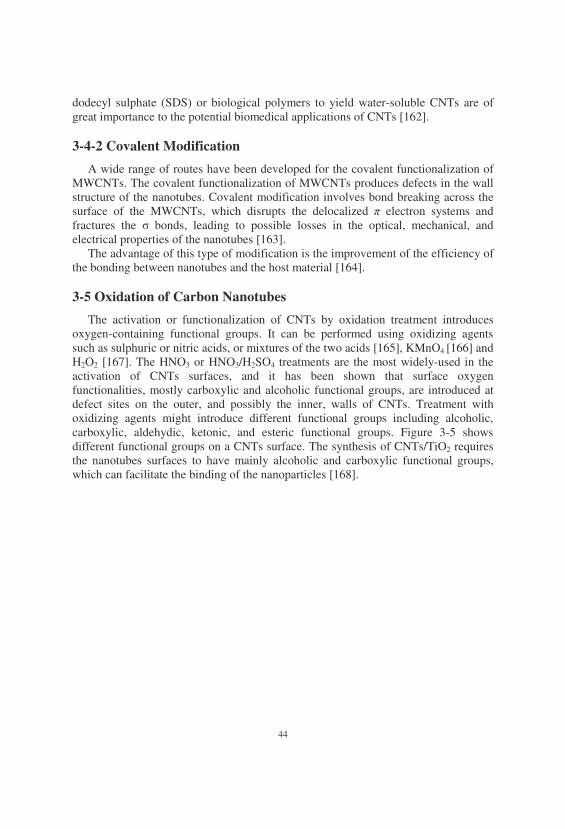
3-5 Oxidation of Carbon Nanotubes
The activation or functionalization of CNTs by oxidation treatment introduces oxygen-containing functional groups. It can be performed using oxidizing agents such as sulphuric or nitric acids, or mixtures of the two acids [165], KMnO4 [166] and H2O2 [167]. The HNO3 or HNO3/H2SO4 treatments are the most widely-used in the activation of CNTs surfaces, and it has been shown that surface oxygen functionalities, mostly carboxylic and alcoholic functional groups, are introduced at defect sites on the outer, and possibly the inner, walls of CNTs. Treatment with oxidizing agents might introduce different functional groups including alcoholic, carboxylic, aldehydic, ketonic, and esteric functional groups. Figure 3-5 shows different functional groups on a CNTs surface. The synthesis of CNTs/TiO2 requires the nanotubes surfaces to have mainly alcoholic and carboxylic functional groups, which can facilitate the binding of the nanoparticles [168].
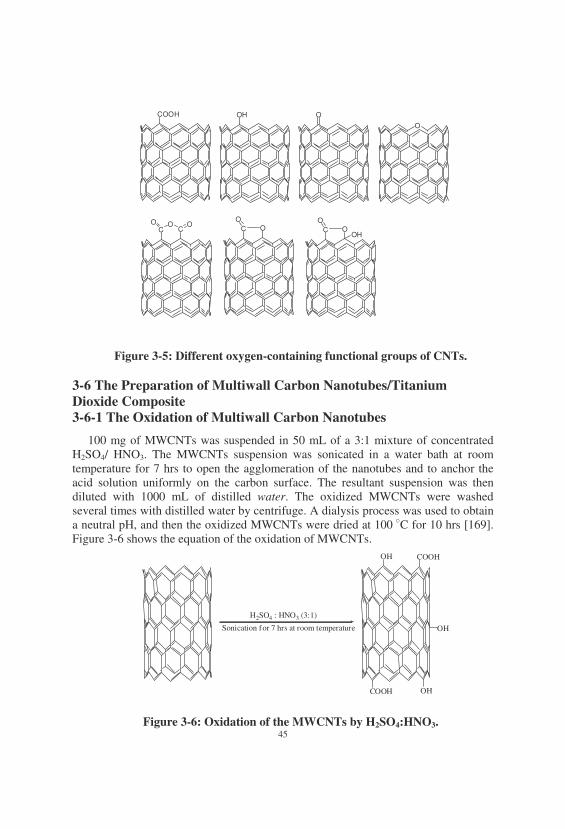
45
Figure 3-5: Different oxygen-containing functional groups of CNTs. 3-6 The Preparation of Multiwall Carbon Nanotubes/Titanium Dioxide Composite 3-6-1 The Oxidation of Multiwall Carbon Nanotubes
100 mg of MWCNTs was suspended in 50 mL of a 3:1 mixture of concentrated H2SO4/ HNO3. The MWCNTs suspension was sonicated in a water bath at room temperature for 7 hrs to open the agglomeration of the nanotubes and to anchor the acid solution uniformly on the carbon surface. The resultant suspension was then diluted with 1000 mL of distilled water. The oxidized MWCNTs were washed several times with distilled water by centrifuge. A dialysis process was used to obtain a neutral pH, and then the oxidized MWCNTs were dried at 100 �C for 10 hrs [169]. Figure 3-6 shows the equation of the oxidation of MWCNTs.
Figure 3-6: Oxidation of the MWCNTs by H2SO4:HNO3.
O
OH OCOOH
CO O
CO
CO
O CO
OOH
H2SO4 : HNO3 (3:1)
Sonication for 7 hrs at room temperature
OH COOH
COOH
OH
OH
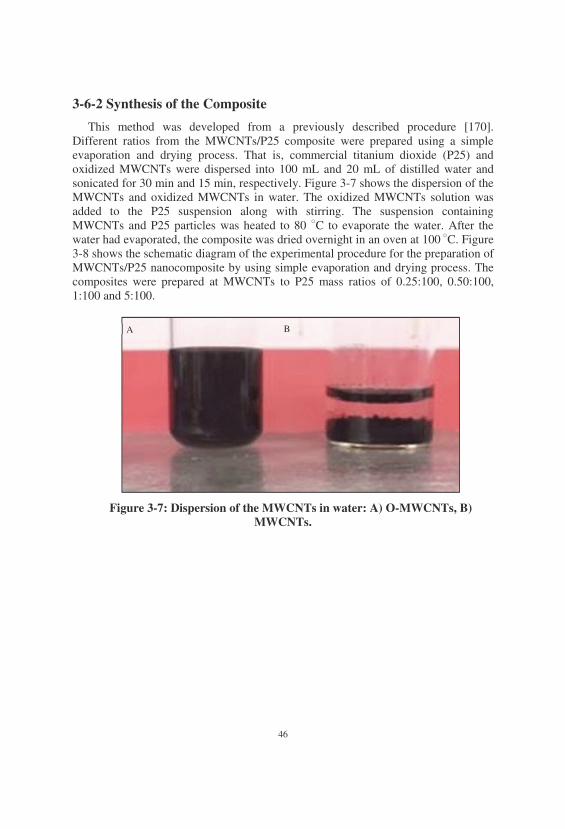
46
3-6-2 Synthesis of the Composite
This method was developed from a previously described procedure [170]. Different ratios from the MWCNTs/P25 composite were prepared using a simple evaporation and drying process. That is, commercial titanium dioxide (P25) and oxidized MWCNTs were dispersed into 100 mL and 20 mL of distilled water and sonicated for 30 min and 15 min, respectively. Figure 3-7 shows the dispersion of the MWCNTs and oxidized MWCNTs in water. The oxidized MWCNTs solution was added to the P25 suspension along with stirring. The suspension containing MWCNTs and P25 particles was heated to 80 �C to evaporate the water. After the water had evaporated, the composite was dried overnight in an oven at 100 �C. Figure 3-8 shows the schematic diagram of the experimental procedure for the preparation of MWCNTs/P25 nanocomposite by using simple evaporation and drying process. The composites were prepared at MWCNTs to P25 mass ratios of 0.25:100, 0.50:100, 1:100 and 5:100.
Figure 3-7: Dispersion of the MWCNTs in water: A) O-MWCNTs, B) MWCNTs.
A B
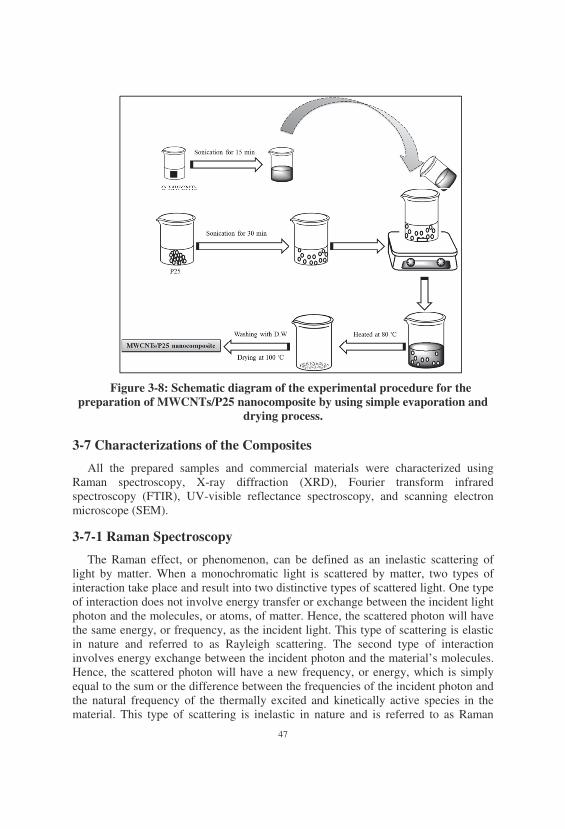
47
Figure 3-8: Schematic diagram of the experimental procedure for the preparation of MWCNTs/P25 nanocomposite by using simple evaporation and
drying process. 3-7 Characterizations of the Composites
All the prepared samples and commercial materials were characterized using Raman spectroscopy, X-ray diffraction (XRD), Fourier transform infrared spectroscopy (FTIR), UV-visible reflectance spectroscopy, and scanning electron microscope (SEM).
3-7-1 Raman Spectroscopy
The Raman effect, or phenomenon, can be defined as an inelastic scattering of light by matter. When a monochromatic light is scattered by matter, two types of interaction take place and result into two distinctive types of scattered light. One type of interaction does not involve energy transfer or exchange between the incident light photon and the molecules, or atoms, of matter. Hence, the scattered photon will have the same energy, or frequency, as the incident light. This type of scattering is elastic in nature and referred to as Rayleigh scattering. The second type of interaction involves energy exchange between the incident photon and the material’s molecules. Hence, the scattered photon will have a new frequency, or energy, which is simply equal to the sum or the difference between the frequencies of the incident photon and the natural frequency of the thermally excited and kinetically active species in the material. This type of scattering is inelastic in nature and is referred to as Raman
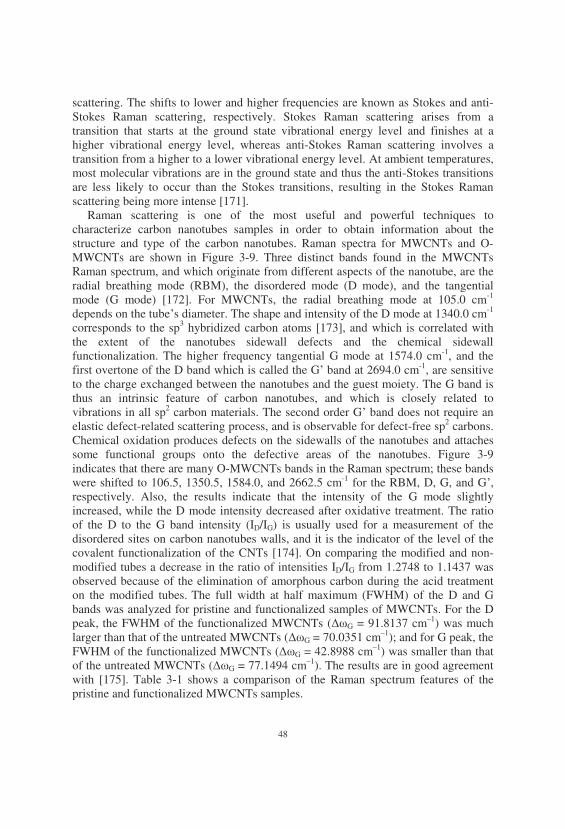
48
scattering. The shifts to lower and higher frequencies are known as Stokes and anti-Stokes Raman scattering, respectively. Stokes Raman scattering arises from a transition that starts at the ground state vibrational energy level and finishes at a higher vibrational energy level, whereas anti-Stokes Raman scattering involves a transition from a higher to a lower vibrational energy level. At ambient temperatures, most molecular vibrations are in the ground state and thus the anti-Stokes transitions are less likely to occur than the Stokes transitions, resulting in the Stokes Raman scattering being more intense [171].
Raman scattering is one of the most useful and powerful techniques to characterize carbon nanotubes samples in order to obtain information about the structure and type of the carbon nanotubes. Raman spectra for MWCNTs and O-MWCNTs are shown in Figure 3-9. Three distinct bands found in the MWCNTs Raman spectrum, and which originate from different aspects of the nanotube, are the radial breathing mode (RBM), the disordered mode (D mode), and the tangential mode (G mode) [172]. For MWCNTs, the radial breathing mode at 105.0 cm-1 depends on the tube�s diameter. The shape and intensity of the D mode at 1340.0 cm-1 corresponds to the sp3 hybridized carbon atoms [173], and which is correlated with the extent of the nanotubes sidewall defects and the chemical sidewall functionalization. The higher frequency tangential G mode at 1574.0 cm-1, and the first overtone of the D band which is called the G� band at 2694.0 cm-1, are sensitive to the charge exchanged between the nanotubes and the guest moiety. The G band is thus an intrinsic feature of carbon nanotubes, and which is closely related to vibrations in all sp2 carbon materials. The second order G� band does not require an elastic defect-related scattering process, and is observable for defect-free sp2 carbons. Chemical oxidation produces defects on the sidewalls of the nanotubes and attaches some functional groups onto the defective areas of the nanotubes. Figure 3-9 indicates that there are many O-MWCNTs bands in the Raman spectrum; these bands were shifted to 106.5, 1350.5, 1584.0, and 2662.5 cm-1 for the RBM, D, G, and G�, respectively. Also, the results indicate that the intensity of the G mode slightly increased, while the D mode intensity decreased after oxidative treatment. The ratio of the D to the G band intensity (ID/IG) is usually used for a measurement of the disordered sites on carbon nanotubes walls, and it is the indicator of the level of the covalent functionalization of the CNTs [174]. On comparing the modified and non-modified tubes a decrease in the ratio of intensities ID/IG from 1.2748 to 1.1437 was observed because of the elimination of amorphous carbon during the acid treatment on the modified tubes. The full width at half maximum (FWHM) of the D and G bands was analyzed for pristine and functionalized samples of MWCNTs. For the D peak, the FWHM of the functionalized MWCNTs (��G = 91.8137 cm–1) was much larger than that of the untreated MWCNTs (��G = 70.0351 cm–1); and for G peak, the FWHM of the functionalized MWCNTs (��G = 42.8988 cm–1) was smaller than that of the untreated MWCNTs (��G = 77.1494 cm–1). The results are in good agreement with [175]. Table 3-1 shows a comparison of the Raman spectrum features of the pristine and functionalized MWCNTs samples.
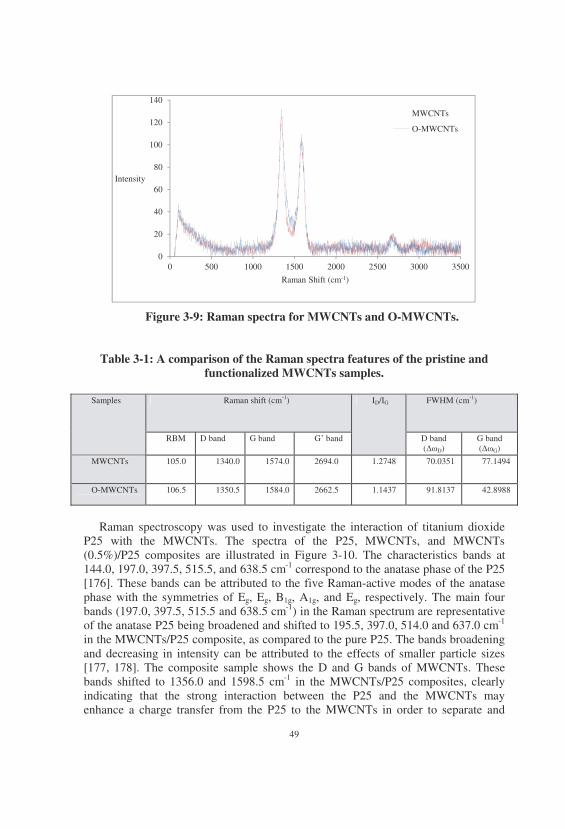
49
Figure 3-9: Raman spectra for MWCNTs and O-MWCNTs.
Table 3-1: A comparison of the Raman spectra features of the pristine and functionalized MWCNTs samples.
Samples Raman shift (cm-1) ID/IG FWHM (cm-1)
RBM D band G band G� band D band (��D)
G band (��G)
MWCNTs 105.0 1340.0 1574.0 2694.0 1.2748 70.0351 77.1494
O-MWCNTs 106.5 1350.5 1584.0 2662.5 1.1437 91.8137 42.8988
Raman spectroscopy was used to investigate the interaction of titanium dioxide
P25 with the MWCNTs. The spectra of the P25, MWCNTs, and MWCNTs (0.5%)/P25 composites are illustrated in Figure 3-10. The characteristics bands at 144.0, 197.0, 397.5, 515.5, and 638.5 cm-1 correspond to the anatase phase of the P25 [176]. These bands can be attributed to the five Raman-active modes of the anatase phase with the symmetries of Eg, Eg, B1g, A1g, and Eg, respectively. The main four bands (197.0, 397.5, 515.5 and 638.5 cm-1) in the Raman spectrum are representative of the anatase P25 being broadened and shifted to 195.5, 397.0, 514.0 and 637.0 cm-1 in the MWCNTs/P25 composite, as compared to the pure P25. The bands broadening and decreasing in intensity can be attributed to the effects of smaller particle sizes [177, 178]. The composite sample shows the D and G bands of MWCNTs. These bands shifted to 1356.0 and 1598.5 cm-1 in the MWCNTs/P25 composites, clearly indicating that the strong interaction between the P25 and the MWCNTs may enhance a charge transfer from the P25 to the MWCNTs in order to separate and
0
20
40
60
80
100
120
140
0 500 1000 1500 2000 2500 3000 3500
Intensity
Raman Shift (cm-1)
MWCNTs
O-MWCNTs
50
stabilize the charge and thereby hinder charge recombination [179-181]. Table 3-2 shows comparison of the Raman spectra features of the P25 and the MWCNTs/P25 composites samples.
Figure 3-10: Raman spectra for P25, MWCNTs (0.5%)/P25 and MWCNTs.
Table 3-2: A comparison of the Raman spectra features of the P25 and the
MWCNTs/P25 composite samples.
Samples Raman shift (cm-1) ID/IG Eg Eg B1g A1g Eg D band G band
P25 144.0 197 397.5 515.5 638.5 …… …… ……
MWCNTs/P25 144.0 195.5 397.0 514.0 637.0 1356.0 1598.5 0.7790
3-7-2 X-ray Diffraction Spectroscopy (XRD)
XRD data were employed to calculate the average crystallite sizes (D) by Scherrer's formula in the following equation [182]:
� � ��
����� 3-13
where: D is the average crystal size, k = 0.94 is the constant crystal lattice, � = 0.154 nm is the X-ray wavelength of Cu K�, � is the full width of the peak measured at half maximum intensity and � is the Bragg’s angle of the peak.
0
500
1000
1500
2000
2500
3000
3500
4000
0 500 1000 1500 2000 2500
Intensity
Raman Shift (cm-1)
P25
MWCNTs (0.5%)/P25
MWCNTs
0
50
100
150
1200 1300 1400 1500 1600 17000
200
400
375 475 575 675
0
2000
4000
110 130 150 170
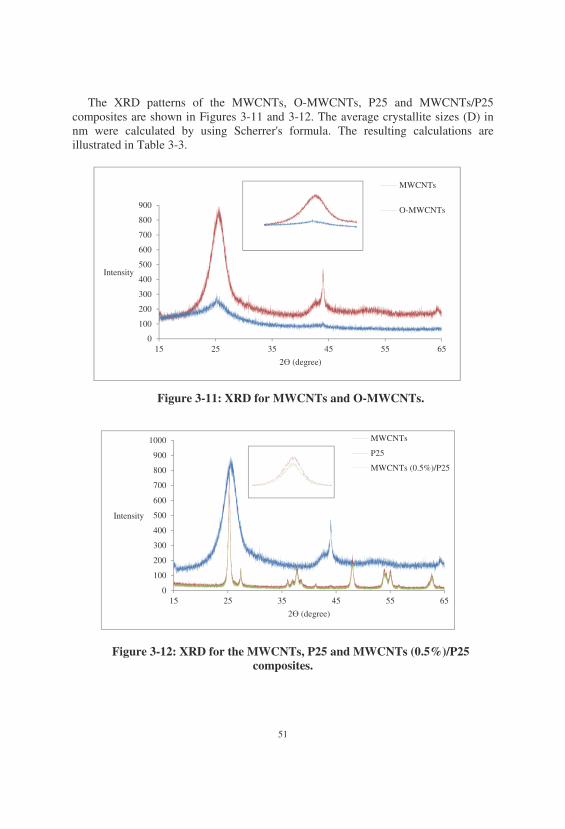
51
The XRD patterns of the MWCNTs, O-MWCNTs, P25 and MWCNTs/P25 composites are shown in Figures 3-11 and 3-12. The average crystallite sizes (D) in nm were calculated by using Scherrer's formula. The resulting calculations are illustrated in Table 3-3.
Figure 3-11: XRD for MWCNTs and O-MWCNTs.
Figure 3-12: XRD for the MWCNTs, P25 and MWCNTs (0.5%)/P25 composites.
0
100
200
300
400
500
600
700
800
900
15 25 35 45 55 65
Intensity
2� (degree)
MWCNTs
O-MWCNTs
0
100
200
300
400
500
600
700
800
900
1000
15 25 35 45 55 65
Intensity
2� (degree)
MWCNTs
P25
MWCNTs (0.5%)/P25
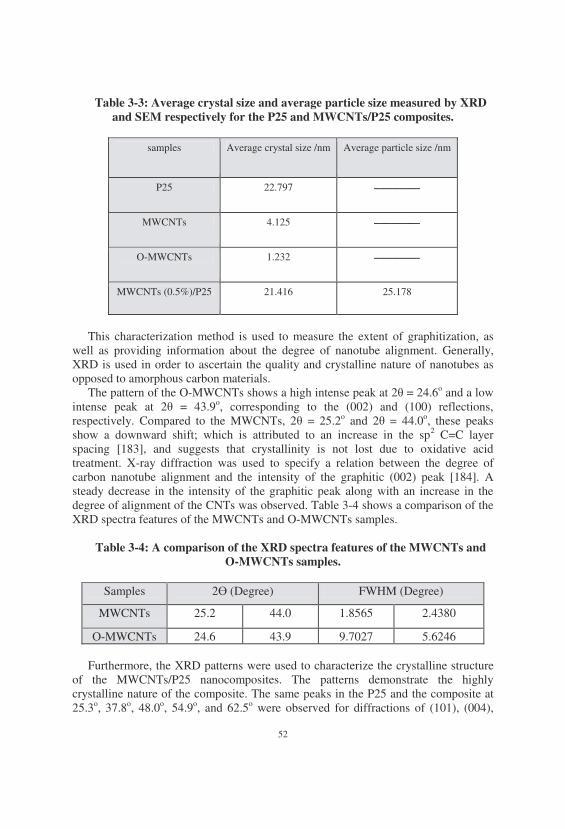
52
Table 3-3: Average crystal size and average particle size measured by XRD and SEM respectively for the P25 and MWCNTs/P25 composites.
Average particle size /nm Average crystal size /nm samples
��������������������� 22.797 P25
��������������������� 4.125 MWCNTs
��������������������� 1.232 O-MWCNTs
25.178 21.416 MWCNTs (0.5%)/P25
This characterization method is used to measure the extent of graphitization, as
well as providing information about the degree of nanotube alignment. Generally, XRD is used in order to ascertain the quality and crystalline nature of nanotubes as opposed to amorphous carbon materials.
The pattern of the O-MWCNTs shows a high intense peak at 2� = 24.6o and a low intense peak at 2� = 43.9o, corresponding to the (002) and (100) reflections, respectively. Compared to the MWCNTs, 2� = 25.2o and 2� = 44.0o, these peaks show a downward shift; which is attributed to an increase in the sp2 C=C layer spacing [183], and suggests that crystallinity is not lost due to oxidative acid treatment. X-ray diffraction was used to specify a relation between the degree of carbon nanotube alignment and the intensity of the graphitic (002) peak [184]. A steady decrease in the intensity of the graphitic peak along with an increase in the degree of alignment of the CNTs was observed. Table 3-4 shows a comparison of the XRD spectra features of the MWCNTs and O-MWCNTs samples.
Table 3-4: A comparison of the XRD spectra features of the MWCNTs and
O-MWCNTs samples.
Samples 2� (Degree) FWHM (Degree)
MWCNTs 25.2 44.0 1.8565 2.4380
O-MWCNTs 24.6 43.9 9.7027 5.6246
Furthermore, the XRD patterns were used to characterize the crystalline structure of the MWCNTs/P25 nanocomposites. The patterns demonstrate the highly crystalline nature of the composite. The same peaks in the P25 and the composite at 25.3o, 37.8o, 48.0o, 54.9o, and 62.5o were observed for diffractions of (101), (004),
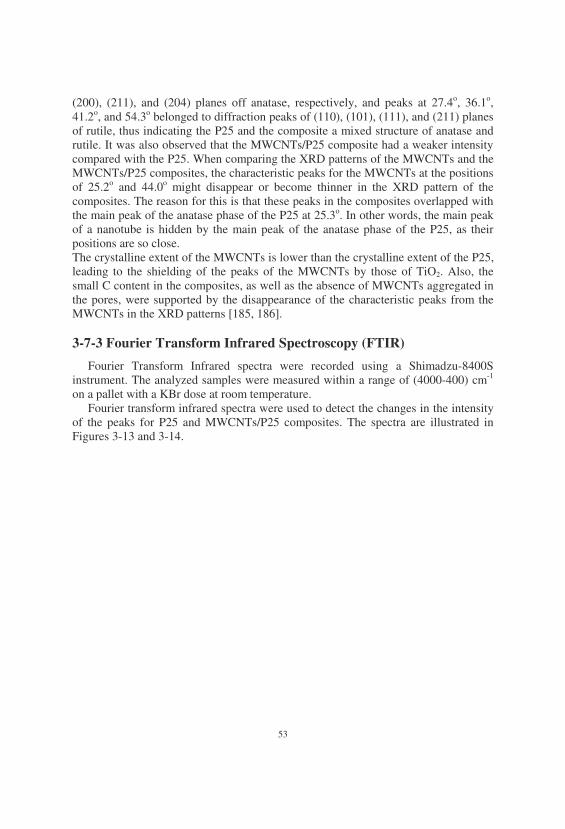
53
(200), (211), and (204) planes off anatase, respectively, and peaks at 27.4o, 36.1o, 41.2o, and 54.3o belonged to diffraction peaks of (110), (101), (111), and (211) planes of rutile, thus indicating the P25 and the composite a mixed structure of anatase and rutile. It was also observed that the MWCNTs/P25 composite had a weaker intensity compared with the P25. When comparing the XRD patterns of the MWCNTs and the MWCNTs/P25 composites, the characteristic peaks for the MWCNTs at the positions of 25.2o and 44.0o might disappear or become thinner in the XRD pattern of the composites. The reason for this is that these peaks in the composites overlapped with the main peak of the anatase phase of the P25 at 25.3o. In other words, the main peak of a nanotube is hidden by the main peak of the anatase phase of the P25, as their positions are so close. The crystalline extent of the MWCNTs is lower than the crystalline extent of the P25, leading to the shielding of the peaks of the MWCNTs by those of TiO2. Also, the small C content in the composites, as well as the absence of MWCNTs aggregated in the pores, were supported by the disappearance of the characteristic peaks from the MWCNTs in the XRD patterns [185, 186]. 3-7-3 Fourier Transform Infrared Spectroscopy (FTIR)
Fourier Transform Infrared spectra were recorded using a Shimadzu-8400S instrument. The analyzed samples were measured within a range of (4000-400) cm-1 on a pallet with a KBr dose at room temperature.
Fourier transform infrared spectra were used to detect the changes in the intensity of the peaks for P25 and MWCNTs/P25 composites. The spectra are illustrated in Figures 3-13 and 3-14.
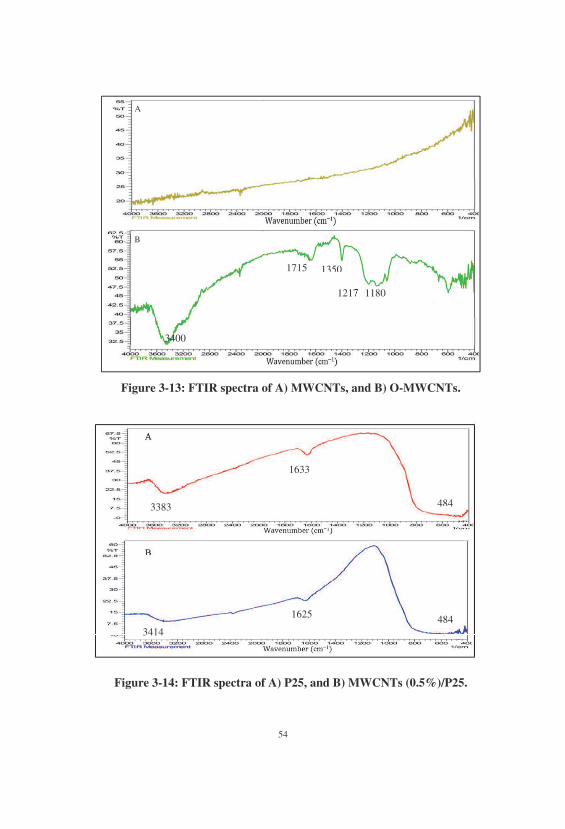
54
Figure 3-13: FTIR spectra of A) MWCNTs, and B) O-MWCNTs.
Figure 3-14: FTIR spectra of A) P25, and B) MWCNTs (0.5%)/P25.
A
B
1715
3400
1350
1217 1180
1633
1625
3414
3383 484
484
55
The Fourier transform infrared spectral data were used to study the carboxylic group functionalization of the MWCNTs. In Figure 3-13 A and B, the FTIR spectra of the MWCNTs and O-MWCNTs are illustrated within a range of 400-4000 cm-1. Figure 3-13 A shows the FTIR spectrum of the MWCNTs, which was a carbon-based material with the absence of any absorption within a range of 400-4000 cm-1. Figure 3-13 B is the FTIR of the O–MWCNTs, showing an absorption peak at 1715 cm−1, corresponding to the stretching vibration of C=O from the carboxylic groups (–COOH). The peak at around 3400 cm−1 corresponds to OH stretching. This peak can be assigned to the hydroxylic group of alcohol or carboxylic groups. A shoulder band at 1350 cm-1 may be due to C=C stretching vibrations. The broad peaks at 1217 cm−1 and 1180 cm-1 could be due to O-H bending and C-O stretching from the phenol or lactone groups, respectively. Similar observations of the FTIR spectra for the MWCNT-COOH were reported by Theodore et al. [187], and Wu et al. [188]. The FTIR spectra for the P25 and the MWCNTs/P25 composites are shown in Figure 3-14 A and B, respectively, the three obvious peaks which correspond to the Ti-O bond at 484 cm-1, the H-O bond at 1633 cm-1, and H bond at 3383 cm-1, possibly arising from the intermolecular condensation of TiO2. However, the three absorption peaks of the MWCNTs/P25 composite shifted towards higher wavelengths due to stronger interactions between the polar groups on the P25 and MWCNTs. The peak at 484 cm-
1 in the MWCNTs/P25 composite spectrum is sharper than that of the pure P25, which may be attributed to the changes in size and crystallinity [189, 190].
3-7-4 UV-visible Reflectance Spectroscopy
Band gap energies of P25 and MWCNTs/P25 composites were determined via the measurement of reflectance data R using a Cary 100 Scan UV-visible spectrophotometer system. This is equipped with a Labsphere integrating sphere diffusing reflectance accessory for diffuse reflectance spectra by employing BaSO4 as a reference material. The measured reflectance data (R) were transformed to the Kubelka-Munk function F(R) by the following equation [191]:
����� � � ������
�� 3-14
������������ � �������
��� ���
���
� 3-
15 The band gap energy for all the samples was measured from the plot of (F(R).E)1/2
versus (E) energy of light (hv) in eV. This depended on the intersection of the tangent via the point of inflection in the absorption band and the photon energy axis.
The UV-visible diffuse reflectance spectra of the P25 and MWCNTs/P25 composites were recorded to investigate the optical band gap energy. The spectra are shown in Figures 3-15 and 3-16, and the results are listed in Table 3-5.
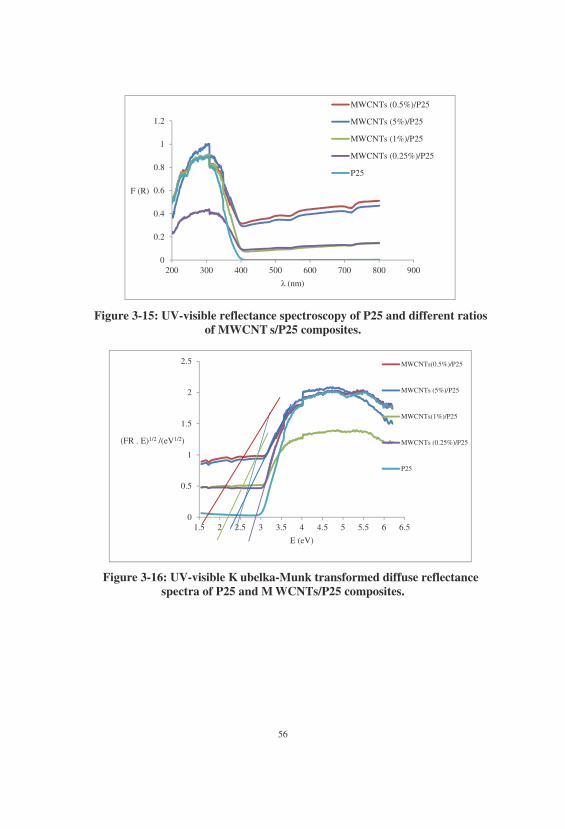
56
Figure 3-15: UV-visible reflectance spectroscopy of P25 and different ratios of MWCNT s/P25 composites.
Figure 3-16: UV-visible K ubelka-Munk transformed diffuse reflectance spectra of P25 and M WCNTs/P25 composites.
0
0.2
0.4
0.6
0.8
1
1.2
200 300 400 500 600 700 800 900
F (R)
� (nm)
MWCNTs (0.5%)/P25
MWCNTs (5%)/P25
MWCNTs (1%)/P25
MWCNTs (0.25%)/P25
P25
0
0.5
1
1.5
2
2.5
1.5 2 2.5 3 3.5 4 4.5 5 5.5 6 6.5
(FR . E)1/2 /(eV1/2)
E (eV)
MWCNTs(0.5%)/P25
MWCNTs (5%)/P25
MWCNTs(1%)/P25
MWCNTs (0.25%)/P25
P25
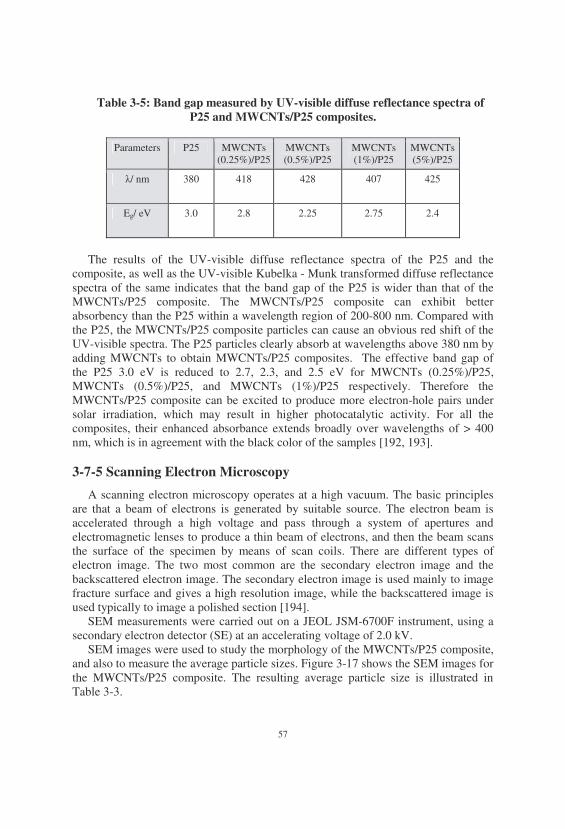
57
Table 3-5: Band gap measured by UV-visible diffuse reflectance spectra of P25 and MWCNTs/P25 composites.
MWCNTs (5%)/P25
MWCNTs (1%)/P25
MWCNTs (0.5%)/P25
MWCNTs (0.25%)/P25
P25 Parameters
425 407 428 418 380 �/ nm
2.4 2.75 2.25 2.8 3.0 Eg/ eV
The results of the UV-visible diffuse reflectance spectra of the P25 and the
composite, as well as the UV-visible Kubelka - Munk transformed diffuse reflectance spectra of the same indicates that the band gap of the P25 is wider than that of the MWCNTs/P25 composite. The MWCNTs/P25 composite can exhibit better absorbency than the P25 within a wavelength region of 200-800 nm. Compared with the P25, the MWCNTs/P25 composite particles can cause an obvious red shift of the UV-visible spectra. The P25 particles clearly absorb at wavelengths above 380 nm by adding MWCNTs to obtain MWCNTs/P25 composites. The effective band gap of the P25 3.0 eV is reduced to 2.7, 2.3, and 2.5 eV for MWCNTs (0.25%)/P25, MWCNTs (0.5%)/P25, and MWCNTs (1%)/P25 respectively. Therefore the MWCNTs/P25 composite can be excited to produce more electron-hole pairs under solar irradiation, which may result in higher photocatalytic activity. For all the composites, their enhanced absorbance extends broadly over wavelengths of > 400 nm, which is in agreement with the black color of the samples [192, 193]. 3-7-5 Scanning Electron Microscopy
A scanning electron microscopy operates at a high vacuum. The basic principles are that a beam of electrons is generated by suitable source. The electron beam is accelerated through a high voltage and pass through a system of apertures and electromagnetic lenses to produce a thin beam of electrons, and then the beam scans the surface of the specimen by means of scan coils. There are different types of electron image. The two most common are the secondary electron image and the backscattered electron image. The secondary electron image is used mainly to image fracture surface and gives a high resolution image, while the backscattered image is used typically to image a polished section [194].
SEM measurements were carried out on a JEOL JSM-6700F instrument, using a secondary electron detector (SE) at an accelerating voltage of 2.0 kV.
SEM images were used to study the morphology of the MWCNTs/P25 composite, and also to measure the average particle sizes. Figure 3-17 shows the SEM images for the MWCNTs/P25 composite. The resulting average particle size is illustrated in Table 3-3.
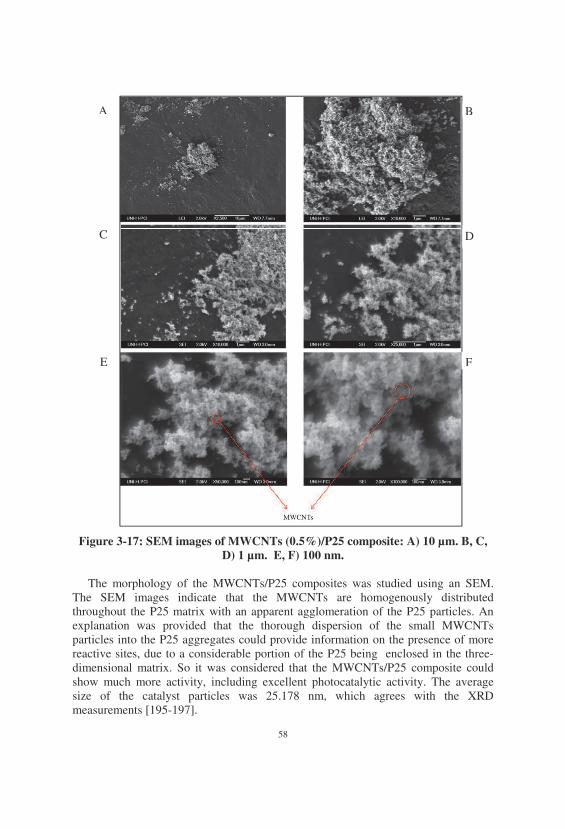
58
Figure 3-17: SEM images of MWCNTs (0.5%)/P25 composite: A) 10 μm. B, C, D) 1 μm. E, F) 100 nm.
The morphology of the MWCNTs/P25 composites was studied using an SEM.
The SEM images indicate that the MWCNTs are homogenously distributed throughout the P25 matrix with an apparent agglomeration of the P25 particles. An explanation was provided that the thorough dispersion of the small MWCNTs particles into the P25 aggregates could provide information on the presence of more reactive sites, due to a considerable portion of the P25 being enclosed in the three-dimensional matrix. So it was considered that the MWCNTs/P25 composite could show much more activity, including excellent photocatalytic activity. The average size of the catalyst particles was 25.178 nm, which agrees with the XRD measurements [195-197].
A B
C D
E F
59
3-8 Photocatalytic Activity Experiments
The photocatalytic activity experiments were conducted using a 200 mL photoreactor. The radiation source used was a 600 mW mercury lamp UV(A), at an intensity of 0.7 mW/cm2 using a Philips (CLEO, Poland) mercury lamps containing 4 lamps with 15W each, and a mean wavelength of � = 350 nm. The suspension solutions were prepared by adding 50 mg of nanocomposite catalysts to 100 mL of 5×10⁻⁵ M BBR aqueous solution. Prior to irradiation, the suspensions were stirred in darkness for 30 min using a magnetic stirrer to ensure adsorption equilibrium. During adsorption and irradiation, the suspensions were sampled at regular intervals. 3 mL of the reaction mixture was collected and centrifuged for 15 min. The supernatant was carefully removed using a syringe with a long, pliable needle, and then centrifuged again at the same speed and for the same period time. The second centrifuge was found necessary to remove fine particles of the catalyst. After the second centrifuge, the absorbance at the maximum wavelength of 459 nm of the BBR was measured with a UV-visible spectrophotometer.
The photocatalytic reactions on the surfaces of MWCNTs/P25 composites can be expressed by the Langmuir-Hinshelwood model [198]. The reaction rate after the adsorption equilibrium can be expressed as:
��� ���� � �� 3-16
where: Ct and Co are the reactant concentration at time t = t and t = 0, respectively, and k and t are the apparent reaction rate constant and time, respectively. A plot of ln (Co/Ct) versus t will yield a slope of k.
The photocatalytic activity of different ratios of MWCNTs/P25 composites was tested for the photocatalytic decolorization of BBR dye in an aqueous solution under UV irradiation. The results were compared with commercial TiO2 (P25) under the same conditions. The photocatalytic reactions were carried out in the presence of catalysts and UV (A) light. The results are shown in Table 3-6 and then illustrated in Figures 3-18 and 3-19.
The photocatalytic activity of all the prepared samples on the photocatalytic decolorization of BBR dye was investigated under predetermined experimental conditions; an initial BBR concentration of 5×10⁻⁵ M, a light intensity equal to 0.7 mW.cm-2, a temperature equal to 298.15 K, and a solution pH equal to 5.
The best ratio of the synthesized MWCNTs/P25 composites gives the maximum photodecolorization efficiency (P.C.D), which was approximately equal to 69% after 60 min of irradiation. The results of the changes in the photocatalytic decolorization compared with ratio of the prepared composites are illustrated in Figure 3-20. The kinetic results are illustrated in Figure 3-21, showing the pseudo-first order reaction curves for all the prepared composites according to the Langmuir Hinshelwood relationship. Figure 3-22 shows the photoreactivity of all the synthesized ratios of the composites as compared with a commercial TiO2 (P25) under the same conditions.
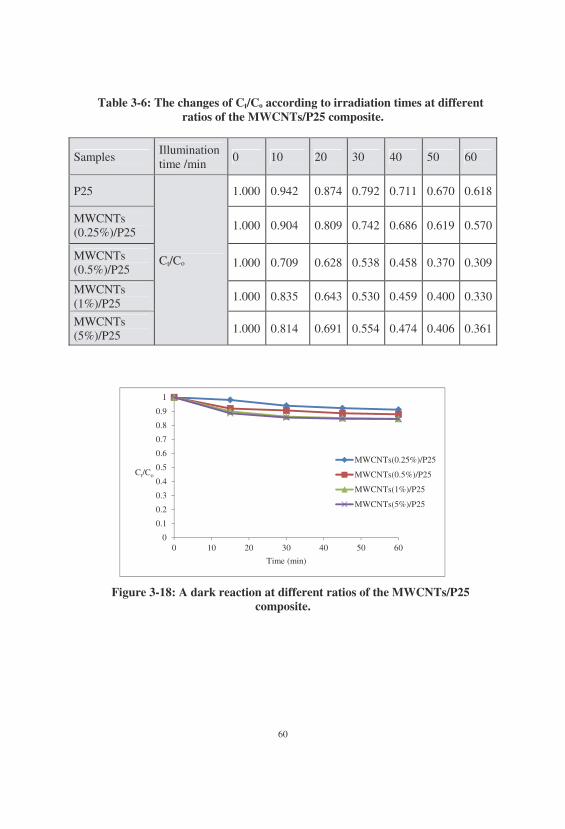
60
Table 3-6: The changes of Ct/C� according to irradiation times at different ratios of the MWCNTs/P25 composite.
Samples Illumination time /min
0 10 20 30 40 50 60
P25
Ct/C�
1.000 0.942 0.874 0.792 0.711 0.670 0.618
MWCNTs (0.25%)/P25
1.000 0.904 0.809 0.742 0.686 0.619 0.570
MWCNTs (0.5%)/P25
1.000 0.709 0.628 0.538 0.458 0.370 0.309
MWCNTs (1%)/P25
1.000 0.835 0.643 0.530 0.459 0.400 0.330
MWCNTs (5%)/P25
1.000 0.814 0.691 0.554 0.474 0.406 0.361
Figure 3-18: A dark reaction at different ratios of the MWCNTs/P25 composite.
0
0.1
0.2
0.3
0.4
0.5
0.6
0.7
0.8
0.9
1
0 10 20 30 40 50 60
Ct/Co
Time (min)
MWCNTs(0.25%)/P25
MWCNTs(0.5%)/P25
MWCNTs(1%)/P25
MWCNTs(5%)/P25
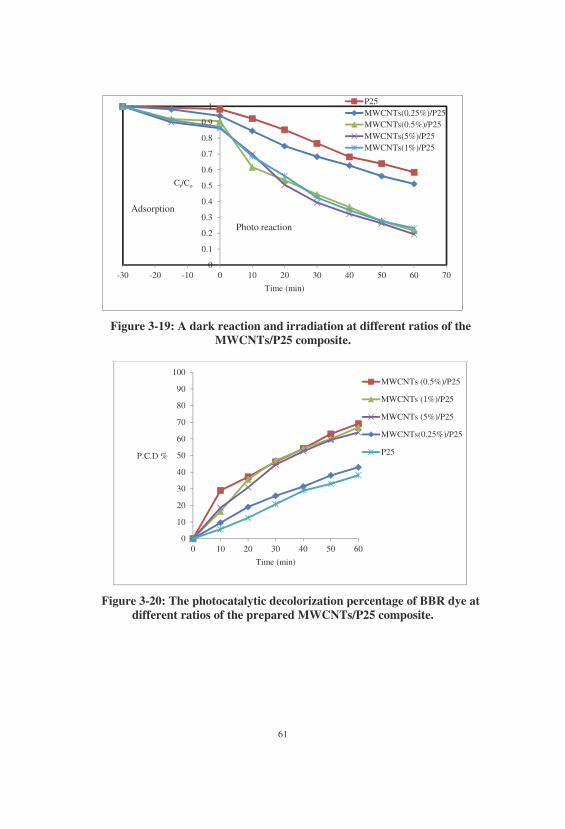
61
Figure 3-19: A dark reaction and irradiation at different ratios of the MWCNTs/P25 composite.
Figure 3-20: The photocatalytic decolorization percentage of BBR dye at different ratios of the prepared MWCNTs/P25 composite.
0
0.1
0.2
0.3
0.4
0.5
0.6
0.7
0.8
0.9
1
-30 -20 -10 0 10 20 30 40 50 60 70
Ct/Co
Time (min)
P25MWCNTs(0.25%)/P25MWCNTs(0.5%)/P25MWCNTs(5%)/P25MWCNTs(1%)/P25
0
10
20
30
40
50
60
70
80
90
100
0 10 20 30 40 50 60
P.C.D %
Time (min)
MWCNTs (0.5%)/P25
MWCNTs (1%)/P25
MWCNTs (5%)/P25
MWCNTs(0.25%)/P25
P25
Adsorption
Photo reaction
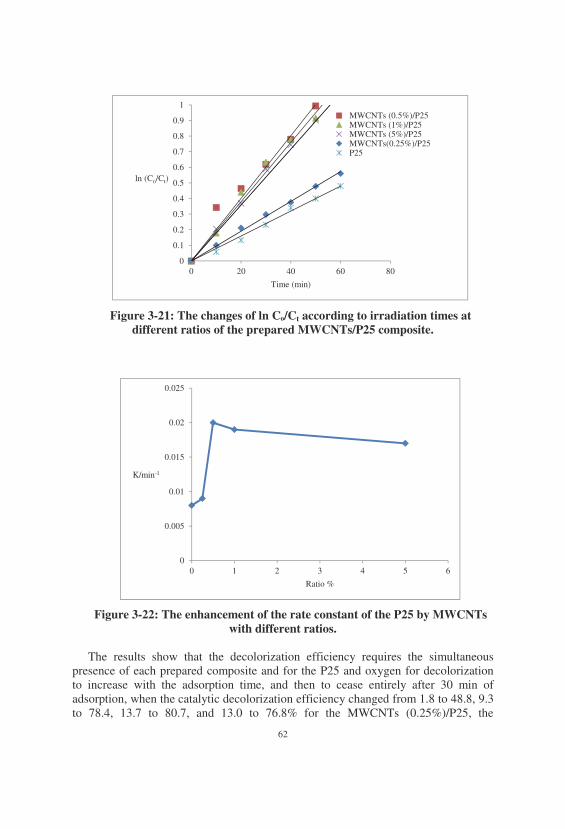
62
Figure 3-21: The changes of ln C�/Ct according to irradiation times at different ratios of the prepared MWCNTs/P25 composite.
Figure 3-22: The enhancement of the rate constant of the P25 by MWCNTs with different ratios.
The results show that the decolorization efficiency requires the simultaneous
presence of each prepared composite and for the P25 and oxygen for decolorization to increase with the adsorption time, and then to cease entirely after 30 min of adsorption, when the catalytic decolorization efficiency changed from 1.8 to 48.8, 9.3 to 78.4, 13.7 to 80.7, and 13.0 to 76.8% for the MWCNTs (0.25%)/P25, the
0
0.1
0.2
0.3
0.4
0.5
0.6
0.7
0.8
0.9
1
0 20 40 60 80
ln (Co/Ct)
Time (min)
MWCNTs (0.5%)/P25MWCNTs (1%)/P25MWCNTs (5%)/P25MWCNTs(0.25%)/P25P25
0
0.005
0.01
0.015
0.02
0.025
0 1 2 3 4 5 6
K/min-1
Ratio %
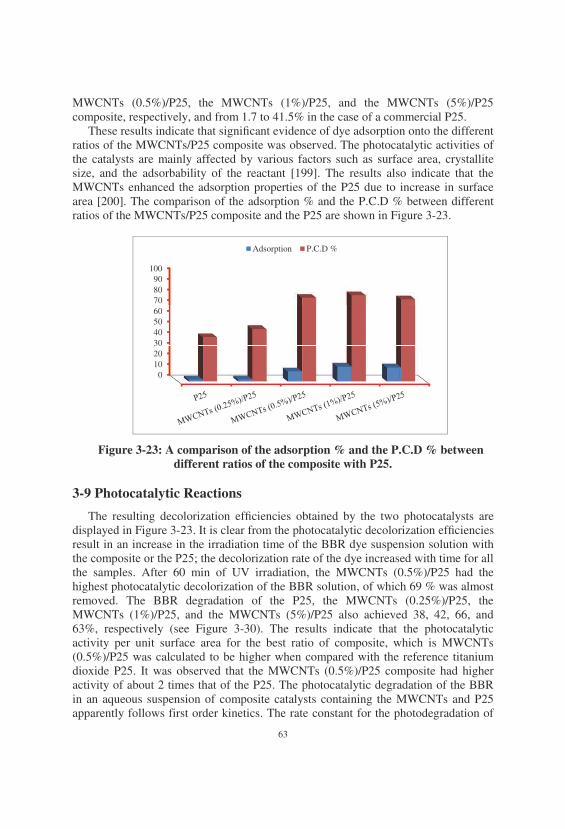
63
MWCNTs (0.5%)/P25, the MWCNTs (1%)/P25, and the MWCNTs (5%)/P25 composite, respectively, and from 1.7 to 41.5% in the case of a commercial P25.
These results indicate that significant evidence of dye adsorption onto the different ratios of the MWCNTs/P25 composite was observed. The photocatalytic activities of the catalysts are mainly affected by various factors such as surface area, crystallite size, and the adsorbability of the reactant [199]. The results also indicate that the MWCNTs enhanced the adsorption properties of the P25 due to increase in surface area [200]. The comparison of the adsorption % and the P.C.D % between different ratios of the MWCNTs/P25 composite and the P25 are shown in Figure 3-23.
Figure 3-23: A comparison of the adsorption % and the P.C.D % between different ratios of the composite with P25.
3-9 Photocatalytic Reactions
The resulting decolorization efficiencies obtained by the two photocatalysts are displayed in Figure 3-23. It is clear from the photocatalytic decolorization efficiencies result in an increase in the irradiation time of the BBR dye suspension solution with ������������������������ the decolorization rate of the dye increased with time for all the samples. After 60 min of UV irradiation, the MWCNTs (0.5%)/P25 had the highest photocatalytic decolorization of the BBR solution, of which 69 % was almost removed. The BBR degradation of the P25, the MWCNTs (0.25%)/P25, the MWCNTs (1%)/P25, and the MWCNTs (5%)/P25 also achieved 38, 42, 66, and 63%, respectively (see Figure 3-30). The results indicate that the photocatalytic activity per unit surface area for the best ratio of composite, which is MWCNTs (0.5%)/P25 was calculated to be higher when compared with the reference titanium dioxide P25. It was observed that the MWCNTs (0.5%)/P25 composite had higher activity of about 2 times that of the P25. The photocatalytic degradation of the BBR in an aqueous suspension of composite catalysts containing the MWCNTs and P25 apparently follows first order kinetics. The rate constant for the photodegradation of
0102030405060708090
100
Adsorption P.C.D %
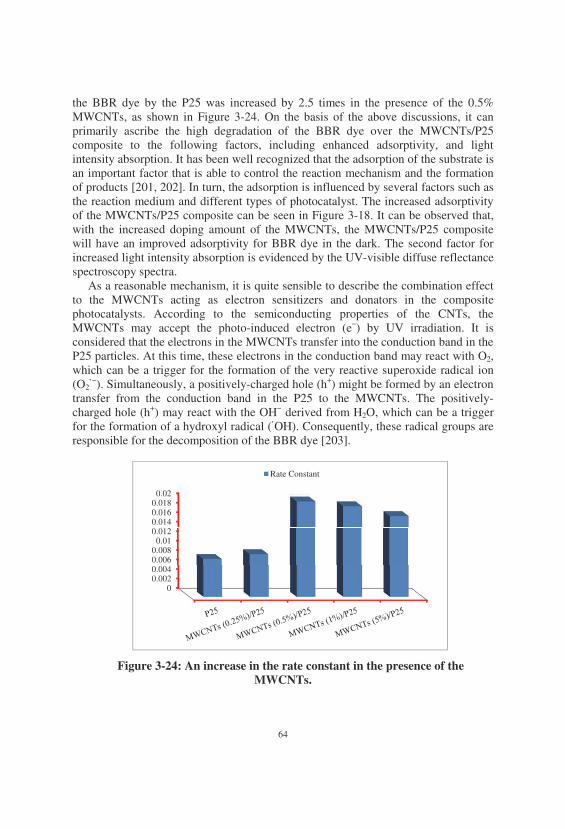
64
the BBR dye by the P25 was increased by 2.5 times in the presence of the 0.5% MWCNTs, as shown in Figure 3-24. On the basis of the above discussions, it can primarily ascribe the high degradation of the BBR dye over the MWCNTs/P25 composite to the following factors, including enhanced adsorptivity, and light intensity absorption. It has been well recognized that the adsorption of the substrate is an important factor that is able to control the reaction mechanism and the formation of products [201, 202]. In turn, the adsorption is influenced by several factors such as the reaction medium and different types of photocatalyst. The increased adsorptivity of the MWCNTs/P25 composite can be seen in Figure 3-18. It can be observed that, with the increased doping amount of the MWCNTs, the MWCNTs/P25 composite will have an improved adsorptivity for BBR dye in the dark. The second factor for increased light intensity absorption is evidenced by the UV-visible diffuse reflectance spectroscopy spectra.
As a reasonable mechanism, it is quite sensible to describe the combination effect to the MWCNTs acting as electron sensitizers and donators in the composite photocatalysts. According to the semiconducting properties of the CNTs, the MWCNTs may accept the photo-induced electron (e−) by UV irradiation. It is considered that the electrons in the MWCNTs transfer into the conduction band in the P25 particles. At this time, these electrons in the conduction band may react with O2, which can be a trigger for the formation of the very reactive superoxide radical ion (O2
·−). Simultaneously, a positively-charged hole (h+) might be formed by an electron transfer from the conduction band in the P25 to the MWCNTs. The positively-charged hole (h+) may react with the OH− derived from H2O, which can be a trigger for the formation of a hydroxyl radical (·OH). Consequently, these radical groups are responsible for the decomposition of the BBR dye [203].
Figure 3-24: An increase in the rate constant in the presence of the MWCNTs.
00.0020.0040.0060.0080.01
0.0120.0140.0160.0180.02
Rate Constant
65
3-10 The Mechanisms of Photocatalysis Enhancement in Carbon
Nanotubes/Titanium Dioxide Composites
CNTs have been determined to be more attractive catalyst supports than activated carbons, because of their electronic, thermal, mechanical, and adsorption properties. There is an appropriate method to increase the photocatalytic efficiency of TiO2, which consists of adding a co-adsorbent such as CNTs [204].
Two mechanisms are under discussion to explain the enhancement of the photocatalytic properties of CNTs/TiO2 composites. The first mechanism is explained by Hoffmann and co-workers [205]. The TiO2 nanoparticles deposited on the surface of the CNTs are excited by UV light. Energy photons are absorbed, and an electron hole pair is produced. The photogenerated electrons are transferred from the conduction band of TiO2 to CNTs, and holes remain on the TiO2 to take part in redox reactions. A schematic of this mechanism is shown in Figure 3-25. The absorption of electrons by CNTs prevents the further recombination of the electrons with the holes. The second model is based on the study of the photo degradation of phenol using CNTs/TiO2 composites under visible light illumination [206]. The study was conducted to demonstrate that CNTs act as sensitizers and transfer electrons to the TiO2. The photogenerated electrons are injected into the conduction band of the TiO2, allowing for the formation of superoxide radicals on the surface of the TiO2. Then, the positively charged CNTs remove an electron from the valence band of the TiO2 leaving a hole behind. The positively charged TiO2 with oxygen radicals on its surface leads the catalytic reaction. This proposed mechanism is illustrated in Figure 3-26. CNTs can act as an impurity to improve the photocatalytic activity of TiO2, as shown in Figure 3-27.
An enhancement in photocatalytic activity can be attributed to improving adsorption properties. The adsorption process is key in the catalytic destruction of organic pollutants. CNTs can adsorb the pollutants which are considered to be the first step in their degradation, due to their large specific surface area and high quality active sites. Also, CNTs can adsorb oxygen molecules onto their surfaces, and thus the promoted electrons in CB might directly react with the adsorbed oxygen molecules and form superoxide anion radicals. This will increase the number of radicals ready to react with the pollutants [207].
On the other hand, the formation of Ti-O-C bonds between the TiO2 and the CNTs lead in terms of close contact, which offers an effective route for electron transfer from the CB to the nanotube. This can reduce the recombination of photogenerated electron-hole pairs [148].
The dispersion of the TiO2 nanoparticles on the surface of the CNTs prevents their agglomeration and thus increases the photocatalytic activity [208].
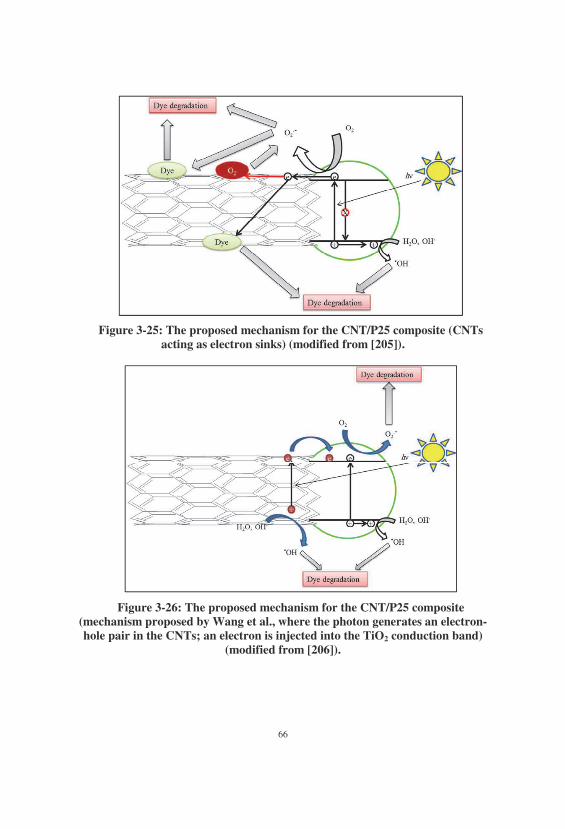
66
Figure 3-25: The proposed mechanism for the CNT/P25 composite (CNTs acting as electron sinks) (modified from [205]).
Figure 3-26: The proposed mechanism for the CNT/P25 composite (mechanism proposed by Wang et al., where the photon generates an electron-hole pair in the CNTs; an electron is injected into the TiO2 conduction band)
(modified from [206]).
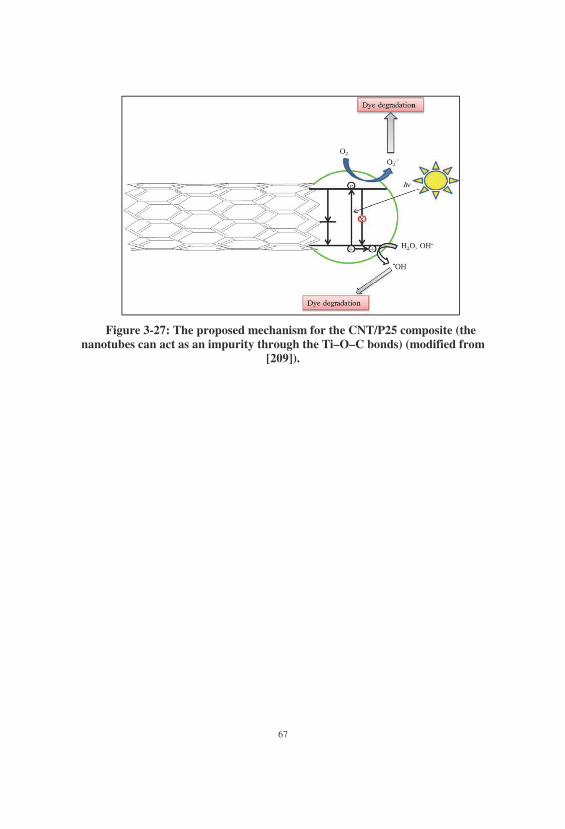
67
Figure 3-27: The proposed mechanism for the CNT/P25 composite (the nanotubes can act as an impurity through the Ti–O–C bonds) (modified from
[209]).
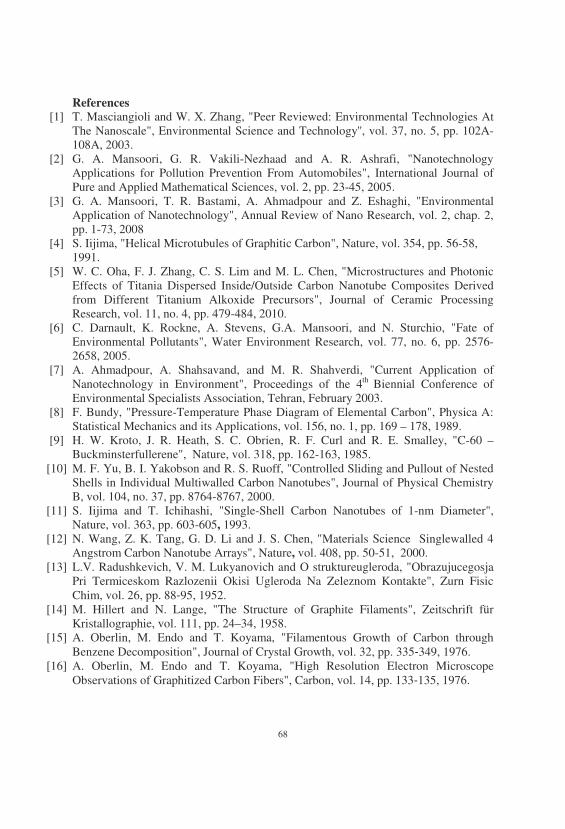
68
References [1] T. Masciangioli and W. X. Zhang, "Peer Reviewed: Environmental Technologies At
The Nanoscale", Environmental Science and Technology'', vol. 37, no. 5, pp. 102A-108A, 2003.
[2] G. A. Mansoori, G. R. Vakili-Nezhaad and A. R. Ashrafi, "Nanotechnology Applications for Pollution Prevention From Automobiles", International Journal of Pure and Applied Mathematical Sciences, vol. 2, pp. 23-45, 2005.
[3] G. A. Mansoori, T. R. Bastami, A. Ahmadpour and Z. Eshaghi, "Environmental Application of Nanotechnology", Annual Review of Nano Research, vol. 2, chap. 2, pp. 1-73, 2008
[4] S. Iijima, "Helical Microtubules of Graphitic Carbon", Nature, vol. 354, pp. 56-58, 1991.
[5] W. C. Oha, F. J. Zhang, C. S. Lim and M. L. Chen, "Microstructures and Photonic Effects of Titania Dispersed Inside/Outside Carbon Nanotube Composites Derived from Different Titanium Alkoxide Precursors", Journal of Ceramic Processing Research, vol. 11, no. 4, pp. 479-484, 2010.
[6] C. Darnault, K. Rockne, A. Stevens, G.A. Mansoori, and N. Sturchio, "Fate of Environmental Pollutants", Water Environment Research, vol. 77, no. 6, pp. 2576-2658, 2005.
[7] A. Ahmadpour, A. Shahsavand, and M. R. Shahverdi, "Current Application of Nanotechnology in Environment", Proceedings of the 4th Biennial Conference of Environmental Specialists Association, Tehran, February 2003.
[8] F. Bundy, "Pressure-Temperature Phase Diagram of Elemental Carbon", Physica A: Statistical Mechanics and its Applications, vol. 156, no. 1, pp. 169 – 178, 1989.
[9] H. W. Kroto, J. R. Heath, S. C. Obrien, R. F. Curl and R. E. Smalley, "C-60 – Buckminsterfullerene", Nature, vol. 318, pp. 162-163, 1985.
[10] M. F. Yu, B. I. Yakobson and R. S. Ruoff, "Controlled Sliding and Pullout of Nested Shells in Individual Multiwalled Carbon Nanotubes", Journal of Physical Chemistry B, vol. 104, no. 37, pp. 8764-8767, 2000.
[11] S. Iijima and T. Ichihashi, "Single-Shell Carbon Nanotubes of 1-nm Diameter", Nature, vol. 363, pp. 603-605, 1993.
[12] N. Wang, Z. K. Tang, G. D. Li and J. S. Chen, "Materials Science Singlewalled 4 Angstrom Carbon Nanotube Arrays", Nature, vol. 408, pp. 50-51, 2000.
[13] L.V. Radushkevich, V. M. Lukyanovich and O struktureugleroda, "Obrazujucegosja Pri Termiceskom Razlozenii Okisi Ugleroda Na Zeleznom Kontakte", Zurn Fisic Chim, vol. 26, pp. 88�95, 1952.
[14] M. Hillert and N. Lange, "The Structure of Graphite Filaments", Zeitschrift für Kristallographie, vol. 111, pp. 24–34, 1958.
[15] A. Oberlin, M. Endo and T. Koyama, "Filamentous Growth of Carbon through Benzene Decomposition", Journal of Crystal Growth, vol. 32, pp. 335�349, 1976.
[16] A. Oberlin, M. Endo and T. Koyama, "High Resolution Electron Microscope Observations of Graphitized Carbon Fibers", Carbon, vol. 14, pp. 133�135, 1976.
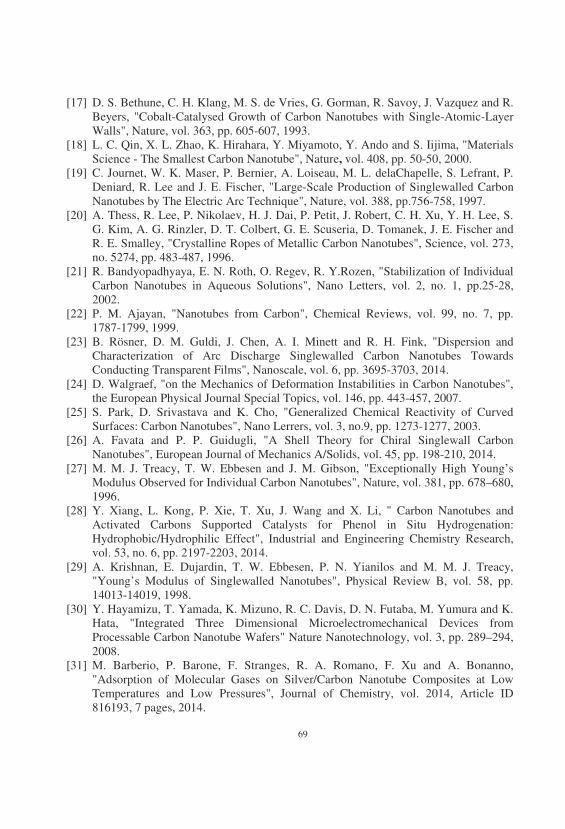
69
[17] D. S. Bethune, C. H. Klang, M. S. de Vries, G. Gorman, R. Savoy, J. Vazquez and R. Beyers, "Cobalt-Catalysed Growth of Carbon Nanotubes with Single-Atomic-Layer Walls", Nature, vol. 363, pp. 605-607, 1993.
[18] L. C. Qin, X. L. Zhao, K. Hirahara, Y. Miyamoto, Y. Ando and S. Iijima, "Materials Science - The Smallest Carbon Nanotube", Nature, vol. 408, pp. 50-50, 2000.
[19] C. Journet, W. K. Maser, P. Bernier, A. Loiseau, M. L. delaChapelle, S. Lefrant, P. Deniard, R. Lee and J. E. Fischer, "Large-Scale Production of Singlewalled Carbon Nanotubes by The Electric Arc Technique", Nature, vol. 388, pp.756-758, 1997.
[20] A. Thess, R. Lee, P. Nikolaev, H. J. Dai, P. Petit, J. Robert, C. H. Xu, Y. H. Lee, S. G. Kim, A. G. Rinzler, D. T. Colbert, G. E. Scuseria, D. Tomanek, J. E. Fischer and R. E. Smalley, "Crystalline Ropes of Metallic Carbon Nanotubes", Science, vol. 273, no. 5274, pp. 483-487, 1996.
[21] R. Bandyopadhyaya, E. N. Roth, O. Regev, R. Y.Rozen, "Stabilization of Individual Carbon Nanotubes in Aqueous Solutions", Nano Letters, vol. 2, no. 1, pp.25-28, 2002.
[22] P. M. Ajayan, "Nanotubes from Carbon", Chemical Reviews, vol. 99, no. 7, pp. 1787-1799, 1999.
[23] B. Rösner, D. M. Guldi, J. Chen, A. I. Minett and R. H. Fink, "Dispersion and Characterization of Arc Discharge Singlewalled Carbon Nanotubes Towards Conducting Transparent Films", Nanoscale, vol. 6, pp. 3695-3703, 2014.
[24] D. Walgraef, "on the Mechanics of Deformation Instabilities in Carbon Nanotubes", the European Physical Journal Special Topics, vol. 146, pp. 443-457, 2007.
[25] S. Park, D. Srivastava and K. Cho, "Generalized Chemical Reactivity of Curved Surfaces: Carbon Nanotubes", Nano Lerrers, vol. 3, no.9, pp. 1273-1277, 2003.
[26] A. Favata and P. P. Guidugli, "A Shell Theory for Chiral Singlewall Carbon Nanotubes", European Journal of Mechanics A/Solids, vol. 45, pp. 198-210, 2014.
[27] M. M. J. Treacy, T. W. Ebbesen and J. M. Gibson, "Exceptionally High Young’s Modulus Observed for Individual Carbon Nanotubes", Nature, vol. 381, pp. 678–680, 1996.
[28] Y. Xiang, L. Kong, P. Xie, T. Xu, J. Wang and X. Li, " Carbon Nanotubes and Activated Carbons Supported Catalysts for Phenol in Situ Hydrogenation: Hydrophobic/Hydrophilic Effect", Industrial and Engineering Chemistry Research, vol. 53, no. 6, pp. 2197-2203, 2014.
[29] A. Krishnan, E. Dujardin, T. W. Ebbesen, P. N. Yianilos and M. M. J. Treacy, "Young’s Modulus of Singlewalled Nanotubes", Physical Review B, vol. 58, pp. 14013-14019, 1998.
[30] Y. Hayamizu, T. Yamada, K. Mizuno, R. C. Davis, D. N. Futaba, M. Yumura and K. Hata, "Integrated Three Dimensional Microelectromechanical Devices from Processable Carbon Nanotube Wafers" Nature Nanotechnology, vol. 3, pp. 289–294, 2008.
[31] M. Barberio, P. Barone, F. Stranges, R. A. Romano, F. Xu and A. Bonanno, "Adsorption of Molecular Gases on Silver/Carbon Nanotube Composites at Low Temperatures and Low Pressures", Journal of Chemistry, vol. 2014, Article ID 816193, 7 pages, 2014.
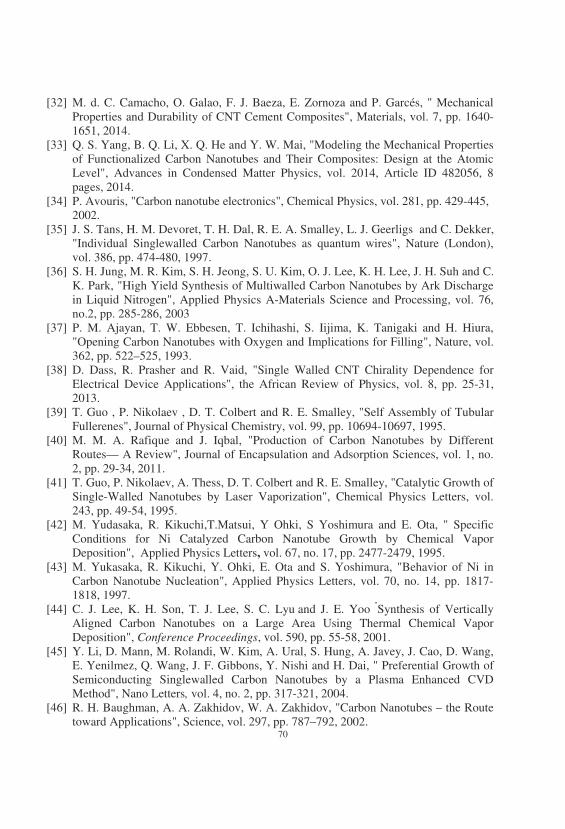
70
[32] M. d. C. Camacho, O. Galao, F. J. Baeza, E. Zornoza and P. Garcés, " Mechanical Properties and Durability of CNT Cement Composites", Materials, vol. 7, pp. 1640-1651, 2014.
[33] Q. S. Yang, B. Q. Li, X. Q. He and Y. W. Mai, "Modeling the Mechanical Properties of Functionalized Carbon Nanotubes and Their Composites: Design at the Atomic Level", Advances in Condensed Matter Physics, vol. 2014, Article ID 482056, 8 pages, 2014.
[34] P. Avouris, "Carbon nanotube electronics", Chemical Physics, vol. 281, pp. 429-445, 2002.
[35] J. S. Tans, H. M. Devoret, T. H. Dal, R. E. A. Smalley, L. J. Geerligs and C. Dekker, "Individual Singlewalled Carbon Nanotubes as quantum wires", Nature (London), vol. 386, pp. 474-480, 1997.
[36] S. H. Jung, M. R. Kim, S. H. Jeong, S. U. Kim, O. J. Lee, K. H. Lee, J. H. Suh and C. K. Park, "High Yield Synthesis of Multiwalled Carbon Nanotubes by Ark Discharge in Liquid Nitrogen", Applied Physics A-Materials Science and Processing, vol. 76, no.2, pp. 285-286, 2003
[37] P. M. Ajayan, T. W. Ebbesen, T. Ichihashi, S. Iijima, K. Tanigaki and H. Hiura, "Opening Carbon Nanotubes with Oxygen and Implications for Filling", Nature, vol. 362, pp. 522–525, 1993.
[38] D. Dass, R. Prasher and R. Vaid, "Single Walled CNT Chirality Dependence for Electrical Device Applications", the African Review of Physics, vol. 8, pp. 25-31, 2013.
[39] T. Guo , P. Nikolaev , D. T. Colbert and R. E. Smalley, "Self Assembly of Tubular Fullerenes", Journal of Physical Chemistry, vol. 99, pp. 10694-10697, 1995.
[40] M. M. A. Rafique and J. Iqbal, "Production of Carbon Nanotubes by Different Routes— A Review", Journal of Encapsulation and Adsorption Sciences, vol. 1, no. 2, pp. 29-34, 2011.
[41] T. Guo, P. Nikolaev, A. Thess, D. T. Colbert and R. E. Smalley, "Catalytic Growth of Single-Walled Nanotubes by Laser Vaporization", Chemical Physics Letters, vol. 243, pp. 49-54, 1995.
[42] M. Yudasaka, R. Kikuchi,T.Matsui, Y Ohki, S Yoshimura and E. Ota, " Specific Conditions for Ni Catalyzed Carbon Nanotube Growth by Chemical Vapor Deposition", Applied Physics Letters, vol. 67, no. 17, pp. 2477-2479, 1995.
[43] M. Yukasaka, R. Kikuchi, Y. Ohki, E. Ota and S. Yoshimura, "Behavior of Ni in Carbon Nanotube Nucleation", Applied Physics Letters, vol. 70, no. 14, pp. 1817-1818, 1997.
[44] C. J. Lee, K. H. Son, T. J. Lee, S. C. Lyu and J. E. Yoo "Synthesis of Vertically Aligned Carbon Nanotubes on a Large Area Using Thermal Chemical Vapor Deposition", Conference Proceedings, vol. 590, pp. 55-58, 2001.
[45] Y. Li, D. Mann, M. Rolandi, W. Kim, A. Ural, S. Hung, A. Javey, J. Cao, D. Wang, E. Yenilmez, Q. Wang, J. F. Gibbons, Y. Nishi and H. Dai, " Preferential Growth of Semiconducting Singlewalled Carbon Nanotubes by a Plasma Enhanced CVD Method", Nano Letters, vol. 4, no. 2, pp. 317-321, 2004.
[46] R. H. Baughman, A. A. Zakhidov, W. A. Zakhidov, "Carbon Nanotubes – the Route toward Applications", Science, vol. 297, pp. 787–792, 2002.
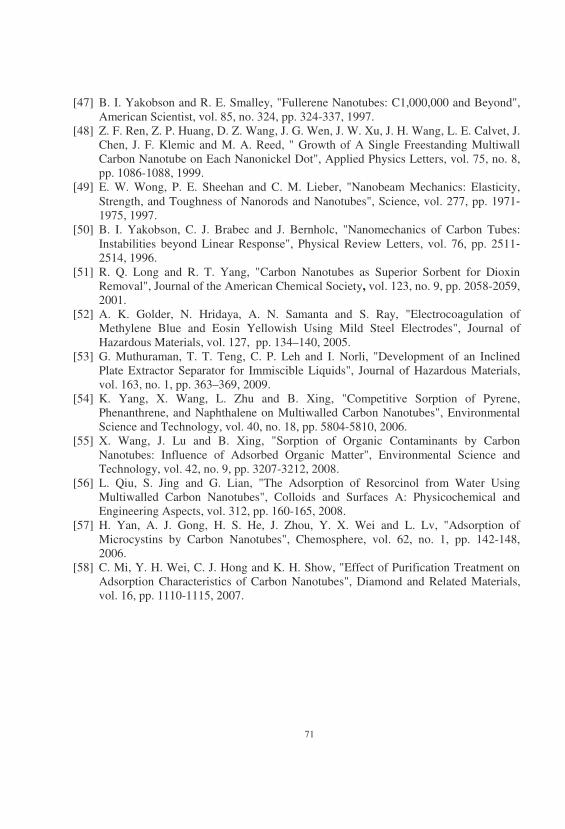
71
[47] B. I. Yakobson and R. E. Smalley, "Fullerene Nanotubes: C1,000,000 and Beyond", American Scientist, vol. 85, no. 324, pp. 324-337, 1997.
[48] Z. F. Ren, Z. P. Huang, D. Z. Wang, J. G. Wen, J. W. Xu, J. H. Wang, L. E. Calvet, J. Chen, J. F. Klemic and M. A. Reed, " Growth of A Single Freestanding Multiwall Carbon Nanotube on Each Nanonickel Dot", Applied Physics Letters, vol. 75, no. 8, pp. 1086-1088, 1999.
[49] E. W. Wong, P. E. Sheehan and C. M. Lieber, "Nanobeam Mechanics: Elasticity, Strength, and Toughness of Nanorods and Nanotubes", Science, vol. 277, pp. 1971�1975, 1997.
[50] B. I. Yakobson, C. J. Brabec and J. Bernholc, "Nanomechanics of Carbon Tubes: Instabilities beyond Linear Response", Physical Review Letters, vol. 76, pp. 2511�2514, 1996.
[51] R. Q. Long and R. T. Yang, "Carbon Nanotubes as Superior Sorbent for Dioxin Removal", Journal of the American Chemical Society, vol. 123, no. 9, pp. 2058-2059, 2001.
[52] A. K. Golder, N. Hridaya, A. N. Samanta and S. Ray, "Electrocoagulation of Methylene Blue and Eosin Yellowish Using Mild Steel Electrodes", Journal of Hazardous Materials, vol. 127, pp. 134–140, 2005.
[53] G. Muthuraman, T. T. Teng, C. P. Leh and I. Norli, "Development of an Inclined Plate Extractor Separator for Immiscible Liquids", Journal of Hazardous Materials, vol. 163, no. 1, pp. 363–369, 2009.
[54] K. Yang, X. Wang, L. Zhu and B. Xing, "Competitive Sorption of Pyrene, Phenanthrene, and Naphthalene on Multiwalled Carbon Nanotubes", Environmental Science and Technology, vol. 40, no. 18, pp. 5804-5810, 2006.
[55] X. Wang, J. Lu and B. Xing, "Sorption of Organic Contaminants by Carbon Nanotubes: Influence of Adsorbed Organic Matter", Environmental Science and Technology, vol. 42, no. 9, pp. 3207-3212, 2008.
[56] L. Qiu, S. Jing and G. Lian, "The Adsorption of Resorcinol from Water Using Multiwalled Carbon Nanotubes", Colloids and Surfaces A: Physicochemical and Engineering Aspects, vol. 312, pp. 160-165, 2008.
[57] H. Yan, A. J. Gong, H. S. He, J. Zhou, Y. X. Wei and L. Lv, "Adsorption of Microcystins by Carbon Nanotubes", Chemosphere, vol. 62, no. 1, pp. 142-148, 2006.
[58] C. Mi, Y. H. Wei, C. J. Hong and K. H. Show, "Effect of Purification Treatment on Adsorption Characteristics of Carbon Nanotubes", Diamond and Related Materials, vol. 16, pp. 1110-1115, 2007.
72
[59] K. Yang, L. Z. Zhu and B. S Xing, "Adsorption of Polycyclic Aromatic Hydrocarbons by Carbon Nanomaterials", Environmental Science & Technology, vol. 40, pp. 1855-1861, 2006.
[60] G. Onyestyak, Z. Otvos, J. Valyon, I. Kiricsi and L. V. C. Rees, "Acetylene Sorption Dynamics in Carbon Nanotubes", Helvetica Chimica Acta, vol. 87, pp. 1508-1514, 2004.
[61] S. Gotovac, Y. Hattori, D. Noguchi, J. Miyamoto, M. Kanamaru, S. Utsumi, H. Kanoh and K. Kaneko, "Phenanthrene Adsorption from Solution on Singlewall Carbon Nanotubes", The Journal of Physical Chemistry B, vol 110, pp. 16219-16224, 2006.
[62] V. Datsyuka, M. Kalyva, K. Papagelis, J. Parthenios, D. Tasisb, A. Siokoua, I. Kallitsisa and C. Galiotisa, "Chemical Oxidation of Multiwalled Carbon Nanotubes", Carbon , vol. 46, pp. 833-840, 2008.
[63] Q. Liao, J. Sun and L. Gao, "Adsorption of Chlorophenols by Multi-Walled Carbon Nanotubes Treated with HNO3 and NH3", Carbon, vol. 46, no. 3, pp. 553-555, 2008.
[64] S. B. Sinnott, "Chemical Functionalization of Carbon Nanotubes", Journal of Nanoscience and Nanotechnology", vol. 2, no. 2, pp. 113-123, 2002.
[65] S. Banerjee, M. G. C. Kahn and S. S. Wong, "Rational Chemical Strategies for Carbon Nanotube Functionalization", Chemistry - A European Journal, vol. 9, no. 9, pp.1898-1908, 2003.
[66] S. Gotovac, L. Song, H. Kanoh and K. Kaneko, "Assembly Structure Control of Single Wall Carbon Nanotubes with Liquid Phase Naphthalene Adsorption", Colloids and Surfaces A, vol. 300, pp. 117-121, 2007.
[67] H. H. Cho, B. A. Smith, J. D. Wnuk, D. H. Fairbrother and W. P. Ball, "Influence of Surface Oxides on The Adsorption Of Naphthalene onto Multiwalled Carbon Nanotubes", Environmental Science and Technology vol. 42, no.8, pp. 2899-2905, 2008.
[68] C. S. Lu, Y. L. Chung and K. F. Chang, "Adsorption Thermodynamic and kinetic Studies of Trihalomethanes on Multiwalled Carbon Nanotubes", Journal of Hazardous Materials, vol. 138, pp. 304-310, 2006.
[69] L. Y. Piao, Q. R. Liu, Y. D. Li and C. Wang, "Adsorption of L-Phenylalanine on Single-Walled Carbon Nanotubes", The Journal of Physical Chemistry C, vol. 112, pp. 2857-2863, 2008.
[70] X. E. Shen, X. Q. Shan, D. M. Dong, X. Y. Hua and G. Owens, "Kinetics and Thermodynamics of Sorption of Nitroaromatic Compounds to As-Grown and Oxidized Multiwalled Carbon Nanotubes", Journal of Colloid and Interface Science, vol. 330, no.1, pp. 1-8, 2009.
[71] F. Ahnert, H. A. Arafat and N. G. Pinto, "A Study of The Influence of Hydrophobicity of Activated Carbon on The Adsorption Equilibrium of Aromatics in Non-Aqueous Media", Adsorption, vol. 9, pp. 311–319, 2003.
[72] L. Chungsying, S. Fengsheng and H. Suhkai, "Surface Modification of Carbon Nanotubes for Enhancing BTEX Adsorption from Aqueous Solutions", Applied Surface Science, vol. 254, no. 21, pp.7035-7041, 2008.
73
[73] J. Chen, W. Chen and D. Zhu, "Adsorption of Nonionic Aromatic Compounds to Single- Walled Carbon Nanotubes: Effects of Aqueous Solution Chemistry", Environmental Science and Technology, vol. 42, no. 19, pp. 7225-7230, 2008.
[74] B. Pan and B. Xing, ''Adsorption Mechanisms of Organic Chemicals on Carbon Nanotubes'', Environ. Sci. Technol., vol. 42, no. 24, pp. 9005-9013, 2008.
[75] X. Wang, S. Tao and B. Xing, "Sorption and Competition of Aromatic Compounds and Humic Acid On Multiwalled Carbon Nanotubes", Environmental Science & Technology, vol. 43, no. 16, pp. 6214-6219, 2009.
[76] B. Pan, D. Lin, H. Mashayekhi and B. Xing, "Adsorption and Hysteresis of Bisphenol A and 17a-Ethinyl Estradiol on Carbon Nanomaterials" Environmental Science and Technology, vol. 42, no. 15, pp. 5480-5485, 2008.
[77] S. Gotovac, C. M. Yang, Y. Hattori, K. Takahashi, H. Kanoh and K. Kaneko, "Adsorption of Polyaromatic Hydrocarbons on Single Wall Carbon Nanotubes Of Different Functionalities And Diameters", Journal of Colloid and Interface Science, vol. 314, no. 1, pp. 18-24, 2007.
[78] W. Chen, L. Duan and D. Zhu, "Adsorption of Polar and Nonpolar Organic Chemicals to Carbon Nanotubes", Environmental Science & Technology, vol. 41, no. 24, pp. 8295-8300, 2007.
[79] D. Lin and B. Xing, "Adsorption of Phenolic Compounds by Carbon Nanotubes: Role of Aromaticity and Substitution of Hydroxyl Groups", Environmental Science and Technology, vol. 42, no. 19, pp. 7254-7259, 2008.
[80] K. Yang and B. Xing, "Desorption of Polycyclic Aromatic Hydrocarbons from Carbon Nanomaterials in water", Environmental Pollution, vol. 145, no. 2, pp. 529-537, 2007.
[81] S. Gotovac, Y. Hattori, D. Noguchi, J. I. Miyamoto, M. Kanamaru, S. Utsumi, H. Kanoh and K. Kaneko, "Phenanthrene Adsorption from Solution on Single Wall Carbon Nanotubes", Journal of Physical Chemistry B, vol. 110, no. 33, pp. 16219-16224, 2006.
[82] K. Yang and B. Xing, "Adsorption of Fulvic Acid by Carbon Nanotubes from Water", Environmental Pollution, vol. 157, no. 4, pp. 1095-1100, 2009.
[83] Y. Cai, G. Jiang, J. Liu and Q. Zhou, "Multiwalled Carbon Nanotubes as A Solidphase Extraction Adsorbent for The Determination Of Bisphenol A, 4-n-Nonylphenol, and 4- Tert-Octylphenol", Analytical Chemistry, vol. 75, no. 10, pp. 2517-2521, 2003.
[84] X. M. Yan, B. Y. Shi, J. J. Lu, C. H. Feng, D. S. Wang and H. X. Tang, "Adsorption and Desorption of Atrazine on Carbon Nanotubes" Journal of Colloid and Interface Science, vol. 321, no. 1, pp. 30-38, 2008.
[85] C. S. Lu, Y. L. Chung and K. F. Chang, "Adsorption of Trihalomethanes from Water with Carbon Nanotubes", Water Research, vol. 39, no. 6, pp. 1183-1189, 2005.
[86] G. Ke, W. C. Guan, C. Y. Tang, Z. Hu, W. J. Guan, D. L. Zeng and F. Deng, "Covalent Modification of Multiwalled Carbon Nanotubes with A Low Molecular Weight Chitosan", Chinese Chemical Letters, vol. 18, pp. 361-364, 2007.
[87] E. W. Bittner, M. R. Smith and B. C. Bockrath, "Characterization of The Surfaces of Single-Walled Carbon Nanotubes Using Alcohols and Hydrocarbons: A Pulse Adsorption Technique", Carbon, vol. 41, pp. 1231-1239, 2003.
74
[88] R. J. Chen, S. Bangsaruntip, K. A. Drouvalakis, N. W. S. Kam, M. Shim, Y. M. Li, W. Kim, P. J. Utz and H. J. Dai, "Noncovalent Functionalization of Carbon Nanotubes for Highly Specific Electronic Biosensor", Proceedings of the National Academy of Science of the United States of America, vol. 100, no. 9, pp. 4984-4989, 2003.
[89] K. Yang, W. H. Wu, Q. F. Jing and L. Z. Zhu, "Aqueous Adsorption of Aniline, Phenol, and Their Substitutes by Multi-Walled Carbon Nanotubes", Environmental Science Technology, vol. 42, pp. 7931-7936, 2008.
[90] G. U. Sumanasekera, B. K. Pradhan, H. E. Romero, K. W. Adu and P. C. Eklund, "Giant Thermopower Effects from Molecular Physisorption On Carbon Nanotubes", Physical Review Letters, vol. 89, Article ID 166801, 4 pages, 2002.
[91] W. Chen, L. Duan, L. Wang and D. Zhu, "Adsorption of Hydroxyl- and Amino-Substituted Aromatics to Carbon Nanotubes", Environmental Science Technology, vol. 42, pp. 6862-6868, 2008.
[92] W. J. Huang, S. Taylor, K. F. Fu, Y. Lin, D. H. Zhang, T. W. Hanks, A. M. Rao and Y. P. Sun, "Attaching Proteins to Carbon Nanotubes via Diimide-Activated Amidation", Nano Letters, vol. 2, pp. 311-314, 2002.
[93] M. Cinke, J. Li, B. Chen, A. Cassell, L. Delzeit, J. Han and M. Meyyappan, "Pore Structure of Raw and Purified HiPco Single-Walled Carbon Nanotubes", Chemical Physics Letters, vol. 365, pp. 69-74, 2002.
[94] Y. B. Wang, Z. Iqbal and S. V. Malhotra, "Functionalization of Carbon Nanotubes with Amines and Enzymes", Chemical Physical Letters, vol. 402, pp. 96-101, 2005.
[95] J. L. Bahr and J. M. Tour, "Highly Functionalized Carbon Nanotubes Using in Situ Generated Diazonium Compounds", Chemistry of Materials, vol. 13, pp. 3823-3824, 2001.
[96] Y. H. Chen and S. J. Mitra, "Fast Microwave-Assisted Purification, Functionalization and Dispersion of Multi-Walled Carbon Nanotubes", Journal of Nanoscience and Nanotechnology, vol. 8, no. 11, pp. 5770-5775, 2008.
[97] S. Mallakpour and A. Zadehnazari, "The Effect of Carboxylated Multi-Walled Carbon Nanotubes on Reinforcement Efficiency of Thiazole-Bearing Poly (Amide-Imide) Composites", Designed Monomers and Polymers, vol. 17, pp. 275-285, 2014.
[98] E. T. Mickelson, C. B. Huffman, A. G. Rinzler, R. E. Smalley, R. H. Hauge and J. L. Margrave, "Fluorination of Single-Wall Carbon Nanotubes", Chemical Physical Letters, vol. 296, pp. 188-194, 1998.
[99] W. J. Kim, S. O. Kang, C. S. Ah, Y. W. Lee, D. H. Ha, I. S. Choi and W. S. Yun, "Functionalization of Shortened SWCNTs Using Esterification", Bulletin of the Korean Chemical Society, vol. 25, pp. 1301-1302, 2004.
[100] Q. Zhang, L. Gao, and J. Guo, "Effects of Calcination on the Photocatalytic Properties of Nanosized TiO2 Powders Prepared by TiCl4 Hydrolysis", Journal of Applied Catalyst B Environmental, vol. 26, pp. 207–215, 2000.
[101] H. Hyung and J. H. Kim, "Natural Organic Matter (NOM) Adsorption to Multi-Walled Carbon Nanotubes: Effect of NOM Characteristics and Water Quality Parameters", Environmental Science Technology, vol. 42, pp. 4416-4421, 2008.
75
[102] M. Hema and S. Arivoli, "Comparative Study on The Adsorption Kinetics and Thermodynamics of Dyes onto Acid Activated Low Cost Carbon", International Journal of Physical Sciences, vol. 2, no. 1, pp. 10-17, 2007.
[103] L. S. A. A. Al-Amri, M. H. H. Al Subhi and R. Namdeti, "Comparison Studies for The Removal of Methylene Blue from Aqueous Solution Using Tea and Coffee Powder", International Journal of Chem Tech Research, vol. 6, no. 1, pp. 619-627, 2014.
[104] A. Amouei1, A. A. Amooey and F. Asgharzadeh, "A Study of Cadmium Removal from Aqueous Solutions by Sunflower Powders and its Modeling Using Artificial Neural Network", Iranian journal of health sciences, vol. 2, no. 1, pp. 28-34, 2014.
[105] Z. Shahryari, A. S. Goharrizi and M. Azadi, "Experimental Study of Methylene Blue Adsorption from Aqueous Solutions onto Carbon Nano Tubes", International Journal of Water Resources and Environmental Engineering, vol. 2, pp. 16-28, 2010.
[106] S. A. Pyrzynska, "Adsorption of Heavy Metal Ions with Carbon Nanotubes", Separation and Purification Technolog, vol. 58, pp. 49–52, 2007.
[107] J. N. Bhakta, P. B. Majumdar and Y. Munekage, "Development of Activated Carbon from Cotton Fibre Waste as Potential Mercury Adsorbent: Kinetic and Equilibrium Studies", International Journal of Chemical Engineering, vol. 2014, Article ID 176483, 7 pages, 2014
[108] M. A. Ahmad, S. G. Herawan and A. A.Yusof, "Equilibrium, Kinetics, and Thermodynamics of Remazol Brilliant Blue R Dye Adsorption onto Activated Carbon Prepared from Pinang Frond", SRN Mechanical Engineering, vol. 2014, Article ID 184265, 7 pages, 2014.
[109] S. Chatterjee , T. Chatterjee , S. R. Lim and S. H. Woo, "Effect of The Addition Mode of Carbon Nanotubes for The Production Of Chitosan Hydrogel Core–Shell Beads on Adsorption of Congo red from Aqueous Solution", Bioresource Technology, vol. 102, pp. 4402–4409, 2011.
[110] M. K. Aroua, S. P. P Leong, L. Y. Teo and M. A. Daud, "Real-time Determination of kinetics of Adsorption of Lead (II) onto Palm Shell-Based Activated Carbon Using Ion Selective Electrode", Journal of Bioresource Technology, vol. 99, pp. 5786–5792, 2008.
[111] A. F. Halbus, Z. H. Athab and F. H. Hussein, "Adsorption of Disperse Blue Dye on Iraqi Date Plam Deeds Activated Carbon", International Journal of Chemistry Science, vol. 11, no. 3, pp. 1219-1233, 2013.
[112] M. Toor and B. Jin, "Adsorption Characteristics, Isotherm, Kinetics, and Diffusion of Modified Natural Bentonite for Removing Diazo Dye", Journal of Chemical Engineering, vol. 187, pp. 79– 88, 2012.
[113] M. Arshadi, F. SalimiVahid, J. W. L. Salvacion and M. Soleymanzadeh, "Adsorption Studies of Methyl Orange on an Immobilized Mn-Nanoparticle: Kinetic and Thermodynamic", RSC Advances, vol. 4, pp. 16005-16017, 2014.
[114] M. A. Atieh, O. Y. Bakather, B. Al-Tawbini, A. A. Bukhari, F. A. Abuilaiwi and M. B. Fettouhi, "Effect of Carboxylic Functional Group Functionalized on Carbon Nanotubes Surface on the Removal of Lead from Water", Bioinorganic Chemistry and Applications, Article ID 603978, 9 pages, 2010.
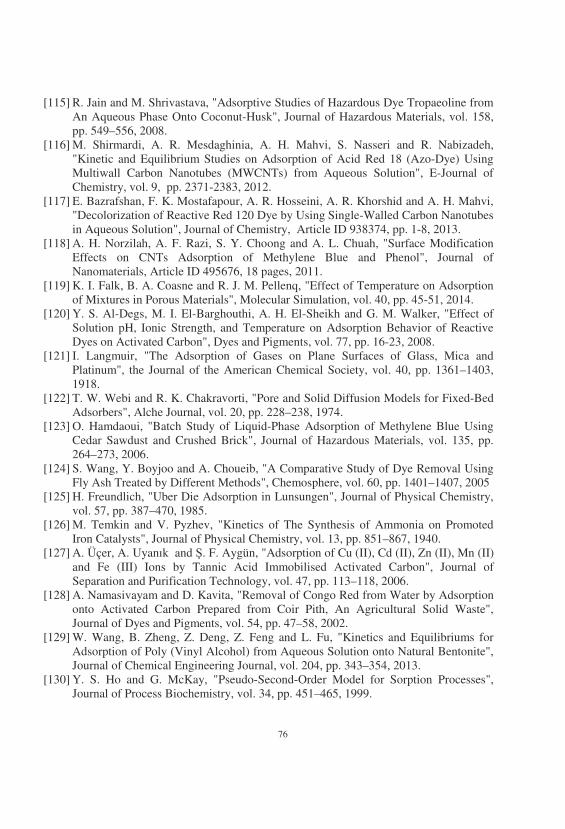
76
[115] R. Jain and M. Shrivastava, "Adsorptive Studies of Hazardous Dye Tropaeoline from An Aqueous Phase Onto Coconut-Husk", Journal of Hazardous Materials, vol. 158, pp. 549–556, 2008.
[116] M. Shirmardi, A. R. Mesdaghinia, A. H. Mahvi, S. Nasseri and R. Nabizadeh, "Kinetic and Equilibrium Studies on Adsorption of Acid Red 18 (Azo-Dye) Using Multiwall Carbon Nanotubes (MWCNTs) from Aqueous Solution", E-Journal of Chemistry, vol. 9, pp. 2371-2383, 2012.
[117] E. Bazrafshan, F. K. Mostafapour, A. R. Hosseini, A. R. Khorshid and A. H. Mahvi, "Decolorization of Reactive Red 120 Dye by Using Single-Walled Carbon Nanotubes in Aqueous Solution", Journal of Chemistry, Article ID 938374, pp. 1-8, 2013.
[118] A. H. Norzilah, A. F. Razi, S. Y. Choong and A. L. Chuah, "Surface Modification Effects on CNTs Adsorption of Methylene Blue and Phenol", Journal of Nanomaterials, Article ID 495676, 18 pages, 2011.
[119] K. I. Falk, B. A. Coasne and R. J. M. Pellenq, "Effect of Temperature on Adsorption of Mixtures in Porous Materials", Molecular Simulation, vol. 40, pp. 45-51, 2014.
[120] Y. S. Al-Degs, M. I. El-Barghouthi, A. H. El-Sheikh and G. M. Walker, "Effect of Solution pH, Ionic Strength, and Temperature on Adsorption Behavior of Reactive Dyes on Activated Carbon", Dyes and Pigments, vol. 77, pp. 16-23, 2008.
[121] I. Langmuir, "The Adsorption of Gases on Plane Surfaces of Glass, Mica and Platinum", the Journal of the American Chemical Society, vol. 40, pp. 1361–1403, 1918.
[122] T. W. Webi and R. K. Chakravorti, "Pore and Solid Diffusion Models for Fixed-Bed Adsorbers", Alche Journal, vol. 20, pp. 228–238, 1974.
[123] O. Hamdaoui, "Batch Study of Liquid-Phase Adsorption of Methylene Blue Using Cedar Sawdust and Crushed Brick", Journal of Hazardous Materials, vol. 135, pp. 264–273, 2006.
[124] S. Wang, Y. Boyjoo and A. Choueib, "A Comparative Study of Dye Removal Using Fly Ash Treated by Different Methods", Chemosphere, vol. 60, pp. 1401–1407, 2005
[125] H. Freundlich, "Uber Die Adsorption in Lunsungen", Journal of Physical Chemistry, vol. 57, pp. 387–470, 1985.
[126] M. Temkin and V. Pyzhev, "Kinetics of The Synthesis of Ammonia on Promoted Iron Catalysts", Journal of Physical Chemistry, vol. 13, pp. 851–867, 1940.
[127] A. Üçer, A. Uyanık and �. F. Aygün, "Adsorption of Cu (II), Cd (II), Zn (II), Mn (II) and Fe (III) Ions by Tannic Acid Immobilised Activated Carbon", Journal of Separation and Purification Technology, vol. 47, pp. 113–118, 2006.
[128] A. Namasivayam and D. Kavita, "Removal of Congo Red from Water by Adsorption onto Activated Carbon Prepared from Coir Pith, An Agricultural Solid Waste", Journal of Dyes and Pigments, vol. 54, pp. 47–58, 2002.
[129] W. Wang, B. Zheng, Z. Deng, Z. Feng and L. Fu, "Kinetics and Equilibriums for Adsorption of Poly (Vinyl Alcohol) from Aqueous Solution onto Natural Bentonite", Journal of Chemical Engineering Journal, vol. 204, pp. 343–354, 2013.
[130] Y. S. Ho and G. McKay, "Pseudo-Second-Order Model for Sorption Processes", Journal of Process Biochemistry, vol. 34, pp. 451–465, 1999.
77
[131] F. Han, G. H. Zhang and P. Gu, "Adsorption Kinetics and Equilibrium Modeling of Cesium on Copper Ferrocyanide", Journal of Radioanal Nucl Chem, vol. 295, pp. 369–377, 2013.
[132] M. Do�an, M. Alkan and Y. Onganer, "Adsorption of Methylene Blue from Aqueous Solution onto Perlite", Journal of Water, Air, and Soil Pollution, vol. 120, pp. 229–248, 2000.
[133] F. B. Daoud, S. Kaddour and T. Sadoun, "Adsorption of Cellulase Aspergillus Niger on A Commercial Activated Carbon: Kinetics and Equilibrium Studies", Journal of Colloids Surfaces B Biointerfaces, vol. 75, pp. 93–99, 2010.
[134] W. Plazinski, W. Rudzinski and A. Plazinska, "Theoretical Models of Sorption Kinetics Including A Surface Reaction Mechanism: A Review", Journal of Advances in Colloid and Interface Science, vol. 152, pp. 2–13, 2009.
[135] I. P. Okoye and C. Obi, ''Thermodynamic and Kinetic Evaluations of Some Heavy Metal Ions on Aluminum-Pillared and Unpillared Bentonite Clays'', International Archive of Applied Sciences and Technology, vol. 3, no. 2, pp. 58-67, 2012.
[136] A. A. Hussain, S. R. Mohammed, M. Nallu and S. Arvoli, "Kinetics and Thermodynamic Studies of Copper (II) Ion from Aqueous Solution by Activated Granite", International journal of advanced scientific research and technology, vol. 3, no. 2, pp. 69–78, 2012.
[137] T. S. Najim, S. A. Yassin and A. J. Majli, "Poly (Furfural-Acetone) as New Adsorbent for Removal of Cu (II) from Aqueous Solution: Thermodynamic and Kinetic Studies", International Journal of Chemistry, vol. 2, no. 2, pp. 44-53, 2010.
[138] X. Kang and S. Chen, "Photocatalytic Reduction of Methylene Blue by TiO2 Nanotube Arrays: Effects of TiO2 Crystalline Phase", Journal of Material Science, vol. 45, pp. 2696–2702, 2010.
[139] L. Chengtang, X. Hui, L. Huaming, L. Ling, X. Li, and Y. Zhixiang, "Efficient Degradation of Methylene Blue Dye by Catalytic Oxidation Using The Na8Nb6O19·13H2O/H2O2 System", Journal of Chemical Engineering, vol. 28, no. 4, pp. 1126–1132, 2011.
[140] H. Park, Y. Park, W. Kim and W. Choi, "Surface Modification of TiO2 Photocatalyst for Environmental Applications", Journal of Photochemistry and Photobiology C: Photochemistry Reviews, vol. 15, pp. 1– 20, 2013.
[141] A. M. Bakhshayesh, M. R. Mohammadi and D. J. Fray, "Controlling Electron Transport Rate and Recombination Process of TiO2 Dye-Sensitized Solar Cells by Design of Double-Layer Films with Different Arrangement Modes", Electrochimica Acta, vol. 78, pp. 384-391, 2012.
[142] T. Jesionowski, "Modification and Characterization of Titanium Dioxide Surface", Pigment and Resin Technology, vol. 30, pp. 287-295, 2001.
[143] L. N. An, W. X. Xu, S. Rajagopalan, C. M. Wang, H. Wang, Y. Fan, L. G. Zhang, D. P. Jiang, J. Kapat, L. Chow, B. H. Guo, J. Liang and R. Vaidyanathan, "Carbon-Nanotube-Reinforced Polymer- Derived Ceramic Composites", Advanced Materials, vol. 16, no. 22, pp. 2036-2040, 2004.
[144] L. A. Dobrza�ski, M. Pawlyta, A. Krzto�, B. Liszka and K. Labisz," Synthesis and Characterization of Carbon Nanotubes Decorated with Platinum Nanoparticles",
78
Journal of Achievements in Materials and Manufacturing Engineering, vol. 39, pp. 184-189, 2010.
[145] J. B. Xu and T. S. Zhao, "Synthesis of Well-Dispersed Pt/Carbon Nanotubes Catalyst Using Dimethylformamide As A Cross-Link", Journal of Power Sources, vol. 195, pp. 1071-1075, 2010.
[146] K. Song, Y. Zhang, J. Meng, E. C. Green, N. Tajaddod, H. Li and M. L. Minus, "Structural Polymer-Based Carbon Nanotube Composite Fibers: Understanding the Processing–Structure–Performance Relationship", Materials, vol. 6, pp. 2543-2577, 2013.
[147] R. Leary and A. Westwood, "Carbonaceous Nanomaterials for the Enhancement of Tio2 Photocatalysis", Carbon, vol. 49, pp. 741-772, 2011.
[148] D. H. Lee, J. G. Park, K. J. Choi, H. J. Choi and D. W. Kim, "Preparation Of Brookite-Type Tio2/Carbon Nanocomposite Electrodes For Application To Li Ion Batteries", European Journal of Inorganic Chemistry, vol. 6, pp. 878-882, 2008.
[149] M. L. Shofner, V. N. Khabashesku and E. V. Barrera, "Processing and Mechanical Properties of Fluorinated Single-Wall Carbon Nanotube-Polyethylene Composites", Chemistry of Materials, vol. 18, no. 4, pp. 906-913, 2006.
[150] P. K. Rai, A. N. P.Vasquez, J. Chattopadhyay, R. A. Pinnick, F. Liang, A. K. Sadana, R. H. Hauge, W. E. Billups and M. Pasquali, "Dispersions of Functionalized Single-Walled Carbon Nanotubes in Strong Acids: Solubility And Rheology", Journal of Nanoscience Nanotechnology, vol. 7, pp. 3378-85, 2007.
[151] R. E. Anderson and A. R. Barron, "Solubilization of Single-Wall Carbon Nanotubes in Organic Solvents without Sidewall Functionalization", Journal of Nanoscience Nanotechnology, vol. 7, pp. 3436-40, 2007.
[152] A. Star, J. F. Stoddart, D. Steuerman, M. Diehl, A. Boukai, E. W. Wong, X. Yang, S. W. Chung, H. Choi and J. R. Heath, "Preparation and Properties of Polymer-Wrapped Single-Walled Carbon Nanotubes", Angewandte Chemie-International Edition , vol. 40, no. 9, pp. 1721-1725, 2001.
[153] D. Baskaran, J. W. Mays and M. S. Bratcher, "Polymer Adsorption in the Grafting Reactions of Hydroxyl Terminal Polymers with Multi-Walled Carbon Nanotubes", Polymer, vol. 46, no. 14, pp. 5050-5057, 2005.
[154] J. J. Ge, D. Zhang, Q. Li, H. Q. Hou, M. J. Graham, L. M. Dai, F. W. Harris and S. Z. D. Cheng, "Multiwalled Carbon Nanotubes with Chemically Grafted Polyetherimides", Journal of The American Chemical Society, vol. 127, no. 28, pp. 9984-9985, 2005.
[155] J. Liu, A. G. Rinzler, H. Dai, J. H. Hafuer, R. K. Bradley, P. J. Boul, A. Lu, T. Iverson, K. Shelimov, C. B. Huffinan, F. M. Rodriguez, S. Y Shon, T. R. Lee, D. T. Colbert and R. E. Smalley, "Fullerene Pipes", Science, vol. 280, pp. 1253-1256, 1998.
[156] B. R. Azamian, J. J. Davis, K. S. Coleman, C. B. Bagshaw and M. L. H. Green, "Bioelectrochemical Single-Walled Carbon Nanotubes", Journal of American Chemical Sociality, vol. 124, pp. 12664-12665, 2002.
[157] J. J. Davis, K. S. Coleman, B. R. Azamian, C. B. Bagshaw and M. L. H., "Chemical and Biochemical Sensing with Modified Single Walled Carbon Nanotubes", Chemistry-A European Journal, vol. 9, pp. 3732-3739, 2003.
79
[158] S. Peng, and K. Cho, "Chemical Control of Nanotube Electronics", Nanotechnology, vol. 11, no. 2, pp. 57-60, 2000
[159] Q. Fu and J. Liu, "Effects of Ionic Surfactant Adsorption on Single-Walled Carbon Nanotube Thin Film Devices in Aqueous Solutions", Langmuir, vol. 21, no. 4, pp. 1162-1165, 2005.
[160] D. Tuncel, "Non-Covalent Interactions between Carbon Nanotubes and Conjugated Polymers", Nanoscale, vol. 3, no. 9, pp. 3545-3554, 2011.
[161] N. Saifuddin, A. Z. Raziah and A. R. Junizah, "Carbon Nanotubes: A Review on Structure and Their Interaction with Proteins", Journal of Chemistry, vol. 2013, Article ID 676815, 18 pages, 2013.
[162] H. Hiura, T. W. Ebbesen and K. Tanigaki, "Opening and Purification of Carbon Nanotubes in High Yields", Advanced Materials, vol. 7, pp. 275-276, 1995.
[163] J. F. Colomer, P. Piedigrosso, A. Fonseca and J. B. Nagy, "Different Purifications of Carbon Nanotubes Produced by Catalytic Synthesis", Synthetic Metals, vol. 103, pp. 2482-2483, 1999.
[164] L. M. Montoro and J. M. Rosolen, "A Multi-Step Treatment to Effective Purification of Single-Walled Carbon Nanotubes", Carbon, vol. 44, pp. 3293-3301, 2006.
[165] P. Slobodian, P. Svoboda, P. Riha, R. Boruta and Petr Saha, "Synthesis of PMMA-co-PMAA Copolymer Brush on Multi-Wall Carbon Nanotubes", Journal of Surface Engineered Materials and Advanced Technology, vol. 2, no. 3A, Article ID:21434, 6 pages, 2012.
[166] T. J. Aitchison, M. G. Markovic, J. G. Matisons, G. P. Simon and P. M. Fredericks, "Purification, Cutting, and Sidewall Functionalization of Multiwalled Carbon Nanotubes Using Potassium Permanganate Solutions", Journal of Physical Chemistry, vol. 111, pp. 2440-2446, 2007.
[167] D. Janas , A. P. Herman , S. Boncel and K. Koziol, "Swift Modification of Resistively Heated Carbon Nanotube Films by The Action of Hydrogen Peroxide", Materials Letters, vol. 119, pp. 115–118, 2014.
[168] T. A. Saleh and V. K. Gupta, "Photo-Catalyzed Degradation of Hazardous Dye Methyl Orange by Use of A Composite Catalyst Consisting of Multi-Walled Carbon Nanotubes and Titanium Dioxide", Journal of Colloid and Interface Science, vol. 371, pp. 101–106, 2012.
[169] H. Zhang, H. Guo, X. Deng, P. Gu, Z. Chen and Z. Jiao, ''Functionalization of Multi-Walled Carbon Nanotubes Via Surface Unpaired Electrons'', Nanotechnology, vol. 21, article ID 085706, 7 pages, 2010.
[170] Y. J. Xu, Y. Zhuang and X. Fu, "New Insight for Enhanced Photocatalytic Activity of TiO2 by Doping Carbon Nanotubes: A Case Study on Degradation of Benzene and Methyl Orange", Journal of Physical Chemistry C, vol. 114, pp. 2669-2676, 2010.
[171] C. V. Raman and K. S. Krishnan, ''A New Type of Secondary Radiation'', Nature, vol. 121, pp. 501-502, 1928.
[172] R. Graupner, "Raman Spectroscopy of Covalently Functionalized Single-wall Carbon Nanotubes", Journal of Raman Spectroscopy, vol. 38, pp. 673-683, 2007.
[173] D. J. Nelson, H. Rhoads and C. Brammer, "Covalently Sidewall-Functionalized SWNTs", Journal of Physical Chemistry C, vol. 111, no. 48, pp. 17872-17878, 2007.
80
[174] S. Mirershadi, S. Z. Mortazavi, A. Reyhani, N. Moniri and A. J. Novinrooz, "Effective Condition for Purification of Multi-Walled Carbon Nanotubes by Nitric Acid", Synthesis and Reactivity in Inorganic, Metal-Organic and Nano-Metal Chemistry, vol. 39, no. 4, pp. 204-208, 2009.
[175] M. S. Tehrani , P. A. Azar, P. E. naming and S. M. Dehaghi, "Removal of Lead Ions from Aqueous Solution Using Multi-Walled Carbon Nanotubes: The Effect of Functionalization", Journal of Applied Environmental and Biological Sciences, vol. 4, no. 2, pp. 316-326, 2014.
[176] L. N. Dlamini, R. W. Krause, G. U. Kulkani and S. H. Durbach, "Photodegradation of Bromophenol Blue with Fluorinated Tio2 Composite", Applied Water Science, vol. 1, pp. 19-24, 2011.
[177] H. C. Choi, Y. M. Jung and S. B. Kim, "Characterization of Raman Spectra of Size-Selected TiO2 Nanoparticles by Two-Dimensional Correlation Spectroscopy", Bulletin Korean Chemistry Society, vol. 25, no. 3, pp. 426-428, 2004.
[178] Y. Xie, S. H. Heo and S. H. Yoo, "Synthesis and Photocatalytic Activity of Anatase TiO2 Nanoparticles Coated Carbon Nanotubes", Nanoscale Research Letters, vol. 5, pp. 603-607, 2010.
[179] C. Dechakiatkrai, J. Chen and G. Lynam, S. Phanichphant and G. Wallace, "Photocatalytic Oxidation of Methanol Using Titanium Dioxide/Single-Walled Carbon Nanotube Composite Batteries and Energy Storage", Journal of Electrochemical Society, vol. 154, no. 5, pp. 407-411, 2007.
[180] B. Réti, K. Mogyorósi, A. Dombi and K. Hernádi, "Substrate Dependent Photocatalytic Performance of TiO2/MWCNT Photocatalysts", Applied Catalysis A: General, vol. 469, pp. 153–158, 2014.
[181] T. Jia, F. Fu, J. Zhao, J. Chen, X. Wang, Z. Fan, L. Cui and F. Meng, "Sonochemical Synthesis, Characterization, and Photocatalytic Activity of N-Doped TiO2 Nanocrystals with Mesoporous Structure", International Journal of Photoenergy, vol. 2014, Article ID 516806, 7 pages, 2014.
[182] P. Scherrer, "Bestimmung Der Grösse Und Der Inneren Struktur Von Kolloidteilchen Mittels Röntgenstrahlen, Nachrichten Von Der Gesellschaft Der Wissenschaften, Göttingen", Mathematisch-Physikalische Klasse, vol. 2, pp. 98-100, 1918.
[183] H. B. Zhang, G. D. Lin, Z. H. Zhou, X. Dong and T. Chen, "Raman Spectra of MWCNTs and MWCNT-Based H2 Adsorbing System", Carbon, vol. 40, pp. 2429-2436, 2002.
[184] Y. Yu, J. C. Yu, J. G. Yu, Y.C. Kwok, Y.K. Che, J.C. Zhao, L Ding, W.K. Ge and P.K. Wong, "Enhancement of Photocatalytic Activity of Mesoporous TiO2 by Using Carbon Nanotubes", Applied Catalysis A: General, vol. 289, pp. 186–196, 2005.
[185] F. K. M. Alosfur, M. H. H. Jumali, S. Radiman, N. J. Ridha and A. A. Umar, "In-situ Dressing of MWCNTs with TiO2 Nanoparticles: Microwave- Assisted Synthesis Towards Water Treatment", Procedia Technology, vol. 12, pp. 264–270, 2014.
[186] Cao, C. Xu, J. Liang, D. Wu and B. Wei, "X-Ray Diffraction Characterization on the Alignment Degree of Carbon Nanotubes", Chemical Physics Letters, vol. 344, pp. 13– 17, 2001.
81
[187] M. Theodore, M. Hosur, J. Thomas and S. Jeelani, "Influence of Functionalization on Properties of MWCNT–Epoxy Nanocomposites", Materials Science and Engineering A, vol. 528, pp. 1192–1200, 2011.
[188] D. C. Wu, L. Shen, J. E. Low, S.Y. Wong, X. Li, W. C. Tjiu, Y. Liu and C. B. He, "Multi-Walled Carbon Nanotube/Polyimide Composite Film Fabricated Through Electrophoretic Deposition", Polymer, vol. 51, pp. 2155–2160, 2010.
[189] Li Chen, X. Pang, G. Yu and J. Zhang, "In-Situ Coating of MWCNTs with Sol-Gel TiO2 Nanoparticles", Advanced Materials Letters, vol. 1, no. 1, pp. 75-78, 2010.
[190] A. Yıldrım and T. Seçkin, "In Situ Preparation of Polyether Amine Functionalized MWCNT Nanofiller as Reinforcing Agents", Advances in Materials Science and Engineering, vol. 2014, Article ID 356920, 6 pages, 2014.
[191] F. Boroumand, J. Moser and H. van den Bergh, "Quantitative Diffuse Reflectance and Transmittance Infrared Spectroscopy of Nondiluted Powders", Applied Spectroscopy, vol. 46, no. 12, pp. 1874-1886, 1992.
[192] Z. R. Tang, F. Li, Y. Zhang, X. Fu and Y. J. Xu, "Composites of Titanate Nanotubes and Carbon Nanotubes as Photocatalyst with High Mineralization Ratio for Gas-Phase Degradation of Volatile Aromatic Pollutant", The Journal of Physical Chemistry C, vol. 115, pp. 7880-7886, 2011.
[193] H. Liu, H. Zhang and H. Yang, "Photocatalytic Removal of Nitric Oxide by Multi-Walled Carbon Nanotubes-Supported TiO2", Chinese Journal of Catalysis, vol. 35, pp. 66–77, 2014.
[194] W. C. Nixon, ''The General Principles of Scanning Electron Microscopy'', Phil. Trans. Ray. Soc. Lond. B., vol. 261, pp. 45-50, 1971.
[195] S. J. Kim, J. S. Im, P. H. Kang, T. Kim and Y. S. Lee, "Photo Catalytic Activity of CNT-TiO2 Nanocomposite in Degrading Anionic and Cationic Dyes", Carbon Letters, vol. 9, no. 4, pp. 294-297, 2008.
[196] B. K. Vijayan, N.M. dimitrijevic, D. F. Shapiro, J. Wu and K. A. Gray, "Coupling Titania Nanotubes and Carbon Nanotubes to Create Photocatalytic Nanocomposites", American Chemical Society Catalysis, vol. 2, pp. 223-229, 2012.
[197] X. Huang, M. Feng and X. Liu, "Design of Bristle-Like TiO2–MWCNT Nanotubes to Improve The Dielectric and Interfacial Properties of Polymer-Based Composite Films", RSC Advances, vol. 4, pp. 4985-4992, 2014.
[198] G. S. Pozan and A. Kambur, "Removal of 4-chlorophenol from Wastewater: Preparation, Characterization and Photocatalytic Activity of Alkaline Earth Oxide Doped TiO2", Journal of Applied Catalysis B: Environmental, vol. 129, pp. 409– 415, 2013.
[199] G. N. Shao, A. Hilonga, S. J. Jeon, J. E. Lee, G. Elineema, D. V. Quang, J. K. Kim and H. T. Kim, "Influence of Titania Content on The Mesostructure of Titania–Silica Composites and Their Photocatalytic Activity", Journal of Powder Technology, vol. 233, pp. 123–130, 2013.
[200] F. Alosfur, M. H. Haji Jumali, S. Radiman, N. J. Ridha, M. A. Yarmo and A. A. Umar, "Visible Light-Responsive TiO2 Coated MWCNTs as a Hybrid Nanocatalysts", International Journal of Electrochemical Science, vol. 8, pp. 2977 – 2982, 2013.
82
[201] K. Rajeshwar, M. E. Osugi, W. Chanmanee, C. R. Chenthamarakshan, M. V. B. Zanoni, P. Kajitvichyanukul and R. K. Ayer, "Heterogeneous Photocatalytic Treatment of Organic Dyes in Air and Aqueous Media", Journal of Photochemistry and Photobiology C: Photochemistry Reviews, vol. 9, pp. 171–192, 2008.
[202] Y. Shiraishi, N. Saito and T. Hirai, "Adsorption-Driven Photocatalytic Activity of Mesoporous Titanium Dioxide", journal of American chemical society, vol. 127, no. 37, pp 12820–12822, 2005.
[203] W. C. Oh and M. L. Chen, "Synthesis and Characterization of CNT/TiO2 Composites Thermally Derived from MWCNT and Titanium (IV) n-Butoxide", Bulletin of the Korean Chemical Society, vol. 29, no. 1, pp. 159-164, 2008.
[204] M. Zarezade, S. Ghasemi and M. R. Gholami, "The Effect of Multiwalled Carbon Nanotubes and Activated Carbon on the Morphology and Photocatalytic Activity of TiO2/C Hybrid Materials", Catalysis Science and Technology, vol. 1, pp. 279-284, 2011.
[205] M. R. Hoffmann, S. T. Martin, W. Y. Choi and D. W. Bahnemann, "Environmental Applications of Semiconductor Photocatalysis", Chemical Review, vol. 95, no. 1, pp. 69-96, 1995.
[206] W. Wang, P. Serp, P. Kalck and J. L. Faria, "Visible Light Photodegradation of Phenol on MWNT-TiO2 Composite Catalysts Prepared by A Modified Sol–Gel Method", vol. 235, pp. 194-199, 2005.
[207] M. Barberio, P. Barone, A. Imbrogno, A. Bonanno and F. Xu, "Optical and Morphological Properties of Carbon Nanotube—Anatase Nanocomposites: Improvements in Visible Absorbance", Chemistry and Materials Science, vol. 4, no. 1, pp. 78-84, 2014.
[208] C. H. Wu, C.Y. Kuo and S. T. Chen, "Synergistic Effects Between TiO2 and Carbon Nanotubes (CNTs) in a TiO2/CNTs System Under Visible Light Irradiation", Environmental Technology, vol. 34, pp. 2513-2519, 2013.
[209] K. Woan, G. Pyrgiotakis and W. Sigmund, "Photocatalytic Carbon-Nanotube–TiO2 Composites", Advanced Materials, vol. 21, pp. 1-7, 2009.