1 / 10 Under Guidance of MEERA MEHTA MONA IYER MAITREE PATEL 3rd Semester Infrastructure Planning | MURP DATE: 08-11-17 Water Sensitive & Sanitized Ahmedabad WATER AND SANITATION Studio FACULTY OF PLANNING Planning for the better future
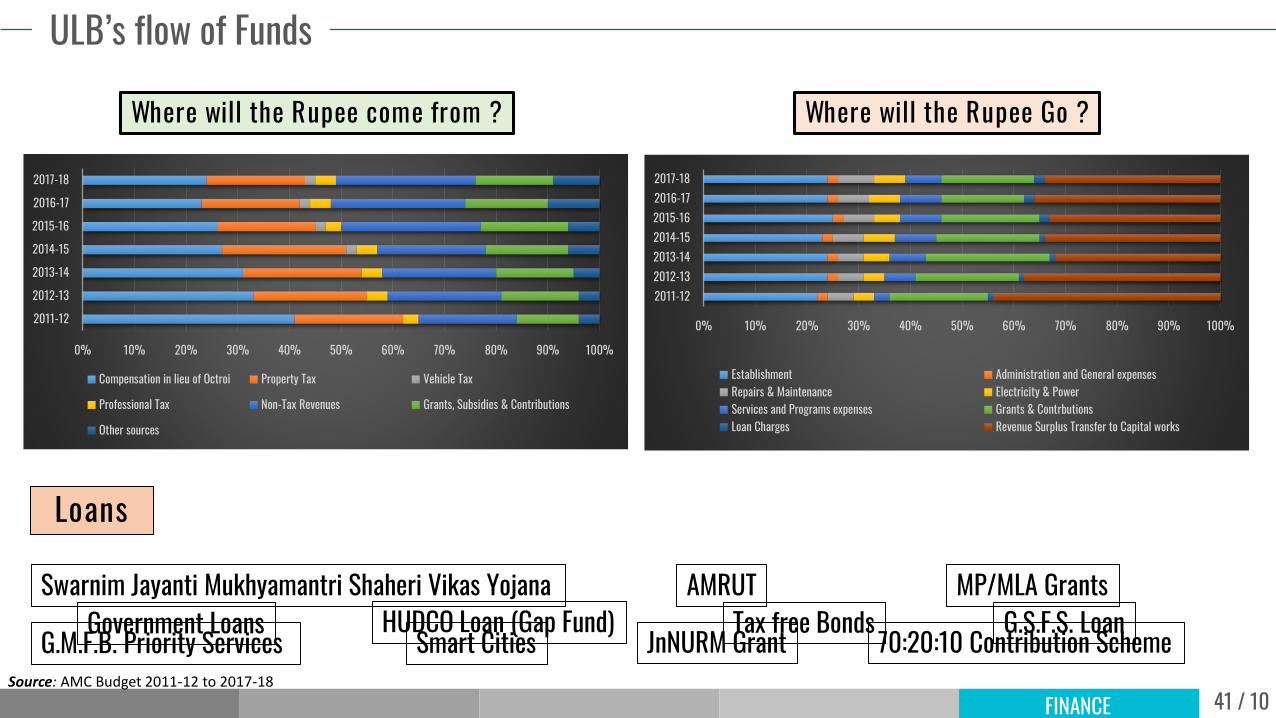
Compensation in lieu of Octroi Property Tax Vehicle Tax
Professional Tax Non-Tax Revenues Grants, Subsidies & Contributions
Other sources
0% 10% 20% 30% 40% 50% 60% 70% 80% 90% 100%
2011-122012-132013-142014-152015-162016-172017-18
Establishment Administration and General expensesRepairs & Maintenance Electricity & PowerServices and Programs expenses Grants & ContrbutionsLoan Charges Revenue Surplus Transfer to Capital works
42 / 122
Under the guidance of Meera MehtaMona IyerMaitree Patel
Water –
Sensitive
AhmedabadPlanning for the better future
3rd SemesterCEPT University
DATE 10th November, 2017
43 / 122WATER
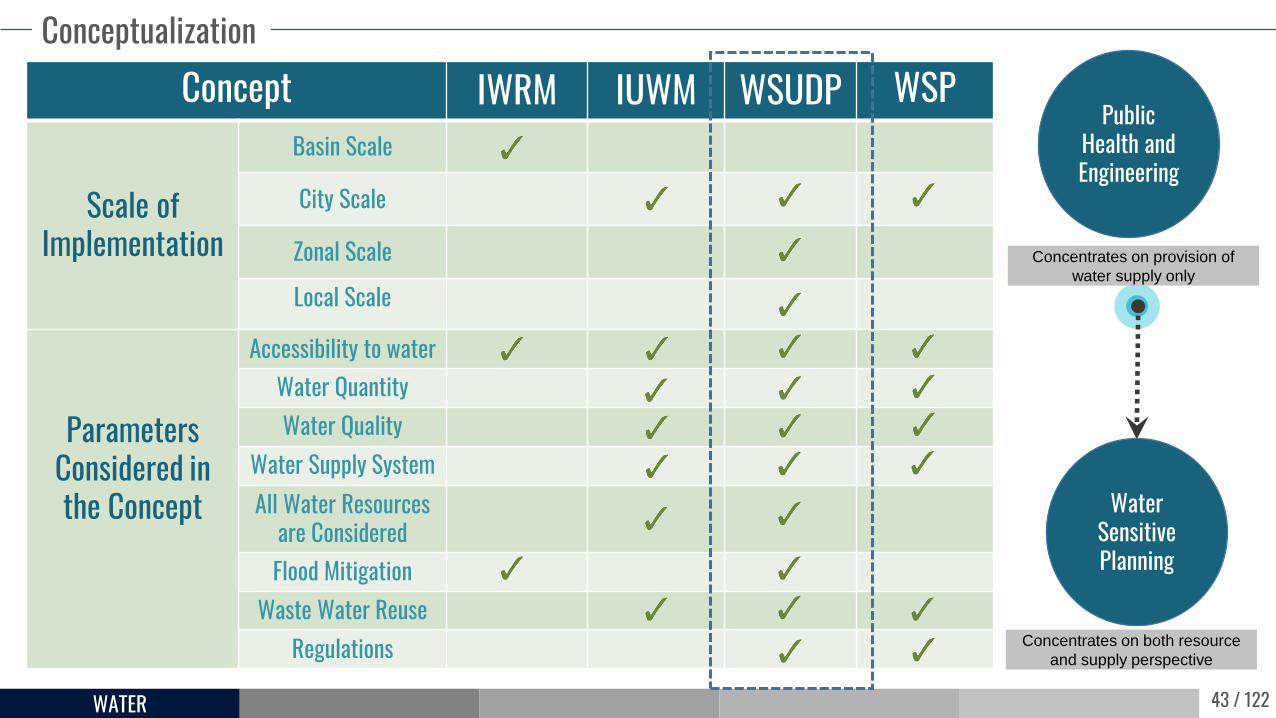
ConceptualizationConcept IWRM IUWM WSUDP WSP
Scale of Implementation
Basin Scale
City Scale
Zonal Scale
Local Scale
ParametersConsidered in the Concept
Accessibility to waterWater QuantityWater Quality
Water Supply SystemAll Water Resources
are ConsideredFlood Mitigation
Waste Water ReuseRegulations
Public Health and Engineering
Concentrates on provision of
water supply only
Water Sensitive Planning
Concentrates on both resource
and supply perspective
44 / 122WATER
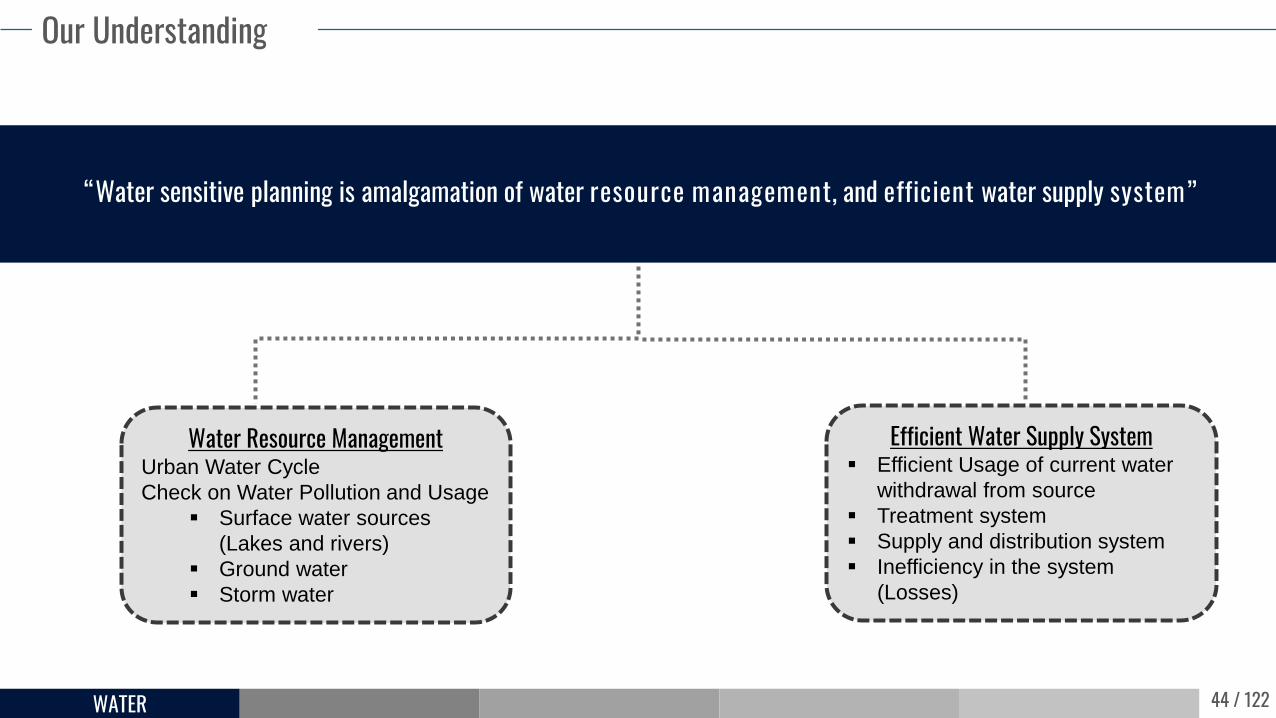
“Water sensitive planning is amalgamation of water resource management, and efficient water supply system”
Our Understanding
Water Resource ManagementUrban Water Cycle
Check on Water Pollution and Usage
Surface water sources
(Lakes and rivers)
Ground water
Storm water
Efficient Water Supply System Efficient Usage of current water
withdrawal from source
Treatment system
Supply and distribution system
Inefficiency in the system
(Losses)
45 / 122WATER
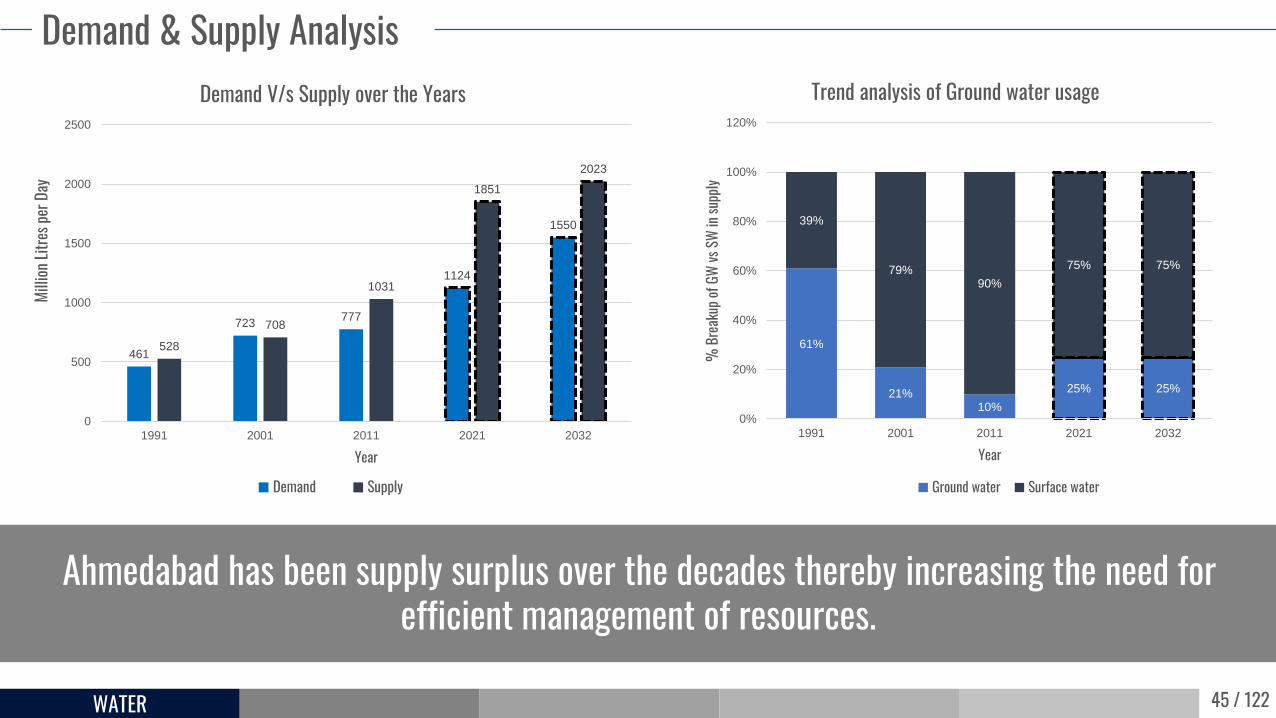
Demand & Supply Analysis
461
723777
1124
1550
528
708
1031
1851
2023
0
500
1000
1500
2000
2500
1991 2001 2011 2021 2032
Millio
n Litr
es pe
r Day
Year
Demand V/s Supply over the Years
Demand Supply
61%
21%10%
25% 25%
39%
79%90%
75% 75%
0%
20%
40%
60%
80%
100%
120%
1991 2001 2011 2021 2032
% B
reak
up of
GW
vs SW
in su
pply
Year
Trend analysis of Ground water usage
Ground water Surface water
Ahmedabad has been supply surplus over the decades thereby increasing the need for efficient management of resources.
46 / 122WATER
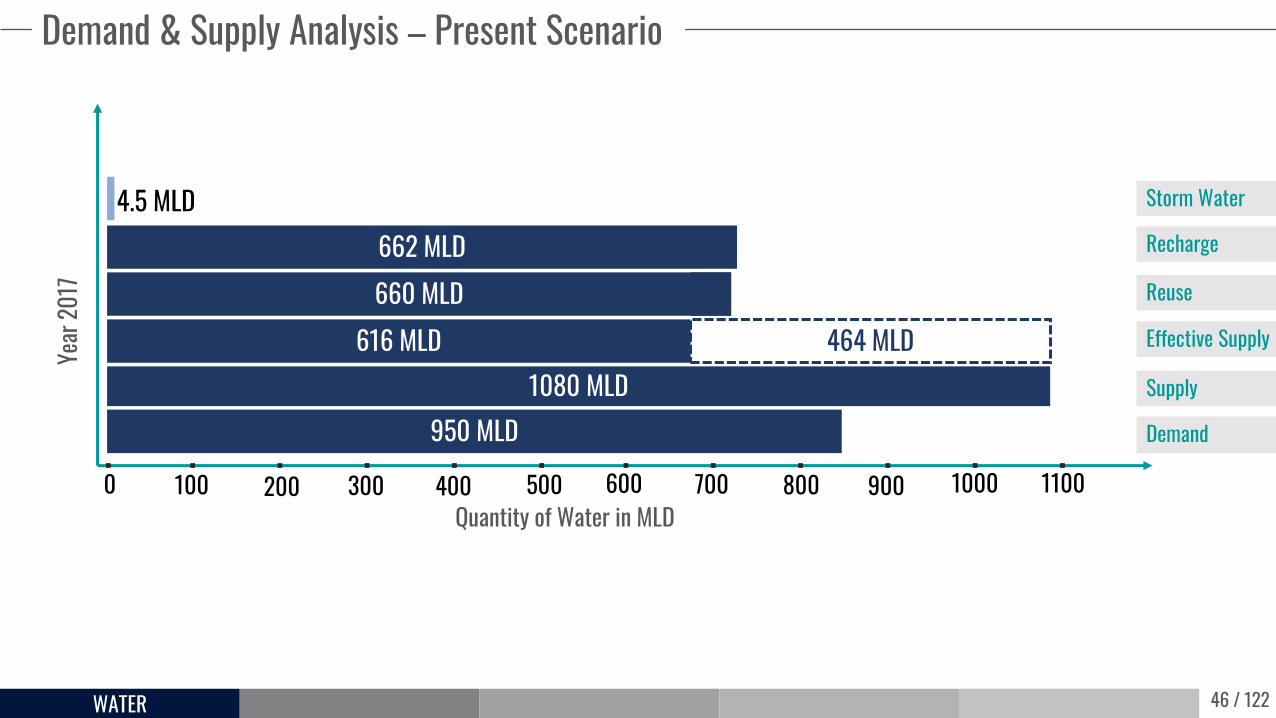
Demand & Supply Analysis – Present Scenario
1080 MLD950 MLD
616 MLD 464 MLD660 MLD662 MLD
4.5 MLD
Quantity of Water in MLD
Year
2017
Demand
Supply
Effective Supply
Reuse
Recharge
Storm Water
100 2000 300 400 500 600 700 800 900 1000 1100
47 / 122
Water Resources
48 / 122WATER
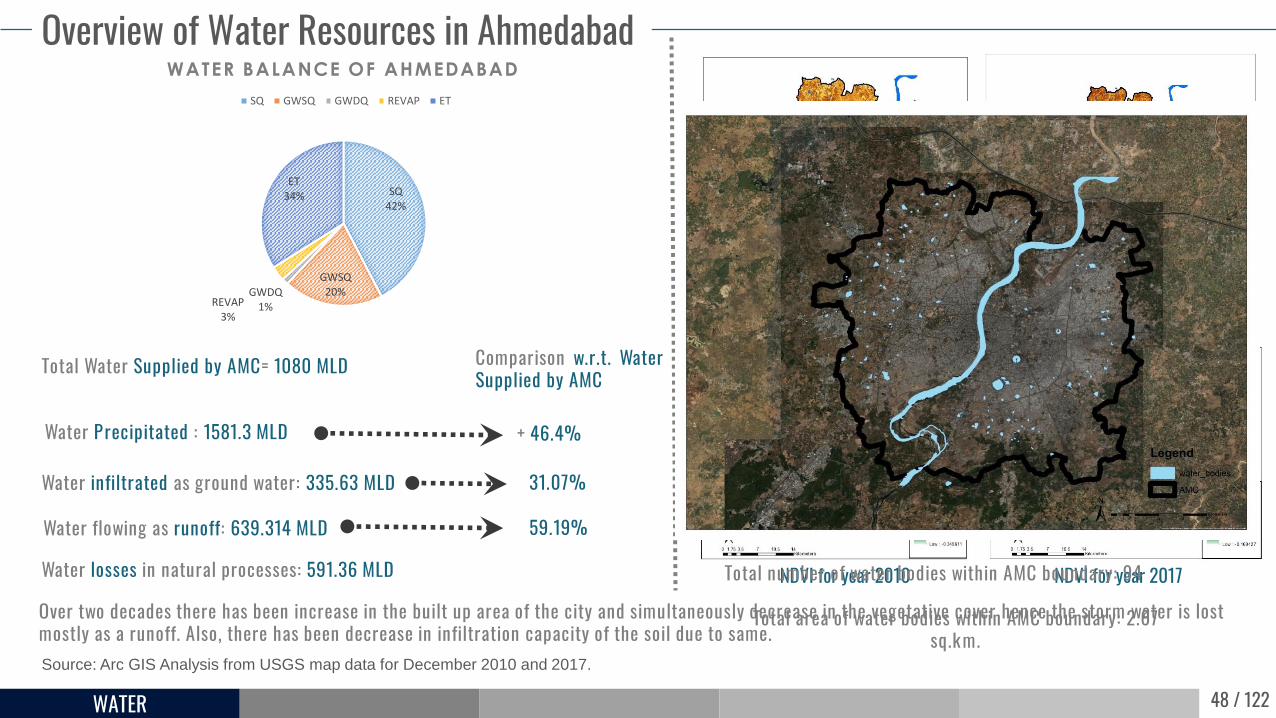
Overview of Water Resources in Ahmedabad
Source: Arc GIS Analysis from USGS map data for December 2010 and 2017.
NDBI for year 2010 NDBI for year 2017
NDVI for year 2010 NDVI for year 2017
Over two decades there has been increase in the built up area of the city and simultaneously decrease in the vegetative cover hence the storm water is lost mostly as a runoff. Also, there has been decrease in infiltration capacity of the soil due to same.
Total Water Supplied by AMC= 1080 MLD
SQ42%
GWSQ20%GWDQ
1%REVAP3%
ET34%
WATER BALANCE OF AHMEDABAD
SQ GWSQ GWDQ REVAP ET
Water Precipitated : 1581.3 MLD
Water infiltrated as ground water: 335.63 MLD
Water flowing as runoff: 639.314 MLD
Water losses in natural processes: 591.36 MLD
31.07%
59.19%
+ 46.4%
Comparison w.r.t. WaterSupplied by AMC
Total number of water bodies within AMC boundary: 94
Total area of water bodies within AMC boundary: 2.67 sq.km.
49 / 122WATER
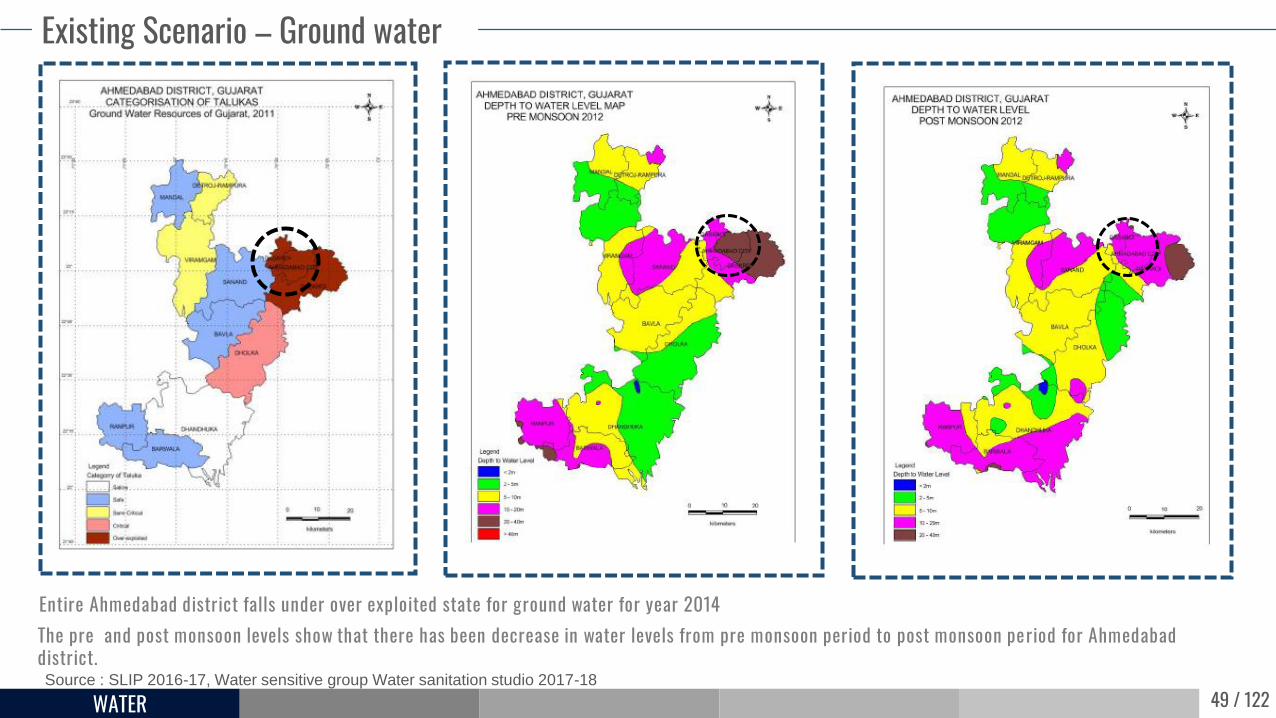
Existing Scenario – Ground water
Source : SLIP 2016-17, Water sensitive group Water sanitation studio 2017-18
Entire Ahmedabad district falls under over exploited state for ground water for year 2014 The pre and post monsoon levels show that there has been decrease in water levels from pre monsoon period to post monsoon period for Ahmedabad district.
50 / 122WATER
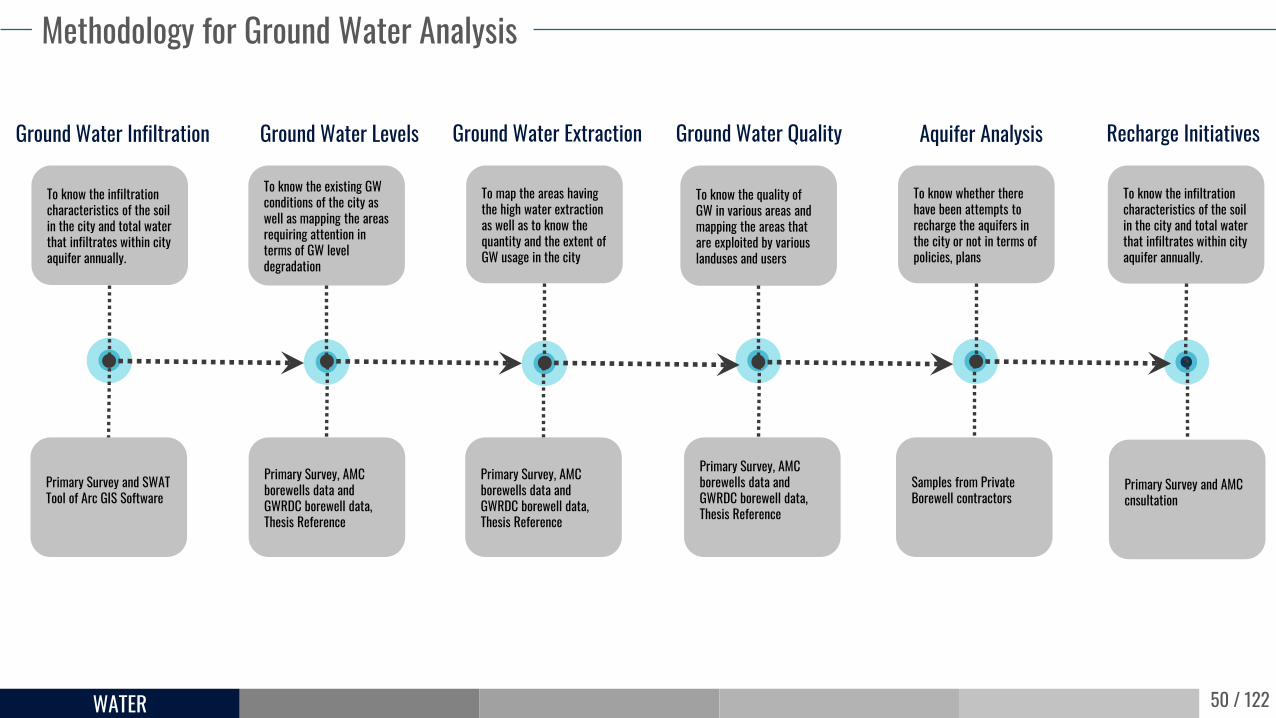
Methodology for Ground Water Analysis
To know the infiltration characteristics of the soil in the city and total water that infiltrates within city aquifer annually.
To know the existing GW conditions of the city as well as mapping the areas requiring attention in terms of GW level degradation
To map the areas having the high water extraction as well as to know the quantity and the extent of GW usage in the city
To know the quality of GW in various areas and mapping the areas that are exploited by various landuses and users
To know whether there have been attempts to recharge the aquifers in the city or not in terms of policies, plans
To know the infiltration characteristics of the soil in the city and total water that infiltrates within city aquifer annually.
Primary Survey and SWAT Tool of Arc GIS Software
Primary Survey, AMC borewells data and GWRDC borewell data, Thesis Reference
Primary Survey, AMC borewells data and GWRDC borewell data, Thesis Reference
Primary Survey, AMC borewells data and GWRDC borewell data, Thesis Reference
Samples from Private Borewell contractors
Primary Survey and AMC cnsultation
Ground Water Infiltration Ground Water Levels Ground Water Extraction Ground Water Quality Aquifer Analysis Recharge Initiatives
51 / 122WATER
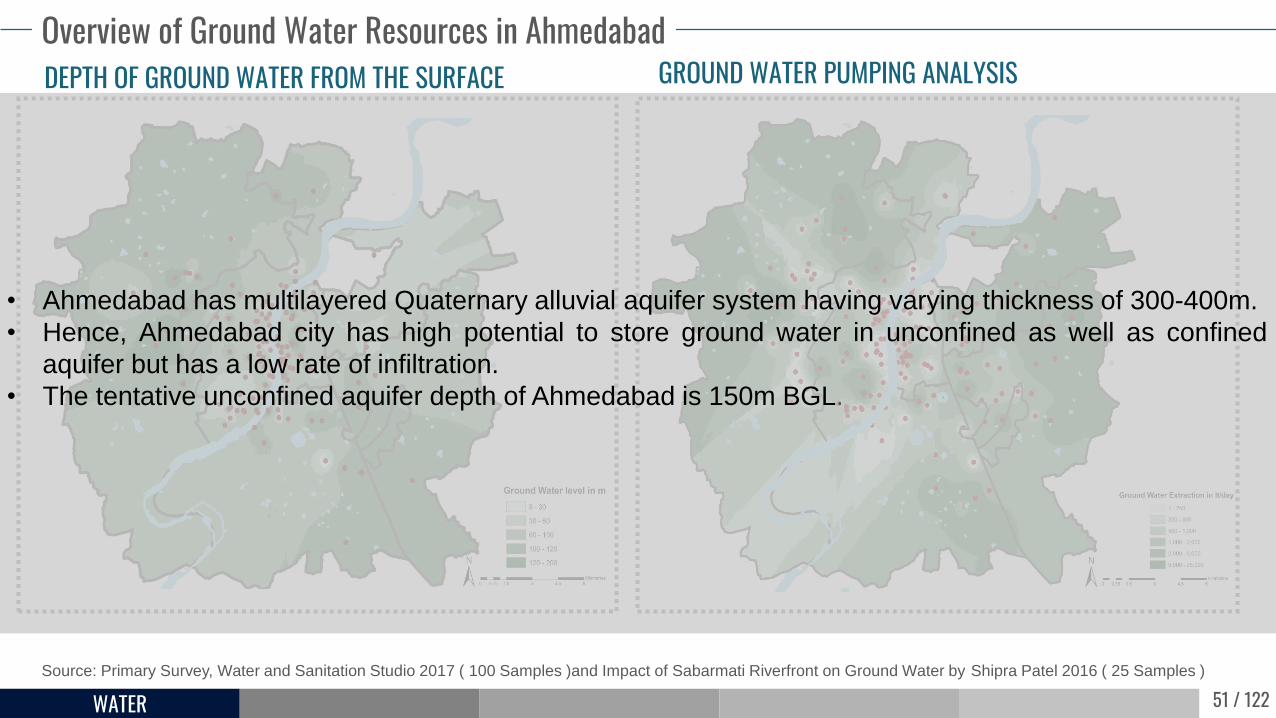
Overview of Ground Water Resources in Ahmedabad
Source: Primary Survey, Water and Sanitation Studio 2017 ( 100 Samples )and Impact of Sabarmati Riverfront on Ground Water by Shipra Patel 2016 ( 25 Samples )
DEPTH OF GROUND WATER FROM THE SURFACE GROUND WATER PUMPING ANALYSIS
• Ahmedabad has multilayered Quaternary alluvial aquifer system having varying thickness of 300-400m.
• Hence, Ahmedabad city has high potential to store ground water in unconfined as well as confined
aquifer but has a low rate of infiltration.
• The tentative unconfined aquifer depth of Ahmedabad is 150m BGL.
52 / 122WATER
Overview of Ground Water Resources in Central Zone
Source: Primary Survey, Water and Sanitation Studio 2017 ( 100 Samples )and Impact of Sabarmati Riverfront on Ground Water by Shipra Patel 2016 ( 25 Samples )
DEPTH OF GROUND WATER FROM THE SURFACE GROUND WATER PUMPING ANALYSIS
• High Ground water table with low extraction
• Highly dependent on AMC water supply
• Because of AMC bore wells .and newly constructed apartments, some parts of this zone shows more extraction and lower ground water table
• Aquifer analysis also justifies the water levels as well as availability of GW at lower depth from ground
60 - 100m
500 - 1500 lt/hr
Majorly Residential
53 / 122WATER
Overview of Ground Water Resources in North Zone
Source: Primary Survey, Water and Sanitation Studio 2017 ( 100 Samples )
DEPTH OF GROUND WATER FROM THE SURFACE GROUND WATER PUMPING ANALYSIS
• Continuous Aquifer available at depth of 80m
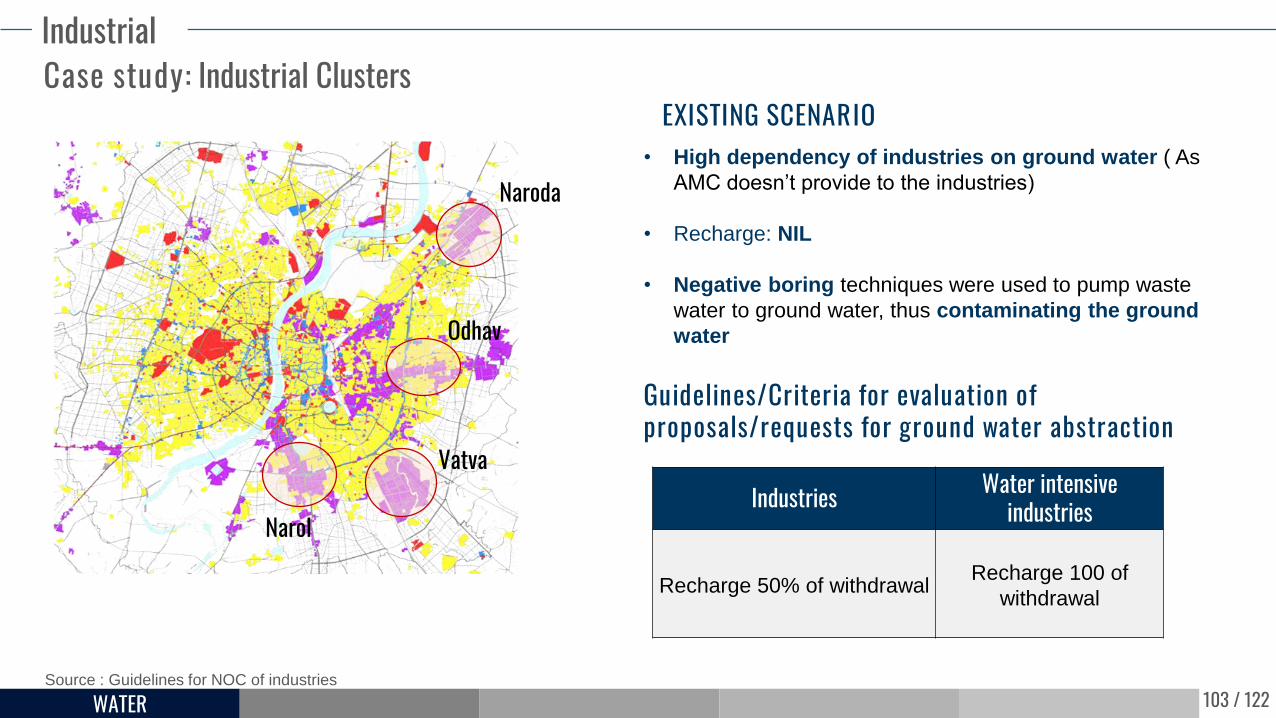
• There are certain regions where GW level is 100 – 120m which is majorly Industrial area (Naroda)
• These Industrial clusters have higher extraction rate also
• From stake holder consultation we came to know about the quality issues around Naroda GIDC at the shallow level due to re flushing of chemicals
60 - 100m
3000 - 5000 lt/hr
Residential and Industrial Clusters
54 / 122WATER
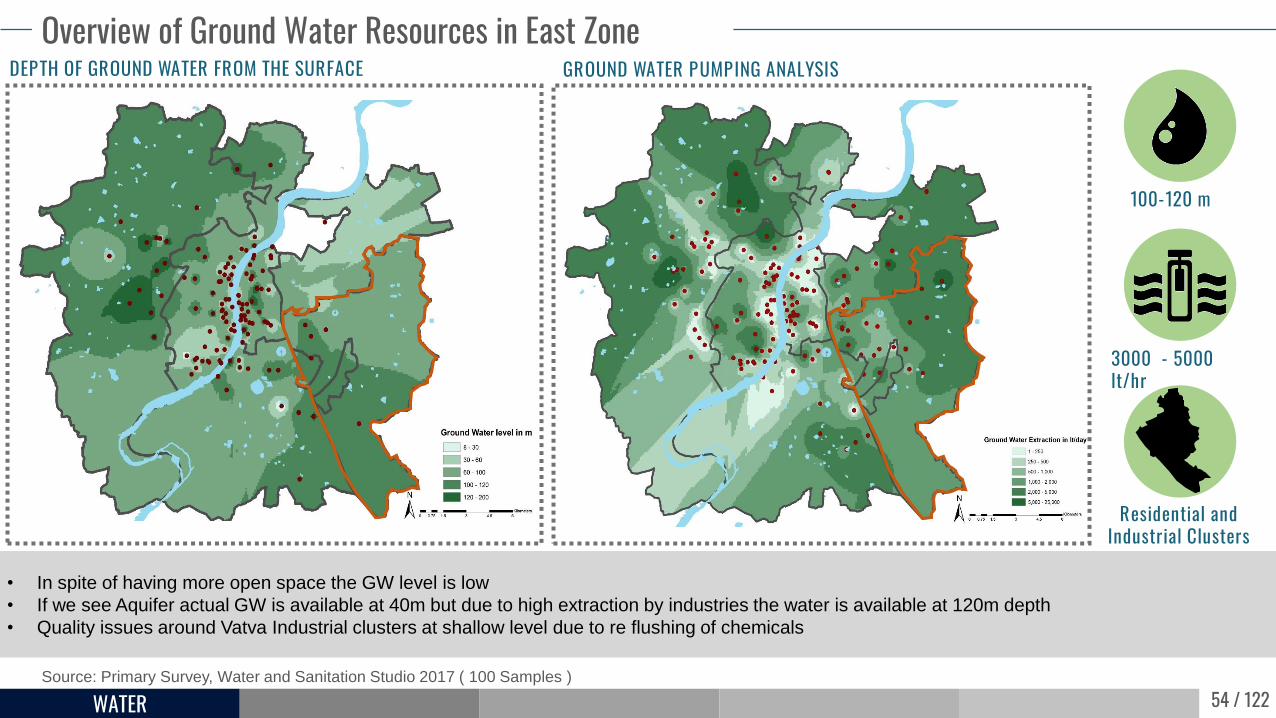
Overview of Ground Water Resources in East Zone
Source: Primary Survey, Water and Sanitation Studio 2017 ( 100 Samples )
DEPTH OF GROUND WATER FROM THE SURFACE GROUND WATER PUMPING ANALYSIS
• In spite of having more open space the GW level is low
• If we see Aquifer actual GW is available at 40m but due to high extraction by industries the water is available at 120m depth
• Quality issues around Vatva Industrial clusters at shallow level due to re flushing of chemicals
100-120 m
3000 - 5000 lt/hr
Residential and Industrial Clusters
55 / 122WATER
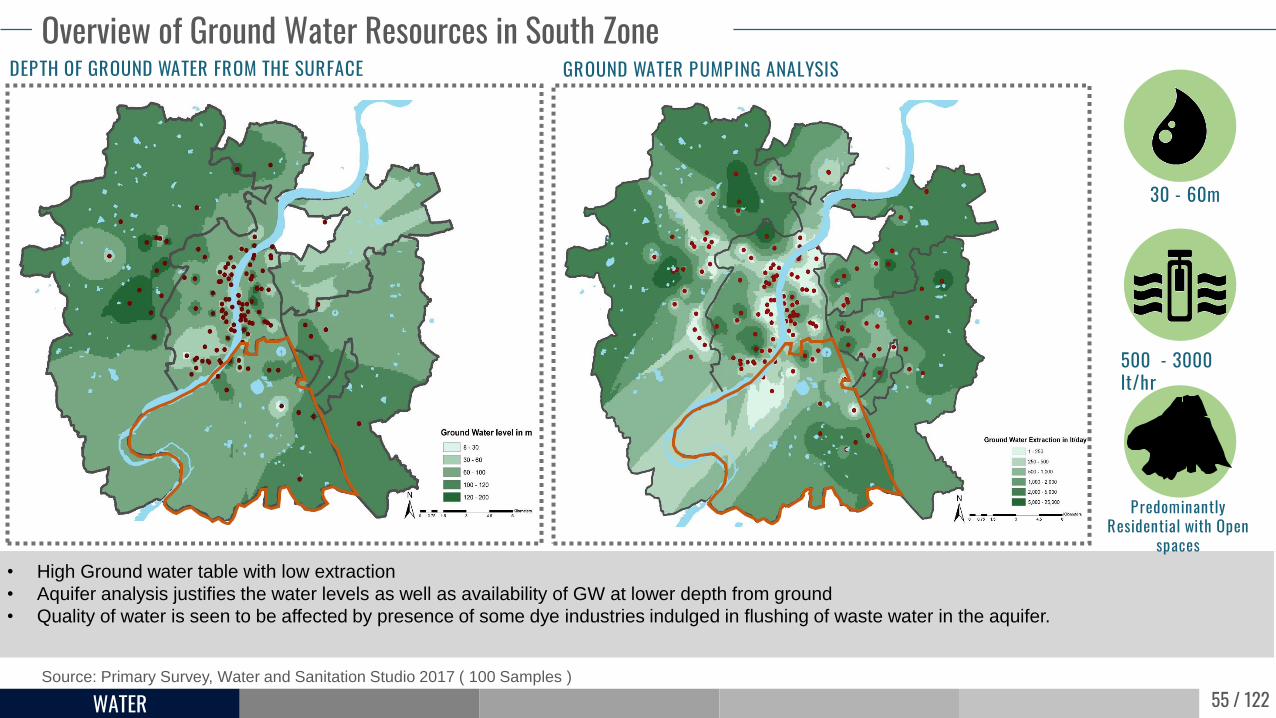
Overview of Ground Water Resources in South Zone
Source: Primary Survey, Water and Sanitation Studio 2017 ( 100 Samples )
DEPTH OF GROUND WATER FROM THE SURFACE GROUND WATER PUMPING ANALYSIS
• High Ground water table with low extraction
• Aquifer analysis justifies the water levels as well as availability of GW at lower depth from ground
• Quality of water is seen to be affected by presence of some dye industries indulged in flushing of waste water in the aquifer.
30 - 60m
500 - 3000 lt/hr
Predominantly Residential with Open
spaces
56 / 122WATER
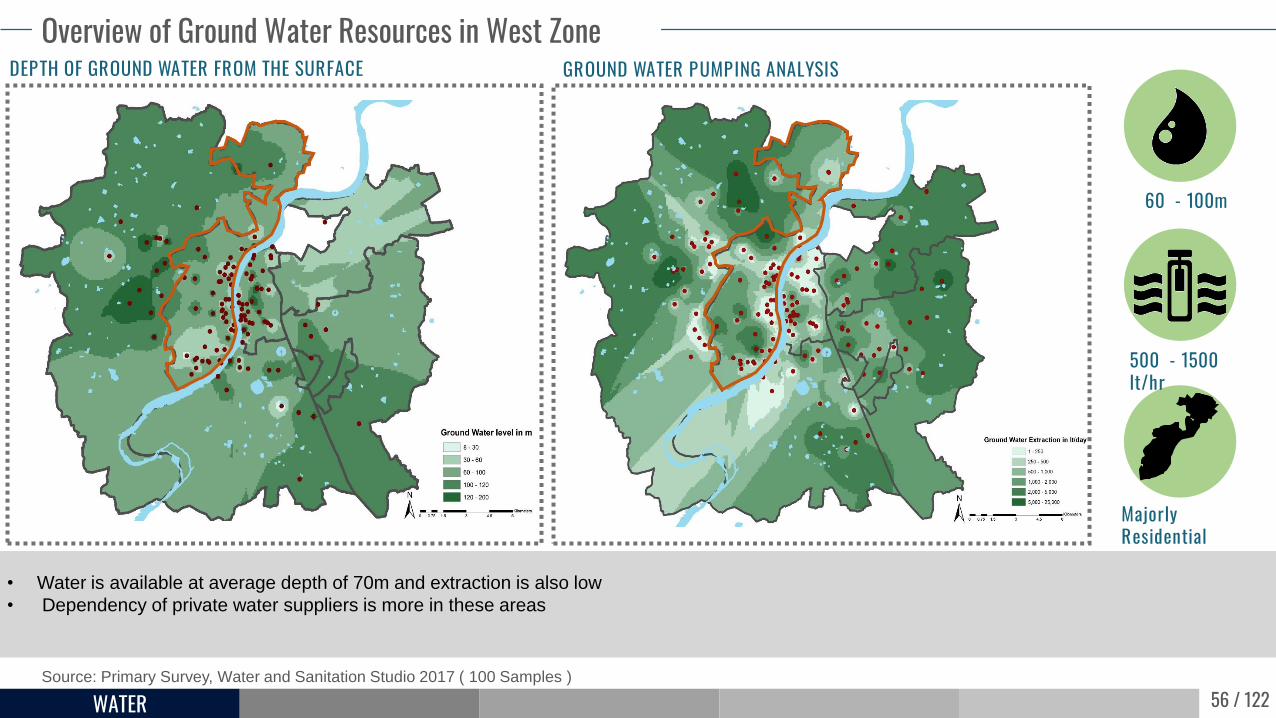
Overview of Ground Water Resources in West Zone
Source: Primary Survey, Water and Sanitation Studio 2017 ( 100 Samples )
DEPTH OF GROUND WATER FROM THE SURFACE GROUND WATER PUMPING ANALYSIS
• Water is available at average depth of 70m and extraction is also low
• Dependency of private water suppliers is more in these areas
60 - 100m
500 - 1500 lt/hr
Majorly Residential
57 / 122WATER
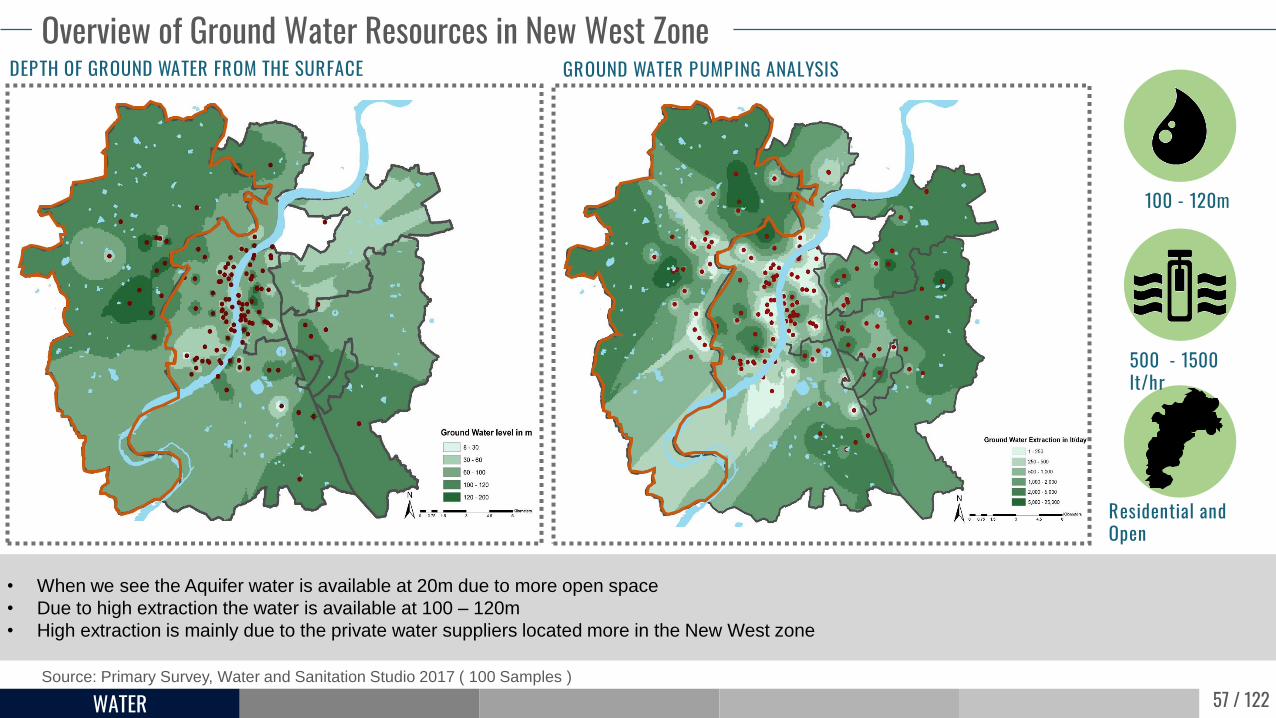
Overview of Ground Water Resources in New West Zone
Source: Primary Survey, Water and Sanitation Studio 2017 ( 100 Samples )
DEPTH OF GROUND WATER FROM THE SURFACE GROUND WATER PUMPING ANALYSIS
• When we see the Aquifer water is available at 20m due to more open space
• Due to high extraction the water is available at 100 – 120m
• High extraction is mainly due to the private water suppliers located more in the New West zone
100 - 120m
500 - 1500 lt/hr
Residential and Open
58 / 122WATER
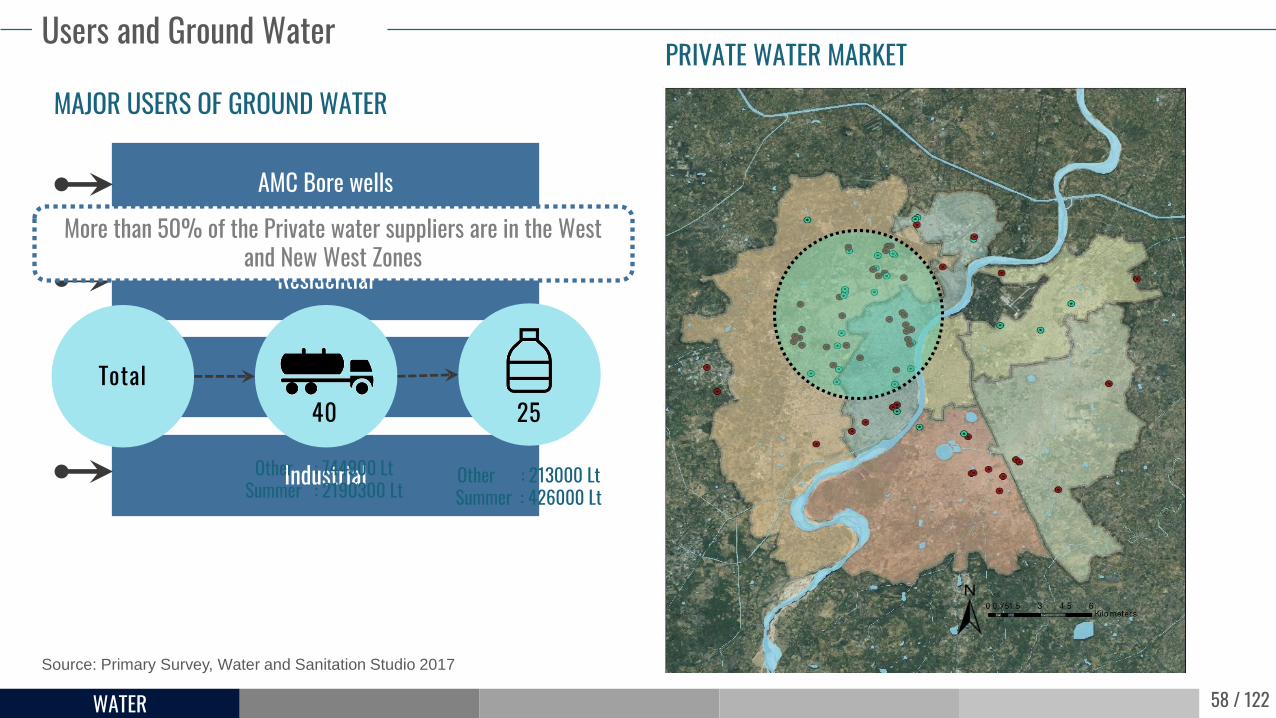
Users and Ground Water
Source: Primary Survey, Water and Sanitation Studio 2017
PRIVATE WATER MARKETMAJOR USERS OF GROUND WATER
Residential
Commercial
Industrial
AMC Bore wells
More than 50% of the Private water suppliers are in the West and New West Zones
Total40 25
Other : 213000 LtSummer : 426000 Lt
Other : 744900 LtSummer : 2190300 Lt
59 / 122WATER
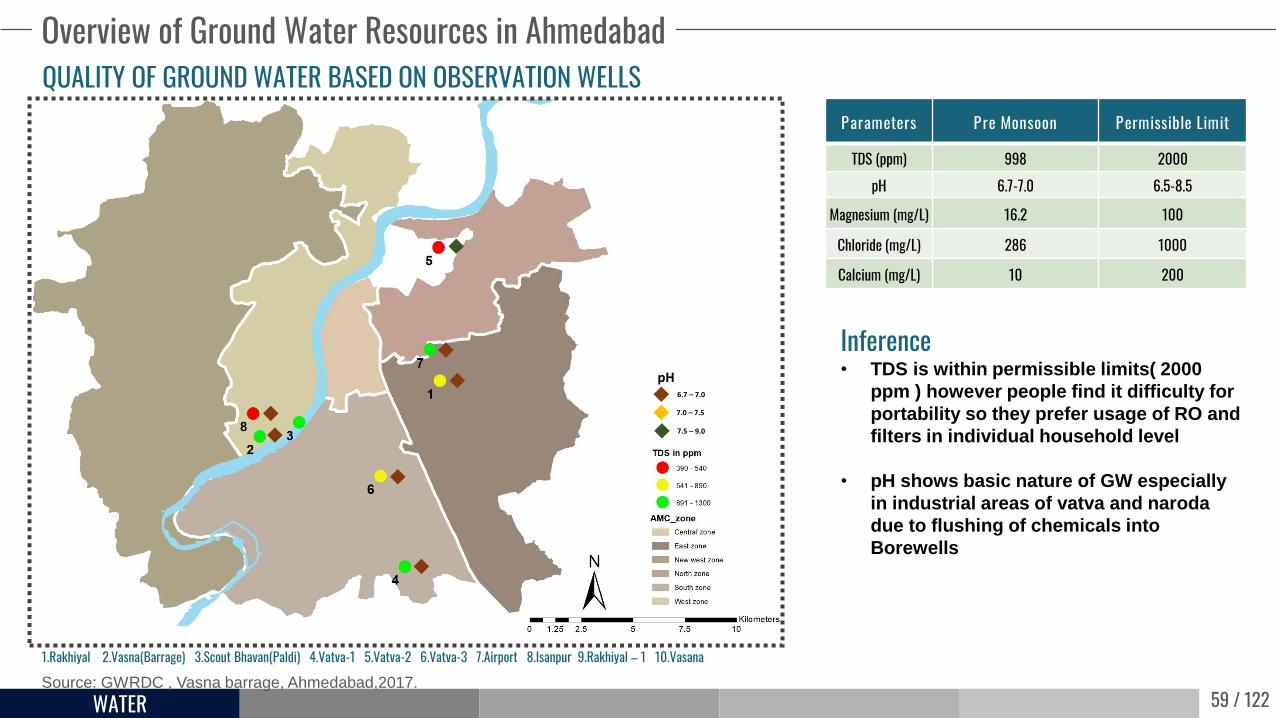
Overview of Ground Water Resources in Ahmedabad
Source: GWRDC , Vasna barrage, Ahmedabad,2017.
QUALITY OF GROUND WATER BASED ON OBSERVATION WELLS
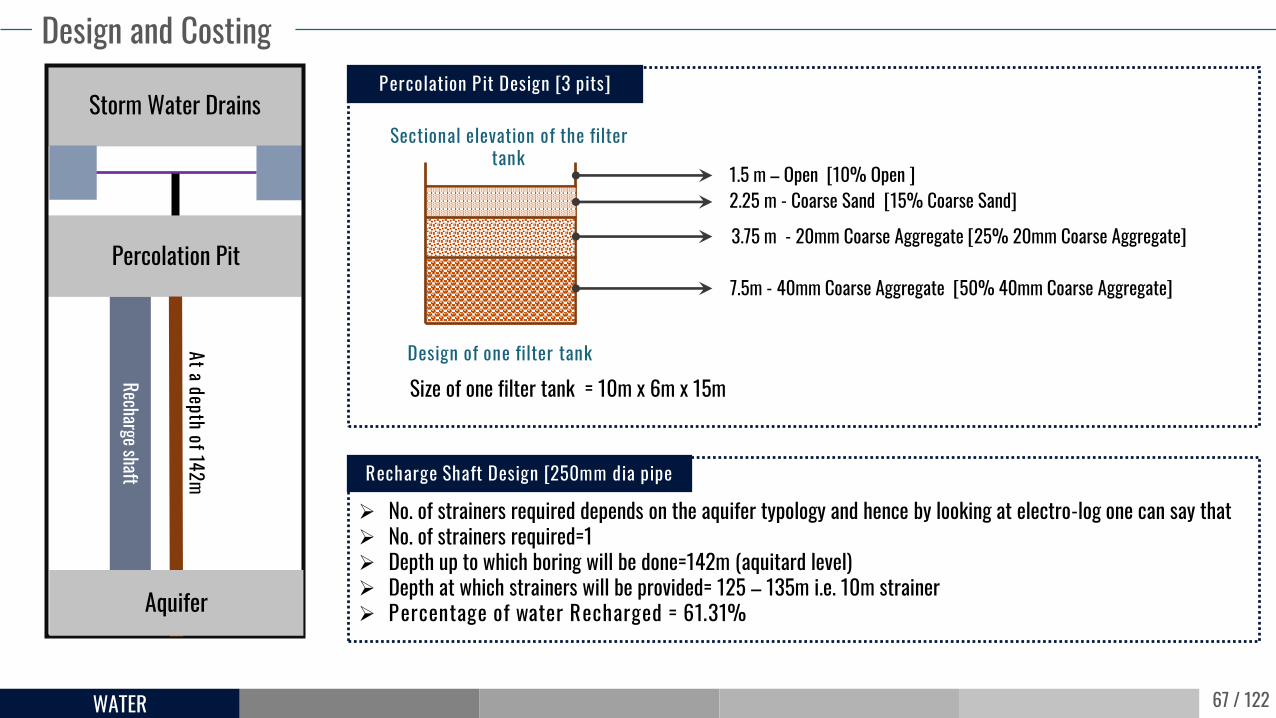
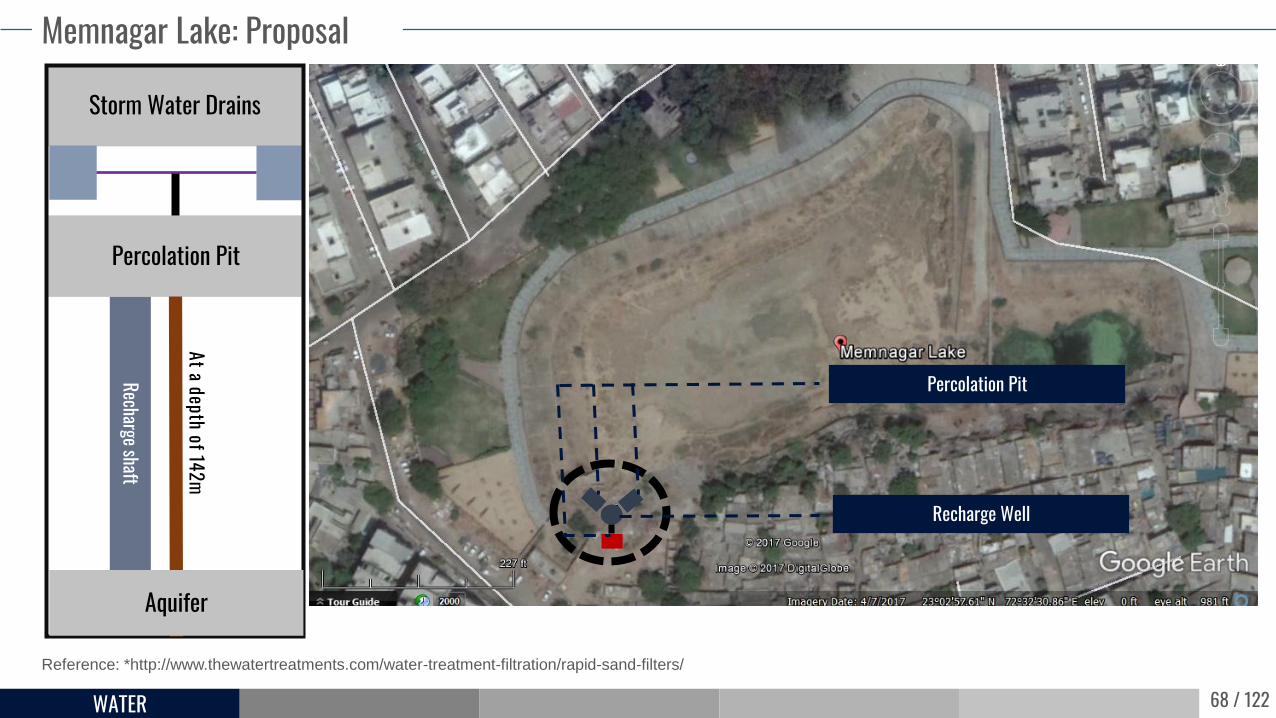
No. of strainers required depends on the aquifer typology and hence by looking at electro-log one can say that No. of strainers required=1 Depth up to which boring will be done=142m (aquitard level) Depth at which strainers will be provided= 125 – 135m i.e. 10m strainer Percentage of water Recharged = 61.31%
Percolation Pit Design [3 pits]
Recharge Shaft Design [250mm dia pipe
Sectional elevation of the filter tank
Design of one filter tank
2.25 m - Coarse Sand [15% Coarse Sand]
3.75 m - 20mm Coarse Aggregate [25% 20mm Coarse Aggregate]
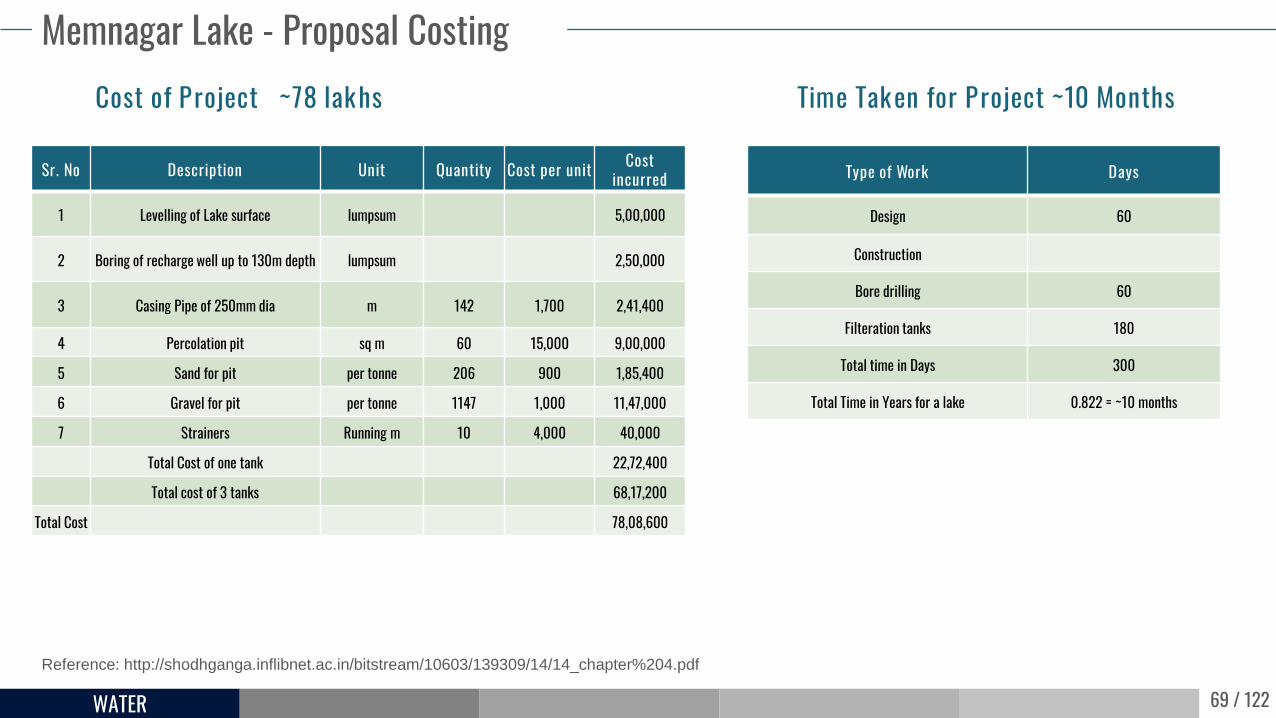
Sr. No Description Unit Quantity Cost per unit Cost incurred
1 Levelling of Lake surface lumpsum 5,00,000
2 Boring of recharge well up to 130m depth lumpsum 2,50,000
3 Casing Pipe of 250mm dia m 142 1,700 2,41,400
4 Percolation pit sq m 60 15,000 9,00,000
5 Sand for pit per tonne 206 900 1,85,400
6 Gravel for pit per tonne 1147 1,000 11,47,000
7 Strainers Running m 10 4,000 40,000
Total Cost of one tank 22,72,400
Total cost of 3 tanks 68,17,200
Total Cost 78,08,600
Time Taken for Project ~10 Months
Type of Work Days
Design 60
Construction
Bore drilling 60
Filteration tanks 180
Total time in Days 300
Total Time in Years for a lake 0.822 = ~10 months
70 / 122WATER
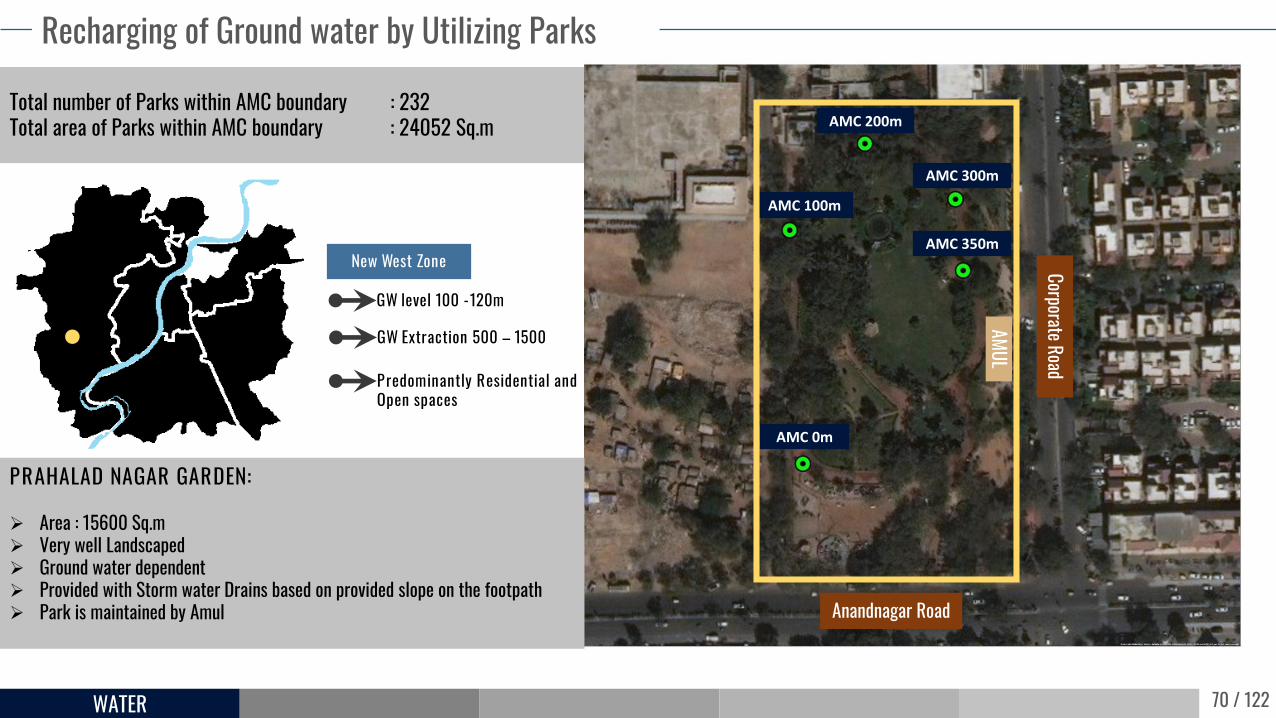
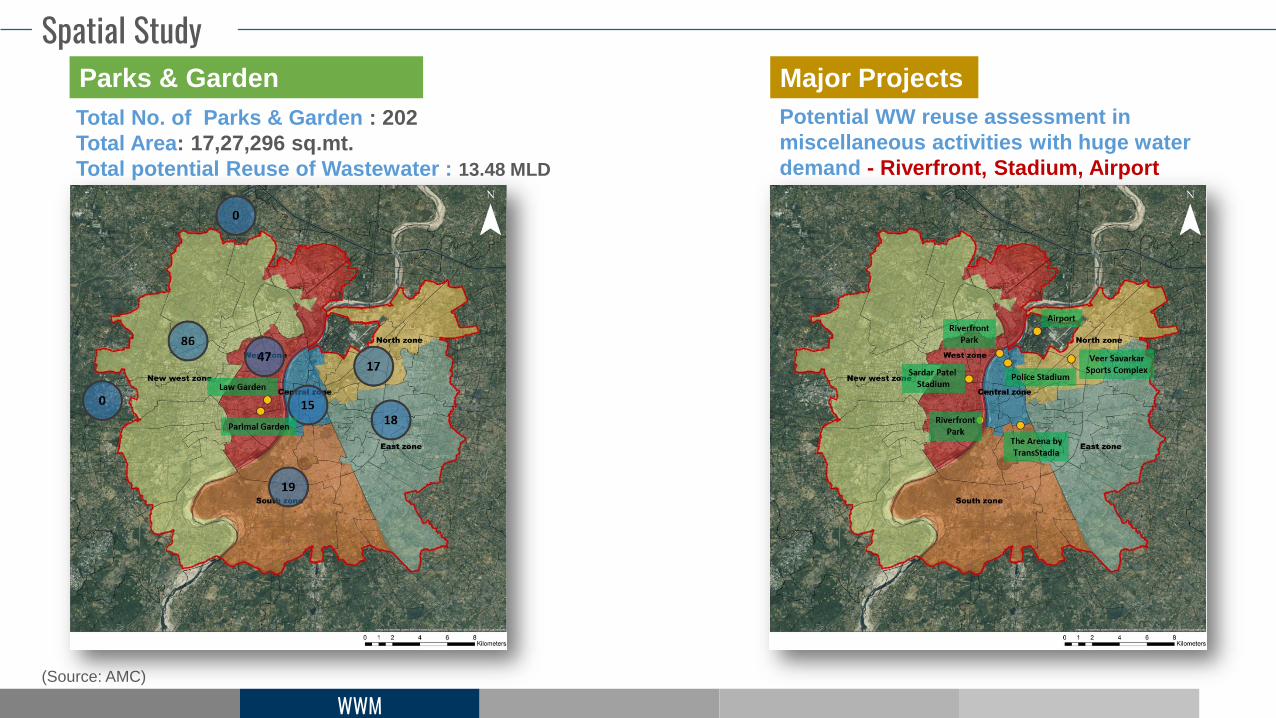
Total number of Parks within AMC boundary : 232Total area of Parks within AMC boundary : 24052 Sq.m
Recharging of Ground water by Utilizing Parks
AMC 0m
AMC 100m
AMC 350m
AMC 300m
AMC 200m
New West Zone
GW level 100 -120m
GW Extraction 500 – 1500
Predominantly Residential and Open spaces
PRAHALAD NAGAR GARDEN:
Area : 15600 Sq.m Very well Landscaped Ground water dependent Provided with Storm water Drains based on provided slope on the footpath Park is maintained by Amul Anandnagar Road
Corporate Road
AMUL
71 / 122WATER
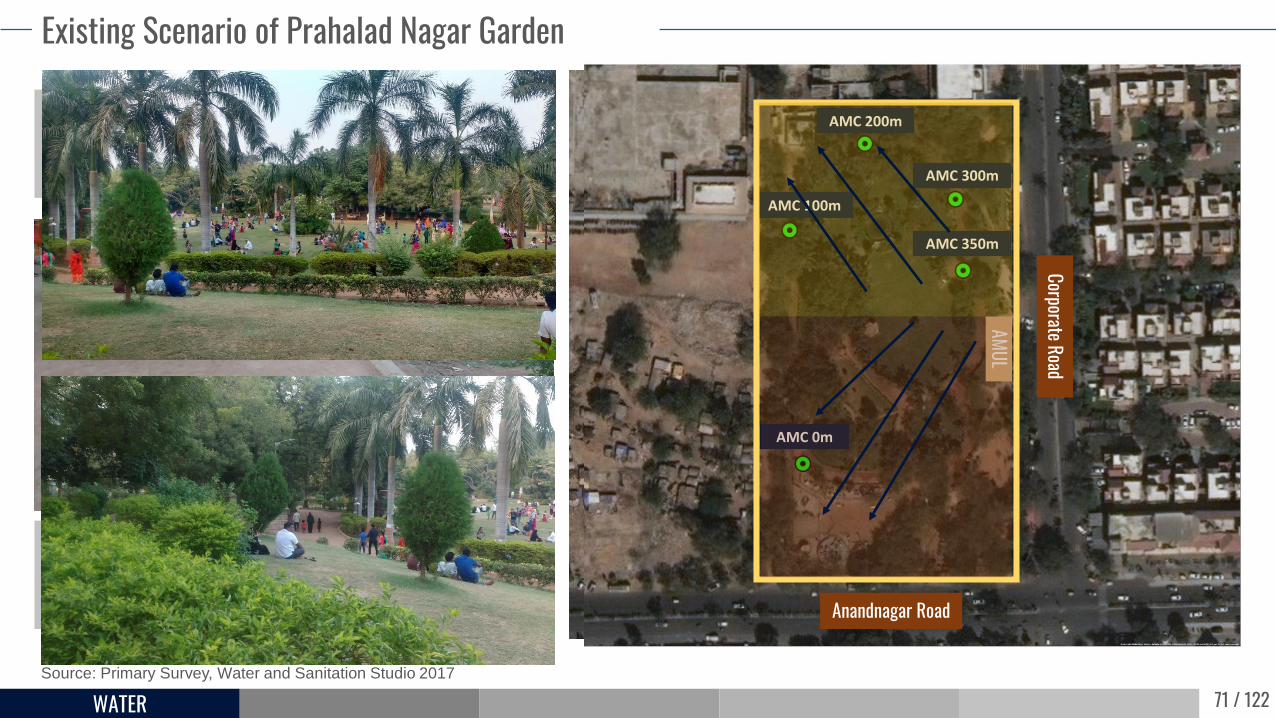
Existing Scenario of Prahalad Nagar Garden
Anandnagar Road
Corporate Road
AMUL
Storm water drains
No Recharge techniques adopted for GW Recharge
More Potential for Recharging and easy to Intervene
AMC 0m
AMC 100m
AMC 350m
AMC 300m
AMC 200m
Anandnagar Road
Corporate Road
AMUL
Source: Primary Survey, Water and Sanitation Studio 2017
72 / 122WATER
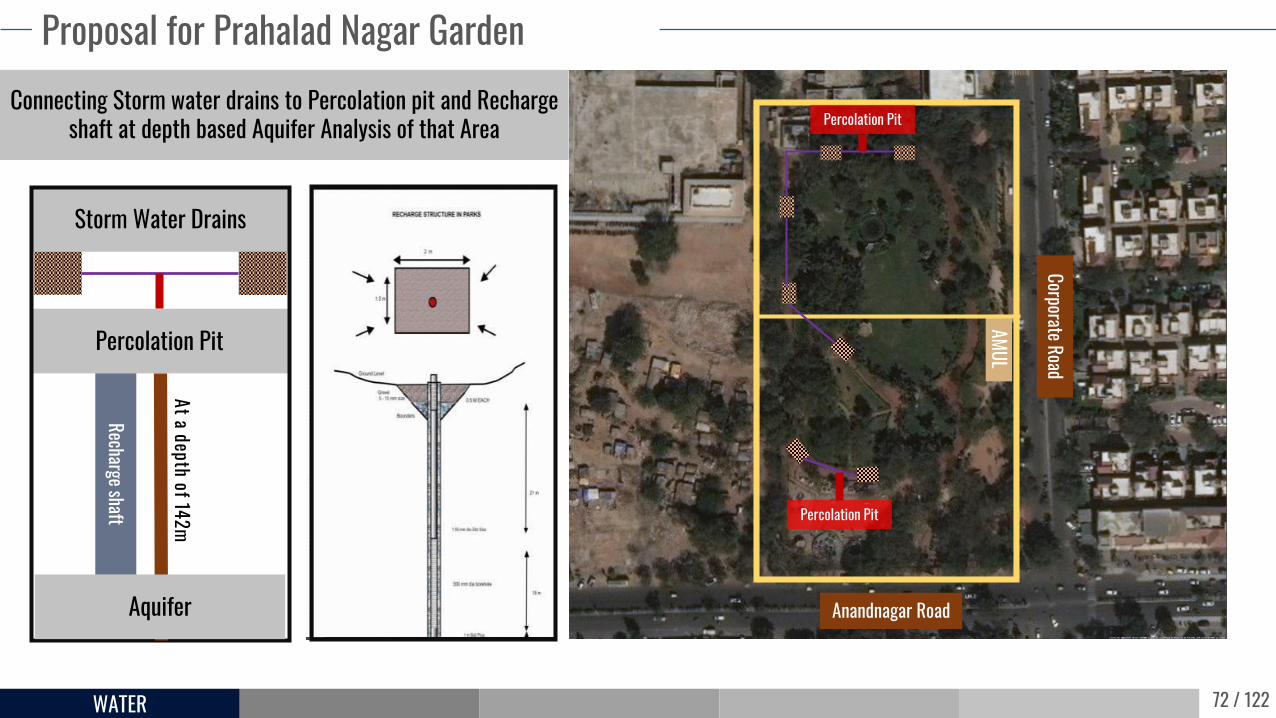
Storm Water Drains
Proposal for Prahalad Nagar Garden
Anandnagar Road
Corporate Road
AMUL
Percolation Pit
Percolation Pit
Connecting Storm water drains to Percolation pit and Recharge shaft at depth based Aquifer Analysis of that Area
Percolation Pit
At a depth of 142m
Aquifer
Recharge shaft
73 / 122WATER
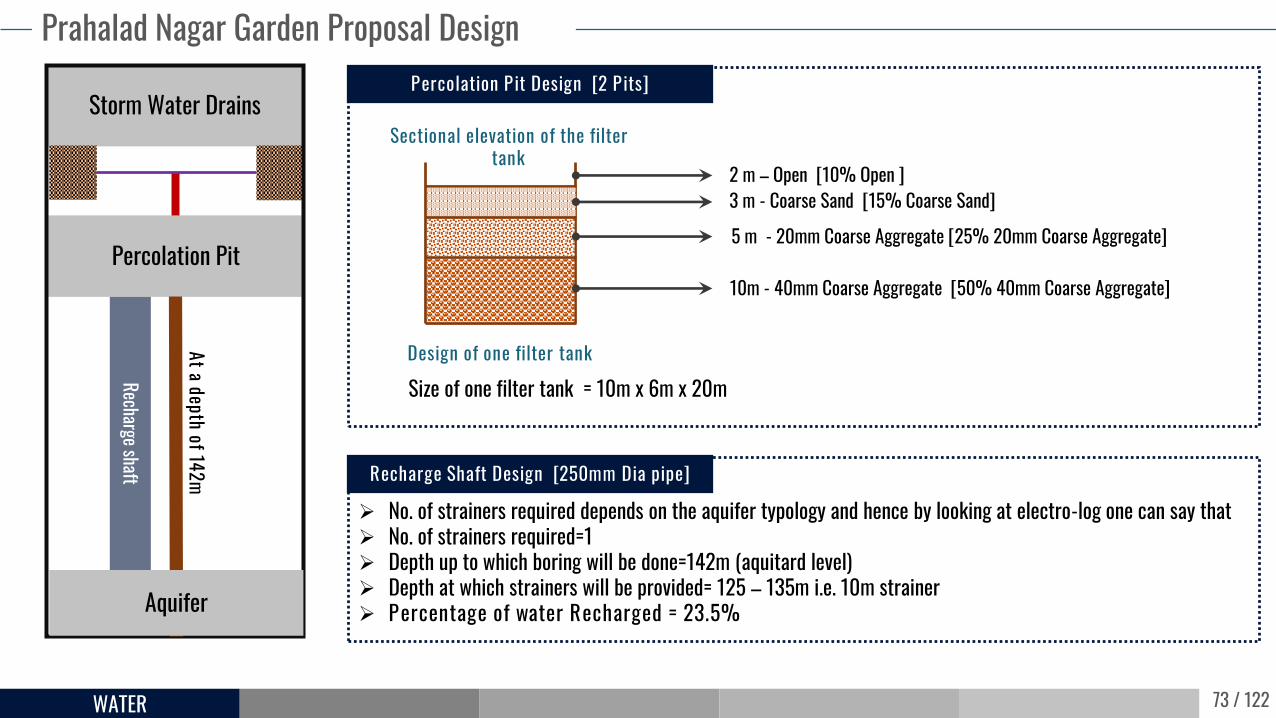
No. of strainers required depends on the aquifer typology and hence by looking at electro-log one can say that No. of strainers required=1 Depth up to which boring will be done=142m (aquitard level) Depth at which strainers will be provided= 125 – 135m i.e. 10m strainer Percentage of water Recharged = 23.5%
Percolation Pit Design [2 Pits]
Recharge Shaft Design [250mm Dia pipe]
Sectional elevation of the filter tank
Design of one filter tank
3 m - Coarse Sand [15% Coarse Sand]
5 m - 20mm Coarse Aggregate [25% 20mm Coarse Aggregate]
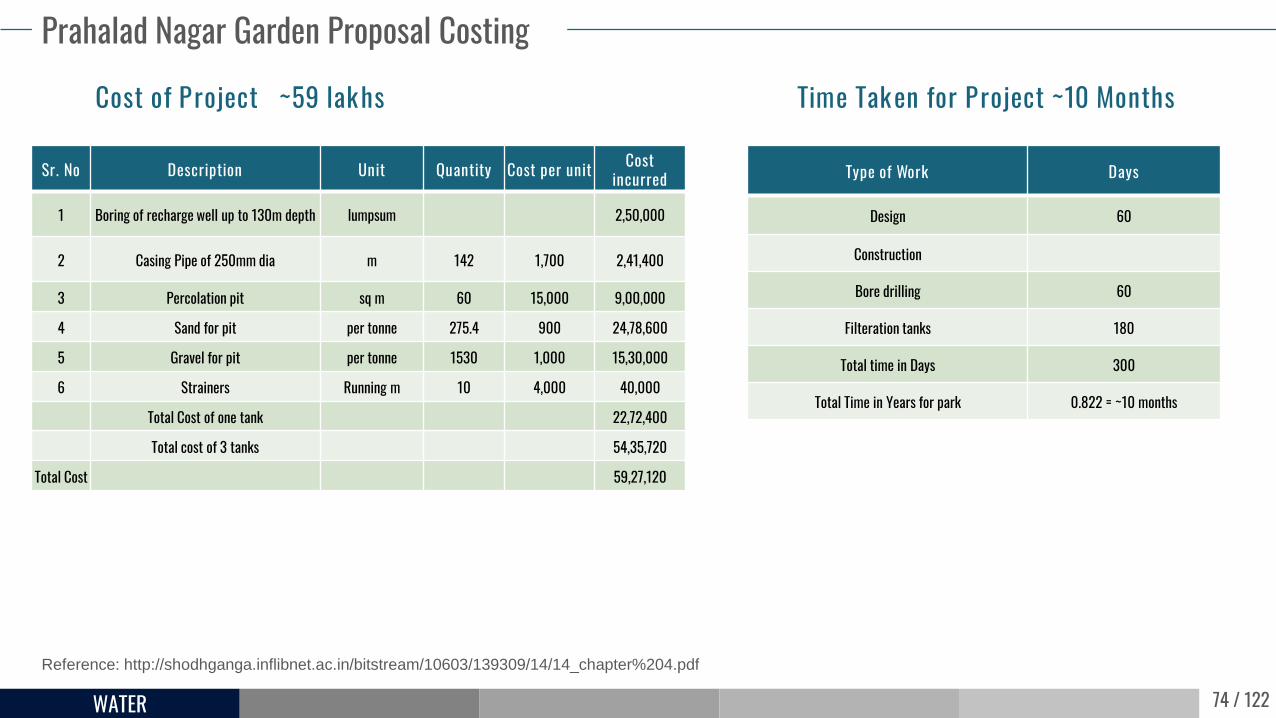
Sr. No Description Unit Quantity Cost per unit Cost incurred
1 Boring of recharge well up to 130m depth lumpsum 2,50,000
2 Casing Pipe of 250mm dia m 142 1,700 2,41,400
3 Percolation pit sq m 60 15,000 9,00,000
4 Sand for pit per tonne 275.4 900 24,78,600
5 Gravel for pit per tonne 1530 1,000 15,30,000
6 Strainers Running m 10 4,000 40,000
Total Cost of one tank 22,72,400
Total cost of 3 tanks 54,35,720
Total Cost 59,27,120
Time Taken for Project ~10 Months
Type of Work Days
Design 60
Construction
Bore drilling 60
Filteration tanks 180
Total time in Days 300
Total Time in Years for park 0.822 = ~10 months
75 / 122WATER
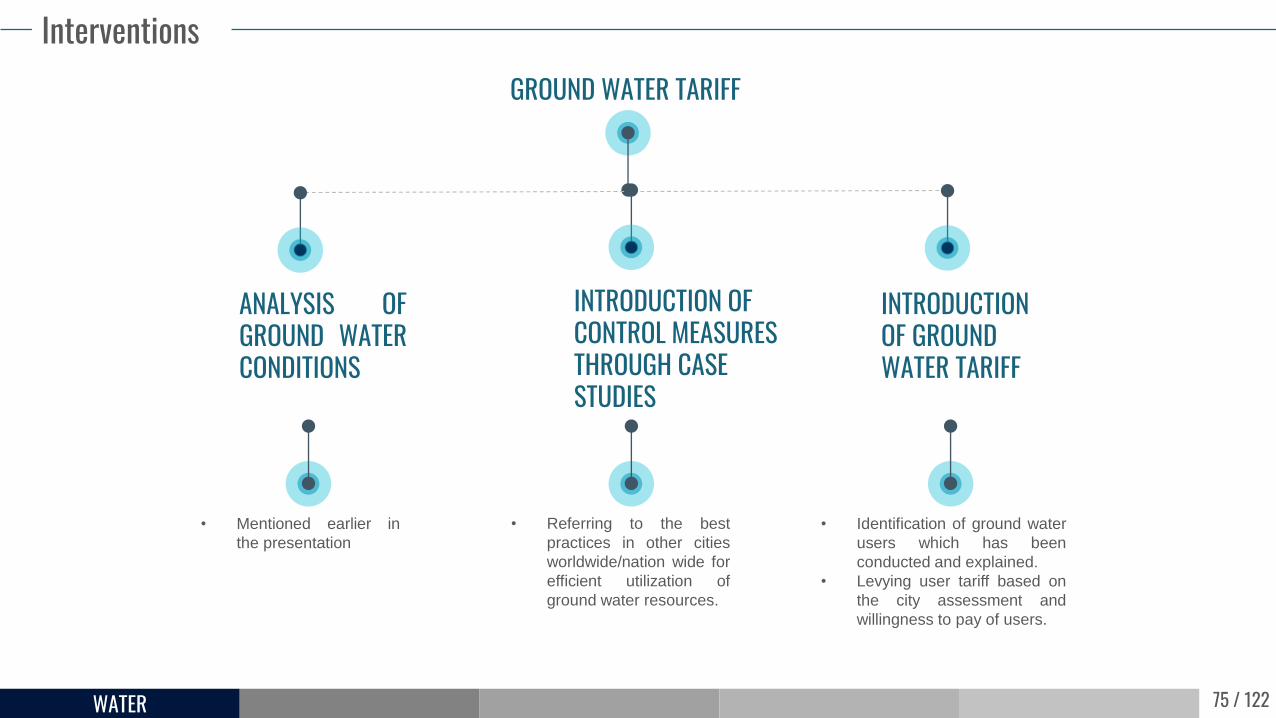
InterventionsGROUND WATER TARIFF
ANALYSIS OFGROUND WATERCONDITIONS
INTRODUCTION OF CONTROL MEASURES THROUGH CASE STUDIES
INTRODUCTION OF GROUND WATER TARIFF
• Mentioned earlier in
the presentation
• Referring to the best
practices in other cities
worldwide/nation wide for
efficient utilization of
ground water resources.
• Identification of ground water
users which has been
conducted and explained.
• Levying user tariff based on
the city assessment and
willingness to pay of users.
76 / 122WATER
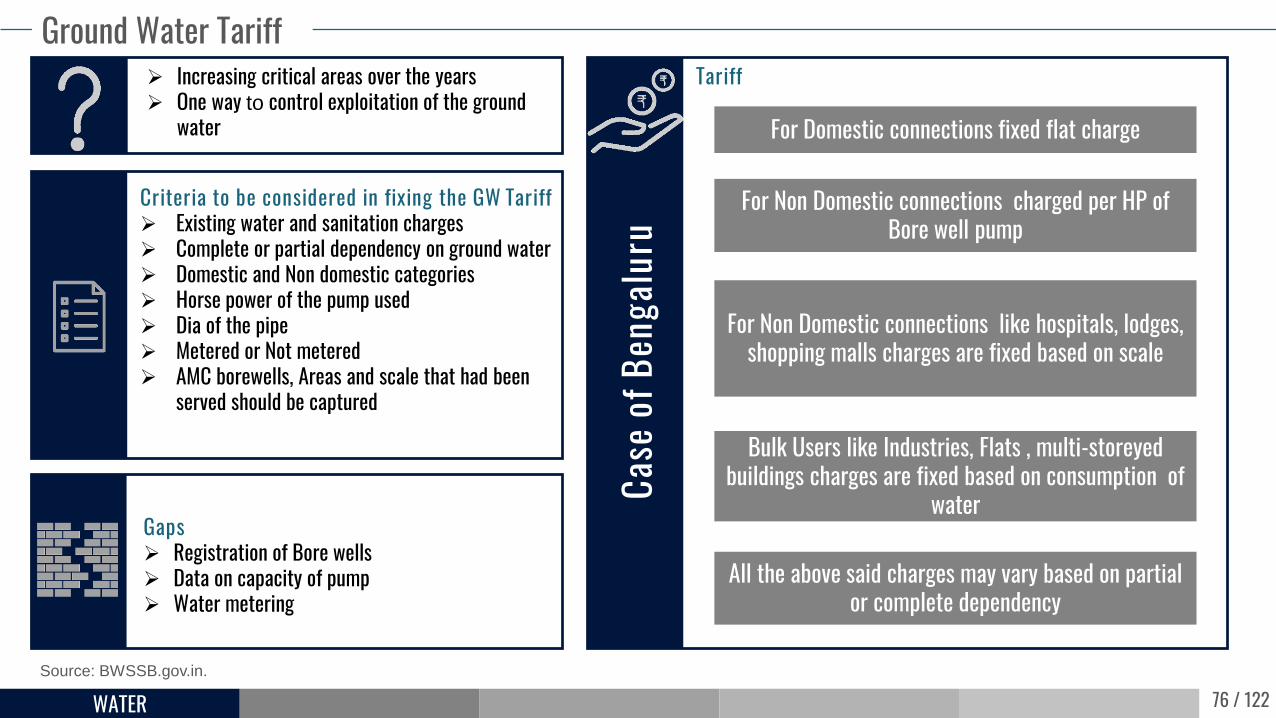
Ground Water Tariff
Criteria to be considered in fixing the GW Tariff Existing water and sanitation charges Complete or partial dependency on ground water Domestic and Non domestic categories Horse power of the pump used Dia of the pipe Metered or Not metered AMC borewells, Areas and scale that had been
served should be captured
Increasing critical areas over the years One way to control exploitation of the ground
water
Gaps Registration of Bore wells Data on capacity of pump Water metering
Tariff
For Domestic connections fixed flat charge
For Non Domestic connections charged per HP of Bore well pump
For Non Domestic connections like hospitals, lodges, shopping malls charges are fixed based on scale
Bulk Users like Industries, Flats , multi-storeyed buildings charges are fixed based on consumption of
water
All the above said charges may vary based on partial or complete dependency
Case
of B
enga
luru
Source: BWSSB.gov.in.
77 / 122
Storm Water Management
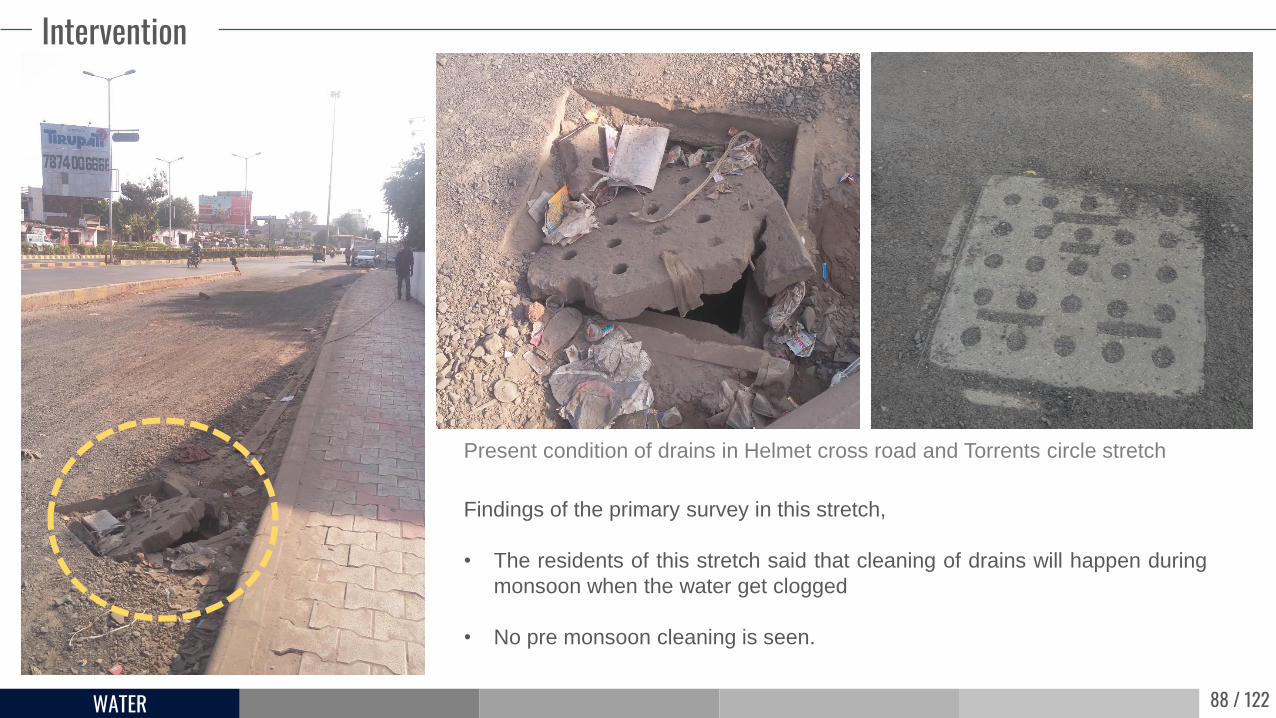
78 / 122WATER
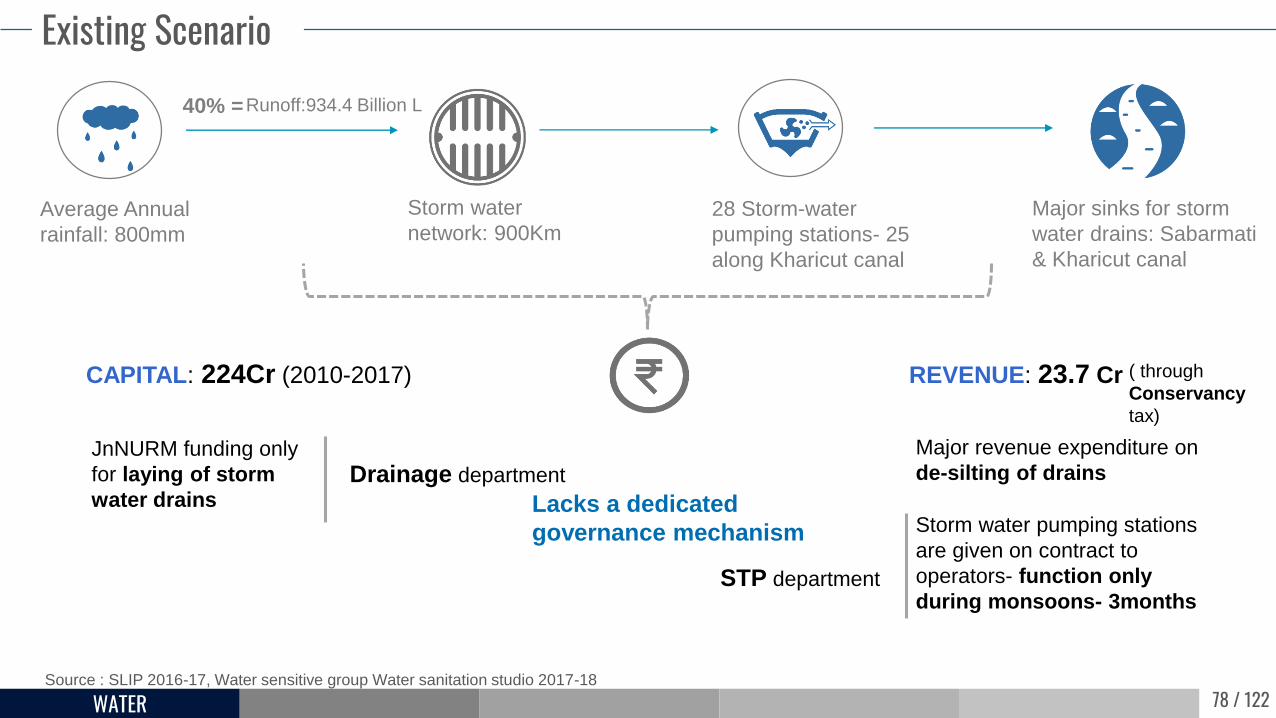
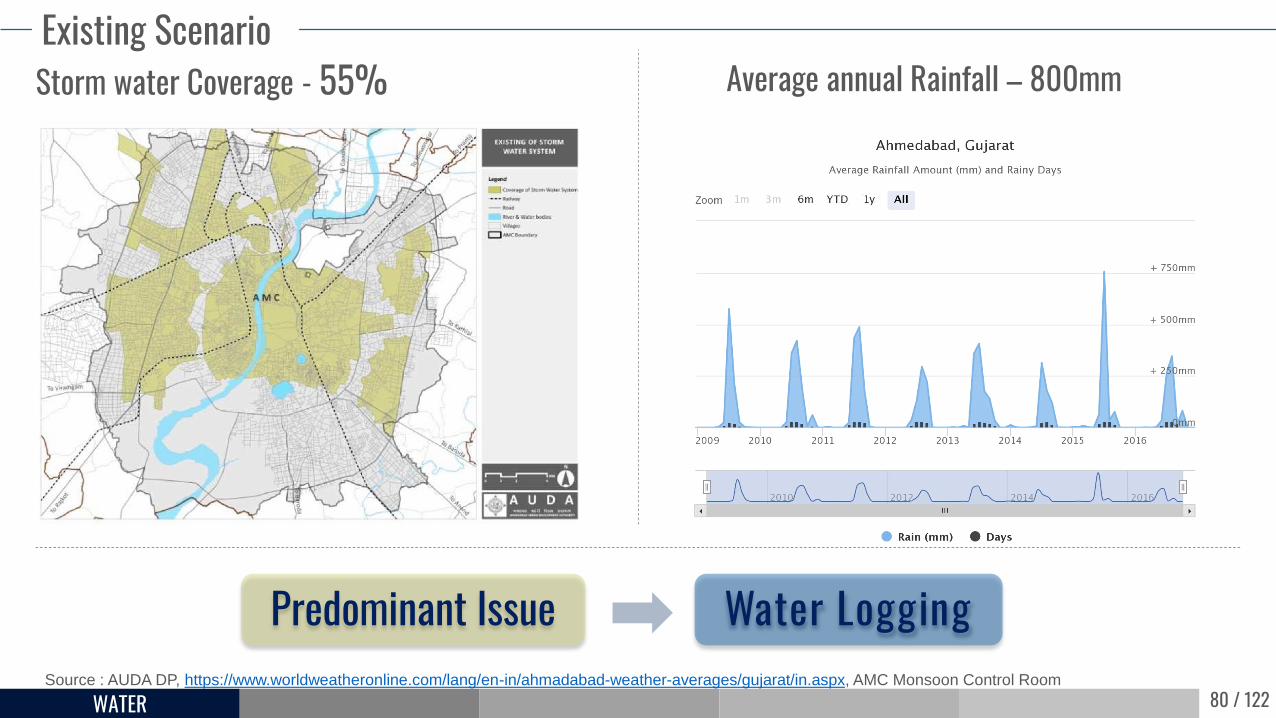
Existing Scenario
Source : SLIP 2016-17, Water sensitive group Water sanitation studio 2017-18
Average Annual
rainfall: 800mm
Storm water
network: 900Km
Runoff:934.4 Billion L
28 Storm-water
pumping stations- 25
along Kharicut canal
Major sinks for storm
water drains: Sabarmati
& Kharicut canal
40% =
CAPITAL: 224Cr (2010-2017) REVENUE: 23.7 Cr
JnNURM funding only
for laying of storm
water drains
Major revenue expenditure on
de-silting of drainsDrainage department
Storm water pumping stations
are given on contract to
operators- function only
during monsoons- 3monthsSTP department
Lacks a dedicated
governance mechanism
( through
Conservancy
tax)
79 / 122WATER
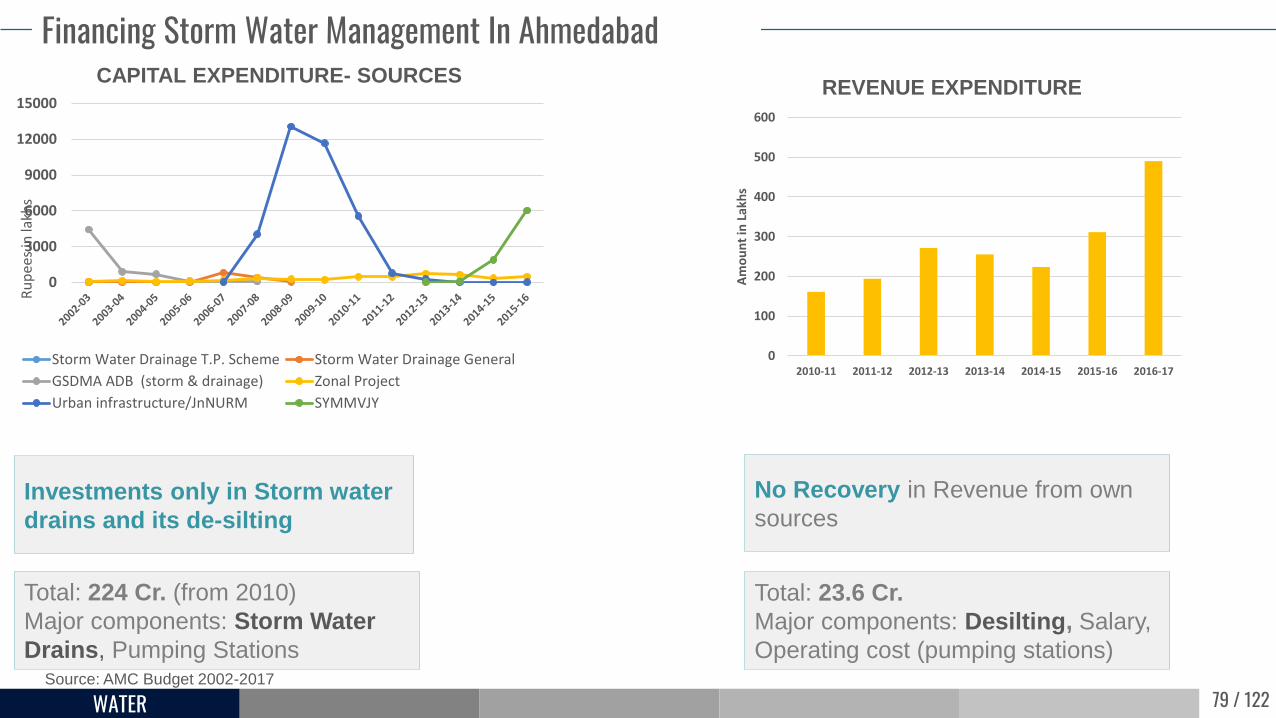
Financing Storm Water Management In Ahmedabad
Total: 224 Cr. (from 2010)
Major components: Storm Water
Drains, Pumping Stations
Total: 23.6 Cr.
Major components: Desilting, Salary,
Operating cost (pumping stations)
No Recovery in Revenue from own
sources
0
3000
6000
9000
12000
15000
Ru
pee
s in
lakh
s
CAPITAL EXPENDITURE- SOURCES
Storm Water Drainage T.P. Scheme Storm Water Drainage General
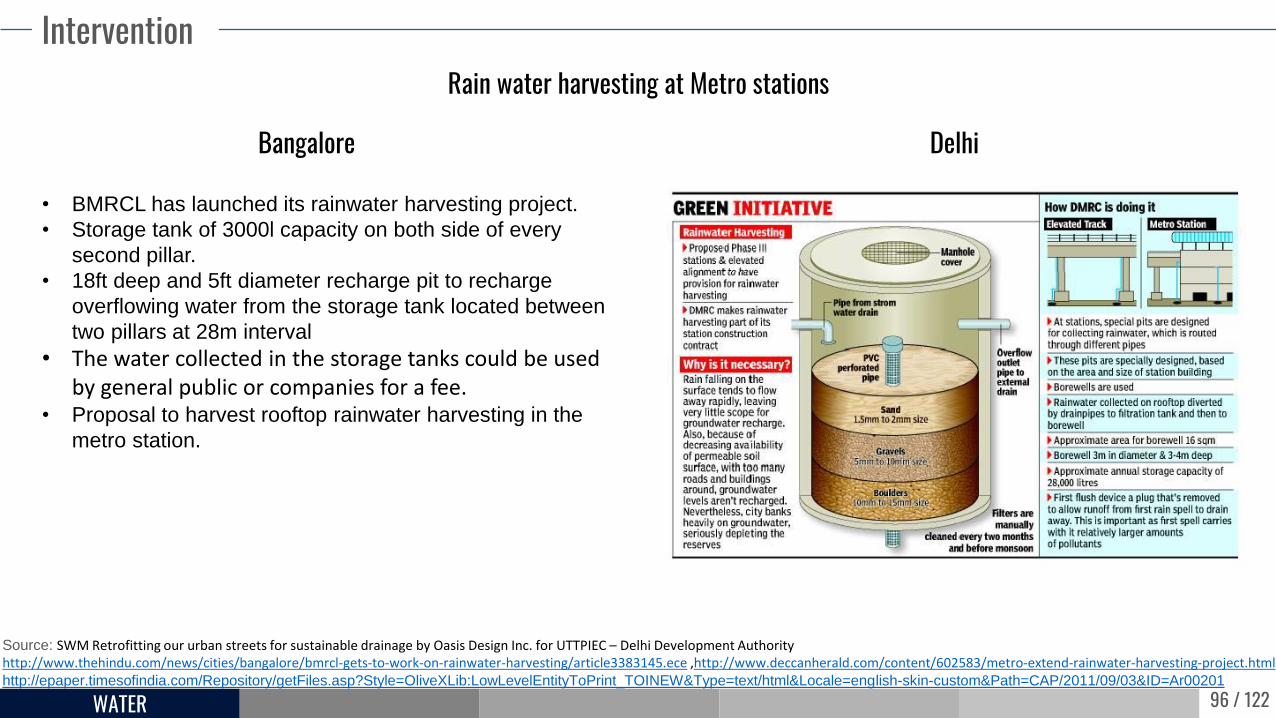
Source: SWM Retrofitting our urban streets for sustainable drainage by Oasis Design Inc. for UTTPIEC – Delhi Development Authority http://www.thehindu.com/news/cities/bangalore/bmrcl-gets-to-work-on-rainwater-harvesting/article3383145.ece ,http://www.deccanherald.com/content/602583/metro-extend-rainwater-harvesting-project.htmlhttp://epaper.timesofindia.com/Repository/getFiles.asp?Style=OliveXLib:LowLevelEntityToPrint_TOINEW&Type=text/html&Locale=english-skin-custom&Path=CAP/2011/09/03&ID=Ar00201
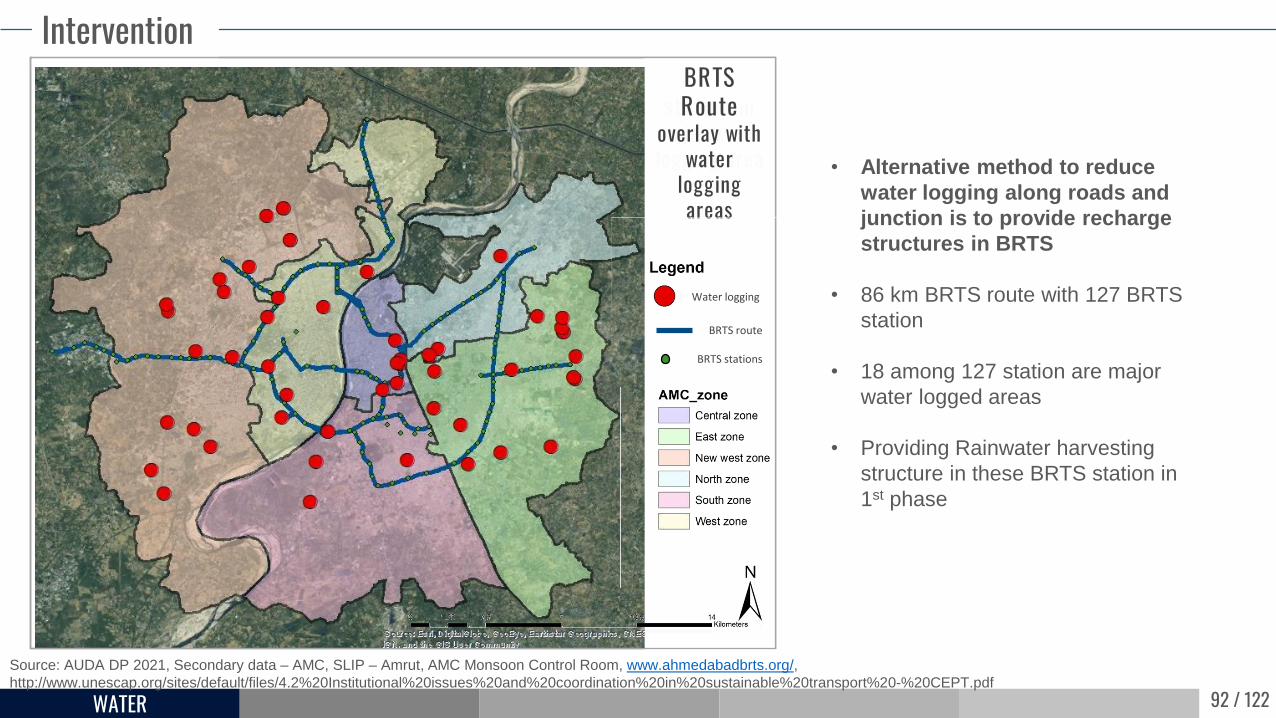
Rain water harvesting at Metro stations
• BMRCL has launched its rainwater harvesting project.
• Storage tank of 3000l capacity on both side of every
second pillar.
• 18ft deep and 5ft diameter recharge pit to recharge
overflowing water from the storage tank located between
two pillars at 28m interval
• The water collected in the storage tanks could be used by general public or companies for a fee.
• Proposal to harvest rooftop rainwater harvesting in the
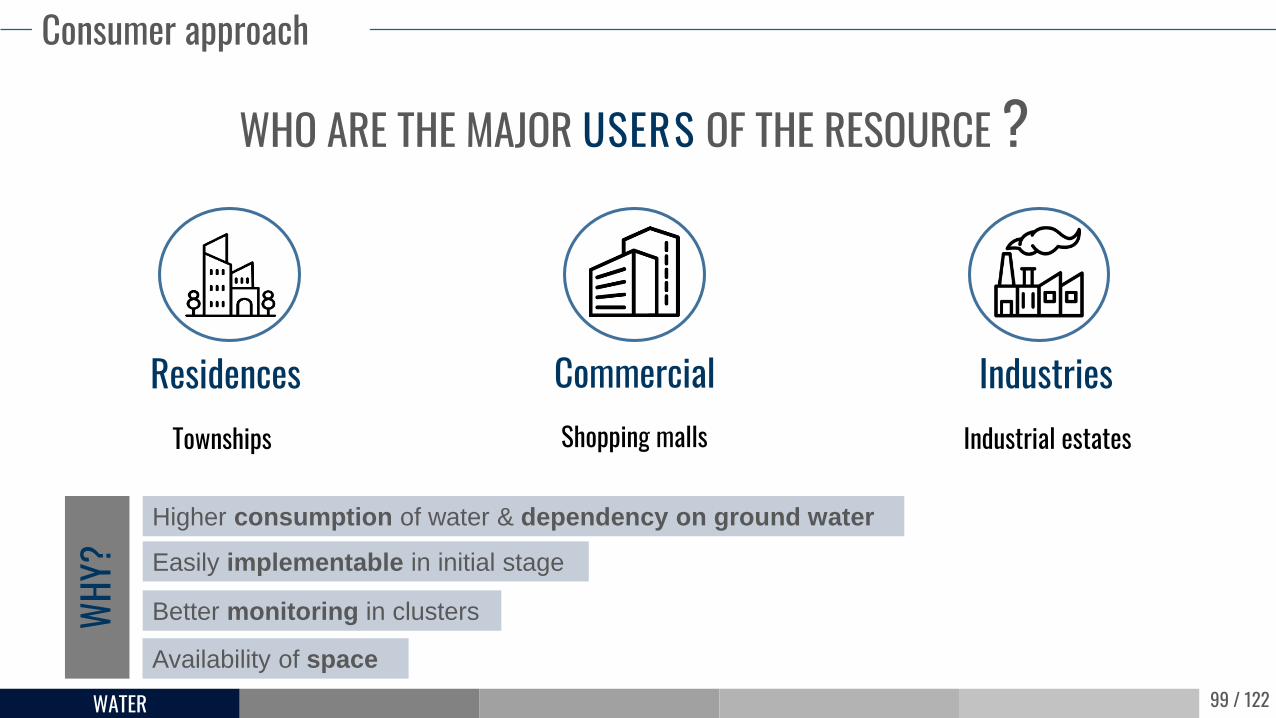
Higher consumption of water & dependency on ground water
WHY?
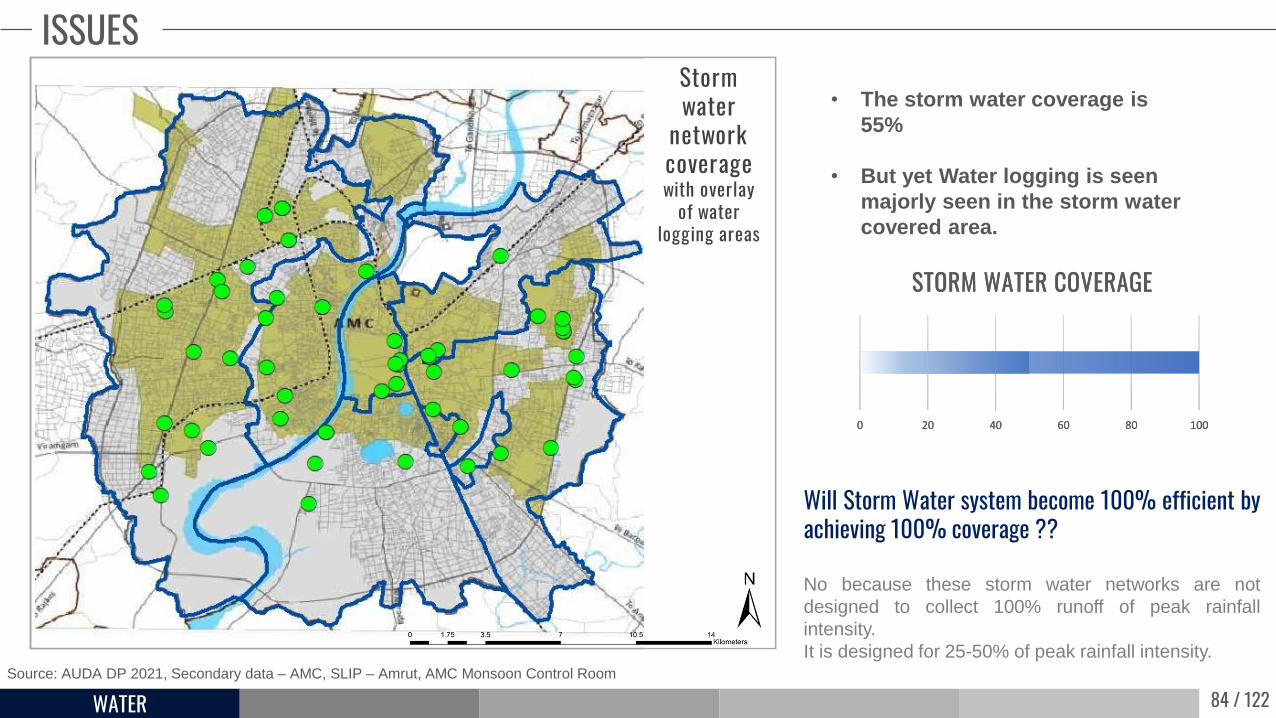
100 / 122WATER
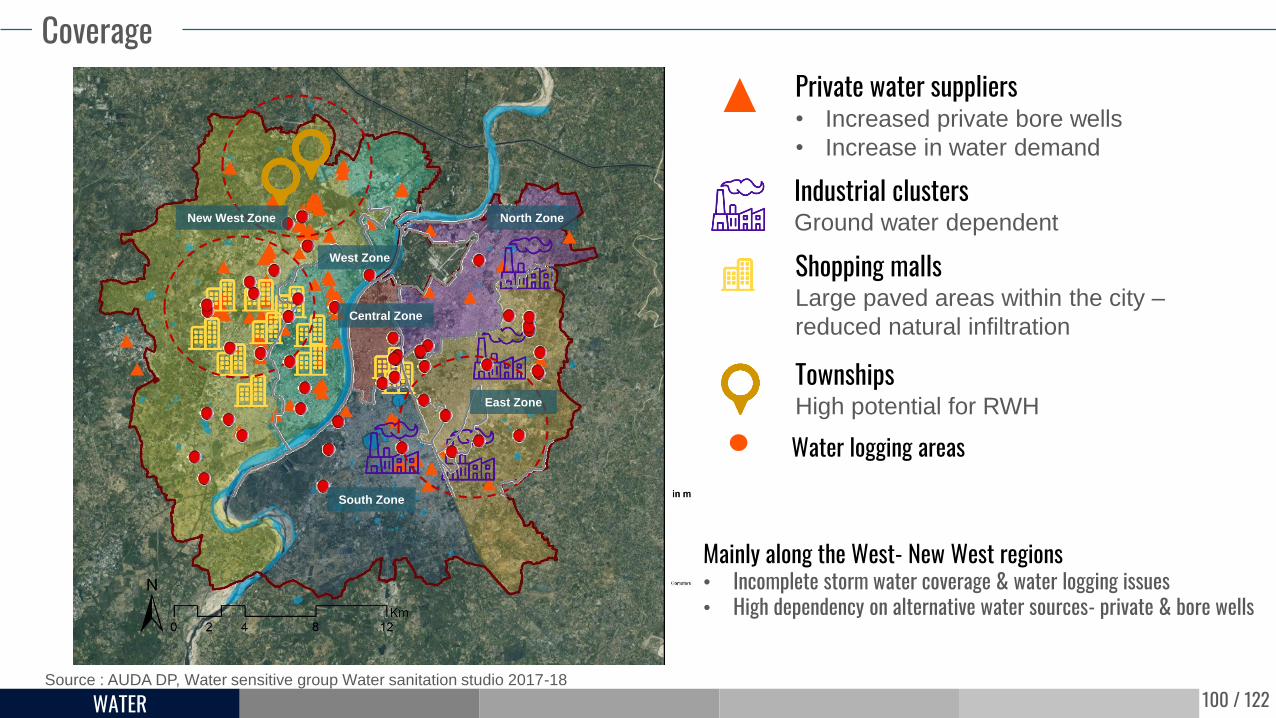
Coverage
Source : AUDA DP, Water sensitive group Water sanitation studio 2017-18
Private water suppliers • Increased private bore wells
• Increase in water demand
Industrial clustersGround water dependent
Shopping mallsLarge paved areas within the city –
reduced natural infiltration
TownshipsHigh potential for RWH
Mainly along the West- New West regions• Incomplete storm water coverage & water logging issues• High dependency on alternative water sources- private & bore wells
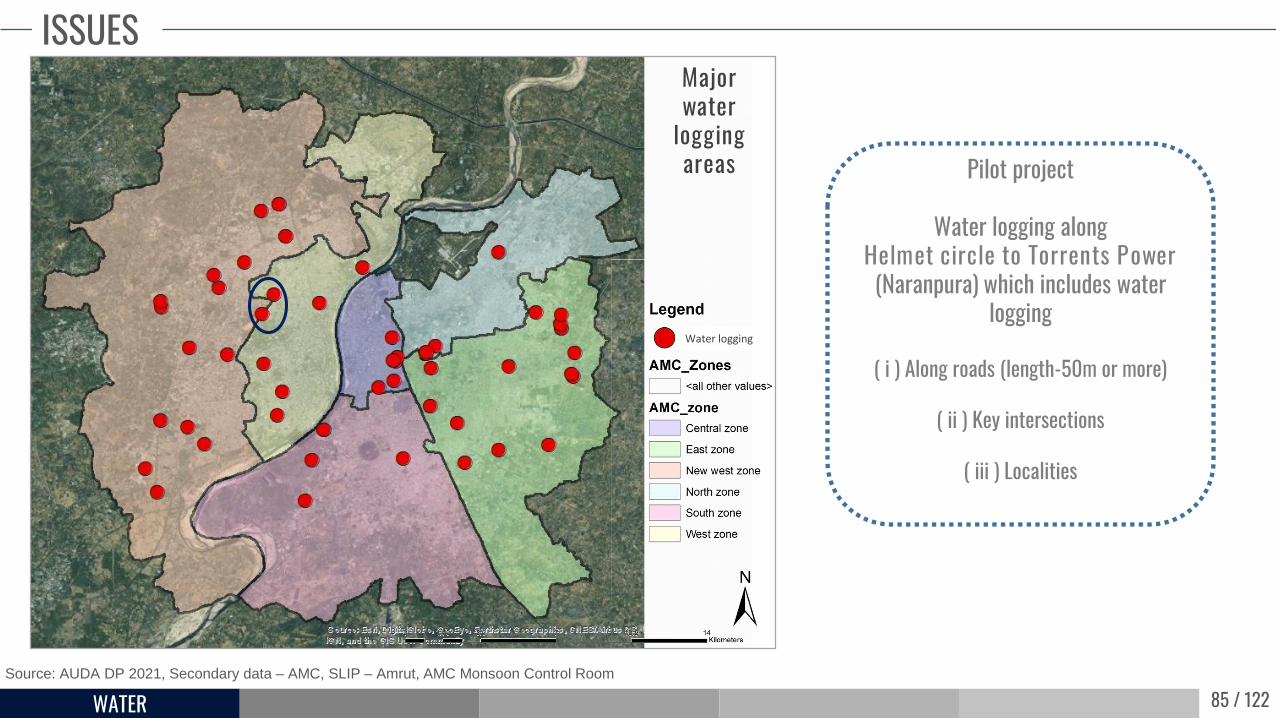
Water logging areas
New West Zone
South Zone
North Zone
East Zone
West Zone
Central Zone
101 / 122WATER
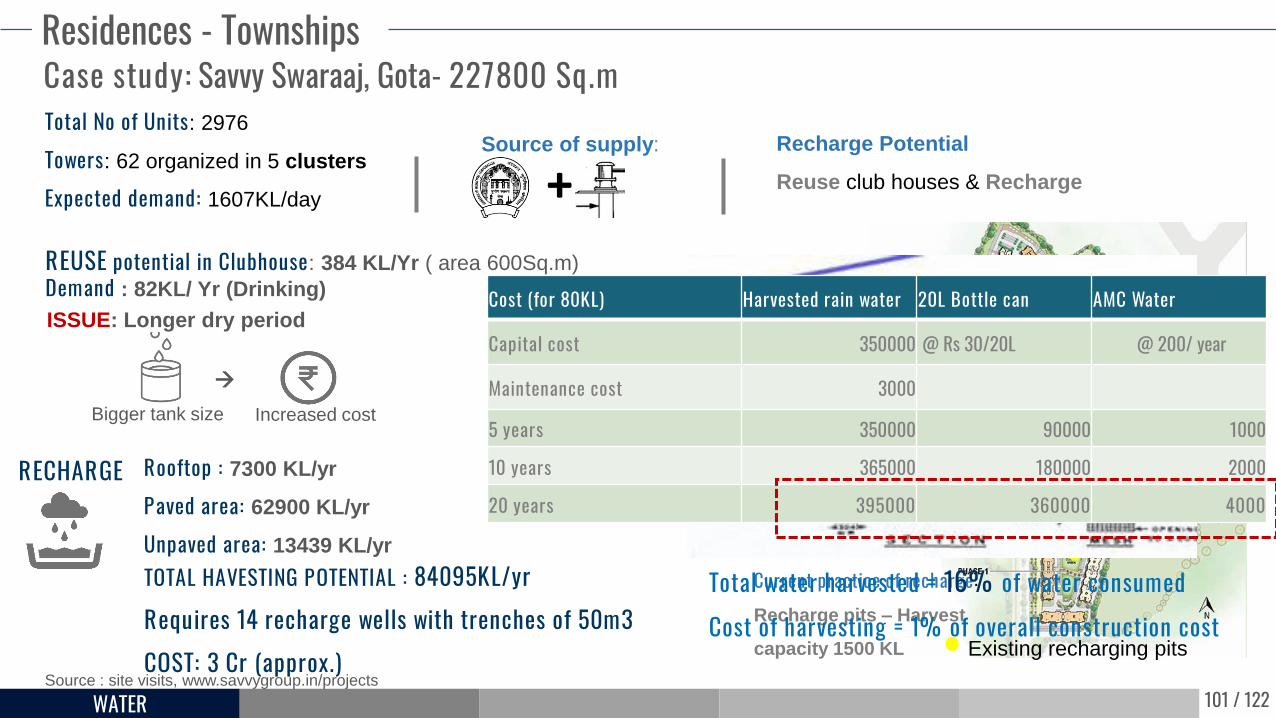
Existing recharging pits
Current practice of recharge: Recharge pits – Harvest
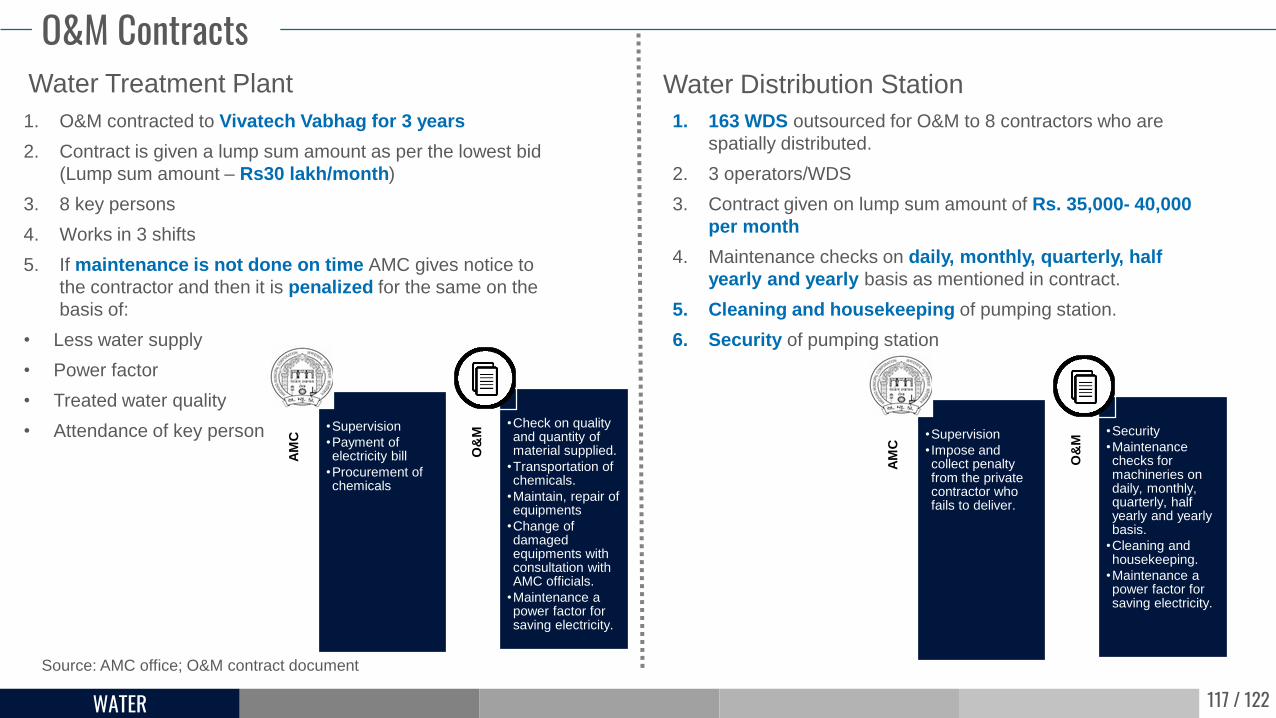
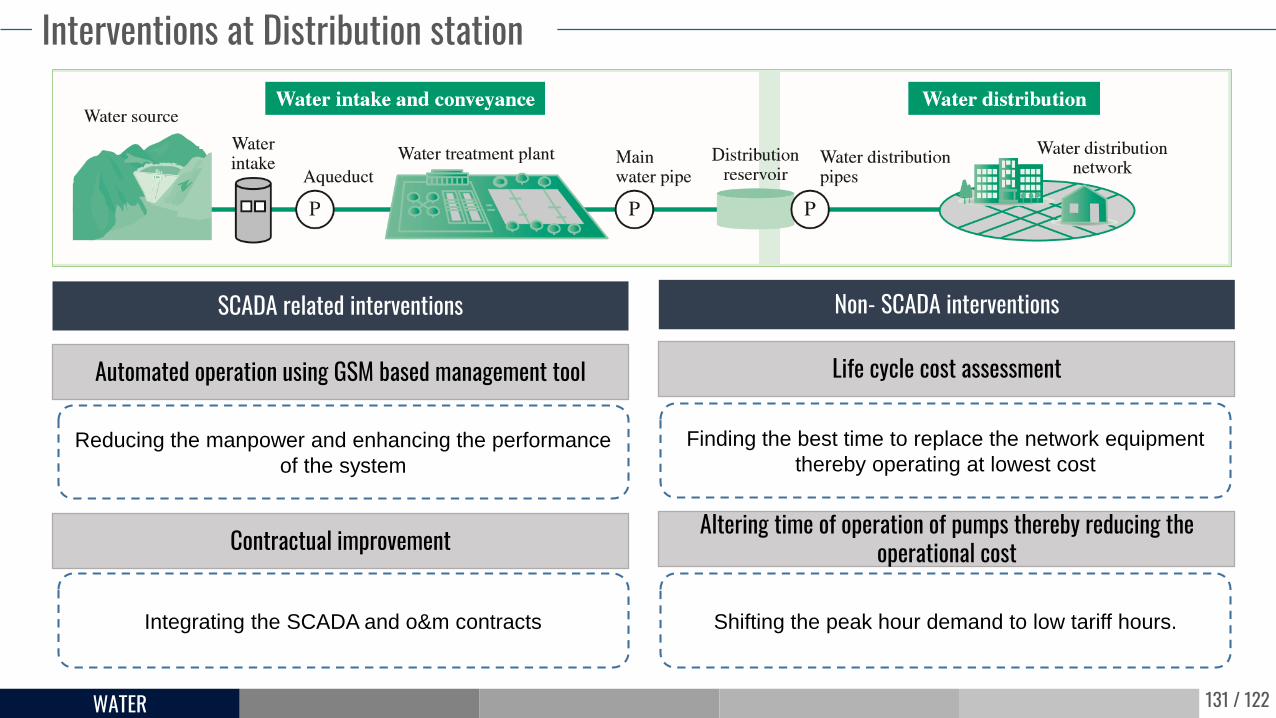
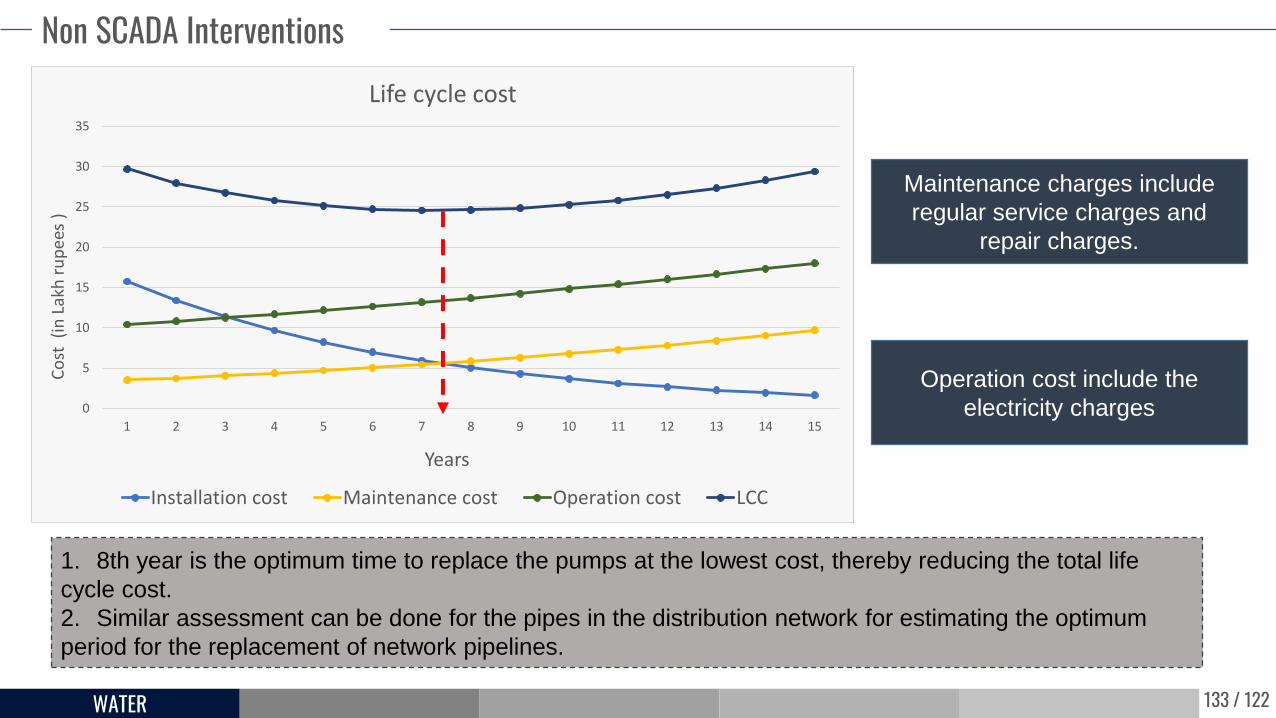
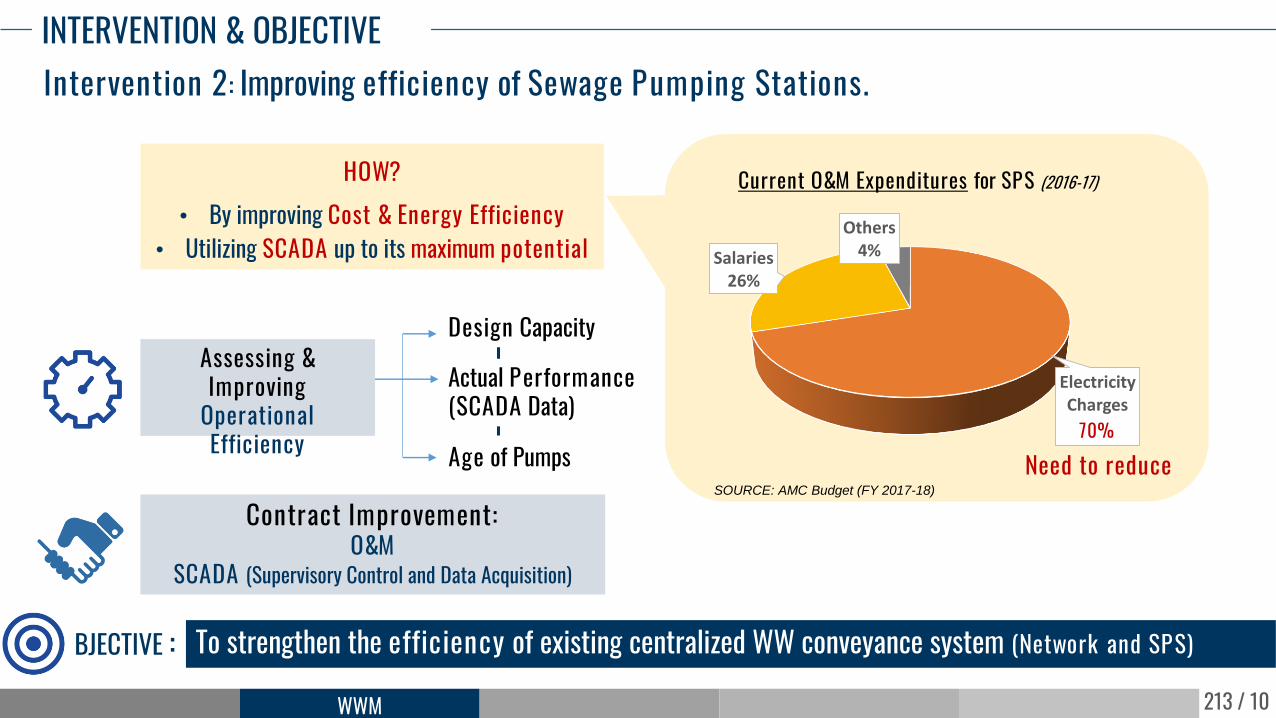
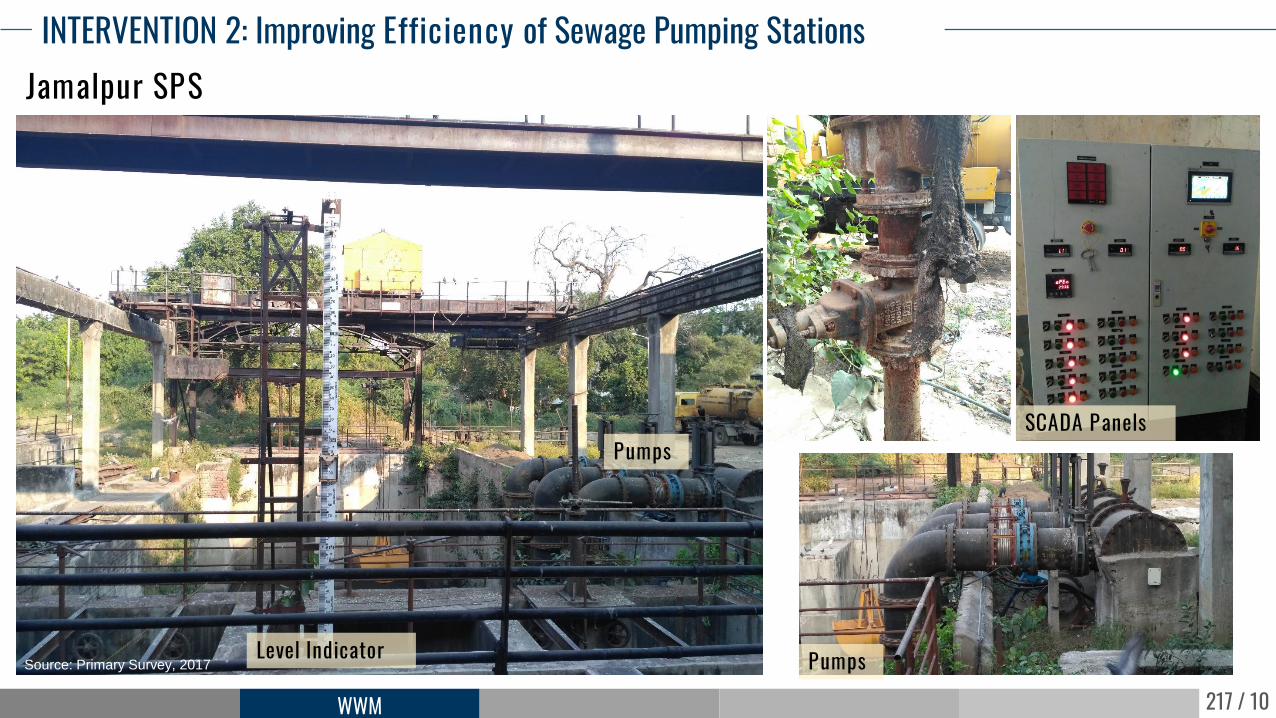
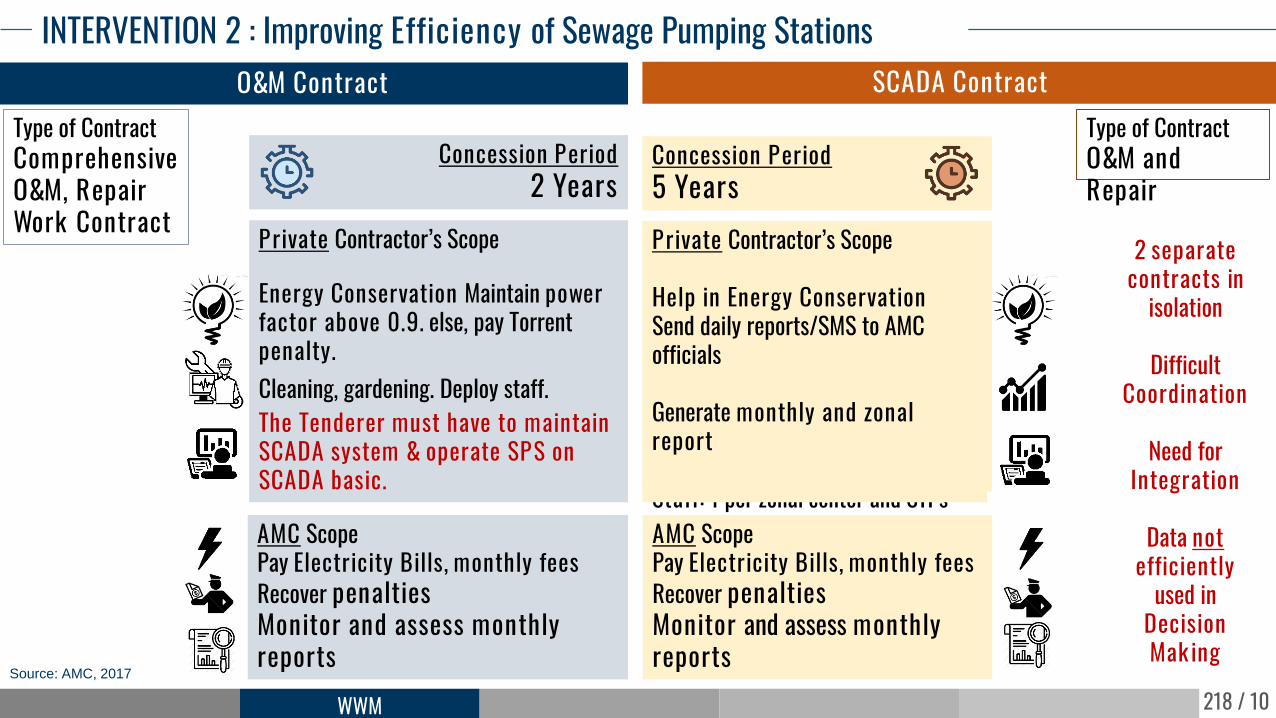
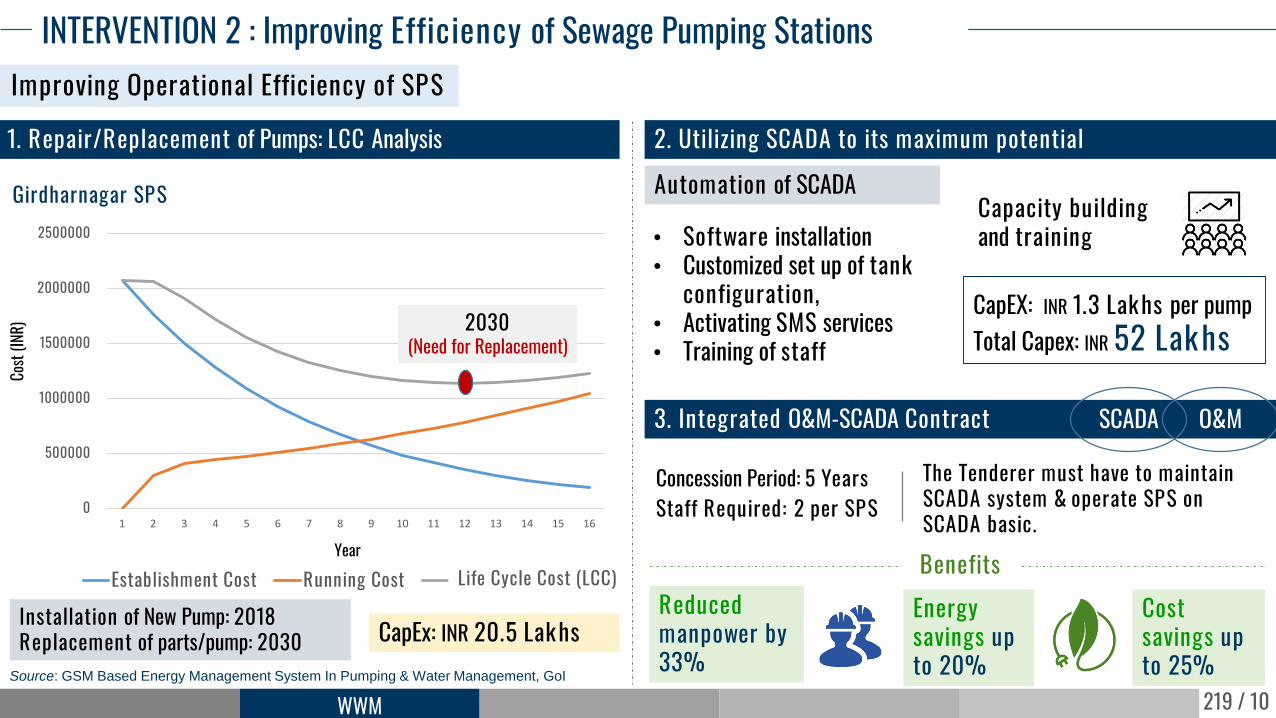
Energy Conservation Maintain power factor above 0.9. else, pay Torrent penalty.Cleaning, gardening. Deploy staff.The Tenderer must have to maintain SCADA system & operate SPS on SCADA basic.
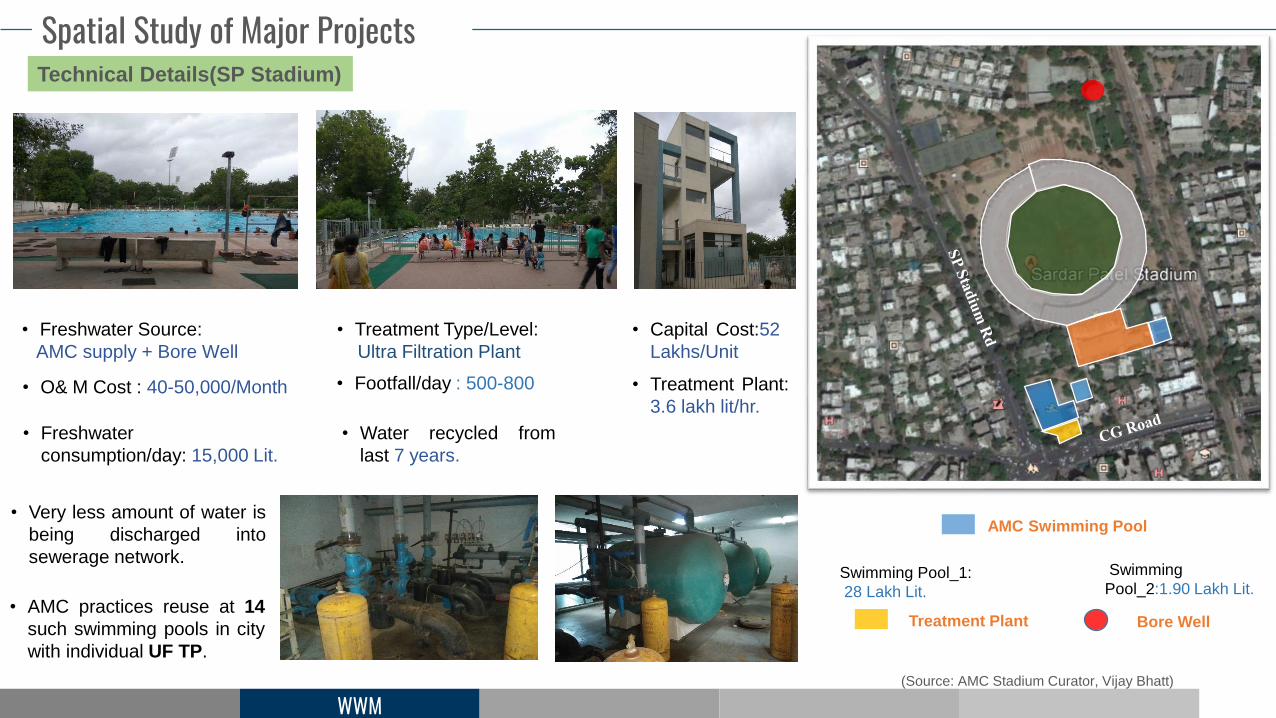
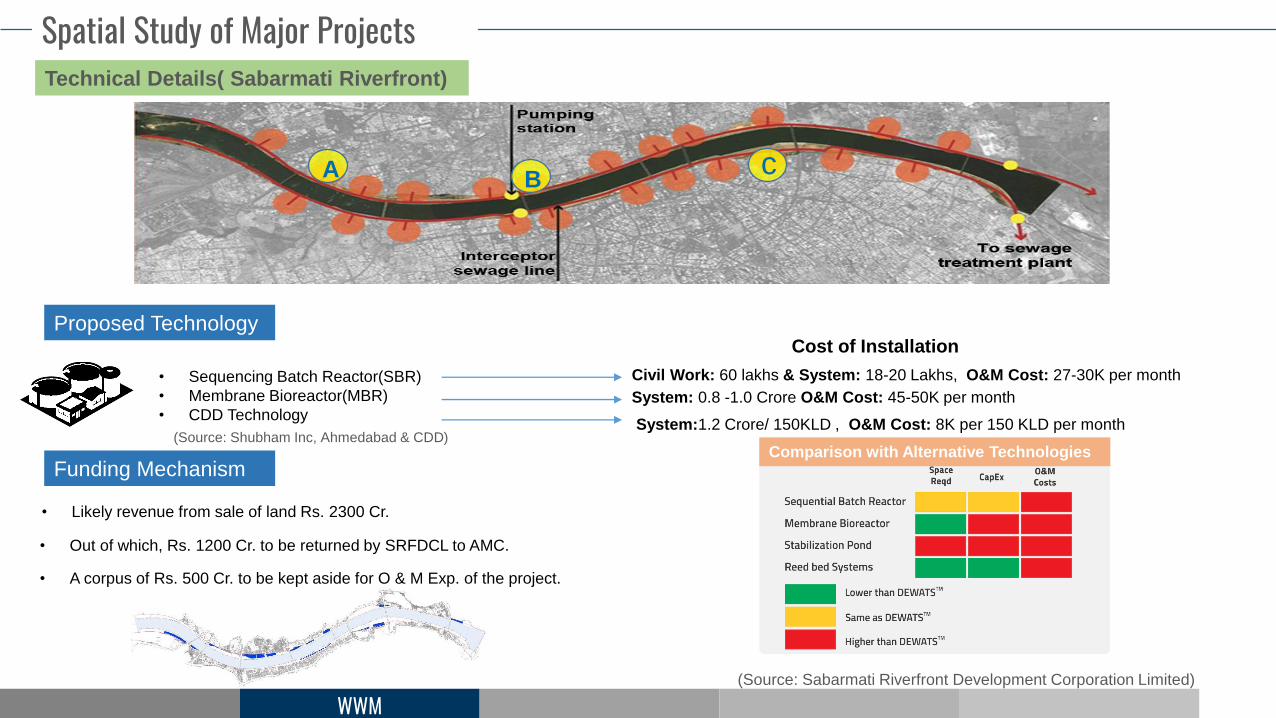
System:1.2 Crore/ 150KLD , O&M Cost: 8K per 150 KLD per month
Funding Mechanism
• Likely revenue from sale of land Rs. 2300 Cr.
• Out of which, Rs. 1200 Cr. to be returned by SRFDCL to AMC.
• A corpus of Rs. 500 Cr. to be kept aside for O & M Exp. of the project.
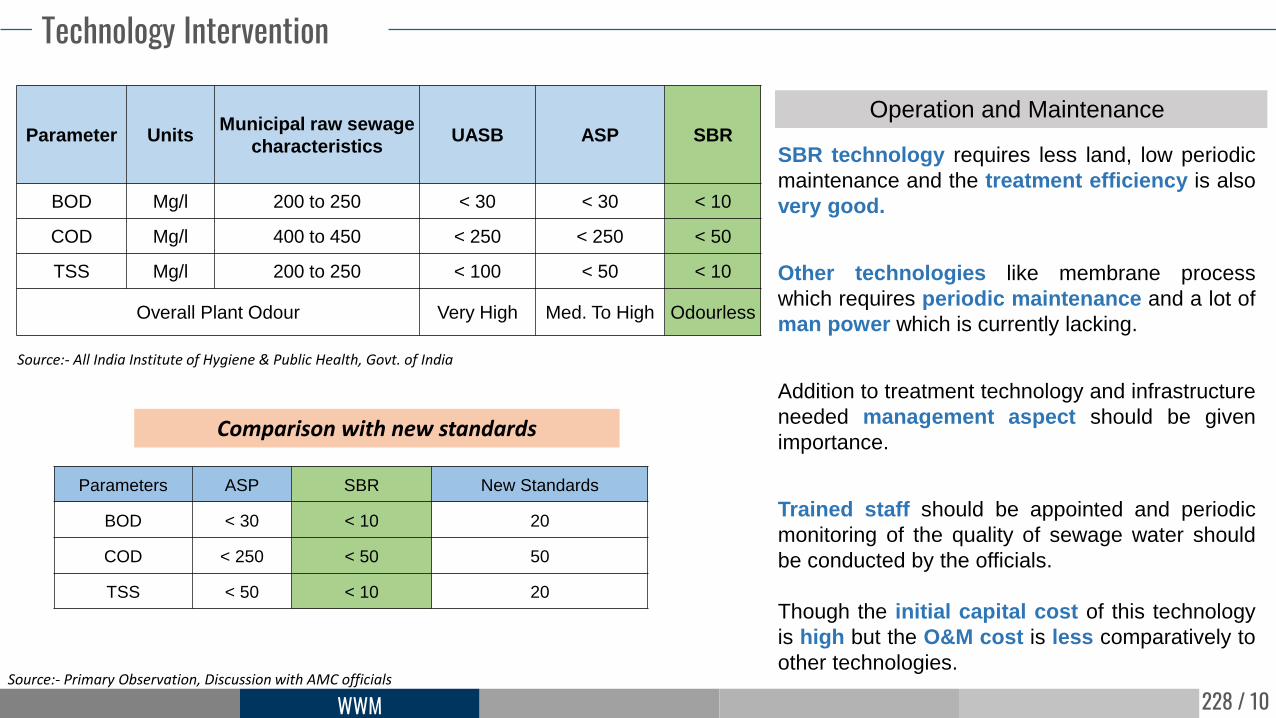
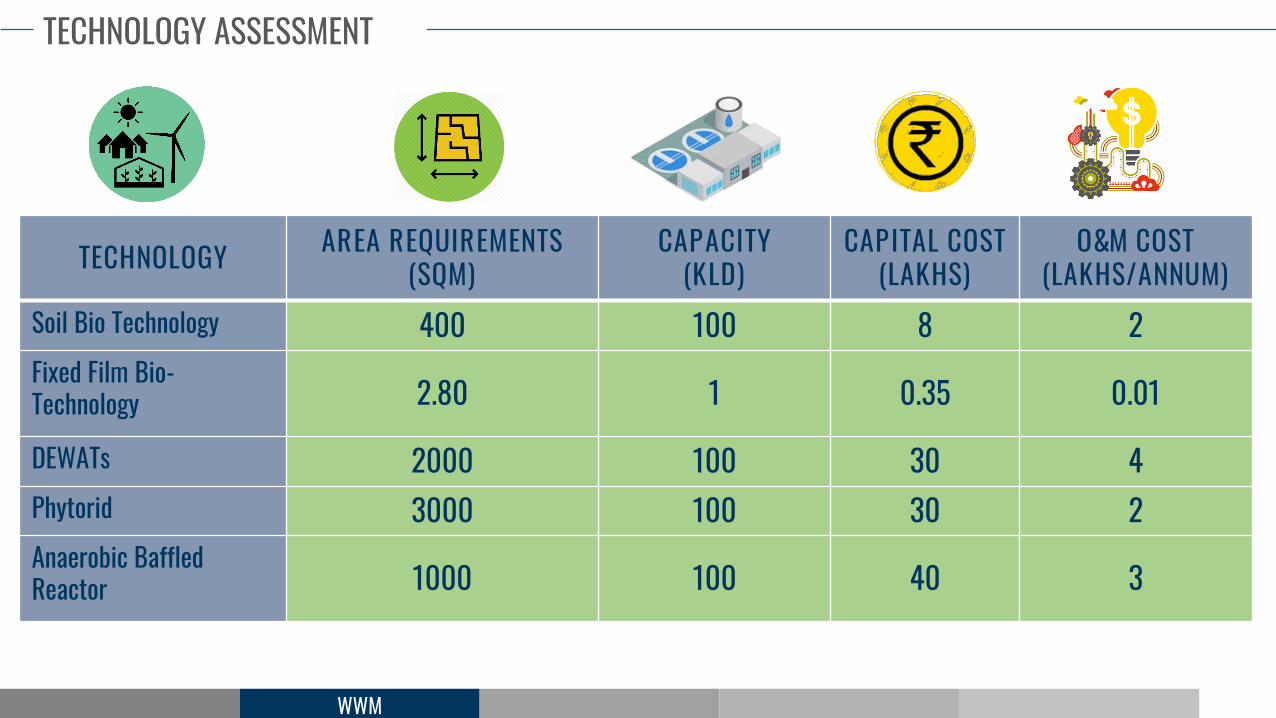
Comparison with Alternative Technologies
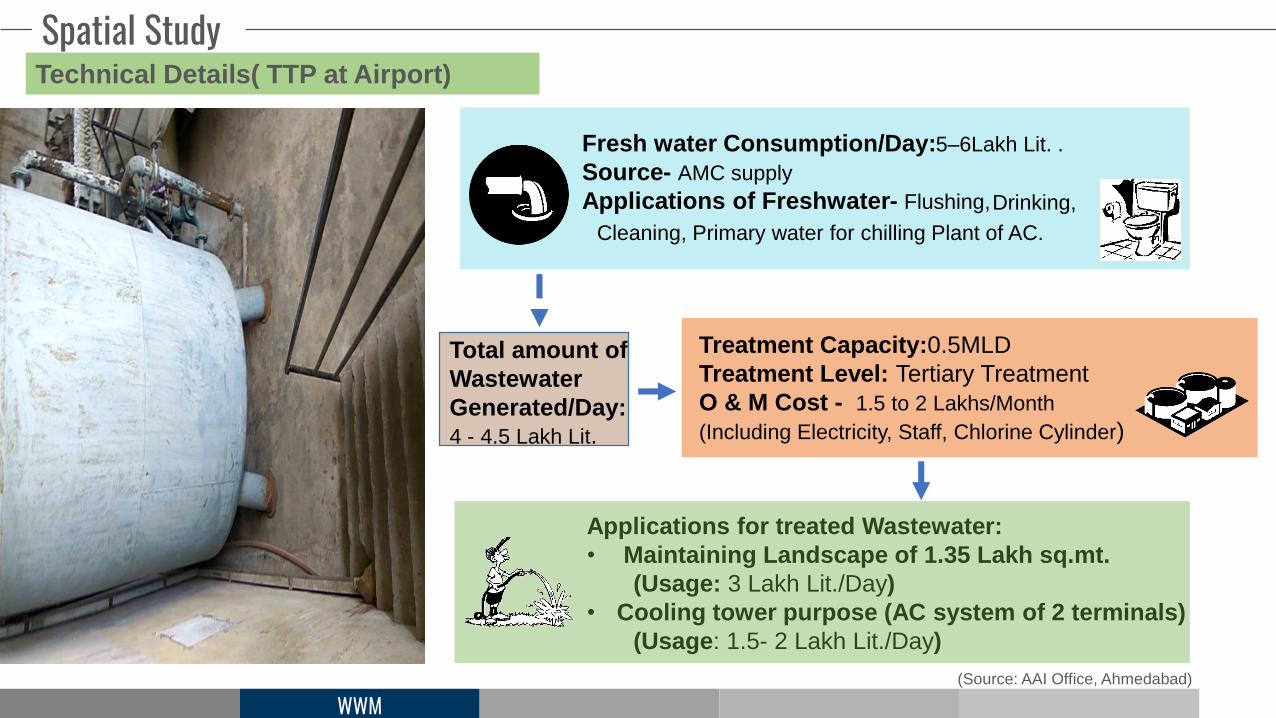
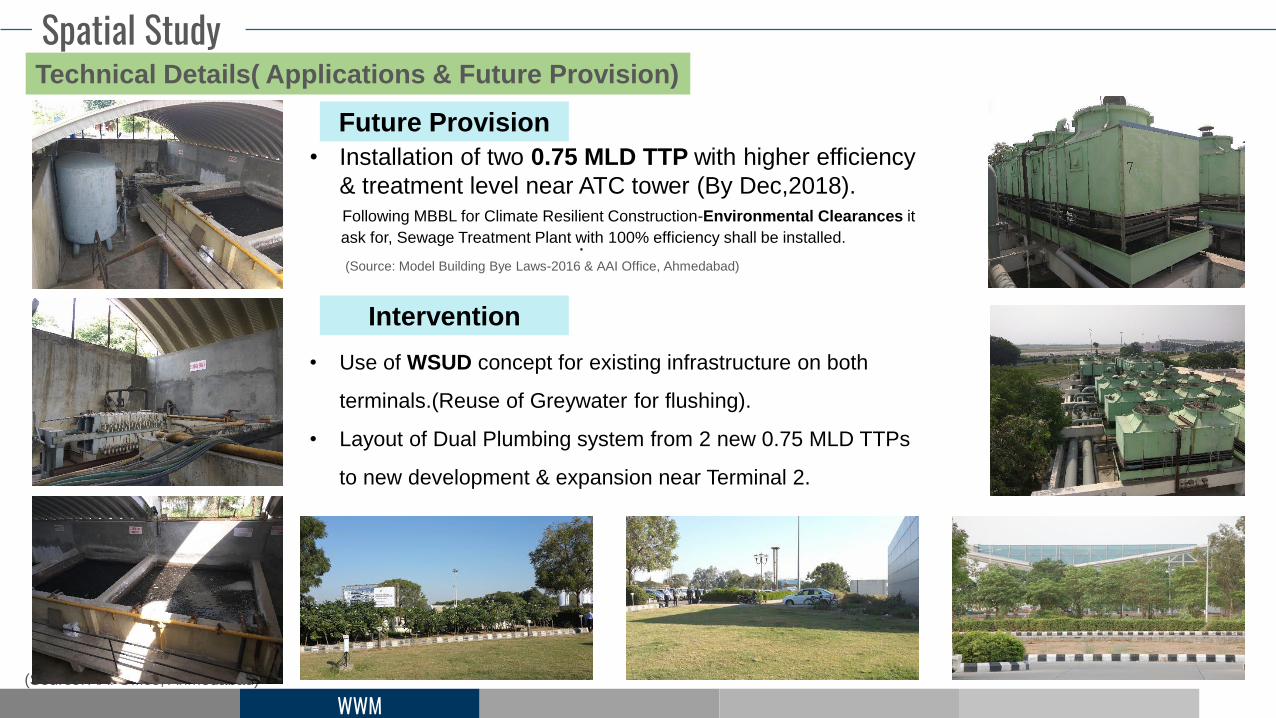
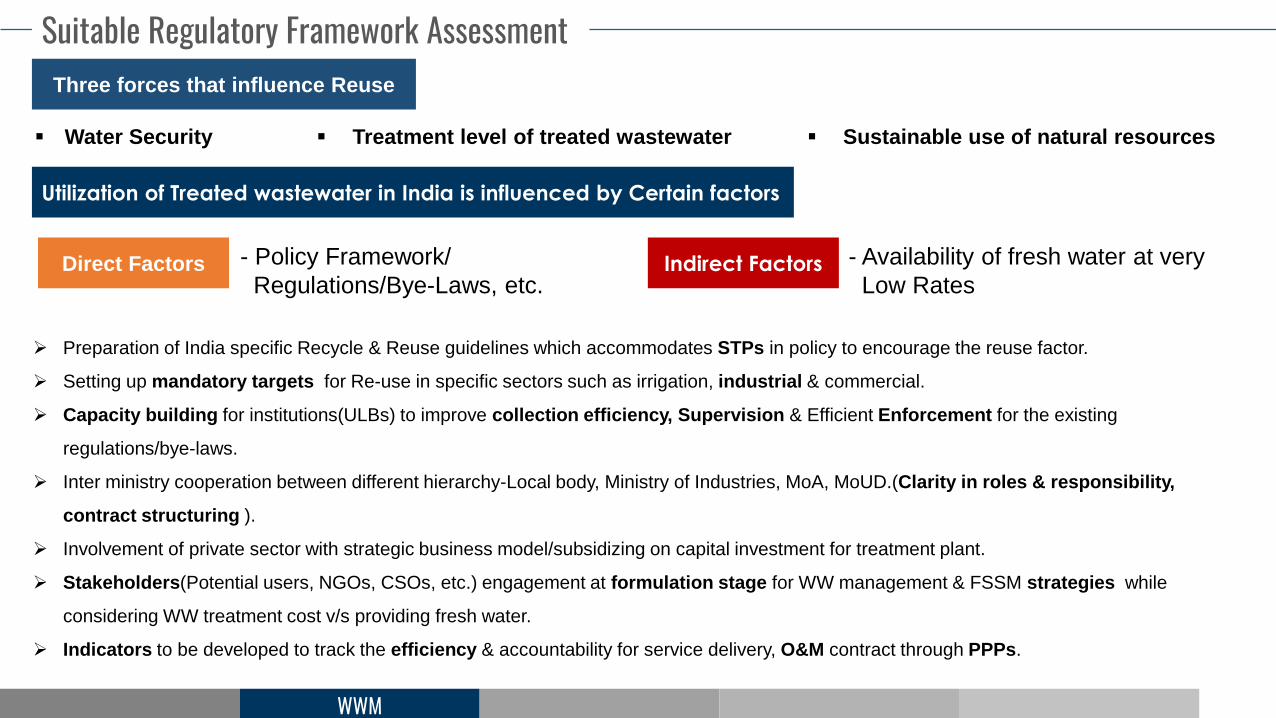
WWM
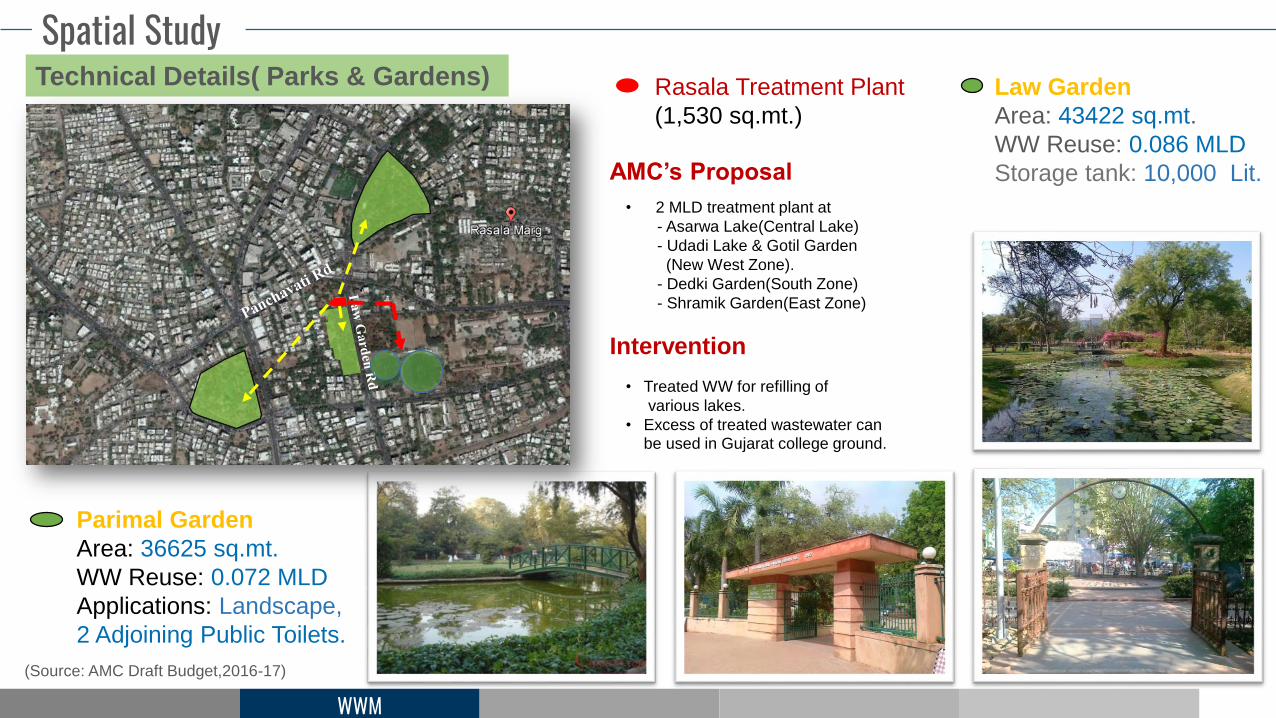
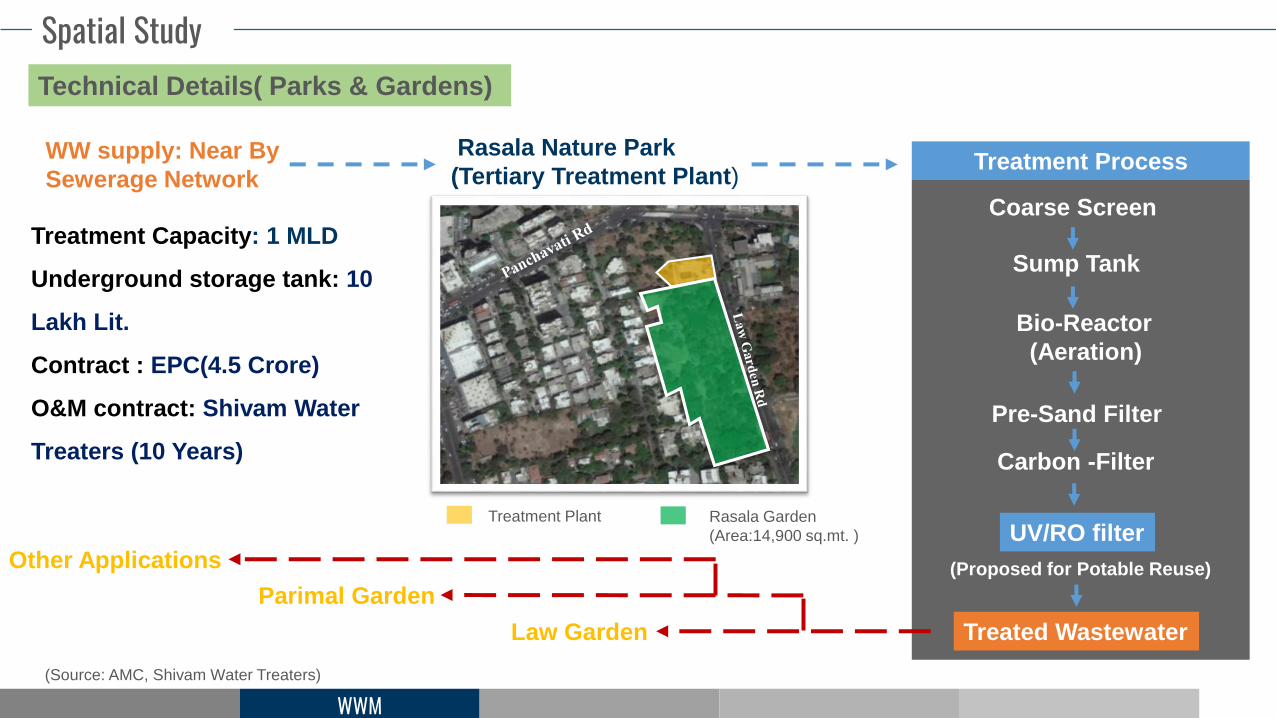
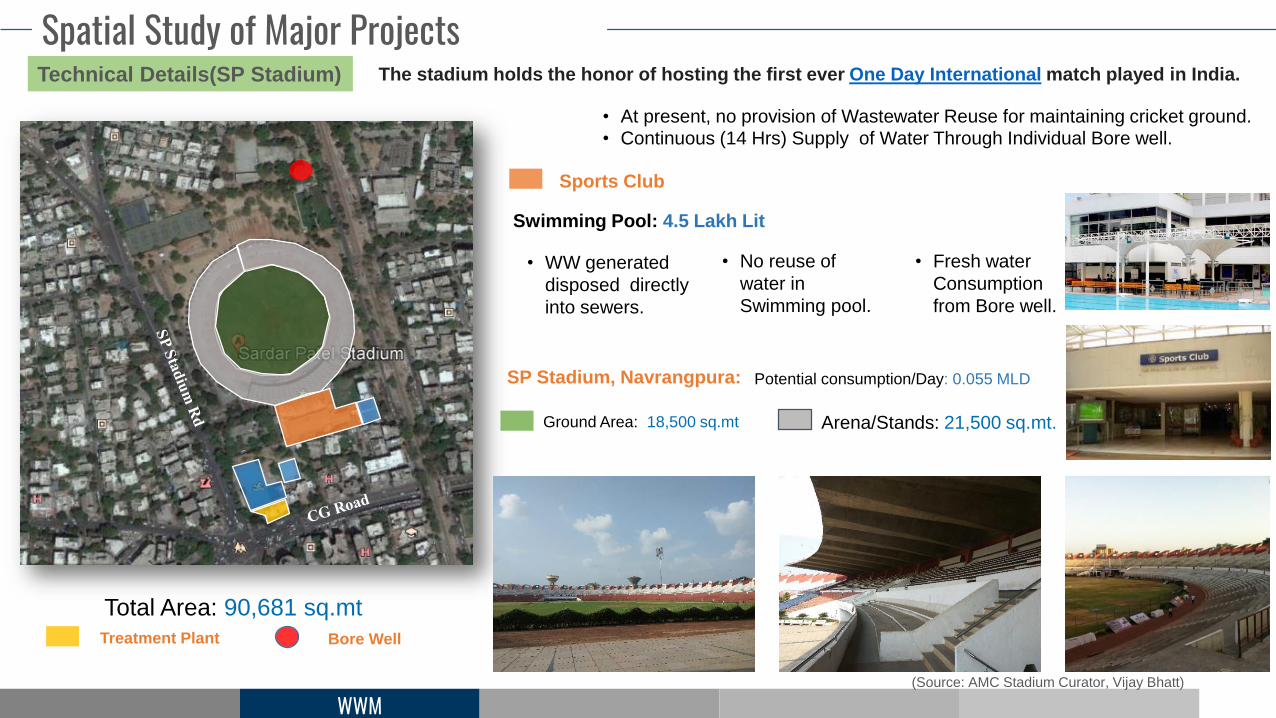
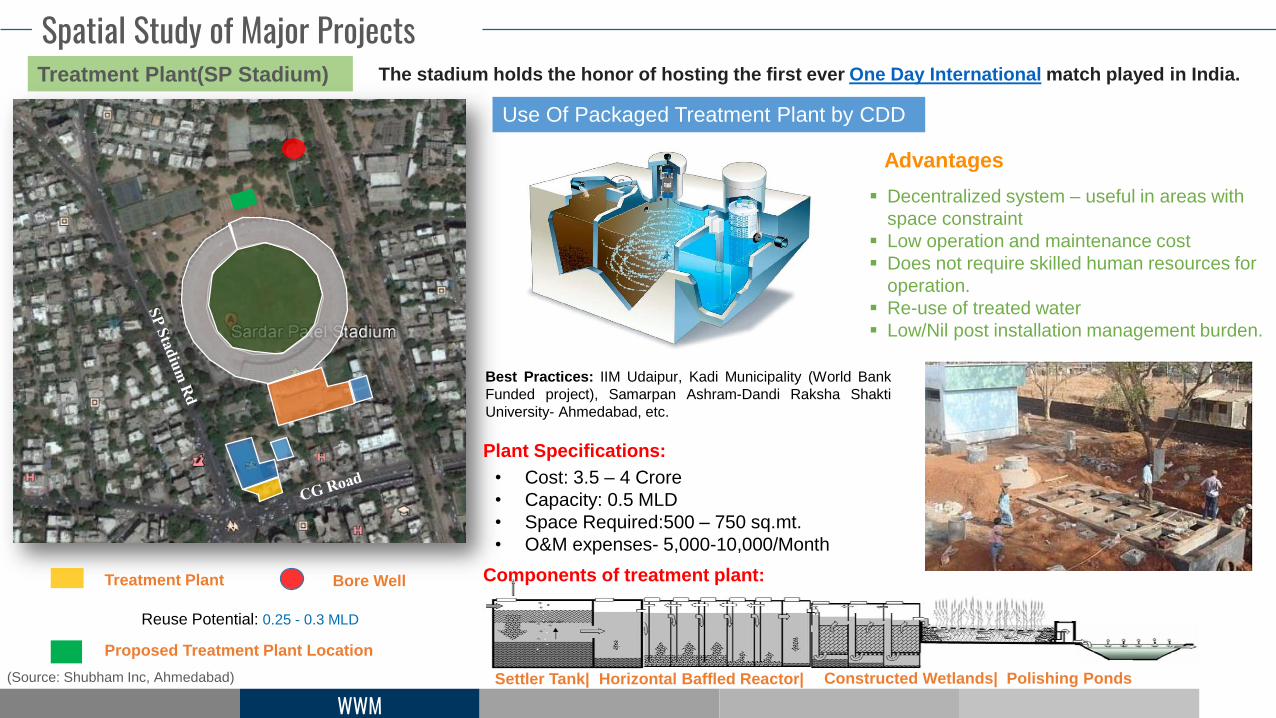
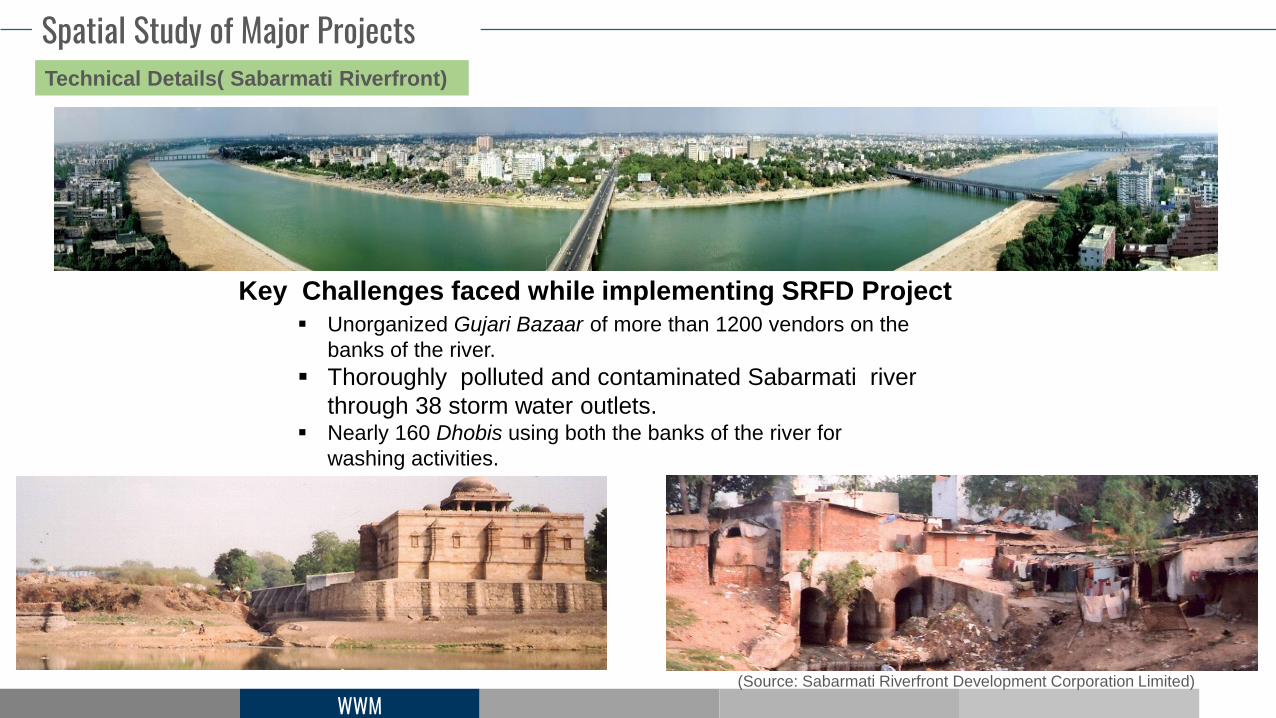
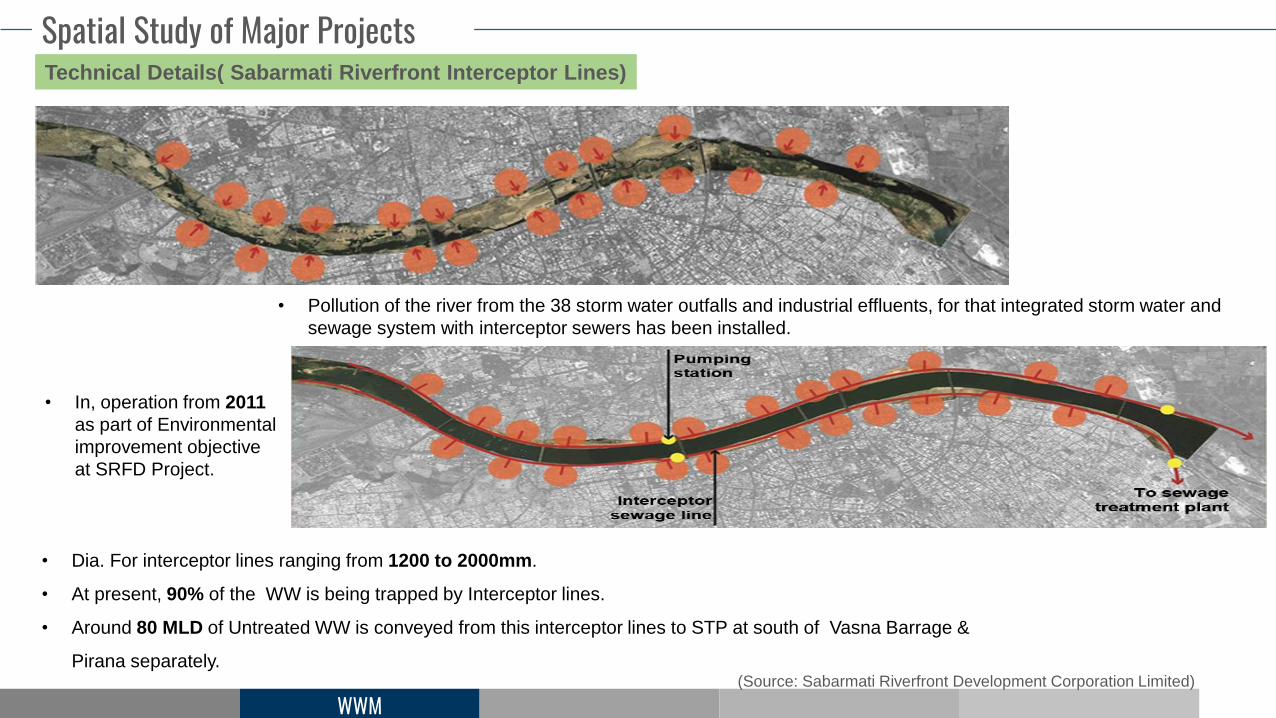
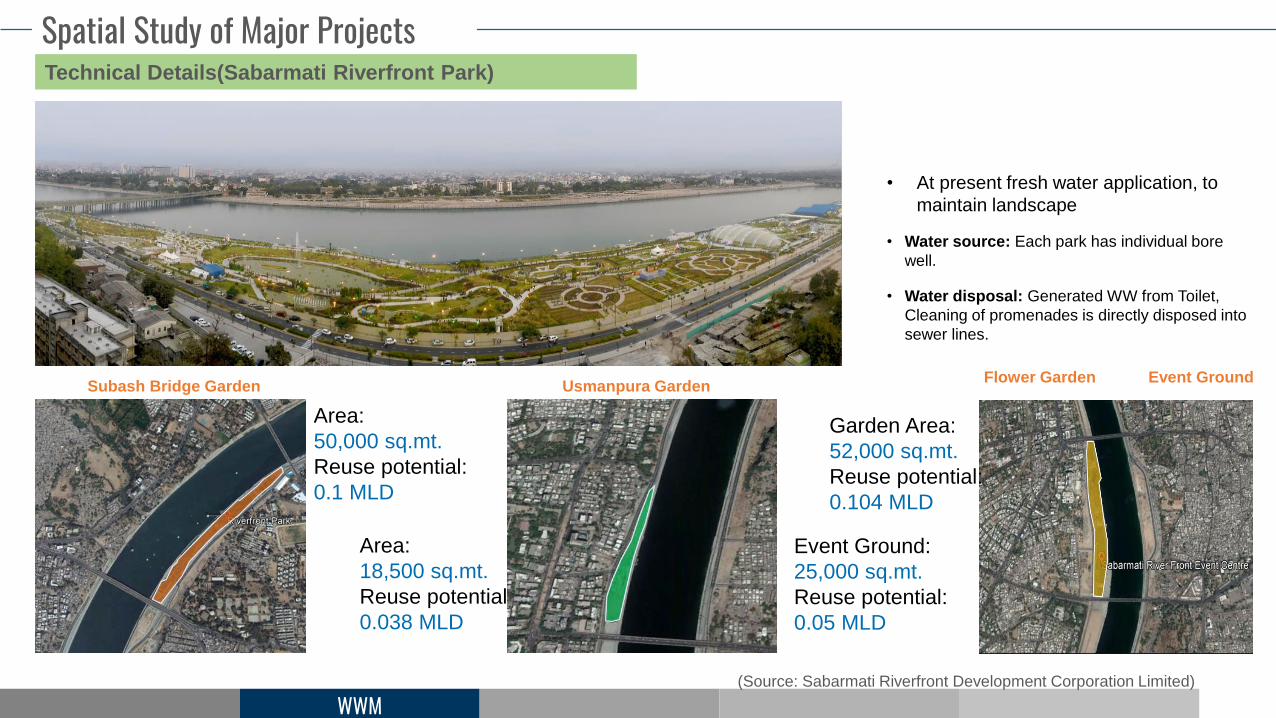
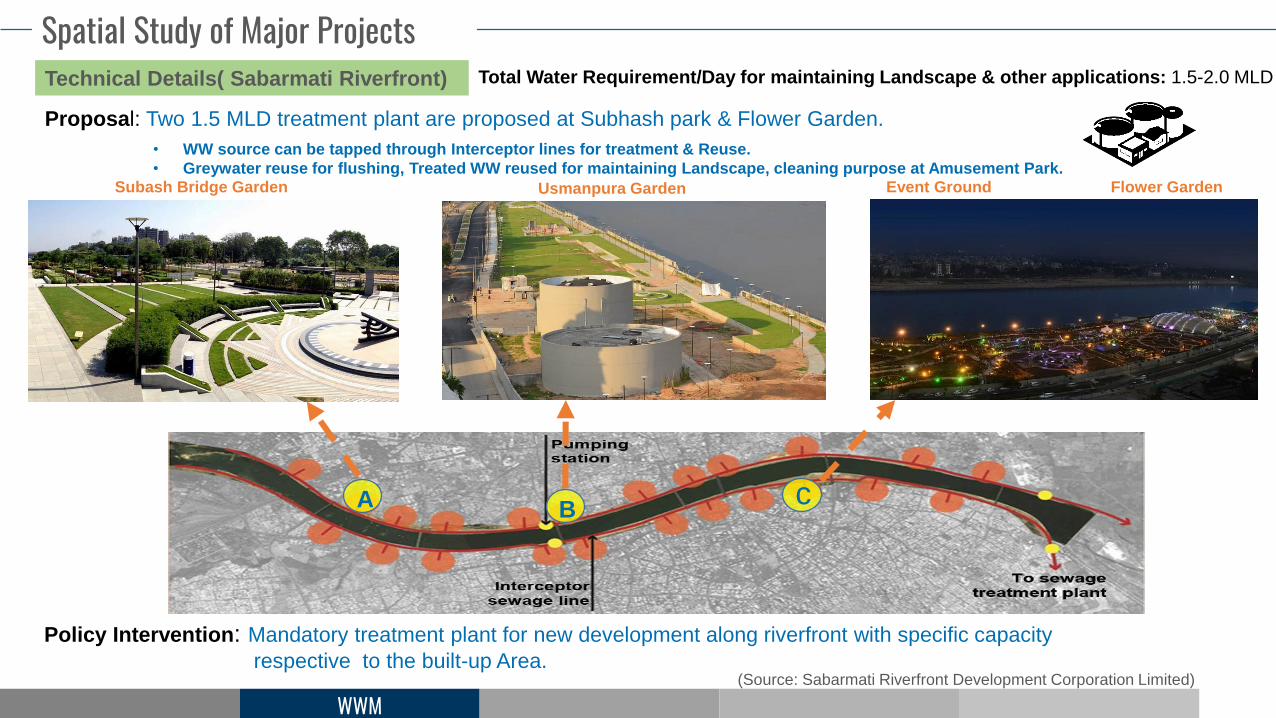
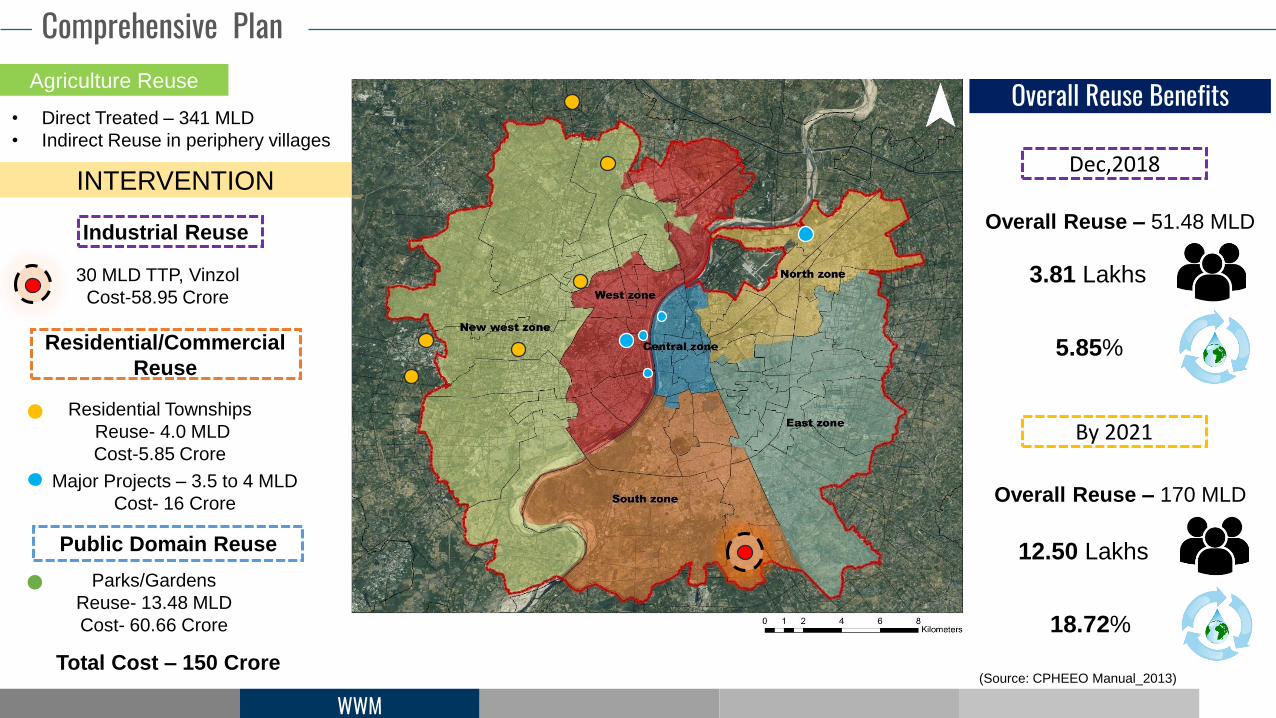
Spatial Study of Major Projects
(Source: Sabarmati Riverfront Development Corporation Limited)
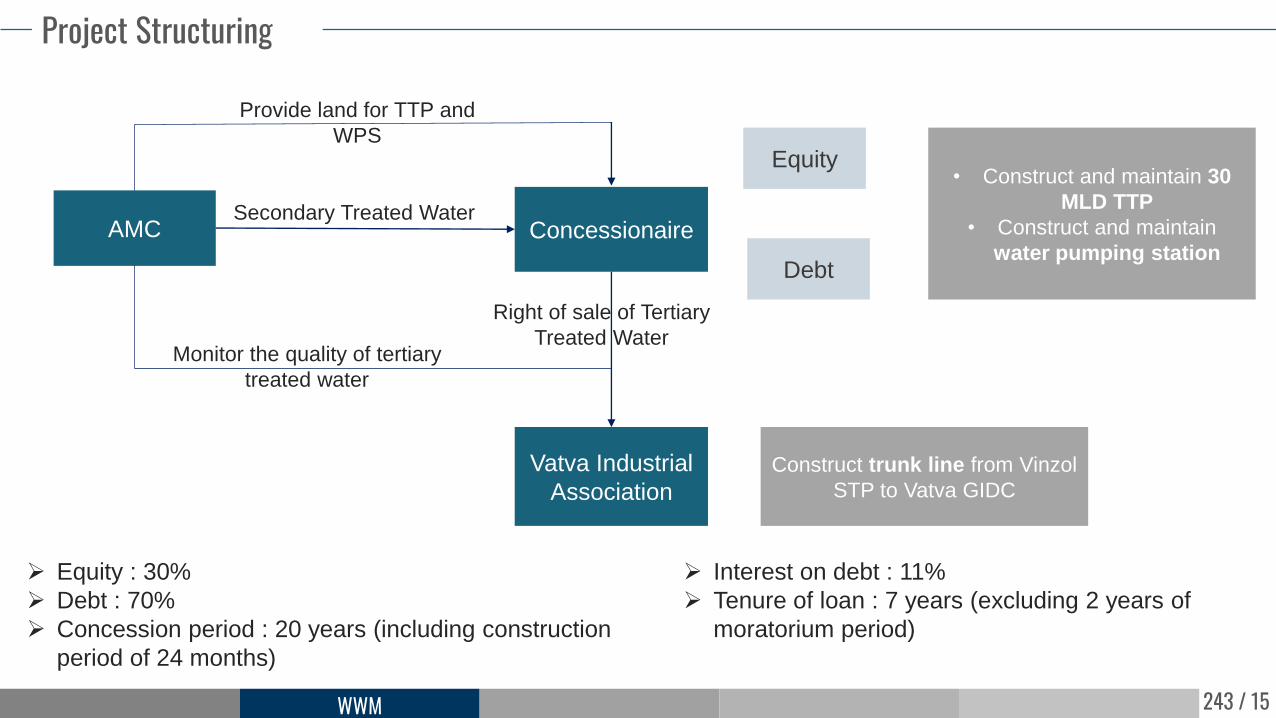
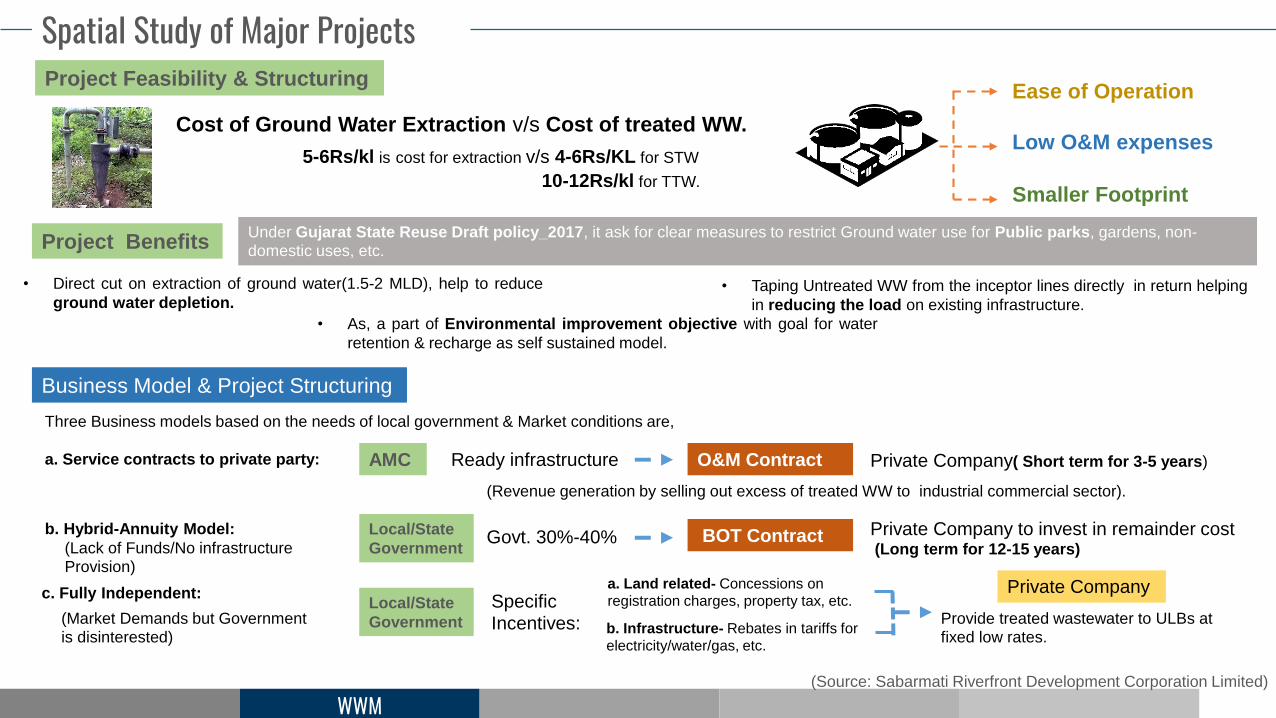
Project Feasibility & Structuring
Business Model & Project Structuring
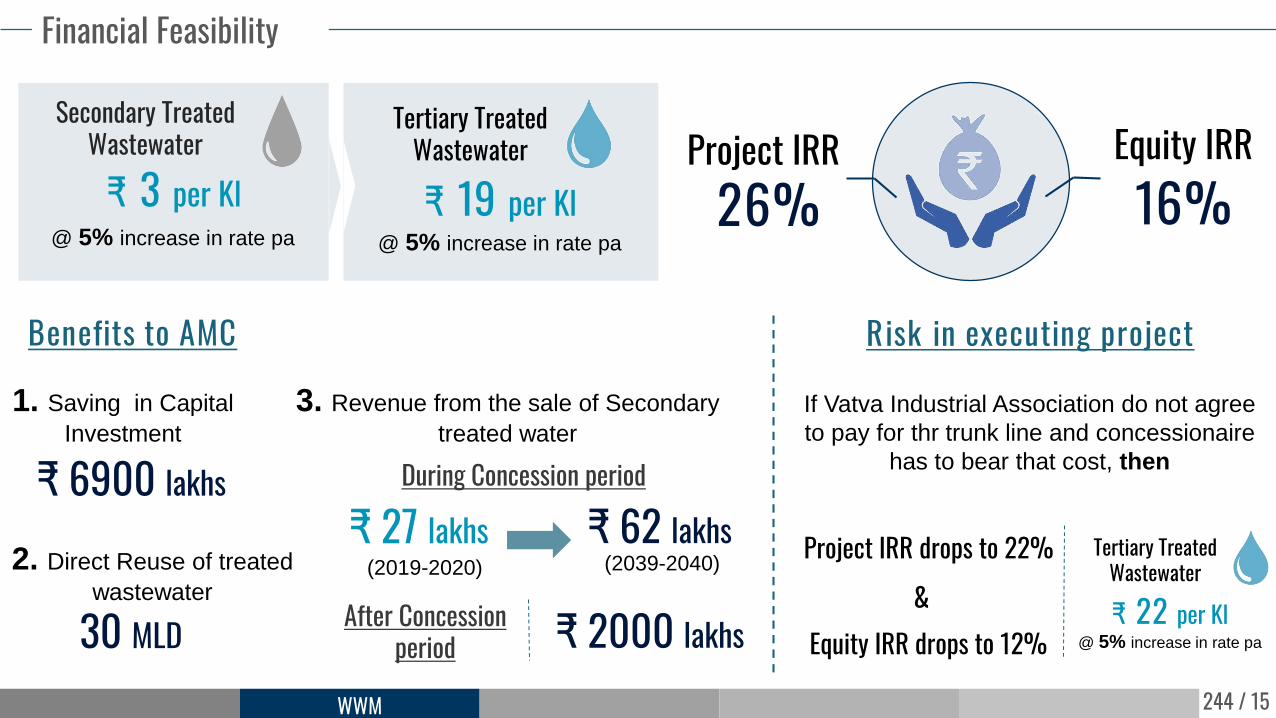
Cost of Ground Water Extraction v/s Cost of treated WW.
Project BenefitsUnder Gujarat State Reuse Draft policy_2017, it ask for clear measures to restrict Ground water use for Public parks, gardens, non-domestic uses, etc.
5-6Rs/kl is cost for extraction v/s 4-6Rs/KL for STW
Ease of Operation
Low O&M expenses
Smaller Footprint
• Direct cut on extraction of ground water(1.5-2 MLD), help to reduce
ground water depletion.
Three Business models based on the needs of local government & Market conditions are,
• As, a part of Environmental improvement objective with goal for water
retention & recharge as self sustained model.
• Taping Untreated WW from the inceptor lines directly in return helping
in reducing the load on existing infrastructure.
AMC Ready infrastructure a. Service contracts to private party: O&M Contract Private Company( Short term for 3-5 years)
(Revenue generation by selling out excess of treated WW to industrial commercial sector).
Local/State
GovernmentGovt. 30%-40%
b. Hybrid-Annuity Model: BOT Contract Private Company to invest in remainder cost (Long term for 12-15 years)(Lack of Funds/No infrastructure
Provision)
c. Fully Independent:Local/State
Government(Market Demands but Government is disinterested)
Specific Incentives:
a. Land related- Concessions on
registration charges, property tax, etc.
b. Infrastructure- Rebates in tariffs for
electricity/water/gas, etc.
Provide treated wastewater to ULBs at fixed low rates.
• Regular water supply into overhead tank by AMC but no water by afternoon because of the broken water pipeline.
• People are urinating or defecating in the open space behind the mobile toilet.
Observations at mobile toilet located opp. to vegetable market
320 / 10SWACHH
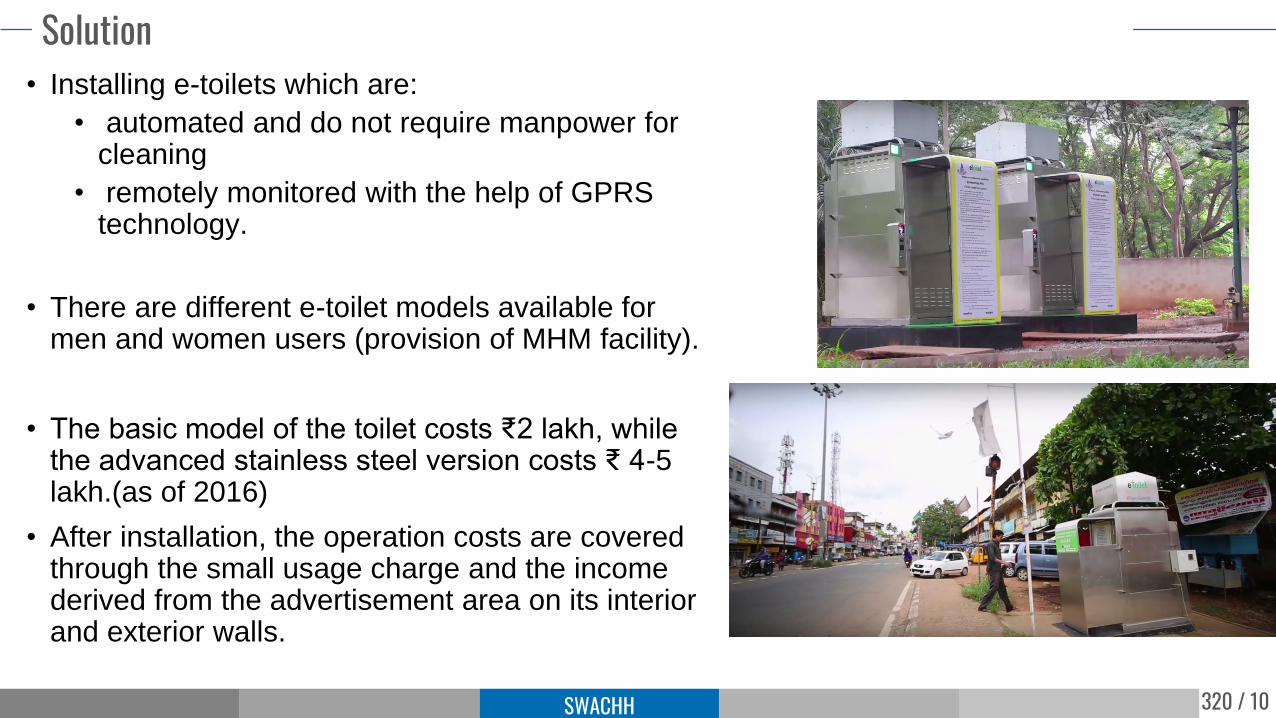
• Installing e-toilets which are:
• automated and do not require manpower for cleaning
• remotely monitored with the help of GPRS technology.
• There are different e-toilet models available for men and women users (provision of MHM facility).
• The basic model of the toilet costs ₹2 lakh, while the advanced stainless steel version costs ₹ 4-5 lakh.(as of 2016)
• After installation, the operation costs are covered through the small usage charge and the income derived from the advertisement area on its interior and exterior walls.
Solution
321 / 10SWACHH
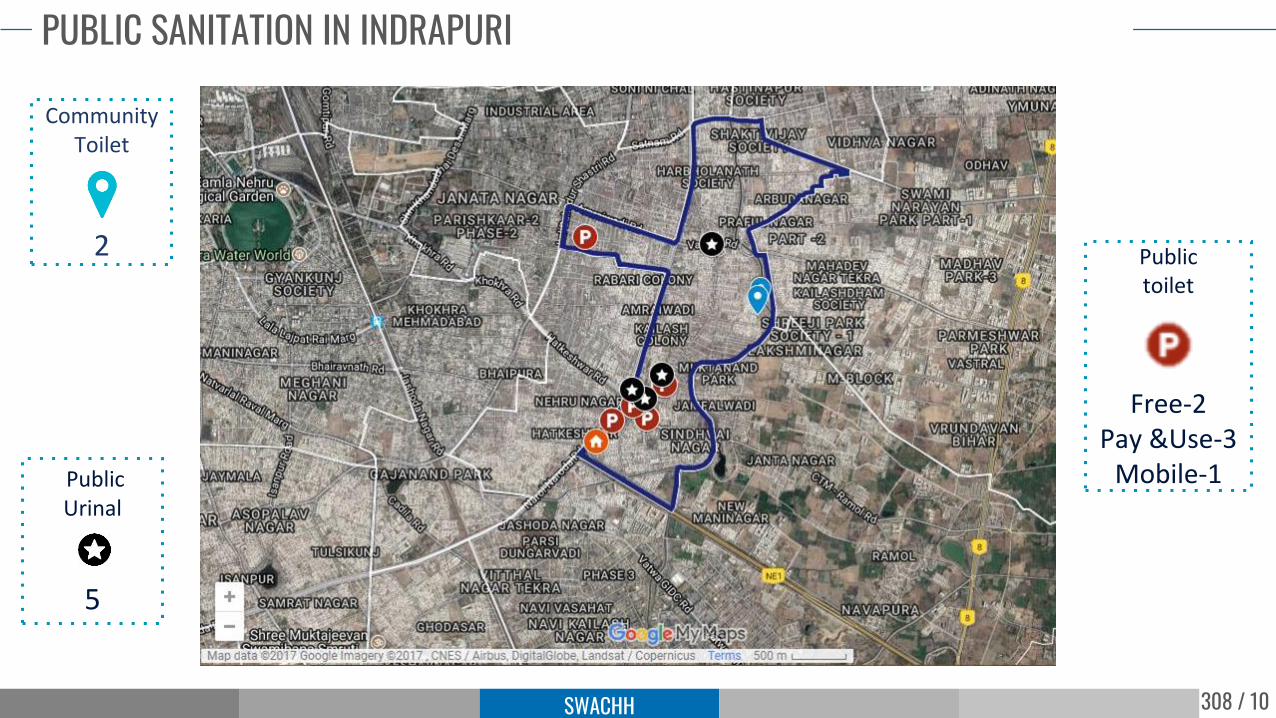
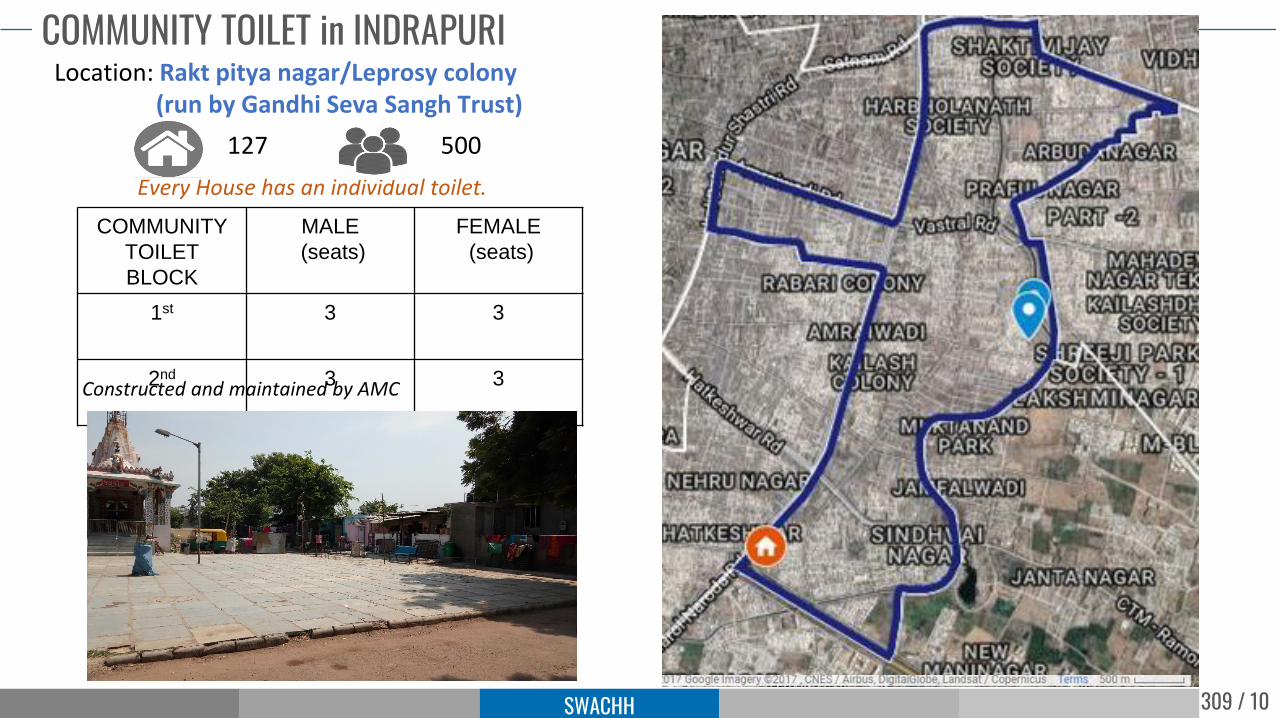
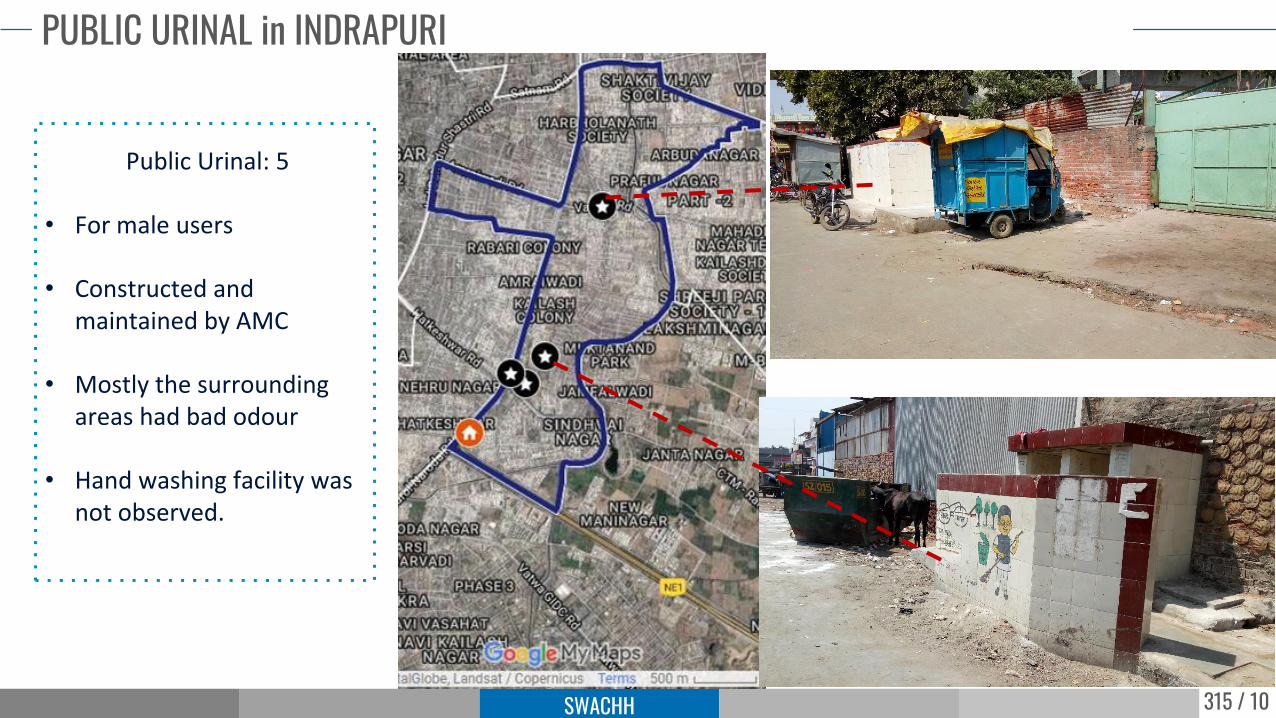
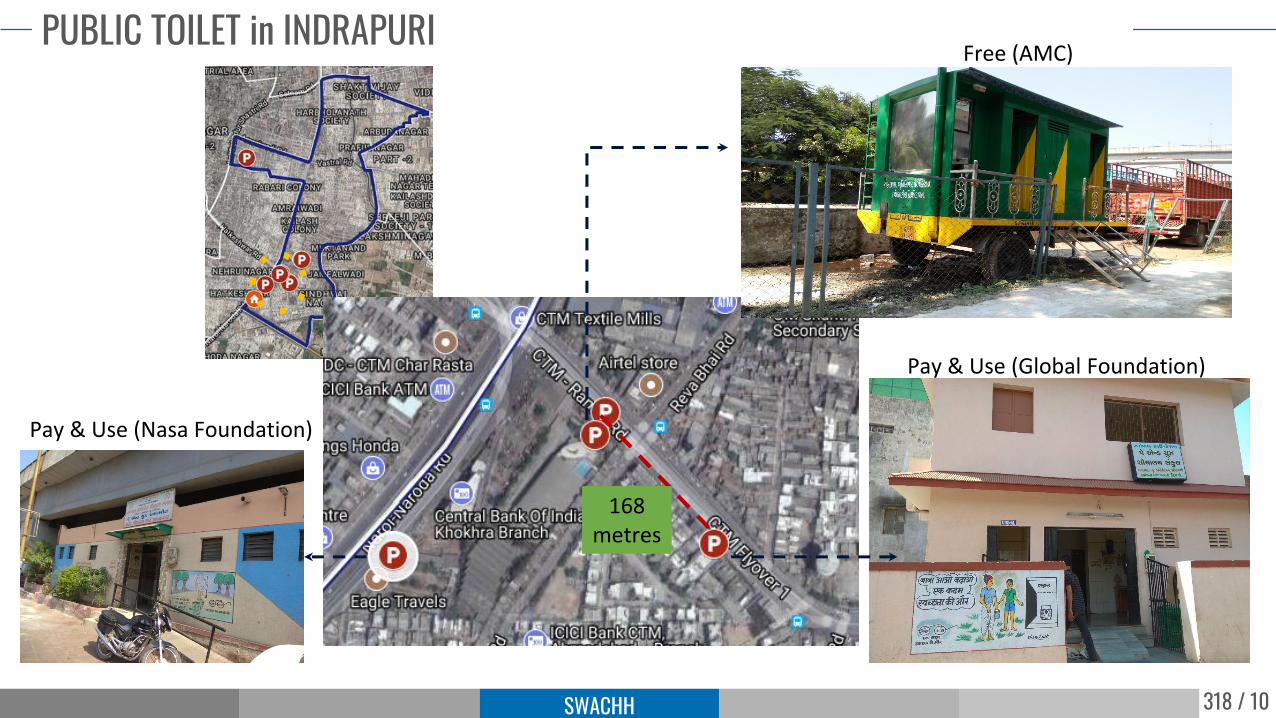
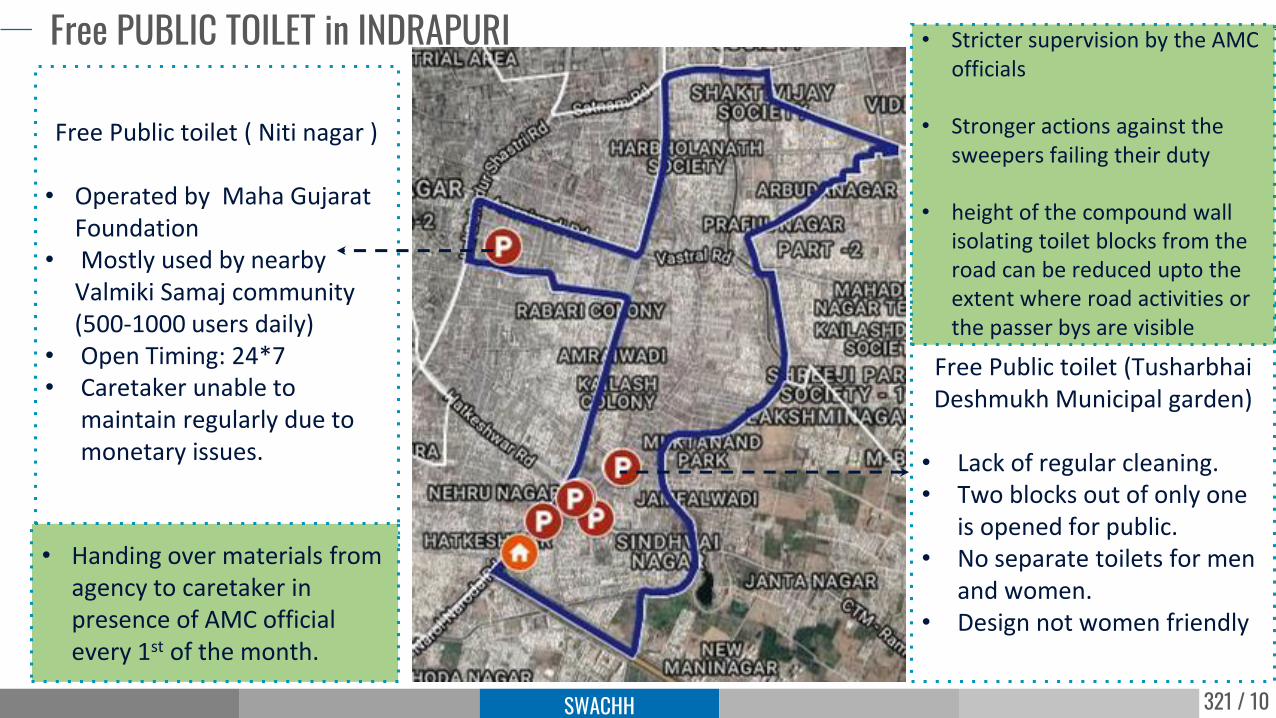
Free PUBLIC TOILET in INDRAPURI
Free Public toilet ( Niti nagar )
• Operated by Maha Gujarat Foundation
• Mostly used by nearby Valmiki Samaj community(500-1000 users daily)
• Open Timing: 24*7• Caretaker unable to
maintain regularly due to monetary issues.
Free Public toilet (Tusharbhai Deshmukh Municipal garden)
• Lack of regular cleaning.• Two blocks out of only one
is opened for public.• No separate toilets for men
and women.• Design not women friendly
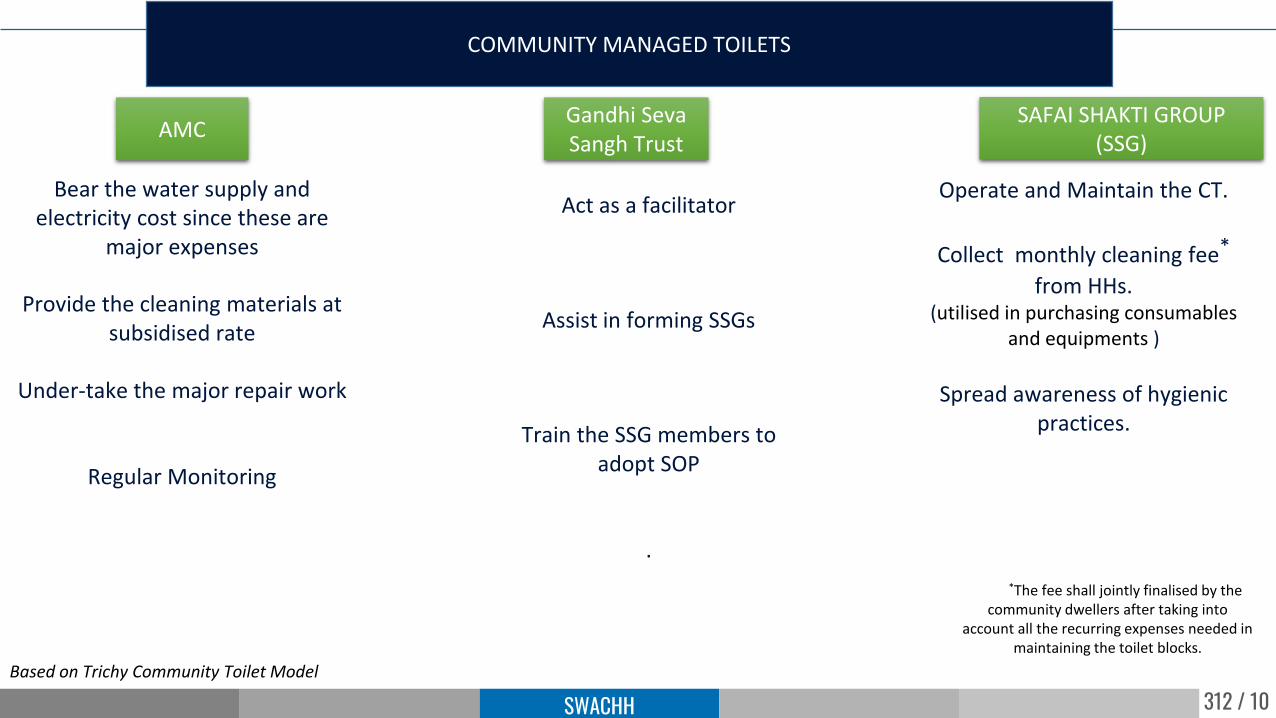
• Handing over materials from agency to caretaker in presence of AMC official every 1st of the month.
• Stricter supervision by the AMC officials
• Stronger actions against the sweepers failing their duty
• height of the compound wall isolating toilet blocks from the road can be reduced upto the extent where road activities or the passer bys are visible
322 / 10SWACHH
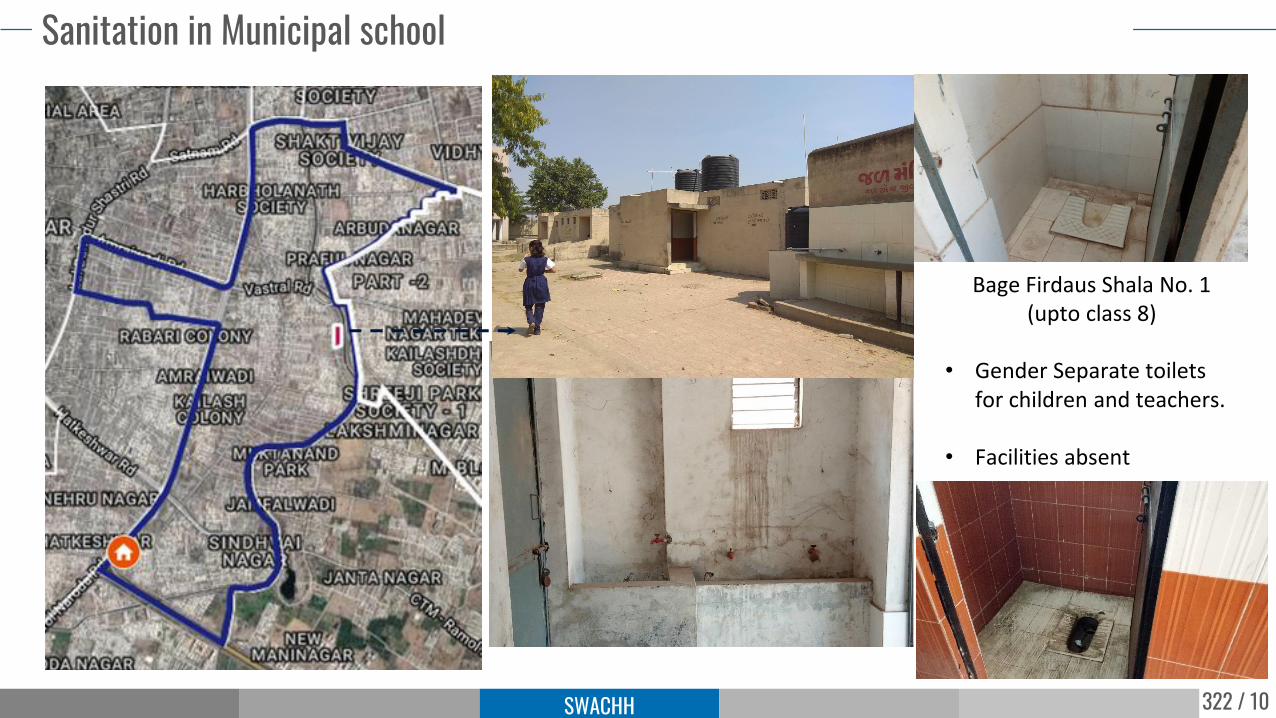
Sanitation in Municipal school
Bage Firdaus Shala No. 1(upto class 8)
• Gender Separate toilets for children and teachers.
• Facilities absent
323 / 10SWACHH
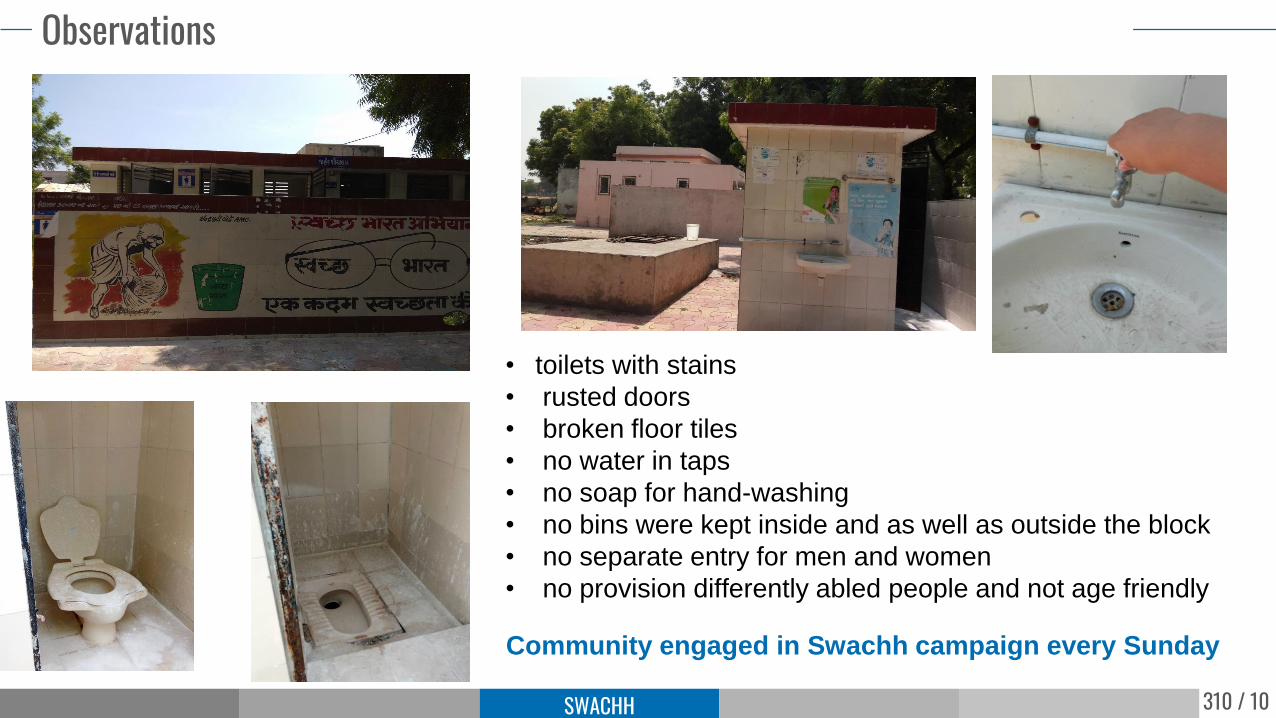
MAJOR ISSUES
• Daily cleaning
• Regular maintenance
• No water supply within toilet for hand washing
• Lack of Facilities: (1) soap/sanitizer for handwashing (2) MHM
• No separate toilet for CWSN
324 / 10SWACHH
Intervention
• AMC should sign the annual School Sanitation Contract, wherein the contractor shall have to:
• follow the SOP guidelines laid out by AMC for cleaning and maintenance of the toilets
• report to PHS of ward about water or electricity related issues
• provide facilities and instructions on how to use them like- liquid soap for handwashing, necessary accessories for girls
• spread awareness about importance of hygienic practices through posters.
• Performance based contract.
• The same contractor shall be appointed to clean fixed number of schools in one particular zone considering the shifts in the schools assigned and the student strength.
325 / 10
Thank You
326 / 70
HeritageThrough the lens of Water and Sanitation
Prepared by : Ghata Radia
Palak Panchal
Yash Sugandhi
327 / 70HERITAGE
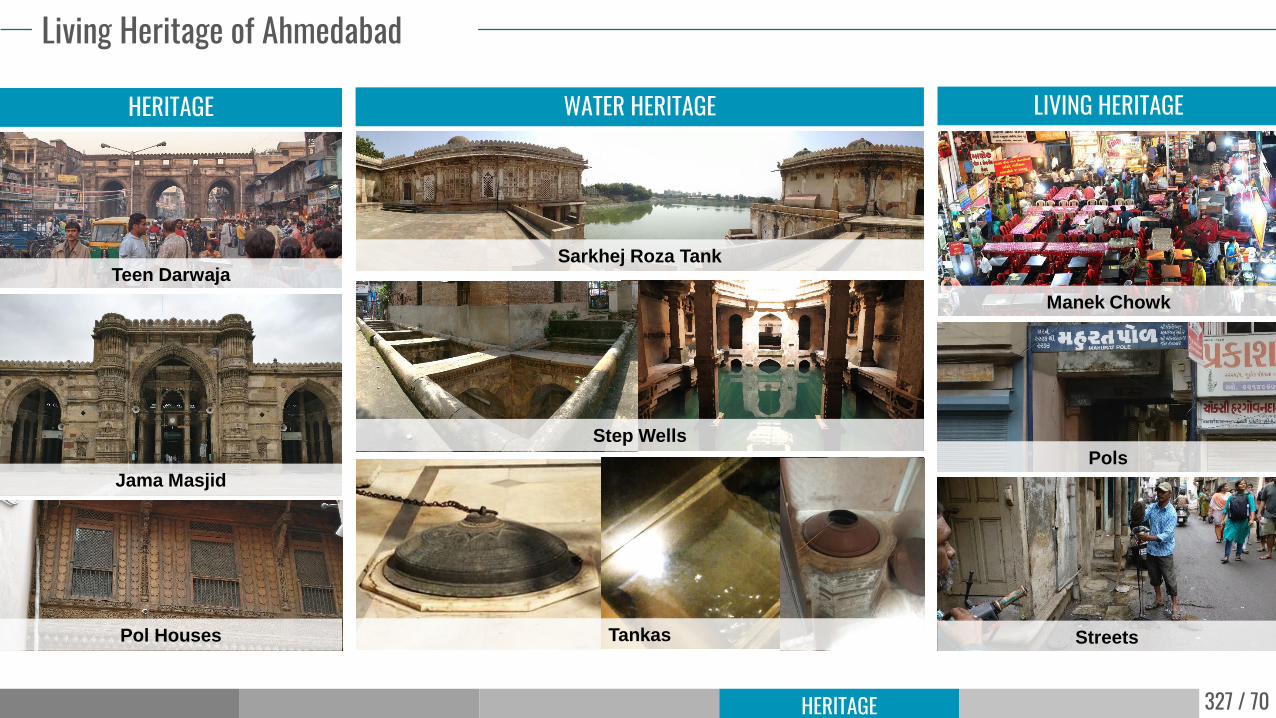
Living Heritage of Ahmedabad
HERITAGE
Teen Darwaja
Jama Masjid
Pol Houses
LIVING HERITAGE
Manek Chowk
Pols
Streets
WATER HERITAGE
Sarkhej Roza Tank
Step Wells
Tankas
328 / 70HERITAGE
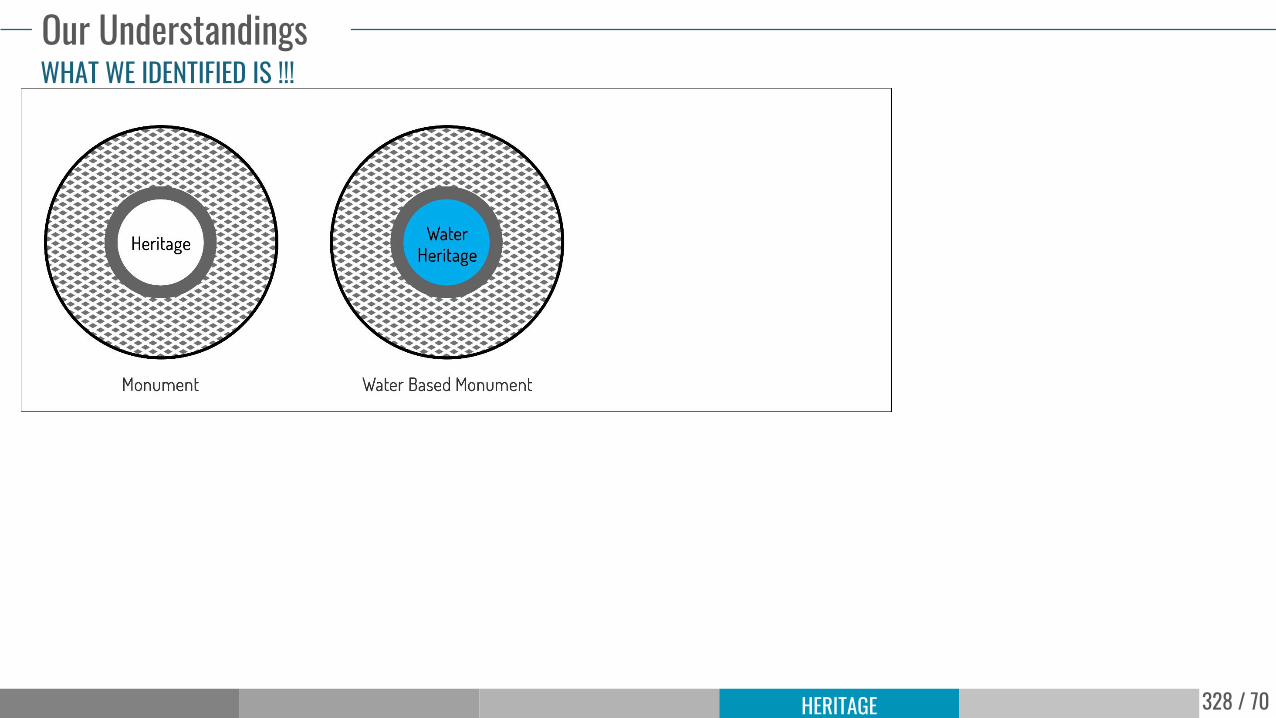
Our UnderstandingsWHAT WE IDENTIFIED IS !!!
TANGIBLEBuildings, Landscapes
INTANGIBLETraditions, Systems,
Networks, Practices and
values of surroundings of
Tangible such as Water
Heritage
It is both tangible and
intangible, that co-exist
and creates a sense of
identification of Spaces –
this concept is equally
applicable to heritage
precincts also.
V
329 / 70HERITAGE
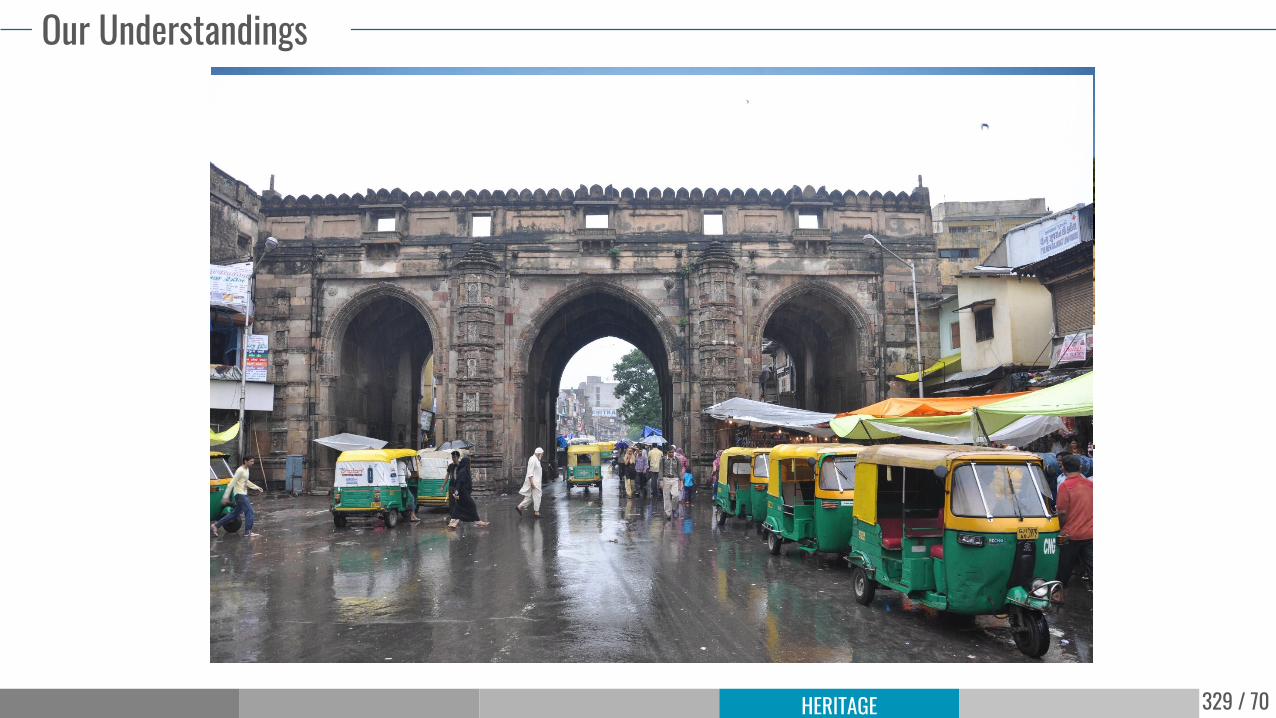
INTANGIBLE | AMC
TANGIBLE | ASI
INTANGIBLE | AMC
TANGIBLE | ASI
Our Understandings
330 / 70HERITAGE
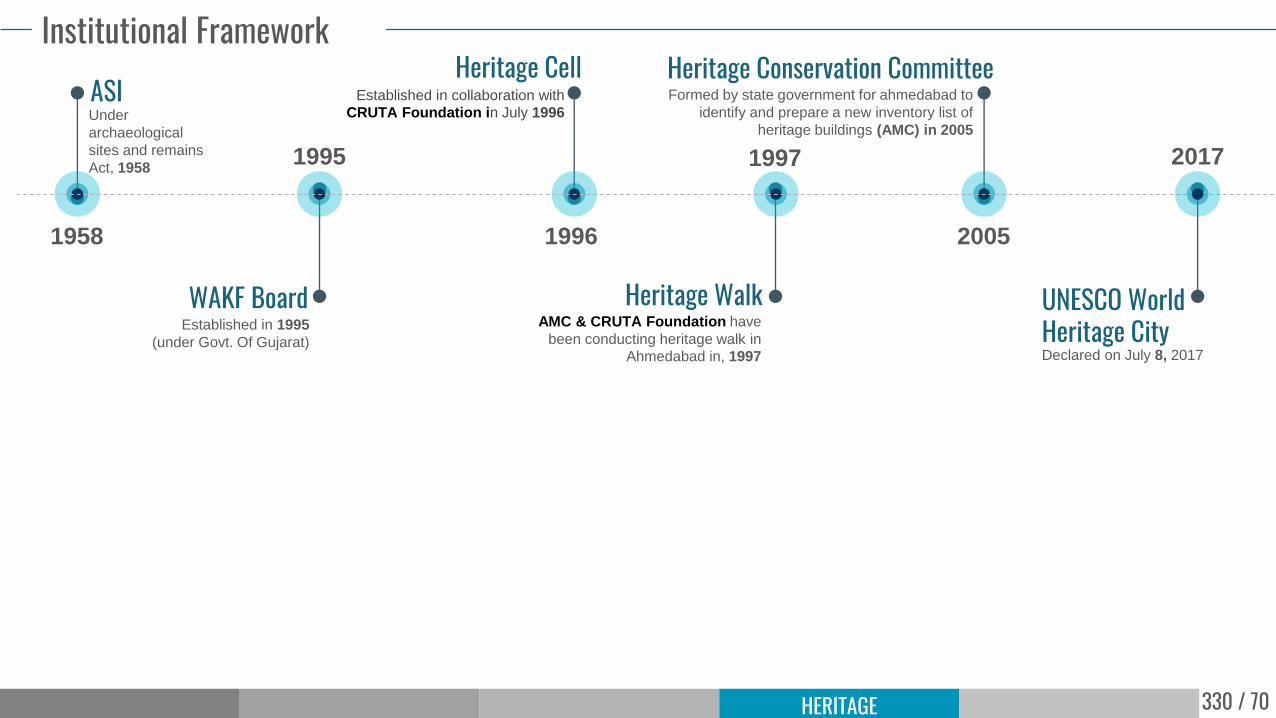
Institutional FrameworkASIUnder
archaeological
sites and remains
Act, 1958
1958
Established in 1995
(under Govt. Of Gujarat)
WAKF Board
1995
Established in collaboration with
CRUTA Foundation in July 1996
Heritage Cell
1996
Heritage WalkAMC & CRUTA Foundation have
been conducting heritage walk in
Ahmedabad in, 1997
1997
Heritage Conservation CommitteeFormed by state government for ahmedabad to
identify and prepare a new inventory list of
heritage buildings (AMC) in 2005
2005
Declared on July 8, 2017
UNESCO World Heritage City
2017
331 / 70HERITAGE
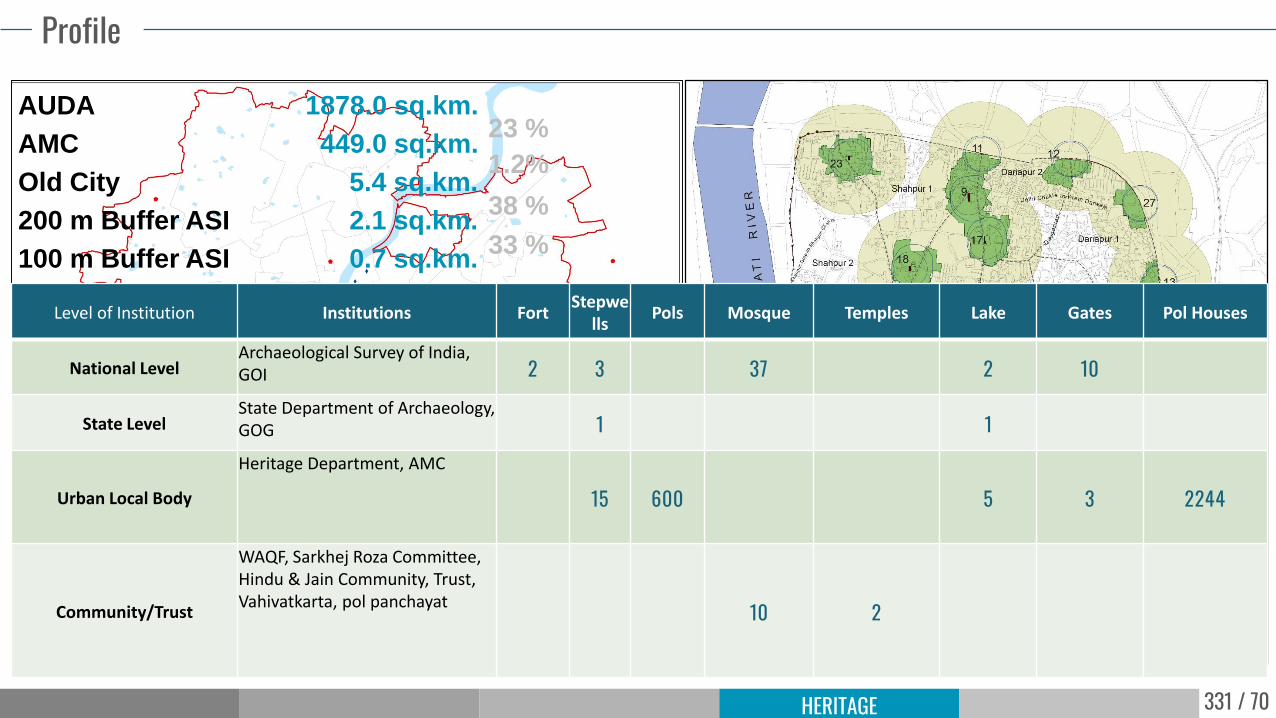
Profile
AUDA 1878.0 sq.km.
AMC 449.0 sq.km.
Old City 5.4 sq.km.
200 m Buffer ASI 2.1 sq.km.
100 m Buffer ASI 0.7 sq.km.33 %
38 %
1.2%
23 %
54 Monuments within Ahmedabad Municipal Corporation28 Monuments lies within Old City of Ahmedabad
Archaeology Survey of India, Government of India
04 Monuments within Ahmedabad Municipal CorporationDepartment of Archaeology, Government of Gujarat
600 Pols lies within Old City of Ahmedabad2244 Notified Houses of Heritage Importance in Old City of Ahmedabad
Heritage Department, Ahmedabad Municipal Corporation
Level of Institution Institutions FortStepwe
llsPols Mosque Temples Lake Gates Pol Houses
National LevelArchaeological Survey of India, GOI 2 3 37 2 10
State LevelState Department of Archaeology, GOG 1 1
Urban Local Body
Heritage Department, AMC
15 600 5 3 2244
Community/Trust
WAQF, Sarkhej Roza Committee, Hindu & Jain Community, Trust, Vahivatkarta, pol panchayat 10 2
332 / 70HERITAGE
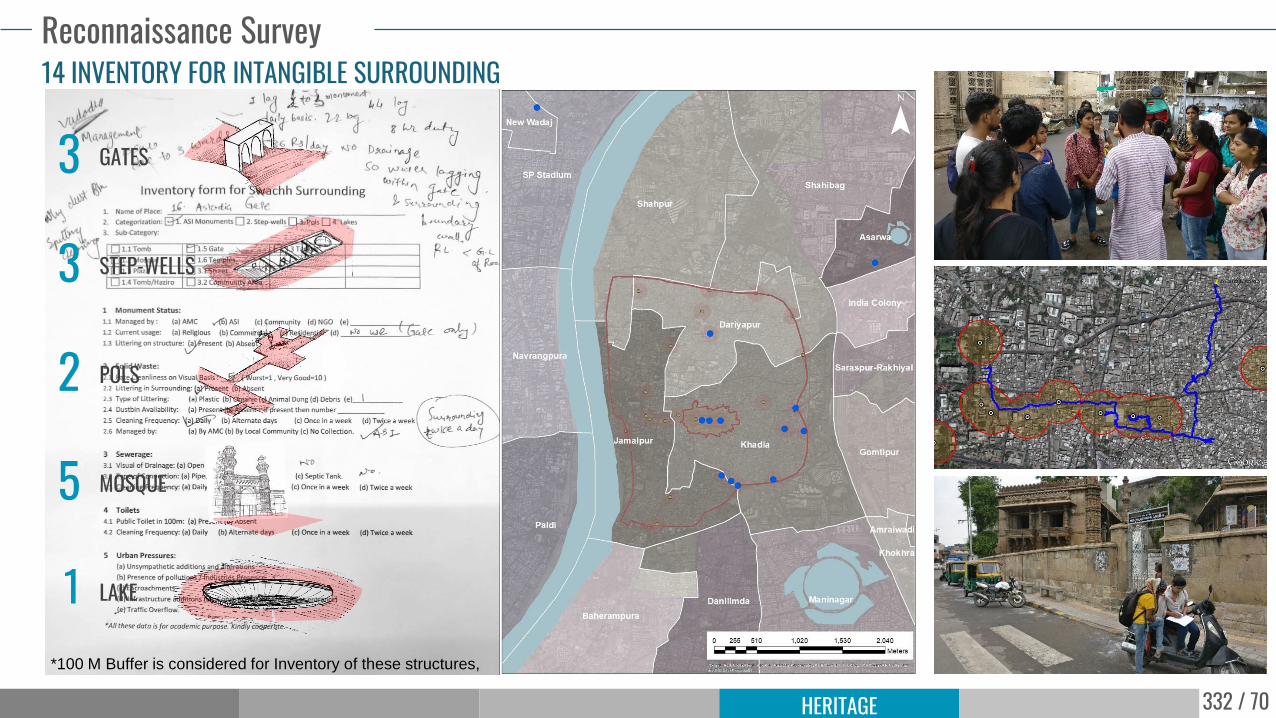
Reconnaissance Survey
GATES3
STEP-WELLS3
POLS2
LAKE1
MOSQUE5
*100 M Buffer is considered for Inventory of these structures,
14 INVENTORY FOR INTANGIBLE SURROUNDING
333 / 70HERITAGE
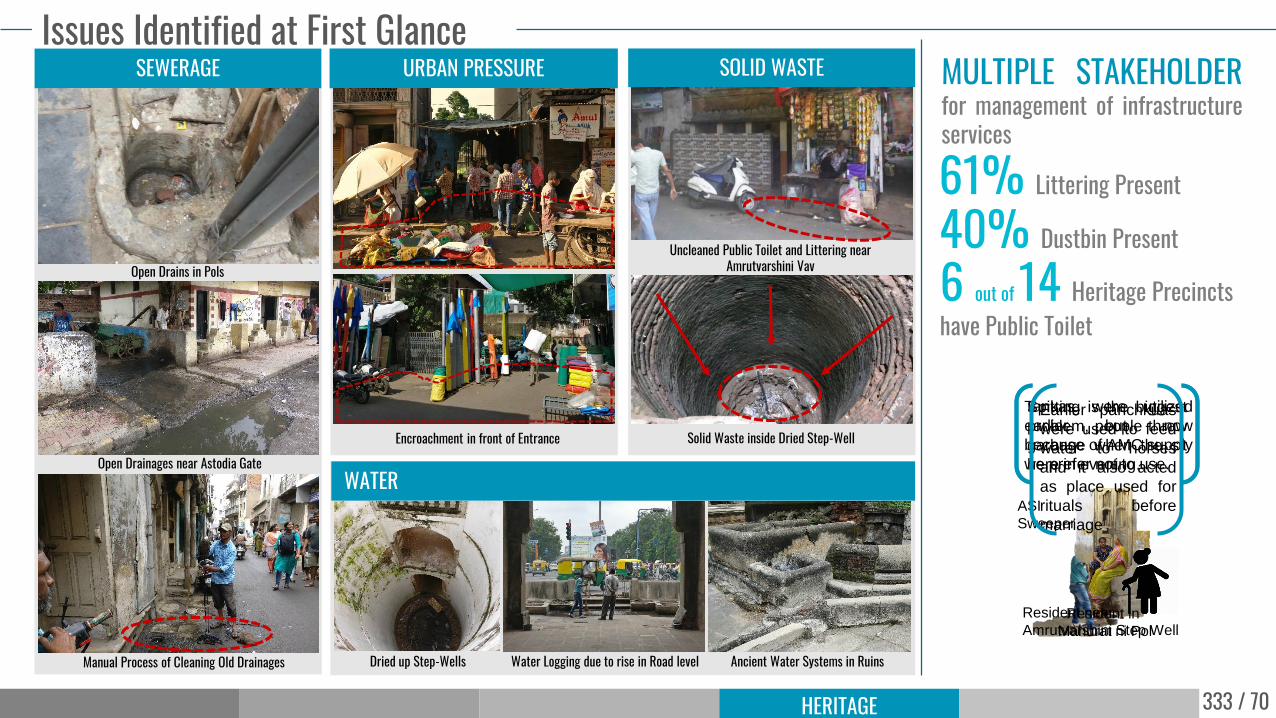
Issues Identified at First GlanceSOLID WASTE
Uncleaned Public Toilet and Littering near Amrutvarshini Vav
Solid Waste inside Dried Step-Well
URBAN PRESSURE
Encroachment in front of Entrance
SEWERAGE
Manual Process of Cleaning Old Drainages
Open Drains in Pols
Open Drainages near Astodia Gate
Dried up Step-Wells Water Logging due to rise in Road level Ancient Water Systems in Ruins
WATER
61% Littering Present
MULTIPLE STAKEHOLDERfor management of infrastructureservices
40% Dustbin Present
6 out of 14 Heritage Precincts have Public Toilet
ASI
Sweeper
Spitting is the biggest
problem, people throw
garbage when the sit
here in evening.
Tankas were utilized
earlier but now
because of AMC supply
we prefer not to use.
Resident in
Mahurat ni Pol
Earlier panchkuas
were used to feed
water to horses
and it also acted
as place used for
rituals before
marriage
Resident near
Amrutvarshini Step Well
334 / 70HERITAGE
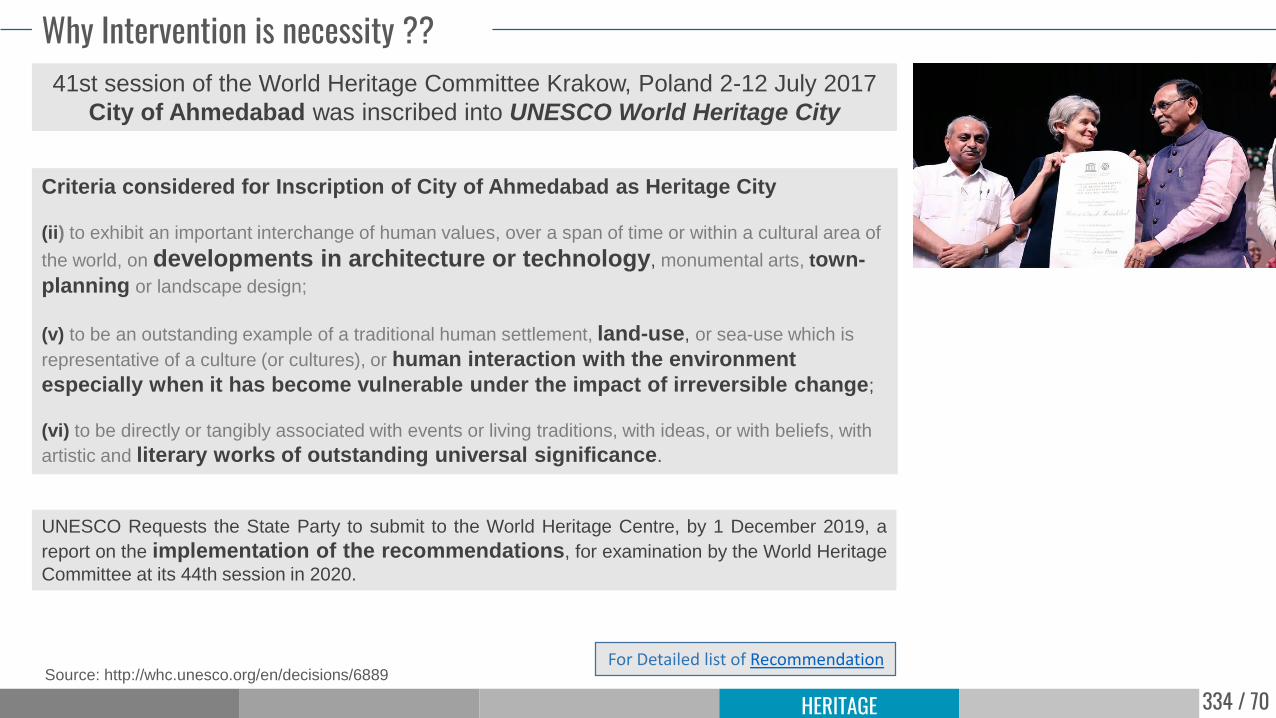
Why Intervention is necessity ??41st session of the World Heritage Committee Krakow, Poland 2-12 July 2017
City of Ahmedabad was inscribed into UNESCO World Heritage City
Criteria considered for Inscription of City of Ahmedabad as Heritage City
(ii) to exhibit an important interchange of human values, over a span of time or within a cultural area of
the world, on developments in architecture or technology, monumental arts, town-
planning or landscape design;
(v) to be an outstanding example of a traditional human settlement, land-use, or sea-use which is
representative of a culture (or cultures), or human interaction with the environment
especially when it has become vulnerable under the impact of irreversible change;
(vi) to be directly or tangibly associated with events or living traditions, with ideas, or with beliefs, with
artistic and literary works of outstanding universal significance.
UNESCO Requests the State Party to submit to the World Heritage Centre, by 1 December 2019, a
report on the implementation of the recommendations, for examination by the World Heritage
Committee at its 44th session in 2020.
For Detailed list of RecommendationSource: http://whc.unesco.org/en/decisions/6889
335 / 70HERITAGE
Vision
To create a consensus by preserving the fragile intangible
heritage precincts in Ahmedabad focusing on its Clean
Surrounding and Management of Water as a Resource.
• To identify and preserve built-heritage which were associated
with practices of water such as preserving natural watershed,
rain water harvesting system, tankas as storages.
• To create a consensus among stakeholder about the idea of
Water-Heritage by restoring Water System and Network, which
are vulnerable to be forgotten.
• To sanitize heritage city of Ahmedabad by inclusion of component
like Solid Waste Management and Sanitation in Integrated
Management Plan (Heritage)
VISION
OBJECTIVE : WATER AS RESOURCE IN WATER BASED HERITAGE MONUMNETS
OBJECTIVE : SWACHH SURROUNDING
336 / 70HERITAGE
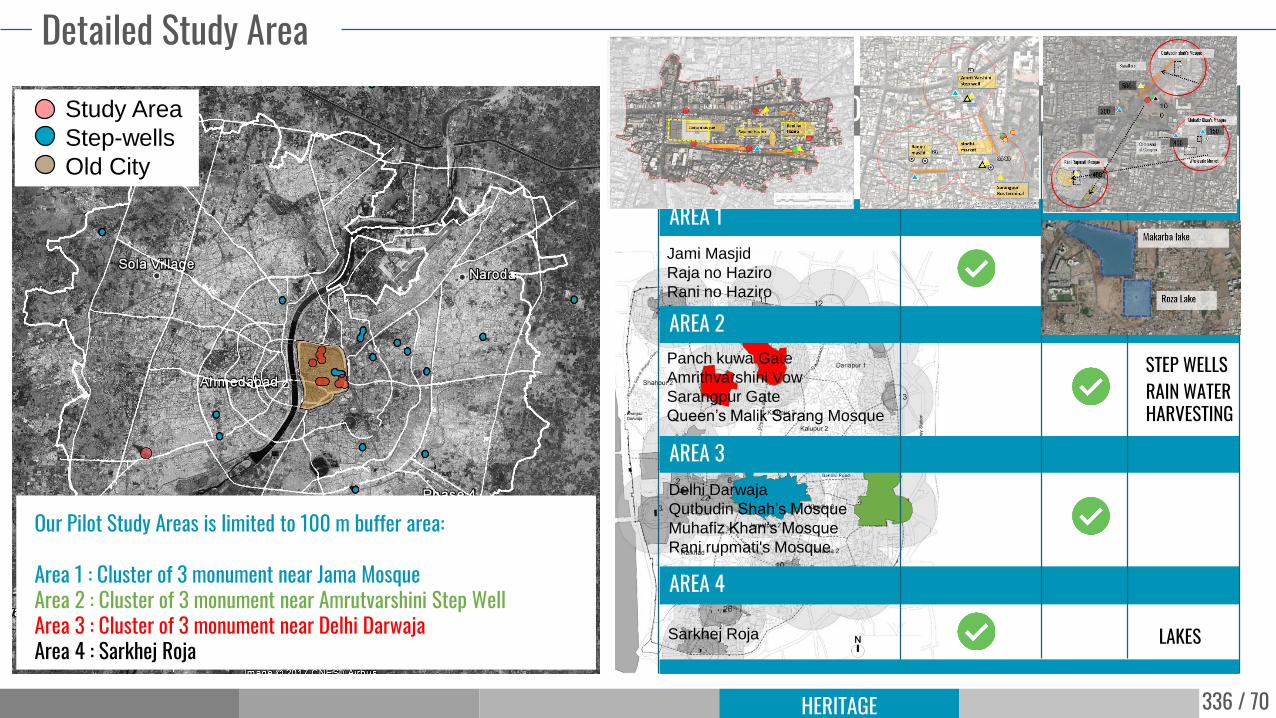
Detailed Study Area
Our Pilot Study Areas is limited to 100 m buffer area:
Area 1 : Cluster of 3 monument near Jama MosqueArea 2 : Cluster of 3 monument near Amrutvarshini Step WellArea 3 : Cluster of 3 monument near Delhi DarwajaArea 4 : Sarkhej Roja
Study Area
Step-wells
Old City
Jami Masjid
Raja no Haziro
Rani no Haziro
Panch kuwa Gate
Amrithvarshini Vow
Sarangpur Gate
Queen’s Malik Sarang Mosque
Delhi Darwaja
Qutbudin Shah’s Mosque
Muhafiz Khan’s Mosque
Rani rupmati's Mosque
Sarkhej Roja
SOLID WASTE MANAGEMENT
PUBLICTOILET
TANKAS
WATER RESOURCE
HERITAGE MONUMENTS AND ITS PRECINTS
AREA 1
AREA 2
AREA 3
AREA 4
RAIN WATER HARVESTING
LAKES
STEP WELLS
TANKAS
RAIN WATER HARVESTING
337 / 70
HeritageSolid Waste Management
338 / 70HERITAGE
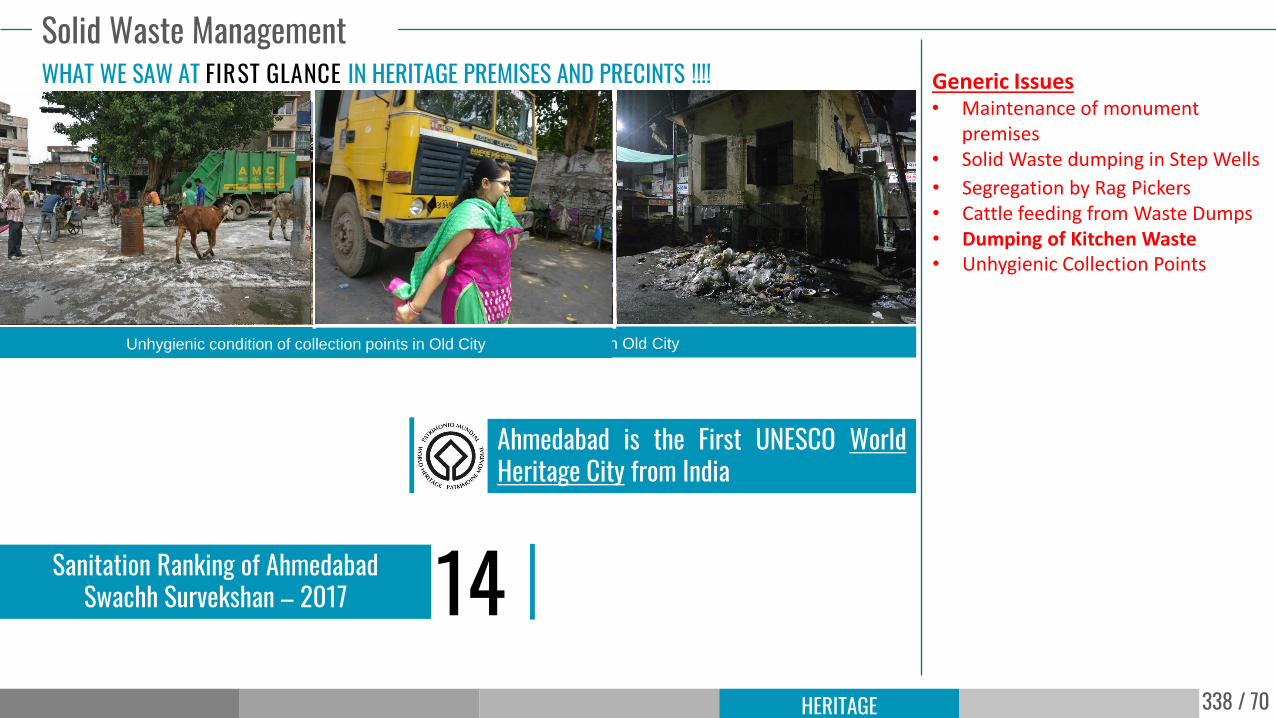
Solid Waste ManagementGeneric IssuesWHAT WE SAW AT FIRST GLANCE IN HERITAGE PREMISES AND PRECINTS !!!!
Lack of up keeping of Rani ni Masjid Visual nuisance due to Solid Waste Solid Waste inside Step Wells
Ahmedabad is the First UNESCO WorldHeritage City from India
Rag Picking, open waste dumping near monuments in Old City
• Maintenance of monument premises
• Solid Waste dumping in Step Wells
• Segregation by Rag Pickers• Cattle feeding from Waste Dumps• Dumping of Kitchen Waste
Unhygienic condition of collection points in Old City
• Unhygienic Collection Points
Sanitation Ranking of Ahmedabad Swachh Survekshan – 2017 14
339 / 70HERITAGE
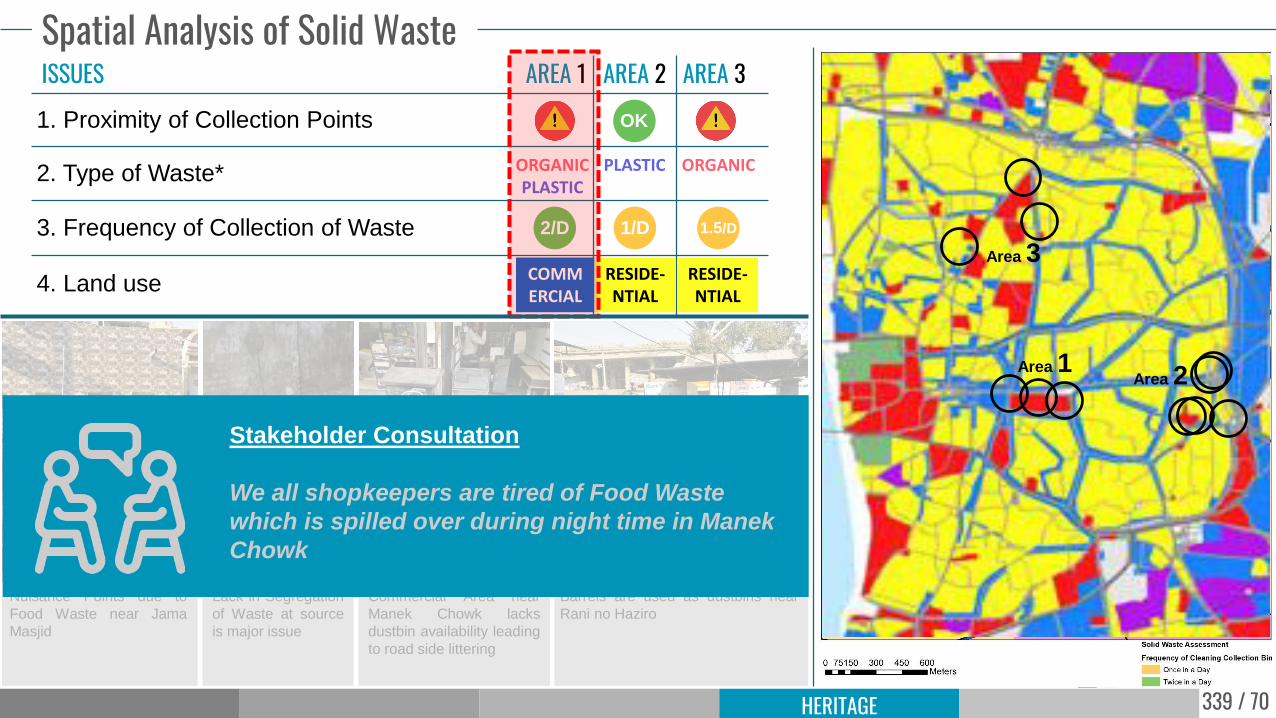
Spatial Analysis of Solid Waste
1. Proximity of Collection Points OK
Collection Point in Immediate surrounding
ISSUES AREA 1 AREA 2 AREA 3
ORGANICPLASTIC
2. Type of Waste* PLASTIC ORGANIC
3. Frequency of Collection of Waste 2/D 1/D 1.5/D
4. Land useCOMMERCIAL
RESIDE-NTIAL
RESIDE-NTIAL
Nuisance Points due to
Food Waste near Jama
Masjid
Lack in Segregation
of Waste at source
is major issue
Commercial Area near
Manek Chowk lacks
dustbin availability leading
to road side littering
Barrels are used as dustbins near
Rani no Haziro
Area 1Area 2
Area 3
Stakeholder Consultation
We all shopkeepers are tired of Food Waste
which is spilled over during night time in Manek
Chowk
341 / 70HERITAGE
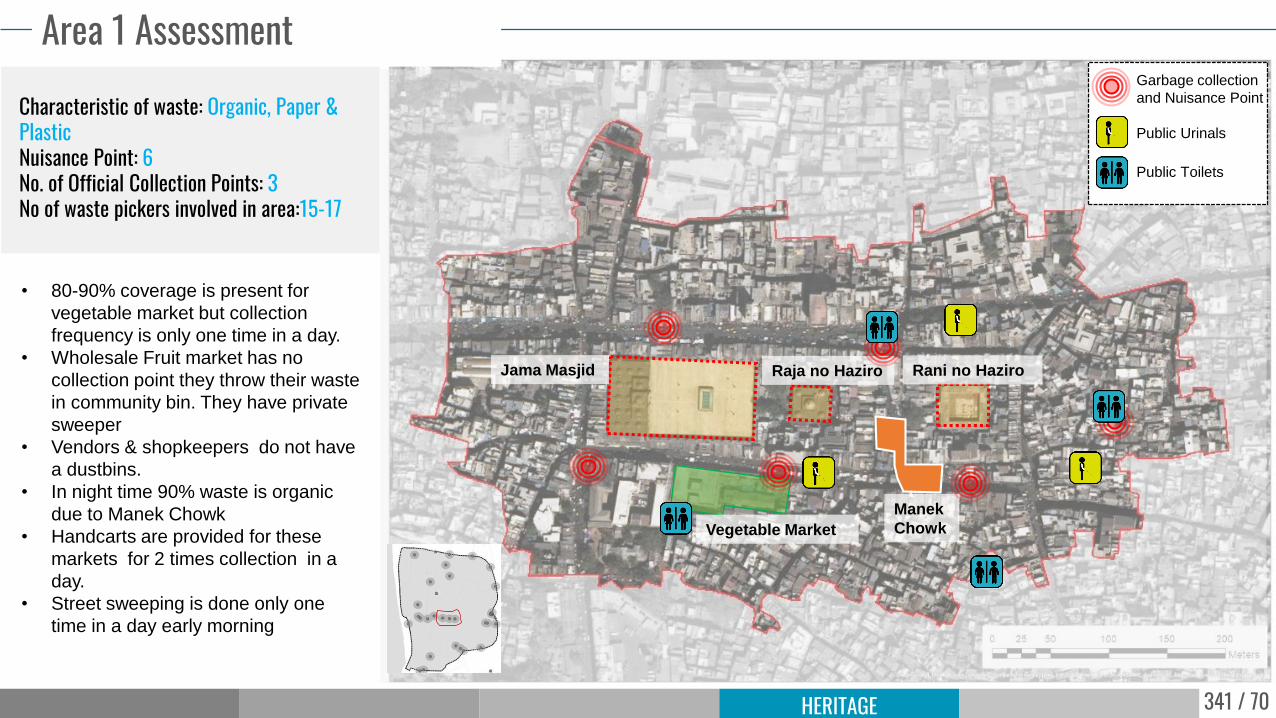
Area 1 Assessment
Jama Masjid Rani no HaziroRaja no Haziro
Vegetable Market
Manek
Chowk
Public Urinals
Garbage collection
and Nuisance Point
Public Toilets
Characteristic of waste: Organic, Paper & PlasticNuisance Point: 6No. of Official Collection Points: 3No of waste pickers involved in area:15-17
• 80-90% coverage is present for
vegetable market but collection
frequency is only one time in a day.
• Wholesale Fruit market has no
collection point they throw their waste
in community bin. They have private
sweeper
• Vendors & shopkeepers do not have
a dustbins.
• In night time 90% waste is organic
due to Manek Chowk
• Handcarts are provided for these
markets for 2 times collection in a
day.
• Street sweeping is done only one
time in a day early morning
342 / 70HERITAGE
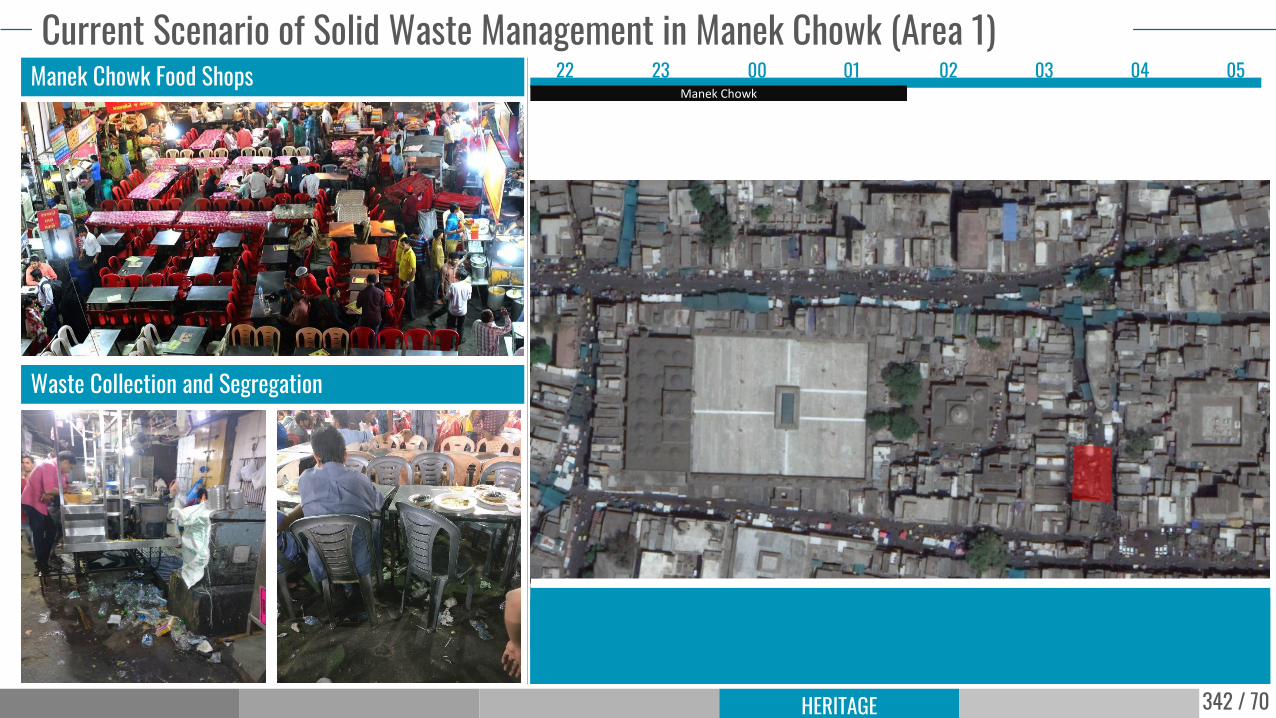
Current Scenario of Solid Waste Management in Manek Chowk (Area 1)22 23 00 01 02 03 04 05
Manek ChowkManek Chowk Food Shops
Waste Collection and Segregation
343 / 70HERITAGE
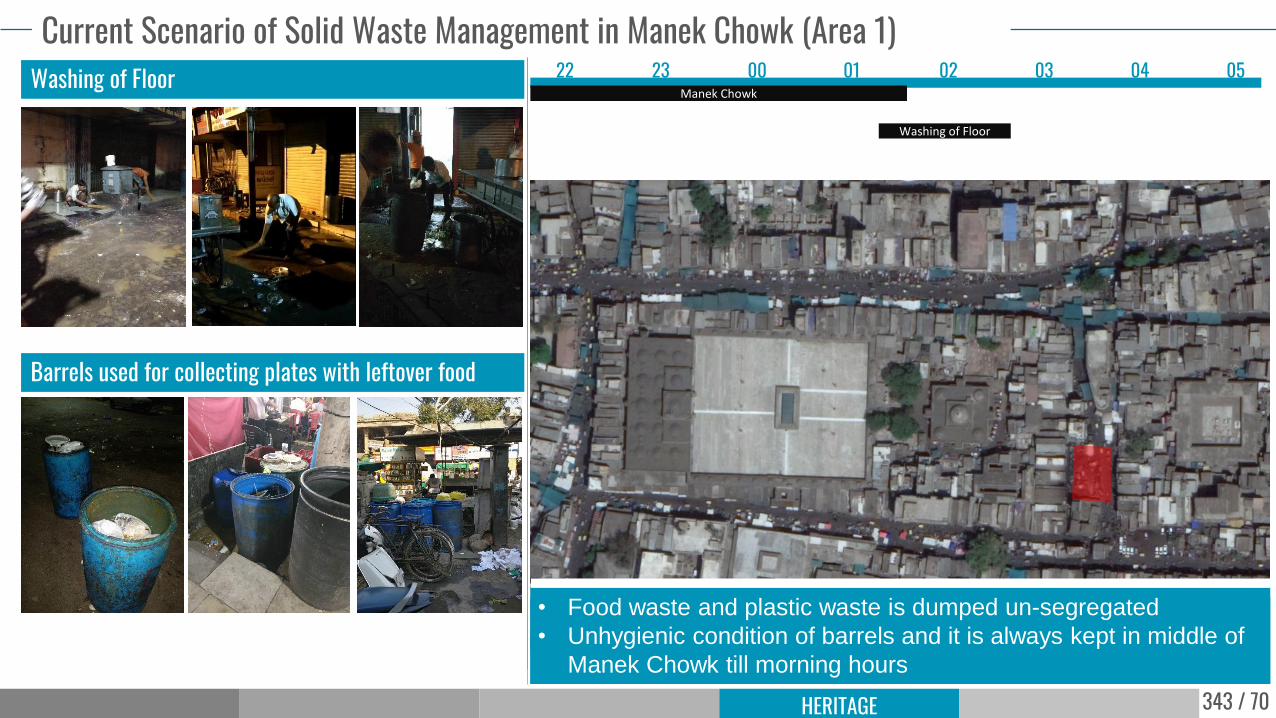
Current Scenario of Solid Waste Management in Manek Chowk (Area 1)22 23 00 01 02 03 04 05
Manek ChowkWashing of Floor
Barrels used for collecting plates with leftover food
Washing of Floor
• Food waste and plastic waste is dumped un-segregated
• Unhygienic condition of barrels and it is always kept in middle of
Manek Chowk till morning hours
344 / 70HERITAGE
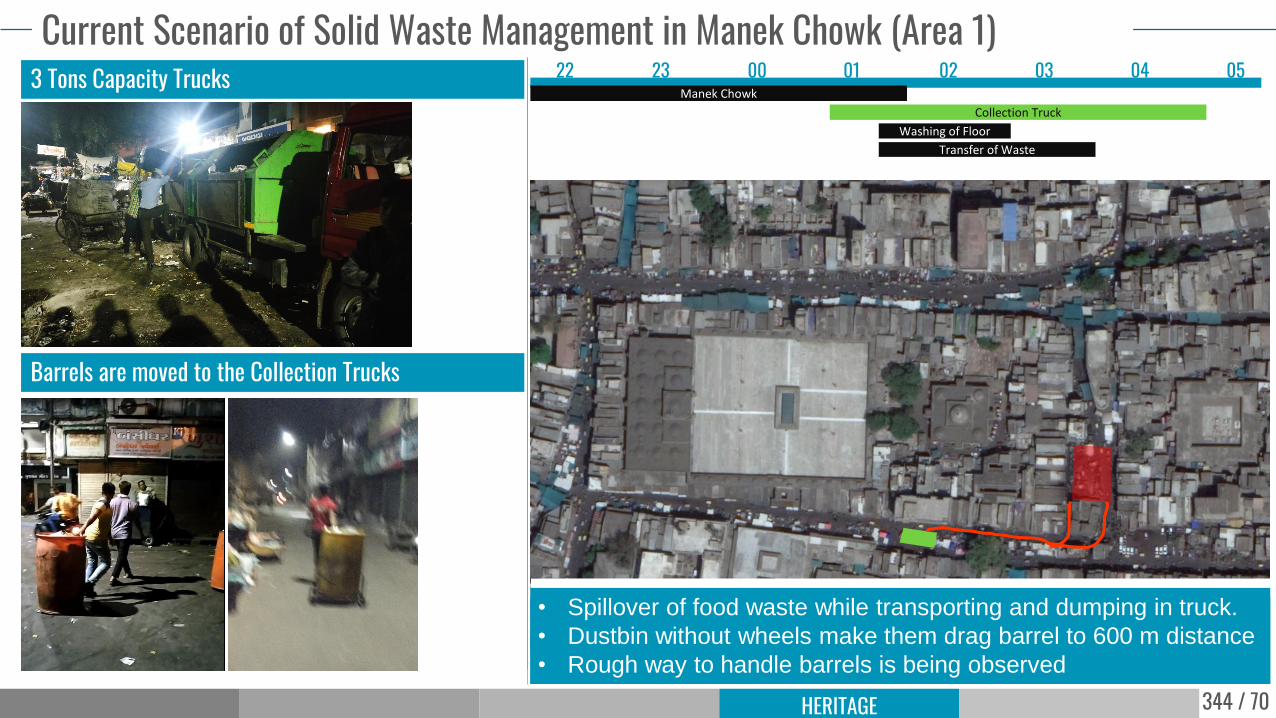
Current Scenario of Solid Waste Management in Manek Chowk (Area 1)22 23 00 01 02 03 04 05
Manek Chowk3 Tons Capacity Trucks
Barrels are moved to the Collection Trucks
Washing of Floor
Transfer of Waste
Collection Truck
• Spillover of food waste while transporting and dumping in truck.
• Dustbin without wheels make them drag barrel to 600 m distance
• Rough way to handle barrels is being observed
345 / 70HERITAGE
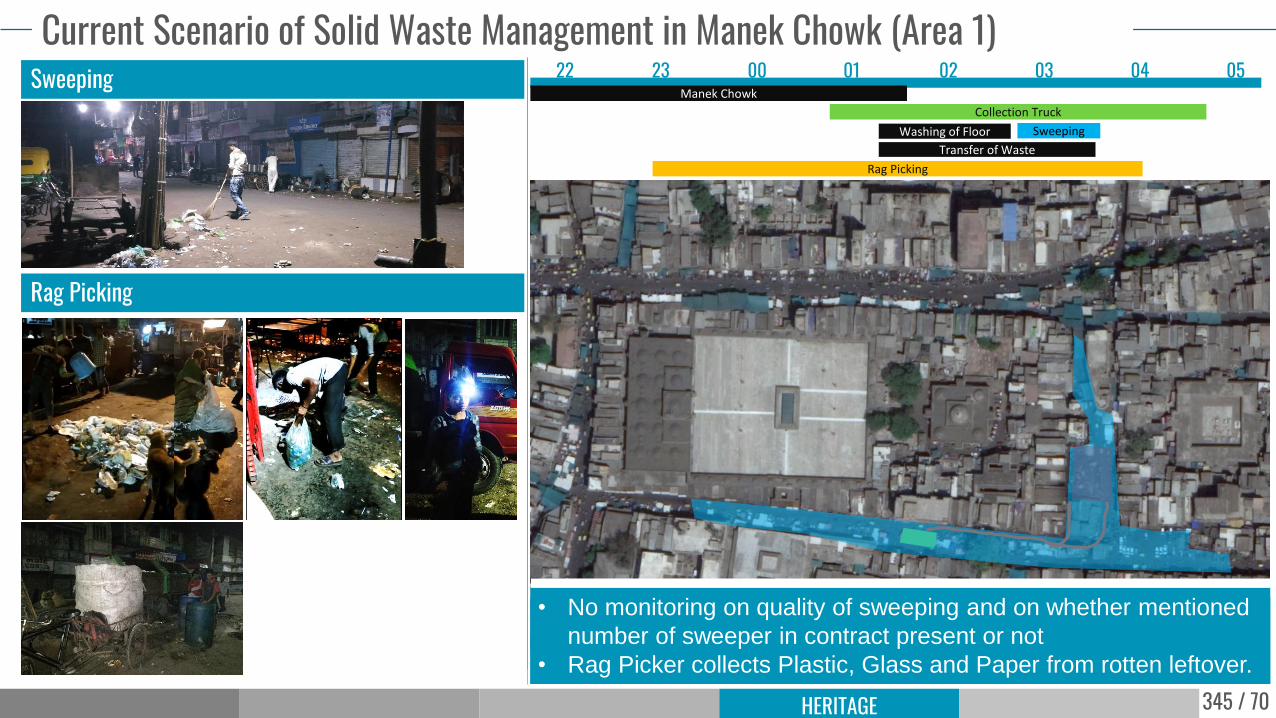
Current Scenario of Solid Waste Management in Manek Chowk (Area 1)22 23 00 01 02 03 04 05
Manek ChowkSweeping
Rag Picking
Washing of Floor
Transfer of Waste
Collection Truck
Sweeping
Rag Picking
• No monitoring on quality of sweeping and on whether mentioned
number of sweeper in contract present or not
• Rag Picker collects Plastic, Glass and Paper from rotten leftover.
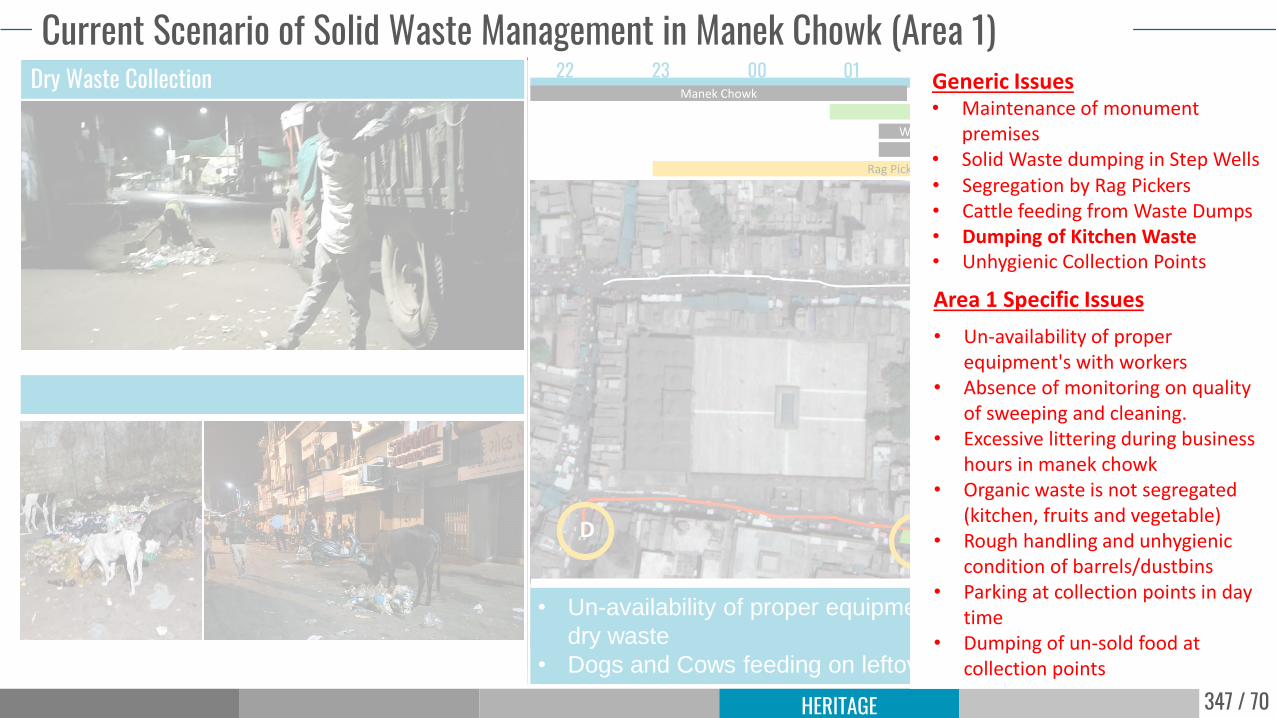
346 / 70HERITAGE
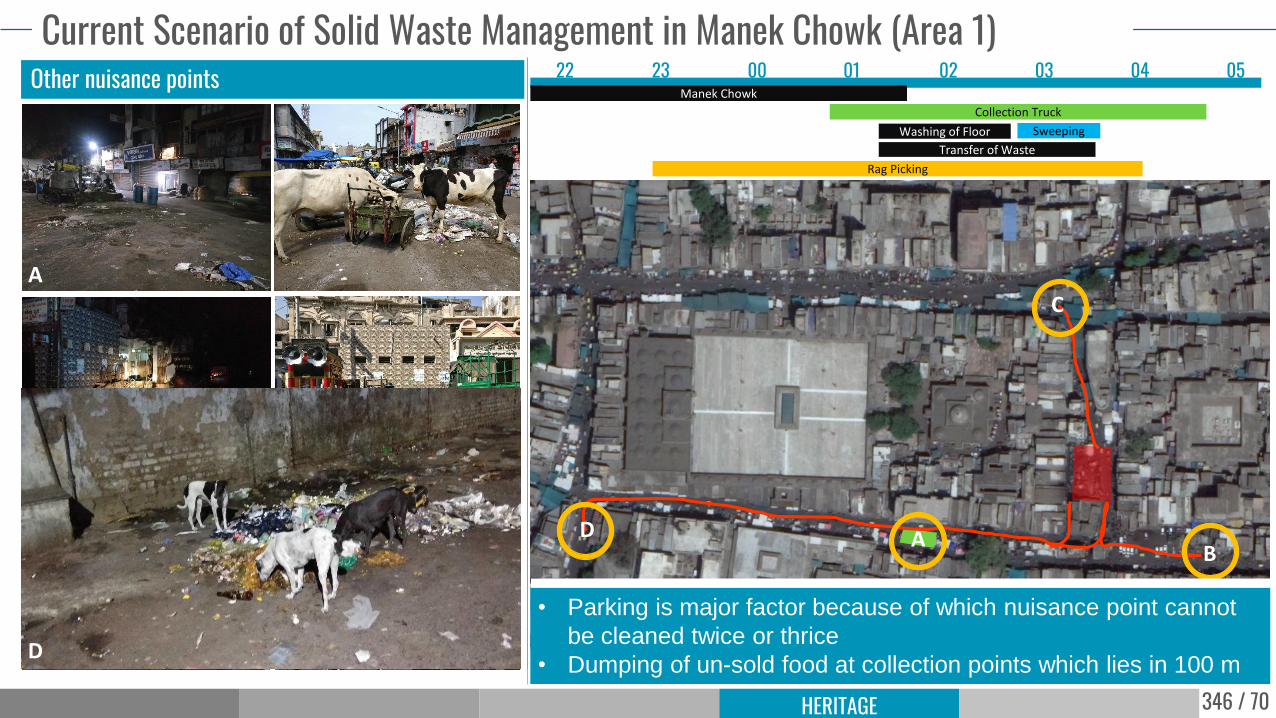
Current Scenario of Solid Waste Management in Manek Chowk (Area 1)22 23 00 01 02 03 04 05
Manek ChowkOther nuisance points
Washing of Floor
Transfer of Waste
Collection Truck
Rag Picking
AB
C
D
A
B
CD
Sweeping
• Parking is major factor because of which nuisance point cannot
be cleaned twice or thrice
• Dumping of un-sold food at collection points which lies in 100 m
347 / 70HERITAGE
Current Scenario of Solid Waste Management in Manek Chowk (Area 1)22 23 00 01 02 03 04 05
Manek ChowkDry Waste Collection
Washing of Floor
Transfer of Waste
Collection Truck
Rag Picking
Tractor Trolley
AB
C
D
Sweeping
• Un-availability of proper equipment's with workers who collects
dry waste
• Dogs and Cows feeding on leftover pile of waste
Area 1 Specific Issues
Generic Issues• Maintenance of monument
premises• Solid Waste dumping in Step Wells• Segregation by Rag Pickers• Cattle feeding from Waste Dumps• Dumping of Kitchen Waste• Unhygienic Collection Points
• Un-availability of proper equipment's with workers
• Absence of monitoring on quality of sweeping and cleaning.
• Excessive littering during business hours in manek chowk
• Organic waste is not segregated (kitchen, fruits and vegetable)
• Rough handling and unhygienic condition of barrels/dustbins
• Parking at collection points in day time
• Dumping of un-sold food at collection points
348 / 70HERITAGE
Aim: To bring awareness among everyone can
that if we want to keep our surroundings clean,
we need to step up rather than blaming everyoneand waiting for govt. to clean it
Bhopal I-Clean Team, Spot fixing Program
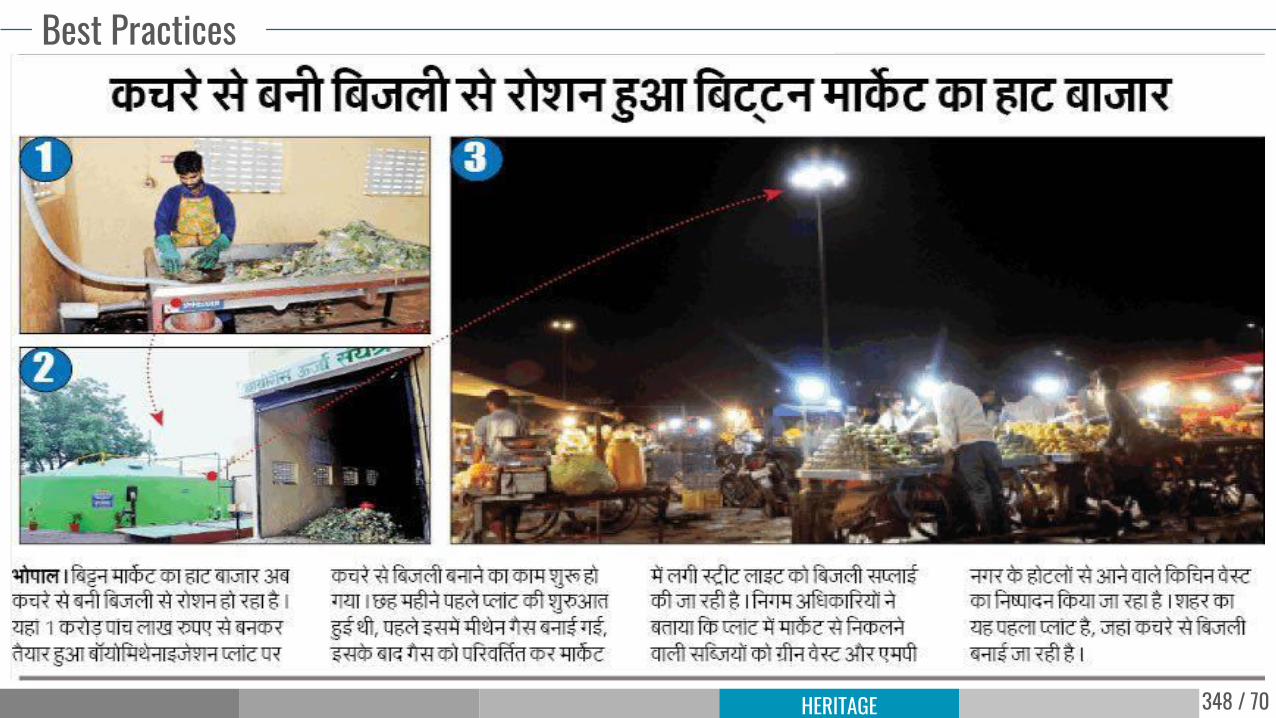
Best Practices
Aim: Improving systems for solid waste
collection in the Heritage Trail. The overall
project goal was to develop a livelihood and
slum upgrading
pilot program around a heritage trail of lesser-known monuments in Agra.
Outcomes:
• Mainstreaming
• Rise in Incomes
• Improved Access to Basic Services
• Strengthened and Supportive Civil Society
Building Sustainable Livelihoods with Heritage Walk, Agra, India
Swachh Iconic Places, India
Aim: To achieve a distinctly higher level of sanitation / cleanliness at 10 special places.
Agenda: (Project of Gangotri, Uttrakhand)
• Deploy Garbage Collecting Vehicles
• Install Hi-tech and Disabled-friendly Toilets
• Impose Heavy Fines on Littering
• Set up Better Drainage system
• Install Sewage treatment plants to treat
wastewater
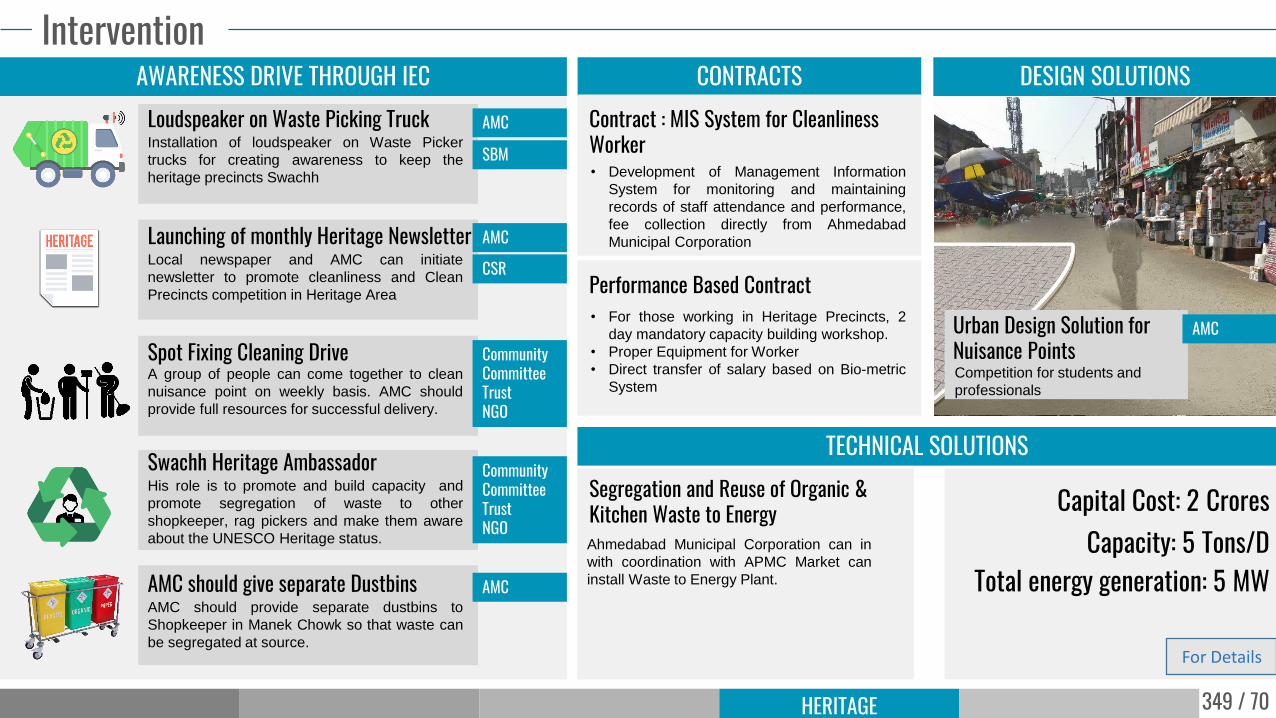
349 / 70HERITAGE
InterventionDESIGN SOLUTIONSAWARENESS DRIVE THROUGH IEC
AMC
AMC
CSR
CommunityCommitteeTrustNGO
CommunityCommitteeTrustNGO
AMC
Loudspeaker on Waste Picking Truck
Launching of monthly Heritage Newsletter
Spot Fixing Cleaning Drive
Swachh Heritage Ambassador
Installation of loudspeaker on Waste Picker
trucks for creating awareness to keep the
heritage precincts Swachh
Local newspaper and AMC can initiate
newsletter to promote cleanliness and Clean
Precincts competition in Heritage Area
A group of people can come together to clean
nuisance point on weekly basis. AMC should
provide full resources for successful delivery.
His role is to promote and build capacity and
promote segregation of waste to other
shopkeeper, rag pickers and make them aware
about the UNESCO Heritage status.
AMC should give separate Dustbins AMC should provide separate dustbins to
Shopkeeper in Manek Chowk so that waste can
be segregated at source.
SBM
CONTRACTS
• Development of Management Information
System for monitoring and maintaining
records of staff attendance and performance,
fee collection directly from Ahmedabad
Municipal Corporation
Contract : MIS System for Cleanliness Worker
• For those working in Heritage Precincts, 2
day mandatory capacity building workshop.
• Proper Equipment for Worker
• Direct transfer of salary based on Bio-metric
System
Performance Based Contract
AMCUrban Design Solution for Nuisance PointsCompetition for students and
professionals
TECHNICAL SOLUTIONS
Ahmedabad Municipal Corporation can in
with coordination with APMC Market can
install Waste to Energy Plant.
Segregation and Reuse of Organic & Kitchen Waste to Energy Capital Cost: 2 Crores
Capacity: 5 Tons/DTotal energy generation: 5 MW
For Details
354 / 70
HeritagePublic Toilets
355 / 70HERITAGE
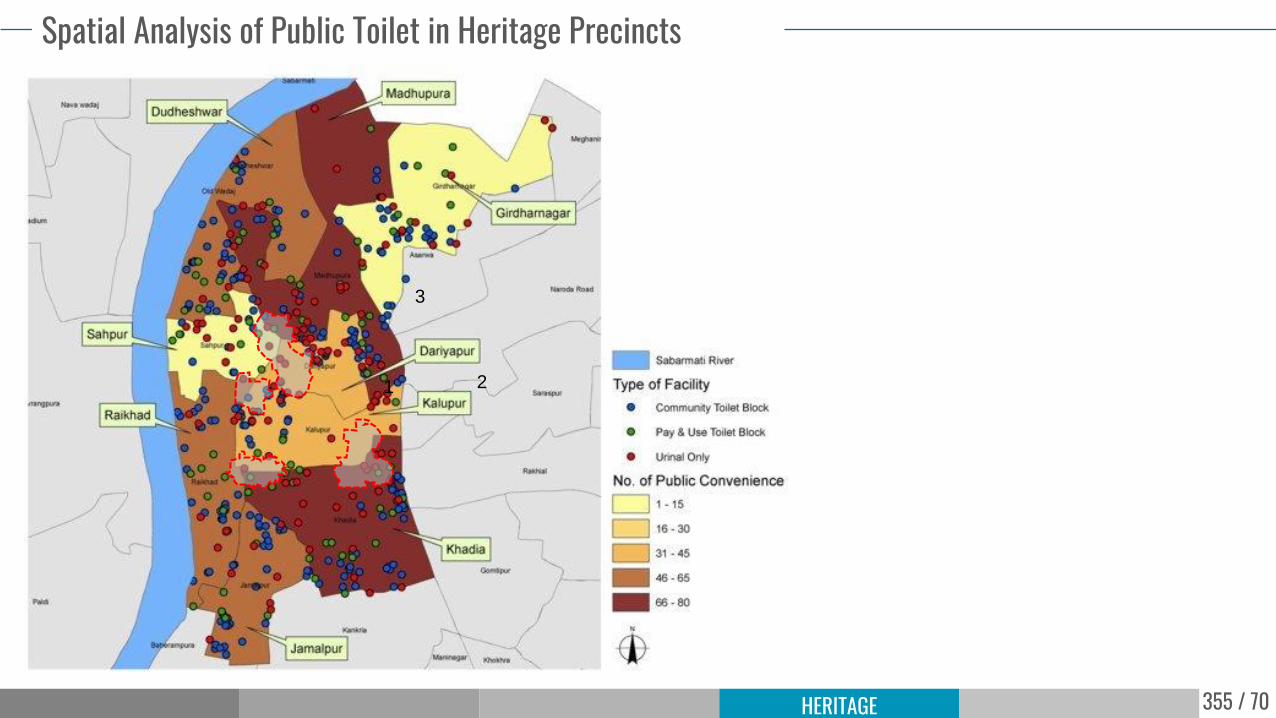
Spatial Analysis of Public Toilet in Heritage Precincts
1 2
3
356 / 70HERITAGE
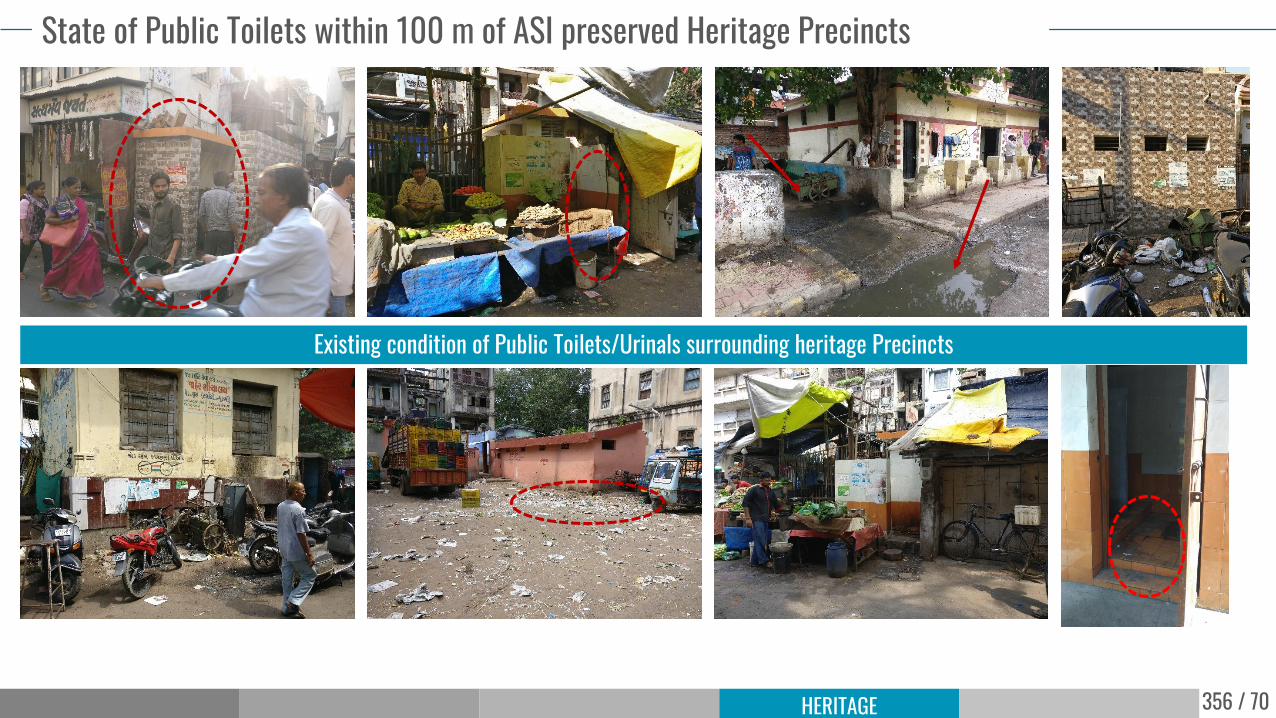
State of Public Toilets within 100 m of ASI preserved Heritage Precincts
Existing condition of Public Toilets/Urinals surrounding heritage Precincts
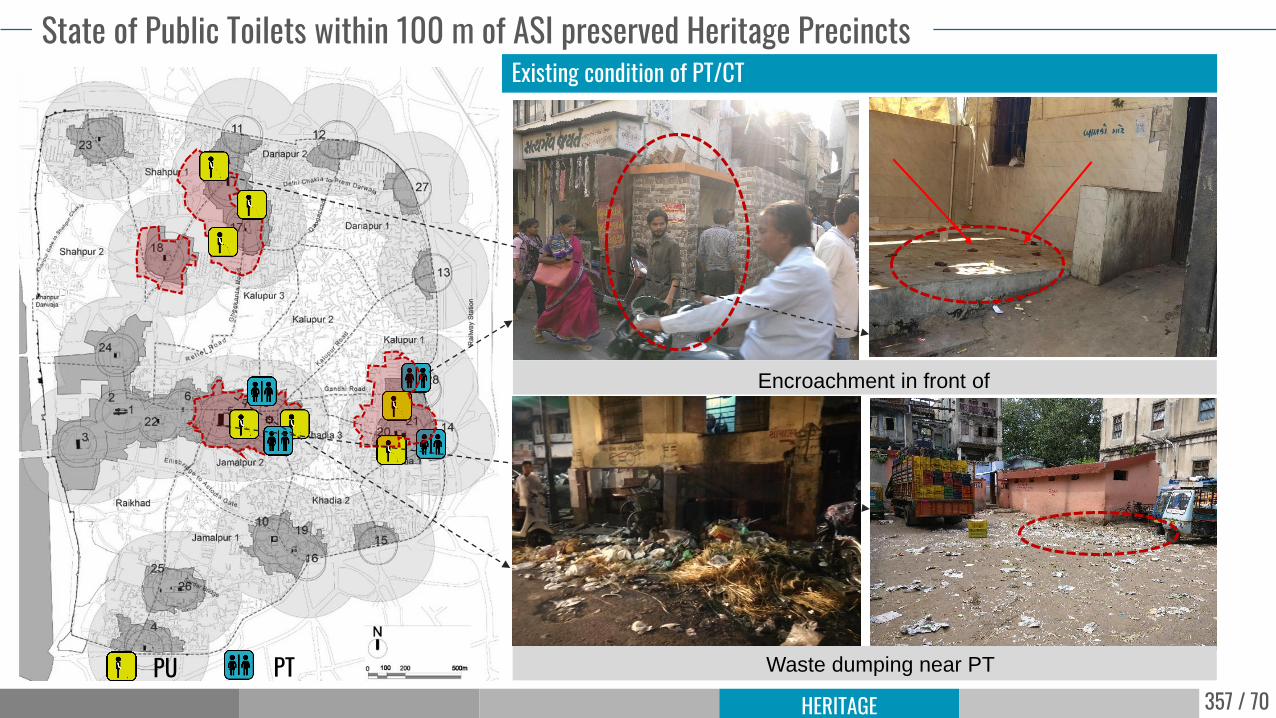
357 / 70HERITAGE
State of Public Toilets within 100 m of ASI preserved Heritage PrecinctsExisting condition of PT/CT
Encroachment in front of
PT
Waste dumping near PTPU PT
358 / 70HERITAGE
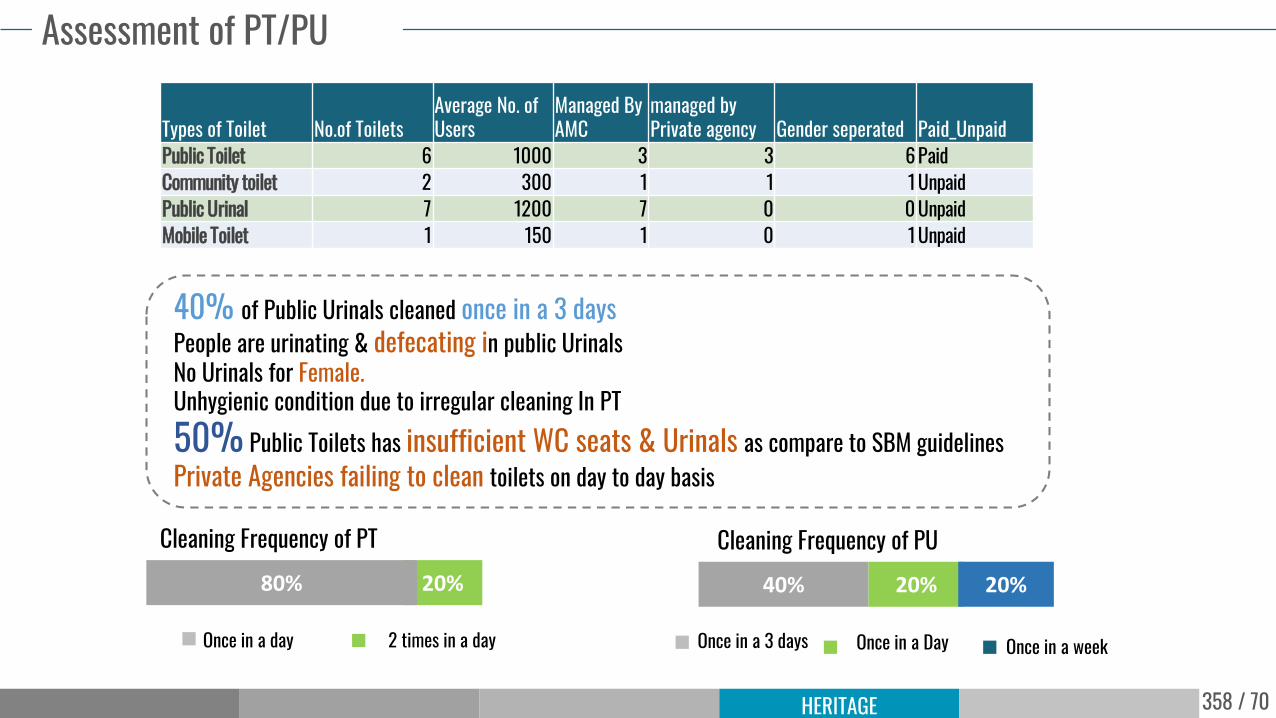
Assessment of PT/PU
Types of Toilet No.of Toilets Average No. of Users
Managed By AMC
managed by Private agency Gender seperated Paid_Unpaid
40% of Public Urinals cleaned once in a 3 daysPeople are urinating & defecating in public UrinalsNo Urinals for Female.Unhygienic condition due to irregular cleaning In PT50% Public Toilets has insufficient WC seats & Urinals as compare to SBM guidelinesPrivate Agencies failing to clean toilets on day to day basis
2 times in a dayOnce in a day
20%80%
Once in a Day Once in a 3 days Once in a week
40% 20% 20%
Cleaning Frequency of PT Cleaning Frequency of PU
359 / 70HERITAGE
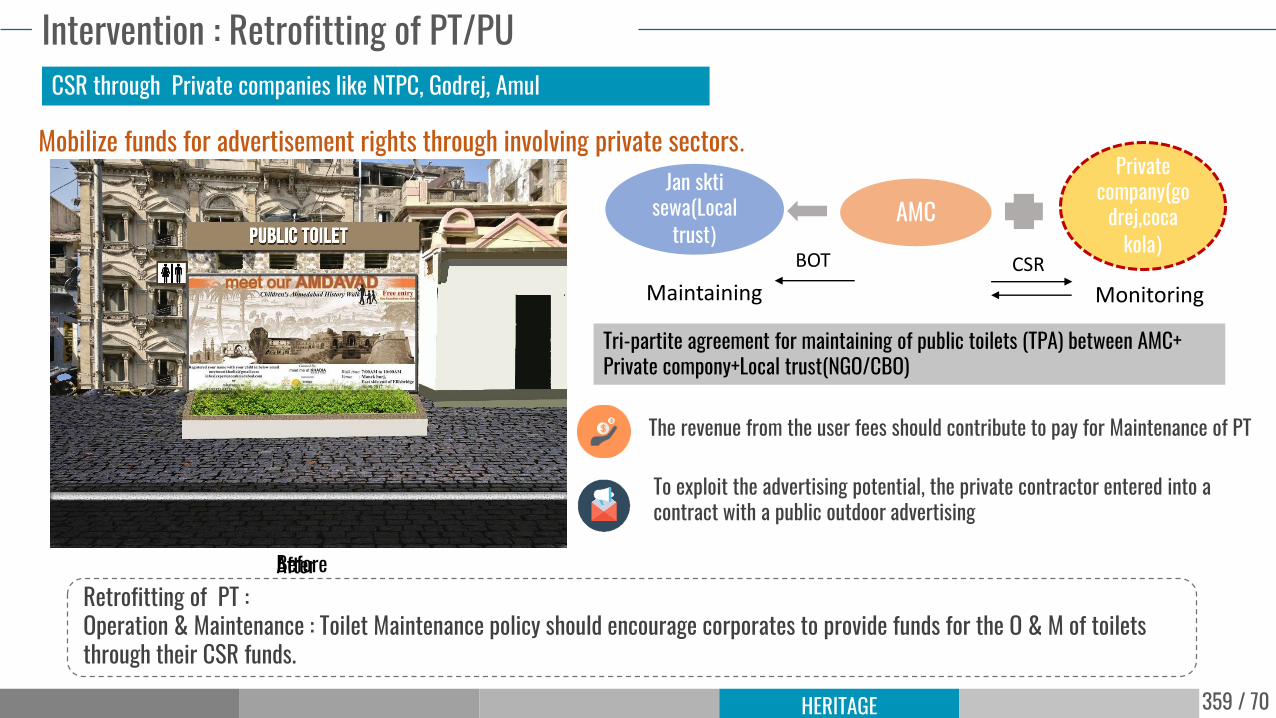
Intervention : Retrofitting of PT/PU CSR through Private companies like NTPC, Godrej, Amul
Private company(go
drej,coca kola)
AMCJan skti
sewa(Local trust)
CSRBOT
MonitoringMaintaining
Mobilize funds for advertisement rights through involving private sectors.
BeforeAfter
Tri-partite agreement for maintaining of public toilets (TPA) between AMC+ Private compony+Local trust(NGO/CBO)
The revenue from the user fees should contribute to pay for Maintenance of PT
To exploit the advertising potential, the private contractor entered into a contract with a public outdoor advertising
Retrofitting of PT :Operation & Maintenance : Toilet Maintenance policy should encourage corporates to provide funds for the O & M of toilets through their CSR funds.
360 / 70
HeritageWater as Heritage | Sarkhej Lake
361 / 70HERITAGE
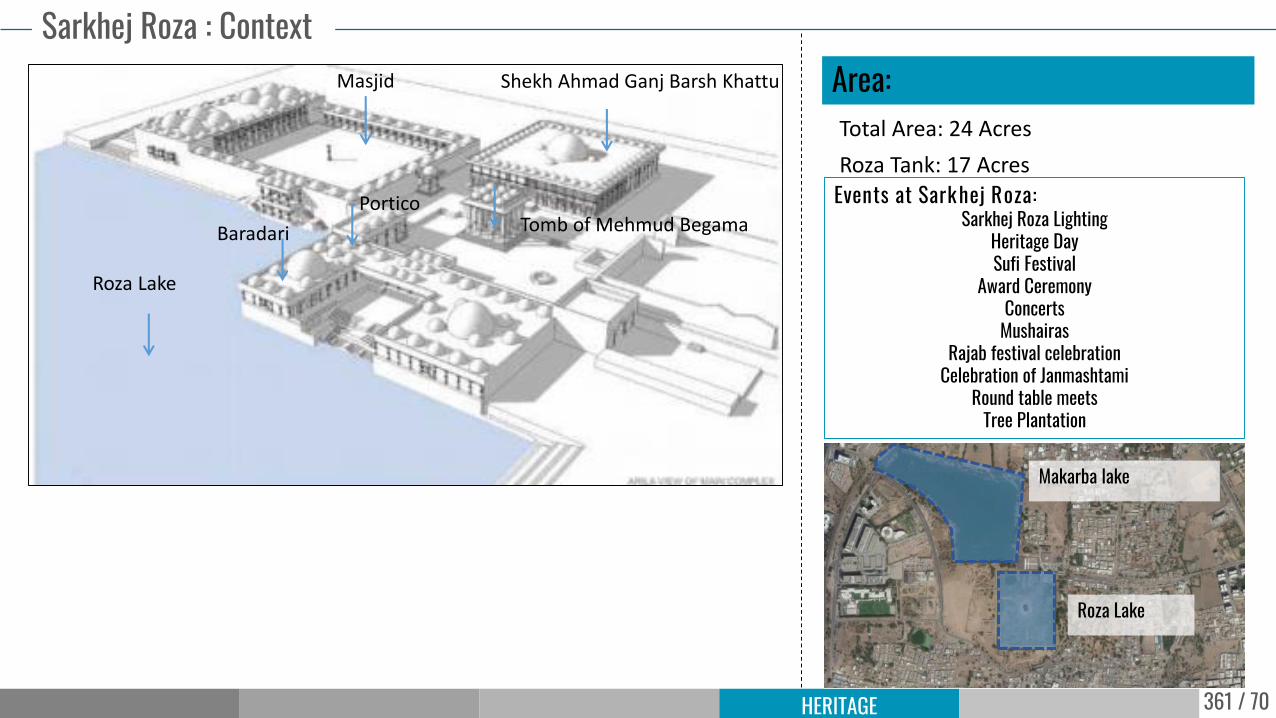
Sarkhej Roza : Context
Events at Sarkhej Roza:Sarkhej Roza Lighting
Heritage DaySufi Festival
Award CeremonyConcerts
MushairasRajab festival celebration
Celebration of JanmashtamiRound table meets
Tree Plantation
Area:Total Area: 24 Acres
Roza Tank: 17 Acres
Makarba lake
Roza Lake
Masjid Shekh Ahmad Ganj Barsh Khattu
Tomb of Mehmud BegamaBaradari
Portico
Roza Lake
362 / 70HERITAGE
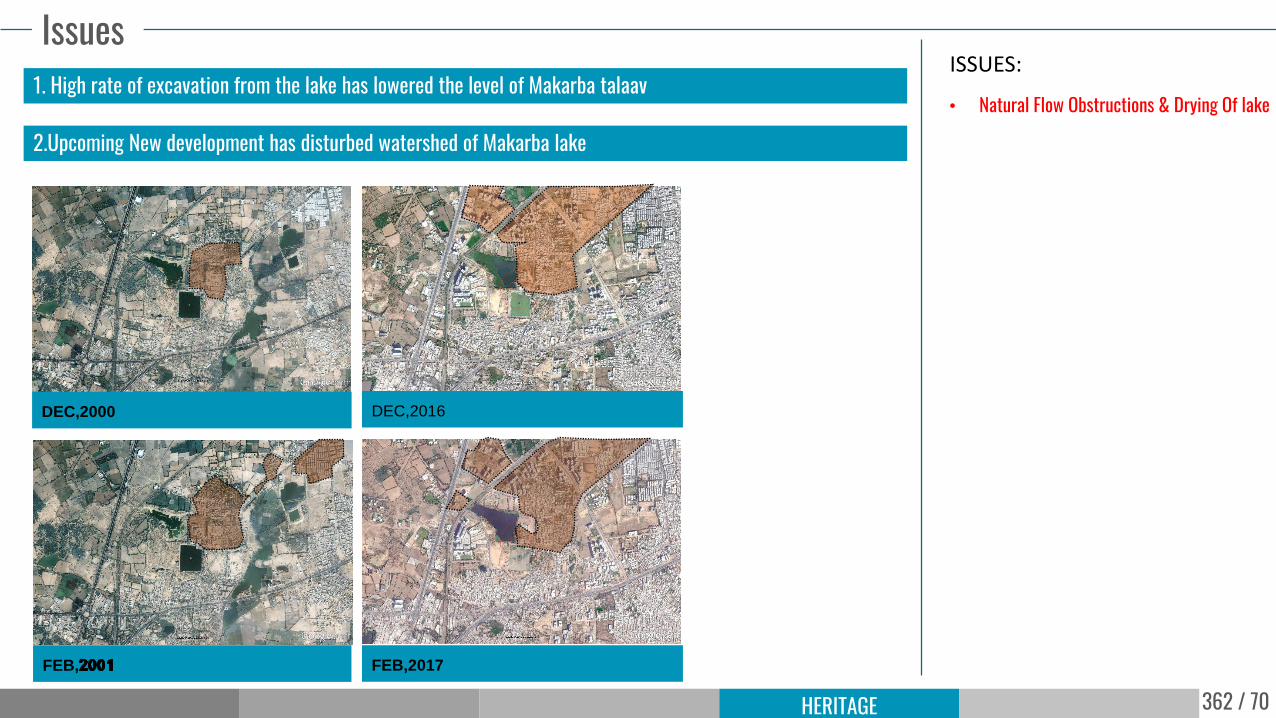
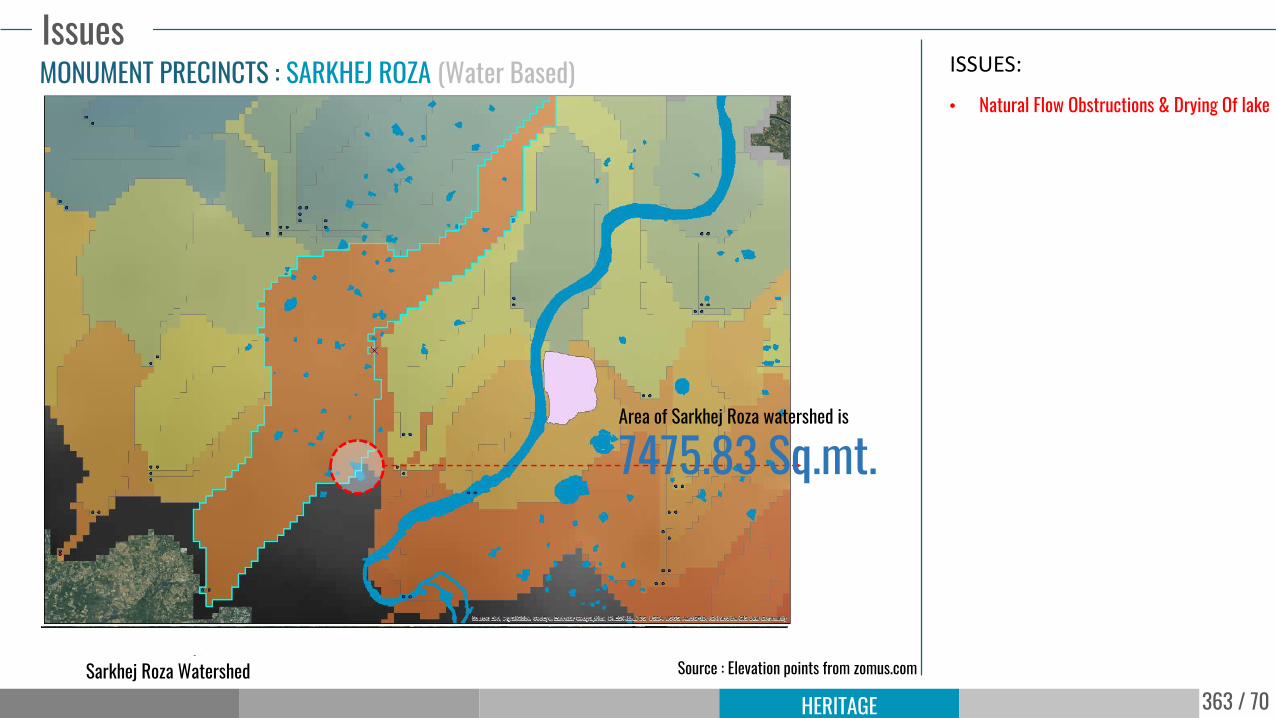
IssuesISSUES:
• Natural Flow Obstructions & Drying Of lake
DEC,2016DEC,2000
FEB,2017FEB,
1. High rate of excavation from the lake has lowered the level of Makarba talaav
2.Upcoming New development has disturbed watershed of Makarba lake
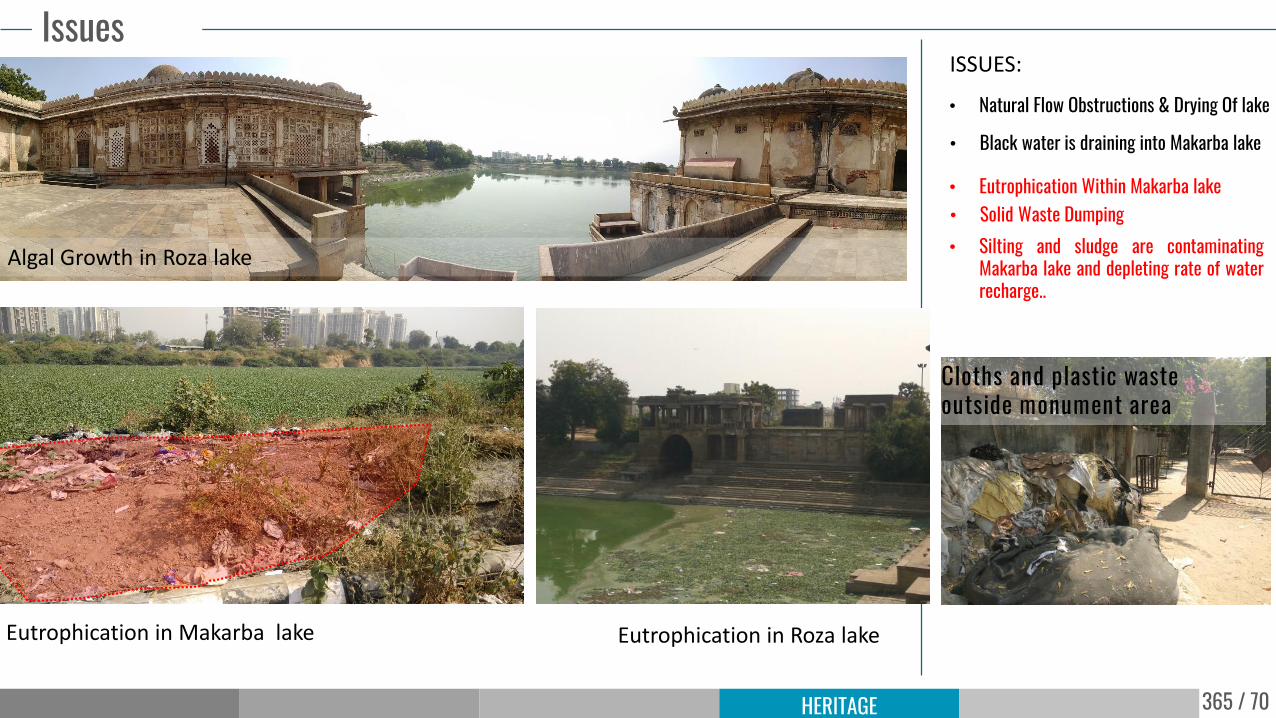
• Solid Waste Dumping• Silting and sludge are contaminating
Makarba lake and depleting rate of waterrecharge..
MONUMENT PRECINCTS : Makarba Lake
Cloths and plastic waste outside monument area
Algal Growth in Roza lake
Eutrophication in Roza lakeEutrophication in Makarba lake
366 / 70HERITAGE
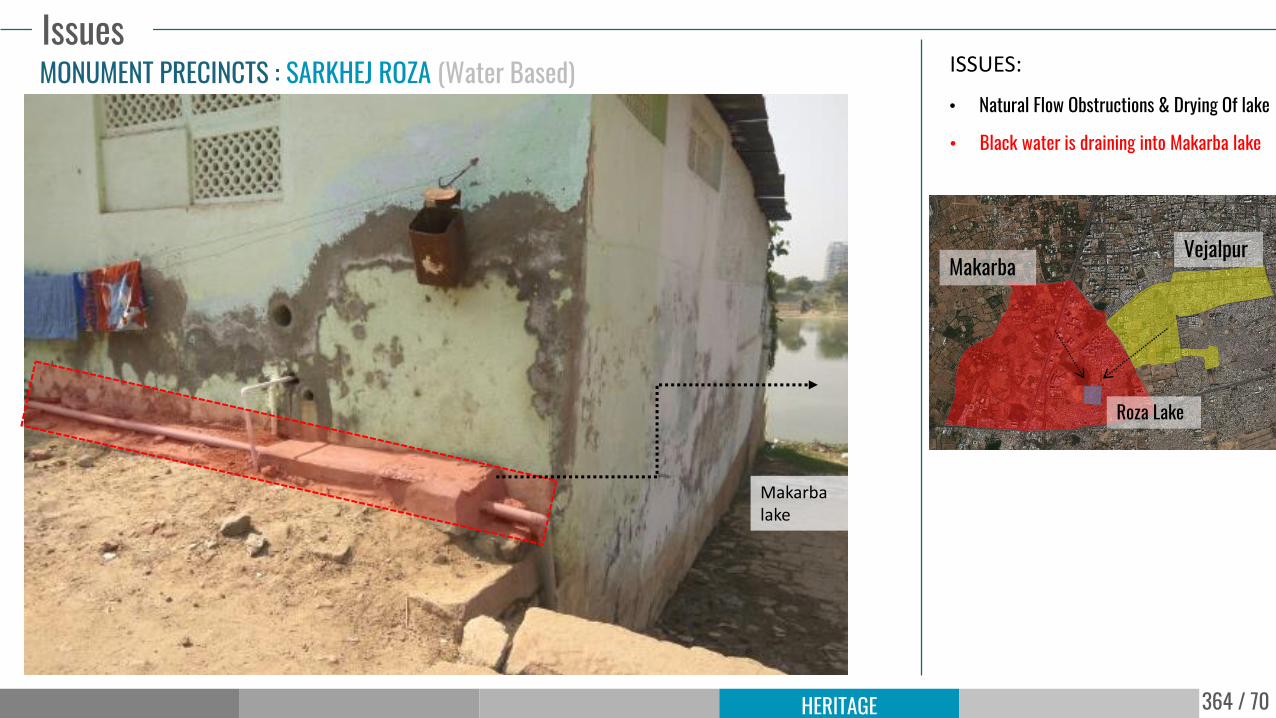
• Black water is draining into Makarba lake
ISSUES:
• Eutrophication Within Makarba lake
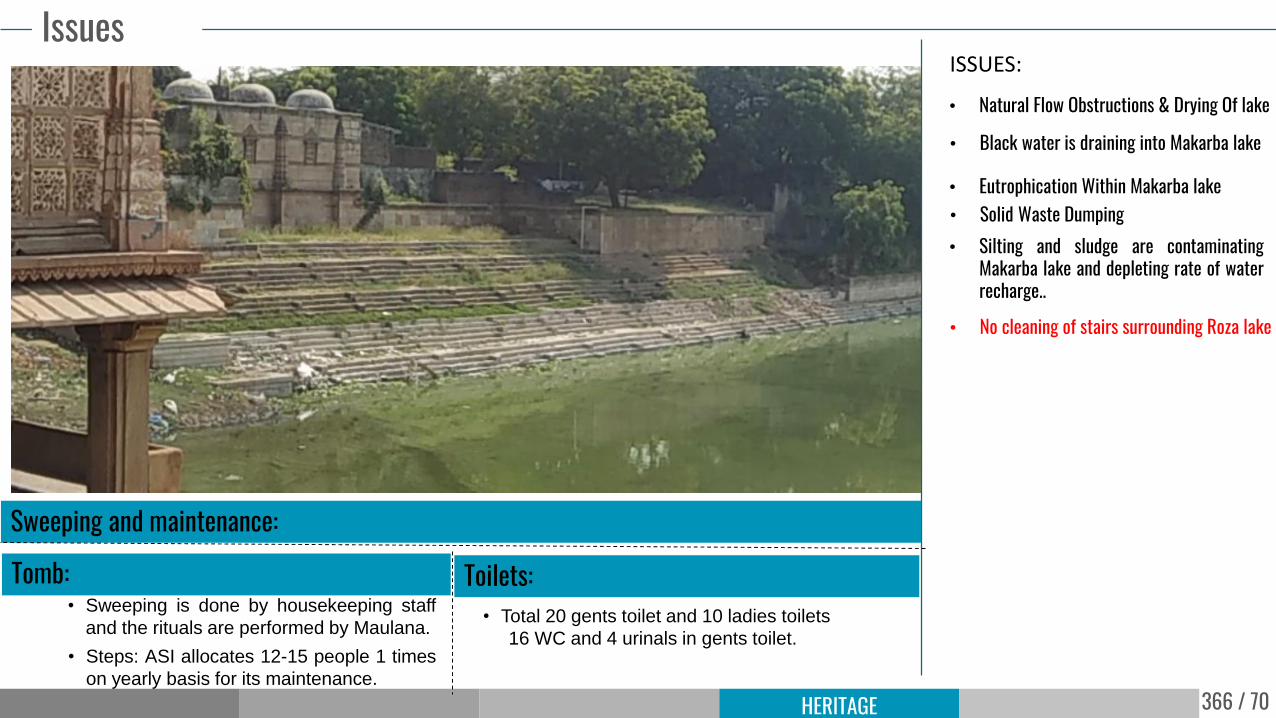
• No cleaning of stairs surrounding Roza lake
• Silting and sludge are contaminatingMakarba lake and depleting rate of waterrecharge..
• Natural Flow Obstructions & Drying Of lake
Issues
• Solid Waste Dumping
• Sweeping is done by housekeeping staff
and the rituals are performed by Maulana.
Sweeping and maintenance:
• Steps: ASI allocates 12-15 people 1 times
on yearly basis for its maintenance.
Tomb:• Total 20 gents toilet and 10 ladies toilets
16 WC and 4 urinals in gents toilet.
Toilets:
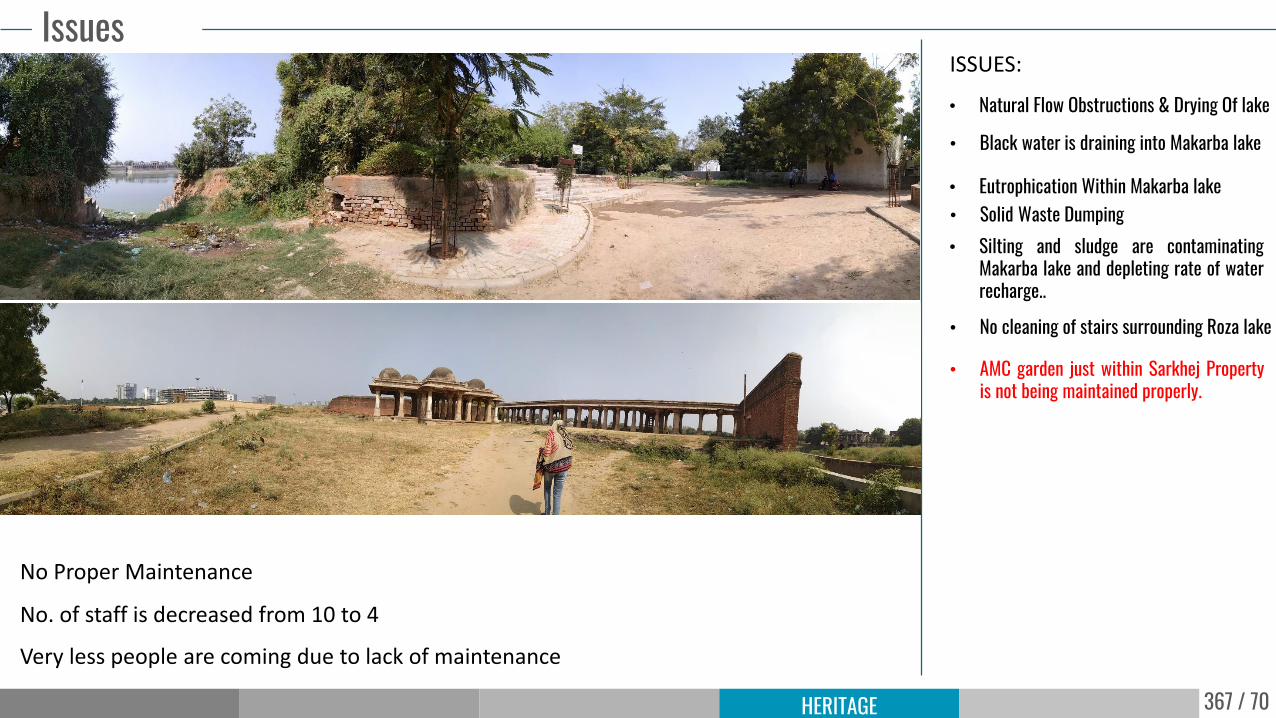
367 / 70HERITAGE
• Black water is draining into Makarba lake
ISSUES:
• Eutrophication Within Makarba lake
• No cleaning of stairs surrounding Roza lake
• AMC garden just within Sarkhej Propertyis not being maintained properly.
• Silting and sludge are contaminatingMakarba lake and depleting rate of waterrecharge..
• Natural Flow Obstructions & Drying Of lake
Issues
• Solid Waste Dumping
No. of staff is decreased from 10 to 4
Very less people are coming due to lack of maintenance
No Proper Maintenance
368 / 70HERITAGE
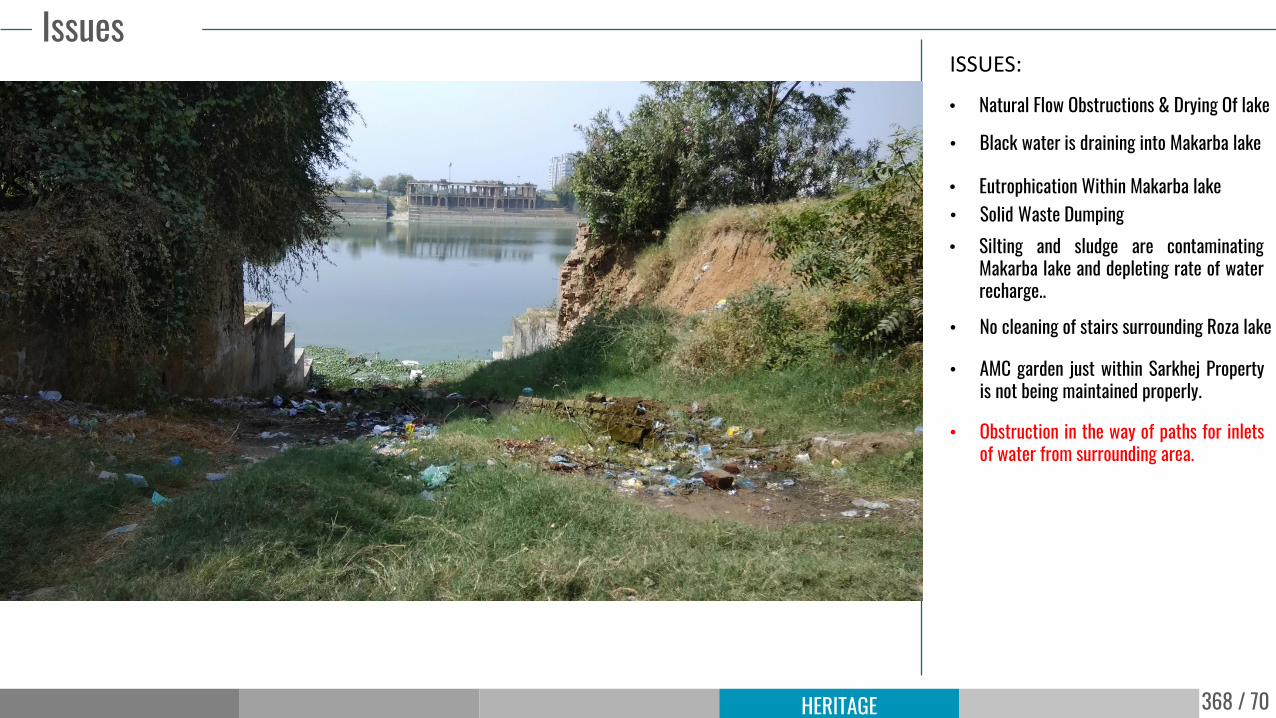
• Black water is draining into Makarba lake
ISSUES:
• Eutrophication Within Makarba lake
• No cleaning of stairs surrounding Roza lake
• AMC garden just within Sarkhej Propertyis not being maintained properly.
• Obstruction in the way of paths for inletsof water from surrounding area.
• Silting and sludge are contaminatingMakarba lake and depleting rate of waterrecharge..
• Natural Flow Obstructions & Drying Of lake
Issues
• Solid Waste Dumping
369 / 70HERITAGE
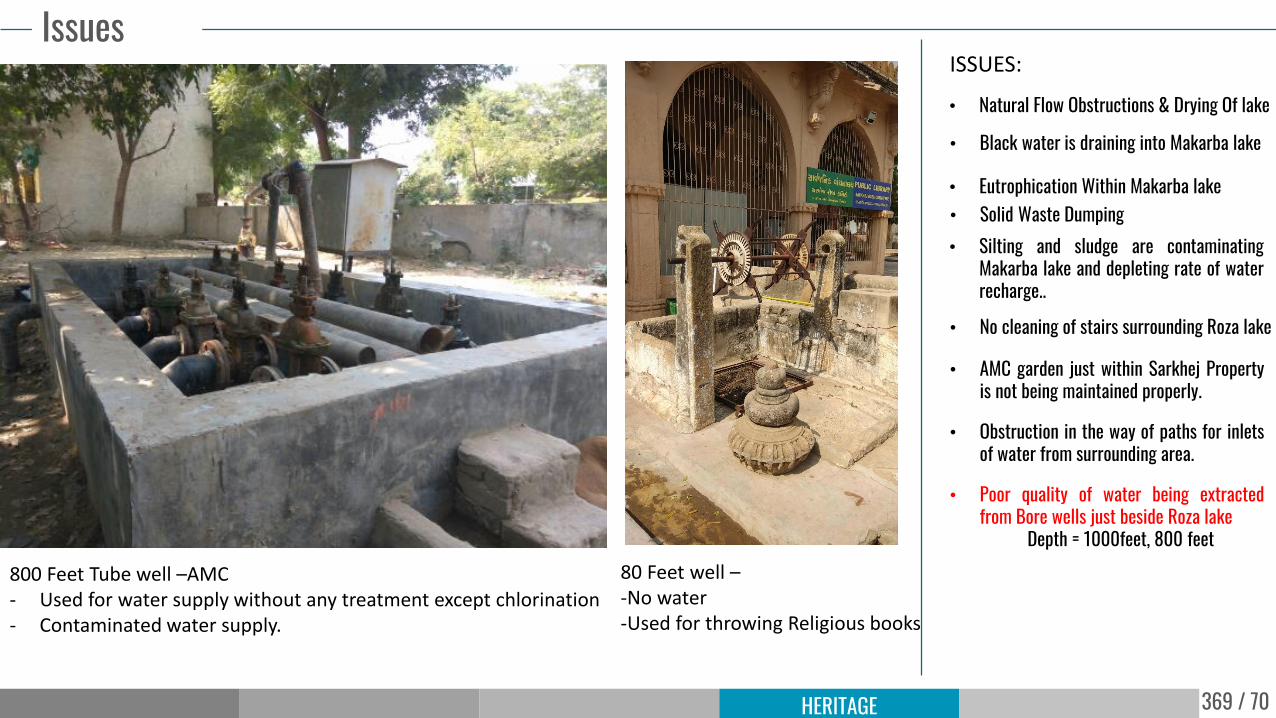
• Black water is draining into Makarba lake
ISSUES:
• Eutrophication Within Makarba lake
• No cleaning of stairs surrounding Roza lake
• AMC garden just within Sarkhej Propertyis not being maintained properly.
• Poor quality of water being extractedfrom Bore wells just beside Roza lake
Depth = 1000feet, 800 feet
• Obstruction in the way of paths for inletsof water from surrounding area.
• Silting and sludge are contaminatingMakarba lake and depleting rate of waterrecharge..
• Natural Flow Obstructions & Drying Of lake
Issues
• Solid Waste Dumping
80 Feet well –-No water -Used for throwing Religious books
800 Feet Tube well –AMC- Used for water supply without any treatment except chlorination - Contaminated water supply.
370 / 70HERITAGE
• Black water is draining into Makarba lake
ISSUES:
• Eutrophication Within Makarba lake
• No cleaning of stairs surrounding Roza lake
• AMC garden just within Sarkhej Propertyis not being maintained properly.
• Poor quality of water being extractedfrom Bore wells just beside Roza lake
Depth = 1000feet, 800 feet
• Obstruction in the way of paths for inletsof water from surrounding area.
• Silting and sludge are contaminatingMakarba lake and depleting rate of waterrecharge..
• Natural Flow Obstructions & Drying Of lake
Issues
• Solid Waste Dumping
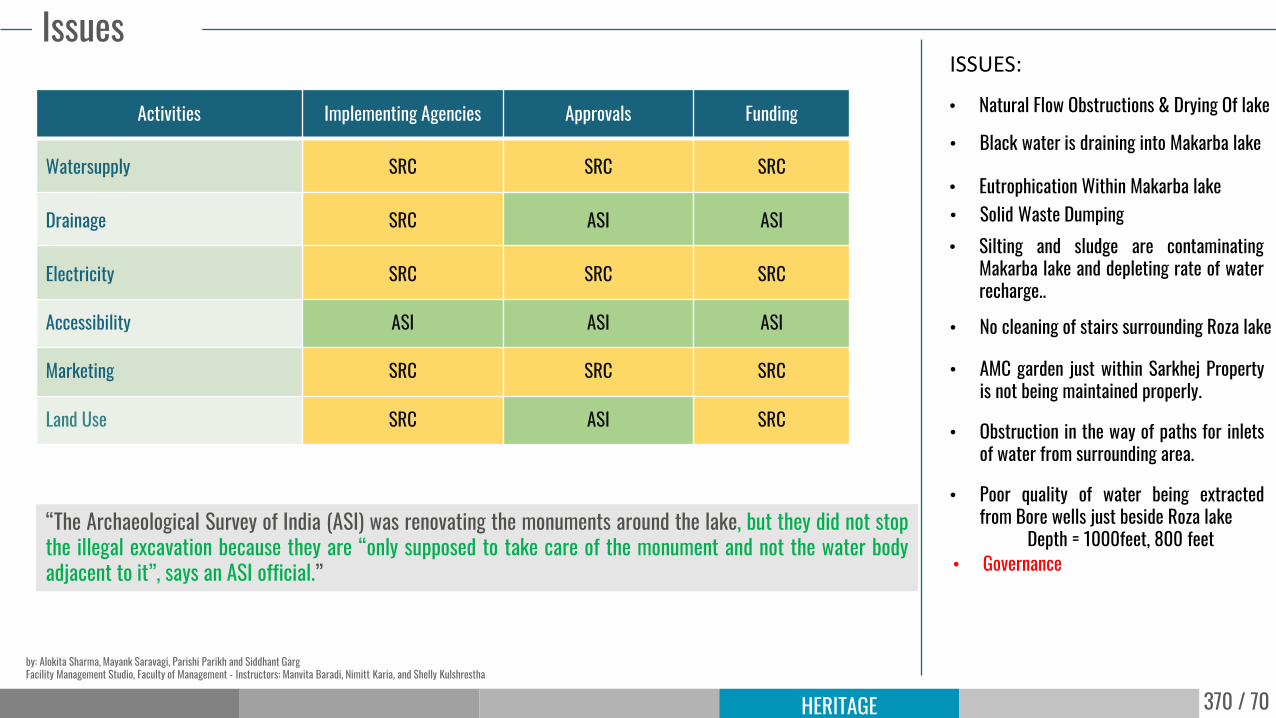
• Governance
“The Archaeological Survey of India (ASI) was renovating the monuments around the lake, but they did not stopthe illegal excavation because they are “only supposed to take care of the monument and not the water bodyadjacent to it”, says an ASI official.”
by: Alokita Sharma, Mayank Saravagi, Parishi Parikh and Siddhant GargFacility Management Studio, Faculty of Management - Instructors: Manvita Baradi, Nimitt Karia, and Shelly Kulshrestha
371 / 70HERITAGE
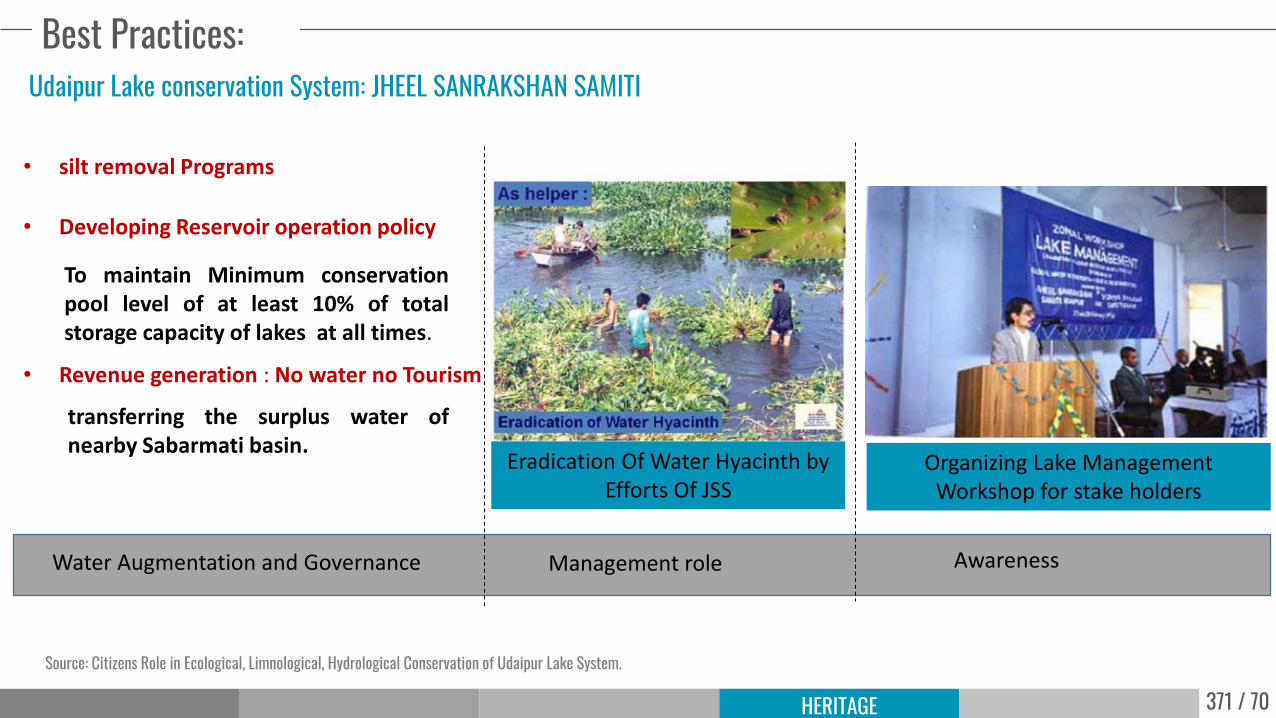
Best Practices:Udaipur Lake conservation System: JHEEL SANRAKSHAN SAMITI
Source: Citizens Role in Ecological, Limnological, Hydrological Conservation of Udaipur Lake System.
Management role AwarenessWater Augmentation and Governance
• silt removal Programs
• Developing Reservoir operation policy
To maintain Minimum conservationpool level of at least 10% of totalstorage capacity of lakes at all times.
• Revenue generation : No water no Tourism
transferring the surplus water ofnearby Sabarmati basin.
Organizing Lake Management Workshop for stake holders
Eradication Of Water Hyacinth by Efforts Of JSS
372 / 70HERITAGE
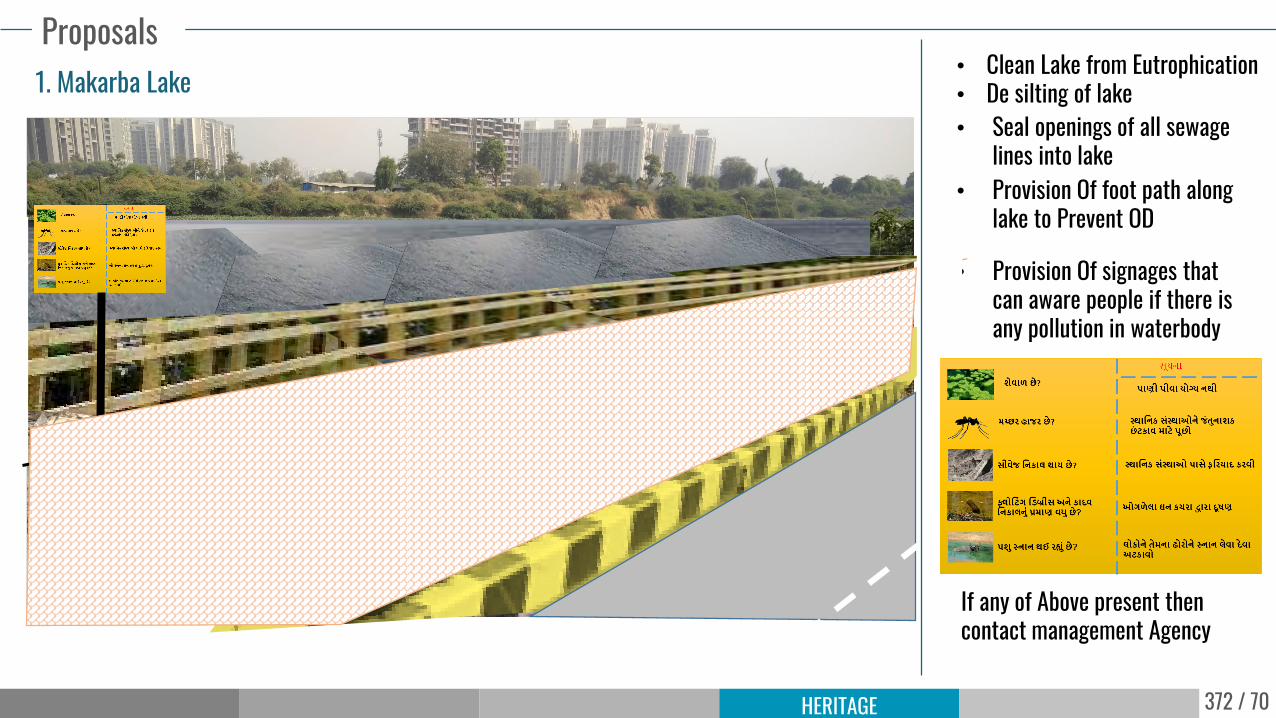
Proposals
• Provision Of foot path along lake to Prevent OD
• Clean Lake from Eutrophication• De silting of lake
• Provision Of signages that can aware people if there is any pollution in waterbody
If any of Above present then contact management Agency
• Seal openings of all sewage lines into lake
1. Makarba Lake
373 / 70HERITAGE
Proposals
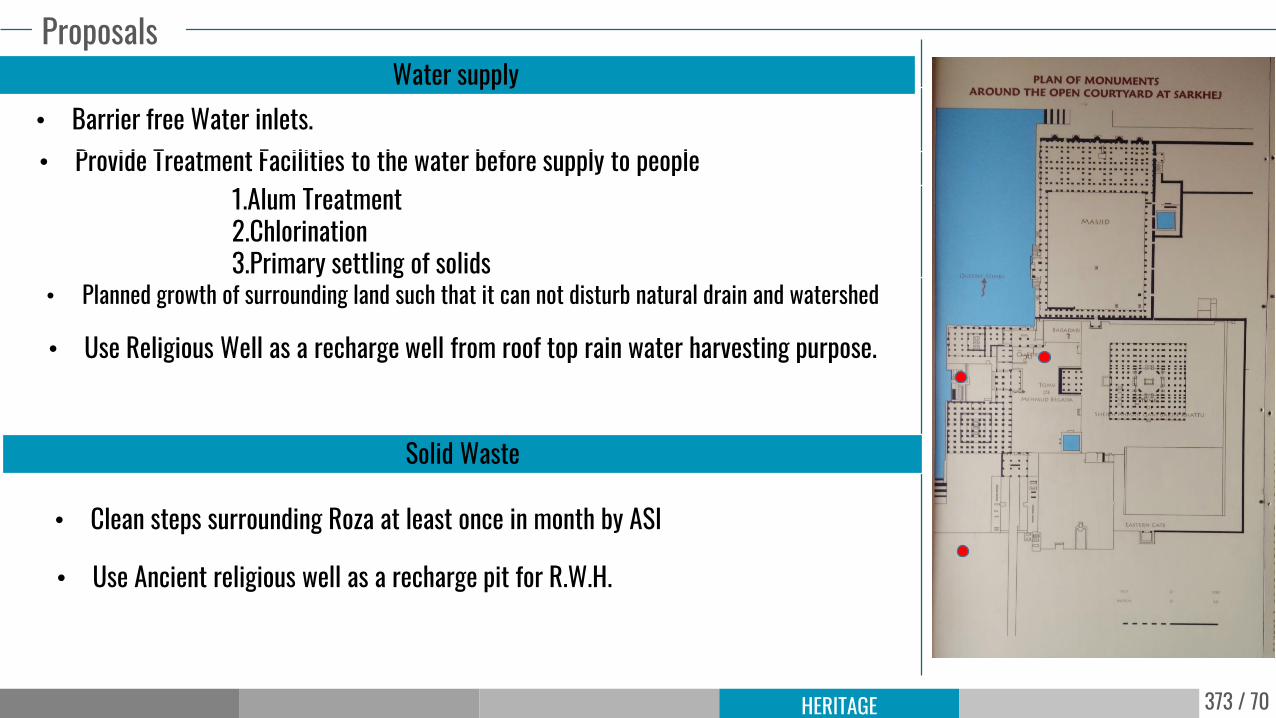
• Provide Treatment Facilities to the water before supply to people1.Alum Treatment2.Chlorination3.Primary settling of solids
• Use Religious Well as a recharge well from roof top rain water harvesting purpose.
• Clean steps surrounding Roza at least once in month by ASI
• Barrier free Water inlets.
• Planned growth of surrounding land such that it can not disturb natural drain and watershed
Solid Waste
Water supply
• Use Ancient religious well as a recharge pit for R.W.H.
374 / 70HERITAGE
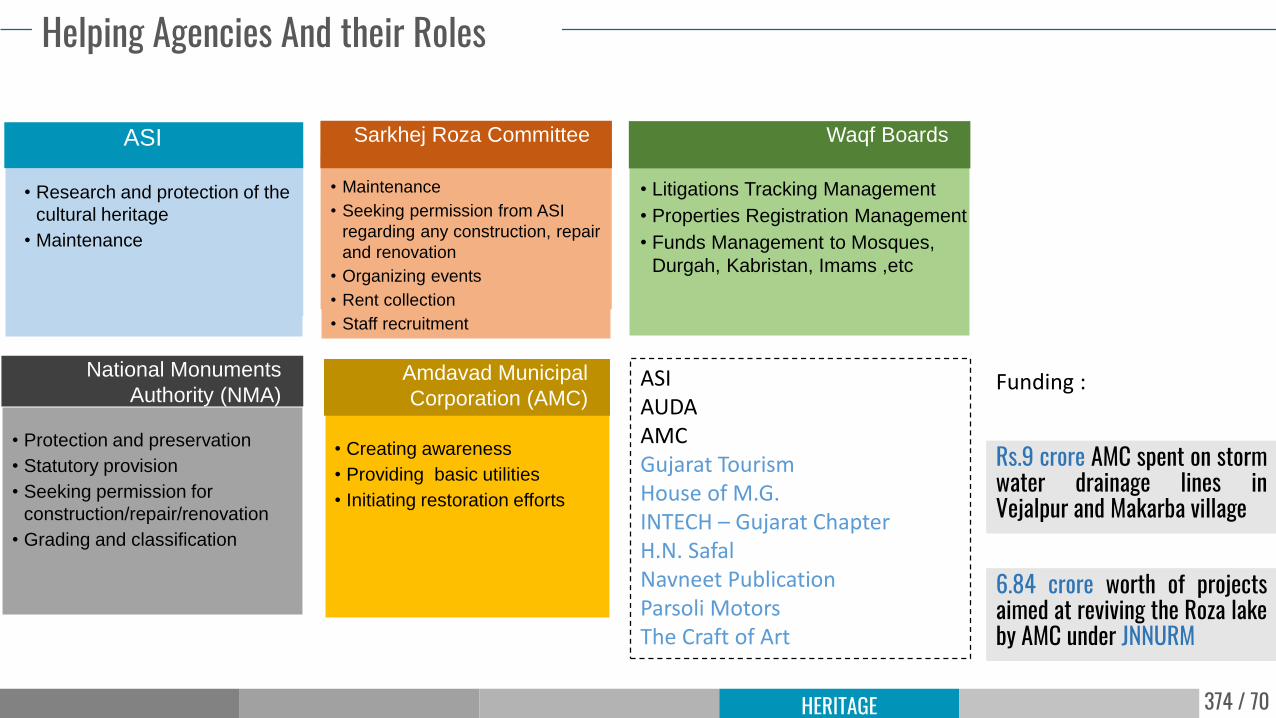
• Maintenance
• Seeking permission from ASI
regarding any construction, repair
and renovation
• Organizing events
• Rent collection
• Staff recruitment
Sarkhej Roza Committee
Helping Agencies And their Roles
ASIAUDAAMCGujarat TourismHouse of M.G.INTECH – Gujarat ChapterH.N. SafalNavneet PublicationParsoli MotorsThe Craft of Art
• Research and protection of the
cultural heritage
• Maintenance
• Litigations Tracking Management
• Properties Registration Management
• Funds Management to Mosques,
Durgah, Kabristan, Imams ,etc
Waqf Boards
• Protection and preservation
• Statutory provision
• Seeking permission for
construction/repair/renovation
• Grading and classification
National Monuments
Authority (NMA)
ASI
• Creating awareness
• Providing basic utilities
• Initiating restoration efforts
Amdavad Municipal
Corporation (AMC)
Rs.9 crore AMC spent on stormwater drainage lines inVejalpur and Makarba village
6.84 crore worth of projectsaimed at reviving the Roza lakeby AMC under JNNURM
Funding :
375 / 70HERITAGE
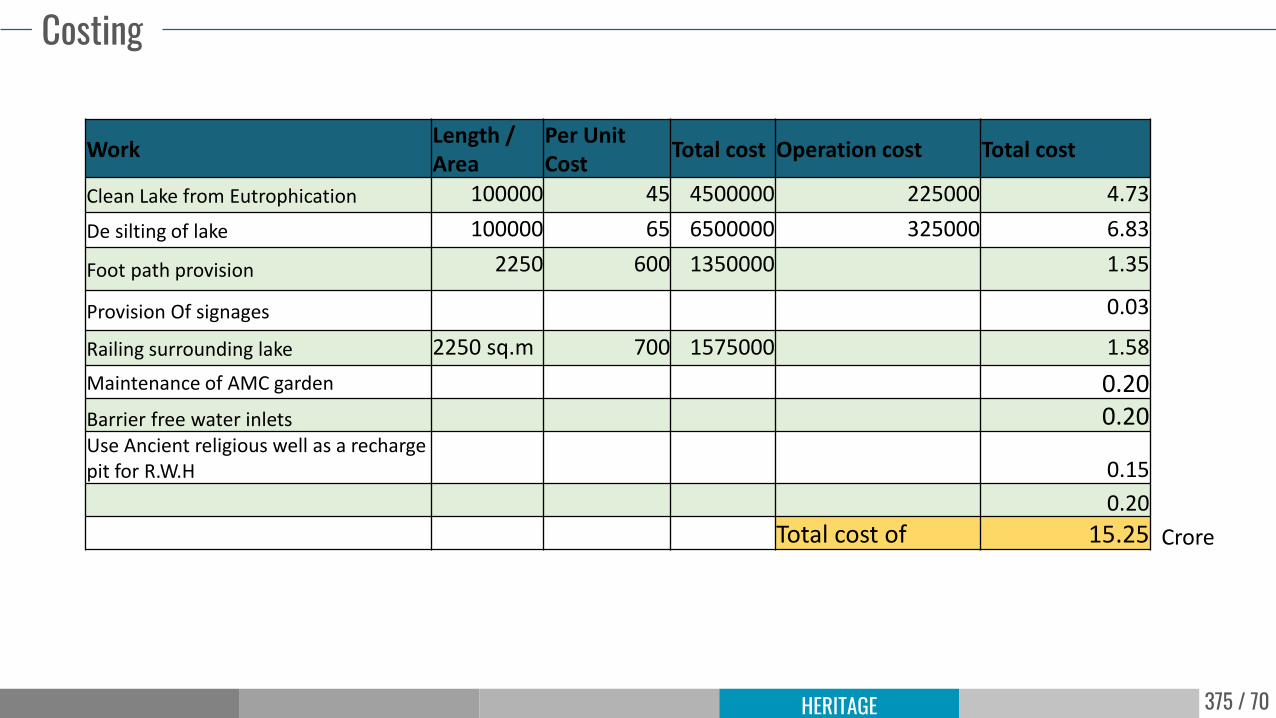
Costing
WorkLength / Area
Per Unit Cost
Total cost Operation cost Total cost
Clean Lake from Eutrophication 100000 45 4500000 225000 4.73
De silting of lake 100000 65 6500000 325000 6.83
Foot path provision 2250 600 1350000 1.35
Provision Of signages 0.03
Railing surrounding lake 2250 sq.m 700 1575000 1.58
Maintenance of AMC garden 0.20
Barrier free water inlets 0.20Use Ancient religious well as a recharge pit for R.W.H 0.15
0.20
Total cost of 15.25 Crore
376 / 70
HeritageStepwell
377 / 70HERITAGE
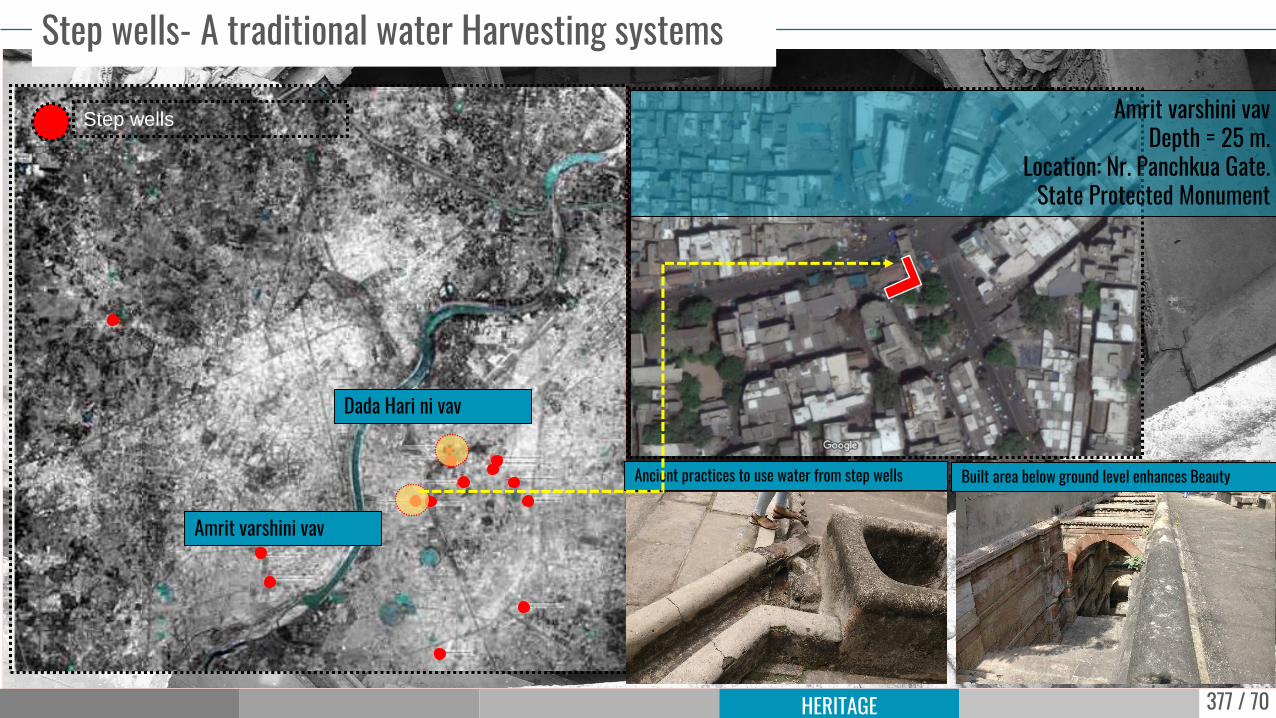
Step wells- A traditional water Harvesting systems
Step wells
Amrit varshini vav
Dada Hari ni vav
Ancient practices to use water from step wells
Amrit varshini vavDepth = 25 m.
Location: Nr. Panchkua Gate.State Protected Monument
Built area below ground level enhances Beauty
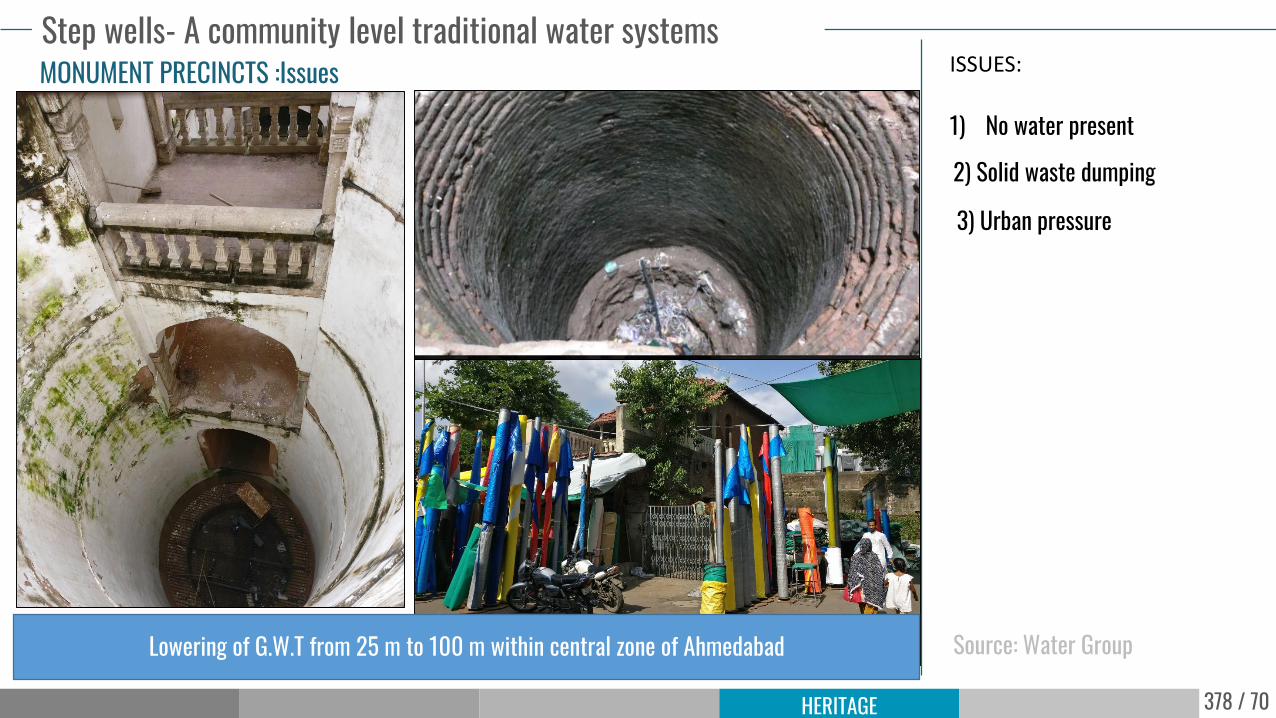
378 / 70HERITAGE
Step wells- A community level traditional water systemsISSUES:
1) No water present
2) Solid waste dumping
3) Urban pressure
MONUMENT PRECINCTS :Issues
Lowering of G.W.T from 25 m to 100 m within central zone of Ahmedabad Source: Water Group
379 / 70HERITAGE
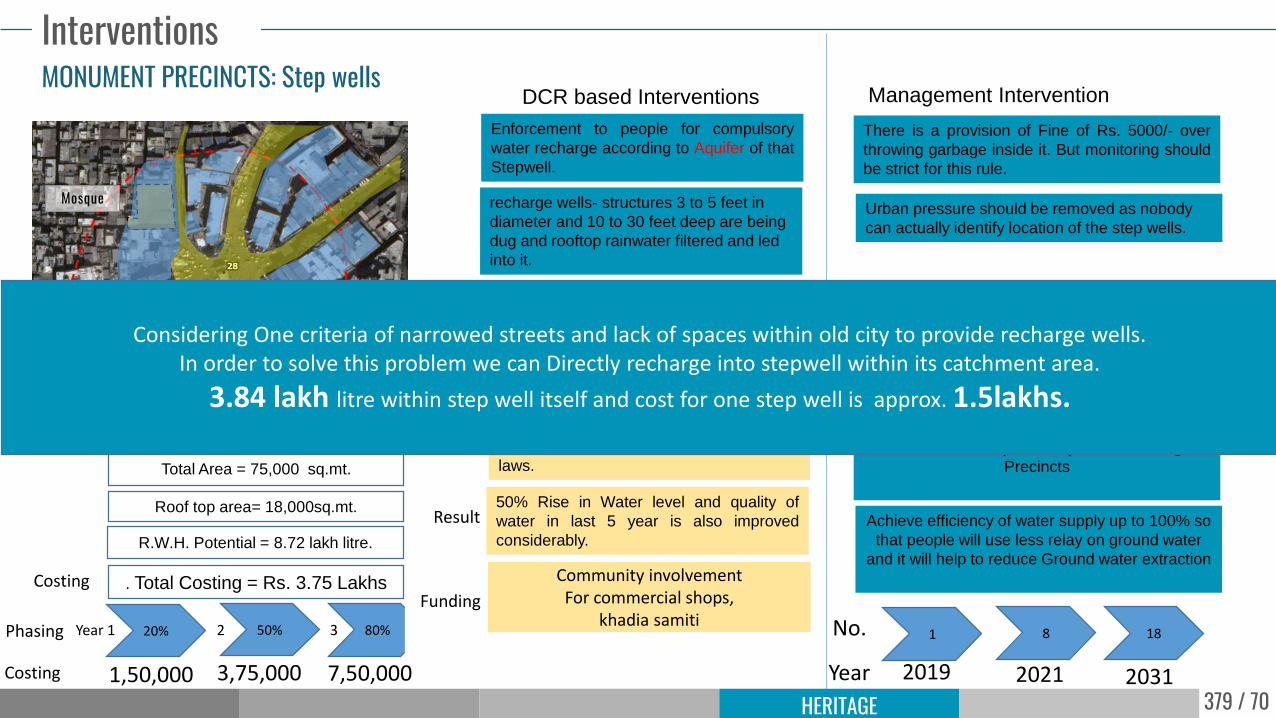
Interventions
Mosque
Temple
Enforcement to people for compulsory
water recharge according to Aquifer of that
Stepwell.
MONUMENT PRECINCTS: Step wells
recharge wells- structures 3 to 5 feet in
diameter and 10 to 30 feet deep are being
dug and rooftop rainwater filtered and led
into it.
There is a provision of Fine of Rs. 5000/- over
throwing garbage inside it. But monitoring should
be strict for this rule.
Urban pressure should be removed as nobody
can actually identify location of the step wells.
Management InterventionDCR based Interventions
Best Practices
Chennai Government has made
mandatory R.W.H. system as their by
laws.
50% Rise in Water level and quality of
water in last 5 year is also improved
considerably.
Result
Total Area = 75,000 sq.mt.
Roof top area= 18,000sq.mt.
R.W.H. Potential = 8.72 lakh litre.
According to the rule, for a coverage area
of over 1,500 square metres, one
percolation well is mandatory to ensure
ground water recharge.
Guidelines
. Total Costing = Rs. 3.75 LakhsCosting
Phasing 20% 50% 80%Year 1 2 3
Costing 1,50,000 3,75,000 7,50,000
Community involvementFor commercial shops,
khadia samiti
Proposal:
Remove Urban pressure just surrounding
Precincts
Achieve efficiency of water supply up to 100% so
that people will use less relay on ground water
and it will help to reduce Ground water extraction
Funding
Considering One criteria of narrowed streets and lack of spaces within old city to provide recharge wells.In order to solve this problem we can Directly recharge into stepwell within its catchment area.
3.84 lakh litre within step well itself and cost for one step well is approx. 1.5lakhs.
1 8 18
2019 2021 2031Year
No.
380 / 70HERITAGE
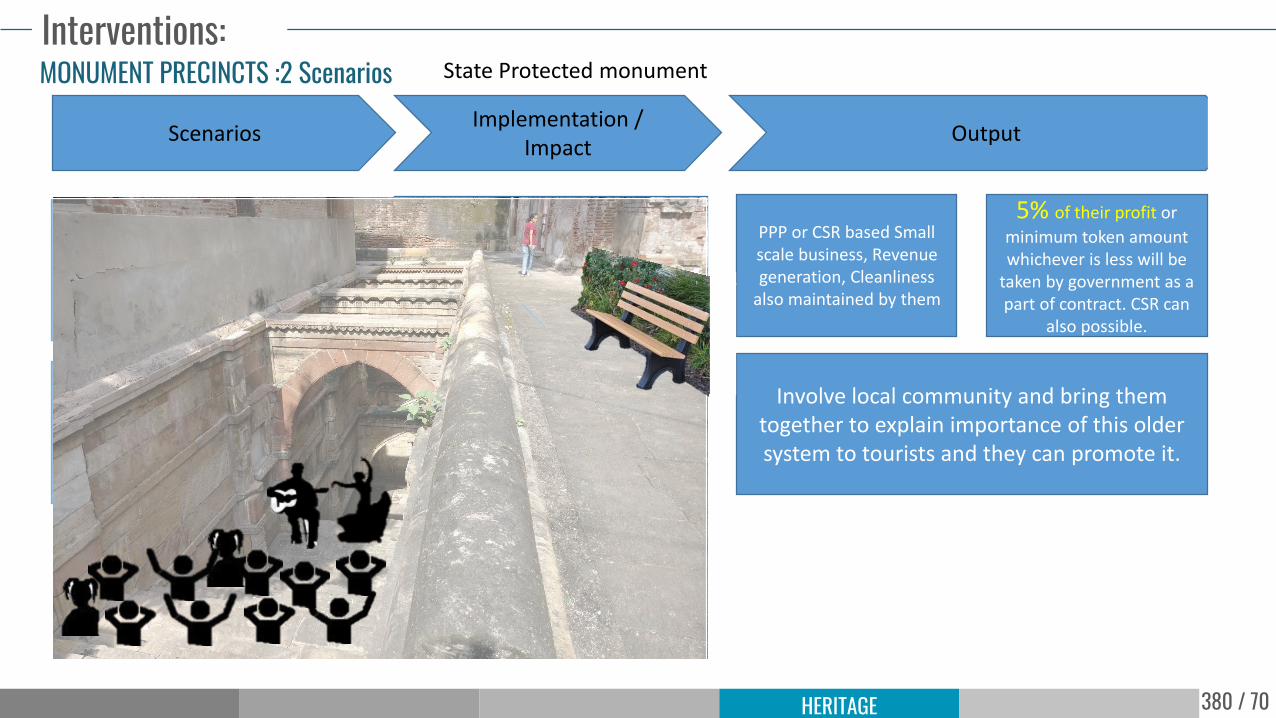
Interventions:
ScenariosImplementation /
ImpactOutput
MONUMENT PRECINCTS :2 Scenarios
Promotion through privatization if permission is
granted
We can provide commercialization such as
Small scale food stalls and art exhibition centre
PPP or CSR based Small scale business, Revenue generation, Cleanliness
also maintained by them
2) It is a state protected monument if permission is
not granted
Associate Value attached Human Activities
( e.g. Festival celebration like Holi, bathing of people, Social
gatherings etc)
Involve local community and bring them together to explain importance of this older system to tourists and they can promote it.
5% of their profit or
minimum token amount whichever is less will be
taken by government as a part of contract. CSR can
also possible.
State Protected monument
381 / 70
HeritageTankas and Rainwater Harvesting
382 / 70HERITAGE
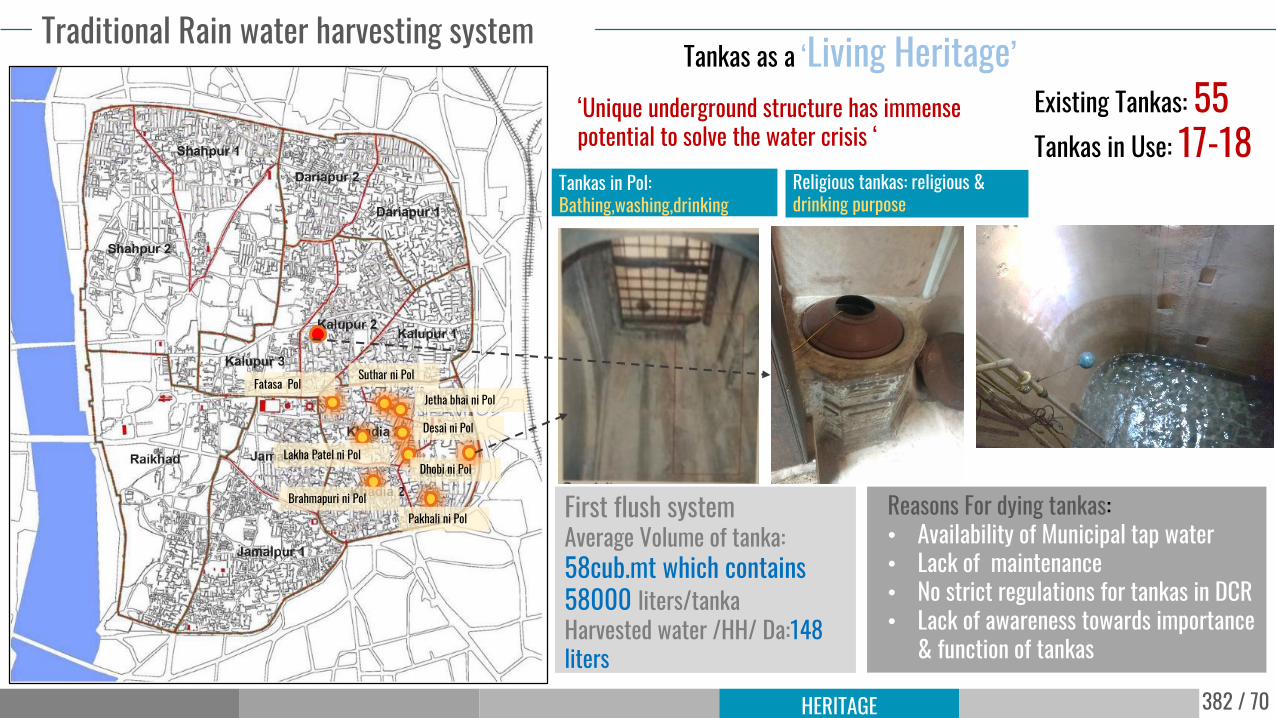
Traditional Rain water harvesting system
Suthar ni Pol
Desai ni Pol
Dhobi ni PolLakha Patel ni Pol
Fatasa PolJetha bhai ni Pol
Pakhali ni PolBrahmapuri ni Pol
Tankas as a ‘Living Heritage’‘Unique underground structure has immense potential to solve the water crisis ‘
Religious tankas: religious & drinking purpose
Tankas in Pol: Bathing,washing,drinking
First flush systemAverage Volume of tanka: 58cub.mt which contains 58000 liters/tankaHarvested water /HH/ Da:148 liters
Existing Tankas: 55Tankas in Use: 17-18
Reasons For dying tankas:• Availability of Municipal tap water• Lack of maintenance• No strict regulations for tankas in DCR• Lack of awareness towards importance
& function of tankas
383 / 70HERITAGE
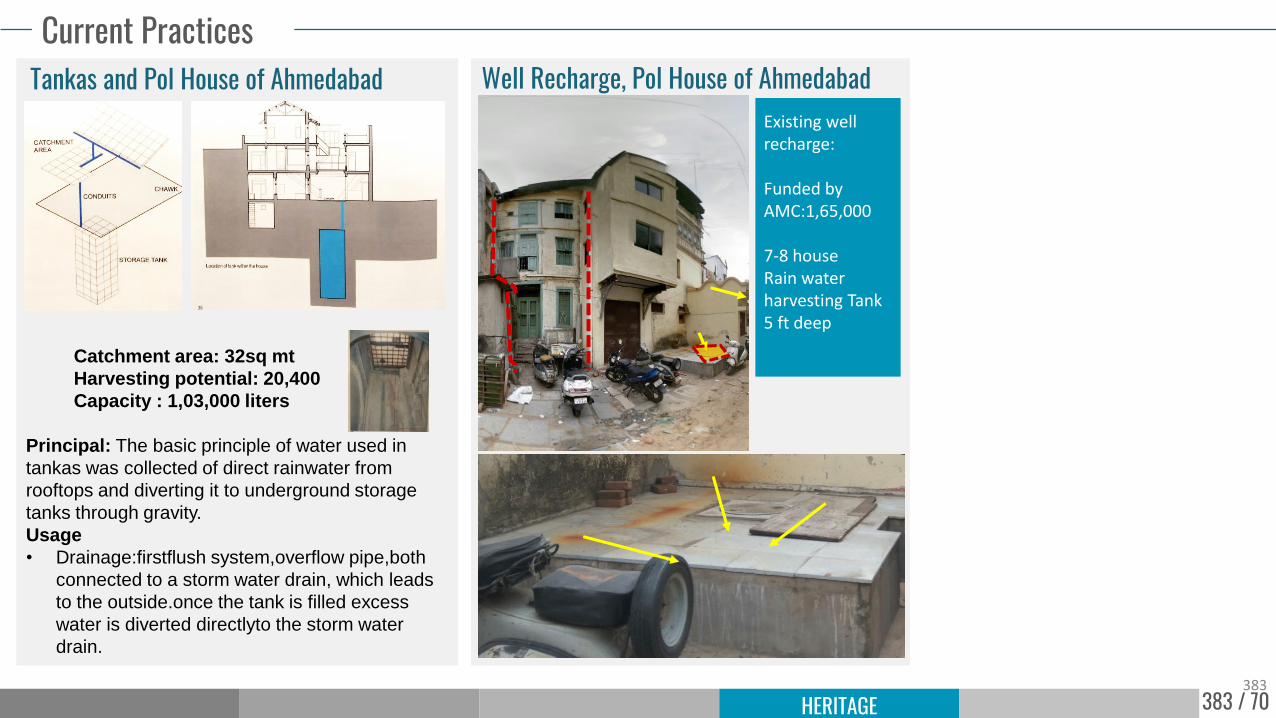
Current Practices
383
Existing well recharge:
Funded by AMC:1,65,000
7-8 houseRain water harvesting Tank5 ft deep
Well Recharge, Pol House of Ahmedabad
Catchment area: 32sq mt
Harvesting potential: 20,400
Capacity : 1,03,000 liters
Principal: The basic principle of water used in
tankas was collected of direct rainwater from
rooftops and diverting it to underground storage
tanks through gravity.
Usage
• Drainage:firstflush system,overflow pipe,both
connected to a storm water drain, which leads
to the outside.once the tank is filled excess
water is diverted directlyto the storm water
drain.
Tankas and Pol House of Ahmedabad
384 / 70HERITAGE
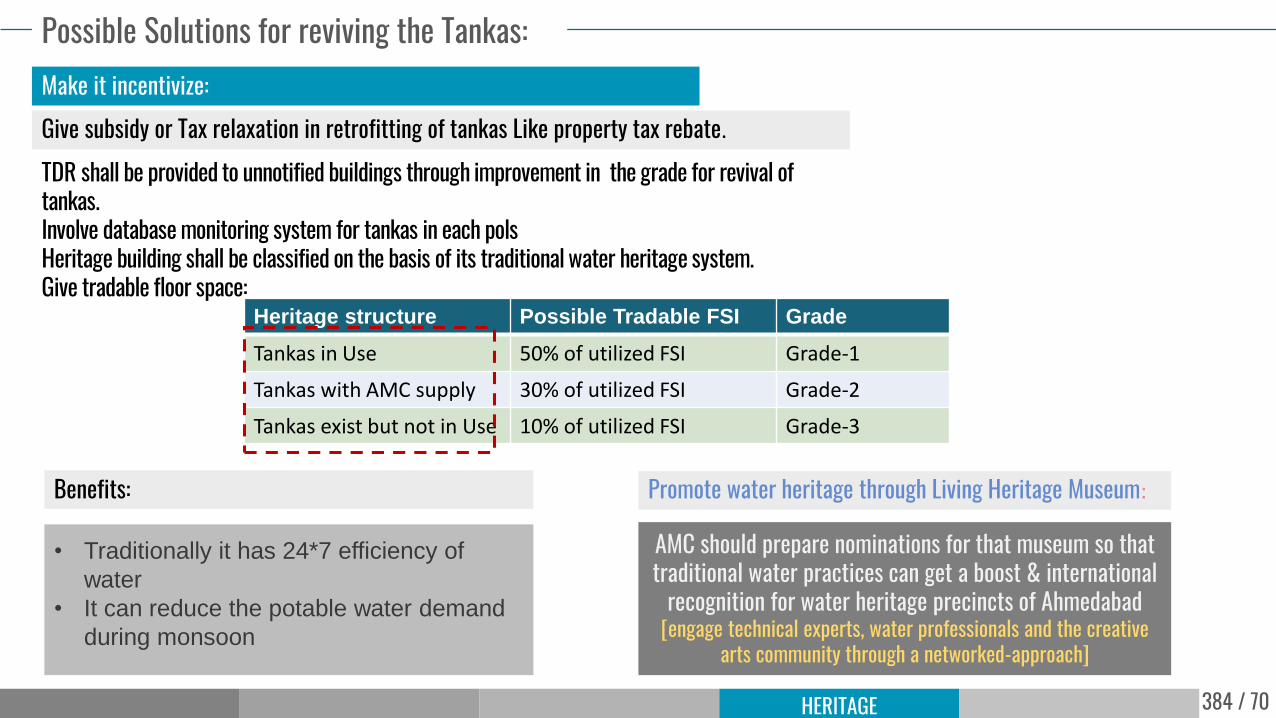
Possible Solutions for reviving the Tankas:Make it incentivize:Give subsidy or Tax relaxation in retrofitting of tankas Like property tax rebate.
TDR shall be provided to unnotified buildings through improvement in the grade for revival of tankas.Involve database monitoring system for tankas in each pols Heritage building shall be classified on the basis of its traditional water heritage system.Give tradable floor space:
Heritage structure Possible Tradable FSI Grade
Tankas in Use 50% of utilized FSI Grade-1
Tankas with AMC supply 30% of utilized FSI Grade-2
Tankas exist but not in Use 10% of utilized FSI Grade-3
Benefits:
• Traditionally it has 24*7 efficiency of
water
• It can reduce the potable water demand
during monsoon
Promote water heritage through Living Heritage Museum:
AMC should prepare nominations for that museum so that traditional water practices can get a boost & international
recognition for water heritage precincts of Ahmedabad[engage technical experts, water professionals and the creative
arts community through a networked-approach]
385 / 70HERITAGE
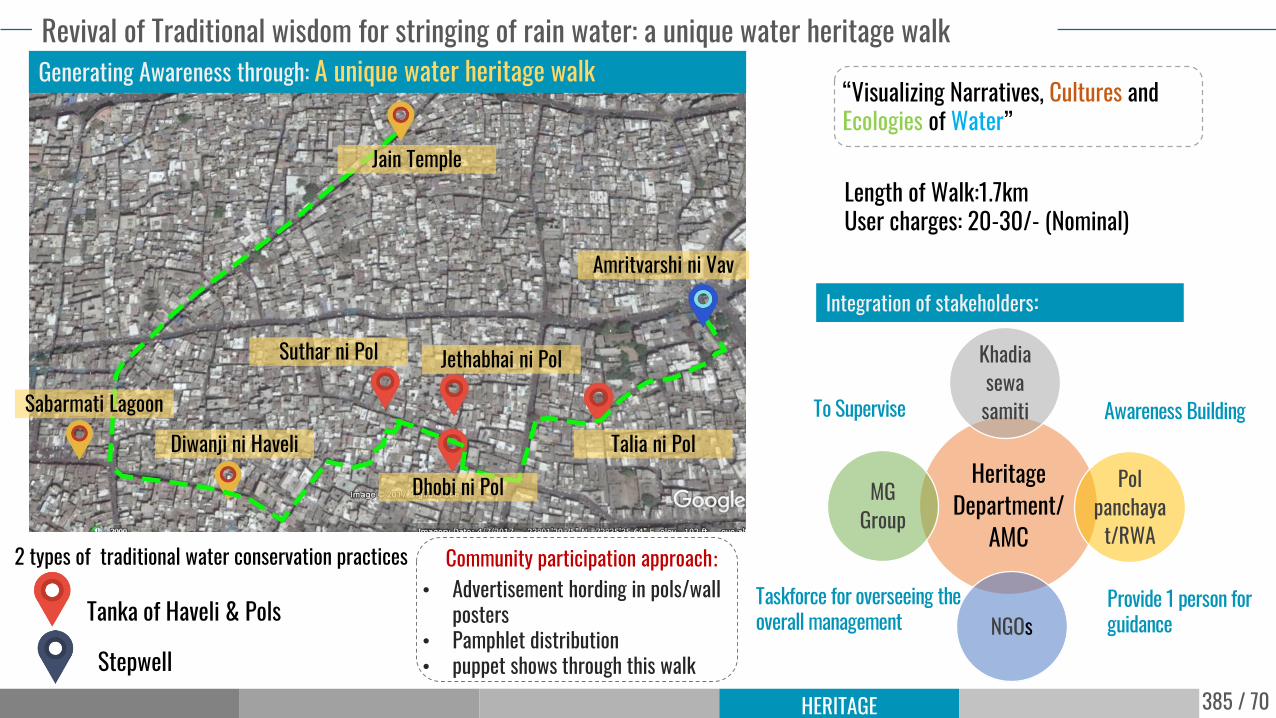
Revival of Traditional wisdom for stringing of rain water: a unique water heritage walk
Length of Walk:1.7kmUser charges: 20-30/- (Nominal)
Dhobi ni Pol
Suthar ni Pol Jethabhai ni Pol
Talia ni Pol
Amritvarshi ni Vav
Diwanji ni Haveli
Generating Awareness through: A unique water heritage walk
Tanka of Haveli & Pols
Stepwell
2 types of traditional water conservation practices
“Visualizing Narratives, Cultures and Ecologies of Water”
Integration of stakeholders:
Heritage Department/
AMC
Khadia sewasamiti
Pol panchaya
t/RWA
NGOs
MG Group
To Supervise
Taskforce for overseeing the overall management
Awareness Building
Community participation approach:
Provide 1 person for guidance
• Advertisement hording in pols/wall posters
• Pamphlet distribution • puppet shows through this walk
Jain Temple
Sabarmati Lagoon
388 / 70
HeritageInstitutional Framework
389 / 70HERITAGE
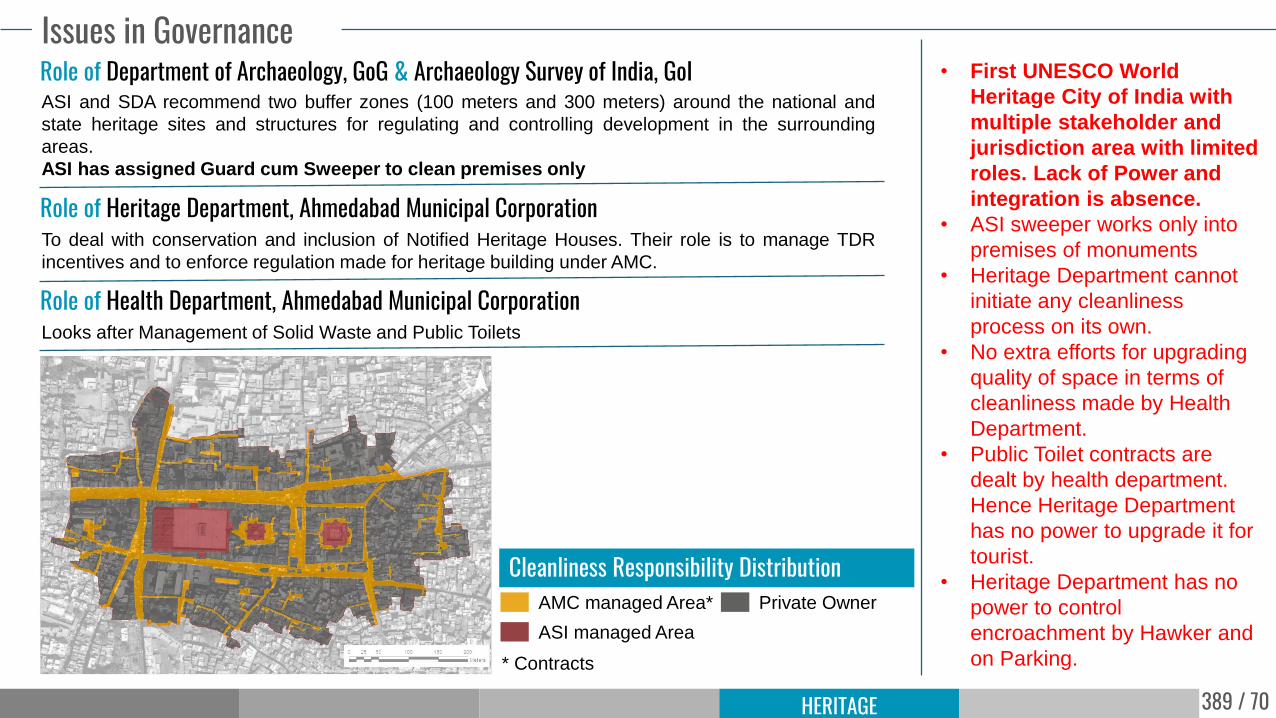
Issues in Governance • First UNESCO World
Heritage City of India with
multiple stakeholder and
jurisdiction area with limited
roles. Lack of Power and
integration is absence.
• ASI sweeper works only into
premises of monuments
• Heritage Department cannot
initiate any cleanliness
process on its own.
• No extra efforts for upgrading
quality of space in terms of
cleanliness made by Health
Department.
• Public Toilet contracts are
dealt by health department.
Hence Heritage Department
has no power to upgrade it for
tourist.
• Heritage Department has no
power to control
encroachment by Hawker and
on Parking.
Role of Department of Archaeology, GoG & Archaeology Survey of India, GoIASI and SDA recommend two buffer zones (100 meters and 300 meters) around the national and
state heritage sites and structures for regulating and controlling development in the surrounding
areas.
ASI has assigned Guard cum Sweeper to clean premises only
Role of Heritage Department, Ahmedabad Municipal CorporationTo deal with conservation and inclusion of Notified Heritage Houses. Their role is to manage TDR
incentives and to enforce regulation made for heritage building under AMC.
Role of Health Department, Ahmedabad Municipal CorporationLooks after Management of Solid Waste and Public Toilets
ASI managed Area
AMC managed Area* Private Owner
Cleanliness Responsibility Distribution
* Contracts
390 / 70HERITAGE
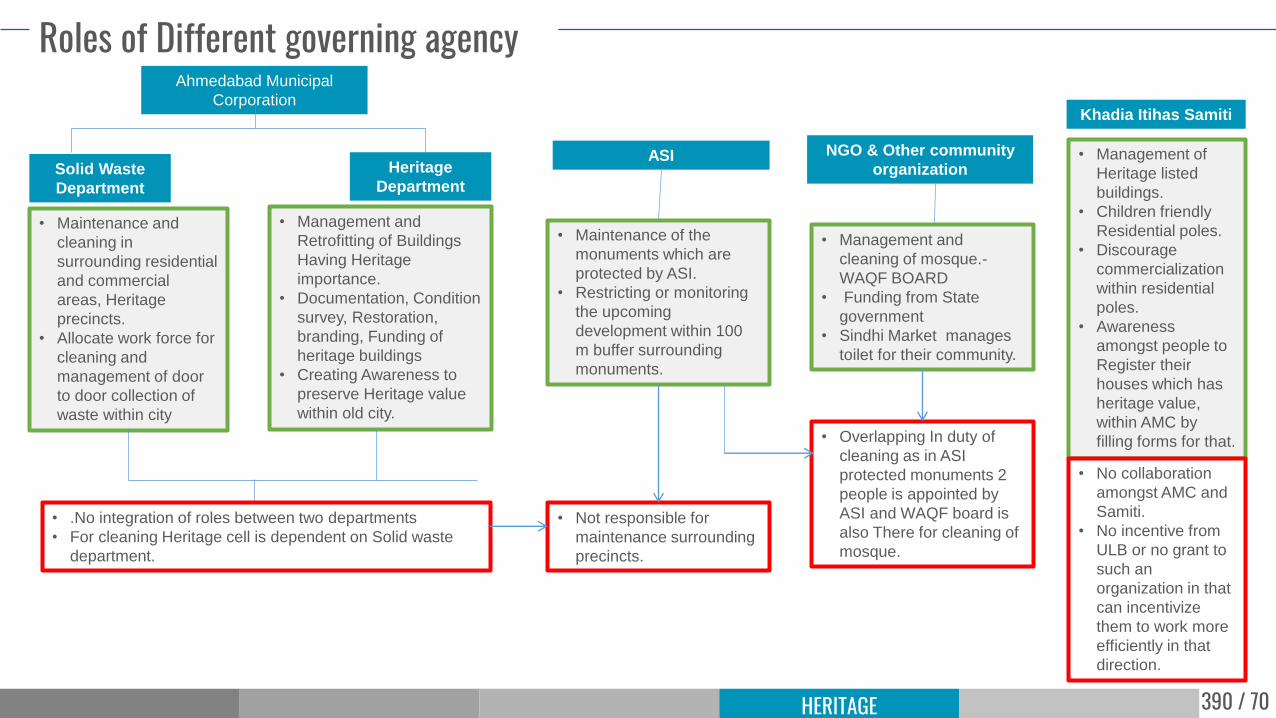
Roles of Different governing agencyAhmedabad Municipal
Corporation
Solid Waste
Department
Heritage
Department
• Maintenance and
cleaning in
surrounding residential
and commercial
areas, Heritage
precincts.
• Allocate work force for
cleaning and
management of door
to door collection of
waste within city
• Management and
Retrofitting of Buildings
Having Heritage
importance.
• Documentation, Condition
survey, Restoration,
branding, Funding of
heritage buildings
• Creating Awareness to
preserve Heritage value
within old city.
• .No integration of roles between two departments
• For cleaning Heritage cell is dependent on Solid waste
department.
ASI
• Maintenance of the
monuments which are
protected by ASI.
• Restricting or monitoring
the upcoming
development within 100
m buffer surrounding
monuments.
• Not responsible for
maintenance surrounding
precincts.
NGO & Other community
organization
• Management and
cleaning of mosque.-
WAQF BOARD
• Funding from State
government
• Sindhi Market manages
toilet for their community.
• Overlapping In duty of
cleaning as in ASI
protected monuments 2
people is appointed by
ASI and WAQF board is
also There for cleaning of
mosque.
Khadia Itihas Samiti
• Management of
Heritage listed
buildings.
• Children friendly
Residential poles.
• Discourage
commercialization
within residential
poles.
• Awareness
amongst people to
Register their
houses which has
heritage value,
within AMC by
filling forms for that.
• No collaboration
amongst AMC and
Samiti.
• No incentive from
ULB or no grant to
such an
organization in that
can incentivize
them to work more
efficiently in that
direction.
391 / 70HERITAGE
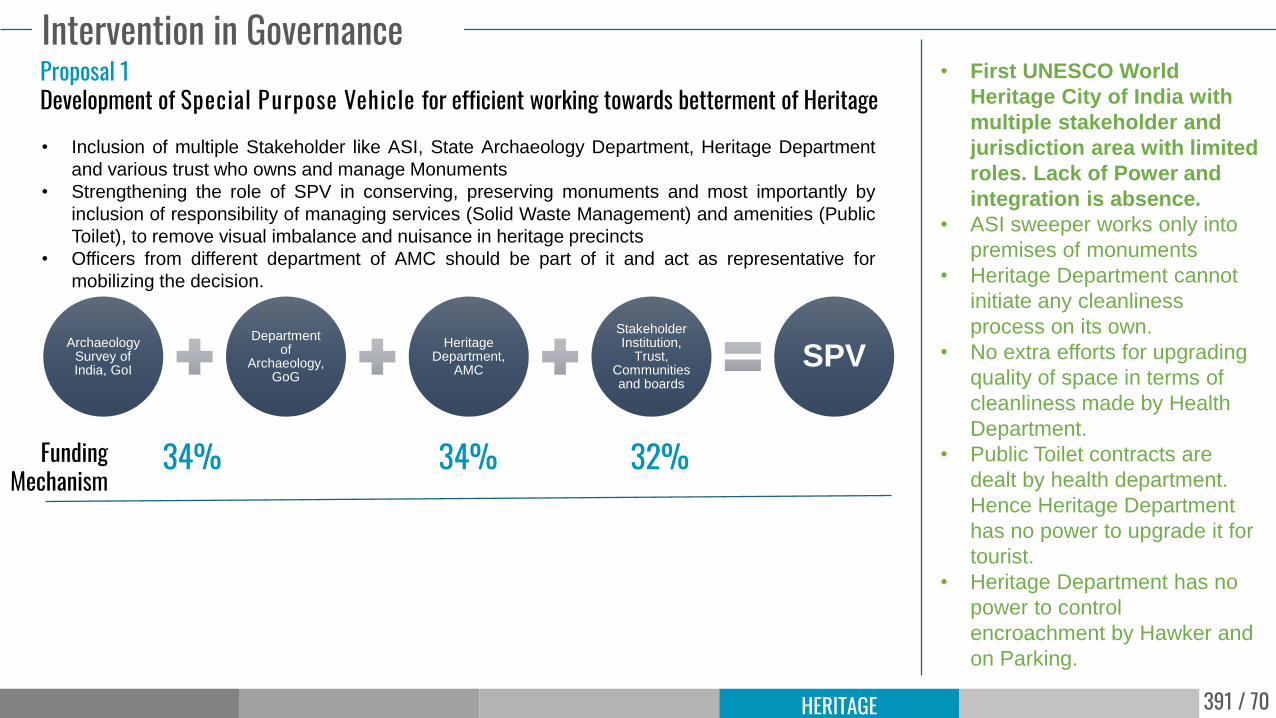
Intervention in Governance• First UNESCO World
Heritage City of India with
multiple stakeholder and
jurisdiction area with limited
roles. Lack of Power and
integration is absence.
• ASI sweeper works only into
premises of monuments
• Heritage Department cannot
initiate any cleanliness
process on its own.
• No extra efforts for upgrading
quality of space in terms of
cleanliness made by Health
Department.
• Public Toilet contracts are
dealt by health department.
Hence Heritage Department
has no power to upgrade it for
tourist.
• Heritage Department has no
power to control
encroachment by Hawker and
on Parking.
Proposal 1Development of Special Purpose Vehicle for efficient working towards betterment of Heritage • Inclusion of multiple Stakeholder like ASI, State Archaeology Department, Heritage Department
and various trust who owns and manage Monuments
• Strengthening the role of SPV in conserving, preserving monuments and most importantly by
inclusion of responsibility of managing services (Solid Waste Management) and amenities (Public
Toilet), to remove visual imbalance and nuisance in heritage precincts
• Officers from different department of AMC should be part of it and act as representative for
mobilizing the decision.
Archaeology Survey of India, GoI
Department of
Archaeology, GoG
Heritage Department,
AMC
Stakeholder Institution,
Trust, Communities and boards
SPV
34% 34% 32%Funding Mechanism
392 / 70HERITAGE
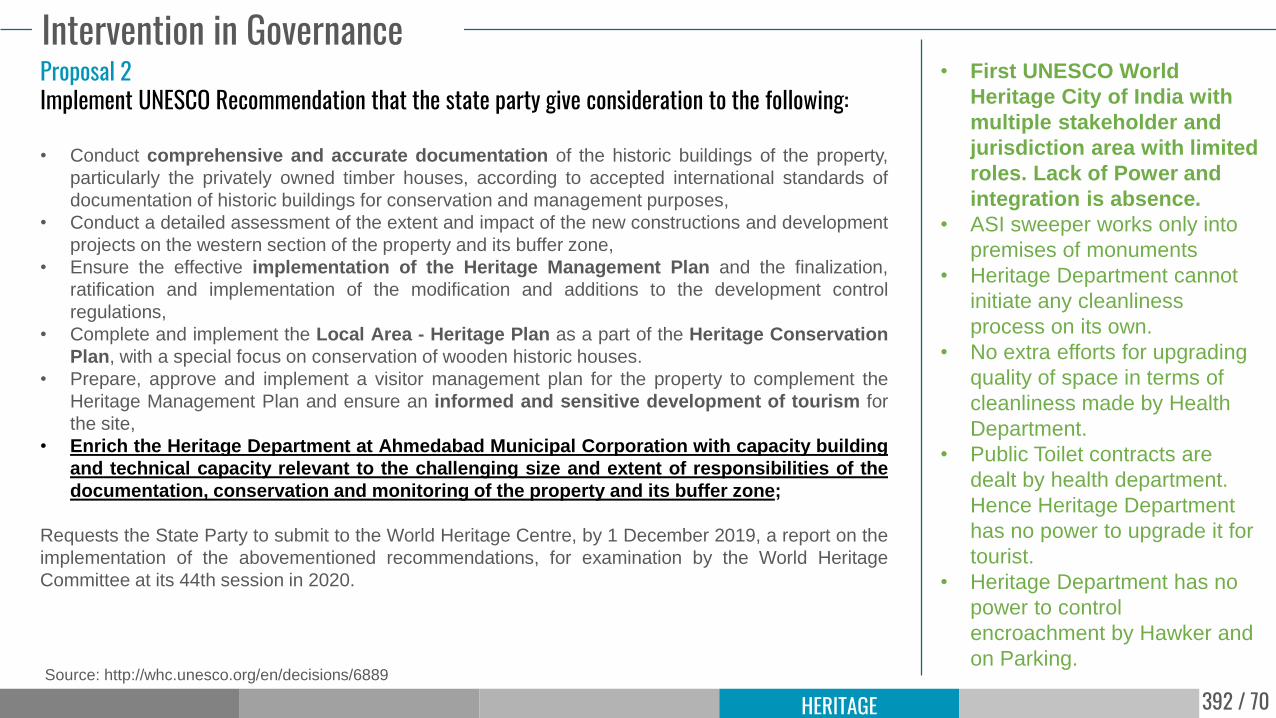
Intervention in Governance• First UNESCO World
Heritage City of India with
multiple stakeholder and
jurisdiction area with limited
roles. Lack of Power and
integration is absence.
• ASI sweeper works only into
premises of monuments
• Heritage Department cannot
initiate any cleanliness
process on its own.
• No extra efforts for upgrading
quality of space in terms of
cleanliness made by Health
Department.
• Public Toilet contracts are
dealt by health department.
Hence Heritage Department
has no power to upgrade it for
tourist.
• Heritage Department has no
power to control
encroachment by Hawker and
on Parking.
Proposal 2Implement UNESCO Recommendation that the state party give consideration to the following:
• Conduct comprehensive and accurate documentation of the historic buildings of the property,
particularly the privately owned timber houses, according to accepted international standards of
documentation of historic buildings for conservation and management purposes,
• Conduct a detailed assessment of the extent and impact of the new constructions and development
projects on the western section of the property and its buffer zone,
• Ensure the effective implementation of the Heritage Management Plan and the finalization,
ratification and implementation of the modification and additions to the development control
regulations,
• Complete and implement the Local Area - Heritage Plan as a part of the Heritage Conservation
Plan, with a special focus on conservation of wooden historic houses.
• Prepare, approve and implement a visitor management plan for the property to complement the
Heritage Management Plan and ensure an informed and sensitive development of tourism for
the site,
• Enrich the Heritage Department at Ahmedabad Municipal Corporation with capacity building
and technical capacity relevant to the challenging size and extent of responsibilities of the
documentation, conservation and monitoring of the property and its buffer zone;
Requests the State Party to submit to the World Heritage Centre, by 1 December 2019, a report on the
implementation of the abovementioned recommendations, for examination by the World Heritage
Committee at its 44th session in 2020.
Source: http://whc.unesco.org/en/decisions/6889
393 / 70393
HeritagePhasing and Financing
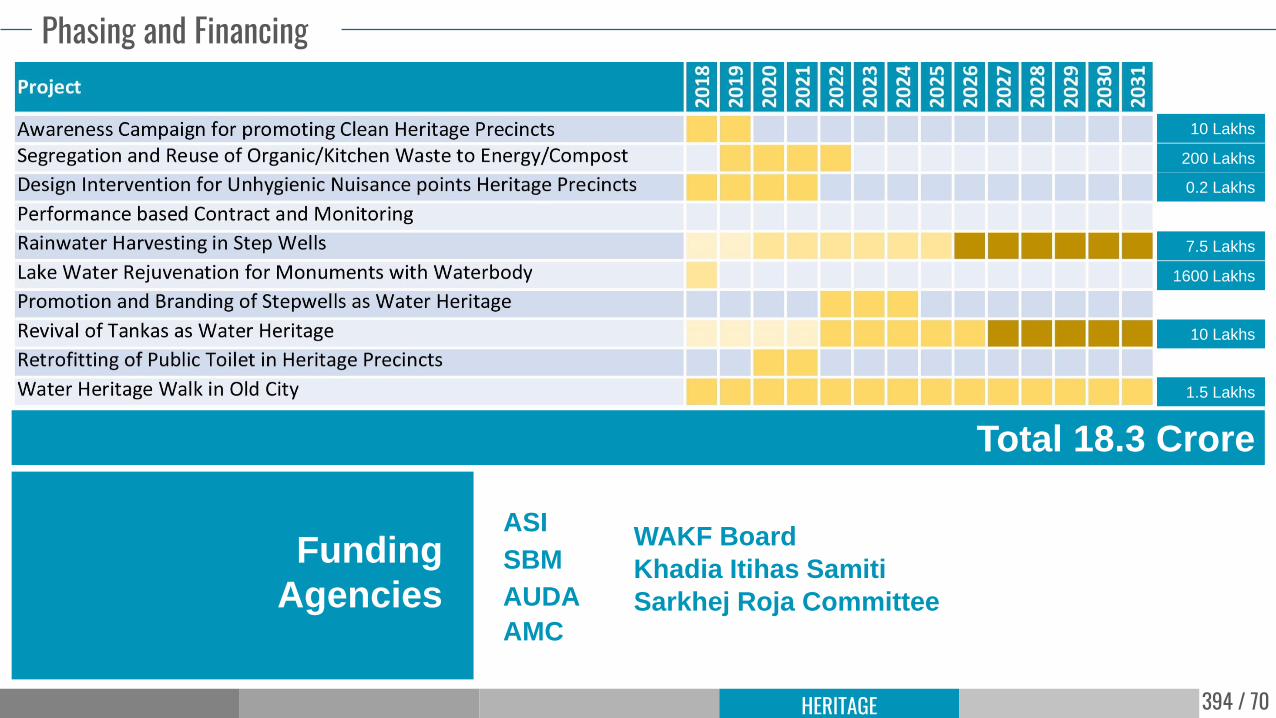
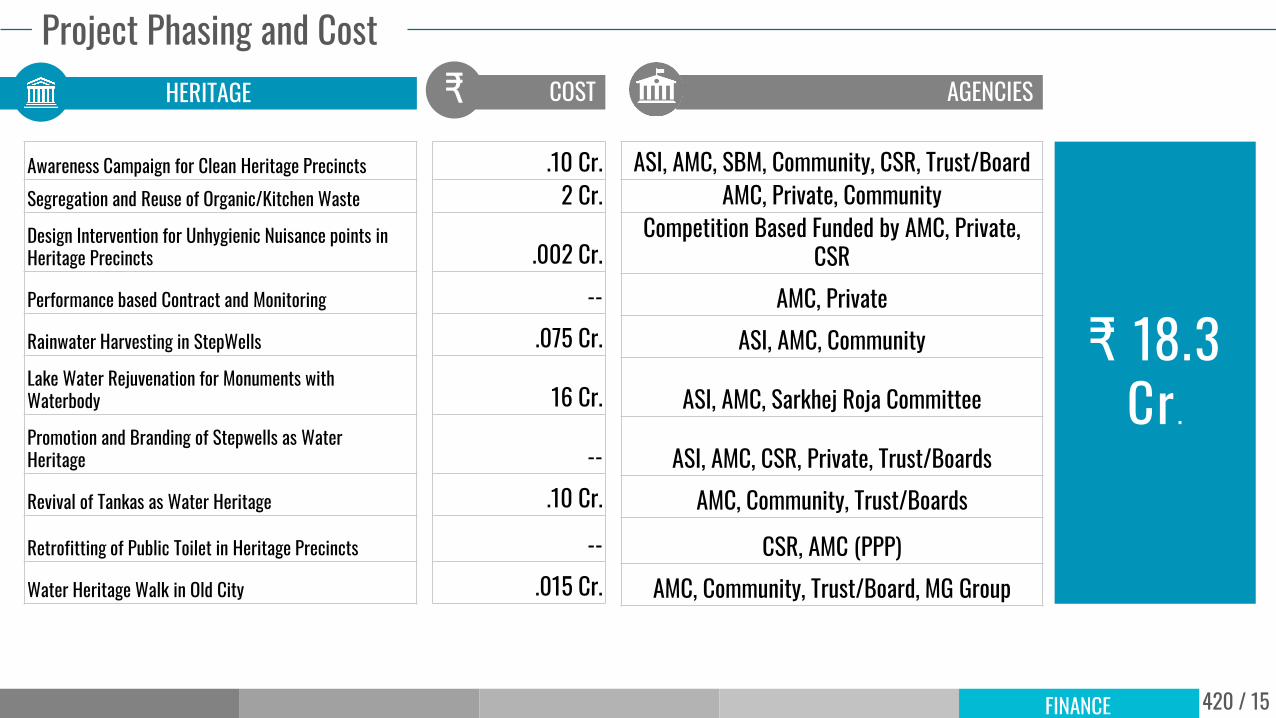
394 / 70HERITAGE
10 Lakhs
200 Lakhs
0.2 Lakhs
7.5 Lakhs
1600 Lakhs
10 Lakhs
1.5 Lakhs
Total 18.3 Crore
Phasing and Financing
AMC
ASI
SBMWAKF Board
Khadia Itihas Samiti
Sarkhej Roja CommitteeAUDA
Funding
Agencies
395 / 70
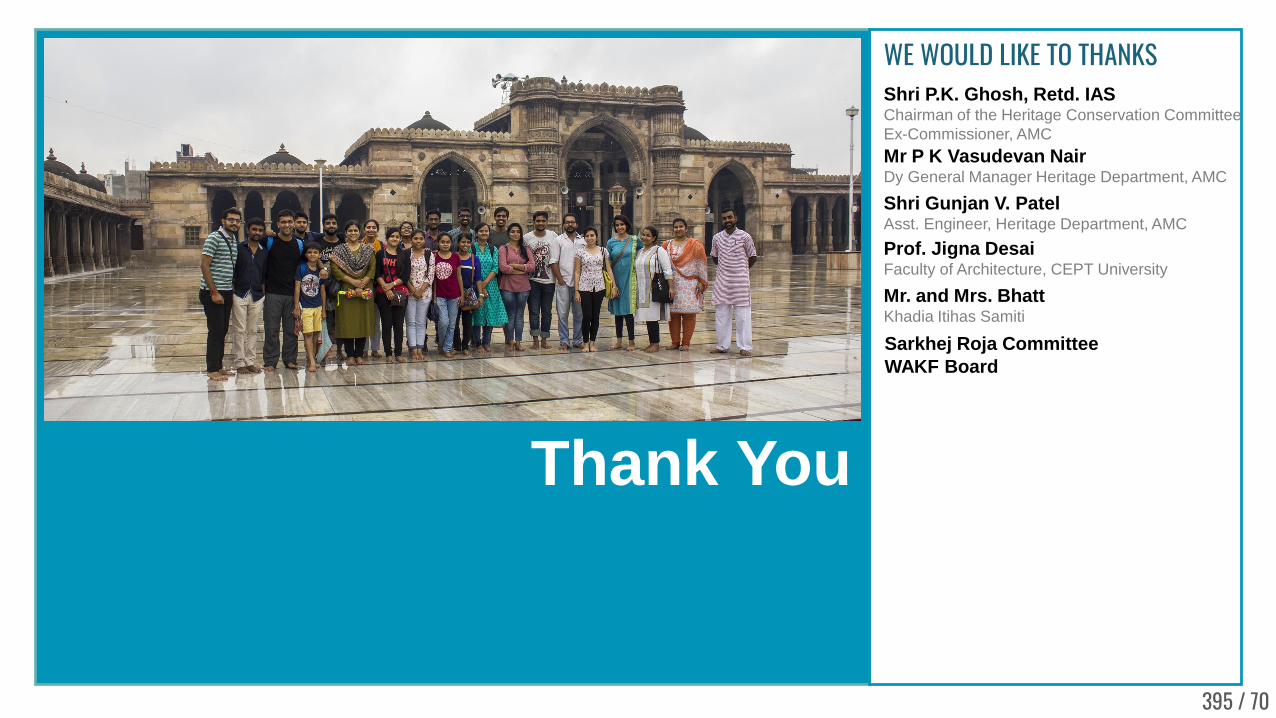
Shri P.K. Ghosh, Retd. IASChairman of the Heritage Conservation Committee
Ex-Commissioner, AMC
Mr P K Vasudevan Nair Dy General Manager Heritage Department, AMC
Shri Gunjan V. PatelAsst. Engineer, Heritage Department, AMC
WE WOULD LIKE TO THANKS
Prof. Jigna DesaiFaculty of Architecture, CEPT University
Mr. and Mrs. BhattKhadia Itihas Samiti
Sarkhej Roja Committee
WAKF Board
Thank You
399 / 10
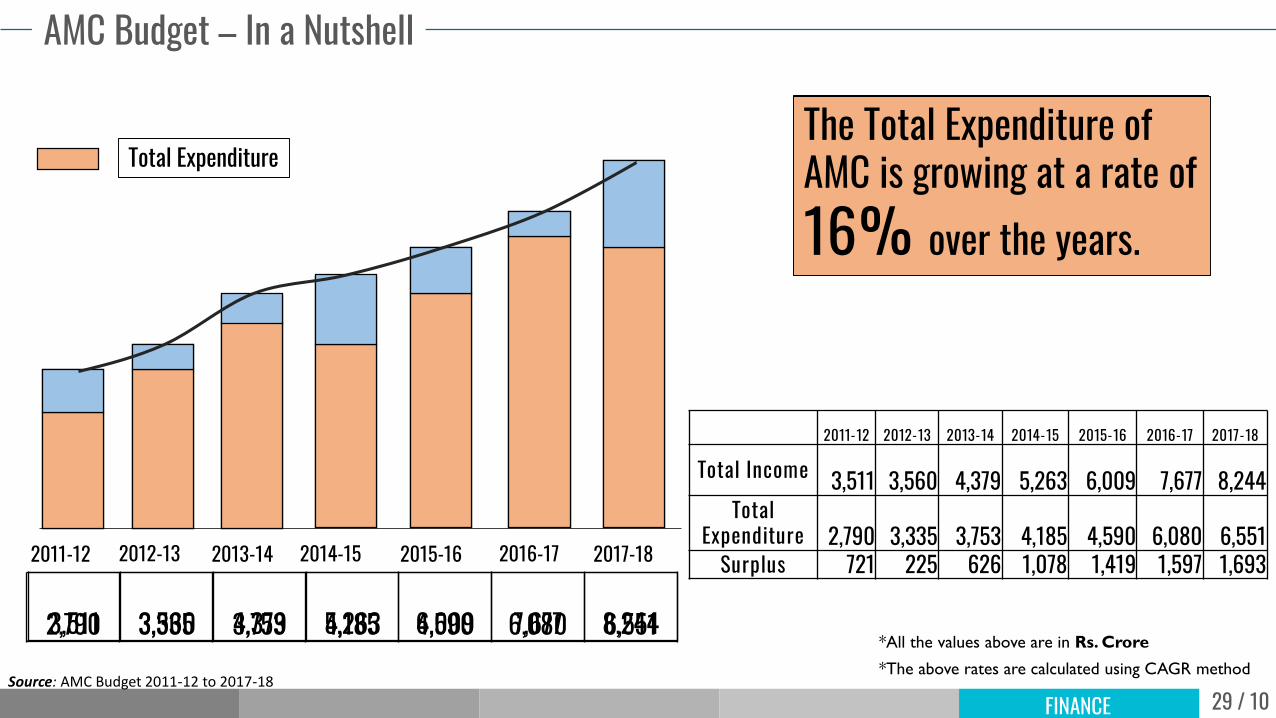
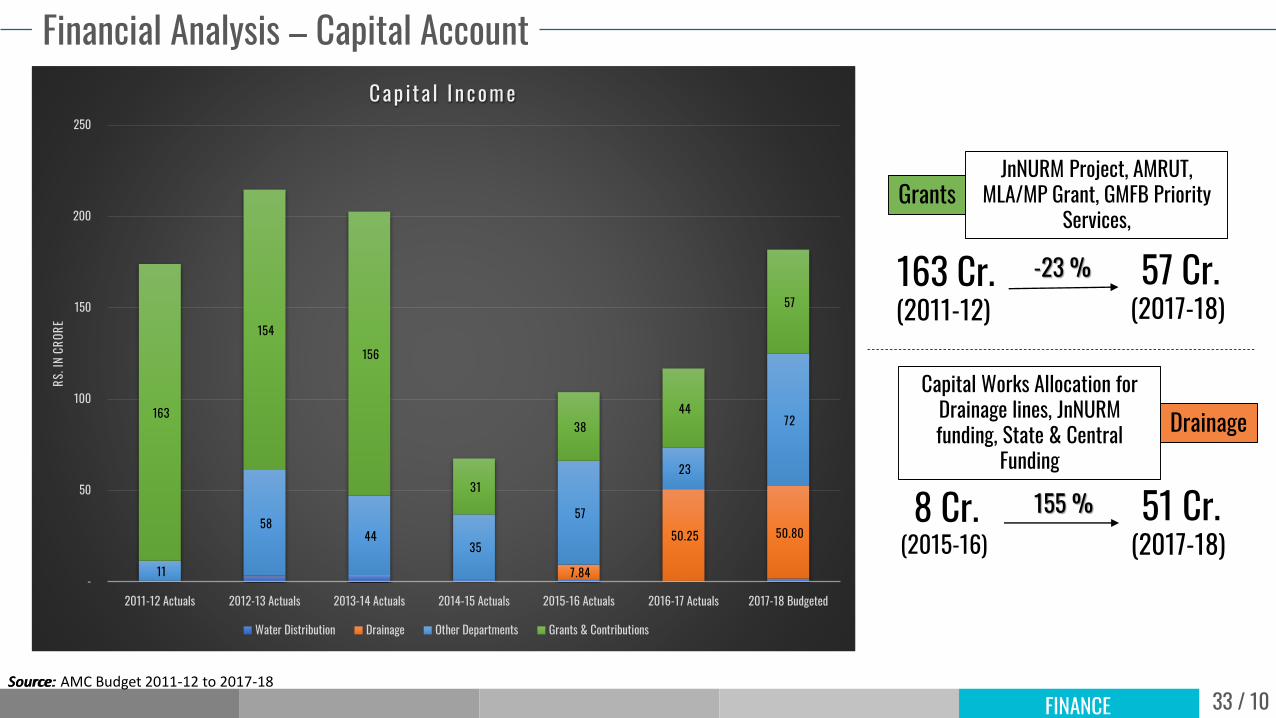
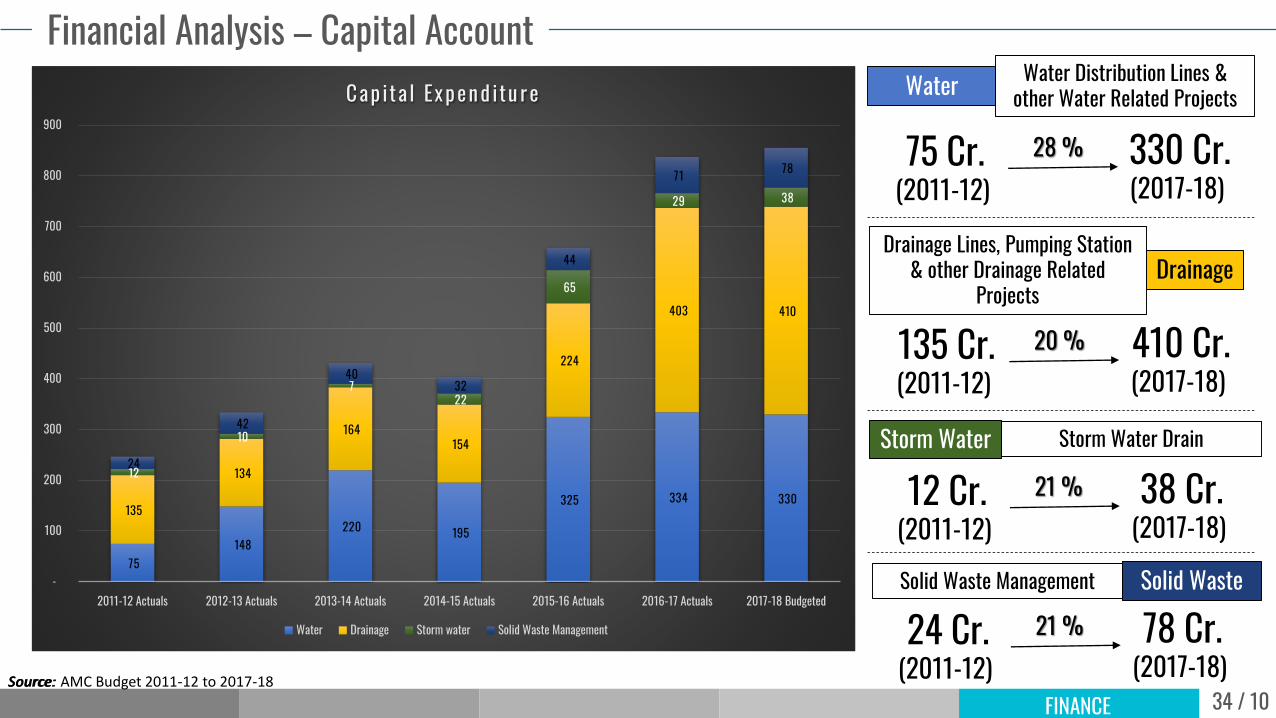
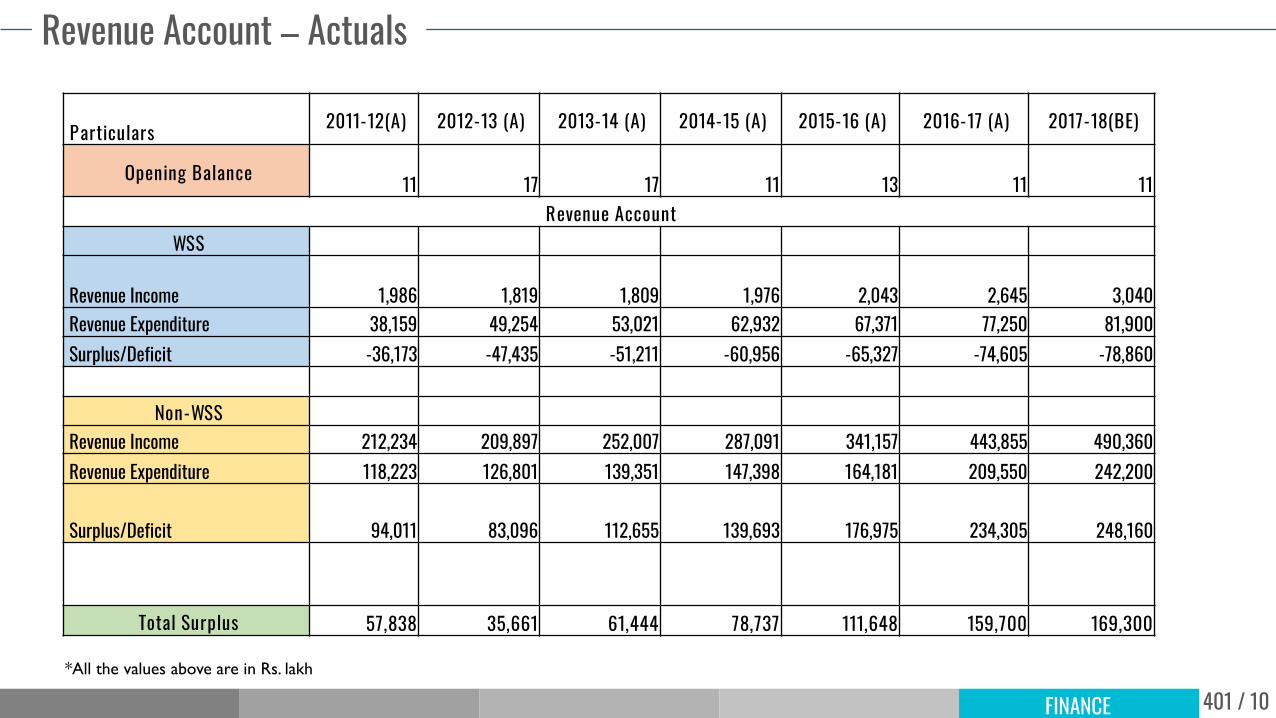
Finance & Governance Overall Budget
400 / 10FINANCE
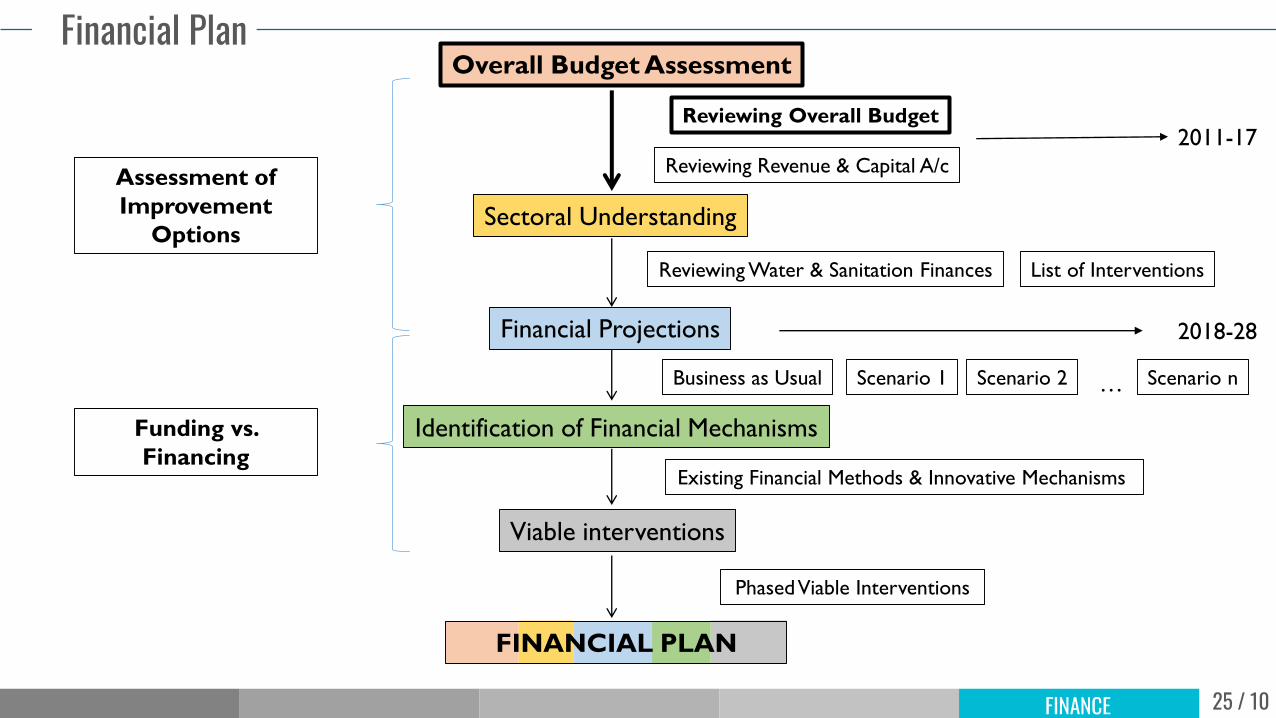
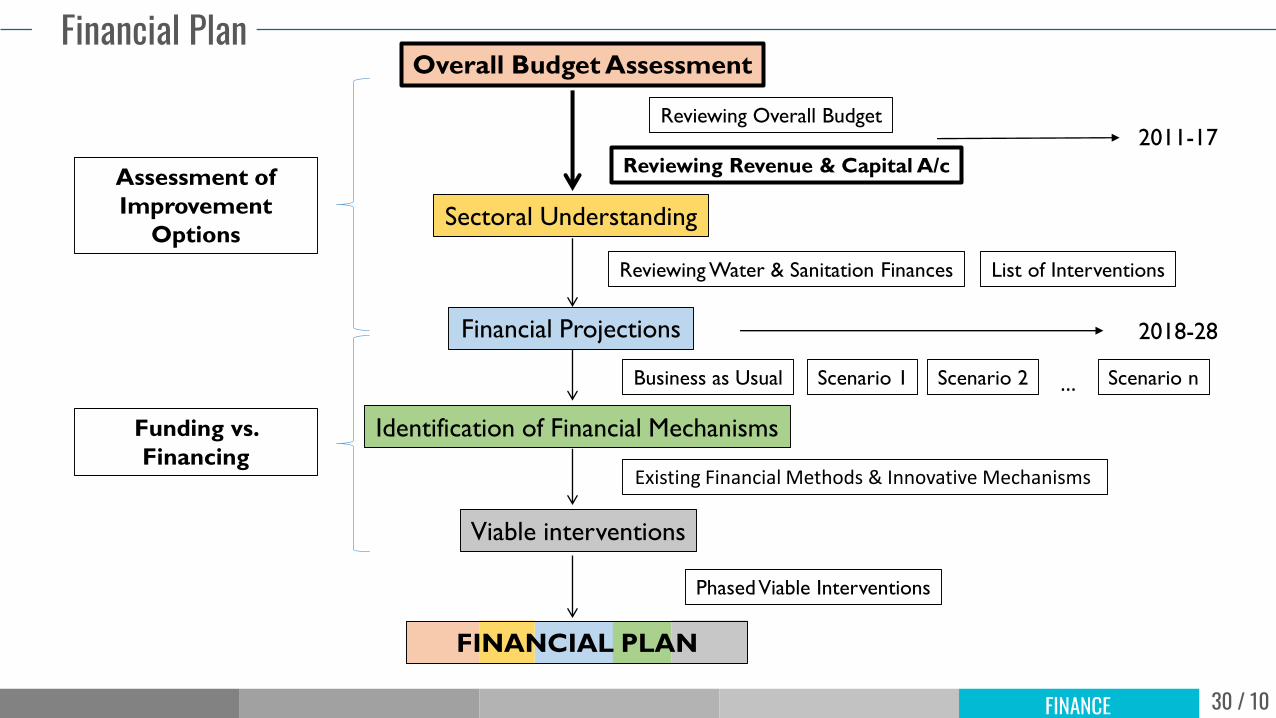
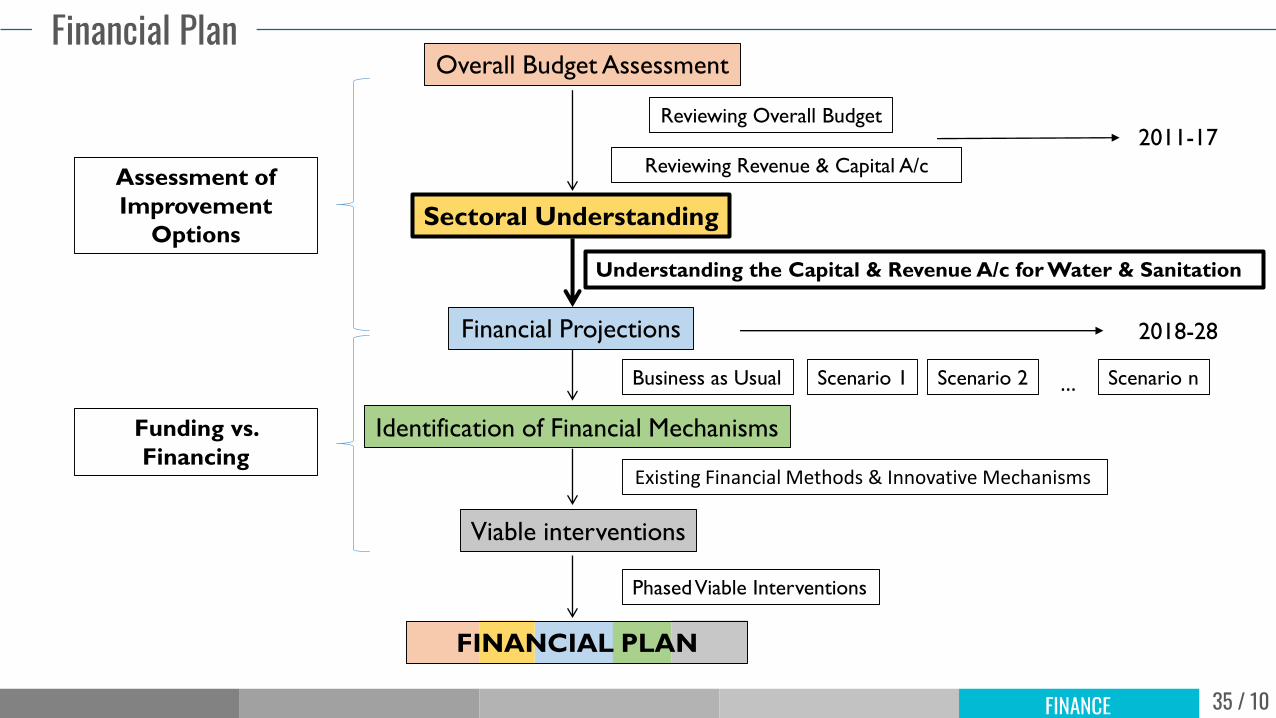
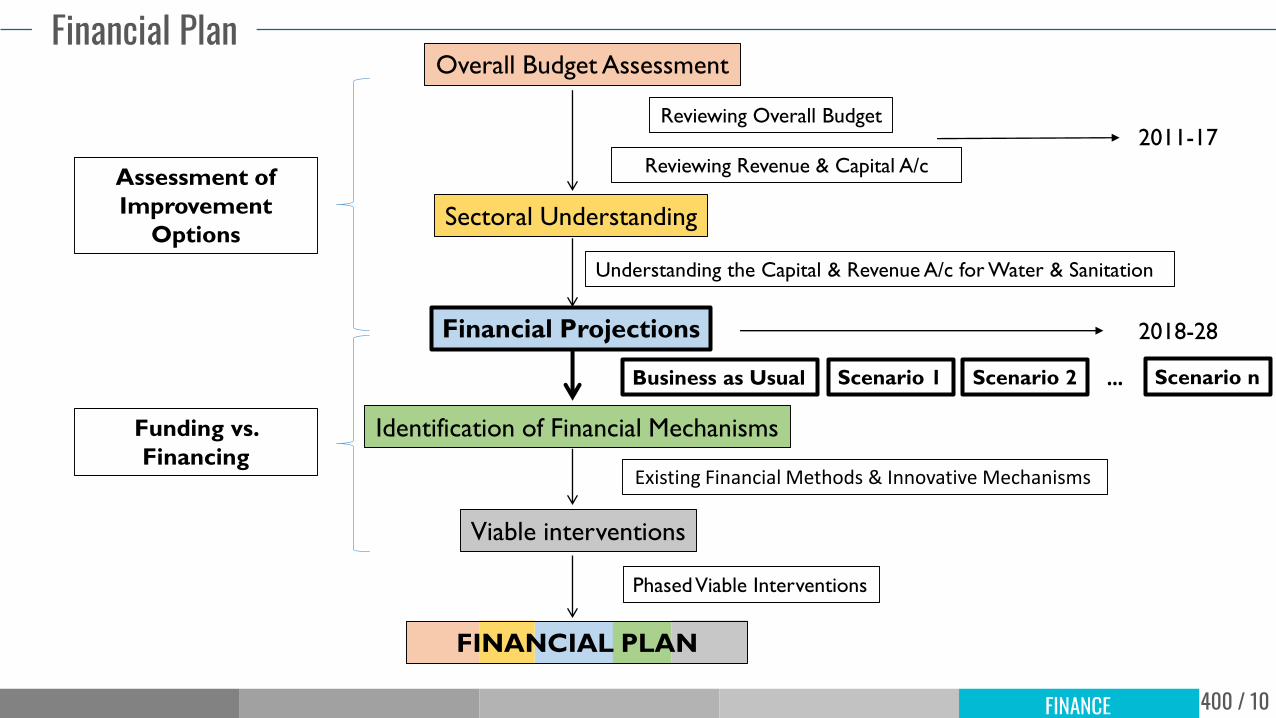
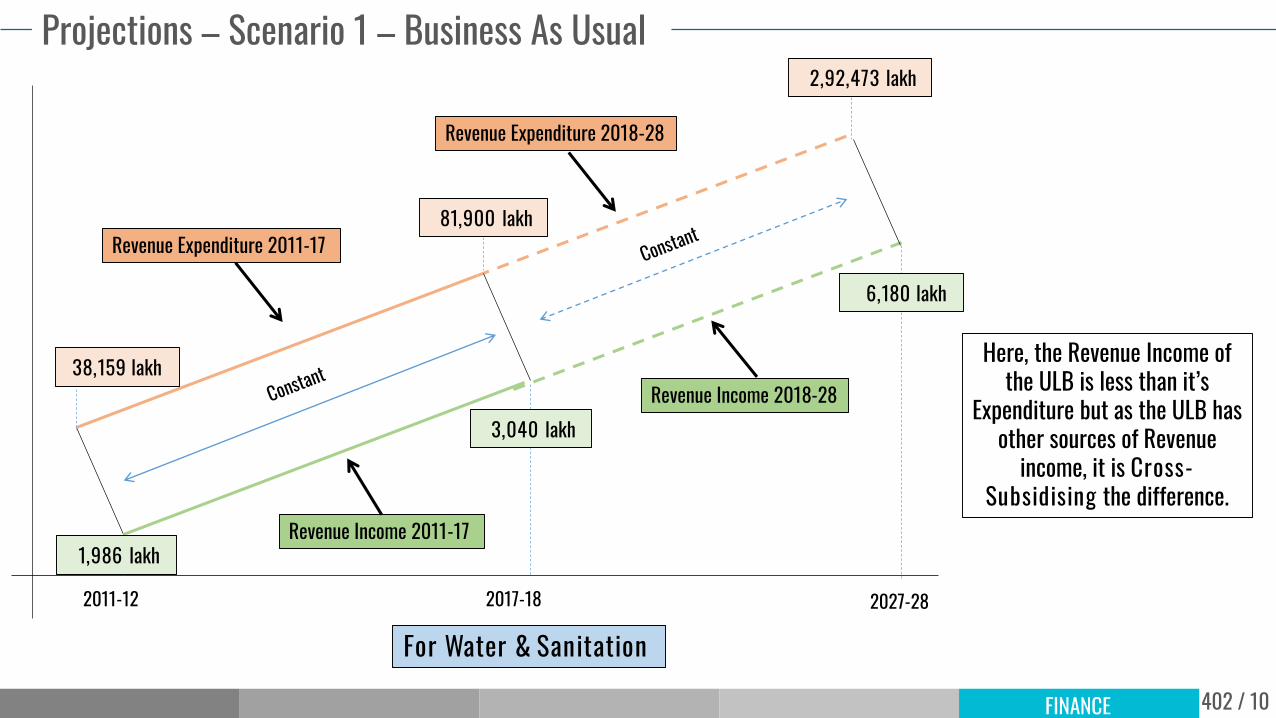
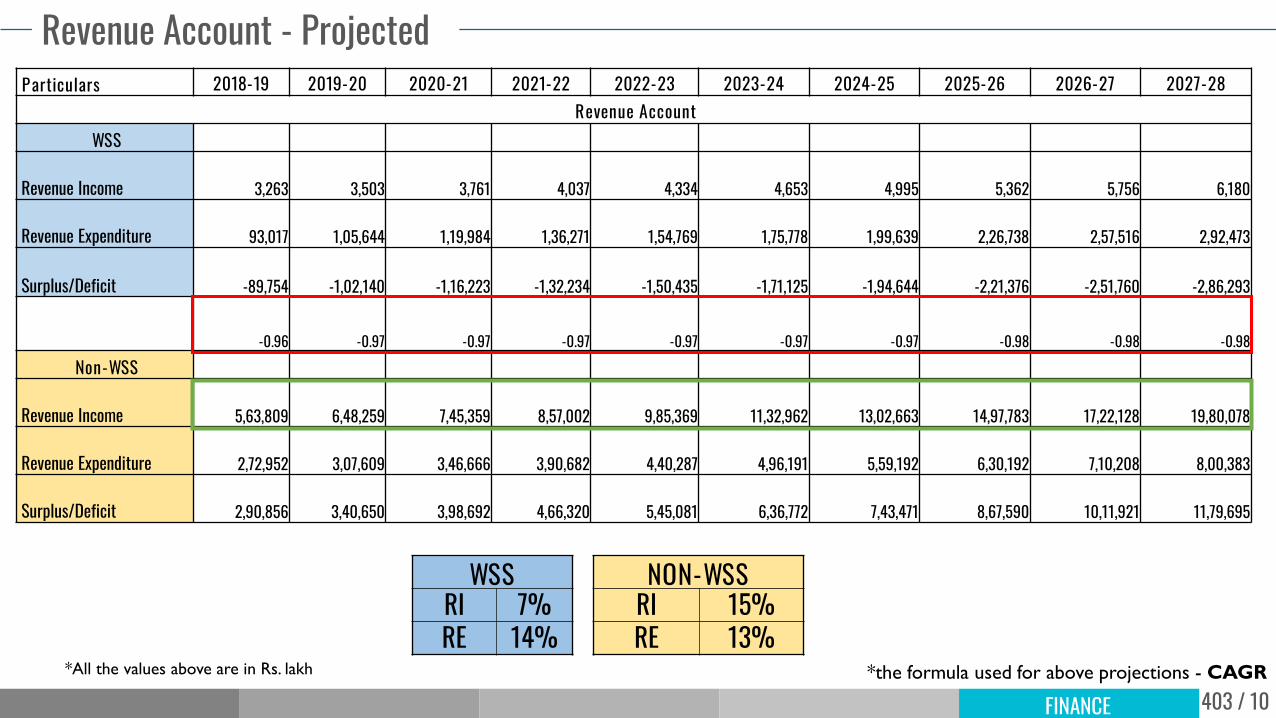
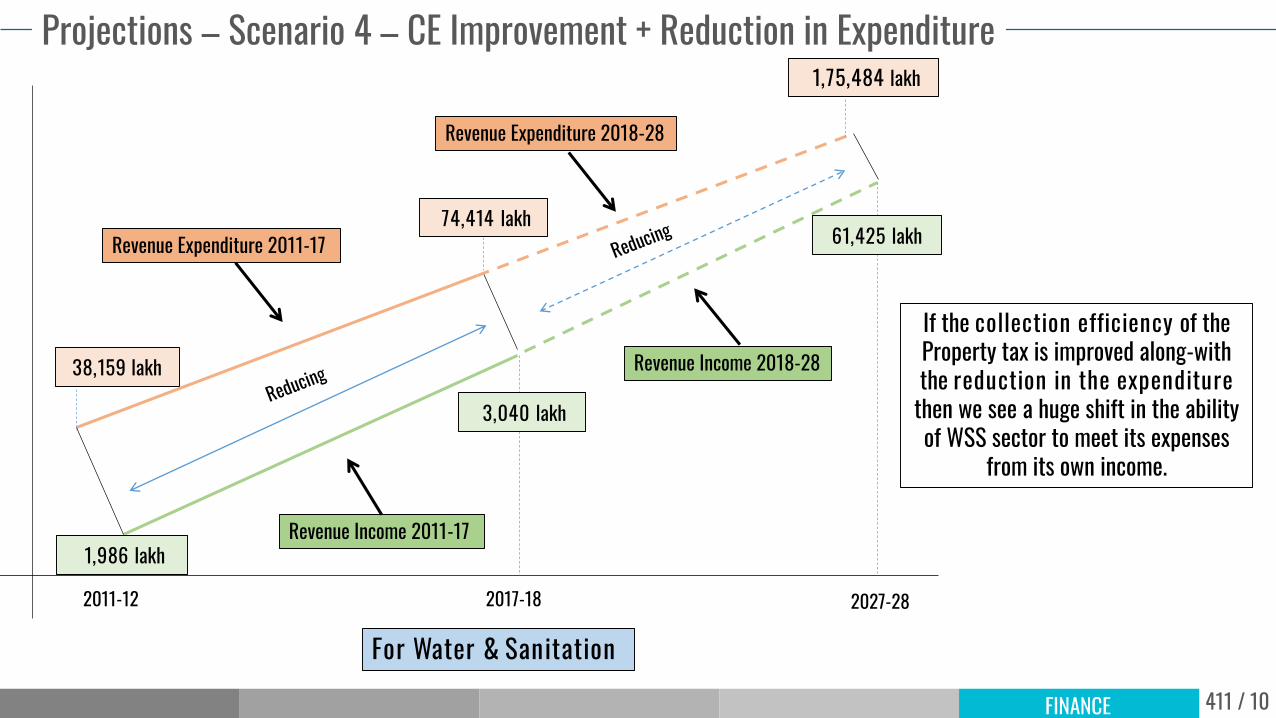
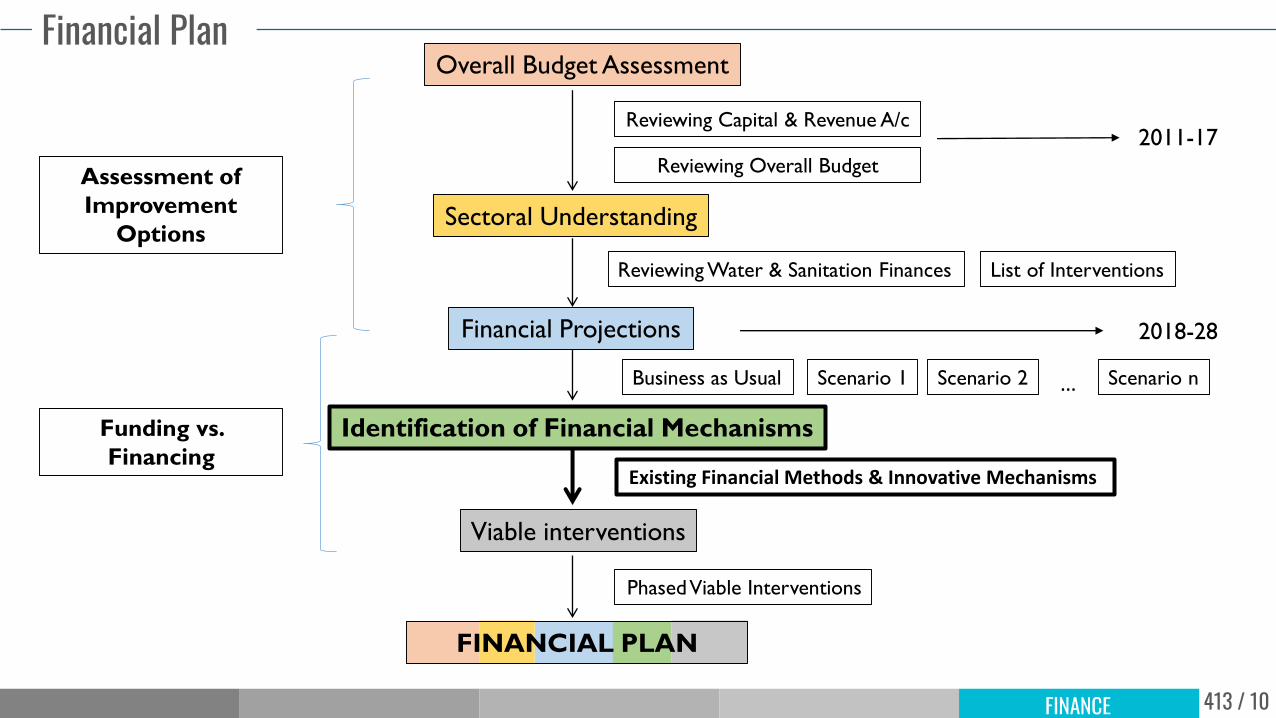
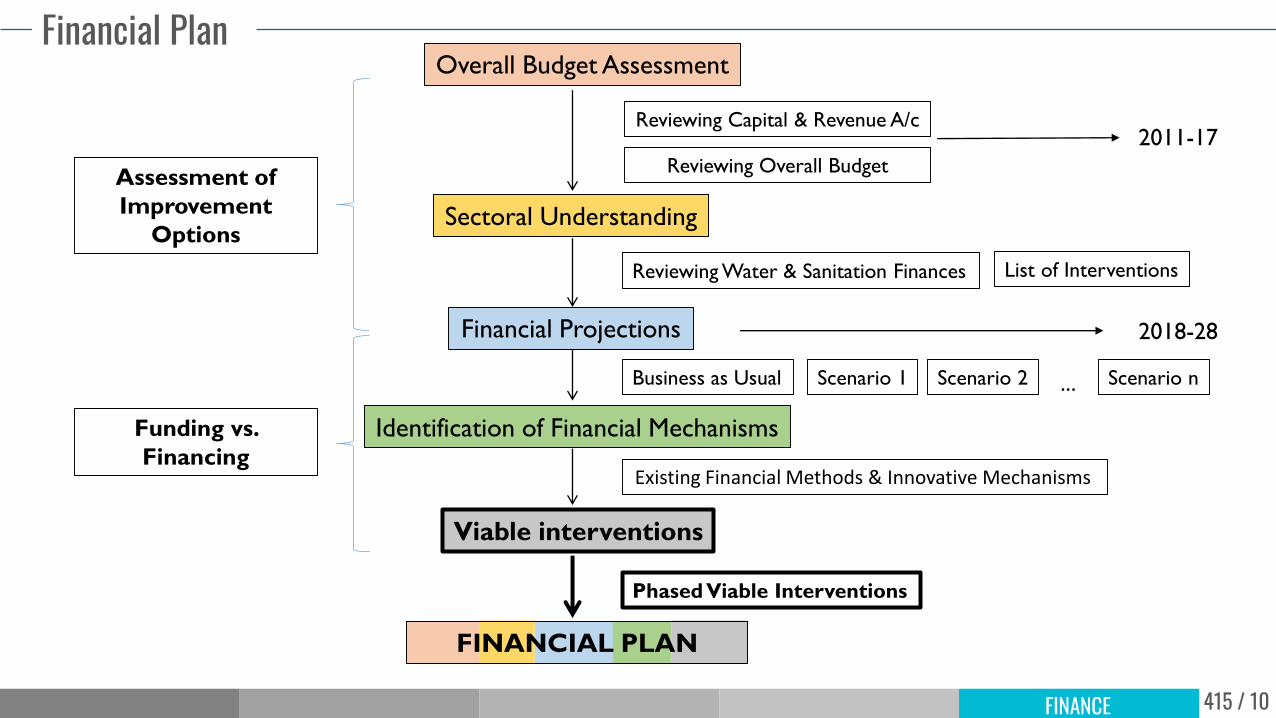
Financial Plan
2011-17
2018-28
Understanding the Capital & Revenue A/c for Water & Sanitation
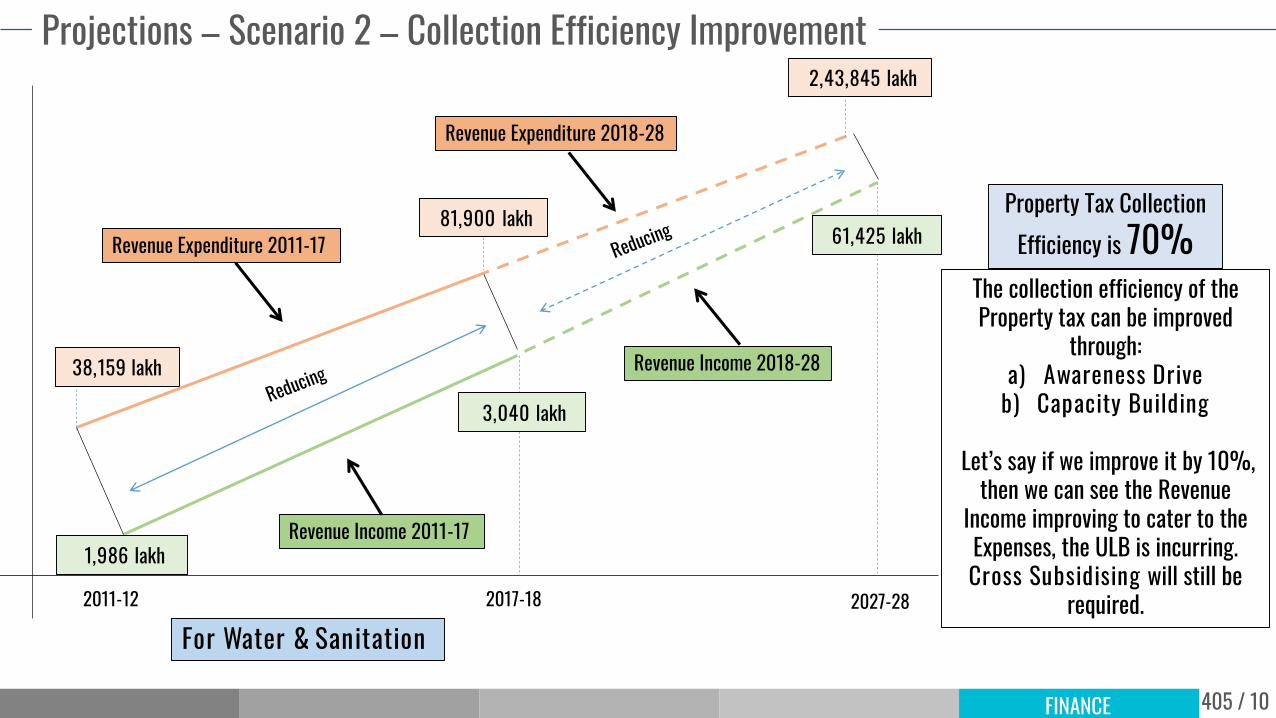
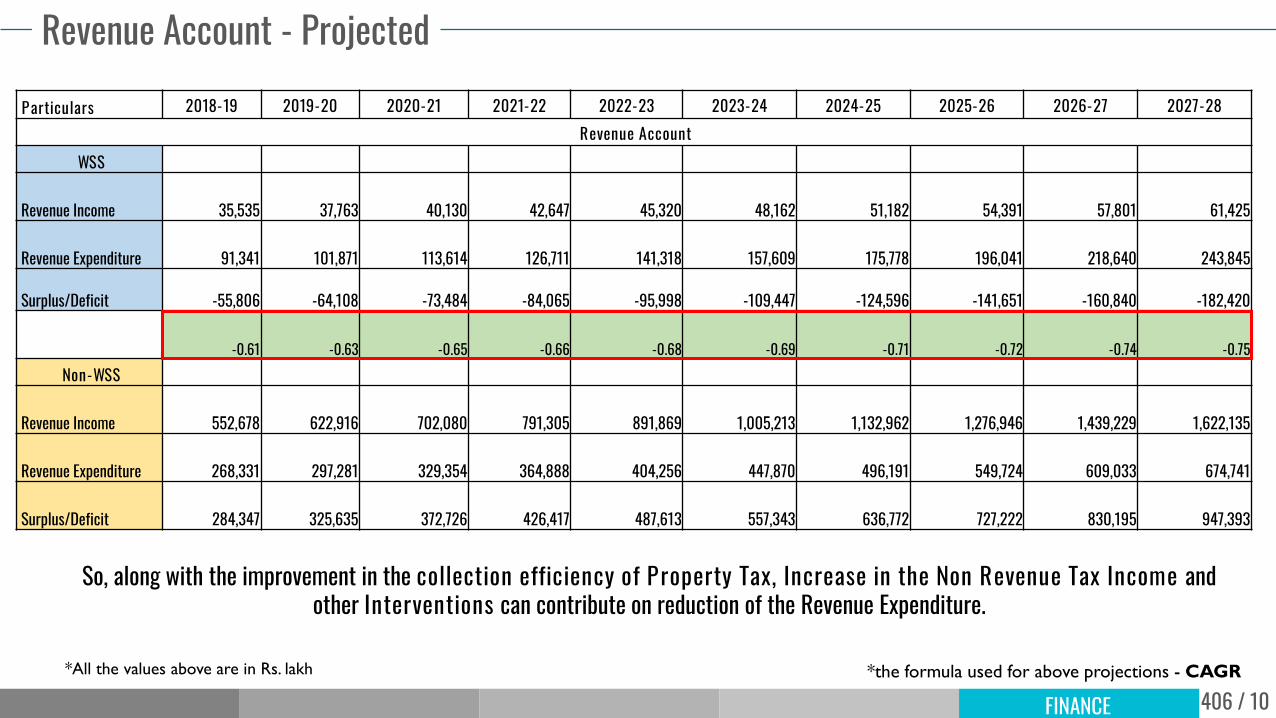
So, along with the improvement in the collection efficiency of Property Tax, Increase in the Non Revenue Tax Income and other Interventions can contribute on reduction of the Revenue Expenditure.
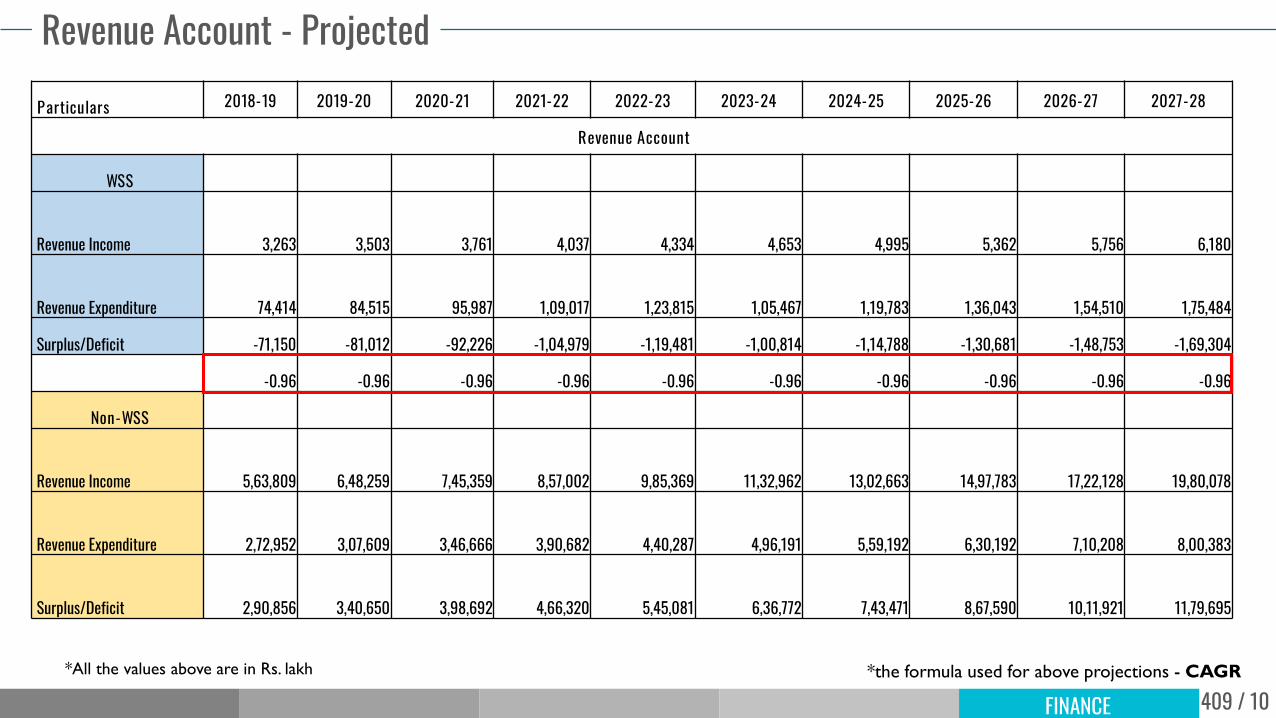
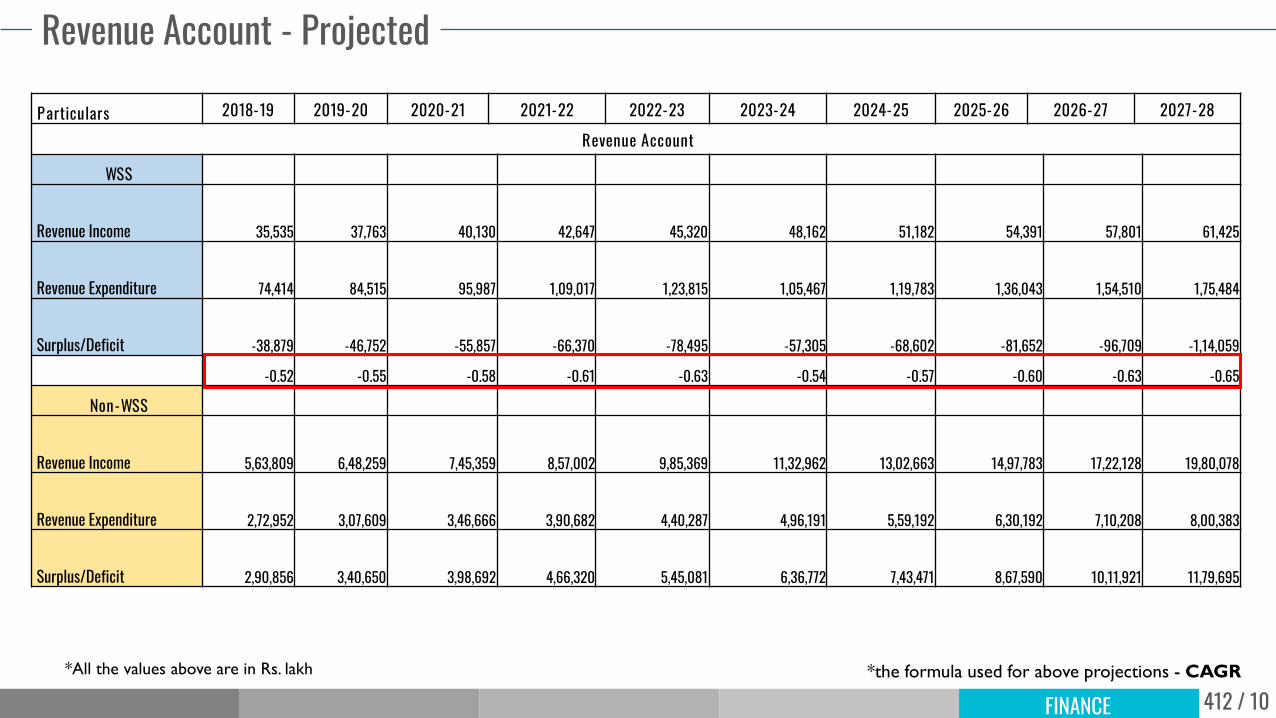
*All the values above are in Rs. lakh *the formula used for above projections - CAGR